Giddy/SIM Valuation for M&A-1 Prof. Ian Giddy New York University Valuation for Mergers & Acquisitions SIM/NYU The Job of the CFO Copyright ©2001 Ian H. Giddy Valuation for M&A 2 giddy.org What’s a Company Worth to Another Company? l Required Returns l Types of Models uBalance sheet models uDividend discount & corporate cash flow models uPrice/Earnings ratios uOption models l Estimating Growth Rates l Application: How These Change with M&A Yeo Hiap Seng

Welcome message from author
This document is posted to help you gain knowledge. Please leave a comment to let me know what you think about it! Share it to your friends and learn new things together.
Transcript

Giddy/SIM Valuation for M&A-1
Prof. Ian GiddyNew York University
Valuationfor Mergers & Acquisitions
SIM/NYUThe Job of the CFO
Copyright ©2001 Ian H. Giddy Valuation for M&A 2giddy.org
What’s a Company Worthto Another Company?
l Required Returnsl Types of ModelsuBalance sheet modelsuDividend discount & corporate cash flow
modelsuPrice/Earnings ratiosuOption models
l Estimating Growth Rates l Application: How These Change with
M&A
Yeo Hiap SengYeo Hiap Seng

Giddy/SIM Valuation for M&A-2
Copyright ©2001 Ian H. Giddy Valuation for M&A 3giddy.org
Framework for Assessing RetructuringOpportunities
RestructuringFramework
1
2
CurrentMarketValue
3
Totalrestructuredvalue
Potentialvalue withinternal+ externalimprovements
Potentialvalue withinternalimprovements
Company’sDCF value
Maximumrestructuringopportunity
Financialstructureimprovements
4
Disposal/Acquisitionopportunities
Operatingimprovements
Current marketoverpricing orunderpricng
5
(Eg Increase D/E)
Copyright ©2001 Ian H. Giddy Valuation for M&A 4giddy.org
Equity Valuation: From the Balance Sheet
Value of Assetsn Bookn Liquidationn Replacement
Value of Liabilities
n Bookn Market
Value of Equity
Giddy/SIM Valuation for M&A-3
Copyright ©2001 Ian H. Giddy Valuation for M&A 5giddy.org
Relative Valuation
l Do valuation ratios make sense?• Price/Earnings (P/E) ratios
q and variants (EBIT multiples, EBITDA multiples, Cash Flow multiples)
• Price/Book (P/BV) ratiosq and variants (Tobin's Q)
• Price/Sales ratios
l It depends on how they are used -- and what’s behind them!
Copyright ©2001 Ian H. Giddy Valuation for M&A 6giddy.org
Discounted Cashflow Valuation: Basis for Approach
uwhere
u n = Life of the asset
u CFt = Cashflow in period t
u r = Discount rate reflecting the riskiness of the estimated cashflows
Value = CFt
(1+r)tt=1
t =n∑
Giddy/SIM Valuation for M&A-4
Copyright ©2001 Ian H. Giddy Valuation for M&A 7giddy.org
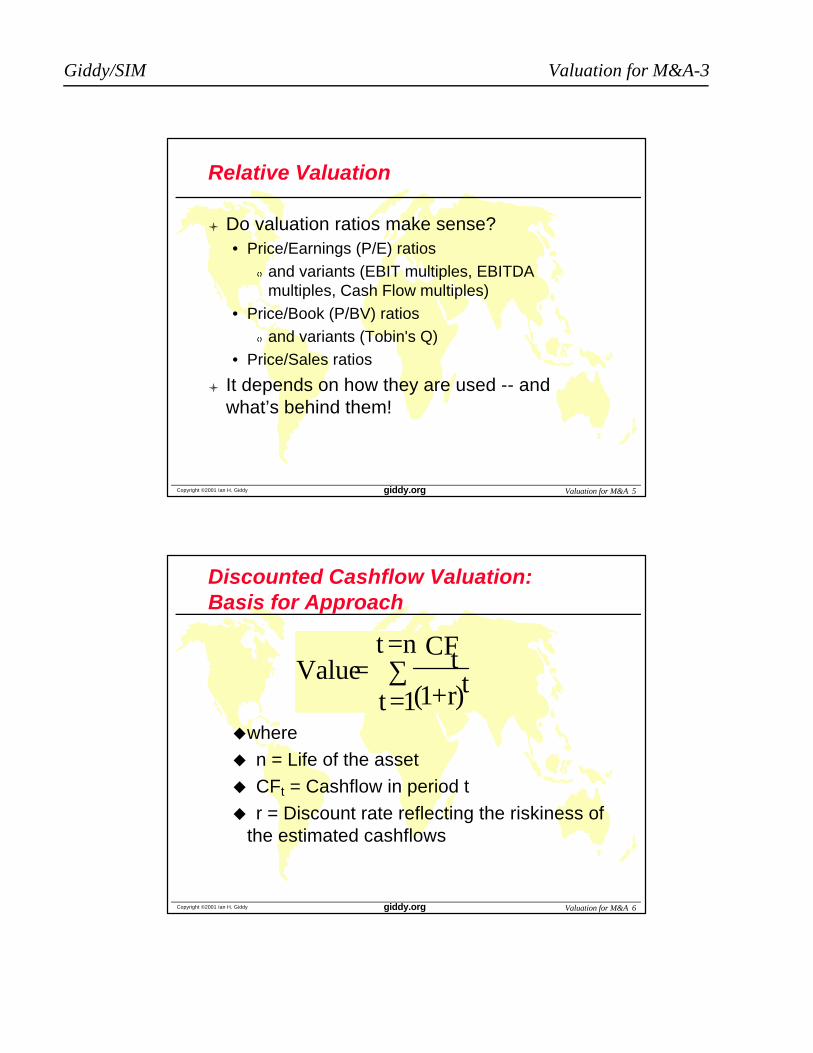
Valuing a Firm with DCF: An Illustration
Historical financial results
Adjust for nonrecurring aspects
Gauge future growth
Adjust for noncash items
Projected sales and operating profits
Projected free cash flows to the firm (FCFF)
Year 1 FCFF
Year 2 FCFF
Year 3 FCFF
Year 4 FCFF
Terminal year FCFF
Stable growth model or P/E comparable
Present value of free cash flows
+ cash, securities & excess assets
- Market value of debt
Value of shareholders equity
…
Discount to present using weighted average cost of capital (WACC)
Copyright ©2001 Ian H. Giddy Valuation for M&A 8giddy.org
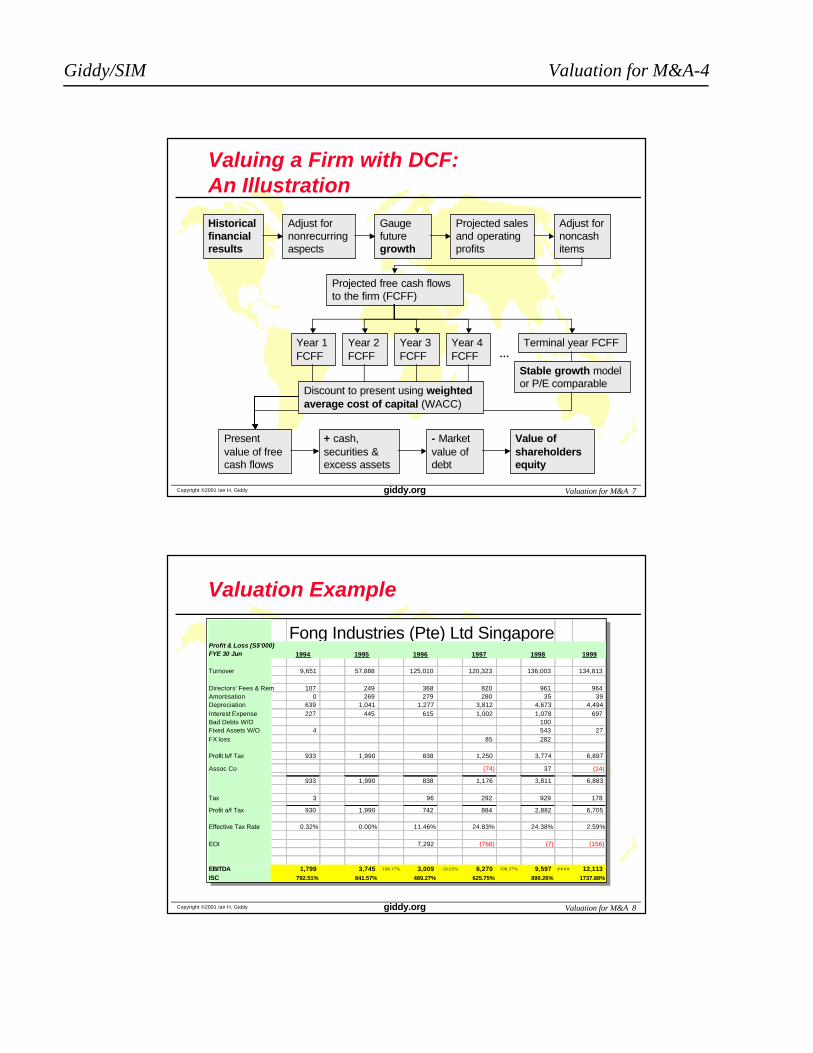
Valuation Example
Fong Industries (Pte) Ltd SingaporeProfit & Loss (S$'000)FYE 30 Jun 1994 1995 1996 1997 1998 1999
Turnover 9,651 57,888 125,010 120,323 136,003 134,813
Directors' Fees & Rem 107 249 368 820 961 964Amortisation 0 269 279 280 35 39Depreciation 639 1,041 1,277 3,812 4,673 4,494Interest Expense 227 445 615 1,002 1,078 697Bad Debts W/O 100Fixed Assets W/O 4 543 27FX loss 85 282
Profit b/f Tax 933 1,990 838 1,250 3,774 6,897
Assoc Co (74) 37 (14)
933 1,990 838 1,176 3,811 6,883
Tax 3 96 292 929 178
Profit a/f Tax 930 1,990 742 884 2,882 6,705
Effective Tax Rate 0.32% 0.00% 11.46% 24.83% 24.38% 2.59%
EOI 7,292 (768) (7) (156)
EBITDA 1,799 3,745 108.17% 3,009 -19.65% 6,270 108.37% 9,597 # # # # 12,113ISC 792.51% 841.57% 489.27% 625.75% 890.26% 1737.88%
Giddy/SIM Valuation for M&A-5
Copyright ©2001 Ian H. Giddy Valuation for M&A 9giddy.org
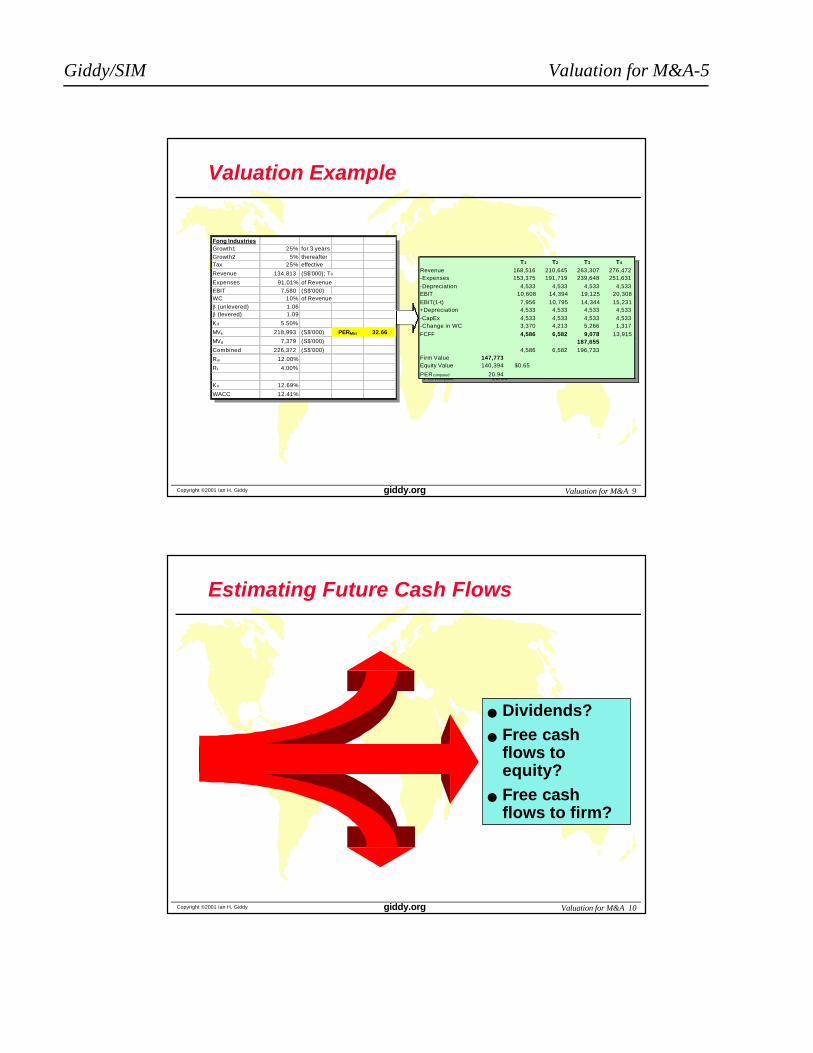
Valuation Example
Fong IndustriesGrowth1 25% for 3 yearsGrowth2 5% thereafterTax 25% effective
Revenue 134,813 (S$'000); T0
Expenses 91.01% of RevenueEBIT 7,580 (S$'000)WC 10% of Revenueβ (unlevered) 1.06β (levered) 1.09
Kd 5.50%
MVe 218,993 (S$'000) PERMkt 32.66
MVd 7,379 (S$'000)
Combined 226,372 (S$'000)
Rm 12.00%
R f 4.00%
Ke 12.69%
WACC 12.41%
T1 T2 T3 T4
Revenue 168,516 210,645 263,307 276,472-Expenses 153,375 191,719 239,648 251,631-Depreciation 4,533 4,533 4,533 4,533EBIT 10,608 14,394 19,125 20,308EBIT(1-t) 7,956 10,795 14,344 15,231+Depreciation 4,533 4,533 4,533 4,533-CapEx 4,533 4,533 4,533 4,533-Change in WC 3,370 4,213 5,266 1,317FCFF 4,586 6,582 9,078 13,915
187,6554,586 6,582 196,733
Firm Value 147,773Equity Value 140,394 $0.65
PERcomputed 20.94
Copyright ©2001 Ian H. Giddy Valuation for M&A 10giddy.org
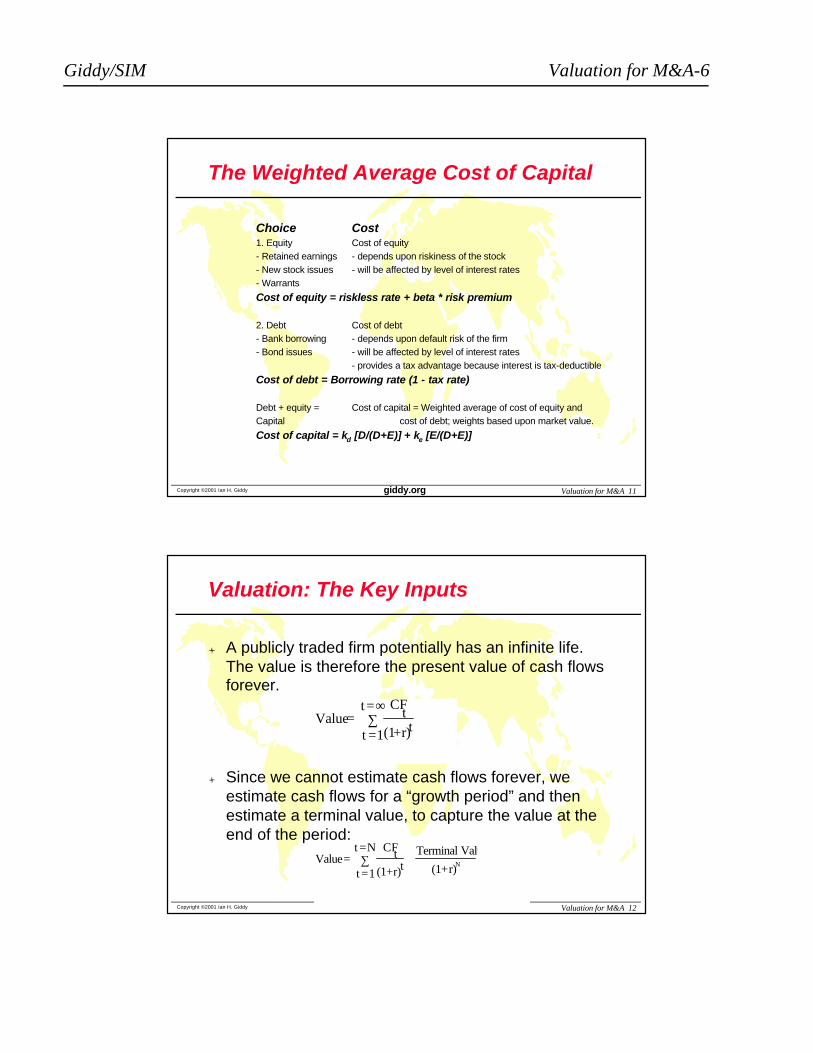
Estimating Future Cash Flows
n Dividends?n Free cash
flows to equity?
n Free cash flows to firm?
Giddy/SIM Valuation for M&A-6
Copyright ©2001 Ian H. Giddy Valuation for M&A 11giddy.org
The Weighted Average Cost of Capital
Choice Cost1. Equity Cost of equity- Retained earnings - depends upon riskiness of the stock- New stock issues - will be affected by level of interest rates- Warrants
Cost of equity = riskless rate + beta * risk premium
2. Debt Cost of debt- Bank borrowing - depends upon default risk of the firm- Bond issues - will be affected by level of interest rates
- provides a tax advantage because interest is tax-deductible
Cost of debt = Borrowing rate (1 - tax rate)
Debt + equity = Cost of capital = Weighted average of cost of equity andCapital cost of debt; weights based upon market value.
Cost of capital = kd [D/(D+E)] + ke [E/(D+E)]
Copyright ©2001 Ian H. Giddy Valuation for M&A 12giddy.org
Valuation: The Key Inputs
l A publicly traded firm potentially has an infinite life. The value is therefore the present value of cash flows forever.
l Since we cannot estimate cash flows forever, we estimate cash flows for a “growth period” and then estimate a terminal value, to capture the value at the end of the period:
Value = CF
t
(1+r)tt =1
t =∞∑
Value = CFt
(1+r)t+
Terminal Value
(1+r)Nt =1
t =N∑
Giddy/SIM Valuation for M&A-7
Copyright ©2001 Ian H. Giddy Valuation for M&A 13giddy.org
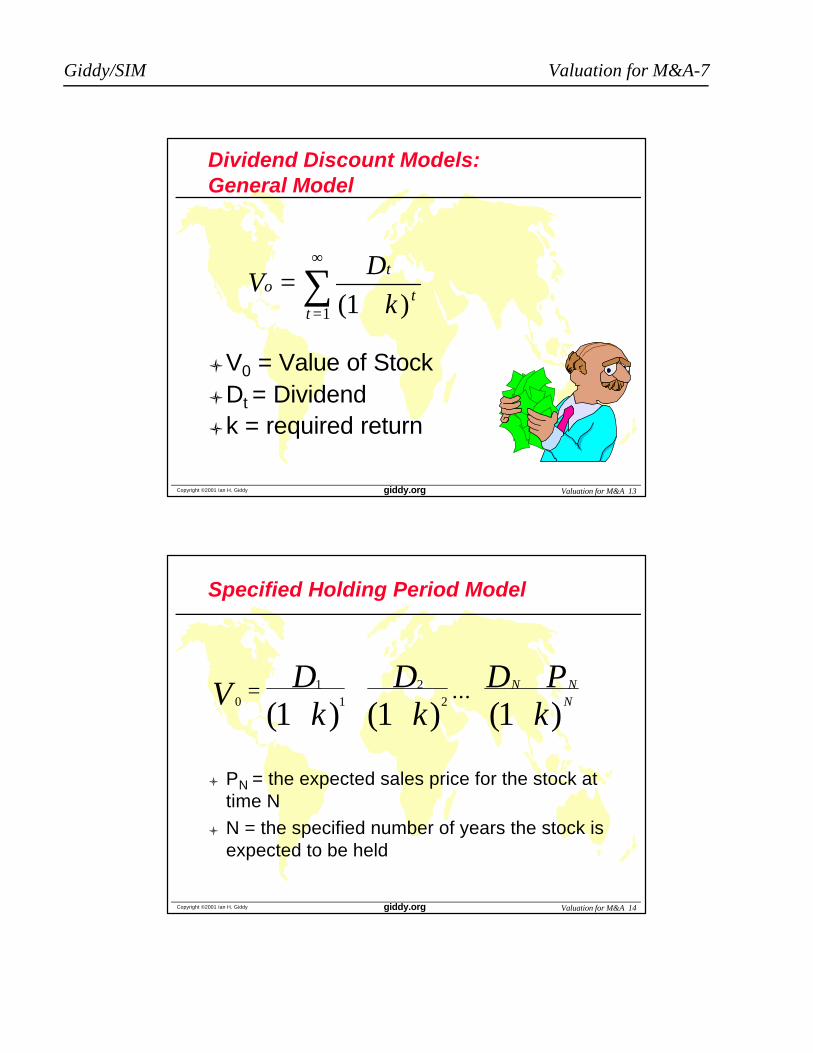
Dividend Discount Models:General Model
VD
ko
t
tt
=+=
∞
∑( )11
lV0 = Value of StocklDt = Dividendlk = required return
Copyright ©2001 Ian H. Giddy Valuation for M&A 14giddy.org
Specified Holding Period Model
01
12
2
1 1 1V D
kD
kD P
kN N
N= + +
+
+ + +( ) ( ) ( )...
l PN = the expected sales price for the stock at time N
l N = the specified number of years the stock is expected to be held

Giddy/SIM Valuation for M&A-8
Copyright ©2001 Ian H. Giddy Valuation for M&A 15giddy.org
No Growth Model
VD
ko =
l Stocks that have earnings and dividends that are expected to remain constant
l Preferred Stock
Copyright ©2001 Ian H. Giddy Valuation for M&A 16giddy.org
No Growth Model: Example
E1 = D1 = $5.00k = .15
V0 = $5.00 / .15 = $33.33
VD
ko =
n Burlington Power & Light has earnings of $5 per share and pays out 100% dividend
n The required return that shareholders expect is 15%
n The earnings are not expected to grow but remain steady indefinitely
n What’s a BPL share worth?
n Burlington Power & Light has earnings of $5 per share and pays out 100% dividend
n The required return that shareholders expect is 15%
n The earnings are not expected to grow but remain steady indefinitely
n What’s a BPL share worth?

Giddy/SIM Valuation for M&A-9
Copyright ©2001 Ian H. Giddy Valuation for M&A 17giddy.org
Constant Growth Model
VoD g
k g
o=
+−
( )1
lg = constant perpetual growth rate
Copyright ©2001 Ian H. Giddy Valuation for M&A 18giddy.org
Constant Growth Model: Example
VoD g
k g
o=
+−
( )1
E1 = $5.00 b = 40% k = 15%(1-b) = 60% D1 = $3.00 g = 8%V0 = 3.00 / (.15 - .08) = $42.86
n Motel 6 has earnings of $5 per share. It reinvests 40% and pays out 60%dividend
n The required return that shareholders expect is 15%
n The earnings are expected to grow at 8% per annum
n What’s an M6 share worth?
n Motel 6 has earnings of $5 per share. It reinvests 40% and pays out 60%dividend
n The required return that shareholders expect is 15%
n The earnings are expected to grow at 8% per annum
n What’s an M6 share worth?
Plowback rate
Giddy/SIM Valuation for M&A-10
Copyright ©2001 Ian H. Giddy Valuation for M&A 19giddy.org
Estimating Dividend Growth Rates
g ROE b= ×
l g = growth rate in dividendsl ROE = Return on Equity for the firml b = plowback or retention percentage rate
i.e.(1- dividend payout percentage rate)
Copyright ©2001 Ian H. Giddy Valuation for M&A 20giddy.org
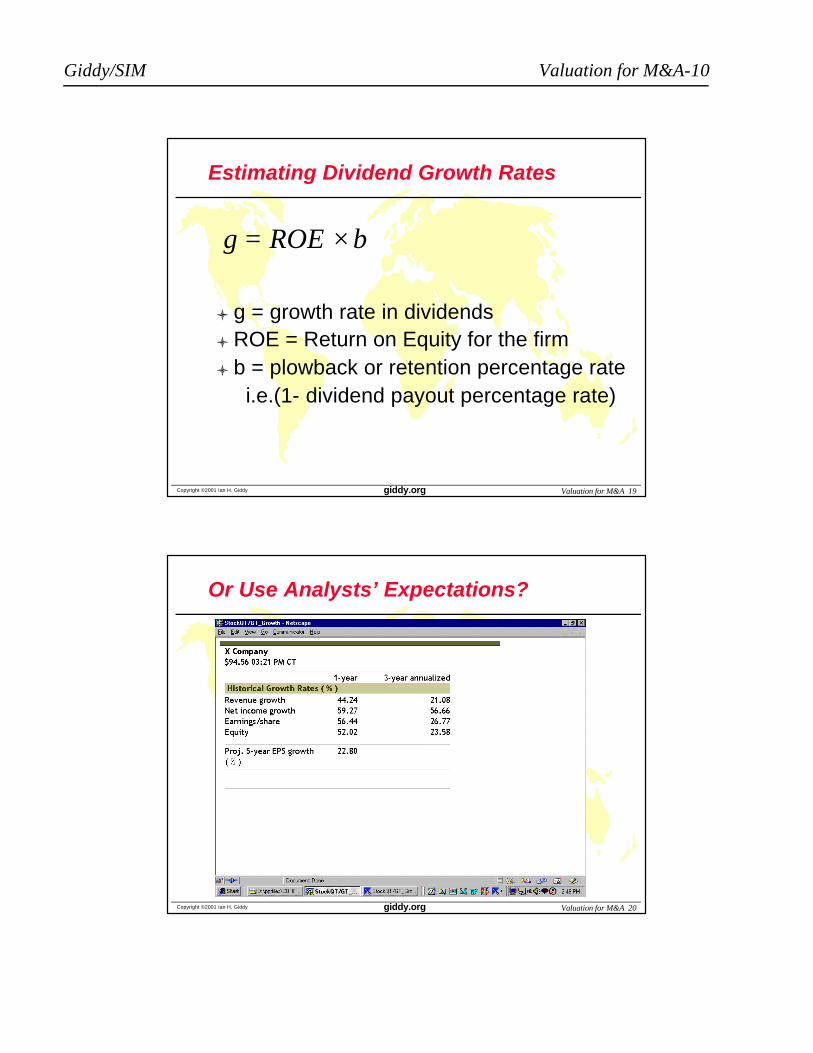
Or Use Analysts’ Expectations?

Giddy/SIM Valuation for M&A-11
Copyright ©2001 Ian H. Giddy Valuation for M&A 21giddy.org
Shifting Growth Rate Model
V Dg
k
D g
k g ko o
t
tt
TT
T=++
++
− +=∑( )
( )
( )
( )( )
1
1
1
1
1
1
2
2
lg1 = first growth ratelg2 = second growth ratelT = number of periods of growth at
g1
Copyright ©2001 Ian H. Giddy Valuation for M&A 22giddy.org
n Mindspringpays dividends $2 per share. The required return that shareholders expect is 15%
n The dividends are expected to grow at 20% for 3 years and 5% thereafter
n What’s a Mindspringshare worth?
n Mindspringpays dividends $2 per share. The required return that shareholders expect is 15%
n The dividends are expected to grow at 20% for 3 years and 5% thereafter
n What’s a Mindspringshare worth?
Shifting Growth Rate Model: Example
D0 = $2.00 g1 = 20% g2 = 5%
k = 15% T = 3 D1 = 2.40
D2 = 2.88 D3 = 3.46 D4 = 3.63
V0 = D1/(1.15) + D2/(1.15)2 + D3/(1.15)3
+ D4 / (.15 - .05) ( (1.15)3
V0 = 2.09 + 2.18 + 2.27 + 23.86 = $30.40
Giddy/SIM Valuation for M&A-12
Copyright ©2001 Ian H. Giddy Valuation for M&A 23giddy.org
Stable Growth and Terminal Value
l When a firm’s cash flows grow at a “constant” rate forever, the present value of those cash flows can be written as:Value = Expected Cash Flow Next Period / (r - g)where,
r = Discount rate (Cost of Equity or Cost of Capital)g = Expected growth rate
l This “constant” growth rate is called a stable growth rate and cannot be higher than the growth rate of the economy in which the firm operates.
l While companies can maintain high growth rates for extended periods, they will all approach “stable growth” at some point intime.
l When they do approach stable growth, the valuation formula above can be used to estimate the “terminal value” of all cash flows beyond.
Copyright ©2001 Ian H. Giddy Valuation for M&A 24giddy.org
Growth Patterns
l A key assumption in all discounted cash flow models is the period of high growth, and the pattern of growth during that period. Ingeneral, we can make one of three assumptions:u there is no high growth, in which case the firm is already in
stable growthu there will be high growth for a period, at the end of which the
growth rate will drop to the stable growth rate (2-stage)u there will be high growth for a period, at the end of which the
growth rate will decline gradually to a stable growth rate(3-stage)
l The assumption of how long high growth will continue will dependupon several factors including:u the size of the firm (larger firm -> shorter high growth periods)u current growth rate (if high -> longer high growth period)u barriers to entry and differential advantages (if high -> longer
growth period)
Giddy/SIM Valuation for M&A-13
Copyright ©2001 Ian H. Giddy Valuation for M&A 25giddy.org
Length of High Growth Period
l Assume that you are analyzing two firms, both of which are enjoying high growth. The first firm is EarthlinkNetwork, an internet service provider, which operates in an environment with few barriers to entry and extraordinary competition. The second firm is Biogen, a bio-technology firm which is enjoying growth from two drugs to which it owns patents for the next decade. Assuming that both firms are well managed, which of the two firms would you expect to have a longer high growth period?
o Earthlink Networko Biogeno Both are well managed and should have the same high
growth period
Copyright ©2001 Ian H. Giddy Valuation for M&A 26giddy.org
Choosing a Growth Pattern: Examples
Company Valuation in Growth Period Stable GrowthDisney Nominal U.S. $ 10 years 5%(long term
Firm (3-stage) nominal growth rate in the U.S. economy
Aracruz Real BR 5 years 5%: based upon Equity: FCFE (2-stage) expected long term
real growth rate for Brazilian economy
Deutsche Bank Nominal DM 0 years 5%: set equal to Equity: Dividends nominal growth rate
in the world economy

Giddy/SIM Valuation for M&A-14
Copyright ©2001 Ian H. Giddy Valuation for M&A 27giddy.org
The Building Blocks of Valuation
Choose aCash Flow Dividends
Expected Dividends to
Stockholders
Cashflows to Equity
Net Income
- (1- δ) (Capital Exp. - Deprec’n)
- (1- δ) Change in Work. Capital
= Free Cash flow to Equity (FCFE)
[δ = Debt Ratio]
Cashflows to Firm
EBIT (1- tax rate)
- (Capital Exp. - Deprec’n)
- Change in Work. Capital
= Free Cash flow to Firm (FCFF)
& A Discount Rate Cost of Equity
• Basis: The riskier the investment, the greater is the cost of equity.
• Models:
CAPM: Riskfree Rate + Beta (Risk Premium)
APM: Riskfree Rate + Σ Betaj (Risk Premiumj): n factors
Cost of Capital
WACC = ke ( E/ (D+E))
+ kd ( D/(D+E))
kd = Current Borrowing Rate (1-t)
E,D: Mkt Val of Equity and Debt
& a growth pattern
t
g
Stable Growth
g
Two-Stage Growth
|High Growth Stable
g
Three-Stage Growth
|High Growth StableTransition
Copyright ©2001 Ian H. Giddy Valuation for M&A 28giddy.org
The Building Blocks of Valuation
Choose aCash Flow Dividends
Expected Dividends to
Stockholders
Cashflows to Equity
Net Income
- (1- δ) (Capital Exp. - Deprec’n)
- (1- δ) Change in Work. Capital
= Free Cash flow to Equity (FCFE)
[δ = Debt Ratio]
Cashflows to Firm
EBIT (1- tax rate)
- (Capital Exp. - Deprec’n)
- Change in Work. Capital
= Free Cash flow to Firm (FCFF)
& A Discount Rate Cost of Equity
• Basis: The riskier the investment, the greater is the cost of equity.
• Models:
CAPM: Riskfree Rate + Beta (Risk Premium)
APM: Riskfree Rate + Σ Betaj (Risk Premiumj): n factors
Cost of Capital
WACC = ke ( E/ (D+E))
+ kd ( D/(D+E))
kd = Current Borrowing Rate (1-t)
E,D: Mkt Val of Equity and Debt
& a growth pattern
t
g
Stable Growth
g
Two-Stage Growth
|High Growth Stable
g
Three-Stage Growth
|High Growth StableTransition
Spreadsheet example
Giddy/SIM Valuation for M&A-15
Copyright ©2001 Ian H. Giddy Valuation for M&A 29giddy.org
Relative Valuation
l In relative valuation, the value of an asset is derived from the pricing of 'comparable' assets, standardized using a common variable such as earnings,cashflows, book value or revenues. Examples include --• Price/Earnings (P/E) ratios
q and variants (EBIT multiples, EBITDA multiples, Cash Flow multiples)
• Price/Book (P/BV) ratiosq and variants (Tobin's Q)
• Price/Sales ratios
Copyright ©2001 Ian H. Giddy Valuation for M&A 30giddy.org
Price Earnings Ratios
l P/E Ratios are a function of two factorsuRequired rates of return (k)
uExpected growth in dividends
l UsesuRelative valuation
uExtensive use in industry
Giddy/SIM Valuation for M&A-16
Copyright ©2001 Ian H. Giddy Valuation for M&A 31giddy.org
Ratios Do Have Meaning
l Gordon Growth Model:l Dividing both sides by the earnings,
l Dividing both sides by the book value of equity,
l If the return on equity is written in terms of the retention ratio and the expected growth rate
l Dividing by the Sales per share,
P 0 =DPS1
r − gn
P 0
EPS 0
= PE = Payout Ratio * (1 + g n )
r-gn
P 0
BV 0= PBV =
ROE - gn
r-gn
P 0
BV 0= PBV =
ROE * Payout Ratio * (1 + g n )
r-g n
P 0
Sales 0= PS =
Profit Margin * Payout Ratio * (1 + g n )
r-gn
Copyright ©2001 Ian H. Giddy Valuation for M&A 32giddy.org
P/E Ratio: No expected growth
PE
kP
E k
01
0
1
1
=
=
l E1 - expected earnings for next yearuE1 is equal to D1 under no growth
l k - required rate of return

Giddy/SIM Valuation for M&A-17
Copyright ©2001 Ian H. Giddy Valuation for M&A 33giddy.org
P/E Ratio with Constant Growth
PD
k g
E b
k b ROE
P
E
b
k b ROE
01 1
0
1
1
1
=−
=−
− ×
=−
− ×
( )
( )
( )
Where
l b = retention ratio
l ROE = Return on Equity
Copyright ©2001 Ian H. Giddy Valuation for M&A 34giddy.org
Numerical Example: No Growth
E0 = $2.50 g = 0 k = 12.5%
P0 = D/k = $2.50/.125 = $20.00P/E = 1/k = 1/.125 = 8
n Quickie Broom Co has earnings of $2.50 per share. It pays out 100%dividend
n The required return that shareholders expect is 12.5% (based on CAPM with Beta of 1, RF = 7%, Market risk premium 5.5%)
n What PE ratio should such a company have?
n Quickie Broom Co has earnings of $2.50 per share. It pays out 100%dividend
n The required return that shareholders expect is 12.5% (based on CAPM with Beta of 1, RF = 7%, Market risk premium 5.5%)
n What PE ratio should such a company have?
Giddy/SIM Valuation for M&A-18
Copyright ©2001 Ian H. Giddy Valuation for M&A 35giddy.org
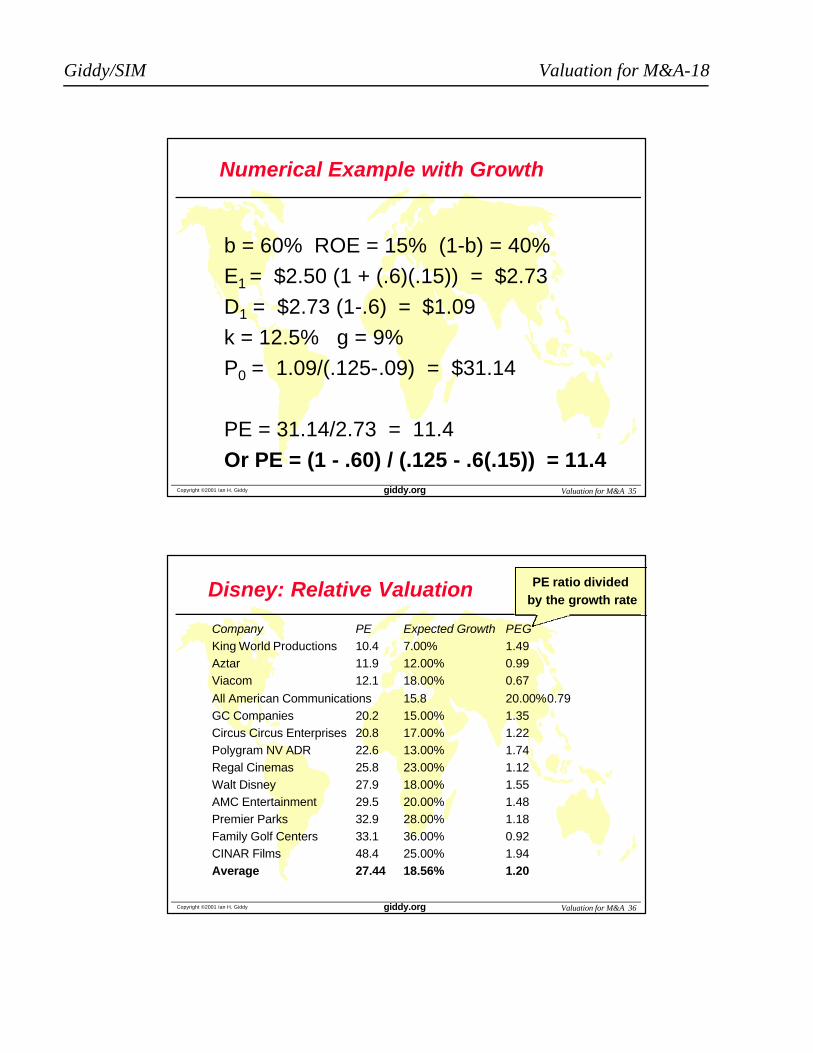
Numerical Example with Growth
b = 60% ROE = 15% (1-b) = 40%
E1 = $2.50 (1 + (.6)(.15)) = $2.73
D1 = $2.73 (1-.6) = $1.09
k = 12.5% g = 9%
P0 = 1.09/(.125-.09) = $31.14
PE = 31.14/2.73 = 11.4
Or PE = (1 - .60) / (.125 - .6(.15)) = 11.4
Copyright ©2001 Ian H. Giddy Valuation for M&A 36giddy.org
Disney: Relative Valuation
Company PE Expected Growth PEGKing World Productions 10.4 7.00% 1.49Aztar 11.9 12.00% 0.99Viacom 12.1 18.00% 0.67
All American Communications 15.8 20.00%0.79GC Companies 20.2 15.00% 1.35Circus Circus Enterprises 20.8 17.00% 1.22Polygram NV ADR 22.6 13.00% 1.74Regal Cinemas 25.8 23.00% 1.12Walt Disney 27.9 18.00% 1.55AMC Entertainment 29.5 20.00% 1.48Premier Parks 32.9 28.00% 1.18Family Golf Centers 33.1 36.00% 0.92CINAR Films 48.4 25.00% 1.94Average 27.44 18.56% 1.20
PE ratio dividedby the growth rate

Giddy/SIM Valuation for M&A-19
Copyright ©2001 Ian H. Giddy Valuation for M&A 37giddy.org
Is Disney fairly valued?
l Based upon the PE ratio, is Disney under, over or correctly valued?o Under Valuedo Over Valuedo Correctly Valued
l Based upon the PEG ratio, is Disney under valued?o Under Valuedo Over Valuedo Correctly Valued
l Will this valuation give you a higher or lower valuation than the discounted CF valuation?o Highero Lower
Copyright ©2001 Ian H. Giddy Valuation for M&A 38giddy.org
Relative Valuation Assumptions
l Assume that you are reading an equity research report where a buy recommendation for Viacom is being based upon the fact that its PE ratio is lower than the average for the industry. Implicitly, what is the underlying assumption or assumptions being made by this analyst?
o The sector itself is, on average, fairly priced
o The earnings of the firms in the group are being measured consistently
o The firms in the group are all of equivalent risko The firms in the group are all at the same stage in the growth cycleo The firms in the group are of equivalent risk and have similar cash
flow patternso All of the above

Giddy/SIM Valuation for M&A-20
Equity Valuation:Application to M&A
Prof. Ian GiddyNew York University
Copyright ©2001 Ian H. Giddy Valuation for M&A 40giddy.org
How Much Should We Pay?
Applying the discounted cash flow approach, we need to know:
1.The incremental cash flows to be generated from the acquisition, adjusted for debt servicing and taxes
2.The rate at which to discount the cash flows (required rate of return)
3.The deadweight costs of making the acquisition (investment banks' fees, etc)
Giddy/SIM Valuation for M&A-21
Copyright ©2001 Ian H. Giddy Valuation for M&A 42giddy.org
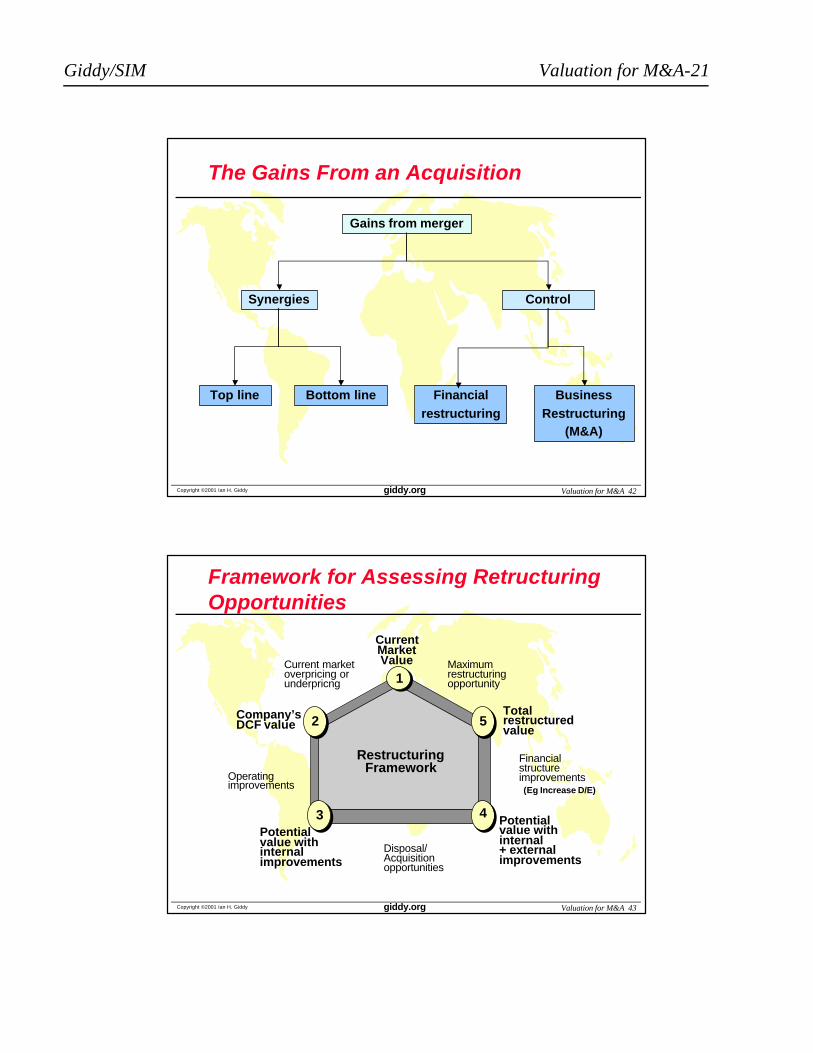
The Gains From an Acquisition
Gains from merger
Synergies Control
Top line Financialrestructuring
BusinessRestructuring
(M&A)
Bottom line
Copyright ©2001 Ian H. Giddy Valuation for M&A 43giddy.org
Framework for Assessing RetructuringOpportunities
RestructuringFramework
1
2
CurrentMarketValue
3
Totalrestructuredvalue
Potentialvalue withinternal+ externalimprovements
Potentialvalue withinternalimprovements
Company’sDCF value
Maximumrestructuringopportunity
Financialstructureimprovements
4
Disposal/Acquisitionopportunities
Operatingimprovements
Current marketoverpricing orunderpricng
5
(Eg Increase D/E)
Giddy/SIM Valuation for M&A-22
Copyright ©2001 Ian H. Giddy Valuation for M&A 44giddy.org
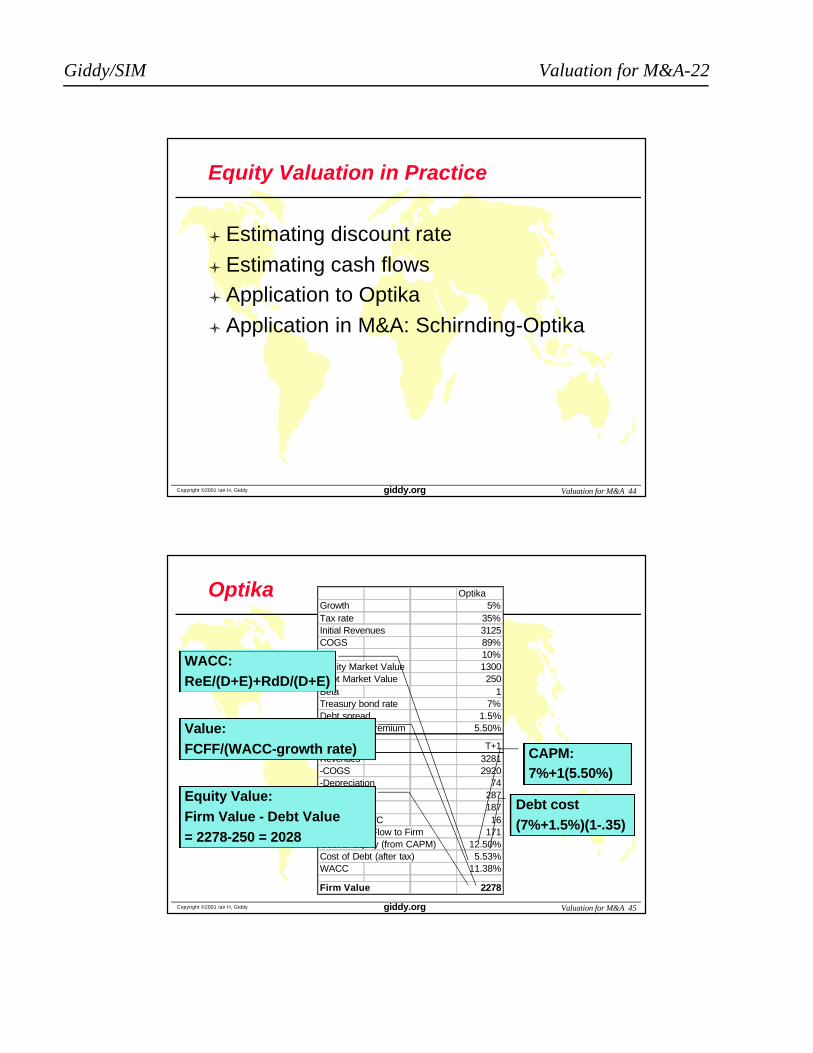
Equity Valuation in Practice
l Estimating discount rate
l Estimating cash flowsl Application to Optika
l Application in M&A: Schirnding-Optika
Copyright ©2001 Ian H. Giddy Valuation for M&A 45giddy.org
Optika OptikaGrowth 5%Tax rate 35%Initial Revenues 3125COGS 89%WC 10%Equity Market Value 1300Debt Market Value 250Beta 1Treasury bond rate 7%Debt spread 1.5%Market risk premium 5.50%
T+1Revenues 3281-COGS 2920-Depreciation 74=EBIT 287EBIT(1-Tax) 187-Change in WC 16=Free Cash Flow to Firm 171Cost of Equity (from CAPM) 12.50%Cost of Debt (after tax) 5.53%WACC 11.38%
Firm Value 2278
CAPM:7%+1(5.50%)
Debt cost(7%+1.5%)(1-.35)
WACC:ReE/(D+E)+RdD/(D+E)
Value:FCFF/(WACC-growth rate)
Equity Value:Firm Value - Debt Value = 2278-250 = 2028
Giddy/SIM Valuation for M&A-23
Copyright ©2001 Ian H. Giddy Valuation for M&A 46giddy.org
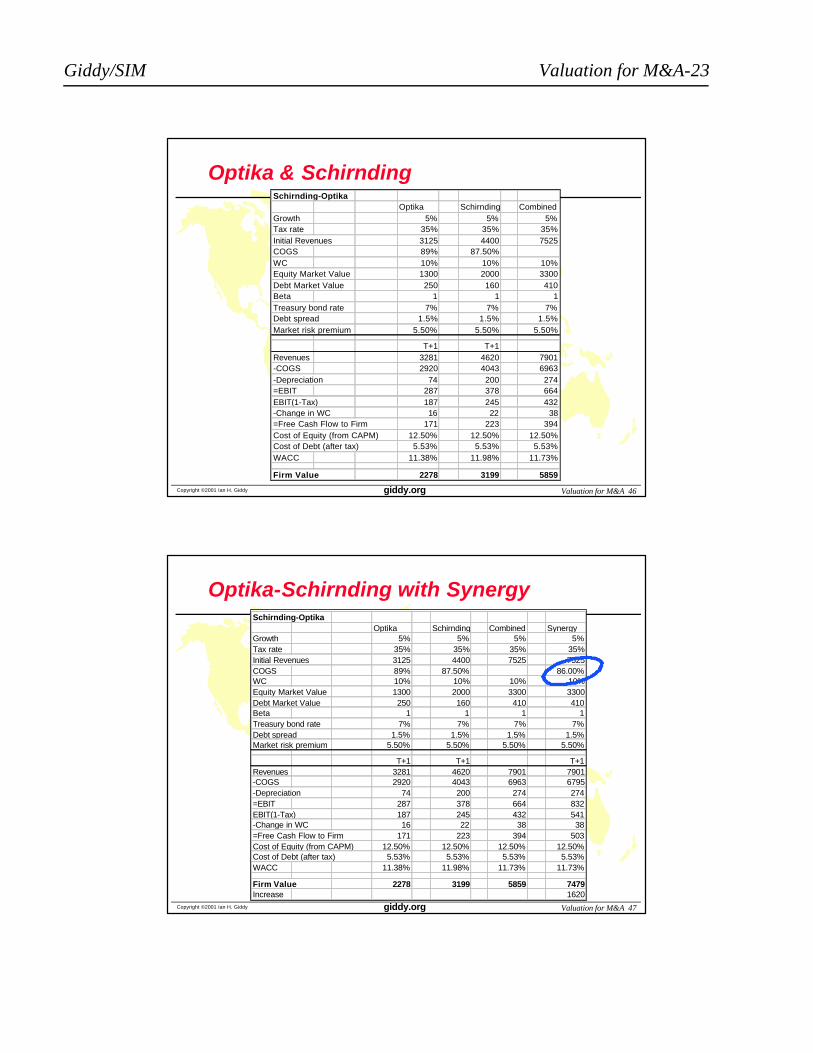
Optika & SchirndingSchirnding-Optika
Optika Schirnding CombinedGrowth 5% 5% 5%Tax rate 35% 35% 35%Initial Revenues 3125 4400 7525COGS 89% 87.50%WC 10% 10% 10%Equity Market Value 1300 2000 3300Debt Market Value 250 160 410Beta 1 1 1Treasury bond rate 7% 7% 7%Debt spread 1.5% 1.5% 1.5%Market risk premium 5.50% 5.50% 5.50%
T+1 T+1Revenues 3281 4620 7901-COGS 2920 4043 6963-Depreciation 74 200 274=EBIT 287 378 664EBIT(1-Tax) 187 245 432-Change in WC 16 22 38=Free Cash Flow to Firm 171 223 394Cost of Equity (from CAPM) 12.50% 12.50% 12.50%Cost of Debt (after tax) 5.53% 5.53% 5.53%WACC 11.38% 11.98% 11.73%
Firm Value 2278 3199 5859
Copyright ©2001 Ian H. Giddy Valuation for M&A 47giddy.org
Optika-Schirnding with SynergySchirnding-Optika
Optika Schirnding Combined SynergyGrowth 5% 5% 5% 5%Tax rate 35% 35% 35% 35%Initial Revenues 3125 4400 7525 7525COGS 89% 87.50% 86.00%WC 10% 10% 10% 10%Equity Market Value 1300 2000 3300 3300Debt Market Value 250 160 410 410Beta 1 1 1 1Treasury bond rate 7% 7% 7% 7%Debt spread 1.5% 1.5% 1.5% 1.5%Market risk premium 5.50% 5.50% 5.50% 5.50%
T+1 T+1 T+1Revenues 3281 4620 7901 7901-COGS 2920 4043 6963 6795-Depreciation 74 200 274 274=EBIT 287 378 664 832EBIT(1-Tax) 187 245 432 541-Change in WC 16 22 38 38=Free Cash Flow to Firm 171 223 394 503Cost of Equity (from CAPM) 12.50% 12.50% 12.50% 12.50%Cost of Debt (after tax) 5.53% 5.53% 5.53% 5.53%WACC 11.38% 11.98% 11.73% 11.73%
Firm Value 2278 3199 5859 7479Increase 1620

Giddy/SIM Valuation for M&A-24
Copyright ©2001 Ian H. Giddy Valuation for M&A 50giddy.org
Breaking Up is Hard to Do
Copyright ©2001 Ian H. Giddy Valuation for M&A 51giddy.org
Implementation
Case Studies:n Intracon Natsteel
Case Studies:n Intracon Natsteel
Giddy/SIM Valuation for M&A-25
Copyright ©2001 Ian H. Giddy Valuation for M&A 52giddy.org
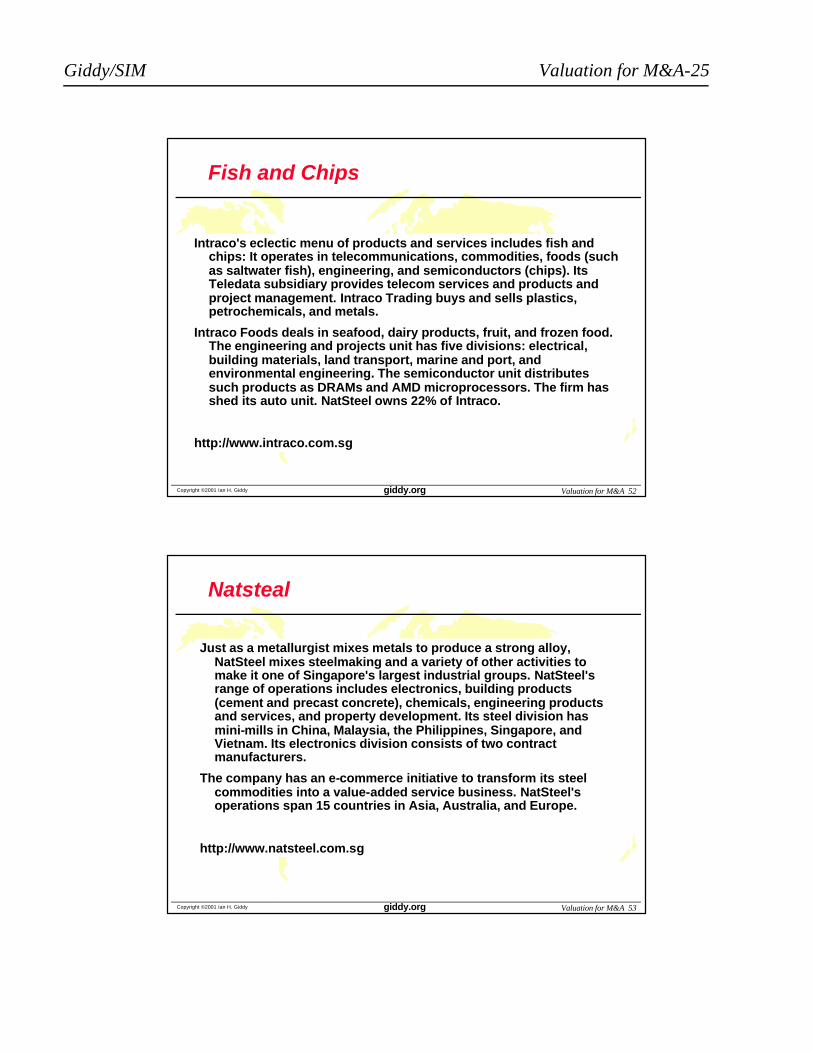
Fish and Chips
Intraco's eclectic menu of products and services includes fish and chips: It operates in telecommunications, commodities, foods (such as saltwater fish), engineering, and semiconductors (chips). ItsTeledata subsidiary provides telecom services and products and project management. Intraco Trading buys and sells plastics, petrochemicals, and metals.
Intraco Foods deals in seafood, dairy products, fruit, and frozen food.The engineering and projects unit has five divisions: electrical, building materials, land transport, marine and port, and environmental engineering. The semiconductor unit distributes such products as DRAMs and AMD microprocessors. The firm has shed its auto unit. NatSteel owns 22% of Intraco.
http://www.intraco.com.sg
Copyright ©2001 Ian H. Giddy Valuation for M&A 53giddy.org
Natsteal
Just as a metallurgist mixes metals to produce a strong alloy,NatSteel mixes steelmaking and a variety of other activities to make it one of Singapore's largest industrial groups. NatSteel'srange of operations includes electronics, building products (cement and precast concrete), chemicals, engineering products and services, and property development. Its steel division has mini-mills in China, Malaysia, the Philippines, Singapore, and Vietnam. Its electronics division consists of two contract manufacturers.
The company has an e-commerce initiative to transform its steel commodities into a value-added service business. NatSteel'soperations span 15 countries in Asia, Australia, and Europe.
http://www.natsteel.com.sg
Giddy/SIM Valuation for M&A-26
Copyright ©2001 Ian H. Giddy Valuation for M&A 54giddy.org
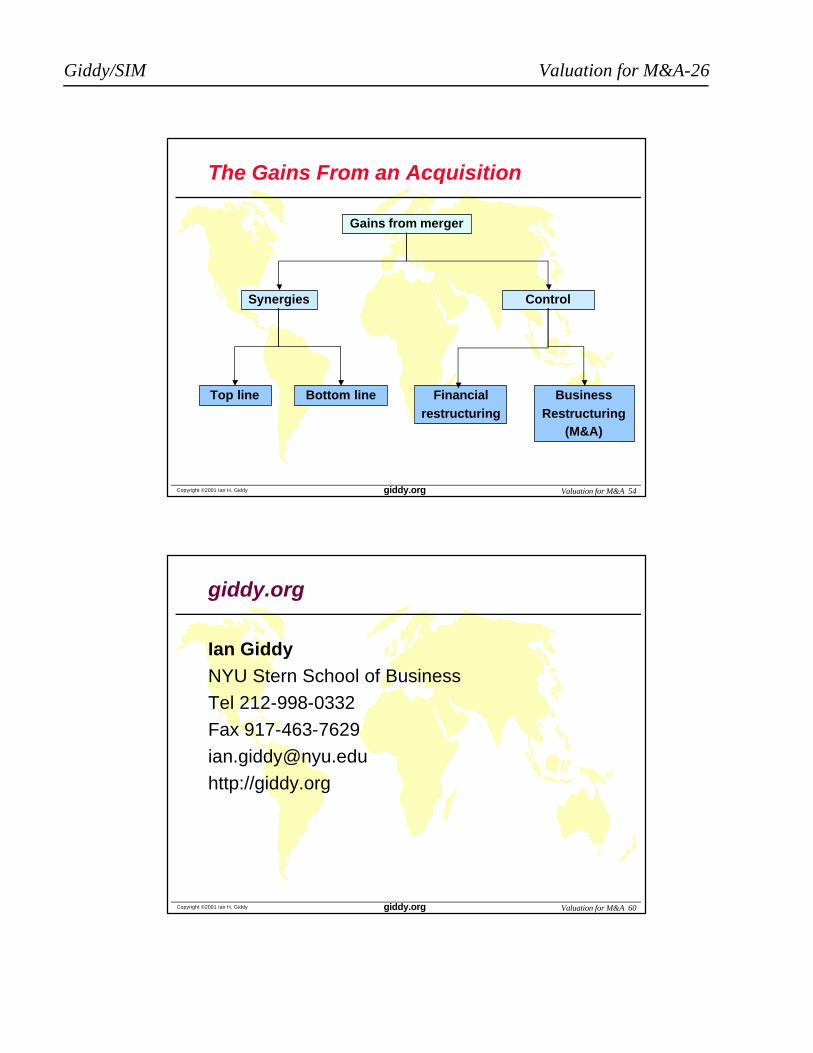
The Gains From an Acquisition
Gains from merger
Synergies Control
Top line Financialrestructuring
BusinessRestructuring
(M&A)
Bottom line
Copyright ©2001 Ian H. Giddy Valuation for M&A 60giddy.org
giddy.org
Ian GiddyNYU Stern School of Business
Tel 212-998-0332
Fax 917-463-7629
http://giddy.org
Related Documents