Santander Product Recommendation Asmit Adgaonkar Brijesh Gupta Chandrashekhar Singapore Management University Abstract: Every business has a catalogue of offerings for the customers but its hard to identify and promote the most relevant product to the customer. This is where recommendations systems come in handy; it studies the association between the products and recommends the most likely product that could be up-sold or cross- sold to the customer based on the existing set of product it holds. However, the traditional recommendation system has its own limitation, that its limited to the association between the products without considering the demographic information of the customers or the customers segment. This research explores the product combination pattern and the behaviour of customer’s historical banking transactions – a research analysis that will help financial firms to recommend the right financial products to their customers, and eventually maximize the impact of their marketing campaigns increasing productivity and efficiency. In this paper, we therefore aim to study the effect of using association rule generated by sequence analysis alongside the demographic information of the customers in predicting the likelihood of a customer buying a specific product. A slight improvement was observed in predicting the true positive cases when compared with the baseline case of only using demographic information in predictive analysis. A further analysis was done by fitting a model for each segment of the customer with no major improvement over the previous model. Motivation: A deeper understanding of customer behaviour and expectations can help banks create highly satisfying banking experiences – they key factor in winning, growing and retaining customers (Global consumer banking survey, 2014 by EY). Another survey of Ernst & Young (GCBS, 2012) revealed that people are twice as likely to switch banks as they were the previous year. Fewer than half of the survey respondents said their current bank adapts products and services to meet their needs. The world economy has seen many drastic changes in past few years. Customer behaviour changes a lot during these periods. However, due to advent of new latest technologies, it is now possible to analyse and predict the customer behaviour in advance. Also, it has been found through research and surveys that majority of the customers of a bank are financially naive and only happen to know about the most popular products, more specifically retail and deposit products. These customers are likely candidates for deploying and

Welcome message from author
This document is posted to help you gain knowledge. Please leave a comment to let me know what you think about it! Share it to your friends and learn new things together.
Transcript

Santander Product RecommendationAsmit Adgaonkar
Brijesh GuptaChandrashekhar
Singapore Management University
Abstract:Every business has a catalogue of offerings for the customers but its hard toidentify and promote the most relevant product to the customer. This is whererecommendations systems come in handy; it studies the association between theproducts and recommends the most likely product that could be up-sold or cross-sold to the customer based on the existing set of product it holds. However, thetraditional recommendation system has its own limitation, that its limited to theassociation between the products without considering the demographicinformation of the customers or the customers segment. This research exploresthe product combination pattern and the behaviour of customer’s historicalbanking transactions – a research analysis that will help financial firms torecommend the right financial products to their customers, and eventuallymaximize the impact of their marketing campaigns increasing productivity andefficiency.
In this paper, we therefore aim to study the effect of using association rulegenerated by sequence analysis alongside the demographic information of thecustomers in predicting the likelihood of a customer buying a specific product. Aslight improvement was observed in predicting the true positive cases whencompared with the baseline case of only using demographic information inpredictive analysis.
A further analysis was done by fitting a model for each segment of the customerwith no major improvement over the previous model.
Motivation:A deeper understanding of customer behaviour and expectations can help bankscreate highly satisfying banking experiences – they key factor in winning,growing and retaining customers (Global consumer banking survey, 2014 by EY).Another survey of Ernst & Young (GCBS, 2012) revealed that people are twice aslikely to switch banks as they were the previous year. Fewer than half of thesurvey respondents said their current bank adapts products and services to meettheir needs. The world economy has seen many drastic changes in past fewyears. Customer behaviour changes a lot during these periods. However, due toadvent of new latest technologies, it is now possible to analyse and predict thecustomer behaviour in advance. Also, it has been found through research andsurveys that majority of the customers of a bank are financially naive and onlyhappen to know about the most popular products, more specifically retail anddeposit products. These customers are likely candidates for deploying and

proposing additional variety of products through a verified and tested productrecommendation system.
Introduction:Santander is one of the biggest bank in Spain with huge customer base andrange of financial products from savings accounts to debts to securities to funds.However, the problem Santander is facing like many other organizations is anineffective recommendation system; recommending many products to onecustomer and very few to others which ends up in missed business opportunitiesand dissatisfied customers.
In this paper, we aim to study and improve the traditional recommendationsystem by reinforcing it with a general and segmented predictive model. Anassociation model is first built and the corresponding association rules arefurther fed to a predictive model to factor in both the demographic as well asproduct association when recommending a product to the customers. This modelhowever, assumes a very general nature of the entire customer base i.e. it triesto fit a general model for the entire customer base. In order to fine tune thisfurther and check if a specialized model catering to each segment of customer isgoing to bring any improvement, we further created a set of models catering toeach of the 10 customer segments.
Methodology:A combination of both JMP and SAS- Enterprise Miner were used to do theanalysis. After extracting the data in JMP, exploratory data analysis was done toidentify the basic behaviour of the data. Then the data was saved in csv formatfor further analysis in SAS- EM where Association and Predictive modelling wereapplied.

Data Sources and Data Preparation:The data for this analysis was collected from an online competition- SantanderProduct Recommendation. It has 1.5 years of customers behaviour data fromSantander bank. The data starts at 2015-01-28 and has monthly records ofproducts a customer has, such as "credit card", "savings account", “loans” etc.
(https://www.kaggle.com/c/santander-product-recommendation)
Data Understanding:
Field Description FieldDescription
Customer Personal Information Product Information
Date When the data was taken Saving Account0- No, 1- Yes
Customer Code Customer identifier Guarantees0- No, 1- Yes
Employee IndexA active, B ex employed, F filial,N not employee, P passive Current Accounts
0- No, 1- Yes
Country of Residence Spain, UK, US, etc Derivative Account
0- No, 1- Yes
Sex M- Male, F- Female Payroll Account0- No, 1- Yes
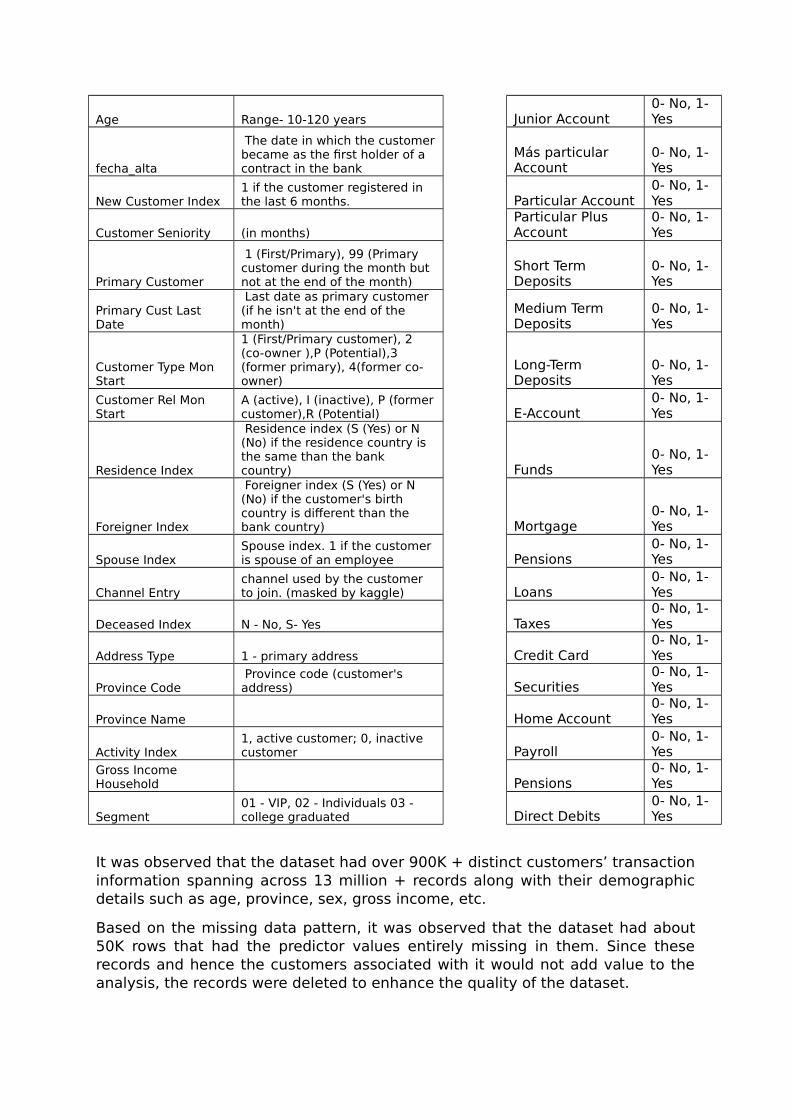
Age Range- 10-120 years Junior Account0- No, 1- Yes
fecha_alta
The date in which the customerbecame as the first holder of a contract in the bank
Más particular Account
0- No, 1- Yes
New Customer Index1 if the customer registered in the last 6 months. Particular Account
0- No, 1- Yes
Customer Seniority (in months) Particular Plus Account
0- No, 1- Yes
Primary Customer
1 (First/Primary), 99 (Primary customer during the month but not at the end of the month)
Short Term Deposits
0- No, 1- Yes
Primary Cust Last Date
Last date as primary customer (if he isn't at the end of the month)
Medium Term Deposits
0- No, 1- Yes
Customer Type Mon Start
1 (First/Primary customer), 2 (co-owner ),P (Potential),3 (former primary), 4(former co-owner)
Long-Term Deposits
0- No, 1- Yes
Customer Rel Mon Start
A (active), I (inactive), P (formercustomer),R (Potential) E-Account
0- No, 1- Yes
Residence Index
Residence index (S (Yes) or N (No) if the residence country is the same than the bank country) Funds
0- No, 1- Yes
Foreigner Index
Foreigner index (S (Yes) or N (No) if the customer's birth country is different than the bank country) Mortgage
0- No, 1- Yes
Spouse IndexSpouse index. 1 if the customer is spouse of an employee Pensions
0- No, 1- Yes
Channel Entrychannel used by the customer to join. (masked by kaggle) Loans
0- No, 1- Yes
Deceased Index N - No, S- Yes Taxes0- No, 1- Yes
Address Type 1 - primary address Credit Card0- No, 1- Yes
Province Code Province code (customer's address) Securities
0- No, 1- Yes
Province Name Home Account0- No, 1- Yes
Activity Index1, active customer; 0, inactive customer Payroll
0- No, 1- Yes
Gross Income Household Pensions
0- No, 1- Yes
Segment01 - VIP, 02 - Individuals 03 - college graduated Direct Debits
0- No, 1- Yes
It was observed that the dataset had over 900K + distinct customers’ transactioninformation spanning across 13 million + records along with their demographicdetails such as age, province, sex, gross income, etc.
Based on the missing data pattern, it was observed that the dataset had about50K rows that had the predictor values entirely missing in them. Since theserecords and hence the customers associated with it would not add value to theanalysis, the records were deleted to enhance the quality of the dataset.

The dataset was further cleansed to remove any customers that had missingmonths of transactions info/data to avoid any gaps in the temporal pattern thedata might end up producing.
Data Analysis:EDA was then performed and here are a few findings from it:

Products were also grouped into categories with the intention of finding anyimmediate insights.
However, because the exact nature and the intention of the product was notmade public by the competition administrators, it was decided that the groupingmight end up with some wrong assumptions for a product and eventuallyincrease the error components by the end of the analysis.
In view of this, it was decided to pursue with the products on an individual basis.
Association Analysis:Association Analysis is a process to identify a statistical association betweenitems/products that occur together in a set of transaction in a process or event.
For example, a transaction involving purchase of product A and Product B, mightreveal an association between A and B implying that item A and B are very likelyto be purchased together. An event could be a customer buying a set ofproducts in a grocery shop or holding/un-holding a specific set of product in abank at different point of time or at the same time.
Association between products is represented as,
{A} -> {B} where A and B are the items showing association and it can be readas A is associated with certain degree of confidence and support with item B.
Above discussion just tells us that A and B are associated, not necessarily theorder in which these could be associated i.e. it does not tell whether A is alwaysfollowed by B or B is always followed by A. When the order of purchase is alsoconsidered during association analysis, its called Sequence Analysis.
Even though association analysis reveal that there are certain statisticalassociation between the items, it should not be taken as a causation relationship.
In association analysis, presence of multiple items in a single event is notimportant; just its presence is required. For example, a customer buying 10 unitsof item A will generate the same association results as with a person buying 1unit of item A. However, the number of transaction involving item A is importantand it influence the final results.
The statistics used to determine the association and measure its strength are“Confidence factor”, “Support factor” and “Lift factor”
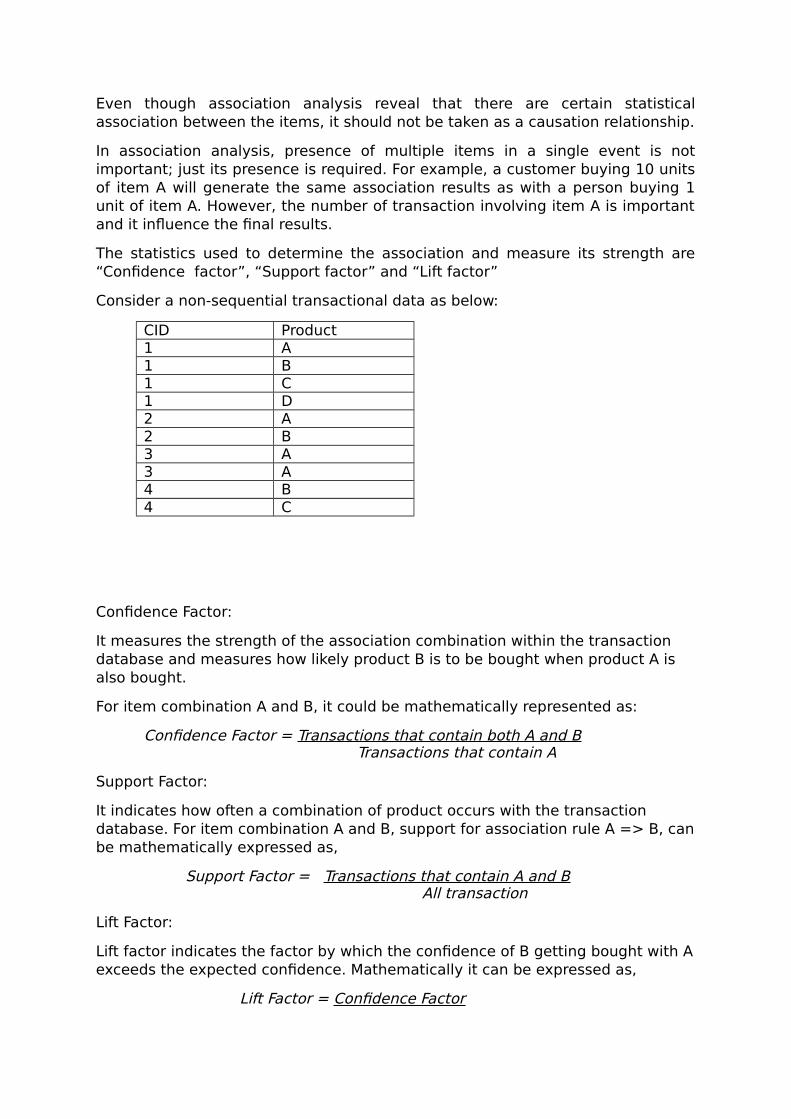
Consider a non-sequential transactional data as below:
CID Product1 A1 B1 C1 D2 A2 B3 A3 A4 B4 C
Confidence Factor:
It measures the strength of the association combination within the transaction database and measures how likely product B is to be bought when product A is also bought.
For item combination A and B, it could be mathematically represented as:
Confidence Factor = Transactions that contain both A and B Transactions that contain A
Support Factor:
It indicates how often a combination of product occurs with the transaction database. For item combination A and B, support for association rule A => B, canbe mathematically expressed as,
Support Factor = Transactions that contain A and B All transaction
Lift Factor:
Lift factor indicates the factor by which the confidence of B getting bought with Aexceeds the expected confidence. Mathematically it can be expressed as,
Lift Factor = Confidence Factor
Support Factor
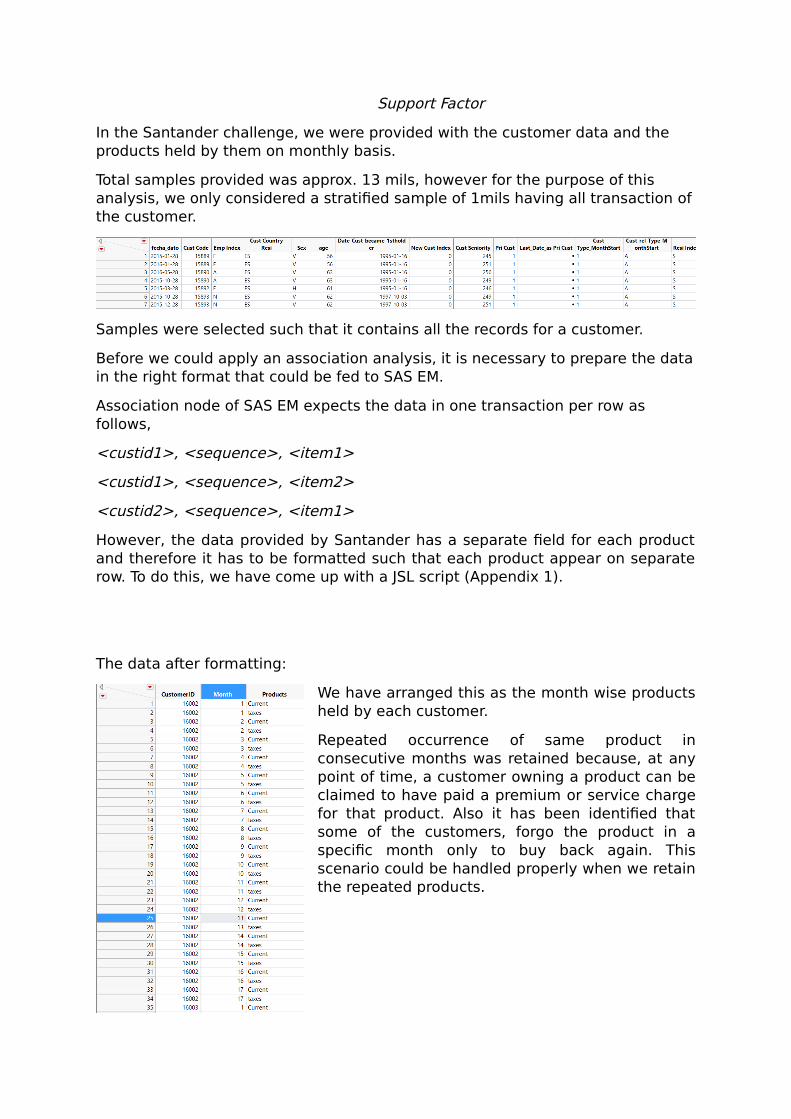
In the Santander challenge, we were provided with the customer data and the products held by them on monthly basis.
Total samples provided was approx. 13 mils, however for the purpose of this analysis, we only considered a stratified sample of 1mils having all transaction ofthe customer.
Samples were selected such that it contains all the records for a customer.
Before we could apply an association analysis, it is necessary to prepare the datain the right format that could be fed to SAS EM.
Association node of SAS EM expects the data in one transaction per row as follows,
<custid1>, <sequence>, <item1>
<custid1>, <sequence>, <item2>
<custid2>, <sequence>, <item1>
However, the data provided by Santander has a separate field for each productand therefore it has to be formatted such that each product appear on separaterow. To do this, we have come up with a JSL script (Appendix 1).
The data after formatting:
We have arranged this as the month wise productsheld by each customer.
Repeated occurrence of same product inconsecutive months was retained because, at anypoint of time, a customer owning a product can beclaimed to have paid a premium or service chargefor that product. Also it has been identified thatsome of the customers, forgo the product in aspecific month only to buy back again. Thisscenario could be handled properly when we retainthe repeated products.
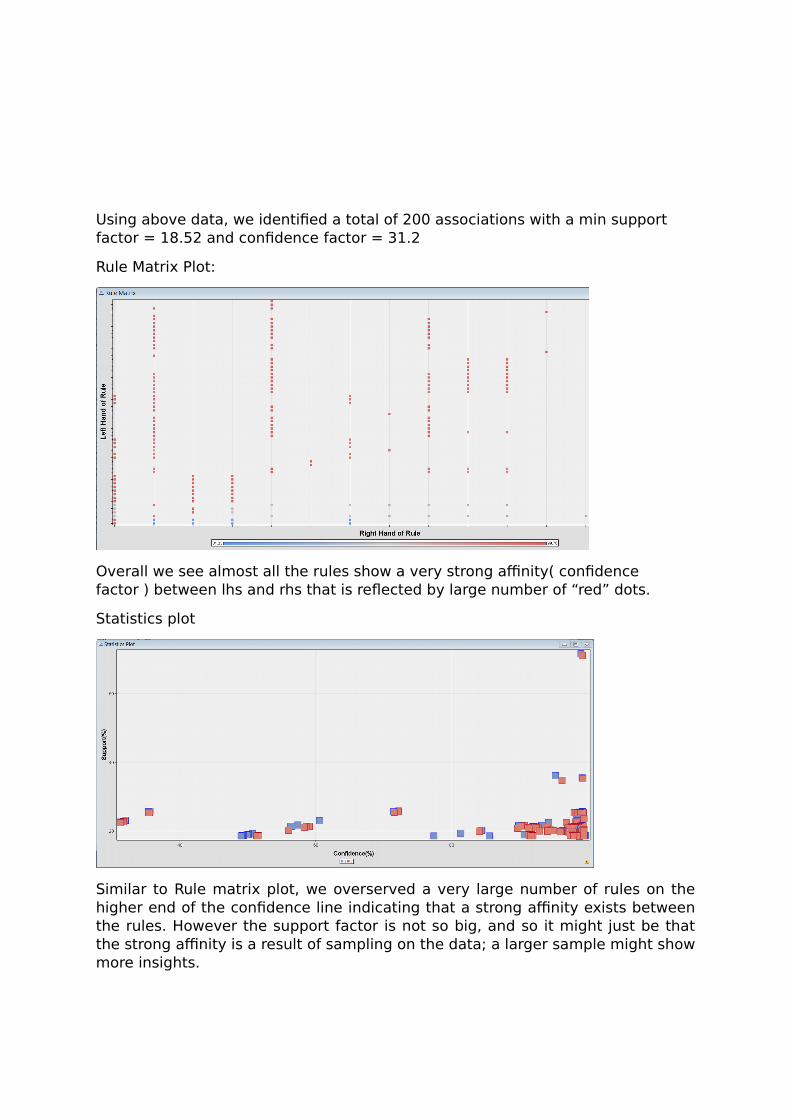
Using above data, we identified a total of 200 associations with a min support factor = 18.52 and confidence factor = 31.2
Rule Matrix Plot:
Overall we see almost all the rules show a very strong affinity( confidence factor ) between lhs and rhs that is reflected by large number of “red” dots.
Statistics plot
Similar to Rule matrix plot, we overserved a very large number of rules on thehigher end of the confidence line indicating that a strong affinity exists betweenthe rules. However the support factor is not so big, and so it might just be thatthe strong affinity is a result of sampling on the data; a larger sample might showmore insights.

Link Graph:
red node – strong node
blue node – weak node
thick red line – strongest association
blue thin line – weak association
Most of the transactions seems to be having current as one of the product whichis reflected in the red colour and size of the node belonging to “current” nodewith red being high number of transaction and blue as low.
On similar line, there seems to be very low number of transactions having bothcurrent and direct debit, or current and particular and so on.
Transactions having “Direct Debit” as one of the product show a very highnumber of associations with many other products which are reflected in the largenumber of links originating form “Direct Debit” node.
We did not find any association with “e-account & taxes” and any other product.
Also, we found that customer with “current” account as one of the product has avery strong likelihood of buying “particular” and “Direct Debit” account whichcan be seen in a very thick and red link originating from current to theseproducts.
Having identified the above associations, we can now use the “Score” node ofSAS EM to recommend products to customers.
To score the results, we will be using a separate score data that we have sampledseparately and not included in the above association analysis.
Predictive Analysis:Association rule, only consider the statistical relationship between the products;the customer demographic detail is not at all used.
Therefore, we want to investigate if there is any effect of including the customerdemographic information when predicting the next product that the customermight buy.
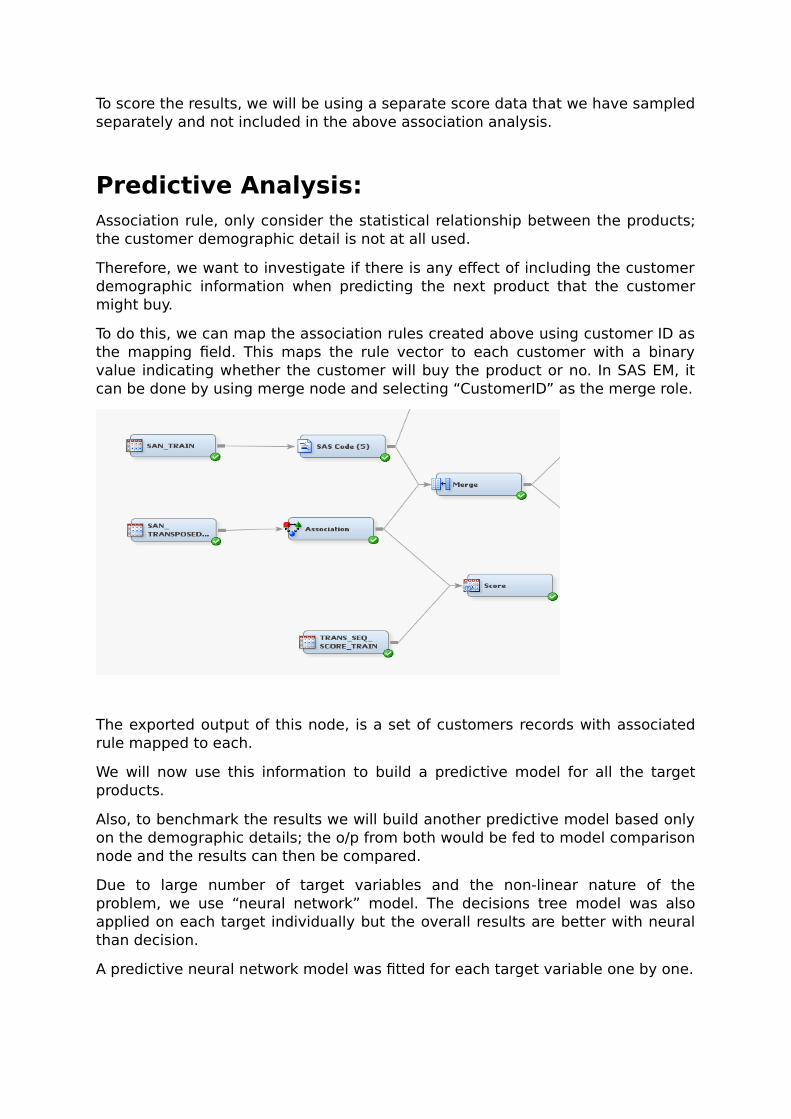
To do this, we can map the association rules created above using customer ID asthe mapping field. This maps the rule vector to each customer with a binaryvalue indicating whether the customer will buy the product or no. In SAS EM, itcan be done by using merge node and selecting “CustomerID” as the merge role.
The exported output of this node, is a set of customers records with associatedrule mapped to each.
We will now use this information to build a predictive model for all the targetproducts.
Also, to benchmark the results we will build another predictive model based onlyon the demographic details; the o/p from both would be fed to model comparisonnode and the results can then be compared.
Due to large number of target variables and the non-linear nature of theproblem, we use “neural network” model. The decisions tree model was alsoapplied on each target individually but the overall results are better with neuralthan decision.
A predictive neural network model was fitted for each target variable one by one.

The true positive rate for each target as predicted by the model using only demographic information and both demographic and Association Rule is as depicted in the table below.
Higher true positive rate was observed for most of the targets where there were enough samples to learn using model2.
The combined true positive rate for all targets can be calculated as,
TPRoverall = Total TP / (Total TP + Total FN)
Valid TrainonlyDemo(Model1) 0.4 0.41AssoAndDemo(Model2) 0.42 0.46

Thus, a model fitted with a combination of association rules and demographicdetails yields slightly better true positive rate than the one fitted with onlydemographic details.
Another improvement that we can do is, to instead of using a generic model forall segments of customer, we build separate mode for each segment.
This essentially entails, clustering the customer data to identify distinct customersegments.
Clustering Results:
10 distinct clusters were identified with 86.76% observations falling in cluster 1.However the top 10 variables considered, ranked according to their relativeimportance does not include any of the demographic data.
A model was fitted for each of these segments for each target and the corresponding TP and FN tabulated as follows.
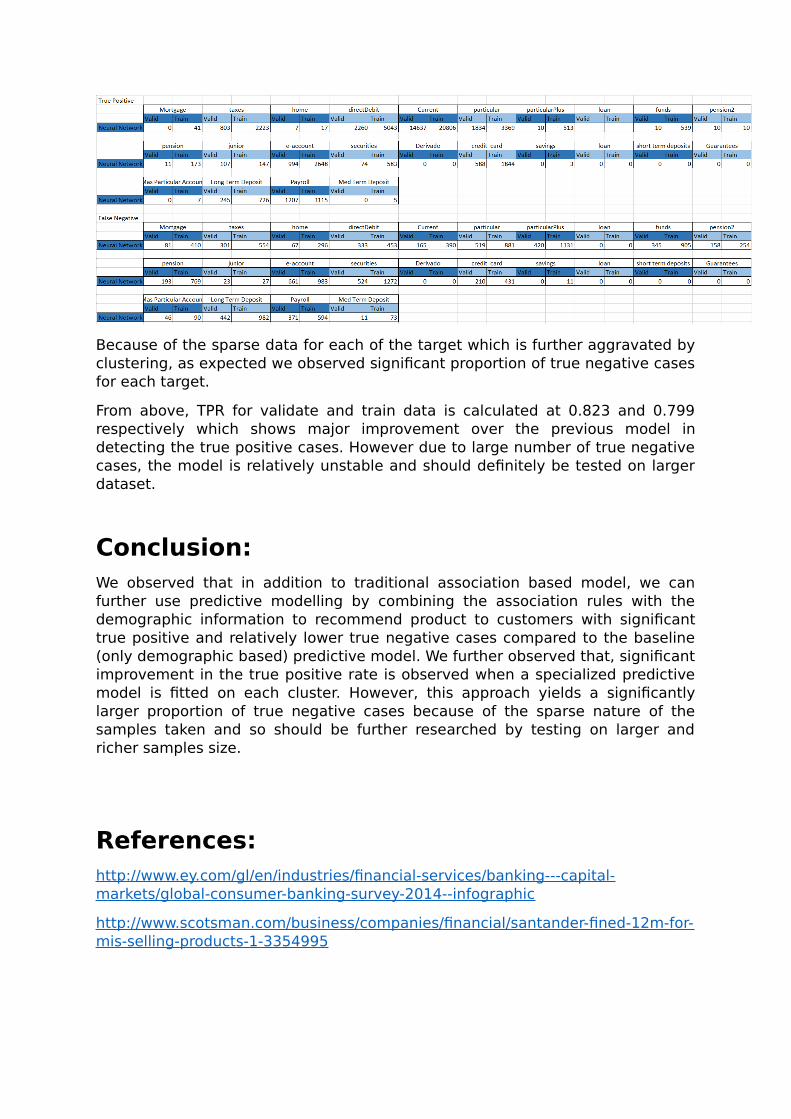
Because of the sparse data for each of the target which is further aggravated byclustering, as expected we observed significant proportion of true negative casesfor each target.
From above, TPR for validate and train data is calculated at 0.823 and 0.799respectively which shows major improvement over the previous model indetecting the true positive cases. However due to large number of true negativecases, the model is relatively unstable and should definitely be tested on largerdataset.
Conclusion:We observed that in addition to traditional association based model, we canfurther use predictive modelling by combining the association rules with thedemographic information to recommend product to customers with significanttrue positive and relatively lower true negative cases compared to the baseline(only demographic based) predictive model. We further observed that, significantimprovement in the true positive rate is observed when a specialized predictivemodel is fitted on each cluster. However, this approach yields a significantlylarger proportion of true negative cases because of the sparse nature of thesamples taken and so should be further researched by testing on larger andricher samples size.
References:http://www.ey.com/gl/en/industries/financial-services/banking---capital-markets/global-consumer-banking-survey-2014--infographic
http://www.scotsman.com/business/companies/financial/santander-fined-12m-for-mis-selling-products-1-3354995
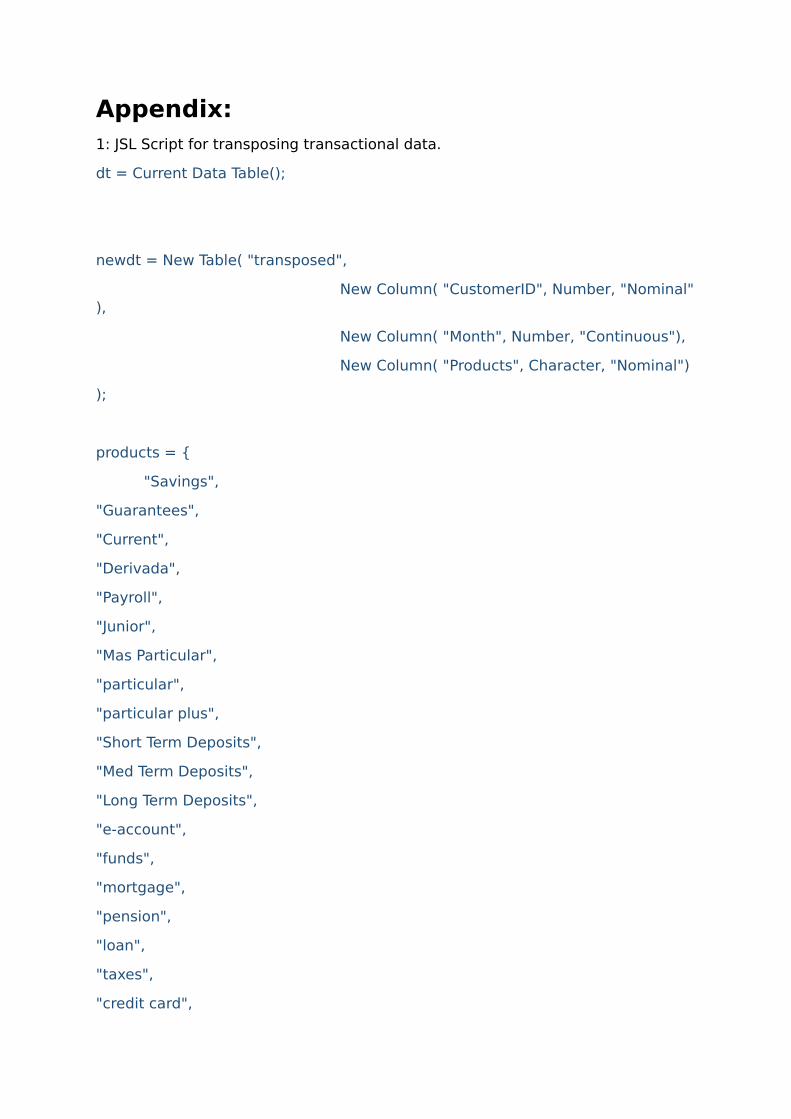
Appendix:1: JSL Script for transposing transactional data.
dt = Current Data Table();
newdt = New Table( "transposed",
New Column( "CustomerID", Number, "Nominal"),
New Column( "Month", Number, "Continuous"),
New Column( "Products", Character, "Nominal")
);
products = {
"Savings",
"Guarantees",
"Current",
"Derivada",
"Payroll",
"Junior",
"Mas Particular",
"particular",
"particular plus",
"Short Term Deposits",
"Med Term Deposits",
"Long Term Deposits",
"e-account",
"funds",
"mortgage",
"pension",
"loan",
"taxes",
"credit card",

"securities",
"home",
"payroll",
"pension2",
"Direct Debit"
};
rowCounter = 1;
For( row = 1, row <= NRow(dt) , row++,
custID = Column( dt,"Cust_Code")[row];
FetchMonth = Column( dt, "fescha_month" )[row];
for( i = 1, i <= 24, i++,
col = Column( dt, char( products[i]));
if( col[row] == 1,
newdt << Add Rows( { :CustomerID = custID, :Month = FetchMonth, :Products = products[i] } );
rowCounter++;
);
);
);