Integrated assessment of cropping systems in the Eastern Indo-Gangetic plain B. Biswas a,1 , D.C. Ghosh b , M.K. Dasgupta b , N. Trivedi a,1 , J. Timsina c , A. Dobermann d, * a Directorate of Agriculture, Government of West Bengal, Kolkata 700 001, India b Institute of Agriculture (Palli-Siksha Bhavana), Visva-Bharati, Sriniketan 731 236, West Bengal, India c CSIRO Land and Water, Griffith, NSW 2680, Australia d Department of Agronomy & Horticulture, University of Nebraska, Lincoln, P.O. Box 830915, Lincoln, NE 68583-0915, USA Received 22 August 2005; received in revised form 28 February 2006; accepted 5 March 2006 Abstract Both intensification and diversification of cropping systems may allow improving the productivity and sustainability of agricultural production in the Indo-Gangetic Plain (IGP), but the choices to be made require integrated assessment of various cropping systems. A field experiment was conducted from 1999 to 2002 on a sandy clay loam (Inceptisol) to evaluate nine predominant cropping systems in West Bengal, India. Productivity, energy use efficiency, and nutrient uptake generally increased with increasing cropping intensity. Positive residual effects of potato and jute on yield and energy output of subsequently grown crops were observed as well as maintenance or improvement of soil properties such as soil organic matter, available P, and available K. The P balance was positive for most systems, except for jute-containing systems. However, negative K balances occurred due to almost complete removal of crop biomass in all systems, suggesting that recommended rates of applied K fertilizer were to low for sustaining soil K supply over the longer term. Cropping systems containing potato had the highest levels of yield, net return, benefit to cost ratio and energy productivity, but energy use efficiency was reduced due to higher energy consumption in these systems. Jute–wheat and jute–rapeseed–rice systems showed high energy use efficiency along with moderate cost and return. Based on economic considerations alone, jute–potato–rice, rice–potato–rice and rice–potato–sesame can be recommended as cropping systems for resource-rich growers in the eastern part of the IGP. Systems such as jute–wheat, rice–wheat and jute– rapeseed–rice appear to be most suitable for small and marginal farmers that cannot afford the large production costs associated with crops such as potato. # 2006 Elsevier B.V. All rights reserved. Keywords: Cropping systems; Productivity; Economics; Energy use efficiency; Soil fertility; Nutrient budget; Rice–wheat system; India 1. Introduction The Lower Gangetic Plain forms the eastern part of the Indo-Gangetic Plain (IGP), one of the world’s most important agricultural eco-regions (Timsina and Connor, 2001). Most of the Lower Gangetic Plain is located in the state of West Bengal, India, which is further divided into six agro-climatic sub regions: (i) the northern hilly zone, (ii) the Tarai-Teesta flood plain, (iii) the Gangetic flood plain, (iv) the coastal flood plain, (v) the Vindhya old flood plain and (vi) the undulating lateritic sub-region of the Eastern Plateau Region (SenGupta, 2001). Of those, the Gangetic flood plain is the largest (19,389 km 2 ) and the most fertile sub region. It is primarily a traditional rice-growing area. On medium lands, farmers used to grow pulses such as grass pea, lentil, or Bengal gram in winter, on residual moisture after harvest of long duration, photosensitive local rice. Productivity and return of those crops were low. However, due to introduction of high-yielding www.elsevier.com/locate/fcr Field Crops Research 99 (2006) 35–47 * Corresponding author. Tel.: +1 402 472 1501. E-mail addresses: [email protected] (B. Biswas), [email protected] (A. Dobermann). 1 Present address: Zonal Adaptive Research Station, Government of West Bengal, Mohitnagar, Jalpaiguri 735 101, India. 0378-4290/$ – see front matter # 2006 Elsevier B.V. All rights reserved. doi:10.1016/j.fcr.2006.03.002

Welcome message from author
This document is posted to help you gain knowledge. Please leave a comment to let me know what you think about it! Share it to your friends and learn new things together.
Transcript
Integrated assessment of cropping systems
in the Eastern Indo-Gangetic plain
B. Biswas a,1, D.C. Ghosh b, M.K. Dasgupta b, N. Trivedi a,1,J. Timsina c, A. Dobermann d,*
a Directorate of Agriculture, Government of West Bengal, Kolkata 700 001, Indiab Institute of Agriculture (Palli-Siksha Bhavana), Visva-Bharati, Sriniketan 731 236, West Bengal, India
c CSIRO Land and Water, Griffith, NSW 2680, Australiad Department of Agronomy & Horticulture, University of Nebraska, Lincoln, P.O. Box 830915, Lincoln, NE 68583-0915, USA
Received 22 August 2005; received in revised form 28 February 2006; accepted 5 March 2006
Abstract
Both intensification and diversification of cropping systems may allow improving the productivity and sustainability of agricultural
production in the Indo-Gangetic Plain (IGP), but the choices to be made require integrated assessment of various cropping systems. A field
experiment was conducted from 1999 to 2002 on a sandy clay loam (Inceptisol) to evaluate nine predominant cropping systems in West
Bengal, India. Productivity, energy use efficiency, and nutrient uptake generally increased with increasing cropping intensity. Positive residual
effects of potato and jute on yield and energy output of subsequently grown crops were observed as well as maintenance or improvement of
soil properties such as soil organic matter, available P, and available K. The P balance was positive for most systems, except for jute-containing
systems. However, negative K balances occurred due to almost complete removal of crop biomass in all systems, suggesting that
recommended rates of applied K fertilizer were to low for sustaining soil K supply over the longer term. Cropping systems containing
potato had the highest levels of yield, net return, benefit to cost ratio and energy productivity, but energy use efficiency was reduced due to
higher energy consumption in these systems. Jute–wheat and jute–rapeseed–rice systems showed high energy use efficiency along with
moderate cost and return. Based on economic considerations alone, jute–potato–rice, rice–potato–rice and rice–potato–sesame can be
recommended as cropping systems for resource-rich growers in the eastern part of the IGP. Systems such as jute–wheat, rice–wheat and jute–
rapeseed–rice appear to be most suitable for small and marginal farmers that cannot afford the large production costs associated with crops
such as potato.
# 2006 Elsevier B.V. All rights reserved.
Keywords: Cropping systems; Productivity; Economics; Energy use efficiency; Soil fertility; Nutrient budget; Rice–wheat system; India
www.elsevier.com/locate/fcr
Field Crops Research 99 (2006) 35–47
1. Introduction
The Lower Gangetic Plain forms the eastern part of the
Indo-Gangetic Plain (IGP), one of the world’s most important
agricultural eco-regions (Timsina and Connor, 2001). Most of
the Lower Gangetic Plain is located in the state of West
* Corresponding author. Tel.: +1 402 472 1501.
E-mail addresses: [email protected] (B. Biswas),
[email protected] (A. Dobermann).1 Present address: Zonal Adaptive Research Station, Government of West
Bengal, Mohitnagar, Jalpaiguri 735 101, India.
0378-4290/$ – see front matter # 2006 Elsevier B.V. All rights reserved.
doi:10.1016/j.fcr.2006.03.002
Bengal, India, which is further divided into six agro-climatic
sub regions: (i) the northern hilly zone, (ii) the Tarai-Teesta
flood plain, (iii) the Gangetic flood plain, (iv) the coastal flood
plain, (v) the Vindhya old flood plain and (vi) the undulating
lateritic sub-region of the Eastern Plateau Region (SenGupta,
2001). Of those, the Gangetic flood plain is the largest
(19,389 km2) and the most fertile sub region. It is primarily a
traditional rice-growing area. On medium lands, farmers used
to grow pulses such as grass pea, lentil, or Bengal gram in
winter, on residual moisture after harvest of long duration,
photosensitive local rice. Productivity and return of those
crops were low. However, due to introduction of high-yielding
B. Biswas et al. / Field Crops Research 99 (2006) 35–4736
short duration rice in the 1970s and increasing irrigated area,
dry season rice replaced most pulses in this area. Crop
intensification and/or diversification has now further
increased with inclusion of short duration rapeseed and
potato in between wet season rice or jute and dry season rice,
resulting in higher production per unit area per unit time,
higher nutrient removal, and varying changes in soil fertility
as compared with rice–rice (R–R) and rice–wheat (R–W)
systems, the two predominant cropping systems of the IGP.
Most micro- and macro-level studies of cropping systems
in the IGP eco-region have focused on agronomic issues
related to R–W systems (Sarkar, 1997; Adhikari et al., 1999;
Yadav et al., 2000; Timsina et al., 2001; Bhandari et al., 2002;
Ladha et al., 2003). In the eastern IGP and similar areas,
several local studies have been conducted in the past to assess
various cropping systems in terms of productivity, profit-
ability, energy efficiency, soil fertility and nutrient balances.
In one of these studies, for example, rice–wheat–jutewas most
productive but had the lowest benefit: cost ratio, whereas rice–
mustard–sesame was least productive but had a high benefit:
cost ratio (R.C. Samui and A.L. Kundu, unpublished). In a
similar study, rice–potato–jute was the most productive and
profitable cropping sequence among five cropping sequences
tested (A.L. Kundu and R.C. Samui, unpublished). Mukho-
padhyaya and Roy (2000) reported potato–jute–rice as a more
productive system than other systems such as potato–moong–
jute, potato–maize–rice and wheat–jute–rice.
Nutrient balances and trends in soil fertility also tend to
vary widely in the various intensive cropping systems of West
Bengal and other areas of the IGP. Timsina et al. (2006)
reported negative N balances, Saleque et al. (2006) negative P
balances, and Panaullah et al. (2006) negative K balances for
rice–wheat–maize and rice–wheat–mungbean sequences in
northwest Bangladesh, a region similar to the lower Gangetic
plain of the eastern IGP in west Bengal. Mandal et al. (1984)
and Saha et al. (2000) reported a decline in soil organic matter
under continuous jute–rice–wheat (J–R–W) cropping.
Mukhopadhyaya and Roy (2000) reported build-up of soil
organic carbon and available P and K in potato–moong–jute,
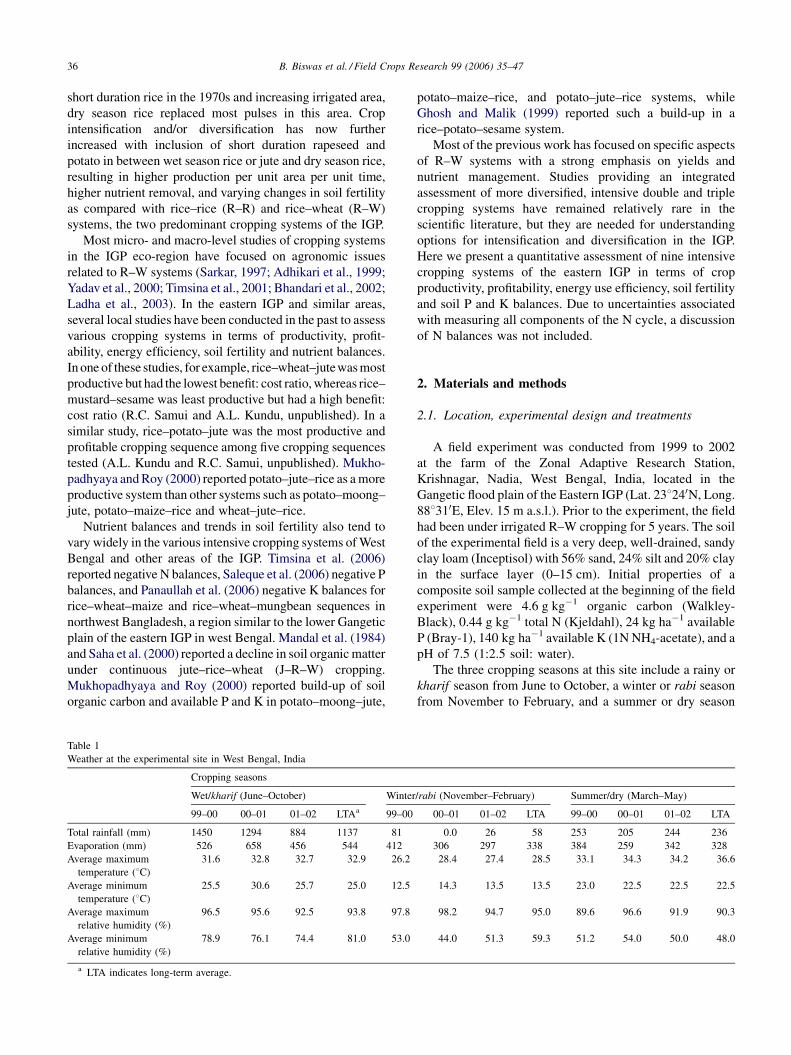
Table 1
Weather at the experimental site in West Bengal, India
Cropping seasons
Wet/kharif (June–October) Winter
99–00 00–01 01–02 LTAa 99–00
Total rainfall (mm) 1450 1294 884 1137 81
Evaporation (mm) 526 658 456 544 412
Average maximum
temperature (8C)
31.6 32.8 32.7 32.9 26.2
Average minimum
temperature (8C)
25.5 30.6 25.7 25.0 12.5
Average maximum
relative humidity (%)
96.5 95.6 92.5 93.8 97.8
Average minimum
relative humidity (%)
78.9 76.1 74.4 81.0 53.0
a LTA indicates long-term average.
potato–maize–rice, and potato–jute–rice systems, while
Ghosh and Malik (1999) reported such a build-up in a
rice–potato–sesame system.
Most of the previous work has focused on specific aspects
of R–W systems with a strong emphasis on yields and
nutrient management. Studies providing an integrated
assessment of more diversified, intensive double and triple
cropping systems have remained relatively rare in the
scientific literature, but they are needed for understanding
options for intensification and diversification in the IGP.
Here we present a quantitative assessment of nine intensive
cropping systems of the eastern IGP in terms of crop
productivity, profitability, energy use efficiency, soil fertility
and soil P and K balances. Due to uncertainties associated
with measuring all components of the N cycle, a discussion
of N balances was not included.
2. Materials and methods
2.1. Location, experimental design and treatments
A field experiment was conducted from 1999 to 2002
at the farm of the Zonal Adaptive Research Station,
Krishnagar, Nadia, West Bengal, India, located in the
Gangetic flood plain of the Eastern IGP (Lat. 238240N, Long.
888310E, Elev. 15 m a.s.l.). Prior to the experiment, the field
had been under irrigated R–W cropping for 5 years. The soil
of the experimental field is a very deep, well-drained, sandy
clay loam (Inceptisol) with 56% sand, 24% silt and 20% clay
in the surface layer (0–15 cm). Initial properties of a
composite soil sample collected at the beginning of the field
experiment were 4.6 g kg�1 organic carbon (Walkley-
Black), 0.44 g kg�1 total N (Kjeldahl), 24 kg ha�1 available
P (Bray-1), 140 kg ha�1 available K (1N NH4-acetate), and a
pH of 7.5 (1:2.5 soil: water).
The three cropping seasons at this site include a rainy or
kharif season from June to October, a winter or rabi season
from November to February, and a summer or dry season
/rabi (November–February) Summer/dry (March–May)
00–01 01–02 LTA 99–00 00–01 01–02 LTA
0.0 26 58 253 205 244 236
306 297 338 384 259 342 328
28.4 27.4 28.5 33.1 34.3 34.2 36.6
14.3 13.5 13.5 23.0 22.5 22.5 22.5
98.2 94.7 95.0 89.6 96.6 91.9 90.3
44.0 51.3 59.3 51.2 54.0 50.0 48.0
B. Biswas et al. / Field Crops Research 99 (2006) 35–47 37
from March to May (Table 1). Weather varied most among
the rainy seasons during the experimental period. Rainfall
during the rainy season always exceeds evaporation, while in
winter and dry seasons the reverse was the case. Maximum
temperatures are relatively stable throughout the year, but
minimum temperatures are lower in winter seasons than
in the other two seasons. Overall, weather during the
experimental period did not deviate much from the long-
term averages (Table 1).
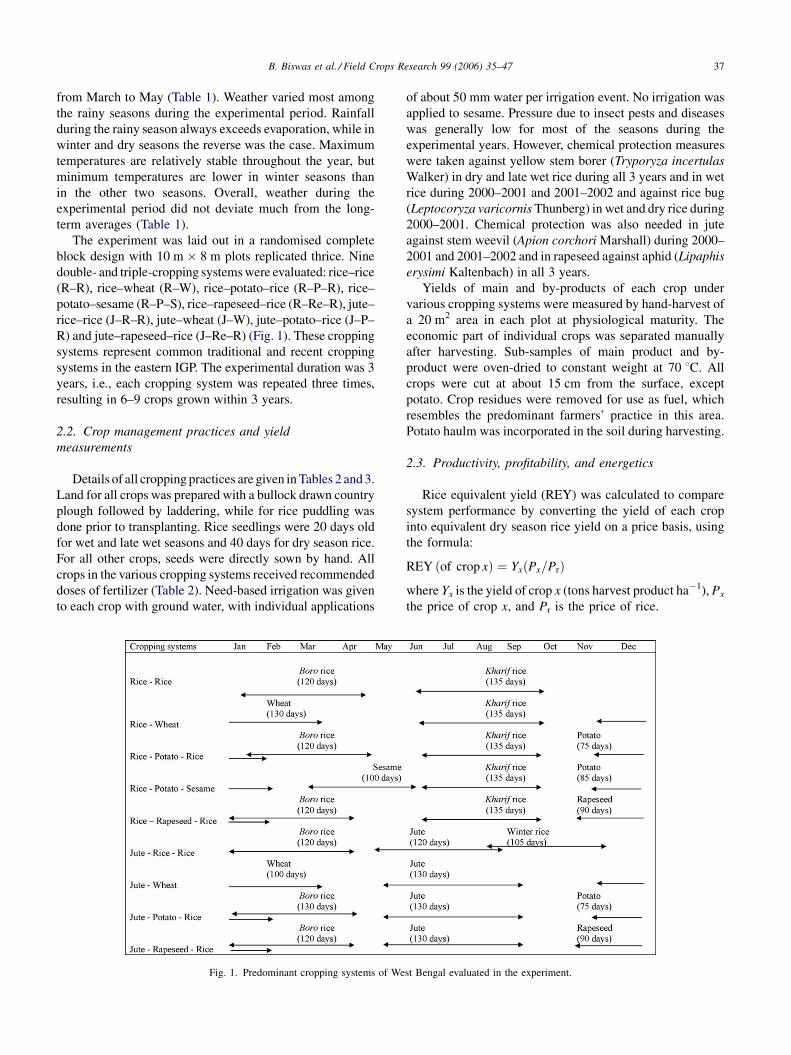
The experiment was laid out in a randomised complete
block design with 10 m � 8 m plots replicated thrice. Nine
double- and triple-cropping systems were evaluated: rice–rice
(R–R), rice–wheat (R–W), rice–potato–rice (R–P–R), rice–
potato–sesame (R–P–S), rice–rapeseed–rice (R–Re–R), jute–
rice–rice (J–R–R), jute–wheat (J–W), jute–potato–rice (J–P–
R) and jute–rapeseed–rice (J–Re–R) (Fig. 1). These cropping
systems represent common traditional and recent cropping
systems in the eastern IGP. The experimental duration was 3
years, i.e., each cropping system was repeated three times,
resulting in 6–9 crops grown within 3 years.
2.2. Crop management practices and yield
measurements
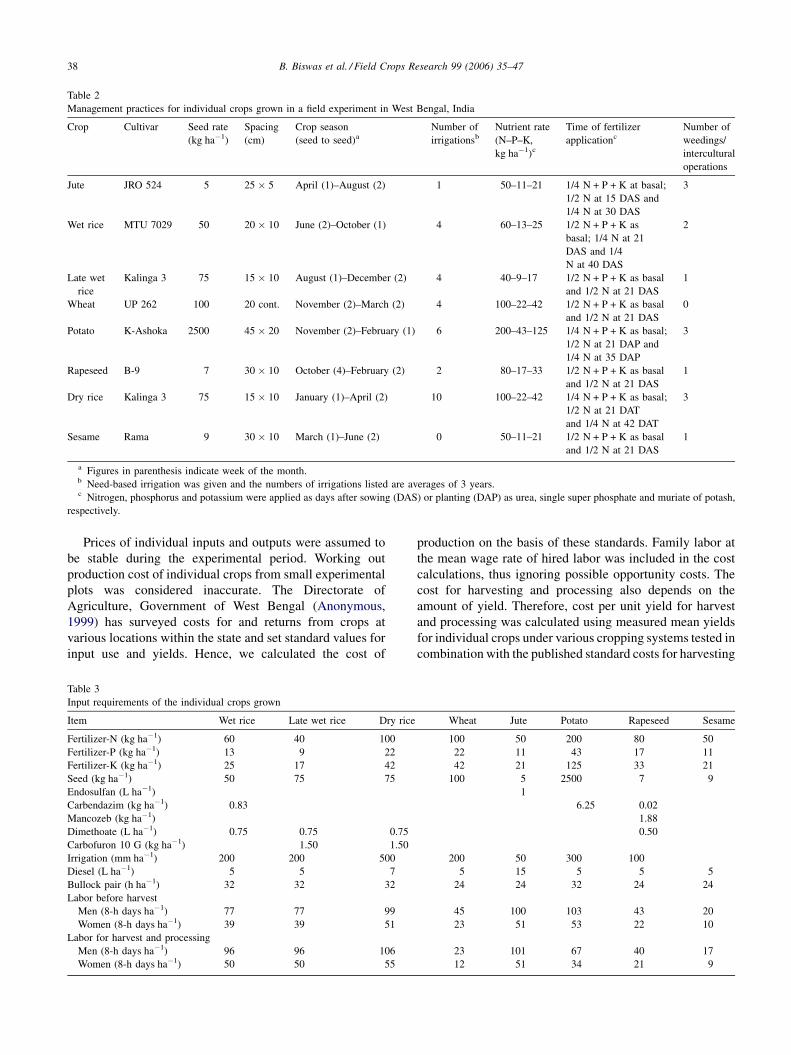
Details of all cropping practices are given in Tables 2 and 3.
Land for all crops was prepared with a bullock drawn country
plough followed by laddering, while for rice puddling was
done prior to transplanting. Rice seedlings were 20 days old
for wet and late wet seasons and 40 days for dry season rice.
For all other crops, seeds were directly sown by hand. All
crops in the various cropping systems received recommended
doses of fertilizer (Table 2). Need-based irrigation was given
to each crop with ground water, with individual applications
Fig. 1. Predominant cropping systems of We
of about 50 mm water per irrigation event. No irrigation was
applied to sesame. Pressure due to insect pests and diseases
was generally low for most of the seasons during the
experimental years. However, chemical protection measures
were taken against yellow stem borer (Tryporyza incertulas
Walker) in dry and late wet rice during all 3 years and in wet
rice during 2000–2001 and 2001–2002 and against rice bug
(Leptocoryza varicornis Thunberg) in wet and dry rice during
2000–2001. Chemical protection was also needed in jute
against stem weevil (Apion corchori Marshall) during 2000–
2001 and 2001–2002 and in rapeseed against aphid (Lipaphis
erysimi Kaltenbach) in all 3 years.
Yields of main and by-products of each crop under
various cropping systems were measured by hand-harvest of
a 20 m2 area in each plot at physiological maturity. The
economic part of individual crops was separated manually
after harvesting. Sub-samples of main product and by-
product were oven-dried to constant weight at 70 8C. All
crops were cut at about 15 cm from the surface, except
potato. Crop residues were removed for use as fuel, which
resembles the predominant farmers’ practice in this area.
Potato haulm was incorporated in the soil during harvesting.
2.3. Productivity, profitability, and energetics
Rice equivalent yield (REY) was calculated to compare
system performance by converting the yield of each crop
into equivalent dry season rice yield on a price basis, using
the formula:
REY ðof crop xÞ ¼ YxðPx=PrÞ
where Yx is the yield of crop x (tons harvest product ha�1), Px
the price of crop x, and Pr is the price of rice.
st Bengal evaluated in the experiment.
B. Biswas et al. / Field Crops Research 99 (2006) 35–4738
Table 2
Management practices for individual crops grown in a field experiment in West Bengal, India
Crop Cultivar Seed rate
(kg ha�1)
Spacing
(cm)
Crop season
(seed to seed)a
Number of
irrigationsb
Nutrient rate
(N–P–K,
kg ha�1)c
Time of fertilizer
applicationc
Number of
weedings/
intercultural
operations
Jute JRO 524 5 25 � 5 April (1)–August (2) 1 50–11–21 1/4 N + P + K at basal;
1/2 N at 15 DAS and
1/4 N at 30 DAS
3
Wet rice MTU 7029 50 20 � 10 June (2)–October (1) 4 60–13–25 1/2 N + P + K as
basal; 1/4 N at 21
DAS and 1/4
N at 40 DAS
2
Late wet
rice
Kalinga 3 75 15 � 10 August (1)–December (2) 4 40–9–17 1/2 N + P + K as basal
and 1/2 N at 21 DAS
1
Wheat UP 262 100 20 cont. November (2)–March (2) 4 100–22–42 1/2 N + P + K as basal
and 1/2 N at 21 DAS
0
Potato K-Ashoka 2500 45 � 20 November (2)–February (1) 6 200–43–125 1/4 N + P + K as basal;
1/2 N at 21 DAP and
1/4 N at 35 DAP
3
Rapeseed B-9 7 30 � 10 October (4)–February (2) 2 80–17–33 1/2 N + P + K as basal
and 1/2 N at 21 DAS
1
Dry rice Kalinga 3 75 15 � 10 January (1)–April (2) 10 100–22–42 1/4 N + P + K as basal;
1/2 N at 21 DAT
and 1/4 N at 42 DAT
3
Sesame Rama 9 30 � 10 March (1)–June (2) 0 50–11–21 1/2 N + P + K as basal
and 1/2 N at 21 DAS
1
a Figures in parenthesis indicate week of the month.b Need-based irrigation was given and the numbers of irrigations listed are averages of 3 years.c Nitrogen, phosphorus and potassium were applied as days after sowing (DAS) or planting (DAP) as urea, single super phosphate and muriate of potash,
respectively.
Prices of individual inputs and outputs were assumed to
be stable during the experimental period. Working out
production cost of individual crops from small experimental
plots was considered inaccurate. The Directorate of
Agriculture, Government of West Bengal (Anonymous,
1999) has surveyed costs for and returns from crops at
various locations within the state and set standard values for
input use and yields. Hence, we calculated the cost of
Table 3
Input requirements of the individual crops grown
Item Wet rice Late wet rice Dry rice
Fertilizer-N (kg ha�1) 60 40 100
Fertilizer-P (kg ha�1) 13 9 22
Fertilizer-K (kg ha�1) 25 17 42
Seed (kg ha�1) 50 75 75
Endosulfan (L ha�1)
Carbendazim (kg ha�1) 0.83
Mancozeb (kg ha�1)
Dimethoate (L ha�1) 0.75 0.75 0.75
Carbofuron 10 G (kg ha�1) 1.50 1.50
Irrigation (mm ha�1) 200 200 500
Diesel (L ha�1) 5 5 7
Bullock pair (h ha�1) 32 32 32
Labor before harvest
Men (8-h days ha�1) 77 77 99
Women (8-h days ha�1) 39 39 51
Labor for harvest and processing
Men (8-h days ha�1) 96 96 106
Women (8-h days ha�1) 50 50 55
production on the basis of these standards. Family labor at
the mean wage rate of hired labor was included in the cost
calculations, thus ignoring possible opportunity costs. The
cost for harvesting and processing also depends on the
amount of yield. Therefore, cost per unit yield for harvest
and processing was calculated using measured mean yields
for individual crops under various cropping systems tested in
combination with the published standard costs for harvesting
Wheat Jute Potato Rapeseed Sesame
100 50 200 80 50
22 11 43 17 11
42 21 125 33 21
100 5 2500 7 9
1
6.25 0.02
1.88
0.50
200 50 300 100
5 15 5 5 5
24 24 32 24 24
45 100 103 43 20
23 51 53 22 10
23 101 67 40 17
12 51 34 21 9
B. Biswas et al. / Field Crops Research 99 (2006) 35–47 39
Table 4
Production costs (Rs. ha�1) of the crops grown in the various cropping systems evaluated
Item Wet rice Late
wet rice
Dry rice Wheat Jute Potato Rapeseed Sesame
Land preparation 1856 1856 1750 1908 2379 2588 940 1800
Seed 500 750 750 1000 250 4500 120 90
Fertilizer 1681 1120 2972 2324 1270 6627 2207 1675
Pesticides 95 190 165 0 148 1039 84 166
Irrigation 267 267 3063 173 338 1993 449 0
Depreciation 224 224 271 277 283 1124 296 90
Tax 17 17 18 18 21 652 22 17
Labor before harvest 3730 3730 5251 2157 5460 5290 2284 1050
Total cost
before harvest
8369 8154 14240 7857 10149 23813 6402 4888
Mean yield (t ha�1)a 4.26 3.08 4.88 3.36 2.80 25.62 1.18 1.10
Cost for harvest
and processing
Rs. ha�1 5108 5108 5605 5504 5330 3527 2128 875
Rs. t�1 yield 1198 1658 1148 1636 1904 138 1811 796
Total cost at Y
ton yield
level (Rs. ha�1)
8369
+ 1198Y
8154
+ 1658Y
14240
+ 1148Y
7857
+ 1636Y
10149
+ 1904Y
23813
+ 138Y
6402
+ 1812Y
4888
+ 796Y
1 US $ = Indian Rupees (Rs.) 48.a Mean yield of a crop obtained under individual cropping systems in the experiment.
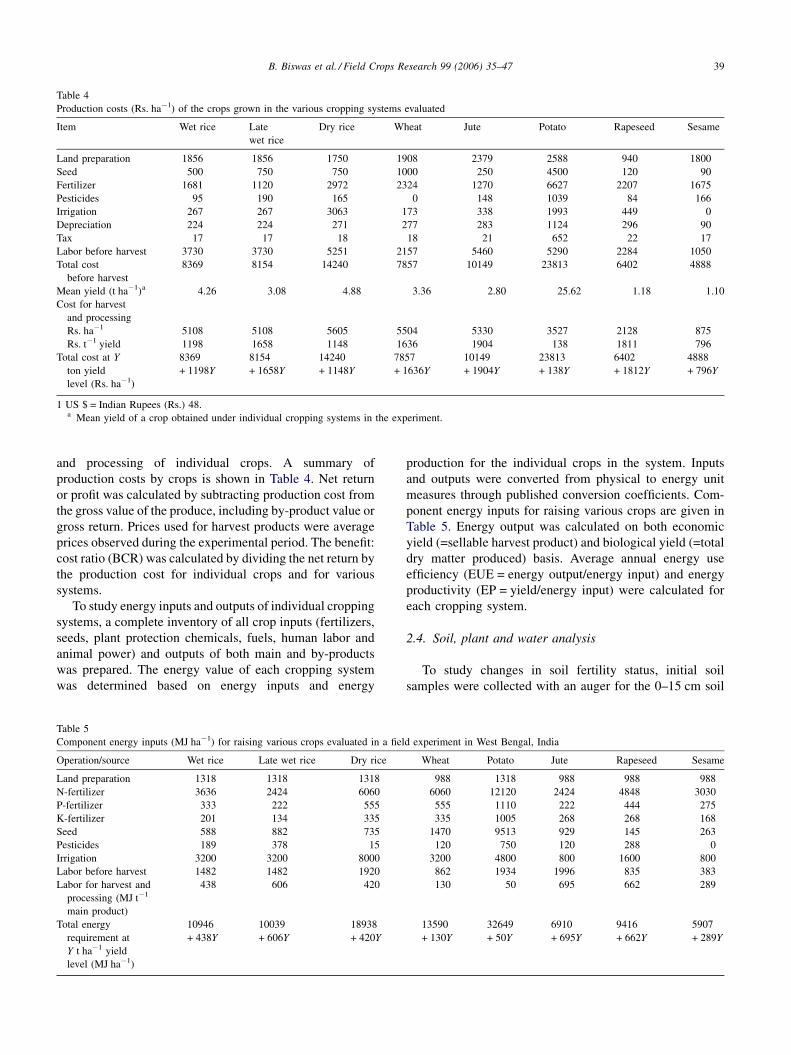
and processing of individual crops. A summary of
production costs by crops is shown in Table 4. Net return
or profit was calculated by subtracting production cost from
the gross value of the produce, including by-product value or
gross return. Prices used for harvest products were average
prices observed during the experimental period. The benefit:
cost ratio (BCR) was calculated by dividing the net return by
the production cost for individual crops and for various
systems.
To study energy inputs and outputs of individual cropping
systems, a complete inventory of all crop inputs (fertilizers,
seeds, plant protection chemicals, fuels, human labor and
animal power) and outputs of both main and by-products
was prepared. The energy value of each cropping system
was determined based on energy inputs and energy
Table 5
Component energy inputs (MJ ha�1) for raising various crops evaluated in a fiel
Operation/source Wet rice Late wet rice Dry rice
Land preparation 1318 1318 1318
N-fertilizer 3636 2424 6060
P-fertilizer 333 222 555
K-fertilizer 201 134 335
Seed 588 882 735
Pesticides 189 378 15
Irrigation 3200 3200 8000
Labor before harvest 1482 1482 1920
Labor for harvest and
processing (MJ t�1
main product)
438 606 420
Total energy
requirement at
Y t ha�1 yield
level (MJ ha�1)
10946
+ 438Y
10039
+ 606Y
18938
+ 420Y
production for the individual crops in the system. Inputs
and outputs were converted from physical to energy unit
measures through published conversion coefficients. Com-
ponent energy inputs for raising various crops are given in
Table 5. Energy output was calculated on both economic
yield (=sellable harvest product) and biological yield (=total
dry matter produced) basis. Average annual energy use
efficiency (EUE = energy output/energy input) and energy
productivity (EP = yield/energy input) were calculated for
each cropping system.
2.4. Soil, plant and water analysis
To study changes in soil fertility status, initial soil
samples were collected with an auger for the 0–15 cm soil
d experiment in West Bengal, India
Wheat Potato Jute Rapeseed Sesame
988 1318 988 988 988
6060 12120 2424 4848 3030
555 1110 222 444 275
335 1005 268 268 168
1470 9513 929 145 263
120 750 120 288 0
3200 4800 800 1600 800
862 1934 1996 835 383
130 50 695 662 289
13590
+ 130Y
32649
+ 50Y
6910
+ 695Y
9416
+ 662Y
5907
+ 289Y
B. Biswas et al. / Field Crops Research 99 (2006) 35–4740
depth at 20 locations of the experimental area. The samples
were thoroughly mixed, dried and passed through 2 mm
sieve and kept in poly bags for chemical analysis of organic
carbon, pH (1:2.5 soil: water), total N, available K (1N NH4-
acetate) and available P (Bray-1). Soil samples were also
taken and analyzed treatment wise after harvest of each crop
in each year under individual cropping systems. Plant
samples were taken at physiological maturity for rice, wheat
and sesame, and at harvest for potato and jute during each
cropping season for the determination of P (Spectro-
photometer method) and K (Flame photometer method) in
economic and by-product parts of the plant. In jute, whole-
plant samples were analyzed for P and K, but in potato, only
tubers were analyzed. Crop uptake of P and K was estimated
by multiplying the dry matter yields (after drying at 70 8C to
constant weight) of each crop with their corresponding
nutrient contents. Nutrient contents in irrigation and rain
water during each cropping season, and in seeds of
individual crops and in potato tubers were measured using
the standard procedures. Average (of 3 years) P and K
contributions through rainwater were 0.0013 and
0.0333 kg ha�1 cm�1, respectively, and through irrigation
water were 0.008 and 0.16 kg ha�1 cm�1, respectively.
2.5. P and K uptake and balances
Apparent balances of P and K were estimated after 3
years under individual cropping systems as
P balance ¼Xðfertilizer P; rain P; irrigation-water P;
P in seedlings and seedsÞ �X
Crop P removal
K balance ¼Xðfertilizer K; rain K; irrigation-water K;
K in seedlings and seedsÞ �XðCrop K removal;
leaching losses of KÞ
Fertilizer inputs to various crops were made as per the
recommendation of the Department of Agriculture, Govern-
ment of West Bengal (Anonymous, 1998). No manure was
applied to any crop, resembling the majority of the farmers’
Table 6
Mean crop productivity and rice equivalent yield (REY) of various cropping sys
Cropping system Yield (t ha�1)
Rainy Winter Summer
R–R 4.09 – 4.58
R–W 3.97 3.01 –
R–P–R 4.65 24.35 5.40
R–P–S 4.63 23.72 1.10
R–Re–R 3.98 1.06 4.29
J–R–R 2.68 3.08 5.00
J–W 2.76 3.72 –
J–P–R 3.18 28.79 5.63
J–Re–R 2.58 1.29 4.40
CD (5%)
R, rice; W, wheat; P, potato; S, sesame; Re, rapeseed; J, jute. Means of pooled R
practice. Roots and stubbles of previous crops and weed
biomass were fully removed so that their nutrient contribu-
tions to apparent balances were almost nil. Average seasonal
rainfall received and irrigation water applied were 806 and
50 mm for jute, 1084 and 200 mm for wet rice, 613 and
200 mm for late wet rice, 36 and 200 mm for wheat, 21 and
300 mm for potato, 36 and 100 mm for rapeseed, 68 and
500 mm for dry rice, and 450 and 0 mm for sesame. The P
and K contributions through rain and irrigation water during
each crop season were estimated by multiplying their
respective concentrations with the amount of rain received
and irrigation water applied over the season. The P
contribution through both rainfall and irrigation was
minimal (0.1–0.8 kg ha�1), compared to K (2.8–
16.0 kg ha�1), and that P and K inputs through rainfall
was much smaller (0.1–5.2 kg ha�1) than irrigation (0.2–
16.0 kg ha�1). We assumed that there would be no loss of P
through leaching or other wise from the soil system
(Dobermann et al., 1996a). Leaching loss of K for all crops
was assumed to be 150 g kg�1 of K input (Smaling and
Fresco, 1993).
3. Results and discussion
3.1. Productivity
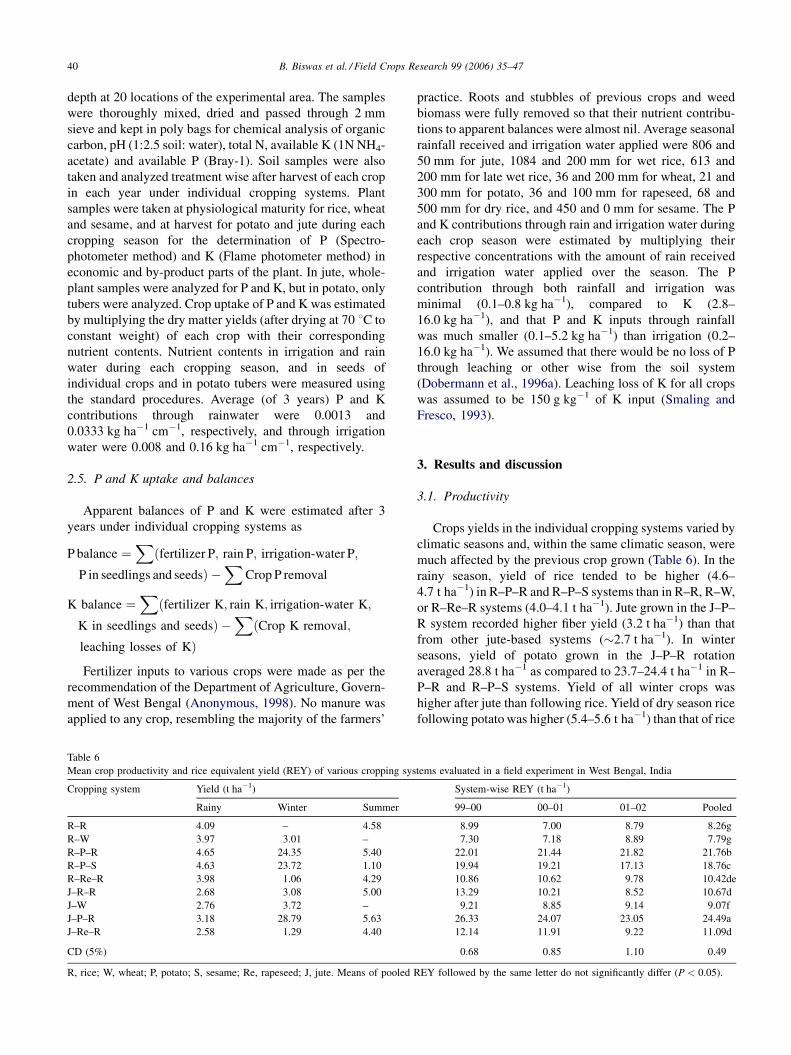
Crops yields in the individual cropping systems varied by
climatic seasons and, within the same climatic season, were
much affected by the previous crop grown (Table 6). In the
rainy season, yield of rice tended to be higher (4.6–
4.7 t ha�1) in R–P–R and R–P–S systems than in R–R, R–W,
or R–Re–R systems (4.0–4.1 t ha�1). Jute grown in the J–P–
R system recorded higher fiber yield (3.2 t ha�1) than that
from other jute-based systems (�2.7 t ha�1). In winter
seasons, yield of potato grown in the J–P–R rotation
averaged 28.8 t ha�1 as compared to 23.7–24.4 t ha�1 in R–
P–R and R–P–S systems. Yield of all winter crops was
higher after jute than following rice. Yield of dry season rice
following potato was higher (5.4–5.6 t ha�1) than that of rice
tems evaluated in a field experiment in West Bengal, India
System-wise REY (t ha�1)
99–00 00–01 01–02 Pooled
8.99 7.00 8.79 8.26g
7.30 7.18 8.89 7.79g
22.01 21.44 21.82 21.76b
19.94 19.21 17.13 18.76c
10.86 10.62 9.78 10.42de
13.29 10.21 8.52 10.67d
9.21 8.85 9.14 9.07f
26.33 24.07 23.05 24.49a
12.14 11.91 9.22 11.09d
0.68 0.85 1.10 0.49
EY followed by the same letter do not significantly differ (P < 0.05).
B. Biswas et al. / Field Crops Research 99 (2006) 35–47 41
following rapeseed or rice (4.3–5 t ha�1). When the system-
wise REY was considered, cropping systems including
potato recorded greater overall production (REY = 19–
25 t ha�1) than any other systems (8–11 t ha�1). Among the
potato-inclusive systems ranking in terms of total produc-
tivity followed the order J–P–R > R–P–R > R–P–S. Other
triple cropping systems that did not include potato recorded
intermediate system REY, whereas the three double
cropping systems (R–R, R–W and J–W) had the lowest
annual productivity.
In the potato-containing triple-cropping systems, rice
yields following potato were significantly higher than when
grown after rice or rapeseed. Residual effects of high doses of
fertilizer applied to potato as well as intensive soil aeration
during potato cropping may have caused benefits for rice, as
has also been observed in other studies with potato systems
(Biswas and Mitra, 1987). Jute also appears to have beneficial
effects on succeeding crops (Mandal et al., 1981; CRIJAF,
2000), which may be associated with improvements in
nutrient cycling, soil structure, and root growth. Jute itself
may perform better in a J–W system than in a J–R–R system
(Tomar and Tiwari, 1990), partly because the dissimilar
nature of crops in the J–W system results in better overall
nutrient use efficiency. Rice and wheat are more nutrient
exhaustive crops than jute and growing two rice crops in a J–
R–R system exhausts more nutrients than a single crop of
wheat in a J–W system. Low grain yields of cereals grown
after nutrient exhausting crops such as rapeseed or mustard
have also been observed in other studies (Singh and Beniwal,
1983). Poor performance of wet season rice in R–R and R–
Re–R systems was probably due to growing two rice crops in
quick succession (Gangwar et al., 1986). Poor performance of
late wet season rice was caused by delayed transplanting,
which can result in cold damage during flowering stage of
rice. Also, late wet season rice suffered from some insect and
diseases damage. Jute had positive residual effects on wheat
grown thereafter because it left the soil with better physical
structure than when wheat was grown after rice. Presence of a
individual crop species in the rotation generally reduced pest
pressure on wheat (data not shown).
Table 7
Economic return of various cropping systems evaluated in a field experiment in
Cropping system Production cost (Rs. ha�1) Net return (R
Rainy Winter Summer System Rainy Wi
R–R 13269 0 19497 32766 10720
R–W 13129 12780 0 25909 10315 12
R–P–R 13935 27165 20442 61543 13191 33
R–P–S 13911 27078 5759 46749 13272 32
R–Re–R 13137 8321 19168 40625 10100 6
J–R–R 15257 13262 19975 48494 9673 5
J–W 15403 13936 0 29339 10237 17
J–P–R 16209 27777 20706 64692 13218 44
J–Re–R 15054 8730 19287 43070 8826 9
CD (5%) 399 262 265 503 1285 1
1 US $ = Rs. 48.
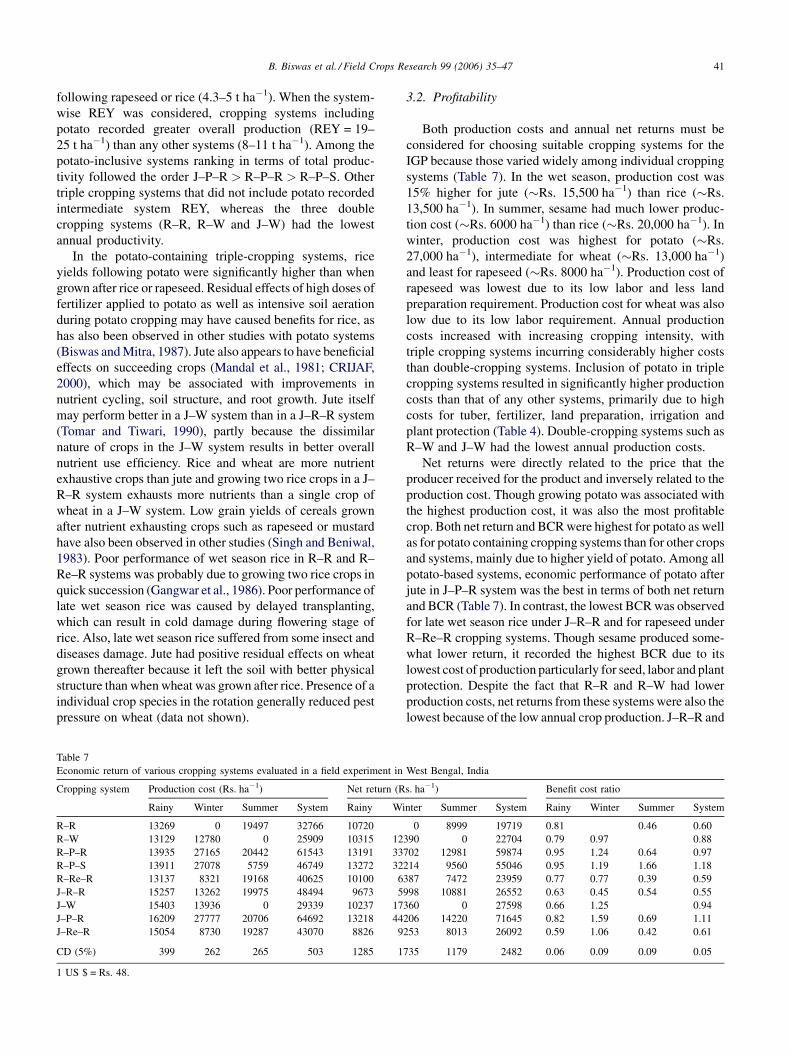
3.2. Profitability
Both production costs and annual net returns must be
considered for choosing suitable cropping systems for the
IGP because those varied widely among individual cropping
systems (Table 7). In the wet season, production cost was
15% higher for jute (�Rs. 15,500 ha�1) than rice (�Rs.
13,500 ha�1). In summer, sesame had much lower produc-
tion cost (�Rs. 6000 ha�1) than rice (�Rs. 20,000 ha�1). In
winter, production cost was highest for potato (�Rs.
27,000 ha�1), intermediate for wheat (�Rs. 13,000 ha�1)
and least for rapeseed (�Rs. 8000 ha�1). Production cost of
rapeseed was lowest due to its low labor and less land
preparation requirement. Production cost for wheat was also
low due to its low labor requirement. Annual production
costs increased with increasing cropping intensity, with
triple cropping systems incurring considerably higher costs
than double-cropping systems. Inclusion of potato in triple
cropping systems resulted in significantly higher production
costs than that of any other systems, primarily due to high
costs for tuber, fertilizer, land preparation, irrigation and
plant protection (Table 4). Double-cropping systems such as
R–W and J–W had the lowest annual production costs.
Net returns were directly related to the price that the
producer received for the product and inversely related to the
production cost. Though growing potato was associated with
the highest production cost, it was also the most profitable
crop. Both net return and BCR were highest for potato as well
as for potato containing cropping systems than for other crops
and systems, mainly due to higher yield of potato. Among all
potato-based systems, economic performance of potato after
jute in J–P–R system was the best in terms of both net return
and BCR (Table 7). In contrast, the lowest BCR was observed
for late wet season rice under J–R–R and for rapeseed under
R–Re–R cropping systems. Though sesame produced some-
what lower return, it recorded the highest BCR due to its
lowest cost of production particularly for seed, labor and plant
protection. Despite the fact that R–R and R–W had lower
production costs, net returns from these systems were also the
lowest because of the low annual crop production. J–R–R and
West Bengal, India
s. ha�1) Benefit cost ratio
nter Summer System Rainy Winter Summer System
0 8999 19719 0.81 0.46 0.60
390 0 22704 0.79 0.97 0.88
702 12981 59874 0.95 1.24 0.64 0.97
214 9560 55046 0.95 1.19 1.66 1.18
387 7472 23959 0.77 0.77 0.39 0.59
998 10881 26552 0.63 0.45 0.54 0.55
360 0 27598 0.66 1.25 0.94
206 14220 71645 0.82 1.59 0.69 1.11
253 8013 26092 0.59 1.06 0.42 0.61
735 1179 2482 0.06 0.09 0.09 0.05
B. Biswas et al. / Field Crops Research 99 (2006) 35–4742
J–W cropping systems gave intermediate returns due to high
production cost of jute and lower market prices of rice and
wheat. It should be noted, however, that the average
production costs and economic returns shown in Table 7
only illustrate the major differences among cropping systems.
Annual price fluctuations are likely to cause significant
variation in the economic performance and also varying
economic risk among the systems.
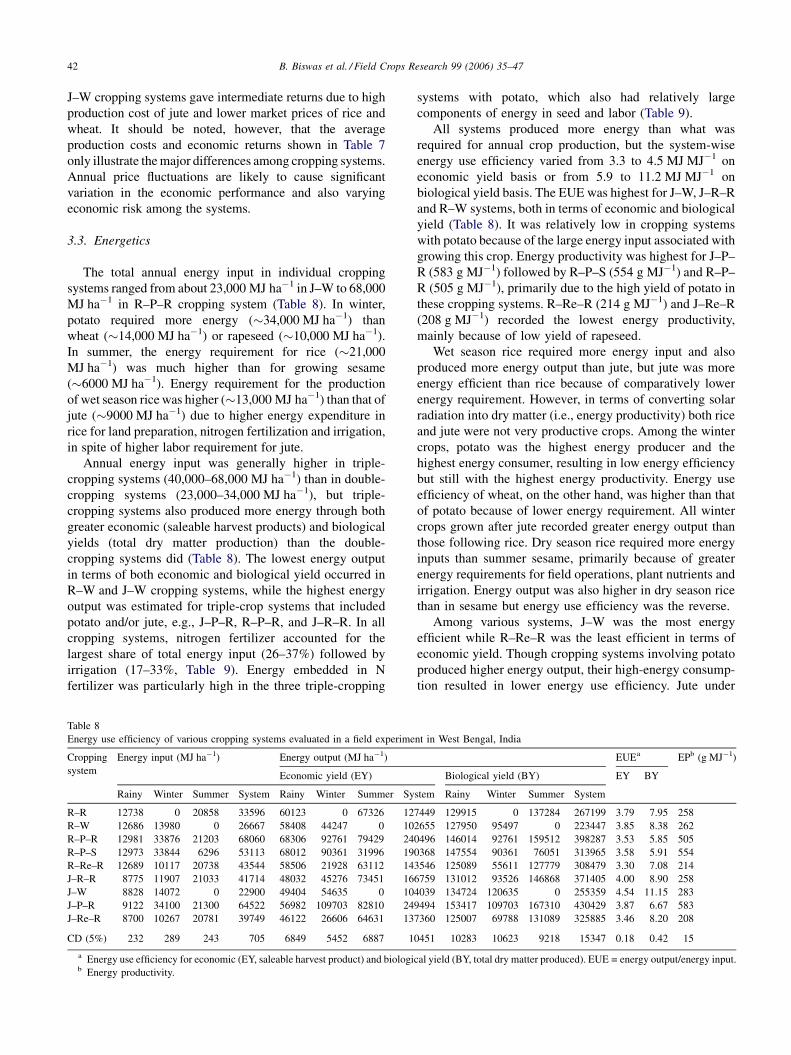
3.3. Energetics
The total annual energy input in individual cropping
systems ranged from about 23,000 MJ ha�1 in J–W to 68,000
MJ ha�1 in R–P–R cropping system (Table 8). In winter,
potato required more energy (�34,000 MJ ha�1) than
wheat (�14,000 MJ ha�1) or rapeseed (�10,000 MJ ha�1).
In summer, the energy requirement for rice (�21,000
MJ ha�1) was much higher than for growing sesame
(�6000 MJ ha�1). Energy requirement for the production
of wet season rice was higher (�13,000 MJ ha�1) than that of
jute (�9000 MJ ha�1) due to higher energy expenditure in
rice for land preparation, nitrogen fertilization and irrigation,
in spite of higher labor requirement for jute.
Annual energy input was generally higher in triple-
cropping systems (40,000–68,000 MJ ha�1) than in double-
cropping systems (23,000–34,000 MJ ha�1), but triple-
cropping systems also produced more energy through both
greater economic (saleable harvest products) and biological
yields (total dry matter production) than the double-
cropping systems did (Table 8). The lowest energy output
in terms of both economic and biological yield occurred in
R–W and J–W cropping systems, while the highest energy
output was estimated for triple-crop systems that included
potato and/or jute, e.g., J–P–R, R–P–R, and J–R–R. In all
cropping systems, nitrogen fertilizer accounted for the
largest share of total energy input (26–37%) followed by
irrigation (17–33%, Table 9). Energy embedded in N
fertilizer was particularly high in the three triple-cropping
Table 8
Energy use efficiency of various cropping systems evaluated in a field experime
Cropping
system
Energy input (MJ ha�1) Energy output (MJ ha�1)
Economic yield (EY)
Rainy Winter Summer System Rainy Winter Summer Sy
R–R 12738 0 20858 33596 60123 0 67326 12
R–W 12686 13980 0 26667 58408 44247 0 10
R–P–R 12981 33876 21203 68060 68306 92761 79429 24
R–P–S 12973 33844 6296 53113 68012 90361 31996 19
R–Re–R 12689 10117 20738 43544 58506 21928 63112 14
J–R–R 8775 11907 21033 41714 48032 45276 73451 16
J–W 8828 14072 0 22900 49404 54635 0 10
J–P–R 9122 34100 21300 64522 56982 109703 82810 24
J–Re–R 8700 10267 20781 39749 46122 26606 64631 13
CD (5%) 232 289 243 705 6849 5452 6887 1
a Energy use efficiency for economic (EY, saleable harvest product) and biologib Energy productivity.
systems with potato, which also had relatively large
components of energy in seed and labor (Table 9).
All systems produced more energy than what was
required for annual crop production, but the system-wise
energy use efficiency varied from 3.3 to 4.5 MJ MJ�1 on
economic yield basis or from 5.9 to 11.2 MJ MJ�1 on
biological yield basis. The EUE was highest for J–W, J–R–R
and R–W systems, both in terms of economic and biological
yield (Table 8). It was relatively low in cropping systems
with potato because of the large energy input associated with
growing this crop. Energy productivity was highest for J–P–
R (583 g MJ�1) followed by R–P–S (554 g MJ�1) and R–P–
R (505 g MJ�1), primarily due to the high yield of potato in
these cropping systems. R–Re–R (214 g MJ�1) and J–Re–R
(208 g MJ�1) recorded the lowest energy productivity,
mainly because of low yield of rapeseed.
Wet season rice required more energy input and also
produced more energy output than jute, but jute was more
energy efficient than rice because of comparatively lower
energy requirement. However, in terms of converting solar
radiation into dry matter (i.e., energy productivity) both rice
and jute were not very productive crops. Among the winter
crops, potato was the highest energy producer and the
highest energy consumer, resulting in low energy efficiency
but still with the highest energy productivity. Energy use
efficiency of wheat, on the other hand, was higher than that
of potato because of lower energy requirement. All winter
crops grown after jute recorded greater energy output than
those following rice. Dry season rice required more energy
inputs than summer sesame, primarily because of greater
energy requirements for field operations, plant nutrients and
irrigation. Energy output was also higher in dry season rice
than in sesame but energy use efficiency was the reverse.
Among various systems, J–W was the most energy
efficient while R–Re–R was the least efficient in terms of
economic yield. Though cropping systems involving potato
produced higher energy output, their high-energy consump-
tion resulted in lower energy use efficiency. Jute under
nt in West Bengal, India
EUEa EPb (g MJ�1)
Biological yield (BY) EY BY
stem Rainy Winter Summer System
7449 129915 0 137284 267199 3.79 7.95 258
2655 127950 95497 0 223447 3.85 8.38 262
0496 146014 92761 159512 398287 3.53 5.85 505
0368 147554 90361 76051 313965 3.58 5.91 554
3546 125089 55611 127779 308479 3.30 7.08 214
6759 131012 93526 146868 371405 4.00 8.90 258
4039 134724 120635 0 255359 4.54 11.15 283
9494 153417 109703 167310 430429 3.87 6.67 583
7360 125007 69788 131089 325885 3.46 8.20 208
0451 10283 10623 9218 15347 0.18 0.42 15
cal yield (BY, total dry matter produced). EUE = energy output/energy input.
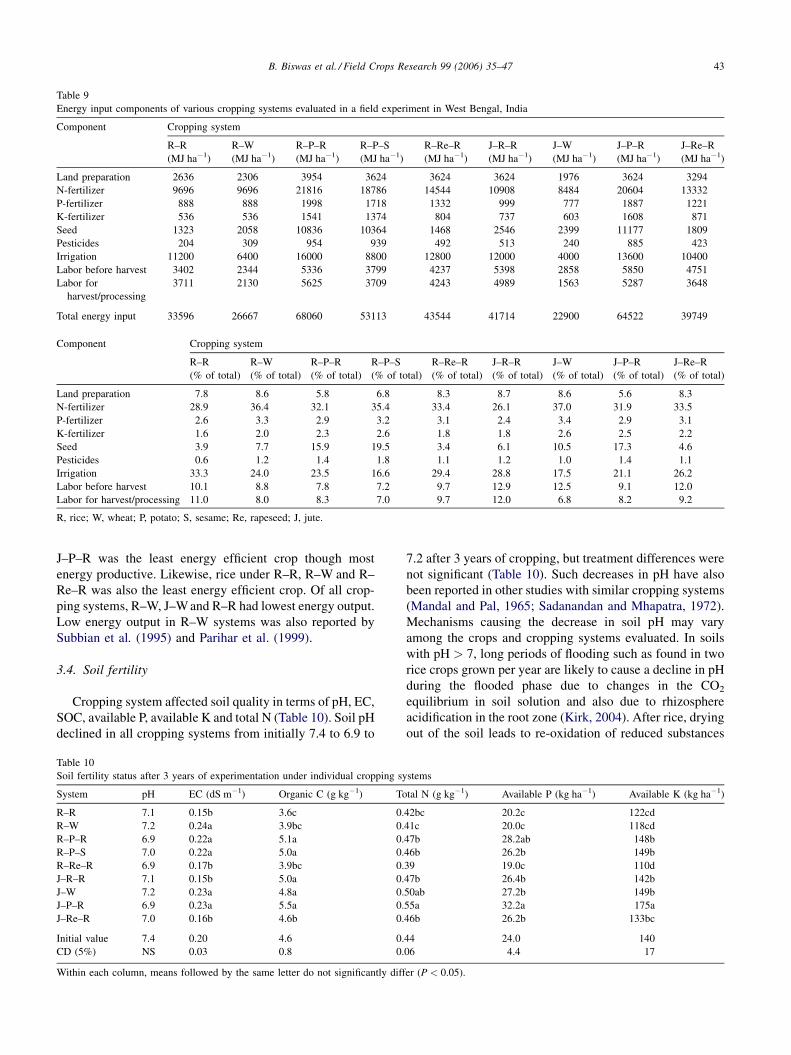
B. Biswas et al. / Field Crops Research 99 (2006) 35–47 43
Table 9
Energy input components of various cropping systems evaluated in a field experiment in West Bengal, India
Component Cropping system
R–R
(MJ ha�1)
R–W
(MJ ha�1)
R–P–R
(MJ ha�1)
R–P–S
(MJ ha�1)
R–Re–R
(MJ ha�1)
J–R–R
(MJ ha�1)
J–W
(MJ ha�1)
J–P–R
(MJ ha�1)
J–Re–R
(MJ ha�1)
Land preparation 2636 2306 3954 3624 3624 3624 1976 3624 3294
N-fertilizer 9696 9696 21816 18786 14544 10908 8484 20604 13332
P-fertilizer 888 888 1998 1718 1332 999 777 1887 1221
K-fertilizer 536 536 1541 1374 804 737 603 1608 871
Seed 1323 2058 10836 10364 1468 2546 2399 11177 1809
Pesticides 204 309 954 939 492 513 240 885 423
Irrigation 11200 6400 16000 8800 12800 12000 4000 13600 10400
Labor before harvest 3402 2344 5336 3799 4237 5398 2858 5850 4751
Labor for
harvest/processing
3711 2130 5625 3709 4243 4989 1563 5287 3648
Total energy input 33596 26667 68060 53113 43544 41714 22900 64522 39749
Component Cropping system
R–R
(% of total)
R–W
(% of total)
R–P–R
(% of total)
R–P–S
(% of total)
R–Re–R
(% of total)
J–R–R
(% of total)
J–W
(% of total)
J–P–R
(% of total)
J–Re–R
(% of total)
Land preparation 7.8 8.6 5.8 6.8 8.3 8.7 8.6 5.6 8.3
N-fertilizer 28.9 36.4 32.1 35.4 33.4 26.1 37.0 31.9 33.5
P-fertilizer 2.6 3.3 2.9 3.2 3.1 2.4 3.4 2.9 3.1
K-fertilizer 1.6 2.0 2.3 2.6 1.8 1.8 2.6 2.5 2.2
Seed 3.9 7.7 15.9 19.5 3.4 6.1 10.5 17.3 4.6
Pesticides 0.6 1.2 1.4 1.8 1.1 1.2 1.0 1.4 1.1
Irrigation 33.3 24.0 23.5 16.6 29.4 28.8 17.5 21.1 26.2
Labor before harvest 10.1 8.8 7.8 7.2 9.7 12.9 12.5 9.1 12.0
Labor for harvest/processing 11.0 8.0 8.3 7.0 9.7 12.0 6.8 8.2 9.2
R, rice; W, wheat; P, potato; S, sesame; Re, rapeseed; J, jute.
J–P–R was the least energy efficient crop though most
energy productive. Likewise, rice under R–R, R–W and R–
Re–R was also the least energy efficient crop. Of all crop-
ping systems, R–W, J–W and R–R had lowest energy output.
Low energy output in R–W systems was also reported by
Subbian et al. (1995) and Parihar et al. (1999).
3.4. Soil fertility
Cropping system affected soil quality in terms of pH, EC,
SOC, available P, available K and total N (Table 10). Soil pH
declined in all cropping systems from initially 7.4 to 6.9 to
Table 10
Soil fertility status after 3 years of experimentation under individual cropping sy
System pH EC (dS m�1) Organic C (g kg�1) To
R–R 7.1 0.15b 3.6c 0.
R–W 7.2 0.24a 3.9bc 0.
R–P–R 6.9 0.22a 5.1a 0.
R–P–S 7.0 0.22a 5.0a 0.
R–Re–R 6.9 0.17b 3.9bc 0.
J–R–R 7.1 0.15b 5.0a 0.
J–W 7.2 0.23a 4.8a 0.
J–P–R 6.9 0.23a 5.5a 0.
J–Re–R 7.0 0.16b 4.6b 0.
Initial value 7.4 0.20 4.6 0.
CD (5%) NS 0.03 0.8 0.
Within each column, means followed by the same letter do not significantly diff
7.2 after 3 years of cropping, but treatment differences were
not significant (Table 10). Such decreases in pH have also
been reported in other studies with similar cropping systems
(Mandal and Pal, 1965; Sadanandan and Mhapatra, 1972).
Mechanisms causing the decrease in soil pH may vary
among the crops and cropping systems evaluated. In soils
with pH > 7, long periods of flooding such as found in two
rice crops grown per year are likely to cause a decline in pH
during the flooded phase due to changes in the CO2
equilibrium in soil solution and also due to rhizosphere
acidification in the root zone (Kirk, 2004). After rice, drying
out of the soil leads to re-oxidation of reduced substances
stems
tal N (g kg�1) Available P (kg ha�1) Available K (kg ha�1)
42bc 20.2c 122cd
41c 20.0c 118cd
47b 28.2ab 148b
46b 26.2b 149b
39 19.0c 110d
47b 26.4b 142b
50ab 27.2b 149b
55a 32.2a 175a
46b 26.2b 133bc
44 24.0 140
06 4.4 17
er (P < 0.05).
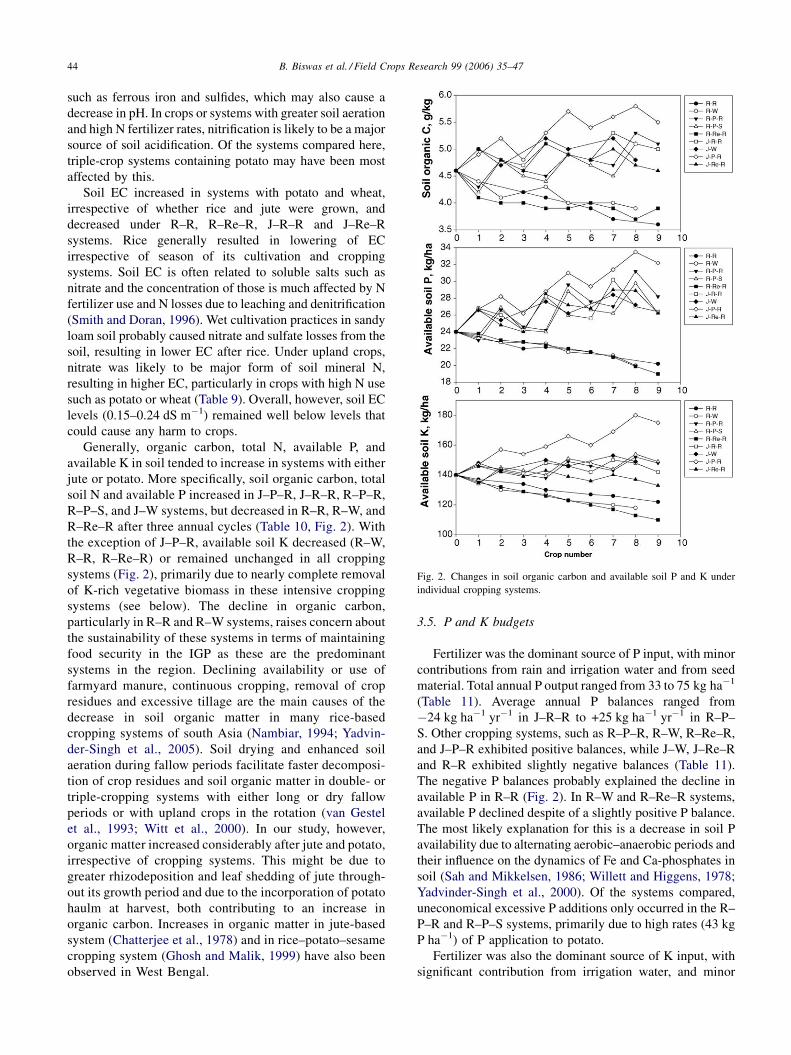
B. Biswas et al. / Field Crops Research 99 (2006) 35–4744
Fig. 2. Changes in soil organic carbon and available soil P and K under
individual cropping systems.
such as ferrous iron and sulfides, which may also cause a
decrease in pH. In crops or systems with greater soil aeration
and high N fertilizer rates, nitrification is likely to be a major
source of soil acidification. Of the systems compared here,
triple-crop systems containing potato may have been most
affected by this.
Soil EC increased in systems with potato and wheat,
irrespective of whether rice and jute were grown, and
decreased under R–R, R–Re–R, J–R–R and J–Re–R
systems. Rice generally resulted in lowering of EC
irrespective of season of its cultivation and cropping
systems. Soil EC is often related to soluble salts such as
nitrate and the concentration of those is much affected by N
fertilizer use and N losses due to leaching and denitrification
(Smith and Doran, 1996). Wet cultivation practices in sandy
loam soil probably caused nitrate and sulfate losses from the
soil, resulting in lower EC after rice. Under upland crops,
nitrate was likely to be major form of soil mineral N,
resulting in higher EC, particularly in crops with high N use
such as potato or wheat (Table 9). Overall, however, soil EC
levels (0.15–0.24 dS m�1) remained well below levels that
could cause any harm to crops.
Generally, organic carbon, total N, available P, and
available K in soil tended to increase in systems with either
jute or potato. More specifically, soil organic carbon, total
soil N and available P increased in J–P–R, J–R–R, R–P–R,
R–P–S, and J–W systems, but decreased in R–R, R–W, and
R–Re–R after three annual cycles (Table 10, Fig. 2). With
the exception of J–P–R, available soil K decreased (R–W,
R–R, R–Re–R) or remained unchanged in all cropping
systems (Fig. 2), primarily due to nearly complete removal
of K-rich vegetative biomass in these intensive cropping
systems (see below). The decline in organic carbon,
particularly in R–R and R–W systems, raises concern about
the sustainability of these systems in terms of maintaining
food security in the IGP as these are the predominant
systems in the region. Declining availability or use of
farmyard manure, continuous cropping, removal of crop
residues and excessive tillage are the main causes of the
decrease in soil organic matter in many rice-based
cropping systems of south Asia (Nambiar, 1994; Yadvin-
der-Singh et al., 2005). Soil drying and enhanced soil
aeration during fallow periods facilitate faster decomposi-
tion of crop residues and soil organic matter in double- or
triple-cropping systems with either long or dry fallow
periods or with upland crops in the rotation (van Gestel
et al., 1993; Witt et al., 2000). In our study, however,
organic matter increased considerably after jute and potato,
irrespective of cropping systems. This might be due to
greater rhizodeposition and leaf shedding of jute through-
out its growth period and due to the incorporation of potato
haulm at harvest, both contributing to an increase in
organic carbon. Increases in organic matter in jute-based
system (Chatterjee et al., 1978) and in rice–potato–sesame
cropping system (Ghosh and Malik, 1999) have also been
observed in West Bengal.
3.5. P and K budgets
Fertilizer was the dominant source of P input, with minor
contributions from rain and irrigation water and from seed
material. Total annual P output ranged from 33 to 75 kg ha�1
(Table 11). Average annual P balances ranged from
�24 kg ha�1 yr�1 in J–R–R to +25 kg ha�1 yr�1 in R–P–
S. Other cropping systems, such as R–P–R, R–W, R–Re–R,
and J–P–R exhibited positive balances, while J–W, J–Re–R
and R–R exhibited slightly negative balances (Table 11).
The negative P balances probably explained the decline in
available P in R–R (Fig. 2). In R–W and R–Re–R systems,
available P declined despite of a slightly positive P balance.
The most likely explanation for this is a decrease in soil P
availability due to alternating aerobic–anaerobic periods and
their influence on the dynamics of Fe and Ca-phosphates in
soil (Sah and Mikkelsen, 1986; Willett and Higgens, 1978;
Yadvinder-Singh et al., 2000). Of the systems compared,
uneconomical excessive P additions only occurred in the R–
P–R and R–P–S systems, primarily due to high rates (43 kg
P ha�1) of P application to potato.
Fertilizer was also the dominant source of K input, with
significant contribution from irrigation water, and minor
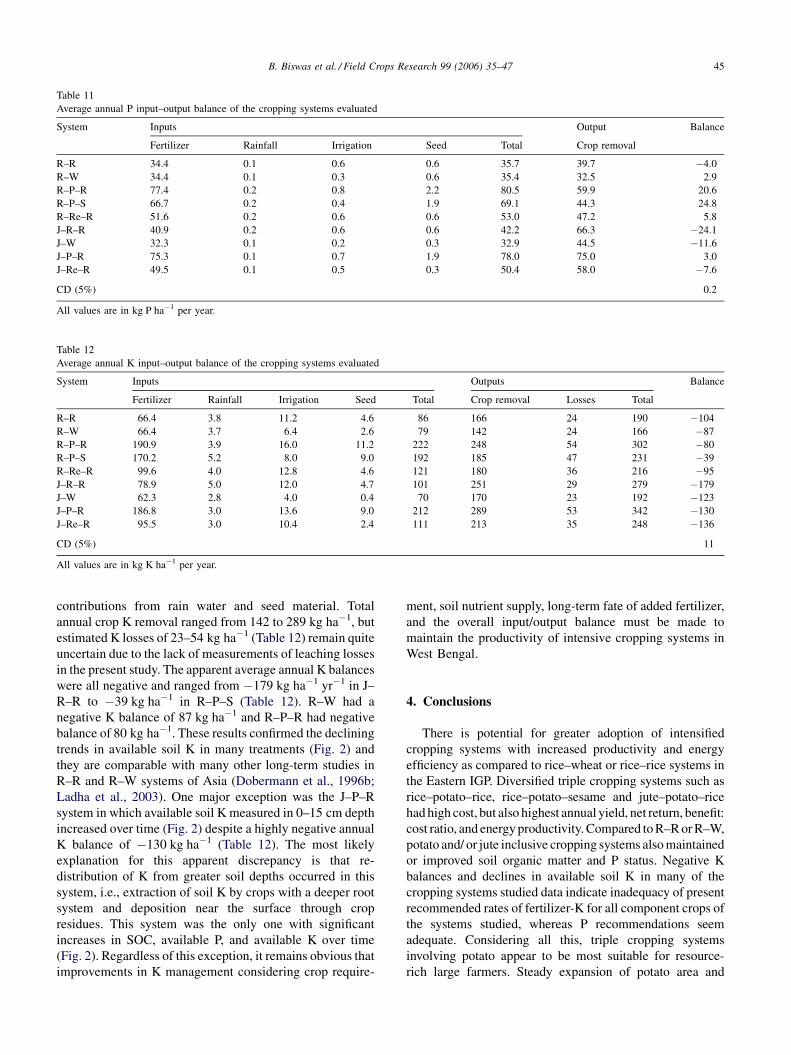
B. Biswas et al. / Field Crops Research 99 (2006) 35–47 45
Table 12
Average annual K input–output balance of the cropping systems evaluated
System Inputs Outputs Balance
Fertilizer Rainfall Irrigation Seed Total Crop removal Losses Total
R–R 66.4 3.8 11.2 4.6 86 166 24 190 �104
R–W 66.4 3.7 6.4 2.6 79 142 24 166 �87
R–P–R 190.9 3.9 16.0 11.2 222 248 54 302 �80
R–P–S 170.2 5.2 8.0 9.0 192 185 47 231 �39
R–Re–R 99.6 4.0 12.8 4.6 121 180 36 216 �95
J–R–R 78.9 5.0 12.0 4.7 101 251 29 279 �179
J–W 62.3 2.8 4.0 0.4 70 170 23 192 �123
J–P–R 186.8 3.0 13.6 9.0 212 289 53 342 �130
J–Re–R 95.5 3.0 10.4 2.4 111 213 35 248 �136
CD (5%) 11
All values are in kg K ha�1 per year.
Table 11
Average annual P input–output balance of the cropping systems evaluated
System Inputs Output Balance
Fertilizer Rainfall Irrigation Seed Total Crop removal
R–R 34.4 0.1 0.6 0.6 35.7 39.7 �4.0
R–W 34.4 0.1 0.3 0.6 35.4 32.5 2.9
R–P–R 77.4 0.2 0.8 2.2 80.5 59.9 20.6
R–P–S 66.7 0.2 0.4 1.9 69.1 44.3 24.8
R–Re–R 51.6 0.2 0.6 0.6 53.0 47.2 5.8
J–R–R 40.9 0.2 0.6 0.6 42.2 66.3 �24.1
J–W 32.3 0.1 0.2 0.3 32.9 44.5 �11.6
J–P–R 75.3 0.1 0.7 1.9 78.0 75.0 3.0
J–Re–R 49.5 0.1 0.5 0.3 50.4 58.0 �7.6
CD (5%) 0.2
All values are in kg P ha�1 per year.
contributions from rain water and seed material. Total
annual crop K removal ranged from 142 to 289 kg ha�1, but
estimated K losses of 23–54 kg ha�1 (Table 12) remain quite
uncertain due to the lack of measurements of leaching losses
in the present study. The apparent average annual K balances
were all negative and ranged from �179 kg ha�1 yr�1 in J–
R–R to �39 kg ha�1 in R–P–S (Table 12). R–W had a
negative K balance of 87 kg ha�1 and R–P–R had negative
balance of 80 kg ha�1. These results confirmed the declining
trends in available soil K in many treatments (Fig. 2) and
they are comparable with many other long-term studies in
R–R and R–W systems of Asia (Dobermann et al., 1996b;
Ladha et al., 2003). One major exception was the J–P–R
system in which available soil K measured in 0–15 cm depth
increased over time (Fig. 2) despite a highly negative annual
K balance of �130 kg ha�1 (Table 12). The most likely
explanation for this apparent discrepancy is that re-
distribution of K from greater soil depths occurred in this
system, i.e., extraction of soil K by crops with a deeper root
system and deposition near the surface through crop
residues. This system was the only one with significant
increases in SOC, available P, and available K over time
(Fig. 2). Regardless of this exception, it remains obvious that
improvements in K management considering crop require-
ment, soil nutrient supply, long-term fate of added fertilizer,
and the overall input/output balance must be made to
maintain the productivity of intensive cropping systems in
West Bengal.
4. Conclusions
There is potential for greater adoption of intensified
cropping systems with increased productivity and energy
efficiency as compared to rice–wheat or rice–rice systems in
the Eastern IGP. Diversified triple cropping systems such as
rice–potato–rice, rice–potato–sesame and jute–potato–rice
had high cost, but also highest annual yield, net return, benefit:
cost ratio, and energy productivity. Compared to R–R or R–W,
potato and/ or jute inclusive cropping systems also maintained
or improved soil organic matter and P status. Negative K
balances and declines in available soil K in many of the
cropping systems studied data indicate inadequacy of present
recommended rates of fertilizer-K for all component crops of
the systems studied, whereas P recommendations seem
adequate. Considering all this, triple cropping systems
involving potato appear to be most suitable for resource-
rich large farmers. Steady expansion of potato area and
B. Biswas et al. / Field Crops Research 99 (2006) 35–4746
production after rice and jute has already occurred in the
eastern IGP in spite of strong price seasonality and higher risk.
Whether this process continues remains to be seen and will
also depend on factors such as prices and cold storage
availability. The main harvest of potato in the eastern IGP
occurs in February and March. Temperatures rise steadily
until the onset of the southwest monsoon in June. Traditional
storage is not an effective option from mid-April onwards, but
prices continue to rise until the rainy season crop is harvested
in October. Recent public and private sector initiatives have
focused on increasing the cold storage area, expansion of
potato exports and diversified processing, thus reducing the
risk of price decline and improving the overall potato market.
Compared to triple-crop system with potato, systems such as
jute–wheat, jute–rapeseed–rice, and rice–wheat require fewer
inputs and are also less risky, which probably makes them
more suitable for resource-poor small farmers.
References
Adhikari, C., Bronson, K.F., Panaullah, G.M., Regmi, A.P., Saha, P.K.,
Dobermann, A., Olk, D.C., Hobbs, P., Pasuquin, E., 1999. On farm soil
N supply and N nutrition in the rice–wheat system of Nepal and
Bangladesh. Field Crops Res. 64, 273–286.
Anonymous, 1998. Soil Test-based Fertilizer Recommendations for Prin-
cipal Crops and Cropping Sequences in West Bengal. Department of
Agriculture, Government of West Bengal.
Anonymous, 1999. Study on Farm Management and Cost of Production of
Crops in West Bengal, 1995–96, Evaluation Wing, vol. XXXVIII.
Directorate of Agriculture, Government of West Bengal, Calcutta.
Bhandari, A.L., Ladha, J.K., Pathak, H., Padre, A.T., Dawe, D., Gupta, R.K.,
2002. Yield and soil nutrient changes in a long-term rice–wheat rotation
in India. Soil Sci. Soc. Am. J. 66, 162–170.
Biswas, G.C., Mitra, P.C., 1987. Residual effect of fertilizers applied to
potato and rice on the yield of jute fibre in rice–potato–jute cropping
sequence. Jute Dev. J. 7 (1), 43–53.
Chatterjee, B.N., Banerjee, N.C., Ghosh, D.C., Debnath, P.K., 1978.
Response to P, K and FYM in multiple cropping with potato. J. Ind.
Potato Assoc. 5, 9–12.
CRIJAF (Central Research Institute of Jute and Allied Fibre), 2000. Annual
Report for 1999–2000, pp. 79–84.
Dobermann, A., Cassman, K.G., Sta. Cruz, P.C., Adviento, M.A.A., Pam-
polino, M.F., 1996a. Fertilizer input, nutrient balance, and soil nutrient
supplying power in intensive, irrigated rice systems. III. Phosphorus.
Nutrient Cycl. AgroEcosyst. 46, 111–125.
Dobermann, A., Sta.Cruz, P.C., Cassman, K.G., 1996b. Fertilizer inputs,
nutrient balance, and soil nutrient supplying power in intensive, irri-
gated rice systems. I. Potassium uptake and K balance. Nutrient Cycl.
Agroecosyst. 46, 1–10.
Gangwar, S.K., Chakraborty, S., Dasgupta, M.K., Huda, A.K.S., 1986.
Modeling yield loss in Indica rice in farmers’ fields due to multiple
pests. Agric. Ecosyst. Environ. 17, 165–171.
Ghosh, D.C., Malik, G.C., 1999. Fertility management in potato under
potato–sesame–rice cropping system. Environ. Ecol. 17, 643–645.
Kirk, G.J.D., 2004. The Biogeochemistry of Submerged Soils. Wiley, New
York.
Ladha, J.K., Dawe, D., Pathak, H., Padre, A.T., Yadav, R.L., Singh, B.,
Singh, Y., Singh, Y., Singh, P., Kundu, A.L., Sakal, R., Ram, N., Regmi,
A.P., Gami, S.K., Bhandari, A.L., Amin, R., Yadav, C.R., Bhattarai,
E.M., Das, S., Aggarwal, H.P., Gupta, R.K., Hobbs, P.R., 2003. How
extensive are yield declines in long-term rice–wheat experiments in
Asia? Field Crops Res. 81, 159–180.
Mandal, A.K., Pal, H., 1965. Study on the soil available phosphorus as
affected by cropping with jute under the influence of nitrogen from
organic and inorganic sources. Jute Bull. 57–59.
Mandal, A.K., Roy, A.B., Pal, H., 1981. Fertilizer use in jute based cropping
system in individual agro-climatic zones. Fert. News 45–50.
Mandal, B.C., Roy, A.B., Saha, M.N., Mondal, A.K., 1984. Wheat yields
and soil nutrient status as influenced by continuous cropping and
manuring in a jute–rice–wheat rotation. J. Ind. Soc. Soil Sci. 32,
696–700.
Mukhopadhyaya, S.K., Roy, D., 2000. Potato-based crop rotations in West
Bengal. Environ. Ecol. 18, 793–797.
Nambiar, K.K.M., 1994. Soil Fertility and Crop Productivity under Long
Term Fertilizer Use in India. ICAR, New Delhi, India, pp. 144.
Panaullah, G.M., Timsina, J., Saleque, M.A., Ishaque, M., Pathan,
A.B.M.B.U., Connor, D.J., Saha, P.K., Quayyum, M.A., Humphreys,
E., Meisner, C.A., 2006. Nutrient uptake and apparent balances for rice–
wheat sequences. III. Potassium. J. Plant Nutr. 29, 173–187.
Parihar, S.S., Pandey, D., Shukla, R.K., Verma, V.K., Chaure, N.K.,
Choudhary, K.K., Pandya, K.S., 1999. Energetics, yield, water use
and economics of rice based cropping system. Ind. J. Agron. 44,
205–209.
Sadanandan, N., Mhapatra, I.C., 1972. Effects of various cropping
patterns on pH of upland alluvial rice soils. Ind. J. Agron. 18,
41–44.
Sah, R.N., Mikkelsen, D.S., 1986. Transformation of inorganic phosphate
during the flooding and draining cycles of soil. Soil Sci. Soc. Am. J. 50,
62–67.
Saha, M.N., Saha, A.R., Mandal, B.C., Roy, P.K., 2000. Effect of long-term
Jute–R–W cropping system on crop yield and soil fertility. In: Abrol,
I.P., Bronson, K.F., Duxbury, J.M., Gupta, R.K. (Eds.), Long-term Soil
Fertility Experiments in R–W Cropping Systems. R–W consortium
Paper Series 6. R–W Consortium for the IGPs, New Dehli, pp. 94–
104.
Saleque, M.A., Timsina, J., Panaullah, G.M., Ishaque, M., Pathan,
A.B.M.B.U., Connor, D.J., Saha, P.K., Quayyum, M.A., Humphreys,
E., Meisner, C.A., 2006. Nutrient uptake and apparent balances for rice–
wheat sequences. II. Phosphorus. J. Plant Nutr. 29, 157–172.
Sarkar, A., 1997. Energy use patterns in sub-tropical rice-wheat cropping
under short-term application of crop residue and fertilizer. Agric.
Ecosyst. Environ. 61, 59–67.
SenGupta, P.K., 2001. Monograph on West Bengal. Directorate of Agri-
culture, Government of West Bengal, Kolkata, India.
Singh, G.B., Beniwal, R.K., 1983. Performance of wheat and mustard in
cropping sequences in Sikkim. Ind. J. Agric. Sci. 53, 820–825.
Smaling, E.M.A., Fresco, L.O., 1993. A decision-support model for mon-
itoring nutrient balances under agricultural land use (NUTMON).
Geoderma 60, 235–256.
Smith, J.L., Doran, J.W., 1996. Measurement and use of pH and electrical
conductivity for soil quality analysis. In: Doran, J.W., Jones, A.J.
(Eds.), Methods for Assessing Soil Quality. SSSA Spec. Pub. No. 49.
SSSA, Madison, WI, pp. 169–185.
Subbian, P., Gopalsundaran, P., Palaniappan, S.P., 1995. Energetics and
water use efficiency of intensive cropping system. Ind. J. Agron. 40,
398–401.
Timsina, J., Connor, D.J., 2001. Productivity and management of R–W
cropping systems: issues and challenges. Field Crops Res. 69, 93–
132.
Timsina, J., Panaullah, G.M., Saleque, M.A., Ishaque, M., Pathan,
A.B.M.B.U., Quayyum, M.A., Connor, D.J., Shah, P.K., Humphreys,
E., Meisner, C.A., 2006. Nutrient uptake and apparent balances for rice–
wheat sequences. I. Nitrogen. J. Plant Nutr. 29, 137–156.
Timsina, J., Singh, U., Badaruddin, M., Meisner, C., Amin, M.R., 2001.
Cultivar, nitrogen, and water effects on productivity, and nitrogen-use
efficiency and balance for rice–wheat sequences of Bangladesh. Field
Crops Res. 72, 143–161.
Tomar, S.S., Tiwari, A.S., 1990. Production potential and economics of
individual crop sequences. Ind. J. Agron. 35, 30–35.

B. Biswas et al. / Field Crops Research 99 (2006) 35–47 47
van Gestel, M., Merckx, R., Vlassak, K., 1993. Microbial biomass responses
to soil drying and rewetting: the fate of fast and slow growing micro-
organisms in the soils from individual.
Willett, I.R., Higgens, M.L., 1978. Phosphate sorption by reduced and
deoxidized rice soils. Aust. J. Soil. Res. 16, 319–326.
Witt, C., Cassman, K.G., Olk, D.C., Biker, U., Liboon, S.P., Samson, M.I.,
Ottow, J.C.G., 2000. Crop rotation and residue management effects on
carbon sequestration, nitrogen cycling and productivity of irrigated rice
systems. Plant Soil 225, 263–278.
Yadav, R.L., Dwivedi, B.S., Pandey, P.S., 2000. Rice–wheat cropping
systems: assessment of sustainability under green manuring and che-
mical fertilisers input. Field Crop. Res. 65, 15–30.
Yadvinder-Singh, Bijay-Singh, Timsina, J., 2005. Crop residue manage-
ment for nutrient cycling and improving soil productivity in rice-based
cropping systems in the tropics. Adv. Agron. 85, 269–407.
Yadvinder-Singh, Dobermann, A., Bijay-Singh, Bronson, K.F., Khind, C.S.,
2000. Optimal phosphorus management strategies for wheat-rice crop-
ping on a loamy sand. Soil Sci. Soc. Am. J. 64, 1413–1422.
Related Documents