POPULATION AND DEVELOPMENT REVIEW 36(2): 309–330 (JUNE 2010) 309 Productivity of Older Workers: Perceptions of Employers and Employees HENDRIK P. VAN DALEN KÈNE HENKENS JOOP SCHIPPERS THE PROSPECT OF an aging workforce has put the question of productivity high on the policy agenda of many industrialized countries. Working longer is generally seen as part of the solution to maintaining economic prosper- ity in the face of population aging. As Joshua Goldstein (2010, p. 30) has put it : “[A]s the first 65-year-old baby boomers prepare to blow out their birthday candles—we must address the larger question of rescheduling life’s turning points, so that people can remain active and productive.” The ques- tions of how the productivity of younger and older workers is perceived by employers and employees and how these stereotypical views are related to the assessment of the skills and capabilities of younger and older workers is largely unanswered. We study these questions using surveys of employees and employers in the Netherlands. Research on the relationship between age and productivity takes place within various disciplines and with various units of measurement (see Skir- bekk 2004, 2008 for an overview). Macroeconomic studies tend to examine the effect of population age structure on labor productivity, and the general consensus is that an aging population exerts a negative effect on labor pro- ductivity (Davis 2005; Feyrer 2008) or on economic growth (Bloom and Wil- liamson 1998; Headey and Hodge 2009). Some studies with a focus on the firm or plant level suggest that high shares of older workers are associated with higher productivity (Malmberg, Lindh, and Halvarsson 2008; Van Ours and Stoeldraijer 2010). Other studies are less confident about this relation- ship. Aubert and Crépon (2007) find that productivity, defined as the average contribution of particular age groups to the productivity of firms, increases

Welcome message from author
This document is posted to help you gain knowledge. Please leave a comment to let me know what you think about it! Share it to your friends and learn new things together.
Transcript

POPULATION AND DEVELOPMENT REVIEW 36(2 ) : 309–330 ( JUNE 2010) 309
Productivity of Older Workers: Perceptions of Employers and Employees
HENDRIK P. VAN DALEN
KÈNE HENKENS
JOOP SCHIPPERS
THE PROSPECT OF an aging workforce has put the question of productivity high on the policy agenda of many industrialized countries. Working longer is generally seen as part of the solution to maintaining economic prosper-ity in the face of population aging. As Joshua Goldstein (2010, p. 30) has put it : “[A]s the first 65-year-old baby boomers prepare to blow out their birthday candles—we must address the larger question of rescheduling life’s turning points, so that people can remain active and productive.” The ques-tions of how the productivity of younger and older workers is perceived by employers and employees and how these stereotypical views are related to the assessment of the skills and capabilities of younger and older workers is largely unanswered. We study these questions using surveys of employees and employers in the Netherlands.
Research on the relationship between age and productivity takes place within various disciplines and with various units of measurement (see Skir-bekk 2004, 2008 for an overview). Macroeconomic studies tend to examine the effect of population age structure on labor productivity, and the general consensus is that an aging population exerts a negative effect on labor pro-ductivity (Davis 2005; Feyrer 2008) or on economic growth (Bloom and Wil-liamson 1998; Headey and Hodge 2009). Some studies with a focus on the firm or plant level suggest that high shares of older workers are associated with higher productivity (Malmberg, Lindh, and Halvarsson 2008; Van Ours and Stoeldraijer 2010). Other studies are less confident about this relation-ship. Aubert and Crépon (2007) find that productivity, defined as the average contribution of particular age groups to the productivity of firms, increases
310 P R O D U C T I V I T Y O F O L D E R W O R K E R S
with age until age 40–45 years and remains stable thereafter. The results are stable across industries. Studies with a focus on the micro level of employees have mixed results.1 In a meta-analysis, Ng and Feldman (2008) evaluated the relationship between age and ten dimensions of job performance on the basis of 380 empirical studies. They suggest that the reason for mixed find-ings is that the empirical studies have focused narrowly on core tasks and neglected the activities that affect the environment in which those tasks are carried out, such as “organizational citizenship behavior” (LePine, Erez, and Johnson 2002; Borman et al. 2001).
Whereas the empirical evidence is inconclusive on the relationship between age and productivity, the evidence seems to be unambiguous with respect to the vulnerability of older workers in the labor market. Older work-ers may exercise choice over whether to retire (Van Solinge and Henkens 2007), but their opportunities to reenter the labor force after a period of unemployment or to change jobs or careers at the end of a working life are limited and largely determined by employers (Berger 2009). A recent OECD report found that “early exit from the labor market tends to be a one-way street, with very few older workers returning to employment” (OECD 2006, p. 10). The OECD suggests that negative stereotypes about the abilities and productivity of older workers as compared with younger workers are critical barriers to the employment prospects of older workers.
To position our study within the existing literature, we focus on general dispositional attitudes toward older workers, rather than on workplace- and context-specific attitudes (cf. Beaty, Cleveland, and Murphy 2001). These general dispositions frame perceptions of the abilities of older workers, and they affect managers’ attitudes toward promotion, training, retention, and retirement of older workers (Chui et al. 2001; Henkens 2005). Although there is a wide-ranging literature on attitudes regarding older workers, these stud-ies are mainly descriptive; they rarely disentangle the multidimensionality of these attitudes.2 This study extends the literature on stereotyping of older workers in two ways.
First, by distinguishing underlying dimensions of the productivity of younger and older workers, we offer a better understanding of stereotypical beliefs about productivity and how these beliefs are interrelated. We disen-tangle the importance of so-called soft versus hard skills or qualities. By soft qualities we mean such elements of job performance as social skills, reliability and commitment, accuracy, and customer-oriented skills. Hard qualities in-clude creativity, mental and physical capacity to deal with workload, willing-ness to learn new skills and adapt to new technology, and flexibility.
Second, we assess whether employers’ stereotypes regarding younger and older workers are shared by employees. If employees share the stereo-typical images, the problem of age discrimination may not only be attribut-able to employers’ behaviors and attitudes, it may also be evident within the

H E N D R I K P . V A N D A L E N / K È N E H E N K E N S / J O O P S C H I P P E R S 311
organization at large. By looking at both employers and employees, we are able to discern the “ingroup bias” in making productivity assessments, a bias that can stem not only from the age of the rater in question, but also from the position within the organization: employer or employee.
Older workers in an aging society
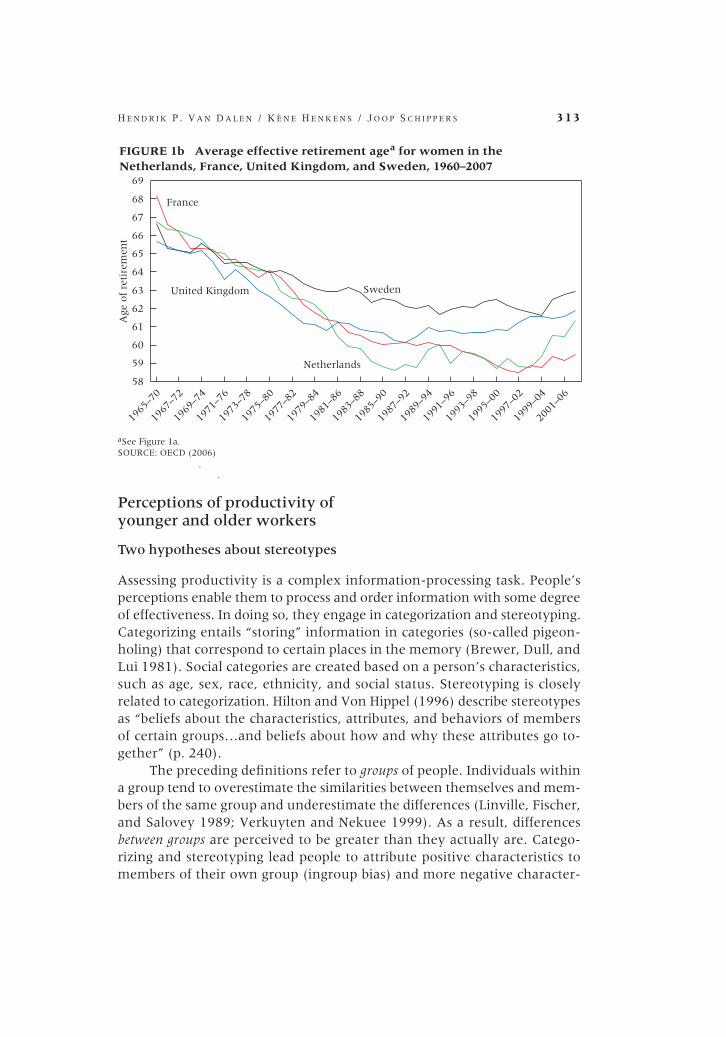
The data examined in this study are from the Netherlands. The Dutch case exemplifies demographic and economic characteristics shared by many other Western European countries: an aging society in the midst of welfare-state reforms aimed at making the labor market more flexible. The changes that have taken place in the past few decades are most clearly expressed through the retirement ages of men and women. The effective retirement age in the Netherlands has been declining over the past few decades. In recent years this trend has ceased, and a gradual increase in retirement age is evident among men and particularly among women (Euwals, De Mooij, and Van Vuuren 2009). The upswing in retirement age is in part explained by the impact of policy reforms. Figures 1a and 1b show trends in average retirement ages for men and women in the Netherlands and three other European countries.
Recent pension reforms have succeeded in restricting the retreat of older workers from the labor market into social security and early retirement programs. This does not mean that the early-exit culture (OECD 2006) that has developed over the years has come to an end. Although the official (and mandatory) retirement age for Dutch men and women is still 65, more than 80 percent of workers retire before that age and the effective retirement age is on average 62. At the organizational level, the early-exit culture is manifest in the lack of support from employers to extend the age of retirement. With the Dutch economy since the end of 2008 in deep recession, support for later retirement has plummeted: employers faced with the prospect of downsiz-ing respond by shedding older workers (Conen, Van Dalen, and Henkens 2009). For those older workers who become unemployed, the chances of reemployment are extremely low: only 1 percent of unemployed workers aged 55 years and older found work within a year. Age discrimination is one of the forces that are suspected to be behind this phenomenon. Koppes et al. (2009) show that in the Netherlands age discrimination is perceived to be substantial: 14 percent of workers reported age discrimination, and in the case of older workers (55–64 years) these self-reported rates of age discrimination are 20 percent. As in other European countries, age discrimination laws in the Netherlands are fairly recent, having been prompted by the EU direc-tive of 2000 on equal treatment in employment and occupation. The Dutch Equal Treatment Commission—set up to promote and monitor compliance with the Dutch Equal Treatment Act that prohibits discrimination by specific categories such as age—reports that about one quarter to one third of dis-

312 P R O D U C T I V I T Y O F O L D E R W O R K E R S
crimination complaints involve cases of age discrimination (Equal Treatment Commission 2007).
With the postwar baby boom generation reaching age 65, the pressure to reform the pension system and the labor market has become increasingly acute. The Dutch Cabinet decided in 2009 to raise the public pension age in two steps: in 2020 it will become 66 and in 2025 it will be 67. Citizens currently aged 55 years or older can still count on retirement at age 65. For employers, the prospect of substantially extended working lives puts questions of the costs and benefits of employing older workers in a new perspective. In the Netherlands seniority-based wage systems are common, resulting in age-wage profiles across the lifecourse that are steeper than the age-productivity profile. Seniority wages imply a heavy burden for employers dealing with an aging workforce. Employers in Europe recognize this problem and expect the gap between pay and productivity to increase in an aging society (Van Dalen, Hen-kens, and Schippers 2009). Policymakers often propose measures designed to narrow the gap between wages and productivity, such as demotion and human capital investment programs for older workers. However, the sense of urgency among employers and employees is considerably less than the level of urgency among policymakers. One reason is the difficulty of defining individual pro-ductivity levels among workers; moreover, assessments of productivity may be subject to biases that stem from stereotypes regarding age.
1965
–70
1967
–72
1969
–74
1971
–76
1973
–78
1975
–80
1977
–82
1979
–84
1981
–86
1983
–88
1985
–90
1987
–92
1989
–94
1991
–96
1993
–98
1995
–00
1997
–02
1999
–04
2001
–06
58
59
60
61
62
63
64
65
66
67
68
69
Age
of
reti
rem
ent
FIGURE 1a Average effective retirement agea for men in the Netherlands,France, United Kingdom, and Sweden, 1965–2007
France
Sweden
United Kingdom
Netherlands
aThe effective retirement age is defined by OECD as the average age at which older workers withdraw fromthe labor force. For a full description, see Scherer (2002) and «http://www.oecd.org/dataoecd/3/0/39371923.pdf».SOURCE: OECD (2006).
H E N D R I K P . V A N D A L E N / K È N E H E N K E N S / J O O P S C H I P P E R S 313
Perceptions of productivity of younger and older workers
Two hypotheses about stereotypes
Assessing productivity is a complex information-processing task. People’s perceptions enable them to process and order information with some degree of effectiveness. In doing so, they engage in categorization and stereotyping. Categorizing entails “storing” information in categories (so-called pigeon-holing) that correspond to certain places in the memory (Brewer, Dull, and Lui 1981). Social categories are created based on a person’s characteristics, such as age, sex, race, ethnicity, and social status. Stereotyping is closely related to categorization. Hilton and Von Hippel (1996) describe stereotypes as “beliefs about the characteristics, attributes, and behaviors of members of certain groups…and beliefs about how and why these attributes go to-gether” (p. 240).
The preceding definitions refer to groups of people. Individuals within a group tend to overestimate the similarities between themselves and mem-bers of the same group and underestimate the differences (Linville, Fischer, and Salovey 1989; Verkuyten and Nekuee 1999). As a result, differences between groups are perceived to be greater than they actually are. Catego-rizing and stereotyping lead people to attribute positive characteristics to members of their own group (ingroup bias) and more negative character-
1965
–70
1967
–72
1969
–74
1971
–76
1973
–78
1975
–80
1977
–82
1979
–84
1981
–86
1983
–88
1985
–90
1987
–92
1989
–94
1991
–96
1993
–98
1995
–00
1997
–02
1999
–04
2001
–06
58
59
60
61
62
63
64
65
66
67
68
69
Age
of
reti
rem
ent
FIGURE 1b Average effective retirement agea for women in theNetherlands, France, United Kingdom, and Sweden, 1960–2007
France
SwedenUnited Kingdom
Netherlands
..
aSee Figure 1a.SOURCE: OECD (2006)

314 P R O D U C T I V I T Y O F O L D E R W O R K E R S
istics to members of other groups (outgroup bias) (Lalonde and Gardner 1989; Tajfel and Turner 1979). Stereotypes are not necessarily negative, but stereotypes about outgroup members tend to be less favorable than those about ingroup members (Hilton and Von Hippel 1996; Tajfel and Turner 1979). Following Finkelstein, Burke, and Raju (1995), we call this the “in-group bias” hypothesis. Ingroup bias may also be relevant with respect to differing perceptions held by employers and employees. Employers must deal with the company’s organizational goals and targets, and they define the performance expectations and standards for older as well as younger workers. Employers are assumed to be more focused than employees on whether and how older and younger workers contribute to these organiza-tional goals. Moreover, research has shown that employers’ attitudes toward employees are strongly determined by employees’ work-related behavior (Beehr et al. 2006). Thus, with respect to age and position in the hierarchy, we formulate the following two hypotheses:
Age ingroup hypothesis: Young raters—employers and employees—will judge the performance of younger workers more favorably than will older raters; and older raters will judge the performance of older workers more favorably than will younger raters.
Employer vs. employee hypothesis: Employees will judge the performance of workers—young and old—more favorably than employers will.
Stereotypes, aging, and productivity
Although information is gradually accumulating on the comparative advan-tages of younger and older workers3 (see Skirbekk 2004 and Munnell and Sass 2008 for an overview), research on perceptions of productivity held by em-ployers and employees is limited. One early study by Kirchner and Durnette (1954) asked production workers and supervisors about the problems related to older employees. Kirchner and Durnette and Bird and Fisher’s (1986) rep-lication of their study led to the conclusion that supervisors had less positive attitudes toward older workers than did production workers. Several other studies have found that biases against older workers are pervasive.4
This body of research has shown that attitudes and stereotypes about older workers are mixed, that is, older persons are viewed as having both positive and negative attributes. Positive characteristics include experience, loyalty to the organization, reliability, and interpersonal skills. Such qualities as the ability to use new technologies and the adjustment to organizational changes are attributed primarily to younger workforce members. Most of the studies, however, are simply descriptive. Finkelstein, Higgins, and Clancy (2000) carried out a study in which managers were asked to provide writ-ten justifications of employment-related ratings. The study showed that the age of employees mattered to most managers. The analysis of employers’

H E N D R I K P . V A N D A L E N / K È N E H E N K E N S / J O O P S C H I P P E R S 315
attitudes highlighted the importance of distinguishing stereotypes regarding various dimensions of productivity. In our study we hypothesize that the “age ingroup” and “employer vs. employee” hypotheses apply not only to stereotypes regarding productivity, but also to the dimensions that underlie productivity. We further hypothesize that the effects of age and group status (employer or employee) on perceptions of productivity are mediated by ste-reotypes regarding the dimensions that underlie productivity.
Data and method
Survey of employers
In May 2005, a questionnaire was sent to a sample of Dutch companies and organizations. The random sample, stratified by size of the organization to ensure that sufficient numbers of large companies were included, was drawn from the register of the Netherlands Chambers of Commerce. A sample of 1,384 companies was drawn from a register of companies with at least ten and at most 49 employees, and another 1,993 companies were drawn from a register of companies with at least 50 employees. The sector classification of the Netherlands Chambers of Commerce coincides with the European Union classification of economic activities. This classification is in line with the one used by Statistics Netherlands (2006). Companies in the agricultural sector were not included in the sample in view of the large percentage of self-em-ployed individuals and small companies in that sector. Separate sources were used for government and health care organizations because relatively few of these are registered with Chambers of Commerce. All 462 Dutch municipali-ties were approached as were 78 general hospitals.
The total sample to which the questionnaire was sent amounted to 3,917 organizations with at least ten employees. The total response rate was 15.2 percent (or N = 597), which is comparable to the response rate of other employer surveys. Response rates for surveys in Europe and the United States tend not to exceed 20–30 percent (see for example Brewster et al. 1994; Kal-leberg et al. 1996).
Respondents were addressed in the questionnaire as “employer.” For the purpose of this study we used only a subsample (N = 443), namely, the sample of employers who completed the survey and who are board members/managing directors (20 percent), owners (17 percent), plant managers (14 percent), and heads of human resources (49 percent). Of the 443 employers, 63 percent were men and 37 percent were women. They ranged in age from 21 to 69 years, with a mean age of 44; 30 percent of the employers were aged 50 years or older. The industrial sectors comprised manufacturing/construc-tion (27 percent), services (banking, transport, insurance, trade, hotels, and restaurants) (41 percent), and the public sector (32 percent).

316 P R O D U C T I V I T Y O F O L D E R W O R K E R S
Survey of employees
To contrast the perceptions of employers, we used an identical questionnaire to gather employee perception data. The employee survey was carried out in March 2007 by the institute CentER Data of Tilburg University. CentER Data maintains an online nationwide panel of households in the Netherlands. The panel is representative of the Dutch population with respect to sex, age, education, religion, and regional distribution. Respondents are interviewed through an Internet connection, and for those who do not have access to the Internet, data are collected through a television Netbox system.5 In general, people participate on the panel for about four years, during which time they are regularly interviewed on several topics. When a respondent leaves the panel, a new respondent is selected on the basis of matching socio-demo-graphic characteristics so that representativeness is maintained.
The response rate for our survey was 70 percent (1,882 of 2,700) of panel participants. We included only workers who were defined as employees according to the Labor Force Survey definition (Statistics Netherlands 2006). This does not include the self-employed, owners of companies, and those who work in a family business. We lacked information about whether the employees held a supervisory position in their organization. However, the respondents were addressed in the questionnaire as “employee.” Furthermore the sample was restricted to employees in the prime working ages of 20–65 years. Age 65 is the statutory retirement age in the Netherlands at which one is eligible for a public pension; in most sectors of industry, retirement is mandatory at this age. Of the 898 employees, 58 percent were men and 42 percent were women. The mean age was 43; 30 percent of the employees were 50 years or older. The industrial sectors comprised manufacturing/con-struction (23 percent), services (banking, transport, insurance, trade, hotels, and restaurants) (33 percent), and the public sector (45 percent).
Measurement of stereotypes
Our measures of stereotypes applied to older workers rely on an extensive international literature.6 The measures contain 10–15 items in which younger and older workers are rated in comparison with each other on aspects of labor productivity. These items include such characteristics as trainability, the ability to deal with technological change, flexibility, creativity, reliability, social skills, organizational commitment, accuracy, customer-oriented skills, the physical and mental capacity to deal with workload, and a general assess-ment of productivity.
In order to extract stereotypical views of younger and older workers, respondents were given a list of 11 characteristics.7 They were first asked, “To what extent, in your view, do the following characteristics apply to workers

H E N D R I K P . V A N D A L E N / K È N E H E N K E N S / J O O P S C H I P P E R S 317
aged 50 years and older?,” with answer categories (1) hardly, (2) somewhat, (3) strongly, and (4) very strongly. They were then asked, “To what extent, in your view, do the following characteristics apply to workers under 35 years of age?,” with the same list of items and answer categories.
Older workers in our survey were defined as those aged 50 years and older, and younger workers as those under age 35 years. The age cutoff of 50 years was chosen because most government (subsidization) programs aimed at stimulating demand for older workers, as well as human resource policies within organizations, refer to older workers as 50 years and older (cf. OECD 2006, p. 111). The definition of younger workers as younger than 35 is based on the midpoint of the remaining age distribution (i.e., from ages 20 to 50). Moreover, age 35 generally marks the time in the life course when Dutch employees obtain tenure.
We included four control variables in our analyses. First, we classified the sectors of industry into three categories, namely manufacturing and con-struction; services; and public, based on the sectors as defined by Eurostat (1990). The respondent’s level of education was indicated by three dummy
TABLE 1 Descriptive statistics of samples of Dutch employers and employees used in analysis
Total sample Employers Employees
Age (in years) 43.0 44.3 42.9Sex (% female) 41 37 42
Education (%) Low 17 4 23 Middle 30 20 35 High 53 75 41
Sector (%) Industry 24 27 23 Services 35 41 32 Public sector 41 32 45
Mean ratingsa
Productivity of younger worker 2.87 2.86 2.88 Productivity of older worker 2.48 2.30 2.57 Soft qualities of younger worker 2.41 2.35 2.43 Hard qualities of younger worker 3.02 2.90 3.08 Soft qualities of older worker 3.07 2.92 3.14 Hard qualities of older worker 2.11 1.94 2.20
N = 1,341 443 898
aRatings of the productivity and of soft and hard qualities of workers range from 1 (lowest) to 4 (highest). Soft qualities include social skills, reliability and commitment, accuracy, and customer-oriented skills; hard qualities include creativity, mental and physical capacity to deal with workload, willingness to learn new skills and adapt to new technology, and flexibility.
SOURCE: Employer survey NIDI-UU (2005) and NIDI Employee survey (March 2007).

318 P R O D U C T I V I T Y O F O L D E R W O R K E R S
variables: “low” (lower general or vocational training), “middle” (high school or intermediate-level vocational training), and “high” (higher vocational training or university). Age is included as a continuous variable. There is conflicting evidence regarding gender differences with respect to sensitivity to age differences. While some studies (Snyder and Miene 1994) report that women are more likely than men to stereotype older adults, most studies find no gender effects (Hummert, Garstka, and Shaner 1997). To account for possible gender differences in stereotyping older workers, sex was included in the analysis (“0” = male, “1” = female). The descriptive statistics for the full set of variables are listed in Table 1. The table shows that employers are, on average, slightly older than employees and have substantially higher educa-tion: 75 percent of the employers are highly educated versus 41 percent of employees. Differences in productivity assessments are discussed below.
Analysis
The analysis is carried out in three steps. First, we describe attitudes toward the productivity of older and younger workers by presenting the mean scores and traditional t-tests to establish whether group differences were statisti-cally significant. Second, we use exploratory factor analysis and multigroup confirmatory factor analysis (Vandenberg and Lance 2000) on the job items related to older and younger workers to analyze the multidimensionality of age-related stereotypes. Third, we use regression analysis to test our hypoth-eses regarding the effect of age and employer’s status on attitudes toward the productivity of younger and older workers. Following Baron and Kenny (1986), we use hierarchical regression models to test whether stereotypes regarding underlying dimensions mediate the effects of age and group status (employer/employee) on perceived productivity. In hierarchical regression analysis one adds terms to the regression model in stages. At each stage, an additional predictor or predictors are added to the model, and the change in R2 is calculated. A test is then performed to determine whether the change in R2 is significantly different from zero. In our models, we added the variables “perceptions of hard and soft qualities of work” during the second step of the analysis.
Results
Differences in mean ratings
We address the question of how younger and older employers rate the pro-ductivity of younger and older workers and whether their opinions differ from the perceptions of employees. The figures in Table 2 reflect employers’ and employees’ average ratings of the productivity of workers aged 50 years

H E N D R I K P . V A N D A L E N / K È N E H E N K E N S / J O O P S C H I P P E R S 319
and older and of workers under age 35 years on a scale from 1 (low) to 4 (high).
Our first comparison is of the perceptions of employers and employees regarding younger and older workers. Employers perceive large differences in the productivity of younger and older workers, rating the productivity of older workers (mean = 2.30) significantly lower than that of younger workers (2.86). Employees also rate the productivity of older workers (2.57) signifi-cantly lower than that of younger workers (2.88). One important exception to this rule involved the assessments made by older employees. Employees aged 50 and older saw no significant difference between younger and older workers.
A second comparison shows that employers had a significantly lower opinion of the productivity of older workers (2.30) than employees did (2.57). But when one looks at the perceptions of the productivity of younger workers made by employers (2.86) and employees (2.88), the differences are small and not significant.
A third comparison relates to the importance of the respondent’s age. Among both employers and employees, the figures suggest that the older the
TABLE 2 Mean ratings of employees and employers regarding perceived productivity of younger and older workersa
Rating of the productivity of
Younger workers Older workers t-test for difference Age of rater (under 35) (aged 50+) between old-young
Employees Under 35 2.95 2.47 7.89** 35–49 2.88 2.52 7.76** 50 and older 2.81 2.75 1.00 Total 2.88 2.57 9.61**Employers Under 35 2.92 2.23 6.59** 35–49 2.85 2.28 11.33** 50 and older 2.84 2.38 5.70** Total 2.86 2.30 13.90**
t-test for differences between employers and employeesb
Both under 35 0.31 2.68* Both 35–49 0.54 4.71** Both 50 and older 0.52 5.17** Total 0.43 7.23**
* p < 0.05; ** p < 0.01 aRatings based on the question: “To what extent does the quality ‘productive’ apply to employees under age 35/aged 50-plus?” Responses are: 1 = hardly, 2 = somewhat, 3 = strongly, 4 = very strongly. Sample size of employ-ers = 443; of employees = 898. bThis test is for group differences in the columns.

320 P R O D U C T I V I T Y O F O L D E R W O R K E R S
respondent, the more positive the perception of older workers’ productivity. We also found that the younger the respondent, the more positive the per-ception of younger workers’ productivity. Employers under age 35 appeared to have the lowest opinion of older workers’ productivity.
The multidimensionality of perceived productivity
The next step is to unravel the dimensions that underlie perceptions of pro-ductivity. Figures 2 and 3 present the ratings of specific abilities possessed by stereotypical younger and older workers. Figure 2 shows the opinions of employers, Figure 3 those of employees.
The patterns found among the answers given by employers and employ-ees are remarkably similar: both report large differences between younger and older workers on each of the productivity dimensions but with differing signs. In short, on abilities for which younger workers receive high ratings, older workers receive low ratings, and vice versa. Older workers are considered to have better social skills and to be more reliable, more accurate, and more committed to their work. Younger employees score much higher on qualities such as new technology skills, mental and physical capacity, willingness to learn, and flexibility.
We examined whether we could discern a clearer pattern in these vari-ous productivity dimensions. To reduce the 11 dimensions to a smaller num-
willingness to learn
physical capacity
new technology skills
flexibility
creativity
mental capacity
accuracy
social skills
customer-oriented skills
commitment to organization
reliability
1 1.5 2 2.5 3 3.5
Average evaluation by employers
Under 35
50 andolder
FIGURE 2 Mean employer ratings of the underlying dimensions ofthe productivity of younger and older workers
NOTE: Answers based on the question: “To what extent do the following characteristics apply to workers aged50 years and older/under age age 35?” Answers are: 1 = hardly, 2 = somewhat, 3 = strongly, 4 = very strongly.

H E N D R I K P . V A N D A L E N / K È N E H E N K E N S / J O O P S C H I P P E R S 321
ber of underlying factors, we conducted factor analyses. We first performed a factor analysis for the combined dataset based on all employers and employ-ees. This exploratory factor analysis (available upon request from [email protected]) revealed that two underlying dimensions were clearly emphasized in the ratings of employers and employees. The first dimension consisted primarily of “soft” qualities that play a role in job performance, such as social skills, commitment, customer-oriented skills, accuracy, and reliability. Some of these qualities are what Ng and Feldman (2008) refer to as “organizational citizen-ship behavior”—that is, pro-social behaviors that are not job-specific, but that support the broader organizational environment in which jobs are performed. The second dimension consisted of “hard” qualities, such as mental and physi-cal capacity, willingness to learn new skills and adapt to new technology, and flexibility. (To compare this two-factor structure across samples, we carried out a multiple-group confirmatory factor analysis, available on request.)
Multivariate analysis
We formulated two main hypotheses as described earlier. First, we expected that older raters would hold more positive views of the productivity of older workers than younger raters, and that younger raters would have more posi-tive views of younger workers. Second, we expected that employers would be less positive in their productivity ratings of all workers than employees
willingness to learn
new technology skills
physical capacity
flexibility
creativity
mental capacity
accuracy
customer-oriented skills
social skills
commitment to organization
reliability
1 1.5 2 2.5 3 3.5
Average evaluation by employees
Under 35
50 andolder
FIGURE 3 Mean employee ratings of the underlying dimensions ofthe productivity of younger and older workers
NOTE: Answers based on the question: “To what extent do the following characteristics apply to workers aged50 years and older/under age 35?” Answers are 1 = hardly, 2 = somewhat, 3 = strongly, 4 = very strongly.
322 P R O D U C T I V I T Y O F O L D E R W O R K E R S
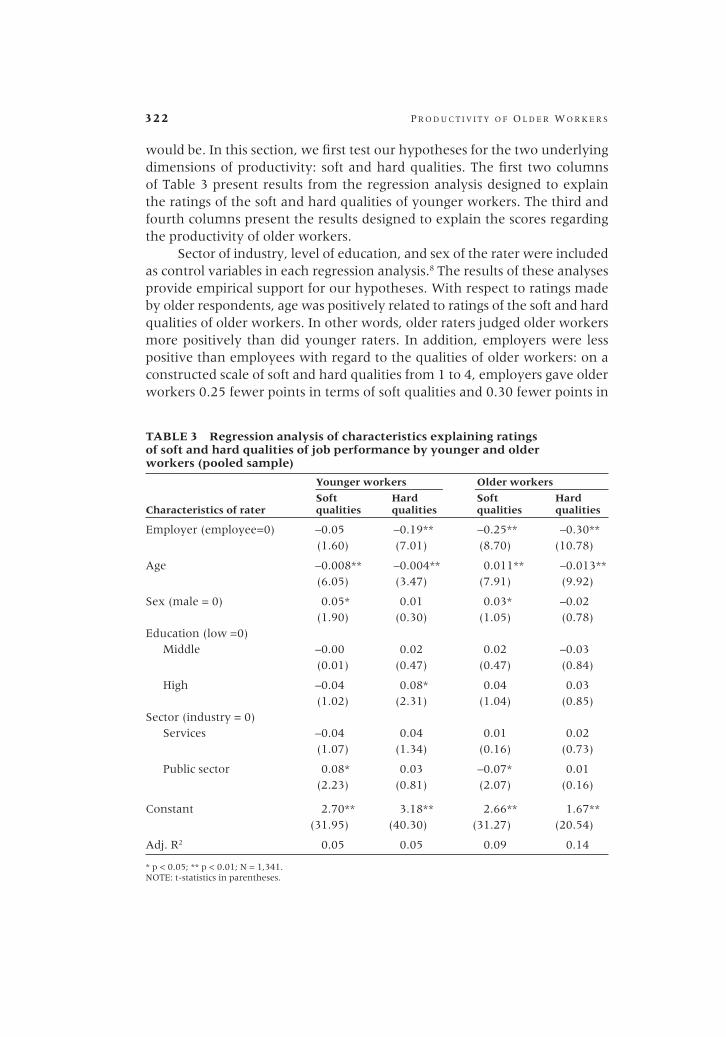
would be. In this section, we first test our hypotheses for the two underlying dimensions of productivity: soft and hard qualities. The first two columns of Table 3 present results from the regression analysis designed to explain the ratings of the soft and hard qualities of younger workers. The third and fourth columns present the results designed to explain the scores regarding the productivity of older workers.
Sector of industry, level of education, and sex of the rater were included as control variables in each regression analysis.8 The results of these analyses provide empirical support for our hypotheses. With respect to ratings made by older respondents, age was positively related to ratings of the soft and hard qualities of older workers. In other words, older raters judged older workers more positively than did younger raters. In addition, employers were less positive than employees with regard to the qualities of older workers: on a constructed scale of soft and hard qualities from 1 to 4, employers gave older workers 0.25 fewer points in terms of soft qualities and 0.30 fewer points in
TABLE 3 Regression analysis of characteristics explaining ratings of soft and hard qualities of job performance by younger and older workers (pooled sample)
Younger workers Older workers
Soft Hard Soft Hard Characteristics of rater qualities qualities qualities qualities
Employer (employee=0) –0.05 –0.19** –0.25** –0.30** (1.60) (7.01) (8.70) (10.78)
Age –0.008** –0.004** 0.011** –0.013** (6.05) (3.47) (7.91) (9.92)
Sex (male = 0) 0.05* 0.01 0.03* –0.02 (1.90) (0.30) (1.05) (0.78)Education (low =0) Middle –0.00 0.02 0.02 –0.03 (0.01) (0.47) (0.47) (0.84)
High –0.04 0.08* 0.04 0.03 (1.02) (2.31) (1.04) (0.85)Sector (industry = 0) Services –0.04 0.04 0.01 0.02 (1.07) (1.34) (0.16) (0.73)
Public sector 0.08* 0.03 –0.07* 0.01 (2.23) (0.81) (2.07) (0.16)
Constant 2.70** 3.18** 2.66** 1.67** (31.95) (40.30) (31.27) (20.54)
Adj. R2 0.05 0.05 0.09 0.14
* p < 0.05; ** p < 0.01; N = 1,341. NOTE: t-statistics in parentheses.

H E N D R I K P . V A N D A L E N / K È N E H E N K E N S / J O O P S C H I P P E R S 323
terms of hard qualities (both compared to the ratings of employees). Support for our hypotheses can also be found in the results of regression analyses explaining the ratings of younger workers. The first and second columns of Table 3 show that the age of the rater was negatively related to the ratings of soft and hard qualities of younger workers. Older raters were less positive about the qualities of younger workers than younger raters were. Regard-ing differences between employers and employees, the results suggest that employers are less positive than employees in assessing the hard qualities of younger workers. In the assessment of soft qualities, we found no significant differences between employers and employees.
Mediation analysis
Table 4 presents ratings of the productivity of older and younger workers as dependent variables. We test whether age and group status are predictors of ratings of productivity and whether ratings of hard and soft qualities mediate those relationships.
Columns 1 and 2 of Table 4 present the results of a hierarchical regres-sion analysis to explain the productivity ratings regarding younger workers; columns 3 and 4 present the same analysis to explain the productivity ratings with respect to older workers. Column 3 shows that age and employer status are both significant predictors of the productivity ratings of older workers. These effects support our hypotheses that older workers are rated more positively by older individuals, and more positively by employees than by employers. In column 4, we include ratings of soft and hard qualities of older workers as possible mediators in the model. The R-squared change is signifi-cant and substantial, with an increase in explained variance from 7 percent to 31 percent. The effect of age on productivity was no longer significant, which suggests that the age effect was fully mediated by the hard and soft qualities. The effect of group status became much smaller when hard and soft qualities were added to the model, but the group differences remained significant, in-dicating a pattern of partial mediation. Even after controlling for differences in ratings of soft and hard qualities, employers were less positive than employees in their judgments of the productivity of older workers.
Columns 1 and 2 show the results of the mediation analysis for the productivity of younger workers. These results are much less pronounced than those for older workers. There was a relatively small effect of age on the ratings of the productivity of younger workers, with older raters being some-what less positive. We found no effect of group status, which suggests that employers and employees have similar opinions regarding the productivity of younger workers. The model in column 2 shows that after inclusion of the ratings of soft and hard qualities, the R-squared increases from 1 percent to 23 percent. The age effect was no longer significant, which suggests that the

324 P R O D U C T I V I T Y O F O L D E R W O R K E R S
effect of age on the productivity ratings of younger workers was again medi-ated by ratings of soft and hard qualities. Employer status was statistically significant, indicating that after controlling for mediating factors, employers were more positive than employees regarding the productivity of younger workers.
The results in Table 4 also reveal how employers and employees weight hard and soft qualities in their perceptions of productivity of both younger and older workers. Columns 2 and 4 show that hard qualities carry far more weight in assessing the productivity of workers than do soft qualities. The result that older and younger workers are evaluated more or less equally with regard to the importance of hard and soft qualities suggests that employers
TABLE 4 Hierarchical regression mediation analysis of characteristics explaining ratings of productivity levels
Productivity of
Characteristics of rater Younger workers Older workers
Employer (employee=0) 0.02 0.13** –0.34** –0.09** (0.40) (3.55) (8.40) (2.54)
Age –0.005** –0.000 0.010** –0.000 (2.80) (0.30) (5.36) (0.26)
Sex (male = 0) 0.06 0.04 –0.02 –0.01 (1.67) (1.30) (0.38) (0.45)Education (low =0) Middle 0.00 –0.00 –0.02 –0.01 (0.07) (0.10) (0.38) (0.16)
High –0.06 –0.09* 0.16** 0.13** (1.22) (2.03) (3.04) (2.90)Sector (industry = 0) Services –0.01 –0.02 0.04 0.03 (0.23) (0.52) (0.92) (0.69)
Public sector –0.02 –0.06 0.06 0.08 (0.47) (1.40) (1.23) (1.83)
Constant 3.05** 0.62** 2.66** 0.34* (26.39) (3.87) (17.42) (2.48)
Rater’s perceptions of
Soft qualities — 0.30** — 0.28** (8.49) (7.90)
Hard qualities — 0.51** — 0.59** (13.42) (16.07)
Adj. R2 0.01 0.23 0.07 0.31
* p < 0.05; ** p < 0.01; N = 1,341. NOTE: t-statistics in parentheses.

H E N D R I K P . V A N D A L E N / K È N E H E N K E N S / J O O P S C H I P P E R S 325
and employees have a uniform way of viewing the productivity of younger and older workers.
Summary and conclusions
This article has examined stereotypical perceptions of employers and employ-ees regarding the productivity of young and older workers in the Netherlands. We found that both employers and employees rate the productivity of older workers substantially lower than that of younger workers. This suggests that the recent economic downturn might have put some older workers at a disadvantage given that employers are more inclined to retain workers they perceive to be the most productive (Henkens, Van Solinge, and Cozijnsen 2009; Munnell, Muldoon, and Sass 2009). Our analysis also revealed that stereotypes about hard qualities and soft qualities of workers underlie percep-tions of productivity. Hard qualities include flexibility, physical and mental capacity, and the willingness to learn new technology skills. Soft qualities include commitment to the organization, reliability, and social skills. The comparative advantage of older workers (aged 50+) lies primarily in their soft qualities, whereas the comparative advantage of younger workers lies primar-ily in their hard qualities. This study shows, however, that hard qualities carry much greater weight than soft qualities in the evaluation of the productivity of older and younger workers alike. These results suggest that employers and employees have a more or less uniform way of assessing the productiv-ity of older and younger workers. Older workers may benefit from appraisal systems that value the soft qualities of work (cf. Welbourne, Johnson, and Erez 1998). In public debates employers are often portrayed as practicing age discrimination or underestimating the potential contributions of older work-ers. Our study shows that stereotypes toward older workers are deeply rooted in the labor market. Overcoming age discrimination in the workplace will be difficult because negative age-related stereotypes are reinforced by workers in non-managerial positions (see Berger 2009).
The question remains whether the perception of older workers’ produc-tivity will change as the aging of the workforce continues. There are several reasons why perceptions of older workers might become more positive. The first is connected to the supply side of the labor market. Research from the OECD (2006) shows that new cohorts of older workers will be healthier and better educated, factors that should enhance their productivity and employ-ability. The second reason is linked to the demand side. Declining employ-ment shares in agriculture and industry and subsequent rising shares in the service sector, thus reducing the number of activities that require greater physical strength and stamina, might prompt employers to adopt a more positive view toward the productivity potential of older workers. On the other hand, it is also possible that with rapid technological change, positive

326 P R O D U C T I V I T Y O F O L D E R W O R K E R S
perceptions of the productivity of younger workers might increase and coun-tervail the aforementioned trends (cf. Beckmann 2005). The evidence that older workers are less able than younger workers to adapt to developments in technologically advanced sectors is not clear and might reflect the persis-tence of negative stereotypes. Another factor that might affect the evaluation of workers is the job or type of occupation. Age-related stereotypes may be related not only to a worker’s age but also to his or her occupation. Future research might examine the way in which these job- and context-specific factors interact with general stereotypes to shape perceptions of the produc-tivity of older workers.
Notes
Figures in this article are available in color in the electronic edition of the journal.
Comments by Douglas Hershey are grate-fully acknowledged, as are suggestions by par-ticipants in the pension workshop of Netspar, Tilburg University, and the 26th IUSSP Inter-national Population Conference at Marrakech, Morocco, 28 September 2009. Information about additional analyses underlying the re-sults of this article can be obtained from the corresponding author, email: [email protected]
1 For instance, an early meta-analysis showed that age was positively related to productivity measures of job performance, but somewhat negatively related to supervisors’ ratings of performance (Waldman and Avolio 1986). McEvoy and Cascio (1989) showed on the basis of 65 empirical studies that the re-lationship between age and performance was virtually absent. Sturman (2003) refined the previous insights by performing a meta-analy-sis of 115 empirical studies. By making use of three age-related variables (chronological age, job experience, and organizational tenure), he showed that the relationship follows an inverted U-shape: a positive relationship be-tween age and performance at young ages and a negative relationship to job performance at later ages (49 years or older).
2 Apart from research by Warr and Pennington (1993), Chiu et al. (2001), and Henkens (2005), little effort has been made to distinguish dimensions of stereotypes about older workers. This is despite many studies showing that attitudes toward older persons
are multidimensional (Chasteen, Schwarz, and Park 2002; Hummert, Garstka, and Sha-ner 1994; Hummert et al. 1997; Schmidt and Boland 1986).
3 Numerous studies support the idea that several cognitive abilities decline from a certain point in life (see Skirbekk 2004 for an overview). In general, a division can be drawn between so-called crystallized abilities and fluid abilities. Crystallized abilities refer to accumulated knowledge. Fluid abilities refer to performance and speed of solving new tasks and include perceptual speed and reasoning. Whereas crystallized abilities are likely to plateau or show minimal growth at older ages, fluid abilities are more likely to decline. A decrease in fluid abilities may result in lower productivity levels, unless increases in experience and domain-specific knowledge compensate for these declines.
4 The most prominent contributions are Blocklyn (1987); Chiu et al. (2001); Finkel-stein, Burke, and Raju (1995); Finkelstein and Burke (1998); Hassell and Perrewe (1995); Henkens (2000); Lee and Clemons (1985); Lo-retto, Duncan, and White (2000); McGregor and Gray (2002); Remery et al. (2003); Rosen and Jerdee (1976a,b); Taylor and Walker (1994, 1998); Wagner (1998); and Warr and Pennington (1993).
5 Participants without Internet access are provided by CentER Data with a modem router, allowing them to access the Internet through their televisions. Households that do not have a television are given one by CentER

H E N D R I K P . V A N D A L E N / K È N E H E N K E N S / J O O P S C H I P P E R S 327
References
Aubert, P. and B. Crépon. 2007. “Are older workers less productive? Firm-level evidence on age-productivity and age-wage profiles,” mimeo, French version published in: Economie et Statistique 2003(368): 95–119.
Baron, R. M., and D. A. Kenny. 1986. “The moderator–mediator variable distinction in social psychological research: conceptual, strategic, and statistical considerations,” Journal of Personality and Social Psychology 51: 1173–1182.
Beaty, J. C., Jr., J. N. Cleveland, and K. R. Murphy. 2001. “The relation between personality and contextual performance in ‘strong’ versus ‘weak’ situations,” Human Performance 14: 125–148.
Beckmann, M. 2005. “Age-biased technological and organizational change: Firm-level evidence for West Germany,” Discussion Paper no. 05-13, Munich: GEABA.
Beehr, T. A. et al. 2006. “The nature of satisfaction with subordinates: Its predictors and im-portance to supervisors,” Journal of Applied Social Psychology 36: 1523–1547.
Berger, E. D. 2009. “Managing age discrimination: An examination of the techniques used when seeking employment,” The Gerontologist 49: 317–332.
Berger, E. D., V. W. Marshall, and F. D. Ashbury. 2005. Organizational and Personal Characteristics Influencing Canadian Employers’ Attitudes toward Older Workers. North Bay, Canada: Nipissing University, Department of Sociology.
Bird, C. P. and T. D. Fisher. 1986. “Thirty years later: Attitudes toward the employment of older workers,” Journal of Applied Psychology 71: 515–517.
Blocklyn, P. L. 1987. “The aging workforce,” Personnel August: 16–19.
Data. For more information on the panel data see «www.centerdata.nl/en/».
6 These studies used attitudinal Likert-type questions developed by Walker and Taylor (IPM 1993), which have been exten-sively applied in the United Kingdom (Loretto, Duncan, and White 2000; Lyon and Pollard 1997; Taylor and Walker 1994, 1998; Warr and Pennington 1993), the United States (Wagner 1998), New Zealand (Gray and McGregor 2003; McGregor and Gray 2002), Canada (Berger, Marshall, and Ashbury 2005; Marshall 1996; Underhill and Marshall 1997), Hong Kong (Chiu et al. 2001), Aus-tralia (Schmidt 1999), and the Netherlands (Henkens 2005).
7 In most studies, stereotypical views of productivity differences between younger and older workers are extracted by Likert-type items (see endnote 6), such as the state-ment “older workers are less productive than younger workers.” This type of measurement is not without problems. First, it does not give information on the perceived level of produc-tivity. Older workers may be viewed as very productive, but still somewhat less productive than younger workers. Second, Likert-type
measures do not account for the possibility that older workers are viewed as more pro-ductive than younger workers.
8 These control variables are available for both samples (i.e., employees and employers). For employers, we also have information on the age composition of the firm and any diffi-culties in recruiting workers. For the employ-ee sample this information is lacking. For the sample of employers we estimated additional models that included as independent variables the percentage of workers aged 50 years and older as well as perceived labor shortages. These models showed no significant effect of the age composition of the firm on perceptions of older workers’ productivity and hard quali-ties. However, we did find a small effect of age composition on the perceived soft qualities. In firms with a large share of older workers, the soft qualities of older workers were rated somewhat lower. This result suggests that ap-preciation of the perceived soft qualities (i.e., the comparative advantage of older workers) is lower when the share of older workers in a firm is larger. The effect of labor shortages on perceptions of older workers’ productivity was not statistically significant.

328 P R O D U C T I V I T Y O F O L D E R W O R K E R S
Bloom, D. E. and J. G. Williamson. 1998. “Demographic transitions and economic miracles in emerging Asia,” World Bank Economic Review 12: 419–455.
Borman, W. C., L. A. Penner, T. D.Allen, and S. J. Motowidlo. 2001. “Personality predictors of citizenship performance,” International Journal of Selection and Assessment 9: 52–69.
Brewer, M. B., V. Dull, and L. Lui. 1981. “Perceptions of the elderly: Stereotypes as prototypes,” Journal of Personality and Social Psychology 41: 656–670.
Brewster, C., A. Hegewisch, L. Mayne, and O. Tregaskis. 1994. “Methodology of the Price Wa-terhouse Cranfield Project,” in C. Brewster and A. Hegewisch (eds.), Policy and Practice in European Human Resource Management. London: Routledge, pp. 230–245.
Byrne, D. 1971. The Attraction Paradigm. New York: Academic Press.Chasteen, A. L., N. Schwarz, and D. C. Park. 2002. “The activation of aging stereotypes in
younger and older adults,” Journal of Gerontology: Psychological Sciences 57B: P540–P547.Chiu, W. C. K., A. W. Chan, E. Snape, and T. Redman. 2001. “Age stereotypes and discrimina-
tory attitudes towards older workers: An East-West comparison,” Human Relations 54: 629–661.
Cleveland, J. N. and F. J. Landy. 1983. “The effects of person and job stereotypes on two per-sonnel decisions,” Journal of Applied Psychology 68: 609–619.
Conen, W., H. P. Van Dalen, and K. Henkens. 2009. “Werkgevers worstelen met verhoging pensioenleeftijd” [Employers struggle with raising the retirement age], Demos 25: 1–4.
Davis, E. P. 2005. “Challenges posed by aging to financial and monetary stability,” Geneva Papers on Risk and Insurance 30: 542–564.
Equal Treatment Commission. 2007. Annual Report 2007. Utrecht.Eurostat. 1990. Statistical Classification of Economic Activities in the European Community, Rev. 1.
Luxembourg.Euwals, R., R. De Mooij, and D. Van Vuuren. 2009. Rethinking Retirement. The Hague: CPB
Netherlands Bureau for Economic Policy Analysis.Feyrer, J. 2008. “Aggregate evidence on the link between age structure and productivity,”
Population and Development Review 34(Supp.): 78–99.Finkelstein, L. M., M. J. Burke, and N. S. Raju. 1995. “Age discrimination in simulated employ-
ment contexts: An integrative analysis,” Journal of Applied Psychology 80: 652–663. Finkelstein, L. M. and M. J. Burke. 1998. “Age stereotyping at work: The role of rater and
contextual factors on evaluations of job applicants,” The Journal of General Psychology 125: 317–345.
Finkelstein, L. M., K. D. Higgins, and M. Clancy. 2000. “Justifications for ratings of old and young job applicants: An exploratory content analysis,” Experimental Aging Research 26: 263–283.
Goldstein, J. R. 2010. “Demographics, in 2020 Visions,” Nature 463: 30. Gray, L. and J. McGregor. 2003. “Human resource development and older workers: Stereotypes
in New Zealand,” Asia Pacific Journal of Human Resources 41: 1–17.Hassell, B. and P. L. Perrewe. 1995. “An examination of beliefs about older workers: Do ste-
reotypes still exist?,” Journal of Organizational Behaviour 16: 457–468.Headey, D. D. and A. Hodge. 2009. “The effect of population growth on economic growth: A
meta-regression analysis of the macroeconomic literature,” Population and Development Review 35: 221–248.
Henkens, K. 2000. “Supervisors’ attitudes about early retirement of subordinates,” Journal of Applied Social Psychology 30: 833–852.
———. 2005. “Stereotyping older workers and retirement, the managers’ point of view,” Canadian Journal on Aging 24: 35–48.
Henkens, K., H. Van Solinge, and R. Cozijnsen. 2009. “Let go or retain? A comparative study of the attitudes of business students and managers about the retirement of older workers,” Journal of Applied Social Psychology 39: 1562–1588.
Hilton, J. L. and W. Von Hippel. 1996. “Stereotypes,” Annual Review of Psychology 47: 237–271.
H E N D R I K P . V A N D A L E N / K È N E H E N K E N S / J O O P S C H I P P E R S 329
Hummert, M. L., T. A. Garstka, J. L. Shaner, and S. Strahm. 1994. “Stereotypes of the elderly held by young, middle-aged, and elderly adults,” Journal of Gerontology: Psychological Sci-ences 49: P240–P249.
Hummert, M. L., T. A. Garstka, and J. L. Shaner. 1997. “Stereotyping of older adults: The role of target facial cues and perceiver characteristics,” Psychology and Aging 12: 107–114.
IPM. 1993. Age and Employment: Policies, Attitudes and Practice. London: Institute of Personnel Management.
Kalleberg, A. L., D. Knoke, P. Marsden, and J. Spaeth. 1996. Organizations in America: Analyzing their Structures and Human Resource Practices. Thousand Oaks, CA: Sage.
Kirchner, W. K., and M. D. Durnette. 1954. “Attitudes toward older workers,” Personnel Psy-chology 7: 257–265.
Koppes, L. L. J., E. M. M. De Vroome, M. E. M. Mol, B. J. M. Janssen, and S. N. J. Van den Bossche. 2009. Nationale Enquête Arbeidsomstandigheden 2008 [National survey of labor conditions, 2008]. Delft: TNO.
Lalonde, R. N. and R. C. Gardner. 1989. “An intergroup perspective on stereotype organization and processing,” British Journal of Social Psychology 28: 289–303.
Lee, J. A. and T. Clemons. 1985. “Factors affecting employment decisions about older workers,” Journal of Applied Psychology 70: 785–788.
LePine, J. A., A. Erez, and D. E. Johnson. 2002. “The nature and dimensionality of organi-zational citizenship behavior: A critical review and meta-analysis,” Journal of Applied Psychology 87: 52–65.
Linville, P. W., G. W. Fischer, and P. Salovey. 1989. “Perceived distributions of the characteristics of ingroup and out-group members: Empirical evidence and a computer simulation,” Journal of Personality and Social Psychology, 57: 165–188.
Loretto, W., C. Duncan, and P. J. White. 2000. “Ageism and employment: Controversies, am-biguities and younger people’s perceptions,” Ageing and Society 20: 279–302.
Lyon, P. and D. Pollard. 1997. “Perceptions of the older employee: Is anything really chang-ing?,” Personnel Review 26: 245–257.
Malmberg, B., T. Lindh, and M. Halvarsson. 2008. “Productivity consequences of workforce aging: Stagnation or Horndal Effect?,” Population and Development Review 34(Supp.): 238–256.
Marshall, V. 1996. Issues of an Aging Workforce in a Changing Society: Cases and Comparisons. Toronto: University of Toronto, Centre for Studies of Aging.
McEvoy, G. M. and W. F. Cascio. 1989. “Cumulative evidence of the relationship between employee age and job performance,” Journal of Applied Psychology 74: 11–17.
McGregor, J. and L. Gray. 2002. “Stereotypes and older workers: The New Zealand experience,” Social Policy Journal of New Zealand 18: 163–177.
Munnell, A. H., D. Muldoon, and S. A. Sass. 2009. “Recessions and older workers,” Issue in Brief Series 9-2. Boston: Center for Retirement Research.
Munnell, A. H. and S. A. Sass. 2008. Working Longer—The Solution to the Retirement Income Chal-lenge. Washington DC: Brookings Institution Press.
Ng, T. W. N. and D. C. Feldman. 2008. “The relationship of age to ten dimensions of job per-formance,” Journal of Applied Psychology 93: 392–423.
Oakes, P. J., S. A. Haslam, and J. C. Turner. 1994. Stereotyping and Social Reality. Cambridge: Blackwell Publishers.
OECD. 2006. Live Longer, Work Longer. Paris: OECD.Remery, C., K. Henkens, J. J. Schippers, and P. Ekamper. 2003. “Managing an aging workforce
and a tight labor market: Views held by Dutch employers,” Population Research and Policy Review 22: 21–40.
Rosen, B. and T. H. Jerdee. 1976a. “The nature of job-related age stereotypes,” Journal of Ap-plied Psychology 61: 180–183.
———. 1976b. “The influence of age stereotypes on managerial decisions,” Journal of Applied Psychology 61: 428–432.

330 P R O D U C T I V I T Y O F O L D E R W O R K E R S
Scherer, P. 2002. “Age of withdrawal from the labour market in OECD countries,” OECD La-bour Market and Social Policy Occasional Papers, No. 49, Paris.
Schmidt, D. F. and S. M. Boland. 1986. “Structure of perceptions of older adults: Evidence for multiple stereotypes,” Psychology and Aging 1: 255–260.
Schmidt, K. 1999. “Employing older workers. Report of a survey of Western Australian human resource professionals,” Discussion paper 3/00, University of Western Australia, Depart-ment of Organisational and Labour Studies.
Shore, L. M., C. B. Goldberg, and J. N. Cleveland. 2003. “Work attitudes and decisions as a function of manager age and employee age,” Journal of Applied Psychology 88: 529–537.
Skirbekk, V. 2004. “Age and individual productivity: A literature survey,” Vienna Yearbook of Population Research 2004: 133–153.
———. 2008. “Age and productivity potential: A new approach based on ability levels and industry-wide task demand,” Population and Development Review 34 (Supp.): 191–207.
Snyder, M. and P. K. Miene. 1994. “Stereotyping of the elderly: A functional approach,” British Journal of Social Psychology 33: 63–82.
Statistics Netherlands. 2006. Methoden en definities Enquête Beroepsbevolking [Methods and defini-tions of the labor force survey]. Voorburg/Heerlen, October.
Sturman, M. C. 2003. “Searching for the inverted U-shaped relationship between time and performance: Meta-analyses of the experience/performance, tenure/performance, and age/performance relationship,” Journal of Management 29: 609–640.
Tajfel, H. and J. C. Turner. 1979. “An integrative theory of intergroup conflict,” in W. G. Austin and S. Worchel (eds), The Social Psychology of Intergroup Relations. Monterey, CA: Brooks-Cole, pp. 33–47.
Taylor, P. and A. Walker, A. 1994. “The aging workforce: Employers’ attitudes towards older people,” Work, Employment and Society 8: 569–591.
———. 1998. “Employers and older workers: Attitudes and employment practices,” Ageing and Society 18: 641–658.
Underhill, S. and V. Marshall. 1997. Survey of Canadian Employers: Final Report. Toronto: Institute for Human Development, Life Course and Aging.
Van Dalen, H. P., K. Henkens, and J. J. Schippers. 2009. “Dealing with older workers in Europe: A comparative survey of employers’ attitudes and actions,” Journal of European Social Policy 19: 47–60.
Vandenberg, R. J. and C. E. Lance. 2000. “A review and synthesis of the measurement in-variance literature: Suggestions, practices, and recommendations for organizational research,” Organizational Research Methods 3: 4–69.
Van Ours, J. C. and L. Stoeldraijer. 2010. “Age, wage and productivity,” CentER Discussion Paper no. 12, Tilburg University.
Van Solinge, H. and K. Henkens. 2007. “Involuntary retirement: The role of restrictive circum-stances, timing, and social embeddedness,” Journal of Gerontology: Social Sciences 62B(5): S295–S303.
Verkuyten, M. and S. Nekuee. 1999. “Ingroup-bias: the effect of self-stereotyping, identification and group threat,” European Journal of Social Psychology 29: 411–418.
Wagner, D. L. 1998. Factors Influencing the Use of Older Workers: A Survey of U.S. Employers. Washington, DC: National Council on Aging.
Waldman, D. A. and B. J. Avolio. 1986. “A meta-analysis of age differences in job performance,” Journal of Applied Psychology 71: 33–38.
Warr, P. and J. Pennington. 1993. “Views about age discrimination and older workers,” in P. A. Taylor et al. (eds.), Age and Employment: Policies, Attitudes, and Practice. London: Institute of Personnel Management, pp. 75–106.
Welbourne, T. M., D. E. Johnson, and A. Erez. 1998. “The role-based performance scale: Valid-ity analysis of a theory-based measure,” Academy of Management Journal 41: 540–555.
Related Documents