UNIVERSITY OF OSLO HEALTH ECONOMICS RESEARCH PROGRAMME Productivity growth in Norwegian psychiatric outpatient clinics A panel data analysis of the period 1996-2001 Vidar Halsteinli Jon Magnussen SINTEF Unimed, Health Services Research Sverre A.C. Kittelsen The Frisch Centre Working Paper 2003: 9

Welcome message from author
This document is posted to help you gain knowledge. Please leave a comment to let me know what you think about it! Share it to your friends and learn new things together.
Transcript

UNIVERSITY OF OSLO HEALTH ECONOMICS RESEARCH PROGRAMME
Productivity growth in Norwegian psychiatric outpatient clinics A panel data analysis of the period 1996-2001
Vidar Halsteinli
Jon Magnussen SINTEF Unimed, Health Services Research Sverre A.C. Kittelsen The Frisch Centre
Working Paper 2003: 9
Productivity growth in Norwegian psychiatric outpatient clinics
A panel data analysis of the period 1996-2001*
by
Vidar Halsteinli1, Jon Magnussen1,2 and Sverre AC. Kittelsen2,3
April, 2003
Health Economics Research programme at the University of Oslo
HERO 2003
JEL classification: C61, D24, I12 Key words: Health Care, Mental health, Productivity, Data Envelopment Analysis, Malmquist
∗ This work is financed by the Norwegian Research Council through HERO and the Norwegian Ministry of Health through SINTEF.
1 SINTEF Unimed, Health Services Research, Norway 2 Health Economics Research Programme at the University of Oslo - HERO 3 The Frisch Centre, Norway Correspondence to: Sverre AC Kittelsen, The Ragnar Frisch Centre for Economic Research, Gaustadalléen 21, N-0349 Oslo, Norway. Tel: +47-22958810 Fax: +47-22958825 0317 Oslo, Norway E-mail: [email protected]
© 2003 HERO and the author – Reproduction is permitted when the source is referred to. Health Economics Research programme at the University of Oslo
Financial support from The Research Council of Norway is acknowledged. ISSN 1501-9071, ISBN 82-7756-112-1

Abstract Norwegian government policy is to increase the supply of psychiatric services to children and young persons, both by increasing the number of personnel and by increasing productivity in the psychiatric outpatient clinics (BUP). Increased accessibility to services is observed for the last years, measured as the number of children receiving services every year. The question is to what extent this is related to increased productivity. The paper aims to estimate change in productivity among outpatient clinics. Questions whether change in productivity is related to the personnel mix of the clinics, growth in treatment capacity or change in financial incentives are analysed. We utilise a non-parametric method called Data Envelopment Analysis (DEA) to estimate a best-practise production frontier. The potential for efficiency improvement are estimated as the difference between actual and best-practice performance, while allowing for trade-offs between different staff groups and different mixes of service production. A Malmquist output-based productivity index is calculated, decomposed in technical efficiency change, scale efficiency change and frontier shifts. The paper analyses panel data on the psychiatric outpatient clinics of Norway for the period of 1996-2001. Output is measured as number of direct and indirect patient-related interventions (visits and consultations) while input is measured by usage of different types of personnel. The results indicate increased overall productivity, with important contribution from increased technical efficiency. Personell growth has a negative influence on productivity growth, while a growth in the share of university educated personell improves productivity. The financial reform of 1997 that gave greater weight for interventions per patient lead to lower productivity growth in the subsequent period for those that had an inital budgetary gain from the reform.

2
1. Introduction
A government white paper in 1996 presented both an increase in capacity and an increase in
productivity as central political goals for the psychiatric health care sector (Ministry of Health
and Social Affairs 1997). To secure an increase in resources a national plan has been
implemented from 1999 (Ministry of Health and Social Affairs 1998). To increase
productivity, however, no particular measures have been taken other than increased political
and public focus on the utilisation of resources. The purpose of this paper is to assess the
effects of this strategy of combined resource growth and “mild coercion”. We do so by
focussing on psychiatric services for children and youths.
In Norway roughly 95 per cent of psychiatric services for children and youths are delivered in
an outpatient setting. They are mainly aimed at treating emotional and mental disorders as
well as correcting undesired behavioural patterns. Services are delivered both as direct
therapy to the patient and indirectly in the form of interaction with the patient’s environment
(relatives, schools etc). It is generally assumed that approximately 5 per cent of all youths
under 18 are in need of specialised psychiatric health care (Verhulst, Berden et al. 1985;
Lavigne, Gibbons et al. 1996). Based on this figure it was estimated that as much as 60 per
cent of Norwegian youths in need of specialised psychiatric health care did not receive such
care in 1996 (Halsteinli 1998). At the same time the number of consultations pr therapist day
in psychiatric outpatient clinics were shown to be as low as 1.1 (Ministry of Health and Social
Affairs 1997). Thus at this time, it was concluded that the sector seemed to be characterised
by a too low capacity level as well as low level of productivity.
When levels of productivity are low, a natural response is to review the payment system with
the aim of providing incentives for increased efficiency. In 1996 psychiatric outpatient clinics
were financed via two sources; around 60 per cent of the income was provided from the
counties by the way of a global budget or lump sum earmarked grants2. The additional 40 per
cent was financed from the state via the National Insurance scheme and related partly to the

3
number of patients treated and partly to the number of employees at the clinic. Up until 1997
the patient related income consisted of a one-time fee for the first consultation only. From
1997, however, an additional fee for multiple interventions was introduced. Thus, for a given
number of patients there was now a stronger incentive to provide more interventions per
patient. It should be noted, however, that even after this change as much as 95per cent of the
outpatient clinic income remains unrelated to the patent related activity. Thus the strongest
incentive provided by the financing system is still to increase number of employees.
With only marginal changes to the financing system the gap between demand and supply of
services had to be closed by other means. The chosen strategy contained two elements; a
strong public and political focus on low levels of productivity and a growth the amount of
resources put in to the sector in order to increase capacity. Suspecting that variations in
efficiency could be attributed to variations in organisational models, the National Board of
Health in 1998 initiated a project that were to review the working processes of psychiatric
outpatient clinics. This project received much attention within the sector, and the resulting
report suggested several areas where changes might lead to improved productivity (Hatling
and Magnussen 1999). As a follow up the National Board of Health has begun implementing
practice guidelines from 2001.
That the authorities in a situation with severe undercapacity and seemingly low levels of
efficiency chose not to focus on the financing system is interesting. We especially note that
that this strategy is in stark contrast to the somatic sector where increased activity and
productivity was sought after mainly by changing the financing system (Biørn, Hagen et al.
2002). This difference may, in part, be explained by the lack of patient classification systems
a la the DRG system for psychiatric patients. Still the lack of psychiatric DRGs cannot fully
explain why the authorities chose to stick to a financing system where the main incentive was
to increase staffing rather than activity. The situation in the somatic sector prior to the reform
of the financing system in 1997 was not that dissimilar to the situation in the psychiatric
sector. Long waiting lists and high waiting times was the main motivation for the reform.
Furthermore, the financial reform in the somatic sector was partly justified by the belief that
increase in resources alone would only lead to lower levels of efficiency.
2 For the period analysed in this paper the 19 county councils were responsible for the financing and delivery of specialised health care services. From 2002 this responsibility are transferred to 5 state owned regional health corporations.

4
The effects of the financial reform of the somatic sector (Biørn, Hagen et al. 2002) indicates
that the financial reform in the somatic sector led to a productivity growth of approximately 2
per cent. The goal for psychiatric outpatient care as it was formulated in public documents in
1996 was for a productivity growth of 50 per cent. This was, of course, optimistic, and the
purpose of this paper is to see whether this strategy of combining external pressure, resource
growth and a minor change in the financing system actually succeeded in increasing levels of
productivity to the extent foreseen. We shall proceed to do this by utilising the concept of a
decomposed Malmquist index to measure the growth of productivity over the six-year period,
1996-2001. We limit the discussion to Norwegian psychiatric outpatient clinics for children
and youths (“BUP-clinics”3). The paper is structured as follows. In section 2 we provide a
more thorough description of the behaviour in and activity of outpatient clinics for children
and youth, and provide the background for the empirical analysis that follows. Section 3
discusses the measurement of inputs and outputs, and present the methodology used. Results
are presented and discussed in section 4, while section 5 concludes the paper.
2. BUP clinics – organisation, behaviour and activity.
Generally the production of health care services takes place in an organisationally complex
environment, making it difficult to formulate precise behavioural models. In the setting of
BUP-clinics this is even more difficult. The main purpose of these clinics is to correct
undesirable behaviour. This may involve only the patient and the therapist, but will often be
more complex, involving several different therapists and include family (parents and siblings)
and school. As is the case for many psychiatric illnesses it is often difficult to set a precise
diagnosis. This leads to a situation where there are few standardised treatment programmes,
and thus difficult to characterise the activity of outpatient clinics by means of homogenous
diagnostic groups. Furthermore this leads to a situation where each outpatient clinic to a large
degree has discretion regarding the type of personnel needed to provide treatment, the type
and quantity of services that are to be delivered to the patients and the duration of treatment.
3 The term BUP is an abbrivation for the Norwegian ”children and youths”.

5
There is clear evidence that different personnel groups both pursue different goals and have
different views as for how the treatment process should be organised (Hatling and Magnussen
1999). In this setting it does not seem fruitful to use standard models of hospital behaviour
(Chalkley and Malcomson 2000) where one hospital decision maker interact with one
principal. Psychiatric outpatient clinics will be characterised by multiple decision makers
providing an array of services in a heterogeneous environment both with respect to means and
goals. We therefore choose to proceed on a more ad-hoc basis when we formulate the specific
questions that we believe is worth pursuing in an empirical analysis
First, on a purely descriptive basis, we are interested in whether or not there is a growth in
total productivity in the sector in the period 1996-2001, and given the aim of a 50 per cent
increase, also in its magnitude.
Second, we are interested in studying where a growth in productivity has taken place. More
specifically; is growth in productivity due to the good becoming better, or is it a case of the
not so good catching up?
Third, previous analysis (Halsteinli, Magnussen et al. 2001) suggest that there are variable
returns to scale in the sector and we would like to pursue this by looking at the relationship
between productivity growth and scale.
Fourth, we wish to see whether the change in productivity, ceteris paribus, is negatively
related to the growth in resources available. This assumption is derived from similar analyses
in the somatic sector (Biørn, Hagen et al. 2002). Basically the argument is that increased
budget levels will increase slack and thereby reduce productivity growth.
Fifth; we wish to see whether the change in productivity, ceteris paribus, is related to the
diversification of the personnel. This is motivated by the assumption that a more homogenous
staff mix will be more unified in the pursuit of goals and thereby spend less time on effort
reducing activities. We have no real theoretical underpinning of this hypotheses, but we note
that the argument is pursued in the sector (Larsen and Hustoft 2002).
Sixth, we wish to see whether the marginal change in the financing system had any effect on
the growth in productivity, ceteris paribus.

6
We now turn to the question of how these issues should be treated empirically.
3. Data and methodology
The treatment process in BUP-clinics will consist of a series of interventions related to each
patient. These interventions can be direct, i.e. by the way of consultations, others are indirect,
i.e. by the way of contacts with the patients environment. The interventions will be of
different form depending on the type of disorder, the social setting and the outpatient clinic
itself. Interventions can take place in situations where the therapist and the patient is alone, or
in a group setting where more therapists are involved and also where the patients family is
involved.
Ideally we would model the input-output relationship using data on number of treated patients
in homogenous groups. If this were possible inefficiencies that arise from using too many
interventions would be detected. As noted this is not possible, since we cannot define
homogenous patient groups. Thus what we do is assume that interventions that are provided
are necessary and choose to measure activity as number of direct and number of indirect
interventions. We have elsewhere (Halsteinli, Magnussen et al. 2001) performed a detailed
analysis of how different ways of measuring input/output affect the efficiency measures.
There we concluded that a model using number of therapist hours spent on direct patient care,
number of therapist hours spent on indirect care, number of university educated staff and
other staff as inputs performed well in the sense that the use of these inputs and outputs
sufficiently captured the information content in the other variables
When we in the present analysis have chosen a slightly different approach, we do this out of
two purposes. Firstly the change in the financing system was related to changing the financing
of interventions. Thus we believe that we may capture the potential effects of this better by
measuring output as number of interventions. Secondly, in order to get as long a series as
possible we have included data from years where the quality of the data on interventions are
believed to be better than the quality of the data on number of hours. Thus we measure the
growth in productivity by using the input and output variables in table 1.

7
Table 1: Descriptive statistics. Annual means for inputs, outputs and other variables.
Year 1996 1997 1998 1999 2000 2001 Outputs
Direct interventions 1ty 1 818 1 947 1 981 2 058 2 263 2 533
(1340) (1597) (1352) (1414) (1566) (1822)
Indirect interventions 2ty 837 917 917 1 055 1 200 1 295
(734) (802) (774) (779) (823) (856) Inputs
University personnel. 1tx 5.6 5.5 5.9 5.8 6.1 6.5
(4.2) (4.5) (4.5) (4.0) (4.2) (4.9)
2tx 7.8 7.9 8.0 7.6 8.0 8.7
College and administrative personnel
(7.9) (8.4) (7.6) (7.3) (7.9) (8.3)
Derived and other variables Interventions - total 2 655 2 864 2 898 3 113 3 463 3 829
(1932) (2289) (1983) (2052) (2204) (2448)
Personnel - total tx 13.4 13.4 13.8 13.4 14.1 15.3 (11.7) (12.6) (11.6) (10.9) (11.7) (12.6)
Patients treated 234 269 274 284 322 359 (135) (175) (156) (156) (189) (219)
Direct interventions per therapist 167 180 184 192 198 203 (54) (62) (56) (46) (44) (48)
Direct interventions per patient 7.6 7.0 7.1 7.1 6.9 6.9 (2.5) (2.3) (2.1) (1.7) (1.7) (1.6)
Number of outpatient clinics 51 45 56 65 67 60 Standard deviations in brackets.
Productivity is normally perceived as the ratio of output to input, but in the presence of
multiple inputs and outputs these are normally weighted by their prices. As is common in
public sector applications, output prices are nonexistent, and even input prices are difficult to
get hold of. Building on Malmquist (1953) one can instead use an estimate of the technology
or production possibility set to measure the change in productivity between periods (Caves,
Christensen et al. 1982). If x is a vector of inputs and y is a vector of outputs, the production
possibility set at time s is defined as
{ }( ) can be produced from at time sP s= y, x y x (1)
Technical productivity of an input-output vector ( , )t ty x at time t with reference to a
technology at time s can following (Farrell 1957; Førsund and Hjalmarsson 1987) be defined
as

8
{ },TP Min ( , )s t t st Pθ λ
θ λ θλ= ∈y x (2)
This is a relative measure which compares the input-output vector ( , )t ty x with the vector
that is of optimal size, keeping constant the mix of inputs and the mix of outputs respectively.
Note that while the own-period (t=s) technical productivity will be less or equal to 1 for all
feasible input-output vectors ( , )t t tP∈y x , this does necessarily not hold for cross-period
comparisons.
Own-period technical productivity as defined in (2) can be decomposed into technical
efficiency relative to the frontier of the production possibility set which in general will exhibit
variable returns to scale (VRS), and scale efficiency which reflects inoptimal scale. Measured
in an outputincreasing direction, the Farrell (1957) measure of technical efficiency is
{ }1TE Min ( , )t t tt Pλ λλ= ∈y x (3)
which in our context is always relative to own-period technology. Scale efficiency can then be
defined as the ratio of technical productivity and technical efficiency, allowing us to write the
decomposition as
TP TE SEtt t t= i (4)
If the technology sP is constant returns to scale (CRS), technical efficiency and technical
productivity will coincide and the scale efficiency will be one, which is why TPtt is
sometimes known as CRS technical efficiency.
The Malmquist index of productivity change from an input-output vector at time t to time u is
then defined by
sTPM TP
ss utu
t= (5)
uMst will be greater (less) than one when productivity improves (deteriorates). Both technical
productivities in (5) are measured relative to the same technology sP , just as a price-based
index would use a constant set of weights. The choice of the reference technology is
somewhat arbitrary. Färe, Grosskopf et al. (1994) suggests using the geometric mean of
indices calculated with each of the two years used as reference, while Berg, Førsund et al.
(1992) argues that circularity requires the use of a fixed base year. In this paper we will use
the envelopment of all technology frontiers as the fixed reference frontier, i.e. s ttP P= ∪ ,

9
thereby fulfilling the circularity condition while at the same time utilising technology
information from all time periods.
As shown in Färe, Grosskopf et al. (1994) the Malmquist index of productivity change could
be decomposed into two terms, reflecting the change in the productivity of the frontier relative
to the common reference technology, and the change in own period technical productivity
TP TPu tu t . Using (4), the last of these can in turn be decomposed into an index reflecting the
change in technical efficiency and an index reflecting the change in scale efficiency. Defining
uTP TP TE SEMF , ME , MSTP TP TE SE
s us u u u u
t tu sus tt t t t
= = = (6)
we can write the three-way decomposition as
u uTP TP TP TP TP TP TE SEM MF ME MSTP TP TP TP TP TP TE SE
s s u u s us su u u u u u u ut t tu sus s t t s t
t t t t t t t t
= = = = (7)
To apply the malmquist index and its decomposition empirically, one needs an estimate of the
technology tP in each time period. The DEA estimate, originally suggested by Farrell (1957)
+
x
y
h
H
O
s
N
n
Kk
D
d F
f
f*
P
p
1 21 2
1 2
1 2
1 2
12
*12
12
12
TP KQ/KF TP kq/kfTE KQ/KD TE kq/kdSE KD/KF SE kd/kf
TP KQ/KN TP kq/knkq/knM KQ/KNkf/knMF Kf KFKF/KNkq/kdME KQ/KDkd/kfMS KD/KF
s s
s
s
= == == =
= =
=
= =
=
=
Figure 1: Efficiency and productivity measures with DEA frontier estimates for observation Q in period 1 and q in period 2
10
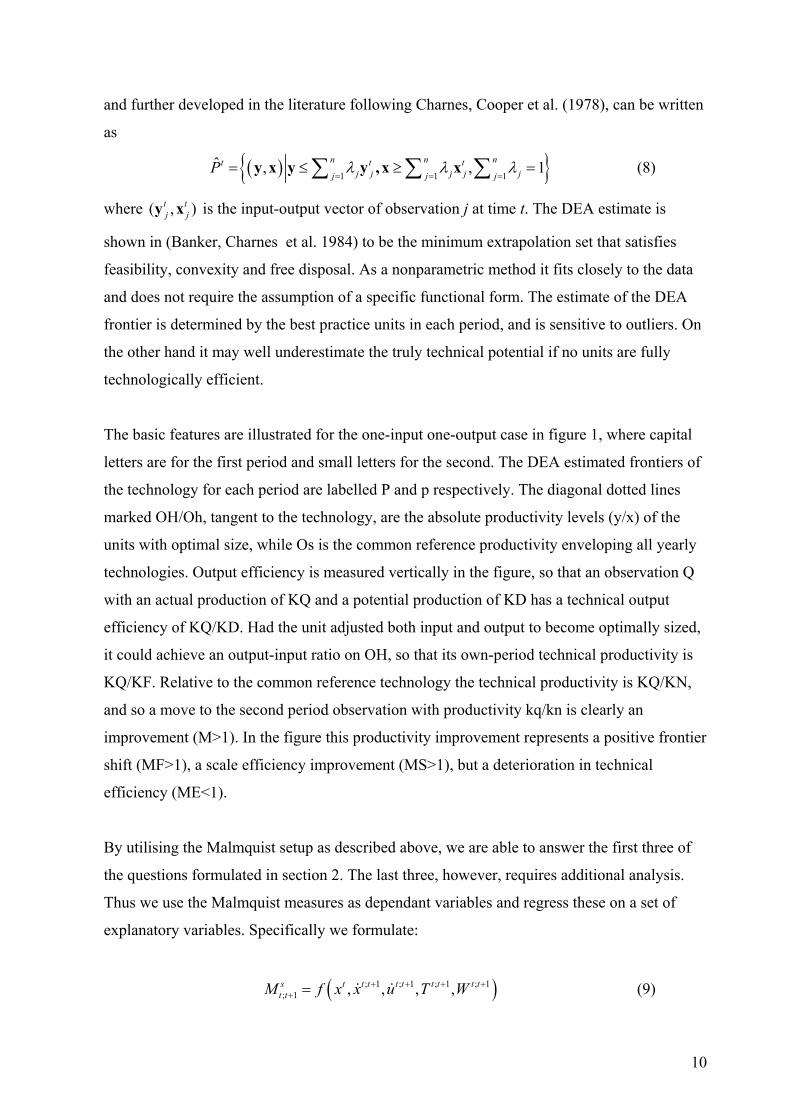
and further developed in the literature following Charnes, Cooper et al. (1978), can be written
as
( ){ }1 1 1ˆ , , 1n n nt t t
j j j j jj j jP λ λ λ
= = == ≤ ≥ =∑ ∑ ∑y x y y ,x x (8)
where ( , )t tj jy x is the input-output vector of observation j at time t. The DEA estimate is
shown in (Banker, Charnes et al. 1984) to be the minimum extrapolation set that satisfies
feasibility, convexity and free disposal. As a nonparametric method it fits closely to the data
and does not require the assumption of a specific functional form. The estimate of the DEA
frontier is determined by the best practice units in each period, and is sensitive to outliers. On
the other hand it may well underestimate the truly technical potential if no units are fully
technologically efficient.
The basic features are illustrated for the one-input one-output case in figure 1, where capital
letters are for the first period and small letters for the second. The DEA estimated frontiers of
the technology for each period are labelled P and p respectively. The diagonal dotted lines
marked OH/Oh, tangent to the technology, are the absolute productivity levels (y/x) of the
units with optimal size, while Os is the common reference productivity enveloping all yearly
technologies. Output efficiency is measured vertically in the figure, so that an observation Q
with an actual production of KQ and a potential production of KD has a technical output
efficiency of KQ/KD. Had the unit adjusted both input and output to become optimally sized,
it could achieve an output-input ratio on OH, so that its own-period technical productivity is
KQ/KF. Relative to the common reference technology the technical productivity is KQ/KN,
and so a move to the second period observation with productivity kq/kn is clearly an
improvement (M>1). In the figure this productivity improvement represents a positive frontier
shift (MF>1), a scale efficiency improvement (MS>1), but a deterioration in technical
efficiency (ME<1).
By utilising the Malmquist setup as described above, we are able to answer the first three of
the questions formulated in section 2. The last three, however, requires additional analysis.
Thus we use the Malmquist measures as dependant variables and regress these on a set of
explanatory variables. Specifically we formulate:
( ); 1 ; 1 ; 1 ; 1; 1 , , , ,s t t t t t t t t t
t tM f x x u T W+ + + ++ = (9)

11
and similar relationships for its components, where
1 2t t tx x x= + , i.e. the total number of personnel in year t, used here as an indicator of the size
of the clinic.
1; 1 tt t
txx x
++ = , annual growth in personnel, capturing the growth in the size of the budget.
1 1
1; 1
1
t tt t
t t
x xu
x x
+ ++ =
, annual growth in share of personnel that are university educated,
capturing to what extent the clinics are becoming less diversified as regards staff mix. If there
is a relationship between the length of education and the quality of the staff this variable may
also be interpreted as a measure of increase in staff quality.
; 1t tT + is a time dummy, where the first period 1996-97 acts as a reference and is therefore
dropped from the regression.
Finally ; 1 ; 11996
t t t tW w T+ += , where w1996 is a dummy for those hospitals that had a case mix in
1996 that meant that they stood to gain from the financial reform in 1996-97. It takes the
value 1 if the number of interventions per patient exceeded seven in 1996. It is multiplied with
the time dummy to capture any period-specific effects of the financial reform, which would be
expected to be significant only for a limited number of years.
The regression analyses were performed using fixed effects, random effects and OLS models.
Using a Hausmann test both the random and fixed effects models are rejected. Thus we only
present results from the OLS model. As argued in section 2, we do not formulate a formal
model of behaviour, so the regression is only meant to reveal statistical association using a
simultaneous method.

12
4. Results and discussion
I section 2 we proposed six questions for the empirical analysis in this paper. Based on the
Malmquist-indices and the regression models we now turn to the results of this analysis.
Total productivity growth
Figure 2 depicts the development in productivity from 1996 (=100) to 2001 both as an
arithmetic mean and a geometric mean of the individual productivity changes. There is a
substantial and significant (at the 2.5 per cent level) growth in productivity in this period.
Mean level of productivity in 2001 is more than 25 per cent higher than it was in 1996. This
implies an average annual growth in productivity of 4.5 per cent4. Thus relative to a goal of a
50 per cent change, the sector seems to have come half the way six years after the goal was
formulated.
4 The number 4.5 per cent is based on a data set consisting of the 37 outpatient clinics that provided data for all the years between 1996 and 2001. The Salter diagram is based on a data set consisting of the 48 outpatient clinics that provided data for (at least) the first and last year.
0.90
1.00
1.10
1.20
1.30
1.40
1.50
1996 1997 1998 1999 2000 2001
Arithmetic mean
Upper and lower limit of
95% Confidence interval
Geometric mean
Figure 2: Productivity change M96;t relative to 1996. Arithmetic and geometric mean of 37 clinics with data for all years.
13
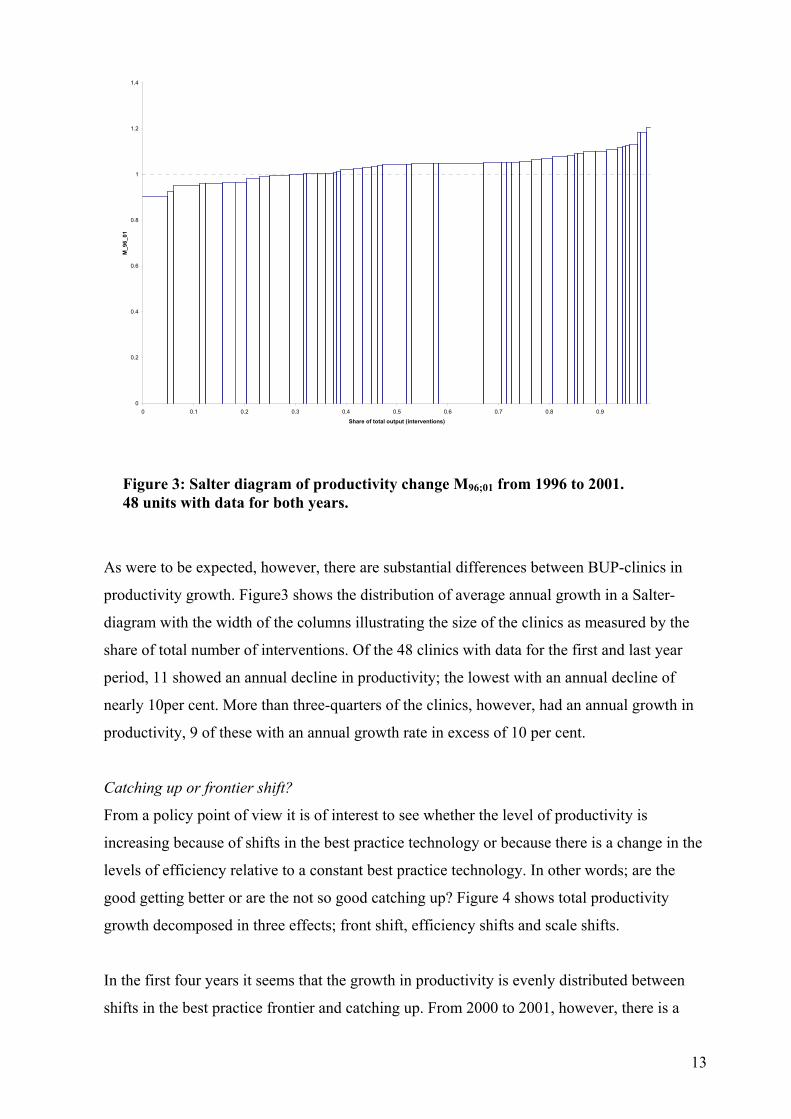
As were to be expected, however, there are substantial differences between BUP-clinics in
productivity growth. Figure3 shows the distribution of average annual growth in a Salter-
diagram with the width of the columns illustrating the size of the clinics as measured by the
share of total number of interventions. Of the 48 clinics with data for the first and last year
period, 11 showed an annual decline in productivity; the lowest with an annual decline of
nearly 10per cent. More than three-quarters of the clinics, however, had an annual growth in
productivity, 9 of these with an annual growth rate in excess of 10 per cent.
Catching up or frontier shift?
From a policy point of view it is of interest to see whether the level of productivity is
increasing because of shifts in the best practice technology or because there is a change in the
levels of efficiency relative to a constant best practice technology. In other words; are the
good getting better or are the not so good catching up? Figure 4 shows total productivity
growth decomposed in three effects; front shift, efficiency shifts and scale shifts.
In the first four years it seems that the growth in productivity is evenly distributed between
shifts in the best practice frontier and catching up. From 2000 to 2001, however, there is a
Figure 3: Salter diagram of productivity change M96;01 from 1996 to 2001. 48 units with data for both years.
0
0.2
0.4
0.6
0.8
1
1.2
1.4
0 0.1 0.2 0.3 0.4 0.5 0.6 0.7 0.8 0.9
Share of total output (interventions)
M_9
6_01

14
large positive shift in the best practice frontier, and a resulting decrease in the catching up
effects. There seems to be no substantial change in scale efficiency in this period. Thus, on
average, productivity growth in this period has been higher in outpatient clinics with initial
low levels of productivity. We note, however, that while front shifts usually are termed
“technical change” this may be misleading in this case. It is more likely that frontier shifts are
the result of the best practice technology closing in on the theoretical frontier, than that this is
the result of true technical change. Also, the position of the best practice frontier will depend
only on a few of the observations. In our case observations from 2001, three BUP-clinics
alone account for more than 50 per cent of the reference technology dominates the frontier.
Thus the results of the decomposition of the efficiency measures will depend on the
measurements of the inputs and outputs. Still we note that the front shift from 2000 to 2001
remains even when “extreme” observations are removed.
Scale efficiency
Productivity growth does not seem to be explained by an increase in scale efficiency. Also,
from the regression analysis (table 2), the size of the clinics does not influence the
productivity growth.
0.90
0.95
1.00
1.05
1.10
1.15
1.20
1.25
1.30
1996 1997 1998 1999 2000 2001
Productivity index M
Frontier shift index MF
Efficiency change index ME
Scale efficiency index MS
Figure 4: Decomposition of productivity index M=MF*ME*MS. Geometric mean of 37 clinics with data for all years.
15
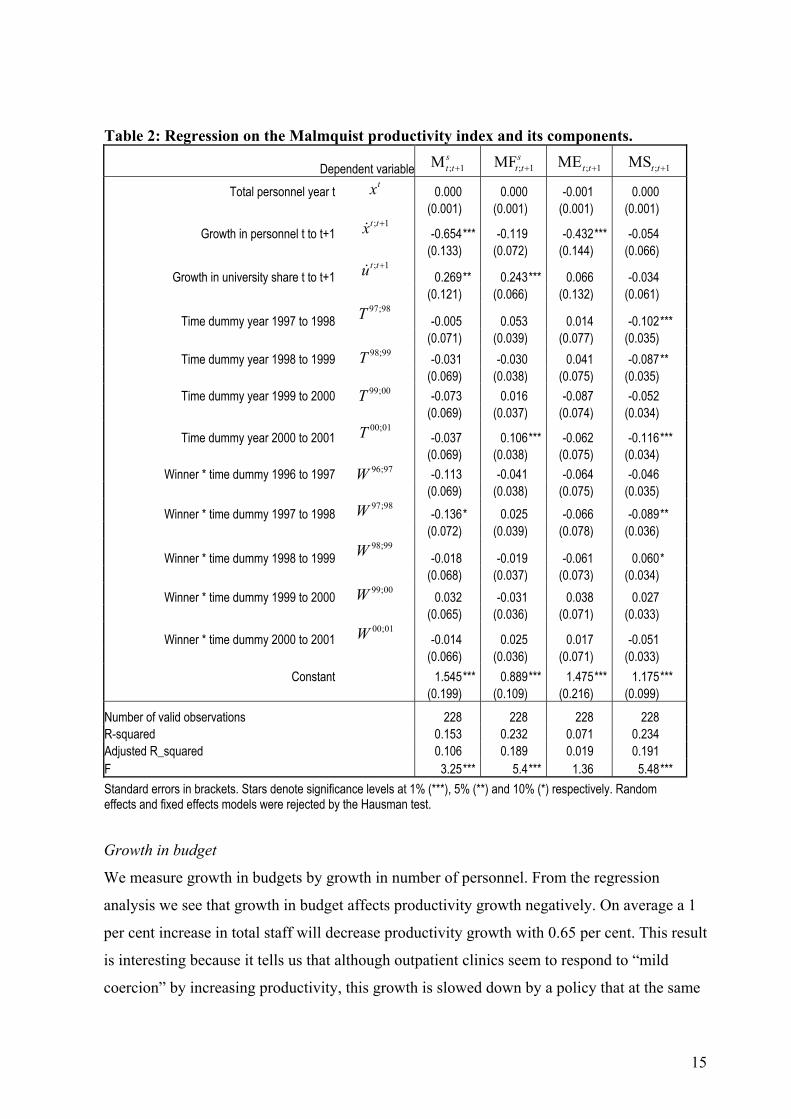
Table 2: Regression on the Malmquist productivity index and its components.
Dependent variable ; 1Mst t+ ; 1MFs
t t+ ; 1MEt t+ ; 1MSt t+
Total personnel year t 0.000 0.000 -0.001 0.000
tx (0.001) (0.001) (0.001) (0.001)
Growth in personnel t to t+1 -0.654*** -0.119 -0.432*** -0.054
; 1t tx +
(0.133) (0.072) (0.144) (0.066)
Growth in university share t to t+1 0.269** 0.243*** 0.066 -0.034
; 1t tu +
(0.121) (0.066) (0.132) (0.061)
Time dummy year 1997 to 1998 -0.005 0.053 0.014 -0.102***
97;98T
(0.071) (0.039) (0.077) (0.035) Time dummy year 1998 to 1999 -0.031 -0.030 0.041 -0.087**
98;99T (0.069) (0.038) (0.075) (0.035)
Time dummy year 1999 to 2000 -0.073 0.016 -0.087 -0.052
99;00T (0.069) (0.037) (0.074) (0.034)
Time dummy year 2000 to 2001 -0.037 0.106*** -0.062 -0.116***
00;01T (0.069) (0.038) (0.075) (0.034)
Winner * time dummy 1996 to 1997 -0.113 -0.041 -0.064 -0.046
96;97W (0.069) (0.038) (0.075) (0.035)
Winner * time dummy 1997 to 1998 -0.136* 0.025 -0.066 -0.089**
97;98W (0.072) (0.039) (0.078) (0.036)
Winner * time dummy 1998 to 1999 -0.018 -0.019 -0.061 0.060*
98;99W
(0.068) (0.037) (0.073) (0.034) Winner * time dummy 1999 to 2000 0.032 -0.031 0.038 0.027
99;00W (0.065) (0.036) (0.071) (0.033)
Winner * time dummy 2000 to 2001 -0.014 0.025 0.017 -0.051
00;01W
(0.066) (0.036) (0.071) (0.033) Constant 1.545*** 0.889*** 1.475*** 1.175***
(0.199) (0.109) (0.216) (0.099)
Number of valid observations 228 228 228 228 R-squared 0.153 0.232 0.071 0.234 Adjusted R_squared 0.106 0.189 0.019 0.191 F 3.25*** 5.4*** 1.36 5.48*** Standard errors in brackets. Stars denote significance levels at 1% (***), 5% (**) and 10% (*) respectively. Random effects and fixed effects models were rejected by the Hausman test.
Growth in budget
We measure growth in budgets by growth in number of personnel. From the regression
analysis we see that growth in budget affects productivity growth negatively. On average a 1
per cent increase in total staff will decrease productivity growth with 0.65 per cent. This result
is interesting because it tells us that although outpatient clinics seem to respond to “mild
coercion” by increasing productivity, this growth is slowed down by a policy that at the same
16
time increases the availability of resources. It should be noted, however, that there are
explanations to why an increase in budgets would slow down productivity growth other than a
decrease in effort. Specifically, at any given point in time, a share of the staff will be in
training for a speciality. When there is a growth in staffing this share is likely to increase, and
this will most likely slow down productivity growth. We also note that a slowdown of
productivity growth in clinics with a large growth in budget size mainly comes as a “falling
behind effect”. This would suggest that outpatient clinics with an initial high level of
productivity is better equipped to handle a growth in staffing than clinics with a low initial
level of productivity. To understand why this should be we would need, however, to perform
a more detailed analysis of the effects of internal organisational factors on productivity.
Staff diversification
Growth in the share of university educated staff increases productivity growth. On average a 1
per cent increase in the share of university staff increases productivity by 0,27 per cent. This
supports our hypotheses that a more unified staff mix will increase productivity. If one
accepts the notion that staff quality is related to share of university educated personnel5 this
also implies than an increase in staff quality will lead to a higher growth in productivity. We
also note that this effect is mainly due to a frontier shift. Thus an increase in staff
quality/share of university educated staff is most effective in clinics that already have a high
level of efficiency. The way we have specified our model productivity will be measured
relative to the best practice units that have a similar staff mix. Thus we cannot say whether
staff diversification, ceteris paribus, leads to a higher or lower level of productivity.
Change in financing system
The change in the financing system did not seem to influence productivity growth, except in
the period after the reform, when a slightly significant effect lead to lower productivity
growth for those that had an initial budgetary gain from the reform This effect seems to have
worked through a reduction in scale efficiency. The lack of a substantial effect of the
financing system is not surprising, though, given the very marginal change in the system.
5 And this notion will be highly controversial, at least in the Norwegian setting.

17
5. Concluding comments
Low levels of productivity and excess demand for services led authorities to implement a
twofold strategy; increased focus on productivity combined with an increase in resources.
From 1996 to 2001 average productivity growth was 25 per cent, and the chosen strategy has
seemingly been a success. Although there is clear evidence of a frontier shift, we see that the
“not so good” on average have increased their productivity more than the best practice units
giving a sector that is more homogenous in 2001 than it was in 1996. Productivity growth has
been slowed down due to an increase in the availability of resources, but this may be due to an
increase in training costs, in which case it is likely to be transitional. Overall we conclude that
productivity growth has been substantial, and further research should focus on the effects of
various organisational models of BUP-clinics and both the level of and change in
productivity. In this context the positive effect of increasing the share of university educated
personnel could provide a fruitful starting point.

18
References:
Banker, R. D., A. Charnes , et al. (1984). "Some models for estimating technical and scale
inefficiencies." Management Science 30: 1078-1092. Berg, S. A., F. R. Førsund, et al. (1992). "Malmquist indices of productivity growth during the
deregulation of norwegian banking 1980-1989." Scandinavian Journal of Economics, Supplement 94: 211-288.
Biørn, E., T. P. Hagen, et al. (2002). The effect of activity-based financing on hospital efficiency: A panel data analysis of DEA efficiency scores 1992-2000. HERO working paper. Oslo, Health Economics Research Programme at the University of Oslo (HERO).
Caves, D. W., L. R. Christensen, et al. (1982). "The economic theory of index numbers and the measurement of input, output, and productivity." Econometrica 50: 1393-1414.
Chalkley, M. and J. M. Malcomson (2000). Government Purchasing of Health Services. Handbook of Health Economics. A. J. Culyer and J. P. Newhouse. Amsterdam, Elsevier Science. 1A: 847-889.
Charnes, A., W. W. Cooper, et al. (1978). "Measuring the Efficiency of Decision Making Units." European Journal of Operational Research 2(6): 429-444.
Farrell, M. J. (1957). "The Measurement of Productive Efficiency." Journal of the Royal Statistical Society 120: 253-281.
Färe, R., S. Grosskopf, et al. (1994). Productivity Developments in Swedish Hospitals; A Malmquis Output Index proach. Data Envelopment Analysis: Theory, Methodology and Applications. A. Charnes, W. Cooper, A. Y. Lewin and L. M. Seiford. Massachusets, Kluwer Academic Publishers.
Førsund, F. R. and L. Hjalmarsson (1987). Analyses of Industrial Structure: A Putty-Clay Approach. Stockholm, Almqvist & Wiksell International.
Halsteinli, V. (1998). Nasjonale utviklingstrekk i BUP. Psykiatritjenesten - på rett veg? H. Hagen. Trondheim, SINTEF Unimed: 81-99.
Halsteinli, V., J. Magnussen, et al. (2001). "Scale, efficiency and organization in Norwegian psychiatric outpatient clinics for children." Journal of Mental Health Policy and Economics 4(2): 79-90.
Hatling, T. and J. Magnussen (1999). Evaluering av arbeidsformer og produktivitet ved voksenpsykiatriske og barne og ungdomspsykiatriske poliklinikker. Trondheim, SINTEF Unimed.
Larsen, T. and K. Hustoft (2002). Psykiatri og kompetanse [Psychiatry and competence]. Dagbladet. Oslo.
Lavigne, J. V., R. D. Gibbons, et al. (1996). "Prevalence rates and correlates of psychiatric disorders among preschool children." Journal of the American Academy of Child & Adolescent Psychiatry. 35(2): 204-14.
Malmquist, S. (1953). "Index numbers and indifference surfaces." Trabajos de estadistica 4: 209-24.
Ministry of Health and Social Affairs (1997). St Meld 25 (1996-97) Åpenhet og helhet. Om psykiske lidelser og tjenestetilbudene. Oslo, Ministry of Health and Social Affairs.
Ministry of Health and Social Affairs (1998). St Prp 63 (1997-98): Om opptrappingsplanen for psykisk helse. Oslo, Ministry of Health and Social Affairs.
Verhulst, F., G. Berden, et al. (1985). "Mental Health in Dutch Children (II): The prevalence of psychiatric disorder and relationships between measures." Acta Psychatr Scand Suppl 324: 1-45.

19
Related Documents