Productivity, efficiency and technical change: measuring the performance of China’s transforming agriculture Songqing Jin Hengyun Ma Jikun Huang Ruifa Hu Scott Rozelle Published online: 27 August 2009 Ó Springer Science+Business Media, LLC 2009 Abstract As China enters the twenty-first century the health of the agricultural economy will increasingly rely, not on the growth of inputs, but on the growth of total factor productivity (TFP). However, the tremendous changes in the sector—sometimes back and sometimes forwards—as well as evolving institutions make it difficult to gauge from casual observation if the sector is healthy or not. Research spending has waxed and waned. Policies to encourage the import of foreign technologies have been applied unevenly. Structural adjustment policies also trig- gered wrenching changes in the sector. Horticulture and livestock production has boomed; while the output of other crops, such as rice, wheat and soybeans, has stagnated or fallen. At a time when China’s millions of producers are faced with complex decisions, the extension system is crumbling and farmer professional associations remain in their infancy. In short, there are just as many reasons to be optimistic about the productivity trends in agriculture as to be pessimistic. In this paper, we pursue one overall goal: to better understand the productivity trends in China’s agri- cultural sector during the reform era—with an emphasis on the 1990–2004 period. To do so, we pursue three specific objectives. First, relying on the National Cost of Produc- tion Data Set—China’s most complete set of farm input and output data—we chart the input and output trends for 23 of China’s main farm commodities. Second, using a stochastic production frontier function approach we esti- mate the rate of change in TFP for each commodity. Finally, we decompose the changes in TFP into two com- ponents: changes in efficiency and changes in technical change. Our findings—especially after the early 1990s are remarkably consistent. China’s agricultural TFP has grown at a healthy rate for all 23 commodities. TFP growth for the staple commodities generally rose around 2% annually; TFP growth for most horticulture and livestock commod- ities was even higher (between 3 and 5%). Equally con- sistent, we find that most of the change is accounted for by technical change. The analysis is consistent with the con- clusion that new technologies have pushed out the pro- duction functions, since technical change accounts for most of the rise in TFP. In the case of many of the commodities, however, the efficiency of producers—that is, the average distance of producers from the production frontier—has fallen. In other words, China’s TFP growth would have been even higher had the efficiency of production not eroded the gains of technical change. Although we do not pinpoint the source of rising inefficiency, the results are consistent with a story that there is considerable disequi- librium in the farm economy during this period of rapid structural change and farmers are getting little help in making these adjustments from the extension system. Paper for Conference on ‘‘Trends & Forces in International Agricultural Productivity Growth,’’ March 15, 2007, Washington, DC. Electronic supplementary material The online version of this article (doi:10.1007/s11123-009-0145-7) contains supplementary material, which is available to authorized users. S. Jin (&) Michigan State University, 213E Agricultural Hall, East Lansing, MI 48824, USA e-mail: [email protected] H. Ma Henan Agricultural University, Zhengzhou, Henan, China J. Huang R. Hu CCAP, Chinese Academy of Sciences, Beijing, China S. Rozelle Stanford University, Stanford, CA, USA 123 J Prod Anal (2010) 33:191–207 DOI 10.1007/s11123-009-0145-7

Welcome message from author
This document is posted to help you gain knowledge. Please leave a comment to let me know what you think about it! Share it to your friends and learn new things together.
Transcript

Productivity, efficiency and technical change: measuringthe performance of China’s transforming agriculture
Songqing Jin Æ Hengyun Ma Æ Jikun Huang ÆRuifa Hu Æ Scott Rozelle
Published online: 27 August 2009
� Springer Science+Business Media, LLC 2009
Abstract As China enters the twenty-first century the
health of the agricultural economy will increasingly rely,
not on the growth of inputs, but on the growth of total
factor productivity (TFP). However, the tremendous
changes in the sector—sometimes back and sometimes
forwards—as well as evolving institutions make it difficult
to gauge from casual observation if the sector is healthy or
not. Research spending has waxed and waned. Policies to
encourage the import of foreign technologies have been
applied unevenly. Structural adjustment policies also trig-
gered wrenching changes in the sector. Horticulture and
livestock production has boomed; while the output of other
crops, such as rice, wheat and soybeans, has stagnated or
fallen. At a time when China’s millions of producers are
faced with complex decisions, the extension system is
crumbling and farmer professional associations remain in
their infancy. In short, there are just as many reasons to be
optimistic about the productivity trends in agriculture as to
be pessimistic. In this paper, we pursue one overall goal: to
better understand the productivity trends in China’s agri-
cultural sector during the reform era—with an emphasis on
the 1990–2004 period. To do so, we pursue three specific
objectives. First, relying on the National Cost of Produc-
tion Data Set—China’s most complete set of farm input
and output data—we chart the input and output trends for
23 of China’s main farm commodities. Second, using a
stochastic production frontier function approach we esti-
mate the rate of change in TFP for each commodity.
Finally, we decompose the changes in TFP into two com-
ponents: changes in efficiency and changes in technical
change. Our findings—especially after the early 1990s are
remarkably consistent. China’s agricultural TFP has grown
at a healthy rate for all 23 commodities. TFP growth for the
staple commodities generally rose around 2% annually;
TFP growth for most horticulture and livestock commod-
ities was even higher (between 3 and 5%). Equally con-
sistent, we find that most of the change is accounted for by
technical change. The analysis is consistent with the con-
clusion that new technologies have pushed out the pro-
duction functions, since technical change accounts for most
of the rise in TFP. In the case of many of the commodities,
however, the efficiency of producers—that is, the average
distance of producers from the production frontier—has
fallen. In other words, China’s TFP growth would have
been even higher had the efficiency of production not
eroded the gains of technical change. Although we do not
pinpoint the source of rising inefficiency, the results are
consistent with a story that there is considerable disequi-
librium in the farm economy during this period of rapid
structural change and farmers are getting little help in
making these adjustments from the extension system.
Paper for Conference on ‘‘Trends & Forces in International
Agricultural Productivity Growth,’’ March 15, 2007, Washington,
DC.
Electronic supplementary material The online version of thisarticle (doi:10.1007/s11123-009-0145-7) contains supplementarymaterial, which is available to authorized users.
S. Jin (&)
Michigan State University, 213E Agricultural Hall, East
Lansing, MI 48824, USA
e-mail: [email protected]
H. Ma
Henan Agricultural University, Zhengzhou, Henan, China
J. Huang � R. Hu
CCAP, Chinese Academy of Sciences, Beijing, China
S. Rozelle
Stanford University, Stanford, CA, USA
123
J Prod Anal (2010) 33:191–207
DOI 10.1007/s11123-009-0145-7

Keywords Productivity � Efficiency � Technical change �China’s transforming agriculture
JEL Classification D24 � O47 � Q16
1 Introduction
During the early reform period there are few scholars that
question the positive role that agriculture played in the
economy and sources of the large rises of food and fiber
(Rozelle et al. 2005). Based in part on the incentives
embodied in the Household Responsibility System, farm
output and productivity grew by 5–10% between 1978 and
1985 (McMillan et al. 1989; Lin 1992). Huang and Rozelle
(1996), and Fan and Pardey (1997) show that better
incentives were enhanced by new technologies. Inputs also
rose as farmers had greater access to fertilizer and other
farm inputs (Stone 1988) and improved water control,
especially due to the emergence of groundwater (Nickum
1998; Wang et al. 2005).
During the mid-1990s, at a time when China’s rapid
growth was becoming recognized as a transformative force
of people’s livelihood, another debate rose about whether
China could feed itself. Brown (1994) among others pointed
out that the level of input use was already high in China and
that future growth would rely on total factor productivity
(TFP) growth. The pessimist (e.g., Wen 1993) suggested
that TFP had stopped growing and that China’s farming
sector was unhealthy. In response, several efforts (e.g., Fan
1997; Jin et al. 2002) used more rigorous methods and
showed that while aggregated inputs had indeed stopped
growing (as labor shifted off the farm; sown area was
stagnant), output continued to grow resulting in positive
TFP growth, which was at a respectable rate of around 2%
per year. Although there were many challenges facing the
agricultural economy as China entered the end of the 1990s,
it was shown that the investment into R&D (which because
of time lags between investment and production of new
varieties had taken place in the late 1970s and 1980s) was
producing the technology that was driving TFP.
Somewhat surprisingly in recent years there has been
almost no work done to continue to monitor the health of
China’s agricultural economy. According to our reading of
the literature, there are no papers that use high quality
nationwide input and output to rigorously measure shifts in
productivity. In contrast, in other countries there are annual
efforts to track changes in productivity.
The lack of information on TFP is all the more sur-
prising since as China enters the twenty-first century the
health of the agricultural economy will increasingly rely,
not on the growth of inputs, but on the growth of total
factor productivity (TFP). There are tremendous changes in
the sector—sometimes back and sometimes forwards—as
well as evolving institutions which make it difficult to
gauge from casual observation if the sector is healthy or
not. Research spending has waxed and waned (Hu et al.
2007). Policies to encourage the import of foreign tech-
nologies have been applied unevenly (Pray et al. 1997).
Structural adjustment policies also triggered wrenching
changes in the sector (Rosen et al. 2004). Horticulture and
livestock production has boomed; while the output of other
crops, such as rice, wheat and soybeans, has stagnated or
fallen (CNBS 2005). At a time when China’s millions of
producers are faced with complex decisions, the extension
system is crumbling and farmer professional associations
remain in their infancy (Huang et al. 2003). In short, there
are just as many reasons to be optimistic about the pro-
ductivity trends in agriculture as to be pessimistic. Yet,
there is no where in the literature to turn to understand the
trends in productivity over the past 15 years.
Because of this absence of information, the overall goal
of this paper is to better understand the productivity trends
in China’s agricultural sector during the reform era—with
an emphasis on the 1990–2004 period. To do so, we pursue
three specific objectives. First, relying on the National Cost
of Production Data Set—China’s most complete set of farm
input and output data—we chart the input and output trends
for 23 of China’s main farm commodities. Second, using a
stochastic production frontier function approach we esti-
mate the rate of change in TFP for each commodity. Finally,
we decompose the changes in TFP into two components:
changes in efficiency and changes in technical change.
Because this already is an ambitious paper, we neces-
sarily must limit the scope of the analysis. Specifically, we
exam the major staple grains and oilseeds, cotton, several
vegetable and fruit crops and most of the major livestock
commodities. In total, the commodities that are covered
accounted for more than 63% of China’s gross value of
agricultural output in 2005 (CNBS 2006). However, due to
the lack of data and time, we do not estimate TFP growth for
several major commodities, including aquaculture, sugar,
edible oils beyond soybeans and many fruits, vegetables and
more minor livestock commodities. In addition, we measure
the productivity shifts on a commodity by commodity basis.
As shown in deBrauw et al. (2004) and Lin (1992), if the
rise of specialization in China is occurring (as is reported in
the literature—Rozelle et al. 2007) and this results in the
positive allocative efficiency gains, our approach underes-
timates the total rise in productivity in China’s farming
sector. We also ignore regional differences in productivity,
even though our results are done on a province by province
basis and aggregated to a national total.
To meet our objectives the rest of the paper is organized
as follows. In the following sections we first present a brief
review of our methodology. Next, we discuss the data. The
192 J Prod Anal (2010) 33:191–207
123

following section contains a brief review of recent changes
in China’s agriculture and how these might be expected to
affect TFP. Understanding these trends will be helpful in
interpreting the results. TFP growth rates and their
decomposition are then presented for the 23 commodities.
The final section concludes.
2 Methodology
Traditional studies of productivity growth in agriculture
have tended to compute productivity as a residual after
accounting for input growth, and to interpret the growth in
productivity as the contribution of technical progress. Such
an interpretation implies that improvements in productivity
can arise only from technical progress. However, this
assumption is valid only if firms are technically efficient,
thus operating on their production frontiers and realizing
the full potential of the technology. The fact is that for
various reasons firms do not operate on their frontiers but
somewhere below them, and TFP measured in this way can
reflect both technological innovation and changes in effi-
ciency. Therefore, technical progress may not be the only
source of total productivity growth, and it will be possible
to increase factor productivity through improving the
method of application of the given technology—that is, by
improving technical efficiency.
To study production efficiency, the stochastic frontier
production function (Aigner et al. 1977; Meeusen and van
den Broeck 1977) has been the subject of considerable
recent research with regard to both extensions and appli-
cations (Battese and Coelli 1995). Stochastic production
function analysis postulates the existence of technical
inefficiency of production of firms involved in producing a
particular output, which reflects the fact that many firms do
not operate on their frontiers but somewhere below them.
Many theoretical and empirical studies on production
efficiency/inefficiency have used stochastic frontier pro-
duction analysis (e.g., Coelli et al. 1998; Kumbhakar and
Lovell 2000).
Stochastic frontier production functions have also been
applied to the analysis of aggregate production data. This is
true when the underlying household data have been
aggregated to the state or country level. For example,
Kooper et al. (1999) use a stochastic frontier production
approach to examine country specific inefficiency of a
group of OECD countries. While Kooper (2001) criticized
Kooper et al. (1999) and Fare et al. (1994) for the
assumption of all these countries facing a common world
production frontier for real GDP, he was focusing on the
manufacturing sector. He argues that it is more realistic to
assume there is a common OECD production function for
machinery production than for GDP as a whole.
There are other examples. Using provincial level panel
data from China’s 30 provinces/cities, Yao et al. (2001) use
frontier production function analysis to examine the tech-
nical efficiency of China’s grain sector. Tian and Wan
(2000) carry out a similar analysis, but at individual crop
level (i.e. rice, wheat and corn, however, still using
aggregate data). In this paper we also adopt stochastic
frontier production function for individual commodities.
Recent development of techniques for measuring pro-
ductive efficiency over time has focused on the use of panel
data (Kumbhakar et al. 1999; Henderson 2003). Panel data
permit a richer specification of technical change and
obviously contain more information about a particular unit
of analysis than does a cross-section of the data. Panel data
also allow the relaxation of some of the strong assumptions
that are related to efficiency measurement in the cross-
sectional framework (Schmidt and Sickles 1984). In the
rest of the paper, we adopt a panel data approach to mea-
sure and decompose TFP for our 23 commodities.
As in Kumbhakar (2000), the stochastic frontier pro-
duction function for panel data can be expressed as:
yit ¼ f ðxit; tÞ expðvit � uitÞ ð1Þ
where yit is the output of the ith firm (i ¼ 1; 2; . . .;NÞ in
period t (t ¼ 1; 2; . . .; TÞ; f (�) is the production technology;
x is a vector of J inputs; t is the time trend variable; vit is
assumed to be an iid Nð0; r2vÞ random variable, indepen-
dently distributed of the uit; and uit is a non-negative ran-
dom variable and output-oriented technical inefficiency
term.
In this paper we assume that the production technology
is translog:
ln yit ¼ a0 þX
jbj ln xjit þ btt
þ 1
2
Xj
Xkbjk ln xjit ln xkit þ
1
2bttt
2
þX
jbjt ln xjitt þ vit � uit ð2Þ
A translog is assumed since it is a flexible functional form.
In addition, it is well known that a translog is a second
order approximation of any production technology, making
it a general functional form.1 In order to account for
unobserved, non-time varying factors (or fixed effects), we
included a set of provincial dummy variables in the spec-
ification. In addition, the time trend variable controls for
time varying, systematic unobserved factors.
There are several specifications that make the technical
inefficiency term uit time-varying, but most of them have
not explicitly formulated a model for these technical
inefficiency effects in terms of appropriate explanatory
1 The translog was chosen not only because it is one of the most
popular function forms in the related literature, but also because it
performs better than other alternatives based on a formal test.
J Prod Anal (2010) 33:191–207 193
123
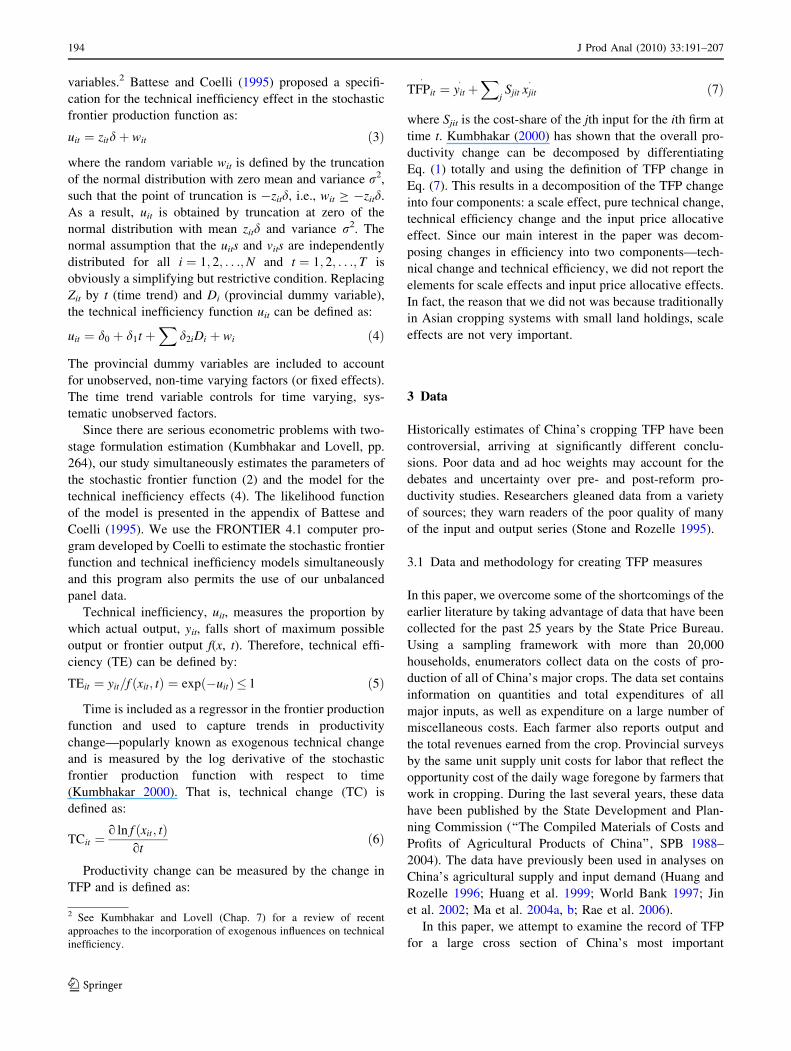
variables.2 Battese and Coelli (1995) proposed a specifi-
cation for the technical inefficiency effect in the stochastic
frontier production function as:
uit ¼ zitdþ wit ð3Þ
where the random variable wit is defined by the truncation
of the normal distribution with zero mean and variance r2,
such that the point of truncation is -zitd, i.e., wit C -zitd.
As a result, uit is obtained by truncation at zero of the
normal distribution with mean zitd and variance r2. The
normal assumption that the uits and vits are independently
distributed for all i ¼ 1; 2; . . .;N and t ¼ 1; 2; . . .; T is
obviously a simplifying but restrictive condition. Replacing
Zit by t (time trend) and Di (provincial dummy variable),
the technical inefficiency function uit can be defined as:
uit ¼ d0 þ d1t þX
d2iDi þ wi ð4Þ
The provincial dummy variables are included to account
for unobserved, non-time varying factors (or fixed effects).
The time trend variable controls for time varying, sys-
tematic unobserved factors.
Since there are serious econometric problems with two-
stage formulation estimation (Kumbhakar and Lovell, pp.
264), our study simultaneously estimates the parameters of
the stochastic frontier function (2) and the model for the
technical inefficiency effects (4). The likelihood function
of the model is presented in the appendix of Battese and
Coelli (1995). We use the FRONTIER 4.1 computer pro-
gram developed by Coelli to estimate the stochastic frontier
function and technical inefficiency models simultaneously
and this program also permits the use of our unbalanced
panel data.
Technical inefficiency, uit, measures the proportion by
which actual output, yit, falls short of maximum possible
output or frontier output f(x, t). Therefore, technical effi-
ciency (TE) can be defined by:
TEit ¼ yit=f ðxit; tÞ ¼ expð�uitÞ� 1 ð5Þ
Time is included as a regressor in the frontier production
function and used to capture trends in productivity
change—popularly known as exogenous technical change
and is measured by the log derivative of the stochastic
frontier production function with respect to time
(Kumbhakar 2000). That is, technical change (TC) is
defined as:
TCit ¼o ln f ðxit; tÞ
otð6Þ
Productivity change can be measured by the change in
TFP and is defined as:
TFPit
�¼ yit
� þX
jSjit xjit
� ð7Þ
where Sjit is the cost-share of the jth input for the ith firm at
time t. Kumbhakar (2000) has shown that the overall pro-
ductivity change can be decomposed by differentiating
Eq. (1) totally and using the definition of TFP change in
Eq. (7). This results in a decomposition of the TFP change
into four components: a scale effect, pure technical change,
technical efficiency change and the input price allocative
effect. Since our main interest in the paper was decom-
posing changes in efficiency into two components—tech-
nical change and technical efficiency, we did not report the
elements for scale effects and input price allocative effects.
In fact, the reason that we did not was because traditionally
in Asian cropping systems with small land holdings, scale
effects are not very important.
3 Data
Historically estimates of China’s cropping TFP have been
controversial, arriving at significantly different conclu-
sions. Poor data and ad hoc weights may account for the
debates and uncertainty over pre- and post-reform pro-
ductivity studies. Researchers gleaned data from a variety
of sources; they warn readers of the poor quality of many
of the input and output series (Stone and Rozelle 1995).
3.1 Data and methodology for creating TFP measures
In this paper, we overcome some of the shortcomings of the
earlier literature by taking advantage of data that have been
collected for the past 25 years by the State Price Bureau.
Using a sampling framework with more than 20,000
households, enumerators collect data on the costs of pro-
duction of all of China’s major crops. The data set contains
information on quantities and total expenditures of all
major inputs, as well as expenditure on a large number of
miscellaneous costs. Each farmer also reports output and
the total revenues earned from the crop. Provincial surveys
by the same unit supply unit costs for labor that reflect the
opportunity cost of the daily wage foregone by farmers that
work in cropping. During the last several years, these data
have been published by the State Development and Plan-
ning Commission (‘‘The Compiled Materials of Costs and
Profits of Agricultural Products of China’’, SPB 1988–
2004). The data have previously been used in analyses on
China’s agricultural supply and input demand (Huang and
Rozelle 1996; Huang et al. 1999; World Bank 1997; Jin
et al. 2002; Ma et al. 2004a, b; Rae et al. 2006).
In this paper, we attempt to examine the record of TFP
for a large cross section of China’s most important
2 See Kumbhakar and Lovell (Chap. 7) for a review of recent
approaches to the incorporation of exogenous influences on technical
inefficiency.
194 J Prod Anal (2010) 33:191–207
123

commodities. Because of this and in order to provide
continuity with previous studies that mostly examined
grain crops, we also examine rice, wheat and maize.
Because the characteristics of major types of rice vary so
much across space and over time, we provide separate TFP
analyses for early and late Indica varieties (or long grain
rice) and for Japonica varieties (short/medium grain rice).
We also examine the productivity trends of China’s largest
non-grain staple crop—soybeans and cotton.
The rise of China as a major horticulture producer (and
exporter) and its clear comparative advantage in producing
labor intensive farm commodities have made us include
four vegetables (capsicum; eggplant, cucumbers and
tomatoes) and two fruit crop (mandarin oranges and regular
oranges). Lack of data preclude including any more.
Because cucumbers and tomatoes are grown in large
quantities both in the field and in greenhouses, we examine
TFP separately for these two crops.
The increasing importance of livestock commodities in
China and the prospect for even greater increases demands
that we examine changes in TFP for major livestock
commodities. Therefore, the study examines TFP growth
for hogs, egg, beef cattle and dairy. Because of the radical
differences in the technologies used in China’s backyard,
specialized household and commercial sectors, in the
analysis of TFP in the livestock sector, we examine pro-
ductivity separately for backyard hog production, produc-
tion by specialized households (those raising relatively
large numbers of hogs) and commercial hog producers
(called state and collective-owned farms). We also exam-
ine production of eggs for both specialized household and
commercial producers. The TFP analysis for beef cattle is
focused on aggregate production only since the data on
backyard, specialized household and commercial producers
are not available. Finally, we examine the changes in TFP
of two types of dairy producers—specialized household
milk producers and the commercial producers.
Data for the livestock sector was particularly problem-
atic for a number of reasons. Because of this, we had to
employ a number of assumptions and external pieces of
information to create consistent and empirical sensible data
series at the province level. These adjustments are descri-
bed in detail in ‘‘Appendix 1’’. Adjustments were also
needed for dairy. These are described in ‘‘Appendix 2’’ and
Ma et al. (2006).
While this is an invaluable data set and matches that
needs of the methodology described in the previous sec-
tion, there are several limitations. First, because of China’s
grain-first mentality in the 1980s, coverage of non-grain
crops is extremely spotty in the 1980s. Because of this we
can only produce TFP estimates in the 1980s for rice,
wheat, maize, soybeans and cotton. All of the rest of the
commodities are reported for 1990–2003 or 2004. Second,
because of data availability by province we necessarily had
to use unbalanced panel methods. The list of coverage
(number of provinces and number of years) for each
commodity is in ‘‘Appendix 3’’.
We have to limit our attention to major agricultural
commodities. The major agricultural commodities that are
included in our study still account for more than 63% of
total gross agricultural value (excluding forestry and fish-
ery) during the period of 2000–2005. The share of each
commodity in nation’s total gross agricultural value from
1980 to 2005 is summarized in ‘‘Appendix 4’’. The diffi-
culties of getting data for other commodities prevent us
from including them in the study.
4 Economic forces, structural change and productivity
Three major forces are likely to be affecting the growth of
TFP of China’s major agricultural commodities: a)
investment in R&D through China’s domestic agricultural
research system and the availability through other channel
to new technologies; b) the performance of the agricultural
extension system; and c) other economic forces that will
push farmers into and out of different agricultural com-
modities, methods of production (e.g., in the backyard or in
commercial lots) and technologies (e.g., greenhouses, etc.).
The strength of the various forces (or lack thereof) will
determine if productivity has been enhanced or limited by
increasing or decreasing efficiency or by increasing or
decreasing technical change. The final magnitude of the
growth or contraction of total factor productivity is decided
by the sum of changes in efficiency and changes in tech-
nical change.
4.1 Technology development
After the 1960s, China’s research institutions grew rapidly,
from almost nothing in the 1950s, to a system that now
produces a steady flow of new varieties and other tech-
nologies. China’s farmers used semi-dwarf varieties sev-
eral years before the release of Green Revolution
technology elsewhere. China was the first country to
develop and extend hybrid rice. Chinese-bred conventional
rice varieties, wheat, and sweet potatoes were comparable
to the best in the world in the pre-reform era (Stone 1988).
Agricultural research and plant breeding in China is
almost completely organized by the government (Huang
et al. 2003—the book). Reflecting the urban bias of food
policy, most crop breeding programs have emphasized fine
grains (rice and wheat) until the 1990s. For national food
security consideration, high yields have been major target
of China’s research program except for recent years when
the quality improvement was introduced into the nation’s
J Prod Anal (2010) 33:191–207 195
123

development plan. In recent years, however, there has been
more effort focused on breeding for horticulture and
livestock.
A nationwide reform in research was launched in the
mid-1980s (Pray et al. 1997). The reforms attempted to
increase research productivity by shifting funding from
institutional support to competitive grants, supporting
research useful for economic development, and encourag-
ing applied research institutes to support themselves by
selling the technology they produce. In addition, in the late
1980s and early 1990s, imports of new horticultural seeds,
genetics for improvement of the nation’s livestock inven-
tories (Rae et al. 2006) and new technologies for dairy (Ma
et al. 2006).
After waning for more than a decade (between the early
1980s and mid-1990s—Pray et al. 1997), investment into
R&D finally began to rise. Funding was greatly increased
for plant biotechnology, although only Bt cotton has been
commercialized in a major way (Huang et al. 2002). Since
1995 investment by the government into R&D increased by
5.5% annually between 1995 and 2000 and by more than
15% annually after 2000 (Hu et al. 2007).
4.2 Extension system
If spending on the agricultural research system is best
characterized as a U-shaped curve and is a system that has
had a modicum of success in reform, the extension system
is best considered a long, downward sloping slide and is
characterized by few, if any, major successes. At its peak,
the extension system in China was one of the most effec-
tive in the developing world. A public funded system, there
were extension agents at the county and township level.
From above, they were supported by ties in a provincial
research system which also had experiment stations in
almost every prefecture. From below, communes during
the Socialist era and villages after reform appointed one or
more representatives from the village to be a liaison
between the farmers and the extension system.
After the mid-1980s, however, fiscal pressures at all
levels of government induced local officials to try to
commercialize the extension system. Although there have
been differences over time and across space, in most
localities commercialization was attempted by partially
privatizing the position of extension agent (Park and
Rozelle 1998). In return for working part of their time
doing traditional extension activities, extension agents
were allowed to go into business, most often selling seeds,
fertilizer and pesticides. The profits from their business
activities were supposed to cross subsidize their extension
activities. At the most extension agents found their salaries
reduced by half or more. In many areas, payments were
completely stopped and they were expected to continue to
do their extension duties while at the same time be a
business person.
As might be expected, because of difficulties in moni-
toring and the incentives to spend most or all of their time
on their income earning activities, the extension system
went into a period of near disintegration. Surveys found
that most farmers rarely, if ever, saw extension agents. In
other work, it has been documented that extension agents
were overselling pesticides, and providing farmers with
inaccurate information when the emergence of new tech-
nologies (e.g., Bt cotton seeds) conflicted with their busi-
ness practices (sales of pesticides—Huang et al. 2003). It
has even been documented empirically, that the greater the
extension effort, the lower the productivity (Jin et al.
2002). A recent survey of dairy, livestock and horticulture
farmers found that there was little if any support for these
activities from the formal extension system (which is still
staffed with agronomists trained during the grain-first years
of China’s agricultural policy).
4.3 Other forces
There are other economic forces that should be expected
to affect the nation’s productivity. First, and above, all
since the structural adjustment policies and the accelera-
tion of China’s growth in the late 1990s, there has been a
veritable tidal wave of change. China’s agricultural
economy has steadily been remaking itself from a grain-
first sector to one producing higher valued cash crops,
horticultural goods and livestock/aquaculture products. In
the early reform period, output growth—driven by
increases in yields—was experienced in all subsectors of
agriculture, including grains. For example, between 1978
and 1984, grain production, in general, increased by 4.7%
per year. Production rose for each of the major grains—
rice, wheat and maize. However, after the mid-1990s,
with the exception of maize that is now almost exclu-
sively used for feed, rice and wheat sown area and pro-
duction have fallen. Although this may concern old-time
grain fundamentalist inside China, in fact, the fall in
supply of grain has been led by the collapse in demand,
as rising incomes in urban and rural areas, migration and
marketization has pushed people away from grains into
alternative crops.
Like the grain sector, cash crops, in general, and specific
crops, such as cotton, edible oils and vegetables and fruit,
also grew rapidly in the early reform period when com-
pared to the 1970s. Unlike grain (with the exception of
land-intensive staples, such as cotton), the growth of the
non-grain sector continued throughout the reform era.
Moreover, the rise in some sectors has been so fast that it
almost defies description. For example, between 1990 and
2004 the increase in vegetable production capacity has
196 J Prod Anal (2010) 33:191–207
123
been so fast that China as a nation is adding the equivalent
of the production capacity of California (the world’s most
productive vegetable basket) every 2 years. When com-
pared on the basis of the share of cultivated area dedicated
to fruit orchards, the share in China (over 5%) is more than
double the share of the next closest major agricultural
nation (including the US, the EU, Japan, India). China
today can more closely be said to following ‘‘taking
cucumbers and oranges as the key link’’ than being a grain-
first agriculture as in the Socialist era.
China also is moving rapidly away from a cropping
agricultural mentality. The rise of livestock and fishery
sectors outpaces the cropping sector, in general, and most
of the subcategories of cropping. Livestock production rose
9.1% per year in the early reform period and has continued
to grow at between 4.5 and 8.8% per year since 1985. The
fisheries subsector is the fastest growing component of
agriculture, rising more than 10% per year in 1985–2000.
Today, more than 70% of the world’s fresh water aqua-
culture is produced in China. And, the rapid and continuous
rise in livestock and fisheries has steadily eroded the pre-
dominance of cropping. After remaining fairly static during
the Socialist era, the share of agriculture contributed by
cropping fell from 76 to 51% between 1980 and 2005. At
the same time, the combined share of livestock and fish-
eries rose to 45%, more than doubling their 1980 share
(only 20%). It is projected that by 2008, cropping will
account for less than 50% of agricultural output in China.
Dairy demand is also rising extremely rapidly (Fuller et al.
2006).
Simultaneous with these changes, China has also expe-
rienced an explosion of market-oriented activities (Rozelle
et al. 2000). While the policies were gradual, throughout
the 1980s and 1990s, the role of the state in China’s mar-
kets has diminished. In its place there has been a rise of
private traders and wholesale markets staffed by private
traders that today has given China one of the most efficient
sets of markets in the world (Huang et al. 2004). Com-
petitive markets also have been documented for the
emerging horticultural sector (Wang et al. 2006). Dairy,
livestock and other commodities also are characterized by
competitive markets.
4.4 Expected effects on TFP
Exante it is difficult to assess how China’s investment into
agricultural R&D and other shifts in policies affecting the
availability of technology; changes in the extension system
and other economic forces have affected total factor pro-
ductivity. The effect of any one of these forces depends on
the direction of the change and its magnitude. Unfortu-
nately, it is difficult to quantify these forces and formally
decompose the change in TFP into its component sources.
Additional complexity is added because some of the
changes will affect efficiency and others will affect tech-
nical change.
However, stepping back there are some forces for which
we have a fairly good intuitive idea about the direction of
the impact. For example, the deterioration of the extension
system almost certainly will have had a negative effect on
TFP and would mainly affect the efficiency of farming by
not teaching farmers how to use the newly available
technologies. In contrast, the new regulations for the
importation of genetics, horticultural varieties and dairy
technology and the rise of markets that make these avail-
able to farmers should promote TFP through the rise of
technical change.
However, the effect of other forces is more difficult to
predict. Will the falling R&D investment in the 1980s and
1990s show up as falling technical change (especially in
the case of grains)? Will the continued restrictions on the
investment into agricultural R&D for the major grains limit
the pace of technical change? At the same time, better
incentives through research reform and better scientific
inputs should raise TFP through its positive influence on
technical change. Hence, for agricultural R&D, in partic-
ular, and for the effect of all economic forces, in general,
the final word on how the health of the agricultural econ-
omy has fared is an empirical one.
5 Inputs, outputs and productivity: before 1995
After the extremely fast growth in output and fall in inputs
(mostly labor that shifted to sidelines and other off farm
activities) that was documented in early 1980s during the
implementation of the Household Responsibility System
(McMillan et al. 1989; Lin 1992), leaders became con-
cerned with the pace of the growth of output during the
subsequent decade. In fact, our data contain traces of evi-
dence that the concerns were justified in the case of some
crops but not others. Figure 1 demonstrates that between
1985 and 1994 the growth rate of output of early and late
indica rice, japonica and soybeans fell to below 2% (top
panel). The growth of early indica rice was almost zero.
While zero growth rates are not always bad from a pro-
ductivity point of view (since inputs could be falling fas-
ter), in the case of these four crops, inputs actually rose
faster, at an annual rate ranging from 1.7 to 4.0%. At least
for these crops, it is clear why officials were concerned
about productivity.
However, in the case of other staple grain crops—wheat
and maize—there is less room for concern. Although in no
way close to the rates of increase that were enjoyed before
1985, between 1985 and 1994 output for wheat and maize
rose, respectively to 2.8 and 3.7% annually. During this
J Prod Anal (2010) 33:191–207 197
123

time inputs for these two crops rose, albeit at a slower rate
(on average—for the three crops—about 2%).
While data are less available for crops beyond grain and
soybeans before the mid-1990s, the record of output and
input trends also is mixed (Tables 1, 2; columns 1 and 2).
The seriousness of nearly uncontrollable outbreaks of
cotton pests can be seen through the fall of output (-0.49%
annually) and sharp rises in inputs (more than 4%, mostly
for labor and materials for pest control). The growth rate of
input used in hog production also rose faster than output.
Therefore, the concerns that the output to input mix in
agriculture extended beyond traditional stable crops at least
had some basis. The case of beef, however, shows that
output was still rising much faster than inputs in other
sectors.
5.1 TFP performance before 1995
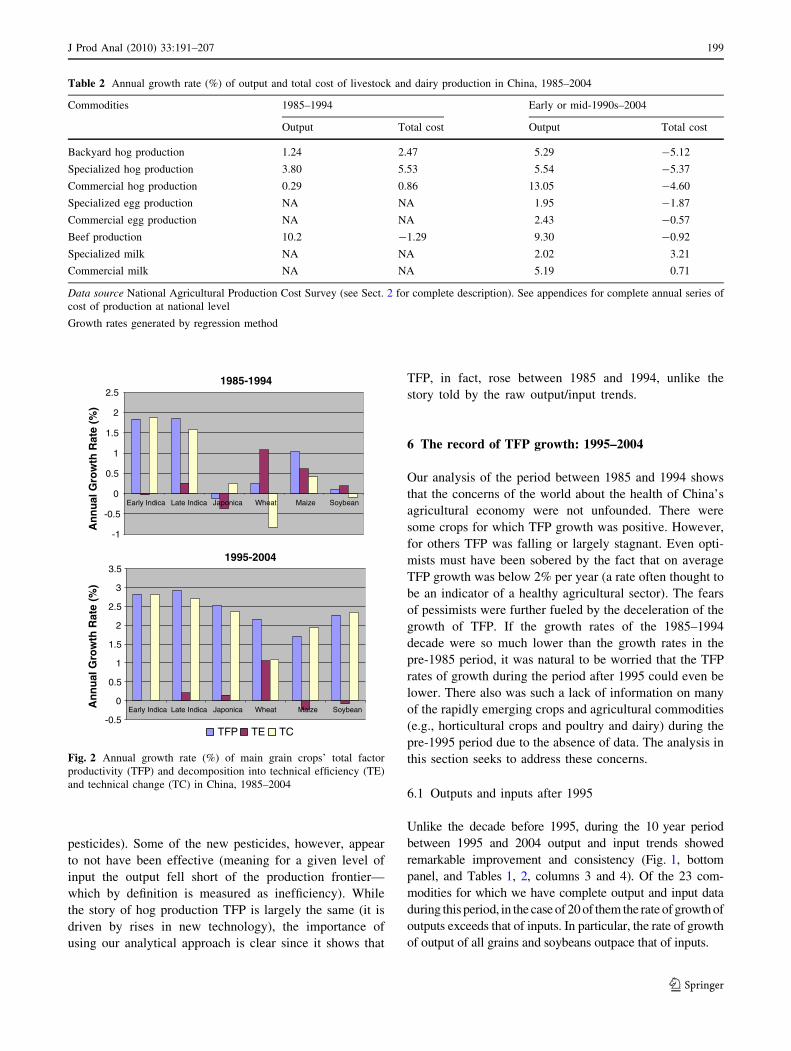
Total factor productivity analysis demonstrates that, while
the concern for low TFP growth in China during the 1985–
1994 decade is real, reliance on output and input trends can
sometimes be somewhat misleading (Fig. 2, top panel).
Perhaps due to smoothing across years (the output and
input growth rates were generated by using linear trends in
the input and output series) using our methodology for
analyzing TFP, early and late indica rice and soybeans, in
fact, show a modest rate of gain of TFP during the late
1980s and early 1990s (about 1.8% annually, on average).
Wheat and maize are also positive (although the increase is
small). In contrast, japonica rice registered a fall in TFP
between 1985 and 1994 (-0.12% annually).
The sources of growth—which can also not be identified
using descriptive statistics and trend analysis—also vary
among the crops. Positive technological change accounted
for almost all the TFP rises for early and late indica rice
and contributed about half of the rise of maize TFP. In
contrast, some or all of the modest rises in TFP for wheat,
maize and soybeans can be accounted for by increased
efficiencies. While we can not identify the exact reason
why there was a measured rise in the efficiency of pro-
duction, these rates of increase are consistent with the
measurements of deBrauw et al. (2004) which shows that
the gradual liberalization of China’s grain markets after
1985 generated efficiency gains for producers.
The record is mixed for non-grain crops (Tables 3, 4).
The fall in cotton TFP (Row 1, columns 1–3, Table 3)
shows that China’s cotton production sector was indeed in
danger of becoming uncompetitive during the 1985–1994
decade (as described in Qiao et al. 2006). Although the
research system helped stem the fall by producing some
new conventional cotton varieties, the efficiency of pro-
duction fell (likely due to the uncontrolled rise in the
large volume of pesticides that appeared on the market to
control the emergence of the cotton bollworm population
that was becoming increasingly resistant to conventional
1985-1994
0
0.5
1
1.5
2
2.5
3
3.5
4
4.5A
nn
ual
Gro
wth
Rat
e (%
)
1995-2004
-2.5
-2
-1.5
-1
-0.5
0
0.5
1
1.5
2
Early Indica Late Indica Japonica Wheat Maize Soybean
Early Indica Late Indica Japonica Wheat Maize Soybean
An
nu
al G
row
th R
ate
(%)
output input
Fig. 1 Annual growth rate (%) of yield and total cost of main grain
crops in China, 1985–2004. Data source National Agricultural
Production Cost Survey (see Sect. 2 for complete description). See
appendices for complete annual series of cost of production at
national level. Growth rates generated by regression method
Table 1 Annual growth rate (%) of yield and total cost of cash crops
(cotton and horticultural crops) in China, 1985–2004
Crop 1985–1994 1995–2004
Output Total cost Output Total cost
Cotton -0.49 4.60 2.68 -1.90
Horticultural crops
Capsicum NA NA 2.87 2.22
Eggplant NA NA 1.47 2.90
Field cucumber NA NA -0.40 -1.79
Field tomato NA NA 1.36 1.94
Greenhouse cucumber NA NA 1.11 0.60
Greenhouse tomato NA NA 2.95 1.50
Mandarin orange NA NA 1.30 0.13
Orange NA NA -1.77 0.30
Data source National Agricultural Production Cost Survey (see Sect.
2 for complete description). See appendices for complete annual
series of cost of production at national level
Growth rates generated by regression method
198 J Prod Anal (2010) 33:191–207
123
pesticides). Some of the new pesticides, however, appear
to not have been effective (meaning for a given level of
input the output fell short of the production frontier—
which by definition is measured as inefficiency). While
the story of hog production TFP is largely the same (it is
driven by rises in new technology), the importance of
using our analytical approach is clear since it shows that
TFP, in fact, rose between 1985 and 1994, unlike the
story told by the raw output/input trends.
6 The record of TFP growth: 1995–2004
Our analysis of the period between 1985 and 1994 shows
that the concerns of the world about the health of China’s
agricultural economy were not unfounded. There were
some crops for which TFP growth was positive. However,
for others TFP was falling or largely stagnant. Even opti-
mists must have been sobered by the fact that on average
TFP growth was below 2% per year (a rate often thought to
be an indicator of a healthy agricultural sector). The fears
of pessimists were further fueled by the deceleration of the
growth of TFP. If the growth rates of the 1985–1994
decade were so much lower than the growth rates in the
pre-1985 period, it was natural to be worried that the TFP
rates of growth during the period after 1995 could even be
lower. There also was such a lack of information on many
of the rapidly emerging crops and agricultural commodities
(e.g., horticultural crops and poultry and dairy) during the
pre-1995 period due to the absence of data. The analysis in
this section seeks to address these concerns.
6.1 Outputs and inputs after 1995
Unlike the decade before 1995, during the 10 year period
between 1995 and 2004 output and input trends showed
remarkable improvement and consistency (Fig. 1, bottom
panel, and Tables 1, 2, columns 3 and 4). Of the 23 com-
modities for which we have complete output and input data
during this period, in the case of 20 of them the rate of growth of
outputs exceeds that of inputs. In particular, the rate of growth
of output of all grains and soybeans outpace that of inputs.
Table 2 Annual growth rate (%) of output and total cost of livestock and dairy production in China, 1985–2004
Commodities 1985–1994 Early or mid-1990s–2004
Output Total cost Output Total cost
Backyard hog production 1.24 2.47 5.29 -5.12
Specialized hog production 3.80 5.53 5.54 -5.37
Commercial hog production 0.29 0.86 13.05 -4.60
Specialized egg production NA NA 1.95 -1.87
Commercial egg production NA NA 2.43 -0.57
Beef production 10.2 -1.29 9.30 -0.92
Specialized milk NA NA 2.02 3.21
Commercial milk NA NA 5.19 0.71
Data source National Agricultural Production Cost Survey (see Sect. 2 for complete description). See appendices for complete annual series of
cost of production at national level
Growth rates generated by regression method
1985-1994
-1
-0.5
0
0.5
1
1.5
2
2.5
An
nu
al G
row
th R
ate
(%)
1995-2004
-0.5
0
0.5
1
1.5
2
2.5
3
3.5
Early Indica Late Indica Japonica Wheat Maize Soybean
Early Indica Late Indica Japonica Wheat Maize SoybeanAn
nu
al G
row
th R
ate
(%)
TFP TE TC
Fig. 2 Annual growth rate (%) of main grain crops’ total factor
productivity (TFP) and decomposition into technical efficiency (TE)
and technical change (TC) in China, 1985–2004
J Prod Anal (2010) 33:191–207 199
123

There are also positive signs of a healthy agriculture
outside the conventional grain economy. The recovery of
China’s cotton industry is shown by the remarkable turn
around in annual output (?2.68%) and input (-1.90%)
trends. No doubt the widespread emergence of Bt cot-
ton—which allowed farmers to dramatically reduce pes-
ticide use (and labor for spraying) while increasing
yields—is a large part of the story. In the case of live-
stock, except for the specialized milk sector (that is
mostly made up of large commercial dairies), the annual
rate of rise of output of all commodities is greater than
that of inputs.
Only in the horticultural sector is the record more
mixed. The growth rate of output of five of the horticultural
crops (capsicum; field cucumbers; greenhouse cucumbers;
greenhouse tomatoes; and mandarin oranges) exceeds the
growth rate of inputs. However, the opposite is true for
eggplant, field tomatoes and conventional oranges. The fact
that growth rate is greater for greenhouse tomatoes, and
other greenhouse vegetables, than for field tomatoes and
vegetables might be due to the more efficient and com-
mercial farmers adopting greenhouses.
6.2 TFP and its sources, 1995–2004
The TFP analysis after 1995 tells an even more positive
story in general about the health of China’s agriculture than
the output and input trends and demonstrates a sharp
resurgence when compared to the 1985–1994 decade
(Fig. 2, bottom panel, and Tables 3, 4, columns 4–6).
Using the stochastic production frontier methods (descri-
bed above—and used in the previous section), the rate of
TFP growth for all 23 commodities—including grains,
soybean, cotton, horticultural crops and livestock com-
modities—were all positive. Moreover, with the exception
of maize (1.10%), capsicum (1.86%), specialized milk
producing households (0.48%) and commercial dairies
(1.31%), the annual growth rate of all commodities were in
excess of 2%. In fact, using the value of output as rough
weights and aggregating across all of the included com-
modities, the overall annual TFP growth rate of China’s
agriculture between 1995 and 2004 exceed 3%. When
averaged with the growth rates during the 1978–1984
period and 1985–1995 period, between 1978 and 2004,
China’s agricultural TFP growth rate is likely to have been
Table 3 Annual growth (%) of
cash crops’ (cotton and
horticultural crops) total factor
productivity (TFP) and
decomposition of TFP into
technical efficiency (TE) and
technical change (TC) in China,
1985–2004
Growth rate (1980s–1990s) Growth rate (1990/1991–2003)
TFP TE TC TFP TE TC
Cotton -0.34 -2.54 2.21 4.16 -3.47 7.63
Horticultural crops
Capsicum NA NA NA 1.86 -0.42 2.28
Eggplant NA NA NA 2.24 -3.14 5.37
Field cucumber NA NA NA 5.15 -1.27 6.42
Field tomato NA NA NA 3.23 -0.50 3.73
Greenhouse cucumber NA NA NA 5.86 0.62 5.24
Greenhouse tomato NA NA NA 4.02 -2.43 6.45
Mandarin orange NA NA NA 2.33 -2.19 4.52
Orange NA NA NA 4.31 -3.20 7.50
Table 4 Annual growth (%) of
livestock and dairy products’
total factor productivity (TFP)
and decomposition into
technical efficiency (TE) and
technical change (TC) in China,
1985–2004
Products Growth rate (1980s–1990s) Growth rate (1990/1991–2003)
TFP TE TC TFP TE TC
Backyard hog production 4.80 1.26 3.54 3.72 1.01 2.72
Specialized hog production 5.58 -0.14 5.72 5.35 -0.72 6.07
Commercial hog production 5.67 0.09 5.58 4.40 -0.38 4.78
Specialized egg production NA NA NA 3.78 0.32 3.46
Commercial egg production NA NA NA 4.83 1.44 3.39
Beef production NA NA NA 4.41 0.01 4.40
Specialized milk NA NA NA 0.48 -6.09 6.58
Commercial milk NA NA NA 1.31 -3.26 4.57
200 J Prod Anal (2010) 33:191–207
123
in excess of 3% annually, a rate that is remarkable for any
country for such an extended period of time (Jin et al.
2002).
6.2.1 Rising technical change
The results also are consistent between the 1980s/early
1990s and late 1990s/2000s with regards to the sources of
growth; technical change is driving the rise in productivity
and is the foundation of the health of China’s economy.
When examining the source of grain and soybean TFP
change (Fig. 2, bottom panel), technical change accounts
for nearly all the rise for all crops except wheat (which
accounts for half of TFP; while efficiency accounts for the
other half). This finding is consistent with the findings of
Jin et al. (2002) that found during the pre-1995 period, all
of the positive change in TFP between the early 1980s and
mid-1990s could be attributed to technological change.
While we can not identify the exact source of technical
change, the findings are consistent with the findings
reported in Jin et al. (2002) that the new varieties that
China’s breeders were producing in the nation’s breeding
program during the 1980s (which were shown to have
greater yield potential, among other new traits) were
making their way into the fields of farmers.
The rise of technical change-based TFP growth in cotton
and horticultural crops after 1995 (Table 3, columns 4–6)
not only shows the effectiveness of China’s domestic
breeding programs (especially in the case of Bt cotton from
the Chinese Academy of Agricultural Sciences), it also
suggests that opening China to the import of new varieties
from outside of China is an effective way to improve
technology and TFP. Because China’s officials allowed
foreign varieties of Bt cotton to be commercialized,
farmers have benefited from having access to a produc-
tivity-increasing, foreign-produced technology (Huang
et al. 2002).3 Our interviews in the horticultural industry
likewise suggest that the large share of the measured rise in
TFP that is due to technical change is from new varieties
that were allowed to be imported from abroad. Since the
early 1990s, horticultural seed industry traders told us that
they faced few barriers in importing horticultural seed from
Europe, Japan or the United States. During our household
interviews during two large household surveys of vegetable
traders in 2005 and 2006 we found that more than half of
the varieties of horticultural crops had names that were
clearly foreign in origin. Farmers told us that the varieties
were both higher yielding and produced higher quality
fruits and vegetables.
Imported technology and rising research effort into
livestock between 1995 and 2004 also is likely to be behind
the rapid rise of technical change-based TFP in the live-
stock sector (Table 4, columns 4–6). During the 1990s
China encouraged the importation of large amounts of new
genetic material for the hog, beef, poultry and dairy
industries. Discussions with officials—from both inside
and outside of China—suggest that new hog varieties from
the US and Japan; new beef and dairy cattle genetics from
Canada, New Zealand and Australia; and poultry technol-
ogy from around the world, including the US, have greatly
increased the genetic quality of China’s livestock industry.
Apparently these new innovations have penetrated into
China’s villages and fledgling commercial sectors as
technical change is shown to have risen sharply.
6.2.2 Falling efficiency
But while the results are consistent with the positive effect
of rising access to new technologies and improved genet-
ics, they also expose some serious weaknesses in China’s
agriculture. In the case of more than half of our study’s
commodities (14 of 23), TFP would have been higher had
not producers become less efficient during the study period,
1995–2004. In the case of maize, soybean, cotton, seven of
the eight horticultural crops (all but greenhouse cucum-
bers) and half of the livestock commodities (specialized
and commercial hog producers; and specialized and com-
mercial dairies), producers were less efficient in 2004 than
they were in 1995.
While the analysis can not identify the precise source of
the fall in efficiency, we believe that there are two sour-
ces—one that may not be addressable by policy; the other
which may be. It is interesting to note that perhaps with the
exception of soybeans, all of the crops that have suffered
falls in efficiency are those that have experienced rapid
expansion since 1995. Maize, almost all horticultural crops
and the specialized and commercial segments of the live-
stock industries have all grown much faster than the gross
value of agricultural output in general; in other words, their
share in the economy is expanding. Therefore, one perhaps
unavoidable source of rising inefficiency is due to the
expected disequilibrium that accompanies the rapid
expansion of any crop (or other industrial product). New
producers are adopting new crops and they require time to
learn how to produce the crop and market it effectively. As
expansion occurs for crops, often times the new cultivated
area is displacing cultivated area of other crops and the new
area may be relatively less favorable. This would, of
course, lead to a fall in the measured efficiency of the
3 As we explain in Huang et al. (2002), Bt cotton varieties are being
created and commercialized by both foreign companies and China’s
own domestic company, an enterprise with ties to the Chinese
Academy of Agricultural Sciences.
J Prod Anal (2010) 33:191–207 201
123

sector. Hence, some of this fall is perhaps unavoidable and
will continue as long as the share of the crop is expanding.
However, it is likely that another part of the fall in
efficiency that is avoidable is occurring due to the deteri-
oration of the extension system. As discussed above, Chi-
na’s extension system has steadily eroded during the
reform era, and a part of this has occurred after 1995.
Especially given three factors—the nature of China’s
farming sector (which is almost all made up of extremely
small farms (CNBS 2005); the absence of cooperation
(Shen et al. 2006); and the rapid rise of technology (which,
as discussed immediately above, is responsible for the rise
in China’s TFP)—the nation needs a strong extension
system. Yet, at the very time extension services are needed,
they are disappearing. Therefore, it is perhaps unsurprising
that in 14 of the 23 commodities production is becoming
more inefficient and in all of the rest the contribution of
efficiency is zero or far below the contribution of technical
change.
7 Conclusions
Our findings in this paper about the record of TFP growth
in China are remarkably consistent—especially after 1995
(the main focus of our paper). Our analysis shows that
China’s agricultural TFP has grown at a healthy rate for all
23 commodities. TFP growth for the staple commodities
generally rose around 2% annually; TFP growth for most
horticulture and livestock commodities was even higher
(between 3 and 5%). This rise in TFP is high by both
historic and international standards and demonstrates the
healthiness of China’s economy.
Equally consistent, we find that most of the change is
accounted for by technical change. The analysis is con-
sistent with the conclusion that new technologies have
pushed out the production functions, since technical change
accounts for most of the rise in TFP. In the case of many of
the commodities, however, the efficiency of producers—
that is, the average distance of producers from the pro-
duction frontier—has fallen. In other words, China’s TFP
growth would have been even higher had the efficiency of
production not eroded the gains of technical change.
Although we do not pinpoint the source of rising inef-
ficiency, the results are consistent with a story that there is
considerable disequilibrium in the farm economy during
this period of rapid structural change. Hence, our paper,
more than anything, establishes a basis for China’s (and
international) leaders and policy makers who are commit-
ted to keeping a strong agricultural supply capacity to
confidently invest in the nation’s agricultural research
system and to open up trade channels to allow for the
importation of new technologies. The basis for doing so
primarily rest on the importance that technology and the
institutions that create, import and spread it has had on TFP
in the past. TFP has continued to rise after 1995 primarily
due to past contributions of technology.
However, our analysis also identified a possible weak-
ness in China’s agriculture. Although part of the measured
fall in efficiency in many of the crops may be due to the
disequilibrium that may naturally occur during the expan-
sion phase of a crop, it also is clear that farmers are getting
little help in making these adjustments from the extension
system. If anything (due to the rise in importance of new
technology), it is a time that China’s extension system
should be built up. Many factors—fiscal; administrative;
etc.—are behind the deterioration of China’s extension
system. One of the biggest challenges for China’s officials,
of course, is to combat this fall. If they can do this,
recapturing the recent fall in efficiency it could be another
source of productivity rise in the coming years.
Acknowledgments Financial support from the European Commu-
nity (Contract No. 044255, SSPE) is greatly acknowledged.
Appendix 1: Details on the data used for the livestock
TFP analysis
An ongoing problem for the study of livestock productivity
in China is obtaining accurate data. The majority of studies
of Chinese agricultural productivity have used data pub-
lished in China’s statistical yearbook. While this source
disaggregates gross value of agricultural output into crops,
animal husbandry, forestry, fishing and sideline activities,
input use is not disaggregated by sector. A major
improvement we introduce is to utilize additional data
collected at the farm level that will allow the construction
of time-series of input use by the livestock farm type. A
further problem with livestock data from the statistical
yearbooks is the apparent over-reporting of both livestock
product output and livestock numbers (Fuller, Hayes and
Smith, ERS). This problem also needs to be addressed if
the possibility of biased livestock productivity estimates is
to be avoided.
We specify four inputs to livestock production—breed-
ing animal inventories, labor, feed and non-livestock cap-
ital. We describe below the construction of data series for
these livestock production inputs, as well as our approach
to overcoming the over-reporting of animal numbers and
outputs.
Livestock commodity outputs
Concerns over the accuracy of official published livestock
data include an increasing discrepancy over time between
202 J Prod Anal (2010) 33:191–207
123

supply and consumption figures and a lack of consistency
between livestock output data and that on feed availability.
Ma et al. (2004a, b—henceforth MHR) have provided
adjusted series for livestock production (and consumption)
that are internally consistent by recognizing that the pub-
lished data do contain valid, albeit somewhat distorted
information. In order to adjust the published series, new
information from several sources is introduced. Specifi-
cally, MHR use the 1997 national census of agriculture as a
baseline to provide an accurate estimate of the size of
China’s livestock economy in at least one time period. The
census is assumed to provide the most accurate measure of
the livestock economy since it covers all rural households
and non-household agricultural enterprises. The census
also collected information on the number of slaughterings
(by type) during the 1996 calendar year. A second source
of additional information is the official annual survey of
rural household income and expenditure (HIES) that is run
by the China National Bureau of Statistics (CNBS).
Information collected in that survey includes the number of
livestock slaughtered and the quantity of meat produced for
swine, poultry, beef cattle, sheep and goats, and eggs.
MHR assumes the production data as published in the
statistical yearbook to be accurate from 1980 to 1986.
Beyond this date, that data are adjusted to both reflect the
annual variation as found in the HIES data and to agree
with the Census data for 1996. Further details of the
adjustment procedure can be found in MHR. The adjusted
series includes provincial data on livestock production,
inventories and slaughterings.
Animals as capital inputs
Following Jarvis we recognize the inventory of breeding
animals as a major capital input to livestock production.
Thus opening inventories of sows, milking cows, laying
hens and female yellow cattle are used as capital inputs in
the production functions for pork, milk, eggs and beef,
respectively. Provincial inventory data for sows, milking
cows and female yellow cattle are taken from official
sources and adjusted for possible over-reporting as
described above.
Additional problems exist with poultry inventories.
China’s yearbooks and other statistical publications contain
poultry inventories aggregated over both layers and broil-
ers. No official statistical sources publish separate data for
layers. Ma et al. (2004a, b), however, provide adjusted data
on egg production, and the State Development Planning
Commission’s agricultural commodity cost and return
survey provided estimates of egg yields per hundred birds.
Thus layer inventories, at both the national and provincial
levels, are calculated by dividing output by yield.4 A
simple test shows that the sum across provinces of our
provincial layer inventories is close to our estimate of the
national layer inventory in each year.5
Feed, labor and non-livestock capital inputs
Provincial data for these production inputs are obtained
directly from the Agricultural Commodity Cost and Return
Survey.6 Thought to be the most comprehensive source of
information for agricultural production in China, the data
have been used in many other studies (e.g., Huang and
Rozelle 1996; Jin et al. 2002). Within each province a
three-stage random sampling procedure is used to select
sample counties, villages and finally individual production
units. Samples are stratified by income levels at each stage.
The cost and return data collected from individual farms
(including traditional backyard households, specialized
households, state- and collective-owned farms and other
larger commercial operations) are aggregated to the pro-
vincial and national level datasets that are published by the
State Development Planning Commission.
The survey provides detailed cost items for all major
animal commodities, including those covered in this paper.
These data included labor inputs (days), feed consumption
(grain equivalent) and fixed asset depreciation on a ‘per
animal unit’ basis. We deflate the depreciation data using a
fixed asset price index. We calculate total feed, labor and
non-livestock capital inputs by multiplying the input per
animal by animal numbers. For the latter, we use our
slaughter numbers for hogs and beef cattle, and the opening
inventories for milking cows and layers since these are the
‘animal units’ used in the cost survey. It is clear that this
procedure, necessitated by the available data, excludes
some input usage, such as that by other animal categories
within the pig and cattle herds.
Livestock production structures
China’s livestock sector is experiencing a rapid evolution
in production structure, with potentially large performance
differences across farm types. For example, traditional
4 The cost and return survey did not contain egg yields for every
province for each of the past 15 years. Provincial trend regressions
were used to estimate yields in such cases.5 Data on inventories of breeding broilers are available only from
1998, and we could not discover any way of deriving earlier data from
the available poultry statistics. This severely limited our ability to
analyze productivity developments in this sector.6 This survey is conducted through a joint effort of the State
Development Planning Commission, the State Economic and Trade
Commission, the Ministry of Agriculture, the State Forestry Admin-
istration, the State Light Industry Administration, the State Tobacco
Administration and the State Supply and Marketing Incorporation.
J Prod Anal (2010) 33:191–207 203
123

backyard producers utilize readily available low-cost
feedstuffs, while specialized households and commercial
enterprises feed more grain and protein meal. The trend
from traditional backyard to specialized household and
commercial enterprises in livestock production systems
therefore implies an increasing demand for grain feed
(Fuller et al. 2002). To estimate productivity growth by
farm type, our data must be disaggregated to that level.
This is not a problem for the feed, labor and non-livestock
capital variables, since they are recorded by production
structure in the cost surveys. However, complete data
series on livestock output and animal inventories by farm
type do not exist.
Our approach to generating output data by farm type is
to first construct provincial ‘share sheets’ that contained
time series data on the share of animal inventories (dairy
cows and layers) and slaughterings (hogs) by each farm
category (backyard, specialized and commercial).7 Inven-
tories of sows by farm type are then generated by multi-
plying the aggregate totals (see earlier section) by the
relevant farm-type hog slaughter share. We note that this
assumes a constant slaughterings-to-inventory share across
farm types for hog production, and therefore assumes away
a possible cause of productivity differences in this
dimension across farm types. However, it proved impos-
sible to gather further data to address this concern.
To disaggregate our adjusted livestock output data by
farm type, it is important to take into account yield dif-
ferences across production structures. From the cost sur-
veys we obtained provincial time-series data on average
production levels per animal (eggs per layer, milk per cow
and mean slaughter liveweights for hogs). Such informa-
tion is then combined with the farm-type data on cow and
layer inventories and hog slaughterings to produce total
output estimates by farm type that were subject to further
adjustment so as to be consistent with the aggregate
adjusted output data.
Information that allows us to estimate the inventory and
slaughter shares by farm type and by province over time
comes from a wide variety of sources. These include the
1997 China Agricultural Census, China’s Livestock Sta-
tistics, a range of published materials (such as annual
reports, authority speeches and specific livestock surveys)
from various published sources, and provincial statistical
websites. The census publications provide an accurate
picture of the livestock production structure in 1996
(Somwaru et al. 2003). However, the census defines
just two types of livestock farms—rural households and
agricultural enterprises (including state- and collective-
owned farms). We interpret the latter as ‘commercial’
units, but additional information is used to disaggregate the
rural households into backyard and specialized units.
Agricultural statistical yearbooks and China’s Livestock
Statistics provide data on livestock production structure
during the early 1980s, when backyard production and state
farms were prevalent. These sources, plus the Animal
Husbandry Yearbooks and provincial statistical websites
also provide estimates of livestock shares for various
livestock types, provinces and years. When all these data
are combined with 1996 values from the census, many
missing values still existed. On the assumption that
declining backyard production and increasing shares of
specialized and commercial operations are gradual pro-
cesses that evolved over the study period, linear interpo-
lations are made to estimate a number of missing values.
Appendix 2: Details on the data used for the dairy
sector TFP analysis
Since dairy sector official statistics face the same over-
reporting problem as described in ‘‘Appendix 1’’ and the
data adjustments for dairy sector were not included in Ma
et al. (2004a, b), we have to adjust data on milk output and
dairy cattle inventories before estimating dairy sector TFP.
To maintain the consistency with the livestock commodi-
ties, we use a similar approach to adjust milk output and
the dairy cattle numbers. In order to adjust the published
series, new information from several sources is introduced.
First, the 1997 national census of agriculture is used as a
baseline to provide an accurate estimate of the size of
China’s dairy sector economy in at least one time period.
As described in Ma et al. (2004a, b), the census is assumed
to provide the most accurate measure of dairy cattle
inventory in 1996 since it covers all rural households and
non-household agricultural enterprises.
Second, we also used the official annual survey of rural
household income and expenditure (HIES) that is run by
the China National Bureau of Statistics (CNBS). Informa-
tion collected in that survey includes the numbers of cow
milk output.
We also assume that the dairy cattle numbers and milk
output data as published in the statistical yearbook are
accurate from 1980 to 1986. Beyond this date, we assume
that the data are adjusted to both reflect the annual varia-
tion as found in the HIES data and to agree with the Census
data for 1996.
The adjustment procedure for dairy sector production
data is the same as described in Ma et al. (2004a, b). The
adjusted series includes provincial data on dairy cattle
inventory and milk output.
7 We did not disaggregate beef data by farm type, since the cost
survey presented beef information for just a single category—rural
households.
204 J Prod Anal (2010) 33:191–207
123
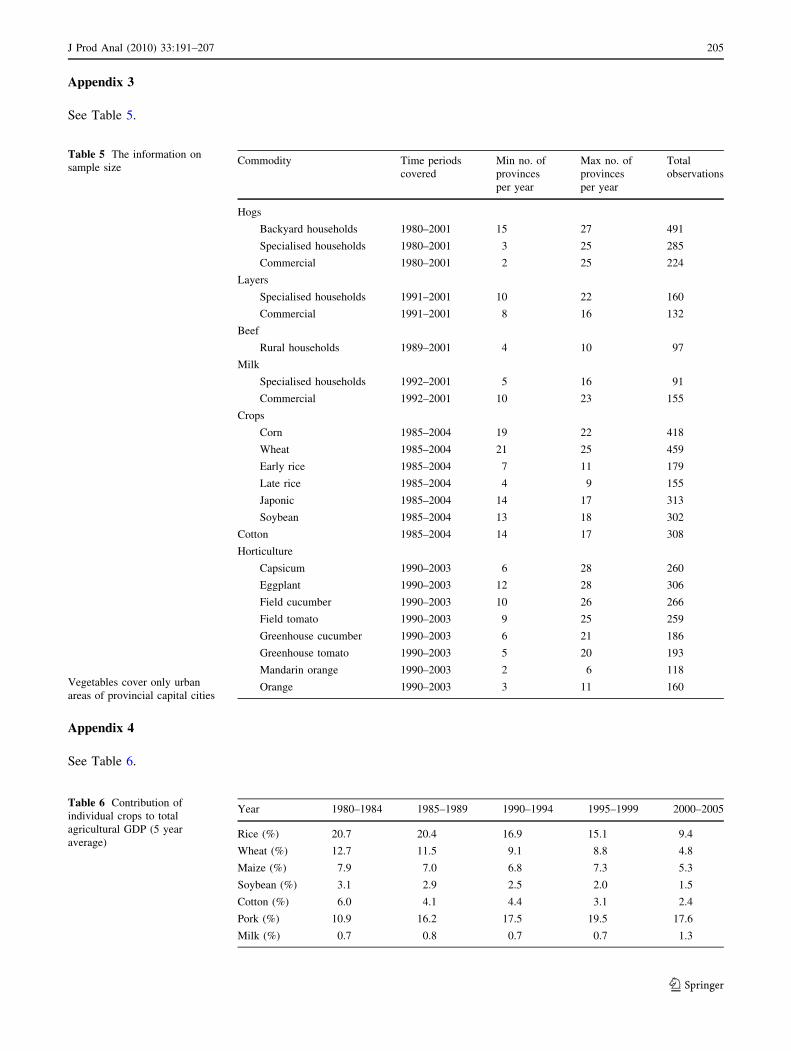
Appendix 3
See Table 5.
Appendix 4
See Table 6.
Table 5 The information on
sample size
Vegetables cover only urban
areas of provincial capital cities
Commodity Time periods
covered
Min no. of
provinces
per year
Max no. of
provinces
per year
Total
observations
Hogs
Backyard households 1980–2001 15 27 491
Specialised households 1980–2001 3 25 285
Commercial 1980–2001 2 25 224
Layers
Specialised households 1991–2001 10 22 160
Commercial 1991–2001 8 16 132
Beef
Rural households 1989–2001 4 10 97
Milk
Specialised households 1992–2001 5 16 91
Commercial 1992–2001 10 23 155
Crops
Corn 1985–2004 19 22 418
Wheat 1985–2004 21 25 459
Early rice 1985–2004 7 11 179
Late rice 1985–2004 4 9 155
Japonic 1985–2004 14 17 313
Soybean 1985–2004 13 18 302
Cotton 1985–2004 14 17 308
Horticulture
Capsicum 1990–2003 6 28 260
Eggplant 1990–2003 12 28 306
Field cucumber 1990–2003 10 26 266
Field tomato 1990–2003 9 25 259
Greenhouse cucumber 1990–2003 6 21 186
Greenhouse tomato 1990–2003 5 20 193
Mandarin orange 1990–2003 2 6 118
Orange 1990–2003 3 11 160
Table 6 Contribution of
individual crops to total
agricultural GDP (5 year
average)
Year 1980–1984 1985–1989 1990–1994 1995–1999 2000–2005
Rice (%) 20.7 20.4 16.9 15.1 9.4
Wheat (%) 12.7 11.5 9.1 8.8 4.8
Maize (%) 7.9 7.0 6.8 7.3 5.3
Soybean (%) 3.1 2.9 2.5 2.0 1.5
Cotton (%) 6.0 4.1 4.4 3.1 2.4
Pork (%) 10.9 16.2 17.5 19.5 17.6
Milk (%) 0.7 0.8 0.7 0.7 1.3
J Prod Anal (2010) 33:191–207 205
123
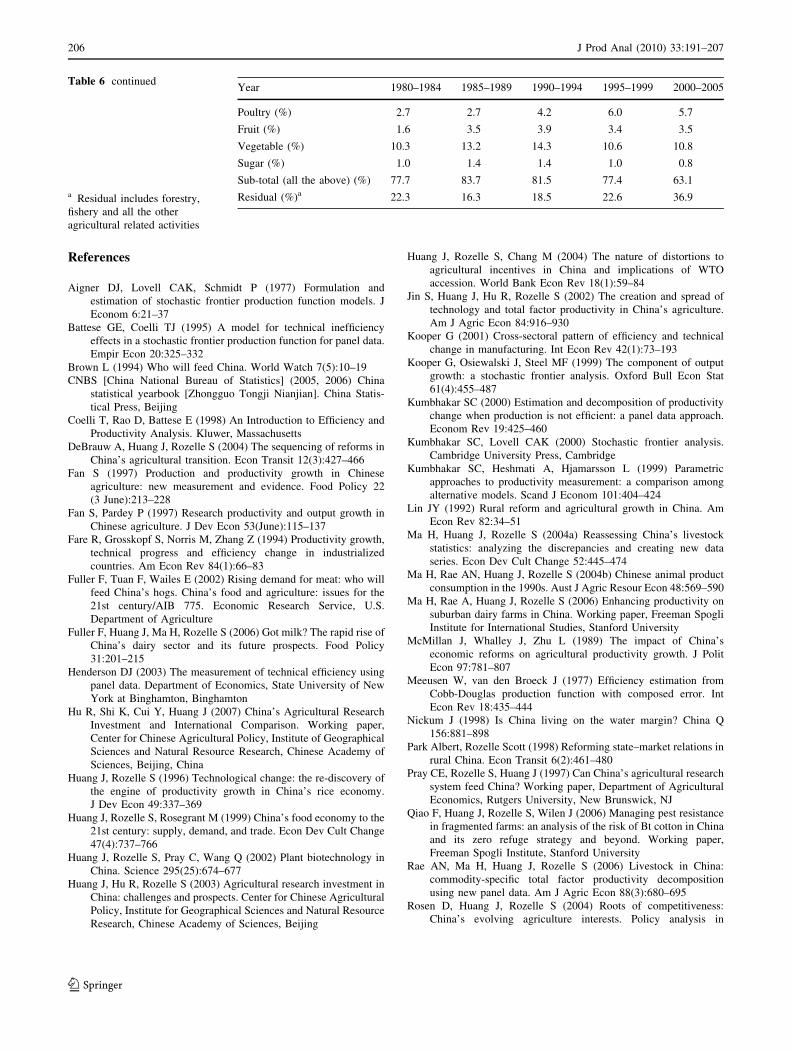
References
Aigner DJ, Lovell CAK, Schmidt P (1977) Formulation and
estimation of stochastic frontier production function models. J
Econom 6:21–37
Battese GE, Coelli TJ (1995) A model for technical inefficiency
effects in a stochastic frontier production function for panel data.
Empir Econ 20:325–332
Brown L (1994) Who will feed China. World Watch 7(5):10–19
CNBS [China National Bureau of Statistics] (2005, 2006) China
statistical yearbook [Zhongguo Tongji Nianjian]. China Statis-
tical Press, Beijing
Coelli T, Rao D, Battese E (1998) An Introduction to Efficiency and
Productivity Analysis. Kluwer, Massachusetts
DeBrauw A, Huang J, Rozelle S (2004) The sequencing of reforms in
China’s agricultural transition. Econ Transit 12(3):427–466
Fan S (1997) Production and productivity growth in Chinese
agriculture: new measurement and evidence. Food Policy 22
(3 June):213–228
Fan S, Pardey P (1997) Research productivity and output growth in
Chinese agriculture. J Dev Econ 53(June):115–137
Fare R, Grosskopf S, Norris M, Zhang Z (1994) Productivity growth,
technical progress and efficiency change in industrialized
countries. Am Econ Rev 84(1):66–83
Fuller F, Tuan F, Wailes E (2002) Rising demand for meat: who will
feed China’s hogs. China’s food and agriculture: issues for the
21st century/AIB 775. Economic Research Service, U.S.
Department of Agriculture
Fuller F, Huang J, Ma H, Rozelle S (2006) Got milk? The rapid rise of
China’s dairy sector and its future prospects. Food Policy
31:201–215
Henderson DJ (2003) The measurement of technical efficiency using
panel data. Department of Economics, State University of New
York at Binghamton, Binghamton
Hu R, Shi K, Cui Y, Huang J (2007) China’s Agricultural Research
Investment and International Comparison. Working paper,
Center for Chinese Agricultural Policy, Institute of Geographical
Sciences and Natural Resource Research, Chinese Academy of
Sciences, Beijing, China
Huang J, Rozelle S (1996) Technological change: the re-discovery of
the engine of productivity growth in China’s rice economy.
J Dev Econ 49:337–369
Huang J, Rozelle S, Rosegrant M (1999) China’s food economy to the
21st century: supply, demand, and trade. Econ Dev Cult Change
47(4):737–766
Huang J, Rozelle S, Pray C, Wang Q (2002) Plant biotechnology in
China. Science 295(25):674–677
Huang J, Hu R, Rozelle S (2003) Agricultural research investment in
China: challenges and prospects. Center for Chinese Agricultural
Policy, Institute for Geographical Sciences and Natural Resource
Research, Chinese Academy of Sciences, Beijing
Huang J, Rozelle S, Chang M (2004) The nature of distortions to
agricultural incentives in China and implications of WTO
accession. World Bank Econ Rev 18(1):59–84
Jin S, Huang J, Hu R, Rozelle S (2002) The creation and spread of
technology and total factor productivity in China’s agriculture.
Am J Agric Econ 84:916–930
Kooper G (2001) Cross-sectoral pattern of efficiency and technical
change in manufacturing. Int Econ Rev 42(1):73–193
Kooper G, Osiewalski J, Steel MF (1999) The component of output
growth: a stochastic frontier analysis. Oxford Bull Econ Stat
61(4):455–487
Kumbhakar SC (2000) Estimation and decomposition of productivity
change when production is not efficient: a panel data approach.
Econom Rev 19:425–460
Kumbhakar SC, Lovell CAK (2000) Stochastic frontier analysis.
Cambridge University Press, Cambridge
Kumbhakar SC, Heshmati A, Hjamarsson L (1999) Parametric
approaches to productivity measurement: a comparison among
alternative models. Scand J Econom 101:404–424
Lin JY (1992) Rural reform and agricultural growth in China. Am
Econ Rev 82:34–51
Ma H, Huang J, Rozelle S (2004a) Reassessing China’s livestock
statistics: analyzing the discrepancies and creating new data
series. Econ Dev Cult Change 52:445–474
Ma H, Rae AN, Huang J, Rozelle S (2004b) Chinese animal product
consumption in the 1990s. Aust J Agric Resour Econ 48:569–590
Ma H, Rae A, Huang J, Rozelle S (2006) Enhancing productivity on
suburban dairy farms in China. Working paper, Freeman Spogli
Institute for International Studies, Stanford University
McMillan J, Whalley J, Zhu L (1989) The impact of China’s
economic reforms on agricultural productivity growth. J Polit
Econ 97:781–807
Meeusen W, van den Broeck J (1977) Efficiency estimation from
Cobb-Douglas production function with composed error. Int
Econ Rev 18:435–444
Nickum J (1998) Is China living on the water margin? China Q
156:881–898
Park Albert, Rozelle Scott (1998) Reforming state–market relations in
rural China. Econ Transit 6(2):461–480
Pray CE, Rozelle S, Huang J (1997) Can China’s agricultural research
system feed China? Working paper, Department of Agricultural
Economics, Rutgers University, New Brunswick, NJ
Qiao F, Huang J, Rozelle S, Wilen J (2006) Managing pest resistance
in fragmented farms: an analysis of the risk of Bt cotton in China
and its zero refuge strategy and beyond. Working paper,
Freeman Spogli Institute, Stanford University
Rae AN, Ma H, Huang J, Rozelle S (2006) Livestock in China:
commodity-specific total factor productivity decomposition
using new panel data. Am J Agric Econ 88(3):680–695
Rosen D, Huang J, Rozelle S (2004) Roots of competitiveness:
China’s evolving agriculture interests. Policy analysis in
Table 6 continued
a Residual includes forestry,
fishery and all the other
agricultural related activities
Year 1980–1984 1985–1989 1990–1994 1995–1999 2000–2005
Poultry (%) 2.7 2.7 4.2 6.0 5.7
Fruit (%) 1.6 3.5 3.9 3.4 3.5
Vegetable (%) 10.3 13.2 14.3 10.6 10.8
Sugar (%) 1.0 1.4 1.4 1.0 0.8
Sub-total (all the above) (%) 77.7 83.7 81.5 77.4 63.1
Residual (%)a 22.3 16.3 18.5 22.6 36.9
206 J Prod Anal (2010) 33:191–207
123

international economics, vol 72. Institute for International
Economics, Washington, DC
Rozelle S, Park A, Huang J, Jin H (2000) Bureaucrat to entrepreneur:
the changing role of the state in China’s transitional commodity
economy. Econ Dev Cult Change 48(2):227–252
Rozelle S, Huang J, Otsuka K (2005) The engines of a viable
agriculture: advances in biotechnology, market accessibility, and
land rentals in rural China. China J 53:81–111
Rozelle S, Sumner DA, Paggi M, Huang J (2007) Rising demand,
trade prospects, and the rise of China’s horticultural industry.
Working paper written for NAAMIC (North American Agricul-
tural Marketing and Industry Consortium)
Schmidt P, Sickles RC (1984) Production frontiers and panel data. J
Bus Econ Stat 2:367–374
Shen M, Rozelle S, Zhang L, Huang J (2006) Farmer’s professional
associations in rural China: state dominated or new state–society
partnerships? Working paper, Freeman Spogli Institute of
International Studies, Stanford University
Somwaru A, Zhang XH, Tuan F (2003) China’s hog production
structure and efficiency. Paper presented at AAEA annual
meeting, Montreal, Canada, 27–30 July 2003
SPB (State price Bureau) (1988 to 2004) Quanguo Nongchanpin
Chengben Shouyi Ziliao Huibian [National agricultural
production cost and revenue information summary]. China Price
Bureau Press, Beijing
Stone B (1988) Developments in agricultural technology. China Q
116:767–822
Stone B, Rozelle S (1995) Foodcrop production variability in China,
1931–1985. In: The school for Oriental and African studies,
research and notes monograph series, vol 9. London
Tian W, Wan G (2000) Technical efficiency and its determinants in
China’s grain production. J Prod Anal 13:159–174
Wang J, Huang J, Rozelle S (2005) Evolution of tubewell ownership
and production in the North China Plain. Aust J Agric Resour
Econ 49(June):177–195
Wang H, Dong X, Rozelle S, Huang J, Reardon T (2006) Producing
and procuring horticultural crops with Chinese characteristics: a
case study in the greater Beijing area. Working paper, Freeman
Spogli Institute, Stanford University
Wen GZ (1993) Total factor productivity change in China’s farming
sector: 1952–1989. Econ Dev Cult Change 42:1–41
World Bank (1997) At China’s table. Monograph, World Bank,
Washington, DC
Yao S, Liu Z, Zhang Z (2001) Spatial differences of grain production
efficiency in China, 1987–1992. Econ Plann 34:139–157
J Prod Anal (2010) 33:191–207 207
123
Related Documents