ORIGINAL ARTICLE Productivity and nutrient use efficiency with integrated fertilization of buckwheat–fenugreek intercrops Aliyeh Salehi . Bano Mehdi . Sina Fallah . Hans-Peter Kaul . Reinhard W. Neugschwandtner Received: 21 June 2017 / Accepted: 8 January 2018 / Published online: 31 January 2018 Ó The Author(s) 2018. This article is an open access publication Abstract Intercrops and organic fertilizers can improve the productivity of cropping systems due to increased soil nutrient availability and plant nutrient use efficiency. A 2-year field experiment was con- ducted to determine the effects of different intercrop- ping ratios and fertilizer types on nitrogen (N) and phosphorus (P) concentrations and yields of fenugreek and buckwheat at the research farm of Shahrekord University, Iran. The treatments consisted of sole cropping of fenugreek (F), buckwheat (B) and three intercropping ratios (F:B = 1:2, 1:1 and 2:1) under three fertilizer types: chemical fertilizer (CF), inte- grated fertilizer (IF) and broiler litter (BL). At flowering and at harvest, intercropping increased total above-ground dry matter (TAGDM), total seed yield, N and P concentrations (plant) and uptake. The applied N use efficiency and applied N recovery efficiency (ANUE, ANRE) in the intercropped plots were also higher as compared to the sole cropping. The intercropping ratio of F:B (2:1) was the most suit- able for improving the tested nutrient variables. The IF and BL showed significant benefits as compared to CF, for TAGDM, total seed yield, N C and P C in the plant, as well as N and P uptake in sole and intercrops. For ANUE and ANRE, CF proved to be more effective. This study showed that a 2:1 fenugreek–buckwheat intercropped system with the application of IF and BL can successfully be implemented for improving pro- ductivity, N and P contents of fenugreek and buck- wheat as well as the nutrient land equivalent ratio (compared with sole cropping with CF) under semi- arid growing conditions. Keywords Cropping system Fenugreek Buckwheat Broiler litter Macronutrients Nutrient land equivalent ratio Introduction Best agricultural management practices implemented in agricultural production systems can help to achieve efficient crop nutrient use as well as improve crop diversity in the landscape. For example, intercropping (with or without legumes), fertilizer management, Electronic supplementary material The online version of this article (https://doi.org/10.1007/s10705-018-9906-x) con- tains supplementary material, which is available to authorized users. A. Salehi S. Fallah Faculty of Agriculture, Shahrekord University, Shahrekord, Iran A. Salehi (&) B. Mehdi H.-P. Kaul R. W. Neugschwandtner Division of Agronomy, Department of Crop Sciences, University of Natural Resources and Life Sciences, Vienna (BOKU), Konrad Lorenz-Straße 24, 3430 Tulln, Austria e-mail: [email protected] 123 Nutr Cycl Agroecosyst (2018) 110:407–425 https://doi.org/10.1007/s10705-018-9906-x

Welcome message from author
This document is posted to help you gain knowledge. Please leave a comment to let me know what you think about it! Share it to your friends and learn new things together.
Transcript

ORIGINAL ARTICLE
Productivity and nutrient use efficiency with integratedfertilization of buckwheat–fenugreek intercrops
Aliyeh Salehi . Bano Mehdi . Sina Fallah . Hans-Peter Kaul .
Reinhard W. Neugschwandtner
Received: 21 June 2017 / Accepted: 8 January 2018 / Published online: 31 January 2018
� The Author(s) 2018. This article is an open access publication
Abstract Intercrops and organic fertilizers can
improve the productivity of cropping systems due to
increased soil nutrient availability and plant nutrient
use efficiency. A 2-year field experiment was con-
ducted to determine the effects of different intercrop-
ping ratios and fertilizer types on nitrogen (N) and
phosphorus (P) concentrations and yields of fenugreek
and buckwheat at the research farm of Shahrekord
University, Iran. The treatments consisted of sole
cropping of fenugreek (F), buckwheat (B) and three
intercropping ratios (F:B = 1:2, 1:1 and 2:1) under
three fertilizer types: chemical fertilizer (CF), inte-
grated fertilizer (IF) and broiler litter (BL). At
flowering and at harvest, intercropping increased total
above-ground dry matter (TAGDM), total seed yield,
N and P concentrations (plant) and uptake. The
applied N use efficiency and applied N recovery
efficiency (ANUE, ANRE) in the intercropped plots
were also higher as compared to the sole cropping. The
intercropping ratio of F:B (2:1) was the most suit-
able for improving the tested nutrient variables. The IF
and BL showed significant benefits as compared to CF,
for TAGDM, total seed yield, NC and PC in the plant,
as well as N and P uptake in sole and intercrops. For
ANUE and ANRE, CF proved to be more effective.
This study showed that a 2:1 fenugreek–buckwheat
intercropped system with the application of IF and BL
can successfully be implemented for improving pro-
ductivity, N and P contents of fenugreek and buck-
wheat as well as the nutrient land equivalent ratio
(compared with sole cropping with CF) under semi-
arid growing conditions.
Keywords Cropping system � Fenugreek �Buckwheat � Broiler litter � Macronutrients � Nutrientland equivalent ratio
Introduction
Best agricultural management practices implemented
in agricultural production systems can help to achieve
efficient crop nutrient use as well as improve crop
diversity in the landscape. For example, intercropping
(with or without legumes), fertilizer management,
Electronic supplementary material The online version ofthis article (https://doi.org/10.1007/s10705-018-9906-x) con-tains supplementary material, which is available to authorizedusers.
A. Salehi � S. FallahFaculty of Agriculture, Shahrekord University,
Shahrekord, Iran
A. Salehi (&) � B. Mehdi � H.-P. Kaul �R. W. Neugschwandtner
Division of Agronomy, Department of Crop Sciences,
University of Natural Resources and Life Sciences,
Vienna (BOKU), Konrad Lorenz-Straße 24, 3430 Tulln,
Austria
e-mail: [email protected]
123
Nutr Cycl Agroecosyst (2018) 110:407–425
https://doi.org/10.1007/s10705-018-9906-x
crop rotations and reduced tillage practices can lead to
lower external inputs, efficient crop nutrient use and
yield improvements (Scalise et al. 2015; Dahmardeh
and Hodiani 2016; Jouzi et al. 2017). Benefits for the
soil can also be realized through improved biological
and chemical characteristics (Oelbermann and Echarte
2011; Chapagain and Riseman 2014).
Intercropping is a widespread practice that has been
successfully performed in most parts of the world,
including Southeast Asia, Latin America, Africa,
China, India (Yan et al. 2014) and in tropical regions
(Dhima et al. 2007) and is also becoming more
common in Europe (Hauggaard-Nielsen et al. 2009b).
Typical species used in intercropping systems include
legumes such as clover (Trifolium), vetch (Vicia),
beans (Phaseolus vulgaris) and peas (Pisum sativum)
and non-legumes such as barley (Hordeum vulgare),
buckwheat (Fagopyrum esculentum), rye (Secale
cereale), oat (Avena sativa), wheat (Triticum) and
flax (Linum usitatissimum) (Chapagain and Riseman
2014; Hamzei and Seyyedi 2016). Intercropping with
legumes can particularly enhance soil fertility by
increasing soil nitrogen (N) through the N-fixing
ability of rhizobacteria, thereby allowing more fixed-
N to remain in the upper soil layers and be plant
available (Hauggaard-Nielsen et al. 2009a; Chapagain
and Riseman 2014). Intercropping has been found to
increase the use of available N (Bedoussac and Justes
2010) as well as macro- and micronutrients in crops
(Neugschwandtner and Kaul 2016). Consequently, the
nutrient use efficiency can be improved and fertilizer
requirements of the main crops can be reduced
compared with regular non-intercropped crop stands
(Ghosh et al. 2009; Rostaei et al. 2014). Sahota and
Malhi (2012) showed that the LER from barley ? pea
intercropping was 1.3 as compared to sole crop of
barley.
A relatively new intercropping system is a cereal
intercropped with a leguminous medicinal plant, such
as fenugreek (Trigonella foenum-graecum L.), which
possesses multiple uses for food, feed and health.
Medicinal plants, such as fenugreek, not only provide
an important contribution to human health, they also
can improve the soil fertility by increasing N available
for plant uptake through biological fixation (Dadrasan
et al. 2015). Furthermore, medicinal plants can also
provide an interesting source of alternative income for
farmers especially on marginal lands, for example, Dai
et al. (2013) demonstrated that peanut (Arachis
hypogaea) intercropped with the medicinal plant
Atractylodes (Atractylodes lancea) increased peanut
yields and also increased the incomes of some farmers
because the Atractylodes were more valuable as
compared to traditional agricultural crops in the
subtropical China.
Fenugreek is an annual legume and one of the
oldest medicinal plants from the Fabacea family; it is
native to Eastern Europe to Central Asia (Kenny et al.
2013; Ahmad et al. 2016). It is cultivated widely in
Africa, India and the United States of America for
food, feed and for the substantial medicinal values of
its seeds (Ahmad et al. 2016). For example, consuming
fenugreek has been correlated with many positive
health benefits related to improving hyperglycaemia
(Ruby et al. 2005) and diabetes (Saxena and Vikram
2004).
Medicinal plants as intercrops are gaining interest
in both developing and developed countries and can
provide a novel strategy for sustainable agricultural
cropping systems (Chandrashekara and Somashekar-
appa 2016).
The common buckwheat (Fagopyrum esculentum
Moench) from the family Polygonaceae can be
intercropped with fenugreek and also shows health-
promoting benefits, specifically with regards to vita-
mins, proteins, minerals, antioxidants, flavonoids
(rutin, catechins) and dietary fibre. These properties
have helped to keep demands for buckwheat high
(Alamprese et al. 2007).
Studies have shown that use of organic manures has
several benefits over chemical fertilizers, for example
they improve soil phosphorus (P) availability, in
particular the P adsorption and desorption amounts,
and consequently increase the P recovery by the crops
as compared to chemical fertilizers (Iyamuremye and
Dick 1996). The application of organic fertilizers in a
groundnut (Arachis hypogaea)-corn intercropping
system showed significant positive effects on the crop
P concentration, P uptake, biomass and also soil
residual nutrients as compared to chemical fertilizers
(Mohanty et al. 2006). Moreover, the applications of
organic manures can be a valuable resource to
replenish the organic matter content in most soils
(Damodar Reddy et al. 2000). However, a growing
livestock industry as well as the large amounts of
livestock waste increasingly applied to arable land can
lead to a surplus of N and P applied to agricultural
fields (Yan et al. 2013). By applying high amounts of
408 Nutr Cycl Agroecosyst (2018) 110:407–425
123

manure, the soil inorganic P, the P saturation ratio and
phosphates can significantly be increased (Yan et al.
2016). One strategy for maintaining soil quality and
fertility, including the adequate application of crop
nutrients, is through the application of integrated
fertilizers, e.g. combined animal manure with chem-
ical fertilizers (Alizadeh et al. 2012).
Integrated fertilizers have several benefits, for
example integrating chemical fertilizer with liquid
pig manure was shown to supply a valuable nutrient
source for wheat production with improved N nutrition
(Meade et al. 2011). A significantly higher wheat and
soybean yield and P uptake through the application of
integrated fertilizer (cattle manure and chemical P) as
compared to their sole application was reported by
Damodar Reddy et al. (2000). He et al. (2015) showed
that applying chemical fertilizer plus manure (horse
manure, pig manure, and cattle manure) contributed to
higher C and N inputs and increased the biomass of
roots due to improved crop growth. Thus, the inter-
cropping system and the fertilizer type affect the
availability of N and P for the plant as well as the
nutrient use efficiency. For a fenugreek–buckwheat
intercropped system little information on the N and P
content of the plant and seeds is available with the
application of organic and chemical fertilizers. Hence,
the objectives of this study were to: (1) compare the
application of different fertilizer types on the N and P
concentration and yield of fenugreek and buckwheat,
(2) quantify the N and P uptake of the sole and
intercropped plants, (3) compare biomass and seed
production of the sole and intercrops plants and (4)
calculate any competitive nutrient land equivalent
ratios of intercropped fenugreek and buckwheat.
Materials and methods
Experimental site
A field experiment was established at the research
farm of Shahrekord University (32�210N, 50�490E;2050 m a.s.l.), Iran, in 2014 and 2015. The research
farm is characterized by an average annual mean
temperature of 10.5 �C and average annual rainfall of
280 mm. The soil texture is a clay loam and the soil
type is a fine, carbonatic, mesic Calcixerept.
A two-factorial experiment in a randomized com-
plete block design was conducted with three
replications. The first factor was the cropping system
with 5 levels: sole cropping of fenugreek (F), sole
cropping of buckwheat (B) and three substitutive row
intercropping ratios: F:B = 1:2 (one row of fenu-
greek ? two rows of buckwheat), 1:1 (one row of
fenugreek ? one row of buckwheat) and 2:1 (two
rows of fenugreek ? one row of buckwheat). The
second factor was the N fertilizer type with 3 levels:
chemical fertilizer (CF), broiler litter (BL) and inte-
grated fertilizer (IF = 50% CF ? 50% BL). Thus, the
field experiment consisted of 45 plots in two nearby
sites A and B in 2014 and 2015, respectively (Fig. 1S).
Individual experimental plots had an area of 7.5 m2
(2.5 9 3 m) and comprised 10 rows with 0.25 m
spacing. To avoid contamination by the seepage of
irrigation water from adjacent plots, a distance of
1.5 m between plots and between blocks was kept.
The amount of N applied to fenugreek and buckwheat
was 80 and 60 kg N ha-1, respectively, according to
local farmers’ practices. The application of 10 and
7.5 Mg ha-1 of broiler litter provided the 80 and
60 kg N ha-1, respectively, assuming 50% of miner-
alization of broiler litter N during the first cropping
season as observed earlier in the study region by
Alizadeh et al. (2012). Intercrops received equivalent
fertilizer amounts according to their species compo-
sition. After soil tillage with a moldboard plough on
May 1, 2014 and April 24, 2015, the broiler litter was
applied by hand. In the chemical fertilizer treatments,
urea was applied with one-third of the total rate
applied at planting and two-thirds applied 30 days
after planting. Phosphorus (P) was applied as triple
superphosphate, and Fe, Mn, Cu, and Zn were applied
to the urea-fertilized plots at a rate equivalent to the
total amounts added by the broiler litter treatments in
order to compensate for the nutrient inputs of these
elements with the organic fertilizer. In the integrated
fertilizer treatments, 50% of chemical fertilizer and
50% of broiler litter was applied to each plot.
Seeds of fenugreek (Isfahan landrace) and buck-
wheat were provided by Pakan Bazr, Iran and Rudloff
Feldsaaten, Germany, respectively. The crops were
sown by hand on May 29, 2014 and on May 23, 2015.
Fenugreek and buckwheat were sown at 50 and
120 plants m-2 at a depth of 0.01–0.02 and
0.02–0.04 m, respectively, both in the sole and in the
intercropped plots. In each planting hole, three seeds
of fenugreek or buckwheat were sown. To obtain the
required plant densities, fenugreek and buckwheat
Nutr Cycl Agroecosyst (2018) 110:407–425 409
123
seedlings were thinned at the 3–4 leaf stage. The
experimental plots were irrigated at 6-day intervals.
Mechanical hand weeding was performed.
Sampling and measurements
Soil and nutrient sampling
Before sowing, composite soil samples were taken at
0–0.3 m depth from the experimental field for chem-
ical analysis in both years. The broiler litter was also
analysed to determine the nutrient characteristics in
2014 and 2015 (Table 1S).
Plant analysis
Each year, the dry biomass was determined during the
flowering stage of fenugreek and buckwheat plants.
The plant samples were oven-dried at 70 �C for 48 h
to obtain a constant dry weight and the samples were
subsequently powdered by a miller. The above-ground
dry matter of the individual plant species (AGDMP) in
kg ha-1 was calculated by taking the oven dry weight
of only fenugreek or only of buckwheat and calculat-
ing the weight on a per ha basis.
Furthermore, the total above-ground dry matter at
the flowering stage of all plants (TAGDM) in kg ha-1
was calculated by adding the AGDMP of fenugreek
and of buckwheat.
Seed analysis
Each year, the plants were harvested manually to
determine the macronutrient content of seeds. Samples
of 20 plants for each crop were sampled by cutting the
plant at the base at full maturity; for buckwheat on
September 6, 2014 and September 1, 2015 and for
fenugreek on September 12, 2014 and September 15,
2015. Thereafter, seeds were separated from plants
and oven-dried at 70 �C for 48 h to obtain a constant
weight. The sample of seeds from each plot was
ground by using a grinding mill. The total seed yield in
kg ha-1 was calculated by adding the seed yield of
fenugreek with the seed yield of buckwheat.
Determination of N and P concentrations
and uptake
To determine the N concentration (NC), milled
samples of the plants (at flowering stage) and seeds
(after harvesting) were digested using the Kjeldahl
method (Bremner 1996). To determine the P concen-
tration (PC), the spectrophotometric method (Jackson
1958) was used. The N uptake (NUp) and P uptake
(PUp) were calculated for each crop at the flowering
stage and also for the seeds by multiplying the
AGDMP and the seed yield with both the Nc and Pc,
respectively. The total N uptake in seeds (TNUp) in
kg ha-1 was calculated by adding the NUp of fenu-
greek with the NUp of buckwheat in the seed.
Likewise, the total P uptake in seeds (TPUp) in
kg ha-1 was calculated by adding the PUp of fenugreek
with the PUp of buckwheat in the seed.
Determination of the nutrient land equivalent ratio
The nutrient land equivalent ratio for nitrogen (N-
LER) and phosphorus (P-LER) in the total above-
ground dry matter (TAGDM) and for the seed yield
were calculated. The land equivalent ratio considers
the yield ratios to indicate the amount of land required
to grow sole crops of each as compared to the amount
of land required to grow both crops as intercrops. This
concept can be applied to nutrients such as N and P to
determine the nutritional advantage of intercropping.
The nutrient LER was determined for each treatment
at the flowering stage and for the seed yield according
to Mead and Willey (1980) as follows:
N� LER ¼ NupYfb
NupYffþ NupYbf
NupYbbð1Þ
P� LER ¼ PupYfb
PupYffþ PupYbf
PupYbbð2Þ
where Nup is the nitrogen uptake of the plant or the
seed, Pup is the phosphorus uptake of the plant or the
seed, Yff is the yield of fenugreek in the sole plots,
Ybb is the yield of buckwheat in the sole plots, Yfb is
the yield of the fenugreek in the intercropped plots,
and Ybf is the yield of buckwheat in the intercropped
plots.
The nutrient LER is the summation of the partial
nutrient LERs of the single crops in the intercropped
system. Partial nutrient LERs show the relative
410 Nutr Cycl Agroecosyst (2018) 110:407–425
123
competitive abilities of single crops in intercropping
(Neugschwandtner and Kaul 2014). A nutrient
LER[ 1 indicates a nutritional advantage while a
nutrient LER\ 1 indicates a disadvantage of the
intercropping system.
Determination of applied N use and N recovery
efficiency
The applied N use efficiency (ANUE) in the seeds and
the applied N recovery efficiency (ANRE) were
calculated as follows:
ANUE ðkg kg�1Þ ¼ Y=NAp ð3Þ
ANRE %ð Þ ¼ NUp=NAp ð4Þ
where Y is total seed yield, NAp is the total applied N
and NUp is the total N uptake from the seeds of
fenugreek and buckwheat. For both the ANUE and the
ANRE, the total amount of applied N in BL and IF
were taken in consideration (not just the assumed
mineralized 50%, CF. Chapter 2.1.).
Statistical analysis
An analysis of variance (PROC ANOVA) using SAS
version 9.2 for two factorial experiments was per-
formed on data from each year considering intercrop-
ping ratio as the first factor and fertilizer type as the
second factor. Means were separated by least signif-
icant differences (LSD) when the F-test indicated
factorial effects at the significance level p\ 0.05. The
significance of the relationships between N and P
concentrations, uptake and production (AGDMP and
seed yield) at the flowering stage and at maturity was
determined using the Pearson correlation coefficient
(Tables 1, 2 in Appendix).
Results
Above-ground dry matter (AGDMP)
In both years, a significant effect of intercropping and
fertilizer type was found on the AGDMP of fenugreek
and buckwheat at the flowering stage (Fig. 1a–d). The
fenugreek AGDMP was highest in the sole fenugreek
treatment and decreased with increasing rows of
buckwheat (Fig. 1a, b). Furthermore, the AGDMP
was mostly higher in the IF and BL fertilized
treatments, compared with the chemical fertilizer
treatment (CF). In 2014, when IF and BL were
applied, the sole fenugreek plots had significantly
higher AGDMP, on an average by 27% as compared to
the CF (Fig. 1a). This trend was also observed in the
intercropped plots, where the AGDMP was signifi-
cantly higher by 22% in the IF and BL treatments. In
2015, in the sole plots, the AGDMP was significantly
higher by 16% in the BL treatment compared with the
CF treatment (Fig. 1b). In the intercropped treatments,
no significant AGDMP differences were found, except
for the BL treatment in the fenugreek: buckwheat (1:2)
treatment, which had lower AGDMP by 16% (Fig. 1a,
b).
For buckwheat, in both years, the AGDMP of
buckwheat was highest in the sole buckwheat plots
and decreased with increasing share of fenugreek
(Fig. 1c, d). Once more, the AGDMP was higher in the
IF and BL fertilized treatments, compared with the CF
fertilizer treatment, except at the fenugreek: buck-
wheat (1:1 and 2:1) treatments in 2014 (Fig. 1c).
When IF and BL were applied, the buckwheat
AGDMP in the sole plots was significantly higher,
on an average by 55% (2014) and 56% (2015) as
compared to the CF. Also in 2015 in the intercropped
plots, the AGDMP was significantly higher by 40%
average in both IF and BL treatments (Fig. 1d).
Seed yield
In both years, the seed yield of both fenugreek and
buckwheat was significantly affected by intercropping
and fertilizer type (Fig. 1e–h). For fenugreek, the seed
yield was highest in the sole fenugreek plots and
decreased with increasing share of buckwheat
(Fig. 1e, f). In 2015, the highest seed yield of
fenugreek was found in the IF and BL treatments (on
an average higher by 27%) as compared to CF
treatments (Fig. 1f).
For buckwheat, the seed yield was highest in the
sole plots and increased with increasing share of
fenugreek in intercropped plots in 2015 (Fig. 1g, h).
The sole plots fertilized with IF and BL had a higher
seed yield on an average by 46% (2014) and 21%
(2015) than the CF treatments. In 2014, a higher seed
yield was observed in the IF and BL fertilized
fenugreek: buckwheat (2:1) plots by 42% average as
compared to CF treatment (Fig. 1g). In 2015, the
Nutr Cycl Agroecosyst (2018) 110:407–425 411
123
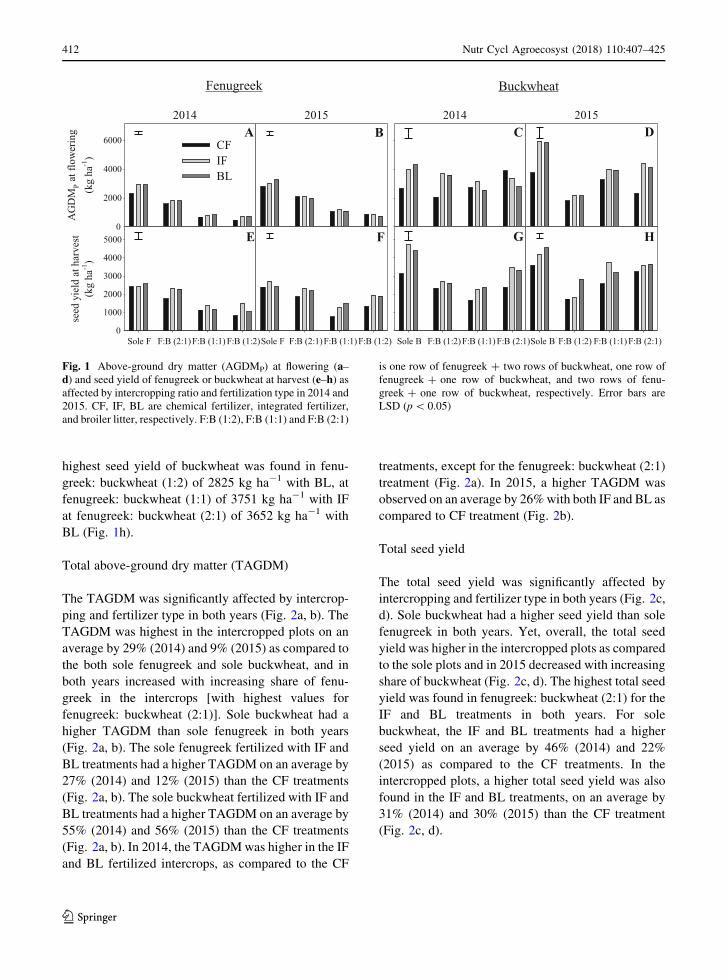
highest seed yield of buckwheat was found in fenu-
greek: buckwheat (1:2) of 2825 kg ha-1 with BL, at
fenugreek: buckwheat (1:1) of 3751 kg ha-1 with IF
at fenugreek: buckwheat (2:1) of 3652 kg ha-1 with
BL (Fig. 1h).
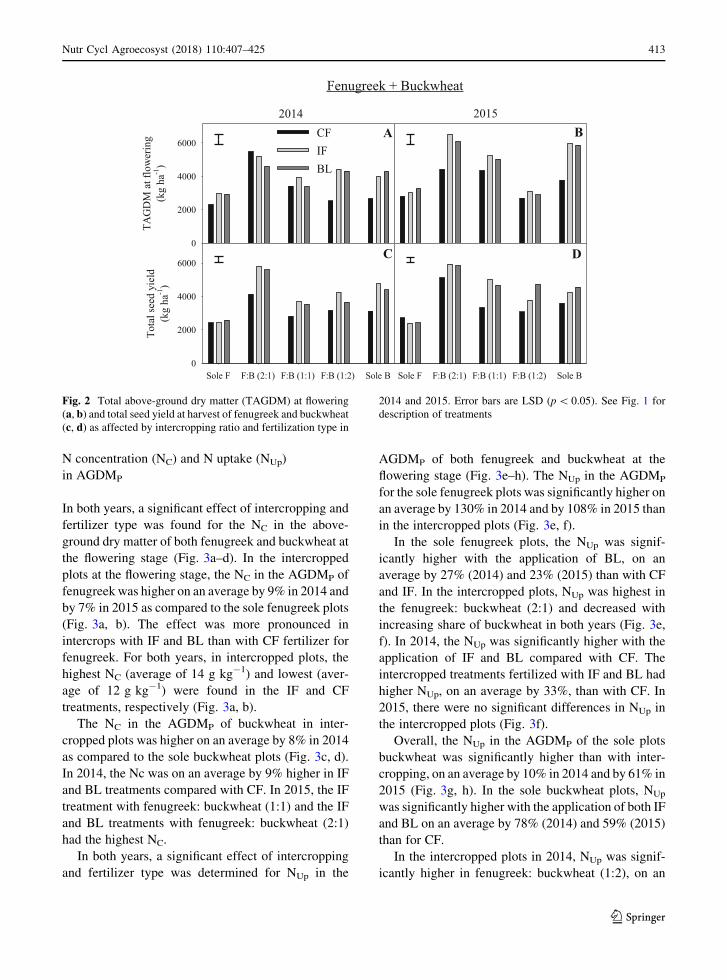
Total above-ground dry matter (TAGDM)
The TAGDM was significantly affected by intercrop-
ping and fertilizer type in both years (Fig. 2a, b). The
TAGDM was highest in the intercropped plots on an
average by 29% (2014) and 9% (2015) as compared to
the both sole fenugreek and sole buckwheat, and in
both years increased with increasing share of fenu-
greek in the intercrops [with highest values for
fenugreek: buckwheat (2:1)]. Sole buckwheat had a
higher TAGDM than sole fenugreek in both years
(Fig. 2a, b). The sole fenugreek fertilized with IF and
BL treatments had a higher TAGDM on an average by
27% (2014) and 12% (2015) than the CF treatments
(Fig. 2a, b). The sole buckwheat fertilized with IF and
BL treatments had a higher TAGDM on an average by
55% (2014) and 56% (2015) than the CF treatments
(Fig. 2a, b). In 2014, the TAGDMwas higher in the IF
and BL fertilized intercrops, as compared to the CF
treatments, except for the fenugreek: buckwheat (2:1)
treatment (Fig. 2a). In 2015, a higher TAGDM was
observed on an average by 26%with both IF and BL as
compared to CF treatment (Fig. 2b).
Total seed yield
The total seed yield was significantly affected by
intercropping and fertilizer type in both years (Fig. 2c,
d). Sole buckwheat had a higher seed yield than sole
fenugreek in both years. Yet, overall, the total seed
yield was higher in the intercropped plots as compared
to the sole plots and in 2015 decreased with increasing
share of buckwheat (Fig. 2c, d). The highest total seed
yield was found in fenugreek: buckwheat (2:1) for the
IF and BL treatments in both years. For sole
buckwheat, the IF and BL treatments had a higher
seed yield on an average by 46% (2014) and 22%
(2015) as compared to the CF treatments. In the
intercropped plots, a higher total seed yield was also
found in the IF and BL treatments, on an average by
31% (2014) and 30% (2015) than the CF treatment
(Fig. 2c, d).
Buckwheat
2014
MD
GA
Pgnire
wolftaah
gk(1-)
0
2000
4000
6000 CFIF BL
2015 2014 2015
Fenugreek
Sole F F:B (2:1)F:B (1:1) F:B (1:2)
tsevrahtadlei y
deesah
gk(1 -)
0
1000
2000
3000
4000
5000
Sole F F:B (2:1)F:B (1:1) F:B (1:2) Sole B F:B (1:2)F:B (1:1) F:B (2:1)Sole B F:B (1:2) F:B (1:1) F:B (2:1)
A B DC
HF GE
Fig. 1 Above-ground dry matter (AGDMP) at flowering (a–d) and seed yield of fenugreek or buckwheat at harvest (e–h) asaffected by intercropping ratio and fertilization type in 2014 and
2015. CF, IF, BL are chemical fertilizer, integrated fertilizer,
and broiler litter, respectively. F:B (1:2), F:B (1:1) and F:B (2:1)
is one row of fenugreek ? two rows of buckwheat, one row of
fenugreek ? one row of buckwheat, and two rows of fenu-
greek ? one row of buckwheat, respectively. Error bars are
LSD (p\ 0.05)
412 Nutr Cycl Agroecosyst (2018) 110:407–425
123
N concentration (NC) and N uptake (NUp)
in AGDMP
In both years, a significant effect of intercropping and
fertilizer type was found for the NC in the above-
ground dry matter of both fenugreek and buckwheat at
the flowering stage (Fig. 3a–d). In the intercropped
plots at the flowering stage, the NC in the AGDMP of
fenugreek was higher on an average by 9% in 2014 and
by 7% in 2015 as compared to the sole fenugreek plots
(Fig. 3a, b). The effect was more pronounced in
intercrops with IF and BL than with CF fertilizer for
fenugreek. For both years, in intercropped plots, the
highest NC (average of 14 g kg-1) and lowest (aver-
age of 12 g kg-1) were found in the IF and CF
treatments, respectively (Fig. 3a, b).
The NC in the AGDMP of buckwheat in inter-
cropped plots was higher on an average by 8% in 2014
as compared to the sole buckwheat plots (Fig. 3c, d).
In 2014, the Nc was on an average by 9% higher in IF
and BL treatments compared with CF. In 2015, the IF
treatment with fenugreek: buckwheat (1:1) and the IF
and BL treatments with fenugreek: buckwheat (2:1)
had the highest NC.
In both years, a significant effect of intercropping
and fertilizer type was determined for NUp in the
AGDMP of both fenugreek and buckwheat at the
flowering stage (Fig. 3e–h). The NUp in the AGDMP
for the sole fenugreek plots was significantly higher on
an average by 130% in 2014 and by 108% in 2015 than
in the intercropped plots (Fig. 3e, f).
In the sole fenugreek plots, the NUp was signif-
icantly higher with the application of BL, on an
average by 27% (2014) and 23% (2015) than with CF
and IF. In the intercropped plots, NUp was highest in
the fenugreek: buckwheat (2:1) and decreased with
increasing share of buckwheat in both years (Fig. 3e,
f). In 2014, the NUp was significantly higher with the
application of IF and BL compared with CF. The
intercropped treatments fertilized with IF and BL had
higher NUp, on an average by 33%, than with CF. In
2015, there were no significant differences in NUp in
the intercropped plots (Fig. 3f).
Overall, the NUp in the AGDMP of the sole plots
buckwheat was significantly higher than with inter-
cropping, on an average by 10% in 2014 and by 61% in
2015 (Fig. 3g, h). In the sole buckwheat plots, NUp
was significantly higher with the application of both IF
and BL on an average by 78% (2014) and 59% (2015)
than for CF.
In the intercropped plots in 2014, NUp was signif-
icantly higher in fenugreek: buckwheat (1:2), on an
2014
gnirewolft a
MD
GAT
a hg k(
1-)
0
2000
4000
6000CFIF BL
Fenugreek + Buckwheat
2015A B
Sole F F:B (2:1) F:B (1:1) F:B (1:2) Sole B
dleiydees lato Ta h
g k(1 -)
0
2000
4000
6000
Sole F F:B (2:1) F:B (1:1) F:B (1:2) Sole B
C D
Fig. 2 Total above-ground dry matter (TAGDM) at flowering
(a, b) and total seed yield at harvest of fenugreek and buckwheat(c, d) as affected by intercropping ratio and fertilization type in
2014 and 2015. Error bars are LSD (p\ 0.05). See Fig. 1 for
description of treatments
Nutr Cycl Agroecosyst (2018) 110:407–425 413
123
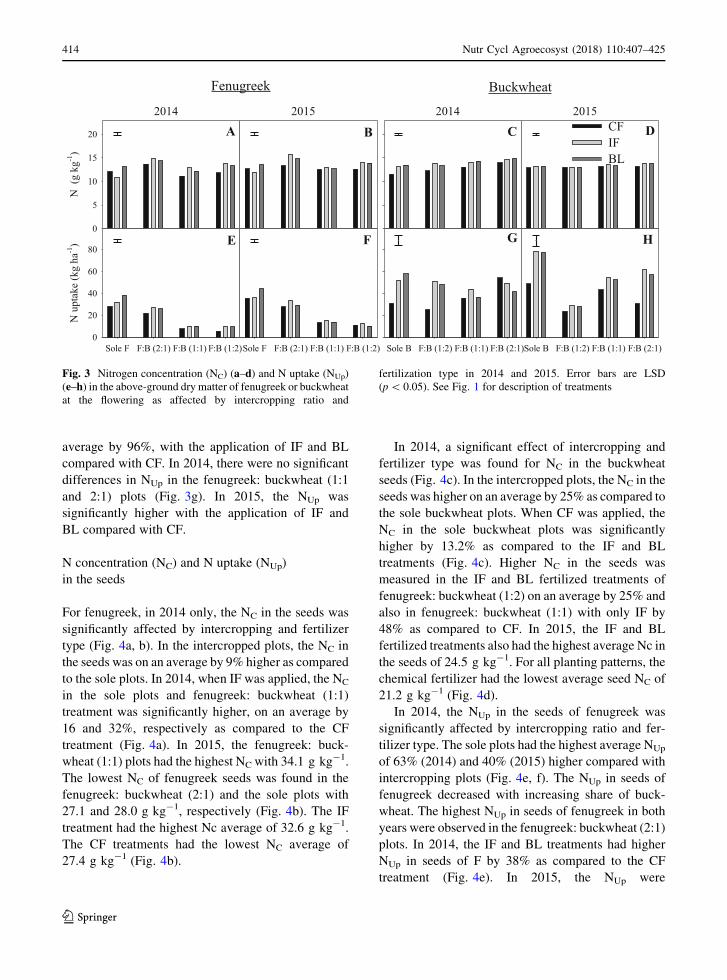
average by 96%, with the application of IF and BL
compared with CF. In 2014, there were no significant
differences in NUp in the fenugreek: buckwheat (1:1
and 2:1) plots (Fig. 3g). In 2015, the NUp was
significantly higher with the application of IF and
BL compared with CF.
N concentration (NC) and N uptake (NUp)
in the seeds
For fenugreek, in 2014 only, the NC in the seeds was
significantly affected by intercropping and fertilizer
type (Fig. 4a, b). In the intercropped plots, the NC in
the seeds was on an average by 9% higher as compared
to the sole plots. In 2014, when IF was applied, the NC
in the sole plots and fenugreek: buckwheat (1:1)
treatment was significantly higher, on an average by
16 and 32%, respectively as compared to the CF
treatment (Fig. 4a). In 2015, the fenugreek: buck-
wheat (1:1) plots had the highest NC with 34.1 g kg-1.
The lowest NC of fenugreek seeds was found in the
fenugreek: buckwheat (2:1) and the sole plots with
27.1 and 28.0 g kg-1, respectively (Fig. 4b). The IF
treatment had the highest Nc average of 32.6 g kg-1.
The CF treatments had the lowest NC average of
27.4 g kg-1 (Fig. 4b).
In 2014, a significant effect of intercropping and
fertilizer type was found for NC in the buckwheat
seeds (Fig. 4c). In the intercropped plots, the NC in the
seeds was higher on an average by 25% as compared to
the sole buckwheat plots. When CF was applied, the
NC in the sole buckwheat plots was significantly
higher by 13.2% as compared to the IF and BL
treatments (Fig. 4c). Higher NC in the seeds was
measured in the IF and BL fertilized treatments of
fenugreek: buckwheat (1:2) on an average by 25% and
also in fenugreek: buckwheat (1:1) with only IF by
48% as compared to CF. In 2015, the IF and BL
fertilized treatments also had the highest average Nc in
the seeds of 24.5 g kg-1. For all planting patterns, the
chemical fertilizer had the lowest average seed NC of
21.2 g kg-1 (Fig. 4d).
In 2014, the NUp in the seeds of fenugreek was
significantly affected by intercropping ratio and fer-
tilizer type. The sole plots had the highest average NUp
of 63% (2014) and 40% (2015) higher compared with
intercropping plots (Fig. 4e, f). The NUp in seeds of
fenugreek decreased with increasing share of buck-
wheat. The highest NUp in seeds of fenugreek in both
years were observed in the fenugreek: buckwheat (2:1)
plots. In 2014, the IF and BL treatments had higher
NUp in seeds of F by 38% as compared to the CF
treatment (Fig. 4e). In 2015, the NUp were
2014
gkg(
N1-)
0
5
10
15
20
2015 2014 2015CFIF BL
E
Sole F F:B (2:1) F:B (1:1) F:B (1:2)
ahgk(
ekatpuN
1-)
0
20
40
60
80F
Sole F F:B (2:1) F:B (1:1) F:B (1:2)
G
Sole B F:B (1:2) F:B (1:1) F:B (2:1)
H
Sole B F:B (1:2) F:B (1:1) F:B (2:1)
A B C D
Fenugreek Buckwheat
Fig. 3 Nitrogen concentration (NC) (a–d) and N uptake (NUp)
(e–h) in the above-ground dry matter of fenugreek or buckwheat
at the flowering as affected by intercropping ratio and
fertilization type in 2014 and 2015. Error bars are LSD
(p\ 0.05). See Fig. 1 for description of treatments
414 Nutr Cycl Agroecosyst (2018) 110:407–425
123
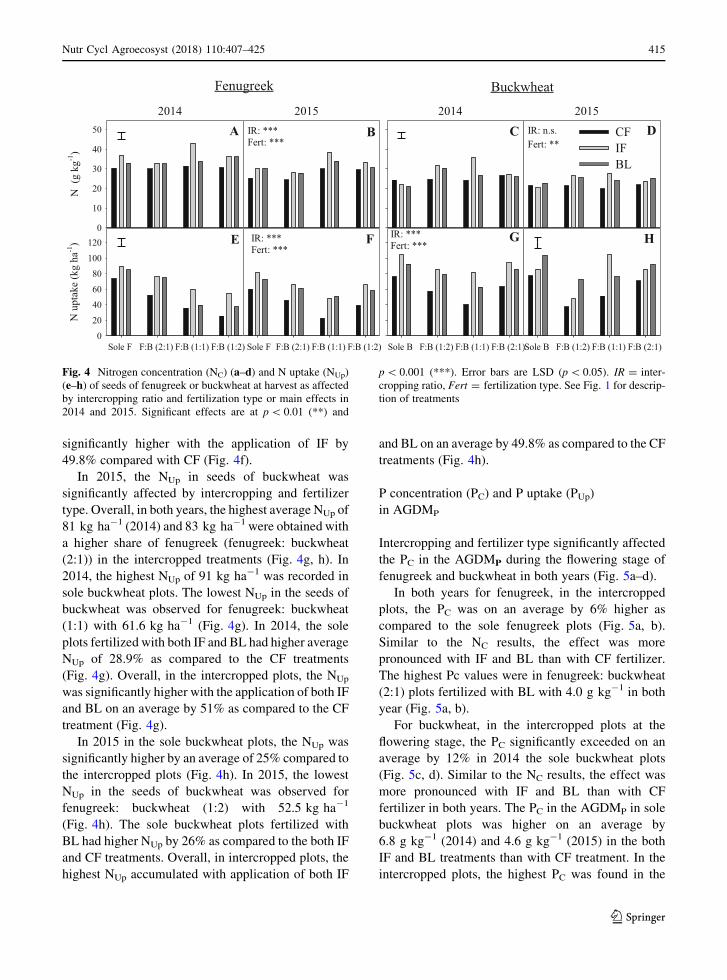
significantly higher with the application of IF by
49.8% compared with CF (Fig. 4f).
In 2015, the NUp in seeds of buckwheat was
significantly affected by intercropping and fertilizer
type. Overall, in both years, the highest average NUp of
81 kg ha-1 (2014) and 83 kg ha-1 were obtained with
a higher share of fenugreek (fenugreek: buckwheat
(2:1)) in the intercropped treatments (Fig. 4g, h). In
2014, the highest NUp of 91 kg ha-1 was recorded in
sole buckwheat plots. The lowest NUp in the seeds of
buckwheat was observed for fenugreek: buckwheat
(1:1) with 61.6 kg ha-1 (Fig. 4g). In 2014, the sole
plots fertilized with both IF and BL had higher average
NUp of 28.9% as compared to the CF treatments
(Fig. 4g). Overall, in the intercropped plots, the NUp
was significantly higher with the application of both IF
and BL on an average by 51% as compared to the CF
treatment (Fig. 4g).
In 2015 in the sole buckwheat plots, the NUp was
significantly higher by an average of 25% compared to
the intercropped plots (Fig. 4h). In 2015, the lowest
NUp in the seeds of buckwheat was observed for
fenugreek: buckwheat (1:2) with 52.5 kg ha-1
(Fig. 4h). The sole buckwheat plots fertilized with
BL had higher NUp by 26% as compared to the both IF
and CF treatments. Overall, in intercropped plots, the
highest NUp accumulated with application of both IF
and BL on an average by 49.8% as compared to the CF
treatments (Fig. 4h).
P concentration (PC) and P uptake (PUp)
in AGDMP
Intercropping and fertilizer type significantly affected
the PC in the AGDMP during the flowering stage of
fenugreek and buckwheat in both years (Fig. 5a–d).
In both years for fenugreek, in the intercropped
plots, the PC was on an average by 6% higher as
compared to the sole fenugreek plots (Fig. 5a, b).
Similar to the NC results, the effect was more
pronounced with IF and BL than with CF fertilizer.
The highest Pc values were in fenugreek: buckwheat
(2:1) plots fertilized with BL with 4.0 g kg-1 in both
year (Fig. 5a, b).
For buckwheat, in the intercropped plots at the
flowering stage, the PC significantly exceeded on an
average by 12% in 2014 the sole buckwheat plots
(Fig. 5c, d). Similar to the NC results, the effect was
more pronounced with IF and BL than with CF
fertilizer in both years. The PC in the AGDMP in sole
buckwheat plots was higher on an average by
6.8 g kg-1 (2014) and 4.6 g kg-1 (2015) in the both
IF and BL treatments than with CF treatment. In the
intercropped plots, the highest PC was found in the
2014
gkg(
N1-)
0
10
20
30
40
50
2015 2014 2015
CFIF BL
E
Sole F F:B (2:1) F:B (1:1) F:B (1:2)
ahgk(
ekatpuN
1-)
0
20
40
60
80
100
120 F
Sole F F:B (2:1) F:B (1:1) F:B (1:2)
G
Sole B F:B (1:2) F:B (1:1) F:B (2:1)
H
Sole B F:B (1:2) F:B (1:1) F:B (2:1)
IR: ***Fert: ***
IR: ***Fert: ***
A B C D
Fenugreek Buckwheat
IR: ***Fert: ***
IR: n.s.Fert: **
Fig. 4 Nitrogen concentration (NC) (a–d) and N uptake (NUp)
(e–h) of seeds of fenugreek or buckwheat at harvest as affected
by intercropping ratio and fertilization type or main effects in
2014 and 2015. Significant effects are at p\ 0.01 (**) and
p\ 0.001 (***). Error bars are LSD (p\ 0.05). IR = inter-
cropping ratio, Fert = fertilization type. See Fig. 1 for descrip-
tion of treatments
Nutr Cycl Agroecosyst (2018) 110:407–425 415
123
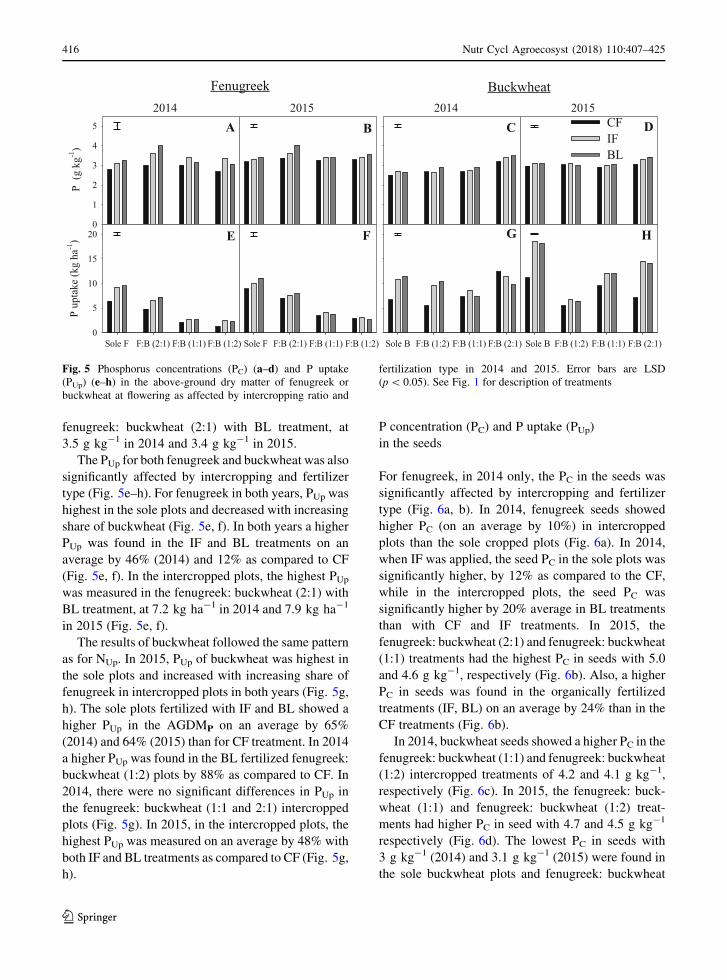
fenugreek: buckwheat (2:1) with BL treatment, at
3.5 g kg-1 in 2014 and 3.4 g kg-1 in 2015.
The PUp for both fenugreek and buckwheat was also
significantly affected by intercropping and fertilizer
type (Fig. 5e–h). For fenugreek in both years, PUp was
highest in the sole plots and decreased with increasing
share of buckwheat (Fig. 5e, f). In both years a higher
PUp was found in the IF and BL treatments on an
average by 46% (2014) and 12% as compared to CF
(Fig. 5e, f). In the intercropped plots, the highest PUpwas measured in the fenugreek: buckwheat (2:1) with
BL treatment, at 7.2 kg ha-1 in 2014 and 7.9 kg ha-1
in 2015 (Fig. 5e, f).
The results of buckwheat followed the same pattern
as for NUp. In 2015, PUp of buckwheat was highest in
the sole plots and increased with increasing share of
fenugreek in intercropped plots in both years (Fig. 5g,
h). The sole plots fertilized with IF and BL showed a
higher PUp in the AGDMP on an average by 65%
(2014) and 64% (2015) than for CF treatment. In 2014
a higher PUp was found in the BL fertilized fenugreek:
buckwheat (1:2) plots by 88% as compared to CF. In
2014, there were no significant differences in PUp in
the fenugreek: buckwheat (1:1 and 2:1) intercropped
plots (Fig. 5g). In 2015, in the intercropped plots, the
highest PUp was measured on an average by 48% with
both IF and BL treatments as compared to CF (Fig. 5g,
h).
P concentration (PC) and P uptake (PUp)
in the seeds
For fenugreek, in 2014 only, the PC in the seeds was
significantly affected by intercropping and fertilizer
type (Fig. 6a, b). In 2014, fenugreek seeds showed
higher PC (on an average by 10%) in intercropped
plots than the sole cropped plots (Fig. 6a). In 2014,
when IF was applied, the seed PC in the sole plots was
significantly higher, by 12% as compared to the CF,
while in the intercropped plots, the seed PC was
significantly higher by 20% average in BL treatments
than with CF and IF treatments. In 2015, the
fenugreek: buckwheat (2:1) and fenugreek: buckwheat
(1:1) treatments had the highest PC in seeds with 5.0
and 4.6 g kg-1, respectively (Fig. 6b). Also, a higher
PC in seeds was found in the organically fertilized
treatments (IF, BL) on an average by 24% than in the
CF treatments (Fig. 6b).
In 2014, buckwheat seeds showed a higher PC in the
fenugreek: buckwheat (1:1) and fenugreek: buckwheat
(1:2) intercropped treatments of 4.2 and 4.1 g kg-1,
respectively (Fig. 6c). In 2015, the fenugreek: buck-
wheat (1:1) and fenugreek: buckwheat (1:2) treat-
ments had higher PC in seed with 4.7 and 4.5 g kg-1
respectively (Fig. 6d). The lowest PC in seeds with
3 g kg-1 (2014) and 3.1 g kg-1 (2015) were found in
the sole buckwheat plots and fenugreek: buckwheat
2014
gkg(
P1-)
0
1
2
3
4
5
2015 2014 2015CFIF BL
E
Sole F F:B (2:1) F:B (1:1) F:B (1:2)
ahgk(
ekatp uP
1 -)
0
5
10
15
20 F
Sole F F:B (2:1) F:B (1:1) F:B (1:2)
G
Sole B F:B (1:2) F:B (1:1) F:B (2:1)
H
Sole B F:B (1:2) F:B (1:1) F:B (2:1)
A B C D
Fenugreek Buckwheat
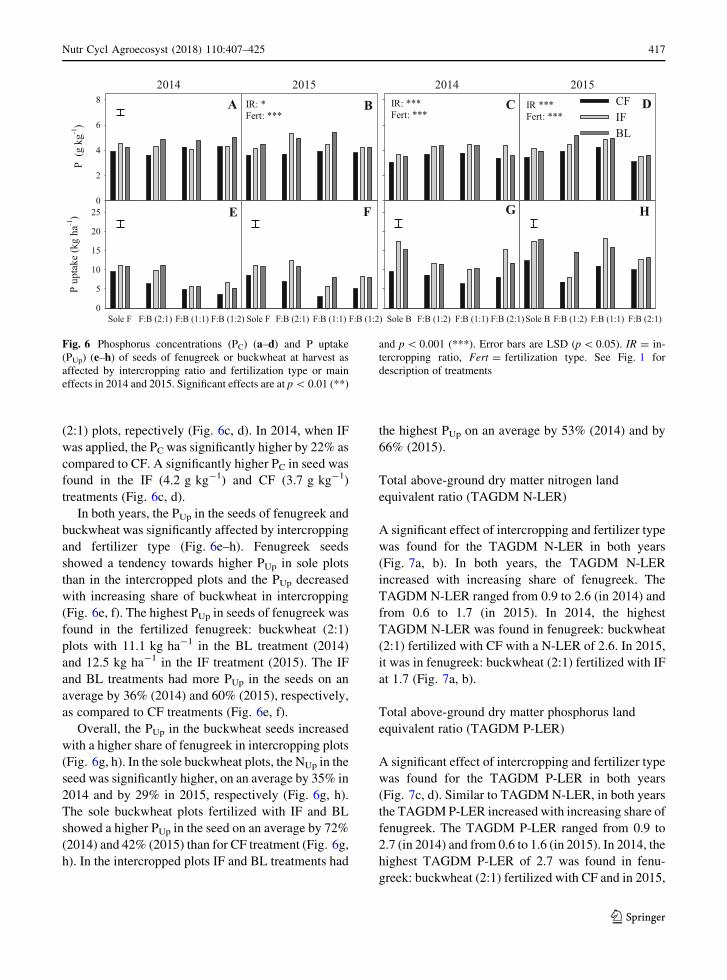
Fig. 5 Phosphorus concentrations (PC) (a–d) and P uptake
(PUp) (e–h) in the above-ground dry matter of fenugreek or
buckwheat at flowering as affected by intercropping ratio and
fertilization type in 2014 and 2015. Error bars are LSD
(p\ 0.05). See Fig. 1 for description of treatments
416 Nutr Cycl Agroecosyst (2018) 110:407–425
123
(2:1) plots, repectively (Fig. 6c, d). In 2014, when IF
was applied, the PC was significantly higher by 22% as
compared to CF. A significantly higher PC in seed was
found in the IF (4.2 g kg-1) and CF (3.7 g kg-1)
treatments (Fig. 6c, d).
In both years, the PUp in the seeds of fenugreek and
buckwheat was significantly affected by intercropping
and fertilizer type (Fig. 6e–h). Fenugreek seeds
showed a tendency towards higher PUp in sole plots
than in the intercropped plots and the PUp decreased
with increasing share of buckwheat in intercropping
(Fig. 6e, f). The highest PUp in seeds of fenugreek was
found in the fertilized fenugreek: buckwheat (2:1)
plots with 11.1 kg ha-1 in the BL treatment (2014)
and 12.5 kg ha-1 in the IF treatment (2015). The IF
and BL treatments had more PUp in the seeds on an
average by 36% (2014) and 60% (2015), respectively,
as compared to CF treatments (Fig. 6e, f).
Overall, the PUp in the buckwheat seeds increased
with a higher share of fenugreek in intercropping plots
(Fig. 6g, h). In the sole buckwheat plots, the NUp in the
seed was significantly higher, on an average by 35% in
2014 and by 29% in 2015, respectively (Fig. 6g, h).
The sole buckwheat plots fertilized with IF and BL
showed a higher PUp in the seed on an average by 72%
(2014) and 42% (2015) than for CF treatment (Fig. 6g,
h). In the intercropped plots IF and BL treatments had
the highest PUp on an average by 53% (2014) and by
66% (2015).
Total above-ground dry matter nitrogen land
equivalent ratio (TAGDM N-LER)
A significant effect of intercropping and fertilizer type
was found for the TAGDM N-LER in both years
(Fig. 7a, b). In both years, the TAGDM N-LER
increased with increasing share of fenugreek. The
TAGDM N-LER ranged from 0.9 to 2.6 (in 2014) and
from 0.6 to 1.7 (in 2015). In 2014, the highest
TAGDM N-LER was found in fenugreek: buckwheat
(2:1) fertilized with CF with a N-LER of 2.6. In 2015,
it was in fenugreek: buckwheat (2:1) fertilized with IF
at 1.7 (Fig. 7a, b).
Total above-ground dry matter phosphorus land
equivalent ratio (TAGDM P-LER)
A significant effect of intercropping and fertilizer type
was found for the TAGDM P-LER in both years
(Fig. 7c, d). Similar to TAGDM N-LER, in both years
the TAGDMP-LER increased with increasing share of
fenugreek. The TAGDM P-LER ranged from 0.9 to
2.7 (in 2014) and from 0.6 to 1.6 (in 2015). In 2014, the
highest TAGDM P-LER of 2.7 was found in fenu-
greek: buckwheat (2:1) fertilized with CF and in 2015,
2014gk
g(P
1-)
0
2
4
6
82015 2014 2015
CFIF BL
E
Sole F F:B (2:1) F:B (1:1) F:B (1:2)
ahgk(
ekatpuP
1-)
0
5
10
15
20
25 F
Sole F F:B (2:1) F:B (1:1) F:B (1:2)
G
Sole B F:B (1:2) F:B (1:1) F:B (2:1)
H
Sole B F:B (1:2) F:B (1:1) F:B (2:1)
A B C DIR: *Fert: ***
IR: ***Fert: ***
IR ***Fert: ***
Fig. 6 Phosphorus concentrations (PC) (a–d) and P uptake
(PUp) (e–h) of seeds of fenugreek or buckwheat at harvest as
affected by intercropping ratio and fertilization type or main
effects in 2014 and 2015. Significant effects are at p\ 0.01 (**)
and p\ 0.001 (***). Error bars are LSD (p\ 0.05). IR = in-
tercropping ratio, Fert = fertilization type. See Fig. 1 for
description of treatments
Nutr Cycl Agroecosyst (2018) 110:407–425 417
123

it was 1.6 in the fenugreek: buckwheat (2:1) fertilized
with IF (Fig. 7c, d).
Total N uptake in seeds (TNUp)
The TNUp in seeds was significantly affected by
intercropping and fertilizer type in both years (Fig. 8a,
b). In the intercropped plots, TNUp in seeds was on an
average by 41% in (2014) and 51% (2015) higher as
compared to the sole plots and decreased with
increasing share of buckwheat in 2015. The TNUp
was higher with IF and BL than with CF fertilizer. Sole
buckwheat had a higher TNUP in seeds than sole
fenugreek in both years (Fig. 8a, b). The sole
fenugreek fertilized with both IF and BL treatments
had a higher TNUp in seeds on an average by 18%
(2014) and 27% (2015) than for CF treatments
(Fig. 8a, b). The sole buckwheat fertilized with both
IF and BL treatments had a higher TNUp in seeds on an
average by 28% (2014) and 22% (2015) than for CF
treatments (Fig. 8a, b). In the intercropped plots, IF
and BL treatments had the highest TNUp in seeds on an
average by 51% (2014) and by 54.9% (2015) as
compared to the CF treatment (Fig. 8a, b).
Total N-LER
In both years, the total N-LER was significantly
affected by the interaction of intercropping and
fertilizer type (Fig. 8c, d). In all treatments, the total
N-LERwas above unity and on average increased with
increasing share of fenugreek in both years. In 2014
the highest N-LER was in fenugreek: buckwheat (2:1)
fertilized with BL and in 2015 in fenugreek: buck-
wheat (1:1) fertilized with IF (both times with 1.8).
The IF and BL fertilized intercrops had higher total
N-LER on an average by 27% (2014) and 26% (2015)
than for the CF treatment (Fig. 8c, d).
Applied N use efficiency (ANUE) and applied N
recovery efficiency (ANRE) in seeds
In both years, a significant interaction effect of
intercropping and fertilizer type was found on ANUE
(Fig. 8e, f). A higher ANUE on an average by 112%
(2014) and 113% (2015) was obtained in sole buck-
wheat as compared to sole fenugreek. Also, the
intercrops had a higher ANUE than the sole fenugreek.
The highest ANUE was found in fenugreek: buck-
wheat (2:1) treatment on an average by 49.0 kg kg-1
Fenugreek + Buckwheat
AREL-
NM
DG
AT
0.000.250.500.751.001.251.501.752.002.252.502.75 B
C
Sole F F:B (2:1) F:B (1:1) F:B (1:2) Sole B
REL-PM
DG
AT
0.000.250.500.751.001.251.501.752.002.252.502.75 D
Sole F F:B (2:1) F:B (1:1) F:B (1:2) Sole B
2014 2015
Fig. 7 Total N-land equivalent ratio for total AGDM (TAGDM
N-LER) (a, b) and total P-land equivalent ratio for total AGDM(TAGDM P-LER) (c, d) of fenugreek and buckwheat at
flowering stage in as affected by intercropping ratio and
fertilization type in 2014 and 2015. Error bars are LSD
(p\ 0.05). The dotted line in a–d are at LER = 1; values[ 1
indicate a TAGDM advantage. See Fig. 1 for description of
treatments
418 Nutr Cycl Agroecosyst (2018) 110:407–425
123

(2014) and 54.6 kg kg-1 (2015). Overall, in the
intercrops, the higher ANUE was obtained with CF
(on an average by 48.0 kg kg-1 in 2014 and
54.5 kg kg-1 in 2015) followed by IF (43.3 kg kg-1
in 2014 and 46.5 kg kg-1 in 2015) (Fig. 8e, f).
In both years, the ANRE was significantly affected
by the interaction of intercropping and fertilizer type
(Fig. 8g, h). A higher ANRE was obtained in sole
buckwheat as compared to sole fenugreek. In the
intercrops, ANRE was significantly higher on an
average by 34% (2014) and 43% (2015) as compared
to both sole crops and increased with increasing share
of fenugreek in 2015 (Fig. 8g, h).
The highest ANRE was found in fenugreek:
buckwheat (2:1) on an average by 140% (2014) and
134% (2015). In 2014, in the intercrops, the higher
ANRE was obtained with IF treatment (on an average
by 143%) followed by the CF treatment (on an average
by 130%). In 2015, in the fertilized intercrops, the
2014
NTP
U)1-ah
gk(sd eesn i
0
50
100
150
200
250
2015
CFIF BL
C
REL-NlatoT
0.000.25
0.50
0.75
1.00
1.25
1.50
1.75 D
A B
Fenugreek + Buckwheat
G
Sole F F:B (2:1) F:B (1:1) F:B (1:2) Sole B
)%(
ER
NA
0
30
60
90
120
150
180 H
Sole F F:B (2:1) F:B (1:1) F:B (1:2) Sole B
E
gkgk(
EU
NA
1-)
0
10
20
30
40
50
60
70 F
Fig. 8 Total N uptake (TNUp) in seeds (a, b), total N-landequivalent ratio (total N-LER) for seeds (c, d), applied N use
efficiency (ANUE) (e, f) and applied N recovery efficiency
(ANRE) (g, h) of fenugreek and buckwheat at harvest as
affected by intercropping ratio and fertilization type in 2014 and
2015. Error bars are LSD (p\ 0.05). The dotted line in c and
d is at LER = 1; values[ 1 indicate a yield advantage. See
Fig. 1 for description of treatments
Nutr Cycl Agroecosyst (2018) 110:407–425 419
123
effect of CF treatment of ANUEwas more pronounced
(Fig. 8g, h).
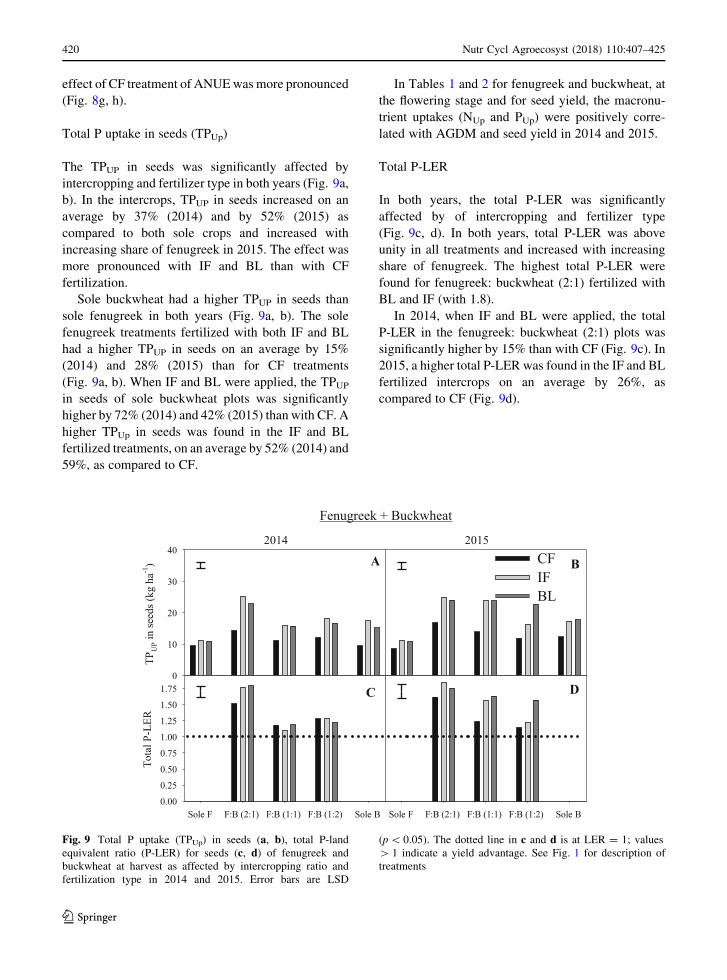
Total P uptake in seeds (TPUp)
The TPUP in seeds was significantly affected by
intercropping and fertilizer type in both years (Fig. 9a,
b). In the intercrops, TPUP in seeds increased on an
average by 37% (2014) and by 52% (2015) as
compared to both sole crops and increased with
increasing share of fenugreek in 2015. The effect was
more pronounced with IF and BL than with CF
fertilization.
Sole buckwheat had a higher TPUP in seeds than
sole fenugreek in both years (Fig. 9a, b). The sole
fenugreek treatments fertilized with both IF and BL
had a higher TPUP in seeds on an average by 15%
(2014) and 28% (2015) than for CF treatments
(Fig. 9a, b). When IF and BL were applied, the TPUPin seeds of sole buckwheat plots was significantly
higher by 72% (2014) and 42% (2015) than with CF. A
higher TPUp in seeds was found in the IF and BL
fertilized treatments, on an average by 52% (2014) and
59%, as compared to CF.
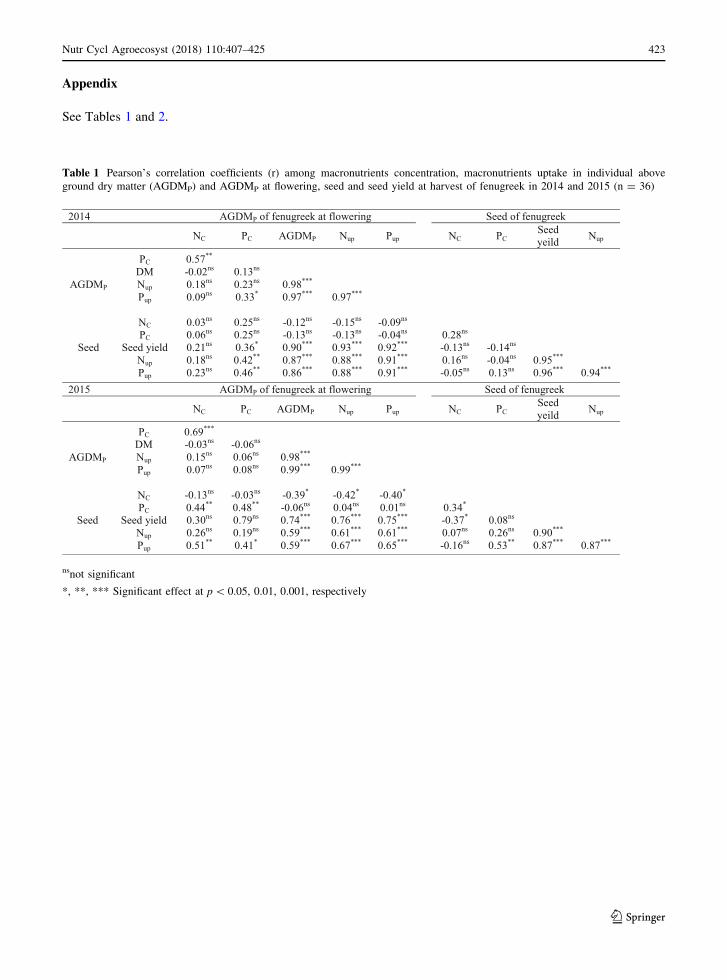
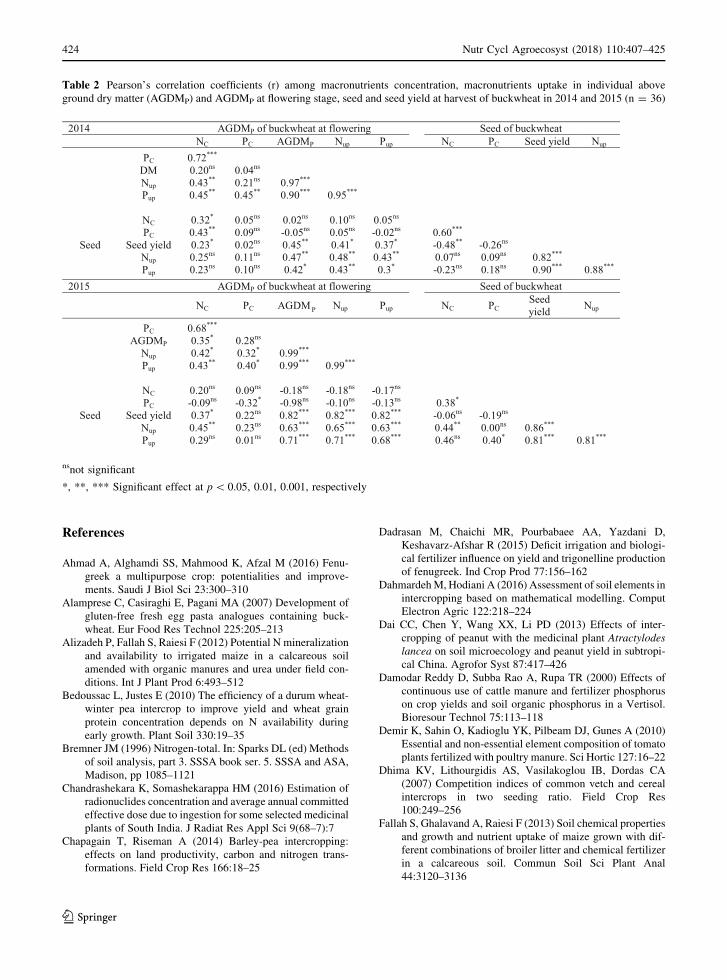
In Tables 1 and 2 for fenugreek and buckwheat, at
the flowering stage and for seed yield, the macronu-
trient uptakes (NUp and PUp) were positively corre-
lated with AGDM and seed yield in 2014 and 2015.
Total P-LER
In both years, the total P-LER was significantly
affected by of intercropping and fertilizer type
(Fig. 9c, d). In both years, total P-LER was above
unity in all treatments and increased with increasing
share of fenugreek. The highest total P-LER were
found for fenugreek: buckwheat (2:1) fertilized with
BL and IF (with 1.8).
In 2014, when IF and BL were applied, the total
P-LER in the fenugreek: buckwheat (2:1) plots was
significantly higher by 15% than with CF (Fig. 9c). In
2015, a higher total P-LER was found in the IF and BL
fertilized intercrops on an average by 26%, as
compared to CF (Fig. 9d).
2014
PTP
Uah
gk(sdee sni
1-)
0
10
20
30
402015
CFIF BL
C
Sole F F:B (2:1) F:B (1:1) F:B (1:2) Sole B
REL-PlatoT
0.00
0.25
0.50
0.75
1.00
1.25
1.50
1.75 D
Sole F F:B (2:1) F:B (1:1) F:B (1:2) Sole B
A B
Fenugreek + Buckwheat
Fig. 9 Total P uptake (TPUp) in seeds (a, b), total P-land
equivalent ratio (P-LER) for seeds (c, d) of fenugreek and
buckwheat at harvest as affected by intercropping ratio and
fertilization type in 2014 and 2015. Error bars are LSD
(p\ 0.05). The dotted line in c and d is at LER = 1; values
[ 1 indicate a yield advantage. See Fig. 1 for description of
treatments
420 Nutr Cycl Agroecosyst (2018) 110:407–425
123
Discussion
Intercropping resulted in higher AGDM (both
AGDMP and TAGDM) at the flowering stage and
higher total seed yields as compared to pure stands.
The intercropping treatment with 2:1 fenugreek:
buckwheat had particularly better results. The higher
yields in intercrops were mainly governed by a higher
share of fenugreek. One reason for the higher biomass
with increasing share of fenugreek may be that there is
more N available through N-fixation as fenugreek is a
legume. Salehi et al. (2016) reported that the highest
seed yield of fenugreek and buckwheat was found with
fenugreek: buckwheat (2:1) intercropped with organic
manure. Similar to our results, Osman and Nersoyan
(1986) found that the highest dry matter yields in
cereal-common vetch intercrops for forage production
were related to a high share of the legume partner.
A higher AGDM at the flowering stage and higher
seed yields with both IF and BL compared with
mineral fertilizer could be the result of several factors,
such as the effect of broiler litter supplying more
nutrients over the growing season for plant growth and
seed filling. For example, Ghosh et al. (2009) reported
that integrated application of chemical with organic
fertilizers (farm yard and poultry manure) produced
higher seed yield of soybean intercropped with
sorghum, as compared to mineral fertilizer. Our
results corroborate with a study by Rostaei et al.
(2014) who reported that application of broiler litter on
intercropped fenugreek-black cumin (Nigella sativa
L.) resulted in higher seed yield in both crops than in
sole crops supplied with chemical fertilizers, espe-
cially for higher shares of fenugreek. As well, broiler
litter can improve the soil chemical, physical and
biological properties as compared to the chemical
fertilizers (Tejada et al. (2011). Fereidooni et al.
(2013) also reported the application of broiler litter
increased soil organic matter and microbial activity
and had a higher potential for enzyme activity leading
to higher maize yields. Finally, Fallah et al. (2013)
explained that the small decline in soil pH could be
attributed to the nitrification of NH4 and various
organic acids produced during the decomposition of
the labile fraction of the manure that could be helpful
to improve yield.
The N and P concentration in the AGDMP and
seeds of both fenugreek and buckwheat were higher in
intercrops than for sole crops. The N and P
concentrations in the AGDMP were generally higher
in both fenugreek and buckwheat intercropped with a
high share of fenugreek [fenugreek: buckwheat (2:1)];
whereas, in the seeds the N and P concentrations were
higher in the fenugreek: buckwheat (1:1). Similarly,
Bedoussac and Justes (2010) reported that inter-
cropped wheat with pea resulted in a 50% higher N
content in wheat seeds as compared to the sole wheat.
Advantages of intercropping cereals with legumes are
attributed to a more efficient utilization of resources
such as nitrogen (Musa et al. 2010). Neugschwandtner
and Kaul (2015) found a higher grain N content of oat
in mixtures with an even share of oat:pea (50:50),
explaining this by the higher availability of soil
mineral N per unit area for individual oat plants due
to reduced intraspecific competition at lower oat
density and less interspecific competition with an
N-fixing legume companion crop.
The results suggest that broiler litter and integrated
fertilizer are recommendable for increasing macronu-
trient (N, P) concentrations in both AGDM and seeds
of fenugreek-buckwheat intercrops. According to
Fallah et al. (2013), adding poultry manure to chem-
ical fertilizers provides an optimum balance between
N and P in the calcareous soils of the study site for
optimum plant growth.
The results of P concentration and uptake are in
agreement with the finding of Mohanty et al. (2006),
who reported that highest P content and uptake were
observed in both groundnut and corn with organic
fertilizer (poultry manure) as compared to single
superphosphate application. The results of the soil
analysis show (Table 1S) a low initial soil organic
matter content (\ 1%) which can limit the nutrient
availability for plants, especially phosphorus. There-
fore, applying a soil amendment, such as broiler litter,
which has a high P content, can increase phosphorus
availability in the soil along with increasing the carbon
content. Demir et al. (2010) also showed that the
application of poultry manure significantly increased
available macronutrients (especially P and N) in the
soil and was one of the important reasons for optimum
plant growth. They concluded that in the case of
poultry manure, the P concentration increased due to
the high P content in manure itself.
A higher total N-LER and P-LER in the AGDM and
in the seeds were found in intercropping (especially
with a higher share of fenugreek (fenugreek: buck-
wheat (2:1)), which indicates an advantage of a
Nutr Cycl Agroecosyst (2018) 110:407–425 421
123

legume intercrop as compared to sole crops. This
shows that one benefit of crops grown in association
with fenugreek can also be measured in terms of the
increased N and P concentration and uptake. Further-
more, the total N-LER and P-LER were considerably
higher than unity across the IF and BL fertilizers in all
intercropped treatments, indicating a nutrient yield
advantage in AGDM at the flowering stage and in the
seeds of fenugreek-buckwheat intercrops as compared
to sole crops.
The enhanced soil N availability with fenugreek
improved the nutrient use efficiency of the cropping
system, these results corroborate with Dahmardeh and
Hodiani (2016). ANUE and ANRE were higher in the
fenugreek-buckwheat intercrops as compared to sole
fenugreek and were furthermore higher with CF than
with BL (as total applied N and not just assumed
mineralized 50% for BL were taken into consideration
for ANUE and ANRE calculations). The broiler litter
and integrated fertilizer had higher soil residual N and
P after harvest than the chemical fertilizer in 2014
(data not shown). Neugschwandtner and Kaul (2015)
have shown that sowing ratio in intercrops and
fertilization level can affect ANUE, in addition to
factors such as sowing date and year (Neugschwandt-
ner et al. 2015). The ANRE of sometimes more than
100% indicates that a high portion of the applied N
was used and indicates that also some of the N taken up
by plants was derived from mineralization processes
in the soil or from N fixation. The higher ANRE in
intercrops may also support the suggestion by Haug-
gaard-Nielsen et al. (2001) that crops grown in
mixtures do not compete for the same resource niche
and therefore are more efficient in their use of
resources.
Conclusions
The application of both broiler litter alone and in an
integrated fertilizer form (broiler litter with chemical
fertilizer) was more effective in enhancing nutrient
concentrations (NC and PC), nutrient uptake (NUp and
PUp), yield and N and P land use advantages of
fenugreek and buckwheat in both the sole and inter-
cropped treatments at the flowering stage and of seed
yields as compared to the chemical fertilizer application.
The N-LER and P-LER, applied N use efficiency
and applied N recovery efficiency increased produc-
tivity of the intercrops (AGDM at flowering and seed
yield) as compared to sole crops. For fenugreek-
buckwheat intercrops, a higher share of fenugreek and
lower share of buckwheat (2:1) appeared to be
optimum for higher yield and nutrient advantage.
Achievement of high yield and nutrient yield advan-
tage in fenugreek and buckwheat by intercropping in
semi-arid areas, through increasing the efficiency of
nitrogen and phosphorus use, can minimize loss of
these nutrients.
Acknowledgements Open access funding provided by
University of Natural Resources and Life Sciences Vienna
(BOKU). We are grateful to Shahrekord University for financial
support of the experiments as well as to the University of Natural
Resources and Life Sciences, Vienna (BOKU) for providing A.
Salehi with a research opportunity.
Open Access This article is distributed under the terms of the
Creative Commons Attribution 4.0 International License (http://
creativecommons.org/licenses/by/4.0/), which permits unre-
stricted use, distribution, and reproduction in any medium,
provided you give appropriate credit to the original
author(s) and the source, provide a link to the Creative Com-
mons license, and indicate if changes were made.
422 Nutr Cycl Agroecosyst (2018) 110:407–425
123
Appendix
See Tables 1 and 2.
Table 1 Pearson’s correlation coefficients (r) among macronutrients concentration, macronutrients uptake in individual above
ground dry matter (AGDMP) and AGDMP at flowering, seed and seed yield at harvest of fenugreek in 2014 and 2015 (n = 36)
2014 AGDMP of fenugreek at flowering Seed of fenugreek
NC PC AGDMP Nup Pup NC PCSeed yeild Nup
AGDMP
PC 0.57**
DM -0.02ns 0.13ns
Nup 0.18ns 0.23ns 0.98***
Pup 0.09ns 0.33* 0.97*** 0.97***
Seed
NC 0.03ns 0.25ns -0.12ns -0.15ns -0.09ns
PC 0.06ns 0.25ns -0.13ns -0.13ns -0.04ns 0.28ns
Seed yield 0.21ns 0.36* 0.90*** 0.93*** 0.92*** -0.13ns -0.14ns
Nup 0.18ns 0.42** 0.87*** 0.88*** 0.91*** 0.16ns -0.04ns 0.95***
Pup 0.23ns 0.46** 0.86*** 0.88*** 0.91*** -0.05ns 0.13ns 0.96*** 0.94***
2015 AGDMP of fenugreek at flowering Seed of fenugreek
NC PC AGDMP Nup Pup NC PCSeed yeild Nup
AGDMP
PC 0.69***
DM -0.03ns -0.06ns
Nup 0.15ns 0.06ns 0.98***
Pup 0.07ns 0.08ns 0.99*** 0.99***
Seed
NC -0.13ns -0.03ns -0.39* -0.42* -0.40*
PC 0.44** 0.48** -0.06ns 0.04ns 0.01ns 0.34*
Seed yield 0.30ns 0.79ns 0.74*** 0.76*** 0.75*** -0.37* 0.08ns
Nup 0.26ns 0.19ns 0.59*** 0.61*** 0.61*** 0.07ns 0.26ns 0.90***
Pup 0.51** 0.41* 0.59*** 0.67*** 0.65*** -0.16ns 0.53** 0.87*** 0.87***
nsnot significant
*, **, *** Significant effect at p\ 0.05, 0.01, 0.001, respectively
Nutr Cycl Agroecosyst (2018) 110:407–425 423
123
References
Ahmad A, Alghamdi SS, Mahmood K, Afzal M (2016) Fenu-
greek a multipurpose crop: potentialities and improve-
ments. Saudi J Biol Sci 23:300–310
Alamprese C, Casiraghi E, Pagani MA (2007) Development of
gluten-free fresh egg pasta analogues containing buck-
wheat. Eur Food Res Technol 225:205–213
Alizadeh P, Fallah S, Raiesi F (2012) Potential N mineralization
and availability to irrigated maize in a calcareous soil
amended with organic manures and urea under field con-
ditions. Int J Plant Prod 6:493–512
Bedoussac L, Justes E (2010) The efficiency of a durum wheat-
winter pea intercrop to improve yield and wheat grain
protein concentration depends on N availability during
early growth. Plant Soil 330:19–35
Bremner JM (1996) Nitrogen-total. In: Sparks DL (ed) Methods
of soil analysis, part 3. SSSA book ser. 5. SSSA and ASA,
Madison, pp 1085–1121
Chandrashekara K, Somashekarappa HM (2016) Estimation of
radionuclides concentration and average annual committed
effective dose due to ingestion for some selected medicinal
plants of South India. J Radiat Res Appl Sci 9(68–7):7
Chapagain T, Riseman A (2014) Barley-pea intercropping:
effects on land productivity, carbon and nitrogen trans-
formations. Field Crop Res 166:18–25
Dadrasan M, Chaichi MR, Pourbabaee AA, Yazdani D,
Keshavarz-Afshar R (2015) Deficit irrigation and biologi-
cal fertilizer influence on yield and trigonelline production
of fenugreek. Ind Crop Prod 77:156–162
DahmardehM, Hodiani A (2016) Assessment of soil elements in
intercropping based on mathematical modelling. Comput
Electron Agric 122:218–224
Dai CC, Chen Y, Wang XX, Li PD (2013) Effects of inter-
cropping of peanut with the medicinal plant Atractylodes
lancea on soil microecology and peanut yield in subtropi-
cal China. Agrofor Syst 87:417–426
Damodar Reddy D, Subba Rao A, Rupa TR (2000) Effects of
continuous use of cattle manure and fertilizer phosphorus
on crop yields and soil organic phosphorus in a Vertisol.
Bioresour Technol 75:113–118
Demir K, Sahin O, Kadioglu YK, Pilbeam DJ, Gunes A (2010)
Essential and non-essential element composition of tomato
plants fertilized with poultry manure. Sci Hortic 127:16–22
Dhima KV, Lithourgidis AS, Vasilakoglou IB, Dordas CA
(2007) Competition indices of common vetch and cereal
intercrops in two seeding ratio. Field Crop Res
100:249–256
Fallah S, Ghalavand A, Raiesi F (2013) Soil chemical properties
and growth and nutrient uptake of maize grown with dif-
ferent combinations of broiler litter and chemical fertilizer
in a calcareous soil. Commun Soil Sci Plant Anal
44:3120–3136
Table 2 Pearson’s correlation coefficients (r) among macronutrients concentration, macronutrients uptake in individual above
ground dry matter (AGDMP) and AGDMP at flowering stage, seed and seed yield at harvest of buckwheat in 2014 and 2015 (n = 36)
2014 AGDMP of buckwheat at flowering Seed of buckwheat NC PC AGDMP Nup Pup NC PC Seed yield Nup
PC 0.72***
DM 0.20ns 0.04ns
Nup 0.43** 0.21ns 0.97***
Pup 0.45** 0.45** 0.90*** 0.95***
Seed
NC 0.32* 0.05ns 0.02ns 0.10ns 0.05ns
PC 0.43** 0.09ns -0.05ns 0.05ns -0.02ns 0.60***
Seed yield 0.23* 0.02ns 0.45** 0.41* 0.37* -0.48** -0.26ns
Nup 0.25ns 0.11ns 0.47** 0.48** 0.43** 0.07ns 0.09ns 0.82***
Pup 0.23ns 0.10ns 0.42* 0.43** 0.3* -0.23ns 0.18ns 0.90*** 0.88***
2015 AGDMP of buckwheat at flowering Seed of buckwheat
NC PC AGDM P Nup Pup NC PCSeed yield Nup
PC 0.68***
AGDMP 0.35* 0.28ns
Nup 0.42* 0.32* 0.99***
Pup 0.43** 0.40* 0.99*** 0.99***
Seed
NC 0.20ns 0.09ns -0.18ns -0.18ns -0.17ns
PC -0.09ns -0.32* -0.98ns -0.10ns -0.13ns 0.38*
Seed yield 0.37* 0.22ns 0.82*** 0.82*** 0.82*** -0.06ns -0.19ns
Nup 0.45** 0.23ns 0.63*** 0.65*** 0.63*** 0.44** 0.00ns 0.86***
Pup 0.29ns 0.01ns 0.71*** 0.71*** 0.68*** 0.46ns 0.40* 0.81*** 0.81***
nsnot significant
*, **, *** Significant effect at p\ 0.05, 0.01, 0.001, respectively
424 Nutr Cycl Agroecosyst (2018) 110:407–425
123

Fereidooni M, Raiesi F, Fallah S (2013) Ecological restoration
of soil respiration, microbial biomass and enzyme activities
through broiler litter application in a calcareous soil
cropped with silage maize. Ecol Eng 58:266–277
Ghosh PK, Tripathi AK, Bandyopadhyay KK, Manna MC
(2009) Assessment of nutrient competition and nutrient
requirement in soybean/sorghum intercropping system.
Eur J Agron 31:43–50
Hamzei J, Seyyedi M (2016) Energy use and input-output costs
sunflower production in sole and intercropping with soy-
bean under different tillage systems. Soil Till Res
157:73–82
Hauggaard-Nielsen H, Ambus P, Jensen ES (2001) Temporal
and spatial distribution of roots and competition for nitro-
gen in pea-barley intercrops-a field study employing P-32
technique. Plant Soil 236:63–74
Hauggaard-Nielsen H, Gooding M, Ambus P, Corre-Hellou G,
Crozat Y, Dahlmann C, Dibet A, Von Fragstein P, Pristeri
A, Monti M, Jensen ES (2009a) Pea-barley intercropping
for efficient symbiotic N2-fixation, soil N acquisition and
use of other nutrients in European organic cropping sys-
tems. Field Crop Res 113:64–71
Hauggaard-Nielsen H, Gooding M, Ambus P, Corre-Hellou G,
Crozat Y, Dahlmann C, Dibet A, Von Fragstein P, Pristeri
A, Monti M, Jensen MES (2009b) Pea–barley intercrop-
ping and short-term subsequent crop effects across Euro-
pean organic cropping conditions. Nutr Cycl Agroecosyst
85:141–155
He YT, ZhangWJ, XuMG, Tong XG, Sun FX,Wang JZ, Huang
SM, Zhu P, He XH (2015) Long-term combined chemical
and manure fertilizations increase soil organic carbon and
total nitrogen in aggregate fractions at three typical crop-
land soils in China. Sci Total Environ 532:635–644
Iyamuremye F, Dick RP (1996) Organic amendments and
phosphorus sorption by soils. Adv Agron 56:139–185
Jackson ML (1958) Soil chemical analysis. Prentice-Hall, Inc.,
Englewood Cliffs, pp 178–182
Jouzi Z, Azadi H, Taheri F, Zarafshani K, Gebrehiwot K, Van
Passel S, Lebailly P (2017) Organic farming and small-
scale sarmers: main opportunities and challenges. Ecol
Econ 132:144–154
Kenny O, Smyth TJ, Hewage CM, Brunton NP (2013)
Antioxidant properties and quantitative UPLC-MS analy-
sis of phenolic compounds from extracts of fenugreek
(Trigonella foenum-graecum) seeds and bitter melon
(Momordica charantia) fruit. Food Chem 141:4295–4302
Mead R,Willey RW (1980) The concept of land equivalent ratio
and advantages in yield from intercropping. Exp Agric
16:217–218
Meade G, Lalorb STJ, Mc Cabea T (2011) An evaluation of the
combined usage of separated liquid pig manure and inor-
ganic fertiliser in nutrient programmes for winter wheat
production. Eur J Agron 34:62–70
Mohanty S, Paikaray NK, Rajan AR (2006) Availability and
uptake of phosphorus from organic manures in groundnut
(Arachis hypogea L.)–corn (Zea mays L.) sequence using
radio tracer technique. Geoderma 133:225–230
Musa M, Leitch MH, Iqbal M, Sahi FUH (2010) Spatial
arrangement affects growth characteristics of barley-pea
intercrops. Int J Agric Biol 12:685–690
Neugschwandtner RW, Kaul H-P (2014) Sowing ratio and N
fertilization affect yield and yield components of oat and
pea in intercrops. Field Crop Res 155:159–163
Neugschwandtner RW, Kaul H-P (2015) Nitrogen uptake, use
and utilization efficiency by oat-pea intercrops. Field Crop
Res 179:113–119
Neugschwandtner RW, Kaul H-P (2016) Concentrations and
uptake of macronutrients by oat and pea in intercrops in
response to N fertilization and sowing ratio. Arch Agron
Soil Sci 62:1236–1249
Neugschwandtner RW, Bohm K, Hall RM, Kaul H-P (2015)
Development, growth, and nitrogen use of autumn- and
spring-sown facultative wheat. Acta Agric Scand Sect B
65:6–13
Oelbermann M, Echarte L (2011) Evaluating soil carbon and
nitrogen dynamics in recently established maize–soyabean
inter-cropping systems. Eur J Soil Sci 62:35–41
Osman AE, Nersoyan N (1986) Effect of the proportion of
species on the yield and quality of forage mixtures, and on
the yield of barley in the following year. Exp Agric
22:345–351
Rostaei M, Fallah S, Abbasi Sorki A (2014) Effect of fertilizer
sources on growth, yield and yield components of fenu-
greek intercropped with black cumin. J Crop Prod
7:197–222
Ruby BC, Gaskill SE, Slivka D, Harger SG (2005) The addition
of fenugreek extract (Trigonella foenum-graecum) to glu-
cose feeding increases muscle glycogen resynthesis after
exercise. Amino Acids 28:71–76
Sahota TS, Malhi SS (2012) Intercropping barley with pea for
agronomic and economic considerations in northern
Ontario. Agric Sci 3(7):889–895
Salehi A, Fallah S, Kaul H-P (2016) Broiler litter and inorganic
fertilizer effects on seed yield and productivity of buck-
wheat and fenugreek in row intercropping. Arch Agron
Soil Sci. https://doi.org/10.1080/03650340.2016.1258114
Saxena A, Vikram NK (2004) Role of selected Indian plants in
management of type 2 diabetes: a review. J Altern Com-
plement Med 10:369–378
Scalise A, Tortorella D, Pristeri A, Petrovicova B, Gelsomino A,
Lindstrom K, Monti M (2015) Legume-barley intercrop-
ping stimulates soil N supply and crop yield in the suc-
ceeding durum wheat in a rotation under rainfed
conditions. Soil Biol Biochem 89:150–161
Tejada M, Benitez C, Parrado J (2011) Application of bios-
timulants in benzo(a)pyrene polluted soils: short-time
effects on soil biochemical properties. Appl Soil Ecol
50:21–26
Yan ZJ, Liu PP, Li YH, Ma L, Alva A, Dou ZX, Chen Q, Zhang
FS (2013) Phosphorus in China’s intensive vegetable pro-
duction systems: over-fertilization, soil enrichment, and
environmental Implications. J Environ Qual 42:982–989
Yan S, Du X, Wu F, Li L, Li C, Meng Z (2014) Proteomics
insights into the basis of interspecific facilitation for maize
(Zea mays) in faba bean (Vicia faba)/maize intercropping.
J Proteomics 109:111–124
Yan Z, Chen S, Li J, Alva A, Chen Q (2016) Manure and
nitrogen application enhances soil phosphorus mobility in
calcareous soil in greenhouses. J Environ Manag
181:26–35
Nutr Cycl Agroecosyst (2018) 110:407–425 425
123
Related Documents