Mascha Jacob Productivity and nutrient relations of trees in deciduous forests differing in tree species diversity Göttingen Centre for Biodiversity and Ecology Biodiversity and Ecology Series B Volume 5

Welcome message from author
This document is posted to help you gain knowledge. Please leave a comment to let me know what you think about it! Share it to your friends and learn new things together.
Transcript
Mascha Jacob
Productivity and nutrient relations of trees in deciduous forests differing in tree species diversity
Göttingen Centre for Biodiversity and Ecology
Biodiversity and Ecology Series B Volume 5
Published as volume 5 in the Series B as part of the „Biodiversity and Ecology Series“ Göttingen Centre for Biodiversity and Ecology 2010
Mascha Jacob Productivity and nutrient relations of trees in deciduous forests differing in tree species diversity Georg-August-Universität Göttingen 2010 This work is licensed under the Creative Commons License 2.0 “by-nd”, allowing you to download, distribute and print the document in a few copies for private or educational use, given that the document stays unchanged and the creator is mentioned. You are not allowed to sell copies of the free version.
Bibliographische Information der Deutschen Nationalbibliothek
Die Deutsche Nationalbibliothek verzeichnet diese Publikation in der Deutschen Nationalbibliographie; detaillierte bibliographische Daten sind im Internet über <http://dnb.ddb.de> abrufbar.
Editor Dr. Dirk Gansert Göttingen Centre for Biodiversity and Ecology, Georg-August-Universität Göttingen, www.biodiversitaet.gwdg.de
Dissertation zur Erlangung des Doktorgrades der Naturwissenschaftlichen Fakultäten der Georg-August-Universität Göttingen vorgelegt von Mascha Jacob Referent: Prof. Dr. Frank Thomas Korreferent: Prof. Dr. Christoph Leuschner
Anschrift des Autors Mascha Jacob e-mail: [email protected] Typesetting and layout: Mascha Jacob Cover image: Mascha Jacob DOI: http://dx.doi.org/10.3249/webdoc-2391 urn:nbn:de:gbv:7-webdoc-2391
GÖTTINGER ZENTRUM FÜR BIODIVERSITÄTSFORSCHUNG UND ÖKOLOGIE
− GÖTTINGEN CENTRE FOR BIODIVERSITY AND ECOLOGY −
Productivity and nutrient relations of trees in deciduous forests differing in tree species diversity
Dissertation zur Erlangung des Doktorgrades der
Mathematisch-Naturwissenschaftlichen Fakultäten der
Georg-August-Universität Göttingen
vorgelegt von
Diplom - Geoökologin
Mascha Jacob
aus Wilhelmshaven
Göttingen, Februar, 2009

Referentin/Referent: Prof. Dr. Frank Thomas
Korreferentin/Korreferent: Prof. Dr. Christoph Leuschner
Tag der mündlichen Prüfung: 19.03.2009
Table of contents Summary.................................................................................................................................... 1
Introduction ............................................................................................................................... 51.1 Biodiversity and ecosystem functions........................................................................................ 6
1.2 Relationship between biodiversity and ecosystems functions ................................................. 7
1.3 Objectives and main hypotheses ................................................................................................ 9
1.4 Study area – The Hainich National Park................................................................................ 10
1.5 Study design............................................................................................................................... 11
1.6 Literature................................................................................................................................... 14
Acidity, nutrient stocks, and organic-matter content in soils of a temperate deciduous forest with different abundance of European beech (Fagus sylvatica L.) ...................................... 19
Productivity of temperate broad-leaved forest stands differing in tree species diversity ...... 47
Leaf litter decomposition in temperate deciduous forest stands along a gradient of increasing tree species diversity .............................................................................................. 71
Nutrient release from decomposing leaf litter of temperate deciduous forest trees along a gradient of increasing tree species diversity........................................................................... 95
Nutrient stocks of five deciduous forest tree species in monospecific and mixed species forest stands ........................................................................................................................... 105
Synopsis ................................................................................................................................. 1257.1 Differ monospecific stands from mixed species stands in ecosystem functions?............... 126
7.2 Differ tree species regarding their ecosystem functions? .................................................... 127
7.3 Differences between beech trees in pure compared to mixed species forest stands .......... 131
7.4 Interactions between tree species and soil parameters ........................................................ 131
7.5 References ................................................................................................................................ 133
Acknowledgements ................................................................................................................ 137
Curriculum vitae.................................................................................................................... 139

Summary
Effects of biodiversity on ecosystem functioning in forests ecosystems are of increasing
interest. There is a vital debate about the influence of species numbers and plant functional
traits for different ecosystem functions such as primary productivity, nutrient cycling and
carbon storage. Only few studies on biodiversity effects were conducted in natural forest,
despite their ecological and socioeconomic importance. Here we studied 12 forest stands in
the Hainich National Park (Thuringia, Central Germany). The general objectives of this
comparative study were (i) to quantify aboveground tree biomass and nutrient content, (ii) to
assess total stand and species-specific productivity, and (iii) to examine decomposition rates
and nutrient release patterns. The focus was to find and understand relations between tree
species diversity and ecosystem functions such as productivity, decomposition and nutrient
release.
Studied forest stands grew on similar soils (physical properties) and bedrock and
differentiated by a gradient of increasing tree species from pure beech forest stands (Fagus
sylvatica), to medium-diverse forests built by beech, ash (Fraxinus excelsior), and lime (Tilia
cordata and T. platyphyllos), and to highly-diverse stands dominated by beech, ash, lime,
maple (Acer pseudoplatanus and A. platanoides), and hornbeam (Carpinus betulus). Stem
wood increment in 2006 and 2007 was measured using permanent measurement tapes. Leaf
and fruits biomass from 2005 to 2007 were collected with litter samplers and a litterbag
experiment was conducted over 22 months to obtain litter, lignin and nutrient release rates.
Total above-ground biomass decreased significantly with tree species diversity from 480 to
200 Mg ha-1. We found distinct differences between the main tree species of our study
regarding total and seasonal production of biomass – e.g. Fraxinus exhibited the highest
wood production, Fagus had higher basal area-related stem wood production than basal
area-related leaf mass production and seasonal growth dynamics of Tilia apparently reacted
most sensitive to actual climatic conditions. Total above-ground production did not differ
significantly between the different forest stands, but exhibited a decreasing tendency with
decreasing beech abundance (9.0, 8.5 and 7.1 Mg ha-1). Leaf biomass was constant for all
forest stands and investigated years ranging from 3.1 to 3.9 Mg ha-1.
Leaf litter and lignin decomposition rates were higher in the mixed species forest stands than
in pure beech stands. Correspondingly, rates of nutrient release from litter mixtures were
significantly higher in the highly diverse stands. Litter decomposition of Fagus was enhanced
in the mixed species stands. Among individual tree species, Fagus leaf litter exhibited
slowest decomposition rates (decomposition rate constant k=0.5), whereas Fraxinus leaf
litter decomposed fastest (k=2). The decomposition rate constants k were closely correlated
- 1 -
with the thickness of the organic litter layer, soil pH, soil fauna abundance and initial C:N, Ca
and N values of leaf litter.
We found the highest nutrient foliar concentrations in Tilia (N, P, K) and Fraxinus (Ca, K,
Mg). Beech foliage and leaf litter had the lowest nutrient concentration compared to the other
deciduous tree species. Basal area-related nutrient stocks were comparable in the ‘storage
compartments’ stem wood and branches. Species-specific differences are high within leaf
litter and fruits for all nutrients. Higher basal area-related total nutrient storage of K, Mg, Ca,
N, and P in mixed species stands compared to monospecific stands was found.
We found no evidence of complementary resource use associated with above-ground
biomass production. Higher decomposition and nutrient release rates indicated a faster
nutrient cycling in the mixed species stands. However, basal area-related productivity of the
monospecific stands was not higher in the mixed than in the pure stands. Instead, mixed
species stands revealed higher nutrients content in all tree compartments of the mixed
species stands. The results suggest that at sites that allow production of broadleaf tree
species with nutrient-rich, easily decomposable foliage the establishment and promotion of
these species is an important silvicultural tool to counteract natural or anthropogenic soil
acidification and to maintain soil productivity. In general, all ecosystem functions were
strongly dependent on the characteristic physiological, morphological and architectural traits,
rather than on tree species number per se.
- 2 -
Zusammenfassung
Die Effekte der Biodiversität auf die Ökosystemfunktionen von Wäldern werden mit
steigendem Interesse diskutiert. Ein Schwerpunkt der Debatte liegt dabei auf dem Einfluss
der Artenzahlen als auch der funktionellen Gruppen auf verschiedene Ökosystemfunktionen,
wie zum Beispiel der Primärproduktion, dem Nährstoffkreislauf oder dem
Kohlenstoffhaushalt. In naturnahen Wäldern wurden trotz ihrer großen ökologischen und
sozioökonomischen Bedeutung bisher nur wenige Studien über Biodiversitätseffekte
durchgeführt. Daher haben wir in einer vergleichenden Studie zwölf Waldbestände im
thüringischen Nationalpark Hainich mit der folgenden Zielsetzung untersucht: (1) die
Quantifizierung der oberirdischen Biomasse und der Nährstoffgehalte der Bäume, (2) die
Bestimmung der Bestandes- und der artspezifischen Produktivität und (3) die
Zersetzungsraten und Nährstofffreisetzungsraten von Blättern zu ermitteln. Der
Schwerpunkt lag dabei auf dem Verständnis der Beziehung zwischen der Baumartenvielfalt
und den einzelnen Ökosystemfunktionen, wie der Produktivität, der Streuzersetzung und der
Nährstofffreisetzung.
Die untersuchten Waldbestände haben vergleichbare physikalische Bodeneigenschaften,
gleiches Ausgangsgestein und unterscheiden sich durch einen Gradienten mit zunehmender
Baumartendiversität von reinen Buchenbeständen (Fagus sylvatica), über mittel-diversen
Beständen aus Buche, Esche (Fraxinus excelsior) und Linde (Tilia cordata und T.
platyphyllos) zu hoch-diversen Beständen aus Buche, Esche, Linde, Ahorn (Acer
pseudoplatanus und A. platanoides) und Hainbuche (Carpinus betulus).
Stammholzzuwächse wurden ab dem Jahr 2006 mit dauerhaft installierten Messbändern
aufgenommen. Die Blatt und Fruchtmassen wurden von 2005 bis 2007 mit Streusammlern
aufgefangen und gewogen und mittels eines Streuzersetzungsexperiments (‘litterbag
experiment’) wurden 22 Monate lang die Abbauraten der Streu, des Ligningehaltes in der
Streu und die Nährstofffreisetzungsraten bestimmt.
Die gesamte oberirdische Biomasse ist signifikant mit der Baumartendiversität von 480 auf
200 Mg ha-1 gesunken. Wir haben deutliche Unterschiede zwischen den Hauptbaumarten
unserer Studie in dem saisonalen Zuwachsverhalten erkennen können – so hatte Fraxinus
beispielsweise die höchste Holzproduktion, Fagus eine, auf die Basalfläche bezogen größere
Stammholz- als Blattmasseproduktion und die saisonale Zuwachsdynamik von Tilia scheint
am sensitivsten mit der aktuellen Witterung zusammenzuhängen. Die gesamte oberirdische
Produktion hat sich zwischen den verschiedenen Waldbeständen nicht signifikant
unterschieden, aber eine abnehmende Tendenz mit abnehmender Buchenhäufigkeit (9,0;
8,5 und 7,1 Mg ha-1) ist erkennbar. Die Blattbiomasse war in allen Waldbeständen und in
allen Untersuchungsjahren konstant (zwischen 3,1 und 3,9 Mg ha-1).

Die Streu- und Ligninzersetzungsraten waren höher in den Mischbeständen als in den reinen
Buchenbeständen. Entsprechend waren auch die Nährstofffreisetzungsraten signifikant
höher in den hoch-diversen Beständen. Die Streuzersetzung von Fagus war in den
Mischbeständen deutlich erhöht. Bei den einzelnen Baumarten hatte die Buchenstreu
allerdings die langsamste Streuzersetzungsrate (‘decomposition rate constant’ k=0.5),
wohingegen die Eschenstreu als schnellste zersetzt wurde (k=2). Die k-Werte der
Zersetzungsraten waren eng mit der Mächtigkeit der organischen Auflage, dem pH-Wert des
Oberbodens, der Anzahl der Bodenfauna und den Anfangsgehalten von C:N, Ca und N in
der Streu korreliert.
Wir haben die höchsten Nährstoffkonzentrationen in frischen Blättern von Tilia (N, P, K) und
Fraxinus (Ca, K, Mg) gefunden. Buchenlaub und Buchenstreu hatte die geringsten
Nährstoffkonzentrationen verglichen mit denen anderer Laubbaumarten. Auf die Basalfläche
bezogene Nährstoffvorräte waren in den ‚Speicherkompartimenten’ Holz und Ästen
vergleichbar hoch. Artspezifische Unterschiede sind bei allen Nährstoffen in der Streu und in
den Früchten vorhanden. Höhere basalflächenbezogene Nährstoffvorräte von K, Mg, Ca, N
und P konnten in den Mischbeständen verglichen mit den reinen Buchenbeständen
nachgewiesen werden.
Wir haben keinen Hinweis auf komplementären Ressourcenverbrauch in Verbindung mit der
oberirdischen Biomasseproduktion gefunden. Höhere Zersetzungs- und
Nährstofffreisetzungsraten weisen auf einen höheren Nährstoffkreislauf in den
Mischbeständen hin. Jedoch ist die Produktivität bezogen auf die Basalfläche der Bäume in
den Mischbeständen nicht höher verglichen mit den reinen Buchenbeständen. Wir haben
sogar höhere Nährstoffgehalte in allen Baumkompartimenten in den Mischbeständen
gefunden. Die Ergebnisse zeigen, dass vor allem für Standorte, die für den Anbau von
Laubbaumarten mit ihrer nährstoffreichen und leicht zersetzbaren Streu geeignet sind, mit
diesen Arten ein wichtiges forstwirtschaftliches Instrument gegeben ist, um natürlicher oder
anthropogener Bodenversäuerung entgegen zu wirken und die Produktivität der Böden zu
erhalten. Im Allgemeinen waren alle Ökosystemfunktionen stark abhängig von den für die
jeweilige Baumart charakteristischen physiologischen, morphologischen und
architektonischen Eigenschaften als nur von der Baumartenanzahl allein.

Chapter
1
Introduction
- 5 -
Chapter 1
1.1 Biodiversity and ecosystem functions
Biodiversity or biological diversity is defined as “the variability among living organisms from
all sources including, inter alia, terrestrial, marine and other aquatic ecosystems and the
ecological complexes of which they are part; this includes diversity within species, between
species and of ecosystems” (CBD 2006). Biodiversity can also be described in terms of
numbers (e.g. plant species, genes, ecosystems), the evenness of their distribution, the
differences in their functional traits and the corresponding interactions (Hooper et al. 2005).
During the past two decades, there was a vital debate about the effects of biodiversity on
ecosystem functions such as primary productivity, nutrient cycling and carbon storage in
managed and near-natural ecosystems (e.g., Loreau et al. 2002, Hooper et al. 2005, Hector
et al. 2007).
Effects of biodiversity on ecosystem functioning were mainly studied with experiments in
even-aged, short-lived systems such as grasslands. These experiments artificially create
gradients in grassland plant diversity (Leuschner et al. 2009). Forest ecosystems with a high
longevity of dominant trees and a complex stand structure were largely excluded from
biodiversity experiments, despite their ecological and socioeconomic importance (Scherer-
Lorenzen et al. 2007). Most studies comparing species-poor and species-rich stands
contrasted plots with one and two tree species (cf. Cannell et al. 1992). Only during the past
decade, a few large-scale experimental designs with more tree species were established in
forest biomes worldwide: e.g. in a neotropical forest in Panama (1-6 tree species), a
palaeotropical forest in Malaysian Borneo (1-16 tree species), a boreal forest in Finland (1-5
tree species), and a mixed temperate forest in Germany (1-6 tree species) (Scherer-
Lorenzen et al. 2005a). The temperate forest experiment, BIOTREE, was planted in 2003
and is situated in Central Germany, Thuringia, close to the Hainich National Park. Response
variables in this experiment also focus on productivity and biogeochemical cycles (Scherer-
Lorenzen et al. 2007).
Such experiments with artificially created gradients of even-aged and long-lived plants are
important to detect underlying mechanisms of relationships between diversity and ecosystem
processes, although they have shortcomings to transfer these results to multi-aged mature
forest stands with its complex stand structure (Leuschner et al. 2009). Therefore,
observational studies that compare diversity and ecosystem processes in different existing
forest stands (e.g. Caspersen and Pacala 2001, Vilà et al. 2003, Vilà et al. 2007) are needed
to complement manipulative experiments. Observational studies in mixed forests have the
advantage to compare adult trees of stands with near-natural structure, intact food web
structures and nutrient contents in biomass at a quasi steady state (Leuschner et al. 2009).
- 6 -
Introduction
However, covarying factors such as environmental conditions, land use history, or
management may obscure potential effects of biodiversity on ecosystem processes and site
conditions therefore have to be very similar (Mund and Schulze 2005, Vilà et al. 2005).
Due to the Ice Ages and geological barriers (the Alps), the tree species diversity of Central-
European forests is much lower than in the temperate zones of other continents. European
beech (Fagus sylvatica L.) would dominate natural forest vegetation in Central Europe
without anthropogenic interference, except for the upper montane regions (e.g. Ellenberg
1996). Because of climate change, which is expected to result in weather extremes and
lowered precipitation in summer, silvicultural measures are undertaken to convert
monospecific into mixed stands (e.g. BMVEL 2001) to strengthen the stability and resilience
of the forest stands (cf. Scherer-Lorenzen et al. 2005b). In beech forests, management
programs aim at increasing the portion of other broad-leaved tree species such as ash
(Fraxinus excelsior L.), lime (Tilia spp.), maple (Acer spp.) and hornbeam (Carpinus betulus
L.). However, the consequences of this conversion for productivity, biotic interactions and the
fluxes of energy and matter as well as for ecosystem goods and services used by man are
insufficiently known.
1.2 Relationship between biodiversity and ecosystems functions
Biomass and productivity In synthetic grassland communities, mostly positive effects of plant species diversity on plant
biomass production have been found (e.g. Tilman et al. 1997, Hector et al. 1999, Caldeira et
al. 2001, van Ruijven and Berendse 2003, Roscher et al. 2005). In theory, increased
biomass production in stands that are more diverse in plant species or plant functional
groups may be a consequence of positive interactions among the species or may result from
complementarity in resource use, e.g., increased depletion of light, water or nutrients by
coexisting plant species (e.g. Hooper and Vitousek 1997). Positive mixture effect with
increasing productivity of one or two of the investigated tree species compared to the
corresponding pure stands, so called overyielding, can be explained with complementarity in
resource use.
In forest ecosystems, observational studies addressing the biodiversity-functioning relation
started only recently and have not yet found strong evidence for consistent mixture effects on
productivity (e.g. Ewel et al. 1991, Cannell et al. 1992, Wright 1996, Vilà et al. 2003, Scherer-
Lorenzen et al. 2005b). A survey in Mediterranean-type forests across a broad range of
environmental conditions found significantly higher wood production with increasing local tree
species richness and no effect within functional species richness (Vilà et al. 2007). A
- 7 -

Chapter 1
previous study in this region found no significant effect of tree species richness on wood
production, when environmental factors, such as climate, bedrock types, and radiation were
included in the analysis (Vilà et al. 2003). For temperate North American forests, Casperson
and Pacala (2001) reported an asymptotic increase in wood production with increasing tree
species richness. A study on productivity – diversity relations of forests worldwide failed to
yield relationships between tree species number and production of above-ground tree
biomass (Enquist and Niklas 2001). Our study will show further results on the biodiversity-
richness relation in temperate forests.
Foresters in European countries have conducted comparative studies mainly with pure and
two-species stands on the effects of species mixtures on wood production for nearly a
century (e.g. Cannell et al. 1992, Oltshoorn et al. 1999, Pretzsch 2005). Studies in temperate
forests revealed that the productivity of mixed stands can decrease or increase by up to 30%
compared to monospecies stands, depending on the specific physiology and growth potential
of the species (Pretzsch 2005). Positive mixture effect with increasing productivity of one or
two of the investigated tree species compared to the corresponding pure stands, so called
overyielding, could be explained with complementarity in resource use (similar to results in
grasslands) and decreased interspecific concurrence (e.g. Kennel 1965, Assmann 1970,
Brown 1992, Morgan et al. 1992). No or negative effects of mixing species, due to
competitive interactions where the inferior competitor can only be sustained by silvicultural
interference are also for long known by foresters (e.g. Smith and Long 1992, Yanai 1992,
Pretzsch 2005).
Decomposition, nutrient release and mineralization Plant species composition affects ecosystem nutrient cycling through plant-nutrient uptake
and use, amount and chemical composition of the leaf litter, rhizosphere interactions and
microenvironmental changes (Hättenschwiler et al. 2005, Hättenschwiler and Gasser 2005).
Grassland experiments mainly focused on primary productivity, ecosystem nutrient retention
and to a lower extent on decomposition and nutrient cycling (e.g. Hooper et al. 2005, Spehn
et al. 2005). About 40 studies on the relationship between tree species diversity and litter
decomposition and/or N mineralization showed no coherent pattern (Schmid et al. 2001,
Balvanera et al. 2006, Roscher et al. 2008).
There also seems to be no general relation between biodiversity and nutrient cycling in
boreal and temperate forests (Rothe and Binkley 2001), although niche partitioning and
complementarity models would lead one to expect so (Tilman 1999, Chesson et al. 2002).
Again, some mixtures show, for example, enhanced nutrient uptake in comparison to the
- 8 -
Introduction
corresponding monospecific stands, and others do not. Diversity effects on decomposition
and nutrient mineralization are known for some litter mixtures due to inter- and intraspecific
variations in litter quality (Hättenschwiler 2005, Hättenschwiler and Gasser 2005). However,
the relationship between litter species diversity and process rate does not yet appear to be
predictable, and species identity within a mixture seems to be more important than the mere
number of species (Scherer-Lorenzen et al. 2005, Hättenschwiler et al. 2005). Generally, in
temperate forest ecosystems, the existence of species-specific traits of the trees seem to
render the effects of litter mixing and effects on the decomposition rates are hardly
predictable (Hättenschwiler et al. 2005, Madritch and Cardinale 2007, De Deyn et al. 2008).
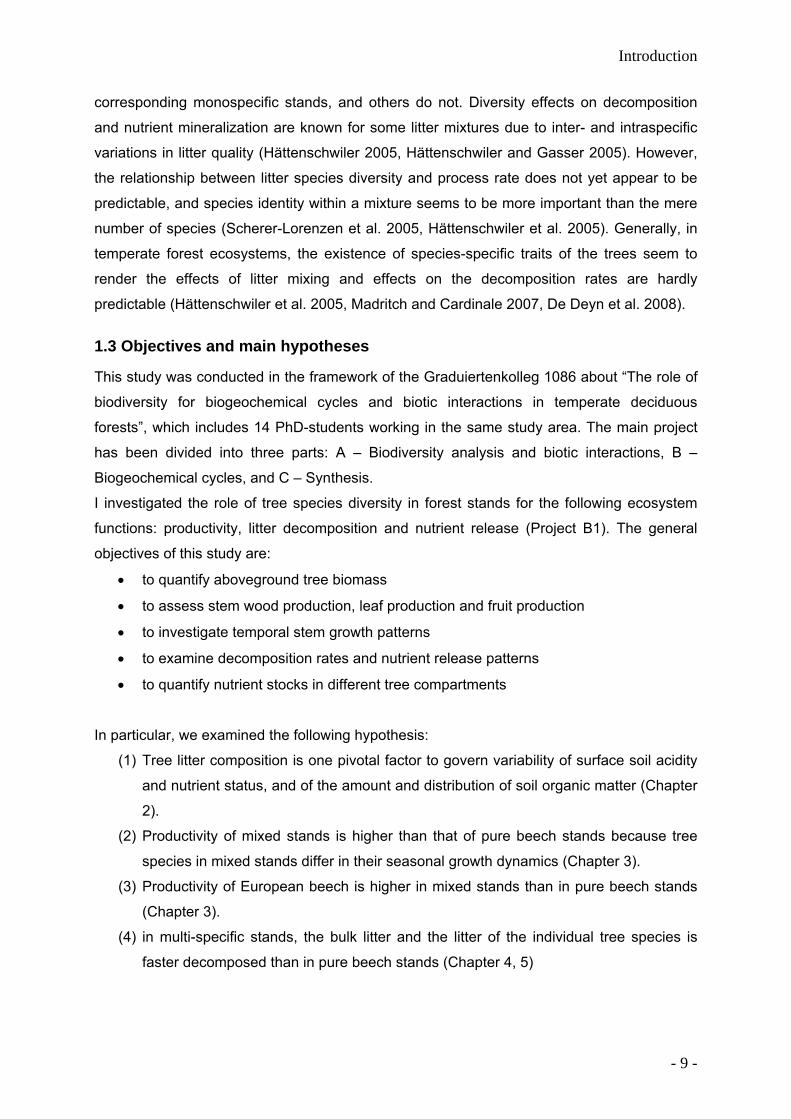
1.3 Objectives and main hypotheses
This study was conducted in the framework of the Graduiertenkolleg 1086 about “The role of
biodiversity for biogeochemical cycles and biotic interactions in temperate deciduous
forests”, which includes 14 PhD-students working in the same study area. The main project
has been divided into three parts: A – Biodiversity analysis and biotic interactions, B –
Biogeochemical cycles, and C – Synthesis.
I investigated the role of tree species diversity in forest stands for the following ecosystem
functions: productivity, litter decomposition and nutrient release (Project B1). The general
objectives of this study are:
• to quantify aboveground tree biomass
• to assess stem wood production, leaf production and fruit production
• to investigate temporal stem growth patterns
• to examine decomposition rates and nutrient release patterns
• to quantify nutrient stocks in different tree compartments
In particular, we examined the following hypothesis:
(1) Tree litter composition is one pivotal factor to govern variability of surface soil acidity
and nutrient status, and of the amount and distribution of soil organic matter (Chapter
2).
(2) Productivity of mixed stands is higher than that of pure beech stands because tree
species in mixed stands differ in their seasonal growth dynamics (Chapter 3).
(3) Productivity of European beech is higher in mixed stands than in pure beech stands
(Chapter 3).
(4) in multi-specific stands, the bulk litter and the litter of the individual tree species is
faster decomposed than in pure beech stands (Chapter 4, 5)
- 9 -

Chapter 1
(5) The nutrient release rates of each diversity level and of all single tree species are
higher in the multi-specific stands compared to monospecific beech stands (Chapter
5)
(6) Total nutrient amounts in monospecific beech stands are higher than in the mixed
stands (Chapter 6)
(7) basal area-related beech nutrient stocks are highest in the mixed species stands
(Chapter 6)
1.4 Study area – The Hainich National Park
We conducted the study in the Hainich National Park, Thuringia, Central Germany - an
outstanding example of a highly diverse European temperate broad-leaved forest. All
research plots are situated at an elevation of about 350 m a.s.l. near the village of
Weberstedt (51° 06’ N, 10° 31’ E). The mean annual temperature at the Weberstedt
meteorological station is 7.5 °C and the mean annual precipitation is 670 mm. Soils are
Luvisols with stagnic properties, developed from Pleistocene loess and underlain by
limestone (Triassic Upper Muschelkalk formation) (FAO 2006). They are characterized by
high silt contents (about 75%), and have a loess cover of at least 60 cm (Guckland et al.
2009). Dominant forest communities are the Galio-Fagetum, the Hordelymo-Fagetum, and
the Stellario-Carpinetum (Mölder et al. 2008).
Mean stand age of canopy trees ranged between 90 and 150 years (Schmidt et al. 2008). All
research sites have been permanently covered by deciduous forest for at least 200 years.
Historic forest utilization from the middle of the 19th century until the early 20th century
included initial coppice with standards system (Mittelwald), and later high forest (Hochwald)
and the multiple aged forest system Plenterwald (Schmidt et al. 2009). For the past four
decades, the studied stands could develop a near-natural structure, since there was no more
harvesting and thinning when the military training area was founded in 1964 and the national
park was established in 1997 (Mölder et al. 2008).
- 10 -
Introduction
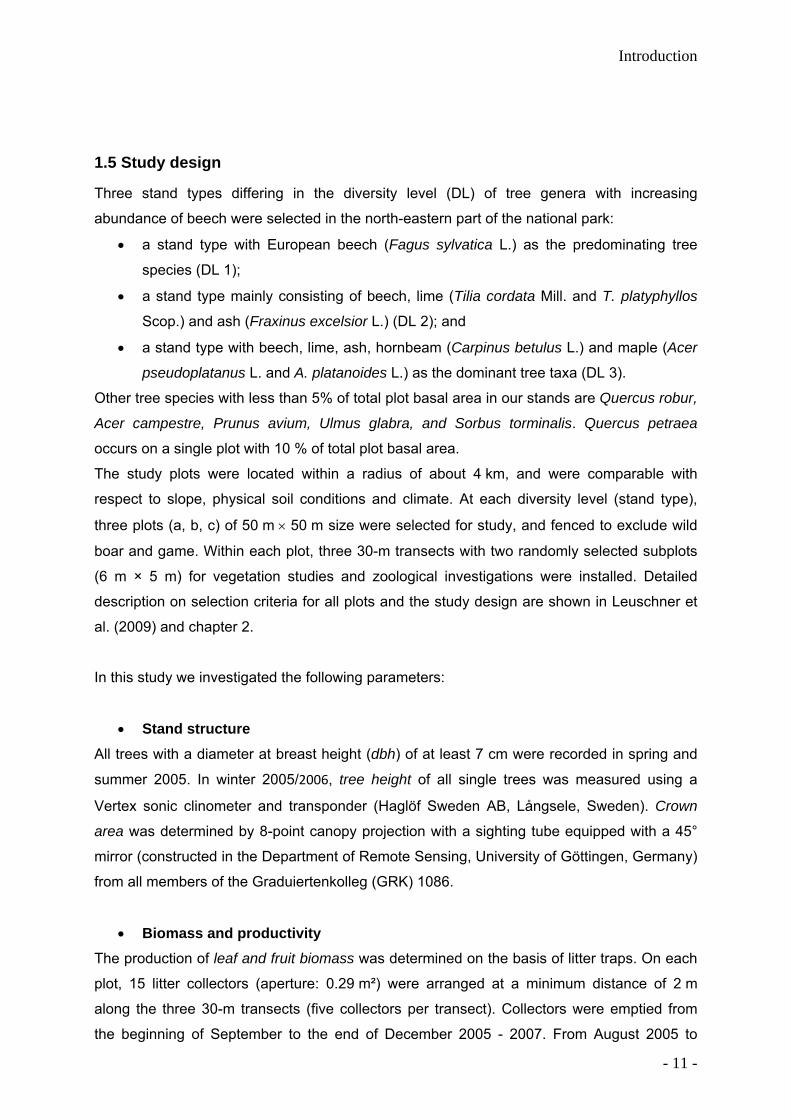
1.5 Study design
Three stand types differing in the diversity level (DL) of tree genera with increasing
abundance of beech were selected in the north-eastern part of the national park:
• a stand type with European beech (Fagus sylvatica L.) as the predominating tree
species (DL 1);
• a stand type mainly consisting of beech, lime (Tilia cordata Mill. and T. platyphyllos
Scop.) and ash (Fraxinus excelsior L.) (DL 2); and
• a stand type with beech, lime, ash, hornbeam (Carpinus betulus L.) and maple (Acer
pseudoplatanus L. and A. platanoides L.) as the dominant tree taxa (DL 3).
Other tree species with less than 5% of total plot basal area in our stands are Quercus robur,
Acer campestre, Prunus avium, Ulmus glabra, and Sorbus torminalis. Quercus petraea
occurs on a single plot with 10 % of total plot basal area. The study plots were located within a radius of about 4 km, and were comparable with
respect to slope, physical soil conditions and climate. At each diversity level (stand type),
three plots (a, b, c) of 50 m × 50 m size were selected for study, and fenced to exclude wild
boar and game. Within each plot, three 30-m transects with two randomly selected subplots
(6 m × 5 m) for vegetation studies and zoological investigations were installed. Detailed
description on selection criteria for all plots and the study design are shown in Leuschner et
al. (2009) and chapter 2.
In this study we investigated the following parameters:
• Stand structure All trees with a diameter at breast height (dbh) of at least 7 cm were recorded in spring and
summer 2005. In winter 2005/2006, tree height of all single trees was measured using a
Vertex sonic clinometer and transponder (Haglöf Sweden AB, Långsele, Sweden). Crown
area was determined by 8-point canopy projection with a sighting tube equipped with a 45°
mirror (constructed in the Department of Remote Sensing, University of Göttingen, Germany)
from all members of the Graduiertenkolleg (GRK) 1086.
• Biomass and productivity The production of leaf and fruit biomass was determined on the basis of litter traps. On each
plot, 15 litter collectors (aperture: 0.29 m²) were arranged at a minimum distance of 2 m
along the three 30-m transects (five collectors per transect). Collectors were emptied from
the beginning of September to the end of December 2005 - 2007. From August 2005 to
- 11 -

Chapter 1
December 2007, stem diameter increment was measured in about 900 trees with different
dbh-classes (7-20, 20-40, 40-60, >60 cm) using increment measurement tapes (D1
permanent measurement tape, UP, Cottbus, Germany). Annual wood production at the plot
level (in Mg ha-1 a-1) was calculated from the relative annual increment of wood biomass of all
tree species present (Chapter 3).
• Decomposition To determine decomposition rates of single tree species litter and stand-characteristic litter
mixtures, a litterbag experiment was set up in November 2005 for two years (Chapter 4, 5).
• Nutrient release Lignin was measured in all fresh leaf samples and subsamples of tree cores and leaf litter
from the main tree species (all from 2006), as well as in litterbag samples from mono and
mixed litterbags. Mono litterbags contained only tree species litter of Fagus, Fraxinus, Tilia,
Carpinus, Acer platanoides and Acer pseudoplatanus. Mixed litterbags represent stand-
specific tree litter mixtures. The bulk of the samples was analysed for lignin concentration
using near-infrared spectroscopy (NIRS) and acetylbromide method (Chapter 4). Other
samples of monospecific and mixed species litterbags were used to determine nutrient
release rates.
• Nutrient stocks Nutrient concentrations of N, P, S, K, Ca, Mg in samples of green leaves, leaf litter, fruits
wood cores and stem bark were measured. All samples were taken in 2006. Nutrient stocks
were calculated as nutrient concentration x biomass of tree compartment (Chapter 6).
- 12 -

Introduction
Transect with leaf litter samplers and rain gauge in a highly diverse forest stand (Foto: M. Jacob).
- 13 -
Chapter 1
1.6 Literature
Assmann E, 1970. The Principles of Forest Yield study: Studies in the Organic Production,
Structure, Increment and Yield of Forest Stands. Pergamon Press, Oxford etc. 506 pp.
Balvanera P, Pfisterer AB, Buchmann N, He J-S, Nakashizuka T, Raffaelli D, Schmid B,
2006. Quantifying the evidence for biodiversity effects on ecosystem functioning and
services. Ecology Letters 9: 1146-1156.
BMVEL (Bundesministerium für Verbraucherschutz, Ernährung und Landwirtschaft), ed.,
2001. Gesamtwaldbericht der Bundesregierung. BMVEL, Bonn.
Brown AFH, 1992. Functioning of mixed-species stands at Gisburn, N.W. England. In:
Cannell MGR, Malcolm DC, Robertson PA (eds.). The ecology of mixed-species stands of
trees. Blackwell, Oxford, pp. 125-150.
Caldeira MC, Ryel RJ, Lawton JH, Pereira JS, 2001. Mechanisms of positive biodiversity-
production relationships: insights provided by δ13C analysis in experimental Mediterranean
grassland plots. Ecology Letters 4: 439-443.
Cannell MGR, Malcolm DC, Robertson PA (eds.), 1992. The ecology of mixed-species
stands of trees. Blackwell, Oxford.
Caspersen JP, Pacala SW, 2001. Successional diversity and forest ecosystem function.
Ecological Research 16: 895-903.
CBD, 2006. Global Biodiversity Outlook 2, Convention on biological diversity,
http://www.biodiv.org/GB02.
Chesson P, Pacala S, Neuhauser C, 2002. Environmental niches and ecosystem functioning.
In: Kinzig AP, Pacala SW, Tilman D (eds.). The functional consequences of biodiversity.
Empirical progress and theoretical extensions. Princeton Univ. Press, Princeton, 213-245.
De Deyn GB, Cornelissen JHC, Bardgett RD, 2008. Plant functional traits and soil carbon
sequestration in contrasting biomes. Ecol Letters 11:516-531.
Ellenberg H, 1996. Vegetation Mitteleuropas mit den Alpen, 5th edn. Ulmer, Stuttgart.
Enquist BJ, Niklas KJ, 2001. Invariant scaling relations across tree-dominated communities.
Nature 410: 655-660.
- 14 -
Introduction
Ewel JJ, Mazzarino MJ, Berish CW, 1991. Tropical soil fertility changes under monocultures
and successional communities of different structure. Ecological Applications 1: 289-302.
Guckland A, Jacob M, Flessa H, Thomas FM, Leuschner C, 2009. Acidity, nutrient stocks,
and organic-matter content in soils of a temperate deciduous forest with different
abundance of European beech (Fagus sylvatica L.). J Plant Nutr Soil Sci 172:200-511.
Hättenschwiler S, 2005. Effects of tree species diversity on litter quality and decomposition.
In: Scherer-Lorenzen M, Körner Ch, Schulze ED, eds. Forest diversity and function -
temperate and boreal systems. Ecological Studies 176. Springer, Berlin. pp 149-164.
Hättenschwiler S, Tiunov AV, Scheu S, 2005. Biodiversity and litter decomposition in
terrestrial ecosystems. Annu Rev Ecol Evol Syst 36:191-218.
Hättenschwiler S, Gasser P, 2005. Soil animals alter plant litter diversity effects on
decomposition. PNAS 102:1519-1524.
Hector A, Joshi J, Scherer-Lorenzen M, Schmid B, Spehn EM, Wacker L, Weilenmann M,
Bazeley-White E, Beierkuhnlein C, Caldeira MC, Dimitrakopoulos PG, Finn JA, Huss-
Danell K, Jumpponen A, Leadley PW, Loreau M, Mulder CHP, Neßhöver C, Palmborg C,
Read DJ, Siamantziouras ASD, Terry C, Troumbis AY, 2007. Plant diversity and
productivity experiments in European grasslands. Science 286:1123-1127.
Hector A, Schmid B, Beierkuhnlein C, Caldeira MC, Diemer M, Dimitrakopoulos PG, Finn JA,
Freitas H, Giller PS, Good J, Harris R, Högberg P, Huss-Danell K, Joshi J, Jumpponen A,
Körner C, Leadley PW, Loreau M, Minns A, Mulder CPH, O’Donovan G, Otway SJ,
Pereira JS, Prinz A, Read DJ, Scherer-Lorenzen M, Schulze ED, Siamantziouras ASD,
Spehn EM, Terry AC, Troumbis AY, Woodward FI, Yachi S, Lawton JH, 1999. Plant
diversity and productivity experiments in European grasslands. Science 286:1123-1127.
Hooper DU, Chapin FS, Ewel JJ, Hector A, Inchausti P, Lavorel S, Lawton JH, Lodge DM,
Loreau M, Naeem S, Schmid B, Setälä H, Symstad AJ, Vandermeer J, Wardle DA, 2005.
Effects of biodiversity on ecosystem functioning: A consensus of current knowledge.
Ecological Monographs 75:3-35.
Hooper DU, Vitousek PM, 1997. The effects of plant composition and diversity on ecosystem
processes. Science 277:1302-1305.
Kennel, R. 1965. Untersuchungen über die Leistung von Fichte und Buche im Rein- und
Mischbestand. Allgemeine Forst- und Jagdzeitung 136:149-161; 173-189.
- 15 -

Chapter 1
Leuschner C, Jungkunst HF, Fleck S, 2009. Functional role of forest diversity: pros and cons
of synthetic stands and across-site comparisons in established forests. Basic Appl Ecol
10, 1-9.
Loreau M, Naeem S, Inchausti P, 2002. Perspectives and challenges. In: Loreau M, Naeem
S, Inchausti P, eds. Biodiversity and ecosystem functioning – Synthesis and perspectives.
Oxford: Blackwell Oxford, pp 237-242.
Madritch MD, Cardinale BJ, 2007. Impacts of tree species diversity on litter decomposition in
northern temperate forests of Wisconsin, USA: a multi-site experiment along a latitudinal
gradient. Plant Soil 292:147-159.
Mölder A, Bernhardt-Römermann M, Schmidt W, 2008. Herb-layer diversity in deciduous
forests: Raised by tree richness or beaten by beech? For Ecol Manage 256:272-281.
Morgan JL, Campbell JM, Malcolm DC, 1992. Nitrogen relations of mixed-species stands on
oligotrophic soils. In: Cannell MGR, Malcolm DC, Robertson PA (eds.) The ecology of
mixed-species stands of trees. Blackwell, London, pp. 65-85.
Mund M, Schulze ED, 2005. Silviculture and its interactions with biodiversity and the carbon
balance of forest soils. In: Scherer-Lorenzen M, Körner Ch, Schulze ED, eds. Forest
diversity and function - temperate and boreal systems. Ecological Studies 176. Springer,
Berlin, pp 185-210.
Olsthoorn AFM, Bartelink HH, Gardiner JJ, Pretzsch H, Hekhuis HJ, Franc A, 1999.
Management of mixed-species forest: silviculture and economics. IBN Scient. Contrib. 15:
1-389.
Roscher C, Temperton VM, Scherer-Lorenzen M, Schmitz M, Schumacher J, Schmid B,
Buchmann N, Weisser WW, Schulze ED, 2005. Overyielding in experimental grassland
communities — irrespective of species pool or spatial scale. Ecology Letters 8: 419-429.
Roscher C, Thein S, Schmid B, Scherer-Lorenzen M, 2008. Complementary nitrogen use
among potentially dominant species in a biodiversity experiment varies between two
years. Journal of Ecology 96: 477-488.
Rothe A, Binkley D, 2001. Nutritional interactions in mixed species forests: a synthesis.
Canadian Journal of Forest Research 31: 1855-1870.
- 16 -

Introduction
Pretzsch H, 2005. Diversity and productivity in forests: evidence from long-term experimental
plots. In: Scherer-Lorenzen M, Körner Ch, Schulze ED, eds. Forest diversity and function -
temperate and boreal systems. Ecological Studies 176. Berlin: Springer Berlin. pp 41-64.
Scherer-Lorenzen M, Potvin C, Koricheva J, Schmid B, Hector A, Bornik Z, Reynolds G and
Schulze ED, 2005a. The design of experimental tree plantations for functional biodiversity
research. In: Scherer-Lorenzen M, Körner Ch, Schulze ED, eds. Forest diversity and
function - temperate and boreal systems. Ecological Studies 176. Springer, Berlin, pp
347–376.
Scherer-Lorenzen M, Körner C, Schulze ED, 2005b. The functional significance of forest
diversity: a synthesis. In: Scherer-Lorenzen M, Körner Ch, Schulze ED, eds. Forest
diversity and function - temperate and boreal systems. Ecological Studies 176. Springer,
Berlin, pp 377-389.
Scherer-Lorenzen M, Schulze ED, Don A, Schumacher J, Weller E, 2007. Exploring the
functional significance of forest diversity: A new long-term experiment with temperate tree
species (BIOTREE). Perspectives in Plant Ecology, Evolution and Systematics 9, 53-70
Schmid B, Joshi J, Schläpfer F, 2001. Empirical evidence for biodiversity-ecosystem
functioning relationships. In: Kinzig AP, Pacala SW, Tilman D (eds.) The functional
consequences of biodiversity: empirical progress and theoretical extensions. Monographs
in Population Biology 33, Princeton University Press, Princeton and Oxford, pp. 120-150.
Schmidt I, Leuschner C, Mölder A, Schmidt W, 2009. Structure and composition of the seed
bank in monospecific and tree species-rich temperate broad-leaved forests. Forest
Ecology and Management, 257: 695–702.
Smith FW, Long JN, 1992. A comparison of stemwood production in monocultures and
mixtures of Pinus contorta var. latifolia and Abies lasiocarpa. In: Cannell MGR, Malcolm
DC, Robertson PA (eds.) The ecology of mixed-species stands of trees. Blackwell,
London, pp. 87-98.
Spehn EM, Hector A, Joshi J, Scherer-Lorenzen M, Schmid B, Bazeley-White E,
Beierkuhnlein C, Caldeira MC, Diemer M, Dimitrakopoulos PG, Finn JA, Freitas H, Giller
PS, Good J, Harris R, Högberg P, Huss-Danell K, Jumpponen A, Koricheva J, Leadley
PW, Loreau M, Minns A, Mulder CPH, O'Donovan G, Otway SJ, Palmborg C, Pereira JS,
Pfisterer AB, Prinz A, Read DJ, Schulze ED, Siamantziouras ASD, Terry AC, Troumbis
AY, Woodward FI, Yachi S, Lawton JH, 2005. Ecosystem effects of biodiversity
manipulations in European grasslands. Ecological Monographs 75: 37-63.
- 17 -

Chapter 1
Tilman D, Knops J, Wedin D, Reich P, Ritchie M, Sieman E, 1997. The influence of
functional diversity and composition on ecosystem processes. Science 277:1300-1302.
Tilman D, 1999. The ecological consequences of changes in biodiversity: a search for
general principles. Ecology 80:1455-1474
Van Ruijven J, Berendse F, 2003. Positive effects of plant species diversity on productivity in
the absence of legumes. Ecology Letters 6:170-175.
Vilà M, Vayreda J, Gracia C, Ibáñez JJ, 2003. Does tree diversity increase wood production
in pine forests? Oecologia 135: 299-303.
Vilà M, Inchausti P, Vayreda J, Barrantes O, Gracia C, Ibáñez JJ, Mata T, 2005.
Confounding factors in the observed productivity-diversity relationship in forests. In:
Scherer-Lorenzen M, Körner Ch, Schulze ED, eds. Forest diversity and function -
temperate and boreal systems. Ecological Studies 176. Springer, Berlin, pp 65-86.
Vilà M, Vayreda J, Comas L, Ibáñez JJ, Mata T, Obón B, 2007. Species richness and wood
production: a positive association in Mediterranean forests. Ecology Letters 10: 241-250.
Wright J, 1996. Plant species diversity and ecosystem functioning in tropical forests. In:
Orians GH, Dirzo A, Cushman JH (eds.) Biodiversity and ecosystem processes in tropical
forests. Ecological Studies Vol. 122. Springer, Berlin. pp. 11-31.
Yanai RD, 1992. Competitive interactions between Norway spruce and Scots pine at Gisburn
Forest, NW England. Forestry 65: 435-451.
- 18 -

Chapter
2
Acidity, nutrient stocks, and organic-matter content in soils of a temperate deciduous forest with different abundance of European beech (Fagus sylvatica L.)
Anja Guckland, Mascha Jacob, Heiner Flessa, Frank M Thomas, Christoph Leuschner
(Published in: Journal of Plant Nutrition and Soil Science, 2009, 172:200-511)
- 19 -

Chapter 2
2.1 Abstract
The production and composition of leaf litter, soil acidity, exchangeable nutrients, and the
amount and distribution of soil organic matter were analyzed in a broad-leaved mixed forest
on loess over limestone in Central Germany. The study aimed at determining the current
variability of surface soil acidification and nutrient status, and at identifying and evaluating the
main factors that contributed to the variability of these soil properties along a gradient of
decreasing predominance of European beech (Fagus sylvatica L.) and increasing tree
species diversity. Analyses were carried out in a) mature monospecific stands with a
predominance of beech (DL 1), b) mature stands dominated by three deciduous tree species
(DL 2: beech, ash (Fraxinus excelsior L.), lime (Tilia cordata Mill. and/or T. platyphyllos
Scop.)), and c) mature stands dominated by five deciduous tree species (DL 3: beech, ash,
lime, hornbeam (Carpinus betulus L.), maple (Acer pseudoplatanus L. and/or A. platanoides
L.)).
The production of leaf litter was similar in all stands (3.2 to 3.9 Mg dry matter ha-1 yr-1) but the
total quantity of Ca and Mg deposited on the soil surface by leaf litter increased with
increasing tree species diversity and decreasing abundance of beech (47 to 88 kg Ca ha-1
yr-1; 3.8 to 7.9 kg Mg ha-1 yr-1). The soil pH (H2O) and base saturation (BS) measured at
three soil depths down to 30 cm (0-10 cm, 10-20 cm, 20-30 cm) were lower in stands
dominated by beech (pH = 4.2 to 4.4, BS = 15 to 20%) than in mixed stands (pH = 5.1 to 6.5,
BS = 80 to 100%). The quantities of exchangeable Al and Mn increased with decreasing pH
and were highest beneath beech. Total stocks of exchangeable Ca (0 - 30 cm) were 12 to 15
times larger in mixed stands (6660 to 9650 kg ha-1) than in beech stands (620 kg ha-1).
Similar results were found for stocks of exchangeable Mg that were 4 to 13 times larger in
mixed stands (270 to 864 kg ha-1) than in beech stands (66 kg ha-1). Subsoil clay content and
differences in litter composition were identified as important factors that contributed to the
observed variability of soil acidification and stocks of exchangeable Ca and Mg. Organic
carbon accumulation in the humus layer was highest in beech stands (0.81 kg m-2) and
lowest in stands with the highest level of tree species diversity and the lowest abundance of
beech (0.27 kg m-2). The results suggest that redistribution of nutrients via leaf litter has a
high potential to increase base saturation in these loess-derived surface soils that are
underlain by limestone. Species-related differences of the intensity of soil-tree cation cycling
can thus influence the rate of soil acidification and the stocks and distribution of nutrients.
- 20 -
Tree species diversity and soils
2.2 Introduction
Natural forest vegetation in Central Europe is unique due to the widespread occurrence of
quasi-monospecific beech forests (Fagus sylvatica L.) in which this single species is
occupying 80 to 100% of the canopy area. Land use changes and forest management have
greatly reduced the area coverage of these beech forests. Transformation to even-aged
monospecific coniferous forests has even resulted in a substantial decrease of forest
structural diversity. However, the conversion to mixed stands of beech with other broad-
leaved or coniferous species increased structural and species diversity.
Changes of tree species can have a pronounced influence on various chemical, physical,
and biological soil properties due to differences in nutrient uptake from soil, litter chemistry,
root activity, canopy interception and growth (Alriksson and Eriksson, 1998; Binkley and
Giardina, 1998). Several studies have shown that the composition of the forest overstory can
influence soil nutrient status (Dijkstra, 2003; Berger et al., 2004), mineralization processes on
and Lee, 1997), soil acidity (Binkley and Valentine, 1991; Reich et al., 2005) and mineral
weathering (Augusto et al., 2000). In addition, tree species can influence the mass of organic
carbon stored in the humus layer and in the mineral soil (Raulund-Rasmussen and Vejre,
1995), the composition and activity of soil fauna and microflora (Saetre et al., 1999; Neirynck
et al., 2000) and soil structure (Graham et al., 1995). Distinctive differences were found
between conifers and hardwood species in affecting soil chemistry or ecosystem
biogeochemistry (Rothe et al., 2002; Augusto et al., 2002), but even among hardwood
species striking differences can occur (Norden, 1994). Comprehensive reviews on the impact
of several common European and American tree species on soil properties were published
by Augusto et al. (2002) and Binkley (1995).
Use and management of beech forests in limestone areas of Central Europe often resulted in
an admixture of different proportions of other broad-leaved species and an increase of tree
species diversity. One outstanding example of a temperate broad-leaved forest with large
gradients in beech abundance and tree species diversity is found in the Hainich National
Park in Central Germany. Here, different forest ownerships have generated a small-scale
stand mosaic of species-poor, beech-dominated forest patches and stands with up to 14
deciduous tree species per hectare that are all growing under similar climate and on the
same geological substrate (Triassic limestone (Muschelkalk) covered by loess). In 2005, a
long-term study on biogeochemical cycles and biotic interactions in stands with decreasing
abundance of beech and associated increasing tree species diversity has been initiated in
the Hainich National Park (http://www.forest-diversity.uni-goettingen.de). This study
compares i) mature monospecific stands with predominance of European beech (Fagus
- 21 -

Chapter 2
sylvatica L.) to ii) mature stands dominated by three deciduous tree species (beech, ash
(Fraxinus excelsior L.), lime (Tilia cordata Mill. and/or T. platyphyllos Scop.) and to iii) mature
stands dominated by five deciduous tree species (beech, ash, lime, hornbeam (Carpinus
betulus L.), maple (Acer pseudoplatanus L. and/or A. platanoides L.).
Here, we present and discuss results on soil properties in these stands. The objectives of our
study were to determine soil acidification, soil nutrient status and the amount and distribution
of soil organic matter (SOM) in these stands with different abundance of beech and tree
species diversity and to identify and evaluate the main factors that contributed to the
variability of these soil properties. Special attention is given to the effects of tree litter
composition and to the small scale heterogeneity of soil parent material. We hypothesize that
these are pivotal factors in governing the current variability of the surface soil acidity and
nutrient status, and of the amount and distribution of SOM.
We like to point out that such an observational study that compares soil properties in existing
forest stands with different mixtures of tree species in general has strong limitations with
regard to the analysis of putative causal relationships between tree species and soil
properties or ecosystem functions because there are no exact replicates of treatments as it is
the case in planted experimental stands. In addition, the natural variability of edaphic, climate
and soil parent material properties or differences in land use history can introduce several
covarying factors (Leuschner et al., 2009). Despite these shortcomings, such observational
studies are indispensable to gain an insight into long-term effects of tree species and species
diversity on soil properties since planted large-scale biodiversity experiments with trees have
been initiated just recently (Scherer-Lorenzen, 2005) and do not yet allow the analysis of
long-term effects.
2.3 Materials and methods
2.3.1 Study sites The study was conducted in multiple-aged stands of deciduous forest in the Hainich National
Park, Thuringia, Central Germany, at an elevation of approximately 350 m a.s.l. All stands
had a high proportion of mature trees with an age of 100 to 200 y and a long-term forest
history of at least 200 y. Historic forest utilization includes coppice-with-standards systems
and selective cutting. Details of stand characteristics are given in Table 1. The mean annual
temperature is 7.5 °C and the mean annual precipitation is 670 mm. The geological substrate
of the study sites is Triassic limestone covered by loess. The forest has not been managed
since 1990; before that time, it had been used for military training since the 1960s. In
December 1997, it became a National Park. In the NE part of the National Park, study plots
- 22 -
Tree species diversity and soils
that belong to three different diversity levels (DL) of tree species were selected: a)
monospecies stands with European beech (Fagus sylvatica L.) as predominant tree species
(diversity level 1, DL 1), b) three-species stands with beech, ash (Fraxinus excelsior L.) and
lime (Tilia cordata Mill. and T. platyphyllos Scop.) as predominant species (diversity level 2,
DL 2), and c) five-species stands with beech, ash, lime, hornbeam (Carpinus betulus L.) and
maple (Acer pseudoplatanus L., A. platanoides L., A. campestre L.) as predominant species
(diversity level 3, DL 3). The mean abundance of beech decreased in the order DL 1 > DL 2
> DL3 (Table1). Within a radius of approximately 4 km four replicate plots were selected for
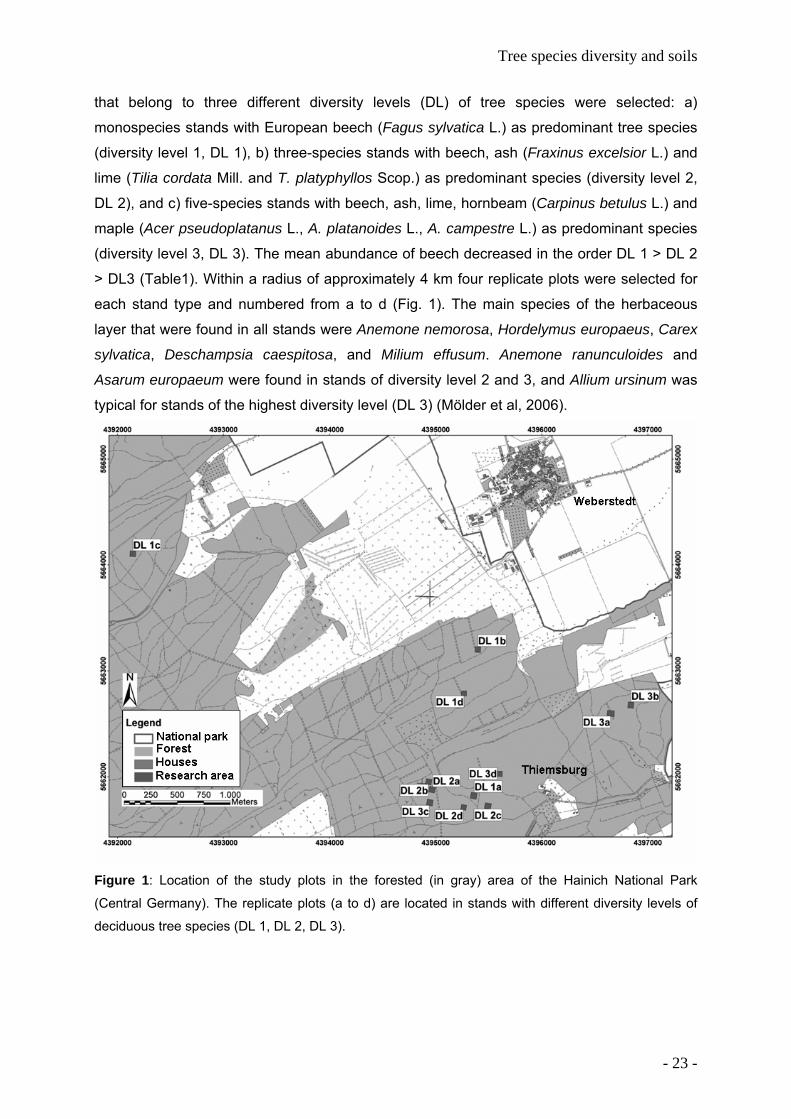
each stand type and numbered from a to d (Fig. 1). The main species of the herbaceous
layer that were found in all stands were Anemone nemorosa, Hordelymus europaeus, Carex
sylvatica, Deschampsia caespitosa, and Milium effusum. Anemone ranunculoides and
Asarum europaeum were found in stands of diversity level 2 and 3, and Allium ursinum was
typical for stands of the highest diversity level (DL 3) (Mölder et al, 2006).
Figure 1: Location of the study plots in the forested (in gray) area of the Hainich National Park
(Central Germany). The replicate plots (a to d) are located in stands with different diversity levels of
deciduous tree species (DL 1, DL 2, DL 3).
- 23 -
Chapter 2
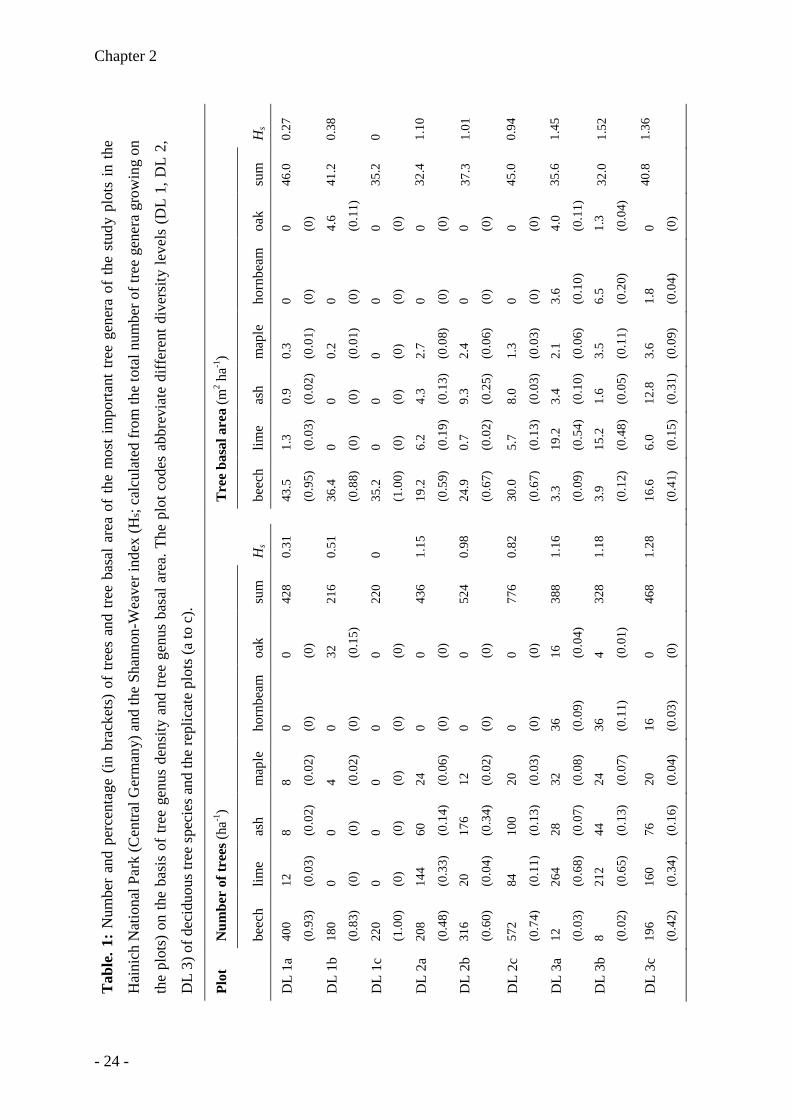
Tab
le. 1
: N
umbe
r an
d pe
rcen
tage
(in
bra
cket
s) o
f tre
es a
nd tr
ee b
asal
are
a of
the
mos
t im
porta
nt tr
ee g
ener
a of
the
Hai
nich
Nat
iona
l Par
k (C
entra
l Ger
man
y) a
nd th
e Sh
anno
n-W
eave
r ind
ex (H
s; ca
lcul
ated
from
the
tota
l num
ber o
f tre
e g
the
plot
s) o
n th
e ba
sis
of tr
ee g
enus
den
sity
and
tree
gen
us b
asal
are
a. T
he p
lot c
odes
abb
revi
ate
diff
eren
t div
ersi
ty le
v
DL
3) o
f dec
iduo
us tr
ee sp
ecie
s and
the
repl
icat
e pl
ots (
a to
c).
Plot
N
umbe
r of
tree
s (ha
-1)
T
ree
basa
l are
a (m
2 ha-1
)
stud
y pl
ots
in th
e
ener
a gr
owin
g on
els
(DL
1, D
L 2,
be
ech
lime
ash
map
le
horn
beam
oa
k su
m
Hs
be
ech
lime
ash
map
le
horn
beam
oa
k su
m
Hs
DL
1a
400
(0.9
3)
12
(0.0
3)
8 (0.0
2)
8 (0.0
2)
0
(0)
0
(0)
428
0.31
43.5
(0.9
5)
1.3
(0.0
3)
0.9
(0.0
2)
0.3
(0.0
1)
0
(0)
0
(0)
46.0
0.27
DL
1b
180
(0.8
3)
0
(0)
0
(0)
4 (0.0
2)
0
(0)
32
(0.1
5)
216
0.51
36.4
(0.8
8)
0
(0)
0
(0)
0.2
(0.0
1)
0
(0)
DL
1c
220
(1.0
0)
0
(0)
0
(0)
0
(0)
0
(0)
0
(0)
220
0
35.2
(1.0
0)
0
(0)
0
(0)
0
(0)
0
(0)
DL
2a
208
4.6
(0.1
1)
41.2
0.38
0
(0)
35.2
0
(0.4
8)
144
(0.3
3)
60
(0.1
4)
24
(0.0
6)
0
(0)
0
(0)
436
1.15
19.2
(0.5
9)
6.2
(0.1
9)
4.3
(0.1
3)
2.7
(0.0
8)
0
(0)
0
(0)
32.4
1.10
0
(0)
37.3
1.01
DL
2b
316
(0.6
0)
20
(0.0
4)
176
(0.3
4)
12
(0.0
2)
0
(0)
0
(0)
524
0.98
24.9
(0.6
7)
0.7
(0.0
2)
9.3
(0.2
5)
2.4
(0.0
6)
0
(0)
DL
2c
572
(0.7
4)
84
(0.1
1)
100
(0.1
3)
20
(0.0
3)
0
(0)
0
(0)
776
0.82
30.0
(0.6
7)
5.7
(0.1
3)
8.0
(0.0
3)
1.3
(0.0
3)
0
(0)
0
(0)
45.0
0.94
DL
3a
12
(0.0
3)
264
(0.6
8)
28
(0.0
7)
32
(0.0
8)
36
(0.0
9)
16
(0.0
4)
388
1.16
3.3
(0.0
9)
19.2
(0.5
4)
3.4
(0.1
0)
2.1
(0.0
6)
3.6
(0.1
0)
4.0
(0.1
1)
35.6
1.45
DL
3b
8
(0.0
2)
212
(0.6
5)
44
(0.1
3)
24
(0.0
7)
36
(0.1
1)
4 (0.0
1)
328
1.18
3.9
(0.1
2)
15.2
(0.4
8)
1.6
(0.0
5)
3.5
(0.1
1)
6.5
(0.2
0)
1.3
(0.0
4)
32.0
1.52
DL
3c
196
(0.4
2)
160
(0.3
4)
76
(0.1
6)
20
(0.0
4)
16
(0.0
3)
0
(0)
468
1.28
16.6
(0.4
1)
6.0
(0.1
5)
12.8
(0.3
1)
3.6
(0.0
9)
1.8
(0.0
4)
0
(0)
40.8
1.36
- 24 -

Tree species diversity and soils
The study sites are close to a meteorological station (Meteomedia, station
Weberstedt/Hainich; 51°06' N, 10°31' E; 270 m a.s.l.). All plots had to fulfil the following
criteria: level or only slightly inclined terrain (inclination < 5%) on eutrophic soils formed on
limestone with a loess cover of at least 60 cm; near-natural stands without distinct
anthropogenic impact on their structure during the last several decades; closed canopy;
homogeneous stand structure among all plots. In each stand type, three plots (a, b, c) met all
of the above-mentioned requirements. These were considered core plots, and an area of 54
m × 54 m around a previously designated central tree was fenced. Within this area,
investigations were performed on the innermost 50 m × 50 m area, which is only walked on
for measurement purposes. On each plot, all trees with a diameter at breast height (dbh) of
at least 7 cm were recorded in spring 2005. To evaluate the tree species diversity we
computed the Shannon-Weaver index (Hs). This index (Hs) was calculated for both density
(number of stems with a dbh > 7 cm) and stem basal area per hectare: Hs = -∑ pi ln pi, where
pi = proportion of total density or of total basal area of tree genus i. Hs based on density and
Hs based on basal area increased in the order DL 1 < DL 2 < DL3 (Table 1).
The soil type was a Luvisol developed from loess which is underlain by limestone (FAO,
1998). Soil texture in the upper mineral soil (0-30 cm) of all plots was characterized by high
silt content (mean silt content of 74 ± 8% (mean ± standard deviation)) and low sand content
(< 5%) (silt loam to silt clay loam, Table 2). The thickness of the loess cover that was
generally free of carbonates varied between 60 and 120 cm (Table 2); it was on average 72
cm on DL 3 plots, 80 cm on DL 2 plots and 87 cm on DL 1 plots. The clay content in 20 to 30
cm differed depending on the thickness of the clay-depleted E horizon (Al according to the
German classification system) and the depth of the underlying Bt horizon. The mean clay
content in 20 to 30 cm was higher in DL 3 stands (30%) than in DL 1 stands (15%) (Table 2)
and it was in-between in DL 2 stands (26%). Tree roots easily reached the calcareous
subsoil horizons developed from limestone at each study plot. The two-layer soils (loess over
limestone) showed stagnic properties during winter and spring, and they were dry during
summer. The soil physical properties of the experimental plots are summarized in Table 2.
2.3.2 Sampling design For soil inventory and sampling within plots a grid of 12 m x 12 m (12 sampling points per
plot) was established within a radius of 25 m around the central tree. In addition, a soil-profile
pit was dug adjacent to each plot. Further, on all plots randomly distributed sampling
subplots have been established as follows: Three transects (30 m long and 3 m wide) were
randomly distributed over each plot by randomly determining a) their starting point within a 2
m × 2 m grid and b) their angle to the x-axis of this grid. If the transects were not completely
located within the 50 m × 50 m area of the plot or in the case of overlapping, they were
- 25 -

Chapter 2
shifted along the x- and the y-axis of the grid to the smallest possible extent. The minimum
distance between two transects was 1 m. Along each transect, 31 points (including starting
and end point) that were separated by distances of 1 m were marked. Five of these points
were randomly selected for the installation of litter collectors, resulting in a total number of 15
litter collectors per plot.
Table 2: Thickness of the loess cover, soil texture, and soil bulk density of the replicated (a to c) plots
with different diversity levels (DL 1, DL 2, DL 3) of deciduous tree species.
Plot Soil texture (sand / silt / clay) (%) Bulk density (g cm-3)
Thickness of loess cover (cm)
0-10 cm 10-20 cm 20-30 cm 0-10 cm 10-20 cm 20-30 cm
DL 1a 120 4 / 78 / 18 3 / 82 / 15 4 / 80 / 16 0.9 1.1 1.4
DL 1b 70 3 / 83 / 14 3 / 83 / 14 4 / 82 / 14 1.2 1.3 1.5
DL 1c 75 3 / 82 / 15 2 / 83 / 15 2 / 83 / 15 1.3 1.3 1.4
DL 2a 60 2 / 73 / 25 2 / 77 / 21 3 / 73 / 24 1.1 1.2 1.5
DL 2b 60 3/ 64 / 33 2 / 68 / 30 2 / 63 / 35 1.0 1.3 1.4
DL 2c 120 2 / 78 / 20 3 / 80 / 17 3 / 79 / 18 1.2 1.4 1.6
DL 3a 75 3 / 74 / 23 2 / 74 / 24 2 / 74 / 24 1.0 1.2 1.3
DL 3b 80 2 / 76 / 22 3 / 75 / 22 3 / 75 / 22 1.2 1.3 1.3
DL 3c 60 2 / 66 / 32 3 / 65 / 32 2 / 53 / 45 1.2 1.3 1.4
2.3.3 Litter sampling and analyses For tree litter sampling, 35 L buckets with a surface of 0.29 m² were placed on wooden
frames above the forest floor at randomly selected sampling points (see section 2.2). From
September to December 2005, the buckets were cleared at monthly intervals. The biomass
of leaf litter was determined after drying at 70 °C. Leaf litter from all litter collectors of the
same transect line (see 2.2) was mixed resulting in three mixed samples per plot. These
mixed samples were ground and used to determine the mean quantity and the mean
composition of leaf litter within a plot. Total C and N contents were determined by an
automated C and N analyzer (Heraeus Elementar Vario EL, Hanau, Germany).
Concentrations of Ca, Mg, P, and Mn in the litter were determined by ICP-AES (Spectro,
Kleve, Germany) after pressure digestion with concentrated nitric acid. The ash alkalinity of
leaf litter was determined by titration using the method described by Jungk (1968).
- 26 -
Tree species diversity and soils
2.3.4 Soil sampling and analyses In the winter of 2004/2005, soil cores with a diameter of 6.4 cm were taken from the upper 30
cm of the soil at all 12 sampling points per plot (see 2.2), and the thickness of the loess cover
was determined using a soil auger. Additionally, samples of the organic surface layer were
collected at each sampling point (sampled surface of 300 cm²). The soil cores were divided
into three parts representing the soil depths of 0 to 10 cm, 10 to 20 cm and 20 to 30 cm.
Samples were dried at 40 °C and passed through a 2 mm sieve.
Soil pH was measured in a suspension with distilled H2O and 1M KCl (5 g of soil, 15 ml of
H2O or KCl solution). Organic carbon (SOC) and total N (Nt) contents of soil and forest floor
samples were determined by an automated C and N analyzer (Heraeus Elementar Vario EL,
Hanau, Germany) after grinding the samples (all samples were free of carbonates). Cation-
exchange capacity (CEC) of mineral soil samples was determined at three sampling points
per plot. These points were randomly selected from the grid of 12 sampling points (depths of
sampling: 0-10, 10-20, 20-30 cm). Soil samples were leached with 100 ml of 1M ammonium
chloride (NH4Cl) for 4 h as described by König and Fortmann (1996). Cations in the extract
were quantified by atomic absorption spectroscopy, and exchangeable protons were
calculated from pH of the NH4Cl solution before and after percolation. The CEC was
calculated as the equivalent sum of the exchangeable Na, K, Ca, Mg, Mn, Fe, Al and H ions.
Base saturation was defined as the equivalent sum of base cations (Na, K, Ca and Mg) as
percent of CEC. The soil texture was determined using the sieving and pipette method
(Schlichting et al., 1995). The texture analysis was performed on all samples that were used
for CEC determination. After drying at 105°C, soil bulk density was determined
gravimetrically from undisturbed soil cores (125 cm3, n = 3) taken from the adjacent soil-
profile pit.
2.3.5 Statistical analyses To examine differences among the stands (DL 1, DL 2, DL 3) with regard to (1) the
production and composition of tree leaf litter, (2) soil acidification and amount of
exchangeable cations, (3) the stocks of soil organic carbon and total nitrogen, (4) the
thickness of loess cover, and (5) the clay content we performed an analysis of variance
(ANOVA) followed by the Tukey test for all pairwise mean comparisons of diversity level
effects. The assumptions of normality and homogeneity of variance were met in nearly all
cases (p > 0.05; Shapiro-Wilk’s test, Levene’s test). Only in a few cases (base saturation,
stocks of exchangeable Ca and Mg) the p-level of these assumptions were lower (p > 0.01).
Differences among species mixtures were analyzed separately for each soil depth.
Significant differences were evaluated at the p < 0.05 level. Correlation (Pearson) and
regression analyses were used to analyse the relationship between (1) different soil
- 27 -

Chapter 2
properties, (2) the Shannon index and soil properties, (3) the relative abundance of beech
and soil properties, (4) litter Ca and Mg contents and soil properties, and (5) the thickness of
loess cover and soil properties.
2.4. Results
2.4.1 Production and composition of tree litter There was no significant influence of the level of tree species diversity on tree basal area
(Table 1) and leaf litter production (Table 3). The C:N ratio of litter decreased with increasing
tree species diversity from 62 in DL 1 stands to 49 in DL 3 stands (Table 3). Total N input via
leaf litter increased with increasing level of tree species diversity (from 26 to 40 kg ha-1).
Concentrations of Ca and Mg in leaf litter were nearly twice as high 1 in DL 3 stands than in
DL 1 stands (Table 3) and they were in between in DL 2 stands. Thus, the total quantity of
Ca and Mg deposited yearly on the soil surface by leaf litter increased in the order DL 1 (47
kg Ca and 3.8 kg Mg ha-1), DL 2 (77 kg Ca and 5.8 kg Mg ha-1), DL 3 (88 kg Ca and 7.9 kg
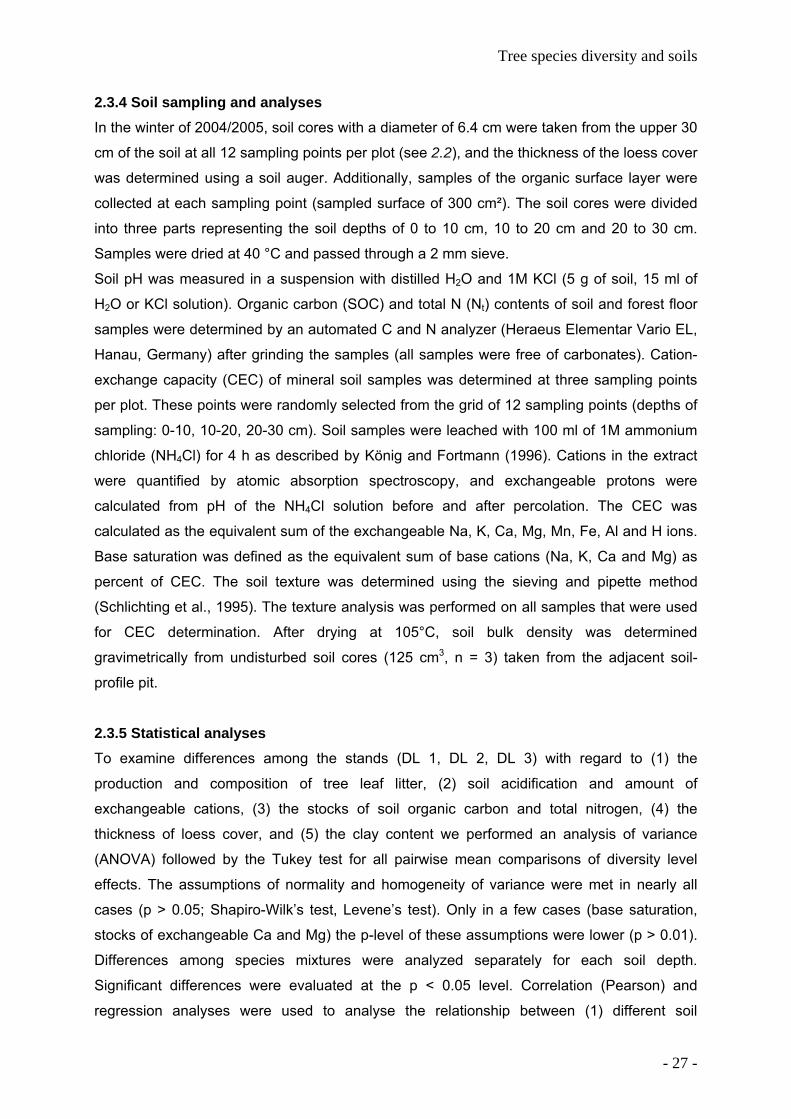
Mg ha-1). There was a close linear relationship between the annual input of Ca and Mg via
leaf litter and the stocks of exchangeable Ca and Mg in the upper 20 cm of the soils (Fig. 2).
The concentration of P in the tree litter was not affected by tree species diversity (Table 3).
The concentration of Mn in leaf litter was three to five times higher in beech dominated
stands than in mixed stands (Table 3). The ash alkalinity of freshly fallen leaf litter was higher
in DL 2 and DL 3 stands than in beech-dominated stands (Table 3).
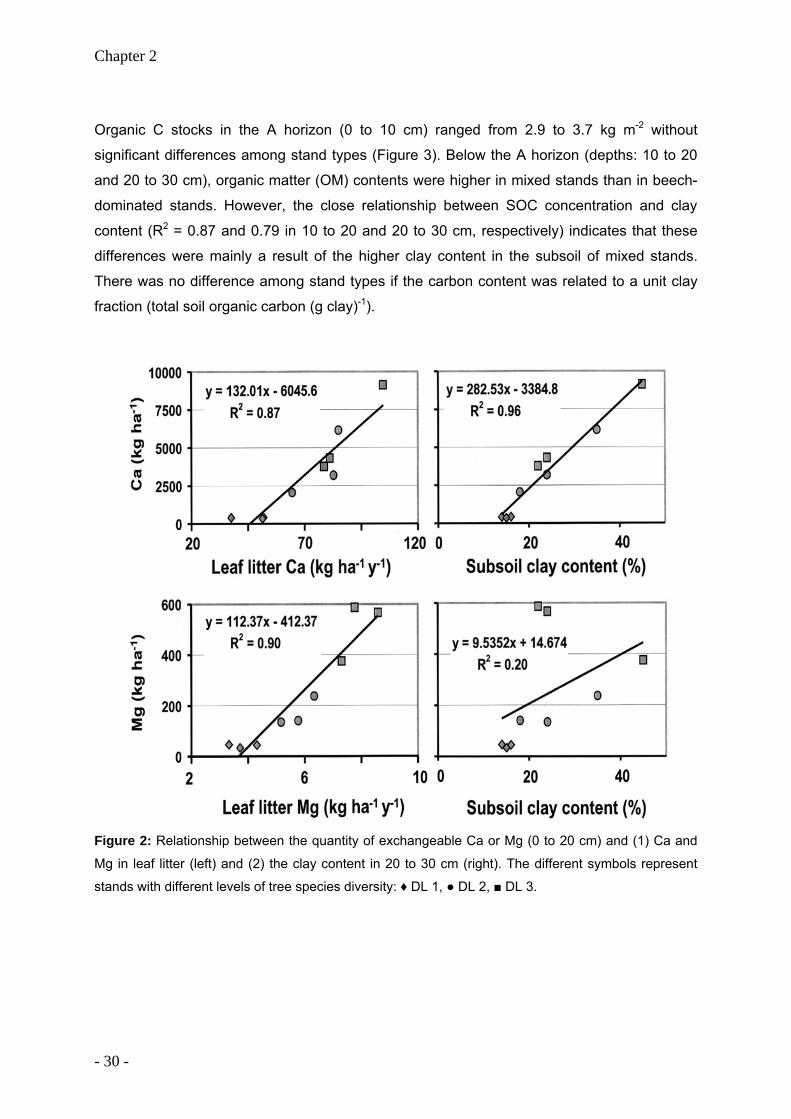
2.4.1 Soil organic matter Organic-C stocks in the organic surface layer were higher in beech-dominated stands than in
mixed stands (Figure 3). Samples of the organic surface layer exhibited a C:N ratio of
approximately 30, and C:N did not differ among stands with different species diversity level (Table 4). There was mull type humus at all sites, but it exhibited distinct differences. The
thin surface layer of mixed stands (DL 2, DL 3) consisted primarily of leaf litter from the
previous year, whereas in beech-dominated stands (DL 1) litter from several years
accumulated and formed a permanent thin layer of partly decomposed tree remains.
According to the German classification system, the humus type was L-Mull in DL 2 and DL 3
stands and F-Mull in DL 1 stands (Anonymous, 2005). The mean ratio of C stocks in the
organic surface layer to annual C input via tree leaf litter was 5.2 for the beech-dominated
sites, 1.8 for stands with diversity level DL 2 and 1.6 for stands with the highest species
diversity level (DL 3). There was a positive relationship between forest floor C and the
relative abundance of beech (R2 = 0.66) (Figure 4).
- 28 -

Tree species diversity and soils
- 29 -
r com
posi
tion
(C/N
ratio
, con
cent
ratio
n
uous
tree
spe
cies
(DL
1, D
L 2,
DL
3)
nd ty
pes.
Div
ersi
ty
leve
l
Lea
f-lit
ter
prod
uctio
n
Lea
f-lit
ter
com
posi
tion
dry
mat
ter
C
N
C
:N
C
a M
g P
Mn
as
h al
kalin
ity
Mg
ha-1
y-1
(mg
g-1)
(m
mol
c kg-1
)
Tab
le 3
: Soi
l are
a-re
late
d pr
oduc
tion
of le
af li
tter w
ith c
orre
spon
ding
mas
ses o
f C a
nd N
, lea
f litt
e
of C
a, M
g, P
, Mn)
and
ash
alk
alin
ity o
f lea
f litt
er in
sta
nds
with
diff
eren
t div
ersi
ty le
vels
of d
ecid
(mea
ns a
nd st
anda
rd d
evia
tion,
n =
3).
Diff
eren
t let
ters
indi
cate
sign
ifica
nt d
iffer
ence
s am
ong
sta
DL
1 3.
2a
(0.2
2)
1.58
a (0
.10)
0.
026a
(0.0
04)
62
.4a
(6.5
)
14.2
8a (1
.94)
1.
16a
(0.1
2)
0.43
a (0
.13)
2.
08a
(0.6
2)
20
30a
(50)
DL
2 3.
9a
(0.3
7)
1.91
a (0
.18)
0.
034a
(0.0
04)
57
.4ab
(2
.6)
19
.74b
(1.5
6)
1.48
ab
(0.1
5)
0.47
a
(0.0
6)
0.67
b (0
.05)
223
0b (7
0)
DL
3 3.
9a
(0.5
9)
1.92
a (0
.28)
0.
040a
(0.0
09)
49
.4b
(4.7
)
22.4
4b (0
.98)
2.
05b
(0.4
4)
0.55
a (0
.07)
0.
37b
(0.0
9)
21
80b
(130
)
Chapter 2
Organic C stocks in the A horizon (0 to 10 cm) ranged from 2.9 to 3.7 kg m-2 without
significant differences among stand types (Figure 3). Below the A horizon (depths: 10 to 20
and 20 to 30 cm), organic matter (OM) contents were higher in mixed stands than in beech-
dominated stands. However, the close relationship between SOC concentration and clay
content (R2 = 0.87 and 0.79 in 10 to 20 and 20 to 30 cm, respectively) indicates that these
differences were mainly a result of the higher clay content in the subsoil of mixed stands.
There was no difference among stand types if the carbon content was related to a unit clay
fraction (total soil organic carbon (g clay)-1).
Figure 2: Relationship between the quantity of exchangeable Ca or Mg (0 to 20 cm) and (1) Ca and
Mg in leaf litter (left) and (2) the clay content in 20 to 30 cm (right). The different symbols represent
stands with different levels of tree species diversity: ♦ DL 1, ● DL 2, ■ DL 3.
- 30 -
Tree species diversity and soils
0
1
2
3
4
5
Humus layer 0-10 cm 10-20 cm 20-30 cm
DL 1 DL 2 DL 3
a b b a a a a b b a b b
Car
bon
stoc
ks(k
g C
m-2
)
Depth (cm)
0
1
2
3
4
5
Humus layer 0-10 cm 10-20 cm 20-30 cm
DL 1 DL 2 DL 3
a b b a a a a b b a b b
Car
bon
stoc
ks(k
g C
m-2
)
Depth (cm)
Figure 3: Organic-C stocks in the organic surface layer and at different depths in the mineral soil of
stands with different diversity levels of deciduous tree species (DL 1, DL 2, DL 3). (Means and
standard deviation, n = 3). Different letters specify significant differences among the diversity levels
within a given soil layer.
2.4.2 Soil acidity and exchangeable cations Soil pH(H2O) was lower in beech stands (DL 1) than in DL 2 or DL 3 stands (Figure 5). It
generally increased with soil depth; however, this increase was more pronounced in mixed
stands than in beech-dominated stands. There was no significant relationship between the
thickness of the loess cover and the pH of the surface soil (0-10 cm). However, pH of the
surface soil tended to increase with increasing clay content of the subsoil (20-30 cm) (R2 =
0.41).
The CEC of the soil varied considerably within the same stand type (Table 5). It was primarily
related to the clay content (R2 = 0.89), and its variability could be explained to a large extent
by differences in clay content, organic matter concentration and soil pH (Figure 6, R2 = 0.93).
The specific CEC of soil organic matter (SOM) differed in stands with different tree-species
diversity. If we consider the well-established positive relationship between soil pH and CEC
to SOM in temperate humid climates (Anonymous, 2005), the mean total contribution of SOM
to CEC down to a depth of 30 cm was 2.6 molc m-2 in the beech-dominated soil (DL 1); it was
6.9 molc m-2 in the soil of DL 2 stands; and it was highest under stands with the highest level
of tree species diversity (DL 3; 9.9 molc m-2) (Figure 7).
- 31 -

Chapter 2
Fore
stflo
orC
(kg
m-2
)M
g (k
g ha
-1)
Ca
(kg
ha-1
)
0.1
0.3
0.5
0.7
0.9
0
2500
5000
7500
10000
0
200
400
600
y = 0.1926e1.2863x
R2 = 0.6555
Beech abundance (%)
y = 11029e-2.9366x
R2 = 0.5945
0 25 50 75 100
y = 996.74e-3.1698x
R2 = 0.9161
Fore
stflo
orC
(kg
m-2
)M
g (k
g ha
-1)
Ca
(kg
ha-1
)
0.1
0.3
0.5
0.7
0.9
0
2500
5000
7500
10000
0
200
400
600
y = 0.1926e1.2863x
R2 = 0.6555
Beech abundance (%)
y = 11029e-2.9366x
R2 = 0.5945
0 25 50 75 100
y = 996.74e-3.1698x
R2 = 0.9161
Figure 4: Relationship between the abundance of beech expressed as percentage of the total tree
basal area and (1) the C stocks of the organic surface layer, (2) the quantity of exchangeable Mg (0-
20 cm), and (3) the quantity of exchangeable Ca (0-20 cm). The different symbols represent stands
with different levels of tree species diversity: ♦ DL 1, ● DL 2, ■ DL 3.
Base saturation in the upper 30 cm of the mineral soil was much lower in DL 1 stands (<
20%) than in mixed stands with several deciduous tree species (DL 2, DL 3 > 75%) (Fig. 5).
Exchangeable Al percentage in soil was highest under beech (DL 1) in all soil horizons and
lowest in mixed stands with the highest level of species diversity (DL 2, DL 3) (Table 5).
Exchangeable Al was generally low in soil samples with pH > 5. In contrast, at pH < 5 it
strongly increased with decreasing pH. Exchangeable Mn percentage was also higher under
beech than in the soil of DL 3 stands, and it also increased with decreasing soil pH.
- 32 -
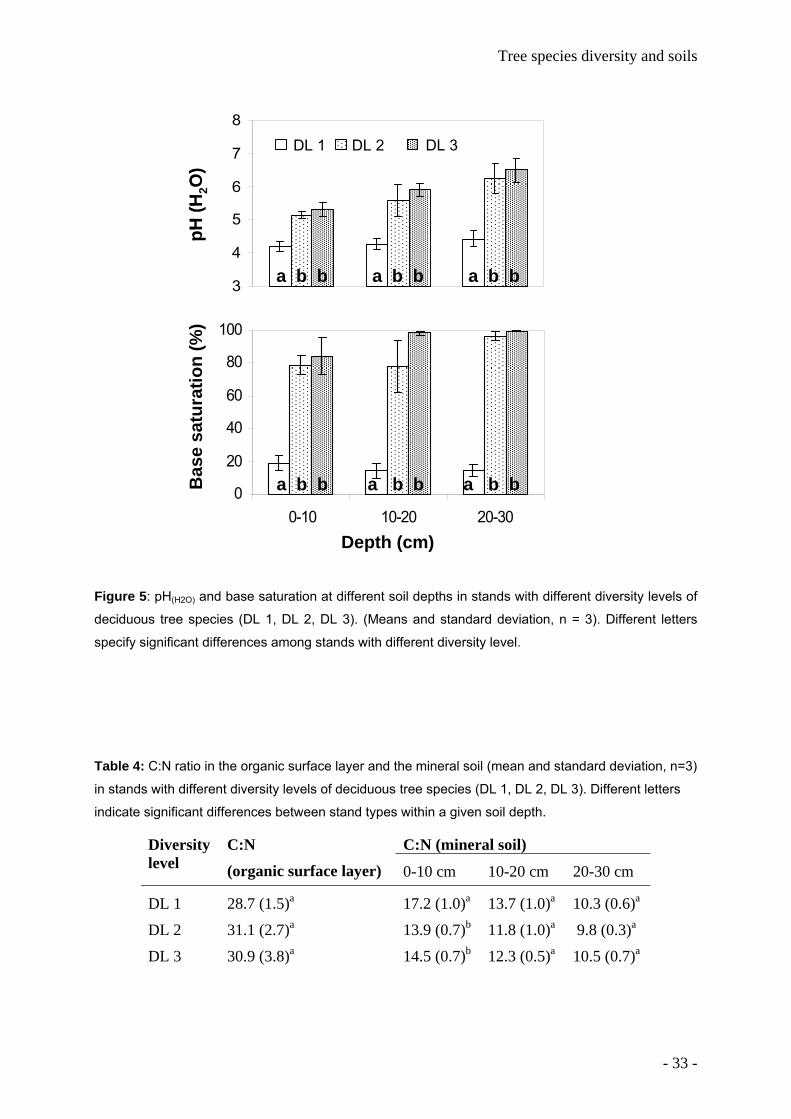
Tree species diversity and soils
0
20
40
60
80
100
0-10 10-20 20-30
3
4
5
6
7
8I III V
a b b a b b a b b
Depth (cm)
Bas
e sa
tura
tion
(%)
pH(H
2O)
a b b a b b a b b
DL 1 DL 2 DL 3
0
20
40
60
80
100
0-10 10-20 20-30
3
4
5
6
7
8I III V
a b b a b b a b b
Depth (cm)
Bas
e sa
tura
tion
(%)
pH(H
2O)
a b b a b b a b b
DL 1 DL 2 DL 3
Figure 5: pH(H2O) and base saturation at different soil depths in stands with different diversity levels of
deciduous tree species (DL 1, DL 2, DL 3). (Means and standard deviation, n = 3). Different letters
specify significant differences among stands with different diversity level.
Table 4: C:N ratio in the organic surface layer and the mineral soil (mean and standard deviation, n=3)
in stands with different diversity levels of deciduous tree species (DL 1, DL 2, DL 3). Different letters
indicate significant differences between stand types within a given soil depth.
C:N (mineral soil) Diversity level
C:N
(organic surface layer) 0-10 cm 10-20 cm 20-30 cm
DL 1 28.7 (1.5)a 17.2 (1.0)a 13.7 (1.0)a 10.3 (0.6)a
DL 2 31.1 (2.7)a 13.9 (0.7)b 11.8 (1.0)a 9.8 (0.3)a
DL 3 30.9 (3.8)a 14.5 (0.7)b 12.3 (0.5)a 10.5 (0.7)a
- 33 -
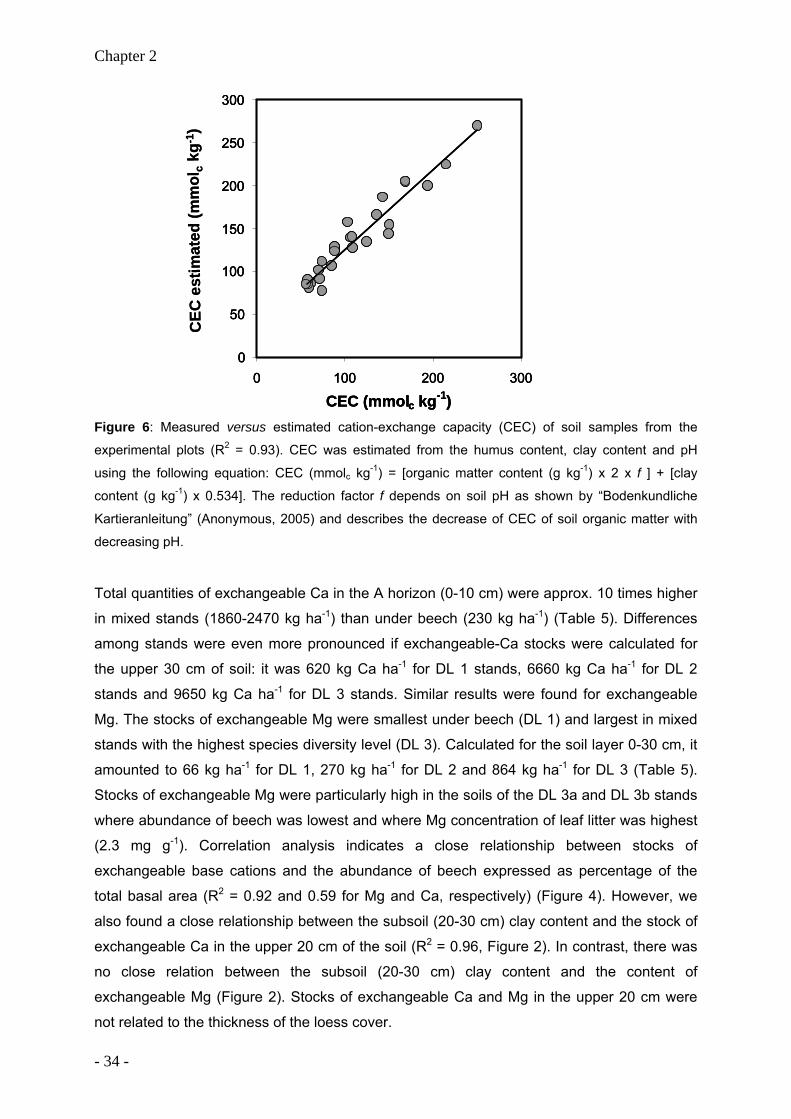
Chapter 2
CEC
est
imat
ed(m
mol
ckg
-1)
0
50
100
150
200
250
300
0 100 200 300
CEC (mmolc kg-1)
CEC
est
imat
ed(m
mol
ckg
-1)
0
50
100
150
200
250
300
0 100 200 300
CEC (mmolc kg-1)
0
50
100
150
200
250
300
0 100 200 300
CEC (mmolc kg-1)
Figure 6: Measured versus estimated cation-exchange capacity (CEC) of soil samples from the
experimental plots (R2 = 0.93). CEC was estimated from the humus content, clay content and pH
using the following equation: CEC (mmolc kg-1) = [organic matter content (g kg-1) x 2 x f ] + [clay
content (g kg-1) x 0.534]. The reduction factor f depends on soil pH as shown by “Bodenkundliche
Kartieranleitung” (Anonymous, 2005) and describes the decrease of CEC of soil organic matter with
decreasing pH.
Total quantities of exchangeable Ca in the A horizon (0-10 cm) were approx. 10 times higher
in mixed stands (1860-2470 kg ha-1) than under beech (230 kg ha-1) (Table 5). Differences
among stands were even more pronounced if exchangeable-Ca stocks were calculated for
the upper 30 cm of soil: it was 620 kg Ca ha-1 for DL 1 stands, 6660 kg Ca ha-1 for DL 2
stands and 9650 kg Ca ha-1 for DL 3 stands. Similar results were found for exchangeable
Mg. The stocks of exchangeable Mg were smallest under beech (DL 1) and largest in mixed
stands with the highest species diversity level (DL 3). Calculated for the soil layer 0-30 cm, it
amounted to 66 kg ha-1 for DL 1, 270 kg ha-1 for DL 2 and 864 kg ha-1 for DL 3 (Table 5).
Stocks of exchangeable Mg were particularly high in the soils of the DL 3a and DL 3b stands
where abundance of beech was lowest and where Mg concentration of leaf litter was highest
(2.3 mg g-1). Correlation analysis indicates a close relationship between stocks of
exchangeable base cations and the abundance of beech expressed as percentage of the
total basal area (R2 = 0.92 and 0.59 for Mg and Ca, respectively) (Figure 4). However, we
also found a close relationship between the subsoil (20-30 cm) clay content and the stock of
exchangeable Ca in the upper 20 cm of the soil (R2 = 0.96, Figure 2). In contrast, there was
no close relation between the subsoil (20-30 cm) clay content and the content of
exchangeable Mg (Figure 2). Stocks of exchangeable Ca and Mg in the upper 20 cm were
not related to the thickness of the loess cover.
- 34 -

Tree species diversity and soils
Tab
le 5
: C
atio
n-ex
chan
ge c
apac
ity (
CEC
), ex
chan
geab
le c
atio
ns a
s pe
rcen
tage
of
tota
l C
EC a
nd s
tock
s of
exc
hang
(mea
ns a
nd s
tand
ard
devi
atio
n, n
= 3
) at d
iffer
ent s
oil d
epth
s in
sta
nds
with
diff
eren
t div
ersi
ty le
vels
of d
ecid
uous
-tre
2, D
L 3)
. Diff
eren
t let
ters
indi
cate
sign
ifica
nt d
iffer
ence
s am
ong
stan
d ty
pes c
ompa
ring
the
sam
e so
il de
pth.
Soil
dept
h (c
m)
Div
ersi
ty
leve
l
CE
C
(mm
olc
kg-1
)
Con
trib
utio
n to
CE
C (%
) E
xcha
nab
le C
(Mg
ha
eabl
e C
a an
d M
g
e sp
ecie
s (D
L 1,
DL
ge-
a -1)
Exc
hang
e-ab
le M
g (M
g ha
-1)
H
Na
K
Ca
Mg
Fe
Mn
Al
0-10
DL
1
72.7
a (1
2.6)
5.
8a
(1.6
) 0.
4a (0
.2)
2.4a
(0.6
) 14
.2a
(6.4
) 2.
5a (0
.8)
0.8a
(0.8
) 4.
1a (1
.5)
69.8
a (7
.9)
0.23
a (0
.05)
0.02
4 a
(0
.004
)
DL
2
119.
9a (4
2.6)
2.
0b (1
.4)
0.3a
(0.1
) 2.
6a (0
.5)
62.9
b (2
6.8)
6.
0ab
(1.6
) 0.
1a (0
.1)
4.1a
(1.2
) 22
.8b
(25.
5)
1.86
a (0
.85)
0.
098
b
(0
.022
)
DL
3
152.
6a (5
5.8)
0.
8b (1
.3)
0.4a
(0.2
) 2.
5a (0
.5)
68.2
b (1
9.0)
13
.1b
(5.7
) 0.
2a (0
.3)
2.6b
(1.1
) 12
.1b
(17.
1)
2.47
a (1
.84)
10-2
0
DL
1
60.2
a (1
.6)
5.2a
(1.1
) 0.
4a (0
.3)
2.0a
(0.6
) 10
.1a
(9.4
) 1.
9a (1
.5)
0.3a
(0.2
) 2.
7a (0
.9)
77.2
a (1
0.4)
0.
16 a
(0.0
7)
DL
2
100.
5a
0.21
0 c
(0
.019
)
0.
018
a
(0
.007
)
b (3
8.0)
3.
0b (2
.0)
0.4a
(0.1
) 2.
0a (0
.6)
64.8
b (3
0.7)
4.
3a (1
.5)
0.0b
(0.1
) 2.
9a (1
.1)
23.9
b
(29.
2)
1.93
ab
0.07
2 a
(1.2
7)
b
(0
.031
)
DL
3
156.
7b (3
5.4)
0.
0b (0
.0)
0.4a
(0.2
) 1.
9a (0
.3)
81.8
b (6
.5)
14.1
b (6
.4)
0.0b
(0.0
) 1.
1b (0
.7)
0.7b
(1.5
) 3.
27 b
(1.1
2)
0.29
9 b
(0
.105
)
0.
024
a (0
.012
)
DL
2
117.
2a (4
7.8)
1.
9
20-3
0
DL
1 62
.9a
(10.
0)
5.8a
(2.4
) 0.
5a (0
.2)
2.1a
(0.5
) 11
.4a
(8.7
) 2.
1a (1
.3)
0.4a
(0.7
) 3.
3a (1
.8)
74.4
a (1
1.8)
0.
23 a
(0.1
3)
b (1
.8)
0.4a
(0.1
) 2.
5a (0
.7)
80.5
b (2
4.6)
4.
9a (1
.3)
0.0a
(0.0
) 1.
7ab
(1.0
) 9.
7b (2
3.6)
2.
87 a
(1.3
3)
0.10
0 ab
(0
.028
)
DL
3 16
9.5a
(72.
8)
0.0
bb
(0.0
) 0.
4a (0
.2)
2.4a
(0.9
) 81
.3b
(7.8
) 15
.3b
(7.7
) 0.
0a (0
.0)
0.6b
(0.3
) 0.
0b (0
.0)
3.91
a (2
.28)
0.
355
(0
.110
)
- 35 -
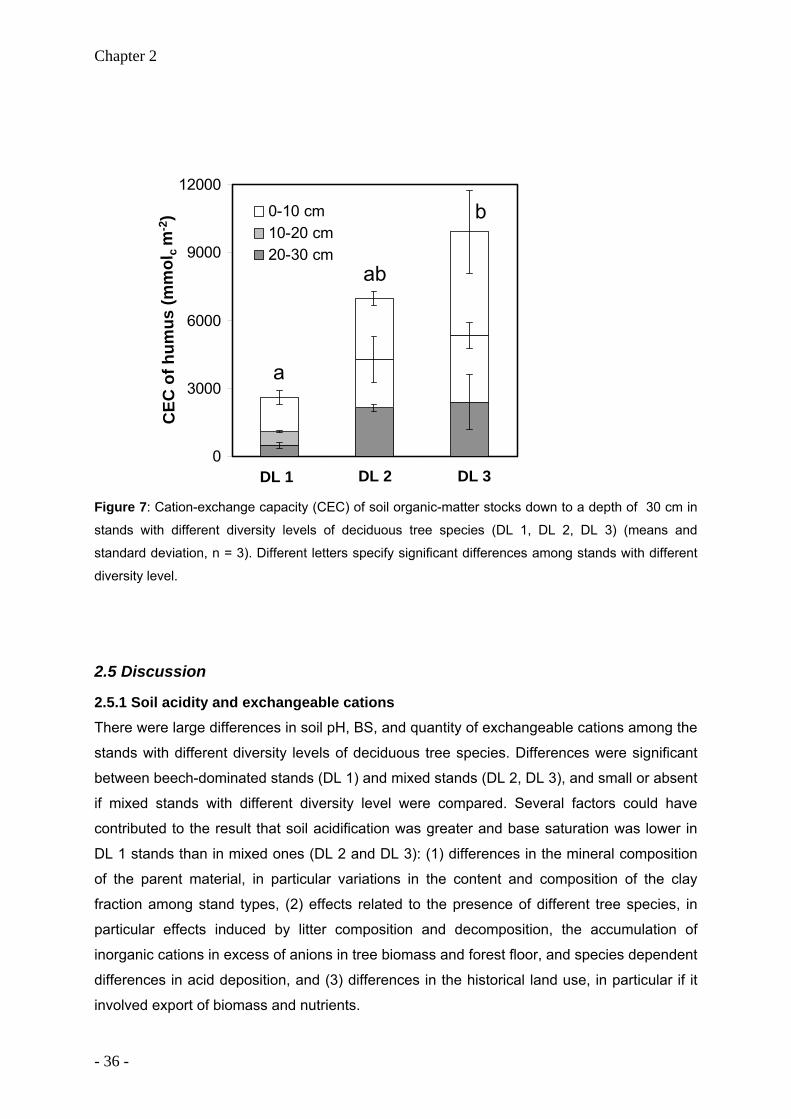
Chapter 2
0
3000
6000
9000
12000
0-10 cm10-20 cm20-30 cm
CEC
of h
umus
(mm
olc
m-2
)
DL 1 DL 2 DL 3
a
ab
b
Figure 7: Cation-exchange capacity (CEC) of soil organic-matter stocks down to a depth of 30 cm in
stands with different diversity levels of deciduous tree species (DL 1, DL 2, DL 3) (means and
standard deviation, n = 3). Different letters specify significant differences among stands with different
diversity level.
2.5 Discussion
2.5.1 Soil acidity and exchangeable cations There were large differences in soil pH, BS, and quantity of exchangeable cations among the
stands with different diversity levels of deciduous tree species. Differences were significant
between beech-dominated stands (DL 1) and mixed stands (DL 2, DL 3), and small or absent
if mixed stands with different diversity level were compared. Several factors could have
contributed to the result that soil acidification was greater and base saturation was lower in
DL 1 stands than in mixed ones (DL 2 and DL 3): (1) differences in the mineral composition
of the parent material, in particular variations in the content and composition of the clay
fraction among stand types, (2) effects related to the presence of different tree species, in
particular effects induced by litter composition and decomposition, the accumulation of
inorganic cations in excess of anions in tree biomass and forest floor, and species dependent
differences in acid deposition, and (3) differences in the historical land use, in particular if it
involved export of biomass and nutrients.
- 36 -
Tree species diversity and soils
Due to these manifold factors that might have contributed to the observed differences in soil
chemistry and that even interact in their potential effects on soil nutrient status, it is not
possible to quantify exactly the effects of single factors in our observational study. However,
our results help to assess the potential importance of at least some of these factors.
2.5.2 Effect of soil parent material Soil parent material is a main factor determining nutrient uptake of trees, litter composition
and soil acidification (Sariyildiz and Anderson, 2005; Meier et al., 2005). Although we put
much effort into the selection of stands with similar parent material and only sites on
limestone with a significant loess cover were included (see 2.1), differences in soil parent
material, such as thickness of the loess layer, differences in clay content or clay mineralogy
might have influenced the degree of soil acidification in the analyzed stands. We found no
evidence of a significant influence of the thickness of the loess cover (60-120 cm) on nutrient
stocks or acidity of the surface soil. This is in line with the field observation that tree roots
reached the calcareous subsoil in all stands. The results indicate that the loess layer did not
act as a significant barrier that hampers nutrient uptake from the calcareous bedrock. The
close relationship between clay content and CEC suggests that mineral composition of the
clay fraction was similar in all soil samples even if the clay content differed considerably.
Thus, differences in soil chemistry cannot be explained by a different mineralogy of the clay
fraction. The observed CEC of the clay fraction (0.534 mmolc g-1, regression equation in the
title of Figure 6) is typical for loess-derived soils in Central and Northern Germany (Renger,
1965).
Our results suggest that the subsoil (20-30 cm) clay content was a decisive factor that
determined the variability of the exchangeable Ca content in the surface soil. The highly
significant relationship between these soil properties indicates that an increasing subsoil clay
content reduced soil acidification and losses of exchangeable base cations probably by
providing increasing subsoil nutrient stocks and acid neutralization capacity. However,
differences in clay content were relatively small if compared with the observed large
variability of exchangeable-Ca and -Mg stocks in the upper 20 cm that were 12 and 15 times
higher in DL 3 stands than DL 1 stands. In addition, differences in subsoil clay content only
partly explained the variability of exchangeable Mg in the surface soil. The results suggest
that the subsoil clay content was an important but not the only factor that contributed to the
observed differences of soil acidification and stocks of exchangeable nutrients.
- 37 -
Chapter 2
2.5.3 Effects related to tree species The evaluation of tree species effects is hampered by the fact that clay content was higher in
mixed stands (DL 2, DL 3) than in beech stands (DL 1) and that both factors (i.e. soil texture
and tree species) have probably contributed to the observed differences in soil chemistry.
Nevertheless, the results on nutrient recycling via leaf litter provide insight into the potential
of the investigated species mixtures to influence soil acidity and stocks of exchangeable
cations.
The quantity of litterfall was similar in all stands, but annual deposition of Ca, Mg and
alkalinity to the soil surface via leaf litter increased with increasing species diversity and
decreasing abundance of beech. Calculated for a period of 50 y total Ca and Mg deposition
via leaf litter of trees was by 2057 kg Ca ha-1 and 205 kg Mg ha-1 higher in DL 3 stands than
DL1 stands. This is in the same order of magnitude as the observed differences of
exchangeable Ca and Mg in the Ah horizon of these stands and shows the great potential of
tree litter composition to influence stocks of exchangeable cations in the upper soil horizon.
The close relationships between litter Ca and Mg and stocks of exchangeable Ca and Mg in
the surface soil (0-20 cm) supports this conclusion even if the results raise the question
about the cause-effect chain. Are stocks of exchangeable Ca and Mg large because of high
Ca and Mg inputs via leaf litter or are litter concentrations high because of the high nutrient
availability? Both factors are closely linked and cannot be separated. However, long-term
changes of the surface soil nutrient status are strongly influenced by the ability of different
tree species to improve or maintain soil productivity via nutrient uptake and redistribution
(Neirynck et al., 2000). Differences in subsoil clay content have probably contributed to the
higher litter Ca and Mg concentrations in mixed stands than beech stands. However, the
effect of clay content on litter composition was probably minor because we found no
relationship between subsoil clay content and litter Ca and Mg within mixed stands.
Moreover, the mixed stands with relatively low subsoil clay content (DL 2c, DL 3b) also
showed much higher leaf litter Ca and Mg contents than beech stands. The results suggest
that the differences in litter Ca and Mg were largely driven by species-specific differences in
litter quality. This conclusion is also supported by first results on leaf litter composition of
different tree species in the mixed stands DL 2 and DL 3 that indicate lowest Ca and Mg
concentrations in beech and oak litter (Jacob, personal communication).
Our results support the observation that litter quality of different species and the associated
nutrient recycling through the soil-tree system can have significant implications for the
pattern of soil fertility and soil acidity in mixed stands (Norden, 1994; Finzi et al., 1998a;
Rothe and Binkley, 2001). The striking differences between beech-dominated stands (DL 1)
- 38 -

Tree species diversity and soils
and mixed stands (DL 2, DL 3) suggest that the presence and abundance of beech
contributed to the observed differences in soil acidity and availability of Ca and Mg. This
assumption is supported by the significant negative correlation between the percentage of
beech expressed as proportion of tree basal area and the stocks of exchangeable Ca and
Mg and the positive relationship between the abundance of beech and the accumulated soil
acidity in the form of exchangeable Al. Several studies have reported distinct differences
among deciduous tree species in their ability to acidify the upper mineral soil in terms of a
decrease of exchangeable base cation pools and increase of exchangeable Al. In deciduous
forests in Sweden, Tilia cordata acidified the soil the least, whereas sites covered by Fagus
sylvatica exhibited considerably lower pH values and base saturation (Norden, 1994). Similar
results were reported by Finzi et al. (1998a) and Neirynck et al. (2000), who found much
lower pH and base saturation beneath canopies of Fagus species than under Tilia, Fraxinus
and Acer species. In these studies, the largest differences in soil acidification occurred
beneath Acer sacccharum and Fagus grandifolia, and Tilia platyphyllos and Fagus sylvatica,
respectively. Augusto et al. (2002) summarized effects of tree species on soil fertility in
European temperate forests and concluded that the acidifying ability of Fagus sylvatica and
Quercus species was higher than that of all other deciduous tree species. The ability of tree
species to change chemical soil properties related to acidity and exchangeable cations was
shown to be largely mediated by litter Ca and Mg concentrations and litter ash alkalinity
(Noble and Randall, 1999; Dijkstra, 2003; Reich et al., 2005), which fits to our results on litter
quality and soil acidity in stands of different diversity levels. Differences among tree species
growing under similar soil and climate conditions in nutrient uptake and leaf litter chemistry
are considered as intrinsic species-specific traits, and several mechanisms of enhanced
nutrient acquisition that are primarily related to growth and activity of roots or mycorrhiza
have been described (Washburn and Arthur, 2003; Reich et al., 2005). The redistribution of
Ca, Mg and alkalinity in the soil profile by different tree species through nutrient uptake, litter
deposition and mineralization and the induced changes in soil chemistry depend on the
nutrient availability and buffer capacity in different soil depths (Noble and Randall, 1999;
Augusto et al., 2002; Meier et al., 2005). At our experimental plots, this process of “biological
pumping” had a highly beneficial effect since it enabled the translocation of base cations and
alkalinity from the alkaline subsoil (limestone) to the surface parent material (loess), which
has a rather low buffer capacity and thus tends to form strongly acid forest soils. This
ameliorating effect obviously differed due to the abundance of different tree species. It
counteracted the accumulation of acidic cations such as Al3+, Mn2+ and Fe3+ at the exchange
complex and, thus, reduced the replacement of exchangeable "base" cations, in particular
Ca2+.
- 39 -
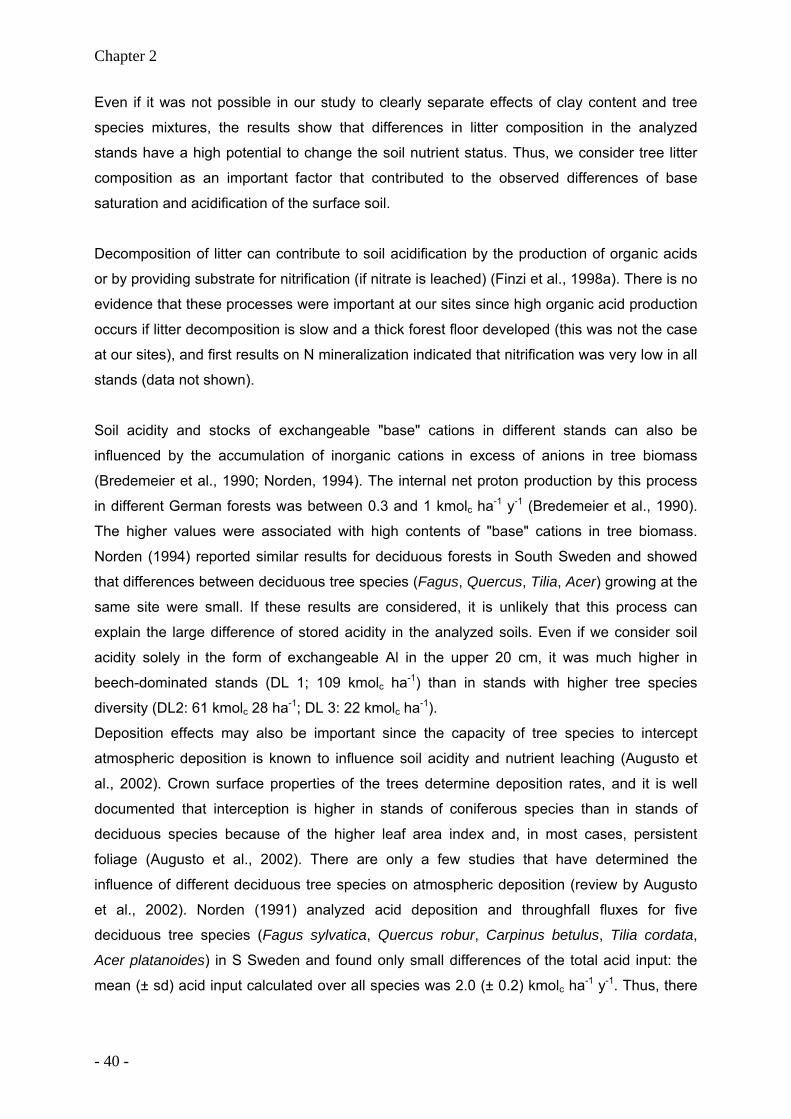
Chapter 2
Even if it was not possible in our study to clearly separate effects of clay content and tree
species mixtures, the results show that differences in litter composition in the analyzed
stands have a high potential to change the soil nutrient status. Thus, we consider tree litter
composition as an important factor that contributed to the observed differences of base
saturation and acidification of the surface soil.
Decomposition of litter can contribute to soil acidification by the production of organic acids
or by providing substrate for nitrification (if nitrate is leached) (Finzi et al., 1998a). There is no
evidence that these processes were important at our sites since high organic acid production
occurs if litter decomposition is slow and a thick forest floor developed (this was not the case
at our sites), and first results on N mineralization indicated that nitrification was very low in all
stands (data not shown).
Soil acidity and stocks of exchangeable "base" cations in different stands can also be
influenced by the accumulation of inorganic cations in excess of anions in tree biomass
(Bredemeier et al., 1990; Norden, 1994). The internal net proton production by this process
in different German forests was between 0.3 and 1 kmolc ha-1 y-1 (Bredemeier et al., 1990).
The higher values were associated with high contents of "base" cations in tree biomass.
Norden (1994) reported similar results for deciduous forests in South Sweden and showed
that differences between deciduous tree species (Fagus, Quercus, Tilia, Acer) growing at the
same site were small. If these results are considered, it is unlikely that this process can
explain the large difference of stored acidity in the analyzed soils. Even if we consider soil
acidity solely in the form of exchangeable Al in the upper 20 cm, it was much higher in
beech-dominated stands (DL 1; 109 kmolc ha-1) than in stands with higher tree species
diversity (DL2: 61 kmolc 28 ha-1; DL 3: 22 kmolc ha-1).
Deposition effects may also be important since the capacity of tree species to intercept
atmospheric deposition is known to influence soil acidity and nutrient leaching (Augusto et
al., 2002). Crown surface properties of the trees determine deposition rates, and it is well
documented that interception is higher in stands of coniferous species than in stands of
deciduous species because of the higher leaf area index and, in most cases, persistent
foliage (Augusto et al., 2002). There are only a few studies that have determined the
influence of different deciduous tree species on atmospheric deposition (review by Augusto
et al., 2002). Norden (1991) analyzed acid deposition and throughfall fluxes for five
deciduous tree species (Fagus sylvatica, Quercus robur, Carpinus betulus, Tilia cordata,
Acer platanoides) in S Sweden and found only small differences of the total acid input: the
mean (± sd) acid input calculated over all species was 2.0 (± 0.2) kmolc ha-1 y-1. Thus, there
- 40 -

Tree species diversity and soils
is no evidence of large species-related differences of atmospheric deposition that could
explain the different acidification in the analyzed soils.
2.5.4 Land-use history The forest history, in particular if it involved biomass and nutrient export as charcoal
production, litter raking or grazing can significantly increase soil acidification and decrease
base saturation (Hüttl and Schaaf, 1995). The present composition and diversity of tree
species in the Hainich National Park is strongly determined by former forest use and
management. It indicates that former management of the investigated stands differed.
Although historical documents provide no evidence of different biomass export from our
experimental sites or former agricultural use, we cannot exclude the possibility that present
soil conditions might be influenced by historical land use since such effects can persist for
very long periods. We consider historical land use as the main factor of uncertainty that might
have contributed to the observed differences in base saturation and acidification of the
surface soil.
2.5.5 Soil organic matter There was a striking effect of tree species on C and N stocks in the forest floor. The larger C
and N accumulation in the organic surface layer of beech-dominated stands (DL 1)
compared to DL 2 and DL 3 stands was not due to higher litter production, but to lower decay
rates in the DL 1 stands. This can be explained by the relatively high recalcitrance of beech
litter that was found to depend on the lower nutrient concentrations and on the higher lignin
to N ratio compared with litter of Acer and Fraxinus species (Melillo et al., 1982; Finzi et al.,
1998b). In addition, litter decomposition probably was hampered by the lower soil pH. Our
findings are in accordance with the results of other studies that showed that the organic
surface layer generally is thicker beneath beech than beneath other hardwood species with
the exception of oak (Finzi et al., 1998b; Neirynck et al., 2000). Neirynck et al. (2000)
concluded that Fagus and Quercus belong to mullmoder-forming species, whereas Tilia,
Acer and Fraxinus are mull-forming trees. The results suggest that the abundance of beech
was the key factor that determined the mass of the organic surface layer at our experimental
sites. This conclusion is supported by the significant positive correlation between the
percentage of beech expressed as the proportion of tree basal area and the quantity of C
stocks in the organic surface layer. Similar forest floor C stocks under beech were reported
for other limestone areas in Central Europe (Leuschner et al., 2006). Differences in the C to
N ratio were found for leaf litter of different stands but not for forest floor samples. This might
be explained by the accumulation of more decomposed tree remains under beech that have
very likely a narrower C/N ratio compared with the fresh litter material in mixed stands.
- 41 -
Chapter 2
Differences in the organic carbon content of the mineral soil (comparing the same soil depth)
resulted mainly from differences in the clay content and there was no evidence of a
significant effect of the tree species diversity.
The results show that the quality of soil organic matter in terms of its ability to bind and store
exchangeable cations was lower in beech-dominated stands than in stands with higher
portions of lime, ash and maple. This was due to the strong effect of pH on the surface
charge soil organic matter and, thus, on the factors that contributed to the variability of soil
acidification (see 4.1).
2.6 Conclusion We found distinct differences in surface soil acidification, stocks of exchangeable base
cations and carbon accumulation in the humus layer in temperate broad-leaved mixed forest
stands on loess over limestone. Subsoil clay content and differences in litter composition
were identified as important factors that contributed to the variability of these soil properties.
The redistribution of Mg, Ca and alkalinity via tree litter has a high potential to increase base
saturation in these loess-derived surface soils that are underlain by limestone. Our results
suggest that this process of “biological pumping” of base cations increased with decreasing
abundance of beech. In addition, beech abundance influenced litter decomposition rate and
nutrient accumulation in the organic surface layer. Thus, the conversion of quasi
monospecific beech forests to mixed stands of beech with other broad-leaved species
appeared to increase the intensity of soil-tree cation cycling and as a consequence it can
influence the rate of soil acidification and nutrient stocks in the surface soil. The results
suggest that at sites that allow production of broadleaf tree species with nutrient-rich, easily
decomposable foliage the establishment and promotion of these species is an important
silvicultural tool to counteract natural or anthropogenic soil acidification and to maintain soil
productivity.
However, the significance of our results is impaired by the interfering effects of soil texture
and tree species composition, and in addition, by the uncertainty associated with the
historical land use. A follow-up study will be conducted in clusters of single tree species
within the selected stands to reduce these factors of uncertainty and to constrain the effects
of tree species composition on soil properties.
- 42 -

Tree species diversity and soils
Acknowledgements The study was funded by the Deutsche Forschungsgemeinschaft (DFG; Graduiertenkolleg
1086). We thank Inga Mölder for helpful discussion on historical land use.
2.7 References
Alriksson, A., Eriksson, H. M., 1998. Variations in mineral nutrient and C distribution in the
soil and vegetation compartments of five temperate tree species in NE Sweden. For. Ecol.
Manage. 108, 261-273.
Anonymous, 2005. Bodenkundliche Kartieranleitung. Bodenkundliche Kartieranleitung.
Bundesanstalt für Geowissenschaften und Rohstoffe und Geologische Landesämter der
Bundesrepublik Deutschland (Eds), Schweizerbart´sche Verlagsbuchhandlung, Stuttgart,
Germany.
Augusto, L., Turpault, M.P., Ranger, J., 2000. Impact of tree species on feldspar weathering
rates. Geoderma 96, 215-237.
Augusto, L., Ranger, J., Binkley, D., Rothe, A., 2002. Impact of several common tree species
of European temperate forests on soil fertility. Ann. For. Sci. 59, 233-253.
Berger, T.W., Köllensperger, G., Wimmer, R. 2004. Plant-soil feedback in spruce (Picea
abies) and mixed spruce-beech (Fagus sylvatica) stands as indicated by dendrochemistry.
Plant Soil 264, 69-83
Binkley, D., 1995. The influence of tree species on forest soils: Processes and patterns. In:
Mead, D.J., Cornforth, I.S. (Eds.), Proceedings of the Trees and Soils Workshop, Lincoln
University 28 February-2 March 1994. Agronomy Society of New Zealand, Special
Publications No. 10, Lincoln University Press, Canterbury, New Zealand.
Binkley D., Giardina, C., 1998. Why do tree species affect soils? The warp and woof of tree
soil interactions. Biogeochemistry 42, 89-106.
Binkley D., Valentine, D., 1991. Fifty-year biogeochemical effects of green ash, white pine
and Norway spruce in a replicated experiment. For. Ecol. Manage. 40, 13-25.
Bredemeier, M., Matzner, E., Ulrich, B., 1990. Internal and external proton load to forest soils
in Northern Germany. J. Environ. Qual. 19, 469-477.
- 43 -

Chapter 2
Dijkstra, F.A., 2003. Calcium mineralization in the forest floor and surface soil beneath
different tree species in the northeastern US. For. Ecol. Manage. 175, 185-194.
FAO, 1998. FAO, ISRIC, ISSS World Reference Base for Soil Resources. World Soil
Resources Reports 84. Rome, Italy.
Finzi, A.C., Canham, C.D., Van Breemen, N., 1998a. Canopy tree-soil interactions within
temperate forests: Species effects on pH and cations. Ecol. Appl. 8, 447-454.
Finzi, A.C., Canham, C.D., Van Breemen, N., 1998b. Canopy tree-soil interactions within
temperate forests: Species effects on soil carbon and nitrogen. Ecol. Appl. 8, 440-446.
Graham, R.C., Ervin, J.O., Wood, H.B., 1995. Aggregate stability under oak and pine after
four decades of soil development. Soil. Sci. Soc. Am. J. 59, 1740-1744.
Hüttl, R.E., Schaaf, W., 1995. Nutrient supply of forest soils in relation to management and
site history. Plant Soil 168-169, 31-41.
Jungk, A., 1968. Die Alkalität der Pflanzenasche als Maß für den Kationenüberschuß in der
Pflanze. Z. Pflanzenernähr. Bodenk. 120, 99-105.
König, N., Fortmann, H., 1996. Probenvorbereitungs-, Untersuchungs- und
Elementbestimmungsmethoden des Umweltanalytiklabors der Niedersächsischen
Forstlichen Versuchsanstalt und des Zentrallabor 2 des Forschungszentrums
Waldökosysteme. Berichte des Forschungszentrums Waldökosysteme, Reihe B, Band 49,
Göttingen, Germany.
Leuschner, C., Jungkunst, H.F., Fleck, S., 2009 Functional role of forest diversity: pros and
cons of synthetic stands and across-site comparisons in established forests. Basic and
Applied Ecology, 10, 1-9
Leuschner, C., Meier, I.C., Hertel, D., 2006. On the niche breadth of Fagus sylvatica: soil
nutrient status in 50 Central European beech stands on a broad range of bedrock types.
Plant Ann. For. Sci. 63, 355-368.
Meier, I.C., Leuschner, C., Hertel, D., 2005. Nutrient return with litter fall in Fagus sylvatica
forests across a soil fertility gradient. Plant Ecology 177, 99-112.
Melillo, J.M., Aber, J.D., Muratore, J.F., 1982. Nitrogen and lignin control of hardwood leaf
litter decomposition dynamics. Ecology 63, 621-626.
- 44 -
Tree species diversity and soils
Mölder, A., Bernhardt-Römermann M., Schmidt, W. 2006. Forest ecosystem research in the
Hainich National Park (Thuringia): First results on flora and vegetation in stands with
contrasting tree species diversity. Waldökologie-Online 3, 83-99
Neirynck, J., Mirtcheva, S., Sioen, G., Lust, N., 2000. Impact of Tilia platyphyllos Scop.,
Fraxinus excelsior L., Acer pseudoplatanus L., Quercus robur L. and Fagus sylvatica L. on
earthworm biomass and physico-chemical properties of a loamy soil. For. Ecol. Manage.
133, 8 275-286.
Noble, A.D., Randall, P.J., 1999. Alkalinity effects of different tree litters 2 incubated in an
acid soil of N.S.W., Australia. Agrofor. Syst. 46, 147-160.
Nordén, U., 1991. Acid deposition and throughfall fluxes of elements as related to tree
species in deciduous forests of South Sweden. Water Air Soil Poll. 60, 209-230.
Nordén, U., 1994. Influence of tree species on acidification and mineral pools in deciduous
forest soils of South Sweden. Water Air Soil Poll. 76, 363-381.
Raulund-Rasmussen, K., Vejre, H., 1995. Effect of tree species and soil properties on
nutrient immobilization in the forest floor. Plant Soil 168, 345-352.
Reich, P.B., Oleksyn, J., Modrzynski, J., Mrozinski, P., Hobbie, S.E., Eissenstat, D.M.,
Chorover, J., Chadwick, O., Hale, C.M., Tjoelker, M.G., 2005. Linking litter calcium,
earthworm and soil properties: a common garden test with 14 tree species. Ecol. Letters
8, 811-818.
Renger, M., 1965. Berechnung der Austauschkapazität der organischen und anorganischen
Anteile der Böden. Zeitschrift für Pflanzenernährung Düngung Bodenkunde 110,10-26.
Rothe, A., Binkley, D., 2001. Nutritional interactions in mixed species forests: a synthesis.
Can. J. For. Res. 31, 1855-1870.
Rothe, A., Huber, C., Kreutzer, K., Weis, W., 2002a. Deposition and soil leaching in stands of
Norway spruce and European beech: Results from the Höglwald research in comparison
with other European case studies. Plant Soil 240, 33-45.
Saetre, P., Brandtberg, P.-O., Lundkvist, H., Bengtsson, J., 1999. Soil organisms and
carbon, nitrogen and phosphorus mineralisation in Norway spruce and mixed Norway
spruce – birch stands. Biol. Fertil. Soils 28, 382-388.
- 45 -
Chapter 2
Sariyildiz, T., Anderson, J.M., 2005. Variation in the chemical composition of green leaves
and leaf litters from three deciduous tree species growing on different soil types. For. Ecol.
Manage. 210, 303-319.
Scherer-Lorenzen, M., Potvin, C., Koricheva, J., Schmidt, B., Hector, A., Bornik, Z.,
Reynolds, G., Schulze, E.-D. 2005. The design of experimental tree plantations for
functional biodiversity research. In M. Scherer-Lorenzen, Ch. Körner & E.-D. Schulze
(Eds.), Forest Diversity and Function (pp. 347-376). Ecol. Stud. 176. Berlin, Springer,
pp.347-376.
Schlichting, E., Blume, H.-P., Stahr, K., 1995. Bodenkundliches Praktikum. Pareys
Studientexte 81. Blackwell Wissenschafts-Verlag, Wien, pp. 112-116.
Son, Y., Lee, I.K., 1997. Soil nitrogen mineralization in adjacent stands of larch, pine and oak
in central Korea. Ann. Sci. For. 54, 1-8.
Washburn, C.S.M., Arthur, M.A., 2003. Spatial variability in soil nutrient availability in an oak-
pine forest: potential effects of tree species. Can. J. For. Res. 33, 2321-2330.
- 46 -

Chapter
3
Productivity of temperate broad-leaved forest stands differing in tree species diversity
Mascha Jacob, Christoph Leuschner, Frank M. Thomas
(Published in: Annals of Forest Science, in press)

Chapter 3
3.1 Abstract
Understanding the effects of tree species diversity on stocks and production of tree biomass
in forests is fundamental for developing strategies for carbon sequestration strategies,
particularly in the perspective of the current climate change. However, the diversity-
productivity relationship in old-growth forests is not well understood. We quantified biomass
and above-ground production in nine forest stands with increasing tree species diversity from
monocultures of beech to stands consisting of up to five deciduous tree species (Fagus
sylvatica, Fraxinus excelsior, Tilia spp., Carpinus betulus, Acer spp.) to examine (a) if mixed
stands are more productive than monospecific stands, (b) how tree species differ in the
productivity of stem wood, leaves and fruits, and (c) if beech productivity increases with tree
diversity due to a lower intraspecific competition and complementary resource use. Total
above-ground biomass and wood production decreased with increasing tree species
diversity. In Fagus and Fraxinus, the basal area-related wood productivity exceeded those of
the co-occuring tree species, while Tilia had the highest leaf productivity. Fagus trees
showed no elevated production per basal area in the mixed stands. We found no evidence of
complementary resource use associated with biomass production. We conclude that above-
ground productivity of old-growth temperate deciduous forests depend more on tree species-
specific traits than on tree diversity itself.
3.2 Introduction
The role of plant species diversity for ecosystem processes such as biomass production,
sequestration of nutrients, and the fluxes of energy and matter belongs to the most
challenging topics of current ecological research, especially on the background of the current
climate change (e.g. Yachi and Loreau, 2007; Fornara and Tilman, 2008). Whilst, during the
past two decades, extensive studies have been conducted on the effects of plant species
diversity on biomass production in grasslands (e.g. Hooper et al., 2005; Spehn et al., 2005),
such studies have been performed to a much smaller extent in forest ecosystems. In theory,
increased biomass production in stands that are more diverse in plant species or plant
functional groups may be a consequence of positive interactions among the species or may
result from complementarity in resource use, e.g., increased depletion of light, water or
nutrients by coexisting plant species (e.g. Hooper and Vitousek, 1997). In forest ecosystems,
most studies comparing species-poor and species-rich stands contrasted plots with one and
two tree species (cf. Cannell et al., 1992). Hitherto, the number of studies on the effects of
tree species diversity on tree biomass production is too small to allow general conclusions on
systematic productivity differences between monospecific tree stands and stands with more
than one tree species (Rothe and Binkley, 2001; Rothe et al., 2002).
- 48 -
Above-ground productivity
Due to the Ice Ages, the tree species diversity of Central-European forests, which - without
anthropogenic interference - would be dominated by the European beech (Fagus sylvatica
L.) except for very dry, wet or acidic sites and the upper montane regions, is much lower than
in the temperate zones of other continents. Anthropogenic use during the past two millennia,
including the establishment of fast-growing monospecific coniferous stands outside their
natural habitats, has lowered tree species diversity even more. Currently, Central-European
forestry is conducting a conversion of monospecific into mixed stands in part of the forested
area (e.g. BMVEL 2001). However, the consequences of this conversion for productivity,
biotic interactions and the fluxes of energy and matter as well as for ecosystem goods and
services used by man are insufficiently known. Therefore, a long-term study on the role of
biodiversity for biogeochemical cycles and biotic interactions has been established in the
Hainich National Park (Thuringia, Central Germany), which is richer in tree species (up to 14
deciduous tree species per hectare) than most other forest ecosystems in Central Europe. In
the context of the Hainich Tree Diversity Matrix Project, mature monospecific stands built by
European beech are being compared to mature stands consisting of three or five deciduous
tree species (Guckland et al., 2009; Leuschner et al., 2009). One of the foci of the study is to
analyze the relationship between tree species diversity and above-ground biomass
production, which is not fully understood. The results of field studies (Cannell et al., 1992;
Vilà et al., 2003) and of a meta-analysis (Augusto et al., 2002) failed to yield general
relationships between tree species number and production of above-ground tree biomass
(Enquist and Niklas, 2001). However, a possibility not investigated so far is that the
productivity of mixed stands is higher than that of pure beech stands because different tree
species in mixed stands differ in their seasonal growth dynamics. In this case,
complementarity would be due to temporal rather than spatial partitioning of essential
resources such as light, water and nutrients, and one would expect that the productivity of
European beech is higher in mixed stands than in pure beech stands. In addition, the
productivity of the beech in mixed stands may be higher in pure beech stands due to the
alleviation of intraspecific competition (cf. Pretzsch and Schütze, 2009). We tested these
hypotheses by analyzing stem increment and biomass production of leaves and fruits, and by
relating productivity to tree species diversity. This comparative study in the old-growth stands
of the Hainich Tree Diversity Matrix is viewed as a complementary research approach to
recently initiated experiments with planted stands differing in tree diversity (e.g. Scherer-
Lorenzen et al., 2005).
- 49 -
Chapter 3
3.3 Materials and methods
Study area and sampling design We conducted the study in the Hainich National Park, Thuringia, Central Germany, in old-
growth deciduous forest stands that differ in tree species diversity. All research sites are
situated at an elevation of about 350 m a.s.l. near the village of Weberstedt (51° 06’ N,
10° 31’ E). The mean annual temperature at the Weberstedt meteorological station is 7.5 °C
and the mean annual precipitation is 670 mm. Soils are Luvisols with a loess cover of at least
60 cm and stagnic properties, and are underlain by limestone (Guckland et al., 2009). The
studied stands have been managed only with stem wise extraction for the past four decades
and have developed a near-natural structure. A small-scale mosaic of forest ownership with
different forest management systems including coppice with standards and selective tree
cutting has resulted in the existence of tree species-poor and tree species-rich stands in
close neighborhood (Leuschner et al., 2009).
In April 2005, forest stands differing in tree taxa diversity were selected in the north-eastern
part of the national park and grouped into three diversity levels (DL): (i) four forest stands of
European beech (Fagus sylvatica L.) contributing with 85% to 100 % to the total tree basal
area (DL 1); (ii) four stands mainly consisting of beech, lime (Tilia cordata Mill. and T.
platyphyllos Scop.) and ash (Fraxinus excelsior L.) (DL 2); and (iii) four stands with five
dominant tree taxa (beech, lime, ash, hornbeam (Carpinus betulus L.) and maple (Acer
pseudoplatanus L. and A. platanoides L.)) (DL 3). The dominant trees had an average age of
85-148 years (in 2006) according to wood core analysis conducted by Schmidt et al. (2009).
The plot size within a forest stand was 50 m × 50 m. At each DL, all forest stands were
located within a radius of about 4 km, and were comparable with respect to slope, physical
soil conditions and climatic conditions. The fenced plots also exhibited the same soil physical
conditions. Their stand characteristics are presented in Table 1.
- 50 -

Above-ground productivity
Tab.1: Study sites description. Given are means ± 1 SE of data from three plots. Different letters indicate significant differences between the diversity levels; p < 0.05.
Site structure DL 1 DL 2 DL 3
Shannon index for species (No. of stems) 0.3 ± 0.1 c 1.1 ± 0.1 b 1.6 ± 0.1 a Mean number of tree genera per plot 3 ± 0.9 b 5 ± 0.7 ab 6 ± 0.7 a Basal area (m² ha-1) 41 ± 2.8 a 39 ± 3.7 a 36 ± 2.4 a Stem density (>7cm dbh) (ha-1) 291 ± 69 a 581 ± 101 a 397 ± 39 a Mean age of canopy trees (yr) 148 ± 25 a 85 ± 6.5 b 100 ± 8.4 abMean tree height (m)* 35.7 ± 1.5 a 28.7 ± 0.6 b 26.7 ± 0.4 b Height/diamenter (HD-value) (m m-²)* 73.5 ± 2.5 a 84.6 ± 4.5 a 75.1 ± 3.2 a Leaf area index (m² m-²) 6.4 ± 0.3 a 6.9 ± 0.3 a 7.1 ± 0.5 a Mean crown area (m²)* 55.9 ± 10 a 36.7 ± 6.9 a 51.2 ± 1.9 a Mean crown diameter (m)* 8.0 ± 0.8 a 6.5 ± 0.6 a 7.5 ± 0.2 a Height of crown base (m)* 18.5 ± 0.6 a 14.7 ± 0.9 b 13.5 ± 0.2 b Total canopy cover (%) 85.5 ± 1.5 b 90.8 ± 0.6 a 89.3 ± 1.5 a Fagus (% of total canopy cover) 96.1 ± 1.9 a 67.1 ± 3.5 b 21.4 ± 13 c Tilia (% of total canopy cover) 0.8 ± 0.8 b 13.1 ± 5.3 ab 40.3 ± 11 a Fraxinus (% of total canopy cover) 0.5 ± 0.5 a 14.2 ± 3.9 a 10.7 ± 4.3 a Acer (% of total canopy cover) 0.9 ± 0.4 b 4.5 ± 1.0 b 8.5 ± 1.3 a Carpinus (% of total canopy cover) 0.0 ± 0.0 b 0.0 ± 0.0 b 14.7 ± 5.2 a Others (% of total canopy cover) 1.7 ± 1.7 a 1.0 ± 1.0 a 4.5 ± 2.9 a
* dominant and co-dominant trees, class 1 and 2 after Kraft 1884
Determination of biomass and productivity In summer 2005, the diameter at breast height (dbh) was recorded using measurement tapes
in all trees of the 12 forest stands with a dbh exceeding 7 cm. For all calculations, however,
the values of the nine finced plots were used. In winter 2005/2006, tree height was measured
using a Vertex sonic clinometer and transponder (Haglöf Sweden AB, Långsele, Sweden),
and crown area was determined by 8-point canopy projection with a sighting tube equipped
with a 45° mirror (constructed in the Department of for Remote Sensing, University of
Göttingen, Germany). Mean tree height was calculated from dominant and co-dominant trees
according to class 1 and 2 after Kraft (1884) to minimize e.g. the influence of self-thinning
processes or the regeneration differences of the stands. Species-specific allometric biomass
equations were used to calculate above-ground woody biomass of the trees. Biomass of
Fagus and Carpinus was computed using linear equations with natural logarithmic
transformation based on dbh and tree height (Wirth et al., 2004):
ln(y) = a + b · ln(dbh) + c · ln(dbh)2 + d · ln(h) + e · ln(h)2;
where y = biomass (kg dry mass); a = -3.4719, b = 1.90119, c = 0, d = 0.98218, e = 0 for
stems; a = -0.92263, b = 2.68122, c = 0.09993, d = -1.91638, e = 0.14018 for branches and
- 51 -
Chapter 3
twigs; dbh = diameter at breast height (cm), h = tree height (m). Total above-ground woody
biomass was calculated by summing up the biomasses of stem, branches and twigs.
The woody biomass of T. cordata, A. pseudoplatanus, and F. excelsior was determined
according to Bunce (1968) (see also Zianis et al., 2005):
ln(ABW) = a + b · ln(dbh);
where a = -2.6788 and b = 2.4542 in the Tilia species; a = -2.7606 and b = 2.5189 in the
Acer species; a = -2.4598 and b = 2.4882 for F. excelsior; ABW = above-ground woody
biomass (kg dry mass), dbh = diameter at breast height (cm). For all forest stands, the soil
surface area-related woody biomass (in Mg ha-1) was calculated.
From August 2005 to December 2007, stem diameter increment was measured at a height of
130 cm in all trees with dbh ≥ 40 cm using increment measurement tapes (D1 permanent
measurement tape, UP, Cottbus, Germany). Trees with a smaller dbh were assigned to two
stem diameter classes (7 to < 20 cm and 20 to < 40 cm), and subsamples of these classes
were considered for growth increment measurements according to their share in total stem
number. Annual wood production at the plot level (in Mg ha-1 yr-1) was calculated from the
relative annual increment of wood biomass of all tree species present. Two plots (DL 1c and
DL 3a) were partly destroyed by storms in summer 2006 and winter 2007/2008. These plots
were excluded from the increment measurements and in these cases, wood productivity was
calculated from the unfenced plots DL 1d and DL 3d.
In the nine fenced forest stands, we determined the production of leaf and fruit biomass
using litter traps. In each forest stand, 15 litter collectors (aperture: 0.29 m²) were arranged at
a minimum distance of 2 m along randomly positioned 30-m transects. Water was allowed to
drain from the collectors through 8-mm holes drilled through the bottom. Leaf litter was
sampled every two to three weeks during September to December 2005-2007 and,
additionally, once in spring and once in late summer of 2006. All samples were separated
into leaves, fruits, flowers and twigs. Leaves and fruits were assigned to the different tree
species, oven-dried at 70 °C for 48 h, and weighed. Tilia cordata and T. platyphyllos were
considered as one taxon as they hybridize and could not be separated into species. Soil
surface area-related annual leaf production was calculated as the sum of the collected mass
of leaf litter divided by the surface area of the collector. The leaves were scanned and the
surface area was calculated using WinFolia software (Regent Instruments, Quebec,
Canada). LAI was obtained by multiplying stand leaf biomass per species with the species-
specific average of specific leaf area (SLA).
- 52 -

Above-ground productivity
Statistical analyses Statistical data analysis and regression analyses were conducted using the software
packages R, version 2.8.1 (R Development Core Team, Vienna, Austria) and SigmaPlot,
version 10.0 (Systat Software Inc., San Jose, USA). To examine differences among the
diversity levels (DL 1 - 3) between the study years and between tree species within one
diversity level, we performed an analysis of variance (ANOVA) followed by the Tukey test for
all pairwise comparisons of means when assumptions of normality and homogeneity were
met (p < 0.05; Shapiro-Wilk test, Levene test). In the case of non-normally distributed data, a
Kruskal-Wallis single factor analysis of variance followed by non-parametric Mann-Whitney
two sample U-tests was applied (p < 0.05 in all analyses).
Simple regression analyses were used to analyze the relationship between tree species
diversity (Shannon Index H’) on the one hand, and total above-ground biomass, LAI, and
variables of productivity, on the other. We conducted a multiple regression analysis after zero
mean – unit variance standardisation of the explanatory variables Shannon Index H’ and
stand age to consider the effects of these factors on the productivity of leaves, fruits, wood
and total above-ground productivity (sum of leaves, fruits and wood) simultaneously.
Autocorrelation between the explanatory variables was moderate (R² = 0.45) and the
variance inflation factor of the models was considerably low (VIF = 2.046). The fit of the
model was checked graphically on normal distribution and heteroscedasticity of the model
residuals. Akaike’s Information Criterion (AIC) of each model were given.
Within a given diversity level, we performed a Kruskal-Wallis single factor analysis and non-
parametric Mann-Whitney two sample U-tests to examine differences between tree species
in the cumulative relative diameter growth. Trees with no basal area increment in the specific
year were excluded.
3.4 Results Stand structure The forest stands of the three diversity levels (DL) did not differ significantly in basal area,
stem density, height:diameter ratio (HD value), LAI, mean crown area or mean crown
diameter (Table 1). Significant differences between the diversity levels existed for tree age,
tree height and height of crown base, which were higher in the monospecific forest stands,
and for total canopy cover. The absolute differences between the three levels were rather
small, however. Thus, the forest stands were comparable with regard to fundamental
characteristics of their stand and canopy structure. The differences in the tree species
composition among the three DL are reflected by a significantly decreasing fraction of Fagus
and increasing fractions of Tilia, Acer and C. betulus in the total canopy cover, and by a
concomitant increase from DL 1 to DL 3 in the tree genus-related Shannon index, as
calculated for tree species and based on stem numbers (Table 1).
- 53 -

Chapter 3
Above-ground biomass and productivity The total above-ground tree biomass of the nine forest stands ranged from 200 to
480 Mg ha-1 (Fig. 1). The highest figure was determined in an almost pure Fagus stand. The
above-ground biomass decreased significantly with increasing Shannon diversity H’ of the
tree layer.
Fig. 1: Relationship between total above-ground biomass (stem and branch wood, leaves, fruits) and
the Shannon Index H’ of the tree layer (calculated from the basal area of all tree genera). N=3 plots
per diversity level, DL 1; ♦ DL 2; ▲ DL 3.
The production of leaves and fruits did not correlate with the tree diversity (Fig. 2). In 2006,
which was a mast year in beech, the mass of produced fruits reached almost 3 Mg ha-1 in the
DL 1 and DL 2 forest stands and, thus, was nearly as high as leaf production.
The production of wood and total above-ground biomass was highest in the pure Fagus
stands and decreased with increasing tree species diversity H’ (significant in 2007). The
results of the regression analysis showed a higher influence of H’ than of stand age or the
interaction of both factors on productivity measures (Tab. 2). The coefficients can be directly
compared because the explanatory variables were standardised to zero mean and unit
variance.
When relating the production of wood, leaves and fruits to the tree basal area instead of the
plot area, a similar picture of species-specific and DL-specific production patterns appeared
(Electronic supplementary material (ESM) S1) as in the plot-area related data (ESM S2).
- 54 -
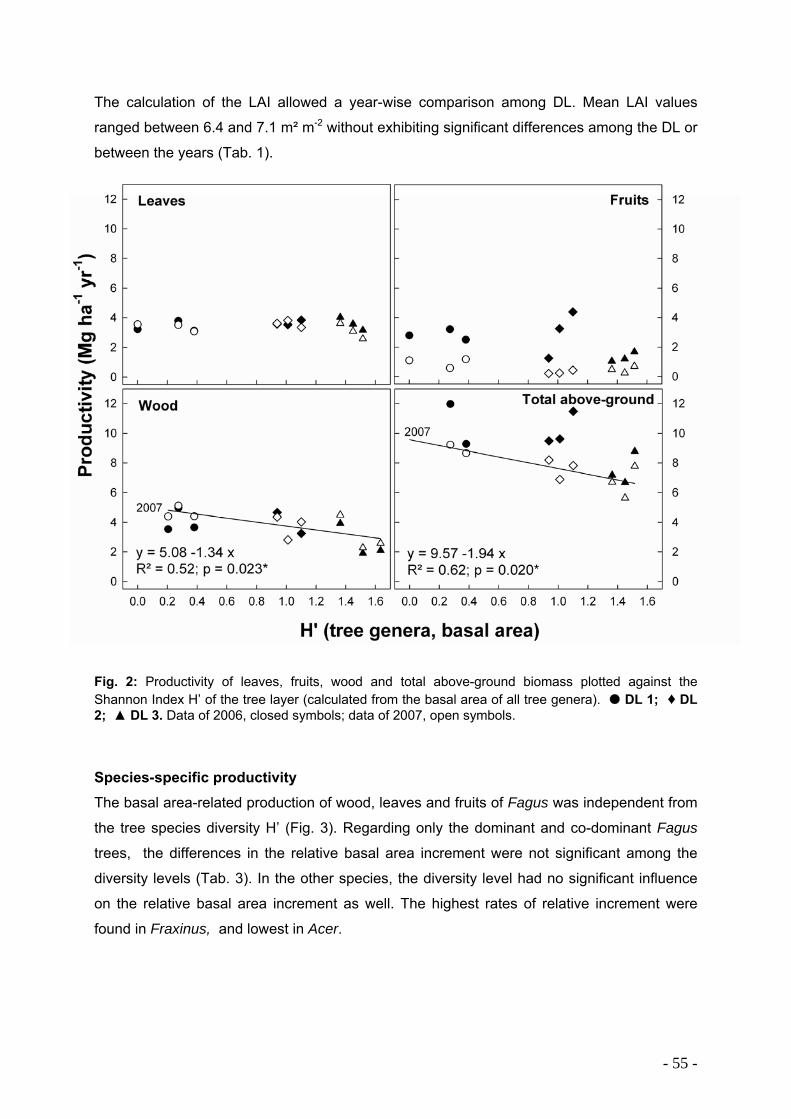
Above-ground productivity
- 55 -
The calculation of the LAI allowed a year-wise comparison among DL. Mean LAI values
ranged between 6.4 and 7.1 m² m-2 without exhibiting significant differences among the DL or
between the years (Tab. 1).
Fig. 2: Productivity of leaves, fruits, wood and total above-ground biomass plotted against the Shannon Index H’ of the tree layer (calculated from the basal area of all tree genera). DL 1; ♦ DL 2; ▲ DL 3. Data of 2006, closed symbols; data of 2007, open symbols.
Species-specific productivity The basal area-related production of wood, leaves and fruits of Fagus was independent from
the tree species diversity H’ (Fig. 3). Regarding only the dominant and co-dominant Fagus
trees, the differences in the relative basal area increment were not significant among the
diversity levels (Tab. 3). In the other species, the diversity level had no significant influence
on the relative basal area increment as well. The highest rates of relative increment were
found in Fraxinus, and lowest in Acer.
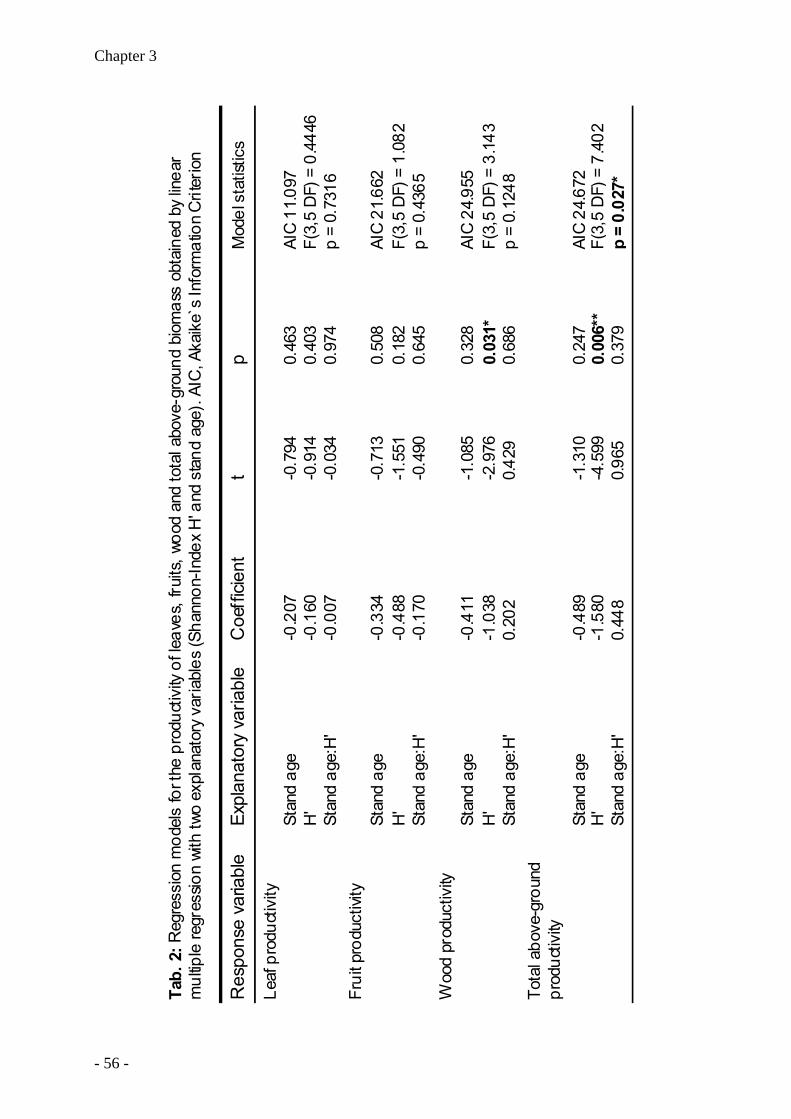
Chapter 3
- 56 -
Mod
el s
tatis
tics
AI
C 1
1.09
7F(
3,5
DF)
= 0
.444
6p
= 0.
7316
AIC
21.
662
F(3,
5 D
F) =
1.0
82p
= 0.
4365
Stan
d ag
e-0
.411
-1.0
850.
328
AIC
24.
955
H'
-1.0
38-2
.976
0.03
1*F
Res
pons
e va
riabl
eEx
plan
ator
y va
riabl
eC
oeffi
cient
t
p
Leaf
pro
duct
ivity
Stan
d ag
e-0
.207
-0.7
940.
463
H'
-0.1
60-0
.914
0.40
3St
and
age:
H'
-0.0
07-0
.034
0.97
4Fr
uit p
rodu
ctivi
tySt
and
age
-0.3
34-0
.713
0.50
8H
' -0
.488
-1.5
510.
182
Stan
d ag
e:H
'-0
.170
-0.4
900.
645
Woo
d pr
oduc
tivity
(3,5
DF)
= 3
.143
Stan
d ag
e:H
'0.
202
0.42
90.
686
p =
0.12
48To
tal a
bove
-gro
und
prod
uctiv
it ySt
and
age
-0.4
89-1
.310
0.24
7AI
C 2
4.67
2H
' -1
.580
-4.5
990.
006*
*F (
3,5
DF)
= 7
.402
Stan
d ag
e:H
'0.
448
0.96
50.
379
p =
0.02
7*
ss o
btai
ned
by li
near
Ta
b. 2
: Reg
ress
ion
mod
els
for t
he p
rodu
ctiv
ity o
f lea
ves,
frui
ts, w
ood
and
tota
l abo
ve-g
roun
d bi
oma
mul
tiple
regr
essio
n wi
th tw
o ex
plan
ator
y va
riabl
es (S
hann
on-In
dex
H' a
nd s
tand
age
). AI
C, A
kaik
e`s
Info
rmat
ion
Crit
erio
n

Above-ground productivity
Tilia and Fraxinus occur in the mixed species forest stands of DL 2 and DL 3. Related to the
basal area, Tilia produced significantly more basal area-related leaf biomass, while wood
productivity of ash was significantly higher compared to the other species (Fig. 4). In the
mast year of 2006, only Carpinus reached values of fruit production that were similar to those
of Fagus (ESM S2).
The relative basal area increment of dominant and co-dominant Fagus trees tended to be
higher at DL 2 and DL 3 than in DL 1, but the differences were not significant (Table 4). In
the other species, the diversity level had no significant influence on relative basal area
increment as well. The highest rates of relative increment were found in Fraxinus, and the
lowest in Acer.
Fig. 3: Relationship between the basal area-related productivity of leaves, fruits, and wood in Fagus sylvatica and the Shannon Index H’ of the tree layer (calculated from the basal area of all tree genera).
DL 1; ♦ DL 2; ▲ DL 3. Data of 2006, closed symbols; data of 2007, open symbols.
Tab. 3: Relative basal area-increment of dominant and co-dominant trees (in % yr-1) (means ± 1 SE of data from 3 plots). Different lower-case letters indicate significant differences between the three diversity levels, capital letters indicate significant differences between different years.
DL 1 DL 2 DL3 2006 2007 2006 2007 2006 2007
Fagus sylvatica 0.90 ± 0.11 1.08 ± 0.07 1.25 ± 0.23 1.47 ± 0.24 1.01 ± 0.23 1.11 ± 0.18 a A a A a A a A a A a A
Fraxinus excelsior 1.92 ± 0.24 1.67 ± 0.06 1.78 ± 0.33 2.04 ± 0.20 a A a A a A a A
Tilia sp. 0.69 ± 0.24 1.12 ± 0.12 0.80 ± 0.09 1.43 ± 0.15 a A a A a A a B
Acer sp. 0.57 ± 0.17 0.76 ± 0.25 A A
Carpinus betulus 0.89 ± 0.22 0.92 ± 0.33 A A
- 57 -
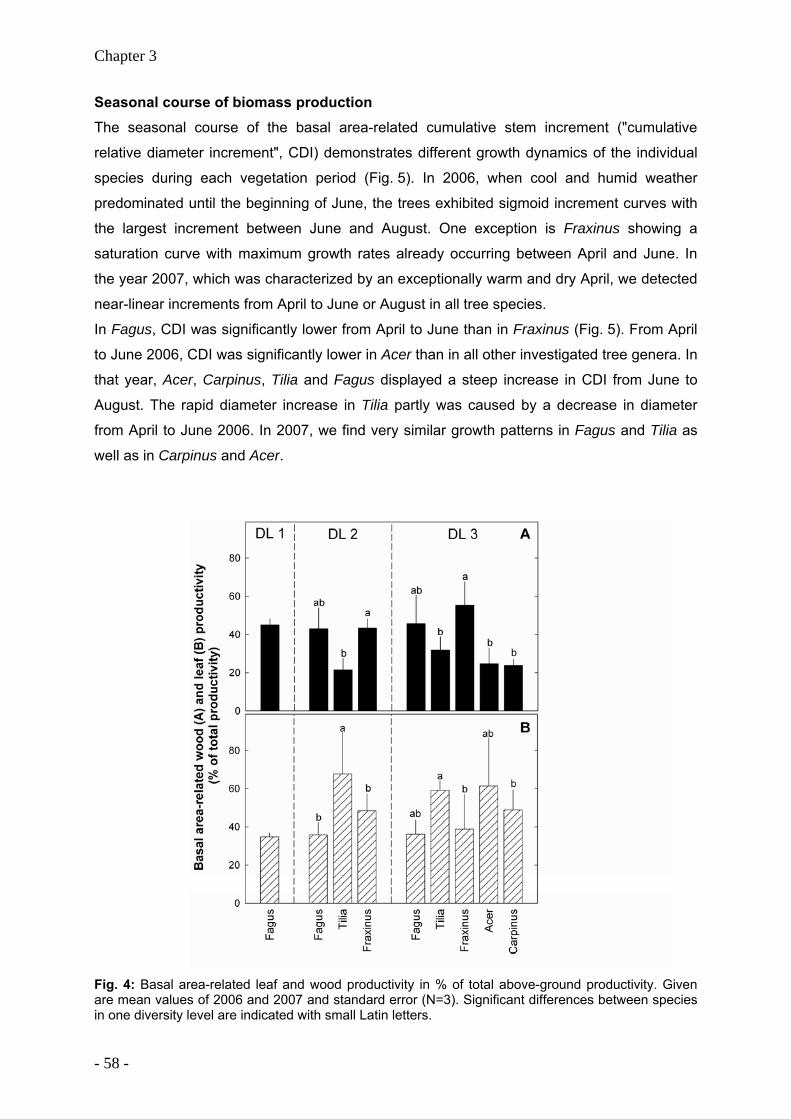
Chapter 3
Seasonal course of biomass production The seasonal course of the basal area-related cumulative stem increment ("cumulative
relative diameter increment", CDI) demonstrates different growth dynamics of the individual
species during each vegetation period (Fig. 5). In 2006, when cool and humid weather
predominated until the beginning of June, the trees exhibited sigmoid increment curves with
the largest increment between June and August. One exception is Fraxinus showing a
saturation curve with maximum growth rates already occurring between April and June. In
the year 2007, which was characterized by an exceptionally warm and dry April, we detected
near-linear increments from April to June or August in all tree species.
In Fagus, CDI was significantly lower from April to June than in Fraxinus (Fig. 5). From April
to June 2006, CDI was significantly lower in Acer than in all other investigated tree genera. In
that year, Acer, Carpinus, Tilia and Fagus displayed a steep increase in CDI from June to
August. The rapid diameter increase in Tilia partly was caused by a decrease in diameter
from April to June 2006. In 2007, we find very similar growth patterns in Fagus and Tilia as
well as in Carpinus and Acer. Fig. 4: Basal area-related leaf and wood productivity in % of total above-ground productivity. Given are mean values of 2006 and 2007 and standard error (N=3). Significant differences between species in one diversity level are indicated with small Latin letters.
- 58 -

Above-ground productivity
Fig. 5: Relative cumulative seasonal diameter growth for the dominant species in the three diversity levels in the year 2006 and 2007. Significant differences between species in one diversity level are indicated with small Latin letters. The number of trees per diversity level is shown in brackets.
- 59 -
Chapter 3
3.5 Discussion
In nine old-growth forest stands with increasing tree species diversity of broad-leaved
Central-European tree species, we found no increase in above-ground productivity with
increasing tree species diversity. Rather, there was a decline of wood and total above-
productivity with increasing diversity of tree genera. This finding is in contrast to the results of
several other studies on forests. Whilst model simulations predict that the productivity of
mixed stands will generally be intermediate between that of the respective monospecies
stands (Bartelink, 2000), field studies revealed that, compared to monospecies stands, the
productivity of mixed stands can decrease or increase by up to 30%, depending on the
specific physiology and growth potential of the species (Pretzsch, 2005). In Southern
Germany, mixed stands of Fagus sylvatica and Picea abies produced up to 59% more
above-ground biomass than adjacent pure stands (Pretzsch and Schütze, 2009). The
authors explained this finding by a reduction in intraspecific competition among Fagus trees
(which, for beech, is more severe than interspecific competition with spruce), and by
facilitation brought about by Fagus to the benefit of Picea through an improvement of nutrient
supply by deeper soil exploitation, higher nutrient turnover, and activation of the humus layer.
In contrast, wood production did not differ significantly among monospecies and mixed
forests dominated by Pinus sylvestris or P. halepensis in Southeastern Spain when
environmental factors, such as climate, bedrock types, and radiation were included in the
analysis (Vilà et al., 2003). However, in early-successional Mediterranean-type forests in
Northeastern Spain, Vilà et al. (2007) detected a significant increase of wood production with
increasing tree species richness across a broad range of environmental conditions. Age-
dependent growth patterns of juniper woodlands in Spain result from differences in the
management system. Rozas et al. (2008) found that Juniper productivity did change abruptly
with the transformations of the traditional management system. A livestock decrease,
however, could also have led to higher plant species diversity. Most differences observed in
above-ground productivity among forest stands differing in tree species richness could be
attributed to species-specific traits or contrasting site conditions rather than to the number of
tree species present (Kerr et al., 1992; Vilà et al., 2003; Pretzsch, 2005; Sánchez-Gómez et
al. 2008).
The decline of wood productivity with increasing diversity of tree genera of our study is
probably related to the observed decrease in total above-ground tree biomass. Similar
results were obtained in a study conducted in a variety of unmanaged forest stands in the
Czech Republic, Poland and Slovakia, which covered stands composed of one to eight tree
species (Szwagrzyk and Gazda, 2007). That study revealed a negative (yet insignificant)
- 60 -
Above-ground productivity
trend of above-ground biomass with increasing tree species richness within a range of
above-ground biomass (169-536 Mg ha-1) that was similar to our study (200-480 Mg ha-1).
With regard to biomass accumulation by Fagus sylvatica, the results obtained in the study by
Szwagrzyk and Gazda (2007) fit our findings well: the share of beech was positively
correlated with biomass accumulation, and the highest above-ground biomass was found in
pure stands of Fagus. However, in our study, this result cannot be explained by the
"sampling effect", i.e. the effect that the most productive species of a given community
determines the level of productivity (cf. Hooper et al., 2005). In our study, the trend towards a
higher biomass in the pure beech stands could be due to the increased tree age of the
canopy trees. However, multiple regression analysis revealed a higher influence of the tree
diversity compared to stand age or the interaction of both factors. Furthermore, the higher
biomass accumulation in beech stands cannot be attributed to a better nutrient supply:
compared to the mixed species stands, the Fagus stands exhibited a significantly lower soil
pH and base saturation, and tended towards a lower cation exchange capacity and higher
C:N ratios (Guckland et al., 2009), which is believed to be mainly a result of Fagus leaf and
root litter effects on the soil.
In the investigated forest stands, the annual production of wood and leaves was similar to
that of a highly diverse (eight predominating tree species) mesic temperate deciduous forest
in the Southeast of North America (Newman et al., 2006). In contrast to Newman et al.
(2006), the total production of wood and leaves in our study did not differ significantly in most
cases, despite distinct differences in the weather conditions between the study years. The
increase in the leaf area index (LAI) with increasing tree species diversity can be explained
with a larger biomass investment into the leaves (compared to wood) in Tilia, Carpinus and
Acer that, in addition, also display a high specific leaf area (SLA) (data on request).
Different tree species are capable of using the water and nutrient resources from the soil in a
complementary manner due to differences in root architecture (cf. Köstler et al., 1968;
Polomski and Kuhn, 1998; Kutschera and Lichtenegger, 2002). In the present study, we did
not find such positive effects of complementarity on the production and accumulation of
biomass as there were no significant species differences in rooting patterns among the three
diversity levels (Meinen, 2009). Complementarity could also be possible with regard to
temporal differences in the use of below-ground or above-ground resources. In the mixed
species forest stands of our study, Fraxinus had reached 60-80% of its annual increment in
basal area already at the end of June, whereas the seasonal growth dynamics of Tilia
seemed to be more dependent on the weather: growth of Tilia was slow in the cool and moist
spring of 2006, but much faster in the warm spring of 2007. Fraxinus, the only ring-porous
- 61 -
Chapter 3
tree species of our study, leaves out later than the other tree species. Therefore, its early
stem growth cannot be explained by higher photosynthesis rates but rather by the formation
of early wood and of the main conducting vessels for water transport (Leuschner et al., in
revision).
The growth of Fagus was slower than that of Fraxinus in the mixed forest stands. Most likely,
rapid early stem growth of Fraxinus can be tolerated by Fagus because the slender crowns
of Fraxinus, which can utilize even small gaps within a closed forest stand, only have a small
shading effect on the surrounding trees. On the other hand, Fagus is competitively superior
to other Central European deciduous forest tree species due to its higher shade tolerance in
juvenile stages (Ellenberg, 1996), its low crown transmissivity of photosynthetically active
radiation that causes severe shading of competing species (Leuschner, 1998), and its
capability of efficiently exploring the crown space by its foliage mass and its annual branch
volume increment (Reiter et al., 2005). However, differential seasonal growth patterns among
the species did not result in increased productivity at the plot level compared to the
monospecific stands.
We summarize that above-ground productivity of the investigated mature temperate
deciduous forest stands is remarkably constant not only for different levels of tree species
diversity but also over subsequent years, if water availability is sufficient. Tilia, Acer and
Carpinus invest a large fraction of carbon into the production of foliage and, thus, enhance
carbon cycling in mixed species stands, whereas the production of stem wood in Fagus trees
exceeds leaf production and results in longer carbon storage in monospecific stands. Our
data suggest that above-ground net primary production is much more under the control of
climate and edaphic factors than dependent on tree species diversity. Furthermore,
characteristic physiological, morphological and architectural traits, which control productivity,
seem to be more influential than the mere number of species present.
Acknowledgements
We thank the German Research Council (DFG) for funding within the Research Training
Group (Graduiertenkolleg) 1086. Many colleagues from the Research Training Group
supported our studies with data and comments.
- 62 -
Above-ground productivity
3.6 References
Augusto L., Ranger J., Binkley D., Rothe A., 2002. Impact of several common tree species of
European temperate forests on soil fertility. Ann. For. Sci. 59: 233-253.
Bartelink H.H., 2000. Effects of stand composition and thinning in mixed-species forests: a
modeling approach applied to Douglas-fir and beech. Tree Physiol 20: 399-406.
BMVEL, 2001. Gesamtwaldbericht der Bundesregierung. BMVEL (Bundesministerium für
Verbraucherschutz, Ernährung und Landwirtschaft), Bonn, 141 p.
Bunce R.G.H., 1968. Biomass and production of trees in a mixed deciduous woodland: I.
Girth and height as parameters for estimation of tree dry weight. J Ecol 56: 759-775.
Cannell M.G.R., Malcolm D.C., Robertson P.A. (Eds.), 1992. The ecology of mixed-species
stands of trees. Blackwell, Oxford, 312 p.
Ellenberg H., 1996. Vegetation Mitteleuropas mit den Alpen, Ulmer, Stuttgart, 981 p.
Enquist B.J., Niklas K.J., 2001. Invariant scaling relations across tree-dominated
communities. Nature 410: 655-660.
Fornara D.A., Tilman D., 2008. Plant functional composition influences rates of soil carbon
and nitrogen accumulation. J Ecol 9: 314-322.
Guckland A, Jacob M, Flessa H, Thomas FM, Leuschner C. 2009. Acidity, nutrient stocks,
and organic-matter content in soils of a temperate deciduous forest with different
abundance of European beech (Fagus sylvatica L.). J Plant Nut Soil Sci, 172:500-511.
Hooper D.U., Chapin F.S., Ewel J.J., Hector A., Inchausti P., Lavorel S., Lawton J.H., Lodge
D.M., Loreau M., Naeem S., Schmid B., Setälä H., Symstad A.J., Vandermeer J., Wardle
D.A., 2005. Effects of biodiversity on ecosystem functioning: A consensus of current
knowledge. Ecol Monogr 75: 3-35.
Hooper D.U., Vitousek P.M., 1997. The effects of plant composition and diversity on
ecosystem processes. Science 277: 1302-1305.
Kerr G., Nixon C.J., Matthews R.W., 1992. Silviculture and yield of mixed-species stands: the
UK experience. In: Cannell M.G.R., Malcolm D.C., Robertson P.A. (Eds). The ecology of
mixed-species stands of trees. Oxford: Blackwell Oxford, pp. 35-51.
- 63 -
Chapter 3
Kraft G., 1884. Beiträge zur Lehre von den Durchforstungen, Schlagstellungen und
Lichtungshieben. Klindworth’s Verlag, Hannover.
Köstler J.N., Brückner E., Bibelriether H., 1968. Die Wurzeln der Waldbäume. Parey,
Hamburg, 284 p.
Kutschera L., Lichtenegger E., 2002. Wurzelatlas mitteleuropäischer Waldbäume und
Sträucher. Leopold Stocker Verlag, Graz, 604 p.
Leuschner C., 1998. Mechanismen der Konkurrenzüberlegenheit der Rotbuche. Berichte der
Reinhold-Tüxen-Gesellschaft 10: 5-18.
Leuschner C., Gebauer T., Horna V., 2009. Canopy transpiration in temperate broad-leaved
forests of low, moderate and high tree species diversity. In revision.
Leuschner C., Jungkunst H., Fleck S., 2009. Functional role of forest diversity: Pros and cons
of synthetic stands and across-site comparisons in established forests. Basic Appl. Ecol.
10, 1-9.
Lindner M., Karjalainen T., 2007. Carbon inventory methods and carbon mitigation potentials
of forests in Europe: a short review of recent progress. Eur J Forest Res 126: 149-156.
Meinen C.,Hertel D., Leuschner C., 2009. Biomass and morphology of fine roots in
temperate broad-leaved forests differing in tree species diversity: is there evidence of
below-ground overyielding? Oecologia, 161:99-11.
Newman G.S., Arthur M.A., Muller R.N., 2006. Above- and belowground net primary
production in a temperate mixed deciduous forest. Ecosystems 9: 317-329.
Pretzsch H., 2005. Diversity and productivity in forests: evidence from long-term
experimental plots. In: Scherer-Lorenzen M., Körner Ch., Schulze E.D. (Eds). Forest
Diversity and Function - Temperate and Boreal Systems. Ecological Studies 176. Berlin:
Springer Berlin, pp. 41-64.
Pretzsch H., Schütze G., 2009. Transgressive overyielding in mixed compared with pure
stands of Norway spruce and European beech in Central Europe: evidence on stand level
and explanation on individual tree level. Eur J Forest Res 128:183-204.
R Development Core Team, 2008. R: A language and environment for statistical computing.
R Foundation for Statistical Computing, Vienna, Austria. ISBN 3-900051-07-0, URL
http://www.R-project.org.
- 64 -

Above-ground productivity
Reiter I.M., Häberle K.H., Nunn A.J., Heerdt C., Reitmayer H., Grote R., Matyssek R., 2005.
Competitive strategies in adult beech and spruce: space-related foliar carbon investment
versus carbon gain. Oecologia 146: 337-349.
Rothe A., Binkley D., 2001. Nutritional interactions in mixed species forests: a synthesis. Can
J Forest Res 31: 1855-1870.
Rothe A., Kreutzer K., Küchenhoff H., 2002. Influence of tree species composition on soil
and soil solution properties in two mixed spruce-beech stands with contrasting history in
Southern Germany. Plant Soil 240: 47-56.
Rozas V., Olano J.M., De Soto L., Bartolomé D., 2008. Large-scale structural variation and
long-term growth dynamics of Juniperus thurifera trees in a managed woodland in Soria,
central Spain. Ann. For. Sci. 65:809p1-809p10
Sánchez-Gómez D., Zavala M.A., Van Schalkwijk D.B., Urbieta I.R., Valladares F., 2008.
Rank reversals in tree growth along tree size, competition and climatic gradients for four
forest canopy dominant species in Central Spain. Ann. For. Sci. 65:605p1-605p9
Scherer-Lorenzen M., Körner Ch., Schulze E.D., 2005. The functional significance of forest
diversity: a synthesis. In: Scherer-Lorenzen M., Körner Ch., Schulze E.D. (Eds). Forest
Diversity and Function - Temperate and Boreal Systems, Ecological Studies 176, Springer
Berlin, pp. 377-389.
Schmidt I., Leuschner C., Mölder A., Schmidt W., 2009. Structure and composition of the
seed bank in monospecific and tree species-rich temperate broad-leaved forests. Forest
Ecology and Management, 257: 695-702.
Spehn E.M., Hector A., Joshi J., Scherer-Lorenzen M., Schmid B., Bazeley-White E.,
Beierkuhnlein C., Caldeira M.C., Diemer M., Dimitrakopoulos P.G., Finn J.A., Freitas H.,
Giller P.S., Good J., Harris R., Högberg P., Huss-Danell K., Jumpponen A., Koricheva J.,
Leadley P.W., Loreau M., Minns A., Mulder C.P.H., O'Donovan G., Otway S.J., Palmborg
C., Pereira J.S., Pfisterer A.B., Prinz A., Read D.J., Schulze E.D., Siamantziouras A.S.D.,
Terry A.C., Troumbis A.Y., Woodward F.I., Yachi S., Lawton J.H., 2005. Ecosystem
effects of biodiversity manipulations in European grasslands. Ecol Monogr 75: 37-63.
Szwagrzyk J., Gazda A., 2007. Above-ground standing biomass and tree species diversity in
natural stands of Central Europe. J Veg Sci 18: 555-562.
Vilà M., Vayreda J., Gracia C., Ibáñez J.J., 2003. Does tree diversity increase wood
production in pine forests? Oecologia 135: 299-303.
- 65 -

Chapter 3
Vilà M., Vayreda J., Comas L., Ibáñez J.J., Mata T., Obón B., 2007. Species richness and
wood production: a positive association in Mediterranean forests. Ecol Lett 10: 241-250.
Wirth C., Schulze E.D., Schwalbe G., Tomczyk S., Weber G., Weller E., 2004. Dynamik der
Kohlenstoffvorräte in den Wäldern Thüringens. Thüringer Landesanstalt für Wald, Jagd
und Fischerei, Mitteilungen 23/2004. Gotha.
Yachi S., Loreau M., 2007. Does complementary resource use enhance ecosystem
functioning? A model of light competition in plant communities. Ecol Lett 10: 54-62.
Zianis D., Muukkonen P., Mäkipää R., Menuccini M., 2005. Biomass and stem volume
equations for tree species in Europe. Silva Fenn Monogr 4.
- 66 -

Above-ground productivity
Supplementary material
- 67 -
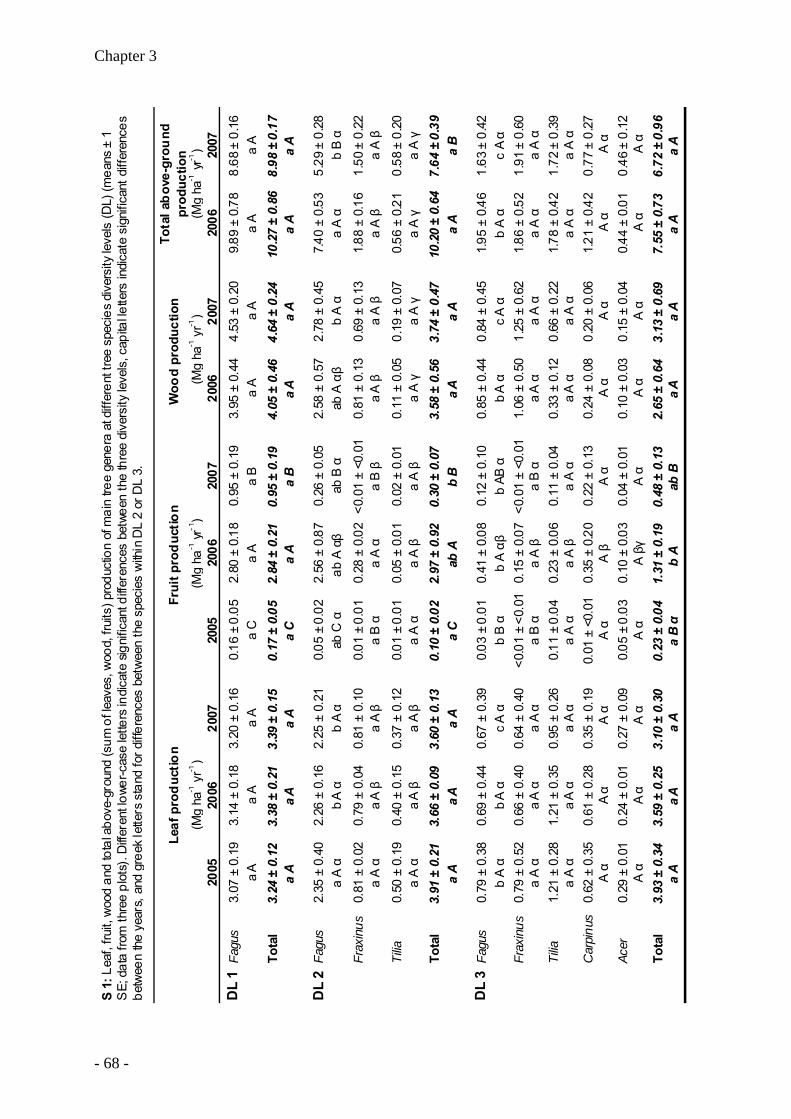
Chapter 3
- 68 -
Car
pinu
s
Acer
Tota
la
Aa
Aa
A
A α
A
DL
1Fa
gus
Tota
l
DL
2Fa
gus
Frax
inus
Tilia
Tota
l
DL
3Fa
gus
Frax
inus
Tilia
α A
α A
α A
αA α
6.72
± 0
.96
A α
a A
ab B
b A
a
B α
a A
a
Aa
A
A α
3.93
± 0
.34
a A
β
0.50
± 0
.19
2.97
± 0
.92
0.10
± 0
.02
3.60
± 0
.13
a A β
3.66
± 0
.09
a A α
0.02
± 0
.01
0.05
± 0
.01
<0.0
1 ±
<0.0
1
0.30
± 0
.07
10
0.79
± 0
.04
0.28
± 0
.0
.20
± 0.
64
20.
01 ±
0.0
10.
81 ±
0.1
0a
A α
a B β
0.40
± 0
.15
0.01
± 0
.01
0.37
± 0
.12
0.0.
19 ±
0.0
70.
11 ±
0.0
0.58
± 0
.20
56 ±
0.2
15
a A β
1.0.
69 ±
0.1
30.
81 ±
0.1
3
a A
αb
A α
b A α
ab B
a A β
a A β
1.50
± 0
.22
88 ±
0.1
6
b B α
a A α
αab
A αβ
ab C
α
0.81
± 0
.02
0.26
± 0
.05
2.56
± 0
.87
b A α
ab A
αβ
7.2.
78 ±
0.4
52.
58 ±
0.5
72.
35 ±
0.4
00.
05 ±
0.0
22.
25 ±
0.2
12.
26 ±
0.1
6
a A
a B
a A
a C
a A
a A
3.24
± 0
.12
104.
64 ±
0.2
44.
05 ±
0.4
60.
95 ±
0.1
9
3.14
± 0
.18
3.20
± 0
.16
a A
a A
2.84
± 0
.21
0.17
± 0
.05
3.39
± 0
.15
3.38
± 0
.21
a A
0.16
± 0
.05
2.80
± 0
.18
4.53
± 0
.20
9.0.
95 ±
0.1
93.
95 ±
0.4
4
5.29
± 0
.28
40 ±
0.5
3
8.98
± 0
.17
.27
± 0.
86a
Aa
A
a A
a A
89 ±
0.7
88.
68 ±
0.1
6
(Mg
ha-1
yr-1
) (M
g ha
-1yr
-1)
(Mg
ha-1
yr-1
) (M
g ha
-1 y
r-1)
Tota
l ab
ove-
grou
nd
prod
uctio
nLe
af p
rod
uctio
nFr
uit p
rod
uctio
n W
ood
prod
uctio
n
2005
2006
2007
2007
2006
2007
2006
2007
2006
a C
a A
a B
a A
3.58
± 0
.56
2005
a A
3.07
± 0
.19
a A
αa
A β
a A β
a B α
a A
a A
ab A
a C
a A γ
a A γ
a A β
a A β
3.74
± 0
.47
a
a A γ
a A
γ7.
64 ±
0.3
9a
BA
a A
b B
0.69
± 0
.44
a A
βa
A α
3.91
± 0
.21
a A
a a
AA
b A
α
a A
1.0.
84 ±
0.4
50.
85 ±
0.4
40.
12 ±
0.1
00.
41 ±
0.0
80.
03 ±
0.0
10.
67 ±
0.3
9
0.66
± 0
.40
0.79
± 0
.38
c A
αb
A α
b AB
αb
A αβ
b B
1.63
± 0
.42
95 ±
0.4
6c
A α
b A α
αc
A α
1.21
± 0
.35
b A
α1.
1.91
± 0
.60
86 ±
0.5
21.
25 ±
0.6
21.
06 ±
0.5
0<0
.01
± <0
.01
0.15
± 0
.07
<0.0
1 ±
<0.0
10.
64 ±
0.4
0a
A α
0.79
± 0
.52
1.72
± 0
.39
78 ±
0.4
1.2
0.66
± 0
.22
0.33
± 0
.12
0.11
± 0
.04
0.23
± 0
.06
0.11
± 0
.04
0.95
± 0
.26
0.61
± 0
.28
1.21
± 0
.28
0.24
± 0
.01
0.77
± 0
.27
1.21
± 0
.4
a A α
a A α
a A α
a A
αa
B α
a A β
a B α
a A α
a A
α
20.
20 ±
0.0
60.
24 ±
0.0
80.
22 ±
0.1
30.
35 ±
0.2
00.
01 ±
<0.
01
0.48
± 0
.13
0.62
± 0
.35
0.46
± 0
.12
0.44
± 0
.01
0.15
± 0
.04
0.10
± 0
.03
0.04
± 0
.01
0.10
± 0
.03
0.05
± 0
.03
0.29
± 0
.01
A α
7.55
± 0
.73
3.13
± 0
.69
2.65
± 0
.64
a A α
a A α
a A α
a A
αa
A α
a A β
a A α
0.27
± 0
.09
0.35
± 0
.19
A β
A
a A
α
α
3.10
± 0
.30
A α
3.59
± 0
.25
1.31
± 0
.19
0.23
± 0
.04
A βγ
vels
(DL)
(mea
ns ±
1
te s
igni
fican
t diff
eren
ces
S 1
: Lea
f, fru
it, w
ood
and
tota
l abo
ve-g
roun
d (s
um o
f lea
ves,
woo
d, fr
uits
) pro
duct
ion
of m
ain
tree
gene
ra a
t diff
eren
t tre
e sp
ecie
s di
vers
ity le
SE;
dat
a fro
m th
ree
plot
s). D
iffer
ent l
ower
-cas
e le
tters
indi
cate
sig
nific
ant d
iffer
ence
s be
twee
n th
e th
ree
dive
rsity
leve
ls, c
apita
l lette
rs in
dica
betw
een
the
year
s, a
nd g
reek
lette
rs s
tand
for d
iffer
ence
s be
twee
n th
e sp
ecie
s w
ithin
DL
2 or
DL
3.
a A α
a A
α
A α
A α
A α
A α
A α
A α
A α
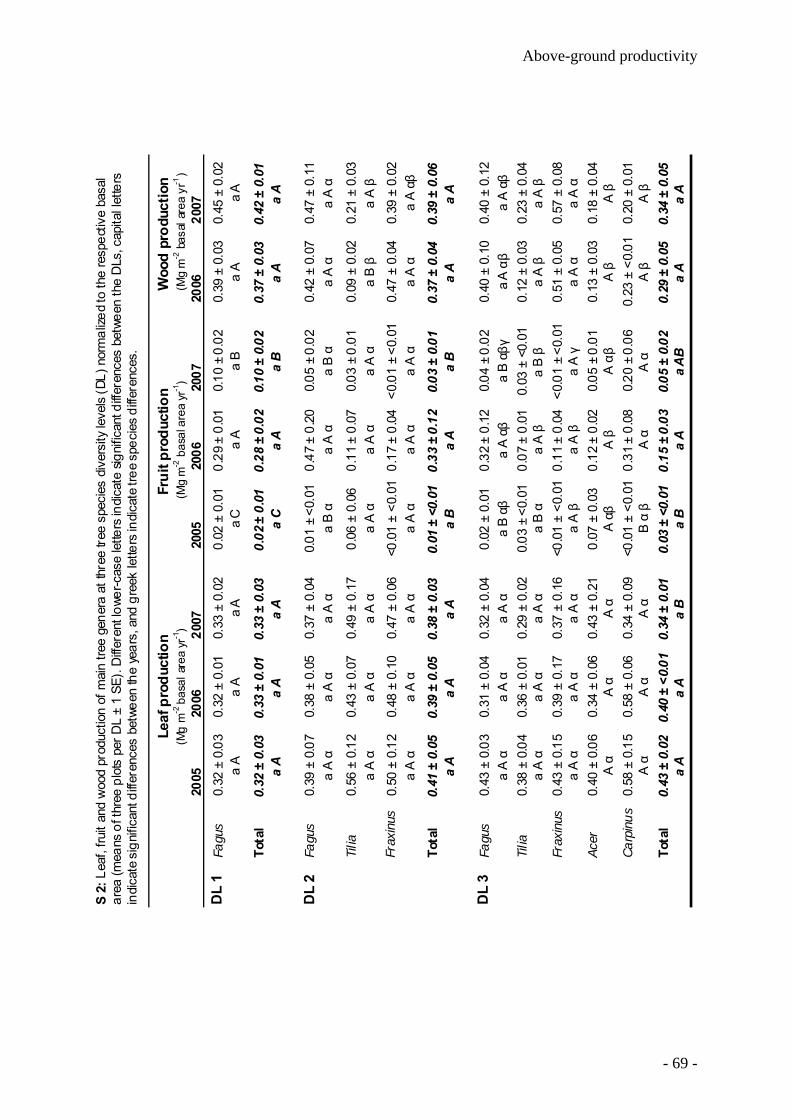
Above-ground productivity
00
2005
2006
2007
2005
2006
2007
2006
27
DL
1Fa
gus
Tota
l
DL
2Fa
gus
Tilia
Frax
inus
Tota
l
DL
3Fa
gus
Tilia
Frax
inus
Acer
Carp
inus
0.23
± <
0.01
0.20
± 0
.06
A β
A α
a A
αa
A γ
a A β
A αβ
A β
A β
A α
A α
A α
A α
0.31
± 0
.08
B α β
A αβ
A α
A α
A α
0.
a A α
a A
βa
B β
a A β
a A β
a A
αa
A α
a A α
a B αβ
a A
αa
A α
a A α
a A
αβ
a B αβγ
a A αβ
a A
a A
a B
a A
a A
αa
A α
a A α
a A α
a A
αa
A α
a A α
a B
βa
A α
a A α
a A α
a A
αa
A α
a A α
a A
αa
B α
a A α
a B α
a A
αa
A α
a A α
a A
a A
a A
a B
a A
0.0.
39 ±
0.0
3
a
Tota
la
Aa
Aa
Ba
B
A β
a A
a A
Ba
Aa
A
A β
20 ±
0.0
1
a A
β
a A
α
a A αβ
a A
a A αβ
a A
β
a A
α
a A
45 ±
0.0
2
Ca
A
0.10
± 0
.02
0.29
± 0
.01
a A
a B
a A
Woo
d pr
od(M
g m
-2ba
sal a
Frui
t pro
duct
ion
Leaf
pro
duct
ion
(Mg
m-2
basa
l are
a y
a A
uctio
n re
a yr
-1)
r-1)
(Mg
m-2
basa
l are
a yr
-1)
0.32
± 0
.01
0.32
± 0
.03
0.02
± 0
.01
0.33
± 0
.02
a C
a A
a A
a A
0.0.
37 ±
0.0
30.
10 ±
0.0
20.
28 ±
0.0
2
0.0.
42 ±
0.0
70.
05 ±
0.0
20.
47 ±
0.2
0
0.06
± 0
.06
0.49
± 0
.17
0.33
± 0
.01
0.32
± 0
.03
0.01
± <
0.01
0.37
± 0
.04
0.38
± 0
.05
0.39
± 0
.07
0.02
± 0
.01
0.33
± 0
.03
0.0.
09 ±
0.0
20.
03 ±
0.0
10.
11 ±
0.0
70.
43 ±
0.0
70.
56 ±
0.1
2
0.0.
47 ±
0.0
4<0
.01
± <0
.01
0.17
± 0
.04
<0.0
1 ±
<0.0
10.
47 ±
0.0
60.
48 ±
0.1
00.
50 ±
0.1
2
0.43
± 0
.03
0.0.
37 ±
0.0
40.
03 ±
0.0
10.
33 ±
0.1
20.
01 ±
<0.
010.
38 ±
0.0
3a
Ba
Aa
A
a A α
0.39
± 0
.05
0.41
± 0
.05
0.0.
40 ±
0.1
00.
04 ±
0.0
20.
32 ±
0.1
20.
02 ±
0.0
10.
32 ±
0.0
40.
31 ±
0.0
4
0.03
± <
0.01
0.29
± 0
.02
a B α
a A
α0.
0.12
± 0
.03
0.03
± <
0.01
0.07
± 0
.01
0.36
± 0
.01
0.38
± 0
.04
0.0.
51 ±
0.0
5<0
.01
± <0
.01
0.11
± 0
.04
<0.0
1 ±
<0.0
10.
37 ±
0.1
60.
39 ±
0.1
70.
43 ±
0.1
5
0.0.
13 ±
0.0
30.
05 ±
0.0
10.
12 ±
0.0
20.
40 ±
0.0
6
<0.0
1 ±
<0.0
10.
34 ±
0.0
90.
58 ±
0.0
60.
58 ±
0.1
5
0.07
± 0
.03
0.43
± 0
.21
S 2
: Lea
f, fru
it an
d w
ood
prod
uctio
n of
mai
n tre
e ge
nera
at t
hree
tree
spe
cies
div
ersi
ty le
vels
(DL)
nor
mal
ized
to th
e re
spec
tivar
ea (m
eans
of t
hree
plo
ts p
er D
L ±
1 SE
). D
iffer
ent l
ower
-cas
e le
tters
indi
cate
sig
nific
ant d
iffer
ence
s be
twee
n th
e D
Ls, c
apita
indi
cate
si
42 ±
0.0
1
47 ±
0.1
1
21 ±
0.0
3
39 ±
0.0
2
39 ±
0.0
6
40 ±
0.1
2
23 ±
0.0
4
57 ±
0.0
8
18 ±
0.0
4
e ba
sal
l let
ters
gn
ifica
nt d
iffer
ence
s be
twee
n th
e ye
ars,
and
gre
ek le
tters
indi
cate
tree
spe
cies
diff
eren
ces.
0.34
± 0
.06
0.40
± <
0.01
0.43
± 0
.02
0.34
± 0
.05
0.29
± 0
.05
0.05
± 0
.02
0.15
± 0
.03
0.03
± <
0.01
0.34
± 0
.01
- 69 -

- 70 -
Chapter
4
Leaf litter decomposition in temperate deciduous forest stands along a gradient of increasing tree species
diversity
Mascha Jacob, Karin Viedenz, Andrea Polle, Frank M. Thomas
(In revision)
- 71 -

Chapter 4
4.1 Abstract We hypothesised that the decomposition rates of leaf litter will increase along a gradient of
increasing tree species diversity in the generally bech-dominated Central-European
temperate deciduous forests due to an increase in the quality of the litter. We studied the
decomposition of litter and lignin in stands composed of European beech (Fagus sylvatica;
DL 1); beech, ash (Fraxinus excelsior L.) and lime (Tilia spp.) (DL 2); or beech, ash, lime,
maple (Acer spp.) and hornbeam (Carpinus betulus L.) (DL 3) for up to 22 months. We
measured mass loss from mesh bags filled with representative bulk litter (MIX bags) from
stands DL 1, DL 2 or DL 3. In addition, we incubated bags containing litter from only one of
the five tree species (MONO bags) in replicated plots at all diversity levels. In the MIX bags,
litter and lignin decomposition was faster at DL 2 and DL 3 than at DL 1. In the MONO bags,
litter and lignin decomposition of the individual species litter (except for beech) did not differ
among DL, but was most rapid in ash and slowest in beech in an interspecific comparison. In
the litter mixtures, decomposition was not significantly more rapid than predicted by MONO
bags. Leaf litter decomposition rates were positive correlated with the initial N and Ca
concentrations of the litter, and negatively, with the initial C:N, C:P and lignin:N ratios, but not
with the initial lignin concentrations. The results support our hypothesis that the
decomposition rates are controlled by the chemical composition of the individual litter species
and not by synergistic effects assignable to mixtures of litter composed of different tree
species. Thus, the presence of individual tree species in an ecosystem seems to be more
important for the litter decomposition rates than the tree species diversity itself.
4.2 Introduction The significance of plant species diversity for ecosystem functions is a central issue in
current ecological research (Hooper et al. 2005; Balvanera et al. 2006). To date most studies
have focused on diversity-productivity relationships in experimental grasslands or forest
plantations (Scherer-Lorenzen et al. 2005; Spehn et al. 2005). In these studies, positive
relationships have generally been found between primary productivity and plant-species
diversity (Hooper et al. 2005; Spehn et al., 2005). Less is known on biodiversity effects on
other key ecosystem processes such as decomposition and nutrient cycling. The
decomposition process of plant litter controls the release of essential plant nutrients such as
nitrogen (N) and, thereby, exerts a large influence on the growth rates of plant species (e.g.,
Cotrufo et al. 2000; Parton et al. 2007).
Most studies on litter decomposition in forests have included only two or three tree litter
species and compared monocultures with just one mixing treatment. According to
- 72 -
Litter decomposition
Hättenschwiler et al. (2005), this narrow range of methodical approaches strongly limits the
thorough assessment of diversity effects and is one reason why generalisations of litter-mass
loss as a function of litter diversity are not yet possible.
A substantial fraction of studies performed indicates that mass loss from various litter
mixtures is more rapid than would have been predicted from the decay rates of the individual
species included in the mixture. Accordingly, it exhibits non-additive characteristics, which is
in contrast to additive responses that can be predicted from the decay of the individual litter
species (Gartner & Cardon 2004). The potential mechanisms underlying the non-additive
effects result from the different physical and chemical traits of litter species such as leaf
toughness, the concentrations of nutrients and lignin, and lignin:nutrient ratios
(Hättenschwiler et al. 2005). The decomposition of litter from deciduous woody species of
temperate regions was non-additive in its N dynamics, but was additive in its mass loss (Ball
et al. 2008). To date, however, no general pattern of litter-diversity effects on the mass loss
from litter during decomposition has emerged (e.g., Wardle et al. 1997; Wardle et al. 2009).
Effects exerted by litter mixtures can be influenced by the quality of the component litter
species (e.g., Meier & Bowman 2008). In general, decomposition rates increase with a
decrease in the ratio of carbon to N (C:N ratio), which is therefore an important indicator of
litter quality (e.g., Heal et al. 1997). Another constituent limiting the rate of litter degradation
is lignin (e.g., Melillo et al. 1982; Osono & Takeda 2005), a complex aromatic heteropolymer
in cell walls (Boerjan et al. 2003), which is one of the litter components that are most
recalcitrant to decomposition (Osono 2007, Berg & McClaugherty 2008). Therefore, not only
the species mixture of the litter per se, but also the presence or absence of individual litter
species can influence the decomposition rate within a mixture.
In temperate forests, several studies have already been conducted on the effects of litter
diversity on litter decomposition (cf. Gartner & Cardon 2004; Hättenschwiler et al. 2005), but
investigations covering a broader gradient of deciduous tree species including the European
beech (Fagus sylvatica L.), the predominant tree species in the temperate deciduous forests
of Central Europe (e.g., Ellenberg 1996), are relatively scarce. As a consequence of land use
history, monospecific stands with beech, whose litter exhibits slow decomposition rates (e.g.,
Wise & Schaefer 1994, Hättenschwiler & Gasser 2005), are abundant in Central Europe. In
beech forests, silvicultural management programs attempt to increase the fractions of other
broad-leaved tree species such as ash (Fraxinus excelsior L.), lime (Tilia spp.), maple (Acer
spp.) and hornbeam (Carpinus betulus L.). However, the effects of elevated tree species
- 73 -
Chapter 4
diversity on leaf litter decomposition and the ecosystem fluxes of carbon and mineral
nutrients still are largely unknown.
To investigate whether litter decomposition in Central European forests is controlled by tree
identity or diversity, we investigated mass loss, lignin and nutrient element composition in
litter mixtures of one (beech), three (beech, ash, lime) and five tree species (beech, ash,
lime, hornbeam, maple) as well as in single-species litter samples incubated on-site in
litterbags. The study was performed in a temperate deciduous forest of Central Germany,
which is exceptionally rich in tree species (up to 14 species per hectare) compared to the
majority of Central European forests that are poor in tree species due to the impact of the ice
age. We hypothesised that the decomposition rates of (i) stand-specific litter mixtures and
(ii) of litter of the individual tree species increase along the gradient of increasing tree
species diversity due to increasing fractions of litter species with a higher litter quality in the
mixture or in the surroundings of the incubated litterbags. We expected that the higher
decomposition rates of litter mixtures can sufficiently be explained by additive effects on the
basis of the quality of the individual litter species rather than by mixture-specific, non-additive
effects.
4.3 Materials and methods Study site The study was conducted in semi-natural, old-growth forest stands (85 to 148-year-old in
2006; Schmidt et al. 2009) in the Hainich National Park, Thuringia, Central Germany. All
research stands are situated at an elevation of about 350 m a.s.l. near the village of
Weberstedt (51° 06’ N, 10° 31’ E). At the Weberstedt meteorological station, the mean
annual temperature is 7.5 °C, and the mean annual precipitation, 670 mm. The soils are
Luvisols with stagnic properties, developed from Pleistocene loess and are underlain by
limestone (Triassic Upper Muschelkalk formation) (FAO 2006). They are characterized by
high silt contents (approximately 75%), and have a loess cover of at least 60 cm (Guckland
et al. 2009). For the past four decades, the studied stands have developed a near-natural
structure (cf. Mölder et al. 2008; Leuschner et al. 2009). Details of the stand structure are
given in Table 1.
In April 2005, three stand types differing in their diversity levels (DL) of tree taxa were
selected in the north-eastern part of the national park: (i) a stand type with European beech
- 74 -
Litter decomposition
(Fagus sylvatica L.) as the predominating tree species (DL 1); (ii) a stand type mainly
consisting of beech, lime (Tilia cordata Mill. and T. platyphyllos Scop.) and ash (Fraxinus
excelsior L.) (DL 2); and (iii) a stand type with beech, lime, ash, hornbeam (Carpinus betulus
L.) and maple (Acer pseudoplatanus L. and A. platanoides L.) as the dominant tree taxa
(DL 3). At each diversity level (stand type), three plots of 50 m × 50 m size each were
selected, and fenced to exclude wild boars and other game. All plots were located within a
radius of about 4 km, and were comparable with respect to slope, physical soil conditions
and climate. From the beginning of September, leaf litter was continuously sampled with litter
collectors (aperture: 0.29 m²) that were arranged at a minimum distance of 2 m along three
randomly positioned 30-m-long transects per plot (five collectors per transect). The bulk of
the leaf litter fell from the beginning of October until mid-November. The collectors were
emptied every two to three weeks from the beginning of September to the end of December
2005-2007. At all study plots, the air temperature was continuously recorded with
temperature sensors 5 cm above the ground (HOBO RH/Temp H08-32-08; Onset Computer
Corporation, Bourne, USA).
Litterbag experiment At the beginning of November 2005, 8 g of oven-dried (25 °C for 48 h) litter that had been
collected in 2005 between the beginning of September until 31 October was filled into nylon
bags with a surface area of 20 cm2 and a mesh size of 5 mm. Two types of bags were
prepared in this manner: (i) bags that contained litter in a mixture that was representative of
the litter composition of the respective plot (MIX bags), and (ii) bags that contained litter of
only one out of the five investigated tree species (Acer platanoides, Carpinus betulus, Fagus
sylvatica, Fraxinus excelsior, Tilia cordata; i.e. MONO bags). The MONO-bag litter was
derived from a random species-specific mixture from the plots of all DL levels, at which the
respective tree species occurred. In part of the remaining litter, the initial concentrations of
lignin and calcium (Ca) as well as the initial ratios of carbon to nitrogen (C:N ratios) and
carbon to phosphorus (C:P ratios) were determined (see below). On 17 November 2005, the
litterbags were placed into the upper stratum of the organic surface layer. To cover 6
sampling dates, 6 MIX bags were incubated in each plot of all diversity levels (18 bags per
DL, 6 sampling dates; 324 bags in total). In the case of the MONO bags, three bags per tree
species and plot were placed in one plot at each per diversity level for being resampled on 3
dates (3 bags per DL, 5 species, 3 sampling dates; 135 bags in total). For the determination
of mass loss on the basis of remaining litter, litterbags were removed on the following dates:
15 December 2005, 27 March 2006, 19 June 2006, 26 September 2006, 24 April 2007, and
18 September 2007. On these dates (except for sampling dates in 2007, when a large part of
- 75 -
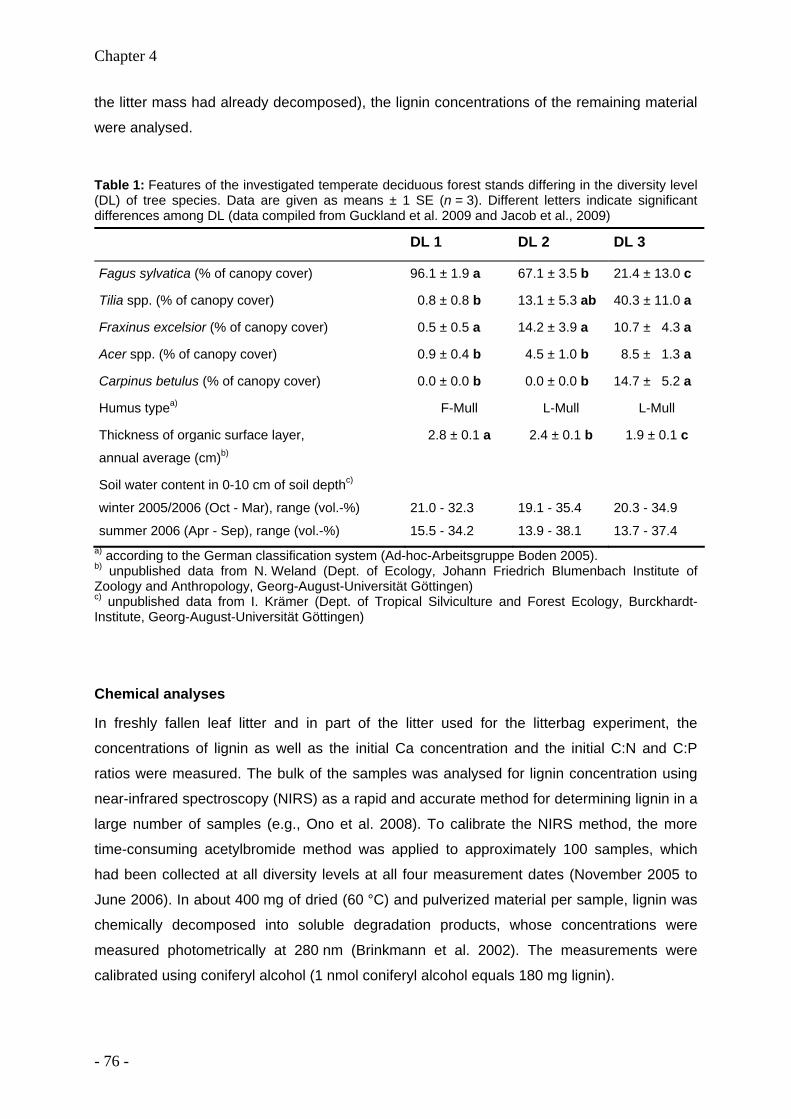
Chapter 4
the litter mass had already decomposed), the lignin concentrations of the remaining material
were analysed.
Table 1: Features of the investigated temperate deciduous forest stands differing in the diversity level (DL) of tree species. Data are given as means ± 1 SE (n = 3). Different letters indicate significant differences among DL (data compiled from Guckland et al. 2009 and Jacob et al., 2009)
DL 1 DL 2 DL 3
Fagus sylvatica (% of canopy cover) 96.1 ± 1.9 a 67.1 ± 3.5 b 21.4 ± 13.0 c
Tilia spp. (% of canopy cover) 0.8 ± 0.8 b 13.1 ± 5.3 ab 40.3 ± 11.0 a
Fraxinus excelsior (% of canopy cover) 0.5 ± 0.5 a 14.2 ± 3.9 a 10.7 ± 4.3 a
Acer spp. (% of canopy cover) 0.9 ± 0.4 b 4.5 ± 1.0 b 8.5 ± 1.3 a
Carpinus betulus (% of canopy cover) 0.0 ± 0.0 b 0.0 ± 0.0 b 14.7 ± 5.2 a
Humus typea) F-Mull L-Mull L-Mull
Thickness of organic surface layer,
annual average (cm)b)
2.8 ± 0.1 a 2.4 ± 0.1 b 1.9 ± 0.1 c
Soil water content in 0-10 cm of soil depthc)
winter 2005/2006 (Oct - Mar), range (vol.-%)
summer 2006 (Apr - Sep), range (vol.-%)
21.0 - 32.3
15.5 - 34.2
19.1 - 35.4
13.9 - 38.1
20.3 - 34.9
13.7 - 37.4 a) according to the German classification system (Ad-hoc-Arbeitsgruppe Boden 2005). b) unpublished data from N. Weland (Dept. of Ecology, Johann Friedrich Blumenbach Institute of Zoology and Anthropology, Georg-August-Universität Göttingen) c) unpublished data from I. Krämer (Dept. of Tropical Silviculture and Forest Ecology, Burckhardt-Institute, Georg-August-Universität Göttingen)
Chemical analyses
In freshly fallen leaf litter and in part of the litter used for the litterbag experiment, the
concentrations of lignin as well as the initial Ca concentration and the initial C:N and C:P
ratios were measured. The bulk of the samples was analysed for lignin concentration using
near-infrared spectroscopy (NIRS) as a rapid and accurate method for determining lignin in a
large number of samples (e.g., Ono et al. 2008). To calibrate the NIRS method, the more
time-consuming acetylbromide method was applied to approximately 100 samples, which
had been collected at all diversity levels at all four measurement dates (November 2005 to
June 2006). In about 400 mg of dried (60 °C) and pulverized material per sample, lignin was
chemically decomposed into soluble degradation products, whose concentrations were
measured photometrically at 280 nm (Brinkmann et al. 2002). The measurements were
calibrated using coniferyl alcohol (1 nmol coniferyl alcohol equals 180 mg lignin).
- 76 -

Litter decomposition
For the lignin determination by NIRS, dried and pulverised litter material was homogeneously
filled into quartz cuvettes with a diameter of 2 cm. In each sample, the reflectance was
measured twice at wavelengths between 400 and 2500 nm at 2-nm increments using an NIR
spectrometer (Foss NIRSystems 6500, Silver Spring, MD, USA). To minimise the effects of
light scattering, the spectra were mathematically transformed to the second derivative
(Brinkmann et al. 2002; Mclellan et al. 1991). Calibration was performed using the built-in
WinISI software (WinISI II-software systems, Foss, Silver Spring, MD, USA) (for technical
details see Tilmann 1996 and Brinkmann et al. 2002). In the samples measured by both
methods, the lignin concentrations determined through the acetylbromide method and by
NIRS correlated at an R2 of 0.969.
The C and N concentrations of the leaf litter were measured using an automated C:N
analyser (Heraeus Elementar Vario EL, Hanau, Germany). The concentrations of Ca and P
were determined by ICP-AES (Spectro, Kleve, Germany) after pressure digestion with
concentrated nitric acid.
Data evaluation
Decomposition rates k (litter or lignin mass decomposed per g initial litter mass and per day)
were calculated using linear regressions from the mass losses during the first seven months
of decomposition (November 2005 through June 2006; four dates of measurement). As the
mass loss during this time period was approximately linear (cf. Fig. 1), we used linear
regressions instead of the negative exponential decay that is often used in similar studies
(Olson 1963, Bärlocher 2007). Means ± 1 standard error are given in the presentation of the
results. Differences among the diversity levels within a given tree species, and among the
tree species within a given diversity level, were tested using the Kruskal Wallis test, followed
by multiple pairwise Mann-Whitney Rank Sum tests (U tests) in the case of significance.
Differences among the time courses of litter or lignin decomposition at the three diversity
levels were tested using the Friedman test, followed by multiple pairwise comparisons using
the Student-Newman-Keuls test in the case of significance. For the decomposition rates in
the MONO bags, ANOVA was used for comparing the individual tree species (average
values for all DL) or DL (average values for all tree species), followed by post-hoc LSD in the
case of significant differences. For each tree species, we tested the differences between
predicted (on the basis of MONO litterbags) and measured percentages (in MIX litterbags) of
the foliar litter mass remaining after seven months of incubation using the t test for paired
differences after having tested the differences on deviation from the normal distribution using
the Kolmogorov-Smirnov test. Interrelationships between the initial Ca, N and lignin
concentrations in the litter as well as the initial C:N, C:P and lignin:N ratios as the predictor
- 77 -
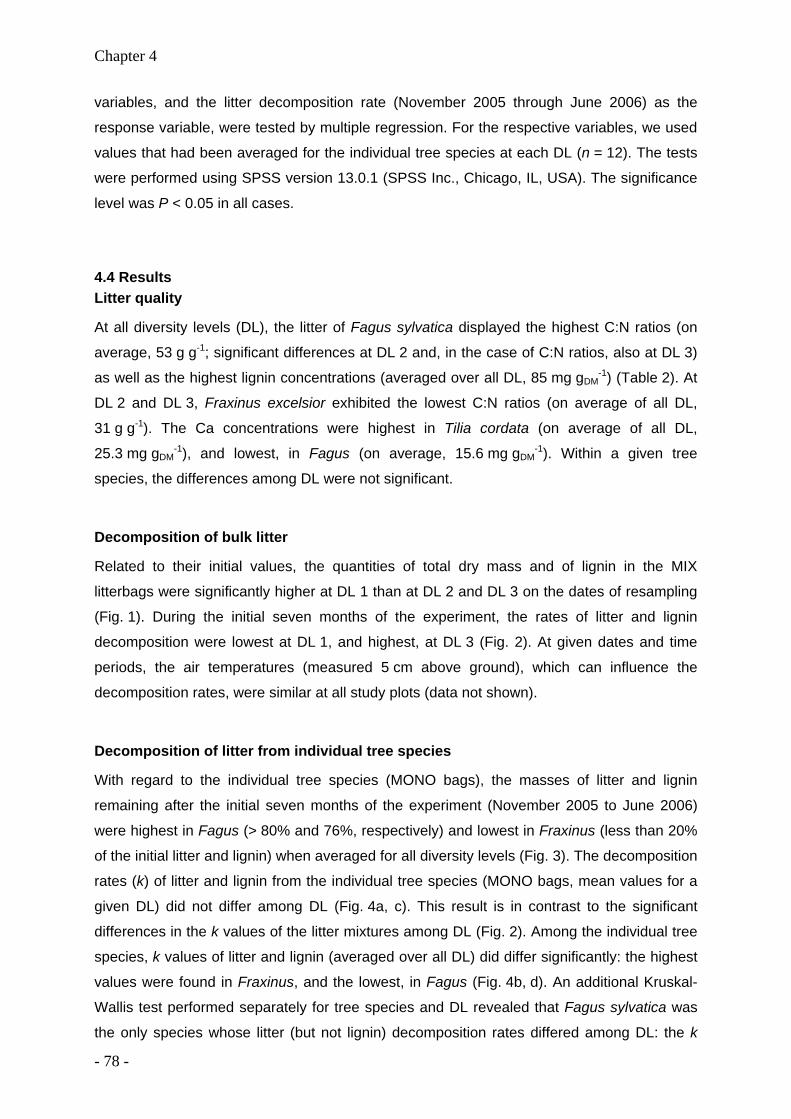
Chapter 4
variables, and the litter decomposition rate (November 2005 through June 2006) as the
response variable, were tested by multiple regression. For the respective variables, we used
values that had been averaged for the individual tree species at each DL (n = 12). The tests
were performed using SPSS version 13.0.1 (SPSS Inc., Chicago, IL, USA). The significance
level was P < 0.05 in all cases.
4.4 Results Litter quality
At all diversity levels (DL), the litter of Fagus sylvatica displayed the highest C:N ratios (on
average, 53 g g-1; significant differences at DL 2 and, in the case of C:N ratios, also at DL 3)
as well as the highest lignin concentrations (averaged over all DL, 85 mg gDM-1) (Table 2). At
DL 2 and DL 3, Fraxinus excelsior exhibited the lowest C:N ratios (on average of all DL,
31 g g-1). The Ca concentrations were highest in Tilia cordata (on average of all DL,
25.3 mg gDM-1), and lowest, in Fagus (on average, 15.6 mg gDM
-1). Within a given tree
species, the differences among DL were not significant.
Decomposition of bulk litter
Related to their initial values, the quantities of total dry mass and of lignin in the MIX
litterbags were significantly higher at DL 1 than at DL 2 and DL 3 on the dates of resampling
(Fig. 1). During the initial seven months of the experiment, the rates of litter and lignin
decomposition were lowest at DL 1, and highest, at DL 3 (Fig. 2). At given dates and time
periods, the air temperatures (measured 5 cm above ground), which can influence the
decomposition rates, were similar at all study plots (data not shown).
Decomposition of litter from individual tree species
With regard to the individual tree species (MONO bags), the masses of litter and lignin
remaining after the initial seven months of the experiment (November 2005 to June 2006)
were highest in Fagus (> 80% and 76%, respectively) and lowest in Fraxinus (less than 20%
of the initial litter and lignin) when averaged for all diversity levels (Fig. 3). The decomposition
rates (k) of litter and lignin from the individual tree species (MONO bags, mean values for a
given DL) did not differ among DL (Fig. 4a, c). This result is in contrast to the significant
differences in the k values of the litter mixtures among DL (Fig. 2). Among the individual tree
species, k values of litter and lignin (averaged over all DL) did differ significantly: the highest
values were found in Fraxinus, and the lowest, in Fagus (Fig. 4b, d). An additional Kruskal-
Wallis test performed separately for tree species and DL revealed that Fagus sylvatica was
the only species whose litter (but not lignin) decomposition rates differed among DL: the k
- 78 -

Litter decomposition
value of Fagus litter was significantly higher at DL 1 (0.70 ± 0.02 mg gDM-1 d-1) than at DL 2
and DL 3 (0.56 ± 0.07 and 0.42 ± 0.01 mg gDM-1 d-1).
Month
Lign
in (%
of i
nitia
l mas
s)
0
20
40
60
80
100
DL1 ADL2 B DL3 B
Month
Litte
r (%
of i
nitia
l mas
s)
0
20
40
60
80
100
DL1 DL2 DL3
(a)
(b)
a
b
b
a
b
c
a
b
c
a
b
c
N D J F M AM J JA S O N D J F M A M J J A S
N D J F M AM J JA S O N D J F M A M J J A S
Fig. 1 Decomposition of (a) foliar litter and (b) foliar lignin in percent of their initial mass in the MIX litterbags exposed in temperate deciduous forest stands differing in tree species diversity (DL 1 - DL 3) from November 2005 until (a) September 2007 (entire incubation period, 22 months) or (b) September 2006 (initial seven months of the incubation) (means ± 1 SE). Different capital letters next to the symbol legends indicate significant differences among DL for the entire time course (Friedman test, followed by multiple pairwise comparisons using the Student-Newman-Keuls test; P < 0.05). Different lower-case letters indicate significant differences among DL on a given date (Kruskal Wallis test, followed by multiple pairwise U tests; P < 0.05) (The latter test was not performed on the lignin values due to a lack of repetitive analyses on some dates).
- 79 -
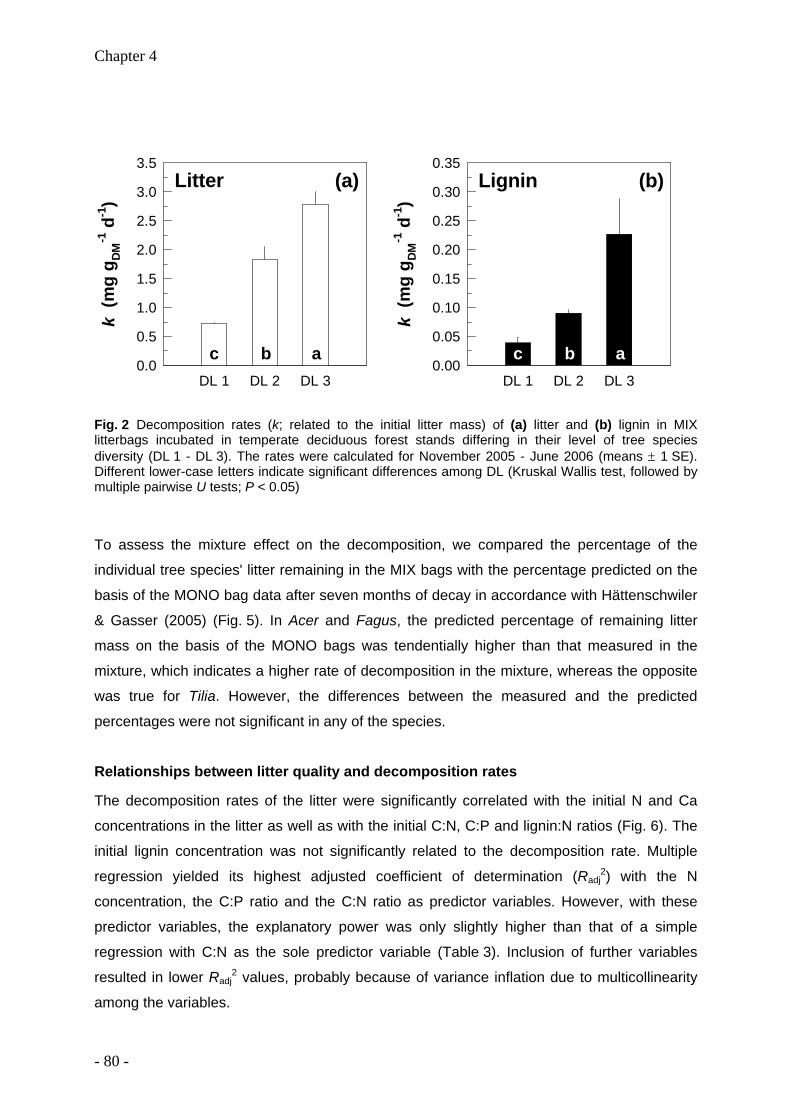
Chapter 4
DL 1 DL 2 DL 3
k (m
g g DM
-1 d
-1)
0.0
0.5
1.0
1.5
2.0
2.5
3.0
3.5
abcDL 1 DL 2 DL 3
k (m
g g DM
-1 d
-1)
0.00
0.05
0.10
0.15
0.20
0.25
0.30
0.35Litter Lignin(a) (b)
c b a
Fig. 2 Decomposition rates (k; related to the initial litter mass) of (a) litter and (b) lignin in MIX litterbags incubated in temperate deciduous forest stands differing in their level of tree species diversity (DL 1 - DL 3). The rates were calculated for November 2005 - June 2006 (means ± 1 SE). Different lower-case letters indicate significant differences among DL (Kruskal Wallis test, followed by multiple pairwise U tests; P < 0.05) To assess the mixture effect on the decomposition, we compared the percentage of the
individual tree species' litter remaining in the MIX bags with the percentage predicted on the
basis of the MONO bag data after seven months of decay in accordance with Hättenschwiler
& Gasser (2005) (Fig. 5). In Acer and Fagus, the predicted percentage of remaining litter
mass on the basis of the MONO bags was tendentially higher than that measured in the
mixture, which indicates a higher rate of decomposition in the mixture, whereas the opposite
was true for Tilia. However, the differences between the measured and the predicted
percentages were not significant in any of the species.
Relationships between litter quality and decomposition rates
The decomposition rates of the litter were significantly correlated with the initial N and Ca
concentrations in the litter as well as with the initial C:N, C:P and lignin:N ratios (Fig. 6). The
initial lignin concentration was not significantly related to the decomposition rate. Multiple
regression yielded its highest adjusted coefficient of determination (Radj2) with the N
concentration, the C:P ratio and the C:N ratio as predictor variables. However, with these
predictor variables, the explanatory power was only slightly higher than that of a simple
regression with C:N as the sole predictor variable (Table 3). Inclusion of further variables
resulted in lower Radj2 values, probably because of variance inflation due to multicollinearity
among the variables.
- 80 -
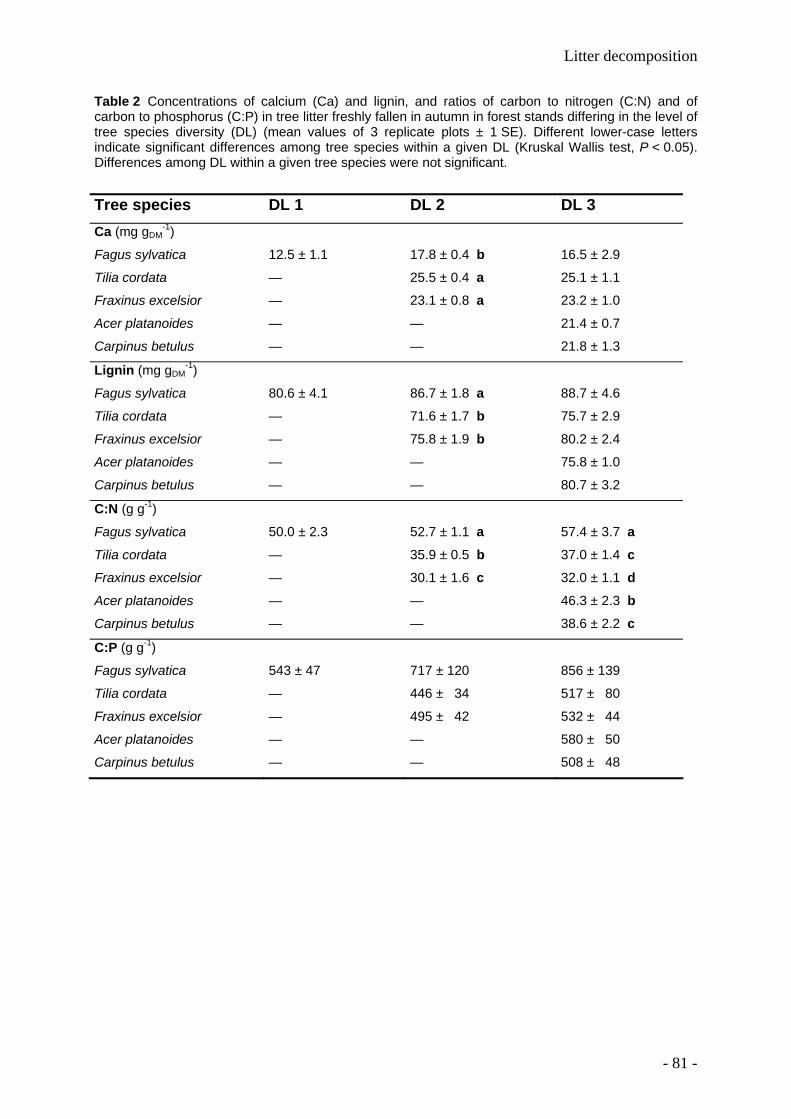
Litter decomposition
Table 2 Concentrations of calcium (Ca) and lignin, and ratios of carbon to nitrogen (C:N) and of carbon to phosphorus (C:P) in tree litter freshly fallen in autumn in forest stands differing in the level of tree species diversity (DL) (mean values of 3 replicate plots ± 1 SE). Different lower-case letters indicate significant differences among tree species within a given DL (Kruskal Wallis test, P < 0.05). Differences among DL within a given tree species were not significant.
Tree species DL 1 DL 2 DL 3 Ca (mg gDM
-1)
Fagus sylvatica 12.5 ± 1.1 17.8 ± 0.4 b 16.5 ± 2.9 Tilia cordata — 25.5 ± 0.4 a 25.1 ± 1.1 Fraxinus excelsior — 23.1 ± 0.8 a 23.2 ± 1.0 Acer platanoides — — 21.4 ± 0.7 Carpinus betulus — — 21.8 ± 1.3
Lignin (mg gDM-1)
Fagus sylvatica 80.6 ± 4.1 86.7 ± 1.8 a 88.7 ± 4.6
Tilia cordata — 71.6 ± 1.7 b 75.7 ± 2.9
Fraxinus excelsior — 75.8 ± 1.9 b 80.2 ± 2.4 Acer platanoides — — 75.8 ± 1.0 Carpinus betulus — — 80.7 ± 3.2
C:N (g g-1)
Fagus sylvatica 50.0 ± 2.3 52.7 ± 1.1 a 57.4 ± 3.7 a Tilia cordata — 35.9 ± 0.5 b 37.0 ± 1.4 c Fraxinus excelsior — 30.1 ± 1.6 c 32.0 ± 1.1 d Acer platanoides — — 46.3 ± 2.3 b Carpinus betulus — — 38.6 ± 2.2 c
C:P (g g-1)
Fagus sylvatica 543 ± 47 717 ± 120 856 ± 139
Tilia cordata — 446 ± 34 517 ± 80
Fraxinus excelsior — 495 ± 42 532 ± 44
Acer platanoides — — 580 ± 50
Carpinus betulus — — 508 ± 48
- 81 -
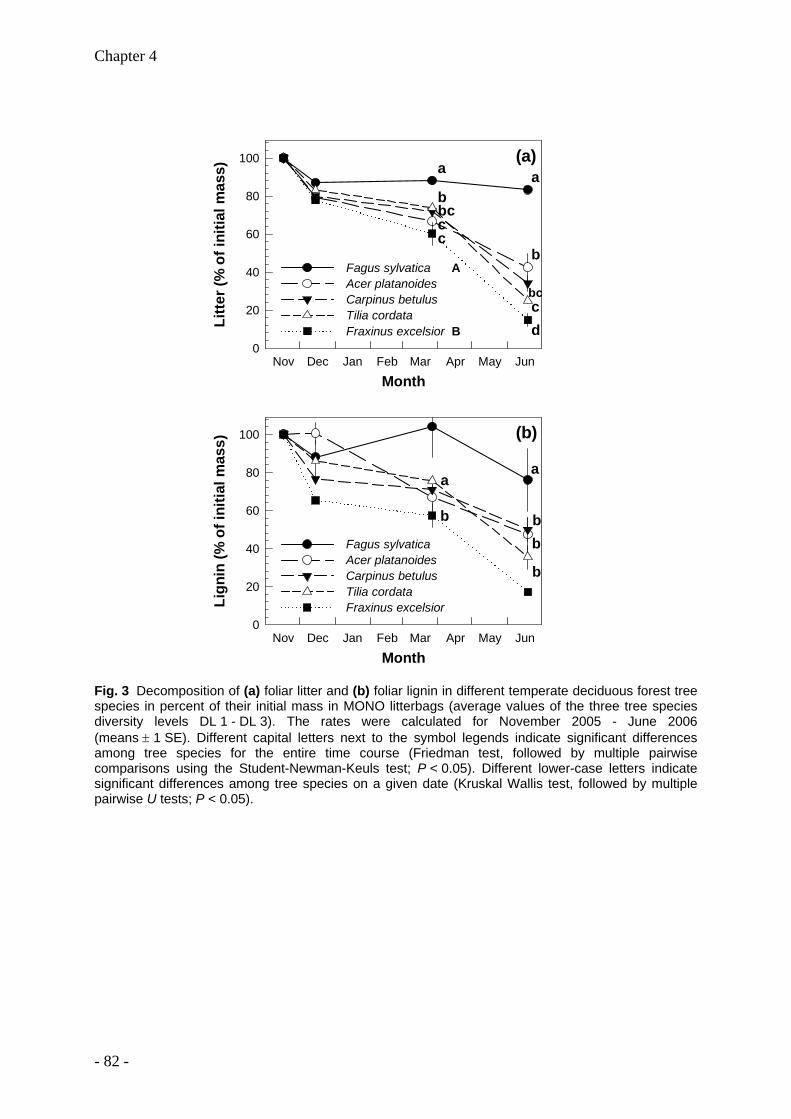
Chapter 4
Month
Litte
r (%
of i
nitia
l mas
s)
0
20
40
60
80
100
Fagus sylvatica AAcer platanoides Carpinus betulus Tilia cordataFraxinus excelsior B
Month
Lign
in (%
of i
nitia
l mas
s)
0
20
40
60
80
100
Fagus sylvaticaAcer platanoides Carpinus betulus Tilia cordata Fraxinus excelsior
Nov Dec Jan Feb Mar Apr May Jun
a
b
a
b
bb
Nov Dec Jan Feb Mar Apr May Jun
(a)
(b)
a
bbccc
a
b
dcbc
Fig. 3 Decomposition of (a) foliar litter and (b) foliar lignin in different temperate deciduous forest tree species in percent of their initial mass in MONO litterbags (average values of the three tree species diversity levels DL 1 - DL 3). The rates were calculated for November 2005 - June 2006 (means ± 1 SE). Different capital letters next to the symbol legends indicate significant differences among tree species for the entire time course (Friedman test, followed by multiple pairwise comparisons using the Student-Newman-Keuls test; P < 0.05). Different lower-case letters indicate significant differences among tree species on a given date (Kruskal Wallis test, followed by multiple pairwise U tests; P < 0.05).
- 82 -
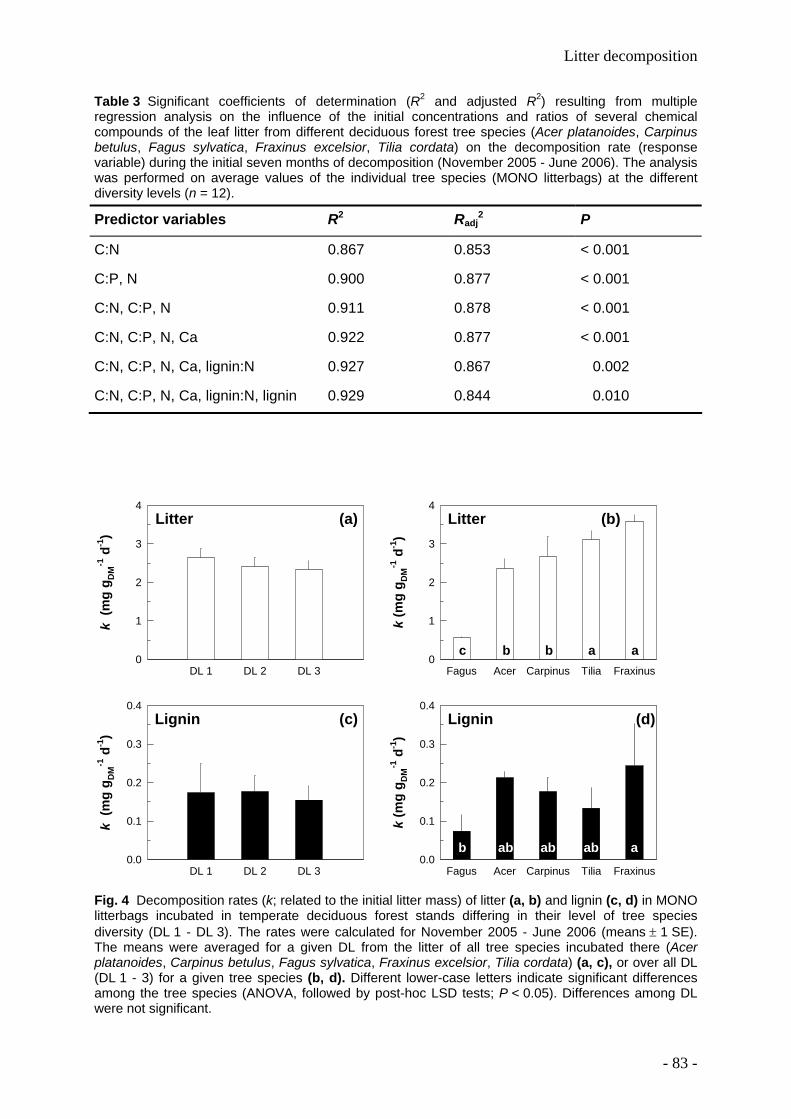
Litter decomposition
Table 3 Significant coefficients of determination (R2 and adjusted R2) resulting from multiple regression analysis on the influence of the initial concentrations and ratios of several chemical compounds of the leaf litter from different deciduous forest tree species (Acer platanoides, Carpinus betulus, Fagus sylvatica, Fraxinus excelsior, Tilia cordata) on the decomposition rate (response variable) during the initial seven months of decomposition (November 2005 - June 2006). The analysis was performed on average values of the individual tree species (MONO litterbags) at the different diversity levels (n = 12).
Predictor variables R2 Radj2 P
C:N 0.867 0.853 < 0.001
C:P, N 0.900 0.877 < 0.001
C:N, C:P, N 0.911 0.878 < 0.001
C:N, C:P, N, Ca 0.922 0.877 < 0.001
C:N, C:P, N, Ca, lignin:N 0.927 0.867 0.002
C:N, C:P, N, Ca, lignin:N, lignin 0.929 0.844 0.010
DL 1 DL 2 DL 3
k (m
g g D
M-1
d-1
)
0
1
2
3
4Litter (a)
Fagus Acer Carpinus Tilia Fraxinus
k (m
g g D
M-1
d-1
)
0
1
2
3
4Litter
c b b a a
DL 1 DL 2 DL 3
k (m
g g D
M-1
d-1
)
0.0
0.1
0.2
0.3
0.4Lignin (c)
Fagus Acer Carpinus Tilia Fraxinus
k (m
g g D
M-1
d-1
)
0.0
0.1
0.2
0.3
0.4Lignin
(b)
ab ab ab ab
(d)
Fig. 4 Decomposition rates (k; related to the initial litter mass) of litter (a, b) and lignin (c, d) in MONO litterbags incubated in temperate deciduous forest stands differing in their level of tree species diversity (DL 1 - DL 3). The rates were calculated for November 2005 - June 2006 (means ± 1 SE). The means were averaged for a given DL from the litter of all tree species incubated there (Acer platanoides, Carpinus betulus, Fagus sylvatica, Fraxinus excelsior, Tilia cordata) (a, c), or over all DL (DL 1 - 3) for a given tree species (b, d). Different lower-case letters indicate significant differences among the tree species (ANOVA, followed by post-hoc LSD tests; P < 0.05). Differences among DL were not significant.
- 83 -

Chapter 4
Predicted litter mass (% of initial)
0 20 40 60 80 100
Litte
r mas
s (%
of i
nitia
l)
0
20
40
60
80
100
Fagus sylvaticaFraxinus excelsior Tilia cordata Acer platanoides Carpinus betulus
(faster than predicted)
(slower than predicted)
Fig. 5 Predicted (on the basis of MONO litterbags) and measured percentages (in MIX litterbags) of the different tree species foliar litter remaining after seven months of incubation in all DL (DL 1-3). The diagonal represents a 1:1 ratio. Within a given tree species, the differences between measured and predicted differences were not significant (t test for paired differences).
4.5 Discussion The litter decomposition rates varied among the investigated tree species but, in most
species, were neither influenced by litter mixing (i.e., by raising the litter diversity) nor by the
degree of the tree species diversity at the sites of decomposition.
Decomposition of litter from individual tree species
A recent study by Kalbitz et al. (2006) on the dynamics of litter decomposition in temperate
forests, including the Central-European deciduous tree species Acer pseudoplatanus and
Fagus sylvatica, provided evidence of a two-phase kinetics of litter decay: a first, almost
linear phase of mass loss in the initial 5-12 months, and a second, more or less saturated
phase in the subsequent 15 months. Our results are in accordance with these observations
and show an approximately linear course of litter degradation during the initial seven months
(Fig. 1). This time course also fits the well-known general dynamics of litter decay, which
exhibit a nearly linear course in the early stage of decomposition (Olson 1963; Berg 2000).
Therefore, the approximation of a linear decomposition rate for the initial seven months of the
experiment is justified.
- 84 -
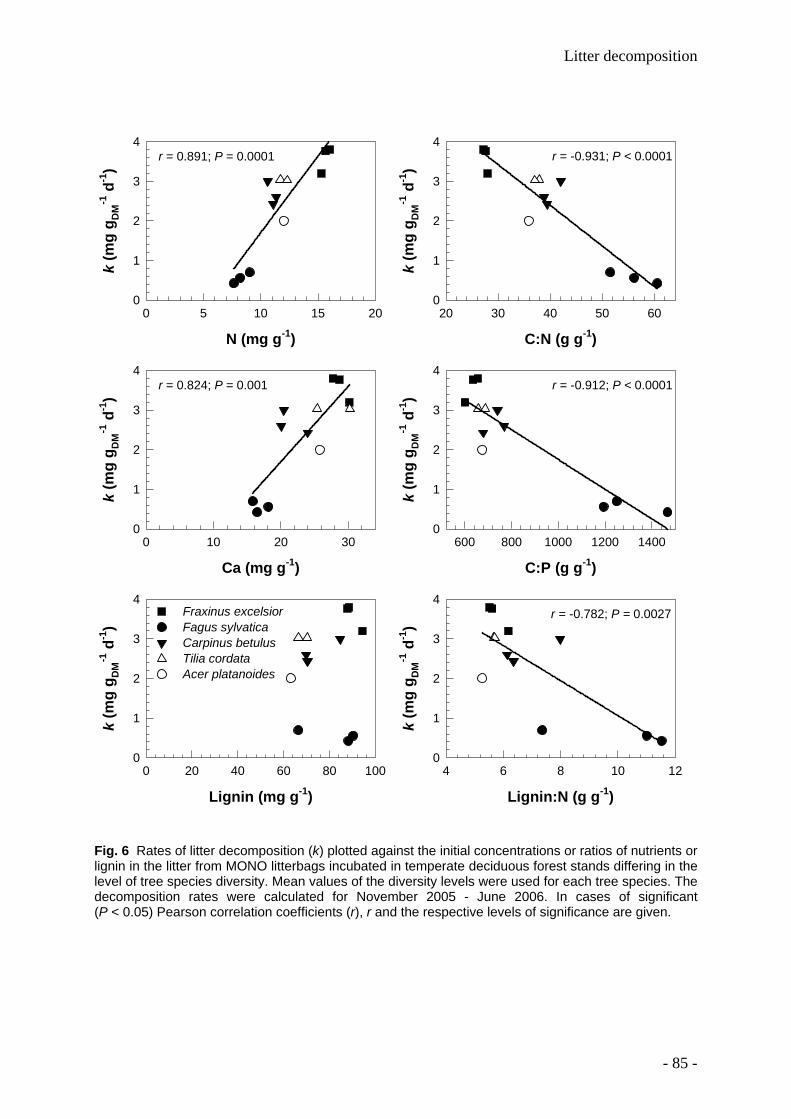
Litter decomposition
Lignin (mg g-1)
0 20 40 60 80 100
k (m
g g D
M-1
d-1
)
0
1
2
3
4
N (mg g-1)
0 5 10 15 20
k (m
g g D
M-1
d-1
)
0
1
2
3
4
Fraxinus excelsiorFagus sylvatica Carpinus betulus Tilia cordata Acer platanoides
r = 0.891; P = 0.0001
C:N (g g-1)
20 30 40 50 60
k (m
g g D
M-1
d-1
)
0
1
2
3
4r = -0.931; P < 0.0001
Ca (mg g-1)
0 10 20 30
k (m
g g D
M-1
d-1
)
0
1
2
3
4r = 0.824; P = 0.001
C:P (g g-1)
600 800 1000 1200 1400
k (m
g g D
M-1
d-1
)
0
1
2
3
4r = -0.912; P < 0.0001
Lignin:N (g g-1)
4 6 8 10 12
k (m
g g D
M-1
d-1
)
0
1
2
3
4r = -0.782; P = 0.0027
Fig. 6 Rates of litter decomposition (k) plotted against the initial concentrations or ratios of nutrients or lignin in the litter from MONO litterbags incubated in temperate deciduous forest stands differing in the level of tree species diversity. Mean values of the diversity levels were used for each tree species. The decomposition rates were calculated for November 2005 - June 2006. In cases of significant (P < 0.05) Pearson correlation coefficients (r), r and the respective levels of significance are given.
- 85 -
Chapter 4
Generally, the beech leaf litter exhibits only slow decomposition rates, which commonly is
ascribed to its relatively high C:N ratio of approximately 40-60 g g-1 compared to the distinctly
lower C:N ratios in the litter of ash, hornbeam and lime (e.g., Wise & Schaefer 1994; Cotrufo
et al. 2000; Hättenschwiler & Gasser 2005; Ritter & Bjørnlund 2005; Hobbie et al. 2006). In
our study, the initial litter decomposition rates were significantly correlated with the initial N
concentrations as well as with the initial C:N and lignin:N ratios of the litter. Therefore, our
results support the finding that the N concentrations, or the ratios of N to other foliar
compounds, are among the principal factors affecting the rates of litter decomposition in a
particular climatic region (Cornelissen 1996; Aerts 1997; Heal et al. 1997; Parton et al. 2007).
The concentrations of macronutrients other than N in the litter can influence the
decomposition. For example, in line with our study, the decomposition rates of litter from
Central-European forest trees including Acer pseudoplatanus, Carpinus betulus, Fagus
sylvatica and Tilia cordata were positively correlated with the Ca concentration of the litter in
a common-garden experiment (Hobbie et al. 2006). However, in this context two aspects
have to be considered: (i) that correlations between nutrient concentrations and litter
decomposition rates do not necessarily imply that litter quality controls litter decay, and (ii)
that simple extrapolations of decomposition rates from early stages of decay to long-term
rates might yield erroneous results (Prescott 2005).
In contrast to other studies on temperate forest tree species (Osono & Tadeka 2005; Hobbie
et al. 2006; Madritch & Cardinale 2007; Sariyildiz 2008), we found no significant correlation
between decomposition rates and the lignin concentration of the litter. This was probably due
to the relatively small range of lignin concentrations in the litter. Moreover, lignin’s regulation
of litter decomposition is generally not presumed to take effect before the onset of the
second phase of degradation (Kalbitz et al. 2006; Berg & McClaugherty 2008), which starts
when the mass loss of litter exceeds a species-specific level. This level might not have been
reached during the period for which the decomposition rates were calculated.
Due to the chemical composition of their leaves, forest trees create specific conditions that
influence the decomposition of their own litter in the long-term (Reich et al. 2005; Sariyildiz &
Anderson 2005; Vivanco & Austin 2008). Apart from affecting the chemical composition of
the soil, litter that is only slowly degradable builds up thicker layers of organic matter on the
soil surface, which persist over longer periods of time. The structure of the organic surface
layer, in turn, can affect the rates of litter decomposition as a result of the microclimatic
conditions (Sayer 2006; Sariyildiz 2008). In our study, the thicker organic surface layer in the
stands dominated by Fagus sylvatica (DL 1) might have preserved a more favourable
moisture regime during the decomposition process than at DL 2 and DL 3. At the latter
- 86 -

Litter decomposition
diversity levels (especially at DL 3), the more rapid decomposition of the readily degradable
Fraxinus and Tilia litter, which presumably is a more attractive resource to the decomposers
due to its lower C:N ratios, left behind a thinner litter layer. In late spring (seven months after
the onset of decomposition), this layer consisted mainly of the more persistent Fagus litter,
whose decomposition might have been further retarded by the lower moisture during the
warm summer months. In the multispecific stands, this might have impeded the degradation
of Fagus litter even more. The moisture regime in the litter layer and decomposer
preferences might explain the finding that the decomposition rates of Fagus litter at DL 2 and
DL 3 during the first seven months of decay were significantly lower than in the almost pure
Fagus stands of DL 1. However, when a longer time period (22 months) of decomposition is
considered, the decomposition of Fagus litter was more rapid at DL 3 than at DL 1; (Jacob et
al. 2009). On the basis of our results, we have to reject the hypothesis that, in its initial
phase, Fagus litter decomposition is more rapid in the presence of more readily degradable
leaf litter of other deciduous species.
Decomposition across the diversity levels
The large differences between the decomposition rates of beech litter and those of litter from
the other investigated tree species also influenced the decomposition rates of the stand-
specific litter mixtures, which were highest at DL 3. In those stands with the highest tree
diversity, tree species with low initial C:N ratios in their litter (Carpinus betulus, Fraxinus
excelsior, Tilia cordata) together made up nearly two thirds of the canopy cover, whereas the
species with the highest C:N ratio (Fagus sylvatica) contributed only about 21%. The stand-
specific litter mixtures reflected the contribution of the tree species to the canopy cover.
Despite distinct differences among DL in soil chemistry (Guckland et al. 2009), the nutrient
concentrations and ratios of Fagus litter did not differ significantly among DL. Thus, high
fractions of Fagus sylvatica in the litter mixtures were connected with lower decomposition
rates of total litter and lignin. The decomposition of litter from individual tree species in litter
mixtures did not differ significantly from that predicted on the basis of litter decomposed in
isolation. These results are indicative of additive decomposition characteristics as opposed to
non-additive ones (c.f. Gartner & Cardon 2004). Hence, the differences among the
decomposition rates of the litter mixtures from the various diversity levels were due to the
specific traits of the individual tree species involved, and to their interrelations with the site
factors rather than to the diversity of the litter mixtures per se. On a larger geographical
scale, a similar result was found in a study investigating a transect from dry to mesic forests
in Central North America including broad-leaved deciduous tree species (Madritch &
Cardinale 2007): the decomposition rates were strongly dependent on the presence or
absence of few individual species, but not on leaf litter diversity itself. Generally, the
- 87 -
Chapter 4
existence of species-specific traits of the trees in temperate forest ecosystems seems to
make the effects of litter mixing on the decomposition rates nearly unpredictable
(Hättenschwiler et al. 2005; De Deyn et al. 2008). This also seems to be true for tropical
forest plantations (Scherer-Lorenzen et al. 2007), and for forest and non-forest ecosystems
of chronosequences on a global scale (Wardle et al. 2009).
The annual leaf litter production of the investigated stands was 3.2—3.9 Mg ha-1 yr-1, with no
significant differences among the levels of tree species diversity (Guckland et al. 2009). The
higher decomposition rates in the stands with a higher tree species diversity is indicative of a
faster release of nutrients and, thus, of a more rapid nutrient cycling. However, the basal
area-related productivity of the beech is not higher in the mixed than in the pure ones (Jacob
et al. in press). Hence, along the investigated gradient of tree species diversity, the
productivity of the beech seems to be unaffected by current litter decomposition rates. This is
consistent with the objection by Prescott (2005) that rates of litter decomposition may not be
critical for productivity. In contrast, high rates of litter decomposition may be essential for
sustaining the productivity of the stands with higher tree species diversity. These stands also
harbour a more diverse herb layer (Mölder et al. 2008), which most probably influences the
decomposition rates (e.g., Wise & Schaefer 1994). Thus, the site conditions of the different
stand types, in combination with the specific traits of the predominating tree species, might
be more important for the rates of litter decomposition and nutrient release than tree species
diversity itself.
Acknowledgements We thank Nadine Weland (Dept. of Ecology, Johann Friedrich Blumenbach Institute of
Zoology and Anthropology, Georg-August-Universität Göttingen) for providing data on the
thickness of the organic surface layer; and Inga Krämer (Dept. of Tropical Silviculture and
Forest Ecology, Burckhardt-Institute, Georg-August-Universität Göttingen) for providing data
on the soil water content. The study was funded by the Deutsche Forschungsgemeinschaft
(Graduiertenkolleg 1086). The experiments comply with the laws of Germany where they
have been conducted.
- 88 -

Litter decomposition
4.6 References Ad-hoc-Arbeitsgruppe Boden (2005) Bodenkundliche Kartieranleitung. Schweizerbart'sche
Verlagsbuchhandlung, Stuttgart
Aerts R (1997) Climate, leaf litter chemistry and leaf litter decomposition in terrestrial
ecosystems: A triangular relationship. Oikos 79:439-449
Ball BA, Hunter MD, Kominoski JS, Swan CM, Bradford MA (2008) Consequences of non-
random species loss for decomposition dynamics: experimental evidence for additive and
non-additive effects. J Ecol 96:303-313
Balvanera P, Pfisterer AB, Buchmann N, He JS, Nakshizuka T, Raffaelli D, Schmid B (2006)
Quantifying the evidence for biodiversity effects on ecosystem functioning and services.
Ecol Letters 9:1146-1156
Bärlocher F (2007) Leaf mass loss estimated by litter bag technique. In: Graça MAS,
Bärlocher F, Gessner MO (eds) Methods to Study Litter Decomposition — A Practical
Guide. Springer, Dordrecht, pp 37-42
Berg B (2000) Litter decomposition and organic matter turnover in northern forest soils. For
Ecol Manage 133:13-22
Berg B, McClaugherty C (2008) Plant Litter — Decomposition, Humus Formation, Carbon
Sequestration, 2nd edn. Springer, Berlin
Boerjan W, Ralph J, Baucher M (2003) Lignin biosynthesis. Annu Rev Plant Biol 54:519-546
Brinkmann K, Blaschke L, Polle A (2002) Comparison of different methods for lignin
determination as a basis for calibration of near-infrared reflectance spectroscopy and
implications of lignoproteins. J Chem Ecol 28:2483-2501
Cornelissen JHC (1996) An experimental comparison of leaf decomposition rates in a wide
range of temperate plant species and types. J Ecol 84:573-582
Cotrufo MF, Miller M, Zeller B (2000) Litter decomposition. In: Schulze E-D (ed) Carbon and
Nitrogen Cycling in European Forest Ecosystems. Ecological Studies 142. Springer, Berlin
etc., pp 276-296
De Deyn GB, Cornelissen JHC, Bardgett RD (2008) Plant functional traits and soil carbon
sequestration in contrasting biomes. Ecol Letters 11:516-531
Ellenberg H (1996) Vegetation Mitteleuropas mit den Alpen, 5th edn. Ulmer, Stuttgart
- 89 -
Chapter 4
FAO (2006) FAO, ISRIC, ISSS World Reference Base for Soil Resources 2006. Report No.
103, World Soil Resources Reports, Rome
Gartner TB, Cardon ZG (2004) Decomposition dynamics in mixed-species leaf litter. Oikos
104:230-246
Guckland A, Jacob M, Flessa H, Thomas FM, Leuschner C (2009) Acidity, nutrient stocks,
and organic-matter content in soils of a temperate deciduous forest with different
abundance of European beech (Fagus sylvatica L.). J Plant Nutr Soil Sci 172:500-511
Hättenschwiler S, Gasser P (2005) Soil animals alter plant litter diversity effects on
decomposition. PNAS 102:1519-1524
Hättenschwiler S, Tiunov AV, Scheu S (2005) Biodiversity and litter decomposition in
terrestrial ecosystems. Annu Rev Ecol Evol Syst 36:191-218
Heal OW, Anderson JM, Swift MJ (1997) Plant litter quality and decomposition: An historical
overview. In: Cadish G, Giller KE (eds) Driven by Nature: Plant litter quality and
decomposition. CAB International, Wallingford, pp 3-30
Hobbie SE, Reich PB, Oleksyn J, Ogdahl M, Zytkowiak R, Hale C, Karolewski P (2006) Tree
species effects on decomposition and forest floor dynamics in a common garden. Ecology
87:2288-2297
Hooper DU, Chapin III FS, Ewel JJ, Hector A, Inchausti P, Lavorel S, Lawton JH, Lodge DM,
Loreau M, Naeem S, Schmid B, Setälä H, Symstad AJ, Vandermeer J, Wardle DA (2005)
Effects of biodiversity on ecosystem functioning: A consensus of current knowledge. Ecol.
Monogr 75:3-35
Jacob M, Weland N, Platner C, Schaefer M, Leuschner C, Thomas FM (2009) Nutrient
release from decomposing leaf litter of temperate deciduous forest trees along a gradient
of increasing tree species diversity. Soil Biol Biochem 41:2122-2130
Jacob M, Leuschner C, Thomas FM (2010). Productivity of temperate broad-leaved forest
stands differing in tree species diversity. Ann For Sci (in press)
Kalbitz K, Kaiser K, Bargholz J, Dardenne P (2006) Lignin degradation controls the
production of dissolved organic matter in decomposing foliar litter. Eur J Soil Sci57:504-
516
- 90 -
Litter decomposition
Leuschner C, Jungkunst HF, Fleck S (2009) Functional role of forest diversity: pros and cons
of synthetic stands and across-site comparisons in established forests. Basic Appl Ecol
10, 1-9
Madritch MD, Cardinale BJ (2007) Impacts of tree species diversity on litter decomposition in
northern temperate forests of Wisconsin, USA: a multi-site experiment along a latitudinal
gradient. Plant Soil 292:147-159
McLellan TM, Aber JD, Martin ME, Melillo JM, Nadelhoffer KJ (1991) Determination of
nitrogen, lignin, and cellulose content of decomposing leaf material by near-infrared
reflectance spectroscopy. Can J For Res 21:1684-1688
Meier CL, Bowman WD (2008) Links between plant litter chemistry, species diversity, and
below-ground ecosystem function. PNAS 105:19780-19785
Melillo JM, Aber JD, Muratore JF (1982) Nitrogen and lignin control of hardwood leaf litter
decomposition dynamics. Ecology 63:621-626
Mölder A, Bernhardt-Römermann M, Schmidt W (2008) Herb-layer diversity in deciduous
forests: Raised by tree richness or beaten by beech? For Ecol Manage 256:272-281
Olson JS (1963) Energy storage and balance of producers and decomposers in ecological
systems. Ecology 44:322-331
Ono K, Miki K, Amari M, Hirai K (2008) Near-infrared reflectance spectroscopy for the
determination of lignin-derived compounds in the decomposed and humified litters of
coniferous and deciduous temperate forests in Northern Kanto District, Central Japan. Soil
Sci Plant Nutr 54:188-196
Osono T (2007) Ecology of ligninolytic fungi associated with leaf litter decomposition. Ecol
Res 22:955-974
Osono T, Takeda H (2005) Decomposition of organic chemical components in relation to
nitrogen dynamics in leaf litter of 14 tree species in a cool temperate forest. Ecol Res
20:41-49
Parton W, Silver WL, Burke IC, Grassens L, Harmon ME, Currie WS, King JY, Adair EC,
Brandt LA, Hart SC, Fasth B (2007) Global-scale similarities in nitrogen release patterns
during long-term decomposition. Science 315:361-364
Prescott CE (2005) Do rates of litter decomposition tell us anything we really need to know?
For Ecol Manage 220:66-74
- 91 -

Chapter 4
Reich PB, Oleksyn J, Modrzynski J, Mrozinski P, Hobbie SE, Eissenstat DM, Chorover J,
Chadwick OA, Hale CM, Tjoelker MG (2005) Linking litter calcium, earthworms and soil
properties: a common garden test with 14 tree species. Ecol Letters 8:811-818
Ritter E, Bjørnlund L (2005) Nitrogen availability and nematode populations in soil and litter
after gap formation in a semi-natural beech-dominated forest. Appl Soil Ecol 28:175-189
Sariyildiz T (2008) Effects of gap-size classes on long-term litter decomposition rates of
beech, oak and chestnut species at high elevations in Northeast Turkey. Ecosystems
11:841-853
Sariyildiz T, Anderson JM (2005) Variation in the chemical composition of green leaves and
leaf litters from three deciduous tree species growing on different soil types. For Ecol
Manage 210:303-319
Sayer EJ (2006) Using experimental manipulation to assess the roles of leaf litter in the
functioning of forest ecosystems. Biol Rev 81:1-31
Scherer-Lorenzen M, Bonilla JL, Potvin C (2007) Tree species richness affects litter
production and decomposition rates in a tropical biodiversity experiment. Oikos 116:2108-
2124
Scherer-Lorenzen M, Körner C, Schulze E-D (2005) The functional significance of forest
diversity: a synthesis. In: Forest Diversity and Function. Ecological Studies 176. Springer,
Berlin Heidelberg New York, pp 377-389
Schmidt I, Leuschner C, Mölder A, Schmidt W (2009) Structure and composition of the seed
bank in monospecific and tree species-rich temperate broad-leaved forests. For Ecol
Manage 257: 695–702
Schulze E-D (2000) The carbon and nitrogen cycle of forest ecosystems. In: Schulze E-D
(ed) Carbon and Nitrogen Cycling in European Forest Ecosystems. Ecological Studies
142. Springer, Berlin etc., pp 3-13
Spehn EM, Hector A, Joshi J, Scherer-Lorenzen M, Schmid B, Bazeley-White E,
Beierkuhnlein C, Caldeira MC, Diemer M, Dimitrakopoulos PG, Finn JA, Freitas J, Giller
PS, Good J, Harris R, Hogberg P, Huss-Danell K, Jumpponen A, Koricheva J, Leadley
PW, Loreau M, Minns A, Mulder CPH, O’Donovan G, Otway SJ, Palmborg C, Pereira JS,
Pfisterer AB, Prinz A, Read DJ, Schulze E-D, Siamantziouras ASD, Terry AC, Troumbis
AY, Woodward FI, Yachi S, Lawton JH, (2005) Ecosystem effects of biodiversity
manipulations in European grasslands. Ecol Monogr 75:37-63
- 92 -

Litter decomposition
Tillmann P (1996) Kalibrationsentwicklung für NIRS-Geräte — eine Einführung. Cuvillier-
Verlag, Göttingen
Vivanco L, Austin AT (2008) Tree species identity alters forest litter decomposition through
long-term plant and soil interactions in Patagonia, Argentina. J Ecol 96:727-736
Wardle DA, Bardgett RD, Walker LR, Bonner KI (2009) Among- and within-species variation
in plant litter decomposition in contrasting long-term chronosequences. Funct Ecol
23:442-453
Wardle DA, Bonner KI, Nicholson KS (1997) Biodiversity and plant litter: experimental
evidence which does not support the view that enhanced species richness improves
ecosystem function. Oikos 79:247-258
Wise DH, Schaefer M (1994) Decomposition of leaf litter in a mull beech forest: comparison
between canopy and herbaceous species. Pedobiologia 38:269-288
- 93 -

- 94 -

Chapter
5 Nutrient release from decomposing leaf litter of temperate deciduous forest trees along a gradient of increasing tree
species diversity Mascha Jacob, Nadine Weland, Christian Platner, Matthias Schaefer, Christoph Leuschner,
Frank M Thomas
(Published in: Soil Biology and Biochemistry 41:2122-2130)
- 95 -
Chapter 5
- 96 -
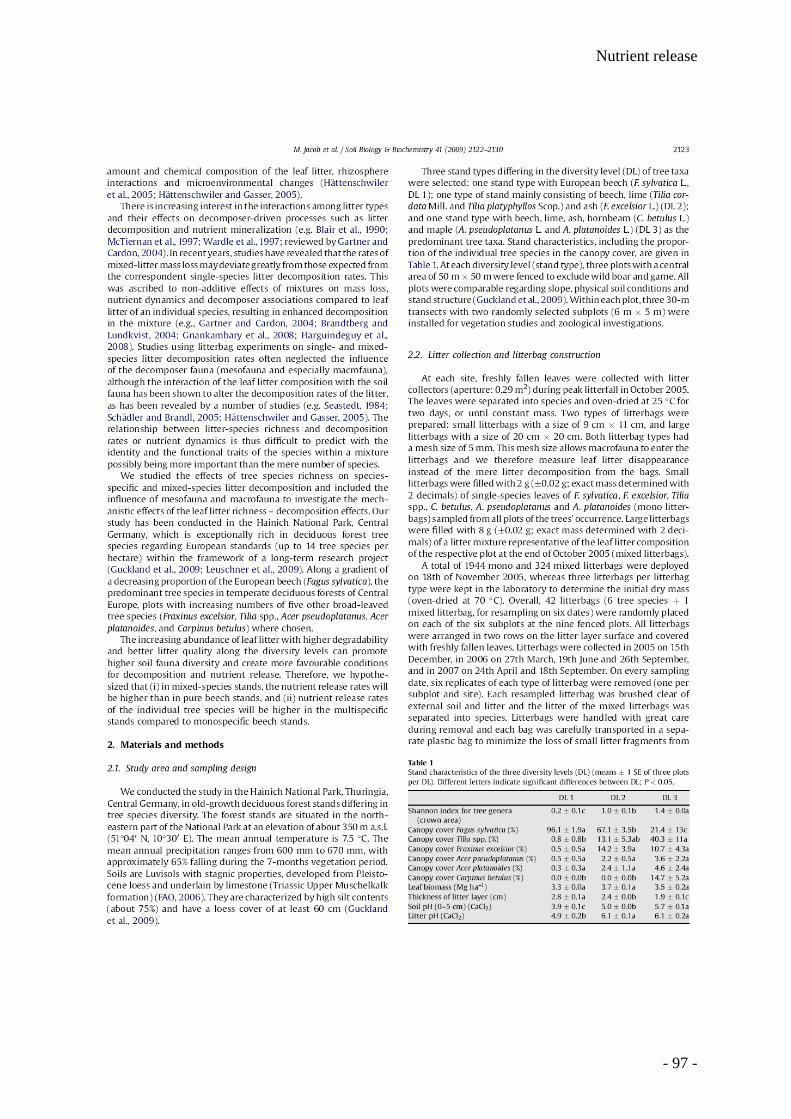
Nutrient release
- 97 -

Chapter 5
- 98 -
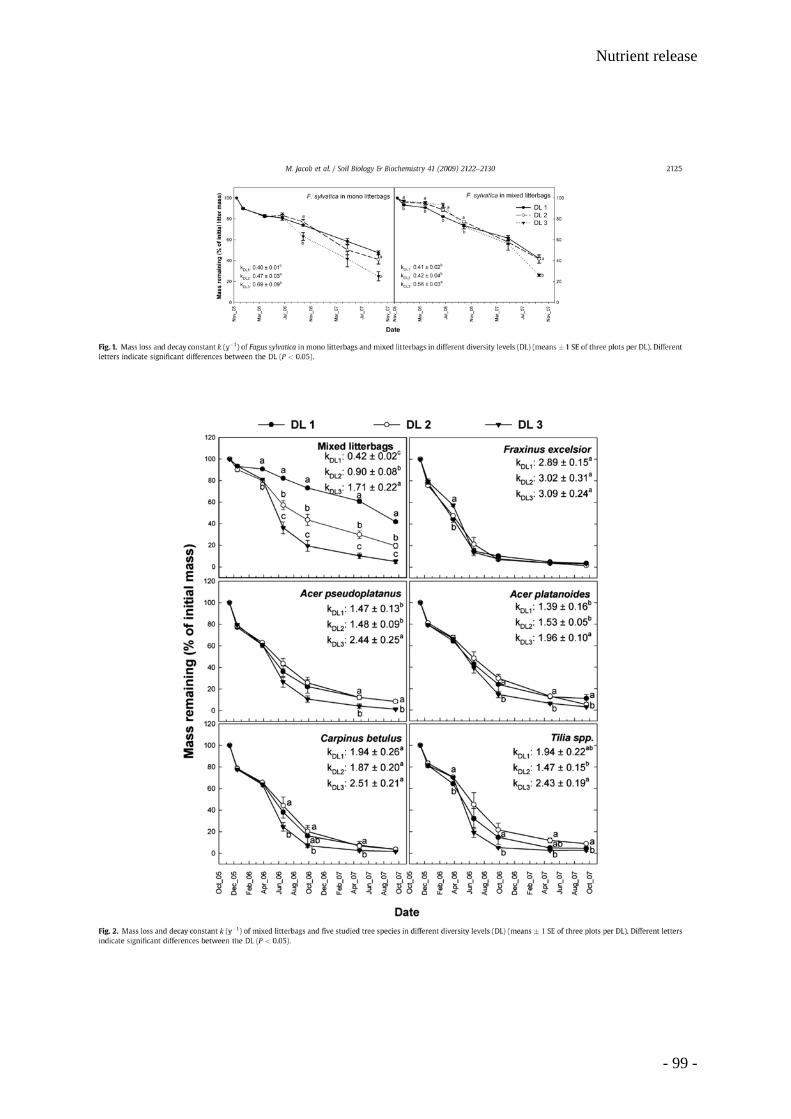
Nutrient release
- 99 -

Chapter 5
- 100 -

Nutrient release
- 101 -

Chapter 5
- 102 -

Nutrient release
- 103 -
Chapter 5
- 104 -
Chapter
6
Nutrient stocks of five deciduous forest tree species in monospecific and mixed species forest stands
Mascha Jacob, Christoph Leuschner, Frank M Thomas
- 105 -

Chapter 6
6.1 Abstract
Forests are facing tremendous impacts due to the changing climate and new management
schemes in European forestry. These two factors will probably lead to a more diverse tree
species composition in European forests. Tree nutrition in mixtures commonly matches the
nutritional status in monocultures, but nonlinear interactions can also occur and this
relationship needs to be investigated. We have therefore selected forest stands with
increasing tree species diversity from monocultures of European beech (diversity level 1, DL
1) to stands of beech plus two or four other deciduous tree genera (DL 2 and DL 3) to
investigate the concentrations of N, P, K, Mg and Ca in the different tree compartments
(stem wood, branches, stem bark, foliage and fruits) as well as the corresponding nutrient
stocks.
The nutritional status in the investigated forest was good, except for P. Nutrient
concentrations were generally lower in the beech compared to the other deciduous tree
species. N, P, K and Mg were contained to 40-60 % in stem wood, 10-20 % in branches, 10-
20 % in stem bark, 5-15 % in fresh leaves, and 1.5-7 % in fruits. Except for N, the total
nutrient stocks did not differ significantly among DL, although the biomasses of stem wood
and branches and, therefore, the total biomass were significantly higher at DL 1. The basal
area-related stocks of all investigated nutrients and all tree compartments increased with
increasing tree species diversity. They were less variable in the ‘storage compartments’ stem
wood and branches than in the ‘productivity compartments’ fruits and leaves, which exhibited
larger interspecific differences.
6.2 Introduction
Different tree species may greatly influence the biogeochemistry of forest ecosystems due to
differences in nutrient uptake from the soil, litter chemistry, root activity, canopy interception
and growth. Tree species composition can also influence the understory vegetation (Mölder
et al. 2008), the soil nutrient status (Dijkstra, 2003), the soil acidity (Binkley and Valentine
1991, Reich et al. 2005), the composition and activity of the soil fauna and microflora
(Neirynck et al. 2000, Cesarz et al. 2007), and the stocks of organic carbon and
exchangeable cations (Guckland et al. 2009). Distinctive differences were found between
conifers and hardwood species in affecting ecosystem biochemistry or soil chemistry (Rothe
et al. 2002, Augusto et al. 2002), but even among hardwood species, remarkable differences
can occur (Nordén 1994). So far, only few generalizations about the influence of tree species
in mixtures, or about the interaction between environmental factors and nutritional effects can
be supported by empirical studies on the nutrition of mixed-species stands (Rothe and
Binkley 2001). Tree nutrition in mixtures commonly matches nutrition in monocultures, but
- 106 -
Nutrient stocks
other interactions can also occur and this relationship needs to be investigated (Rothe and
Binkley 2001).
Natural forest vegetation in Central Europe is unique because of the widespread occurrence
of beech forests (Fagus sylvatica L.) and its low tree species diversity compared to
temperate zones of other continents. European beech is extraordinary among temperate tree
species in forming monospecific stands in most parts of its distribution range. Against the
background of climate change, which is expected to result in weather extremes and lower
amounts of precipitation in the summer (Schönwiese et al. 2003), silvicultural management is
promoting mixed stands consisting of beech and secondary broad-leaved tree species to
ensure stable and productive forest stands (BMVEL 2001, Röhrig et al. 2006). In beech
forests, management programs aim at increasing the portion of other broad-leaved tree
species such as ash (Fraxinus excelsior L.), lime (Tilia spp.), maple (Acer spp.), and
hornbeam (Carpinus betulus L.).
We sampled data from a range of deciduous tree species along an increasing tree diversity
gradient to examine the relationship between above-ground nutrient chemistry and tree
species diversity. In previous studies, we found on the one hand that the leaf production and
the root biomass did not differ significantly between the mixed-species stands and the pure
beech stands, although the total above-ground biomass was highest in the latter ones (Jacob
et al. 2010, Meinen et al. 2009a). On the other hand, decomposition rates (Jacob et al.
2009), lumbricid abundance (Cesarz et al. 2007), litter quality and stocks of exchangeable
Ca and Mg (Guckland et al. 2009) were higher in the mixed species stands than in the
monospecific stands. On the basis of these results, we hypothesized that (1) total nutrient
stocks are highest in monospecific beech stands due to a higher standing biomass in these
stands, (2) basal area-related nutrient stocks are higher in the mixed species stands, (3)
basal area-related nutrient stocks of beech are higher in the mixed stands, and (4) compared
to the beech, nutrient concentrations and basal area-related nutrient stocks are higher in the
tree genera that only occur in the mixed stands as leaf litter decomposition and nutrient
release rates are increased in these tree species.
- 107 -

Chapter 6
6.3 Materials and Methods
Study area This study was conducted in mature stands of deciduous forest trees in the Hainich National
Park, Thuringia – Germany’s largest semi-natural broad-leaved forest covering a total area of
16,000 ha with about 7,500 ha being protected area. All research sites are situated in the
north-eastern part of the national park near the village and meteorological station of
Weberstedt (51° 06’ N, 10° 31’ E). The mean annual temperature is 7.5 °C and the mean
annual precipitation ranges from 600 mm to 670 mm. All plots are situated at an elevation of
about 350 m a.s.l. Soils are Luvisols, developed from Pleistocene loess underlain by
limestone (Triassic Upper Muschelkalk formation) (FAO 2006). They have a loess cover of at
least 60 cm and the texture of the mineral soil is characterised by high silt contents
(Guckland et al. 2009). The area had been used for military training from the 1960s until
1990 and became a national park in December 1997. Before that time, a small-scale mosaic
of forest ownership with different forest management systems from coppice with standards to
multiple-aged forests has resulted in contiguous tree species-poor and tree species-rich
stands (Leuschner et al. 2009).
In April 2005, three stand types differing in the diversity level (DL) of tree taxa were selected:
one stand type consisted of European beech (Fagus sylvatica L.) (DL 1); one was mainly
characterised by beech, lime (Tilia cordata Mill. and T. platyphyllos Scop.) and ash (Fraxinus
excelsior L.) (DL 2); and one stand type was formed by beech, lime, ash, hornbeam
(Carpinus betulus L.) and maple (Acer pseudoplatanum L. and A. platanoides L.) as the
dominant tree taxa (DL 3). Other tree species like Quercus robur, Quercus petraea, Prunus
avium, Ulmus glabra, and Sorbus torminalis are found occasionally in the mixed-species
stands (DL 2 and DL 3). At each diversity level (stand type), three plots with a central area of
50 m × 50 m were fenced to exclude wild boar and game. All plots were comparable
regarding slope, physical soil conditions and stand structure. More details about stand
structure and soil parameters are shown in Table 1 (but see also Guckland et al. 2009, Jacob
et al. 2010). N inputs from the atmosphere were moderate with 13 kg ha-1 (Mund 2004).
Sampling and biomass calculation Production of leaf and fruit biomass was determined with 15 litter collectors (aperture: 0.29
m²) per plot that were arranged at a minimum distance of 2 m along three transects (five
collectors per transect). All collectors had 8-mm holes drilled through the bottom to allow
water drainage from the litter collector. Leaf litter was sampled every two to three weeks
during September to December 2005 - 2007 and, additionally, once in spring and once in late
summer of 2006. From all samples, leaves, twigs, fruits and flowers were assigned to the
- 108 -
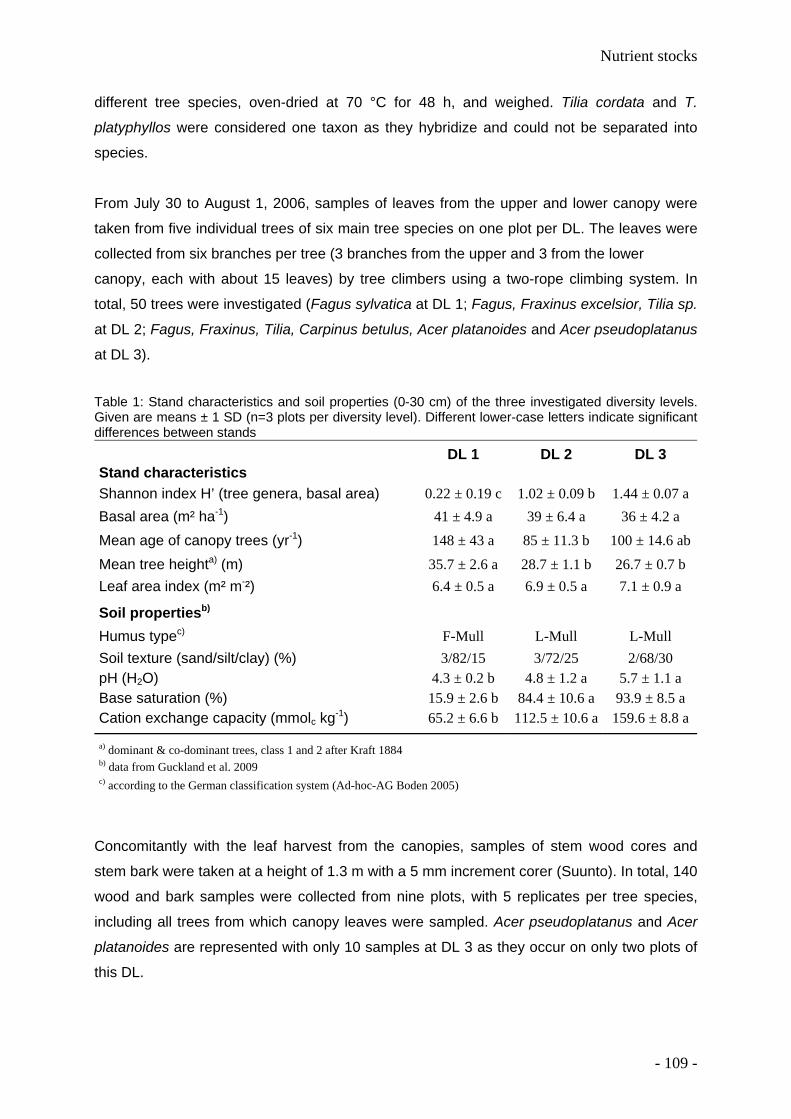
Nutrient stocks
different tree species, oven-dried at 70 °C for 48 h, and weighed. Tilia cordata and T.
platyphyllos were considered one taxon as they hybridize and could not be separated into
species.
From July 30 to August 1, 2006, samples of leaves from the upper and lower canopy were
taken from five individual trees of six main tree species on one plot per DL. The leaves were
collected from six branches per tree (3 branches from the upper and 3 from the lower
canopy, each with about 15 leaves) by tree climbers using a two-rope climbing system. In
total, 50 trees were investigated (Fagus sylvatica at DL 1; Fagus, Fraxinus excelsior, Tilia sp.
at DL 2; Fagus, Fraxinus, Tilia, Carpinus betulus, Acer platanoides and Acer pseudoplatanus
at DL 3).
Table 1: Stand characteristics and soil properties (0-30 cm) of the three investigated diversity levels. Given are means ± 1 SD (n=3 plots per diversity level). Different lower-case letters indicate significant differences between stands
DL 1 DL 2 DL 3 Stand characteristics Shannon index H’ (tree genera, basal area) 0.22 ± 0.19 c 1.02 ± 0.09 b 1.44 ± 0.07 a Basal area (m² ha-1) 41 ± 4.9 a 39 ± 6.4 a 36 ± 4.2 a
Mean age of canopy trees (yr-1) 148 ± 43 a 85 ± 11.3 b 100 ± 14.6 ab
Mean tree heighta) (m) 35.7 ± 2.6 a 28.7 ± 1.1 b 26.7 ± 0.7 b Leaf area index (m² m-²) 6.4 ± 0.5 a 6.9 ± 0.5 a 7.1 ± 0.9 a
Soil propertiesb) Humus typec) F-Mull L-Mull L-Mull Soil texture (sand/silt/clay) (%) 3/82/15 3/72/25 2/68/30 pH (H2O) 4.3 ± 0.2 b 4.8 ± 1.2 a 5.7 ± 1.1 a Base saturation (%) 15.9 ± 2.6 b 84.4 ± 10.6 a 93.9 ± 8.5 a Cation exchange capacity (mmolc kg-1) 65.2 ± 6.6 b 112.5 ± 10.6 a 159.6 ± 8.8 a
a) dominant & co-dominant trees, class 1 and 2 after Kraft 1884 b) data from Guckland et al. 2009 c) according to the German classification system (Ad-hoc-AG Boden 2005)
Concomitantly with the leaf harvest from the canopies, samples of stem wood cores and
stem bark were taken at a height of 1.3 m with a 5 mm increment corer (Suunto). In total, 140
wood and bark samples were collected from nine plots, with 5 replicates per tree species,
including all trees from which canopy leaves were sampled. Acer pseudoplatanus and Acer
platanoides are represented with only 10 samples at DL 3 as they occur on only two plots of
this DL.
- 109 -
Chapter 6
Species-specific allometric biomass equations were used to calculate above-ground woody
biomass of the trees (c.f. Jacob et al. 2010). Biomass of stem bark and branches was
estimated with the program SILVA 2.1 (Meschederu 1997). Leaf biomass was derived from
litter sampling. The nutrient stocks of the different tree compartments were computed by
multiplying biomass with nutrient concentration. Nutrient concentrations of branches were not
available. Therefore, we calculated stem wood concentration times branch biomass to obtain
branch nutrient stocks. However, this approach can only be an approximation as branch
nutrient concentrations usually increase with decreasing diameter and are higher than those
of stem wood (André and Ponette 2003, Augusto et al 2000). Stand nutrient stocks were
computed as the sum of nutrient stocks of all nutrient compartments.
Chemical analyses Total C and N contents were determined in pulverized leaf, fruit, wood, and bark material by
an automated C and N analyzer (Heraeus Elementar Vario EL, Hanau, Germany). The
concentrations of Ca, K and Mg in green leaves, fruits, leaf litter, stem wood and stem bark
were analyzed by ICP-AES (Spectro, Kleve, Germany) after pressure digestion (10 h, 180
°C) with 65 % HNO3. Beech fruits were analysed in equal amounts of nuts and capsules per
sample.
Soil pH was measured in 1 M KCl. Organic C (SOC) and total N (Nt) contents of soil and
forest floor samples were determined by an automated C and N analyzer (Heraeus
Elementar Vario EL, Hanau, Germany) after grinding the samples (all samples were free of
carbonates). Cation exchange capacity (CEC) of mineral soil samples were calculated as the
equivalent sum of the exchangeable Na, K, Ca, Mg, Mn, Fe, Al and H ions after leaching the
soil samples with 100 ml of 1 M ammonium chloride (NH4Cl). Base saturation was defined as
the sum of base cation equivalents (Na, K, Ca and Mg) in percent of CEC (Guckland et al.
2009).
Statistical analyses Statistical data analysis was conducted using the software R, version 2.9.1 (R Development
Core Team, Vienna, Austria, 2008) with the package nparcomp. We used a non-parametric
multiple comparison procedure after Hothorn et al. (2008), implemented for Tukey-contrasts,
to detect differences between the three diversity levels and between tree species.
Significance was assumed for two-sided p-values < 0.05 in all cases.
- 110 -
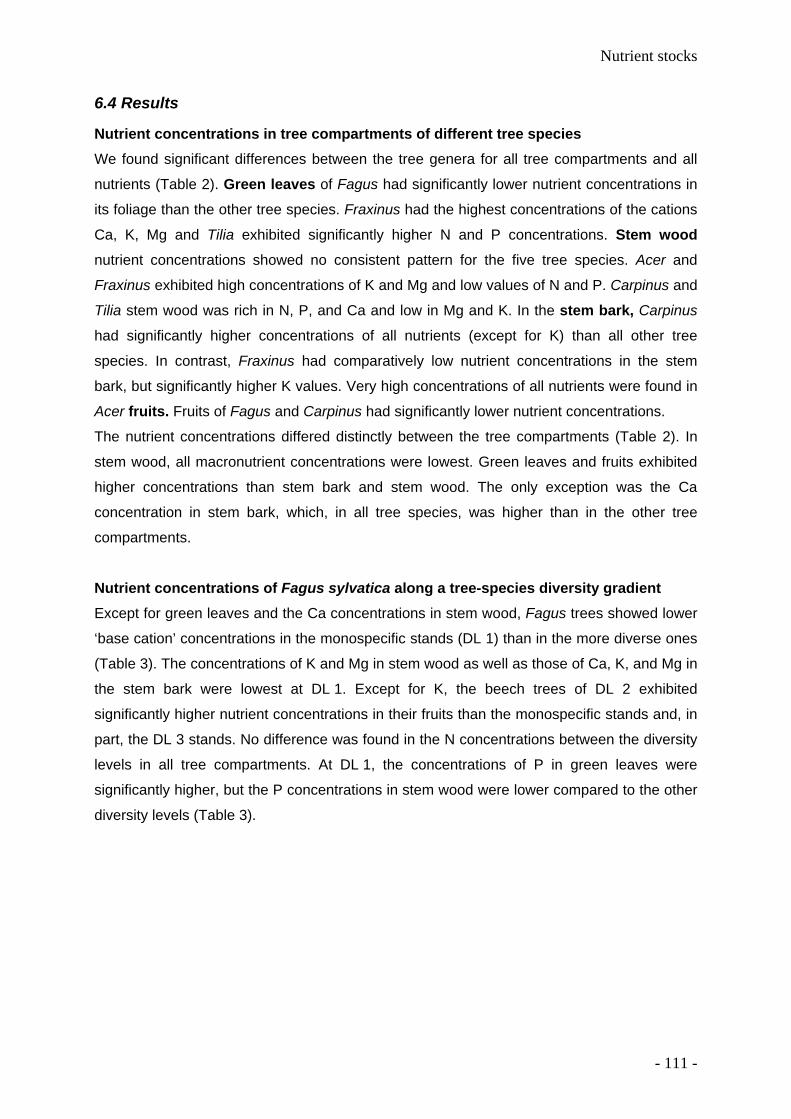
Nutrient stocks
6.4 Results
Nutrient concentrations in tree compartments of different tree species We found significant differences between the tree genera for all tree compartments and all
nutrients (Table 2). Green leaves of Fagus had significantly lower nutrient concentrations in
its foliage than the other tree species. Fraxinus had the highest concentrations of the cations
Ca, K, Mg and Tilia exhibited significantly higher N and P concentrations. Stem wood
nutrient concentrations showed no consistent pattern for the five tree species. Acer and
Fraxinus exhibited high concentrations of K and Mg and low values of N and P. Carpinus and
Tilia stem wood was rich in N, P, and Ca and low in Mg and K. In the stem bark, Carpinus
had significantly higher concentrations of all nutrients (except for K) than all other tree
species. In contrast, Fraxinus had comparatively low nutrient concentrations in the stem
bark, but significantly higher K values. Very high concentrations of all nutrients were found in
Acer fruits. Fruits of Fagus and Carpinus had significantly lower nutrient concentrations.
The nutrient concentrations differed distinctly between the tree compartments (Table 2). In
stem wood, all macronutrient concentrations were lowest. Green leaves and fruits exhibited
higher concentrations than stem bark and stem wood. The only exception was the Ca
concentration in stem bark, which, in all tree species, was higher than in the other tree
compartments.
Nutrient concentrations of Fagus sylvatica along a tree-species diversity gradient Except for green leaves and the Ca concentrations in stem wood, Fagus trees showed lower
‘base cation’ concentrations in the monospecific stands (DL 1) than in the more diverse ones
(Table 3). The concentrations of K and Mg in stem wood as well as those of Ca, K, and Mg in
the stem bark were lowest at DL 1. Except for K, the beech trees of DL 2 exhibited
significantly higher nutrient concentrations in their fruits than the monospecific stands and, in
part, the DL 3 stands. No difference was found in the N concentrations between the diversity
levels in all tree compartments. At DL 1, the concentrations of P in green leaves were
significantly higher, but the P concentrations in stem wood were lower compared to the other
diversity levels (Table 3).
- 111 -

Chapter 6
Table 2: Mean nutrient concentration and standard deviation of five main tree genera (mg g-1 dm). All data from 2006. Different lower-case letters indicate significant differences between tree species within a tree compartment (p < 0.05).
N sd P sd Ca sd K sd Mg sd Fresh leaves Acer 22.49 ± 2.94 b 1.53 ± 0.37 b 13.12 ± 3.63 b 14.44 ± 4.02 a 2.09 ± 0.70 bFagus 22.78 ± 1.52 b 1.29 ± 0.32 b 11.06 ± 4.24 b 8.50 ± 2.55 b 1.73 ± 0.68 bFraxinus 21.79 ± 2.37 b 1.52 ± 0.37 b 17.03 ± 6.00 a 15.16 ± 3.57 a 3.23 ± 0.88 aCarpinus 20.73 ± 2.62 b 1.44 ± 0.33 b 10.58 ± 2.59 b 7.75 ± 1.65 b 2.13 ± 0.57 abTilia 26.87 ± 2.06 a 1.89 ± 0.37 a 13.36 ± 2.47 b 14.36 ± 4.61 a 2.02 ± 0.61 b Fruits Acer 21.32 ± 4.81 a 2.60 ± 0.59 a 13.37 ± 2.72 a 10.93 ± 2.11 a 1.77 ± 0.14 aFagus 13.91 ± 3.20 b 1.20 ± 0.23 c 4.87 ± 0.79 d 6.37 ± 0.74 c 0.92 ± 0.15 dFraxinus 20.95 ± 1.41 a 2.13 ± 0.18 b 5.96 ± 0.48 c 8.14 ± 1.29 b 1.35 ± 0.17 c Carpinus 12.52 ± 2.20 bc 1.05 ± 0.16 d 7.81 ± 0.71 b 4.48 ± 0.84 d 1.28 ± 0.21 c Tilia 11.62 ± 3.04 c 0.98 ± 0.37 d 13.55 ± 1.71 a 4.85 ± 1.34 d 1.54 ± 0.22 b Stem wood Acer 1.11 ± 0.30 b 0.10 ± 0.02 bc 1.41 ± 0.78 a 1.22 ± 0.69 ab 0.31 ± 0.17 aFagus 1.21 ± 0.16 b 0.08 ± 0.02 c 0.96 ± 0.33 b 1.17 ± 0.39 b 0.22 ± 0.10 aFraxinus 1.21 ± 0.15 b 0.08 ± 0.03 c 0.90 ± 0.15 b 1.39 ± 0.23 a 0.21 ± 0.04 aCarpinus 1.60 ± 0.22 a 0.10 ± 0.02 b 1.20 ± 0.15 a 1.03 ± 0.21 b 0.14 ± 0.05 bTilia 1.35 ± 0.16 b 0.13 ± 0.03 a 1.16 ± 0.21 a 0.77 ± 0.21 c 0.14 ± 0.06 b Stem bark Acer 7.25 ± 1.41 abc 0.49 ± 0.04 a 34.74 ± 4.81 b 3.18 ± 0.19 b 0.73 ± 0.17 abFagus 6.84 ± 0.43 b 0.31 ± 0.02 b 27.49 ± 3.69 c 2.31 ± 0.28 c 0.56 ± 0.13 c Fraxinus 6.05 ± 0.77 c 0.32 ± 0.02 b 23.64 ± 2.94 d 5.52 ± 0.82 a 0.62 ± 0.09 bcCarpinus 8.95 ± 0.81 a 0.41 ± 0.07 a 43.14 ± 1.99 a 1.99 ± 0.23 c 1.01 ± 0.15 aTilia 6.02 ± 0.40 c 0.47 ± 0.07 a 22.81 ± 4.36 d 3.54 ± 0.53 b 0.58 ± 0.15 bc
Nutrient stocks along a diversity gradient Total nutrient stocks did not differ significantly between the three diversity levels (except for
N), although the biomasses of stem wood, branches and therefore total biomass were
significantly higher at DL 1 (Table 4). However, basal area-related nutrient stocks increased
with increasing tree species diversity. This holds true for all nutrients and all tree
compartments (Table 5).
The stocks of most nutrients exhibited a similar distribution pattern across the individual tree
compartments. N, P, K and Mg contents were contained to 40-60 % in stem wood, 10-20 %
in branches, 10-20 % in stem bark, 5-15 % in green leaves, and 1.5-7 % in fruits. Ca stocks
were an exception with only 30 % in stem wood, 10 % in branches and 50 % in stem bark
(Tables 4, 5).
- 112 -
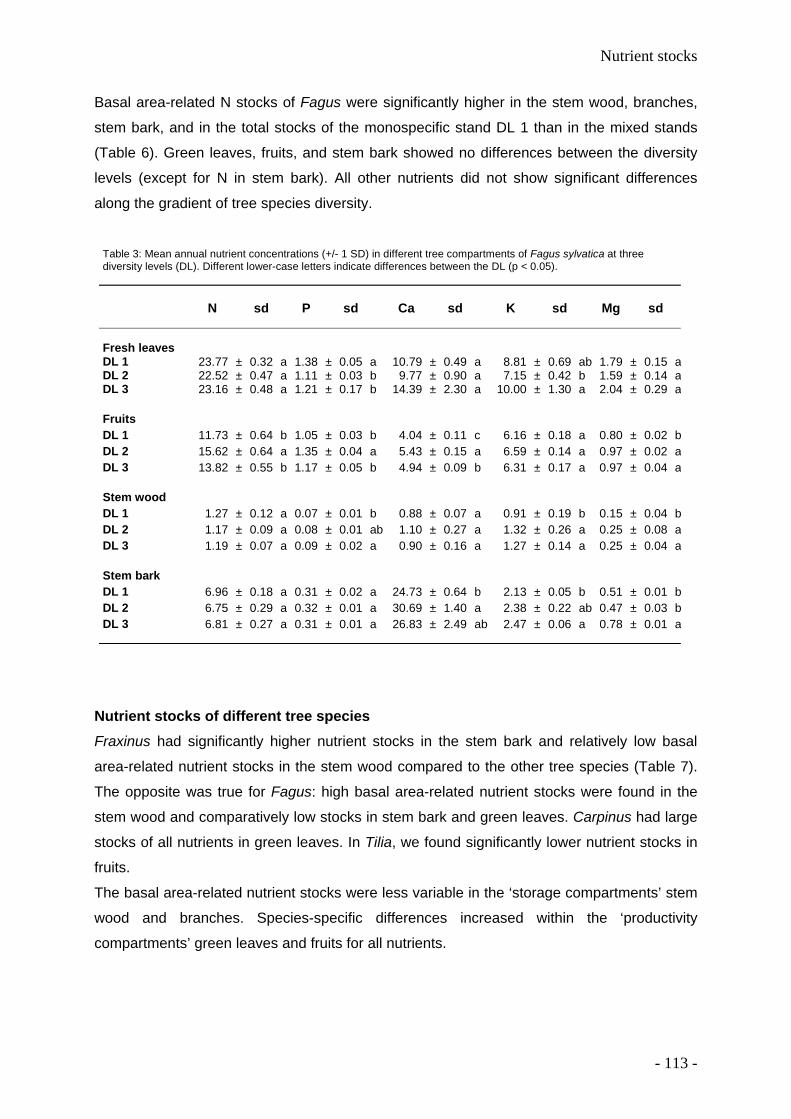
Nutrient stocks
Basal area-related N stocks of Fagus were significantly higher in the stem wood, branches,
stem bark, and in the total stocks of the monospecific stand DL 1 than in the mixed stands
(Table 6). Green leaves, fruits, and stem bark showed no differences between the diversity
levels (except for N in stem bark). All other nutrients did not show significant differences
along the gradient of tree species diversity.
Table 3: Mean annual nutrient concentrations (+/- 1 SD) in different tree compartments of Fagus sylvatica at three diversity levels (DL). Different lower-case letters indicate differences between the DL (p < 0.05).
N sd P sd Ca sd K sd Mg sd Fresh leaves DL 1 23.77 ± 0.32 a 1.38 ± 0.05 a 10.79 ± 0.49 a 8.81 ± 0.69 ab 1.79 ± 0.15 aDL 2 22.52 ± 0.47 a 1.11 ± 0.03 b 9.77 ± 0.90 a 7.15 ± 0.42 b 1.59 ± 0.14 aDL 3 23.16 ± 0.48 a 1.21 ± 0.17 b 14.39 ± 2.30 a 10.00 ± 1.30 a 2.04 ± 0.29 a Fruits DL 1 11.73 ± 0.64 b 1.05 ± 0.03 b 4.04 ± 0.11 c 6.16 ± 0.18 a 0.80 ± 0.02 bDL 2 15.62 ± 0.64 a 1.35 ± 0.04 a 5.43 ± 0.15 a 6.59 ± 0.14 a 0.97 ± 0.02 aDL 3 13.82 ± 0.55 b 1.17 ± 0.05 b 4.94 ± 0.09 b 6.31 ± 0.17 a 0.97 ± 0.04 a Stem wood DL 1 1.27 ± 0.12 a 0.07 ± 0.01 b 0.88 ± 0.07 a 0.91 ± 0.19 b 0.15 ± 0.04 bDL 2 1.17 ± 0.09 a 0.08 ± 0.01 ab 1.10 ± 0.27 a 1.32 ± 0.26 a 0.25 ± 0.08 aDL 3 1.19 ± 0.07 a 0.09 ± 0.02 a 0.90 ± 0.16 a 1.27 ± 0.14 a 0.25 ± 0.04 a Stem bark DL 1 6.96 ± 0.18 a 0.31 ± 0.02 a 24.73 ± 0.64 b 2.13 ± 0.05 b 0.51 ± 0.01 bDL 2 6.75 ± 0.29 a 0.32 ± 0.01 a 30.69 ± 1.40 a 2.38 ± 0.22 ab 0.47 ± 0.03 bDL 3 6.81 ± 0.27 a 0.31 ± 0.01 a 26.83 ± 2.49 ab 2.47 ± 0.06 a 0.78 ± 0.01 a
Nutrient stocks of different tree species Fraxinus had significantly higher nutrient stocks in the stem bark and relatively low basal
area-related nutrient stocks in the stem wood compared to the other tree species (Table 7).
The opposite was true for Fagus: high basal area-related nutrient stocks were found in the
stem wood and comparatively low stocks in stem bark and green leaves. Carpinus had large
stocks of all nutrients in green leaves. In Tilia, we found significantly lower nutrient stocks in
fruits.
The basal area-related nutrient stocks were less variable in the ‘storage compartments’ stem
wood and branches. Species-specific differences increased within the ‘productivity
compartments’ green leaves and fruits for all nutrients.
- 113 -
Chapter 6
Table 4: Mean aboveground biomass and nutrient stocks in different tree compartments. N=3 at each diversity level (DL). Different lower-case letters indicate significant differences between the DL (p < 0.05).
DL Biomass N P Ca K Mg
Mg ha-1
% of total stand
biomass kg ha-1
Stem wood 1 316 a 70.0 401.4 a 21.7 ab 281.8 a 286.8 a 47.1 a 2 228 b 69.4 269.5 b 19.0 b 245.7 ab 281.9 a 51.6 a 3 202 b 68.6 265.3 b 21.4 a 220.7 b 213.1 a 38.7 a
Branches 1 114.84 a 25.3 145.9 a 7.9 ab 102.2 a 104.1 a 17.2 a 2 78.26 b 23.8 92.3 b 6.6 b 85.1 a 96.2 a 17.8 a 3 75.24 b 25.4 98.7 b 7.9 a 81.7 a 79.5 a 14.4 a
Stem bark 1 14.79 a 3.27 102.5 a 4.6 a 363.9 a 32.3 b 7.5 b 2 15.22 a 4.62 100.1 a 5.1 a 405.8 a 52.2 a 8.0 ab 3 12.85 a 4.33 86.4 a 4.8 a 355.8 a 46.8 ab 8.4 a
Fresh leaves 1 3.79 a 0.75 91.0 a 5.4 a 41.3 c 35.5 a 6.7 b 2 3.76 a 1.14 86.4 a 4.8 a 50.1 b 38.5 a 8.1 a 3 3.58 a 1.21 79.6 a 4.7 a 58.1 a 45.5 a 8.5 a
Fruits 1 2.84 ab 0.63 32.2 a 2.8 a 11.7 a 17.4 a 2.3 a 2 2.97 ab 0.98 48.3 ab 4.3 ab 17.2 a 20.3 ab 3.0 a 3 1.31 b 0.45 18.8 b 1.7 b 10.8 a 8.1 b 1.8 a
Total above-ground 1 453 a 100 773 a 42 a 801 a 476 a 81 abiomass 2 328 b 100 597 b 40 a 804 a 489 a 89 a 3 295 b 100 549 b 41 a 727 a 393 a 72 a
Soil (0-30 cm)a,b) 1 3252c) b 862b) a 612a) b 212c) b 66a) c 2 5512c) a 1336b) a 6653a) a 392c) a 270a) b 3 5771c) a 1353b) a 9645a) a 524c) a 864a) a
Total 1 4025 b 904 a 1413 b 688 a 146 c 2 6109 a 1376 a 7456 a 881 a 359 b 3 6319 a 1394 a 10372 a 917 a 936 a
a) data from Guckland et al. 2009, b) data after Talkner et al. 2009 c) Guckland, personal communication
- 114 -
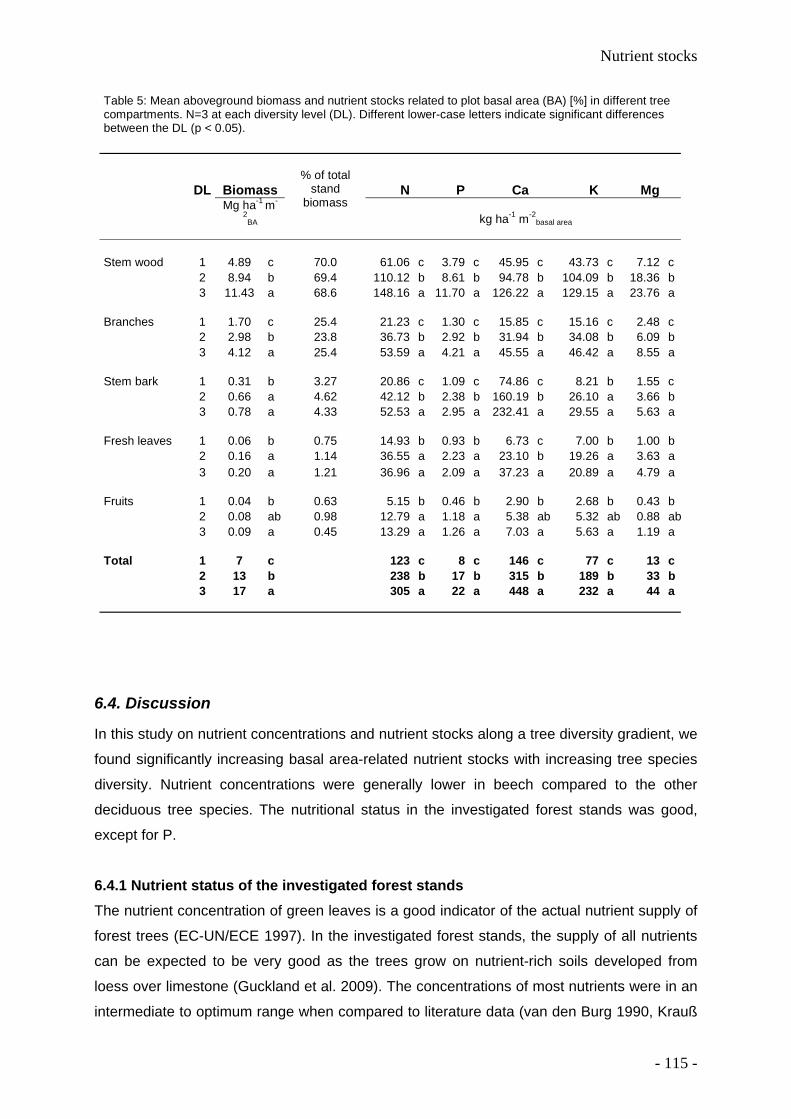
Nutrient stocks
Table 5: Mean aboveground biomass and nutrient stocks related to plot basal area (BA) [%] in different tree compartments. N=3 at each diversity level (DL). Different lower-case letters indicate significant differences between the DL (p < 0.05).
DL Biomass N P Ca K Mg
Mg ha-1 m-
2BA
% of total stand
biomass kg ha-1 m-2
basal area
Stem wood 1 4.89 c 70.0 61.06 c 3.79 c 45.95 c 43.73 c 7.12 c 2 8.94 b 69.4 110.12 b 8.61 b 94.78 b 104.09 b 18.36 b 3 11.43 a 68.6 148.16 a 11.70 a 126.22 a 129.15 a 23.76 a Branches 1 1.70 c 25.4 21.23 c 1.30 c 15.85 c 15.16 c 2.48 c 2 2.98 b 23.8 36.73 b 2.92 b 31.94 b 34.08 b 6.09 b 3 4.12 a 25.4 53.59 a 4.21 a 45.55 a 46.42 a 8.55 a Stem bark 1 0.31 b 3.27 20.86 c 1.09 c 74.86 c 8.21 b 1.55 c 2 0.66 a 4.62 42.12 b 2.38 b 160.19 b 26.10 a 3.66 b 3 0.78 a 4.33 52.53 a 2.95 a 232.41 a 29.55 a 5.63 a Fresh leaves 1 0.06 b 0.75 14.93 b 0.93 b 6.73 c 7.00 b 1.00 b 2 0.16 a 1.14 36.55 a 2.23 a 23.10 b 19.26 a 3.63 a 3 0.20 a 1.21 36.96 a 2.09 a 37.23 a 20.89 a 4.79 a Fruits 1 0.04 b 0.63 5.15 b 0.46 b 2.90 b 2.68 b 0.43 b 2 0.08 ab 0.98 12.79 a 1.18 a 5.38 ab 5.32 ab 0.88 ab 3 0.09 a 0.45 13.29 a 1.26 a 7.03 a 5.63 a 1.19 Total 1 7 c 123 c 8 c 146 c 77 c 13 c 2 13 b 238 b 17 b 315 b 189 b 33 b 3 17 a 305 a 22 a 448 a 232 a 44 a
a
6.4. Discussion
In this study on nutrient concentrations and nutrient stocks along a tree diversity gradient, we
found significantly increasing basal area-related nutrient stocks with increasing tree species
diversity. Nutrient concentrations were generally lower in beech compared to the other
deciduous tree species. The nutritional status in the investigated forest stands was good,
except for P.
6.4.1 Nutrient status of the investigated forest stands The nutrient concentration of green leaves is a good indicator of the actual nutrient supply of
forest trees (EC-UN/ECE 1997). In the investigated forest stands, the supply of all nutrients
can be expected to be very good as the trees grow on nutrient-rich soils developed from
loess over limestone (Guckland et al. 2009). The concentrations of most nutrients were in an
intermediate to optimum range when compared to literature data (van den Burg 1990, Krauß
- 115 -
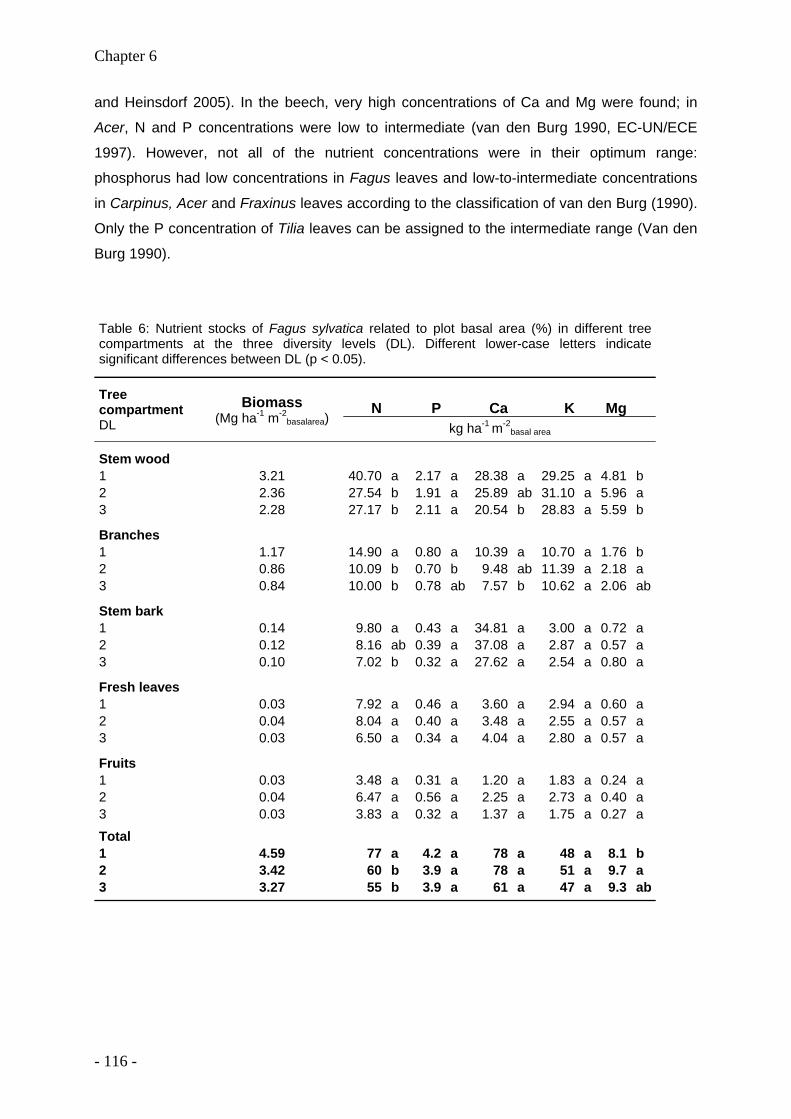
Chapter 6
and Heinsdorf 2005). In the beech, very high concentrations of Ca and Mg were found; in
Acer, N and P concentrations were low to intermediate (van den Burg 1990, EC-UN/ECE
1997). However, not all of the nutrient concentrations were in their optimum range:
phosphorus had low concentrations in Fagus leaves and low-to-intermediate concentrations
in Carpinus, Acer and Fraxinus leaves according to the classification of van den Burg (1990).
Only the P concentration of Tilia leaves can be assigned to the intermediate range (Van den
Burg 1990).
Table 6: Nutrient stocks of Fagus sylvatica related to plot basal area (%) in different tree compartments at the three diversity levels (DL). Different lower-case letters indicate significant differences between DL (p < 0.05).
N P Ca K Mg Tree compartment DL
Biomass (Mg ha-1 m-2
basalarea) kg ha-1 m-2basal area
Stem wood 1 3.21 40.70 a 2.17 a 28.38 a 29.25 a 4.81 b 2 2.36 27.54 b 1.91 a 25.89 ab 31.10 a 5.96 a 3 2.28 27.17 b 2.11 a 20.54 b 28.83 a 5.59 b
Branches 1 1.17 14.90 a 0.80 a 10.39 a 10.70 a 1.76 b 2 0.86 10.09 b 0.70 b 9.48 ab 11.39 a 2.18 a 3 0.84 10.00 b 0.78 ab 7.57 b 10.62 a 2.06 ab
Stem bark 1 0.14 9.80 a 0.43 a 34.81 a 3.00 a 0.72 a 2 0.12 8.16 ab 0.39 a 37.08 a 2.87 a 0.57 a 3 0.10 7.02 b 0.32 a 27.62 a 2.54 a 0.80 a
Fresh leaves 1 0.03 7.92 a 0.46 a 3.60 a 2.94 a 0.60 a 2 0.04 8.04 a 0.40 a 3.48 a 2.55 a 0.57 a 3 0.03 6.50 a 0.34 a 4.04 a 2.80 a 0.57 a
Fruits 1 0.03 3.48 a 0.31 a 1.20 a 1.83 a 0.24 a 2 0.04 6.47 a 0.56 a 2.25 a 2.73 a 0.40 a 3 0.03 3.83 a 0.32 a 1.37 a 1.75 a 0.27 a
Total 1 4.59 77 a 4.2 a 78 a 48 a 8.1 b 2 3.42 60 b 3.9 a 78 a 51 a 9.7 a 3 3.27 55 b 3.9 a 61 a 47 a 9.3 ab
- 116 -
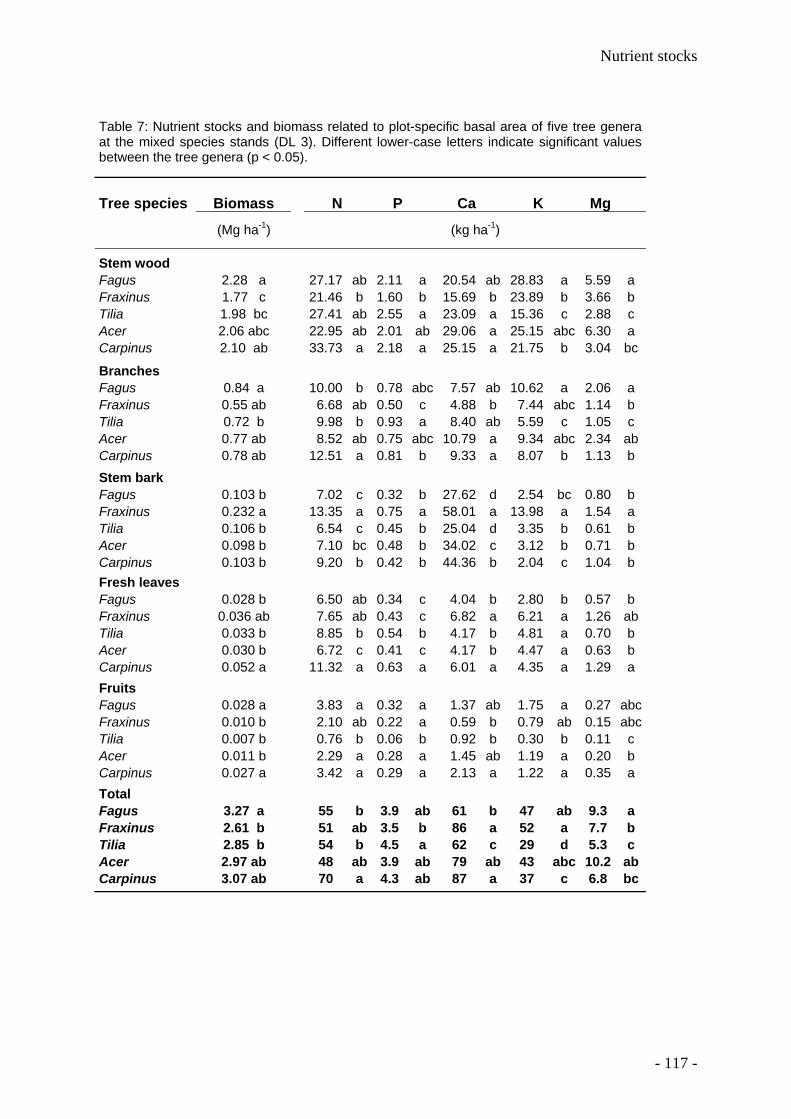
Nutrient stocks
Table 7: Nutrient stocks and biomass related to plot-specific basal area of five tree genera at the mixed species stands (DL 3). Different lower-case letters indicate significant values between the tree genera (p < 0.05).
Tree species Biomass N P Ca K Mg
(Mg ha-1)
(kg ha-1)
Stem wood Fagus 2.28 a 27.17 ab 2.11 a 20.54 ab 28.83 a 5.59 a Fraxinus 1.77 c 21.46 b 1.60 b 15.69 b 23.89 b 3.66 b Tilia 1.98 bc 27.41 ab 2.55 a 23.09 a 15.36 c 2.88 c Acer 2.06 abc 22.95 ab 2.01 ab 29.06 a 25.15 abc 6.30 a Carpinus 2.10 ab 33.73 a 2.18 a 25.15 a 21.75 b 3.04 bc
Branches Fagus 0.84 a 10.00 b 0.78 abc 7.57 ab 10.62 a 2.06 a Fraxinus 0.55 ab 6.68 ab 0.50 c 4.88 b 7.44 abc 1.14 b Tilia 0.72 b 9.98 b 0.93 a 8.40 ab 5.59 c 1.05 c Acer 0.77 ab 8.52 ab 0.75 abc 10.79 a 9.34 abc 2.34 ab Carpinus 0.78 ab 12.51 a 0.81 b 9.33 a 8.07 b 1.13 b Stem bark Fagus 0.103 b 7.02 c 0.32 b 27.62 d 2.54 bc 0.80 b Fraxinus 0.232 a 13.35 a 0.75 a 58.01 a 13.98 a 1.54 a Tilia 0.106 b 6.54 c 0.45 b 25.04 d 3.35 b 0.61 b Acer 0.098 b 7.10 bc 0.48 b 34.02 c 3.12 b 0.71 b Carpinus 0.103 b 9.20 b 0.42 b 44.36 b 2.04 c 1.04 b Fresh leaves Fagus 0.028 b 6.50 ab 0.34 c 4.04 b 2.80 b 0.57 b Fraxinus 0.036 ab 7.65 ab 0.43 c 6.82 a 6.21 a 1.26 ab Tilia 0.033 b 8.85 b 0.54 b 4.17 b 4.81 a 0.70 b Acer 0.030 b 6.72 c 0.41 c 4.17 b 4.47 a 0.63 b Carpinus 0.052 a 11.32 a 0.63 a 6.01 a 4.35 a 1.29 a Fruits Fagus 0.028 a 3.83 a 0.32 a 1.37 ab 1.75 a 0.27 abc Fraxinus 0.010 b 2.10 ab 0.22 a 0.59 b 0.79 ab 0.15 abc Tilia 0.007 b 0.76 b 0.06 b 0.92 b 0.30 b 0.11 c Acer 0.011 b 2.29 a 0.28 a 1.45 ab 1.19 a 0.20 b Carpinus 0.027 a 3.42 a 0.29 a 2.13 a 1.22 a 0.35 a Total Fagus 3.27 a 55 b 3.9 ab 61 b 47 ab 9.3 a Fraxinus 2.61 b 51 ab 3.5 b 86 a 52 a 7.7 b Tilia 2.85 b 54 b 4.5 a 62 c 29 d 5.3 c Acer 2.97 ab 48 ab 3.9 ab 79 ab 43 abc 10.2 ab Carpinus 3.07 ab 70 a 4.3 ab 87 a 37 c 6.8 bc
- 117 -

Chapter 6
Overall, the highest foliar nutrient concentrations were measured in Tilia and Fraxinus, and
were similar to data published in other studies on deciduous tree species (Hagen-Thorn et al.
2004, Hagemeier 2002). In particular, high N concentrations were found in Tilia and Carpinus
compared to Fagus, Quercus and Betula (Hagemeier 2002). Tilia and Carpinus also were the
tree species with the highest leaf area-related N concentrations in the sun leaves compared
to shade leaves of the same species (Hagemeier 2002). With regard to the N concentrations,
we found no distinct difference between sun and shade leaves of all tree species occurring at
different diversity levels. Compared to other deciduous forest tree species, beech exhibited
low or even the lowest foliar nutrient concentrations on different types of soil (sandy soils,
Hagen-Thorn et al. 2004, Hagemeier 2002; eutric Cambisols, Hagen-Thorn et al. 2004;
Luvisols, this study).
6.4.2 Nutrient concentrations in different tree compartments In the investigated forest stands, differences between species in the nutrient concentrations
of the stem wood only partly corresponded to the differences in foliar concentrations. Stem
wood (sapwood and heartwood) generally has lower nutrient concentrations than all other
tree compartments (Jacobsen et al. 2003, Augusto et al. 2000). In our study, the stem wood
concentrations of all nutrients represented the integrated inter-specific differences across
heart- and sapwood at dbh level. The formation of heartwood and the possible differences
between species in nutrient resorption from senescing sapwood may strongly influence the
total nutrient content of the sampled stem wood core (Augusto and Bert 2005, Meerts 2002).
In the beech, we found significantly lower concentrations of most elements in the stem wood
of the monospecific stands. This might be due to the elevated tree height and tree age of the
beech trees in the pure stands or to a lower nutrient availability in the soils of these stands
(Guckland et al. 2009) compared to beech trees in the DL 3 stands. The P and base cation
concentrations of sun and shade leaves were correlated with the tree diversity, whereas the
N concentrations were similar on all plots and diversity levels.
The Ca concentrations of the stem bark were exceptionally high in all tree species. This
result can be explained by weathering of the calcareous bedrock. High values were also
found in other studies on a range of soils, with Ca concentrations in oak stem bark of about
30 to 50 times higher than in the sapwood of trees growing on podzol to dystrochrept soil
(André and Ponette 2003, Whittaker et al 1979), and about 20-30 mg g-1 on fertilized cambic
podzols and dystric cambisols in Fagus sylvatica in southern Sweden (Jönsson 2000). In our
study, Fagus sylvatica showed significantly higher Ca concentrations in the stem bark with
increasing tree species diversity and increasing exchangeable Ca stocks in the soil.
As hypothesized, most nutrient concentrations of beech were lower compared to other
genera that only occurred in the mixed species stands.
- 118 -
Nutrient stocks
6.4.3 Are nutrient stocks higher in the monospecific stands? For most nutrients, we could not confirm our first hypothesis that nutrient stocks are highest
in the monospecific stands. We expected the absolute nutrient stocks generally to be higher
in these stands due to their significantly higher biomass (Jacob et al. 2010). This was not
true for the Ca, Mg, K and P stocks as they did not show any significant differences between
the forest stands. However, there was one exception: the N stocks were significantly higher
in the pure beech stands compared to the mixed species stands.
The finding that the total nutrient stocks of Ca, Mg, K and P were similar at all diversity levels
was due to (1) higher nutrient concentrations (P, K, Mg) in the stem wood of beech trees in
the mixed species stands compared to beech growing in monospecific stands and (2) higher
nutrient concentration of most tree species occurring only in the mixed species stands
compared to the beech.
The higher nutrient concentrations in beech stem wood in the mixed species stands can be
explained by higher nutrient stocks in the soil. In a previous study, Guckland et al. (2009)
found that deciduous tree species diversity along a gradient of beech abundance positively
influenced the stocks of Ca, Mg and organic carbon in the upper 30 cm of the mineral soil.
The soils of DL1 stands had a lower effective cation exchange capacity and base saturation
than those of DL2 and DL3 stands. Hence, the trees could take up more ‘base’ cations in the
mixed species stands than in the pure beech stands and this in turn resulted in higher
contents of base cations in stands with higher tree species diversity. The P stocks in the soil
did not differ significantly between the forest stands but the stock of organic P was
significantly higher in the mixed species stands. This might explain the higher P
concentrations in the stem wood of the beech in the mixed species stands (Talkner et al.
2009).
The higher total N stocks (sum of stem wood, branches, stem bark, green leaves and fruits)
in the pure beech stands can be related to the significantly higher biomass of the tree
compartments at DL 1. Stem wood and branches had significantly higher biomasses and N
stocks in the pure stands, whereas N stocks of green leaves and stem bark were similar at
all diversity levels. We therefore can conclude that stem wood biomass exerts the largest
effect on the total nutrient stocks. In contrast to the concentrations of P, Mg and K, we did not
find higher N concentrations in the stem wood of the beech in the mixed species stands
compared to the pure beech stands. In most terrestrial ecosystems, an increase in N supply
will result in increased biomass production rather than in N accumulation in structural
compartments of the plants (Jacobsen et al. 2003). However, in previous studies we found
significantly higher biomass and wood productivity in the pure beech stands compared to the
mixed stands (Jacob et al. 2010). This could be due to the species-specific trait of beech to
- 119 -

Chapter 6
produce comparably more wood than leaf biomass. This reverse was true for Tilia – one of
the main tree species in the mixed species stands (Jacob et al. 2010).
6.4.4 Do nutrient stocks increase along the tree diversity gradient? Contrary to our third hypothesis, basal area-related nutrient stocks in the beech did not differ
significantly between diversity levels for most nutrients and tree compartments. In the beech-
dominated stands, the basal area-related N stocks are the only nutrient stocks that were
significantly higher than in the mixed-species stands.
We could confirm our hypothesis by finding an increase in basal area-related nutrient stocks
from pure beech stands to mixed species forest stands for all nutrients and in all tree
compartments.
In theory, the relatively higher nutrient stocks in mixed species stands could be due to spatial
niche complementarity of resource use in the rhizosphere by means of species-specific
architecture of the root system and, consequently, differences among species in the root
distribution in the soil. This might result in a higher nutrient flux into the trees in the mixed
stands than in the beech-dominated stands. However, Meinen et al. (2009b) found no
indication of a vertical or horizontal niche-partitioning of tree roots of the different tree
species in the mixed compared to monospecific stands.
Acknowledgements
We would like to thank the ‚Deutsche Forschungsgemeinschaft’ (DFG) for funding of the
Graduiertenkolleg 1086. We thank Helmut Schwengels (Zweigwerk – Baumpflege) for his
professional assistance with climbing our trees and collecting the fresh leaf samples.
Valuable help with the laboratory work was provided by Alena Vacátková, Nicolai Brock,
Hawa Kamara, Johanna Ropertz, and Alexander Kraft.
- 120 -
Nutrient stocks
6.5 References
Ad-hoc-Arbeitsgruppe Boden (2005) Bodenkundliche Kartieranleitung. Schweizerbart'sche
Verlagsbuchhandlung, Stuttgart
André F, Ponette Q, 2003. Comparison of biomass and nutrient content between oak
(Quercus petraea) and hornbeam (Carpinus betulus) trees in a coppice-with-standards
stand in Chimay (Belgium). Ann. For. Sci 60, 489-502.
Augusto L, Bert D, 2005. Estimating stemwood nutrient concentration with an increment
borer: a potential source of error. Forestry 78,451-455.
Augusto, L, Ranger J, Binkley D, Rothe A, 2002. Impact of several common tree species of
European temperate forests on soil fertility. Ann. For. Sci. 59, 233-253.
Augusto L, Ranger J, Ponette Q, Rapp M, 2000. Relationship between forest tree species,
stand production and stand nutrient amount. Ann. For. Sci. 57, 313-324.
Binkley D, Valentine D, 1991. Fifty-year biogeochemical effects of green ash, white pine and
Norway spruce in a replicated experiment. For. Ecol. Manage. 40, 13-25.
BMVEL (Bundesministerium für Verbraucherschutz, Ernährung und Landwirtschaft) (Ed.),
2001. Gesamtwaldbericht der Bundesregierung. BMVEL, Bonn.
Cesarz S, Fahrenholz N, Migge-Kleian S, Platner C, Schaefer M, 2007. Earthworm
communities in relation to tree diversity in a deciduous forest. European Journal of Soil
Biologie 43, S61-S67
Dijkstra FA, 2003. Calcium mineralization in the forest floor and surface soil beneath different
tree species in the northeastern US. For. Ecol. Manage. 175, 185-194.
EC-UN/ECE, Stefan K, Fürst A, Hacker R, Bartels U, 1997. Forest Foliar Condition in Europe
- Results of large-scale foliar chemistry surveys 1995, EC,UN/ECE, 207 pp.
FAO, ISRIC, ISSS World Reference Base for Soil Resources 2006. Report No. 103, World
Soil Resources Reports, Rome
Guckland A, Jacob M, Flessa H, Thomas FM, Leuschner C, 2009. Acidity, nutrient stocks,
and organic-matter content in soils of a temperate deciduous forest with different
abundance of European beech (Fagus sylvatica L.). J Plant Nutr Soil Sci 172:500-511
- 121 -

Chapter 6
Hagemeier M, 2002. Funktionale Kronenarchitektur mitteleuropäischer Baumarten am
Beispiel von Hängebirke, Waldkiefer, Traubeneiche, Hainbuche, Winterlinde und
Rotbuche. Berlin, Dissertationes Botanicae, Bd. 361
Hagen-Thorn A, Armolaitis K, Callesen I, Stjernquist I, 2004. Macronutrients in tree stems
and foliage: a comparative study of six temperate forest species planted at the same sites.
Ann For Sci, 61, 489-498.
Hothorn T, Bretz F, Westfall P, 2008. Simultaneous inference in general parametric models.
Biometric Journal 50, 346-363
Jacob M, Leuschner C, Thomas FM, 2010. Productivity of temperate broad-leaved forest
stands differing in tree species diversity. Ann For Sci (in press)
Jacob M, Weland N, Leuschner C, Schaefer M, Thomas FM, 2009: Nutrient release from
decomposing leaf litter of temperate deciduous forest trees along a gradient of increasing
tree species diversity. Soil Biology and Biochemistry, 41: 2122-2130
Jacobsen C, Rademacher P, Meesenburg H, Meiwes KJ, 2003. Gehalte chemischer
Elemente in Baumkompartimenten. Literaturstudie und Datensammlung.
Forschungzentrum Waldökosysteme, Göttingen, B, 69, 81 pp.
Jönsson AM, 2000. Mineral nutrients of beech (Fagus sylvatica) bark in relation to frost
sensivity and soil treatments in southern Sweden. Ann For Sci 57, 1-8.
Kraft G., 1884. Beiträge zur Lehre von den Durchforstungen, Schlagstellungen und
Lichtungshieben. Klindworth’s Verlag, Hannover.
Krauß H-H, Heinsdorf D, 2005. Ernährungsstufen für wichtige Wirtschaftsbaumarten.
Beiträge für Forstwirtschaft & Landschaftsökologie, 39, 172–179.
Leuschner C, Jungkunst H, Fleck S, 2009. Functional role of forest diversity: pros and cons
of synthetic stands and across-site comparisons in established forests. Basic and Applied
Ecology 10, 1-9.
Meerts P, 2002. Mineral nutrient concentrations in sapwood and heartwood: a literature
review. Ann. For. Sci. 59, 713-722
Meinen C, Hertel D, Leuschner C, 2009a. Biomass and morphology of fine roots in
temperate broad-leaved forests differing in tree species diversity: is there evidence of
below-ground overyielding? Oecologia 161:99–111
- 122 -

Nutrient stocks
Meinen C, Leuschner C, Ryan NT, Hertel D, 2009b. No evidence of spatial root system
segregation and elevated fine root biomass in multi-species temperate broad-leaved
forests. Trees 23:941–950
Meschederu M, 1997. Bilanzierung von Biomassen, Kohlenstoff und Stickstoffgehalten mit
dem Wuchsmodell SILVA 2.1. Jahrestagung der Sektion Ertragskunde (DVFFi\1 in
Grünberg. 35-44
Mölder A, Bernhardt-Römermann M, Schmidt W (2008) Herb-layer diversity in deciduous
forests: Raised by tree richness or beaten by beech? For Ecol Manage 256:272-281
Mund M, 2004. Carbon pools of European beech forests (Fagus sylvatica) under different
silvicultural management. Forschungszentrum Waldökosysteme, Reihe A, 189
Neirynck J, Mirtcheva S, Sioen G, Lust N, 2000. Impact of Tilia platyphyllos Scop., Fraxinus
excelsior L., Acer pseudoplatanus L., Quercus robur L. and Fagus sylvatica L. on
earthworm biomass and physico-chemical properties of a loamy soil. For. Ecol. Manage.
133, 8 275-286.
Nordén, U., 1994. Influence of tree species on acidification and mineral pools in deciduous
forest soils of South Sweden. Water Air Soil Poll. 76, 363-381.
Reich PB, Oleksyn J, Modrzynski J, Mrozinski P, Hobbie SE, Eissenstat DM, Chorover J,
Chadwick OA, Hale CM, Tjoelker MG (2005) Linking litter calcium, earthworms and soil
properties: a common garden test with 14 tree species. Ecol Letters 8:811-818
Röhrig E, Bartsch N, Lüpke B von, 2006. Waldbau auf ökologischer Grundlage. Ulmer,
Stuttgart
Rothe A, Binkley D, 2001. Nutritional interactions in mixed species forests: a synthesis. Can.
J. For. Res. 31, 1855-1870.
Rothe A, Kreutzer K, Küchenhoff H, 2002. Influence of tree species composition on soil and
soil solution properties in two mixed spruce-beech stands with contrasting history in
Southern Germany. Plant Soil 240, 47-56.
Schönwiese CD, Bader S, Böhm R, Claussen M, Cubasch U, Fischer H, Gärtner U, Graßl H,
Rahmstorf S, Südermann J , Claussen M, Kromp-Kolb H, Richner H, 2003 .
Klimastatement 2003 der Deutschen Meteorologischen Gesellschaft (DMG), der
Österreichischen Gesellschaft für Meteorologie (ÖGM) und der Schweizerischen
- 123 -

Chapter 6
Gesellschaft für Meteorologie (SGM).
http://www.dMgev.de/gesellschaft/aktivtaeten/pdf/klimastatement_2003
Talkner U, Jansen M, Beese FO, 2009. Soils phosphorus status and turnover in central-
European beech forest ecosystems with differing tree species diversity. European Journal
of Soil Science 60: 338-346.
Van den Burg J, 1990. Foliar analysis for determination of tree nutrient status – a compilation
of literature data. 2. Literature 1985-1989. ‘De Dorschkamp’, Institute for Forestry and
Urban Ecology Wageningen, the Netherlands Rapport 591, 220 pp.
Whittaker RH, Likens GE, Bormann FH, Easton JS, Siccama TG, 1979. The Hubbard Brook
ecosystem study: Forest nutrient cycling an element behavior. Ecology 60, 203-220.
- 124 -

Chapter
7
Synopsis
- 125 -

Chapter 7
7.1 Differ monospecific stands from mixed species stands in ecosystem
functions?
Biomass and productivity Above-ground biomass decreased significantly with increasing Shannon diversity of the tree
layer (200 - 480 Mg ha-1). Similar results were obtained in a variety of unmanaged forest
stands in the Czech Republic, Poland and Slovakia with one to eight tree species, within a
range of above-ground biomass (169 - 536 Mg ha-1) (Szwagrzyk and Gazda 2007).
In this study, total above-ground production did not differ significantly between the different
forest stands, but exhibited a decreasing tendency with decreasing beech abundance (9.0,
8.5 and 7.1 Mg ha-1). Leaf production and LAI (leaf area index) were comparable in all
investigated forest stands. We observed higher wood production than leaf production in the
monospecific stands. These findings are in contrast of synthetic grasslands, where an
increase in biomass production with increasing plant diversity has been observed in many
studies (e.g. Tilman et al. 1997, Hector et al. 1999, Caldeira et al. 2001, van Ruijven and
Berendse 2003, Roscher et al. 2005, Hooper et al. 2005). The diversity-productivity
relationship in forests seems to be much more ambiguous, field studies revealed either no
differences (Vilà et al. 2003, this study), a significant increase of wood production with
increasing tree species diversity (Vilà et al. 2007) or a range from decrease to increase of
mixed stands, compared to monospecies stands (e.g. Pretzsch 2005).
We found no evidence of complementary resource use associated with above-ground
biomass production (see Chapter 2). These findings suggest that above-ground net primary
production is more under the control of climate and edaphic factors than dependent on tree
species diversity. Furthermore, characteristic physiological, morphological and architectural
traits, which control productivity, seem to be more influential than the mere number of
species present.
Leaf litter decomposition and nutrient release We could confirm the hypothesis that in the mixed species stands, leaf litter and lignin
decomposition rates are higher than in pure beech stands. Correspondingly, rates of nutrient
release from the litter mixtures were significantly higher in the highly diverse DL 3 stands.
Annual decomposition rate constants k of the litter mixtures were similar to literature data of
central-European tree species (e.g. Irmler 2000, Hobbie et al. 2006, Seastedt 1984, Schaefer
1990). For all DL and tree species, the litter decomposition rates were positively correlated
with the initial N and Ca concentrations of the litter, Shannon index of tree genera and crown
area, soil pH and macro- and mesofauna abundance and negatively, with the initial C:N ratio
(which explained almost 90% of the total variance), C:P, lignin:N, and the thickness of the
litter layer. We conclude that - besides chemical composition of the litter - the structure of the
- 126 -
Synopsis
organic surface layer and the associated meso- and macrofauna abundance, influenced litter
decomposition rates.
Higher decomposition and nutrient release rates indicated faster nutrient cycling in the mixed
species stands. However, basal area-related productivity is not higher in the mixed than in
the pure stands. Hence, along the investigated gradient of tree species diversity, productivity
seems to be unaffected by current litter decomposition rates. In contrast, high rates of litter
decomposition may be essential for sustaining productivity and nutrient storage of the stands
with higher tree species diversity.
Nutrient stocks Our study revealed higher basal area-related nutrient storage of K, Mg, Ca, N, and P in
mixed species stands compared to monospecific stands. Absolute total nutrient stocks did
not differ significantly between the forest stands (except for nitrogen). This was surprising, as
total biomass was significantly higher in the beech stands (factor 1.5 compared to the mixed
species stands) and nutrient concentrations varied in an expected range. Consequently,
basal area-related nutrient stocks are higher in the mixed species forest stands. The latter
applies for all nutrients and in all tree compartments (stem wood, branches, foliage, fruits).
As shown before, higher leaf litter decomposition and nutrient release rates, did not result in
increased above-ground productivity. We could not confirm the theory, that the relatively
higher nutrient stocks in the mixed species stands could be explained by spatial niche
complementarity of resource use in the rhizosphere and a higher nutrient flux into the trees.
Meinen (2008) found no different vertical or horizontal niche-partitioning of tree roots of
different species in mixed compared to monospecific beech stands.
7.2 Do tree species differ regarding their ecosystem functions?
Above-ground biomass and productivity Most differences observed in above-ground biomass production among forest stands
differing in tree species richness could be attributed to species-specific traits or contrasting
site conditions (Kerr et al. 1992, Vilà et al. 2003, Pretzsch 2005). We found distinct
differences between the main tree species of our study regarding total and seasonal
production of biomass (Chapter 2): Fraxinus exhibited the highest wood production of all
species (up to 0.6 Mg ha-1 yr-1 m-2 basal area), and reached 60 - 80% of its annual increment
in basal area already at the end of June. Stem wood production in Fagus exceeded its leaf
mass production and basal area-related stem wood production was higher than in the co-
occurring tree species Carpinus, Tilia and Acer. Seasonal growth dynamics of Tilia seemed
to be more dependent on the prevailing climatic conditions. The stem wood increment was
slow in the cool and moist spring of 2006, but much faster in the warm spring of 2007. In
- 127 -
Chapter 7
Tilia, Carpinus and Acer, leaf production exceeded stem wood production by factors of 4 to
1.5.
However, differential seasonal growth patterns among the species did not result in increased
productivity at the plot level compared to the monospecific stands. Tilia, Acer and Carpinus
betulus invest more carbon into the production of foliage and, thus, enhance carbon cycling
in mixed species stands, whereas the production of stem wood in Fagus trees exceeds leaf
production and results in longer carbon storage in plants in monospecific stands. Our data
suggest that above-ground net primary production is more under the control of tree specific
traits than dependent on tree species diversity.
Influence of litter quality on species-specific litter decomposition and nutrient release Fagus leaf litter exhibited slowest decomposition rates (k = 0.5) of the investigated tree
species, whereas Fraxinus leaf litter decomposed fastest (k = 2). After 6 months of exposure,
leaf litter decomposition of Tilia and Carpinus ranges between 55 and 70% (Bocock and
Gilbert, 1957, Cornelissen, 1996), and Fraxinus litter decay usually reaches more than 80%
(Bocock et al., 1960, Cornelissen, 1996). This is in accordance with the results of our study,
in which a mass loss of 80% was found at the mixed species stands with significant fractions
of Carpinus, Fraxinus and Tilia in the tree species composition.
Generally, slower decomposition rates of beech litter is ascribed to its relatively high C:N
ratio of about 40 - 60 compared to the noticeably lower C:N ratios in the litter of ash,
hornbeam and lime (Cotrufo et al. 2000; Hättenschwiler and Gasser 2005; Hobbie et al.
2006; Wise and Schaefer 1994). In this study, litter decomposition rates were positively
correlated with initial N concentrations and negatively with the initial C:N, C:P and lignin:N
ratios of the litter. The initial C:N ratio of the litter explained almost 90% of the total variance.
Our results support the finding that within a particular climatic region, N concentrations, or
ratios of N to other foliar compounds, belong to the main factors that influence the rates of
litter decomposition (Aerts 1997; Cornelissen 1996; Parton et al. 2007).
Nitrogen release patterns from the leaf litter differed between tree species and can also be
related to initial N content in leaves. In Tilia, Fraxinus and Carpinus, we observed an
immediate N release after incubation. However, Fagus, showed typical triphasic pattern of N
leaching, microbial immobilization and mineralization (Berg and McClaugherty, 2008). N
immobilization has often been related to initial litter N concentration, the influence of these
values is best explained by the growth of fungal hyphae into the litter and their need for N.
Macronutrients other than N in the litter can influence decomposition as well. We found a
positive correlation between litter decomposition rates and initial calcium concentration of the
litter, which was observed by other studies (Hobbie et al. 2006).
- 128 -
Synopsis
In contrast to many other studies and tree species, we found no or only little accumulation of
calcium (Ca) in the leaf litter but a fast Ca release from the litter of Tilia, Fraxinus and Acer
platanoides. Ca is known to be part of the structural plant tissue, hence its release is related
to the second decomposition phase (Blair, 1988, Laskowski et al., 1995).
In contrast to other studies on temperate forest tree species (Hobbie et al. 2006; Madritch
and Cardinale 2007; Osono and Takeda 2005; Sariyildiz 2008), we found no significant
correlation between decomposition rates and lignin concentration of the litter. This could be
because lignin has not yet passed the second phase of degradation (Berg and McClaugherty
2008; Kalbitz et al. 2006), which starts when the mass loss of litter exceeds a species-
specific level.
The large differences between the decomposition rates of beech litter and those of litter from
the other investigated tree species influenced the decomposition rates of the stand-specific
litter mixtures, which were highest at mixed forest stands. In these stands, tree species with
low initial C:N ratios in their litter (Carpinus betulus, Fraxinus excelsior, Tilia cordata)
together formed nearly two thirds of the canopy cover. On the other hand, high fractions of
Fagus sylvatica in the canopy cover were connected with lower decomposition rates of total
litter and lignin. Thus, the decomposition and also nutrient rates were strongly dependent on
the presence or absence of few individual species, but not on leaf litter diversity per se.
Interrelation between soil fauna, leaf litter decomposition and nutrient dynamics Comparing the decomposition of different litter mixtures, a large influence of the fauna on
decomposition is found, although the effect changed with litter type (e.g. Schädler and Brandl
2005). The positive effects of the soil fauna on decomposition were highest in N rich and C
poor litter. Higher leaf litter decay rate in mixed species forest stands was probably due to
the combined effect of higher earthworm abundance, better litter quality and elevated soil pH
values. The decomposition rate constant k of Tilia, Acer and Carpinus leaf litter as well as of
the litter mixtures were positively correlated to earthworm abundance. On the other hand, we
found an overall close correlation between the decomposition rate of Fagus sylvatica litter
and isopod abundance.
Soil fauna can be effective in reducing nutrient immobilization by accelerating decomposition
rates (Anderson, 1973, Staaf 1987, Joergensen, 1991). Soil fauna abundances in our study
were correlated with the length of time lag before N and P release of almost all tree species
studied. Similar findings for N release in beech showed a positive correlation to earthworm
biomass (Irmler 2000).
- 129 -
Chapter 7
Nutrient concentrations and stocks in different tree compartmentsWe found the highest foliar concentration in Tilia (N, P, K) and Fraxinus (Ca, K, Mg). These
two species differ in leaf N concentration: linden had the highest N concentration, ash lower
values compared to all tree species. Low N concentration of ash could be explained with low
concentration in petioles, which Hagen-Thorn et al. (2004) found to be less than one third of
leaflets. A possible explanation for the high N contents in lime is its significantly higher N
concentration in sun leaves per leaf area, measured by Hagemeier (2002).
Differences between species foliage nutrient concentrations only partly corresponded to
differences in species stem wood concentration. Ash had the highest foliage concentrations
of S and the ‘base’ cations (Ca, K, Mg) but showed only relatively high concentrations of K
and Mg in the stem wood. Lime had highest foliage N and P concentration, but in stem wood
only P concentration was significantly higher than in all other tree species.
Beech foliage and leaf litter had the lowest nutrient concentrations compared to the other
deciduous tree species. Rather constant N concentration of beech litter and comparably low
concentrations of beech foliage were found in Fagus stands across a soil fertility gradient
(Meier et al. 2005), from sandy soils (Hagemeier 2002), eutric cambisols (Hagen-Thorn et al.
2004) and nutrient rich luvisols on loess over limestone (this study).
Ca concentration, which is known to be soil dependent (Jacobsen et al. 2003) accumulated
in leaf litter compared to foliage concentration. This finding was confirmed and was similar for
all tree species. Stem bark concentration of Ca were exceptionally high, which can be
explained by the calcareous bedrock of our study area. Fraxinus concentrated 67% of its
total Ca amount in the stem bark. Fraxinus had relatively low basal area-related stem wood
and higher stem bark nutrient stocks of all nutrients compared to the other tree species.
The reverse was true for Fagus, the basal area-related nutrient amounts in stem wood were
high (Mg reached a maximum with 60 % of the total Mg content stored in stem wood), and
comparatively low basal area-related nutrient amounts in stem bark, green leaves and leaf
litter.
The variation of all nutrient stocks is within the factors of 1.3 to 1.9 in lime, 1.4 to 3.4 in
hornbeam (except P) and 2.5 to 5.75 in beech. This matches to the observation of Augusto
et al. (2000), in which literature data show linear relationships between total ‘arial biomass’
and nutrient content for different species. The basal area-related nutrient stocks were less
variable in the ‘storage compartments’ stem wood and branches and species-specific
differences increased for the more easily decomposable ‘compartments’ fine roots, leaf litter
and fruits for all nutrients.
- 130 -

Synopsis
7.3 Differences between beech trees in pure compared to mixed species forest
stands
Fagus sylvatica trees produced similar amounts of leaves, fruits or wood independently of
tree diversity. At the same time the tendency towards a higher biomass accumulation in the
F. sylvatica stands are not due to a better nutrient supply: compared to the mixed forest
stands. F. sylvatica stands exhibited significantly lower soil pH and base saturation, and
tended towards lower cation exchange capacity and higher C:N ratios (Guckland et al. 2009).
It was suggested that this soil nutrient deficiency of the beech stands were mainly the result
of Fagus leaf and root litter effects.
Generally, Fagus leaf litter had high C:N ratios and low nutrient concentrations in their
foliage, which led to less degradability compared to other tree species. Beech litter had
significantly higher N, P, S and lower Ca and Mg concentrations in the monospecific forest
stands. Annual litter N input and N storage in the organic layer and in the mineral soil
increased with increasing tree species diversity and decreasing beech abundance (Guckland
et al. 2009 and pers. comm.). Litter decomposition of Fagus is enhanced in mixed species
stands. Nutrient release rates of N in beech started earlier and were significantly higher in
mixed species stands. Higher beech leaf litter decay rates in mixed species forest stands
were probably due to the higher earthworm abundance and elevated soil pH values.
Significantly lower concentrations of most elements were found in beech stem wood in
monospecific stands (except N and Ca). Phosphorus in beech revealed higher concentration
in beech stem wood in the mixed stands and high beech foliage concentration in pure
stands. P stocks in different tree compartment however, differed only in branches between
the diversity levels. Differences in total basal area-related nutrients stocks of N, Mg and S
were related to significant differences in nutrient amounts of stem wood and branches.
7.4 Interactions between tree species and soil parameters
We found distinct differences in surface soil acidification, stocks of exchangeable base
cations and carbon accumulation in the humus layer of temperate broad-leaved mixed forest
stands on loess over limestone. Subsoil clay content and differences in litter composition
were identified as important factors that contributed to the variability of these soil properties.
Deciduous tree species litter diversity positively influenced stocks of calcium, magnesium
and organic carbon in the upper 30 cm of the mineral soil. This is due to the high nutrient
contents in lime, ash, hornbeam and maple leaf litter and the lower leaf litter concentration of
base cations within a beech. The soils of the mixed specific beech stands had higher
effective cation exchange capacity and base saturation than the beech dominated stands.
Elevated Ca concentration in leaf litter, higher Ca release rates of litter and the increased Ca
- 131 -
Chapter 7
nutrient stocks in the soil, were favourable for the abundance of Lumbricus terrestris, which,
in turn, was most important for the enhanced decomposition rates of all tree species litter.
Magnesium (Mg) dynamics are comparable to those of Ca. Mg is a rather mobile element
with concentration in leaves strongly dependent on soil properties and bedrock type (Berg
and Laskowski, 2006). Talkner et al. (2009) found higher leaching rates of K+, Ca2+ and Mg2+
from the foliage of mixed species stands. Hence, higher potential of leaf litter for the
redistribution of nutrients via litter fall and foliage leaching was suggested to be due to
species-specific differences in cation cycling.
The differences in soil clay content between the three diversity levels could explain higher
exchangeable Ca and Mg stocks in the soil and subsequently, the relatively higher nutrient
stocks in trees in the mixed species stands. However, a study conducted with a higher
spatial resolution at the investigated stands had shown that beech abundance is clearly the
most influencing factor on soil acidification and the nutrient status of the mineral soil
(Guckland 2009, Holzwart pers. comm.).
Annual litter N input and N storage in the organic layer and in the mineral soil increased with
increasing tree species diversity and decreasing beech abundance (Guckland et al. pers.
comm.). Litter N turnover is faster in the organic layer (2-13 years) (Guckland et al. pers.
comm.) and leaf litter decomposition is much faster at the mixed species stands (Jacob et al.
2009).
Fagus had higher P concentrations in stem wood and total basal area-related P stocks in the
diverse stands. These stands had higher stocks of organic P and 5 times shorter P turnover
times in the organic surface layers, which were explained by Talkner et al. (2009) with
differences in tree species litter quality.
Our results suggest that the process of “biological pumping” of base cations, the uptake by
tree roots of different tree species in different soil depth, increased with decreasing
abundance of beech. In addition, beech abundance influenced litter decomposition rate and
nutrient accumulation in the organic surface layer and above-ground biomass. Thus, the
conversion of quasi monospecific beech forests to mixed stands of beech with other broad-
leaved species appeared to increase the intensity of soil-tree cation cycling and as a
consequence it can influence the rate of soil acidification and nutrient stocks in the surface
soil. The results suggest that at sites that allow production of broadleaf tree species with
nutrient-rich, easily decomposable foliage the establishment and promotion of these species
is an important silvicultural tool to counteract natural or anthropogenic soil acidification and to
maintain soil productivity.
- 132 -

Synopsis
7.5 References
Aerts R, 1997. Climate, leaf litter chemistry and leaf litter decomposition in terrestrial
ecosystems: A triangular relationship. Oikos 79: 439-449.
Anderson JM, 1973. The breakdown and decomposition of sweet chestnut (Castanea sativa
Mill.) and beech (Fagus sylvatica L.) leaf litter in two deciduous woodland soils. 1.
Breakdown, leaching and decomposition. Oecologia 12: 251–274.
Augusto L, Ranger J, Ponette Q, Rapp M, 2000. Relationship between forest tree species,
stand production and stand nutrient amount. Ann. For. Sci. 57: 313-324.
Berg B, Laskowski R, 2006. Litter decomposition: A guide to carbon and nutrient turnover.
Advances in Ecological Research, Elsevier, Amsterdam, 421 pp.
Berg B, McClaugherty C, 2008. Plant litter - decomposition, humus formation, carbon
sequestration. Springer, Berlin, 338 pp.
Blair JM, 1988. Nutrient release from decomposing foliar litter of three species with special
reference to calcium, magnesium and potassium dynamics. Plant and Soil 110: 49–55.
Bocock KL, Gilbert OJW, 1957. The disappearance of leaf litter under different woodland
conditions. Plant and Soil 9: 179–185.
Burschel P, Huss J, 1987. Grundriß des Waldbaus. Paul Parey, Hamburg.
Caldeira MC, Ryel RJ, Lawton JH, Pereira JS, 2001. Mechanisms of positive biodiversity-
production relationships: insights provided by δ13C analysis in experimental
Mediterranean grassland plots. Ecology Letters 4: 439-443.
Cornelissen JHC, 1996. An experimental comparison of leaf decomposition rates in a wide
range of temperate plant species and types. The Journal of Ecology 84: 573–582.
Cotrufo MF, Miller M, Zeller B, 2000. Litter decomposition. In: Schulze E-D (Ed.), Carbon and
nitrogen cycling in European forest ecosystems, Springer, Berlin, Vol. 142, pp. 276–296.
Guckland A, Jacob M, Flessa H, Thomas FM, Leuschner C, 2009. Acidity, nutrient stocks,
and organic-matter content in soils of a temperate deciduous forest with different
abundance of European beech (Fagus sylvatica L.). Journal of Plant Nutrition and Soil
Science, 172: 500-511.
- 133 -
Chapter 7
Hagemeier M, 2002. Funktionale Kronenarchitektur mitteleuropäischer Baumarten am
Beispiel von Hängebirke, Waldkiefer, Traubeneiche, Hainbuche, Winterlinde und
Rotbuche. Berlin, Dissertationes Botanicae, Bd. 361
Hagen-Thorn A, Armolaitis K, Callesen I, Stjernquist I, 2004. Macronutrients in tree stems
and foliage: a comparative study of six temperate forest species planted at the same sites.
Ann For Sci 61: 489-498.
Hättenschwiler S, Gasser P, 2005. Soil animals alter plant litter diversity effects on
decomposition. PNAS 102: 1519-1524.
Hector A, Schmid B, Beierkuhnlein C, Caldeira MC, Diemer M, Dimitrakopoulos PG, Finn JA,
Freitas H, Giller PS, Good J, Harris R, Högberg P, Huss-Danell K, Joshi J, Jumpponen A,
Körner C, Leadley PW, Loreau M, Minns A, Mulder CPH, O’Donovan G, Otway SJ,
Pereira JS, Prinz A, Read DJ, Scherer-Lorenzen M, Schulze ED, Siamantziouras ASD,
Spehn EM, Terry AC, Troumbis AY, Woodward FI, Yachi S, Lawton JH, 1999. Plant
diversity and productivity experiments in European grasslands. Science 286: 1123-1127.
Hobbie SE, Reich PB, Oleksyn J, Ogdahl M, Zytkowiak R, Hale C, Karolewski P, 2006. Tree
species effects on decomposition and forest floor dynamics in a common garden. Ecology
87: 2288–2297.
Hooper DU, Chapin FS, Ewel JJ, Hector A, Inchausti P, Lavorel S, Lawton JH, Lodge DM,
Loreau M, Naeem S, Schmid B, Setälä H, Symstad AJ, Vandermeer J, Wardle DA, 2005.
Effects of biodiversity on ecosystem functioning: A consensus of current knowledge.
Ecological Monographs 75: 3-35.
Irmler U, 2000. Changes in the fauna and its contribution to mass loss and N release during
leaf litter decomposition in two deciduous forests. Pedobiologia 44: 105-118.
Jacob M, Weland N, Platner C, Schaefer M, Leuschner C, Thomas Frank M, 2009. Nutrient
release from decomposing leaf litter of temperate deciduous forest trees along a gradient
of increasing tree species diversity. Soil Biology & Biochemistry 41: 2122-2130.
Joergensen RG, 1991. Organic matter and nutrient dynamics of the litter layer on a forest
rendzina under beech. Biology and Fertility of Soils 11: 163-169.
Kalbitz K, Kaiser K, Bargholz J, Dardenne P, 2006. Lignin degradation controls the
production of dissolved organic matter in decomposing foliar litter. Eur J Soil Sci 57: 504-
516.
- 134 -

Synopsis
Kerr G, Nixon CJ, Matthews RW, 1992. Silviculture and yield of mixed-species stands: the
UK experience. Cannell MGR, Malcolm DC, Robertson PA, eds. The ecology of mixed-
species stands of trees. Oxford: Blackwell Oxford, p35-51.
Laskowski R, Niklińska M, Maryański M, 1995. The dynamics of chemical elements in forest
litter. Ecology 76: 1393–1406.
Madritch MD, Cardinale BJ, 2007. Impacts of tree species diversity on litter decomposition in
northern temperate forests of Wisconsin, USA: a multi-site experiment along a latitudinal
gradient. Plant Soil 292: 147-159.
Meier IC, Leuschner Ch, Hertel D, 2005. Nutrient return with leaf litter fall in Fagus sylvatica
forests across a soil fertility gradient. Plant Ecology 177: 99-112.
Meinen C, 2008. Fine root dynamics in broad-leaved deciduous forest stands differing in tree
species diversity. http://webdoc.sub.gwdg.de/diss/2008/meinen/meinen.pdf
Osono T, Takeda H, 2005. Decomposition of organic chemical components in relation to
nitrogen dynamics in leaf litter of 14 tree species in a cool temperate forest. Ecol Res 20:
41-49.
Parton,W, Silver WL, Burke IC, Grassens L, Harmon ME, Currie WS, King JY, Adair EC,
Brandt LA, Hart SC, Fasth B, 2007. Global-scale similarities in nitrogen release patterns
during long-term decomposition. Science 315: 361–364.
Pretzsch H, 2005. Diversity and productivity in forests: evidence from long-term experimental
plots. Scherer-Lorenzen M, Körner Ch, Schulze ED, editors. Forest Diversity and Function
- Temperate and Boreal Systems. Ecological Studies 176. Berlin: Springer Berlin. p41-64.
Roscher C, Temperton VM, Scherer-Lorenzen M, Schmitz M, Schumacher J, Schmid B,
Buchmann N, Weisser WW, Schulze ED, 2005. Overyielding in experimental grassland
communities — irrespective of species pool or spatial scale. Ecology Letters 8: 419-429.
Sariyildiz T, 2008. Effects of gap-size classes on long-term litter decomposition rates of
beech, oak and chestnut species at high elevations in Northeast Turkey. Ecosystems 11:
841-853.
Schädler M, Brandl R, 2005. Do invertebrate decomposers affect the disappearance rate of
litter mixtures? Soil Biology & Biochemistry 37: 329–337.
- 135 -
Chapter 7
Schaefer M, 1990. The soil fauna of a beech forest on limestone: trophic structure and
energy budget. Oecologia 82: 128–136.
Seastedt TR, 1984. The role of microarthropods in decomposition and mineralization
processes. Annual Review of Entomology 29: 25–46.
Staaf H, 1987. Foliage litter turnover and earthworm populations in three beech forests of
contrasting soil and vegetation types. Oecologia 72: 58–64.
Szwagrzyk J, Gazda A. 2007. Above-ground standing biomass and tree species diversity in
natural stands of Central Europe. Journal of Vegetation Science 18: 555-562.
Talkner U, Jansen M, Beese FO, 2009. Soils phosphorus status and turnover in central-
European beech forest ecosystems with differing tree species diversity. European Journal
of Soil Science, 60: 338-346.
Tilman D, Knops J, Wedin D, Reich P, Ritchie M, Sieman E, 1997. The influence of
functional diversity and composition on ecosystem processes. Science 277: 1300-1302.
Van Ruijven J, Berendse F, 2003. Positive effects of plant species diversity on productivity in
the absence of legumes. Ecology Letters 6: 170-175.
Vilà M, Vayreda J, Gracia C, Ibáñez JJ, 2003. Does tree diversity increase wood production
in pine forests? Oecologia 135: 299-303.
Vilà M, Vayreda J, Comas L, Ibáñez JJ, Mata T, Obón B, 2007. Species richness and wood
production: a positive association in Mediterranean forests. Ecology Letters 10: 241-250.
Wise DH, Schaefer M, 1994. Decomposition of leaf litter in a mull beech forest: comparison
between canopy and herbaceous species. Pedobiologia 38: 269-288
- 136 -
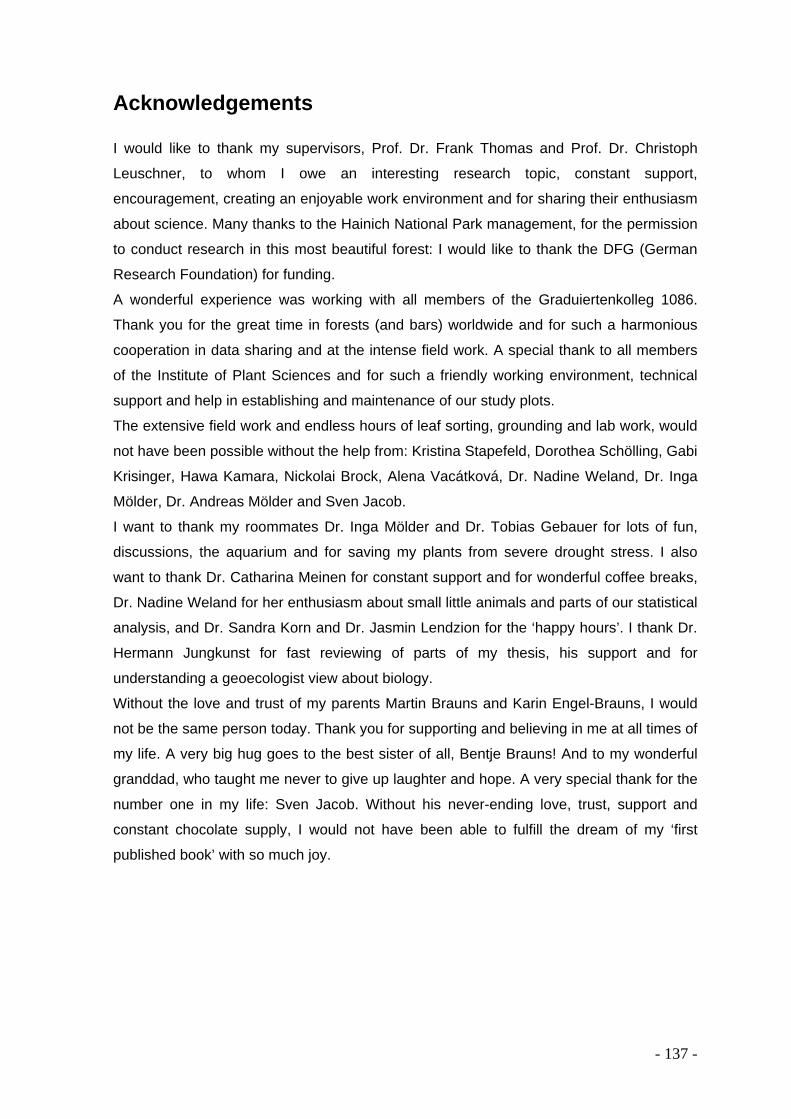
- 137 -
Acknowledgements
I would like to thank my supervisors, Prof. Dr. Frank Thomas and Prof. Dr. Christoph
Leuschner, to whom I owe an interesting research topic, constant support,
encouragement, creating an enjoyable work environment and for sharing their enthusiasm
about science. Many thanks to the Hainich National Park management, for the permission
to conduct research in this most beautiful forest: I would like to thank the DFG (German
Research Foundation) for funding.
A wonderful experience was working with all members of the Graduiertenkolleg 1086.
Thank you for the great time in forests (and bars) worldwide and for such a harmonious
cooperation in data sharing and at the intense field work. A special thank to all members
of the Institute of Plant Sciences and for such a friendly working environment, technical
support and help in establishing and maintenance of our study plots.
The extensive field work and endless hours of leaf sorting, grounding and lab work, would
not have been possible without the help from: Kristina Stapefeld, Dorothea Schölling, Gabi
Krisinger, Hawa Kamara, Nickolai Brock, Alena Vacátková, Dr. Nadine Weland, Dr. Inga
Mölder, Dr. Andreas Mölder and Sven Jacob.
I want to thank my roommates Dr. Inga Mölder and Dr. Tobias Gebauer for lots of fun,
discussions, the aquarium and for saving my plants from severe drought stress. I also
want to thank Dr. Catharina Meinen for constant support and for wonderful coffee breaks,
Dr. Nadine Weland for her enthusiasm about small little animals and parts of our statistical
analysis, and Dr. Sandra Korn and Dr. Jasmin Lendzion for the ‘happy hours’. I thank Dr.
Hermann Jungkunst for fast reviewing of parts of my thesis, his support and for
understanding a geoecologist view about biology.
Without the love and trust of my parents Martin Brauns and Karin Engel-Brauns, I would
not be the same person today. Thank you for supporting and believing in me at all times of
my life. A very big hug goes to the best sister of all, Bentje Brauns! And to my wonderful
granddad, who taught me never to give up laughter and hope. A very special thank for the
number one in my life: Sven Jacob. Without his never-ending love, trust, support and
constant chocolate supply, I would not have been able to fulfill the dream of my ‘first
published book’ with so much joy.

- 138 -

- 139 -
Curriculum vitae
Personal data
Name
Mascha Jacob
Date of birth
14.05.1978
Place of birth
Wilhelmshaven
Nationality
German
Education
Apr 05 – Mar 09 University of Göttingen, Germany;
PhD study “Biodiversity and Ecology”
PhD degree (Dr. rer nat)
Oct 97 – Aug 04 Technical University of Braunschweig, Germany
Study of Geoecology
Degree obtainded: Diplom - Geoökologin
Jun 88 - Jul 97 Theodor-Heuss-Gymnasium (high school), Göttingen, Germany
High school diploma: Abitur.

Editorial Board for Biodiversity and Ecology Series
Prof. Dr. Hermann Behling, Dept. of Palynology and Climate DynamicsProf. Dr. Erwin Bergmeier, Dept. of Vegetation Analysis and Phytodiversity Prof. Dr. Susanne Bögeholz, Dept. of Didactics of BiologyProf. Dr. Norbert Elsner, Dept. of NeurobiologyProf. Dr. Thomas Friedl, Dept. of Experimental PhycologyProf. Dr. Gerhard Gerold, Dept. of Landscape EcologyProf. Dr. S. Robbert Gradstein, Dept. of Systematic BotanyProf. Dr. Bernd Herrmann, Dept. of Historical Anthropology and Human EcologyProf. Dr. Peter Kappeler, Dept. of SociobiologyProf. Dr. Christoph Leuschner, Dept. of Plant Ecology and Ecosystems ResearchProf. Dr. Michael Mühlenberg, Dept. of Conservation BiologyProf. Dr. Joachim Reitner, Dept. of GeobiologyProf. Dr. Matthias Schaefer, Dept. of Animal EcologyProf. Dr. Wolfgang Schmidt, Dept. of Silviculture of the Temperate Zones and Forest EcologyProf. Dr. Henner Simianer, Dept. of Animal BreedingProf. Dr. Teja Tscharntke, Dept. of AgroecologyProf. Dr. Stefan Vidal, Dept. of AgroentomologyProf. Dr. Rainer Willmann, Dept. of Animal Morphology, Systematics and Evolutionary BiologyProf. Dr. Gert Wörheide, Dept. of Geobiology
Members of the Göttingen Centre for Biodiversity and Ecology
Coloured cover images by Göttingen Centre for Biodiversity and Ecology (legend top to bottom)
1 Mixed deciduous forest in the Hainich region (Central Germany)2 Different insect taxa on the flowers of a thistle (Cirsium sp.)3 Glomeris sp., a member of the decomposing soil fauna in forest ecosystems4 Pleodorina californica (Chlorophyceae), colony-forming freshwater phytoplankton species 5 Grasshopper Tettigonia cantans, distributed from the Pyrenees to Northeastern China6 Microcebus berthae (Cheirogaleidae), the smallest extant Primate species (Madagascar)7 Tropical rain forest (Greater Daintree, Australia)8 Lethocolea glossophylla (Acrobolbaceae), a liverwort of alpine mountain ranges in South America9 Part of a coral reef in the Red Sea
Related Documents


