© 2017 Cengage Learning®. May not be scanned, copied or duplicated, or posted to a publicly accessible website, in whole or in part, except for use as permitted in a license distributed with a certain product or service or otherwise on a password-protected website or school-approved learning management system for classroom use. Chapter 2 Production Possibilities, Opportunity Cost, and Economic Growth CHAPTER SUMMARY The What, How and For Whom questions are introduced as the fundamental economic questions that must be addressed by all societies. Because any nation's resources are scarce and its wants are unlimited then all nations are faced with scarcity. Therefore, we must all try to do the best with what we have---to maximize production given limited resources. This is shown in terms of the production possibilities model. There are only two general types of products which can be produced. These are consumer and capital products. Consumer products satisfy our wants directly and in the present. Capital products satisfy our wants indirectly and in the future. If we are efficient with our use of resources then we are producing a combination of consumer and capital products shown by a point on the production possibilities curve. Inefficiency is shown by a point inside the curve. A point outside is a combination of output which is currently unobtainable. However, the greater the investment in capital production, then the greater the rate of economic growth and therefore the larger the rightward shifts of the production possibilities curve and the sooner the nation will be able to produce any point which is currently outside its curve. But, the opportunity cost of greater rates of economic growth over time is foregone consumer goods production today, and therefore current satisfaction. Indeed, there is an increasing opportunity cost associated with producing ever larger quantities of any one good. Marginal analysis enables us to make more rational decisions by concentrating on the marginal, or extra, benefits and costs associated with a decision to see if that activity or good "is worth it." NEW CONCEPTS INTRODUCED What, How and For Whom Questions marginal analysis law of increasing opportunity cost investment opportunity cost economic growth production possibilities curve technology LEARNING OBJECTIVES After completing this chapter, you should be able to: 1. Explain the three fundamental economic questions. 2. Explain opportunity cost using examples.. 3. Explain marginal analysis using examples. 4. Understand a production possibilities curve. 5. Illustrate economic growth using a production possibilities curve. 6. Define investment. Microeconomics For Today 9th Edition Tucker Solutions Manual Full Download: http://testbanklive.com/download/microeconomics-for-today-9th-edition-tucker-solutions-manual/ Full download all chapters instantly please go to Solutions Manual, Test Bank site: testbanklive.com

Welcome message from author
This document is posted to help you gain knowledge. Please leave a comment to let me know what you think about it! Share it to your friends and learn new things together.
Transcript
© 2017 Cengage Learning®. May not be scanned, copied or duplicated, or posted to a publicly accessible website,
in whole or in part, except for use as permitted in a license distributed with a certain product or service or otherwise
on a password-protected website or school-approved learning management system for classroom use.
Chapter 2
Production Possibilities, Opportunity Cost, and
Economic Growth
CHAPTER SUMMARY
The What, How and For Whom questions are introduced as the fundamental economic questions that
must be addressed by all societies. Because any nation's resources are scarce and its wants are unlimited
then all nations are faced with scarcity. Therefore, we must all try to do the best with what we have---to
maximize production given limited resources. This is shown in terms of the production possibilities
model. There are only two general types of products which can be produced. These are consumer and
capital products. Consumer products satisfy our wants directly and in the present. Capital products satisfy
our wants indirectly and in the future. If we are efficient with our use of resources then we are producing
a combination of consumer and capital products shown by a point on the production possibilities curve.
Inefficiency is shown by a point inside the curve. A point outside is a combination of output which is
currently unobtainable. However, the greater the investment in capital production, then the greater the rate
of economic growth and therefore the larger the rightward shifts of the production possibilities curve and
the sooner the nation will be able to produce any point which is currently outside its curve. But, the
opportunity cost of greater rates of economic growth over time is foregone consumer goods production
today, and therefore current satisfaction.
Indeed, there is an increasing opportunity cost associated with producing ever larger quantities of
any one good. Marginal analysis enables us to make more rational decisions by concentrating on the
marginal, or extra, benefits and costs associated with a decision to see if that activity or good "is worth it."
NEW CONCEPTS INTRODUCED
What, How and For Whom Questions marginal analysis law of increasing opportunity cost
investment opportunity cost economic growth
production possibilities curve technology
LEARNING OBJECTIVES
After completing this chapter, you should be able to:
1. Explain the three fundamental economic questions.
2. Explain opportunity cost using examples..
3. Explain marginal analysis using examples.
4. Understand a production possibilities curve.
5. Illustrate economic growth using a production possibilities curve.
6. Define investment.
Microeconomics For Today 9th Edition Tucker Solutions ManualFull Download: http://testbanklive.com/download/microeconomics-for-today-9th-edition-tucker-solutions-manual/
Full download all chapters instantly please go to Solutions Manual, Test Bank site: testbanklive.com
2 Economics for Today
© 2017 Cengage Learning®. May not be scanned, copied or duplicated, or posted to a publicly accessible website,
in whole or in part, except for use as permitted in a license distributed with a certain product or service or otherwise
on a password-protected website or school-approved learning management system for classroom use.
CHAPTER OUTLINE
2-1 Three Fundamental Economic Questions
a. What To Produce?
b. How To Produce?
c. For Whom To Produce?
2-2 Opportunity Cost
Exhibit 1 “The Links between Scarcity, Choice, and Opportunity Cost”
2-3 Marginal Analysis
2-4 The Production Possibilities Curve
Exhibit 2 "The Production Possibilities Curve for Military Goods and Consumer Goods"
2-5 The Law of Increasing Opportunity Costs
Exhibit 3 "The Law of Increasing Opportunity Costs"
2-6 Sources of Economic Growth
a. Changes in Resources
b. Technological Change
Exhibit 4 "An Outward Shift of the Production Possibilities Curve for Computers and Pizzas"
Checkpoint: "What Does a War of Terrorism Really Mean?"
You're The Economist: Analyze the Issue
"FedEx Wasn't an Overnight Success" Applicable Concept: entrepreneurship.
2-7 Present Investment and Future Production Possibilities Curve
Exhibit 5 "Alpha's and Beta's Present and Future Production Possibilities Curves"
Global Economics: Analyze the Issue
"How Does Public Capital Affect a Nation’s Curve?” Applicable Concept: economic growth.
Summary of Conclusion Statements
a. Scarcity limits an economy to points on or below its production possibilities curve.
b. The production possibilities curve consists of all efficient output combinations where an
economy can produce more of one good only by producing less of the other good.
c. The lack of perfect interchangeability between workers is the cause of increasing opportunity
costs and the bowed-out shape of the production possibilities curve.
d. A nation can accelerate economic growth by increasing its production of capital goods in excess
of the capital being worn out in the production process.
Chapter 2: Production Possibilities, Opportunity Costs and Economic Growth 3
© 2017 Cengage Learning®. May not be scanned, copied or duplicated, or posted to a publicly accessible website,
in whole or in part, except for use as permitted in a license distributed with a certain product or service or otherwise
on a password-protected website or school-approved learning management system for classroom use.
HINTS FOR EFFECTIVE TEACHING 1. Some instructors prefer to teach comparative advantage with the concepts in this chapter. These
instructors should assign the first few pages of Chapter 28 which covers this topic.
2. You may want to elaborate on the three fundamental economic questions ("How", "What" and "For
Whom") which any society must address. These fundamental questions are related to the desire to
maximize production, to produce a combination of products most desired by society, and to distribute
products in some equitable manner. All nations have to grapple with these issues as a result of
scarcity. You may have alluded to this in the first chapter. You may want to ask students what they
think the answers are to these questions. In the process point out that in a capitalist system consumer
demand (sovereignty) predominately determines what gets produced. The "How" question is
predominately answered by businesses when they determine the resource mix used in the production
process subject to their desire to limit their costs and to maximize their profits. For whom goods and
services are produced is largely determined by the distribution of income. If you have more money
you get more goods and services.
Moreover, you may want to reiterate that social and political forces, in addition to economic
forces also help to determine the answers to the fundamental economic questions. Ask students to
provide examples of how social and political forces can impact these fundamental economic
questions.
3. Because opportunity cost is such a fundamental economic concept you should make sure that students
understand what it is through the use of several examples. Ask them what their opportunity cost is for
being in class today.
4. Point out that opportunity costs are associated with every decision. Sometimes they are not so
obvious--they are often implicit costs.
5. Point out that all costs are opportunity costs. Note that opportunity costs cannot always be measured
in dollars and cents.
6. You may wish to elaborate on marginal analysis, which is at the heart of rational decision making.
Note that if the marginal benefits exceed the marginal costs of a decision, then it is rational to do
more of that activity because "its worth it"---you are adding more in benefits than in costs; and vice
versa. Point out, however, that benefits and costs of a decision are not always clear. You don't always
know what they are going to be. Moreover, they may not be easily measured or quantified. Instead,
they often must be subjectively estimated. Therefore, what may appear as rational to one person may
not appear as rational to someone else because of the different subjective estimates of benefits and
costs.
After discussing a consumption decision, you may want to drive the point home by pointing out
that reasonable people can disagree over whether government involvement in a particular situation is
"worth it" or not, because of their differing subjective measures of the benefits and costs associated
with that government involvement.
7. Stress that all nations attempt to produce on their production possibilities curves---to maximize
production given their limited resources. To do so will require employing all their resources. This is
why full employment is a universal national economic (macroeconomic) goal. Because full
employment is illustrated as a point on the curve, then all nations attempt to be on their production
possibilities curves. If some unemployment and/or underemployment is experienced, then it is
illustrated as a combination of output shown by a point inside the curve.
4 Economics for Today
© 2017 Cengage Learning®. May not be scanned, copied or duplicated, or posted to a publicly accessible website,
in whole or in part, except for use as permitted in a license distributed with a certain product or service or otherwise
on a password-protected website or school-approved learning management system for classroom use.
A point outside the curve is currently unattainable. However, with enough economic growth that
combination of consumer and capital products may be feasible.
8. In terms of the production possibilities model, stress that there are only two general types of products
which can be produced---consumer and capital products. Consumer products satisfy our wants
directly and in the present. Capital products satisfy our wants indirectly and in the future. It may
appear tempting to produce a lot of consumer products now because this will satisfy us more now.
However, the opportunity cost is fewer capital goods production which is necessary for future growth.
(Explain that investment in capital goods will increase future production possibilities because workers
are more productive the more plant and equipment they have to work with. Emphasize that greater
growth is illustrated as a rightward shift of the production possibilities curve.) Therefore, if we choose
a lot of consumer goods production now it will be at the expense of not so much later on. In short, our
present location on the production possibilities curve will determine the future location of the curve.
Moreover, emphasize that economic growth is another one of the three major macroeconomic
goals. It is a major macroeconomic goal because it increases the size of the "economic pie."
Assuming no change in the distribution of income, growth ensures that everyone gets "a bigger piece
of the pie." Otherwise stated, economic growth is desired because it increases the nation's average
absolute standard of living. But, higher standards of living require the sacrifice of current
consumption in order to free up resources to be devoted to the production of capital products. We
need less consumption and more investment for greater growth and higher standards of living.
CRITICAL THINKING/GROUP DISCUSSION QUESTIONS
1. How does government affect the answer to the "What" fundamental economic question?
Whenever it taxes or spends money, or when it bans the production of some products...
2. How does government affect the answer to the "How" fundamental economic question?
By setting government standards and regulatory guidelines...
3. How does government affect the answer to the "For Whom" fundamental economic question?
By redistributing income via the personal income tax system...
4. What is the opportunity cost of attending college?
The foregone income which could have been earned working full time.
5. What is the cost of a new car?
The amount of other goods and services which could have been purchased but now must be
given up.
6. What is the profit-maximizing quantity of output for a firm to produce?
That output in which the marginal benefits from production no longer exceed the marginal cost
(where MR = MC).
7. Under what conditions would a nation be able to currently produce more of both consumer and
capital products?
If production is currently occurring at a point inside its production possibilities curve---if there
is currently some unemployment and/or underemployment.
8. What are the necessary ingredients for a nation to experience greater rates of economic growth,
higher average standards of living, and a greater ability to compete in the global economy? That is,
what could the U.S. do to achieve all this?
Need: 1) investment in private capital; 2) investment in public capital (infrastructure); 3)
investment in human capital---people (e.g. education); 4) growth in technology; 5)
entrepreneurship; 6) stable political environment.
9. What are some problems associated with economic growth?
Environmental problems...Note, one needs to weigh the benefits against the costs to determine
whether more growth is worth it.
Chapter 2: Production Possibilities, Opportunity Costs and Economic Growth 5
© 2017 Cengage Learning®. May not be scanned, copied or duplicated, or posted to a publicly accessible website,
in whole or in part, except for use as permitted in a license distributed with a certain product or service or otherwise
on a password-protected website or school-approved learning management system for classroom use.
CLASSROOM GAMES Approximately 170 non-computerized economic games (experiments) for use in the classroom are
available for free at http://www.marietta.edu/~delemeeg/games/. The following games are recommended
to help teach some of the concepts in this chapter:
Game #107—Objective: To illustrate a production process subject to diminishing returns and illustrate the
construction of a production possibilities frontier.
Games #117— Objective: To illustrate the impact of specialization of resources on the construction of a
production possibilities frontier.
ANSWERS TO: "You're the Economist” and “Global Economics:” “Analyze the Issue"
FEDEX WASN'T AN OVERNIGHT SUCCESS
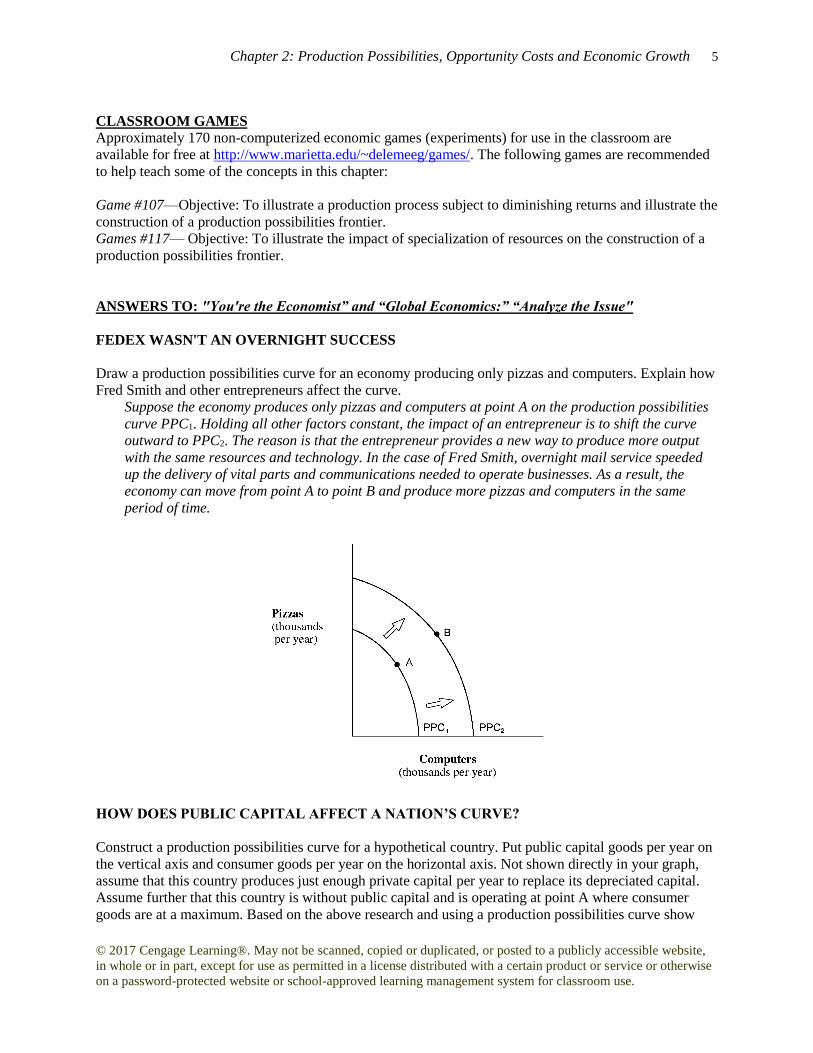
Draw a production possibilities curve for an economy producing only pizzas and computers. Explain how
Fred Smith and other entrepreneurs affect the curve.
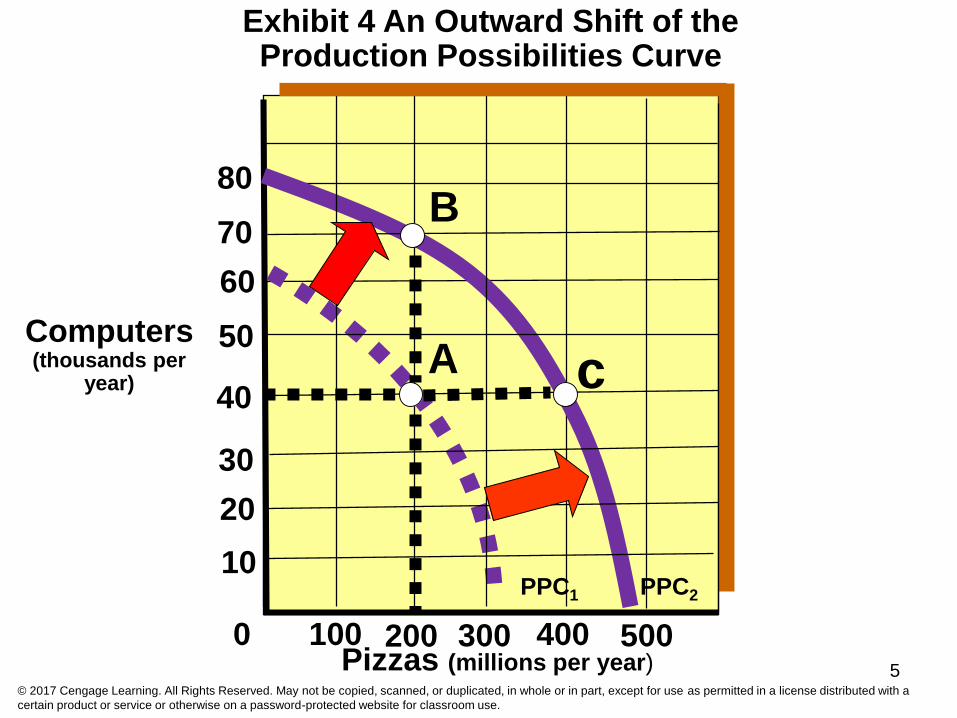
Suppose the economy produces only pizzas and computers at point A on the production possibilities
curve PPC1. Holding all other factors constant, the impact of an entrepreneur is to shift the curve
outward to PPC2. The reason is that the entrepreneur provides a new way to produce more output
with the same resources and technology. In the case of Fred Smith, overnight mail service speeded
up the delivery of vital parts and communications needed to operate businesses. As a result, the
economy can move from point A to point B and produce more pizzas and computers in the same
period of time.
HOW DOES PUBLIC CAPITAL AFFECT A NATION’S CURVE?
Construct a production possibilities curve for a hypothetical country. Put public capital goods per year on
the vertical axis and consumer goods per year on the horizontal axis. Not shown directly in your graph,
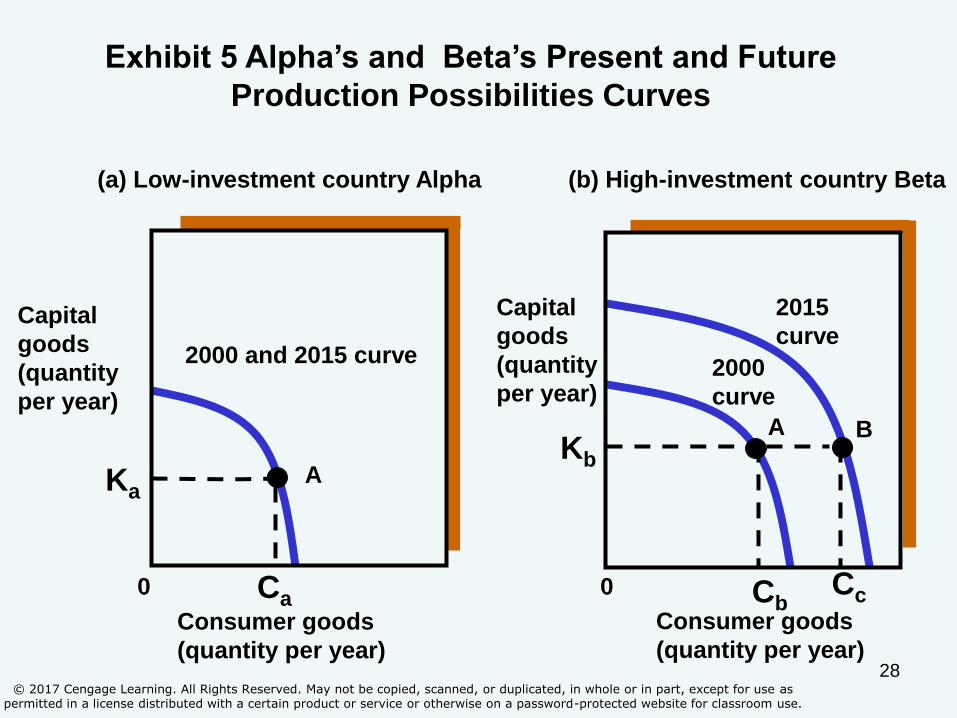
assume that this country produces just enough private capital per year to replace its depreciated capital.
Assume further that this country is without public capital and is operating at point A where consumer
goods are at a maximum. Based on the above research and using a production possibilities curve show
6 Economics for Today
© 2017 Cengage Learning®. May not be scanned, copied or duplicated, or posted to a publicly accessible website,
in whole or in part, except for use as permitted in a license distributed with a certain product or service or otherwise
on a password-protected website or school-approved learning management system for classroom use.
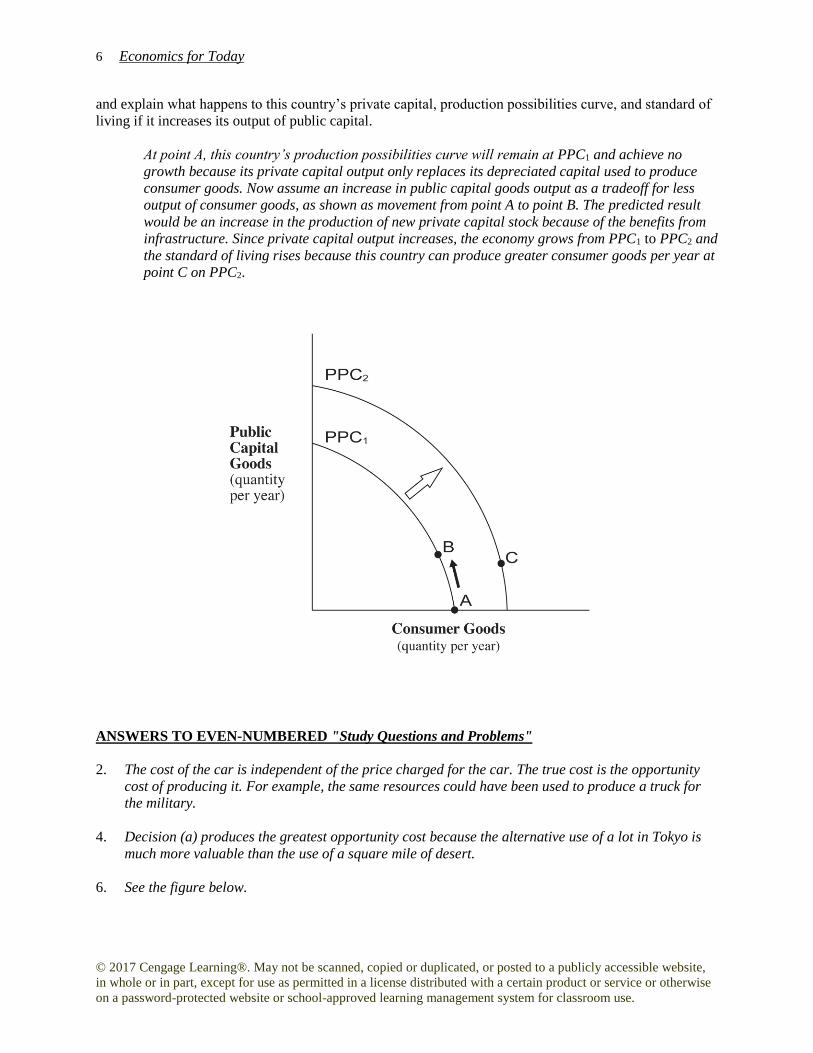
and explain what happens to this country’s private capital, production possibilities curve, and standard of
living if it increases its output of public capital.
At point A, this country’s production possibilities curve will remain at PPC1 and achieve no
growth because its private capital output only replaces its depreciated capital used to produce
consumer goods. Now assume an increase in public capital goods output as a tradeoff for less
output of consumer goods, as shown as movement from point A to point B. The predicted result
would be an increase in the production of new private capital stock because of the benefits from
infrastructure. Since private capital output increases, the economy grows from PPC1 to PPC2 and
the standard of living rises because this country can produce greater consumer goods per year at
point C on PPC2.
ANSWERS TO EVEN-NUMBERED "Study Questions and Problems"
2. The cost of the car is independent of the price charged for the car. The true cost is the opportunity
cost of producing it. For example, the same resources could have been used to produce a truck for
the military.
4. Decision (a) produces the greatest opportunity cost because the alternative use of a lot in Tokyo is
much more valuable than the use of a square mile of desert.
6. See the figure below.
Chapter 2: Production Possibilities, Opportunity Costs and Economic Growth 7
© 2017 Cengage Learning®. May not be scanned, copied or duplicated, or posted to a publicly accessible website,
in whole or in part, except for use as permitted in a license distributed with a certain product or service or otherwise
on a password-protected website or school-approved learning management system for classroom use.
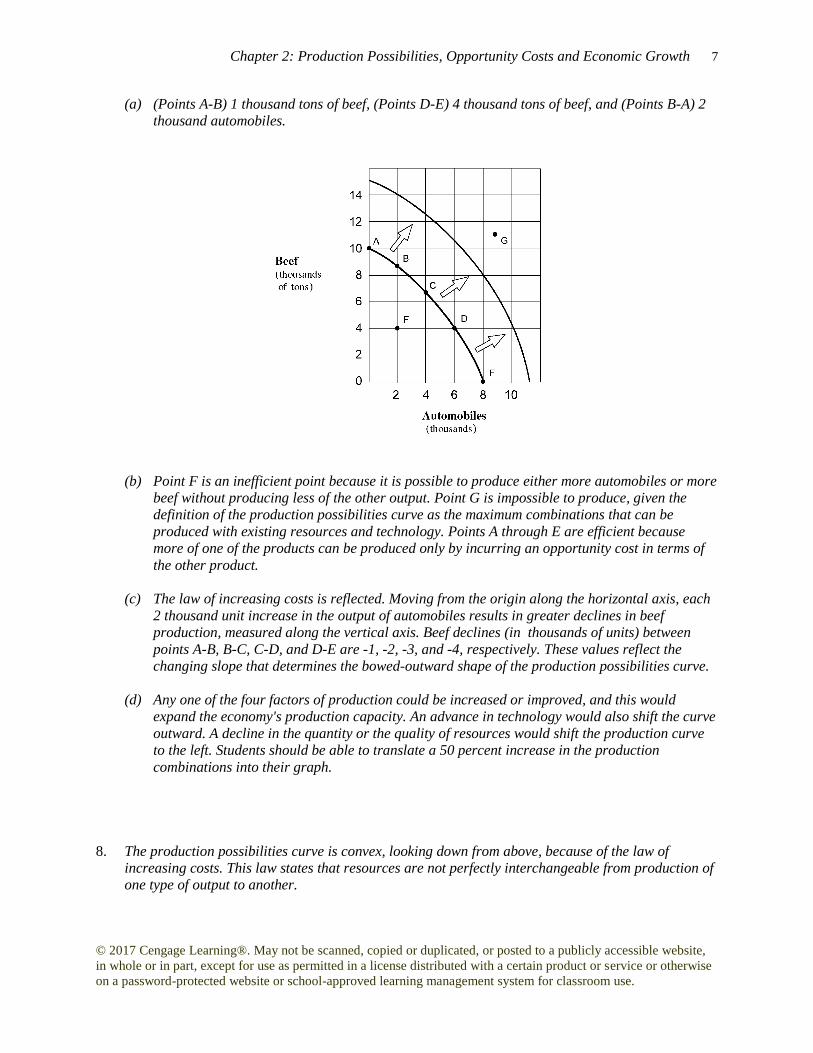
(a) (Points A-B) 1 thousand tons of beef, (Points D-E) 4 thousand tons of beef, and (Points B-A) 2
thousand automobiles.
(b) Point F is an inefficient point because it is possible to produce either more automobiles or more
beef without producing less of the other output. Point G is impossible to produce, given the
definition of the production possibilities curve as the maximum combinations that can be
produced with existing resources and technology. Points A through E are efficient because
more of one of the products can be produced only by incurring an opportunity cost in terms of
the other product.
(c) The law of increasing costs is reflected. Moving from the origin along the horizontal axis, each
2 thousand unit increase in the output of automobiles results in greater declines in beef
production, measured along the vertical axis. Beef declines (in thousands of units) between
points A-B, B-C, C-D, and D-E are -1, -2, -3, and -4, respectively. These values reflect the
changing slope that determines the bowed-outward shape of the production possibilities curve.
(d) Any one of the four factors of production could be increased or improved, and this would
expand the economy's production capacity. An advance in technology would also shift the curve
outward. A decline in the quantity or the quality of resources would shift the production curve
to the left. Students should be able to translate a 50 percent increase in the production
combinations into their graph.
8. The production possibilities curve is convex, looking down from above, because of the law of
increasing costs. This law states that resources are not perfectly interchangeable from production of
one type of output to another.
8 Economics for Today
© 2017 Cengage Learning®. May not be scanned, copied or duplicated, or posted to a publicly accessible website,
in whole or in part, except for use as permitted in a license distributed with a certain product or service or otherwise
on a password-protected website or school-approved learning management system for classroom use.
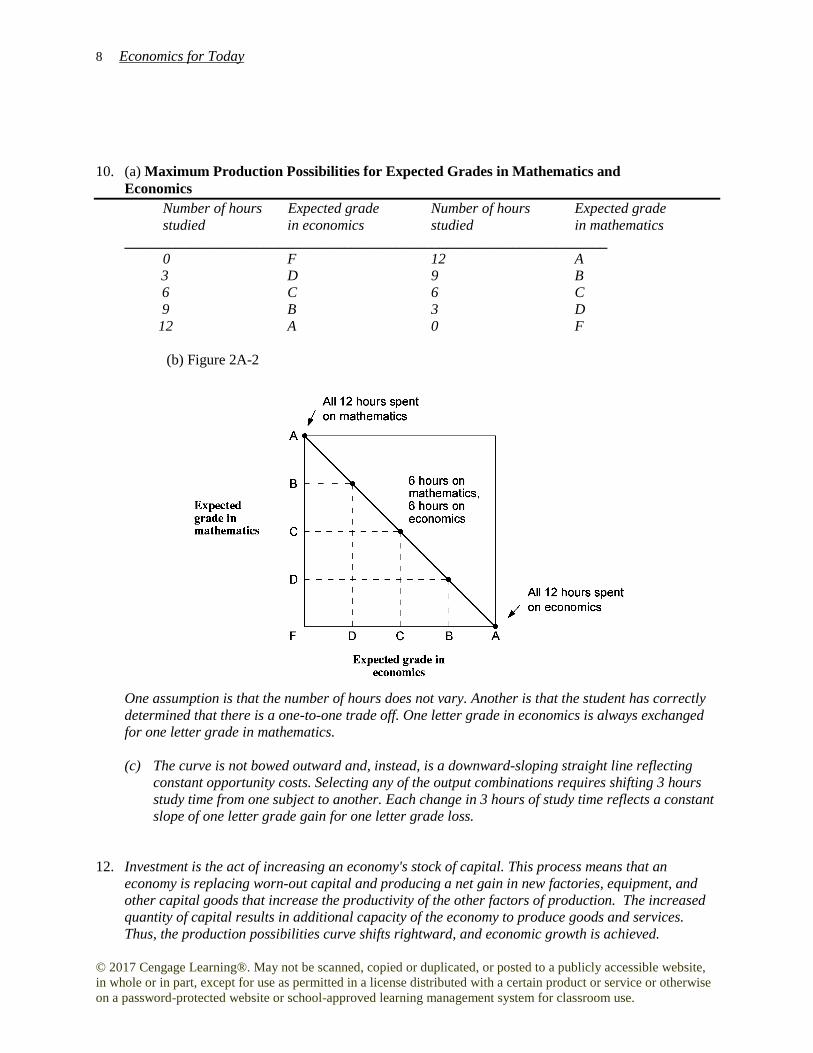
10. (a) Maximum Production Possibilities for Expected Grades in Mathematics and
Economics
Number of hours Expected grade Number of hours Expected grade
studied in economics studied in mathematics
__________________________________________________________________
0 F 12 A
3 D 9 B
6 C 6 C
9 B 3 D
12 A 0 F
(b) Figure 2A-2
One assumption is that the number of hours does not vary. Another is that the student has correctly
determined that there is a one-to-one trade off. One letter grade in economics is always exchanged
for one letter grade in mathematics.
(c) The curve is not bowed outward and, instead, is a downward-sloping straight line reflecting
constant opportunity costs. Selecting any of the output combinations requires shifting 3 hours
study time from one subject to another. Each change in 3 hours of study time reflects a constant
slope of one letter grade gain for one letter grade loss.
12. Investment is the act of increasing an economy's stock of capital. This process means that an
economy is replacing worn-out capital and producing a net gain in new factories, equipment, and
other capital goods that increase the productivity of the other factors of production. The increased
quantity of capital results in additional capacity of the economy to produce goods and services.
Thus, the production possibilities curve shifts rightward, and economic growth is achieved.
Chapter 2: Production Possibilities, Opportunity Costs and Economic Growth 9
© 2017 Cengage Learning®. May not be scanned, copied or duplicated, or posted to a publicly accessible website,
in whole or in part, except for use as permitted in a license distributed with a certain product or service or otherwise
on a password-protected website or school-approved learning management system for classroom use.
CHAPTER 2 SUMMARY QUIZ
1. Which of the following statements is true?
a. An opportunity cost is what must be given up in order to get something else.
b. The three fundamental economic questions refer to What to produce? How to produce? and
When to produce?
c. The term "investment" refers to the purchase of stocks and bonds and other financial securities.
d. The law of increasing opportunity cost implies that as production of one type of good is
expanded then fewer and fewer of other goods must be given up.
2. Which of the following statements is false?
a. Marginal analysis is an examination of the effects of additions or subtractions from a current
situation.
b. The production possibilities curve shows the maximum combination of two outputs that an
economy can produce, given its available resources and technology.
c. Technology is the body of knowledge and skills applied to how goods are produced.
d. Economic growth is illustrated as an inward shift of the production possibilities curve.
3. Given a production possibilities curve, a point:
a. inside the curve represents unemployment.
b. on the curve represents full employment.
c. outside the curve is currently unattainable.
d. all of the above.
4. A rightward (an outward) shift of a nation's production possibilities curve could be caused by:
a. a decrease in technology.
b. an increase in resources.
c. producing more consumer and fewer capital goods.
d. a decline in the labor force's level of education and skills.
ANSWERS TO CHAPTER 2 SUMMARY QUIZ
1. a
2. d
3. d
4. b
1
Chapter 2 Production Possibilities, Opportunity Cost, and Economic Growth
CHAPTER IN A NUTSHELL
In this chapter, you continue your quest to learn the economic way of thinking. The chapter
begins with the three basic questions each economy must answer: (1) What to produce? (2) How
to produce? and (3) For whom to produce? The chapter then introduces concepts which
economists use to analyze choice-the production possibilities curve and opportunity costs. The
production possibilities curve indicates various maximum combinations of the output of two
goods a simple economy can produce. The economy can achieve economic growth by pushing
the production possibilities curve outward. This shift in the curve can be caused by increasing
resources and/or advances in technology.
KEY CONCEPTS
Economic growth Opportunity cost
Investment Production possibilities curve
Law of increasing opportunity Technology
costs What, How, and
Marginal analysis For Whom questions
LEARNING OBJECTIVES After completing this chapter, you should be able to: 1. Explain how capitalism answers the What, How, and For Whom fundamental economic
questions.
2. Understand what is meant by an opportunity cost and give some examples.
3. Explain why an opportunity cost is an implicit cost incurred in making all decisions.
4. Explain why marginal analysis can give rise to more rational decisions.
5. Graphically express a production possibilities model.
6. Understand that the production possibilities model illustrates the problem of scarcity, therefore
choices have to made, and when choices are made that an opportunity cost is incurred.
7. Illustrate production efficiency and inefficiency in the context of the production possibilities
graph.
8. Describe what is meant by the law of increasing opportunity cost and why it exists.
9. Explain what is meant by investment.
2
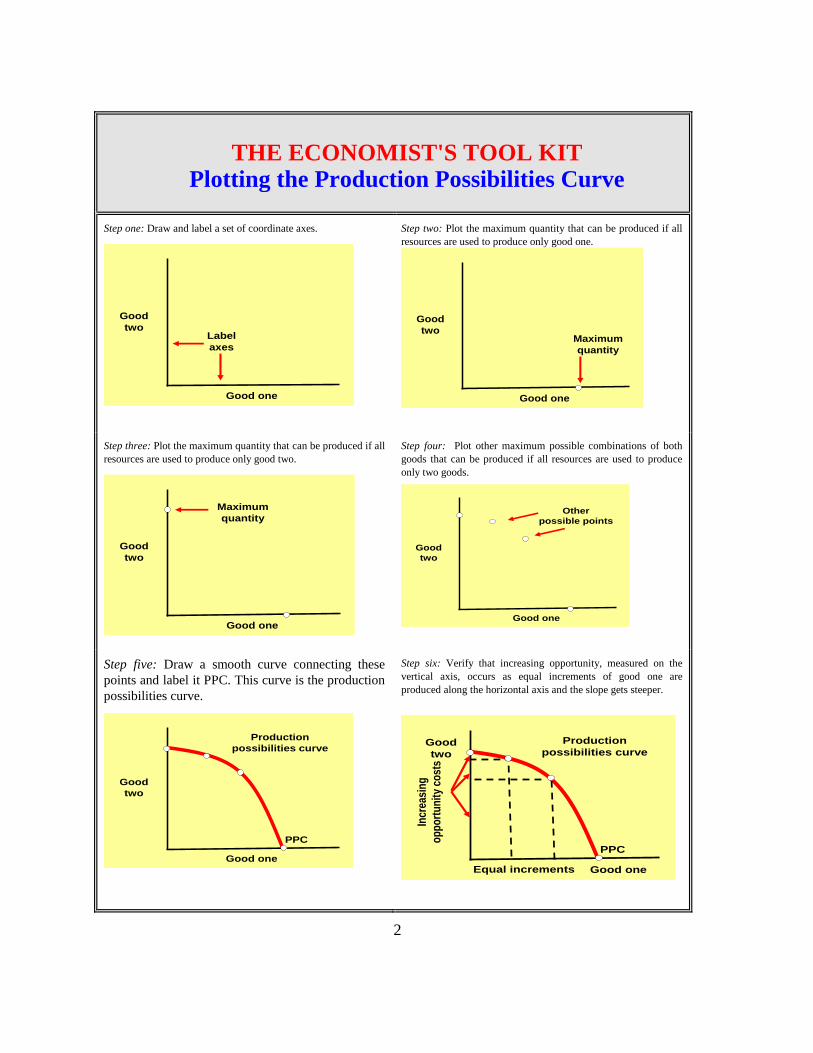
THE ECONOMIST'S TOOL KIT Plotting the Production Possibilities Curve
Step one: Draw and label a set of coordinate axes.
Good
twoLabel
axes
Good one
Step two: Plot the maximum quantity that can be produced if all
resources are used to produce only good one.
Good
twoMaximum
quantity
Good one
Step three: Plot the maximum quantity that can be produced if all
resources are used to produce only good two.
Good
two
Maximum
quantity
Good one
Step four: Plot other maximum possible combinations of both
goods that can be produced if all resources are used to produce
only two goods.
Good
two
Other
possible points
Good one
Step five: Draw a smooth curve connecting these
points and label it PPC. This curve is the production
possibilities curve.
Good
two
Production
possibilities curve
Good one
PPC
Step six: Verify that increasing opportunity, measured on the
vertical axis, occurs as equal increments of good one are
produced along the horizontal axis and the slope gets steeper.
Good
two
Production
possibilities curve
Good one
PPC
Equal increments
Incr
easi
ng
op
po
rtu
nit
y co
sts
3
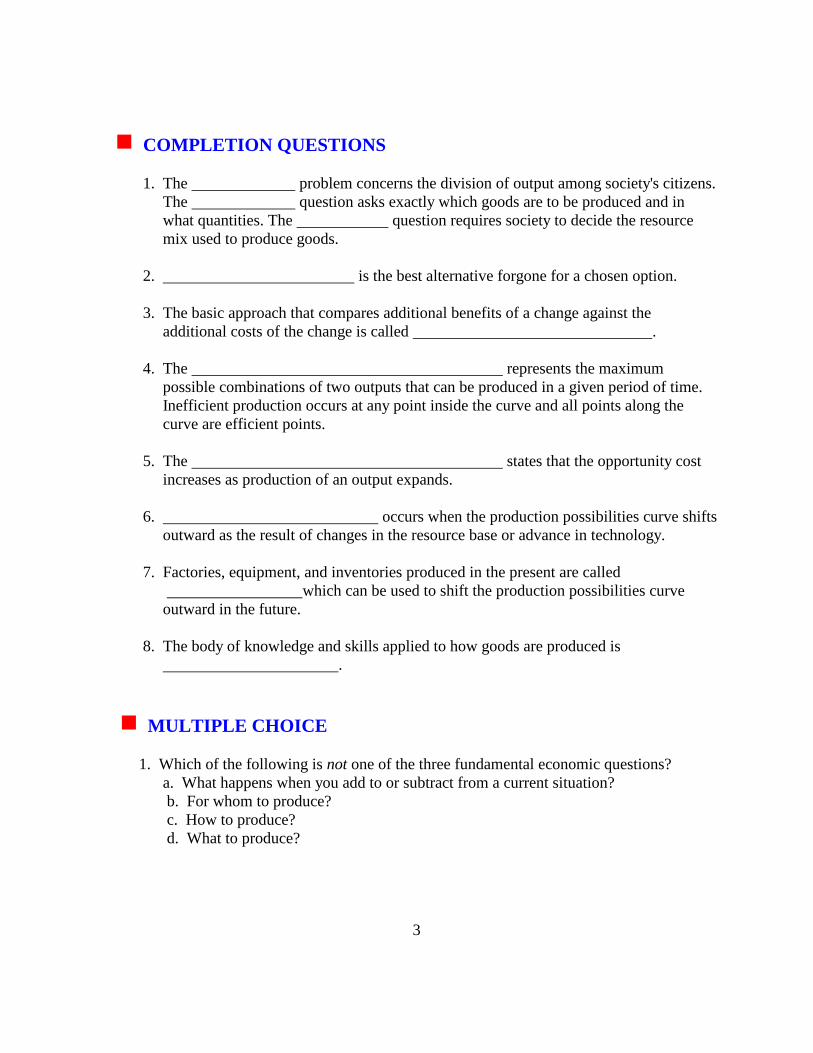
COMPLETION QUESTIONS
1. The problem concerns the division of output among society's citizens.
The question asks exactly which goods are to be produced and in
what quantities. The question requires society to decide the resource
mix used to produce goods.
2. is the best alternative forgone for a chosen option.
3. The basic approach that compares additional benefits of a change against the
additional costs of the change is called .
4. The represents the maximum
possible combinations of two outputs that can be produced in a given period of time.
Inefficient production occurs at any point inside the curve and all points along the
curve are efficient points.
5. The states that the opportunity cost
increases as production of an output expands.
6. occurs when the production possibilities curve shifts
outward as the result of changes in the resource base or advance in technology.
7. Factories, equipment, and inventories produced in the present are called
which can be used to shift the production possibilities curve
outward in the future.
8. The body of knowledge and skills applied to how goods are produced is
.
MULTIPLE CHOICE
1. Which of the following is not one of the three fundamental economic questions?
a. What happens when you add to or subtract from a current situation?
b. For whom to produce?
c. How to produce?
d. What to produce?
4
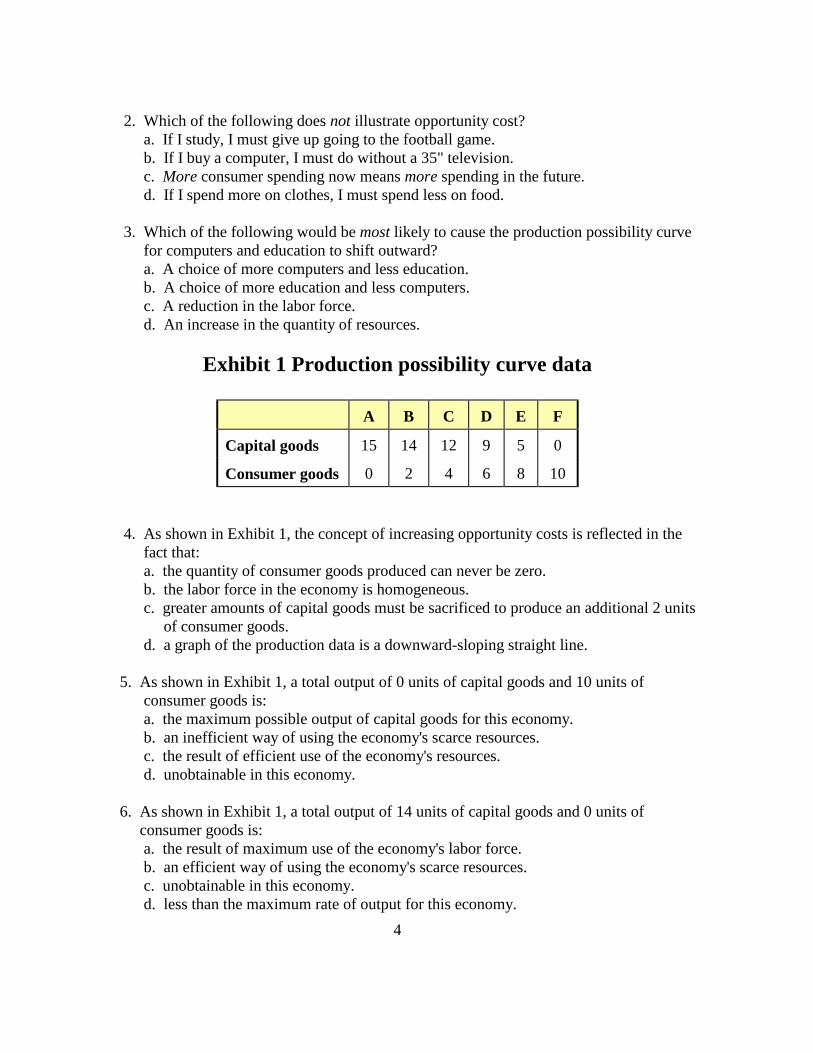
2. Which of the following does not illustrate opportunity cost?
a. If I study, I must give up going to the football game.
b. If I buy a computer, I must do without a 35" television.
c. More consumer spending now means more spending in the future.
d. If I spend more on clothes, I must spend less on food.
3. Which of the following would be most likely to cause the production possibility curve
for computers and education to shift outward?
a. A choice of more computers and less education.
b. A choice of more education and less computers.
c. A reduction in the labor force.
d. An increase in the quantity of resources.
Exhibit 1 Production possibility curve data
A B C D E F
Capital goods 15 14 12 9 5 0
Consumer goods 0 2 4 6 8 10
4. As shown in Exhibit 1, the concept of increasing opportunity costs is reflected in the
fact that:
a. the quantity of consumer goods produced can never be zero.
b. the labor force in the economy is homogeneous.
c. greater amounts of capital goods must be sacrificed to produce an additional 2 units
of consumer goods.
d. a graph of the production data is a downward-sloping straight line.
5. As shown in Exhibit 1, a total output of 0 units of capital goods and 10 units of
consumer goods is:
a. the maximum possible output of capital goods for this economy.
b. an inefficient way of using the economy's scarce resources.
c. the result of efficient use of the economy's resources.
d. unobtainable in this economy.
6. As shown in Exhibit 1, a total output of 14 units of capital goods and 0 units of
consumer goods is:
a. the result of maximum use of the economy's labor force.
b. an efficient way of using the economy's scarce resources.
c. unobtainable in this economy.
d. less than the maximum rate of output for this economy.

5
Exhibit 2 Production possibilities curve
0 100 200 300 400
Food
(millions of tons per year)
100
200
300
400
500
Tractors
(millions per
year)
Z
X
Y
W
7. If the economy represented in Exhibit 2 is operating at Point W:
a. no tractor production must be forgone to produce more food in the current period.
b. resources are not fully used.
c. some tractor production must be forgone to produce more food in the current
period.
d. increased food production would be impossible.
8 Which of the following moves from one point to another in Exhibit 2 would represent
an increase in economic efficiency?
a. Z to W
b. W to Y
c. W to X
d. X to Y
9. Movement along the production possibilities curve shown in Exhibit 2 indicates:
a. that labor is not equally productive or homogeneous.
b. declining opportunity costs.
c. all inputs are homogeneous.
d. All of the answers above are correct.
10. In order for the economy shown in Exhibit 2 to reach point Z, it must:
a. suffer resource unemployment.
b. experience an increase in its resources and/or an improvement in its technology.
c. use its resources more efficiently than at point W or Y.
d. All of the answers above are correct.

6
11. The following two alternatives exist for a student who has one evening in which to
prepare for two exams on the following day:
Possibility Score in Economics Score in Accounting
A 95 80
B 80 90
The opportunity cost of receiving a 90 rather than an 80 on the accounting exam is
represented by how many points on the economics exam?
a. 15 points.
b. 80 points.
c. 90 points.
d. 10 points.
12. On a production possibilities curve, a change from economic inefficiency to economic
efficiency is obtained by:
a. movement along the curve.
b. movement from outside the frontier to a point on the curve.
c. movement from a point inside the frontier to a point on the curve.
d. a change in the slope of the curve.
13. One of the assumptions underlying the production possibilities curve for any given
economy is that:
a. the state of technology is changing.
b. there is an unlimited supply of available resources.
c. there is full employment and no underemployment of resources when the economy
is operating on the curve.
d. goods can be produced in unlimited quantities.
14. Any point on the production possibilities curve illustrates:
a. minimum production combinations.
b. maximum production combinations.
c. economic growth.
d. a nonfeasible production combination.
15. A production possibilities curve has "good X" on the horizontal axis and "good Y" on
the vertical axis. On this diagram, the opportunity cost of good X, in terms of good Y,
is represented by the:
a. distance to the curve from the horizontal axis.
b. distance to curve from the vertical axis.
c. movement along the curve.
d. None of the answers above are correct.

7
16. As production of a good increases, opportunity costs rise because:
a. there will be more inefficiency.
b. people always prefer having more goods.
c. of inflationary pressures.
d. workers are not equally suited to all tasks.
17. Which of the following would be most likely to cause the production possibility curve
for tanks and cars to shift outward?
a. A reduction in the labor force.
b. A choice of more tanks and fewer cars.
c. A choice of more cars and fewer tanks.
d. An increase in the quantity of natural resources.
18. Which of the following cause(s) economic growth?
a. Answers c and d are correct.
b. Answers d and e are correct.
c. The production of more scarce goods
d. A technological improvement
e. The production of more capital goods
19. A source of economic growth is:
a. unemployment.
b. inefficiency.
c. less resources.
d. greater entrepreneurship.
20. In economics, investment refers to the process of accumulating:
a. capital goods.
b. inefficiency.
c. money.
d. stocks and bonds.
TRUE OR FALSE
1. T F The opportunity cost of a good is the good or service forgone for a
chosen good or service.
2. T F If some resources were used inefficiently, the economy would tend to
operate outside its production possibilities curve.
8
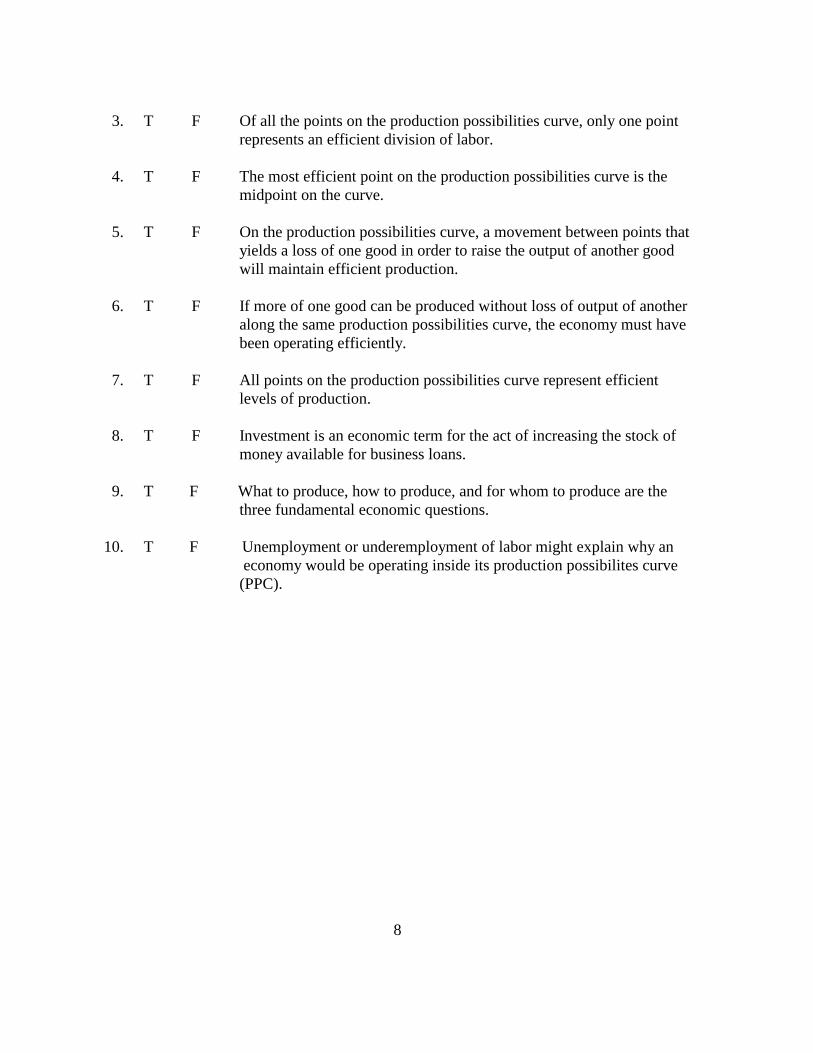
3. T F Of all the points on the production possibilities curve, only one point
represents an efficient division of labor.
4. T F The most efficient point on the production possibilities curve is the
midpoint on the curve.
5. T F On the production possibilities curve, a movement between points that
yields a loss of one good in order to raise the output of another good
will maintain efficient production.
6. T F If more of one good can be produced without loss of output of another
along the same production possibilities curve, the economy must have
been operating efficiently.
7. T F All points on the production possibilities curve represent efficient
levels of production.
8. T F Investment is an economic term for the act of increasing the stock of
money available for business loans.
9. T F What to produce, how to produce, and for whom to produce are the
three fundamental economic questions.
10. T F Unemployment or underemployment of labor might explain why an
economy would be operating inside its production possibilites curve
(PPC).
9
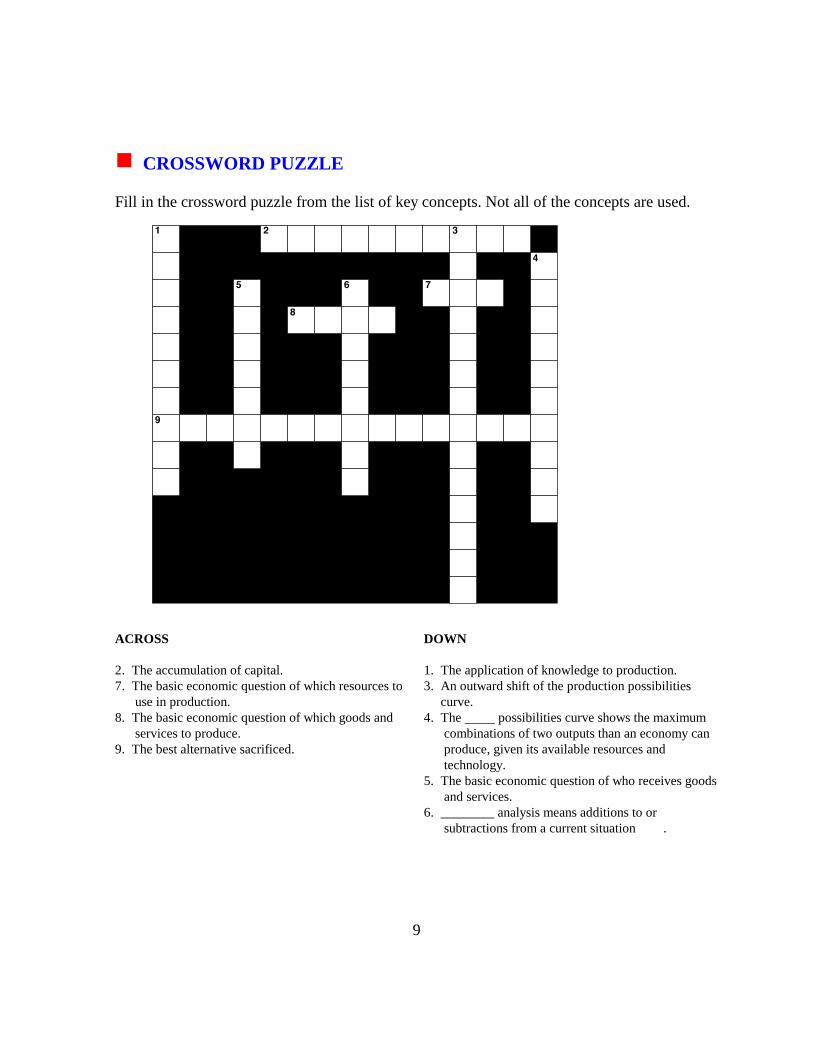
CROSSWORD PUZZLE
Fill in the crossword puzzle from the list of key concepts. Not all of the concepts are used.
ACROSS
2. The accumulation of capital.
7. The basic economic question of which resources to
use in production.
8. The basic economic question of which goods and
services to produce.
9. The best alternative sacrificed.
DOWN
1. The application of knowledge to production.
3. An outward shift of the production possibilities
curve.
4. The possibilities curve shows the maximum
combinations of two outputs than an economy can
produce, given its available resources and
technology.
5. The basic economic question of who receives goods
and services.
6. ________ analysis means additions to or
subtractions from a current situation .
10
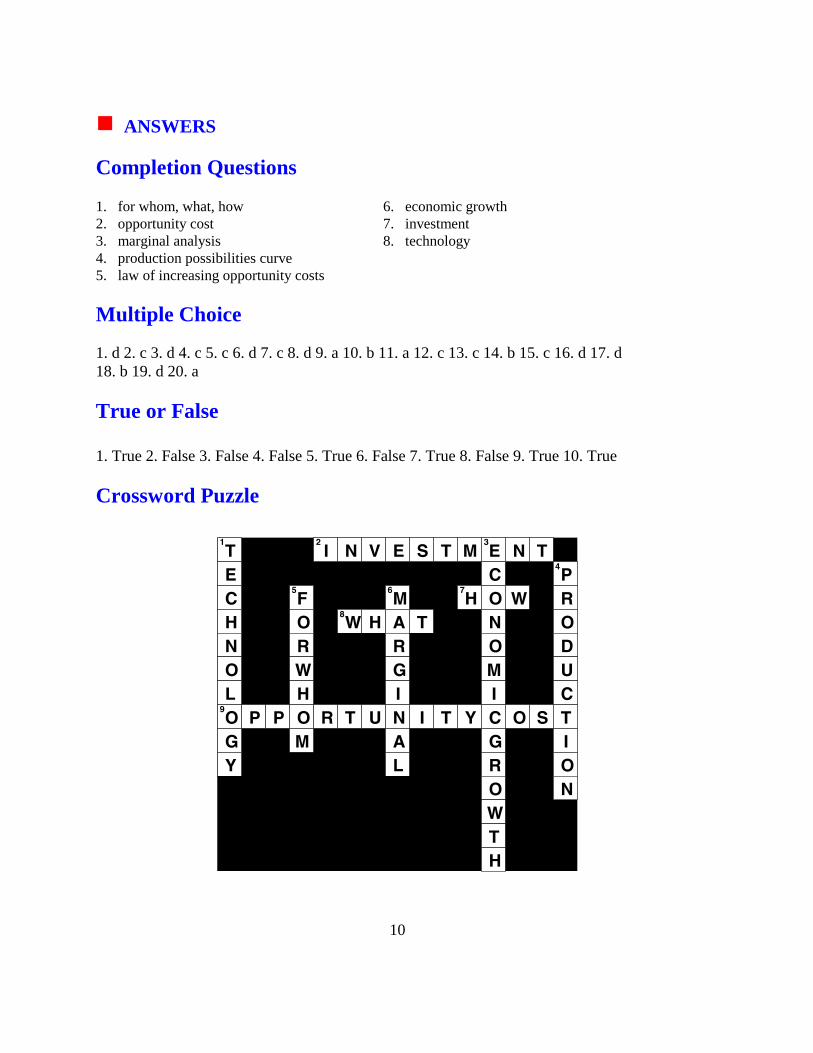
ANSWERS
Completion Questions 1. for whom, what, how 6. economic growth
2. opportunity cost 7. investment
3. marginal analysis 8. technology
4. production possibilities curve
5. law of increasing opportunity costs
Multiple Choice
1. d 2. c 3. d 4. c 5. c 6. d 7. c 8. d 9. a 10. b 11. a 12. c 13. c 14. b 15. c 16. d 17. d
18. b 19. d 20. a
True or False 1. True 2. False 3. False 4. False 5. True 6. False 7. True 8. False 9. True 10. True
Crossword Puzzle

1
Chapter 2Production Possibilities, Opportunity
Cost, and Economic Growth
© 2017 Cengage Learning. All Rights Reserved. May not be copied, scanned, or duplicated, in whole or in part, except for use as permitted in a license distributed with a
certain product or service or otherwise on a password-protected website for classroom use.
Exhibit Slides
Microeconomics for Today
Irvin B. Tucker

2
Scarcity
Choice
OpportunityCost
Exhibit 1 The
Links Between
Scarcity, Choice,
and Opportunity
Cost
© 2017 Cengage Learning. All Rights Reserved. May not be copied, scanned, or duplicated, in whole or in part, except for use as permitted in a license distributed with a
certain product or service or otherwise on a password-protected website for classroom use.
3
A
Ou
tpu
t o
f m
ilit
ary
go
od
s
Output of consumer goods
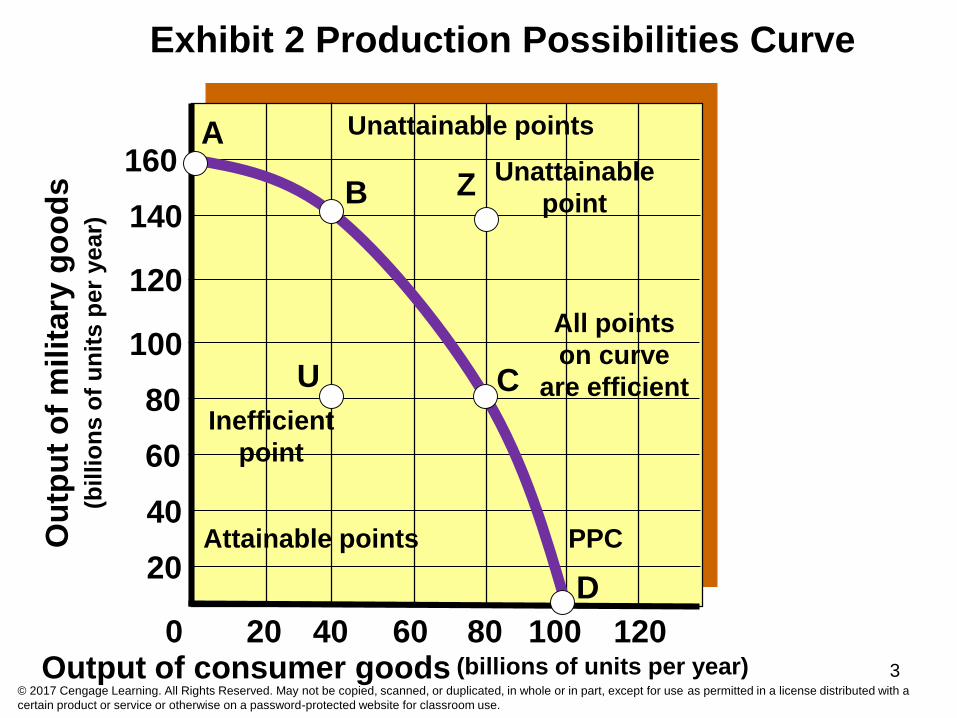
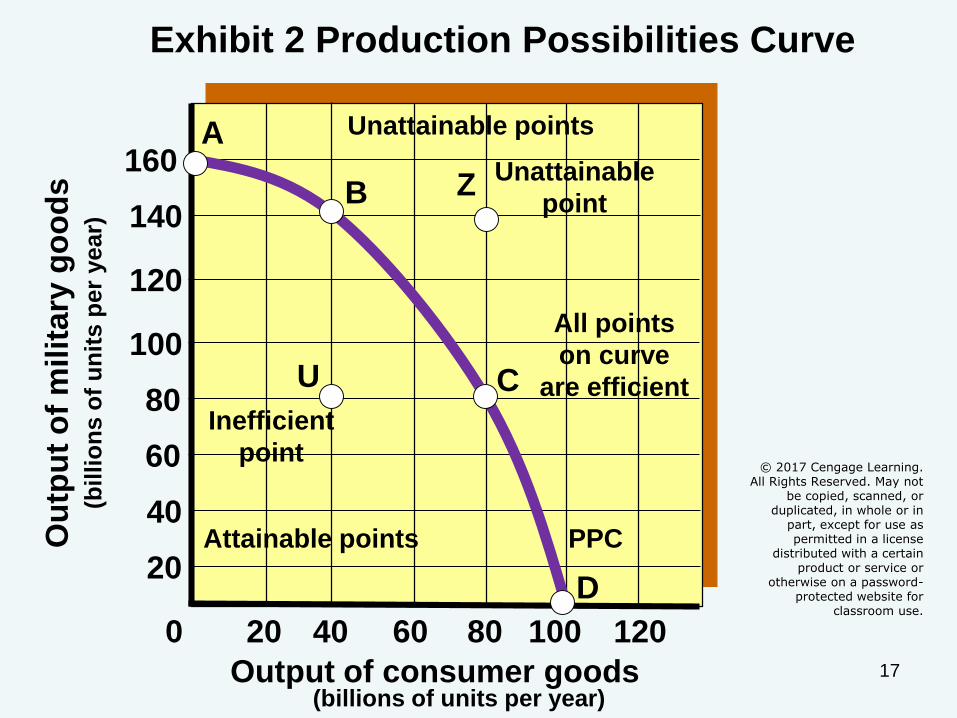
Exhibit 2 Production Possibilities Curve
B
D
U
Inefficient
point
Z Unattainable
point
All points
on curve
are efficient
(billions of units per year)
(bil
lio
ns o
f u
nit
s p
er
year)
0 40 80 120100
160
20 60
C
PPC20
40
60
80
100
120
140
Attainable points
Unattainable points
© 2017 Cengage Learning. All Rights Reserved. May not be copied, scanned, or duplicated, in whole or in part, except for use as permitted in a license distributed with a
certain product or service or otherwise on a password-protected website for classroom use.
4
A
Sailboats (thousands of units per year)
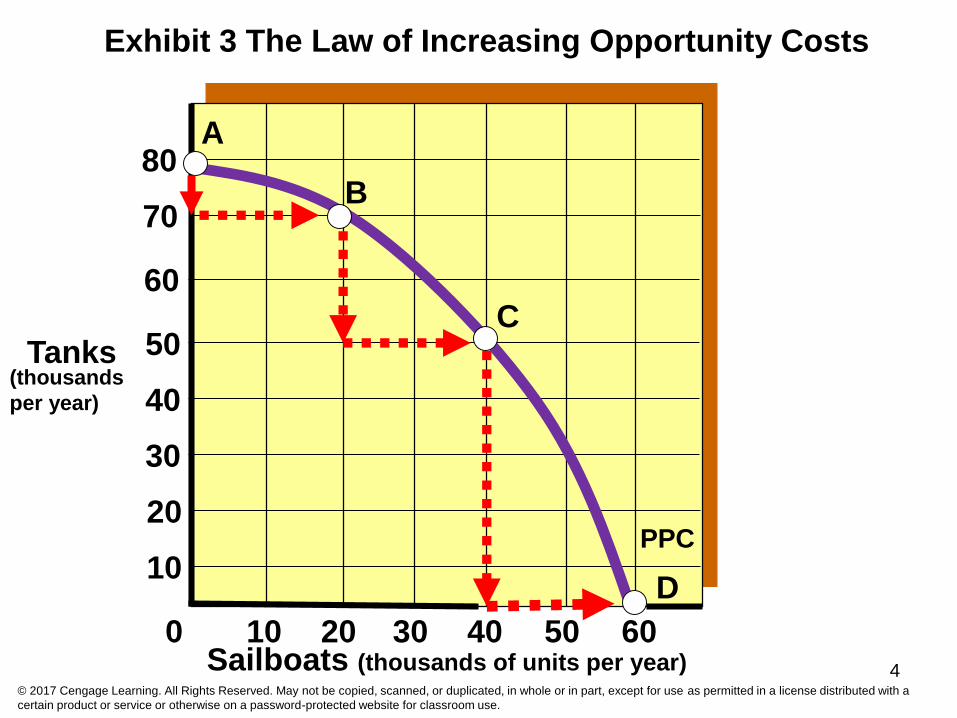
Exhibit 3 The Law of Increasing Opportunity Costs
B
D
0 20 40 60
80
10 30
C
PPC10
20
30
40
50
60
70
Tanks(thousands
per year)
50
© 2017 Cengage Learning. All Rights Reserved. May not be copied, scanned, or duplicated, in whole or in part, except for use as permitted in a license distributed with a
certain product or service or otherwise on a password-protected website for classroom use.
5
Computers (thousands per
year)
Pizzas (millions per year)
Exhibit 4 An Outward Shift of the Production Possibilities Curve
A c
200 400
40
B70
0 100 300 500
30
20
10
50
60
80
PPC1 PPC2
© 2017 Cengage Learning. All Rights Reserved. May not be copied, scanned, or duplicated, in whole or in part, except for use as permitted in a license distributed with a
certain product or service or otherwise on a password-protected website for classroom use.
6
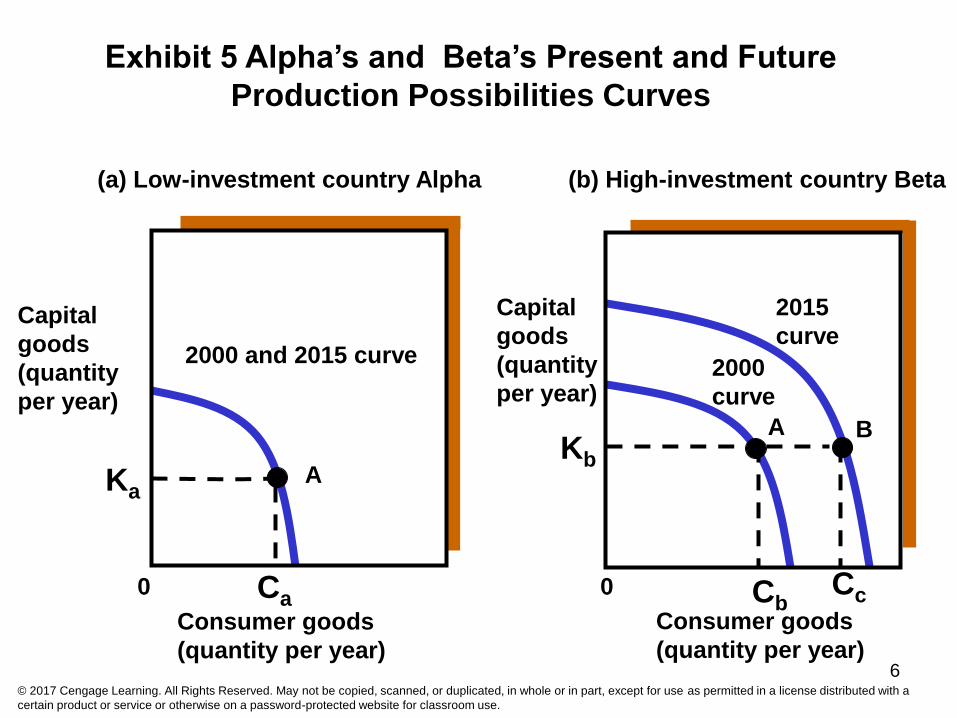
Exhibit 5 Alpha’s and Beta’s Present and Future
Production Possibilities Curves
Capital
goods
(quantity
per year)
(a) Low-investment country Alpha (b) High-investment country Beta
Consumer goods
(quantity per year)
Consumer goods
(quantity per year)
2000 and 2015 curve
A
A B
2015
curve
2000
curve
0 0
Ka
Ca
Kb
CbCc
Capital
goods
(quantity
per year)
© 2017 Cengage Learning. All Rights Reserved. May not be copied, scanned, or duplicated, in whole or in part, except for use as permitted in a license distributed with a
certain product or service or otherwise on a password-protected website for classroom use.

7
END
1
Chapter 2Production Possibilities, Opportunity
Cost, and Economic Growth
© 2017 Cengage Learning. All Rights Reserved. May not be copied, scanned, or duplicated, in whole or in part, except for use as permitted in a license distributed with a certain product or service or otherwise on a password-protected website for classroom use.
Lecture Slides
Microeconomics for Today
Irvin B. Tucker

2
What will I learn in this chapter?
•Having learned that scarcity forces choices, here you will study choices people make in more detail
© 2017 Cengage Learning. All Rights Reserved. May not be copied, scanned, or duplicated, in whole or in part, except for use as permitted in a license distributed with a certain product or service or otherwise on a password-protected website for classroom use.
3
What are the three fundamental
economic questions?
1.What to produce?
2.How to produce?
3.For whom to produce?© 2017 Cengage Learning. All Rights Reserved. May not be copied, scanned, or duplicated, in whole or in part, except for use as permitted
in a license distributed with a certain product or service or otherwise on a password-protected website for classroom use.
4
What are two key concepts in this
chapter?
•Opportunity costs
•Marginal analysis
© 2017 Cengage Learning. All Rights Reserved. May not be copied, scanned, or duplicated, in whole or in part, except for use as permitted in a license distributed with a certain product or service or otherwise on a password-protected website for classroom
use.

5
What isopportunity cost?
•The best alternative sacrificed for a chosen alternative
© 2017 Cengage Learning. All Rights Reserved. May not be copied, scanned, or duplicated, in whole or in part, except for use as permitted in a license distributed with a certain product or service or otherwise on a password-protected website for classroom use.

6
What opportunity cost may you now be experiencing?
•The most money that you could be making if you were somewhere else instead of studying these slides
© 2017 Cengage Learning. All Rights Reserved. May not be copied, scanned, or duplicated, in whole or in part, except for use as permitted in a license distributed with a certain product or service or otherwise on a password-protected website for classroom use.

7
Can opportunity cost be something other
than money?
•Yes, the most desired good or service or use of time that you are presently giving up is an opportunity cost
© 2017 Cengage Learning. All Rights Reserved. May not be copied, scanned, or duplicated, in whole or in part, except for use as permitted in a license distributed with a certain product or service or otherwise on a password-protected website for classroom use.

8
Scarcity
Choice
OpportunityCost
Exhibit 1 The
Links Between
Scarcity, Choice,
and Opportunity
Cost
© 2017 Cengage Learning. All Rights Reserved. May not be copied, scanned, or duplicated, in whole or in part, except for use as permitted in a license distributed with a certain product or service or otherwise on a password-protected website for classroom use.
9
What ismarginal analysis?
•An examination of the effects of additions to or subtractions from a current situation
© 2017 Cengage Learning. All Rights Reserved. May not be copied, scanned, or duplicated, in whole or in part, except for use as permitted in a license distributed with a certain product or service or otherwise on a password-protected website for classroom use.

10
What is an example of marginal analysis?
•When your benefit of studying these slides exceeds the opportunity cost, you will spend time studying these slides
© 2017 Cengage Learning. All Rights Reserved. May not be copied, scanned, or duplicated, in whole or in part, except for use as permitted in a license distributed with a certain product or service or otherwise on a password-protected website for classroom use.
11
What is a production possibilities curve?
•A curve that shows the maximum combinations of two outputs that an economy can produce, given its available resources and technology
© 2017 Cengage Learning. All Rights Reserved. May not be copied, scanned, or duplicated, in whole or in part, except for use as permitted in a license distributed with a certain product or service or otherwise on a password-protected website for classroom use.

12
What is technology?
•The body of knowledge and skills applied to how goods are produced
© 2017 Cengage Learning. All Rights Reserved. May not be copied, scanned, or duplicated, in whole or in part, except for use as permitted in a license distributed with a certain product or service or otherwise on a password-protected website for classroom use.

13
What assumptions underlie the production
possibilities model?
1.Fixed resources
2.Fully employed resources
3.Technology unchanged© 2017 Cengage Learning. All Rights Reserved. May not be copied, scanned, or duplicated, in whole or in part, except for use as
permitted in a license distributed with a certain product or service or otherwise on a password-protected website for classroom use.
14
What is the conclusion of the production
possibilities curve?
•Scarcity limits an economy to points on or below its production possibilities curve
© 2017 Cengage Learning. All Rights Reserved. May not be copied, scanned, or duplicated, in whole or in part, except for use as permitted in a license distributed with a certain product or service or otherwise on a password-protected website for
classroom use.
15
What are efficient points?
•Because all the points along the curve are maximum output levels with given resources and technology, they are called efficient points
© 2017 Cengage Learning. All Rights Reserved. May not be copied, scanned, or duplicated, in whole or in part, except for use as permitted in a license distributed with a certain product or service or otherwise on a password-protected website for classroom use.
16
What happens when we move between two
efficient points?•A movement between any two efficient points on the curve means that more of one product is produced only by producing less of the other product
© 2017 Cengage Learning. All Rights Reserved. May not be copied, scanned, or duplicated, in whole or in part, except for use as permitted in a license distributed with a certain product or service or otherwise on a password-protected website for classroom use.
17
A
Ou
tpu
t o
f m
ilit
ary
go
od
s
Output of consumer goods
Exhibit 2 Production Possibilities Curve
B
D
U
Inefficient
point
Z Unattainable
point
All points
on curve
are efficient
(billions of units per year)
(bil
lio
ns o
f u
nit
s p
er
year)
0 40 80 120100
160
20 60
C
PPC20
40
60
80
100
120
140
Attainable points
© 2017 Cengage Learning. All Rights Reserved. May not
be copied, scanned, or duplicated, in whole or in
part, except for use as permitted in a license
distributed with a certain product or service or
otherwise on a password-protected website for
classroom use.
Unattainable points

18
What is the law of increasing
opportunity costs?
•The principle that the opportunity cost increases as production of one output expands
© 2017 Cengage Learning. All Rights Reserved. May not be copied, scanned, or duplicated, in whole or in part, except for use as permitted in a license distributed with a certain product or service or otherwise on a password-
protected website for classroom use.

19
A
Sailboats
Exhibit 3 The Law of Increasing Opportunity Costs
B
D
(thousands of units per year)
0 20 40 60
80
10 30
C
PPC10
20
30
40
50
60
70
Tanks(thousands
per year)
50
© 2017 Cengage Learning. All Rights Reserved. May
not be copied, scanned, or duplicated, in whole or in
part, except for use as permitted in a license
distributed with a certain product or service or
otherwise on a password-protected website for
classroom use.

20
What iseconomic growth?
•The ability of an economy to produce greater levels of output, represented by an outward shift of its production possibilities curve.
© 2017 Cengage Learning. All Rights Reserved. May not be copied, scanned, or duplicated, in whole or in part, except for use as permitted in a license distributed with a certain product or service or otherwise on a password-protected website for classroom use.
21
What makes possible economic growth?
• Increase in resources
•Technological change
© 2017 Cengage Learning. All Rights Reserved. May not be copied, scanned, or duplicated, in whole or in part, except for use as permitted in a license distributed with a certain product or service or otherwise on a password-protected website for classroom use.

22
Technological
Advances
Economicgrowth
© 2017 Cengage Learning. All Rights Reserved. May not be copied, scanned, or duplicated, in whole or in part, except for use as permitted in a license distributed with a certain product or service or otherwise on a password-protected website for classroom use.
Increase in
Resources

23
Computers (thousands per
year)
Pizzas
Exhibit 4 An Outward Shift of the Production Possibilities Curve
A c
(millions per year)
200 400
40
B70
0 100 300 500
30
20
10
50
60
80
PPC1 PPC2
© 2017 Cengage Learning. All Rights Reserved. May not be
copied, scanned, or duplicated, in whole or in part, except for use as permitted in
a license distributed with a certain product or service or
otherwise on a password-protected website for
classroom use.
24
What happens when a country does not invest
in new technology?
•Everything else being equal, the country will not grow
© 2017 Cengage Learning. All Rights Reserved. May not be copied, scanned, or duplicated, in whole or in part, except for use as permitted in a license distributed with a certain product or service or otherwise on a password-protected website for classroom use.

25
What is investment?
•The accumulation of capital, such as factories, machines, and equipment, that is used to produce goods and services
© 2017 Cengage Learning. All Rights Reserved. May not be copied, scanned, or duplicated, in whole or in part, except for use as permitted in a license distributed with a certain product or service or otherwise on a password-protected website for classroom use.
26
What is the opportunity cost of
investment?
•A country must decide how to allocate its resources between producing capital goods and consumer goods
© 2017 Cengage Learning. All Rights Reserved. May not be copied, scanned, or duplicated, in whole or in part, except for use as permitted in a license distributed with a certain product or service or otherwise on a password-protected website for
classroom use.
27
What does producing capital exceeding the amount required to
replenish its depreciated capital?
•Economic growth and a higher standard of living
© 2017 Cengage Learning. All Rights Reserved. May not be copied, scanned, or duplicated, in whole or in part, except for use as permitted in a license distributed with a certain product or service or otherwise on a password-protected website for classroom use.
28
Exhibit 5 Alpha’s and Beta’s Present and Future
Production Possibilities Curves
Capital
goods
(quantity
per year)
(a) Low-investment country Alpha (b) High-investment country Beta
Consumer goods
(quantity per year)
Consumer goods
(quantity per year)
2000 and 2015 curve
A
A B
2015
curve
2000
curve
0 0
Ka
Ca
Kb
CbCc
Capital
goods
(quantity
per year)
© 2017 Cengage Learning. All Rights Reserved. May not be copied, scanned, or duplicated, in whole or in part, except for use as permitted in a license distributed with a certain product or service or otherwise on a password-protected website for classroom use.
29
What conclusion can we make about investments?
•A nation can accelerate growth by increasing production of capital goods in excess of the capital being worn out
© 2017 Cengage Learning. All Rights Reserved. May not be copied, scanned, or duplicated, in whole or in part, except for use as permitted in a license distributed with a certain

30
END
Microeconomics For Today 9th Edition Tucker Solutions ManualFull Download: http://testbanklive.com/download/microeconomics-for-today-9th-edition-tucker-solutions-manual/
Full download all chapters instantly please go to Solutions Manual, Test Bank site: testbanklive.com
Related Documents