Production of Energy from MSW 1.1. Introduction The start of civilization has seen the human race generating waste as bones and other parts of animals they slaughter for their food or the wood they cut to make their shelters , tools, carts etc. the advancement of civilization has witnessed the waste generation getting enhanced, and becoming more complex in nature. The beginning of industrial era has had enormous effects on the life style of people which have started changing with the availability of many consumer products and services in the market. The manufacturing and usage of vast range of products as well as management of the resulting waste give rise to emission of green house gases. This has led not only to the pollution of air and water but has affected the planet Earth through global warming. Rapid migration of rural populations to urban centers, in search of better opportunities of livelihood, has resulted in an over whelming demographic growth in many cities worldwide. The situation is more pronounced especially in Asia and Africa. The projected rate in North America is less because it has already recording the growth rate of > 70%. Also in Europe, the situation is similar. But in Africa and Asia, around 35% of the population presently is urban fig (1.1). Asian countries are experiencing an urban growth of approximately 4% per year. This growth rate is expected to continue for several more years, and by 2025, 52% of Asian population is likely to be living in urban centers. As in 1

Welcome message from author
This document is posted to help you gain knowledge. Please leave a comment to let me know what you think about it! Share it to your friends and learn new things together.
Transcript
Production of Energy from MSW
1.1. Introduction
The start of civilization has seen the human race generating
waste as bones and other parts of animals they slaughter for
their food or the wood they cut to make their shelters , tools,
carts etc. the advancement of civilization has witnessed the
waste generation getting enhanced, and becoming more complex in
nature. The beginning of industrial era has had enormous effects
on the life style of people which have started changing with the
availability of many consumer products and services in the
market. The manufacturing and usage of vast range of products as
well as management of the resulting waste give rise to emission
of green house gases. This has led not only to the pollution of
air and water but has affected the planet Earth through global
warming.
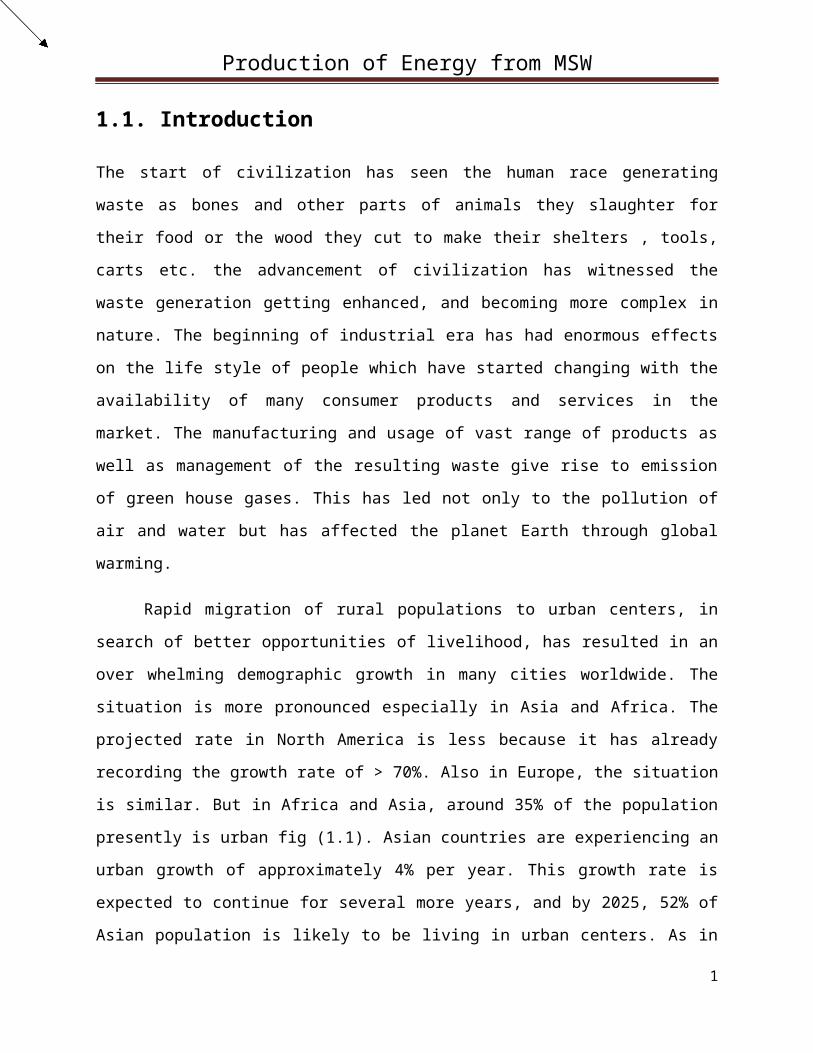
Rapid migration of rural populations to urban centers, in
search of better opportunities of livelihood, has resulted in an
over whelming demographic growth in many cities worldwide. The
situation is more pronounced especially in Asia and Africa. The
projected rate in North America is less because it has already
recording the growth rate of > 70%. Also in Europe, the situation
is similar. But in Africa and Asia, around 35% of the population
presently is urban fig (1.1). Asian countries are experiencing an
urban growth of approximately 4% per year. This growth rate is
expected to continue for several more years, and by 2025, 52% of
Asian population is likely to be living in urban centers. As in
1

Production of Energy from MSW
Asia, Africa’s population is mainly rural at present. However,
Africa is also experiencing a high rate of urbanization at 4-5%
per annum, and by 2025, urbanization is likely to be similar to
Asia. The high rate of urbanization can lead to serious
environmental degradation in and around several cities [1].
Figure 1.1: urban
growth rate [2]
Pakistan has an estimated 2.61% population growth rate per year[3], which is the highest in Asia. Today, Pakistan is the 6th most
populous country in the world with a population of approx. 180
million. By 2020, Pakistan’s population is expected to reach the
210 million mark - a situation that will burden its limited
resources making it difficult for the country to meet the
requirements of its people [4].
2
Production of Energy from MSW
This alarming growth rate is causing immense pressure on the
country’s resources. As the population of Pakistan is increasing
day by day, so the waste generated by them is also increasing day
by day. We must develop the alternative sources of energy like
the “energy from municipal solid wastes [4].
1.2. Waste and its types:
Waste (also known as rubbish. Trash, refuse, garbage, junk) is
any unwanted or useless materials. Or it may also be defined as
“any materials unused and rejected as worthless or unwanted” and
“a useless or profitless activity; using or expending or
consuming thoughtlessly or carelessly”. It may be solid waste,
liquid waste or gaseous waste.
1.2.1. Solid Waste
It is defined as “Non-liquid, non soluble materials ranging from
municipal garbage to industrial wastes that contain complex and
sometimes hazardous substances”. It may include sewage sludge,
Demolition& construction wastes, ashes, industrial waste, medical
waste, dead animal and agriculture refuse [5].
1.2.2. Domestic wastes
3

Production of Energy from MSW
Are generated by household activities such as cooking, cleaning,
repairs, interior decoration, and used products/ materials such
as empty glass/ plastic/ metal containers, packing stuff,
clothing, old books, newspapers, old furnishings, etc. commercial
wastes are the waste generated in offices, whole sale stores,
shops, restaurants and hotels, vegetable, fish and meat markets,
warehouses and other commercial establishments. Institutional
wastes are generated from institutions such as schools, colleges,
hospitals, research institutions. The waste includes mostly
paper, cardboards etc, and hazardous wastes. Municipal wastes are
wastes generated due to municipal services such as street
sweeping, and dead animals, market waste and abandoned vehicles
or parts; also includes already mentioned domestic wastes,
institutional wastes and commercial wastes. Garbage includes
animals and vegetable wastes due to various activities like
storage, preparation and sale, cooking and serving; theses are
biodegradable [1].
1.2.3. Ashes
Residues from the burning of wood, charcoal, coke for coking and
the heating in the houses, institutions and small industries.
Ashes consist of fine powders, cinders and clinker often mixed
with small pieces of metal and glass.
1.2.4. Rubbish
4
Production of Energy from MSW
Apart from garbage and ashes, other solid wastes produced in
households, commercial establishments, and institutions.
1.2.5. Bulky wastes
Bulky wastes are large household appliances such as cookers,
refrigerators and washing machines as well as furniture, crates,
vehicle parts, tyres, wood, trees and branches. The bulky
metallic wastes are sold as scrap metal but some portion is
disposed as sanitary landfills.
1.2.6. Street wastes
Street wastes include paper, cardboard, plastic, dirt, dust,
leaves and other vegetable matter collected from streets,
walkways, alleys, parks and vacant plots. Municipal waste
includes street waste also.
1.2.7. Dead animals
It includes animals that die naturally or killed by accident. It
does not include carcass and animals parts from slaughterhouses
as they are considered as industrial wastes.
1.2.8. Construction and demolition wastes
Some quantities of the major components of the construction
materials such as cement, bricks, cement plaster, steel, rubber,
5
Production of Energy from MSW
stone, timber, plastic and iron pipes are left out as waste
during construction as well as demolition. About 50% of the waste
is not currently recycled and 70% of the construction industry is
not aware of recycling techniques.
1.2.9. Industrial wastes
These are non-hazardous solid material discarded from
manufacturing processes and industrial operations, and are not
considered as municipal wastes. However, solid wastes from small
industrial plants and ash from power plants are frequently
disposed of at municipal landfills [1].
Similarly, the industrial waste is made up of a wide variety
of non-hazardous materials that result from the productions of
goods and products. Commercial and institutional, or industrial
waste is often a significant portion of municipal solid waste,
even in small cities and suburbs.
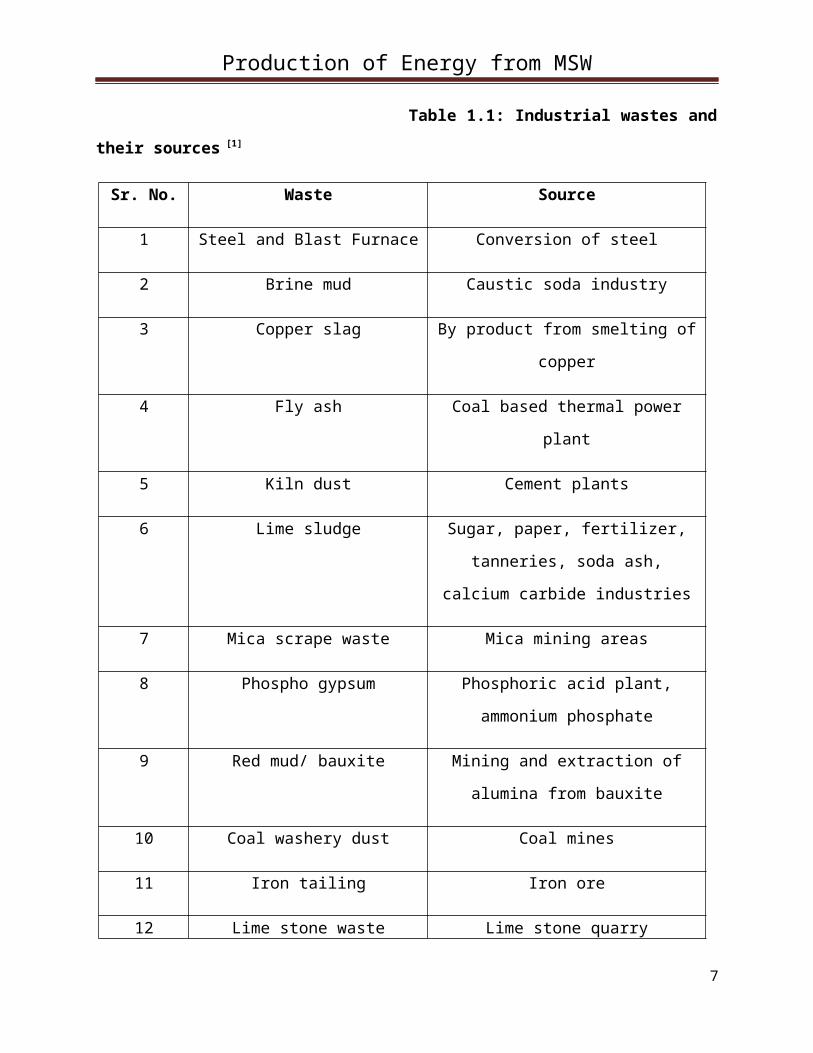
Some of the wastes referred to as Special wastes include (i)
Cement kiln dust, (ii) Mining waste, (iii) Oil and gas drilling
mud and oil production brines, (iv) Phosphate rock mining,
beneficiation, and processing waste, (v) Uranium waste, and (vi)
Utility waste(i.e., fossil fuel combustion waste). These are
generated in large volumes and are believed to cause less risk to
human health and the environment than the wastes specified as
hazardous waste [1]. The table shows the major industrial wastes
and their sources in Pakistan:
6
Production of Energy from MSW
Table 1.1: Industrial wastes and
their sources [1]
Sr. No. Waste Source
1 Steel and Blast Furnace Conversion of steel
2 Brine mud Caustic soda industry
3 Copper slag By product from smelting of
copper
4 Fly ash Coal based thermal power
plant
5 Kiln dust Cement plants
6 Lime sludge Sugar, paper, fertilizer,
tanneries, soda ash,
calcium carbide industries
7 Mica scrape waste Mica mining areas
8 Phospho gypsum Phosphoric acid plant,
ammonium phosphate
9 Red mud/ bauxite Mining and extraction of
alumina from bauxite
10 Coal washery dust Coal mines
11 Iron tailing Iron ore
12 Lime stone waste Lime stone quarry
7

Production of Energy from MSW
Beside these, industrial waste water discharge from industries in
the country has been estimated at 6.25(in 2010) to a projected
value of 12.50 million cubic meters/ annum (in 2025). A combined
pollution load(BOD, COD & TDS) in waste water discharged to
inland water bodies has been estimated at 28.6 (in 2010) to a
projected value of 58.6 million tons/annum [6]. Degradation of
water quality, both for human consumption and irrigation, due to
industrial waste water discharge with high pollution load and its
resulting impacts on public health and environment are most
obvious. In a recent SDPI survey of 38 polluted sites in the
country, it was shocking to observe, waste water from industrial
estates and industrial units being discharged into agriculture
fields most for cash crops but also in the few, for food crops
and vegetables, both on large and small scale [7]. Water and soil
are known and well established pathways for toxic chemicals
(metals non metals & organics) getting into food chain and
ultimately into human bodies, besides, to a lesser extent through
air.
1.2.10. Medical waste (or Hospital waste)
It refers to the waste materials generated at health care
facilities, such as hospitals, clinics, physician’s offices,
dental practices, blood banks, and veterinary hospitals/clinics,
as well as medical research facilities and laboratories. The
8
Production of Energy from MSW
medical waste is defined as “any solid waste that is generated in
the diagnosis, treatment, or immunization of human beings or
animals, in related research, or in the production or testing of
biological.” For example, the following trash constitutes medical
waste: blood soaked bandages, culture dishes and other glassware,
discarded surgical gloves, discarded surgical instruments,
discarded needles used to give shots or draw blood, cultures,
stocks, swabs used to inoculate cultures, removed body organs
(e.g., tonsils, appendices, limbs), and discarded lancets.
Several health hazards are associated with poor management of
medical wastes like injury from sharps to staff and waste
handlers associated with health care establishments, Hospital
Acquired Infection (HAI) of patients due to spread of infection,
and Occupational risk associated with hazardous chemicals, drugs,
unauthorized repackaging and sale of disposable items and
unused/date expired drugs. This waste is highly infectious and
can be a serious threat to human health if not managed in a
scientific manner. It has been roughly estimated that of the 4 kg
of waste generated in a hospital at least 1 kg would be infected[1].
Around 250,000 tons of medical waste is annually produced from
all sorts of health care facilities in the country, revealed
Sikandar K Sherwani, a lecturer of microbiology at the Federal
Urdu University [8].
1.2.11. Hazardous waste
9
Production of Energy from MSW
The waste that is dangerous or potentially harmful to human
health or the environment is called hazardous waste which can be
in the form of liquids, solids, gases, or sludge. The discarded
commercial products like cleaning fluids or pesticides, or the
by-products of manufacturing processes can also be hazardous [1].
This hazardous waste may include the medical waste, some
industrial waste and other is the agricultural waste, which
mostly include pesticides. According a study conducted by GTZ on
“inventory of obsolete pesticides in Punjab, Sindh and
Baluchistan” by Mr. wolfgang A Schimpf, it has been estimated
that the stocks of outdated pesticides lying in Pakistan is
between 1,000 to 1,500 tons [3].
1.2.12. E-wasteElectronic waste or e-waste is referred to the end-of-life
electronic and telecommunication equipment and consumer
electronic to be specific, computers, laptops, television sets
DVD players, mobile phones etc, which are to be disposed. UN
estimates that between 20 and 60 million tons of e-waste are
generated worldwide every year at approximately 12 million tons
of this comes from Asian countries.
E-waste is the fastest growing segment of MSW streamed e-
waste equals 1% of solid waste on average in developed countries
which grew to 2% by 2010. In developing countries, e-waste is
0.01% to 1% of the total solid waste. Globally, computer sales
continue to grow at > 10% rates annually. Sales of DVD players
10

Production of Energy from MSW
are doubling year over year. As a result a high percentage of
electronics are ending up in the waste stream releasing dangerous
toxins into the environment. These are a division of WEEE (Waste
Electrical and Electronic Equipment). The categories under WEEE
are: large household appliances, small appliances, IT and
telecommunication equipment, electrical and electronic tools,
medical devices. Monitoring and control instruments and so on.
Most of the equipment is made of components, some of which
contain toxic substances. If proper processing and disposal
methods are not followed, these substances affect human health as
well as the environment. For example, cathode rays tube contains
large amounts of carcinogens such as lead, barium, phosphorus and
other heavy metals. If they are broken or disposed in an
uncontrollable manner without taking safety precautions, it can
result in harmful effects for the workers, and pollute the soil,
air and ground water by releasing toxins. Special care is
warranted during recycling and land filling of e-waste as they
are prone to hazards [1].
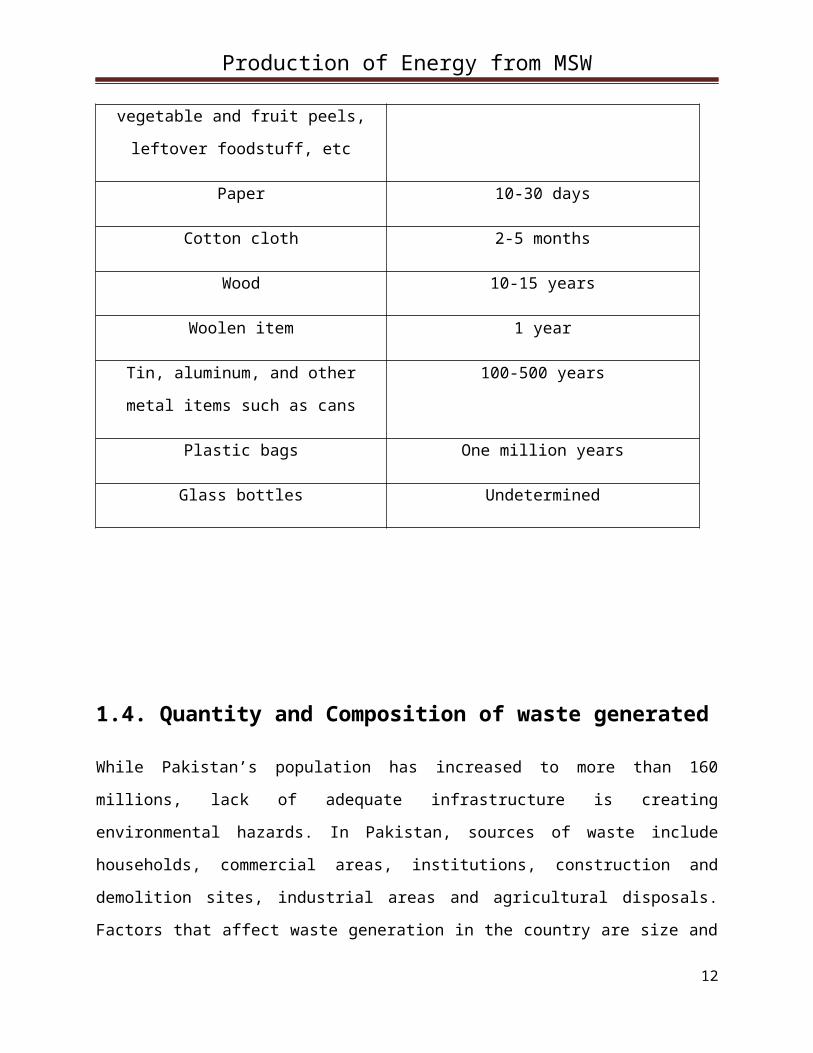
1.3. Degradation time for some daily wastes
Table 1.2: wastes and their time
to degenerate [5]
Type of wastes Approximate time it takes to
degenerate
Organic waste such as A week or two
11
Production of Energy from MSW
vegetable and fruit peels,
leftover foodstuff, etc
Paper 10-30 days
Cotton cloth 2-5 months
Wood 10-15 years
Woolen item 1 year
Tin, aluminum, and other
metal items such as cans
100-500 years
Plastic bags One million years
Glass bottles Undetermined
1.4. Quantity and Composition of waste generated
While Pakistan’s population has increased to more than 160
millions, lack of adequate infrastructure is creating
environmental hazards. In Pakistan, sources of waste include
households, commercial areas, institutions, construction and
demolition sites, industrial areas and agricultural disposals.
Factors that affect waste generation in the country are size and
12
Production of Energy from MSW
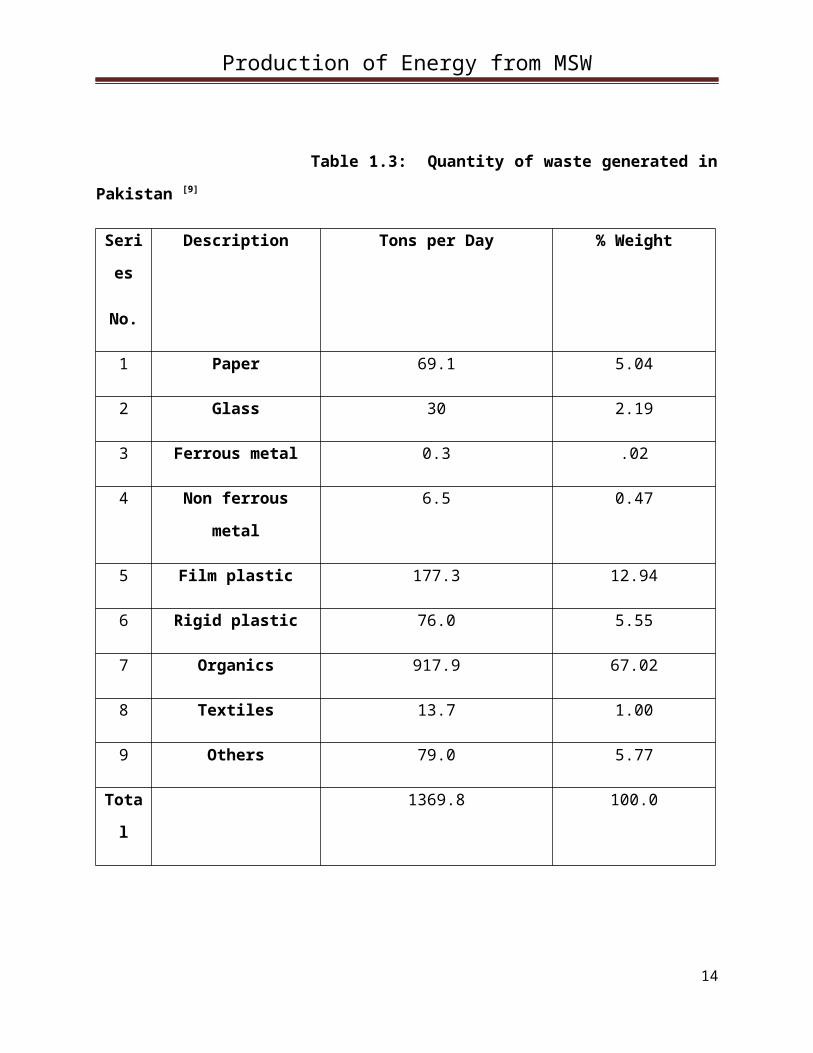
type of the community and level of communities ‘income. Solid
waste generated mostly ends up in empty plots, place of
generation, in drains causing blockage in sewage system or on
road sides. Composition of solid waste generally comprises of
plastic and rubber, metal, paper and cardboard, textile waste,
glass, food waste, animal waste, leaves, grass, straws, fodder,
bones, wood and stones, as shown in the table below. Apart from
this, substantial amount of hospital waste is also produced in
the country [9].
13
Production of Energy from MSW
Table 1.3: Quantity of waste generated in
Pakistan [9]
Seri
es
No.
Description Tons per Day % Weight
1 Paper 69.1 5.04
2 Glass 30 2.19
3 Ferrous metal 0.3 .02
4 Non ferrous
metal
6.5 0.47
5 Film plastic 177.3 12.94
6 Rigid plastic 76.0 5.55
7 Organics 917.9 67.02
8 Textiles 13.7 1.00
9 Others 79.0 5.77
Tota
l
1369.8 100.0
14

Production of Energy from MSW
According to various studies conducted on waste management in the
country, about 54,888 tons of solid waste is generated daily in
urban areas of Pakistan and 60% of it is collected by municipal
authorities. However, according to official estimates, 30% to 50%
of solid waste generated within most cities is not collected [3].
The amount of waste generated strongly depends on the level
of consumption and lifestyle besides population. That in Pakistan
shows a particular trend that increases in waste generation has
occurred in accordance with the city’s social and economic
development (JICA, 2005:2008). The Ministry of Environment and
Urban Affairs Division, Government of Pakistan (1996) Revealed
that the average rate of waste generation from municipalities
varies from 0.283kg/capita/day to 0.613 kg/capita/day or from
1.896 kg/capita/day to 4.29 kg/capita/day in all selected cities
from Sibi to Karachi. In related to nine cities, the average of
waste generation from nine cities ranges from 115 ton/day of DG
Khan to 5000 ton/day of Lahore [9] as shown in the figure below:
15
Production of Energy from MSW
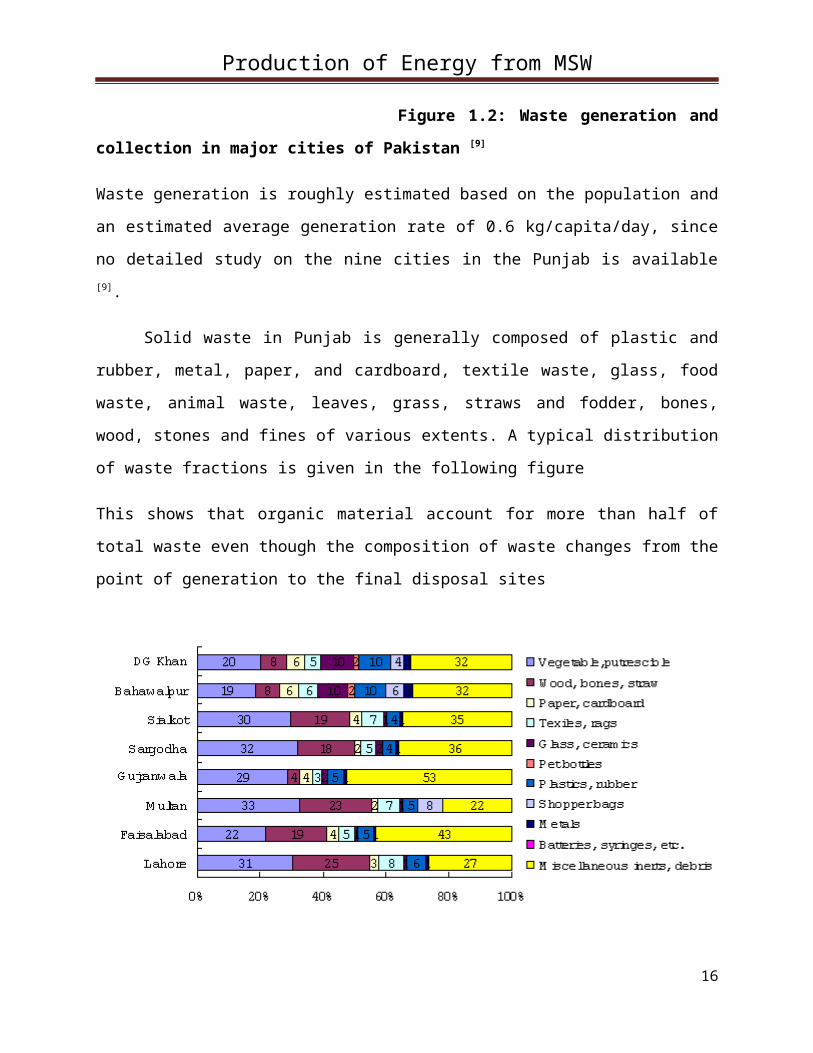
Figure 1.2: Waste generation and
collection in major cities of Pakistan [9]
Waste generation is roughly estimated based on the population and
an estimated average generation rate of 0.6 kg/capita/day, since
no detailed study on the nine cities in the Punjab is available[9].
Solid waste in Punjab is generally composed of plastic and
rubber, metal, paper, and cardboard, textile waste, glass, food
waste, animal waste, leaves, grass, straws and fodder, bones,
wood, stones and fines of various extents. A typical distribution
of waste fractions is given in the following figure
This shows that organic material account for more than half of
total waste even though the composition of waste changes from the
point of generation to the final disposal sites
16
Production of Energy from MSW
Figure 1.3: Composition of waste in major
cities of Pakistan [9]
1.5. Municipal Waste Collection Services
The responsibility of solid waste management rests basically with
the municipalities. Traditionally, in Pakistan’s large cities,
the local Government collects waste from households in middle to
high-income areas and is in charge of street sweeping. Solid
waste collection services by the government in Punjab’s cities
averages only 50 percent of waste generated: however, for cities
to be relatively clean, at least 75% of these quantities should
be collected. The uncollected waste remains on street or road
corners, open spaces and vacant plots, etc., polluting the
environment continuously. The rate and amount of the waste
collected in all the selected cities are given in the following
table (JICA, 2005: 11-12). The available fleet for the waste
collection and transport typically is composed of handcarts,
donkeys and bulla carts for primary collection; and open trucks,
tractors/trolleys systems, arm roll containers/trucks for the
secondary collection and transport. A number of municipalities
have hired the sweepers and sanitary workers. Workers collect the
solid waste from small heaps and dustbins with the help of heel
borrow and brooms and store it at formal and informal depots and
then carry out the sweeping of the streets and roads. The
proportion of the waste collected is much less in many other
areas of the country, particularly in poorer areas, where the
17

Production of Energy from MSW
only means of solid waste disposal is often informal scavenging
by people and animals, local self-help for the disposal to
informal (technical illegal)dumping sites [9].
1.6. Solid waste management
4R’s (recycle, refuse, reuse and reduce) has to be followed for
the solid waste management.
Refuse: Instead of buying new containers from the market, use the
ones that are in the house. Refuse to buy the new items though
you may think they are prettier than the ones you already have.
Reuse: Do not through away the soft drink cans and bottles; cover them with homemade paper or paint on them and use them as
pencil stand or as small vases.
Recycle: Use the shopping bags which are made of cloth or jute, which can be used over and over again.
Reduce: Reduce the generation of unnecessary waste. E.g. carry your own shopping bag when you go to the market and put all your
purchase into it [5].
1.7. Waste management in Pakistan
Before promulgation of the local government in 2001, the
provincial Public Health Engineering Department (PHED) was
responsible for the development and maintenance of water and
sanitation services including solid waste management. Under the
18
Production of Energy from MSW
recently prevailing system of local government, it is the
responsibility of Town/Tehsil Municipal Administration (TMAs);
however the sighting of disposal facilities is primarily the
function of Zila Council. Paid sanitary workers are employed by
TMAs to sweep the streets and collect the trash at a specified
place from where it is taken to the dumping site by ht municipal
carrier.
In addition to these there are some private entrepreneurs
who have entered the field. Private sector is involved in waste
management activities in the country may be divided into formal
and informal categories. The formal sector consists of govt.
organization and non government organization (NGOs). The informal
sector is significant in size as it consists of thousands of
itinerant traders (called kabarias or kabari-wallas) spread
throughout the cities who are engaged in collection of waste
material of different kinds.
Private sector firms have initiated projects based on
organic and in-organic waste management. Organic waste is used to
produce organic fertilizer. Inorganic waste is first sorted into
paper, plastic, tin, etc, and it is then sold to respective
industries where it is recycled to make products such as; Plastic
Wood and Tetra Sheets. Unplanned urbanization, poor sanitation
and drainage system, inadequate human and capital resources for
collecting waste, unavailability of official dumping sites,
absence of weigh bridges for exact measurement of waste coming at
19
Production of Energy from MSW
sites, and almost negligible presence of recycling processes have
negatively impacted waste management in the country.
In Pakistan there is immense potential to convert waste into
resources for the economy. In this regard, some NGOs and private
firms have already stepped into the industry. These organizations
collect waste and reprocess it to produce fertilizers, plastic
bottles, and tetra packs. A private firm has established a
recycling facility in Lahore where it is engaged to produce
refuse-derived fuel (RDF) based on the concept of waste to
energy. Similarly an NGO in Karachi encourages people to sell
their waste to them and prepares soil conditioning fertilizer.
Thus the government of Pakistan is aware of the role of waste
management industry. However there is a need of more pro-active
approach, likely to be based on public private partnership to
help this industry provide a cleaner environment while adding
value to economy [10].
1.8. Solid waste recycling
In fact, presently none of the municipalities have formal
recycling systems in place. The mostly informal classification
activities take place at various step of the cycle, from the
source to the disposal site. What happens normally is that the
main recyclable items such as paper, plastic, glass and metals
are retained by the people themselves, which are later sold to
stree hawkers or waste dealers for recycling. The recyclable
20

Production of Energy from MSW
mixed with discharged waste are picked up by the scavengers who
make trips to two to three different dumps and earn approximately
Rs to 200/day. As a whole, however, according to estimates the
amount of recyclable waste varies from 1000 tones/year in sibi to
513743 tons/year in Karachi. The city-wise potential for the
waste recycling is given in the following table (JICA, 2005: 12)[9].
1.9. Solid waste treatment
Besides there being a great number of illegal dumping sites at
any open space, the “official” disposal sites are far from being
acceptable from an environment point of view. Delivered garbage
is dumped without any base protection from potential leachate
infiltration into ground water; leach ate collection and
treatment nor collection and control or gas evacuation/ flaring
system- those being the minimum requirements for an acceptable
practice. The presence of waste pickers on the sites is hindering
a more efficient operation of them and is critical from a public
health perspective (IP: 14-5).
Treatment and disposal technologies such as sanitary land
filling, composting and incineration are comparatively new
concepts in Pakistan. Open dumping is the most common practice
throughout Pakistan and dumpsites are commonly set on fire to
reduce the volume of accumulating waste, hence adding to the air
pollution caused by the uncovered dumped waste itself. The
21
Production of Energy from MSW
practice of sanitary land fling is still in its infancy in
Pakistan and the first site has yet to be developed. At present,
there is no landfill regulation or standards that provide a basis
for compliance and monitoring, but national guidelines for these
standards are being prepared by the consultant under the National
Environmental Action Plan Support Program (NEAPSP) [9].
1.10. Legal and institutional framework
regarding Solid Waste Management in Pakistan
Presently the legal rules and regulations dealing with solid
waste management in Pakistan are as follows:
Current
Section 11 of Pakistan Environmental Protection Act
prohibits discharge of waste in an amount or concentration
that violates the National Environmental Quality Standards.
Draft Hazardous Substances Rules of 1999.
Islamabad Capital Territory Bye Laws, 1986 by Capital
Development Authority Islamabad.
Section 132 of the Cantonment Act 1924 deals with Deposits
and disposals of rubbish etc.
Provision contained in the Local Government Ordinance, 2001
Required
The rules and guidelines that are yet to be introduced include:
22

Production of Energy from MSW
Basic Recycling rules
Waste Management rules
E-waste Management rules
Development of Environmental Performance Indicators (EPI)
Eco-Labeling guidelines Assessment Approaches
Guidelines for Environmentally Sound Collections and
Disposal
Guidelines for model landfill site [11].
2.1. Waste to energy
23
Production of Energy from MSW
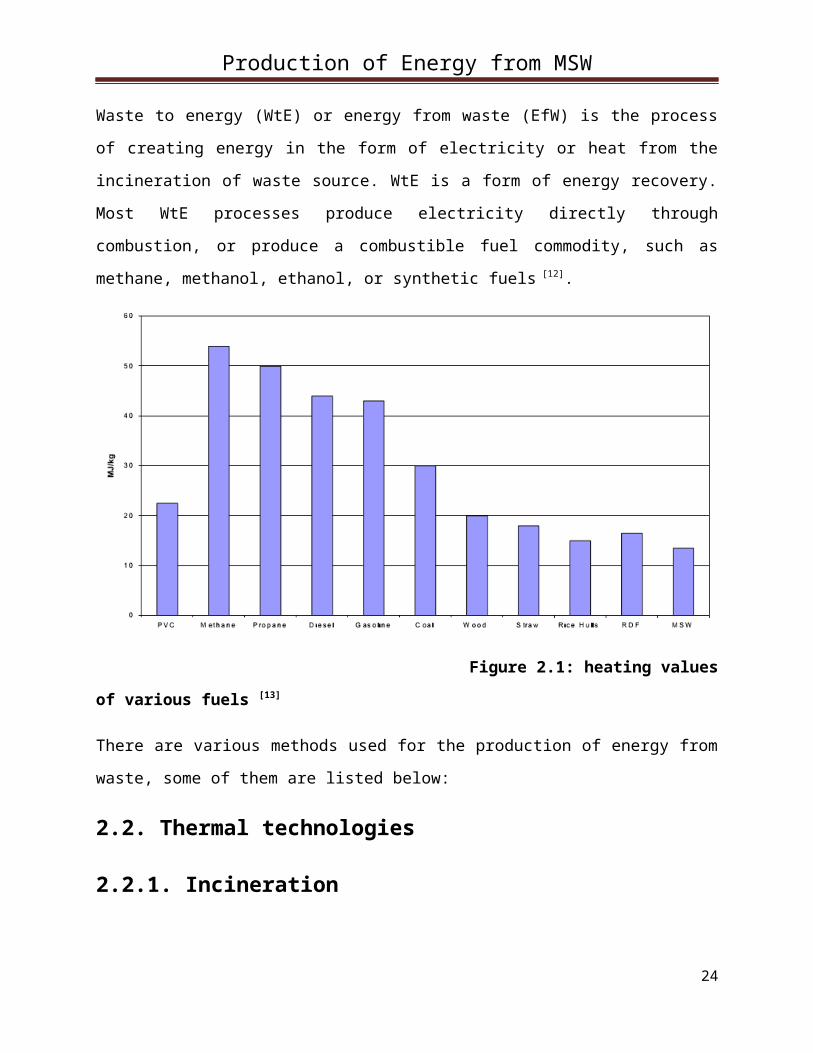
Waste to energy (WtE) or energy from waste (EfW) is the process
of creating energy in the form of electricity or heat from the
incineration of waste source. WtE is a form of energy recovery.
Most WtE processes produce electricity directly through
combustion, or produce a combustible fuel commodity, such as
methane, methanol, ethanol, or synthetic fuels [12].
Figure 2.1: heating values
of various fuels [13]
There are various methods used for the production of energy from
waste, some of them are listed below:
2.2. Thermal technologies
2.2.1. Incineration
24
Production of Energy from MSW
Incineration, the combustion of organic material such as waste
with energy recovery is the most common WtE implementation. All
new WtE plants in developing countries must meet strict emission
standards including those on nitrogen oxides (NO), sulpher
dioxide (SO2), heavy metals and dioxins[14][15]. Hence modern
incineration plants are very vastly different from the old types,
some of which neither recovered energy nor materials. Modern
incinerators reduce the volume of the original waste by 95-96 %,
depending upon composition and degree of recovery of materials
such as metals from the ash for recycling [16].
Concerns regarding the operation of incinerators include
fine particulate, heavy metals, trace dioxin and acid gas
emissions, even through these emissions are relatively low [17]
from modern incinerators. Other concerns include toxic fly ash
and incinerators bottom ash (IBA) management [18]. Discussions
regarding waste resource ethics include the opinion that
incinerators destroy valuable resources and the fear that they
may reduce the incentives for recycling and waste minimization
activities. This is open to question, however, as the Refuse
Derived Fuel (RDF) is produce by recycling centres (MRFs), which
make their money from selling on recoverable material, and the
name Residue Derived Fuel (RDF) even suggests that it’s made from
what’s left over, not the materials being pulled out. It is not
in the interests of the MRF operators to give away for free the
very materials they could otherwise sell. Incinerators have
electric efficiencies on the order of 14-28%. The rest of the25

Production of Energy from MSW
energy can be utilized for e.g. district heating, but is
otherwise lost as waste heat.
The method of using incineration to convert municipal solid
waste (MSW) to energy is relatively old method of waste to energy
production. Incineration generally entails burning an RDF to boil
water which powers steam generators that make electric energy to
be used in our homes and businesses. One problem associated with
incinerating MSW to make electrical energy, is the potential for
pollutants to enter the atmosphere with the flue gases from
boiler. Theses pollutants can be acidic and in the 1980s were
reported to cause environmental damage by turning rain into
acidic rain. Since then, the industry has removed the problem by
the use of lime scrubbers and electro-static precipitators on
smokestacks. The limestone mineral used in these scrubbers has a
Ph of approximately 8 which means it is a base. By passing the
smoke through the lime scrubbers, any acids that may be in the
smoke are neutralized which prevents the acid from reaching the
atmosphere and hunting our environment [19].
2.2.2. Pyrolysis
26

Production of Energy from MSW
Pyrolysis is a thermochemical decomposition of organic material
at elevated temperatures without the participation of oxygen. It
involves the simultaneous change of chemical composition and
physical phase, and is irreversible. The word is coined from the
Greek derived elements pyr “fire” and lysis “separating”.
Pyrolysis is a case of thermolysis, and is most commonly
used for organic materials, being, therefore, one of the
processes involved in charring. The pyrolysis of wood which
starts at 200-300 degree C, [20] occurs for example in fires where
solid fuels are burning or when vegetation comes into contact
with lava in volcanic eruption. In general, pyrolysis of organic
substances produces gas and liquid products and leaves mostly
carbon as the residue, is called carbonization.
The process is used heavily in the chemical industry, for
example, to produce charcoal, activated carbon, methanol and
other chemicals from wood, to convert ethylene dichloride into
vinyl chloride to make PVC, to produce coke from coal, to convert
biomass into syngas and biochar to turn waste into safely
disposable substances, and for transforming medium weight
hydrocarbons from oil into lighter ones like gasoline. These
specialized uses of pyrolysis may be called various names, such
as dry distillation, destructive distillation or cracking.
27

Production of Energy from MSW
Figure 2.2: Simplified depiction
of pyrolysis chemistry [20].
Pyrolysis also plays an important role in several cooking
procedures, such as baking, frying, grilling and caramelizing. In
addition, it is a tool of chemical analysis, for example, in mass
spectrometry and in carbon-14 dating. Indeed many important
chemical substances, such as phosphorous and sulfuric acid, were
first obtained by this process. Pyrolysis has been assumed to
take place during pyrography. In their embalming process, the
ancient Egyptians used a mixture of substances, including
methanol, which they obtained from the pyrolysis of wood.
Pyrolysis differs from other high-temperature processes like
combustion and hydrolysis in that it usually does not involve
reactions with oxygen, water, or any other reagents. In practice,
it is not possible to achieve a completely oxygen-free
atmosphere. Because some oxygen is present in any pyrolysis
system, a small amount of oxidation occurs.
28
Production of Energy from MSW
The term has also been applied to the decomposition of
organic material in the presence of superheated water or steam
(hydrous pyrolysis), for example, in the steam cracking of oil[20].
2.2.3. Plasma gasification
It is a process to convert organic matter into syngas by using
plasma processing. Plasma gasification technologies use an
electric arc gasifier (plasma torch) to create a high-temperature
ionized gas which breaks organic matter primarily into syngas and
solid waste (slag) [21][22][23][24] in a controlled vessel (plasma
converter-either furnace or reactor). Its main use is as a waste
treatment technology as it allows full decomposition and
disintegration of organic components; however, it is also tested
for the biomass and solid hydrocarbons, such as coal, oil shale[25], gasification. The process is intended to be a net generator
of electricity, depending upon the composition of input wastes,
and to reduce the volumes of waste being sent to landfill sites[26].
A plasma torch uses inert gases (steam) and metal electrodes
(copper, tungsten, hafnium, zirconium, etc.). Relatively high
voltage, high current electricity is passed between two
electrodes, spaced apart, creating an electrical arc. Pressurized
inert gas is ionized when passing through the arc creating
plasma. The temperature of the plasma torch can be in the range
29
Production of Energy from MSW
4000-25000 degree Fahrenheit; [27] at these temperatures molecular
bond break down into basic elemental components in a gaseous
from, and complex molecules are separated into individual atoms.
This process is called molecular dissociation and molecular
dissociation using plasma is called plasma pyrolysis.
2.2.4. Thermal depolymerization
Thermal depolymerization (TDP) is a deploymerization process
using hydrous pyrolysis for the reduction of complex organic
materials (usually waste products of various sorts, often biomass
and plastic) into light crude oil. It mimics the natural
geological processes thought to be involved in the production of
fossil fuels. Under pressure and heat, long chain polymers of
hydrogen, oxygen, and carbon decompose into short-chain petroleum
hydrocarbons with a maximum length of around 18 carbons.
Thermal depolymerization is similar to other processes which use
superheated water as a major step to produce fuels, such as
direct hydrothermal liquefaction [28].
2.3. Non thermal technologies
2.3.1. Anaerobic digestion
It is a three step process as given below:
Hydrolysis
30

Production of Energy from MSW
In the first step (hydrolysis), the organic matter is enzymolyzed
externally by extracellular enzymes (cellulase, amylase, protease
and lipase) of microorganisms. Bacteria decompose the long chains
of the complex carbohydrates, proteins and lipids into shorter
parts. For example, polysaccharides are converted into
monosaccharaides. Proteins are split into peptides and amino
acids.
Acidification
Acid-producing bacteria, involved in the second step, convert the
intermediates of fermenting bacteria into acetic acid (CH3COOH),
hydrogen (H2) and carbon dioxide (CO2). These bacteria are
facultatively anaerobic and can grow under acid conditions. To
produce acetic acid, they need oxygen and carbon. For this, they
use the oxygen dissolved in the solution or bounded-oxygen.
Hereby, the acid-producing bacteria create an anaerobic condition
which is essential for the methane producing microorganisms.
Moreover, they reduce the compounds with a low molecular weight
into alcohols, organic acids, amino acids, carbon dioxide,
hydrogen sulphide and traces of methane. From a chemical
standpoint, this process is partially endergonic (i.e. only
possible with energy input), since bacteria alone are not capable
of sustaining that type of reaction
Methane formation
31

Production of Energy from MSW
Methane-producing bacteria, involved in the third step, decompose
compounds with a low molecular weight. For example, they utilize
hydrogen, carbon dioxide and acetic acid to form methane and
carbon dioxide.
Under natural conditions, methane producing microorganisms
occur to the extent that anaerobic conditions are provided, e.g.
under water (for example in marine sediments), in ruminant
stomachs and in marshes. They are obligatory anaerobic and very
sensitive to environmental changes. In contrast to the acidogenic
and acetogenic bacteria, the methanogenic bacteria belong to the
archaebacter genus, i.e. to a group of bacteria with a very
heterogeneous morphology and a number of common biochemical and
molecular-biological properties that distinguish them from all
other bacterial general. The main difference lies in the makeup
of the bacteria’s cell walls
It is used as a part of the process to treat biodegradable
waste and sewage sludge. As part of an integrated waste
management system, anaerobic digestion reduces the emission of
landfill gas into atmosphere. Anaerobic digesters can also be fed
with purpose-grown energy crops, such as maize [29].
32
Production of Energy from MSW
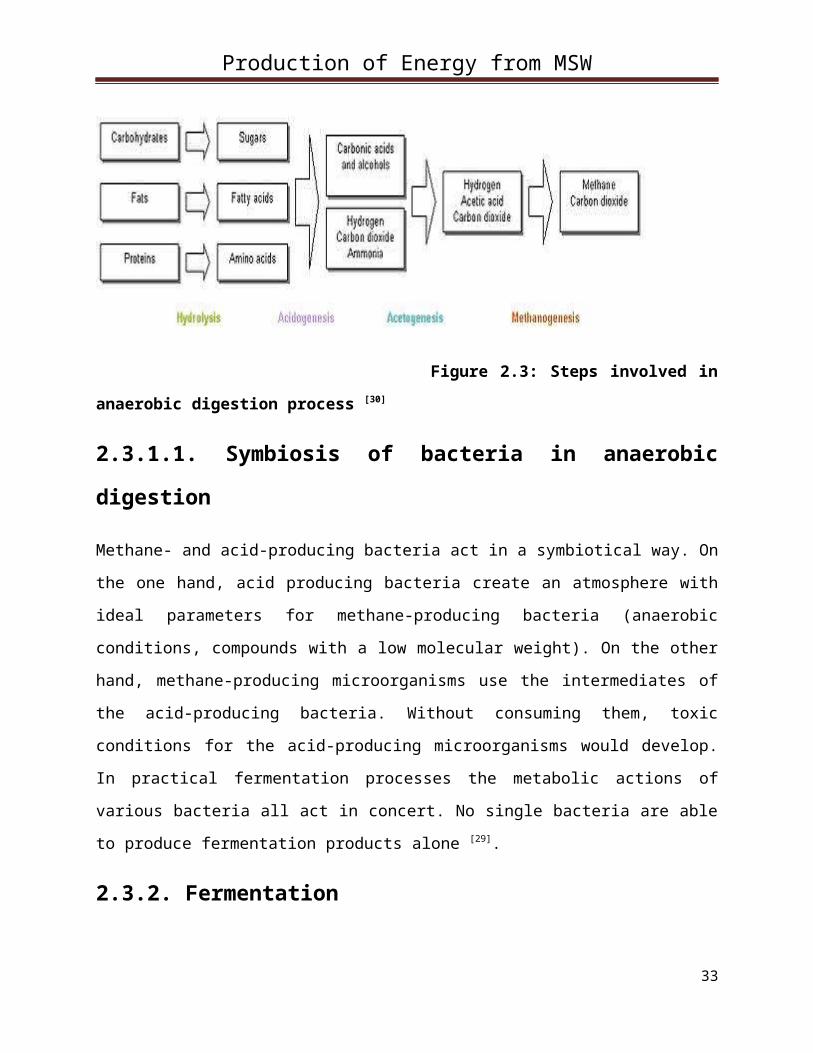
Figure 2.3: Steps involved in
anaerobic digestion process [30]
2.3.1.1. Symbiosis of bacteria in anaerobic
digestion
Methane- and acid-producing bacteria act in a symbiotical way. On
the one hand, acid producing bacteria create an atmosphere with
ideal parameters for methane-producing bacteria (anaerobic
conditions, compounds with a low molecular weight). On the other
hand, methane-producing microorganisms use the intermediates of
the acid-producing bacteria. Without consuming them, toxic
conditions for the acid-producing microorganisms would develop.
In practical fermentation processes the metabolic actions of
various bacteria all act in concert. No single bacteria are able
to produce fermentation products alone [29].
2.3.2. Fermentation
33
Production of Energy from MSW
Fermentation is the process of extracting energy from the
oxidation of organic compounds, such as carbohydrates [31], using
an endogenous electron acceptor, which is usually an organic
compound. In contrast, respiration is where electrons are denoted
to an exogenous electron acceptor, such as oxygen, via an
electron transport chain. Fermentation is important in an
anaerobic condition when there is no oxidative phosphorylation to
maintain the production of ATP (adenosine triphosphate) by
glycolysis.
During fermentation, pyruvate is metabolized to various
compounds. Homolactic fermentation is the production of lactic
acid from pyruvate; alcoholic fermentation is the conversion of
pyruvate into ethanol and carbon dioxide; and heterolactic
fermentation is the production of lactic acid as well as other
acids and alcohols. Fermentation does not necessarily have to be
carried in an anaerobic environment. For example, even in the
presence of abundant oxygen, yeast cells greatly prefer
fermentation to oxidative phosphorylation, as long as sugars are
readily available for consumption (a phenomenon known as the
crabtree effect) [32].
Sugars ate the most common substrate of fermentation, and
typical examples of fermentation products are ethanol, lactic
acid, lactose, and hydrogen. However, more exotic compounds can
be produced by fermentation, such as butyric acid and acetone.
Yeast carries out fermentation in the production of ethanol in
34

Production of Energy from MSW
beers, wines, and other alcoholic drinks, along with the
production of large quantities of carbon dioxide. Fermentation
occurs in mammalian muscles during periods of intense exercise
where oxygen supply becomes limited, resulting in the creation of
lactic acid [33].
2.3.3. Mechanical biological treatment (MBT)
A mechanical biological treatment system is a type of waste
processing facility that combines a sorting facility with a form
of biological treatment such as composting or anaerobic
digestion. MBT plants are designed to process mixed household
waste as well as commercial and industrial wastes [34][35].
Figure 2.3: Mechanical
biological treatment of waste [34]
35
Production of Energy from MSW
2.3.4. Refused-derived fuel (RDF)
Refuse derived fuel (RDF) or solid recovered fuel/ specified
recovered fuel (SRF) is a fuel produced by shredding and
dehydrating solid waste (MSW) with a waste converter technology.
RDF consists largely of combustible components of municipal waste
such as plastic and biogradable waste RDF processing facilities
are normally located near a source of MSW and, while an optional
combustion facility is normally close to the processing facility,
it may also located at a remote location [36].
36
Production of Energy from MSW
3.1. GASIFICATION PROCESS
Gasification processes involve the reaction of carbonaceous
feedstock with an oxygen-containing reagent, usually oxygen, air,
steam or carbon dioxide, generally at temperatures in excess of
800°C. It involves the partial oxidation of a substance which
implies that oxygen is added but the amounts are not sufficient
to allow the fuel to be completely oxidised and full combustion
to occur. The process is largely exothermic but some heat may be
required to initialise and sustain the gasification process.
The main product is a syngas, which contains carbon monoxide,
hydrogen and methane. Typically, the gas generated from
gasification will have a net calorific value of 4 - 10 MJ/Nm3.The
other main product produced by gasification is a solid residue of
non-combustible materials (ash) which contains a relatively low
level of carbon. Syngas can be used in a number of different
ways, for example:
Syngas can be burned in a boiler to generate steam which may
be used for power generation or industrial heating.
Syngas can be used as a fuel in a dedicated gas engine.37
Production of Energy from MSW
Syngas, after reforming, may be suitable for use in a gas
turbine
Syngas can also be used as a chemical feedstock.
Gasification plants, based on syngas production, are relatively
small scale, flexible to different inputs and modular
development. Producing syngas to serve multiple end-uses could
complicate delivery of the plants but it could provide a higher
degree of financial security [37].
3.2. Gasification of Municipal Solid WasteThe most important reason for the growing popularity of thermal
processes for the treatment of solid wastes has been the
increasing technical, environmental and public dissatisfaction
with the performance of conventional incineration processes. MSW
is difficult to handle, segregate and feed in a controlled manner
to a waste-to-energy facility. MSW has a high tendency to form
fused ash deposits on the internal surfaces of furnaces and high
temperature reactors, and to form bonded fouling deposits on heat38
Production of Energy from MSW
exchanger surfaces. The products of the combustion of MSW are
also very aggressive, in that the flue gases are erosive and the
relatively high levels of chloride containing species in the flue
gases can lead to high rates of metal wastage of heat exchange
tube surfaces due to high temperature corrosion.
While evaluating gasification or other thermal technologies,
the degree of pre-processing required in conversion of MSW into a
suitable feed material is a major criterion. Unsorted MSW is not
suitable for most thermal technologies because of its varying
composition and size of some of its constituent materials. It may
also contain undesirable materials which can play havoc with the
process or emission control systems.
The main steps involved in pre-processing of MSW include
manual and mechanical separation or sorting, shredding, grinding,
blending with other materials, drying and pelletization. The
purpose of pre-processing is to produce a feed material with
consistent physical characteristics and chemical properties. Pre-
processing operations are also designed to produce a material
that can be safely handled, transported and stored [37].
3.2.1. Chemical reactions
In a gasifier, the carbonaceous material undergoes several
different processes:
39
Production of Energy from MSW
1. The dehydration or drying process occurs at around 100°C.
Typically the resulting steam is mixed into the gas flow and
may be involved with subsequent chemical reactions, notably
the water-gas reaction if the temperature is sufficiently
high enough (see step #5).
2. The pyrolysis (or devolatilization) process occurs at around
200-300°C. Volatiles are released and char is produced,
resulting in up to 70% weight loss for coal. The process is
dependent on the properties of the carbonaceous material and
determines the structure and composition of the char, which
will then undergo gasification reactions.
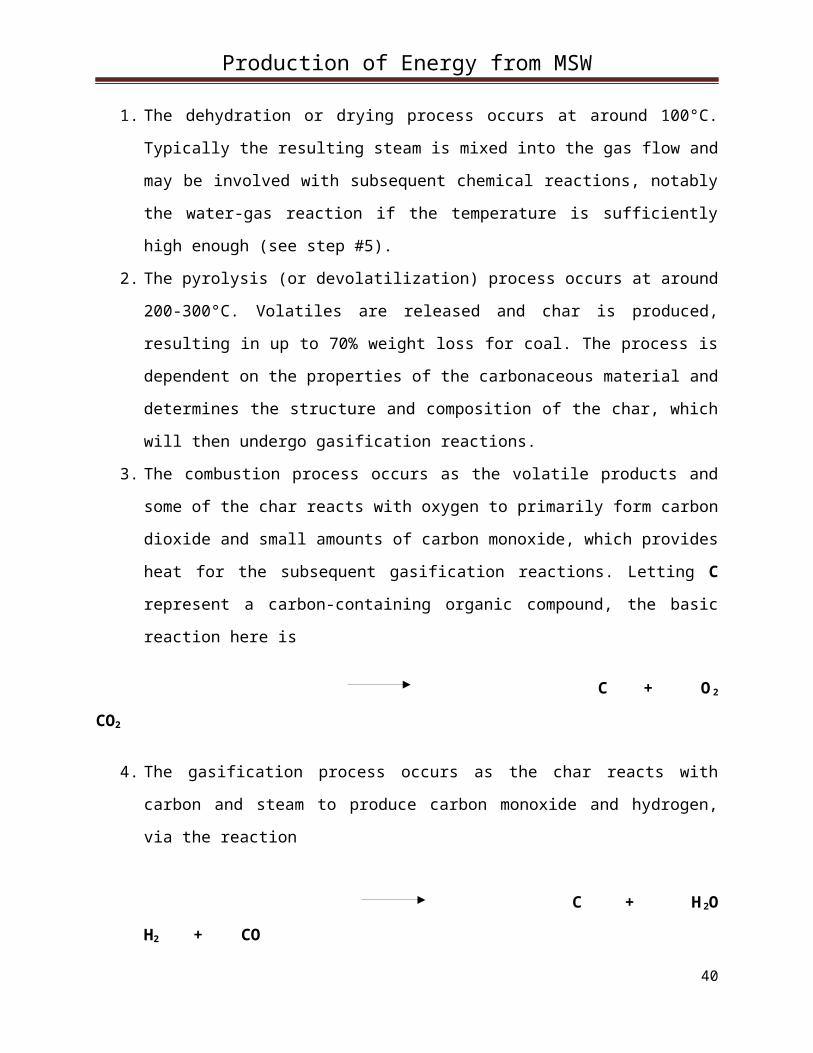
3. The combustion process occurs as the volatile products and
some of the char reacts with oxygen to primarily form carbon
dioxide and small amounts of carbon monoxide, which provides
heat for the subsequent gasification reactions. Letting C
represent a carbon-containing organic compound, the basic
reaction here is
C + O 2
CO2
4. The gasification process occurs as the char reacts with
carbon and steam to produce carbon monoxide and hydrogen,
via the reaction
C + H 2O
H2 + CO
40

Production of Energy from MSW
5. In addition, the reversible gas phase water gas shift
reaction reaches equilibrium very fast at the temperatures
in a gasifier. This balances the concentrations of carbon
monoxide, steam, carbon dioxide and hydrogen
CO + H 2O
CO2 + H2
Figure 3.1:
Gasification of char [38]
In essence, a limited amount of oxygen or air is introduced into
the reactor to allow some of the organic material to be "burned"
to produce carbon monoxide and energy, which drives a second
reaction that converts further organic material to hydrogen and
additional carbon dioxide. Further reactions occur when the
formed carbon monoxide and residual water from the organic
material react to form methane and excess carbon dioxide. This
third reaction occurs more abundantly in reactors that increase
the residence time of the reactive gases and organic materials,41
Production of Energy from MSW
as well as heat and pressure. Catalysts are used in more
sophisticated reactors to improve reaction rates, thus moving the
system closer to the reaction equilibrium for a fixed residence
time [38].
3.3. Types of gasifiers
3.3.1. Fixed bed gasifiers
Fixed bed gasifiers typically have a grate to support the feed
material and maintain a stationary reaction zone. They are
relatively easy to design and operate, and are therefore useful
for small and medium scale power and thermal energy uses. The two
primary types of fixed bed gasifiers are updraft and downdraft[37].
3.3.2. Updraught or counter current gasifier
The oldest and simplest type of gasifier is the counter current
or updraught gasifier shown schematically in Fig below:
42

Production of Energy from MSW
Figure 3.1: Updraught or counter current gasifier [39]
The air intake is at the bottom and the gas leaves at the top.
Near the grate at the bottom the combustion reactions occur,
which are followed by reduction reactions somewhat higher up in
the gasifier. In the upper part of the gasifier, heating and
pyrolysis of the feedstock occur as a result of heat transfer by
forced convection and radiation from the lower zones. The tars
and volatiles produced during this process will be carried in the
gas stream. Ashes are removed from the bottom of the gasifier.
43
Production of Energy from MSW
The major advantages of this type of gasifier are its
simplicity, high charcoal burn-out and internal heat exchange
leading to low gas exit temperatures and high equipment
efficiency, as well as the possibility of operation with many
types of feedstock (sawdust, cereal hulls, etc.) .
Major drawbacks result from the possibility of "channelling" in
the equipment, which can lead to oxygen break-through and
dangerous, explosive situations and the necessity to install
automatic moving grates, as well as from the problems associated
with disposal of the tar-containing condensates that result from
the gas cleaning operations. The latter is of minor importance if
the gas is used for direct heat applications, in which case the
tars are simply burnt.
3.3.3. Downdraught or co-current gasifiersA solution to the problem of tar entrainment in the gas stream
has been found by designing co-current or downdraught gasifiers,
in which primary gasification air is introduced at or above the
oxidation zone in the gasifier. The producer gas is removed at
the bottom of the apparatus, so that fuel and gas move in the
same direction, as schematically shown in Fig below:
44
Production of Energy from MSW
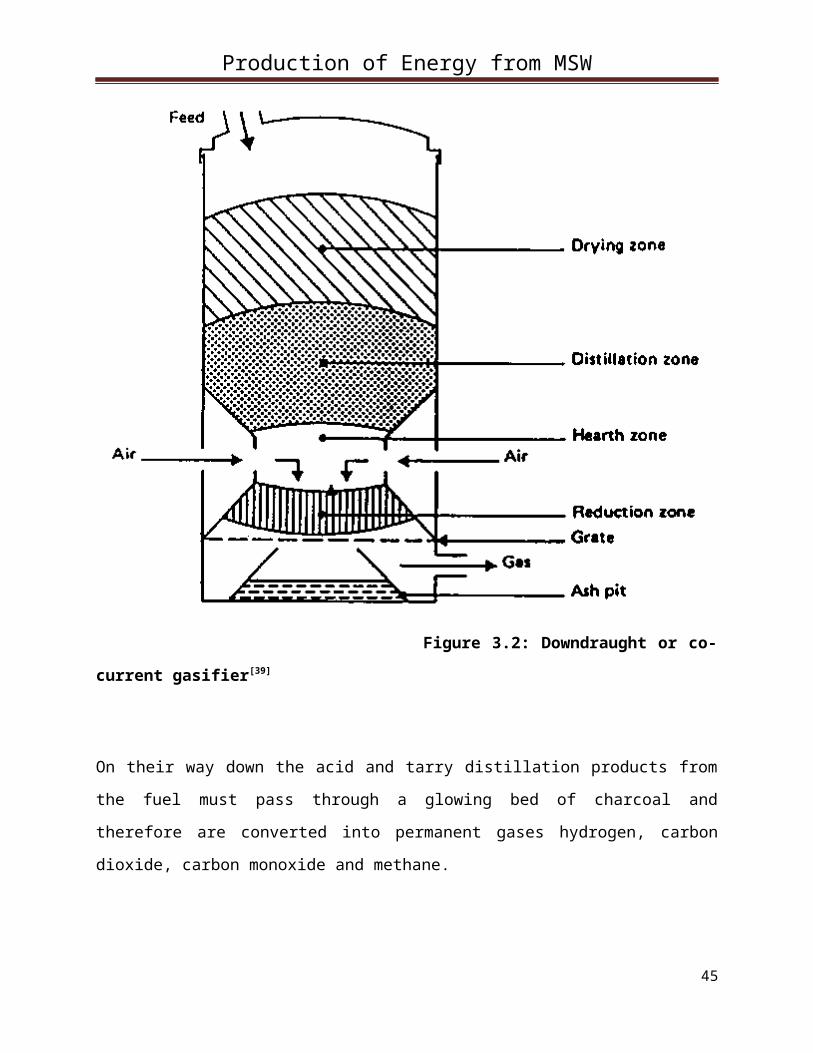
Figure 3.2: Downdraught or co-
current gasifier[39]
On their way down the acid and tarry distillation products from
the fuel must pass through a glowing bed of charcoal and
therefore are converted into permanent gases hydrogen, carbon
dioxide, carbon monoxide and methane.
45

Production of Energy from MSW
Depending on the temperature of the hot zone and the residence
time of the tarry vapours, a more or less complete breakdown of
the tars is achieved.
The main advantage of downdraught gasifiers lies in the
possibility of producing a tar-free gas suitable for engine
applications.
In practice, however, a tar-free gas is seldom if ever achieved
over the whole operating range of the equipment: tar-free
operating turn-down ratios of a factor 3 are considered standard;
a factor 5-6 is considered excellent.
Because of the lower level of organic components in the
condensate, downdraught gasifiers suffer less from environmental
objections than updraught gasifiers.
A major drawback of downdraught equipment lies in its
inability to operate on a number of unprocessed fuels. In
particular, fluffy, low density materials give rise to flow
problems and excessive pressure drop, and the solid fuel must be
pelletized or briquetted before use. Downdraught gasifiers also
suffer from the problems associated with high ash content fuels
(slagging) to a larger extent than updraught gasifiers.
Minor drawbacks of the downdraught system, as compared to
updraught, are somewhat lower efficiency resulting from the lack
of internal heat exchange as well as the lower heating value of
the gas. Besides this, the necessity to maintain uniform high
46

Production of Energy from MSW
temperatures over a given cross-sectional area makes impractical
the use of downdraught gasifiers in a power range above about 350
kW (shaft power).
3.3.4. Cross-draught gasifierCross-draught gasifiers, schematically illustrated in Figure
below are an adaptation for the use of charcoal. Charcoal
gasification results in very high temperatures (1500 °C and
higher) in the oxidation zone which can lead to material
problems. In cross draught gasifiers insulation against these
high temperatures is provided by the fuel (charcoal) itself.
Advantages of the system lie in the very small scale at
which it can be operated. Installations below 10 kW (shaft power)
can under certain conditions be economically feasible. The reason
is the very simple gas-cleaning train (only a cyclone and a hot
filter) which can be employed when using this type of gasifier in
conjunction with small engines.
A disadvantage of cross-draught gasifiers is their minimal
tar-converting capabilities and the consequent need for high
quality (low volatile content) charcoal.
47

Production of Energy from MSW
It is because of the uncertainty of charcoal quality that a
number of charcoal gasifiers employ the downdraught principle, in
order to maintain at least a minimal tar-cracking capability.
Figure 3.3: Cross-draught
gasifier [39]
3.3.5. Fluidized bed gasifierThe operation of both up and downdraught gasifiers is influenced
by the morphological, physical and chemical properties of the
48
Production of Energy from MSW
fuel. Problems commonly encountered are: lack of bunkerflow,
slagging and extreme pressure drop over the gasifier
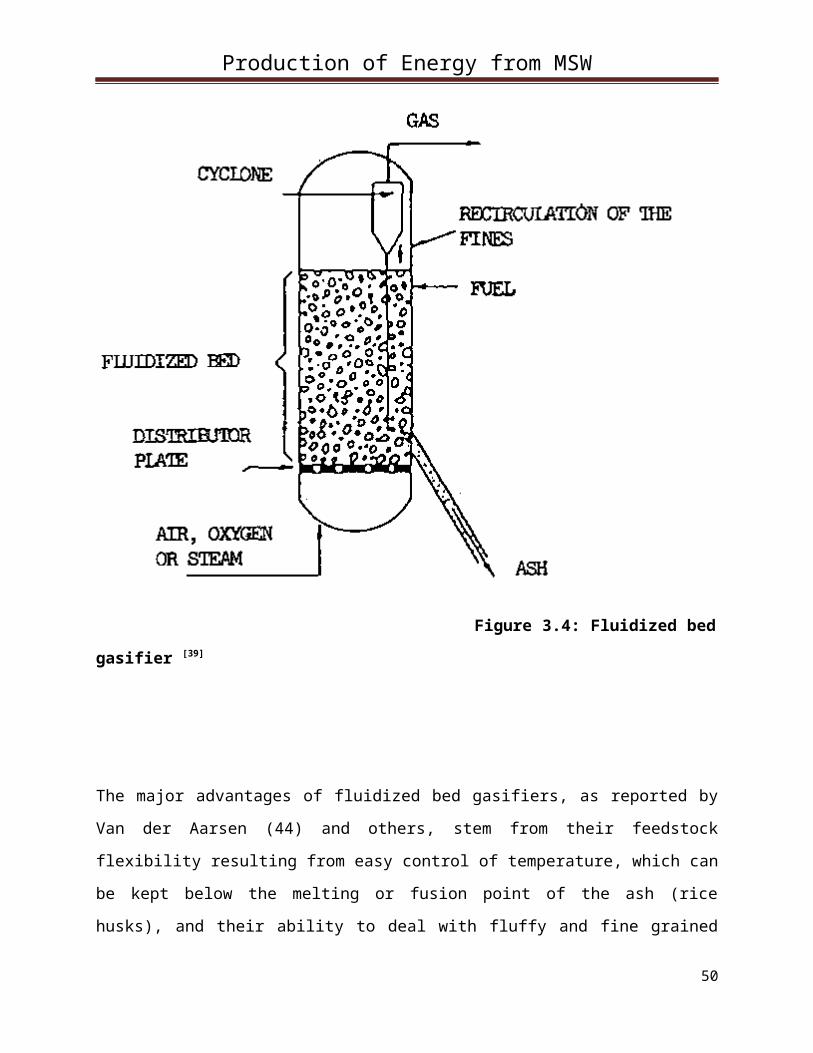
A design approach aiming at the removal of the above difficulties
is the fluidized bed gasifier illustrated schematically in Fig.
3.4.
Air is blown through a bed of solid particles at a sufficient
velocity to keep these in a state of suspension. The bed is
originally externally heated and the feedstock is introduced as
soon as a sufficiently high temperature is reached. The fuel
particles are introduced at the bottom of the reactor, very
quickly mixed with the bed material and almost instantaneously
heated up to the bed temperature. As a result of this treatment
the fuel is pyrolysed very fast, resulting in a component mix
with a relatively large amount of gaseous materials. Further
gasification and tar-conversion reactions occur in the gas phase.
Most systems are equipped with an internal cyclone in order to
minimize char blow-out as much as possible. Ash particles are
also carried over the top of the reactor and have to be removed
from the gas stream if the gas is used in engine applications.
49
Production of Energy from MSW
Figure 3.4: Fluidized bed
gasifier [39]
The major advantages of fluidized bed gasifiers, as reported by
Van der Aarsen (44) and others, stem from their feedstock
flexibility resulting from easy control of temperature, which can
be kept below the melting or fusion point of the ash (rice
husks), and their ability to deal with fluffy and fine grained
50
Production of Energy from MSW
materials (sawdust etc.) without the need of pre-processing.
Problems with feeding, instability of the bed and fly-ash
sintering in the gas channels can occur with some biomass fuels.
Other drawbacks of the fluidized bed gasifier lie in the rather
high tar content of the product gas (up to 500 mg/m³ gas), the
incomplete carbon burn-out, and poor response to load changes.
Particularly because of the control equipment needed to cater for
the latter difficulty, very small fluidized bed gasifiers are not
foreseen and the application range must be tentatively set at
above 500 kW (shaft power) [39].
In a Bubbling Fluidized Bed (BFB), the gas velocity must be
high enough so that the solid particles, comprising thebed
material, are lifted, thus expanding the bed and causing it to
bubble like a liquid. A bubbling fluidized bed reactor typically
has a cylindrical or rectangular chamber designed so that contact
between the gas and solids facilitates drying and size reduction
(attrition). As waste isintroduced into the bed, most of the
organics vaporize pyrolytically and are partially combusted in
the bed. Typical desired operating temperatures range from 900°
to 1000 °C.
A circulating fluidized bed (CFB) is differentiated from a
bubbling fluid bed in that there is no distinct separation
between the dense solids zone and the dilute solids zone. The
51

Production of Energy from MSW
capacity to process different feedstock with varying compositions
and moisture contents is a major advantage in such systems [37].
3.4. Other types of gasifiersA number of other biomass gasifier systems (double fired,
entrained bed, molten bath), which are partly spin-offs from coal
gasification technology, are currently under development. In some
cases these systems incorporate unnecessary refinements and
complications, in others both the size and sophistication of the
equipment make near term application in developing countries
unlikely. For these reasons they are omitted from this account.
3.5. Thermal capacity of different gasfiers
Gasification technology is selected on the basis of available
fuel quality, capacity range, and gas quality conditions. The
main reactors used for gasification of MSW are fixed beds and
fluidized beds. Larger capacity gasifiers are preferable for
treatment of MSW because they allow for variable fuel feed,
uniform process temperatures due to highly turbulent flow through
52
Production of Energy from MSW
the bed, good interaction between gases and solids, and high
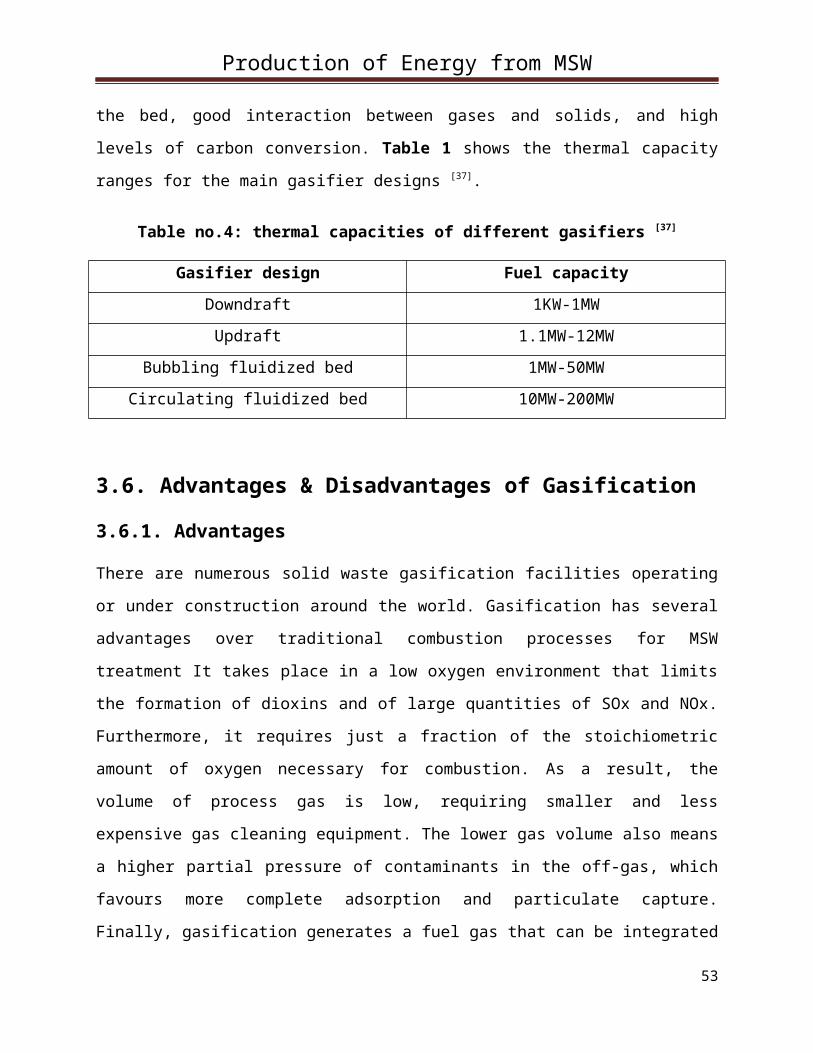
levels of carbon conversion. Table 1 shows the thermal capacity
ranges for the main gasifier designs [37].
Table no.4: thermal capacities of different gasifiers [37]
Gasifier design Fuel capacityDowndraft 1KW-1MWUpdraft 1.1MW-12MW
Bubbling fluidized bed 1MW-50MWCirculating fluidized bed 10MW-200MW
3.6. Advantages & Disadvantages of Gasification
3.6.1. Advantages
There are numerous solid waste gasification facilities operating
or under construction around the world. Gasification has several
advantages over traditional combustion processes for MSW
treatment It takes place in a low oxygen environment that limits
the formation of dioxins and of large quantities of SOx and NOx.
Furthermore, it requires just a fraction of the stoichiometric
amount of oxygen necessary for combustion. As a result, the
volume of process gas is low, requiring smaller and less
expensive gas cleaning equipment. The lower gas volume also means
a higher partial pressure of contaminants in the off-gas, which
favours more complete adsorption and particulate capture.
Finally, gasification generates a fuel gas that can be integrated
53
Production of Energy from MSW
with combined cycle turbines, reciprocating engines and,
potentially, with fuel cells that convert fuel energy to
electricity more efficiently than conventional steam boilers.
3.6.2. Disadvantages
During gasification, tars, heavy metals, halogens and alkaline
compounds are released within the product gas and can cause
environmental and operational problems. Tars are high molecular
weight organic gases that ruin reforming catalysts, sulfur
removal systems, ceramic filters and increase the occurrence of
slagging in boilers and on other metal and refractory surfaces.
Alkalis can increase agglomeration in fluidized beds that are
used in some gasification systems and also can ruin gas turbines
during combustion. Heavy metals are toxic and accumulate if
released into the environment. Halogens are corrosive and are a
cause of acid rain if emitted to the environment. The key to
achieving cost efficient, clean energy recovery from municipal
solid waste gasification will be overcoming problems associated
with the release and formation of these contaminants [37].
3.7. Process description
The sun dried and preheated MSW is subjected to magnetic
separator, from separator it enters into the air classifier the
shredded waste will be conveyed and heaped in a hoper. The size
of hoper will depend upon the volume of the MSW to be contained.
54
Production of Energy from MSW
The hoper is then connected to gasifier in which the gasification
takes place and the syngas produce.
Magnetic Separation
This is the most commonly used method when separating metallic
materials from wastes whether crushed or not. A permanent or
electro magnet is used. No power is required when we using a
permanent magnet but capacity is relatively small.
The efiiciency of collecting metallic elements from wastes can
vary according to the power of magnet, size of belt, and
thickness of motes on conveyor.
3.7.1. Gassifier
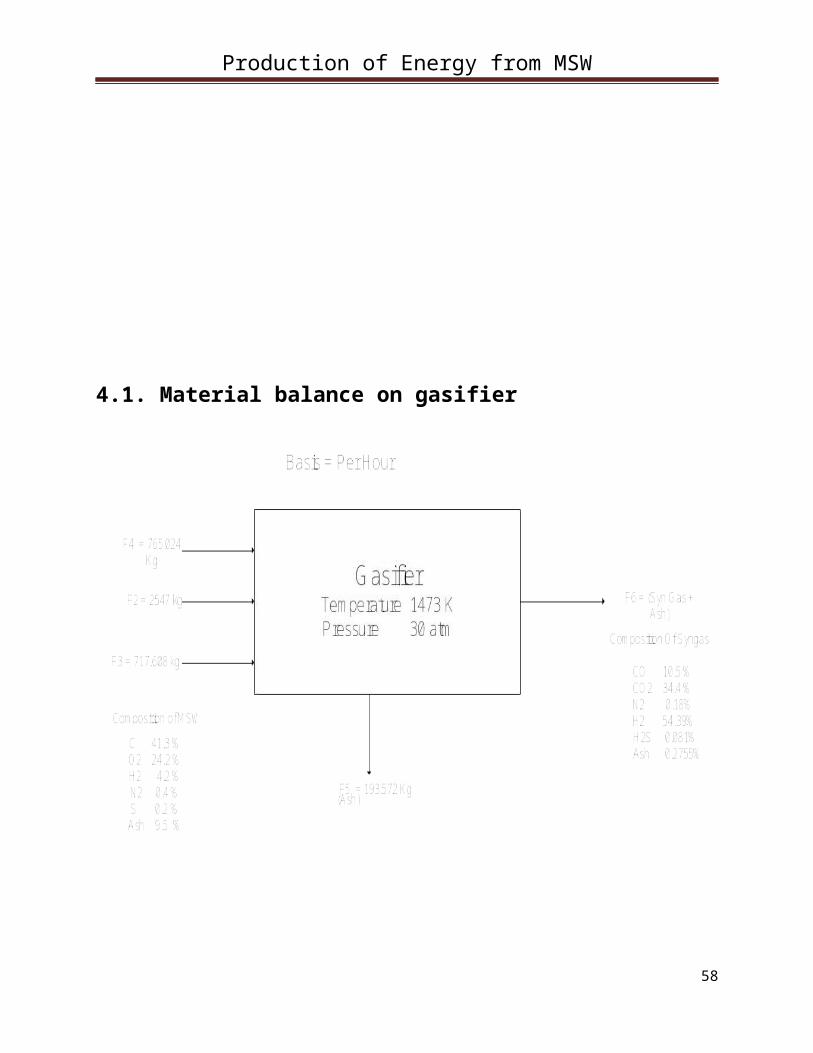
The gasifier is an internally heated vessel. The heating source
comprises of electrical coils. The primary purpose of gasifier is
to convert MSW into synthersis gas. The gasifier operates at an
internal pressure of 30 atm and internal temperature of 1200 °C.
The MSW enters the flidized bed gasifier almost at room
temperature. As it moves down the gasifier, through different
temperature zones, it becomes almost moisture free. During the
course of its download fall, it interacts counter currently with
steam and gasifies giving synthesis gas, tar and leaving behind
char. The char leaves from the gasifier at the bottom through
similar auger conveyer setting as described above, whereas, due
to high temperatrure inside the gasifier, the tar gets vaporized
55

Production of Energy from MSW
and moves upward with the synthesis gas towards the outlet of the
gasifier where the suction is created.
3.7.2. Cyclon separator
Before entering the cyclone separator the gas first enters into
the heat exchanger in which it exchange heat with cold water and
the temperature of syngas is reduces, the heat obtained from the
syngas is used in the production of steam and the boiler load can
be reduce.
The gas is then passed through the cyclone separator to
remove any dirt particles larger than 3 micro meter size. The
dirt is collected at the bottom whereas the gas leaves from the
top.
3.7.3. Scrubber
Then the gas enters into the scrubber in which CO2 is removed
water is sprayed and solvent is used to separate the dust
particles and also use to minimize the CO2 so as to syngas is
used for burning purposes. The solubility of CO2 changes with the
temperature of the syngas thus it is important to maintain a
particular temperature of the syngas before it enters into the
scrubber, thus the CO2 is removed efficiently.
56

Production of Energy from MSW
3.7.4. Knock out drum
Knock out vessels are used to slow down gasses and allow liquids
to "fall out" of the gas stream. Knock out drums can be installed
either in the waste gas header, or in the flare stack base
itself. Knock out drums can be configured in either a horizontal
or vertical arrangement. When horizontal, a knock out drum will
be constructed with one gas stream inlet, and two outlets, which
can then be joined with a manifold. Another configuration that
can be used is one inlet with a much larger outlet. A liquid
level gauge or indicator should always be included, as these
vessels must remain drained and free of excess liquid. In a
vertical arrangement the knock out drum can have a side inlet
with a larger exit which will slow down the gasses.
The gas stream enters into the knock out drum and moisture is
removed from it and thus moisture free gas obtained at the outlet
of the knock out drum.
57
Production of Energy from MSW
4.1. Material balance on gasifier
58

Production of Energy from MSW
N2-Balance
0.4/100 (2547/28) = nN2F6
NN2F6 = 0.36385 kg mole
C-Balance:
41.3/100 (2547/12) = nCOF6 + nCO2
F6
nCOF6 + nCO2
F6 = 87.659 kg mole
S-Balance
0.2/100(2547/32) = nH2SF6
nH2SF6 = 0.15918 kgmole
H2-Balance
F3 + 4.2/100 (2547/2) + 20.2/100(2547/18)
= nH2F6 + nH2S
F6
nH2F6 + nH2S
F6 =F3 + 53.487 + 28.5832
nH2F6 + nH2S
F6 = F3 + 82.07
O2-Balance
F 4 + 24.2/100 (2547/32) + 0.5x20.2/100
(2547/18) + 0.5F3 =0.5 nCOF6 + nCO2
F6
59

Production of Energy from MSW
F4 + 19.2616 + 14.2915 + 0.5F3 = 0.5 nCOF6 +
nCO2F6
F 4 + 19.2616 + 14.2915 + 0.5F3 = 0.5 nCOF6 +
nCO2F6
Ash-Balance
F5 = 0.80(0.095)(2547)
F5 = 193.572 kg/hr
Total Ash
0.095x2547 = 241.965 kg/hr = 241.965/90.33 =
2.678 kg mol/hr
Chemical Reactions
2.2C + 0.6O2+H2O
2.2CO + H2
2.2 K mol of C require = 0.6 K mol of O2
1 K mol of C require = 0.6/2.2
60

Production of Energy from MSW
87.659 K mol of C require = 0.6/2.2 (87.659)
F4 = 23.907 kg mol
F4 = 23.907x32 = 765.024
kg/hr
2.2 K mol of C require = 1 Kmol H2O
87.659 K mol of C require = 87.659/2.2
F3 = 39.845 kg mol
F3 = 39.845x18.01 =
717.608 kg/hr
From H2 Balance equation
F3+ 82.07 = nH2F6 + nH2S
F6
nH2F6 + nH2S
F6 = 23.907 + 82.07
nH2F6 + nH2S
F6 = 105.977
equation A
Equation of C- Balance gives
87.659 = nCOF6 + nCO2
F6
equation B
From O2 Balance equation
F4 + 19.2616 + 14.2915 + 0.5F3 = 0.5 nCO + nCO2
23.907 + 33.553 + 0.5 (39.845) = 0.5nCO + nCO2
61
Production of Energy from MSW
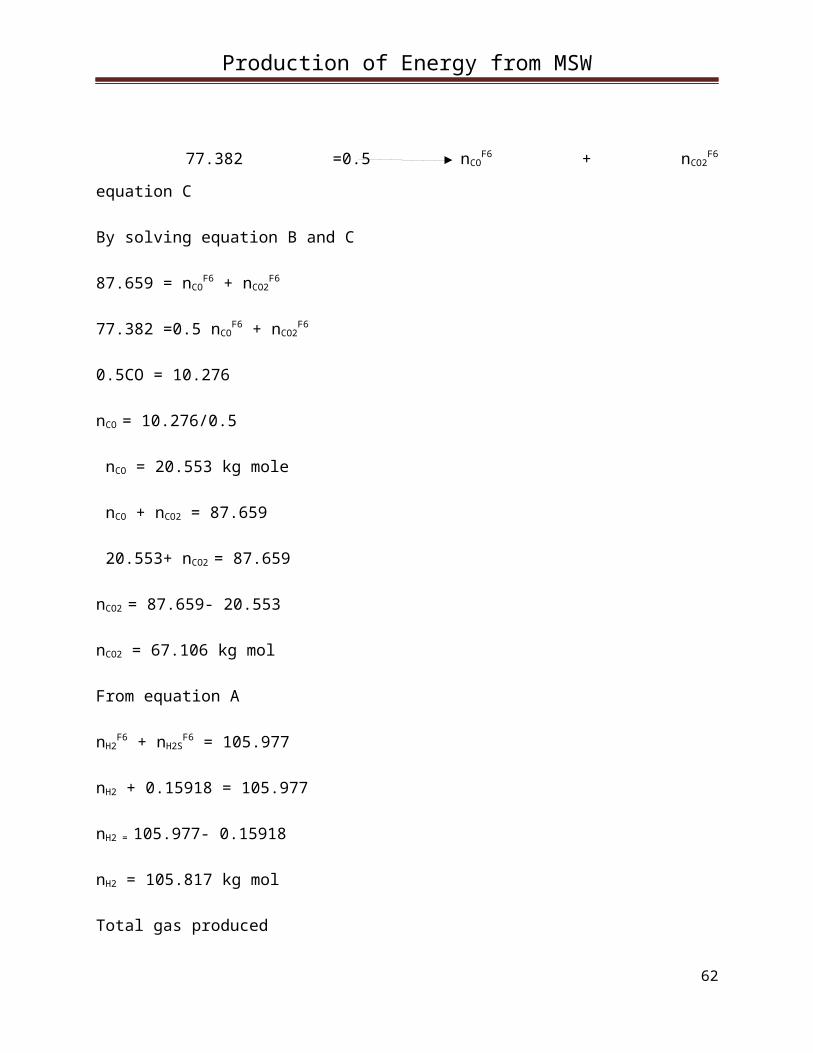
77.382 =0.5 nCOF6 + nCO2
F6
equation C
By solving equation B and C
87.659 = nCOF6 + nCO2
F6
77.382 =0.5 nCOF6 + nCO2
F6
0.5CO = 10.276
nCO = 10.276/0.5
nCO = 20.553 kg mole
nCO + nCO2 = 87.659
20.553+ nCO2 = 87.659
nCO2 = 87.659- 20.553
nCO2 = 67.106 kg mol
From equation A
nH2F6 + nH2S
F6 = 105.977
nH2 + 0.15918 = 105.977
nH2 = 105.977- 0.15918
nH2 = 105.817 kg mol
Total gas produced
62
Production of Energy from MSW
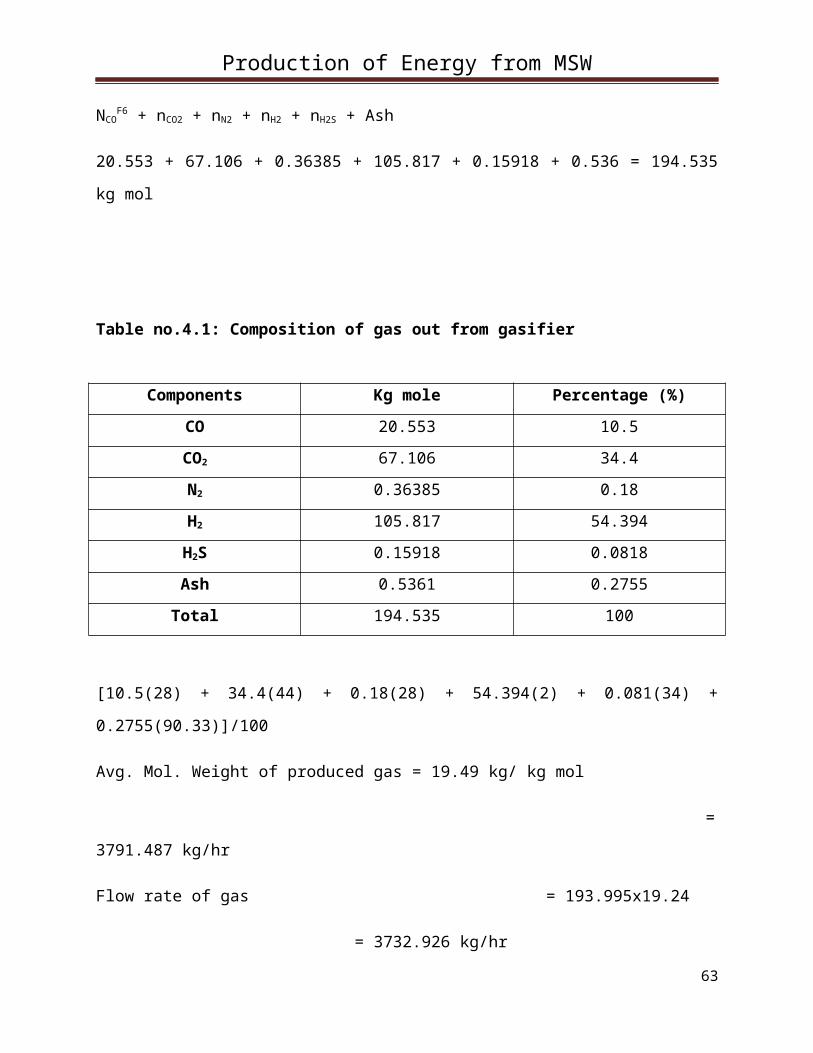
NCOF6 + nCO2 + nN2 + nH2 + nH2S + Ash
20.553 + 67.106 + 0.36385 + 105.817 + 0.15918 + 0.536 = 194.535
kg mol
Table no.4.1: Composition of gas out from gasifier
Components Kg mole Percentage (%)CO 20.553 10.5CO2 67.106 34.4N2 0.36385 0.18H2 105.817 54.394H2S 0.15918 0.0818Ash 0.5361 0.2755Total 194.535 100
[10.5(28) + 34.4(44) + 0.18(28) + 54.394(2) + 0.081(34) +
0.2755(90.33)]/100
Avg. Mol. Weight of produced gas = 19.49 kg/ kg mol
=
3791.487 kg/hr
Flow rate of gas = 193.995x19.24
= 3732.926 kg/hr
63

Production of Energy from MSW
F2 + F3 + F4 = F5 + F6
2547+ 717.608 + 768.024 = 241.965 + 3791.656
4033 = 4033.621
4.2. Material Balance around Cyclone
64
Production of Energy from MSW
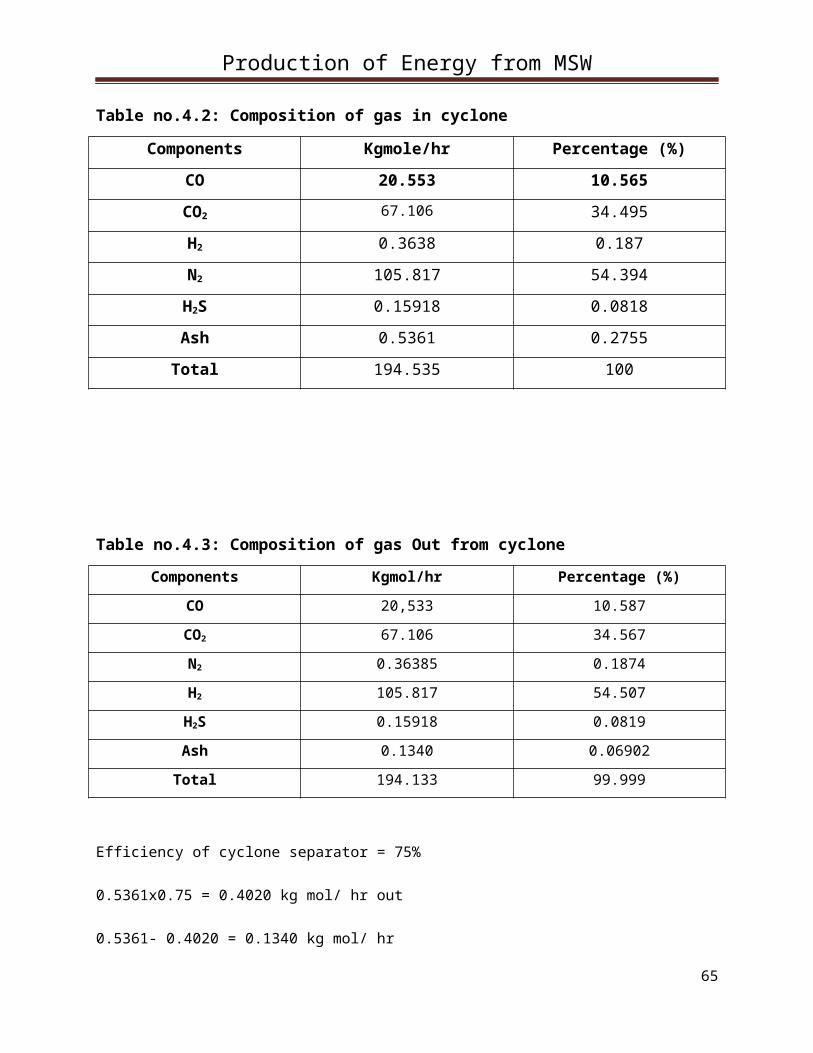
Table no.4.2: Composition of gas in cyclone
Components Kgmole/hr Percentage (%)CO 20.553 10.565CO2 67.106 34.495H2 0.3638 0.187N2 105.817 54.394H2S 0.15918 0.0818Ash 0.5361 0.2755Total 194.535 100
Table no.4.3: Composition of gas Out from cyclone Components Kgmol/hr Percentage (%)
CO 20,533 10.587CO2 67.106 34.567N2 0.36385 0.1874H2 105.817 54.507H2S 0.15918 0.0819Ash 0.1340 0.06902
Total 194.133 99.999
Efficiency of cyclone separator = 75%
0.5361x0.75 = 0.4020 kg mol/ hr out
0.5361- 0.4020 = 0.1340 kg mol/ hr
65

Production of Energy from MSW
4.3. Material Balance around Scrubber
66
Production of Energy from MSW
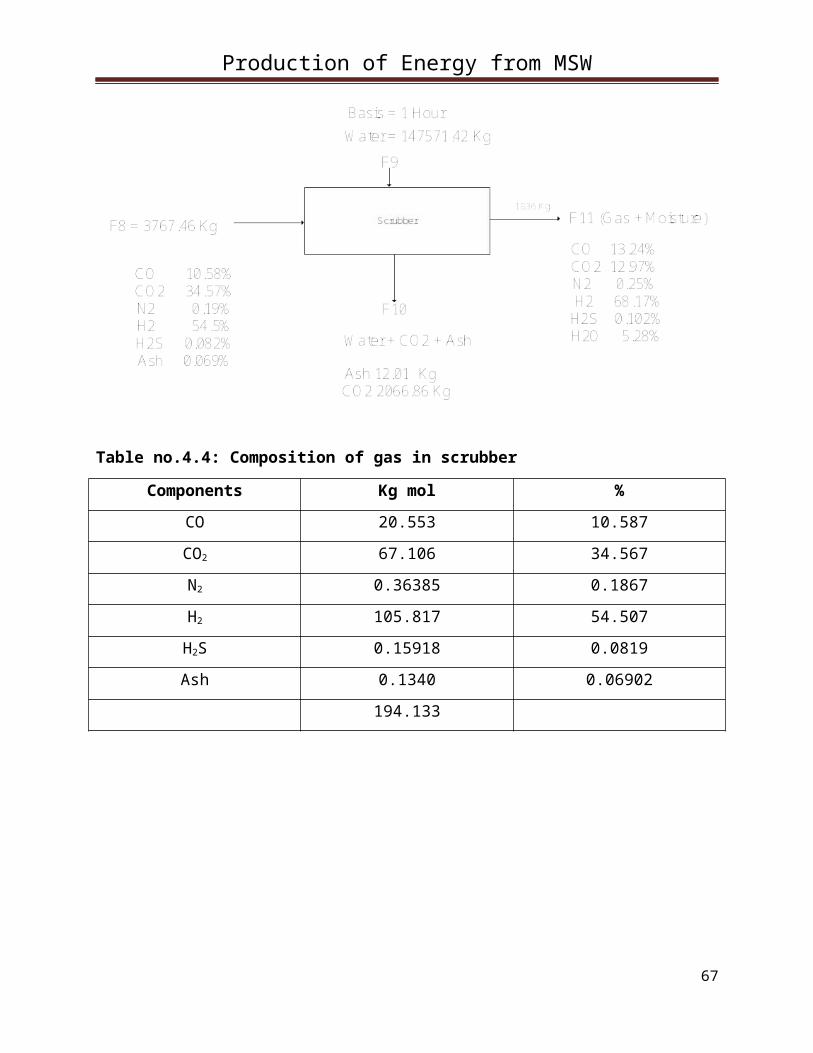
Table no.4.4: Composition of gas in scrubber
Components Kg mol %CO 20.553 10.587CO2 67.106 34.567N2 0.36385 0.1867H2 105.817 54.507H2S 0.15918 0.0819Ash 0.1340 0.06902
194.133
67
Production of Energy from MSW
Components Kg mole %CO 20.553 13.241CO2 20.1381 12.969N2 0.36385 0.2344H2 105.817 68.172H2S 0.15918 0.102H2O 8.1938 0.102
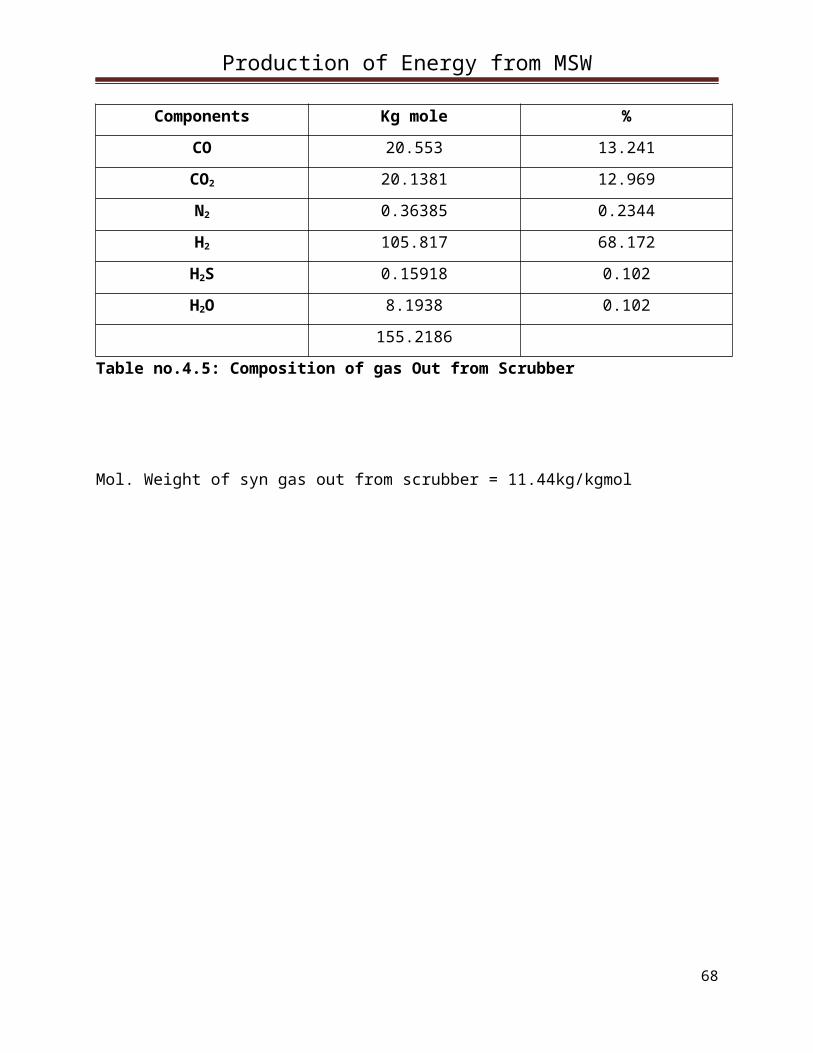
155.2186Table no.4.5: Composition of gas Out from Scrubber
Mol. Weight of syn gas out from scrubber = 11.44kg/kgmol
68
Production of Energy from MSW
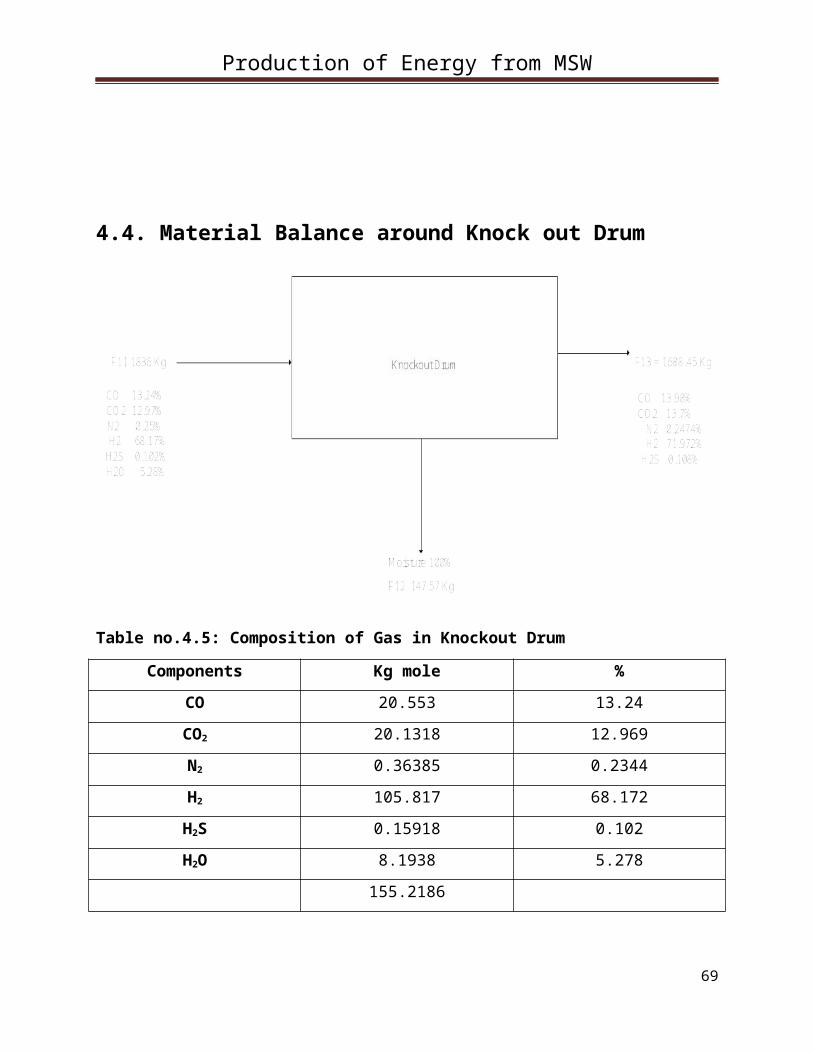
4.4. Material Balance around Knock out Drum
Table no.4.5: Composition of Gas in Knockout Drum
Components Kg mole %CO 20.553 13.24CO2 20.1318 12.969N2 0.36385 0.2344H2 105.817 68.172H2S 0.15918 0.102H2O 8.1938 5.278
155.2186
69
Production of Energy from MSW
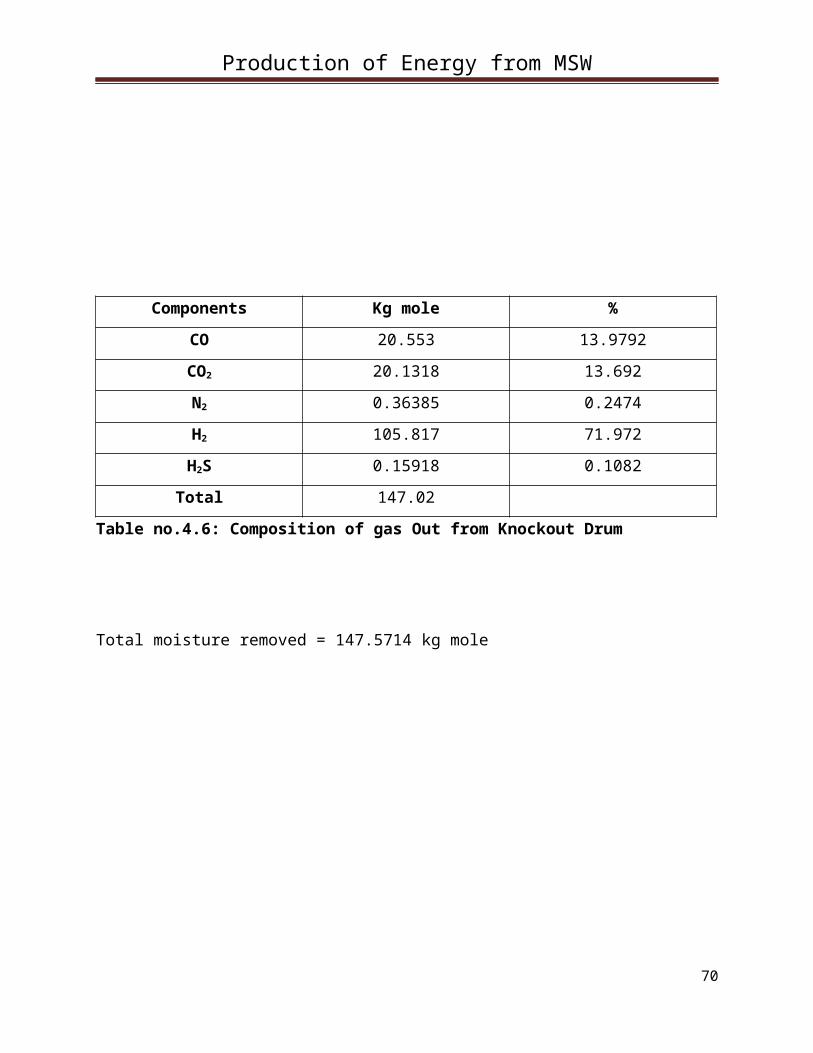
Components Kg mole %CO 20.553 13.9792CO2 20.1318 13.692N2 0.36385 0.2474H2 105.817 71.972H2S 0.15918 0.1082
Total 147.02Table no.4.6: Composition of gas Out from Knockout Drum
Total moisture removed = 147.5714 kg mole
70
Production of Energy from MSW
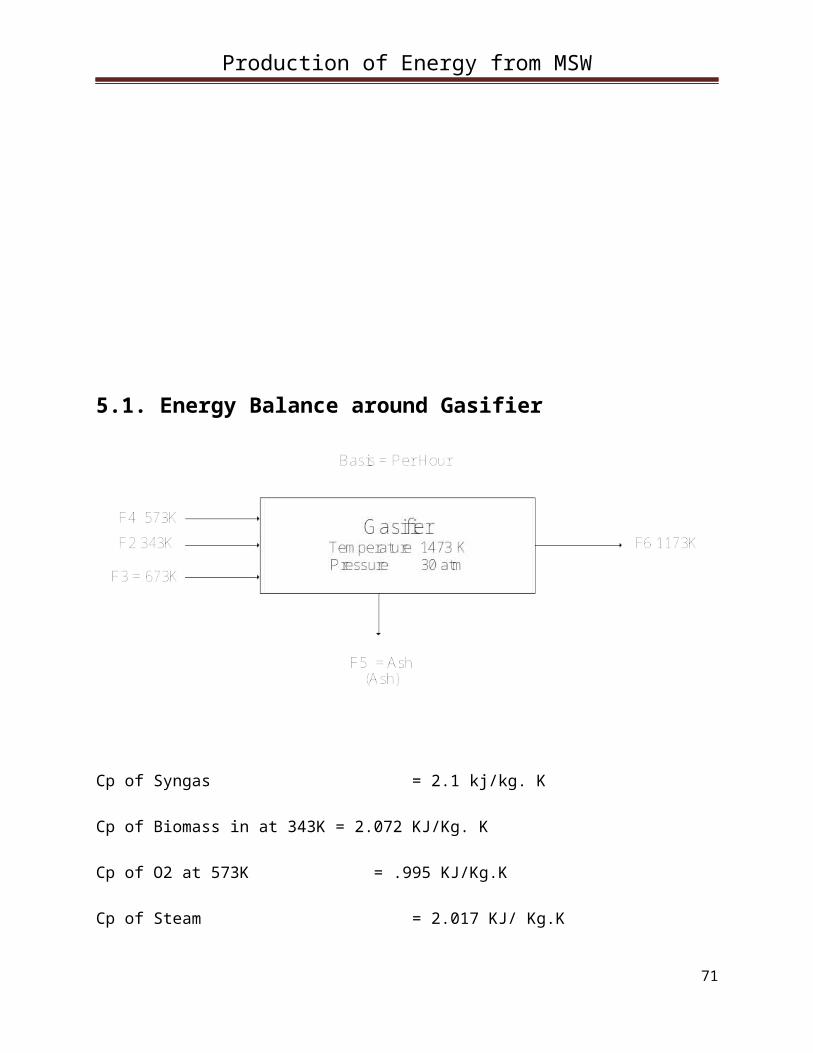
5.1. Energy Balance around Gasifier
Cp of Syngas = 2.1 kj/kg. K
Cp of Biomass in at 343K = 2.072 KJ/Kg. K
Cp of O2 at 573K = .995 KJ/Kg.K
Cp of Steam = 2.017 KJ/ Kg.K
71

Production of Energy from MSW
Energy in with biomass
H = mCpΔT
= 2547* 2.072(343-298)/3600
= 65.967 KW
Energy in with O2 at 573 K
H = mCpΔT
= 765.02 * .9959 (573-298)/3600
= 58.199 KW
Energy in with Steam
H = mCpΔT
=717.608 * 2.017 ((673-298) + 2350)/3600
= 624.144KW
Generation with Biomass
H = mCpΔT
= 2547 * 2.072 (1173-343)/3600
72
Production of Energy from MSW
=1216.73KW
In – out + Generation= Consumption
(58.199 + 624.144 + 65.9673) – (1935.235 + 21.4192) + 1216.73 =
Consumption
8.621 KW = Consumption
5.2. Energy Balance on Heat Exchanger
73
Production of Energy from MSW
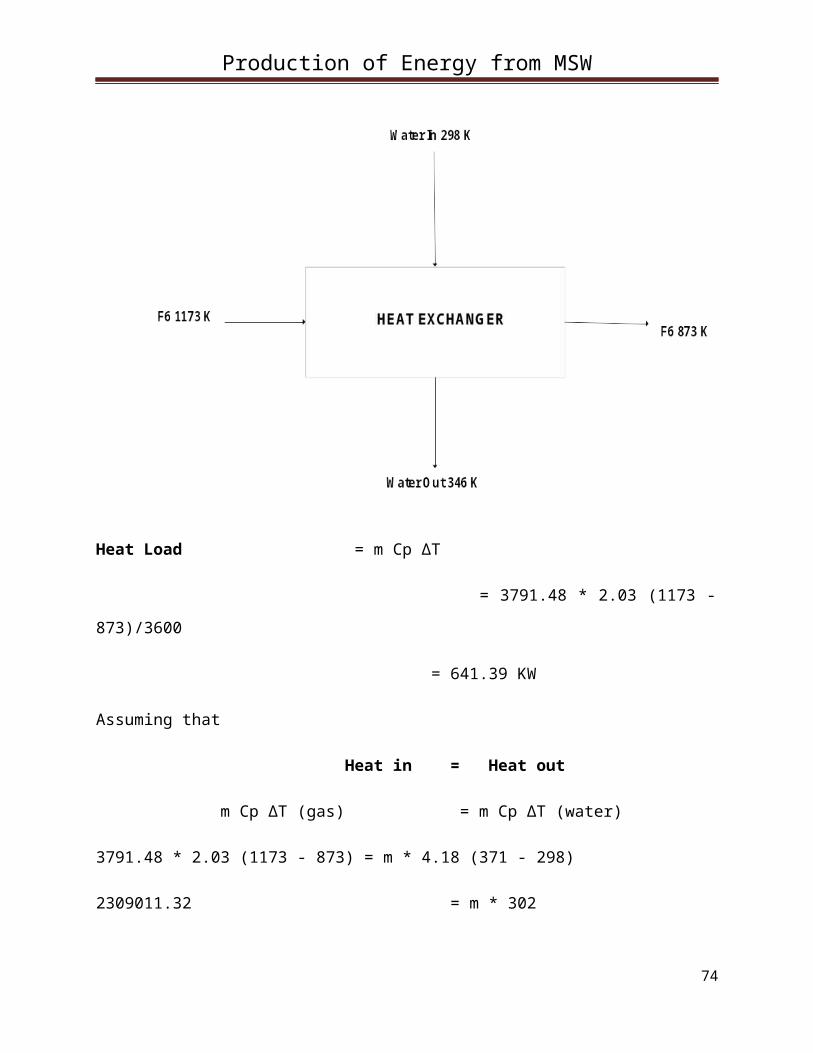
Heat Load = m Cp ΔT
= 3791.48 * 2.03 (1173 -
873)/3600
= 641.39 KW
Assuming that
Heat in = Heat out
m Cp ΔT (gas) = m Cp ΔT (water)
3791.48 * 2.03 (1173 - 873) = m * 4.18 (371 - 298)
2309011.32 = m * 302
74

Production of Energy from MSW
M (water) = 7567.055 Kg/hr
5.3. Energy Balance around Scrubber
Sp of gas at 873K = 2.0 KJ/Kg. K
Sp of gas at 831K = 1.99 KJ/Kg.K
Average Cp of bottom effluents = 0.7 KJ/Kg.K at 320K
Heat in by Gas = m Cp ΔT
=3787.48 *
2.0 (873 - 298)/3600
=1208.66 KW
Heat out by Gas = m Cp ΔT
= 1836 *
1.99 (813 - 298)
= 522.6 KW
75
Production of Energy from MSW
Heat out by bottom effluents (Co2 + water + solids) = m Cp ΔT
= 150000 * 0.7 (320 - 298)/3600
= 641.666 KW
Heat Losses = In – Out
= 1208.666 – (522.6 + 641.666)
= 44.32 KW
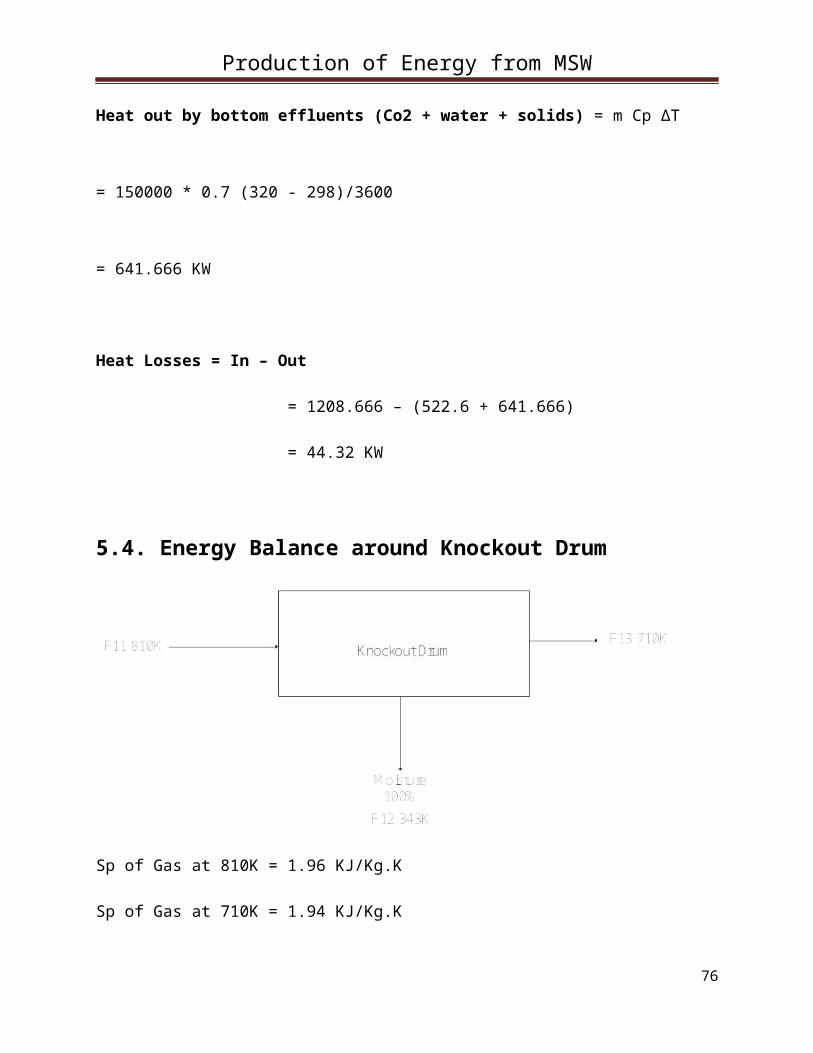
5.4. Energy Balance around Knockout Drum
Sp of Gas at 810K = 1.96 KJ/Kg.K
Sp of Gas at 710K = 1.94 KJ/Kg.K
76

Production of Energy from MSW
Sp of Moisture = 1.92 KJ/Kg.K
Heat in by gas = m Cp ΔT
=1836 * 1.96 (810 - 298)
= 509.99 KW
Heat out by gas = m Cp ΔT
= 374.87 KW
Heat out by Moisture = m Cp ΔT
= 147.571 * 1.96 (343 -
298)/3600
= 3.615 KW
Heat Losses = Heat in – Heat Out
= 509.99 – (374.87 + 3.615)
= 132.3 KW
77
Production of Energy from MSW
6.1. Design of Gasifier
Operating temperature = 1473K
Operating pressure = 90 atm
Chemical Reactions
C + H2O 2CO
CO + H2O CO2 + H2
C + H2O CO + H2
Rate Determining Step
78
Production of Energy from MSW
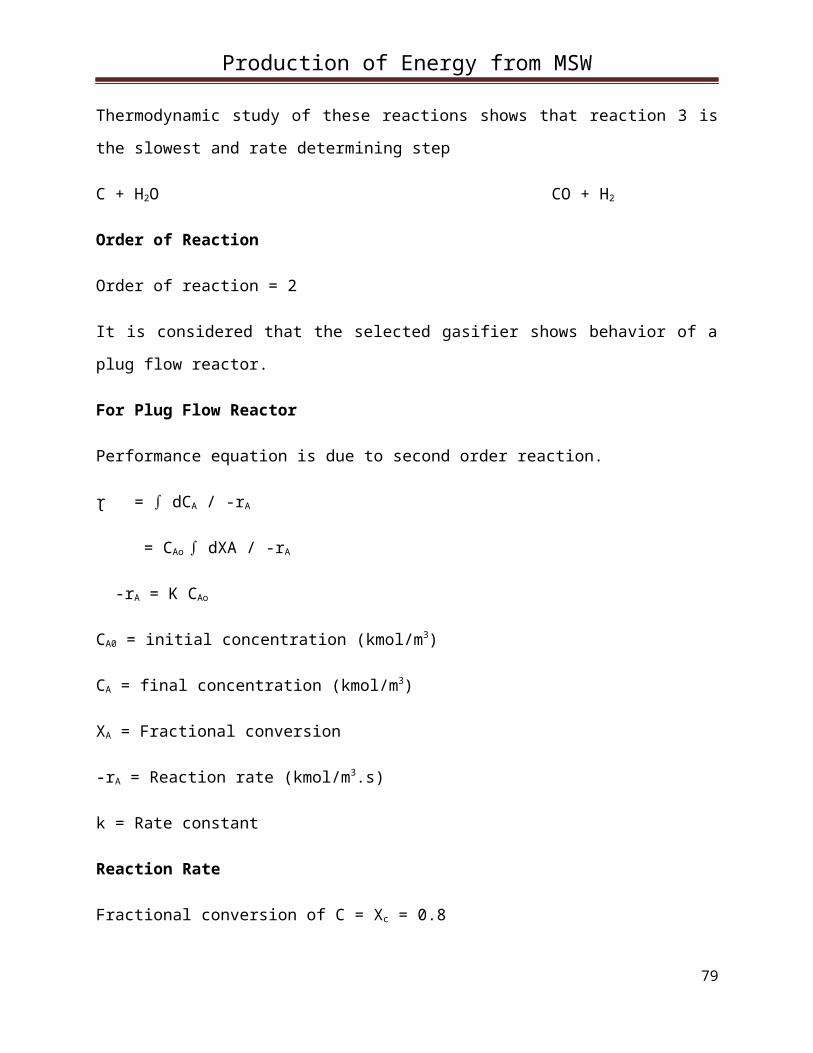
Thermodynamic study of these reactions shows that reaction 3 is
the slowest and rate determining step
C + H2O CO + H2
Order of Reaction
Order of reaction = 2
It is considered that the selected gasifier shows behavior of a
plug flow reactor.
For Plug Flow Reactor
Performance equation is due to second order reaction.
ɽ = dC∫ A / -rA
= CAo dXA / -r∫ A
-rA = K CAo
CA0 = initial concentration (kmol/m3)
CA = final concentration (kmol/m3)
XA = Fractional conversion
-rA = Reaction rate (kmol/m3.s)
k = Rate constant
Reaction Rate
Fractional conversion of C = Xc = 0.8
79
Production of Energy from MSW
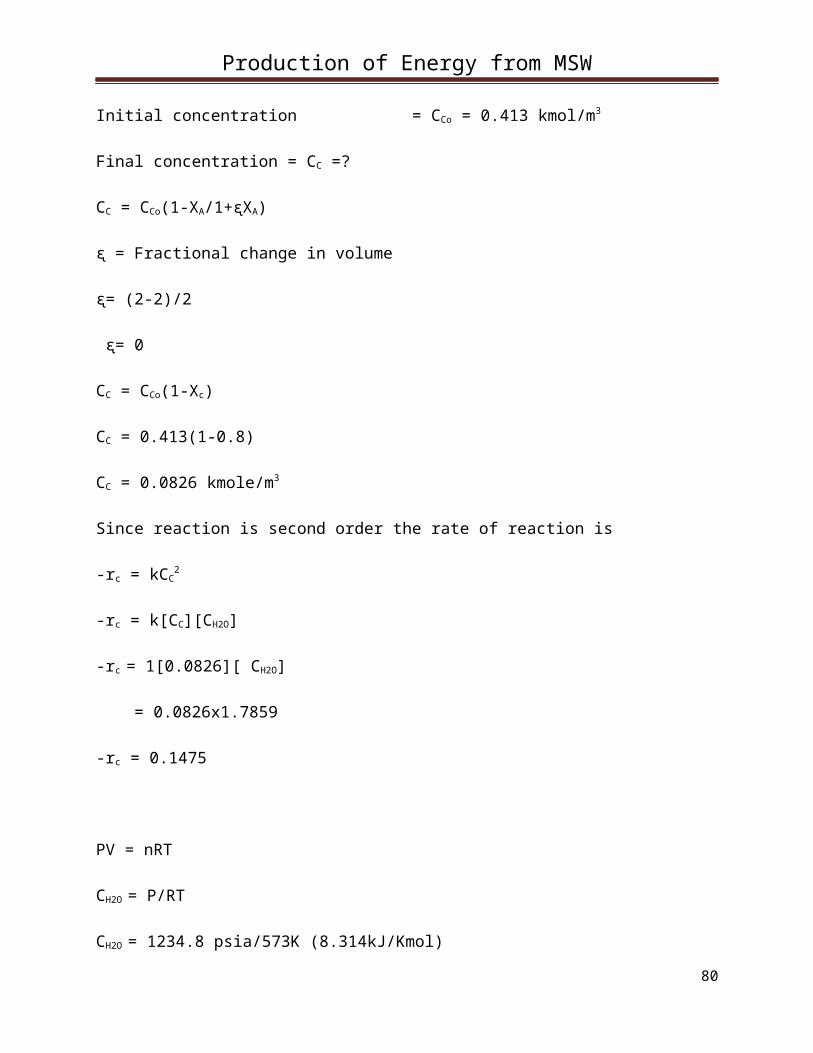
Initial concentration = CCo = 0.413 kmol/m3
Final concentration = CC =?
CC = CCo(1-XA/1+ᶓXA)
ᶓ = Fractional change in volume
ᶓ= (2-2)/2
ᶓ= 0
CC = CCo(1-Xc)
CC = 0.413(1-0.8)
CC = 0.0826 kmole/m3
Since reaction is second order the rate of reaction is
-rc = kCC2
-rc = k[CC][CH2O]
-rc = 1[0.0826][ CH2O]
= 0.0826x1.7859
-rc = 0.1475
PV = nRT
CH2O = P/RT
CH2O = 1234.8 psia/573K (8.314kJ/Kmol)
80

Production of Energy from MSW
CH2O = 0.2591 psia Kmol/KJ.K
= 1.7859 Kmol/m3
Residence Time
ɽ = CAo ∫00.8dXA / -rA
= 0.413/ 0.1475 (0.8 - 0)
= 2.23 sec
A
emf depends on the shape of the particles. For spherical
particles emf is usually 0.4 – 0.45.If emf is unknown than Wen
and Yu found for many systems:
B
Using A & B and putting values in equation we get
81
(ρg−ρf)g=ρfu0
2
ΦsDpε3 [150 (1−ε)μ
ΦsDpu0ρf+1.75]
Φsεmf3 ≃
114
1−εmfΦS2εmf
3 ≃11
Remf=[ (33.7)2+0.0408Dp3ρf (ρp−ρf)g
μ2 ]−33.7Br=[ Dp3ρf (ρp−ρf)g
μ2 ]
Production of Energy from MSW
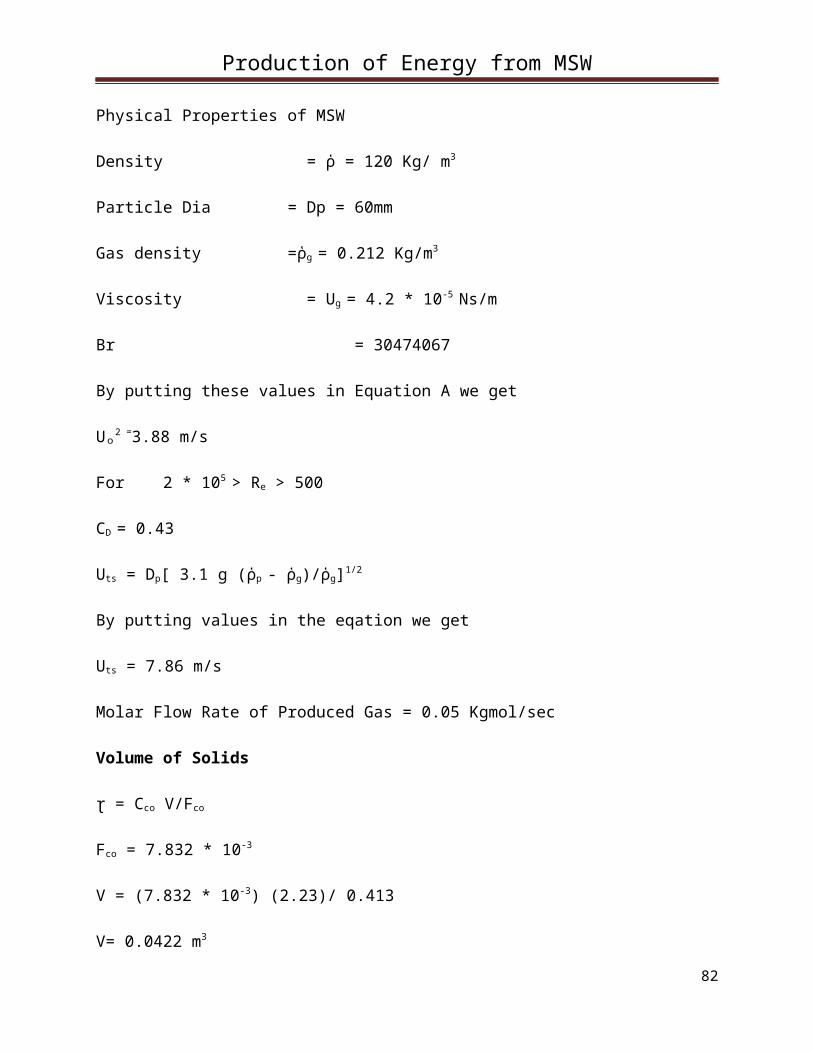
Physical Properties of MSW
Density = ῥ = 120 Kg/ m3
Particle Dia = Dp = 60mm
Gas density =ῥg = 0.212 Kg/m3
Viscosity = Ug = 4.2 * 10-5 Ns/m
Br = 30474067
By putting these values in Equation A we get
Uₒ2 =3.88 m/s
For 2 * 105 > Re > 500
CD = 0.43
Uts = Dp[ 3.1 g (ῥp - ῥg)/ῥg]1/2
By putting values in the eqation we get
Uts = 7.86 m/s
Molar Flow Rate of Produced Gas = 0.05 Kgmol/sec
Volume of Solids
ɽ = Cco V/Fco
Fco = 7.832 * 10-3
V = (7.832 * 10-3) (2.23)/ 0.413
V= 0.0422 m3
82
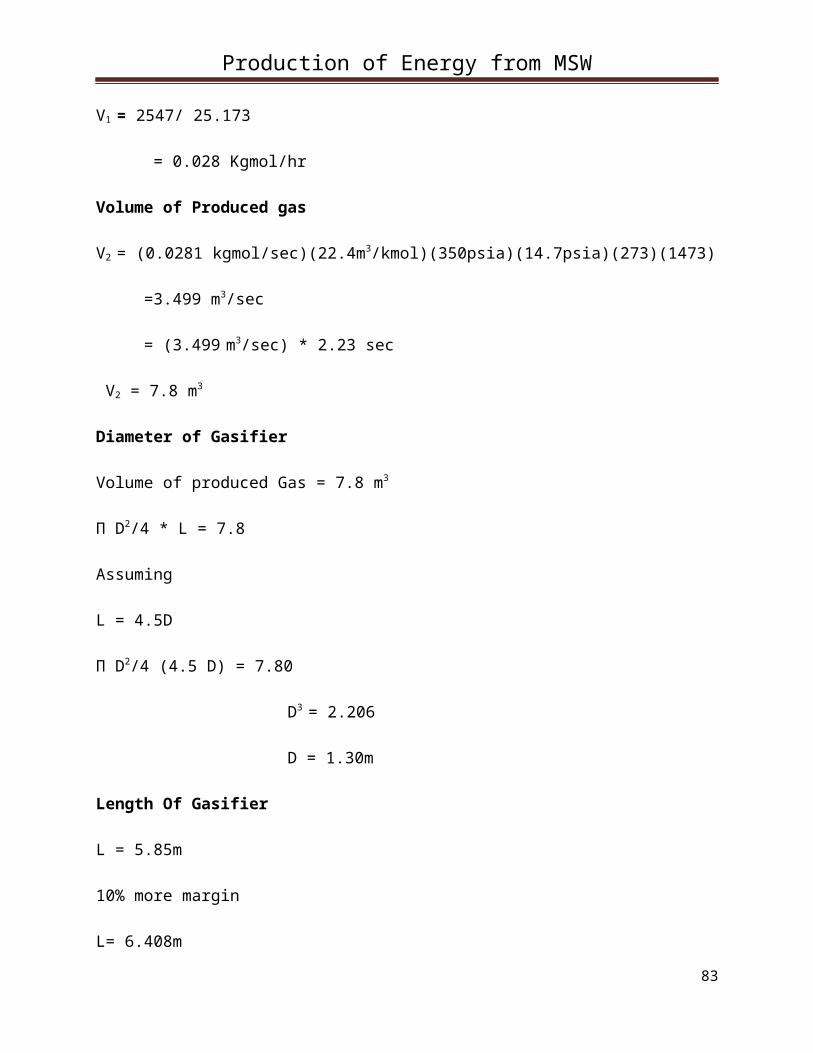
Production of Energy from MSW
V1 = 2547/ 25.173
= 0.028 Kgmol/hr
Volume of Produced gas
V2 = (0.0281 kgmol/sec)(22.4m3/kmol)(350psia)(14.7psia)(273)(1473)
=3.499 m3/sec
= (3.499 m3/sec) * 2.23 sec
V2 = 7.8 m3
Diameter of Gasifier
Volume of produced Gas = 7.8 m3
Π D2/4 * L = 7.8
Assuming
L = 4.5D
Π D2/4 (4.5 D) = 7.80
D3 = 2.206
D = 1.30m
Length Of Gasifier
L = 5.85m
10% more margin
L= 6.408m
83
Production of Energy from MSW
Volume of Gasifier
Total volume of gasifier = volume occupied by solids + Volume
occupied by Produced Gas
= 0.042289 +
7.80
Total volume of Gasifier = 7.842289 m3
Insulation Jacket
Flow rate of gas in = 3791 kg/hr
Let consider the avg. of zone temperature inside the gasifier
Tavg = 1300K
Outlet temperature of gas = 1173K
(3791/3600) x2.1x (1300-1173)
Q = 280.84 KW
Consider water is coming out at 343K
Water remained for cooling
84
Production of Energy from MSW
Q = m Cp ∆T
280.84 = mH2Ox (4.18)x (343-298)
mH2O = 1.49308 kg/sec
mH2O = 5375.11 kg/hr
Q = UA.ᶿm
A = Q/U ᶿm
The overall heat transfer coefficient for Jacketed vessel for
water and gas system ranges from 20-300 W/m2.0C
ᶿm = T1-T2/ln(T1/ T2)
When
Temperature in combustion zone = 2226.33K
Now
T = 2226.33 – 1173= 1053.33K
ᶿm = (1053.33-45)/ln(1053.33/45)
85

Production of Energy from MSW
ᶿm = 319.800
So area required
A = Q/U ᶿm
A = 280.84x10³/160x319.800
A = 5.489 m2
Thickness of Insulation:
Heat out by gases = 1935.235KW
Assuming 20% heat losses
Heat losses = 387.047 KW = 387047W
Length of Gasifier = 6.408m
Q/L =2 π (T1 – T2)/(ln (r1/ro))/ k1 + (ln (r2 / r1))/k2
Let
r = radius of refractory brick lining
r1 = inner radius of steel shell
r2 = outer radius of steel shell
D = 1.30m
86
Production of Energy from MSW
ri = D/2 = 1.30/2 =0.65m
Let the thickness of steel shell be 0.02m then
r0 = 0.65+0.02 = 0.67m
k1 = thermal conductivity of bricks (aluminium) = 3.1 W/mK
k2 = thermal conductivity of steel = 4.5 W/mK
387047/6.408 = 2(3.142)(1173-298)/ (ln (0.65/rr))/3.1 +( ln
(0.67/ 0.65))/45
60400.593/1 = 5498.5/ln (0.65/rr)/3.1 + 6.7345x10⁻⁴
5498.5 = 60400.59 ln (0.65/rr/3.1) + 60400.59x 6.7345x10-4
5498.5 = 19484.061 ln(0.65/rr) + 40.6767
19484.061 ln(0.65/rr) = 5498.5 – 40.6767
ln(0.65/rr) = 0.28011
0.65/rr = e0.28011
rr/0.65 = 1/1.32327
rr = 0.65/1.32327
Dr = 0.491 m
Dr = 2(rr)
Dr = 2 * 0.491
Dr = 0.982 m
87
Production of Energy from MSW
Thickness of insulation = ri-rr
= 0.65-0.491
Thickness of insulation = 0.159 m
Volume of Insulating Material:
Amount of material used = Areax Length
= π (Di2-Dr
2)/4 x 6.408
= π (1.302- 0.9822)/4 x 6.0404
= 3.142(1.69-0.9643)/4 x 6.0408
r = 3.443 m2
6.2. Heat Exchanger DesignThere are two purposes for installing the heat exchanger. First we want to heat the feed stream so preheating can reduce the load
88
Production of Energy from MSW
on the furnace. Second, we want to reduce temperature of stream coming from the reactor. Syngas is on the tube side and water is on the shell side
Flow rate of syngas = 3791.48 kg/hr
Flow rate of water = 7567 kg/hr
Initial temperature of syngas = 1173K
Final temperature of syngas = 873K
Initial Temperature of water = 298K
Final temperature of water = 371K
Sp heat of syngas = 2.03 KJ/Kg-K
Sp of water = 4.18 KJ/Kg-K
Heat Load
Q = mCp (t1- t2)
Q = 3791.48 * 2.03 * (1173 - 873)
Q = 2309011.32/3600
Q = 641.392 KW
89

Production of Energy from MSW
LMTD
∆tm = ∆t2 - ∆t1 / ln (∆t2 / ∆t1)
= 802 – 575 / ln (802/ 575)
= 682.217 K
Corrected LMTD
R = T1 – T2/t2 – t1
= (1173 - 873) / (371 - 298)
R = 4.10
S = t2 – t1 / T1 – t1
= 371 – 298 / 1173 – 298
S = 0.083
So from Graph Ft = 0.912
Corrected LMTD = ∆tm = ∆tm * Ft
= 409.217 * 0.912
= 373.205°
Suppose,
U = 30.05 W / m2 - K
Q =U A ∆tm
90
Production of Energy from MSW
A = Q / U ∆tm
A = 641.392/ 30.05 * 682.217
= 0.0313 * 1000 = 31.30 m2
Now we must have shell diameter, no of tubes and length
of heat exchanger and diameter of tubes.
Let,
Outer dia. of the tubes = do = 40 mm = 0.04m
Inner Dia= di = 32mm = 0.032m
Tube Thickness = 4mm = 0.004m
Length of tube = L = 10 m
(suppose)
So,
Area of tube = π * do * L
= π * (0.04) * 10
= 1.256 m2
No. of tubes = Nt= total area / area of one tube
= 31.30/ 1.256
= 25 tubes
Now
91
Production of Energy from MSW
Bundle Diameter
Db = d0 (Nt / Ki)1/h1
As the shell side fluid is relatively clean use 1,25 triangular
pitch
Db = 40 (25 / 0.249)1/2.207
Db = 42.04mm
Shell side Dia
Bundle dia clearance = 7.84 mm
Shell Dia = Ds = 50.781 mm
Tube Side Coefficient
Mean Temperature = 1173 + 873 / 2
= 1023K
= π/4 (32)2
= 803.84 mm2
Tube per Pass = 25/2 = 12.5 = 13
Total flow area = 13 * 803.84 *10-6
= 0.0104m2
Mass velocity:
92
Production of Energy from MSW
Gs= 3791.48/ 3600 * 0.0104
= 100 Kg / sec m2
Density = 0.1681 Kgm-3
Linear Velocity= Ut=100/ 0.1681
= 594.88 ms-1
hi= 4200 (1.35 + 0.02t) Ut.8/ di
.2
= 1153.57
Hidi/Kf= jhRe Pr.33 (μ / μw)0.14
Viscosity of syngas = μ= 0.02257 mNs
Thermal Conductivity = Kf = 0.250 W/m ° C
= Re = di U l /μ
= 141780.17
Pr = Cpμ/ K
Pr= 0.5219
Neglect μ/ μio
93
Production of Energy from MSW
L / di = 10 / 32* 10-3
= 312.5
Using Graph Jh= 5 * 10-3
Now putting the value in Equation we get
Hi = 4470.46 W / m2 °C
Baffle Spacing = Ds / 5 = 10.1562
Lb = 10.1562 mm
Tube Pitch = Pt = 1.25 * 40 = 50 mm
Cross- sectional Area = As = (Pt – do)Dslb/ Pt
= (50 – 40 ) * 50.781 * 10.1562 * 10-6 / 25
= 0.000206 m2
Mass Velocity = Gs= 7567.055 / 3600 * 0.000206
= 10203.68 Kg/ s. m2
EquivelantDia = de= 1.10/ de (Pt2 - 0.917 do
2)
= 1.10/40 (502 – 0.917 (40)2)
= 28.402mm
Mean Shell Side Temp = 371 + 298 / 2 = 334.5 K
Density = 1000 Kgm-3
μ = 0.8904 mNs/ m2
94
Production of Energy from MSW
Heat capacity = Cp = 4.18 KJ/Kg.K
Thermal Cunductivity = K = 0.611 W / m.K
Re = Gsde/ μ
Re = 25477,223
Pr = Cp H/ K
= 4.18 *03 * 0.8904 * 10-3 / 0.614
= 6.09144
Choosing 25% Baffle cut
JH = 1.7 * 10-2
Without Viscosity Correction term
hs = JH * Re * Pr1/3 / de
hs = 216064 w / m2 °C
Overall Coefficient
1 / Uo= 1 / ho + do ln (do/ di)/2 Kw+ 1 / hi(do/ di)
1/Uo = 1/ 216064 + 0.04 ln (0.04 / 0.032) + 1/ 4470.46 (40/32)
1/Uo = 2608.16 W/m2 °C
Too much above the assumed value
Tube side Re = 141780 and using Graph jf= 4.2 * 10-3
95

Production of Energy from MSW
Pressure Drop Calculation
For tube side
∆Pt = Np[ 8jf (L/di)(μ/μw) + 2.5 ] ρ ut2/2
= 80 Kpa
6.3. Design of Cyclon Separator
Flow Rate of gas=G = 3791.48 kg/hr
= 1.0532 kg/sec
96
Production of Energy from MSW
Volume of product gas = 3.4999 m3/sec
Density of product gas =1.0532/3.499
= 0.3010 kg/m3
The optimum velocity of separation having range 10-20
Let
U = 15 m/sec
We know that
G = ῥUA
Inlet Duct Area of gas = G =ῥUA1
1.0532 = (0.3010)
(15)A1
A1 = 0.23m2
Diameter of cyclone:
Area of duct = Ai = 0.5xDcx 0.2Dc
0.23 = Ai = 0.1Dc2
Dc2 = 0.23/0.1
Dc2 = 0.23
Dc = 1.516 m
97
Production of Energy from MSW
Length of upper section:
Lc = 1.5Dc
Lc = 1.5x1.516
Lc = 2.274 m
Length of lower Section:
Zc = 2.5Dc
Zc = 2.5x1.516
Zc = 3.79 m
Outlet Duct Area of gas:
Do = 0.5Dc
Do = 0.5x1.516
Do = 0.758 m
Ao = π/4 Do2
Ao = 3.14/4 (0.758)2
Ao = 0.451 m2
Dia of Dust Collector:
Dd = 0.357xDc
Dd = 0.357x1.516
Dd = 0.541 m
98
Production of Energy from MSW
Effective no. of special Paths
The effective no. of special pattern taken by the gas within the
body of cyclone is
U = 15 m/s
N = 3.5
Terminal velocity of smaller particles:
Uo = 0.2
Thickness of Material used
Inner Diameter of duct = 0.765m
Volume of portion A
Volume = π (R2 – r2) * L
V1 = 3.14 * (0.7652 – 0.7582) * 2.274
= 0.076 m3
= 0.076 (3.28)3 = 2.686 ft3
Volume of portion B
V2= 1.489 ft3
99

Production of Energy from MSW
Total Volume = 1.489 + 2.686 = 44.175 Ft3
Density of stainless steel = 489 and mass of steel used = 4.175 *
489 = 2041.86 lbs
Pressure drop in Cyclon
∆P = ρ /203(U1(1+2∅2(2rtℜ −1))+2 (u2 )2)
U1 = velocity at the inlet = 15 m/s
ῥ = density of gas = 0.3010 kg/m3
Ai = area of inlet duct
=0.5Dc x0.2Dc
=0.1Dc2
Where Dc = 1.516
Ai = 0.1x (1.516)2
Ai = 0.2298 m2
As = cyclone surface Area
As =π x Dcx (Lc+Zc)
Where
Lc = 2.274 m
Zc = 3.79 m
100
Production of Energy from MSW
So
As = 3.14x1.516x (2.274+3.79)
As = 28.8660 m2
Fc = Friction factor = 0.005 for gases
φ=¿ fcAs/Ai
= (0.005x28.866)/0.2298
φ = 0.62806
rt = radius of circle to which the center line of inlet is
tangential
rt = Dc – (0.2xDc/2)
rt = 1.516 – (0.2x1.516/2) where Dc = 1.516 m
rt = 1.516 – 0.1516
rt = 1.3644 m
re = radius of exit pipe = Do/2 where Do = 0.758 m
re = 0.758/2
re = 0.379 m
Now the ratio
rt/re = 1.3644/0.379
rt/re = 3.6
101
Production of Energy from MSW
By using rt/re and φ calculate∅ from graph (10.47)
(Reference ?)
∅ = 2
Area of exit pipe = Ae = π x re2
Ae = 3.14x0.3792
Ae = 0.451 m2
U2 = G/ ῥ xAe where ῥ = 0.3010kg/m3 and G = 1.0532 kg/sec
U2 = 1.0532/(0.3010x0.451)
U2 = 7.7583 m/sec
Putting all values and evaluate
∆P = 0.3010/203 (15(1+2(2)2)(2(3.6)-1)+2(7.75)2))
= 1.482x10⁻³(15(1+8 (6.2) + 2(60.0625)))
= 1.482x10⁻³[15 (55.8+120.125)]
= 1.482x10⁻³(2638.875) = 3.91Pa
7.1. Production cost
Total investment required for project
F.C.I = Fixed capital investment
W.C.I = Working capital investment
Total investment = F.C.I + W.C.I
102
Production of Energy from MSW
7.2. Fixed Capital Investment
Total purchase cost
Total physical plant cost
7.3. Working Capital Investment
The capital which is necessary for the operation of plant is
called working capital investment.
7.4. Production Cost
Variable Cost
Fixed Cost
7.5. Estimation of Fixed Capital Investment
7.5.1. Total purchased cost
This includes cost of gasifier, belt, conveyor, magnetic
separator, and shredder.
7.5.2. Cost of Gasifier
Length of gasifier = 6.408 m
Diameter of gasifier = 1.30 m
Material of construction = stainless steel
Pressure = 30 atm
103
Production of Energy from MSW
Material factor = 2
Pressure factor = 1.4
Bare cost = 30000$
Purchased cost = 30000x2x1.4
Purchased cost = 84000$
In year 2013
n = 9
Every year 2.5% increase
100% already so 1+ 0.025 = 1.025
Now
Purchased Cost of gasifier = 84000x (1.025)9
Purchased cost of gasifier = 104904$
7.5.3. Heat Exchanger
Heat transfer Area = A = 31.30 m2
Material of construction for shell = carbon steel
Material of construction for tubes = carbon steel
Type = Floating
Head
Pressure = 40 bar
104
Production of Energy from MSW
Pressure Factor = 1.3
Type Factor = 1.0
Bare Cost = 15000$
Purchased Cost = 15000 x (1.0)
x1.3
Purchased Cost = 19500$
In Year 2013
n = 9
Every year increase 2.5%
100% already so 1+ 0.025 = 1.025
Now
Purchased Cost of Heat Exchanger = 19500x (1.025)9
Purchased Cost of Heat Exchanger = 24352.82$
7.5.4. Knockout Drum
S =1738.9 kg/hr
S =CxS0.6
S = 2900x (1738.9)0.6
S = 211045.45 kg/hr
= 211045.45x (1.025)9
105
Production of Energy from MSW
= $263566.8552
7.5.5. Scrubber
In 1998 cost was $67700
In 2010 cost of scrubber = (cost of scrubber in 1998) (cost index
in 2010/cost index in 1998)
= 67700x (200/132)
=$102576
7.5.6. Cyclon Separator
In 1990 cost of cyclone separator was $35000
Cost index in 2010/Cost index in 1990 = 1582.9/924
=
1.713
Cost of cyclone in 2013 = $35000x1.713
=
$59955
106

Production of Energy from MSW
7.5.6. Total Equipment Cost
=
104904.48+24352.82+263566.85+1025.76+59955
Total Equipment Cost = $555355.15
7.6. Estimation of Fixed Capital Cost
Typical factors for estimation of project
Fixed Capital Cost Elements
Items
Factors
Equipment Errection
0.45
Piping
0.45
107
Production of Energy from MSW
Instrumentation
0.15
Electrical
0.10
Buildings, Process
0.10
Utilities
0.45
Storage
0.20
Site Development
0.05
Auxillary Buildings
0.20
Physical Plant Cost = Total equipment Cost
(1+0.45+0.45+0.15+0.10+0.10+0.45+0.20+0.05+0.20)
Physical Plant Cost = $1749368.7
Fixed Capital Cost
Design & Engineering
0.25
108
Production of Energy from MSW
Construction Fee
0.05
Contingency
0.10
Fixed Capital = Physical Plant Cost
(1+0.25+0.05+0.10)
= $2449116.213
7.7. Estimation of Working Capital
Working Capital = 5% of fixed capital cost of
fixed capital used
Working Capital = $122455.81
Total Investments
Total Investments required = Fixed Capital + Working Capital
= 2449116.212 +
122455.818
= $2571572.023
Total Operating Cost = $2571572.023
7.8. Summary of Production Costs
7.8.1 Fixed Costs
109
Production of Energy from MSW
Plant Attainment = 85%
Operating time = 365x0.85
= 310.25 days/yr
= 7446 hr/yr
Maintenance Cost = 10% of fixed Capital
= 0.10x (2449116.212)
= 244911.621
Operating Labour = 15% of total operating Cost
= 0.15x (2571572.023)
= 385735.80
Plant Overhead = 50% of operating labour
= 0.50x (385735.80)
= $192867.9
Capital charges = 10% of fixed Capital
Capital charges = 0.10x2449116.212
Capital charges = $244911.6212
Insurance = 1% of fixed Capital
= 0.01x2449116.212
Insurance = $24491.16212
110
Production of Energy from MSW
Local taxes = 2% of fixed capital
= 0.02x2449116.212
Local taxes = $48982.3
Royalties and License fee = 5% of fixed capital
= 0.05x2449116.212
Royalties and License fee = $122455.81
Total fixed cost = $1154146.214
7.8.2. Variable Cost
Variable costs = Raw material + Miscellaneous
materials + Utilities
Raw Material Cost
MSW cost used = 1.27$/ton = 3000kg/hr
Total used cost = (3000 kg/hr)(1.27$/ton)
(1ton/1000kg)(7446hr/yr)
Total cost used = 28369.2$/yr
Oxygen Used = 23.907 kgmol
Oxygen cost = 12c/m3
(12c/m3)(1$/100C)(23.907kgmol/hr)(22.4m3/1kmol)(7446hr/year)
= $478494.97
111
Production of Energy from MSW
Process water:
Cost of water used = 50c/ton
= 8139.86 + 39.845
= 8233.7kgmol/hr
Cost of water used = 148289.02
Total cost of water = (50c/ton)(1$/100c)
(148289.02kg/hr)(1ton/1000kg)(7446hr/yr)
Total cost of water = 552080$/yr
Total Raw Material Cost = 28369.2 + 148289.52 + 552080
Total Raw Material Cost = 728738.24$/yr
7.8.2.1. Miscellaneous Material Cost
Miscellaneous Material Cost = 10% of fixed Capital
=
0.10x2449116.212
Miscellaneous Material Cost = 244911.6212
7.8.2.2. Utilities
112
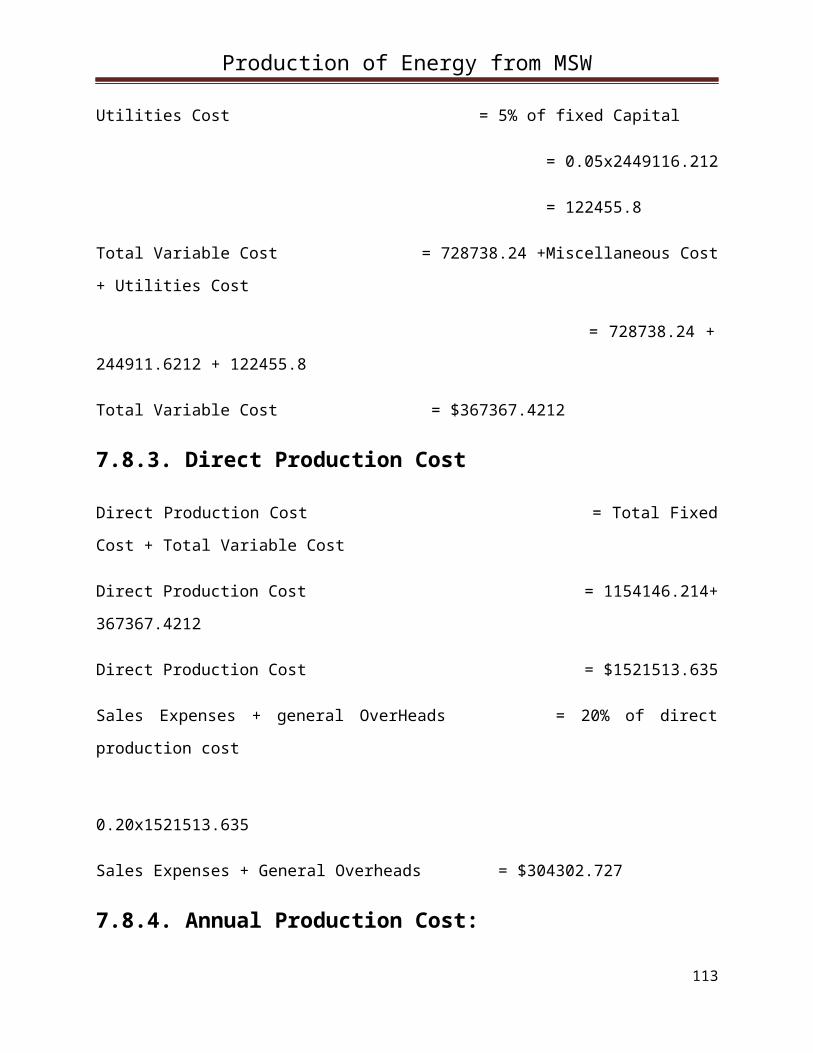
Production of Energy from MSW
Utilities Cost = 5% of fixed Capital
= 0.05x2449116.212
= 122455.8
Total Variable Cost = 728738.24 +Miscellaneous Cost
+ Utilities Cost
= 728738.24 +
244911.6212 + 122455.8
Total Variable Cost = $367367.4212
7.8.3. Direct Production Cost
Direct Production Cost = Total Fixed
Cost + Total Variable Cost
Direct Production Cost = 1154146.214+
367367.4212
Direct Production Cost = $1521513.635
Sales Expenses + general OverHeads = 20% of direct
production cost
0.20x1521513.635
Sales Expenses + General Overheads = $304302.727
7.8.4. Annual Production Cost:
113
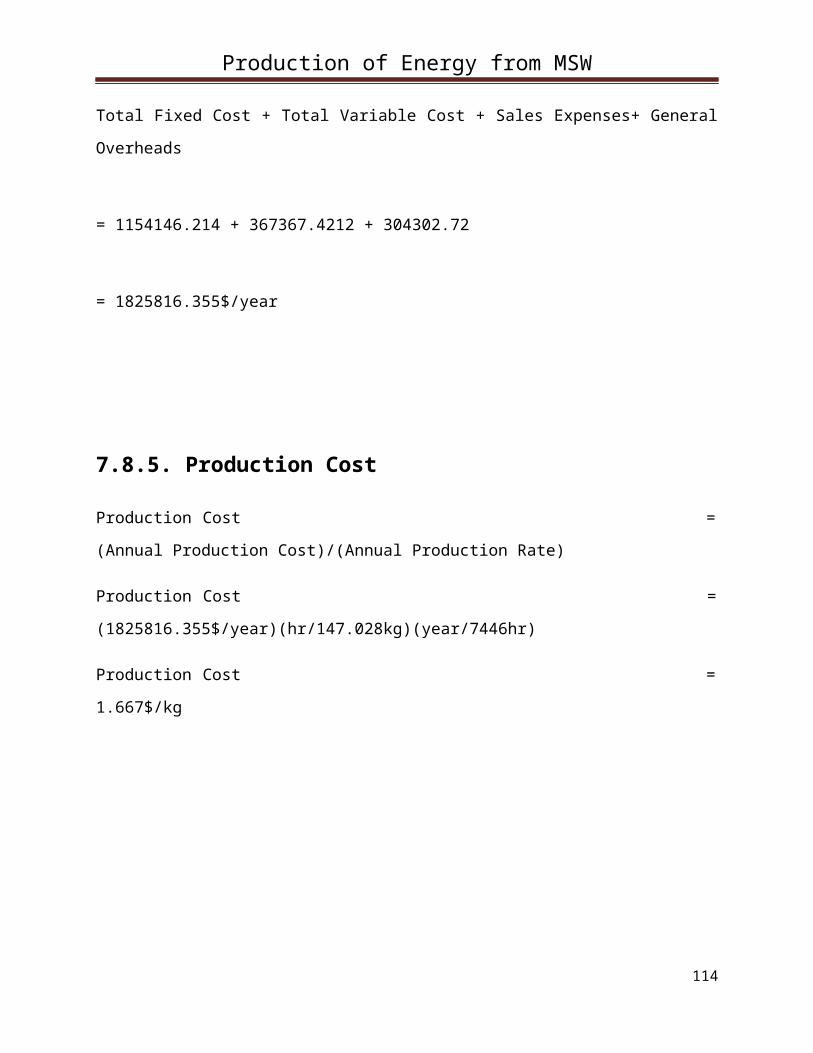
Production of Energy from MSW
Total Fixed Cost + Total Variable Cost + Sales Expenses+ General
Overheads
= 1154146.214 + 367367.4212 + 304302.72
= 1825816.355$/year
7.8.5. Production Cost
Production Cost =
(Annual Production Cost)/(Annual Production Rate)
Production Cost =
(1825816.355$/year)(hr/147.028kg)(year/7446hr)
Production Cost =
1.667$/kg
114

Production of Energy from MSW
8.1. Instrumentation and process controlThe important feature common to all process is that a process is
never in state of static equilibrium except for a very short
period of time. Process is a dynamic entity subject to continual
upset and disturbance which tend to drive it away from the
desired state of equilibrium; the process must then be
manipulated upon or corrected to derive some disturbances bring
about only transient effect of process behavior. These passes
115
Production of Energy from MSW
away and they never occur again. Others may apply periodic or
cycle forces which may make the process respond in a cyclic or
periodic fashion. Most disturbances are completely random w.r.t
time and show no repetitive pattern. Thus, their occurrence may
be accepted but cannot be predicted at any particular time. If a
process is to operate efficiently the disturbances process must
be controlled.
A process is design for a particular objective or output and
is then found, sometimes by trial and error ans some time by
previous experience that control of a particular variable
associated with some stages of the process is necessary to
achieve the desired efficiency.
Each process will have associated with it a number of
variables which are likely to change at random. Each such change
will lead to changes in the dependent variable of the process.
One of which is selected as being indicative of successful
operation. One of the input variables will be manipulate d to
cause further changes in the output variables to restore the
optimal condition.
Process may be controlled more precisely to give more uniform and
high quality products by the application of automatic control,
which often leads to highest profits. Additionally, process which
response too rapidly, and is to be controlled by human operators,
can be controlled automatically, automatic control is also
beneficial in certain remote, hazardous or routine operations.
116
Production of Energy from MSW
Automatically control processing systems which may too large and
too complex for effective direct human control.
Sensors to measure process conditions and valves to
influence process operations are essential for all aspects of
engineering practice. While sensors and valves are important in
all aspects of engineering, they assume greatest importance in
the study of automatic control, which is termed as process
control when applied in the process industries. Process control
deals with the regulation process by applying the feedback
principle using various computing devices, principally digital
computation. Process control requires sensors for measuring
variables and valves for implementing decisions; therefore, the
presentation of this material is designed to complement other
learning topics in process control.
Since successful process control requires appropriate
instrumentation, engineers should understand the principals of
common instruments introduced in this section. The descriptions
in this section cover the basic principles and information on the
performance for standard, commercially available instruments.
Thus, selection and sizing of standard equipment is emphasized,
not designing equipment “from scratch” [40].
8.1.1. Elements of automatic process
control
117
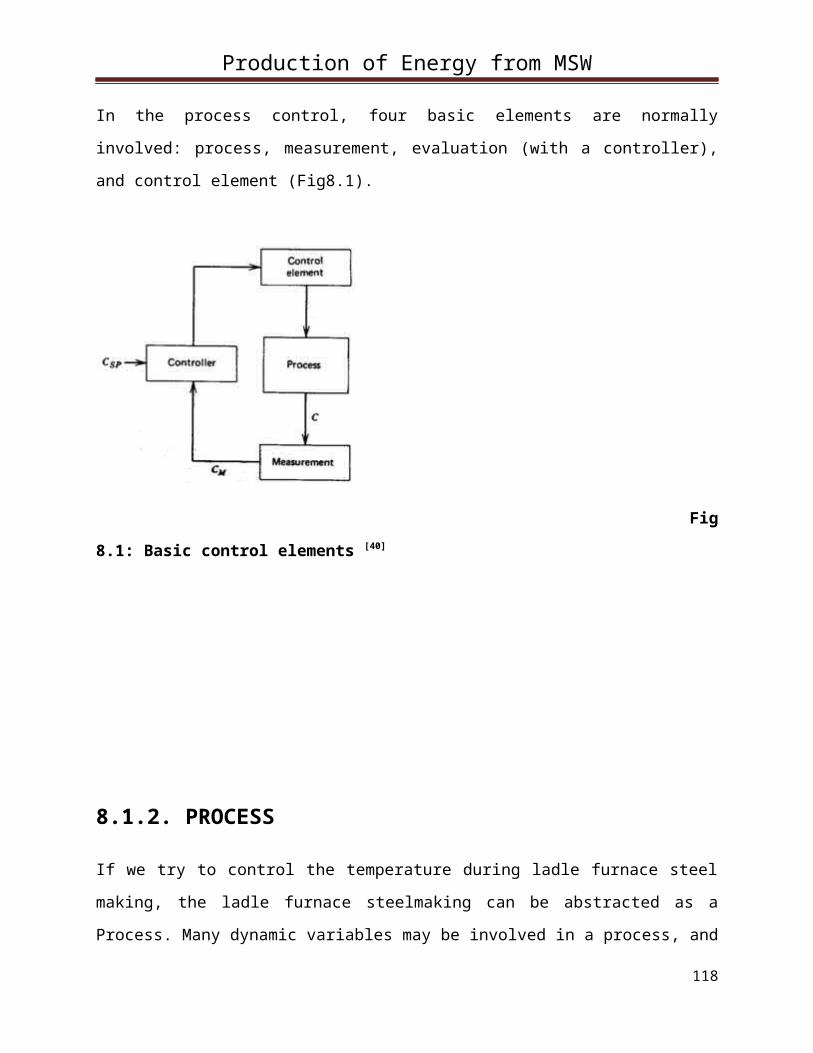
Production of Energy from MSW
In the process control, four basic elements are normally
involved: process, measurement, evaluation (with a controller),
and control element (Fig8.1).
Fig
8.1: Basic control elements [40]
8.1.2. PROCESS
If we try to control the temperature during ladle furnace steel
making, the ladle furnace steelmaking can be abstracted as a
Process. Many dynamic variables may be involved in a process, and
118
Production of Energy from MSW
it may be desirable to control all those variables at the same
time. There are single-variable processes, in which only one
variable is to be controlled. However, most industrial processes
are multivariable processes, in which many variables, perhaps
interrelated, may require regulation.
8.1.3. MEASUREMENT
Control is in nature to effect control of a dynamic variable in a
process. To perform control, we have to perform measurement, so
that we can have information on the variable itself. In general,
a measurement refers to the transduction of the variable into
some corresponding analog of the variable, such as a pneumatic
pressure, an electrical voltage, or current. A transducer is a
device that performs the initial measurement and energy
conversion of a dynamic variable into analogous electrical or
pneumatic information. Further transformation or signal
conditioning may be required to complete the measurement
function. The result of the measurement is a transformation of
the dynamic variable into some proportional information in a
useful form required by the other elements in the process-control
loop.
8.1.4. EVALUATION
The next step in the process-control sequence is to examine the
measurement and determine what action, if any, should be taken. A
controller is commonly used in this step to perform the
119

Production of Energy from MSW
evaluation. The evaluation may be performed by an operator, or by
(electronic/pneumatic) signal processing, or by a computer.
Computer use is growing rapidly in the field of process control
because it is easily adapted to the decisionmaking operations and
because of its inherent capacity to handle control of
multivariable systems. The controller requires an input of both a
measured representation of the dynamic variable and a
representation of the desired value of the variable, expressed in
the same terms as the measured value. The desired value of the
dynamic variable is referred to as the setpoint. Thus, the
evaluation consists of a comparison of the controlled variable
measurement and the setpoint and a determination of action
required bring the controlled variable to the setpoint value.
8.1.5. CONTROL ELEMENT
The final element in the process-control loop is the device that
exerts a direct influence on the process, that is, that provides
those required changes in the dynamic variable to bring it to the
setpoint condition. This element accepts an input from the
controller, which is then transformed into some proportional
operation performed on the process. In our previous example, the
control element is the value that adjusts the outflow of fluid
from the tank. This element is also referred to as the final
control element [39].
8.1.6. Block Diagram
120
Production of Energy from MSW
Each element in a process-control loop is represented in a block
diagram a separate step. Figure 1 is actually a block diagram
constructed from the element defined in the previous section. The
controlled dynamic variable in the process is denoted by C in
this diagram, and the measured representation of the controlled
dynamic variable is labeled CM. The controlled variable setpoint
labeled CSP and must be expressed in the same proportion as that
provided the measurement function.
In many cases, the controller block is presented in a fashion
that carr over from electronic feedback or servo analysis. This
presents the evaluation operation as a summation point that
outputs an error signal E = CM - CSP to the controller for
comparison and action.
To further illustrate, the block diagram concept in Fig. 8.2
shows a block diagram for a typical flow control system. In this
example, the dynamic variable is the flow rate that is converted
to electric current as an analog. The process is the flow, and
the measurement is to determine the difference of pressure. With
the setpoint in the controller, the flow process is controlled
through the control element, the valve [41].
121

Production of Energy from MSW
Fig 8.2: A process-control system to regulate flow and the
corresponding block diagram [41]
8.2. Sensors
A sensor (also called detector) is a converter that measures a
physical quantity and converts it into a signal which can be read
by an observer or by an (today mostly electronic) instrument. For
example, a mercury-in-glass thermometer converts the measured
temperature into expansion and contraction of a liquid which can
be read on a calibrated glass tube. A thermocouple converts
temperature to an output voltage which can be read by a uy7. For
accuracy, most sensors are calibrated against known standards.
Sensors are used in everyday objects such as touch-sensitive
elevator buttons (tactile sensor) and lamps which dim or brighten
by touching the base. There are also innumerable applications for
sensors of which most people are never aware. Applications
122
Production of Energy from MSW
include cars, machines, aerospace, medicine, manufacturing and
robotics.
A sensor is a device which receives and responds to a signal when
touched. A sensor's sensitivity indicates how much the sensor's
output changes when the measured quantity changes. For instance,
if the mercury in a thermometer moves 1 cm when the temperature
changes by 1 °C, the sensitivity is 1 cm/°C (it is basically the
slope Dy/Dx assuming a linear characteristic). Sensors that
measure very small changes must have very high sensitivities.
Sensors also have an impact on what they measure; for instance, a
room temperature thermometer inserted into a hot cup of liquid
cools the liquid while the liquid heats the thermometer. Sensors
need to be designed to have a small effect on what is measured;
making the sensor smaller often improves this and may introduce
other advantages. Technological progress allows more and more
sensors to be manufactured on a microscopic scale as micro
sensors using MEMS technology. In most cases, a micro sensor
reaches a significantly higher speed and sensitivity compared
with macroscopic approaches [42].
8.2.1. Temperature sensors
Temperature control is important for separation and reaction
processes, and temperature must be maintained within limits to
ensure safe and reliable operation of process equipment.
123

Production of Energy from MSW
Temperatures can sense by many methods; several of the more
common are described below [43]
Table no.8.1: Summary of temperature sensors [43]
Criteria Thermocouple RTD Thermistor
Temperature
range
Very wide Wide Narrow
124

Production of Energy from MSW
-450°F
+4200°F
-400°F +1200°F -100°F
+500°F
Interchangeab
ility
Good Excellent Poor to fair
Long term
Stability
Poor to fair Good Poor
Accuracy Medium High Medium
Repeatability Fair Excellent Fair to good
Sensitivity
(output)
Low Medium Very high
Response Medium to
fast
Medium Medium to
fast
Linearity Fair Good Poor
Self heating No Very low to
low
High
Point(end)
sensitive
Excellent Fair Good
Lead effect High Medium Low
Size/
packaging
Small to
large
Medium to
small
Small to
medium
125

Production of Energy from MSW
Table no. 8.2. Temperature sensors advantages and disadvantages[43]
Sensors Advantages Disadvantages
Thermocoup
le
No resistance lead
wire problems
Fastest response
Simple, rugged
Inexpensive
High temperature
operation
Point temperature
sensing
Non-linear
Low voltage
Least stable,
repeatable
Least sensitive
RTD
Most stable,
accurate
Contamination
resistant
More linear than
thermocouple
Current source
required
Self-heating
Slow response time
Low sensitivity to
small temperature
126

Production of Energy from MSW
Area temperature
sensing
Most repeatable
temperature
measurement
changes
8.2.2 Flow sensors
A flow sensor is a device for sensing the rate of fluid flow.
Typically a flow sensor is the sensing element used in a flow
meter, or flow logger, to record the flow of fluids. As is true
for all sensors, absolute accuracy of a measurement requires
functionality for calibration.
There are various kinds of flow sensors and flow meters,
including some that have a vane that is pushed by the fluid, and
can drive a rotary potentiometer, or similar devices.
127

Production of Energy from MSW
Other flow sensors are based on sensors which measure the
transfer of heat caused by the moving medium. This principle is
common for micro sensors to measure flow.
Flow meters are related to devices called velocimeters that
measure velocity of fluids flowing through them. Laser-based
interferometry is often used for air flow measurement, but for
liquids, it is often easier to measure the flow. Another approach
is Doppler-based methods for flow measurement. Hall Effect
sensors may also be used, on a flapper valve, or vane, to sense
the position of the vane, as displaced by fluid flow.
128
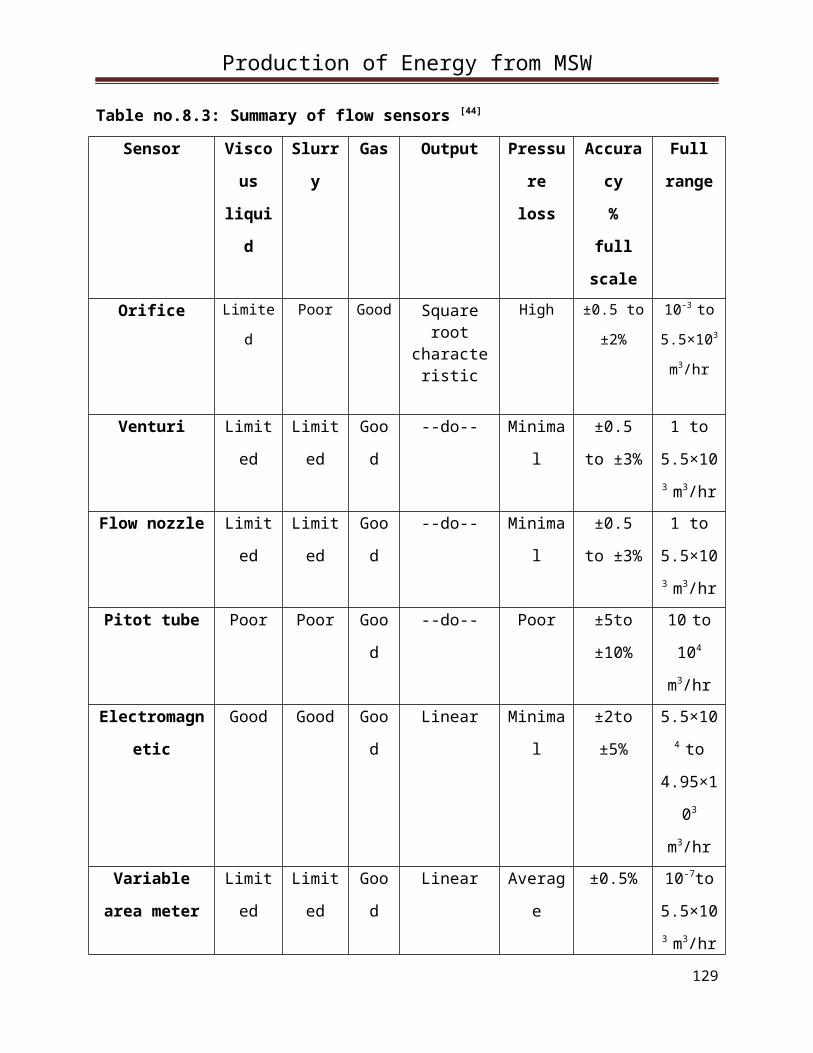
Production of Energy from MSW
Table no.8.3: Summary of flow sensors [44]
Sensor Visco
us
liqui
d
Slurr
y
Gas Output Pressu
re
loss
Accura
cy
%
full
scale
Full
range
Orifice Limite
d
Poor Good Squareroot
characteristic
High ±0.5 to
±2%
10-3 to
5.5×10³
m3/hr
Venturi Limit
ed
Limit
ed
Goo
d
--do-- Minima
l
±0.5
to ±3%
1 to
5.5×10³ m3/hr
Flow nozzle Limit
ed
Limit
ed
Goo
d
--do-- Minima
l
±0.5
to ±3%
1 to
5.5×10³ m3/hr
Pitot tube Poor Poor Goo
d
--do-- Poor ±5to
±10%
10 to
104
m3/hrElectromagn
etic
Good Good Goo
d
Linear Minima
l
±2to
±5%
5.5×10⁴ to
4.95×1
03
m3/hrVariable
area meter
Limit
ed
Limit
ed
Goo
d
Linear Averag
e
±0.5% 10-7to
5.5×10³ m3/hr
129

Production of Energy from MSW
Positive
displacemen
t
Good Good Goo
d
Linear Minima
l
±0.5
to ±1%
10-5to
5×10²
m3/hrTurbine Limit
ed
Poor Poo
r
Linear Minima
l
±2to
±5%
05 to
4.95×1
02
m3/hr
8.2.3. Pressure sensors
A pressure sensor measures pressure, typically of gases or
liquids. Pressure is an expression of the force required to stop
a fluid from expanding, and is usually stated in terms of force
per unit area. A pressure sensor usually acts as a transducer; it
generates a signal as a function of the pressure imposed. For the
purposes of this article, such a signal is electrical.
Pressure sensors are used for control and monitoring in thousands
of everyday applications. Pressure sensors can also be used to
indirectly measure other variables such as fluid/gas flow, speed,
water level, and altitude. Pressure sensors can alternatively be
called pressure transducers, pressure transmitters, pressure
senders, pressure indicators and piezometers, manometers, among
other names.130
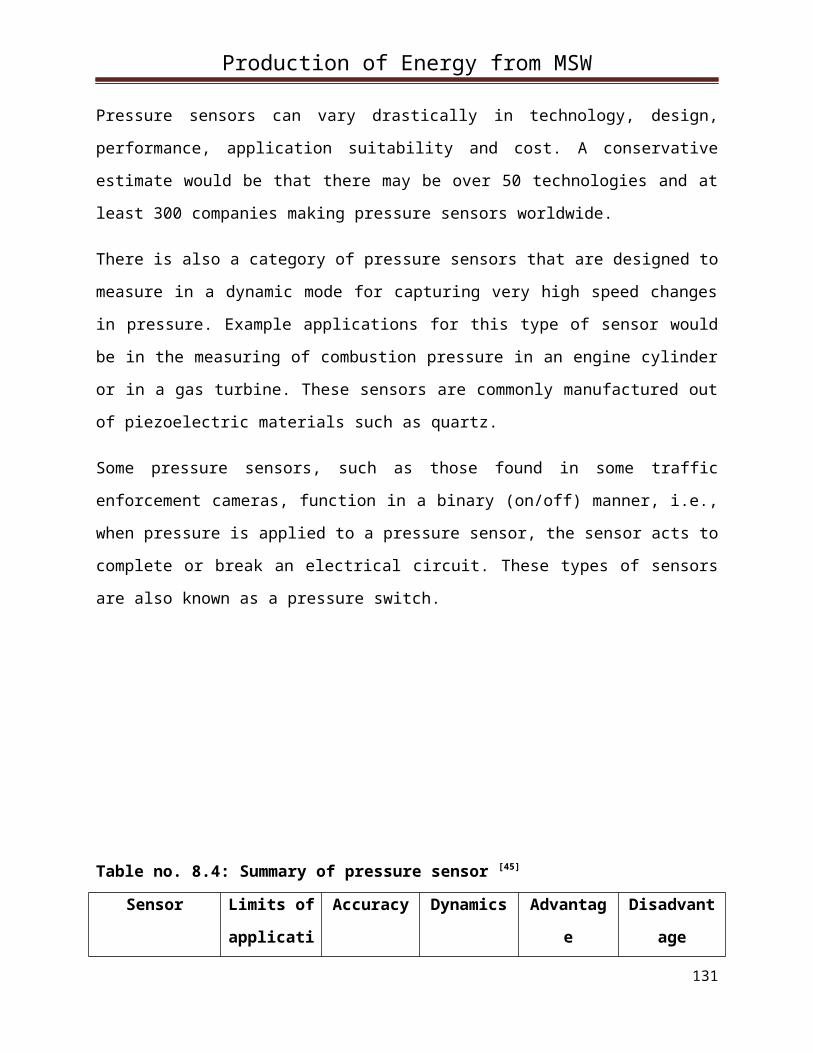
Production of Energy from MSW
Pressure sensors can vary drastically in technology, design,
performance, application suitability and cost. A conservative
estimate would be that there may be over 50 technologies and at
least 300 companies making pressure sensors worldwide.
There is also a category of pressure sensors that are designed to
measure in a dynamic mode for capturing very high speed changes
in pressure. Example applications for this type of sensor would
be in the measuring of combustion pressure in an engine cylinder
or in a gas turbine. These sensors are commonly manufactured out
of piezoelectric materials such as quartz.
Some pressure sensors, such as those found in some traffic
enforcement cameras, function in a binary (on/off) manner, i.e.,
when pressure is applied to a pressure sensor, the sensor acts to
complete or break an electrical circuit. These types of sensors
are also known as a pressure switch.
Table no. 8.4: Summary of pressure sensor [45]
Sensor Limits of
applicati
Accuracy Dynamics Advantag
e
Disadvant
age
131
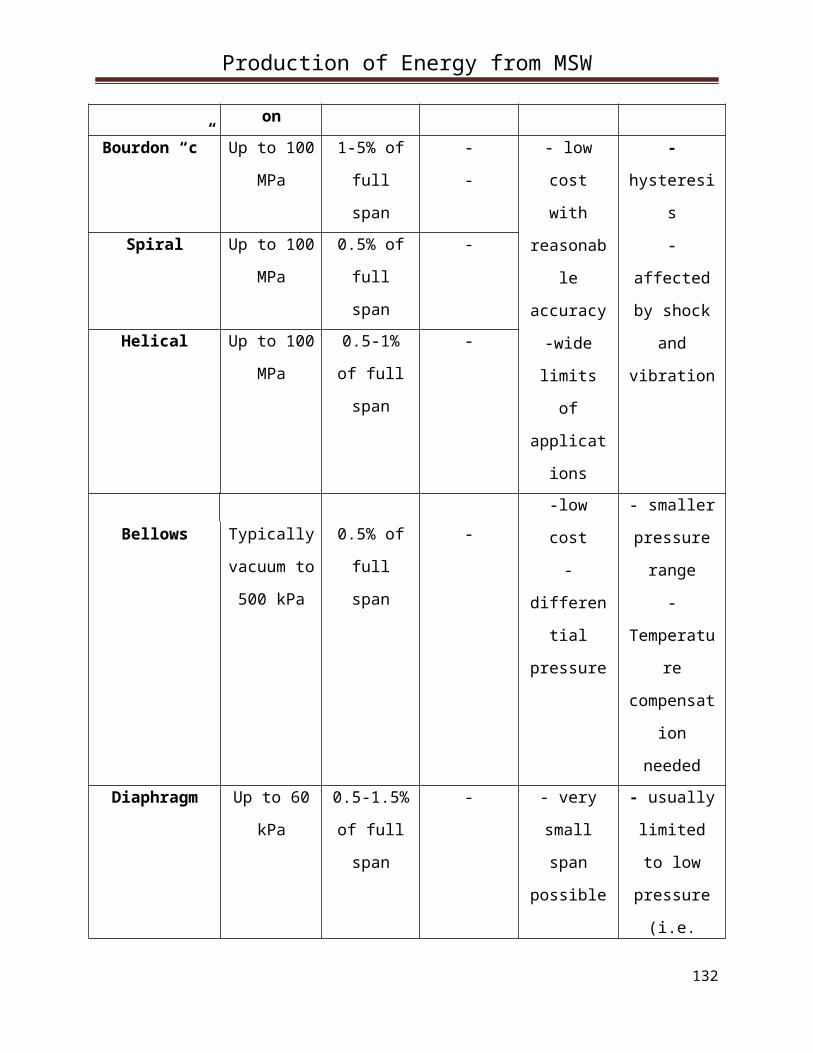
Production of Energy from MSW
onBourdon “c” Up to 100
MPa
1-5% of
full
span
-
-
- low
cost
with
reasonab
le
accuracy
-wide
limits
of
applicat
ions
-
hysteresi
s
-
affected
by shock
and
vibration
Spiral Up to 100
MPa
0.5% of
full
span
-
Helical Up to 100
MPa
0.5-1%
of full
span
-
-low
cost
-
differen
tial
pressure
- smaller
pressure
range
-
Temperatu
re
compensat
ion
needed
Bellows Typically
vacuum to
500 kPa
0.5% of
full
span
-
Diaphragm Up to 60
kPa
0.5-1.5%
of full
span
- - very
small
span
possible
- usually
limited
to low
pressure
(i.e.
132
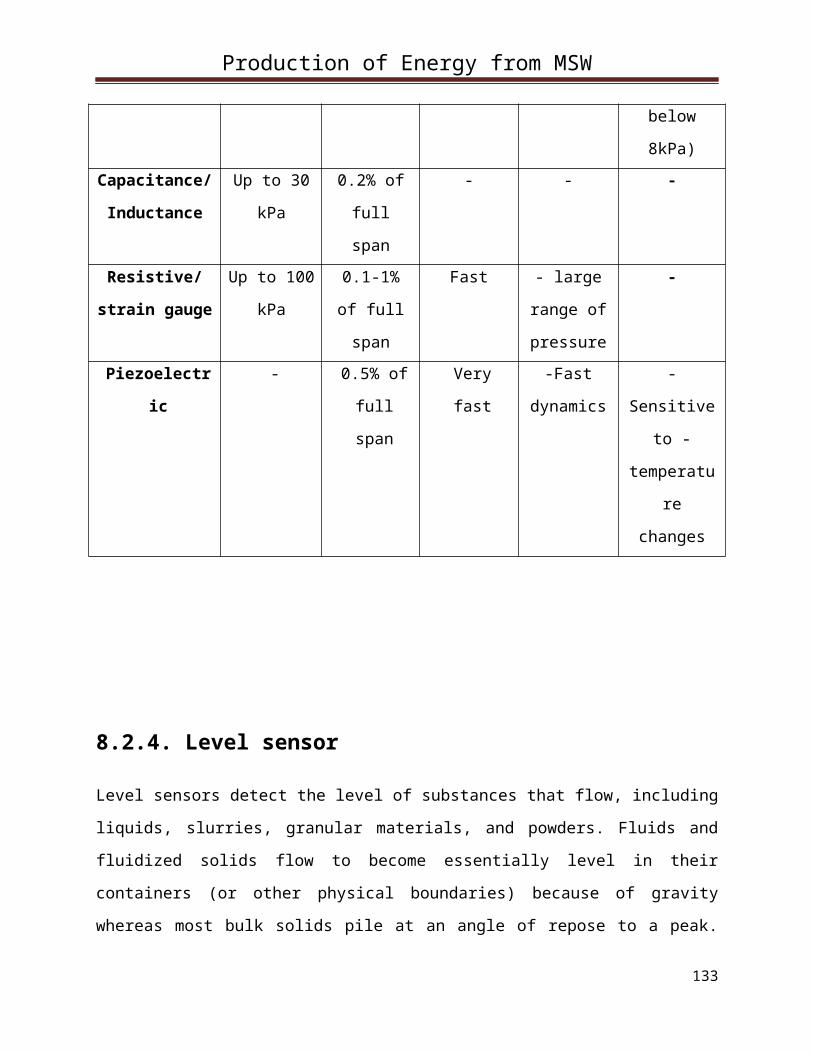
Production of Energy from MSW
below
8kPa)Capacitance/
Inductance
Up to 30
kPa
0.2% of
full
span
- - -
Resistive/
strain gauge
Up to 100
kPa
0.1-1%
of full
span
Fast - large
range of
pressure
-
Piezoelectr
ic
- 0.5% of
full
span
Very
fast
-Fast
dynamics
-
Sensitive
to -
temperatu
re
changes
8.2.4. Level sensor
Level sensors detect the level of substances that flow, including
liquids, slurries, granular materials, and powders. Fluids and
fluidized solids flow to become essentially level in their
containers (or other physical boundaries) because of gravity
whereas most bulk solids pile at an angle of repose to a peak.
133
Production of Energy from MSW
The substance to be measured can be inside a container or can be
in its natural form (e.g., a river or a lake). The level
measurement can be either continuous or point values. Continuous
level sensors measure level within a specified range and
determine the exact amount of substance in a certain place, while
point-level sensors only indicate whether the substance is above
or below the sensing point. Generally the latter detect levels
that are excessively high or low.
There are many physical and application variables that affect the
selection of the optimal level monitoring method for industrial
and commercial processes. The selection criteria include the
physical: phase (liquid, solid or slurry), temperature, pressure
or vacuum, chemistry, dielectric constant of medium, density
(specific gravity) of medium, agitation (action), acoustical or
electrical noise, vibration, mechanical shock, tank or bin size
and shape. Also important are the application constraints: price,
accuracy, appearance, response rate, ease of calibration or
programming, physical size and mounting of the instrument,
monitoring or control of continuous or discrete (point) levels[43].
134
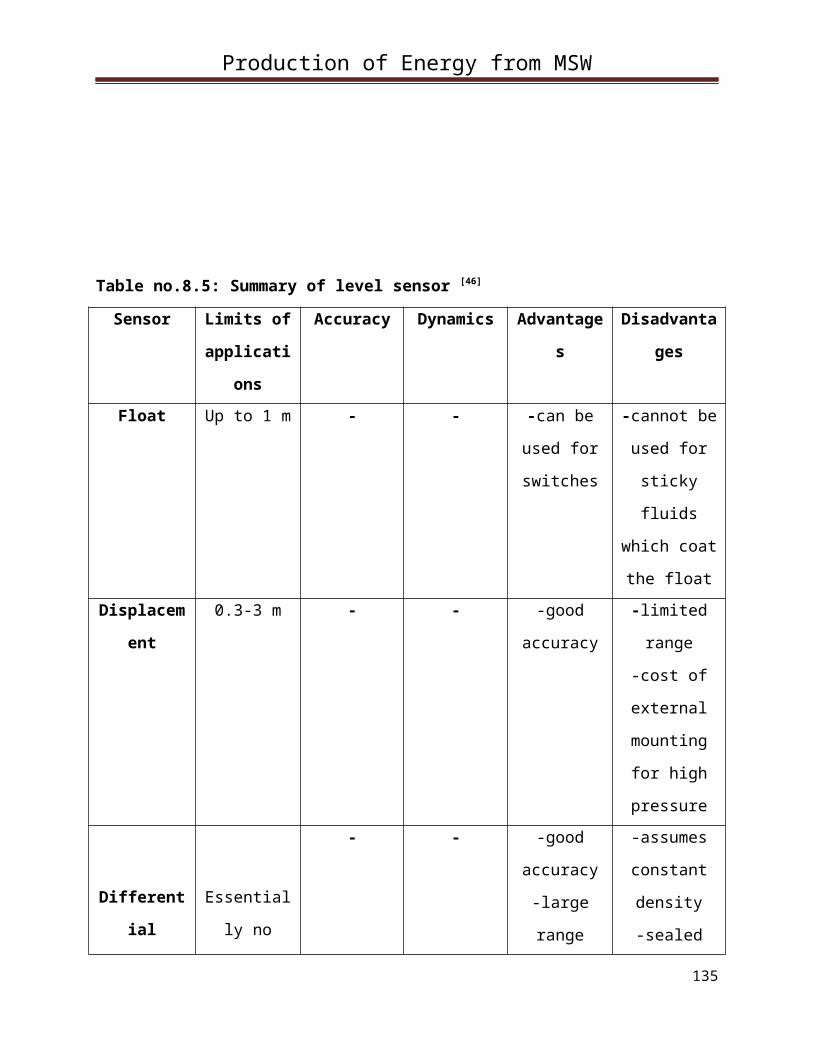
Production of Energy from MSW
Table no.8.5: Summary of level sensor [46]
Sensor Limits of
applicati
ons
Accuracy Dynamics Advantage
s
Disadvanta
ges
Float Up to 1 m - - -can be
used for
switches
-cannot be
used for
sticky
fluids
which coat
the floatDisplacem
ent
0.3-3 m - - -good
accuracy
-limited
range
-cost of
external
mounting
for high
pressure
Different
ial
Essential
ly no
- - -good
accuracy
-large
range
-assumes
constant
density
-sealed
135

Production of Energy from MSW
pressure upper
limit
-
applicabl
e to
slurries
with the
use of
sealed
lines
lines
sensitive
to
temperatur
e
Capacitan
ce
Up to 30
m
- - -
applicabl
e to
slurries
- level
switch
for many
difficult
fluids
-affected
by density
variations
8.3. On stream analyzers
The term analyzer refers to any sensor that measures a physical
property of the process material. This property could relate to
136

Production of Energy from MSW
purity (e.g., mole % of various components), a basic physical
property (e.g., density or viscosity), or an indication of
product quality demanded by the customers in the final use of
material (e.g., gasoline octane for fuel heating value).
Analyzers rely on a wide range of physical principals; their
unifying characteristics is a greatly increased sensor complexity
when compared with the saturated temperature, flow, pressure and
level (T,F,P and L) sensors. In many situations, the analyzers is
located in a centralized laboratory and processes samples
collected at the plant and transported to the laboratory. This
procedure reduces the cost of analyzer, but it introduces long
delays before a measurement is available for use in plant
operations.
8.4. Control valves
Control valves are valves used to control conditions such as
flow, pressure, temperature, and liquid level by fully or
partially opening or closing in response to signals received from
controllers that compare a "setpoint" to a "process variable"
whose value is provided by sensors that monitor changes in such
conditions.[47]
The opening or closing of control valves is usually done
automatically by electrical, hydraulic or pneumatic actuators.
Positioners are used to control the opening or closing of the
actuator based on electric, or pneumatic signals. These control
137
Production of Energy from MSW
signals, traditionally based on 3-15psi (0.2-1.0bar), more common
now are 4-20mA signals for industry, 0-10V for HVAC systems, and
the introduction of "Smart" systems, HART, Fieldbus Foundation,
and Profibus being the more common protocols.
A control valve consists of three main parts in which each part
exist in several types and designs:
Valve's actuator
Valve's positioned
Valve's body
9.1. Future consideration
We have made the design of gasification plant to the best of our
knowledge. Although the energy balance around the plant yielded a
net positive energy of MW/hr, but after detailed analysis,
thorough study and research, we have come to a conclusion that
may be some aspects, which can be modified in order to improve
the overall efficiency of the plant. These can be summarized as
under:
1. The increased amounts of CO2 in the synthesis gas are big
factor in its relatively low heating value. This problem can
be overcome by feeding the gasifier with coal or coke along
with MSW. This will favor the following reaction:
138
Production of Energy from MSW
CO2 + C
2CO
This will decrease the CO2 contents of the synthesis gas and will
ultimately increase the calorific value of synthesis gas.
2. Methane is a high calorific value gas. In the gasification
process, it yielded by the following reaction:
CO + 3H2
C2H4 + H2O
The above depicted reaction is a shift reaction in the forward
direction, depending on the pressure. Increasing the pressure
inside the gasifier can eventually increase the yield of methane
contents of the synthesis gas.
3. In the gasifier plant we have designed, the furnace is the
most energy consuming unit. This can be lower down by
heating the gasifier externally, using a part of synthesis
gas produced.
4. The synthesis gas produced, can be used to generate the
following fuels by Fischer-Tropsc process:
139

Production of Energy from MSW
Methanol
Bio-diesel
Petroleum like fuels
140

Production of Energy from MSW
References
1- P Jayarama Reddy “municipal solid waste management,
processing energy recovery, global examples”
2- http://news.bbc.co.uk/2/hi/science/nature/5054052.stm
3- Draft (guideline for solid waste management) june 2005,
Pakistan Environmental Protection Agency, JICA, UNDP, page
no. 5-16.
4- http://www.Pakistantoday.com.pk/2012/15/comment/editors-
mail/alarming-population-growth/
5- SHARISH, Solid Waste and its Management ppt.
6- Khan, Azher Uddin, “Evaluation of industrial Environmental
Management-Pakistan,”May,(2010
7- Khwaja, Mahmood A., Shahenn, Nazma and Yasmeen,
Farzana,”Mapping of Chemically polluted sites in
Pakistan,”SDPI, Islamabad, 2010(in preparation)
8- http://tribune.com.pk/story/26620/pakistan-produces-250000-tons-
of-medical-waste-annually/
9- Dr. Jeong, Hoi-seong & Dr. Kim, Kwang-Yim “ Koica-world
bank joint study on solid waste management in Punjab,
Pakistan
10- State Bank of Pakistan “Waste Management: Recent
Developments in Pakistan”.
11- Brief report on solid waste management in Pakistan
12- NW BIORENEW
141

Production of Energy from MSW
13- Alexander Klein and Nickolas J. Themelis “Energy
Recovery from Municipal Solid Waste by Gasification.
14- "Waste incineration". Europa. October 2011.
15- "DIRECTIVE 2000/76/EC OF THE EUROPEAN PARLIAMENT AND OF
THE COUNCIL of 4 December 2000 on the incineration of
waste". European Union. 4 December 2000.
16- Waste to Energy in Denmark by Ramboll Consult
17- Emissionsfaktorer og emissionsopgørelse for decentral
kraftvarme, Kortlægning af emissioner fra decentrale
kraftvarmeværker, Ministry of the Environment of Denmark
2006 (in Danish)
18- Waste Gasification: Impacts on the Environment and
Public Health
19- Rosenthal, Elisabeth (12 April 2010). "Europe Finds
Clean Energy in Trash, but U.S. Lags". The New York Times.
20- Burning of wood , InnoFireWood's website. Accessed on
2010-02-06.
21- Moustakasa, K.; Fattab, D.; Malamisa, S.; Haralambousa,
K.; Loizidoua, M. (2005-08-31). "Demonstration plasma
gasification/vitrification system for effective hazardous
waste treatment". Journal of Hazardous Materials 123 (1–3): 120–
126. doi:10.1016/j.jhazmat.2005.03.038. (subscription
required). Retrieved 2012-03-08.
22- "How Stuff Works- Plasma Converter". Retrieved 2012-
09-09.
142

Production of Energy from MSW
23- Kalinenko, R. A.; Kuznetsov, A. P.; Levitsky, A. A.;
Messerle, V. E.; Mirokhin, Z. B.; Polak; Sakipov, L. S.;
Ustimenko, A. B. (1993). "Pulverized coal plasma
gasification". Plasma Chemistry and Plasma Processing 13 (1): 141–
167. doi:10.1007/BF01447176. (subscription required).
Retrieved 2012-03-08.
24- Messerle, V. E.; Ustimenko, A. B. (2007). "Solid Fuel
Plasma Gasification". In Syred, Nick; Khalatov, Artem.
Advanced Combustion and Aerothermal Technologies. Environmental Protection
and Pollution Reductions. Springer Netherlands. pp. 141–156.
doi:10.1007/978-1-4020-6515-6. ISBN 978-1-4020-6515-6.
(subscription required). Retrieved 2012-03-08.
25- "The Recovered Energy System: Discussion on Plasma
Gasification". Retrieved 2008-10-20.
26- Bratsev, A. N.; V. E. Popov, A. F. Rutberg, S. V.
Shtengel’ (2006). "A Facility for Plasma Gasification of
Waste of Various Types". High temperature 44 (6): 823–828.
Retrieved 2013-03-12.
27- Huang, H.; Lan Tang, C. Z. Wu (2003). "Characterization
of Gaseous and Solid Product from Thermal Plasma Pyrolysis
of Waste Rubber". Environmental science & technology 37 (19): 4463–
4467. Retrieved 2013-03-12.
28- "Biomass Program, direct Hydrothermal Liquefaction" . US
Department of Energy. Energy Efficiency and Renewable
Energy. 2005-10-13. Retrieved 2008-01-12.
143
Production of Energy from MSW
29- Werner Kossmann, UtaPönitz, Stefan Habermehl “Biogas
Digest volume 1”
30- Anaerobic digestion , waste.nl. Retrieved 19.08.07
31- Klein, Donald W.; Lansing M.; Harley, John (2006).
Microbiology (6th ed.). New York: McGraw-Hill. ISBN 978-0-07-
255678-0.
32- Dickinson, J. R. (1999). "Carbon metabolism". In J. R.
Dickinson and M. Schweizer. The metabolism and molecular physiology
of Saccharomyces cerevisiae. Philadelphia, PA: Taylor & Francis.
ISBN 978-0-7484-0731-6.
33- Voet, Donald & Voet, Judith G. (1995). Biochemistry (2nd
ed.). New York, NY: John Wiley & Sons. ISBN 978-0-471-58651-
7.
34- Enviros (2006) Mechanical biological treatment website,
www.mbt.landfill-site.com, Waste Technology Home Page,
Accessed 22.11.06
35- Juniper (2005) MBT: A Guide for Decision Makers –
Processes, Policies & Markets, www.juniper.co.uk, (Project
funding supplied by Sita Environmental Trust), Accessed
22.11.06
36- Velis C. et al. (2010) Production and quality assurance
of solid recovered fuels using mechanical—biological
treatment (MBT) of waste: a comprehensive assessment
37- http://www.altenergymag.com/emagazine.php?
issue_number=09.06.01&article=zafar
144
Production of Energy from MSW
38- Kamka, Frank; Jochmann, Andreas (June 2005).
"Development Status of BGL-Gasification" (PDF).
International Freiberg Conference on IGCC & XtL Technologies
speaker Lutz Picard.
http://www.iec.tu-freiberg.de/conference/conference_05/pdf/
21_Picard.pdf. Retrieved 2011-03-19.
39- http://www.fao.org/docrep/t0512e/T0512e0a.htm
40- Smith and Corpio “Process Dynamics and Control.
41- Curtis D. Johnson: Process Control Instrumentation
Technology, 3rd Ed. John Wiley & Sons, Inc., 1988. ISBN 0-
471-85340-2.
42- M. Kretschmar and S. Welsby (2005), Capacitive and
Inductive Displacement Sensors, in Sensor Technology
Handbook, J. Wilson editor, Newnes: Burlington, MA
43- http://www.watlow.com/reference/guides/0205.cfm
44- http://enggyd.blogspot.com/2011/04/comparison-of-flow-
meters.html
45- Elastic hologram' pages 113-117, Proc. of the IGC 2010,
ISBN 978-0-9566139-1-2 here:
http://www.dspace.cam.ac.uk/handle/1810/225960
46- Sapcon Instruments. "Fly Ash Level Detection?".
Retrieved 2008-05-05.
47- Control valve tutorials Tutorials covering the sizing,
capacity and characteristics of control valves. Actuators,
positioners
145
Related Documents