136 10 CHAPTER Human Resources, Job Design, and Work Measurement D ISCUSSION Q UESTIONS 1. One would expect that elements of Maslow’s needs hierarchy, Herzberg’s Dual Factor theory, and Hackman and Oldham’s core job characteristics would be contained in the answer. 2. Jobs have been considered “bad” because they are physically dangerous, “dirty,” or “noisy”; psychologically repulsive, too mo- notonous; present too great a physical or intellectual challenge; or offend an individual’s preferences with regard to general lifestyle or employment. Students should be encouraged not to identify a particular “right” job, but to try to identify precisely what issues relevant to the job appeal to or offend him or her. Note the core job characteristics of Hackman and Oldham: skill variety, job identity in job significance, autonomy, feedback. 3. Again, there is no set answer to this question. The important considerations are: The changes suggested should address the reasons that the original job was considered “bad”—not merely make the job different. The changes must be realistic—resources must exist or must be able to be developed that would allow implemen- tation of the suggested job changes. The student should be encouraged to consider the differ- ence between “production” and “productivity.” 4. Jobs that can push the man-machine interface to the limit of man’s capacity usually require a high rate of information process- ing, a high rate and accuracy of physical response, or both. Exam- ples would be found in terms of pilots of high-performance jet or rocket-powered aircraft, crane operators, and a safety monitor for working at a nuclear power station. 5. The student should be encouraged to include Hackman and Oldham’s five core job characteristics of skill variety, job identity, job significance, autonomy, and feedback. 6. Job enrichment relates primarily to increasing the cognitive or intellectual requirements for the job, often by increasing authority and responsibility. Job enlargement relates primarily to an increase in the num- ber of tasks to be performed. Job rotation implies a formal arrangement for job switching among a particular group of workers within a specific set of jobs. Usually the workers are cross-trained on all or most jobs within the set. Job specialization implies the opposite of job enrichment or job enlargement, where the job becomes narrow and the range of responsibility and authority restricted. Employee empowerment is the practice of enriching jobs so that employees accept responsibility for a variety of deci- sions normally associated with staff specialists. Teams often satisfy empowerment, core job characteristics, and higher level needs. 7. Ergonomics is the study of human factors, the study of work. Ergonomics can make work safer, less damaging, by redesign to tools, workspaces, and worker motions. 8. Techniques for methods analysis include: flow diagrams, process charts, activity charts, and operations charts. 9. Labor standards are set in four ways: historical experience, time studies, predetermined time standards, and work sampling. 10. Labor standards are used to: 1. Determine labor content of items produced 2. Determine staffing needs of organizations 3. Determine cost and time estimates prior to production 4. Determine crew size and work balance 5. Determine production expected 6. Determine the basis of wage-incentive plans 7. Determine efficiency of employees and supervision 11. Classify as follows: a) The operator stops to talk to you: do not include (delay) b) The operator lights up a cigarette: do not include (personal) c) Operator opens lunch pail: do not include (personal) 12. Waiting time: waiting time is included in an allowance as delay. 13. Material movement or replenishment: include in the stan- dard unless a separate materials handling group exists. 14. Operator drops a part, you pick it up and hand it to him: do not include. Outside help or interference distorts the results of the study. A CTIVE M ODEL E XERCISE ACTIVE MODEL 10.1: Work Sampling 1. Scroll over the graph to determine what the sample size should be if p = 30%. 933 2. Based on the graph, what value of p requires the largest sample size? 0.5 3. Use the scrollbar to determine what happens to the sample size as the number of standard deviations, z, increases? The sample size increases. 4. Use the scrollbar to determine what happens to the sample size as the acceptable error, h, increases? The sample size decreases.

Production Management
Dec 27, 2015
Heizer Production Management
Welcome message from author
This document is posted to help you gain knowledge. Please leave a comment to let me know what you think about it! Share it to your friends and learn new things together.
Transcript
136
10C H A P T E R
Hu man Resources, Job Design, and W ork Measurement
DISCUSSION Q UESTIONS 1. One would expect that elements of Maslow’s needs hierarchy, Herzberg’s Dual Factor theory, and Hackman and Oldham’s core job characteristics would be contained in the answer.
2. Jobs have been considered “bad” because they are physically dangerous, “dirty,” or “noisy”; psychologically repulsive, too mo-notonous; present too great a physical or intellectual challenge; or offend an individual’s preferences with regard to general lifestyle or employment. Students should be encouraged not to identify a particular “right” job, but to try to identify precisely what issues relevant to the job appeal to or offend him or her. Note the core job characteristics of Hackman and Oldham: skill variety, job identity in job significance, autonomy, feedback.
3. Again, there is no set answer to this question. The important considerations are:
The changes suggested should address the reasons that the original job was considered “bad”—not merely make the job different.
The changes must be realistic—resources must exist or must be able to be developed that would allow implemen-tation of the suggested job changes.
The student should be encouraged to consider the differ-ence between “production” and “productivity.”
4. Jobs that can push the man-machine interface to the limit of man’s capacity usually require a high rate of information process-ing, a high rate and accuracy of physical response, or both. Exam-ples would be found in terms of pilots of high-performance jet or rocket-powered aircraft, crane operators, and a safety monitor for working at a nuclear power station.
5. The student should be encouraged to include Hackman and Oldham’s five core job characteristics of skill variety, job identity, job significance, autonomy, and feedback.
6. Job enrichment relates primarily to increasing the cognitive or intellectual requirements for the job, often by increasing authority and responsibility.
Job enlargement relates primarily to an increase in the num-ber of tasks to be performed.
Job rotation implies a formal arrangement for job switching among a particular group of workers within a specific set of jobs. Usually the workers are cross-trained on all or most jobs within the set.
Job specialization implies the opposite of job enrichment or job enlargement, where the job becomes narrow and the range of responsibility and authority restricted.
Employee empowerment is the practice of enriching jobs so that employees accept responsibility for a variety of deci-sions normally associated with staff specialists.
Teams often satisfy empowerment, core job characteristics, and higher level needs.
7. Ergonomics is the study of human factors, the study of work. Ergonomics can make work safer, less damaging, by redesign to tools, workspaces, and worker motions.
8. Techniques for methods analysis include: flow diagrams, process charts, activity charts, and operations charts.
9. Labor standards are set in four ways: historical experience, time studies, predetermined time standards, and work sampling.
10. Labor standards are used to: 1. Determine labor content of items produced 2. Determine staffing needs of organizations 3. Determine cost and time estimates prior to production 4. Determine crew size and work balance 5. Determine production expected 6. Determine the basis of wage-incentive plans 7. Determine efficiency of employees and supervision 11. Classify as follows:
a) The operator stops to talk to you: do not include (delay) b) The operator lights up a cigarette: do not include (personal) c) Operator opens lunch pail: do not include (personal) 12. Waiting time: waiting time is included in an allowance as delay. 13. Material movement or replenishment: include in the stan-dard unless a separate materials handling group exists. 14. Operator drops a part, you pick it up and hand it to him: do not include. Outside help or interference distorts the results of the study.
ACTIVE MO DEL EXERCISE ACTIVE MODEL 10.1: Work Sampling 1. Scroll over the graph to determine what the sample size should be if p = 30%.
933
2. Based on the graph, what value of p requires the largest sample size?
0.5
3. Use the scrollbar to determine what happens to the sample size as the number of standard deviations, z, increases?
The sample size increases.
4. Use the scrollbar to determine what happens to the sample size as the acceptable error, h, increases?
The sample size decreases.
CHAPTER 10 H U M A N R E S O U R C E S , J O B D E S I G N , A N D W O R K M E A S U R E M E N T 137
ETHICAL DILEM M A McWane Inc. is an interesting company—a repeat polluter, a dan-gerous workplace, a tough management team, privately held—yet it is a major philanthropic family in Birmingham and is respected for what it has given the city culturally. It also claims to be “cleaning up its act” in response to the terrible publicity it has received over the years. Students should use the Internet to update the 2003–2004 New York Times and The Wall Street Journal articles sourced. This will make for a lively classroom discussion.
(a) A new company nurse at McWane. Should she contact OSHA, quit, force the issue with management? These are usually no-win situations for employees.
(b) A purchase of McWane’s products. Do you insist on ethics in your supply chain? This is an issue facing U.S. clothing makers whose factories are in China, Bangladesh, and Vietnam. Public opinion usually forces companies to insist their suppliers follow the same code of ethics they apply internally.
(c) McWane’s banker. Do you intrude on your good cus-tomer’s business ethics or keep your eyes and ears closed, hoping the attorneys and accountants handle the bad press?
(d) A supplier to McWane. Do you tell McWane you will not sell them $10 million in material per month because you don’t approve of their treatment of employees and the envi-ronment? Are you responsible to your shareholders to make a profit or set standards for a customer’s ethics?
END-OF-CHAPTER PROBLEMS
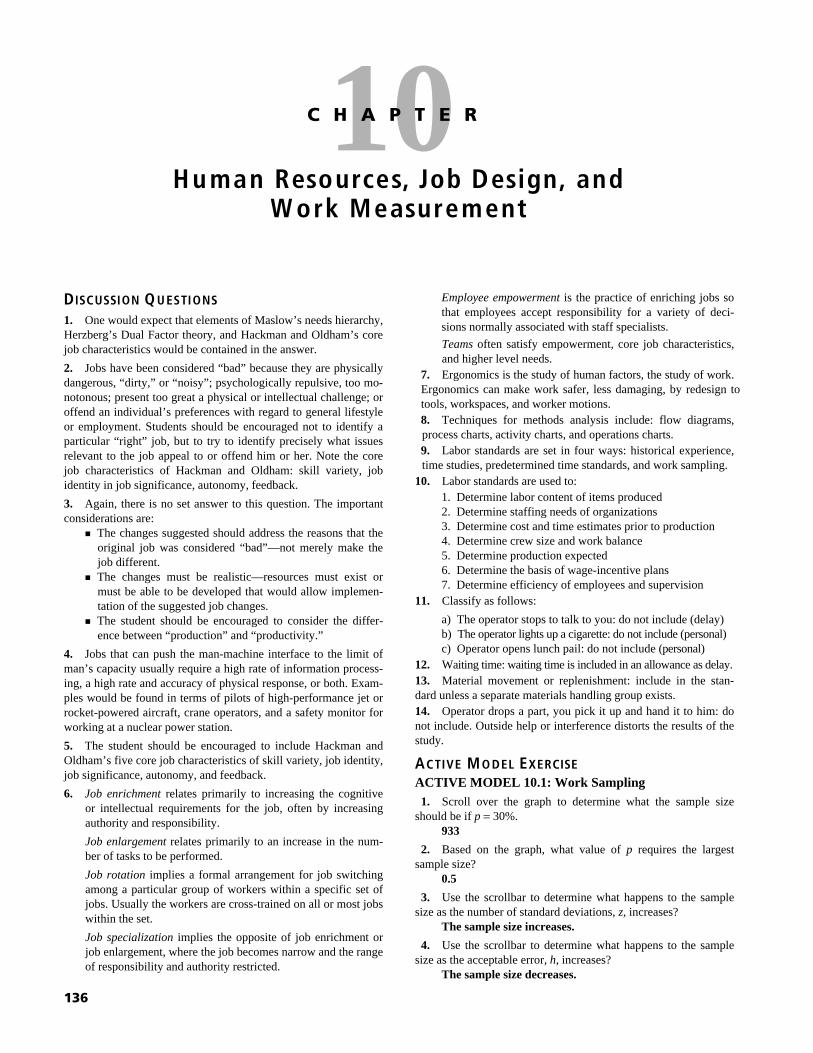
10.1
10.2
138 CHAPTER 10 H U M A N R E S O U R C E S , J O B D E S I G N , A N D W O R K M E A S U R E M E N T
10.3 This problem is probably best solved by students who haveexperienced one of these concerts! Of major importance in the so-lution is that everything be coordinated (both performers and sets may have to be changed; performers may have to change cos-tume, etc.) and that all performers be allowed time to recuperate.
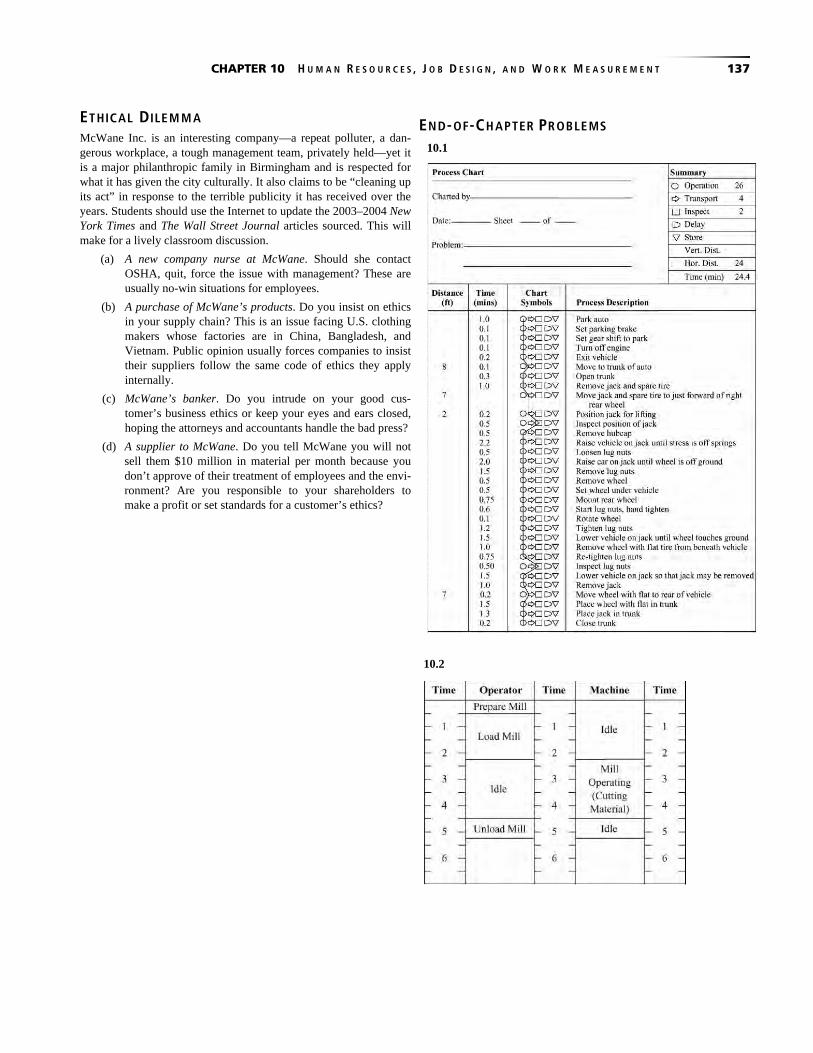
The operations chart presented here as a solution to part (a) is typi-cal of left-hand/right-hand charts, containing numerous small mo-tions. Placing a paper clip on a set of papers is somewhat simpler,but contains many of the same motions. Adding paper to a printermight be more complex, and might require more mechanical dexter-ity or strength, but it too could be analyzed with a chart analogousto this one.
10.4
CHAPTER 10 H U M A N R E S O U R C E S , J O B D E S I G N , A N D W O R K M E A S U R E M E N T 139
10.6 The important point raised by this question is that actual rat-ings will depend on both the job and the psychological needs of the individual student. Students should be encouraged to evaluate the degree to which they require each of the psychological components cited by Hackman and Oldham; then to evaluate several jobs.
The following two examples are offered:
Job Characteristic
Example 1: Fast-Food
Kitchen Staff
Example 2: College Professor
Skill variety 3 5 Changes that mig ht lead to higher Job Ide nti ty 4 9 score: fo r the fast-food w orker, job Job Signi ficance 3 8 enlarge m e nt wo uld lead to greater job A u to n o my 4 9 variety. For the college pro fessor, Feed back 7 6 m o re f req uent p er f o r ma nce reviews. Total 20 37
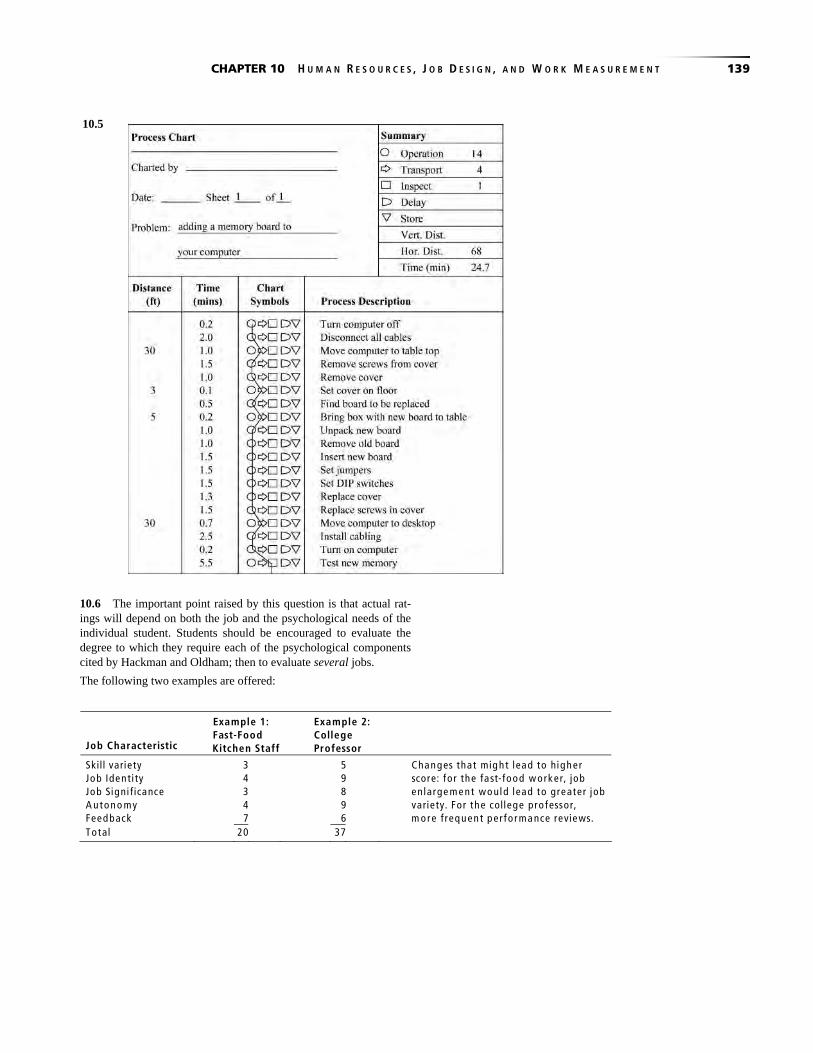
10.5
140 CHAPTER 10 H U M A N R E S O U R C E S , J O B D E S I G N , A N D W O R K M E A S U R E M E N T
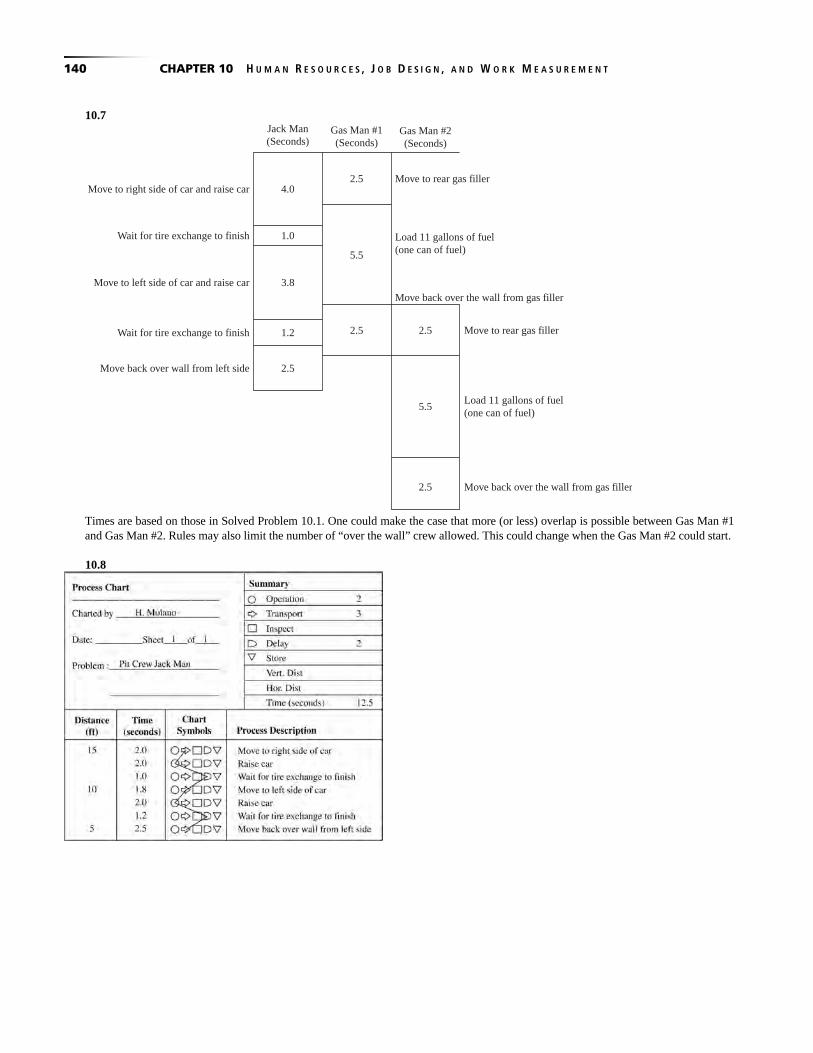
10.7
Times are based on those in Solved Problem 10.1. One could make the case that more (or less) overlap is possible between Gas Man #1 and Gas Man #2. Rules may also limit the number of “over the wall” crew allowed. This could change when the Gas Man #2 could start. 10.8
Move to right side of car and raise car
Jack Man(Seconds)
Gas Man #1(Seconds)
Gas Man #2(Seconds)
Move to rear gas filler
Move to rear gas filler
Load 11 gallons of fuel(one can of fuel)
Load 11 gallons of fuel(one can of fuel)
Move back over the wall from gas filler
Move back over the wall from gas filler
Move to left side of car and raise car
Wait for tire exchange to finish
Wait for tire exchange to finish
Move back over wall from left side
4.0
1.0
3.8
2.5
2.5 2.5
2.5
5.5
5.5
2.5
1.2
CHAPTER 10 H U M A N R E S O U R C E S , J O B D E S I G N , A N D W O R K M E A S U R E M E N T 141
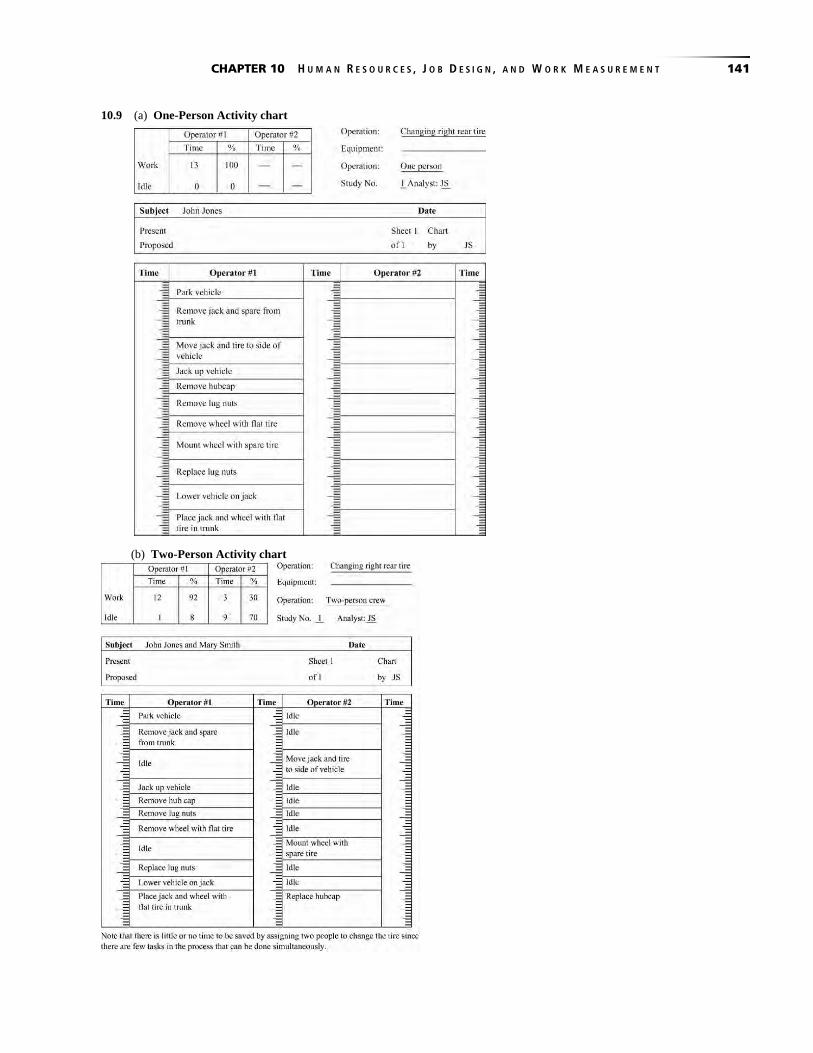
10.9 (a) One-Person Activity chart (b) Two-Person Activity chart
142 CHAPTER 10 H U M A N R E S O U R C E S , J O B D E S I G N , A N D W O R K M E A S U R E M E N T
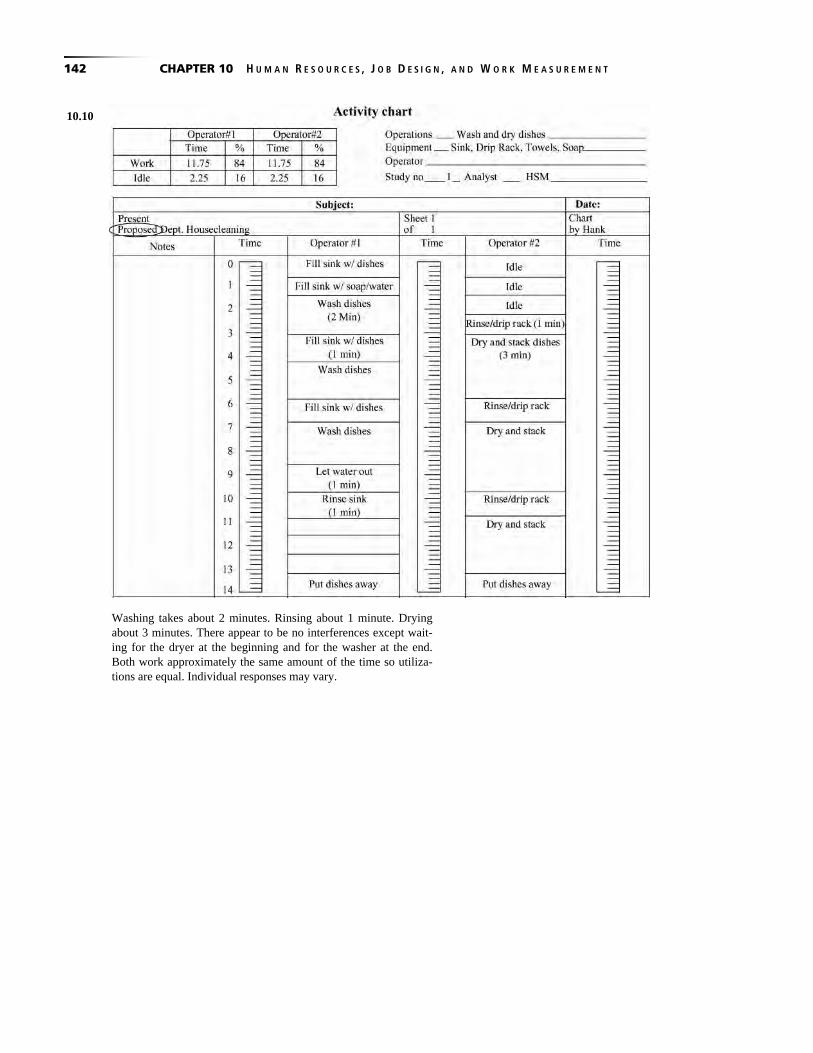
10.10
Washing takes about 2 minutes. Rinsing about 1 minute. Drying about 3 minutes. There appear to be no interferences except wait-ing for the dryer at the beginning and for the washer at the end.Both work approximately the same amount of the time so utiliza-tions are equal. Individual responses may vary.

CHAPTER 10 H U M A N R E S O U R C E S , J O B D E S I G N , A N D W O R K M E A S U R E M E N T 143
10.11 One way to do this is to divide the parts of the car between the three people. For example, A can do the wheels and the top. B does the right side and hood, grill and bumper. C does the left side, trunk, and rear grill, lights, and bumper. Notes can be added under that column to give specific instructions and details.
144 CHAPTER 10 H U M A N R E S O U R C E S , J O B D E S I G N , A N D W O R K M E A S U R E M E N T
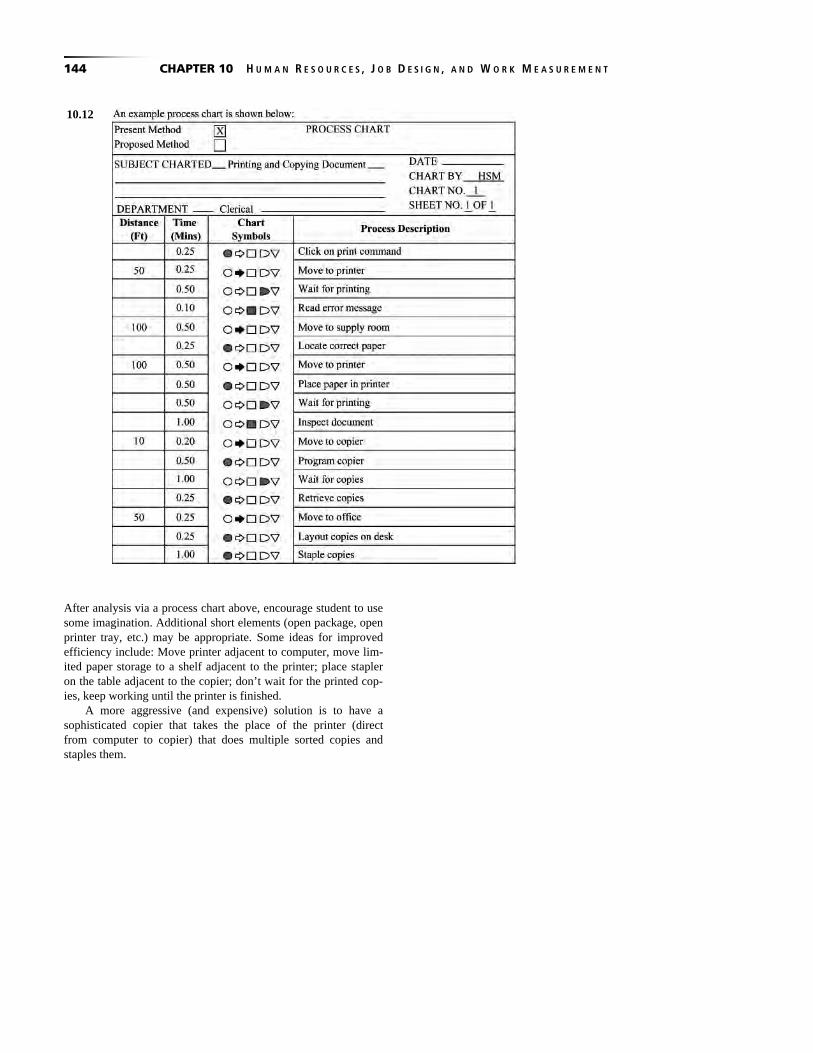
After analysis via a process chart above, encourage student to use some imagination. Additional short elements (open package, open printer tray, etc.) may be appropriate. Some ideas for improved efficiency include: Move printer adjacent to computer, move lim-ited paper storage to a shelf adjacent to the printer; place stapler on the table adjacent to the copier; don’t wait for the printed cop-ies, keep working until the printer is finished.
A more aggressive (and expensive) solution is to have a sophisticated copier that takes the place of the printer (direct from computer to copier) that does multiple sorted copies and staples them.
10.12
CHAPTER 10 H U M A N R E S O U R C E S , J O B D E S I G N , A N D W O R K M E A S U R E M E N T 145
10.13 NT = Avg × PR = 8.5 × 1.10 = 9.35 seconds; worker is faster than normal
10.14 NT = Avg × PR = 8.5 × 0.90 = 7.65 seconds; worker is slower than normal
10.15 = = =− −
9.35(a) 11 seconds
1 1 0.15
NTST
AF
= = =− −
7.65(b) 9.33 seconds
1 1 0.18
NTST
AF
Sum of times 1.74 (a) Average time = =
Number of cycles 16
= 0.10875 minutes = 6.525 seconds
(b) Normal time = (Average time) × (Performance rating factor)
= 6.525 × 95% = 6.2 seconds
Normal(c) Standard time =
10.16
time
1 – Allowance factor6.2 6.2
= = = 6.739 seconds1 – 8% 92%
10.17 NT = Average observed cycle time × PR = (50) × (1.10) = 55 seconds
10.18 (a) Normal time = 12 minutes × 1.05 = 12.6 minutes
=−
= =−
Normal time (b) Standard time
1 Allowance fraction12.6
15 minutes1 0.16
10.22
10.19 + + + + =2.2 2.6 2.3 2.5 2.4
Avg = 2.4 minutes5
NT = 2.4 × 1.05 = 2.52
2.52
2.8 minutes1 0.10
ST = =−
10.20 (a) Normal time = 12 seconds × 1.00 = 12.0 seconds
Normal time(b) Standard time
1 Allowance factor12.0
14.12 seconds1 0.15
=−
= =−
10.21 Normal time = 5.3 minutes × 1.05 = 5.565 minutes
+ +
+ += =
Personal Fatigue DelayAllowance Fraction =
60 minutes3 2 1 6
= 0.1060 60
Normal timeStandard time =
1 Allowance factor5.565
6.183 minutes1 0.10
−
= =−
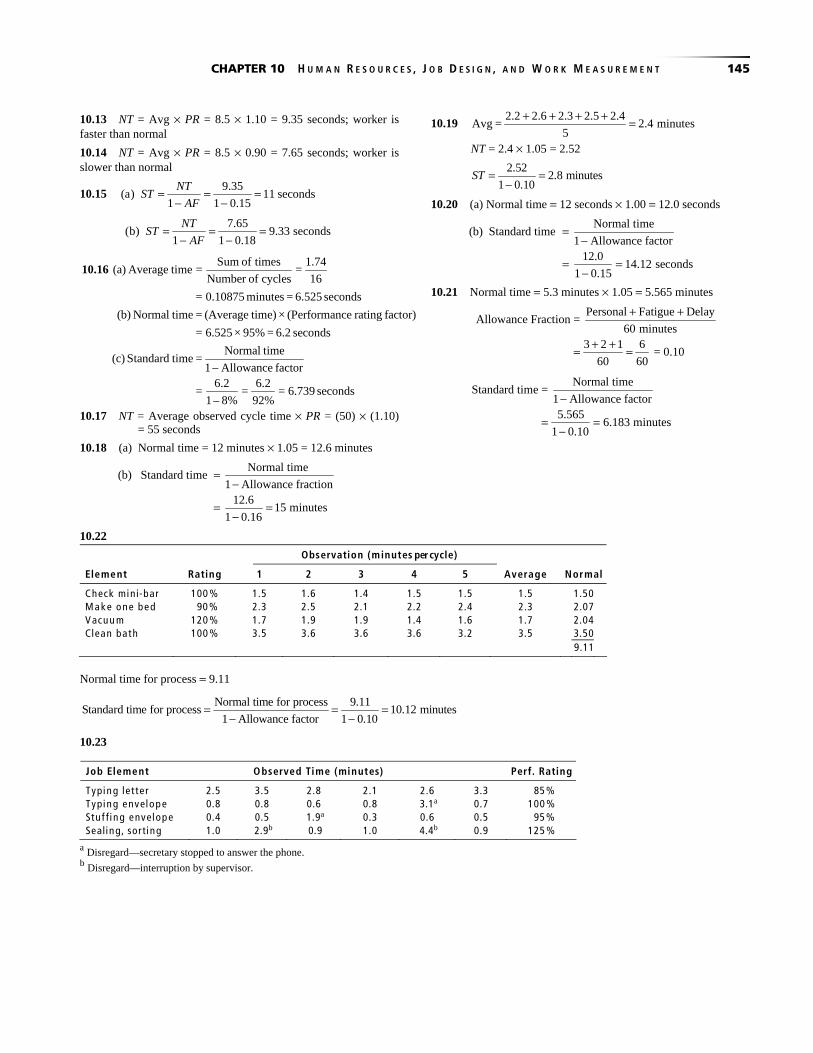
Normal time for process = 9.11
Normal time for process 9.11Standard time for process 10.12 minutes
1 Allowance factor 1 0.10= = =
− −
10.23
a Disregard—secretary stopped to answer the phone. b Disregard—interruption by supervisor.
bservation (minutes pe cycle) r
Element Rating 1 2 3 4 5 Average Normal
Check mini-bar 100 % 1.5 1.6 1.4 1.5 1.5 1.5 1.50 M a ke one bed 90 % 2.3 2.5 2.1 2.2 2.4 2.3 2.07 Vacuu m 120 % 1.7 1.9 1.9 1.4 1.6 1.7 2.04 Clean bath 100 % 3.5 3.6 3.6 3.6 3.2 3.5 3.50
9.11
Job Element Observed Time (minutes) Perf. Rating
Typing let ter 2.5 3.5 2.8 2.1 2.6 3.3 85 % Typing envelop e 0.8 0.8 0.6 0.8 3.1a 0.7 100 % Stuf f ing envelop e 0.4 0.5 1.9a 0.3 0.6 0.5 95 % Sealing, sorting 1.0 2.9b 0.9 1.0 4.4b 0.9 125 %
O
146 CHAPTER 10 H U M A N R E S O U R C E S , J O B D E S I G N , A N D W O R K M E A S U R E M E N T
Calculating average observed cycle time:
+ + + + += = =
+ + + += = =
+ + + += = =
+ + += = =
2.5 3.5 2.8 2.1 2.6 3.3 16.8Element 1 2.8 minutes
6 60.8 0.8 0.6 0.8 0.7 3.7
Element 2 0.74 minutes5 5
0.4 0.5 0.3 0.6 0.5 2.3Element 3 0.46 minutes
5 51.0 0.9 1.0 0.9 3.8
Element 4 0.95 minutes4 4
Calculating normal time for each task element: Normal time = Observed cycle time × Peformance rating Element 1 = 2.80 × 0.85 = 2.38 minutes Element 2 = 0.74 × 1.00 = 0.74 minutes Element 3 = 0.46 × 0.95 = 0.44 minutes Element 4 = 0.95 × 1.25 = 1.19 minutes
10.24 (Contd)
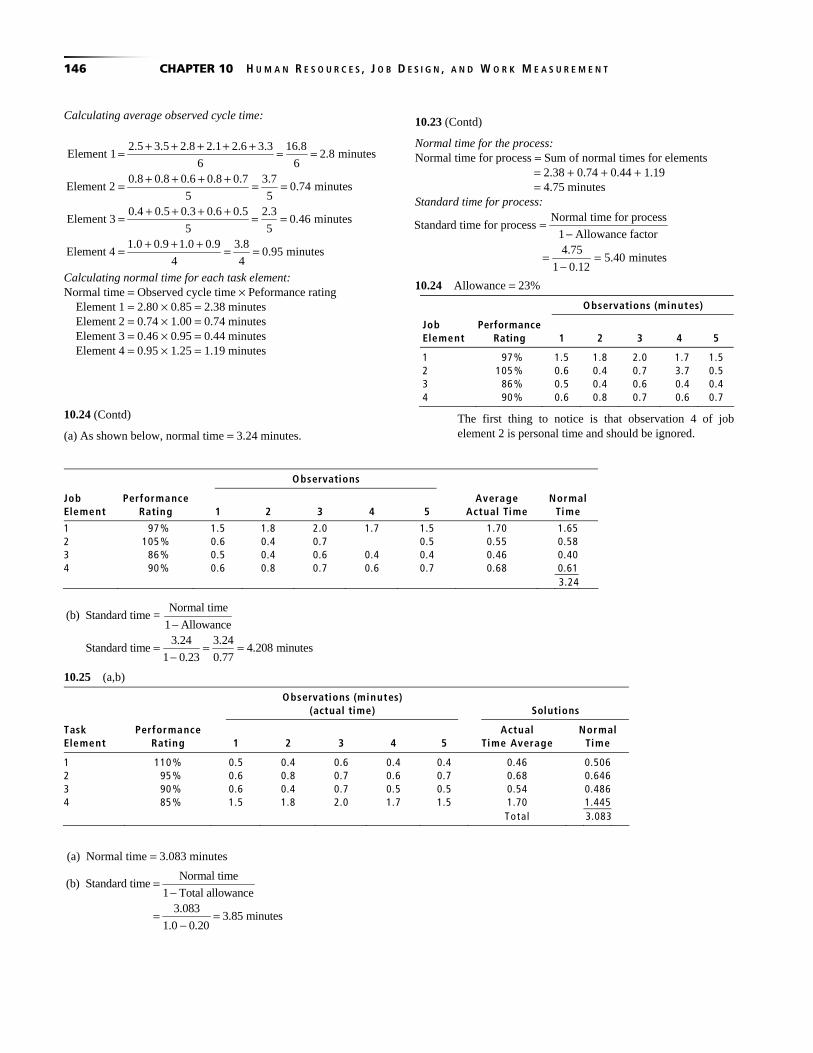
(a) As shown below, normal time = 3.24 minutes.
10.23 (Contd)
Normal time for the process: Normal time for process = Sum of normal times for elements
= 2.38 + 0.74 + 0.44 + 1.19 = 4.75 minutes
Standard time for process: Normal time for process
Standard time for process1 Allowance factor4.75
5.40 minutes1 0.12
=−
= =−
10.24 Allowance = 23%
The first thing to notice is that observation 4 of job element 2 is personal time and should be ignored.
Normal time
(b) Standard time = 1 Allowance
3.24 3.24Standard time 4.208 minutes
1 0.23 0.77
−
= = =−
10.25 (a,b)
(a) Normal time = 3.083 minutes
Normal time(b) Standard time
1 Total allowance3.083
3.85 minutes1.0 0.20
=−
= =−
Observations (minutes)
Job Element
PerformanceRating
1
2
3
4
5
1 97 % 1.5 1.8 2.0 1.7 1.5 2 105 % 0.6 0.4 0.7 3.7 0.5 3 86 % 0.5 0.4 0.6 0.4 0.4 4 90 % 0.6 0.8 0.7 0.6 0.7
Observations
Job Element
Performance Rating
1
2
3
4
5
Average Actual Time
Normal Time
1 97 % 1.5 1.8 2.0 1.7 1.5 1.70 1.65 2 105 % 0.6 0.4 0.7 0.5 0.55 0.58 3 86 % 0.5 0.4 0.6 0.4 0.4 0.46 0.40 4 90 % 0.6 0.8 0.7 0.6 0.7 0.68 0.61 3.24
Observations (minutes) (actual time)
Solutions
Task Element
Performance Rating
1
2
3
4
5
Actual Time Average
Normal Time
1 110 % 0.5 0.4 0.6 0.4 0.4 0.46 0.506 2 95 % 0.6 0.8 0.7 0.6 0.7 0.68 0.646 3 90 % 0.6 0.4 0.7 0.5 0.5 0.54 0.486 4 85 % 1.5 1.8 2.0 1.7 1.5 1.70 1.445 Total 3.083
CHAPTER 10 H U M A N R E S O U R C E S , J O B D E S I G N , A N D W O R K M E A S U R E M E N T 147
10.26 Initial sample: 3.5, 3.2, 4.1, 3.6, 3.9
2
2 2
22
18.33.5 3.2 4.1 3.6 3.9 3.66
5
(Sample observation ) 0.492s 0.123 0.35
n 1 5 1
1.96 0.35
0.05 3.66
.6863.76 14.13, or 15 observations.
.183
x
x
zsn
hx
= + + + + = =
∑ −= = = =− −
×⎛ ⎞ ⎛ ⎞= =⎜ ⎟ ⎜ ⎟⎝ ⎠ ⎝ ⎠×
⎛ ⎞= = =⎜ ⎟⎝ ⎠
⎛ ⎞⎛ ⎞ ⎛ ⎞= = = =⎜ ⎟ ⎜ ⎟⎜ ⎟⎝ ⎠ ⎝ ⎠⎝ ⎠
= = = =
22 2(2.58)(1.28) 3.30
426(0.05)(3.20) 0.16
where 2.58, 1.28, 0.05, 3.20
zsn
hx
z s h x
10.27
Sample size 45 is not adequate. They need 381 more observations.
10.28
Element
Observed Time (minutes)
Perf. Rating
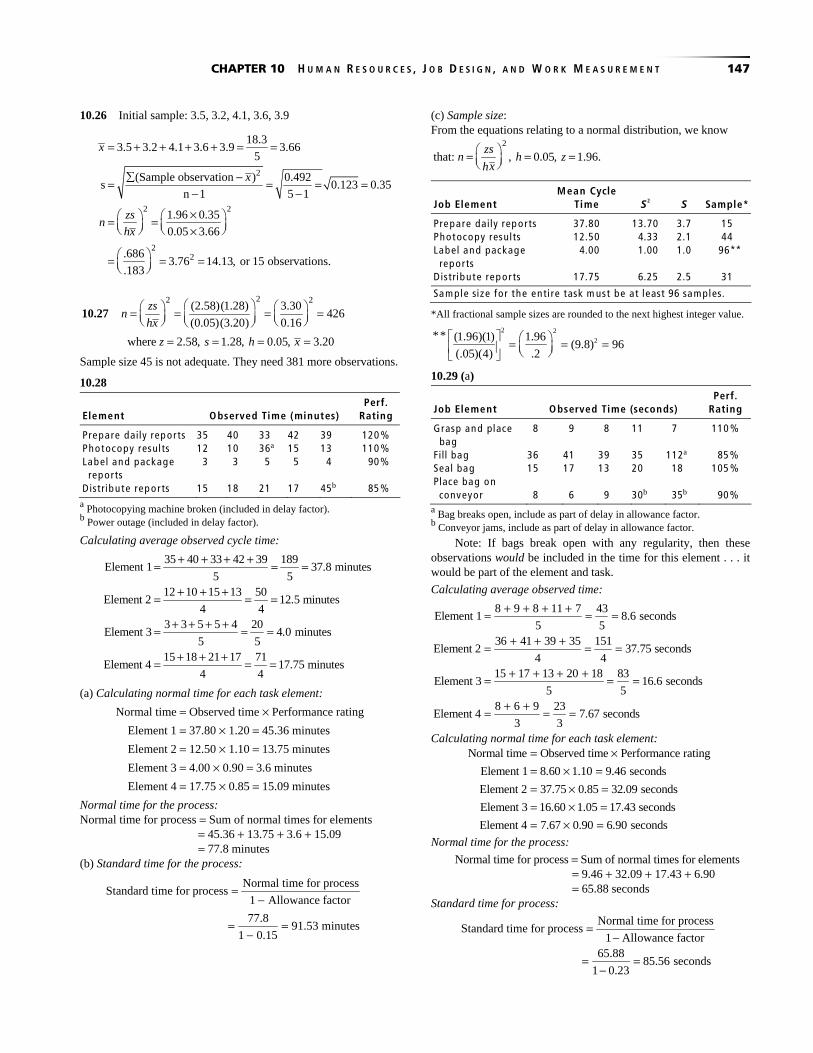
Pre pare daily rep or ts 35 40 33 42 39 120 % Photocopy results 12 10 36a 15 13 110 % Label and packag e rep orts
3 3 5 5 4 90 %
Distrib ute rep or ts 15 18 21 17 45b 85 % a Photocopying machine broken (included in delay factor). b Power outage (included in delay factor).
Calculating average observed cycle time:
35 40 33 42 39 189Element 1 37.8 minutes
5 512 10 15 13 50
Element 2 12.5 minutes4 4
3 3 5 5 4 20Element 3 4.0 minutes
5 515 18 21 17 71
Element 4 17.75 minutes4 4
+ + + += = =
+ + += = =
+ + + += = =
+ + += = =
(a) Calculating normal time for each task element:
Normal time = Observed time × Performance rating
Element 1 = 37.80 × 1.20 = 45.36 minutes
Element 2 = 12.50 × 1.10 = 13.75 minutes
Element 3 = 4.00 × 0.90 = 3.6 minutes
Element 4 = 17.75 × 0.85 = 15.09 minutes
Normal time for the process: Normal time for process = Sum of normal times for elements
= 45.36 + 13.75 + 3.6 + 15.09 = 77.8 minutes
(b) Standard time for the process:
Normal time for processStandard time for process
1 Allowance factor
77.8 91.53 minutes
1 0.15
=−
= =−
(c) Sample size: From the equations relating to a normal distribution, we know
2
that: , 0.05, 1.96.zs
n h zhx
⎛ ⎞= = =⎜ ⎟⎝ ⎠
Job Element
Mean Cycle Time
S2
S
Sample*
Prepare daily rep or ts 37.80 13.70 3.7 15 Photocopy results 12.50 4.33 2.1 44 Label and packag e rep orts
4.00 1.00 1.0 96*
Distribute rep or ts 17.75 6.25 2.5 31
Sa m ple size fo r the enti re task m ust be at least 96 sa mples.
*All fractional sample sizes are rounded to the next highest integer value.
2 2
2** (1.96)(1) 1.96(9.8) 96
(.05)(4) .2
⎡ ⎤ ⎛ ⎞= = =⎜ ⎟⎢ ⎥ ⎝ ⎠⎣ ⎦
10.29 (a)
Job Element
Observed Time (seconds)
Perf. Rating
Grasp and place bag
8 9 8 11 7 110 %
Fill bag 36 41 39 35 112a 85 % Seal bag 15 17 13 20 18 105 % Place bag on conveyor
8
6
9
30b
35b
90 %
a Bag breaks open, include as part of delay in allowance factor. b Conveyor jams, include as part of delay in allowance factor.
Note: If bags break open with any regularity, then these observations would be included in the time for this element . . . it would be part of the element and task.
Calculating average observed time:
8 9 8 11 7 43Element 1 8.6 seconds
5 536 41 39 35 151
Element 2 37.75 seconds4 4
15 17 13 20 18 83Element 3 16.6 seconds
5 58 6 9 23
Element 4 7.67 seconds3 3
+ + + += = =
+ + += = =
+ + + += = =
+ += = =
Calculating normal time for each task element: Normal time Observed time Performance rating
Element 1 8.60 1.10 9.46 seconds
Element 2 37.75 0.85 32.09 seconds
Element 3 16.60 1.05 17.43 seconds
Element 4 7.67 0.90 6.90 seconds
= ×= × == × == × == × =
Normal time for the process:
Normal time for process = Sum of normal times for elements = 9.46 + 32.09 + 17.43 + 6.90 = 65.88 seconds
Standard time for process:
Normal time for processStandard time for process
1 Allowance factor65.88
85.56 seconds1 0.23
=−
= =−
*
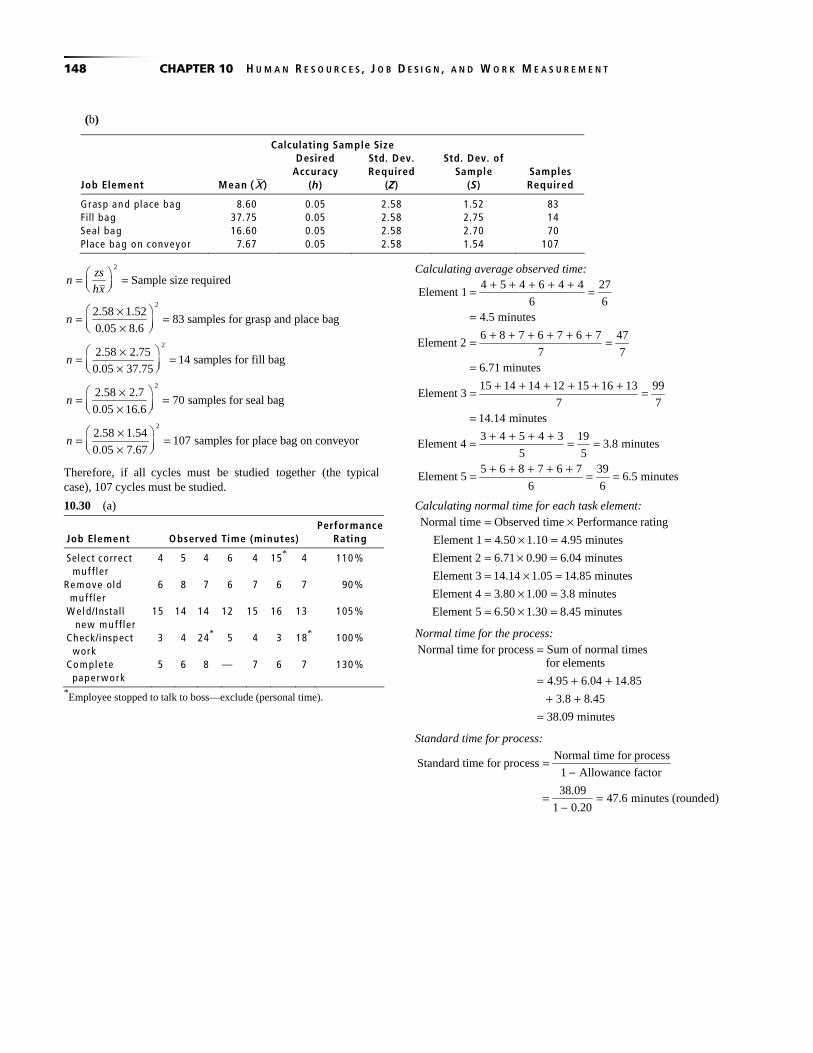
148 CHAPTER 10 H U M A N R E S O U R C E S , J O B D E S I G N , A N D W O R K M E A S U R E M E N T
2
2
2
2
Sample size required
2.58 1.52 83 samples for grasp and place bag0.05 8.6
2.58 2.75 14 samples for fill bag0.05 37.75
2.58 2.7 70 samples for seal bag0.05 16.6
2
zsn
hx
n
n
n
n
⎛ ⎞= =⎜ ⎟⎝ ⎠
⎛ ⎞×= =⎜ ⎟×⎝ ⎠
⎛ ⎞×= =⎜ ⎟×⎝ ⎠
⎛ ⎞×= =⎜ ⎟×⎝ ⎠
=2
.58 1.54 107 samples for place bag on conveyor0.05 7.67
⎛ ⎞× =⎜ ⎟×⎝ ⎠
There fore, if all cycles must be studied together (the typical case), 107 cycles must be studied.
10.30 (a)
Job Element
Observed Time (minutes)
PerformanceRating
Select correct muf f ler
4 5 4 6 4 15* 4 110 %
Re m ove old muf f ler
6 8 7 6 7 6 7 90 %
W el d/Install new m uf fler
15 14 14 12 15 16 13 105 %
Check/inspect work
3 4 24* 5 4 3 18* 100 %
Co m plete paper w ork
5 6 8 — 7 6 7 130 %
*Employee stopped to talk to boss—exclude (personal time).
Calculating average observed time: + + + + += =
=+ + + + + += =
=+ + + + + += =
=+ + + += = =
+ + + + += = =
4 5 4 6 4 4 27Element 1
6 64.5 minutes
6 8 7 6 7 6 7 47Element 2
7 76.71 minutes
15 14 14 12 15 16 13 99Element 3
7 714.14 minutes
3 4 5 4 3 19Element 4 3.8 minutes
5 55 6 8 7 6 7 39
Element 5 6.5 minut6 6
es
Calculating normal time for each task element: = ×= × == × == × == × == × =
Normal time Observed time Performance rating
Element 1 4.50 1.10 4.95 minutes
Element 2 6.71 0.90 6.04 minutes
Element 3 14.14 1.05 14.85 minutes
Element 4 3.80 1.00 3.8 minutes
Element 5 6.50 1.30 8.45 minutes
Normal time for the process: Normal time for process Sum of normal times
for elements
4.95 6.04 14.85
3.8 8.45
938.0 minutes
=
= + ++ +
=
Standard time for process:
Normal time for processStandard time for process
1 Allowance factor
38.0947.6 minutes (rounded)
1 0.20
=−
= =−
Calculating Sample Size
(b)
Job Element
Mean ( )X
Desired Accuracy
(h)
Std. Dev. Required
(Z)
Std. Dev. of Sample
(S)
Samples Required
Grasp and place bag 8.60 0.05 2.58 1.52 83 Fill bag 37.75 0.05 2.58 2.75 14 Seal bag 16.60 0.05 2.58 2.70 70 Place bag on conveyor 7.67 0.05 2.58 1.54 107

CHAPTER 10 H U M A N R E S O U R C E S , J O B D E S I G N , A N D W O R K M E A S U R E M E N T 149
(b) Calculating sample size:
22(1.96)(0.836)
75(0.05)(3.8)
zsn
hx⎡ ⎤⎛ ⎞= = =⎜ ⎟ ⎢ ⎥⎝ ⎠ ⎣ ⎦
Element 4 required a sample of 75, thus the sample size for the study is 75.
10.31 2 2
2 2
(1 ) 2.0 .15 .85Sample size 319.
.04
Z p p
h
− × ×= = =
Therefore, minimum sample size is 319 samples.
10.32 2 2
2.33(1 ) (0.2)(0.8) 347.45 348
0.05
Zn p p
h⎛ ⎞ ⎛ ⎞= − = = =⎜ ⎟ ⎜ ⎟⎝ ⎠ ⎝ ⎠
(rounded up)
10.33
(a) Standard time in minutes per chair = 480 minutes per day/ 130 chairs
= 3.69 minutes
(b) Total allowances = 18% (6 + 6 + 6 = 18) Normal time = Standard time × (1 − Allowance time) Therefore: 3.69 × (1 − .18) = 3.69 × .82 = 3.026 minutes = Normal time
10.34 858 + 220 + 85 = 1,163
= = =858% spent working 0.738 73.8%
1,163
10.35 (a) 250
.833 83.3%300
= =
2
2
(1 )(b)
(at 95% confidence level and 3% acceptable error)
Z p pn
h
−=
=2
2
(1.96) (0.167)(0.833)
(0.03)
(3.84)(0.167)(0.833) 593.7 594
0.0009
n =
= = ≅
(c) The sample size was only about half the desired size.
10.36 M otion T M U’s
1 Reach 4 inches fo r the pencil 6 2 Grasp pencil 2 3 M ove pencil 6 inches 10 4 Position the pencil 20 5 Insert the pencil into the sharpener 4 6 Sharpen the pencil 120 7 Disenga ge the pencil 10 8 M ove the pencil 6 inches 10
182
Given that 1 TMU = 0.0006 minutes: Time = 182 × 0.0006 = 0.1092 minutes (6.55 seconds)
10.37 Tell the supervisor that delay was over 8% and the sample size was adequate (for a 95% confidence and 3% acceptable error):
Delay: 105
0.0875 8.75%1200
= =
Sample size:
2
2
(1.96) (0.0875)(1 0.0875)
(0.03)
(3.84)(0.0875)(0.9125) 341
0.0009
n−=
= =
10.38 (a) Minutes available per day = 6 hours − 2 hours
= 4 × 60 min. = 240 min. (b) Minutes of room cleaning required 200 room @ 30 min. each = 6,000 minutes 200 room @ 15 min. each = 3,000 minutes Total of 9,000 minutes = 150 hours (c) Each employee can clean 8 rooms (4 hr/.5 hr = 8) Each employee can refresh 16 rooms
(4 hr/.25 hr = 16) 9,000 min.
Total housekeepers needed today 37.5 38240 min.
= = ≈
(d) 400 room @ .5 hr each = 200 hr 200/4 = 50 employees required to thoroughly clean all
400 rooms.
Job Element
Mean Observed Time ( )X
Desired Accuracy
(h)
Std. Dev. Required
(Z)
Std. Dev. of Sample
(S)
Samples Required
Select correct mu f fler 4.50 0.05 1.96 0.836 53 Re m ove old m u f fler 6.71 0.05 1.96 0.755 20 W el d/Install new m uf fler 14.14 0.05 1.96 1.345 14 Check/inspect work 3.80 0.05 1.96 0.836 75 Co m plete paperw ork 6.50 0.05 1.96 1.048 40
150 CHAPTER 10 H U M A N R E S O U R C E S , J O B D E S I G N , A N D W O R K M E A S U R E M E N T
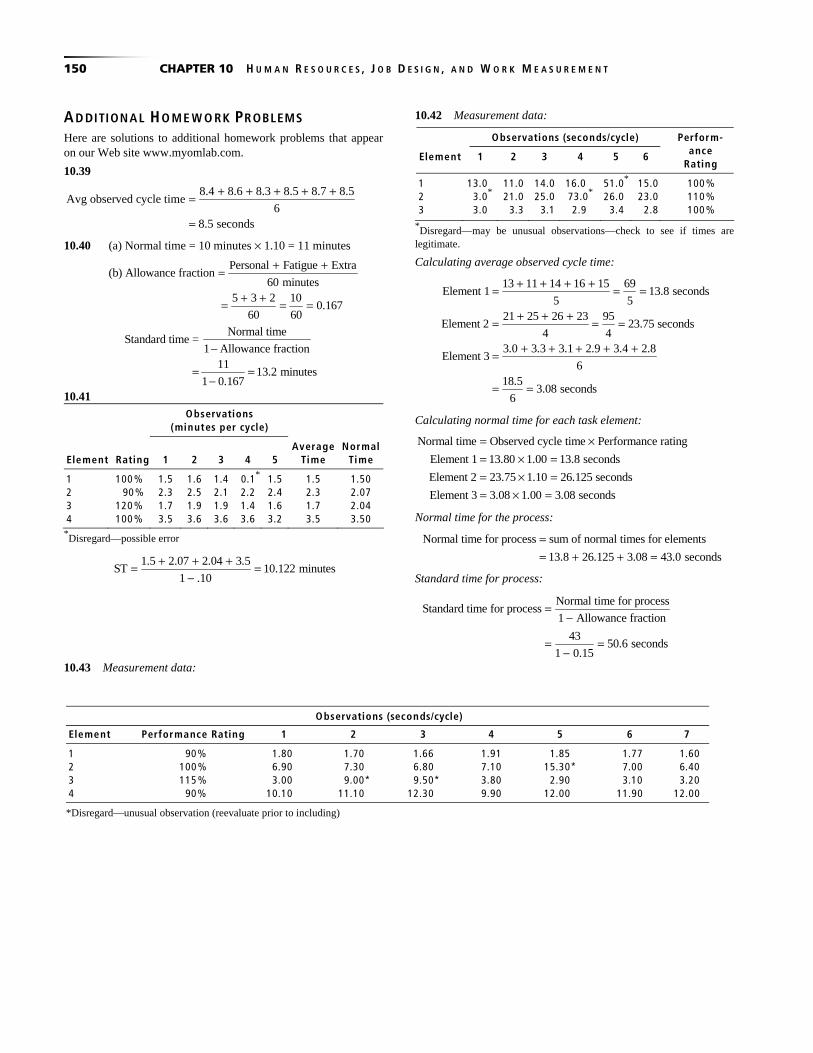
AD DITIONAL HO ME W O RK PROBLEMS Here are solutions to additional homework problems that appear on our Web site www.myomlab.com.
10.39
+ + + + +=
=
8.4 8.6 8.3 8.5 8.7 8.5Avg observed cycle time
68.5 seconds
10.40 (a) Normal time = 10 minutes × 1.10 = 11 minutes
Personal Fatigue Extra(b) Allowance fraction
60 minutes5 3 2 10
0.16760 60
+ +=
+ += = =
Normal timeStandard time =
1 Allowance fraction11
13.2 minutes1 0.167
−
= =−
10.41
*Disregard—possible error
1.5 2.07 2.04 3.5
ST 10.122 minutes1 .10
+ + += =−
10.43 Measurement data:
10.42 Measurement data:
*Disregard—may be unusual observations—check to see if times are legitimate.
Calculating average observed cycle time:
13 11 14 16 15 69Element 1 13.8 seconds
5 521 25 26 23 95
Element 2 23.75 seconds4 4
3.0 3.3 3.1 2.9 3.4 2.8Element 3
618.5
3.08 seconds6
+ + + += = =
+ + += = =
+ + + + +=
= =
Calculating normal time for each task element:
Normal time Observed cycle time Performance rating
Element 1 13.80 1.00 13.8 seconds
Element 2 23.75 1.10 26.125 seconds
Element 3 3.08 1.00 3.08 seconds
= ×= × == × == × =
Normal time for the process:
Normal time for process sum of normal times for elements
13.8 26.125 3.08 43.0 seconds
== + + =
Standard time for process:
=−
= =−
Normal time for processStandard time for process
1 Allowance fraction
4350.6 seconds
1 0.15
Observations (seconds/cycle)
Element 1 2 3 4 5 6
Perform-ance
Rating
1 13.0 11.0 14.0 16.0 51.0* 15.0 100 % 2 3.0* 21.0 25.0 73.0* 26.0 23.0 110 % 3 3.0 3.3 3.1 2.9 3.4 2.8 100 %
Observations (minutes per cycle)
Element
Rating
1
2
3
4
5
AverageTime
NormalTime
1 100 % 1.5 1.6 1.4 0.1* 1.5 1.5 1.50 2 90 % 2.3 2.5 2.1 2.2 2.4 2.3 2.07 3 120 % 1.7 1.9 1.9 1.4 1.6 1.7 2.04 4 100 % 3.5 3.6 3.6 3.6 3.2 3.5 3.50
Observations (seconds/cycle)
Element Performance Rating 1 2 3 4 5 6 7
1 90 % 1.80 1.70 1.66 1.91 1.85 1.77 1.60 2 100 % 6.90 7.30 6.80 7.10 15.30* 7.00 6.40 3 115 % 3.00 9.00* 9.50* 3.80 2.90 3.10 3.20 4 90 % 10.10 11.10 12.30 9.90 12.00 11.90 12.00
*Disregard—unusual observation (reevaluate prior to including)

CHAPTER 10 H U M A N R E S O U R C E S , J O B D E S I G N , A N D W O R K M E A S U R E M E N T 151
Calculating average observed cycle time:
1.80 1.70 1.66 1.91 1.85 1.77 1.60Element 1
712.29
1.76 minutes7
6.9 7.3 6.8 7.1 7.0 6.4Element 2
641.5
6.92 minutes6
3.0 3.8 2.9 3.1 3.2Element 3
516
3.2 minutes5
10.1 11.1 12.3 9.9 12.0 11Element 4
+ + + + + +=
= =
+ + + + +=
= =
+ + + +=
= =
+ + + + += .9 12.0
779.3
11.33 minutes7
+
= =
Calculating normal time for each task element:
Normal time Observed cycle time Performance rating
Element 1 1.76 0.90 1.58 minutes
Element 2 6.92 1.00 6.92 minutes
Element 3 3.20 1.15 3.68 minutes
Element 4 11.33 0.90 10.20 minutes
= ×= × == × == × == × =
Normal time for the process:
Normal time for process sum of normal times for elements
1.58 6.92 3.68 10.20
22.37 minutes
== + + +=
Standard time for process: Normal time for process
Standard time for process1 Allowance fraction
22.3729.8 minutes
1 0.25
=−
= =−
10.44
22(3.0)(1.25)
(0.05)(5)
225. Sample size of 225 is required.
ZSn
hX
⎛ ⎞⎛ ⎞= = ⎜ ⎟⎜ ⎟⎝ ⎠ ⎝ ⎠
=
10.45
X = Average task time = 1.5 minutes
S = Standard deviation of the cycle = 0.0707
22 2(2.58)(0.0707) 0.1824
(0.05)(1.5) 0.075
5.9 6 observations are required.
ZSn
hX
⎛ ⎞⎛ ⎞ ⎛ ⎞= = =⎜ ⎟⎜ ⎟ ⎜ ⎟⎝ ⎠ ⎝ ⎠⎝ ⎠
= ≈
10.46
2 2( );
1ix xZS
n shX n
−⎛ ⎞= =⎜ ⎟ −⎝ ⎠Σ
+ + + += =0.04 0.04 0.01 0.01 00.158
4
95.45 2, 2.4, 0.10z x h= = =
10% accuracy:
22(0.158)
1.734 2 observations0.10(2.4)
n⎛ ⎞= = →⎜ ⎟⎝ ⎠
5% accuracy:
22(0.158)
6.9 7 observations0.05(2.4)
n⎛ ⎞= = →⎜ ⎟⎝ ⎠
CASE STUDY
JACKSON MANUFACTURING CO. 1. Actual observed cycle times
x x −x x − 2( )x x
2.05 1.90 0.1488 0.0221 1.92 1.90 0.0188 0.0004 2.01 1.90 0.1088 0.0118 1.89 1.90 −0.0112 0.0001 1.77 1.90 −0.1312 0.0172 1.80 1.90 −0.1012 0.0102 1.86 1.90 −0.0412 0.0017 1.83 1.90 −0.0712 0.0051 1.93 1.90 0.0288 0.0008 1.96 1.90 0.0588 0.0035 1.95 1.90 0.0488 0.0024 2.05 1.90 0.1488 0.0221 1.79 1.90 −0.1112 0.0124 1.82 1.90 −0.0812 0.0066 1.85 1.90 −0.0512 0.0026 1.85 1.90 −0.0512 0.0026 1.99 1.90 0.0888 0.0079
1.90x = 20.1296 ( )x x= ∑ − h = 0.05, n = 17, z = 3
2( ) 0.1296
Std. dev. 0.08991 16
x x
n
∑ −= = =−
⎛ ⎞×⎛ ⎞= = = ≈⎜ ⎟ ⎜ ⎟⎝ ⎠ ×⎝ ⎠
223 0.0899
Sample size required 8.07 9.05 1.9
zs
hx
This can be rounded up to 9 for statistical accuracy. 2. A sample size of 17 is more than adequate, given the low variation in cycle times; indeed, a sample size of 8 or 9 would be adequate.
3. Available time = 7.5 × 60 = 450 minutes
Observed cycle time = 1.90; normal time = 1.90 × 1.15 = 2.185
( ) ( ) ( ) ( ) ( )2 2 2 2 22.2 2.4 2.6 2.4 2.3 2.4 2.5 2.4 2.4 2.4
5 1s
− + − + − + − + −=
−

152 CHAPTER 10 H U M A N R E S O U R C E S , J O B D E S I G N , A N D W O R K M E A S U R E M E N T
1
2
2.185 2.185
Std. time = 2.60 minutes1 .16 .84
= =−
450
Number of units processed 173.10 1732.60
= = ≈
4. $100 = ($12.50 × 8.0) = total cost per day
$100So, $.578 per unit
173=
VIDEO CASE STUDY
HARD ROCK’S HUMAN RESOURCE STRATEGY There is an 8-minute video, available from Prentice Hall, filmed specifically for this text that can be shown at this time.
1. Hard Rock has lower employee turnover than the industry due to its
thorough screening at hiring tolerant, even accepting culture of diversity great benefit package effective indoctrination and training, empowerment focus on team work and even outside volunteer work.
2. The human resource department supports the overall theme restaurant strategy (the experience economy concept) by aggressive screening, including an evaluation of how the employee will con-tribute to the Hard Rock experience. The human resource depart-ment at Hard Rock recognizes that they are responsible for a critical element in Hard Rock’s strategy. So they must recruit and retain the human capital that is necessary to fulfill that mission and strategy.
3. An automobile assembly line probably allows less opportu-nity for creativity and individual expression than a waiter or wait-ress at Hard Rock, although both organizations can probably put motivated well-trained personnel to good use.
4. The job design literature is rich with many improvements that can be made in the traditional assembly line. The Hackman and Oldham core job characteristics can, with a little imagination, be applied to the assembly line. Job rotation can aid Skill Variety; helping employees see the fruits of their labor in the finished product will help with Job Identity and Job Significance; provid-ing opportunity for self-direction by adding planning and control tasks to the job can contribute to Autonomy; and Supervisory Feedback is easy for the tuned-in supervisor. All these are further augmented by job enlargement, job enrichment, Maslow’s self-actualization, and Hertzberg’s motivators, such as responsibility, the work itself, recognition, advancement, and achievement. And, of course, the hygiene factors of security, status, working condi-tions, pay, interpersonal relations, supervision, and company policy and administration can all play a positive role in the quality of life on the job/assembly line. Note: Maslow’s hierarchy and Hertzberg’s dual factors are not discussed in the chapter.
AD DITIONAL CASE STUDIES
CHICAGO SOUTHERN HOSPITAL 1. Sampling Plan:
Do studies on all shifts (probably four shifts; three each day plus the weekend shift) to get data on workload dif-ferences by shift. Then cross-check with other studies by function (intensive care, maternity, postoperation, etc.). If identifiable differences are present, then judgments will need to be made about additional studies.
It may well be that major differences exist, suggesting that more extensive studies be made.
Generate a random sample of which nurse to sample when using a true random device, such as the random number table provided in the text in Appendix III.
Perform an adequate number of samples (per question 2). 2 2
2 2
(1 ) (1.96) (0.15)(0.85) Sample size
(0.04)
3.84 0.1275 0.49306.13 306
0.0016 0.0016
Z p pn
h
× − ×= = =
×= = = ⇒
2.
Note: The sample size will change if the 15% vs. 85% is not close to accurate. This difference may suggest that a larger sample be taken. 3. By structuring the study across different nurses, different shifts, and different hospital processes (areas/functions), there should be an adequately diverse cross section. Some postsample check to ensure a mix of nurses, shifts, and functions should be made.
KARSTADT vs JCPENNEY The case examines the differences in work ethic between a German department store employee and an American department store employee.
Key Points
Andreas Drauschke and Angie Clark hold positions at similar levels in department stores, and receive similar pay. However, Drauschke, who works in Germany, works far fewer hours than Clark, who works in the U.S.
In fact, Drauschke works just 37 hours a week, and receives six weeks vacation each year, while Clark works at least 44 hours a week, and takes off only a week at a time. Clark notes that Germans see leisure time as being more important than work time.
The difference between the German work style and the American work style extends in to other areas. For example, turnover at the German store is all but nonexistent, while at the American store it is 40 percent a year. In addition, German employees receive extensive training, while workers at the American store receive minimal instruction.
Many employees at the American store also have a second job, however Drauschke values his free time, and works no longer than absolutely necessary. His view point is shared by other Germans who fiercely protested the recent mandate that depart-ment stores would stay open one evening each week. Germany also prohibits working second jobs during vacation time.
* These cases can be found on our Companion Web site, www.pearsonhighered.com/heizer.
CHAPTER 10 H U M A N R E S O U R C E S , J O B D E S I G N , A N D W O R K M E A S U R E M E N T 153
3
1. How does the work culture in the United States differ from that in Germany? Human resource management (HRM) refers to the activities directed at attracting, developing, and maintaining an effec-tive workforce to achieve an organization’s objectives. Stu-dents will probably conclude that at least in the retailing industry, American HR managers spend less time both in recruiting and selecting managers, and preparing them for their jobs than their German counterparts. As a result, turn-over is very high in the U.S. as compared to Germany. While the case does not provide information regarding how employ-ees in either country are evaluated, the total compensation package received by Germans seems to be preferable to that which American workers receive.
2. What do you see as the basic advantages and disadvantages of each system? Most students will probably suggest that the extensive effort that appears to go into selecting and training German workers is a clear advantage of the German system. Students taking this perspective are likely to support their contention by pointing to the high turnover rate in the U.S. as compared to Germany. Many students may see the restriction faced by German workers regarding second jobs as being an intrusion in an individual’s private life, and therefore see it as a disad-vantage. Finally, most students will probably agree that the compensation package received by German workers is far more likely to improve employee morale than the package received by American workers.
3. If you were the top operations executive for an international department store chain with stores in both Germany and the United States, what basic issues would you need to address regarding corporate human resource policies? A primary issue that would have to be addressed is the differ-ence in compensation packages between the U.S. and Germany. German workers have shorter work weeks and far more vacation time than their American counterparts, yet re-ceive similar pay. A second issue that would have to be addressed is the difference in worker training and develop-ment. German department stores may spend two or three years preparing employees, while American stores might spend just two or three days. Furthermore, recruiting and se-lection issues would have to be addressed, not only because German employees frequently complete an apprentice pro-gram prior to becoming full-time employees, and thus require very careful selection, but also because turnover is much higher in the U.S. than in Germany.
4. Are retailing employee issues different than other industries? Most students will probably suggest that the issues outlined in question 3 above are probably important in all industries. One area that might be different is the issue of turnover. While turnover is very high in U.S. retailing, it is likely to be less of a problem in industries where workers receive extensive training and/or belong to unions.
5. Under which system would you prefer to work? Most students will probably suggest that the German work system is preferable than the American work system. Students taking this perspective will probably point out that American workers frequently appear to be stressed out on the job and do
not have enough time with family. Other students, however, might object to some of the constraints of the German system, such as the prohibition of second jobs during vacation time. Students taking this perspective are likely to suggest that there should be no limits to working as hard as possible in or-der to get ahead.
Additional Case Application
Case question 3 asks students to identify issues that would be faced by an American operations manager who worked for an in-ternational department store chain with branches in both the U.S. and Germany. Students can carry this exercise one step further by holding a round table discussion reading compensation packages. Each student can be assigned to take on the role of either the American executive, a German worker, or an American worker.
Source: R.W. Griffin and M.W. Pustay, International Business 2nd ed. (Reading, MA, Addison-Wesley), 1999. Solution appears on page 347–349 of Instructor’s Manual by V. Horton and S.K. Sokoya.
THE FLEET THAT WANDERS Can you imagine an analytical approach to documenting the prob-lems reported by drivers?
We often use this case to explain that not all problems of this nature are behavioral. Indeed, this is a true case designed to show students that, based on what is known about human factors, the sit- uation can be studied analytically. The design methodology for documenting Mr. Southard’s case was to put monitors on the truck drivers to provide a record of their cardiovascular activity. Most of the drivers were doing day drives, that is, going and returning on the same day, thus the design called for monitoring a number of trips by each driver over the same routes using both the new and old trucks. In this way, comparisons could be made between the work required to drive each truck as shown on the records from each driver. Additionally, the steering wheel on each truck was fit- ted with sensors to record the amount of motion required to con-trol each kind of truck. The hypothesis was that the truck that required more work would also require greater steering wheel movement. The measure of steering wheel movement was used as evidence to validate the work implied by the record of cardiovas-cular activity.
There were, of course, some difficulties with this design. It was expensive to outfit the trucks and drivers with the monitoring devices. The cooperation of the drivers was needed because the use of the monitors constituted an invasion of privacy. In addition, on longer trips, the cardiovascular sensors needed to be removed before, and reattached after, every break or delivery stop.
Note: This can make for an excellent classroom exercise and discussion.
Related Documents