PRODUCTION LINE: EFFECT OF DIFFERENT INSPECTION STATION ALLOCATION UNDER ACCEPTS REJECT INSPECTION POLICY UMOL SYAMSYUL BIN RAKIMAN A thesis submitted in fulfilment of the requirement for the award of the Master of Science in Technology Management by research Faculty of Technology Management and Business Universiti Tun Hussein Onn Malaysia MARCH 2013

Welcome message from author
This document is posted to help you gain knowledge. Please leave a comment to let me know what you think about it! Share it to your friends and learn new things together.
Transcript

PRODUCTION LINE: EFFECT OF DIFFERENT INSPECTION STATION
ALLOCATION UNDER ACCEPTS REJECT INSPECTION POLICY
UMOL SYAMSYUL BIN RAKIMAN
A thesis submitted in
fulfilment of the requirement for the award of the
Master of Science in Technology Management by research
Faculty of Technology Management and Business
Universiti Tun Hussein Onn Malaysia
MARCH 2013

vv
ABSTRACT
Manufacturing system is one of the most important parts in any organization as it
produces the output of the company which will generate the profit. It consists partly of
the production line which plays the role as the centre of production to create the end
product which could be half finished or the full product. It is a big problem for the
company to determine which is the better arrangement and combination of the tools or
machines available in this area of the organization as different combination will greatly
impact the productivity of the production line together with the profit of the company.
This research intend to analyze a new production line in a metal stamping company
based on the complain from the company and try to explore the better layout or
arrangement in the production line in reflect to the complained problem and constrain of
the provided of accept the defect and repair inspection policy. The production line is first
being analyzed in response to complain through computer simulation. After the problem
had been identified, the researcher tried different alternatives in the attempt to seek for
the better layout or arrangement in the production line. The effect of different inspection
station allocation layout is then being evaluated in term of the production time. The
research has resulted in the finding of the cause for the long production time in the
factory which is the long inspection steps which consumed much of the production time.
After a few alternatives have been explored in allocating the inspection station, it is
obvious that the current approach of the production line is the better one. Even by
reducing the number of inspection station, interesting enough, the production time does
not seem to decrease but yet increased. This finding contradicts the normal thought of
fewer stations means shorter time. This finding could be the founding basic in the future
research regarding the allocation of the inspection station following certain provided

vi
policy. This is also very helpful in real life practice in company as to help them improve
their production time. As for the time being, there is yet a research addressing this issue
pertaining the given inspection policy.

viivii
ABSTRAK
Sistem pembuatan adalah salah satu bahagian yang paling penting dalam mana-mana
organisasi kerana ia menghasilkan output syarikat yang akan menjana keuntungan. Ia
terdiri sebahagiannya dari barisan pengeluaran yang berperanan sebagai pusat
pengeluaran untuk menghasilkan produk akhir yang separuh siap atau produk penuh. Ia
adalah satu masalah besar bagi syarikat yang berkenaan untuk menentukan susunan yang
lebih baik dan gabungan alat atau mesin yang terdapat di kawasan ini sebagai kombinasi
yang berlainan dan dapat memberi kesan kepada produktiviti barisan pengeluaran serta
keuntungan syarikat. Kajian ini adalah untuk menganalisis satu barisan pengeluaran baru
dalam syarikat ―metal stamping‖ berdasarkan aduan dari syarikat terbabit dan cuba
untuk meneroka susun atur yang lebih baik dalam barisan pengeluaran dalam
mencerminkan masalah yang diadukan dan kekangan yang dihadapi. Sebagai permulaan,
barisan pengeluaran dianalisis sebagai respon kepada aduan dengan mengggunakan
simulasi komputer. Setelah masalah dikenal pasti, penyelidik telah mencuba beberapa
alternatif dalam usaha untuk mendapatkan susun atur atau perkiraan yang berbeza yang
lebih baik dalam barisan pengeluaran yang berkenaan. Kesan susun atur stesen
pemeriksaan yang berbeza kemudiannya dinilai dalam bentuk masa pengeluaran. Kajian
ini telah menghasilkan dapatan bagi punca bagi masa pengeluaran yang lama di mana
ianya terletak pada langkah-langkah pemeriksaan yang memakan banyak masa
pengeluaran. Selepas beberapa alternative diterokai dalam memperuntukkan stesen
pemeriksaan, ia jelas menunjukkan bahawa pendekatan sedia ada barisan pengeluaran
adalah yang terbaik. Walaupun dengan mengurangkan bilangan stesen pemeriksaan,
masa pengeluaran tidak berkurang malah semakin meningkat. Penemuan ini bercanggah
dengan pemikiran biasa di mana stesen yang kurang, bermakna masa yang lebih singkat.

xi
Penemuan ini boleh menjadi asas dalam penyelidikan masa depan mengenai peruntukan
stesen pemeriksaan berdasarkan polisi tertentu yang telah disediakan. Ia juga sangat
membantu dalam amalan kehidupan sebenar syarikat untuk membantu mereka
memperbaiki masa pengeluaran. Buat masa ini, masih belum terdapat kajian yang cuba
menangani isu ini.

viii
CONTENTS
TITLE
DECLARATION
i
ii
DEDICATION
ACKNOWLEDGEMENT
iii
iv
ABSTRACT
CONTENTS
v
ix
LISTS OF TABLE
LISTS OF CHART/FIGURE
xiv
xvi
APPENDIX xviii
CHAPTER 1
INTRODUCTION
Introduction
1.1 Introduction
1
1.2 Background of study 2
1.3 Problem statement 3
1.4 Research question 6
1.5 Research objective 7
1.6 Research scope 7
1.7 Importance of research 8

xx
1.8 Research overview 8
CHAPTER 2 LITERATURE REVIEW
2.1 Introduction 9
2.2 Production line definition 10
2.3 Productivity definition 12
2.4 Simulation definition 14
2.5 ProModel 16
2.5.1 Locations 16
2.5.2 Entities 17
2.5.3 Arrivals 17
2.5.4 Processing 17
2.6 Relation between 18
2.7
productivity and simulation
Relevant literature on facility
20
2.8
layout
Relevant literature on inspection
26
allocation in the production line
2.8.1 Inspection allocation in serial
26
multistage production systems
2.8.2 Inspection allocation in 27
non-serial multistage production
systems
2.9 Conclusion 28
CHAPTER 3 METHODOLOGY
3.1 Introduction 30
3.2 Research design 30

xi
3.3 Data collection 31
3.3.1 Identyfying triggering events 31
3.4.2 Key impact factors 31
3.3.3 Isolate actual activity times 32
3.3.4 Focus on the essence rather than
substance
32
3.3.5 Separate input variables from
response variables
32
3.4 Fitting theoritical distribution to data 33
3.5 Software being used 35
3.5.1 ProModel features 35
3.5.1.1 Customization 36
3.6 Methodology flow chart 37
3.7 Conclusion 40
CHAPTER 4 RESEARCH FINDING AND ANALYSIS
4.1 Introduction 41
4.2 Description of the production line 42
4.3 The simulation 43
4.3.1 Original layout 45
4.3.2 Simulation of the production
line without inspection station
47
4.3.3 Simulation of the production
line with inspection station only
50
4.3.4
at the assembly and finishing line
Simulation of the production
52
line with shared inspection station
at the fixed and moving blade
and at the assembly and finishing

xiixii
4.3.5
line
Simulation of the production
54
line with inspection station being
shared at the fixed and moving
blade line but the remaining stay
with the same inspection process as
4.3.6
original
Simulation of the production
57
line with inspection station
at each line
4.3.7 Simulation of the production
line with only one shared
59
inspection station
4.4 Discussion of the result 62
4.4.1 Problem of the current approach in 63
the production line
4.4.2 Proposed alternatives and the effect 64
4.5 Conclusion 68
CHAPTER 5 CONCLUSION AND FUTURE RESEARCH
5.1 Intoduction 69
5.2 Discussion 69
5.3 Action to be taken 72
5.4 Contributions 72
5.5 Future research 74
5.6 Conclusion of the research 75
REFERENCES 76
APPENDIX 91

xiiixiiixiii
VITA 131

xivxiv
LISTS OF TABLE
2.1 Comparison of basic productivity measure types 14
2.2 Literatures on facility layout 20
4.1 Average simulation time for the original layout 45
4.2 Failed arrival for the original layout 46
4.3 Entities activity for the original layout 46
4.4 Average simulation time of the production line without
inspection station
48
4.5 Failed arrival for the production line without inspection 48
4.6 Entities activity for the production line without inspection 49
4.7 Average simulation time of the production line with
inspection station only at the assembly and finishing line
50
4.8 Failed entity arrival of the production line with inspection
station only at the assembly and finishing line
51
4.9 Entities activity of the production line with inspection
station only at the assembly and finishing line
51
4.10 Average simulation time of the production line with
Shared inspection station at the fixed and moving blade
52
4.11
and at the assembly and finishing line
Failed arrival of the production line with shared inspection
53
station at the fixed and moving blade and at the assembly
and finishing line
4.12 Entities activity of the production line with shared
inspection station at the fixed and moving blade and
53
at the assembly and finishing line

xvxv
4.13 Average simulation time of the the production line with
inspection station being shared at the fixed and moving
55
blade line but the remaining stay with the same
inspection process as original
4.14 Failed entities arrival of the the production line with
inspection station being shared at the fixed and moving
55
blade line but the remaining stay with the same inspection
process as original
4.15 Entities activity of the the production line with inspection
station being shared at the fixed and moving blade line but
56
the remaining stay with the same inspection process as
original
4.16 Average simulation time for the production line with
inspection station at each line
57
4.17 Failed entity arrival for the production line with inspection
station at each line
58
4.18 Entity arrival for the production line with inspection
station at each line
58
4.19 Average simulation time of the production line with only
one shared inspection station
59
4.20 Failed entity arrival of the production line with only one
shared inspection station
60
4.21 Entity activities of the production line with only one
shared inspection station
61
4.22 Result comparison between different inspection station
allocations
62
4.23 Comparison of alternative layouts 68
4.24 Estimated cost of different alternative layouts 71
xvixvi
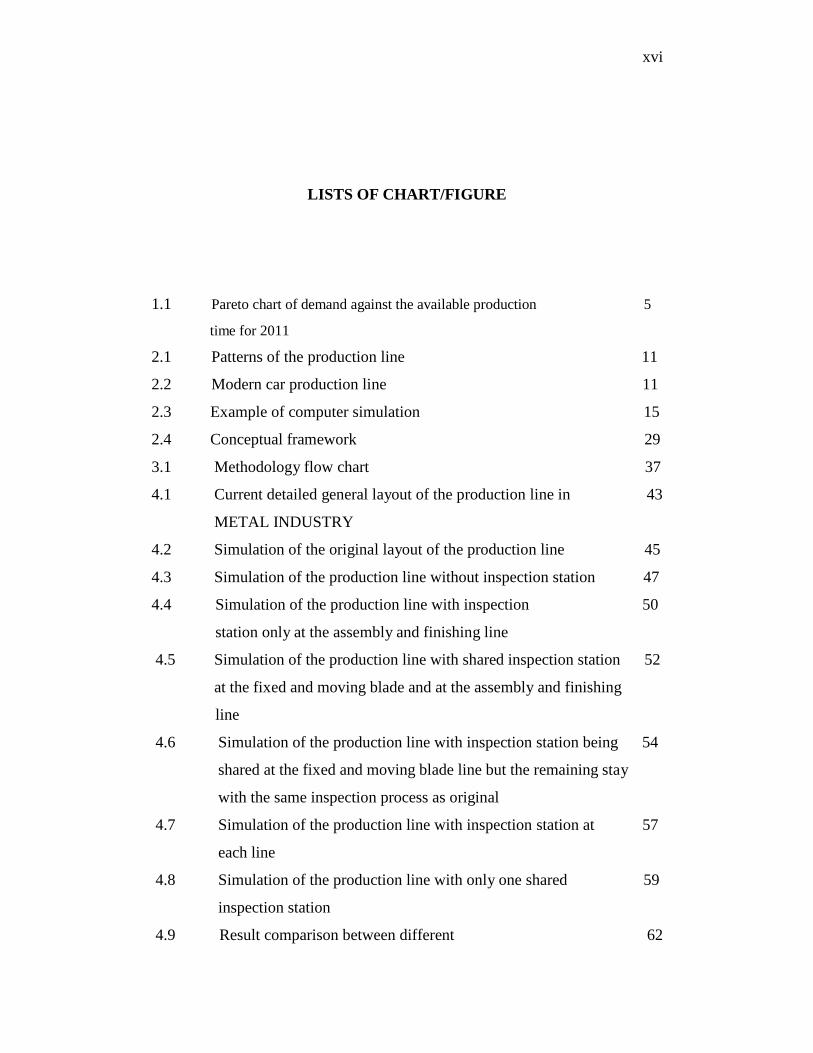
LISTS OF CHART/FIGURE
1.1 Pareto chart of demand against the available production
time for 2011
5
2.1 Patterns of the production line 11
2.2 Modern car production line 11
2.3 Example of computer simulation 15
2.4 Conceptual framework 29
3.1 Methodology flow chart 37
4.1 Current detailed general layout of the production line in 43
METAL INDUSTRY
4.2 Simulation of the original layout of the production line 45
4.3 Simulation of the production line without inspection station 47
4.4 Simulation of the production line with inspection 50
station only at the assembly and finishing line
4.5 Simulation of the production line with shared inspection station 52
at the fixed and moving blade and at the assembly and finishing
line
4.6 Simulation of the production line with inspection station being 54
shared at the fixed and moving blade line but the remaining stay
with the same inspection process as original
4.7 Simulation of the production line with inspection station at 57
each line
4.8 Simulation of the production line with only one shared 59
inspection station
4.9 Result comparison between different 62

xviixvii
inspection station allocations

xviii
APPENDIX
A Data output
B Interview transcript
C Data collection letter
D Data collection table

CHAPTER 1
INTRODUCTION
1.1 Introduction
According to Groover M.P., (2010), manufacturing can be defined in two ways, one
technologically, and the other one economically. Manufacturing in the technological
term means the application of physical and chemical processes to alter the geometry,
properties, or appearance of a given starting material to make parts or products. It also
includes assembly of multiple parts to make products. In the economic term,
manufacturing means, the transformation of materials into items of greater value by
means of one or more processing or assembly operations. In easy words, manufacturing
adds value to the material by changing its shape or properties, or by combining it with
other materials that have been similarly altered.
Basically, this process is not as easy as it seems. A lot of problems could occur
during this process which requires a lot of preparation and consideration so that
everything will run as it should. Two main method can be done to achieve this desire,
one is through the rigorous on the floor tests combined with mathematical problem
solving, and the other one through the simulation by the aid of computer software which
will give the prediction on how well the whole or partly processes of manufacturing
could be done to be compared with the real one.

2
These two processes start quite a long time ago to help the people in the
manufacturing field to make decisions which will greatly affect the company future. But
the preferable method is to use the computer simulation which is cheaper and more
appropriate in the new millennium as we are really lack of time in doing many things
including manufacturing.
This research intends to look upon the situation of the manufacturing system
specifically in the production line to help the possible improvement of the
manufacturing system in term of the application of the simulation software. As being
cited in previous research, it is widely recognized that innovation is a key factor in
sustaining Malaysia’s competitiveness in the face of rapid globalization (Chandran. et.
al., 2009) and the productivity in the production line is an element in maintaining that
competitiveness. While there have been few studies on innovation (Hobday,1996;
Rasiah, 2003; Narayanan and Wah, 2000) and internationalization of R&D activities
(Ariffin and Figueiredo, 2004) in Malaysia, less attention has been paid to analyzing the
issue as a system hence providing little evidence for any significant policy directions
which in this case the implementation of simulation software. Furthermore, the need to
visualize the system will attract more attention from the managerial line to incorporate
possible alternatives into the company itself and simulation come in handy as the answer
(Swenseth. et.al. 2002).
1.2 Background of study
Manufacturing has become part of all human activity since a long time ago until it is
quite impossible to track back when all of this whole process started. This is because,
human body itself is a very complex system which produces a lot of things such as
voice, movement, idea to create a book, journal and the list seems endless. If we really
want to establish this entire event, we must find the first human or creature that live in
this world. But the problem is, after centuries, scientist kept finding the older human
body than the previous finding.

3
On a focused manner, the history of manufacturing can be separated into two
subjects. The first one is man’s discovery and invention of materials and processes to
make things, while the second one is the development of the systems of production.
Groover M.P. (2010) stated that the event of human discovery to invent materials
and processes to make things started several millennia ago. Some of the processes are
the casting process, hammering (forging), and grinding which dated back more than
6000 years ago.
For this research, the focus is towards the understanding of the production
systems and possible improvement in the productivity. Thus, an efficient production line
design as part of a manufacturing system is a vital problem for some companies (Yaman.
R 2008). In order to make this research possible, an organization had been selected as
the place to conduct this study. The chosen company is a Metal Industry in Perak Darul
Ridzuan.
Metal Industry is a company which manufactures and supply the inner
component for machines such as computer, booster, oil pump and many more. This
company started the operation in 1994. There are more than 70 employees which work
in this company. Recently, there is no software or advance technique being employed in
order to assist the managers to understand and subsequently improve on the productivity
of the company. In this case, this research intend to help them to understand and
improve their productivity through the utilization of computer software which in this
case, ProModel. The focus is more towards the production line in the company which
they process and join the components to create a product.
1.3 Problem statement
―The possible permutations and combinations of work pieces, tools, pallets,
transportation vehicles, transport routes, operations, etc., and their resulting
performance, are almost endless. Computer simulation has become an absolute necessity
in the design of practical systems, and trend towards broadening its capabilities is

4
continuing as system move to encompass more and more of the factory‖, Kochan
(1986).
Today's complex, unpredictable and unstable marketplace requires flexible
manufacturing systems capable of cost-effective high variety-low volume production in
frequently changing product demand and mix.
From the above statement, we could see that the problem in the manufacturing
system is endless as it composed of many variables that contribute towards the
productivity in manufacturing. It is very wise for the managerial people in this area to
select the right method to determine the ideal combination and arrangement of those
factors so that the productivity of the manufacturing system will be maximized or at
least improved. Production line is one of the components in the manufacturing system. A
slight different in the arrangement of the entities will bring a big different in the outcome
such as profit, unit of product being produced and much more.
To further support the above statement, a real example of the problem in the
manufacturing system should be included. Based on the cases being handled by
ProModel Software Company (a software company which provide simulation software
to simulate the manufacturing system), a lot of problems being faced in the
manufacturing process can be successfully overcome with the use of a computer
simulation like theirs. One of the examples where this simulation software could be
implemented is in Metal Industry. The company wants to improve and increase its
production capacity, quality, and net profit. According to their experience, they do not
have any bottleneck on the production and procurement part of the manufacturing. They
are having some curiosity in a recently developed production line for a new product
requested by their customer.
They have to implement an exhaustive step of inspection as prepared and
requested by the customer themselves. Due to strict agreement of the customer with the
factory, the details of the steps in the production line could not be included or explained
too much in this research. They just allow exposing it generally.
Basically this new production line was developed to produce a part from a
cashier machine, to be specific, the part to cut the paper inserted into the cash machine
or the receipt. In the time being this is the sole product being produced in the production

5
line. There are generally 24 steps or stations to produce this product. The production line
processes the input in batches of 50 each time. From the 24 steps required, there are 9
stations of inspection all over the production line. The inspection station is more
concentrated in the beginning of the line which appears nearly after each step.
Sometimes, the demands for the product fluctuate. In moment of low demand,
the factory is comfortable and could meet the demand in time while following the
required steps. But then, when the demand is high, the rigorous steps could hinder from
high production due to long time of production with limited available time frame. In
moment like this they wish that they could eliminate some steps in order to save some
production time to produce more item as ordered. Figure 1.1 shows the fluctuation of
demand and the available production time in 2011.
Figure 1.0: Pareto chart of demand against the available production time for 2011
Based on the experience of the worker, some steps could be combined but never
be skipped such in the many steps of inspection. They have not yet tested this in reality
and wish to see how it will impact on the production time. This has attracted the
attention of the manager in charge and the researcher of the affect of this action on the
production time. For this reason, they have decided to explore a number of scenarios to
help in this problem. This problem could be helped by a production line simulation, and

6
this solution may also improve most of the outcomes for the business. They also
stipulate the following limitations (problem statements):
- the solution must not require high investment and technology;
- the solution must follow the inspection policy of the acceptance of the defective
units which requires repairing of the defective units after detection;
- solution must not require highly skill workers (they should be trained in a few
working days);
- the processes or steps in the production of the product cannot be skipped but can
be combined.
The above idea suggests that there is a need for a simulation technology in order to
overcome the manufacturing problem.
Basically there are two ways in accomplishing this objective. The first method is
by field measurement which is costly and time consuming. While the second method is
through computer simulation which had been mentioned and proposed in the above
statement. It also could be derived that the application of simulation being even broader,
relevant and practical as the time passes by suitable with the technological change that
continuously happen. Simulation is considered as an increasingly important computer
aid to the design process, partly because of the growing complexity of manufacturing
systems, and partly because of their dynamic and stochastic behaviour (Carrie, 1988;
Kochhar, 1989; Law and Haider, 1989; Baldwin et.al, 2005). Simulation is one type of
modelling, and it offers many benefits including in the manufacturing system and
production line (Bhaskar et al., 1994; Giaglis et al., 1999; Lee and Elcan, 1996).
1.4 Research question
a) What is the problem in the new production line?
b) What are the alternatives to improve the current production line?
c) What is the effect of different inspection allocation on the production time within
these limitations?

7
- the solution must not require high investment and technology;
- the solution must follow the inspection policy of the acceptance of the defective
units which requires repairing of the defective units after detection;
- solution must not require highly skill workers (they should be trained in a few
working days);
- the processes or steps in the production of the product cannot be skipped but can
be combined.
1.5 Research objective
The study aims to achieve the following objectives:
i. To evaluate the current approach of the production line.
ii. To propose a few alternatives in the production line within the scope of the given
inspection policy.
iii. To investigate the impact of different inspection station allocation on the production
time through the usage of computer simulation within the scope of acceptance of
defective units and repair inspection policy.
1.6 Research scope
This research focused on the production line which is applicable in the area of the
manufacturing system in any organization in Malaysia. In accordance with this research
and suitable with the research objective, it will be conducted in the production line in a
metal stamping company. This company manufactures parts and components for petrol
pump, ATM (Automated Teller Machines) machines and others. The variable to be
measured is the productivity of the company based on the computer simulation that will

8
be done. This research also tests only the different scenario of inspection policy being
implemented in the production line based on the acceptance of defects and repair
inspection policy.
1.7 Importance of research
1.7.1 To understand the problem in the production line.
1.7.2 To propose alternatives and select the better strategy to complete the
manufacturing process in the production line in a timely manner.
1.7.3 To understand the effect of different inspection station allocation under the
given inspection policy.
1.7.4 Can examine the various scheme of inspection policy.
1.7.5 Can simulate the production line in a realistic, flexible, and marginal cost
compared to mathematical model and experimentation.
1.7.6 Giving the suggestion to the related department or organization on the
method available to plan the production system.
1.7.7 Provide some idea or foundation for further research in the production area.
1.8 Research overview
In order to achieve the objectives of the research, Chapter 2 does include the related
definitions and literature review on the previous research in the related field. While in
Chapter 3, the methodology to acquire the listed objectives will be presented. Moving to
Chapter 4 the results to answer the research questions and objectives will be apparent.
The fifth chapter will discuss on the result and how it may benefit in the future research.

CHAPTER 2
LITERATURE REVIEW
2.1 Introduction
The next step in completing this research is to review the past literature on the same or
related area of study that is connected to the research being done. Moreover this chapter
will further explain on what this research are all about and how the previous scholar or
researchers conduct their study in the related areas together with their findings. The
definition of the essential terms in this will be explained and the related literatures also
will be unveiled to better serve the understanding of the reader.
2.2 Production line definition
―Production line is a series of arranged workstations so that the product moves from one
station to the next, and at each location a portion of the total work is performed on it
(Groover M.P, 2010).‖ This is where the materials available in the manufacturing system
being processed and joined together to create a product which could be neither finished
product or half finished product which will be supplied for another process.

10
Basically there are two main types of production line. The first type of
production line is where every product is identical. As an example is the production line
to produce a car, there is only one type of window, one type of door, one type of tyre
and so on to produce a single type of car.
While the second type of production line is the mixed-model production line.
This type of production line applies to the situations where there is soft variety in the
product made on the line. Modern automobile is an example, where there are many types
of car body, door, tyre and so on to produce many types of cars. Cars coming off this
production line have variations in options and trim representing different models and in
many cases different nameplates of the same basic car design.
From those two types of production lines, according to Jonsson, et al. (2004),
there are several flow patterns or design of the production line. The first type is the
single product flow pattern. The second pattern is the semi-parallel product flow pattern,
and the last pattern is the parallel product flow pattern.

11
Figure 2.1: Patterns of the assembly/production line (Jonsson, et al. (2004))
Figure 2.2: Modern car production lines (http://en.wikipedia.org/wiki/Assembly_line)
Flow lines, of which, production lines are an example is the most commonly
used system in a mass production environment. Production lines enable the processing
of complex products by workers who have received a short training period (Gunasekaran
and Cecile, 1998). Thus, an efficient production line design as part of a manufacturing
system is a vital problem for some companies.

12
2.3 Productivity definition
―Productivity is generally defined as the relation of output (i.e. produced goods) to input
(i.e. consumed resources) in the manufacturing transformation process‖, (Sumanth,
1994). While according to Stefan, (2005), the meaning of productivity can vary,
depending on the context within which it is used across the fields. But basically,
productivity is a measure of output from a production process, per unit. For
example, labour productivity is typically measured as a ratio of output per labour-hour
(an input).
Subsequently, an increase in productivity is characterized by a shift of the production
function and a consequent change to the output/input relation. The formula of total
productivity is normally written as follows:
Total productivity = Output quantity / Input quantity
According to changes in input and output, productivity has to be measured all-
encompassing of both quantitative and qualitative changes. In practice, quantitative and
qualitative changes take place when relative quantities and relative prices of different
input and output factors alter. In order to emphasize qualitative changes in output and
input, the formula of total productivity shall be written as follows:
Total productivity = Output quality and quantity / Input quality and quantity
The other way of calculating productivity is partial productivity. Measurement of
partial productivity refers to the measurement solutions which do not meet the
requirements of total productivity measurement. Partial productivity measurement is
equally important as it is being practicable as indicators of total productivity. In practice,
measurement in production means measures of partial productivity. In this case, the
objects of measurement are components of total productivity, and interpreted correctly,
these components are indicative of productivity development. The term of partial
productivity illustrates well the fact that total productivity is only measured partially or
approximately. In a way, measurements are defective but, by understanding the logic of
total productivity, it is possible to interpret correctly the results of partial productivity
and to benefit from them in practical situations.

13
These are the typical solutions of partial productivity:
i) Single factor productivity
ii) Value added productivity
iii) Unit cost accounting
iv) Efficiency ratios
v) Managerial control ratio system
Single-factor productivity refers to the measurement of productivity that is a ratio
of output and one input factor. A most well-known measure of single-factor productivity
is the measure of output per work input, describing work productivity. Sometimes it is
practical to employ the value added as output. Productivity measured in this way is
called Value-added productivity. Also, productivity can be examined in cost accounting
using Unit costs. Then it is mostly a question of exploiting data from standard cost
accounting for productivity measurements. Efficiency ratios, which tell something about
the ratio between the values produced and the sacrifices made for it, are available in
large numbers. Managerial control ratio systems are composed of single measures which
are interpreted in parallel with other measures related to the subject. Ratios may be
related to any success factor of the area of responsibility, such as profitability, quality,
position on the market, etc. Ratios may be combined to form one whole using simple
rules, hence, creating a key figure system.
The measures of partial productivity are physical measures, nominal price value
measures and fixed price value measures. These measures differ from one another by the
variables they measure and by the variables excluded from measurements. By excluding
variables from measurement makes it possible to better focus the measurement on a
given variable, yet, this means a more narrow approach. Table 2.1 below was compiled
to compare the basic types of measurement. The first column presents the measure types,
the second the variables being measured, and the third column gives the variables
excluded from measurement.

14
Table 2.1: Comparison of basic productivity measure types (Saari 2006)
TYPE OF MEASURE Variables to be measured Variables excluded Physical Quantity Quality and distribution Fixed price value Quantity and quality Distribution Nominal price value Quantity, quality and distribution None
2.4 Simulation definition
According to Schriber (1987), simulation is ―the modelling of a process or system in
such a way that the model mimics the response of the actual system to events that take
place overtime‖. During the last three decades there has been a dramatic increase in the
use of simulation to design and optimise manufacturing and warehousing systems
(Hollocks, 1992). There are three main reasons for the increase in use of simulation in
manufacturing. Firstly, increasing competition as a result of greater emphasis on
automation to increase productivity, quality, and reduce costs, has led to an increased
complexity which can be analysed only by simulation. Secondly, there has been a large-
scale reduction in the cost of computer hardware required to run the simulation models,
in addition to the availability of advanced simulation software. Thirdly, the introduction
of animation has resulted in a greater understanding of simulation by non-simulationists
such as managers and manufacturing engineers (Baldwin. et al. 2005).
In accordance with this study, the concern of the simulation is via the usage of
computer software to imitate the real situation that take place inside an organization, in
particular, the manufacturing process. In an easy word, simulation is the process of
imitating a dynamic system using a computer model in order to evaluate and improve
system performance. Through the study of the behaviour of the model, we can insights
about the behaviour of the actual system and the possible improvement to be made.
Simulation is a well-established methodology that has received great attention in
the literature, has a widespread application base in manufacturing and offers, at least in

15
theory, to be an attractive approach to supporting manufacturing management. There is a
wealth of literature on the subject and most offer guidelines for undertaking a simulation
study (e.g. Law and Kelton, 1991; Pidd, 1988; Von Uthman and Becker, 1999). Several
more studies have employed simulation for evaluating and investigating the application
of production methodologies and tools. For example, Chan and Smith (1993), Lovell
(1992) and Wu (1994) investigate just in time (JIT) (Meta Software Corporation Design,
1992), Schafer and Meredith (1993) consider cellular manufacturing, and Schian and
Morrison (1992), Yenradee (1994) and Yavuz and Satir (1995) consider optimised
production technology.
Computer simulations are used to model the new improved operation prior to its
implementation. Software programs, such as, Microsoft Visio, Excel, and Arena, can be
used to map, analyze and simulate the changes incorporated to the operation (Edson,
1999; Garbowski, 2000, b; Walkenbach, 1999; Kelton et al., 2002). Microsoft Visio has
an excellent interface with both Microsoft Excel and Arena.
Figure 2.3: Example of computer simulation
(http://www.promodel.com/solutions/manufacturing/manufacturing-example-model.asp)

16
2.5 ProModel
ProModel is the acronym for production modeller by PROMODEL Corporation which is
a simulation tool for modelling various manufacturing and service systems, Harrell et al.
(2011). This simulation software could be used to model the manufacturing system prior
to the real implementation so that the cost and investment on the decision to raise the
productivity is not wasted and maximized. This software covers job shops, conveyors,
transfer lines, mass production, assembly lines, flexible manufacturing systems, cranes,
just in time systems, kanban systems, and so forth.
ProModel focus on resource utilization, production capacity, productivity,
inventory levels, bottlenecks, throughput times, and other performance measures. It is a
discrete event simulator and intended to model discrete systems. The time resolution to
simulate the event or system is controllable and adjustable which ranges from 0.01 hours
to 0.00001 seconds. This software uses a graphical user interface (GUI) and also
compatible to be used with Windows operating system such as Windows XP, Me, 2000,
98, 95, or NT. It utilizes all Window features such as standard user interface,
multitasking, built-in printer drivers, and ―point and click‖ operation. It also provides an
online help system and a trainer.
Based on the book produced by the PROMODEL Corporation, Harrell et al.
(2011), the basic modelling element which needed in order to start the simulation is
locations, entities, arrivals and processing.
2.5.1 Locations.
Locations represent fixed places in the system where entities are routed for processing,
delay storage, decision making, or some other activity. It requires some type of receiving
locations to hold incoming entities. Other than that, the processing locations where
entities have value added to them is also needed.

17
2.5.2 Entities.
Anything that a model can process is called an entity. The examples of entities are parts
or widgets in a factory, patients in hospital, customers in a bank or a grocery store, and
travellers calling in for airline reservations.
2.5.3 Arrivals.
Arrivals are the mechanism for defining how entities enter the system. The entities can
be in a single form or in batches. The number of entities arriving at a time is called the
batch size (Qty each). The time between the arrivals of successive entities is called
interarrival time (Frequency). The total number of batches of arrivals is the occurrences.
The batch size, time between successive arrivals, and total number of batches can be
either constants or random (statistical distributions).
2.5.4 Processing.
Processing describes the operations that take place at a location. This can be the amount
of time an entity spends there, the resources it needs to complete processing, and
anything else that happens at the location, including selecting an entity’s next
destination.

18
2.6 Relation between productivity and simulation
After going through journals and books, it could be identified how strong the correlation
between computer simulation and manufacturing system in determining and improving
the productivity of the system itself. As being written previously, productivity being
measured by calculating the ratio between input and output. It is not an easy task in
order to achieve the optimal productivity, as it had been said by Park et al. (2002),
―difficult lies in the need to synchronize several processes to create a flow through the
plant. There are larger numbers of constraints and very little work in process is
allowed.‖
From the above statement, we could see that the higher managerial position want
to cut off as much work as possible so that the cost needed through the manufacturing
process could be minimized greatly. In contrast to that demand, higher productivity rate
is being desired by the higher authority of the organization. A tool that could solve this
big problem is in dire need, but at the same moment, will not consume a large proportion
of the cost required.
This is where computer simulation comes with a big hand to help the company
achieve that seemingly impossible desire. According to Harrel et al. (2011), rather than
leave decisions to chance, simulation provides a way to validate whether or not the best
decision are being made. Furthermore, simulations avoid the expensive, time
consuming, and disruptive nature of trial-and-error techniques. It is no longer relevant to
rely on the traditional trial-and-error methods with the emphasis today on time based
competition. The power of simulation lies in the fact that it provides a method of
analysis that is not only formal and predictive, but is capable of accurately predicting
performance of even the most complex systems.
The need and urge to implement computer simulation in the manufacturing
process can easily being seen by the words of Shi (2001),‖ An international contractor
has reported productivity improvements due to the simulation ranging from 30% to
300%. In this case, for every hour of simulation analysis used a saving of $2,500
achieved in 1999‖.

19
In this statement we can easily see the simple figure of how the computer
simulation could affect the productivity of the manufacturing system. Even though the
example taken was from a construction site, but it is still a manufacturing system.
Although construction even rather complicated as it deals with people (human resource),
materials, costs, elements of nature (weather etc) and much more. A computer
simulation still could provide some form of solution which is worth while to be
considered.
Based on that, it is wise to select the right method to coordinate all of the
resources available so that it could be used to the maximum to achieve the highest
productivity efficiency level and nothing would be wasted. It also mean the move or
choice to manipulate the computer simulation software is the right way as it is less costly
but could make a really big difference.
Some of the application of computer simulation:
-estimate the possible delays,
-productivity determination and improvement,
-resource management and optimization,
-system stochastic response to unforeseen conditions
-ability to respond to random and dynamic features in the operation of the system
(Zayed and Halpin, 2001)
In addition, Marmon (1991) and Luk (1990) emphasised the use of simulation to
study design, construction and production phases of the facilities in order in order to
justify and fine tune the impacts on process design changes.

20
2.7 Relevant literature on facility layout.
Table 2.2: Literatures on facility layout
No. Author Year Approach Measurement Discussion 1) Hong et. al. 2011 Simulation. Time/ speed. This research focuses on the
design of the egg
inspecting/grading process.
It emphasized on the
required steps in egg
grading and the speed. The
production line itself is an
inspection. 2) Judi et. al. 2011 Simulation. Total surface
area. The emphasized improvement is focused on
the layout of the computer
laboratory based on a few
established shapes and the
one proposed by the
researcher. 3) Xiaohong et. al. 2011 Simulation. Manufacturing
cost. The emphasized
improvement is focused on
the layout of the
manufacturing system based
on the minimum
manufacturing cost. 4) Junzheng et. al. 2011 Genetic
algorithm &
simulation.
Manufacturing cost.
The emphasized improvement is focused on
the layout of the
manufacturing system based
on the set-up cost, holding
cost, material handling cost
and facility allocation cost. 5) Miller et. al. 2011 Simulation. Movement &
speed. This research tackled the problem of the conveyer
layout in the production line
which concern on the ease
or less movement and the
speed. 6) Lizhi et. al. 2011 Mathematical
model &
simulation.
Distribution cost. This research emphasized the problem of the
distribution considering
centralized or decentralized
layout options.
7) Seyed et. al. 2011 Mathematical modeling.
Manufacturing efficiency
(distance
traveled
to retrieve parts,
This research tries to look upon the influence of
different work cell layout
towards the efficiency of the
manufacturing system.

21
average daily output of
engines, labour
cost per unit
produced, and
the amount of
time
the engine
remains in each
cell)
8) Vasudevan et. al.
2010 Simulation. Throughput. This research discusses on how to improve the
production line by mainly
alternating with two options
or scenarios which is the
change of crane efficiency
in the production line 9) Niu et. al. 2010 Simulation. Ergonomic. The improvement is
emphasized on how to
transform the current
production line into being
ergonomic. 10) Jayachitra R. and
Prasad P. S. S 2010 Genetic
algorithm &
simulation.
Machine
utilization,
throughput,
average distance
travelled by parts
and average
work-in-process
This research test these
three layouts in the chosen
company:
i) virtual cellular
layout
ii) existing functional
layout
iii) classical cellular
layout 11) Hemanta Doloi 2010 Simulation. Time
Utilization
Combined with
strategic business
objectives.
The focus of the research is more on decision making
based on business objectives
and facility layout.
12) Chen G.Y.H 2007 Ant Colony Optimization.
Total cost. This research tries to test different dynamic facility
layout by using the Ant
Colony Optimization
method. 13) Bozer and Hsieh. 2005 Quadratic
assignment
problem.
Throughput. Different types of conveyors were tested such as discrete
space, fixed window and
closed loop in determining
the layout. 14) Chiang and Lee. 2004 Genetic-based
algorithm Flow cost. Addresses the joint problem
of the cell formation and the
intercell layout, in which
machine cells are located
along a linear flow layout. 15) Saad, S.M. and
Lassila, A.M. 2004 Heuristic. Resource
requirements and
material
In this paper, various fractal cell configuration methods
for different system design

22
movements. objectives and constraints are proposed
16) Chien T.K 2004 Systematic layout planning
Multiple objective
decision making
& analytic
hierarchy
process.
The focus of the research is developing a procedure on
decision making in term of
selecting facility layout
based on Muther’s
systematic layout planning
procedure. 17) Gopalakrishnan
et. al. 2003 Splitting
departmental
approach.
Material handling costs.
This research tries to look upon the different layout
based on data acquisition
module, a pair-wise
departmental exchange
module, a layout
development module, and a
graphical representation
module. 18) Castilloy, I. and
Peters, B.A. 2003 Heuristic. Inter-department
unit load size,
intra-department
material handling
cost, inter-
department
material handling
cost, user-
specified space
filling curve, and
part process
routing
information.
In this paper, it considers manufacturing systems in
which replicates the same
machine type which may
exist in the facility.
19) Selim H.M. 2002 Heuristic. Design flexibility.
This research compared different cellular
manufacturing layout design
presented in a graph as a
new way of arranging the
manufacturing. 20) Huq et. al. 2001 Simulation. Time &
throughput. This research tries to compare the performance of
functional layouts and the
cellular layouts which
produce better productivity. 21) Shouman et. al. 2001 Artificial
intelligent. Cost. Different techniques were
tested such as fuzzy logic,
genetic algorithms and
neural network in order to
determine the layout of
facility. 22) Yang et. al. 2000 Systematic
layout planning Multiple objective
decision making
& analytic
hierarchy
process.
The focus of the research is developing a procedure on
decision making in term of
selecting facility layout.
23) Rooks B. 2000 Simulation. Bottleneck & investment
The development of new simulation software based

23
return. on two company case study was proposed and it focuses
on the assembly line layout
improvement. 24) Caron et. al. 2000 Simulation. Time. Compared random or cube
per order index (COI)-based
storage policies. 25) Kerns F. 1999 Strategic
facilities
planning
Key principles & key stages in
facility layout
planning.
Outlines the evolution of facilities design to the point
where it is capable of
supporting an organization’s
strategic content. Explains
the key principles of
strategic facility planning
(SFP) 26) Brooks A. 1998 Survey
Ergonomic. Ergonomic. Highlight the improvement
of the facility layout
emphasizing on the
ergonomic criteria. 27) D.J. Hall, & T.Q.
Ford 1998 Heuristic. Meeting the
requirements of
the company,
management by
prevention, cost
of quality and
error- free work.
Provides a link between the total quality philosophy and
building design/factory
layout.
28) Wainwright C.E.R.
1996 Queuing theory. Cost, size and scheduling
effectiveness.
The focus of the research is to alternate layout approach
based on the queuing
theory.
The extant research on the facility layout problem is broad and extensive; and the layout
design problem was tackled using different approaches. Examples of approaches and
techniques include: mathematical models based on queuing theory (Wainwright, 1996),
simulation (Caron et al., 2000; Huq et al., 2001; Rooks, 2000; Lizhi et. al., 2011; Seyed
et. al., 2011), strategic facilities planning (Kerns, 1999), ergonomics (Brooks, 1998), a
systematic layout planning (SLP) (Yang et al.; 2000; Chien, 2004), heuristic (Hall and
Ford, 1998; Selim, 2002; Castilloy and Peters, 2003; Saad and Lassila, 2004), artificial
intelligent (Shouman et al., 2001), a splitting departmental approach (Gopalakrishnan et
al., 2003), a genetic-based algorithm (Chiang and Lee, 2004), and quadratic assignment
problem (Bozer and Hsieh, 2005) and much more just to name a few such as Chien T.K
(2004), Vasudevan et. al. (2010), Niu et. al. (2010), Jayachitra R. and Prasad P. S. S
(2010), Hemanta Doloi (2010), and Seyed et. al. (2011) as being listed in the above
table.

24
The layout design problem has been an active research area in the past years.
Sule (1994) argued that the facility layout problem is a long-term, costly proposition,
and any modifications or rearrangements of the existing layout represent a large expense
and cannot be easily accomplished. Canen and Williamson (1998) presented in
chronological order, a non-exhaustive survey of the most representative and historical
computer software for facility layout evaluation. Shouman et al. (2001) presented a
summary of the most recent developments of conventional algorithms and intelligent
techniques for FLP.
Sha and Chen (2001) developed a new approach for combining the quantitative
and qualitative objectives to resolve the facility layout problem, and offered a new
measure of solution quality, the probability of superiority for the determination of the
probability that one layout is better than the others. They reported that optimal-seeking
methods are computationally infeasible for large layout problems. However, they were
optimistic that their proposed approach will be helpful in assisting the layout planners to
select good-quality solutions in practical facility-layout problems. Chiang (2001)
presented an integrated visual facility layout design system to solve layout problems
with geometric constraints on a continuous planar site. Vongpisal and Sangswang (2003)
developed a program that applied the Computerized Relationship Layout Planning
(CORELAP) principles to construct a facility layout from the SLP principle, by
reference to minimize distance-weighted adjacency-based objective that considered
rectilinear distance and adjacency in a unique way by using the concept of the total
closeness rating (TCR).
Gopalakrishnan et al. (2003) introduced a split departmental facility layout
generation system that developed layouts based on minimizing material handling costs.
The system consists of a data acquisition module, a pair-wise department exchange
module, a layout development module and a graphical representation module. They
reported that the developed system flow-oriented material handling cost could be
reduced significantly by adopting the split departmental approach. In 2004,
Gopalakrishnan et al., developed a system that integrates raw material storage, inventory
management, scheduling, and rack system design with facility layout development for

76
REFERENCES
Ariffin, N., & Figueiredo, P. N. (2004). Internationalization of innovative capabilities:
Counter-evidence from the electronics industry in Malaysia and Brazil. Oxford
Development Studies, 32(4), 559-583.
Baldwin. L.P, Eldabi T, and Paul. R.J,(2005). “Business process re-engineering;
Simulation; Computer software.” Business Process Management Journal. Vol.
11, No.1, pp. 22-36.
Ballou, D. and Pazer, H.L., The impact of inspector fallibility on the inspection policy in
serial production systems. Manage. Sci., 1982, 28, 387–399.
Bhaskar, R., Lee, H.S., Levas, A., Petrakian, R., Tsai, F., & Tulskie, B. (1994).
Analyzing and reengineering business processes using simulation. Proceedings
of the 1994 Winter Simulation Conference, Lake Buena Vista, Florida, 1206-
1213.
Bozer, Y. and Hsieh, Y-J. (2005), ―Throughput performance analysis and machine
layout for discrete-space closed-loop conveyors‖, IIE Transactions, Vol. 37, pp.
77-89.
Britney, R., Optimal screening plans for non serial production systems. Manage. Sci.,
1972, 18, 550–559.

77
Brooks, A. (1998), ―Ergonomic approaches to office layout and space planning‖,
Facilities, Vol. 16 Nos 3/4, pp. 73-8.
Brox JA, Fader C. The set of just-in-time management strategies: an assessment of their
impact on plant-level productivity and input-factor substitutability using variable
cost function estimates. Int J Prod Res 2002;40: 2705–20.
Canen, A.G. and Williamson, G.H. (1998), ―Facility layout overview: towards
competitive advantage‖, Facilities, Vol. 16 Nos 7/8, pp. 198-203.
Caron, F., Marchet, G. and Perego, A. (2000), ―Layout design in manual picking
systems: a simulation approach‖, Integrated Manufacturing System, Vol. 11 No.
2, pp. 94-104.
Carrie, A. (1988), Simulation of Manufacturing Systems, John Wiley & Sons,
Chichester.
Castilloy, I. and Peters, B.A. (2003), ―An extended distance-based facility layout
problem‖, Int. J. Production Research, Vol. 41 No. 11, pp. 2451-79.
Chan, F.T.S., Smith, A.M. (1993), "Simulation aids JIT assembly line manufacture: a
case study", International Journal of Operations & Production Management,
Vol. 13 No.4, .
Chandran V G R, Rasiah R and Wad P (2009), “Malaysian Manufacturing Systems of
Innovation and Internationalization of R&D from Centre for Business and
Development Studies Porcelænshaven 18 DK-2000 Frederiksberg Denmark of
Copanhagen Business School.
Chen G.Y.H (2007) ―Multi-Objective Evaluation of Dynamic Facility Layout Using Ant
Colony Optimization‖ University of Texas.

78
Chiang, C-P. and Lee, S-D. (2004), ―A genetic-based algorithm with the optimal
partition approach for the cell formation in bi-directional linear flow layout‖, Int.
J. Computer Integrated Manufacturing, Vol. 17 No. 4, pp. 364-75.
Chiang, W-C. (2001), ―Visual facility layout design system‖, Int. J. Production
Research, Vol. 39 No. 9, pp. 1811-36.
Chien, T-K. (2004), ―An empirical study of facility layout using a modified SLP
procedure‖, Journal of Manufacturing Technology Management, Vol. 15 No. 6,
pp. 455-65.
Chong A.Y.L., Chan F.T.S., Ooi K.B. and Sim J.J. (2010), ―Can Malaysian firms
improve organizational/innovation performance via SCM?‖, Industrial
Management & Data Systems Vol. 111 No. 3, 2011 pp. 410-431.
Edson, D. (1999), Professional Development with Visio 2000, Sams, Indianapolis.
Eppen, G.D. and Hurst, G., Optimal location of inspection stations in a multistage
production process. Manage. Sci., 1974, 20, 1194–1200.
Fozzard G, Spragg J. and Tyler D. (1996). “Simulation of flow lines in clothing
manufacture. Part 1: model construction.‖ International Journal of Clothing
Science and Technology. Vol. 8, No. 4, pp. 17-27.
Fozzard G, Spragg J. and Tyler D. (1996). “Simulation of flow lines in clothing
manufacture. Part 2: model construction.‖ International Journal of Clothing
Science and Technology. Vol. 8, No. 5, pp. 42-50.
Garbowski, R. (2000), Learn Visio 2000, Wordware Publishing, Plano, TX.

79
Garcia-Diaz, A., Foster, J.W. and Bonyuet, M., Dynamic programming analysis of
special multi-stage inspection systems. IEE Trans., 1984, 16, 115–125.
Garg S, Vrat P, and Arun Kanda. (2002). “Trade-offs between multiskilling and
inventory in assembly line operations under demand variability.‖ International
Journal of Operations & Production Management. Vol. 22, No. 5, pp. 565-583.
Giaglis, G.M., Paul, R.J., & Hlupic, V. (1999). Integrating simulation in organizational
design studies. International Journal of Information Management, 19, 219-236.
Gopalakrishnan, B., Turuvekere, R. and Gupta, D.P. (2004), ―Computer integrated
facilities planning and design‖, Facilities, Vol. 22 Nos 7/8, pp. 199-209.
Gopalakrishnan, B., Weng, Li and Gupta, D.P. (2003), ―Facilities design using a split
departmental layout configuration‖, Facilities, Vol. 21 Nos 3/4, pp. 66-73.
Greene, J.H. (1987), Production and Inventory Control Handbook, McGraw-Hill, Inc,
New York, NY, .
Groover M.P. (2010) The Fundamental of Modern Manufacturing: Materials,
Processes, and Systems. 3rd
Ed. Wiley.
Gunasekaran, A., Cecile, P. (1998), "Implementation of productivity improvement
strategies in a small company", Technovation, Vol. 18 No.5, pp.311-20.
Hall, D.J. and Ford, T.Q. (1998), ―A quality approach to factory design?‖, Industrial
Management & Data Systems, Vol. 98 No. 6, pp. 241-5.
Harrell C, Ghosh BK, Bawden R. Simulation using ProModel. 3nd ed. London, UK:
McGraw-Hill Higher Education; 2011.Harrell C. & Ghosh B.K. (2011).

80
Hassan M and Gruber S. (2008).‖ Application of discrete-event simulation to study the
paving operation of asphalt concrete.‖ Construction Innovation: Information,
Process, Management. Vol. 8, No. 1, pp. 7-22.
Hemanta Doloi, and Ali Jaafari. (2002). “Conceptual simulation model for strategic
decision evaluation in project management.‖ Logistics Information Management.
Vol. 15, No. 2, pp. 88-104.
Ho W. and Emrouznejad A. (2009).‖ A mathematical model for assembly line
balancing model to consider disordering sequence of workstations.‖ Assembly
Automation. Vol. 29, No. 1, pp. 49-51.
Hobday, M. (1996). Innovation in South-East Asia: Lessons for Europe. Management
Science, 34(9), 71-81.
Hollocks, B. (1992), "A well-kept secret? Simulation in manufacturing industry
review", OR Insight, Vol. 5 No.4, pp.12-17.
Hong Jiang; Huang Dingshi; Tang Ning; Zhang Cong (2011),
―The Layout Design and Finite Element Analysis of theInspection Equipment of
Egg Automatic Grading Line‖ Control, Automation and Systems Engineering
(CASE), 2011 International Conference on Communication, Networking &
Broadcasting ;Components, Circuits, Devices & Systems ; Computing &
Processing (Hardware/Software) ; Power, Energy, & Industry
Applications ; Robotics & Control Systems ; Signal Processing & Analysis pp. 1
– 4.
http://www.promodel.com/solutions/manufacturing/

81
Huq, F., Hensler, D.A. and Mohamed, Z.M. (2001), ―A simulation analysis of factors
influencing the flow time and through-put performance of functional and cellular
layouts‖, Integrated Manufacturing Systems, Vol. 12 No. 4, pp. 285-95.
Jayachitra R. and Prasad P. S. S (2010), ―Design and selection of facility layout using
simulation and design of experiments‖ Indian Journal of Science and
Technology,Vol. 3 No. 4 pp. 437- 446.
Jonsson D., Medbo L., and Engström T., (2004) "Some considerations relating to the
reintroduction of assembly lines in the Swedish automotive industry",
International Journal of Operations & Production Management, Vol. 24 Iss: 8,
pp.754 – 772.
Jorgenson, D.W. & Griliches, Z. (1967). ―The explanation of Productivity Change‖.
Review of Economic Studies 34 (99): 249-283.
Judi, H.M.; Yeoh Zhi Cheng; Tan Boon Seong; Lim Zi Yuan; Ho Hoe Yen; Ling Woi
Voon (2011), ―A case of computer laboratory layout modeling and analysis‖
Electrical Engineering and Informatics (ICEEI), 2011 International Conference
on Communication, Networking & Broadcasting ;Components, Circuits, Devices
& Systems ; Computing & Processing (Hardware/Software) ; Engineered
Materials, Dielectrics & Plasmas ; Fields, Waves & Electromagnetics ;General
Topics for Engineers (Math, Science & Engineering) pp. 1 – 4
Junzheng Huang; Aiping Li; Liyun Xu (2011),
―Economic production quantity model research based
on facility layout planning‖ Electronic and Mechanical Engineering and
Information Technology (EMEIT), 2011 International
Conference on Bioengineering ; Communication, Networking &
Broadcasting ; Components, Circuits, Devices & Systems ;Computing &

82
Processing (Hardware/Software) ; Engineered Materials, Dielectrics &
Plasmas ; Fields, Waves & Electromagnetics ; General Topics for Engineers
(Math, Science & Engineering) ; Geoscience ; Photonics & Electro-
Optics ; Power, Energy, & Industry Applications ; Robotics & Control
Systems ; Signal Processing & Analysis Volume: 2 pp. 604 – 608
Kaspi, M. and Raz, T., Optimal sequencing of production and inspection operations. Int.
J. Prod. Res., 1994, 32, 209–221.
Kelton, W.D., Sadowski, R.P., Sadowski, D. (2002), Simulation with Arena, 2nd ed.,
McGraw-Hill, New York, NY, .
Kerns, F. (1999), ―Strategic facility planning (SFP)‖, Work Study, Vol. 48 No. 5, pp.
176-81.
Kochan, D. CAM Developments in Computer Integrated Manufacturing, Berlin,
Springer-Verlag, 1986.
Kochhar, A.K. (1989), "Computer simulation of manufacturing systems – three decades
of progress", Proceedings of the 3rd European Simulation Congress, The Society
for Computer Simulation, San Diego, CA, pp.3-9.
Law, A.M., Haider, S.W. (1989), "Simulation in manufacturing – selecting simulation
software for manufacturing applications: practical guidelines and software
survey", Industrial Engineering, Vol. 31 pp.33-56.
Law, A.M., Kelton, W. (1991), Simulation Modeling and Analysis, McGraw-Hill, New
York, NY, .
Lee Y., & Elcan, A. (1996). Simulation modelling for process reengineering in the
telecommunications industry. Interfaces, 22(6), 1-9.

83
Lee, J. and Unnikrishnan, S., Planning quality inspection operations in multistage
manufacturing system with inspection errors. Int. J. Prod. Res., 1998, 36, 141–
155.
Lindsay, G.F. and Bishop, A.B., Allocation of screening inspection effort—a dynamic
programming approach. Manage. Sci., 1964, 10, 342.
Lizhi Wan; Zailin Guan; Xinyu Shao (2011),
―Simulation based study on the layout of an enterprise distribution center‖
Transportation, Mechanical, and Electrical Engineering (TMEE), 2011
International Conference on Communication, Networking & Broadcasting
;Components, Circuits, Devices & Systems ; Computing & Processing
(Hardware/Software) ; Fields, Waves & Electromagnetics ; Robotics
& Control Systems ; Signal Processing & Analysis ; Transportation. pp. 279 -
283
Lovell, M.C. (1992), "Simulating a 100% just-in-time economy", International Journal
of Production Economics, Vol. 26 pp.71-8.
Lubicz, M., On the problem of optimization of a quality inspection process structure. Int.
J. Prod. Res., 1983, 21, 369–381.
Luk, M. (1990), "Hong Kong Air Cargo terminals to work in Synch because of
simulation applications", Industrial Engineering, Vol. 11 pp.42-5.
Marmon, C. (1991), "Teledyne applies simulation to the design and justification of a
new facility", Industrial Engineering, Vol. 3 pp.29-32.

84
Miller, L.; Bradley, A.; Tish, A.; Tongdan Jin; Jimenez, J.A.; Wright, R. (2011),
―Simulating conveyor-based AMHS layout
configurations in small wafer lot manufacturing environments‖
Simulation Conference (WSC), Proceedings of the 2011 Winter Communication,
Networking & Broadcasting ;Components, Circuits, Devices &
Systems ; Computing & Processing (Hardware/Software) ; Engineered
Materials, Dielectrics & Plasmas ; Fields, Waves & Electromagnetics pp. 1939 -
1947
Nadia B, Gregory G, and Vince T (2006). ―Engineering change request management in a
new product development process.‖ European Journal of Innovation
Management. Vol. 9, pp 5-10.
Narayanan, S., & Wah, L. Y. (2000). Technological Maturity and Development without
Research: The Challenge for Malaysian Manufacturing. Development and
Change, 31, 435-457.
Neumann W.P, Winkel J, Medbo L, Magneberg R, and Mathiassen S.E (2006).
―Production system design elements influencing productivity and ergonomics: A
case study of parallel and serial flow strategies.‖ International Journal of
Operations & Production Management. Vol. 26, No. 8, pp. 904-923.
Niu, J.W.; Zhang, X.W.; Zhang, X.; Ran, L.H. (2010),
―Investigation of ergonomics in automotive assemblyline using Jack‖, Industrial
Engineering and Engineering Management (IEEM), 2010 IEEE International
Conference on Communication, Networking & Broadcasting ;Computing &
Processing (Hardware/Software) ; General Topics for Engineers (Math, Science
& Engineering) pp. 1381 – 1385.

85
Oke S.A, and Owaba C(2006).‖ A sensitivity analysis of an optimal Gantt charting
maintenance scheduling model.‖ International Journal of Quality & Reliability
Management. Vol. 23, No. 2, pp. 197-229.
Pidd, M. (1988), Computer Simulation in Management Science, John Wiley & Sons,
New York, NY, . Porteus, E.L. (1986), "Optimal lot listing, process quality
improvement and setup cost reduction", Operations Research, Vol. 34 No.1,
pp.137-44.
Pruzan, P.M. and Jackson, J.T.R., A dynamic programming application in production
line inspection. Technometrics., 1967, 9, 73–81.
Rasiah, R. (2003). Foreign ownership, technology and electronics exports from Malaysia
and Thailand. Journal of Asian Economics, 14(5), 785-811.
Rau, H. and Chu, Y.H., Inspection allocation planning with two types of workstations:
WVD and WAD. Int. J. Adv. Manuf. Technol., 2005, 25, 947–953.
Raz, T. and Kaspi, M., Location and sequencing of imperfect inspection operations in
serial multi-stage production systems. Int. J. Prod. Res., 1991, 29, 1645–1659.
Rohit Verma, Gerald D.and Richard J. (2000). “Redesigning check-processing
operations using animated computer simulation.‖ Business Process Management
Journal. Vol. 6, No. 1, pp. 54-64.
Rooks, B. (2000), ―Software planning of assembly lines‖, Assembly Automation, Vol.
20 No. 4, pp. 300-4.
Saad, S.M. and Lassila, A.M. (2004), ―Layout design in fractal organizations‖, J.
Production Research, Vol. 42 No. 17, pp. 3529-50.

86
Saari, S. (2006). "Productivity. Theory and Measurement in Business". Espoo, Finland:
European Productivity Conference.
Sandanayake YG, Oduoza CF (2007) Design of a performance measurement system for
just-in-time production: a methodological framework International Journal of
Manufacturing Technology Management vol. 10(2/3), pp. 276–29
Sandor Ujvari, and Olli-Pekka Hilmola. (2006). “Advanced manufacturing simulation:
Minor system details can be major issues in the real world.‖ Industriall
Management & Data Systems. Vol. 106, No. 8, pp. 1166-1186.
Sarkar BR, Fitzsimmons JA. The performance of push and pull systems: a simulation
and comparative study. Int J Prod Res 1989;27(10):1715–31.
Sbiti, N., Di Mascolo, M., Amghar, M. (2005), "Modeling and properties of generalized
kanban controlled assembly systems",Proceedings of the 5th International
Conference on Analysis of Manufacturing Systems – Production Management,
Zakynthos Island, Greece, 20-25 May, .
Schafer, S.M., Meredith, J.R. (1993), "An empirically-based simulation study of
functional versus cellular layouts with operations overlapping", International
Journal of Operations & Production Management, Vol. 13 No.2, .
Schian, C.R., Morrison, K.R. (1992), "Using simulation to improve synchronous flow in
pinion manufacturing", Computers and Industrial Engineering, Vol. 23 No.1,
pp.267-73.
Schriber, T. J.(1987), ―The Nature and Role of Simulation in the Design of
Manufacturing Systems,‖ in Simulation in CIM and Artificial Intelligence
Techniques, J. Retti and K. E. Wichmann (eds.), Society for Computer
Simulation, pp. 5-18.

87
Selim, H.M. (2002), ―Manufacturing cell formation problem: a graph partitioning
approach‖, Industrial Management & Data Systems, Vol. 102 No. 6, pp. 341-52.
Seyed-Mahmoud Aghazadeh, Saeedreza Hafeznezami, Lotfollah Najjar, Ziaul Huq,
(2011),"The influence of work-cells and facility layout on the manufacturing
efficiency", Journal of Facilities Management, Vol. 9 Iss: 3 pp. 213 – 224.
Sha, D.Y. and Chen, C-W. (2001), ―A new approach to the multiple objective facility
layout problem‖, Integrated Manufacturing Systems, Vol. 12 No. 1, pp. 59-66.
Shi, J.J. (2001), "Practical approaches for validating a construction
simulation", Proceedings of the 2001 Winter Simulation Conference, Society for
Computer Simulation, pp.1534-40.
Shiau, Y.R., Inspection resource allocation in a multistage manufacturing system with an
inspection error model. Int. J. Prod. Res., 2002, 40, 1787–1806.
Shouman, M.A., Nawara, G.M., Reyad, A.H. and EL-Darandaly, K.H. (2001), ―Facility
layout problem (FL) and intelligent techniques: a survey‖, paper presented at 7th
International conference on Production Engineering, Design and Control,
Alexandria, Egypt, February.
Stefan Tangen, (2005) "Demystifying productivity and performance", International
Journal of Productivity and Performance Management, Vol. 54 Iss: 1, pp.34 – 46.
Sule, D.R. (1994), Manufacturing Facilities – Location, Planning, and Design, 2nd ed.,
PWS-KENT, Boston, MA.
Sumanth, D. (1994), Productivity Engineering and Management, McGraw-Hill, New
York, NY, .

88
Swenseth S.R., Olson J.R., and Southard P.B. (2002), ―Extending Product Profiling
Through Simulation.‖ International Journal of Operations & Production
Management, Vol. 22, No. 9, pp. 956-971(16)
Toyoda, E. 1987, Toyota: First Fifty Years in Motion, Kodansha International, Tokyo.
Vasudevan, K.; Lammers, E.J.; Williams, E.J.; Ulgen, O.M. (2010),
―Application of Simulation to Design and Operation of
Steel Mill Devoted to Manufacture of Line Pipes‖ Advances in
System Simulation (SIMUL), 2010 Second International Conference on
Communication, Networking & Broadcasting. pp. 1 – 6.
Von Uthman, C., Becker, J. (1999), "Guidelines for business process simulation", in
Scholz-Reiter, B., Stahlmann, H.D., Nethe, A. (Eds),Process Modelling,
Springer, Berlin, .
Vongpisal, C., Sangswang, O. (2003), "Computer aided layout planning with department
relationship", Proceedings of the 31st International Conference and Industrial
Engineering, July, Greece.
Wainwright, C.E.R. (1996), ―The application of queuing theory in the analysis of plant
layout‖, International Journal of Operations & Production Management, Vol. 16
No. 1, pp. 50-74.
Wu, B. (1994), Manufacturing Systems Design and Analysis, Chapman and Hall,
London, . Walkenbach, J. (1999), Microsoft Excel 2000 Bible, IDG Books,
Foster City, CA.
Xiaohong Suo; Xian Chi; Xiaoxia Sun; Hujun Wang (2011),
―Modeling and simulating of facility layout based on manufacturing costs‖

89
Electronic and Mechanical Engineering and Information Technology (EMEIT),
2011 International Conference on Bioengineering ; Communication,
Networking & Broadcasting ; Components, Circuits, Devices &
Systems ;Computing & Processing (Hardware/Software) ; Engineered
Materials, Dielectrics & Plasmas ; Fields, Waves & Electromagnetics ; General
Topics for Engineers (Math, Science & Engineering) ; Geoscience ; Photonics &
Electro-Optics ; Power, Energy, & Industry Applications ; Robotics & Control
Systems ; Signal Processing & Analysis pp. 279 – 283.
Yaman R, (2008) "An assembly line design and construction for a small manufacturing
company", Assembly Automation, Vol. 28 Iss: 2, pp.163 – 172
Yang, T., Su, C-T. and Hsu, Y-R. (2000), ―Systematic layout planning: a study on
semiconductor wafer fabrication facilities‖, International Journal of Operation
Production Management, Vol. 20 No. 11, pp. 1360-72.
Yavuz, I.H., Satir, A. (1995), "Kanban-based operational planning and control:
simulation modelling", Production Planning and Control, Vol. 6 No.4, .
Yenradee, P. (1994), "Application of optimized production technology in a capacity
constrained flow shop a case study in a battery factory", Computers and
Industrial Engineering, pp.217-20.
Yum, B.J. and McDowell, E.D., 1987, Optimal inspection policies in a serial production
system including scrap, rework and repair: An MILP approach, International
Journal of Production Research, 25(10), 1451-1464
Yum, B.J. and McDowell, E.D., The optimal allocation of inspection effort in a class of
nonserial production systems. AIIE Trans., 1981, 13, 285–293.

90
Zayed, T.M., Halpin, D. (2001), "Simulation of concrete batch plant
production", Journal of Construction Engineering and Management, ASCE, Vol.
127 No.2, pp.132-41.
Related Documents