Production and utilization of organic matter in different P-availability conditions: A mesocosm experiment in the Northern Adriatic Sea Chiara Larato a,1 , Mauro Celussi a, ⁎ ,1 , Damiano Virgilio a , Ana Karuza a , Claus Falconi a , Cinzia De Vittor a , Paola Del Negro a , Serena Fonda Umani b a Dipartimento di Oceanografia Biologica, Istituto Nazionale di Oceanografia e Geofisica Sperimentale (OGS), Via A. Piccard 54, 34151014 Trieste, Italy b Dipartimento di Scienze della Vita, Università di Trieste, Via Valerio 28/1-34127 Trieste, Italy abstract article info Article history: Received 13 September 2009 Received in revised form 16 June 2010 Accepted 17 June 2010 Keywords: Gulf of Trieste Phosphorous Phytoplankton Prokaryotes The growth, activity and structure of a marine plankton assemblage from the Gulf of Trieste (NE Adriatic Sea) were monitored in a short-term mesocosm experiment (25 L) in order to investigate the influence of phosphorous availability on the production and utilization of organic matter. The coastal community, dimensionally selected (b 200 μm), was grown under different P-concentrations. The results obtained from the nutrient enriched enclosures highlighted the microbial food web potential in high productivity systems: the phytoplankton community grew to a bloom-like state and resulted particularly productive enhancing the development of the prokaryotic population (especially of its active fraction). Glucidic exoenzymes operated at high hydrolysis rates in order to recycle extracellular carbohydrate/exudates produced by the abundant phytoplankton community. Intense prokaryotic production, directed prevalently to replication rather than to biomass production, increased the density of prokaryotic cells on levels that particularly favoured virus proliferation, acting thus as feedback control on the bacterial population. Different P concentrations also strongly influenced the structure of the bacterial community (either directly or indirectly) analyzed through denaturing gradient gel electrophoresis (DGGE), by selecting two diverse assemblages at the end of the experiment. Conversely to high N:P ratios observed throughout the year in the Northern Adriatic Sea, our study simulated a phosphorous-balanced condition and pointed out how nutrient limitation affects the entire microbial plankton community, reducing the trophic status of the environment through the control of phytoplankton production. © 2010 Elsevier B.V. All rights reserved. 1. Introduction The interaction between the dissolved organic matter (DOM) and planktonic heterotrophic prokaryotes plays a central role in the aquatic carbon cycle (Amon and Benner, 1996). However, the magnitude of DOC-released fluxes remains largely uncertain, repre- senting from 2% to 100% of primary production (Teira et al., 2003 and references therein), especially in oligotrophic regions (Teira et al., 2001). Many studies (Ducklow and Carlson, 1992; Williams, 2000) have demonstrated the tight coupling of primary production and bacterial utilization, since phytoplankton-derived DOM sustains bacterial production (Cole et al., 1988; Obernosterer and Herndl, 1995). Moreover, it is well known that the rate of DOM uptake largely depends on its biochemical composition (Amon and Benner, 1996; Becquevort et al., 2002). Some authors support the hypothesis that the semi-labile phytoplankton-derived DOC, mainly associated with grazing and/or cell lysis, could induce uncoupling between the processes of DOC production and consumption (Teira et al., 2003). Other studies suggested that bacteria-derived DOC originated by viral lysis can be an important substrate source stimulating the growth of non-infected bacterial populations (e.g. Middelboe et al., 1996; 2003; Riemann et al., 2009). The ecological consequence of a temporal uncoupling of DOM production and degradation is that microbial activity and regenera- tion of nutrients are not intimately linked with primary production (Søndergaard et al., 2000). Unused DOM might accumulate under appropriate physical conditions of the water column, leading to mucilage events, which sporadically affect the northern Adriatic Sea (Del Negro et al., 2005; Fonda Umani et al., 2007). Although the phenomenon remains still scarcely known, common to many hypotheses are the steps of production and accumulation of DOM resistant to degradation due to a P-limited system (Del Negro et al., 2005). In fact, it is well known that mineral P-limitation has crucial implications for DOC dynamics affecting both primary productivity and bacterial utilization (Thingstad et al., 1998; Puddu et al., 2003). Moreover, there is evidence that the rate of organic matter uptake Journal of Experimental Marine Biology and Ecology 391 (2010) 131–142 ⁎ Corresponding author. Tel.: +39 0402249732; fax: +39 0402249770. E-mail address: [email protected] (M. Celussi). 1 Chiara Larato and Mauro Celussi contributed equally to this work. 0022-0981/$ – see front matter © 2010 Elsevier B.V. All rights reserved. doi:10.1016/j.jembe.2010.06.020 Contents lists available at ScienceDirect Journal of Experimental Marine Biology and Ecology journal homepage: www.elsevier.com/locate/jembe

Welcome message from author
This document is posted to help you gain knowledge. Please leave a comment to let me know what you think about it! Share it to your friends and learn new things together.
Transcript
Journal of Experimental Marine Biology and Ecology 391 (2010) 131–142
Contents lists available at ScienceDirect
Journal of Experimental Marine Biology and Ecology
j ourna l homepage: www.e lsev ie r.com/ locate / jembe
Production and utilization of organic matter in different P-availability conditions: Amesocosm experiment in the Northern Adriatic Sea
Chiara Larato a,1, Mauro Celussi a,⁎,1, Damiano Virgilio a, Ana Karuza a, Claus Falconi a, Cinzia De Vittor a,Paola Del Negro a, Serena Fonda Umani b
a Dipartimento di Oceanografia Biologica, Istituto Nazionale di Oceanografia e Geofisica Sperimentale (OGS), Via A. Piccard 54, 34151014 Trieste, Italyb Dipartimento di Scienze della Vita, Università di Trieste, Via Valerio 28/1-34127 Trieste, Italy
⁎ Corresponding author. Tel.: +39 0402249732; fax:E-mail address: [email protected] (M. Celussi).
1 Chiara Larato and Mauro Celussi contributed equall
0022-0981/$ – see front matter © 2010 Elsevier B.V. Aldoi:10.1016/j.jembe.2010.06.020
a b s t r a c t
a r t i c l e i n f oArticle history:Received 13 September 2009Received in revised form 16 June 2010Accepted 17 June 2010
Keywords:Gulf of TriestePhosphorousPhytoplanktonProkaryotes
The growth, activity and structure of a marine plankton assemblage from the Gulf of Trieste (NE Adriatic Sea)were monitored in a short-term mesocosm experiment (25 L) in order to investigate the influence ofphosphorous availability on the production and utilization of organic matter. The coastal community,dimensionally selected (b200 μm), was grown under different P-concentrations. The results obtained fromthe nutrient enriched enclosures highlighted the microbial food web potential in high productivity systems:the phytoplankton community grew to a bloom-like state and resulted particularly productive enhancing thedevelopment of the prokaryotic population (especially of its active fraction). Glucidic exoenzymes operatedat high hydrolysis rates in order to recycle extracellular carbohydrate/exudates produced by the abundantphytoplankton community. Intense prokaryotic production, directed prevalently to replication rather than tobiomass production, increased the density of prokaryotic cells on levels that particularly favoured virusproliferation, acting thus as feedback control on the bacterial population. Different P concentrations alsostrongly influenced the structure of the bacterial community (either directly or indirectly) analyzed throughdenaturing gradient gel electrophoresis (DGGE), by selecting two diverse assemblages at the end of theexperiment. Conversely to high N:P ratios observed throughout the year in the Northern Adriatic Sea, ourstudy simulated a phosphorous-balanced condition and pointed out how nutrient limitation affects theentire microbial plankton community, reducing the trophic status of the environment through the control ofphytoplankton production.
+39 0402249770.
y to this work.
l rights reserved.
© 2010 Elsevier B.V. All rights reserved.
1. Introduction
The interaction between the dissolved organic matter (DOM) andplanktonic heterotrophic prokaryotes plays a central role in theaquatic carbon cycle (Amon and Benner, 1996). However, themagnitude of DOC-released fluxes remains largely uncertain, repre-senting from 2% to 100% of primary production (Teira et al., 2003 andreferences therein), especially in oligotrophic regions (Teira et al.,2001).
Many studies (Ducklow and Carlson, 1992; Williams, 2000) havedemonstrated the tight coupling of primary production and bacterialutilization, since phytoplankton-derived DOM sustains bacterialproduction (Cole et al., 1988; Obernosterer and Herndl, 1995).Moreover, it is well known that the rate of DOM uptake largelydepends on its biochemical composition (Amon and Benner, 1996;Becquevort et al., 2002). Some authors support the hypothesis that
the semi-labile phytoplankton-derived DOC, mainly associated withgrazing and/or cell lysis, could induce uncoupling between theprocesses of DOC production and consumption (Teira et al., 2003).Other studies suggested that bacteria-derived DOC originated by virallysis can be an important substrate source stimulating the growth ofnon-infected bacterial populations (e.g. Middelboe et al., 1996; 2003;Riemann et al., 2009).
The ecological consequence of a temporal uncoupling of DOMproduction and degradation is that microbial activity and regenera-tion of nutrients are not intimately linked with primary production(Søndergaard et al., 2000). Unused DOM might accumulate underappropriate physical conditions of the water column, leading tomucilage events, which sporadically affect the northern Adriatic Sea(Del Negro et al., 2005; Fonda Umani et al., 2007). Although thephenomenon remains still scarcely known, common to manyhypotheses are the steps of production and accumulation of DOMresistant to degradation due to a P-limited system (Del Negro et al.,2005). In fact, it is well known that mineral P-limitation has crucialimplications for DOC dynamics affecting both primary productivityand bacterial utilization (Thingstad et al., 1998; Puddu et al., 2003).Moreover, there is evidence that the rate of organic matter uptake
132 C. Larato et al. / Journal of Experimental Marine Biology and Ecology 391 (2010) 131–142
depends on the physiological state of bacteria (Moriarty and Bell,1993).
Numerous studies showed evidence of qualitative and quantitativemodification of the photosynthetic extracellular release in the case ofnutrient limitation, especially under P-limited condition (Obenostererand Herndl, 1995; Myklestad, 2000). It has been commonly reportedthat nutrient depletion tends to result in enhanced rates of DOCproduction (Maranon et al., 2004 and references therein). DOMproduction may be enhanced under nutrient depletion condition as amechanism for dissipating cellular energy under relatively high-lightconditions (Wetz and Wheeler, 2007 and references therein).
Under P-limited condition, a large amount of photosyntheticextracellular release is incorporated into bacteria with a lowerefficiency (Obenosterer and Herndl, 1995), partly due to themodification of the biochemical composition of the released organicmatter (Fajon et al., 1999), but also because bacterial metabolism isaffected by the same phosphorous limitation (Kuparinen andHeinänen, 1993; Zweifel et al., 1995). According to Fajon et al.(1999), the ability of the bacteria to use the C-rich substrate is limitedwhen P is lacking; moreover Puddu et al. (2003) evidenced reducedbacterial specific growth rates and carbon demand in the exudatesfrom P-depleted algae. Thingstad et al. (1997) noticed that, in nutrientlimited conditions, bacteria cannot consume all the degradable DOCreleased from the food web as fast as it is produced possibly leading toits accumulation in some marine environments (Fonda Umani et al.,2007).
The knowledge of the bacterial utilization of extracellular organicmatter produced by phytoplankton and bacterial response to P-unbalanced conditions in terms of degradation processes is not yetexhaustive. The aim of the experiment was to investigate theinfluence of P-availability or limitation on the production of DOMby a natural phytoplankton community and determine its utilizationby prokaryotes in the Gulf of Trieste. In particular we tested the Pinfluence on the phytoplankton growth and productivity and itsconsequent effect on the structure and activity of the prokaryoticcommunity (abundance of prokaryotes, viruses and active bacteria,leucine/thymidine uptake, hydrolysis rates, DGGE fingerprinting).
2. Methods
The experiment was conducted from the 23rd of July to the 1st ofAugust 2003. Surface seawater was collected at a coastal station(45°42′03″N, 13°42′36″E) in the Gulf of Trieste (northern AdriaticSea) and immediately pre-screened through a 200-μm mesh toremove microplankton grazers. The initial volume (150 L) was mixedand split into six translucent polycarbonate 20 L bottles (Nalgene),previously washed with HCl (1 N) and rinsed with Milli-Q water(Millipore). Before the repartition into the incubation bottles, asample (subsequently called ‘untreated’) was taken in order todetermine initial DOC concentration, prokaryotic and viral abun-dances, and bacterial community structure. Furthermore, in order toinduce a phytoplanktonic bloom, each mesocosm enclosure wasenriched with phytoplankton organisms (from 4 to 7×with respect tothe in situ determination — D. Fornasaro, personal communication)collected at the same station using a 100-μmpore-size planktonmesh.
The same quantity of inorganic nutrients and vitamins was addedto each mesocosm bottle in order to obtain the following concentra-tions: nitrates (NaNO3) (final concentration 50 μM), silicates(Na2SiO3×9 H2O) (final concentration 50 μM), vitamins (vitamin B1Tiamin×HCl) (final concentration 0.1 mg L−1); vitamin B12 (Cobala-min final concentration 0.5 μg L−1); vitamin H (Biotin) (finalconcentration 0.5 μg L−1) and iron (FeCl3) (final concentration9.5 μM). Phosphate was added (NaH2PO4×H2O) (final concentration4.5 μM) only to 3 out of the 6 mesocosm bottles. Thus, differentphosphorus availability conditions were produced in triplicate:phosphorus depleted condition P(−) in the first bottles (1, 2 and 3)
and phosphorus enriched condition P(+) in the other bottles (4, 5,and 6). Inorganic nutrients were added in order to obtain concentra-tions up to 5–10× (5× for NO3¯ and SiO3¯ and 10× for PO4
3¯) themaxima measured in the sampling area during a 5-year time series(Falconi, 2009); vitamins and iron concentrations are the ones used inthe f/2 culture media for algal growth.
Samples were incubated in situ for 9 days and sampled initially(d0), on the 25th of July (d2), on the 29th of July (d6) and on 1st ofAugust (d9) at the same hour (between 12:00 and 13:00). Thefollowing parameters were determined: Primary Production (PP),Dissolved Organic Carbon (DOC), Particulate Organic Carbon (POC),dissolved macronutrients, total prokaryotic abundance, active pro-karyote abundance, virus abundance, prokaryotic carbon production(by using both 3H-Thymidine and 3H-Leucine incorporation), exoen-zymatic activity (α-glucosidase, β-glucosidase, β-galactosidase, li-pase, phosphatase and leucine aminopeptidase), bacterial andphytoplankton community structure.
2.1. Nutrients
Water for the determination of dissolved inorganic nutrientconcentrations (NO2
−, NO3−, NH4
+, PO43− and SiO3
−) was sampled andfiltered through Whatman GF/F filters (0.7 μm pore size, WhatmanInternational Ltd). Analyses were conducted at room temperature ona five-channel Bran+Luebbe Autoanalyzer 3 Continuous FlowAnalyzer (Bran+Luebbe, Norderstedt, Germany), according to Kor-oleff and Grasshof (1983). The efficiency of the system was checkedbefore and after sample analyses by doing replicates of internalstandards.
2.2. Dissolved Organic Carbon (DOC)
Samples for DOC analyses were filtered through precombusted(4 h at 480 °C) and acidified (1 N HCl) Whatman GF/F glass fibrefilters (0.7 μm nominal pore size). Filtration was performed using aglass syringe and a filter holder in order to prevent atmosphericcontamination. The filtered samples were stored frozen (−20 °C) in20 mL glass vials (previously treated with chromic mixture andprecombusted 4 h at 480 °C). Before the analysis, samples wereacidified (pH b2) with 6 N HCl solution and purged for 8 min usinghigh-purity oxygen bubbling (150 mL min−1). DOC analyses weremade with the HTCO method using a Shimadzu TOC 5000A with aquartz combustion column filled with 1.2% Pt on silica pillows with anapproximate diameter of 3 mm (Cauwet, 1994). 100 μL of sample wasinjected. Carbon concentration was determined by automatic com-parison with four−point calibration curves. Standardization wascarried out every day using potassium hydrogen phthalate. Each valuewas determined from a minimum of three injections, with a variationcoefficient b2%. The replicate samples showed dispersion between 1.5and 4%.
2.3. Particulate Organic Carbon (POC)
Particulate Organic Carbon (POC) concentrations were measuredon samples (250 mL) filtered onto precombusted (450 °C for 4 h)glass fibre filters (Whatman GF/F) under low vacuum. The filters wereplaced in precombusted glass tubes and dried at 60 °C. POC wasdetermined by high temperature oxidation using a CHNS 2400 PerkinElmer Elemental Analyzer after acidification with 1 N HCl to removethe inorganic carbon (Nieuwenhuize et al., 1994). Acetanilide wasused to create the calibration curve.
2.4. Phytoplankton abundance
Phytoplankton samples were collected at d0, d6 and d9 andpreserved with hexamethylene tetramine-buffered formalin (1.6%
133C. Larato et al. / Journal of Experimental Marine Biology and Ecology 391 (2010) 131–142
final concentration) at 4 °C. Qualitative and quantitative phytoplank-ton analyses were performed by the Utermöhl (1958) method usingan inverted microscope (Zeiss Axiovert 135) equipped with phasecontrast.
2.5. Primary Production (PP)
Phytoplankton primary production was measured using the 14Cmethod (Steeman Nielsen, 1952). Water samples were poured intotransparent and dark sets of 6 polycarbonate bottles (75 mL) andamended with 222 KBq of NaH14CO3. Samples were incubated at insitu temperature in a thermostatic bath exposed to natural light for2 h around noon. After the incubation period, 25 mL of each samplewas filtered onto 0.2 μm pore-size polycarbonate (Whatman Nucle-pore). Filters (for estimation of primary productivity) and 5 mL offiltrate (for estimation of exudation rate) were placed intoscintillation vials and soaked with a few drops of 5 N HCl to removeresidual (14C) bicarbonate. 12 h after acidification, scintillationcocktail (5 mL Filter Count, Perkin Elmer, for filters and 10 mLUltima Gold XR, Perkin Elmer, for filtrate) was added and sampleswere radioassayed in a Quanta Smart TriCarb 2900 TR LiquidScintillation Analyzer (Packard Bioscience, USA) including quench-ing correction, obtained using internal standard. Activity of 14C wasestimated plating 222 KBq of NaH14CO3 solution with scintillationcocktail and counted. Inorganic carbon concentration (tCO2) wascalculated from the total alkalinity. Assimilation of carbon wascalculated according to Gargas (1975), assuming 5% isotopediscrimination.
2.6. Prokaryotic abundance
Samples (10 mL) for prokaryotic abundance determination werepreserved in pre-filtered (through 0.2 μm Acrodisc syringe filter)formalin (2% v/v final concentration) at 4 °C and processed within48 h. After staining for 15 min with 4'6 diamidino-2-phenylindole(DAPI, Sigma) at 1 μg mL−1
final concentration (Porter and Feig,1980), samples were filtered in triplicate (1–2 mL per subsample)onto 0.2 μm pore-size black-stained polycarbonate filters (Ø 25 mm,Nuclepore).
Filters were mounted on microscope slides using not fluorescentoil (Olympus) and stored at −20 °C. Prokaryotes enumeration wascarried out using an Olympus BX 60 F5 epifluorescence microscopeequipped with a 100 W high-pressure mercury burner (HPO 100 W/2) at 1000× magnification under UV excitation light (BP 330–385, BA420nM). A minimum of 300 cells were counted for each filter in atleast 20 randomly selected fields.
2.7. Active prokaryote abundance
The abundance of active prokaryote was determined according toChoi et al. (1996) with a slight modification of the protocol describedby Paoli et al. (2006).
Immediately after the deliver in the laboratory CTC was added to4 mL of seawater sample to yield a 3 mM CTC final concentration.Samples were incubated in the dark at the in situ temperature for 2 h.Incubation was stopped by adding borate buffered formalin (pre-filtered through 0.2 μm Acrodisc Syringe filters) at 5% v/v finalconcentration. 1 mL aliquots were filtered in quadruplicate onto0.2 μm black-stained polycarbonate filters (Millipore) and mountedonto microscope slides between layers of non-fluorescent immersionoil (Olympus). Enumeration of active cells was carried out under agreen filter set (BP 480–550, BA 590nM) as described for prokaryoticabundance.
2.8. Prokaryotic Carbon Production
Prokaryotic Carbon Production (PCP) was assayed by both theincorporation of [3H]-leucine method (3H-Leu) (Smith and Azam,1992) and by the [methyl-3H]-thymidine (3H-TdR) incorporationmethod (Fuhrman and Azam, 1982). Triplicate 1.7 mL samples andtwo killed controls (90 μL 100% trichloracetic acid — TCA) weretreated with 20 nM radiotracer and incubated for 1 h at the in situtemperature.
Incubations were stopped with 90 μL 100% TCA and the extractionwith TCA 5% and ethanol 80%, was carried out by microcentrifugationmethod (Smith and Azam, 1992). Incorporated radioactivity wasmeasured using a Packard Tri-Carb 300 scintillation counter afteraddition of 1 mL scintillation cocktail (Ultima Gold MV; Packard).Incorporation of 3H-leucine was converted into carbon produced viabacterial protein production according to Simon and Azam (1989),assuming a 2-fold isotope dilution for Leu. Incorporated moles of 3H-TdR were transformed into bacteria cell number using a ThymidineConversion Factor (Riemann and Bjørnsen, 1987) of 1.1×10¹⁸ cellsper 1 mol 3H-TdR and, finally, Prokaryotic Carbon Production (PCP)was calculated using a Carbon Conversion Factor of 20 fgC perprokaryotic cell (Lee and Fuhrman, 1987).
Prokaryotic Carbon Demand (PCD) is the sum of PCP andrespiration. A medium Prokaryotic Growth Efficiency (PGE) of 30%(del Giorgio and Cole, 1998; Hoppe et al., 2002; Fonda Umani et al.,2007) was used for our computations.
2.9. Viral abundance
Virus abundance was estimated according to Noble and Fuhrman(1998) protocol. Formalin-fixed samples (final concentration 1%)were filtered in triplicate onto 0.02 μm pore-size Al2O3 inorganicmembrane filters (Anodisc, Whatman) after 2 h. 200 μL subsampleswere diluted 1:10 in 0.02-μm pore-size prefiltered (virus-free)seawater in order to homogenize virus particles distribution in theglass funnel. The membrane was filtered to dryness and laid on a dropof SYBR Green I (Molecular Probes) reaching a final concentration of50× of the dye in a sample (Noble and Fuhrman, 1998). After 15 minin the dark, the filters were mounted on a glass slide between 2 drops(25 μL each) of antifade solution (50% glycerol, 49% PBS and 1%ascorbic acid) and counted as described for prokaryotic abundanceunder a blue filter set (BP 420–480nM, BA 515nM).
Virus-to-Prokaryote Ratio (VPR) was calculated dividing thenumber of viruses by the prokaryotic number.
2.10. Hydrolytic enzyme activity
Hydrolytic enzyme activity was measured with fluorogenicanalogs of natural substrates (Hoppe, 1993): methyl umbelliferyl-β-D-glucoside (MUF, β-D-glucosidase) methyl umbelliferyl-β-D-gluco-side (MUF, β-D-glucosidase), methyl umbelliferyl-β-D-galactoside(MUF, β-D-galactosidase), methyl umbelliferyl phosphate (MUF,phosphatase), 4-methylumbelliferyl oleate (MUF, oleate) and L-leucine-4-methylcoumarinile-7-amide (MCA, aminopeptidase).
After evaluation of the saturating concentrations, hydrolysis ratewas measured by incubation of 2.5 mL subsamples with 200 μMMUF-β-glucoside, MUF-β-glucoside, MUF-β-galactoside and leucine-MCAsubstrates; 100 μM MUF-oleate and 50 μM MUF-phosphate. Incuba-tion was performed in the dark at in situ temperatures for 1 h.
Fluorescence was measured at 380/365 nM excitation and 440/455 nM emission for MUF/MCA substrates using a fluorometer(Shimadzu RF 1501). Standard solutions of MUF and MCA wereused to calibrate the fluorometer.
All results are expressed as mean±standard deviation for each setof triplicates (P-depleted and P-enriched enclosures).
134 C. Larato et al. / Journal of Experimental Marine Biology and Ecology 391 (2010) 131–142
2.11. Bacterial community structure
Samples for bacterial community structure analysis were collectedin the original environmental sample and at d6 and d9. 6 mL sampleswere prefiltered through a 20 μm nylon screen, centrifuged at20,000×g at room temperature for 15 min and the pellet addedwith 175 μL of lysis buffer (400 mM NaCl, 750 mM sucrose, 20 mMethylenediaminetetraacetic acid, 50 mM Tris–HCl pH 9.0). DNA wasextracted according to Boström et al. (2004). PCR and DenaturingGradient Gel Electrophoresis (DGGE) were performed using auniversal primer complementary to position 517–534 (5'-ATTACCGCGGCTGCTGG-3') and a bacterial primer complementary to posi-tion 341–358 plus a GC clamp (5'CGCCCGCCGCGCGCGGCGGGCGGGGCGGGGGCACGGGGGGCCTACGGGAGGCAGCAG-3') as previouslydescribed (Celussi et al., 2008). DGGE banding patterns were usedto determine bacterioplankton community structure. Bands indifferent lanes corresponding to the same Operational TaxonomicUnit (OTU) were identified by using the EquiBands applet (Huber andPeduzzi, 2004) and band patterns were turned into a presence/absence matrix.
DGGE banding patterns were then analysed with the Primer5 v5.2.9 (Plymouth Marine Laboratory, UK) program using clusteranalysis performed calculating the Bray-Curtis similarity coefficientfor all pairs of samplings in each station. Clusters were formed usingthe single linkage method between similarities.
2.12. Statistical analysis
A principal component analysis (PCA), performed with thePrimer5 v 5.2.9 (Plymouth Marine Laboratory, UK) program, wasused to better understand the information of ourmultivariate data set,considering all values of Dissolved Inorganic Nitrogen (DIN),Dissolved Inorganic Phosphorous (DIP), silicate (Si), DOC, POC,primary production (PP), percentage of extracellular release (PER),total prokaryotic abundance (TP), active prokaryote abundance (AP),3H-leucine (Leu) and 3H-thymidine (TdR) incorporation, viralabundance (VIRUS), β-glucosidase (BGLU), alkaline phosphatase(APA), leucine aminopeptidase (AMA) and lipase, both in the P(−)and in the P(+) treatments. The data set was standardised bysubtracting the mean and dividing by the standard deviation. Thismultivariate analysis rotates a cloud of data points such that themaximum variability is visible in order to identify the most importantgradients over the sampling period.
3. Results
3.1. Nutrients
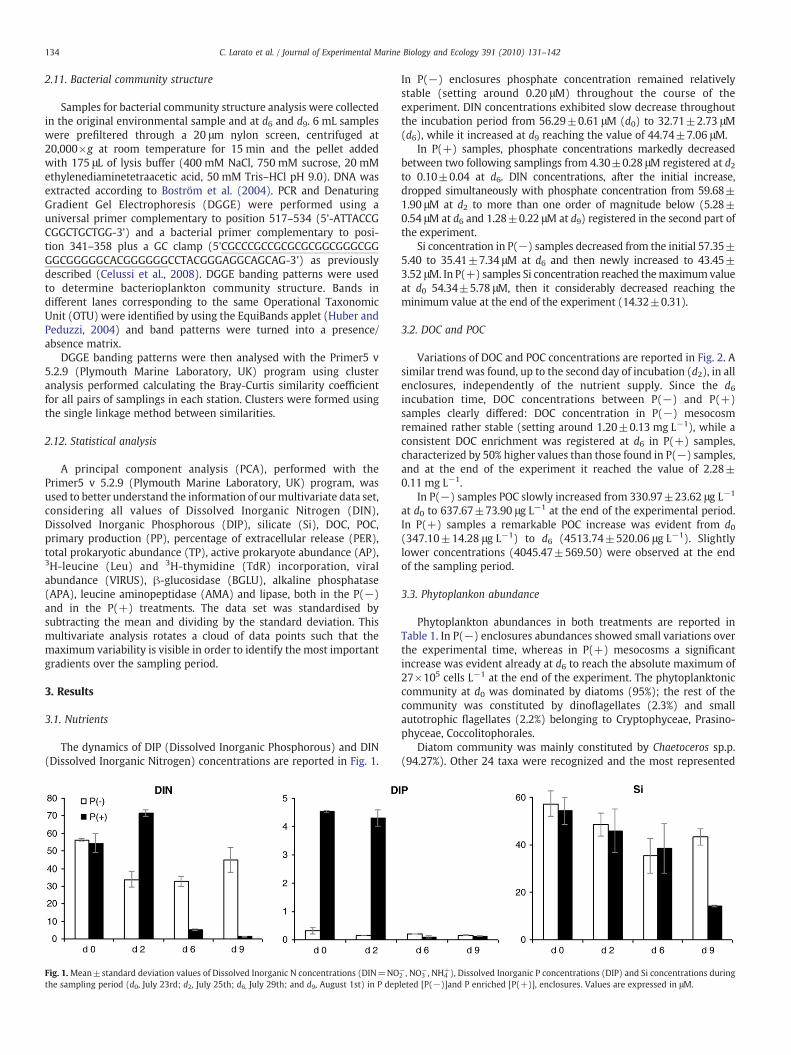
The dynamics of DIP (Dissolved Inorganic Phosphorous) and DIN(Dissolved Inorganic Nitrogen) concentrations are reported in Fig. 1.
Fig. 1.Mean±standard deviation values of Dissolved Inorganic N concentrations (DIN=NOthe sampling period (d0, July 23rd; d2, July 25th; d6, July 29th; and d9, August 1st) in P dep
In P(−) enclosures phosphate concentration remained relativelystable (setting around 0.20 μM) throughout the course of theexperiment. DIN concentrations exhibited slow decrease throughoutthe incubation period from 56.29±0.61 μM (d0) to 32.71±2.73 μM(d6), while it increased at d9 reaching the value of 44.74±7.06 μM.
In P(+) samples, phosphate concentrations markedly decreasedbetween two following samplings from 4.30±0.28 μM registered at d2to 0.10±0.04 at d6. DIN concentrations, after the initial increase,dropped simultaneously with phosphate concentration from 59.68±1.90 μM at d2 to more than one order of magnitude below (5.28±0.54 μM at d6 and 1.28±0.22 μM at d9) registered in the second part ofthe experiment.
Si concentration in P(−) samples decreased from the initial 57.35±5.40 to 35.41±7.34 μM at d6 and then newly increased to 43.45±3.52 μM. In P(+) samples Si concentration reached themaximum valueat d0 54.34±5.78 μM, then it considerably decreased reaching theminimum value at the end of the experiment (14.32±0.31).
3.2. DOC and POC
Variations of DOC and POC concentrations are reported in Fig. 2. Asimilar trend was found, up to the second day of incubation (d2), in allenclosures, independently of the nutrient supply. Since the d6incubation time, DOC concentrations between P(−) and P(+)samples clearly differed: DOC concentration in P(−) mesocosmremained rather stable (setting around 1.20±0.13 mg L−1), while aconsistent DOC enrichment was registered at d6 in P(+) samples,characterized by 50% higher values than those found in P(−) samples,and at the end of the experiment it reached the value of 2.28±0.11 mg L−1.
In P(−) samples POC slowly increased from 330.97±23.62 μg L−1
at d0 to 637.67±73.90 μg L−1 at the end of the experimental period.In P(+) samples a remarkable POC increase was evident from d0(347.10±14.28 μg L−1) to d6 (4513.74±520.06 μg L−1). Slightlylower concentrations (4045.47±569.50) were observed at the endof the sampling period.
3.3. Phytoplankon abundance
Phytoplankton abundances in both treatments are reported inTable 1. In P(−) enclosures abundances showed small variations overthe experimental time, whereas in P(+) mesocosms a significantincrease was evident already at d6 to reach the absolute maximum of27×105 cells L−1 at the end of the experiment. The phytoplanktoniccommunity at d0 was dominated by diatoms (95%); the rest of thecommunity was constituted by dinoflagellates (2.3%) and smallautotrophic flagellates (2.2%) belonging to Cryptophyceae, Prasino-phyceae, Coccolitophorales.
Diatom community was mainly constituted by Chaetoceros sp.p.(94.27%). Other 24 taxa were recognized and the most represented
2−, NO3
−, NH4+), Dissolved Inorganic P concentrations (DIP) and Si concentrations during
leted [P(−)]and P enriched [P(+)], enclosures. Values are expressed in μM.
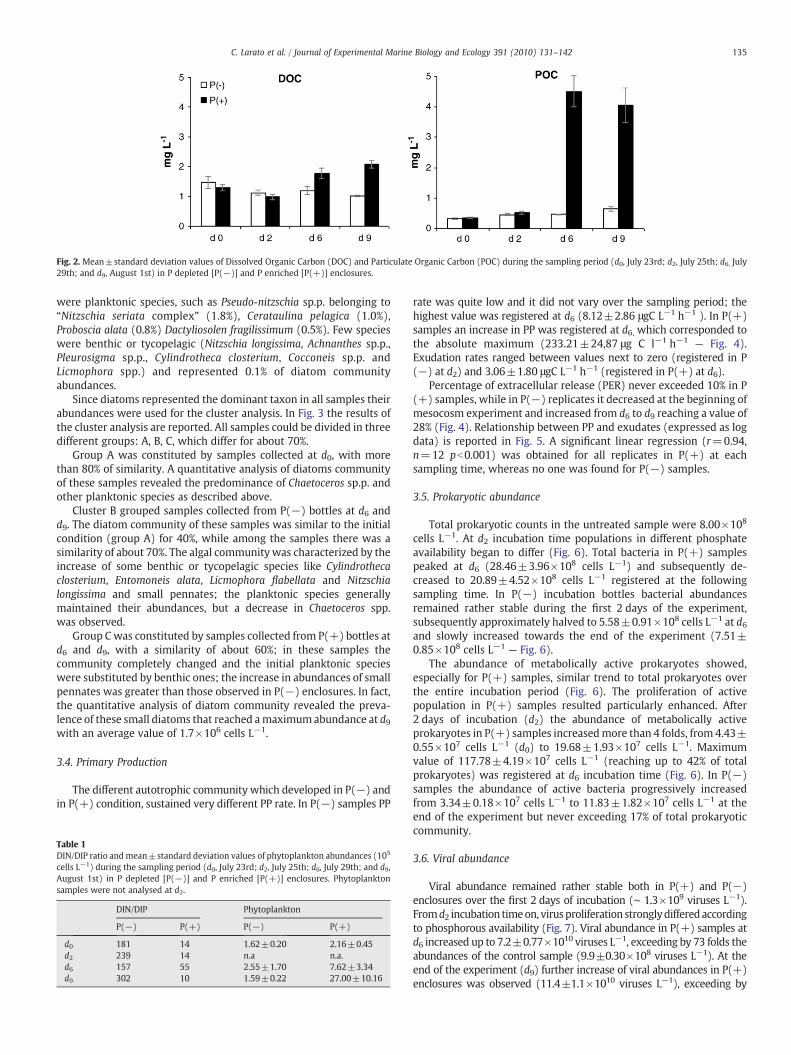
Fig. 2. Mean±standard deviation values of Dissolved Organic Carbon (DOC) and Particulate Organic Carbon (POC) during the sampling period (d0, July 23rd; d2, July 25th; d6, July29th; and d9, August 1st) in P depleted [P(−)] and P enriched [P(+)] enclosures.
135C. Larato et al. / Journal of Experimental Marine Biology and Ecology 391 (2010) 131–142
were planktonic species, such as Pseudo-nitzschia sp.p. belonging to“Nitzschia seriata complex” (1.8%), Cerataulina pelagica (1.0%),Proboscia alata (0.8%) Dactyliosolen fragilissimum (0.5%). Few specieswere benthic or tycopelagic (Nitzschia longissima, Achnanthes sp.p.,Pleurosigma sp.p., Cylindrotheca closterium, Cocconeis sp.p. andLicmophora spp.) and represented 0.1% of diatom communityabundances.
Since diatoms represented the dominant taxon in all samples theirabundances were used for the cluster analysis. In Fig. 3 the results ofthe cluster analysis are reported. All samples could be divided in threedifferent groups: A, B, C, which differ for about 70%.
Group A was constituted by samples collected at d0, with morethan 80% of similarity. A quantitative analysis of diatoms communityof these samples revealed the predominance of Chaetoceros sp.p. andother planktonic species as described above.
Cluster B grouped samples collected from P(−) bottles at d6 andd9. The diatom community of these samples was similar to the initialcondition (group A) for 40%, while among the samples there was asimilarity of about 70%. The algal community was characterized by theincrease of some benthic or tycopelagic species like Cylindrothecaclosterium, Entomoneis alata, Licmophora flabellata and Nitzschialongissima and small pennates; the planktonic species generallymaintained their abundances, but a decrease in Chaetoceros spp.was observed.
Group C was constituted by samples collected from P(+) bottles atd6 and d9, with a similarity of about 60%; in these samples thecommunity completely changed and the initial planktonic specieswere substituted by benthic ones; the increase in abundances of smallpennates was greater than those observed in P(−) enclosures. In fact,the quantitative analysis of diatom community revealed the preva-lence of these small diatoms that reached amaximumabundance at d9with an average value of 1.7×10⁶ cells L−1.
3.4. Primary Production
The different autotrophic community which developed in P(−) andin P(+) condition, sustained very different PP rate. In P(−) samples PP
Table 1DIN/DIP ratio andmean±standard deviation values of phytoplankton abundances (105
cells L−1) during the sampling period (d0, July 23rd; d2, July 25th; d6, July 29th; and d9,August 1st) in P depleted [P(−)] and P enriched [P(+)] enclosures. Phytoplanktonsamples were not analysed at d2.
DIN/DIP Phytoplankton
P(−) P(+) P(−) P(+)
d0 181 14 1.62±0.20 2.16±0.45d2 239 14 n.a n.a.d6 157 55 2.55±1.70 7.62±3.34d9 302 10 1.59±0.22 27.00±10.16
rate was quite low and it did not vary over the sampling period; thehighest value was registered at d6 (8.12±2.86 μgC L−1 h−1 ). In P(+)samples an increase in PP was registered at d6, which corresponded tothe absolute maximum (233.21±24,87 μg C l−1 h−1 — Fig. 4).Exudation rates ranged between values next to zero (registered in P(−) at d2) and 3.06±1.80 μgC L−1 h−1 (registered in P(+) at d6).
Percentage of extracellular release (PER) never exceeded 10% in P(+) samples, while in P(−) replicates it decreased at the beginning ofmesocosm experiment and increased from d6 to d9 reaching a value of28% (Fig. 4). Relationship between PP and exudates (expressed as logdata) is reported in Fig. 5. A significant linear regression (r=0.94,n=12 pb0.001) was obtained for all replicates in P(+) at eachsampling time, whereas no one was found for P(−) samples.
3.5. Prokaryotic abundance
Total prokaryotic counts in the untreated sample were 8.00×10⁸
cells L−1. At d2 incubation time populations in different phosphateavailability began to differ (Fig. 6). Total bacteria in P(+) samplespeaked at d6 (28.46±3.96×10⁸ cells L−1) and subsequently de-creased to 20.89±4.52×10⁸ cells L−1 registered at the followingsampling time. In P(−) incubation bottles bacterial abundancesremained rather stable during the first 2 days of the experiment,subsequently approximately halved to 5.58±0.91×10⁸ cells L−1 at d6and slowly increased towards the end of the experiment (7.51±0.85×10⁸ cells L−1 — Fig. 6).
The abundance of metabolically active prokaryotes showed,especially for P(+) samples, similar trend to total prokaryotes overthe entire incubation period (Fig. 6). The proliferation of activepopulation in P(+) samples resulted particularly enhanced. After2 days of incubation (d2) the abundance of metabolically activeprokaryotes in P(+) samples increasedmore than 4 folds, from 4.43±0.55×10⁷ cells L−1 (d0) to 19.68±1.93×10⁷ cells L−1. Maximumvalue of 117.78±4.19×10⁷ cells L−1 (reaching up to 42% of totalprokaryotes) was registered at d6 incubation time (Fig. 6). In P(−)samples the abundance of active bacteria progressively increasedfrom 3.34±0.18×10⁷ cells L−1 to 11.83±1.82×10⁷ cells L−1 at theend of the experiment but never exceeding 17% of total prokaryoticcommunity.
3.6. Viral abundance
Viral abundance remained rather stable both in P(+) and P(−)enclosures over the first 2 days of incubation (∼ 1.3×10⁹ viruses L−1).Fromd2 incubation timeon, virusproliferation stronglydifferedaccordingto phosphorous availability (Fig. 7). Viral abundance in P(+) samples atd6 increased up to 7.2±0.77×10¹⁰ viruses L−1, exceeding by 73 folds theabundances of the control sample (9.9±0.30×10⁸ viruses L−1). At theend of the experiment (d9) further increase of viral abundances in P(+)enclosures was observed (11.4±1.1×10¹⁰ viruses L−1), exceeding by
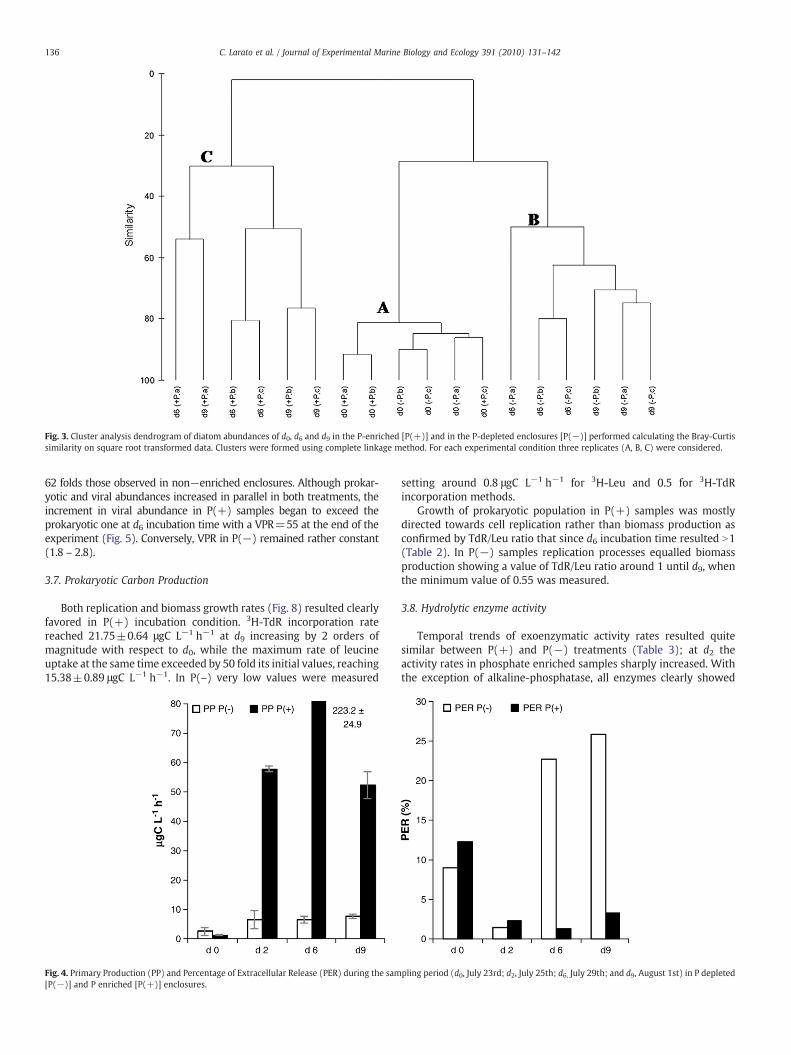
Fig. 3. Cluster analysis dendrogram of diatom abundances of d0, d6 and d9 in the P-enriched [P(+)] and in the P-depleted enclosures [P(−)] performed calculating the Bray-Curtissimilarity on square root transformed data. Clusters were formed using complete linkage method. For each experimental condition three replicates (A, B, C) were considered.
136 C. Larato et al. / Journal of Experimental Marine Biology and Ecology 391 (2010) 131–142
62 folds those observed in non−enriched enclosures. Although prokar-yotic and viral abundances increased in parallel in both treatments, theincrement in viral abundance in P(+) samples began to exceed theprokaryotic one at d6 incubation time with a VPR=55 at the end of theexperiment (Fig. 5). Conversely, VPR in P(−) remained rather constant(1.8 – 2.8).
3.7. Prokaryotic Carbon Production
Both replication and biomass growth rates (Fig. 8) resulted clearlyfavored in P(+) incubation condition. 3H-TdR incorporation ratereached 21.75±0.64 μgC L−1 h−1 at d9 increasing by 2 orders ofmagnitude with respect to d0, while the maximum rate of leucineuptake at the same time exceeded by 50 fold its initial values, reaching15.38±0.89 μgC L−1 h−1. In P(–) very low values were measured
Fig. 4. Primary Production (PP) and Percentage of Extracellular Release (PER) during the sam[P(−)] and P enriched [P(+)] enclosures.
setting around 0.8 μgC L−1 h−1 for 3H-Leu and 0.5 for 3H-TdRincorporation methods.
Growth of prokaryotic population in P(+) samples was mostlydirected towards cell replication rather than biomass production asconfirmed by TdR/Leu ratio that since d6 incubation time resulted N1(Table 2). In P(−) samples replication processes equalled biomassproduction showing a value of TdR/Leu ratio around 1 until d9, whenthe minimum value of 0.55 was measured.
3.8. Hydrolytic enzyme activity
Temporal trends of exoenzymatic activity rates resulted quitesimilar between P(+) and P(−) treatments (Table 3); at d2 theactivity rates in phosphate enriched samples sharply increased. Withthe exception of alkaline-phosphatase, all enzymes clearly showed
pling period (d0, July 23rd; d2, July 25th; d6, July 29th; and d9, August 1st) in P depleted
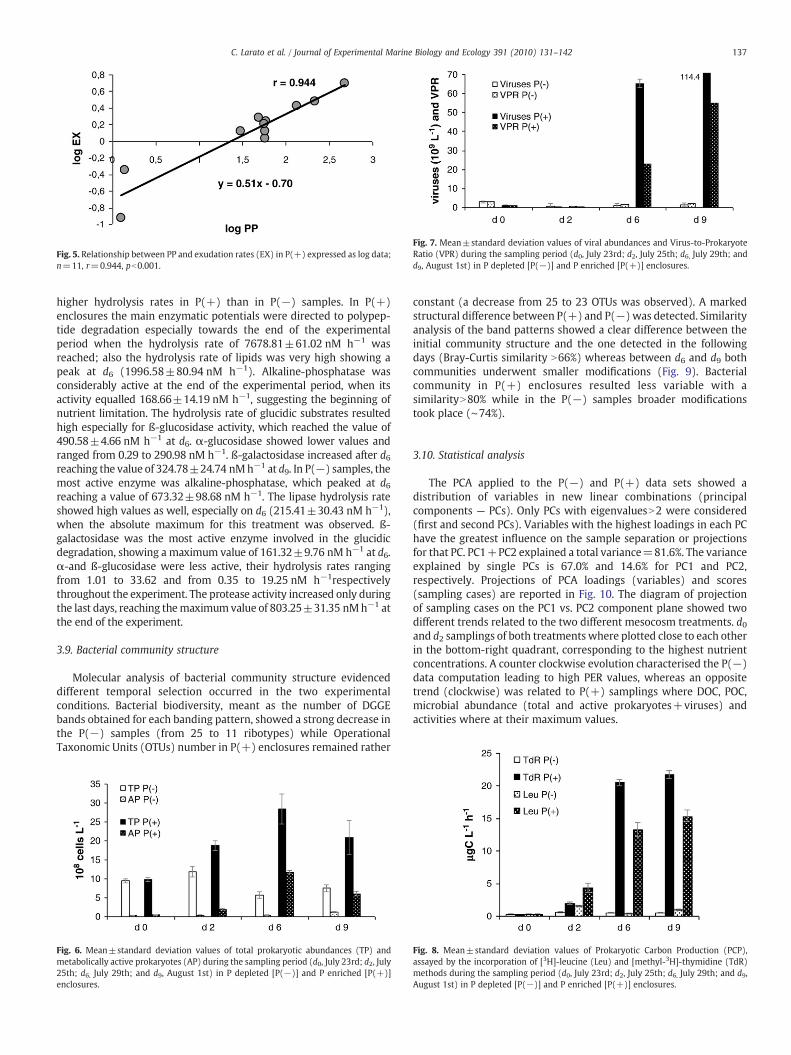
Fig. 5. Relationship between PP and exudation rates (EX) in P(+) expressed as log data;n=11, r=0.944, pb0.001.
Fig. 7. Mean±standard deviation values of viral abundances and Virus-to-ProkaryoteRatio (VPR) during the sampling period (d0, July 23rd; d2, July 25th; d6, July 29th; andd9, August 1st) in P depleted [P(−)] and P enriched [P(+)] enclosures.
137C. Larato et al. / Journal of Experimental Marine Biology and Ecology 391 (2010) 131–142
higher hydrolysis rates in P(+) than in P(−) samples. In P(+)enclosures the main enzymatic potentials were directed to polypep-tide degradation especially towards the end of the experimentalperiod when the hydrolysis rate of 7678.81±61.02 nM h−1 wasreached; also the hydrolysis rate of lipids was very high showing apeak at d6 (1996.58±80.94 nM h−1). Alkaline-phosphatase wasconsiderably active at the end of the experimental period, when itsactivity equalled 168.66±14.19 nM h−1, suggesting the beginning ofnutrient limitation. The hydrolysis rate of glucidic substrates resultedhigh especially for ß-glucosidase activity, which reached the value of490.58±4.66 nM h−1 at d6. α-glucosidase showed lower values andranged from 0.29 to 290.98 nM h−1. ß-galactosidase increased after d6reaching the value of 324.78±24.74 nMh−1 at d9. In P(−) samples, themost active enzyme was alkaline-phosphatase, which peaked at d6reaching a value of 673.32±98.68 nM h−1. The lipase hydrolysis rateshowed high values as well, especially on d6 (215.41±30.43 nM h−1),when the absolute maximum for this treatment was observed. ß-galactosidase was the most active enzyme involved in the glucidicdegradation, showing a maximum value of 161.32±9.76 nM h−1 at d6.α-and ß-glucosidase were less active, their hydrolysis rates rangingfrom 1.01 to 33.62 and from 0.35 to 19.25 nM h−1respectivelythroughout the experiment. The protease activity increased only duringthe last days, reaching themaximumvalue of 803.25±31.35 nMh−1 atthe end of the experiment.
3.9. Bacterial community structure
Molecular analysis of bacterial community structure evidenceddifferent temporal selection occurred in the two experimentalconditions. Bacterial biodiversity, meant as the number of DGGEbands obtained for each banding pattern, showed a strong decrease inthe P(−) samples (from 25 to 11 ribotypes) while OperationalTaxonomic Units (OTUs) number in P(+) enclosures remained rather
Fig. 6. Mean±standard deviation values of total prokaryotic abundances (TP) andmetabolically active prokaryotes (AP) during the sampling period (d0, July 23rd; d2, July25th; d6, July 29th; and d9, August 1st) in P depleted [P(−)] and P enriched [P(+)]enclosures.
constant (a decrease from 25 to 23 OTUs was observed). A markedstructural difference between P(+) and P(−) was detected. Similarityanalysis of the band patterns showed a clear difference between theinitial community structure and the one detected in the followingdays (Bray-Curtis similarity N66%) whereas between d6 and d9 bothcommunities underwent smaller modifications (Fig. 9). Bacterialcommunity in P(+) enclosures resulted less variable with asimilarityN80% while in the P(−) samples broader modificationstook place (∼74%).
3.10. Statistical analysis
The PCA applied to the P(−) and P(+) data sets showed adistribution of variables in new linear combinations (principalcomponents — PCs). Only PCs with eigenvaluesN2 were considered(first and second PCs). Variables with the highest loadings in each PChave the greatest influence on the sample separation or projectionsfor that PC. PC1+PC2 explained a total variance=81.6%. The varianceexplained by single PCs is 67.0% and 14.6% for PC1 and PC2,respectively. Projections of PCA loadings (variables) and scores(sampling cases) are reported in Fig. 10. The diagram of projectionof sampling cases on the PC1 vs. PC2 component plane showed twodifferent trends related to the two different mesocosm treatments. d0and d2 samplings of both treatments where plotted close to each otherin the bottom-right quadrant, corresponding to the highest nutrientconcentrations. A counter clockwise evolution characterised the P(−)data computation leading to high PER values, whereas an oppositetrend (clockwise) was related to P(+) samplings where DOC, POC,microbial abundance (total and active prokaryotes+viruses) andactivities where at their maximum values.
Fig. 8. Mean±standard deviation values of Prokaryotic Carbon Production (PCP),assayed by the incorporation of [3H]-leucine (Leu) and [methyl-3H]-thymidine (TdR)methods during the sampling period (d0, July 23rd; d2, July 25th; d6, July 29th; and d9,August 1st) in P depleted [P(−)] and P enriched [P(+)] enclosures.
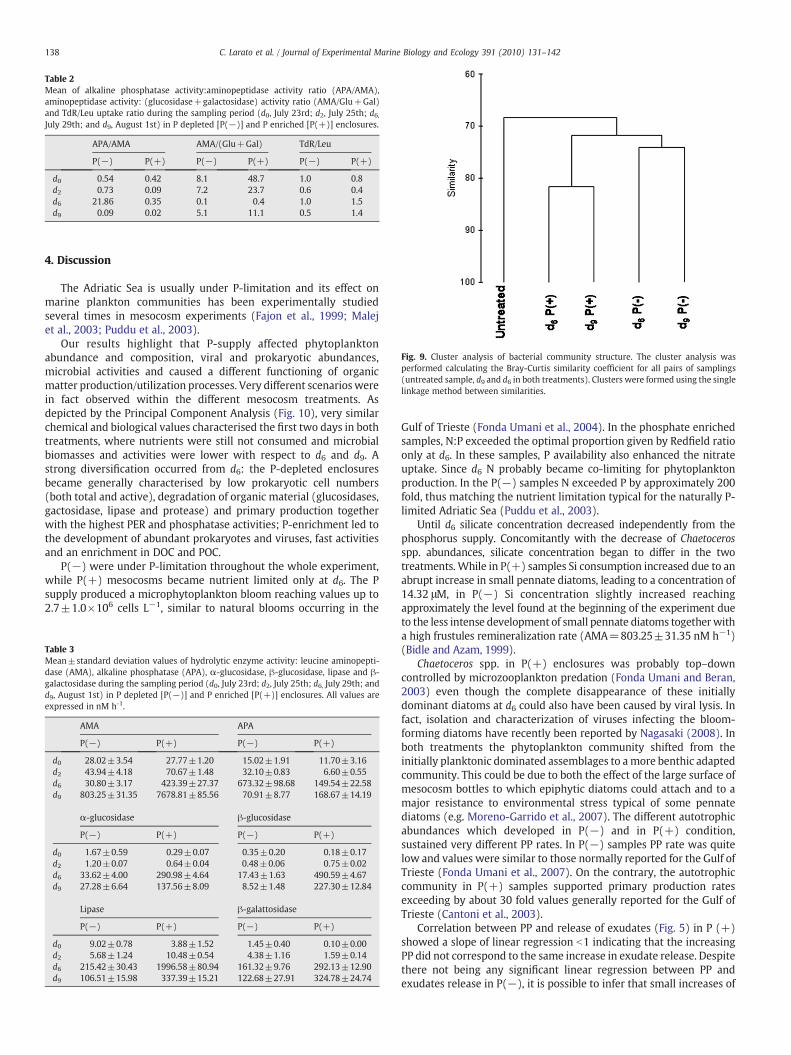
Table 2Mean of alkaline phosphatase activity:aminopeptidase activity ratio (APA/AMA),aminopeptidase activity: (glucosidase+galactosidase) activity ratio (AMA/Glu+Gal)and TdR/Leu uptake ratio during the sampling period (d0, July 23rd; d2, July 25th; d6,July 29th; and d9, August 1st) in P depleted [P(−)] and P enriched [P(+)] enclosures.
APA/AMA AMA/(Glu+Gal) TdR/Leu
P(−) P(+) P(−) P(+) P(−) P(+)
d0 0.54 0.42 8.1 48.7 1.0 0.8d2 0.73 0.09 7.2 23.7 0.6 0.4d6 21.86 0.35 0.1 0.4 1.0 1.5d9 0.09 0.02 5.1 11.1 0.5 1.4
Fig. 9. Cluster analysis of bacterial community structure. The cluster analysis wasperformed calculating the Bray-Curtis similarity coefficient for all pairs of samplings(untreated sample, d9 and d6 in both treatments). Clusters were formed using the singlelinkage method between similarities.
138 C. Larato et al. / Journal of Experimental Marine Biology and Ecology 391 (2010) 131–142
4. Discussion
The Adriatic Sea is usually under P-limitation and its effect onmarine plankton communities has been experimentally studiedseveral times in mesocosm experiments (Fajon et al., 1999; Malejet al., 2003; Puddu et al., 2003).
Our results highlight that P-supply affected phytoplanktonabundance and composition, viral and prokaryotic abundances,microbial activities and caused a different functioning of organicmatter production/utilization processes. Very different scenarioswerein fact observed within the different mesocosm treatments. Asdepicted by the Principal Component Analysis (Fig. 10), very similarchemical and biological values characterised the first two days in bothtreatments, where nutrients were still not consumed and microbialbiomasses and activities were lower with respect to d6 and d9. Astrong diversification occurred from d6: the P-depleted enclosuresbecame generally characterised by low prokaryotic cell numbers(both total and active), degradation of organic material (glucosidases,gactosidase, lipase and protease) and primary production togetherwith the highest PER and phosphatase activities; P-enrichment led tothe development of abundant prokaryotes and viruses, fast activitiesand an enrichment in DOC and POC.
P(−) were under P-limitation throughout the whole experiment,while P(+) mesocosms became nutrient limited only at d6. The Psupply produced a microphytoplankton bloom reaching values up to2.7±1.0×10⁶ cells L−1, similar to natural blooms occurring in the
Table 3Mean±standard deviation values of hydrolytic enzyme activity: leucine aminopepti-dase (AMA), alkaline phosphatase (APA), α-glucosidase, β-glucosidase, lipase and β-galactosidase during the sampling period (d0, July 23rd; d2, July 25th; d6, July 29th; andd9, August 1st) in P depleted [P(−)] and P enriched [P(+)] enclosures. All values areexpressed in nM h-1.
AMA APA
P(−) P(+) P(−) P(+)
d0 28.02±3.54 27.77±1.20 15.02±1.91 11.70±3.16d2 43.94±4.18 70.67±1.48 32.10±0.83 6.60±0.55d6 30.80±3.17 423.39±27.37 673.32±98.68 149.54±22.58d9 803.25±31.35 7678.81±85.56 70.91±8.77 168.67±14.19
α-glucosidase β-glucosidase
P(−) P(+) P(−) P(+)
d0 1.67±0.59 0.29±0.07 0.35±0.20 0.18±0.17d2 1.20±0.07 0.64±0.04 0.48±0.06 0.75±0.02d6 33.62±4.00 290.98±4.64 17.43±1.63 490.59±4.67d9 27.28±6.64 137.56±8.09 8.52±1.48 227.30±12.84
Lipase β-galattosidase
P(−) P(+) P(−) P(+)
d0 9.02±0.78 3.88±1.52 1.45±0.40 0.10±0.00d2 5.68±1.24 10.48±0.54 4.38±1.16 1.59±0.14d6 215.42±30.43 1996.58±80.94 161.32±9.76 292.13±12.90d9 106.51±15.98 337.39±15.21 122.68±27.91 324.78±24.74
Gulf of Trieste (Fonda Umani et al., 2004). In the phosphate enrichedsamples, N:P exceeded the optimal proportion given by Redfield ratioonly at d6. In these samples, P availability also enhanced the nitrateuptake. Since d6 N probably became co-limiting for phytoplanktonproduction. In the P(−) samples N exceeded P by approximately 200fold, thus matching the nutrient limitation typical for the naturally P-limited Adriatic Sea (Puddu et al., 2003).
Until d6 silicate concentration decreased independently from thephosphorus supply. Concomitantly with the decrease of Chaetocerosspp. abundances, silicate concentration began to differ in the twotreatments. While in P(+) samples Si consumption increased due to anabrupt increase in small pennate diatoms, leading to a concentration of14.32 μM, in P(−) Si concentration slightly increased reachingapproximately the level found at the beginning of the experiment dueto the less intense development of small pennate diatoms togetherwitha high frustules remineralization rate (AMA=803.25±31.35 nM h−1)(Bidle and Azam, 1999).
Chaetoceros spp. in P(+) enclosures was probably top–downcontrolled by microzooplankton predation (Fonda Umani and Beran,2003) even though the complete disappearance of these initiallydominant diatoms at d6 could also have been caused by viral lysis. Infact, isolation and characterization of viruses infecting the bloom-forming diatoms have recently been reported by Nagasaki (2008). Inboth treatments the phytoplankton community shifted from theinitially planktonic dominated assemblages to amore benthic adaptedcommunity. This could be due to both the effect of the large surface ofmesocosm bottles to which epiphytic diatoms could attach and to amajor resistance to environmental stress typical of some pennatediatoms (e.g. Moreno-Garrido et al., 2007). The different autotrophicabundances which developed in P(−) and in P(+) condition,sustained very different PP rates. In P(−) samples PP rate was quitelow and values were similar to those normally reported for the Gulf ofTrieste (Fonda Umani et al., 2007). On the contrary, the autotrophiccommunity in P(+) samples supported primary production ratesexceeding by about 30 fold values generally reported for the Gulf ofTrieste (Cantoni et al., 2003).
Correlation between PP and release of exudates (Fig. 5) in P (+)showed a slope of linear regression b1 indicating that the increasingPP did not correspond to the same increase in exudate release. Despitethere not being any significant linear regression between PP andexudates release in P(−), it is possible to infer that small increases of
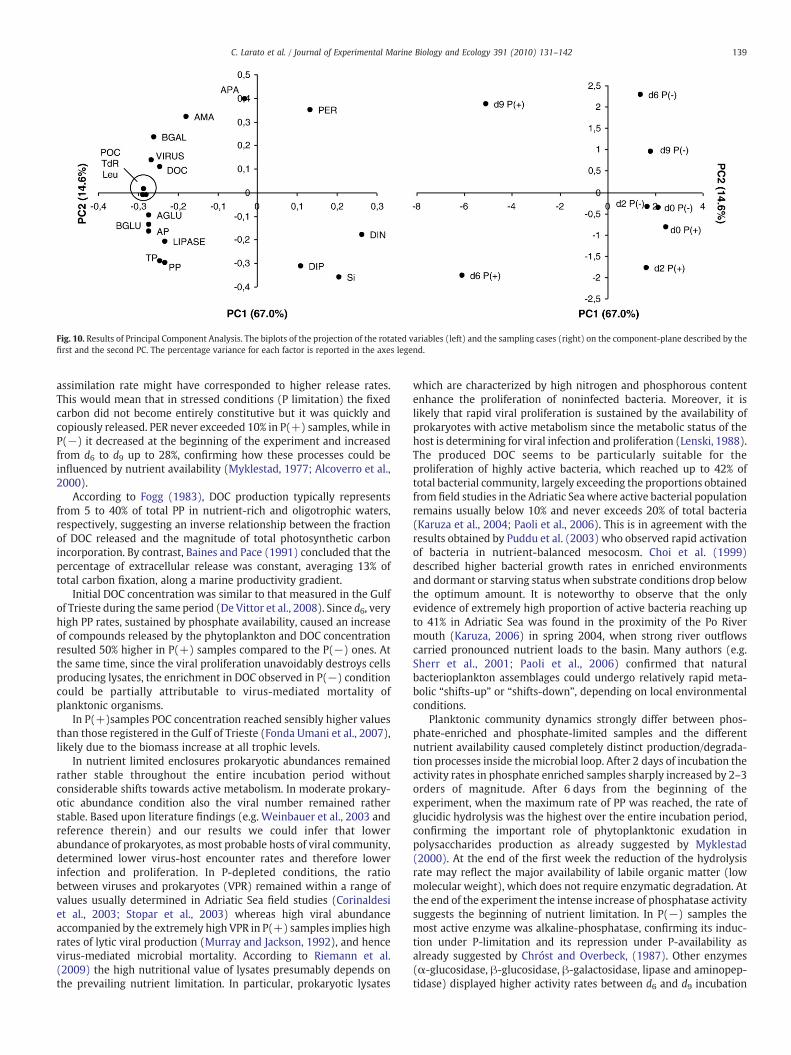
Fig. 10. Results of Principal Component Analysis. The biplots of the projection of the rotated variables (left) and the sampling cases (right) on the component-plane described by thefirst and the second PC. The percentage variance for each factor is reported in the axes legend.
139C. Larato et al. / Journal of Experimental Marine Biology and Ecology 391 (2010) 131–142
assimilation rate might have corresponded to higher release rates.This would mean that in stressed conditions (P limitation) the fixedcarbon did not become entirely constitutive but it was quickly andcopiously released. PER never exceeded 10% in P(+) samples, while inP(−) it decreased at the beginning of the experiment and increasedfrom d6 to d9 up to 28%, confirming how these processes could beinfluenced by nutrient availability (Myklestad, 1977; Alcoverro et al.,2000).
According to Fogg (1983), DOC production typically representsfrom 5 to 40% of total PP in nutrient-rich and oligotrophic waters,respectively, suggesting an inverse relationship between the fractionof DOC released and the magnitude of total photosynthetic carbonincorporation. By contrast, Baines and Pace (1991) concluded that thepercentage of extracellular release was constant, averaging 13% oftotal carbon fixation, along a marine productivity gradient.
Initial DOC concentration was similar to that measured in the Gulfof Trieste during the same period (De Vittor et al., 2008). Since d6, veryhigh PP rates, sustained by phosphate availability, caused an increaseof compounds released by the phytoplankton and DOC concentrationresulted 50% higher in P(+) samples compared to the P(−) ones. Atthe same time, since the viral proliferation unavoidably destroys cellsproducing lysates, the enrichment in DOC observed in P(−) conditioncould be partially attributable to virus-mediated mortality ofplanktonic organisms.
In P(+)samples POC concentration reached sensibly higher valuesthan those registered in the Gulf of Trieste (Fonda Umani et al., 2007),likely due to the biomass increase at all trophic levels.
In nutrient limited enclosures prokaryotic abundances remainedrather stable throughout the entire incubation period withoutconsiderable shifts towards active metabolism. In moderate prokary-otic abundance condition also the viral number remained ratherstable. Based upon literature findings (e.g. Weinbauer et al., 2003 andreference therein) and our results we could infer that lowerabundance of prokaryotes, as most probable hosts of viral community,determined lower virus-host encounter rates and therefore lowerinfection and proliferation. In P-depleted conditions, the ratiobetween viruses and prokaryotes (VPR) remained within a range ofvalues usually determined in Adriatic Sea field studies (Corinaldesiet al., 2003; Stopar et al., 2003) whereas high viral abundanceaccompanied by the extremely high VPR in P(+) samples implies highrates of lytic viral production (Murray and Jackson, 1992), and hencevirus-mediated microbial mortality. According to Riemann et al.(2009) the high nutritional value of lysates presumably depends onthe prevailing nutrient limitation. In particular, prokaryotic lysates
which are characterized by high nitrogen and phosphorous contentenhance the proliferation of noninfected bacteria. Moreover, it islikely that rapid viral proliferation is sustained by the availability ofprokaryotes with active metabolism since the metabolic status of thehost is determining for viral infection and proliferation (Lenski, 1988).The produced DOC seems to be particularly suitable for theproliferation of highly active bacteria, which reached up to 42% oftotal bacterial community, largely exceeding the proportions obtainedfrom field studies in the Adriatic Sea where active bacterial populationremains usually below 10% and never exceeds 20% of total bacteria(Karuza et al., 2004; Paoli et al., 2006). This is in agreement with theresults obtained by Puddu et al. (2003) who observed rapid activationof bacteria in nutrient-balanced mesocosm. Choi et al. (1999)described higher bacterial growth rates in enriched environmentsand dormant or starving status when substrate conditions drop belowthe optimum amount. It is noteworthy to observe that the onlyevidence of extremely high proportion of active bacteria reaching upto 41% in Adriatic Sea was found in the proximity of the Po Rivermouth (Karuza, 2006) in spring 2004, when strong river outflowscarried pronounced nutrient loads to the basin. Many authors (e.g.Sherr et al., 2001; Paoli et al., 2006) confirmed that naturalbacterioplankton assemblages could undergo relatively rapid meta-bolic “shifts-up” or “shifts-down”, depending on local environmentalconditions.
Planktonic community dynamics strongly differ between phos-phate-enriched and phosphate-limited samples and the differentnutrient availability caused completely distinct production/degrada-tion processes inside themicrobial loop. After 2 days of incubation theactivity rates in phosphate enriched samples sharply increased by 2–3orders of magnitude. After 6 days from the beginning of theexperiment, when the maximum rate of PP was reached, the rate ofglucidic hydrolysis was the highest over the entire incubation period,confirming the important role of phytoplanktonic exudation inpolysaccharides production as already suggested by Myklestad(2000). At the end of the first week the reduction of the hydrolysisrate may reflect the major availability of labile organic matter (lowmolecular weight), which does not require enzymatic degradation. Atthe end of the experiment the intense increase of phosphatase activitysuggests the beginning of nutrient limitation. In P(−) samples themost active enzyme was alkaline-phosphatase, confirming its induc-tion under P-limitation and its repression under P-availability asalready suggested by Chróst and Overbeck, (1987). Other enzymes(α-glucosidase, β-glucosidase, β-galactosidase, lipase and aminopep-tidase) displayed higher activity rates between d6 and d9 incubation
140 C. Larato et al. / Journal of Experimental Marine Biology and Ecology 391 (2010) 131–142
period, butwithmuchmoremoderate intensity than in P(+) samples.Probably, prokaryotes were unable to efficiently utilize extracellularproducts released from phosphate-limited phytoplankton as reportedby Obernosterer and Herndl, (1995), since their metabolism wasaffected by the same P-limitation (Thingstad et al., 1998).
It is interesting to observe high proteasic activity in bothtreatments, which particularly increased during the last days,indicating the beginning of N limitation. In P(−) samples APA:AMA,proposed as a proxy of P deficiency in microbial assemblages (Sala etal., 2001), was extremely high at d6 confirming a P-limited condition(Table 2). In both treatments aminopeptidase activity:glucosidase andgalactosidase activities ratio (AMA:Glu+Gal) was N1 for most of thetime, evidencing a preferential decomposition of polypeptides (sourceof both organic C and N) rather than polysaccharides as alreadyobserved by several authors (e.g. Grossart and Plug, 2001). At thesame time the glucidic activities seem to be rapidly limited by the lackof nutrients as observed by Fajon et al. (1999). According to thishypothesis, when all nutrients are totally consumed, the phytoplank-ton and prokaryotic communities enter into a stationary phase and anincrease in proteasic activity occurs.
Our results showed an increase in prokaryotic carbon production(either in terms of replication and biomass up to 20 and 40 foldsrespectively) in P(+) samples compared to the controls. Previousinvestigations highlighted that P supply can directly enhance PCP(Toolan et al., 1991) being a constitutive element of key moleculesnecessary for life (nucleic acids, lipids, etc.). The nutrient-dependentstimulation of substrate uptake can also be phytoplankton mediated, asP enhances organic carbon synthesis, and thus potentially availablesubstrate for prokaryotes (e.g. Puddu et al., 2003). Furthermore,radiotracer uptake was significantly correlated to the number of activeprokaryotes (TdR: ρ=0.79, pb0.05; Leu: ρ=0.86, p=0.01; n=8),confirming the relationship between nutrient-enhanced metabolicrates (CTC stained cells) and substrate consumption, as previouslyobserved at the sampling site (Paoli et al., 2006). In our P(+) enclosures,PCP was mostly directed towards cell replication processes rather thanbiomass production as emerged from the TdR/Leu ratio that after d6resulted N1 and considerably exceeded initial ratios. In P(−) samplesprotein biosynthesis exceeded or equalled replication processes con-firming that P-limitation strongly influences bacterial growth efficiencyeven more than the phytoplanktonic one (Obernosterer and Herndl1995; Thingstad et al., 1998), being structurally characterized by higherproportion of nucleic acid versus proteic biomass.
Puddu et al. (2003) showed that bacterial specific growth rates andcarbon demand were significantly lower in the presence of exudatesfrom algae grown in P-depleted conditions and our results confirmthese data. Prokaryotic Carbon Demand (PCD) was calculated,according to del Giorgio and Cole (1998), using a 30% prokaryoticgrowth efficiency (PGE) representative for the northern Adriatic SeaSea (Del Negro et al., 2005). Particularly high PP rate, in P(+) samples,was balanced by the prokaryotic carbon demand, as evidenced byPrimary Production/ Prokaryotic Carbon Demand ratio (PP/PCD)equal to 1 at the end of the experimental period, thus highlighting acoupling between organic matter production and utilization process-es. In P(−) samples, on the contrary, bacteria utilized the producedorganic matter less efficiently, as evidenced by the PP/PCD ratio,which resulted N1 during the entire experiment.
Different P availability also affected the bacterial communitystructure by selecting two different bacterial assemblages whichsustained different processes in the enclosures as already reported byPuddu et al. (2003). As shown by the cluster analysis, the DGGE bandpatterns in the P(−) samples substantially changed, suggesting thatour incubation condition had an effect on bacterial communitycomposition, either directly or indirectly, via the incubation effecton the organic matter production. According to the multivariateanalysis in Fig. 10, d6 and d9 in the two treatments were characterisedby very different scenarios both on a chemical and on a biological
aspect. It is likely that in the P(+) enclosures a bacterial assemblageadapted to eutrophic conditions developed, whereas in P-limitedconditions more meso- or oligo-trophic taxa have prevailed (acomprehensive review on the ecology of different bacterial taxa isprovided by Fuhrman and Hagström, 2008). It has been demonstratedthat there is a tight link between typical phytoplankton andbacterioplankton communities (Pinhassi et al., 2004), as can be seenalso by the similar distribution of the bacterial and the phytoplanktoncommunities dendrograms. This is thought to happen because algalcommunities made up of peculiar taxa can produce diverse kinds oforganic compounds (both in terms of constitutive carbon andexudates) affecting the total DOM pool in the medium (Shäfer et al.,2002). It is also known that loss factors due to predation areresponsible for selectivity in the temporal evolution of bacterialassemblages (e.g. Weinbauer et al., 2003); this top-down control isexerted both by protists (not analyzed here) and viruses. In fact,beside the direct effect on phyto- and bacterioplankton development,the major inorganic nutrient availability in P(+) have enhanced alsoviral production (inferred by viral abundance) as already speculatedby different authors (e.g. Wilson et al., 1996; Williamson et al., 2002;Riemann et al., 2009). Viruses are clearly but indirectly influenced bynutrient limitation by controlling directly their resources, i.e. theirhosts (Weinbauer et al., 2003); viruses can only respond to changes inhost organisms induced by environmental differences, as virusesthemselves cannot take up or process chemical changes (Sandaa et al.,2009). It is also possible that viral lysis played a role in redistributionof nutrients, thus shifting the competitive equilibrium for growth-limiting nutrients between phytoplankton and bacteria (Brussaard etal., 2008). Based on the evidence provided by Sandaa et al. (2009)whofound pronounced change in the structure of bacterial communityconcomitantly to important variations in viral community relative tothe control as a consequence of P supply, it is likely that viralproduction contributed to the change of bacterial diversity (side-incontrol). Viral proliferation could have affected bacterial communitystructure (Bouvier and del Giorgio, 2007) by selectively killing themost dominant taxa, which are probably the most active members ofthe community (Wommack and Colwell, 2000).
5. Conclusions
The results obtained from the nutrient enriched enclosureshighlighted the potential of microbial food web in high productivitysystems: the phytoplankton community was particularly productiveenhancing the development of the prokaryotic population, especiallyof its active fraction. Glucidic enzymes operated at high hydrolysisrates in order to recycle extracellular carbohydrates produced by therich phytoplankton community. Intense prokaryotic productiondirected prevalently to replication rather than to biomass productionincreased the density of cells on levels that particularly favoured virusproliferation, acting thus as feedback control on bacterial population.
Conversely to high N:P ratios observed throughout the year in thenorthern Adriatic Sea, our study simulated the phosphorus-balancedcondition and pointed out how P-limitation affects the entiremicrobial plankton community, reducing the trophic status of theenvironment through the control of phytoplankton production. P-limitation condition confirmed its profound effect on organic mattercomposition and prokaryotic activities.
The study of P-limitation effects on the microbial food webevidenced that nutrient limitation notably affected the proliferation ofsingle compartments of plankton community (phytoplankton, bacte-ria and viruses) changing the balance of their interactions.
Acknowledgements
This study was carried out under the auspices of the INTERREG 3Italy — Slovenia project funded by EU and regional administrations.
141C. Larato et al. / Journal of Experimental Marine Biology and Ecology 391 (2010) 131–142
The authors would like to thank A. Acquavita, B. Cataletto, T. Cibic, E.Crevatin, D. Fornasaro and A. Paoli for their helpful contribution. Weare also indebted to C. A. Nelson and H. A. Russell for languagerevision. The constructive comments of an anonymous reviewer andthe editor S. Shumway on earlier versions of the manuscript helped toimprove the paper. [SS]
References
Alcoverro, T., Conte, E., Gazzella, L., 2000. Production of mucillage by the Adriaticepipelic diatom Cylindrotheca closterium: effects of nutrient condition. J. Phycol. 36,1087–1095.
Amon, R.M.W., Benner, R., 1996. Bacterial utilization of different size classes ofdissolved organic matter. Limnol. Oceanogr. 41 (1), 41–51.
Baines, S.B., Pace, M.L., 1991. The production of dissolved organic matter byphytoplankton and its importance to bacteria: patterns across marine andfreshwater systems. Limnol. Oceanogr. 36, 1078–1090.
Bequevort, S., Bouvier, T., Lancelot, C., Cauvet, G., Deliat, G., Egorov, V.N., Popovichev, V.N.,2002. The seasonal modulation of organic matter utilization by bacteria in theDanube–Black Sea mixing zone. Estuar. Coast. Shelf Sci. 54, 337–354.
Bidle, K.D., Azam, F., 1999. Accelerated dissolution of diatom silica by marine bacterialassemblages. Nature 397, 508–512.
Boström, K.H., Simu, K., Hagström, Å., Riemann, L., 2004. Optimization of DNAextraction for quantitative marine bacterioplankton community analysis. Limnol.Oceanogr. Methods 2, 365–373.
Bouvier, T., Del Giorgio, P.A., 2007. Key role of selective viral-induced mortality indetermining marine bacterial community composition. Environ. Microbiol. 9,287–297.
Brussaard, C.P.D., Wilhelm, S.W., Thingstad, F., Weinbauer, M.G., Bratbak, G., Heldal, M.,Kimmance, S.A., Middelboe, M., Nagasaki, K., Paul, J.H., Schroeder, D.C., Suttle, C.A.,Vaqué, D., Wommack, K.E., 2008. Global-scale processes with a nanoscale drive: therole of marine viruses. ISME J. 2, 575–578.
Cantoni, C., Cozzi, S., Pecchiar, I., Cabrini, M., Mozetič, P., Catalano, G., Fonda Umani, S.,2003. Short-term variability of primary production and inorganic nitrogen uptakerelated to the environmental conditions in a shallow coastal area (Gulf of Trieste, NAdriatic Sea). Oceanol. Acta 26, 565–575.
Cauwet, G., 1994. HTCO method for dissolved organic carbon analysis in influence ofcatalyst on blank estimation. Mar. Chem. 47, 55–64.
Celussi, M., Paoli, A., Bernardi Aubry, F., Bastianini, M., Del Negro, P., 2008. Diel microbialvariations at a coastal Northern Adriatic station affected by Po River outflows.Estuar. Coast. Shelf Sci. 76 (1), 36–44.
Choi, J.W., Sherr, E.B., Sherr, B.F., 1996. Relation between presence absence of a visiblenucleoid and metabolic activity in bacterioplankton cells. Limnol. Oceanogr. 41,1161–1168.
Choi, J.W., Sherr, B.F., Sherr, E.B., 1999. Dead or alive? A large fraction of ETS- 385 inactivemarine bacterioplankton cells, as assessed by reduction of CTC, can become ETS-active with incubation and substrate addition. Aquat. Microb. Ecol. 18, 105–115.
Chróst, R.J., Overbeck, J., 1987. Kinetics of alkaline phosphatase activity and phosphorusavailability for phytoplankton and bacterioplankton in the lake Plußsee (northGermany eutrophic lake). Microb. Ecol. 13, 229–248.
Cole, J.J., Findlay, S., Pace, M.L., 1988. Bacterial production in fresh and seawaterecosystem: a cross-system overview. Mar. Ecol. Prog. Ser. 43, 1–10.
Corinaldesi, C., Crevatin, E., Del Negro, P., Marini, M., Russo, A., Fonda Umani, S.,Danovaro, R., 2003. Large-scale spatial distribution of virioplankton in the Adriaticsea: testing the trophic state control hypothesis. Appl. Environ. Microbiol. 69,2664–2673.
De Vittor, C., Paoli, A., Fonda Umani, S., 2008. Dissolved organic carbon variability in ashallow coastal marine system (Gulf of Trieste, northern Adriatic Sea). Estuar.Coast. Shelf Sci. 78, 280–290.
del Giorgio, P., Cole, J., 1998. Bacteril growth efficiency in natural acquatic system. Annu.Rev. Ecol. Syst. 29, 503–541.
Del Negro, P., Crevatin, E., Larato, C., Ferrari, C.R., Totti, C., Pompei, M., Giani, M., Berto,D., Fonda Umani, S., 2005. Mucilage microcosms. Sci. Total Environ. 353, 258–269.
Ducklow, H.W., Carlson, C.A., 1992. Oceanic bacterial production. Adv. Microb. Ecol. 12,113–181.
Fajon, C., Cauwet, G., Lebaron, P., Terzic, S., Ahel, M., Malej, A., Mozetič, P., Turk, V., 1999.The accumulation and release of polysaccharides by planktonic cells and thesubsequent bacterial response during a controlled experiment. FEMS Microbiol.Ecol. 29, 351–363.
Falconi, C.F., 2009. Complex water column nutrient dynamics in the Gulf of Trieste;freshwater nutrient discharge vs biologically mediated cycling of dissolved organicmatter. Ph. D. Thesis, Università degli Studi di Trieste, Italy, unpublished.
Fogg, G.E., 1983. The ecological significance of extracellular products of phytoplanktonphotosynthesis. Bot. Mar. 26, 3–14.
Fonda Umani, S., Beran, A., 2003. Seasonal variations in the dynamics of microbialplankton communities: first estimates from experiments in the Gulf of Trieste,Northern Adriatic Sea. Mar. Ecol. Prog. Ser. 247, 1–16.
Fonda Umani, S., Beran, A., Parlato, S., Virgilio, D., Zollet, T., de Olazabal, A., Lazzarini, B.,Cabrini, M., 2004. Noctiluca scintillans MACARTNEY in the Northern Adriatic Sea:long-term dynamics, relationship with temperature and eutrophication, and role inthe food web. J. Plankton Res. 26, 545–561.
Fonda Umani, S., Del Negro, P., Larato, C., De Vittor, C., Cabrini, M., Celio, M., Falconi, C.,Tamberlich, F., Azam, F., 2007. Major inter-annual variations in microbial dynamics
in the Gulf of Trieste (Northern Adriatic Sea) and their ecosystem implications.Aquat. Microb. Ecol. 46, 163–175.
Fuhrman, J.A., Azam, F., 1982. Thymidine incorporation as a measure of heterotrophicbacterioplankton production in marine surface waters: evaluation and field results.Mar. Biol. 66, 109–120.
Fuhrman, J.A., Hagström, Å., 2008. Bacterial and Archaeal community structure and itspatterns, In: Kirchman, D.L. (Ed.), Microbial Ecology of the Oceans, Second Edition.Inc, John Wiley and sons, pp. 45–90.
Gargas, E., 1975. A manual for phytoplankton primary production studies in the Baltic.In: Gargas, E. (Ed.), The Baltic marine biologist. Danish Water Quality Institute,Hørsholm, pp. 1–18.
Grossart, H.-P., Ploug, H., 2001. Microbial degradation of organic carbon and nitrogen ondiatom aggregates. Limnol. Oceanogr. 38, 532–546.
Hoppe, H.G., 1993. Use of fluorogenicmodel substrates for extracellular enzyme activity(EEA)measurement of bacteria. In: Kemp, P.F., Sherr, B.F., Sherr, E.B., Cole, J.J. (Eds.),Current methods in aquatic microbial ecology. Boca Raton, CRC Press, pp. 423–431.
Hoppe,H.G., Gocke, K., Koppe,R., Begler, C., 2002. Bacterial growthandprimary productionalong a north–south transect of the Atlantic Ocean. Nature 416, 168–171.
Huber, F., Peduzzi, P., 2004. Online tool for analysis of denaturing gradient gelelectrophoresis profiles. Appl. Environ. Microbiol. 70, 4390–4392.
Karuza, A., 2006. Biogeochemical cycle of organic matter in coastal marineenvironment: the role of viruses in controlling bacterial proliferation. Ph. D. Thesis,Università degli Studi di Trieste, Italy, unpublished.
Karuza, A., Del Negro, P., Paoli, A., Comisso, S., Fonda Umani, S., 2004. Highly activebacteria in the surface waters of Gulf of Trieste (Northern Adriatic Sea). Rapp.Comm. Int. Mer Médit. 37, 277.
Koroleff, F., Grasshof, K., 1983. Determination of nutrients. In: Grasshof, K., Erhardt,M., Kremling, K. (Eds.), Methods of Seawater Analyses. Verlag Chemie,Weinheim,pp. 125–188.
Kuparinen, J., Heinänen, A., 1993. Inorganic nutrient and carbon controlled bacter-ioplankton growth in the Baltic Sea. Estuar. Coast. Shelf Sci. 37, 271–285.
Lee, S., Fuhrman, J.A., 1987. Relationship between biovolume and biomass of naturallydelivered marine bacterioplankton. Appl. Environ. Microbiol. 53, 1298–1303.
Lenski, R.E., 1988. Dynamics of interactions between bacteria and virulent bacterio-phage. Adv. Microb. Ecol. 10, 1–44.
Malej, A., Mozetič, P., Turk, V., Terzič, S., Ahel, M., Cauwet, G., 2003. Changes inparticulate and dissolved organic matter in nutrient-enriched enclosures from anarea influenced by mucilage: the northern Adriatic Sea. J. Plankton Res. 25,949–966.
Maranon, E., Cermeño, P., Fernández, E., Rodriguez, J., Zabala, L., 2004. Significance andmechanisms of photosynthetic production of dissolved organic carbon in a coastaleutrophic ecosysem. Limnol. Oceanogr. 49 (5), 1652–1666.
Middelboe, M., Jorgensen, N.O.G., Kroer, N., 1996. Effects of viruses on nutrient turnoverand growth efficiency of noninfected marine bacterioplankton. Appl. Environ.Microbiol. 62, 1991–1997.
Middelboe, M., Riemann, L., Steward, G.F., Hansen, V., Nybroe, O., 2003. Virus-inducedtransfer of organic matter between marine bacteria in a model community. Aquat.Microb. Ecol. 33, 1–10.
Moreno-Garrido, I., Lubián, L.M., Jiménez, B., Soares, A.M.V.M., Blasco, J., 2007. Estuarinesediment toxicity tests on diatoms: sensitivity comparison for three species. Estuar.Coast. Shelf Sci. 71, 278–286.
Moriarty, D.J.W., Bell, R.T., 1993. Bacterial growth and starvation in aquatic environ-ments. In: Kjelleberg, S. (Ed.), Starvation in bacteria. Plenum Press, New York, N.Y.,pp. 25–53.
Murray, A.G., Jackson, G.A., 1992. Viral dynamics: a model of the effects size, shape,motion and abundance of single-celled planktonic organisms and other particles.Mar. Ecol. Prog. Ser. 89, 103–116.
Myklestad, S.M., 1977. Production of carbohydrates by marine planktonic diatoms. II.Influence of the N/P ratio in the growth medium on the assimilation ratios, growthrate and production of cellular and extracellular carbohydrates by Chaetocerosaffinis var. Willei (Gran.) Hustedt and Skeletonema costatum (Grev.) Cleve. J. Exp.Mar. Biol. Ecol. 29, 161–179.
Myklestad, S.M., 2000. Dissolved organic carbon from phytoplankton. In: Hutzinger,O. (Ed.), The Handbook of Environmental Chemistry. : (D) Marine Chemistry, 5.Springer-Verlag, Berlin Heidelberg, pp. 111–138.
Nagasaki, K., 2008. Dinoflagellates, diatoms, and their viruses. J. Microbiol. 46, 235–243.Nieuwenhuize, J., Maas, E.M., Middelburg, J.J., 1994. Rapid analysis of organic carbon
and nitrogen in particulate materials. Mar. Chem. 45, 217–224.Noble, R.T., Fuhrman, J.A., 1998. Use of SYBER Green I for rapid epifluorescence counts of
marine viruses and bacteria. Aquat. Microb. Ecol. 14, 113–118.Obernosterer, I., Herndl, G., 1995. Phytoplankton extracellular release and bacterial
growth: dependence on the inorganic N:P ratio. Mar. Ecol. Prog. Ser. 116, 247–257.Paoli, A., Del Negro, P., Fonda Umani, S., 2006. Daily variations of highly active bacteria
in Northern Adriatic Sea. Journal of Plankton Research 28, 325–335.Pinhassi, J., Sala, M.M., Havskum, H., Peter, F., Guadayol, O., Malits, A., Marrasé, C., 2004.
Changes in bacterioplankton composition under different phytoplankton regimens.Appl. Environ. Microbiol. 70, 6753–6766.
Porter, K.G., Feig, Y.S., 1980. The use of DAPI for identifying and counting acquaticmicroflora. Limnol. Oceanogr. 25, 943–948.
Puddu,A., Zoppini, A., Fazi, S., Rosati,M., Amalfitano, S.,Magaletti,M., 2003. Bacterial uptakeofDOM released from P-limited phytoplankton. FEMS Microbiol. Ecol. 46, 257–268.
Riemann, B., Bjørnsen, P.K., 1987. Calculation of bacterioplankton production frommeasurements of 3H-thymidine incorporation. Limnol. Oceanogr. 32, 471–476.
Riemann, L., Holmfeldt, K., Titleman, J., 2009. Importance of viral lysis and dissolvedDNA for bacterioplankton activity in a P-limited estuary, northern Baltic Sea.Microb. Ecol. 57, 286–294.
142 C. Larato et al. / Journal of Experimental Marine Biology and Ecology 391 (2010) 131–142
Sala, M.M., Karner, M., Arin, L., Marrasé, C., 2001. Measurement of ectoenzyme activitiesas an indication of inorganic nutrient imbalance in microbial communities. Aquat.Microb. Ecol. 23, 301–311.
Sandaa, R.A., Gómez-Consarnau, L., Pinhassi, J., Riemann, L., Malits, A., Weinbauer, M.G.,Gasol, J.M., Thingstad, T.F., 2009. Viral control of bacterial biodiversity-evidence fromanutrient-enrichedmarinemesocosm experiment. Environ. Microbiol. 11, 2585–2597.
Shäfer, H., Abbas, B., Witte, H., Muyzer, G., 2002. Genetic diversity of “satellite” bacteriapresent in cultures of marine diatoms. FEMS Microbiol. Ecol. 42, 25–35.
Sherr, E.B., Sherr, B.F., Cowles, T.J., 2001. Mesoscale variability in bacterial activity in theNortheast Pacific Ocean off Oregon. USA. Aquat. Microb. Ecol. 25, 21–30.
Simon, M., Azam, F., 1989. Protein content and protein synthesis rates of planktonicmarine bacteria. Mar. Ecol. Prog. Ser. 51, 201–213.
Smith, D.C., Azam, F., 1992. A simple, economical method for measuring bacterial proteinsynthesis rates in seawater using H3 leucine.Mar. Microb. FoodWebs 6 (2), 107–114.
Søndergaard, M., Borch, N.H., Riemann, B., 2000. Dynamics of biodegradable DOCproduced by freshwater plankton communities. Aquat. Microb. Ecol. 10, 69–85.
Steeman Nielsen, E., 1952. The use of radioactive 14C for measuring organic productionin the sea. J. Cons. Int. Explor. Mer 18, 117–140.
Stopar, D., Cerne, A., Zigman, M., Poljsak-Prijatelj, M., Turk, V., 2003. Viral abundanceand a high proportion of lysogens suggest that viruses are important members ofthe microbial community in the Gulf of Trieste. Microb. Ecol. 46, 249–256.
Teira, E., Pazò, M.J., Serret, P., Fernández, E., 2001. Dissolved organic carbon production bymicrobial populations in the Atlantic Ocean. Limnol. Oceanogr. 46 (6), 1370–1377.
Teira, E., Pazò, M.J., Quevedo, M., Fueintes, M.V., Niell, F.X., Fernández, E., 2003. Rates ofdissolved organic carbon production and bacterial activity in the eastern NorthAtlantic Subtropical Gyre during summer. Mar. Ecol. Prog. Ser. 249, 53–67.
Thingstad, T.F., Hagström, Å., Rassoulzadegan, F., 1997. Accumulation of degradableDOC in surface waters: is it caused by a malfunctioning microbial loop? Limnol.Oceanogr. 42, 398–404.
Thingstad, T.F., Zweifel, U.L., Rassoulzadegan, F., 1998. P limitation of heterotrophicbacteria and phytoplankton in the Northwest Mediterranean. Limnol. Oceanogr. 43(1), 88–94.
Toolan, T., Wehr, J.D., Findlay, S., 1991. Inorganic phosphorus stimulation ofbacterioplankton production in a meso-eutrophic lake. Appl. Environ. Microbiol.57, 2074–2078.
Utermöhl, H., 1958. Zur Vervolkommnung der quantitativen Phytoplankn-Methodik.Mitt. Int. Ver. Theor. Angew. Limnol. 9, 1–38.
Weinbauer, M.G., Christaki, U., Nedoma, J., Šimek, K., 2003. Comparing the effects ofresource enrichment and grazing on viral production in a meso-eutrophicreservoir. Aquat. Microb. Ecol. 31, 137–144.
Wetz, M.S., Wheeler, P., 2007. Release of dissolved organic matter by coastal diatoms.Limnol. Oceanogr. 52 (2), 798–807.
Williams, P.J.leB., 2000. Heterotrophic bacteria and dynamics of dissolved organicmaterial. In: Kirchman, D.L. (Ed.), Microbial ecology of the oceans. Wiley-Liss, NewYork, pp. 153–200.
Williamson, S.J., Houchin, L.A., McDaniel, L., Paul, J.H., 2002. Seasonal variation inlysogeny as depicted by prophage induction in Tampa Bay. Florida. Appl. Environ.Microbiol. 68, 4307–4314.
Wilson,W.H., Carr, N.G., Mann, N.H., 1996. The effect of phosphate status on the kineticsof cyanophage infection in the oceanic cyanobactenum Synechococcus sp. WH7803.J. Phycol. 32, 506–516.
Wommack, K.E., Colwell, R.R., 2000. Virioplankton: viruses in aquatic ecosystems.Microb. Mol. Biol. Rev. 64, 69–114.
Zweifel, U.L., Wikner, J., Hagström, Å., Lundberg, E., Norrman, B., 1995. Dynamics ofdissolved organic carbon in a costal ecosystem. Limnol. Oceanogr. 40, 299–305.
Related Documents