Welcome message from author
This document is posted to help you gain knowledge. Please leave a comment to let me know what you think about it! Share it to your friends and learn new things together.
Transcript

Product Review Summarization: A Multi-Method Combination Approach with Empirical Evaluation
Project Study
Benjamin Tumele
Student ID No.: (Nagaoka) 15905583 | (Darmstadt) 1731857
Major: (Nagaoka) Information and Management Systems Engineering |
(Darmstadt) M.Sc. Wirtschaftsinformatik

Declaration of Authorship
I hereby declare that the thesis submitted is my own unaided work. All direct or indirect
sources used are acknowledged as references.
This paper was not previously presented to another examination board and has not been
published.
Nagaoka (Japan), March 3, 2016

Table of Contents I
Table of Contents
List of Figures ........................................................................................................................ III
List of Tables .......................................................................................................................... V
List of Abbreviations ............................................................................................................. VII
1 Introduction ................................................................................................................... 1
2 Theory and Related Works .............................................................................................. 2
2.1 Definition and Characteristics of Product Reviews .................................................... 2
2.2 Product Feature Extraction ...................................................................................... 3
2.3 Sentiment Analysis................................................................................................... 5
2.4 Summarization ........................................................................................................ 7
3 Research Approach ......................................................................................................... 9
4 Proposed Method .......................................................................................................... 10
4.1 Preprocessing ......................................................................................................... 10
4.2 Feature Extraction ................................................................................................. 13
4.2.1 Wang et al. (2013) .......................................................................................... 13
4.2.2 Scaffidi et al. (2007) and Ramkumar et al. (2010) .......................................... 14
4.2.3 Author’s Approach ........................................................................................... 14
4.3 Sentiment Analysis................................................................................................. 18
4.3.1 Hu and Liu (2004a) ........................................................................................ 18
4.3.2 Zhang et al. (2012) ......................................................................................... 19
4.3.3 Najmi et al. (2015).......................................................................................... 19
4.3.4 Bafna and Toshniwal (2013) ........................................................................... 20
4.3.5 Wei et al. (2010) ............................................................................................. 21
4.3.6 Author’s Approach ........................................................................................... 21
4.4 Summarization ...................................................................................................... 26
4.4.1 Hu and Liu (2004a) ........................................................................................ 26
4.4.2 Bafna and Toshniwal (2013) ........................................................................... 27
4.4.3 Dave et al. (2003) ........................................................................................... 27
4.4.4 Wang et al. (2013) .......................................................................................... 28
4.4.5 Author’s Approach ........................................................................................... 28
5 Evaluation .................................................................................................................... 33
5.1 Feature Extraction ................................................................................................. 33
5.1.1 Evaluation Process .......................................................................................... 33
5.1.2 Results ............................................................................................................ 35
5.2 Survey ................................................................................................................... 40
5.2.1 Advantages and disadvantages of doing an online survey ................................ 40
5.2.2 Question Design and Pretest ............................................................................ 41
5.2.3 Survey Description .......................................................................................... 43
5.2.4 Survey Results ................................................................................................. 46
6 Conclusion .................................................................................................................... 74
Appendix - Survey .................................................................................................................. V
Survey General Part ............................................................................................................ V

Table of Contents II
Survey Feature Extraction Part (Movie) ........................................................................... VIII
Survey Feature Extraction Part (Smartphone) ................................................................... XII
Survey Summary Layout Part (Movie) ............................................................................. XVI
Survey Summary Layout Part (Smartphone) ................................................................... XXII
Survey Sentiment Analysis Part (Movie) ..................................................................... XXVIII
Survey Sentiment Analysis Part (Smartphone) .............................................................XXXVI
Survey Final Part ........................................................................................................... XLVI
References ....................................................................................................................... XLVIII
List of Figures III
List of Figures
Figure 1: Product Review Summarization Process .................................................................. 2
Figure 2: F1-Measure Product A ........................................................................................... 36
Figure 3: F1-Measure Product B ........................................................................................... 37
Figure 4: F1-Measure Product C ........................................................................................... 37
Figure 5: F1-Measure Product D ........................................................................................... 38
Figure 6: F1-Measure Product E ........................................................................................... 38
Figure 7: F1-Measure Product F ............................................................................................ 39
Figure 8: Survey Results - Gender ......................................................................................... 47
Figure 9: Survey Results - Age .............................................................................................. 47
Figure 10: Survey Results - Employment .............................................................................. 48
Figure 11: Survey Results - Avg. Number of Reviews Read ................................................... 49
Figure 12: Survey Results - Feeling When Reading Product Reviews ..................................... 49
Figure 13: Survey Results - Wish for Product Review Summaries.......................................... 50
Figure 14: Survey Results - Product Category Sample Size ................................................... 51
Figure 15: Survey Results - Product Knowledge .................................................................... 51
Figure 16: Survey Results - Extraction Method -Total- .......................................................... 52
Figure 17: Survey Results - Extraction Method -Movie vs. Smartphone- ................................ 53
Figure 18: Survey Results - Extraction Method -Product Knowledge- .................................... 53
Figure 19: Survey Results - Quality of Feature Extraction -Total- .......................................... 54
Figure 20: Survey Results - Quality of Feature Extraction -Movie vs. Smartphone- ................ 54
Figure 21: Survey Results - Quality of Feature Extraction -Product Knowledge- .................... 55
Figure 22: Survey Results - Quality of Feature Names -Total- ............................................... 56
Figure 23: Survey Results - Quality of Feature Names -Movie vs. Smartphone- ..................... 57
Figure 24: Survey Results - Quality of Feature Names -Product Knowledge- ......................... 58
Figure 25: Survey Results - SA Configuration Rating ............................................................ 59
Figure 26: Survey Results - SA Mean Rating -Total- .............................................................. 60
Figure 27: Survey Results - SA Mean Rating -Movie vs. Smartphone- ................................... 64
Figure 28: Survey Results - List vs. Table Layout -Total- ....................................................... 67
List of Figures IV
Figure 29: Survey Results - List vs. Table Layout -Female vs. Male- ...................................... 68
Figure 30: Survey Results - Review Count ............................................................................ 68
Figure 31: Survey Results - Sentiment Analysis Score ........................................................... 69
Figure 32: Survey Results - Features per Summary -Total- .................................................... 70
Figure 33: Survey Results - Features per Summary -Movie vs. Smartphone- ......................... 70
Figure 34: Survey Results - Sentences per Feature and Polarity -Total- ................................. 71
Figure 35: Survey Results - Sentences per Feature and Polarity -Movie vs. Smartphone- ....... 72
Figure 36: Survey Results - Buying Decision -Total- .............................................................. 73
Figure 37: Survey Results - Buying Decision -Movie vs. Smartphone-.................................... 74
List of Tables V
List of Tables
Table 1: Hu, Liu (2004a) Summary Layout ........................................................................... 26
Table 2: Dave et al. (2003) Summary Layout ....................................................................... 27
Table 3: Wang et al. (2013) Summary Layout ...................................................................... 28
Table 4: Variant "List" Summary Layout ............................................................................... 32
Table 5: Variant "Table" Summary Layout ............................................................................ 32
Table 6: Feature Extraction Recall Comparison .................................................................... 35
Table 7: F1-Measure Comparision ........................................................................................ 46
Table 8: t-Test - Feeling When Reading Product Reviews ...................................................... 50
Table 9: t-Test - Wish for Product Review Summaries ........................................................... 51
Table 10: t-Test - Quality of Feature Extraction -Movie vs. Smartphone- ............................... 55
Table 11: t-Test - Quality of Feature Extraction -Product Knowledge- ................................... 56
Table 12: t-Test - Quality of Feature Names -Movie vs. Smartphone- .................................... 57
Table 13: t-Test - Quality of Feature Names -Product Knowledge- ........................................ 58
Table 14: ANOVA Test – Mean SA rating comparison (all configurations) -Total- ................. 60
Table 15: ANOVA Test – Mean SA rating comparison (real configurations) -Total- ............... 61
Table 16: t-Test - SA Rating (Random vs. Base) -Total- ........................................................ 61
Table 17: t-Test - SA Rating (Random vs. Verb) -Total- ........................................................ 61
Table 18: t-Test - SA Rating (Random vs. Aspect) -Total- ..................................................... 62
Table 19: t-Test - SA Rating (Base vs. Verb) -Total- .............................................................. 62
Table 20: t-Test - SA Rating (Base vs. Aspect) -Total- ........................................................... 63
Table 21: ANOVA Test – Mean SA rating comparison (all configurations) -Movie- ................ 64
Table 22: ANOVA Test – Mean SA rating comparison (all configurations) -Smartphone- ...... 65
Table 23: t-Test - SA Rating (Random vs. Base) -Movie- ....................................................... 65
Table 24: t-Test - SA Rating (Random vs. Verb) -Movie- ....................................................... 65
Table 25: t-Test - SA Rating (Random vs. Aspect) -Movie- .................................................... 66
Table 26: t-Test - SA Rating (Random vs. Base) -Smartphone- .............................................. 66
Table 27: t-Test - SA Rating (Random vs. Verb) -Smartphone-.............................................. 66
Table 28: t-Test - SA Rating (Random vs. Aspect) -Smartphone- ........................................... 67

List of Tables VI
Table 29: t-Test - Feature per Summary -Movie vs. Smartphone- .......................................... 71
Table 30: t-Test - Sentences per Feature and Polarity - Movie vs. Smartphone. ..................... 72
Table 31: t-Test - Buying Decision ........................................................................................ 74

List of Abbreviations VII
List of Abbreviations
ANOVA Analysis of variance
GAAC Group Average Agglomerative Clustering
NLP Natural Language Processing
NLTK Python Natural Language Toolkit
POS Part of speech
SVM Support vector machine
TF-IDF Term Frequency – Inverse Document Frequency
TF-ISF Term Frequency – Inverse Sentence Frequency
1. Introduction 1
1 Introduction
Studies have shown that product reviews have a significant influence on the purchase
decisions of customers.1 With Web 2.0 the amount of reviews is increasing day by day,
resulting in information overload if one attempts to read them all.2 A customer is therefore in
a situation where he is not able to read all reviews about a product and instead focuses on a
small amount of reviews, leading to a biased und possibly suboptimal purchase decision.3
The market has recognized this problem and more and more shops are using recommender
systems4 in order to help their customers make a decision. The problem with this is that the
customers do not know how these systems work which results in trust issues.5 Therefore a
different system is needed that helps customers with their need to process the information in
product reviews. For this reason, this paper will present a method to automatically summarize
reviews of a given product. Customers read reviews to find unique information about products
and reduce the risk of their buying decision.6 Summarizing the reviews can thus help the
customers make better decisions.
Apart from the practical need for this kind of technology, this problem is also interesting from
a research perspective as e.g. “product reviews are the key area that benefits from sentiment
analysis.”7
This work aims to develop an approach that is usable for any kind of product by combining
and modifying existing methods together with new ideas for every sub step of the product
review summarization process. The resulting methods are empirically evaluated through a
survey to show their applicability. In contrast to other papers, the survey also empirically
proves the customer benefit provided by review summaries in addition to the above
mentioned theoretical argumentation.
The rest of this work is organized as follows: Chapter 2 will explain the theory behind product
reviews and the product review summarization process as well as briefly showing related
works. The research approach is described in detail in chapter 3. For every sub step of the
summarization process, chapter 4 will describe the papers that this work is based on before
1 cf. Duric;Song (2012), p. 704.
2 cf. Baek et al. (2012), p. 99.
3 cf. Bafna;Toshniwal (2013), p. 143 and cf. Hu;Liu (2004a), p. 168.
4 See Lu et al. (2015) for a survey about recommender systems.
5 cf. Bafna;Toshniwal (2013), p. 143.
6 cf. Burton;Khammash (2010), p. 238f.
7 Kurian;Asokan (2015), p. 94.
2. Theory and Related Works 2
Preprocessing Feature
Extraction Sentiment
Analysis Summari-
zation
explaining the methods that are proposed in this work. The evaluation of these methods is
conducted in chapter 5. Chapter 6 summarizes the results and explains limitations as well as
opportunities for further research.
2 Theory and Related Works
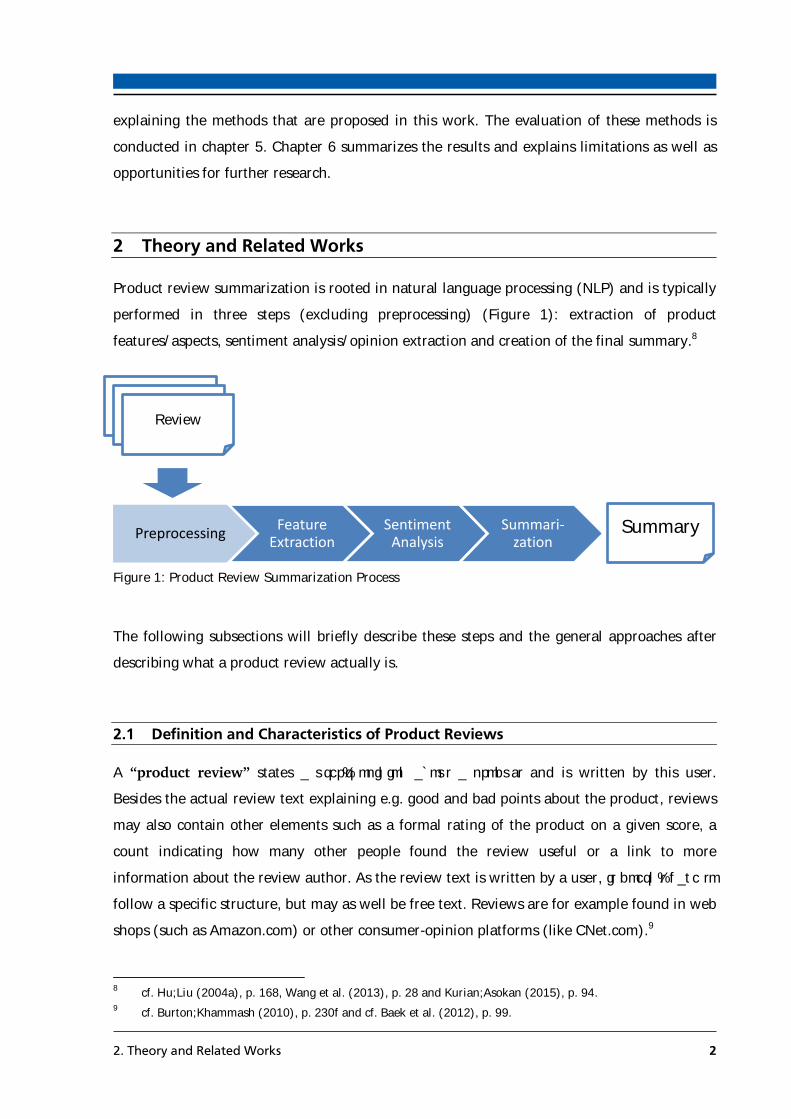
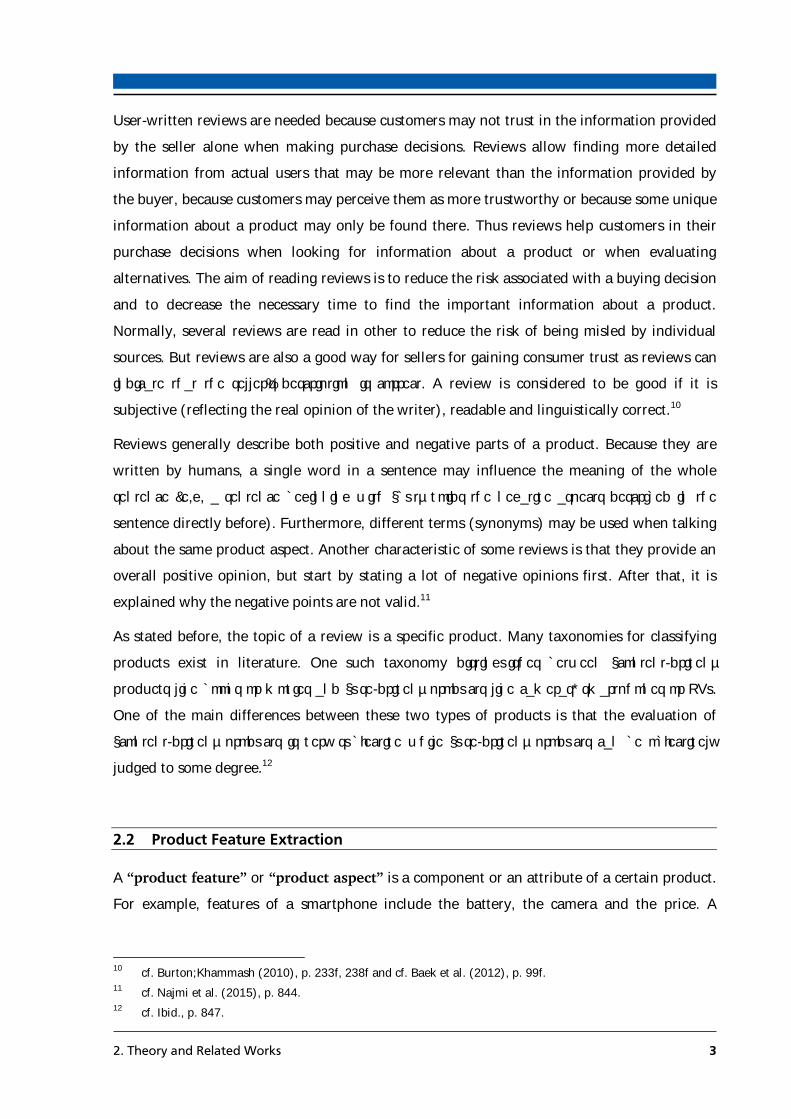
Product review summarization is rooted in natural language processing (NLP) and is typically
performed in three steps (excluding preprocessing) (Figure 1): extraction of product
features/aspects, sentiment analysis/opinion extraction and creation of the final summary.8
The following subsections will briefly describe these steps and the general approaches after
describing what a product review actually is.
2.1 Definition and Characteristics of Product Reviews
A “product review” states a user’s opinion about a product and is written by this user.
Besides the actual review text explaining e.g. good and bad points about the product, reviews
may also contain other elements such as a formal rating of the product on a given score, a
count indicating how many other people found the review useful or a link to more
information about the review author. As the review text is written by a user, it doesn’t have to
follow a specific structure, but may as well be free text. Reviews are for example found in web
shops (such as Amazon.com) or other consumer-opinion platforms (like CNet.com).9
8 cf. Hu;Liu (2004a), p. 168, Wang et al. (2013), p. 28 and Kurian;Asokan (2015), p. 94.
9 cf. Burton;Khammash (2010), p. 230f and cf. Baek et al. (2012), p. 99.
Review Review
Review
Summary
Figure 1: Product Review Summarization Process
2. Theory and Related Works 3
User-written reviews are needed because customers may not trust in the information provided
by the seller alone when making purchase decisions. Reviews allow finding more detailed
information from actual users that may be more relevant than the information provided by
the buyer, because customers may perceive them as more trustworthy or because some unique
information about a product may only be found there. Thus reviews help customers in their
purchase decisions when looking for information about a product or when evaluating
alternatives. The aim of reading reviews is to reduce the risk associated with a buying decision
and to decrease the necessary time to find the important information about a product.
Normally, several reviews are read in other to reduce the risk of being misled by individual
sources. But reviews are also a good way for sellers for gaining consumer trust as reviews can
indicate that the seller’s description is correct. A review is considered to be good if it is
subjective (reflecting the real opinion of the writer), readable and linguistically correct.10
Reviews generally describe both positive and negative parts of a product. Because they are
written by humans, a single word in a sentence may influence the meaning of the whole
sentence (e.g. a sentence beginning with “but” voids the negative aspects described in the
sentence directly before). Furthermore, different terms (synonyms) may be used when talking
about the same product aspect. Another characteristic of some reviews is that they provide an
overall positive opinion, but start by stating a lot of negative opinions first. After that, it is
explained why the negative points are not valid.11
As stated before, the topic of a review is a specific product. Many taxonomies for classifying
products exist in literature. One such taxonomy distinguishes between “content-driven”
products like books or movies and “use-driven” products like cameras, smartphones or TVs.
One of the main differences between these two types of products is that the evaluation of
“content-driven” products is very subjective while “use-driven” products can be objectively
judged to some degree.12
2.2 Product Feature Extraction
A “product feature” or “product aspect” is a component or an attribute of a certain product.
For example, features of a smartphone include the battery, the camera and the price. A
10
cf. Burton;Khammash (2010), p. 233f, 238f and cf. Baek et al. (2012), p. 99f. 11
cf. Najmi et al. (2015), p. 844. 12
cf. Ibid., p. 847.

2. Theory and Related Works 4
product may have a lot of features, some being more important for customers when making a
buying decision than others.13
“Product Feature Extraction” is the process of extracting the product features from review
texts. It is therefore a form of information extraction that aims to extract specific information
(the product features) from text documents (the product reviews).14
There are two broad classes of feature extraction approaches: supervised and unsupervised
methods. The difference between those two is that supervised methods need labeled training
data. The training reviews are used to train a machine-learning algorithm to become able to
extract product features from new reviews. Although supervised methods can be reasonably
effective, the result greatly depends on the quality of the training data, but labeling training
data is highly time-consuming. Moreover, because of the necessity of training data, supervised
methods are often domain-dependent. Unsupervised methods on the other hand rely on
heuristics and rules without the need for additional training data and are therefore more
flexible.15
Past studies have shown that product features are generally nouns or noun phrases found in
the review bodies. Because of this, a lot of approaches use part-of-speech tagging (apart from
other preprocessing like stop word removal, stemming and tokenization16) in order to extract
the nouns and noun phrases.17
One of the most cited unsupervised approach was developed by Hu and Liu (2004) and
further enhanced by Wei et al. (2010) and Bafna and Toshniwal (2013):18 First, association
mining is used in order to find frequently occurring nouns or noun phrases. Second, this
initial item list is then pruned in order to remove items that are likely meaningless
(compactness pruning; based on the distance between nouns) and lexically subsumed by
others (redundancy pruning). Third, infrequent features are discovered by assigning the
nearest noun as the product feature to an adjective in a sentence without a frequent feature
(see section 2.3 for the rationale behind focusing on adjectives). Wei et al. (2010) enhanced
this approach using a manually crafted list of adjectives for a semantic analysis of the reviews
to further prune the feature list (features should appear together with adjectives). The 13
cf. Zha et al. (2014), p. 1211 and Zhang et al. (2012), p. 10283. 14
cf. Hotho et al. (2005), p. 5. 15
cf. Wei et al. (2010), p. 152f and Khan et al. (2013), p. 344 16
See section 4.1 for an explanation for these preprocessing steps. 17
cf. Zha et al. (2014), p. 1213, Wang et al. (2013), p. 28 and Hu;Liu (2004b), p. 756ff. 18
See the following papers for all details: Hu;Liu (2004a), Hu;Liu (2004b), Wei et al. (2010) and
Bafna;Toshniwal (2013).

2. Theory and Related Works 5
infrequent feature discovery is also improved by using a more sophisticated rule for the
assignment of adjective to noun. Bafna and Toshiwal (2013) on the other hand use a
probabilistic approach to improve the feature extraction with the assumption that nouns and
noun phrases corresponding to product features of a given domain have a higher probability
of occurrence in a document of the this domain than in a document of another domain.
Further approaches that are used as the basis for this work’s approach are described in section
4.2.
A great problem for feature extraction methods are implicit product features and irony.19 An
explicit product feature is a feature whose name (or synonym) appears directly in a sentence.
In contrast, implicit feature don’t appear directly in a sentence, but can be inferred from the
sentence’s meaning.20 Example:
Explicit feature “price”: The price is very low.
Implicit feature “price”: This product costs only 20 Dollars is therefore very cheap.
Both these sentences talk about the product price. In the first sentence, the feature name
“price” directly appears making “price” an explicit feature in this sentence whereas in the
second sentence “price” does not appear. Only the word “cheap” and the mentioning of the 20
Dollars make it clear that this sentence talks about the price, making “price” an implicit
feature in this case.21
This work does not specifically handle implicit product features, but as proven further below,
still manages to extract some of them. Irony is not considered in this work.
2.3 Sentiment Analysis
The problem of sentiment analysis (sometimes also called opinion mining, appraisal
extraction or attitude analysis) consists of detecting whether a given text represents a positive
or negative (or neutral) opinion.22 An “opinion” is a sentiment, view, attitude, emotion or
appraisal about an entity such as a product, a person or a topic or an aspect of that entity
from a user or a group of users.23 When analyzing the sentiment, “opinion words” that are
19
cf. Zhang et al. (2012), p. 10284 and Reyes;Rosso (2012) p, 754ff. 20
cf. Zhang et al. (2012), p. 10283f. 21
Note that the mentioning of the 20 Dollars is necessary to establish the context of “cheap” as the price in this
example. Otherwise “cheap” could also mean “bad quality”. 22
cf. Medhat et al. (2014), p. 1093f and Ravi;Ravi (2015, in press), p. 1. 23
cf. Serrano-Guerrero et al. (2015), p. 19.

2. Theory and Related Works 6
usually used to express an opinion are examined.24 Most approaches in literature focus on
adjective and adverbs as opinion words25, but generally verbs and nouns may also carry
sentiment.26
Sentiment analysis can be performed on three different levels of a document: (1) “Document-
level sentiment analysis” aims to classify a whole document as expressing a positive or
negative opinion. (2) “Sentence-level sentiment analysis” analyses each sentence of a
document individually regarding whether the sentence expresses a positive or negative
opinion. In order to do that, it has to be determined first, if the sentence is objective and
therefore expresses no opinion or if it is subjective. As sentences can be regarded as small
documents, there is no fundamental difference between document-level and sentence-level
sentiment analysis. (3) “Aspect-level sentiment analysis” aims at classifying sentiment with
respect to specific aspects or features of a document. For this, the features have to be
identified first. Sentiment analysis with respect to product features is an example for aspect-
level sentiment analysis.27
The two main approaches for this task are the “lexical/lexicon-based approach” and the
“machine learning approach”: In the lexicon-based approach a list of words with known
polarity is used. Difficulty arises from complex sentences that contain negation or “but”-
clauses. On the other hand, machine learning approaches use tagged training data together
with a series of feature vectors in order to infer a model that can then be used on new data.
Again, creating training data is greatly time-consuming, but by focusing on a single domain,
good results are achievable.28
One prominent lexicon used in lexicon-based approaches is SentiWordNet29. SentiWordNet is
built on top of WordNet30. WordNet is a network organizing English nouns, verbs and
adjectives into synonym sets, called “synsets”. Each synset represents one underlying lexical
concept. The synsets are linked by different relations like synonym/antonym-relationship,
making it possible to traverse the network.31 SentiWordNet is the result of automatic
24
cf. Medhat et al. (2014), p. 1095. 25
Examples: Hu;Liu (2004a), Hu;Liu (2004b), Wang et al. (2013), Baek et al. (2012), Bafna;Toshniwal (2013),
Kurian;Asokan (2015) ibid., Zimmermann et al. (2015, in press) 26
cf. Ravi;Ravi (2015, in press), p. 17, Duric;Song (2012), p. 705. 27
cf. Medhat et al. (2014), p. 1093f. 28
cf. Bhadane et al. (2015), p. 808f, Najmi et al. (2015), p. 848f and Zhang et al. (2012), p. 10284. 29
Baccianella et al. (2010) 30
Miller et al. (1990) 31
cf. Ibid., p. 235ff.
2. Theory and Related Works 7
annotation of every WordNet synsets according to their degree of “positivity”, “negativity” and
“neutrality” with respect to sentiment.32
Analogous to the feature extraction step, irony is also a very hard problem when doing
sentiment analysis. One problem is the lack of a formal definition for irony and sarcasm.33 As
said before, irony is not considered in this work.
Pang et al. (2002) use three different machine learning methods, Naïve Bayes, maximum
entropy classifier and support vector machines (SVMs), for sentiment classification. The result
of their experiment indicates that SVMs perform best and Naïve Bayes performs worst,
although the difference is not very large.34 Bhadane et al. (2015) use an SVM together with a
domain specific lexicon for sentiment analysis of product reviews of a single product
domain.35 Kurian and Asokan (2015) uses cross-domain sentiment analysis to classify the
sentiment of products from product domains without labeled data. This uses the sentiment
information of another product domain with labeled data to infer sentiment information of a
domain without labeled data. The accuracies are comparable to using SentiWordNet.36
The papers on whose ideas this work is based on are described in section 4.3. For a detailed
overview about sentiment analysis refer to Medhat et al. (2014) and Ravi and Ravi (2015, in
press).
2.4 Summarization
The purpose of summarization is to create a smaller version of a document that retains the
most important information of the source.37 “Automated text summarization aims at providing
a condensed representation of the content according to the information that the user wants to
get.38 But the problem with this is, that “it is still difficult to teach software to analyze
semantics and to interpret meaning”39.
32
cf. Baccianella et al. (2010), p. 2200ff. 33
cf. Serrano-Guerrero et al. (2015), p. 20. 34
cf. Pang et al. (2002), p. 81f, 84f. 35
cf. Bhadane et al. (2015), p. 811ff. 36
cf. Kurian;Asokan ibid., p. 96ff. 37
cf. Ramezani;Feizi-Derakhshi (2014), p. 178 and Babar;Patil (2015), p. 354 38
Kiyoumarsi (2015), p. 85. 39
Gupta;Lehal (2009), p. 62.

2. Theory and Related Works 8
There are two types of summaries: extractive and abstractive summaries. An “extractive
summary”, as the name implies, extracts sentences from the original text and concatenates
them to create the summary. In contrast, “abstractive summaries” create new sentences.
They therefore have to deeply understand the main concepts of the source text and they have
to be able to generate clear natural language sentences. With the difficulty of this task, it is
not surprising that most of the works in the area of summarization are following the
extractive approach.40 This is especially true for product review summarization as in this
problem field a summary has to be created from several source documents (multi-document
summarization).41
There are several possibilities in how to decide what sentences should be part of the summary
when creating extractive summaries: Machine learning approaches use reference summaries
and a number of textual features42 (e.g. sentence length or sentence position in a review) to
learn rules that lead to the creation of “good” summaries.43 Other approaches score sentences
using some metrics and select the sentences based on these metrics. E.g. Nishikawa et al.
(2010) assigns a readability and informativeness score to each sentence and solves an
optimization problem in order to select the sentences with the highest informativeness and
readability while subject to a maximum summary length.44 Other systems specifically aimed at
product review summarization use the result of the feature extraction and sentiment analysis
steps to select sentences.45
Existing systems in the domain of product reviews produce text reviews grouped by product
features46, but there also exist graphical summaries. For example, Kurian and Asokan (2015)
display the number of sentences that a product feature is mentioned positively and negatively.
The summarization approaches that this work is based on are described in section 4.4.
40
cf. Kurian;Asokan (2015), p. 94, Kiyoumarsi (2015), p. 84 and Babar;Patil (2015), p. 354f 41
cf. Wang et al. (2013), p. 28ff. 42
Note that this is different from product features. The textual features are derived from the structure of the
text, not its content. 43
cf. Kiyoumarsi (2015), p. 85ff. 44
cf. Nishikawa et al. (2010), p. 326ff. Note that informativeness and readability may be conflicting goals.
Because of this, the system in this paper assigns weights to these two factors. 45
Examples: cf. Hu;Liu (2004a), p. 174 and Dave et al. (2003), p. 526. 46
Examples: Wang et al. (2013), Hu;Liu (2004a), Dave et al. (2003)
3. Research Approach 9
3 Research Approach
The goal of this work is to create a universally usable system for product review
summarization. The general approach is to combine various existing techniques for the three
steps: feature extraction, sentiment analysis and summarization. In addition, some other
techniques that were not implemented in other papers are proposed. The system is
implemented in such a way that many different configurations are possible, creating the
possibility to find the configuration that results in the best summaries.
For this the feature extraction output is evaluated by manually tagging the features in reviews
from different products and calculating a score. Section 5.1 describes this in detail. In
addition, all steps are evaluated through an online survey. This survey and the results are
described in section 5.2. As the summaries are created for humans, the author believes that a
survey is necessary in order to evaluate the quality of the proposed approach.
To the best of the author’s knowledge no prior work tried to combine various techniques for
the three steps of product review summarization in the way this work does (although there
exist very few papers that use a different method as a subsequent tool). In addition,
evaluation through customer survey has also been neglected by the majority of papers.
Especially no paper was found that verified the need for review summaries not only
theoretically but explicitly asked users. The different configurations for the summarization
system in this work also far exceed other papers.
This work uses Amazon review data provided by Julian McAuley et al.47 consisting of 143.7
million reviews spanning the timeframe of May 1996 until July 2014. The dataset consists of
the reviews (including rating, reviewer, helpfulness) and metadata (price, related product
information) of 9.45 million products organized in 24 product categories. For evaluation,
example products were selected as described in chapter 5.
The following chapter explains the theoretical foundation and subsequent implementation of
this work’s proposed approach for all steps of the product review summarization process.
After that the evaluation of the proposed approach is described.
47
McAuley et al. (2015a), McAuley et al. (2015b). Also see: http://jmcauley.ucsd.edu/data/amazon/

4. Proposed Method 10
4 Proposed Method
This section will explain the data preprocessing and the implemented method for feature
extraction, sentiment analysis and summary creation.
The method is implemented with Anaconda48 for Python 3.4 v2.3.0. The included Python
Natural Language Toolkit (NLTK)49 is used for some of the text processing, especially the
preprocessing as mentioned in the next section.
Example summaries can be found as part of the survey in the appendix.50
4.1 Preprocessing
The following nine preprocessing steps are carried out and will in the following be further
explained:
1. Sentence Segmentation
2. Tokenization
3. Part of Speech Tagging
4. Case Folding
5. Fuzzy Matching of Nouns
6. Lemmatization and Stemming
7. Negation Tagging
8. Stopword Removal
9. Noun Phrase Tagging
“Sentence Segmentation” consists of separating a body of text into individual sentences. A
trained machine learning-based sentence tokenizer for English is included in the NLTK and
was subsequently used.51
48
https://www.continuum.io/why-anaconda 49
Bird et al. (2009) 50
Especially in the sections “Survey Sentiment Analysis Part (Movie)” and “Survey Sentiment Analysis Part
(Smartphone)” of the appendix. 51
Papers explicitly stating sentence segmentation as a preprocessing step are for example: Babar;Patil (2015),
p. 356, Kurian;Asokan ibid., p. 96, Duric;Song (2012), p. 709.
4. Proposed Method 11
“Tokenization” is the process of converting a string into a list of words (called tokens) based
on punctuation marks, whitespaces etc.52 Again NLTK’s included tokenizer was used for this
step. These first two steps are necessary as the subsequent steps require tokens or sentences
represented as a list of tokens as input.53
“Part of Speech (POS) Tagging”, also called grammatical tagging, determines the part of
speech (e. g. noun, verb, adjective) for each token based on the token itself and its context,
i.e. the relationship with other tokens in the sentence (like its position).54 The “Stanford Part
of Speech Tagger”55 was used to carry out the POS tagging as it was also used in many other
papers.56 The build-in NLTK-POS-tagger was also tested, but provided unsatisfactory results
based on manually checking of the POS-tags of sample data. 57 The model “english-
bidirectional-distsim” was used, as it provides slightly better accuracy than the recommended
model, even though it is a bit slower.58 In a practical scenario each review must only be POS-
tagged once and as the task can be executed in parallel, speed should not be a critical issue.59
“Case Folding” means converting all characters to the same letter case (lower case in this
work).60
“Fuzzy Matching” is used to deal with misspellings (“battery vs. batery") and word variants
(“auto-focus” vs. “autofocus”).61 A distance function between two strings is defined and two
strings are considered equal if their distance is lower than or equal to a given threshold. In
this paper the “Levenshtein distance” (sometimes just called “edit distance”) is used. The
distance of two strings is equal to the minimum number of single-character edits (insertions,
52
cf. Babar;Patil (2015), p. 356. 53
Tokenization was, for example, used in the following papers: ibid., p. 356, Kurian;Asokan ibid., p. 96, Najmi
et al. (2015), p. 847 54
cf. Bhadane et al. (2015), p. 809f, Hotho et al. (2005), p. 9 and Ravi;Ravi (2015, in press), p. 3. 55
Toutanova et al. (2003), Toutanova;Manning (2000), http://nlp.stanford.edu/software/tagger.shtml 56
cf. for example Bafna;Toshniwal (2013), p. 146 and Najmi et al. (2015), p. 847. 57
E.g. in the sentence „This is a powerful light smartphone.” “light” is identified as a noun by the NLTK-POS-
tagger while being correctly identified as an adjective by the Stanfort POS-tagger. With the missing comma
after “light” both taggers would produce the same result, but errors like missing commas are common in
product reviews. As the Stanford POS-tagger performed better for the tested example sentences, it was used
instead of the build-in NLTK-POS-tagger 58
cf. http://nlp.stanford.edu/software/pos-tagger-faq.shtml#h 59
The following papers included part of speech tagging in their preprocessing: Hu;Liu (2004b), p. 757,
Bhadane et al. (2015), p. 809f, Medhat et al. (2014), p. 1095, Wang et al. (2013), p. 29, Scaffidi et al.
(2007), p. 3, Dave et al. (2003), p. 521, Bafna;Toshniwal (2013), p. 146, Kurian;Asokan (2015) ibid., p. 96,
Najmi et al. (2015), p. 847, Zhang et al. (2012), p. 10285, Wei et al. (2010), p. 155. 60
cf. Gupta;Lehal (2009), p. 63. 61
cf. Hu;Liu (2004b), p. 757 and Bafna;Toshniwal (2013), p. 145.

4. Proposed Method 12
deletions, substitutions) necessary to transform one string into the other.62 Various threshold
values have been tested. The best results were achieved by setting a threshold of one and
regarding the transposition of adjacent characters as one edit (resulting in the so called
“Damerau–Levenshtein distance”63). Furthermore, only tokens with at least 3 characters are
considered. As the noun matching is especially important for feature extraction only nouns are
processed.64
“Stemming” reduces a word to its stem (a natural group of words with equal or very similar
meaning), stripping it of its prefixes and suffices (e. g. stripping “ing” from verbs). So
stemming emphasizes the semantics of a word. Stemming is normally implemented as a rule-
based algorithm. “Lemmatization” tries to map nouns to their singular form and verbs to
infinitive tense (that is also found in dictionaries), but for that the POS has to be known and
the process is slow and error-prone.65 This work uses the NLTK’s Snowball stemmer66 and
WordNet67 for lemmatization. But as stemming is preferred by most other papers, this work
also mainly uses stemming and only uses lemmatization when using SentiWordNet as
lemmatized words are a prerequisite to use SentiWordNet.68
Negation words like “not”, “isn’t” etc. change the sentimental direction of the words following
them (e. g. “good” vs “not good”). “Negation Tagging” is the process of tagging the words
whose sentimental direction is reversed by the negation word.69 Following the method
proposed by Fang and Chen (2011) this work tags every word between a negation word and
the first punctuation mark70 following the negation word.71
62
cf. Levenshtein (1966). 63
Damerau (1964). 64
See section 2.2 for the importance of nouns in feature extraction. 65
cf. Hotho et al. (2005), p. 7, Gupta;Lehal (2009), p. 63 and Ravi;Ravi (2015, in press), p. 3. 66
Snowball is considered superior to the well-known Porter stemmer according to NLTK (cf.
http://www.nltk.org/howto/stem.html). 67
Miller et al. (1990). „WordNet groups English words into sets of synonyms called synsets and provides short,
general definitions, and records the various semantic relations between these synonym sets.” (Bhadane et al.
(2015), p. 810). 68
Lemmatization is (within the considered literature) only used by Scaffidi et al. (2007), p. 3 and Wei et al.
(2010), p. 155. Stemming is for example in the following works: Hu;Liu (2004b), p. 757, Bhadane et al.
(2015), p. 809, Babar;Patil ibid., p. 356, Dave et al. (2003), p. 522, Najmi et al. (2015), p. 847, 69
cf. Pang et al. (2002) p. 83 and Bhadane et al. (2015), p. 810. 70
Used markers: “. : ; ! ?” With the addition of “;” they correspond to the list of Duric;Song (2012), S. 709. 71
See http://sentiment.christopherpotts.net/lingstruc.html#negation for implementation details including a
negation word overview. Other works with this approach: Pang et al. (2002), p. 83, Bhadane et al. (2015), p.
810.
4. Proposed Method 13
“Stopwords” are common words with no semantics that appear in all texts that provide little
to no information for the task to be solved. Examples are articles, conjunctions, prepositions,
pronouns. “Stopword Removal” is the process of removing these words from the text to be
analyzed in order to reduce the “noise”.72 In this paper the stopword list provided by NLTK is
used.73
“Noun phrases”74 are word sequences like “a reliable camera”. “Noun Phrase Tagging” (or
“Noun Phrase Chunking”) is the process of extracting the noun phrases of a text. In this work
noun phrases are defined as follows: one optional determiner (“all”, “any” etc.), followed by
an arbitrary amount of adjectives, followed by at least one noun.75
4.2 Feature Extraction
Before the description of the author’s actual implementation, the general feature extraction
ideas of the papers that this work is based on are briefly described.
4.2.1 Wang et al. (2013)
In this paper, noun and noun phrases are considered as potential features and subsequently
extracted from the reviews. For each of these terms the “term frequency-inverse sentence
frequency” (TF-ISF) is calculated. The 20 terms with the highest TF-ISF score are further
examined. If these selected terms have adjectives nearby, they are considered a product
feature.76 The top five features (with the highest TF-ISF score) are shown to the user.77
In other words, nouns and noun phrases near adjectives are ordered by TF-ISF score.
72
cf. Gupta;Lehal (2009), p. 63, Hotho et al. (2005), p. 7, Bhadane et al. (2015), p. 810 and Babar;Patil ibid.,
p. 356. 73
Other works using stopword removal are for example: Hu;Liu (2004b), p. 757, Wang et al. (2013), p. 29,
Bhadane et al. (2015), p. 810, Babar;Patil ibid., p. 356, Zhang et al. (2012), p. 10286. 74
Product features are often nouns or noun phrases (cf. section 2.2). 75
For implementation details refer to Bird et al. (2009), chapter 7.2 (also available online:
http://www.nltk.org/book/ch07.html) and https://stackoverflow.com/questions/7619109/nltk-chunking-
and-walking-the-results-tree (last accessed 30.11.2015 21:20).
Papers using noun phrase tagging are for example: Hu;Liu (2004a), p. 171, Wei et al. (2010), p. 154ff, Wang
et al. (2013), p. 29. 76
See section 2.3: Sentiment is typically carried by adjectives. Therefore terms without nearby adjectives are
not considered as no sentiment information can be found for them making them useless in a summary. 77
cf. Wang et al. (2013), p. 29. Note that the paper does not explain why they use only the top 20 candidates
and show only five features to the user.
4. Proposed Method 14
4.2.2 Scaffidi et al. (2007) and Ramkumar et al. (2010)
This approach is based on word occurrence probability and uses an external source with
statistics about how often terms appear in general English language texts. All single nouns
and noun bigrams78 are extracted from the review texts of one product category and their
number of occurrence nx is counted. Under the assumptions that the occurrence of a term in a
certain position in a text is independent of whether the term occurs in other positions and that
the occurrence is independent of the position, the probability that the term would appear nx
times in a random English text containing a series of N noun occurrences is calculated. The
Poisson distribution is used as an approximation to the binomial distribution to calculate the
probability. The bigram calculation is analogous as under the stated assumptions the
probability of the bigram is the product of the individual probabilities. The paper point out
that the assumptions don’t hold in reality, but the results will still be acceptable. All terms are
then ordered by probability.79
Ramkumar et al. (2010) extend this approach by clustering terms together. The clustering
approach uses lexical analysis like substring matching, bigrams sharing a word and fuzzy
matching80 for different spellings. WordNet is used to find synonyms in the given terms.
Furthermore a semantic similarity matching concept is used to cluster semantically similar
words like “power” and “battery”.81
In other words, noun and noun bigrams are clustered and then ordered by probability of
occurrence using external word occurrence statistics.
4.2.3 Author’s Approach
This section will explain the modifications to the above mentioned feature extraction methods
that are used in this work and one additional feature extraction idea. But first, the reason for
not using machine learning is explained.
78
A “noun bigram” consist of two successive nouns. 79
cf. Scaffidi et al. (2007), p. 3f. 80
See section 4.1. 81
cf. Ramkumar et al. (2010), p. 6864.
4. Proposed Method 15
4.2.3.1 Why a machine learning approach was not used
One assumption of the author is that while products belonging to the same product group
have a lot of common features, each product may also have individual features that are not
present in other products. One example that was observed is a mobile phone where the model
number, though not necessarily considered a “product feature”, has been mentioned in a lot
of reviews. This is thus information that is of interest for a customer. Therefore, only the
reviews of one product and not e.g. all reviews in a product category are used as the basis for
the feature extraction and subsequent steps in summary generation in this work. Under this
assumption and considering the difficulty of training a machine learning approach for this
task (due to lack of and cost of producing training data), machine learning approaches are
considered unsuitable for the goal of implementing a universally useable summarization
approach.
4.2.3.2 Implementation of Wang et al. (2013)
The approach of Wang et al. (2013) has been implemented with the following modifications:
Instead of using TF-ISF “term frequency – inverse document frequency” (TF-IDF) is used. One
review is one document in this scenario. After implementing TF-ISF a manual check of the
extracted features of three mobile phones and three kitchen utilities (that had been randomly
selected under the constraint that the review count is not too high) has been done. The ten
features with the highest score and six sentences per feature have been examined. As the
quality of this sample result was unsatisfying, TF-IDF has been adopted and examined in the
same way. Here the results were much better with more real product features having a high
score compared to TF-ISF. One explanation for this is that a feature is rarely present more
than once in a sentence, so term frequency and sentence frequency will correlate strongly
resulting in a TF-ISF score around one for almost every term.
The manual examination also showed that a lot of terms represent the same product feature.
Therefore a second modification is the clustering of candidate terms before calculating the TF-
IDF scores in order to subsequently consider all terms in one cluster equal. Two clustering
approaches have been tested: The approach by Ramkumar et al. (2010) with some
modifications and “Group Average Agglomerative Clustering” (GAAC)82. GAAC was chosen as
82
GAAC is a bottom-up hierarchical clustering algorithm and generates a dendrogram. It uses Cosine distance
(cf. Hotho et al. (2005), p. 8f) to calculate the distance between terms combining two clusters to a bigger one
in every step. It is therefore necessary to specify the number of clusters. (cf. Cambria et al. (2014), p. 1519).

4. Proposed Method 16
it has a very high accuracy when clustering features.83 The modifications to Ramkumar et al.
(2010) were as follows: As preprocessing already applies fuzzy matching this step is omitted.
Substring matching has been tried but it resulted in some clusters being totally wrong,
because of a short term being a substring of another term. The WordNet-synonym check
resulted in a very big cluster containing various product features for one product. In the end
only the term matching remained. While this approach is conservative, it resulted in the best
result (from a subjective point of view) for the examined sample. The outcome of a manual
comparison of the clustering results between GAAC and Ramkumar et al. (2010) showed that
the modified Ramkumar et al. (2010) approach achieved better clustering results for the
regarded sample. Consequently, this approach has been adopted.
The last modification is that not only the 20 terms with the highest TF-IDF score are checked
for nearby adjectives, but every term. With this, the system may return an arbitrary amount of
features.
4.2.3.3 Implementation of Scaffidi et al. (2007) and Ramkumar et al. (2010)
The approach of Scaffidi et al. (2007) and Ramkumar et al. (2010) has been adopted in the
following way:
Terms are clustered as above before calculating the probabilities and only the reviews of the
current product are considered instead of all reviews in the current product category.
Furthermore, instead of just considering nouns and noun bigrams, noun phrases (containing
an arbitrary number of adjectives and at least one noun) are used. Using the independent
assumptions of Scaffidi et al. (2007)84 the probability calculation formula85 has been adapted
to handling these n-grams. The statistics in Leech et al. (2001) have been used for the
reference noun and adjective probabilities of occurrence.86 If a term is not found in the
reference statistics, the average probability of the term’s POS-group (i.e. noun or adjective) is
used.87 Again, all terms are ordered by their final score.
83
cf. Cambria et al. (2014), p. 1519. 84
See section 4.2.2. 85
Scaffidi et al. (2007), p. 4 Eq. 3. 86
The statistics are available online: http://ucrel.lancs.ac.uk/bncfreq/ 87
cf. Scaffidi et al. (2007), p. 3.
4. Proposed Method 17
4.2.3.4 Meta approach
One assumption of the author is that different approaches have different strengths and
weaknesses and will therefore rank features or feature clusters differently. As the goal of this
work is to develop a universally usable product review summarization system, the bias of each
method should be minimized. Therefore, the following “Meta approach” has been developed:
Inputs are an arbitrary number of feature extraction algorithms conforming to the following
rules:
The result of the algorithm is an ordered list of features, i.e. each feature must have a
score with more extreme scores meaning the feature is more likely to be an actual
product feature.
Each feature is rated with a score between 0 and 1 with 1 meaning that the algorithm
regards this feature as having the highest chance of being a real product feature.88
For each feature a list of sentences that contain the feature must be provided.
The Meta approach will then take the results of all input algorithms and calculate the mean
score for each feature89. All extracted features will be combined in a list ordered by the mean
score. The sentence lists for each feature will be combined (in the case that different
algorithms consider different sentences to be important for a given feature).90 It is possible to
assign weights to each input algorithm. The feature scores are then averaged through a
weighted mean.
For this paper, the two approaches described in this section are used as input algorithms for
the Meta approach. But the concept is applicable to an arbitrary amount of input algorithms.
4.2.3.5 Summary of the feature extraction approach
In summary, there are three implemented feature extraction approaches. Wang et al. (2013)
as well as Scaffidi et al (2007) and Ramkumar et al. (2010) have been implemented with
some modifications. In addition, a Meta approach that combines the output of these two
methods is proposed. The different methods are evaluated in section 5.1 and section 5.2.4.2.
88
This is easily achievable by normalizing scores to [0, 1]. 89
If one algorithm does not extract the given feature, the score of the feature for this algorithm is 0. 90
Duplicate entries are prevented.
4. Proposed Method 18
4.3 Sentiment Analysis
As before, first the general sentiment analysis ideas of the papers that this work is based on
are briefly described. Then the author’s implementation is described.
4.3.1 Hu and Liu (2004a)
In this paper only adjectives are considered as opinion words that carry the sentiment for a
feature. For each sentence of every review that contains a feature, every adjective in the
sentence is extracted. Furthermore for every feature in each sentence the nearest adjective is
associated to that feature.91
In order to find the semantic orientation for an adjective, the following strategy is used:
Starting with a list of seed adjectives with known orientation, WordNet92 is used to expand
this list by traversing the WordNet graph. WordNet contains information about synonyms and
antonyms for adjectives. Using the idea that the semantic orientation of synonyms is the same
and the orientation of antonyms is the opposite, it is possible to discover other adjectives with
the same and the opposite semantic orientation when starting with a list with known
orientation. Adjectives that WordNet cannot recognize are ignored.93
The semantic orientation of a sentence is predicted as follows: If there are more positive
adjectives than negative adjectives the sentence is considered positive. If the negative
adjectives are dominant, it is considered negative. If there is an equal amount of positive and
negative sentences only the orientation of the nearest adjective per feature is regarded.
Negation94 is payed attention to.95
In summary, this paper uses sentence-level sentiment analysis based on adjectives as opinion
words. WordNet is used together with a seed list to generate the opinion word list.
91
cf. Hu;Liu (2004a), p. 171f. 92
See section 2.3. 93
cf. Hu;Liu (2004a), p. 172f. 94
See section 4.1 Negation Tagging. 95
cf. Hu;Liu (2004a), p. 173f.

4. Proposed Method 19
4.3.2 Zhang et al. (2012)
This paper uses a manually created list of adjectives and considers only these words to carry
sentiment. The words can carry a positive or negative sentiment with a score of “+1” or “-1”
respectively. In addition, adverbs of degree like “very” or “a bit” can modify the score of the
opinion words. The weights (e.g. 0.5 or 2) were manually defined. The sentiment score is
calculated by sentence. If an adverb of degree is in the same clause as an adjective, the
adjective score will be multiplied with the adverb of degree’s weight. If a negation word is
encountered, the scores of all adjectives in the same clause are multiplied with -1.96
In summary, this paper uses sentence-level sentiment analysis based on adjectives as opinion
words while considering adverbs of degree to modify the sentiment strength of an adjective. A
manually created opinion word list is used.
4.3.3 Najmi et al. (2015)
This paper uses a machine learning approach to classify sentences into either positive,
negative or neutral and works in two steps: In step one, one classifier97 is used to find neutral
sentences that don’t carry sentiment. These sentences are removed for the subsequent
analysis. In the second step, another classifier98 separates the remaining sentences into
positive and negative.99
Similar to Hu and Liu (2004a) this paper uses SentiWordNet100 to find adjectives with known
polarity. SentiWordNet runs on top of WordNet and adds three sentiment scores for every
term (“positive sentiment”, “negative sentiment” and “neutral sentiment”) that add up to one.
The sentiment score for a word is calculated as follows:101
𝑝𝑜𝑠𝑖𝑡𝑖𝑣𝑒 (+1)
⇔ 𝑝𝑜𝑠𝑖𝑡𝑖𝑣𝑒 𝑠𝑒𝑛𝑡𝑖𝑚𝑒𝑛𝑡 − 𝑛𝑒𝑔𝑎𝑡𝑖𝑣𝑒 𝑠𝑒𝑛𝑡𝑖𝑚𝑒𝑛𝑡 > 𝑡ℎ𝑟𝑒𝑠ℎ𝑜𝑙𝑑
𝑛𝑒𝑔𝑎𝑡𝑖𝑣𝑒 (−1)
⇔ 𝑛𝑒𝑔𝑎𝑡𝑖𝑣𝑒 𝑠𝑒𝑛𝑡𝑖𝑚𝑒𝑛𝑡 − 𝑝𝑜𝑠𝑖𝑡𝑖𝑣𝑒 𝑠𝑒𝑛𝑡𝑖𝑚𝑒𝑛𝑡 > 𝑡ℎ𝑟𝑒𝑠ℎ𝑜𝑙𝑑
𝑛𝑒𝑢𝑡𝑟𝑎𝑙 (0)
⇔ |𝑝𝑜𝑠𝑖𝑡𝑖𝑣𝑒 𝑠𝑒𝑛𝑡𝑖𝑚𝑒𝑛𝑡 − 𝑛𝑒𝑔𝑎𝑡𝑖𝑣𝑒 𝑠𝑒𝑛𝑡𝑖𝑚𝑒𝑛𝑡| < 𝑡ℎ𝑟𝑒𝑠ℎ𝑜𝑙𝑑
96
cf. Zhang et al. (2012), p. 10287f. 97
The classifier uses features like the word letter case, the POS of a word, the adjectives in the currently
regarded sentence etc. For a full list see Najmi et al. (2015), p. 851 Table 3. 98
This classifier uses features like the polarity of a word, if the word is a negation word etc. For a full list see
ibid., p. 852 Table 4. 99
cf. Ibid., p. 851f. 100
See section 2.3. 101
cf. Najmi et al. (2015), p. 850f.
4. Proposed Method 20
Like Zhang et al. (2012) this paper considers adverbs of degree (and some nouns like
“nothing”) that may modify the sentiment score of a verb by manually creating a list of words
and assigning weights. Negation is also considered.102
In summary, this paper uses sentence-level sentiment analysis by using a machine learning
approach. Adjectives are used as opinion words and a manually created list of words that
modify the sentiment score are considered. SentiWordNet is used to calculate the sentiment
orientation of adjectives.
4.3.4 Bafna and Toshniwal (2013)
This paper uses adjectives as opinion words. An online available list of adjectives103 with
known orientation (positive, negative or neutral) is used. If an adjective is not in this list,
SentiWordNet is used. If this is also not successful, a human is asked to classify the word.104
An adjective is assigned to the nearest feature (aspect-level sentiment analysis). The rationale
behind this is that the opinion words describing a feature will be the closest ones around the
feature. To achieve this, the distance (amount of words in the sentence between two regarded
words)105 of each opinion word to each feature in a sentence is calculated. If two or more
features have the same distance, the opinion word is assigned to the feature mentioned
first.106
If a negation word is encountered near an adjective, the adjective’s polarity is reversed. For
each feature all positive and negative polarity scores are added up independently to generate
a final opinion for each feature.107
In summary, this paper uses aspect-level sentiment analysis with adjectives as opinion words.
An opinion word list and SentiWordNet are used to calculate the sentiment orientation of the
opinion words.
102
cf. Ibid., p. 850ff. 103
Opinion Lexicon, see Liu et al. (2005). Online available: https://github.com/jeffreybreen/twitter-sentiment-
analysis-tutorial-201107/tree/master/data/opinion-lexicon-English 104
cf. Bafna;Toshniwal (2013), p. 148. 105
Or put in another way: The amount of words separating the two regarded words in the sentence. 106
cf. Bafna;Toshniwal (2013), p. 148. 107
cf. Ibid., p. 149.

4. Proposed Method 21
4.3.5 Wei et al. (2010)
The aim of this paper is only feature extraction and not sentiment analysis, but opinion words
are used to find product features in review texts.108 As opinion words are considered, some
ideas of this paper can be used in sentiment analysis.
In this paper too, a list of adjectives with known polarity (positive or negative) is used as
opinion words. The “General Inquirer”109 is the source for the adjectives, but the list was
manually cleaned in order to only contain adjectives that refer to subjective opinions of
customers.110
Using verbs with known polarity (positive or negative) in addition to adjectives as opinion
words has also been tested in this paper. The source of these verbs is again the General
Inquirer. In this paper, using verbs in addition to adjectives has a negative effect on the result.
The paper explains this with the possibility that many of the considered verbs are often used
to express emotional behavior rather than subjective opinions.111
In summary, this paper uses adjectives and (in contrast to the other papers described above)
verbs as opinion words when extracting product features, although verbs worsen the result.
4.3.6 Author’s Approach
In this work a combination approach using ideas from the above mentioned five papers is
used for sentiment analysis.
4.3.6.1 Why a machine learning approach was not used
Although Najmi et al. (2015) uses a machine learning approach, a lexicon based-approach is
used in this work for the following reasons:
As mentioned before112, getting the necessary amount of labeled training data is extremely
costly and not feasible in the scope of this work. Although machine learning approaches are
108
cf. Wei et al. (2010), p.151. 109
Stone et al. (1966). 110
cf. Wei et al. (2010), p. 156f. An adjective that is used in an objective way is “able” as it is often used to
describe a product’s ability to do something. (cf. Ibid., p. 157). 111
cf. Ibid., p. 164f. 112
See section 4.2.3 for example.
4. Proposed Method 22
superior to dictionary-based approaches when implementing them for specific domains113, the
overall goal of this work is the development of a universally usable product review
summarization approach not restricted to specific product domains.
One solution to still use machine learning could be to use the review rating (often in the form
of a star rating) as an estimator for the user’s opinion. For example, Scaffidi et al. (2007)
work under the assumption that the rating reflects the user’s opinion towards all product
features mentioned in his review.114 But it is easy to see that this assumption is wrong.115
Reviews can rate the overall product highly while still criticizing some features of the product.
This fact is even admitted in Scaffidi et al. (2007).116 So there is no real alternative to creating
training data manually.
4.3.6.2 The implemented approach
The implemented approach for the sentiment analysis will be described from here on: The
input of the sentiment analysis is the output of the feature extraction. Any of the methods
described in section 4.2.3 may be used.
The general approach is similar to Hu and Liu (2004a) and Zhang et al. (2012): Adjectives
are used as opinion words and for each feature each sentence containing this feature is
analyzed independently using all found opinion words (sentence-level sentiment analysis).
The Negation Tagging step of the preprocessing117 is used to consider negation. If an opinion
word is tagged as “negated” the opinion score will be reversed. Opinion words may be
positive (score “+1”), negative (score “-1”) or neutral (score “0”).
The polarity calculation for adjectives works similar to Bafna and Toshniwal (2013): Two
sources of adjectives are used118, the Opinion Lexicon also used by Bafna and Toshniwal
(2013)119 and SentiWordNet120. For SentiWordNet all synsets121 of the word matching the
word’s POS-tag are collected. A weighted sum of the positive and negative sentiment scores of
113
cf. Najmi et al. (2015), p. 849. 114
cf. Scaffidi et al. (2007), p. 4. 115
See for example Najmi et al. (2015), p. 857. 116
cf. Scaffidi et al. (2007), p. 8. 117
See section 4.1. 118
It is possible to use only one of the sources by switching a flag in the source code. 119
Opinion Lexicon, see Liu et al. (2005). Online available: https://github.com/jeffreybreen/twitter-sentiment-
analysis-tutorial-201107/tree/master/data/opinion-lexicon-English 120
Baccianella et al. (2010). 121
See section 2.3.
4. Proposed Method 23
all these synsets is calculated. As the synsets in SentiWordNet are ordered by probability, the
sentiment scores are weighted accordingly meaning the first synset gets the largest weight.
The reason behind this is that any retrieved synsets could possibly be the correct one for the
given sentence. Without analyzing the semantics of the sentence, there is no way to know the
correct one, but analyzing the semantics is very hard considering the fact that the product
domain is not limited to one or two product categories. So an overall sentiment score over all
possible synsets considering their probability is calculated instead. If the overall positive score
is greater than the overall negative score, the adjective is considered positive (score “+1”). If
the overall negative score is great, it is considered negative (score “-1”). If both values are
equal, the adjective is considered neutral (score “0”). As there is a lot of uncertainty in this
approach, SentiWordNet is only used if the Opinion Lexicon does not contain the adjective. If
both Opinion Lexicon and SentiWordNet do not know the adjective, it is considered
neutral.122
4.3.6.3 Optional extensions
Similar to Najmi et al. (2015) and Zhang et al. (2012) adverbs of degree may modify the
sentiment score of opinion words. As no complete list of adverbs was found, a list of 130
adverbs was manually created from several different sources123. Like in the two papers, the
weights in this work were also manually assigned. This work uses the interval [0.1, 2.0] in
0.1-steps. The sentiment score modification works as follows: The sentiment score of an
opinion word is multiplied with the adverb’s weight. If several adverbs are used their weight
is multiplied. If after an opinion word another opinion word follows, its score is also
multiplied with the same weight. The rationale behind this is that phrases like “very fast, light
and handy” often imply “very fast, very light and very handy”.124 If no opinion word follows,
the multiplier gets reset to one. Stopwords are ignored.
122
As the goal is a fully automatic process for product review summarization, asking a human as done in
Bafna;Toshniwal (2013) is no option. 123
Sources: Paradis (1997), http://www.netdata.com/Netsite/0800d48a/Adverbs-of-Degree-List,
http://rattanji77.blogspot.jp/2013/08/list-of-adverbs-of-degree-or-quantity-57.html,
http://www.grammar-quizzes.com/adv_degree.html, https://www.englishclub.com/vocabulary/adverbs-
degree.htm, http://lognlearn.jimdo.com/grammar-tips/adverbs/intensifiers-adverbs-of-degree/,
https://en.wikipedia.org/wiki/Intensifier, http://www.gingersoftware.com/content/grammar-
rules/adverb/adverbs-degree/. All websites were accessed on 13.12.2015. 124
Of course, this is not always the case. But without analyzing the semantic there is no way of knowing what
the author meant. Even with analyzing the semantic, the sentence could still be ambiguous.

4. Proposed Method 24
Using the idea of Wei et al. (2010) there is the option to use verbs as additional opinion
words. The process is exactly same as for the adjectives (see above). Opinion Lexicon and
SentiWordNet are also used to calculate the polarity of the verbs as both these sources also
contain verbs.
Another option is to use the review time in order to weight the final sentiment score of a
feature for a sentence. As time passes, the user’s opinion towards a product may change (e.g.
because of technological development or newer products), so newer reviews may be more
meaningful for customers interested in the product. This idea is proposed by Najmi et al.
(2015), but not implemented there.125 Here this idea is implemented as follows: The final
sentiment score of a feature for a specific sentence is multiplied with a time weight
corresponding to the age of a review in relation to the newest review. To achieve this, reviews
are grouped by their month and year. The month and year with the newest review gets a
weight of 2.5. For every month in the past, the weight is reduced by 0.1 until the minimum
weight of 0.1 is reached. Reviews that are older than two years will all be weighted with the
same weight of 0.1. But the weighting is only carried out, if the time between the newest and
the oldest review is at least four weeks. It is important to note that this does not mean that
the newest review’s sentences will always have the highest score as the original sentiment
score of an older review’s sentence for a feature may be so high that it still has a higher score
even when considering the review time.
The rationale for this implementation is the following: First of all, if the total time horizon is
too short, weighting reviews according to the review time is not reasonable as the time that
passed is simply too short to significantly change the customer opinion.126 The reason for
weighting reviews equally if they are older than two years is that so much time has passed
already, that it, for example, doesn’t really matter anymore if the review is two and a half or
three years old. The opinions will be outdated anyway. Using a linear monthly decrease is
only one possibility. Without further analysis it is not possible to determine the best weighting
strategy. As this analysis is outside the scope of this work and as no other paper was found
that regards review time when doing product review summarization, the linearly decreasing
scheme was chosen.
125
cf. Najmi et al. (2015), p. 847. 126
Of course, there are exceptions to that: A problem with a product that fundamentally changes the customer
opinion could be found after one or two weeks. But this situation can be constructed for any number of
passed days. So even when only considering two days, the opinions could be quite different in such a
situation.

4. Proposed Method 25
The final option uses the idea of Bafna and Toshniwal (2013) to implement aspect-level
sentiment analysis. For every opinion word in a sentence, the distance to each product
feature associated with the sentence is calculated. Distance is defined as the number of tokens
in the sentence from the opinion word to the beginning or end of the product feature.127 As
features in this work are noun phrases128, they may contain more than one token. Therefore
the beginning and end of the noun phrase has to be considered when calculating the distance.
The sentiment score is in this work also associated with the closest feature. If the distance to
two or more features is the same, the score is associated with the feature mentioned first.129
One other special case, originating from the fact that features are noun phrases in this work,
is that an opinion word may be part of the feature name (e.g. “fast screen”). If the opinion
word is part of the feature, the sentiment score is associated with this feature. The last thing
to note is that a feature consists of several noun phrases that are clustered together.130
Therefore, when calculating the distance all possible noun phrases associated to a feature
need to be tested as any of them could be the one in the currently analyzed sentence.
4.3.6.4 Summary of the sentiment analysis approach
In summary, the implemented sentiment analysis system uses two sources of opinion words:
Opinion Lexicon and SentiWordNet.131 Apart from using adjectives as opinion words there are
four additional options: (1) using adverbs of degree to modify the sentiment score of
following opinion words, (2) using verbs as additional opinion words, (3) weighting the
sentiment scores by considering the review time and (4) doing aspect-level sentiment analysis
by assigning the sentiment score of an opinion word only to the nearest feature. This makes a
total of 24=16 possible configurations for the sentiment analysis.
127
Example: “The fast screen is fantastic”. The distance of “fast” and “screen” is one and the distance of
“fantastic” and “screen” is two. Stopwords are considered when calculating the distance. 128
cf. section 4.2.3. 129
This is the same behavior as proposed by Bafna;Toshniwal (2013). See also section 4.3.4. 130
cf. section 4.2.3. 131
As written above, it is actually possible to configure the system to only use Opinion Lexicon or only use
SentiWordNet, but as the change to recognize opinion words is higher if both sources are used, this
configuration is used.

4. Proposed Method 26
4.4 Summarization
In this section the summarization approaches of papers that this work is based on are briefly
described. Then the implemented approach is explained. The focus is the content of the
summaries (i.e. which information is shown) as well as how the content is chosen and the
layout of the summaries.
4.4.1 Hu and Liu (2004a)
The approach of this paper is as follows: For each feature all positive and negative sentences
are collected and a count with the amount of reviews that mention the feature positively and
negatively is calculated per feature. For each feature a short review is created. First the
positive sentences of this feature are listed and after that the negative sentences. The paper
does not mention an ordering scheme for the individual sentences. For each category
(positive, negative) the calculated review count is also shown. As a lot of sentences are
shown, they are hidden behind a drop down list. For each sentence, a hyperlink to the original
review is created.132
These feature reviews are shown in an ordered list. The default ordering shows the feature
that is most talked about, i.e. mentioned in the highest number of reviews, first. Other
ordering according to only the positive or only the negative review count is possible. The
summaries look like this (Table 1):133
Feature: FEATURE NAME Positive: COUNT
SINGLE SENTENCE SINGLE SENTENCE …
Negative: COUNT SINGLE SENTENCE SINGLE SENTENCE …
Feature: FEATURE NAME …
Table 1: Hu, Liu (2004a) Summary Layout
132
cf. Hu;Liu (2004a), p. 174. 133
cf. Ibid., p. 174.
Legend: UPPER CASE = is replaced
with actual values in the real summary
… = etc.
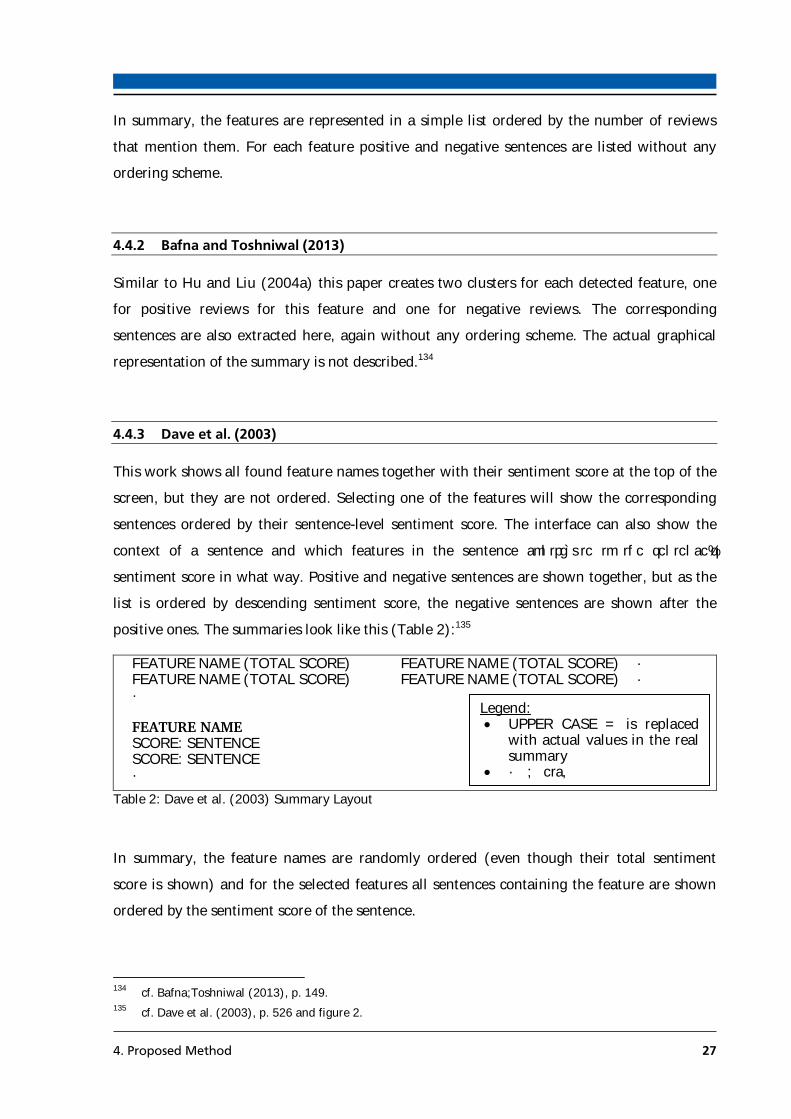
4. Proposed Method 27
In summary, the features are represented in a simple list ordered by the number of reviews
that mention them. For each feature positive and negative sentences are listed without any
ordering scheme.
4.4.2 Bafna and Toshniwal (2013)
Similar to Hu and Liu (2004a) this paper creates two clusters for each detected feature, one
for positive reviews for this feature and one for negative reviews. The corresponding
sentences are also extracted here, again without any ordering scheme. The actual graphical
representation of the summary is not described.134
4.4.3 Dave et al. (2003)
This work shows all found feature names together with their sentiment score at the top of the
screen, but they are not ordered. Selecting one of the features will show the corresponding
sentences ordered by their sentence-level sentiment score. The interface can also show the
context of a sentence and which features in the sentence contribute to the sentence’s
sentiment score in what way. Positive and negative sentences are shown together, but as the
list is ordered by descending sentiment score, the negative sentences are shown after the
positive ones. The summaries look like this (Table 2):135
FEATURE NAME (TOTAL SCORE) FEATURE NAME (TOTAL SCORE) … FEATURE NAME (TOTAL SCORE) FEATURE NAME (TOTAL SCORE) … … FEATURE NAME SCORE: SENTENCE SCORE: SENTENCE …
Table 2: Dave et al. (2003) Summary Layout
In summary, the feature names are randomly ordered (even though their total sentiment
score is shown) and for the selected features all sentences containing the feature are shown
ordered by the sentiment score of the sentence.
134
cf. Bafna;Toshniwal (2013), p. 149. 135
cf. Dave et al. (2003), p. 526 and figure 2.
Legend: UPPER CASE = is replaced
with actual values in the real summary
… = etc.
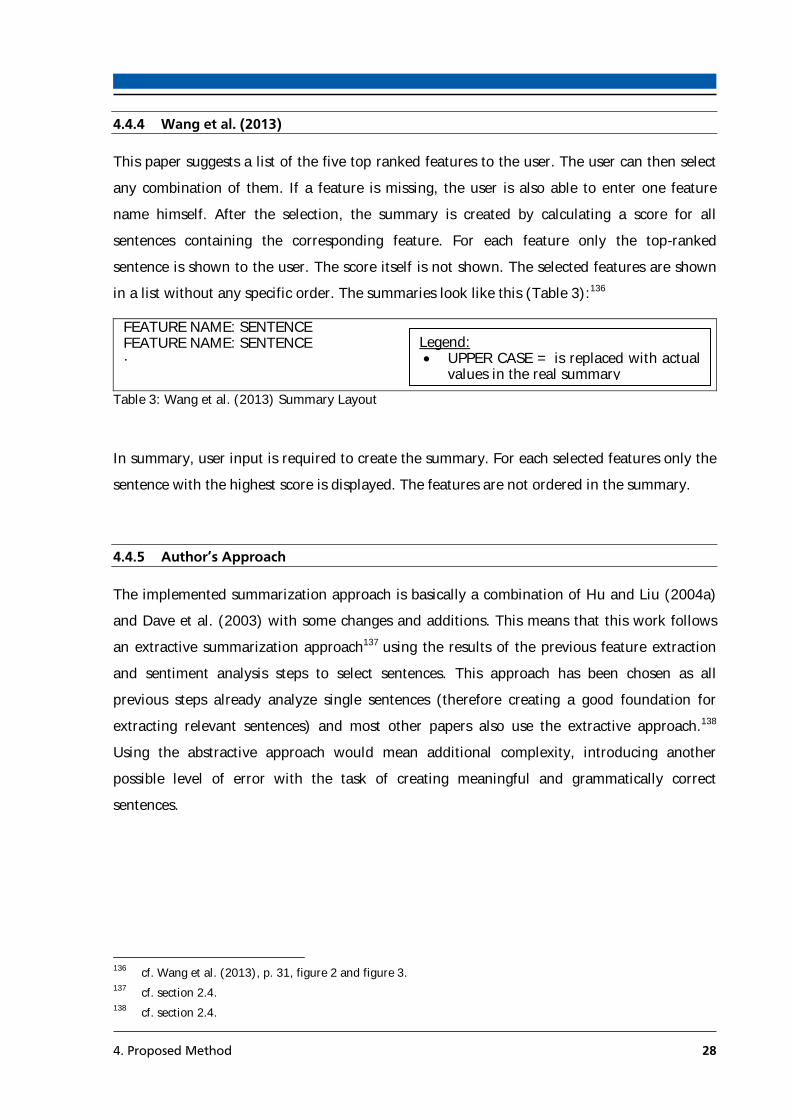
4. Proposed Method 28
4.4.4 Wang et al. (2013)
This paper suggests a list of the five top ranked features to the user. The user can then select
any combination of them. If a feature is missing, the user is also able to enter one feature
name himself. After the selection, the summary is created by calculating a score for all
sentences containing the corresponding feature. For each feature only the top-ranked
sentence is shown to the user. The score itself is not shown. The selected features are shown
in a list without any specific order. The summaries look like this (Table 3):136
FEATURE NAME: SENTENCE FEATURE NAME: SENTENCE …
Table 3: Wang et al. (2013) Summary Layout
In summary, user input is required to create the summary. For each selected features only the
sentence with the highest score is displayed. The features are not ordered in the summary.
4.4.5 Author’s Approach
The implemented summarization approach is basically a combination of Hu and Liu (2004a)
and Dave et al. (2003) with some changes and additions. This means that this work follows
an extractive summarization approach137 using the results of the previous feature extraction
and sentiment analysis steps to select sentences. This approach has been chosen as all
previous steps already analyze single sentences (therefore creating a good foundation for
extracting relevant sentences) and most other papers also use the extractive approach.138
Using the abstractive approach would mean additional complexity, introducing another
possible level of error with the task of creating meaningful and grammatically correct
sentences.
136
cf. Wang et al. (2013), p. 31, figure 2 and figure 3. 137
cf. section 2.4. 138
cf. section 2.4.
Legend: UPPER CASE = is replaced with actual
values in the real summary
4. Proposed Method 29
4.4.5.1 The implemented approach
The general input of the summarization step consists of the output of the feature extraction
and sentiment analysis steps139. From the feature extraction step the n features with the
highest score are selected to be part of the summary and they appear in the summary exactly
in this order. Like in Hu and Liu (2004a) and Bafna and Toshniwal (2013), sentences
belonging to a feature are divided into sentences with positive sentiment and sentences with
negative sentences. Objective sentences are not part of the summary as they carry no opinion
about a product feature.
Per sentiment polarity and feature at most m sentences (less if there are not enough
sentences) are shown. The reason for limiting the sentences, as also done by Wang et al.
(2013), is that showing all sentences would make the review too long and therefore run
contrary to the goal of a summary, namely saving time. But showing only one sentence would
also run contrary as a lot of information would be missed when showing only one sentence
per polarity. Because this could lead to a biased decision, m should be greater than one. The
m sentences per polarity that are displayed are the ones with the highest positive or negative
sentiment score for the regarded features as calculated in the sentiment analysis step. Like
Dave et al. (2003), the sentences are ordered by their sentiment score. The reason for this is
that the sentences with the most extreme sentiment carry the most meaningful information
for the regarded feature and should therefore be read first.
4.4.5.2 Not implemented and implemented optional extensions
The sentiment score of every sentence can be optionally displayed and like Hu and Liu
(2004a) the number of reviews that mention the regarded feature positively and negative
respectively can also be shown, but with the addition of always showing the total number of
reviews for the product, too.140 With this the customer can always put the review count for
one feature and polarity in relation to the total review count. The reason for making the
display of the numbers optional is that it has to be tested whether customers actually want to
see these numbers or would prefer to not see them (see section 5.2 for the customer survey).
It would be easy to add the option to display a graphical representation of these optional
numbers to follow the idea of Bafna and Toshniwal (2013), but this has not been
139
See sections 4.2.3 and 4.3.6. 140
Example: “30 out of 500” instead of just “30”.
4. Proposed Method 30
implemented for the following reasons: (1) The only thing graphically displayable would be
the above mentioned review counts. While this could give an overview about the general
sentiment distribution, it doesn’t give any information about the features itself. A user looking
at the graphic would still not know would exactly is good or bad with one product feature. It
would have no real benefit for assessing the product. (2) As the summaries should have an
adequate length, there should be no need to summarize some parts of the summary again. (3)
As mentioned above, it is not known whether customers are even interested in these numbers.
There would be the possibility to consider the “was this review helpful” statistics when
choosing which sentences to use in the summary, but this measure is fundamentally biased in
three ways and should therefore not be used: Firstly, often reviews are marked as “helpful”
even though they are not (imbalance vote bias). Secondly, reviews with an already high
amount of positive votes are read more often and receive even more votes (winner circle
bias). Finally, earlier reviews are viewed more often compared to newer reviews and can
therefore get more votes (early bird bias).141
Instead one additional idea that does not originate from any of the mentioned papers can be
used. The idea is to limit the amount of sentences coming from one review, so that for all
features at most u sentences come from the same review. The rationale behind this is that a
single review should not dominate the summary as it would contradict the goal of showing
diverse opinions and would instead possibly lead to a biased decision. This idea is
implemented as follows: As searching for a global maximum in sentence distribution for all
features would need an objective function rating the sentence distribution and a lot of time142,
a greedy approximation is used instead. The feature with the highest score in the feature
extraction step is supposed to be the most important feature for customers. It should therefore
get the sentences with the most extreme opinions, in order to give customers the best insight
in the good and bad sides of this feature. For less important features it is not that big of a
problem to get less diverse sentences. The approximation hence first distributes sentences to
the most important feature, then to the second most important feature etc.
141
cf. Najmi et al. (2015), p. 856f. 142
A distribution problem like this normally has an exponentially growing number of possible solutions making
the search for a globally optimal solution very time-consuming.
4. Proposed Method 31
4.4.5.3 Summary layout
The actual summary layout comes in two variants and is described as follows: Both variants
start with a header containing the product title, the price, the number of reviews and the
review timespan, i.e. the review time of the oldest and newest review. When embedding a
summary e.g. into product page in a web shop, title and price are unnecessary as this
information is already available on the web page, but these facts are included here as the
summary is a stand-alone text. Number of reviews and review timespan may also be available
in a web shop. Number of reviews is shown, so that the customer can evaluate the size of
information source of the summary. The review timespan is shown, so that the customer
knows what kind of information in terms of age he can expect.
After the header the product features are shown in a list in the summary body. The variants
differ by how the positive and negative sentences for a review are displayed. In variant
“List”, the sentences are displayed the same as in Hu and Liu (2004a) starting with the
positive sentences. Variant “Table” shows positive and negative sentences in a table, so that
positive and negative sentences are next to each other. The general layout is as shown in
Table 4 and Table 5 (see the appendix sections “Survey Summary Layout Part (Movie)” and
“Survey Summary Layout Part (Smartphone)” for actual summaries using these two layouts).
Which layout is preferred by the customers will be analyzed in section 5.2.
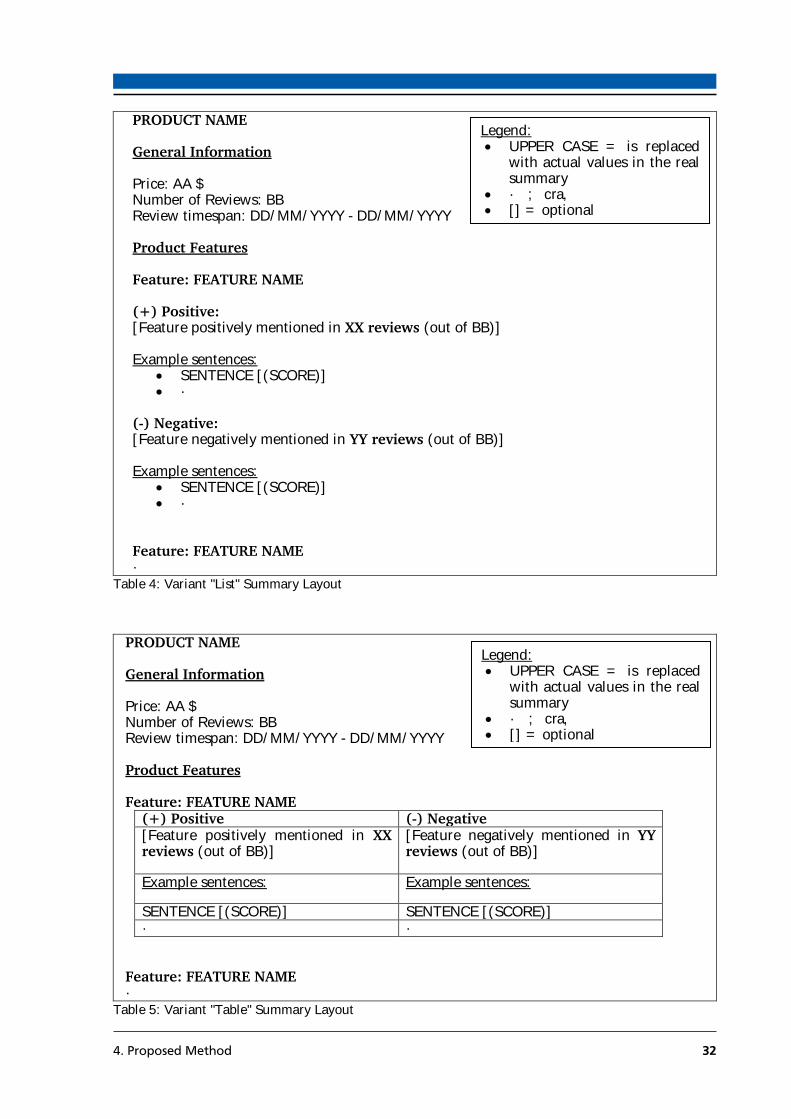
4. Proposed Method 32
PRODUCT NAME General Information Price: AA $ Number of Reviews: BB Review timespan: DD/MM/YYYY - DD/MM/YYYY Product Features Feature: FEATURE NAME (+) Positive: [Feature positively mentioned in XX reviews (out of BB)] Example sentences:
SENTENCE [(SCORE)] …
(-) Negative: [Feature negatively mentioned in YY reviews (out of BB)] Example sentences:
SENTENCE [(SCORE)] …
Feature: FEATURE NAME …
Table 4: Variant "List" Summary Layout
PRODUCT NAME General Information Price: AA $ Number of Reviews: BB Review timespan: DD/MM/YYYY - DD/MM/YYYY Product Features Feature: FEATURE NAME
(+) Positive (-) Negative [Feature positively mentioned in XX reviews (out of BB)]
[Feature negatively mentioned in YY reviews (out of BB)]
Example sentences: Example sentences:
SENTENCE [(SCORE)] SENTENCE [(SCORE)] … …
Feature: FEATURE NAME …
Table 5: Variant "Table" Summary Layout
Legend: UPPER CASE = is replaced
with actual values in the real summary
… = etc. [] = optional
Legend: UPPER CASE = is replaced
with actual values in the real summary
… = etc. [] = optional

5. Evaluation 33
4.4.5.4 Summary of the summarization approach
In summary, the n most important features will be listed. For each feature the m most positive
and m most negative sentences will be shown in either a list or a table. Optionally, the count
of reviews mentioning a feature positively or negatively respectively and sentiment scores of
the example sentences can be displayed. There is also the option to limit the number of
sentences in the summary that can originate from one review.
5 Evaluation
The next section will show the results of the evaluation of the implemented method. Section
5.1 describes process and result of a manual evaluation of the feature extraction for a sample
of six products. The survey described in section 5.2 uses products with a lot more reviews
compared to the manual evaluation and evaluates all three steps of product review
summarization.
5.1 Feature Extraction
First, this section will describe the general description of the evaluation process for the feature
selection. After that the results are discussed.
5.1.1 Evaluation Process
In literature, most papers use the measures of recall, precision and F1-measure (or a subset of
these measures) to evaluate their feature extraction. Usually a comparison with other
methods that are used as a baseline is performed.143 Let c be the number actual product
features that the algorithms extracted. Let e be the number of features (actual or not)
extracted by the algorithm and let m be the number of actual product features. Then the
above measures are defined as follows:144
𝑅𝑒𝑐𝑎𝑙𝑙 =𝑐
𝑚
𝑃𝑟𝑒𝑐𝑖𝑠𝑖𝑜𝑛 =𝑐
𝑒
143
Papers using (some of) these measures include the following: Hu;Liu (2004b), p. 759f, Ramkumar et al.
(2010), p. 6864f, Zhang et al. (2012) ibid., p. 10290 and Table 7, Wei et al. (2010), p. 160ff. 144
cf. Zhang et al. (2012), p. 10290f and Wei et al. (2010), p. 161.

5. Evaluation 34
𝐹1 − 𝑀𝑒𝑎𝑠𝑢𝑟𝑒 =2 × 𝑃𝑟𝑒𝑐𝑖𝑠𝑖𝑜𝑛 × 𝑅𝑒𝑐𝑎𝑙𝑙
𝑃𝑟𝑒𝑐𝑖𝑠𝑖𝑜𝑛+𝑅𝑒𝑐𝑎𝑙𝑙
The difficulty lies in m as the actual product features are normally not known. Of course,
manufacturers write down features in their product description and advertisements, but these
lists are not suitable as the source for the product features. Firstly, the lists may not be
exhaustive or aspects that some users are interested in could be missing.145 Secondly, such
lists are not always available, e. g. for movies there is hardly information about the picture
quality (apart from resolution etc.) available as this matter is very subjective. So the general
approach is to extract features by hand which, of course, may introduce errors due to
subjectivity and human error. Still, often this is the only choice. This is therefore the approach
that is used in this work to evaluate the performance of the different feature extraction
methods described above.146
The approach of this work is as follows: Recall is compared between the methods in the way
that each method returns all potential features (no matter the score). The lists are manually
checked for the actual features. In addition, the F1-Measure is calculated for varying amounts
of extracted product features. For each product, the range from one up to the number
manually extracted product features is calculated. In order to calculate the F1-Measure, the
correctly extracted features are again marked manually.
Recall can be increased by sacrificing Precision and vice versa. The F1-Measure has the benefit
over Precision and Recall that both metrics are considered so that a tradeoff is not possible.147
The result is therefore more meaningful.
The Meta approach is used with equal weights for the two input algorithms in this evaluation.
In addition to these quantitative measures, a qualitative analysis is performed and the feature
extraction performance is also analyzed in the survey (see section 5.2.4.2).
145
cf. Scaffidi et al. (2007), p. 9. For example, in one of the sample products there were quite a few reviews that
talked about that the manufacturer provided description of the product is not correct. This is hardly a product
feature, but it is still of interest for a customer, as the item description will also be a source of information for
him. So this information could also be part of a summary. For another sample product, the model number
was often mentioned as a specific model number was sought by the customers. This is also not a real product
feature, but is also of interest for a customer. 146
Papers that extract features by hand include: Hu;Liu (2004b), p. 760, Wei et al. (2010), p. 160, Zhang et al.
(2012), p. 10285, 10290, Bafna;Toshniwal (2013), p. 149. 147
cf. Hotho et al. (2005), p. 10f.
5. Evaluation 35
5.1.2 Results
The sample consists of six products: Three mobile phones and three router/networking
devices. These categories were chosen as the products are highly structured. It is therefore
relatively easy to extract product features by hand. For each product category there is one
product with less than ten reviews, one with 30 to 40 reviews and one with more than 60
reviews, but less than 100. These review counts were chosen to evaluate the feature
extraction depending on the review count while still being feasible to read all reviews in an
appropriate amount of time.
The methods that are tested are described in section 4.2.3. This section also describes the
shortcomings of the original methods of Wang et al. (2013) and Scaffidi et al. (2007).
Because of these shortcomings only the modified approaches are evaluated. Table 6 shows the
achieved recall for the above mentioned sample:
Number of
Reviews
Number of
manually
extracted
features
Modified
Wang et al.
(2013)
Modified
Scaffidi et al.
(2007)
Meta
approach
Mobile Phones:
Product A 8 8 0.5 0.875 0.875
Product B 37 25 0.88 0.96 0.96
Product C 80 25 0.76 0.8 0.8
Average 0.713 0.878 0.878
Router/Networking Devices
Product D 6 9 0.556 0.667 0.667
Product E 35 18 1 1 1
Product F 65 17 0.941 0.941 0.941
Average 0.832 0.869 0.869
Total Average 0.773 0.874 0.874
Table 6: Feature Extraction Recall Comparison
For every product of the sample except one Wang et al. (2013) achieves a lower Recall than
the other two approaches. This is explainable with the fact that Wang et al. (2013) reduces
the number of possible features by searching for nearby adjectives.148 Scaffidi et al. (2007)
does not reduce the feature number. As the Meta approach uses all features of all input
algorithms, the Recall is exactly the same as Scaffidi et al. (2007).
148
See section 4.2.1.

5. Evaluation 36
There is no clear trend regarding the influence of the review count recognizable. For the
products with less than 10 products a lower Recall is achieved most of the time compared to
the other products. This seems to be especially true for Wang et al. (2013). Then again, the
sample is too small for a clear statement. It seems plausible that a higher review count could
lead to a higher Recall. As most reviews mention more than one product feature, the chance is
higher that an actual product feature gets mentioned more often and is therefore easier to
recognize for the feature extraction algorithm.149
With 77 to 87 percent average Recall, all methods perform quite well for the given sample. It
is noteworthy that the methods also extract implicit features150, although the feature name is
not always suitable or not as much a general term as a human would choose.
Figure 2 to Figure 7 show the F1-Measure for each product depending on the number of
features. Each method extracts the top features (i.e. features with the highest score).
Figure 2: F1-Measure Product A
149
But on the other hand, every product has short reviews that do not mention any feature in particular. 150
Implicit features extraction is considered very tough (cf. Zhang et al. (2012), p. 10284).

5. Evaluation 37
Figure 3: F1-Measure Product B
Figure 4: F1-Measure Product C
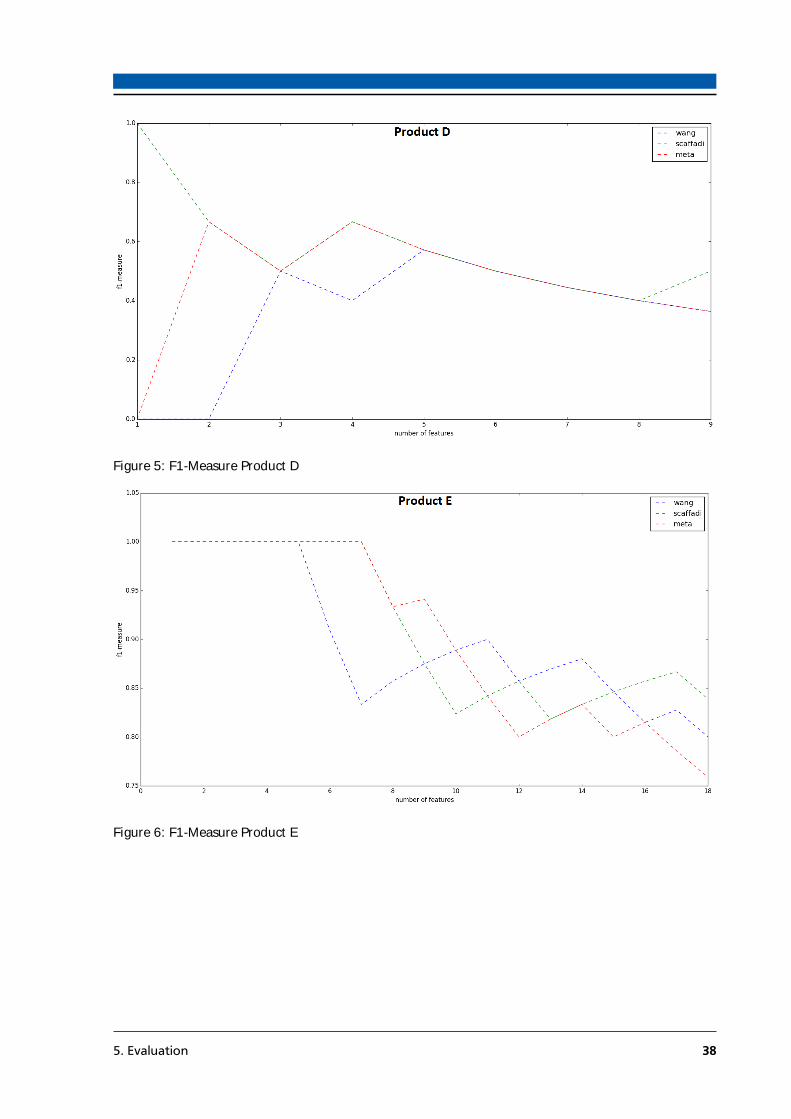
5. Evaluation 38
Figure 5: F1-Measure Product D
Figure 6: F1-Measure Product E
5. Evaluation 39
Figure 7: F1-Measure Product F
There is no real trend recognizable. Wang et al. (2013) achieves the best result for product A
and is very good for B, but performs worst for C and F for most of the time. For product D and
F Scaffidi et al. (2007) seems to perform best, but it performs badly for A for product D. The
Meta approach performs best for product C for most of the feature counts. For product E there
is no clear winner as depending on the feature count another method has the best
performance.
Further manual testing is necessary, but can’t be performed in the scope of this work. More
products in the same and different categories should be tested and the Meta approach should
especially be tested with more input algorithms. Again, this is out of scope for this work. The
current result does not clearly show whether the Meta approach can achieve a better
performance than each input method. But for some products and feature numbers the Meta
approach performs clearly better than each input method. This at least justifies further
development and testing.
A qualitative analysis of the extracted features shows two problems: First, the clustering is not
perfect, so that the same actual product feature is sometimes returned more than once
(although with a different name)151. Future research should develop a better noun phrase
clustering as this is the source of this problem in this work. Second, the returned feature name
151
Example: In one mobile phone the extracted features “amazing optical zoom camera feature” and “proper
optical zoom lens” both describe the phone’s camera and should therefore have been clustered together.
5. Evaluation 40
is not always accurate (i.e. it does not perfectly reflect the content of the cluster).152 This may
also be the result of the suboptimal clustering and the current scheme of choosing the longest
cluster member as the feature name.
All in all, all feature extraction approaches show satisfying results and are therefore suitable
as the basic for the sentiment analysis step of the product review summarization process.
5.2 Survey
This section will describe the survey that was conducted to evaluate the summarization
approach. First, the rational for conducting an online survey is explained, then the survey
design is explained and finally the results are discussed.
5.2.1 Advantages and disadvantages of doing an online survey
As the aim of this work is to develop a product review summarization approach that will
benefit the users, the quality of the generated summaries should be judged by potential users.
Therefore an online survey was conducted.153 This reasoning is further verified by the fact that
there exists no benchmark data and evaluation for review summarization tasks.154
As the object to evaluate is developed to be used in the Internet, conducting an online survey
helps reaching the potential users, namely online shoppers. This paper therefore follows the
practice of using an online survey when studying the Internet use and people’s opinion about
Internet technology.155
Using online survey instead of other methods like paper survey or interviews offers several
advantages, but also has disadvantages. Advantages include the ability to quickly create a
survey that is instantly available in the world allowing for a possibly very high number of
respondents. The cost for conducting a survey is therefore lower compared to normal paper
surveys while offering a greater reach. Online surveys allow fixing the order in which
questions should be answered to prevent a possible bias by answering later questions first and
they also allow to randomize the question order to prevent systematic bias through the
152
Example: For the mobile phone’s display “great screen” might be a better feature name than “entire screen“.
Both strings appear in the same noun phrase cluster for this product. 153
The used tool to do the survey is https://www.soscisurvey.de/ 154
cf. Wang et al. (2013), p. 32. 155
cf. Selm;Jankowski, p. 436f.
5. Evaluation 41
question order. Furthermore, the need to manually input the data into a computer is
eliminated which greatly speeds up the data analysis and prevents manual copy errors. Online
surveys can force that questions need to be answered before continuing, preventing non-
response for certain questions. They also eliminate a possible interviewer bias and are
convenient for the respondents as they can choose when to do them or even take breaks in
between.156
The main disadvantage of online surveys is the sampling bias, making it practically impossible
to achieve a random sample of Internet users as there is no central register of all users.
Furthermore, the Internet population is not representative of the general population, although
this is changing as using the Internet becomes more common. As a website makes it possible
to track user data without them noticing, privacy concerns could lower response rate of online
surveys. Online surveys in general provide relatively low response rates, although the absolute
number of respondents could be very high as explained above.157
As the survey in this work aims at Internet users, the none-representativeness of the Internet
population is no problem. Privacy concerns can be reduced with proper survey design158 and
as there is no specific user group that this work targets, an unrestricted sample159, where the
survey is just advertised in the Internet and free for everyone to participate, can be used. So
for this work the advantages of online surveys clearly outweigh the disadvantages.
5.2.2 Question Design and Pretest
For the questions and general survey design criteria this work follows the guidelines of
several works whose key points will be briefly described in the following:160
Not too many questions should be used, because the users will quit if the survey takes too
long. Using double negations etc. may result in users misunderstanding the questions, so easy
to understand language should be used. Precise formulation of every question is necessary, to
ask about only one specific concept per question without room for interpretation. Violating
this may lead to poor results that can’t to trusted. Open questions that allow free text
156
cf. Ibid., p. 437-439 and cf. Evans;Mathur (2005), p. 196ff. 157
cf. Selm;Jankowski (2006), p. 439 and cf. Evans;Mathur (2005), p. 201f. 158
cf. Andrews et al. (2003), p. 5f. 159
cf. Selm;Jankowski (2006), p. 440. 160
Cf. the following papers for the rest of this section: Andrews et al. (2003), Aschemann-Pilshofer (2001), Gräf
(1999), Gräf (2010), p. 74-79.
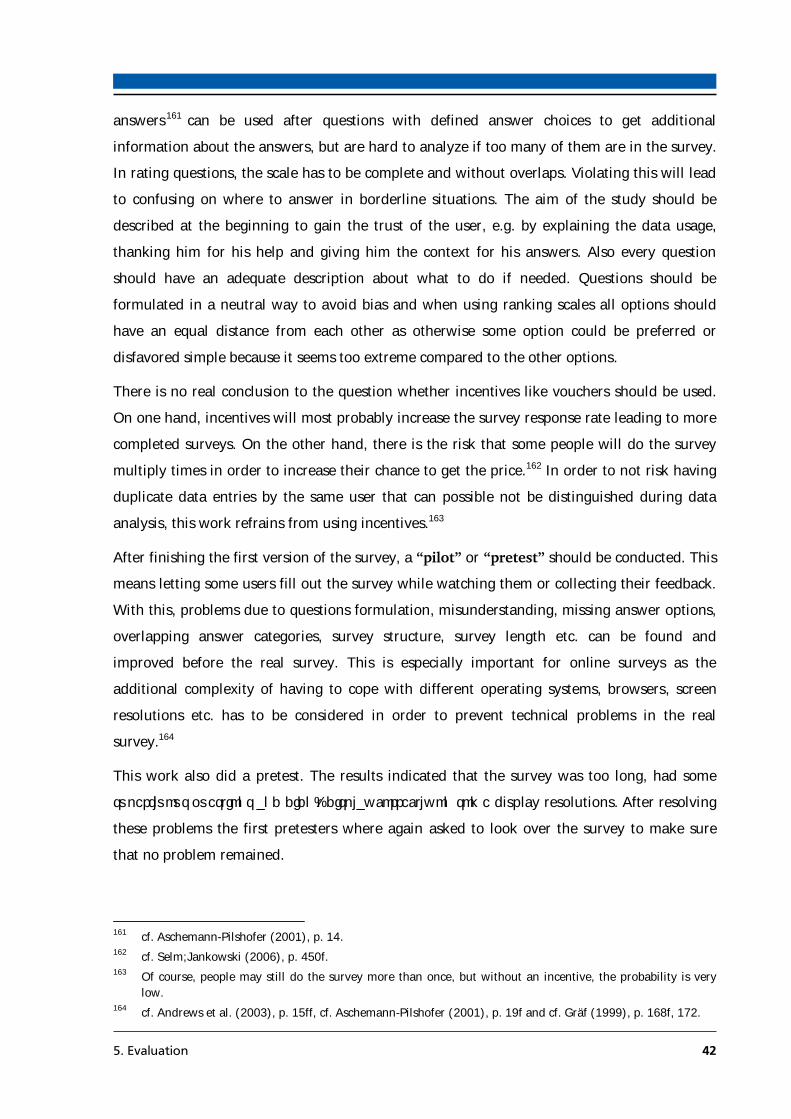
5. Evaluation 42
answers161 can be used after questions with defined answer choices to get additional
information about the answers, but are hard to analyze if too many of them are in the survey.
In rating questions, the scale has to be complete and without overlaps. Violating this will lead
to confusing on where to answer in borderline situations. The aim of the study should be
described at the beginning to gain the trust of the user, e.g. by explaining the data usage,
thanking him for his help and giving him the context for his answers. Also every question
should have an adequate description about what to do if needed. Questions should be
formulated in a neutral way to avoid bias and when using ranking scales all options should
have an equal distance from each other as otherwise some option could be preferred or
disfavored simple because it seems too extreme compared to the other options.
There is no real conclusion to the question whether incentives like vouchers should be used.
On one hand, incentives will most probably increase the survey response rate leading to more
completed surveys. On the other hand, there is the risk that some people will do the survey
multiply times in order to increase their chance to get the price.162 In order to not risk having
duplicate data entries by the same user that can possible not be distinguished during data
analysis, this work refrains from using incentives.163
After finishing the first version of the survey, a “pilot” or “pretest” should be conducted. This
means letting some users fill out the survey while watching them or collecting their feedback.
With this, problems due to questions formulation, misunderstanding, missing answer options,
overlapping answer categories, survey structure, survey length etc. can be found and
improved before the real survey. This is especially important for online surveys as the
additional complexity of having to cope with different operating systems, browsers, screen
resolutions etc. has to be considered in order to prevent technical problems in the real
survey.164
This work also did a pretest. The results indicated that the survey was too long, had some
superfluous questions and didn’t display correctly on some display resolutions. After resolving
these problems the first pretesters where again asked to look over the survey to make sure
that no problem remained.
161
cf. Aschemann-Pilshofer (2001), p. 14. 162
cf. Selm;Jankowski (2006), p. 450f. 163
Of course, people may still do the survey more than once, but without an incentive, the probability is very
low. 164
cf. Andrews et al. (2003), p. 15ff, cf. Aschemann-Pilshofer (2001), p. 19f and cf. Gräf (1999), p. 168f, 172.

5. Evaluation 43
5.2.3 Survey Description
The actual survey consists of the following five subtopics that are asked in this order:
1. Personal data
2. Motivation/need for using product review summary
3. Comparing the three different feature extraction methods
4. Comparing different summary layouts
5. Evaluating summaries created by using different sentiment analysis configurations
Personal data is used for cross-analysis to compare different user groups. After that some
questions are asked about the online shopping experience of the users like how many reviews
they normally read for a product, how they feel when reading reviews or if they ever wished
to have a summary instead of the reviews. These questions aim to verify the actual need for
automated review summarization which was disregarded by other papers.
After that, the users are randomly assigned to one of two products. One group will see
summaries about a smartphone for the rest of the survey while the other will see summaries
of a movie. Those two products were randomly chosen from their respective product
categories with the only restriction being that both should have around 300 reviews in order
to create summaries for a realistic scenario where they could be needed. A review count of
around 300 was chosen to work with a relatively popular product while keeping processing
speed in reasonable levels.165 The two product categories, smartphones and movies, were
chosen as they represent completely different product types: Smartphones (an example of a
“use-driven” product166) are very structured and technical, making them easily describable in
terms of their different parts like camera or display. This also allows for objectively measuring
their quality to some degree like amount main memory, weight, processing speed. Lastly,
nowadays, a lot of people have experience with smartphones, making it easier for them to
judge the summaries. On the other hand, movies (belonging to the “content-driven” product
class) can’t be easily broken down into smaller parts. Although sub-aspects like music or
lighting exist, they can’t be objectively measured as everything about movies is subjective
opinion. As the aim of this study is a universally useable summarization approach, using
165
The implementation does not focus on processing speed, but on analyzability of each sub-step and modularity
to allow for different configurations and easy extensibility. Therefore processing takes a considerably long
time on the author’s computer. In a practical scenario a performance-focused implementation can be used
and the possibility to use several servers or a cloud for the analysis exists to greatly speed up the analysis. 166
See section 2.1.

5. Evaluation 44
products from two different product categories makes it possible to at least get an indication
whether the approach really works universally. In order to really assess this, a survey that
only focuses on this point has to be conducted, e.g. using many products from many different
categories. But as this survey focuses more on the different configurations for the
summarization approach167, only two products were chosen.
For the feature extraction evaluation, the user gets lists with the top ten feature names
together with some other feature members from the three implemented feature extraction
methods168. The user is asked to choose the list that best fits the product and to rate the
feature names. The aim is to find the best extraction method according to the user and
evaluate the quality of the chosen feature name. A free answer field allows for additional
comments.
After that the user should evaluate the summary layout. They first have to choose whether
the list or table layout169 is better. After that two questions are asked in random order to
eliminate a possible bias through the question order: (1) Do the users prefer to see sentiment
scores or not and (2) do they want to see the amount of reviews that mention a feature
positively and negatively. The actual content of the summaries is always the same, only the
layout differs at this time of the survey. Therefore preference for one option should only come
from the actual layout and not the summary content. The shown summaries at this point only
have one feature each, so the users are also asked how many features they would like to see
per feature and how many sentences per feature the summary should contain. Again, a free
answer field can be used for additional comments.
The last part of the survey is used to evaluate the different sentiment analysis approaches.
For this, the users have to actually read the content of summaries about the smartphone or
movie and rate their quality on a seven-point rating scale. As the table layout was randomly
chosen for these summaries, these questions are asked after the layout questions in order to
prevent bias from being exposed to one layout for a long time. Four different summaries are
shown to the user in random order, each with the same layout. The summaries only differ in
the used sentiment analysis configuration. Therefore, a difference in the user rating reflects
the difference in the quality of the sentiment analysis configurations.
167
See sections 4.2.3, 4.3.6 and 4.4.5. 168
See section 4.2.3. 169
See section 4.4.5.3.

5. Evaluation 45
The following four configurations are used:170
Random: From all sentences associated to a feature, sentences are randomly selected
and classified as positive or negative sentences.
Base: Adjectives and adverbs of degree as modifiers are used to calculate a sentiment
score for a sentence.
Verb: In addition to the Base-configuration, verbs are also used as opinion words.
Aspect: Using the Base-configuration, aspect-level sentiment analysis is performed
instead of sentence-level sentiment analysis.
Random is used as a benchmark for the other three configurations. If the users rate them
significantly higher than the Random-configuration, the configurations are able to analyze
sentiment. The Base-configuration is used as a minimal configuration for the system. While it
is possible to use only adjectives without adverbs, using adverbs is a natural way to make the
sentiment analysis more precise. As the result in Wei et al. (2010) indicated that using verbs
in addition to adjectives had a negative effect on the sentiment analysis quality, it is
interesting to see whether the result will be the same in the method proposed by this work.
Lastly, it needs to be analyzed whether aspect-level sentence sentiment analysis has a positive
effect on the user rating.
In the pretest two more configurations where tested:
Time: Using the Base-configurations, the sentiment score is weighted according to the
review time.
All: Includes all options used in Base-, Verb-, Aspect- and Time-configuration.
As the pretest showed that the survey was too long and the users didn’t want to read this
many summaries, these two configurations were removed for the following reasons:
Evaluating the Time-configuration only really works when creating various summaries with
different time reference points. Only like this would the effect of weighting by review time be
actually observable. As this would make the survey way too long, this configuration was
removed. Still, as discussed in section 4.3.6.3, using the review time should be beneficial in
practice. While having an All-configuration would be useful to evaluate interaction effects
between the configurations, evaluating the configurations themselves first is more important.
Therefore this configuration was also cut from the summary. Additionally, the option to limit
170
See section 4.3.6 for all possible configurations and details about them.

5. Evaluation 46
the amount of sentences from one review171 is also not used for summaries in the survey as
this option possible hinders the sentiment analysis to choose the top rated sentences for a
feature. Therefore the user rating could also differ between summaries because less extreme
sentences are selected for some features and not only because of the different sentiment
analysis configurations. But as discussed in section 4.4.5.2, in a practical scenario this option
should be used.
For all summaries created in the survey, a feature extraction method had to be chosen. For
this the result of the comparison of six products described in section 5.1 is used. Table 7
shows how often each method has the highest F1-Measure for five features. A feature count of
five has been chosen as it seemed reasonable for the author to include this amount of features
into a summary. But as this had to be chosen before conducting the survey, the survey results
for the ideal feature count (see section 5.2.4.4) could not be considered.
Modified Wang et al.
(2013)
Modified Scaffidi et
al. (2007)
Meta approach
5 features 5/6 5/6 3/6
Table 7: F1-Measure Comparision
For five features Wang et al. (2013) and Scaffidi et al. (2007) perform best. For the survey,
one of those two methods should therefore be used as basis for the sentiment analysis
questions. As there is no clear winner between the two even when looking at Figure 2 to
Figure 7, Wang et al. (2013) has been randomly selected. Still, as all created summaries use
the same feature extraction, differences in the rating are still only produced by the different
sentiment analysis configurations. Even if Wang et al. (2013) is not the optimal configuration,
it should not affect the result of the sentiment analysis configuration comparison.
5.2.4 Survey Results
To find users for the survey, links to the survey were put on several websites including
Reddit172 and Facebook. The full survey for the smartphone and movie respectively can be
found in the appendix. The following sections will explain the results of the various survey
parts.
171
See section 4.4.5.2. 172
https://www.reddit.com/r/SampleSize/

5. Evaluation 47
5.2.4.1 Personal Data and Motivation for Using Product Review Summary
The survey was open for three weeks and was started 214 times. 52 surveys were completed
and subsequently used for the evaluation. Figure 8 shows the gender distribution and Figure 9
shows the age distribution. The survey was mainly completed by males between 25 and 29
years. This may stem from the fact that the survey was advertised at places like Reddit and
the author’s university major’s Facebook group where there might be more male than female
members. Figure 10 shows the employment situation of the respondents. As the survey was
advertised in a university’s Facebook page it is not surprising that mainly university students
answered the survey. The one person who selected “other” as his occupation stated that he is
a solder.
Figure 8: Survey Results - Gender
Figure 9: Survey Results - Age
10
42
Gender (N=52)
female
male
2
6
1 1
12
24
5
1
0
5
10
15
20
25
30
20 - 24 25 - 29 30 - 34 35 - 39 65 or older
Age (N=52)
female
male
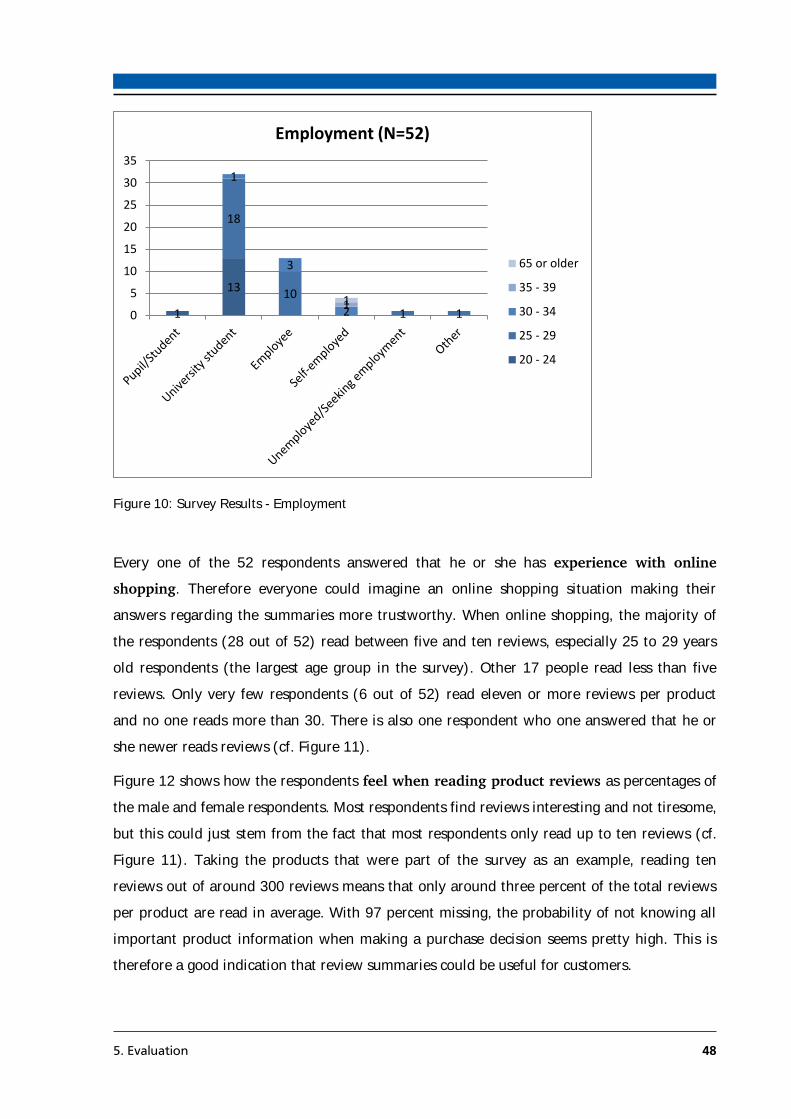
5. Evaluation 48
Figure 10: Survey Results - Employment
Every one of the 52 respondents answered that he or she has experience with online
shopping. Therefore everyone could imagine an online shopping situation making their
answers regarding the summaries more trustworthy. When online shopping, the majority of
the respondents (28 out of 52) read between five and ten reviews, especially 25 to 29 years
old respondents (the largest age group in the survey). Other 17 people read less than five
reviews. Only very few respondents (6 out of 52) read eleven or more reviews per product
and no one reads more than 30. There is also one respondent who one answered that he or
she newer reads reviews (cf. Figure 11).
Figure 12 shows how the respondents feel when reading product reviews as percentages of
the male and female respondents. Most respondents find reviews interesting and not tiresome,
but this could just stem from the fact that most respondents only read up to ten reviews (cf.
Figure 11). Taking the products that were part of the survey as an example, reading ten
reviews out of around 300 reviews means that only around three percent of the total reviews
per product are read in average. With 97 percent missing, the probability of not knowing all
important product information when making a purchase decision seems pretty high. This is
therefore a good indication that review summaries could be useful for customers.
1
13
18
10
1 1
1
3
2 1 1
0
5
10
15
20
25
30
35
Employment (N=52)
65 or older
35 - 39
30 - 34
25 - 29
20 - 24

5. Evaluation 49
Figure 11: Survey Results - Avg. Number of Reviews Read
Figure 12: Survey Results - Feeling When Reading Product Reviews
Figure 12 seems to indicate that males feel more interested when reading reviews than
females, but as this could just stem from the fact that the sample size between males and
females differs, a t-Test was conducted to test whether the mean rating of males and females
is equal or not (Table 8). The result indicates that there is no significant difference between
males and females in the survey respondents concerning their feeling when reading product
reviews.
7 5
1 1 1
4
22
3
4
1
1
1 1
0
5
10
15
20
25
30
never read less than 5 5 - 10 11 - 20 21 - 30
Avg. amount of read reviews for a prodcut (N=52)
65 or older
35 - 39
30 - 34
25 - 29
20 - 24
0%
20%
0%
50%
20%
10%
2% 5% 12%
31%
48%
2%
0%
10%
20%
30%
40%
50%
60%
tiresome slightly tiresome neutral slightlyinteresting
interesting very interesting
Feeling when reading product reviews (N=52)
female male

5. Evaluation 50
Feeling when reading product reviews – two-sided t-Test for two samples with unequal variance
Test Hypothesis H0 Mean of male = Mean of females
female Male
N 10 41
Mean Value 5 5.238095238
Empirical Variance 1.555555556 1.06387921
Degrees of Freedom (dF) 12
t-Statistics -0.559819751
Alpha 0.05
Critical Value t-Distribution 2.17881283
p-Value 0.585900816 => cannot reject H0 Table 8: t-Test - Feeling When Reading Product Reviews
Lastly, the respondents were directly asked whether they would like product review
summaries or not. The results indicate that the majority (39 out of 52) would like to have
review summaries (Figure 13). This supports the indication described above that there is a
need for product review summaries, therefore proving the theoretical derived need for
summaries described in the introduction of this paper (see chapter 1).
Figure 13: Survey Results - Wish for Product Review Summaries
As above a t-Test was performed to check whether a difference between males and females
exists regarding their wish for product review summaries. The result is shown in Table 9 and
indicates that there is no significant difference. Together with the results described above, this
indicates that there is no difference between male and female customers for the online
shopping situation. Everyone finds reading reviews interesting while at the same time only
reading a very small amount of reviews. This result together with the explicit wish for
summaries proves the need for product review summarization.
8 2
31
11 0
10
20
30
40
50
Yes No
Wish for review summaries (N=52)
male
female
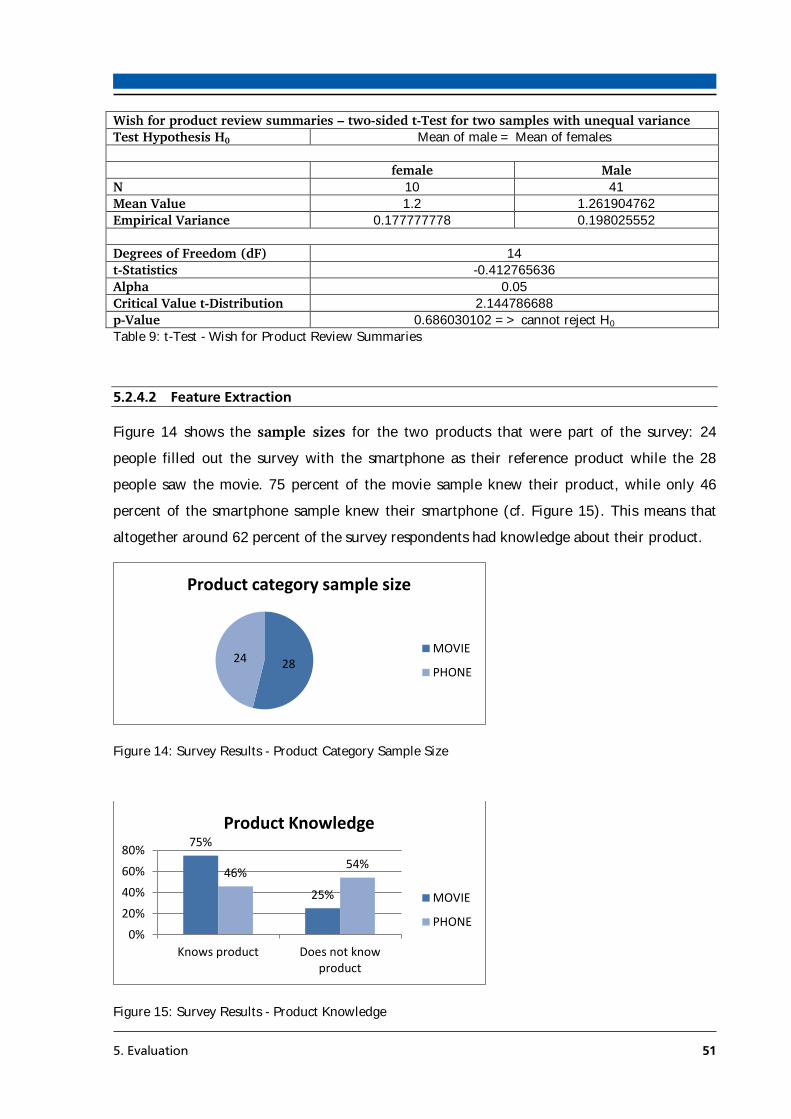
5. Evaluation 51
Wish for product review summaries – two-sided t-Test for two samples with unequal variance
Test Hypothesis H0 Mean of male = Mean of females
female Male
N 10 41
Mean Value 1.2 1.261904762
Empirical Variance 0.177777778 0.198025552
Degrees of Freedom (dF) 14
t-Statistics -0.412765636
Alpha 0.05
Critical Value t-Distribution 2.144786688
p-Value 0.686030102 => cannot reject H0 Table 9: t-Test - Wish for Product Review Summaries
5.2.4.2 Feature Extraction
Figure 14 shows the sample sizes for the two products that were part of the survey: 24
people filled out the survey with the smartphone as their reference product while the 28
people saw the movie. 75 percent of the movie sample knew their product, while only 46
percent of the smartphone sample knew their smartphone (cf. Figure 15). This means that
altogether around 62 percent of the survey respondents had knowledge about their product.
Figure 14: Survey Results - Product Category Sample Size
Figure 15: Survey Results - Product Knowledge
28 24
Product category sample size
MOVIE
PHONE
75%
25%
46% 54%
0%
20%
40%
60%
80%
Knows product Does not knowproduct
Product Knowledge
MOVIE
PHONE

5. Evaluation 52
Figure 16 and Figure 17 show the results for the comparison of three different feature
extraction methods implemented in this work173. The survey results indicate that the Meta
approach performs best in an overall setting.174 For the movie, the modified Scaffidi et al.
(2007) approach performs best, but the Meta approach is close behind. For the smartphone,
the modified Wang et al. (2013) approach wins, although it is rated worst when considering
both products. For the smartphone, the Meta approach again achieves a good second place.
This indicates that while different methods may perform better for different product
categories, the Meta approach (through the combination of the various input approaches) is
able to achieve the best result when considering all product categories at the same time. It
therefore suits the goal of this work, a universally usable summarization approach, best.
Apart from this, 18 percent of the movie sample (five people) and 13 percent of the
smartphone sample (three people) consider none of the methods as good. This clearly
indicates that the feature extraction approach can be further enhanced, but this also shows
that 85 percent of all respondents (44 people) thought that the feature extraction methods are
usable. This is therefore great evidence that the implemented approaches can be used in
practice.
Figure 16: Survey Results - Extraction Method -Total-
173
See section 4.2.3. 174
Although by only one vote.
8
13 15
16
0
5
10
15
20
None of them Wang Scaffidi Meta
Best feature extraction method (N=52) - Total -

5. Evaluation 53
Figure 17: Survey Results - Extraction Method -Movie vs. Smartphone-
Figure 18 shows the result of the feature extraction evaluation when considering the
respondent’s knowledge about the product. People who know the product consider Scaffidi et
al. (2007) as the best method, but the Meta approach is not that far behind. For people
without knowledge about the product, both Wang et al. (2013) and the Meta approach
perform equally well. This again shows that the Meta approach seems to be the most
promising method of the three tested ones as it works well for both groups.
Figure 18 also shows that 19 percent of the respondents who know the product don’t like any
of the three approaches (vs. only ten percent for respondents without knowledge). This,
again, shows that the feature extraction can be further enhanced, but that the methods work
around 90 percent of the sample is strong evidence that they can be successfully used in
practice.
Figure 18: Survey Results - Extraction Method -Product Knowledge-
18% 14%
36% 32%
13%
38%
21%
29%
0%
10%
20%
30%
40%
None of them Wang Scaffidi Meta
Best feature extraction method (N=52) - Movie vs. Smartphone -
MOVIE
PHONE
19% 19%
34%
28%
10%
35%
20%
35%
0%
10%
20%
30%
40%
None of them Wang Scaffidi Meta
Best feature extraction method (N=52) - Product known vs. not known -
Knows product
Does not know product
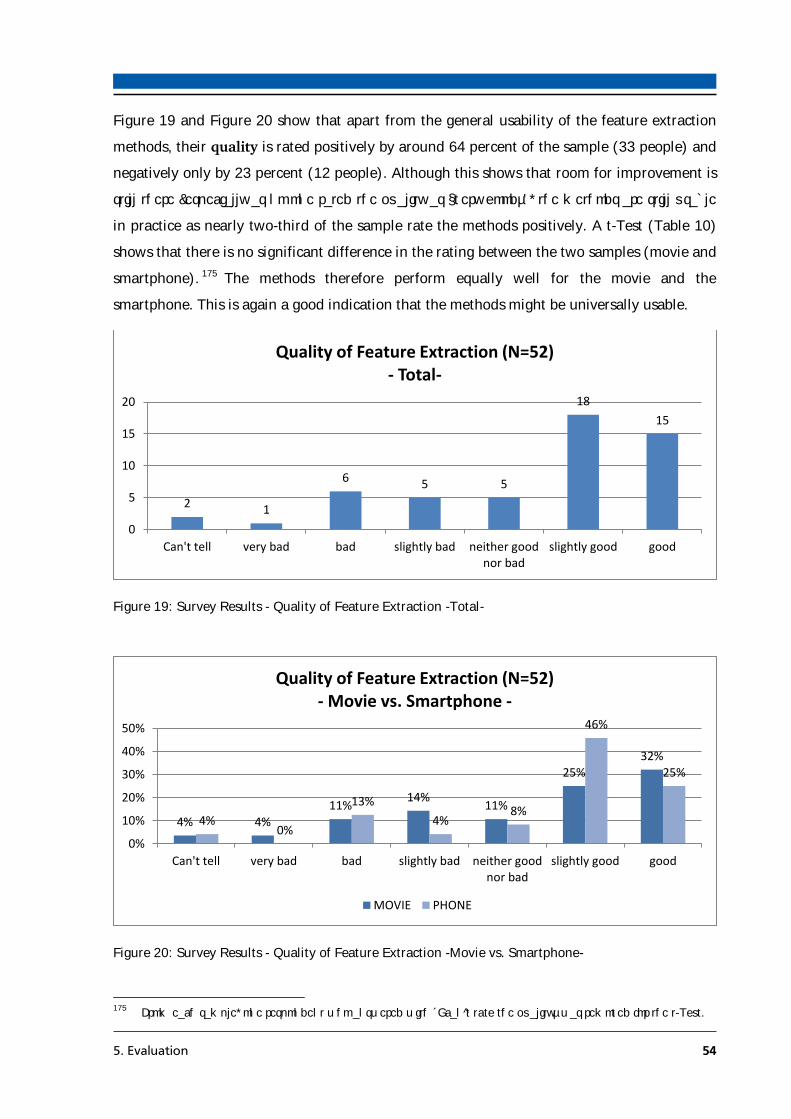
5. Evaluation 54
Figure 19 and Figure 20 show that apart from the general usability of the feature extraction
methods, their quality is rated positively by around 64 percent of the sample (33 people) and
negatively only by 23 percent (12 people). Although this shows that room for improvement is
still there (especially as no one rated the quality as “very good”), the methods are still usable
in practice as nearly two-third of the sample rate the methods positively. A t-Test (Table 10)
shows that there is no significant difference in the rating between the two samples (movie and
smartphone). 175 The methods therefore perform equally well for the movie and the
smartphone. This is again a good indication that the methods might be universally usable.
Figure 19: Survey Results - Quality of Feature Extraction -Total-
Figure 20: Survey Results - Quality of Feature Extraction -Movie vs. Smartphone-
175
From each sample, one respondent who answered with „I can‘t rate the quality” was removed for the t-Test.
2 1
6 5 5
18
15
0
5
10
15
20
Can't tell very bad bad slightly bad neither goodnor bad
slightly good good
Quality of Feature Extraction (N=52) - Total-
4% 4% 11%
14% 11%
25% 32%
4% 0%
13%
4% 8%
46%
25%
0%
10%
20%
30%
40%
50%
Can't tell very bad bad slightly bad neither goodnor bad
slightly good good
Quality of Feature Extraction (N=52) - Movie vs. Smartphone -
MOVIE PHONE

5. Evaluation 55
Quality of feature extraction – two-sided t-Test for two samples with unequal variance
Test Hypothesis H0 Mean of movie = Mean of smartphone
movie smartphone
N 27 23
Mean Value 4.444444444 4.695652174
Empirical Variance 2.41025641 1.675889328
Degrees of Freedom (dF) 28
t-Statistics -0.623873598
Alpha 0.05
Critical Value t-Distribution 2.010634758
p-Value 0.535664412 => cannot reject H0 Table 10: t-Test - Quality of Feature Extraction -Movie vs. Smartphone-
When testing whether knowledge about the product has an effect or not, Figure 21 shows that
respondents who don’t know the product rate the quality of the feature extraction better than
respondents who know (70 percent vs. 59 percent with a rating of “slightly good” or better).
But a t-Test shows that this difference is not significant (Table 11).176 The implemented
methods therefore work independently from the product knowledge. This proves a universal
applicability for all potential users.
Figure 21: Survey Results - Quality of Feature Extraction -Product Knowledge-
176
For „knows product“ two people who answered “I can’t rate the quality” were removed for the test.
6% 3%
13% 9% 9%
25%
34%
0% 0%
10% 10% 10%
50%
20%
0%
10%
20%
30%
40%
50%
60%
Can't tell very bad bad slightly bad neither goodnor bad
slightly good good
Quality of Feature Extraction (N=52) - Product known vs. not known -
Knows product Does not know product
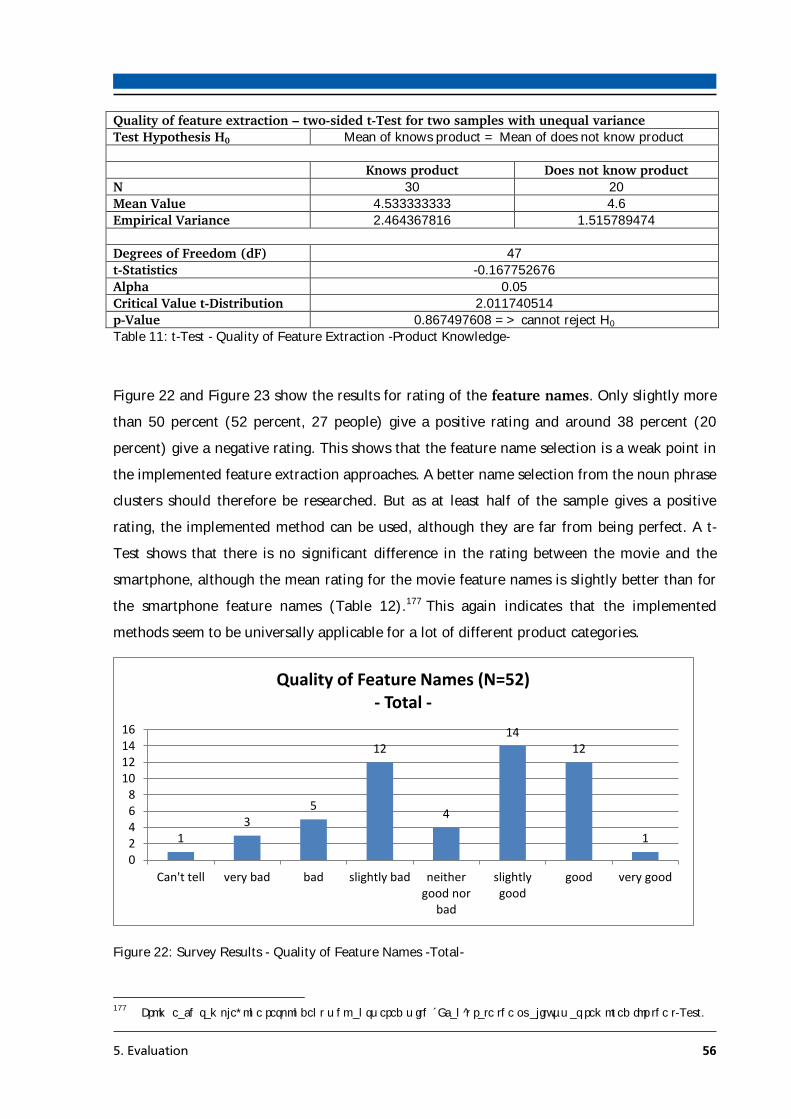
5. Evaluation 56
Quality of feature extraction – two-sided t-Test for two samples with unequal variance
Test Hypothesis H0 Mean of knows product = Mean of does not know product
Knows product Does not know product
N 30 20
Mean Value 4.533333333 4.6
Empirical Variance 2.464367816 1.515789474
Degrees of Freedom (dF) 47
t-Statistics -0.167752676
Alpha 0.05
Critical Value t-Distribution 2.011740514
p-Value 0.867497608 => cannot reject H0 Table 11: t-Test - Quality of Feature Extraction -Product Knowledge-
Figure 22 and Figure 23 show the results for rating of the feature names. Only slightly more
than 50 percent (52 percent, 27 people) give a positive rating and around 38 percent (20
percent) give a negative rating. This shows that the feature name selection is a weak point in
the implemented feature extraction approaches. A better name selection from the noun phrase
clusters should therefore be researched. But as at least half of the sample gives a positive
rating, the implemented method can be used, although they are far from being perfect. A t-
Test shows that there is no significant difference in the rating between the movie and the
smartphone, although the mean rating for the movie feature names is slightly better than for
the smartphone feature names (Table 12).177 This again indicates that the implemented
methods seem to be universally applicable for a lot of different product categories.
Figure 22: Survey Results - Quality of Feature Names -Total-
177
From each sample, one respondent who answered with „I can‘t rate the quality” was removed for the t-Test.
1 3
5
12
4
14 12
1
02468
10121416
Can't tell very bad bad slightly bad neithergood nor
bad
slightlygood
good very good
Quality of Feature Names (N=52) - Total -

5. Evaluation 57
Figure 23: Survey Results - Quality of Feature Names -Movie vs. Smartphone-
Quality of feature names– two-sided t-Test for two samples with unequal variance
Test Hypothesis H0 Mean of movie = Mean of smartphone
movie smartphone
N 28 24
Mean Value 4.5 3.625
Empirical Variance 2.259259259 3.635869565
Degrees of Freedom (dF) 44
t-Statistics 1.815906189
Alpha 0.05
Critical Value t-Distribution 2.015367574
p-Value 0.076202554 => cannot reject H0 Table 12: t-Test - Quality of Feature Names -Movie vs. Smartphone-
When controlling for the knowledge about the product (Figure 24), a t-Test shows again no
significant difference between people who know the product and people who don’t (Table
13). The mean values of both groups are close to the “neither good nor bad”-category which
again indicates that the feature names are acceptable, but not really good.
0% 4% 4%
25%
11%
25% 29%
4% 4% 8%
17% 21%
4%
29%
17%
0% 0%
5%
10%
15%
20%
25%
30%
35%
Can't tell very bad bad slightly bad neithergood nor
bad
slightlygood
good very good
Quality of Feature Names (N=52) - Movie vs. Smartphone -
MOVIE PHONE
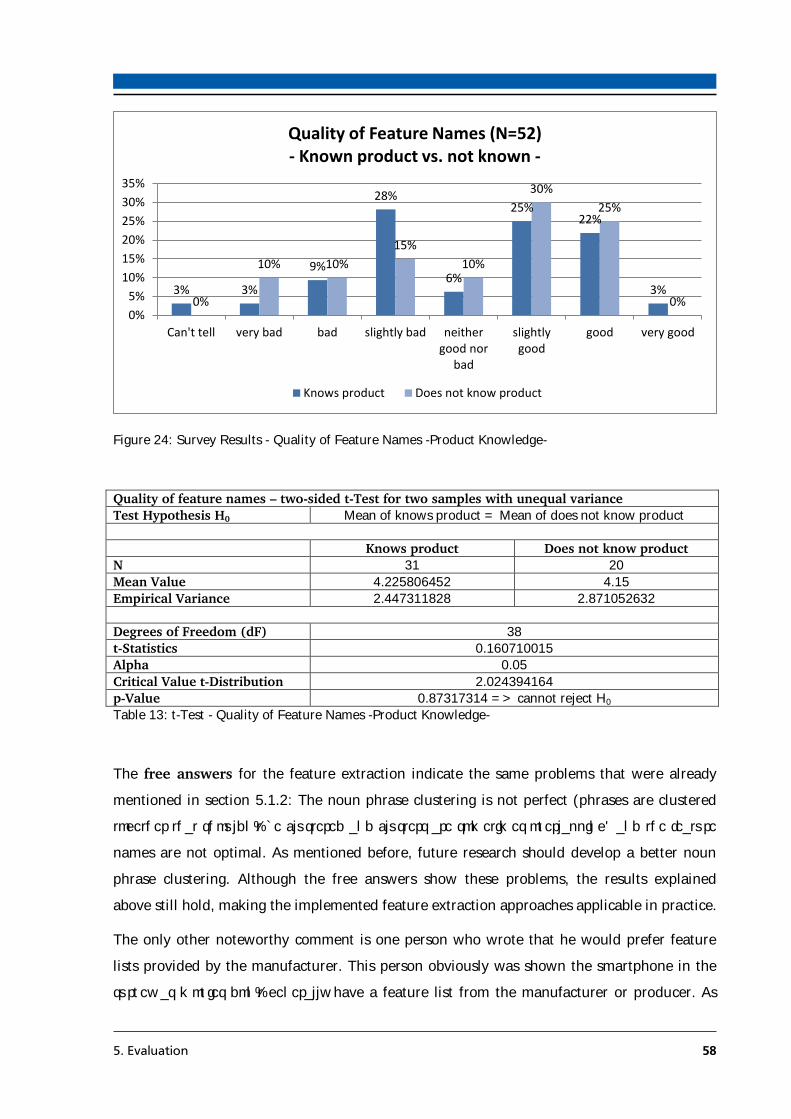
5. Evaluation 58
Figure 24: Survey Results - Quality of Feature Names -Product Knowledge-
Quality of feature names – two-sided t-Test for two samples with unequal variance
Test Hypothesis H0 Mean of knows product = Mean of does not know product
Knows product Does not know product
N 31 20
Mean Value 4.225806452 4.15
Empirical Variance 2.447311828 2.871052632
Degrees of Freedom (dF) 38
t-Statistics 0.160710015
Alpha 0.05
Critical Value t-Distribution 2.024394164
p-Value 0.87317314 => cannot reject H0 Table 13: t-Test - Quality of Feature Names -Product Knowledge-
The free answers for the feature extraction indicate the same problems that were already
mentioned in section 5.1.2: The noun phrase clustering is not perfect (phrases are clustered
together that shouldn’t be clustered and clusters are sometimes overlapping) and the feature
names are not optimal. As mentioned before, future research should develop a better noun
phrase clustering. Although the free answers show these problems, the results explained
above still hold, making the implemented feature extraction approaches applicable in practice.
The only other noteworthy comment is one person who wrote that he would prefer feature
lists provided by the manufacturer. This person obviously was shown the smartphone in the
survey as movies don’t generally have a feature list from the manufacturer or producer. As
3% 3%
9%
28%
6%
25% 22%
3% 0%
10% 10%
15%
10%
30%
25%
0% 0%
5%
10%
15%
20%
25%
30%
35%
Can't tell very bad bad slightly bad neithergood nor
bad
slightlygood
good very good
Quality of Feature Names (N=52) - Known product vs. not known -
Knows product Does not know product
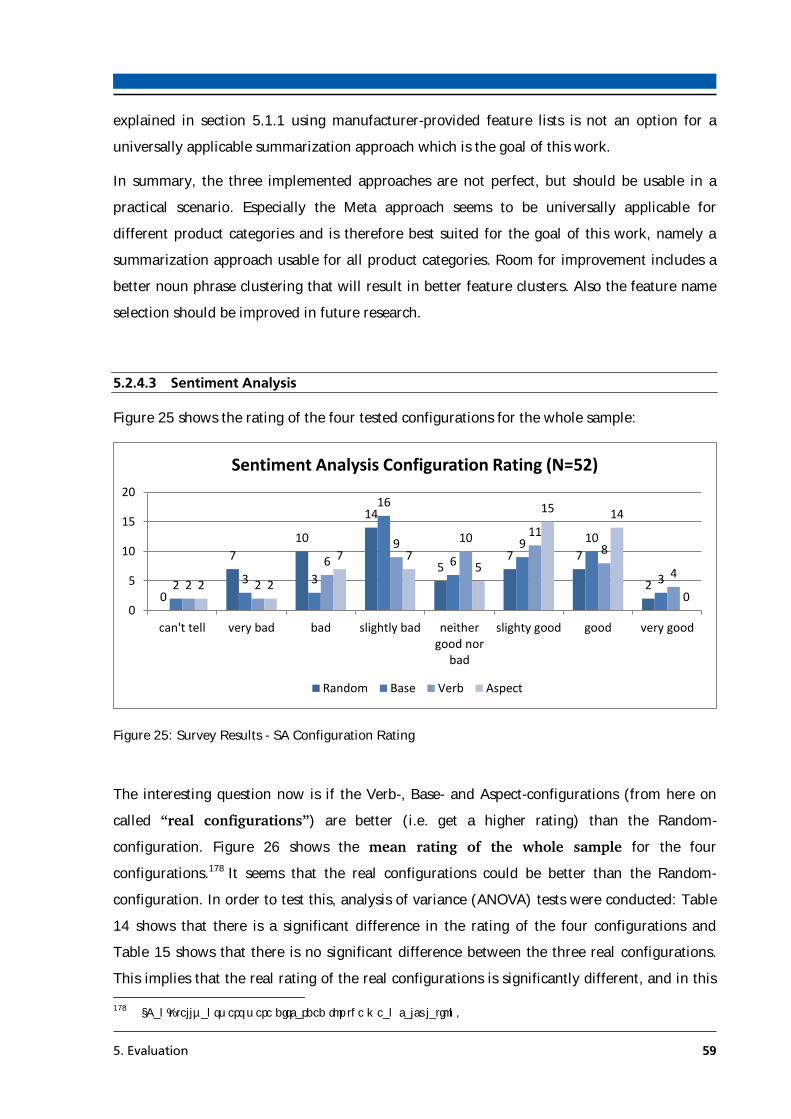
5. Evaluation 59
explained in section 5.1.1 using manufacturer-provided feature lists is not an option for a
universally applicable summarization approach which is the goal of this work.
In summary, the three implemented approaches are not perfect, but should be usable in a
practical scenario. Especially the Meta approach seems to be universally applicable for
different product categories and is therefore best suited for the goal of this work, namely a
summarization approach usable for all product categories. Room for improvement includes a
better noun phrase clustering that will result in better feature clusters. Also the feature name
selection should be improved in future research.
5.2.4.3 Sentiment Analysis
Figure 25 shows the rating of the four tested configurations for the whole sample:
Figure 25: Survey Results - SA Configuration Rating
The interesting question now is if the Verb-, Base- and Aspect-configurations (from here on
called “real configurations”) are better (i.e. get a higher rating) than the Random-
configuration. Figure 26 shows the mean rating of the whole sample for the four
configurations.178 It seems that the real configurations could be better than the Random-
configuration. In order to test this, analysis of variance (ANOVA) tests were conducted: Table
14 shows that there is a significant difference in the rating of the four configurations and
Table 15 shows that there is no significant difference between the three real configurations.
This implies that the real rating of the real configurations is significantly different, and in this 178
“Can’t tell” answers were discarded for the mean calculation.
0
7
10
14
5 7 7
2 2 3 3
16
6
9 10
3 2 2
6
9 10 11
8
4 2 2
7 7 5
15 14
0 0
5
10
15
20
can't tell very bad bad slightly bad neithergood nor
bad
slighty good good very good
Sentiment Analysis Configuration Rating (N=52)
Random Base Verb Aspect
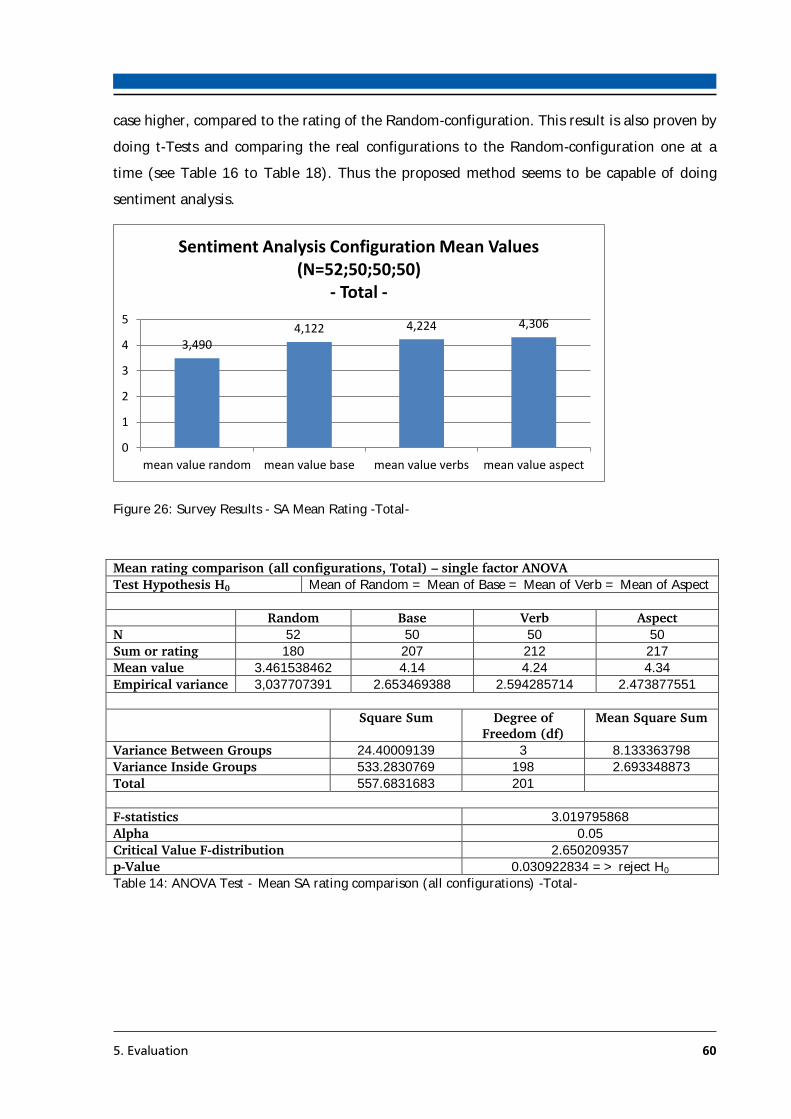
5. Evaluation 60
case higher, compared to the rating of the Random-configuration. This result is also proven by
doing t-Tests and comparing the real configurations to the Random-configuration one at a
time (see Table 16 to Table 18). Thus the proposed method seems to be capable of doing
sentiment analysis.
Figure 26: Survey Results - SA Mean Rating -Total-
Mean rating comparison (all configurations, Total) – single factor ANOVA
Test Hypothesis H0 Mean of Random = Mean of Base = Mean of Verb = Mean of Aspect
Random Base Verb Aspect
N 52 50 50 50
Sum or rating 180 207 212 217
Mean value 3.461538462 4.14 4.24 4.34
Empirical variance 3,037707391 2.653469388 2.594285714 2.473877551
Square Sum Degree of
Freedom (df)
Mean Square Sum
Variance Between Groups 24.40009139 3 8.133363798
Variance Inside Groups 533.2830769 198 2.693348873
Total 557.6831683 201
F-statistics 3.019795868
Alpha 0.05
Critical Value F-distribution 2.650209357
p-Value 0.030922834 => reject H0
Table 14: ANOVA Test – Mean SA rating comparison (all configurations) -Total-
3,490 4,122 4,224 4,306
0
1
2
3
4
5
mean value random mean value base mean value verbs mean value aspect
Sentiment Analysis Configuration Mean Values (N=52;50;50;50)
- Total -
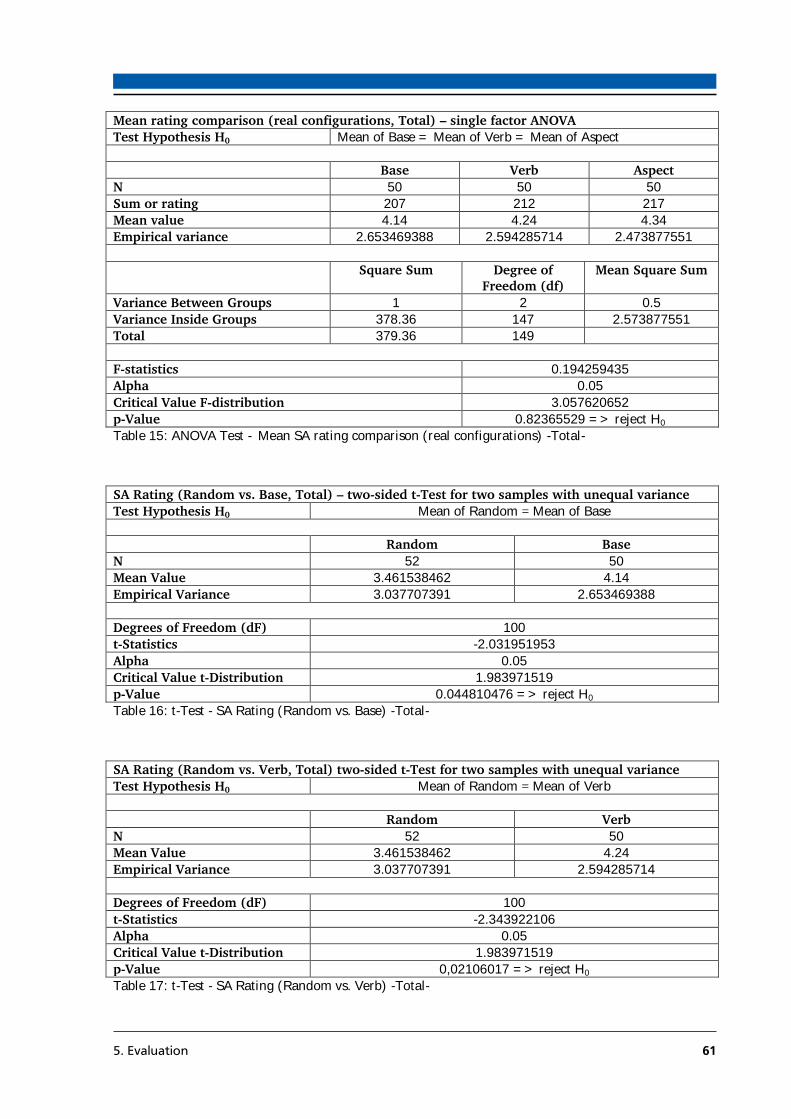
5. Evaluation 61
Mean rating comparison (real configurations, Total) – single factor ANOVA
Test Hypothesis H0 Mean of Base = Mean of Verb = Mean of Aspect
Base Verb Aspect
N 50 50 50
Sum or rating 207 212 217
Mean value 4.14 4.24 4.34
Empirical variance 2.653469388 2.594285714 2.473877551
Square Sum Degree of
Freedom (df)
Mean Square Sum
Variance Between Groups 1 2 0.5
Variance Inside Groups 378.36 147 2.573877551
Total 379.36 149
F-statistics 0.194259435
Alpha 0.05
Critical Value F-distribution 3.057620652
p-Value 0.82365529 => reject H0
Table 15: ANOVA Test – Mean SA rating comparison (real configurations) -Total-
SA Rating (Random vs. Base, Total) – two-sided t-Test for two samples with unequal variance
Test Hypothesis H0 Mean of Random = Mean of Base
Random Base
N 52 50
Mean Value 3.461538462 4.14
Empirical Variance 3.037707391 2.653469388
Degrees of Freedom (dF) 100
t-Statistics -2.031951953
Alpha 0.05
Critical Value t-Distribution 1.983971519
p-Value 0.044810476 => reject H0 Table 16: t-Test - SA Rating (Random vs. Base) -Total-
SA Rating (Random vs. Verb, Total) two-sided t-Test for two samples with unequal variance
Test Hypothesis H0 Mean of Random = Mean of Verb
Random Verb
N 52 50
Mean Value 3.461538462 4.24
Empirical Variance 3.037707391 2.594285714
Degrees of Freedom (dF) 100
t-Statistics -2.343922106
Alpha 0.05
Critical Value t-Distribution 1.983971519
p-Value 0,02106017 => reject H0 Table 17: t-Test - SA Rating (Random vs. Verb) -Total-
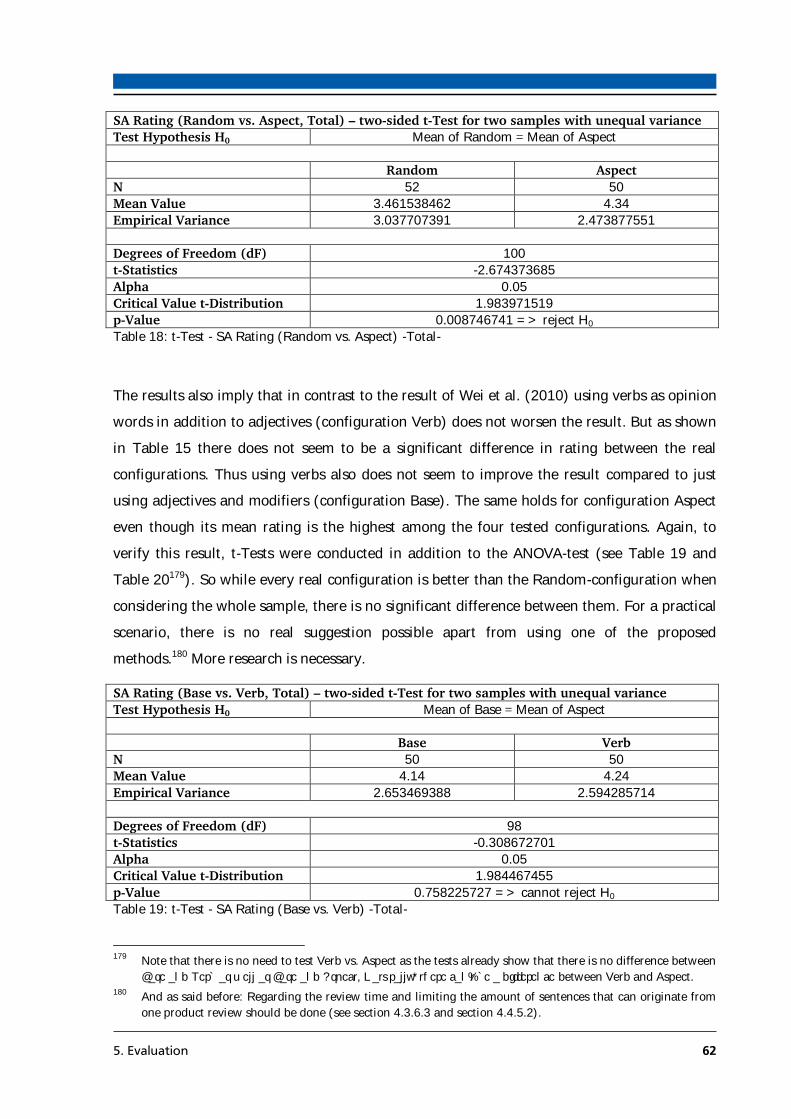
5. Evaluation 62
SA Rating (Random vs. Aspect, Total) – two-sided t-Test for two samples with unequal variance
Test Hypothesis H0 Mean of Random = Mean of Aspect
Random Aspect
N 52 50
Mean Value 3.461538462 4.34
Empirical Variance 3.037707391 2.473877551
Degrees of Freedom (dF) 100
t-Statistics -2.674373685
Alpha 0.05
Critical Value t-Distribution 1.983971519
p-Value 0.008746741 => reject H0 Table 18: t-Test - SA Rating (Random vs. Aspect) -Total-
The results also imply that in contrast to the result of Wei et al. (2010) using verbs as opinion
words in addition to adjectives (configuration Verb) does not worsen the result. But as shown
in Table 15 there does not seem to be a significant difference in rating between the real
configurations. Thus using verbs also does not seem to improve the result compared to just
using adjectives and modifiers (configuration Base). The same holds for configuration Aspect
even though its mean rating is the highest among the four tested configurations. Again, to
verify this result, t-Tests were conducted in addition to the ANOVA-test (see Table 19 and
Table 20179). So while every real configuration is better than the Random-configuration when
considering the whole sample, there is no significant difference between them. For a practical
scenario, there is no real suggestion possible apart from using one of the proposed
methods.180 More research is necessary.
SA Rating (Base vs. Verb, Total) – two-sided t-Test for two samples with unequal variance
Test Hypothesis H0 Mean of Base = Mean of Aspect
Base Verb
N 50 50
Mean Value 4.14 4.24
Empirical Variance 2.653469388 2.594285714
Degrees of Freedom (dF) 98
t-Statistics -0.308672701
Alpha 0.05
Critical Value t-Distribution 1.984467455
p-Value 0.758225727 => cannot reject H0 Table 19: t-Test - SA Rating (Base vs. Verb) -Total-
179
Note that there is no need to test Verb vs. Aspect as the tests already show that there is no difference between
Base and Verb as well as Base and Aspect. Naturally, there can’t be a difference between Verb and Aspect. 180
And as said before: Regarding the review time and limiting the amount of sentences that can originate from
one product review should be done (see section 4.3.6.3 and section 4.4.5.2).

5. Evaluation 63
SA Rating (Base vs. Aspect, Total) – two-sided t-Test for two samples with unequal variance
Test Hypothesis H0 Mean of Base = Mean of Aspect
Base Aspect
N 50 50
Mean Value 4.14 4.34
Empirical Variance 2.653469388 2.473877551
Degrees of Freedom (dF) 98
t-Statistics -0.62455206
Alpha 0.05
Critical Value t-Distribution 1.984467455
p-Value 0.533716452 => cannot reject H0 Table 20: t-Test - SA Rating (Base vs. Aspect) -Total-
The results change if the rating is analyzed per product category (Figure 27). Using ANOVA
there is no difference between any of the configurations detectable (Table 21 and Table 22).
Because this contradicts the previous result and because the test statistics are very close to
being significant on the five percent level, t-Tests were conducted again in which the Random-
configuration is tested against each of the real configurations (see Table 23 to Table 25 for
the movie subsample and Table 26 to Table 28 for the smartphone subsample). For both
subsamples only one configuration is significantly better than the Random-configuration. For
the movie the Aspect-configuration is significantly better and for the smartphone the Verb-
configuration is rated significantly higher. The survey data does not show why these
differences exist, but this result implies that depending on the product category different
configurations should be used, but it also implies that at least one of the proposed methods
always works.
Again, making a suggestion for a practical scenario is difficult. Choosing the configuration per
product category is difficult and not really a universally usable solution. But it at least seems
that the Base-configuration is not enough. When regarding the result of the whole sample
together with the subsample results, using the Verb- or Aspect-configuration seems promising,
but it could be even better to use the Verb- and Aspect-configuration at the same time.181
Maybe this would work for the movie and the smartphone as well as other product categories.
As this could not be tested in the scope of the conducted survey, more research is necessary.
181
Together with the review time and the sentence limitation.
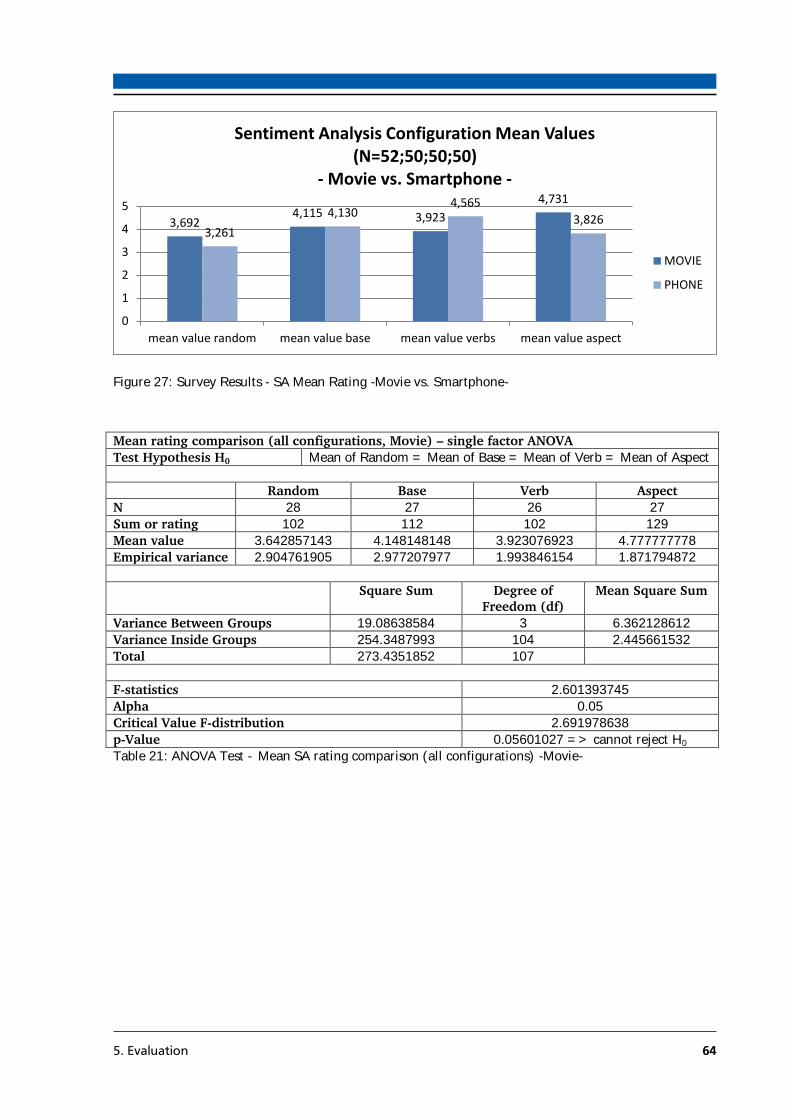
5. Evaluation 64
Figure 27: Survey Results - SA Mean Rating -Movie vs. Smartphone-
Mean rating comparison (all configurations, Movie) – single factor ANOVA
Test Hypothesis H0 Mean of Random = Mean of Base = Mean of Verb = Mean of Aspect
Random Base Verb Aspect
N 28 27 26 27
Sum or rating 102 112 102 129
Mean value 3.642857143 4.148148148 3.923076923 4.777777778
Empirical variance 2.904761905 2.977207977 1.993846154 1.871794872
Square Sum Degree of
Freedom (df)
Mean Square Sum
Variance Between Groups 19.08638584 3 6.362128612
Variance Inside Groups 254.3487993 104 2.445661532 Total 273.4351852 107
F-statistics 2.601393745
Alpha 0.05
Critical Value F-distribution 2.691978638
p-Value 0.05601027 => cannot reject H0
Table 21: ANOVA Test – Mean SA rating comparison (all configurations) -Movie-
3,692 4,115 3,923
4,731
3,261
4,130 4,565
3,826
0
1
2
3
4
5
mean value random mean value base mean value verbs mean value aspect
Sentiment Analysis Configuration Mean Values (N=52;50;50;50)
- Movie vs. Smartphone -
MOVIE
PHONE
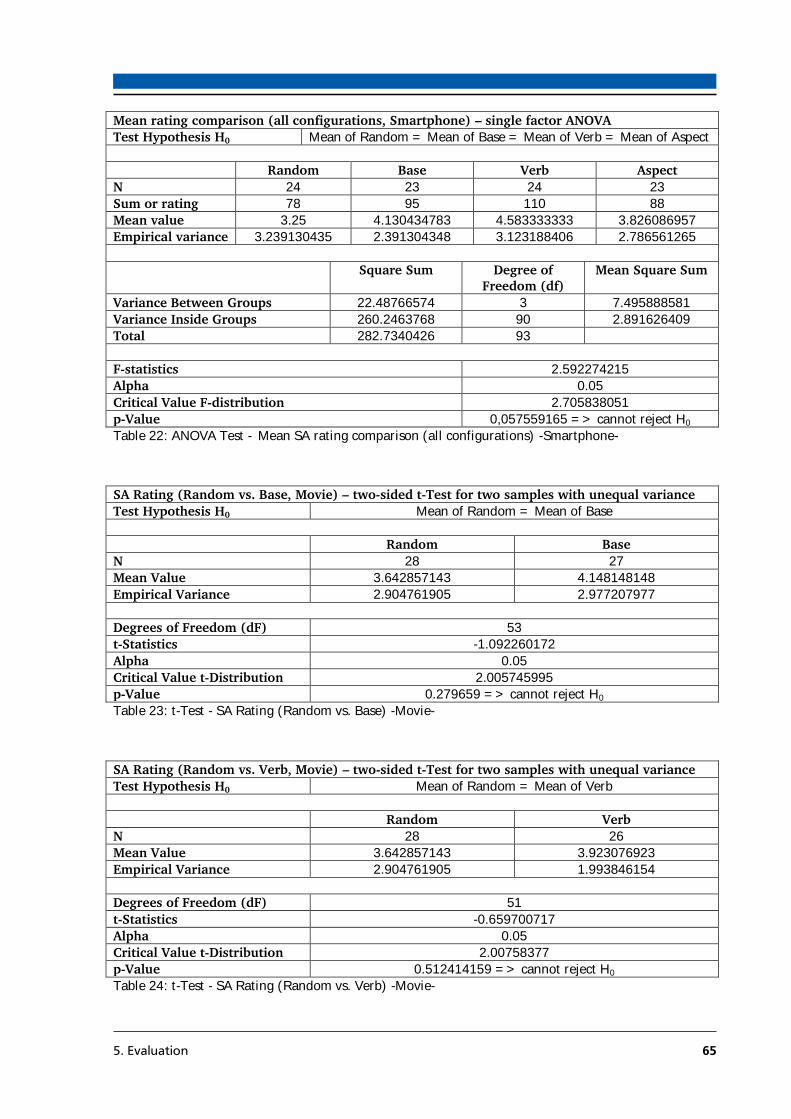
5. Evaluation 65
Mean rating comparison (all configurations, Smartphone) – single factor ANOVA
Test Hypothesis H0 Mean of Random = Mean of Base = Mean of Verb = Mean of Aspect
Random Base Verb Aspect
N 24 23 24 23
Sum or rating 78 95 110 88
Mean value 3.25 4.130434783 4.583333333 3.826086957
Empirical variance 3.239130435 2.391304348 3.123188406 2.786561265
Square Sum Degree of
Freedom (df)
Mean Square Sum
Variance Between Groups 22.48766574 3 7.495888581
Variance Inside Groups 260.2463768 90 2.891626409 Total 282.7340426 93
F-statistics 2.592274215
Alpha 0.05
Critical Value F-distribution 2.705838051
p-Value 0,057559165 => cannot reject H0
Table 22: ANOVA Test – Mean SA rating comparison (all configurations) -Smartphone-
SA Rating (Random vs. Base, Movie) – two-sided t-Test for two samples with unequal variance
Test Hypothesis H0 Mean of Random = Mean of Base
Random Base
N 28 27
Mean Value 3.642857143 4.148148148
Empirical Variance 2.904761905 2.977207977
Degrees of Freedom (dF) 53
t-Statistics -1.092260172
Alpha 0.05
Critical Value t-Distribution 2.005745995
p-Value 0.279659 => cannot reject H0 Table 23: t-Test - SA Rating (Random vs. Base) -Movie-
SA Rating (Random vs. Verb, Movie) – two-sided t-Test for two samples with unequal variance
Test Hypothesis H0 Mean of Random = Mean of Verb
Random Verb
N 28 26
Mean Value 3.642857143 3.923076923
Empirical Variance 2.904761905 1.993846154
Degrees of Freedom (dF) 51
t-Statistics -0.659700717
Alpha 0.05
Critical Value t-Distribution 2.00758377
p-Value 0.512414159 => cannot reject H0 Table 24: t-Test - SA Rating (Random vs. Verb) -Movie-
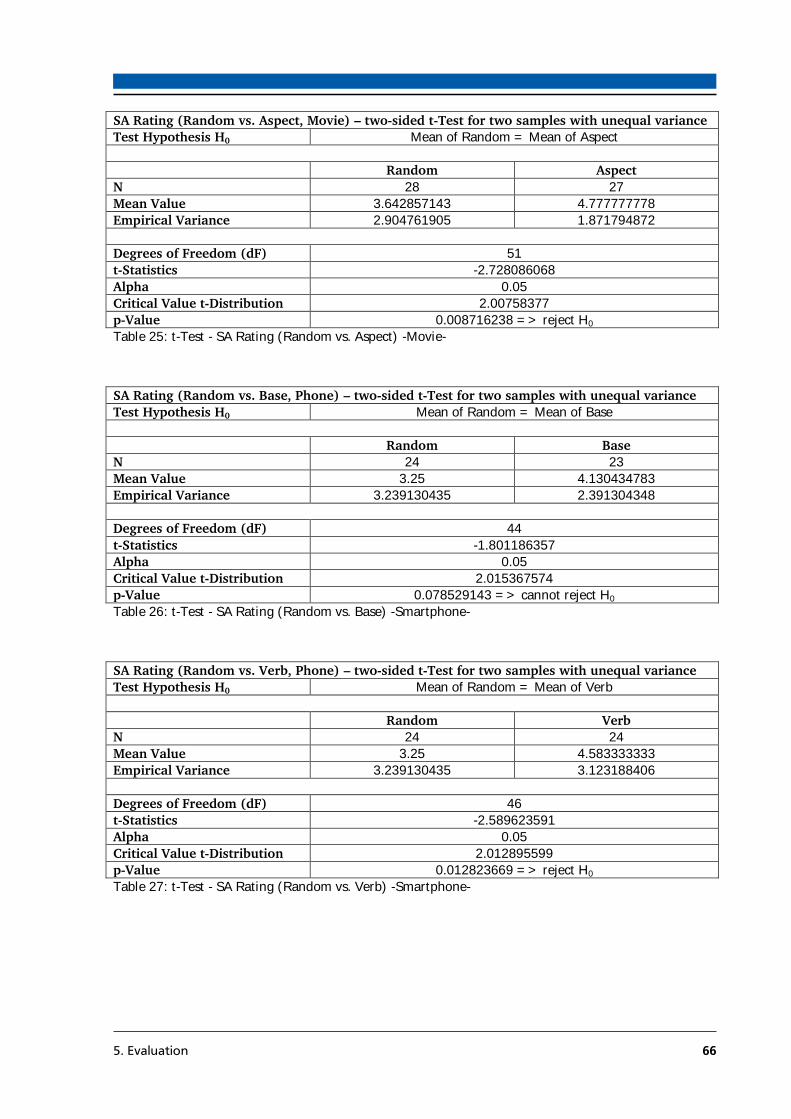
5. Evaluation 66
SA Rating (Random vs. Aspect, Movie) – two-sided t-Test for two samples with unequal variance
Test Hypothesis H0 Mean of Random = Mean of Aspect
Random Aspect
N 28 27
Mean Value 3.642857143 4.777777778
Empirical Variance 2.904761905 1.871794872
Degrees of Freedom (dF) 51
t-Statistics -2.728086068
Alpha 0.05
Critical Value t-Distribution 2.00758377
p-Value 0.008716238 => reject H0 Table 25: t-Test - SA Rating (Random vs. Aspect) -Movie-
SA Rating (Random vs. Base, Phone) – two-sided t-Test for two samples with unequal variance
Test Hypothesis H0 Mean of Random = Mean of Base
Random Base
N 24 23
Mean Value 3.25 4.130434783
Empirical Variance 3.239130435 2.391304348
Degrees of Freedom (dF) 44
t-Statistics -1.801186357
Alpha 0.05
Critical Value t-Distribution 2.015367574
p-Value 0.078529143 => cannot reject H0 Table 26: t-Test - SA Rating (Random vs. Base) -Smartphone-
SA Rating (Random vs. Verb, Phone) – two-sided t-Test for two samples with unequal variance
Test Hypothesis H0 Mean of Random = Mean of Verb
Random Verb
N 24 24
Mean Value 3.25 4.583333333
Empirical Variance 3.239130435 3.123188406
Degrees of Freedom (dF) 46
t-Statistics -2.589623591
Alpha 0.05
Critical Value t-Distribution 2.012895599
p-Value 0.012823669 => reject H0 Table 27: t-Test - SA Rating (Random vs. Verb) -Smartphone-
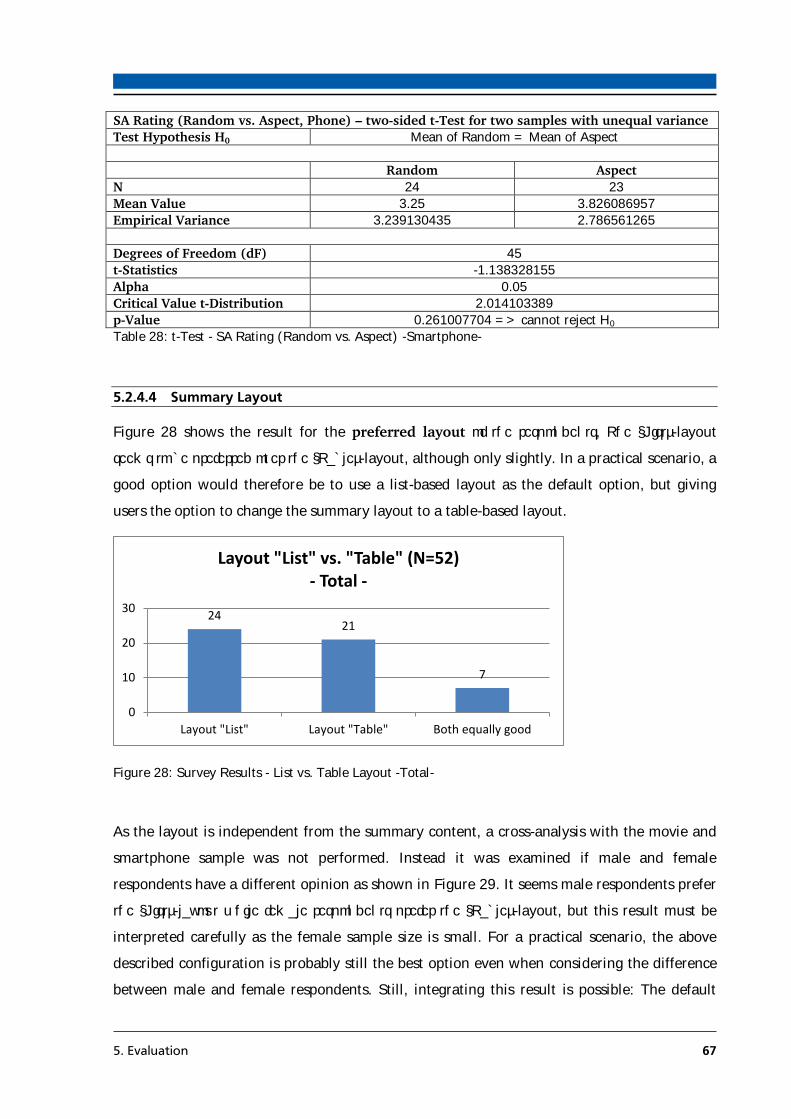
5. Evaluation 67
SA Rating (Random vs. Aspect, Phone) – two-sided t-Test for two samples with unequal variance
Test Hypothesis H0 Mean of Random = Mean of Aspect
Random Aspect
N 24 23
Mean Value 3.25 3.826086957
Empirical Variance 3.239130435 2.786561265
Degrees of Freedom (dF) 45
t-Statistics -1.138328155
Alpha 0.05
Critical Value t-Distribution 2.014103389
p-Value 0.261007704 => cannot reject H0 Table 28: t-Test - SA Rating (Random vs. Aspect) -Smartphone-
5.2.4.4 Summary Layout
Figure 28 shows the result for the preferred layout of the respondents. The “List”-layout
seems to be preferred over the “Table”-layout, although only slightly. In a practical scenario, a
good option would therefore be to use a list-based layout as the default option, but giving
users the option to change the summary layout to a table-based layout.
Figure 28: Survey Results - List vs. Table Layout -Total-
As the layout is independent from the summary content, a cross-analysis with the movie and
smartphone sample was not performed. Instead it was examined if male and female
respondents have a different opinion as shown in Figure 29. It seems male respondents prefer
the “List”-layout while female respondents prefer the “Table”-layout, but this result must be
interpreted carefully as the female sample size is small. For a practical scenario, the above
described configuration is probably still the best option even when considering the difference
between male and female respondents. Still, integrating this result is possible: The default
24 21
7
0
10
20
30
Layout "List" Layout "Table" Both equally good
Layout "List" vs. "Table" (N=52) - Total -

5. Evaluation 68
option for unregistered members of a shop is a list-based layout. After registration, once the
gender is known, the default layout changes to list-based for men and table-based for women
while having the option to change the layout to the other one.
Figure 29: Survey Results - List vs. Table Layout -Female vs. Male-
Figure 30 clearly shows that the amount of reviews that mention a feature positively and
negatively should be shown in the summary. One explanation for this that it helps put the
features importance and opinion into perspective.182
Figure 30: Survey Results - Review Count
Figure 31 shows that most respondents don’t want to see the sentiment analysis score that
indicates how positive or negative a sentence is in the summaries. But the lead is only very
small. The reason for not wanting to see the score might be that the interpretation is hard or
the general idea that a computer may score the positivity or negativity of sentence might be
hard to grasp. One respondent mentioned in a free-text answer that the interpretation is
182
Also see section 4.4.5.2 for the reason to always show the total review count.
40%
50%
10%
48%
38%
14%
0%
10%
20%
30%
40%
50%
60%
Layout "List" Layout "Table" Both equally good
Layout "List" vs. "Table" (N=52) - Female vs. Male -
female
male
6
45
1 0
20
40
60
without review count with review count both equally good
Review count in summary (N=52)
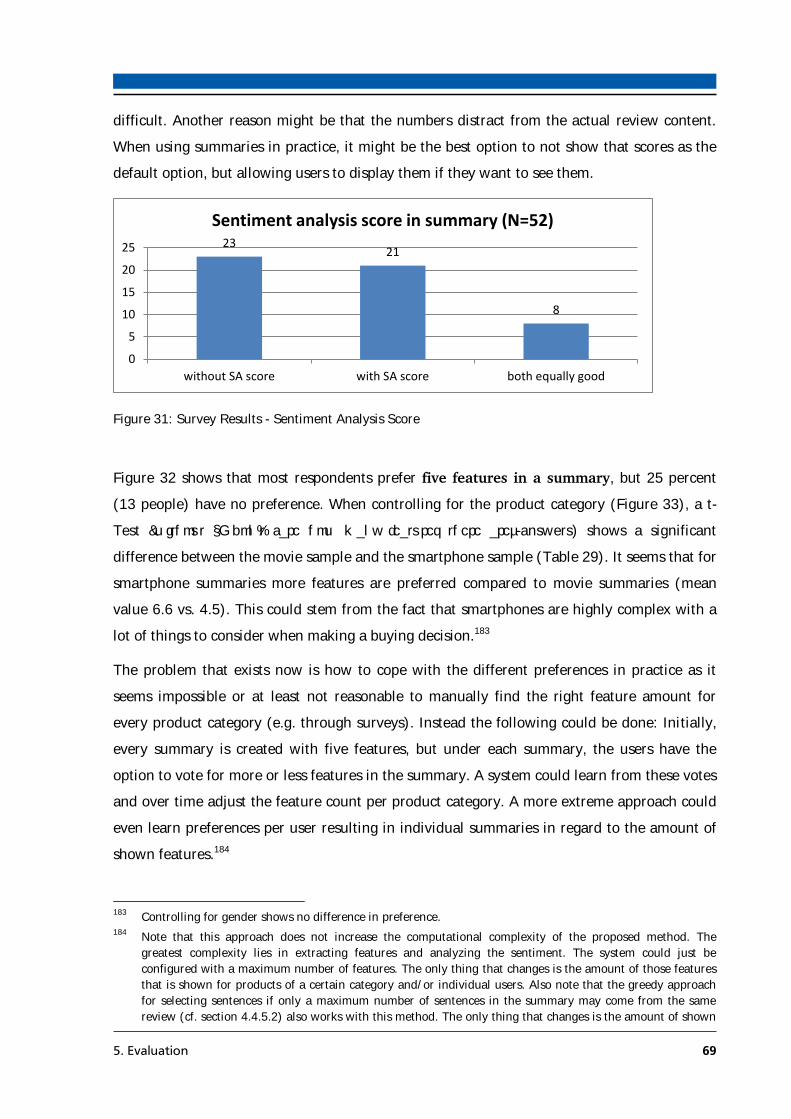
5. Evaluation 69
difficult. Another reason might be that the numbers distract from the actual review content.
When using summaries in practice, it might be the best option to not show that scores as the
default option, but allowing users to display them if they want to see them.
Figure 31: Survey Results - Sentiment Analysis Score
Figure 32 shows that most respondents prefer five features in a summary, but 25 percent
(13 people) have no preference. When controlling for the product category (Figure 33), a t-
Test (without “I don’t care how many features there are”-answers) shows a significant
difference between the movie sample and the smartphone sample (Table 29). It seems that for
smartphone summaries more features are preferred compared to movie summaries (mean
value 6.6 vs. 4.5). This could stem from the fact that smartphones are highly complex with a
lot of things to consider when making a buying decision.183
The problem that exists now is how to cope with the different preferences in practice as it
seems impossible or at least not reasonable to manually find the right feature amount for
every product category (e.g. through surveys). Instead the following could be done: Initially,
every summary is created with five features, but under each summary, the users have the
option to vote for more or less features in the summary. A system could learn from these votes
and over time adjust the feature count per product category. A more extreme approach could
even learn preferences per user resulting in individual summaries in regard to the amount of
shown features.184
183
Controlling for gender shows no difference in preference. 184
Note that this approach does not increase the computational complexity of the proposed method. The
greatest complexity lies in extracting features and analyzing the sentiment. The system could just be
configured with a maximum number of features. The only thing that changes is the amount of those features
that is shown for products of a certain category and/or individual users. Also note that the greedy approach
for selecting sentences if only a maximum number of sentences in the summary may come from the same
review (cf. section 4.4.5.2) also works with this method. The only thing that changes is the amount of shown
23 21
8
0
5
10
15
20
25
without SA score with SA score both equally good
Sentiment analysis score in summary (N=52)

5. Evaluation 70
Figure 32: Survey Results - Features per Summary -Total-
Figure 33: Survey Results - Features per Summary -Movie vs. Smartphone-
features, but the content of the feature summaries is always the same (continue reading the main text to see
prove that the number of sentences per feature and sentiment polarity should be the same for all product
categories).
1 1 5
2
20
1 2 1 1 4
1
13
0
10
20
30
1 2 3 4 5 6 7 8 9 10 12 Don'tcare
Features per summary (N=52) - Total -
4%
4%
11%
7%
39%
4%
4%
4%
0%
0%
0%
25%
0%
0%
8%
0%
38%
0%
4%
0%
4%
17%
4%
25%
0% 5% 10% 15% 20% 25% 30% 35% 40% 45%
1
2
3
4
5
6
7
8
9
10
12
Don't care
Features per summary (N=52) - Movie vs. Smartphone -
PHONE MOVIE

5. Evaluation 71
Features per summary – two-sided t-Test for two samples with unequal variance
Test Hypothesis H0 Mean of movie = Mean of smartphone
movie smartphone
N 21 18
Mean Value 4.571428571 6.611111111
Empirical Variance 2.457142857 7.663398693
Degrees of Freedom (dF) 26
t-Statistics -2.768612608
Alpha 0.05
Critical Value t-Distribution 2.055529439
p-Value 0.010241266 => reject H0 Table 29: t-Test - Feature per Summary -Movie vs. Smartphone-
Figure 34 indicates that most people seem to prefer seeing only two sentences per feature
and polarity (positive, negative), but three sentences were also often mentioned. Around 23
percent of all respondents don’t have a preference and there is only one respondent who
wants more than five sentences. Controlling for the product category (Figure 35) shows no
significant difference between smartphones and movies (Table 30). Both samples have a
mean value of around three sentences per feature and polarity. This means that in practice,
there should be no need to change the sentence amount between different product categories
and that two to three sentences per feature and polarity seem best.185 Controlling for gender
did not show significant differences.
Figure 34: Survey Results - Sentences per Feature and Polarity -Total-
185
This also benefits the above mentioned way to handle the differences in the amount of features that should
be in a summary depending on the product category and/or the user. Were the preferences different, the
system would have to create individual summaries for each user as the sentence selection might change if the
option to only allow a maximum number of sentences originating from one review is used.
3
17
10
3 6
1
12
0
5
10
15
20
1 2 3 4 5 10 Don't care
Sentences per feature and polarity (N=52) - Total-

5. Evaluation 72
Figure 35: Survey Results - Sentences per Feature and Polarity -Movie vs. Smartphone-
Sentences per feature and polarity – two-sided t-Test for two samples with unequal variance
Test Hypothesis H0 Mean of movie = Mean of smartphone
movie smartphone
N 23 17
Mean Value 3.086956522 2.823529412
Empirical Variance 3.992094862 1.029411765
Degrees of Freedom (dF) 34
t-Statistics 0.544425489
Alpha 0.05
Critical Value t-Distribution 2.032244509
p-Value 0.589701793 => cannot reject H0 Table 30: t-Test - Sentences per Feature and Polarity - Movie vs. Smartphone.
5.2.4.5 Summary of the Results
The survey showed that there is a clear benefit when doing product review summarization for
both male and female customers. This work on contrast to other papers proves this
empirically and not only theoretically.
The proposed feature extraction methods seem to be universally applicable for all kinds of
users and products. While specific methods may perform best for some product category, the
Meta approach seems most promising as a universally usable method, performing best when
regarding the whole sample. Still, the results could be even better with a better noun phrase
clustering and better feature name selection.
11%
32%
14%
7%
14%
4%
18%
0%
33%
25%
4% 8%
0%
29%
0%
10%
20%
30%
40%
1 2 3 4 5 10 Don't care
Sentences per feature and polarity (N=52) - Movie vs. Smartphone -
MOVIE PHONE
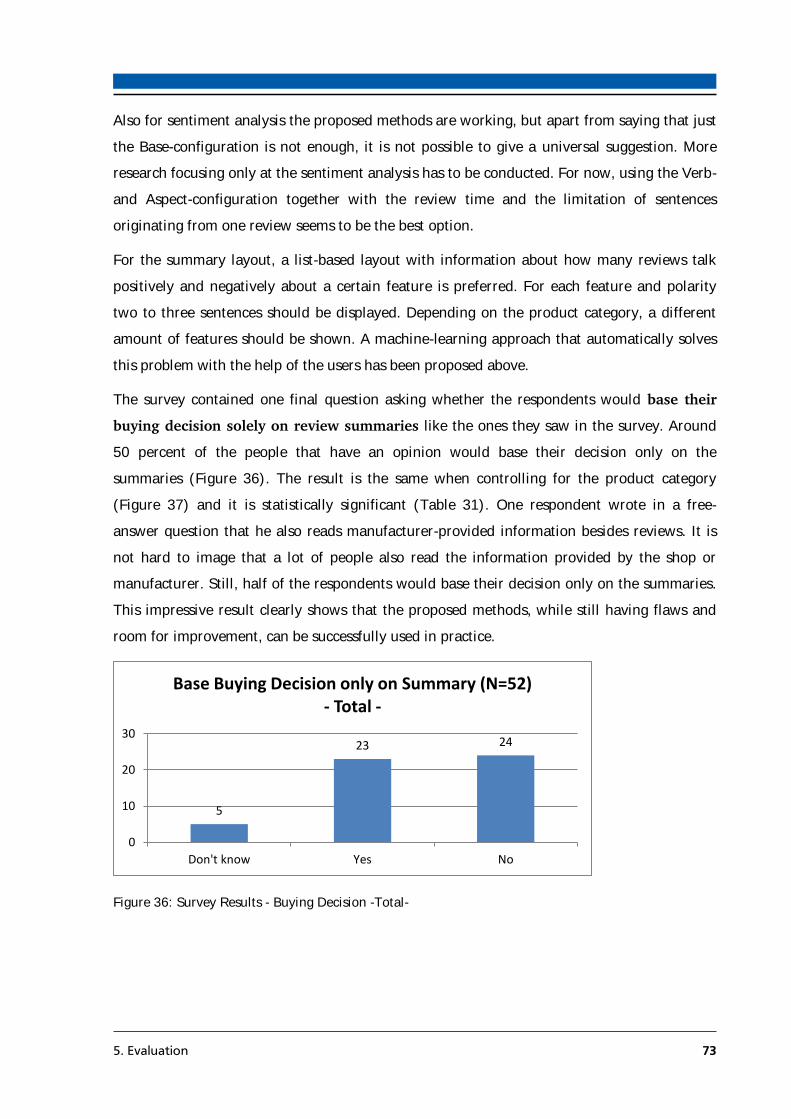
5. Evaluation 73
Also for sentiment analysis the proposed methods are working, but apart from saying that just
the Base-configuration is not enough, it is not possible to give a universal suggestion. More
research focusing only at the sentiment analysis has to be conducted. For now, using the Verb-
and Aspect-configuration together with the review time and the limitation of sentences
originating from one review seems to be the best option.
For the summary layout, a list-based layout with information about how many reviews talk
positively and negatively about a certain feature is preferred. For each feature and polarity
two to three sentences should be displayed. Depending on the product category, a different
amount of features should be shown. A machine-learning approach that automatically solves
this problem with the help of the users has been proposed above.
The survey contained one final question asking whether the respondents would base their
buying decision solely on review summaries like the ones they saw in the survey. Around
50 percent of the people that have an opinion would base their decision only on the
summaries (Figure 36). The result is the same when controlling for the product category
(Figure 37) and it is statistically significant (Table 31). One respondent wrote in a free-
answer question that he also reads manufacturer-provided information besides reviews. It is
not hard to image that a lot of people also read the information provided by the shop or
manufacturer. Still, half of the respondents would base their decision only on the summaries.
This impressive result clearly shows that the proposed methods, while still having flaws and
room for improvement, can be successfully used in practice.
Figure 36: Survey Results - Buying Decision -Total-
5
23 24
0
10
20
30
Don't know Yes No
Base Buying Decision only on Summary (N=52) - Total -
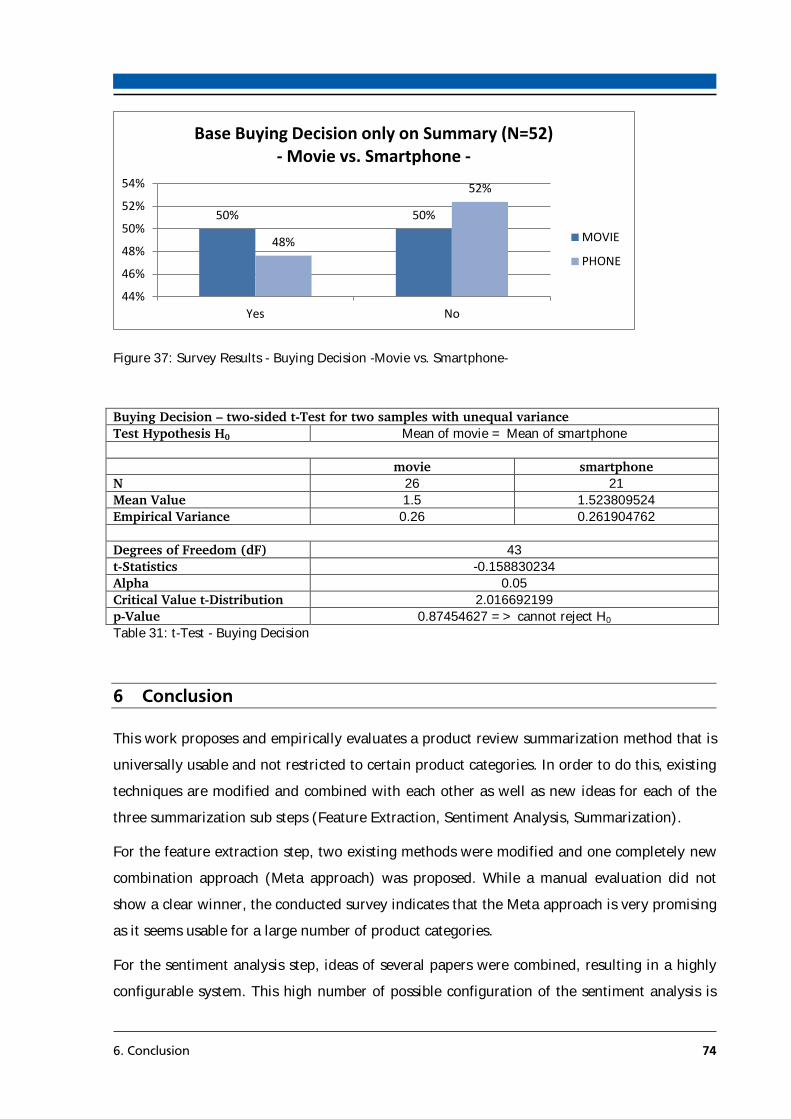
6. Conclusion 74
Figure 37: Survey Results - Buying Decision -Movie vs. Smartphone-
Buying Decision – two-sided t-Test for two samples with unequal variance
Test Hypothesis H0 Mean of movie = Mean of smartphone
movie smartphone
N 26 21
Mean Value 1.5 1.523809524
Empirical Variance 0.26 0.261904762
Degrees of Freedom (dF) 43
t-Statistics -0.158830234
Alpha 0.05
Critical Value t-Distribution 2.016692199
p-Value 0.87454627 => cannot reject H0 Table 31: t-Test - Buying Decision
6 Conclusion
This work proposes and empirically evaluates a product review summarization method that is
universally usable and not restricted to certain product categories. In order to do this, existing
techniques are modified and combined with each other as well as new ideas for each of the
three summarization sub steps (Feature Extraction, Sentiment Analysis, Summarization).
For the feature extraction step, two existing methods were modified and one completely new
combination approach (Meta approach) was proposed. While a manual evaluation did not
show a clear winner, the conducted survey indicates that the Meta approach is very promising
as it seems usable for a large number of product categories.
For the sentiment analysis step, ideas of several papers were combined, resulting in a highly
configurable system. This high number of possible configuration of the sentiment analysis is
50% 50%
48%
52%
44%
46%
48%
50%
52%
54%
Yes No
Base Buying Decision only on Summary (N=52) - Movie vs. Smartphone -
MOVIE
PHONE
6. Conclusion 75
unique to this work as none of the cited papers has this level of configurability. Apart from
this, this work is also the first186 that actually realizes some ideas that were only proposed in
other papers, most notably using the review time when rating sentences in order to penalize
sentences from old reviews for being outdated. The empirical evaluation shows the
applicability of the proposed methods, but does not give a clear answer to the question of
which configuration is best.
For the summarization step, this work proposed a list-based and a table-based layout with
optional displayable information. The survey showed that customers prefer the list-based
layout with information about how many reviews talk about a product feature in a positive
and negative way. This work therefore not only evaluates the general layout of the summaries
compared to other papers, it is also the first187 that directly asks the customers how many
features and sentences the customers would like to read. A machine-learning approach is
proposed to be able to generate ideal summaries (in terms of layout and feature count) for
every product category and customer.
This work is also the only one so far188 that empirically proves the benefit of review
summaries and therefore the need for research in this field. Still, this work is not without
limitations and therefore opportunities for further research, the biggest one being that the
survey is very limited in the amount of tested products:
The feature extraction step is not perfect. Especially the noun phrase clustering should be
improved to provide mutually exclusive clusters. There is also the possibility of errors in the
manual evaluation of the feature extraction approaches as the features were extracted by
hand. Also only a small sample could be analyzed, so the results may only apply to this
sample. Further research should also especially be done on the proposed Meta approach in
order to evaluate this approach with more input algorithms and for more product categories.
For the sentiment analysis more research is necessary on which configuration is the best. Not
all possible combinations could be tested in the scope of this work and only two product
categories with one product each could be tested. The results of the survey may thus be
limited to this sample, making further research necessary. Additional options or other
implementations for the sentiment analysis could also be explored, e.g. other ways of using
the review time to penalize old reviews.
186
To the best of the author’s knowledge. 187
To the best of the author’s knowledge. 188
To the best of the author’s knowledge.

6. Conclusion 76
One missing part of the summarization step is the graphical design of the summaries. In this
work only the general layout was researched, but not the graphical representation that may
have a strong impact on the usability of the summaries in practice. One opportunity for
further research is therefore the design and its effect on the perceived quality of the
summaries. Apart from that, other layouts, additional graphical information etc. can be
researched. The above mentioned possible limited generalizability also applies to the survey
results concerning the summarization.
Even with these limitations, the survey has shown that 50 percent of all respondents would
base their buying decision only on summaries like the ones they saw in the survey. While this
could also only hold for the tested sample, it is still an impressive result that proves the
applicability and quality of the proposed methods and other review summarization
approaches in practice.

Appendix - Survey V
Appendix - Survey
Each respondent only sees the parts for the movie or the parts for the smartphone. After the
general part they are randomly assigned to one of those two groups. Please also refer to
section 5.2.3 for the other random parts of the survey. The information about which
configuration belongs to which summary is only shown here, but was not shown to the survey
respondents.
Survey General Part
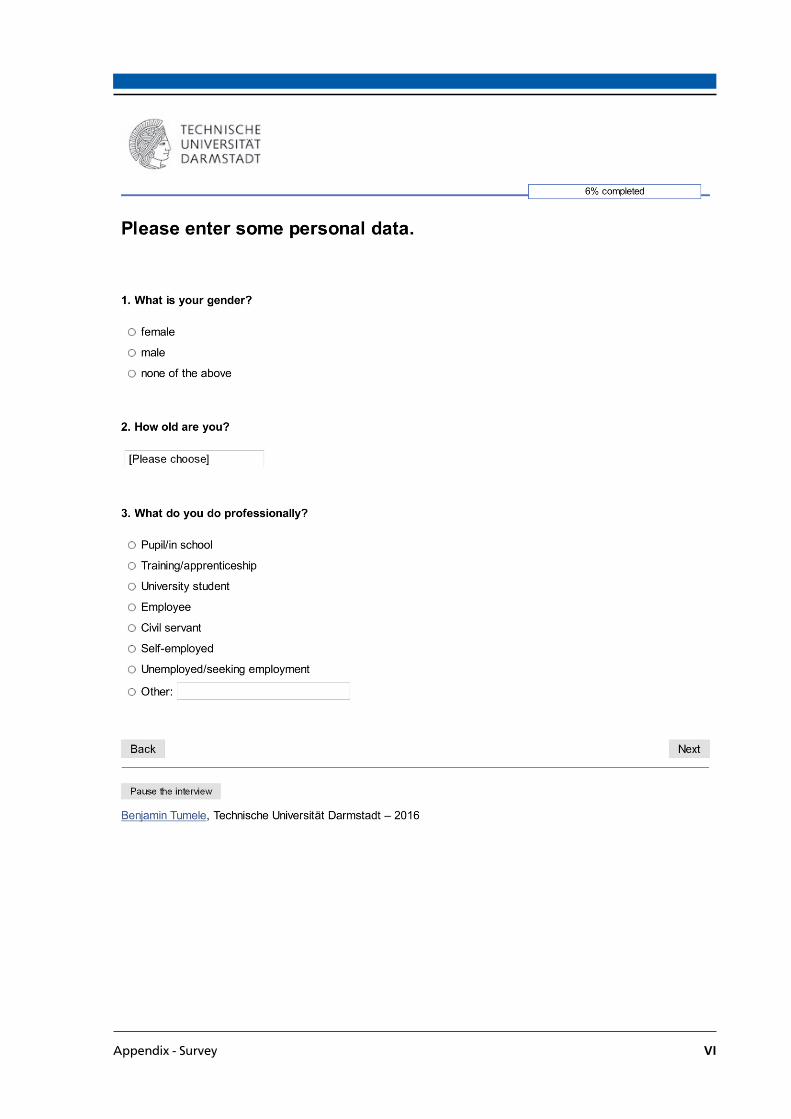
Appendix - Survey VI
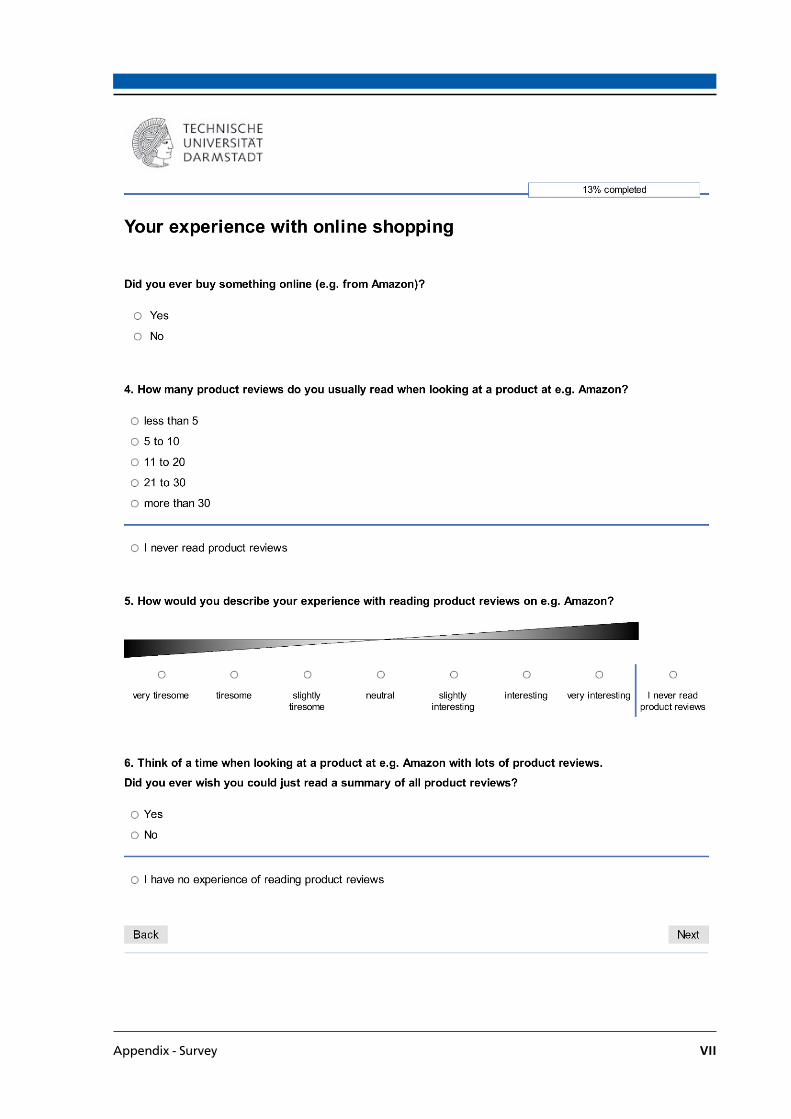
Appendix - Survey VII
Appendix - Survey VIII
Survey Feature Extraction Part (Movie)

Appendix - Survey IX
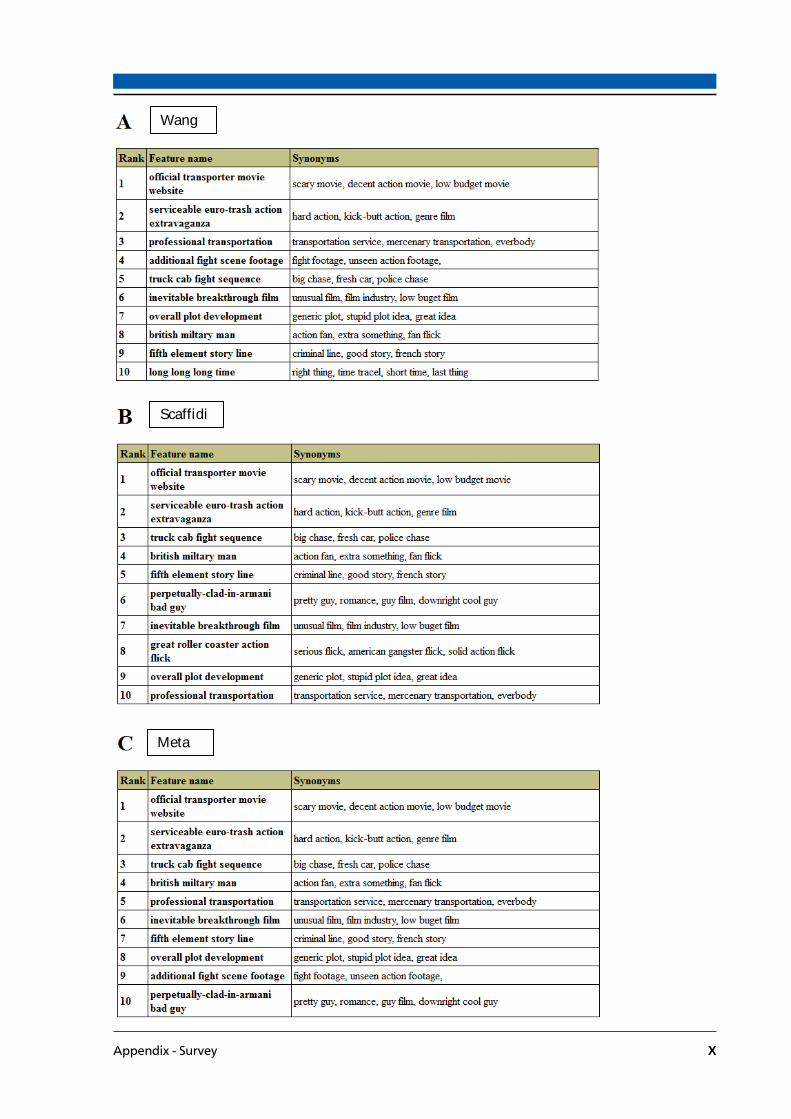
Appendix - Survey X
Wang
Scaffidi
Meta
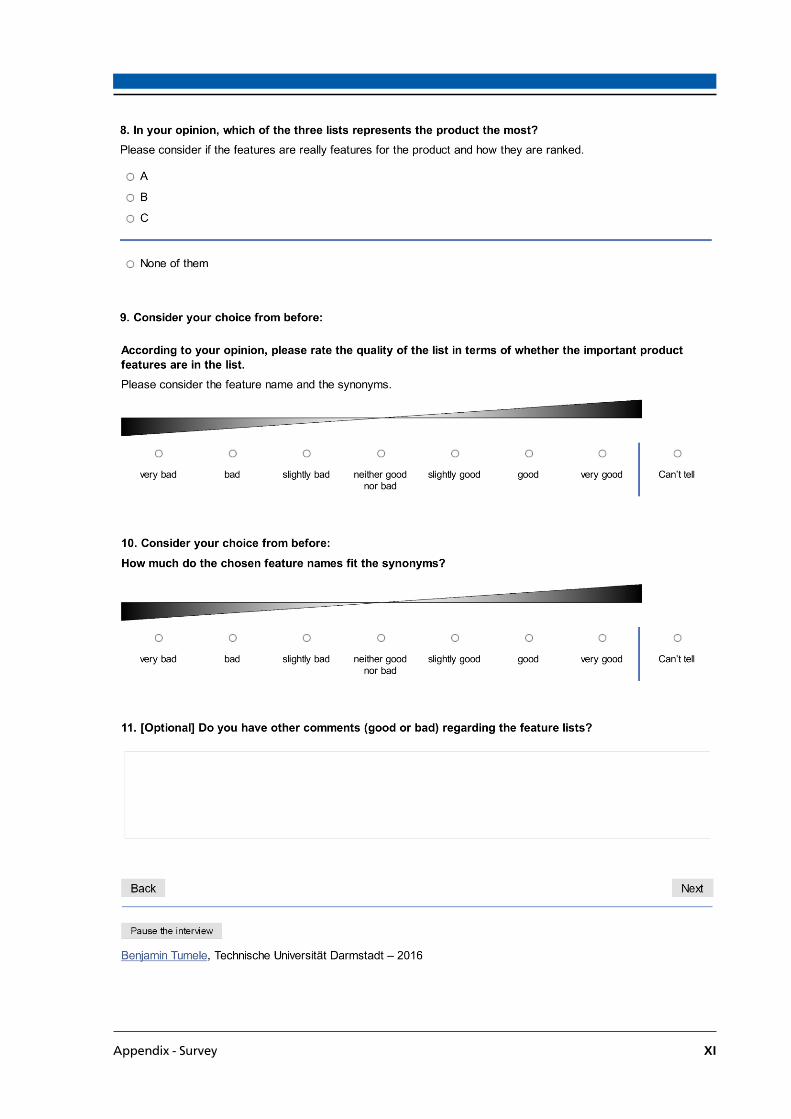
Appendix - Survey XI

Appendix - Survey XII
Survey Feature Extraction Part (Smartphone)
Appendix - Survey XIII

Appendix - Survey XIV
Wang
Scaffidi
Meta

Appendix - Survey XV
Appendix - Survey XVI
Survey Summary Layout Part (Movie)

Appendix - Survey XVII

Appendix - Survey XVIII
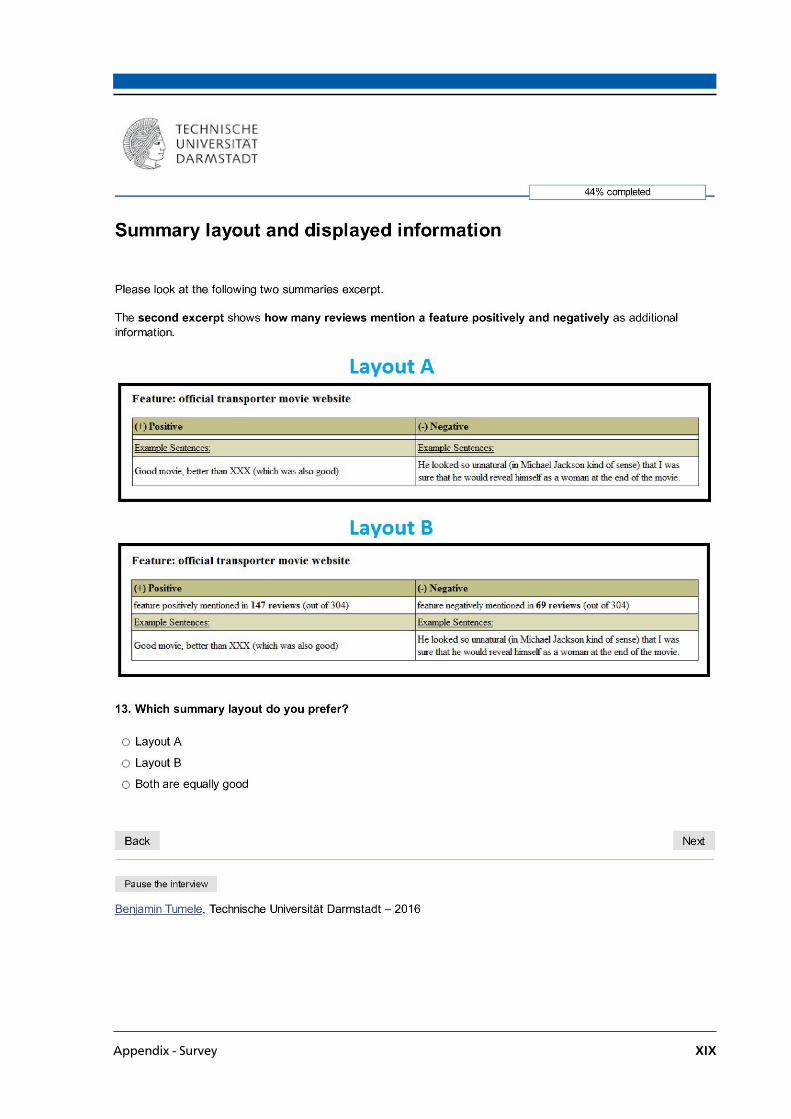
Appendix - Survey XIX
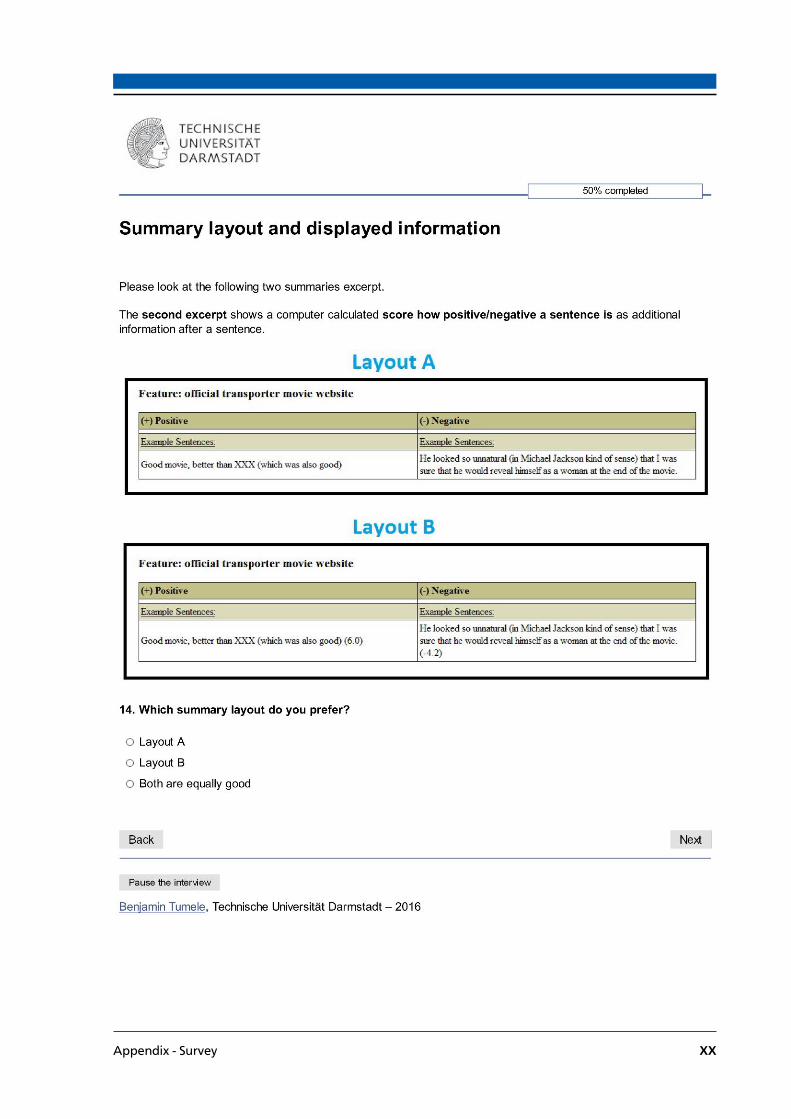
Appendix - Survey XX
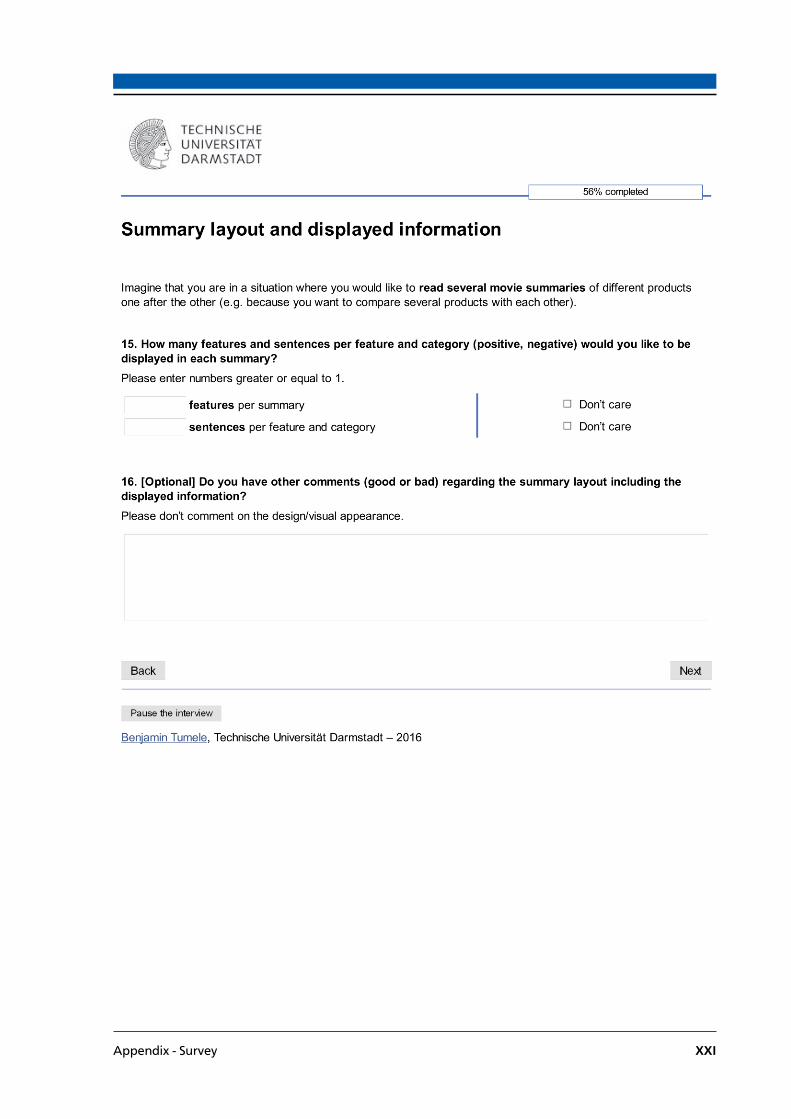
Appendix - Survey XXI
Appendix - Survey XXII
Survey Summary Layout Part (Smartphone)

Appendix - Survey XXIII

Appendix - Survey XXIV

Appendix - Survey XXV
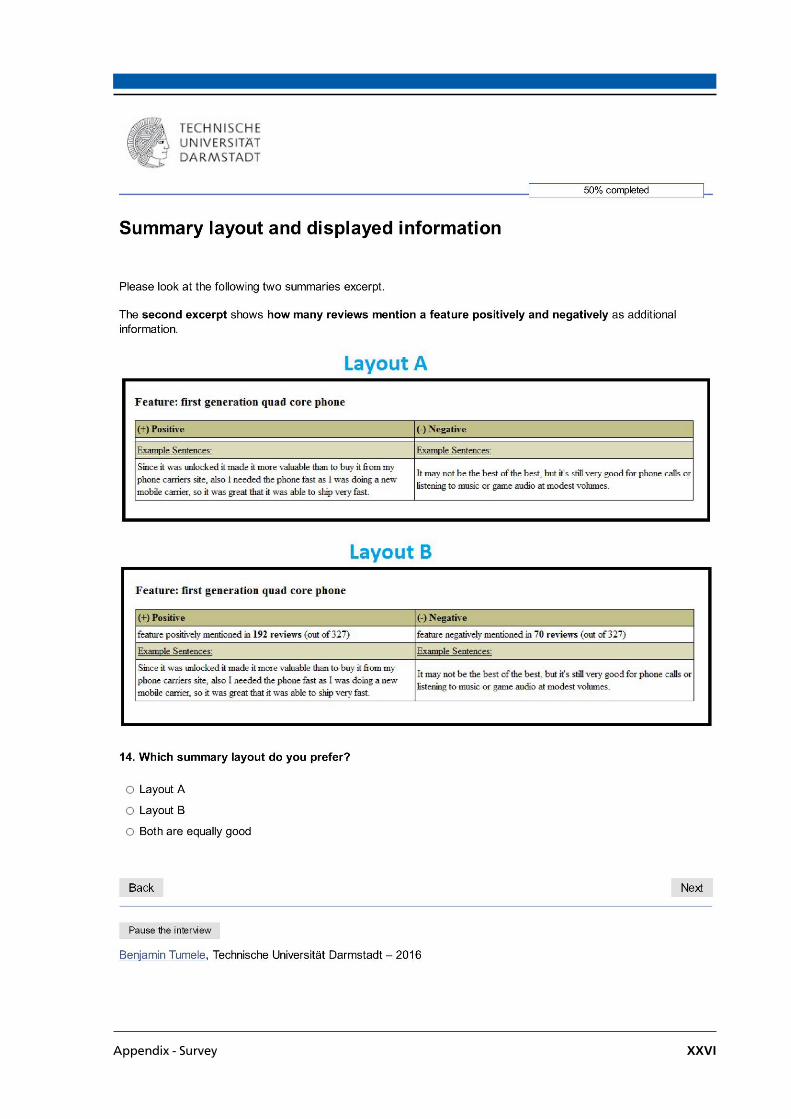
Appendix - Survey XXVI

Appendix - Survey XXVII
Appendix - Survey XXVIII
Survey Sentiment Analysis Part (Movie)
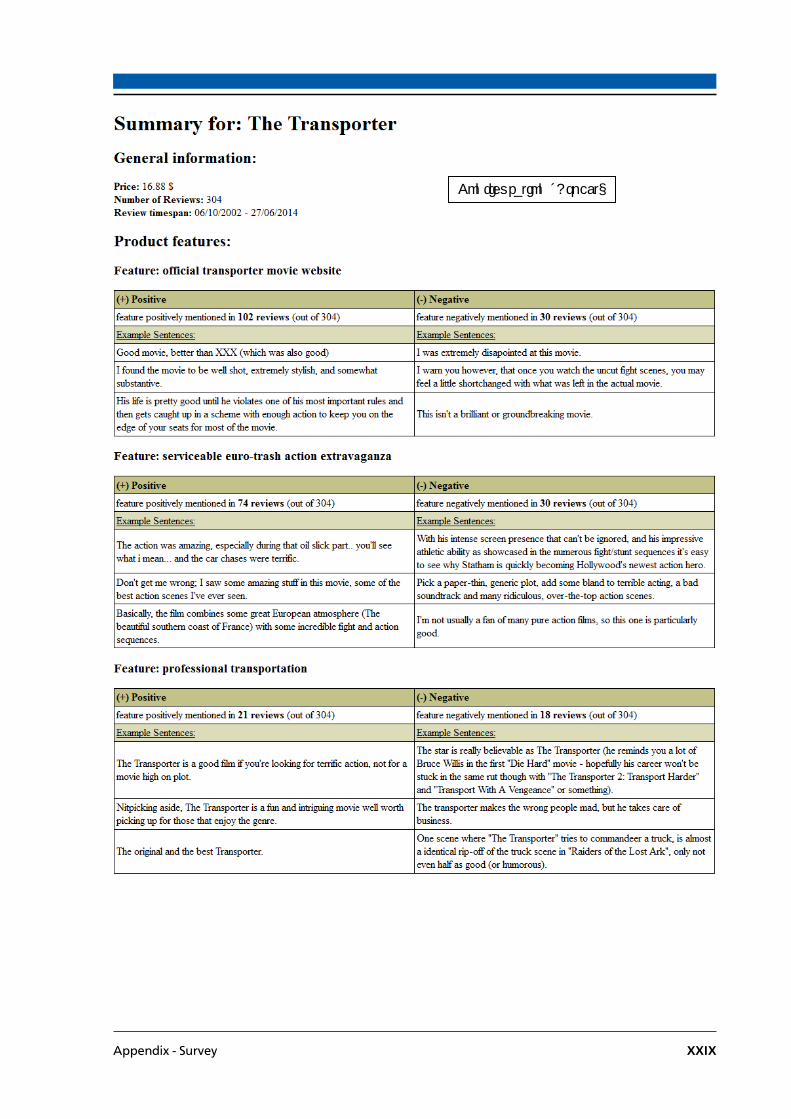
Appendix - Survey XXIX
Configuration „Aspect“

Appendix - Survey XXX

Appendix - Survey XXXI
Configuration „Verb“
Appendix - Survey XXXII
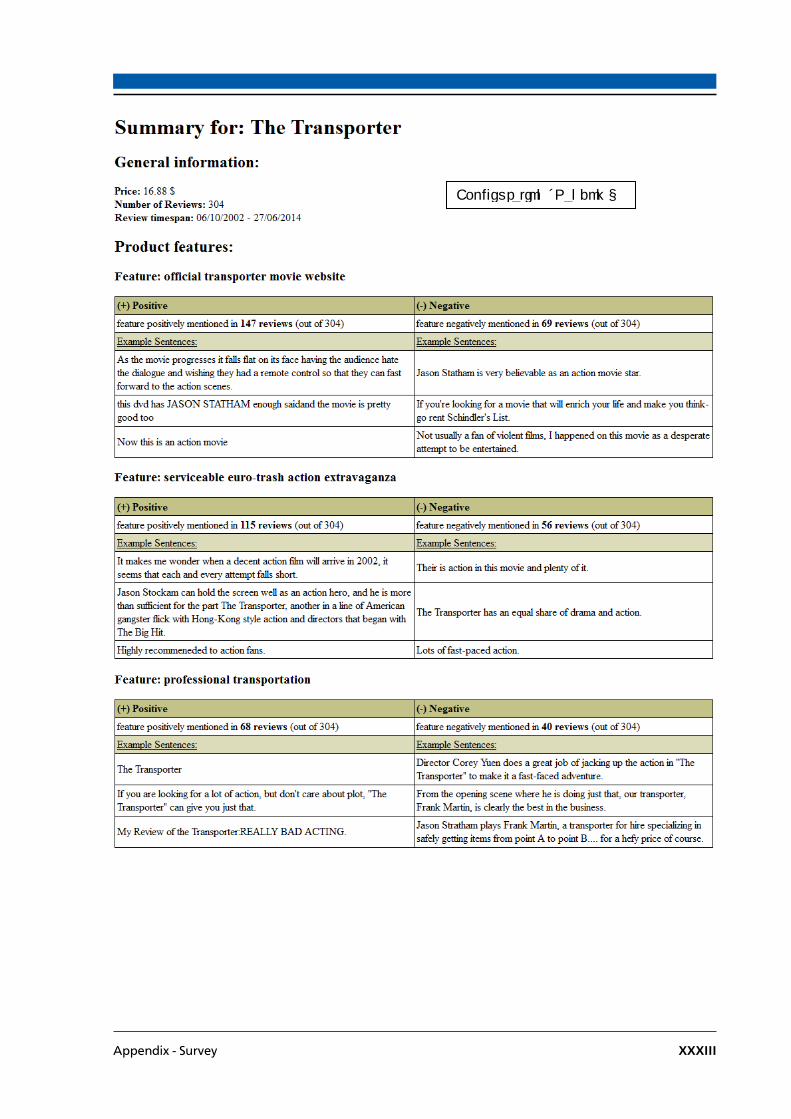
Appendix - Survey XXXIII
Configuration „Random“

Appendix - Survey XXXIV

Appendix - Survey XXXV
Configuration „Base“
Appendix - Survey XXXVI
Survey Sentiment Analysis Part (Smartphone)

Appendix - Survey XXXVII

Appendix - Survey XXXVIII
Configuration „Random“

Appendix - Survey XXXIX

Appendix - Survey XL
Configuration „Aspect“

Appendix - Survey XLI
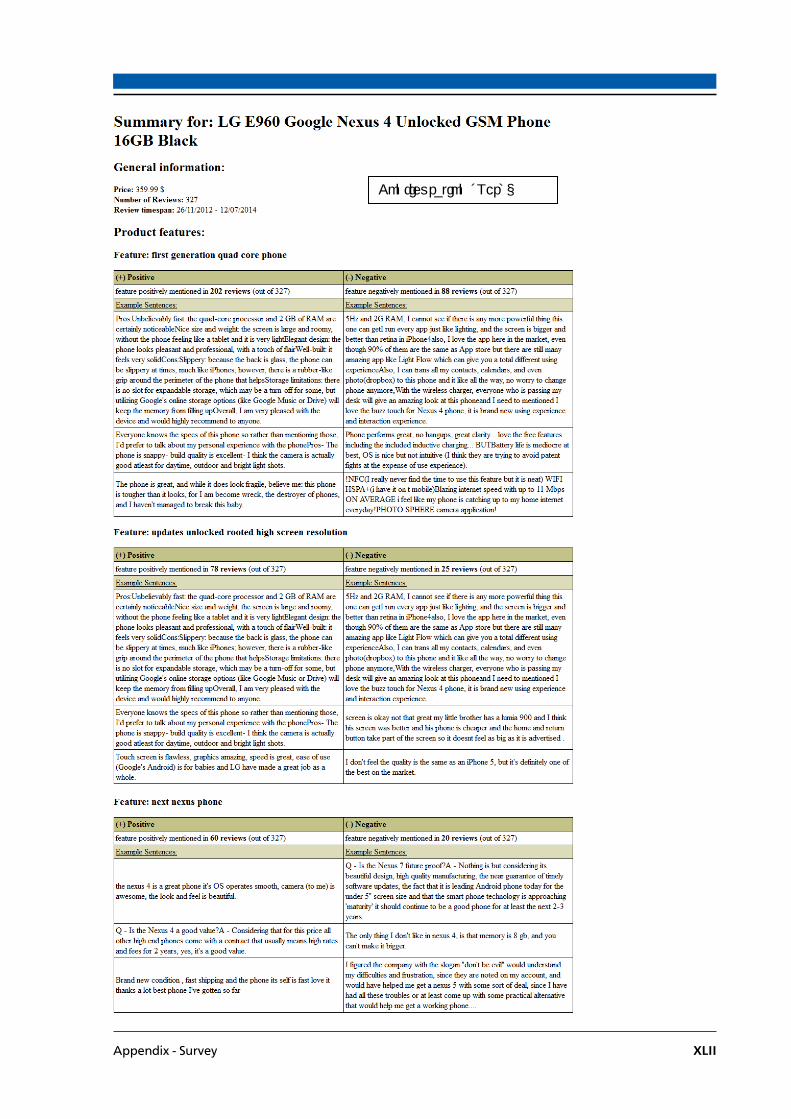
Appendix - Survey XLII
Configuration „Verb“

Appendix - Survey XLIII

Appendix - Survey XLIV
Configuration „Base“
Appendix - Survey XLV

Appendix - Survey XLVI
Survey Final Part
Appendix - Survey XLVII
References XLVIII
References
Andrews, Dorine; Nonnecke, Blair; Preece, Jennifer (2003): Conducting Research on the Internet: Online Survey Design, Development and Implementation Guidelines. In: International Journal of Human-Computer Interaction, 16 (2), S. 185-210.
Aschemann-Pilshofer, Birgit (2001): Wie erstelle ich einen Fragebogen? Ein Leitfaden für
die Praxis. Wissenschaftsladen Graz, Graz. Babar, S. A.; Patil, Pallavi D. (2015): Improving Performance of Text Summarization. In:
Procedia Computer Science, 46, S. 354-363. Baccianella, Stefano; Esuli, Andrea; Sebastiani, Fabrizio (2010): SentiWordNet 3.0: An
Enhanced Lexical Resource for Sentiment Analysis and Opinion Mining. LREC. In: LREC. Band 10, S. 2200-2204.
Baek, Hyunmi; Ahn, JoongHo; Choi, Youngseok (2012): Helpfulness of Online Consumer
Reviews: Readers' Objectives and Review Cues. In: International Journal of Electronic Commerce, 17 (2), S. 99-126.
Bafna, Kushal; Toshniwal, Durga (2013): Feature based Summarization of Customers’
Reviews of Online Products. In: Procedia Computer Science, 22, S. 142-151. Bhadane, Chetashri; Dalal, Hardi; Doshi, Heenal (2015): Sentiment Analysis: Measuring
Opinions. In: Procedia Computer Science, 45, S. 808-814. Bird, Steven; Klein, Ewan; Loper, Edward (2009): Natural Language Processing with
Python. O'Reilly Media, Inc. Burton, Jamie; Khammash, Marwan (2010): Why do people read reviews posted on
consumer-opinion portals? In: Journal of Marketing Management, 26 (3/4), S. 230-255.
Cambria, Erik; Olsher, Daniel; Rajagopal, Dheeraj (2014): SenticNet 3: a common and
common-sense knowledge base for cognition-driven sentiment analysis. Twenty-eighth AAAI conference on artificial intelligence. In: Twenty-eighth AAAI conference on artificial intelligence.
Damerau, Fred J. (1964): A technique for computer detection and correction of spelling
errors. In: Commun. ACM, 7 (3), S. 171-176. Dave, Kushal; Lawrence, Steve; Pennock, David M. (2003): Mining the peanut gallery:
opinion extraction and semantic classification of product reviews. Proceedings of the 12th international conference on World Wide Web. Budapest, Hungary, ACM: 519-528.
Duric, Adnan; Song, Fei (2012): Feature selection for sentiment analysis based on content
and syntax models. In: Decision Support Systems, 53 (4), S. 704-711. Evans, Joel R.; Mathur, Anil (2005): The value of online surveys. In: Internet Research, 15
(2), S. 195-219.

References XLIX
Fang, Ji; Chen, Bi (2011): Incorporating Lexicon Knowledge into SVM Learning to Improve Sentiment Classification. In: Sentiment Analysis where AI meets Psychology (SAAIP), S. 94.
Gräf, Lorenz (1999): Optimierung von WWW-Umfragen: Das Online Pretest-Studio. In:
Batinic, B.; Werner, A.; Gräf, L.; Bandilla, W. (Hrsg.): Online Research. Methoden, Anwendungen und Ergebnisse. Hogrefe, Göttingen, S. 324.
Gräf, Lorenz (2010): Online-Befragung: Eine praktische Einführung für Anfänger.
Sozialwissenschaftliche Methoden LIT-Verlag, Münster. Gupta, Vishal; Lehal, Gurpreet S (2009): A survey of text mining techniques and
applications. In: Journal of emerging technologies in web intelligence, 1 (1), S. 60-76. Hotho, Andreas; Nürnberger, Andreas; Paaß, Gerhard (2005): A Brief Survey of Text
Mining. Ldv Forum. In: Ldv Forum. Band 20, S. 19-62. Hu, Minqing; Liu, Bing (2004a): Mining and summarizing customer reviews. Proceedings of
the tenth ACM SIGKDD international conference on Knowledge discovery and data mining. Seattle, WA, USA, ACM: 168-177.
Hu, Minqing; Liu, Bing (2004b): Mining opinion features in customer reviews. AAAI. In:
AAAI. Band 4, S. 755-760. Khan, Khairullah; Baharudin, Baharum B.; Khan, Aurangzeb (2013): Mining Opinion
Targets from Text Documents: A Review. In: Journal of emerging technologies in web intelligence, 5 (4), S. 343-353.
Kiyoumarsi, Farshad (2015): Evaluation of Automatic Text Summarizations based on
Human Summaries. In: Procedia - Social and Behavioral Sciences, 192, S. 83-91. Kurian, Neethu; Asokan, Shimmi (2015): Summarizing User Opinions: A Method for
Labeled-data Scarce Product Domains. In: Procedia Computer Science, 46, S. 93-100. Leech, G.; Rayson, P.; Wilson, A. (2001): Word Frequencies in Written and Spoken English:
Based on the British National Corpus. Longman Press. Levenshtein, Vladimir (1966): Binary codes capable of correcting deletions, insertions, and
reversals. Soviet Physics Doklady. 10: 707-710. Liu, Bing; Hu, Minqing; Cheng, Junsheng (2005): Opinion observer: analyzing and
comparing opinions on the Web. Proceedings of the 14th international conference on World Wide Web. Chiba, Japan, ACM: 342-351.
Lu, Jie; Wu, Dianshuang; Mao, Mingsong; Wang, Wei; Zhang, Guangquan (2015):
Recommender system application developments: A survey. In: Decision Support Systems, 74, S. 12-32.
McAuley, Julian; Pandey, Rahul; Leskovec, Jure (2015a): Inferring Networks of
Substitutable and Complementary Products. Proceedings of the 21th ACM SIGKDD International Conference on Knowledge Discovery and Data Mining. In: Proceedings of the 21th ACM SIGKDD International Conference on Knowledge Discovery and Data Mining. ACM, S. 785-794.
McAuley, Julian; Targett, Christopher; Shi, Qinfeng; Hengel, Anton van den (2015b):
Image-based Recommendations on Styles and Substitutes. Special Interest Group on Information Retrieval. In: Special Interest Group on Information Retrieval. Chile.

References L
Medhat, Walaa; Hassan, Ahmed; Korashy, Hoda (2014): Sentiment analysis algorithms
and applications: A survey. In: Ain Shams Engineering Journal, 5 (4), S. 1093-1113. Miller, George A.; Beckwith, Richard; Fellbaum, Christiane; Gross, Derek; Miller,
Katherine J. (1990): Introduction to WordNet: An On-line Lexical Database. In: International Journal of Lexicography, 3 (4), S. 235-244.
Najmi, Erfan; Hashmi, Khayyam; Malik, Zaki; Rezgui, Abdelmounaam; Khan, Habib
(2015): CAPRA: a comprehensive approach to product ranking using customer reviews. In: Computing, 97 (8), S. 843-867.
Nishikawa, Hitoshi; Hasegawa, Takaaki; Matsuo, Yoshihiro; Kikui, Genichiro (2010):
Optimizing informativeness and readability for sentiment summarization. Proceedings of the ACL 2010 Conference Short Papers. Uppsala, Sweden, Association for Computational Linguistics: 325-330.
Pang, Bo; Lee, Lillian; Vaithyanathan, Shivakumar (2002): Thumbs up?: sentiment
classification using machine learning techniques. Proceedings of the ACL-02 conference on Empirical methods in natural language processing-Volume 10. In: Proceedings of the ACL-02 conference on Empirical methods in natural language processing-Volume 10. Association for Computational Linguistics, S. 79-86.
Paradis, Carita (1997): Degree modifiers of adjectives in spoken British English. Lund
Studies in English 92 Lund University Press. Ramezani, Majid; Feizi-Derakhshi, Mohammad-Reza (2014): Automated Text
Summarization: An Overview. In: Applied Artificial Intelligence, 28 (2), S. 178-215. Ramkumar, V.; Rajasekar, S.; Swamynathan, S. (2010): Scoring products from reviews
through application of fuzzy techniques. In: Expert Systems with Applications, 37 (10), S. 6862-6867.
Ravi, Kumar; Ravi, Vadlamani (2015, in press): A survey on opinion mining and sentiment
analysis: Tasks, approaches and applications. In: Knowledge-Based Systems. Reyes, Antonio; Rosso, Paolo (2012): Making objective decisions from subjective data:
Detecting irony in customer reviews. In: Decision Support Systems, 53 (4), S. 754-760. Scaffidi, Christopher; Bierhoff, Kevin; Chang, Eric; Felker, Mikhael; Ng, Herman; Jin,
Chun (2007): Red Opal: product-feature scoring from reviews. Proceedings of the 8th ACM conference on Electronic commerce. San Diego, California, USA, ACM: 182-191.
Selm, Martine; Jankowski, Nicholas W. (2006): Conducting Online Surveys. In: Quality and
Quantity, 40 (3), S. 435-456. Serrano-Guerrero, Jesus; Olivas, Jose A.; Romero, Francisco P.; Herrera-Viedma,
Enrique (2015): Sentiment analysis: A review and comparative analysis of web services. In: Information Sciences, 311, S. 18-38.
Stone, Philip J.; Dunphy, Dexter C.; Smith, Marshall S. (1966): The General Inquirer: A
Computer Approach to Content Analysis. M.I.T. Press, Oxford, England. Toutanova, Kristina; Klein, Dan; Manning, Christopher D.; Singer, Yoram (2003):
Feature-rich part-of-speech tagging with a cyclic dependency network. Proceedings of the 2003 Conference of the North American Chapter of the Association for

References LI
Computational Linguistics on Human Language Technology - Volume 1. Edmonton, Canada, Association for Computational Linguistics: 173-180.
Toutanova, Kristina; Manning, Christopher D. (2000): Enriching the knowledge sources
used in a maximum entropy part-of-speech tagger. Proceedings of the 2000 Joint SIGDAT conference on Empirical methods in natural language processing and very large corpora: held in conjunction with the 38th Annual Meeting of the Association for Computational Linguistics - Volume 13. Hong Kong, Association for Computational Linguistics: 63-70.
Wang, Dingding; Zhu, Shenghuo; Li, Tao (2013): SumView: A Web-based engine for
summarizing product reviews and customer opinions. In: Expert Systems with Applications, 40 (1), S. 27-33.
Wei, Chih-Ping; Chen, Yen-Ming; Yang, Chin-Sheng; Yang, Christopher (2010):
Understanding what concerns consumers: a semantic approach to product feature extraction from consumer reviews. In: Information Systems & e-Business Management, 8 (2), S. 149-167.
Zha, Zheng-Jun; Yu, Jianxing; Tang, Jinhui; Wang, Meng; Chua, Tat-Seng (2014):
Product Aspect Ranking and Its Applications. In: IEEE Transactions on Knowledge & Data Engineering, 26 (5), S. 1211-1224.
Zhang, Wenhao; Xu, Hua; Wan, Wei (2012): Weakness Finder: Find product weakness from
Chinese reviews by using aspects based sentiment analysis. In: Expert Systems with Applications, 39 (11), S. 10283-10291.
Zimmermann, Max; Ntoutsi, Eirini; Spiliopoulou, Myra (2015, in press): Extracting
opinionated (sub)features from a stream of product reviews using accumulated novelty and internal re-organization. In: Information Sciences.

Related Documents