Kenneth Crow DRM Associates PD-Trak Solutions © 2004 DRM Associates. All rights reserved. Unauthorized reproduction or use prohibited. PRODUCT PORTFOLIO MANAGEMENT

Product Portfolio Management
Nov 12, 2014
Welcome message from author
This document is posted to help you gain knowledge. Please leave a comment to let me know what you think about it! Share it to your friends and learn new things together.
Transcript

Kenneth CrowDRM AssociatesPD-Trak Solutions
© 2004 DRM Associates. All rights reserved. Unauthorized reproduction or use prohibited.
PRODUCT PORTFOLIO MANAGEMENT

© 2004 DRM ASSOCIATES
ABOUT THE WORKSHOP LEADERKenneth A. Crow is President of DRM Associates, a consulting and training firm specializing in product development, and is a Principal of PD-Trak Solutions, a provider of NPD project/process management software. He is a recognized expert in the field of new product development with over thirty years of experience consulting with major companies in aerospace, automotive, capital equipment, consumer products, defense, high technology, and medical equipment.He has worked with management to develop product strategies and plan NPD improvement initiatives. He has assisted product development teams develop their teamwork, plan and manage projects, investigate customer needs (VOC), plan their product strategy, develop a business case, and apply DFM/A, QFD, VA, & Target Costing to optimize their designs. He has helped assess and reengineer clients’product development processes, assisted with the evaluation and implementation of NPD project/process management and PDM systems, and instituted portfolio management and pipeline management processes.He has written papers, contributed to books, conducted training, and spoken at many conferences on product development and manufacturing. He is the past President and founding member of the Society of Concurrent Product Development and a member of PDMA and Engineering Mgt. Society. He is a Certified New Product Development Professional through PDMA. For further information, contact:
DRM Associates, 2613 Via Olivera, Palos Verdes, CA 90274Telephone (310) 377-5569; Fax (310) 377-1315; E-mail: [email protected] sites: www.npd-solutions.com | www.pd-trak.com | www.pdforum.com

© 2004 DRM ASSOCIATES
PRODUCT PORTFOLIO MANAGEMENT
Definition:The process of managing new product ideas, proposed projects and current projects under development as a portfolio to 1.) maximize the value of the portfolio, 2.) keep it in balance, and 3.) align it with company strategy. By character-izing and reviewing the projects in a company’s portfolio as a whole, a big picture is presented and used to prioritize and select projects.
Reward (Expected NPV)
Prob
abili
ty o
f Suc
cess
Risk - Reward

© 2004 DRM ASSOCIATES
PORTFOLIO MANAGEMENT ELEMENTS
1. Product strategy specifies:
• New product goals (e.g., sales from new products)
• Areas of focus (e.g., those markets and product areas that new products will be developed for)
• Relative priorities (e.g., the breakdown of R&D investment by market, product area & project type
2. Product development process has gates where go/kill decisions are made on individual projects and hence resources are allocated
3. Portfolio Review where the executive management periodically reviews all projects & determines: Do we have the right projects? Is this really how we want to spend our money?
© 2004 DRM ASSOCIATES
STARTS WITH STRATEGY & BUSINESS PLAN
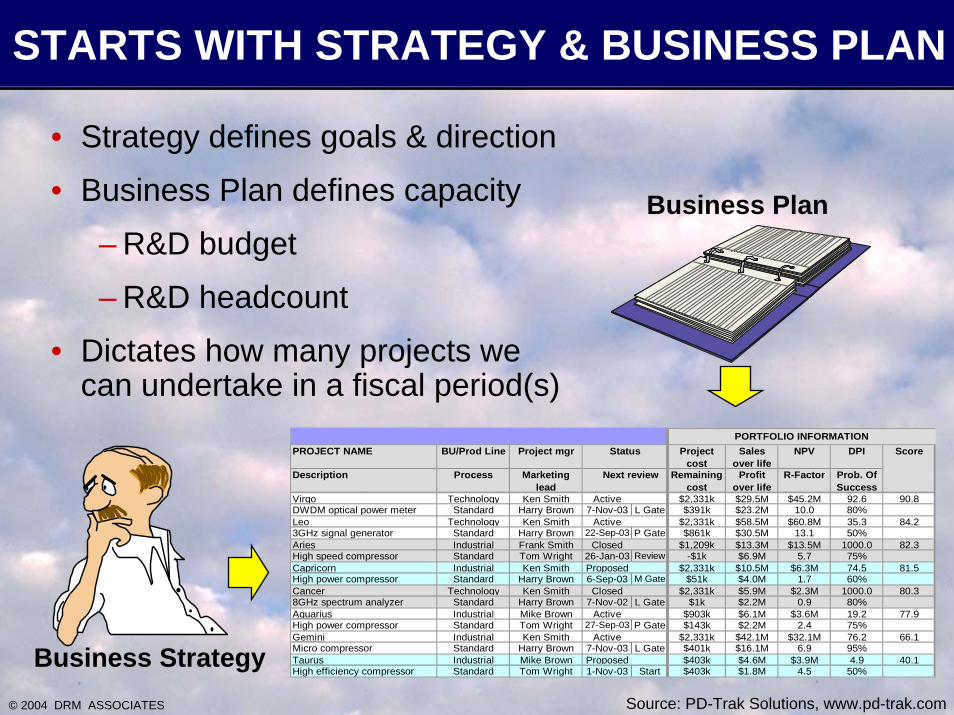
• Strategy defines goals & direction
• Business Plan defines capacity
– R&D budget
– R&D headcount
• Dictates how many projects we can undertake in a fiscal period(s)
Business Plan
PROJECT NAME BU/Prod Line Project mgr Projectcost
Salesover life
NPV DPI
Description Process Marketing lead
Remainingcost
Profitover life
R-Factor Prob. Of Success
Virgo Technology Ken Smith Active $2,331k $29.5M $45.2M 92.6 90.8DWDM optical power meter Standard Harry Brown 7-Nov-03 L Gate $391k $23.2M 10.0 80%Leo Technology Ken Smith Active $2,331k $58.5M $60.8M 35.3 84.23GHz signal generator Standard Harry Brown 22-Sep-03 P Gate $861k $30.5M 13.1 50%Aries Industrial Frank Smith Closed $1,209k $13.3M $13.5M 1000.0 82.3High speed compressor Standard Tom Wright 26-Jan-03 Review -$1k $6.9M 5.7 75%Capricorn Industrial Ken Smith Proposed $2,331k $10.5M $6.3M 74.5 81.5High power compressor Standard Harry Brown 6-Sep-03 M Gate $51k $4.0M 1.7 60%Cancer Technology Ken Smith Closed $2,331k $5.9M $2.3M 1000.0 80.38GHz spectrum analyzer Standard Harry Brown 7-Nov-02 L Gate $1k $2.2M 0.9 80%Aquarius Industrial Mike Brown Active $903k $6.1M $3.6M 19.2 77.9High power compressor Standard Tom Wright 27-Sep-03 P Gate $143k $2.2M 2.4 75%Gemini Industrial Ken Smith Active $2,331k $42.1M $32.1M 76.2 66.1Micro compressor Standard Harry Brown 7-Nov-03 L Gate $401k $16.1M 6.9 95%Taurus Industrial Mike Brown Proposed $403k $4.6M $3.9M 4.9 40.1High efficiency compressor Standard Tom Wright 1-Nov-03 Start $403k $1.8M 4.5 50%
MPS baseline date: 10/10/03 PORTFOLIO INFORMATIONStatus
Next review
Score
Proposed/On holdActive
Business StrategySource: PD-Trak Solutions, www.pd-trak.com
© 2004 DRM ASSOCIATES
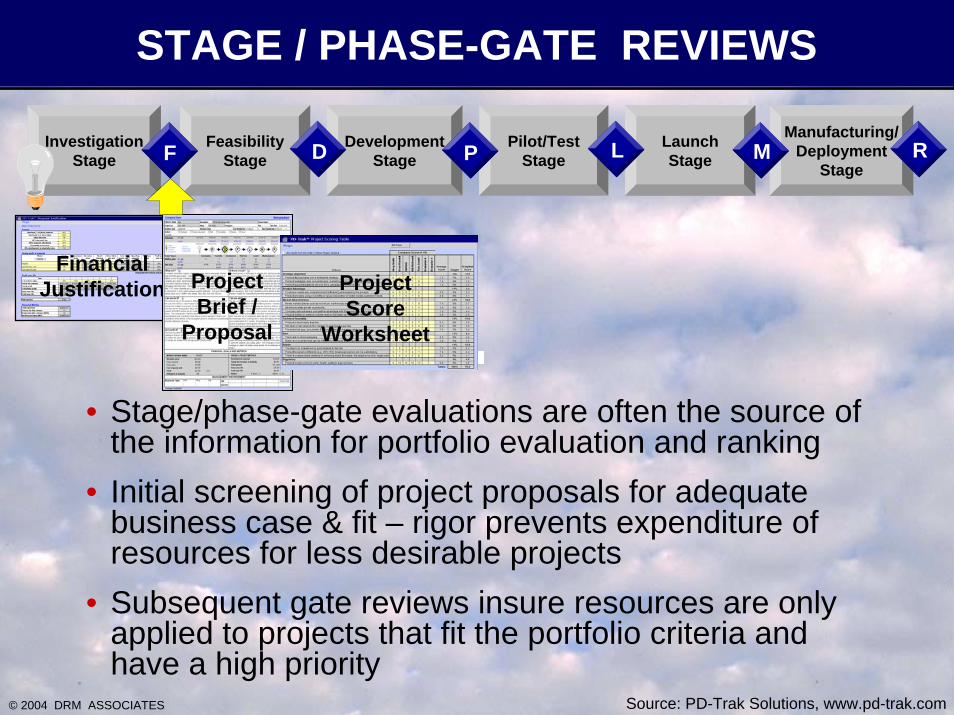
STAGE / PHASE-GATE REVIEWS
DevelopmentStage
FeasibilityStage
LaunchStage
InvestigationStage
Manufacturing/Deployment
Stage
Pilot/TestStageDF P L M R
Financial Justification Project
Brief / Proposal
Project Score
Worksheet
• Stage/phase-gate evaluations are often the source of the information for portfolio evaluation and ranking
• Initial screening of project proposals for adequate business case & fit – rigor prevents expenditure of resources for less desirable projects
• Subsequent gate reviews insure resources are only applied to projects that fit the portfolio criteria and have a high priority
Source: PD-Trak Solutions, www.pd-trak.com

© 2004 DRM ASSOCIATES
REQUIRES EFFECTIVE GATE PROCESS
Portfolio Management requires an effective gate process to kill bad or marginal projects. This can be a challenge because:
• Management has had a tough time killing projects -“sacred cows” and personal commitment
• Lack of effective gate criteria
• Projects get a life of there own
• Teams tweak the project business case until acceptable
© 2004 DRM ASSOCIATES
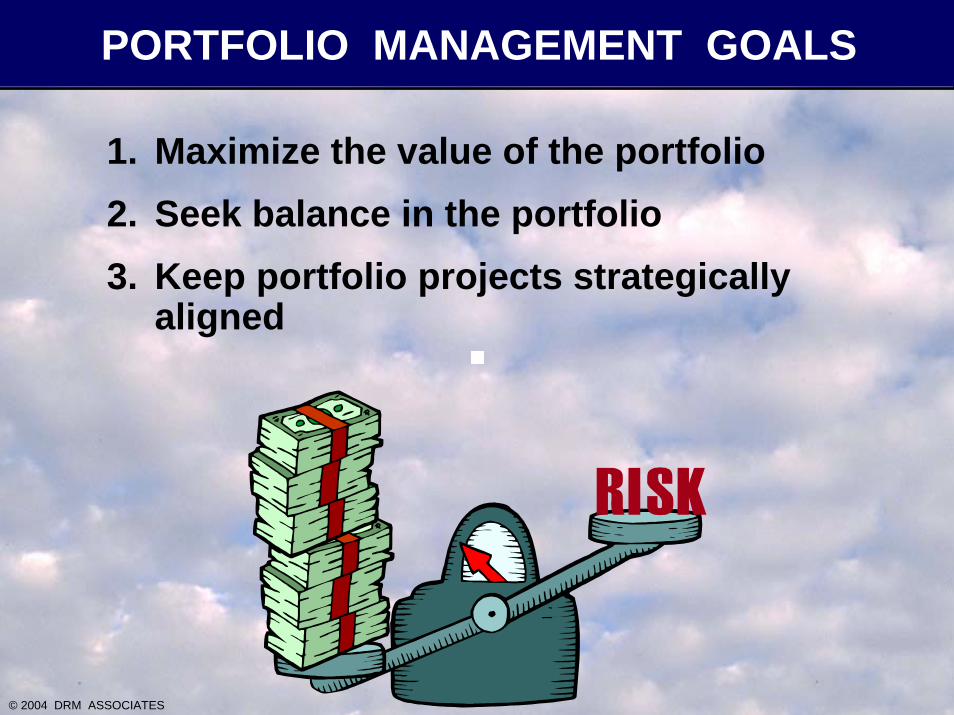
PORTFOLIO MANAGEMENT GOALS
1. Maximize the value of the portfolio2. Seek balance in the portfolio3. Keep portfolio projects strategically
aligned
© 2004 DRM ASSOCIATES
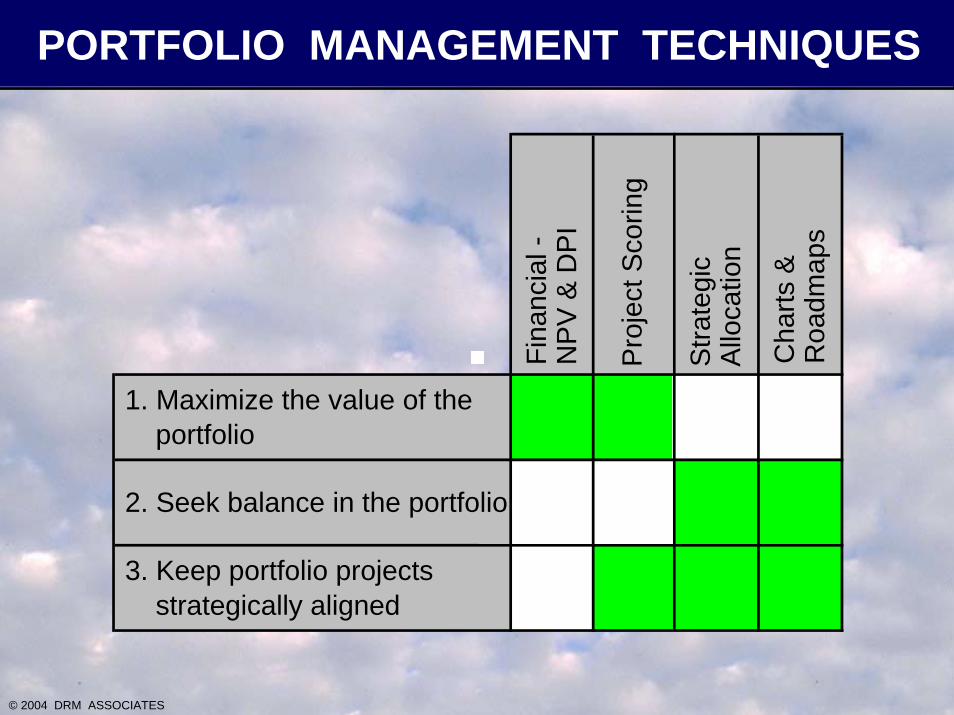
PORTFOLIO MANAGEMENT TECHNIQUES
Fina
ncia
l -N
PV
& D
PI
Pro
ject
Sco
ring
Stra
tegi
c A
lloca
tion
Cha
rts &
R
oadm
aps
1. Maximize the value of the portfolio
2. Seek balance in the portfolio
3. Keep portfolio projects strategically aligned
© 2004 DRM ASSOCIATES
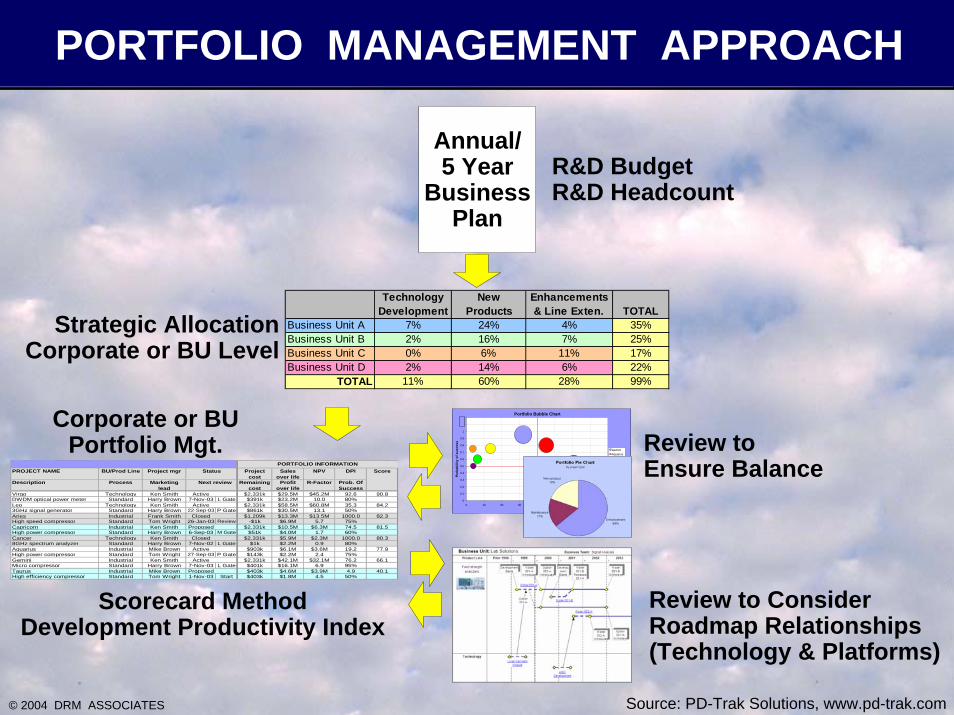
PORTFOLIO MANAGEMENT APPROACH
Technology Development
New Products
Enhancements & Line Exten. TOTAL
Business Unit A 7% 24% 4% 35%Business Unit B 2% 16% 7% 25%Business Unit C 0% 6% 11% 17%Business Unit D 2% 14% 6% 22%
TOTAL 11% 60% 28% 99%
Annual/5 Year
BusinessPlan
R&D BudgetR&D Headcount
Strategic AllocationCorporate or BU Level
Corporate or BUPortfolio Mgt.
PROJECT NAME BU/Prod Line Project mgr Projectcost
Salesover life
NPV DPI
Description Process Marketing lead
Remainingcost
Profitover life
R-Factor Prob. Of Success
Virgo Technology Ken Smith Active $2,331k $29.5M $45.2M 92.6 90.8DWDM optical power meter Standard Harry Brown 7-Nov-03 L Gate $391k $23.2M 10.0 80%Leo Technology Ken Smith Active $2,331k $58.5M $60.8M 35.3 84.23GHz signal generator Standard Harry Brown 22-Sep-03 P Gate $861k $30.5M 13.1 50%Aries Industrial Frank Smith Closed $1,209k $13.3M $13.5M 1000.0 82.3High speed compressor Standard Tom Wright 26-Jan-03 Review -$1k $6.9M 5.7 75%Capricorn Industrial Ken Smith Proposed $2,331k $10.5M $6.3M 74.5 81.5High power compressor Standard Harry Brown 6-Sep-03 M Gate $51k $4.0M 1.7 60%Cancer Technology Ken Smith Closed $2,331k $5.9M $2.3M 1000.0 80.38GHz spectrum analyzer Standard Harry Brown 7-Nov-02 L Gate $1k $2.2M 0.9 80%Aquarius Industrial Mike Brown Active $903k $6.1M $3.6M 19.2 77.9High power compressor Standard Tom Wright 27-Sep-03 P Gate $143k $2.2M 2.4 75%Gemini Industrial Ken Smith Active $2,331k $42.1M $32.1M 76.2 66.1Micro compressor Standard Harry Brown 7-Nov-03 L Gate $401k $16.1M 6.9 95%Taurus Industrial Mike Brown Proposed $403k $4.6M $3.9M 4.9 40.1High efficiency compressor Standard Tom Wright 1-Nov-03 Start $403k $1.8M 4.5 50%
MPS baseline date: 10/10/03 PORTFOLIO INFORMATIONStatus
Next review
Score
Proposed/On holdActive
Review to Ensure Balance
Portfolio Bubble Chart
0
0.1
0.2
0.3
0.4
0.5
0.6
0.7
0.8
0.9
1
1.1
1.2
0 10 20 30 40 50 60 70 80
NPV
Prob
abili
ty o
f suc
cess
GeminiAquariusAriesCapricornTaurusVirgoLeo
Review to ConsiderRoadmap Relationships(Technology & Platforms)
Scorecard MethodDevelopment Productivity Index
Source: PD-Trak Solutions, www.pd-trak.com

© 2004 DRM ASSOCIATES
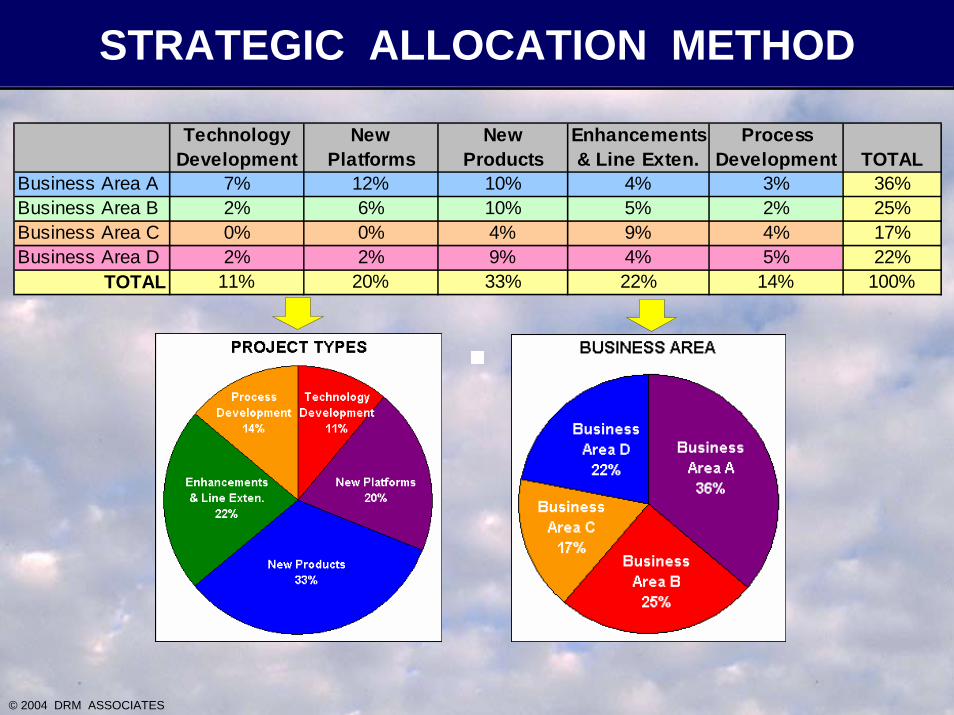
STRATEGIC ALLOCATION METHOD
• The business strategy dictates the allocation of resources into buckets
• Projects are rank ordered within buckets
• Different criteria are used to rank order projects for each bucket

© 2004 DRM ASSOCIATES
STRATEGIC ALLOCATION BASIS
• Strategic goals - defending the base, expanding the base, diversifying, etc.
• Business unit allocation• Product line allocation• Project type - new product, upgrade, process
improvement, cost reduction, technology development, research, etc.
• Familiarity - product technology newness, process newness, market newness, etc.
• Geography
© 2004 DRM ASSOCIATES
STRATEGIC ALLOCATION METHOD
Technology Development
New Platforms
New Products
Enhancements & Line Exten.
Process Development TOTAL
Business Area A 7% 12% 10% 4% 3% 36%Business Area B 2% 6% 10% 5% 2% 25%Business Area C 0% 0% 4% 9% 4% 17%Business Area D 2% 2% 9% 4% 5% 22%
TOTAL 11% 20% 33% 22% 14% 100%
© 2004 DRM ASSOCIATES
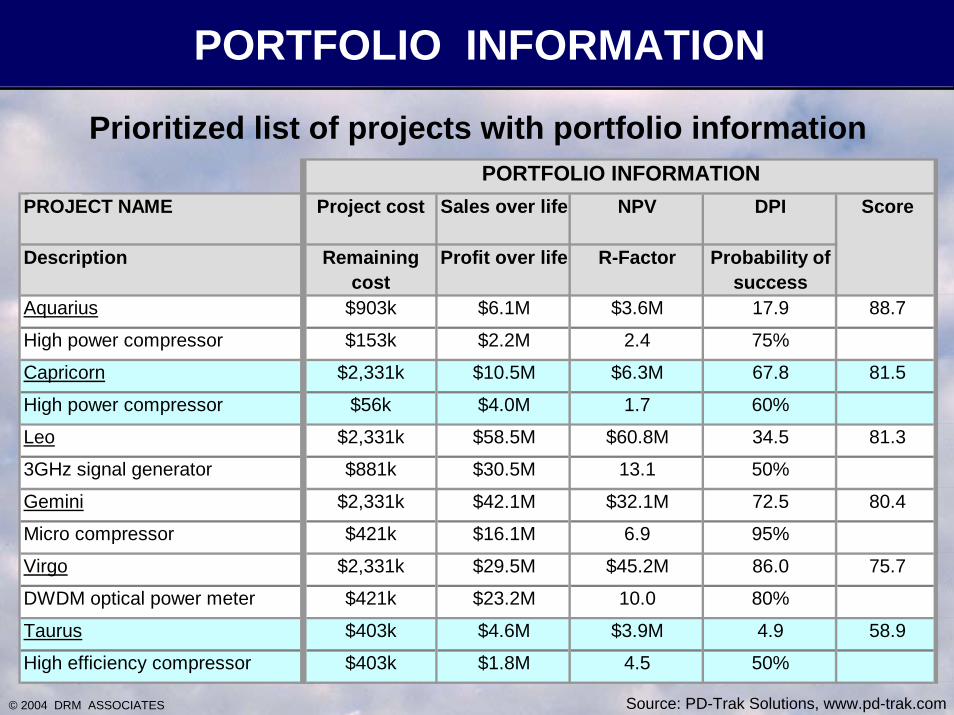
PORTFOLIO INFORMATION
Prioritized list of projects with portfolio information
PROJECT NAME
Description
Aquarius
High power compressor
Capricorn
High power compressor
Leo
3GHz signal generator
Gemini
Micro compressor
Virgo
DWDM optical power meter
Taurus
High efficiency compressor
Project cost Sales over life NPV DPI Score
Remaining cost
Profit over life R-Factor Probability of success
$903k $6.1M $3.6M 17.9 88.7
$153k $2.2M 2.4 75%
$2,331k $10.5M $6.3M 67.8 81.5
$56k $4.0M 1.7 60%
$2,331k $58.5M $60.8M 34.5 81.3
$881k $30.5M 13.1 50%
$2,331k $42.1M $32.1M 72.5 80.4
$421k $16.1M 6.9 95%
$2,331k $29.5M $45.2M 86.0 75.7
$421k $23.2M 10.0 80%
$403k $4.6M $3.9M 4.9 58.9
$403k $1.8M 4.5 50%
PORTFOLIO INFORMATION
Source: PD-Trak Solutions, www.pd-trak.com

© 2004 DRM ASSOCIATES
PROJECT SCORING
Stev
e W
right
Bill
Sam
pson
Ral
ph P
orte
r
Hor
osi A
naki
Terr
y A
rthu
r
8 7 9 7 87 8 7 8 98 9 8 7 8
7 6 7 6 86 7 8 7 8
8 8 9 8 97 10 9 7 88 8 8 9 87 7 7 6 7
6 8 7 6 78 8 7 6 89 7 8 8 7
7 8 9 7 107 8 8 8 9
7 7 6 6 78 7 7 6 68 8 8 7 7
7 8 8 9 8Regulatory
Product meets environmental, health, safety & legal policies
The return on investment is good relative to the riskProduct's overall profitability (e.g., NPV, ROI, breakeven period, etc.) is satisfactoryThere is a reasonable certainty of achieving sales forecasts, the target price & target cost
There are no show stoppersRisks and uncertainties can be effectively managed and responded to
Return
The technical gap, complexity, & technical risk can be adequately managedRisk
Technical FeasibilityProduct is technically feasible We have or can acquire the needed knowledge & expertise
Market provides growth opportunityCompany can achieve a competitive advantage with this product in this marketProduct meets an existing market need or the need can be readily developed
Market AttractivenessMeets market criteria such as minimum market size requirements
Product AdvantageCustomer needs are understood and effectively addressed by the productProduct provides unique benefits or value proposition or better meets customer needs
Product fits business unit & enterprise strategyProduct leverages core competencies: marketing, technical, manufacturingProduct supports balance among BU's, geography & product lines
CriteriaStrategic alignment
Average Score Weight
Weighted Score
16% 12.67.8 7% 5.57.8 4% 3.18.0 5% 4.0
11% 7.76.8 5% 3.47.2 6% 4.3
22% 17.48.4 5% 4.28.2 6% 4.98.2 6% 4.96.8 5% 3.4
16% 11.76.8 6% 4.17.4 5% 3.77.8 5% 3.9
12% 9.78.2 6% 4.98.0 6% 4.8
18% 12.66.6 6% 4.06.8 6% 4.17.6 6% 4.6
5% 4.08.0 5% 4.0
Totals: 100% 75.7
Source: PD-Trak Solutions, www.pd-trak.com

© 2004 DRM ASSOCIATES
SCORING METHODNPV DPI Score
R-Factor Probability of success
$3.6M 17.9 88.72.4 75%
$6.3M 67.8 81.51.7 60%
$60.8M 34.5 81.313.1 50%
$32.1M 72.5 80.46.9 95%
$45.2M 86.0 75.710.0 80%
$3.9M 4.9 58.94.5 50%
PROJECT NAME
Description
AquariusHigh power compressorCapricornHigh power compressorLeo3GHz signal generatorGeminiMicro compressorVirgoDWDM optical power meterTaurusHigh efficiency compressor
12 Mo CumulativeReqmts Personnel Action
4.9 4.9 Go
11.5 16.4 Go
5.3 21.7 Go
4.1 25.8 Hold
5.3 31.2 Hold
3.3 34.5 Kill
Rank by Total Score
Average Project Cycle Time = 12 mo.
Sustaining & Administrative Time = 15%
Available staff = 26
Proceed with first 3 projectsSource: PD-Trak Solutions, www.pd-trak.com
© 2004 DRM ASSOCIATES
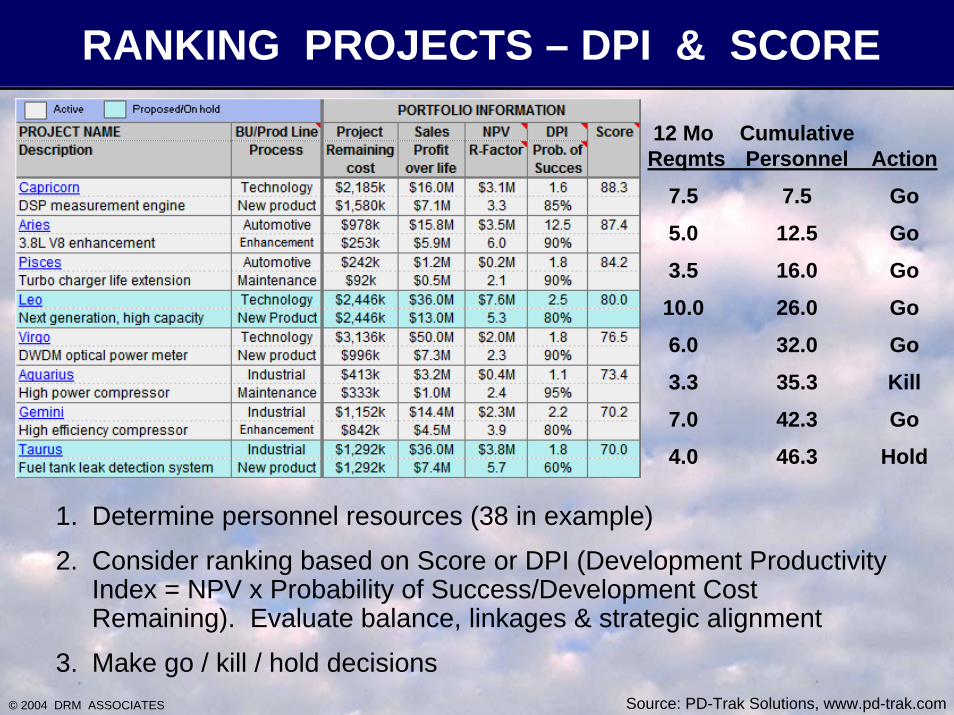
RANKING PROJECTS – DPI & SCORE
12 Mo CumulativeReqmts Personnel Action
7.5 7.5 Go
5.0 12.5 Go
3.5 16.0 Go
10.0 26.0 Go
6.0 32.0 Go
3.3 35.3 Kill
7.0 42.3 Go
4.0 46.3 Hold
1. Determine personnel resources (38 in example)
2. Consider ranking based on Score or DPI (Development ProductivityIndex = NPV x Probability of Success/Development Cost Remaining). Evaluate balance, linkages & strategic alignment
3. Make go / kill / hold decisionsSource: PD-Trak Solutions, www.pd-trak.com
© 2004 DRM ASSOCIATES
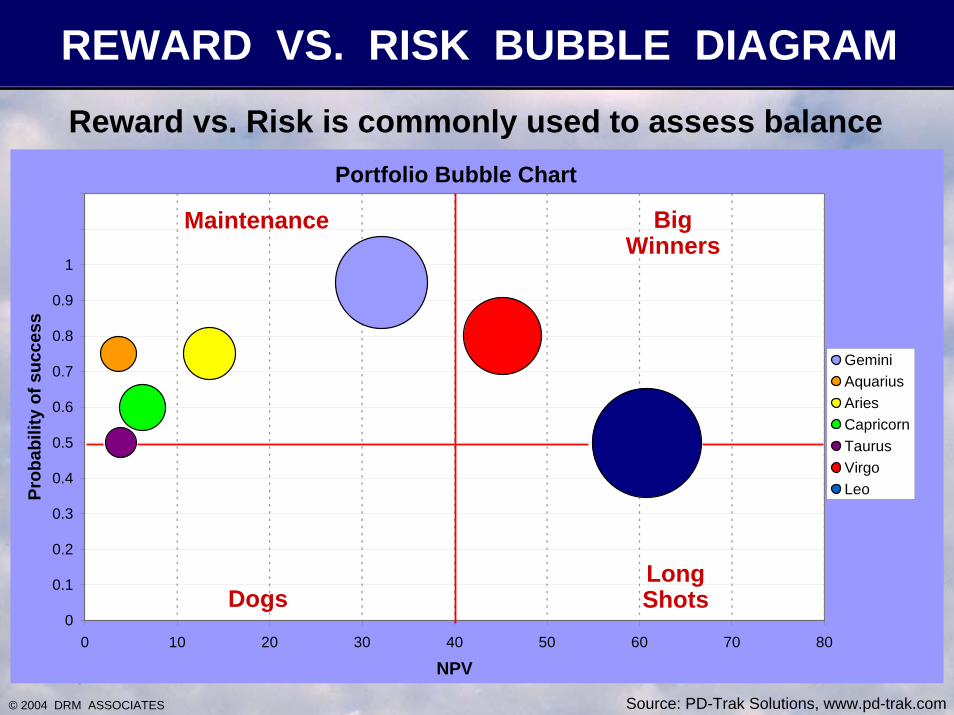
REWARD VS. RISK BUBBLE DIAGRAMReward vs. Risk is commonly used to assess balance
Portfolio Bubble Chart
0
0.1
0.2
0.3
0.4
0.5
0.6
0.7
0.8
0.9
1
1.1
1.2
0 10 20 30 40 50 60 70 80
NPV
Prob
abili
ty o
f suc
cess
GeminiAquariusAriesCapricornTaurusVirgoLeo
Big Winners
Dogs
Maintenance
Long Shots
Source: PD-Trak Solutions, www.pd-trak.com

© 2004 DRM ASSOCIATES
REWARD VS. RISK PROJECT TYPES
• Big Winners - high reward & high probability of success; want more of this type of project
• Long Shots - high reward & low probability of success projects; a technical breakthrough may lead to a winner
• Maintenance - low reward & high probability projects typical of product upgrades & line extensions; common for companies to have too many of these projects
• Losers - low reward, low probability (high risk) projects; once approved (perhaps with a different initial assessment), they are difficult to kill

© 2004 DRM ASSOCIATES
PORTFOLIO MANAGEMENT ALLOCATIONPie chart used to indicate distribution
of project characteristics
Source: PD-Trak Solutions, www.pd-trak.com

© 2004 DRM ASSOCIATES
STRATEGIC ALLOCATION METHODStrategic allocation used with Development Productivity Index
DescriptionProject Type
Net Present
Value
Prob. of
Succ.Develop.
Cost
Dev. Prod. Index
New Prod 45%
Upgrade 35% Tech. 20%
Budget Allocation $7,200,000 $5,600,000 $3,200,000Field Strength Analyzer Upgrade $3,415,564 90% $1,100,000 2.79 $1,100,000Netw ork Tester New product $3,579,785 80% $1,196,000 2.39 $1,196,000Broadband Optical Detector Upgrade $1,561,897 95% $694,002 2.14 $694,002Netw ork Driver Softw are Upgrade $758,040 95% $346,894 2.08 $346,894Optical Sensor New product $1,677,893 80% $756,611 1.77 $756,611ATM Sw itch Upgrade $1,093,648 95% $742,000 1.40 $742,000DWDM Optical Pow er Meter New product $4,433,684 80% $2,583,000 1.37 $2,583,000Optical Coupling Module New product $321,766 75% $187,453 1.29 $187,45310GB Optical Transceiver New product $3,546,755 80% $2,322,017 1.22 $2,322,017Optical Demux Upgrade $1,304,088 90% $983,671 1.19 $983,671Optical Multiplexer New product $428,408 75% $1,200,000 0.27 $1,200,000DSP Measurement Engine Technology $0 70% $933,000 0.00 $933,000Next Gen Optical Sensor Technology $0 60% $2,405,000 0.00 $2,405,0001000GB Core Technology Technology $0 60% $4,435,000 0.00 $4,435,000Total All Projects $19,884,648 $8,245,081 $3,866,567 $7,773,000Total Selected Projects $7,045,081 $3,866,567 $3,338,000

© 2004 DRM ASSOCIATES
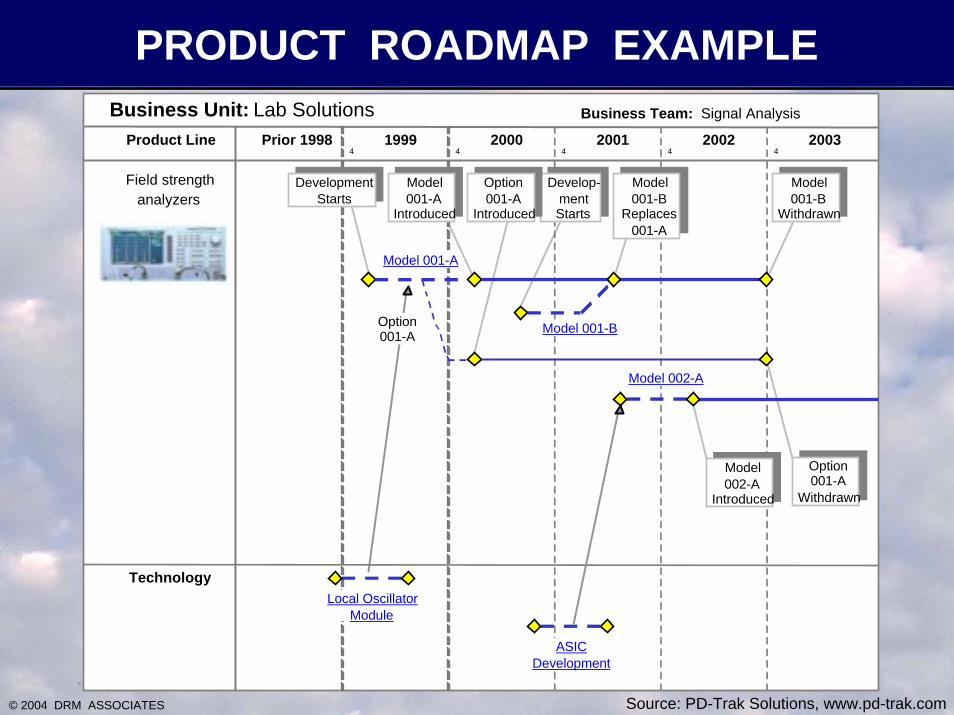
PRODUCT ROADMAP METHOD
• Business strategy defines goals & strategic arenas
• Determine what major initiatives must be done to win in each arena
• Determine types of platforms and technologies to invest in:
– Research & development
– Technology acquisition
• Cluster projects and identify logical development sequence; consider market opportunity, competition, technology development timing, etc.
• Describe via a Product / Technology Roadmap
• Check the roadmap against the portfolio plan to identify prerequisite projects that were killed or placed on hold
© 2004 DRM ASSOCIATES
PRODUCT ROADMAP EXAMPLE
4 4 4 4 4
Business Unit: Lab Solutions Business Team: Signal Analysis
Prior 1998 1999 2000 2001 2002 2003
Field strengthanalyzers
Product Line
Technology
DevelopmentStarts
DevelopmentStarts
Model001-B
Replaces001-A
Model001-B
Replaces001-A
Model002-A
Introduced
Model002-A
Introduced
Develop-mentStarts
Develop-mentStarts
Model001-A
Introduced
Model001-A
Introduced
Option001-A
Introduced
Option001-A
Introduced
Model001-B
Withdrawn
Model001-B
Withdrawn
Model 001-A
Option001-A Model 001-B
Option001-A
Withdrawn
Option001-A
Withdrawn
Local OscillatorModule
ASICDevelopment
Model 002-A
Source: PD-Trak Solutions, www.pd-trak.com

© 2004 DRM ASSOCIATES
RECOMMENDED APPROACH
Three-stage process:
1. How should we spend our R&D budget in terms of markets, business units, product lines, & development categories?
2. Which projects should we undertake & what are the priorities?
3. Does this prioritization achieve the desired balance and address technology & platform prerequisites?
PROJECT NAME BU/Prod Line Project mgr Projectcost
Salesover life
NPV DPI
Description Process Marketing lead
Remainingcost
Profitover life
R-Factor Prob. Of Success
Virgo Technology Ken Smith Active $2,331k $29.5M $45.2M 92.6 90.8DWDM optical power meter Standard Harry Brown 7-Nov-03 L Gate $391k $23.2M 10.0 80%Leo Technology Ken Smith Active $2,331k $58.5M $60.8M 35.3 84.23GHz signal generator Standard Harry Brown 22-Sep-03 P Gate $861k $30.5M 13.1 50%Aries Industrial Frank Smith Closed $1,209k $13.3M $13.5M 1000.0 82.3High speed compressor Standard Tom Wright 26-Jan-03 Review -$1k $6.9M 5.7 75%Capricorn Industrial Ken Smith Proposed $2,331k $10.5M $6.3M 74.5 81.5High power compressor Standard Harry Brown 6-Sep-03 M Gate $51k $4.0M 1.7 60%Cancer Technology Ken Smith Closed $2,331k $5.9M $2.3M 1000.0 80.38GHz spectrum analyzer Standard Harry Brown 7-Nov-02 L Gate $1k $2.2M 0.9 80%Aquarius Industrial Mike Brown Active $903k $6.1M $3.6M 19.2 77.9High power compressor Standard Tom Wright 27-Sep-03 P Gate $143k $2.2M 2.4 75%Gemini Industrial Ken Smith Active $2,331k $42.1M $32.1M 76.2 66.1Micro compressor Standard Harry Brown 7-Nov-03 L Gate $401k $16.1M 6.9 95%Taurus Industrial Mike Brown Proposed $403k $4.6M $3.9M 4.9 40.1High efficiency compressor Standard Tom Wright 1-Nov-03 Start $403k $1.8M 4.5 50%
MPS baseline date: 10/10/03 PORTFOLIO INFORMATIONStatus
Next review
Score
Proposed/On holdActive
Technology Development
New Products
Enhancements & Line Exten. TOTAL
Business Unit A 7% 24% 4% 35%Business Unit B 2% 16% 7% 25%Business Unit C 0% 6% 11% 17%Business Unit D 2% 14% 6% 22%
TOTAL 11% 60% 28% 99%
Strategic Allocation
Portfolio Bubble Chart
0
0.1
0.2
0.3
0.4
0.5
0.6
0.7
0.8
0.9
1
1.1
1.2
0 10 20 30 40 50 60 70 80
NPV
Prob
abili
ty o
f suc
cess
GeminiAquariusAriesCapricornTaurusVirgoLeo
Source: PD-Trak Solutions, www.pd-trak.com

© 2004 DRM ASSOCIATES
BUSINESS PLANNING INTEGRATION
Annual/5 Year
BusinessPlan
PROJECT NAME BU/Prod Line Project mgr Projectcost
Salesover life
NPV DPI
Description Process Marketing lead
Remainingcost
Profitover life
R-Factor Prob. Of Success
Virgo Technology Ken Smith Active $2,331k $29.5M $45.2M 92.6 90.8DWDM optical power meter Standard Harry Brown 7-Nov-03 L Gate $391k $23.2M 10.0 80%Leo Technology Ken Smith Active $2,331k $58.5M $60.8M 35.3 84.23GHz signal generator Standard Harry Brown 22-Sep-03 P Gate $861k $30.5M 13.1 50%Aries Industrial Frank Smith Closed $1,209k $13.3M $13.5M 1000.0 82.3High speed compressor Standard Tom Wright 26-Jan-03 Review -$1k $6.9M 5.7 75%Capricorn Industrial Ken Smith Proposed $2,331k $10.5M $6.3M 74.5 81.5High power compressor Standard Harry Brown 6-Sep-03 M Gate $51k $4.0M 1.7 60%Cancer Technology Ken Smith Closed $2,331k $5.9M $2.3M 1000.0 80.38GHz spectrum analyzer Standard Harry Brown 7-Nov-02 L Gate $1k $2.2M 0.9 80%Aquarius Industrial Mike Brown Active $903k $6.1M $3.6M 19.2 77.9High power compressor Standard Tom Wright 27-Sep-03 P Gate $143k $2.2M 2.4 75%Gemini Industrial Ken Smith Active $2,331k $42.1M $32.1M 76.2 66.1Micro compressor Standard Harry Brown 7-Nov-03 L Gate $401k $16.1M 6.9 95%Taurus Industrial Mike Brown Proposed $403k $4.6M $3.9M 4.9 40.1High efficiency compressor Standard Tom Wright 1-Nov-03 Start $403k $1.8M 4.5 50%
MPS baseline date: 10/10/03 PORTFOLIO INFORMATIONStatus
Next review
Score
Proposed/On holdActive
2004 2005 2006 2007 2008New Product Sales $15.4M $28.5M $36.8M $37.2M $31.2MNew Product Profit $4.1M $7.1M $8.8M $9.0M $7.6MDev. Expense-Committed $12.6M $12.7M $6.5M $0.0M $0.0MDev. Expense-Planned $6.3M $13.4M $13.7MDevelopment Headcount 72 72 74 74 76
Meet Plan?YesStop
No
Adjust PlanAdjust Portfolio
Portfolio Business Summary
R&D BudgetR&D HeadcountSales from New ProductsProfit from New Products
Project Portfolio(Master Project Schedule)
© 2004 DRM ASSOCIATES
PORTFOLIO MANAGEMENT & GATES
Two approaches:
1. Gate-Focused
• For larger, more mature firm with a relatively stable product portfolio & environment
• Strong stage-gate process
• The project under gate review must pass gate criteria and then resources are allocated based on how it stacks up relative to all other projects
• Portfolio management reviews held twice a year primarily to oversee gate process and make course corrections
© 2004 DRM ASSOCIATES
PORTFOLIO MANAGEMENT & GATES
Two approaches:
2. Portfolio Management-Focused
• For fast-paced companies in fluid markets and a dynamic environment
• Reprioritization of projects essential because of the changes in the market
• Portfolio management reviews held at least quarterly
• All projects reviewed and then killed or reprioritized

© 2004 DRM ASSOCIATES
A TOTAL MANAGEMENT SYSTEMBusiness Plan
Project Brief &
Strategy
Financial Justification
3.A Phase/Stage-Gate process
1.Decision on the overall level of investment in R&D and our general product development strategy
2. A solid business case and product strategy for each proposed development project
Phase/Stage 1G G Phase/
Stage 2to rigorously evaluate projects at critical points and approve or kill projects

© 2004 DRM ASSOCIATES
A TOTAL MANAGEMENT SYSTEMBusiness Plan
PROJECT NAME BU/Prod Line Project mgr Projectcost
Salesover life
NPV DPI
Description Process Marketing lead
Remainingcost
Profitover life
R-Factor Prob. Of Success
Virgo Technology Ken Smith Active $2,331k $29.5M $45.2M 92.6 90.8DWDM optical power meter Standard Harry Brown 7-Nov-03 L Gate $391k $23.2M 10.0 80%Leo Technology Ken Smith Active $2,331k $58.5M $60.8M 35.3 84.23GHz signal generator Standard Harry Brown 22-Sep-03 P Gate $861k $30.5M 13.1 50%Aries Industrial Frank Smith Closed $1,209k $13.3M $13.5M 1000.0 82.3High speed compressor Standard Tom Wright 26-Jan-03 Review -$1k $6.9M 5.7 75%Capricorn Industrial Ken Smith Proposed $2,331k $10.5M $6.3M 74.5 81.5High power compressor Standard Harry Brown 6-Sep-03 M Gate $51k $4.0M 1.7 60%Cancer Technology Ken Smith Closed $2,331k $5.9M $2.3M 1000.0 80.38GHz spectrum analyzer Standard Harry Brown 7-Nov-02 L Gate $1k $2.2M 0.9 80%Aquarius Industrial Mike Brown Active $903k $6.1M $3.6M 19.2 77.9High power compressor Standard Tom Wright 27-Sep-03 P Gate $143k $2.2M 2.4 75%Gemini Industrial Ken Smith Active $2,331k $42.1M $32.1M 76.2 66.1Micro compressor Standard Harry Brown 7-Nov-03 L Gate $401k $16.1M 6.9 95%Taurus Industrial Mike Brown Proposed $403k $4.6M $3.9M 4.9 40.1High efficiency compressor Standard Tom Wright 1-Nov-03 Start $403k $1.8M 4.5 50%
MPS baseline date: 10/10/03 PORTFOLIO INFORMATIONStatus
Next review
Score
Proposed/On holdActive
Portfolio Bubble Chart
0
0.1
0.2
0.3
0.4
0.5
0.6
0.7
0.8
0.9
1
1.1
1.2
0 10 20 30 40 50 60 70 80
NPV
Prob
abili
ty o
f suc
cess
GeminiAquariusAriesCapricornTaurusVirgoLeo
2004 2005 2006 2007 2008New Product Sales $15.4M $28.5M $36.8M $37.2M $31.2MNew Product Profit $4.1M $7.1M $8.8M $9.0M $7.6MDev. Expense-Committed $12.6M $12.7M $6.5M $0.0M $0.0MDev. Expense-Planned $6.3M $13.4M $13.7MDevelopment Headcount 72 72 74 74 76
6. An integrated business planning process that shows the result of portfolio decisions on the plan
4. A portfolio management process to select an optimum mix of projects that will meet business objectives
5. A pipeline management process to plan resource requirements and control the release of development projects

© 2004 DRM ASSOCIATES
QUESTIONS? COMMENTS?
Thank you for your attention and participation
Feel free to contact me with questions or for further help at [email protected] or (310) 377-5569
Related Documents


