APM Product Introduction Issue 01 Date 2019-07-11 HUAWEI TECHNOLOGIES CO., LTD.

Welcome message from author
This document is posted to help you gain knowledge. Please leave a comment to let me know what you think about it! Share it to your friends and learn new things together.
Transcript

APM
Product Introduction
Issue 01
Date 2019-07-11
HUAWEI TECHNOLOGIES CO., LTD.

Copyright © Huawei Technologies Co., Ltd. 2020. All rights reserved.
No part of this document may be reproduced or transmitted in any form or by any means without priorwritten consent of Huawei Technologies Co., Ltd. Trademarks and Permissions
and other Huawei trademarks are trademarks of Huawei Technologies Co., Ltd.All other trademarks and trade names mentioned in this document are the property of their respectiveholders. NoticeThe purchased products, services and features are stipulated by the contract made between Huawei andthe customer. All or part of the products, services and features described in this document may not bewithin the purchase scope or the usage scope. Unless otherwise specified in the contract, all statements,information, and recommendations in this document are provided "AS IS" without warranties, guaranteesor representations of any kind, either express or implied.
The information in this document is subject to change without notice. Every effort has been made in thepreparation of this document to ensure accuracy of the contents, but all statements, information, andrecommendations in this document do not constitute a warranty of any kind, express or implied.
Issue 01 (2019-07-11) Copyright © Huawei Technologies Co., Ltd. i

Contents
1 What Is APM?........................................................................................................................... 1
2 Functions................................................................................................................................... 4
3 Application Scenarios............................................................................................................. 7
4 Basic Concepts........................................................................................................................13
5 Permissions Management................................................................................................... 17
6 Data Collection...................................................................................................................... 19
7 Usage Restrictions.................................................................................................................22
8 Billing....................................................................................................................................... 26
9 Change History...................................................................................................................... 30
APMProduct Introduction Contents
Issue 01 (2019-07-11) Copyright © Huawei Technologies Co., Ltd. ii

1 What Is APM?
O&M ChallengesIn the cloud era, there are more and more applications under the distributedmicroservice architecture. The number of users also increases explosively, facingvarious application exceptions. In traditional O&M mode, metrics of multiple O&Msystems cannot be associated for analysis. O&M personnel need to checkapplication exceptions one by one based on experience, resulting in low efficiency,costly maintenance, and poor stability.
When there are massive quantities of services, O&M personnel face the followingchallenges:
● Large distributed applications have complex relationships, making it difficultto analyze and locate problems. Specifically, O&M personnel face problemssuch as how to ensure normal application running, and quickly locate faultsand performance bottlenecks.
● Users choose to leave due to poor experience. O&M personnel fail to detectand track services with poor experience in real time, and cannot diagnoseapplication exceptions in a timely manner, severely affecting user experience.
APMProduct Introduction 1 What Is APM?
Issue 01 (2019-07-11) Copyright © Huawei Technologies Co., Ltd. 1

Introduction to APMApplication Performance Management (APM) monitors and manages theperformance of cloud applications in real time. APM provides performanceanalysis of distributed applications, helping O&M personnel quickly locate andresolve faults and performance bottlenecks.
As a cloud application diagnosis service, APM has powerful analysis tools. Itdisplays the application status, call processes, and user operations throughtopologies, tracing, and transaction analysis, so that you can quickly locate andresolve faults and performance bottlenecks.
Figure 1-1 APM architecture
1. Access APM: You can access APM by creating an Identity and AccessManagement (IAM) agency and implementing Access Key ID/Secret AccessKey (AK/SK) authentication.
2. Data collection: APM can collect data about applications, basic resources, anduser experience from Java probes, and Istio mesh in non-intrusive mode.
3. Service implementation: APM supports topology, tracing, and transactionanalysis.
4. Service expansion:– Application Operations Management (AOM) monitors application O&M
metrics in real time while APM quickly diagnoses applicationperformance bottlenecks through topologies and tracing.
APMProduct Introduction 1 What Is APM?
Issue 01 (2019-07-11) Copyright © Huawei Technologies Co., Ltd. 2

– Cloud Performance Test Service (CPTS) implements association analysisand generates performance reports after APM identifies performancebottlenecks.
– Based on the historical metric data learned using intelligent algorithms,APM associates metrics for analysis from multiple dimensions, extractsthe context data of both normal and abnormal services for comparison,and locates root causes through cluster analysis.
Advantages
Connects to applications without having to modify code, and collects data in anon-intrusive way. Data comes from:
● Java probe: Collects service call data, service inventory data, and call KPI datain non-intrusive mode based on the pinpoint open-source project.
● PHP probe: Collects service call data, resource information, and call KPI datain non-intrusive mode based on the PHP architecture.
● Istio mesh: Collects service call data, resource information, and call KPI data innon-intrusive mode through the Kubernetes platform.
Delivers high throughput (hundreds of millions of API calls), ensuring premiumexperience.
Analyzes root causes using Artificial Intelligence (AI)-powered threshold detectionand machine learning based on historical baseline data.
Opens O&M data query APIs and collection standards, and supports independentdevelopment.
APMProduct Introduction 1 What Is APM?
Issue 01 (2019-07-11) Copyright © Huawei Technologies Co., Ltd. 3

2 Functions
As a cloud application diagnosis service, Application Performance Management(APM) supports full-link topology display, tracing, transaction analysis andinsights, and device-side analysis.
Topology● Visible topology: APM displays application call and dependency relationships
in topologies. Application Performance Index (Apdex) is used to quantify usersatisfaction with application performance. Different colors indicate differentApdex value ranges, helping you quickly detect and locate performanceproblems. Figure 2-1 shows the application relationships, call data (serviceand instance metrics), and health status.
Figure 2-1 Topology
Microservice name: Tier2; number of instances: 3; container type: TomcatDescription: A circle indicates a microservice and is divided into 3 sectionsbased on the number of instances. Different colors indicate different instancestatuses. Red indicates abnormal, yellow indicates warning, and greenindicates normal.
● Inter-application calling: APM can display call relationships betweenapplication services on the topology. When services are called across
APMProduct Introduction 2 Functions
Issue 01 (2019-07-11) Copyright © Huawei Technologies Co., Ltd. 4

applications, APM can collect inter-application call relationships and displayapplication performance data.
● SQL analysis: APM can count and display key metrics about databases or SQLstatements on the topology. APM provides graphs of key metrics such as thenumber of SQL statement calls, response time, and number of errors. Basedon these graphs, you are able to analyze database performance problemscaused by slow and incorrect SQL statements.
● JVM metric monitoring: APM can count and display JVM metric data ofinstances on the topology. APM monitors the memory and thread metrics inthe JVM running environment in real time, enabling you to quickly detectmemory leakage and thread exceptions.
Tracing● Tracing: APM comprehensively monitors the number of calls, response time,
and number of errors, and displays the service running track and status,helping you quickly demarcate performance bottlenecks and faults. As shownin Figure 2-2, if an exception (the red service in the topology) occurs, locateroot causes based on the call status, duration, and API call information.
Figure 2-2 Tracing
● Method tracing: APM dynamically traces a method of a class. When themethod of this class is called, the APM probe collects the call data of themethod based on the configured method tracing rule and displays the calldata on the tracing page. Method tracing is used to help applicationdevelopers locate method-level performance problems online.
Transaction AnalysisTransaction analysis: APM analyzes the transactions (full-stack process from thebrowser or mobile device to the server) in real time, displays key metrics includingthroughput, error rate, and latency, and uses Apdex to evaluate applicationperformance, intuitively reflecting users' satisfaction with applications. Iftransactions are abnormal, alarms are reported. For transactions with poor user
APMProduct Introduction 2 Functions
Issue 01 (2019-07-11) Copyright © Huawei Technologies Co., Ltd. 5

experience, locate problems through topologies and tracing. Figure 2-3 shows thetransaction status of an e-commerce application. If the health status of atransaction is abnormal, user experience is poor.
Figure 2-3 Transaction analysis
Device-Side Analysis● Mobile: This function provides clear monitoring data about mobile app
performance. By displaying performance data from multiple dimensions, suchas Apdex, throughput, number of errors, crash, and Application NotResponding (ANR), this function enables you to quickly locate performancebottlenecks and optimize performance.
● Browser: This function provides clear monitoring data about frontendperformance. By displaying site performance data from multiple dimensions,such as Apdex, throughput, and number of errors, this function enables you toquickly locate performance bottlenecks and optimize performance.
APMProduct Introduction 2 Functions
Issue 01 (2019-07-11) Copyright © Huawei Technologies Co., Ltd. 6
3 Application Scenarios
Application Performance Management (APM) is widely used. You can learn how touse APM based on the following four typical application scenarios.
Device-Cloud Full-link Monitoring
Pain Points
If a performance problem such as slow page loading or frame freezing occurs andcannot be reproduced, it is difficult to quickly detect performance bottlenecks andlocate causes. For example, when a user reports slow page loading, is this problemcaused by the faulty network, resource loading, or Document Object Model(DOM) parsing? Is it related to the province or country where the user locates, orthe browser or device of the user? Another example, when a user reports framefreezing, is this problem caused by the faulty network between the user deviceand the server? Is the server or database overloaded? It is also difficult to quicklylocate root causes in code.
Service Implementation
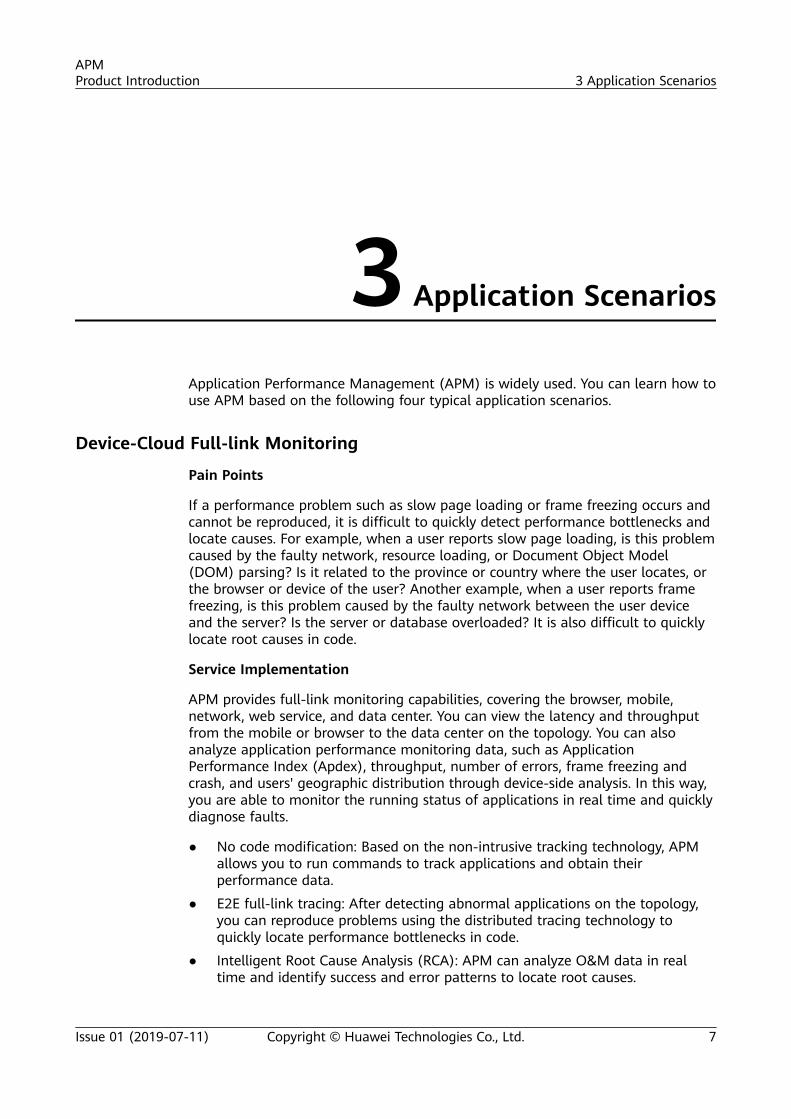
APM provides full-link monitoring capabilities, covering the browser, mobile,network, web service, and data center. You can view the latency and throughputfrom the mobile or browser to the data center on the topology. You can alsoanalyze application performance monitoring data, such as ApplicationPerformance Index (Apdex), throughput, number of errors, frame freezing andcrash, and users' geographic distribution through device-side analysis. In this way,you are able to monitor the running status of applications in real time and quicklydiagnose faults.
● No code modification: Based on the non-intrusive tracking technology, APMallows you to run commands to track applications and obtain theirperformance data.
● E2E full-link tracing: After detecting abnormal applications on the topology,you can reproduce problems using the distributed tracing technology toquickly locate performance bottlenecks in code.
● Intelligent Root Cause Analysis (RCA): APM can analyze O&M data in realtime and identify success and error patterns to locate root causes.
APMProduct Introduction 3 Application Scenarios
Issue 01 (2019-07-11) Copyright © Huawei Technologies Co., Ltd. 7
Diagnosis of Application ExceptionsPain Points
In the distributed microservice architecture, enterprises can develop diversecomplex applications efficiently. However, this architecture poses great challengesto traditional O&M and diagnosis technologies. In the example of an e-commerceapplication, problems are as follows:
● Difficult fault locatingAfter receiving the feedback from customers, customer service personnelsubmit problems to technical personnel for troubleshooting. In the distributedmicroservice architecture, a request usually undergoes multiple services/nodesbefore a result is returned. If a fault occurs, O&M personnel need torepeatedly view logs on multiple hosts to locate the fault. Even for simpleproblems, troubleshooting requires cooperation from multiple teams.
● Difficult architecture sort-outWhen service logic becomes complex, it is difficult to find out the downstreamservices (databases, HTTP APIs, and caches) that an application depends on,and external services that depend on the application from the codeperspective. It is also difficult to sort out the service logic, manage thearchitecture, and plan capacities. For example, enterprises are hard todetermine the number of hosts required for online promotion activities onNovember 11.
Service Implementation
APM can diagnose exceptions in large distributed applications. When anapplication breaks down or a request fails, you can locate faults in minutesthrough topologies and drill-downs.
● Visible topology: Abnormal application instances can be automaticallydiscovered on the topology.
APMProduct Introduction 3 Application Scenarios
Issue 01 (2019-07-11) Copyright © Huawei Technologies Co., Ltd. 8

● Tracing: You can locate root causes in code through drill-downs afteridentifying abnormal applications on the topology.
● SQL analysis: APM displays graphs of key metrics (such as number of SQLstatement calls, latency, and number of errors), and supports analysis ofdatabase performance problems caused by abnormal SQL statements.
APMProduct Introduction 3 Application Scenarios
Issue 01 (2019-07-11) Copyright © Huawei Technologies Co., Ltd. 9

User Experience ManagementPain Points
In the Internet era where user experience is of crucial importance, you cannotobtain user access information even if backend services run stably. It is much moredifficult to locate frontend problems that occur occasionally. After a system goesonline, if users cannot access the system due to errors and you fail to obtain theinformation in time, you will lose lots of users. If users reports page usageproblems, how to reproduce the users' problems immediately? How to obtainerror details and quickly solve problems.
Service Implementation
APM provides experience management capabilities. Specifically, it analyzes thecomplete process (user request > server > database > server > user request) ofapplication transactions in real time, and provides Apdex scores, enabling you tomonitor comprehensive user experience in real time. For transactions with pooruser experience, locate problems through topologies and tracing.
● Application KPI analysis: KPIs such as throughput, latency, and call successrate are displayed, so that you can monitor user experience easily.
● Full-link performance tracing: Web services, caches, and databases are traced,so that you can detect performance bottlenecks quickly.
APMProduct Introduction 3 Application Scenarios
Issue 01 (2019-07-11) Copyright © Huawei Technologies Co., Ltd. 10

Intelligent DiagnosisPain Points
For massive services, there is rich but unassociated application O&M data, such ashundreds of monitoring metrics, KPI data, and call tracing data. How to associatemetric and alarm data from multiple perspectives (such as applications, services,instances, hosts, and transactions), and automatically complete RCA? How toprovide possible causes during intelligence exception analysis based on thelearned historical data and O&M experience library?
Service Implementation
APM supports automatic detection of faults using machine learning algorithms,and intelligent diagnosis. When an exception occurs in a transaction, APM learnshistorical metric data based on intelligent algorithms, associates exception metricsfor multi-dimensional analysis, extracts characteristics of context data (such asresources, parameters, and call structures) when services are normal andabnormal, and locate root causes through cluster analysis. APM can collect andcompare the historical data about good and poor experience, and record theenvironment data that may cause application errors, including input and outputparameters, tracing, resource data, and JVM parameters. Based on the EnterpriseIntelligent (EI) engine, APM can train historical data online and make predictions.
APMProduct Introduction 3 Application Scenarios
Issue 01 (2019-07-11) Copyright © Huawei Technologies Co., Ltd. 11

APMProduct Introduction 3 Application Scenarios
Issue 01 (2019-07-11) Copyright © Huawei Technologies Co., Ltd. 12

4 Basic Concepts
TopologyA topology graphically displays call and dependency relationships betweenapplications. It is composed of circles, lines with arrows, and resources. Each circlerepresents a service, and each section in the circle represents an instance. Thefraction in each circle indicates number of active instance/total number ofinstances. The values below the fraction separately indicate the service latency,number of calls, and number of errors. Each line with an arrow represents a callrelationship. Thicker lines indicate more calls. The values above a line separatelyindicate the throughput and total latency. Throughput is the number of callswithin the selected period. Application Performance Index (Apdex) is used toquantify user satisfaction with application performance. Different colors indicatedifferent Apdex value ranges, helping you quickly detect and locate performanceproblems.
TransactionA transaction is usually an HTTP request (complete process: user request > webserver > database > web server > user request). In real life, a transaction is a one-time task. A user completes a task by using an application. In the example of ane-commerce application, a commodity query is a transaction, and a payment isalso a transaction.
TracingBy tracing and recording service calls, Application Performance Management(APM) visually restores the execution track and status of service requests in
APMProduct Introduction 4 Basic Concepts
Issue 01 (2019-07-11) Copyright © Huawei Technologies Co., Ltd. 13

distributed systems, so that you can quickly demarcate performance bottlenecksand faults.
Application
An application is a group of the same or similar services categorized based onservice requirements. You can put services that fulfill the same function into oneapplication for performance management. For example, you can put accounts,products, and payment services into the Mall application.
Apdex
Apdex is an open standard developed by the Apdex alliance. It defines a standardmethod to measure application performance. The Apdex standard converts theapplication response time into user satisfaction with application performance inthe range of 0 to 1.
● Apdex principle
Apdex defines the optimal threshold, T for the application response time. T isdetermined by the performance evaluation personnel based on performanceexpectations. Based on the actual response time and T, user experience can becategorized as follows:
Satisfied: indicates that the actual response time is shorter than or equal to T. Forexample, if T is 1.5s and the actual response time is 1s, user experience is satisfied.
Tolerating: indicates that the actual response time is greater than T, but shorterthan or equal to 4T. For example, if T is 1s, the tolerable upper threshold for theresponse time is 4s.
Frustrated: indicates that the actual response time is greater than 4T.
● Apdex calculation methodIn APM, the Apdex threshold is the value configured in Setting ApdexThresholds. The application response latency is the service latency. The Apdexvalue ranges from 0 to 1 and is calculated as follows:Apdex = (Number of satisfied samples + Number of tolerating samples x 0.5)/Total number of samples
Apdex indicates application performance status, that is, user satisfaction withapplication performance. Different colors indicate different Apdex ranges, asshown in Table 4-1.
Table 4-1 Apdex description
Apdex Color Description
0.75 ≤ Apdex ≤ 1 Green Fast response; good user experience
APMProduct Introduction 4 Basic Concepts
Issue 01 (2019-07-11) Copyright © Huawei Technologies Co., Ltd. 14

Apdex Color Description
0.3 ≤ Apdex < 0.75 Yellow Slow response; fair user experience
0 ≤ Apdex < 0.3 Red Very slow response; poor user experience
● Configuring an Apdex threshold
You can configure an Apdex threshold according to Setting Apdex Thresholds.
TP99 LatencyTP99 latency is the minimum time meeting requirements of 99% requests. InAPM, latency refers to TP99 latency.
Example: Assume that there are 100 requests, and the time consumed by therequests is 1s, 2s, 3s, 4s...98s, 99s, and 100s. To meet the requirements of 99%requests, at least 99s is required. Therefore, TP99 latency is 99s.
Calculation: Sort all requests by the consumed time in ascending order. TP99latency = Time consumed by the Nth request. N is the rounded value of 99% xTotal number of requests.
Overall Latency/Service LatencyLatency refers to the period from initiating a request to getting a response. InAPM, the overall latency refers to the total time consumed by a request, and theservice latency refers to the time consumed by a service. For example, assume thatservice A calls service B, and service B calls service C, as shown in the followingfigure:
Overall latency = TA; Latency of service A = TA; Latency of service B = TB1 + TB2;Latency of service C = TC
ProbesProbes use the bytecode enhancement technology to track calls and generatedata. The data will be collected by the ICAgent and then displayed on the UI. Ifthe memory detection mechanism is enabled and the instance memory is toolarge, probes enter the hibernation state, that is, stop collecting data. For how tocollect probe data, click here.
APMProduct Introduction 4 Basic Concepts
Issue 01 (2019-07-11) Copyright © Huawei Technologies Co., Ltd. 15

MeshThe Istio mesh obtains input and output application program data in non-intrusivemode. Then, the ICAgent and Cloud Container Engine (CCE) Istio mixer obtain andprocess the mesh data, and report it to APM. You can enable the Istio to collectmesh data. For how to collect mesh data, click here.
ICAgentICAgent is a collection agent of APM. It runs on the server where applications aredeployed to collect the data obtained by probes in real time. For details about thedata collection and purposes, see APM Service Agreement. Installing theICAgent is prerequisite for using APM.
APMProduct Introduction 4 Basic Concepts
Issue 01 (2019-07-11) Copyright © Huawei Technologies Co., Ltd. 16

5 Permissions Management
If you need to assign different permissions to employees in your enterprise toaccess your Application Performance Management (APM) resources, Identity andAccess Management (IAM) is a good choice for fine-grained permissionsmanagement. IAM provides identity authentication, permissions management,and access control, helping you secure access to your HUAWEI CLOUD resources.
With IAM, you can use your HUAWEI CLOUD account to create IAM users for youremployees, and assign permissions to the users to control their access to specificresource types. For example, some software developers in your enterprise need touse APM resources but must not delete them or perform any high-risk operations.To achieve this result, you can create IAM users for the software developers andgrant them only the permissions required for using APM resources.
If your HUAWEI CLOUD account does not need individual IAM users forpermissions management, you may skip over this chapter.
IAM can be used free of charge. You pay only for the resources in your account.For more information about IAM, see IAM Service Overview.
APM PermissionsBy default, new IAM users do not have any permissions assigned. You need to adda user to one or more groups, and assign permissions policies or roles to thesegroups. The user then inherits permissions from the groups it is a member of. Thisprocess is called authorization. After authorization, the user can perform specifiedoperations on APM.
APM is a project-level service deployed and accessed in specific physical regions.To assign APM permissions to a user group, specify the scope as region-specificprojects and select projects for the permissions to take effect. If All projects isselected, the permissions will take effect for the user group in all region-specificprojects. When accessing APM, the users need to switch to a region where theyhave been authorized to use this service.
You can grant users permissions by using roles and policies.
Policies: A type of fine-grained authorization mechanism that defines permissionsrequired to perform operations on specific cloud resources under certainconditions. This mechanism allows for more flexible policy-based authorization,meeting requirements for secure access control. For example, you can grant Elastic
APMProduct Introduction 5 Permissions Management
Issue 01 (2019-07-11) Copyright © Huawei Technologies Co., Ltd. 17

Cloud Server (ECS) users only the permissions for managing a certain type ofECSs. Most policies define permissions based on APIs. For the API actionssupported by APM, see Permissions Policies and Supported Actions.
Table 5-1 lists all the system permissions supported by APM.
Table 5-1 System permissions supported by APM
Role/PolicyName
Description Role/Policy Type
APM FullAccess Administrator permissions for APM.Users granted these permissions canoperate and use APM.
System-definedpolicy
APMReadOnlyAccess
Read-only permissions for APM. Usersgranted these permissions can onlyview APM data.
System-definedpolicy
APMAdministrator
Administrator permissions for APM. System-definedrole
APMProduct Introduction 5 Permissions Management
Issue 01 (2019-07-11) Copyright © Huawei Technologies Co., Ltd. 18

6 Data Collection
When you enable data collection, Application Performance Management (APM)collects service tracing data, resource information, resource attributes, memorydetection information, and call request KPI data, but does not collect yourpersonal data. The collected data is used only for performance analysis and faultdiagnosis, and is not used for commercial purposes.
DataType
Collected Data TransmissionMode
StorageMode
Function StoragePeriod
Servicetracing data
Tracing spandata
TransmissionthroughHTTPSencryptionand AccessKey ID/SecretAccess Key(AK/SK)authentication
Project-basedisolatedstorage
Query anddisplay at thetracingfrontend
Configurable (7daysatmost). Thedatawillbedeleteduponexpiration.
APMProduct Introduction 6 Data Collection
Issue 01 (2019-07-11) Copyright © Huawei Technologies Co., Ltd. 19
DataType
Collected Data TransmissionMode
StorageMode
Function StoragePeriod
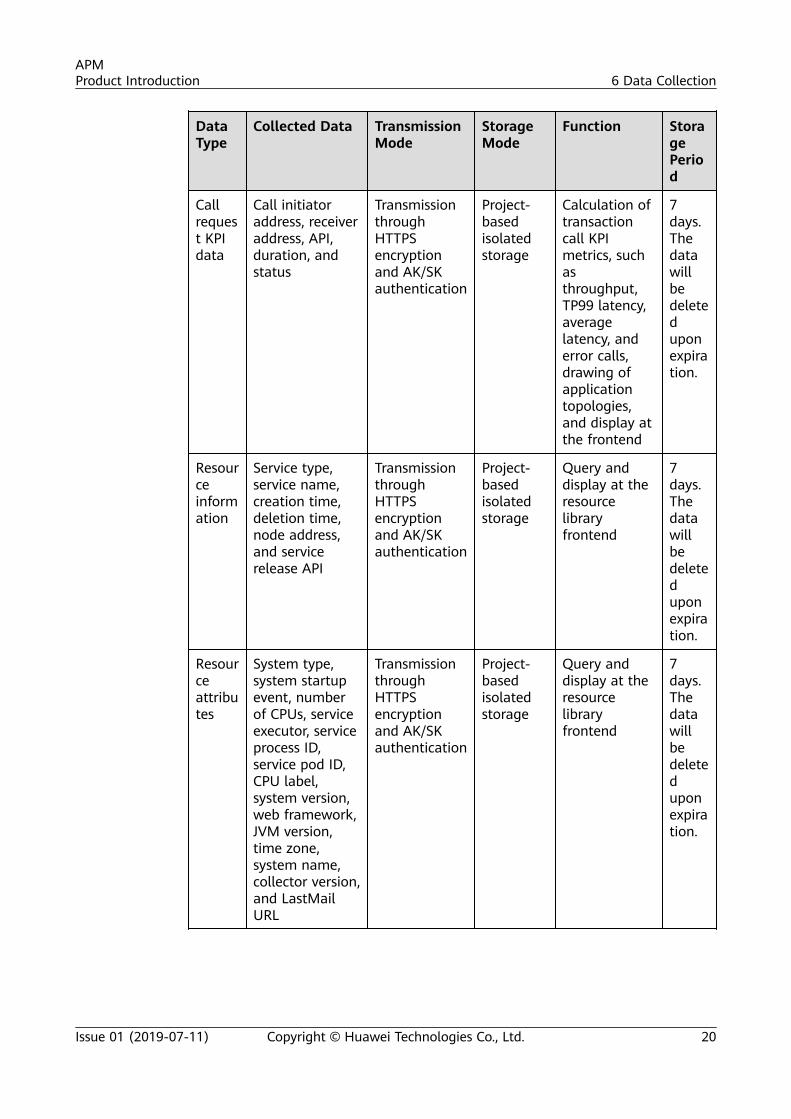
Callrequest KPIdata
Call initiatoraddress, receiveraddress, API,duration, andstatus
TransmissionthroughHTTPSencryptionand AK/SKauthentication
Project-basedisolatedstorage
Calculation oftransactioncall KPImetrics, suchasthroughput,TP99 latency,averagelatency, anderror calls,drawing ofapplicationtopologies,and display atthe frontend
7days.Thedatawillbedeleteduponexpiration.
Resourceinformation
Service type,service name,creation time,deletion time,node address,and servicerelease API
TransmissionthroughHTTPSencryptionand AK/SKauthentication
Project-basedisolatedstorage
Query anddisplay at theresourcelibraryfrontend
7days.Thedatawillbedeleteduponexpiration.
Resourceattributes
System type,system startupevent, numberof CPUs, serviceexecutor, serviceprocess ID,service pod ID,CPU label,system version,web framework,JVM version,time zone,system name,collector version,and LastMailURL
TransmissionthroughHTTPSencryptionand AK/SKauthentication
Project-basedisolatedstorage
Query anddisplay at theresourcelibraryfrontend
7days.Thedatawillbedeleteduponexpiration.
APMProduct Introduction 6 Data Collection
Issue 01 (2019-07-11) Copyright © Huawei Technologies Co., Ltd. 20

DataType
Collected Data TransmissionMode
StorageMode
Function StoragePeriod
Memorymonitoringinformation
Memory usage,used memory,maximummemory,remainingmemory,memorythreshold-crossing time,and memorymonitoringconfigurations
TransmissionthroughHTTPSencryptionand AK/SKauthentication
Project-basedisolatedstorage
Query anddisplay at theresourcelibraryfrontend
7days.Thedatawillbedeleteduponexpiration.
APMProduct Introduction 6 Data Collection
Issue 01 (2019-07-11) Copyright © Huawei Technologies Co., Ltd. 21

7 Usage Restrictions
Supported Linux OSsApplication Performance Management (APM) supports multiple Linux OperatingSystems (OSs). When purchasing an Elastic Cloud Server (ECS), select an OS thatis listed in Table 7-1.
Table 7-1 Supported OSs and versions
OS Version
SUSE SUSEEnterprise 11SP4 64-bit
SUSEEnterprise 12SP1 64-bit
SUSEEnterprise 12SP2 64-bit
SUSEEnterprise 12SP3 64-bit
openSUSE 13.2 64-bit 15.0 64-bitCurrently,syslog logscannot becollected.
42.2 64-bit
EulerOS 2.2 64-bit 2.3 64-bit
CentOS 6.3 64-bit 6.5 64-bit 6.8 64-bit 6.9 64-bit
6.10 64-bit 7.1 64-bit 7.2 64-bit 7.3 64-bit
7.4 64-bit 7.5 64-bit 7.6 64-bit
Ubuntu 14.04 server64-bit
16.04 server64-bit
18.04 server 64-bit
Fedora 24 64-bit 25 64-bit 29 64-bit
Debian 7.5.0 32-bit 7.5.0 64-bit 8.2.0 64-bit 8.8.0 64-bit
9.0.0 64-bit
APMProduct Introduction 7 Usage Restrictions
Issue 01 (2019-07-11) Copyright © Huawei Technologies Co., Ltd. 22

Supported Java TypesCurrently, APM can connect to Java applications. APM supports multiplemainstream Java frameworks, web servers, communications protocols, anddatabases. For details, see Table 7-2.
Table 7-2 Supported Java types
Type Name Version
Tool JDK JDK 7 and JDK 8
Communicationsprotocol
HttpClient Apache HttpClient 3, Apache HttpClient4, and JDK HttpURLConnection
Javaframework
CXF Client 2.6.0–3.2.1
iBATIS 2.3.0 and 2.3.4.726
Jersey 2.0–2.9.1
MyBatis 1.0.0–1.3.1 (MyBatis-Spring) and 3.0.1–3.4.5 (MyBatis 3)
Spring 3.1.x–5.0.x
springboot 1.2.x–1.5.x and 2.0.4–2.0.9
Dubbo 2.5.3–2.6.2 (Dubbo RPC and DubboREST) and 2.8.4 (Dubbo RPC and DubboREST)
Huawei's Cloud ServiceEngine (CSE)
1.0.0.B011–1.1.0.B046 (REST overServlet, REST over Vert.x, and HighwayRPC)
gRPC 1.11.x–1.14.x
Database MySQL mysql-connector-java 5.1.X
Oracle ojdbc5, ojdbc6, and ojdbc14
Sybase 2.6.0–3.2.1
MariaDB 1.3.x
VoltDB 6.x–7.x
PostgreSQL 9.0.x, 9.1.x, 9.2.x, 9.3.x, 9.4.x, 42.0.x, and42.1.x
Webserver
Tomcat 6.x, 7.x, and 8.x
Jetty 7.6.x–8.0.0 and 8.1.x–9.x.x
APMProduct Introduction 7 Usage Restrictions
Issue 01 (2019-07-11) Copyright © Huawei Technologies Co., Ltd. 23
Type Name Version
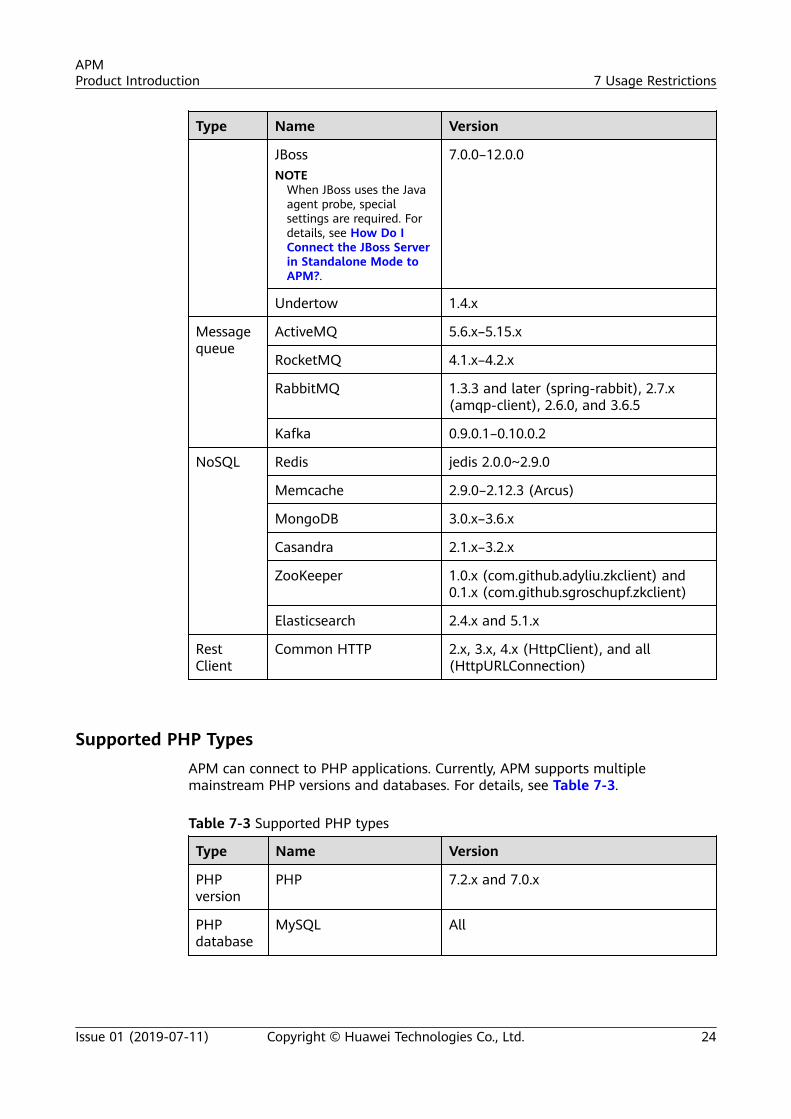
JBossNOTE
When JBoss uses the Javaagent probe, specialsettings are required. Fordetails, see How Do IConnect the JBoss Serverin Standalone Mode toAPM?.
7.0.0–12.0.0
Undertow 1.4.x
Messagequeue
ActiveMQ 5.6.x–5.15.x
RocketMQ 4.1.x–4.2.x
RabbitMQ 1.3.3 and later (spring-rabbit), 2.7.x(amqp-client), 2.6.0, and 3.6.5
Kafka 0.9.0.1–0.10.0.2
NoSQL Redis jedis 2.0.0~2.9.0
Memcache 2.9.0–2.12.3 (Arcus)
MongoDB 3.0.x–3.6.x
Casandra 2.1.x–3.2.x
ZooKeeper 1.0.x (com.github.adyliu.zkclient) and0.1.x (com.github.sgroschupf.zkclient)
Elasticsearch 2.4.x and 5.1.x
RestClient
Common HTTP 2.x, 3.x, 4.x (HttpClient), and all(HttpURLConnection)
Supported PHP TypesAPM can connect to PHP applications. Currently, APM supports multiplemainstream PHP versions and databases. For details, see Table 7-3.
Table 7-3 Supported PHP types
Type Name Version
PHPversion
PHP 7.2.x and 7.0.x
PHPdatabase
MySQL All
APMProduct Introduction 7 Usage Restrictions
Issue 01 (2019-07-11) Copyright © Huawei Technologies Co., Ltd. 24

More types are being developed.
Probe QuantityAPM collects performance metrics, including tracing, SLA, SQL statement call, andJVM metrics. The resources consumed for collecting these metrics are closelyrelated to the number of APM probes, number of inter-service calling times, andsampling ratio. To ensure data collection reliability, you are advised to use amaximum of 20 APM probes on a single node.
APMProduct Introduction 7 Usage Restrictions
Issue 01 (2019-07-11) Copyright © Huawei Technologies Co., Ltd. 25

8 Billing
BillingApplication Performance Management (APM) supports both pay-per-use andpackage billing modes. The two modes can be used at the same time. That is, ifyou use more instances than those included in a package, you will be billed on apay-per-use basis for the excess instances used. If you use APM withoutpurchasing any package, you will be billed on a pay-per-use basis for all instances.For more information, see APM Pricing Details.
APM provides probe and mesh products. Probe products include the basic,professional, enterprise, and platinum editions while mesh products include thebasic and professional editions.
● The professional, enterprise, and platinum editions of probe products supportconnection to APM through Java.
● The professional edition of mesh products supports connection to APM through Istio(without language constraints).
● Probe instances will be billed based on one hour, rounded up to the nearest one hour.● A professional-edition probe instance is one billing unit. An enterprise-edition probe
instance is billed by two billing units. A platinum-edition probe instance is billed byseven billing units.
A probe billing unit refers to the basic billing unit of probe instances during pay-per-use or package billing. Probe instances of different editions can be convertedinto certain number of probe billing units for billing. For example, when youpurchase a package with 100 professional-edition probe instances (100 probebilling units), you can choose to use 50 enterprise-edition probe instances (100probe billing units/2) or 14 platinum-edition probe instances (100 probe billingunits/7) in one hour.
Package DetailsThe following table lists the functions supported by different editions of probeproducts.
APMProduct Introduction 8 Billing
Issue 01 (2019-07-11) Copyright © Huawei Technologies Co., Ltd. 26

Edition Basic Professional Enterprise Platinum
Functions 50 times; onehour each timeIf you use APMfor more thanone hour eachtime, APMautomaticallystops datacollection andyou can onlyqueryhistorical dataon the page.You need tomanuallyapply tocontinue usingthe freeedition orswitch to theprofessional,enterprise, orplatinumedition. If youuse APM 50times, youneed to switchto theprofessional,enterprise, orplatinumedition.
Open Open OpenMobile andbrowsermonitoringfunctions areprovided forfree in China.
Datastorageduration
7 days 7 days 30 days 90 days
Applicationtopology
√ √ √ √
Tracing √ √ √ √
Transactionanalysis
√ √ √ √
Slow SQLanalysis
√ √ √ √
JVManalysis
√ x √ √
AIcapability
√ x √ √
APMProduct Introduction 8 Billing
Issue 01 (2019-07-11) Copyright © Huawei Technologies Co., Ltd. 27
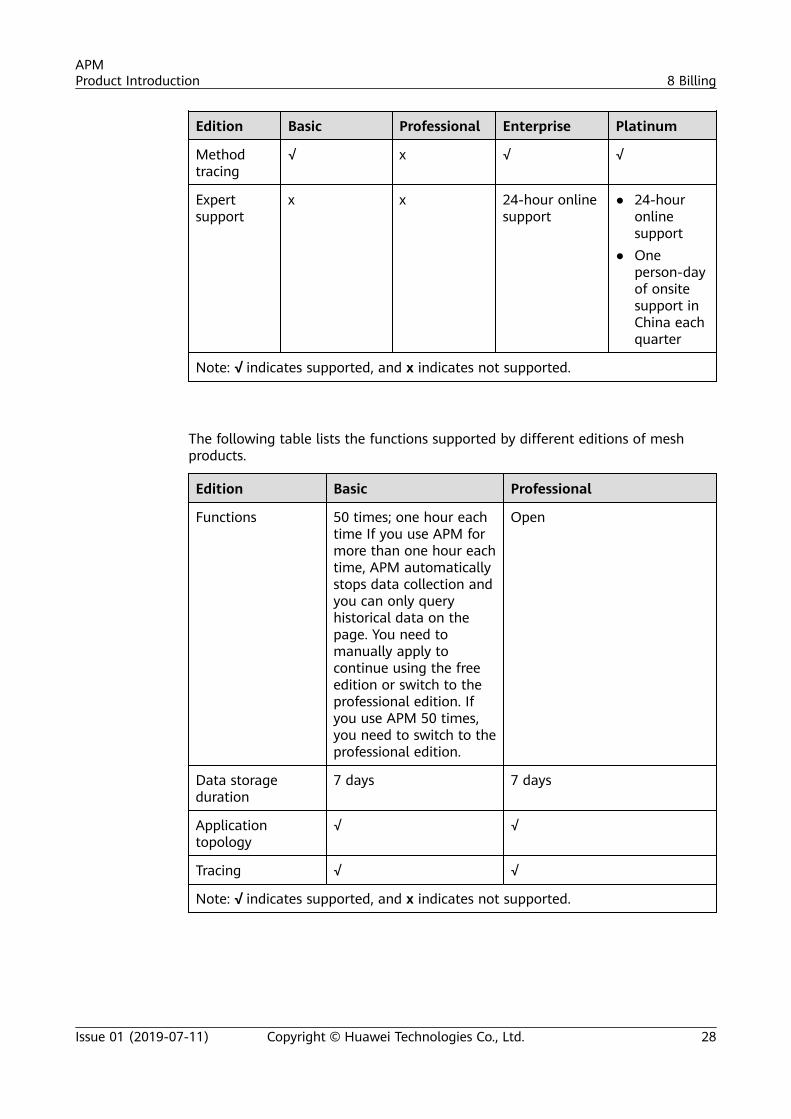
Edition Basic Professional Enterprise Platinum
Methodtracing
√ x √ √
Expertsupport
x x 24-hour onlinesupport
● 24-houronlinesupport
● Oneperson-dayof onsitesupport inChina eachquarter
Note: √ indicates supported, and x indicates not supported.
The following table lists the functions supported by different editions of meshproducts.
Edition Basic Professional
Functions 50 times; one hour eachtime If you use APM formore than one hour eachtime, APM automaticallystops data collection andyou can only queryhistorical data on thepage. You need tomanually apply tocontinue using the freeedition or switch to theprofessional edition. Ifyou use APM 50 times,you need to switch to theprofessional edition.
Open
Data storageduration
7 days 7 days
Applicationtopology
√ √
Tracing √ √
Note: √ indicates supported, and x indicates not supported.
APMProduct Introduction 8 Billing
Issue 01 (2019-07-11) Copyright © Huawei Technologies Co., Ltd. 28
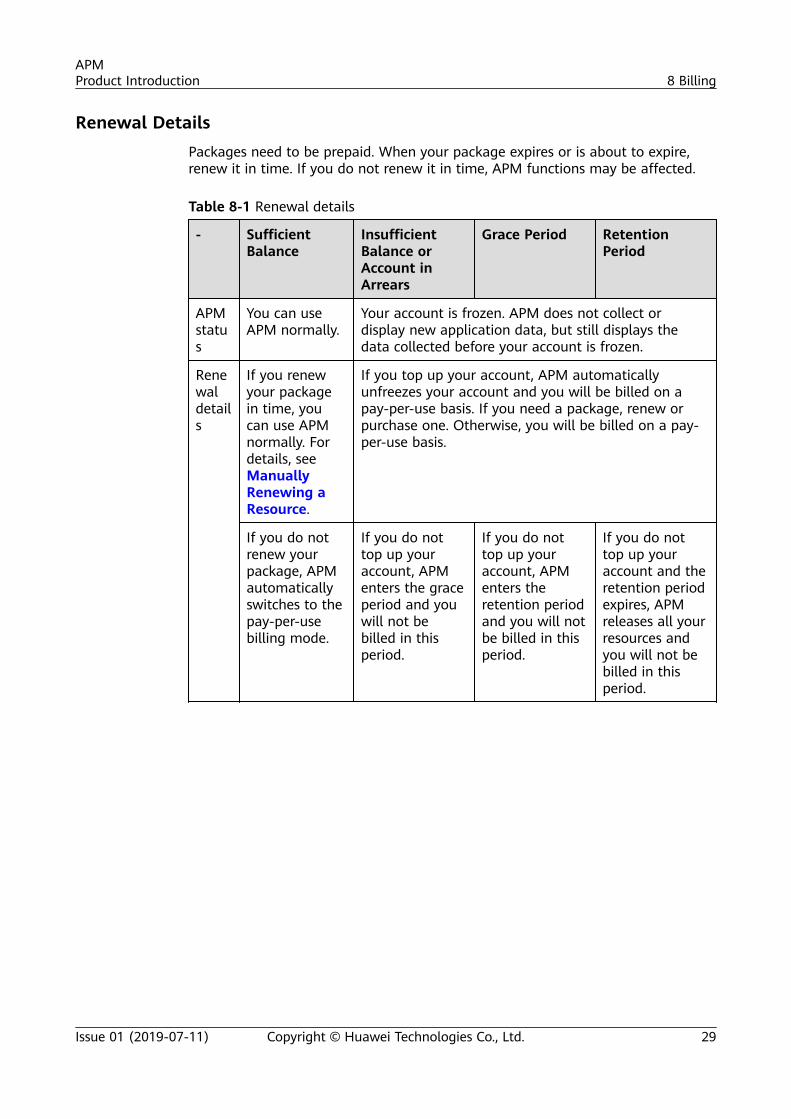
Renewal DetailsPackages need to be prepaid. When your package expires or is about to expire,renew it in time. If you do not renew it in time, APM functions may be affected.
Table 8-1 Renewal details
- SufficientBalance
InsufficientBalance orAccount inArrears
Grace Period RetentionPeriod
APMstatus
You can useAPM normally.
Your account is frozen. APM does not collect ordisplay new application data, but still displays thedata collected before your account is frozen.
Renewaldetails
If you renewyour packagein time, youcan use APMnormally. Fordetails, seeManuallyRenewing aResource.
If you top up your account, APM automaticallyunfreezes your account and you will be billed on apay-per-use basis. If you need a package, renew orpurchase one. Otherwise, you will be billed on a pay-per-use basis.
If you do notrenew yourpackage, APMautomaticallyswitches to thepay-per-usebilling mode.
If you do nottop up youraccount, APMenters the graceperiod and youwill not bebilled in thisperiod.
If you do nottop up youraccount, APMenters theretention periodand you will notbe billed in thisperiod.
If you do nottop up youraccount and theretention periodexpires, APMreleases all yourresources andyou will not bebilled in thisperiod.
APMProduct Introduction 8 Billing
Issue 01 (2019-07-11) Copyright © Huawei Technologies Co., Ltd. 29

9 Change History
Pinpoint Description
Table 9-1 Pinpoint description
Version
ReleasedOn
Description
1.0.29 2020-05-09 Supported the Hystrix asynchronous mode of SpringCloud OpenFeign.
1.0.28 2020-02-12 Fixed the Redis Lettuce bug (that is, memory leakagemay occur).
1.0.27 2019-11-30 1. Supported the MySQL mysql-connector-java-8.x.xclient.
2. Supported the Redis Lettuce client.3. Supported the new Jetty version.4. Fixed the Netty bug (that is, memory leakage may
occur).5. Optimized probe resource usage.
1.0.14(latestCCEversion)
2019-10-30 Supported Apache Dubbo 2.7.1.
1.0.4CCE
2019-05-06 1. Supported gRPC 1.11.x–1.14.x.2. Supported Thrift 0.11.
0.1.36CCE
2019-03-15 1. Supported ServiceComb 2.3.25–2.3.52.2. Supported Netty 4.1.22.3. Solved the JDK HTTP tracing interruption.4. Supported Docker application access for non-CCE
users.
APMProduct Introduction 9 Change History
Issue 01 (2019-07-11) Copyright © Huawei Technologies Co., Ltd. 30

Version
ReleasedOn
Description
0.1.25CCE
2018-12-24 1. Supported JVM metric monitoring.2. Supported configuration of return codes and
exceptions to be ignored.3. Added the http.url attribute to the tracing of the
JDK HTTP client.4. Supported parameter collection for method tracing.
Feature Description
Table 9-2 Feature description
ReleasedOn
Description
2019-06-15
Supported installation of PHP probes.
2019-06-11
Supported transaction grouping and rule customization.
2019-06-04
Supported installation, upgrade, and uninstall of the ICAgent fornon-HUAWEI CLOUD hosts.
2019-05-22
1. Connected Docker applications to APM.2. Connected Deployment applications to APM.
2019-04-18
Obtained an Access Key ID/Secret Access Key (AK/SK) by creatingan Identity and Access Management (IAM) agency.
2019-03-15
Supported customization of threshold rules and statistics for JVMmonitoring.
2019-03-06
Optimized service and instance metrics, and displayed topologydetails to enhance full-link topology functions.
2018-12-26
1. Monitoring of JVM memory and thread: Displays metrics aboutthe JVM heap memory, JVM non-heap memory, and thread toquickly detect exceptions such as memory leakage and threadsuspension.
2. Exceptions whitelist: Set return codes and exceptions to beignored.
2018-09-13
Device-side analysis: Supports performance metric and crashanalysis on mobile and browser sides to achieve full control.
2018-07-20
Supported both pay-per-use and package billing modes. For moreinformation, see APM Pricing Details.
APMProduct Introduction 9 Change History
Issue 01 (2019-07-11) Copyright © Huawei Technologies Co., Ltd. 31
ReleasedOn
Description
2018-06-11
Launched Application Performance Management (APM) at theHUAWEI CLOUD (international) website.
ICAgent Description
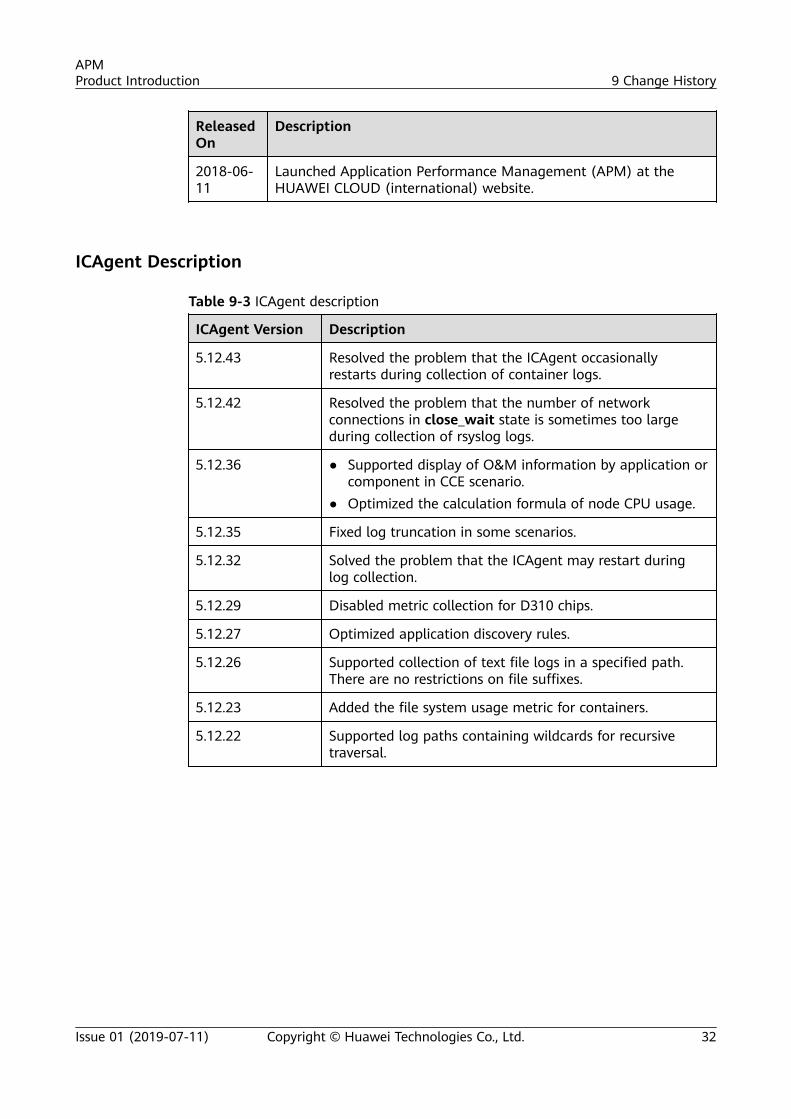
Table 9-3 ICAgent description
ICAgent Version Description
5.12.43 Resolved the problem that the ICAgent occasionallyrestarts during collection of container logs.
5.12.42 Resolved the problem that the number of networkconnections in close_wait state is sometimes too largeduring collection of rsyslog logs.
5.12.36 ● Supported display of O&M information by application orcomponent in CCE scenario.
● Optimized the calculation formula of node CPU usage.
5.12.35 Fixed log truncation in some scenarios.
5.12.32 Solved the problem that the ICAgent may restart duringlog collection.
5.12.29 Disabled metric collection for D310 chips.
5.12.27 Optimized application discovery rules.
5.12.26 Supported collection of text file logs in a specified path.There are no restrictions on file suffixes.
5.12.23 Added the file system usage metric for containers.
5.12.22 Supported log paths containing wildcards for recursivetraversal.
APMProduct Introduction 9 Change History
Issue 01 (2019-07-11) Copyright © Huawei Technologies Co., Ltd. 32
Related Documents