Chapter 3 Product & Process Design Part 2: Process Design

Product and Process Desgin
Dec 23, 2015
Make to stock and Make to Order overview
Welcome message from author
This document is posted to help you gain knowledge. Please leave a comment to let me know what you think about it! Share it to your friends and learn new things together.
Transcript

Chapter 3Product & Process Design
Part 2: Process Design

Product vs. Process Design
Which comes first: Design of process or Design of product?
The answer is ??
Product Strategy
Once a company decides to produce a given product or offer a particular service, company should decide if product or service is to be Made-to-order Assemble-to-order (or Built-to-
Order) Made-to-stock
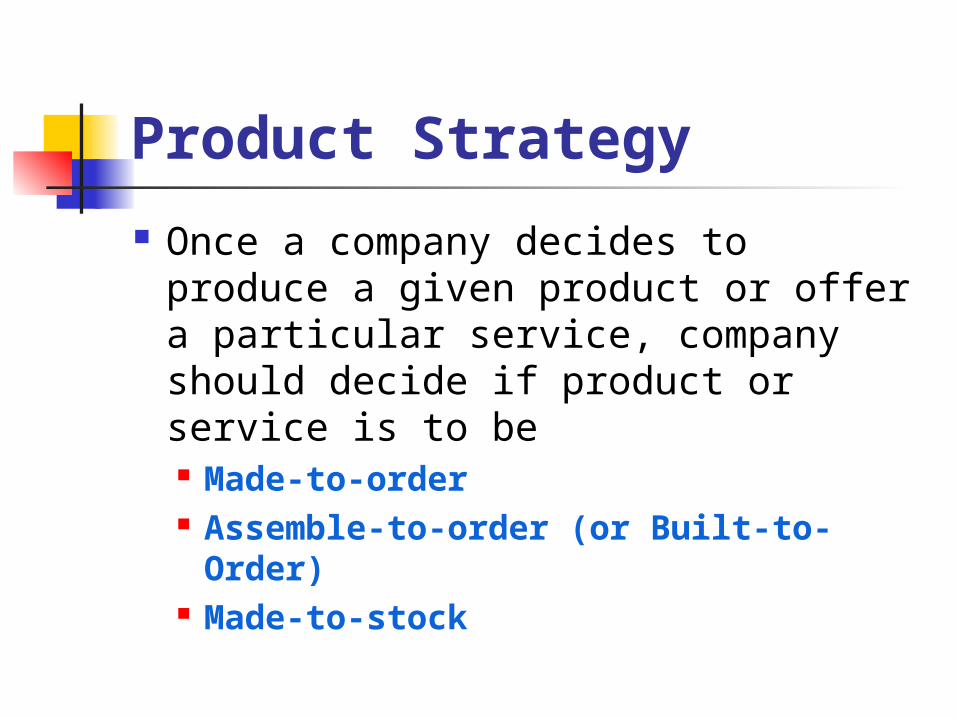
Make-to-order Products/services that are made to
customer’s specs but only after an order is received.
Product/service is customized Volume is ?? Inventory level is ?? Delivery time—from time order is
place to time it is received--is generally ??
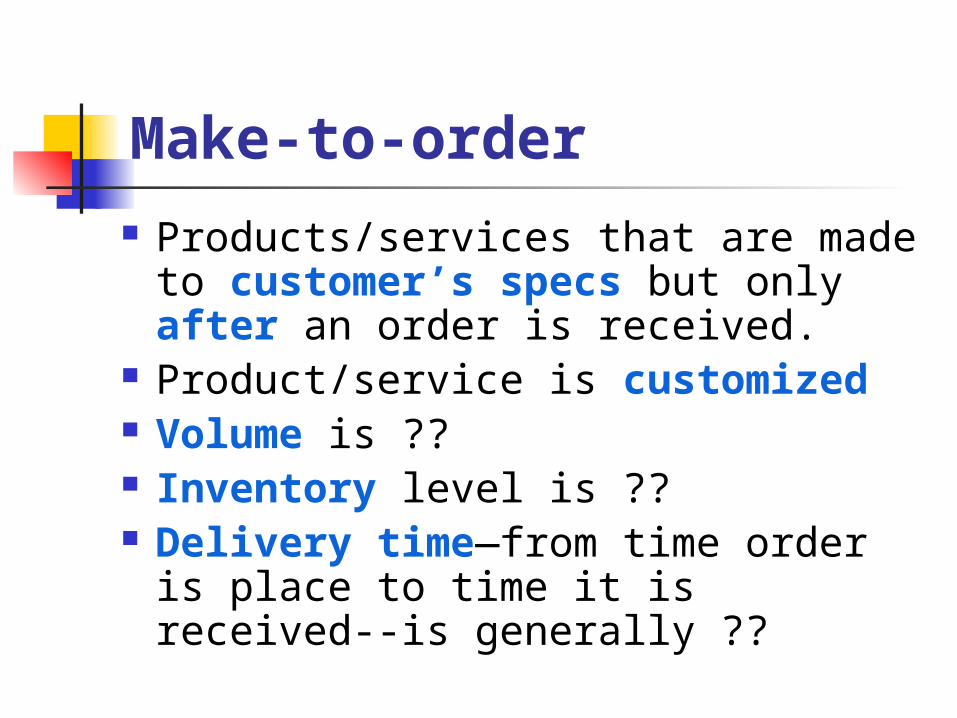
Make-to-order
Examples Custom built home or office building Tailor made suit Commercial airplane Wedding cake Professional services (law case,
prescriptions, some medical procedures, etc.)
Hair styling
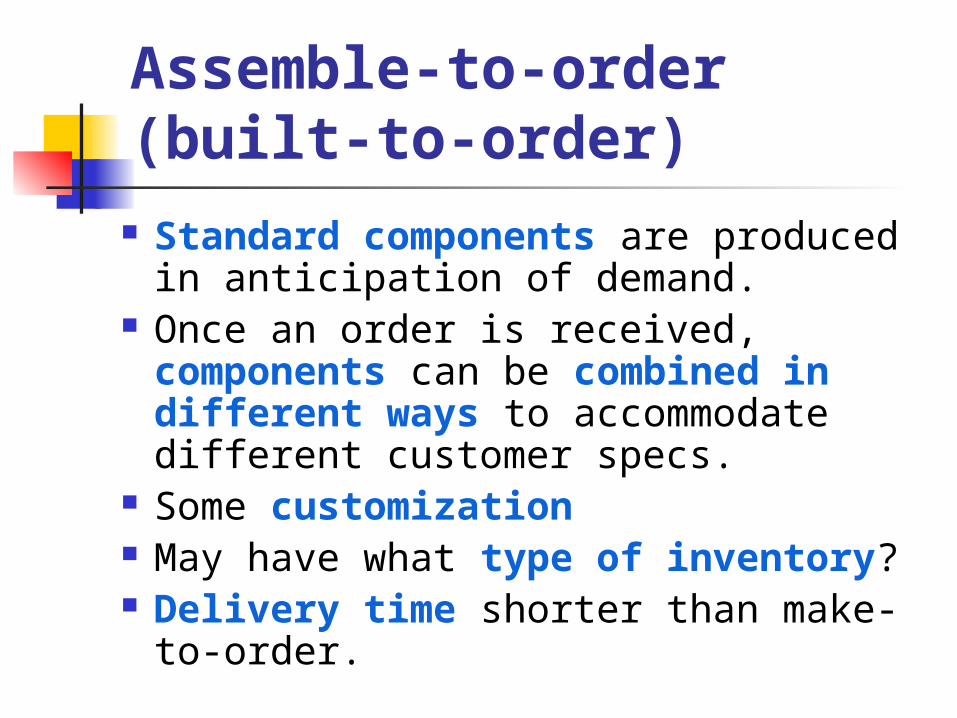
Assemble-to-order (built-to-order)
Standard components are produced in anticipation of demand.
Once an order is received, components can be combined in different ways to accommodate different customer specs.
Some customization May have what type of inventory? Delivery time shorter than make-to-
order.
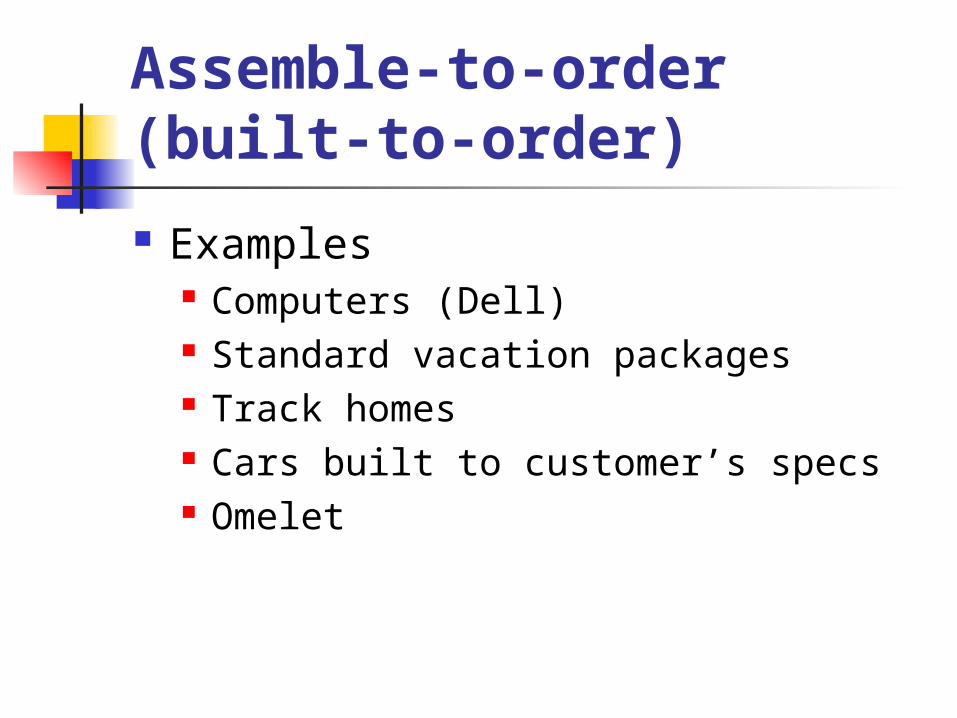
Assemble-to-order (built-to-order)
Examples Computers (Dell) Standard vacation packages Track homes Cars built to customer’s specs Omelet
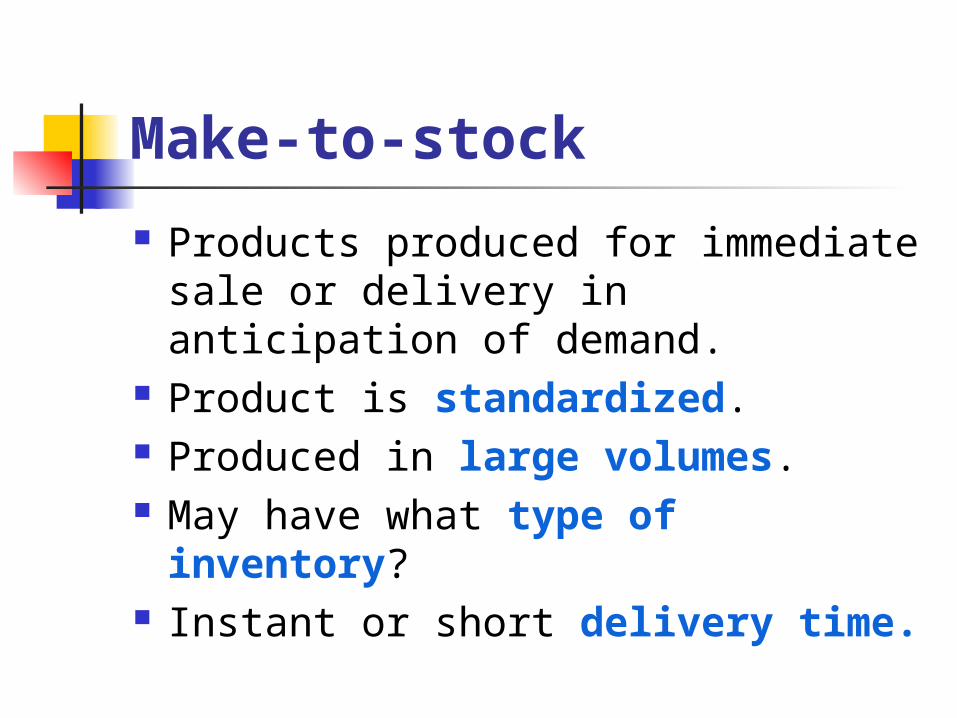
Make-to-stock
Products produced for immediate sale or delivery in anticipation of demand.
Product is standardized. Produced in large volumes. May have what type of
inventory? Instant or short delivery time.
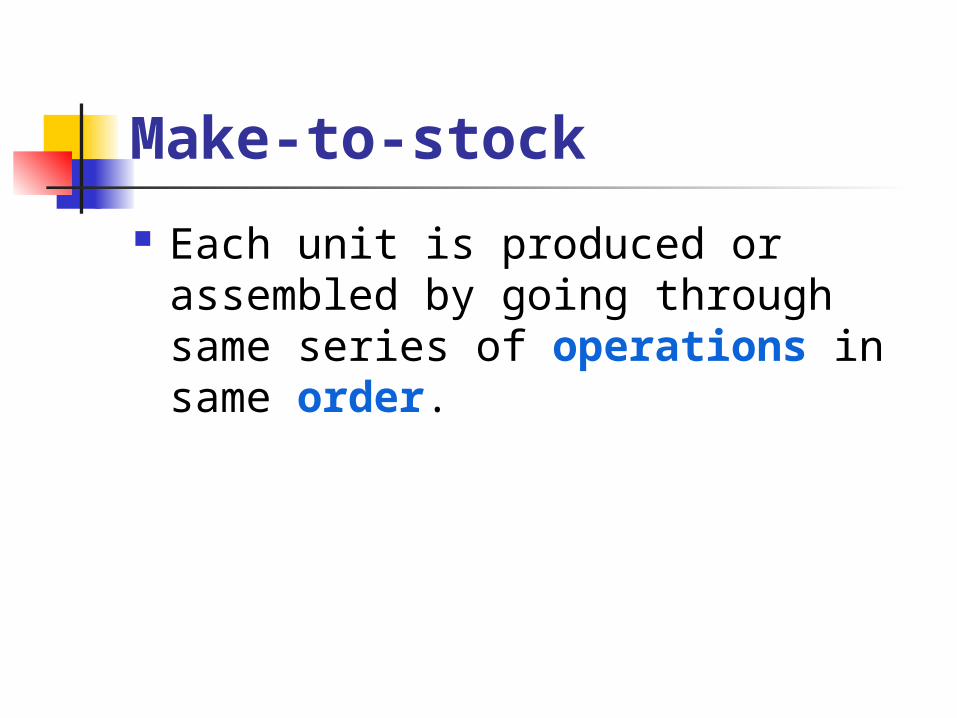
Make-to-stock
Each unit is produced or assembled by going through same series of operations in same order.
Make-to-stock
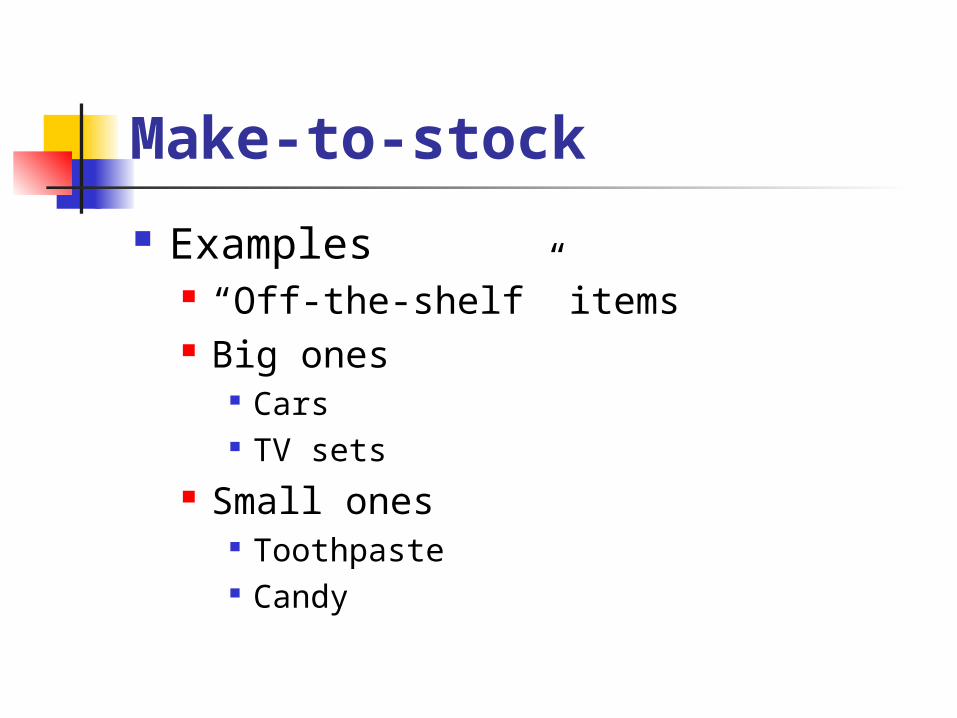
Examples “Off-the-shelf” items Big ones
Cars TV sets
Small ones Toothpaste Candy

Overview of Product Strategy
Bake
Product Strategies
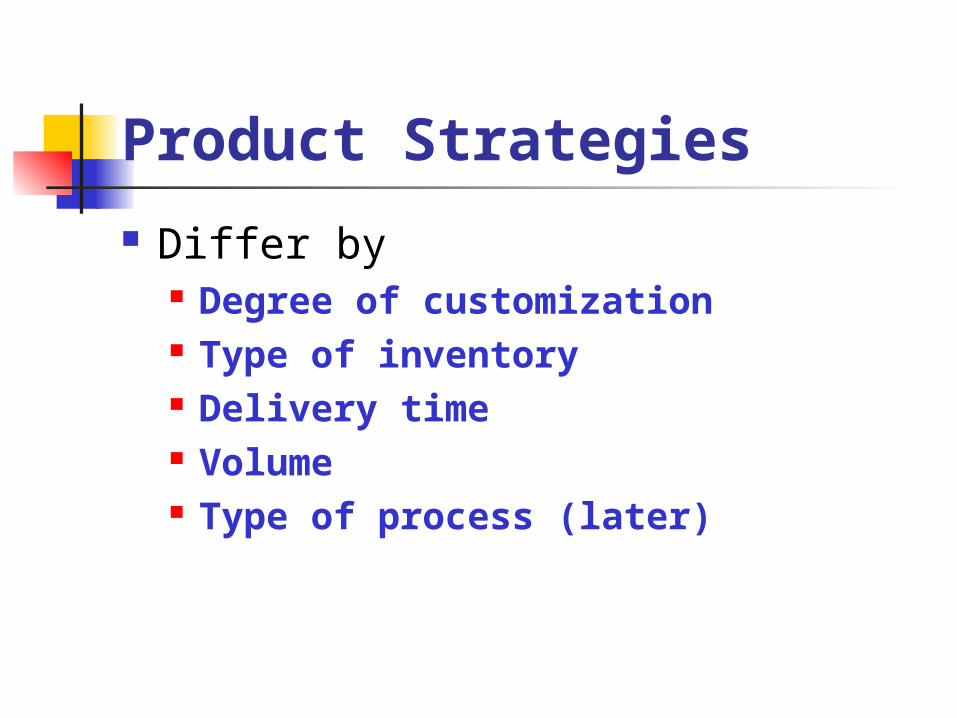
Differ by Degree of customization Type of inventory Delivery time Volume Type of process (later)
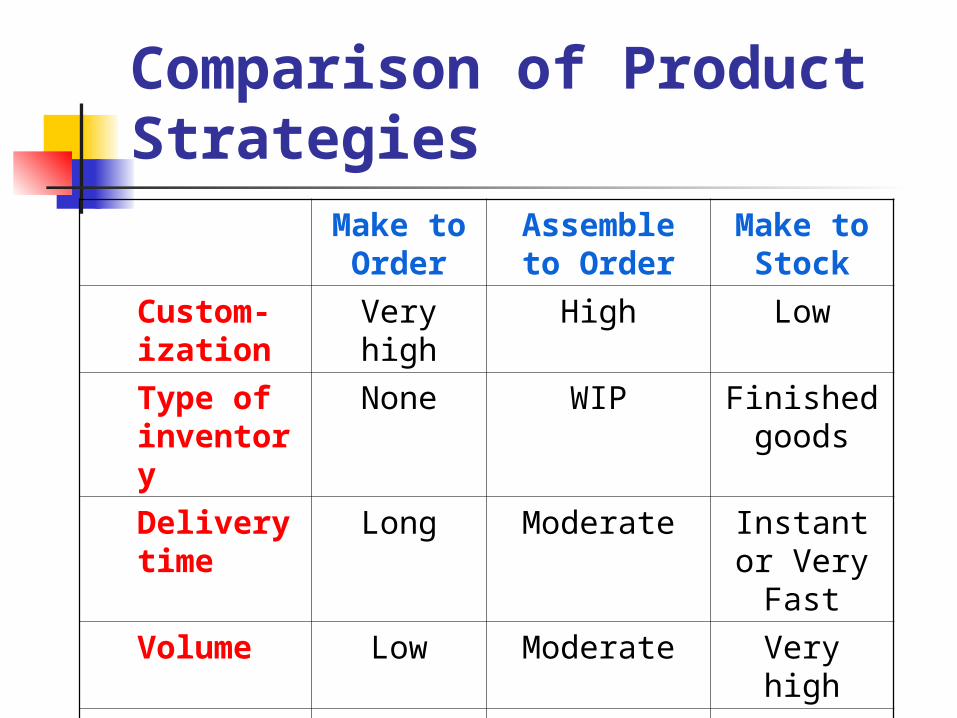
Comparison of Product Strategies
Make to Order
Assemble to Order
Make to Stock
Custom-ization
Very high High Low
Type of inventory
None WIP Finished goods
Delivery time
Long Moderate Instant or Very Fast
Volume Low Moderate Very high
Process Project Batch Line or continuou
s

Types of Processes
What type of process is best for each type of product strategy?
Processes can be classified as Project Batch Line Continuous

Project Process (Custom Job Shop)
A process set that makes a one-at-a-time product exactly to customer specifications.
Product has its own unique processing requirements.
Product is routed to different operations (workstations), depending on its own unique needs.
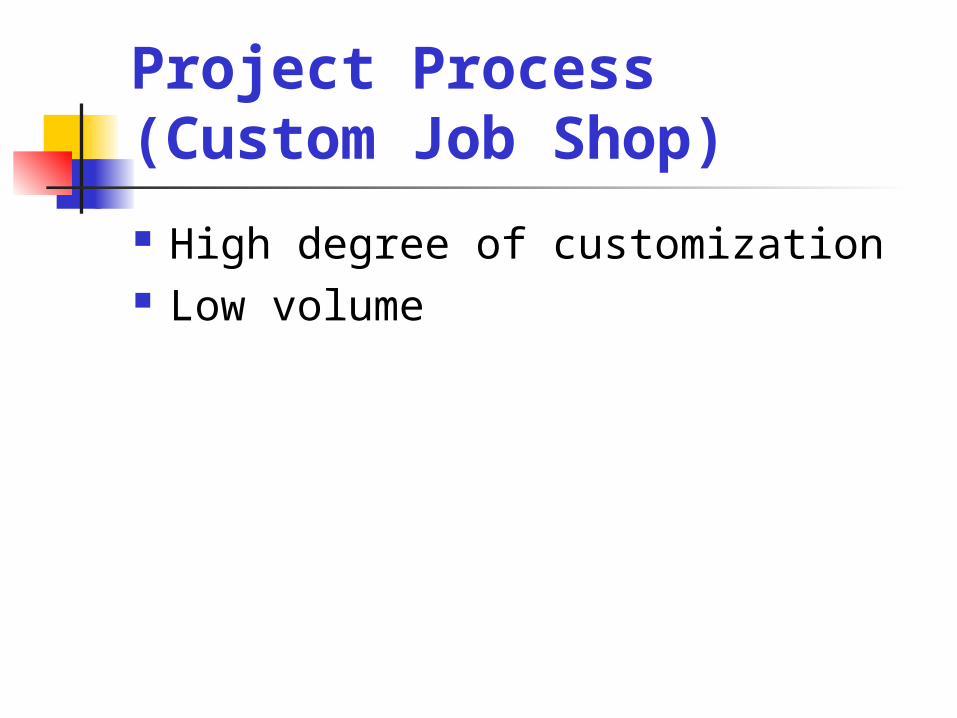
Project Process (Custom Job Shop)
High degree of customization Low volume

Project Process
Construction, some medical procedures, landscaping, custom built home, tailor made suit.
Therefore, use with products that are “make to order.”
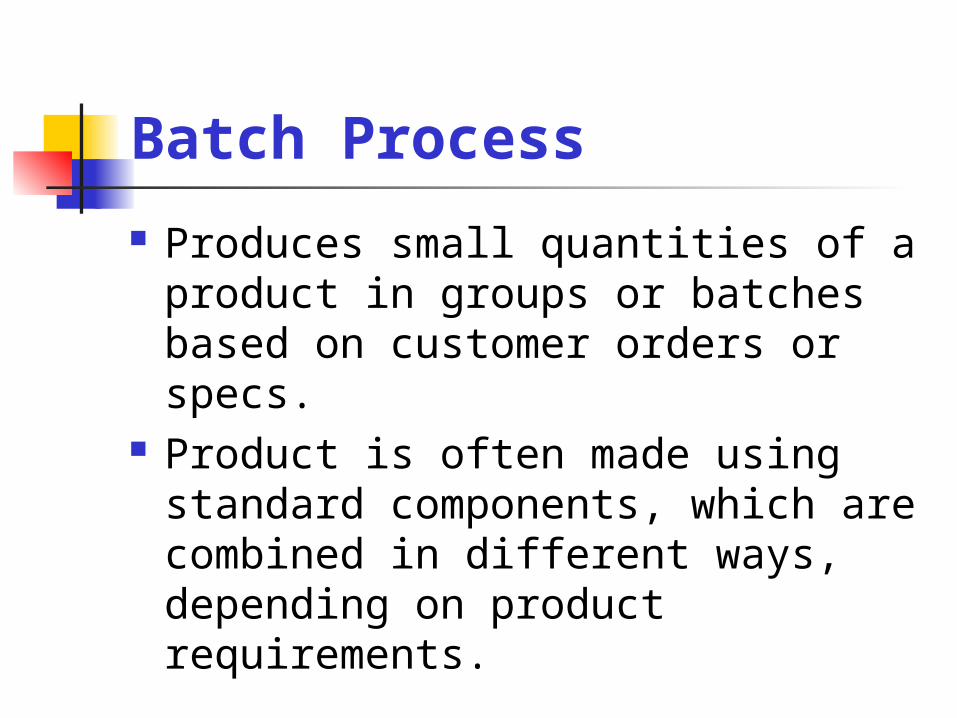
Batch Process
Produces small quantities of a product in groups or batches based on customer orders or specs.
Product is often made using standard components, which are combined in different ways, depending on product requirements.
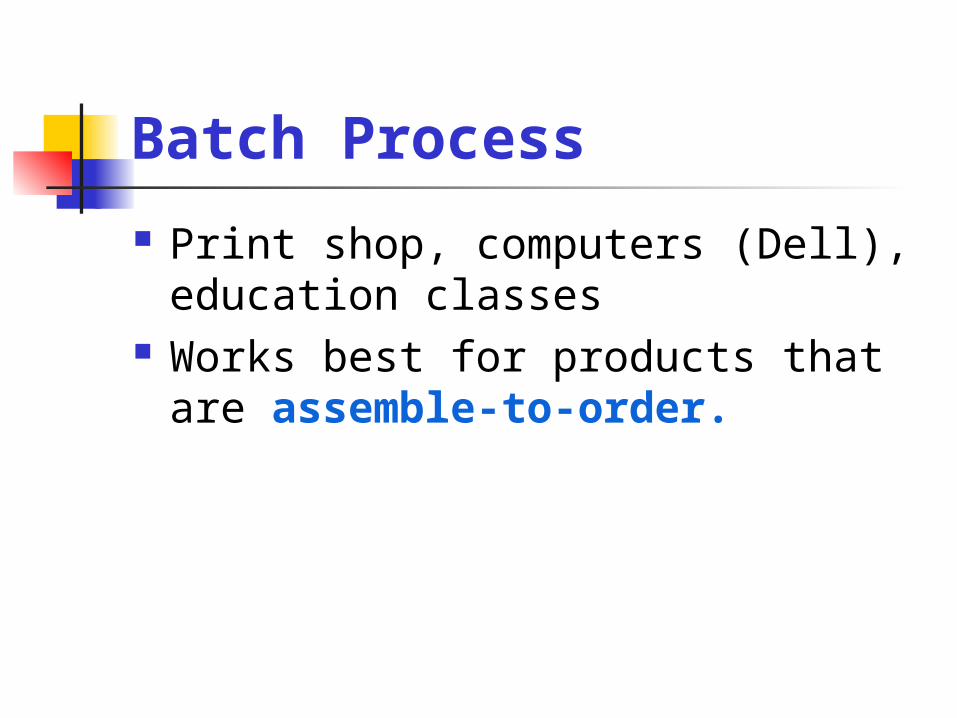
Batch Process
Print shop, computers (Dell), education classes
Works best for products that are assemble-to-order.

Example of Layout of a Project or Batch Process: Hospital

Line process (or assembly line) Produces large quantities of a
standardized product. Assembly line operation designed for
mass production. Each unit is produced or assembled by
going through same series of operations performed in same order.
Cars, off the shelf items. Works best for make-to-stock
products.

Continuous Process Very high volumes of a fully
standardized product Product is continuous – liquid or gas
Oil refinery Water purification plant Liquid chemicals
Capital intensive and automated Use for make-to-stock products

Example of Repetitive Process: Car Wash
DryRinseSoapSpray

Example of Line Process: Hotel Laundry

Classification of Processes
Project Batch Line Continuous
Intermittent Repetitive
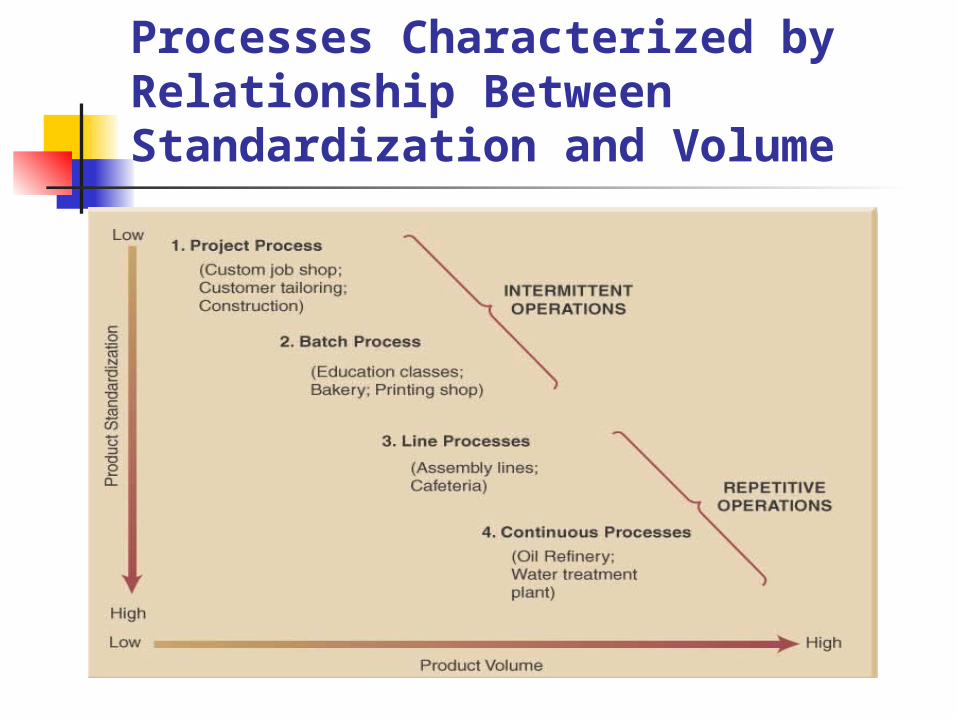
Processes Characterized by Relationship Between Standardization and Volume
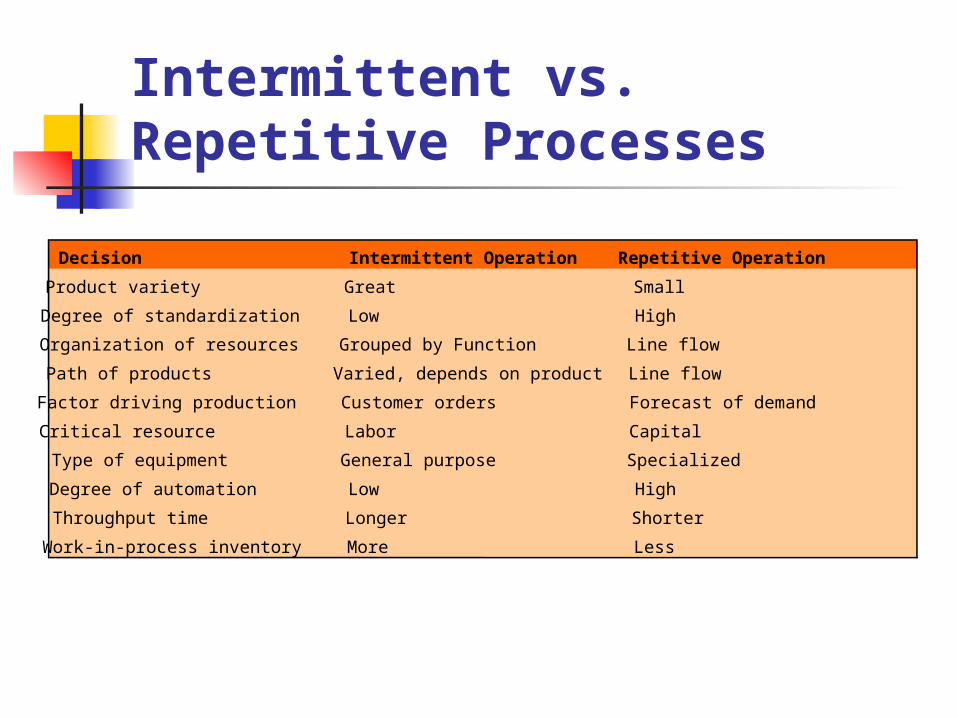
Decision Intermittent Operation Repetitive Operation
Product variety Great Small
Degree of standardization Low High
Organization of resources Grouped by Function Line flow
Path of products Varied, depends on product Line flow
Factor driving production Customer orders Forecast of demand
Critical resource Labor Capital
Type of equipment General purpose Specialized
Degree of automation Low High
Throughput time Longer Shorter
Work-in-process inventory More Less
Intermittent vs. Repetitive Processes

Types of Processes vs. Product Strategy
Types of Process
Product Strategy
Project Made to order
Batch Assemble to order
LineMake to stock
Continuous

Process Performance Metrics
To determine if a process is functioning properly, we must measure its performance.
To measure performance, process should be in statistical control.

Process Performance Metrics

Process Velocity
timeadded-Value
timeThroughputVelocity Process
Should ratio be big or small? What does a ratio of 1.0 imply? Greater than 1.0?
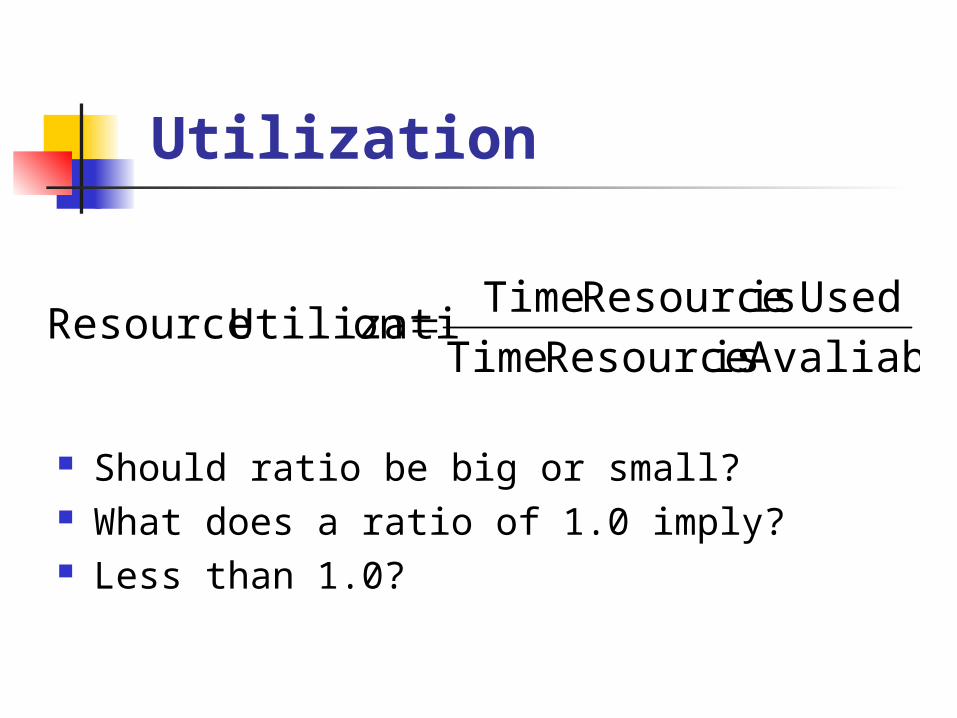
Utilization
Avaliable is Resource Time
Usedis Resource Timeon UtilizatiResource
Should ratio be big or small? What does a ratio of 1.0 imply? Less than 1.0?
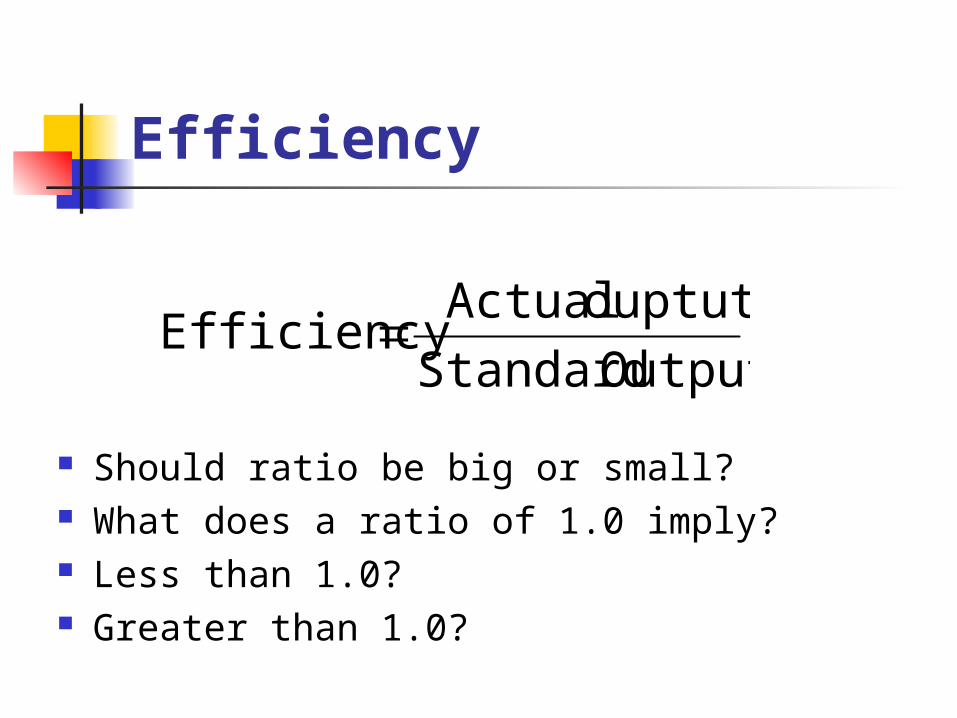
Output Standard
ouptut ActualEfficiency
Efficiency
Should ratio be big or small? What does a ratio of 1.0 imply? Less than 1.0? Greater than 1.0?
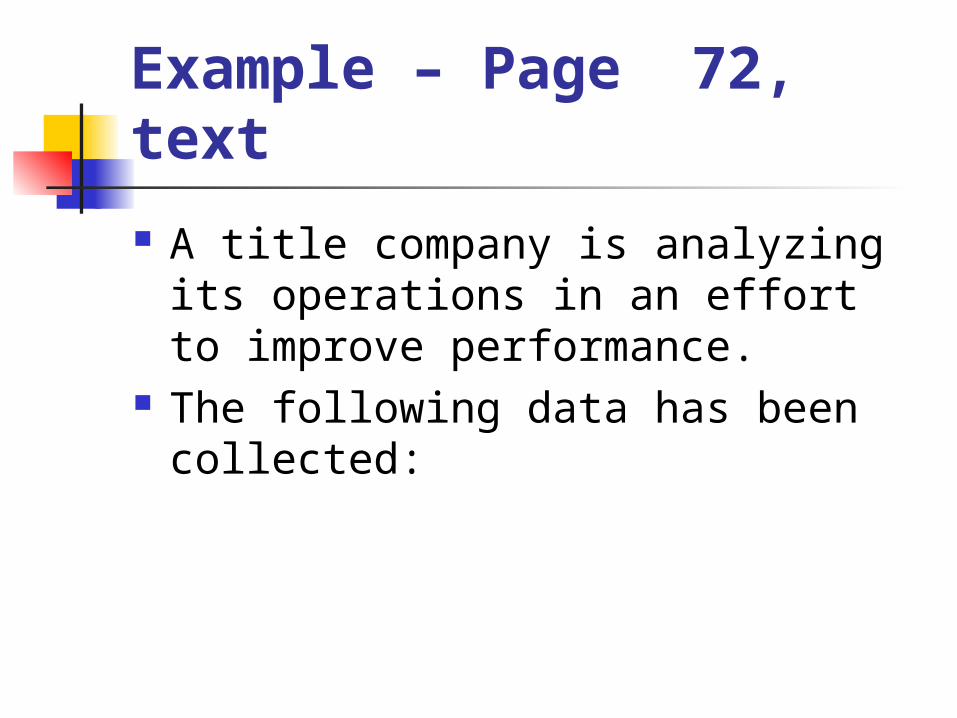
Example – Page 72, text
A title company is analyzing its operations in an effort to improve performance.
The following data has been collected:
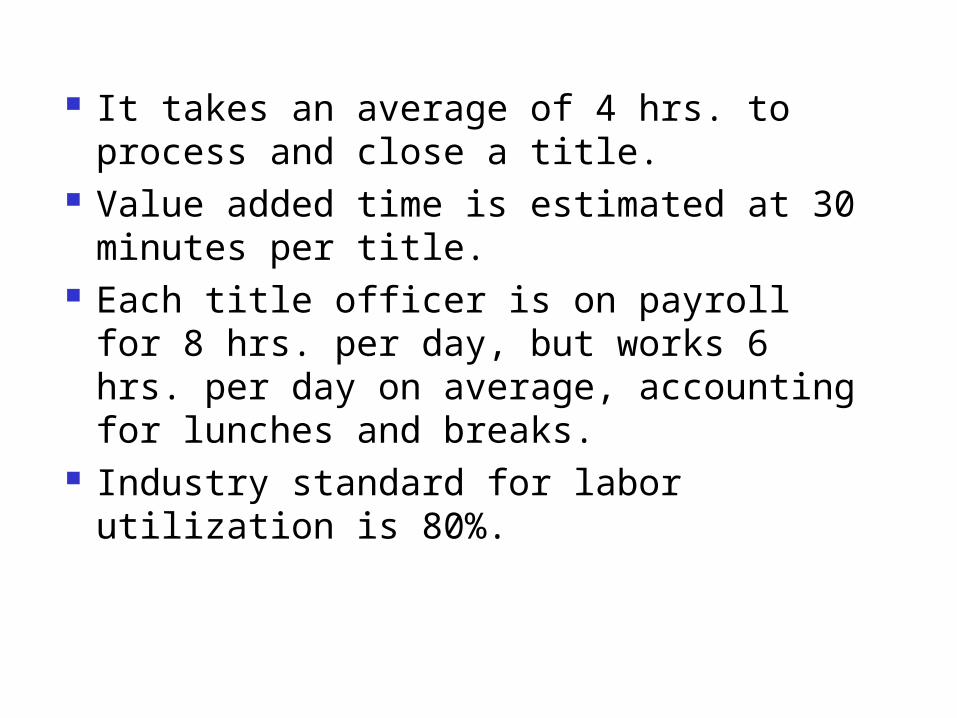
It takes an average of 4 hrs. to process and close a title.
Value added time is estimated at 30 minutes per title.
Each title officer is on payroll for 8 hrs. per day, but works 6 hrs. per day on average, accounting for lunches and breaks.
Industry standard for labor utilization is 80%.

The company closes 8 titles per day. Industry standard at comparable
companies is 10 titles closed per day. Compute
Process velocity Labor utilization Efficiency

Process Velocity
8
hrs./title 1/2
hrs./title 4
timeadded-Value
timeThroughputVelocity Process
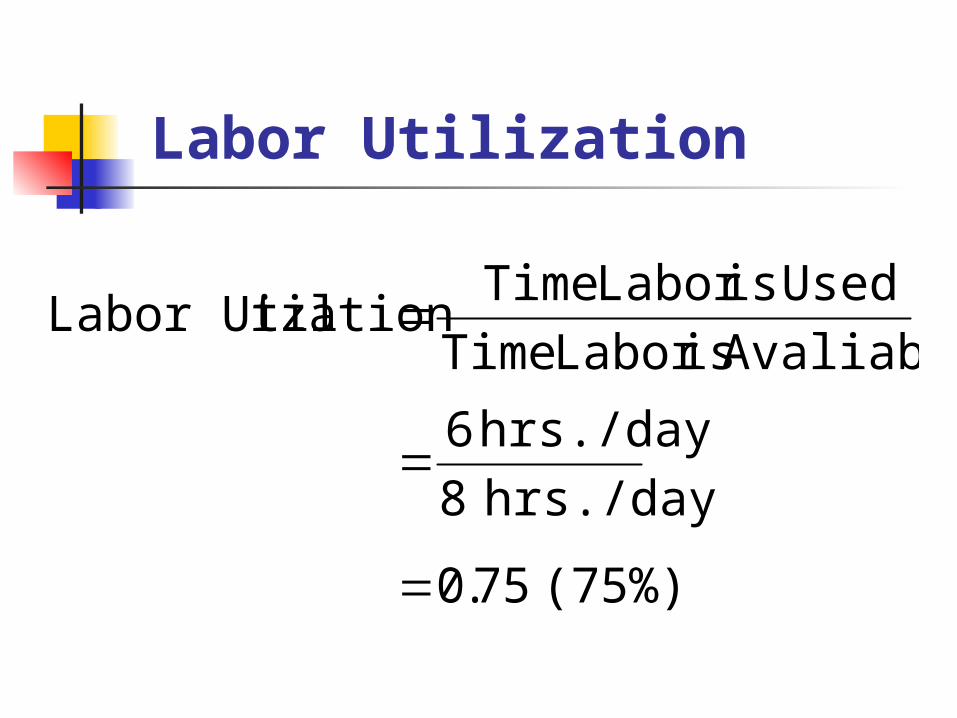
Labor Utilization
(75%) 75.0
hrs./day 8
hrs./day 6
Avaliable isLabor Time
UsedisLabor TimeizationLabor Util
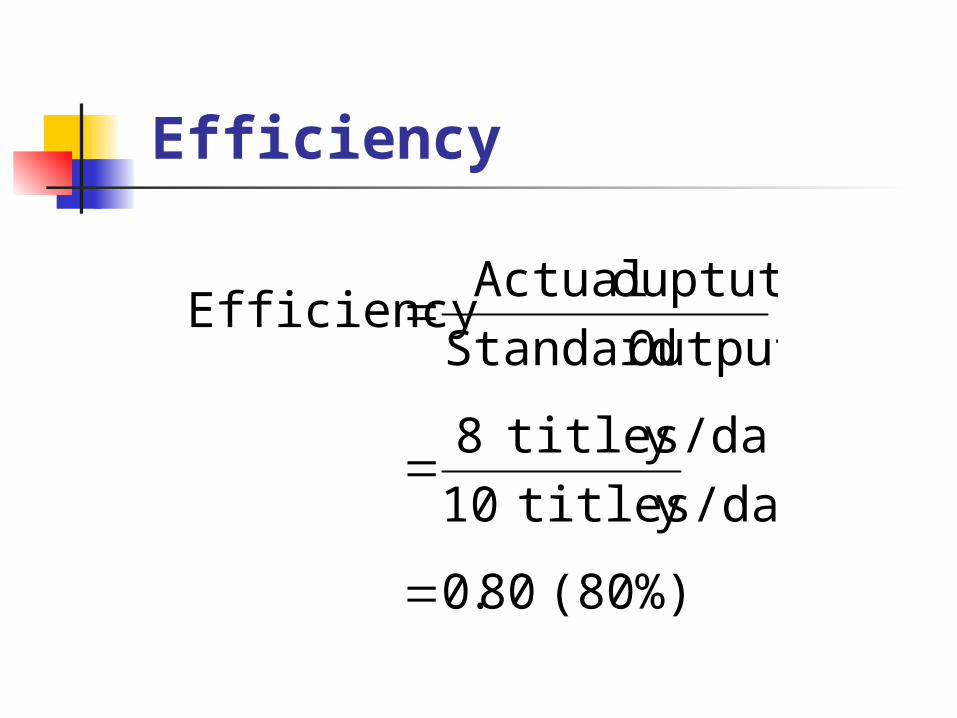
Efficiency
(80%) 80.0
y titles/da10
y titles/da8
Output Standard
ouptut ActualEfficiency
Related Documents