Producing Data and Designing Research Projects Feb 14-15, 2012 PPAL 6200

Welcome message from author
This document is posted to help you gain knowledge. Please leave a comment to let me know what you think about it! Share it to your friends and learn new things together.
Transcript

Producing Data and Designing Research Projects
Feb 14-15, 2012
PPAL 6200

To start….
• To start today I just want to briefly point out we are actually going to talk about something not in the book at all, then Chapter 9 before we do Chapter 8.
• Not sure why the book is arranged the way it is but it seems to make more sense to discuss designs for studies before you discuss sampling.

Outline• Some Really Important Things Not in the
Book: The Research Cycle
• The Different Designs Research Can Take
• Sampling
Some things not in the book
• In order to develop a social science project we need to look at some of the steps involved in moving from an idea to a completed project.

The Research Development Process or CycleStage 1
• A Problem or Observation
• A Question
• Background Research– Generally a literature of previous research on
topics related to your question.
Stage 2
• A Hypothesis– A statement that something (the explanatory
or independent variable[s]) causes or influences variation in something else (the dependent or response variable), and possibly how this is done.
• To do this you must have a conceptual definition of your variables

Stage 3
• Operationalizing your variables – How are you going to measure your variables– How are you going to collect those
measurements
How you go about collecting data depends on the problem and question you began with
• In many cases the literature review you have conducted will reveal not only what people have found on topics related to the question you have, but also how people have gone about studying these topics as well.
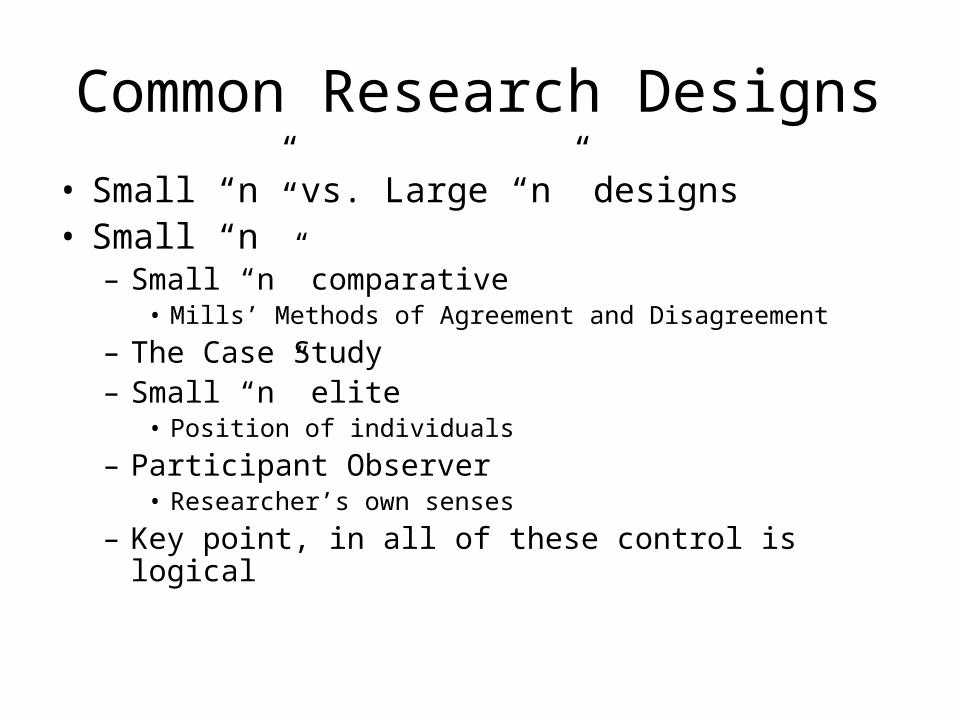
Common Research Designs
• Small “n” vs. Large “n” designs• Small “n”
– Small “n” comparative• Mills’ Methods of Agreement and Disagreement
– The Case Study– Small “n” elite
• Position of individuals
– Participant Observer• Researcher’s own senses
– Key point, in all of these control is logical
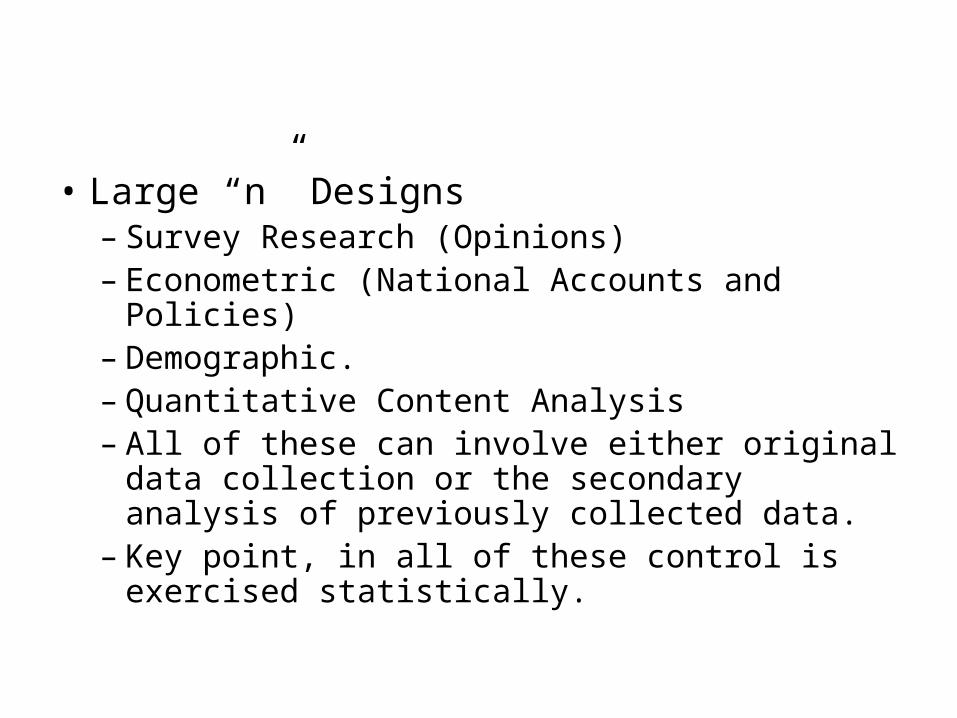
• Large “n” Designs– Survey Research (Opinions)– Econometric (National Accounts and Policies)– Demographic.– Quantitative Content Analysis– All of these can involve either original data
collection or the secondary analysis of previously collected data.
– Key point, in all of these control is exercised statistically.
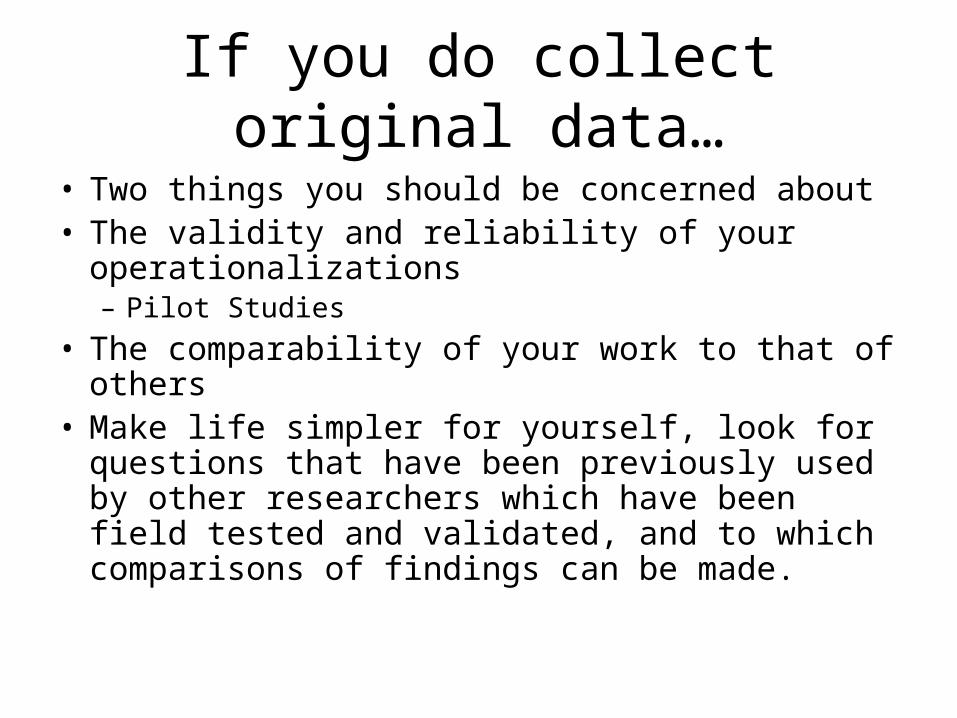
If you do collect original data…
• Two things you should be concerned about• The validity and reliability of your
operationalizations– Pilot Studies
• The comparability of your work to that of others• Make life simpler for yourself, look for questions
that have been previously used by other researchers which have been field tested and validated, and to which comparisons of findings can be made.
Stage 4
• Executing your design

Stage 5
• Analyzing your data

Stage 6
• Drawing your conclusions
Stage 7
• Writing your report
Break Time
Observation vs. Experiments
• An Experiment is a special kind of research study that imposes or applies a treatment in order to observe responses so as to determine if the treatment causes a change in response
• An observational study observes variation in individual variables of interest but does not attempt to manipulate them in order to influence or produce responses
• In many cases social scientists are interested in, it is probably not ethical to conduct genuine experiments.

Subjects, Factors, Treatments
• The book describes a “study” as “an experiment when we actually do something to people, animals,… in order to observe the response.”
• Not sure. Another view is that a study is any systematic investigation.
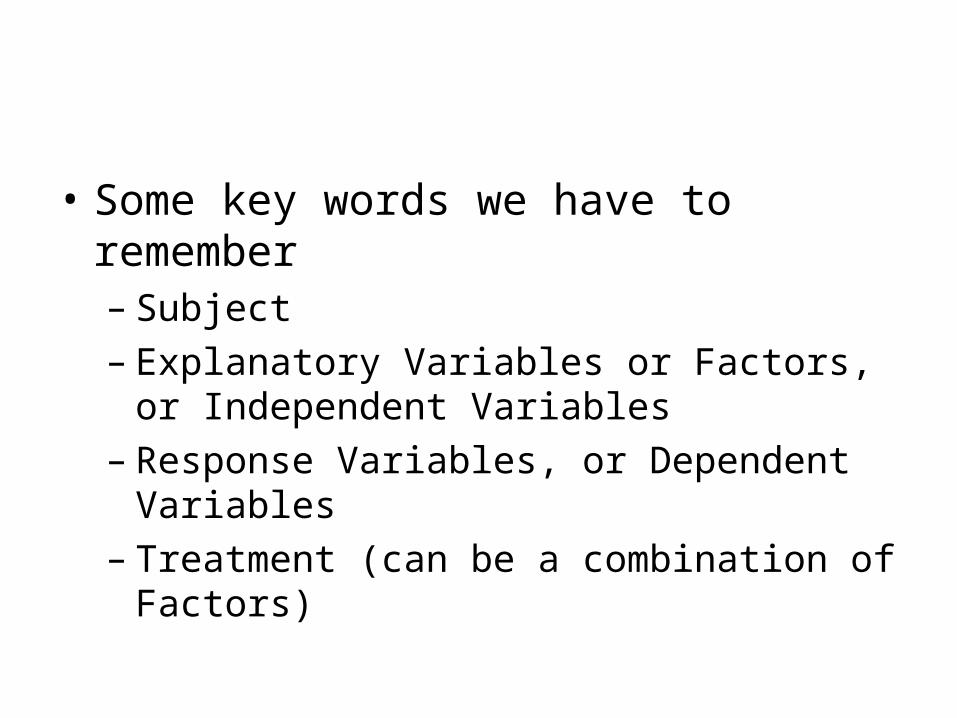
• Some key words we have to remember– Subject– Explanatory Variables or Factors, or
Independent Variables– Response Variables, or Dependent Variables– Treatment (can be a combination of Factors)
Experiments Good and Bad
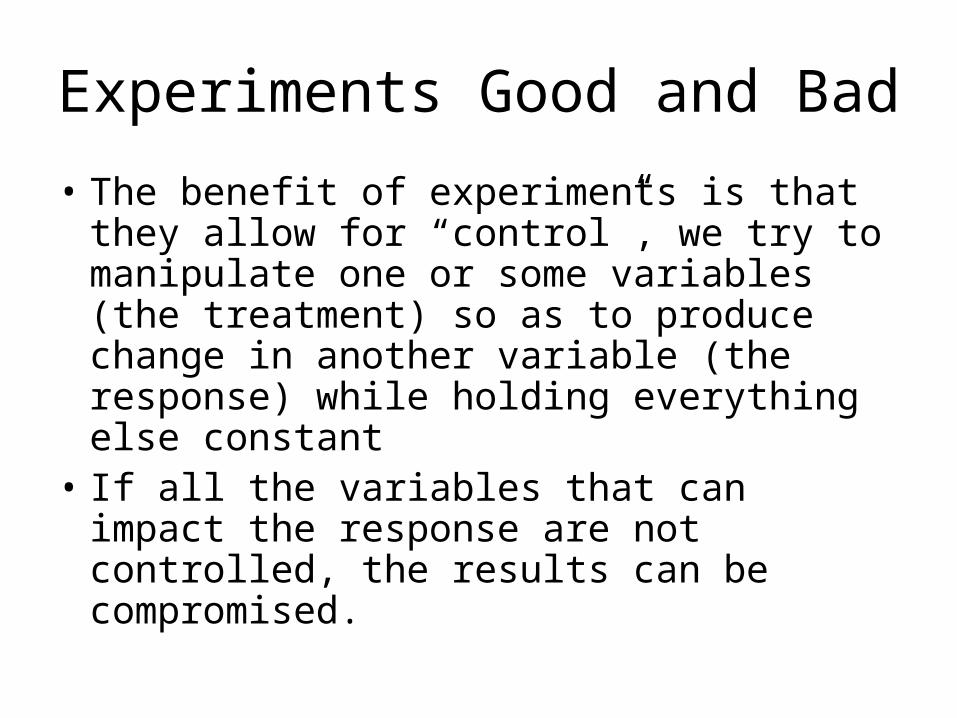
• The benefit of experiments is that they allow for “control”, we try to manipulate one or some variables (the treatment) so as to produce change in another variable (the response) while holding everything else constant
• If all the variables that can impact the response are not controlled, the results can be compromised.
Three types of Control
• Physical control
• Statistical control
• Logical
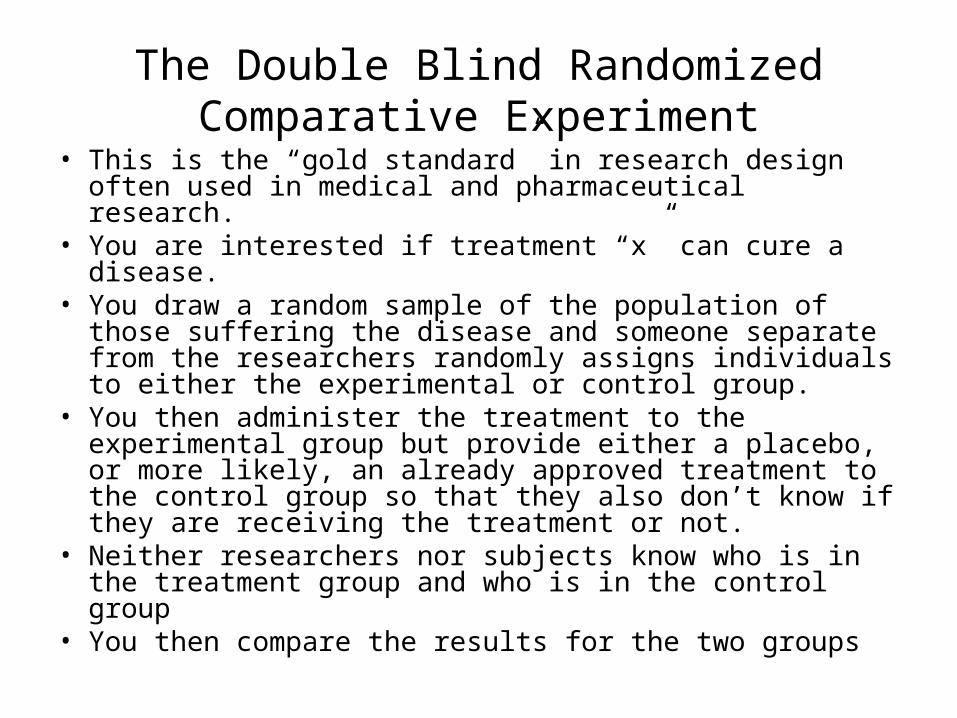
The Double Blind Randomized Comparative Experiment
• This is the “gold standard” in research design often used in medical and pharmaceutical research.
• You are interested if treatment “x” can cure a disease.• You draw a random sample of the population of those
suffering the disease and someone separate from the researchers randomly assigns individuals to either the experimental or control group.
• You then administer the treatment to the experimental group but provide either a placebo, or more likely, an already approved treatment to the control group so that they also don’t know if they are receiving the treatment or not.
• Neither researchers nor subjects know who is in the treatment group and who is in the control group
• You then compare the results for the two groups
The Logic of a Randomized Comparative Experiment
• Randomized selection and assignment to treatment and control groups mean all variations among the cases ought to be equally represented in each group
• Therefore, any differences in average response must be due either to the treatment or (as occasionally discovered pure random chance).
• However, if you use enough subjects random chance ought not to play a role.

• As we noted before, there is always a chance that results are the product of pure chance.
• A result that is so strong that it is unlikely to be the product of pure random chance is said to be statistically significant.

Matched pairs and other block designs
• Sometimes the gold standard is not possible but other experimental designs are.
• Essentially this is like a randomized comparative experiment except that the assignment of individuals is done one pair at a time so randomization is not as thorough.
Break Time

Producing Data
• MY BEST ADVICE REGARDING THE GENERATION OF DATA SUITABLE FOR STATISTICAL ANALYSIS IS DON’T!!!!!!!DON’T!!!!!!!
• HOWEVER, having noted that, you do need to be aware of how people go about collecting the data you are using and the limits that are imposed on your work by these methods
Sampling…
• Some Key Terms– Population (the entire group of individual cases about
which we want information)– Sample (a part of the population from which we
actually collect information and from which we will draw conclusions about the entire population)
– Sampling Design (the method we use to choose a sample from the population)
– Inference (the process of generalizing our results from our sample to the wider population)
The Ideal Sample• A sound sampling design is essential if we are
going to produce results that are generalizable from our sample to the entire population
• In the ideal sample design:1. Each individual case has an equal probability of
being drawn as part of the sample2. Each characteristic of relevance to the study is
present in equal probability in our sample and the population-at-large. ****NOTE: by the end of today’s lesson we will see that this second characteristic is not essential as long as:1. The first point is realized 2. and the sample we draw is large enough
However, for now we will assume it is a good idea to aim for

Garbage In… Garbage Out…• The truth of the matter is
– It is very hard to absolutely achieve both of the ideal characteristics of a sample
• For some populations it might be impossible such as relatively small groups (think about policy-makers and advisors for example)
– It is getting harder all the time to do so– The best we can probably ever hope to do is
“approximate” the two characteristics.
• The closer we approximate the two characteristics
• The better will be the accuracy of our inferences
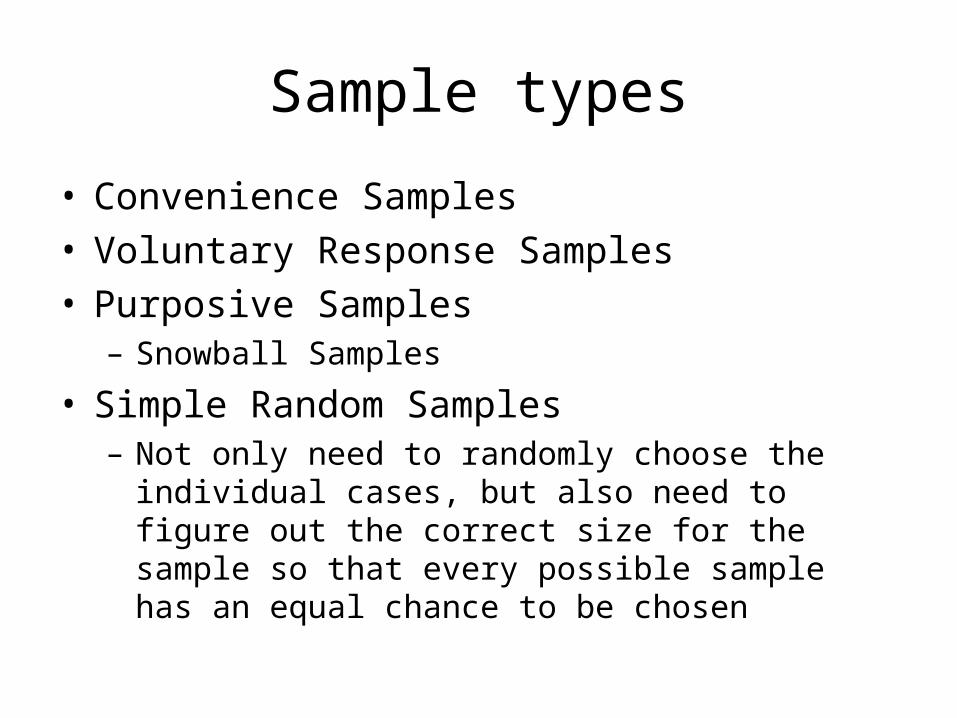
Sample types
• Convenience Samples• Voluntary Response Samples• Purposive Samples
– Snowball Samples
• Simple Random Samples– Not only need to randomly choose the individual
cases, but also need to figure out the correct size for the sample so that every possible sample has an equal chance to be chosen

• Stratified Random Sample– Sometimes you want to go beyond a Simple
Random Sample so as to ensure certain characteristics are not left to even the chance of error. This is common in public opinion polling where several Simple Random Samples will be drawn for populations identified along geographic lines.
• The next slide portrays a multistage stratified random sample
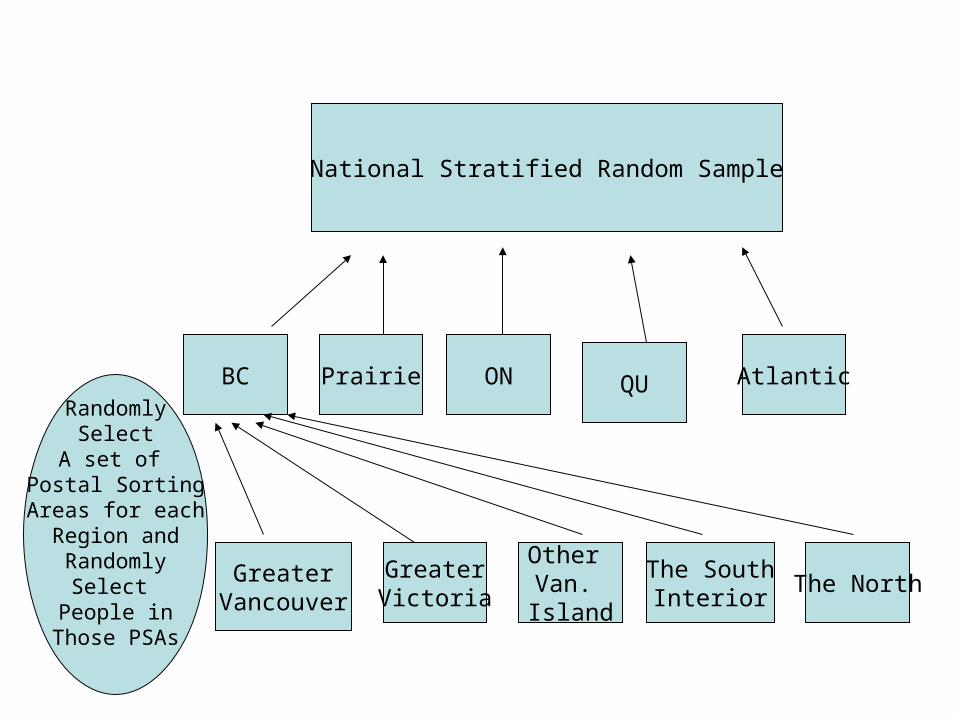
BC Prairie ON QU AtlanticRandomly
SelectA set of
Postal SortingAreas for each
Region andRandomly
Select People in
Those PSAs
National Stratified Random Sample
GreaterVancouver
GreaterVictoria
Other Van. Island
The SouthInterior
The North
• Stratification need not be done on geographic lines (though it often is)
• Any characteristic can be used as the basis of stratification.
• What matters is that it is something of importance to your research
Caution• As the book notes, a sample’s quality is built on
more than just the sampling technique• We need to have reliable information about the
population before we can even begin to select a decent sample
• Non-responses• Response bias• And many other factors can also degrade a
sample’s quality and the quality of the data we can get out of it.
Related Documents