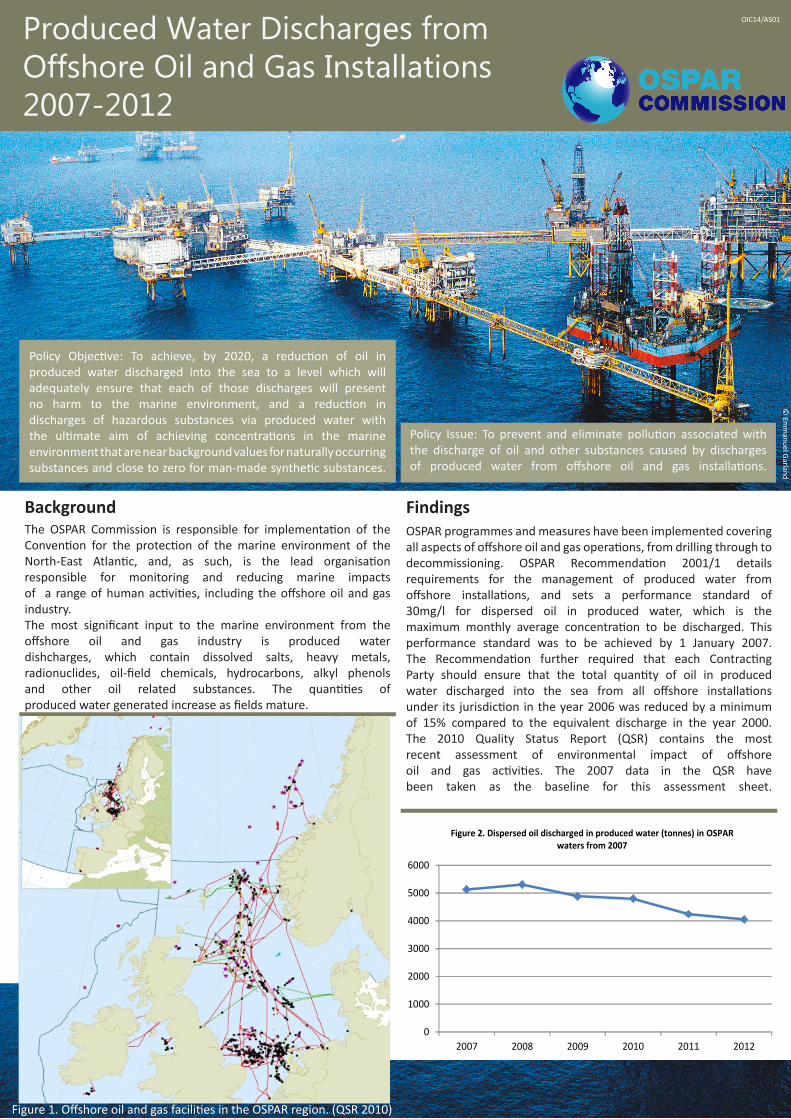
Produced Water Discharges from Offshore Oil and Gas Installations 2007-2012 Policy Issue: To prevent and eliminate polluon associated with the discharge of oil and other substances caused by discharges of produced water from offshore oil and gas installaons. Policy Objecve: To achieve, by 2020, a reducon of oil in produced water discharged into the sea to a level which will adequately ensure that each of those discharges will present no harm to the marine environment, and a reducon in discharges of hazardous substances via produced water with the ulmate aim of achieving concentraons in the marine environment that are near background values for naturally occurring substances and close to zero for man-made synthec substances. OIC14/AS01 Background The OSPAR Commission is responsible for implementaon of the Convenon for the protecon of the marine environment of the North-East Atlanc, and, as such, is the lead organisaon responsible for monitoring and reducing marine impacts of a range of human acvies, including the offshore oil and gas industry. The most significant input to the marine environment from the offshore oil and gas industry is produced water dishcharges, which contain dissolved salts, heavy metals, radionuclides, oil-field chemicals, hydrocarbons, alkyl phenols and other oil related substances. The quanes of produced water generated increase as fields mature. Findings OSPAR programmes and measures have been implemented covering all aspects of offshore oil and gas operaons, from drilling through to decommissioning. OSPAR Recommendaon 2001/1 details requirements for the management of produced water from offshore installaons, and sets a performance standard of 30mg/l for dispersed oil in produced water, which is the maximum monthly average concentraon to be discharged. This performance standard was to be achieved by 1 January 2007. The Recommendaon further required that each Contracng Party should ensure that the total quanty of oil in produced water discharged into the sea from all offshore installaons under its jurisdicon in the year 2006 was reduced by a minimum of 15% compared to the equivalent discharge in the year 2000. The 2010 Quality Status Report (QSR) contains the most recent assessment of environmental impact of offshore oil and gas acvies. The 2007 data in the QSR have been taken as the baseline for this assessment sheet. 0 1000 2000 3000 4000 5000 6000 2007 2008 2009 2010 2011 2012 Figure 2. Dispersed oil discharged in produced water (tonnes) in OSPAR waters from 2007 Figure 1. Offshore oil and gas facilies in the OSPAR region. (QSR 2010) © Emmanuel Garland

Welcome message from author
This document is posted to help you gain knowledge. Please leave a comment to let me know what you think about it! Share it to your friends and learn new things together.
Transcript
Produced Water Discharges from Offshore Oil and Gas Installations 2007-2012
Policy Issue: To prevent and eliminate pollution associated with the discharge of oil and other substances caused by discharges of produced water from offshore oil and gas installations.
Policy Objective: To achieve, by 2020, a reduction of oil in
produced water discharged into the sea to a level which will adequately ensure that each of those discharges will present no harm to the marine environment, and a reduction in discharges of hazardous substances via produced water with the ultimate aim of achieving concentrations in the marine environment that are near background values for naturally occurring substances and close to zero for man-made synthetic substances.
OIC14/AS01
BackgroundThe OSPAR Commission is responsible for implementation of the Convention for the protection of the marine environment of the North-East Atlantic, and, as such, is the lead organisation responsible for monitoring and reducing marine impacts of a range of human activities, including the offshore oil and gas industry.The most significant input to the marine environment from the offshore oil and gas industry is produced water dishcharges, which contain dissolved salts, heavy metals, radionuclides, oil-field chemicals, hydrocarbons, alkyl phenolsand other oil related substances. The quantities of produced water generated increase as fields mature.
FindingsOSPAR programmes and measures have been implemented covering all aspects of offshore oil and gas operations, from drilling through to decommissioning. OSPAR Recommendation 2001/1 details requirements for the management of produced water from offshore installations, and sets a performance standard of 30mg/l for dispersed oil in produced water, which is the maximum monthly average concentration to be discharged. This performance standard was to be achieved by 1 January 2007. The Recommendation further required that each Contracting Party should ensure that the total quantity of oil in produced water discharged into the sea from all offshore installations under its jurisdiction in the year 2006 was reduced by a minimum of 15% compared to the equivalent discharge in the year 2000. The 2010 Quality Status Report (QSR) contains the most recent assessment of environmental impact of offshore oil and gas activities. The 2007 data in the QSR have been taken as the baseline for this assessment sheet.
0
1000
2000
3000
4000
5000
6000
2007 2008 2009 2010 2011 2012
Figure 2. Dispersed oil discharged in produced water (tonnes) in OSPAR waters from 2007
Figure 1. Offshore oil and gas facilities in the OSPAR region. (QSR 2010)
© Em
manuel Garland

Future considerationsImprovements and developments in Best Available Technology and Best Environmental Practice have brought about reductions in the concentrations of dispersed oil in the produced water. Continued improvements and developments will help to further reduce discharges of dispersed oil and other contaminants. The re-injection of produced water has reduced the discharge of associated oil and chemicals and increases in the use of re-injection would further reduce discharges.In 2012, OSPAR Recommendation 2012/5 and associated guidelines for the implementation of a risk-based approach to the management of produced water discharges from offshore installations were adopted. This measure requires a systematic assessment of the risk associated with produced water discharges and, where appropriate, action to reduce the risk posed by the most hazardous substances. This interim evaluation indicates that OSPAR Recommendation 2001/1 has been successful in achieving reductions in the dispersed oil discharged in produced water. When applied in conjunction with OSPAR Recommendation 2012/5, the goal is to achieve further significant improvements in line with the 2020 target.
What has been achieved?Following adoption of OSPAR Recommendation 2001/1 (and subsequent amendments), an overall 15% reduction in the discharge of oil in produced water was achieved in 2006. As can be seen in Figure 2, a further 20% reduction in the quantity of dispersed oil discharged in produced water has been achieved between 2007 and 2012. Figure 3 confirms that the total volume of produced and displaced water discharged (PW+DW) has fallen during the period 2007 – 2012, and there has been an increase in the volume of produced water re-injected.
Sources of data and information:
OSPAR Quality Status Report- http://qsr2010.ospar.org/en/ch07.htmlOSPAR Annual Reports- http://www.ospar.org/v_publications/browse.asp?menu=00080800000000_000000_000000
© Emmanuel Garland
Produced Water Discharges from Offshore Oil and Gas Installations 2007-2012
OIC14/AS01
0
20
40
60
80
100
120
0
50
100
150
200
250
300
350
400
450
500
2007 2008 2009 2010 2011 2012
Inje
cted
Pro
duce
d W
ater
(mill
ion
m3/
year
)
Prod
uced
and
Dis
plac
emen
t Wat
er
Disc
harg
ed (m
illio
n m
3/ye
ar)
Year
Figure 3. Total volume of produced water and displacement water discharged, and produced water injected (m3)
PW+DW IPW
Related Documents


![[Document title] - Marine Scotlandmarine.gov.scot/sites/default/files/moray_east_dslp... · 2018-09-28 · 1 Produced by Moray Offshore WindFarm (East) Limited Produced by John McIntyre](https://static.cupdf.com/doc/110x72/5f9779be379ab463bb03ab14/document-title-marine-2018-09-28-1-produced-by-moray-offshore-windfarm-east.jpg)