Expanded edition Design and produce business documents (Office 2013) suitable for use in training packages where BSBITU306A is an imported Unit This workbook supports BSBITU306A Design and produce business documents in the BSB07 Business Services Training Package. © Millbank Investments Ltd, NZ, 2015 Software Publications writing team ISBN 978-1-925291-14-8 Disclaimer All rights reserved. No part of this publication may be reproduced or transmitted in any form or by any means, electronic or mechanical, including photocopying, scanning, recording, or any information storage and retrieval system, without permission in writing from Millbank Investments Ltd, NZ or Software Publications Pty Ltd. No patent liability is assumed with respect to the use of the information contained herein. While every precaution has been taken in the preparation of this book, the publisher and authors assume no responsibility for errors or omissions. Neither is any liability assumed for damages resulting from the use of the information contained herein. Software Publications Pty Ltd (ABN 75 078 026 150) Head Office - Sydney Unit 3 25 Gibbes Street Chatswood NSW 2067 www.SoftwarePublications.com.au Published and printed in Australia

Welcome message from author
This document is posted to help you gain knowledge. Please leave a comment to let me know what you think about it! Share it to your friends and learn new things together.
Transcript
Expanded edition Design and produce business documents (Office 2013) suitable for use in training packages where BSBITU306A is an imported Unit This workbook supports BSBITU306A Design and produce business documents in the BSB07 Business Services Training Package. © Millbank Investments Ltd, NZ, 2015
Software Publications writing team
ISBN 978-1-925291-14-8 Disclaimer
All rights reserved. No part of this publication may be reproduced or transmitted in any form or by any means, electronic or mechanical, including photocopying, scanning, recording, or any information storage and retrieval system, without permission in writing from Millbank Investments Ltd, NZ or Software Publications Pty Ltd. No patent liability is assumed with respect to the use of the information contained herein. While every precaution has been taken in the preparation of this book, the publisher and authors assume no responsibility for errors or omissions. Neither is any liability assumed for damages resulting from the use of the information contained herein. Software Publications Pty Ltd (ABN 75 078 026 150) Head Office - Sydney Unit 3 25 Gibbes Street Chatswood NSW 2067 www.SoftwarePublications.com.au
Published and printed in Australia
© Millbank Investments Ltd, 2015 Study Guide BSBITU306A i
Introduction
The authors have applied the performance criteria and range of variables for this module to enable students to learn about integration of Microsoft Office applications. The following applications have been included: Microsoft Word 2013 Microsoft Excel 2013 Microsoft Access 2013 Microsoft PowerPoint 2013 We have arranged the book into workplace scenarios with tasks using the above applications. A task sheet is included at the beginning of each section (after the section page).
The following is a synopsis of the workbook. Section 1 Care Cosmetics - This includes the creation of Word documents such as letters, memos, faxes, and mail merges along with the creation and use of templates and styles. It also includes basic spreadsheets and charts.
Section 2 Care Cosmetics (continued) - Word and Excel documents are copied and pasted, linked and embedded and links are updated in this section. A simple database is opened and viewed and then one is created which is used in a Word mail merge. A PowerPoint presentation combining previous tasks ends this scenario.
Section 3 Hillside College - This section uses different functions in Excel within a student grade worksheet. Charts will be created which will be linked to a Word memo. Next, a template is compiled for future student results. A PowerPoint presentation with transitions is used to link the information and to show these results at a teachers’ meeting.
Section 4 Accurate Training Pty Ltd - This section uses a database to create queries, e.g. student details, exam results, extract specific students. These queries will be used to perform a mail merge and to analyse data in Excel. The PivotChart feature is used to arrange data to display results. Charts created in Excel are linked to a Word document.
Section 5 Main Mags Book Store - This section is a scenario with advanced features and tasks requiring use of the four Microsoft applications to produce documents for the opening of a new store. This includes more difficult database features and queries, Word hyperlinking, spreadsheet calculations and creation of a presentation.
Revision Supplements Four supplementary sections have included at the end of this workbook covering Word 2013, Excel 2013, PowerPoint 2013 and Access 2013 for learners who are unfamiliar with these applications. The contents of these supplements are not assessed as part of the unit.
ii Study Guide BSBITU306A © Millbank Investments Ltd, 2015
BSBITU306A Design and produce business documents
Unit descriptor This unit describes the performance outcomes, skills and knowledge required to design and produce various business documents and publications. It includes selecting and using a range of functions on a variety of computer applications.
No licensing, legislative, regulatory or certification requirements apply to this unit at the time of endorsement.
Application of the unit This unit applies to individuals who possess fundamental skills in computer operations and keyboarding. They may exercise discretion and judgement using appropriate theoretical knowledge of document design and production to provide technical advice and support to a team.
Employability skills This unit contains employability skills.
Prerequisites There are no prerequisites for this unit.
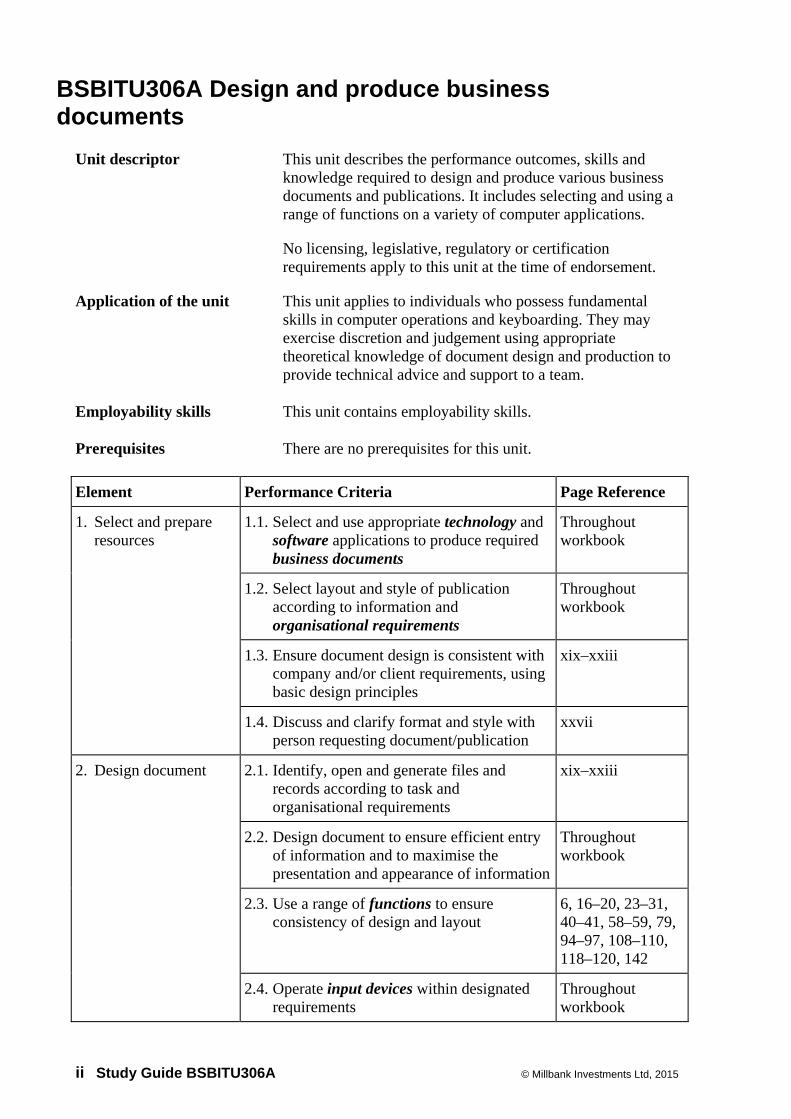
Element Performance Criteria Page Reference
1. Select and prepare resources
1.1. Select and use appropriate technology and software applications to produce required business documents
Throughout workbook
1.2. Select layout and style of publication according to information and organisational requirements
Throughout workbook
1.3. Ensure document design is consistent with company and/or client requirements, using basic design principles
xix–xxiii
1.4. Discuss and clarify format and style with person requesting document/publication
xxvii
2. Design document 2.1. Identify, open and generate files and records according to task and organisational requirements
xix–xxiii
2.2. Design document to ensure efficient entry of information and to maximise the presentation and appearance of information
Throughout workbook
2.3. Use a range of functions to ensure consistency of design and layout
6, 16–20, 23–31, 40–41, 58–59, 79, 94–97, 108–110, 118–120, 142
2.4. Operate input devices within designated requirements
Throughout workbook
© Millbank Investments Ltd, 2015 Study Guide BSBITU306A iii
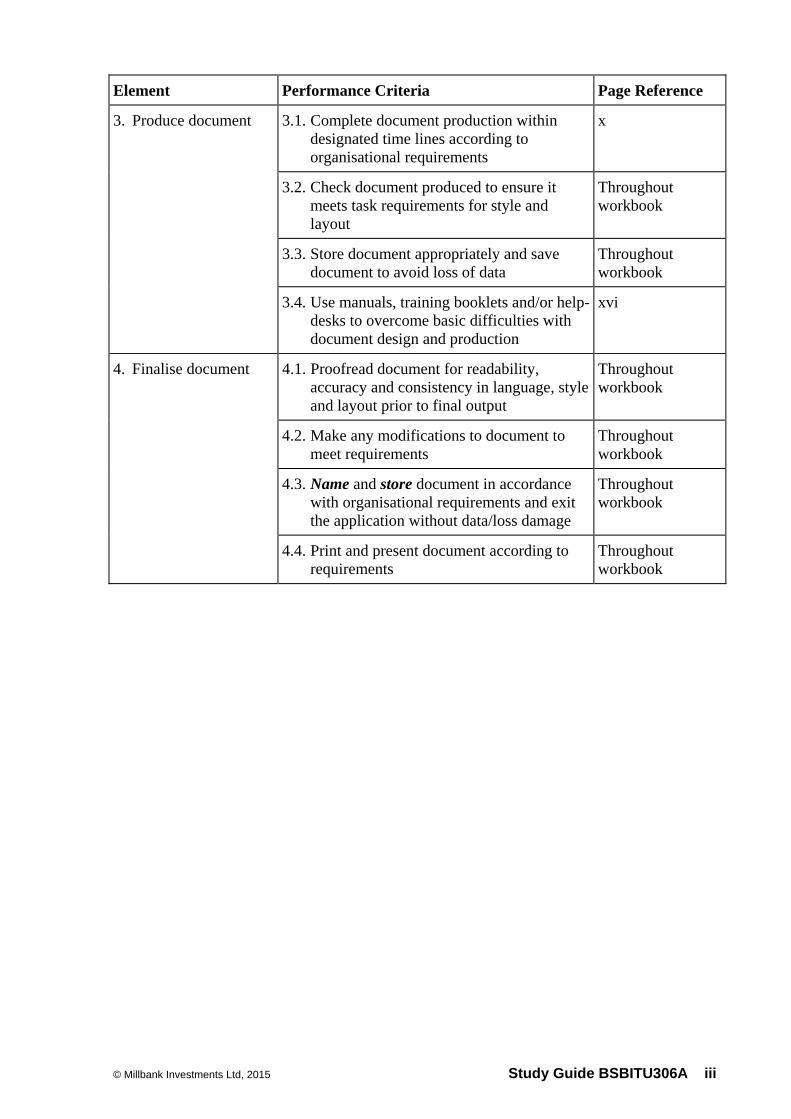
Element Performance Criteria Page Reference
3. Produce document 3.1. Complete document production within designated time lines according to organisational requirements
x
3.2. Check document produced to ensure it meets task requirements for style and layout
Throughout workbook
3.3. Store document appropriately and save document to avoid loss of data
Throughout workbook
3.4. Use manuals, training booklets and/or help-desks to overcome basic difficulties with document design and production
xvi
4. Finalise document 4.1. Proofread document for readability, accuracy and consistency in language, style and layout prior to final output
Throughout workbook
4.2. Make any modifications to document to meet requirements
Throughout workbook
4.3. Name and store document in accordance with organisational requirements and exit the application without data/loss damage
Throughout workbook
4.4. Print and present document according to requirements
Throughout workbook
iv Study Guide BSBITU306A © Millbank Investments Ltd, 2015
Skills and Knowledge
This section describes the skills and knowledge required for this unit.
Required skills
keyboarding and computer skills to complete a range of formatting and layout tasks
literacy skills to read and understand a variety of texts; to prepare general information and papers according to target audience; and to edit and proofread documents to ensure clarity of meaning and conformity to organisational requirements
numeracy skills to access and retrieve data
problem-solving skills to determine document design and production processes.
Required knowledge
appropriate technology for production requirements
functions and features of contemporary computer applications
organisational policies, plans and procedures
organisational requirements for document design, e.g. style guide.
© Millbank Investments Ltd, 2015 Study Guide BSBITU306A v
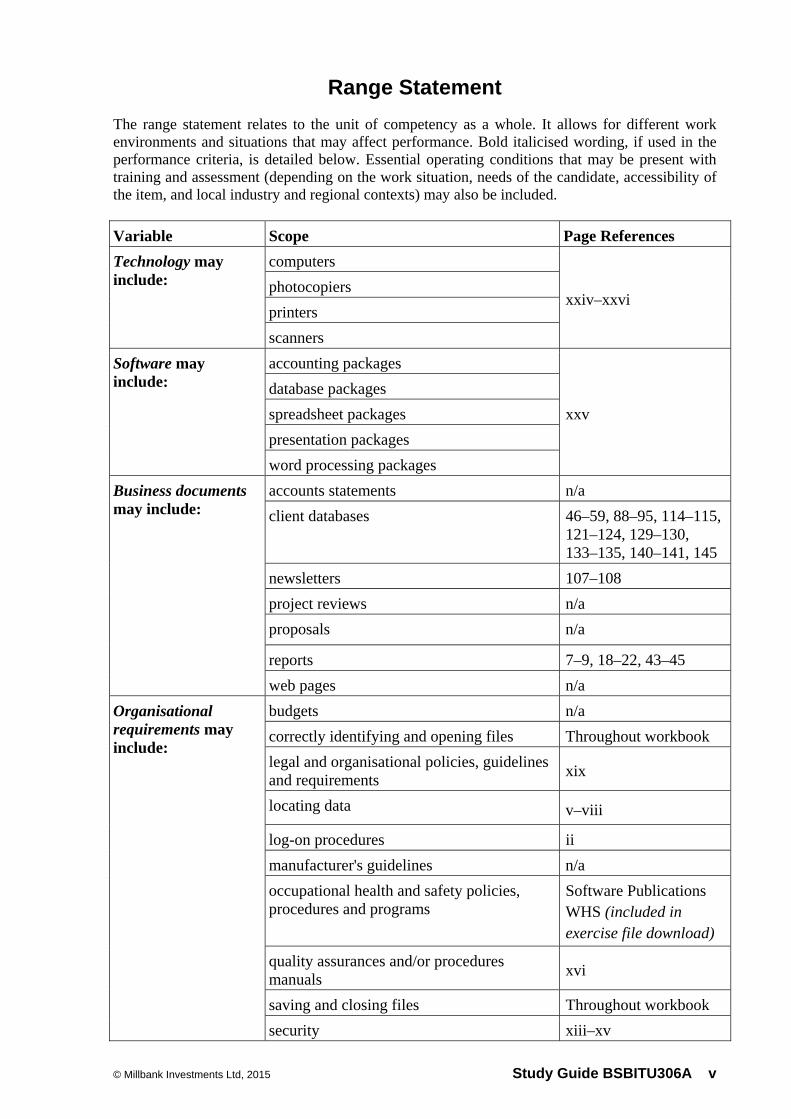
Range Statement
The range statement relates to the unit of competency as a whole. It allows for different work environments and situations that may affect performance. Bold italicised wording, if used in the performance criteria, is detailed below. Essential operating conditions that may be present with training and assessment (depending on the work situation, needs of the candidate, accessibility of the item, and local industry and regional contexts) may also be included. Variable Scope Page References Technology may include:
computers
xxiv–xxvi photocopiers printers scanners
Software may include:
accounting packages
xxv database packages spreadsheet packages presentation packages word processing packages
Business documents may include:
accounts statements n/a client databases 46–59, 88–95, 114–115,
121–124, 129–130, 133–135, 140–141, 145
newsletters 107–108 project reviews n/a proposals n/a
reports 7–9, 18–22, 43–45 web pages n/a
Organisational requirements may include:
budgets n/a correctly identifying and opening files Throughout workbook legal and organisational policies, guidelines and requirements xix
locating data v–viii
log-on procedures ii manufacturer's guidelines n/a occupational health and safety policies, procedures and programs
Software Publications WHS (included in exercise file download)
quality assurances and/or procedures manuals xvi
saving and closing files Throughout workbook security xiii–xv
vi Study Guide BSBITU306A © Millbank Investments Ltd, 2015
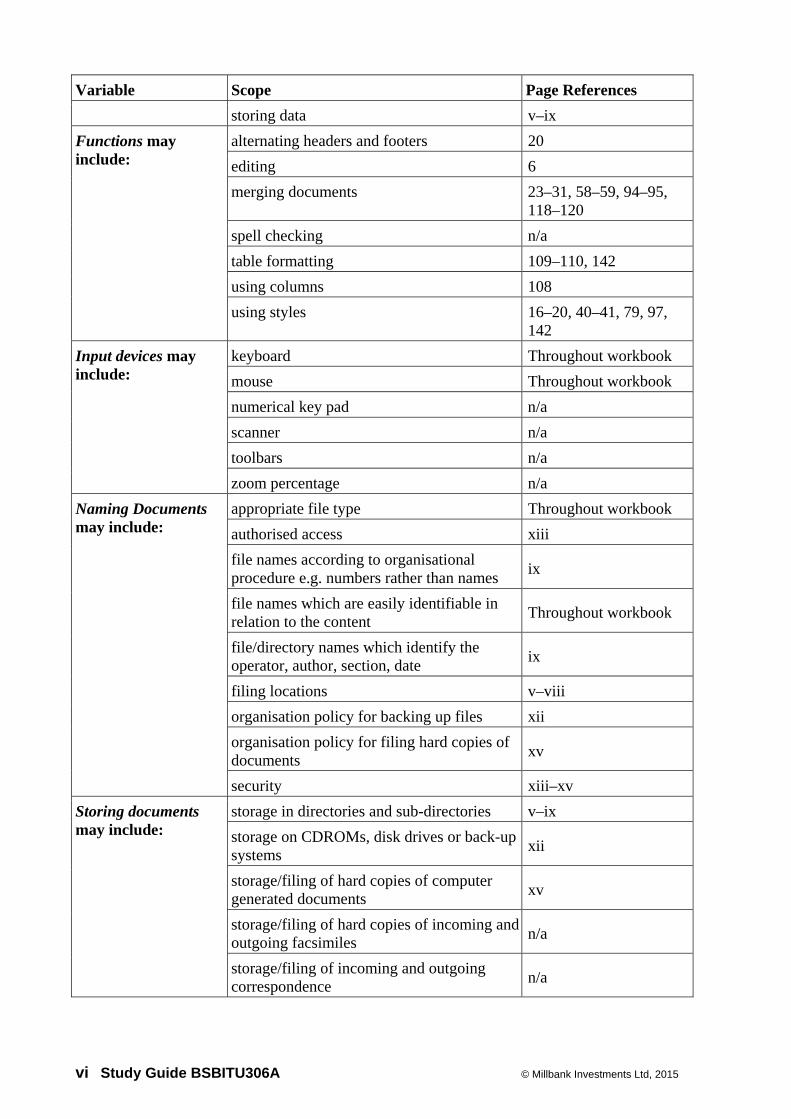
Variable Scope Page References storing data v–ix
Functions may include:
alternating headers and footers 20 editing 6 merging documents 23–31, 58–59, 94–95,
118–120 spell checking n/a table formatting 109–110, 142 using columns 108 using styles 16–20, 40–41, 79, 97,
142 Input devices may include:
keyboard Throughout workbook mouse Throughout workbook numerical key pad n/a scanner n/a toolbars n/a zoom percentage n/a
Naming Documents may include:
appropriate file type Throughout workbook authorised access xiii file names according to organisational procedure e.g. numbers rather than names ix
file names which are easily identifiable in relation to the content Throughout workbook
file/directory names which identify the operator, author, section, date ix
filing locations v–viii organisation policy for backing up files xii organisation policy for filing hard copies of documents xv
security xiii–xv Storing documents may include:
storage in directories and sub-directories v–ix storage on CDROMs, disk drives or back-up systems xii
storage/filing of hard copies of computer generated documents xv
storage/filing of hard copies of incoming and outgoing facsimiles n/a
storage/filing of incoming and outgoing correspondence n/a
© Millbank Investments Ltd, 2015 Study Guide BSBITU306A vii
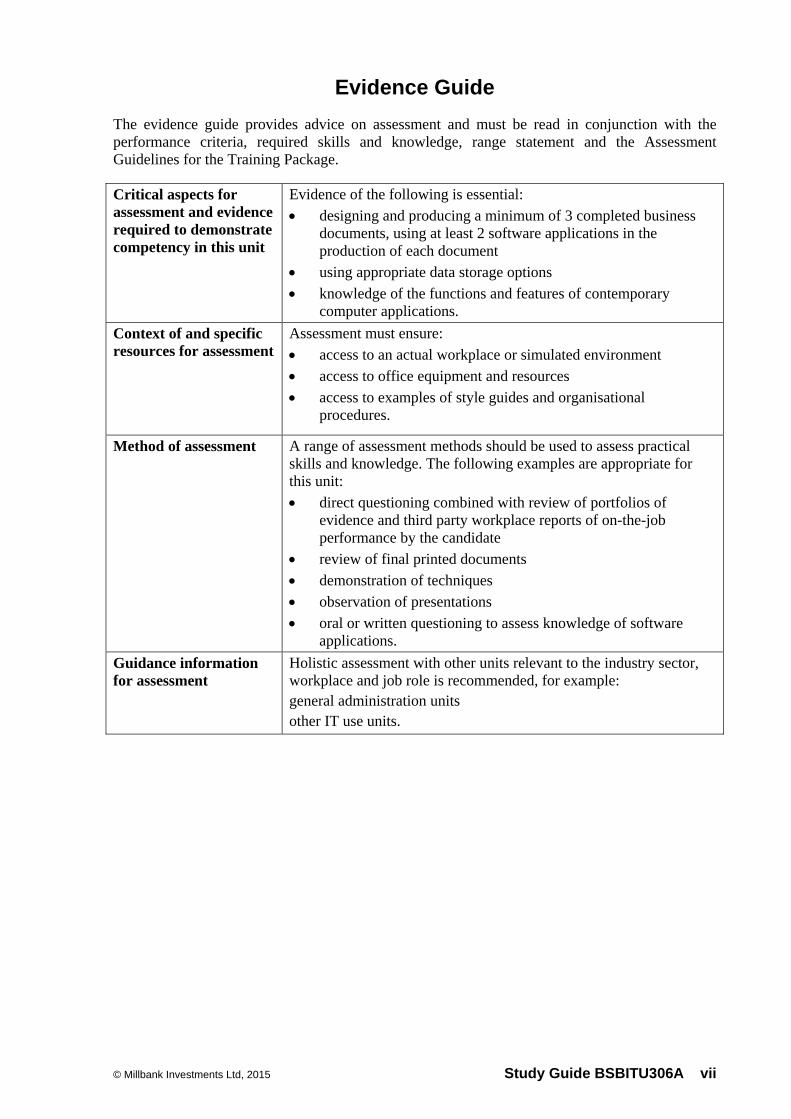
Evidence Guide
The evidence guide provides advice on assessment and must be read in conjunction with the performance criteria, required skills and knowledge, range statement and the Assessment Guidelines for the Training Package.
Critical aspects for assessment and evidence required to demonstrate competency in this unit
Evidence of the following is essential: designing and producing a minimum of 3 completed business
documents, using at least 2 software applications in the production of each document
using appropriate data storage options knowledge of the functions and features of contemporary
computer applications. Context of and specific resources for assessment
Assessment must ensure: access to an actual workplace or simulated environment access to office equipment and resources access to examples of style guides and organisational
procedures.
Method of assessment A range of assessment methods should be used to assess practical skills and knowledge. The following examples are appropriate for this unit: direct questioning combined with review of portfolios of
evidence and third party workplace reports of on-the-job performance by the candidate
review of final printed documents demonstration of techniques observation of presentations oral or written questioning to assess knowledge of software
applications. Guidance information for assessment
Holistic assessment with other units relevant to the industry sector, workplace and job role is recommended, for example: general administration units other IT use units.
© Millbank Investments Ltd, 2015 SECTION 1 15
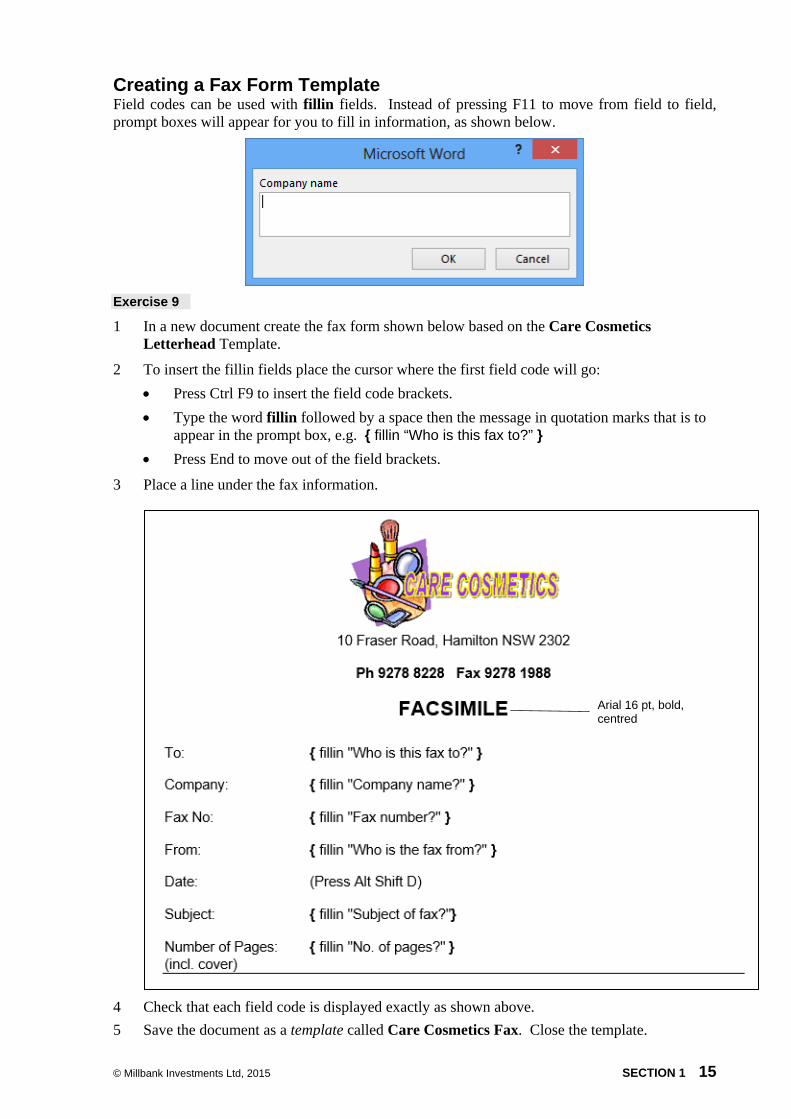
Creating a Fax Form Template Field codes can be used with fillin fields. Instead of pressing F11 to move from field to field, prompt boxes will appear for you to fill in information, as shown below.
Exercise 9
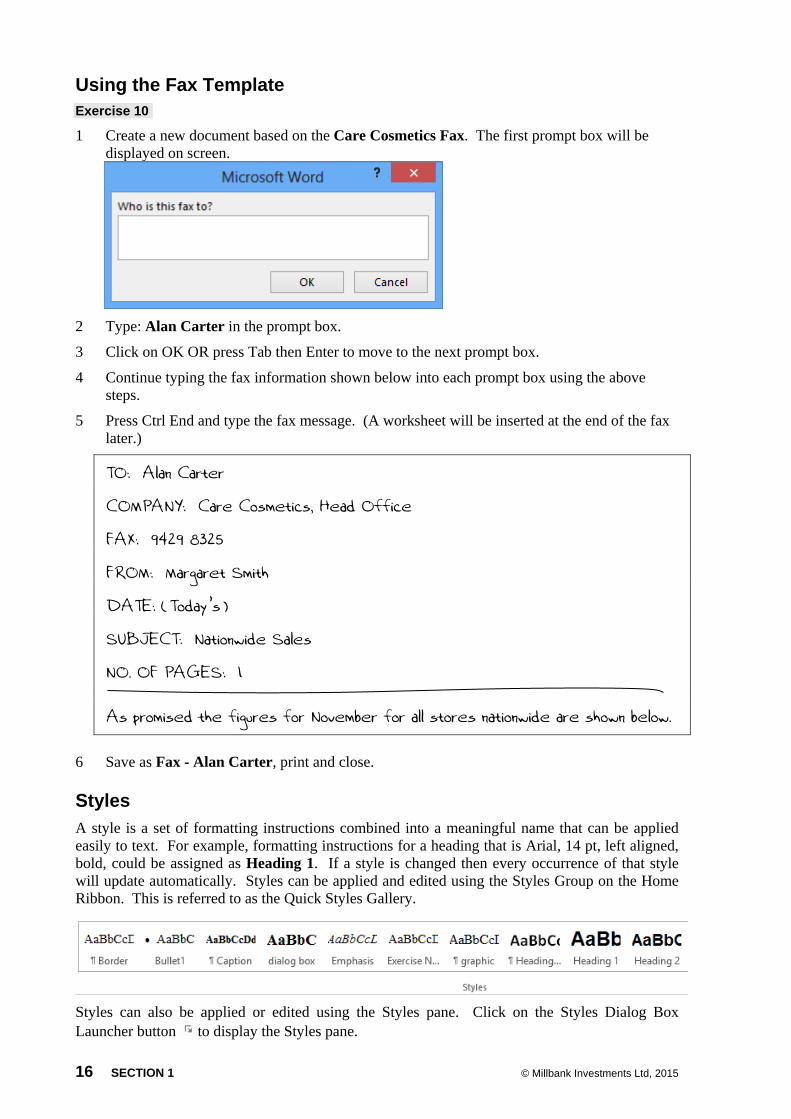
1 In a new document create the fax form shown below based on the Care Cosmetics Letterhead Template.
2 To insert the fillin fields place the cursor where the first field code will go: • Press Ctrl F9 to insert the field code brackets. • Type the word fillin followed by a space then the message in quotation marks that is to
appear in the prompt box, e.g. { fillin “Who is this fax to?” } • Press End to move out of the field brackets.
3 Place a line under the fax information.
4 Check that each field code is displayed exactly as shown above. 5 Save the document as a template called Care Cosmetics Fax. Close the template.
Arial 16 pt, bold, centred
16 SECTION 1 © Millbank Investments Ltd, 2015
Using the Fax Template Exercise 10
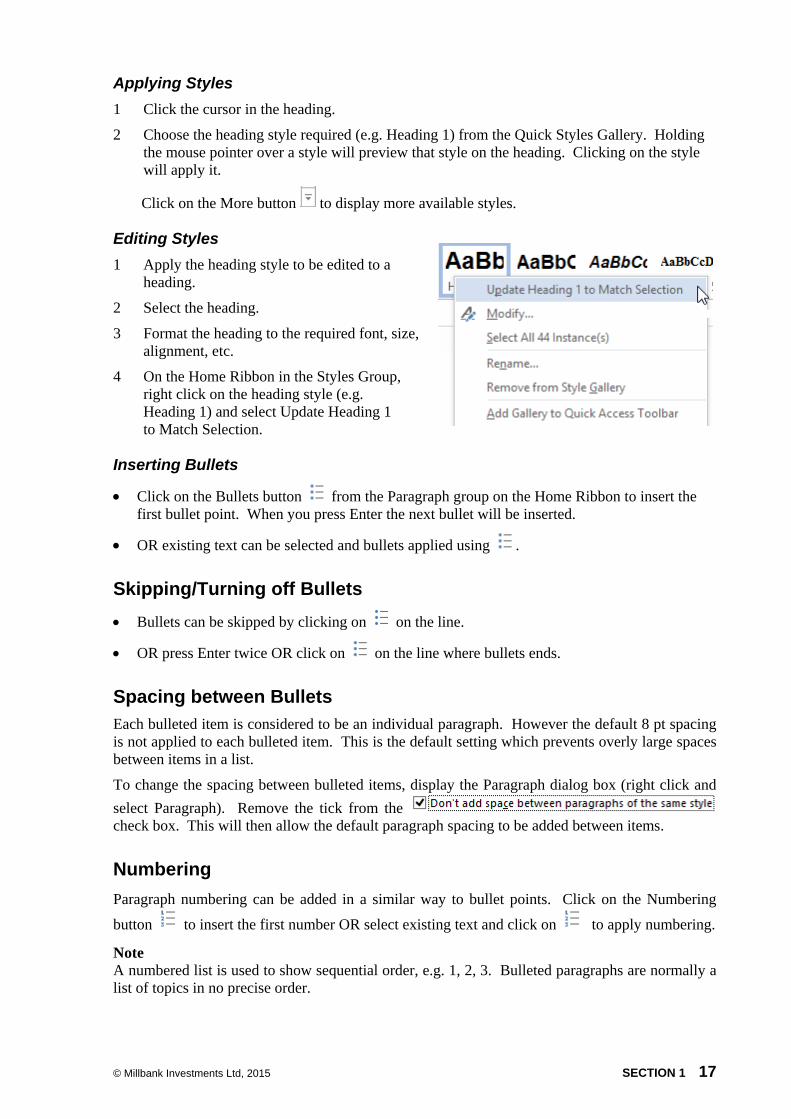
1 Create a new document based on the Care Cosmetics Fax. The first prompt box will be displayed on screen.
2 Type: Alan Carter in the prompt box.
3 Click on OK OR press Tab then Enter to move to the next prompt box.
4 Continue typing the fax information shown below into each prompt box using the above steps.
5 Press Ctrl End and type the fax message. (A worksheet will be inserted at the end of the fax later.)
TO: Alan Carter
COMPANY: Care Cosmetics, Head Office
FAX: 9429 8325
FROM: Margaret Smith
DATE: (Today’s)
SUBJECT: Nationwide Sales
NO. OF PAGES: 1 As promised the figures for November for all stores nationwide are shown below.
6 Save as Fax - Alan Carter, print and close.
Styles A style is a set of formatting instructions combined into a meaningful name that can be applied easily to text. For example, formatting instructions for a heading that is Arial, 14 pt, left aligned, bold, could be assigned as Heading 1. If a style is changed then every occurrence of that style will update automatically. Styles can be applied and edited using the Styles Group on the Home Ribbon. This is referred to as the Quick Styles Gallery.
Styles can also be applied or edited using the Styles pane. Click on the Styles Dialog Box Launcher button to display the Styles pane.
© Millbank Investments Ltd, 2015 SECTION 1 17
Applying Styles 1 Click the cursor in the heading.
2 Choose the heading style required (e.g. Heading 1) from the Quick Styles Gallery. Holding the mouse pointer over a style will preview that style on the heading. Clicking on the style will apply it.
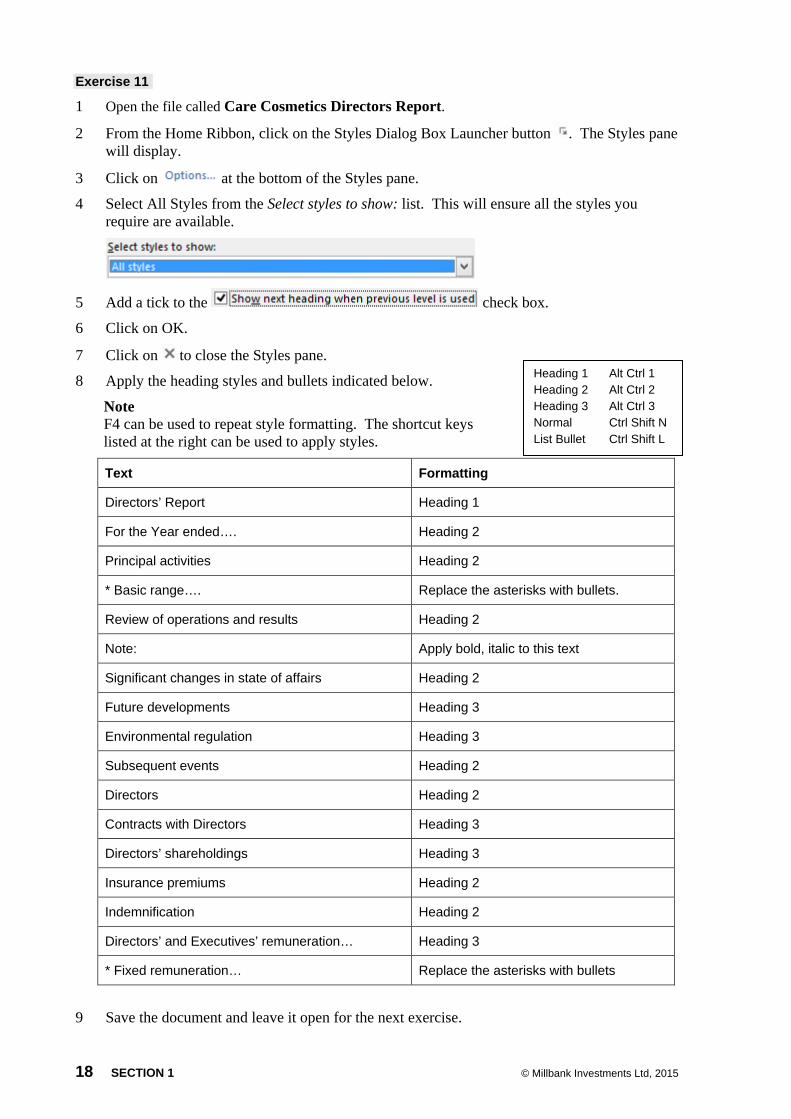
Click on the More button to display more available styles. Editing Styles 1 Apply the heading style to be edited to a
heading.
2 Select the heading.
3 Format the heading to the required font, size, alignment, etc.
4 On the Home Ribbon in the Styles Group, right click on the heading style (e.g. Heading 1) and select Update Heading 1 to Match Selection.
Inserting Bullets
• Click on the Bullets button from the Paragraph group on the Home Ribbon to insert the first bullet point. When you press Enter the next bullet will be inserted.
• OR existing text can be selected and bullets applied using .
Skipping/Turning off Bullets • Bullets can be skipped by clicking on on the line.
• OR press Enter twice OR click on on the line where bullets ends.
Spacing between Bullets Each bulleted item is considered to be an individual paragraph. However the default 8 pt spacing is not applied to each bulleted item. This is the default setting which prevents overly large spaces between items in a list.
To change the spacing between bulleted items, display the Paragraph dialog box (right click and select Paragraph). Remove the tick from the check box. This will then allow the default paragraph spacing to be added between items.
Numbering Paragraph numbering can be added in a similar way to bullet points. Click on the Numbering
button to insert the first number OR select existing text and click on to apply numbering.
Note A numbered list is used to show sequential order, e.g. 1, 2, 3. Bulleted paragraphs are normally a list of topics in no precise order.
18 SECTION 1 © Millbank Investments Ltd, 2015
Exercise 11
1 Open the file called Care Cosmetics Directors Report.
2 From the Home Ribbon, click on the Styles Dialog Box Launcher button . The Styles pane will display.
3 Click on at the bottom of the Styles pane.
4 Select All Styles from the Select styles to show: list. This will ensure all the styles you require are available.
5 Add a tick to the check box.
6 Click on OK.
7 Click on to close the Styles pane.
8 Apply the heading styles and bullets indicated below.
Note F4 can be used to repeat style formatting. The shortcut keys listed at the right can be used to apply styles.
Text Formatting
Directors’ Report Heading 1
For the Year ended…. Heading 2
Principal activities Heading 2
* Basic range…. Replace the asterisks with bullets.
Review of operations and results Heading 2
Note: Apply bold, italic to this text
Significant changes in state of affairs Heading 2
Future developments Heading 3
Environmental regulation Heading 3
Subsequent events Heading 2
Directors Heading 2
Contracts with Directors Heading 3
Directors’ shareholdings Heading 3
Insurance premiums Heading 2
Indemnification Heading 2
Directors’ and Executives’ remuneration… Heading 3
* Fixed remuneration… Replace the asterisks with bullets
9 Save the document and leave it open for the next exercise.
Heading 1 Alt Ctrl 1 Heading 2 Alt Ctrl 2 Heading 3 Alt Ctrl 3 Normal Ctrl Shift N List Bullet Ctrl Shift L
48 SECTION 2 © Millbank Investments Ltd, 2015
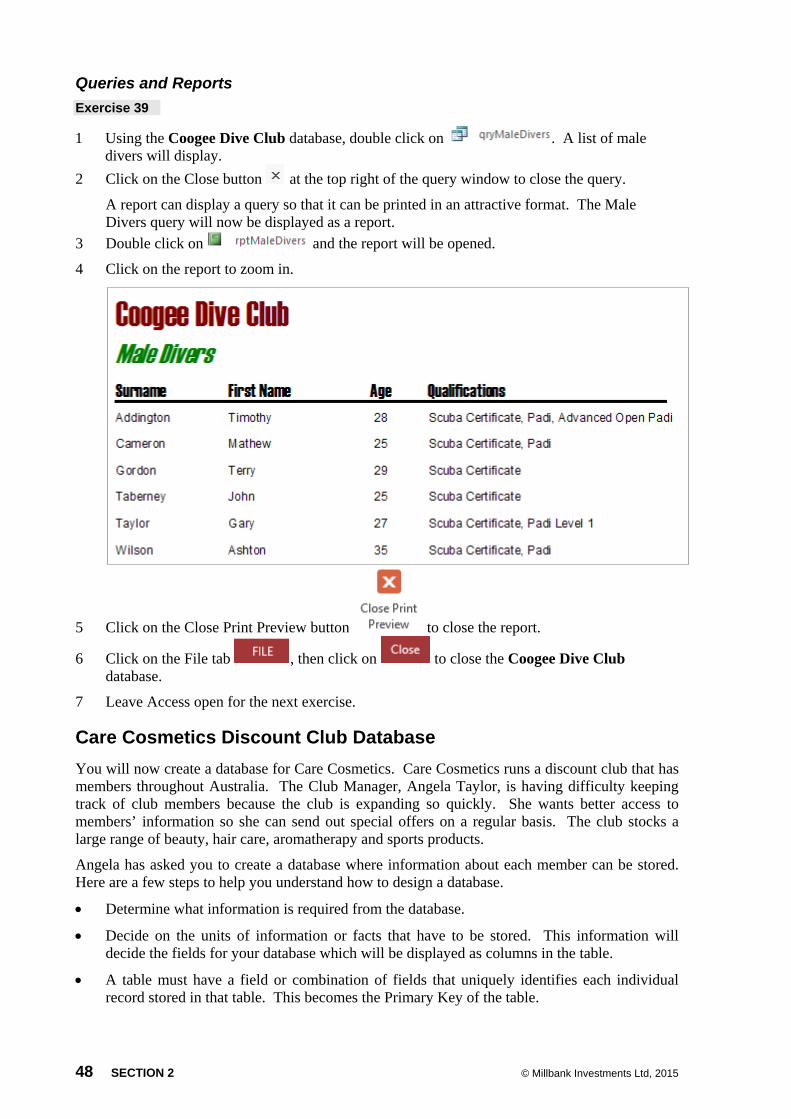
Queries and Reports Exercise 39
1 Using the Coogee Dive Club database, double click on . A list of male divers will display.
2 Click on the Close button at the top right of the query window to close the query.
A report can display a query so that it can be printed in an attractive format. The Male Divers query will now be displayed as a report.
3 Double click on and the report will be opened.
4 Click on the report to zoom in.
5 Click on the Close Print Preview button to close the report.
6 Click on the File tab , then click on to close the Coogee Dive Club database.
7 Leave Access open for the next exercise.
Care Cosmetics Discount Club Database You will now create a database for Care Cosmetics. Care Cosmetics runs a discount club that has members throughout Australia. The Club Manager, Angela Taylor, is having difficulty keeping track of club members because the club is expanding so quickly. She wants better access to members’ information so she can send out special offers on a regular basis. The club stocks a large range of beauty, hair care, aromatherapy and sports products.
Angela has asked you to create a database where information about each member can be stored. Here are a few steps to help you understand how to design a database.
• Determine what information is required from the database.
• Decide on the units of information or facts that have to be stored. This information will decide the fields for your database which will be displayed as columns in the table.
• A table must have a field or combination of fields that uniquely identifies each individual record stored in that table. This becomes the Primary Key of the table.
© Millbank Investments Ltd, 2015 SECTION 2 49
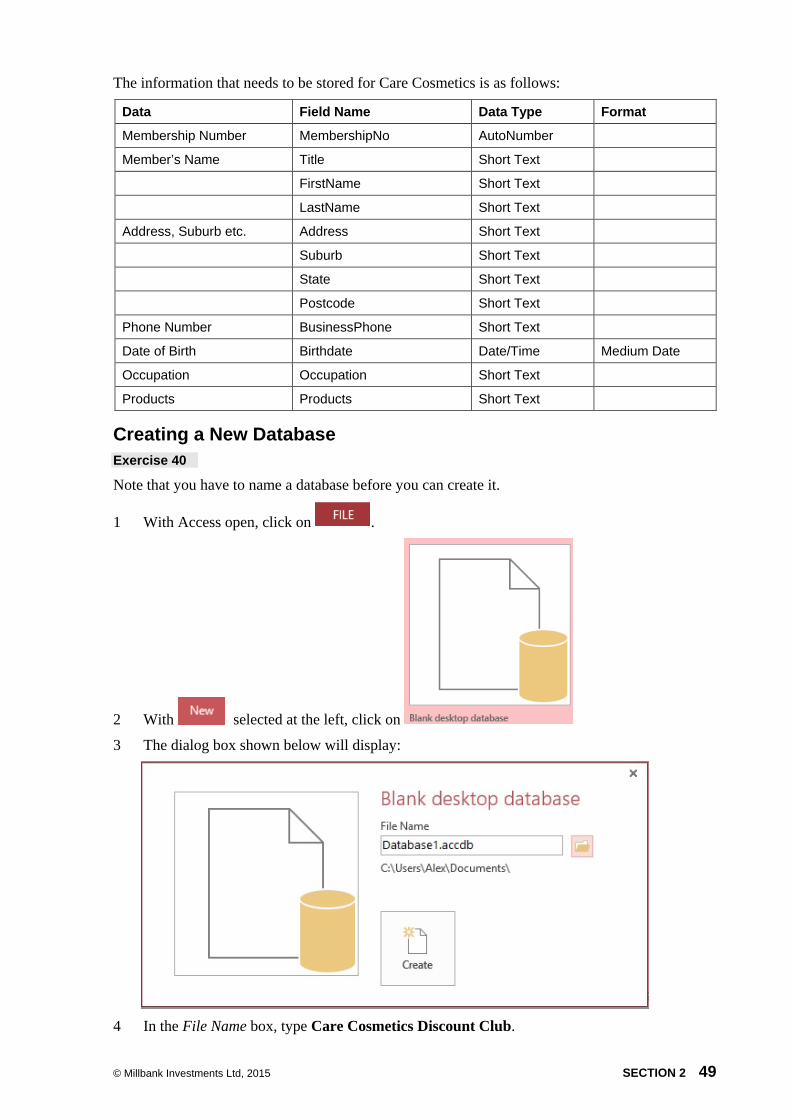
The information that needs to be stored for Care Cosmetics is as follows:
Data Field Name Data Type Format
Membership Number MembershipNo AutoNumber
Member’s Name Title Short Text
FirstName Short Text
LastName Short Text
Address, Suburb etc. Address Short Text
Suburb Short Text
State Short Text
Postcode Short Text
Phone Number BusinessPhone Short Text
Date of Birth Birthdate Date/Time Medium Date
Occupation Occupation Short Text
Products Products Short Text
Creating a New Database Exercise 40
Note that you have to name a database before you can create it.
1 With Access open, click on .
2 With selected at the left, click on
3 The dialog box shown below will display:
4 In the File Name box, type Care Cosmetics Discount Club.
50 SECTION 2 © Millbank Investments Ltd, 2015
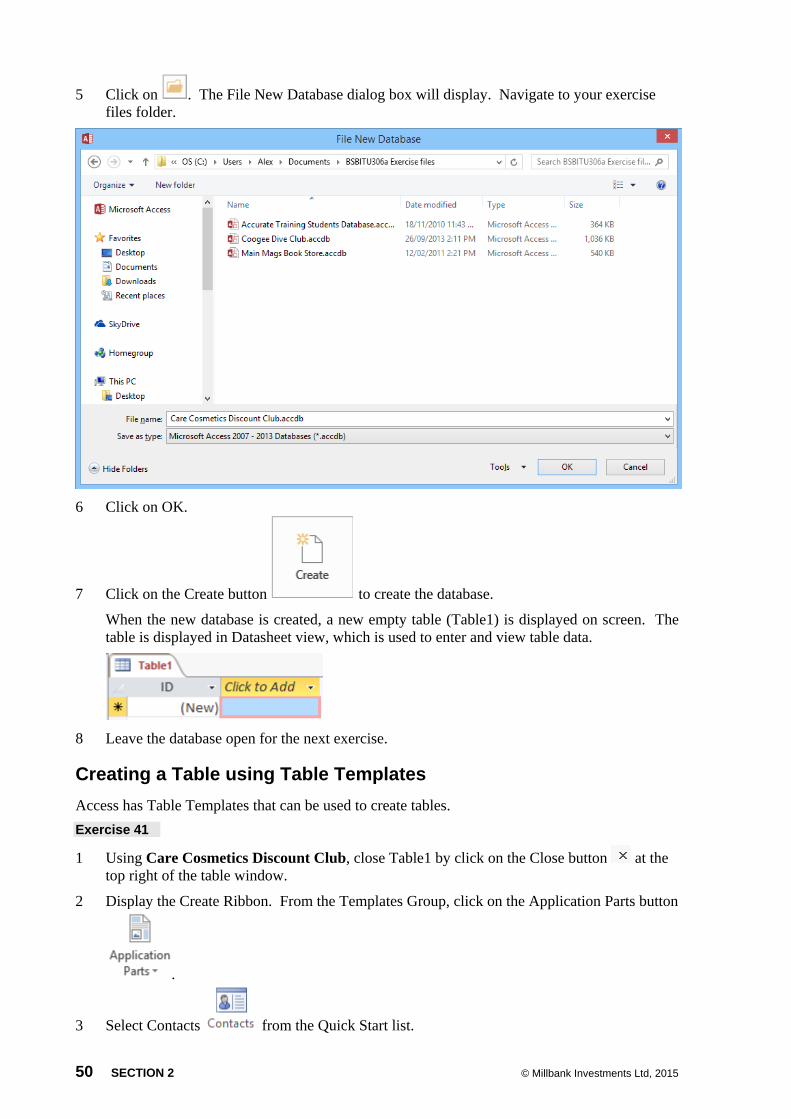
5 Click on . The File New Database dialog box will display. Navigate to your exercise files folder.
6 Click on OK.
7 Click on the Create button to create the database.
When the new database is created, a new empty table (Table1) is displayed on screen. The table is displayed in Datasheet view, which is used to enter and view table data.
8 Leave the database open for the next exercise.
Creating a Table using Table Templates Access has Table Templates that can be used to create tables. Exercise 41
1 Using Care Cosmetics Discount Club, close Table1 by click on the Close button at the top right of the table window.
2 Display the Create Ribbon. From the Templates Group, click on the Application Parts button
.
3 Select Contacts from the Quick Start list.
© Millbank Investments Ltd, 2015 SECTION 2 51
4 If the security warning displays click on .
5 A new table called Contacts will be listed in the Navigation Pane. Double click on to open the table in Datasheet view.
6 Display the Home Ribbon. Click on the arrow at the bottom of the View button and
select . The table will display in Design View with the first Field Name (ID) selected.
7 With the ID field name selected type: MembershipNo and press Tab three times.
8 With the Company field name selected type: Title and press Tab.
9 Position the mouse pointer in the row header of the EmailAddress field. The pointer will display as .
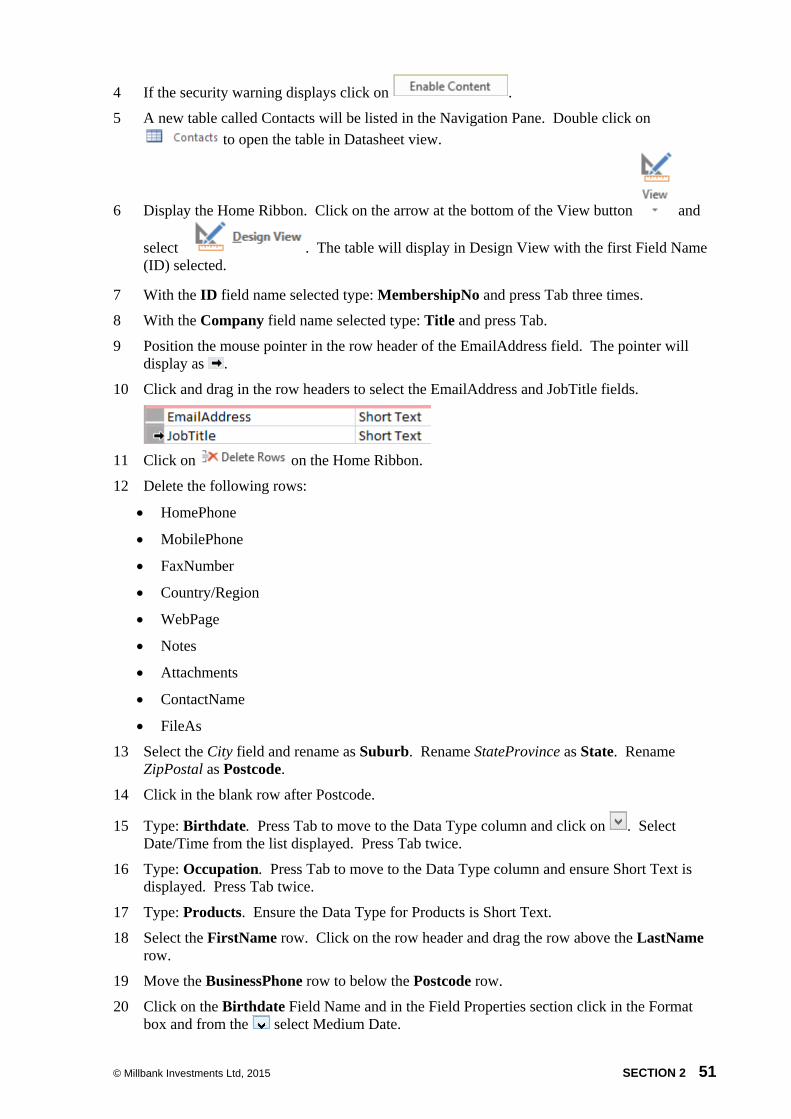
10 Click and drag in the row headers to select the EmailAddress and JobTitle fields.
11 Click on on the Home Ribbon.
12 Delete the following rows:
• HomePhone
• MobilePhone
• FaxNumber
• Country/Region
• WebPage
• Notes
• Attachments
• ContactName
• FileAs
13 Select the City field and rename as Suburb. Rename StateProvince as State. Rename ZipPostal as Postcode.
14 Click in the blank row after Postcode.
15 Type: Birthdate. Press Tab to move to the Data Type column and click on . Select Date/Time from the list displayed. Press Tab twice.
16 Type: Occupation. Press Tab to move to the Data Type column and ensure Short Text is displayed. Press Tab twice.
17 Type: Products. Ensure the Data Type for Products is Short Text.
18 Select the FirstName row. Click on the row header and drag the row above the LastName row.
19 Move the BusinessPhone row to below the Postcode row.
20 Click on the Birthdate Field Name and in the Field Properties section click in the Format box and from the select Medium Date.
52 SECTION 2 © Millbank Investments Ltd, 2015
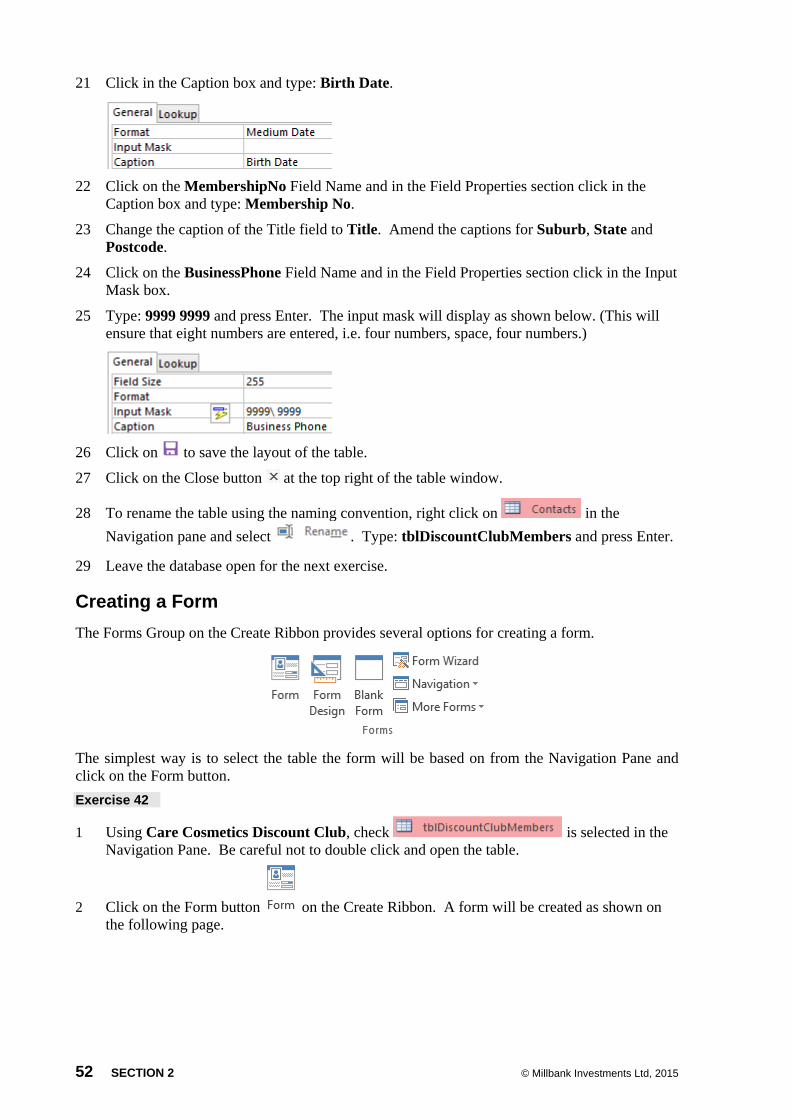
21 Click in the Caption box and type: Birth Date.
22 Click on the MembershipNo Field Name and in the Field Properties section click in the
Caption box and type: Membership No.
23 Change the caption of the Title field to Title. Amend the captions for Suburb, State and Postcode.
24 Click on the BusinessPhone Field Name and in the Field Properties section click in the Input Mask box.
25 Type: 9999 9999 and press Enter. The input mask will display as shown below. (This will ensure that eight numbers are entered, i.e. four numbers, space, four numbers.)
26 Click on to save the layout of the table.
27 Click on the Close button at the top right of the table window.
28 To rename the table using the naming convention, right click on in the Navigation pane and select . Type: tblDiscountClubMembers and press Enter.
29 Leave the database open for the next exercise.
Creating a Form The Forms Group on the Create Ribbon provides several options for creating a form.
The simplest way is to select the table the form will be based on from the Navigation Pane and click on the Form button. Exercise 42
1 Using Care Cosmetics Discount Club, check is selected in the Navigation Pane. Be careful not to double click and open the table.
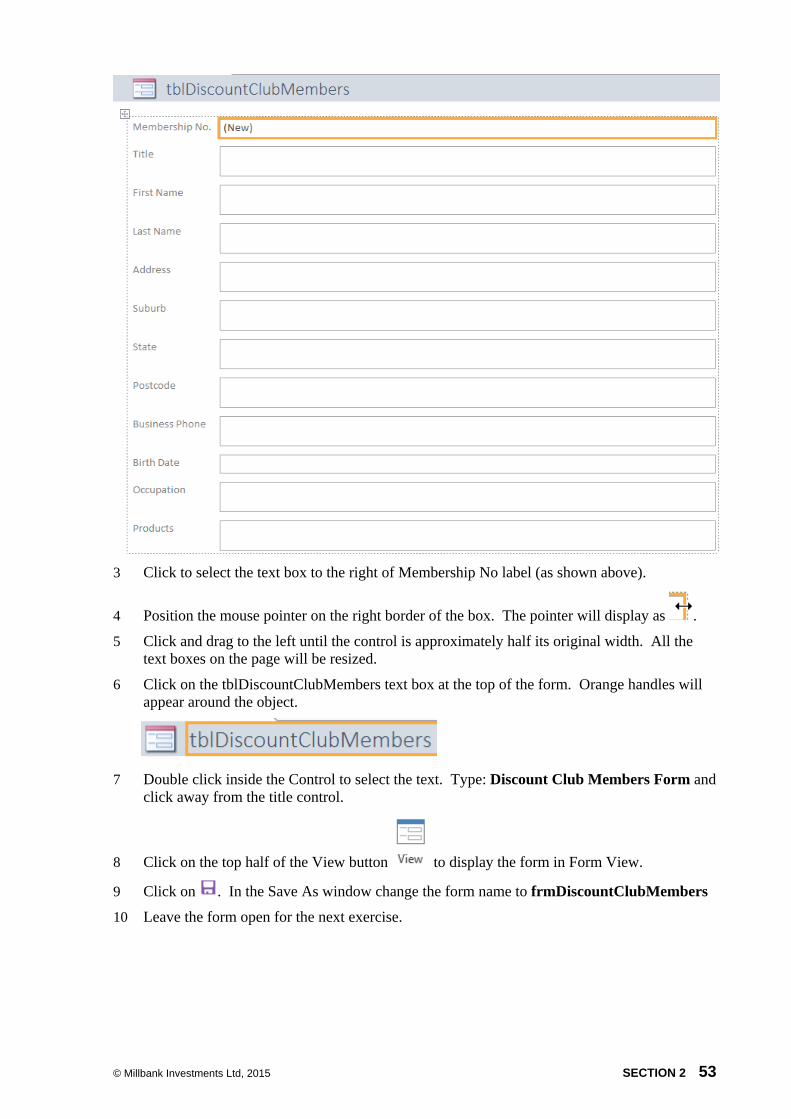
2 Click on the Form button on the Create Ribbon. A form will be created as shown on the following page.
© Millbank Investments Ltd, 2015 SECTION 2 53
3 Click to select the text box to the right of Membership No label (as shown above).
4 Position the mouse pointer on the right border of the box. The pointer will display as .
5 Click and drag to the left until the control is approximately half its original width. All the text boxes on the page will be resized.
6 Click on the tblDiscountClubMembers text box at the top of the form. Orange handles will appear around the object.
7 Double click inside the Control to select the text. Type: Discount Club Members Form and
click away from the title control.
8 Click on the top half of the View button to display the form in Form View.
9 Click on . In the Save As window change the form name to frmDiscountClubMembers
10 Leave the form open for the next exercise.
© Millbank Investments Ltd, 2015 SECTION 3 81
Linking Data and Charts The teachers are meeting next week to review all mid semester exam results and would like that information presented in a PowerPoint presentation. Exercise 69
1 Open PowerPoint and create a new blank presentation.
2 Display the Design Ribbon. From the Themes Group, scroll down and select the Integral theme.
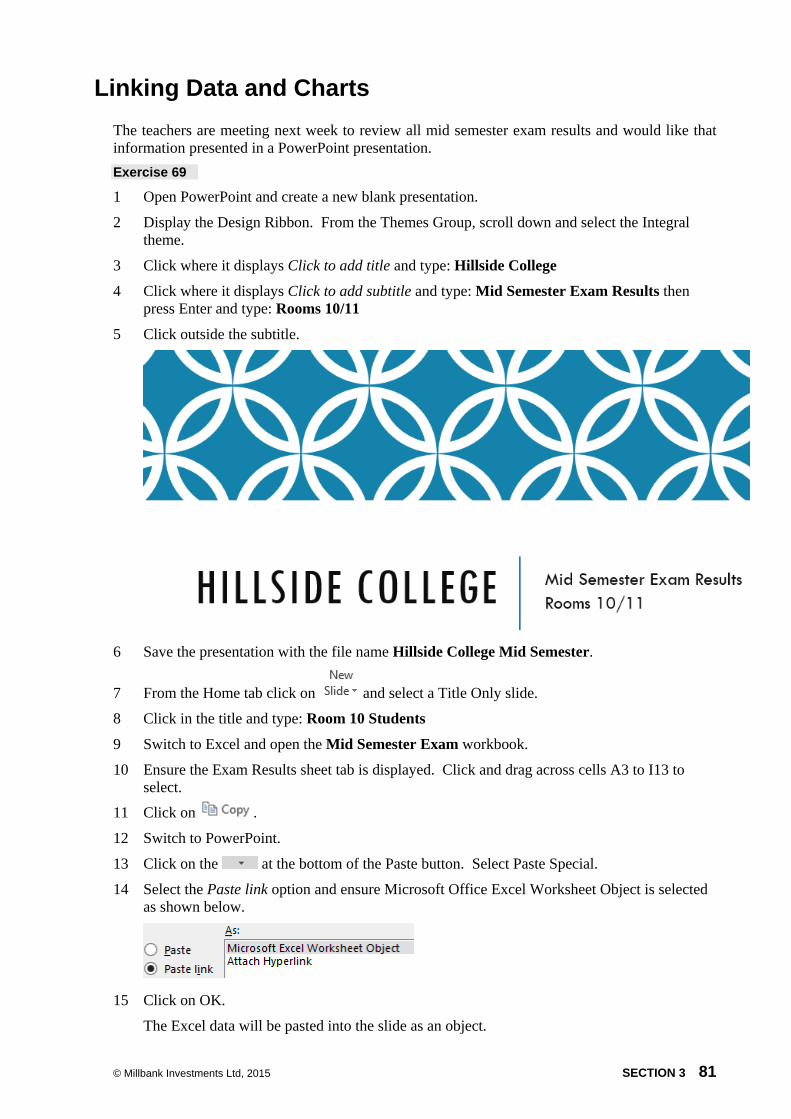
3 Click where it displays Click to add title and type: Hillside College
4 Click where it displays Click to add subtitle and type: Mid Semester Exam Results then press Enter and type: Rooms 10/11
5 Click outside the subtitle.
6 Save the presentation with the file name Hillside College Mid Semester.
7 From the Home tab click on and select a Title Only slide.
8 Click in the title and type: Room 10 Students
9 Switch to Excel and open the Mid Semester Exam workbook.
10 Ensure the Exam Results sheet tab is displayed. Click and drag across cells A3 to I13 to select.
11 Click on .
12 Switch to PowerPoint.
13 Click on the at the bottom of the Paste button. Select Paste Special.
14 Select the Paste link option and ensure Microsoft Office Excel Worksheet Object is selected as shown below.
15 Click on OK.
The Excel data will be pasted into the slide as an object.
82 SECTION 3 © Millbank Investments Ltd, 2015
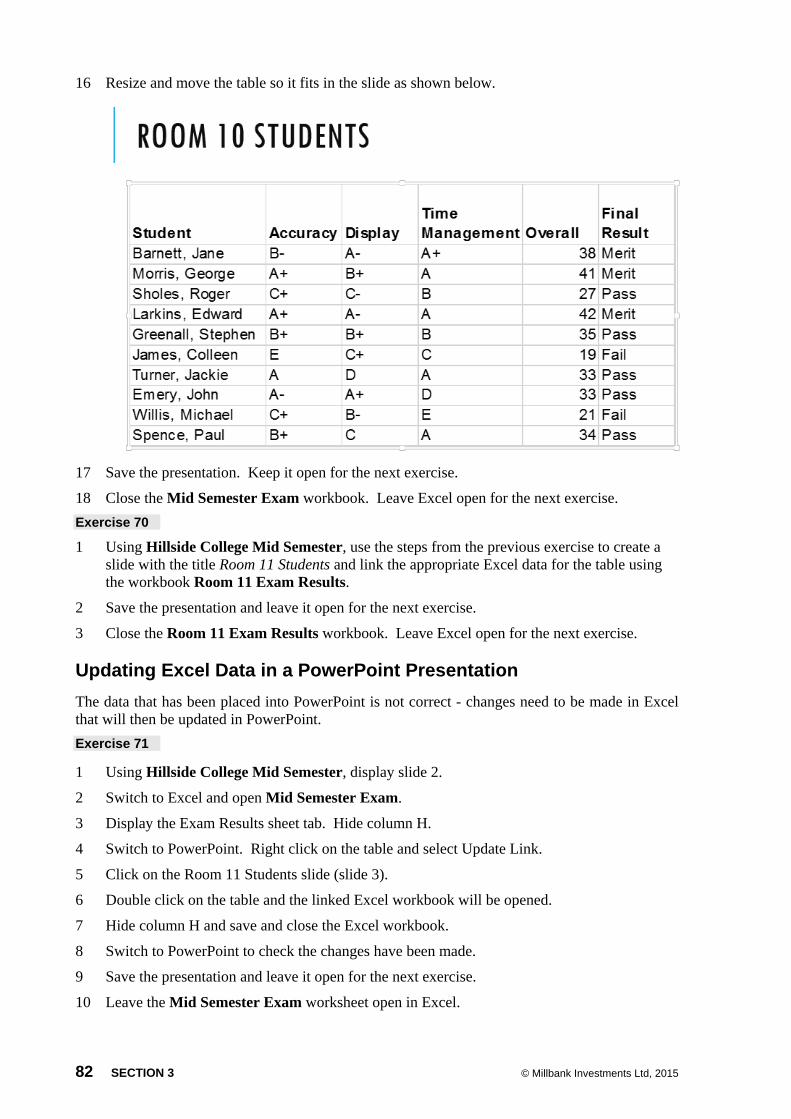
16 Resize and move the table so it fits in the slide as shown below.
17 Save the presentation. Keep it open for the next exercise.
18 Close the Mid Semester Exam workbook. Leave Excel open for the next exercise. Exercise 70
1 Using Hillside College Mid Semester, use the steps from the previous exercise to create a slide with the title Room 11 Students and link the appropriate Excel data for the table using the workbook Room 11 Exam Results.
2 Save the presentation and leave it open for the next exercise.
3 Close the Room 11 Exam Results workbook. Leave Excel open for the next exercise.
Updating Excel Data in a PowerPoint Presentation The data that has been placed into PowerPoint is not correct - changes need to be made in Excel that will then be updated in PowerPoint. Exercise 71
1 Using Hillside College Mid Semester, display slide 2.
2 Switch to Excel and open Mid Semester Exam.
3 Display the Exam Results sheet tab. Hide column H.
4 Switch to PowerPoint. Right click on the table and select Update Link.
5 Click on the Room 11 Students slide (slide 3).
6 Double click on the table and the linked Excel workbook will be opened.
7 Hide column H and save and close the Excel workbook.
8 Switch to PowerPoint to check the changes have been made.
9 Save the presentation and leave it open for the next exercise.
10 Leave the Mid Semester Exam worksheet open in Excel.
© Millbank Investments Ltd, 2015 SECTION 3 83
Linking to a Pie Chart The presentation also requires a slide that shows the overall results by Merit, Pass and Fail. This is stored in an Excel pie chart.
In the following exercises you will use two different methods to link a chart into a presentation and compare the results. In the first example the chart is inserted as an object. Exercise 72
1 Using Hillside College Mid Semester, create a new Title Only Slide after slide 3.
2 Add the title: Room 10 – Overall Results.
3 On the Taskbar switch to Excel and ensure that the Mid Semester Exam workbook is open.
4 Select the Pie Chart sheet tab and copy the pie chart.
5 Switch back to PowerPoint.
6 Click on the Paste button and select Paste Special. Ensure the Paste link option is selected for Microsoft Office Excel Chart Object.
7 Click on OK. The pie chart will be pasted into the slide.
8 Resize the chart so it fits under the heading.
11 Save the presentation and leave it open for the next exercise.
Updating Formatting Changes Because it is difficult to see the information in the slide you will change some of the formatting in the pie chart. Exercise 73
1 Check Hillside College Mid Semester open in PowerPoint with slide 4 displayed.
2 Double click on the pie chart to display the pie chart Excel. This can be done because the chart has been linked as an object.
3 Change the font size of the data labels (percent) to 20 pt. Move the data labels if required so they are outside the edge of the pie chart.
4 Change the callout text (Excellent Class Achievement) to italic, 18 pt. Right align the text and resize the callout to fit all text on one line.
5 Save and close the workbook. Exit Excel.
6 With PowerPoint displayed, right click on the chart and select Update Link.
7 Save the presentation and leave it open for the next exercise. Exercise 74
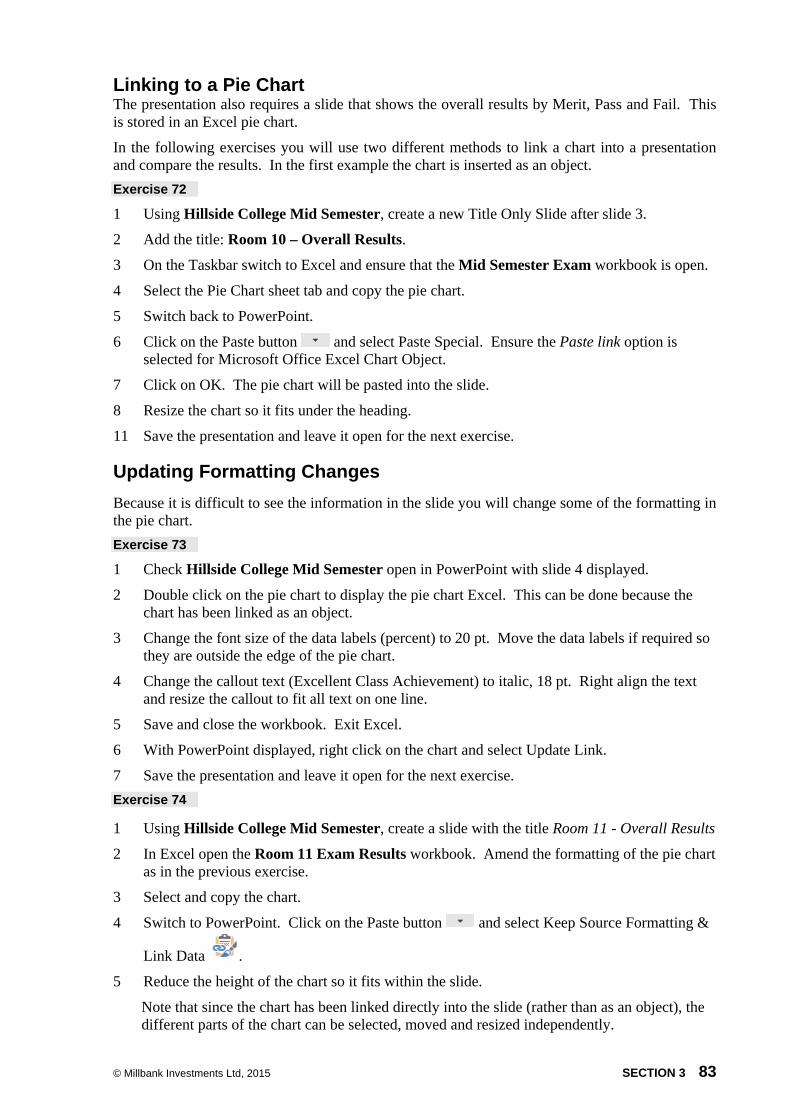
1 Using Hillside College Mid Semester, create a slide with the title Room 11 - Overall Results
2 In Excel open the Room 11 Exam Results workbook. Amend the formatting of the pie chart as in the previous exercise.
3 Select and copy the chart.
4 Switch to PowerPoint. Click on the Paste button and select Keep Source Formatting &
Link Data .
5 Reduce the height of the chart so it fits within the slide.
Note that since the chart has been linked directly into the slide (rather than as an object), the different parts of the chart can be selected, moved and resized independently.
84 SECTION 3 © Millbank Investments Ltd, 2015
6 If required, resize and reposition the Excellent Class Achievement label and/or the data labels.
7 Compare the charts in slides 4 and 5. Note the following:
• The image quality of the chart on slide 4 is not as good as than the quality of the chart on slide 5. This is because a picture of the chart has been inserted rather than the chart itself.
• Double clicking on the chart object on slide 4 will open the chart in Excel. This does not happen when double clicking on the chart in slide 5.
• Each part of the chart in slide 5 can be selected and formatted independently, whereas the parts of the chart on slide 4 cannot be independently selected.
• The chart on slide 4 can be resized easily – it stays in proportion. When resizing the chart on slide 5 there is a danger of losing proportion.
The factors above should all be considered when deciding how best to link a chart into a PowerPoint presentation or Word document.
8 Save and close the presentation.
9 Save and close Room 11 Exam Results and exit Excel.
Completing the Slide Show The presentation will now be completed by sorting the slides, applying animation schemes and running the slide show to check it runs correctly. Exercise 75
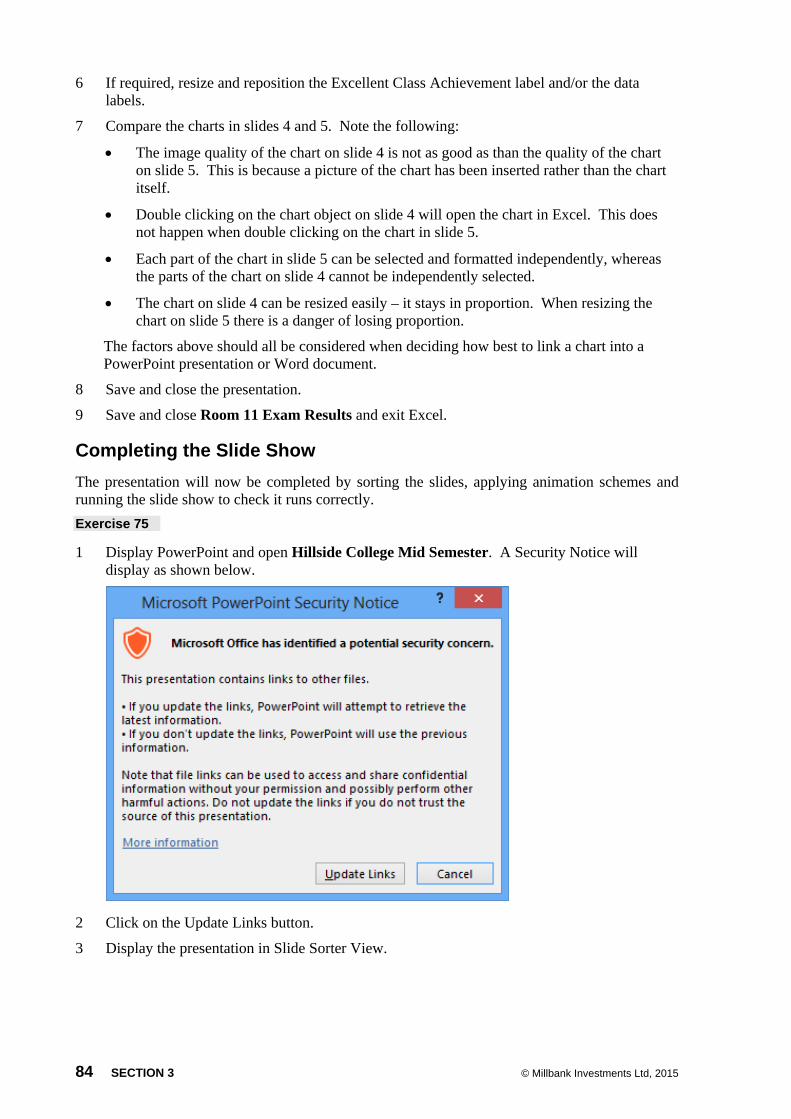
1 Display PowerPoint and open Hillside College Mid Semester. A Security Notice will display as shown below.
2 Click on the Update Links button.
3 Display the presentation in Slide Sorter View.
© Millbank Investments Ltd, 2015 SECTION 3 85
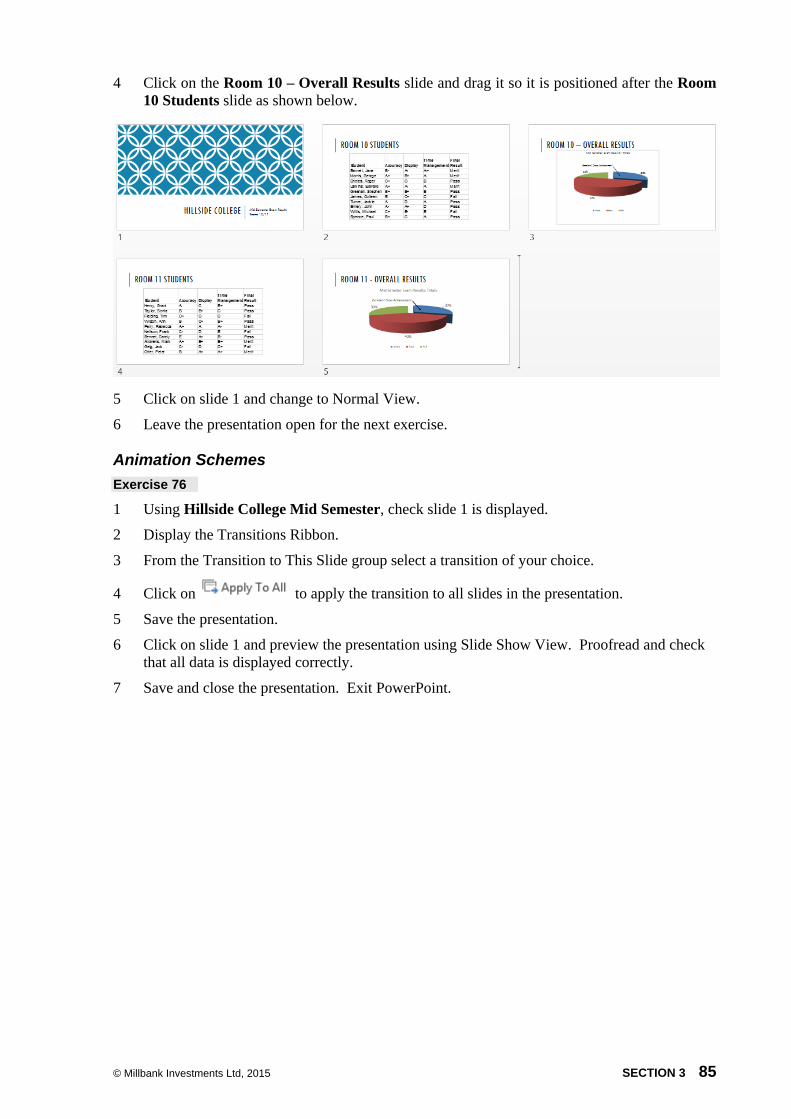
4 Click on the Room 10 – Overall Results slide and drag it so it is positioned after the Room 10 Students slide as shown below.
5 Click on slide 1 and change to Normal View.
6 Leave the presentation open for the next exercise. Animation Schemes Exercise 76
1 Using Hillside College Mid Semester, check slide 1 is displayed.
2 Display the Transitions Ribbon.
3 From the Transition to This Slide group select a transition of your choice.
4 Click on to apply the transition to all slides in the presentation.
5 Save the presentation.
6 Click on slide 1 and preview the presentation using Slide Show View. Proofread and check that all data is displayed correctly.
7 Save and close the presentation. Exit PowerPoint.
© Millbank Investments Ltd, 2015 SECTION 4 89
What is a Query? Queries enable you to ask questions about the data in a database. The basic function of queries is the retrieval of a subset of data (i.e. information) from one or more tables in the database.
There are several types of queries and they can be divided into two main groups:
• Data Retrieval queries that perform a specialised data retrieval task.
• Action queries that perform a specific data management task, including updating, deleting, adding data and creating new tables based on existing data.
Data Retrieval Queries The most commonly used data retrieval query is called a select query. All other queries are based on the select query.
You may not always want to look at all the fields in a table, or all the records. A select query can be used to select only the data to be displayed from one table or more. Select queries are often referred to simply as “queries”, which is the term used for the rest of this book. Specialised queries will be named according to their specific function.
When you run a query, the subset of data retrieved is called a dynaset - a dynamic view from one table or more, selected and sorted as specified by the query. A dynaset is displayed in a datasheet, and looks and performs like a table.
Queries may return data directly from the database, or manipulate it to provide summarised or analysed information. Queries can be used as a basis for a form, report, graph or even for another query.
Queries can be created manually or by using one of the specialised query wizards, from anywhere in the Database window.
The Simple Query Wizard Create a select query using the Simple Query Wizard as follows. Exercise 77
1 Using Access, open Accurate Training Students Database. Ensure all content in the database is enabled.
2 Click on the Create Ribbon, then click on the Query Wizard button .
3 Ensure Simple Query Wizard is selected and click on OK.
4 From the Tables/Queries list, click on and select Table: tblStudentInfo.
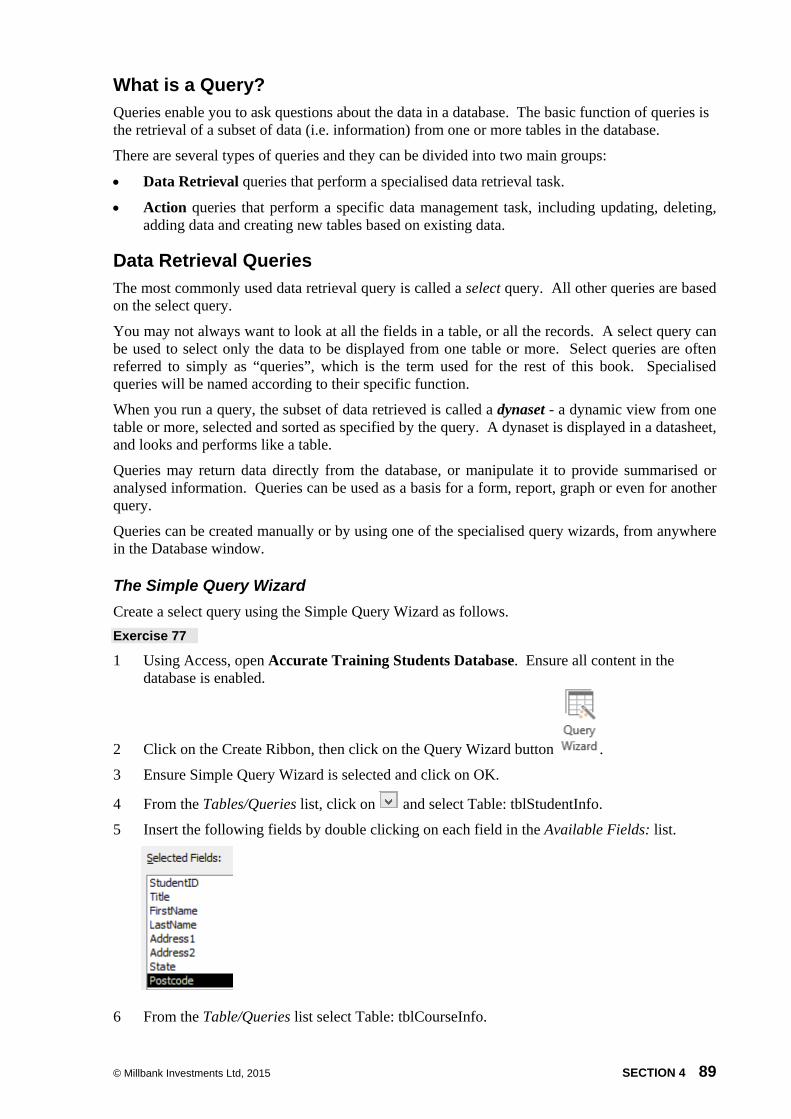
5 Insert the following fields by double clicking on each field in the Available Fields: list.
6 From the Table/Queries list select Table: tblCourseInfo.
90 SECTION 4 © Millbank Investments Ltd, 2015
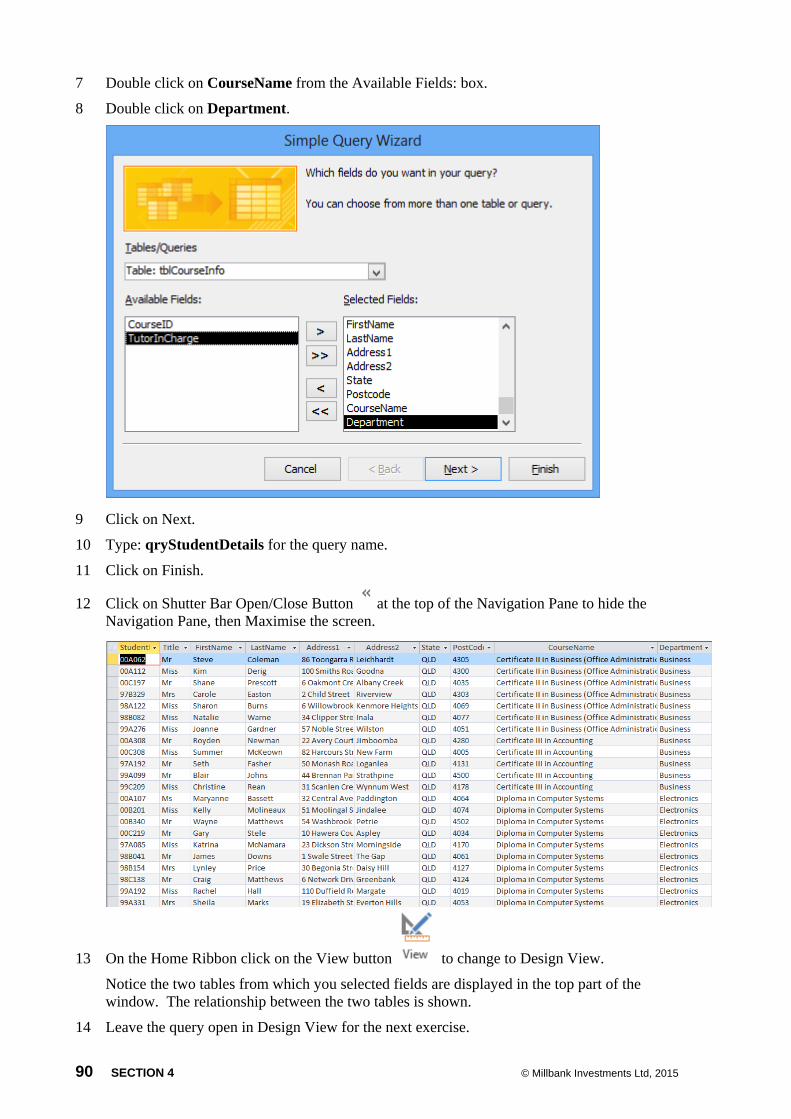
7 Double click on CourseName from the Available Fields: box.
8 Double click on Department.
9 Click on Next.
10 Type: qryStudentDetails for the query name.
11 Click on Finish.
12 Click on Shutter Bar Open/Close Button at the top of the Navigation Pane to hide the Navigation Pane, then Maximise the screen.
13 On the Home Ribbon click on the View button to change to Design View.
Notice the two tables from which you selected fields are displayed in the top part of the window. The relationship between the two tables is shown.
14 Leave the query open in Design View for the next exercise.
© Millbank Investments Ltd, 2015 171
BSB Business Services Training Package
Supplement
This workbook can be used by learners completing a qualification in the BSB Business Services Training Package.
172 © Millbank Investments Ltd, 2015
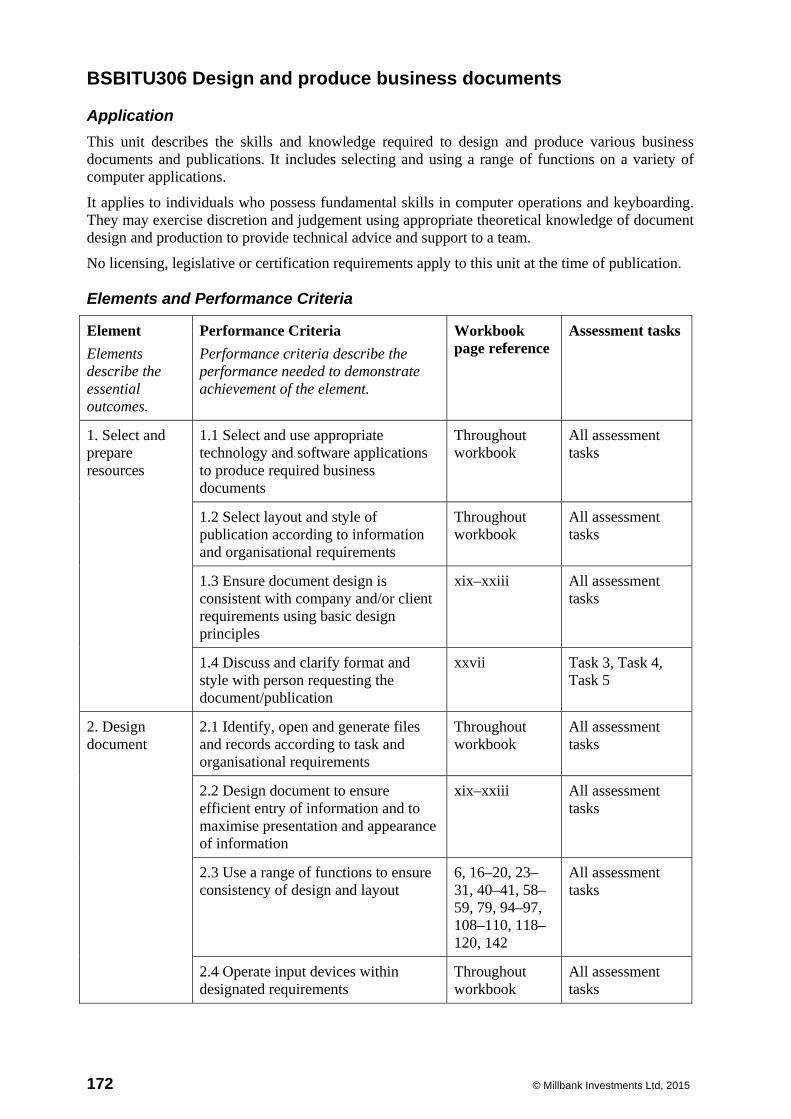
BSBITU306 Design and produce business documents Application
This unit describes the skills and knowledge required to design and produce various business documents and publications. It includes selecting and using a range of functions on a variety of computer applications.
It applies to individuals who possess fundamental skills in computer operations and keyboarding. They may exercise discretion and judgement using appropriate theoretical knowledge of document design and production to provide technical advice and support to a team.
No licensing, legislative or certification requirements apply to this unit at the time of publication. Elements and Performance Criteria
Element Elements describe the essential outcomes.
Performance Criteria Performance criteria describe the performance needed to demonstrate achievement of the element.
Workbook page reference
Assessment tasks
1. Select and prepare resources
1.1 Select and use appropriate technology and software applications to produce required business documents
Throughout workbook
All assessment tasks
1.2 Select layout and style of publication according to information and organisational requirements
Throughout workbook
All assessment tasks
1.3 Ensure document design is consistent with company and/or client requirements using basic design principles
xix–xxiii All assessment tasks
1.4 Discuss and clarify format and style with person requesting the document/publication
xxvii Task 3, Task 4, Task 5
2. Design document
2.1 Identify, open and generate files and records according to task and organisational requirements
Throughout workbook
All assessment tasks
2.2 Design document to ensure efficient entry of information and to maximise presentation and appearance of information
xix–xxiii All assessment tasks
2.3 Use a range of functions to ensure consistency of design and layout
6, 16–20, 23–31, 40–41, 58–59, 79, 94–97, 108–110, 118–120, 142
All assessment tasks
2.4 Operate input devices within designated requirements
Throughout workbook
All assessment tasks
© Millbank Investments Ltd, 2015 173
Element Elements describe the essential outcomes.
Performance Criteria Performance criteria describe the performance needed to demonstrate achievement of the element.
Workbook page reference
Assessment tasks
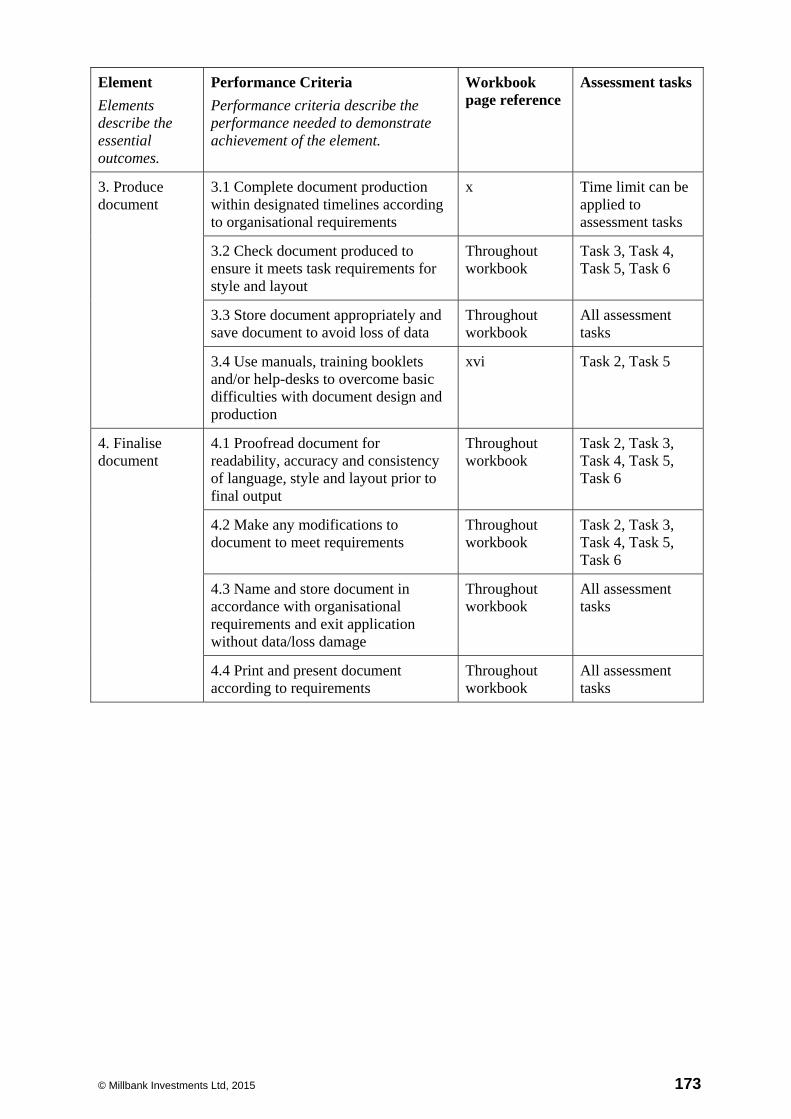
3. Produce document
3.1 Complete document production within designated timelines according to organisational requirements
x Time limit can be applied to assessment tasks
3.2 Check document produced to ensure it meets task requirements for style and layout
Throughout workbook
Task 3, Task 4, Task 5, Task 6
3.3 Store document appropriately and save document to avoid loss of data
Throughout workbook
All assessment tasks
3.4 Use manuals, training booklets and/or help-desks to overcome basic difficulties with document design and production
xvi Task 2, Task 5
4. Finalise document
4.1 Proofread document for readability, accuracy and consistency of language, style and layout prior to final output
Throughout workbook
Task 2, Task 3, Task 4, Task 5, Task 6
4.2 Make any modifications to document to meet requirements
Throughout workbook
Task 2, Task 3, Task 4, Task 5, Task 6
4.3 Name and store document in accordance with organisational requirements and exit application without data/loss damage
Throughout workbook
All assessment tasks
4.4 Print and present document according to requirements
Throughout workbook
All assessment tasks
174 © Millbank Investments Ltd, 2015
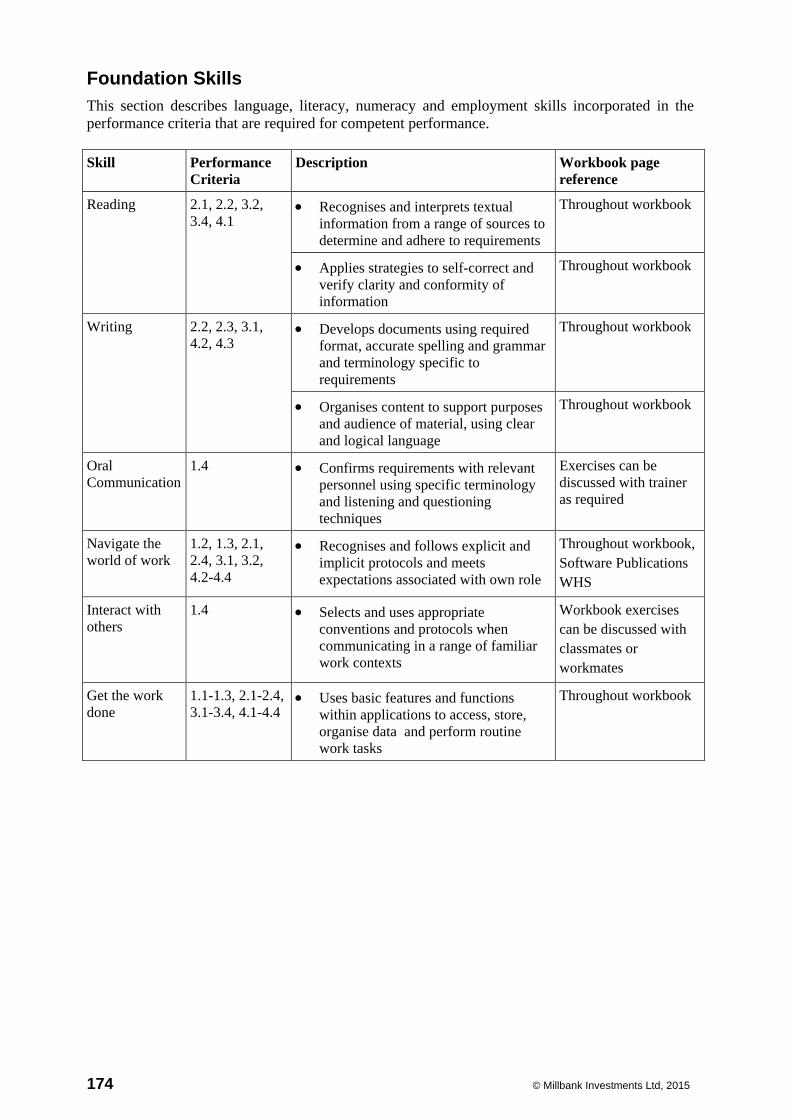
Foundation Skills
This section describes language, literacy, numeracy and employment skills incorporated in the performance criteria that are required for competent performance. Skill Performance
Criteria Description Workbook page
reference
Reading 2.1, 2.2, 3.2, 3.4, 4.1
Recognises and interprets textual information from a range of sources to determine and adhere to requirements
Throughout workbook
Applies strategies to self-correct and verify clarity and conformity of information
Throughout workbook
Writing 2.2, 2.3, 3.1, 4.2, 4.3
Develops documents using required format, accurate spelling and grammar and terminology specific to requirements
Throughout workbook
Organises content to support purposes and audience of material, using clear and logical language
Throughout workbook
Oral Communication
1.4 Confirms requirements with relevant personnel using specific terminology and listening and questioning techniques
Exercises can be discussed with trainer as required
Navigate the world of work
1.2, 1.3, 2.1, 2.4, 3.1, 3.2, 4.2-4.4
Recognises and follows explicit and implicit protocols and meets expectations associated with own role
Throughout workbook, Software Publications WHS
Interact with others
1.4 Selects and uses appropriate conventions and protocols when communicating in a range of familiar work contexts
Workbook exercises can be discussed with classmates or workmates
Get the work done
1.1-1.3, 2.1-2.4, 3.1-3.4, 4.1-4.4
Uses basic features and functions within applications to access, store, organise data and perform routine work tasks
Throughout workbook
© Millbank Investments Ltd, 2015 175
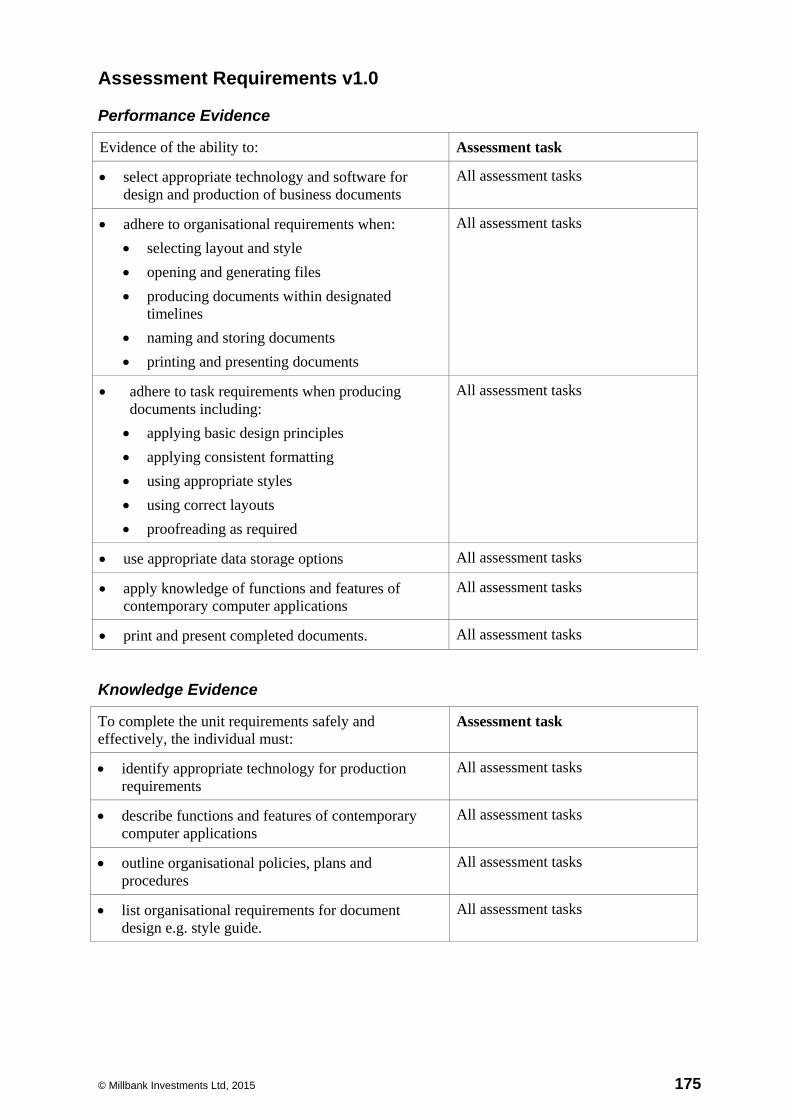
Assessment Requirements v1.0 Performance Evidence
Evidence of the ability to: Assessment task
select appropriate technology and software for design and production of business documents
All assessment tasks
adhere to organisational requirements when: selecting layout and style opening and generating files producing documents within designated
timelines naming and storing documents printing and presenting documents
All assessment tasks
adhere to task requirements when producing documents including: applying basic design principles applying consistent formatting using appropriate styles using correct layouts proofreading as required
All assessment tasks
use appropriate data storage options All assessment tasks
apply knowledge of functions and features of contemporary computer applications
All assessment tasks
print and present completed documents. All assessment tasks
Knowledge Evidence
To complete the unit requirements safely and effectively, the individual must:
Assessment task
identify appropriate technology for production requirements
All assessment tasks
describe functions and features of contemporary computer applications
All assessment tasks
outline organisational policies, plans and procedures
All assessment tasks
list organisational requirements for document design e.g. style guide.
All assessment tasks
Related Documents