R Copyright © 2018, Everest Global, Inc. EGR-2018-22-CA-2588 Procurement Outsourcing (PO) BPO – Service Provider Landscape with Services PEAK Matrix™ Assessment 2018 Procurement Outsourcing (PO) Market Report – March 2018: Complimentary Abstract / Table of Contents R

Welcome message from author
This document is posted to help you gain knowledge. Please leave a comment to let me know what you think about it! Share it to your friends and learn new things together.
Transcript
R
Copyright © 2018, Everest Global, Inc.EGR-2018-22-CA-2588
Procurement Outsourcing (PO) BPO – Service Provider Landscape with Services PEAK Matrix™ Assessment 2018
Procurement Outsourcing (PO)Market Report – March 2018: Complimentary Abstract / Table of Contents
R
Copyright © 2018, Everest Global, Inc.EGR-2018-22-CA-2588 2
R
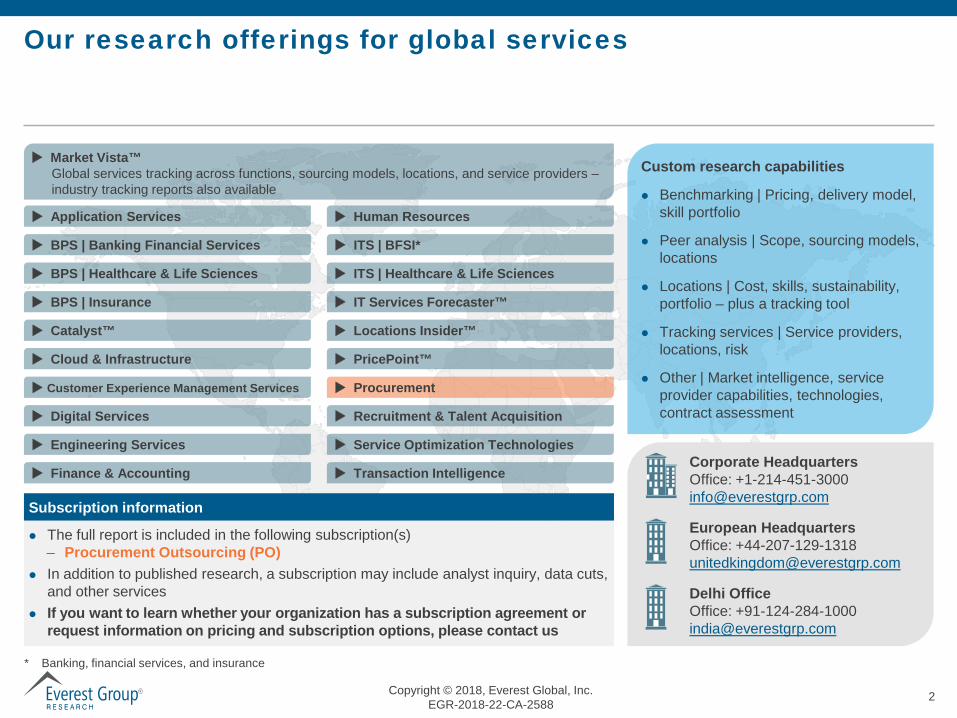
Our research offerings for global services
Custom research capabilities
Benchmarking | Pricing, delivery model, skill portfolio
Peer analysis | Scope, sourcing models, locations
Locations | Cost, skills, sustainability, portfolio – plus a tracking tool
Tracking services | Service providers, locations, risk
Other | Market intelligence, service provider capabilities, technologies, contract assessment
* Banking, financial services, and insurance
Subscription information
The full report is included in the following subscription(s)– Procurement Outsourcing (PO)
In addition to published research, a subscription may include analyst inquiry, data cuts, and other services
If you want to learn whether your organization has a subscription agreement or request information on pricing and subscription options, please contact us
European HeadquartersOffice: [email protected]
Delhi OfficeOffice: [email protected]
BPS | Healthcare & Life Sciences
BPS | Insurance
Procurement
Human Resources
Recruitment & Talent Acquisition
PricePoint™
Locations Insider™
Transaction Intelligence
ITS | Healthcare & Life Sciences
Application Services
BPS | Banking Financial Services
Service Optimization Technologies Engineering Services
Catalyst™
Customer Experience Management Services
Cloud & Infrastructure
Digital Services
Market Vista™Global services tracking across functions, sourcing models, locations, and service providers –industry tracking reports also available
IT Services Forecaster™
ITS | BFSI*
Finance & AccountingCorporate HeadquartersOffice: [email protected]
Copyright © 2018, Everest Global, Inc.EGR-2018-22-CA-2588 3
R
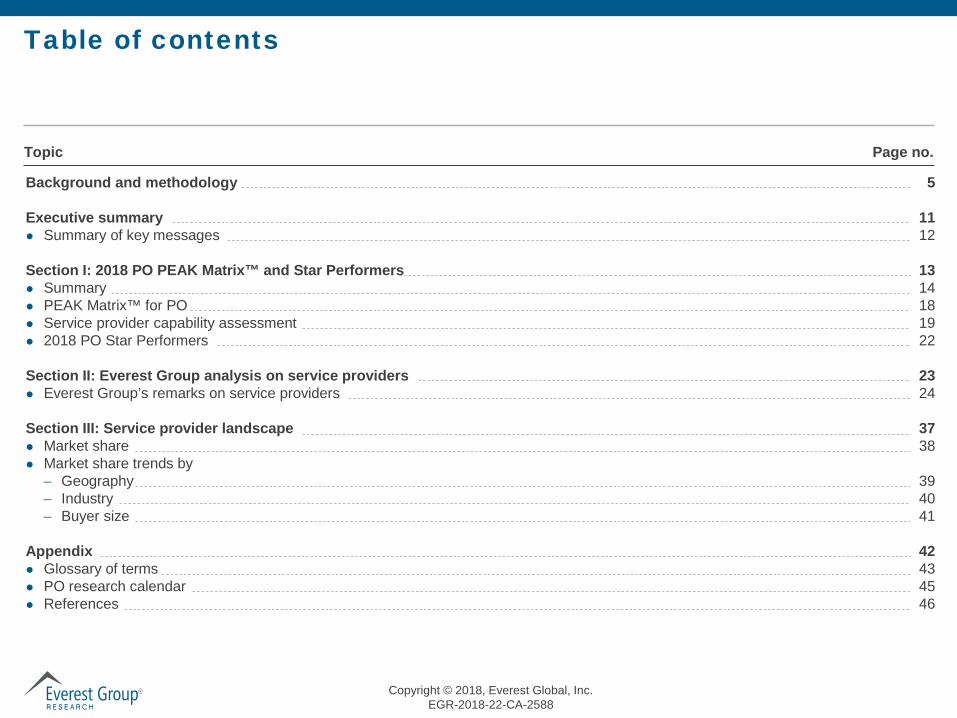
Table of contents
Background and methodology 5
Executive summary 11 Summary of key messages 12
Section I: 2018 PO PEAK Matrix™ and Star Performers 13 Summary 14 PEAK Matrix™ for PO 18 Service provider capability assessment 19 2018 PO Star Performers 22
Section II: Everest Group analysis on service providers 23 Everest Group’s remarks on service providers 24
Section III: Service provider landscape 37 Market share 38 Market share trends by
– Geography 39– Industry 40– Buyer size 41
Appendix 42 Glossary of terms 43 PO research calendar 45 References 46
Topic Page no.
Copyright © 2018, Everest Global, Inc.EGR-2018-22-CA-2588 4
R
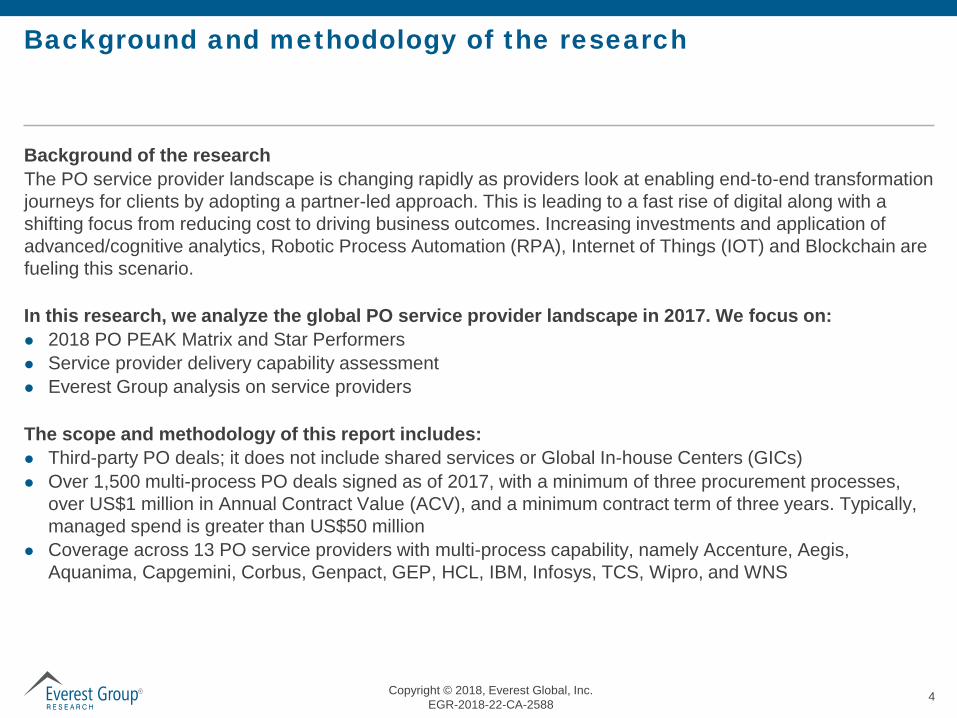
Background and methodology of the research
Background of the researchThe PO service provider landscape is changing rapidly as providers look at enabling end-to-end transformation journeys for clients by adopting a partner-led approach. This is leading to a fast rise of digital along with a shifting focus from reducing cost to driving business outcomes. Increasing investments and application of advanced/cognitive analytics, Robotic Process Automation (RPA), Internet of Things (IOT) and Blockchain are fueling this scenario.
In this research, we analyze the global PO service provider landscape in 2017. We focus on: 2018 PO PEAK Matrix and Star Performers Service provider delivery capability assessment Everest Group analysis on service providers
The scope and methodology of this report includes: Third-party PO deals; it does not include shared services or Global In-house Centers (GICs) Over 1,500 multi-process PO deals signed as of 2017, with a minimum of three procurement processes,
over US$1 million in Annual Contract Value (ACV), and a minimum contract term of three years. Typically, managed spend is greater than US$50 million
Coverage across 13 PO service providers with multi-process capability, namely Accenture, Aegis, Aquanima, Capgemini, Corbus, Genpact, GEP, HCL, IBM, Infosys, TCS, Wipro, and WNS
Copyright © 2018, Everest Global, Inc.EGR-2018-22-CA-2588 5
R
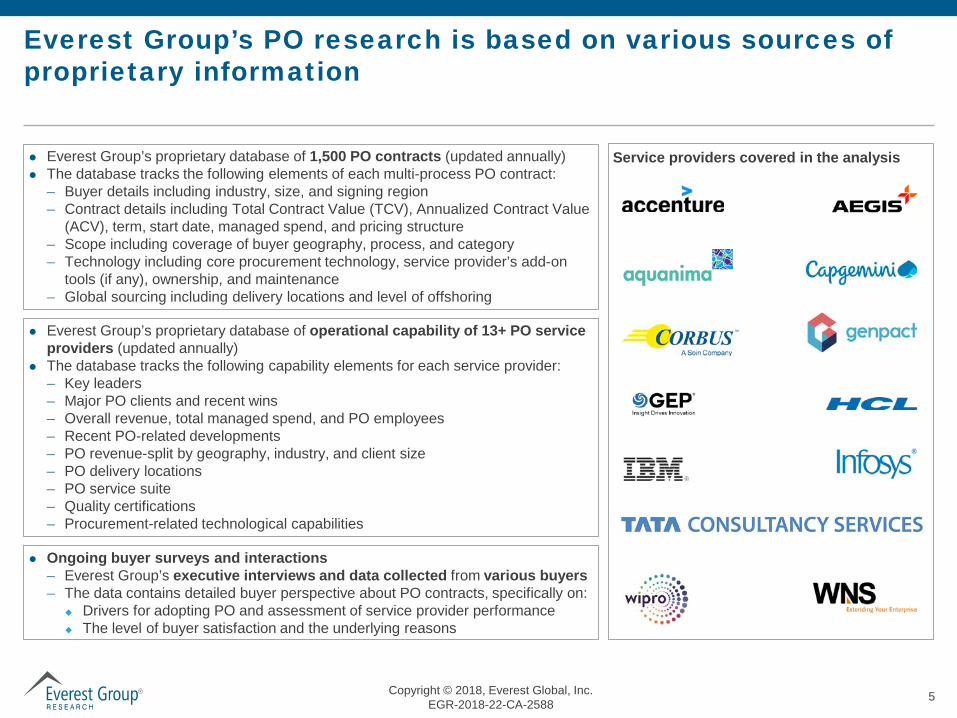
Everest Group’s PO research is based on various sources of proprietary information
Everest Group’s proprietary database of 1,500 PO contracts (updated annually) The database tracks the following elements of each multi-process PO contract:
– Buyer details including industry, size, and signing region– Contract details including Total Contract Value (TCV), Annualized Contract Value
(ACV), term, start date, managed spend, and pricing structure– Scope including coverage of buyer geography, process, and category– Technology including core procurement technology, service provider’s add-on
tools (if any), ownership, and maintenance– Global sourcing including delivery locations and level of offshoring
Everest Group’s proprietary database of operational capability of 13+ PO service providers (updated annually)
The database tracks the following capability elements for each service provider:– Key leaders– Major PO clients and recent wins – Overall revenue, total managed spend, and PO employees– Recent PO-related developments– PO revenue-split by geography, industry, and client size– PO delivery locations– PO service suite– Quality certifications– Procurement-related technological capabilities
Ongoing buyer surveys and interactions– Everest Group’s executive interviews and data collected from various buyers– The data contains detailed buyer perspective about PO contracts, specifically on:
Drivers for adopting PO and assessment of service provider performance The level of buyer satisfaction and the underlying reasons
Service providers covered in the analysis
Copyright © 2018, Everest Global, Inc.EGR-2018-22-CA-2588 6
R
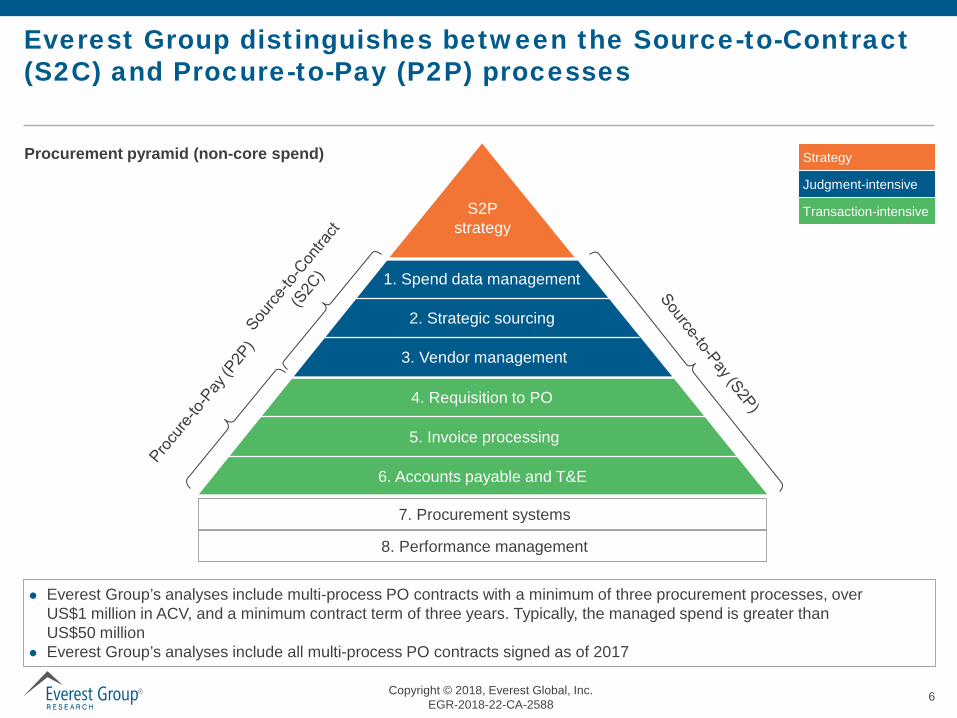
Everest Group distinguishes between the Source-to-Contract (S2C) and Procure-to-Pay (P2P) processes
Procurement pyramid (non-core spend)
S2Pstrategy
4. Requisition to PO
6. Accounts payable and T&E
5. Invoice processing
7. Procurement systems
1. Spend data management
2. Strategic sourcing
3. Vendor management
8. Performance management
Strategy
Judgment-intensive
Transaction-intensive
Everest Group’s analyses include multi-process PO contracts with a minimum of three procurement processes, over US$1 million in ACV, and a minimum contract term of three years. Typically, the managed spend is greater than US$50 million
Everest Group’s analyses include all multi-process PO contracts signed as of 2017
Copyright © 2018, Everest Global, Inc.EGR-2018-22-CA-2588 7
R
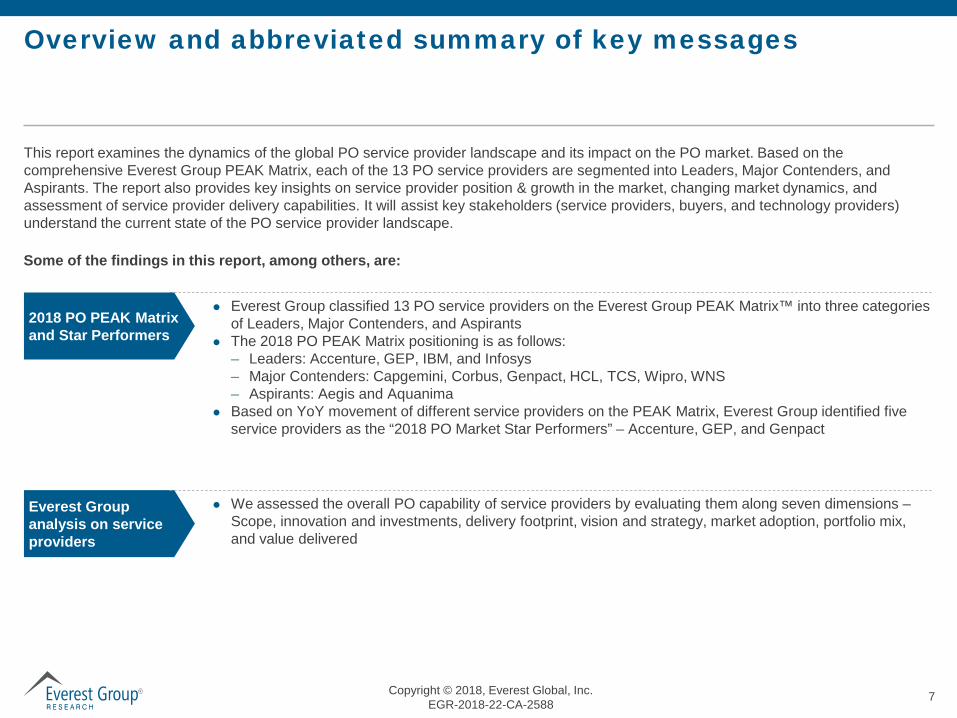
Overview and abbreviated summary of key messages
This report examines the dynamics of the global PO service provider landscape and its impact on the PO market. Based on the comprehensive Everest Group PEAK Matrix, each of the 13 PO service providers are segmented into Leaders, Major Contenders, and Aspirants. The report also provides key insights on service provider position & growth in the market, changing market dynamics, and assessment of service provider delivery capabilities. It will assist key stakeholders (service providers, buyers, and technology providers) understand the current state of the PO service provider landscape.
Some of the findings in this report, among others, are:
2018 PO PEAK Matrix and Star Performers
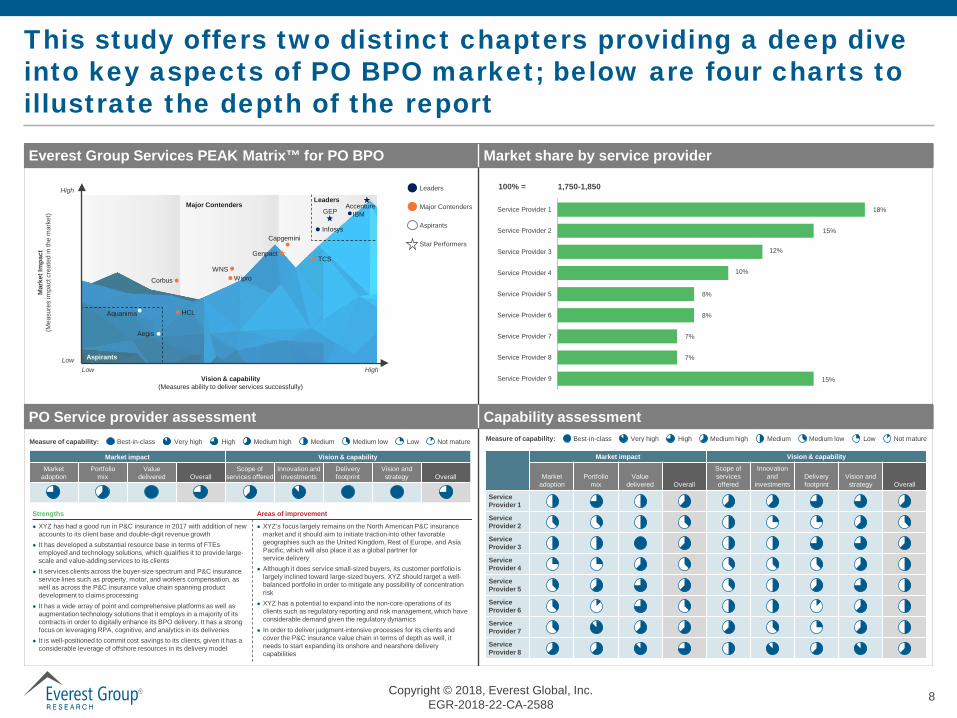
Everest Group classified 13 PO service providers on the Everest Group PEAK Matrix™ into three categories of Leaders, Major Contenders, and Aspirants
The 2018 PO PEAK Matrix positioning is as follows:– Leaders: Accenture, GEP, IBM, and Infosys– Major Contenders: Capgemini, Corbus, Genpact, HCL, TCS, Wipro, WNS – Aspirants: Aegis and Aquanima
Based on YoY movement of different service providers on the PEAK Matrix, Everest Group identified five service providers as the “2018 PO Market Star Performers” – Accenture, GEP, and Genpact
We assessed the overall PO capability of service providers by evaluating them along seven dimensions –Scope, innovation and investments, delivery footprint, vision and strategy, market adoption, portfolio mix, and value delivered
Everest Group analysis on service providers
Copyright © 2018, Everest Global, Inc.EGR-2018-22-CA-2588 8
R
This study offers two distinct chapters providing a deep dive into key aspects of PO BPO market; below are four charts to illustrate the depth of the report
Everest Group Services PEAK Matrix™ for PO BPO Market share by service provider
PO Service provider assessment Capability assessment
Leaders
Major Contenders
Aspirants
Star Performers
Vision & capability(Measures ability to deliver services successfully)
Mar
ket I
mpa
ct(M
easu
res
impa
ct c
reat
ed in
the
mar
ket)
High
LowLow High
100% =
15%
7%
7%
8%
8%
10%
12%
15%
18%
Service Provider 9
Service Provider 8
Service Provider 7
Service Provider 6
Service Provider 5
Service Provider 4
Service Provider 3
Service Provider 2
Service Provider 1
Aegis
Aquanima HCL
CorbusWNS
Wipro
TCS
Capgemini
GEPAccenture
IBM
Genpact
Infosys
Aspirants
LeadersMajor Contenders
Market impact Vision & capability
Market adoption
Portfolio mix
Value delivered Overall
Scope of services offered
Innovation and
investmentsDelivery footprint
Vision and strategy Overall
Service Provider 1
Service Provider 2
Service Provider 3
Service Provider 4
Service Provider 5
Service Provider 6
Service Provider 7
Service Provider 8
Measure of capability: Best-in-class Very high High Medium high Medium Medium low Low Not mature
Market impact Vision & capabilityMarket
adoptionPortfolio
mixValue
delivered OverallScope of
services offeredInnovation and
investmentsDelivery footprint
Vision and strategy Overall
Strengths Areas of improvement
XYZ has had a good run in P&C insurance in 2017 with addition of new accounts to its client base and double-digit revenue growth
It has developed a substantial resource base in terms of FTEs employed and technology solutions, which qualifies it to provide large-scale and value-adding services to its clients
It services clients across the buyer-size spectrum and P&C insurance service lines such as property, motor, and workers compensation, as well as across the P&C insurance value chain spanning product development to claims processing
It has a wide array of point and comprehensive platforms as well as augmentation technology solutions that it employs in a majority of its contracts in order to digitally enhance its BPO delivery. It has a strong focus on leveraging RPA, cognitive, and analytics in its deliveries
It is well-positioned to commit cost savings to its clients, given it has a considerable leverage of offshore resources in its delivery model
XYZ’s focus largely remains on the North American P&C insurance market and it should aim to initiate traction into other favorable geographies such as the United Kingdom, Rest of Europe, and Asia Pacific, which will also place it as a global partner for service delivery
Although it does service small-sized buyers, its customer portfolio is largely inclined toward large-sized buyers. XYZ should target a well-balanced portfolio in order to mitigate any possibility of concentration risk
XYZ has a potential to expand into the non-core operations of its clients such as regulatory reporting and risk management, which have considerable demand given the regulatory dynamics
In order to deliver judgment-intensive processes for its clients and cover the P&C insurance value chain in terms of depth as well, it needs to start expanding its onshore and nearshore delivery capabilities
Measure of capability: Best-in-class Very high High Medium high Medium Medium low Low Not mature
1,750-1,850
Copyright © 2018, Everest Global, Inc.EGR-2018-22-CA-2588 9
R
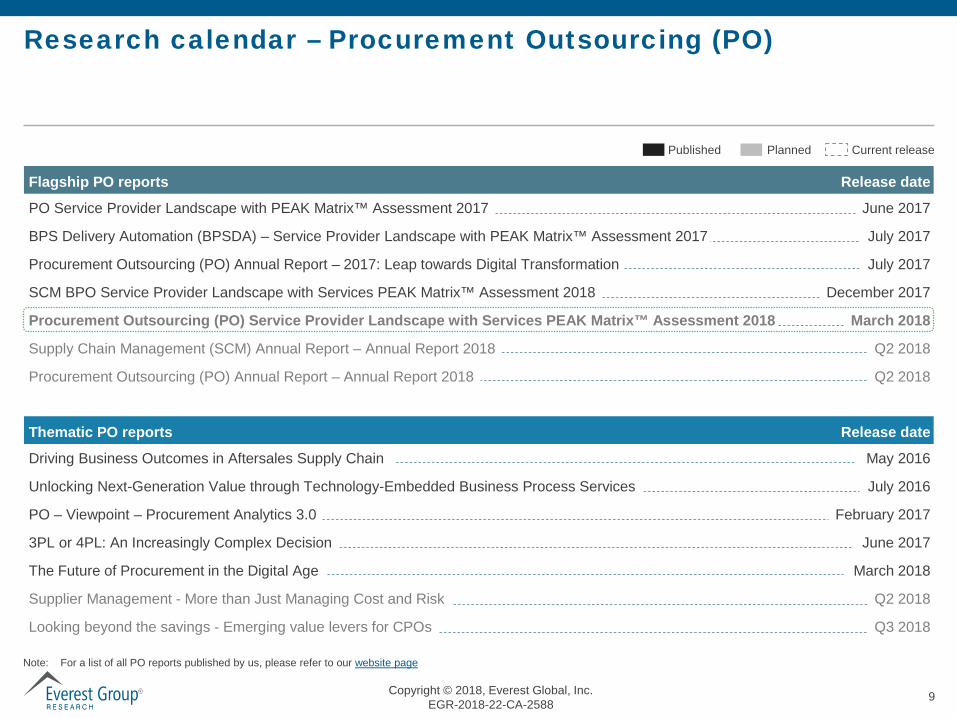
Research calendar – Procurement Outsourcing (PO)
PlannedPublished Current release
PO Service Provider Landscape with PEAK Matrix™ Assessment 2017 June 2017
BPS Delivery Automation (BPSDA) – Service Provider Landscape with PEAK Matrix™ Assessment 2017 July 2017
Procurement Outsourcing (PO) Annual Report – 2017: Leap towards Digital Transformation July 2017
SCM BPO Service Provider Landscape with Services PEAK Matrix™ Assessment 2018 December 2017
Procurement Outsourcing (PO) Service Provider Landscape with Services PEAK Matrix™ Assessment 2018 March 2018
Supply Chain Management (SCM) Annual Report – Annual Report 2018 Q2 2018
Procurement Outsourcing (PO) Annual Report – Annual Report 2018 Q2 2018
Flagship PO reports Release date
Driving Business Outcomes in Aftersales Supply Chain May 2016
Unlocking Next-Generation Value through Technology-Embedded Business Process Services July 2016
PO – Viewpoint – Procurement Analytics 3.0 February 2017
3PL or 4PL: An Increasingly Complex Decision June 2017
The Future of Procurement in the Digital Age March 2018
Supplier Management - More than Just Managing Cost and Risk Q2 2018
Looking beyond the savings - Emerging value levers for CPOs Q3 2018
Thematic PO reports Release date
Note: For a list of all PO reports published by us, please refer to our website page
Copyright © 2018, Everest Global, Inc.EGR-2018-22-CA-2588 10
R
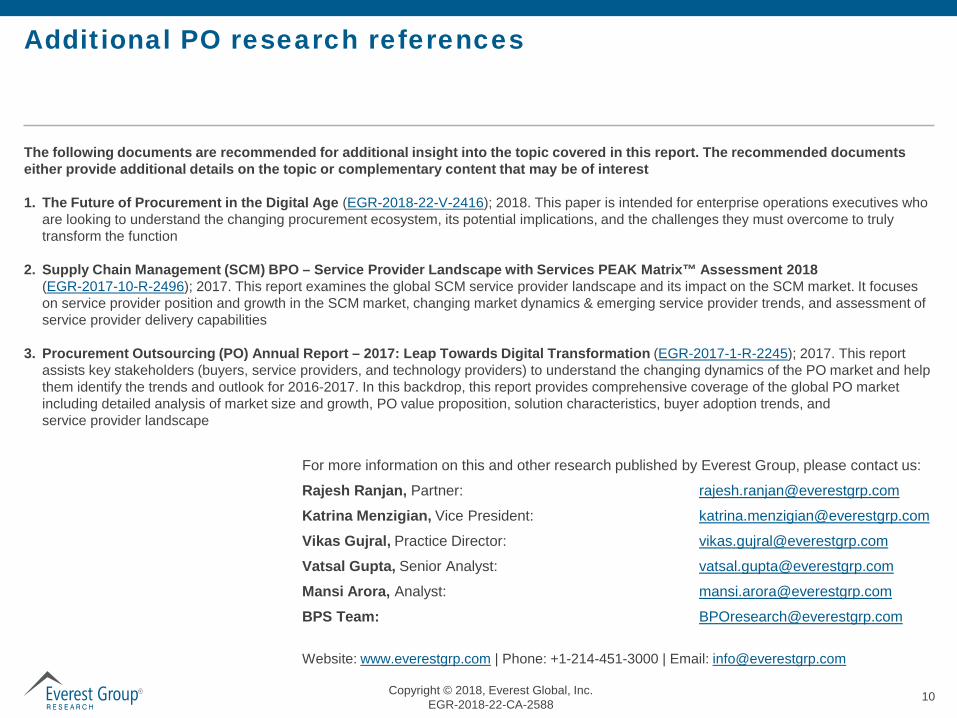
Additional PO research references
The following documents are recommended for additional insight into the topic covered in this report. The recommended documents either provide additional details on the topic or complementary content that may be of interest
1. The Future of Procurement in the Digital Age (EGR-2018-22-V-2416); 2018. This paper is intended for enterprise operations executives who are looking to understand the changing procurement ecosystem, its potential implications, and the challenges they must overcome to truly transform the function
2. Supply Chain Management (SCM) BPO – Service Provider Landscape with Services PEAK Matrix™ Assessment 2018 (EGR-2017-10-R-2496); 2017. This report examines the global SCM service provider landscape and its impact on the SCM market. It focuses on service provider position and growth in the SCM market, changing market dynamics & emerging service provider trends, and assessment of service provider delivery capabilities
3. Procurement Outsourcing (PO) Annual Report – 2017: Leap Towards Digital Transformation (EGR-2017-1-R-2245); 2017. This report assists key stakeholders (buyers, service providers, and technology providers) to understand the changing dynamics of the PO market and help them identify the trends and outlook for 2016-2017. In this backdrop, this report provides comprehensive coverage of the global PO market including detailed analysis of market size and growth, PO value proposition, solution characteristics, buyer adoption trends, and service provider landscape
Website: www.everestgrp.com | Phone: +1-214-451-3000 | Email: [email protected]
For more information on this and other research published by Everest Group, please contact us:
Rajesh Ranjan, Partner: [email protected]
Katrina Menzigian, Vice President: [email protected]
Vikas Gujral, Practice Director: [email protected]
Vatsal Gupta, Senior Analyst: [email protected]
Mansi Arora, Analyst: [email protected]
BPS Team: [email protected]
Copyright © 2018, Everest Global, Inc.EGR-2018-22-CA-2588 11
R
About Everest Group
Everest Group is a consulting and research firm focused on strategic IT, business services, and sourcing. We are trusted advisors to senior executives of leading enterprises, providers, and investors. Our firm helps clients improve operational and financial performance through a hands-on process that supports them in making well-informed decisions that deliver high-impact results and achieve sustained value. Our insight and guidance empower clients to improve organizational efficiency, effectiveness, agility, and responsiveness. What sets Everest Group apart is the integration of deep sourcing knowledge, problem-solving skills and original research. Details and in-depth content are available at www.everestgrp.com.
Dallas (Headquarters)[email protected]+1-214-451-3000
[email protected]+91-804-276-4533
[email protected]+91-124-496-1000
[email protected]+44-207-129-1318
New [email protected]+1-646-805-4000
[email protected]+1-416-388-6765
Social Media@EverestGroup
@Everest Group
Stay connected
Website
www.everestgrp.com
Blog
www.sherpasinblueshirts.com
Sherpas In Blue Shirts
Related Documents