APPROVED: Linda L. Marshall, Major Professor and Chair of the Department of Psychology Michael M. Beyerlein, Committee Member Michael Clark, Committee Member Joel Quintela, Committee Member Sandra L. Terrell, Dean of the Robert B. Toulouse School of Graduate Studies PROCTORED VERSUS UNPROCTORED ONLINE TESTING USING A PERSONALITY MEASURE: ARE THERE ANY DIFFERENCES? Dipti Gupta, B.A, M.A. Dissertation Prepared for the Degree of DOCTOR OF PHILOSOPHY UNIVERSITY OF NORTH TEXAS August 2007

Welcome message from author
This document is posted to help you gain knowledge. Please leave a comment to let me know what you think about it! Share it to your friends and learn new things together.
Transcript

APPROVED: Linda L. Marshall, Major Professor and Chair of
the Department of Psychology Michael M. Beyerlein, Committee Member Michael Clark, Committee Member Joel Quintela, Committee Member Sandra L. Terrell, Dean of the Robert B. Toulouse
School of Graduate Studies
PROCTORED VERSUS UNPROCTORED ONLINE TESTING USING A PERSONALITY
MEASURE: ARE THERE ANY DIFFERENCES?
Dipti Gupta, B.A, M.A.
Dissertation Prepared for the Degree of
DOCTOR OF PHILOSOPHY
UNIVERSITY OF NORTH TEXAS
August 2007
Gupta, Dipti. Proctored versus unproctored online testing using a personality measure:
Are there any differences? Doctor of Philosophy (Industrial and Organizational Psychology),
August 2007, 79 pp., 12 tables, 11 figures, references, 94 titles.
Impetus in recruiting and testing candidates via the Internet results from the popularity of
the World Wide Web. There has been a transition from paper-pencil to online testing because of
large number of benefits afforded by online testing. Though the benefits of online testing are
many, there may be serious implications of testing job applicants in unproctored settings. The
focus of this field study was two-fold: (1) to examine differences between the proctored and
unproctored online test administrations of the ipsative version of Occupational Personality
Questionnaire (OPQ32i and (2) to extend online testing research using OPQ32i with a U.S
population. A large sample (N = 5223) of archival selection data from a financial company was
used, one group was tested in proctored and the other in unproctored settings. Although some
statistical differences were found, very small to small effect sizes indicate negligible differences
between the proctored and unproctored groups. Principal component analysis with varimax
rotation was conducted. The scales not only loaded differently from the Great Eight factor
model suggested by SHL, but also differently for the two groups, limiting their interpretability.
In addition to the limitations and future directions of the study, the practical implications of the
results for companies considering unproctored, online personality testing as a part of their
selection process are discussed.

ii
Copyright 2007
by
Dipti Gupta

iii
ACKNOWLEDGEMENTS
The dissertation process has been a long and trying road and I have been blessed with
great family and friends who have lent me support, encouragement and guidance along the way.
In walking this road many people have contributed to the successful completion of my
Dissertation, loved ones I would like to thank. First, I would like to thank my parents, Mrs
Vinodini Kareer and Maj Gen (Retd.) R. S. Kareer who raised me to believe in myself and have
value for education. My younger sister, Aparna who was confident I could do it and I love her
for her faith in me. Second, I would like to thank my husband Ajay Gupta whose relentless push,
encouragement, and support helped me finish. I thank my close friend Upasna who kept me sane
and patiently heard me vent every single day and always had words of encouragement for me.
My special thanks go to Sarah Bodner, my mentor who took the time to encourage and guide me
throughout the process. Last of all I thank each and everyone of my friends, neighbors,
classmates, and professors who had faith I could complete the process.

iv
TABLE OF CONTENTS
Page
ACKNOWLEDGEMENTS........................................................................................................... iii
LIST OF TABLES...........................................................................................................................v
LIST OF ILLUSTRATIONS......................................................................................................... vi INTRODUCTION ...........................................................................................................................1
Online Proctored versus Unproctored Testing Using a Personality Measure for Selection: Are there Any Differences?
From Paper-Pencil to Internet Testing
Modes of Administration
Behavioral Differences Due to Monitor/Proctor Presence
Personality Traits Used in Selection
Summary
Hypotheses METHODS ....................................................................................................................................28
Sample
Measures
Procedure RESULTS ......................................................................................................................................35
Scoring of Data
Significance Testing
Exploratory Analysis DISCUSSION................................................................................................................................62
Limitations
Future Directions
Conclusion REFERENCES ..............................................................................................................................72

v
LIST OF TABLES
Page
1. Sample Descriptive including Gender, Race, and Age of Proctored Group......................29
2. Description of the OPQ32 Scales and Domains ................................................................31
3. List of OPQ32 Scales Measuring the Big Five Dimensions..............................................33
4. Range, Skewness and Kurtosis of the Sample ...................................................................36
5. Inter Scale Correlations for the Sample .............................................................................38
6. Means, 95 % Inferential Confidence Intervals (ICI) for Means (M), Independent Samples t-Tests, Corrected p Values (FDR), Cohen’s d and 95% Confidence Intervals (CI) for Cohen’s d for OPQ32 Scales .............................................................................................40
7. Means, 95 % Inferential Confidence Intervals (ICI) for Means (M), Independent Samples t-Tests, Corrected p Values (FDR), Cohen’s d and 95% Confidence Intervals (CI) for Cohen’s d for Big Five Dimensions...................................................................................41
8. Initial Eigenvalues and Total Variance Explained for Unproctored Group ......................55
9. Initial Eigenvalues and Total Variance Explained for Proctored Group ...........................56
10. Nine-Component Varimax Rotation Component Loadings for 27 Scales for the Proctored Group .................................................................................................................................59
11. Nine-Component Varimax Rotation Component Loadings for 27 Scales for the Unproctored Group ............................................................................................................60
12. Comparison of Proctored and Unproctored Groups on Component Loadings for OPQ Scales using Principal Component Analysis with Varimax Rotation................................61
vi
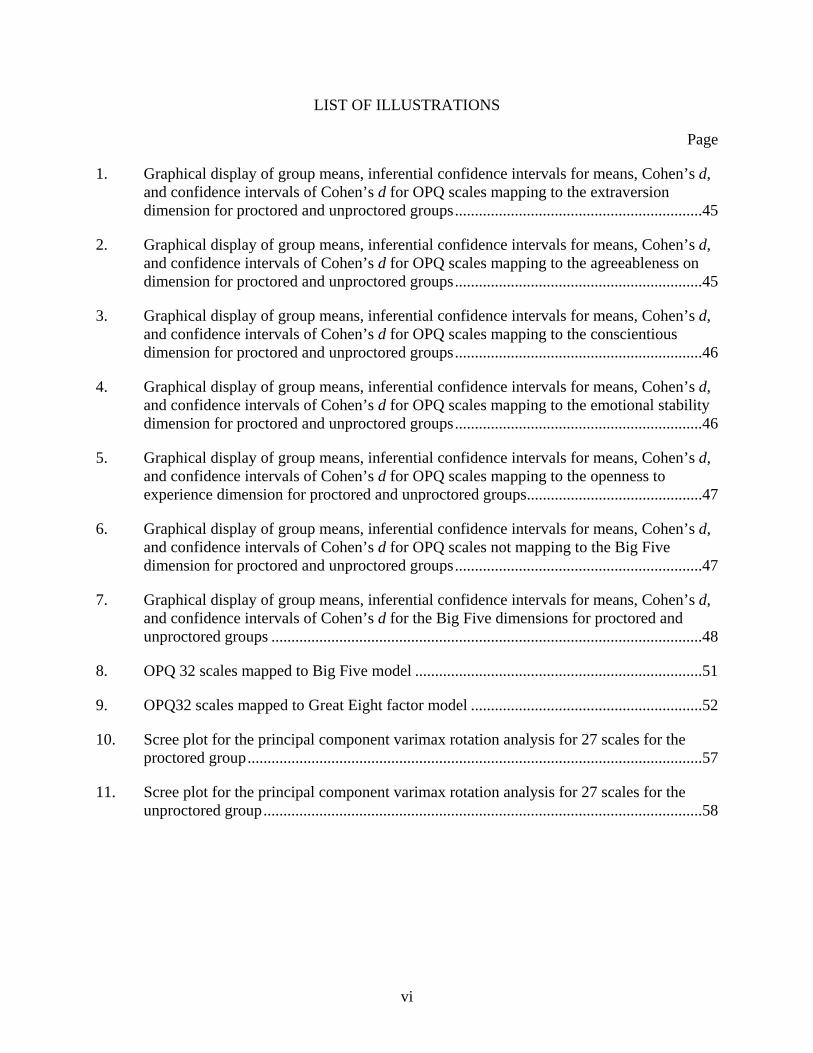
LIST OF ILLUSTRATIONS
Page
1. Graphical display of group means, inferential confidence intervals for means, Cohen’s d, and confidence intervals of Cohen’s d for OPQ scales mapping to the extraversion dimension for proctored and unproctored groups..............................................................45
2. Graphical display of group means, inferential confidence intervals for means, Cohen’s d, and confidence intervals of Cohen’s d for OPQ scales mapping to the agreeableness on dimension for proctored and unproctored groups..............................................................45
3. Graphical display of group means, inferential confidence intervals for means, Cohen’s d, and confidence intervals of Cohen’s d for OPQ scales mapping to the conscientious dimension for proctored and unproctored groups..............................................................46
4. Graphical display of group means, inferential confidence intervals for means, Cohen’s d, and confidence intervals of Cohen’s d for OPQ scales mapping to the emotional stability dimension for proctored and unproctored groups..............................................................46
5. Graphical display of group means, inferential confidence intervals for means, Cohen’s d, and confidence intervals of Cohen’s d for OPQ scales mapping to the openness to experience dimension for proctored and unproctored groups............................................47
6. Graphical display of group means, inferential confidence intervals for means, Cohen’s d, and confidence intervals of Cohen’s d for OPQ scales not mapping to the Big Five dimension for proctored and unproctored groups..............................................................47
7. Graphical display of group means, inferential confidence intervals for means, Cohen’s d, and confidence intervals of Cohen’s d for the Big Five dimensions for proctored and unproctored groups ............................................................................................................48
8. OPQ 32 scales mapped to Big Five model ........................................................................51
9. OPQ32 scales mapped to Great Eight factor model ..........................................................52
10. Scree plot for the principal component varimax rotation analysis for 27 scales for the proctored group..................................................................................................................57
11. Scree plot for the principal component varimax rotation analysis for 27 scales for the unproctored group..............................................................................................................58

1
INTRODUCTION
Online Proctored vs Unproctored Testing Using a Personality Measure for Selection: Are There Any Differences?
The popularity of the World Wide Web has opened up the possibility for human resource
departments (HR) to recruit and test candidates over the Internet (Greenberg, 1999; Lievens &
Harris, 2003). Traditionally, after applying via regular mail, fax or email, candidates would be
tested and interviewed in person. This process made record keeping challenging and
cumbersome as methods of receiving job applications were not consistent. To make the process
more manageable and simple, companies now use Internet recruiting. As a result, candidates are
required to go online on the company Website, gather information about the company and apply
for the posted job. This process makes it easier and faster for candidates to apply for a job, yields
a wider pool of candidates and decreases the “time-to-hire” process (Leivens & Harris, 2003;
Nagelieri, Drasgow, Schmidt, Handler, Prifitera, Margolis & Velasquez, 2004; Tippins, 2005). In
a study of HR managers from 125 companies in North America, Chapman and Webster (2003)
summarized that companies are moving to online recruiting to be competitive and HR managers
believe that companies must spend money on technology based recruiting solutions.
Recently, reliance on the Internet has advanced from recruiting to testing candidates via
the Internet due to the benefits of cost, speed and convenience (Lievens & Harris, 2003). Internet
or online testing is using the Internet to test and assess candidates for selection purposes (Leivens
& Harris, 2003). Several terms are used including, online testing (Nagelieri, Drasgow, Schmidt,
Handler, Prifitera, Margolis & Velasquez, 2004); Internet-based testing (Barak & English, 2002;
Greenberg, 1999); Web or Web-based testing (Leivens & Harris, 2003; Potosky & Bobko,
2004); and remote testing (Hartson, Castillo, Kelso, Kamler, & Neale, 2005).

2
From Paper-Pencil to Internet Testing
There has been a transition from paper-pencil tests to computerized or computer-based
testing, and then to Internet testing. Computer-based testing (CBT) refers to delivering the test
via a local computer that could be connected to the server on the intranet (Tippins, 2005).
Although paper-pencil tests are cost effective to administer to large groups of people in
controlled testing sessions, they were replaced by CBT for testing small groups of applicants
(Greenberg, 1999). A large number of commonly used paper-pencil tests have been converted to
computerized versions and research on their equivalence has been established (Mead &
Drasgow, 1993; Richman, Keisler, Weisband, & Drasgow, 1997).
Barak and English (2002) outlined several benefits of CBT that led to the first change.
Administration convenience and cost savings in terms of labor and of supplies are some of the
more obvious benefits. Other benefits include standardized administration processes (i.e.,
standard test instructions, time keeping), minimal scoring mistakes, and immediate reporting and
feedback. Labor costs are saved because norms can be easily adjusted using the test database. In
addition, computer based assessments require fewer proctors and less proctor training to
administer the tests (Mead & Drasgow, 1993).
The change from CBT to Internet testing affords additional advantages to companies.
Internet testing projects a “high-tech image” (Tippins, Beaty, Drasgow, Gibson, Pearlman, &
Seagull, 2006), “positive image” and provides a realistic job preview (Reynolds & Sinar, 2001;
Wiechmann & Ryan, 2003). The advantage of maintaining consistency across sites and test
administration such as standardized instructions increases the efficiency of test delivery (Barak
& English, 2002; Leivens & Harris, 2003; Tippins et al., 2006). Modifying and updating test
content (Naglieri et al., 2004) like adding or deleting items, deploying new forms, resetting

3
cutoff scores (Tippins et al., 2006) and adjusting norms (Barak & English, 2002) are other
administrative advantages of online testing. Deploying tests over the Internet also allows scores
to be captured in an electronic form leading to automatic and accurate scoring and reporting
more effectively and efficiently than the paper-pencil format (Leivens & Harris, 2004; Nagelieri
et al., 2004; Tippins et al., 2006). It also provides employers and applicants the flexibility of
where and when to test (Leivens & Harris, 2004) and applicants have a better experience
(Anderson, 2003). Companies are able to save money and time associated with travel (Naglieri et
al., 2004), paper copies of test booklets and answer sheets (Leivens & Harris, 2003). An
additional benefit of testing online is continuous testing called “rolling recruitment” (Weiner,
2004), with candidates tested until the job posting is closed.
Some of the challenges associated with online testing are computer and technology
problems including software functionality, slow modem and/or connection speed (Barak &
English, 2002; Tippins et al., 2006); computer processing speed and performance (Potosky &
Bobko, 2004); lack of mobility of equipment; impersonal nature of testing; test content security,
identity of candidates (Greenberg, 1999, Tippins et al., 2006); and cheating or faking on the test
(Drasgow, 1999; Drasgow et al., 2003; Tippins et al., 2006). Another issue is the problem of fair
assessment in case of minorities (Naglieri et al., 2004). Hispanics and African Americans use
computer and Internet less frequently than Whites or Asian (United States Department of
Commerce, 2002). Due to the relative lack of availability of computer resources, minorities may
be at a disadvantage for Internet application and testing. The ethnic and age differences in
computer access has been termed the “digital divide” (US Department of Commerce, 1995;
2002) Older adults and women have more computer anxiety than young adults or men, and hence

4
they are at a disadvantage when testing via the Internet (Langford, Bell, & Elias, 1994; Barak &
English, 2002).
Recent research on “digital divide” has shown some shifts. National Telecommunications
and Information Administration (as cited in Payne & Weiss, 2006) reported that White and Asian
households were more likely to have easy access to computers than African-American or
Hispanic households. Recently, Wilson, Wallin, and Reiser (as cited in Payne and Weiss, 2006)
found that even though African Americans may not own a computer, they know where to access
public computer resources. Pre- and post-comparisons of unproctored Internet testing (UIT) in a
Fortune 100 company showed a 10 % increase in the female and 35 % increase in the minority
applicants (Gauer & Beaty, 2006). For entry-level positions, percentage of female hires doubled
post-UIT, and percentage of minorities increased at the rate of 5 % a year since the
implementation of UIT in this company (Gauer & Beaty, 2006). Recently more and more
companies are only accepting job applications via their company Websites. This means either the
adults have no option but to go online themselves or have their children/grandchildren fill out
their job applications online for them. Even though more adults are getting online to apply for
jobs, people living in rural areas, African Americans, Hispanics and women are still behind
younger adults, people living in urban areas, Asians, Whites, and males in applying for jobs
online (Payne & Weiss, 2006).
Internet testing is used for personnel selection and employee development. Online tests
used to screen and select candidates is referred to as a “high-stakes” situation and because the
consequences “affect the company and others beyond the individual tested” (Tippins et al., 2006,
pg. 192). Based on the test results, the company may or may not hire or promote an individual,
thus increasing the candidate's incentive to cheat (Drasgow, 2004). In “low-stakes testing” (i.e.,

5
developmental purpose, self-diagnosis to identify work related interests and personal
characteristics) the results only affect the individual (Tippins et al., 2006).
Testing for the purpose of development is seen as a low stakes situation and testing for
selection is seen as a high stakes situation. Therefore, the candidate's motivation to cheat or fake
on a selection test becomes high if given an opportunity, which could present itself in the form of
unproctored online testing, where there is no monitoring or supervision.
Drasgow (2004) conducted laboratory and field studies comparing proctored testing to
unproctored Internet testing session. In the laboratory condition, Psychology students were told
that they would be entered in a lottery to win $100 based on the number of correct answers. They
were administered biodata, personality and cognitive ability measures. Students were randomly
assigned to proctored lab session (n = 252) and unproctored Internet session (n = 163). Results
indicated that the students performed better in the proctored setting then the unproctored setting.
Drasgow (2004) conducted a field study and compared proctored to unproctored online testing
using assessments of conscientiousness, leadership and problem solving. Large sample sizes for
unproctored (n = 2628) and proctored (n = 1502) were used, and means, t-scores and effect sizes
were calculated. Results from the field study showed that the differences between the two modes
of administration were significant due to large sample sizes and effect sizes for the mode of
administration were very small (d < .30 for the three assessments), meaning that there was no
evidence of cheating at this company. Drasgow (2004) reasoned that since both a prize of one
hundred dollars and selection for a low paying hourly job were comparatively low stakes
situations hence, there were no differences between proctored and unproctored testing settings.
Cheating behavior can be difficult to study in a `real' high stakes situation because real
candidates will not be comfortable disclosing they cheated on the test. But it is safe to assume

6
that given an opportunity and motivation of being selected for a job, some candidates will try to
cheat or fake to improve their performance and chances of getting hired.
Modes of Administration
Online testing administrations can be proctored or unproctored. In a proctored session
candidates take the test in a controlled setting under the supervision of a test administrator. This
is done in the company's test center or in other test centers operated by providers of Internet
based testing and assessment. The proctor's role is to verify the identification, help candidates
log on to the test Web site, and monitor the candidates to prevent cheating. The proctor may be
present in the room or enter the room every few minutes, or use a camera or a combination of
these procedures; e.g., Psychological Services, Inc. administers certification and licensure
examinations at their sites, using cameras to monitor candidates and performance assessment
network administering pre-employment tests for their client companies, and using proctors to
monitor candidates.
In unproctored online testing session a candidate can log on to a computer anywhere
(e.g., library, home or office) and at any time to be tested. The benefits of letting candidates test
from a remote location include reduced time-to-hire, flexibility, in terms of taking the test on
week nights and weekends, and recruiting already employed candidates who would otherwise be
unable to come in for testing. Testing under uncontrolled conditions can increase inconsistency
of test administration leading to candidate getting distracted by environmental conditions
including noise, temperature, and illumination, fatigue and mood changes. The lack of control
over the setting makes identification and verification of candidates a challenge (Lievens, van

7
Dam, & Anderson, 2003). Also, there is no guarantee that a candidate will complete the test
without help.
Weiner (2004) suggested unproctored delivery was appropriate for screening job
applications and for personality, biodata and preliminary skills screening. According to
Performance Assessment Network, a leader in Web-based e-testing process, some of their clients
use unproctored online testing sessions to get biographical information from candidates. They
also ‘screen out’ candidates using unproctored sessions of personality assessment, work style and
attitude measures. Once the candidates pass these two initial hurdles, they are called in to a
proctored site to take the final phase of testing, a cognitive ability test that “selects in” or
“screens in” the candidates. Other researchers suggest unproctored Internet testing administration
using valid, empirically scored biodata, situational judgment and personality inventories that are
resistant to overt cheating (e.g., Drasgow, 2004; Tippins et al., 2006). This reduces the applicant
pool and decreases the overall selection costs. This pre-screen or initial hurdle can then be
followed by proctored assessment of similar content where the identity of the candidate can be
verified and any cheating detected (Tippins et al., 2006).
Equivalence of Measures
Sufficient research has been conducted on the equivalence of paper-pencil measures and
their computerized versions. Research from various fields (e.g., education, e-learning, selection
and employment) using school performance tests, cognitive ability tests, personality, biodata,
situational judgment tests has found that online or computerized test administrations and paper-
pencil test administrations were equivalent (e.g., Buchanan & Smith, 1999; Davis, 1999).

8
Pencil and paper tests were easily converted into their computerized versions, all except
one test, a self-report personality inventory, the Self-Trust Questionnaire that was developed for
use on the Internet exclusively and does not have a paper-pencil version (Pasveer & Ellard,
1998). Most computerized tests are “exact replicas” of their paper-pencil counterparts that have
been previously validated and extensively used (Buchanan, Ali, Heffernan, Ling, Parrott,
Rodgers, & Scholey, 2005). The computerized tests consist of identical items in the same order
as their paper-pencil counterparts. Even though these tests are essentially the same, however,
these have to be considered different forms of the same test because of delivery method
differences. Hence, equivalency studies must be conducted to see if differences in delivery
method affect the candidates' responses on the computer-based or online test versions. The
validity of Internet versions must be established. Buchanan & Smith (1999) noted that an online
test must not only reliably measure the construct but also it must measure the same variable as its
paper-pencil or computer based version.
Both field and laboratory studies using a wide variety of measures have established
equivalence for the two formats of administration- (a) paper-pencil and (b) computerized or
online versions of the measures. Mead and Drasgow (1993) conducted a meta-analysis to study
the effect of test administration (paper-pencil versus computerized) on timed power and speed
cognitive ability tests. 123 correlations for timed power tests and 36 from speed tests were meta-
analyzed. The corrected cross-mode correlation was .91 when all tests (speed and power) were
analyzed together. Speed moderated the effects of administration and it was .97 for timed power
tests and .72 for speed tests. In addition to the pencil-paper and computerized versions, the
computer adaptive and standard computerized versions of the tests were equivalent.

9
Buchanan & Smith (1999) examined the equivalence between the paper-pencil and
Internet version of the Gangster and Snyder's (1985) self-monitoring scale. There were 963
responses on the Internet version and 224 for paper-pencil version. Using confirmatory factor
analysis and model of goodness fitness indices, the psychometric properties of the two test
administrations were similar. In addition they found a higher correlation (r = .97) between the
first factor called Other-Directness and the total scale for the Internet version than its paper-
pencil counterpart (r =.87) reported by Gangster and Synder. The authors concluded the online
version of the self-monitoring scale was superior. Perhaps, people tend to disclose personal
information about sensitive issues online due to perception of anonymity (Buchanan & Smith,
1999; Locke & Gilbert, 1995).
Personality trait measures have also been studied for equivalence. Using a within-subject
design, Mead and Coussons-Read (2002) examined the equivalence of test delivery method of 16
PF. The sample consisted of 64 students who took the paper-pencil version followed by the
Internet version of the test after two weeks. Cross-mode average correlation of .85 indicated that
the two forms of the 16 PF were equivalent (as reported by Leiven and Harris, 2003). A few
studies examined the equivalence of the two forms of the measures using actual candidates who
applied for a job. While Reynolds, Sinar, and McClough (2000) found equivalence of a Biodata
type instrument using 10,000 candidates who applied for entry level sales position, Ployhard,
Weekley, Holtz and Kemp (2002) did not yield favorable results with actual applicants seeking a
teleservice position. Results from the multiple group confirmatory factor analysis used to
compare the paper-pencil and online versions of a Big Five personality measure indicated that
the factor loading were not equal for both groups and also the means were higher for the paper-
pencil version as compared to the online measure.

10
Bartram and Brown (2004) compared paper-pencil proctored testing sessions to Web-
based unproctored testing sessions using OPQ 32i with managerial and professional and graduate
student samples from United Kingdom and Hong Kong. Both administrations showed
comparable psychometric properties including both reliability and relationships between scales.
Davis (1999) found that a measure of rumination tendencies was as consistent on the Web
(Cronbach’s alpha = .82) as for three paper-pencil samples (Cronbach’s alpha = .88 for upper
level psychology students; .88 for non-psychology students and .83 for introductory psychology
students). In a field study, Stanton (1998) compared the Web-based survey results to the paper-
pencil version and found no significant differences. But, the sample size of the Web survey was
small (n = 50) compared to the paper-pencil survey administration (n = 181), suggesting
interpreting results with caution. There is evidence for similar psychometric properties when the
paper-pencil and computerized versions of the measures were compared.
Distance learning has become a popular means of attaining education. Students take
courses online, submit assignments via email, complete learning assignments on the Web and
take tests via the Internet. Alexander, Bartlet, Truell, and Ouwenga (2001) examined the
equivalence of online and paper-pencil test administration on student performance in a computer
technology course. Results of a quasi-experimental design indicated no significant differences in
age, gender or classroom standing. Although the two groups had equivalent test scores, students
who took the test online completed it in less time than the paper-pencil group. The students were
proficient in computer technology; hence it could explain taking less time to complete the test.
Bicanich, Slivinski, Hardwicke, and Kapes (1997) reported similar findings in a statewide pilot
project in Pennsylvania. Studies in various settings also show the equivalency of the paper-pencil

11
and computerized formats. This means that computerized versions are equivalent to paper-pencil
tests and can be used without comprising the psychometric properties of the test.
Research on distance learning, surveys, cognitive and non-cognitive measures indicate
conclusively that the test delivery methods, i.e., paper-pencil, traditional measures and their
online versions are equivalent in their psychometric properties. Therefore, computerized or
online test versions can be used in lieu of the traditional format in education and real selection
settings
Differences in Modes of Test Administration
Another line of research examined not only the test delivery format of paper-pencil and
online but also the mode of administration, i.e., either proctored or unproctored setting.
Researchers expect to see differences between groups, especially in a high stakes situation.
When a test administrator does not administer the selection tests, he/she has no control over the
applicant's environment, technology variability, and the temporary emotional states (e.g., fatigue,
mood). These factors influence the applicants' responses and the test administrators are not aware
of them. In addition to these factors, the administrator cannot establish rapport with the test taker
and often the applicant may only see the recruiter when they are invited to interview (Buchanan
& Smith, 1999). Testing in an unproctored environment lacks administration consistency and
may affect test-taker's performance. In addition, applicants in a high stakes situation may be
motivated to cheat or fake when they are not monitored or proctored during their test session
(Drasgow, 2004; Tippins, Beaty, Drasgow, Gibson, Pearlman & Seagull, 2006).
A number of laboratory and field studies examined the differences between paper-pencil,
proctored test sessions to unproctored Internet test sessions using different cognitive and non-

12
cognitive measures (e.g., Bartram and Brown, 2004; Beaty, Fallon and Shepard, 2002; Coyne,
Warstza, Beadle & Sheehan, 2005; Drasgow, 2004; Kriek & Joubert, 2007). There is evidence of
significant but small to medium mean differences (d < .30) between the different modes of
administration. Using Cohen’s classification, researchers concluded that there were no
differences between the modes of administration. Hence, presence of a proctor may not affect
test scores.
Oswald, Carr, and Schmidt (2001) compared the proctored and unproctored groups using
both personality and cognitive measures and hypothesized that the measures would be less
reliable and not have a clear factor structure for the unproctored group (as referenced by Leivens
& Harris, 2003). Multiple group confirmatory analyses results indicated that personality measure
was a good fit for the proctored group than the unproctored group. Surprisingly the model fit for
cognitive ability tests was similar for both the proctored and unproctored groups (as referenced
in Leivens and Harris, 2003).Two field studies by Beaty, Fallon and Shepard (2002) and
Templer (2005) compared the equivalence of proctored versus unproctored test conditions using
the within-subject design. Beaty et al. (2001) found negligible differences in test scores of the
subjects that took the test in a proctored setting first and then again remotely in an unproctored
setting. The average mean test score for the proctored group was 42.2 (SD= 2.0) and 44.1 (SD =
4.9). Templer (2005) used a combined laboratory-field and between subject-within-subject
design with two control and experimental groups. In the control groups' participants took the
cognitive ability and personality tests under proctored conditions and unproctored conditions in
both test administrations. In the experimental group, where candidates first tested in unproctored
settings and then in proctored setting, he found score increases in the proctored setting. In the
second experimental group, where the individuals tested in proctored and then in unproctored

13
settings showed a decrease in scores, concluding that the differences in means were due to
repeated test administrations and not mode of administrations. Using paired t-tests, Templar
(2005) found no indication of difference between results from proctored and unproctored online
testing conditions for non-cognitive and cognitive measures. The limitation of this study was that
it was conducted in Singapore and used Asian subjects; there could be some culture effects and
the results are limited in applicability and generalizibility to the US population.
Bartram and Brown (2004) explored the equivalence1 of unproctored online and
proctored paper-pencil administrations of the ipsative version of the Occupational Personality
Questionnaire (OPQ 32i). Matched samples in terms of assessment purpose (selection or
development), level (managerial/professional and graduate students), and industry section from
United Kingdom and Hong Kong were analyzed for equivalence between proctored and
unproctored test administrations. The results indicated that there were very small differences (d <
.28) if any, indicating that in high stakes situations, lack of presence of a proctor does not affect
the test scores. Using large sample sizes of 2628 (unproctored) and 1502 (proctored) applicants,
Drasgow (2004) also found very small significant differences in effect sizes (d < .30) for
proctored and unproctored administrations of online assessments of conscientiousness,
leadership, and problem solving.
Comparison research from surveys administered via the Internet in an unproctored setting
and their paper-pencil counterparts in a proctored setting has shown that there are no significant
differences between the two survey administrations. Results indicate that people are reluctant to
participate in Web surveys if they feel that their responses will not be kept confidential. In
addition, motivation may play an important role when participants are asked to fill a survey
1 It should be noted that the authors talk about “equivalence”, but did not use any statistical method to conduct equivalence testing such as Tyron’s inferential confidence intervals approach.

14
online in unsupervised conditions. Cronk and West (2002) found that data collection via the
Internet was comparable to traditional form of paper-pencil surveys. They varied administration
(paper-pencil versus Web-based) and setting (proctored versus unproctored). There were no
differences between subjects in unproctored Web-based surveys and paper-pencil versions in
controlled, proctored settings, but fewer participants completed surveys on the Internet. The
authors reasoned that people who have experience and comfort with using computers were not
motivated enough and choose not to complete the survey from home on the Web. Carlsmith and
Chabot (1997) found that there were no significant differences between participants who
completed surveys online in unsupervised conditions and participants who completed surveys in
laboratory under supervised conditions.
Few studies used personality measures based on five factor model (FFM) to compare the
two modes of administration. Using large sample size of 370,122 applicants from 61
organizations Robie and Brown (2006) studied the equivalence of a personality measure across
Internet and kiosk (small computer stations at company site). The Internet group took the test
online from a remote, unproctored location and the other group took the test online but from a
kiosk at an in-store location. The kiosk group would be similar to a proctored group; they would
be affected by presence of others around them. Additionally the applicants may feel pressured to
complete the test quickly as other applicants would be waiting for the kiosk and may also get
distracted by shoppers. In terms of distraction level, the two groups could be very much alike.
The analysis reported no evidence for differential item functioning. The intercorrelations
between the scales for both groups were similar. They reported that Conscientiousness and
Agreeableness showed negligible mean differences between the two modes of administrations.
Emotional Stability showed a one-fourth standard deviation differences between the two modes

15
of administration. They concluded that the candidates from the kiosk group were more distracted
than the Internet group. The Internet group may have had fewer distractions and carefully
thought through the Emotionally Stable items. Since it is the least socially desirable of the FFM
scales, applicants could fake on those items. In summary, they concluded that the personality
measure was equivalent across the two groups.
Using a quasi-experimental design, Coyne, Warszta, Beadle, and Sheehan (2005)
compared proctored paper-pencil and unproctored online administrations of a personality
questionnaire based on FFM. They found small mean differences (Cohen’s d) ranging from .02
to -.10 and hence established equivalence between the two modes of administration. The
conclusion of equivalence must be treated with caution because of small sample size of 86
subjects who were not real job applicants. Since it was not a real stakes situation, subjects were
probably not affected by the presence of a proctor and not motivated to fake good.
Two research studies using real selection data, one published (Bartram & Brown, 2004)
and another (Kriek & Joubert, 2007) presented at the 2007 International Conference of Society
for Industrial and Organizational Psychologists (SIOP) examined the differences between
proctored and unproctored test administrations using the ipsative version of the Occupational
Personality Questionnaire (OPQ32i). However both studies used samples from countries other
than the United States, thus limiting its inference and applicability for US populations. Bartram
and Brown (2004) explored the equivalence between the proctored pencil-paper test
administrations to unproctored online test administration of the OPQ 32i. Data were collected
from global financial companies in the United Kingdom and Hong Kong and matched according
to purpose of assessment (selection or development), and sample (graduate or managerial). Using
effect sizes (Cohen's d) for all the 32 scales and the Big Five dimensions, they found small

16
differences if any. The negative effect size meant that unproctored candidates scored lower than
the proctored group, while positive effect sizes meant that the unproctored group scored higher
than the proctored group. The largest difference in Hong Kong samples was - 0.23 for the
Conceptual scale with the unproctored participants scoring lower than proctored participants. On
the Tough-minded scale, unproctored participants scored higher (d = 0.24). These values were
significant but small according to Cohen's classification. The UK samples were not matched as
well as the Hong Kong samples, which may have caused the differences to be larger. The effect
sizes ranged from - 0.20 to 0.67, with half the scales showing negative effect, i.e., the proctored
group scored higher than the unproctored group. The weighted average of Cohen’s d ranged
from .00 (Socially confident) to 0.27 (Data rational and Detail conscious). The scales that had the
biggest differences in one sample showed negative or no differences in the other sample. In case
of graduate samples of the weighted average effect sizes ranged from .01 (Independent minded)
to - 0.43 (Conceptual). In case of the Big Five dimensions, the mean scale differences ranged
from .16 for Consciousness and - .15 for Openness to Experience.
Using a South African sample, Kriek and Joubert (2007) compared online unproctored
test to proctored paper-pencil version of the same test, the OPQ32i. The sample group of
unproctored online (n =1091) and proctored paper-pencil (n =1136) was taken from real job
applicants who tested for various positions in different industries. They found very small to
medium mean scale differences (Cohen’s d) ranging from .01 to -.57, thus concluding
equivalence between the two modes of administrations.
Studies in survey research, educational, and employment settings have found paper-
pencil and computerized or online versions of tests to be equivalent and hence online tests can be
used without compromising their psychometric properties. In addition, very small differences

17
between proctored and unproctored online test administrations have been observed, meaning that
absence of proctoring may not affect test scores.
Behavioral Differences Due to Monitor/Proctor Presence
Presence of a monitor or proctor can affect an individual's performance or their behavior.
Close monitoring could prevent candidates from talking to each other, soliciting help or faking
on the test. On the other hand, candidates who take the test online in an unproctored setting can
easily get help from friends or family or the Internet while taking the test. In a high stakes
situation, when the applicants are competing for a job, social desirability and faking behaviors on
a personality measure can be affected by the presence of supervision.
Social Desirability
Since a personality measure has no correct or incorrect answers and candidates know that
their responses cannot be verified, they may respond in a manner that they think will portray a
favorable image (Bowen, Martin, & Hunt, 2002). They distinguished between faking, impression
management, and socially desirable responding. Socially desirable responding can be defined as
an individual's tendency to give overly positive self-descriptions and “favorable to current norms
and standards” (Zerbe & Paulhus, 1987, pg. 250).
Many researchers and practitioners believe that social desirability is a response bias that
causes concern among practitioners against the use of personality instruments in personnel
selection (e.g., Gatewood & Field, 1994). A review of social desirability scales showed that
socially desirable responses do not affect the criterion related validities of the personality
measures and does not moderate the personality and job performance relationships (Hough,

18
Eaton, Dunnette, Kamp, & McCloy, 1990). Ones, Viswesvaran & Reiss's (1996) meta analysis of
the social desirability scales showed that the responses do not predict job performance or
counterproductive behaviors. They indicated that the Big Five traits of emotional stability (r =
.37, n = 143,794, K = 157) and conscientiousness (r = .20, n = 46,972, K = 239) correlated with
social desirability ore strongly than agreeableness (r =.14, n = 41,874, K = 147), extraversion (r
= .06, n = 81,683, K = 274) and openness to experience (r = .00, n = 39,314, K = 126). Although
this meta analysis indicates that it does not decrease the criterion-related validity of a personality
measure to predict job performance if people respond in a socially desirable manner, but it does
not explain what may happen if people fake their responses and respond in a perceived job
desirable way (Kluger & Colella, 1993, Kluger, Reillt, Russell, 1991; Ones, Viswesvaran, &
Reiss, 1996). Most research on the topic has dealt with social desirability. Job desirability
responding is different from and more than socially desirable responding. The candidates modify
their responses based on the job they are applying for. They may respond possessing qualities
that they perceive will increase their chances to get a job, and these may not be necessarily
socially desirable. (Kluger & Colella, 1993) reported that faking does occur in real life settings
and that transparent items affected the means and variances when warning against faking was
issued to the participants.
Social desirability distortion has also been studied in computer-administered non-
cognitive instruments. Most research has focused on whether the mode of administration has
changed participants socially desirable responding. Some studies show that there is less socially
desirable responding and participants are more frank in responding to items presented via the
computer than its paper-pencil version (Buchanan & Smith, 1999; Locke & Gilbert, 1995).
Survey research using computers also indicates that people have a sense of anonymity and hence

19
more openness to respond honestly (Buchanan & Smith, 1999; Locke & Gilbert, 1995). Others
indicate no difference (Booth-Kewley, Edwards, Rosefeld, 1992; Fox & Shwartz, 2002). Yet
some others unexpectedly found that more socially desirable responding occurred in computer
than the traditional version of attitude and personality instruments (Lautensclager & Flaherty,
1990; Potosky, & Bobko, 1997). A meta analysis conducted by Richman, Keisler, Weisband, &
Drasgow (1999) on non-cognitive measures concluded that social desirable responding distortion
was less in Internet than in the traditional condition. Research results are mixed in case of
socially desirable responding occurring in Internet and paper-pencil testing conditions.
Faking in Online Personality Testing
Faking is referred to as an individuals' conscious attempt to represent themselves
according to the situation (Bowen, Martin & Hunt, 2002). On personality measures, cheating
takes the form of faking (Weiner and Ruch, 2006). Several studies have documented candidates
raising their scores on non-cognitive tests of .5 to 1.0 standard deviations (Barrick & Mount,
1996; Ones, Vishwesvaran, & Korbin, 1995; Rosse, Stecher, Miller, Levin, 1998). Verbal
protocol analysis to evaluate the motivation to cheat also indicated that people fake on
personality measures and people who fake take more time to complete the test and make more
corrections that people who reported they were honest (Robie, Brown, & Beaty, 2005).
When a personality test is constructed as a form of a knowledge test, not information
blank, motivated candidates will make an attempt to increase their performance on the test by
misrepresentation or “self-present positively” (Thissen-Roe, Scarborough, Chambless & Hunt,
2006). In this case, the candidate consistently selects the favorable answer, thus not being honest
about himself/herself. Theissen-Roe et al. (2006) studied extreme responding and its effect on

20
termination using data (N = 370,121) from twenty-four companies. The job applications (n =
84,298) that were applied onsite was considered under proctored settings, where applicants came
in the store and applied for the job and tested in the presence of a manager. Applicants who
applied on the Web (n = 285,824) were considered under unproctored conditions. Results
indicated that there were significant differences in responding between the proctored and
unproctored groups. Candidates in the proctored setting responded more extremely than
candidates who tested in the unproctored setting. Hence the presence of a proctor can affect the
candidates' motivation to perform well and fake good.
In summary, in high stakes situations candidates will be motivated to fake their responses
to appear more job desirable Even though faking is prevalent in personality measures, it does not
affect the validity or predictability of the measure (Barrick & Mount, Ones et al., 1995; Hough,
Eaton, Dunnette, Kamp, & McCloy, 1990). Faking also does not affect hiring decisions (Weiner
& Gibson, 2000; Ellingson, Sackett, & Hough, 1999). If applicants are able to overcome the
hurdle of the personality measure, they can still be screened out after taking the cognitive ability
test and/or interviews.
Personality Traits Used in Selection
Personality is defined as an individual's unique feelings, thoughts and emotions that
determine his/her interaction with their environment, including working conditions, interaction
with others etc (Gatewood & Field, 2001). The history of personality testing in selection started
in the early part of the 20th century with the World War I Army recruit-screening program
(Hogan, Carpenter, Briggs, Hanssen, 1985). Thereafter companies began using short cut,
unscientific measures of personality assessment like handwriting analysis and physical

21
characteristics to hire stable and productive workers (Anastasi, 1982). Research done on
personality testing in the 1950s and 1960s indicated that these shortcut methods were of little
value in determining a person's personality. They also had no predictive value, and thus were not
recommended for personnel selection (Ellis, 1946; Ghiselli & Bartol, 1953; Guion & Gottier,
1965,). There were a large number of problems with the studies conducted including small
sample sizes (Hollenbeck & Whitner, 1988), poorly timed criterion collection (Helmreich, Sawin
& Carsrud, 1986), and the test's inability to predict future success (Ferris, Bergin, & Gilmore,
1986; Guion, 1965).
Personality measures became a focus in personnel selection during the 1990s (Salgodo
and Moscoso, 2003). They are considered very useful in predicting performance and assessing
potential (Harold, McFarland, Dudley, & Odin, 2005). In a review on personality done by Ones
(2005), research has shown the evidence for personality traits and their consistency in predicting
behavior across time and jobs. In addition personality inventories show incremental validities
over cognitive ability tests (Bobko, Roth, & Potosky, 1999). Research on personality inventories
suggests that they predict performance over a variety of job families (Barrick & Mount, 1991)
and especially for customer service settings (Frei & McDaniel, 1998; Mount, Barrick, & Stewart,
1998). The value of using personality measures to test candidates has a cascading effect on
individual, team and organization performance. Thus, personality traits are very useful in
“understanding, explaining, and predicting behaviors in organizations” (Ones, 2005).
Research has examined a number of personality traits and has concluded that all the traits
cluster under five dimensions and have become known as the Big Five personality dimensions.
These dimensions include (1) emotional stability, (2) extraversion, (3) openness, (4)
agreeableness, and (5) conscientiousness. These personality dimensions were found in ratings of

22
human personality by Tupes and Christal between 1954 and 1961 and confirmed by Norman in
the 1960s (as cited in Dilcert, Ones, Van Rooy, & Viswesvaran, 2005).
Dilcert et al. (2005) described the first dimension of Emotional Stability refers to the
individual's tendency to get upset or behave in a neurotic behavior. When individuals score high
on this dimension, they may possess traits like anger, fearfulness, depression, anxiousness,
instability, and insecurity if individuals score. Individuals who score low on this dimension are
even-tempered people who are relaxed and calm.
Extraversion, the second dimension refers to the tendency to seek other's company and be
joyful (Dilcert et al., 2005). High scorers tend to be energetic, happy, talkative, fun loving, and
positive. Individuals who score low are more likely to be introverts, passive, reserved and prefer
to be alone.
Openness to experience is also referred to as Openness to intellect and culture. Traits
encompassing this dimension include intelligence, curiosity, broadmindedness, and originality,
and creativity. Low scorers are conceptualized as being unoriginal, conventional and lacking
imagination (Dilcert et al., 2005).
The dimension of Agreeableness as described by Dilcert et al. (2005) includes traits like
kindness, courteousness, friendliness, sensitivity, caring, and cooperativeness. Consciousness,
last dimension of Big Five include traits like achievement orientation, responsibility, preference,
and dependability. People who score high on this dimension are very organized, hard workers,
driven, are perfectionists and rule following. People who score low are often described as
impulsive, careless, and not dependable.
The five factor model (FFM) of personality is a more widely accepted and used model
than the trait based model such as 16 PF. A large number of studies suggest that the Big Five

23
personality dimensions are generalizeable and a number of meta-analyses have provided the
support for robustness across various theoretical frameworks, various measures and in other
cultures (Dilcert et al., 2005). Barrick, Mount, and Judge (2001) conducted a meta-analysis to
examine the relationship between personality traits and job performance. Across all occupational
groups, conscientiousness and to a lesser degree emotional stability were valid correlates of job
performance (r =. 33). Hurtz and Donovan's (2000) meta-analysis also supported these results.
They concluded that for sales, customer service, managers, and skills and semi skilled positions,
conscientiousness was the highest predictor of overall job performance and validities were
highest for sales and customer service. When job performance was broken down into task
performance, job dedication, and interpersonal facilitation, conscientiousness and emotional
stability predicted all the three dimensions of job performance, and agreeableness predicted
interpersonal facilitation. Salgado's (2002) meta-analysis of the Big Five personality dimensions
and counter-productive work behaviors showed less conscientious and agreeable employees
displayed more counter-productive behaviors.
Personality constructs can be assessed through a variety of methods, such as, self-report
inventories, behavioral judgments, biodata, assessment center ratings, situational judgment tests
and interviews (Gatewood & Field, 2001; Ones, 2005). Self-report inventories consist of items
that ask the respondents to indicate their personal information about their thoughts, feelings,
emotions and past experiences. Some examples of such inventories are the California Personality
Inventory (CPI), Occupational Personality Questionnaire (OPQ 32i or OPQ 32 n), Hogan
Personality Inventory and others.
Though it is difficult to cheat on a personality measure because the items do not have any
correct or incorrect answers, candidates can still fake good or respond in a socially desirable

24
way. They can misrepresent themselves by portraying the traits that are necessary for the job but
not possessed by them, provided they know what traits the company is looking for. They can
possibly glean some information on traits and competencies from the job descriptions and job
postings.
Summary
The use of unproctored online testing is becoming pervasive in making selection
decisions. More companies are using online testing in their selection processes due to benefits of
speed of time-to-hire, cost and convenience to the candidates. Previous research focused on
establishing equivalence of online tests with their paper-pencil counterparts. Two groups of
research using personality measures are currently being pursued. One group is focused on
comparing online proctored and unproctored test administrations to see if any differences in test
scores exist between the two groups. The second line of research is focused on the issues of
faking and social desirability in unproctored administration of personality measures. In their
review, Lievens and Harris (2003) noted that preliminary research found equivalence between
online and paper-pencil tests. They also indicated that small differences were found between
supervised paper-pencil and unsupervised online test administrations. However, they advised
caution in interpreting these results due to small number of studies in this area of research.
Experts in the field suggest companies administer cognitive ability tests in a proctored setting, as
they are prone to cheating. Biodata and personality measures can be administered in an
unproctored environment to screen out candidates and decrease selection process cost.
Even though equivalence across modes of administration is not fully established, many
companies are using selection measures in unproctored settings, including personality

25
questionnaires to screen out applicants. Further research using real applicants should determine if
any differences exist between modes of administration, i.e., a candidate would get the same score
regardless whether he or she takes the test in a controlled proctored or a remote, unproctored
setting.
Hypotheses
Research in the field of online testing has concentrated on examining the equivalence
between the test delivery methods (traditional paper-pencil versus online tests). These studies
have compared proctored paper and pencil mode of administration to unproctored online testing
(e.g., Bartram and Brown, 2004; Coyne et al., 2005; Cronk and West, 2002; Kriek & Joubert,
2007). The limitation of past research was in the design, i.e., the test delivery method (online
test) was not kept constant. Most studies compared proctored paper-pencil with unproctored
online test administrations. As a result, equivalence was established between traditional and
online testing, not necessarily between modes of administration (proctored versus unproctored).
There is evidence of only one study done in Singapore that kept the delivery method constant
and examined the equivalence between proctored and unproctored online testing both between
and within groups over time (Templer, 2005).
Increasing numbers of companies are recruiting via the Internet and interested in online
testing. Many companies are already using unproctored online testing, even though equivalence
of the proctored and unproctored test administrations has not been established. The objective of
this research study is to add to the current research on unproctored online testing. It aims to
examine whether lack of presence of a monitor/proctor can in any way change the data quality
when compared with online testing in the presence of a proctor. There was a need to resolve

26
design issues and conduct a research study in which all other variables were kept constant so that
if significant differences were found, they would represent true differences between the modes of
administration. In addition to comparing the proctored versus unproctored groups, this study
would extend the online testing research using the OPQ32 on US population. If differences are
not found between the two groups, then equivalence would be established between the modes of
administration. If results indicated presence of statistical significant differences between the two
groups, then following questions can be asked:
1. What is causing these differences, is it because of faking to appear more job desirable, transparency of the personality measure, or applicants’ cognitive ability?
2. Do these differences matter in the real world?
3. What can companies do to prevent applicants from faking on the personality measures?
Results from using real selection data will provide some direction to vendor companies hosting
unproctored online testing sessions and client companies using or considering unproctored online
testing.
The design of the present study is unique, in that all the variables including test delivery
(online), company, close time period and jobs were kept constant. The two sample groups were
taken from the same company and all candidates applied for management positions. The two
samples were also close to each other in time period, hence there would be no differences
between candidates applying for the jobs due to the digital divide. The study was so designed so
that if significant scale mean differences were found between the two groups, they would reflect
the true differences due to mode of administration (proctored versus unproctored setting) and not
due to test delivery method (paper-pencil versus online).
Results from past research using personality measures found similar means and variances
for the two groups (Cronk & West, 2002, Drasgow, 2004) and small to medium effect sizes

27
between the proctored and unproctored groups (Coyne, Warstza, Beadle, & Sheehan, 2005;
Drasgow, 2004). In previous research on proctored paper-pencil and unproctored versions of
OPQ32i, very small to medium effect sizes were reported (Bartram & Brown, 2004); Kriek &
Joubert, 2007).
Because small to medium differences were found in research, it cannot be concluded
conclusively that the modes of administrations were equivalent. Researchers concluded
equivalence based on Cohen’s rules of thumb, not based on prior research or knowledge about
the scales. They did not indicate how small of a difference would indicate that the scores were
not affected by the presence of a proctor or conversely how big of a range of mean differences
would conclude that there was indeed a difference. The results have to be used with caution
because the confidence interval (CI) estimates were not reported which would give more support
for the hypothesis test. Also, most of the research using the personality measure used in the study
has been done using samples from other countries, limiting the practicality and implications to
the US population.
Hypothesis 1: There will be no mean scale differences between the proctored and unproctored testing session across the 32 scales.
Hypothesis 2: There will be no mean differences between the proctored and unproctored groups across the Big Five dimensions.
Hypothesis 3: The factor structure of the OPQ32i will be similar for both proctored and unproctored groups. The scale loadings on the factors will be similar for both the groups.

28
METHODS
Sample
Archival data was obtained from a Fortune 500 financial company. The sample consisted
of responses from 5290 candidates who took the personality measure as a part of the selection
process. One group was administered the questionnaire online in a proctored testing session, and
the other group of candidates completed the questionnaire from an unproctored, remote location.
The proctored group data was collected from the Web server of the client financial company and
the unproctored group came from the Web server of a host company. The proctored
administrations were available from year 2005 and the remote online (i.e., unproctored)
administrations were available from June 2005 to November 2006. Scores from 803 applicants
were available from the proctored testing sessions and 4487 applicants for the unproctored
session. The candidates applied for one of three management positions: Analyst, Specialist, or
Technical. The proctored group consisted of 551 (68.6 %) males and 208 (25.9 %) females. The
ethnic distribution of this group consisted of 437 White candidates (54.4 %), 43 identified
themselves as African American (5.4 %), 25 were Hispanic (3.1 %), and 187 applicants were
Asian (23.3 %). In terms of the age of applicants, 574 candidates (71.5 %) indicated being over
40 years, 168 reported being under 40 years (20.9 %). The details of the proctored group
descriptives are presented in Table 1. Demographic information for the unproctored group was
not available because it was not collected by the online testing host company.
Measures
During the application process, the candidates reported their gender, race, and age. Age
could be reported as over 40 years, under 40 years and not reported. The race categories that

29
candidates could select included: White, African American, Hispanic, American Indian, Asian,
Other and not reported. Gender categories included Male, Female, and Not reported.
Table 1
Sample Descriptive including Gender, Race and Age of Proctored Group*
Number Percentage (%)
Male 551 68.6
Female 208 25.9 Gender
Not Indicated 44 5.5
White 437 54.4
African American 43 5.4
Hispanic 25 3.1
American Indian 47 5.9
Asian 187 23.3
Other 0 0
Race
Not Indicated 64 8
Above 40 years 574 71.5
Below 40 years 168 20.9 Age
Not Indicated 64 7.6 * Demographic information was not available for unproctored group.
The Occupational Personality Questionnaire 32, ipsative version (OPQ 32i; Technical &
Users' Manual, 1999) is a multidimensional measure. In the normative version, candidates report
their agreement with each of the 230 items. In the ipsative (forced choice) format the items are
arranged in groups of 4 items with the test-taker choosing one item as being most like me and one
as least like me.

30
Table 2 shows the 32 personality scales (dimensions) on the OPQ 32i consisting of 13
items grouped in three domains. These domains are Interpersonal Style (Relationships with
People), Cognitive Style (Thinking Style), and Affect (Feelings and Emotions). As shown in
Table 2, there are 10 scales for the Interpersonal Style and Affect domains and 12 dimensions in
the Cognitive domain. There are 104 quads, four items or statements make a quad, totaling to
416 items on the measure. For each of the quad, four statements are given and the respondents
are asked to choose one statement that is most like me and one as least like me. The average time
to complete the OPQ 32i is about 45 minutes. This measure was specifically designed to be
resistant to “faking good,” impression management, or response distortion (Bartram & Brown,
2004; Martin, Bowen, & Hunt, 2002). Martin et al. reasoned that the forced-choice measure is
superior because the choices could be balanced for social desirability. This may be why it is so
often used in Asia and Europe and its use is spreading in Australia (Bartram & Brown, 2004;
Bowen et al., 2002). The respondents are unable to elevate their scores when the forced-choice
method is used because this format adds the scores of scales to give a constant. In the US,
researchers may be resistant to using forced-choice methods because it can be only scored by
computer (Bowen et al., 2002). In addition, ipsative data is difficult to analyze and interpret
using standard statistical procedures (Baron, 2005; Hicks, 1970).
The OPQ 32 is a product of SHL Company, a leading company doing objective
assessment of people. It has been used internationally since 1984, with translations in 43
languages. According to the technical manual (SHL, 1999), the measure was based on an
occupational model of personality to describe dimensions of an individual's typical style of
behavior. Norms are available and reported for several countries (see OPQ 32 Technical Manual,
2006). The internal consistency reliabilities for OPQ 32i scales were reported for large sample of

31
data drawn from a range of countries (UK, South Africa, and Japan). The UK standardization
sample had a median reliability of .80, Japan a median reliability of .75, and South African
White only sample a median reliability of .80 but lower for ethnic sample .69 and a second
mixed racial South African group a median reliability of .81. Large dataset (N = 40,922) from 12
European countries produced median reliabilities for 32 scales ranging from .67 to.81. The
internal consistency reliability estimates of OPQ 32i scales ranged from 0.66 to 0.87 with a
median of 0.77 (OPQ 32 Technical Manual, 2006).
Table 2
Description of the OPQ32 Scales and Domains
Domains Scales or Dimensions Definitions
Persuasive The degree to which someone enjoys negotiating selling and changing other’s views
Controlling The degree to which someone enjoys taking charge and leading others
Outspoken The degree to which someone freely expresses their opinions and prepares to criticize others
Independent Minded The degree to which someone like to follow own approach
Outgoing The extent to which someone is talkative and enjoys attention
Affiliative The degree to which someone enjoys being around people
Socially Confident The degree to which someone is comfortable in social settings
Modest The degree to which someone keeps personal achievements quiet
Democratic The degree to which someone involves everybody concerned in decisions making
Interpersonal Style (Relationships with people)
Caring The degree to which someone is helping and supportive of others
(table continues)

32
Table 2 (continued).
Domains Scales or Dimensions Definitions
Data Rational The degree to which someone like statistical analysis and bases all decisions on facts and figures
Evaluative The degree to which someone critically analyzes information
Behavioral The degree to which someone analyzes people
Conventional The degree to which someone is conventional
Conceptual The degree to which someone enjoys discussing abstract concepts
Innovative The degree to which someone is creative and comes up with original ideas
Variety Seeking The degree to which someone tries new things and gets bored doing routine tasks
Adaptive The degree to which someone is able to change as the situation warrants it
Forward thinking The degree to which someone takes a long-term view
Detail Conscious The degree to which someone is methodical and detail oriented
Conscientious The degree to which someone is persistent until the job is done
Cognitive (Thinking Style)
Rule Following The degree to which someone follows rules
Relaxed The degree to which someone remains calm
Worrying The degree to which someone gets nervous
Tough Minded The degree to which someone is tough minded
Optimistic The degree to which someone is positive
Trusting The degree to which someone believes in others
Emotionally Controlled
The degree to which someone does not display any emotions
Vigorous The degree to which someone likes to do a a lot of things
Competitive The degree to which someone enjoys winning
Achieving The degree to which someone is ambitious
Affect (Feelings and Emotions)
Decisive The degree to which someone is quick to make decisions
Note: OPQ32 Technical Manual, pg 11.

33
The OPQ model was not specifically developed to fit the Five Factor model (FFM) of
personality, but the Big Five is the most accepted model and its use is pervasive in research and
industry (Bartram & Brown, 2004). However, its scales cover the entire personality domain;
hence a relationship between the OPQ model and the Big Five model was established. Factor
Analyses of the OPQ 32 produced five factors. Table 3 lists the division of OPQ 32 scales to the
Five Factor Model (FFM). The reliability for OPQ 32 based Big Five scales range from .84 to
.95 (OPQ 32 Technical Manual, 2006).
Table 3
List of OPQ32 Scales Measuring the Big Five Dimensions
Big Five Dimensions OPQ32 Scales Outgoing Socially Confident Affiliative Emotionally Controlled (reversed) Persuasive
Extraversion
Controlling Caring Democratic Independent Minded (reversed) Trusting
Agreeableness
Competitive (reversed) Conscientiousness Detail Conscious Vigorous Forward Thinking
Conscientiousness
Achieving Worrying (reversed) Relaxed Tough Minded Socially Confident
Neuroticism/ Emotionally Stability
Optimistic Innovative Conventional (reversed) Conceptual Variety Seeking
Openness to Experience
Behavioral

34
Procedure
After candidates in the proctored group applied for a management position in the analyst,
technical and specialist tracks, they completed a recruiter telephone interview as the first step in
the old selection process. The applicants who qualified were then invited for proctored
personality and cognitive ability testing. Applicants who passed this testing phase went through
3-5 structured behavioral interviews before an offer was made. In the new process, applicants
first complete an initial telephone interview. After applicants qualify, they are invited to take the
personality measure (OPQ 32i) online from anywhere at anytime. These applicants are not
proctored. Applicants may then be called in for a cognitive ability test session at a proctored site
(company office or partner site) after which they would complete 3 to 5 structured behavioral
interviews before an offer is made.
Applicants who take the OPQ 32i via a remote location receive a tester and test
administrator ID by a company known for its Web-based e-testing process. This Web-based
system distributes, administers, and analyzes professional tests, assessments and surveys. After
entering their ID on the testing Web page, candidates click submit to read the instructions and
take the test. Once a candidate has taken the test and has submitted it, he or she cannot take it
using the same tester ID. This procedure of providing access codes to test takers prevents
duplicate submissions (Cronk & West, 2002; Buchanan, 2000).
In the proctored session, the proctor helped the candidates to login on the Web page and
enter their tester ID provided by the company. Candidates were given standardized instructions
and then asked to begin the test. The candidate checked out of the system after completing the
test.

35
RESULTS
Scoring of Data
Archival data were used from a Fortune 500 financial company. Item level data were
received for both the proctored and unproctored groups. The proctored group data were received
in its raw form (e.g., most like me and least like me selections in the format of A, B, C, D). This
format was changed to the numerical form using the method as outlined by SHL: The most like
me items in the quad was given a score of 2, least like me, a score of 0, and the two remaining
statements in the quad were given a score of 1 each, totaling to a score of 4 for each quad. Each
quad gets a score of 4 and 104 quads total to 416. Statistical Package for the Social Sciences
SPSS (ver. 15) was used to yield scores on 32 scales for both proctored and unproctored groups.
In addition scoring algorithms (sent by SHL) were used to map the scales to Big Five dimensions
scores on dimensions of Extraversion, Agreeableness, Emotional Stability, Conscientiousness
and Openness to Experience and were obtained for both proctored and unproctored groups.
Sum of scores for all the items totaled to 416. This total sum for each individual was
checked for possible entry errors. Each scale can have a score ranging from 0 to 26 for the 32
scales. The total score for all subjects would each add to 416. The data was checked for extreme
scores. Out of 803 cases in the proctored group, 67 cases had a total sum of either less or more
than 416. This inconsistency may be due to miskeying of selections of A, B, C and D to the
Excel data file that was sent by the company. Therefore, these cases were deleted to yield scores
on 736 applicants. In case of the unproctored group, no inconsistencies were found. Errors were
less likely because once the applicant hit the submit button after completing the online test, the
selections were scored automatically and stored in the host company’s database.

36
Range, skewness and kurtosis of the proctored and unproctored groups are presented in
Table 4. The distribution was examined for normality for all 32 scales. On examination of the
histograms of all 32 scales, normality was assumed. Examination of the histograms revealed that
Data Rational and Worrying scales, in comparison to the other scales were slightly skewed. The
Data Rational scale was reasonably normally distributed with slight negative skewness
(skewness = -.752, kurtosis = -.087) in comparison to other scales. This indicates that more
number of applicants indicated that they liked to work with data and statistical analyses. This can
be attributed to the fact that applicants applied for management positions in a financial company.
The Worrying scale was slightly positively skewed for both the groups (skewness = .859,
kurtosis = .203), indicating that perhaps the applicants were in a stressed state of mind about
performing well on the test and displaced this stress on their response on the measure. Since the
skewness and kurtosis values were close to zero, the sample was reasonably normally distributed
and transformation of the data were not necessary
Table 4
Range, Skewness and Kurtosis of the Sample
Scales Min Max Skewness SE Skewness Kurtosis SE
Kurtosis Persuasive 0 26 .323 .034 -.492 .068 Controlling 0 26 -.082 .034 -.400 .068 Outspoken 0 25 .131 .034 -.322 .068 Independent Minded 0 23 .342 .034 -.017 .068 Outgoing 0 25 .357 .034 -.220 .068 Affiliative 0 25 .206 .034 -.063 .068 Socially Confident 0 26 -.147 .034 -.324 .068 Modest 0 26 .231 .034 -.418 .068 Democratic 2 26 -.069 .034 -.324 .068 Caring 2 26 -.050 .034 -.217 .068 Data Rational 0 26 -.752 .034 -.087 .068 Evaluative 3 26 -.139 .034 -.367 .068 Behavioral 1 26 .179 .034 -.503 .068
(table continues)

37
Table 4 (continued).
Scales Min Max Skewness SE Skewness Kurtosis SE
Kurtosis Conventional 0 26 .113 .034 -.338 .068 Conceptual 1 26 .094 .034 -.415 .068 Innovative 0 26 -.141 .034 -.593 .068 Variety Seeking 0 26 .177 .034 -.358 .068 Adaptable 0 26 .377 .034 -.437 .068 Forward Thinking 1 26 -.068 .034 -.352 .068 Detail Oriented 0 26 -.271 .034 -.218 .068 Conscientious 4 26 -.474 .034 .148 .068 Rule Following 0 26 .152 .034 -.298 .068 Relaxed 0 26 .276 .034 -.112 .068 Worrying 0 26 .859 .034 .203 .068 Tough Minded 1 26 .060 .034 -.084 .068 Optimistic 1 26 -.192 .034 -.236 .068 Trusting 0 26 .050 .034 .039 .068 Emot. Controlled 0 25 .445 .034 .032 .068 Vigorous 2 25 -.147 .034 -.260 .068 Competitive 0 26 .090 .034 -.636 .068 Achieving 3 26 -.443 .034 -.037 .068 Decisive 0 26 .417 .034 -.266 .068 Note: n = 5223; Min = minimum; Max = maximum; SE = standard error
Table 5 shows the correlations among the 32 scales for the sample, range is from -.00 to
.38. Even though these correlations are very low, they are significant at .05 alpha level. The size
of the correlations were very small and mostly negative because the forced choice method
restricts the scale variances and forces the raw scores to add to a constant for all applicants
(OPQ32 Technical Manual, Chapter 7, pg 86). This occurs because the score on one item is
dependent on the score of another item in a quad, such that one statement that is chosen as most
like me get a score of 2 is dependent on a statement that is chosen as least like me that then gets a
score of 0. This introduces dependence between the different scales scores that restricts the
scores to add to a constant sum for all individuals (Baron, 1996). This limitation of negative
multicollinarity could limit the use of factor analysis techniques.

38
Table 5 Correlations between the OPQ Scales 1 2 3 4 5 6 7 8 9 10 11 12 13 14 15 16 17 18 19 20 21 22 23 24 25 26 27 28 29 30 31 32 1. Pers 1 2. Cont .29 3. Outs .03 .13 4. Inde -.14 -.04 .15 5. Outg .29 .18 .18 -.04 6. Affi -.12 -.14 -.08 -.02 .31 7. Soci .36 .13 .05 -.21 .47 .10 8. Mode -.20 -.28 -.22 .07 -.27 -.01 -.18 9. Demo -.07 -.12 .02 -.23 .02 .22 -.01 .03 10. Cari -.15 -.23 -.22 -.08 -.07 .25 -.00 12 .27 11. Data -.26 -.15 -.08 -.15 -.25 -.08 -.18 -.08 -.04 -.08 12. Eval -.08 -.00 .15 -.02 -.21 -.26 -.11 -.11 -.01 -.18 .21 13. Beha .01 -.04 -.04 .05 .04 .11 .03 -.08 .10 .19 -.17 .06 14. Conv -.16 -.19 -.14 -.05 -.26 -.05 -.18 .18 -.06 .03 .07 -.09 -.21 15. Conc -.17 -.14 .07 .11 -.12 -.16 -.15 -.08 .01 -.07 .09 .28 .15 -.09 16. Inno .21 .13 .04 -.01 .02 -.21 .03 -.21 -.06 -.13 -.00 .09 -.05 -.31 .25 17. Vari -.15 -.03 .06 .25 .04 .05 -.11 .07 -.05 -.04 -.18 -.05 .06 -.27 .06 .15 18. Adap -.04 -.06 -.10 .01 .04 .12 -.06 -.06 -.00 .02 -.06 -.14 .04 -.04 -.11-.12 .02 19. Forw -.09 -.01 -.14 -.06 -.23 -.22 -.14 -.08 -.02 -.08 .04 .09 -.04 .00 .04 .06 -.04 -.10 20. Deta -.18 -.12 -.10 -.17 -.26 -.15 -.11 .05 -.00 .01 .23 .14 -.16 .29 -.02 -.18 -.26 -.07 .11 21. Cons -.13 -.03 -.08 -.16 -.24 -.13 -.09 .05 -.05 -.05 .12 .07 -.23 .18 -.15 -.14 -.16 -.14 .09 .38 22. Rule -.14 -.17 -.18 -.17 -.23 -.11 -.15 .16 -.04 .05 .07 -.04 -.19 .47 -.12 -.28 -.33 -.05 .00 .36 .27 23. Rela -.02 -.08 .03 -.02 -.03 -.06 .13 -.04 -.16 -.03 .03 -.12 -.10 .03 -.03 -.02 -.08 -.12 -.08 -.03 -.07 -.04 24. Worr -.29 -.27 -.10 .15 -.14 .17 -.39 .23 .09 .11 -.00 -.08 .06 .20 .01 -.29 .08 .17 -.11 .01 -.03 .12 -.31 25. Toug .03 -.08 .02 -.07 .01-.09 .14 .09 -.05 -.03 -.08 -.05 .00 -.07 .00 -.01 -.04 -.09 -.08 -.05 -.08 -.03 .30 -.17 26. Opti -.09 -.12 -.15 -.02 -.01 .05 .05 -.04 -.03 .12 -.10 -.25 -.07 .02 -.13 -.03 -.03 -.03 .16 -.13 -.03 -.02 .16 -.08 -.02 27. Trus -.14 -.18 -.09 -.17 -.09 .15 -.03 .02 .22 .29 -.01 -.18 -.04 .11 -.13 -.11 -.11 -.02 -.11 -.00 -.03 .06 .02 .06 -.05 .21 28. Emot -.16 -.16 -.25 .09 -.27-.06 -.23 .45 -.10 -.03 -.03 -.13 -.09 .19 -.12 -.20 .03 .08 -.06 .03 -.02 .17 .05 .29 .09 -.04 -.02 29. Vigo -.02 .03 -.05 -.08 .05 -.05 .03 -.04 -.14 -.07 -.02 -.05 -.12 -.07 -.14 -.06 .03 -.09 .00 .06 .20 -.00 -.11 -.08 -.07 -.08 -.08 -.09 30. Comp .16 .23 .04 .10 .03 -.07 -.08 -.17 -.22 -.28 .02 .00 -.11 -.12 -.12 .00 .01 -.02 -.00 -.26 -.09 -.13 -.07 -.07 -.16 -.10 -.18 -.08 .01 31. Achi .12 .21 -.07 -.08 .03 -.15 .05 -.18 -.15 -.16 -.01 .08 -.06 -.23 -.06 .09 .00 -.15 .17 -.08 .13 -.05 -.12 -.23 -.09 -.06 -.19 -.23 .28 .31 32. Deci .00 .11 .13 .07 -.03 -.14 -.13 -.08 -.16 -.19 -.06 .02 -.11 -.05 -.03 .08 .05 .01 -.02 -.15 -.07 -.19 .04 -.07 -.04 -.01 -.02 -.07 -.02 .06 .08 _________________________________________________________________________________________________________________________________ Note. Significant at ρ > 0.05 (2-tailed).

39
Significance Testing
The mean scale differences were used to determine if there were any significant
differences in results between proctored and unproctored groups. The t-tests coupled with mean
group inferential confidence intervals were used to determine statistical significance and effect
size estimates (Cohen’s d) and their confidence intervals were used to examine the practical
significance. The t-tests for independent samples were conducted using SPSS (ver. 15). The use
of multiple scales indicated there was heterogeneity of variance, therefore the Welch’s solution
was reported for t-tests, because it adjusts the degrees of freedom (df) downwards to correct for
the amount of heterogeneity indicated by the samples (Zimmerman, 1996). The t-tests results for
the 32 scales and Big Five dimensions are presented in Tables 6 and 7 respectively.
Next a correction to the p values was made. When multiple comparisons of the same type
are conducted, it leads to a possibility of making Type 1 error. Benjamini and Hochberg (1995)
introduced a new approach to address problems of multiple significance testing called false
discovery rate (FDR). It is defined as “the expected ratio of erroneous rejections to the number of
rejected hypotheses” (Benjamini and Hochberg, 2000).
The FDR method controls the proportion of errors among tests whose null hypothesis are
rejected. The FDR method increases power and reduces the chance of Type 1 error when large
number of comparisons of the same type is to be done, 32 comparisons in this study (Benjamini
and Rochberg, 2000). It is recommended for a large number of comparisons as it has more
statistical power than other methods (e.g., Bonferroni, Tuckey, Ryan). Also, significant
differences were not expected for many of the 32 scales, hence the FDR method was most
appropriate to use compared to other methods including Bonferroni, Tuckey, etc.

40
Table 6
Means, 95 % Inferential Confidence Intervals (ICI) for Means (M), Independent Samples t-Tests, Corrected p Values (FDR), Cohen’s d and 95 % Confidence Intervals (CI) for Cohen’s d for OPQ 32 Scales
Scales
M Unproctored
Group
UOT M ICI
M Proctored
Group
POT M ICI
t**
df
Corrected p values
Cohen’s d** Cohen’s d CI
Persuasive 12.26 12.14<μ<12.38 12.45 12.16<μ<12.74 -5.54 ~996 0.00* -0.22 -.297<d<-.140 Controlling 13.85 13.75<μ<13.95 15.14 14.91<μ<15.37 -7.42 ~1060 0.00* -0.27 -.350<d<-.194 Outspoken 11.70 11.61<μ<11.79 11.66 11.43<μ<11.89 0.28 ~993 0.89 0.01 -.069<d< .087 Ind. Minded 9.37 9.29<μ<9.46 9.00 8.79<μ<9.21 2.52 ~986 0.02 0.10 .022<d< .178 Outgoing 10.09 10.00<μ<10.18 9.75 9.51<μ<9.99 2.01 ~999 0.08 0.08 -.001<d< .155 Affiliative 11.57 11.48<μ<11.66 10.79 10.58<μ<11.00 5.10 ~1017 0.00* 0.20 .111<d< .276 Soc. Confident 13.17 13.08<μ<13.26 13.31 13.09<μ<13.53 -0.84 ~1022 0.46 -0.03 -.111<d< .045 Modest 12.04 11.93<μ<12.15 11.85 11.52<μ<12.18 1.04 ~1042 0.38 0.04 -.039<d< .117 Democratic 14.91 14.83<μ<14.99 15.11 14.89<μ<15.33 -1.31 ~990 0.26 -0.05 -.132<d< .024 Caring 14.32 14.24<μ<14.40 13.94 13.75<μ<14.13 2.71 ~1030 0.02 0.10 .025<d< .181 Data Rational 19.05 18.93<μ<19.17 17.99 17.46<μ<18.32 4.53 ~952 0.00* 0.19 .114<d< .270 Evaluative 16.46 16.38<μ<16.54 16.84 16.63<μ<17.05 -2.51 ~997 0.02 -0.10 -.178<d<-.022 Behavioral 12.68 12.57<μ<12.79 12.40 12.14<μ<12.66 1.45 ~995 0.21 0.06 -.020<d< .136 Conventional 11.13 11.04<μ<11.22 10.48 10.26<μ<10.70 4.09 ~994 0.00* 0.16 .083<d< .239 Conceptual 13.77 13.67<μ<13.87 13.58 13.31<μ<13.85 0.99 ~967 0.40 0.04 -.038<d< .118 Innovative 14.88 14.76<μ<15.00 15.62 15.33<μ<15.91 -3.53 ~991 0.00* -0.14 -.219<d<-.063 Vari. Seeking 12.60 12.51<μ<12.69 12.62 12.38<μ<12.86 -0.12 ~1007 0.96 -0.01 -.083<d< .073 Adaptable 10.63 10.52<μ<10.74 10.96 10.70<μ<11.22 -1.73 ~1034 0.13 -0.07 -.144<d< .012 For. Thinking 14.89 14.80<μ<14.98 15.65 15.44<μ<15.86 -4.72 ~1041 0.00* -0.18 -.257<d<-.101 Detail Cons. 15.08 14.99<μ<15.17 14.92 14.68<μ<15.16 0.90 ~997 0.43 0.04 -.041<d< .115 Conscientious 18.98 18.91<μ<19.05 18.98 18.80<μ<19.16 -0.03 ~1009 0.99 0.02 -.060<d< .096 Rule Following 12.34 12.23<μ<12.45 11.72 11.46<μ<11.98 3.32 ~1031 0.00* 0.13 .047<d< .203 Relaxed 10.87 10.78<μ<10.96 10.31 10.07<μ<10.55 3.24 ~1003 0.00* 0.13 .050<d< .206 Worrying 6.68 6.58<μ<6.78 5.75 5.53<μ<5.79 5.62 ~1095 0.00* 0.20 .120<d< .276 Tough Minded 12.68 12.60<μ<12.76 12.15 11.95<μ<12.30 3.65 ~1001 0.00* 0.14 .064<d< .220 Optimistic 15.27 15.18<μ<15.36 15.70 15.47<μ<15.93 -2.62 ~1018 0.02 -0.10 -.177<d<-.021 Trusting 11.65 11.56<μ<11.74 11.65 11.44<μ<11.86 -0.02 ~1040 0.99 0.01 -.073<d< .083 Emo. Controlled 8.51 8.42<μ<8.60 8.23 8.02<μ<8.43 1.80 ~1036 0.12 0.07 -.011<d< .145 Vigorous 15.11 15.03<μ<15.19 15.46 15.27<μ<15.65 -2.38 ~1063 0.03 -0.09 -.165<d<-.009 Competitive 12.59 12.46<μ<12.72 12.95 12.64<μ<13.26 -1.60 ~999 0.16 -0.06 -.142<d< .014 Achieving 17.87 17.79<μ<17.95 18.42 18.24<μ<18.60 -4.09 ~1036 0.00* -0.15 -.232<d<-.076 Decisive 9.98 9.88<μ<10.08 10.61 10.36<μ<10.86 -3.48 ~1008 0.00* -0.13 -.212<d<-.056 Note. * Values are less than .001** Negative values indicate proctored group scored higher than unproctored group.

41
Table 7
Means, 95 % Inferential Confidence Intervals (ICI) for Means (M), Independent Samples t-Tests, Corrected p Values (FDR), Cohen’s d and 95 % Confidence Intervals (CI) for Cohen’s d for OPQ Scales Mapped to Big Five Dimensions
Scales Extraversion Openness Emot. Stability Agreeableness Consciousness
M Unproctored Group 8.69 7.37 8.63 5.94 16.52
UOT Group M ICIs 8.63<μ<8.75 7.31<μ<7.43 8.57<μ<8.69 5.88<μ<6.00 16.47<μ<16.57
M Proctored Group 8.89 7.60 8.70 5.87 16.72
POT Group M ICIs 8.75<μ<9.03 7.45<μ<7.75 8.57<μ<8.83 5.73<μ<6.01 16.60<μ<16.84
t* -1.97 -2.46 -0.70 0.55 -2.24
df ~1020 ~993 ~1028 ~1012 ~1010
Corr.p values 0.08 0.06 0.58 0.58 0.12
Cohen’s d* -0.08 -0.10 -0.03 0.03 -0.08
CI Estimates -.15<d<-.003 -.18<d<-.02 -.10<d< .05 -.05<d< .10 -.16<d<-.005
*Negative sign indicates that proctored group scored higher than unproctored group.
The present research study aims to conduct multiple tests for 32 separate scales of related
hypothesis of difference between proctored and unproctored groups. Conducting these separate
analyses for 32 scales and reaching a decision of no difference between the proctored and
unproctored groups is based on a few significant results, which may be problematic. This causes
problems of unequal variances due to difference in group sizes (proctored group, n = 736 and

42
unproctored, n = 4487) and chance of committing a Type I error. Other methods like Bonferroni
could be used but using the this adjustment reduces the comparisons in its standard form. Hence
Benjamini-Hochberg (BH) correction was made using MULTTEST package from the R
Foundation for Statistical Computing Package’s (R.2.5.0) to yield corrected p values. The
corrected p values for the 32 scales are displayed in Table 6 and Big Five dimensions are
displayed in Table 7.
When mean difference scores are used, individual group data might get lost. Tryon’s
approach of inferential confidence intervals (ICI) are used for graphical display of group means
and their confidence intervals. It is also used for equivalence testing, to show statistical
significant difference, equivalence, and it also allows indeterminancy, when no difference or
equivalence is found. For group differences a correction or reduction term must be calculated.
This reduction term is the ratio of the standard error of difference between means to the sum of
the standard errors. Tryon’s combined numeric and graphical approach to test significant
difference helps to avoid the common interpretive problems associated with null hypothesis
statistical testing (NHST). The typical method of NHST looks for differences between groups by
concluding that if there is no difference, there must be equivalence (Tryon, 2001). In the ICI
approach, there must be a substantial difference large enough to conclude it is not due to
sampling error. And if there is a small substantial difference, small enough to reject that the
closeness is due to sampling difference. According to Tryon (2001), statistical difference
between two groups exists if the two inferential confidence intervals (ICI) do not overlap; the
higher limit of the lesser mean is less than the lower limit of the higher mean. Statistical
equivalence results when the maximum mean difference estimate by the ICI is less than the
amount that defines equivalence. Statistical indeterminacy occurs when the means are neither

43
statistically different nor equivalent. Graphically, statistical difference results if there is no
overlap between the group means. If an overlap is observed, statistical equivalence result is
noticed. When the group means ICIs neither overlap nor, not overlap with each other, it provides
a result of indeterminancy.
R 2.5.0 was used to calculate the inferential confidence intervals (ICIs) for the group
means. The group means and their ICIs are displayed in Table 6 and 7 for OPQ scales and Big
Five dimensions respectively. The graphs are consistent with the uncorrected t-tests. The
graphical representation of the group means and their ICIs are displayed in Figure 1-6 for the
scales under the umbrella of the Big Five dimensions and “Other” dimension consisting of OPQ
32 scales not mapped to Big Five dimensions for easy comparison. The group mean ICIs of the
nineteen scales did not overlap, meaning that they were statistically different. The ICIs of means
for the remaining thirteen scales showed overlap, hence they were statistically equivalent. The
graphical representation of the group means and their ICIs are displayed in Figure 7 for the Big
Five dimensions. Out of the Big Five dimensions, the group mean ICIs for Emotional stability
and Agreeableness showed overlap, hence they were statistically equivalent. The profile of the
groups were similar for all the 32 scales and the Big Five dimensions, as noticed in Figures 1-7,
indicating that there are no practical differences between the two groups across the OPQ 32
scales.
To test the practical significance, effect size estimates were used. Cohen’s d was the
effect size of choice that was reported. Cohen’s d was used to evaluate effect size (ES) estimate
which is the magnitude of difference between two independent groups-proctored and
unproctored measured by the standardized difference between the two means. Cohen (1977)
offered some guidelines to interpret effect sizes, though he emphasized that interpretation must

44
be based on prior research and knowledge of the scale. In general, the effect size of .2 can be
considered small, .5 medium and .8 a large difference. The R.2.5.0 MBESS was used to calculate
the standardized mean scale differences. This is shown in column for Cohen’s d in Table 6 and 7
for 32 scales and Big Five dimensions respectively. A negative value means that online
proctored scores are greater than unproctored; a positive value means that the unproctored scores
are greater than the proctored scores. Cohen’s d ranged from .01 (Outspoken and Trusting scales)
to -.27 (Controlling scale). The largest positive difference was .20 indicating the unproctored
group scored higher on Worrying and Affiliative Scales. The largest negative difference was .27
showing that the proctored scored higher on the Controlling Scale.
Confidence intervals (CI) were then calculated for Cohen’s d using R.2.5.0 MBESS.
Researchers and American Psychological Association recommends the reporting of CI,
especially for effect sizes estimates (Thompson, 2002). The CIs along with the effect size
estimates for the 32 scales and Big Five dimensions are reported in Tables 6 and 7 respectively.
The graphs are consistent with the uncorrected t-tests. The CI is a representation of any values
that can exist between the intervals (Thompson, 2002). If the CIs do not include a value of zero,
then the significance test for that data is always statistically significant. The graphical display of
Cohen’s d and their CI for all 32 scales was constructed using R 2.5.0 GPLOTS. These are
displayed according to scales mapped to the Big Five dimensions and other scales not mapped to
Big Five (Figures 1 - 6). The width of the confidence intervals indicates precision. When the
widths of the CIs are large, there is less precision of the study (Thompson, 2002). As noticed in
Figures 1-7, the width of the Cohen’s d CIs was small, indicating precision of the study.

45
810
1214
16
Scales
Gro
up M
eans
ICI
OutgoingSocially
Confident AffiliativeEmotionallyControlled Persuasive Controlling
810
1214
168
1012
1416
Scales
Gro
up M
eans
ICI
OutgoingSocially
Confident AffiliativeEmotionallyControlled Persuasive Controlling
810
1214
16 Unproctored GroupProctored Group
-1.0
-0.5
0.0
0.5
1.0
Scales
Coh
en's
d w
ith C
I
OutgoingSocially
Confident AffiliativeEmotionallyControlled Persuasive Controlling
Figure 1. Graphical display of group means, inferential confidence intervals for means, Cohen’s d and confidence intervals for Cohen’s d of OPQ scales mapping to the Extraversion dimension for proctored and unproctored groups.
1012
1416
Scales
Gro
up M
eans
ICI
Caring DemocraticIndepedendent
Minded TrustingCompetitive
911
1315
1012
1416
Scales
Gro
up M
eans
ICI
Caring DemocraticIndepedendent
Minded TrustingCompetitive
911
1315
Unproctored GroupProctored Group
-1.0
-0.5
0.0
0.5
1.0
Scales
Coh
en's
d w
ith C
I
Caring DemocraticIndepedendent
Minded TrustingCompetitive
Figure 2. Graphical display of group means, inferential confidence intervals, Cohen’s d, confidence intervals for Cohen’s d of OPQ scales mapping to the Agreeableness dimension for proctored and unproctored groups.

46
1415
1617
1819
Scales
Gro
up M
eans
ICI
ConscientiousDetail
Conscious VigorousForwardThinking Achieving
1415
1614
1516
1718
19
Scales
Gro
up M
eans
ICI
ConscientiousDetail
Conscious VigorousForwardThinking Achieving
1415
16
Unproctored GroupProctored Group
-1.0
-0.5
0.0
0.5
1.0
Scales
Coh
en's
d w
ith C
I
ConscientiousDetail
Conscious VigorousForwardThinking Achieving
Figure 3. Graphical display of group means, inferential confidence intervals of means, Cohen’s d, confidence intervals of Cohen’s d of OPQ scales mapping to the Conscientiousness dimension for proctored and unproctored groups.
68
1014
Scales
Gro
up M
eans
ICI
Worrying RelaxedTough
MindedSocially
Confident Optimistic
57
911
146
810
14
Scales
Gro
up M
eans
ICI
Worrying RelaxedTough
MindedSocially
Confident Optimistic
57
911
14
Unproctored GroupProctored Group
-1.0
-0.5
0.0
0.5
1.0
Scales
Coh
en's
d w
ith C
I
Worrying RelaxedTough
MindedSocially
Confident Optimistic
Figure 4. Graphical display of group means, inferential confidence intervals of means, Cohen’s d, confidence intervals of Cohen’s d for OPQ scales mapping to the Emotional Stability dimension for proctored and unproctored groups.

47
1012
1416
Scales
Gro
up M
eans
ICI
Innovative Conventional ConceptualVariety
Seeking Behavioural
1012
1416
1012
1416
Scales
Gro
up M
eans
ICI
Innovative Conventional ConceptualVariety
Seeking Behavioural
1012
1416 Unproctored Group
Proctored Group
-1.0
-0.5
0.0
0.5
1.0
Scales
Coh
en's
d w
ith C
I
Innovative Conventional ConceptualVariety
Seeking Behavioural
Figure 5. Graphical display of group means, inferential confidence intervals of means, Cohen’s d and confidence intervals of Cohen’s d for OPQ scales mapping to the Openness to Experience dimension for proctored and unproctored groups.
1014
18
Scales
Gro
up M
eans
ICI
OutspokenData
Rational Evaluative AdaptableRule
Following Decisive Modest
911
1410
1418
Scales
Gro
up M
eans
ICI
OutspokenData
Rational Evaluative AdaptableRule
Following Decisive Modest
911
14
Unproctored GroupProctored Group
-1.0
-0.5
0.0
0.5
1.0
Scales
Coh
en's
d w
ith C
I
OutspokenData
Rational Evaluative AdaptableRule
Following Decisive Modest
Figure 6. Graphical display of group means, inferential confidence intervals of means, Cohen’s d, and confidence intervals of Cohen’s d for OPQ scales not mapping to the Big Five dimensions for proctored and unproctored groups.

48
46
812
16
Big Five Dimensions
Gro
up M
eans
ICI
ExtraversionOpenness
to ExperienceEmotionalStability Agreeableness Conscientiousness
46
811
1417
46
812
16
Big Five Dimensions
Gro
up M
eans
ICI
ExtraversionOpenness
to ExperienceEmotionalStability Agreeableness Conscientiousness
46
811
1417 Unproctored Group
Proctored Group
-1.0
-0.5
0.0
0.5
1.0
Big Five Dimensions
Coh
en's
d w
ith C
I
Extraversion OpennessEmotionalStability Agreeableness Conscientiousnes
Figure 7. Graphical display of group means, inferential confidence intervals of means, Cohen’s d, and confidence intervals of Cohen’s d for Big Five dimensions for proctored and unproctored groups.
The effect sizes (Cohen’s d) for 32 scales range from very small to small, as is consistent
with previous research using OPQ32i (Bartram and Brown, 2004, Kriek and Joubert, 2007). In
fact, the effect sizes estimates in this study are smaller than those obtained in previous research,
which were small to medium effect size estimates. The small effect sizes suggest that practically
there are no differences between proctored and unproctored groups. These estimates are very
small according to Cohen’s classification and prior research (Bartram and Brown, 2004, Kriek
and Joubert, 2007).

49
Examination of Table 6 shows there are some statistical but very small differences
between the proctored and unproctored groups across a few of the 32 scales, largely due to the
large sample size. For the Persuasive scale, the proctored group (M = 12.45, SD = 5.38, n =736)
was significantly higher than the unproctored group (M = 11.26, SD = 5.43, n = 4487), t (~996) =
-5.54, p = <.001, d =-.22. A 95% confidence interval for the difference between the two groups
run from -.30 to -.14. Since the CI does not contain zero as a possible effect, hence the null
hypothesis of no difference is rejected. In case of the Socially Confident scale, the proctored
group (M = 13.31, SD = 4.07, n = 736) did not differ significantly from the unproctored group
(M = 13.17, SD = 4.30, n = 4487), t(~1022) = -.84, p = .46, d =-.03. A 95% confidence interval
for the difference between the two groups range from -.11 to .05. Since this confidence interval
contains 0, hence the null hypothesis of no difference was accepted.
In sum, the proctored group scored higher in Persuasive, Controlling, Socially Confident,
Democratic, Evaluative, Innovative, Variety Seeking, Adaptable, Optimistic, Vigorous,
Competitive, Achieving and Decisive. There was statistical difference between the two groups
for 14 of the 32 scales. However, despite the statistical differences, the Cohen’s d range from .02
to .27 and the largest possible effect size (-.27) is small, concluding that there are negligible
differences between the two groups.
The effect sizes for Big Five factors ranged from .03 (Emotional Stability/Neuroticism
and Agreeableness) to .10 (Openness to Experience). All the Big Five dimensions had very small
effect size estimates (Table 7). The proctored and unproctored groups showed statistical
significant differences across all Big Five dimensions except for Emotional Stability and
Agreeableness for which the null hypothesis was accepted (Table 7). However, the highest

50
effect size on dimension of Openness to Experience was very small (d = .10), hence negligible
differences between the two groups can be concluded.
In summary, there were statistical differences for the 32 scales and the Big Five
dimensions. For 14 of the 32 scales and the dimension of Emotional Stability and Agreeableness
from the Big Five dimensions, null hypothesis of no difference was accepted. For the other
scales and the Big Five dimensions, the null hypothesis was rejected. However, the effect sizes
ranged from small to very small (d ≤ .27) across the 32 scales and (d ≤.11) across Big Five
dimensions, concluding practically there were negligible differences between the two groups.
Hence, Hypothesis 1 of no difference between proctored and unproctored groups across 32 scales
and Hypothesis 2 of no difference between proctored and unproctored groups across the Big Five
dimensions were supported.
Exploratory Analysis
Although factor analysis had been planned to confirm the factor structure of the scales
that mapped to Big Five dimensions (Figure 8) and mapped to Great Eight factor model (Figure
9), it could not be conducted because the correlation matrix was not positive definite. The
correlations among the scales were mostly negative and small. Since the scores for all applicants
across the scales was a constant, leading to no variability from one applicant to another, the
ipsative data was not factor analyzable. Hicks (1970) listed some properties of ipsative measures,
originally reported by Clemens (1966) and Radcliffe (1963). The first property of ipsative
measures is the sums of columns and rows of the covariance matrix are zero. When variances are
zero, the intercorrelation matrices are also zero. The average intercorrelation will be limited to -
1/ (m-1), where m is the number of scales or traits in the ipsative measure. The fourth property is

51
the sum of the covariances terms obtained between a specified criterion and a set of ipsative
scores is zero. The final property is that when variances are equal, the sum of the validity
coefficient is also zero. Due to these properties of ipsative data, standard statistical procedures
including Factor Analysis (FA) cannot be conducted.
Outgoing Socially Confident Affiliative Emotionally Controlled Persuasive Controlling Caring Democratic Independent Minded Trusting Competitive Conscientious Detail Conscious Vigorous Forward Thinking Achieving Worrying Relaxed Tough Minded Socially Confident Optimistic Innovative Conventional Conceptual Variety Seeking Behavioral
Figure 8. OPQ scales mapped to Big Five model.
On Saville and Willson’s (1991) suggestion, principal component analysis (PCA) using
Varimax rotation was conducted to determine the components for proctored and unproctored
groups separately to identify differences between the two groups. Dunlap and Willson (1994)
suggested dropping one scale to reduce the ipsative nature of the data before conducting the
PCA. Data rational scale was dropped and PCA was conducted on 31 scales for both proctored
and unproctored groups and eleven components were extracted. After this exploratory analysis,
Personality
Extraversion
Agreeableness
Conscientious
Emotional Stability
Openness to Experience

52
out of the 32 scales, 27 were used in the analysis because these mapped to the Great Eight factor
model suggested by SHL (Figure 9). Varimax rotation was used because it provides the simplest
component structure and it simplifies components by maximizing the variance of the loadings
with components across variables (Tabachnick & Fidell, 2001).
Controlling Worrying Decisive Caring Democratic Outspoken Behavioral Persuasive Socially Confident Outgoing Adaptive Data Rational Conceptual Evaluative Innovative Forward Thinking Conventional Conceptual Detail Rational Rule Following Conscientious Vigorous Tough Minded Relaxed Optimistic Independent Minded Achieving Competitive
Figure 9. OPQ scales mapped to Great Eight factor model.
For both proctored and unproctored groups, the PCA identified nine components based
on the initial eigenvalues of 1.0 criterion accounting for 59.92 % of the variance for the
proctored group (Table 9) and 59.39 % for the unproctored group (Table 8). The loadings on
components were cleaner for the proctored group. Visual inspection of the Scree plots for both
Personality
Factor 1
Factor 2
Factor 3
Factor 4
Factor 5
Factor 6
Factor 7
Factor 8

53
proctored (Figure 10) and unproctored group (Figure 11) suggests that there are nine components
that are extracted.
For the unproctored group, the first component has an eigenvalue of more than 3, the next
two components have a value of more than 2 and the rest have an eigenvalue of more than 1.0
criterion. Analysis of the PCA pattern matrix indicated that the 27 scales loaded significantly on
the components with loadings above .30 (Table 10). The scales did not exactly load according to
the mapping of eight-factor model proposed by authors of OPQ32 (Figure 9). Loadings on
component fit the scale loadings on Factor six of the Great Eight factor model with the exception
of Vigorous. Detail Conscious, Conscientious, Conventional and Rule following loaded on the
first component. Controlling, Worrying, and Persuasive loaded on Component two that was
similar to the original factor one with the exception of Persuasive. The Caring, Behavioral,
Outspoken loaded onto a component similar to the original mapping with an exception of the
Decisive scale. Innovative, Optimistic, Evaluative, Adaptable and Outspoken scales loaded on
the third component. None of these except Persuasive and Outspoken mapped the original factor
7. Some components are difficult to interpret as the loadings of the scales do not lend themselves
to be easily interpretable. Some scales including Innovative, Outspoken, Independent Minded
and behavioral scales cross load on more than two components.
PCA on proctored data also resulted in extraction of nine factors. Though the component
structure was less difficult to interpret but most scales did not map to the Great Eight factor
model presented by SHL. The first component had an eigenvalue of more than three, the next
two components more than two and the rest of the components more than one. The loadings were
slightly cleaner for the proctored group as compared to the unproctored group (Table 9).

54
The scale loadings on a few components were similar to the factor loadings on the Great
eight factor model. Some components had scale loadings that did not completely match the eight
factor model loadings. Other components indicated overlap of a few scales. Comparison of the
principal component pattern matrix (Table 12) for proctored and unproctored groups indicates
that the loadings of scales on the components are similar for only for component one, two, eight
and nine.
In sum, the results from the Principal Component Analysis showed very little overlap
with the factor loadings on the Great Eight factor model. Some loadings of scales on the
components were random and thus were difficult to interpret. In addition, there was presence of
bipolar factors loading on the same component. As seen in Table 12, the scale loadings differed
for proctored and unproctored groups, except some similarity on four components. Hypothesis 3
that stated there will be similar factor structure for both proctored and unproctored groups was
rejected.

55
Table 8 Initial Eigenvalues and Total Variance Explained for Unproctored Group
Initial Eigenvalues Extraction Sums of Squared Loadings Rotation Sums of Squared Loadings Total % of Variance Cumulative % Total % of Variance Cumulative % Total % of Variance Cumulative %
1 3.325 12.315 12.315 3.325 12.315 12.315 2.465 9.129 9.129 2 2.344 8.683 20.998 2.344 8.683 20.998 2.428 8.993 18.122 3 2.135 7.908 28.906 2.135 7.908 28.906 1.883 6.976 25.098 4 1.792 6.637 35.542 1.792 6.637 35.542 1.808 6.697 31.795 5 1.666 6.169 41.711 1.666 6.169 41.711 1.686 6.245 38.040 6 1.479 5.477 47.188 1.479 5.477 47.188 1.531 5.669 43.709 7 1.157 4.285 51.472 1.157 4.285 51.472 1.505 5.573 49.282 8 1.083 4.013 55.485 1.083 4.013 55.485 1.415 5.239 54.521 9 1.053 3.901 59.387 1.053 3.901 59.387 1.314 4.865 59.387 10 .973 3.603 62.989 11 .937 3.469 66.458 12 .897 3.322 69.780 13 .814 3.015 72.795 14 .787 2.916 75.711 15 .680 2.519 78.230 16 .654 2.421 80.651 17 .648 2.401 83.052 18 .600 2.220 85.273 19 .577 2.138 87.410 20 .538 1.994 89.404 21 .512 1.897 91.301 22 .477 1.767 93.068 23 .472 1.747 94.815 24 .454 1.681 96.496 25 .427 1.582 98.078 26 .386 1.431 99.510 27 .132 .490 100.000
Extraction Method: Principal Component Analysis.

56
Table 9 Intial Eigenvalues and Total Variance Explained for the Proctored Group
Initial Eigenvalues Extraction Sums of Squared Loadings Rotation Sums of Squared Loadings Component Total % of Variance Cumulative % Total % of Variance Cumulative % Total % of Variance Cumulative % 1 3.051 11.299 11.299 3.051 11.299 11.299 2.259 8.366 8.366 2 2.444 9.050 20.349 2.444 9.050 20.349 1.917 7.099 15.465 3 2.162 8.008 28.357 2.162 8.008 28.357 1.893 7.011 22.476 4 1.893 7.011 35.369 1.893 7.011 35.369 1.845 6.833 29.309 5 1.662 6.155 41.524 1.662 6.155 41.524 1.803 6.679 35.989 6 1.445 5.353 46.877 1.445 5.353 46.877 1.788 6.621 42.610 7 1.246 4.617 51.494 1.246 4.617 51.494 1.650 6.110 48.720 8 1.201 4.447 55.941 1.201 4.447 55.941 1.571 5.818 54.538 9 1.074 3.977 59.917 1.074 3.977 59.917 1.452 5.379 59.917 10 .967 3.580 63.498 11 .952 3.527 67.025 12 .855 3.166 70.191 13 .803 2.972 73.163 14 .742 2.749 75.913 15 .734 2.718 78.631 16 .685 2.538 81.168 17 .658 2.436 83.605 18 .593 2.197 85.802 19 .555 2.056 87.858 20 .536 1.984 89.841 21 .529 1.960 91.801 22 .476 1.762 93.563 23 .455 1.685 95.248 24 .409 1.515 96.763 25 .386 1.431 98.194 26 .365 1.350 99.544 27 .123 .456 100.000
Extraction Method: Principal Component Analysis.

57
Figure 10. Scree plot for the principal component varimax rotation analysis for 27 scales for the proctored group
Component Number
27
26
25
24 23
22
21
20
19
18
17
16
15
14
13
12
11
10
987654321
Eige
nval
ue
4
3
2
1
0

58
Figure 11. Scree plot for the principal component varimax rotation analysis for 27scales for the unproctored group
Component Number27262524232221 20 19181716151413121110987654 321
Eige
nval
ue
4
3
2
1
0

59
Table 10 Nine-Factor Varimax Rotation Component Loadings for 27 Scales for the Proctored Group*
Scales Component 1 2 3 4 5 6 7 8 9 Conventional .789 Rule following .759 Detail Conscious .489 .353 Innovative -.488 .351 Persuasive .732 Controlling .608 Outgoing -.694 Forward Minded .680 Socially Confident -.619 .346 Relaxed .740 Tough Minded .676 Worrying -.381 -.652 Optimistic -.733 Evaluative .666 Conceptual -.328 .302 .456 Democratic .700 Competitive -.670 Caring -.305 .469 .331 Adaptable -.391 -.321 Vigorous .777 Achieving .566 Conscientious .348 .492 Decisive -.660 Behavioral .574 Outspoken .359 -.562 Data Rational -.315 .730 Independent Minded -.662
* Factor loadings less than .30 were suppressed

60
Table 11 Nine-Factor Varimax Rotation Component Loadings for 27 Scales for the Unproctored Group*
Component
1 2 3 4 5 6 7 8 9 Rule Following .769 Conventional .736 Detail Conscious .640 Conscientious .524 .478 Innovative -.412 .315 .324 Persuasive .741 Socially Confident .659 Controlling .554 Worrying -.549 -.402 -.314 Outgoing -.304 .515 -.345 Evaluative .735 Conceptual .608 Adaptable -.366 -.353 -.344 Competitive .727 Democratic -.662 -.308 Caring -.513 -.399 Relaxed .778 Tough Minded .683 Vigorous .818 Achieving .417 .537 Forward Minded .726 Optimistic -.500 .545 Decisive .684 Outspoken .322 .526 .377 Behavioral -.334 -.481 .316 Data rational -.657 Independent Minded -.386 .316 .570
* Factor loadings less than .30 were suppressed

61
Table 12 Comparison of Proctored and Unproctored Groups on Component Loadings for 27 Scales Using Principal Component Analysis with Varimax Rotation Scales Components (C) C1 C2 C3 C4 C5 C6 C7 C8 C9 Conventional X Rule following X Detail Conscious X P Innovative -X P U U Persuasive X Controlling X Outgoing -U U -P -U Forward Minded P U Socially Confident -P P Relaxed P U Tough Minded P U -U Worrying -X -P -U Optimistic -U -P U Evaluative U P Conceptual -P X Democratic -U -U P Competitive U -P Caring -U -P P P,-U Adaptable -U -P -X -U Vigorous U P Achieving U U P Conscientious X U P Decisive -P,U Behavioral P,-U U Outspoken U -P,U U Data Rational -U P -U, P Independent Minded -P U U,-P X- Component loadings in both Proctored and Unproctored groups U-Loading only on Unproctored P-Loading only on Proctored

62
DISCUSSION
This purpose of this research study was to determine whether differences existed when
pre-employment testing was conducted either in a controlled, proctored or a remote, unproctored
setting. The very small to small effect sizes indicate, practically there are negligible differences
between the proctored and unproctored groups, are in accord with previous research (Bartram
and Brown, 2004; Coyne,Warszta, Beadle & Sheehan, 2005; Drasgow, 2004; Kriek & Joubert,
2007; Robie & Brown, 2004; Templar, 2005) and are encouraging for companies planning to
migrate to online testing in unproctored settings. The overall result is that there are no
noticeably mean differences between the job applicants’ scores across the proctored and
unproctored modes of administrations. Even though this study indicated statistical differences
between the two groups, these differences were likely due to a large sample size (N=5223).
This study has various advantages over other studies in this area of research. One
advantage of using real job applicants who took the personality questionnaire as a part of the
selection process has implications for practitioners. Second, all the other variables including,
company, type of job position, test delivery (online test) and close time period were kept
constant. So if differences were found, they could be attributed genuinely to difference in mode
of administration. In addition, this study used a US sample. Other studies specifically using the
OPQ32i were done on samples from other countries including UK, Singapore, South Africa and
conducted by the measure’s developers. Therefore, another objective was to extend research on
OPQ32i using US population.
Results from comparison of the two groups on the 32 scales indicated that the
unproctored group scored slightly higher than the proctored group in 19 of the 32 scales. When
the scales were converted into the Big Five dimensions and the two groups compared, the

63
proctored group scored higher than the unproctored group on all dimensions except for
Agreeableness. On examining of the ICIs of the group means, the two groups indicated statistical
significance for 19 scales and statistical largest difference was noticed for Data rational, Rule
following, Worrying and Affiliative scales. These were higher in the unproctored group as
compared to the proctored group. Higher scores on the Worrying scale may indicate the
unproctored group was more worried than proctored group because of lack of control over their
environment including modem speed, computer processing speed, Internet connection problems,
mood changes, distractions, etc while taking the test under unproctored conditions. The
unproctored group may have scored higher on Rule following than proctored group because they
wanted to emphasize they were rule followers who did not cheat. The unproctored group also
scored higher on Data Rational and indicated that they liked analyzing numbers. Since the
applicants were applying for management positions in a financial company, indicating their
interest in mathematics and analyzing and interpreting data would be to their advantage. The
reason for the statistical differences between the two groups is merely speculation on the
researcher’s part as there was no data to support this conclusively.
The profiles of the two groups in the graphs were similar. For some scales (Data
Rational, Decisive, Controlling, Conventional, Rule Following), there was separation which is
attributed to random sampling. Practically, because the effect sizes ranged from very small to
small, there were no differences between the proctored and unproctored groups indicating that
absence of a proctor may not overly affect the scores of real job applicants on a personality
measure. This is especially encouraging for companies who are using unproctored online
personality testing or plan to implement online testing. In a survey conducted by Piotrowski and
Armstrong (2004) on pre-selection methods in major companies in the US, one-fifth of the 151

64
companies plan to implement online testing. Based on the results of this study, companies can
move confidently to using online personality measures to screen out applicants in unproctored
settings.
The small statistical differences between the two groups raise two questions: (1) What is
causing this difference? (2) If a significant but small difference is noticed, what are the
implications in the real world? This study was done in a high stakes situation, where presence of
a proctor can easily affect the scores of job applicants. The statistical difference may be due to
motivated faking or response distortion by the candidates in order to appear more job desirable.
There is some research that suggests that forced choice methods puts more demands on the
cognitive ability of the applicants and response distortion is equated with motivation leading the
applicants pick the most obvious desirable response (Christianson, Montgomery, and Burns,
2007). Also, the candidates responses maybe affected by either their stereotypes about traits that
they think are important for job success or traits that they picked out from the detailed job
descriptions of the job. In the present study there is no way of knowing if the job applicants
identified the traits important to the company and had faked their responses accordingly. Faking
of responses to appear more desirable could occur because of the high stakes situation for both
groups. Even if applicants in either of the groups or both groups faked through the test, results of
this study showed only negligible differences, hence practically faking may not be such a big
problem. The many reasons for small differences presented here are merely speculation, without
more research, it cannot be said conclusively why there may be differences between the two
groups.
In the current field study, OPQ32i a personality measure was used to screen-out
candidates before being screened-in using a cognitive measure in a proctored setting. Companies

65
use a personality measure earlier in the selection process to screen out unqualified candidates.
This step helps reduce the number of applicants and result in a smaller applicant pool that is
administered a cognitive measure. Even if some candidates were smart enough to “beat the test”
and be selected, they could potentially be screened out in the subsequent steps of the selection
process including a cognitive measure and structured interviews. The company still benefits
from the unproctored personality testing because clearly unqualified candidates are eliminated
early. Moreover, there may be job applicants who distort their responses on the personality
measure even when they are proctored. Therefore, companies could really benefit from using an
online personality measure especially one that uses forced choice method of responding in an
unproctored environment without adverse effect.
The caveat of the overall result of statistical differences between the two groups may be
due to the large sample size and genuine sample effects. The results of small differences might
indicate that the applicants were not able to distort their responses to that extent to appear more
job desirable because of the forced choice nature of the questionnaire used. The ipsative measure
is designed to resist faking. Hence, a practical implication is that more forced choice personality
measures that reduce or eliminate faking must be developed and administered without
supervision to real job applicants without any adverse effect. Even if there is chance that an
ipsative measure reduces some faking, companies can certainly take the advantage of using
ipsative rather than normative personality measures.
Due to the limitations on conducting standard statistical procedures on ipsative data,
factor analysis could not be used. The exploratory principal component analysis on the (32-1)
scales resulted in random scale loadings onto eleven components that were extracted. Analysis
conducted by SHL produced mappings of 25 scales to the Big Five factor model and 27 scales to

66
the Great Eight Factor model. The 27 scales that map to the Great Eight factor are based on
SHL’s, Universal Competency Framework (UCF) which describes the competency domain in
terms of detailed 112 components that map to 20 competencies which in turn map into eight
broad areas- Great Eight Competency factors (Bartram and Brown, 2005). “These emerged from
factor analysis and multidimensional scaling analyses of self and manager ratings of the
workplace performance rather than from the analysis of ability test, motivation and personality
questionnaires” (Bartram and Brown, 2005, OPQ Great Eight Factor model OPQ32 report, pg.
2). The OPQ scales were used to develop scoring equations for the Great Eight factor model.
Therefore, the 27 scales that were used in the scoring equations were used in the PCA to yield a
cleaner component model than using all the 32 scales. PCA resulted in loading of the scales on
nine components for both proctored and unproctored groups. The loadings were similar for about
three components in both the groups. The loadings of the scales in the proctored groups were
more interpretable than the unproctored groups. Scales loaded on three components were similar
to the loadings on the Great eight factor model. For other components, there was overlap of no
more than two scales that were similar to factor loadings on the Great Eight factor model. The
other components comprised of loadings of scales that were bipolar, for example, Conventional
and Innovative, Democratic and Competitive, Touch minded and Worrying. Some scales loaded
appropriately on a component including, Relaxed and Tough Minded in case of component eight
of the proctored group. Other scale loadings did not make any sense including Data Rational and
Independent minded or Forward minded and Conceptual. The bipolar factors and combination of
loadings made the PCA results difficult to interpret as in previous research (Cornwell & Dunlap,
1994; Dunlap & Cornwell, 1994).

67
Limitations
No research is without its limitations. A potential limitation of the research was the
archival nature of the data and restriction on data availability. The demographic information was
only available for the proctored group. The present study could be extended to investigate
differences between gender, race and age across modes of administration.
Since restrictions were placed on the availability of additional data, scores from the
Biodata, cognitive measure, and interview results and pass/fail status were not known. The
company did not use all the OPQ 32 scales scores in their decision to calculate the cut-offs. This
information about which scale was used and the cut-offs were not disclosed. Thus, performance
criterion data was also not available. This study could be extended to provide validation support
for the measure using US population.
One limitation of the sample was that outliers were noticed only for the proctored group.
The data for this group was received in a raw form which included the selections of statements
A, B, C, or D as “Most like me” and “Least like me.” The raw data may have been manually
added to the Excel document, therefore some selections of A, B, C, or D may have been
miskeyed to yield same selections (for example, statement A for both Most and Least like me
selections, totaling to a score of 2 instead of 4 for that quad).
One major limitation of the data was that it was ipsative, not normative in nature.
Therefore, making it difficult to analyze and interpret data using standard statistical procedures.
Data is called ipsative when the sum of columns and rows for all the subjects are the same
(Brown, 2007; Clemens, 1966; Cornwell & Dunlap 1994; Hicks, 1970). In the case of OPQ32,
all individuals have a constant sum of scores across all scales. An individual cannot get
consistently score high or low on all scales, but scores high on some scales and low on others

68
(Brown, 2007). With an ipsative measure, a profile of the individual can be created showing
which traits were rated strongest and weakest. Since the scales are ranked within an individual,
ipsative measures cannot be used when the researcher’s motive is to investigate inter-individual
rather than intra-individual differences (Hicks, 1970) and can give categorical information
between individuals (Cornwell and Dunlap, 1994). However, when the scores are normed,
individuals can be compared to each other (Baron, 1996).
Factor analysis would be useful to validate the Big Five dimensions and Great Eight
factor model, but ipsative data places limitations on correlations and covariances matrices,
making it difficult to even use and interpret CFA (Chan and Bentler, 1998, Meade, 2004) and
PCA (Dunlap and Cornwell, 1994) in a meaningful way. However, Ten Berge (1999) argued that
PCA could be interpretable with ipsative data if there was a balance of negative and positive
items (as cited in Meade, 2004). The general consensus is that FA results of ipsative data are
questionable.
Some of the constraints that ipsative data places on the matrices include the sum of
columns and rows of the covariance matrix is zero and where variances are equal, the average
intercorrelation will be limited to -1/ (m-1) where m is the number of scales. Because the off
diagonals average correlation for 32 scales is -1/ (32-1) or -.032, it gives rises to problems of
negative multicollinearlity. In addition, correlations and covariances cannot be interpreted
because the true scores of all scales are part of the correlation between two variables (Meade,
2006). The problems of negative multicollinearity, lack of independence between scales gives
rise to artifactual bipolar factors, leading researchers to recommend against the use of FA
techniques with ipsative data (Corwell & Dunlap, 1994; Chan and Bentler, 1998; Cheung, 2006;

69
Dunlap and Cornwell, 1994; Loo, 1999; Meade, 2004). In sum, the results of the PCA were
difficult to interpret.
Future Directions
The present study can lead to many avenues for future research. One avenue of research
concerns job desirability and a personality measure’s transparency. Items on personality
measures can be transparent to job applicants. Smart individuals can identify the traits that might
be important to the company and respond accordingly. In addition they might get cues from job
postings and job descriptions. Research in this direction needs to be conducted to investigate if
job descriptions can provide cues to applicants that would lead them to fake their responses to
appear more job desirable.
Practitioners are concerned about a personality measure’s potential of response distortion
and transparency. There is some glimmer of hope for practitioners who want to include
personality measures as a part of their screening process. Personality measures that use ipsative
responding are designed to resist faking. Hence, researchers must develop more personality
measures that use forced choice or ipsative as compared to Likert or normative type of
responding scale.
More research must be conducted using a design where the test delivery method (online)
is kept constant using real selection data to look for differences between modes of administration
of personality measures. Follow-up research must be conducted using the normative version of
the OPQ to investigate if differences between proctored and unproctored groups exist. If medium
to large significant scale mean scale differences are found and the mean scales scores for the
unproctored groups are higher than the proctored group, it would indicate that applicants

70
responded to appear more job desirable. Additional research comparing unproctored test
administrations of ipsative and normative versions of the personality measure can be conducted.
Another avenue for further research would be to transform the ipsative data and conduct
Confirmatory Factor Analysis (CFA) to test the Big Five and Great Eight-factor model using
OPQ32i. A number of researchers (e.g., Brown, 2007; Chan and Bentler, 1998; Maydeu-
Olevares, 1999) proposed methods to recover preipsative information from ipsative data in order
to conduct further data analysis. In 1927, Thurston proposed a theory that makes comparative
judgment based on basic utility value of unobserved traits. Chan and Bentler (1999) proposed
analyzing the covariance structure of ordinal ipsative data using paired comparisons between a
trait ranked first to all the traits. Maydeu-Olevares (1999) proposed a method that uses all paired
comparisons of the data. In a paper presented at the 22nd Annual Conference of Society for
Industrial and Organizational Psychologists, Brown (2007) extended Maydeu-Olevares approach
and proposed an IRT model based on Thurstonian approach to comparative judgment. She
proposes breaking the quad of items into six paired comparisons: {A,B}, {A,C}, {A,D}, {B,C},
{B,D} and {C,D}. This method breaks the quad into pairs and removes the interdependency
between the items. However, conducting this conversion on 104 quads will yield 624 pairs and
conducting factor analysis will be a daunting task.
Conclusion
The results of the comparison between the proctored and unproctored groups indicate that
small statistical differences and small effect size estimates are consistent with prior research
using the OPQ32i. Practically, there are no differences between the scores of an individual who
would take the test in a proctored environment as compared to a candidate who would take the

71
test unproctored from a remote location. This has practical implications for companies who are
considering using unproctored online personality measures. Companies can take the advantage of
testing their candidates using personality measures in unproctored settings. Benefits of cost, time
saved, and smaller pool of qualified candidates as a result of online unproctored personality
testing early on in the selection process is tremendous.

72
REFERENCES
Alexander, M. W., Bartlett, J. E., Truell, A. D. & Ouwenga, K. (2001). Testing in a computer technology course: An investigation in performance between online and paper-pencil methods. Journal of Career and Technical Education, 18 (1), 69-80.
Anastasi, A. (1982). Psychological testing (5th ed.). New York: Macmillian.
Anderson, N (2003). Applicant and recruiter reactions to new technology in selection: A critical review and agenda for future research. International Journal of Selection and Assessment, 11(2/3), 121-136.
Barak, A., & English, N. (2002). Prospects and limitations of psychological testing on the Internet. Journal of Technology in Human Services, 19 (2/3), 65-89.
Baron, H. (1996). Strengths and limitations of ipsative measures. Journal of Occupational and Organizational Psychology, 69, 49-56.
Barrick, M. R. & Mount, M. K. (1991). The Big Five personality dimensions and job performance. A meta analysis. Personnel Psychologist, 44, 1-26
Barrick. M. R., Mount, M. K., & Judge, T.A. (2001). Personality and performance at the beginning of the new millennium: What do we know and where do we go next? International Journal of Selection and Assessment, 9, 9-30.
Bartram, D., & Brown, A. (2004). Online testing: Mode of administration and the stability of OPQ32i scores. International Journal of Selection and Assessment, 12 (3), 284.
Bartram, D., & Brown, A. (2005). Five factor model (Big Five) OPQ32 report. OPQ32 technical manual supplement. SHL Group.
Bartram, D., & Brown, A. (2005). Great Eight factor model OPQ32 report. OPQ32 technical manual supplement. SHL Group.
Bartram, D., Brown, A., Fleck, S., Inceoglu, I., & Ward, K. (2006). OPQ32: Technical manual. SHL Group.
Beaty, J. C., Fallon, J., & Shepard, W. (2002). Proctored versus unproctored Web-based administration of a cognitive ability test. Paper presented in the 13th annual conference of Society for Industrial and Organizational Psychology, Toronto, Canada.
Benjamini, Y. & Hochberg, Y. (2000). On the adaptive control of the false discovery rate in multiple testing with independent statistics. Journal of Educational and Behavioral Statistics, 25(1), 60-83.
Bicanich, E., Silvinski, T., Hardwicke, S. B., & Kapes, J. T. (1997). Internet-based testing: A vision or reality? Retrieved on December 5, 2005 from http://thejournal.com/magazine/vault/articleprintversion.cfm?aid=1918

73
Booth-Kewley, S., Edwards, J. E., & Rosenfeld, P. (1992). Impression management, social desirability, and computer administration of attitude questionnaires: Does the computer make a difference? Journal of Applied Psychology, 77(4), 562-566.
Bowen, C., Martin, B. A. & Hunt, S. T. (2002). A comparison of ipsative and normative approaches for ability to control faking in personality questionnaires. International Journal of Organizational Analysis, 10(3), 240-259.
Brown, A. (2007). An IRT model for multidimensional forced-choice items: Recovering normative scores from ipsative data. Paper presented I P. Converse (chair) symposium, Forced choice measures in selection, at the 22nd Annual Conference of Society for Industrial and Organizational Psychology, New York, NY.
Buchnan, T., Ali, T., Heffernan, T., Ling, J., Parrott, A., Rodgers, J., & Scholey, A. (2005). Nonequivalence of on-line and paper-and-pencil psychological tests: The case of the prospective memory questionnaire. Behaviors Research Methods, 37(1), 148-154.
Buchanan, T. & Smith, J. L. (1999). Using the Internet for psychological research: Personality testing on the World Wide Web. British Journal of Psychology, 90(1), 125-144.
Carlsmith, K. M. & Chabot, H. F. (1997). A review of computer-based survey methodology. Journal of Psychological Practice, 3(2), 20-26.
Chan, W. & Bentler, P. M. (1998). Covariance structure analysis of ordinal ipsative data. Psychometrika, 63, 369-399.
Chapman, D. S. & Webster, J. (2003). The use of technologies in the recruiting, screening, and selection processes for job candidates. International Journal of Selection and Assessment, 11(2/3), 113-120.
Cheung, M. W. L. (2006). Recovering preipsative information from additive ipsatized data. Educational and Psychological Measurement, 66(4), 565-588.
Christianson, N. D.; Montgomery, G. F.; & Burns, G. N. (2007). Removing cognitive effects from forced-choice personality assessments. Paper presented at the 22nd Conference for Society for Industrial and Organizational Psychology, New York, NY.
Cornwell, J. M. & Dunlap, W. P. (1994). On the questionable soundness of factoring ipsative data: A response to Saville & Willson (1991). Journal of Occupational and Organizational Psychology, 67, 89-100.
Coyne, Warszta, Beadle, & Sheehan (2005). The impact of mode of administration on the equivalence of a test battery: A quasi-experimental design. International Journal of Selection and Assessment, 13(3), 220-224.
Cronk, B.B. & West, J. L. (2002). Personality research on the Internet: A comparison of Web-based and traditional instruments in take home and in-class settings. Behaviors Research Methods, Instruments and Computers, 34(2), 177-180.

74
Davis, R. N. (1999). Web-based administration of a personality questionnaire: Comparison with traditional methods. Behavior, Research Methods, Instruments & Computers, 31(4), 572-577.
Dilcert, S., Ones, D. S., Van Rooy, D. L. & Viswesvaran, C. (in press). Big Five factors of personality. In J. H. Greenhaus & G. A. Callanan (Eds.), Encyclopedia of career development. Thousand Oaks, CA: Sage.
Drasgow, F. (2004) An update on computerized testing: Boon or boondoggle. Symposium presented in IPMAAC 28th Annual Conference on Personnel Assessment.
Dunlap, W. P. & Cornwell, J. M. (1994). Factor analysis of ipsative data. Multivariate Behavioral Research, 29(1), 115-126.
Ellingson, J. E., Sackett, P.R., & Hough, L. M. (1999). Social desirability corrections in personality measurement: Issues of applicant comparison and construct validity. Journal of Applied Psychology, 84(2), 155-166.
Ellis, A. (1946). The validity of personality questionnaires. Psychological Bulletin, 43(5), 385-440.
Ferris, G. R., Bergin, T. G., & Gilmore, D. C. (1986). Personality and ability predictors of training performance for flight attendants. Group & Organizational Studies, 11(4), 419-435.
Fox, S. & Schwartz, D. (2002). Social desirability and controllability in computerized and paper-and-pencil questionnaires. Computers in Human Behavior, 18, 389-410.
Frei, R. L., & McDaniel, M. A. (1998). Validity of customer service measures in personnel selection: A review of criterion and construct evidence. Human Performance, 11(1), 1-27.
Gatewood, R. D. & Field, H. S. (2001). Human resource selection. Harcourt Brace & Company, Orlando, FL.
Gauer, E. & Beaty, J. (2006). Unproctored Internet setting: Important questions and empirical questions. Paper presented at the 21st annual conference of Society for Industrial and Organizational Psychology, Dallas, TX.
Ghiselli, E. E. & Barthol, R. P. (1953). The validity of personality inventories in the selection of employees. Journal of Applied Psychology, 37(1), 18-20.
Greenberg, C. L. (1999). Technological innovations and advancements for psychologists working with organizations. Psychologist-Manager Journal, 3(2), 181-190.
Guion, R. M. & Gottier, R. F. (1965). Validity of personality measures in personnel selection. Personnel Psychology, 18(2), 135-164.

75
Harold, C. M., McFarland, L. A., Dudley, N., & Odin, E. P. (2006). Personality and faking behavior: Does warning moderate validity? Poster presented in the 21st annual conference of Society for Industrial and Organizational Psychology, Dallas, TX.
Hartson, H. R., Castillo, J.C., Kelso, J., Kamler, J., & Neale, W. C. (2005). Remote evaluation: The network as an extension of the usability laboratory. Retrieved on September 9, 2005 from http://www.pages.drexel.edu/~zwz22/Remote.htm
Helmreich, R. L., Sawin, L. L., & Carsrud, A. L. (1986). The honeymoon effect in job performance: Temporal increases in the predictive power of achievement motivation. Journal of Applied Psychology, 71(2), 185-188.
Hicks, L. E. (1970). Some properties of ipsative, normative, and forced-choice normative measures. Psychological Bulletin, 74(3), 167-184.
Hogan, R., Carpenter, B. N., Briggs, S. R., & Hansson, R. O. (1985). Personality assessment and personnel selection. In H.J. Bernardin & D. A. Bownas (Eds.), Personality assessment in organizations (pp. 21-52).
Hollenbeck, J. R. & Whitener, E. M. (1988). Reclaiming personality traits for personnel selection: Self-esteem as an illustrative case. Journal of Management, 14(1), 81-91.
Hough, L. M., Eaton, N. K., Dunnette, M. D., Kamp, J. D., & McCloy, R. A. (1990). Criterion-related validities of personality constructs and the effect of response distortion on those validities. Journal of Applied Psychology, 75(5), 581-595.
Hurtz, G. M. & Donovan, J. J. (2000). Personality and job performance: The Big Five revisited. Journal of Applied Psychology, 85(6), 869-879.
Jones, J. W. & Dages, K. D. (2003). Technology trends in staffing and assessment: A practice note. International Journal of Selection and Assessment, 11(2/3), 247-252.
Kriek, H. & Joubert, T. (2007). Personality testing online (Unsupervised) and paper and pencil (supervised). Paper presented at the 20th annual conference of Society for Industrial and Organizational Psychology, New York, NY.
Kluger, A. N. & Colella, A. (1993). Beyond the mean bias: The effect of warning against faking on biodata item variances. Personnel Psychology, 46(4), 763-780.
Kluger, A. N., Reilly, R. R., & Russell, C. J. (1991). Faking biodata tests: Are option keyed instruments more resistant? Journal of Applied Psychology, 76(6), 889-896.
Lautenschlager, G. J. & Flaherty, V. L. (1990). Computer administration of questions: More desirable or more social desirability? Journal of Applied Psychology, 75(3), 310-314.
Lievens, F., van Dam, K, & Anderson, N. (2003). Recent trends and challenges in personnel research. Personnel Review, 31(5), 580-613.

76
Lievens, F., & Harris, M. M. (2003). Research on Internet recruiting and testing: Current status and future directions. In C. L. Cooper & I. T. Robertson (Eds.), International review of industrial and organizational psychology: Vol. 16 (pp. 131-165). Chichester: John Wiley & Sons, Ltd.
Locke, S. D. & Gilbert, B. O. (1995). Method of psychological assessment, self-disclosure, and experiential differences: A study of computer, questionnaire, and interview assessment formats. Journal of Social Behavior & Personality, 10, 255-263.
Loo, R. (1999). Issues in factor-analyzing ipsative measures: The learning style inventory (LSI-1985) example. Journal of Business and Psychology, 14(1), 149-154.
Maydeu-Olivares, A. (1999). Thurstonian modeling of ranking data via mean and covariance structure analysis. Psychometrika, 64(3), 325-340.
McFarland, L. A. (2003). Warning against faking on a personality test: Effects on applicant reactions and personality. International Journal of Selection and Assessment, 11(4), 265-276.
Mead, A. D. (2001). How well does Web-based testing work? Results of a survey of users of NetAssess. Paper presented at the 16th annual conference of the Society for Industrial and Organizational Psychology, San Diego, CA.
Mead, A. D. & Drasgow, F. (1993). Equivalence of computerized and paper-pencil cognitive ability tests: A meta-analysis. Psychological Bulletin, 114(4), 449-458.
Mead, A. W. (2004). Psychometric problems and issues involved with creating and using ipsative measures for selection. Journal of Occupational and Organizational Psychology, 77, 531-552.
Mount, M. K., Barrick, M. R., & Stewart, G. L. Five-factor model of personality and performance in jobs involving interpersonal interactions. Human Performance, 11(2/3), 145-166.
Naglieri, J. A., Drasgow, F., Schmidt, M., Handler, L., Prifitera, A., Margolis, A., & Velasquez, R. (2004). Psychological testing on the Internet: New problems, old issues. American Psychologist, 59(3), Retrieved October 3, 2005 from, PsycARTICLES database.
Ones, D. S. (2005). On the usefulness of personality variables: An empirical perspective, PowerPoint Presentation.
Ones, D. S., Viswesvaran, C, & Reiss, A. D. (1996). Role of social desirability in personality testing for personnel selection: The red herring. Journal of Applied Psychology, 81(6), 660-679.

77
Ones, D. S., Viswesvaran, C, & Korbin, W. (1995). Meta-analysis of fakability estimates: between subjects versus within subjects designs. Paper presented at a symposium conducted at the 10th annual conference of the Society for Industrial and Organizational Psychology, Orlando. FL
Pasveer, K. A. & Ellard, J. H. (1998). The making of a personality inventory: Help from the WWW. Behavior Research Methods, 30(2), 309-313.
Payne, H. S. & Weiss, R. J. (2006). Leading edge: The international digital divide and its local subdivisions. Industrial-Organizational Psychologist, 43(3), 49-54.
Piotrowski, C. & Armstrong, T. (2006). Current recruitment and selection practices: A national survey of fortune 1000 firms. North American Journal of Psychology, 8(3), 489-496.
Potosky, D. & Bobko, P. (1997). Computer versus paper-pencil administration mode and response distortion on non-cognitive selection tests. Journal of Applied Psychology, 82 (2), 293-299.
Reynolds, D. H., Sinar, E. F., & McClough, A. C. (2000). Evualtion of an Internet-based selection procedure. Paper presented at the 15th annual conference of the Society for Industrial and Organizational Psychology, New Orleans, LA.
Richman, W. L., Keisler, S., Weisband, S., & Drasgow, F. (1999). A meta-analytic study of social desirability distortion in computer administered questionnaires, traditional questionnaires, and interviews. Journal of Applied Psychology, 84(5), 754-775.
Robie, C., Brown, D. J., & Beaty, J. C. (in press). Do people fake on personality inventories? A verbal protocol analysis. Journal of Business and Psychology.
Robie, C. & Brown, D. J. (2006). Measurement equivalence of a personality test administered on the Internet versus kiosk. Poster presented in the 21st annual conference of Society of Industrial and Organizational Psychology, Dallas, TX.
Rosse, J. G., Stecher, M. D., Miller, J. L., & Levin, R. A. (1998). The impact of response distortion on pre employment personality and hiring decisions. Journal of Applied Psychology, 83(4), 634-644.
Salgado, J. L. & Moscoso, S. (2003). Internet-based personality testing: Equivalence of measures and assesses' perceptions and reactions. International Journal of Selection and Assessment, 11(2/3), 194-205.
Saville, P. & Willson, E (1991). The reliability and validity of normative and ipsative approaches in the measurement of personality. Journal of Occupational Psychology, 64, 219-238.
Sinar, E. F., Reynolds, D. H., & Paquet, S. L. (2003). Nothing but net? Corporate image and Web-based testing. International Journal of Selection and Assessment, 11(2/3), 150-157.

78
Tabachnick, B. G., & Fidell, L. S. (2001). Using multivariate statistics (4th ed.). Needham, MA: Allyn & Bacon.
Templer, K. (2005). Internet testing: Equivalence between proctored lab and unproctored field conditions. Paper presented at the 20th annual conference of Society for Industrial and Organizational Psychology, Los Angeles, CA.
Tippins, N. T, Beaty, J., Drasgow, F., Gibson, W. M., Pearlman, K., Seagall, D. O., Shepard, W. (2006). Unproctored, Internet testing in employment settings. Personnel Psychology, 59, 189-225.
Thiessen-Roe, A., Scarborough, D., Chamless, B., & Hunt, S. (2006). Inadvertent honesty: Occurrence and meaning of applicant faking in unproctored personality tests. A paper presented at the 21st annual conference of the Society of Industrial and Organizational Psychologists in Dallas, TX.
Thompson, B. (2002). What future qualitative social science research could look like: Confidence intervals for effect sizes. Educational Researcher, 25-32.
United States Department of Commerce. (2002). A nation online: How Americans are expanding their use of the Internet. Retrieved September 15, 2005 from http://www.ntia.gov/ntiahome/dn/index.html
United States Department of Commerce. (1995). Falling through the net: A survey of the `have nots' in rural and urban America. Retrieved September 15, 2005 from http://www.ntia.doc.gov/ntiahome/digitaldivide/
Weichmann, D., & Ryan, A. M. (2003). Reactions to computerized testing in selection contexts. International Journal of Selection Assessment, 2(2/3), 215-229.
Weiner, J. A. (June, 2004). Web-based assessment: Issues and applications in personnel selection. Symposium presented in IPMAAC 28th Annual Conference on Personnel Assessment.
Weiner, J. A. & Gibson, W. M. (2000). Practical effects of faking on job attitude test scores. Paper presented in the 15th Annual Conference of the Society for Industrial and Organizational Psychology, New Orleans, LA.
Weiner, J. A., Reynolds, D., Hayes, T., & Doverspike, D. (2005). Unproctored Internet-based testing: Emerging issues and challenges. Presented in the 20th Annual Meeting of the Society for Industrial and Organizational Psychology in Los Angeles, CA.
Weiner, J. A. & Reynolds, D. (2006). Issues in unproctored online testing. Presentation at the Associated of Test Publishers Annual Conference, Orlando, FL.
Weiner. J. A. & Ruch, W.W. (2006). Effects of cheating in unproctored Internet based testing: A Monte Carlo investigation. A paper presented at the 21st Annual Conference of the Society of Industrial and Organizational Psychologists in Dallas, TX.

79
Zerbe, W. J. & Paulhus, D. L. (1987). Socially desirable responding in organizational behavior: A reconception. Academy of Management Review, 12(2), 250-264.
Related Documents