Processor Analysis and Tuning

Welcome message from author
This document is posted to help you gain knowledge. Please leave a comment to let me know what you think about it! Share it to your friends and learn new things together.
Transcript
Processor Analysis and Tuning
Velocity Software, IncCopyright 2007 Velocity Software, Inc. All Rights Reserved.
6/2
2/
2
• What is CPU utilization • Theory of processor speed • Common problems • LPAR, HiperDispatch, Horizontal • Overview of Processors • Processor measurements • Steal time • Master Processor • PLDV, Dispatch rates • MFC, SMT
Processor Topics
Velocity Software, IncCopyright 2007 Velocity Software, Inc. All Rights Reserved.
6/2
2/
3
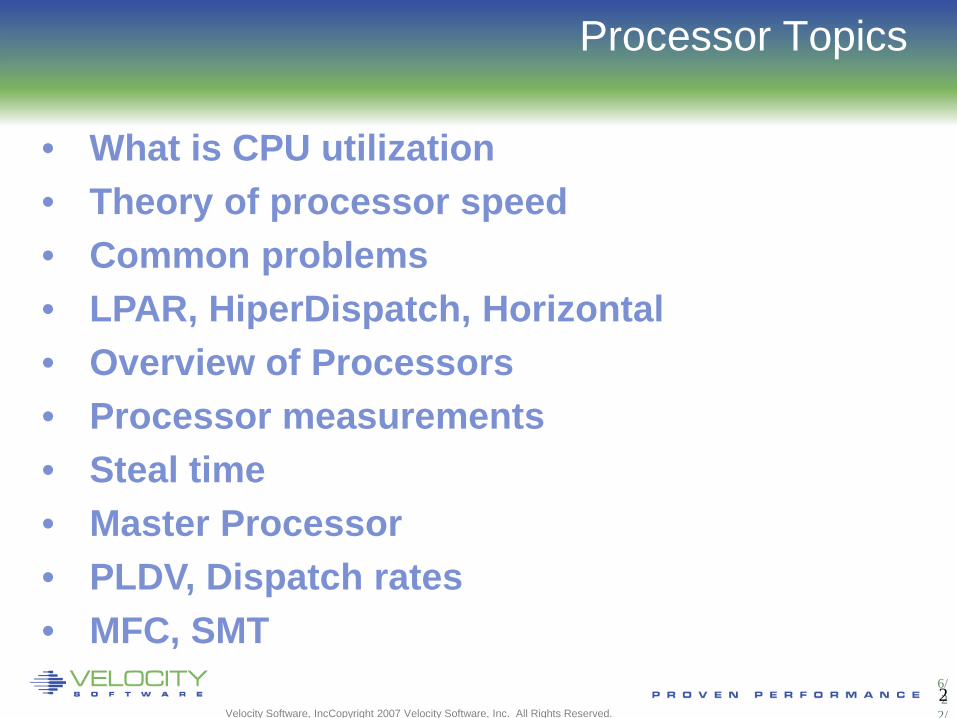
Processor Performance Concepts - Utilization
What is important? • TOTAL IFL Utilization • LPAR Utilization • “My” share
CPU Utilization used for: • Performance Analysis • Capacity Planning • Accounting/Chargeback
Utilization measured in many ways
• Virtual Linux measures what? Percent of something. • z/VM under LPAR measures what? CPU Seconds • Hardware measurement only valid method of measuring CPU

4
Processor Performance Concepts - Utilization
What is “CPU Utilization”? Percent of Percent misleading
• Can not be used directly for capacity planning • Can not be used directly for accounting/chargeback • Often misleading for performance analysis
All zVPS numbers are measured in CPU Seconds • Percent is always based on CPU seconds divided by wall clock
Impacts measurements of • LPAR • z/VM Virtual Machines • Linux processes • zVSE Jobs/Partitions

Velocity Software, IncCopyright 2007 Velocity Software, Inc. All Rights Reserved.
6/2
2/
5
Processor CAPACITY Concepts – Adding IFLs
Adding processors in MP environment reduces MSU / CP in z/OS Adding processors in z/VM MP environment
• Reduces queuing time • increases CPU available • Cost money
Service levels comparison at 50% CPU Queue time • One CPU: 50% busy, queue time = cpu time • Two CPUs: 70% busy, queue time = cpu time • Three CPUS: 79% busy, queue time = cpu time • Four CPUs: 84% busy, queue time = cpu time
The 2nd CPU almost triples the capacity at target service level The 3rd CPU adds 70% to capacity
More processors operate at higher utilization with good performance
Velocity Software, IncCopyright 2007 Velocity Software, Inc. All Rights Reserved.
6/2
2/
6
Processor speed
• Many expensive mistakes based on mis-understanding • More hardware costs money, financial choices • Understand Impacts (common mistakes)
• Number of vcpu in LPAR (impact on relative weight?) • Number of vcpu in virtual machine (impact on relative share)? • ALL single threaded large CPU Consumers! MP doesn’t help? • ALL CPU intensive applications
• CPU response time is a function of processor speed and CPUs. • Faster processors mean shorter service time. • More processors means lowering queuing time.
• Which provides better response time, • 2 x 20 MIP engines, or 1 x 40 MIP engine? • at what percent utilization?

Velocity Software, IncCopyright 2007 Velocity Software, Inc. All Rights Reserved.
6/2
2/
7
Processor Performance Concepts
• Which provides better response time multi-process workload, • 2 x 20 MIP engines, (LESS QUEUEING) • 1 40 MIP engine? (SMALLER SERVICE TIME)
• at what percent utilization? (“x” is cpu requirement)
• MM1: 2x20: resp(50%) = 2x/(1-(.5*.5)) = 2.66x • MM1: 1x40: resp(50%) = x / (1-.5) = 2x
• MM1: 2x20: resp(90%) = 2x/(1-.9*.9) = 10.52x • MM1: 1x40: resp(90%) = x/(1-.9) = 10x
• MM1: 2x20: resp(95%) = 2x/(1-.95*.95) = 20.51*x • MM1: 1x40: resp(95%) = x/(1-.95) = 20x
8
Processor Performance Concepts
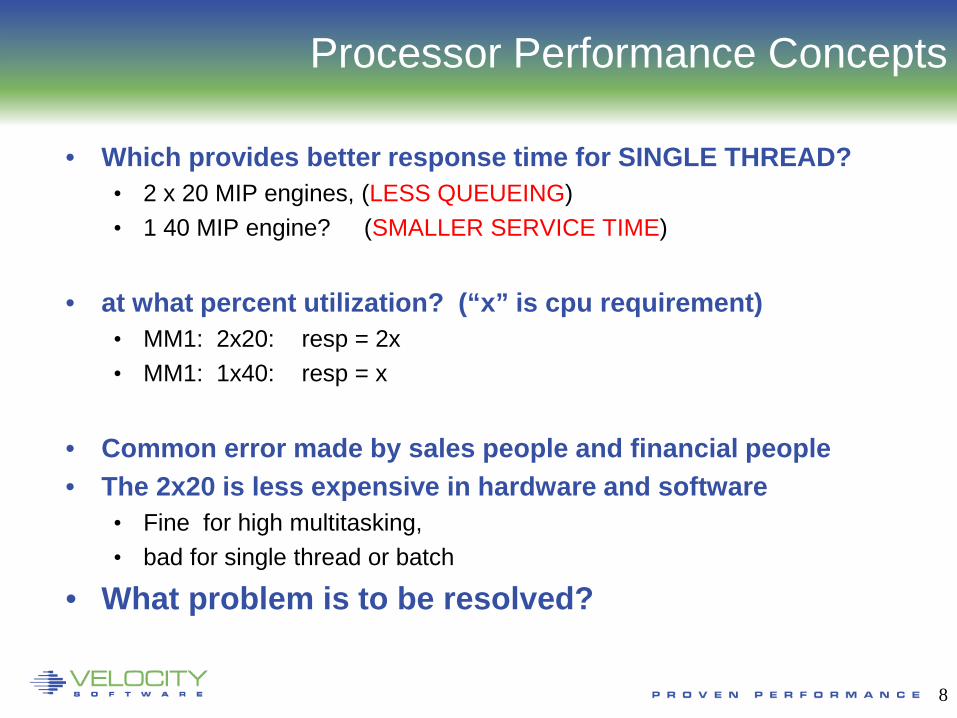
• Which provides better response time for SINGLE THREAD? • 2 x 20 MIP engines, (LESS QUEUEING) • 1 40 MIP engine? (SMALLER SERVICE TIME)
• at what percent utilization? (“x” is cpu requirement)
• MM1: 2x20: resp = 2x • MM1: 1x40: resp = x
• Common error made by sales people and financial people • The 2x20 is less expensive in hardware and software
• Fine for high multitasking, • bad for single thread or batch
• What problem is to be resolved?
Velocity Software, IncCopyright 2007 Velocity Software, Inc. All Rights Reserved. 9
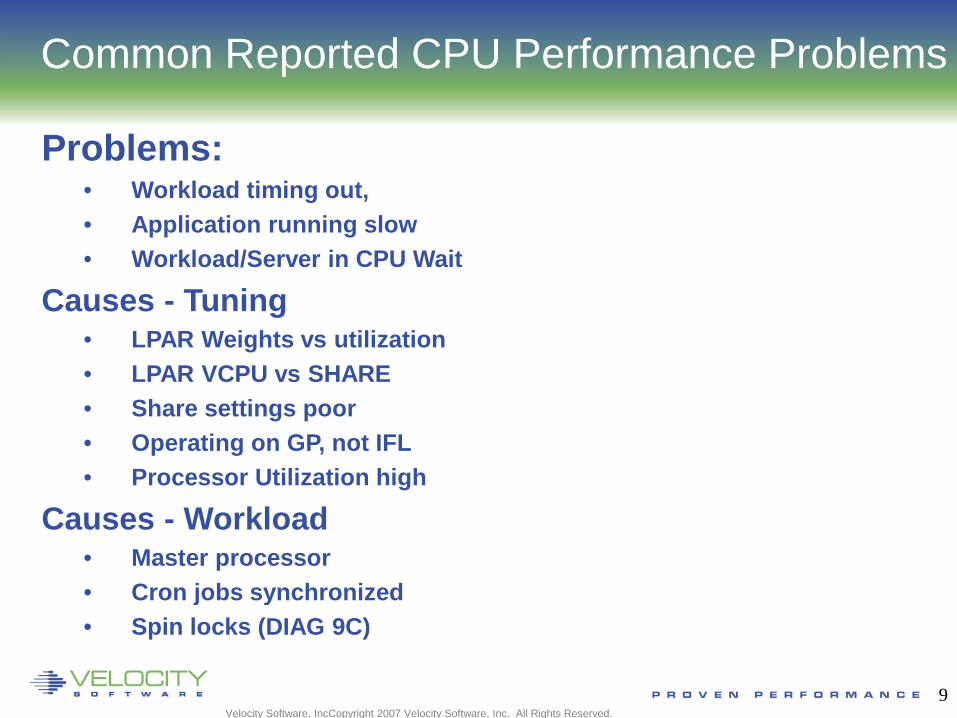
Problems: • Workload timing out, • Application running slow • Workload/Server in CPU Wait
Causes - Tuning • LPAR Weights vs utilization • LPAR VCPU vs SHARE • Share settings poor • Operating on GP, not IFL • Processor Utilization high
Causes - Workload • Master processor • Cron jobs synchronized • Spin locks (DIAG 9C)
Common Reported CPU Performance Problems

Velocity Software, IncCopyright 2007 Velocity Software, Inc. All Rights Reserved.
6/2
2/
10
Objective: operate at high utilization • Requires management decisions, prioritization • Alternative to management is more
hardware/licensing Managing distribution: • z/VM LPAR share of IFLs
• Based on weight of LPAR • Based on number of IFLs (1 40 mip vs 2 20 mip)
• Linux server’s share is • Share of z/VM LPAR (relative/absolute) • Based on number of vcpu
• Process “niced”, “priority”
Processor Distribution Management

Velocity Software, IncCopyright 2007 Velocity Software, Inc. All Rights Reserved.
6/2
2/
11
z/VM share of IFLs Report: ESALPARS Logical Partition Summary ----------------------------------------------------------------------- <--Complex--> <--------Logical Partition-------> <-Assigned Phys Dispatch Virt CPU <%Assigned> <---LPAR--> Time CPUs Slice Name Nbr CPUs Type Total Ovhd Weight Pct -------- ---- -------- -------- --- ---- ---- ----- ---- ------ ---- 00:15:00 23 Dynamic Totals: 0 22 CP 506.0 4.5 999 100 Totals: 0 23 IFL 903.1 8.6 1000 100 ZVMQA 11 6 IFL 374.8 0.9 150 15.0 MVSPRD 7 10 CP 320.1 3.2 860 86.1 MVSQA 1 6 CP 181.8 1.1 71 7.1 ZVMDEQ 9 4 IFL 131.6 2.0 100 10.0 ZVMPRD 8 10 IFL 333.7 4.9 650 65.0 ZVMSHR 12 3 IFL 63.0 0.8 80 8.0 MVSTST 17 3 CP 5.1 0.1 8 0.8 Totals by Processor type: <---------CPU-------> <-Shared Processor busy-> Type Count Ded shared Total Logical Ovhd Mgmt ---- ----- --- ------ ------ -------- ---- ---- CP 7 0 7 511.9 501.5 4.5 5.9 IFL 10 0 10 915.6 894.5 8.6 12.5 ZIIP 3 0 3 23.9 22.3 0.4 1.2
LPAR Configuration

Velocity Software, IncCopyright 2007 Velocity Software, Inc. All Rights Reserved.
6/2
2/
12
Processor Utilization Components
LPAR Physical Overhead LPAR Assigned Logical Partition
• Logical Partition Logical Overhead • LPAR logical time
z/VM (LPAR logical time) • System Time (z/VM Control Program) • Emulation (z/VM Guest time) • User Overhead (allocated system time)
Linux (Emulation time) • System time (kernel time) • IRQ Time • User time
IDLE

Velocity Software, IncCopyright 2007 Velocity Software, Inc. All Rights Reserved.
6/2
2/
13
z/VM share of IFLs Report: ESALPARS Logical Partition Summary ----------------------------------------------------------------------- <--Complex--> <--------Logical Partition-------> <-Assigned Phys Dispatch Virt CPU <%Assigned> <---LPAR--> Time CPUs Slice Name Nbr CPUs Type Total Ovhd Weight Pct -------- ---- -------- -------- --- ---- ---- ----- ---- ------ ---- 00:15:00 23 Dynamic Totals: 0 22 CP 506.0 4.5 999 100 Totals: 0 23 IFL 903.1 8.6 1000 100 ZVMQA 11 6 IFL 374.8 0.9 150 15.0 ZVMDEQ 9 4 IFL 131.6 2.0 100 10.0 ZVMPRD 8 10 IFL 333.7 4.9 650 65.0 ZVMSHR 12 3 IFL 63.0 0.8 80 8.0 Totals by Processor type: <---------CPU-------> <-Shared Processor busy-> Type Count Ded shared Total Logical Ovhd Mgmt ---- ----- --- ------ ------ -------- ---- ---- IFL 10 0 10 915.6 894.5 8.6 12.5
• ZVMQA is allocated 150/1000 of 10 SHARED IFLs • ZVMQA is using 37.5% of 10 SHARED IFLs • IFLs running 91.6% busy
LPAR Configuration

Velocity Software, IncCopyright 2007 Velocity Software, Inc. All Rights Reserved.
6/2
2/
14
LPAR Weights
Each LPAR gets a weight LPAR’s share:
• (LPAR Weight) / SUM(LPAR Weights)
Processor share of system:
• (LPAR Share) / (Number CPUs in LPAR)
Processor share of a CPU is • (Processor share of system) * (Number physical processors)

Velocity Software, IncCopyright 2007 Velocity Software, Inc. All Rights Reserved.
6/2
2/
15
LPAR Weights Example
• ESALPAR (Partial report) • Note each vcpu running at 10%? • z/VM can dispatch 8 concurrent virtual machines
• Less queueing, slower service • But, each single vcpu runs “slow”
<--Complex--> <--Logical-> <--------Logical Processor-------- Phys Dispatch <-Partition> VCPU <%Assigned> Cap- Wait Time CPUs Slice Name No. Addr Total Ovhd Weight ped Comp -------- ---- -------- -------- --- ---- ----- ---- ------ ---- ---- Average: 8 Dynamic ZVM 6 0 8.3 0.2 10 No No 1 10.2 0.2 10 No No 2 11.0 0.2 10 No No 3 11.1 0.2 10 No No 4 10.5 0.2 10 No No 5 10.5 0.2 10 No No 6 10.5 0.2 10 No No 7 10.6 0.2 10 No No ----- ---- LPAR 82.8 1.4
Velocity Software, IncCopyright 2007 Velocity Software, Inc. All Rights Reserved.
6/2
2/
16
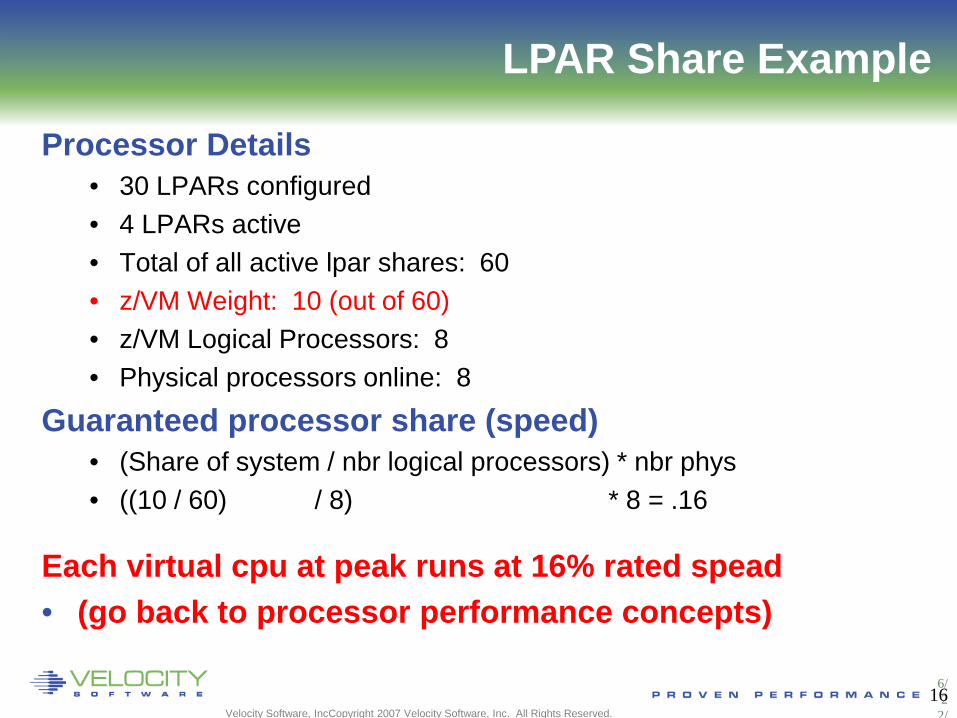
Processor Details • 30 LPARs configured • 4 LPARs active • Total of all active lpar shares: 60 • z/VM Weight: 10 (out of 60) • z/VM Logical Processors: 8 • Physical processors online: 8
Guaranteed processor share (speed) • (Share of system / nbr logical processors) * nbr phys • ((10 / 60) / 8) * 8 = .16
Each virtual cpu at peak runs at 16% rated spead • (go back to processor performance concepts)
LPAR Share Example

Velocity Software, IncCopyright 2007 Velocity Software, Inc. All Rights Reserved.
6/2
2/
17
LPAR Share Example
Processor Details: If change to 4 logical processors: • 4 LPARs active • Total of all shares: 60 • z/VM Weight: 10 (out of 60) • z/VM Logical Processors: 4 • Physical processors online: 8
Guaranteed processor share (speed) • ((10 / 60) / 4) * 8 = .32 • Real problem in many installations
Too many logical processors will slow you down! • Specifically the master processor…. • The same concept applies to Linux virtual processors • SEE DISCUSSION ON HIPERDISPATCH!!!
Velocity Software, IncCopyright 2007 Velocity Software, Inc. All Rights Reserved.
6/2
2/
18
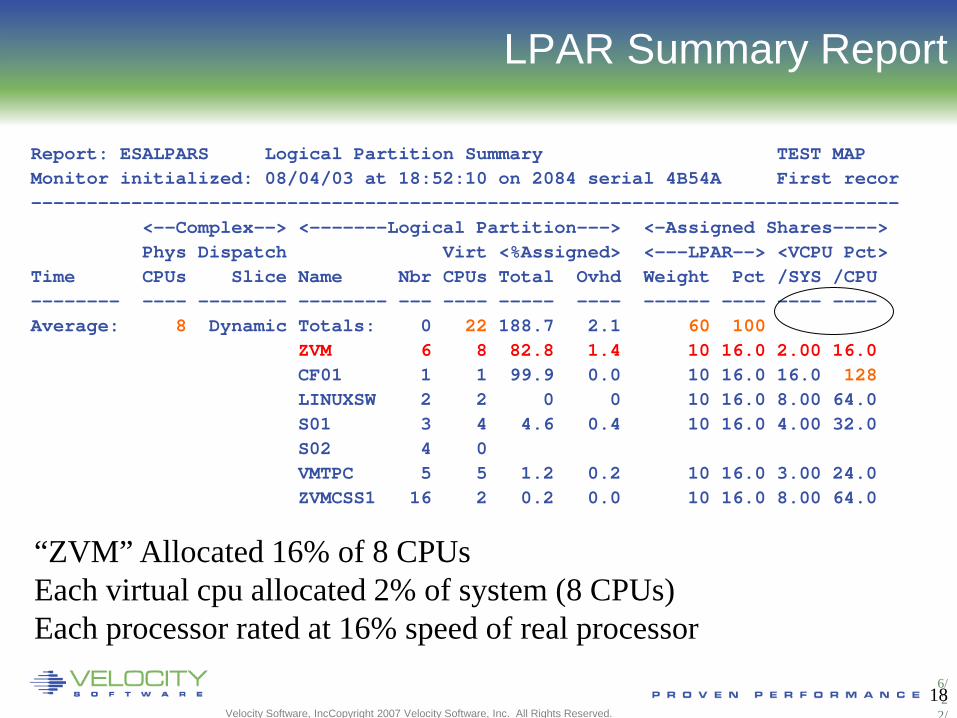
Report: ESALPARS Logical Partition Summary TEST MAP Monitor initialized: 08/04/03 at 18:52:10 on 2084 serial 4B54A First recor ------------------------------------------------------------------------------ <--Complex--> <-------Logical Partition---> <-Assigned Shares----> Phys Dispatch Virt <%Assigned> <---LPAR--> <VCPU Pct> Time CPUs Slice Name Nbr CPUs Total Ovhd Weight Pct /SYS /CPU -------- ---- -------- -------- --- ---- ----- ---- ------ ---- ---- ---- Average: 8 Dynamic Totals: 0 22 188.7 2.1 60 100 ZVM 6 8 82.8 1.4 10 16.0 2.00 16.0 CF01 1 1 99.9 0.0 10 16.0 16.0 128 LINUXSW 2 2 0 0 10 16.0 8.00 64.0 S01 3 4 4.6 0.4 10 16.0 4.00 32.0 S02 4 0 VMTPC 5 5 1.2 0.2 10 16.0 3.00 24.0 ZVMCSS1 16 2 0.2 0.0 10 16.0 8.00 64.0
LPAR Summary Report
“ZVM” Allocated 16% of 8 CPUs Each virtual cpu allocated 2% of system (8 CPUs) Each processor rated at 16% speed of real processor
Velocity Software, IncCopyright 2007 Velocity Software, Inc. All Rights Reserved.
6/2
2/
19
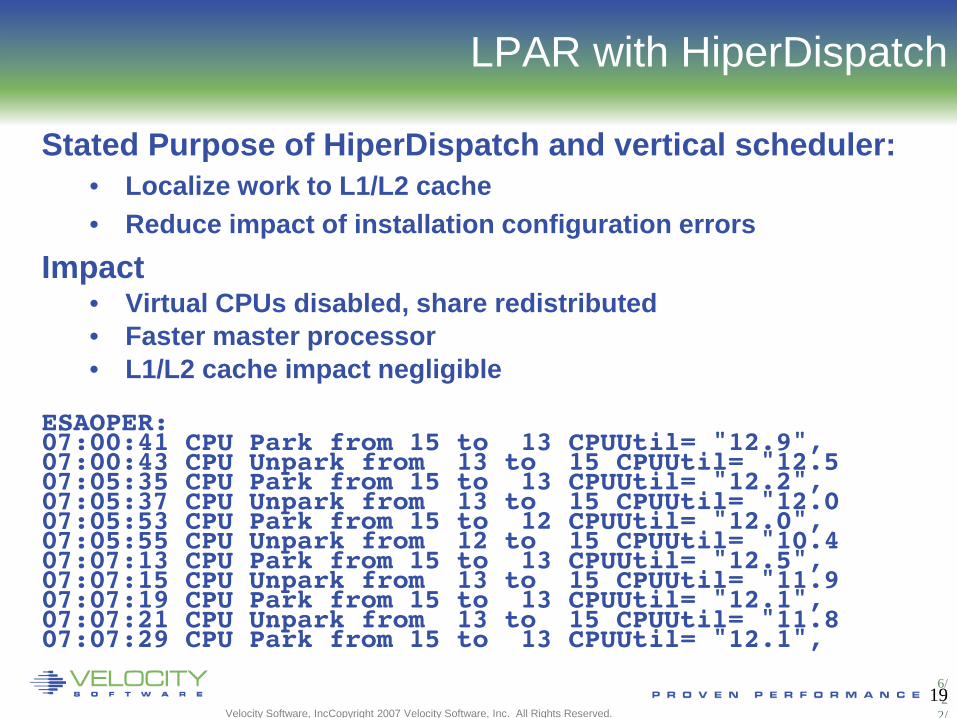
Stated Purpose of HiperDispatch and vertical scheduler: • Localize work to L1/L2 cache • Reduce impact of installation configuration errors
Impact • Virtual CPUs disabled, share redistributed • Faster master processor • L1/L2 cache impact negligible
ESAOPER: 07:00:41 CPU Park from 15 to 13 CPUUtil= "12.9", 07:00:43 CPU Unpark from 13 to 15 CPUUtil= "12.5 07:05:35 CPU Park from 15 to 13 CPUUtil= "12.2", 07:05:37 CPU Unpark from 13 to 15 CPUUtil= "12.0 07:05:53 CPU Park from 15 to 12 CPUUtil= "12.0", 07:05:55 CPU Unpark from 12 to 15 CPUUtil= "10.4 07:07:13 CPU Park from 15 to 13 CPUUtil= "12.5", 07:07:15 CPU Unpark from 13 to 15 CPUUtil= "11.9 07:07:19 CPU Park from 15 to 13 CPUUtil= "12.1", 07:07:21 CPU Unpark from 13 to 15 CPUUtil= "11.8 07:07:29 CPU Park from 15 to 13 CPUUtil= "12.1",
LPAR with HiperDispatch
Velocity Software, IncCopyright 2007 Velocity Software, Inc. All Rights Reserved.
6/2
2/
20
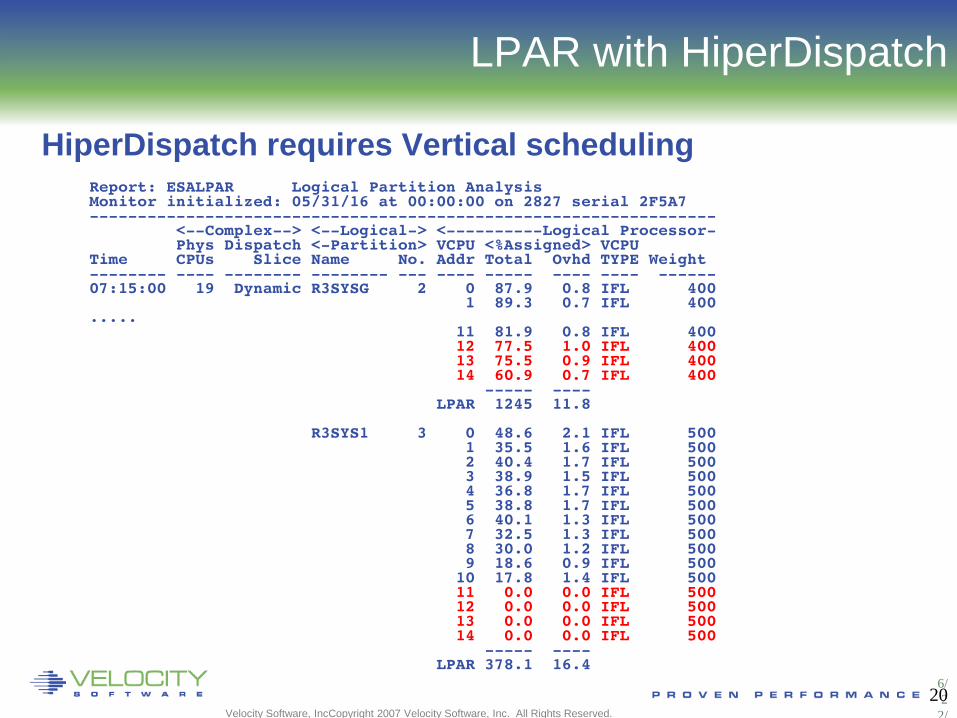
HiperDispatch requires Vertical scheduling
Report: ESALPAR Logical Partition Analysis Monitor initialized: 05/31/16 at 00:00:00 on 2827 serial 2F5A7 ----------------------------------------------------------------- <--Complex--> <--Logical-> <----------Logical Processor- Phys Dispatch <-Partition> VCPU <%Assigned> VCPU Time CPUs Slice Name No. Addr Total Ovhd TYPE Weight -------- ---- -------- -------- --- ---- ----- ---- ---- ------ 07:15:00 19 Dynamic R3SYSG 2 0 87.9 0.8 IFL 400 1 89.3 0.7 IFL 400 ..... 11 81.9 0.8 IFL 400 12 77.5 1.0 IFL 400 13 75.5 0.9 IFL 400 14 60.9 0.7 IFL 400 ----- ---- LPAR 1245 11.8 R3SYS1 3 0 48.6 2.1 IFL 500 1 35.5 1.6 IFL 500 2 40.4 1.7 IFL 500 3 38.9 1.5 IFL 500 4 36.8 1.7 IFL 500 5 38.8 1.7 IFL 500 6 40.1 1.3 IFL 500 7 32.5 1.3 IFL 500 8 30.0 1.2 IFL 500 9 18.6 0.9 IFL 500 10 17.8 1.4 IFL 500 11 0.0 0.0 IFL 500 12 0.0 0.0 IFL 500 13 0.0 0.0 IFL 500 14 0.0 0.0 IFL 500 ----- ---- LPAR 378.1 16.4
LPAR with HiperDispatch

Velocity Software, IncCopyright 2007 Velocity Software, Inc. All Rights Reserved.
6/2
2/
21
LPAR Options
Time Slice: Dynamic, used exclusively Weights: Sets priority between Logical Partitions Virtual processors Capping
• Limits Assigned time to LPAR • Useful for outsourcing, fixed contracts
Wait Completion • “no” gives up processor if idle (default) • “yes”, Partition keeps processor even if idle (rarely/never used)

Velocity Software, IncCopyright 2007 Velocity Software, Inc. All Rights Reserved.
6/2
2/
22
LPAR Dispatching
CEC Processor Utilization: • Physical overhead • Assigned time (physical cpu assigned to logical cpu)
• Logical overhead • Assigned time (work)
Each LPAR gets a “Share” LPAR was based on CP, much of LPAR has the same
concepts as CP Physical overhead is cost of dispatching lpar vcpus
Copyright 2011 Velocity Software, Inc. All Rights Reserved.
23
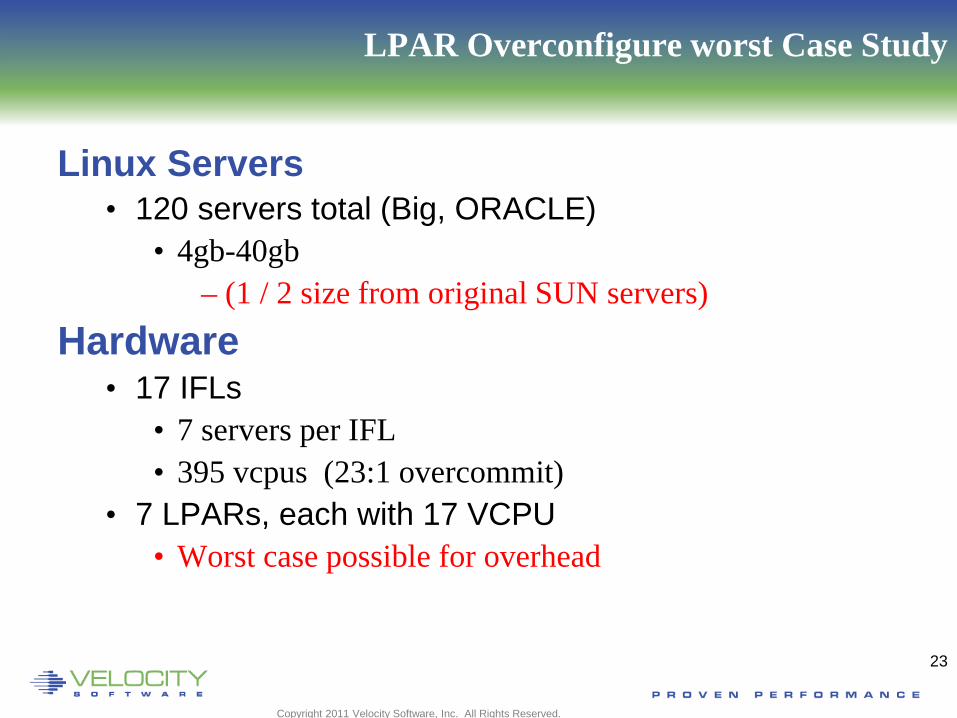
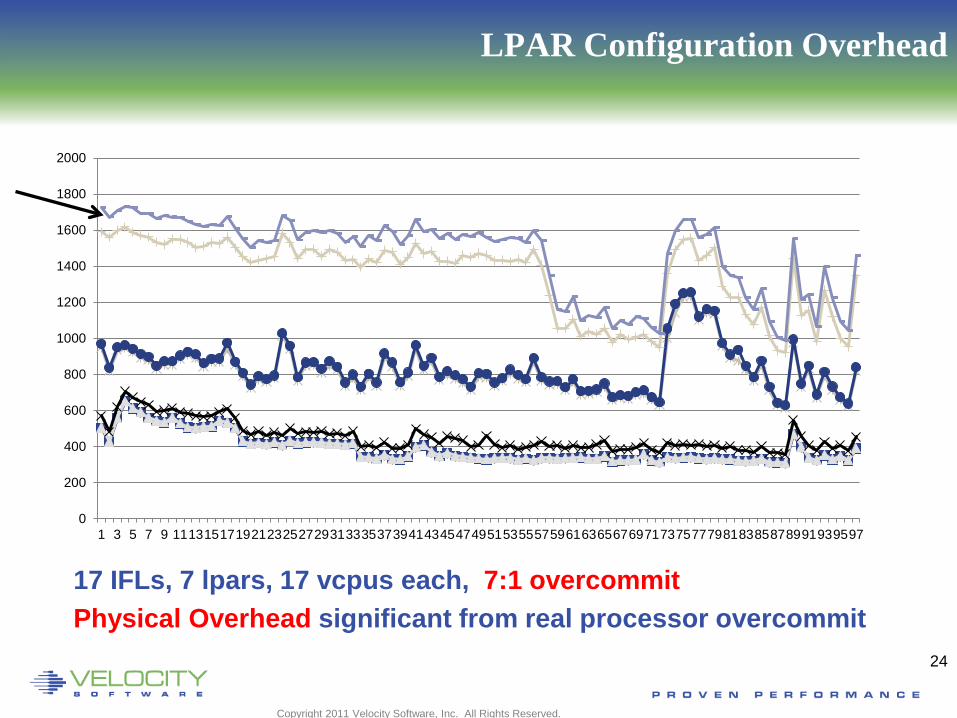
LPAR Overconfigure worst Case Study
Linux Servers • 120 servers total (Big, ORACLE)
• 4gb-40gb – (1 / 2 size from original SUN servers)
Hardware • 17 IFLs
• 7 servers per IFL • 395 vcpus (23:1 overcommit)
• 7 LPARs, each with 17 VCPU • Worst case possible for overhead
Copyright 2011 Velocity Software, Inc. All Rights Reserved.
24
LPAR Configuration Overhead
17 IFLs, 7 lpars, 17 vcpus each, 7:1 overcommit Physical Overhead significant from real processor overcommit
0
200
400
600
800
1000
1200
1400
1600
1800
2000
1 3 5 7 9 1113151719212325272931333537394143454749515355575961636567697173757779818385878991939597
25
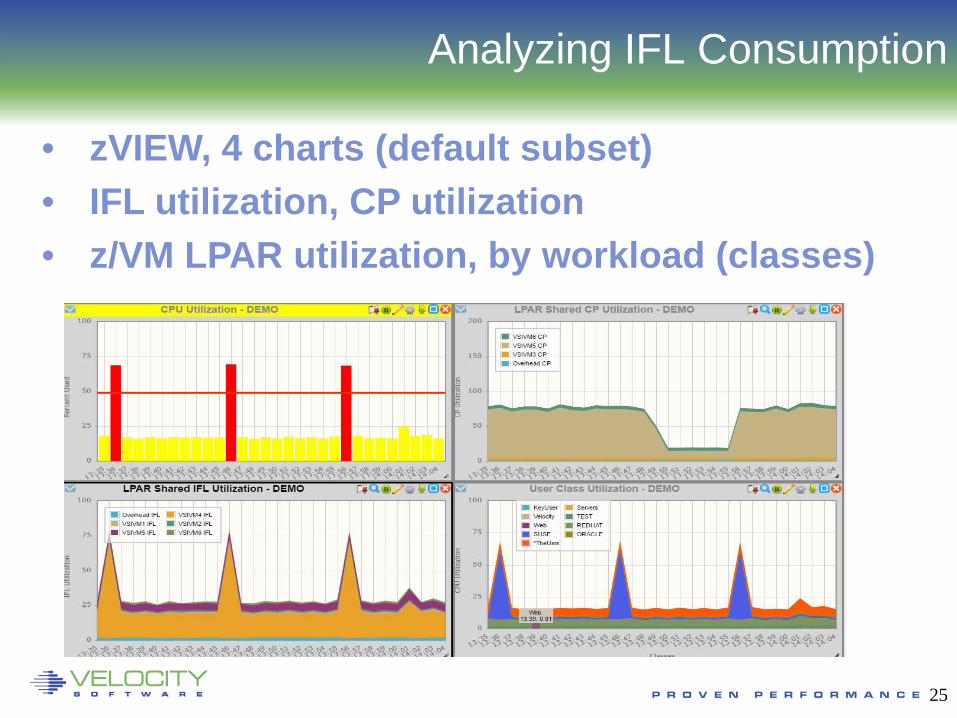
• zVIEW, 4 charts (default subset) • IFL utilization, CP utilization • z/VM LPAR utilization, by workload (classes)
Analyzing IFL Consumption
Velocity Software, IncCopyright 2007 Velocity Software, Inc. All Rights Reserved.
6/2
2/
26
CPU distribution depends on • LPAR Weight (and impact of other LPARs) • Share within z/VM LPAR • Impact of other virtual servers
Share analysis:
• ESALPARS for LPAR / IFL utilization • ESALPARS for LPAR allocation • ESACPUU / ESACPUA for z/VM perspective • ESAUSRC for share settings • ESAUSP2 for how much am I getting out of used
Managing Distribution - What is my share?
Velocity Software, IncCopyright 2007 Velocity Software, Inc. All Rights Reserved.
6/2
2/
27
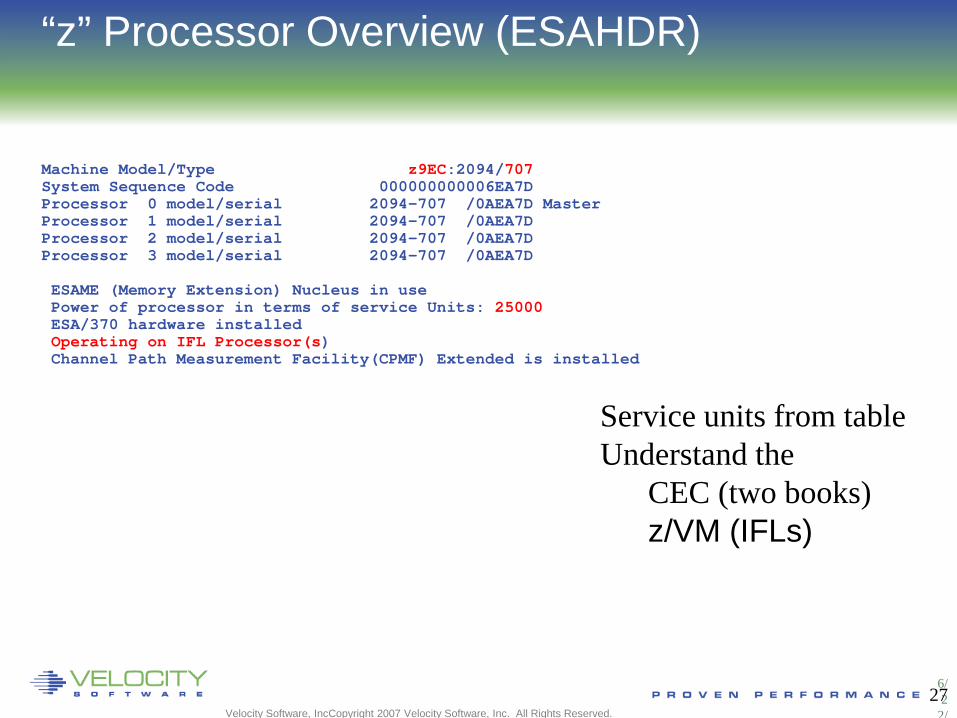
“z” Processor Overview (ESAHDR)
Machine Model/Type z9EC:2094/707 System Sequence Code 000000000006EA7D Processor 0 model/serial 2094-707 /0AEA7D Master Processor 1 model/serial 2094-707 /0AEA7D Processor 2 model/serial 2094-707 /0AEA7D Processor 3 model/serial 2094-707 /0AEA7D ESAME (Memory Extension) Nucleus in use Power of processor in terms of service Units: 25000 ESA/370 hardware installed Operating on IFL Processor(s) Channel Path Measurement Facility(CPMF) Extended is installed
Service units from table Understand the
CEC (two books) z/VM (IFLs)

Velocity Software, IncCopyright 2007 Velocity Software, Inc. All Rights Reserved.
6/2
2/
28
Report: ESACPUU CPU Utilization Report Linux Test Monitor initialized: 05/06/08 at 12:00:00 on 2094 serial AEA7D First record analyzed: ----------------------------------------------------------------------------------------- <----Load----> <-----CPU (percentages)-----> <------External (per second)--- <-Users-> Tran Total Emul User Sys Idle <--Page---> <--Spool--> RSCH+ Time Actv In Q /sec CPU util time ovrhd ovrhd time Read Write Read Write SSCH -------- ---- ---- ---- - ----- ----- ----- ----- ----- ----- ----- ----- ----- ----- 12:01:00 103 118 9.1 0 92.8 88.6 2.3 1.9 7.2 11 52 0 0 220 1 93.8 90.5 2.2 1.0 6.2 14 0 0 0 182 2 94.4 90.9 2.2 1.2 5.6 17 0 0 0 196 3 94.5 90.9 2.1 1.5 5.5 13 0 0 0 179 ----- ----- ----- ----- ----- ----- ----- ----- ----- ----- System: 375.4 361.0 8.9 5.5 24.4 55 52 0 0 778
• Processor utilization has three components: • Emulation time – running users in Interpretive Execution • User overhead – CP time performing services for a user • System overhead – CP “housekeeping” • Note master processor – only problem if architecturally constrained
Processor Measurement
29
Processor Measurements User View
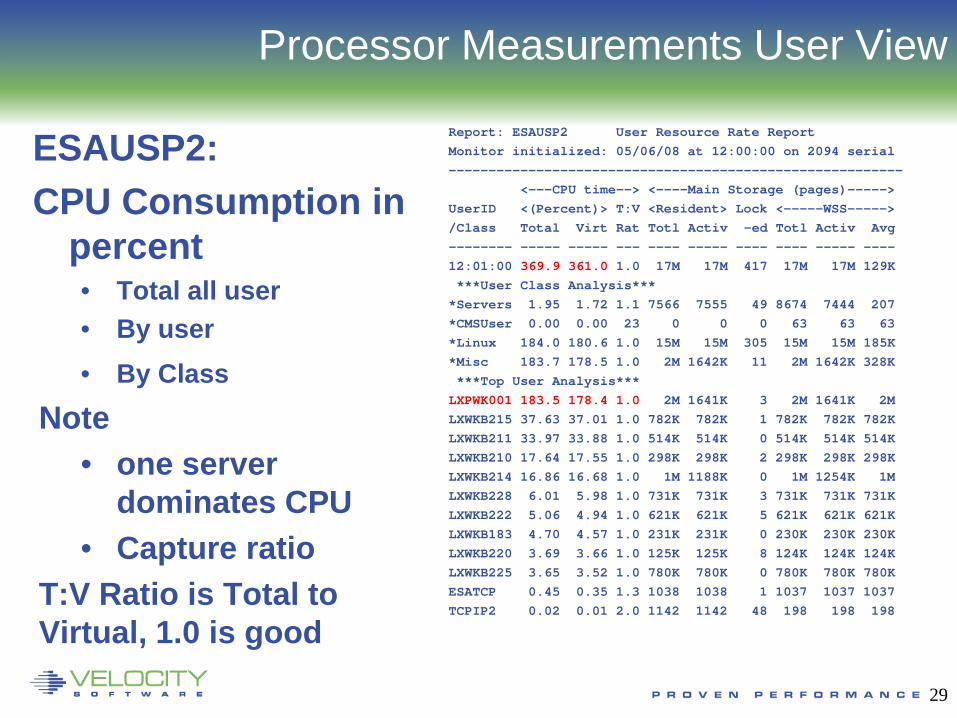
Report: ESAUSP2 User Resource Rate Report Monitor initialized: 05/06/08 at 12:00:00 on 2094 serial --------------------------------------------------------- <---CPU time--> <----Main Storage (pages)-----> UserID <(Percent)> T:V <Resident> Lock <-----WSS-----> /Class Total Virt Rat Totl Activ -ed Totl Activ Avg -------- ----- ----- --- ---- ----- ---- ---- ----- ---- 12:01:00 369.9 361.0 1.0 17M 17M 417 17M 17M 129K ***User Class Analysis*** *Servers 1.95 1.72 1.1 7566 7555 49 8674 7444 207 *CMSUser 0.00 0.00 23 0 0 0 63 63 63 *Linux 184.0 180.6 1.0 15M 15M 305 15M 15M 185K *Misc 183.7 178.5 1.0 2M 1642K 11 2M 1642K 328K ***Top User Analysis*** LXPWK001 183.5 178.4 1.0 2M 1641K 3 2M 1641K 2M LXWKB215 37.63 37.01 1.0 782K 782K 1 782K 782K 782K LXWKB211 33.97 33.88 1.0 514K 514K 0 514K 514K 514K LXWKB210 17.64 17.55 1.0 298K 298K 2 298K 298K 298K LXWKB214 16.86 16.68 1.0 1M 1188K 0 1M 1254K 1M LXWKB228 6.01 5.98 1.0 731K 731K 3 731K 731K 731K LXWKB222 5.06 4.94 1.0 621K 621K 5 621K 621K 621K LXWKB183 4.70 4.57 1.0 231K 231K 0 230K 230K 230K LXWKB220 3.69 3.66 1.0 125K 125K 8 124K 124K 124K LXWKB225 3.65 3.52 1.0 780K 780K 0 780K 780K 780K ESATCP 0.45 0.35 1.3 1038 1038 1 1037 1037 1037 TCPIP2 0.02 0.01 2.0 1142 1142 48 198 198 198
ESAUSP2: CPU Consumption in
percent • Total all user • By user • By Class
Note • one server
dominates CPU • Capture ratio
T:V Ratio is Total to Virtual, 1.0 is good

Velocity Software, IncCopyright 2007 Velocity Software, Inc. All Rights Reserved.
6/2
2/
30
Master Processor Overview
Much system code NOT re-entrant • Must be single threaded • Can not update one control block by multiple processors
simultaneously
Implementation • hardware locks: TS, CS, CDS instructions • software locks: “ownership” of resources
• (such as in database) • running on the Master Processor
SPIN Locks • Test for lock, if fail, test for lock • Linux uses “spin lock”, replaced with Diag44 -> DIAG9C • Linux spin locks an issue, cost in CPU

Velocity Software, IncCopyright 2007 Velocity Software, Inc. All Rights Reserved.
6/2
2/
31
Resource Serialization Master Processor
Many CP processes run “master only” to ensure the integrity of the system
• Spooling • some IUCV services (*MSG, *RPI, *ACCOUNT from CP) • Page migration • execution of ALL CP commands • Line mode console I/O
Master processor utilization shows up as higher System Overhead and User Overhead on the Master Processor. Higher Master CPU busy is worse on a system with more processors.
• Master calls is measured • Simulation wait is measured • Processor imbalance can be a problem
32
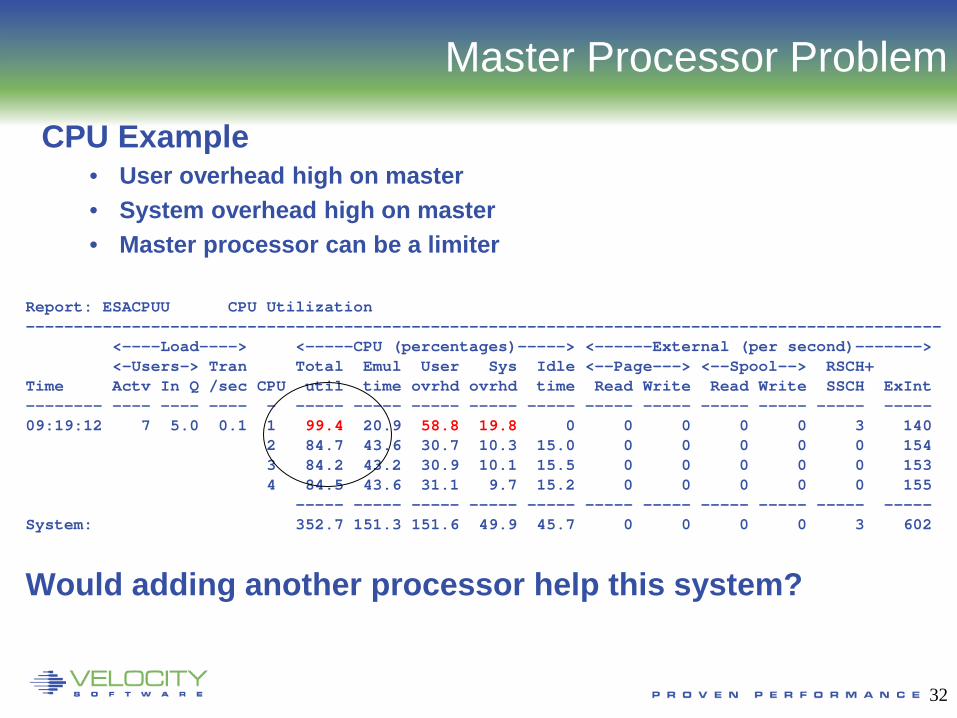
Report: ESACPUU CPU Utilization ----------------------------------------------------------------------------------------------- <----Load----> <-----CPU (percentages)-----> <------External (per second)-------> <-Users-> Tran Total Emul User Sys Idle <--Page---> <--Spool--> RSCH+ Time Actv In Q /sec CPU util time ovrhd ovrhd time Read Write Read Write SSCH ExInt -------- ---- ---- ---- - ----- ----- ----- ----- ----- ----- ----- ----- ----- ----- ----- 09:19:12 7 5.0 0.1 1 99.4 20.9 58.8 19.8 0 0 0 0 0 3 140 2 84.7 43.6 30.7 10.3 15.0 0 0 0 0 0 154 3 84.2 43.2 30.9 10.1 15.5 0 0 0 0 0 153 4 84.5 43.6 31.1 9.7 15.2 0 0 0 0 0 155 ----- ----- ----- ----- ----- ----- ----- ----- ----- ----- ----- System: 352.7 151.3 151.6 49.9 45.7 0 0 0 0 3 602
Would adding another processor help this system?
Master Processor Problem
CPU Example • User overhead high on master • System overhead high on master • Master processor can be a limiter

Velocity Software, IncCopyright 2007 Velocity Software, Inc. All Rights Reserved.
6/2
2/
33
MASTER Processor Analysis
• Investigating Master Overhead • User overhead high on master • System overhead high on master • All spool I/O performed by master Note I/O lower on master?
• ESAIUCV: RPI, MSG IUCV • ESACPUA: Page migration, Spool I/O
<––––Load–––> <–––––CPU (percentages)–––––> . <–––External (per second)–> <–Users> Tran Total Emul User Sys Idle . <––Page––> <–Spool––> RSCH+
Time Actv InQ /sec CPU util time ovrhd ovrhd time . Read Write Read Write SSCH
–––––––– –––– ––– –––– – ––––– ––––– ––––– ––––– ––––– . –––– ––––– –––– ––––– ––––
10:21:09 255 20 23.9 0 86.4 16.7 53.6 16.2 13.4 . 60 71 9 4 86
1 67.9 35.9 23.7 8.4 31.9 . 82 56 0 0 135
2 69.5 36.4 24.5 8.7 30.3 . 89 58 0 0 140
3 67.0 35.4 23.2 8.4 32.8 . 76 71 0 0 134
––––– ––––– ––––– ––––– ––––– . –––– ––––– –––– ––––– ––––
System 290.9 124.3 124.9 41.7 108.4 . 307 256 9 4 496
34
Processor Local Dispatch Vectors
• Users are selected for dispatch from a PLDV. • Each processor has a local PLDV.
• Master ONLY PLDV • Some work for users • Some System work • The System VMDBK
• The System VMDBK and users on the Master Only PLDV are dispatched on the Master Processor.

35
Dispatch Vector Activity
Report: ESAPLDV Processor Local Dispatch Vector Activity Linux Test ESAMAP 3.7.4 ------------------------------------------------------------------------------------------------- <----Users-----> Tran <VMDBK Moves/sec> <--------PLDV Lengths------> Dispatcher Time Logged Actv In Q /sec CPU Steals To Master Avg Max Mstr MstrMa %Empty Long Paths -------- ------ ---- ---- ----- - ------ --------- ---- --- ---- ------ ------ ---------- 12:01:00 129 103 118 9.1 0 0 2.5 3.2 4.0 0.0 1. 8.3 4497.1 1 0 0 2.1 4.0 . 38.3 3942.1 2 0 0 2.0 4.0 . 41.7 3942.7 3 0 0 1.8 3.0 . 38.3 3741.7 ------ --------- ---- --- ---- ------ ------ ---------- System: 0 2.5 9.2 15.0 0.0 1. 126.7 16123.5
• The Dispatcher selects users from the CPU’s Processor Local Dispatch Vector (PLDV).
• Each processor has a Local PLDV. • The Master Processor has a special PLDV from which
“master only” work for users is selected.

Velocity Software, IncCopyright 2007 Velocity Software, Inc. All Rights Reserved.
6/2
2/
36
Processor Utilization (Is it correct?) • Why is the Linux LPAR always 100% busy? (RMF)
• Dedicated processors show up as 100%
• Processor utilization measurements are NOT consistent between products/commands • This matters when running second level, or in an LPAR • CP Indicate shows percent of what is available • CP Does NOT KNOW what is available
• ESAMON/ESAMAP show absolute utilization • LPAR information is available
• Measuring Linux under VM or LPAR had same issue Linux reported a percent of a percent busy
Velocity Software, IncCopyright 2007 Velocity Software, Inc. All Rights Reserved.
6/2
2/
37
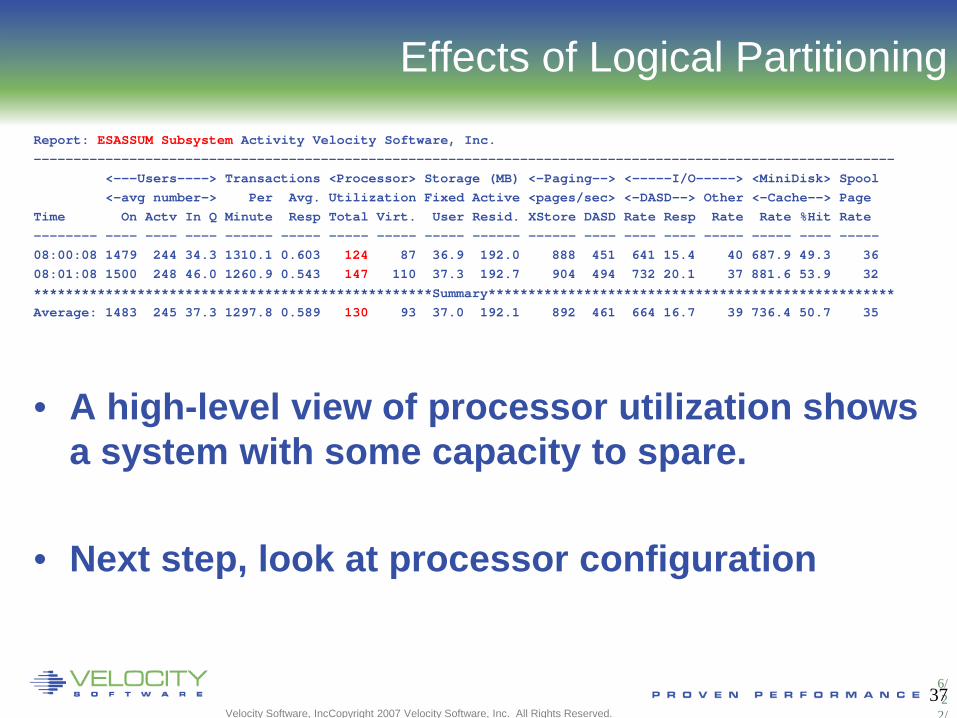
Effects of Logical Partitioning Report: ESASSUM Subsystem Activity Velocity Software, Inc. –––––––––––––––––––––––––––––––––––––––––––––––––––––––––––––––––––––––––––––––––––––––––––––––––––––––––––– <–––Users––––> Transactions <Processor> Storage (MB) <–Paging––> <–––––I/O–––––> <MiniDisk> Spool <–avg number–> Per Avg. Utilization Fixed Active <pages/sec> <–DASD––> Other <–Cache––> Page Time On Actv In Q Minute Resp Total Virt. User Resid. XStore DASD Rate Resp Rate Rate %Hit Rate –––––––– –––– –––– –––– –––––– ––––– ––––– ––––– ––––– –––––– –––––– –––– –––– –––– ––––– ––––– –––– ––––– 08:00:08 1479 244 34.3 1310.1 0.603 124 87 36.9 192.0 888 451 641 15.4 40 687.9 49.3 36 08:01:08 1500 248 46.0 1260.9 0.543 147 110 37.3 192.7 904 494 732 20.1 37 881.6 53.9 32 **************************************************Summary*************************************************** Average: 1483 245 37.3 1297.8 0.589 130 93 37.0 192.1 892 461 664 16.7 39 736.4 50.7 35
• A high-level view of processor utilization shows
a system with some capacity to spare.
• Next step, look at processor configuration
Velocity Software, IncCopyright 2007 Velocity Software, Inc. All Rights Reserved.
6/2
2/
38
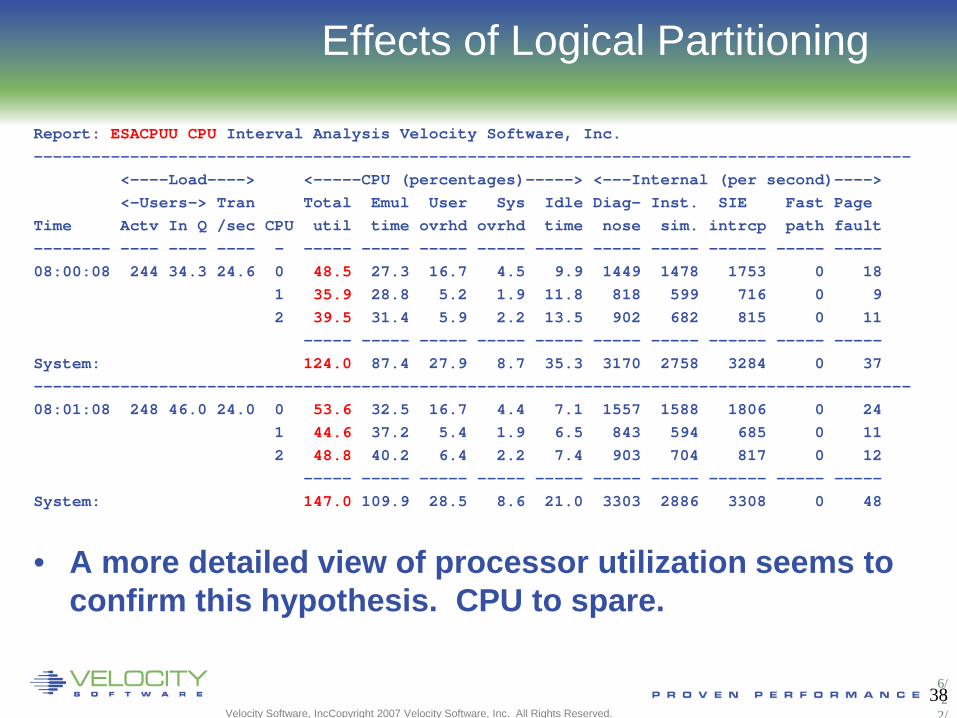
Effects of Logical Partitioning
Report: ESACPUU CPU Interval Analysis Velocity Software, Inc. ––––––––––––––––––––––––––––––––––––––––––––––––––––––––––––––––––––––––––––––––––––––––––– <––––Load––––> <–––––CPU (percentages)–––––> <–––Internal (per second)––––> <–Users–> Tran Total Emul User Sys Idle Diag– Inst. SIE Fast Page Time Actv In Q /sec CPU util time ovrhd ovrhd time nose sim. intrcp path fault –––––––– –––– –––– –––– – ––––– ––––– ––––– ––––– ––––– ––––– ––––– –––––– ––––– ––––– 08:00:08 244 34.3 24.6 0 48.5 27.3 16.7 4.5 9.9 1449 1478 1753 0 18 1 35.9 28.8 5.2 1.9 11.8 818 599 716 0 9 2 39.5 31.4 5.9 2.2 13.5 902 682 815 0 11 ––––– ––––– ––––– ––––– ––––– ––––– ––––– –––––– ––––– ––––– System: 124.0 87.4 27.9 8.7 35.3 3170 2758 3284 0 37 ––––––––––––––––––––––––––––––––––––––––––––––––––––––––––––––––––––––––––––––––––––––––––– 08:01:08 248 46.0 24.0 0 53.6 32.5 16.7 4.4 7.1 1557 1588 1806 0 24 1 44.6 37.2 5.4 1.9 6.5 843 594 685 0 11 2 48.8 40.2 6.4 2.2 7.4 903 704 817 0 12 ––––– ––––– ––––– ––––– ––––– ––––– ––––– –––––– ––––– ––––– System: 147.0 109.9 28.5 8.6 21.0 3303 2886 3308 0 48
• A more detailed view of processor utilization seems to confirm this hypothesis. CPU to spare.

Velocity Software, IncCopyright 2007 Velocity Software, Inc. All Rights Reserved.
6/2
2/
39
Effects of Logical Partitioning
Report: ESAXACT Transaction Analysis Velocity Software, Inc. ––––––––––––––––––––––––––––––––––––––––––––––––––––––––––––––––––––––––––––––––––––––––– <––––––––––––––Percent non–dormant––––––––––––––––––> UserID <–Samples–> E– D– T– Tst Lim Pct /Class Total In Q Run Sim CPU SIO Pg SVM SVM SVM CF Idl I/O Ldg Oth Lst Elig –––––––– ––––– ––––– ––– ––– ––– ––– –– ––– ––– ––– –– ––– ––– ––– ––– ––– –––– System: 5936 149 5.4 34 8.7 0 3 0 0 6.0 2 36 4.7 . 0 . 0 Hi–Freq: 176K 7057 2.0 17 2.8 0 1 0 3.8 4.2 49 17 3.1 0 0 . 0 ***Resource use by User Class *Servers 3720 568 3.0 29 4.2 0 0 0 21 6.9 1 28 7.6 0 0 . 0 *Keys 1080 490 1.6 0.6 6.7 0 0 0 16 19 1 43 13 0 0 . 0 *TheUsrs 172K 6108 1.9 16 2.6 0 1 0 1.2 3.0 57 14 2.5 0 0 . 0
• User state sampling shows significant amount of CPU
wait as compared to “Running”, Simulation wait even greater.
Velocity Software, IncCopyright 2007 Velocity Software, Inc. All Rights Reserved.
6/2
2/
40
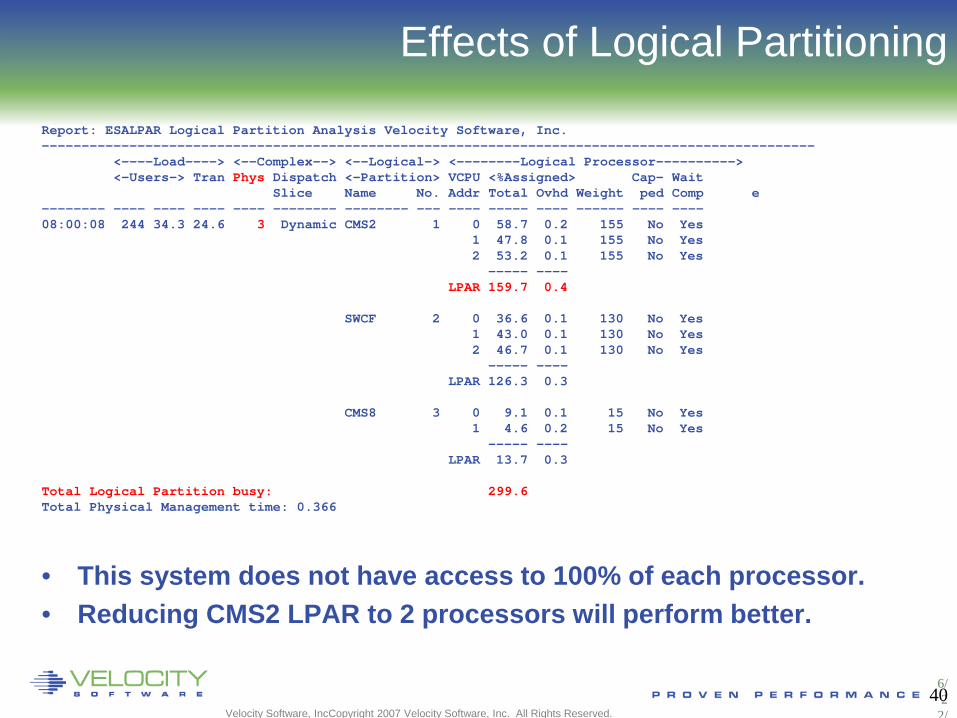
Effects of Logical Partitioning
Report: ESALPAR Logical Partition Analysis Velocity Software, Inc. ––––––––––––––––––––––––––––––––––––––––––––––––––––––––––––––––––––––––––––––––––––––––––––––––– <––––Load––––> <––Complex––> <––Logical–> <––––––––Logical Processor––––––––––> <–Users–> Tran Phys Dispatch <–Partition> VCPU <%Assigned> Cap– Wait Slice Name No. Addr Total Ovhd Weight ped Comp e –––––––– –––– –––– –––– –––– –––––––– –––––––– ––– –––– ––––– –––– –––––– –––– –––– 08:00:08 244 34.3 24.6 3 Dynamic CMS2 1 0 58.7 0.2 155 No Yes 1 47.8 0.1 155 No Yes 2 53.2 0.1 155 No Yes ––––– –––– LPAR 159.7 0.4 SWCF 2 0 36.6 0.1 130 No Yes 1 43.0 0.1 130 No Yes 2 46.7 0.1 130 No Yes ––––– –––– LPAR 126.3 0.3 CMS8 3 0 9.1 0.1 15 No Yes 1 4.6 0.2 15 No Yes ––––– –––– LPAR 13.7 0.3 Total Logical Partition busy: 299.6 Total Physical Management time: 0.366
• This system does not have access to 100% of each processor. • Reducing CMS2 LPAR to 2 processors will perform better.
41
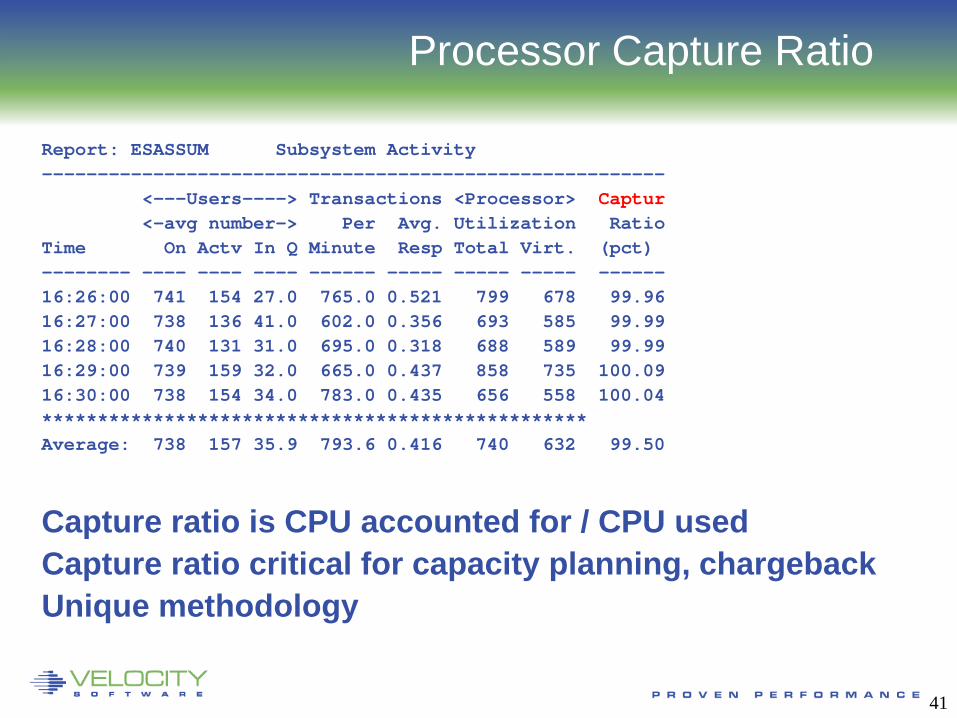
Processor Capture Ratio
Report: ESASSUM Subsystem Activity -------------------------------------------------------- <---Users----> Transactions <Processor> Captur <-avg number-> Per Avg. Utilization Ratio Time On Actv In Q Minute Resp Total Virt. (pct) -------- ---- ---- ---- ------ ----- ----- ----- ------ 16:26:00 741 154 27.0 765.0 0.521 799 678 99.96 16:27:00 738 136 41.0 602.0 0.356 693 585 99.99 16:28:00 740 131 31.0 695.0 0.318 688 589 99.99 16:29:00 739 159 32.0 665.0 0.437 858 735 100.09 16:30:00 738 154 34.0 783.0 0.435 656 558 100.04 ************************************************* Average: 738 157 35.9 793.6 0.416 740 632 99.50
Capture ratio is CPU accounted for / CPU used Capture ratio critical for capacity planning, chargeback Unique methodology

42
Managing the delivery of CPU Resource
Options for tuning processor
• Reducing overhead • Application tuning to reduce processor demand • Reducing system overhead
• Reallocating resources • Adjust SHARE values • Limit DSPBUF occupancy • Dedicate processors • Interactive BIAS (SET SRM IABIAS)
43
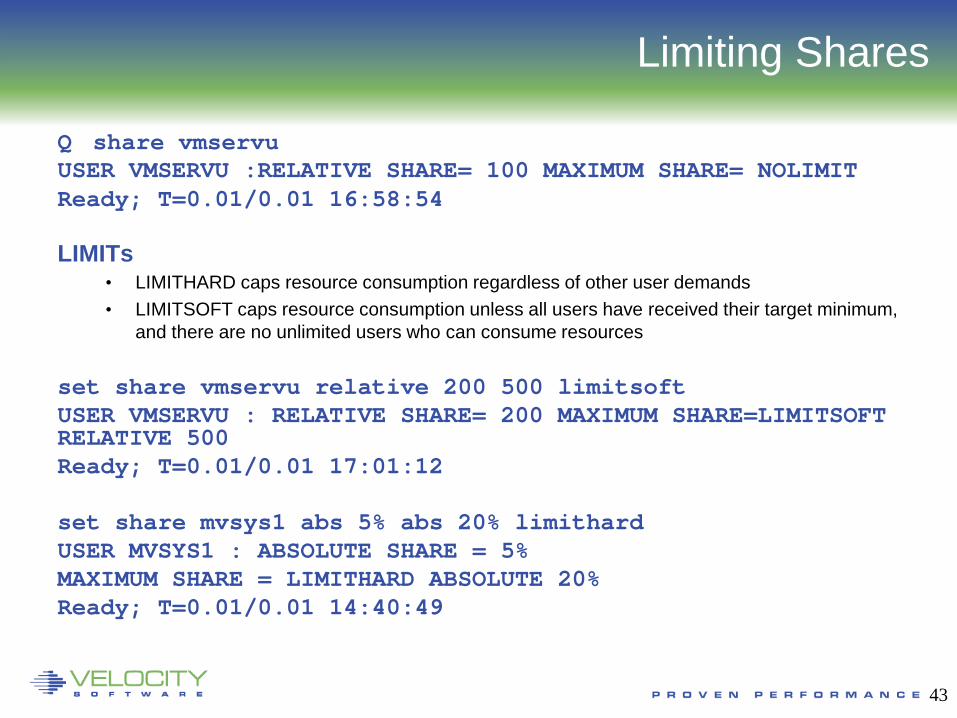
Limiting Shares
Q share vmservu USER VMSERVU :RELATIVE SHARE= 100 MAXIMUM SHARE= NOLIMIT Ready; T=0.01/0.01 16:58:54
LIMITs
• LIMITHARD caps resource consumption regardless of other user demands • LIMITSOFT caps resource consumption unless all users have received their target minimum,
and there are no unlimited users who can consume resources
set share vmservu relative 200 500 limitsoft USER VMSERVU : RELATIVE SHARE= 200 MAXIMUM SHARE=LIMITSOFT RELATIVE 500 Ready; T=0.01/0.01 17:01:12
set share mvsys1 abs 5% abs 20% limithard USER MVSYS1 : ABSOLUTE SHARE = 5% MAXIMUM SHARE = LIMITHARD ABSOLUTE 20% Ready; T=0.01/0.01 14:40:49

44
Adjusting DSPBUF values
• The purpose of the Dispatch Buffer (DSPBUF) is the limit on the number of users of each Scheduler class allowed in the Dispatch List – thereby controlling CPU utilization
• If CPU is 100% busy, try lowering the Q3 value. • Watch CPU busy very carefully.
• What happens if DSPBUF is lowered too far for Q3? • (Hint: How is Elapsed Time Slice determined?)
• Experimenting with DSPBUF is not for the casual tuner or the faint of heart.

45
I/O Processor - SAP
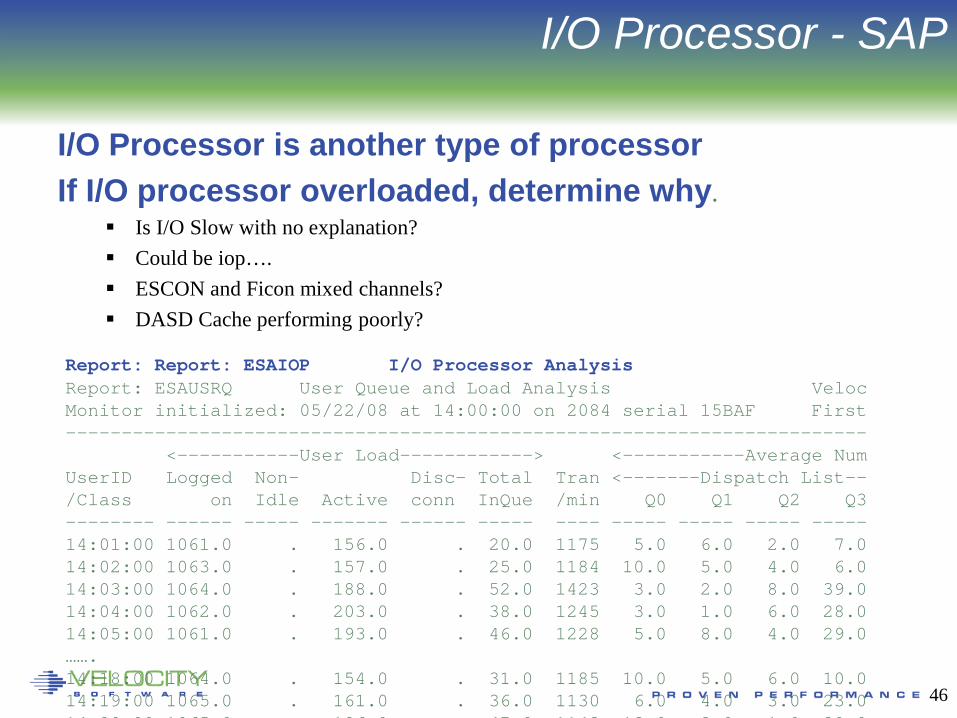
I/O Processor is another type of processor If I/O processor overloaded, determine why.
Is I/O Slow with no explanation? Could be iop…. ESCON and Ficon mixed channels? DASD Cache performing poorly?
Report: Report: ESAIOP I/O Processor Analysis ------------------------------------------------------------------ I/O <-----------------I/O Processor--------------------> Proc <Pct Util> <Rate/Second> <-Percent of Strts busy-> Time Nmbr Busy Idle SSCH Intrpts chan switch CtlUnit Device -------- ---- ---- ----- ----- ------- ---- ------ ------- ------ 21:22:00 0 65.8 34.2 2690 2402 1488 12.7 0.3 1.5 1 55.6 44.4 2939 3686 837 4.3 0.3 0.1 2 54.2 45.8 1684 2979 1756 0.6 0.5 0.4 21:27:00 0 50.6 49.4 2227 2190 1374 12.6 0.4 0.9 1 39.8 60.2 2540 2997 648 3.6 0.4 0.2 2 41.2 58.8 1711 2691 1334 0.7 0.4 0.5
46
I/O Processor - SAP
I/O Processor is another type of processor If I/O processor overloaded, determine why.
Is I/O Slow with no explanation? Could be iop…. ESCON and Ficon mixed channels? DASD Cache performing poorly?
Report: Report: ESAIOP I/O Processor Analysis Report: ESAUSRQ User Queue and Load Analysis Veloc Monitor initialized: 05/22/08 at 14:00:00 on 2084 serial 15BAF First ------------------------------------------------------------------------ <-----------User Load------------> <-----------Average Num UserID Logged Non- Disc- Total Tran <-------Dispatch List-- /Class on Idle Active conn InQue /min Q0 Q1 Q2 Q3 -------- ------ ----- ------- ------ ----- ---- ----- ----- ----- ----- 14:01:00 1061.0 . 156.0 . 20.0 1175 5.0 6.0 2.0 7.0 14:02:00 1063.0 . 157.0 . 25.0 1184 10.0 5.0 4.0 6.0 14:03:00 1064.0 . 188.0 . 52.0 1423 3.0 2.0 8.0 39.0 14:04:00 1062.0 . 203.0 . 38.0 1245 3.0 1.0 6.0 28.0 14:05:00 1061.0 . 193.0 . 46.0 1228 5.0 8.0 4.0 29.0 ……. 14:18:00 1064.0 . 154.0 . 31.0 1185 10.0 5.0 6.0 10.0 14:19:00 1065.0 . 161.0 . 36.0 1130 6.0 4.0 3.0 23.0 14 20 00 1065 0 186 0 47 0 1143 13 0 3 0 1 0 30 0
47
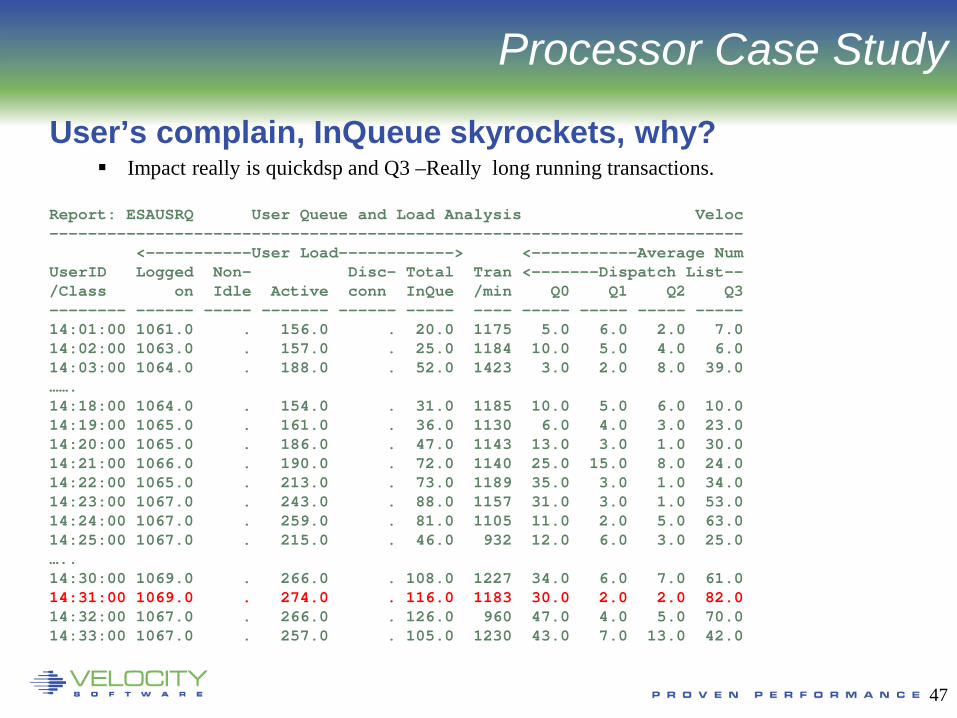
Processor Case Study User’s complain, InQueue skyrockets, why?
Impact really is quickdsp and Q3 –Really long running transactions.
Report: ESAUSRQ User Queue and Load Analysis Veloc ------------------------------------------------------------------------ <-----------User Load------------> <-----------Average Num UserID Logged Non- Disc- Total Tran <-------Dispatch List-- /Class on Idle Active conn InQue /min Q0 Q1 Q2 Q3 -------- ------ ----- ------- ------ ----- ---- ----- ----- ----- ----- 14:01:00 1061.0 . 156.0 . 20.0 1175 5.0 6.0 2.0 7.0 14:02:00 1063.0 . 157.0 . 25.0 1184 10.0 5.0 4.0 6.0 14:03:00 1064.0 . 188.0 . 52.0 1423 3.0 2.0 8.0 39.0 ……. 14:18:00 1064.0 . 154.0 . 31.0 1185 10.0 5.0 6.0 10.0 14:19:00 1065.0 . 161.0 . 36.0 1130 6.0 4.0 3.0 23.0 14:20:00 1065.0 . 186.0 . 47.0 1143 13.0 3.0 1.0 30.0 14:21:00 1066.0 . 190.0 . 72.0 1140 25.0 15.0 8.0 24.0 14:22:00 1065.0 . 213.0 . 73.0 1189 35.0 3.0 1.0 34.0 14:23:00 1067.0 . 243.0 . 88.0 1157 31.0 3.0 1.0 53.0 14:24:00 1067.0 . 259.0 . 81.0 1105 11.0 2.0 5.0 63.0 14:25:00 1067.0 . 215.0 . 46.0 932 12.0 6.0 3.0 25.0 ….. 14:30:00 1069.0 . 266.0 . 108.0 1227 34.0 6.0 7.0 61.0 14:31:00 1069.0 . 274.0 . 116.0 1183 30.0 2.0 2.0 82.0 14:32:00 1067.0 . 266.0 . 126.0 960 47.0 4.0 5.0 70.0 14:33:00 1067.0 . 257.0 . 105.0 1230 43.0 7.0 13.0 42.0
Velocity Software, IncCopyright 2007 Velocity Software, Inc. All Rights Reserved.
6/2
2/
48
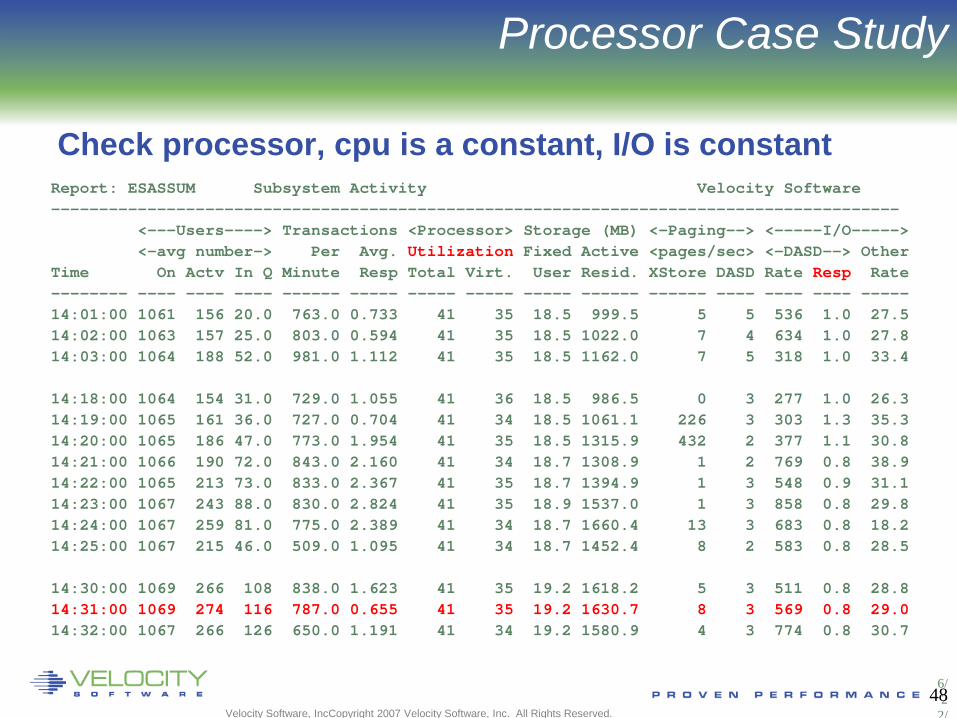
Processor Case Study
Check processor, cpu is a constant, I/O is constant Report: ESASSUM Subsystem Activity Velocity Software ---------------------------------------------------------------------------------------- <---Users----> Transactions <Processor> Storage (MB) <-Paging--> <-----I/O-----> <-avg number-> Per Avg. Utilization Fixed Active <pages/sec> <-DASD--> Other Time On Actv In Q Minute Resp Total Virt. User Resid. XStore DASD Rate Resp Rate -------- ---- ---- ---- ------ ----- ----- ----- ----- ------ ------ ---- ---- ---- ----- 14:01:00 1061 156 20.0 763.0 0.733 41 35 18.5 999.5 5 5 536 1.0 27.5 14:02:00 1063 157 25.0 803.0 0.594 41 35 18.5 1022.0 7 4 634 1.0 27.8 14:03:00 1064 188 52.0 981.0 1.112 41 35 18.5 1162.0 7 5 318 1.0 33.4 14:18:00 1064 154 31.0 729.0 1.055 41 36 18.5 986.5 0 3 277 1.0 26.3 14:19:00 1065 161 36.0 727.0 0.704 41 34 18.5 1061.1 226 3 303 1.3 35.3 14:20:00 1065 186 47.0 773.0 1.954 41 35 18.5 1315.9 432 2 377 1.1 30.8 14:21:00 1066 190 72.0 843.0 2.160 41 34 18.7 1308.9 1 2 769 0.8 38.9 14:22:00 1065 213 73.0 833.0 2.367 41 35 18.7 1394.9 1 3 548 0.9 31.1 14:23:00 1067 243 88.0 830.0 2.824 41 35 18.9 1537.0 1 3 858 0.8 29.8 14:24:00 1067 259 81.0 775.0 2.389 41 34 18.7 1660.4 13 3 683 0.8 18.2 14:25:00 1067 215 46.0 509.0 1.095 41 34 18.7 1452.4 8 2 583 0.8 28.5 14:30:00 1069 266 108 838.0 1.623 41 35 19.2 1618.2 5 3 511 0.8 28.8 14:31:00 1069 274 116 787.0 0.655 41 35 19.2 1630.7 8 3 569 0.8 29.0 14:32:00 1067 266 126 650.0 1.191 41 34 19.2 1580.9 4 3 774 0.8 30.7
Velocity Software, IncCopyright 2007 Velocity Software, Inc. All Rights Reserved.
6/2
2/
49
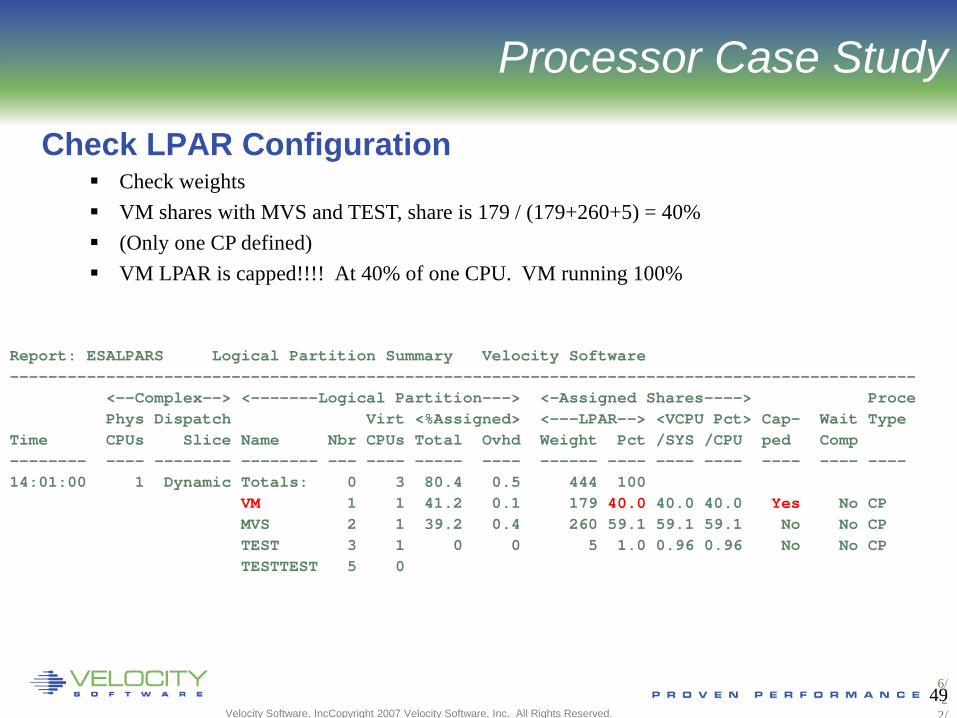
Processor Case Study
Check LPAR Configuration Check weights VM shares with MVS and TEST, share is 179 / (179+260+5) = 40% (Only one CP defined) VM LPAR is capped!!!! At 40% of one CPU. VM running 100%
Report: ESALPARS Logical Partition Summary Velocity Software ---------------------------------------------------------------------------------------------- <--Complex--> <-------Logical Partition---> <-Assigned Shares----> Proce Phys Dispatch Virt <%Assigned> <---LPAR--> <VCPU Pct> Cap- Wait Type Time CPUs Slice Name Nbr CPUs Total Ovhd Weight Pct /SYS /CPU ped Comp -------- ---- -------- -------- --- ---- ----- ---- ------ ---- ---- ---- ---- ---- ---- 14:01:00 1 Dynamic Totals: 0 3 80.4 0.5 444 100 VM 1 1 41.2 0.1 179 40.0 40.0 40.0 Yes No CP MVS 2 1 39.2 0.4 260 59.1 59.1 59.1 No No CP TEST 3 1 0 0 5 1.0 0.96 0.96 No No CP TESTTEST 5 0

Velocity Software, IncCopyright 2007 Velocity Software, Inc. All Rights Reserved.
6/2
2/
50
Processor Case Study
Check User Wait States Running went down as percent of non-dormant, inqueue time. CPU wait stayed the same Asynchronous I/O wait is bottleneck – but DASD I/O was constant? Clue – something was on the Limit List – this is result of SHARE CAP Wait state sampling tests I/O Wait before testing Limit. If I/O wait, stops.
Report: ESAXACT Transaction Delay Analysis Velocity Software ---------------------------------------------------------------------------------------------- <---------------Percent non-dormant----------------------> Times UserID <-Samples-> E- D- T- Tst <Asynch> Lim Pct I/O /Class Total In Q Run Sim CPU SIO Pag SVM SVM SVM CF Idl I/O Pag Ldg Oth Lst Elig Throttl -------- ----- ----- --- --- --- --- --- --- --- --- --- --- --- --- --- --- --- ---- ------- 14:01:00 1061 20 5.0 5.0 40 0 0 0 0 10 0 35 0 . 0 0 0 . Hi-Freq: 62599 1880 3.1 1.5 39 2.8 0 0 23 4.3 3.3 22 0.8 0 0 0 3.0 0 0 ---------------------------------------------------------------------------------------------- 14:31:00 1069 116 0.9 0.9 34 0 0 0 0 1.7 0 3.4 59 . 0 0 0 . Hi-Freq: 64140 7755 0.7 1.2 39 1.0 0 0 9.1 2.1 0.3 4.0 42 0 0 0.5 0 0 0 ---------------------------------------------------------------------------------------------- 14:32:00 1067 125 0 4.0 46 0 0 0 0 2.4 0 5.6 42 . 0 0 0 . Hi-Freq: 64020 7508 0.8 1.2 42 1.0 0 0 8.7 2.1 0.3 3.7 40 0 0 0.5 0 0 0

Velocity Software, IncCopyright 2007 Velocity Software, Inc. All Rights Reserved.
6/2
2/
51
Processor Case Study
Check User Share settings Cap on the database servers CPU consumption reaches point where database servers are limited Fall over the cliff Solution: Remove all caps. z/VM does a better job
Report: ESAUSRC User Configuration -------------------------------------------------------------- <---------SHARE---------> Account ACI Grp <Normal> <-Maximum> UserID ClassID Code Name Rel Abs Type Share Limit -------- -------- -------- -------- ---- --- ---- ----- ----- TIFSHRE *BMAdmn SYSTEMS . 200 . Abs 10.0 Soft TIFSHRE2 *BMAdmn SYSTEM . 200 . Abs 10.0 Soft TIFSHRE3 *BMAdmn SYSTEMS . 200 . Abs 10.0 Soft TIFSHRE4 *BMAdmn SYSTEM . 200 . Abs 10.0 Soft
Related Documents