Processing Graded Feedback: Electrophysiological Correlates of Learning from Small and Large Errors Caroline Di Bernardi Luft 1,2 , Emilio Takase 2 , and Joydeep Bhattacharya 1 Abstract ■ Feedback processing is important for learning and therefore may affect the consolidation of skills. Considerable research demonstrates electrophysiological differences between correct and incorrect feedback, but how we learn from small versus large errors is usually overlooked. This study investigated elec- trophysiological differences when processing small or large error feedback during a time estimation task. Data from high- learners and low-learners were analyzed separately. In both high- and low-learners, large error feedback was associated with higher feedback-related negativity (FRN) and small error feedback was associated with a larger P300 and increased amplitude over the motor related areas of the left hemisphere. In addition, small error feedback induced larger desynchroni- zation in the alpha and beta bands with distinctly different topographies between the two learning groups: The high- learners showed a more localized decrease in beta power over the left frontocentral areas, and the low-learners showed a widespread reduction in the alpha power following small error feedback. Furthermore, only the high-learners showed an increase in phase synchronization between the midfrontal and left central areas. Importantly, this synchronization was correlated to how well the participants consolidated the esti- mation of the time interval. Thus, although large errors were associated with higher FRN, small errors were associated with larger oscillatory responses, which was more evident in the high-learners. Altogether, our results suggest an important role of the motor areas in the processing of error feedback for skill consolidation. ■ INTRODUCTION Learning motor skills is often considered implicit: The learning is slow and incremental, and the learned knowl- edge is difficult to express verbally. Furthermore, a lot of practice is needed to learn a skill (Diedrichsen, White, Newman, & Lally, 2010), and feedback from various sources is often required for learning to take place (Masters, Maxwell, & Eves, 2009). Here, feedback can be conceptualized as an outcome of an action that can be obtained from various sources, from direct sensory registrations, like looking where the ball goes after kick- ing it, to more intricate ones, like the coachʼs verbal feed- back about a specific movement. As learning crucially depends on the type of information used to guide per- formance (Wolpert, Diedrichsen, & Flanagan, 2011), feedback is widely investigated in the research on learn- ing (Wulf, Chiviacowsky, Schiller, & Avila, 2010; Wu & Zhou, 2009; Kawashima et al., 2000; Burkhard, Patterson, & Rapue, 1967). An often-studied measure of how feedback is pro- cessed in the brain is the feedback-related negativity (FRN), a negative deflection in the ERP that starts ∼150 msec and peaks between 230 and 330 msec following an in- correct or error feedback (Holroyd & Krigolson, 2007; Luu, Tucker, Derryberry, Reed, & Poulsen, 2003; Miltner, Braun, & Coles, 1997) or punishments like monetary losses (Cohen & Ranganath, 2007; Hajcak, Moser, Holroyd, & Simons, 2007). The FRN has a midfrontal topography and is likely to be generated in the ACC, especially the dorsal portion (Balconi & Scioli, 2011; Santesso et al., 2012; Potts, Martin, Kamp, & Donchin, 2011; Zhou, Yu, & Zhou, 2010; Ladouceur, Dahl, & Carter, 2007; Luu et al., 2003; Van Veen & Carter, 2002; Carter et al., 1998; Miltner et al., 1997). Most studies that have investigated feedback pro- cessing by FRN have provided feedback in a categorical format, for example, correct versus incorrect, yet in real- life learning situations, feedback information is mostly obtained in a graded or exact form. Nonetheless, some studies with gambling tasks comparing different mag- nitudes of reward have found that the FRN reflects an evaluation of whether an event was good or bad rather than how good or bad they were (Hajcak, Moser, Holroyd, & Simons, 2006; Yeung & Sanfey, 2004; Gehring & Willoughby, 2002). There are only few studies analyzing the ERPs in response to graded feedback. They suggest that the FRN is not sensitive to the magnitude of the performance feedback (Mars, Bruijn, Hulstijn, Miltner, & Coles, 2004; Tucker, Luu, Frishkoff, Quiring, & Poulsen, 2003), and the results remain inconclusive (Walsh & Anderson, 2012), with some studies indicating that the 1 University of London, 2 University of Santa Catarina © 2014 Massachusetts Institute of Technology Journal of Cognitive Neuroscience 26:5, pp. 1180–1193 doi:10.1162/jocn_a_00543

Welcome message from author
This document is posted to help you gain knowledge. Please leave a comment to let me know what you think about it! Share it to your friends and learn new things together.
Transcript

Processing Graded Feedback: ElectrophysiologicalCorrelates of Learning from Small and Large Errors
Caroline Di Bernardi Luft1,2, Emilio Takase2,and Joydeep Bhattacharya1
Abstract
■ Feedback processing is important for learning and thereforemay affect the consolidation of skills. Considerable researchdemonstrates electrophysiological differences between correctand incorrect feedback, but how we learn from small versuslarge errors is usually overlooked. This study investigated elec-trophysiological differences when processing small or largeerror feedback during a time estimation task. Data from high-learners and low-learners were analyzed separately. In bothhigh- and low-learners, large error feedback was associatedwith higher feedback-related negativity (FRN) and small errorfeedback was associated with a larger P300 and increasedamplitude over the motor related areas of the left hemisphere.In addition, small error feedback induced larger desynchroni-zation in the alpha and beta bands with distinctly different
topographies between the two learning groups: The high-learners showed a more localized decrease in beta power overthe left frontocentral areas, and the low-learners showed awidespread reduction in the alpha power following small errorfeedback. Furthermore, only the high-learners showed anincrease in phase synchronization between the midfrontaland left central areas. Importantly, this synchronization wascorrelated to how well the participants consolidated the esti-mation of the time interval. Thus, although large errors wereassociated with higher FRN, small errors were associated withlarger oscillatory responses, which was more evident in thehigh-learners. Altogether, our results suggest an important roleof the motor areas in the processing of error feedback for skillconsolidation. ■
INTRODUCTION
Learning motor skills is often considered implicit: Thelearning is slow and incremental, and the learned knowl-edge is difficult to express verbally. Furthermore, a lot ofpractice is needed to learn a skill (Diedrichsen, White,Newman, & Lally, 2010), and feedback from varioussources is often required for learning to take place(Masters, Maxwell, & Eves, 2009). Here, feedback canbe conceptualized as an outcome of an action that canbe obtained from various sources, from direct sensoryregistrations, like looking where the ball goes after kick-ing it, to more intricate ones, like the coachʼs verbal feed-back about a specific movement. As learning cruciallydepends on the type of information used to guide per-formance (Wolpert, Diedrichsen, & Flanagan, 2011),feedback is widely investigated in the research on learn-ing (Wulf, Chiviacowsky, Schiller, & Avila, 2010; Wu &Zhou, 2009; Kawashima et al., 2000; Burkhard, Patterson,& Rapue, 1967).
An often-studied measure of how feedback is pro-cessed in the brain is the feedback-related negativity (FRN),a negative deflection in the ERP that starts ∼150 msecand peaks between 230 and 330 msec following an in-correct or error feedback (Holroyd & Krigolson, 2007;
Luu, Tucker, Derryberry, Reed, & Poulsen, 2003; Miltner,Braun, & Coles, 1997) or punishments like monetarylosses (Cohen & Ranganath, 2007; Hajcak, Moser, Holroyd,& Simons, 2007). The FRN has a midfrontal topographyand is likely to be generated in the ACC, especially thedorsal portion (Balconi & Scioli, 2011; Santesso et al.,2012; Potts, Martin, Kamp, & Donchin, 2011; Zhou, Yu, &Zhou, 2010; Ladouceur, Dahl, & Carter, 2007; Luu et al.,2003; Van Veen & Carter, 2002; Carter et al., 1998; Miltneret al., 1997).Most studies that have investigated feedback pro-
cessing by FRN have provided feedback in a categoricalformat, for example, correct versus incorrect, yet in real-life learning situations, feedback information is mostlyobtained in a graded or exact form. Nonetheless, somestudies with gambling tasks comparing different mag-nitudes of reward have found that the FRN reflects anevaluation of whether an event was good or bad ratherthan how good or bad they were (Hajcak, Moser, Holroyd,& Simons, 2006; Yeung & Sanfey, 2004; Gehring &Willoughby, 2002). There are only few studies analyzingthe ERPs in response to graded feedback. They suggestthat the FRN is not sensitive to the magnitude of theperformance feedback (Mars, Bruijn, Hulstijn, Miltner, &Coles, 2004; Tucker, Luu, Frishkoff, Quiring, & Poulsen,2003), and the results remain inconclusive (Walsh &Anderson, 2012), with some studies indicating that the1University of London, 2University of Santa Catarina
© 2014 Massachusetts Institute of Technology Journal of Cognitive Neuroscience 26:5, pp. 1180–1193doi:10.1162/jocn_a_00543

FRN is sensitive to the magnitude of the reward (Kreusselet al., 2012, 2013; Bellebaum, Polezzi, & Daum, 2010; Wu& Zhou, 2009), and others not (Hajcak et al., 2006; Satoet al., 2005; Yeung & Sanfey, 2004). Furthermore, thesestudies provided graded feedback belonging to a lim-ited number of categories (i.e., fast, medium, slow),yet in many tasks (i.e., sensorimotor), the feedback isavailable in a more finely graded format. For example,when throwing a dart, visual feedback indicates howfar it has landed from the target, not just the categori-cal result (hit or miss, or good, medium and bad hitor miss). Despite the importance of finely graded feed-back in many learning situations, the neural repre-sentation of finely graded feedback remains largelyuncharacterized.As stated earlier, the FRN is an ERP component that is
obtained after signal averaging across trials. The FRN,therefore, cannot capture time-varying neural oscillationsand intersite synchronizations, which are not locked tothe onset of feedback. Recent evidence indeed suggeststhat the oscillatory correlates of feedback processing canshed new light on the understanding of how the feed-back is processed for learning (Luft, Nolte, & Bhattacharya,2013; Cavanagh, Zambrano-Vazquez, & Allen, 2012;HajiHosseini, Rodriguez-Fornells, & Marco-Pallares, 2012;Cohen, Wilmes, & Vijver, 2011; van de Vijver, Ridderinkhof,& Cohen, 2011; Marco-Pallares et al., 2008; Cohen, Elger,& Ranganath, 2007). For instance, negative feedback isassociated with higher midfrontal theta (4–8 Hz) power,whereas positive feedback is associated with an increasein the beta (around 15–30 Hz) power (HajiHosseini et al.,2012; van de Vijver et al., 2011; Marco-Pallares et al., 2008;Cohen et al., 2007). Furthermore, synchronization betweenmidfrontal (midline electrodes FCz, Fz, Fpz) and pre-frontal regions (electrodes F5/F6) is increased during erroridentification and subsequent adjustments (van de Vijveret al., 2011; Cavanagh, Frank, Klein, & Allen, 2010;Cavanagh, Cohen, & Allen, 2009). However, to our knowl-edge, there is currently no study characterizing the oscilla-tory correlates of feedback processing in response todifferent magnitudes of graded feedback.In a recent study (Luft et al., 2013), we observed that
high-learners, that is, participants who quickly and reli-ably learned a time interval estimation task, demon-strated larger phase synchronization between left central(sensorimotor) and midfrontal and between midfrontaland prefrontal areas (electrodes F5/F6) in the theta fre-quency range following categorical feedback. In addition,we found that high-learners demonstrated larger mid-frontal theta oscillations in response to incorrect feed-back compared with low-learners. In this study, we adoptedthe same experimental paradigm, but with a modifiedfeedback format, where feedback was provided in afinely graded manner. Specifically, instead of receivingcategorical outcome feedback (i.e., correct or incorrect),the participants were informed exactly how many milli-seconds their time estimations deviated from the target.
This allowed us to compare the brain responses (ERPs,oscillations, and intersite synchronization) to feedbackwith identical valence but specific gradation. There-fore, this study aimed to address the following questions:(1) What are the differences in the electrophysiolog-ical correlates of processing small and large errorfeedback? (2) Is there a difference between high- andlow-learners in relation to the way they process gradedfeedback?
Following earlier studies investigating the FRN in re-sponse to various feedback magnitudes (Kreussel et al.,2012, 2013; Bellebaum et al., 2010; Wu & Zhou, 2009;Hajcak et al., 2006; Sato et al., 2005; Yeung & Sanfey,2004), our main prediction was that small error feedbackwould be processed as “correct,” whereas large errorswould have the same neural correlates of “incorrect.”Our second prediction was that the high-learners woulddiffer from low-learners in relation to their neural re-sponses to small and large error feedback. Finally, follow-ing our previous study (Luft et al., 2013), we alsopredicted that the high-learners will show higher intersiteconnectivity in response to feedback compared with thelow-learners.
METHODS
Participants
Thirty-two healthy adults (mean age = 24.4 years,SD = 5.08 years, 11 men, 2 left-handed) with normalhearing (self-reported) and normal or corrected-to-normal vision participated in the experiment. The samplewas equally divided into two groups according to theperformance on the experimental task, as explained later.This procedure resulted in two groups: the high-learners(n = 16, mean age = 24.8 years, 5 men) and the low-learners (n = 16, mean age = 24 years, 6 men). Theparticipation was entirely voluntary, and no one receivedany payment or incentive for taking part in this study. Allparticipants provided written informed consent. Thestudy was approved by the local ethics committee ofthe Department of Psychology at Goldsmiths, Universityof London, and conducted in accordance with theDeclaration of Helsinki.
Experimental Task
We used a modified version of a time estimation task(Miltner et al., 1997), in which a participant is requiredto estimate the time interval of 1 sec after the presenta-tion of a sound by pressing a button. In our study, theparticipants were required to estimate the time intervalof 1.7 sec. The time interval was modified from the origi-nal 1 sec (Miltner et al., 1997) to 1.7 sec for the two follow-ing reasons: (1) With integer second durations, participantstend to rely more on counting than on feedback whiletrying to adjust their estimation; (2) The brain mechanisms
Luft, Takase, and Bhattacharya 1181
for sub- and suprasecond time estimations are different,with the suprasecond durations less automatic than thesubseconds ones (Lewis & Miall, 2003). The experimentalparadigm was similar to our previous study (Luft et al.,2013) apart from the fact that the feedback was providedas graded information which indicated the exact difference(in msec) between the participantʼs estimation and thetarget (1700 msec).
Each trial started with a fixation cross presented for atime interval varying randomly between 300 and 900 msecand was followed by an auditory beep (800 Hz, 50 msec),which indicated the beginning of the time estimation.Participants were required to press a button with theirright thumb (including the left-handed participants)whenever they thought 1.7 sec had elapsed. Six hundredmilliseconds after the button press, participants receiveda feedback indicating the magnitude (the exact difference[in msec] between the participantʼs estimation and thetarget) and the sign (a negative sign indicated that theestimation was shorter, whereas a positive sign indicatedlonger than the target) of their estimation error. Thefeedback was presented for 1 sec.
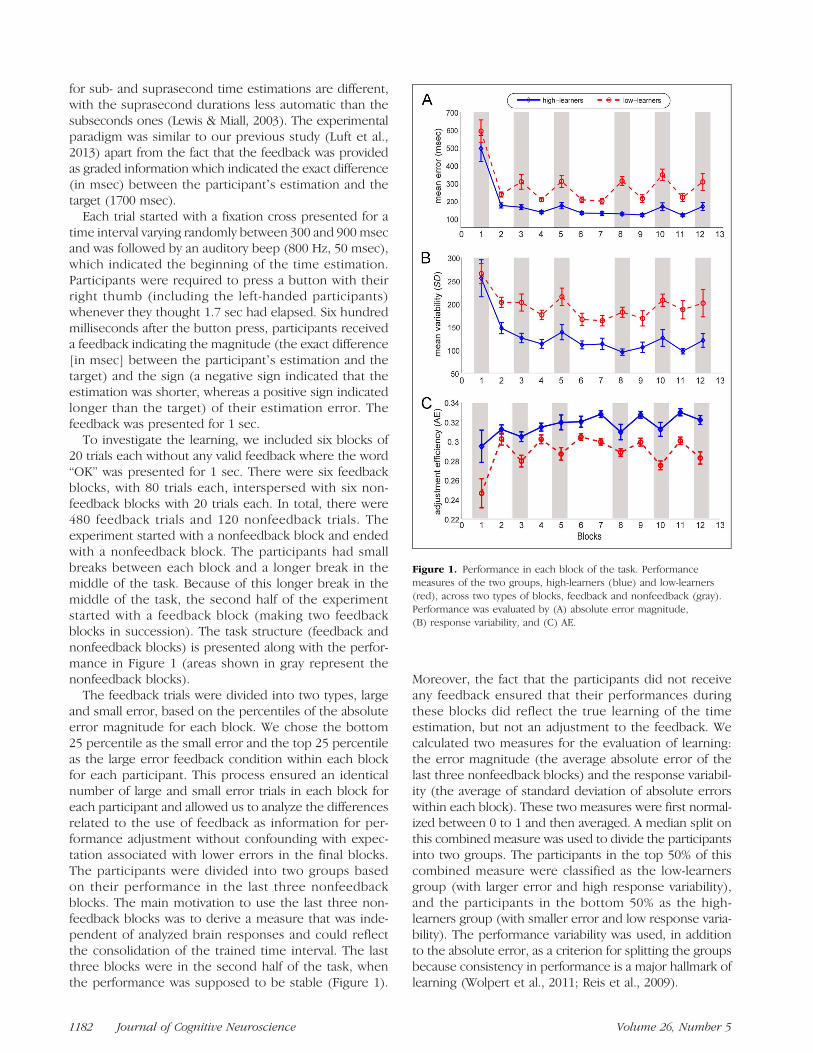
To investigate the learning, we included six blocks of20 trials each without any valid feedback where the word“OK” was presented for 1 sec. There were six feedbackblocks, with 80 trials each, interspersed with six non-feedback blocks with 20 trials each. In total, there were480 feedback trials and 120 nonfeedback trials. Theexperiment started with a nonfeedback block and endedwith a nonfeedback block. The participants had smallbreaks between each block and a longer break in themiddle of the task. Because of this longer break in themiddle of the task, the second half of the experimentstarted with a feedback block (making two feedbackblocks in succession). The task structure (feedback andnonfeedback blocks) is presented along with the perfor-mance in Figure 1 (areas shown in gray represent thenonfeedback blocks).
The feedback trials were divided into two types, largeand small error, based on the percentiles of the absoluteerror magnitude for each block. We chose the bottom25 percentile as the small error and the top 25 percentileas the large error feedback condition within each blockfor each participant. This process ensured an identicalnumber of large and small error trials in each block foreach participant and allowed us to analyze the differencesrelated to the use of feedback as information for per-formance adjustment without confounding with expec-tation associated with lower errors in the final blocks.The participants were divided into two groups basedon their performance in the last three nonfeedbackblocks. The main motivation to use the last three non-feedback blocks was to derive a measure that was inde-pendent of analyzed brain responses and could reflectthe consolidation of the trained time interval. The lastthree blocks were in the second half of the task, whenthe performance was supposed to be stable (Figure 1).
Moreover, the fact that the participants did not receiveany feedback ensured that their performances duringthese blocks did reflect the true learning of the timeestimation, but not an adjustment to the feedback. Wecalculated two measures for the evaluation of learning:the error magnitude (the average absolute error of thelast three nonfeedback blocks) and the response variabil-ity (the average of standard deviation of absolute errorswithin each block). These two measures were first normal-ized between 0 to 1 and then averaged. A median split onthis combined measure was used to divide the participantsinto two groups. The participants in the top 50% of thiscombined measure were classified as the low-learnersgroup (with larger error and high response variability),and the participants in the bottom 50% as the high-learners group (with smaller error and low response varia-bility). The performance variability was used, in additionto the absolute error, as a criterion for splitting the groupsbecause consistency in performance is a major hallmark oflearning (Wolpert et al., 2011; Reis et al., 2009).
Figure 1. Performance in each block of the task. Performancemeasures of the two groups, high-learners (blue) and low-learners(red), across two types of blocks, feedback and nonfeedback (gray).Performance was evaluated by (A) absolute error magnitude,(B) response variability, and (C) AE.
1182 Journal of Cognitive Neuroscience Volume 26, Number 5

We also analyzed the efficiency of performance adjust-ment based on the feedback by introducing a measure,called the adjustment efficiency (AE), calculated as
AE ¼ eði−1Þ−eðiÞeði−1Þ ¼ Δe
eði−1Þ
where e(i) is the error magnitude of ith trial. This in-dex varies from minus infinity to +1 as the maximumimprovement. Zero AE represents no adjustment inperformance. It indicates how well the adjustmentswere made, on average, by each group (low- and high-learners) and during feedback and nonfeedback blocks.We divided the amount of improvement by the error inthe previous trial based on the assumption that largeadjustments are easier to accomplish than small ones.For example, the total adjustment from 800 to 400 msecerror is larger than 80 to 40 msec, but the latter is harderbecause it requires a more precise control of the timeestimation. Considering that feedback was used to adjustperformance, we expected the AE values to be higher onthe feedback than on the nonfeedback blocks.
EEG Recording and Analyses
EEG signals were recorded by 64 active electrodes placedaccording to the extended 10–20 system of electrodeplacement and amplified by a BioSemi ActiveTwoamplifier (www.biosemi.com). The vertical and horizon-tal EOGs were recorded using four additional electrodesto monitor eye blinks and horizontal eye movements.The EEG signals were recorded with a sampling fre-quency of 512 Hz, band-pass filtered between 0.16 and100 Hz. The task was presented on a PC using the MATLAB(The MathWorks, Inc., Natick, MA)-based toolbox Cogent2000 (www.vislab.ucl.ac.uk/cogent.php). The EEG datawere processed and analyzed using the following MATLAB-based toolboxes: EEGLAB (Delorme & Makeig, 2004)for data preprocessing and FieldTrip (Oostenveld, Fries,Maris, & Schoffelen, 2011) for data analysis and statisticalcomparisons.
Preprocessing
The EEG data were re-referenced to a common averagereference for ERP and wavelet analyses. The use of com-mon average reference has been recommended for bothERPs and oscillations (Picton et al., 2000; Pfurtscheller &Lopes da Silva, 1999) because it is a less biased methodfor comparing across scalp topographies. For the inter-site synchronization analysis, we used the arithmeticaverage of the two earlobes because common averagereference could introduce spurious correlations or inter-dependences between electrodes (Pereda, Quiroga, &Bhattacharya, 2005). The data were high-pass filtered at0.5 Hz and epoched from−600msec before and 1000msec
after feedback. The artifacts were treated in a semi-automated fashion: visual inspection was initially done toremove large muscle artifacts, followed by an independentcomponent analysis for correcting the eye blink-relatedartifacts. Subsequent to the eye blink correction, epochscontaining amplitudes exceeding ±80 μV were discardedfor future analysis. The average number of artifact-freetrials per participant (feedback trials only) was as follows:for the high-learners group, 103 (SD = 9.2) and 101 (6.8)trials for small and large errors, respectively, and for thelow-learners group, 103 (1.3) and 100 (15.1) trials.
ERP Analysis
For the ERP analysis only, we applied a low-pass filter at35 Hz, and the filtered epoch of 200 msec before feed-back and 1 sec after feedback were averaged over trials toobtain the ERP signals. The ERPs were baseline (−200 to0 msec) subtracted.
Time–Frequency Analysis
The time-varying spectral content of the EEG data wereestimated by Morlet wavelet based time–frequency rep-resentation (TFR). Each individual epoch, 600 msecbefore feedback to 1 sec after feedback, was convolvedwith complex Morlet wavelet on single-trial basis andsubsequently averaged across trials. We used four cyclewavelets for lower frequencies (4–35 Hz) and seven cyclewavelets for higher frequencies (>35 Hz). To calculatethe relative spectral power in each frequency, the TFRwas normalized by dividing the spectral power in eachfrequency by its baseline value, from −200 msec to theonset of feedback.
Intersite Synchronization Analysis
Oscillatory activity represents local neuronal synchroniza-tion, whereas intersite or long-range neuronal synchroni-zation can be measured by various connectivity-basedindices (for a review, see Pereda et al., 2005). Here, weused a recently introduced measure of functional con-nectivity, the Weighted Phase Lag Index (WPLI), to studythe patterns of phase synchronization from 3 to 67 Hzin steps of 4 Hz. Vinck, Oostenveld, van Wingerden,Battaglia, and Pennartz (2011) introduced WPLI as anextension of the Phase Lag Index (PLI; Stam, Nolte, &Daffertshofer, 2007) by weighting PLI according to theImaginary Component of the Coherency (ImC; Nolteet al., 2004). The ImC is a measure of connectivity thatis robust against volume conduction and uncorrelatedsources (Nolte et al., 2004). However, Stam and colleagues(2007) remarked that ImC could be affected by the phaseof the coherency: It is most effective for detecting synchro-nizations with a phase lag of a quarter cycle but is ineffec-tive if the two signals are in phase or in phase opposition.The PLI index was proposed as an improvement over the
Luft, Takase, and Bhattacharya 1183

ImC by measuring to what extent phase leads and lagsbetween two channels are nonequiprobable (Stam et al.,2007). One problem with the PLI is that it is sensitive tonoise because small perturbations can turn phase leadsinto lags and vice versa. To improve this index, the WPLIwas developed by weighting the phase leads and lags bythe magnitude of the imaginary component of the cross-spectrum (Vinck et al., 2011). The WPLI was shown to bemore robust to volume conduction and measurementnoise than both ImC and PLI besides more sensitive to trueinteractions. In this study, we used a debiased version ofWPLI after Vinck et al. (2011).
Each epoch (−0.25 to 1 sec) was divided into non-overlapping five segments of 250 msec each, and the WPLIwas calculated on each of those segments. Consideringthat only a few studies analyzed the feedback-relatedconnectivity (Cohen et al., 2011; Cavanagh et al., 2009,2010; van de Vijver et al., 2011), we did not restrict ouranalysis to any specific electrode pair. First, we plottedtheWPLI as a function of frequency, which led us to choosethe beta band (19–23 Hz) as the frequency range of inter-est, because WPLI values peaked at these frequencies. Forvisualization, we used the “heads-in-head” plot (Nolte &Muller, 2010; Nolte et al., 2004, 2008), which allows a simul-taneous visualization of the connections between eachelectrode region. It also helped choosing the electrodepairs subsequently used for statistical comparisons.
Statistical Analysis
We used a nonparametric cluster permutation test, whichis a biologically inspired statistical approach to analyzemultidimensional EEG/MEG data in an exploratory frame-work but without compromising with the notorious issueof multiple comparisons (Maris & Oostenveld, 2007). Themethod combines statistical significance with biological/cognitive significance as follows. For an effect to be bothstatistically significant and biologically relevant, it needsto be found over a cluster of data points in all analyzeddimensions such as time, space (electrodes), and fre-quency, but an isolated significant difference found at anonspecific data point would not be considered biologi-cally relevant, therefore would not yield a significantcluster, even if it is highly significant statistically (i.e., p <.00001). This method is found to be as robust againstType I error as more conservative criteria like Bonferroniʼscorrection, but with an improved sensitivity and withoutthe requirement of hypothesis a priori. It has been suc-cessfully applied to EEG (Lindsen, Jones, Shimojo, &Bhattacharya, 2010; Sandkuhler & Bhattacharya, 2008)and MEG (Osipova et al., 2006).
The procedure (Maris & Oostenveld, 2007) involvesfinding clusters and then calculating the cluster statisticsin the following steps: (i) calculate a t statistics (pairedor independent) at each data point in the multidimen-sional space, (ii) apply threshold to these sample-specificstatistics, (iii) construct connected clusters that exceed
the threshold and have the same sign, (iv) calculate thecluster level statistics by summing the values of t statisticsover the cluster, (v) identify the maximum of the clusterlevel statistics, and (vi) evaluate this maximum valueagainst a permutated distribution by calculating the exactprobability that a cluster with the maximum cluster levelstatistic was observed under the assumption that thebrain responses for the two compared conditions werenot significantly different.Here, we used this method to compare brain responses
(ERPs and TFRs) to small and large error feedback foreach group separately. The permutation distribution wasderived from the statistic values of paired t tests basedon 500 random permutations. The probability thresholdfor the inclusion in the cluster was set at p = .05. We con-sidered electrodes with a distance of less than 5 cm asneighbors, yielding on average 4.2 neighbors per electrode.We used the cluster-based permutation to find the
main differences between small and large error feedbackand to define the ROIs on the multidimensional space(time, electrode, and frequency), which were sub-sequently analyzed by standard ANOVA as appropriate.Simple independent and paired t tests were used toinvestigate simple effects. All statistical analyses weredone using Statistical Package for the Social Sciences(Version 18.0; SPSS, Inc., Chicago, IL). The ANOVA wasnecessary to allow comparisons between groups andinteractions, which were not accounted in the clusterpermutation, because the latter was exclusively done tofind the difference between small and large error feed-back within each group.The possible relationships between brain responses at
the ROIs as defined by the cluster-based permutation testand performance during the nonfeedback blocks wereinvestigated by Pearsonʼs correlation. We were principallyinterested in the nonfeedback blocks because the perfor-mance on these trials was expected to represent theappropriateness and maintenance of the internal represen-tation of the time interval learned during the feedbacktrials. It was not possible to evaluate the internal represen-tation during the feedback blocks because on these trialsthe performance can be adjusted based on the feedbackrather than on the internal representations of the learnedtime interval.
RESULTS
Behavioral Results
Figure 1 shows the performance as measured by theabsolute error magnitude (Figure 1A), the response varia-bility (Figure 1B), and the AE (Figure 1C) for both groupsin successive blocks of trials. Across blocks, high-learnersshowed lower error magnitude, reduced variability, andhigher AE than low-learners. The low-learners also showedhigher performance decrements in the nonfeedbackblocks, indicating a lower retention of the learned skill.
1184 Journal of Cognitive Neuroscience Volume 26, Number 5

These observations were confirmed as significant usinga 2 × 2 × 2 mixed MANOVA with Feedback (feedback vs.no feedback) and Stage (first vs. second halves of thetask) as within-subjects factors, and Group (high-learnersvs. low-learners) as the between-subject factor. There wasa significant effect for Group, F(2, 29) = 28.53, p < .001,η2 = 0.66, indicating that the performance was higherin the high- than in the low-learners group, and for Stage,F(2, 29) = 19.82, p < .001, η2 = .58, because the par-ticipants significantly improved their performance fromthe first to the second half of the task. Moreover, therewas a significant effect of Feedback, F(2, 29) = 28.14,p < .001, η2 = .66, indicating that the performance inthe feedback blocks was better than in the nonfeedbackones. We also found an interaction between Group andFeedback, F(2, 29) = 4.28, p = .023, η2 = .23, becausethe performance difference between feedback and non-feedback was higher in the low-learners group. Therewas also an interaction between Feedback and Stage, F(2,29) = 17.06, p < .001, η2 = .54, because the performancedifference between feedback and nonfeedback blockswas lower in the second half of the task as compared withthe first.A mixed ANOVA on the AE revealed that the high-
learners presented a larger AE than the low-learners, F(1,30) = 64.90, p < .001, η2 = .68, and that the AE increasedfrom the first to the second half of the task, F(1, 30) =10.31, p < .001, η2 = .26. There was a significant effectof Feedback, F(1, 30) = 32.14, p < .003, η2 = .52, indicat-ing that the AE was higher during the blocks with feed-back. Furthermore, there was an interaction betweenGroup and Feedback, F(1, 30) = 4.21, p = .049, η2 =.12, because the high-learners presented a lower differ-ence in AE between feedback and nonfeedback blocks.
ERP Analysis
We compared the ERPs between two types of trial, withlarge error and small error feedback trials within eachgroup separately by nonparametric cluster-based per-mutation statistic (see Methods). Both groups showeda frontal cluster between 200–300 msec with an FRN-like topography and a parietal cluster between 350 and425 msec (Figure 2A), the latter being larger in the low-learners; following this parietal cluster (425–575 msec), afrontocentral cluster was observed in the high-learnersonly. Figure 2 shows the topographies of the cluster overtime (a) and the waveforms averaged over the clusterelectrodes (b).The average ERP amplitudes over the electrodes and
highlighted areas in Figure 2B were compared separatelyusing a mixed 2 × 2 ANOVA with a within-subject factor,Error Magnitude (large vs. small error feedback), and abetween-subject factor, Group (high-learners vs. low-learners). Across groups, the FRN (averaged over Fz andFCz) amplitude was significantly higher (more negative)for the large error feedback compared with the small error
feedback, F(1, 30) = 36.91, p < .001, η2 = .552. Therewas no effect of Group or interaction between ErrorMagnitude and Group (F < 1.5, p > .25). For the P300-like component, we found a larger P300 following smallthan large error feedback, F(1, 30) = 24.84, p< .001, η2 =.45, but no effect for group or interaction (F < 1.5, p >.25). Furthermore, the amplitude in left central electrodes(C3, C5) was higher for small than for large error feed-back, F(1, 30) = 19.97, p < .001, η2 = .40, but no effectsfor Group or interactions (F< 1, p> .3). Finally, the ERPamplitude over left frontal electrode regions (FC3, F1,F3) was higher for small than large error feedback, F(1,30) = 13.294, p = .002, but there were no significantdifferences between the two groups.
Next we correlated the ERP amplitudes of the ROIs asdescribed earlier with the performance measures (meanerror, variability, and AE) on the three nonfeedbackblocks of the second half of the task (across participants).No significant correlation was observed.
Time–Frequency Analysis
We compared large and small error feedback for eachgroup separately using nonparametric cluster permu-tation, and the results are shown in Figure 3A. For thehigh-learners, we found a significant beta band (17–24 Hz, large > small) cluster in the left sensorimotorregion starting around 350 msec after feedback. For thelow-learners, we found an alpha band (10–13 Hz, large >small) cluster in the posterior parieto-occipital regions inthe later stage of feedback processing, around 600 msecafter feedback. Figure 3B shows the time profiles of thebeta band and alpha band effect for both groups forboth large and small error feedback (Figure 3B).
A mixed ANOVA on the beta power over the clusterelectrodes (highlighted in Figure 3A, left-hand side,high-learners cluster) revealed that the beta desynchroni-zation was higher following small than large error feed-back, F(1, 30) = 50.27, p < .001, η2 = .63, and thatthis difference was similar across groups (F < 1, ns).Moreover, there was no significant effect for Time Window(early [375–525 msec] vs. late [600–800 msec]) andGroup (F < 2, ns). However, there was a significantinteraction between Time Window and Group, F(1, 30) =4.73, p = .038, η2 = .14, which indicates that only thehigh-learners sustained the beta desynchronization inthe late time window, 600–800 msec after feedback.Contrast t tests indicated that the low-learners presenteda significant increase in the beta power from the early tothe late time window following small error feedback,t(15) = −2.537, p = .023, which was not observed in thehigh-learners group, t(15) = .037, p = .971, reinforcingthat only the high-learners sustained this beta desynchro-nization. Following large error feedback, the beta powerin those two time windows were not different (t < 1.5, ns).Further contrasts indicated that the two groups were onlydifferent in the late timewindow, because the high-learners
Luft, Takase, and Bhattacharya 1185

showed significantly lower beta power following small errorfeedback than the low-learners group, t(30) = 2.23, p =.033, but not following large error feedback, t(30) = 1.83,p= .077. The differences between groups in the early timewindow were nonsignificant (t < 1, ns).
Similar statistical analysis was conducted for alphaband power as well over the electrodes in the cluster
(small vs. large error feedback) found in the low-learnersgroup (Figure 3A, right-hand side). The alpha desynchro-nization was higher in small than large error feedback,F(1, 30) = 25.91, p < .001, η2 = .46, and the alpha powerwas lower in the early (375–525 msec) than in the late(600–800 msec) time window, F(1, 30) = 20.59, p <.001, η2 = .40. The high-learners showed significantly
Figure 2. ERP cluster results. (A) Significant clusters of the nonparametric cluster randomization test comparing large and small errors for thetwo groups, high-learners (upper row) and low-learners (bottom row). The highlighted electrodes were significant during the whole time windowdisplayed ( p < .05). (B) The ERP waveforms for each ROI averaging over the electrodes constituting the clusters. The time windows used forsubsequent statistical analysis are highlighted in gray.
1186 Journal of Cognitive Neuroscience Volume 26, Number 5
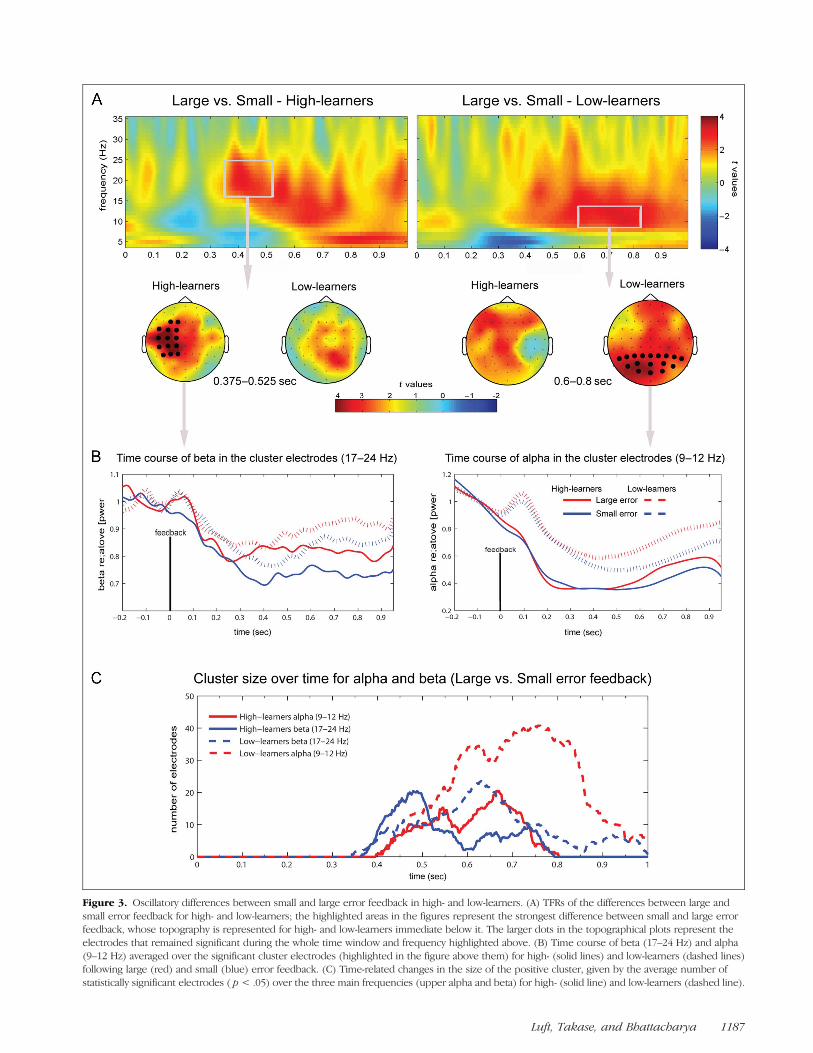
Figure 3. Oscillatory differences between small and large error feedback in high- and low-learners. (A) TFRs of the differences between large andsmall error feedback for high- and low-learners; the highlighted areas in the figures represent the strongest difference between small and large errorfeedback, whose topography is represented for high- and low-learners immediate below it. The larger dots in the topographical plots represent theelectrodes that remained significant during the whole time window and frequency highlighted above. (B) Time course of beta (17–24 Hz) and alpha(9–12 Hz) averaged over the significant cluster electrodes (highlighted in the figure above them) for high- (solid lines) and low-learners (dashed lines)following large (red) and small (blue) error feedback. (C) Time-related changes in the size of the positive cluster, given by the average number ofstatistically significant electrodes ( p < .05) over the three main frequencies (upper alpha and beta) for high- (solid line) and low-learners (dashed line).
Luft, Takase, and Bhattacharya 1187

larger desynchronization than the low-learners, F(1, 30) =4.60, p = .040, η2 = .13. Moreover, there was a significantinteraction between Error Magnitude and Time Window,because there was a greater increase in the alpha powerin the late time window for the large than for the smallerror feedback, which was associated with a sustaineddesynchronization.
Figure 3C shows the time-varying profiles of the size ofthese significant clusters. Whereas the low-learners groupshowed a high number of significant electrodes in thealpha band cluster that peaked between 600 and 800 msec(dashed red line), the high-learners group presented amore localized, earlier cluster, around 400 msec in thebeta band. This result suggests that the differencesbetween large and small error feedback processing arerelated to more a diffused representation in the low-learners and to a more focused sensorimotor represen-tation in the high-learners. For higher frequencies in thegamma range (35–50 Hz), we did not find any significantcluster for any comparisons (small vs. large, high-learnersvs. low-learners).
Connectivity/Synchronization Analysis
Using the WPLI, we found an increase in phase synchro-nization from 0 to 250 msec after feedback in relation tothe baseline in the beta frequency range (17–24 Hz), onlyin the high-learners. The low-learners did not show anyspecific or clear synchronization pattern in any frequencyband. In the high-learners, we observed a stronger inter-site synchronization between the midfrontal (i.e., FCz)and the left central (C3) electrodes (Figure 4A, B). Thisis further demonstrated by the topographical distributionof the WPLI values between FCz and all other electrodes,and this effect was most conspicuous in the high-learnersonly. The averaged WPLI for the FCz–C3 pair in five non-overlapping time segments spanning −250 to 1 sec fol-lowing feedback showed a large increase immediatelyafter feedback for both small and large error feedback(Figure 4D). A mixed design 5 (Time Windows: −250 to0, 0 to 250, 250 to 500, 500 to 750, and 750 to 1000 msecfollowing feedback) × 2 (Error Magnitude: small vs. large)ANOVA revealed a significant effect for Time, F(2.37,30) = 5.79, p= .003, η2 = .16, but not for Error Magnitude,F(1, 30) = 1.66, p = .207. The high-learners group pre-sented significantly larger WPLI values than the low-learners group, F(1, 30) = 5.75, p = .023, η2 = .16. Inaddition, there was a significant interaction betweenTime and Group, F(2.37, 30) = 3.94, p = .018, η2 = .12,because the FCz–C3 synchronization was increased in thehigh-learners group only (Figure 4D). Independent t testsindicated that the high-learners presented significantlyhigher phase synchronization than the low-learners from0 to 250 msec following both small, t(30) = −3.148, p =.004, and large error feedback, t(30) = −3.342, p = .002.There was no significant difference between groups forother time windows.
The WPLI between FCz–C3 from 0 to 250 msec afterfeedback was found to be consistently correlated withmost performance measures: error magnitude (smallerror feedback: r = −0.701, p < .001, see Figure 4C;large error feedback: r = −0.674, p < .001), error varia-bility (small: r = −.530, p = .002; large: r = −.569, p =.001), and AE (small: r= .523, p= .002; large: r= .625, p<.001). These correlations suggest that the higher thesetwo sites (FCz–C3) synchronized in the beta frequencyrange, the better was the performance (lower error, lowervariability, and higher AE).
DISCUSSION
Here we investigated the influence of the magnitude ofthe error feedback on electrophysiological responses andthe further associations with learning performance. Weused a simple task of time interval estimation, providedgraded feedback (i.e., exact difference between the targetand performance), and defined learning as a better main-tenance of the time interval without a feedback. The elec-trophysiological differences between small and largeerrors were compared between high-learners and low-learners, who were categorized based on their perfor-mance during trials with no feedback. The high-learnerswere not only better at performing the task, as expectedbecause of our categorization criterion, but developedbetter internal representations of the learned time inter-val, as they showed lower differences in the performanceduring feedback and nonfeedback trials compared withthe low-learners.First, we discuss the differences between small and
large errors in terms of ERPs, oscillations, and intersitesynchronization. Second, we focus on how these differ-ent correlates were linked to learning the task and howthey correlate with task performance.
Small versus Large Error Feedback: ERPs, TFRs,and Phase Synchronization Differences
What Are the Differences in the ElectrophysiologicalCorrelates of Processing Small and LargeError Feedback?
Similar to previous reports, we found that large errorswere associated with a higher FRN and small errors witha higher P300 (Luft et al., 2013; van de Vijver et al., 2011;Sailer, Fischmeister, & Bauer, 2010; Miltner et al., 1997).In addition, we observed that small errors generateda larger beta desynchronization, which is in contrast tostudies with categorical feedback that showed higherbeta synchronization following correct feedback (Luftet al., 2013; van de Vijver et al., 2011; Marco-Pallareset al., 2008).Our ERP analysis showed that large error, as compared
with small error, feedback was associated with a higherFRN. Studies investigating the link between FRN amplitude
1188 Journal of Cognitive Neuroscience Volume 26, Number 5

and reward/punishment magnitude have been inconclu-sive (Walsh & Anderson, 2012), reporting no (Hajcaket al., 2006; Sato et al., 2005) or some effects (Kreusselet al., 2012; Donamayor, Marco-Pallares, Heldmann,Schoenfeld, & Munte, 2011; Bellebaum et al., 2010; Wu &Zhou, 2009). We also found a higher P300 for small ascompared with large error feedback, which is in agreementwith other studies showing higher P300 for positive com-pared with negative feedback (Luft et al., 2013; Sailer et al.,2010; van der Helden, Boksem, & Blom, 2010; Wu & Zhou,2009; Bellebaum & Daum, 2008; Hajcak et al., 2007).In addition, previous studies showed that the P300 is
sensitive to the reward magnitude (Wu & Zhou, 2009;
Sato et al., 2005), suggesting that, although the FRNreflects a mechanism for evaluating whether the feedbackis consistent or not with the expectations, the P300 rep-resents a later process of outcome evaluation that is top–down regulated for the allocation of attentional resources.In our study, we originally provided graded feedback,which was later divided into two categories, large erroror small error, according to each individualʼs performance.Therefore, it might also be possible that, rather thanshowing a sensitivity to error magnitude, the participantsengaged in a process of an implicit categorization (Seger,2008) in which different errors were categorized as goodor bad.
Figure 4. Phasesynchronization in responseto feedback. (A) Head-in-headplot of the debiased WPLIin the beta range from 0 to250 msec after feedback. Eachchannel is represented by aminitopographical plot showingthe WPLI of it with all otherchannels. In the figure, FCz(the fourth midline electrode)has higher connectionswith left central electrodes,mainly C1 and C3, whichare also synchronized withthe CP3 and CP5. (B) Thetopographical distributionof the WPLI with FCz asthe reference (“R”) forhigh- and low-learners from 0to 250 msec. (C) Correlationbetween average error onthe last three nonfeedbackblocks and the debiased WPLIfor the FCz–C3 pair from 0to 250 msec after feedback.(D) Mean and standard errorsof the debiased WPLI inbeta range for the analyzedsegments after large and smallerror feedback for the high-and low-learners groups.
Luft, Takase, and Bhattacharya 1189

We also found a left-lateralized ERP difference betweensmall and large error feedback over sensorimotor elec-trode regions. A similar pattern is observed when com-paring losses versus wins in a competitive game (Cohen& Ranganath, 2007), suggesting that feedback informa-tion may be processed in the motor cortex, whose roleis to strengthen the winning responses and weaken thelosses. In both studies (Cohen & Ranganath, 2007; andthe present), spatial resolution is limited to determineaccurately whether the hand area was involved, but theelectrodes (C3 and C5) are commonly used to investigatemotor responses (Neuper, Scherer, Wriessnegger, &Pfurtscheller, 2009; Neuper, Scherer, Reiner, & Pfurtscheller,2005). We suggest that our effect represents a similar pro-cess of strengthening/weakening of the neural representa-tion associated with good/poor performance. Anotherpossibility is that we learn not by a single prediction errorfor the whole action but by subsets of prediction error foreach subcomponent of the task. An fMRI study (Gershman,Pesaran, & Daw, 2009) using a bimanual probabilistic taskin which the right- and left-hand responses were inde-pendently rewarded found that the system decomposesthe prediction errors in small subaction spaces. Theyfound that the striatal responses to the prediction errorwere contralateral to the response hand, according to theeffector space (right or left hand).
In brief, we found three main ERP effects related withthe magnitude (small/ large) of the error feedback: (1)higher FRN following large error feedback reflecting errordetection, (2) higher P300 following small error feedbackreflecting attention and memory allocation, and (3) highersensorimotor positivity following small error feedbackreflecting motor reinforcement.
The results so far support that, although large errorsevoked larger FRN, small error feedback seems to allo-cate more resources related to attention and memoryprocesses. This hypothesis was further supported byour analysis based on neural oscillations. Small errorfeedback was associated with a higher decrease in spec-tral power in the alpha and beta frequency bands, indicat-ing larger brain activation in response to small errorfeedback. This interpretation is based on previous stud-ies showing that alpha and beta desynchronizations areinversely related with sensorimotor activation (Neuper,Wortz, & Pfurtscheller, 2006; Pfurtscheller & Lopes da Silva,1999; Pfurtscheller & Neuper, 1997). Previous experimentsfound an increase in the beta power in response to positivefeedback and rewards (HajiHosseini et al., 2012; Marco-Pallares et al., 2008; Cohen et al., 2007; Hallschmid, Mölle,Fischer, & Born, 2002) and others that found a desynchro-nization in beta range following incorrect performancefeedback (Luft et al., 2013; van de Vijver et al., 2011). Theformer studies have found synchronization in the beta orlow-gamma range (20–40 Hz) in response to rewards. Onthe basis of previous animal experiments demonstratingincreased beta, gamma, and high-gamma oscillations instriatum in response to actions associated with rewards
(Berke, 2009; Courtemanche, Fujii, & Graybiel, 2003), itwas suggested that beta and gamma oscillations followingpositive feedback reflect the activation of reward-relatedareas in the brain.There are three main factors that may indicate that the
beta power increase found in these studies are unlikely torepresent the same phenomenon as the one we found inthe present article and that Luft et al. (2013) and van deVijver et al. (2011) also found. First, the paradigmadopted in the Luft et al. (2013) and van de Vijver et al.(2011) studies is a time estimation task whose feedbackrepresents the accuracy of the response (correct or incor-rect) rather than a reward. Second, the topography of thebeta oscillations differs, because the reward studiesfound a frontal or midfrontal topography whereas thelatter studies have a sensorimotor left-lateralized topog-raphy, which is the same topography found in this study.Third, the time estimation studies looked at a slightlylower frequency range (17–24 Hz) than the reward stud-ies (20–40 Hz). We suggest that, for performance feed-back, this desynchronization may reflect a sensorimotorreorganization in response to error. Importantly, Luftet al. (2013) found that the higher the desynchronization,the better the participants learned or consolidated theirtime estimations when feedback was not available.Considering that motor preparation and imagery are
associated with the beta desynchronization over thecontralateral motor areas (Pfurtscheller, Neuper, Ramoser,& Muller-Gerking, 1999; Pfurtscheller & Neuper, 1997) andthat tiny adjustments are harder to accomplish than largeones, this sensorimotor operation may reflect motorimagery processes used to retrieve and restructure thelast trial. In our present study, we support the idea thatthe beta desynchronization over the left-sensorimotorareas may reflect a process of sensorimotor reorganiza-tion based on feedback. Higher beta desynchronizationin response to small rather than large errors might berelated to how much effort a small and a large errorrequires for correction. It is common sense that reach-ing perfection requires more than the initial learning.Therefore, a small error, which requires a precise cor-rection, has the potential to trigger more sophisticatederror correction mechanisms than a large error where thescope for correction is larger.
High- versus Low-learners: ERPs, Oscillations,and Phase Synchronization Differences andCorrelation with Performance
Is There a Difference between High- and Low-learners inRelation to the Way They Process Graded Feedback?
Our high-learners were not only better performers (reducederror and variability), but also better at retaining an internalrepresentation of the learned skill. In addition, the high-learners were better with performance adjustment. Thetwo learning groups differed mainly in terms of neuronal
1190 Journal of Cognitive Neuroscience Volume 26, Number 5

oscillations and intersite synchronization, but not inrelation to ERPs.In our results on oscillations, the topographies of the
clusters found for the small versus large error feedbackcomparisons indicate low-learners presented a largeroverall desynchronization following small error feed-back, mainly in the alpha band, whereas the high-learnersgroup showed an earlier and more localized cluster thatstarts in the left centrofrontal areas around 400 msec inthe beta band and finally spreads to midparietal andtemporal areas in the alpha frequency band. This resultmight indicate that low-learners presented a more gen-eral attention effect related to feedback, whereas thehigh-learners showed a more specific pattern that couldbe related to the brain processes used to learn the task.Earlier we have suggested that the beta desynchroniza-tion over motor areas plays an important role in learningfrom error feedback. This account is further supportedby our result showing larger beta desynchronization inthe high-learners, and this effect was most conspicuousfor small error feedback. Furthermore, studies usingtranscranial direct current stimulation (Galea, Vazquez,Pasricha, de Xivry, & Celnik, 2011; Reis et al., 2009) indi-cated that stimulating the primary motor area promoteda better retention of a motor skill, which means a betterlearning. Therefore, these results altogether supportthe notion that higher activations over the motor cortexare associated with better learning. In addition, wesuggest that the involvement of these areas for feedbackprocessing is relevant for consolidating learned skills.We found that only high-learners showed increased
connectivity between midfrontal (FCz) and left central(C3) sites following both small and large error feedback.This midfrontal region has been widely implicated inperformance monitoring (Balconi & Scioli, 2011; Cohenet al., 2011; Cavanagh et al., 2009, 2010; Luu et al., 2003;Holroyd & Coles, 2002) for correcting actions (Cohen& Ranganath, 2007; Ullsperger & von Cramon, 2006).Cavanagh et al. (2009) showed that the connectivitybetween FCz and the lateral pFC (F5/6) was increasedafter error trials and was further predictive of post-erroradjustment. Moreover, a new framework for understand-ing the neural mechanisms of feedback guided learning,proposed by Cohen et al. (2011), suggested that learningcould be associated with increased synchronization be-tween stimulus-specific and motor areas involved in thelearned skill. In our study, we found that midfrontal region(FCz) was synchronized with the left central area (C3) afterthe presentation of both small and large error feedback.This connectivity pattern was not present in the low-learners group, suggesting that learning might strengthenthe synchronization between these two brain regionsallowing a more efficient error adjustment or that thesynchronization between those two areas in response tofeedback facilitates learning. Our current study could notdissociate between these two possibilities, and futurestudies are needed to establish whether learning is an
effect or cause of synchronization between these areas.Interestingly, this synchronization, between FCz and C3in the beta band, was highly correlated with performancein the nonfeedback blocks, indicating that the more theseareas communicate after feedback, the better is the con-solidation of the learned skill.
Taken together, these results suggest that high- and low-learners differed in the way they processed small and largeerror feedback on electrodes and time windows definedbased on the differences between small and large errorfeedback. Therefore, differences in other areas and otherfrequency bands that were similar for small and large errorfeedback may have been overlooked. Further studies com-paring the brain responses to feedback between goodand poor learners may be necessary to find differences be-tween those two groups that were not linked to processingof distinct performance feedback magnitude.
Conclusion
In this study, we showed the effect of graded feedbackon brain responses and how it differed between indi-viduals with distinct learning abilities in a time estimationtask. We conclude that small rather than large error feed-back is associated with higher alpha and beta desynchro-nization, possibly associated with a more sophisticatedprocess for correcting errors. Individual differences inlearning from graded feedback are mainly evident inthe oscillatory correlates of processing of small ratherthan of large errors. Finally, we found that phase synchro-nization in the beta frequency range between midfrontaland left sensorimotor-related electrodes was correlatedwith how well the participants were able to performwhen no feedback was available.
Acknowledgments
We are thankful to Job Lindsen for the advice on data analysisand to Dr. Stuart Derbyshire for proof reading this manuscript.C. D. B. L. was supported by CAPES Foundation (PDEE pro-gramme, Process number 1428-10-1) to carry out the experi-ment at Goldsmiths, University of London. J. B. was partiallysupported by the grant, TEC-2012-38453-C04-03 of the SpanishMinistry of Economic and Competitiveness.
Reprint requests should be sent to Caroline Di Bernardi Luft,Department of Psychology, Goldsmiths, University of London,New Cross-SE14 6NW, London, UK, or via e-mail: [email protected].
REFERENCES
Balconi, M., & Scioli, S. (2011). Error monitoring functionsin response to an external feedback when an explicitjudgement is required ERP modulation and corticalsource localisation. International Journal ofPsychophysiology, 83, 295–301.
Bellebaum, C., & Daum, I. (2008). Learning-related changesin reward expectancy are reflected in the feedback-relatednegativity. European Journal of Neuroscience, 27,1823–1835.
Luft, Takase, and Bhattacharya 1191

Bellebaum, C., Polezzi, D., & Daum, I. (2010). It is less than youexpected: The feedback-related negativity reflects violationsof reward magnitude expectations. Neuropsychologia, 48,3343–3350.
Berke, J. D. (2009). Fast oscillations in cortical-striatal networksswitch frequency following rewarding events and stimulantdrugs. European Journal of Neuroscience, 30, 848–859.
Burkhard, D. G., Patterson, J., & Rapue, R. (1967). Effect of filmfeedback on learning the motor skills of karate. Perceptual &Motor Skills, 25, 65–69.
Carter, C. S., Braver, T. S., Barch, D. M., Botvinick, M. M., Noll,D., & Cohen, J. D. (1998). Anterior cingulate cortex, errordetection, and the online monitoring of performance.Science, 280, 747–749.
Cavanagh, J. F., Cohen, M. X., & Allen, J. J. (2009). Prelude toand resolution of an error: EEG phase synchrony revealscognitive control dynamics during action monitoring.Journal of Neuroscience, 29, 98–105.
Cavanagh, J. F., Frank, M. J., Klein, T. J., & Allen, J. J. (2010).Frontal theta links prediction errors to behavioral adaptationin reinforcement learning. Neuroimage, 49, 3198–3209.
Cavanagh, J. F., Zambrano-Vazquez, L., & Allen, J. J. (2012).Theta lingua franca: A common mid-frontal substrate foraction monitoring processes. Psychophysiology, 49, 220–238.
Cohen, M. X., Elger, C. E., & Ranganath, C. (2007). Rewardexpectation modulates feedback-related negativity and EEGspectra. Neuroimage, 35, 968–978.
Cohen, M. X., & Ranganath, C. (2007). Reinforcement learningsignals predict future decisions. Journal of Neuroscience, 27,371–378.
Cohen, M. X., Wilmes, K., & Vijver, I. (2011). Corticalelectrophysiological network dynamics of feedback learning.Trends in Cognitive Sciences, 15, 558–566.
Courtemanche, R., Fujii, N., & Graybiel, A. M. (2003). Synchronous,focally modulated beta-band oscillations characterize localfield potential activity in the striatum of awake behavingmonkeys. Journal of Neuroscience, 23, 11741–11752.
Delorme, A., & Makeig, S. (2004). EEGLAB: An open sourcetoolbox for analysis of single-trial EEG dynamics includingindependent component analysis. Journal of NeuroscienceMethods, 134, 9–21.
Diedrichsen, J., White, O., Newman, D., & Lally, N. (2010).Use-dependent and error-based learning of motor behaviors.Journal of Neuroscience, 30, 5159–5166.
Donamayor, N., Marco-Pallares, J., Heldmann, M., Schoenfeld,M. A., & Munte, T. F. (2011). Temporal dynamics of rewardprocessing revealed by magnetoencephalography. HumanBrain Mapping, 32, 2228–2240.
Galea, J. M., Vazquez, A., Pasricha, N., de Xivry, J. J., &Celnik, P. (2011). Dissociating the roles of the cerebellumand motor cortex during adaptive learning: The motor cortexretains what the cerebellum learns. Cerebral Cortex, 21,1761–1770.
Gehring, W. J., & Willoughby, A. R. (2002). The medial frontalcortex and the rapid processing of monetary gains and losses.Science, 295, 2279–2282.
Gershman, S. J., Pesaran, B., & Daw, N. D. (2009). Humanreinforcement learning subdivides structured action spacesby learning effector-specific values. Journal of Neuroscience,29, 13524–13531.
Hajcak, G., Moser, J. S., Holroyd, C. B., & Simons, R. F. (2006).The feedback-related negativity reflects the binary evaluationof good versus bad outcomes. Biological Psychology, 71,148–154.
Hajcak, G., Moser, J. S., Holroyd, C. B., & Simons, R. F. (2007).Itʼs worse than you thought: The feedback negativity andviolations of reward prediction in gambling tasks.Psychophysiology, 44, 905–912.
HajiHosseini, A., Rodriguez-Fornells, A., & Marco-Pallares, J.(2012). The role of beta-gamma oscillations in unexpectedrewards processing. Neuroimage, 60, 1678–1685.
Hallschmid, M., Mölle, M., Fischer, S., & Born, J. (2002). EEGsynchronization upon reward inman.Clinical Neurophysiology:Official Journal of the International Federation of ClinicalNeurophysiology, 113, 1059–1065.
Holroyd, C. B., & Coles, M. G. (2002). The neural basis ofhuman error processing: Reinforcement learning, dopamine,and the error-related negativity. Psychological Review, 109,679–709.
Holroyd, C. B., & Krigolson, O. E. (2007). Reward predictionerror signals associated with a modified time estimation task.Psychophysiology, 44, 913–917.
Kawashima, R., Tajima, N., Yoshida, H., Okita, K., Sasaki, T.,Schormann, T., et al. (2000). The effect of verbal feedbackon motor learning—A PET study. Positron emissiontomography. Neuroimage, 12, 698–706.
Kreussel, L., Hewig, J., Kretschmer, N., Hecht, H., Coles, M. G.,& Miltner, W. H. (2012). The influence of the magnitude,probability, and valence of potential wins and losses on theamplitude of the feedback negativity. Psychophysiology, 49,207–219.
Kreussel, L., Hewig, J., Kretschmer, N., Hecht, H., Coles, M. G.,& Miltner, W. H. (2013). How bad was it? Differences in thetime course of sensitivity to the magnitude of loss in problemgamblers and controls. Behavioural Brain Research, 247,140–145.
Ladouceur, C. D., Dahl, R. E., & Carter, C. S. (2007).Development of action monitoring through adolescence intoadulthood: ERP and source localization. DevelopmentalScience, 10, 874–891.
Lewis, P. A., & Miall, R. C. (2003). Brain activation patternsduring measurement of sub- and supra-second intervals.Neuropsychologia, 41, 1583–1592.
Lindsen, J. P., Jones, R., Shimojo, S., & Bhattacharya, J. (2010).Neural components underlying subjective preferentialdecision making. Neuroimage, 50, 1626–1632.
Luft, C. D. B., Nolte, G., & Bhattacharya, J. (2013). High-learnerspresent larger mid-frontal theta power and connectivity inresponse to incorrect performance feedback. Journal ofNeuroscience, 33, 2029–2038.
Luu, P., Tucker, D. M., Derryberry, D., Reed, M., & Poulsen,C. (2003). Electrophysiological responses to errors andfeedback in the process of action regulation. PsychologicalScience, 14, 47–53.
Marco-Pallares, J., Cucurell, D., Cunillera, T., Garcia, R., Andres-Pueyo, A., Munte, T. F., et al. (2008). Human oscillatoryactivity associated to reward processing in a gambling task.Neuropsychologia, 46, 241–248.
Maris, E., & Oostenveld, R. (2007). Nonparametric statisticaltesting of EEG- and MEG-data. Journal of NeuroscienceMethods, 164, 177–190.
Mars, R. B., Bruijn, E. R. A., Hulstijn, W., Miltner, W. H. R., &Coles, M. G. H. (2004). What if I told you: “You were wrong”?:Brain potentials and behavioral adjustments elicited byfeedback in a time-estimation task. In U. M. Falkenstein (Ed.),Errors, conflicts, and the brain: Current opinions onperformance monitoring (pp. 129–134). Leipzig: MPI ofCognitive Neuroscience.
Masters, R. S., Maxwell, J. P., & Eves, F. F. (2009). Marginallyperceptible outcome feedback, motor learning and implicitprocesses. Consciousness and Cognition, 18, 639–645.
Miltner, W. H. R., Braun, C., & Coles, M. G. H. (1997). Event-related brain potentials following incorrect feedback in atime-estimation task: Evidence for a generic neural systemfor error detection. Journal of Cognitive Neuroscience, 9,788–798.
1192 Journal of Cognitive Neuroscience Volume 26, Number 5
Neuper, C., Scherer, R., Reiner, M., & Pfurtscheller, G. (2005).Imagery of motor actions: Differential effects of kinestheticand visual-motor mode of imagery in single-trial EEG. BrainResearch, Cognitive Brain Research, 25, 668–677.
Neuper, C., Scherer, R., Wriessnegger, S., & Pfurtscheller, G.(2009). Motor imagery and action observation: Modulationof sensorimotor brain rhythms during mental control of abrain-computer interface. Clinical Neurophysiology, 120,239–247.
Neuper, C., Wortz, M., & Pfurtscheller, G. (2006). ERD/ERSpatterns reflecting sensorimotor activation and deactivation.Progress in Brain Research, 159, 211–222.
Nolte, G., Bai, O., Wheaton, L., Mari, Z., Vorbach, S., & Hallett,M. (2004). Identifying true brain interaction from EEG datausing the imaginary part of coherency.Clinical Neurophysiology,115, 2292–2307.
Nolte, G., & Muller, K. R. (2010). Localizing and estimatingcausal relations of interacting brain rhythms. Frontiers inHuman Neuroscience, 4, 209.
Nolte, G., Ziehe, A., Nikulin, V. V., Schlogl, A., Kramer, N.,Brismar, T., et al. (2008). Robustly estimating the flowdirection of information in complex physical systems.Physical Review Letters, 100, 234101.
Oostenveld, R., Fries, P., Maris, E., & Schoffelen, J. M. (2011).FieldTrip: Open source software for advanced analysis of MEG,EEG, and invasive electrophysiological data. ComputationalIntelligence and Neuroscience, 2011, 156869.
Osipova, D., Takashima, A., Oostenveld, R., Fernandez, G.,Maris, E., & Jensen, O. (2006). Theta and gamma oscillationspredict encoding and retrieval of declarative memory.Journal of Neuroscience, 26, 7523–7531.
Pereda, E., Quiroga, R. Q., & Bhattacharya, J. (2005). Nonlinearmultivariate analysis of neurophysiological signals. Progressin Neurobiology, 77, 1–37.
Pfurtscheller, G., & Lopes da Silva, F. H. (1999). Event-relatedEEG/MEG synchronization and desynchronization: Basicprinciples. Clinical Neurophysiology, 110, 1842–1857.
Pfurtscheller, G., & Neuper, C. (1997). Motor imagery activatesprimary sensorimotor area in humans. Neuroscience Letters,239, 65–68.
Pfurtscheller, G., Neuper, C., Ramoser, H., & Muller-Gerking, J.(1999). Visually guided motor imagery activates sensorimotorareas in humans. Neuroscience Letters, 269, 153–156.
Picton, T. W., Bentin, S., Berg, P., Donchin, E., Hillyard, S. A.,Johnson, R., Jr., et al. (2000). Guidelines for using humanevent-related potentials to study cognition: Recording standardsand publication criteria. Psychophysiology, 37, 127–152.
Potts, G. F., Martin, L. E., Kamp, S. M., & Donchin, E. (2011).Neural response to action and reward prediction errors:Comparing the error-related negativity to behavioral errorsand the feedback-related negativity to reward predictionviolations. Psychophysiology, 48, 218–228.
Reis, J., Schambra, H. M., Cohen, L. G., Buch, E. R., Fritsch, B.,Zarahn, E., et al. (2009). Noninvasive cortical stimulationenhances motor skill acquisition over multiple days throughan effect on consolidation. Proceedings of the NationalAcademy of Sciences, U.S.A., 106, 1590–1595.
Sailer, U., Fischmeister, F. P., & Bauer, H. (2010). Effects oflearning on feedback-related brain potentials in a decision-making task. Brain Research, 1342, 85–93.
Sandkuhler, S., & Bhattacharya, J. (2008). Deconstructinginsight: EEG correlates of insightful problem solving.PLoS One, 3, e1459.
Santesso, D. L., Bogdan, R., Birk, J. L., Goetz, E. L., Holmes, A. J.,& Pizzagalli, D. A. (2012). Neural responses to negativefeedback are related to negative emotionality in healthyadults. Social Cognitive and Affective Neuroscience, 7,794–803.
Sato, A., Yasuda, A., Ohira, H., Miyawaki, K., Nishikawa, M.,Kumano, H., et al. (2005). Effects of value and rewardmagnitude on feedback negativity and P300. NeuroReport,16, 407–411.
Seger, C. A. (2008). How do the basal ganglia contribute tocategorization? Their roles in generalization, responseselection, and learning via feedback. Neuroscience andBiobehavioral Reviews, 32, 265–278.
Stam, C. J., Nolte, G., & Daffertshofer, A. (2007). Phase lagindex: Assessment of functional connectivity from multichannel EEG and MEG with diminished bias from commonsources. Human Brain Mapping, 28, 1178–1193.
Tucker, D. M., Luu, P., Frishkoff, G., Quiring, J., & Poulsen, C.(2003). Frontolimbic response to negative feedback in clinicaldepression. Journal of Abnormal Psychology, 112, 667–678.
Ullsperger, M., & von Cramon, D. Y. (2006). How does errorcorrection differ from error signaling? An event-relatedpotential study. Brain Research, 1105, 102–109.
van de Vijver, I., Ridderinkhof, K. R., & Cohen, M. X. (2011).Frontal oscillatory dynamics predict feedback learning andaction adjustment. Journal of Cognitive Neuroscience, 23,4106–4121.
van der Helden, J., Boksem, M. A., & Blom, J. H. (2010). Theimportance of failure: Feedback-related negativity predictsmotor learning efficiency. Cerebral Cortex, 20, 1596–1603.
Van Veen, V., & Carter, C. S. (2002). The timing of action-monitoring processes in the anterior cingulate cortex.Journal of Cognitive Neuroscience, 14, 593–602.
Vinck, M., Oostenveld, R., van Wingerden, M., Battaglia, F., &Pennartz, C. M. (2011). An improved index of phase-synchronization for electrophysiological data in the presenceof volume-conduction, noise and sample-size bias.Neuroimage, 55, 1548–1565.
Walsh, M. M., & Anderson, J. R. (2012). Learning fromexperience: Event-related potential correlates of rewardprocessing, neural adaptation, and behavioral choice.Neuroscience and Biobehavioral Reviews, 36, 1870–1884.
Wolpert, D. M., Diedrichsen, J., & Flanagan, J. R. (2011).Principles of sensorimotor learning. Nature ReviewsNeuroscience, 12, 739–751.
Wu, Y., & Zhou, X. (2009). The P300 and reward valence,magnitude, and expectancy in outcome evaluation. BrainResearch, 1286, 114–122.
Wulf, G., Chiviacowsky, S., Schiller, E., & Avila, L. T. (2010).Frequent external-focus feedback enhances motor learning.Frontiers in Psychology, 1, 190.
Yeung, N., & Sanfey, A. G. (2004). Independent coding ofreward magnitude and valence in the human brain. Journalof Neuroscience, 24, 6258–6264.
Zhou, Z., Yu, R., & Zhou, X. (2010). To do or not to do? Actionenlarges the FRN and P300 effects in outcome evaluation.Neuropsychologia, 48, 3606–3613.
Luft, Takase, and Bhattacharya 1193
Related Documents