3/30 Processing 介紹 莊廷烽、譚聖音

Welcome message from author
This document is posted to help you gain knowledge. Please leave a comment to let me know what you think about it! Share it to your friends and learn new things together.
Transcript

3/30 Processing 介紹莊廷烽、譚聖音
ANIMA ikiimmersive experience of light and sound/2015

»ANIMA« is a sculptural installation developed to explore the relationship between itself and its surroundings through the use of movement, texture, light and sound. The installation consists of a giant glowing sphere measuring two meters in diameter.
The reaction of the programmed light formations is a remediation of the surroundings, feasting on its environment to create an immersive and interactive experience of light and sound.
https://player.vimeo.com/video/128767230

SUPERFICIEhttp://superficie.ink

https://player.vimeo.com/video/143076578


Rain Room, 2012https://youtu.be/EkvazIZx-F0http://random-international.com/work/rainroom

https://player.vimeo.com/video/164197088

https://player.vimeo.com/video/164197088

Sample:Energy Consumption Data Visualization
http://openprocessing.org/sketch/198208
xml:數據文件,在本案例中紀錄10個國家的耗能狀況;
pde:processing的code。

Sample:Energy Consumption Data Visualization
xml:數據文件,在本案例中紀錄10個國家的耗能狀況;

Sample:Energy Consumption Data Visualization
step1:
1. 讀入xml數據文件;
2. 建立arraylist存放所有運動
小球;
3. 建立position的array存放所有國家顯示的位置;
4. 建立ballamount的array存放所有國家的能源數據,也是小球的數目;

Sample:Energy Consumption Data Visualization
step2(setup):
1. 規定一些繪製的規則;
2. 根據讀入的數據,將 step1中
的各個array中填入內容;

Sample:Energy Consumption Data Visualization
position0 1 2 3 4 5 6 7 8 9
ballamount
0 1 2 3 4 5 6 7 8 9
455/40 456/40 461/40 545/40 550/40 601/40 858/40 860/40 3741/40
4693/40
countryname
0 1 2 3 4 5 6 7 8 9
Sample:Energy Consumption Data Visualization
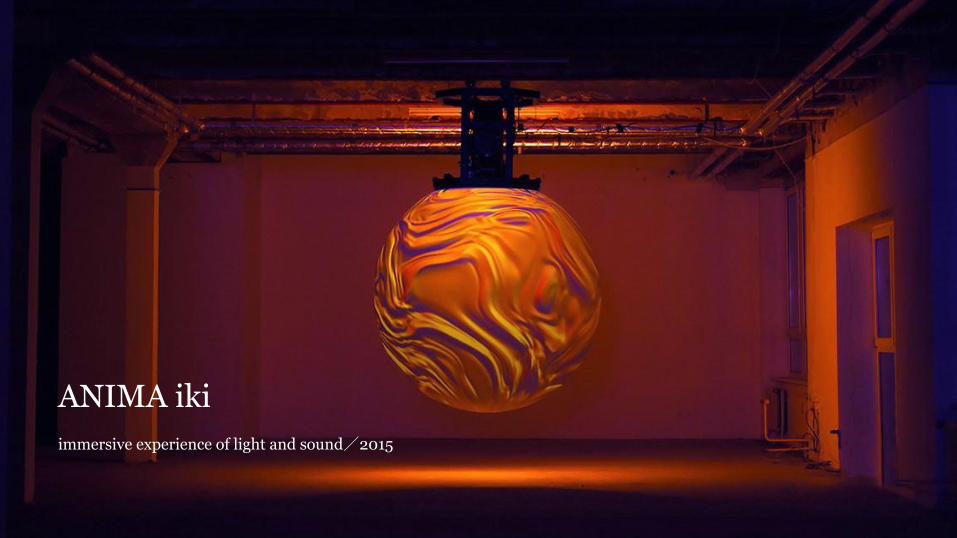
step3(draw):
1. 根據規則、繪製小球;
2. 繪製各個國家能耗數據之間
的連線;
3. 標記國家名稱

Sample:Energy Consumption Data Visualization
else(class ball):
1. 自己建立規則class;
2. class Ball裡包含一些變數和
function;
3. 變數包括小球的旋轉中心、
速度、加速度、大小、旋轉角
度與速度、能量級別等;
4. function包括重新更新旋轉
的中心和繪製。

Sample:Energy Consumption Data Visualization
else(class ball):
1. 自己建立規則class;
2. class Ball裡包含一些變數和
function;
3. 變數包括小球的旋轉中心、
速度、加速度、大小、旋轉角
度與速度、能量級別等;
4. function包括重新更新旋轉
的中心和繪製。

Sample:Energy Consumption Data Visualization
Let’s try (ง •̀_•́)ง
Related Documents