Process Validation Statistics Bass Masri Principal Consultant Statistical Techniques www.statisticaltechniques.com.au

Welcome message from author
This document is posted to help you gain knowledge. Please leave a comment to let me know what you think about it! Share it to your friends and learn new things together.
Transcript
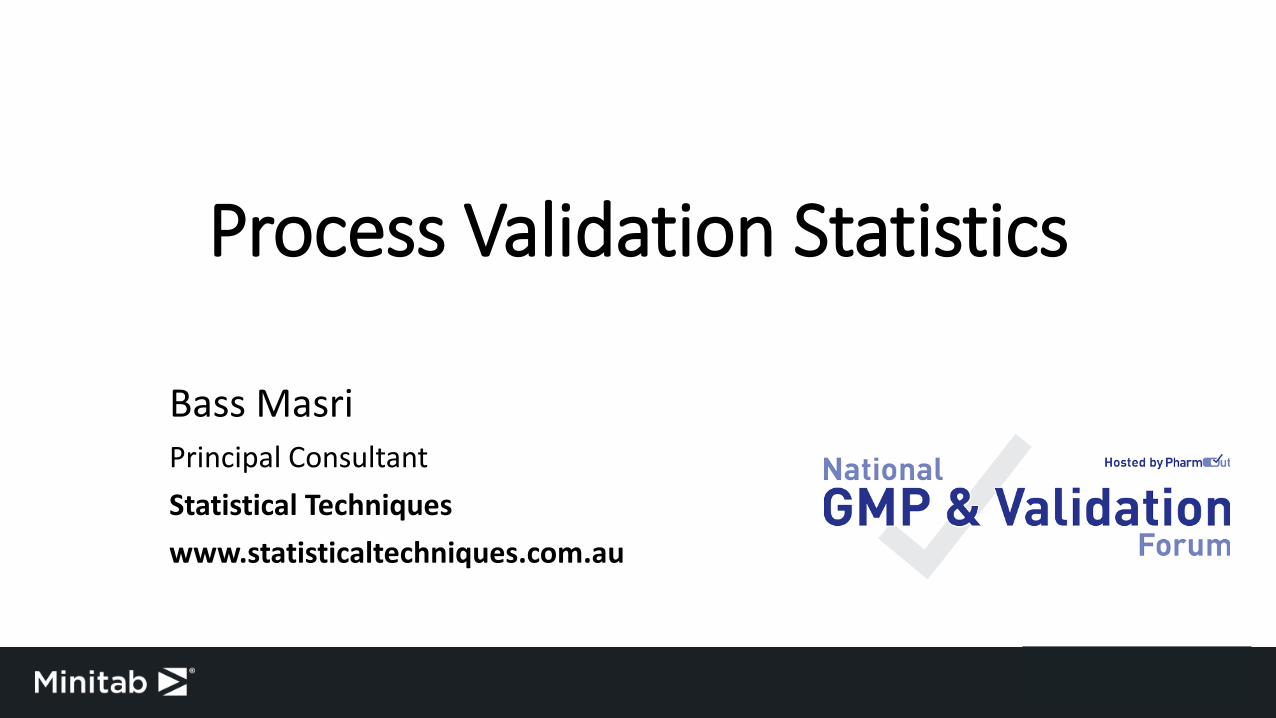
Process Validation Statistics
Bass MasriPrincipal ConsultantStatistical Techniqueswww.statisticaltechniques.com.au
Introduction
• Minitab Statistical Software was first developed in 1972 by threeprofessors to teach their students statistics. Minitab is still a leadingprovider of software and services for quality improvement.
• Statistical Techniques is a Sydney consulting business specializing inquality analysis and strategic research. ‘Statistical Techniques’ is animportant section of Quality Management Systems Regulations.
Tutorial Overview
• This tutorial was developed based on the Global Harmonization TaskForce Quality Management Systems Guidance on Process Validation.
• A ‘heat sealing’ process uses equipment to seal a pouch to act as asterility barrier for a medical device. This process requires validation.
• Where the results of a process cannot be fully verified by inspectionand test, the process shall be validated with high degree of assurance.
Process Validation
Defined as establishing by objective evidence that a process consistentlyproduces a result or product meeting its predetermined requirements.
1. evidence is the documented collection of facts, data and analysisthat demonstrate your process is operating at a validated state.
2. consistently produces links the statistical techniques of processstability (statistical process control) and process capability (Cpk) .
3. predetermined specifications are the specifications that, if metresult in the product meeting customers needs and intended use.
Benefits and Why
• Process validation results in a process that consistently produces ahigh quality product for your customers .
• Think about this in terms of your customer’s satisfaction, customerexperience and your brands reputation.
• Process validation and control results in benefits for your organization(cost of quality) as well as your customers.
• Scrap reduction, reduced rework, increased productivity, reducedcustomer complaints and reduced product liability.
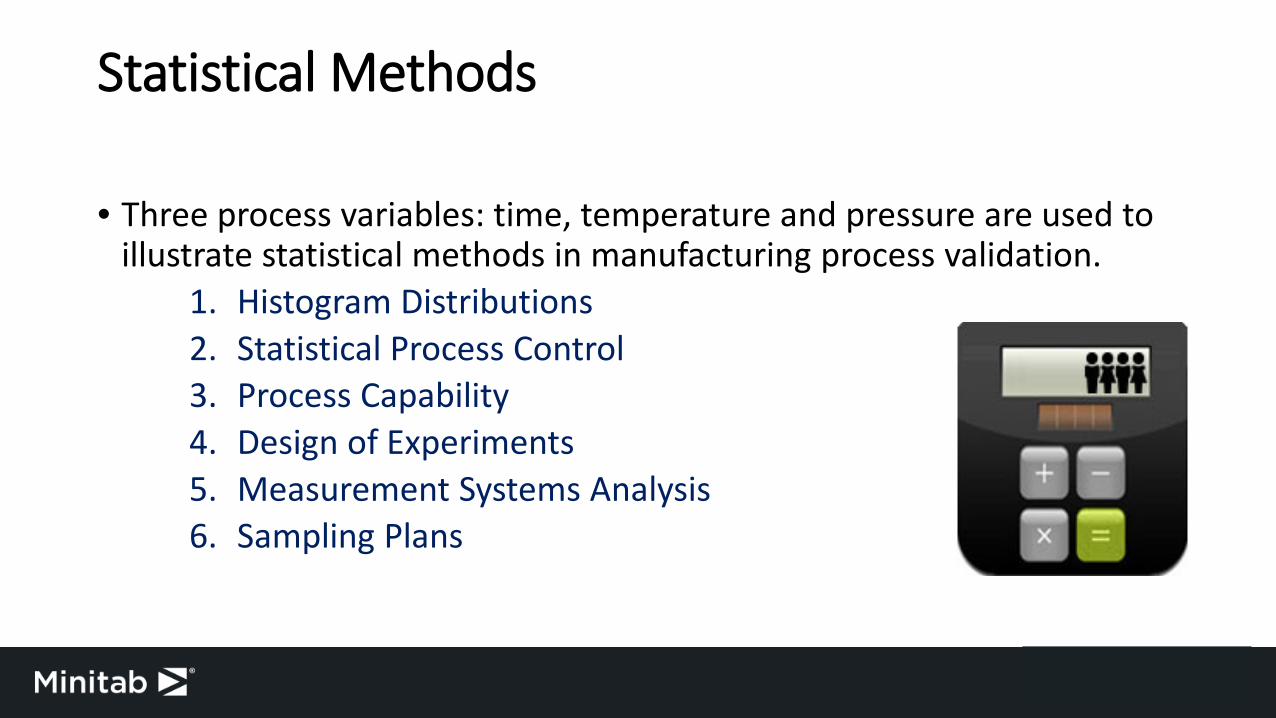
Statistical Methods
• Three process variables: time, temperature and pressure are used to illustrate statistical methods in manufacturing process validation.
1. Histogram Distributions2. Statistical Process Control 3. Process Capability4. Design of Experiments 5. Measurement Systems Analysis6. Sampling Plans
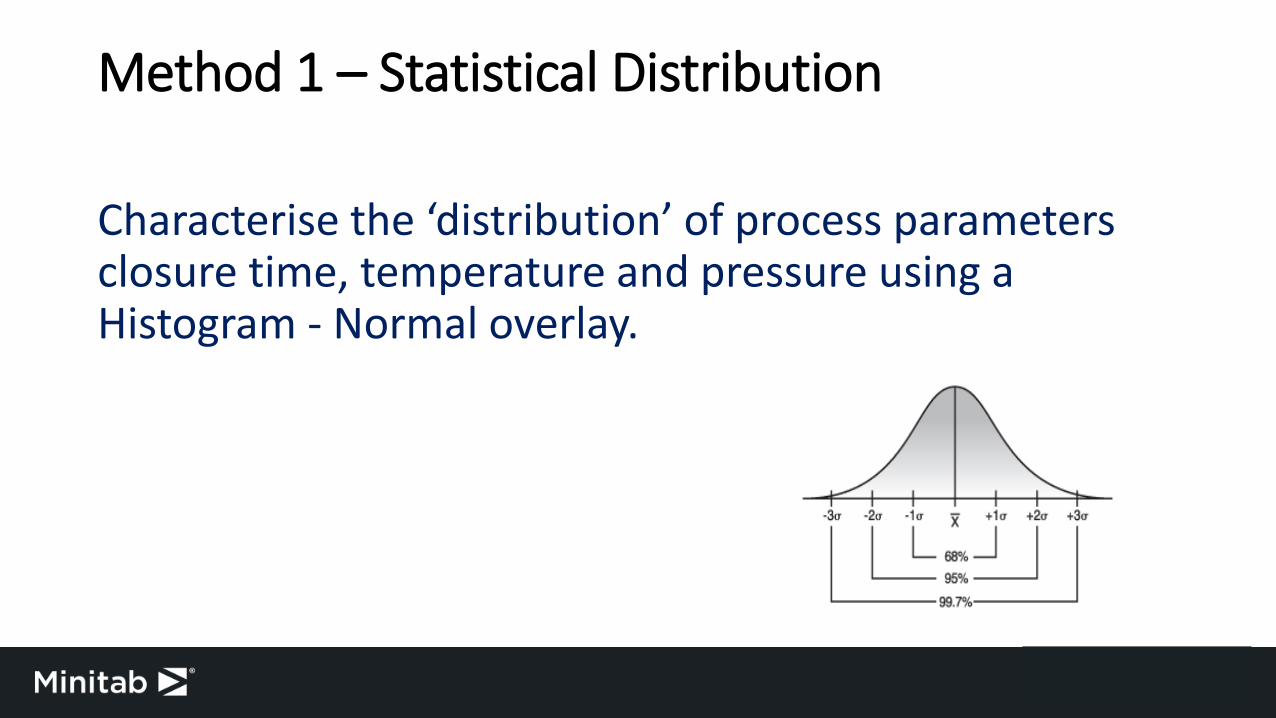
Method 1 – Statistical Distribution
Characterise the ‘distribution’ of process parameters closure time, temperature and pressure using a Histogram - Normal overlay.

Closure Time
1.71.61.51.4
6
5
4
3
2
1
0
Mean 1.533StDev 0.09497N 20
Closure Time
Freq
uenc
y
Histogram of Closure TimeNormal
www.statisticaltechniques.com.au
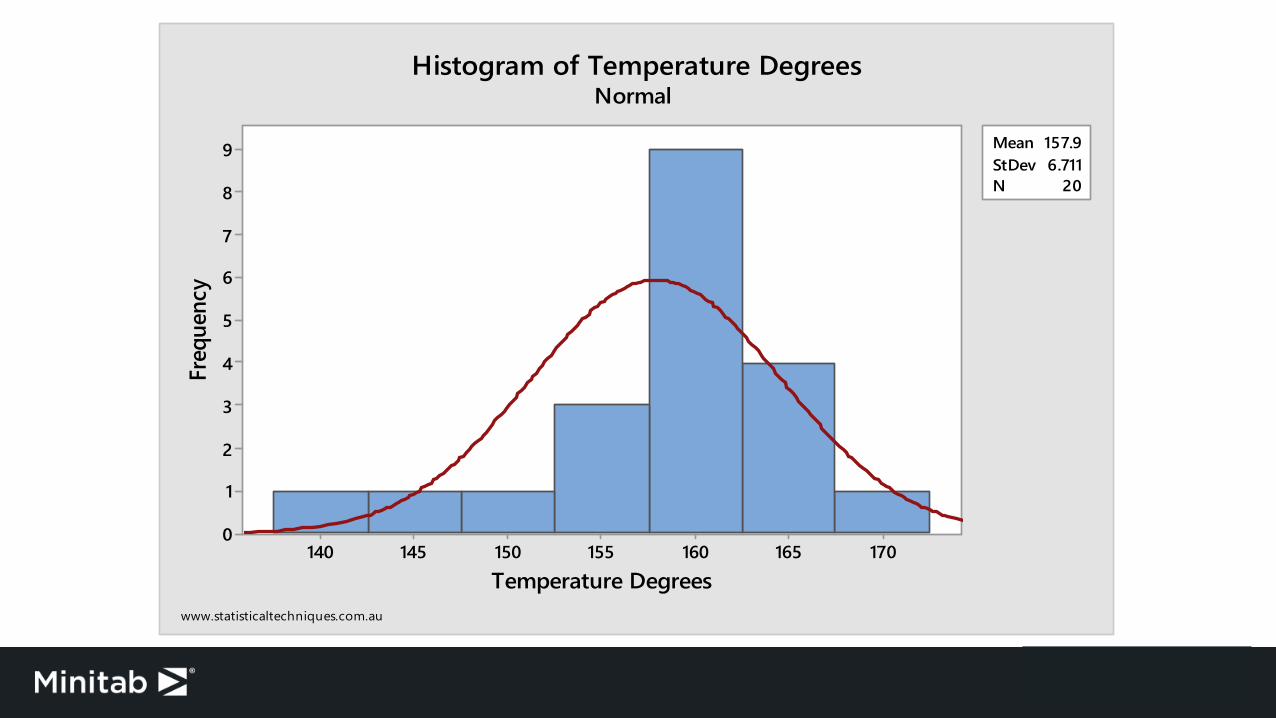
Temperature
170165160155150145140
9
8
7
6
5
4
3
2
1
0
Mean 157.9StDev 6.711N 20
Temperature Degrees
Freq
uenc
y
Histogram of Temperature DegreesNormal
www.statisticaltechniques.com.au

Pressure
332330328326324322320318
6
5
4
3
2
1
0
Mean 324.9StDev 3.307N 20
Pressure kPa
Freq
uenc
y
Histogram of Pressure kPaNormal
www.statisticaltechniques.com.au

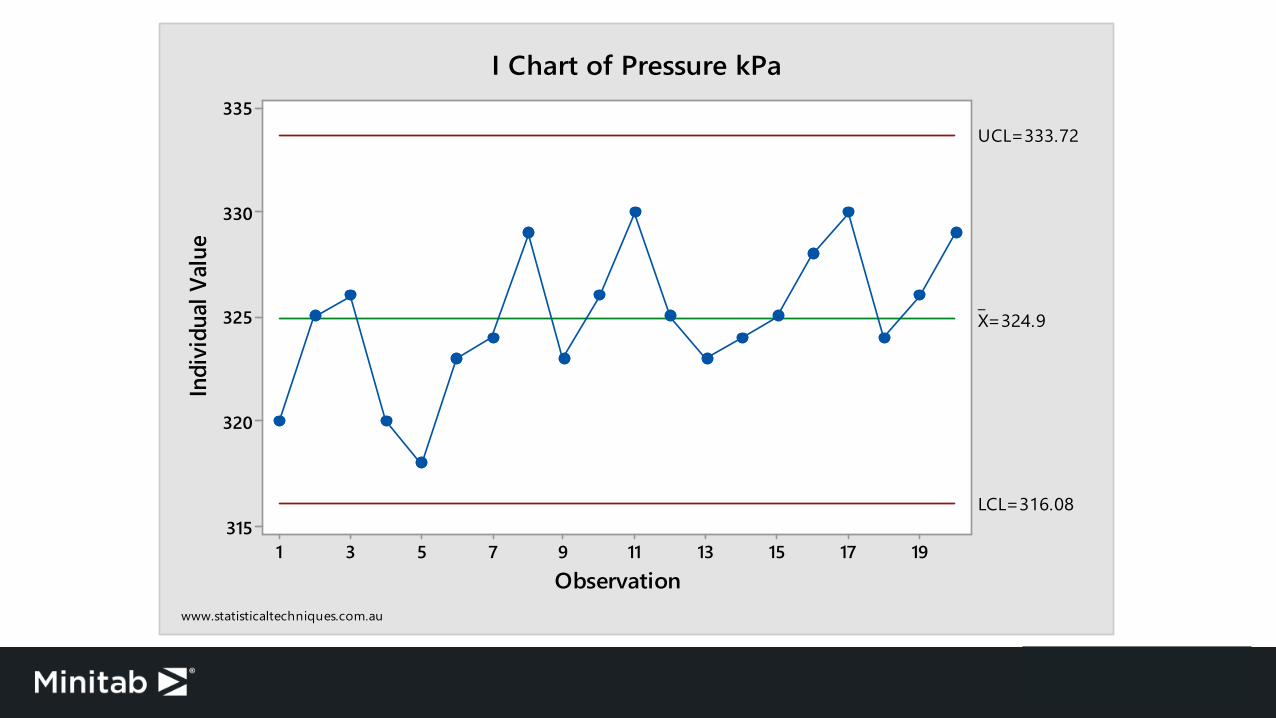
Determine whether the parameters closure time, temperature, and pressure are in ‘statistical control’ using control charts (with tests for special cause 1, 2, 3)
Method 2 – Statistical Process Control

Closure Time
191715131197531
1.8
1.7
1.6
1.5
1.4
1.3
1.2
Observation
Indi
vidu
al V
alue
_X=1.5325
UCL=1.8055
LCL=1.2595
I Chart of Closure Time
www.statisticaltechniques.com.au
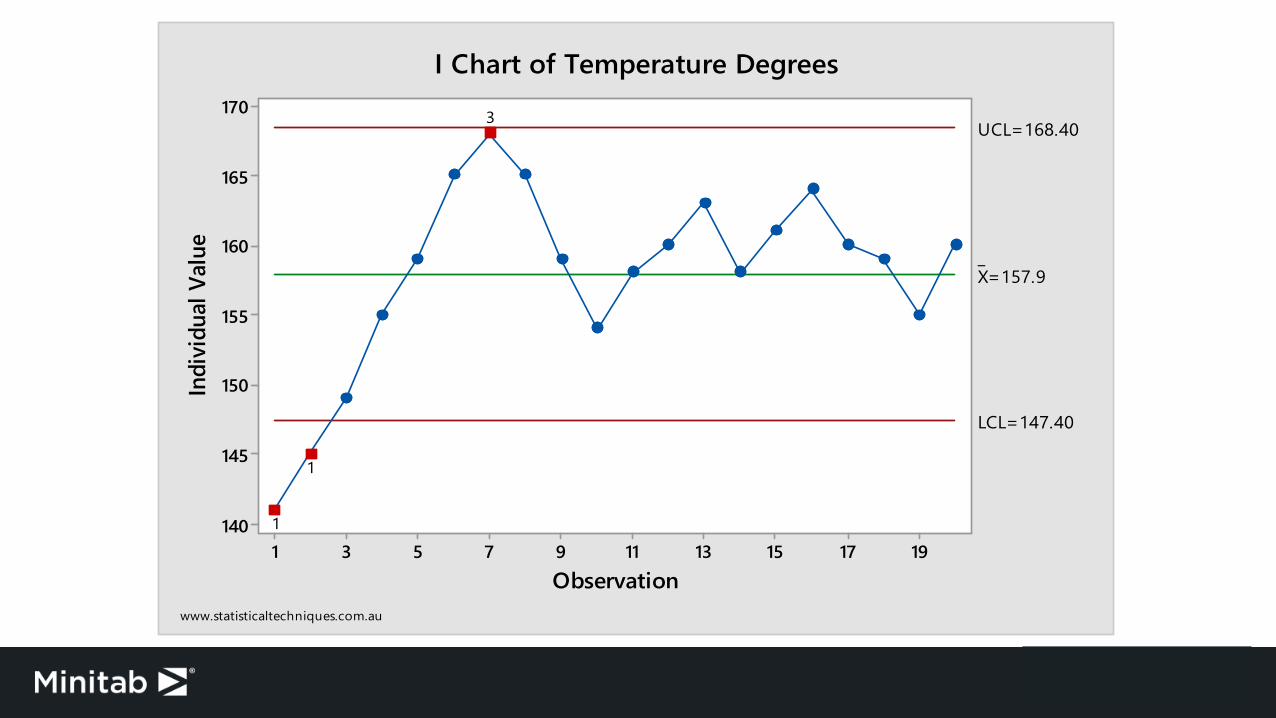
Temperature
191715131197531
170
165
160
155
150
145
140
Observation
Indi
vidu
al V
alue _
X=157.9
UCL=168.40
LCL=147.40
3
1
1
I Chart of Temperature Degrees
www.statisticaltechniques.com.au
Pressure
191715131197531
335
330
325
320
315
Observation
Indi
vidu
al V
alue
_X=324.9
UCL=333.72
LCL=316.08
I Chart of Pressure kPa
www.statisticaltechniques.com.au

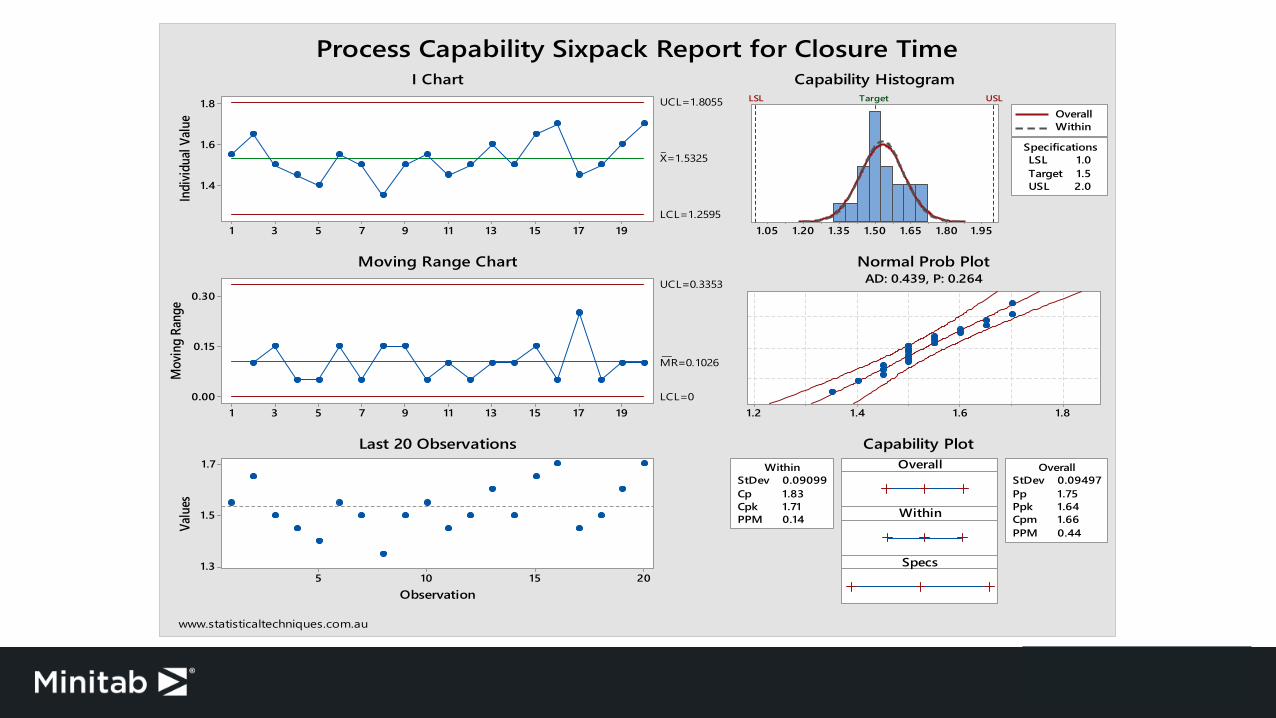
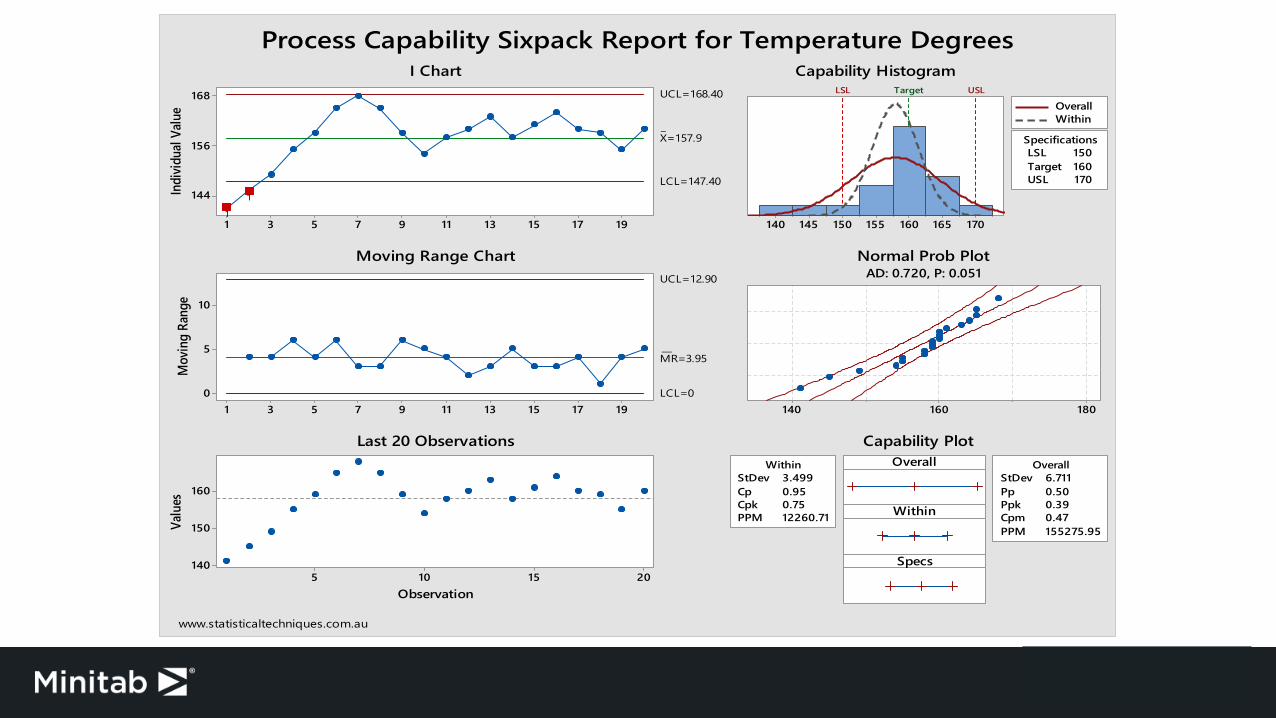
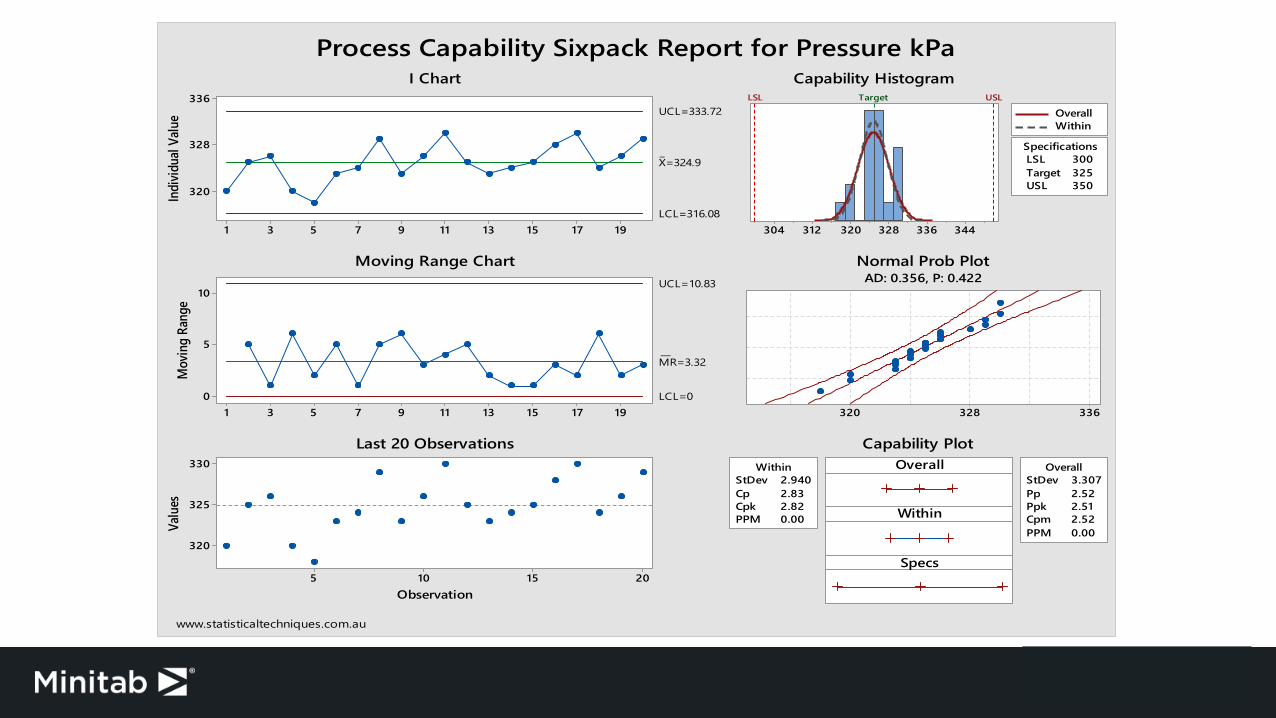
Determine whether the process parameters are in ‘statistical control’, whether the ‘normal distribution’ models the data well and whether these process parameters are ‘capable of consistently’ meeting specifications.
Method 3 – Process Capability
Closure Time
191715131197531
1.8
1.6
1.4In
divid
ual V
alue
_X=1.5325
UCL=1.8055
LCL=1.2595
191715131197531
0.30
0.15
0.00
Mov
ing
Rang
e
__MR=0.1026
UCL=0.3353
LCL=0
2015105
1.7
1.5
1.3
Observation
Valu
es
1.951.801.651.501.351.201.05
LSL 1.0Target 1.5USL 2.0
Specifications
LSL Target USL
OverallWithin
1.81.61.41.2
StDev 0.09099Cp 1.83Cpk 1.71PPM 0.14
WithinStDev 0.09497Pp 1.75Ppk 1.64Cpm 1.66PPM 0.44
OverallOverall
Within
Specs
Process Capability Sixpack Report for Closure Time
www.statisticaltechniques.com.au
I Chart
Moving Range Chart
Last 20 Observations
Capability Histogram
Normal Prob PlotAD: 0.439, P: 0.264
Capability Plot
Temperature
191715131197531
168
156
144Indi
vidua
l Valu
e
_X=157.9
UCL=168.40
LCL=147.40
191715131197531
10
5
0
Mov
ing
Rang
e
__MR=3.95
UCL=12.90
LCL=0
2015105
160
150
140
Observation
Valu
es
170165160155150145140
LSL 150Target 160USL 170
Specifications
LSL Target USL
OverallWithin
180160140
StDev 3.499Cp 0.95Cpk 0.75PPM 12260.71
WithinStDev 6.711Pp 0.50Ppk 0.39Cpm 0.47PPM 155275.95
OverallOverall
Within
Specs
1
1
Process Capability Sixpack Report for Temperature Degrees
www.statisticaltechniques.com.au
I Chart
Moving Range Chart
Last 20 Observations
Capability Histogram
Normal Prob PlotAD: 0.720, P: 0.051
Capability Plot
Pressure
191715131197531
336
328
320Indi
vidua
l Valu
e_X=324.9
UCL=333.72
LCL=316.08
191715131197531
10
5
0
Mov
ing
Rang
e
__MR=3.32
UCL=10.83
LCL=0
2015105
330
325
320
Observation
Valu
es
344336328320312304
LSL 300Target 325USL 350
Specifications
LSL Target USL
OverallWithin
336328320
StDev 2.940Cp 2.83Cpk 2.82PPM 0.00
WithinStDev 3.307Pp 2.52Ppk 2.51Cpm 2.52PPM 0.00
OverallOverall
Within
Specs
Process Capability Sixpack Report for Pressure kPa
www.statisticaltechniques.com.au
I Chart
Moving Range Chart
Last 20 Observations
Capability Histogram
Normal Prob PlotAD: 0.356, P: 0.422
Capability Plot
Determine whether process parameters are ‘capable of consistently’ meeting specifications
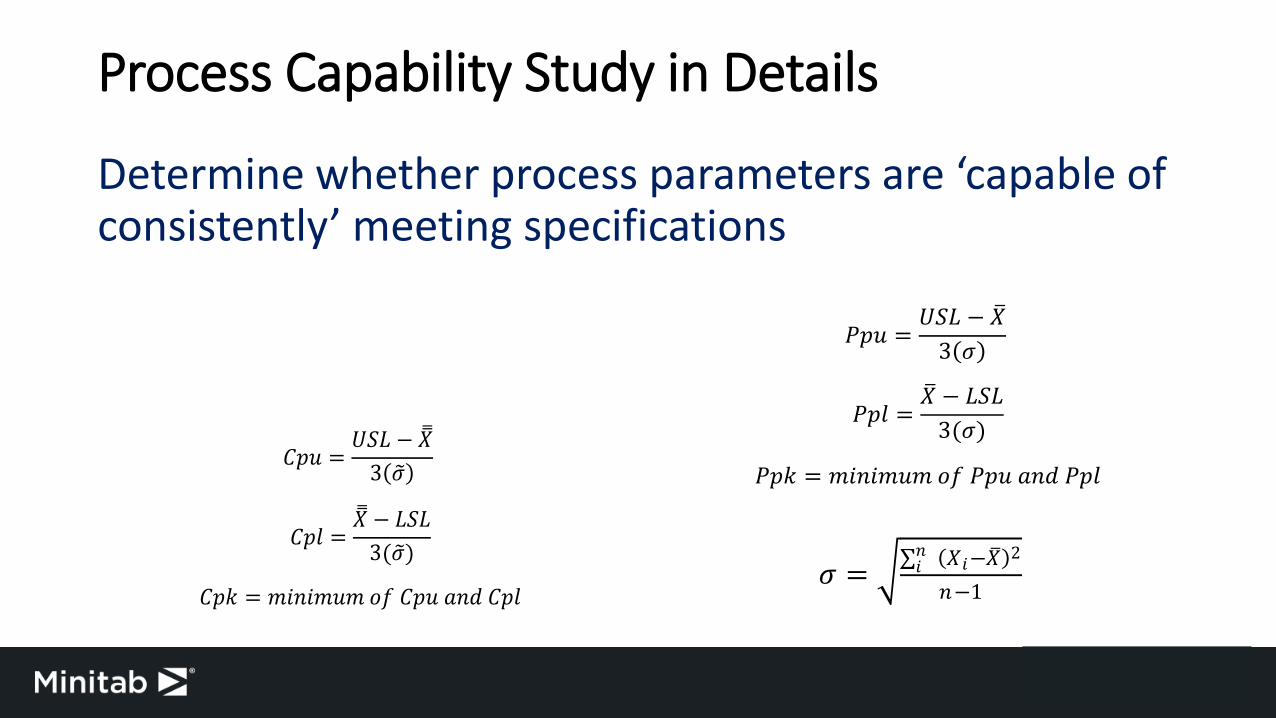
Process Capability Study in Details
𝐶𝐶𝐶𝐶𝐶𝐶 =𝑈𝑈𝑈𝑈𝑈𝑈 − 𝑋𝑋�
3(𝜎𝜎�)
𝐶𝐶𝐶𝐶𝐶𝐶 =𝑋𝑋� − 𝑈𝑈𝑈𝑈𝑈𝑈
3(𝜎𝜎�)
𝐶𝐶𝐶𝐶𝐶𝐶 = 𝑚𝑚𝑚𝑚𝑚𝑚𝑚𝑚𝑚𝑚𝐶𝐶𝑚𝑚 𝑜𝑜𝑜𝑜 𝐶𝐶𝐶𝐶𝐶𝐶 𝑎𝑎𝑚𝑚𝑎𝑎 𝐶𝐶𝐶𝐶𝐶𝐶
𝑃𝑃𝐶𝐶𝐶𝐶 =𝑈𝑈𝑈𝑈𝑈𝑈 − 𝑋𝑋�
3(𝜎𝜎)
𝑃𝑃𝐶𝐶𝐶𝐶 =𝑋𝑋� − 𝑈𝑈𝑈𝑈𝑈𝑈
3(𝜎𝜎)
𝑃𝑃𝐶𝐶𝐶𝐶 = 𝑚𝑚𝑚𝑚𝑚𝑚𝑚𝑚𝑚𝑚𝐶𝐶𝑚𝑚 𝑜𝑜𝑜𝑜 𝑃𝑃𝐶𝐶𝐶𝐶 𝑎𝑎𝑚𝑚𝑎𝑎 𝑃𝑃𝐶𝐶𝐶𝐶
𝜎𝜎 = �∑ (𝑋𝑋𝑚𝑚−𝑋𝑋�)2𝑚𝑚𝑚𝑚𝑚𝑚−1
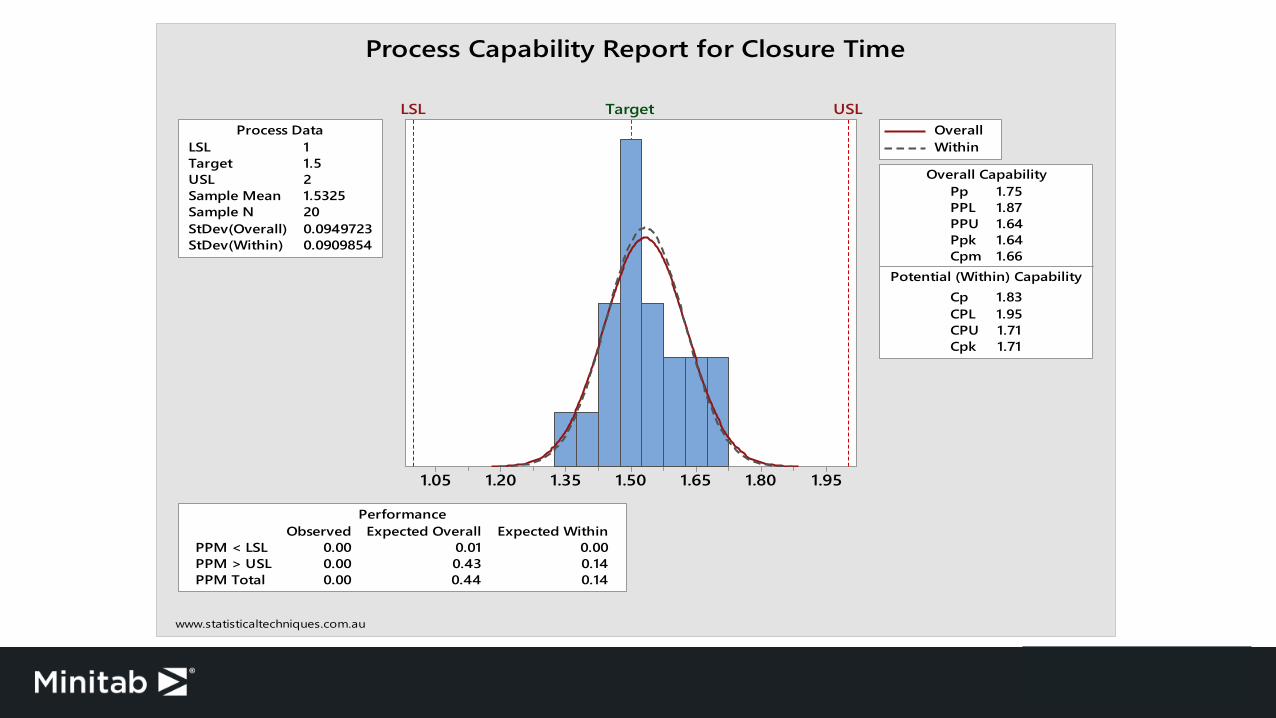
Closure Time
1.951.801.651.501.351.201.05
LSL 1Target 1.5USL 2Sample Mean 1.5325Sample N 20StDev(Overall) 0.0949723StDev(Within) 0.0909854
Process Data
Pp 1.75PPL 1.87PPU 1.64Ppk 1.64Cpm 1.66
Cp 1.83CPL 1.95CPU 1.71Cpk 1.71
Potential (Within) Capability
Overall Capability
PPM < LSL 0.00 0.01 0.00PPM > USL 0.00 0.43 0.14PPM Total 0.00 0.44 0.14
Observed Expected Overall Expected WithinPerformance
LSL Target USLOverallWithin
Process Capability Report for Closure Time
www.statisticaltechniques.com.au

Temperature
170165160155150145140
PPM < LSL 150000.00 119575.42 11988.30PPM > USL 0.00 35700.53 272.41PPM Total 150000.00 155275.95 12260.71
Observed Expected Overall Expected WithinPerformance
LSL 150Target 160USL 170Sample Mean 157.9Sample N 20StDev(Overall) 6.71134StDev(Within) 3.49944
Process Data
Pp 0.50PPL 0.39PPU 0.60Ppk 0.39Cpm 0.47
Cp 0.95CPL 0.75CPU 1.15Cpk 0.75
Potential (Within) Capability
Overall Capability
LSL Target USLOverallWithin
Process Capability Report for Temperature Degrees
www.statisticaltechniques.com.au

Pressure
344336328320312304
LSL 300Target 325USL 350Sample Mean 324.9Sample N 20StDev(Overall) 3.30709StDev(Within) 2.93953
Process Data
Pp 2.52PPL 2.51PPU 2.53Ppk 2.51Cpm 2.52
Cp 2.83CPL 2.82CPU 2.85Cpk 2.82
Potential (Within) Capability
Overall Capability
PPM < LSL 0.00 0.00 0.00PPM > USL 0.00 0.00 0.00PPM Total 0.00 0.00 0.00
Observed Expected Overall Expected WithinPerformance
LSL Target USLOverallWithin
Process Capability Report for Pressure kPa
www.statisticaltechniques.com.au

Determine the parameters which affect seal strength and their optimal values using a two level full factorial design of experiments.
Method 4 – Design of Experiments
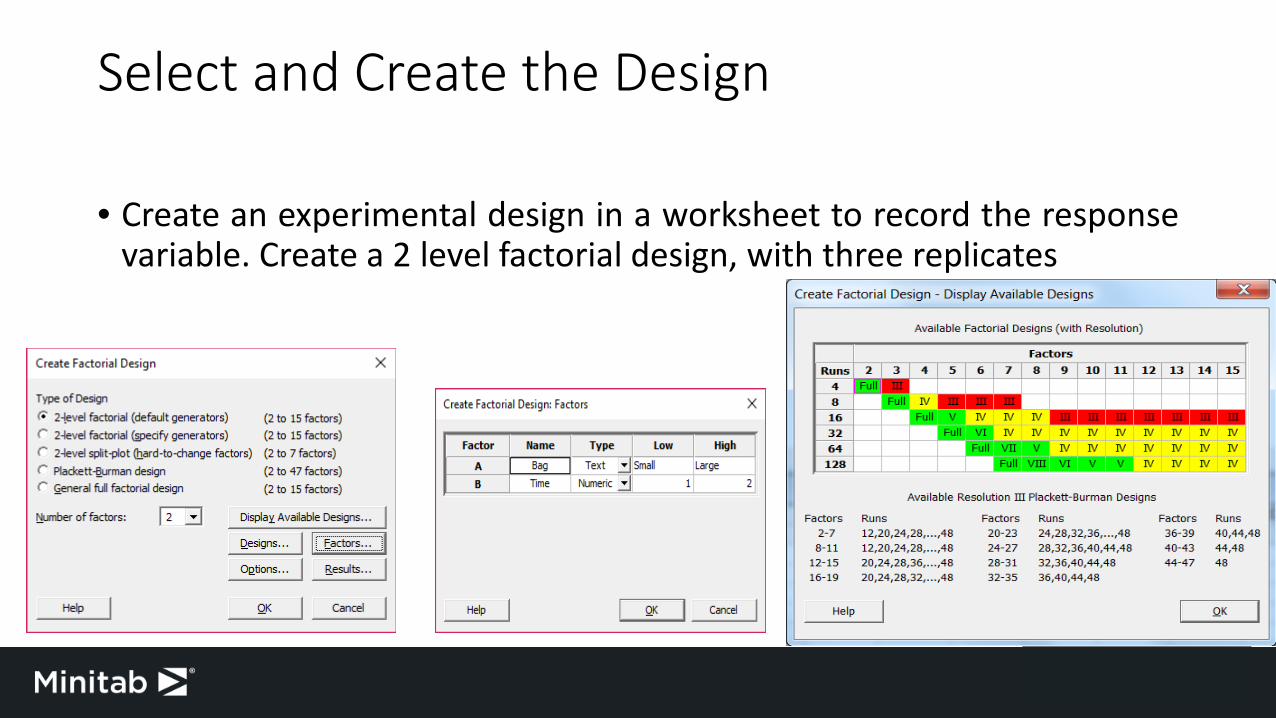
Select and Create the Design
• Create an experimental design in a worksheet to record the responsevariable. Create a 2 level factorial design, with three replicates

View the Design
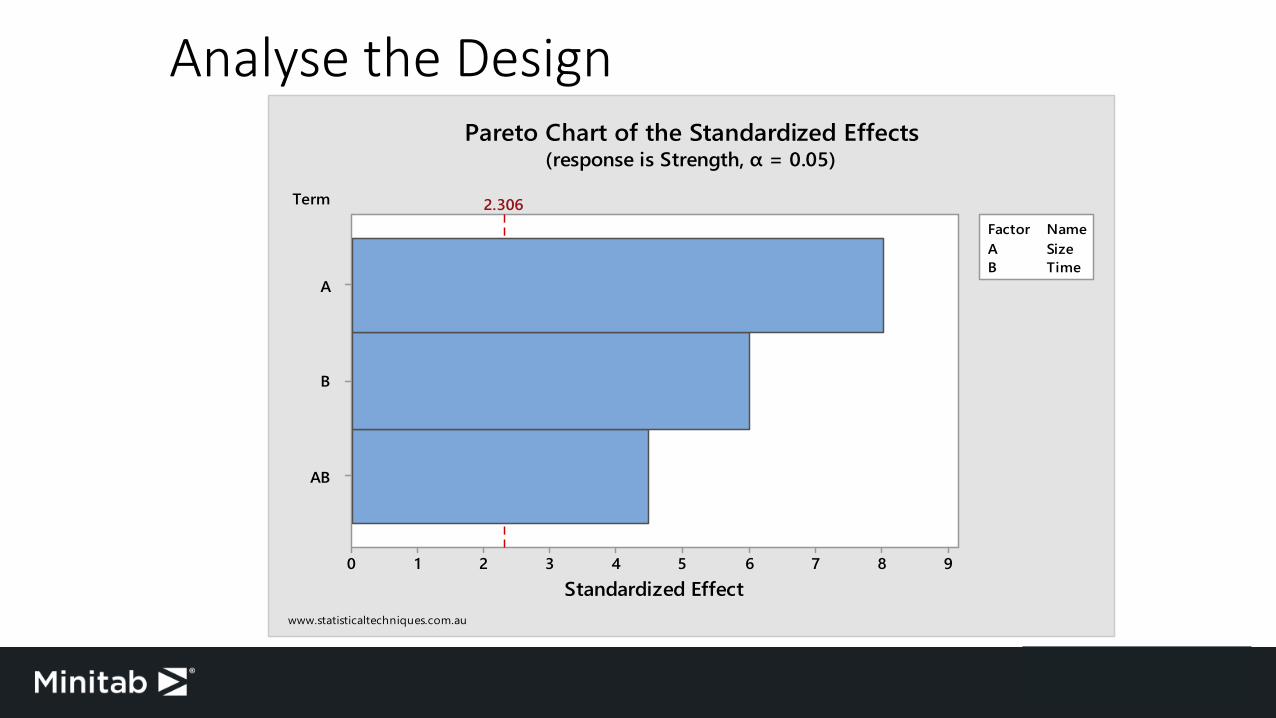
Analyse the Design
Term
AB
B
A
9876543210
A SizeB Time
Factor Name
Standardized Effect
2.306
Pareto Chart of the Standardized Effects(response is Strength, α = 0.05)
www.statisticaltechniques.com.au
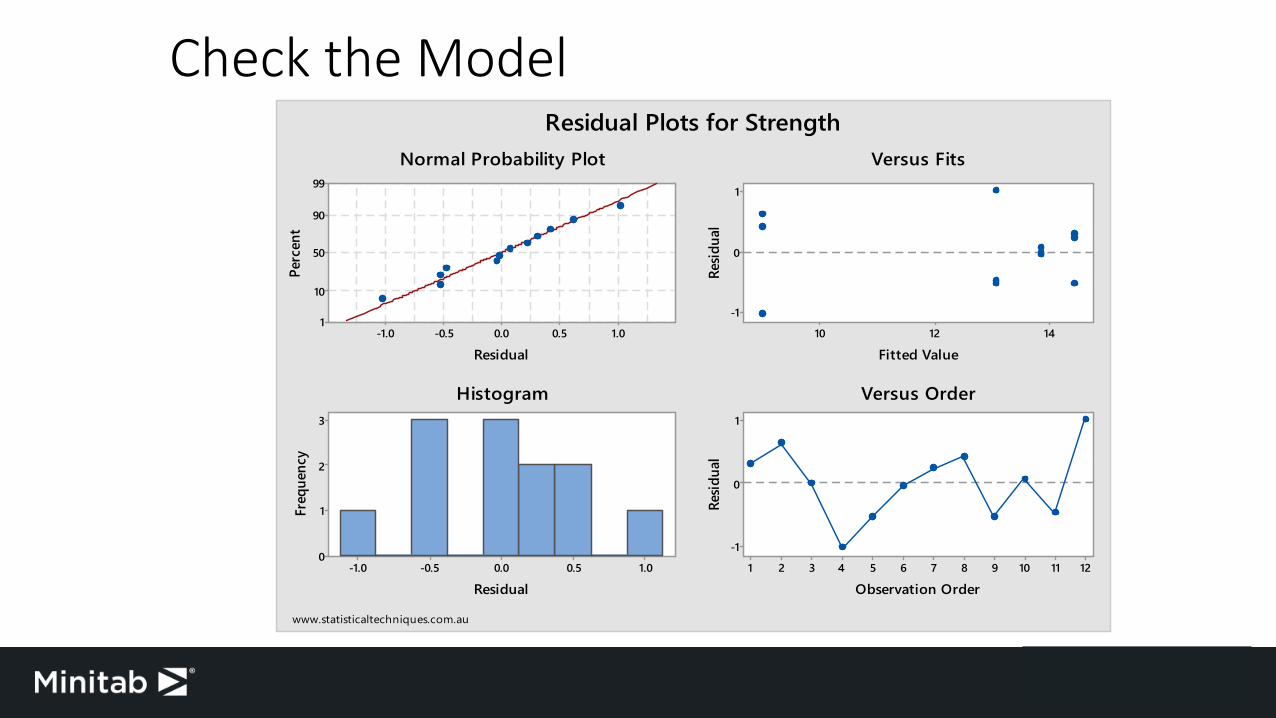
Check the Model
1.00.50.0-0.5-1.0
99
90
50
10
1
Residual
Perc
ent
141210
1
0
-1
Fitted Value
Resid
ual
1.00.50.0-0.5-1.0
3
2
1
0
Residual
Freq
uenc
y
121110987654321
1
0
-1
Observation Order
Resid
ual
Normal Probability Plot Versus Fits
Histogram Versus Order
Residual Plots for Strength
www.statisticaltechniques.com.au

Check for Interactions
LargeSmall
15
14
13
12
11
10
9
Size * Time
Size
Mea
n of
Stre
ngth
1.02.0
Time
Interaction Plot for StrengthFitted Means
www.statisticaltechniques.com.au
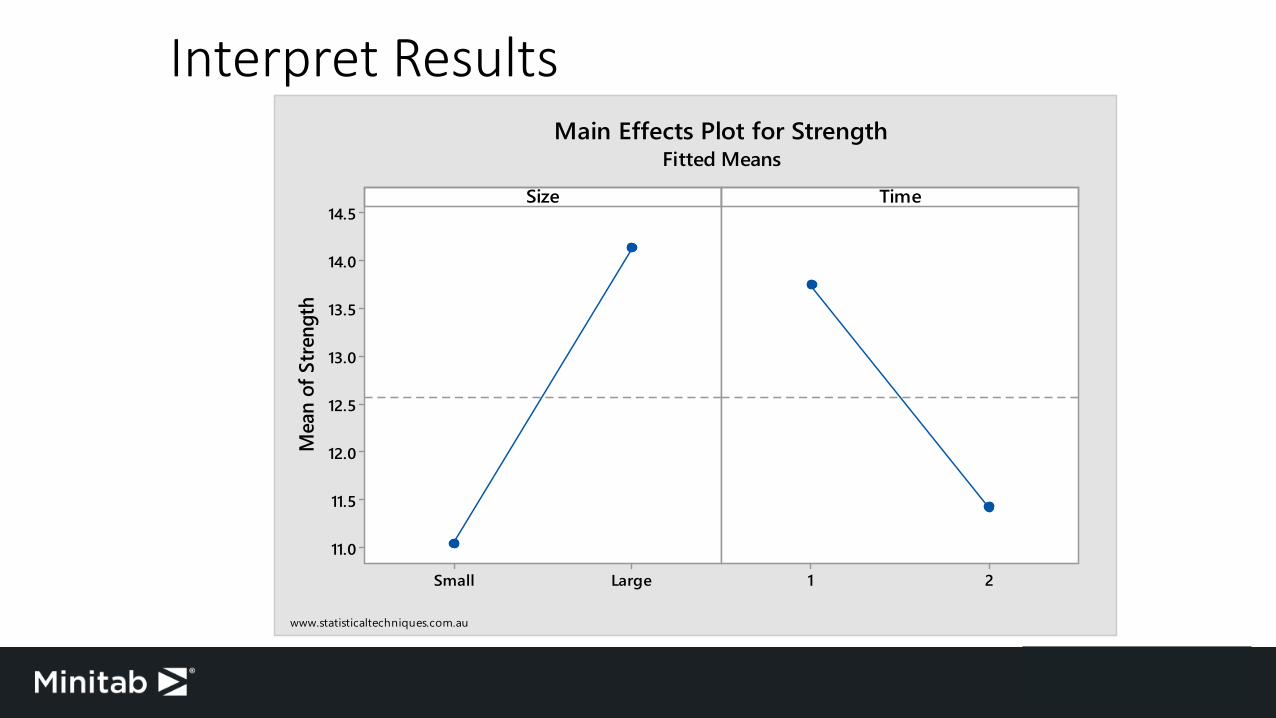
Interpret Results
LargeSmall
14.5
14.0
13.5
13.0
12.5
12.0
11.5
11.0
21
Size
Mea
n of
Stre
ngth
Time
Main Effects Plot for StrengthFitted Means
www.statisticaltechniques.com.au
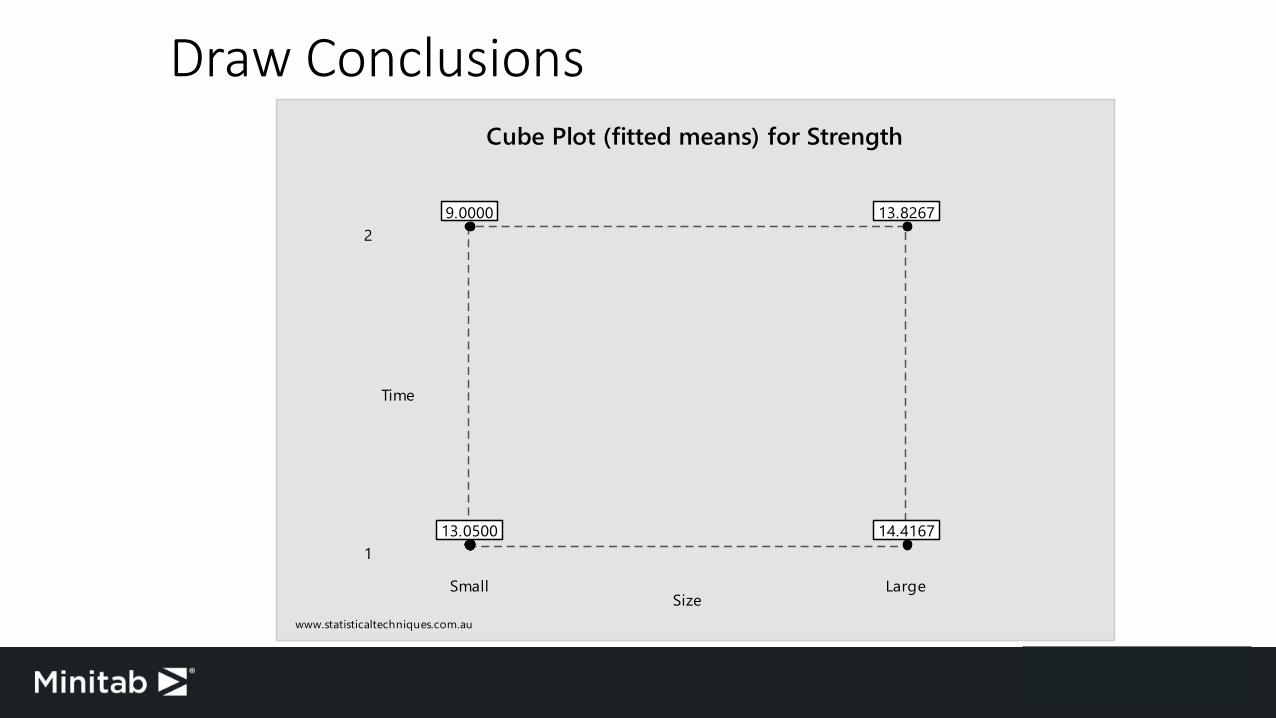
Draw Conclusions
2
1
LargeSmall
Time
Size
13.8267
14.416713.0500
9.0000
Cube Plot (fitted means) for Strength
www.statisticaltechniques.com.au

Determine whether measurements are accurate and precise and if measurements can be trusted – are repeatable and reproducible.
Method 5 – Measurement System Analysis

Measurement System Analysis
• Five main measurement studies for Continuous Variables1. Type one Gage Study2. Gage Run Chart3. Gage Linearity & Bias Study4. Gage R&R Study (Crossed)5. Gage R&R Study (Nested)
• Another study for Attribute Variable1. Attribute Agreement Analysis

Measurement System Analysis
• Before proceeding, quality engineers need to determine whether themeasurements from the digital scale can be trusted.
• To determine acceptability, the engineers use a type one and a gaugerepeatability and reproducibility study, and an …
• Attribute study to show inspectors consistently agree with their ownappraisals, amongst each other and against a standard.
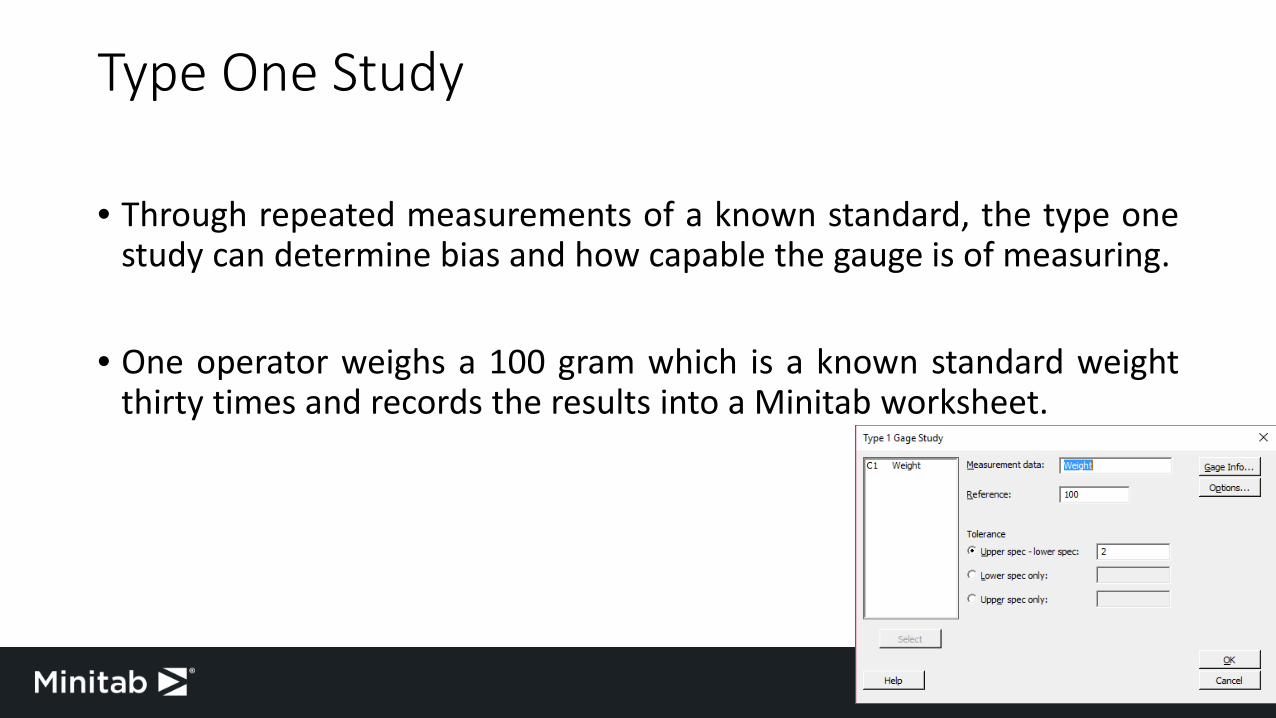
Type One Study
• Through repeated measurements of a known standard, the type onestudy can determine bias and how capable the gauge is of measuring.
• One operator weighs a 100 gram which is a known standard weightthirty times and records the results into a Minitab worksheet.
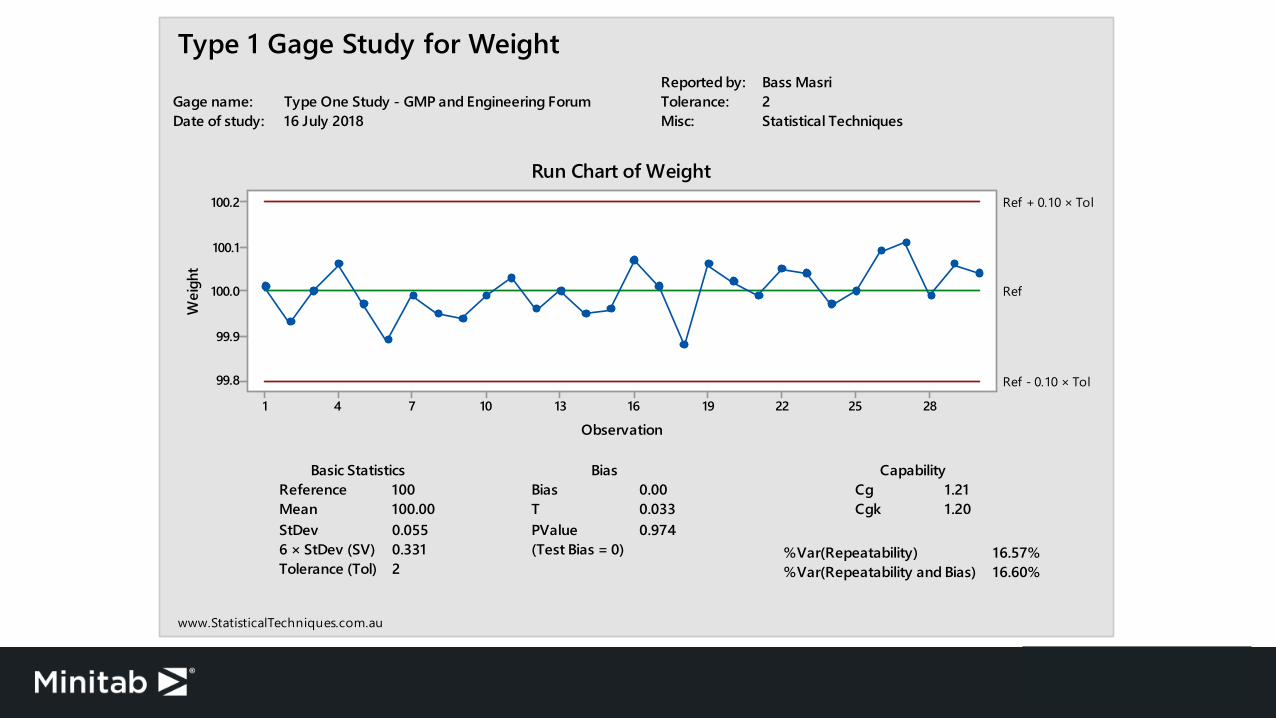
Reference 100Mean 100.00StDev 0.0556 × StDev (SV) 0.331Tolerance (Tol) 2
Basic StatisticsBias 0.00T 0.033PValue 0.974(Test Bias = 0)
BiasCg 1.21Cgk 1.20
Capability
%Var(Repeatability) 16.57%%Var(Repeatability and Bias) 16.60%
Gage name: Type One Study - GMP and Engineering ForumDate of study: 16 July 2018
Reported by: Bass MasriTolerance: 2Misc: Statistical Techniques
28252219161310741
100.2
100.1
100.0
99.9
99.8
Observation
Wei
ght
Ref
Ref + 0.10 × Tol
Ref - 0.10 × Tol
Run Chart of Weight
Type 1 Gage Study for Weight
www.StatisticalTechniques.com.au
Interpretation and Conclusion
• The output shows that for a tolerance of +/- 1 gram the digital scale is acceptable with Cgk that is greater than 1. All measured values are within +/- 10% of the tolerance, at an average of 100 grams.
• The null hypothesis is that there is no bias in measurements from the reference value. The p value (0.974) is greater than 0.05 so we can conclude there is no bias and proceed to the gauge study.
Repeatability & Reproducibility Study
• Gage R&R studies determine how much of the observed processvariation is due to the measurement system: equipment, operatorsenvironment and procedures and how much is due to part variation.
• Repeatability is variation observed when the same operatormeasures the same part repeatedly with the same device.
• Reproducibility is the variation observed when different operatorsmeasure the same parts using the same device.

Gage name: Gage R&R Study - GMP and EngineeringDate of study: 16 July 2018
Reported by: Bass MasriTolerance: +/- 5 GramsMisc: Statistical Techniques
Part-to-PartReprodRepeatGage R&R
100
50
0
Perc
ent
% Contribution% Study Var% Tolerance
5432154321
0.50
0.25
0.00
Parts
Sam
ple
Rang
e
_R=0.24
UCL=0.6178
LCL=0
John Jack
5432154321
25.0
22.5
20.0
Parts
Sam
ple
Mea
n
__X=23.57UCL=23.816LCL=23.324
John Jack
54321
25.0
22.5
20.0
Parts
JackJohn
25.0
22.5
20.0
Operators
54321
25.0
22.5
20.0
Parts
Aver
age John
Jack
Operators
Components of Variation
R Chart by Operators
Xbar Chart by Operators
Measurements by Parts
Measurements by Operators
Parts * Operators Interaction
Gage R&R (ANOVA) Report for Measurements
www.statisticaltechniques.com.au
Interpretation and Conclusion
• Engineers run a gauge study using two inspectors and five parts selected from across the range of the part values 20-30 grams.
• Gauge repeatability and reproducibility or measurement system variation is around 8% of process variation (study variation).
• Most of the study variation comes from the part to part variation. Therefore they can trust their measurement system and proceed.
• In the last step of the process, operators visually assess the seal asclosed or open (conforming or non-conforming, binary variable).
• Two appraisers’ rated 50 bags [to reflect the range of parts] as eithergood-to-go (G) or not good-to-go (NG).
• Each appraiser [Fred and Lee] rate each bag twice, in a random orderto mimic the typical production environment.
Attributes Agreement Analysis

Attributes Agreement Analysis
• Attribute Agreement Analysis shows operators consistently agree withtheir own appraisals, amongst each other and against a standard.
1. Within Appraiser: Does each appraiser rate the same parts,the same way, each time?
2. Between Appraisers: Do the appraisers ratings consistentlyagree with each other?
3. Appraiser versus Standard: Does each appraiser evaluate partsaccurately against a standard?
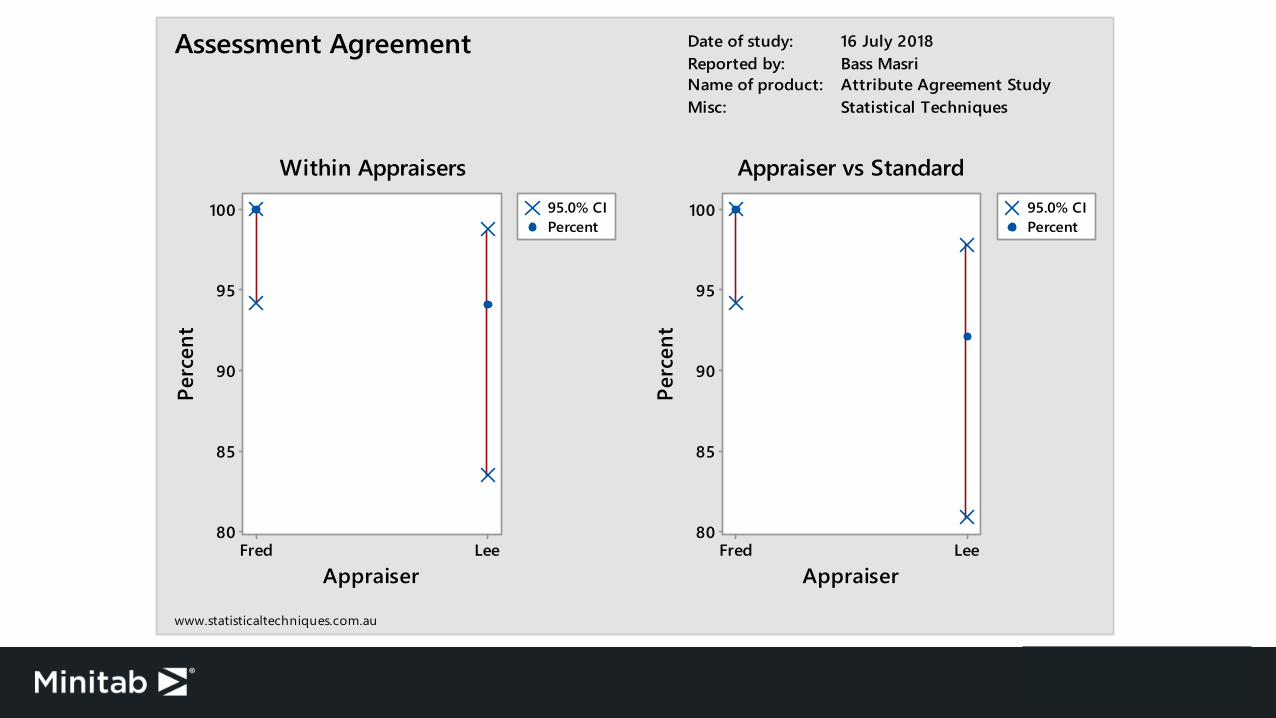
Date of study: 16 July 2018Reported by: Bass MasriName of product: Attribute Agreement StudyMisc: Statistical Techniques
LeeFred
100
95
90
85
80
Appraiser
Perc
ent
95.0% CIPercent
LeeFred
100
95
90
85
80
Appraiser
Perc
ent
95.0% CIPercent
Assessment Agreement
www.statisticaltechniques.com.au
Within Appraisers Appraiser vs Standard
Interpretation and Conclusion
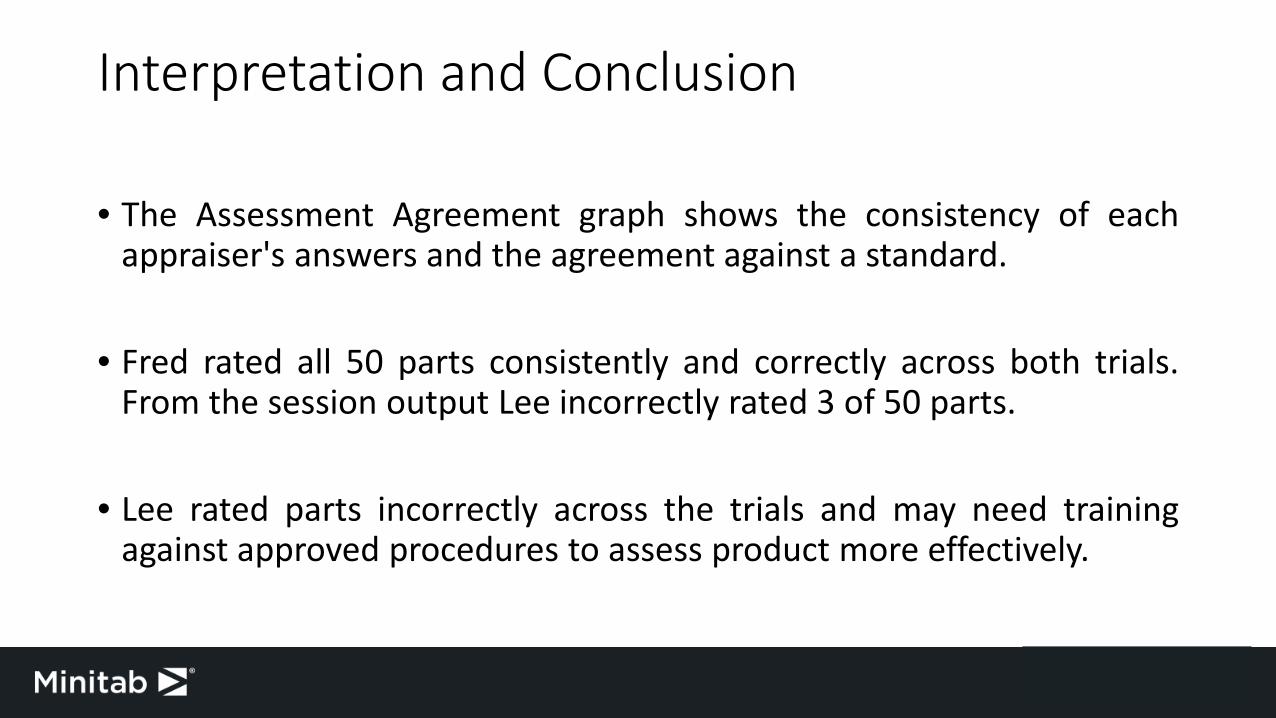
• The Assessment Agreement graph shows the consistency of eachappraiser's answers and the agreement against a standard.
• Fred rated all 50 parts consistently and correctly across both trials.From the session output Lee incorrectly rated 3 of 50 parts.
• Lee rated parts incorrectly across the trials and may need trainingagainst approved procedures to assess product more effectively.
Method 6 – Sampling Plans
The Quality team want to inspect for the correct weight of bags and to ensure the seal on the bag is closed.

Sampling plans
• Measurement studies were successfully completed so we can trustthe measurements of weight and inspector results, we now need todetermine the sample size required to randomly select from the lot.
• It is not always possible, efficient or cost effective to inspect theentire lot. To determine an appropriate sample size the team useinternational standard sampling procedures…
1. Variables Method 2. Attribute MethodISO 3951 (AS2490) ISO 2859-1 (AS1199.1)
Zero Acceptance Plans

• Variables Method: Weight is a variable that is measured so thecontinuous variables method is used. This method has the advantageof requiring a much smaller sample size than the attributes method.But the variables method does require some very basic computation.
• Sample Size Question: Quality Assurance engineers want to evaluatethe weight of bags without having to inspect the entire population.What is an appropriate sample size for a lot size of 1000 bags?
Variables Method
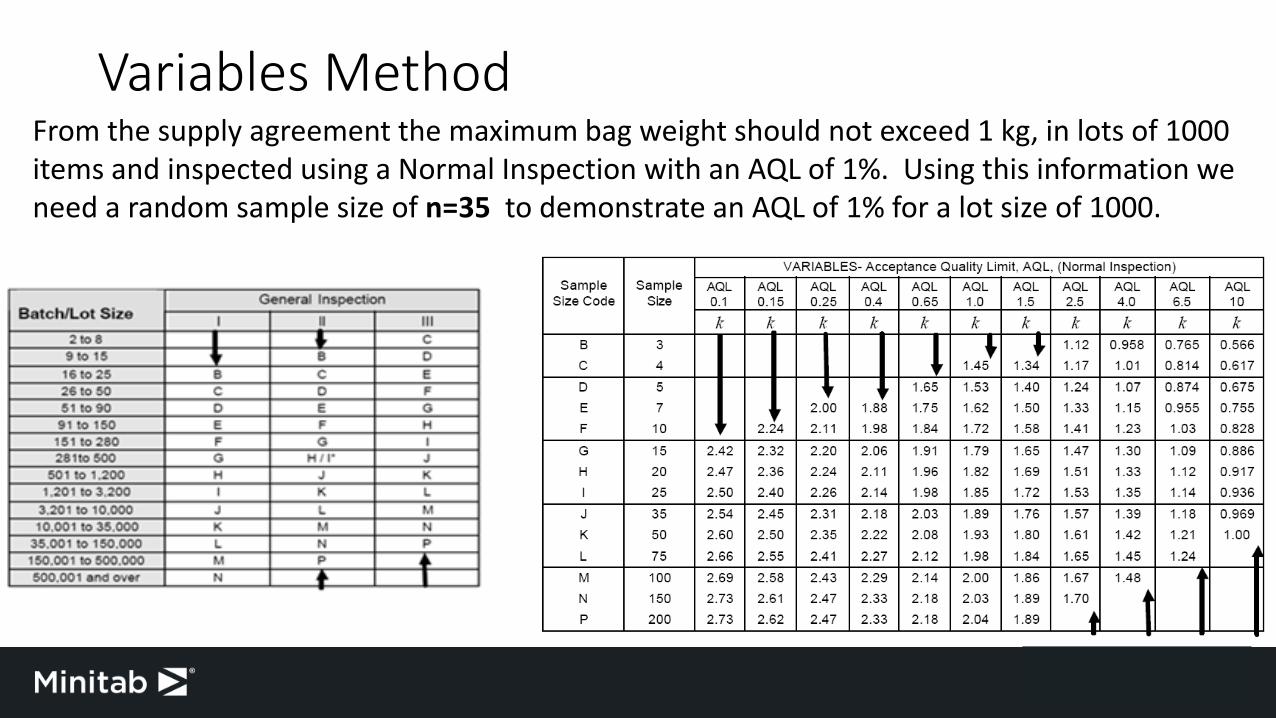
Variables MethodFrom the supply agreement the maximum bag weight should not exceed 1 kg, in lots of 1000 items and inspected using a Normal Inspection with an AQL of 1%. Using this information we need a random sample size of n=35 to demonstrate an AQL of 1% for a lot size of 1000.
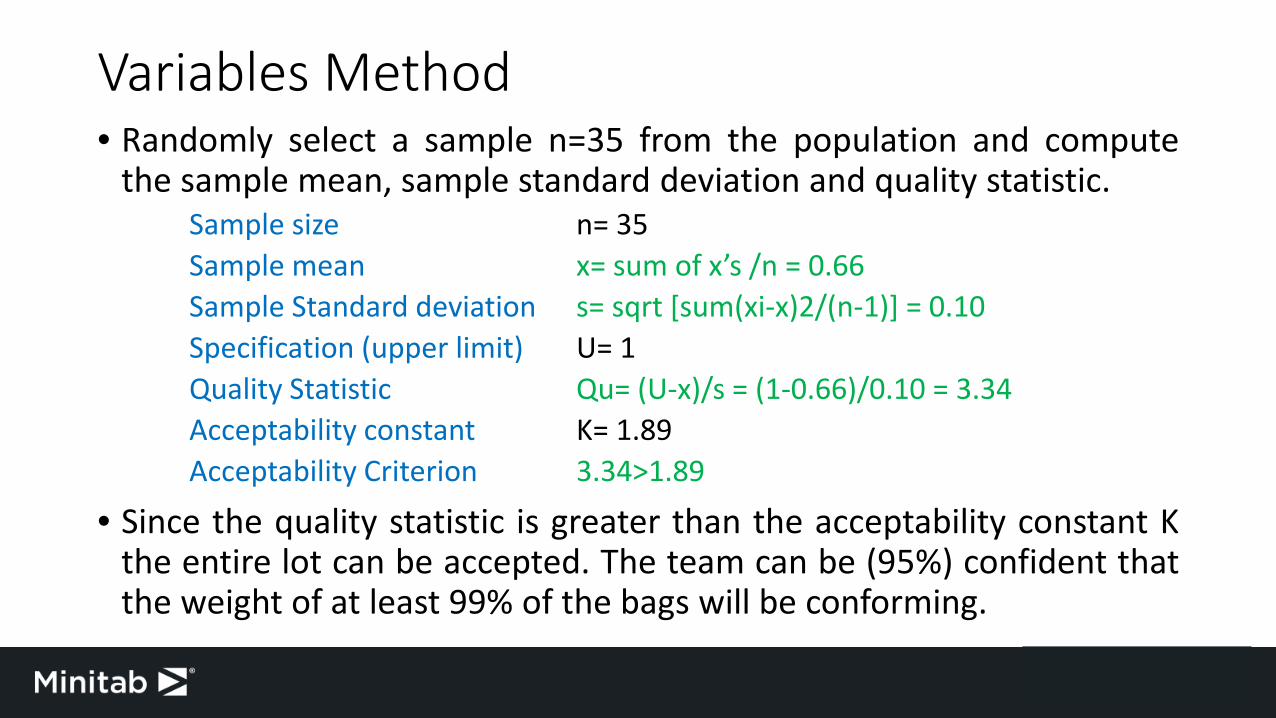
• Randomly select a sample n=35 from the population and computethe sample mean, sample standard deviation and quality statistic.
Sample size n= 35Sample mean x= sum of x’s /n = 0.66Sample Standard deviation s= sqrt [sum(xi-x)2/(n-1)] = 0.10Specification (upper limit) U= 1Quality Statistic Qu= (U-x)/s = (1-0.66)/0.10 = 3.34Acceptability constant K= 1.89Acceptability Criterion 3.34>1.89
• Since the quality statistic is greater than the acceptability constant Kthe entire lot can be accepted. The team can be (95%) confident thatthe weight of at least 99% of the bags will be conforming.
Variables Method
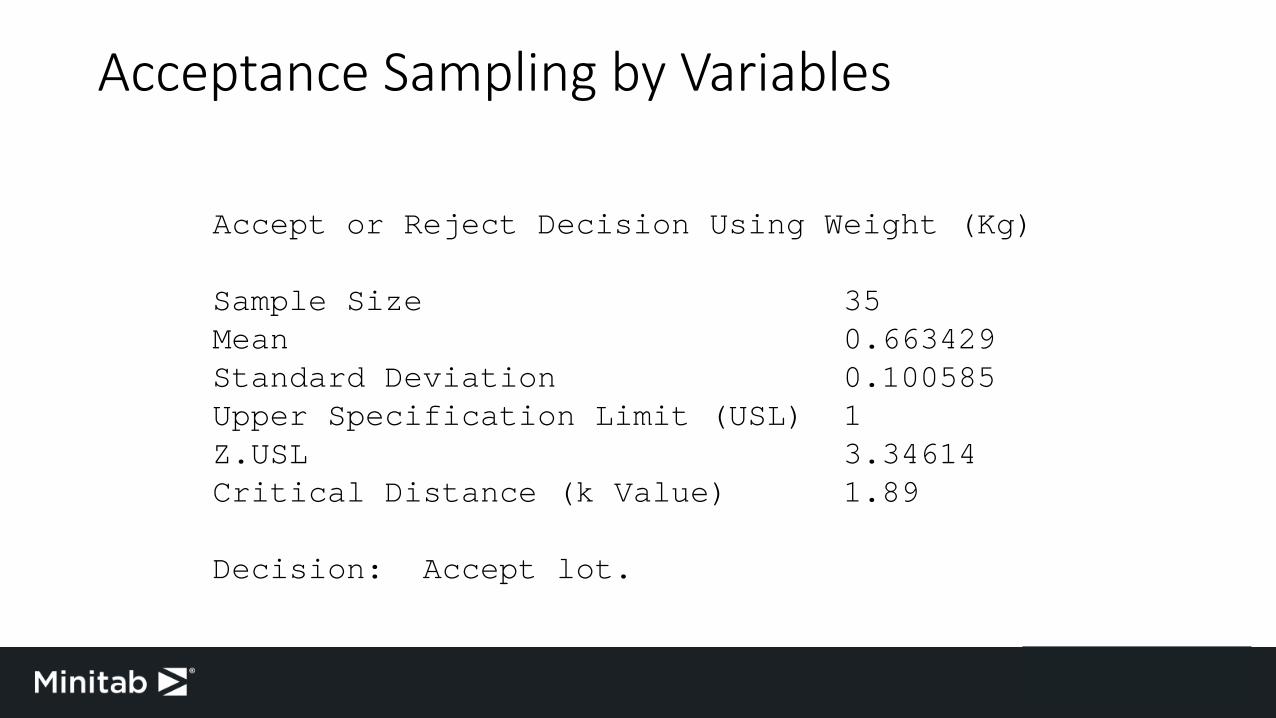
Accept or Reject Decision Using Weight (Kg)
Sample Size 35Mean 0.663429Standard Deviation 0.100585Upper Specification Limit (USL) 1Z.USL 3.34614Critical Distance (k Value) 1.89
Decision: Accept lot.
Acceptance Sampling by Variables

• The attributes inspection method consists of examining items andclassifying them as either conforming or nonconforming.
• To compute the sample size for an attribute variable the team use thesampling procedure for inspection by Attributes. The advantage ofattribute over variable sampling is that there is less time taken toinspect and compute statistics but at a cost of an increased sample.
• A sampling plan requires the acceptance and rejection criteria to bespecified in advance. The acceptance and rejection criteria may bedetailed in a supplier contract, quality document or test protocol.
Attributes Method

Attributes Method
• Seal strength is assessed by visual inspection of the seal. If the sealappears closed, then the seal is considered sufficient to ensureintegrity. If a seal is open then the bag is considered nonconforming.
• Sample Size Question: The Quality Assurance team want to evaluatethe seals in a lot of bags without having to inspect the entirepopulation. What is an appropriate sample size for a lot of 1000 bags?
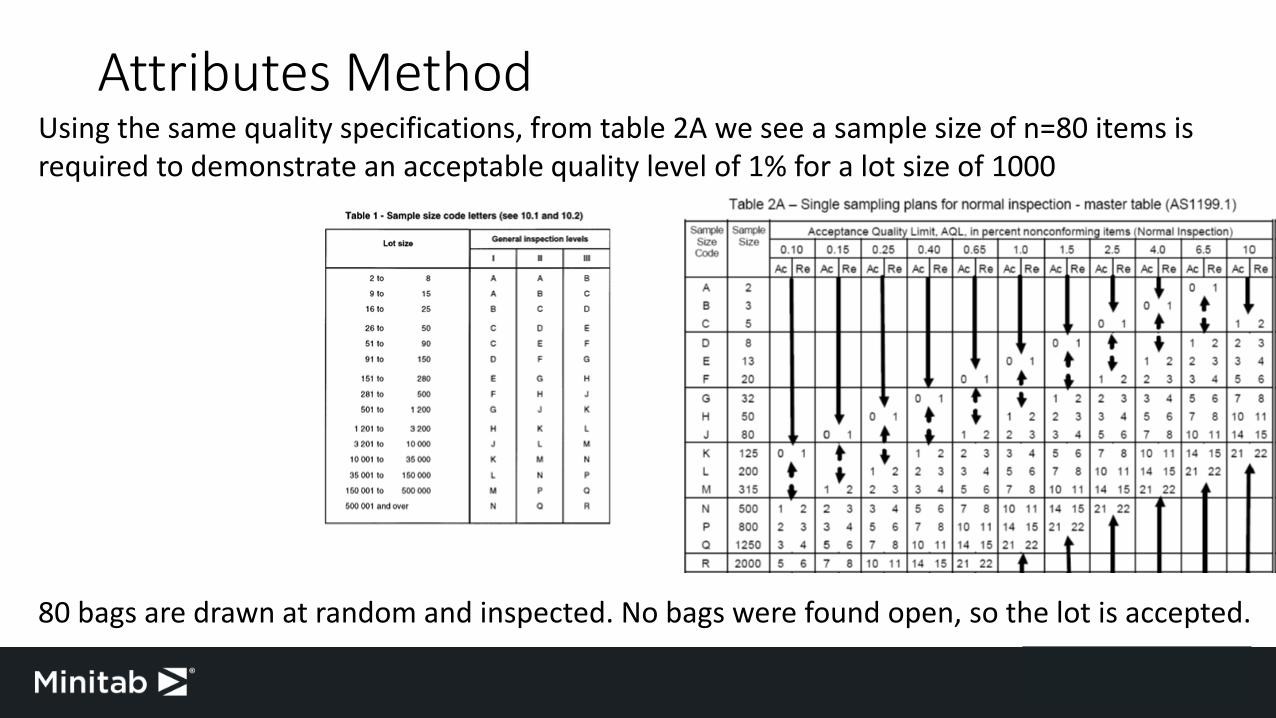
Attributes MethodUsing the same quality specifications, from table 2A we see a sample size of n=80 items is required to demonstrate an acceptable quality level of 1% for a lot size of 1000
80 bags are drawn at random and inspected. No bags were found open, so the lot is accepted.
Attribute Method – Zero Acceptance
• Where no failures are permissible, Zero Acceptance Sampling Plans(Nicholas Squeglia) may be used. Note that Zero Acceptance Samplingis specific to the ‘Normal Inspection’ (not tightened or reduced).
• This method has an advantage over AS1199, as its the simplest planto interpret as the acceptance number is zero in all cases.
• This plan is suited to low cost items. The disadvantage, is that if oneunit fails the entire lot is rejected.

Attribute Method – Zero Acceptance Using the C=0 sampling plan to demonstrate an acceptable quality limit of 1% for lot size of 1000.
The advantage using C=0 plan over AS1199 is the number sampled has reduced from 80 to 34.

Summary
• Three process variables: time, temperature and pressure are used to illustrate statistical methods in manufacturing process validation.
1. Statistical Distributions,2. Statistical Process Control,3. Process Capability,4. Design of Experiments,5. Measurement Systems Analysis and6. Sampling Plans…

• Keen to give it a go? A copy of the Minitab file is available on request!
• Don’t have Minitab? Download a free 30-day trial from www.minitab.com
Minitab Project Files

Further Resources
• Introduction to ‘Statistical Quality Control’ by Douglas C. Montgomery, Fifth Edition.
• Need assistance with quality analysis and strategic research? Contact Bass Masri [email protected]
• Global Harmonization Task Force SG3 Edition 2 - January 2004 –Process Validation Guidance.
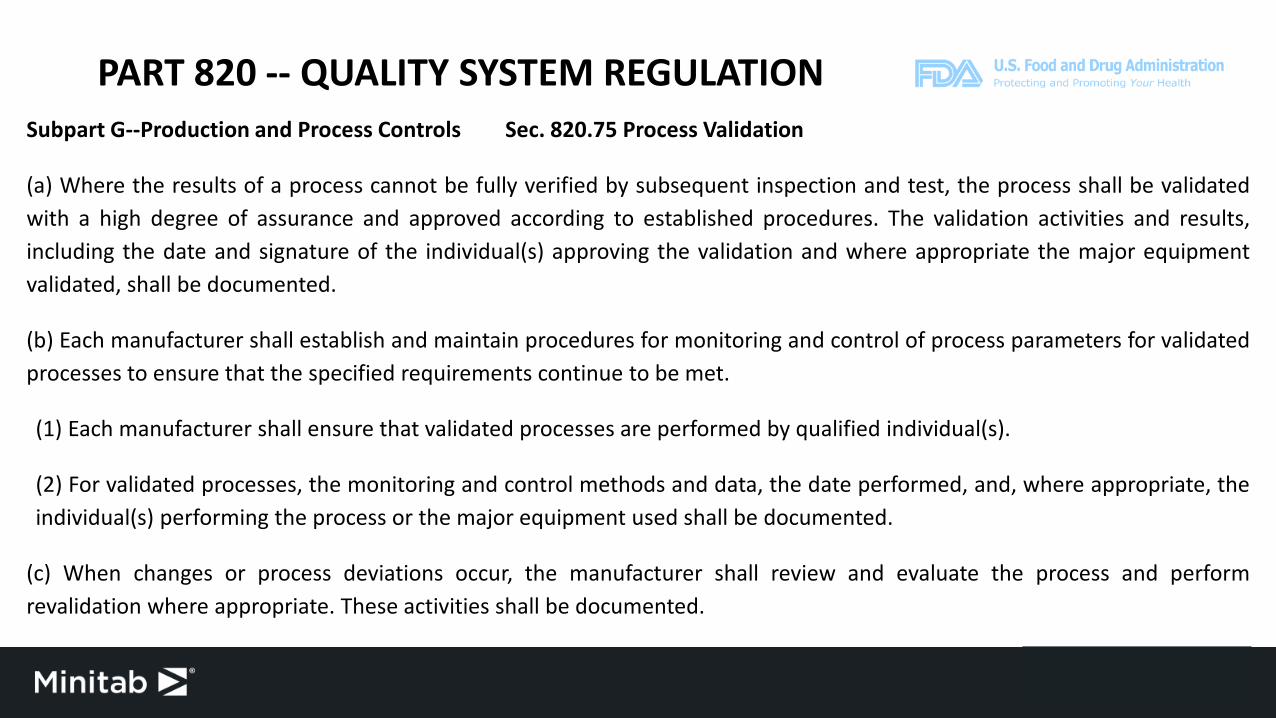
PART 820 -- QUALITY SYSTEM REGULATION Subpart G--Production and Process Controls Sec. 820.75 Process Validation
(a) Where the results of a process cannot be fully verified by subsequent inspection and test, the process shall be validatedwith a high degree of assurance and approved according to established procedures. The validation activities and results,including the date and signature of the individual(s) approving the validation and where appropriate the major equipmentvalidated, shall be documented.
(b) Each manufacturer shall establish and maintain procedures for monitoring and control of process parameters for validatedprocesses to ensure that the specified requirements continue to be met.
(1) Each manufacturer shall ensure that validated processes are performed by qualified individual(s).
(2) For validated processes, the monitoring and control methods and data, the date performed, and, where appropriate, theindividual(s) performing the process or the major equipment used shall be documented.
(c) When changes or process deviations occur, the manufacturer shall review and evaluate the process and performrevalidation where appropriate. These activities shall be documented.

Subpart O--Statistical Techniques Sec. 820.250 Statistical techniques.
(a) Where appropriate, each manufacturer shall establish and maintain procedures for identifying valid statistical techniquesrequired for establishing, controlling, and verifying the acceptability of process capability and product characteristics.
(b) Sampling plans, when used, shall be written and based on a valid statistical rationale. Each manufacturer shall establish andmaintain procedures to ensure that sampling methods are adequate for their intended use and to ensure that when changesoccur the sampling plans are reviewed. These activities shall be documented.
PART 820 -- QUALITY SYSTEM REGULATION
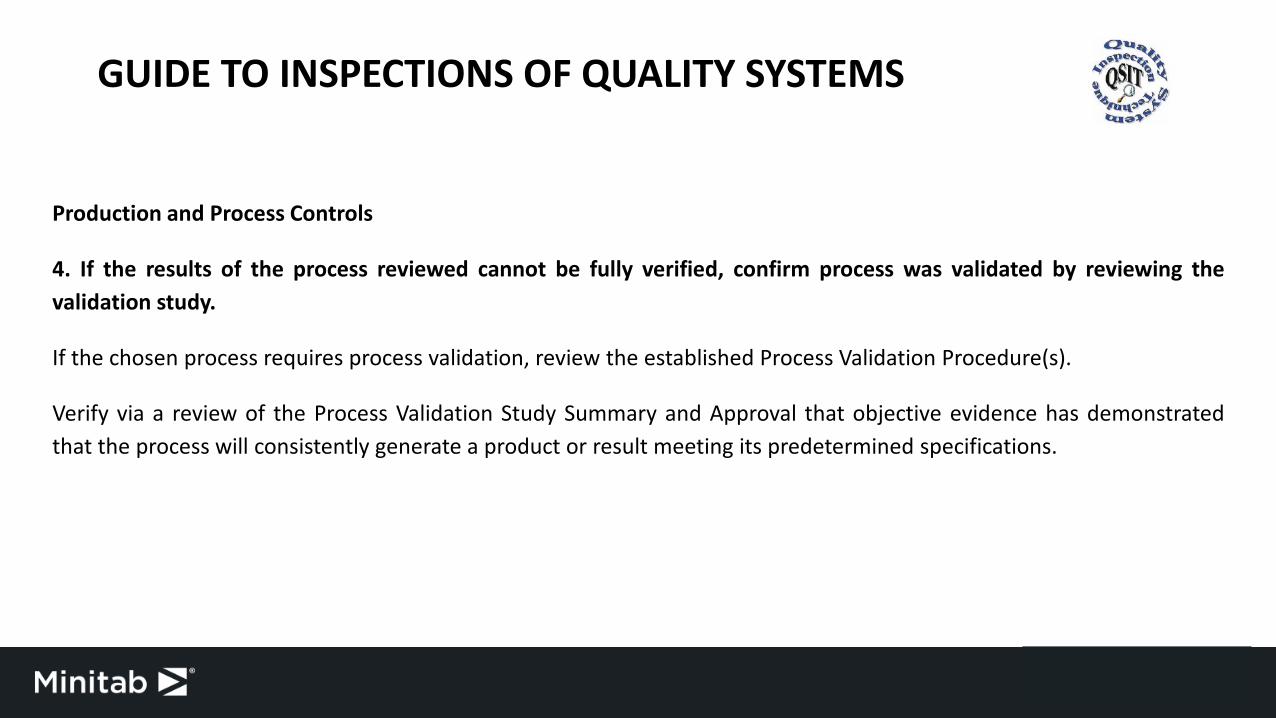
GUIDE TO INSPECTIONS OF QUALITY SYSTEMS
Production and Process Controls
4. If the results of the process reviewed cannot be fully verified, confirm process was validated by reviewing thevalidation study.
If the chosen process requires process validation, review the established Process Validation Procedure(s).
Verify via a review of the Process Validation Study Summary and Approval that objective evidence has demonstratedthat the process will consistently generate a product or result meeting its predetermined specifications.

NOTE: If there are indications of unresolved, potential problems with a validated process, in addition to a review of processmonitoring and control activities, a comprehensive validation study review should be conducted.
1. The instruments used to generate the objective evidence were properly calibrated and maintained prior to the study;
2. Predetermined product specifications were established;
3. Test sample sampling plans were based upon a statistically valid rationale;
4. Objective evidence demonstrates predetermined product specifications were met consistently;
5. Process tolerance limits were challenged;
6. Process equipment was properly installed, adjusted and maintained;
7. Process monitoring instruments are properly calibrated and maintained;
8. Changes to the validated process were appropriately challenged; and,
9. Process operators are appropriately qualified.
GUIDE TO INSPECTIONS OF QUALITY SYSTEMS

Q&A
Related Documents