FACULTÉ DES HAUTES ÉTUDES COMMERCIALES DÉPARTEMENT DES SYSTÈMES D’INFORMATION PROCESS MINING-BASED CUSTOMER JOURNEY ANALYTICS THÈSE DE DOCTORAT présentée à la Faculté des Hautes Études Commerciales de l'Université de Lausanne pour l’obtention du grade de Docteur ès Sciences en systèmes d’information par Gaël BERNARD Directeur de thèse Prof. Kévin Huguenin Co-directeur de thèse Prof. Periklis Andritsos Jury Prof. Felicitas Morhart, présidente Prof. Benoît Garbinato, expert interne Prof. Hajo Reijers, expert externe Prof. Andrea Burattin, expert externe LAUSANNE 2020

Welcome message from author
This document is posted to help you gain knowledge. Please leave a comment to let me know what you think about it! Share it to your friends and learn new things together.
Transcript

FACULTÉ DES HAUTES ÉTUDES COMMERCIALES
DÉPARTEMENT DES SYSTÈMES D’INFORMATION
PROCESS MINING-BASED CUSTOMER JOURNEY ANALYTICS
THÈSE DE DOCTORAT
présentée à la
Faculté des Hautes Études Commerciales de l'Université de Lausanne
pour l’obtention du grade de Docteur ès Sciences en systèmes d’information
par
Gaël BERNARD
Directeur de thèse Prof. Kévin Huguenin
Co-directeur de thèse Prof. Periklis Andritsos
Jury
Prof. Felicitas Morhart, présidente Prof. Benoît Garbinato, expert interne
Prof. Hajo Reijers, expert externe Prof. Andrea Burattin, expert externe
LAUSANNE
2020


Members of the thesis committee
Professor Kévin Huguenin
Professor at the Faculty of Business and Economics of the University of Lausanne.
Thesis Co-Supervisor.
Professor Periklis Andritsos
Professor at the Faculty of Information (iSchool) of the University of Toronto.
Thesis Co-Supervisor.
Professor Felicitas Morhart
Professor at the Faculty of Business and Economics of the University of Lausanne.
President of the Jury.
Professor Benoît Garbinato
Professor at the Faculty of Business and Economics of the University of Lausanne.
Internal Expert.
Professor Dr. Ir. Hajo Reijers
Professor in the Department of Information and Computing Sciences of Utrecht
University.
External Expert.
Professor Andrea Burattin
Professor at the Department of Applied Mathematics and Computer Science of
the Technical University of Denmark.
External Expert.


Abstract
The series of interactions between service providers and customers are called
customer journeys. These customer journeys, today, are highly personalized, due
to the new devices and technologies that are available. At the same time, new
methods are required to help businesses better understand customer behavior. In
this dissertation, we investigate the ways in which process mining and business
process management can help to increase businesses’ comprehension of customer
journeys. One of the key findings is that both the process mining framework and
the XES standard for storing event logs in process mining settings are relevant
for customer journeys. We show that some process mining activities can be
applied as-is while other techniques need to take into account the specifics of
customer journeys. In particular, we contribute by proposing new algorithms
for discovering, enhancing, and exploring customer journeys. We also propose
new techniques for predicting next customer interactions. Overall, we contribute
by leveraging process mining know-how to improve customer journey analytics;
two disciplines that were, to the best of our knowledge, never before considered
together.


Acknowledgements
I am extremely grateful to Prof. Periklis Andritsos for agreeing to supervise my
thesis. You have always been supportive even when I have wanted to work on some
crazy side projects. I am really proud to have you as my supervisor and I could not
have made it without you. Special thanks must also go to Prof. Kévin Huguenin
for having agreed to co-supervise my work and for the insightful and thorough
feedback he provided. I would also like to express my deepest appreciation to
the committee members who agreed to evaluate my dissertation, for their time,
and for their invaluable comments: Prof. Hajo Reijers, Prof. Andrea Burattin, Prof.
Benoît Garbinato, and Prof. Felicitas Morhart. Throughout these five years, I have
had the opportunity to assist with Prof. Pius Bienz’s course. I learned a lot from
you. Thanks for your support and also for our regular Friday lunch.
Eliane, Pierre-Alain, Emilie–my dear parents and sister–thanks for everything
you did for me and for always being there for me. Your support and love was key
in the successful completion of my studies.
Laura, without doubt, you are the one that had to endure my ups and downs.
Thanks for putting up with me, for your help, and your patience. I am looking
forward to all the beautiful projects we have planned together. I love you.
I am also grateful to the MBBLF family and my friends–Adrien, Alexandre,
Christophe, Damien, Fabio, Ludivine, Charlotte, Régis, Sonia, Cecilie, Malika, and
Bruna; to my friends from the engineering school–Grégory, Yannick, Yann, Tania,
Arnaud, Fabien, Cayan, Marouane, Daniel, Mugabo, Luciano, and Milad; and
to the crazy friends I made in Finland–Olivier, Xavier, José, Ángel, Sander, Alex,
Leandra, and András.
Thanks must also go to my extended family: Edith Castella, Daniel, Pauline,
Marie, Catherine, Rémy, Claudine, Edith Corbaz, Yann, Julianne, Clara, Mélissa,
and Didier.
I cannot leave the University of Lausanne without mentioning my colleagues
and friends there: Natasha, Dana, Dina, Michel, Matthieu, Vaibhav, Prof. Christine
Legner, Prof. Thibault Estier, Prof. Yves Pigneur, Thomas, Kazem, Quentin, Endri,
Gianluca, Louis, Nico, and all the DESI members.

viii
To Helen, Philip, Zak, and all the Odaians: Thanks for your trust. I am really
proud of our achievements and look forward to joining you in Toronto. To Pierre-
Alain Steffen, Jon Martin, Xavier Mérour, Yan Borbën, and Leonard Studer: I thank
you for your trust in me at various stages of my professional and academic career.
I feel truly blessed to have been surrounded by all these wonderful people.

Table of contents
1 Introduction 1
1.1 Background . . . . . . . . . . . . . . . . . . . . . . . . . . . . . . . . . 2
1.1.1 Customer Journey . . . . . . . . . . . . . . . . . . . . . . . . . 2
1.1.2 Customer Journey Map . . . . . . . . . . . . . . . . . . . . . . 3
1.1.3 Business Process Management . . . . . . . . . . . . . . . . . . 6
1.1.4 Process Mining . . . . . . . . . . . . . . . . . . . . . . . . . . . 8
1.1.5 Process Mining Framework for CJM . . . . . . . . . . . . . . . 10
1.2 Problem Statement . . . . . . . . . . . . . . . . . . . . . . . . . . . . . 12
1.3 Thesis Structure . . . . . . . . . . . . . . . . . . . . . . . . . . . . . . . 12
2 Contextual and Behavioral Customer Journey Discovery Using a Genetic
Approach 17
2.1 Introduction . . . . . . . . . . . . . . . . . . . . . . . . . . . . . . . . . 17
2.2 Customer Journey Discovery . . . . . . . . . . . . . . . . . . . . . . . 20
2.3 Related Work . . . . . . . . . . . . . . . . . . . . . . . . . . . . . . . . . 21
2.4 Genetic Customer Journey Discovery . . . . . . . . . . . . . . . . . . 22
2.4.1 Preprocessing . . . . . . . . . . . . . . . . . . . . . . . . . . . . 22
2.4.2 Initial Population . . . . . . . . . . . . . . . . . . . . . . . . . . 23
2.4.3 Assignment of Actual Journeys . . . . . . . . . . . . . . . . . . 23
2.4.4 CJM Evaluation Criteria . . . . . . . . . . . . . . . . . . . . . . 23
2.4.5 Stopping Criterion . . . . . . . . . . . . . . . . . . . . . . . . . 25
2.4.6 Genetic Operations . . . . . . . . . . . . . . . . . . . . . . . . . 25
2.5 Evaluation Using Synthetic Datasets . . . . . . . . . . . . . . . . . . . 26
2.5.1 Datasets . . . . . . . . . . . . . . . . . . . . . . . . . . . . . . . 26
2.5.2 Metrics . . . . . . . . . . . . . . . . . . . . . . . . . . . . . . . . 27
2.5.3 Settings . . . . . . . . . . . . . . . . . . . . . . . . . . . . . . . . 29
2.5.4 Results . . . . . . . . . . . . . . . . . . . . . . . . . . . . . . . . 30
2.6 Experiments Using Real Datasets . . . . . . . . . . . . . . . . . . . . . 32
2.7 Conclusion . . . . . . . . . . . . . . . . . . . . . . . . . . . . . . . . . . 34

x Table of contents
3 CJM-ex: Goal-oriented Exploration of Customer Journey Maps using Event
Logs and Data Analytics 35
3.1 Motivations . . . . . . . . . . . . . . . . . . . . . . . . . . . . . . . . . 35
3.2 CJM-ex . . . . . . . . . . . . . . . . . . . . . . . . . . . . . . . . . . . . 37
3.3 Implementation . . . . . . . . . . . . . . . . . . . . . . . . . . . . . . . 39
3.4 Discussion and Outlook . . . . . . . . . . . . . . . . . . . . . . . . . . 41
4 CJM-ab: Abstracting Customer Journey Maps using Process Mining 43
4.1 Introduction . . . . . . . . . . . . . . . . . . . . . . . . . . . . . . . . . 43
4.2 Background . . . . . . . . . . . . . . . . . . . . . . . . . . . . . . . . . 45
4.2.1 Process Mining and Process Discovery . . . . . . . . . . . . . 45
4.2.2 Customer Journey Discovery . . . . . . . . . . . . . . . . . . . 46
4.3 Abstracting Customer Journeys using Process Trees . . . . . . . . . . 47
4.4 Demonstration . . . . . . . . . . . . . . . . . . . . . . . . . . . . . . . 49
4.5 Conclusion . . . . . . . . . . . . . . . . . . . . . . . . . . . . . . . . . . 50
5 Truncated Trace Classifier. Removal of Incomplete Traces from Event
Logs. 51
5.1 Introduction . . . . . . . . . . . . . . . . . . . . . . . . . . . . . . . . . 51
5.2 Preliminaries . . . . . . . . . . . . . . . . . . . . . . . . . . . . . . . . 53
5.2.1 Process Mining . . . . . . . . . . . . . . . . . . . . . . . . . . . 53
5.2.2 Truncated Traces . . . . . . . . . . . . . . . . . . . . . . . . . . 53
5.3 Truncated Trace Classifier . . . . . . . . . . . . . . . . . . . . . . . . . 54
5.4 Benchmark . . . . . . . . . . . . . . . . . . . . . . . . . . . . . . . . . . 56
5.4.1 Datasets . . . . . . . . . . . . . . . . . . . . . . . . . . . . . . . 57
5.4.2 Baseline: Decreasing Factor . . . . . . . . . . . . . . . . . . . . 57
5.4.3 Evaluation . . . . . . . . . . . . . . . . . . . . . . . . . . . . . . 58
5.5 Improving Discovered Process Models with a TTC . . . . . . . . . . . 59
5.6 Improving Next Event Prediction with a TTC . . . . . . . . . . . . . . 62
5.7 Related Work . . . . . . . . . . . . . . . . . . . . . . . . . . . . . . . . . 65
5.8 Conclusion . . . . . . . . . . . . . . . . . . . . . . . . . . . . . . . . . . 65
6 Accurate and Transparent Path Prediction Using Process Mining 67
6.1 Introduction . . . . . . . . . . . . . . . . . . . . . . . . . . . . . . . . . 67
6.2 Preliminaries . . . . . . . . . . . . . . . . . . . . . . . . . . . . . . . . 68
6.3 Related Work . . . . . . . . . . . . . . . . . . . . . . . . . . . . . . . . . 70
6.4 LaFM: Loop-Aware Footprint Matrix . . . . . . . . . . . . . . . . . . . 71
6.4.1 LaFM Data Structure . . . . . . . . . . . . . . . . . . . . . . . . 72
6.4.2 Training Phase: Building LaFM . . . . . . . . . . . . . . . . . . 73

Table of contents xi
6.4.3 Prediction Phase: Using LaFM . . . . . . . . . . . . . . . . . . 75
6.5 Evaluation Procedure . . . . . . . . . . . . . . . . . . . . . . . . . . . . 76
6.6 LaFM: Evaluation . . . . . . . . . . . . . . . . . . . . . . . . . . . . . . 77
6.7 c-LaFM: Clustered Loop-Aware Footprint Matrix . . . . . . . . . . . 79
6.8 c-LaFM: Evaluation . . . . . . . . . . . . . . . . . . . . . . . . . . . . . 81
6.9 Conclusion . . . . . . . . . . . . . . . . . . . . . . . . . . . . . . . . . . 83
7 Conclusion 85
7.1 Contributions . . . . . . . . . . . . . . . . . . . . . . . . . . . . . . . . 85
7.2 Limitations . . . . . . . . . . . . . . . . . . . . . . . . . . . . . . . . . . 86
7.3 Positioning . . . . . . . . . . . . . . . . . . . . . . . . . . . . . . . . . . 87
7.4 Outlook . . . . . . . . . . . . . . . . . . . . . . . . . . . . . . . . . . . . 88
References 91


Chapter 1
Introduction
TODAY, companies often provide highly personalized services to their cus-
tomers. For instance, when a customer books a flight, airlines companies
often propose additional services like priority check-in, private lounges,
extra luggage, insurance, special meals, extra legroom, and assistance, to name a
few. These extra services might be ordered with the plane tickets. However, they
can usually be added at a later stage through various channels, e.g., at the airport,
by phone, by email, or through use of a web interface. These new highly person-
alized services are also increasingly made available to citizens by government
services or to patients by healthcare services. Hence, ‘customers’ should be taken
in the broad sense of the term.
The various combinations of services and channels provide customers options
and freedom. To support such flexible business environments, complex processes
need to be carefully orchestrated to craft a seamless customer journey. Making
sure this journey results in a positive customer experience is crucial for customer
retention and positive word-of-mouth. As highlighted by Edelman and Singer,
“Journeys are [...] becoming central to the customer’s experience of a brand–and as
important as the products themselves in providing competitive advantage” [38].
New methods and approaches are needed to support companies in their quest
for the “perfect” customer journey. Among other insights, companies need to
know if the order in which the customer interacts with the service has an impact on
customer satisfaction, if some channels are more suited than others to a specific
customer segment, or if the next predicted interaction with the customer is likely
to be a complaint. Insights collected through data analysis can help companies
take proactive measures or provide input when they are redesigning the service.
The fact that services can be consumed in various channels at any time is
made possible by the recent development of Information and Communication

2 Introduction
Technologies (ICTs), especially new mobile technologies and modern cloud in-
frastructures. Interestingly, the use of ICTs goes hand in hand with the ubiquitous
availability of individual-level customer data [63]. That is, evidence of what the
customers have experienced during their journey is available in information sys-
tems. However, these details need to be transformed into usable knowledge for
value to be extracted from them. We argue that process mining, an emerging
discipline that enables process models and event logs to be analyzed in various
ways to deliver “fact-based insights” [94], is an ideal technology for extracting
knowledge from customer journey data.
The aim of this thesis is to investigate the intersection between customer
journeys, process mining, and business process management and propose novel
ways to perform data-driven customer journey analytics. In the next section, we
introduce the theoretical foundations of these disciplines. We then detail the
objective of this thesis before describing the six component publications that
constitute its main body.
1.1 Background
We introduce the main concepts of this topic. Specifically, we discuss customer
journeys, customer journey maps, business process management, and process
mining. We then explore the link between these concepts.
1.1.1 Customer Journey
At its most basic, a service is the application of specialized competencies for
the benefit of another entity or the entity itself [99]. When consuming a service,
a customer will interact with a service provider. The interactions between the
customer and the service provider are called touchpoints. The whole sequence
of touchpoints is called a journey. Although the term “customer journey” has
gained momentum in recent years [31], the fact that customers interact with
service providers is not new. So why has the customer journey concept become so
popular lately? We first provide some context and then provide a potential answer
to this question.
Approximately two decades ago, the goods-centered model of economic ex-
change shifted toward a service-centered paradigm. From a goods-centered
perspective, economic activity is the process of making goods and selling them
[99]. In contrast, a service-centered dominant logic entails “collaborating with
and learning from customers and being adaptive to their individual and dynamic

1.1 Background 3
needs” [99]. ICTs have been an enabler for this shift to take place [27]. In this new
paradigm, the customer experience is of utmost importance. This implies that
the customer journey does not stop when the service has been delivered, because
the customer must learn to use the service, adapting it to their unique context
[99]. As a consequence, several internal company functions are involved in every
customer journey, making the alignment of previously unconnected corporate
silos difficult [31].
New forms of ICTs, such as mobile phones, intelligent virtual assistants, or
cloud services, have also allowed companies to develop new types of services
or complement existing ones. As an example, traditional taxi services are now
challenged by companies like Uber, which enables the customer to order and pay
for a taxi from a mobile application. As another example, bricks-and-mortar retail
businesses such as Ikea often have an online version of their physical stores where
customers can order goods. Offering several integrated channels to customers is
referred to as an omnichannel strategy. This strategy “expose[s] customers to a
rich blend of offline sensory information and online content” [21] and has become
the new norm [63]. Accordingly, there is an increasing trend of customers ordering
online. For instance, the Swiss e-commerce market volume grew by 10% in 2018,
reaching CHF 9.5 billion and is estimated to continue to grow by 10% annually for
the next three years [54].
We are now coming back to the question posed at the beginning of this section:
why the customer journey concept has gained so much attention recently. The
service-centered context, the proliferation of ICTs, and the omnichannel strategy
have collectively made customer journeys more complex and also more important
for service providers to understand. It is then unsurprising that “customer journey
analytics solutions continue to garner significant interest from organizations
seeking to improve customer experience” [31].
In the next section, we introduce the Customer Journey Map (CJM), a visual-
ization tool tailored to discuss and improve customer journeys.
1.1.2 Customer Journey Map
A CJM is a visual tool that supports discussions about improving the various types
of journeys customers will experience. The idea of a CJM is to have simple visu-
alization that can be interpreted by a broad audience. In opposition to business
process models, it does not include advanced gateways such as choices, parallels
or loops. Fig. 1.1 shows an example of a CJM. The x-axis represents the time, while

4 Introduction
Renting a car after booking ticket
time
touchpointsBooking an insurance online
Booking an insurance at the service desk
Upgrading to VIP offer
Announcing an accident with the car
Renting a car at the service desk
Picking up the car
Fig. 1.1 Customer Journey Map that displays three variants for renting a car until acar accident happens.
the y-axis lists the touchpoints. In [6], we conducted a literature review to list the
main components of a CJM. The main components are as follows.
Customer. A customer is the stakeholder experiencing a service [104]. A
loose definition should be employed here as it includes people such as patients
[104], students [1, 68], or software users [36, 58]. In [83], the authors highlight the
importance of collecting sociodemographic information to ease CJMs users to
put themselves in customers’ shoes. When a customer is mentioned as a fictional
character, the term “persona” is sometimes used [48, 71, 83, 88].
Journey. A CJM contains at least one journey, which is a typical sequence of
touchpoints followed by a customer. Two types of CJMs exist. One is designed by
internal stakeholders to describe what an ideal journey would look like [1], which
identifies opportunities for novel services [71] or is employed as a diagnostic
tool [83]. We refer to the latter as an expected journey. In contrast, an actual
journey showcases how a journey is experienced by the customer, finds existing
customers’ problems or needs [1, 36, 71, 73], or pictures the consumption of
services by customers [13].
Mapping. Mapping is a process consisting of tracking and describing cus-
tomers’ responses and experiences when using a service [1, 30, 48, 68]. Ultimately,
these elements are reported on a map.
Goal. A customer journey should be mapped with a goal in mind [71, 88],
which is also referred to as scenario [1], prompts [68], story [73], or main intention
[71]. It triggers interactions with users [1], and streamlines the thought process
for users [68]. The goal “connect a low-cost hardware device, such as an Arduino
board, to a desktop computer” is a typical example from the literature [36].
Touchpoint. A touchpoint is an interaction between customers and compa-
nies’ products or services [1, 56, 71, 104] such as “searching for a product” [36], or
“finding seats” [56]. The arrangement of touchpoints can be cyclic: a customer can

1.1 Background 5
iterate a few times over the same touchpoints [80]. Moreover, the arrangement is
non-linear: (1) most of the time, the customer will not go through all the existing
touchpoints [68, 80]; (2) the customer might miss a planned touchpoint; and (3)
the customer can unexpectedly quit the journey.
Timeline. The timeline describes the duration of the journey from the first
until the last touchpoint [58]. Due to the forecast nature of expected journeys,
they typically do not have a timestamp. Yet, a number attached to an event (i.e.,
touchpoint) can depict the sequence within the timeline [68].
Channel. The channel is the method chosen by the customer to interact with
the touchpoint [68, 77] such as a “reference desk” [68] or “social media” [83].
Stage. A stage, encompasses several touchpoints. Some authors used the
splits: before, during, and after the experience, but employing domain-related
steps is also possible. For instance, in [58], the stage refers to the waterfall model
(i.e., software development). Some CJMs do not use stages at all [1, 36, 56, 73].
Experience. The experience encompasses customers’ feedback and emotions.
We identified three elements to express the experience. The first one is the emotion.
Using only one continuum of emotions–such as unhappy to happy–may fail to
depict a customer’s experience [36]. Thus, describing the emotion requires some
flexibility. Second, the scale measures how positive or negative the experience
was for the customer [56]. Third, many studies use customers’ quotes to represent
what customers have been through [30, 36, 73, 104].
Lens. Some components of CJMs are domain-specific. For instance, in [73],
the authors appended a layer below the CJM to indicate the weather because it
impacts customer satisfaction when using the service. We refer to a layer with the
term lens to reflect that multiple views are possible on the same map [58]. Sug-
gestions and opportunities [1, 68] are some other examples of lenses superposed
on top of touchpoints. They are important because they promotes reflection and
analysis of what happened during the journey [58].
Multimedia. The usage of multimedia makes a CJM engaging and simple to
understand [68, 80, 83]. For instance, recording customers while they are filling
out the CJM allows to better understand them [30, 36, 56]. Multiple types of
multimedia are reported: audio [30], video [36, 56], photos [56], and sketches [80].
In the literature, we found that CJMs are used for different purposes, including
to increase understanding [68, 104], to involve [36, 56], and to communicate [30].
In Fig. 1.2, we propose a model that shows the hierarchy between the components
of a CJM [6].
Følstad et al. distinguish two uses of CJMs: one aiming to represent anticipated
journeys, called the expected journey; and the second, the actual journey, aiming

6 Introduction
cjm ▸{goal}
journey ▸
touchpoint ▸customer ▸{name, gender, country, …}
experience{emotion, scale(int), quote}
channel{name}
stage{name}
lens ▸{name, content}
*
*
*
{type}
{timestamp(date), name, content}
XML elementValue of XML attribute ‘key’May contain multiples…Can contain XML element:
LEGEND
*▸
{type, source, description}multimedia
*
Fig. 1.2 Proposed hierarchical presentation of CJMs’ components [6].
to describe how the journey was “really” experienced by customers [41]. For
instance, the CJM displayed in Fig. 1.1 could be used by internal stakeholders
to discuss various available insurance packages and their relevance to service
delivery when a rental car customer has a car accident. Typically, stakeholders
can anticipate that a certain type of journey might not please a customer segment.
The service could then be redesigned to improve the likelihood of that segment’s
satisfaction. In this context, we call these CJMs “expected” because they are
designed by internal stakeholders. In contrast, “actual” CJMs reflect what the
customers have experienced. Because they show the customers’ point of view,
actual CJMs provide company stakeholders a fresh perspective of the journey
[1, 56]. For instance, traces of customer journeys available in information systems
(e.g., logs from a customer navigating through a sales website) could be used
to build a CJM from facts. This CJM can then be compared with an expected
CJM—typically drawn on paper for strategic or ideation purposes—to highlight
differences. As noted in [80], “People don’t behave like robots, and no matter how
well we craft an experience, they will not perceive exactly as we anticipate or hope”.
Hence, a discrepancy might exist between expected and actual CJMs.
1.1.3 Business Process Management
To support customer journeys, companies need to define their business processes
(BPs). Simply put, BPs are what companies do whenever they deliver a service to
customers [37]. BPs comprise the activities and decision points that will impact
the execution of service-related activities [37]. A BP is considered to be good if it
contributes to meeting the strategic objectives of an organization [97]. Business
Process Management (BPM) is the art and science of overseeing work performed
in an organization to ensure consistent outcomes and to take advantage of im-
provement opportunities [37]. BPM is a broad discipline that combines knowledge
from information technology, management, and industrial engineering [94, 97].
Managing business processes takes continuous effort; companies often evolve

1.1 Background 71.4 The BPM Lifecycle 21
Fig. 1.7 BPM lifecycle
of the tasks of the process. This may include assigning tasks to process participants,helping process participants to prioritize their work, providing process participantswith the information they need to perform a task, and performing automated cross-checks and other automated tasks where possible. There are several ways to im-plement such an IT system. This book focuses on one particular approach, whichconsists of extending the to-be process model obtained from the process redesignphase in order to make it executable by a BPMS (cf. Sect. 1.3.3).
Over time, some adjustments might be required because the implemented busi-ness process does not meet expectations. To this end, the process needs to be moni-tored and analysts ought to scrutinize the data collected by monitoring the process inorder to identify needed adjustments to better control the execution of the process.These activities are encompassed by the process monitoring and controlling phase.This phase is important because addressing one or a handful of issues in a processis not the end of the story. Instead, managing a process requires a continuous effort.Lack of continuous monitoring and improvement of a process leads to degradation.As Michael Hammer once put it: “every good process eventually becomes a bad pro-cess”, unless continuously adapted and improved to keep up with the ever-changinglandscape of customer needs, technology and competition. This is why the phasesin the BPM lifecycle should be seen as being circular: the output of monitoring andcontrolling feeds back into the discovery, analysis and redesign phases.
To sum up, we can view BPM as continuous cycle comprising the followingphases (see Fig. 1.7):
• Process identification. In this phase, a business problem is posed, processes rele-vant to the problem being addressed are identified, delimited and related to eachother. The outcome of process identification is a new or updated process archi-tecture that provides an overall view of the processes in an organization and theirrelationships. In some cases, process identification is done in parallel with per-
Fig. 1.3 The Business Process Management Lifecycle [37].
so quickly that a process that was considered good several months ago might no
longer be optimal today. The BPM lifecycle, shown in Fig. 1.3, is a particularly
useful tool for assisting with this. The idea is that once a business process has
been implemented, it should be monitored and analyzed regularly so that it can
be redesigned, if needed, to meet the strategic objectives of the organization.
In a customer journey analytics context, mastering the whole BPM lifecycle is
crucial for companies; ill-defined processes will impact customers, for instance,
because they are sources of delay, error, and miscommunication. As noted by
Tseng: “Organizations setting out to win customers, deliver good service, and
survive vigorous competition have to engage in continuous improvement” [89].
Fundamentally, the goal of BPM is to find models that best describe how to handle
processes, helping analysts and managers to attain high quality and efficiency [67].
It is, therefore, internally oriented. In contrast, customer journey management
(CJM) is about helping internal stakeholders to put themselves in their customers’
shoes. Fig. 1.4 shows how these models convey different information.
CJM depicts journeys as experienced by customers while BPM shows the
available combination of activities using advanced constructs such as XOR or
parallel gateways. Different information is leveraged for CJM than is used for BPM.
For instance, customers’ characteristics, levels of satisfaction, and emotions are
all central pieces of information for CJM. Such information might sporadically

8 Introduction
C
A
D
D
B
E
A
C
B
Etime
Fig. 1.4 Illustration of a process model (left) and a CJM (right) discovered from thesame event logs.
be used to enhance BPM, but usually only once an optimal model has been
discovered. Overall, CJM is used to supplement but not replace BPM [76].
In the next section, we introduce process mining, which is the bridge between
data science and business process management.
1.1.4 Process Mining
Process mining provides a set of tools to discover, monitor, and improve processes
based on event logs [94]. In doing so, it enables a link to be established between
process models and “reality” [94].
The first step before performing process mining activities is to transform the
data captured in information systems into event logs. Event logs have a special
data structure with three minimum requirements. First, activity names are used
to identify events [94]. An event is the execution of an activity defined in a BP. It is
equivalent to a touchpoint. Second, a case identifier should exist to link an event
to a trace. A trace is a set of ordered events. It is equivalent to a journey. Third,
the events must be available in an ordered manner–ideally with timestamps for
the beginning and the end of the activity. The process mining analysis can be
further extended by enriching the events with additional information, such as
an indication of the resource performing the activity or any other relevant data
related to the case.

1.1 Background 9
pred
ict
expl
ore
com
pare
chec
k
dete
ct
prom
ote
diag
nose
enha
nce
disc
over
historic data
current data
mod
els
de facto models
logs
even
t
reco
mm
end
de jure models
Fig. 1.5 Process Mining framework [94].
The literature distinguishes two event data types: historic data refers to com-
plete event logs from the past, while current data represents ongoing processes
typically used to perform operational support. It is also worth mentioning that
one can distinguish a “de jure” from a “de facto” model. The former is normative,
since it intends to steer or control the “reality”, while the latter derives from event
logs, which means that the model seeks to describe reality.
Process mining is employed for different purposes and is used with or without
a priori process models. Altogether, the process mining framework, [94], includes
the following activities (see Fig. 1.5):
1. Check ensuring that a trace fits a process model.
2. Compare finding discrepancies and commonalities between two pro-
cess models.
3. Detect detecting deviation of a trace on a process model at runtime.
4. Diagnose analyzing the process models (without event logs), e.g., struc-
tural analysis of the petri net.
5. Discover mining a process model from an event log.
6. Enhance augmenting a process model with external information, e.g.,
adding timing information to highlight bottlenecks.
7. Explore exploring process models using a combination of event data
and models.

10 Introduction
8. Predict predicting how a running case will unfold (e.g., remaining
time).
9. Promote finding patterns that work well and updating the “de jure”
model accordingly.
10. Recommend recommending the best set of actions to fulfil a requirement
(e.g., minimizing cost).
These ten activities, applied on a combination of current data, historic data,
“de jure” models, and “de facto” models, can inform and motivate a wide spectrum
of actions made possible via process mining. For instance, one can use the activity
‘check’ to realize that the execution of the process often deviates from how it is
defined in the business process model. After further investigation, one could real-
ize that the deviation is beneficial for the company and use the activity ‘promote’
to update the process model and push more employees to execute the process in
such a way. In the next section, we show how to link CJMs to process mining.
1.1.5 Process Mining Framework for CJM
We envision an opportunity to integrate customer journey analytics with the pro-
cess mining framework introduced in the previous section. Indeed, we expect the
knowledge acquired to combine data on top of models in the process mining and
BPM disciplines to provide an ideal basis to discover, analyze, or replay customer
journeys using a rigorous approach. Respectively, the expected and actual CJMs
correspond to the “de jure” and “de facto” process models. The alignment between
a CJM and the process mining framework can be reflected by updating the original
process mining framework (Fig. 1.6).
In order to perform process mining analysis on customer journey data, one
need to map the components of a CJM to the IEEE XES standard [47], which is
the prominent format to import logs in process mining software. Throughout
the thesis, we use the mapping visible in Table 1.1, which we propose in [6]. The
updated process mining framework (see Fig. 1.6) and the mapping (see Table 1.1)
are the cornerstones of this thesis because our contributions are built around
them.

1.1 Background 11
Table 1.1 Mapping between XES and the CJM model
Level XES standard CJM model
log log → cjmlog concept:name → cjm:goaltrace trace → journeytrace concept:name → customer:nameevent event → touchpointevent concept:name → touchpoint:nameevent timestamp:date → touchpoint:timestamp
Process Mining Framework
pred
ict
expl
ore
com
pare
chec
k
dete
ct
prom
ote
diag
nose
enha
nce
disc
over
historic datacurrent data
mod
els
de facto models
logs
even
t
reco
mm
end
de jure models
Customer Journey Mapping Extension
actual CJMsexpected CJMs
Fig. 1.6 Process mining framework from [94] with the proposed extension for CJM.

12 Introduction
1.2 Problem Statement
The core idea of this thesis is to leverage the concept and activities of the process
mining framework to analyze customer journeys. To do so, we pursue two research
questions.
RQ1 How can customer journey maps be discovered, explored, and enhanced from
event logs?
The aim of this question is to propose a novel technique to build a CJM from
event logs, similar to the process mining discovery technique that discovers
a process model from event logs. In the same vein, we also seek to investigate
how a CJM can be enhanced and explored using process mining techniques.
RQ2 How can the touchpoints of a customer journey be predicted?
Customer journeys are increasingly complex. As a consequence, it is difficult
to anticipate how a running customer journey will unfold. However, knowing
the next steps of the journey might be valuable to please the customer. For
instance, if a customer success manager evaluates that the next predicted
steps are not optimal for the customer, she or he could take proactive mea-
sures and propose personalized offers in an effort to positively influence the
next steps.
1.3 Thesis Structure
This thesis is composed of five distinct publications. These publications are
included as they appear in conference proceedings and hence each can be read
independently. For this reason, there is some redundancy between chapters. Note
that page numbers in the reference are given whenever available.
The papers are organized in two main streams that each corresponds to a
research question. The first stream, RQ1, is addressed in Chapters 2 to 4, as these
contributions focus on the discovery, enhancement, and exploration of CJMs
from event logs. The second stream, RQ2, focuses on prediction techniques. The
publications related to RQ2 appear in Chapters 5 and 6.

1.3 Thesis Structure 13
Chapter 2 Bernard, G. and Andritsos, P. (2019b). Contextual and behavioral
customer journey discovery using a genetic approach. In 23rd Eu-
ropean Conference on Advances in Databases and Information Systems
(ADBIS), pages 251–266, Cham. Springer. https://doi.org/10.1007/
978-3-030-28730-6_16
In Chapter 2, we mimic the genetic process to discover process models from
event logs described in [22, 96, 103]. However, we discover CJMs instead of process
models. This paper contributes by defining the customer journey discovery task
and by proposing a genetic implementation that considers both the ordering of
touchpoints and the potential contextual data attached to the touchpoints.
Chapter 3 Bernard, G. and Andritsos, P. (2017a). Cjm-ex: Goal-oriented explo-
ration of customer journey maps using event logs and data analytics. In
BPM Demo Track and BPM Dissertation Award co-located with 15th In-
ternational Conference on Business Process Management (BPM Demo).
http://ceur-ws.org/Vol-1920/
In Chapter 3, we propose a technique to organize CJMs hierarchically so that
we can offer a web interface to drill down into the CJMs. The exploration can
optionally be done with an a priori goal. For instance, one can highlight journeys
that concern a specific customer segment or journeys that contain a specific
touchpoint. When a goal is set, areas of the hierarchical tree that fulfil the goal are
highlighted. This contribution takes the form of a demonstration which is publicly
available.1
Chapter 4 Bernard, G. and Andritsos, P. (2018). Cjm-ab: Abstracting customer jour-
ney maps using process mining. In Forum and Doctoral Consortium
Papers Presented at the 30th International Conference on Advanced
Information Systems Engineering (CAiSE Forum), pages 49–56, Cham.
Springer. https://doi.org/10.1007/978-3-319-92901-9_5
In Chapter 4, we reduce the complexity of very large CJMs by semi-automatically
abstracting similar activities together. For instance, the two activities “paying by
card” and “paying by cash” could be summarized using the activity “paying”. To
measure the proximity between activities, we leverage process discovery tech-
niques. By doing this, we contribute by showing how a process mining algorithm
is used as a proxy to enhance an existing CJM.
1Available at: http://customer-journey.unil.ch/cjm-ex/

14 Introduction
Chapter 5 Bernard, G. and Andritsos, P. (2020). Truncated trace classifier. removal
of incomplete traces from event logs. In 21st International Working
Conference on Business Process Modeling, Development, and Support
(BPMDS), pages 150–165, Cham. Springer.
In Chapter 5, we tackle the task of predicting whether a journey has ended.
Consider a case where a customer visits ten different products on a website within
a one-hour time interval. No new activity from the customer is then observed for
the next three hours following the last touchpoint. We contribute by proposing an
algorithm that gives the likelihood of observing new touchpoints for this journey.
This contribution is especially relevant in a customer journey context, as we do
not have control or even influence over such customers’ decisions. Hence, we
argue that it is harder to predict the end of the CJM trace than to predict the end
of a process model under the control of a company. We contribute by showing
that this type of classifier can help increase the accuracy of predicting next events
and can also improve the quality of the discovered process models.
Chapter 6 Bernard, G. and Andritsos, P. (2019a). Accurate and transparent path
prediction using process mining. In 23rd European Conference on
Advances in Databases and Information Systems (ADBIS), pages 235–
250, Cham. Springer. https://doi.org/10.1007/978-3-030-28730-6_15
In Chapter 6, we do not predict whether a journey has ended, but rather how
it will end. In other words, we predict the activities that will happen until the
completion of the journey. Not only we can predict which activities will happen,
but we can explain our prediction using a process model. Hence, we contribute by
proposing an algorithm that outperforms neural network approaches like LSTM
in terms of both accuracy and transparency. We received the best paper award for
this contribution.
Table. 1.2 provides a complete picture of the nine papers that have been
published as part of this work. Four papers were not included in the thesis for
the following reasons. The paper “A Process Mining Based Model for Customer
Journey Mapping”, [6] was partly integrated in the introduction of this thesis. We
did not add it as an independent chapter to avoid heavy redundancies. The paper
“When Sales Meet Process Mining: A Scientific Approach to Sales Process and
Performance Management”, [12], emphasizes the relevance of process mining
for sales rather than the customer experience. Although both topics are related,
this contribution takes the perspective of the company rather than the customer.

1.3 Thesis Structure 15
The paper “Discovering Customer Journeys from Evidence”, [9], is a research-in-
progress that was completed in the paper [9] visible in Chapter 2. The paper
“Discovering Customer Journey Maps using a Mixture of Markov Models”, [49], is
an alternative CJM discovery approach to [9] that would fit the thesis topic well.
However, this research was mainly conducted by its first author, Matthieu Harbich,
and thus is not included.

16 Introduction
Table 1.2 Complete list of papers published during the thesis in chronologicalorder.
Bernard, G., & Andritsos, P.
Author
Bernard, G., & Andritsos, P.
Bernard, G., & Andritsos, P.
Harbich, M., Bernard, G., Berkes, P., Garbinato, B., & Andritsos, P.
Bernard, G., & Andritsos, P.
Bernard, G., & Andritsos, P.
Bernard, G., Boillat, T., Legner, C., & Andritsos, P.
Bernard, G., & Andritsos, P.
Bernard, G., & Andritsos, P.
European Conference on Advances in Databases and Information Systems (ADBIS)
Conference
European Conference on Advances in Databases and Information Systems (ADBIS)
International Conference on Advanced Information Systems Engineering (CAiSE)
International Symposium on Data-Driven Process Discovery and Analysis (SIMPDA)
International Conference on Business Process Management (BPM)
International Conference on Advanced Information Systems Engineering (CAiSE)
International Conference on Information Systems (ICIS)
International Conference on Advanced Information Systems Engineering (CAiSE)
International Working Conference on Business Process Modeling, Development, and Support (BPMDS)
Conference paper
Type of publication
Conference paper
Demopaper
Short paper
Demopaper
Forum paper
Research-in-progress
Forum paper
Conference paper
Contextual and Behavioral Customer Journey Discovery Using a Genetic Approach.
Title
Accurate and Transparent Path Prediction Using Process Mining.
Abstracting Customer Journey Maps using Process Mining.
Discovering Customer Journey Maps using a Mixture of Markov Models.
Cjm-ex: Goal-oriented exploration of customer journey maps using event logs and data analytics.
A Process Mining Based Model for Customer Journey Mapping.
When sales meet process mining: A scientific approach to sales process and performance management.
Discovering Customer Journeys from Evidence: a Genetic Approach Inspired by Process Mining.
Truncated trace classifier. Removal of incomplete traces from event logs.
2019
Year
2019
2018
2017
2017
2017
2016
2019
2020
2
Thesis Chapter
6
4
Not included
3
1 (partly)
Not included
Not included
5

Chapter 2
Contextual and Behavioral Customer
Journey Discovery Using a Genetic
Approach
Abstract. With the advent of new technologies such as smartphones or
virtual assistants and the increase in customers’ expectations, services
are becoming more complex. This complexity calls for new methods to
understand, analyze, and improve service delivery. Summarizing cus-
tomers’ experience using representative journeys that are displayed on
a Customer Journey Map (CJM) is one of these techniques. We propose
a genetic algorithm that automatically builds a CJM from raw customer
experience recorded in a database. Mining representative journeys can
be seen a clustering task where both the sequence of activities and some
contextual data (e.g., demographics) are considered when measuring
the similarity between journeys. We show that our genetic approach
outperforms traditional ways of handling this clustering task. Moreover,
we apply our algorithm on a real dataset to highlight the benefit of using
a genetic approach.
2.1 Introduction
A customer experience can be defined as a customer’s journey with an organiza-
tion. This journey spans over time and comprises multiple interactions called
touchpoints [63]. Recent studies show that customer interactions are increas-
ing [48], services are becoming more complex, and customers are often unpre-
dictable [77]. In this context, understanding the main journeys that were followed
by customers to consume a service is a complex task. According to Verhoef et

18 Contextual and Behavioral Customer Journey Discovery
Sequence of activities
touchpoints
All other home activitiesAttending classCivic/Religious ActivitiesEat meal outside of homeHealth CareHousehold errandsPersonal BusinessPicked up passengerRecreation/EntertainmentRoutine ShoppingService Private VehicleShopping Visit Friends/RelativesWork/JobWorking at home (for pay)
1
All other home activities
Shopping
Work/JobSequence of activities
touchpoints
2
Fig. 2.1 Two CJMs: ➊ uses actual journeys, and ➋ uses representative journeys.
al., a strategy based on customer experience may provide a superior competitive
advantage [63]. It is, therefore, not surprising that “Characterizing the Customer
Journey [...] and Strategies to Influence the Journey” has been ranked as one of the
most important research priorities for the coming years by the Marketing Science
Institute [70]. A challenge faced by many practitioners is that of understanding
the large number of combinations of activities that may exist when consuming a
service. As a result, new methods employed to design, analyze, and understand
customer journeys are emerging from the industry and are becoming popular
among researchers. One of these conceptual methods that will be the focus of
this work, is called the Customer Journey Map (CJM). By showing typical jour-
neys experienced by customers across several touchpoints, a CJM helps to better
understand customers’ journeys [6].
Fig. 2.1 shows CJMs derived from a real dataset.2 In this dataset, a journey is
all the activities that are performed by a citizen throughout the day. For instance
being at home, attending class and going back home is one of the potential jour-
neys. As can be seen in ➊ of Fig. 2.1, displaying such actual journeys on the CJM
without preprocessing the data results in an overwhelming chart. It becomes
clear that when a company deals with very large numbers of actual journeys, it
is necessary to reduce the complexity and to look at these journeys at a higher
2www.cmap.illinois.gov/data/transportation/travel-survey. Last visited: 11th of March 2020.

2.1 Introduction 19
School
School
Work
Sport
Cinema
Cinema
Sequence:Journey 1
Journey 2
Journey 3Sequence
J2 J3J1
Distance:
One-Dimensional Journey
School
School
Work
Sport
Cinema
Cinema
Sequence: Context:
Age group: teenJourney 1
Journey 2
Journey 3
Age group: teen
Age group: adult
Context
SequenceJ2
J3
J1
Distance:Two-Dimensional Journey
Fig. 2.2 Measuring the distance among three journeys with and without the con-text.
level of abstraction. Specifically, representative journeys address this issue by
summarizing the dataset (using three journeys visible in ➋ of Fig. 2.1) [10].
The existing solutions to summarize collections of journeys [10, 43, 49] con-
sider only the sequence of touchpoints when measuring the distance between
journeys. Fig. 2.2 illustrates the process with 3 short journeys. Using a basic
distance measure between sequences (e.g., edit-distance), we cannot say which
one of ‘Journey 1’ or ‘Journey 3’ is closer to ‘Journey 2’ (top part of Fig. 2.2). We
suggest that demographics and other contextual information might be equally
important to measure the distance between journeys. Hence, in this paper, we
propose to integrate such information when mining journeys. The bottom part of
Fig. 2.2 shows that when we also consider the age group, it becomes clearer that
the closest journey to ‘Journey 2’ is ‘Journey 1’.
We propose an algorithm that summarizes a customer journey using both the
sequence of activities as well as the contextual information. We use a genetic ap-
proach which is an optimization procedure involving iterative search that mimics
natural selection. Our genetic approach uses only three intuitive parameters: (1)
the approximate number of representative journeys to use, (2) the weight of the
sequence of activities, and (3) the weight of the contextual data. In the evaluation
section, we demonstrate that we outperform existing techniques. Finally, we
highlight the impact of the three parameters using a real dataset and illustrate the
results with CJMs.
The chapter is organized as follows. Chapter 2.2 discusses the discovery of
customer journeys. In Chapter 2.3, we outline the existing techniques. Chapter 2.4

20 Contextual and Behavioral Customer Journey Discovery
depicts our genetic algorithm. In Chapter 2.5, we evaluate our approach using
internal and external evaluation metrics. Chapter 2.6 illustrates CJMs produced
by our algorithm. Finally, we conclude in Chapter 2.7.
2.2 Customer Journey Discovery
The goal of a customer journey discovery algorithm is to find a reasonable amount
of representative journeys that summarize well the observed journeys.
Definition 1 (Touchpoint): We define a touchpoint as the interaction between
a company’s products or services and a customer (see Chapter 1.1.2). ‘Buying a
product’ or ‘complaining about a product’ are two examples of touchpoints in an
online retail context. We define t as the touchpoint while T is the collection of all
touchpoints. The touchpoints are visible in the y-axis of the CJMs (Fig. 2.1).
Definition 2 (Actual Journey): An actual journey Ja is a sequence of touch-
points, S, and a set of contextual data C observed from customers. The contextual
data, C is a set of key-value pairs, e.g., (salary:low, city:Toronto). The order of S is
represented by the x-axis of the CJMs visible in Fig. 2.1. Note that only the ordering
of the touchpoints matters and not the exact their exact timestamps.
Definition 3 (Representative Journey): A representative journey, Jr , is a jour-
ney that summarizes a subset of actual journeys. In Fig. 2.1, ➊, shows how a CJM
would look like when we display actual journeys, while the bottom part, ➋, uses
representative journeys. Clearly, as can be seen in Fig. 2.1, the use of representative
journeys increases the readability of the CJM.
Definition 4 (Event Logs): An event log is denoted by JA , which is the list of
all journeys observed by customers.
Definition 5 (Customer Journey Map): By using representative journeys, a CJM
summarizes customer journeys. Let a customer journey map JR be the set of all
the Jr summarizing JA . kR denotes the total number of journeys. Typically, Part
➋ of Fig. 2.1 is a CJM, JR , containing three representative journeys summarizing
an event log.
We define the discovery of customer journeys as a function that maps all mem-
bers of JA to a member of JR ; i.e., that maps all the actual journeys to represen-
tative journeys ultimately displayed on a CJM. Discovering customer journeys
from event logs can be seen as an unsupervised clustering task. This task has
interesting challenges. First, choosing the number of representatives is difficult.
When the goal is to have a general overview about a particular dataset, it seems
reasonable to display only few journeys so the CJM is readable. However, discov-
ering a few dozens of representative journeys might also be a relevant choice if

2.3 Related Work 21
the goal is to catch complex and less generic patterns. Finally, the sequence that
best summarizes its assigned actual journeys needs to be found. It might be the
case that an ideal representative journey was never observed but still summarizes
the actual journeys well. These phenomena were observed by Gabadinho et al.,
and illustrated as follows: “We could imagine synthetic – not observed – typical
sequences, in the same way as the mean of a series of numbers that is generally
not an observable individual value” [44].
2.3 Related Work
There is a body of work in social sciences that is relevant to the summarization
of customer journeys. Typically, in [43, 44], Gabadinho et al. are summarizing
observed sequences with representatives. They define a representative as “a set of
non-redundant ‘typical’ sequences that largely, though not necessarily exhaustively,
cover the spectrum of observed sequences” [43]. The authors propose four ways to
choose a representative. ‘Frequency’, (1), considers the most frequent sequence
as the representative. ‘Neighborhood density’, (2), selects the sequence that has
the most neighbors in a defined diameter. ‘Centrality’, (3), picks the most central
object, i.e., the one having the minimal sum of distances from all other objects.
Finally, ‘sequence likelihood’ takes the most likely sequence according to a first-
order Markov model.
Since Process Mining operates in a bottom-up fashion, from data all the way
to the discovery of conceptual patterns, it is another discipline closely related
to the topic of customer journey discovery. The link between customer journey
maps and process mining was highlighted in the introduction of this thesis (Chap-
ter 1.1.5). However, business process models and CJMs are not built for the same
purpose. While a business process model captures how a process was or should
be orchestrated, a CJM is built for the purpose of better understanding what
customers have experienced.
In [5] (Chapter 3 in this thesis), we propose CJM-ex, an online tool to explore
CJMs.3 Because it uses a hierarchical structure, it allows to efficiently navigate the
space of journeys in CJMs. In [49], it was shown that customer journey maps can
be discovered using Markov models. In [10], we suggested a genetic approach to
discover representative journeys that uses only the sequence of touchpoints to
measure the distance between journeys. Hence, this current work can be seen
3Available at: http://customer-journey.unil.ch/cjm-ex/

22 Contextual and Behavioral Customer Journey Discovery
1. Pre-processing
2. Initial Population
3. Assign actual journeys
6. Genetic Operation
Event logs (input)
5. Stop Criterion Eval.
CJM(output)
4. CJM Evaluation
Fig. 2.3 Proposed genetic steps to generate a CJM.
as an extension of [10] to allow taking both the sequence of touchpoints and the
contextual information into account when building CJMs.
2.4 Genetic Customer Journey Discovery
Our work is inspired by existing genetic approaches to discover business process
models from event logs [22, 96, 103]. These approaches produce random process
models that are then evaluated by replaying event logs on them. Then, genetic
operations such as crossover or mutation are applied on the best process models
to create alternative process models that are, in turn, evaluated. The process
continues until the process reaches a quality threshold or after a fixed number
of generations. The advantage of such approach is the flexibility offered when
measuring the quality of a process model. For instance, we can favor simple
process models (i.e., composed of few elements) or we can favor process models
with higher fitness (i.e., more traces can be replayed on the process models).
Our approach is similar but we tailored it towards CJMs by introducing specific
evaluation metrics suited for them. Fig. 2.3 depicts the main phases of genetic
algorithms: (1) a preprocessing phase, (2) a phase for the generation of the initial
population, (3) the assignment of each actual journey to its closest representative,
(4) the evaluation of the quality of the CJMs, (5) the stopping criterion evalua-
tion, and (6) the creation of new CJMs by applying some genetic operations. We
introduce these phases in details while the Fig. 2.4 illustrates how it works.
2.4.1 Preprocessing
We assume that the representative journeys will be similar to the journeys with
the most frequent patterns of activities. Hence, to reduce computation time, we
extract the most frequent patterns that we use to create new journeys and generate
the initial population. Let Topℓn be the n most occurring patterns of activities
of length ℓ and Topn be the list of all the most occurring patterns of lengths 2 to
m. By using Topn , we reduce the execution time by two without impairing the
quality of the final output.

2.4 Genetic Customer Journey Discovery 23
Final output
J7 Avg. Quality: 0.75 CDE
J6 Avg. Quality: 0.45
CG
DE
J4 Avg. Quality: 0.35 J2 Avg. Quality: 0.50 CDE
J3 Avg. Quality: 0.40
J1 Avg. Quality: 0.45 CDE
J2 Avg. Quality: 0.50 CDE
J5 Avg. Quality: 0.55 CDE
CF
DE
J5 Avg. Quality: 0.55 CDE
CH
DE
Generation 1(initial population)
Generation 2 Generation 3
Fig. 2.4 Illustration of the genetic process for the discovery of the best CJMs.
2.4.2 Initial Population
We start by generating a set of random CJMs. They are created by picking journeys
from Topn . In our running example, depicted in Fig. 2.4, the initial population
is visible in column ‘Generation 1’. In Fig. 2.4, the population size is 3. In our
experiments, we set the population size to 100.
2.4.3 Assignment of Actual Journeys
In order to evaluate the quality of the generated CJMs, it is required to assign each
actual journey to its closest representative. The closeness between Ja and Jr is
measured using the Levenshtein distance [65]. This metric counts the number of
edit operations (i.e., deletions, insertions, and substitutions) required to match
two sequences. Typically, the distance between ⟨XYZ⟩ and ⟨XYYW⟩ is 2 (1 insertion
of y , 1 substitution of z → w). The closest representative is the one being of the
smallest Levenshtein distance to the actual journeys. We break ties by assigning
the actual journey to the representative having the less journeys already assigned
to it. When the actual journeys have been assigned to their respective closest
representative, we can start evaluating the quality of the CJMs.
2.4.4 CJM Evaluation Criteria
We define three criteria to evaluate the quality of CJMs: (1) the fitness, (2) the
number of representatives, and (3) the contextual distance. These metrics measure
different aspects of a CJM. Hence, we define that the final average quality of a CJM

24 Contextual and Behavioral Customer Journey Discovery
is the weighted mean of these three metrics. Next, we introduce these metrics and
define them.
Fitness. Using the Levenshtein distance [65], fitness quality measures the
distance between the representative sequence and the actual journeys assigned
to it.
F i tness(JA , JR) = 1−∑|JA |
i=1 mi n|JR |j=1 (Levenshtei n(σAi ;σRj ))∑|JA |
i=1 Leng th(σAi )(2.1)
where
σAi : ith actual (observed) sequence in JA
σRj : jth representative contained in JR
Leng th(x) : Number of touchpoints in the sequence x
When an actual journey is strictly identical to its representative journey, the
fitness measure is equal to 1.
Number of Representatives. The more the representative journeys we use,
are the more likely the fitness to be high. Hence, without a metric that allows a low
number of representatives, we would obtain a final CJM with several thousands
of representative journeys. Therefore, the goal of this metric is to keep a low
number of representatives. To guide the algorithm towards an ‘ideal’ number
of representatives, we employ a clustering technique that helps in choosing the
number of clusters. More specifically, we used the Calinski-Harabasz index [24].
Let kh be the optimal number of clusters returned by the Calinski-Harabasz index.
To evaluate the quality, we measure the distance between kR and kh using the
following distribution function:
Number O f Repr esent ati ves(kR ,kh , x0) = 1
1+ ( |kR−kh |x0
)2(2.2)
where
kR : number of journeys in JR (i.e., |JR |)kh : ideal number of journeys according to the Calinski-Harabasz index
x0 : x value of the midpoint
We set the value of the midpoint, x0, to 5 for all our experiments. The intuition
behind this parameter is the following: if we have 11 representative journeys
on a CJM and the ideal number of journeys is 6, we would have a quality of 0.5
(midpoint) because the absolute distance between 11 and 6 is 5. Often, the final
output will have a number of representative journeys that differs from kh . This is
due to the fact that there are other evaluation criteria.

2.4 Genetic Customer Journey Discovery 25
Contextual Distance. The contextual distance allows us to consider the set
of contextual data C when grouping similar journeys. The more distant the
set of contextual data is between distinct representative journeys, the better
the quality is. To measure the distance, we first build a value frequency table
which counts the number of key:pair per representative. Let define that vi is
the value frequency counter for Jri . For instance, v1 (salary:low:4, salary:high:20,
city:Toronto:3, city:Lausanne:2) means the representative journey Jr1 contains 4
Ja with low salary, 20 with high salary, 3 from the city of Toronto and 2 from the
city of Lausanne. Then, for each pair of representative journeys, we calculate the
cosine similarity, which is defined as:
Contextual Di st ance(v1, v2) = v1 · v2
||v1|| · ||v2||(2.3)
Finally, the cosine distances are averaged to get the overall contextual distance.
Average Quality. We get the average weighted quality by getting the arithmetic
mean of: the fitness, the number of representatives, and the contextual-distance.
2.4.5 Stopping Criterion
Once we assess the quality of generated CJMs, we assess the stopping criterion. In-
spired by the process mining genetic algorithms, [22, 96], we found three stopping
criteria: (1) a certain amount of generations has been reached, (2) the quality does
not substantially improve anymore, or, (3), a quality threshold has been reached.
Predicting the quality that will be reached by a CJM is difficult. Hence, we believe
that the latter stopping criterion is not advisable. If a stopping criterion is met,
the algorithm stops, returning the best JR . If none of the stopping criteria is met,
we generate new candidates by recursively calling a function that generates the
next population, described in the next section.
2.4.6 Genetic Operations
Before transforming the CJMs, we evaluate and rank them by average quality. We
copy a fraction (i.e., e) of the best CJMs in a set named el i te. In Fig. 2.4, the elite
size is 1. In our experiments, we set the elite size to 5.
By keeping the best CJMs as-is, we ensure that the quality will increase or stay
unchanged. We also generate p −e new CJMs using the following operators. (1)
Addition of a random journey (mutation): A sequence from Topn is added to JR .
(2) Addition of an existing journey (crossover): A journey from the elite population
is added to JR . (3) Deletion of a journey (mutation): A journey is removed from

26 Contextual and Behavioral Customer Journey Discovery
S = ⟨DCE⟩C = {owner:yes}S = ⟨DDFZ⟩C = {owner:no}
JG1
JG2
JA1S = ⟨DCE⟩C = {owner:yes}
JA2S = ⟨DDFEZ⟩C = {owner:no}
JA3S = ⟨DDFZ⟩C = {owner:no}
JA4S = ⟨DDFZ⟩C = {owner:no}
JA5S = ⟨CDE⟩C = {owner:no}
JA6S = ⟨DCEFZ⟩C = {owner:no}
noise-freenoise
Jg (Generative Journeys) Ja (generated actual Journeys)
Fig. 2.5 Illustration of how actual journeys are generated from generative journeys.
JR . Nothing happens if JR contains only one journey. (4) Addition of a touchpoint
(mutation): A touchpoint is inserted in one of the existing journeys. (5) Deletion
of a touchpoint (mutation): A touchpoint is removed from JR .
We loop over each of these 5 types of transformations three times. Each time,
the probability of applying the transformation is 10%. It means that the same
transformation might be applied up to three times (with a probability of 0.1%).
At the very least, one transformation has to be applied. If it is not the case, we
loop over each transformation three times again until at least a transformation is
performed.
In Fig. 2.4, JR5 has been produced by taking JR2 and adding a journey picked
from Topn (defined in Sect. 2.4.1). Once new JRs have been created, we return to
the evaluation phase as shown in Fig. 2.3.
2.5 Evaluation Using Synthetic Datasets
In order to evaluate the quality of our approach to return the best set of repre-
sentative journeys in JR , we evaluate the results using a collection of synthetic
customer journeys that includes some contextual data. We first describe how
we generated the dataset. Then, using this synthetic dataset, we evaluate and
compare our algorithm with existing techniques.
2.5.1 Datasets
In order to evaluate the results of our algorithm, we generated synthetic event
logs that simulate journeys using generative journeys. A generative journey is a
known sequence of activities with a known set of characteristics from which we

2.5 Evaluation Using Synthetic Datasets 27
generate the event logs. These generative journeys represent the ground truth and
ideally the algorithm should return these as representatives. If we used only those
known generative journeys to produce the dataset, we would get only kG distinct
journeys. From a business point of view, this would describe an ideal situation
where each group of customers behaves in an homogeneous way. However, we
know that this is not the case. Having group of similar journeys that slightly differ
from a representative is a more realistic setting. To achieve this, we add some noise
to the generated journeys. Typically, when the noise level is set to 50%, Ja = Jg
is true for half of the journeys. Fig. 2.5 illustrates how six journeys are generated
from two generative journeys. If we assume that the noise level is defined to be
50%, three actual journeys in the event logs deviate from the original generative
journeys. The goal of our experiments is to retrieve the set of generative journeys,
as representatives, from the produced actual journeys. The 40 generated datasets
as well as details on how we produced them are made publicly available.4
2.5.2 Metrics
To evaluate and compare the quality of representative journeys, we rely both on
external and internal evaluations. External evaluations uses the ground truth.
Since we add some random noise, it might be the case that the ground truth is not
the best solution. For this reason, we also use internal evaluation measures which
are not using the ground truth but rely on cluster analysis techniques. These
metrics are described in [44].
External Evaluation - Distance in the Number of Journeys. Measures the
distance between the number of generative journeys and the number of represen-
tative journeys. We evaluate this metric using the following equation:
N b Jour ne y sDi st ance(kG ,kR) = |kG −kR | (2.4)
External Evaluation - Jaccard Distance. We use the Jaccard distance to mea-
sure the intersection of the generative journeys and the representative journeys. A
generative and a representative journey need to have exactly the same sequence
to be considered in the intersection.
Jaccar dDi st ance(σR ,σG ) = 1− |σR ∩σG ||σR ∪σG |
(2.5)
4http://customer-journey.unil.ch/datasets/

28 Contextual and Behavioral Customer Journey Discovery
Internal Evaluation - Mean distance [44]. This metric measures the distance
between the actual journeys and their respective representative.
MeanDi st anceScor ei =∑ki
j=1 D(Si ,Si j )
ki(2.6)
where
D(x1, x2) : Levenshtein distance between two sequences
ki : Number of journeys attached to the representative i
Si : Representative sequence i
Si j : Sequence of journeys j attached to the representative i
Internal Evaluation - Coverage [44]. This metric represents the density of
journeys in the neighborhood n of a representative. In other words, what is
the ratio of journeys that have less than n edit distance with the representative
journey.
Cover ag ei (n) =∑ki
j=1 (D(Si ,Si j ) < n)
ki(2.7)
where
D(x1, x2) : Levenshtein distance between two sequences
ki : Number of journeys attached to the representative i
Si : Representative sequence i
Si j : Sequence of journeys j attached to the representative i
Internal Evaluation - Distance gain [44]. This metric quantifies the gain in
using representative journeys rather than the medoid of the dataset.
Di stGai ni =∑ki
j=1 D(C (σA ),Si j )−∑kij=1 D(Si ,Si j )∑ki
j=1 D(C (σA ),Si j )(2.8)
where
D(x1, x2) : Levenshtein distance between two sequences
ki : Number of journeys attached to the representative i
Si : Representative sequence i
Si j : Sequence of journeys j attached to the representative i
C (x) : True center of the set of actual journeys

2.5 Evaluation Using Synthetic Datasets 29
1000 Journeys (input)
CJM(output)
Genetic algorithm: Population size: 100, Elite size: 5Fitness weight: 5 (ED, cost=1); Nb. of representatives weight: 1; Contextual Distance weight: 1
Genetic 1
1000 Journeys (input)
Generate clusters
CJM(output)
Choose representative*
Traditional approaches
*for each cluster, using the neighbourhood density, the centrality, the frequency, and the likelihood
1000 Journeys (input)
CJM(output)
Genetic 2
Genetic algorithm: Population size: 100, Elite size: 5Fitness weight: 5 (ED, cost=1); Nb. of representatives weight: 1; Contextual Distance weight: 0
Build Distance Metrics (ED, cost=1)
Fig. 2.6 Approach used to evaluate our clustering algorithm from traditional ap-proaches.
2.5.3 Settings
We test two settings of the algorithm against traditional approaches. The tradi-
tional approaches are state-of-the-art techniques that are used to cluster and
summarize sets of sequential and categorical data. Fig. 2.6 depicts the approach at
a high-level. As can be seen, with traditional approaches, we first build a distance
metric. We use the Levenshtein distance with a constant cost operation set to 1.
Once the distance matrix is built, we create k clusters. Because we do not know
the number of representative journeys to be found, we test using from 2 to 12
clusters (above 12 it becomes hard to read the CJM) and use the squared Calinski-
Harabasz index described in [24] to return the most statistically relevant. Next,
we get the best representatives using the neighborhood density, the centrality,
the frequency, or the likelihood using Traminer [42]. These techniques do not
use the contextual data. Hence, to allow for a fair comparison, we compare these
techniques with a version of our genetic algorithm that does not use contextual
data and which was presented in [10]. We call this version Geneti c1. We also test
our genetic algorithm with a version that considers the contextual data, called
Geneti c2. Note that both the traditional and genetic approaches use the same
techniques to find kh and the distance is measured using the Levenshtein distance
with a constant cost operation. To account for the fact that the genetic algorithm
is non-deterministic, we run the algorithm ten times for each setting.

30 Contextual and Behavioral Customer Journey Discovery
0 1 2 3 4 5
Absolute distance in the number of Journeys
Genetic 2
Genetic 1
Traminer 5.38
median: 0.78
median: 0.70(with contextual
information)
0.2 0.3 0.4 0.5 0.6 0.7
Genetic 2
Genetic 1
ND (.10)
Frequency
Centrality
ND (.20)
ND (.05)
SequenceLikelihood
median: 0.205
median: 0.239
0.625
0.384
0.539
0.279
0.279
0.701
(with contextual information)
Jaccard Distance
Fig. 2.7 External evaluation. The genetic algorithm that uses the contextual infor-mation (i.e., Geneti c2) performs best.
2.5.4 Results
Fig. 2.7 shows the external evaluation metrics. It can be seen that the best solution
is the Geneti c2, highlighting that considering the contextual information when
grouping journeys improves the quality. Next, the best solution that does not use
contextual data is Geneti c1 proposed in [10].
The internal evaluation of Fig. 2.8 shows that not only does the genetic algo-
rithm outperforms the traditional approaches, it also proposes a better solution
than the ground truth. This can be explained by the fact that when we inject noise,
we potentially change the optimal solution.
The execution time for one thousand journeys is improved using Traminer
[42] compared to our genetic approach. We compare how the different algorithms
scale when the number of journeys increases. Hence, we ran each configuration
five times with the 40 different datasets. Fig. 2.9 summarizes the results. As can
be seen, the algorithms implemented in Traminer are orders of magnitude faster

2.5 Evaluation Using Synthetic Datasets 31
Coverage0.6
DistGain0.51.01.5
MeanDistanceScore
Genetic 2
Genetic 1
ground truth
density
dist
freq
mscore
prob 0.6740
0.8066
0.8398
0.8509
0.8542
0.8139
0.8053
0.6851
0.6430
0.7917
0.7447
0.8548
0.7992
0.8505
0.8351
0.5561
0.4444
0.7240
0.5850
1.0207
0.4397
1.2439
0.4739
0.6085
0.8 1.00.7 0.8 0.9
Fig. 2.8 Internal evaluation. The Geneti c2 has the best coverage and mean dis-tance while Geneti c1 has the best distance gain.
100 1000 10000nb. journeys
0.1
1
10
100
1'000
Aver
age
time
per
data
set (
seco
nds)
0.2sec
1.7sec
51min
38sec94sec
3.3sec
0.4sec Kmedoids
Traminer
Genetic
4.5min3.2min
Fig. 2.9 CPU time for 100, 1’000, and 10’000 journeys.

32 Contextual and Behavioral Customer Journey Discovery
than our approach when dealing with 100 or 1,000 journeys. However, note that
our algorithm has a better scaling potential when the number of journeys grows.
All the algorithms tested tend to be slow and will not scale when dealing with
several thousand journeys.
2.6 Experiments Using Real Datasets
This section reports on the experiments with a real dataset, the goal being to illus-
trate how a change in the settings impacts the results. We used a publicly available
dataset5 describing the activities performed throughout the day by Chicago’s cit-
izens. There are 15 types of activities, such as, ‘being at home’, ‘attending class’,
‘going shopping’, or ‘doing households errands’. In the context of this dataset, a
journey is the sequence of activities starting from the morning until the night.
Typically, ‘being at home’ → ‘attending class’ → ‘being at home’ is a journey con-
sisting of three activities. The total number of journeys is 29,541 and there are
123,706 activities (with an average of 4.82 activities per journey). This dataset is
interesting not only for the relatively large number of data points describing life
trajectories, but also because of the available detailed contextual data, such as
information on the citizens’ demographics.
The goal of this experiment is to show the influence of taking the citizen’s age
in consideration when measuring the distance between journeys. Fig. 2.10 shows
the results using three different configurations. In Configuration 1, we did not
leverage the contextual data (i.e., the contextual distance weight is set to 0). We
interpret the resulting CJM as follows. The first journey represents people going to
‘work’, going back ‘home’ at noon, and returning to ‘work’ in the afternoon. The
second journey is close to the first one, the main difference being that people do
not seem to go back ‘home’ at noon. The third journey shows citizens being at
‘home’, going ‘shopping’ twice in the afternoon, and going back ‘home’.
In Configuration 2, we test the effect on the resulting CJM when considering
the ages of the customers. Therefore, we changed the weight assigned to the
contextual distance from 0 to 1. As can be seen in Fig. 2.10, three representative
journeys were generated. Each of these journeys has three touchpoints. They start
from ‘home’ and finish at ‘home’. In between, the first journey has the activity
‘work’, the second one has the activity ‘shopping’, and the last one the activity
‘attending class’. It is interesting to note the effect of the configuration on the
contextual data (the distribution charts on the right side of Fig. 2.10). Indeed,
5www.cmap.illinois.gov/data/transportation/travel-survey. Last visited: 11th of March 2020.
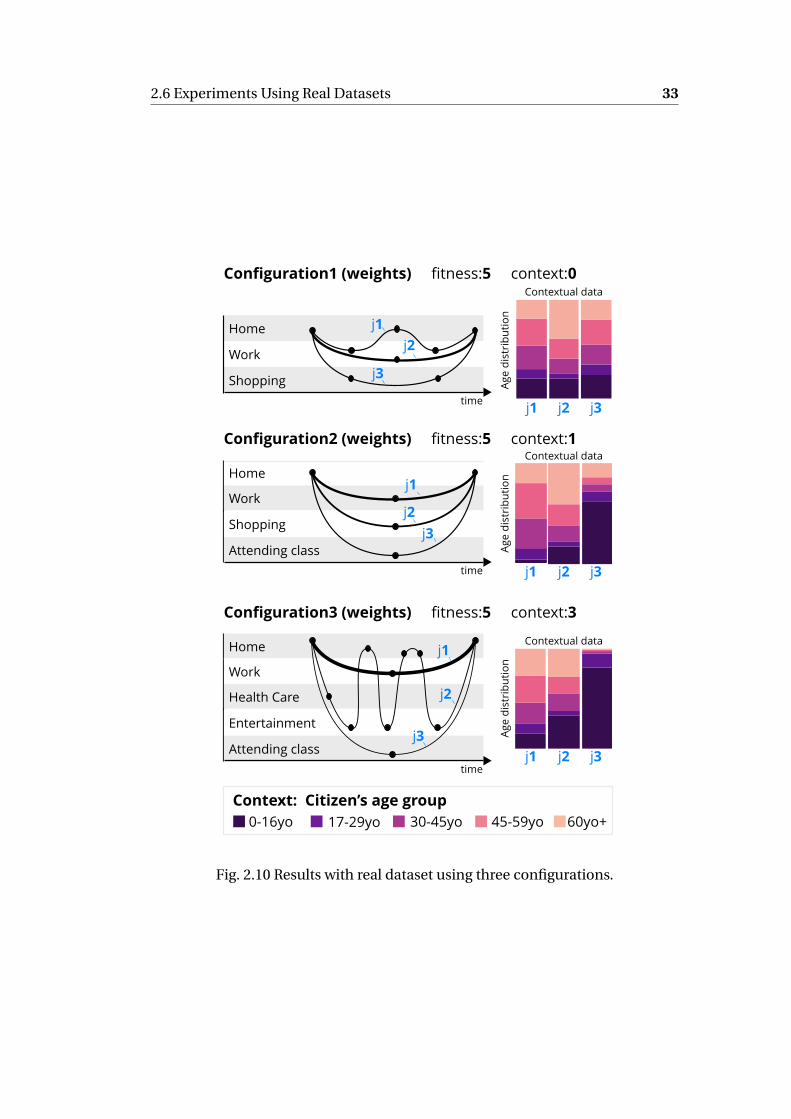
2.6 Experiments Using Real Datasets 33
Age
dist
ribu
tion
j3j1 j2time
Entertainment
Work
Attending class
Home
Health Care
j3
j1
j2
Contextual data
Configuration3 (weights) fitness:5 context:3
j3j1 j2
Age
dist
ribu
tion
time
Shopping
Home
Attending class
Workj1
j2j3
Contextual dataConfiguration2 (weights) fitness:5 context:1
j3j2j1
Age
dist
ribu
tion
time
Work
Shopping
Home j1
j3
j2
Configuration1 (weights) fitness:5 context:0 Contextual data
60yo+45-59yo30-45yo17-29yo0-16yoContext: Citizen’s age group
Fig. 2.10 Results with real dataset using three configurations.

34 Contextual and Behavioral Customer Journey Discovery
while the age was equally distributed for each journey in Configuration 1, we can
observe that the age is discriminant in Configuration 2. For instance, more than
half of the citizens in the journey j3 are under 16 years old, while this population
represents only 8.7% of the entire dataset.
In Configuration 3, we show the effect when we increase the weight put on
the contextual distance parameter. Journeys j1 and j3 are identical to those in
Configuration 2. However, a new and rather complex journey j2 emerges. We
observe that the distribution is impacted when giving more weight to homogeneity.
We interpret the result as follows: Citizens younger than 29 years old tend to have
two typical patterns of activities involving either ‘school’ or ‘entertainment’ while
the most typical journeys for the other citizens involve ‘work’.
Of course, this is an extremely simplified overview of the data. For the al-
most 30,000 actual journeys in the event logs, there are numerous unique actual
journeys that differ from the representative journeys we get from these three
configurations. By letting the business analyst choose the weight for each param-
eter, we let them explore different perspectives of the data. We claim that the
best parameters depend on the dataset, the business context, and the goal of the
exploration.
2.7 Conclusion
Our genetic approach to summarizing a set of customer journeys with the purpose
of displaying them on a CJM offers an interesting alternative to approaches used
in social sciences for three reasons. First, the quality of the results is better, which
is true using both internal and external evaluation metrics. Second, the weights
of the three quality criteria are a flexible way to analyze a dataset under different
perspectives. All the other parameters, such as the number of representative
journeys to display or the length of the representative journeys are left entirely to
the genetic algorithm. Third, in addition to the sequence of activities, our genetic
algorithm can leverage contextual data to group similar journeys. By doing so, we
provide a way to summarize insights from customers that are hidden in the data.
We tackle the challenging task of building a CJM from event logs as a single-
objective optimization problem so that a single ‘best’ CJM is returned. Due to
the inherent conflicting objectives of the quality criteria, we acknowledge that a
multi-objective approach might be a relevant choice that we did not investigate.

Chapter 3
CJM-ex: Goal-oriented Exploration of
Customer Journey Maps using Event
Logs and Data Analytics
Abstract. Customer Journey Mapping (CJM), is an emerging area of
research tackling issues related to customer behavior and customer
journeys when consuming a service. The increasing complexity of the
service industry makes this type of tools popular amongst practitioners.
However, to date, it is not clear how a CJM can be used to depict hun-
dreds or thousands of customer journeys. Inspired by process discovery
techniques – borrowed from Process Mining – we present CJM-explorer
(CJM-ex). CJM-ex is a web interface that uses hierarchical clustering
and statistical indexes to allow interactive navigation, with or without
a-priori information, through numerous journeys stored in standard
event log formats. The exploration of the underlying journeys can be
done in the whole set of data available or driven by user goals in order
to examine events and patterns in specific areas of interest.
3.1 Motivations
In order to deliver great service, companies need to have an understanding of
the quality of customer experience at an end-to-end level [12, 50]. The ever
growing amount of services offered to users for consumption has made the ability
to understand their behavior very important [63]. Similarly important is the
knowledge extracted by the increasing number of ways organizations interact with
their customers; e.g., a customer might visit a physical store, purchase a product
online, and provide feedback on social media. As a response, new customer-

36 CJM-ex
centric approaches have surfaced. The customer journey map (CJM) is an example
of such new techniques. CJMs allow for better understanding of a customer’s
end-to-end experience when using a service by mapping any interactions with
the company (called touchpoints) on a map that ultimately contributes to better
understanding and serving customer needs.
In our previous work, [6] (Chapter 1 of this thesis), we discussed the benefit of
bringing customer journey mapping and process mining together by proposing a
CJM model that can be used with process mining techniques. More specifically,
CJM-ex aims at providing a solution to explore numerous customer journeys
at the same time. Similar to discovery techniques used in process mining, our
algorithm takes event logs as input, without using any a-priori information [94].
However, instead of outputting a business process model (BPM), we display the
journeys onto a CJM. For a complete definition of process mining and event logs,
the reader is referred to the well known Process Mining Manifesto [95]. Visualizing
event logs on CJMs, instead of BPMs, exhibits two interesting features. First,
CJMs focus more on personal customer activities (e.g., by incorporating customer
emotions), rather than the “internally-focus problem-solving approach” of BPMs,
[90]. Second, contrary to BPMs, CJMs can incorporate customer journeys that
are deemed exceptional behaviors, rather than removing them to increase model
readability.
Despite these interesting features, representing many customer journeys onto
a CJM in an intelligible manner remains a challenge. Current research typically
limits the number of journeys to be compared to less than ten, making the overall
process relatively straightforward. However, we argue that companies in the ser-
vice industries tend to deal with hundreds or thousands of journeys. To overcome
this challenge and identify different areas of interest, a hierarchical clustering
algorithm is employed to segment the original data. The hierarchical nature
allows for a top-down navigation of automatically generated groups of similar
journeys. Once the clusters are formed, CJM-ex is able to leverage the contextual
information that comes along a typical customer journey such as the customers’
characteristics, or the emotions, [6]. It does so in two different ways. First, we
employ statistical indexes in order to explain why the different clusters were gener-
ated. Second, we let the users define their own exploration goals, making CJM-ex
the first goal-oriented tool that allows analysts to set a-priori goals to guide their
journey exploration.
We implemented CJM-ex, which aims to: 1) show how numerous event logs
can be displayed onto CJMs; and 2) let users navigate into these journeys. The

3.2 CJM-ex 37
abzacbz …
aecbz acgbz
……
Actual Journey
Representative Journey
Fig. 3.1 Hierarchical clustering of journeys.
next section introduces our tool, while the third section highlights the key parts of
its technical implementation. We conclude by providing an outlook.
3.2 CJM-ex
The main objective of CJM-ex is to let business analysts upload and explore their
own dataset using a customer journey map layout. To limit the number of jour-
neys displayed on the same CJM and allow their intuitive exploration, we took a
hierarchical clustering approach, as illustrated in Fig. 3.1. Each letter represents
an activity and the tree is built bottom up by merging the activities that are most
similar at each iteration. By default, our hierarchical algorithm uses a proximity
measure that takes into account the order of activities and is a variant of the
Jaccard similarity based on shingles [20]. In our clustering tree (or dendrogram),
the journeys seen in the event logs are at the leaf level and as they get merged they
form “representative” journeys (defined in Chapter 2). A representative journey is a
single pattern of activities whose purpose is to summarize the patterns contained
in a cluster. Because the representative journeys at the top of the tree summarize
many – potentially distant – journeys, it will tend to show only few activities shared
by many. In contrast, the representative journeys closer to the leafs will show more
details. Borrowing a cartographic metaphor from [94], the first layers show general
patterns and hide less important activities – like a world map would omit small
cities. However, our application allows a drill-down into ‘countries’ of interest
(i.e., pattern of activities), which would redirect to new CJMs where the previously
hidden ‘cities’ (i.e., omitted activities) will be shown.
CJM-ex is accessible at http://customer-journey.unil.ch/cjm-ex/, where we also
provide a screencast explaining its usage. The screenshot visible in Fig. 3.2 points
out three views that are available to navigate the clusters. Each of these views
fullfills specific objectives. First, the CJM view ➊ shows journeys that are in the
same cluster. This representation allows to easily compare the pattern of activities.

38 CJM-ex
1 2
3
Fig. 3.2 Interface pointing to three views: ➊ CJM, ➋ tree and, ➌ textual boxes.
Second, the tree ➋ displays the hierarchical structure of the journey clusters –
useful in providing a holistic view of the clusters and where we currently are. Third,
a box per cluster ➌ provides a convenient means to display statistical indexes that
we named “salient characteristics”. The salient characteristics is the top 5 results
of a chi-square test applied on all the contextual information. For instance, if at
a global level (the entire dataset) the number of women is equal to the number
of men, it might be surprising to find a cluster with large minority / majority of
women. Therefore, this information might come up as one of the top 5 salient
characteristics.
Moreover, the user might be interested in specific characteristics occurring
during the journey. For this reason, we allow user-defined goals. For instance,
one might be interested in journeys that started by the activity “attending class”
experienced by young people. The top part ➀ of Fig. 3.3 displays the goal which
is typically set by a business analyst, while the bottom part ➁ shows that some
branches of the tree are interesting with regards to the goal (red “hot” area at
the top). Hence, our application allows navigation without using any a-priori
information, but also setting navigation goals, and guidance by the resulting
colors.

3.3 Implementation 39
Fig. 3.3 Interface to add a goal, ➀, and impact on the tree, ➁.
Finally, when moving from one view to the others, the three views are updated
synchronously, allowing a smooth exploration amongst journeys.
3.3 Implementation
CJM-ex is build around four main elements: (1) a web interface; (2) the XES-parser;
(3) Hcluster; and (4) a data warehouse. We will describe the main parameters and
choices we made for each of them.
Web interface. The web interface leverages bootstrap,6 jQuery,7 and d3js8
to provide a user-friendly interface to upload and navigate journeys. Both the
CJM view and the tree view are implemented in d3js. The CJM view is our own
implementation, while the tree is an adaptation of existing code.9
XES Parser. CJM-ex works with event logs. More specifically, we leverage the
XES (eXtensible Event Stream) standard born within the process mining taskforce.
The XES Parser is a Java implementation that encapsulates the OpenXES library10
6http://getbootstrap.com/. Last visited: 18th of March 2020.7https://jquery.com/. Last visited: 18th of March 2020.8https://d3js.org/. Last visited: 18th of March 2020.9http://bl.ocks.org/robschmuecker/7880033. Last visited: 11th of March 2020.
10http://www.XES-standard.org/openXES/start. Last visited: 18th of March 2020.

40 CJM-ex
1. Hierarchical clustering
91 2 43 5 6 7 8
2. Recursive cuts1,2,3,4,5,6,7,8,9
7,8,91,2,3,4 5,6
1,2 3,4
3. Finding Representativeab
abzabc abxy
abcd abce
Fig. 3.4 Data preprocessing phase.
to parse XES file. Use of this open source software ensures that our application is
strictly compatible with the XES standard.
Hcluster. Hcluster is a Python implementation containing the three steps
illustrated in Fig. 3.4. The first one is the hierarchical clustering implemented
using Scipy.11 Two parameters should be provided as inputs: the distance measure
between event sequences and the methods for calculating the distance between
clusters. They can both be chosen by the user when uploading a dataset (see
Fig. 3.5). While further research is needed to understand why these differences
exist, it seems that using shingles, [20], as a distance metric provides a more intu-
itive way to navigate through journeys. Once the hierarchical cluster is formed,
the next step consists of cutting the clustering to form layers. A layer is a set of
predetermined number of journeys that will be grouped together and will ulti-
mately appear on the same CJM. To achieve this, we developed an algorithm that
recursively cuts the dendrogram returned by Scipy. A small number of journeys
will lead to a simple CJM that is easy to visualize, but in more complex tree struc-
tures (i.e., trees with larger height). Finally, the last step consists of finding the
representative journey using a frequent sequences mining algorithm.12
Data Warehouse. Each dataset is saved in its own database schema designed
as a star schema. It stores all the information required to use the application (e.g.,
clusters, journeys, events) as well as some precomputations. For instance, we
11https://docs.scipy.org/doc/scipy/reference/generated/scipy.cluster.hierarchy.linkage.html.Last visited: 18th of March 2020.
12https://github.com/bartdag/pymining/blob/master/pymining/seqmining.py

3.4 Discussion and Outlook 41
Fig. 3.5 Preview of the parameters when uploading a dataset.
count the number of occurences for each characteristic at each cluster, so the
goals and the salient characteristics can be retrieved quickly.
Altogether, the parameters visible in Fig. 3.5 allow users to explore the exact
same dataset from different perspectives.
3.4 Discussion and Outlook
With CJM-ex, we have demonstrated that many journeys can be displayed onto
CJM in an intelligible and efficient manner, offering an alternative to a BPM
representation. As Gartner highlighted, CJMs should be used to complement,
but not to replace, BPMs, [76]. By leveraging a standard born within the process
mining taskforce (i.e., XES) and by mimicking a typical process mining activity (i.e.,
discovery), we bring these techniques closer together. However, further research
is required to fully understand how they can complement each other. This is a
call to the process mining and business process management communities to
consider CJMs as an integral part of the process management toolkit.
Note that we discuss the limitation in terms of evaluation of this chapter in
the conclusion of the thesis (page 86).


Chapter 4
CJM-ab: Abstracting Customer
Journey Maps using Process Mining
Abstract. Customer journey mapping (CJM) is a popular technique
used to increase a company’s understanding of their customers. In its
simplest form, a CJM shows the main customer journeys. Complex cus-
tomers’ journeys are difficult to apprehend, losing the benefit of using a
CJM. We propose CJM-ab (for CJM abstractor) a solution that leverages
the expertise of process discovery algorithms from the process mining
discipline to abstract CJMs. Our tool, CJM-ab, can leverage process
mining models, namely process trees, and business owners’ knowledge
to semi-automatically build a CJM at different levels of granularity. We
applied our approach to a dataset describing a complex process, and
shows that our technique can abstract it in a meaningful way. By doing
so, we contribute by showing how process mining and CJM can be put
closer together.
4.1 Introduction
A customer journey map (CJM) is a conceptual tool used to visualize typical cus-
tomers’ journeys when using a service. In their simplest form, CJMs show the
interactions between a customer and a service provider through time. A series
of interactions is called a journey. Because CJMs give a company a better under-
standing of their customers, they are becoming increasingly popular amongst
practitioners. A CJM can be used as a design thinking tool by internal stakeholders
to anticipate the best – or worst – journeys possible. Such journeys, displayed on
a CJM, are called the expected journeys. However, customers might experience
a different journey from the one anticipated. For this reason, in chapters 2 to 3,

44 CJM-ab
time
➊ invite reviewersget review 2time-out 1time-out 3collect reviewsdecideinvite add. reviewertime-out Xget review Xacceptreject
time
➋
time
invite reviewers
review [1-3]
collect reviews
decide
get add. reviews
accept
reject
Complexity slider:
➌ invite reviewerstime-out 1get review 2time-out 3collect reviewsdecideinvite add. reviewertime-out Xget review Xrejectget review 3accepttime-out 2get review 1
Fig. 4.1 Three possible ways of displaying the handling of reviews for a journal from[92] on a CJM: ➊ projecting the actual journeys (only the first 100 – out of 10,000– journeys are displayed); ➋ using two representative journeys; and, ➌ usingtwo representative journeys and abstracting the activities using the techniquepresented in this paper.
we propose leveraging traces left by customers in information systems to build
CJMs from evidence. Because the journeys that will be displayed on the CJM are
produced from facts, we refer to them as the actual journeys. Such approaches
are in line with the urgent call from the authors Lemon and Verhoef to take a
data-driven approach to map the customer journey [63].
However, when dealing with numerous journeys, it becomes unrealistic to
display all the actual journeys on a single CJM. For illustration purposes, Fig. 4.1
depicts 10,000 instances of the traces related to the handling of reviews for a
journal, a synthetic dataset available in [92]. In the context of this dataset, the
service provider is the conference’s organizing committee, the customers are the
researchers submitting their papers, and a journey describes the handling of
the reviews, from the submission until the final decision. In Fig. 4.1, part ➊, it
is difficult to apprehend the typical journeys of the reviewing process. To this
end, representative journeys have been introduced as a means of reducing the
complexity. Indeed, the central CJM (➋) uses two representative journeys to
summarize 10,000 actual journeys. Although representative journeys decrease
the complexity by reducing the number of journeys, a CJM might still be difficult
to apprehend when it is composed of many activities. Indeed, even though only
representative journeys are used, quickly spotting the main differences between
the two journeys visible in ➋ (Fig. 4.1) is not straightforward due to the high
number of activities and the length of the journeys.
We propose CJM-ab (for CJM abstractor) a solution that leverages the expertise
of process discovery algorithms from the process mining discipline to abstract
CJMs. More precisely, we take as an input a process tree, we parse it, starting from
the leaves, and iteratively ask the end-user if it is relevant to merge the activities

4.2 Background 45
X + X
A B C D E F G τ
Fig. 4.2 One of the possible process trees given the event log T = {⟨BDCEF⟩,⟨ACDEFG⟩, ⟨BCDEFGG⟩}.
that belong to the same control-flow, and, if so, to provide a name for this group
of activities. By doing so, we let the end-user decide which activities should be
merged and how they should be renamed. Then, one can visualize the same CJMs
at different levels of granularity using a slider, which is visible in Fig. 4.1, part ➌.
At a certain level of granularity, we clearly observe, given the end activities, that
one representative journey summarizes the accepted papers, while the other one
depicts the rejected papers. The importance and originality of CJM-ab is that it
explores, for the first time, a seamless integration of business process models with
customer journeys maps.
The chapter is organized as follows. Chapter 4.2 introduces process mining
and the process discovery activity. Chapter 4.3 describes our algorithm, and
Chapter 4.4 provides a demonstration. Finally, Chapter 4.5 opens a discussion
and concludes the chapter.
4.2 Background
4.2.1 Process Mining and Process Discovery
Our approach is a seamless integration of Process Mining with Customer Journey
Mapping and showcases the impact that the latter can have in the analysis of
journeys. Process mining is an emerging discipline sitting between machine
learning and data mining on the one hand, and process modeling and analysis on
the other [94]. In this research, we focus on the discovery of process models, one
of the three types of process mining along with conformance and enhancement.
The idea behind the discovery of process models is to leverage the evidence
left in information systems to build process models from event logs. The resulting
process models are, therefore, based on factual data, showing how the process
was really executed. To build such a model, process mining uses an input data
format called event logs. An event log is a collection of traces, a trace being a single
execution of a process composed of one or multiple activities.

46 CJM-ab
For illustration purposes, let T = {⟨BDCEF⟩,⟨ACDEFG⟩,⟨BCDEFGG⟩} be an event
log composed of 3 traces and 7 distinct activities. Regardless of the notation, the
resulting models can express the control-flow relations between activities. For
instance, for the event log, T , the model might express the following notation: (1)
A and B are in an XOR relation (×); i.e., only one of them is executed; (2) C and D
are executed in parallel (+); i.e., both activities are executed in any order; (3) E
and F are in a sequence relation (→); i.e., F always follows E; (4) G is in a XOR loop
(Combination of × and ⟲); i.e., it can be executed 0 or many times. Note that τ
denotes a silent activity. It is used to correctly execute the process but it will not
result in an activity which will be visible in the event logs. Fig. 4.2 displays the five
aforementioned relations using a process tree.
Discovering a process model from event logs is challenging. Indeed, process
mining algorithms need to be be robust enough to generalize (to avoid overfitting
models) without being too generic. They should also try to build process models
that are as simple as possible [2]. Many representations exist to express the
discovered process models: Petri nets, process trees, or bpmn models, to name
a few. The next section introduces the notation used by our algorithm: process
trees.
Process Tree.A process tree is an abstract hierarchical representation of a
process model introduced by Vanhatalo et al. [98], where the leaves are annotated
with activities and all the other nodes are annotated with operators such as ×[59]. One interesting characteristic of process trees is that they guarantee the
soundness of the models, i.e., all activities can be executed and the end of the
process can be reached. The soundness guarantee is one reason that we choose
the process tree notation. There are also three other reasons. First, process models
in block structure achieve best performance in terms of fitness, precision, and
complexity [2]. Second, the hierarchical structure of process trees is ideal to derive
multiple levels of granularity. Finally, according to Augusto et al. [2], process
trees are used by top-performing process model algorithms, such as the inductive
miner [60–62] or the Evolutionary Tree Miner [23].
4.2.2 Customer Journey Discovery
In [6] (Chapter 1), we proposed a process mining based model that allows us to
map a standard event log from process mining (i.e., XES [47]) to store customer
journeys, a first attempt to bring customer journeys and process mining closer
together.

4.3 Abstracting Customer Journeys using Process Trees 47
Similar to how process discovery algorithms discover process models, we aim
to discover a CJM from event logs. Instead of describing the control flows of activi-
ties using a business process model, the main journeys (i.e., the representative
journeys) are shown using a CJM. It encompasses three important challenges.
First, the number of representative journeys needs to be set (k). Looking at
➊ from Fig. 4.1, it is difficult to say how many representative journeys should be
used to summarize the data. We identify two ways to solve this challenge. The
number of representative journeys can be set manually, or it can also be set using
standard model selection techniques such as the Bayesian Information Criterion
(BIC) penalty [81], or the Calinski-Harabasz index [24].
Second, once k has been defined, actual journeys should be split in k clusters
and a representative journey per cluster must be found. One of the ways, pre-
sented in Chapter 3, is to first define a distance function between actual journeys,
such as the edit distance, or shingles, and to build a distance matrix; then, to split
the actual journeys in k groups using hierarchical clustering techniques.
Third, one need to define the k representative journeys. They can be found
using a frequent sequence mining algorithm [5], by counting the density of se-
quences in the neighborhood of each candidate sequence [44], by taking the most
frequent sequences [44], or by taking the medoid [44]. Instead of inferring the
representative from the distance matrix, it is also possible to obtain it using statis-
tical modeling [44]. We can employ an Expectation-Maximization algorithm on a
mixture of k Markov models, and then for each Markov model the journey with
the highest probability becomes the representative [49].
The next section describes a novel way to leverage business process models to
abstract customer journey maps.
4.3 Abstracting Customer Journeys using Process Trees
CJM-ab uses four steps to render a CJM at different levels of abstraction. They are
depicted in Fig. 4.3. This chapter introduces each step. In the first step, the goal is
to build a process tree given an event log. This can be done using the technique
introduced in Chapter 4.2.1. Next, using the same event log, the goal is to build a
CJM using the technique introduced in Chapter 4.2.2.
The third step consists of parsing the tree obtained in step 1. We use a reverse
breadth-first search, i.e., we traverse the operators in the tree from the lowest ones
to the root in a level-wise way. At each operators of the process tree, we offer the
opportunity to the end-user to merge the leaves under the operator. If the user
chooses to merge the activities, she should provide a new name and the operator

48 CJM-ab
X X X
+
1. Process Mining: Discovering a process tree from event logs
2. Customer Journey Mapping: Discovering a
CJM from event logs
3. Traverse the tree and interact with end-user
to merge activites
4. Transform the representative journeys at
different levels of granularity
time time
touc
hpoi
nts
touc
hpoi
nts
Fig. 4.3 Rendering a CJM at different levels of abstraction in four steps.
virtually becomes a leaf. If the end-user chooses not to merge the activities, we
keep the leaves intact. Otherwise, we keep the activities separated at all levels of
granularities, and we also disable the parents’ steps. Indeed, we postulate that if a
user does not want to merge two activities at a low level of granularity, it does not
make sense to merge them later at a higher level of granularity.
Input :c j m, customer journey mapλ, level of abstractionpt , process tree annotated with merging decisions
Output :c j mλ, cjm at the level of abstraction λ1 Function GetLevelAbstraction(c j m, λ, pt)2 for i ← 0 to λ do3 c j m → Abstract(c j m, pt .oper atori ) // Renaming the activities according to the
merging decisions
4 return c j m
5 Function Abstract(c j m, op)6 foreach j our ne y in c j m do7 j our ne y .replace(op.leaves, op.new_name, removeSeqRepeats=True )
8 return c j m
Algorithm 1: Function to get to the level of complexity λ.
Finally, in step 4, we transform the CJM at different levels of abstraction.
Let λ be the number of abstractions which will be available for a CJM. It can
be seen as the number of steps that will be included in the sliders visible in
Fig. 4.1, part ➌. Note that λ is equal to the number of times the end-user decides
to merge the activities. Let oper atorλ be the λth operator to be merged. Let
GetLevelAbstraction(c j m, λ, pt ) be a function that returns a CJM at the λth level
of abstraction. Algorithm 1 shows how the function Abstract is recursively called to
get to the level of abstraction λ. The parameter removeSeqRepeats in Algorithm 1
in line 7 emphasizes that continuous sequence of activities that are to be replaced,
will be replaced by only one instance of the new name given for this operator.
For instance, if the journey is "AABCBAC", the leaves that are to be replaced, are
"A" and "B" and the new name is "X", the journey will become "XCXC". This
reduces the length of the journeys and, thus, increases the abstraction. One can

4.4 Demonstration 49
add. reviewers
add. reviewer
review 2review 1review 3X X X X
+ τ
X
1 2 3 review X5
4 6
7
9Merge activitiesNOT merging activities
Legend:
reviews 1 to 3
invite rev…
get review 3
time-out 3
get review 1
time-out 1
get review 2
time-out 2
collect reviews
decideinvite add. rev…
time-out X
get review x
reject accept
X 8STEPITER.
STEPITER.
STEPITER.
STEPITER.
STEPITER.
STEPITER.
STEPITER.
STEPITER.
STEPITER.
Fig. 4.4 Process tree annotated with the order in which the operators are parsed(i.e., ‘iter. step’) and the decisions to merge the activities or not (i.e., colors redand green).
go back from more abstract to fine granular again by calling GetLevelAbstraction()
again with a smaller λ. The next section illustrates these four steps with a running
example.
4.4 Demonstration
This section provides a running example of our developed tool. The running
example is based on synthetic event logs describing the handling of reviews for
a journal (from [92]) cited in the introduction. It contains 10,000 journeys and
236,360 activities. This demonstration is available on http://customer-journey.
unil.ch/cjm-ab/. In the first step, we obtained a process tree by using the inductive
miner [59] with default parameters.13 It results in the process tree visible in Fig. 4.4.
In the second step, we obtain a CJM by: (1) measuring the distance between actual
journeys using the edit distance; (2) building a dendrogram using a hierarchical
clustering algorithm; (3) finding k using the Calinski-Harabaz Score (k=2); (4)
finding representative journeys using the function ‘seqrep’ available in Traminer,
a R package.14 It results in a CJM which is visible in ➋ (Fig. 4.1). In the third step,
we parse the XML in javascript. To traverse the tree, we are using a tree-like data
structures 15. The order in which the operators are parsed is depicted in Fig. 4.4
(i.e., ‘step’). Fig. 4.4 shows that we decided to merge 7 out of the 9 operators (in
green in Fig. 4.4). Note that we decided not to merge the activities ‘reject’ and
13Using the software ProM available at http://www.promtools.org/doku.php. Last visited: 18thof March 2020.
14Available at: http://traminer.unige.ch/doc/seqrep.html. Last visited: 18th of March 2020.15Available at: https://github.com/joaonuno/tree-model-js. Last visited: 11th of March 2020.

50 CJM-ab
Fig. 4.5 Screen shot of the application during the merging process at ‘step 1’.
Current Slider Value: 0
invite rev…get review 2time-out 1time-out 3collect reviewsdecideinvite add. reviewertime-out Xget review Xacceptreject
invite rev…
reviews 1 to 3
collect reviews
decide
invite add. reviewer
review X
accept
reject
Current Slider Value: 5
invite rev…
reviews 1 to 3
collect reviews
decide
add. reviewers
accept
reject
Current Slider Value: 7
Fig. 4.6 Results at the levels of abstraction 1, 3, and 7.
‘accept’, which disabled the option of merging all the activities below step 9. The
Fig 4.5 shows a screenshot of the application when merging the activities during
step 1. Finally, the Fig. 4.6 shows the resulting CJMs at three levels of abstraction.
4.5 Conclusion
CJMs are being used more and more to help service providers put themselves in
their customers’ shoes. However, very little research has investigated automated
ways of building them. We contribute by showing how a process mining model
can be used to guide the abstraction of a CJM. By answering few questions about
the merging of the activities and by playing with the abstraction sliders, we antici-
pate that our tool allows practitioners to gain new insights about their data. By
leveraging process trees – a format built within the process mining community –
we can bring customer journey analytics and process mining closer together. We
expect that many algorithms and works from process mining are relevant for the
discovery of customer journeys.
Note that we discuss the limitation in terms of evaluation of this chapter in
the conclusion of the thesis (page 86).

Chapter 5
Truncated Trace Classifier. Removal
of Incomplete Traces from Event
Logs.
Abstract. Process mining can analyze event logs to extract fact-based
insights about business processes. However, performing analysis on
event logs that contain truncated (also called incomplete) traces is prob-
lematic because their presence negatively impacts the process mining
outcomes. We propose the Truncated Trace Classifier (TTC), an algo-
rithm that distinguishes truncated traces from completed ones. We
benchmark 5 TTC implementations that use either LSTM or XGBOOST
on 13 real-life event logs. Accurate TTCs have great potential. In fact,
filtering truncated traces before applying a process discovery algorithm
greatly improves the precision of the discovered process models, by
9.1%. Moreover, we show that TTCs increase the accuracy of a next
event prediction algorithm by up to 7.5%.
5.1 Introduction
The execution of a business process often leaves trails in information systems
called event logs. Using these event logs, process mining techniques can extract
data-driven insights about business processes. For example, it is possible to
discover process models from event logs [62], to predict the next event [8, 85], or
to assess whether an ongoing process will fulfill a time constraint [35].
A truncated trace is a trace where the last events are missing. In fact, these
events happened or will happen, but they are not available at the time of the
analysis. The presence of truncated traces in event logs is acknowledged by

52 Truncated Trace Classifier. Removal of Incomplete Traces from Event Logs.
researchers [16, 40, 94, 100]. Interestingly, organizers of the latest edition of the
Process Discovery Contest [25]–a contest where participants have to infer process
models from event logs–have included truncated traces to make the synthetic
event logs more realistic.
We propose a Truncated Trace Classifier (TTC) that distinguishes truncated
traces from the ones that are not truncated. We refer to the latter as the ‘complete
trace’. We foresee three benefits of using a TTC. First, a TTC can filter truncated
traces. This is important because the success of process mining depends on the
quality of the input event logs [18, 29, 84, 93]. Second, a TTC helps to increase
operational efficiency. For instance, a ticket in a call center might stay open for
several days because an agent forgot to close it or because the customer did not
follow up on a requested action. Using a TTC, we could avoid the manual task of
closing them by doing it in an automated manner. Third, a TTC has potential that
goes beyond filtering techniques. For instance, we show in this work that a TTC
can improve the accuracy of predicting the next event.
It is not uncommon to read that truncated traces can be filtered out by looking
at the very last event [16, 40, 94, 100]. For example, a ticket is complete only when
the activity ‘closing the ticket’ happens. However, such a closing event might not
exist. Instead, a recurring one might occur [82]. For instance, the event ‘delivering
package’ might be a good indicator to predict that an order is fulfilled, but it might
reoccur if some items are being shipped separately. In such a case, relying on
the very last event will result in a poorly performing TTC. This observation is in
line with the conclusion drawn by Conforti et al. that existing techniques to filter
traces are often simplistic [29].
To the best of our knowledge, we are the first work focusing on building an
accurate TTC. Our contributions are the following: (1) We propose five machine
learning-based TTC implementations. (2) We benchmark these five implemen-
tations and a baseline approach using 13 event logs. (3) We highlight the benefit
of using a TTC for two process mining tasks, that of process discovery and next
event prediction.
The rest of this chapter is organized as follows. In Chapter 5.2, we provide
an overview of process mining and define truncated traces. In Chapter 5.3, we
propose several approaches to building a TTC, which we benchmark in Chap-
ter 5.4. Chapters 5.5 and 5.6 demonstrate the value of a TTC by showing how it
can increase the process model precision and next event prediction, respectively.
In Chapter 5.7, we discuss related work and we conclude in Chapter 5.8.

5.2 Preliminaries 53
5.2 Preliminaries
In this section, we briefly introduce the process mining discipline. Then, we define
truncated traces.
5.2.1 Process Mining
Process mining brings data science and business process management closer
together [94]. As stated in the process mining manifesto, the starting point of
process mining is an event log [93]. An event log contains traces, which are
sequences of events. Event logs often contain additional information such as a
timestamp or the resource. We will use the simple event log definition introduced
in [94]. A simple trace σ is a sequence of events. A simple event log L is a multi-set
of traces. For example, L = [⟨abc⟩3,⟨ab⟩2] is an event log containing 5 traces and
13 events. Taking an event log as input, several process mining techniques are
available. Typically, a process discovery algorithm such as the inductive miner,
[60], can infer the most likely business process model behind an event log. To
ensure that process mining works well, event logs need to be noise-free [29, 84, 93].
Truncation is one type of noise [33], which we introduce in the next section.
5.2.2 Truncated Traces
A truncated trace is an ongoing trace where the end of the process is missing.
Truncated traces are sometimes referred to as ‘incomplete cases’ [40, 100], ‘in-
complete traces’ [16], or ‘missing heads’ [84]. We favor the term truncated over
the term incomplete as the latter is often used for the concept of ‘event log incom-
pleteness’, referring to the fact that an event log will most likely not contain all
the combinations of behaviors that are possible because there are too many of
them [93]. For instance, when there is a loop in the process model, the number of
unique combinations is infinite. Event logs will most likely be incomplete while
they may not contain truncated traces.
There are several reasons to explain the existence of incomplete traces. They
might exist because of a flawed event log extraction process that cuts the traces
at a fixed date, leaving the traces that finish after truncated. This issue–named
‘the snapshots challenge’–has been identified by van der Aalst as one of the five
challenges that occurs when extracting event logs [94, chapter 5.3]. This type of
truncated trace could be avoided by extracting only the traces where no event
happens after the extraction date. However, once the data is extracted, we cannot
know which traces are truncated. As another example, incomplete traces can

54 Truncated Trace Classifier. Removal of Incomplete Traces from Event Logs.
truetruefalsetruetruetrue
falsetrue
Target:(Truncated?)
a
a
ababc
acacaacadacadd
InputSample
<abc>
<acadd>
Trace1
4
23
5678
#
Fig. 5.1 The traces ⟨abc⟩ and ⟨acadd⟩ result in eight samples.
exist because the events have not happened yet. This is especially relevant when
working with streaming data. Finally, truncated traces can result from a wrong
execution (e.g., the ticket was supposed to be closed but the agent forgot to do it)
or when the information system fails. In the next section, we introduce a classifier
to automatically detect truncated traces.
5.3 Truncated Trace Classifier
A TTC inputs the current execution of a trace and predicts whether it is truncated.
As shown in Table 5.1, we generate one input sample and one target for each prefix
length of each trace. The input sample represents the current state of the process
on which we apply a TTC. The target is a binary label that is ‘true’ when the trace
is truncated or ‘false’ otherwise.
This setting implies that ‘real’ truncated traces that we would like to identify as
such using the TTC would be labeled as complete. However, our intuition is that
the model will also learn from similar complete traces where the truncated parts
will be labeled as ‘truncated’. For illustration purposes, let us define the following
event logs: ⟨abc3, ab⟩. During the training phase, the sequence ab appears three
times as ‘truncated’ and once as ‘complete’. Hence, during the prediction phase,
the sequence ab would most likely be predicted as ‘truncated’.
To build a classifier, we need to map the input sample to a feature space.
There are several options to do so, covered in depth in [64, 100–102]. We provide
non-exhaustive examples that are illustrated in Fig. 5.2.
Last Event. Relying only on the last event to predict that a trace is truncated
is one option often mentioned in the literature [16, 40, 94, 100]. For example, the
input for sample #3 from Fig. 5.1 would be ‘c’.

5.3 Truncated Trace Classifier 55
acaacad
a10
b00
c00
d01
Last Event.
acaacad
a22
b00
c11
d01
Frequency.
acaacad
a11
b00
c11
d01
Binary.
acaacad
1a11
1b00
1c00
1d00
Index Based Encoding.………
4a00
4b00
4c00
4d01
Sequence Tensor.
acaacad
a11
b00
c11
d01
i=3
acaacad
a11
b00
c11
d01
i=2
acaacad
a11
b00
c00
d00
i=1
Fig. 5.2 Illustration of the feature spaces for the input samples ⟨aca⟩ and ⟨acad⟩.
Frequency Based and Last Activity
XGBOOST
Base Features
(4) FB&LAFrequency
Based
XGBOOST
Base Features
(3) FB (Frequency Based)
Last Activity
XGBOOST
Base Features
(2) LA (Last Activity)
Last Activity
XGBOOST
(1) BL (Baseline)
(5) Soft (Softmax)
Sequence Tensor LSTM
Base Features Fully Connected Layer
Softmax
Neural Network
(6) Sig (Sigmoid)
Sequence Tensor LSTM
Base Features Fully Connected Layer
Sigmoid
Neural Network
Fig. 5.3 Five implemented TTCs.
Frequency. The ‘frequency’ feature space counts the occurrences of each
event. As shown in Fig. 5.2, ⟨aca⟩ becomes {a:2,b:0,c:1,d:0}. This feature space
does not record the order in which the events appear.
Sequence Tensor. A sequence tensor contains an extra ‘timestep’ dimension.
Each timestep is a matrix similar to the ‘last event’; i.e., it describes which event
happens. The extra dimension allows to describe the full sequence of timesteps in
a lossless way. The number of timesteps is equal to the longest sequence in the
event logs.
Once the input samples have been mapped into a feature space, it can be fed
together with the target to a classifier. We propose five TTC implementations
depicted in Fig. 5.3. As can be seen in Fig. 5.3, We also add a few base features:
(1) the number of activities in the prefix, (2) the number of seconds since the
first event in the trace, and (3) the number of seconds since the previous event in
the trace. Such extra features were also added in the predictive business process
monitoring proposed by Tax et al. [85]. The five TTCs are described below.

56 Truncated Trace Classifier. Removal of Incomplete Traces from Event Logs.
1 LA (Last Activity). This TTC relies on the last activity to predict that the trace
is truncated.
2 FB (Frequency Based). This TTC uses the ‘frequency’ feature space described
in Section 5.3.
3 FB&LA. This TTC concatenates the TTCs ‘1 LA’ and ‘2 FB’ because they both
convey complementary information.
4 Soft (Softmax). This TTC corresponds to a next event prediction algorithm. In
fact, the implementation is similar to the predictive business process monitoring
from Tax et al. [85]. Predicting which event will occur is a multi-class prediction
problem. Thus, we rely on the Softmax function because it transforms the output
to a probability distribution. The end of the process is treated as any other event.
If the latter is predicted as the most likely next event, we predict that the trace is
complete. If not, we predict that the trace is truncated.
5 Sig (Sigmoid). The TTC ‘5 Sig’ turns the multi-class problem into a binary
one by using a one-vs-all strategy with the special ‘end’ event. We implemented
both TTCs to compare the accuracy when the neural network is specially trained
to recognize truncated traces (‘5 Sig’) or when the task is to predict the next event
(‘4 Soft’).
TTCs 1 to 3 use XGBoost16 [26], which stands for eXtreme Gradient Boosting.
It relies on an ensemble of decision trees to predict the target. This technique is
widely used among the winning solutions in machine learning challenges [26]. For
the main settings, we set the number of trees to 200 and the maximum depth of the
trees to 8. The last two TTCs rely on a neural network implemented in Keras [28].
As shown in Fig. 5.3, the architecture has two inputs. First, the sequence tensor is
passed to a Long Short-Term Memory (LSTM) network. LSTM is a special type of
Recurrent Neural Network (RNN) introduced in [52]. Compared to RNN, LSTM
possesses a more advanced memory cell that gives LSTM powerful modeling
capabilities for long-term dependencies [85]. The output of the LSTM network
and the base features are provided to a fully connected layer. Both the LSTM
network and the fully connected layer have 16 cells. We use Adam [55] as an
optimizer and we set the number of epochs to 100.
5.4 Benchmark
In this section, we benchmark the five TTCs described in the previous section, in
addition to a baseline approach.
16Available at https://github.com/dmlc/xgboost/tree/master/python-package

5.4 Benchmark 57
5.4.1 Datasets
We used 13 event logs17 well known in the process mining literature. The event
logs come from “real-life” systems, offering the advantage of containing complex
traces and a wide range of characteristics visible in Table 5.1.
To the best of our knowledge, these event logs do not contain truncated traces.
However, this is difficult to confirm. For instance, exceptional events might hap-
pen several months after the event log extraction date. In general, without having
a deep expertise of the domain under analysis and direct access to the person
in charge of the dataset extraction, it is not possible to guarantee that all traces
are complete. We use the term ‘false complete’ to refer to traces that we wrongly
consider complete during the training phase but that are in fact truncated be-
cause more events will happen. We claim that a TTC should be resilient to ‘false
complete’. In other words, a TTC should not overfit on a single ‘false complete’
and wrongly classify all similar traces as complete.
To test the resilience of the TTCs, we generated 0%, 10%, and 20% of ‘false
complete’ traces by randomly cutting them. The setting with 0% of ‘false complete’
reflects how the TTC should be used with a real dataset, i.e., considering all the
traces as complete. For the two other settings, we kept track of the traces that are
truncated and refer to them as ‘ground truth’. To benchmark the various TTCs,
we use the ground truth. For instance, let us define that ⟨abc⟩ is a complete trace
that we randomly cut to become the following ‘false complete’: ⟨ab⟩. During the
training phase, we train the classifier to consider ⟨ab⟩ as a complete trace, while
during the evaluation ⟨ab⟩ should be classified as truncated to be well classified.
5.4.2 Baseline: Decreasing Factor
Standard process mining tools and libraries such as the plugin ‘Filter Log us-
ing Simple Heuristics’ in ProM18, the software Disco19 or the Python library
PM4Py [14] offer some options to remove truncated traces. Typically, a set of
ending activities is selected by the end-user and the traces that do terminate with
the ending activities are considered truncated and removed. It is also possible to
automatically determine the set of ending activities. Let S be the set of ending
activities that we will use to filter the truncated traces. As a baseline, we use the
method implemented in PM4Py which works as follows: First, the number of
occurrences of each activity as a last activity is counted. Let Ci be the count of the
17Downloaded from https://data.4tu.nl/repository/collection:event_logs_real18http://www.promtools.org19https://fluxicon.com/disco/

58 Truncated Trace Classifier. Removal of Incomplete Traces from Event Logs.
Table 5.1 Characteristics of the 13 datasets.
BPI_12 164.5K13.1K 23 96 12.63
BPI_13_CP 6.7K1.5K 7 35 4.51
BPI_13_i 65.5K7.6K 13 123 8.71
BPI_15_1 52.2K1.2K 398 101 43.62
BPI_15_2 44.4K0.8K 410 132 53.31
BPI_15_3 59.7K1.4K 383 124 42.43
BPI_15_4 47.3K1.1K 356 116 44.91
BPI_15_5 59.1K1.2K 389 154 51.15
BPI_17 561.7K31.5K 26 61 17.88
BPI_18 123.3K2.0K 129 680 61.935
Env_permit 38.9K0.9K 381 95 41.62
Helpdesk 13.7K3.8K 9 14 3.61
Dataset #activities#σUniqueactivities
MaxLength(σ)
MinLength(σ)
MeanLength(σ)
BPI_19 1.6M251.7K 42 990 6.31
i th most frequent end activity. We start by adding the most frequent end activity,
C1, to S. Then, we calculate the decreasing factor of the next most frequent activity
using the following formula: Ci /Ci−1. If the decreasing factor is above a defined
threshold we add Ci to S and move to next most frequent activity. If the threshold
is not met, we stop the process. We tried the following thresholds: 0.40, 0.45,
0.50, 0.55, 0.60, 0.65, and 0.70. We report the results obtained using a threshold
of 0.60 as it is the one that yields the best accuracy to detect truncated traces.
Interestingly, it is also the default value in PM4Py.
5.4.3 Evaluation
The first 80% of the traces were used to train the model, and the evaluation was
done on the remaining 20%. Out of the 80% of training data, 20% was used to
validate the parameters. To compare the ground truth with the output of the TTC,
we used the Matthews Correlation Coefficient (MCC) [69]. The MCC has the nice
property of using all the quantities of the confusion matrix, i.e., True Positive
(TP), True Negative (TN), False Positive (FP), and False Negative (FN). Its value lies
between -1 and 1, where 0 represents a random prediction, 1 a perfect score, and
-1 an inverse prediction. It is defined as:
MCC (σ) = T P ·T N −F P ·F Np(T P +F N )(F P +F N )(T N +F P )(T N +F N )

5.5 Improving Discovered Process Models with a TTC 59
Fig. 5.4 aggregates the results per TTC, while Fig. 5.5 contains the detailed re-
sults. In Fig. 5.5, we can see a large MCC score gap per dataset. This gap highlights
the various levels of complexity involved in detecting truncated traces. Also, none
of the techniques always outperforms the others. This is in line with a similar
conclusion that was drawn from large predictive business process monitoring
experiments [34]. Nonetheless, when looking at Fig. 5.4, we observe that the TTC
‘3 FB&LA’ has the highest median MCC score. Interestingly, the performance of
the baseline is comparable to the best implementations for the following five
datasets: BPI_13_CP, BPI_13_i, BPI_18, Env_permit, Helpdesk (see Fig. 5.5). For
the other eight datasets, there is a clear drop in performance between the baseline
and more sophisticated methods. Looking at Table 5.1, we do not see any clear
dataset characteristics to explain the performance gap. We conclude that looking
at the last activity might work well, but for some datasets it is better to use a more
sophisticated TTC.
We also tested the null hypothesis that the results from different TTCs come
from the same distribution. To do this, we ran a permutation test with 100,000
random permutations and a p-value of 0.05. The results are visible in Fig. 5.6. As
can be seen, ‘3 FB&LA’ outperforms the baseline approach with strong statistical
significance. We also observe that transforming a multi-class problem into a
binary classifier–using the ‘4 Soft’ instead of the ‘5 Sig’–does not seem to improve
the ability of the TTC to detect truncated traces, as the MCC scores of Fig. 5.4 are
comparable.
Fig. 5.7 compares the execution time per TTC. The baseline takes in the order
of milliseconds to run. TTCs that are based on XGboost take in the order of
seconds or minutes to run, while approaches that rely on neural networks take
from minutes to hours to run. In fact, the ‘4 Soft’ and ‘5 Sig’ are on average 112
times slower than the other TTCs that rely on XGBoost.
The full benchmark implementations, the parameters, and the event logs, as
well as the results are available online20. The machine used for the experiment
has 61GB of RAM, 4 CPUs, and a GPU that speeds up the neural network training
phase.
5.5 Improving Discovered Process Models with a TTC
A process discovery algorithm discovers a process model from an event log [94].
Because the discovered process model is based on event logs, it offers the advan-
20https://github.com/gaelbernard/truncated-trace-classifier

60 Truncated Trace Classifier. Removal of Incomplete Traces from Event Logs.
0.0 0.2 0.4 0.6 0.8 1.0
1 BL
3 FB4 FB&LA
2 LA
6 Sig5 Soft
Fig. 5.4 Boxplot showing the MCC scores per technique. Each dot depicts anindividual value. The median is written on top.
tage of being a data-driven approach that shows how the process is really executed.
However, discovering a process model from an event log is a challenging task. Typ-
ically, process discovery algorithms are sensitive to noise [84, 29, 93, 18]. Applying
process mining techniques on traces that must supposedly be complete but are
instead truncated is no exception. The quality of a process model is commonly
measured using four competing metrics [93]: (1) The precision measures to what
extent behaviors that were not observed can be replayed on the process model. (2)
The fitness measures to what extent the traces from the event logs can be replayed
on the model. (3) The generalization ensures that the model does not overfit.
Finally, (4) the simplicity measures the complexity involved to read the process
model. When facing truncated traces, a process discovery algorithm will wrongly
infer that the process can be stopped in the middle. This will negatively impact
the precision of the discovered process model. To solve this issue, researchers
advocate removing truncated traces [16, 94, 100]. As highlighted by Conforti et al.,
“[t]he presence of noise tends to lower precision as this noise introduces spurious
connections between event labels” [29].
We ran an experiment to measure the impact of removing truncated traces on
the quality of the process models using PM4Py [14], a process mining library in
Python. We used the default metrics in PM4Py which are described in the follow-
ing papers: precision [72], fitness [94, p. 250], generalization [23], and simplicity
[17]. To start, we randomly generated 100 process models with the PM4py imple-
mentation of PTandLogGenerator [53], using the default parameters21. For each
process model, we produced an event log containing 1,000 traces. We produced
20 variations of each event log with a level of noise ranging from 0 to 1, where 0
means that no traces were truncated and 0.05 means that 5% of the traces were
21Visible at: https://pm4py.fit.fraunhofer.de/documentation#process-tree-generation

5.5 Improving Discovered Process Models with a TTC 61
Noise: 0 Noise: 0.1 Noise: 0.2
BPI_12
BPI_13_CP
BPI_13_i
BPI_15_1
BPI_15_2
BPI_15_3
BPI_15_4
BPI_15_5
BPI_17
BPI_18
BPI_19
Env_permit
Helpdesk
.00 .89 .97 .97 .88 .92 .00 .85 .93 .93 .72 .86 .00 .78 .85 .85 .77 .78
.96 .96 .13 .96 .96 .96 .94 .94 .13 .94 .94 .94 .87 .87 .13 .87 .84 .87
.80 .52 .33 .53 .80 .81 .78 .62 .61 .62 .78 .79 .73 .57 .57 .58 .73 .74
.05 .49 .45 .46 .22 .00 .05 .23 .35 .46 .13 .15 .04 .27 .31 .40 .11 .06
.26 .49 .72 .72 .28 .32 .25 .41 .63 .69 .30 .15 .21 .35 .60 .55 .21 .18
.27 .15 .11 .19 .09 .22 .28 .18 .06 .23 .10 .16 .25 .14 .05 .23 .08 .12
.00 .01 .28 .15 .46 .28 .00 .01 .27 .13 .35 .27 .00 .02 .26 .15 .27 .19
.17 .19 .29 .30 .34 .23 .16 .17 .20 .18 .32 .23 .16 .17 .32 .36 .32 .19
.68 .79 .97 .97 .78 .96 .67 .77 .94 .94 .72 .92 .64 .73 .88 .88 .74 .86
.55 .50 .50 .52 .18 .23 .53 .49 .45 .49 .47 .24 .46 .39 .46 .47 .34 .37
.13 .63 .77 .77 .61 .70 .13 .60 .73 .73 .64 .66 .12 .54 .66 .67 .41 .62
.45 .46 .42 .46 .34 .43 .42 .44 .45 .45 .44 .47 .42 .44 .40 .42 .29 .41
.94 .94 .91 .94 .94 .94 .90 .90 .87 .90 .90 .90 .81 .81 .78 .81 .81 .81
1 BL
2 LA
3 FB
4 FB
&LA
5 So
ft
6 Si
g
1 BL
2 LA
3 FB
4 FB
&LA
5 So
ft
6 Si
g
1 BL
2 LA
3 FB
4 FB
&LA
5 So
ft
6 Si
g
Fig. 5.5 Detailed MCC score.
0 Baseline 1 LA 2 FB 3 LA&FB 4 Sig 5 Soft
0 Baseline1 LA
2 FB
3 LA&FB4 Sig
5 Soft
.906
.188
.959
.974
.151
.906
.268
.941
.929
.146
.188
.268
.206
.204
.008
.959
.941
.206
.986
.141
.974
.929
.204
.986
.147
.151
.146
.008
.141
.147
Fig. 5.6 P-values of the permutation tests between the MCC scores per techniques.

62 Truncated Trace Classifier. Removal of Incomplete Traces from Event Logs.
#Activities
6.7K
13.7
K
38.9
K
44.4
K
47.3
K
52.2
K
59.1
K
59.7
K
65.5
K
124.
3K
164.
5K
561.
7K
1595
.9K
0.1
1
10
100
1'000
10'000
Tim
e To
Bui
ld A
nd T
rain
Mod
el
(Sec
onds
, Log
arith
mic
sca
le)
1 BL 2 LA, 3 FB, 4 FB&LA 5 Soft, 6 SigLegend:
Fig. 5.7 Execution time for the five TTCs. The vertical axis uses a logarithmic scale.
truncated, and so on. Altogether, this process produced 20,000 event logs. For
each of the 20,000 event logs, we ran the following experiment: (1) We applied the
Inductive Miner [60] on the event logs to discover a process model, and (2) then
we replayed the original event log–that did not contain the truncated traces–on
the process model to measure the quality of the discovered process models. This
was the experiment without a TTC. For the experiment with a TTC, we applied
the exact same steps, but, beforehand, we automatically removed the truncated
traces with the TTC ‘3 FB&LA’ described in Section 5.3.
In Fig. 5.8, the results are averaged. As can be seen, the precision and the
generalization metrics are greatly improved, while the simplicity and the fitness
dimensions are negatively impacted. Table 5.9 shows that the average process
quality is improved by 1.7%. Fig. 5.8 shows the link between the ratio of truncated
traces in the event logs and the quality of the resulting process models. The
average process quality visible at the top of Fig. 5.8 shows that when there are
some truncated traces in the event logs, applying the TTC is always beneficial. In
the next section, we show that a TTC can also increase the prediction of the next
events.
5.6 Improving Next Event Prediction with a TTC
The goal of a next event algorithm is to predict the most likely event that will
follow a truncated trace. As shown with the ‘4 Soft’ TTC, we can turn a next event
algorithm into a TTC. Looking at the benchmark in Fig. 5.4, we show that the TTC

5.6 Improving Next Event Prediction with a TTC 63
.0 .1 .2 .3 .4 .5 .6 .7 .8 .9 1.0% truncated traces
.71
.72
.73
Average
Inductive Miner with a TTCInductive Miner
.0 .5 1.0
.48
.50
.52
.54
Precision
% truncated traces.0 .5 1.0
.75
.80
.85
Generalization
% truncated traces.0 .5 1.0
.95
.96
.97
Fitness
% truncated traces.0 .5 1.0
.58
.60
.62
.64Simplicity
% truncated traces
Fig. 5.8 Impact of the truncated traces on the process model qualities.
Fig. 5.9 Mean process quality of the discovered process models with and withoutthe TTC.
Precision
-7.8%-1.7%
Average
Process Quality Dimension increasewithout ttc0.5267
0.7064 1.7%
9.4%0.7413
0.63280.9687
0.8112
0.7184
Fitness
0.4829 9.1%
0.5833Simplicity0.9523
Generalization
with ttc

64 Truncated Trace Classifier. Removal of Incomplete Traces from Event Logs.
Table 5.2 Comparing the accuracy of predicting the next event and the executiontime, without and with a TTC.
116 116Helpdesk --0.8226 0.82263880.2324 - 3730.2325 3.9%Env_permit
0.4755 1.4%BPI_19 87970.4855 86742.1%0.6277 0.6323 786 2.2%0.7%BPI_18 804
1.0%0.6%0.7642 0.7689 23422318BPI_170.0884 663BPI_15_5 1.3% 4.4%6340.0873
0.6% 366BPI_15_4 3830.1385 0.1394 4.4%0.1364 851 2.5%BPI_15_3 0.1364 873-
0.6%increase
0.4%-
3.5%6.6%
521
628
with ttc
172
347
1066172
without ttc
324
1060
606
519
0.1584 5.0%BPI_15_2 0.15090.0851BPI_15_1 0.0915 7.5%
0.68960.5559
with ttc--
increasewithout ttc
0.55590.6899
BPI_13_CPBPI_12Dataset
0.6486 0.1%0.6478BPI_13_i
Accuracy Execution time (in seconds)
‘3 FB&LA’ outperforms the TTC ‘4 Soft’. We have the intuition that combining the
best TTC with a next event algorithm will increase the prediction accuracy. The
rationale is that we will more accurately predict the end of the process with a TTC
because it has been trained for this purpose. Hence, we first rely on the TTC to
predict if more events are expected. If not, we do not need to call the next event
algorithm. Overall, we should improve the results as we avoid predicting a next
event when the trace is not truncated. The goal of this section is to validate this
hypothesis.
As it is initially a next event prediction algorithm, we use the TTC ‘4 Soft’ for the
prediction of the next event. In the setting without a TTC, it is the only algorithm
involved. In the version with a TTC, we complement the architecture with the TTC
‘3 FB&LA’ in the following way. First, we assess if the trace is truncated using the
TTC. If the trace is truncated, we predict the next event. Conversely, if the trace is
already complete, we do not need to predict the next event. The results are visible
in Table 5.2. Including a TTC improves the accuracy by up to 7.5% and on average
by 1.4%. In the experiment, building the TTC took an extra 2.4% of duration. We
claim that including a TTC is beneficial for the accuracy while having a limited
negative execution time impact. A TTC solves one problem noted by Tax et al.:
“We found that LSTMs have problems [...] to predict overly long sequences of the
same activity, resulting in predicted suffixes that are much longer than the ground
truth suffixes” [85].

5.7 Related Work 65
5.7 Related Work
To the best of our knowledge we are the first to focus on the task of distinguishing
truncated from complete traces. Still, existing works—especially in the area of
predictive process monitoring—are relevant to uncover truncated traces.
Predictive process monitoring anticipates whether a running process instance
will comply with a predicate [35]. For instance, a predicate might be about the
process execution time, the execution of a specific event, or the total amount of
sales. As highlighted by Verenich et al., techniques in this space differ according
to their object of prediction [101]. A TTC is a specific type of predictive process
monitoring task where the predicate is whether we will observe more events.
In [66], Maggi et al. propose a generic predictive process monitoring approach.
Once the predicate is set, the most similar prefixes are selected based on the edit
distance. Finally, a classifier is used to correlate the goal with the data associated
with the process execution. Insights are then provided to the end-user to optimize
the fulfillment of the goal while the process is being executed. It was later extended
with a clustering step to decrease the prediction time [35]. Tax et al. propose a
neural network that leverages LSTM that could serve as another generic predictive
process monitoring algorithm capable of fitting different predicates [85]. In our
work, we use the approach from Tax et al. as a baseline (i.e., TTC ‘4 Soft’). Despite
the advantage of being generic, we show that a tailor-made algorithm to detect a
TTC outperforms such an approach.
The goal of a business process deviance mining algorithm is to assign a binary
class–normal or deviant–to a trace. In this sense, it shares similarities with pre-
dictive process monitoring. This is especially true because of their overlapping
inputs and feature extraction methods [74]. However, deviance mining works on
completed instances and focuses on the why [74].
Finally, Bertoli et al. propose a reasoning-based approach to recover missing
information from event logs [15]. Ultimately, it would allow us to turn a truncated
trace into a complete one. To work, this technique requires a reference process
model as input. Therefore, it is not applicable if the task at hand is to discover a
process model.
5.8 Conclusion
Event logs are often noisy, which makes the application of process mining some-
times difficult in a real setting [18]. Typically, the existence of truncated traces
is known. Still, there is a research gap in systematically detecting them. In this

66 Truncated Trace Classifier. Removal of Incomplete Traces from Event Logs.
chapter, we treat the identification of truncated traces as a predictive process
monitoring task and we benchmark several TTCs using 13 complex event logs. We
show that building a TTC that consistently achieves high accuracy is challenging.
This finding highlights the importance of conducting further research to build
an efficient TTC. Typically, for some event logs, using a baseline approach that
relies solely on the last activity works well. Still, we show that the TTC ‘3 FB&LA’
outperforms such baseline approach with strong statistical significance.
We also measure the process model quality impact when a process discovery
algorithm is run on event logs that contain truncated traces. We show that only a
few truncated traces can greatly decrease the process model quality and that a TTC
can alleviate this problem by automatically removing truncated traces. Finally, we
highlight the unexplored potential of a TTC to increase the accuracy of predicting
the next event. We expect that more benefits of TTCs are yet to be discovered,
especially in the predictive business process monitoring area.
In this chapter, we use the sequence of activities as well as some timing infor-
mation. Using more information such as the name of the resource, the day of the
week or any other event attributes could further improve the accuracy of the TTCs.
Higher accuracy could also be achieved by using different classifiers, trying new
neural network architecture, or implementing alternative feature spaces. This is
an area for future research where our work can serve as a baseline.

Chapter 6
Accurate and Transparent Path
Prediction Using Process Mining
Abstract. Anticipating the next events of an ongoing series of activities
has many compelling applications in various industries. It can be used
to improve customer satisfaction, to enhance operational efficiency,
and to streamline health-care services, to name a few. In this work,
we propose an algorithm that predicts the next events by leveraging
business process models obtained using process mining techniques. Be-
cause we build the predictions from business process models, it allows
business analysts to interpret and alter the predictions. We tested our
approach with more than 30 synthetic datasets as well as 6 real datasets.
The results have superior accuracy compared to using neural networks
while being orders of magnitude faster.
6.1 Introduction
After observing a few events of an incomplete sequence of activities, it is possible
to predict the next events until process completion by learning from historical
event logs, an activity coined path prediction [79]. Anticipating the next events
is valuable in a wide range of scenarios. For instance, when a service desk team
predicts the paths taken by open tickets, the results can be used in many different
ways. One proposition is to cut the number of predicted complaints due to delays
by changing the priority of tickets. Another is to reduce the negative impact on
customer satisfaction by preemptively informing them about a delay. One more is
to align the expertise of service desk agents with the events predicted for a ticket.
The predictions could also be used by inexperienced agents to anticipate the
next events better, allowing them to communicate more accurate information to

68 Accurate and Transparent Path Prediction Using Process Mining
the customers. Overall, predicting paths can help improve worker and customer
satisfaction, as well as improve operational efficiency.
There are two main approaches to making predictions for a series of events.
The first uses process mining while the second relies on neural networks [85].
Both approaches have their strengths and limitations. Process mining is more
transparent because it relies on models that can be inspected by business analysts.
This is important, as business analysts may have knowledge that will influence
their confidence in the prediction which might not be available in the data. Fur-
thermore, “business stakeholders are not data scientists [...] they are more likely to
trust and use these models if they have a high-level understanding of the data that
was used to train these models” [3]. In contrast, reasoning about predictions made
by artificial neural networks is complex, if not impossible. Furthermore, a neural
network requires a long training time [79]. However, in terms of performance,
the most recent research shows that predictions using long short-term memory
(LSTM) in a neural network achieves high accuracy [85].
We address the research gap that exists between accurate, but black-box,
techniques and transparent, but less accurate, process mining techniques. Indeed,
we aim to make predictions that are accurate, fast, and interpretable by business
analysts. We propose a matrix named the loop-aware footprint matrix (LaFM),
which captures the behaviors of event logs when replayed on a business process
model obtained automatically using process mining techniques. The captured
behaviors are then retrieved from LaFM to make predictions about uncompleted
traces. We also propose a clustered version of LaFM (c-LaFM) that can cope with
the inherent complexity of real datasets. We evaluate the prediction accuracy of
LaFM with 30 synthetic datasets and the accuracy of c-LaFM with 6 real datasets.
We show that our technique outperforms the LSTM approach introduced in [85].
The chapter is organized as follows. In Chapter 6.2, we introduce the main
definitions and discuss process mining. Chapter 6.3 provides an overview of
existing works. Chapter 6.4 presents the main idea behind LaFM. In Chapter 6.5,
we present the evaluation procedure. In Chapter 6.6 evaluates and compares the
accuracy of the method using synthetic datasets. In Chapter 6.7, we introduce the
clustered version of LaFM, coined c-LaFM, which is evaluated in Chapter 6.8. We
conclude in Chapter 6.9.
6.2 Preliminaries
In this section, we lay out the main definitions and concepts of our approach.
They are part of the well-established process mining discipline. In this paper, we

6.2 Preliminaries 69
seq1
loop5
seq6
E F
xor7
xor3 τ4 τ5
and2
A GD
and4
B C
Fig. 6.1 Process tree obtained by the inductive miner with traces: {⟨ABDEF⟩,⟨BDAEGEF⟩, ⟨DCEFEG⟩, ⟨CDEG⟩}.
consider only the sequence of events, disregarding the timestamps or any other
contextual information in the data. By doing so, we present a simplified view of
process mining, to be complemented with the foundational book about process
mining [94].
Events. An event is a discrete type of data representing the activities executed
in a process. For instance, ‘transferring a ticket’ is an event in a ticket’s lifecycle.
Let e be an event (equivalent to a ‘touchpoint’ in customer journey term) and E
be the set of all distinct events; i.e., e ∈ E .
Trace. A trace is an instance of a process execution. In a service desk context,
a trace is a ticket (equivalent to a ‘journey’ in customer journey term). Let t ={e1,e2, ...;e ∈ E } be a trace: a list of events. For instance ⟨ABBC⟩ is a trace with three
distinct events of length 4 (|t | = 4).
Prefix. Let a prefix pn = {e1,e2, ...,en ;e ∈ t } be the first n events of a trace. Typi-
cally, if t = ⟨ABBC⟩, then p3 = ⟨ABB⟩. A prefix represents the few events observed
from an uncompleted trace that we use to make a prediction.
Suffix. A suffix represents the n last events of a trace. Formally, sn = {e|t |−n , ...,
e|t |−1 ,e|t | ;e ∈ t ; e ∉ pn ; |pn |+ |sn | = |t |}, i.e., the suffix is the complement of the
prefix. The suffix is the set of events that we are trying to predict.
Event logs. An event log L = {t1, t2, ...; } is a collection of traces.
By looking only at the event log, process discovery techniques allow us to infer
the business process model that describes well the behavior of the traces. This is
a challenging task because the algorithm should be able to generalize behaviors
even if only a subset of them is observed, to exclude noise and outliers, and to
discover a model that is simple enough that it can be analyzed by a business
analyst but also precise enough to reflect the behaviors of the event logs. Several
techniques and approaches have been proposed to tackle this task. In this work,
we use the inductive miner [60].

70 Accurate and Transparent Path Prediction Using Process Mining
The inductive miner works by finding the best split in an event log and seeing
how the two parts are related. It does this recursively on both parts. The output
is a process tree (Fig. 6.1), which is a representation of a process model that was
introduced in [98]. A process tree uses four operators: (1) the exclusive choice
operator, xor, expresses that only one of the branches is executed; (2) the parallel
operator, and, indicates that all the branches should be executed, in any order; and
(3) a sequence, seq, forces the execution of the branches from left to right. Finally,
(4) a loop has a more complex execution scheme: the first branch is executed at
least once. Then, either we enter the loop by executing the second branch and
the first branch again (which can be done once or multiple times), or we execute
the third branch to exit the loop. As can be seen in Fig. 6.1, except for the leaves,
these four operators fill the whole tree. The leaves of the tree are composed of the
events E as well as silent activities. Silent activities, τ, can be executed like any
other events in the model, but they will not be seen in the traces.
We have now introduced the main terminology, the inductive miner, and the
process tree. Path prediction is concerned with predicting the suffix for a given
prefix by learning from event logs. It differs from process model discovery in
which the goal is to discover a process model from event logs. While the output is
different, both methods are about understanding the control flow of traces. We
leverage this by using the inductive miner as a first step in making predictions.
6.3 Related Work
The area of predictive analytics is wide as trace predictions can be time-related
(e.g., predicting the remaining time), outcome-oriented (e.g., success vs. fail-
ure), or control-flow oriented (e.g., next event(s) prediction). In this work, we
specifically focus on the latter type of prediction.
A widely adopted approach to prediction is to build a Markov chain that de-
scribes the transition probabilities between events. These transition probabilities
are used to make predictions. A prediction depends only on the previously ob-
served event. In the all-K-order Markov model, [78], the number of levels in the
Markov chain is increased, but this increases the execution time. While the accu-
racy of the prediction increases, it suffers from rigidness in terms of the “patterns
that it can learn” [46]. As another approach, Gueniche et al, propose the compact
prediction tree [46]. It uses three data structures that can be used efficiently to
retrieve the most probable event that might occur after having observed a prefix.
While it predicts with high accuracy which events might occur in the suffix, it does

6.4 LaFM: Loop-Aware Footprint Matrix 71
not return the order in which they will be executed. Hence, compact prediction
trees are not suitable for predicting paths.
There are several process mining approaches for predicting paths. In [57],
Lakshmanan et al. propose a method that estimate the likelihood of the next
activities using a process model and Markov chain. Breuker et al. propose in
[19] a predictive framework that uses grammatical inference and an expectation-
maximization algorithm to estimate the model parameters. Among its predictions,
it can predict the next event. Improving the comprehensibility of the predictions
is one of the design goals of their approach, so that “users without deep technical
knowledge can interpret and understand” [19]. In [79], Polato et al. propose a
labeled transition system and methods for several predictive analytic tasks. Path
prediction can be done by finding a path in the transition system that minimizes
the sum of the weights between the edges.
Recently, neural networks have been studied for predicting the next events. To
the best of our knowledge, Evermann et al. were the first to use a LSTM neural
network approach to predict the next event of an ongoing trace [39]. LSTM, [52], is
a special type of neural network for sequential inputs. It can learn from long-term
dependencies using a sophisticated memory system. The sophisticated memory
system is a double-edged sword: it achieves high accuracy; however, its inherent
complexity makes the inspection of the reasoning behind the predictions difficult.
In [85], Tax et al. generalize the approach of [39]. They evaluate–amongst other
methods–the performance of the algorithm in path prediction and show that it is
more accurate than [19, 39, 79]. Because it achieves the best accuracy, we use it as
a baseline when evaluating the accuracy of LaFM.
Overall, two streams of research dominate path prediction. On one hand,
using process mining techniques, we can make predictions using models that
can be inspected by business analysts. On the other hand, neural networks attain
better performance in terms of accuracy. Our contribution is an algorithm that
utilizes the best aspects of both methods.
6.4 LaFM: Loop-Aware Footprint Matrix
We designed LaFM to store the behavior of traces efficiently when replayed on
business process models. The goal is that the behaviors can be retrieved when
predicting a suffix of events. First, we present the LaFM data structure. Next, we
explain how to build it. Finally, we detail how to use it to make predictions.

72 Accurate and Transparent Path Prediction Using Process Mining
11
1 G
FBDAEGEFABDEF
FG
∅
21
12∅
1
1 ∅ 1
F
G∅
11
C∅2
∅2
∅ and42
2
2
and4∅
C
2
DCEFEGCDEG
and2(1)|
xor3|Ter
minolog
y
Traces and2(2)|
and2(3)|
and4(1)|
and4(2)|
loop5|
xor7|loop5{1}
xor7|loop5{2}
Fig. 6.2 Result of LaFM when the traces ⟨ABDEF⟩, ⟨BDAEGEF⟩, ⟨DCEFEG⟩, and⟨CDEG⟩ are replayed on top of the process tree of Fig. 6.1.
6.4.1 LaFM Data Structure
LaFM records the behavior of traces when replayed on top of a business process
model. An illustration of LaFM is shown in Fig. 6.2. Each row corresponds to a
trace and each column describes the behavior of an operator. LaFM captures the
execution orders of parallel branches, the exclusive choices, and the number of
iterations of each loop. We next describe in more detail the information recorded
by LaFM as well as the used terminology.
Parallel branches. LaFM stores the order in which parallel branches are ex-
ecuted. An incremental index is assigned to each outgoing branch of the andoperators and then propagated to the events and silent activities underneath. For
instance, and2 in Fig. 6.1 has two outgoing branches. The index 1 is assigned to
the first branch, which is propagated to the events below, i.e., 1 is assigned to A, B,
and C. Similarly, task D has index 2. The index is recorded in LaFM for each andoperator
Exclusive choices. The decision made for each exclusive choice is recorded in
LaFM. For example, at xor3 in Fig. 6.1, a choice must be made between and4 and
C. For the trace ⟨CDEG⟩, the choice is C. Hence, C is recorded in LaFM.
Loops. LaFM stores the number of times loops are executed. In Fig. 6.1 for the
trace ⟨CDEG⟩, the value recorded for loop5 is 1 because it was executed once.
Terminology. An operator might be executed multiple times during a single
process execution. For instance, when the trace ⟨BDAEGEF⟩ is replayed on the
process tree in Fig. 6.1, we execute the operator xor7 twice because loop5 above
it is also executed twice. The name ‘loop-aware footprint matrix reflects that the
matrix can store all behaviors, regardless of the number of times a loop is executed.
The terminology used for columns in LaFM allows us to retrieve the behaviors
of an operator using a standardized name: operator|loop. Each operator is
assigned a unique name. For example, in Fig. 6.1, loop5 is an operator. For parallel

6.4 LaFM: Loop-Aware Footprint Matrix 73
gateways, we also append the execution order inside parentheses. For instance,
the second execution of and4 is and4(2). If there are loops, a single operator can
be executed many times, resulting in multiple pieces of information that must be
recorded. Adding the loop position to the terminology allows us to distinguish
this information. Let L be a list of loops that are in the path starting from but
excluding the operator itself to the root of the process tree. L can be empty if an
operator is not contained in a loop. Then, we concatenate ∀l ∈ L the following
strings: lname (li ndex ), i.e., for each loop above an operator, we include its name. In
parentheses, we add the index of the loop. As an example, xor7|loop5{2} points
to the column returning the decisions that are made when the operator xor7 is
executed for the second time.
Three behaviors are captured in the LaFM in Fig. 6.2. Columns 1 to 5 retain
the execution order of parallel gateways; column 6 records the number of times a
loop was taken, and columns 7 to 9 store the decisions made at exclusive choice
gateways.
6.4.2 Training Phase: Building LaFM
To record the decisions made for each operator in the discovered process tree,
we replay the traces we want to learn from a Petri net version of the process tree.
Petri nets can easily be derived from process trees using simple transformation
rules [60]. Petri nets have a strong and executable formalism, which means we
can replay a trace on a Petri net by playing the token game [59]. The token game
takes as input a trace and a Petri net. Then, using a particular set of rules (see
Chapter ‘3.2.2 Petri Nets’ in [94]), the game indicates if the trace fits into the
process model (i.e., the Petri net). Algorithm 2 defines few extra operations that
are performed during the token game to build LaFM. The next section explains
how predictions can be made from LaFM.

74 Accurate and Transparent Path Prediction Using Process Mining
/* Map the parallel operators above the events using a list of tuples (andOperator,
branchIndex). Return an empty list if the event is not included in a parallel operators. */
/* e.g.,: {a: [(and4,0), (and2,0)], b: [(and4,1), (and2,0)], c: [(and2,0)]...} */
1 tsToAnds = getTransitionToAnds(pr ocessTr ee)
/* Map the transitions that occur right after an exclusive gateway. */
/* e.g.,: {and4: Xor3, C: Xor3, F: Xor7, G: Xor7 } */
2 tsToXors = getTransitionToXor(pr ocessTr ee)
/* Map the second branch of loops to tsIncrementLoops and the third one to
tsLeavingLoops */
/* e.g., tsIncrementLoops: {τ4: loop5}; tsLeavingLoops: {τ5: loop5} */
3 tsIncrementLoops = getTransitionToIncrementLoop(pr ocessTr ee)
4 tsLeavingLoops = getTsToLeaveLoop(pr ocessTr ee)
5 laFM = Matrix[]
6 foreach tr ace in log s do
7 counter = initializeCounters()
8 foreach t sF i r ed in tokenGame do
9 manageCounter(t sF i r ed)
10 foreach andOper ator s in t sTo And s[t sF i r ed ] do
11 foreach andOper ator,br anchIndex in andOper ator s do
12 record(tr ace, andOper ator , br anchIndex)
13 if t sF i r ed in t sToX or s then
14 record(tr ace, t sTo And s[t sF i r ed ], t sF i r ed)
15 if t sF i r ed in t sToLeaveLoop then
16 record(tr ace, t sLeavi ng Loops[t sF i r ed ], counter [t sF i r ed ])
17 function manageCounter(t sF i r ed):
18 if t sF i r ed in t sTo And s then
19 foreach andOper ator in t sTo And s[t sF i r ed ] do
20 counter[andOper ator ].increment()
21 if t sF i r ed in t sIncr ementLoops then
22 counter[t sF i r ed ].increment()
23 foreach dependentTr ansi t i on in dependentTr ansi t i ons[t sF i r ed ] do
24 counter[t sF i r ed ].reset()
25 function record(tr ace, tr ansi t i on, val ue):
26 laFM[tr ace][getTerminology(tr ansi t i on)] = value
Algorithm 2: Set of extra operations performed during the token game to
build LaFM.

6.4 LaFM: Loop-Aware Footprint Matrix 75
1. Play the token game with the prefix
2. Get the active transitions
3. Get the highest common operator to at least two transitions
4. Use LaFM to select the most likely transition(s)
5. Fire the transition
Reach end?
More than one active transitions
?
no
yes
no
yes
Fig. 6.3 Five steps in making prediction using LaFM.
6.4.3 Prediction Phase: Using LaFM
Making predictions using LaFM is a five step recursive process, illustrated in
Fig. 6.3.
Step 1. We play the token game with the prefix to get a list of active tokens.
Step 2. From the tokens, we get the list of active transitions, i.e., the activities
that are currently allowed by the business process model. If only one transition is
active, we skip steps 3 and 4 to fire the transition (step 5). Otherwise, we recursively
eliminate transitions that are less likely (steps 3 and 4).
Step 3. We find the highest (closest to the root) operator in the process tree
common to at least two transitions. For example, in Fig. 6.1, if the active transitions
are A, B, and D, the highest common operator is and2.
Step 4. We make a decision about the operator selected in step 3. Depending
on the operator type, we select the branch to execute next, what decision to make
at an exclusive gateway, or whether to stay in or leave a loop. Fig. 6.4 details how we
retrieve the information in LaFM. In Fig. 6.2, in order to know which one of F and
G is the transition most likely to be chosen the first time we are at xor7, we look at
LaFM for xor7|loop5{1} and observe that F occurs more often (three times out
of four). When a tie occurs, we pick the first one. The number of loops in the prefix
might exceed the number of loops that were observed in the data. Alternatively,
we might have a particular order in the prefix that was never observed in the event
logs. We define three levels of abstraction that we apply consecutively when the
previous abstraction fails. The first level of abstraction is to use LaFM as is. The
second level of abstraction is to drop the loop part of the terminology and stack
the columns for the same operator. For example, if xor7|loop5{3} does not exist
in LaFM, we stack the two columns starting with xor7|. If there is still not enough
information, the third abstraction is to make a decision by looking only at the Petri
net. For parallel and exclusive choice transitions, we pick the first branches with
active transitions. For a loop, the decision is to always to leave the loop. Using
these three abstractions, we can always make a prediction. If the list of potential

76 Accurate and Transparent Path Prediction Using Process Mining
1Parallel
Using LaFM, check which branch (that contains at least one active transition) occurs the most. When a tie occurs, return the first one.
Return first branch that contains at least one active transition.
Exclusive choice
Using LaFM, return the most occuring active transition. When a tie occurs, return first one.
Return the first active transition
Loop
Using LaFM, return the median number of times loops are executed. Iff current number of loop < median: stay in loop. Otherwise, leave loops.
Return the transition that leaves the loop
3
Same as abstraction 1, but dropping the loop part from the terminology.2
Abs
trac
tion
Fig. 6.4 Decisions for each operator type at three level of abstractions.
transitions has been reduced to 1, we go to step 5. Otherwise, we recursively go
back to step 3 where the highest common operator will inevitably be lower.
Step 5. We fire the transition. If it is a task ∈ E , we add it to the suffix. Then, we
check to see if we have reached the end of the Petri net. If yes, we return the suffix.
If not, we go back to step 3.
Having defined how to build and use LaFM, we detail in the next section the
evaluation procedure used to assess the quality of the predictions.
6.5 Evaluation Procedure
The evaluation procedure is the same as that described by Tax et al. in [85]. Two-
thirds of the traces in the event logs are added to the training set. Each trace
in the evaluation is tested from a prefix length of 2 to a prefix length of l − 1,
l being the length of the trace. For instance, the trace ⟨ABCD⟩ is decomposed
into: prefix:⟨AB⟩, suffix:⟨CD⟩ and prefix:⟨ABC⟩, suffix:⟨D⟩. The extracted prefix is
added to the evaluation set and the suffix is added to the ground truth set. After
learning from the training set, we use the evaluation set to make predictions about
the prefix. The accuracy is obtained by measuring the Damerau-Levenshtein
similarity between the predicted suffix and the ground truth set. The Damerau-
Levenshtein distance, [32], is an edit-distance-based metric that minimizes the
number of substitutions, deletions, or additions that are needed to align two
sequences. In contrast with the Levenshtein distance, the Damerau-Levenshtein
distance allows us to swap two adjacent activities. Let e be the evaluation set, pi
the ith predicted suffix, and ti the ith ground truth suffix. We evaluate a whole
evaluation set using the following formula:

6.6 LaFM: Evaluation 77
Damer auSi mi l ar i t y(e) = 1−∑|e|
i=1Damer auDi st ance(pi ,ti )
max(leng th(pi ),leng th(ti ))
|e| (6.1)
A Damerau similarity of 1 means that the predicted suffix is identical to the
ground truth. We use the evaluation procedure in the next section to evaluate the
performance of LaFM on synthetic datasets as well as in Chapter 6.8 where the
performance of c-LaFM is tested on real datasets.
All evaluations were processed on a Mac Pro with the following configuration:
3.5 GHz 6-Core Intel Xeon E5, 64 GB 1866 MHz DDR3. We slightly updated LSTM22
so that it does not predict the time remaining. We confirmed that this change
does not impact the accuracy of the next event predictions and slightly reduces
the execution time. LaFM and c-LaFM, as used in the evaluations, are available at:
http://customer-journey.unil.ch/lafm.
6.6 LaFM: Evaluation
To evaluate LaFM, we used a collection of 30 synthetic datasets23 that were cre-
ated from process trees of varying shapes and complexities. These datasets were
initially created and used in [59] for testing process discovery and conformance
checking techniques.
There are three rounds of evaluation. In each round, 10 process trees were
generated. The complexity of the process trees as well as the number of traces
generated increase with the round. Overall, 64 traces were generated in round 3,
256 traces in round 4, and 1025 in round 5. We compared the predictions obtained
using LaFM, Markov chains, and LSTM. We ran the evaluation five times. The
arithmetic means of these five runs is shown in Fig. 6.5. LaFM is deterministic,
therefore, its variance is null. The predictions made using LaFM are closest to the
ground truth (21 times), followed by LSTM (8 times), and Markov chains (4 times).
There are important differences in the execution times of the three techniques
(see Fig. 6.6). Because its predictions rely only on the previous observed event, it is
not surprising that the fastest predictions are made using Markov chains, followed
by LaFM. To put the duration into perspective, the average execution time per
dataset is approximately 111 times slower for LaFM compared to a Markov chain,
and 6140 times slower for LSTM compared to a Markov chain.
22available here: https://verenich.github.io/ProcessSequencePrediction/. Last visited: 13th ofMarch 2020
23 https://data.4tu.nl/repository/uuid:745584e7-8cc0-45b8-8a89-93e9c9dfab05, sets ‘1 - scala-bility’, ‘round 3 to 5’. Last visited: 13th of March 2020

78 Accurate and Transparent Path Prediction Using Process Mining
Rou
nd 4
treeSeed
LaFM
lstm
markov
1
0.55
0.81
0.84
2
0.89
0.85
0.90
3
0.26
0.43
0.39
4
0.31
0.35
0.30
6
0.43
0.51
0.54
7
0.17
0.35
0.39
8
0.32
0.36
0.34
9
0.45
0.50
0.51
10
0.50
0.24
0.52
5
0.72
0.83
0.66
Rou
nd 5
treeSeed
LaFM
lstm
markov
1
0.28
0.56
0.51
2
0.42
0.36
0.48
3
0.13
0.21
0.24
4
0.41
0.42
0.50
6
0.56
0.62
0.63
7
0.17
0.30
0.36
8
0.17
0.14
0.21
9
0.50
0.22
0.48
10
0.47
0.29
0.54
5
0.45
0.85
0.86
treeSeed
LaFM
lstm
markovRou
nd 3
1
0.60
1.00
1.00
2
1.00
1.00
1.00
3
0.20
0.50
0.58
4
0.37
0.29
0.31
6
0.60
0.60
0.70
7
0.15
0.42
0.57
8
0.33
0.44
0.46
9
0.46
0.50
0.66
10
0.92
0.92
0.91
5*
n/a*
n/a*
n/a*
*not enough data for the evaluationbecause 84% of the traces havea length of 1.
Vari
ance LaFM
lstm
markov
Max
0.0120
0.0146
0.0000
Arithmetic mean
0.0009
0.0018
0.0000
Median
0.0000
0.0002
0.0000
Fig. 6.5 Comparing LaFM, LSTM and Markov Chains using the Damerau similaritymetric. The closer to 1, the closer the predictions are to the ground truth.
round
LaFM
lstm
markovTrai
ning
3
< 1 sec
~2.5 min
~24 sec
4
< 1 sec
~18 min
~28 sec
5
< 1 sec
~6 hours
~2.5 min
round
LaFM
lstm
markovPre
dict
ion
3
< 1 sec
~1 min
~3 sec
4
< 1 sec
~5 min
~1 min
5
~17 sec
~22 hours
~27 min
Fig. 6.6 Performance comparison of the training and predictions times.

6.7 c-LaFM: Clustered Loop-Aware Footprint Matrix 79
HDBSCANHDBSCAN
Process tree + Petri net
Token Game
LaFM
2. Build LaFM(for each cluster…)
Strong rep.
Inductive miner
Weak & Strong rep.In
put
Out
put
Proc
essi
ng
Classifier
3. Train Classifier
Strong rep.
SGDClassifier
4. Make Prediction
Prefix
SGDPrediction
Prediction
Cluster (LaFM + Process Tree)
SuffixStrong rep.
Weak rep.
ngrams
Distance matrix
HDBSCAN
Training set
1. Make clusters
Grid search on the minimum cluster size
Fig. 6.7 Overview of the 4 steps approach of c-LaFM.
6.7 c-LaFM: Clustered Loop-Aware Footprint Matrix
The accuracy of the predictions made using LaFM is dependent on the quality
of the discovered process tree. While the previous section showed that LaFM
performs well with synthetic datasets generated from well-structured process
trees, the accuracy will drop with real datasets, which often have very complex
behaviors and noise that cannot be described well using a single model. Our
intuition is that we should group similar traces using clustering techniques and,
for each group, discover a process tree that well describes a subset of similar traces.
Hence, we propose an updated version of LaFM with a clustering step, named
c-LaFM for clustered LaFM.
We propose a four-step clustering method, as shown in Fig. 6.7. In step 1,
we extract the features that will be used to group similar traces. Thus, we count
the number of ngrams ranging in size from 1 to 2. For instance, the trace ⟨ABA⟩becomes: {A:2, B:1, AB:1, BA:1}. Then, we cluster the traces using HDBSCAN,24
which has the advantage of having only one intelligible parameter to set, the
minimum number of traces per cluster. According to our experiment, from 2 to 10
traces per cluster yields the best results. However, it is difficult to anticipate the
best minimum cluster size. Hence, we perform a hyperparameter optimization of
a type grid search by using 10% of the training data set to evaluate the accuracy
of the minimum cluster size and retain the best-performing one. Instead of
attributing each trace to a single cluster, we rely on a soft clustering approach,
which returns, for each trace, the probability of it belonging to all the clusters.
Fig. 6.8 illustrates the soft clustering approach. Each point represents a trace.
The closer two traces are, the more ngrams they share. The strong representatives
are used to discover the process tree, while the weak and the strong representatives
24https://github.com/scikit-learn-contrib/hdbscan. Last visited: 13th of March 2020

80 Accurate and Transparent Path Prediction Using Process Mining
Cluster 2Strong representatives
Weak representatives
Cluster 1
Fig. 6.8 Illustration of the soft clustering concept.
will be replayed over the process tree and are available in LaFM. The strong
representatives are the traces that have a probability higher than 80% of belonging
to a cluster and the weak representatives have a probability higher than 20% but
less than 80%. Using a soft clustering approach has two main advantages. First,
the inductive miner is sensitive to noise. Hence, we want to learn only from the
strong representatives (i.e., with a high probability of belonging to the clusters)
with the aim of capturing only the main behaviors. Second, although we do not
use them to build the process trees, borderline traces might contain interesting
behaviors for several clusters. By using a soft clustering approach, we can assign
these single traces to several clusters.
In step 2, the strong representatives are used to build the process tree. Then,
the process tree is transformed to a Petri net so that the weak representatives can
be replayed on it to build a local LaFM, a mechanism that is described in Chapter
6.4.2.
In step 3, we train a stochastic gradient descent classifier25 to predict which
cluster a prefix belongs to. Although the clustering is done only once for the entire
complete traces, we build one classifier for each prefix length. If an unexpected
prefix length comes from a never-seen-before instance, we select the classifier
that was built with the largest prefix length.
In step 4, we predict the suffix of a given prefix using the cluster returned by
the classifier. Altogether, these four steps allow us to make predictions in the
presence of noise and outliers, which are often found in real datasets. This is what
we evaluate in the next section.25 http://scikit-learn.org/stable/modules/sgd.html. Last visited: 13th of March 2020

6.8 c-LaFM: Evaluation 81
Table 6.1 Datasets used for the evaluation.
Name (doi) Description #traces #events #uniqueevents
1 helpdesk (10.17632/39bp3vv62t.1) Events from a ticketing system 3’804 13’710 9
2 bpi12 (10.4121/uuid:3926db30-f712-4394-aebc-75976070e91f)
Loan process for a financial industry. Note:keeping only manual task and lifecycle:complete as described in [85]
9’658 72’413 23
3 bpi13 closeP (10.4121/c2c3b154-ab26-4b31-a0e8-8f2350ddac11)
Closed problem - management system fromVolvo IT Belgium
6’660 1’487 7
4 bpi13 incidents (10.4121/3537c19d-6c64-4b1d-815d-915ab0e479da)
Incidents - management system from VolvoIT Belgium
7’554 65’533 13
5 bpi13 openP (10.4121/500573e6-accc-4b0c-9576-aa5468b10cee)
Open problems - management system fromVolvo IT Belgium
819 2’351 5
6 envPermit (10.4121/uuid:26aba40d-8b2d-435b-b5af-6d4bfbd7a270)
Execution of a building permit applicationprocess. Note: we pick the Municipality 1
937 38’944 381
bpi12 bpi13 closedP bpi13 incidents bpi13 openP envPermit helpdesk
LaFM0.0
0.2
0.4
0.6
0.8
Dam
erau
Sim
ilarit
y
0.24
0.06
0.53
0.17
0.25
0.150.20
0.16
0.75 0.76
0.53
LSTM LaFM LSTM LaFM LSTM LaFM LSTM LaFM LSTM LaFM LSTM
0.48
Fig. 6.9 Comparing c-LaFM to LSTM using real datasets. Each datasets was evalu-ated 10 times.
6.8 c-LaFM: Evaluation
To test our approach, we used six publicly available event logs, as described in
Table. 6.1. Because the event logs reflect activities performed in real life, making
predictions is a complex task. Typically, for the event logs describing the execution
of a building permit application (envPermit), “almost every case follows a unique
path” [85].
In contrast to LaFM, c-LaFM is non-deterministic due to the clustering step.
Hence, we ran the experiment 10 times with c-LaFM and LSTM using the pro-
cedure described in Chapter 6.5. Fig. 6.9 compares the accuracy of LSTM and
c-LaFM. c-LaFM is more accurate for five datasets out of six. We compare the
execution times in Fig. 6.10. On average, c-LaFM is 9 times faster than LSTM.
Overall, we have shown that the clustered version of LaFM is accurate and fast.

82 Accurate and Transparent Path Prediction Using Process Mining
Execution
time
Dataset
LaFM
LSTM
bpi12
~15.4 hours
~45 min
bpi13 closedP
~35 min
~2 min
bpi13 incidents
~20.6 hours
~47 min
bpi13 openP
~18 min
~1 min
envPermit
~5.6 hours
~3.1 hours
helpdesk
~41 min
~2 min
Fig. 6.10 Comparing the total execution time to obtain predictions using c-LaFMand LSTM. The value reported is the average of 10 executions.
Application submission
Pre-accepted app.
Pre-accepted app.
Pre-accepted app.
Pre-accepted app.
Assessing the app.
Given prefix:
Suffix predicted:Assessing the
app.Seeking add.
infoSeeking add.
infoSeeking add.
infoSeeking add.
infoAssessing the
app.
Application submission
Pre-accepted app.
Assessing the app.
Seeking add. info
The prediction was made on the following business process and using these 5 cases: 174252, 186059,
194145, 199498, 200716 (case id)
Fig. 6.11 Displaying an actual prediction from the dataset envPermit next to thebusiness process model that was used to make the prediction.

6.9 Conclusion 83
Fig. 6.11 shows one of the predictions for the execution of a building permit
using a business process model, which was derived from the process tree that
was used to make the prediction. This is an illustration of how we can provide,
not only the predictions itself, but a way to express the reasoning behind the
prediction. For instance, a business worker could–after investigating traces like
those used to make the prediction–decide not to trust the prediction because they
have knowledge about the context that is not available in the event logs.
6.9 Conclusion
We propose an algorithm that relies on process models to make future path predic-
tion. More specifically, we propose a matrix coined LaFM that retrieves the most
likely next events. We also propose c-LaFM, a version which is more suited to deal
with the inherent complexity of real datasets. The algorithm shows promising
results in terms of accuracy and execution time.
The results showcase the value of the process models discovered using a pro-
cess discovery algorithm. Indeed, not only are these business models intrinsically
interesting for business process analysts, but we also show that they can be used to
make predictions. A limitation of this work is that we choose to rely on the induc-
tive miner. In our future work, we plan to measure how the use of different process
discovery techniques may impact the accuracy of the predictions. We anticipate
that mining hidden rules between LaFM columns will yield interesting results,
especially if we consider extending LaFM with contextual information. This would
allow us to detect long-term dependencies that could be used to improve the
accuracy further.
Business analysts can be reluctant to trust predictions they do not understand
[19]. Because in our work the predictions are made with business process models,
the predictions can be manually inspected by business analysts. Currently, our
algorithm returns only the predictions, limiting the explainability of the results.
However, we envision a framework that includes an advanced visualization system
that explains how the predictions are made and allows business analysts to alter
the predictions if they have knowledge that is not in the data. This type of system
would display the process model, the traces on which the predictions were made,
and the reasoning behind the predictions. Gartner has urged us to move toward
explainable artificial intelligence that gives visibility to business stakeholders “by
leveraging historical data, explaining model inputs, simplifying results or exposing
underlying data in human understandable ways” [3]. Our work contributes by
providing the foundation on which a fully comprehensible prediction system

84 Accurate and Transparent Path Prediction Using Process Mining
can be built. Interestingly, in the same report, [3], Gartner states that there is
a trade-off between explainability and accuracy. Our results highlight that this
trade-off does not necessarily hold here as we can provide results that are both
transparent and more accurate than state-of-the-art neural network approaches.

Chapter 7
Conclusion
We conclude this dissertation in three parts. First, we highlight how our contribu-
tions link back to the two research questions. Second, we position our contribu-
tions with related works. Third, we conclude by providing an outlook.
7.1 Contributions
This dissertation contributes in the following ways. To start, we bring process
mining and customer journeys closer together in Chapter 1, by showing that the
process mining framework and the related XES standard are relevant to customer
journeys. As such, this chapter can be seen as a foundational pillar supporting the
contributions that follow.
In Chapter 2, we propose a genetic approach to discovering customer journey
maps, similar to process discovery techniques that can discover process models
from event logs. In Chapter 3, we propose a novel way of navigating customer
journey maps hierarchically, with the option of adding a goal (e.g., journeys that
concern people above 40 years old). Next, Chapter 4 contributes by showing how
a process tree produced by the inductive miner can help to semi-automatically
abstract related activities (e.g., “paying by card” and “paying by cash” become
“paying”). Together, Chapters 2 to 4 answer the first research question posed in
the introduction: How can customer journey maps be discovered, explored, and
enhanced from event logs? A short answer is that the XES standard from process
mining can be used as-is: existing process mining algorithms can be leveraged to
enhance CJM (e.g., the inductive miner can abstract CJM), while the peculiarities
of a CJM visualization call for specific customer journey discovery algorithms to
replace the process discovery ones.

86 Conclusion
The last part of the dissertation, Chapters 5 and 6, address the second research
question: How can the touchpoints of a customer journey be predicted? In Chap-
ter 5, we propose an autonomous truncated trace classifier that can predict, given
a prefix of events, whether more events are expected (i.e., truncated) or not (i.e.,
complete). Finally, in Chapter 6, we propose an algorithm that takes as input a
prefix of events and returns the most likely sequence of events that will follow until
the trace is complete. In contrast to Chapters 2 to 4, which relate specifically to
customer journeys, Chapters 5 and 6 are more generic; indeed, their contributions
can be used as-is by the process mining community. However, they fit this disser-
tation well because they address prediction techniques that are especially needed
for customer journeys. In fact, events that belong to customers (e.g., “buying a
product”) cannot be controlled from a company perspective. Hence, we anticipate
that the level of uncertainty will be higher and that predicting whether a journey
will be completed or how it will be completed are challenging but insightful tasks.
The answer to the second research question is that existing next events prediction
algorithms from process mining can also be used to predict the next touchpoints
of a customer journey.
7.2 Limitations
The tools CJM-explorer and CJM-abstractor, presented in Chapters 3 and 4, are
submitted as demos. As such, they are not as strongly evaluated as the tools
presented in other chapters.
One way to strengthen these chapters would be to study the use of these tools
by practitioners in several industries and to build a taxonomy of insights that can
be extracted from them. Exposing the tools to practitioners might highlight some
drawbacks, missing features, or misunderstandings that can be improved. Design
science approaches could be the perfect candidate to carry such iterative work
(e.g., [51]). This would be an ambitious project that would require several case
studies within multiple companies. However, it would validate the type of insight
that can be extracted from such tools and close the gaps between practitioners
and academics.
Another approach could be to make the tools available for the industry and to
collect feedback using surveys. The goal would be to validate some hypothesis,
e.g., ‘using a customer journey analysis approach I get a new perspective compare
to a business process analysis approach’. Again, designing a relevant survey and
making the tool available for several companies are challenging tasks but with a
high potential to close the gaps between academy and industry.

7.3 Positioning 87
7.3 Positioning
Several studies by Hassani et al. leverage the mapping we propose in [6] to extend
the link between process mining and customer journey analysis. First, Terragni
and Hassani [86, 87] propose a recommender system for customer journeys. Their
research shows an interesting interplay between process mining, which is used
to define key performance indicators and customer journeys, which are used as
implicit recommendation feedbacks. Second, in [45], Goossens et al. propose
an alternative recommender system that takes into account the order of the
touchpoints. Third, Nooyen [75] focuses on the task of predicting a customer
complaint in a customer journey. This is made possible by using process mining
to measure the similarities among journeys. These works further highlight the
potential of brining customer journeys and process mining closer together.
Some authors propose domain-specific graphical representations of customer
journeys. In [4], Berendes et al. propose a customer journey modeling language
for which they have coined the name High Street Journey Modeling Language
(HSJML). Because it is retail-specific, its notation imposes a list of predetermined
phrases (e.g., “pre-purchase,” “post-purchase”) and touchpoints (e.g., “customer
has published a review”). Ultimately, this standardization allows for adequate
comparison of journeys from multiple stores. In [91], van den Bos proposes an
extension to Archimate, an enterprise architecture modeling language. The aim
of the extension is to create user journeys that ensure alignment between user
experience designers and enterprise architects.
In this dissertation, we choose to stick to the main components of the customer
journey to stay domain-agnostics. However, this does not prevent someone else
from extending the mapping we proposed in the introduction (Fig. 1.1, page 11)
to meet the specific needs of a particular industry. Our work differs from other
approaches for the reasons that follow. First, the link between process mining
and customer journeys was not existing before the publication of our related
paper, [6]. The subsequent papers that follow, [45, 75, 86, 87], nicely illustrate
the generalizable nature of this contribution. Second, our contributions [5, 7, 10]
differ from existing works because, to the best of our knowledge, we show how
to automatically build and transform CJMs using event logs. Existing works (e.g.,
[4, 91]) that deals with CJMs are working with expected CJMs, they are not inferred
from the data.

88 Conclusion
7.4 Outlook
In Chapter 1, we present the ten process mining activities from the process mining
framework. We repeat them here, as they will serve as an outlook for future work:
(1) explore, (2) predict, (3) recommend, (4) detect, (5) check, (6) compare, (7)
promote, (8) discover, (9) enhance, and (10) diagnose. In this dissertation, we
propose techniques related to the following activities: discover (Chapters 1 and 2),
enhance (Chapter 4), explore (Chapter 3), and predict (Chapters 5 and 6). Other
researchers have shown the relevance of the activity “recommend” for process
mining [86, 87, 45], while Nooyen proposes a solution to predict customers’ com-
plaints [75]. Clearly, there are more spaces for further research that investigates
the relevance of process mining activities for customer journey analytics.
Coming back to the BPM lifecycle introduced in Fig. 1.3 (page 7), we claim
that we contribute to the discovery and analysis of the customer process, i.e.,
the customer journey. According to the lifecycle, the insights extracted from
these steps should be used as input to redesign the customer journey; this could
be done using an expected CJM. We believe that the most interesting premise
for future work is contributions that will allow closing of the BPM lifecycle, i.e.,
linking expected CJMs back to actual CJMs. To achieve this, one has to answer the
following question: How can we best implement and monitor customer journeys?
One idea to explore would be a framework for running marketing campaigns on
top of expected customer journeys. Another idea, which is similar to conformance
analysis in process mining, would be to check discrepancies between expected
and actual customer journeys; feedback could be collected from customers who
have experienced unexpected journeys.
One of the key challenges of customer journeys is that they exist from cus-
tomers’ perspectives and are outside the control of companies. For instance, some
touchpoints along the journey could happen on external systems (e.g., social
media) or even offline (e.g., interaction in a store). Collecting such interactions
is still an open challenge that needs to be resolved to capture the full customer
journey. Being able to extract events logs from sparse information systems is a
well-recognized dilemma within the process mining community [94]. Because
CJMs are intrinsically linked with context data, such as customers’ emotions, an
even higher level of complexity is expected. However, we argue that CJMs built
from event logs can also be used to complement existing CJMs built “by hand”.
For instance, the former can be used to validate the activities’ ordering of the latter.
In other words, we can at least confront the sequence of activities expected with
the reality captured in the logs. Some activities may not be recorded at all (e.g.,

7.4 Outlook 89
visiting concurrent websites). Superposing both models should help pinpoint
which activities are not available in the logs.
Clearly, there are more spaces for further research that investigates the rele-
vance of process mining activities for customer journey analytics. For instance,
Nooyen propose the customer journey specific activity of predicting a customer
complaint [75]. Are there any other activities that are relevant for customer jour-
neys that do not exist in the process mining framework? Similar to the discover of
representative journeys (Chapters 2 and 3), we believe that it would be interest-
ing to discover representative customers. In other words, are there some groups
of customers that behave in similar way which could be explained using demo-
graphic information? In the dissertation, we put a large emphasis on the behaviors
of customers. However, in a customer journey analytics context, demographic
information is also very important. Another area for further research might consist
of offering a way to translate an expected journey into demographic information
and the other way around. Simply put: “give me a typical journey and I would
tell you, by analyzing the event logs, what is the most likely characteristic of the
customer”, or “give me some customer information I will return the most likely
customer journey”. We believe that such ‘fact-checking’ tool would greatly help
during workshops.
To conclude, tools such as the BPM lifecycle and the process mining frame-
work from the process mining and BPM fields are highly relevant when analyzing
customer journeys. However, as shown in this dissertation, the switches in per-
spective, the new types of visualization, and the fact that customers cannot be
controlled impose new challenges that need to be tackled.


References
[1] Andrews, J. and Eade, E. (2013). Listening to students: Customer journeymapping at birmingham city university library and learning resources. NewReview of Academic Librarianship, 19(2):161–177.
[2] Augusto, A., Conforti, R., Dumas, M., La Rosa, M., Maggi, F. M., Marrella, A.,Mecella, M., and Soo, A. (2017). Automated discovery of process models fromevent logs: Review and benchmark. IEEE Transactions on Knowledge and DataEngineering, 31(4):686–705.
[3] Baker, V., Clark, W., and Alaybeyi, S. (2018). Build trust with business usersby moving toward explainable ai. Technical report, Gartner. https://www.gartner.com/doc/3891245/build-trust-business-users-moving (Last visited:3rd of June 2020).
[4] Berendes, C. I., Bartelheimer, C., Betzing, J. H., and Beverungen, D. (2018).Data-driven customer journey mapping in local high streets: A domain-specificmodeling language. In 39th International Conference on Information Systems(ICIS, Research-in-Progress).
[5] Bernard, G. and Andritsos, P. (2017a). Cjm-ex: Goal-oriented exploration ofcustomer journey maps using event logs and data analytics. In BPM Demo Trackand BPM Dissertation Award co-located with 15th International Conference onBusiness Process Management (BPM Demo).
[6] Bernard, G. and Andritsos, P. (2017b). A process mining based model forcustomer journey mapping. In Forum and Doctoral Consortium Papers Pre-sented at the 29th International Conference on Advanced Information SystemsEngineering (CAiSE Forum), pages 49–56. CEUR workshop proceedings.
[7] Bernard, G. and Andritsos, P. (2018). Cjm-ab: Abstracting customer journeymaps using process mining. In Forum and Doctoral Consortium Papers Pre-sented at the 30th International Conference on Advanced Information SystemsEngineering (CAiSE Forum), pages 49–56, Cham. Springer.
[8] Bernard, G. and Andritsos, P. (2019a). Accurate and transparent path pre-diction using process mining. In 23rd European Conference on Advances inDatabases and Information Systems (ADBIS), pages 235–250, Cham. Springer.
[9] Bernard, G. and Andritsos, P. (2019b). Contextual and behavioral customerjourney discovery using a genetic approach. In 23rd European Conference onAdvances in Databases and Information Systems (ADBIS), pages 251–266, Cham.Springer.

92 References
[10] Bernard, G. and Andritsos, P. (2019c). Discovering customer journeys fromevidence: A genetic approach inspired by process mining. In Forum andDoctoral Consortium Papers Presented at the 31st International Conferenceon Advanced Information Systems Engineering (CAiSE Forum), pages 36–47,Cham. Springer.
[11] Bernard, G. and Andritsos, P. (2020). Truncated trace classifier. removal ofincomplete traces from event logs. In 21st International Working Conference onBusiness Process Modeling, Development, and Support (BPMDS), pages 150–165,Cham. Springer.
[12] Bernard, G., Boillat, T., Legner, C., and Andritsos, P. (2016). When salesmeet process mining: A scientific approach to sales process and performancemanagement. In 37th International Conference on Information Systems (ICIS,Research-in-Progress).
[13] Berre, A. J., Lew, Y., Elvesæter, B., and de Man, H. (2013). Service innovationand service realisation with vdml and serviceml. In IEEE 17th InternationalEnterprise Distributed Object Computing Conference Workshops (EDOC), pages104–113. IEEE.
[14] Berti, A., van Zelst, S. J., and van der Aalst, W. M. (2019). Process miningfor python (pm4py): Bridging the gap between process-and data science. InICPM Demo Track 2019 co-located with 1st International Conference on ProcessMining (ICPM), pages 13–16. CEUR workshop proceedings.
[15] Bertoli, P., Di Francescomarino, C., Dragoni, M., and Ghidini, C. (2013).Reasoning-based techniques for dealing with incomplete business processexecution traces. In 13th International Conference of the Italian Association forArtificial Intelligence (AI*IA), pages 469–480, Cham. Springer.
[16] Bezerra, F., Wainer, J., and van der Aalst, W. M. (2009). Anomaly detectionusing process mining. In Enterprise, Business-Process and Information SystemsModeling, pages 149–161, Berlin, Heidelberg. Springer.
[17] Blum, F. R. (2015). Metrics in process discovery. Technical report, Universidadde Chile. https://www.dcc.uchile.cl/TR/2015/TR_DCC-20151221-007.pdf (Lastvisited: 5th of June 2020).
[18] Bose, R. J. C., Mans, R. S., and van der Aalst, W. M. (2013). Wanna improveprocess mining results? In IEEE Symposium on Computational Intelligence andData Mining (CIDM), pages 127–134. IEEE.
[19] Breuker, D., Matzner, M., Delfmann, P., and Becker, J. (2016). Comprehensiblepredictive models for business processes. MIS Q., 40(4):1009–1034.
[20] Broder, A. Z., Glassman, S. C., Manasse, M. S., and Zweig, G. (1997). Syntacticclustering of the web. Computer Networks and ISDN Systems, 29:1157–1166.
[21] Brynjolfsson, E., Hu, Y. J., and Rahman, M. S. (2013). Competing in the age ofomnichannel retailing. MIT Sloan Management Review, 54(4):23.
References 93
[22] Buijs, J. C., van Dongen, B. F., and van der Aalst, W. M. (2012). A geneticalgorithm for discovering process trees. In IEEE Congress on EvolutionaryComputation (CEC), pages 1–8.
[23] Buijs, J. C., van Dongen, B. F., and van der Aalst, W. M. (2014). Quality dimen-sions in process discovery: the importance of fitness, precision, generalizationand simplicity. International Journal of Cooperative Information Systems, 23(1).
[24] Calinski, T. and Harabasz, J. (1974). A dendrite method for cluster analysis.Communications in Statistics - Theory and Methods, 3(1):1–27.
[25] Carmona, J., de Leoni, M., and Depaire, B. (2019). Process discovery contest2019 co-located with the international conference on process mining (icpm).Technical report. https://icpmconference.org/2019/process-discovery-contest(Last visited: 9th of June 2020).
[26] Chen, T. and Guestrin, C. (2016). XGBoost: A scalable tree boosting system.In 22nd ACM SIGKDD International Conference on Knowledge Discovery andData Mining, pages 785–794, New York, NY, USA. Association for ComputingMachinery.
[27] Chesbrough, H. and Spohrer, J. (2006). A research manifesto for servicesscience. Communications of the ACM, 49(7):35–40.
[28] Chollet, F. et al. (2015). Keras. https://github.com/fchollet/keras (Last visited:5th of June 2020).
[29] Conforti, R., La Rosa, M., and ter Hofstede, A. H. (2017). Filtering out in-frequent behavior from business process event logs. IEEE Transactions onKnowledge and Data Engineering, 29(2):300–314.
[30] Crosier, A. and Handford, A. (2012). Customer journey mapping as an ad-vocacy tool for disabled people: A case study. Social Marketing Quarterly,18(1):67–76.
[31] Daigler, J., Davies, J., Manusama, B., and Bharaj, G. (2019). Market guide forcustomer journey analytics. Technical report, Gartner. https://www.gartner.com/en/documents/3900263/market-guide-for-customer-journey-analytics(Last visited: 3rd of June 2020).
[32] Damerau, F. J. (1964). A technique for computer detection and correction ofspelling errors. Communications of the ACM, 7(3):171–176.
[33] de Medeiros, A. K., Weijters, T. A., and van der Aalst, W. M. (2007). Geneticprocess mining: an experimental evaluation. Data Mining and KnowledgeDiscovery, 14(2):245–304.
[34] Di Francescomarino, C., Dumas, M., Federici, M., Ghidini, C., Maggi, F. M.,Rizzi, W., and Simonetto, L. (2018). Genetic algorithms for hyperparameteroptimization in predictive business process monitoring. Information Systems,74:67–83.

94 References
[35] Di Francescomarino, C., Dumas, M., Maggi, F. M., and Teinemaa, I. (2019).Clustering-based predictive process monitoring. IEEE Transactions on ServicesComputing, 12(6):896–909.
[36] Dove, L., Reinach, S., and Kwan, I. (2016). Lightweight journey mapping:The integration of marketing and user experience through customer drivennarratives. In 34th ACM Conference on Human Factors in Computing Systems(CHI Extended Abstracts), pages 880–888. ACM.
[37] Dumas, M., La Rosa, M., Mendling, J., and Reijers, H. A. (2013). Fundamentalsof business process management, volume 1. Springer.
[38] Edelman, D. C. and Singer, M. (2015). Competing on customer journeys.Harvard Business Review, 93(11):88–100.
[39] Evermann, J., Rehse, J.-R., and Fettke, P. (2017). A deep learning approachfor predicting process behaviour at runtime. In Business Process ManagementWorkshops, in conjunction with the 15th International Conference on BusinessProcess Management (BPM Workshops), pages 327–338, Cham. Springer.
[40] Fluxicon (2020). Deal with incomplete cases, process mining in practice.Technical report. http://processminingbook.com/incompletecases.html (Lastvisited: 4th of June 2020).
[41] Følstad, A., Kvale, K., and Halvorsrud, R. (2013). Customer journey measures-state of the art research and best practices. Technical report, SINTEF. https://sintef.brage.unit.no/sintef-xmlui/handle/11250/2390670 (Last visited: 3rd ofJune 2020).
[42] Gabadinho, A. and Ritschard, G. (2013). Searching for typical life trajectoriesapplied to childbirth histories. Gendered life courses between individualizationand standardization. A European approach applied to Switzerland, pages 287–312.
[43] Gabadinho, A., Ritschard, G., Studer, M., and Müller, N. S. (2009). Summa-rizing sets of categorical sequences: selecting and visualizing representativesequences. In International Conference on Knowledge Discovery and Informa-tion Retrieval, in conjunction with the 1st International Joint Conference onKnowledge Discovery, Knowlege Engineering and Knowledge Management (IC3K2011), pages 62–69. Springer.
[44] Gabadinho, A., Ritschard, G., Studer, M., and Müller, N. S. (2011). Extractingand rendering representative sequences. In 3rd International Joint Conferenceon Knowledge Discovery, Knowlege Engineering and Knowledge Management(IC3K), pages 94–106, Berlin, Heidelberg. Springer.
[45] Goossens, J., Demewez, T., and Hassani, M. (2018). Effective steering ofcustomer journey via order-aware recommendation. In IEEE InternationalConference on Data Mining Workshops (ICDMW), pages 828–837. IEEE.
[46] Gueniche, T., Fournier-Viger, P., and Tseng, V. S. (2013). Compact predictiontree: A lossless model for accurate sequence prediction. In 9th InternationalConference on Advanced Data Mining and Applications (ADMA), pages 177–188,Berlin, Heidelberg. Springer.

References 95
[47] Günther, C. W. and Verbeek, E. (2016). IEEE standard for extensible eventstream (XES) for achieving interoperability in event logs and event streams.https://xes-standard.org/ (Last visited: 27th of May 2020).
[48] Gürvardar, I., Rızvanoglu, K., Öztürk, Ö., and Yavuz, Ö. (2016). How to im-prove the overall pre-purchase experience through a new category structurebased on a compatible database: Gittigidiyor (ebay turkey) case. In 5th Inter-national Conference on Design, User Experience, and Usability (DUXU), pages366–376, Cham. Springer.
[49] Harbich, M., Bernard, G., Berkes, P., Garbinato, B., and Andritsos, P. (2017).Discovering customer journey maps using a mixture of markov models. In7th International Symposium on Data-driven Process Discovery and Analysis,volume 2016 of CEUR Workshop Proceedings, pages 3–7. CEUR workshop pro-ceedings.
[50] Haugstveit, I. M., Halvorsrud, R., and Karahasanovic, A. (2016). Supportingredesign of c2c services through customer journey mapping. In Conference onService Design Geographies (ServDes 2016), number 125, pages 215–227. SINTEF,Linköping University Electronic Press.
[51] Hevner, A. R., March, S. T., Park, J., and Ram, S. (2004). Design science ininformation systems research. MIS Q., 28(1):75–105.
[52] Hochreiter, S. and Schmidhuber, J. (1997). Long short-term memory. NeuralComputation, 9(8):1735–1780.
[53] Jouck, T. and Depaire, B. (2016). Ptandloggenerator: a generator for artificialevent data. In BPM Demo Track co-located with 14th International Conferenceon Business Process Management (BPM Demo), page 23.
[54] Kessler, P. and Giuriato, L. (2019). Marché suisse du commerce enligne et à distance. Technical report, L’Association Suisse de vente à Dis-tance. https://www.vsv-versandhandel.ch/wp-content/uploads/2019/02/F-Version-finale-2018.pdf (Last visited: 5th of June 2020).
[55] Kingma, D. P. and Ba, J. (2015). Adam: A method for stochastic optimization.In 3rd International Conference on Learning Representations (ICLR).
[56] Kojo, I., Heiskala, M., and Virtanen, J.-P. (2014). Customer journey mappingof an experience-centric service by mobile self-reporting: Testing the qualiwalltool. In 3rd International Conference on Design, User Experience and Usability(DUXU), pages 261–272, Cham. Springer.
[57] Lakshmanan, G. T., Shamsi, D., Doganata, Y. N., Unuvar, M., and Khalaf, R.(2015). A markov prediction model for data-driven semi-structured businessprocesses. Knowledge and Information Systems, 42(1):97–126.
[58] Lane, S., O’Raghallaigh, P., and Sammon, D. (2016). Requirements gathering:the journey. Journal of Decision Systems, 25:302–312.
[59] Leemans, S. J. (2017). Robust process mining with guarantees. PhD thesis,Eindhoven University of Technology.

96 References
[60] Leemans, S. J., Fahland, D., and van der Aalst, W. M. (2013a). Discoveringblock-structured process models from event logs - a constructive approach.In 34th International Conference on Application and Theory of Petri Nets andConcurrency (PETRI NETS), pages 311–329, Berlin, Heidelberg. Springer.
[61] Leemans, S. J., Fahland, D., and van der Aalst, W. M. (2013b). Discoveringblock-structured process models from event logs containing infrequent be-haviour. In 11th International Conference on Business Process Management(BPM), pages 66–78. Springer.
[62] Leemans, S. J., Fahland, D., and van der Aalst, W. M. (2014). Discovering block-structured process models from incomplete event logs. In 35th InternationalConference on Application and Theory of Petri Nets and Concurrency (PETRINETS), pages 91–110, Cham. Springer.
[63] Lemon, K. N. and Verhoef, P. C. (2016). Understanding customer experiencethroughout the customer journey. Journal of Marketing, 80(6):69–96.
[64] Leontjeva, A., Conforti, R., Di Francescomarino, C., Dumas, M., and Maggi,F. M. (2016). Complex symbolic sequence encodings for predictive monitoringof business processes. In 14th International Conference on Business ProcessManagement (BPM), pages 297–313. Springer.
[65] Levenshtein, V. I. (1966). Binary codes capable of correcting deletions, inser-tions, and reversals. In Soviet physics doklady, volume 10, pages 707–710.
[66] Maggi, F. M., Di Francescomarino, C., Dumas, M., and Ghidini, C. (2014).Predictive monitoring of business processes. In 26nd International Conferenceon Advanced Information Systems Engineering (CAiSE), pages 457–472, Cham.Springer.
[67] Malik, S. and Bajwa, I. S. (2012). Back to origin: Transformation of businessprocess models to business rules. In Business Process Management Workshops,in conjunction with the 10th International Conference on Business Process Man-agement (BPM 2012), volume 132, pages 611–622.
[68] Marquez, J. J., Downey, A., and Clement, R. (2015). Walking a mile in theuser’s shoes: Customer journey mapping as a method to understanding theuser experience. Internet Reference Services Quarterly, 20(3-4):135–150.
[69] Matthews, B. (1975). Comparison of the predicted and observed secondarystructure of t4 phage lysozyme. Biochimica et Biophysica Acta (BBA) - ProteinStructure, 405(2):442–451.
[70] Mela, C. F. (2018). Research priorities 2018-2020. Technical re-port, Marketing Science Institute (MSI). https://www.msi.org/articles/marketers-top-challenges-2018-2020-research-priorities/ (Last visited: 3rdof June 2020).
[71] Moon, H., Han, S. H., Chun, J., and Hong, S. W. (2016). A design process for acustomer journey map: A case study on mobile services. Human Factors andErgonomics in Manufacturing & Service Industries, 26(4):501–514.

References 97
[72] Muñoz-Gama, J. and Carmona, J. (2010). A fresh look at precision in processconformance. In 8th International Conference on Business Process Management,pages 211–226. Springer.
[73] Nakatani, T. and Sato, K. (2013). Mulsa: Multi-layered scenario analysis foran advanced driver assistance system. In 8th International Joint Conference onSoftware Technologies (ICSOFT), pages 83–91.
[74] Nguyen, H., Dumas, M., La Rosa, M., Maggi, F. M., and Suriadi, S. (2016).Business process deviance mining: review and evaluation. arXiv preprintarXiv:1608.08252.
[75] Nooyen, J. (2020). Predicting the occurrence of complaints within the cus-tomer journey based on process mining techniques. Master’s thesis, EindhovenUniversity of Technology.
[76] Olding, E., Cantara, M., Robertson, B., Dunie, R., Huang, O., and Searle,S. (2015). Predicts 2016: Business transformation and process managementbridge the strategy-to execution gap. Technical report, Gartner. https://www.gartner.com/doc/3173020/predicts--business-transformation-process (Lastvisited: 3rd of June 2020).
[77] Peltola, S., Vainio, H., and Nieminen, M. (2015). Key factors in developingomnichannel customer experience with finnish retailers. In HCI in Business,pages 335–346, Cham. Springer.
[78] Pitkow, J. and Pirolli, P. (1999). Mining longest repeating subsequences topredict world wide web surfing. In 2nd Conference on USENIX Symposium onInternet Technologies and Systems (USITS), page 13, USA. USENIX Association.
[79] Polato, M., Sperduti, A., Burattin, A., and de Leoni, M. (2018). Time and activ-ity sequence prediction of business process instances. Computing, 100(9):1005–1031.
[80] Richardson, A. (2010). Using customer journey maps to improve customerexperience. Harvard business review, 15(1):2–5.
[81] Schwarz, G. (1978). Estimating the dimension of a model. Annals of Statistics,6(2):461–464.
[82] Selig, H. (2017). Continuous event log extraction for process mining. Master’sthesis, School of Information and Communication Technology. KTH RoyalInstitute of Technology in Stockholm.
[83] Stickdorn, M., Schneider, J., Andrews, K., and Lawrence, A. (2011). This isservice design thinking: Basics, tools, cases, volume 1. Wiley.
[84] Suriadi, S., Andrews, R., ter Hofstede, A. H., and Wynn, M. T. (2017). Eventlog imperfection patterns for process mining: Towards a systematic approachto cleaning event logs. Information Systems, 64:132–150.
[85] Tax, N., Verenich, I., La Rosa, M., and Dumas, M. (2017). Predictive businessprocess monitoring with lstm neural networks. In 29th International Conferenceon Advanced Information Systems Engineering (CAiSE), pages 477–492, Cham.Springer.

98 References
[86] Terragni, A. and Hassani, M. (2018). Analyzing customer journey with pro-cess mining: From discovery to recommendations. In IEEE 6th InternationalConference on Future Internet of Things and Cloud (FiCloud), pages 224–229.IEEE.
[87] Terragni, A. and Hassani, M. (2019). Optimizing customer journey usingprocess mining and sequence-aware recommendation. In Proceedings of the34th ACM/SIGAPP Symposium on Applied Computing (SAC), pages 57–65, NewYork, NY, USA. Association for Computing Machinery.
[88] Tholath, D. I. and S.J., F. C. (2016). Customer journey maps for demographiconline customer profiles. International Journal of Virtual Communities andSocial Networking (IJVCSN), 8(1):1–18.
[89] Tseng, M. M., Qinhai, M., and Su, C.-J. (1999). Mapping customers’ serviceexperience for operations improvement. Business Process Management Journal,5(1):50–64.
[90] van den Bergh, J., Isik, O., Viaene, S., and Helsen, E. (2015). Re-positioningbusiness process management: Exploring key capabilities for successful busi-ness transformation. Technical report. https://repository.vlerick.com/handle/20.500.12127/5349 (Last visited: 5th of June 2020).
[91] van den Bos, L. (2019). A bridge between ux design and enterprise architec-ture. Master’s thesis, University of Utrecht.
[92] van der Aalst, W. M. (2010). Synthetic event logs - review example large.xes.gz.https://doi.org/10.4121/uuid:da6aafef-5a86-4769-acf3-04e8ae5ab4fe (Last vis-ited: 27th of May 2020).
[93] van der Aalst, W. M. (2011). Process Mining: Discovery, Conformance andEnhancement of Business Processes. Springer, 1st edition.
[94] van der Aalst, W. M. (2016). Process Mining: Data Science in Action. Springer,Berlin, Heidelberg.
[95] van der Aalst, W. M., Adriansyah, A., de Medeiros, A. K., Arcieri, F., Baier,T., Blickle, T., Bose, J. C., et al. (2012). Process mining manifesto. In BusinessProcess Management Workshops, in conjunction with the 10th InternationalConference on Business Process Management (BPM Workshops), pages 169–194,Berlin, Heidelberg. Springer.
[96] van der Aalst, W. M., de Medeiros, A. K., and Weijters, T. A. (2005). Geneticprocess mining. In 26th International Conference on Application and Theoryof Petri Nets and Other Models of Concurrency (ICATPN), pages 48–69, Berlin,Heidelberg. Springer.
[97] van der Aalst, W. M., La Rosa, M., and Santoro, F. M. (2016). Business processmanagement. don’t forget to improve the process! Business & InformationSystems Engineering, 58(1):1–6.

References 99
[98] Vanhatalo, J., Völzer, H., and Koehler, J. (2009). Refined process structure tree.Data & Knowledge Engineering, 68(9):793–818. Five selected and extended pa-pers from the 6th International Conference on Business Process Management(BPM 2008).
[99] Vargo, S. L. and Lusch, R. F. (2004). Evolving to a new dominant logic formarketing. Journal of Marketing, 68(1):1–17.
[100] Verenich, I. (2018). Explainable predictive monitoring of temporal measuresof business processes. PhD thesis, School of Information Systems. Science andEngineering Faculty. Queensland University of Technology.
[101] Verenich, I., Dumas, M., La Rosa, M., Maggi, F. M., Chasovskyi, D., andRozumnyi, A. (2016a). Tell me what’s ahead? predicting remaining activitysequences of business process instances.
[102] Verenich, I., Dumas, M., La Rosa, M., Maggi, F. M., and Di Francescomarino,C. (2016b). Complex symbolic sequence clustering and multiple classifiers forpredictive process monitoring. In Business Process Management Workshops, inconjunction with the 14th International Conference on Business Process Man-agement (BPM Workshops), pages 218–229, Cham. Springer.
[103] Vázquez-Barreiros, B., Mucientes, M., and Lama, M. (2015). Prodigen:Mining complete, precise and minimal structure process models with a geneticalgorithm. Information Sciences, 294:315–333. Innovative Applications ofArtificial Neural Networks in Engineering.
[104] Wheelock, A., Miraldo, M., Parand, A., Vincent, C., and Sevdalis, N. (2014).Journey to vaccination: a protocol for a multinational qualitative study. BMJOpen, 4(1).

Related Documents