30 Monument Square Suite 300 Concord, MA 01742 (978) 369-2944 www.norbridgeinc.com Prepared by Process Improvement in the Mining Industry Processes, Tools, Techniques and Results September 20, 2005

Welcome message from author
This document is posted to help you gain knowledge. Please leave a comment to let me know what you think about it! Share it to your friends and learn new things together.
Transcript

30 Monument SquareSuite 300Concord, MA 01742(978) 369-2944www.norbridgeinc.com
Prepared by
Process Improvement in the Mining Industry
Processes, Tools, Techniques and Results September 20, 2005

2
Contents
Introduction
What Processes and Issues are Typically Addressed?
What is a Typical Project Like?
What Tools and Techniques are Used?
What Results Can be Achieved?
Information about Norbridge
3
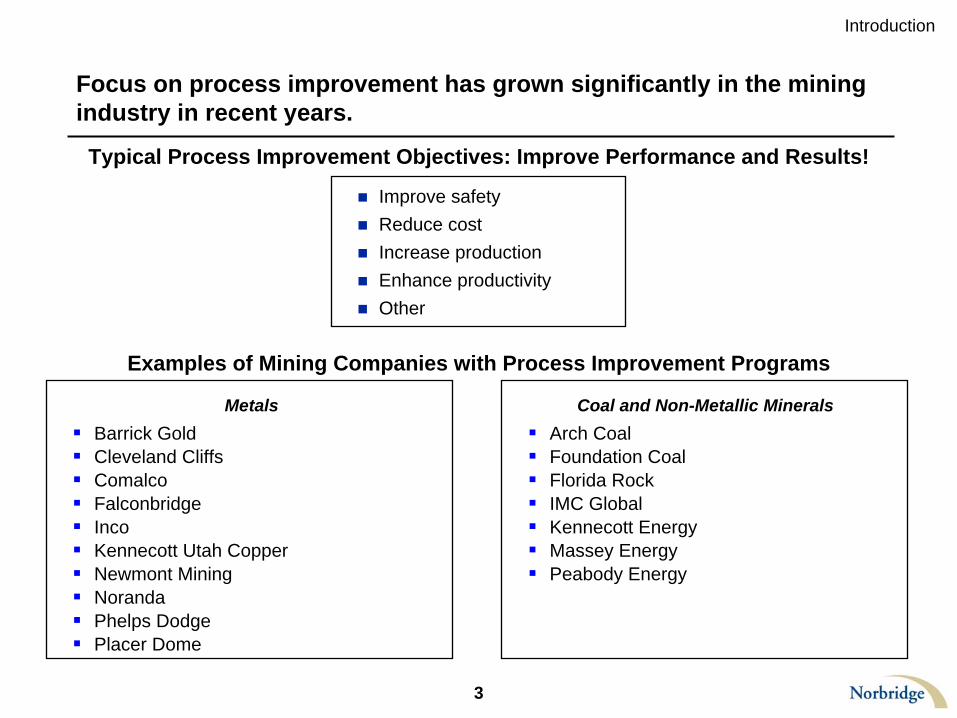
Focus on process improvement has grown significantly in the mining industry in recent years.
Improve safety
Reduce cost
Increase production
Enhance productivity
Other
Typical Process Improvement Objectives: Improve Performance and Results!
Examples of Mining Companies with Process Improvement Programs
Barrick Gold
Cleveland Cliffs
Comalco
Falconbridge
Inco
Kennecott Utah Copper
Newmont Mining
Noranda
Phelps Dodge
Placer Dome
Arch Coal
Foundation Coal
Florida Rock
IMC Global
Kennecott Energy
Massey Energy
Peabody Energy
Metals Coal and Non-Metallic Minerals
Introduction
4
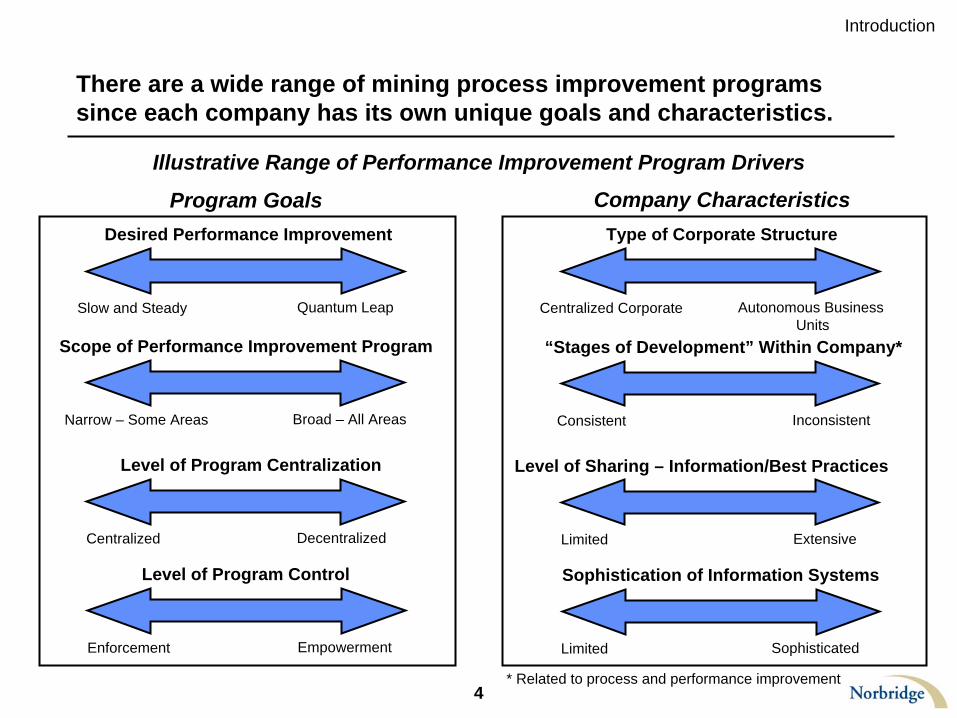
There are a wide range of mining process improvement programs since each company has its own unique goals and characteristics.
Illustrative Range of Performance Improvement Program Drivers
Desired Performance Improvement
Slow and Steady Quantum Leap
Type of Corporate Structure
Centralized Corporate Autonomous Business Units
Scope of Performance Improvement Program
Narrow – Some Areas Broad – All Areas
Level of Program Centralization
Centralized Decentralized
Level of Program Control
Enforcement Empowerment
Program Goals Company Characteristics
“Stages of Development” Within Company*
Consistent Inconsistent
Level of Sharing – Information/Best Practices
Limited Extensive
Sophistication of Information Systems
Limited Sophisticated
* Related to process and performance improvement
Introduction

5
As a result, companies follow different performance improvement models based on their needs, cultures and styles.
Level of CentralizationCentralized Decentralized
Empo
wer
men
tEn
forc
emen
t
Level ofControl
Example of Spectrum for Performance Improvement Programs
Model A
Large corporate program
Highly centralized
“Top down”
Model B
No corporate program
Project- or issue-driven
Local/regional autonomy
Highly decentralized
“Bottom up”Hybrid Approach
Model C
Project or issue focus
Local/regional autonomy
Driven by corporate performance guidelines
Sharing of information and best practices
Mixture of “top down” and “bottom up”
Introduction
“Do Your Own Thing”
“Do the Corporate Thing”

6
Contents
Introduction
What Processes and Issues are Typically Addressed?
What is a Typical Project Like?
What Tools and Techniques are Used?
What Results Can be Achieved?
Information about Norbridge

7
While performance improvement programs differ across mining companies, the types of processes they address are similar.
Operational
Mining Processing Transportation Safety
Planning Budgeting Purchasing Other
Administrative
Examples of Processes Addressed in Mining Process Improvement Programs
This seminar focuses on operational processes in the mining industry.
What Processes and Issues are Typically Addressed?
8
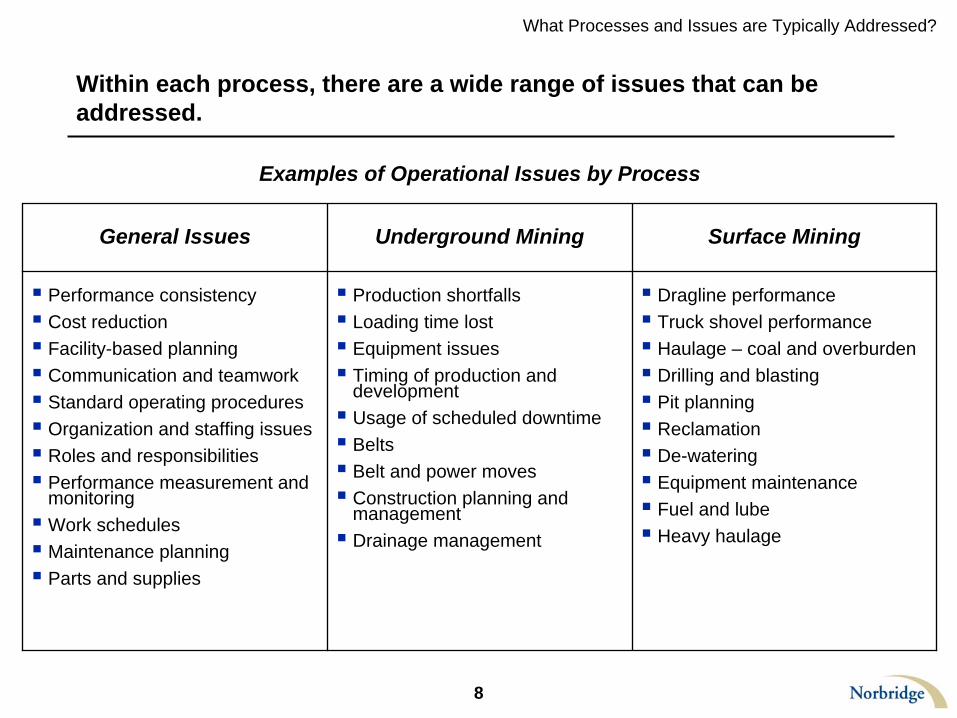
Within each process, there are a wide range of issues that can be addressed.
Examples of Operational Issues by Process
General Issues Underground Mining Surface Mining
Performance consistency
Cost reduction
Facility-based planning
Communication and teamwork
Standard operating procedures
Organization and staffing issues
Roles and responsibilities
Performance measurement and monitoring
Work schedules
Maintenance planning
Parts and supplies
Production shortfalls
Loading time lost
Equipment issues
Timing of production and development
Usage of scheduled downtime
Belts
Belt and power moves
Construction planning and management
Drainage management
Dragline performance
Truck shovel performance
Haulage – coal and overburden
Drilling and blasting
Pit planning
Reclamation
De-watering
Equipment maintenance
Fuel and lube
Heavy haulage
What Processes and Issues are Typically Addressed?

9
Within each process, there are a wide range of issues that can be addressed.
Examples of Operational Issues by Process (Continued)
Processing Transportation Safety
Plant availability shortfalls
Feed rates
Linkage to mine operating plans
Sampling
Refuse disposal
Mobile equipment productivity and management
Magnetite usage
Coal losses
Coal quality compliance
Priority/Effectiveness of loadout operations
Integration of mining, processing and loading
Delay tracking
Loadout maintenance
Utilization and maximization of track/loadout capacity
Manual processes
Railroad issues, for example:Bad carsCrew availability/timingDispatching
Training
Awareness
Communication, coordination and teamwork
Safe operating procedures
Supervision
Monitoring and enforcement
Accident investigation
Repeat incidents
Root cause analysis
Analysis e.g. injury types and categories
What Processes and Issues are Typically Addressed?

10
Contents
Introduction
What Processes and Issues are Typically Addressed?
What is a Typical Project Like?
What Tools and Techniques are Used?
What Results Can be Achieved?
Information about Norbridge
11
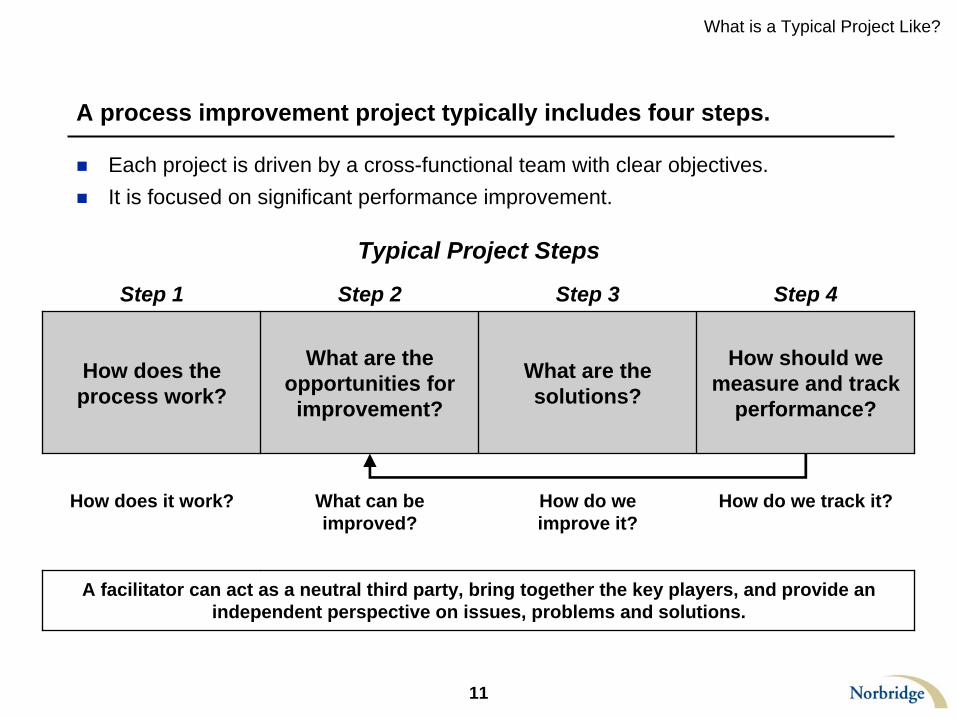
A process improvement project typically includes four steps.
Each project is driven by a cross-functional team with clear objectives.
It is focused on significant performance improvement.
Typical Project Steps
Step 1 Step 2 Step 3 Step 4
How does the process work?
What are the opportunities for
improvement?
What are the solutions?
How should we measure and track
performance?
How does it work? What can be improved?
How do we improve it?
How do we track it?
A facilitator can act as a neutral third party, bring together the key players, and provide an independent perspective on issues, problems and solutions.
What is a Typical Project Like?

12
Step 1: How does the process work?
Belt and Power Moves
Safety
Utility/Support Maintenance
Preparation
Pillaring
Cutting, Loading and Haulage
Coal Mining Process
Illustrative Example of Underground Coal Mining Process
Illustrative Example of Preparation Sub-Process
Hang curtain/ tubes
Ready for Next Cut
Loading Crew
Ventilation Man
Roof Bolters
Scoop Man
Section Boss
Finish Cut
Bolt and Ventilate
Clean and Dust
Do safety checks
What is a Typical Project Like?
13
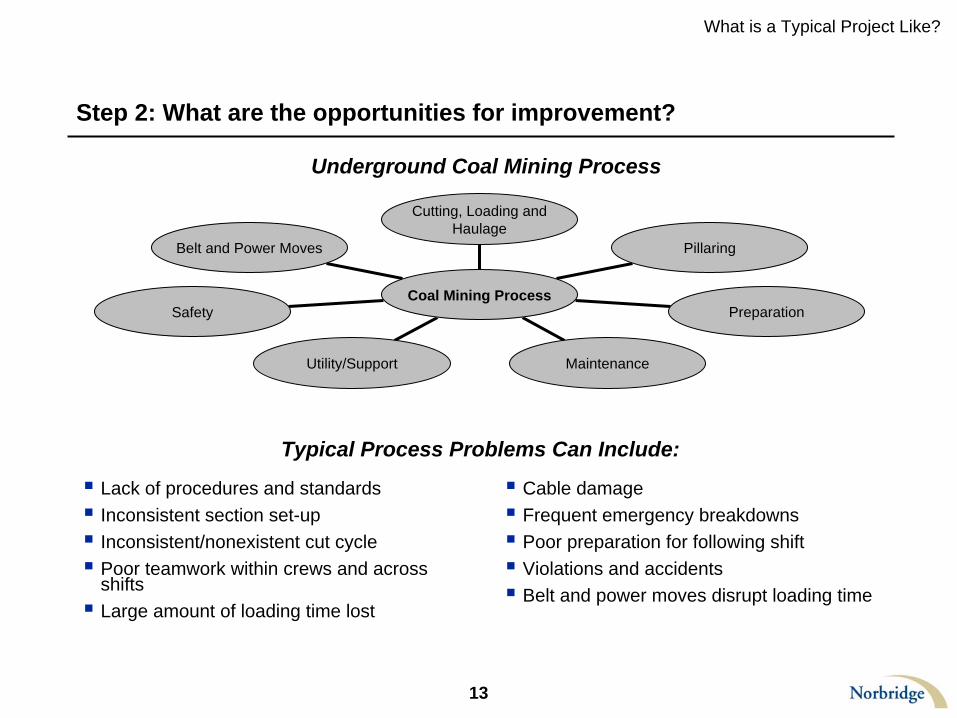
Step 2: What are the opportunities for improvement?
What is a Typical Project Like?
Belt and Power Moves
Safety
Utility/Support Maintenance
Preparation
Pillaring
Cutting, Loading and Haulage
Coal Mining Process
Underground Coal Mining Process
Typical Process Problems Can Include:
Lack of procedures and standards
Inconsistent section set-up
Inconsistent/nonexistent cut cycle
Poor teamwork within crews and across shifts
Large amount of loading time lost
Cable damage
Frequent emergency breakdowns
Poor preparation for following shift
Violations and accidents
Belt and power moves disrupt loading time
14
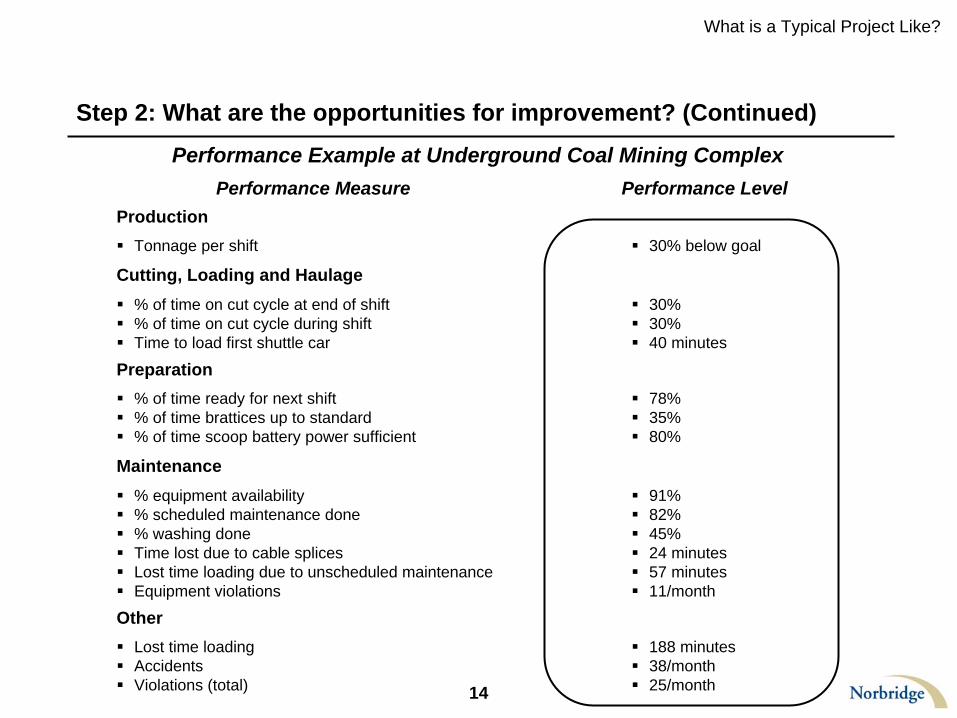
Step 2: What are the opportunities for improvement? (Continued)
Performance Example at Underground Coal Mining ComplexPerformance Measure Performance Level
Production
Tonnage per shift
30% below goal
Cutting, Loading and Haulage
% of time on cut cycle at end of shift
% of time on cut cycle during shift
Time to load first shuttle car
30%
30%
40 minutes
Preparation
% of time ready for next shift
% of time brattices up to standard
% of time scoop battery power sufficient
78%
35%
80%
Maintenance
% equipment availability
% scheduled maintenance done
% washing done
Time lost due to cable splices
Lost time loading due to unscheduled maintenance
Equipment violations
91%
82%
45%
24 minutes
57 minutes
11/month
Other
Lost time loading
Accidents
Violations (total)
188 minutes
38/month
25/month
What is a Typical Project Like?

15
Step 2: What are the opportunities for improvement? (Continued)
What is a Typical Project Like?
Rail Loadout Process Times
6:50
5:40
6:30
3:05
3:00
3:10
1:50
1:30
1:45
2:20
2:00
2:05
3:00
2:45
2:30
2005
2004
2003
Hours
13:30
12:10
14:05
3:00 6:00 9:00 12:00 15:00
Train Arrival
Begin Loading
Finish Loading
Crew Aboard
Train Departure
Time Between Trains

16
Step 3: What are the solutions?
There are frequently many options to address the problem areas that have been identified.
Options need to be identified, evaluated and narrowed down before the best solutions can be selected.
What is a Typical Project Like?
Examples of Key Options in Underground Coal Mining Process*
Cutting, Loading and Haulage Other
What is the best section layout/set-up?
What is the best cut cycle?
Do we run two continuous miners at the same time or not?
How many entries do we have?
What cut depth should we have?
What do we do when we get off the cut cycle?
How do we leave the section for the next shift?
What preventive maintenance/servicing system is best for the cut cycle?
Do we have on-shift or off-shift maintenance?
How many men should there be on each section?
What equipment should each section have?
* Based on continuous miners
17
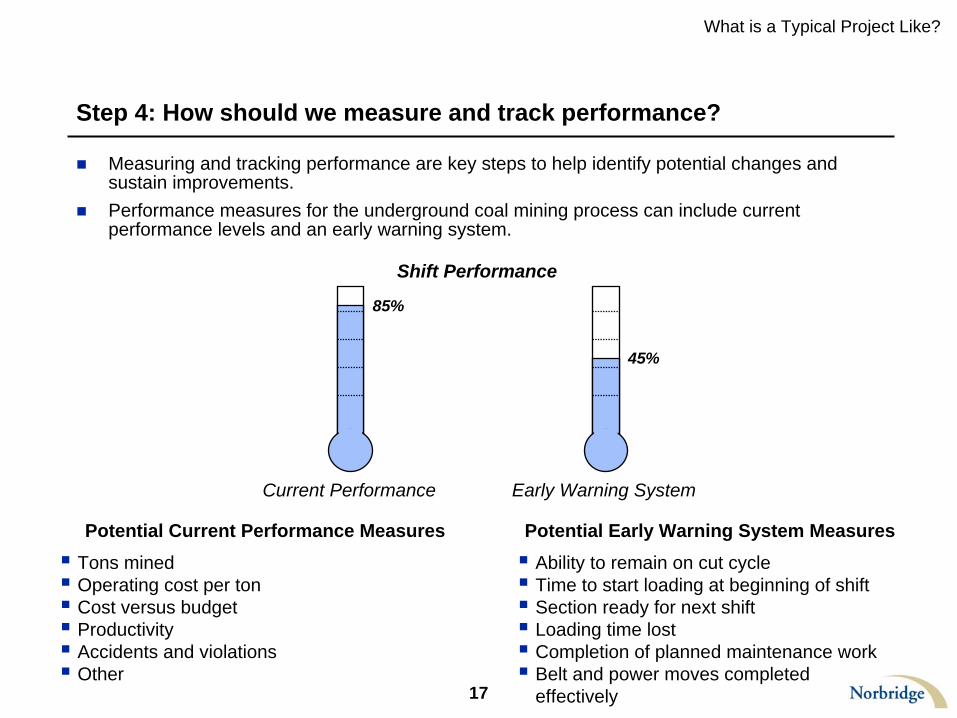
Step 4: How should we measure and track performance?
Measuring and tracking performance are key steps to help identify potential changes and sustain improvements.
Performance measures for the underground coal mining process can include current performance levels and an early warning system.
What is a Typical Project Like?
Potential Current Performance Measures Potential Early Warning System Measures
Tons mined
Operating cost per ton
Cost versus budget
Productivity
Accidents and violations
Other
Ability to remain on cut cycle
Time to start loading at beginning of shift
Section ready for next shift
Loading time lost
Completion of planned maintenance work
Belt and power moves completed effectively
Early Warning SystemCurrent Performance
Shift Performance
85%
45%

18
Step 4: How should we measure and track performance? (Continued)
Performance Measurement System at Underground Coal Mining Complex
Cutting, Loading and Haulage• % of time on cut cycle at end of shift• % of time on cut cycle during shift• Time to load first shuttle car
Performance Measure
Preparation• % of time ready for next shift• % of time brattices up to standard• % of time scoop battery power sufficient
Maintenance• % equipment availability• % scheduled maintenance done• % washing done• Time lost due to cable splices• Lost time loading due to unsch. maint.• Equipment violations
Other• Lost time loading• Accidents• Violations (total)
Performance Level
• 30%• 30%• 40 minutes
• 78%• 35%• 80%
• 91%• 82%• 45%• 24 minutes• 57 minutes• 11/month
• 188 minutes• 38/month• 25/month
Production• Tonnage per shift • 2,200
Short-Term Goal
• 95%• 95%• 15 minutes
• 100%• 95%• 100%
• 95%• 90%• 90%• 15 minutes• 30 minutes• 5/month
• 90 minutes• 0/month• 12/month
• 3,100
Long-Term Goal
• 98%• 98%• 15 minutes
• 100%• 98%• 100%
• 98%• 95%• 95%• 7 minutes• 26 minutes• 0/month
• 75 minutes• 0/month• 0/month
• 4,500
What is a Typical Project Like?

19
Surveyed companies highlighted keys to success for BPI programs.
Examples of Keys to Success
BPI Projects
Focus on the issues that count
Scope the projects appropriately – not too big; not too small
Get the key people involved
Reward results
Give credit to the people involved
Hold people accountable
Build management systems to support sustainability of results– Measurement– Monitoring– Information– Communication
Follow up! Follow up! Follow up!
What is a Typical Project Like?

20
While the programs are diverse, the problems are similar – most are people issues.
Examples of BPI Problems
Senior/middle management resistance– People are set in their ways and don’t want to
change– People may perceive BPI as a threat e.g.
cost-cutting– Turf issues– Getting people to recognize the value
Project/initiative overload– Lean staffing at many companies– Lots of initiatives – BPI and other– Concern about workload “in addition to” their
regular jobs
BPI staffing and training– Hard to find enough qualified people– Hard to “replace” their operating expertise– Hard to replace people if/when they go from
BPI role back into operations – lots of BPI training required
Unwillingness to share and utilize best practices
– “Not invented here”– Jealousy of ownership
Difficulty in quantifying value creation for specific projects
– Costs for many inputs are rising– Difficult to split out project value– How much resource/time to apply to it?
Sustainability– Sustaining BPI programs and platforms over
the long-term
Many of the programs/platforms are new
Many companies had previous programs that were discontinued or changed
– Sustaining results after projects are completed
What is a Typical Project Like?

21
Surveyed companies gave examples of problems and how they attempt to overcome them.
What is a Typical Project Like?
Examples of BPI Problems and Suggested Solutions
BPI Problem Suggested Solution
Senior/middle management resistance
Lots of awareness training on BPI and its value
Presentations from managers who have “seen the light” e.g. before and after; “how it changed me”
Highlight the “wins” to show the value
Allocate benefits to the field to incent desired behavior at facilities
Project/initiative overload
Combine projects, if possible
Highlight that BPI projects are not “in addition to” people’s jobs, they are “part of” their jobs
Focus projects on the issues that people care about most – the project will help solve their problems
BPI staffing and training
Focus on the best and the brightest
Give them the tools/training to succeed
Replace them in their previous positions as effectively as possible – most people aren’t irreplaceable
Be flexible – if they need to move back, move them back

22
Surveyed companies gave examples of problems and how they attempt to overcome them. (Continued)
What is a Typical Project Like?
Examples of BPI Problems and Suggested Solutions
BPI Problem Suggested Solution
Unwillingness to share and utilize best practices
Use cross-site training/projects e.g. cross-fertilize
Leverage corporate personnel to spread best ideas from one facility to others
Utilize and encourage e-mail/internet forum to ask questions and share ideas e.g. “Chat room”; “Has anyone done this before?”
Set aggressive targets
Leverage senior management to ask tough questions – “why aren’t we doing this everywhere?”
Difficulty in quantifying value creation for specific projects
Set clear criteria and clear measures during project for how project value is to be measured
Get Finance Department involved if needed
Determine, in advance, how much rigor is needed e.g. Are benefits to be made public? How much rigor is required to ensure that results are credible? Is a range of results sufficient?
Sustainability
See keys to success (already discussed)

23
Contents
Introduction
What Processes and Issues are Typically Addressed?
What is a Typical Project Like?
What Tools and Techniques are Used?
What Results Can be Achieved?
Information about Norbridge
24
Process Improvement Tools and Techniques
Root cause analysis
Process mapping
Importance/Performance matrix
Histogram
Pareto chart
Run chart/control chart
Flow chart
Scatter diagram
Force field chart
What Tools and Techniques are Used?

25
Root cause analysis is used to “drill down” from the symptoms of a problem to the actual root cause.
What Tools and Techniques are Used?
Example Problem: A Slow Draining Sink
Water slow to drain in sink
Pipe keeps clogging
Problem
Proximate Cause / Symptom
Food stuck in drain
Garbage disposal broken
Fork jammed in disposal
Secondary Cause
Tertiary Cause
ROOT cause
WHY?
WHY?
WHY?
WHY?
Definition: Root Cause Analysis is a step by step method that leads to the discovery of a fault’s first or root cause. A RCA investigation traces the cause and effect trail from the end failure to the root cause (beyond just symptoms), similar to a detective solving a crime. The detective follows up on each clue to narrow down the possibilities.

26
A great tool for performing root cause analysis is the fishbone diagram.
Help search for root causes
Identify and categorize all potential causes of a problem
Understand the relationships between various causes of a problem
Provide structure and focus for a brainstorming session
Evaluate processes e.g. why are they having difficulties, problems or breakdowns? Why are they not producing desired results?
What Tools and Techniques are Used?
A fishbone diagram shows the relationship between a problem and its root causes. Because it is structured in a way to look at many different causes, it can be used to analyze any type of problem. Fishbone diagrams are typically used to:

27
How is a fishbone diagram constructed?
1. Draw the “spine” and identify the problem (the “head” of the fish)
2. Draw and label the factors that may be causing the problem (the main bones)
3. Brainstorm the potential causes of the problem
4. Identify sub-causes (root causes, or “why does this happen?”)
5. Identify the most likely causes
What Tools and Techniques are Used?
The Problem
1.
2. 2.
2. 2.
3.
4.
The “Spine”
1.
Creating a Fishbone Diagram
Continue to ask “why” until it cannot be asked anymore!
28
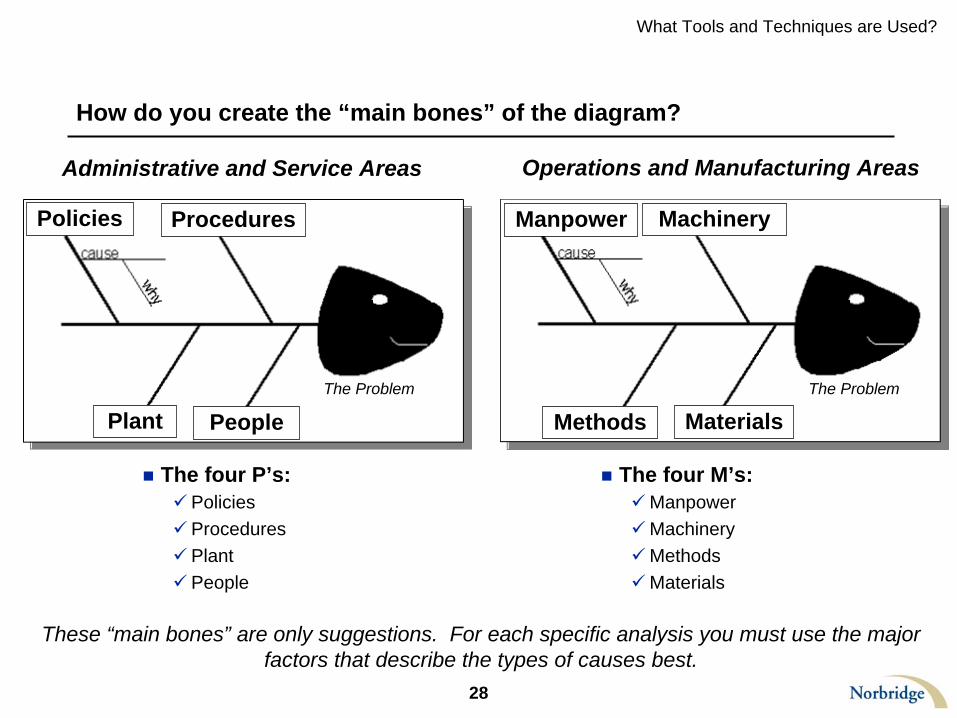
How do you create the “main bones” of the diagram?
What Tools and Techniques are Used?
Administrative and Service Areas Operations and Manufacturing Areas
Policies Procedures
Plant People
Manpower Machinery
Methods Materials
The four P’s:PoliciesProceduresPlantPeople
The four M’s:ManpowerMachineryMethodsMaterials
These “main bones” are only suggestions. For each specific analysis you must use the major factors that describe the types of causes best.
The ProblemThe Problem

29
External Example: Why is your car getting poor gas mileage?
Manpower Materials
Methods Machinery
Poor Gas Mileage
What Tools and Techniques are Used?

30
External Example: Why is your car getting poor gas mileage?
What Tools and Techniques are Used?
No mon
eyNo a
waren
ess
Poor t
raini
ng
Wro
ng oi
lNo o
il cha
nge
Hard t
o infl
ate
Impa
tienc
e
Can’t h
ear e
ngine
Drive too fast
Use wrong gearsUnder-inflated tires
Bad oil
Poor driving habits
Poor maintenance
Always late
Radio too loud
Poor hearing
Poor design
No $
Poor t
raini
ng
Wro
ng pr
essu
re
No manual
Wrong gas
Manpower Materials
Methods Machinery
Wrong fuel mixPoor Gas Mileage

31
Process Mapping Definition
Typical Components
Overall inputs and outputs
Responsible parties
Activities performed
Activity inputs and outputs
Activity dependencies
Timeline
What Tools and Techniques are Used?
Person or Group 1 Activity 1
Person or Group 2
Person or Group 3
Person or Group 4
Person or Group 5
Activity 2
Activity 3
Activity 4
Activity 5
Activity 6
Input
Output
Definition: A process map is a diagram of a business process. It helps define and understand dependencies and handoffs.
32
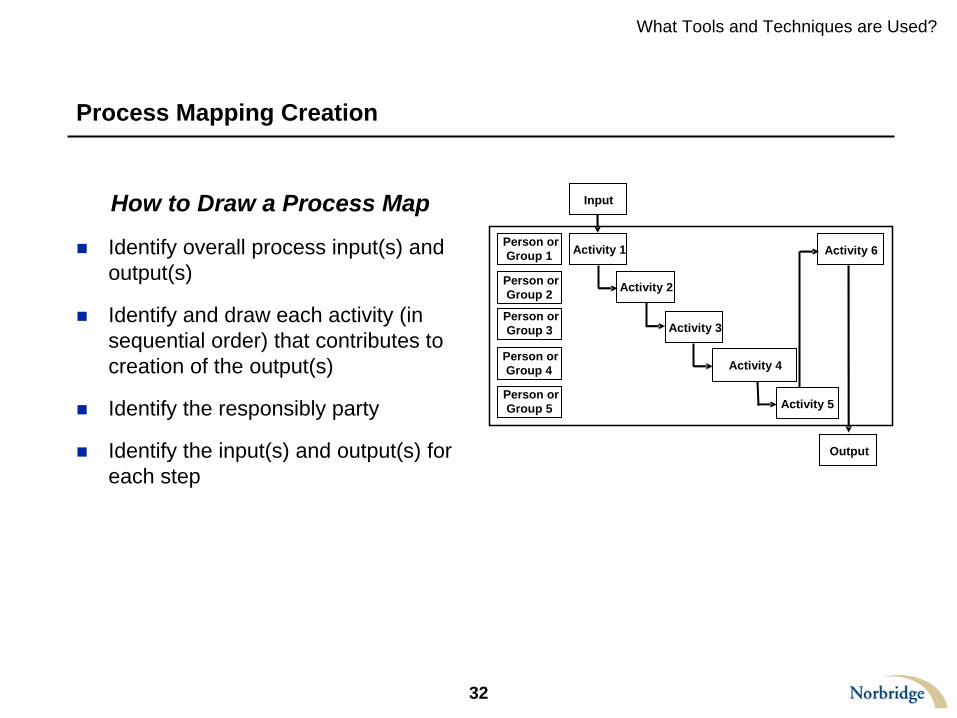
Process Mapping Creation
What Tools and Techniques are Used?
How to Draw a Process Map
Identify overall process input(s) and output(s)
Identify and draw each activity (in sequential order) that contributes to creation of the output(s)
Identify the responsibly party
Identify the input(s) and output(s) for each step
Person or Group 1 Activity 1
Person or Group 2
Person or Group 3
Person or Group 4
Person or Group 5
Activity 2
Activity 3
Activity 4
Activity 5
Activity 6
Input
Output

33
Process Mapping Example
What Tools and Techniques are Used?
Hang Curtain/ Tubes
Ready for Next Cut
Loading Crew
Ventilation Man
Roof Bolters
Scoop Man
Section Boss
Finish Cut
Bolt and Ventilate
Clean and Dust
Do Safety Checks
Illustrative Example of Preparation Sub-Process

34
Importance / Performance Matrix Definition
What Tools and Techniques are Used?
Definition: An importance/performance matrix is a chart used to identify areas for improvement. Each point represents a specific item that has been rated on importance and performance.
Importance is represented on the horizontal axis
Performance is shown on the vertical axis
The highlighted quadrant shows the priority areas for improvement
Typical Layout
Importance
Perf
orm
ance
High
LowLow High

35
Importance / Performance Matrix Creation
What Tools and Techniques are Used?
Quantify the average performance and importance for each item to be shown
Draw the box and add a scale to the axes
Add performance average to the chart
Add the importance average to the chart
Plot each item on the chart
How to Draw an Importance / Performance Matrix
Importance
Perf
orm
ance
High
LowLow High
36
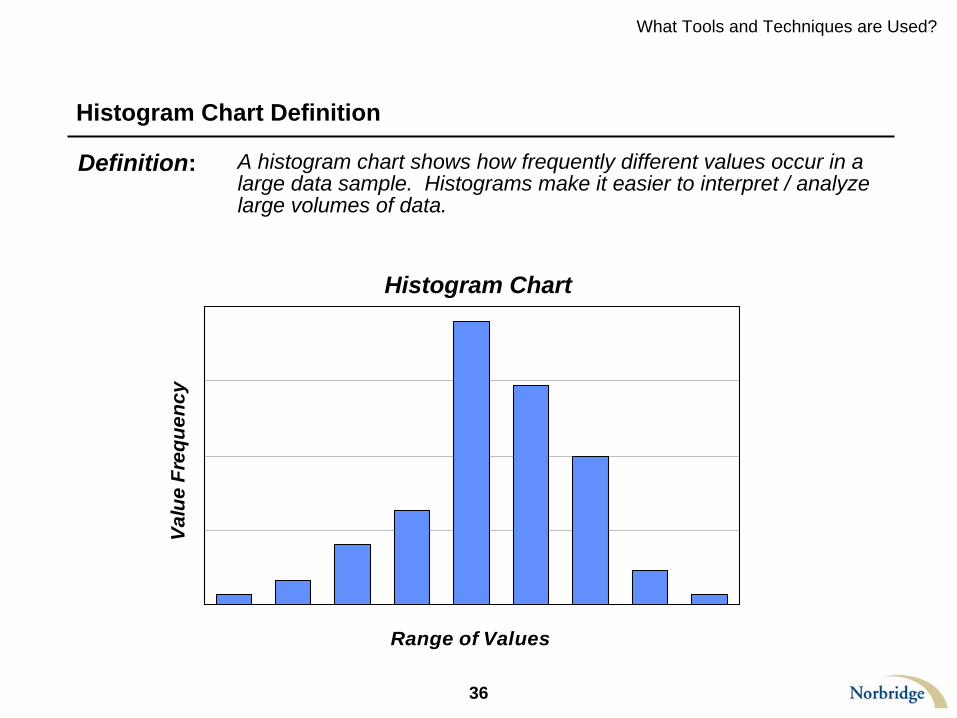
Histogram Chart Definition
Definition: A histogram chart shows how frequently different values occur in a large data sample. Histograms make it easier to interpret / analyze large volumes of data.
What Tools and Techniques are Used?
Range of Values
Val
ue F
requ
ency
Histogram Chart
37
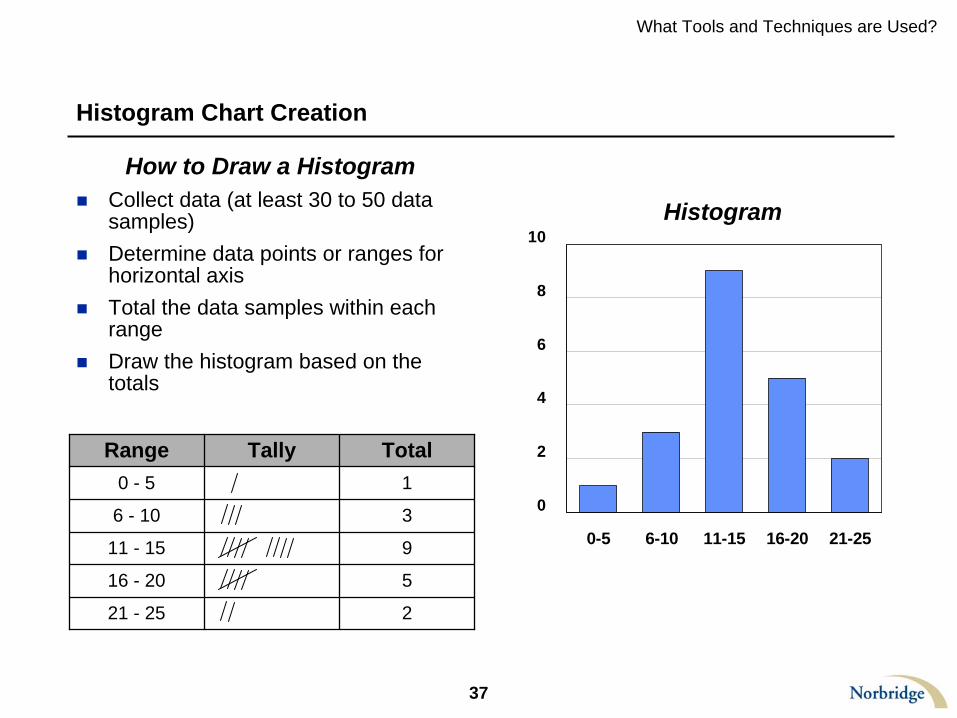
Histogram Chart Creation
How to Draw a Histogram
Collect data (at least 30 to 50 data samples)
Determine data points or ranges for horizontal axis
Total the data samples within each range
Draw the histogram based on the totals
What Tools and Techniques are Used?
Range Tally Total0 - 5 1
6 - 10 3
11 - 15 9
16 - 20 5
21 - 25 2
0
2
4
6
8
10
0-5 6-10 11-15 16-20 21-25
Histogram
38
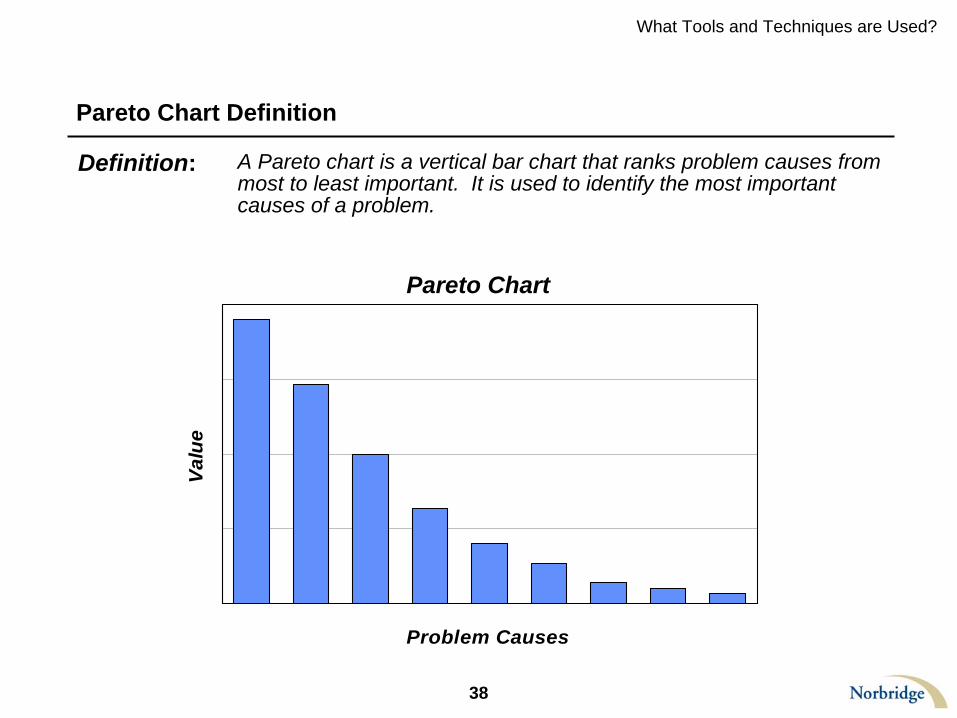
Pareto Chart Definition
Definition: A Pareto chart is a vertical bar chart that ranks problem causes from most to least important. It is used to identify the most important causes of a problem.
What Tools and Techniques are Used?
Problem Causes
Valu
e
Pareto Chart

39
Pareto Chart Creation
What Tools and Techniques are Used?
How to Draw a Pareto Chart
Identify the problem to be studied
List the problem areas / causes for which data is to be gathered
Collect the data for each problem area / cause
– Be consistent with the time frame
– Use the same units of measure (such as number of occurrences, cost, etc.)
Construct the Pareto chart with the problem areas / causes listed in descending order
Problem Causes
Valu
e
Pareto ChartHigh
LowMost Frequent
Least Frequent
40
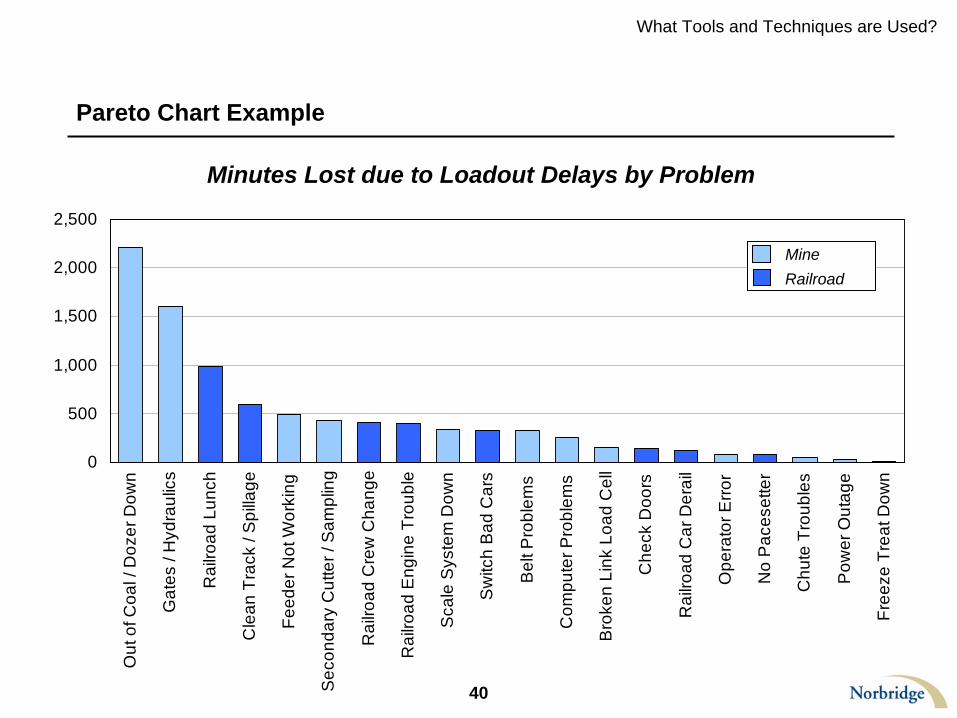
Pareto Chart Example
What Tools and Techniques are Used?
0
500
1,000
1,500
2,000
2,500
Out
of C
oal /
Doz
er D
own
Gat
es /
Hyd
raul
ics
Rai
lroad
Lun
ch
Cle
an T
rack
/ S
pilla
ge
Feed
er N
ot W
orki
ng
Sec
onda
ry C
utte
r / S
ampl
ing
Rai
lroad
Cre
w C
hang
e
Rai
lroad
Eng
ine
Trou
ble
Sca
le S
yste
m D
own
Sw
itch
Bad
Car
s
Bel
t Pro
blem
s
Com
pute
r Pro
blem
s
Bro
ken
Link
Loa
d C
ell
Che
ck D
oors
Rai
lroad
Car
Der
ail
Ope
rato
r Erro
r
No
Pac
eset
ter
Chu
te T
roub
les
Pow
er O
utag
e
Free
ze T
reat
Dow
n
Minutes Lost due to Loadout Delays by Problem
MineRailroad

41
Run Chart Definition
What Tools and Techniques are Used?
Definition: A run chart shows data in time-ordered sequence. It tracks the performance of a process over time, and can visually show if the long-term average is changing.
0
5
10
15
20Run Chart
Average
Time

42
Run Chart Creation
How to Draw a Run Chart
Collect data and order them in chronological order
Draw a graph with time on the horizontal axis and units of measure on the vertical axis
Plot each point and connect adjacent points
Calculate the average and graph it with a solid line
What Tools and Techniques are Used?
0
5
10
15
20Run Chart
Average
Time

43
Run Chart Example
What Tools and Techniques are Used?
0
200,000
400,000
600,000
Jan-
2002
Feb-
2002
Mar
-200
2
Apr
-200
2
May
-200
2
Jun-
2002
Jul-2
002
Aug
-200
2
Sep
-200
2
Oct
-200
2
Nov
-200
2
Dec
-200
2
Jan-
2003
Feb-
2003
Mar
-200
3
Apr
-200
3
May
-200
3
Jun-
2003
Jul-2
003
Aug
-200
3
Sep
-200
3
Oct
-200
3
Nov
-200
3
Dec
-200
3
Tons Loaded Per Month
Average
Tons

44
Control Chart Definition
What Tools and Techniques are Used?
Definition: A control chart is similar to a run chart, but includes upper and lower control limits. It shows whether a process is stable over time by determining if the associated measure falls within the control limits.
0
5
10
15
20
0
5
10
15
20
Time Time
UCL
LCL
UCL
LCL
Unstable Process(Several Points Fall Outside the Control Limits)
Stable Process(All Points Fall Within the Control Limits)
45
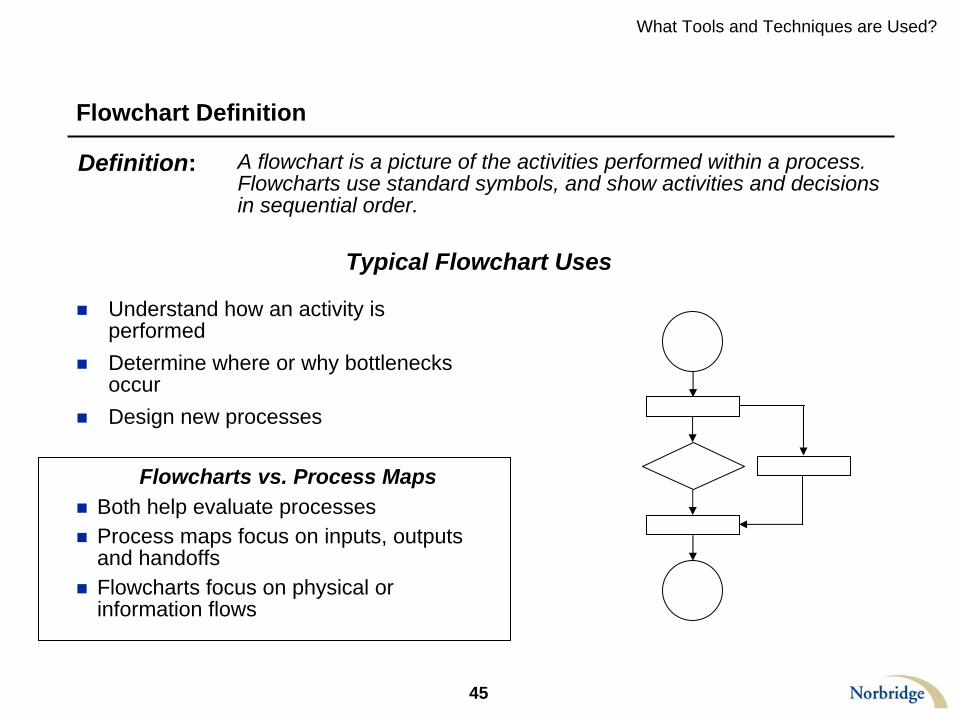
Flowchart Definition
What Tools and Techniques are Used?
Definition: A flowchart is a picture of the activities performed within a process. Flowcharts use standard symbols, and show activities and decisions in sequential order.
Understand how an activity is performed
Determine where or why bottlenecks occur
Design new processes
Flowcharts vs. Process Maps
Both help evaluate processes
Process maps focus on inputs, outputs and handoffs
Flowcharts focus on physical or information flows
Typical Flowchart Uses

46
Flowchart Creation
What Tools and Techniques are Used?
How to Draw a Flowchart
Write a description of the activity
Draw the symbols for the activity (see below)
Connect each symbol with arrows
Work Activity
Storage
Decision
Begin or End Information Input
or Output
Common Flowchart Symbols

47
Scatter Diagram Definition
Definition: A scatter diagram shows the relationship between two variables by showing what happens to one variable when the other changes.
Positive Correlation Negative Correlation No Correlation
What Tools and Techniques are Used?
48
Scatter Diagram Creation
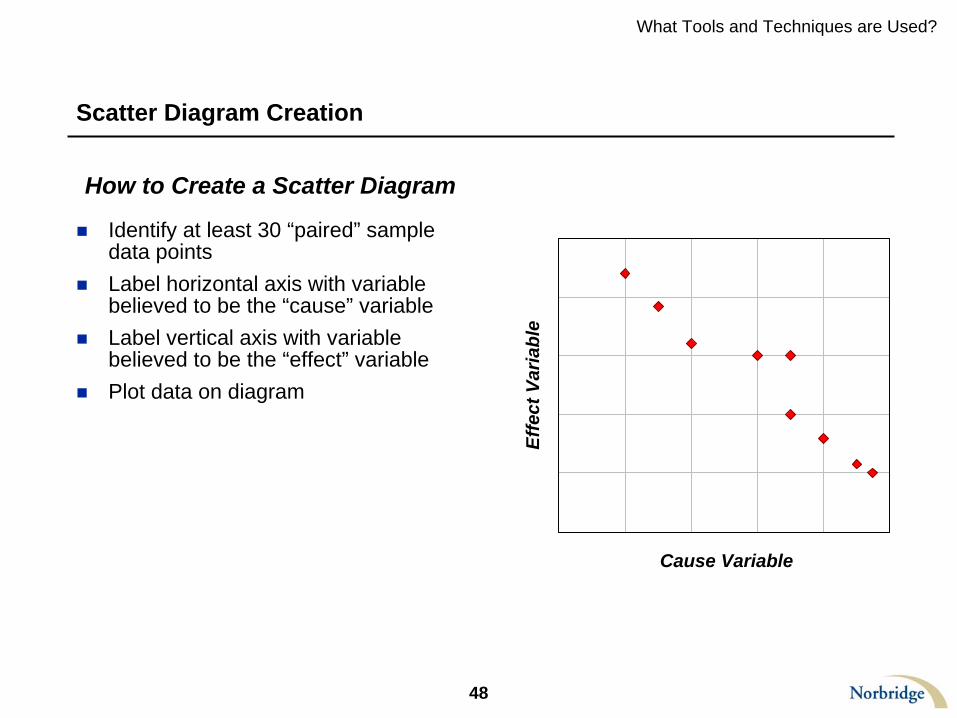
What Tools and Techniques are Used?
How to Create a Scatter Diagram
Identify at least 30 “paired” sample data points
Label horizontal axis with variable believed to be the “cause” variable
Label vertical axis with variable believed to be the “effect” variable
Plot data on diagram
Cause VariableEf
fect
Var
iabl
e
49
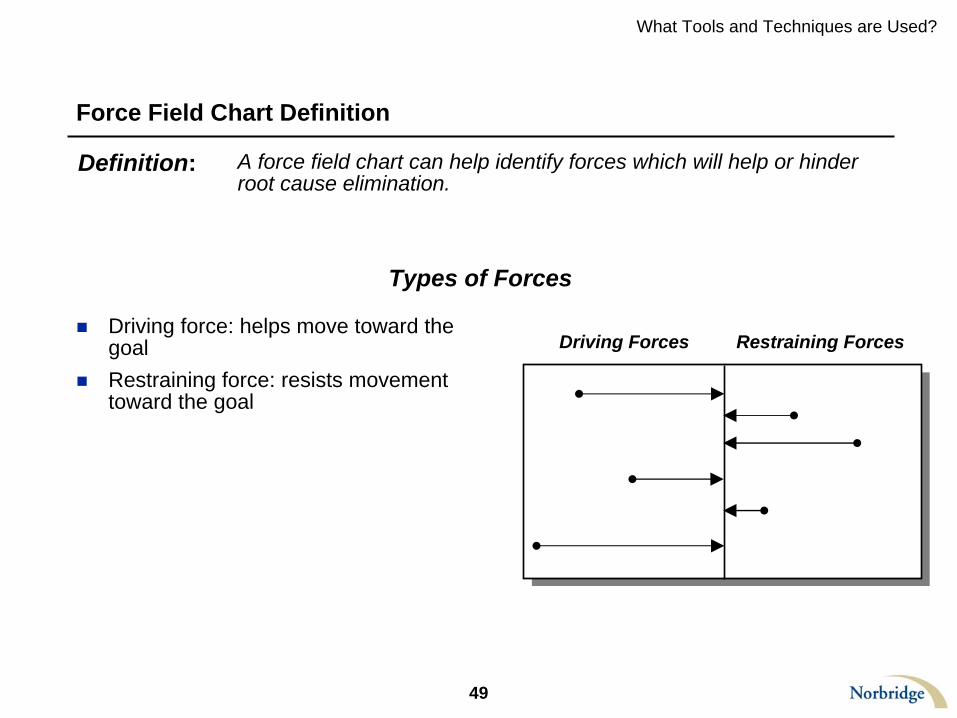
Force Field Chart Definition
What Tools and Techniques are Used?
Definition: A force field chart can help identify forces which will help or hinder root cause elimination.
Driving force: helps move toward the goal
Restraining force: resists movement toward the goal
Types of Forces
Driving Forces Restraining Forces

50
5 4 3 2 1 1 2 3 4 5
Force Field Chart Creation
How to Create a Force Field Chart
State the solution or goal
Brainstorm current forces impacting ability to achieve the goal
Rate the strength of each force’s influence on achieving the goal
– 1 = no influence
– 5 = highest level of influence
Add labels and arrows
– Driving forces on the left
– Restraining forces on the right
Driving Forces Restraining Forces Goal
What Tools and Techniques are Used?

51
Contents
Introduction
What Processes and Issues are Typically Addressed?
What is a Typical Project Like?
What Tools and Techniques are Used?
What Results Can be Achieved?
Information about Norbridge

52
Example of Results for Mining Project
After implementation, overall costs declined by 17%, and all cost categories were reduced.
What Results Can be Achieved?
2000 2001 2002 2003 2004
Dol
lars
per
Ton
Mine Operating Cost
4% Decline
2% Decline
5% Increase
11% Decline
Project Implementation

53
Example of Results for Processing Project
Plant availability rose significantly, even with rising throughput.
Magnetite usage declined by about 70%, with annual savings over $0.5 Million.
What Results Can be Achieved?
75%80%
85%90%
95%100%
2000 2001 2002 2003 2004
Plant Availability and Utilization
Project Implementation
July 2001
Magnetite Usage (Lbs Per Raw Ton Processed)
0
1
2
3
4
2001 2002 2003 2004
2.9
2.3
0.90.6
Plant Utilization
Plant Availability
54
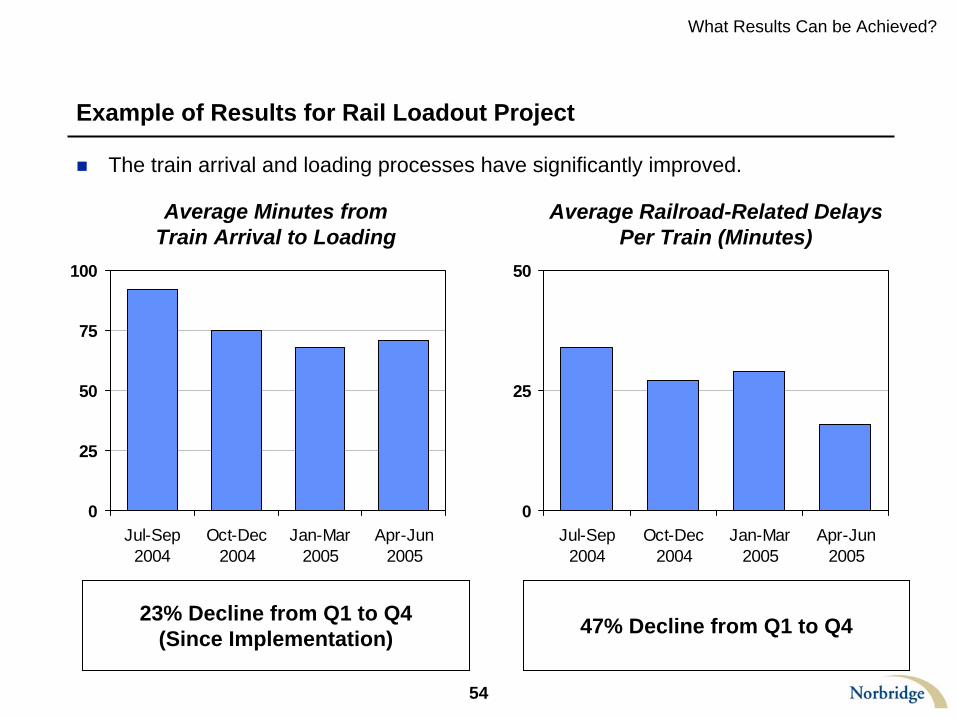
Example of Results for Rail Loadout Project
What Results Can be Achieved?
0
25
50
75
100
Jul-Sep2004
Oct-Dec2004
Jan-Mar2005
Apr-Jun2005
Average Minutes from Train Arrival to Loading
Average Railroad-Related Delays Per Train (Minutes)
23% Decline from Q1 to Q4 (Since Implementation)
0
25
50
Jul-Sep2004
Oct-Dec2004
Jan-Mar2005
Apr-Jun2005
47% Decline from Q1 to Q4
The train arrival and loading processes have significantly improved.
55
Contents
Introduction
What Processes and Issues are Typically Addressed?
What is a Typical Project Like?
What Tools and Techniques are Used?
What Results Can be Achieved?
Information about Norbridge

56
We leverage our process-driven approach, “HOME TEAM”, to support performance improvement in the mining industry.
Information About Norbridge
Key Characteristics of “HOME TEAM” at Mines, Processing Plants and Loadouts
Locally- Driven
Facility- Specific
ManagementSystem
Norbridge- Supported
Production
Cost
Safety
Other (facility-based)
Communication and information
Standard operating procedures
Enforcement and reinforcement
Measurement and monitoring
Issues to be addressed
Decisions and strategies
Mining expertise
Training/implementation
Project management
Coordination
Structured approach
Facilitation and problem solving
Tailored and flexible “game plan”
Not “one size fits all”
Not “black box”
Not “program of the month”
Results- Focused
HOME TEAM
57
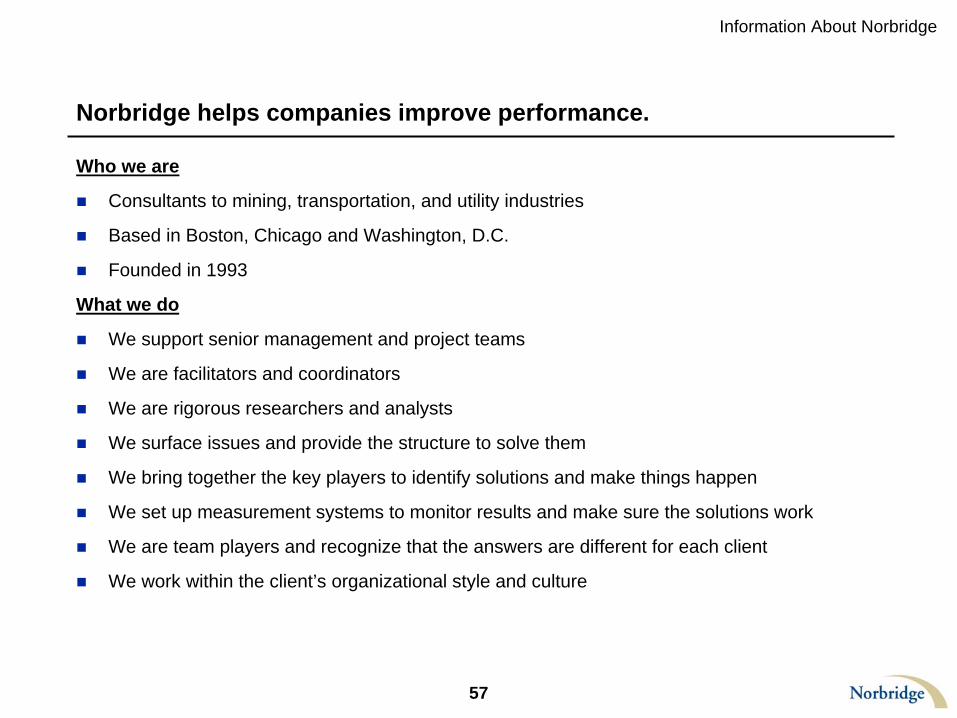
Norbridge helps companies improve performance.
Who we are
Consultants to mining, transportation, and utility industries
Based in Boston, Chicago and Washington, D.C.
Founded in 1993
What we do
We support senior management and project teams
We are facilitators and coordinators
We are rigorous researchers and analysts
We surface issues and provide the structure to solve them
We bring together the key players to identify solutions and make things happen
We set up measurement systems to monitor results and make sure the solutions work
We are team players and recognize that the answers are different for each client
We work within the client’s organizational style and culture
Information About Norbridge

58
We are contributors to the mining community.
We have conducted projects for:
– Mines
– Processing plants
– Transportation loadouts
– Facility safety
– Root cause analysis
We conducted a benchmarking study on mining company performance
– Focused on performance improvement challenges, opportunities and results
– Seventeen of the leading North American mining companies participated
We co-founded this conference in 2004 with the Penn State Mining Engineering Department on performance improvement in the mining industry
We speak regularly at industry conferences – SME, Coal Marketing Days, Coal Market Strategies, Other
Information About Norbridge

59
We provide a wide range of services.
Information About Norbridge
Core IndustriesCore Industries Functional ServicesFunctional Services
Mining
Transportation
Maritime and ports
Electric utilities
Pharmaceutical and medical products
Operations improvement
Process management
Corporate and business unit development and planning
Business modeling
Market, product, and sales strategy
eCommerce strategy
Organization development
Supply chain and logistics management
Purchasing and procurement
Norbridge Industry and Functional Focus
A broad range of general management consulting support for a select group of industries and clients

60
Norbridge frequently works at mining facilities – mines, processing plants, and transportation loadouts – to help improve performance.*
Information About Norbridge
Norbridge’s Facility-Specific Approach
Our projects are highly results-driven. We focus on achieving significant and sustained performance improvements in the areas that clients care about most: production, cost, safety, communication, teamwork and other areas.
Our Norbridge project teams are cost effective. We do not send a large project team to "swarm" across mining operations, but rather work closely with the project team and tailor our efforts to do what needs to be done.
We are facilitators and problem solvers. We do not come in, claim to be mining experts, and tell people what to do. Rather, we work closely with the project team to identify the problems, develop and implement the game plan to improve performance, and "make it stick".
We are not the program of the month. The "game plans" that our project teams implement are strong, flexible, and designed to "stand the test of time“.
We build teamwork and get employees involved. To improve performance significantly and sustain strong results over the long-term, mining facilities need a strong management team and a workforce that feels they are an important "part of the team". The teamwork and communication when we finish a project is typically much stronger than when we arrive on site.
We build strong performance measurement systems. To improve performance, we work with the project team to build an integrated performance measurement system including two types of measures: current performance measures and early warning measures. To manage mining operations most effectively, it is particularly important to have a measurement system for each facility which tells management what they need to know today, but also which highlights potential problems for the future that need to be addressed. Our measurement systems often track issues, problems or processes that have not been tracked by our clients in the past.
* For more information about Norbridge, visit our website at www.norbridgeinc.com
Related Documents