Energy and Environment Research; Vol. 4, No. 2; 2014 ISSN 1927-0569 E-ISSN 1927-0577 Published by Canadian Center of Science and Education 105 Process Evaluation of Carbon Dioxide Capture for Coal-Fired Power Plants Satoshi Kodama 1 , Kazuya Goto 2 & Hidetoshi Sekiguchi 1 1 Department of Chemical Engineering, Graduate School of Science and Engineering, Tokyo Institute of Technology, Tokyo, Japan 2 Chemical Research Group, Research Institute of Innovative Technology for the Earth, Kyoto, Japan Correspondence: Satoshi Kodama, Department of Chemical Engineering, Graduate School of Science and Engineering, Tokyo Institute of Technology, 2-12-1-S4-1 Ookayama, Meguro-ku Tokyo, Japan. Tel: 81-3-5734-2135. E-mail: [email protected] Received: December 25, 2013 Accepted: February 15, 2014 Online Published: April 30, 2014 doi:10.5539/eer.v4n2p105 URL: http://dx.doi.org/10.5539/eer.v4n2p105 Abstract Carbon capture is a promising technology for carbon dioxide (CO 2 ) removal from large stationary CO 2 sources. The effects of carbon dioxide capture process on output efficiency of fossil power plants were investigated. Supercritical pulverized coal and integrated coal gasification combined cycle (IGCC) were assumed as model coal-fired power plants for this investigation. Heat-driven and pressure-driven CO 2 capture processes such as chemical absorption and physical adsorption were assumed for CO 2 capture process. In this study, these technologies were evaluated and compared under the unified basis and conditions by using the commercial process simulator. For IGCC plant, the efficiency penalty by installing water-gas shift reaction was also investigated. Gross and net power generation, efficiency and the efficiency penalty by CO 2 capture process were calculated. Heat duty for CO 2 capture process and CO 2 compression conditions were varied, and those effects on the efficiency penalty were obtained. The results provide a guideline for development of CO 2 capture process of power plants. Keywords: carbon dioxide capture, power plant, process simulation 1. Introduction In working group I contribution to the fifth assessment report of the Intergovernmental Panel on Climate Change (IPCC), it is reported that “Warming of the climate system is unequivocal, and since the 1950s, many of the observed changes are unprecedented over decades to millennia” (IPCC, 2013). Several scenarios which reduce the carbon dioxide (CO 2 ) emission and stabilize the global climate change are proposed, such as the 450 scenario and the 550 scenario. The 450 scenario can control the average temperature rise within 2 °C by stabilizing the CO 2 concentration in the atmosphere for 450 ppm. In the scenario, 14 GT/y of CO 2 emission must be reduced in 2030. To reduce the CO 2 emission, it is suggested to use renewable energy, biofuels, nuclear power and carbon capture and storage (CCS), as well as energy saving. CCS is expected to remove 2 GT/yr of CO 2 emission (IEA, 2009). CO 2 is generated by various human activities, such as electricity and heat producing, manufacturing, transport etc. The CO 2 from electricity and heat generation and manufacturing are typically emitted from large exhaust stacks, and they can be described as large stationary sources. The large stationary sources represent potential opportunities for the addition of CO 2 capture plants. The properties of each CO 2 -containing gas is different, while the CO 2 partial pressure is important for CO 2 capture. Coal for power generation is primarily burnt in pulverized-coal (PC) boilers producing an atmospheric pressure flue gas stream with a CO 2 partial pressure of up to 0.014 MPa. The newer and potentially more efficient integrated coal gasification combined cycle (IGCC) technology has been developed, and CO 2 partial pressure of CO 2 capture target gas is up to 0.014 MPa (post combustion) or 1.4 MPa (pre combustion) (IPCC, 2005). There are several CO 2 captuure technologies, which use sorbent, solvent or membranes etc. The technologies are also classified as heat and/or pressure driven process. For example, absorption by chemical solvents and temperature swing adsorption are a heat driven process. On the other hand, the physical absorption of physical solvents, pressure swing adsorption and membrane separation are a pressure driven process. Generally, heat-driven CO 2 capture is used for low CO 2 partial pressure on target gas, while pressure-driven process is used

Welcome message from author
This document is posted to help you gain knowledge. Please leave a comment to let me know what you think about it! Share it to your friends and learn new things together.
Transcript
Energy and Environment Research; Vol. 4, No. 2; 2014 ISSN 1927-0569 E-ISSN 1927-0577
Published by Canadian Center of Science and Education
105
Process Evaluation of Carbon Dioxide Capture for Coal-Fired Power Plants
Satoshi Kodama1, Kazuya Goto2 & Hidetoshi Sekiguchi1 1 Department of Chemical Engineering, Graduate School of Science and Engineering, Tokyo Institute of Technology, Tokyo, Japan 2 Chemical Research Group, Research Institute of Innovative Technology for the Earth, Kyoto, Japan
Correspondence: Satoshi Kodama, Department of Chemical Engineering, Graduate School of Science and Engineering, Tokyo Institute of Technology, 2-12-1-S4-1 Ookayama, Meguro-ku Tokyo, Japan. Tel: 81-3-5734-2135. E-mail: [email protected]
Received: December 25, 2013 Accepted: February 15, 2014 Online Published: April 30, 2014
doi:10.5539/eer.v4n2p105 URL: http://dx.doi.org/10.5539/eer.v4n2p105
Abstract Carbon capture is a promising technology for carbon dioxide (CO2) removal from large stationary CO2 sources. The effects of carbon dioxide capture process on output efficiency of fossil power plants were investigated. Supercritical pulverized coal and integrated coal gasification combined cycle (IGCC) were assumed as model coal-fired power plants for this investigation. Heat-driven and pressure-driven CO2 capture processes such as chemical absorption and physical adsorption were assumed for CO2 capture process. In this study, these technologies were evaluated and compared under the unified basis and conditions by using the commercial process simulator. For IGCC plant, the efficiency penalty by installing water-gas shift reaction was also investigated. Gross and net power generation, efficiency and the efficiency penalty by CO2 capture process were calculated. Heat duty for CO2 capture process and CO2 compression conditions were varied, and those effects on the efficiency penalty were obtained. The results provide a guideline for development of CO2 capture process of power plants. Keywords: carbon dioxide capture, power plant, process simulation
1. Introduction In working group I contribution to the fifth assessment report of the Intergovernmental Panel on Climate Change (IPCC), it is reported that “Warming of the climate system is unequivocal, and since the 1950s, many of the observed changes are unprecedented over decades to millennia” (IPCC, 2013). Several scenarios which reduce the carbon dioxide (CO2) emission and stabilize the global climate change are proposed, such as the 450 scenario and the 550 scenario. The 450 scenario can control the average temperature rise within 2 °C by stabilizing the CO2 concentration in the atmosphere for 450 ppm. In the scenario, 14 GT/y of CO2 emission must be reduced in 2030. To reduce the CO2 emission, it is suggested to use renewable energy, biofuels, nuclear power and carbon capture and storage (CCS), as well as energy saving. CCS is expected to remove 2 GT/yr of CO2 emission (IEA, 2009). CO2 is generated by various human activities, such as electricity and heat producing, manufacturing, transport etc. The CO2 from electricity and heat generation and manufacturing are typically emitted from large exhaust stacks, and they can be described as large stationary sources. The large stationary sources represent potential opportunities for the addition of CO2 capture plants. The properties of each CO2-containing gas is different, while the CO2 partial pressure is important for CO2 capture. Coal for power generation is primarily burnt in pulverized-coal (PC) boilers producing an atmospheric pressure flue gas stream with a CO2 partial pressure of up to 0.014 MPa. The newer and potentially more efficient integrated coal gasification combined cycle (IGCC) technology has been developed, and CO2 partial pressure of CO2 capture target gas is up to 0.014 MPa (post combustion) or 1.4 MPa (pre combustion) (IPCC, 2005).
There are several CO2 captuure technologies, which use sorbent, solvent or membranes etc. The technologies are also classified as heat and/or pressure driven process. For example, absorption by chemical solvents and temperature swing adsorption are a heat driven process. On the other hand, the physical absorption of physical solvents, pressure swing adsorption and membrane separation are a pressure driven process. Generally, heat-driven CO2 capture is used for low CO2 partial pressure on target gas, while pressure-driven process is used

www.ccsenet.org/eer Energy and Environment Research Vol. 4, No. 2; 2014
106
for higher CO2 partial pressure. The combination of heat and pressure-driven CO2 capture process such as MDEA process is also evaluated. From the point of view of development of CO2 capture process, it is important to estimate the efficiency penalty of power plants. There are many studies which analyze the effect of operating conditions of CO2 capture process on power plant efficiency (Abu Zhara, 2011; Cifre, 2009; Goto, 2013; Strube, 2011). However, the relationship between heat and energy duty of CO2 capture process and compressors on the efficiency of the power plants is not cleared yet.
In this study, PC and IGCC power plants were modelled by using a process simulator. The effect of properties of CO2 capture process on power plant efficiency was investigated under the unified basis and conditions, such as coal property, efficiency of compressors or pumps etc. For IGCC plant, the efficiency penalty by installing water-gas shift reaction was also investigated. Gross and net power generation, efficiency and the efficiency penalty by CO2 capture process were calculated. Heat duty for CO2 capture process and CO2 compression conditions were varied, and those effects on the efficiency penalty were obtained.
2. Development of Process Simulation Models A commercial process simulator Aspen Plus 7.3 was used for the process modelling of power plants. The design basis of PC and IGCC power plant was referred from literature (NETL, 2007). The design coal was bituminous (Illinois No. 6) as shown in the reference. The high heat value (HHV) and low heat value (LHV) of the coal is 27,113 KJ/kg and 26,151 KJ/kg, respectively.
2.1 PC Power Plant
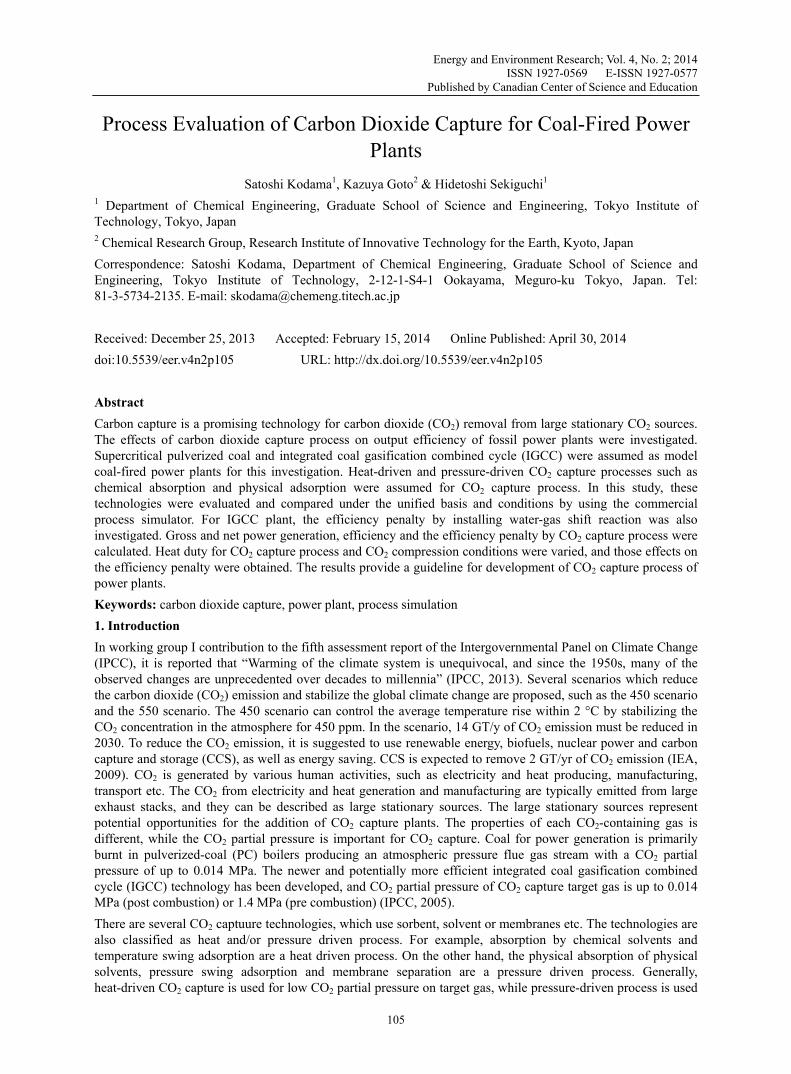
For the development of PC power plant with CO2 removal, “Case12 PC with supercritical case” in the NETL report was referred (NETL, 2007). Process flow diagram of the PC power plant is shown in Figure 1. Pulverized coal was supplied to the burner. In this burner, steam was generated and was supplied to steam turbines. The steam turbines consist of high-pressure (HP), intermediate-pressure (IP) and low-pressure (LP) turbines as shown in Figure 2. The steam temperature generated by the heater was 593 °C and the pressure of superheated steam was 24.1 MPa. The flue gas from the burner was treated by selective catalytic reduction (SCR), bag filter and flue gas desulfurization (FGD). Finally, CO2 was removed from the gas and treated flue gas was released from the stack. The separated CO2 was compressed and liquefied by compressors to sequestration-ready pressure, 15.2 MPa. The details of CO2 compression process and steam turbines are described in 2.3 and 2.4.
Figure 1. Process flow diagram of PC power plant with CO2 post-combustion capture (Case12 in the literature
(NETL, 2007))
www.ccsenet.org/eer Energy and Environment Research Vol. 4, No. 2; 2014
107
Figure 2. Steam extraction from steam turbines to CO2 capture process
2.2 IGCC Power Plant
2.2.1 IGCC Without CO2 Capture
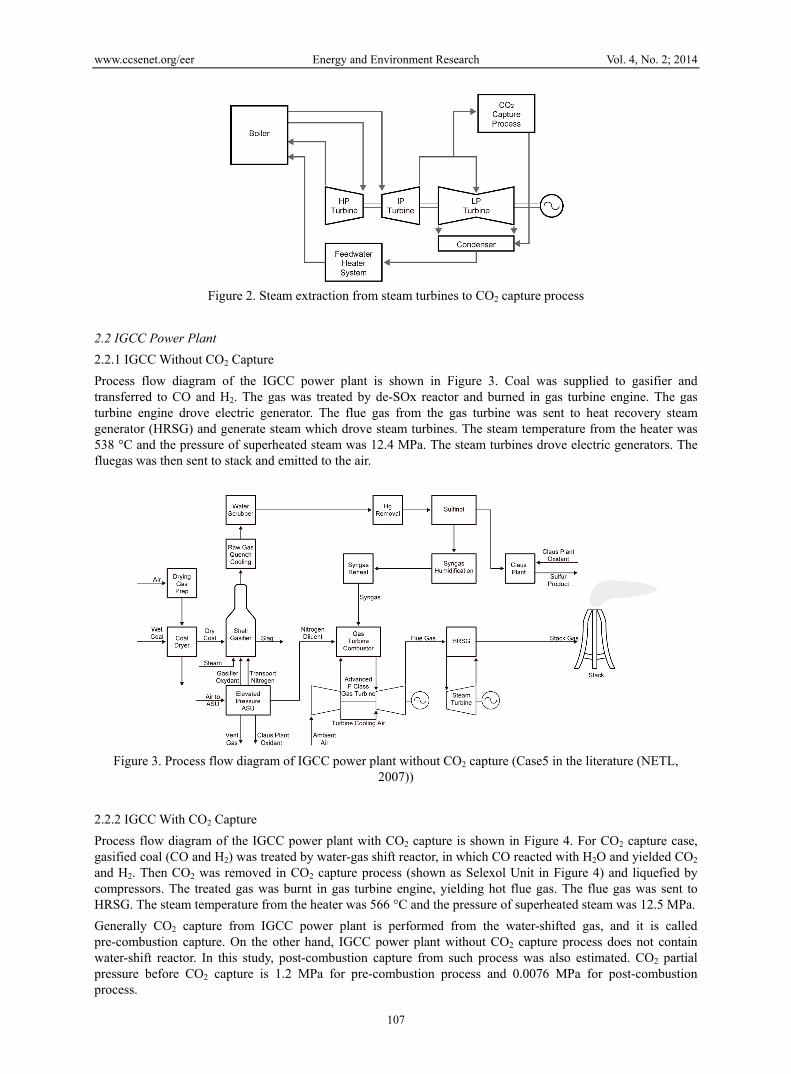
Process flow diagram of the IGCC power plant is shown in Figure 3. Coal was supplied to gasifier and transferred to CO and H2. The gas was treated by de-SOx reactor and burned in gas turbine engine. The gas turbine engine drove electric generator. The flue gas from the gas turbine was sent to heat recovery steam generator (HRSG) and generate steam which drove steam turbines. The steam temperature from the heater was 538 °C and the pressure of superheated steam was 12.4 MPa. The steam turbines drove electric generators. The fluegas was then sent to stack and emitted to the air.
Figure 3. Process flow diagram of IGCC power plant without CO2 capture (Case5 in the literature (NETL,
2007))
2.2.2 IGCC With CO2 Capture
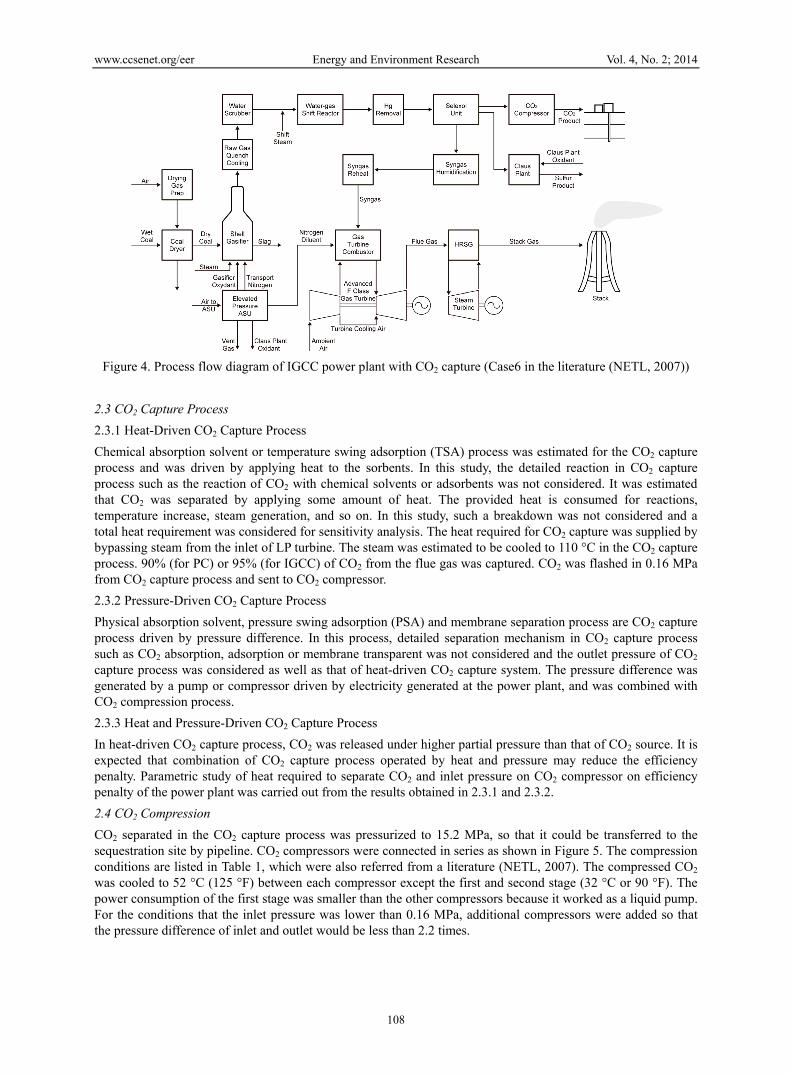
Process flow diagram of the IGCC power plant with CO2 capture is shown in Figure 4. For CO2 capture case, gasified coal (CO and H2) was treated by water-gas shift reactor, in which CO reacted with H2O and yielded CO2 and H2. Then CO2 was removed in CO2 capture process (shown as Selexol Unit in Figure 4) and liquefied by compressors. The treated gas was burnt in gas turbine engine, yielding hot flue gas. The flue gas was sent to HRSG. The steam temperature from the heater was 566 °C and the pressure of superheated steam was 12.5 MPa.
Generally CO2 capture from IGCC power plant is performed from the water-shifted gas, and it is called pre-combustion capture. On the other hand, IGCC power plant without CO2 capture process does not contain water-shift reactor. In this study, post-combustion capture from such process was also estimated. CO2 partial pressure before CO2 capture is 1.2 MPa for pre-combustion process and 0.0076 MPa for post-combustion process.
www.ccsenet.org/eer Energy and Environment Research Vol. 4, No. 2; 2014
108
Figure 4. Process flow diagram of IGCC power plant with CO2 capture (Case6 in the literature (NETL, 2007))
2.3 CO2 Capture Process
2.3.1 Heat-Driven CO2 Capture Process
Chemical absorption solvent or temperature swing adsorption (TSA) process was estimated for the CO2 capture process and was driven by applying heat to the sorbents. In this study, the detailed reaction in CO2 capture process such as the reaction of CO2 with chemical solvents or adsorbents was not considered. It was estimated that CO2 was separated by applying some amount of heat. The provided heat is consumed for reactions, temperature increase, steam generation, and so on. In this study, such a breakdown was not considered and a total heat requirement was considered for sensitivity analysis. The heat required for CO2 capture was supplied by bypassing steam from the inlet of LP turbine. The steam was estimated to be cooled to 110 °C in the CO2 capture process. 90% (for PC) or 95% (for IGCC) of CO2 from the flue gas was captured. CO2 was flashed in 0.16 MPa from CO2 capture process and sent to CO2 compressor.
2.3.2 Pressure-Driven CO2 Capture Process
Physical absorption solvent, pressure swing adsorption (PSA) and membrane separation process are CO2 capture process driven by pressure difference. In this process, detailed separation mechanism in CO2 capture process such as CO2 absorption, adsorption or membrane transparent was not considered and the outlet pressure of CO2 capture process was considered as well as that of heat-driven CO2 capture system. The pressure difference was generated by a pump or compressor driven by electricity generated at the power plant, and was combined with CO2 compression process.
2.3.3 Heat and Pressure-Driven CO2 Capture Process
In heat-driven CO2 capture process, CO2 was released under higher partial pressure than that of CO2 source. It is expected that combination of CO2 capture process operated by heat and pressure may reduce the efficiency penalty. Parametric study of heat required to separate CO2 and inlet pressure on CO2 compressor on efficiency penalty of the power plant was carried out from the results obtained in 2.3.1 and 2.3.2.
2.4 CO2 Compression
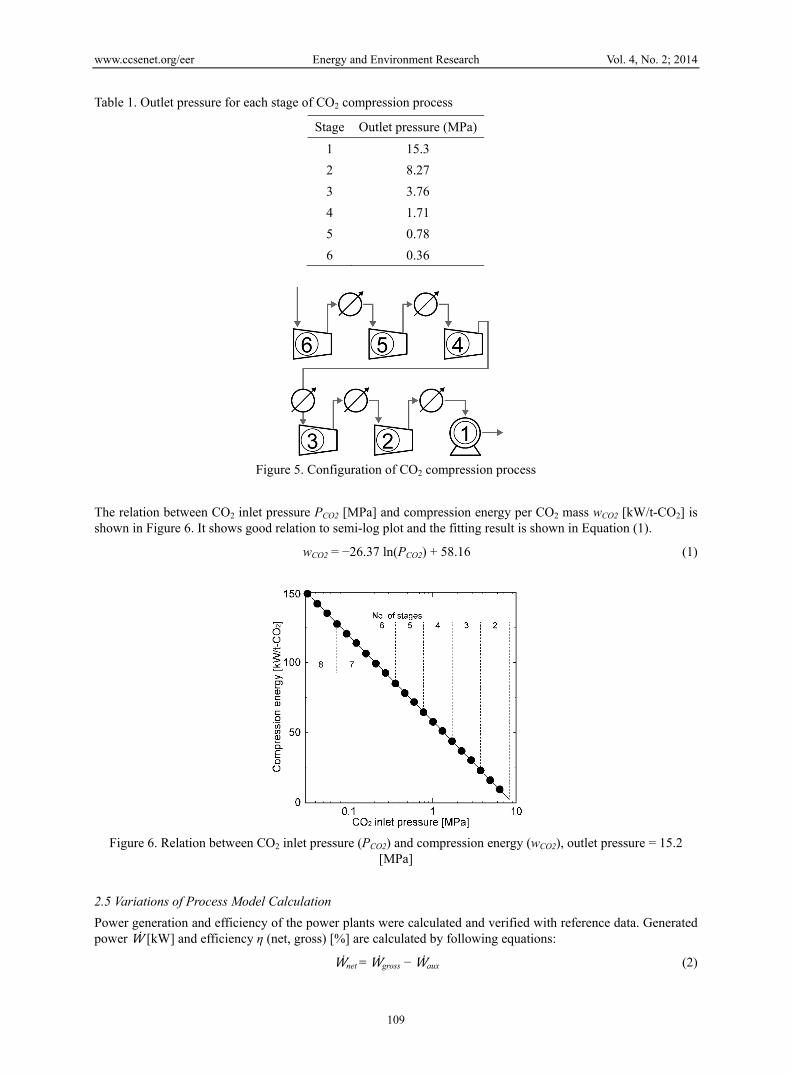
CO2 separated in the CO2 capture process was pressurized to 15.2 MPa, so that it could be transferred to the sequestration site by pipeline. CO2 compressors were connected in series as shown in Figure 5. The compression conditions are listed in Table 1, which were also referred from a literature (NETL, 2007). The compressed CO2 was cooled to 52 °C (125 °F) between each compressor except the first and second stage (32 °C or 90 °F). The power consumption of the first stage was smaller than the other compressors because it worked as a liquid pump. For the conditions that the inlet pressure was lower than 0.16 MPa, additional compressors were added so that the pressure difference of inlet and outlet would be less than 2.2 times.
www.ccsenet.org/eer Energy and Environment Research Vol. 4, No. 2; 2014
109
Table 1. Outlet pressure for each stage of CO2 compression process
Stage Outlet pressure (MPa)
1 15.3
2 8.27
3 3.76
4 1.71
5 0.78
6 0.36
Figure 5. Configuration of CO2 compression process
The relation between CO2 inlet pressure PCO2 [MPa] and compression energy per CO2 mass wCO2 [kW/t-CO2] is shown in Figure 6. It shows good relation to semi-log plot and the fitting result is shown in Equation (1).
wCO2 = −26.37 ln(PCO2) + 58.16 (1)
Figure 6. Relation between CO2 inlet pressure (PCO2) and compression energy (wCO2), outlet pressure = 15.2
[MPa]
2.5 Variations of Process Model Calculation
Power generation and efficiency of the power plants were calculated and verified with reference data. Generated power Ẇ [kW] and efficiency η (net, gross) [%] are calculated by following equations:
Ẇnet = Ẇgross − Ẇaux (2)
www.ccsenet.org/eer Energy and Environment Research Vol. 4, No. 2; 2014
110
ηgross = (Ẇgross × 3.6) / coal × 100 (3)
ηnet = (Ẇnet × 3.6) / coal × 100 (4)
Where coal is thermal input to the plant by coal combustion [GJ/h], 3.6 is a conversion factor from kW to GJ/h.
CO2 recovery ratio was 90% for PC case and 95% for IGCC cases, therefore
ṁCO2-sep = 0.90 ṁCO2-gen (for PC), ṁCO2-sep = 0.95 ṁCO2-gen (for IGCC) (5)
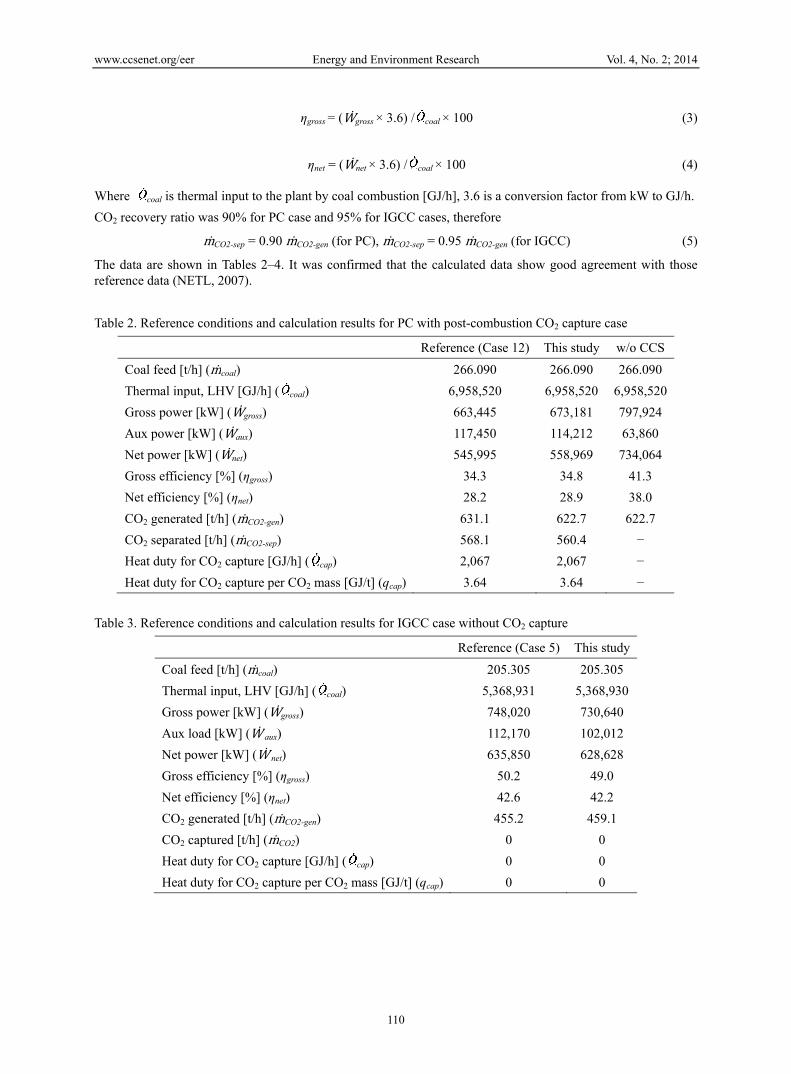
The data are shown in Tables 2–4. It was confirmed that the calculated data show good agreement with those reference data (NETL, 2007).
Table 2. Reference conditions and calculation results for PC with post-combustion CO2 capture case
Reference (Case 12) This study w/o CCS
Coal feed [t/h] (ṁcoal) 266.090 266.090 266.090
Thermal input, LHV [GJ/h] ( coal) 6,958,520 6,958,520 6,958,520
Gross power [kW] (Ẇgross) 663,445 673,181 797,924
Aux power [kW] (Ẇaux) 117,450 114,212 63,860
Net power [kW] (Ẇnet) 545,995 558,969 734,064
Gross efficiency [%] (ηgross) 34.3 34.8 41.3
Net efficiency [%] (ηnet) 28.2 28.9 38.0
CO2 generated [t/h] (ṁCO2-gen) 631.1 622.7 622.7
CO2 separated [t/h] (ṁCO2-sep) 568.1 560.4 −
Heat duty for CO2 capture [GJ/h] ( cap) 2,067 2,067 −
Heat duty for CO2 capture per CO2 mass [GJ/t] (qcap) 3.64 3.64 −
Table 3. Reference conditions and calculation results for IGCC case without CO2 capture
Reference (Case 5) This study
Coal feed [t/h] (ṁcoal) 205.305 205.305
Thermal input, LHV [GJ/h] ( coal) 5,368,931 5,368,930
Gross power [kW] (Ẇgross) 748,020 730,640
Aux load [kW] (Ẇ aux) 112,170 102,012
Net power [kW] (Ẇ net) 635,850 628,628
Gross efficiency [%] (ηgross) 50.2 49.0
Net efficiency [%] (ηnet) 42.6 42.2
CO2 generated [t/h] (ṁCO2-gen) 455.2 459.1
CO2 captured [t/h] (ṁCO2) 0 0
Heat duty for CO2 capture [GJ/h] ( cap) 0 0
Heat duty for CO2 capture per CO2 mass [GJ/t] (qcap) 0 0
www.ccsenet.org/eer Energy and Environment Research Vol. 4, No. 2; 2014
111
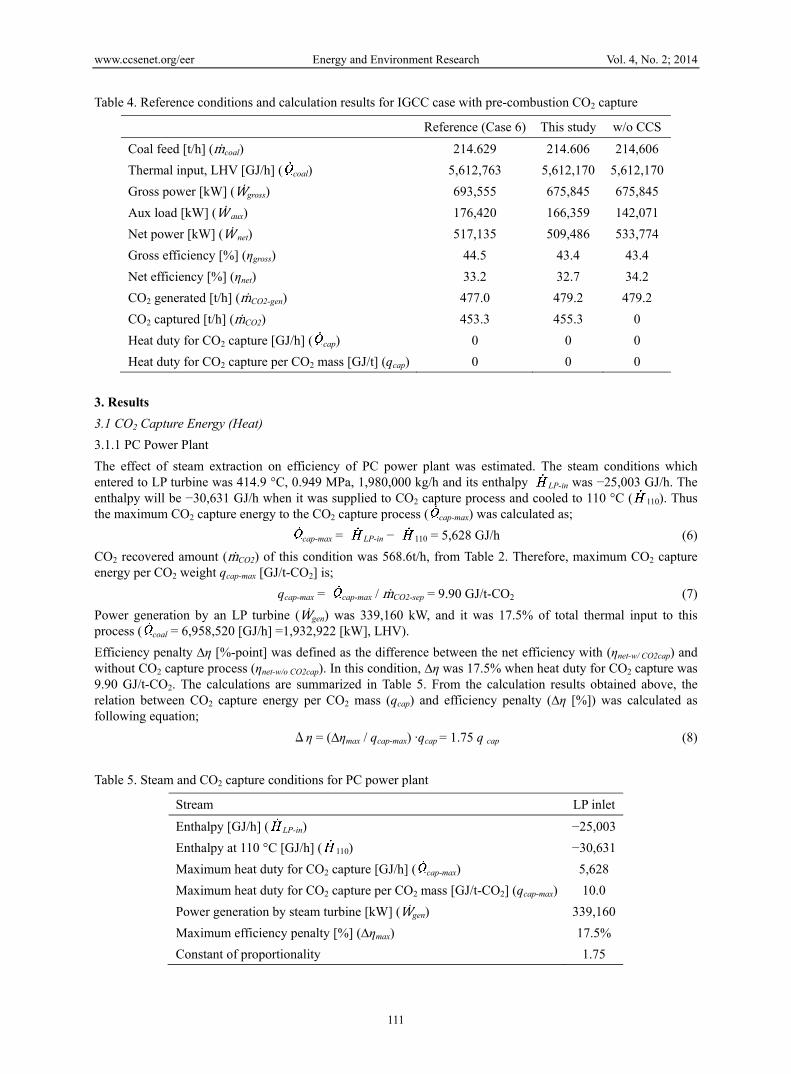
Table 4. Reference conditions and calculation results for IGCC case with pre-combustion CO2 capture
Reference (Case 6) This study w/o CCS
Coal feed [t/h] (ṁcoal) 214.629 214.606 214,606
Thermal input, LHV [GJ/h] ( coal) 5,612,763 5,612,170 5,612,170
Gross power [kW] (Ẇgross) 693,555 675,845 675,845
Aux load [kW] (Ẇ aux) 176,420 166,359 142,071
Net power [kW] (Ẇ net) 517,135 509,486 533,774
Gross efficiency [%] (ηgross) 44.5 43.4 43.4
Net efficiency [%] (ηnet) 33.2 32.7 34.2
CO2 generated [t/h] (ṁCO2-gen) 477.0 479.2 479.2
CO2 captured [t/h] (ṁCO2) 453.3 455.3 0
Heat duty for CO2 capture [GJ/h] ( cap) 0 0 0
Heat duty for CO2 capture per CO2 mass [GJ/t] (qcap) 0 0 0
3. Results 3.1 CO2 Capture Energy (Heat)
3.1.1 PC Power Plant
The effect of steam extraction on efficiency of PC power plant was estimated. The steam conditions which entered to LP turbine was 414.9 °C, 0.949 MPa, 1,980,000 kg/h and its enthalpy LP-in was −25,003 GJ/h. The enthalpy will be −30,631 GJ/h when it was supplied to CO2 capture process and cooled to 110 °C ( 110). Thus the maximum CO2 capture energy to the CO2 capture process ( cap-max) was calculated as;
cap-max = LP-in − 110 = 5,628 GJ/h (6)
CO2 recovered amount (ṁCO2) of this condition was 568.6t/h, from Table 2. Therefore, maximum CO2 capture energy per CO2 weight qcap-max [GJ/t-CO2] is;
qcap-max = cap-max / ṁCO2-sep = 9.90 GJ/t-CO2 (7)
Power generation by an LP turbine (Ẇgen) was 339,160 kW, and it was 17.5% of total thermal input to this process ( coal = 6,958,520 [GJ/h] =1,932,922 [kW], LHV).
Efficiency penalty ∆η [%-point] was defined as the difference between the net efficiency with (ηnet-w/ CO2cap) and without CO2 capture process (ηnet-w/o CO2cap). In this condition, ∆η was 17.5% when heat duty for CO2 capture was 9.90 GJ/t-CO2. The calculations are summarized in Table 5. From the calculation results obtained above, the relation between CO2 capture energy per CO2 mass (qcap) and efficiency penalty (∆η [%]) was calculated as following equation;
Δη = (∆ηmax / qcap-max) ·qcap = 1.75 q cap (8)
Table 5. Steam and CO2 capture conditions for PC power plant
Stream LP inlet
Enthalpy [GJ/h] ( LP-in) −25,003
Enthalpy at 110 °C [GJ/h] ( 110) −30,631
Maximum heat duty for CO2 capture [GJ/h] ( cap-max) 5,628
Maximum heat duty for CO2 capture per CO2 mass [GJ/t-CO2] (qcap-max) 10.0
Power generation by steam turbine [kW] (Ẇgen) 339,160
Maximum efficiency penalty [%] (∆ηmax) 17.5%
Constant of proportionality 1.75
www.ccsenet.org/eer Energy and Environment Research Vol. 4, No. 2; 2014
112
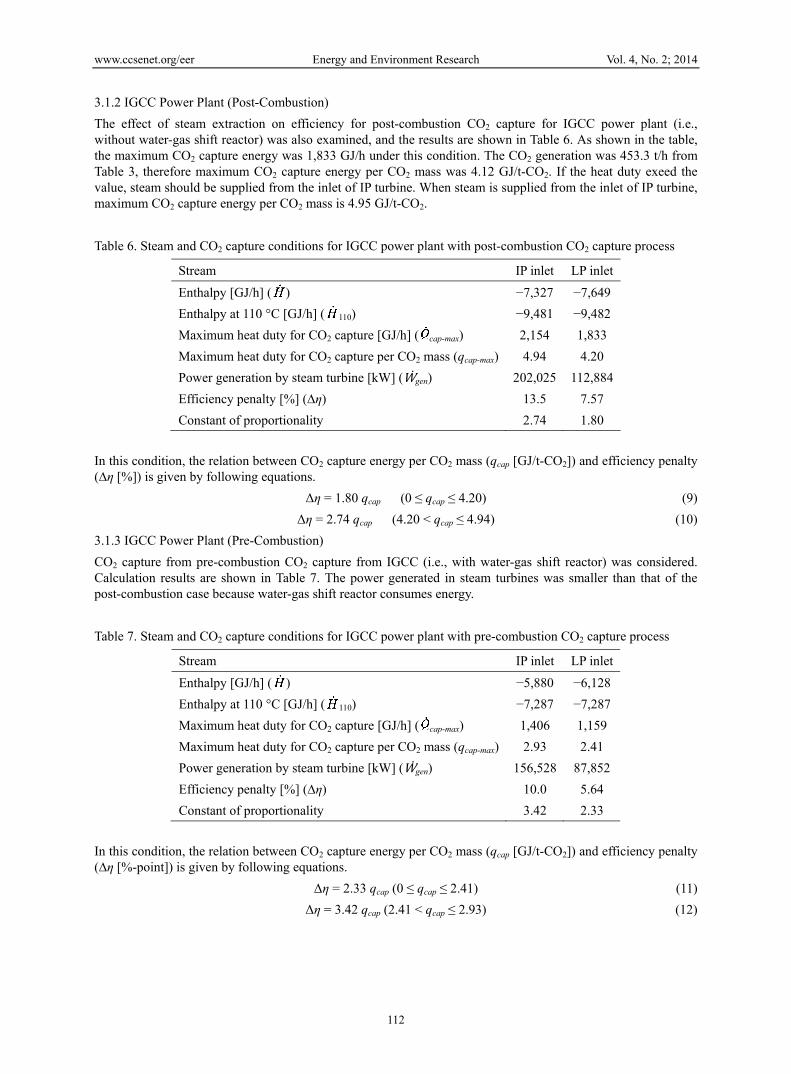
3.1.2 IGCC Power Plant (Post-Combustion)
The effect of steam extraction on efficiency for post-combustion CO2 capture for IGCC power plant (i.e., without water-gas shift reactor) was also examined, and the results are shown in Table 6. As shown in the table, the maximum CO2 capture energy was 1,833 GJ/h under this condition. The CO2 generation was 453.3 t/h from Table 3, therefore maximum CO2 capture energy per CO2 mass was 4.12 GJ/t-CO2. If the heat duty exeed the value, steam should be supplied from the inlet of IP turbine. When steam is supplied from the inlet of IP turbine, maximum CO2 capture energy per CO2 mass is 4.95 GJ/t-CO2.
Table 6. Steam and CO2 capture conditions for IGCC power plant with post-combustion CO2 capture process
Stream IP inlet LP inlet
Enthalpy [GJ/h] ( ) −7,327 −7,649
Enthalpy at 110 °C [GJ/h] ( 110) −9,481 −9,482
Maximum heat duty for CO2 capture [GJ/h] ( cap-max) 2,154 1,833
Maximum heat duty for CO2 capture per CO2 mass (qcap-max) 4.94 4.20
Power generation by steam turbine [kW] (Ẇgen) 202,025 112,884
Efficiency penalty [%] (∆η) 13.5 7.57
Constant of proportionality 2.74 1.80
In this condition, the relation between CO2 capture energy per CO2 mass (qcap [GJ/t-CO2]) and efficiency penalty (∆η [%]) is given by following equations.
Δη = 1.80 qcap (0 ≤ qcap ≤ 4.20) (9)
Δη = 2.74 qcap (4.20 < qcap ≤ 4.94) (10)
3.1.3 IGCC Power Plant (Pre-Combustion)
CO2 capture from pre-combustion CO2 capture from IGCC (i.e., with water-gas shift reactor) was considered. Calculation results are shown in Table 7. The power generated in steam turbines was smaller than that of the post-combustion case because water-gas shift reactor consumes energy.
Table 7. Steam and CO2 capture conditions for IGCC power plant with pre-combustion CO2 capture process
Stream IP inlet LP inlet
Enthalpy [GJ/h] ( ) −5,880 −6,128
Enthalpy at 110 °C [GJ/h] ( 110) −7,287 −7,287
Maximum heat duty for CO2 capture [GJ/h] ( cap-max) 1,406 1,159
Maximum heat duty for CO2 capture per CO2 mass (qcap-max) 2.93 2.41
Power generation by steam turbine [kW] (Ẇgen) 156,528 87,852
Efficiency penalty [%] (∆η) 10.0 5.64
Constant of proportionality 3.42 2.33
In this condition, the relation between CO2 capture energy per CO2 mass (qcap [GJ/t-CO2]) and efficiency penalty (∆η [%-point]) is given by following equations.
Δη = 2.33 qcap (0 ≤ qcap ≤ 2.41) (11)
Δη = 3.42 qcap (2.41 < qcap ≤ 2.93) (12)
www.ccsenet.org/eer Energy and Environment Research Vol. 4, No. 2; 2014
113
3.2 CO2 Capture Energy (Pressure)
As discussed in 2.4, there is a linear semi-log relation between CO2 compression energy and CO2 inlet pressure to the compression process. The CO2 compression energy wCO2 can be converted to efficiency penalty ∆η for PC and IGCC (post and pre-combustion CO2 capture) processes by following equation.
∆η = wCO2 × (ṁCO2 / coal) × 100 (13)
The y-axis intercept and constant of proportionality of Equation (1) are converted as shown in Table 8.
Table 8. Slopes and y-intercepts of the relation between CO2 inlet pressure PCO2 and compression energy wCO2 for PC and IGCCpower plants
Slope y-intercept
PC with post-combustion CO2 capture −0.765 1.69
IGCC with post-combustion CO2 capture −0.771 1.70
IGCC with pre-combustion CO2 capture −0.770 1.70
4. Discussion 4.1 CO2 Capture Energy (Combination of Heat and Pressure)
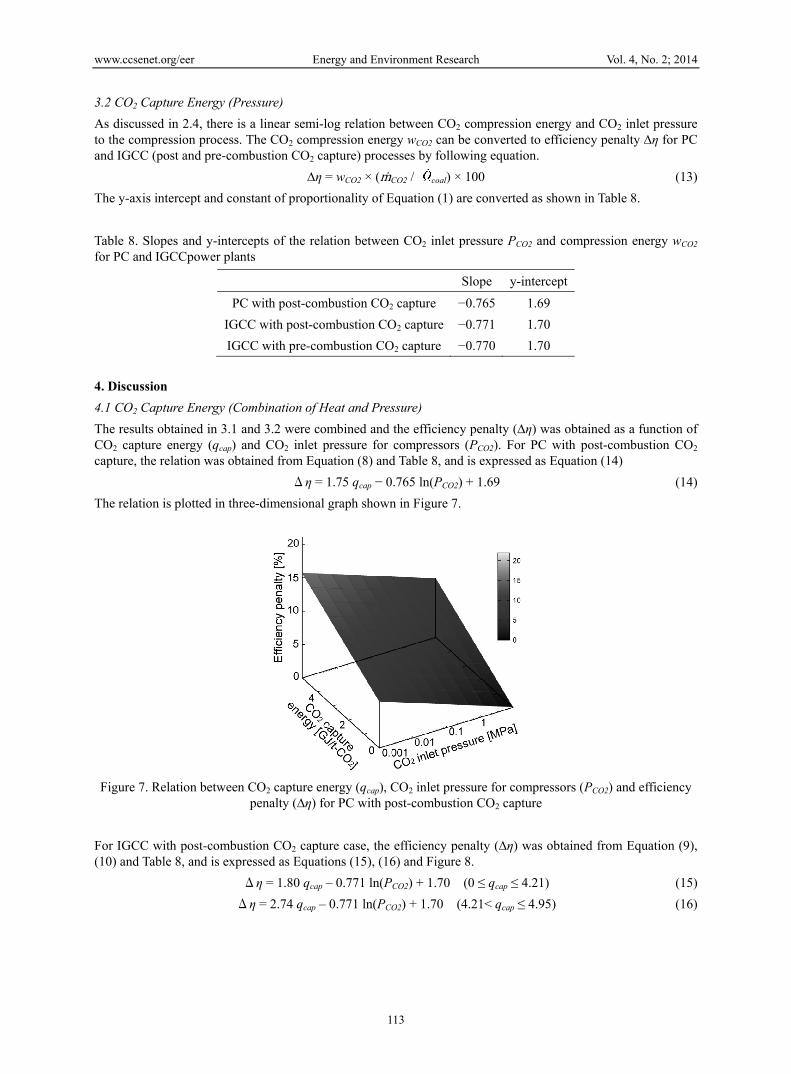
The results obtained in 3.1 and 3.2 were combined and the efficiency penalty (∆η) was obtained as a function of CO2 capture energy (qcap) and CO2 inlet pressure for compressors (PCO2). For PC with post-combustion CO2 capture, the relation was obtained from Equation (8) and Table 8, and is expressed as Equation (14)
Δη = 1.75 qcap − 0.765 ln(PCO2) + 1.69 (14)
The relation is plotted in three-dimensional graph shown in Figure 7.
Figure 7. Relation between CO2 capture energy (qcap), CO2 inlet pressure for compressors (PCO2) and efficiency
penalty (∆η) for PC with post-combustion CO2 capture
For IGCC with post-combustion CO2 capture case, the efficiency penalty (∆η) was obtained from Equation (9), (10) and Table 8, and is expressed as Equations (15), (16) and Figure 8.
Δη = 1.80 qcap – 0.771 ln(PCO2) + 1.70 (0 ≤ qcap ≤ 4.21) (15)
Δη = 2.74 qcap – 0.771 ln(PCO2) + 1.70 (4.21< qcap ≤ 4.95) (16)
www.ccsenet.org/eer Energy and Environment Research Vol. 4, No. 2; 2014
114
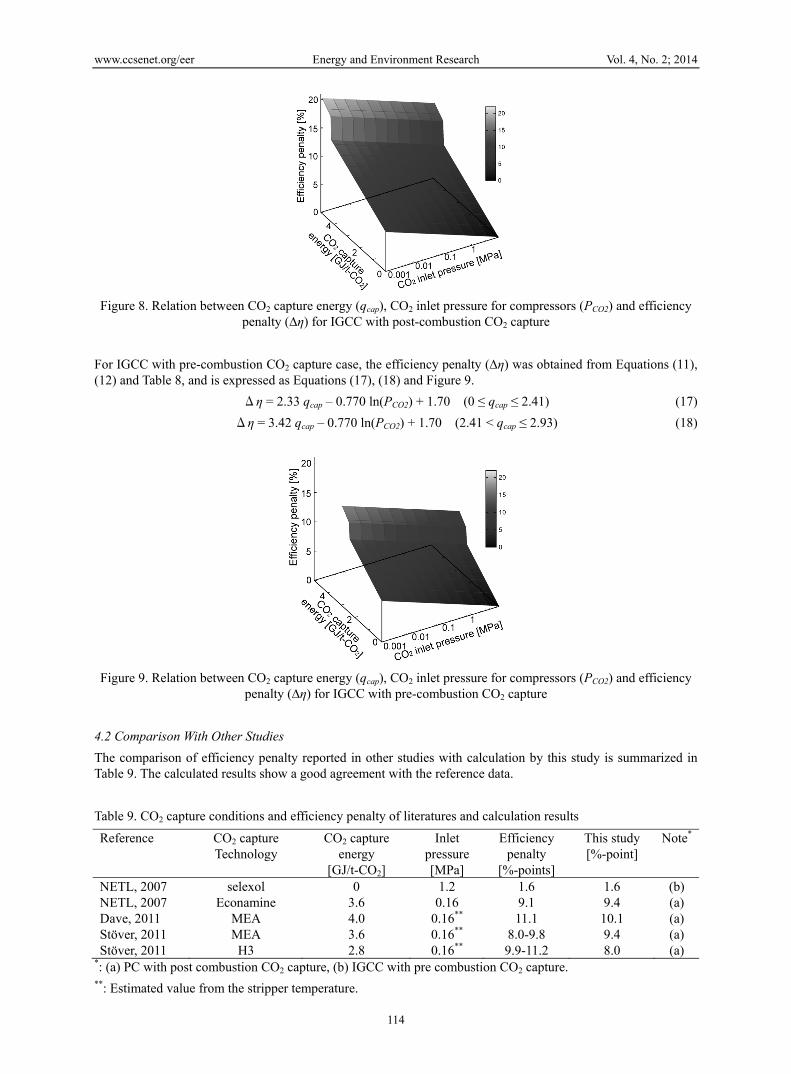
Figure 8. Relation between CO2 capture energy (qcap), CO2 inlet pressure for compressors (PCO2) and efficiency
penalty (∆η) for IGCC with post-combustion CO2 capture
For IGCC with pre-combustion CO2 capture case, the efficiency penalty (∆η) was obtained from Equations (11), (12) and Table 8, and is expressed as Equations (17), (18) and Figure 9.
Δη = 2.33 qcap – 0.770 ln(PCO2) + 1.70 (0 ≤ qcap ≤ 2.41) (17)
Δη = 3.42 qcap – 0.770 ln(PCO2) + 1.70 (2.41 < qcap ≤ 2.93) (18)
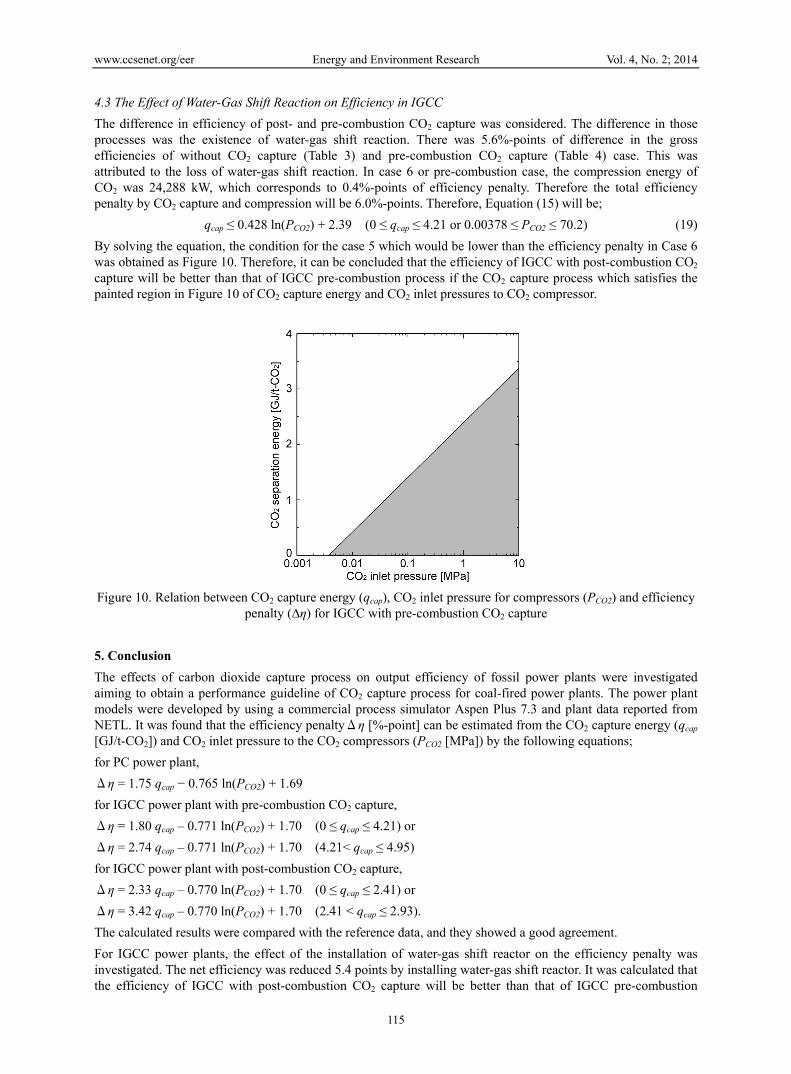
Figure 9. Relation between CO2 capture energy (qcap), CO2 inlet pressure for compressors (PCO2) and efficiency
penalty (∆η) for IGCC with pre-combustion CO2 capture
4.2 Comparison With Other Studies
The comparison of efficiency penalty reported in other studies with calculation by this study is summarized in Table 9. The calculated results show a good agreement with the reference data.
Table 9. CO2 capture conditions and efficiency penalty of literatures and calculation results
Reference CO2 capture Technology
CO2 capture energy
[GJ/t-CO2]
Inlet pressure [MPa]
Efficiency penalty
[%-points]
This study [%-point]
Note*
NETL, 2007 selexol 0 1.2 1.6 1.6 (b) NETL, 2007 Econamine 3.6 0.16 9.1 9.4 (a) Dave, 2011 MEA 4.0 0.16** 11.1 10.1 (a) Stöver, 2011 MEA 3.6 0.16** 8.0-9.8 9.4 (a) Stöver, 2011 H3 2.8 0.16** 9.9-11.2 8.0 (a)
*: (a) PC with post combustion CO2 capture, (b) IGCC with pre combustion CO2 capture. **: Estimated value from the stripper temperature.
www.ccsenet.org/eer Energy and Environment Research Vol. 4, No. 2; 2014
115
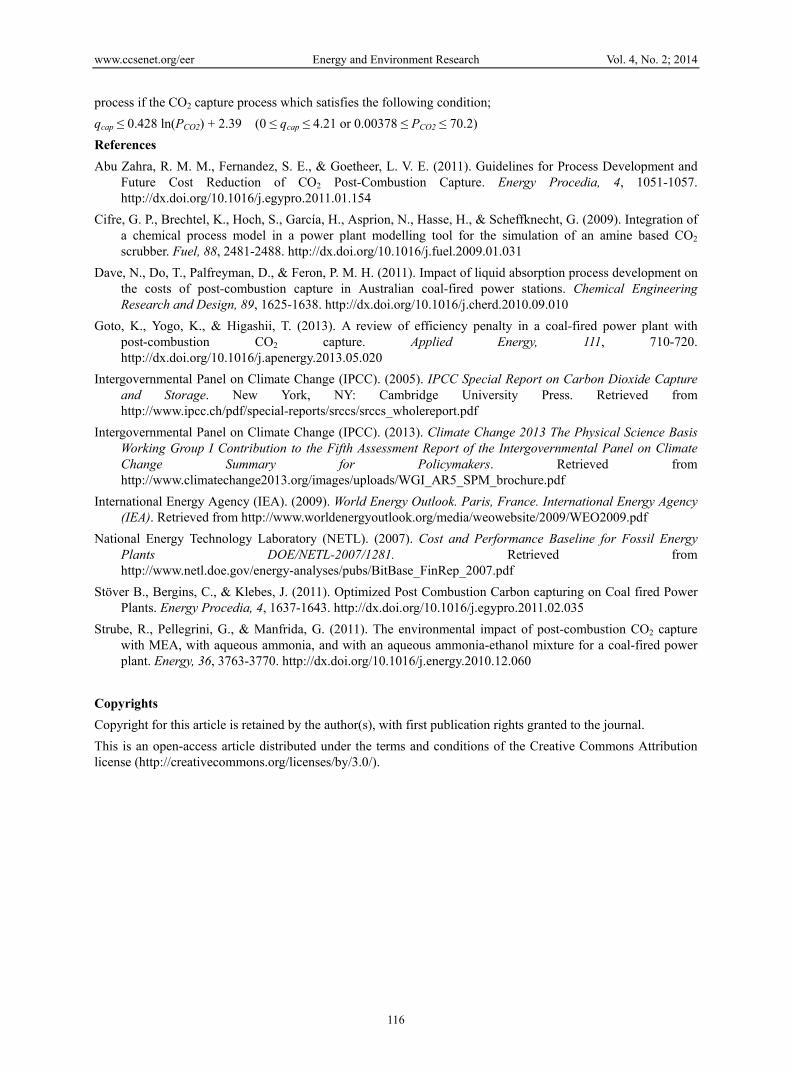
4.3 The Effect of Water-Gas Shift Reaction on Efficiency in IGCC
The difference in efficiency of post- and pre-combustion CO2 capture was considered. The difference in those processes was the existence of water-gas shift reaction. There was 5.6%-points of difference in the gross efficiencies of without CO2 capture (Table 3) and pre-combustion CO2 capture (Table 4) case. This was attributed to the loss of water-gas shift reaction. In case 6 or pre-combustion case, the compression energy of CO2 was 24,288 kW, which corresponds to 0.4%-points of efficiency penalty. Therefore the total efficiency penalty by CO2 capture and compression will be 6.0%-points. Therefore, Equation (15) will be;
qcap ≤ 0.428 ln(PCO2) + 2.39 (0 ≤ qcap ≤ 4.21 or 0.00378 ≤ PCO2 ≤ 70.2) (19)
By solving the equation, the condition for the case 5 which would be lower than the efficiency penalty in Case 6 was obtained as Figure 10. Therefore, it can be concluded that the efficiency of IGCC with post-combustion CO2 capture will be better than that of IGCC pre-combustion process if the CO2 capture process which satisfies the painted region in Figure 10 of CO2 capture energy and CO2 inlet pressures to CO2 compressor.
Figure 10. Relation between CO2 capture energy (qcap), CO2 inlet pressure for compressors (PCO2) and efficiency
penalty (∆η) for IGCC with pre-combustion CO2 capture
5. Conclusion The effects of carbon dioxide capture process on output efficiency of fossil power plants were investigated aiming to obtain a performance guideline of CO2 capture process for coal-fired power plants. The power plant models were developed by using a commercial process simulator Aspen Plus 7.3 and plant data reported from NETL. It was found that the efficiency penaltyΔη [%-point] can be estimated from the CO2 capture energy (qcap [GJ/t-CO2]) and CO2 inlet pressure to the CO2 compressors (PCO2 [MPa]) by the following equations;
for PC power plant,
Δη = 1.75 qcap − 0.765 ln(PCO2) + 1.69
for IGCC power plant with pre-combustion CO2 capture,
Δη = 1.80 qcap – 0.771 ln(PCO2) + 1.70 (0 ≤ qcap ≤ 4.21) or
Δη = 2.74 qcap – 0.771 ln(PCO2) + 1.70 (4.21< qcap ≤ 4.95)
for IGCC power plant with post-combustion CO2 capture,
Δη = 2.33 qcap – 0.770 ln(PCO2) + 1.70 (0 ≤ qcap ≤ 2.41) or
Δη = 3.42 qcap – 0.770 ln(PCO2) + 1.70 (2.41 < qcap ≤ 2.93).
The calculated results were compared with the reference data, and they showed a good agreement.
For IGCC power plants, the effect of the installation of water-gas shift reactor on the efficiency penalty was investigated. The net efficiency was reduced 5.4 points by installing water-gas shift reactor. It was calculated that the efficiency of IGCC with post-combustion CO2 capture will be better than that of IGCC pre-combustion
www.ccsenet.org/eer Energy and Environment Research Vol. 4, No. 2; 2014
116
process if the CO2 capture process which satisfies the following condition;
qcap ≤ 0.428 ln(PCO2) + 2.39 (0 ≤ qcap ≤ 4.21 or 0.00378 ≤ PCO2 ≤ 70.2)
References Abu Zahra, R. M. M., Fernandez, S. E., & Goetheer, L. V. E. (2011). Guidelines for Process Development and
Future Cost Reduction of CO2 Post-Combustion Capture. Energy Procedia, 4, 1051-1057. http://dx.doi.org/10.1016/j.egypro.2011.01.154
Cifre, G. P., Brechtel, K., Hoch, S., García, H., Asprion, N., Hasse, H., & Scheffknecht, G. (2009). Integration of a chemical process model in a power plant modelling tool for the simulation of an amine based CO2 scrubber. Fuel, 88, 2481-2488. http://dx.doi.org/10.1016/j.fuel.2009.01.031
Dave, N., Do, T., Palfreyman, D., & Feron, P. M. H. (2011). Impact of liquid absorption process development on the costs of post-combustion capture in Australian coal-fired power stations. Chemical Engineering Research and Design, 89, 1625-1638. http://dx.doi.org/10.1016/j.cherd.2010.09.010
Goto, K., Yogo, K., & Higashii, T. (2013). A review of efficiency penalty in a coal-fired power plant with post-combustion CO2 capture. Applied Energy, 111, 710-720. http://dx.doi.org/10.1016/j.apenergy.2013.05.020
Intergovernmental Panel on Climate Change (IPCC). (2005). IPCC Special Report on Carbon Dioxide Capture and Storage. New York, NY: Cambridge University Press. Retrieved from http://www.ipcc.ch/pdf/special-reports/srccs/srccs_wholereport.pdf
Intergovernmental Panel on Climate Change (IPCC). (2013). Climate Change 2013 The Physical Science Basis Working Group I Contribution to the Fifth Assessment Report of the Intergovernmental Panel on Climate Change Summary for Policymakers. Retrieved from http://www.climatechange2013.org/images/uploads/WGI_AR5_SPM_brochure.pdf
International Energy Agency (IEA). (2009). World Energy Outlook. Paris, France. International Energy Agency (IEA). Retrieved from http://www.worldenergyoutlook.org/media/weowebsite/2009/WEO2009.pdf
National Energy Technology Laboratory (NETL). (2007). Cost and Performance Baseline for Fossil Energy Plants DOE/NETL-2007/1281. Retrieved from http://www.netl.doe.gov/energy-analyses/pubs/BitBase_FinRep_2007.pdf
Stöver B., Bergins, C., & Klebes, J. (2011). Optimized Post Combustion Carbon capturing on Coal fired Power Plants. Energy Procedia, 4, 1637-1643. http://dx.doi.org/10.1016/j.egypro.2011.02.035
Strube, R., Pellegrini, G., & Manfrida, G. (2011). The environmental impact of post-combustion CO2 capture with MEA, with aqueous ammonia, and with an aqueous ammonia-ethanol mixture for a coal-fired power plant. Energy, 36, 3763-3770. http://dx.doi.org/10.1016/j.energy.2010.12.060
Copyrights Copyright for this article is retained by the author(s), with first publication rights granted to the journal.
This is an open-access article distributed under the terms and conditions of the Creative Commons Attribution license (http://creativecommons.org/licenses/by/3.0/).
Related Documents