YSSP Young Scientists Summer Program 40 th Anniversary a new generation of scientists Proceedings of the YSSP Final Colloquium 2017

Welcome message from author
This document is posted to help you gain knowledge. Please leave a comment to let me know what you think about it! Share it to your friends and learn new things together.
Transcript

YSSPYoung Scientists Summer Program
40 th Anniversary
a new generation of scientists
Proceedings of the YSSP Final Colloquium 2017

YSSP Summer Colloquium 2017
1
IIASA’s annual three-month Young Scientists Summer Program (YSSP) offers research opportunities to
talented young researchers whose interests correspond with IIASA’s ongoing research on issues of
global environmental, economic, and social change. From June through August each year participants
work within the Institute’s research programs under the guidance of IIASA scientific staff.
The Proceedings of the Final Colloquium comprises summaries of the research results obtained during
the YSSP that were presented at a workshop at the International Institute for Applied Systems Analysis,
Laxenburg, Austria, 24–25 August 2017.
The Proceedings are the sole work of the authors with limited or no review by their IIASA supervisors
or any other staff of the Institute. They are not for publication in the current form. Views or opinions
expressed herein do not necessarily represent those of the Institute, its National Member Organizations,
or other organizations supporting the work. This compilation contains all the summaries available at the
time of finalization of the Proceedings.
Proceedings editors: Örjan Grönlund, Saige Wang, and Brian Fath
YSSP Summer Colloquium 2017
2
Contents
Arctic Futures Initiative .......................................................................................................................................... 8
Air Quality and Greenhouse Gases ......................................................................................................................10
Advanced Systems Analysis .................................................................................................................................15
Evolution and Ecology .........................................................................................................................................21
Energy ..................................................................................................................................................................26
Ecosystems Services and Management ................................................................................................................32
Exploratory Special Projects ................................................................................................................................46
World Population ..................................................................................................................................................48
Risk and Resilience ..............................................................................................................................................52
Transitions to New Technologies .........................................................................................................................60
Water ....................................................................................................................................................................62

YSSP Summer Colloquium 2017
3
Thursday, 24 August 2017
9:00 –
9:10
Welcome and Introduction by YSSP Dean JoAnne Bayer
(Wodak Room)
WODAK Room GVISHIANI Room
Day 1 -
Session
1
Agent Based Models
Chair: Nikita Strelkovsky
Renewable Energy Transitions
Chair: Luis Tudeschini
09:10 –
09:35
Xiaogang
He WAT
Investigation of drought
adaptation options using
an integrated hydrological
and agent-based model
Esperanza
González ENE
How residential nearly zero
energy buildings (nzeb) can
contribute to Brazil’s role in
achieving the global warming
objective of 1.5°C
09:35 –
10:00
Leila
Niamir AIR
Assessing the
macroeconomic impact of
heterogeneous
households’ energy-saving
behavior on air quality
Meng Jiang ESP
Assessing energy and natural
resource footprints under
China’s sustainable economic
transformation
10:00 –
10:25
Liv
Lundberg RISK
Auctions for renewable
energy – risks and
opportunities
Kasparas
Spokas ESM
Incorporating geological
constraints and risk in
spatially explicit optimizations
of carbon capture and
sequestration projects
1 0 : 2 5 – 1 0 : 4 5
B R E A K
Day 1 -
Session
2
Networks and I/O Analysis
Chair: Ed Byers
Energy Systems Models
Chair: Piera Patrizio
10:45 –
11:10
Saige
Wang ASA
Sectoral energy–water
nexus in China under
different energy generation
mix scenarios
Karl-Kiên
Cao ENE
A novel method for
incorporating power
exchange limitations into
energy system models and
the impact of spatial
aggregation
11:10 –
11:35 Nemi Vora ASA
A systems perspective to
understanding U.S. food-
energy-water nexus
through ecological network
analysis
An Ha
Truong ESM
Co-firing biomass with coal
for electricity in Vietnam:
Where, when, and how
much?
11:35 –
12:00 Gibran Vita ENE
The dynamics of stocks or
flows for environmental
impact and human
development
Mahban
Arghavani RISK
Seismic resilience of the
electricity transmission grid of
Qom in Iran: analysis of a
prototype model
1 2 : 0 0 – 1 3 : 3 0
B R E A K

YSSP Summer Colloquium 2017
4
Thursday, 24 August 2017
WODAK Room GVISHIANI Room
Day 1 -
Session
3
Wildlife Conservation
Chair: Åke Brännström
Electric Power Grid
Chair: Clara Orthofer
13:30 –
13:55 Ziyuan Zhu RISK
A global analysis of wildlife
damage risk financing
Ryan
Hanna ENE
The impact of microgrid
adoption on greenhouse gas
emissions
from the electric power sector
13:55 –
14:20
Bernd
Lenzner ESM
Developing the first global
scenarios for biological
invasions in
the 21st century
Dmitrii
Iakubovskii RISK
Risk of multiple failures in
electrical grids due to natural
hazards in the Eurasian
Economic Union
14:20 –
14:45
Perla
Catalina
Chaparro
Pedraza
EEP
Fisheries-induced life-
history evolution in
anadromous stocks
Yaru Zhang TNT/
ENE
An analysis of energy
transportation strategy for
China’s electricity system
1 4 : 4 5 – 1 5 : 0 0
B R E A K
Day 1 -
Session
4
Biodiversity and Ecological Change
Chair: Brian Fath
Water Management
Chair: Simon Langan
15:00 –
15:25
Vanessa
Haller ASA
Optimizing the functional
grouping of species in
ecosystem models
José Pablo
Ortiz
Partida
WAT
Robust management of
multipurpose reservoirs under
uncertainty
15:25 –
15:50 Takuji Oba EEP
Towards enhanced
realism in models of
biodiversity evolution
Francine
van
Brandeler
WAT
Can a water crisis be averted
in Mexico City? The
effectiveness of water use
rights in promoting
sustainable water use and
reducing groundwater over-
exploitation
15:50 –
16:15
Maisa
Nevalainen AFI
Assessing the risk posed
by oil spills to Arctic
marine areas—
Index-based approach for
estimating vulnerability
and
sensitivity of Arctic biota
Tobias
Sieg RISK
Assessment of direct and
indirect economic effects of
flood damage – An
application to German
companies
1 6 : 1 5 – 1 6 : 3 0
B R E A K

YSSP Summer Colloquium 2017
5
Thursday, 24 August 2017
WODAK Room GVISHIANI Room
Day 1 -
Session
5
Iron and Steel
Chair: Sennai Mesfun
Drought Risk and Impacts on Agriculture
Chair: Susanne Hanger
16:30 –
16:55 Ming Ren ASA
Robust solutions for the
sustainable development of
the iron and steel industry in
the Beijing-Tianjin-Hebei,
China
Claudia
Canedo RISK
Drought impacts and risks on
agricultural production in the
Bolivian Altiplano
16:55 –
17:20
Hana
Mandová ESM
Optimization of biomass
resources for integrated
steel plants to meet EU-28
emission reduction targets
Hanqing
Xu WAT
Drought risk, irrigation
demand, and maize yield
under climate change in the
northeast farming region of
China

YSSP Summer Colloquium 2017
6
Friday, 25 August 2017
9:00 –
9:10
Welcome and Introduction by YSSP Scientific Coordinator Brian Fath
(Wodak Room)
WODAK Room GVISHIANI Room
Day 2 -
Session
1
Grazing System Impacts
Chair: Myroslava Lesiv
Resources Management
Chair: Karl Sigmund
09:10 –
09:35
Radost
Stanimirova ESM
Modeling dynamics of
South American
rangelands to climate
variability and human
impact
Cornelius
Hirsch ESM
The rush for foreign land –
agro-ecological drivers of
FDI in land
09:35 –
10:00 Nannan Zhang AIR
Reducing NH3 emission
from dairy production in
China: Mitigation
options, emission
reduction potentials and
costs
Daniel
Cooney EEP
Emergence of efficient
extraction in social-
ecological models for
fisheries
10:00 –
10:25 Cécile Godde ESM
Intensification of grazing
systems: Challenges
and
opportunities
Lavinia
Perumal ASA
Assessing the impact of
transport infrastructure on
biodiversity
1 0 : 2 5 – 1 0 : 4 5
B R E A K
Day 2 -
Session
2
Health, Well-being, and Emerging
Vulnerabilities.COM
Chair: Warren Sanderson
Climate and Land Change Impacts
Chair: Fabian Wagner
10:45 –
11:10 Jeofrey Abalos POP
Adult children’s
education and parents’
health status in the
Philippines
Yaoping
Wang ENE
Investigation of the water
use of power plants under
changes in water
temperature and availability
11:10 –
11:35 Jillian Student RISK
Vulnerability is dynamic:
Approaching the
emerging
challenges of coastal
tourism
Karl
Seltzer AIR
Sectoral strategies for
reducing ozone in China
11:35 –
12:00
Parul Tewari
COM
From shelves to the
public: making science
accessible
Milton A.
Uba de
Andrade
Junior
ESM
Exploring future scenarios
of ethanol demand in Brazil
and their land-use
implications
Caroline
Wamaitha
1 2 : 0 0 – 1 3 : 3 0
B R E A K

YSSP Summer Colloquium 2017
7
Friday, 25 August 2017
WODAK Room GVISHIANI Room
Day 2 -
Session
3
Labor and Education Dynamics
Chair: Wolfgang Lutz
Forests!
Chair: Nicklas Forsell
13:30 –
13:55 Sara Loo EEP
Cultural evolution of low
fertility at high
socioeconomic status
Cholho
Song ESM
Assessing forest ecosystem
under different management
activities along climatic
gradient in East Asia using
BGC-MAN model
13:55 –
14:20
Karen
Umansky POP
The impact of education
on attitudes toward
immigration in Europe
Hadi ESM
Three decades of forest
cover changes in the humid
tropical Indonesia: Detection
and verification at high
resolution
14:20 –
14:45 Malan Huang ESM
Rural labor and evolution
of cropping systems in
China
Örjan
Grönlund ESM
Nature conservation
management forests in
Sweden; a spatially explicit
analysis of current
management potentials and
societal trade-offs
1 4 : 4 5 – 1 5 : 0 0
B R E A K
Day 2 -
Session
4
Air Quality Measurements and Effects
Chair: Winfried Winiwarter
Algae Blooms
Chair: Peter Burek
15:00 –
15:25
Olugbemisola
Samuel POP
Dependency on use of
solid fuel in the household
and under-five mortality
rate in Nigeria
Jing Li WAT
How nutrients are interacting
with Cyanobacteria growth?
--Aquatic Ecosystem, Lake
Vombsjön, Sweden
15:25 –
15:50 Andrew Fang AIR
Assessing the
effectiveness of urban
emission control
strategies in Hebei, China
Shaohui
Tang ESM
Effectively controlling
phosphorus emission from
agricultural fields under an
uncertain climate: A
dynamic stochastic
agricultural phosphorus
management model
E N D O F C O L L O Q U I U M
R E C E P T I O N I N C O N F E R E N C E A R E A

YSSP Summer Colloquium 2017
8
Arctic Futures Initiative
(AFI)
YSSP Summer Colloquium 2017
9
Assessing the risk posed by oil spills to Arctic marine areas — index-based
approach for estimating biotas vulnerability and sensitivity
Maisa Nevalainen, University of Helsinki, Finland
Email: [email protected]
IIASA Supervisors: Brian Fath (ASA), Mia Landauer (AFI) and Wei Liu (RISK)
Introduction. Oil spill risk is a great matter of concern due to increasing maritime traffic in the Arctic. Assessing
the risks related to such accidents is difficult due to lack of data, but improved understanding could help us to
characterize risk and make informed decisions to reduce risk. The aim of the study is to develop an oil spill
impact index of key Arctic ecological functional groups accounting for both their vulnerability and sensitivity.
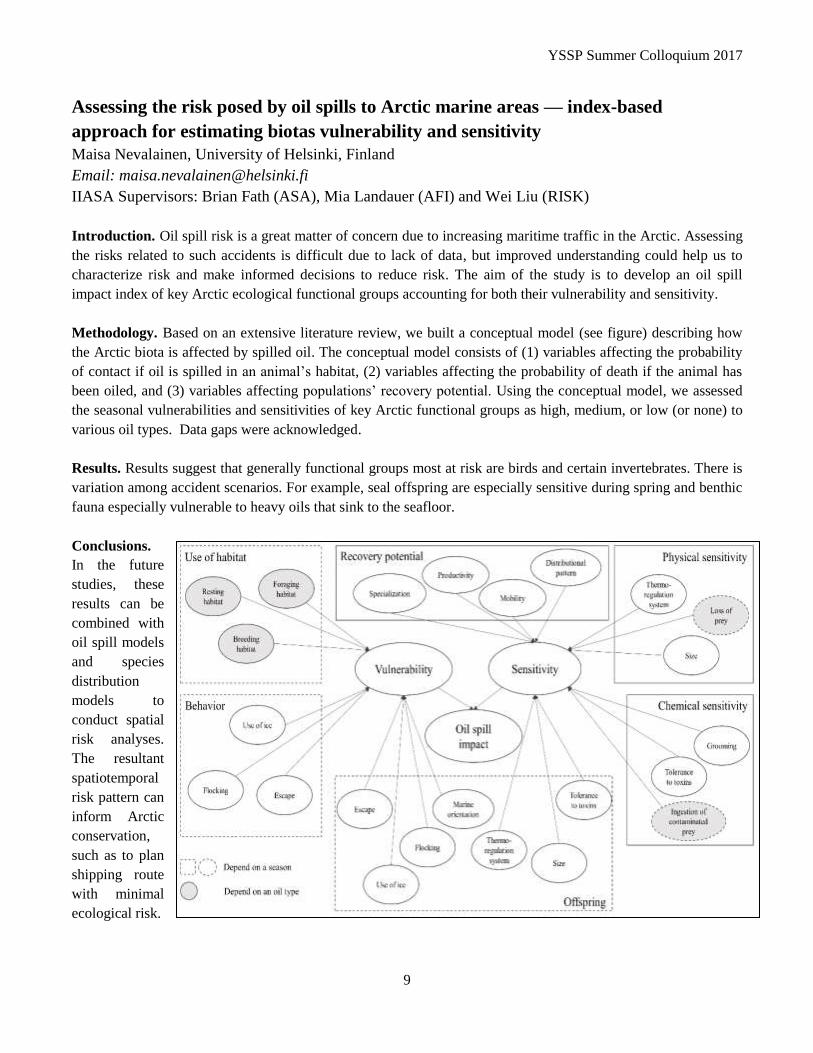
Methodology. Based on an extensive literature review, we built a conceptual model (see figure) describing how
the Arctic biota is affected by spilled oil. The conceptual model consists of (1) variables affecting the probability
of contact if oil is spilled in an animal’s habitat, (2) variables affecting the probability of death if the animal has
been oiled, and (3) variables affecting populations’ recovery potential. Using the conceptual model, we assessed
the seasonal vulnerabilities and sensitivities of key Arctic functional groups as high, medium, or low (or none) to
various oil types. Data gaps were acknowledged.
Results. Results suggest that generally functional groups most at risk are birds and certain invertebrates. There is
variation among accident scenarios. For example, seal offspring are especially sensitive during spring and benthic
fauna especially vulnerable to heavy oils that sink to the seafloor.
Conclusions.
In the future
studies, these
results can be
combined with
oil spill models
and species
distribution
models to
conduct spatial
risk analyses.
The resultant
spatiotemporal
risk pattern can
inform Arctic
conservation,
such as to plan
shipping route
with minimal
ecological risk.

YSSP Summer Colloquium 2017
10
Air Quality and Greenhouse Gases
(AIR)
YSSP Summer Colloquium 2017
11
Assessing the Effectiveness of Urban Emission Control Strategies in Hebei, China
Andrew Fang, University of Minnesota, Humphrey School of Public Affairs, USA
Email: [email protected]
IIASA Supervisors: Fabian Wagner (AIR) and Gregor Kiesewetter (AIR)
Introduction. Rapid urbanization and industrialization have created hazardous air pollution levels in Chinese
cities, while domestic coal use has been shown to be an important, but overlooked contributor to local air
pollution challenges (Liu et al. 2016).This work focuses on PM2.5 reduction strategies because of its localized
nature and its well-known health impacts. The study below explores the effectiveness of reducing urban domestic
emissions in the Hebei province through the comparison of two models, which seek to quantify the impact of
urban emission reduction on air quality in Chinese cities.
Methodology. Although both models estimate urban PM2.5concentrations, the approach taken is different. The
Carbon Footprinting and Air Pollution Dispersion (CFAD) model estimates the local air pollution and health
benefits of reduced PM2.5 emissions through an air pollution dispersion model (Ramaswami et al 2017). The
GAINS model estimates PM2.5 concentrations at the sub-provincial scale and uses a downscaling approach
(Kiesewetter et al 2016) by urban areas to determine the effect of urban emissions on urban air pollution
concentrations. Domestic emission reductions for the year 2010 are modelled across city, provincial, and regional
scales to determine the response of each model. Model comparison is used to develop heuristics for the interaction
of urban and regional emission effects on urban air quality.
Results. Initial comparison of the models for the Hebei province indicates similar energy use and PM2.5 emissions
from the domestic sector. Baoding is chosen as a case study city due to the similar area and population
characteristics in both models. The GAINS model estimates approximately 28% of Baoding’s PM2.5
concentrations are attributable to primary PM2.5 emissions from inside the city, while CFAD estimates that only
10% of the concentration is attributable to emissions from the city. Subsequently, the GAINS model shows more
sensitivity to domestic emission reductions across all urban areas in the Hebei province; for the same level of
domestic emission reduction, the concentration response is 1.7 times higher on average in GAINS than in CFAD.
Conclusions. Comparison of the two models indicates that although total provincial emissions are similar, the
distribution of emissions across the province differs. In particular, because urban areas are defined differently, by
population density and administrative boundary, the distribution of emission intensities across cities in the
province differs. Therefore, while results point to the effectiveness of regional over local emission reduction
strategies, they also point to the need for empirical data on spatial distribution of urban emissions within the
province in determining the impact of emission reduction strategies.
References Liu, J., D.L. Mauzerall, Q. Chen, Q. Zhang, Y. Song, W. Peng, Z. Klimont, et al. 2016. Air pollutant emissions from Chinese households:
A major and underappreciated ambient pollution source. Proceedings of the National Academy of Sciences 113(28): 7756–7761.
Kiesewetter, G., Schoepp, W., Amann, M., 2016. A Scalable Approach to Modelling Health Impacts of Air Pollution Based on Globally
Available Data. Presented at the 8th International Congress on Environmental Modelling and Software: Supporting Sustainable Futures,
Toulouse, France.
Ramaswami, A., Tong, K., Fang, A., Lal, R., Nagpure, A.S., Li, Y., Yu, H., Jiang, D., Russell, A., Shi, L., Chertow, M., Wang, Y., Wang,
S. (2017). Urban Cross-Sector Actions for Carbon Mitigation with Local Health Co-Benefits in China. Nature Climate Change. Accepted.
YSSP Summer Colloquium 2017
12
Sectoral Strategies for Reducing Ozone in China
Karl Seltzer, Duke University, Nicholas School of the Environment, USA
Email: [email protected]
IIASA Supervisors: Chris Heyes (AIR) and Jens Borken-Kleefeld (AIR)
Introduction. While fine particulates (PM2.5) are generally targeted for reducing global air quality induced
premature deaths, ozone (O3) alone causes hundreds of thousands of premature deaths, typically in Asian
countries (Anenberg, et al 2016, Lelieveld, et al 2015, WHO 2016). In addition, O3 also reduces crop productivity
and is a greenhouse gas (Shindell, et al 2012, Myhre, et al 2013), providing several additional motivations for its
reduction at the surface throughout the world. Since there are many precursors to the formation of O3 in the
atmosphere and its chemistry is non-linear, prescriptions for reducing O3 in a given area can be complicated. This
project seeks to evaluate strategies for reducing O3 in China, where a majority of the premature mortalities due to
ambient air pollution occurs (Lelieveld, et al 2015).
Methodology. The GAINS model, developed at IIASA, is used to simulate scenarios for reducing emissions from
various sectors. Since sectors emit precursors to O3 with varying proportions and quantities, this framework will
evaluate each sector independently to determine the best sector to target for efficient reductions. The sectors
included in this analysis are industry, residential, solvents, and transportation. GEOS-Chem, a chemical transport
model (CTM), is then used to simulate the evolution of the atmosphere’s chemistry from each set of strategies.
Finally, to quantify impacts to human health, appropriate averaging values of O3 from the CTM are used with
concentration response functions developed from epidemiological studies (Jerrett, et al 2009, Turner, et al 2016).
Results. China is making a concerted effort to reduce the impacts of air pollution in the coming years, and these
efforts are captured in the baseline simulations. PM2.5 concentrations drop precipitously (~50%) and O3 features
modest reductions (~10-15%) in the most populated regions by 2030. Since O3 features a smaller reduction than
PM2.5, it inherits a larger proportion of the total premature deaths due to ambient air quality in the coming
decades. The control measures related to the industry sector, which largely consists of the installation of selective
catalytic reduction control technologies on solid fuel fired boilers and furnaces, generates the largest reductions in
O3, with preliminary results indicating that the strategies could lead to a reduction of up to 30,000 premature
deaths in China, per year. The results also indicate that while portions of the country may be limited in volatile
organic compounds (VOC) for the formation of O3 for several seasons of the year, nitrogen oxides (NOx) are
limited throughout the country in the summer months when O3 concentrations peak.
Conclusions. Reducing O3 concentrations during summer months is key to reducing O3 for averaging periods that
are associated with concentration response functions for human-health. Throughout most of the country, NOx is
the limiting species during peak hours of summer months when O3 is formed. Many strategies exist for reducing
NOx emissions during these key periods, but the industrial sector provides the opportunity for the largest
reductions, and subsequently the largest benefits for future human health.
References Anenberg, S. C., et. al., (2010). An Estimate of the Global Burden of Anthropogenic Ozone and Fine Particulate Matter on Premature
Human Mortality Using Atmospheric Modeling. Environmental Health Perspectives 118(9), 1189–1195.
Lelieveld, J., et. al., (2015). Nature 525, 367- 371.
World Health Organization (2016). Ambient Air Pollution: A global assessment of exposure and burden of disease.
Shindell, D., et. al., (2012). Simultaneously Mitigating Near-Term Climate Change and Improving Human Health and Food Security.
Science 335, 183–189.
Myhre, G., et. al., (2013). Anthropogenic and Natural Radiative Forcing. In: Climate Change 2013: The Physical Science Basis, 659–740
Jerrett, M., et. al., (2009). Long-Term Ozone Exposure and Mortality. New England Journal of Medicine 360, 1085–1095.
Turner, M.C., et. al., (2016). American Journal of Respiratory and Critical Care Medicine 193, 1134–1142.
YSSP Summer Colloquium 2017
13
Assessing the Macroeconomic Impact of Households’ Energy-saving Behavior
on Air Quality and Climate
Leila Niamir, University of Twente, Netherlands
Email: [email protected]
IIASA Supervisors: Gregor Kiesewetter (AIR), Wolfgang Schöpp (AIR), and Fabian Wagner (AIR)
Introduction. Residential energy demand accounts for almost 24% of greenhouse gas (GHG) emissions in
Europe. There are many ways to reduce households’ GHG emissions, such as technological energy efficiency
solutions, switching to low-carbon energy sources, and behavioral change. The impacts of the former two are
readily traceable with the help of numerous macroeconomic, integrated assessment and technological models;
however quantifying the macro impacts and drivers of energy-saving behavioral changes remains a challenge.
Some rough assessments indicate that behavioral change alone can contribute from 4% (McKinsey 2009) to 5-8%
(Faber, Schoroten et al. 2012) to the reduction of CO2 emissions. Most of energy saving and air quality related
studies has been focused on the national and global levels, and thus neglected the provincial and individual
heterogeneity.
Methodology. To assess the impact of households’ energy-saving behavior on air quality and climate, we design
and implement a modeling framework that comprises several methods and tools within the same platform. To be
able to go beyond a classical economics models and stylized representation of perfectly informed optimizer, the
BENCH agent-based model has been developed further by adding a multi-stage behavioral process of decision-
making among households who consider energy-saving decisions based on solid theoretical and empirical ground.
The BENCH model was calibrated with the collected survey data in Navarre-Spain (800 households) and
Overijssel-The Netherlands (1400 households). The BENCH calculates changes in electricity consumption and
consequently avoided CO2 emissions by households’ energy-saving behavior annually.
Results. By running BENCH model, we track individual and cumulative impacts on CO2 emissions of energy-
saving behavioral changes among 3468 individual households in the Navarre region in Spain over 14 years (2016-
2030). We design several socio-economic (bottom-up and top-down) scenarios, aiming to explore: (1) the impact
of individuals’ heterogeneities in terms of socio-economic factors e.g. income and electricity consumption;
psychological factors e.g. attitudes and personal norms; and social factors e.g. social norms and learning; (2) the
impact of climate-energy-economy policies e.g. carbon price pressure. The results show the impact of
heterogeneous households’ interactions (social dynamics) and carbon pricing strategy (10-50 € per ton by 2030)
result in approximately 26% and 13% CO2 emissions reduction by 2030 respectively. By combining both
scenarios, about 31% of household electricity related CO2 emissions can be avoided.
Conclusions. In this research, we aimed to shed light on the effects of individuals’ decisions in the complex
climate-energy-economy system and explore the impact of socio-economic heterogeneity on carbon emissions.
By designing and running many socio-economic end-user scenarios and comparing with a business as usual
scenario, we conclude that a combination of social dynamics (learning) and carbon price scenarios is the best
strategy to reduce emissions.
References Faber, J., A. Schoroten, M. Bles, M. Sevenster, A. Markowska, M. Smit, C. Rohde, E. Dütschke, J. Köhler, M. Gigli, K. Zimmermann, R.
Soboh and J. Riet (2012). Behavioural Climate Change Mitigation Options and Their Appropriate Inclusion in Quantitative Longer Term
Policy Scenarios. Delft.
McKinsey (2009). Pathways to a Low-Carbon Economy.
YSSP Summer Colloquium 2017
14
Reducing NH3 emission from dairy production in China: mitigation options,
emission reduction potentials and costs
Nannan Zhang, Center for Agricultural Resources Research, Institute of Genetics and Developmental
Biology, Chinese Academy of Science, China
Email: [email protected]
IIASA Supervisors: Wilfried Winiwarter (AIR) and Zbigniew Klimont (AIR)
Introduction. Ammonia in the atmosphere contributes to several environmental problems. As an important
precursor of inorganic aerosols, ammonia plays an important role in the formation of PM2.5 (Huang et al., 2014;
Gu et al., 2015). Most of the NH3 emissions are from livestock production, including the dairy sector. In this
study, we aim to 1) assess the potential of abatement options on reducing ammonia emission from dairy
production in China, 2) estimate the related economic costs and 3) explore the further pathways of emission
abatement for dairy production in China.
Methodology. Ammonia emission abatement options considered in this study are based on the local experiments
conducted in industrial dairy farms in China. This study explores the implementation of the control options and
collects related economic parameters. We make use of the GAINS model that is a tool to estimate the
environmental effects of air pollution and allows assessing options to reduce emissions and the costs of their
implementation.
Results. We selected several ammonia emission abatement options and tested them for a Chinese dairy
production system. Specifically, this included diet manipulation, acidification of manure under slatted floor in
dairy housing, and different covers for slurry, solid and liquid manure, the latter separated from slurry. Ammonia
emission reduction efficiencies for each option ranged from 7 to 94%. Compaction for solid manure separated
from slurry can reduce ammonia emission, but the emission abatement efficiency was affected by ammonia
emission from liquid waste released in the compaction process. The total costs for the implementation of the
options ranged from -462.5 to 5070 CNY·cow-1
·yr-1
(-60 – 655 EUR cow-1
·yr-1
). Lower crude protein input for
dairy diet is the only cost saving option, while the acidification in dairy housing (employing lactic acid) is the
most expensive option.
Conclusions. Results from this study showed diet manipulation being an economically profitable way of reducing
ammonia emissions. Covered storage is another cost effective way for ammonia emission abatement but comes at
certain (low) costs. Ammonia emission from liquid waste released from solid manure during compaction reduced
the emission abatement efficiency of compaction. Nitrogen retention in manure and use as a replacement of
mineral N fertilizers in crop production can balance part of the cost for implementation.
References Gu B, Ju X, Chang J, Ge Y, Vitousek P (2015). Integrated reactive nitrogen budgets and future trends in China. Proceedings of the National
Academy of Sciences 112: 8792-8797.
Huang R, Zhang Y, Bozzetti C, Ho K, Cao J, Han Y, Deallenbach K, Slowik J, Platt S, Bruns E, Crippa M, Ciarelli G, Piazzalunga A,
Schwikowshi M, Abbaszade G, Schnelle K, Zimmermann R, An Z, Szidat S, Baltensperger U, Haddad I, Prevot A (2014). High secondary
aerosol contribution to particulate pollution during haze events in China. Nature 514: 218-222.

YSSP Summer Colloquium 2017
15
Advanced Systems Analysis
(ASA)
YSSP Summer Colloquium 2017
16
Optimising the functional grouping of species in ecosystem models
Vanessa Haller, James Cook University, Centre of Excellence for Coral Reef Studies, Australian
Institute of Marine Science, Australia
Email: [email protected]
IIASA Supervisor: Elena Rovenskaya (ASA)
Introduction. Ecosystems around the world are faced with multiple and interacting threats. These interactions can
only be detected with a full system analysis. For this end, a network analysis is often used. However, the first step
in the network analysis is to assign the nodes that will be modelled. In ecosystems, the assignments of nodes
could be on many levels ranging from species to broad functional groups. This could mean a network size from
700 to 20 nodes. This study aims to find the optimal number of nodes as well as the uncertainties that are
introduced through exaggerated grouping.
Methodology. For this study used a network of a coral reef from the Great Barrier Reef. The EcoPath-based
network utilized data from an honors thesis (Tudman, 2001) and the online database FishBase. The network
incorporates 197 nodes at species level and eight nodes at a level of broad functional groups; mostly invertebrates,
plankton and plants. System behavior was investigated by simulating the network over time after a threat had been
introduced (reduction of biomass in one node). Then, two groups at a time were merged and the error between the
reduced system and the full system was calculated.
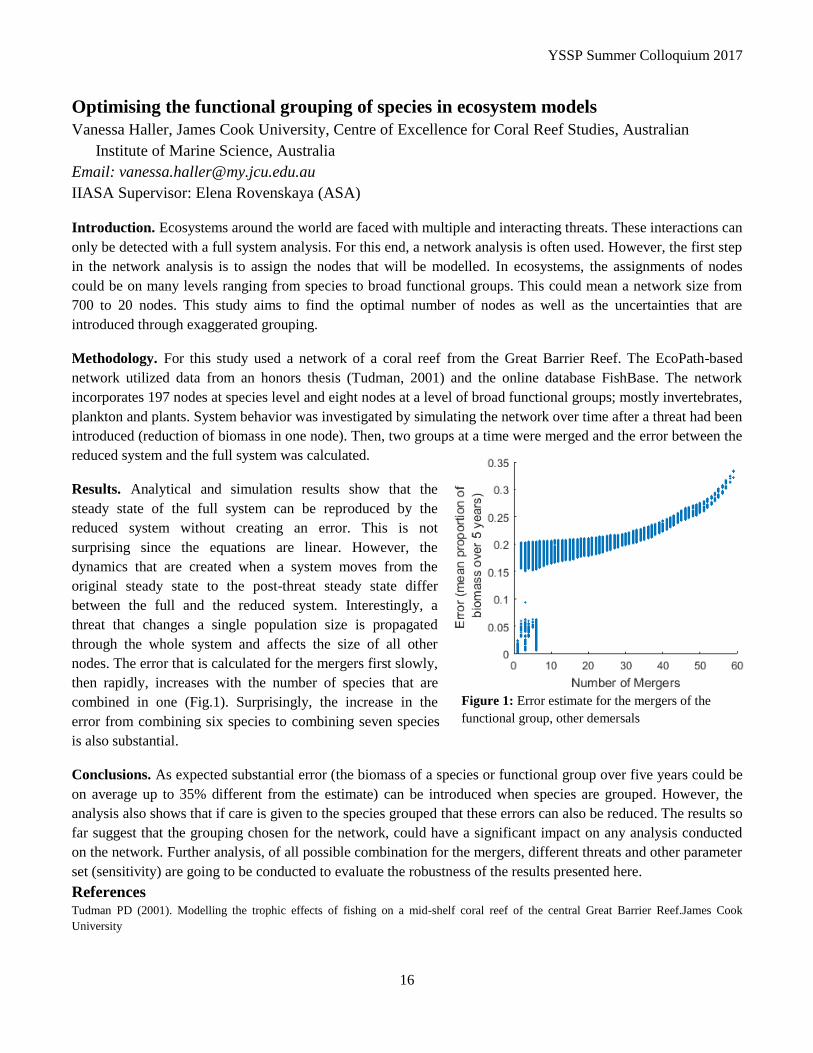
Results. Analytical and simulation results show that the
steady state of the full system can be reproduced by the
reduced system without creating an error. This is not
surprising since the equations are linear. However, the
dynamics that are created when a system moves from the
original steady state to the post-threat steady state differ
between the full and the reduced system. Interestingly, a
threat that changes a single population size is propagated
through the whole system and affects the size of all other
nodes. The error that is calculated for the mergers first slowly,
then rapidly, increases with the number of species that are
combined in one (Fig.1). Surprisingly, the increase in the
error from combining six species to combining seven species
is also substantial.
Conclusions. As expected substantial error (the biomass of a species or functional group over five years could be
on average up to 35% different from the estimate) can be introduced when species are grouped. However, the
analysis also shows that if care is given to the species grouped that these errors can also be reduced. The results so
far suggest that the grouping chosen for the network, could have a significant impact on any analysis conducted
on the network. Further analysis, of all possible combination for the mergers, different threats and other parameter
set (sensitivity) are going to be conducted to evaluate the robustness of the results presented here.
References Tudman PD (2001). Modelling the trophic effects of fishing on a mid-shelf coral reef of the central Great Barrier Reef.James Cook
University
Figure 1: Error estimate for the mergers of the
functional group, other demersals
YSSP Summer Colloquium 2017
17
Assessing the impact of transport infrastructure on biodiversity
Lavinia Perumal, University of Cape Town, Environmental and Geographical Science, South Africa
Email: [email protected]
IIASA Supervisors: Matthias Jonas (ASA) and Wei Liu (RISK)
Introduction. Globally, more than 25 million kilometres of new road development are expected by 2050 (Laurance et al 2014).
The majority of construction will take place in developing countries and will include many areas that have high
biodiversity and provide important ecosystem goods and services. Road development affects landscapes and
biodiversity far beyond its immediate area and at multiple spatial scales. Despite this, long-term effects of roads
on biodiversity over time are very rarely investigated. To determine the impacts of proposed road development in
Africa we need to understand how roads have influenced the landscapes in the past. Therefore, my YSSP study
involves exploring past interactions between roads and biodiversity. In this study, I use land cover as a proxy for
biodiversity.
Methodology. Using spatial analysis in ArcGIS and Land Cover Modeler in TerrSet, I analysed land cover transition in South
Africa between 1990 and 2014 at both national and regional scales. The Cape Floristic Region (CFR), one of
Earth’s most biologically diverse terrestrial regions, was selected as a test case for exploring the effects of road on
land cover change. The potential of land cover change and transition, at the pixel level was modelled using
elevation, slope, distance to major roads and the density of major roads as explanatory variables. We focused on
transitions from natural to non-natural and non-natural to natural land cover.
Results.
At the national scale, we found strong variation in land cover transitions across major regions and biomes,
indicating high level of heterogeneity on the relationship between roads and biodiversity. Preliminary modelling
results of the CFR show that, controlling on other biophysical and human variables, distance to the nearest major
road and increasing road density both exhibited Influence on land cover transition, implying that roads might
have negatively impact biodiversity.
Conclusion.
The preliminary findings confirmed our expectation of the impacts of roads on biodiversity in a globally
important biome. We can build on these results to further explore the interrelationship between roads and
biodiversity in other biomes and at larger spatial scales.
References
Laurance WF, Clements GR, Sloan S, O’Connell CS, Mueller ND, Goosem M, Venter O, Edwards DP, Phalan B, Balmford A, Van Der
Ree R, and Arrea IB (2013). A global strategy for road building. Nature 513: 229-234.
YSSP Summer Colloquium 2017
18
Robust solutions for the sustainable development of the iron and steel industry in
the Beijing-Tianjin-Hebei, China
Ming Ren, China University of Mining and Technology, Beijing, China
Email: [email protected]
IIASA Supervisors: Yurii Yermoliev (ASA) and Tatiana Ermolieva (ESM)
Introduction. Beijing-Tianjin-Hebei region accounts for nearly 1/3 of China’s iron and steel production.
However, iron and steel production consumes large quantities of energy and water and discharge a lot of CO2 and
air pollutants. The central government has made powerful policy to support introduction of advanced steel
production technologies with lower energy and water consumption. This project developed a dynamic stochastic
model, which includes current and future advanced iron and steel production technologies along with energy,
water and environmental security constraints to explore the optimal and robust technological development path of
iron and steel industry to 2030 in this region.
Methodology. The project develops a dynamic stochastic integrated model based on linear programing
methodology, which includes current and future advanced iron and steel production technologies along with
energy, water and environmental security and resource availability constraints. The model explored the optimal
and robust technological development path of iron and steel industry to 2030 in Beijing-Tianjin-Hebei region,
identifying the advantages of “with natural gas” and “without natural gas” technological options. Uncertainty
about water availability was addressed with the two-stage (two types of decisions) stochastic optimization method
(Ermoliev and Wets, 1988).
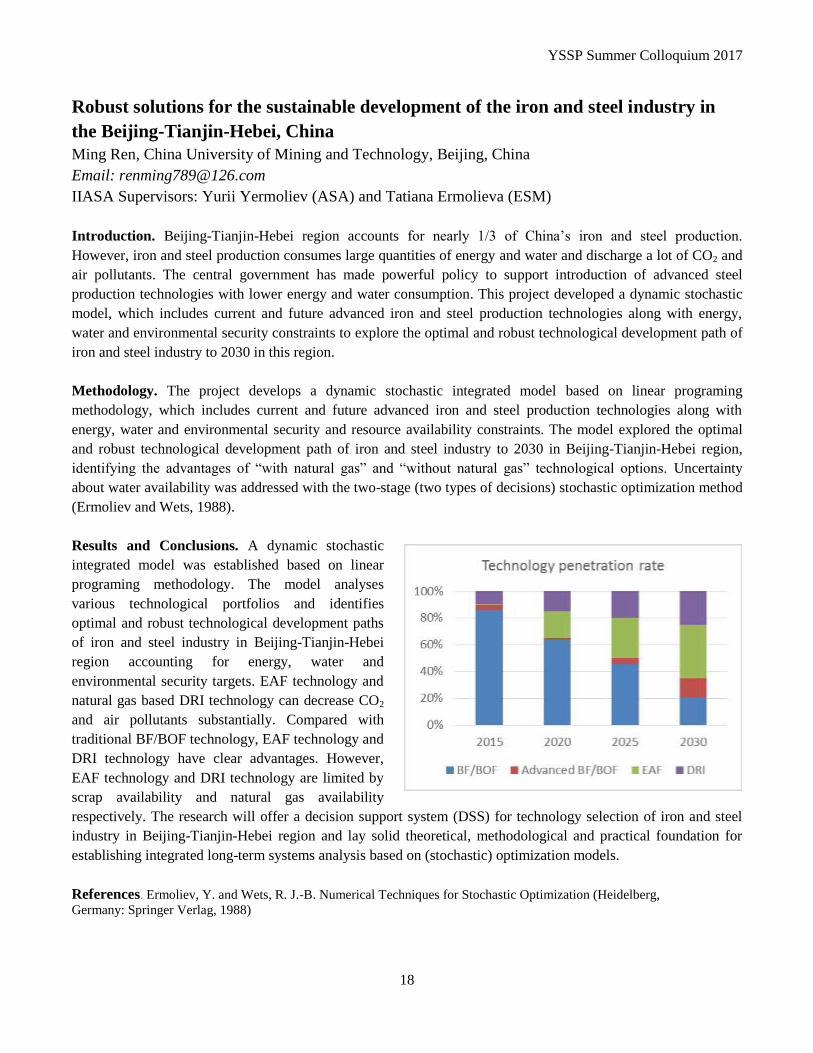
Results and Conclusions. A dynamic stochastic
integrated model was established based on linear
programing methodology. The model analyses
various technological portfolios and identifies
optimal and robust technological development paths
of iron and steel industry in Beijing-Tianjin-Hebei
region accounting for energy, water and
environmental security targets. EAF technology and
natural gas based DRI technology can decrease CO2
and air pollutants substantially. Compared with
traditional BF/BOF technology, EAF technology and
DRI technology have clear advantages. However,
EAF technology and DRI technology are limited by
scrap availability and natural gas availability
respectively. The research will offer a decision support system (DSS) for technology selection of iron and steel
industry in Beijing-Tianjin-Hebei region and lay solid theoretical, methodological and practical foundation for
establishing integrated long-term systems analysis based on (stochastic) optimization models.
References. Ermoliev, Y. and Wets, R. J.-B. Numerical Techniques for Stochastic Optimization (Heidelberg, Germany: Springer Verlag, 1988)
YSSP Summer Colloquium 2017
19
A systems perspective to understanding U.S. food-energy-water nexus through
ecological network analysis
Nemi Vora, University of Pittsburgh, Civil and Environmental Engineering, USA
Email: [email protected]
IIASA Supervisor: Brian Fath (ASA)
Introduction. The interdependencies between food, energy, and water systems have been widely recognized with
a call to adopt a systems perspective to understand synergies and trade-offs in their management(Hoff, 2011).
Food trade provides pathways for vast quantities of embodied resource (energy, water, etc.) and emissions flows,
providing a spatial understanding of food-energy-water teleconnections. This work utilizes ecological network
analysis (ENA) to understand patterns and structure of domestic food trade in the United States (U.S.) and
associated irrigation impacts. While our focus is on a single chain of interaction for food-water-energy through
irrigation systems, the well-connected network stemming from free trade situation results in a complex system.
ENA provides a useful tool of analysis by providing a holistic systems perspective through integrating direct and
indirect impacts of interactions.
Methodology. The domestic food trade network focuses on cereal (barley, corn, rye, rice, sorghum, oats, and
wheat) trade within the U.S. The data were obtained from publicly available government datasets and formed into
weighted and directed multi-layer networks. There are 50 nodes in each network representing individual states (+
District of Columbia) and links include physical food trade, virtual irrigation water, irrigation associated
embodied energy, and greenhouse gas emissions overlaid as distinct networks. This work applied three diverse
levels of measures, each focusing on a different aspect of the network. We employed pointwise mutual
information criteria (Fano & Hawkins, 1961) to analyse pairwise trade preferences and dependencies. Network
relational analysis was used to quantify indirect effects of trade on given nodes and compared across virtual
resource networks(Fath & Patten, 1998). Finally, we analyzed overall system robustness through calculating the
network balance between efficiency and redundancy(Rutledge, Basore, & Mulholland, 1976).
Results and Conclusions. The prelim results on node dependencies demonstrate the significant reliance on
within-state flows and transfers from neighbouring states. These results have important implications for water
based food resiliency as a state may rely on singular irrigation source spanning multiple neighbouring states (e.g.,
Ogallala aquifer). We also find that indirect trade relations change from the direct ones ~60% of the time,
resulting in more competitive compared to beneficial relations. Overall, the system demonstrates a fine balance
between network efficiency and redundancy, producing a robust structure usually observed in highly evolved
ecological systems. The results indicate the need to provide a systems-level perspective along with direct trade
analysis to avoid misrepresentation of system level interactions.
References
Fano, R. M., & Hawkins, D. (1961). Transmission of information: A statistical theory of communications. American Journal of Physics,
29(11), 793-794.
Fath, B. D., & Patten, B. C. (1998). Network synergism: emergence of positive relations in ecological systems. Ecological Modelling,
107(2), 127-143.
Hoff, H. (2011). Understanding the nexus: Background paper for the Bonn2011 Nexus Conference.
Rutledge, R. W., Basore, B. L., & Mulholland, R. J. (1976). Ecological stability: an information theory viewpoint. Journal of theoretical
biology, 57(2), 355-371.
YSSP Summer Colloquium 2017
20
Sectoral energy–water nexus in China under different energy generation mix
scenarios
Saige Wang, Beijing Normal University, China
Email: [email protected]
IIASA Supervisor: Brian Fath (ASA)
Introduction. Increasing demand for energy, an evolving generation mix, and water demand from competing
sectors have important implications for water budgets and energy planning. The great diversity of water intensity
among different energy types determines the water impacts of an energy system. To analyze water–related
impacts in energy–related decisions, we extended the input–output analysis (IOA) and ecological network
analysis (ENA) to future energy generation mix scenarios to assess the pressure energy development put on water
resources.
Methodology. In this study, four energy generation scenarios for 2050, as planned in climate change mitigation
roadmaps, and one baseline scenario were set up. The sectoral direct energy, water, water–related energy and
energy–related water were inventoried. Then embodied water/energy consumption and sectoral energy/water
flows were analyzed via IOA to build the nexus networks. The sectoral relationship and system properties of
energy–water nexus networks were analyzed through tools, like control and dependence analysis, from ENA. A
new indicator called sectoral nexus impact was defined to investigate the influence of the energy–water linkage
on energy and water systems.
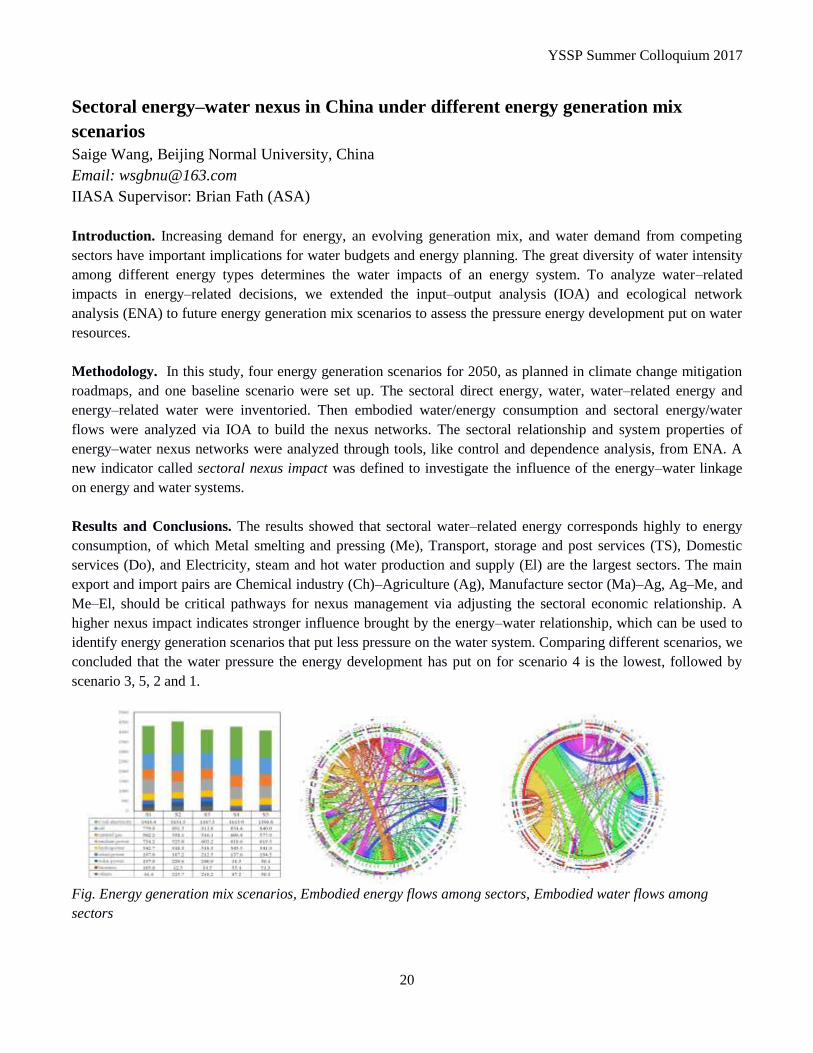
Results and Conclusions. The results showed that sectoral water–related energy corresponds highly to energy
consumption, of which Metal smelting and pressing (Me), Transport, storage and post services (TS), Domestic
services (Do), and Electricity, steam and hot water production and supply (El) are the largest sectors. The main
export and import pairs are Chemical industry (Ch)–Agriculture (Ag), Manufacture sector (Ma)–Ag, Ag–Me, and
Me–El, should be critical pathways for nexus management via adjusting the sectoral economic relationship. A
higher nexus impact indicates stronger influence brought by the energy–water relationship, which can be used to
identify energy generation scenarios that put less pressure on the water system. Comparing different scenarios, we
concluded that the water pressure the energy development has put on for scenario 4 is the lowest, followed by
scenario 3, 5, 2 and 1.
Fig. Energy generation mix scenarios, Embodied energy flows among sectors, Embodied water flows among
sectors

YSSP Summer Colloquium 2017
21
Evolution and Ecology
(EEP)
YSSP Summer Colloquium 2017
22
Fisheries-induced life-history evolution in migratory stocks
Catalina Chaparro Pedraza, University of Amsterdam, Netherlands
Email: [email protected]
IIASA Supervisors: Ulf Dieckmann (EEP) and Mikko Heino (EEP)
Introduction. While salmon’s share in world fishery trade is currently at 14% (FAO 2014), the exploitation of
wild stocks has caused the decline of population abundances (Limburg & Waldman 2009). Salmon uses two
habitats during their life cycle: the freshwater habitat in rivers and the ocean habitat. The timing of the switch
between those habitats is critical for the survival and reproduction of individuals; therefore, it is subject to natural
and anthropogenic selection pressures. Here we study how mortality caused by fishing affects the evolution of the
timing of this habitat switch.
Methodology. We have developed a semi-discrete model with two habitats and a physiologically structured
population. We use the bioenergetics approach by Martin et al. (2017) to model the energy allocation and
demography of individuals. The two habitats differ in the strength of density dependence resulting from food
competition. Survival in the freshwater habitat is constant, while survival in the ocean is assumed to depend on
body size due to predation. In addition, individuals experience starvation, fishing, and background mortality. We
use adaptive dynamics theory to study the outcomes of the evolutionary process with and without fishing
mortality.
Results. Without fishing mortality, individuals switch from the freshwater habitat to the ocean habitat later if their
length at maturation is small and earlier if it is large. In addition, evolutionary bistability in the habitat switch
appears when increasing the length at maturation. Similarly, when the population is under fishing pressure,
smaller lengths at switching to the ocean are evolutionarily selected when the length at maturation is large.
However, bistability does not occur and the evolution of smaller lengths at switching to the ocean may even result
in selection-driven extinction.
Conclusions. Mortality caused by fishing results in selection-driven extinction (‘evolutionary suicide’) when
maturation occurs at large lengths. Therefore, overfishing can lead a population to extinction not only because of
the depletion of individuals (ecological effects) but also because, after a few generations, smaller and smaller
lengths of switching to the ocean are selected for, up to the point at which a very small length of switching drives
the population to extinction. In migratory fish stocks, overfishing can thus cause extinctions due to both
ecological and evolutionary causes.
References FAO (2014). The state of world fisheries and aquaculture. Food and Agriculture Oraganization of the United Nations (Vol. 2014).
Limburg KE & Waldman JR (2009). Dramatic declines in North Atlantic diadromous fishes. BioScience 59(11): 955–965.
Martin B, Heintz R, Danner E & Nisbet R (2017). Integrating lipid storage into general representations of fish energetics. Journal of
Animal Ecology 86(2): 812–825.
YSSP Summer Colloquium 2017
23
Emergence of efficient extraction in social-ecological models for fisheries
Daniel Cooney, Princeton University, USA
Email: [email protected]
IIASA Supervisors: Ulf Dieckmann (EEP) and Karl Sigmund (EEP)
Introduction. With around 30 percent of the world’s fisheries classified as overexploited or depleted and another
58 percent considered fully exploited (FAO 2016), the social-ecological dynamics of fisheries provide an
interesting and relevant example of the ‘tragedy of the commons’ and highlight the need for designing effective
schemes for managing the utilization of common-pool resources. Previous work on fisheries management has
described the effectiveness of punishing overfishers in promoting the stability of efficient extraction in two-
strategy models of fisher extraction (Tilman et al. 2017), and it has been shown that hybridized schemes of
rewarding cooperators and punishing defectors can promote and stabilize cooperation in public goods games
(Chen et al. 2015). Integrating these approaches in this project, we examine how a social institution can best
promote efficient extraction via rewards and penalties when fishers choose from a continuum of extraction levels.
Methodology. We model the dynamics of fisheries by coupling a bio-economic model of fish population
dynamics and harvesting by fishers with a game-theoretic model for the payoffs that fishers gain from harvesting
fish and from rewards or penalties meted out by a social institution. We describe the distribution of extraction
levels in the fisher population by a probability density function and derive a differential equation for the change in
this density as fishers use social learning to update their extraction levels. To extend the idea of rewarding
cooperators and punishing defectors to a continuous-strategy setting, we introduce thresholds identifying the
extraction levels eligible for rewards or penalties. We then choose these thresholds so as to maximize the rate of
adjustment of the fisher population’s average extraction level towards the socially optimal level of fish extraction.
Results. We show, for the continuous-strategy replicator dynamics, that the social institution should, at any given
population state, either invest entirely in rewarding or entirely in punishing. Furthermore, given that the institution
thus focuses on either rewarding or punishing, we show that it is optimal to concentrate the institutional incentives
either on the efficient extractors or on the overfishers at the extremes of the fisher population’s distribution of
extraction levels. In addition, we derive conditions on the mean of this distribution that characterize when it is
optimal to reward and when it is optimal to punish. Further, we define a more general social learning dynamics
for the updating of extraction levels and describe optimal institutional designs in terms of a calculus-of-variations
problem.
Conclusions. We have constructed a model of the social-ecological dynamics of fisheries incorporating
continuous fisher extraction levels and have explored the role of institutional incentives in driving the average
fisher extraction level towards its social optimum. We have identified directions for further research on optimal
institutional design via functional analysis and the calculus of variations, and we have made contributions to
understanding the evolution of cooperation and social optimality in continuous-strategy social dilemmas.
References Chen X, Sasaki T, Brännström Å & Dieckmann U (2015). First carrot, then stick: How the adaptive hybridization of incentives promotes
cooperation. Journal of the Royal Society Interface 12: 20140935.
Food and Agriculture Organization of the United Nations (2016). State of World Fisheries and Aquaculture (SOFIA) 2016. FAO Fisheries
Department.
Tilman AR, Watson JR & Levin S (2017). Maintaining cooperation in social-ecological systems: Effective bottom-up management often
requires sub-optimal resource use. Theoretical Ecology 10: 155–165.
YSSP Summer Colloquium 2017
24
Cultural evolution of low fertility at high socio-economic status
Sara L. Loo, University of Sydney, Australia
Email: [email protected]
IIASA Supervisors: Karl Sigmund (EEP) and Ulf Dieckmann (EEP)
Introduction. As populations have developed and disparities between the rich and the poor have increased, there
has been a distinct global transition of fertility from high to low, to the point where over half the global population
live in countries with below-replacement fertility (Wilson 2004). Counterintuitively, socio-economic status is
increasingly observed to be negatively correlated with fertility (Livi-Bacci 1986; Borgerhoff-Mulder 1998). This
project explores the effect of cultural evolution on this correlation.
Methodology. Within the framework of cultural evolution, an integro-difference equation model is used to
investigate the evolution of a large population that varies in socio-economic status and the endowment target
according to which parents provide resources to each of their children. The number of children born to parents is
proportional to their disposable wealth and inversely proportional to their endowment target. Children are
assigned a socio-economic status according to their rank in parental endowment. Children learn their endowment
target from their parents or socially, from a role model with similar socio-economic. We investigate how the
evolution of endowment targets depends on social learning and a population’s wealth distribution.
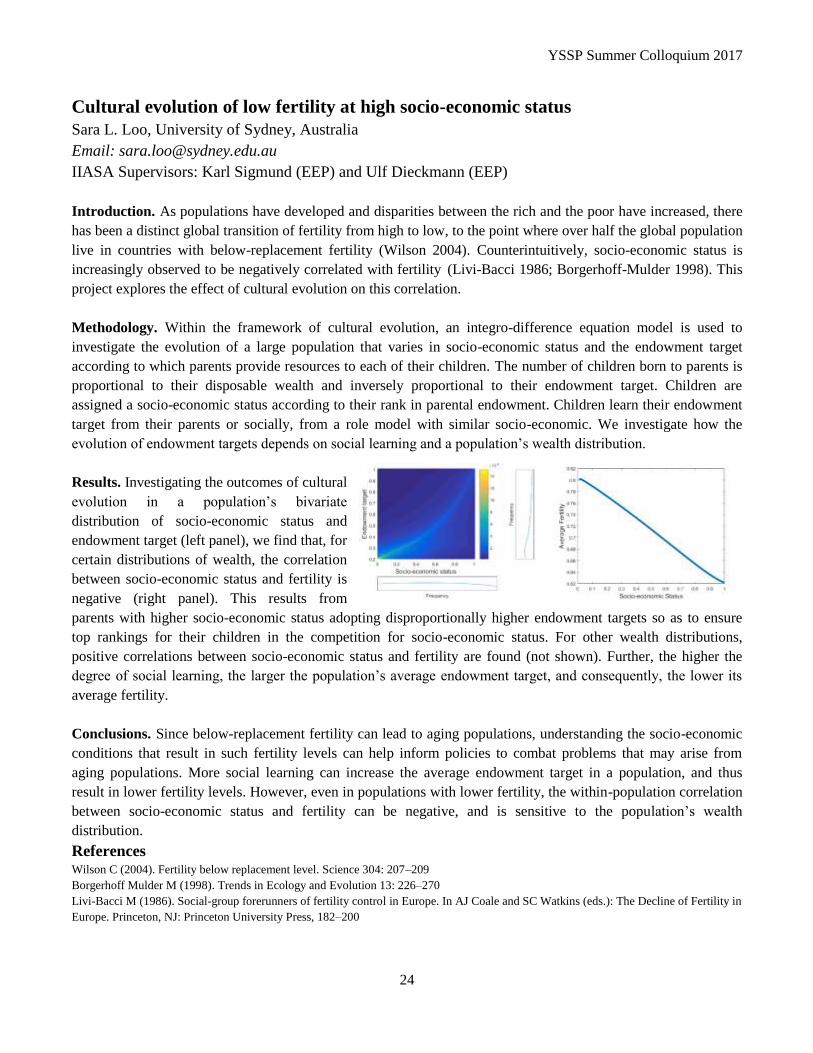
Results. Investigating the outcomes of cultural
evolution in a population’s bivariate
distribution of socio-economic status and
endowment target (left panel), we find that, for
certain distributions of wealth, the correlation
between socio-economic status and fertility is
negative (right panel). This results from
parents with higher socio-economic status adopting disproportionally higher endowment targets so as to ensure
top rankings for their children in the competition for socio-economic status. For other wealth distributions,
positive correlations between socio-economic status and fertility are found (not shown). Further, the higher the
degree of social learning, the larger the population’s average endowment target, and consequently, the lower its
average fertility.
Conclusions. Since below-replacement fertility can lead to aging populations, understanding the socio-economic
conditions that result in such fertility levels can help inform policies to combat problems that may arise from
aging populations. More social learning can increase the average endowment target in a population, and thus
result in lower fertility levels. However, even in populations with lower fertility, the within-population correlation
between socio-economic status and fertility can be negative, and is sensitive to the population’s wealth
distribution.
References Wilson C (2004). Fertility below replacement level. Science 304: 207–209
Borgerhoff Mulder M (1998). Trends in Ecology and Evolution 13: 226–270
Livi-Bacci M (1986). Social-group forerunners of fertility control in Europe. In AJ Coale and SC Watkins (eds.): The Decline of Fertility in
Europe. Princeton, NJ: Princeton University Press, 182–200
YSSP Summer Colloquium 2017
25
Towards enhanced realism in models of biodiversity evolution
Takuji Oba, Kyoto University, Graduate School of Informatics, Japan
Email: [email protected] IIASA Supervisors: Åke Brännström (EEP) and Hans Metz (EEP)
Introduction. Human societies depend on ecosystem services, which are maintained by biodiversity.
Mathematical models of food-web evolution help to understand how biodiversity patterns and are increasingly
used to inform ecosystem management and conservation. At the heart of these models are functional responses—
the relationships between prey densities and predator intake rates—but the most commonly used functional
responses are potentially problematic in that they have been developed under the assumption that prey densities
are effectively constant on the timescale of predation (Holling 1959), an assumption which is generally not
fulfilled in food-web model because multiple species consume each other.
Methodology. The aims of my project are to investigate the sensitivity of model predictions to the
aforementioned timescale assumption and explore potential model improvements. Focusing on a classical
nonlinear functional response, I (1) investigate the difference between a food-web model with a classical
nonlinear functional response and a more realistic, but also more complex, counterpart and (2) propose a new
functional response corresponding to the classical one that that can potentially yield more realistic dynamics in
complex models of food-web evolution. I consider several model parameterizations from the literature.
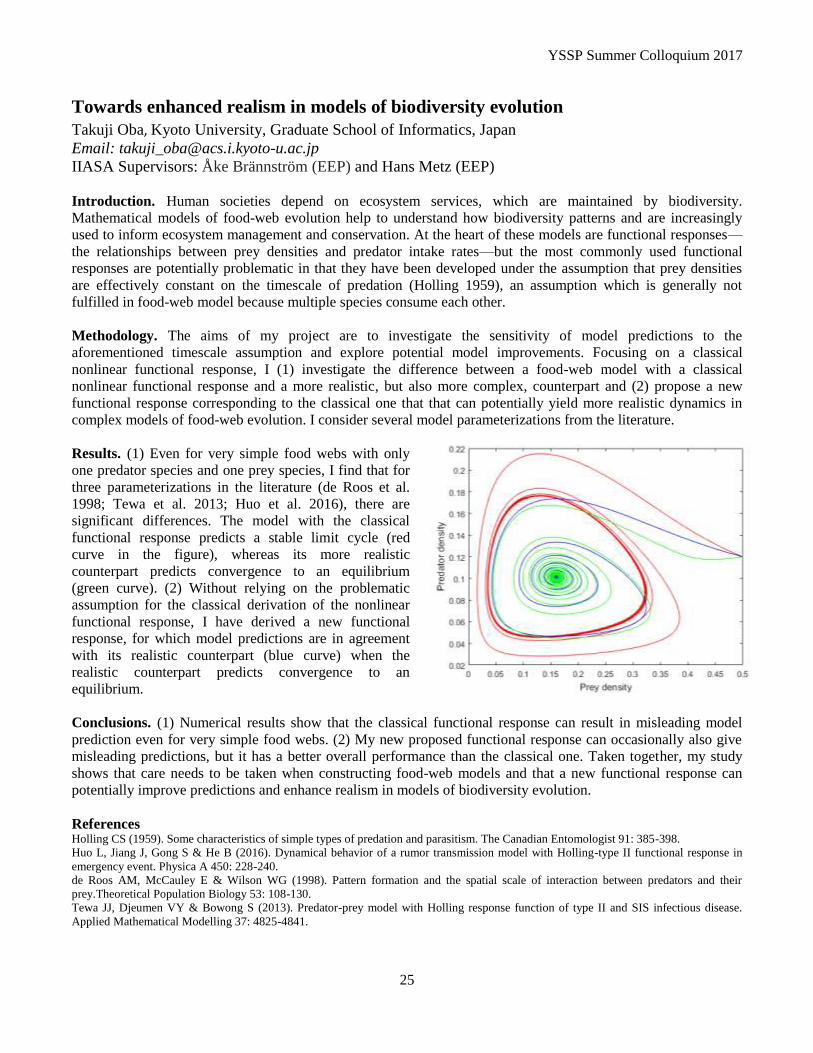
Results. (1) Even for very simple food webs with only
one predator species and one prey species, I find that for
three parameterizations in the literature (de Roos et al.
1998; Tewa et al. 2013; Huo et al. 2016), there are
significant differences. The model with the classical
functional response predicts a stable limit cycle (red
curve in the figure), whereas its more realistic
counterpart predicts convergence to an equilibrium
(green curve). (2) Without relying on the problematic
assumption for the classical derivation of the nonlinear
functional response, I have derived a new functional
response, for which model predictions are in agreement
with its realistic counterpart (blue curve) when the
realistic counterpart predicts convergence to an
equilibrium.
Conclusions. (1) Numerical results show that the classical functional response can result in misleading model
prediction even for very simple food webs. (2) My new proposed functional response can occasionally also give
misleading predictions, but it has a better overall performance than the classical one. Taken together, my study
shows that care needs to be taken when constructing food-web models and that a new functional response can
potentially improve predictions and enhance realism in models of biodiversity evolution.
References Holling CS (1959). Some characteristics of simple types of predation and parasitism. The Canadian Entomologist 91: 385-398. Huo L, Jiang J, Gong S & He B (2016). Dynamical behavior of a rumor transmission model with Holling-type II functional response in
emergency event. Physica A 450: 228-240. de Roos AM, McCauley E & Wilson WG (1998). Pattern formation and the spatial scale of interaction between predators and their
prey.Theoretical Population Biology 53: 108-130. Tewa JJ, Djeumen VY & Bowong S (2013). Predator-prey model with Holling response function of type II and SIS infectious disease.
Applied Mathematical Modelling 37: 4825-4841.

YSSP Summer Colloquium 2017
26
Energy
(ENE)
YSSP Summer Colloquium 2017
27
A novel method for incorporating power exchange limitations into energy system
models and the impact of spatial aggregation Karl-Kiên Cao, German Aerospace Center, Institute for Engineering Thermodynamics, Germany
Email: [email protected]
IIASA Supervisors: Volker Krey (ENE) and Daniel Huppmann (ENE)
Introduction. Optimizing energy system models (ESM) are frequently applied tools for the development of
energy scenarios. A current challenge concerning their application is that they often need to be simplified [1]. One
of these simplifications is the aggregation of spatial data. In the context of power systems, this translates into
overlooking possible transmission grid congestion. These bottlenecks become crucial in systems that rely on high
shares of variable renewable energy sources as electricity demand centers and resources hotspots are typically
remote from one another and thus the expansion of electricity transmission grids needs to be considered. The
objective of this research project is to derive ESM instances that maintain critical transmission links for energy
scenario analysis while reducing spatial detail to a level that is computationally manageable.
Methodology. In order to identify critical transmission links, a highly spatially resolved model (benchmark
model) is set up. For its creation a data scrap of the ENTSO-E power map is used [2]. As a case study for
developing the algorithm we initially pick Germany for two reasons, (i) data availability for renewable power
generation at high spatial resolution, and (ii) high wind and solar PV penetration which allows for model
validation. As basic implementation the ESM REMix [3] is parameterized using empirical data of the year 2012.
Spatially aggregated ESM instances are subsequently derived from the benchmark model by application of
spectral clustering. Therefore, we use electricity prices as affinity attributes. The simplified ESM instances are
finally evaluated against observables from the same year such as the frequency of congestion events.
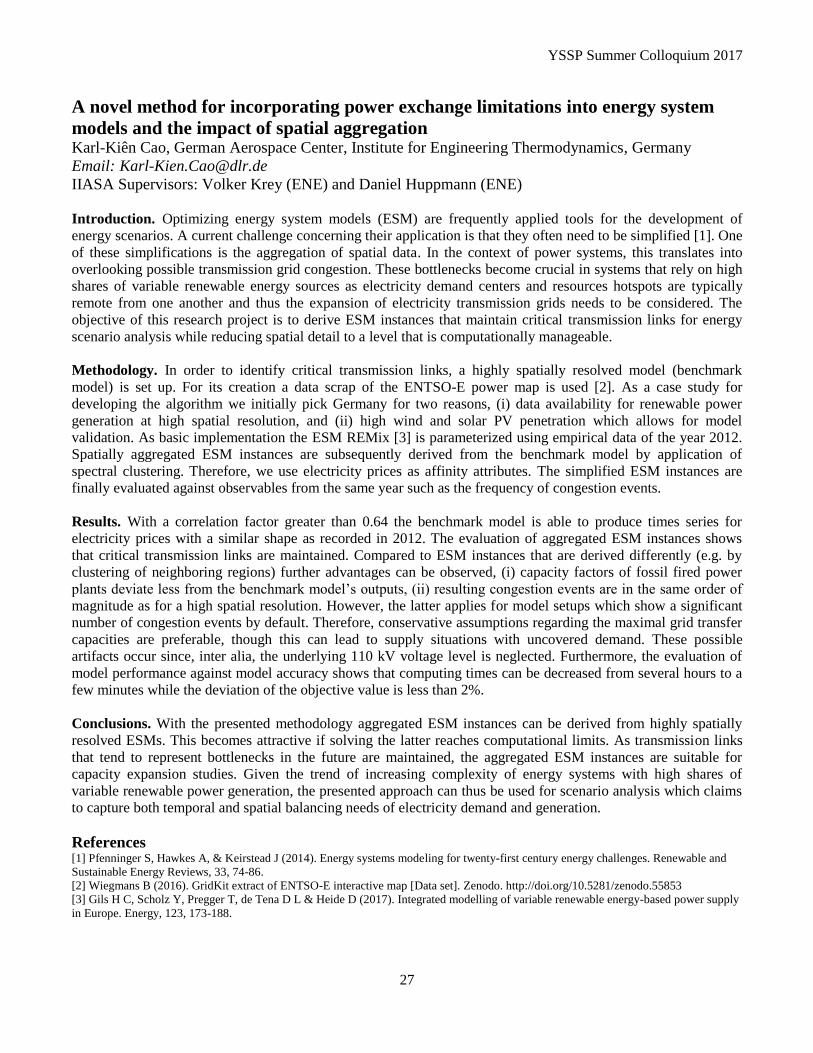
Results. With a correlation factor greater than 0.64 the benchmark model is able to produce times series for
electricity prices with a similar shape as recorded in 2012. The evaluation of aggregated ESM instances shows
that critical transmission links are maintained. Compared to ESM instances that are derived differently (e.g. by
clustering of neighboring regions) further advantages can be observed, (i) capacity factors of fossil fired power
plants deviate less from the benchmark model’s outputs, (ii) resulting congestion events are in the same order of
magnitude as for a high spatial resolution. However, the latter applies for model setups which show a significant
number of congestion events by default. Therefore, conservative assumptions regarding the maximal grid transfer
capacities are preferable, though this can lead to supply situations with uncovered demand. These possible
artifacts occur since, inter alia, the underlying 110 kV voltage level is neglected. Furthermore, the evaluation of
model performance against model accuracy shows that computing times can be decreased from several hours to a
few minutes while the deviation of the objective value is less than 2%.
Conclusions. With the presented methodology aggregated ESM instances can be derived from highly spatially
resolved ESMs. This becomes attractive if solving the latter reaches computational limits. As transmission links
that tend to represent bottlenecks in the future are maintained, the aggregated ESM instances are suitable for
capacity expansion studies. Given the trend of increasing complexity of energy systems with high shares of
variable renewable power generation, the presented approach can thus be used for scenario analysis which claims
to capture both temporal and spatial balancing needs of electricity demand and generation.
References [1] Pfenninger S, Hawkes A, & Keirstead J (2014). Energy systems modeling for twenty-first century energy challenges. Renewable and
Sustainable Energy Reviews, 33, 74-86.
[2] Wiegmans B (2016). GridKit extract of ENTSO-E interactive map [Data set]. Zenodo. http://doi.org/10.5281/zenodo.55853
[3] Gils H C, Scholz Y, Pregger T, de Tena D L & Heide D (2017). Integrated modelling of variable renewable energy-based power supply
in Europe. Energy, 123, 173-188.
YSSP Summer Colloquium 2017
28
How residential nearly zero energy buildings (nZEB) can contribute to Brazil’s role
in achieving the global warming objective of 1.5°C
Esperanza González, Universidade Federal do Rio de Janeiro, Programa de Planejamento Energético,
Brazil
Email: [email protected]
IIASA Supervisors: Alessio Mastrucci (ENE) and Rao Narasimha (ENE)
Introduction. Buildings account for 14.6% of the final energy consumption and more than half of the electricity
consumption in Brazil. The housing demand in Brazil is expected to substantially grow. Demand-side measures
are relevant to achieve Brazil’s nationally determined contribution (NDC) for climate mitigation, because of the
limited remaining hydroelectric generation potential [1] and the expectation of high fossil fuel growth in the
energy supply system in the coming years [2]. The objective of this research is to investigate the potential
contribution of nearly Zero Energy Buildings (nZEB) in the Brazilian residential sector to meet Brazil’s NDC and
the global climate stabilization target of 1.5°C.
Methodology. The methodology consists of four steps. First, we define housing archetypes by region and income
level, from which we derive hourly-basis demand by end-use, including space cooling (EnergyPlus dynamic
model); hot water (based on Procel data) and other electric appliances (bottom-up demand model). Second, we
use a mixed-integer linear programming (OPTbuild model) to select the optimal on-site renewable technology
choices to meet energy demand at the lowest cost for the different archetypes, considering technology sizing and
costs, operational schedules and fuel and electricity market prices. In the third step, we extrapolate the results to
the country scale using future income distribution scenarios. Finally, we run the model MESSAGE Brazil to
measure the emissions impact of implementing nZEBs.
Preliminary results. Findings show that, by implementing nZEBs for the new residential buildings, Brazil´s
residential energy demand can be reduced by 20.6% in 2050, which would reduce 15 % of the accumulated CO2
emissions between 2015-2050. If the entire stock of residential buildings in Brazil were to be replaced by nZEBs,
the corresponding CO2 emissions reduction would be 55.8% in 2050. The least-cost technology choice by 2020
would include solar PV, thermal solar collector and electricity purchases from the grid. By 2050, the battery
would be in the mix of technologies.
Conclusions. nZEBs offer a CO2 mitigation potential from buildings by including energy efficiency measures,
envelope improvement and integration of renewable energy supply technologies into new building construction.
By 2050, it is technically possible to substantially reduce residential building energy consumption in Brazil
through nZEBs. However, the implementation of on-site renewable technologies requires changes to the net
metering policy and financial support to make these changes affordable. Moreover, policies oriented towards
reducing barriers to retrofitting existing buildings would be necessary. Finally, Brazil should consider establishing
a comprehensive building code and enforce a Brazilian Labelling Program.
References [1] EPE (2015). Plano Decenal de Energia 2024. Available from: < http://www.epe.gov.br/PDEE/Relatorio Final do PDE 2024.pdf >.
[Accessed on 8 August 2016].
[2] A.F.P. Lucena, L. Clarke, R. Schaeffer, A. Szklo, P.R.R. Rochedo, L.P.P. Nogueira, K. Daenzer, A. Gurgel, A. Kitous, T. Kober
(2015). Climate policy scenarios in Brazil : A multi-model comparison for energy, Energy Economics 56: 564-574.
YSSP Summer Colloquium 2017
29
0 1 2 3 4 5 6 70
0.5
1
1.5
2
2.5
3
Total emissions [1000 tCO2]
Tota
l cost
[M$]
Hospital
Office bldg.
School
Utilty customer
Microgrid, baseline
Microgrid, no thermal DERs
Figure 2. Total cost and emissions.
The impact of microgrid adoption on greenhouse gas emissions from the electric
power sector
Ryan Hanna, University of California, San Diego, USA
Email: [email protected]
IIASA Supervisors: Daniel Huppmann (ENE) and Shinichiro Fujimori (ENE)
Introduction. Technology, policy, and market forces are interacting in ways that make insular power networks an
attractive option for electric utility customers. Such “microgrids”, which can use renewables and fossil fuels, can
increase reliability relative to the bulk grid and may reduce energy costs. As industry forecasts point to increasing
adoption rates, it is important to understand how greenhouse gas (GHG) emissions from these systems compare
with marginal emissions from standard utility service. This study is the first to assess these impacts—and does so
for likely first adopters who have a need for reliable service. It further analyzes the effect of a carbon tax.
Methodology. The methodological basis for the work is a new model that determines least-cost investment and
operation of distributed energy resources (DERs; e.g. natural gas generators, solar photovoltaics (PV), battery and
thermal energy storage) in a microgrid for utility customers like hospitals and office campuses. The model
includes the key costs that affect economics— investment cost, energy provision, emissions & expected reliability
losses (i.e., costs due to power outages)—and computes costs, supply and demand of energy services (i.e.
electricity, heating, cooling, natural gas) and carbon dioxide emissions relative to provision by a central utility.
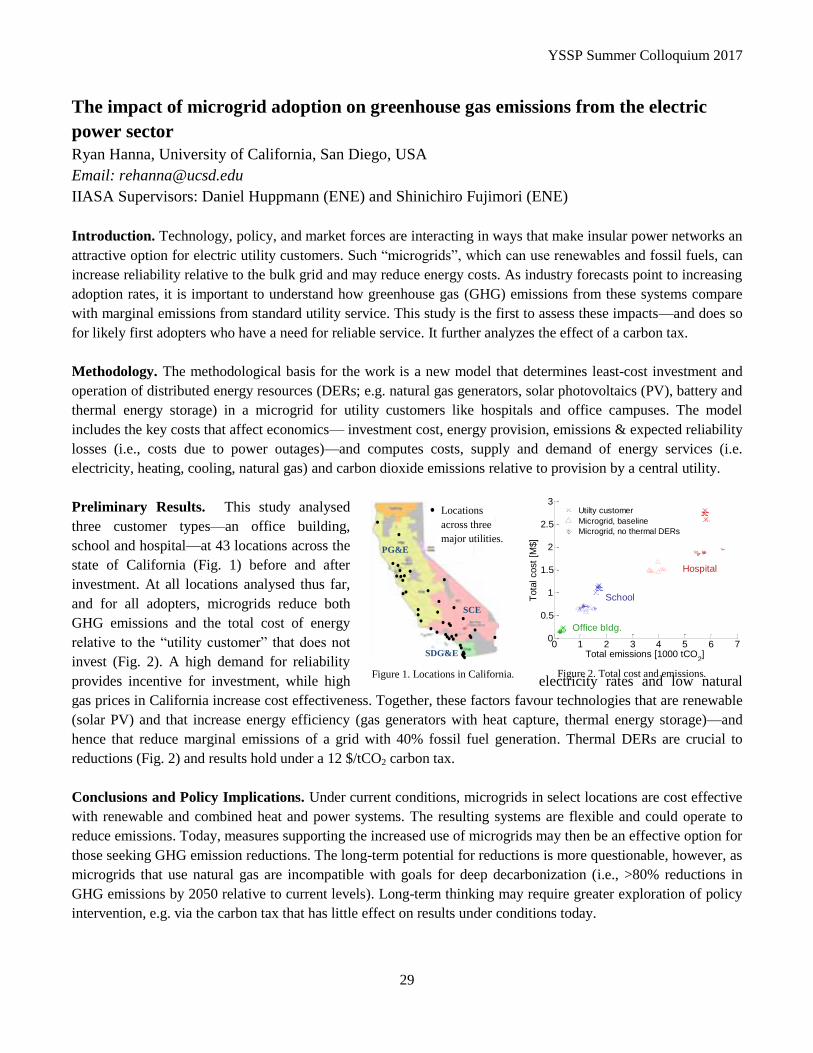
Preliminary Results. This study analysed
three customer types—an office building,
school and hospital—at 43 locations across the
state of California (Fig. 1) before and after
investment. At all locations analysed thus far,
and for all adopters, microgrids reduce both
GHG emissions and the total cost of energy
relative to the “utility customer” that does not
invest (Fig. 2). A high demand for reliability
provides incentive for investment, while high electricity rates and low natural
gas prices in California increase cost effectiveness. Together, these factors favour technologies that are renewable
(solar PV) and that increase energy efficiency (gas generators with heat capture, thermal energy storage)—and
hence that reduce marginal emissions of a grid with 40% fossil fuel generation. Thermal DERs are crucial to
reductions (Fig. 2) and results hold under a 12 $/tCO2 carbon tax.
Conclusions and Policy Implications. Under current conditions, microgrids in select locations are cost effective
with renewable and combined heat and power systems. The resulting systems are flexible and could operate to
reduce emissions. Today, measures supporting the increased use of microgrids may then be an effective option for
those seeking GHG emission reductions. The long-term potential for reductions is more questionable, however, as
microgrids that use natural gas are incompatible with goals for deep decarbonization (i.e., >80% reductions in
GHG emissions by 2050 relative to current levels). Long-term thinking may require greater exploration of policy
intervention, e.g. via the carbon tax that has little effect on results under conditions today.
Locations
across three
major utilities.
Figure 1. Locations in California.
PG&E
SCE
SDG&E
YSSP Summer Colloquium 2017
30
The evolution of embodied energy in household durables, consumables and services
from 1995 to 2011 across nations
Gibran Vita, Norwegian University of Science and Technology, Industrial Ecology, Norway
Email: [email protected]
IIASA Supervisors: Narasimha Rao (ENE) and Jihoon Min (ENE)
Introduction. Household consumption is a main driver of global environmental impact [1]. Sustainability
agendas encourage lifestyles changes and production strategies to extend the lifetime of goods. However, a decent
modern life implies material prerequisites, including a bundle of household durables and consumables [2].
Durables (vehicle) require consumables (fuel) and services (mechanics, insurances). How much energy resources
are captive directly and indirectly to household durables?
Methodology. We calculate the life cycle energy footprints (EF) of 200 different goods of 44 nations and 5
continents from 1995 to 2011 using EXIOBASE 3, an Environmentally Extended Multiregional Input-Output
(EE-MRIO). We employ consumption-based accounting, where the consumer of a good is accountable for all
upstream resources. Thus, the EF of a household equals to the energy consumed directly plus the embodied
energy in all purchased goods.
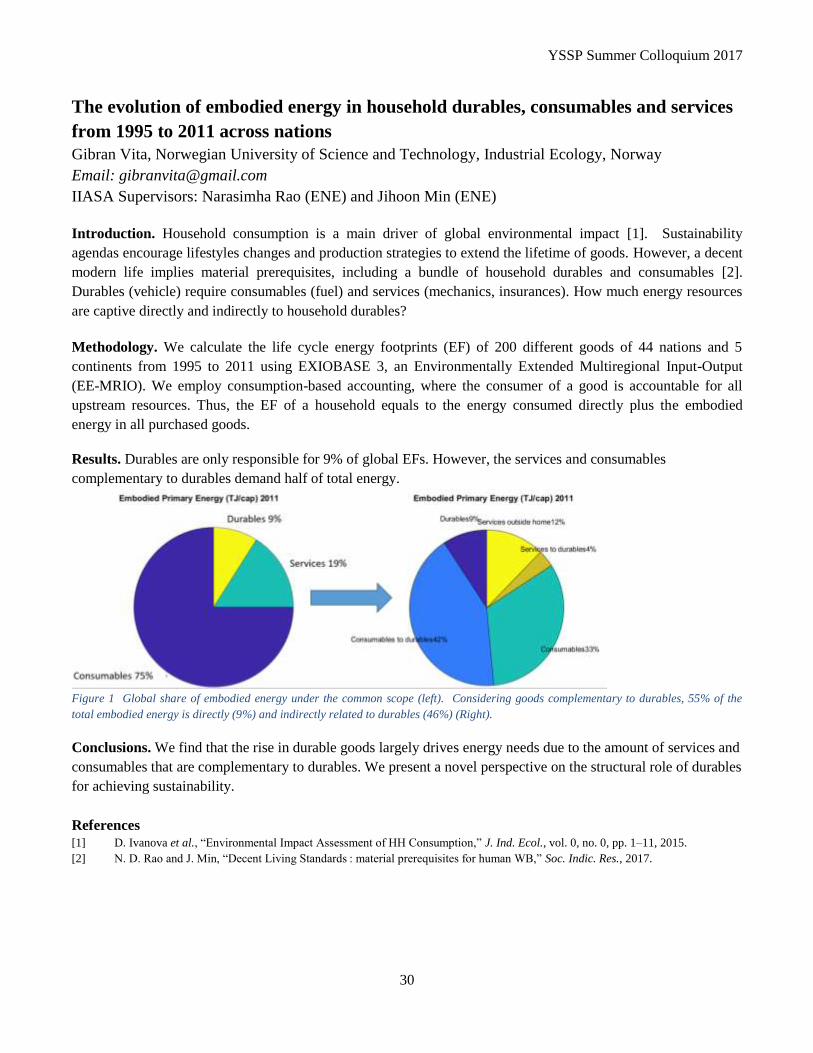
Results. Durables are only responsible for 9% of global EFs. However, the services and consumables
complementary to durables demand half of total energy.
Figure 1 Global share of embodied energy under the common scope (left). Considering goods complementary to durables, 55% of the
total embodied energy is directly (9%) and indirectly related to durables (46%) (Right).
Conclusions. We find that the rise in durable goods largely drives energy needs due to the amount of services and
consumables that are complementary to durables. We present a novel perspective on the structural role of durables
for achieving sustainability.
References
[1] D. Ivanova et al., “Environmental Impact Assessment of HH Consumption,” J. Ind. Ecol., vol. 0, no. 0, pp. 1–11, 2015.
[2] N. D. Rao and J. Min, “Decent Living Standards : material prerequisites for human WB,” Soc. Indic. Res., 2017.
YSSP Summer Colloquium 2017
31
Investigation of the water use of power plants under changes in water temperature
and availability
Yaoping Wang, The Ohio State University, Environmental Sciences Graduate Program, USA
Email: [email protected]
IIASA Supervisors: Edward Byers (ENE) and Simon Parkinson (ENE)
Introduction. Thermoelectric power generation requires cooling, normally provided by wet cooling systems. The
withdrawal and discharge of cooling water are subject to regulation. As a result, operation of power plants may be
vulnerable to changes in streamflow availability and rises in air and water temperatures. In Asia, about 489 GW of
coal-fired power plants (~37% of existing coal-generation capacity), are currently under construction, permitted,
or announced for operation before 2028. These power plants may add to existing water stress in the thermoelectric
sector, and may face water limitation themselves.
Methodology. We combined high-resolution (0.08ox0.08
o) outputs from a global hydrological model,
PCRGLOBWB, with cooling water use models (Bartos and Chester, 2015) to calculate the potential available
capacity for each existing and planned coal power plant in Asia at a daily time step. The location and design of the
existing and planned coal power plants are from the Global Coal Plant Tracker dataset and a previously geo-
referenced dataset (CoalSwarm, 2017; Raptis and Pfister, 2016). Three climate change scenarios (1.5oC, 2
oC, and
3oC warming in global mean temperatures) from the GFDL-ESM2M global climate model were compared.
Results. The total potential available capacity for the coal power plants in the study region increases by ~4%, due
to an overall increase in streamflow, from historical to the different warming scenarios. Under the same warming
scenario, if all the planned coal power plants were added to existing power plants, the total potential available
capacity increases, but the average capacity factor decreases from ~0.72 to ~0.7, suggesting an increase in water
limitation. Spatially, many planned and existing power plants in Pakistan and northwestern India, northern China,
and northwestern China have near-zero potential available capacity (assuming use of cooling tower with
freshwater). Water-limited power plants also occur throughout India and in central China. At watershed level, two
of the six watersheds that have the highest installed generating capacities expect decrease in potential available
capacity (Yangtze River Basin: -2.9%; Huai River Basin: -1.7%) for existing power plants and the others expect
increase (Yellow River Basin: 10.5%; eastern India: 7.3%; Hai River Basin: +6.3%; Pearl River Basin: +0.1%).
Conclusions. Climate change may bring some positive influence to the thermoelectric generation sector in Asia
by increasing the available streamflow for cooling water, but the historically water-scare regions remain under
high water stress, and the coal power plants there cannot operate with wet cooling systems without over-
extracting the available streamflow. The projected decrease in potential available capacity in the Yangtze River in
central China also suggest more attention be paid to the water resources constraint on the development of power
supply in this traditionally water-abundant region.
References Bartos, M.D., Chester, M. V., 2015. Impacts of climate change on electric power supply in the Western United States. Nat. Clim. Chang. 5,
748–752. doi:10.1038/nclimate2648
CoalSwarm, 2017. Global Coal Plant Tracker [WWW Document]. URL http://endcoal.org/tracker/
Raptis, C.E., Pfister, S., 2016. Global freshwater thermal emissions from steam-electric power plants with once-through cooling systems.
Energy 97, 46–57. doi:http://dx.doi.org/10.1016/j.energy.2015.12.107

YSSP Summer Colloquium 2017
32
Ecosystems Services and Management
(ESM)
YSSP Summer Colloquium 2017
33
Exploring future scenarios of ethanol demand in Brazil and their land-use
implications
Milton Aurelio Uba de Andrade Junior, The University of Queensland, Australia
Email: [email protected]
IIASA Supervisors: Hugo Valin (ESM) and Aline Soterroni (ESM)
Introduction. Brazil is the world’s largest sugar producer and exporter, and the second largest ethanol producer
(FAO, 2016; RFA, 2016), using 9.13 million hectares of sugarcane cropland area in 2014/2015 (CONAB, 2016).
The ethanol share of this production is essentially directed to meet the high domestic demand in Brazil. This
demand is mainly influenced by different factors, such as: ethanol-gasoline blend mandates (which may change
under policy interventions); size and structure of the fleet (considering the rampant increase of flex-fuel vehicles),
and relative prices between ethanol and ethanol-gasoline blend (which lead consumers’ choice between the fuel-
blend and ethanol). Because the increased demand for sugarcane ethanol in Brazil has the potential to cause
significant land use and environmental impacts, we first design in this study different possible scenarios of future
ethanol demand to better understand these impacts, and then analyse their implications in an economic model of
agricultural and land use in Brazil.
Methodology. We based our demand projections using historical data on fleet numbers and structure, found in the
National Emissions Inventory for Road Vehicles (2013) and SINDIPEÇAS & ABIPEÇAS (2017). We designed
three scenarios based on the Shared-Socioeconomic Pathways (SSPs) narratives, using different projections of
gross domestic product (GDP) and population growth adapted to the national context. The scenarios called
Renewable fuels oriented (RF), Business as usual (BAU), and Fossil fuels oriented (FF) were also set with
different fuel-blend mandates and relative prices variation between ethanol and the fuel-blend. Land-use was
assessed by projecting Brazil’s land-use change and agricultural outputs through 2030, taking into account future
ethanol demand, as well as external trade and exogenous drivers. Our approach is based on the GLOBIOM-Brazil,
a bottom-up global economic partial equilibrium model of agriculture, forestry and bioenergy sectors, especially
refined for Brazil.
Results. Our projections indicate that ethanol demand is highly sensitive to variation in relative prices between
ethanol and the fuel-blend, and to the increasing share of flex-fuel vehicles in the fleet. Depending on the SSPs,
future number of flex fuel vehicles, including motorcycles, could vary from 56.5 million to 70.8 million, leading
to corresponding ethanol demand of 48.8 billion litres in the BAU scenario, 31.9 billion litres in the FF and 63.6
billion litres in the RF scenario. Respectively, these numbers are 64%, 7% and 114% higher than the production
observed in 2015. Preliminary results show that sugarcane expansion is sensitive to the future demand of ethanol.
Conclusions. We expect to suggest possible mitigation strategies in terms of deforestation and carbon emissions.
Our scenarios also show the extent to which potential government interventions (i.e., fuel-blend mandates and
influences on fuels prices) could influence the Brazilian ethanol demand and related land-use change.
References BRASIL (2013). Inventário Nacional de Emissões Atmosféricas por Veículos Automotores Rodoviários. MMA, 114p.
Camara, G, Soterroni, A, Ramos, F, Carvalho, A, Andrade, P, Souza, RC, Mosnier, A, Mant, R, Buurman, M, Pena, M, Havlik, P, Pirker, J,
Kraxner, F, Obersteiner, M, Kapos, V, Affonso, A, Espindola, G & Bocqueho, G (2015). Modelling Land Use Change in Brazil: 2000–
2050, INPE, IPEA, IIASA, UNEP-WCMC, Sao Jose dos Campos, Brasilia, Laxenburg, Cambridge.
CONAB (2016). Levantamentos da safra de cana-de-açucar. Available at: http://www.conab.gov.br/conteudos.php?a=1253&t=2.
FAO (2016). FAOSTAT database collections. Available at: faostat.fao.org.
RFA (2016). Ethanol Industry Outlook. Washington, DC: Renewable Fuels Association 40.
SINDIPEÇAS & ABIPEÇAS (2017). Relatório da frota circulante 2016. Sindicato Nacional da Indústria de Componentes para Veículos
Automotores, e Associação Brasileira da Indústria de Autopeças. São Paulo, Brazil, 5p.
YSSP Summer Colloquium 2017
34
Grazing systems intensification: Challenges and opportunities
Cécile Godde, CSIRO, University of Queensland, Australia
Email: [email protected]
IIASA Supervisors: Petr Havlík (ESM) and David Leclère (ESM)
Introduction. Global demand for livestock products and competition for land are growing rapidly. In this context,
grazing systems intensification, by increasing food production per unit area, has been suggested as an important
way of increasing livestock product outputs while sparing land for other uses (e.g. afforestation, bioenergy and
crop production), and limiting environmental impacts. In this study, we aim to better understand the global
potential for grazing systems intensification in a context of climate change, its role for food production, land
sparing and climate change mitigation, in order to identify policy interventions for more sustainable livestock
production pathways.
Methodology. The intensification strategies tested are nitrogen fertilisation, legume sowing and ruminant
stocking rate optimisation. Pasturelands, for which the three intensification strategies are considered, are
represented by the EPIC model [1]. Rangelands, which are in remote areas and for which only stocking rate
optimisation is considered, are represented by the G-range model [2]. Stocking rate optimisation is represented by
a global stocking rate optimiser developed based on Wirsenius et al. (in prep.)’s work for the Brazilian beef
sector. Livestock greenhouse gas (GHG) emissions and food production are estimated by the digestion and
metabolism model RUMINANT [3]. The climate change scenarios are sampled from the ISI‐MIP scenarios [4], in
order to account for uncertainties in the radiative forcing and in the response from the climate system.
Uncertainties concerning CO2 effects on grasslands are also considered. The outputs analysed are soil carbon,
GHG emissions from grasslands and ruminants as well as ruminant food production at a 0.5-degree spatial
resolution on a global scale for years 2000 and 2050.
Preliminary results. EPIC and G-range models were harmonised in their main biophysical processes. Their
outputs were consistent with evaluation datasets. Legumes sowing seems to have the highest potential for
grasslands GHG emissions reduction globally, while stocking rate optimisation could bring around substantial
benefits, especially in parts of Sub-Saharan Africa and Latin America.
Conclusions. Although grasslands represent about a third of the earth land surface, they are poorly understood.
Our results suggest that grasslands are not only one of the largest land use types but also great resources which, if
properly managed, can provide in a sustainable way large amounts of the additional food humanity will need in
the coming decades. Production-side mitigation options considered here add to the sometimes rather simplistic
literature seeing the only opportunity for emissions reduction in agriculture through substantially reducing beef
consumption.
References
1. J. R. Williams, The EPIC Model. In V. Singh,ed., Comput. Model. Watershed Hydrol. (Highlands Ranch, CO: Water Resources
Publications, 1995), pp. 909–1000.
2. R. B. Boone, R. T. Conant, & T. E. Hilinski, G-Range: Development and Use of a Beta Global Rangeland Model (2011).
3. M. Herrero, P. Havlík, H. Valin, A. M. Notenbaert, M. C. Rufino, P. K. Thornton, M. Blümmel, F. Weiss, D. Grace, & M. Obersteiner.
PNAS, 110 (2013) 20888–93.
4. L. Warszawski, K. Frieler, V. Huber, F. Piontek, O. Serdeczny, & J. Schewe. PNAS, 111 (2014) 3228–3232.
YSSP Summer Colloquium 2017
35
Nature conservation management forests in Sweden; a spatially explicit analysis of
current management potentials and societal trade-offs Örjan Grönlund, Forestry Research Institute of Sweden, Skogforsk, Swedish University of Agricultural
Sciences, Department of Forest Biomaterials and Technology, Sweden
Email: [email protected]
IIASA Supervisors: Fulvio Di Fulvio (ESM), Anu Korosuo (ESM), and Nicklas Forsell (ESM)
Introduction. The dominant use of the Swedish forestland is highly efficient forestry based on clearcutting and
replanting of a few tree species. However, a significant share of the Swedish forestland is dedicated to voluntary
set aside natural conservation. From a forest management perspective, there are two main types of conservation
approaches: forest stands left to free development, and stands in need of active Nature Conservation Management
(NCM) to maintain their conservation values. The latter alone is reported to amount to more than three percent of
the Swedish forestland. However, there is no comprehensive national data on these areas, neither on actual areas
and it’s management nor the potential values. On the contrary, there is only a consensus among foresters that
NCM is not carried out to the extent needed, presumably caused by expectations of low profitability of NCM.
The aim of this project is twofold; 1) to describe forests in Sweden currently chosen for NCM 2) to quantify the
profitability of the management of these stands.
Methodology. First, a set of categories were defined in order to describe the management objectives on the NCM
stands. These categories were based on descriptions of habitats in need of special consideration during forest
operations formulated by the Swedish Forestry Agency. Second, a spatially explicit analysis was made over a
dataset of 27 000 NCM stands (130 000 ha) to analyse the occurrence of the different categories in Sweden..
Third, management profitability, the difference between revenues and costs, was calculated for each stand in the
dataset. Revenues were simulated for different thinning strategies and intensities, removal of between 20 to 40%
of standing volume, in “type stands” which were representative stands selected in each geographical region, age
class, and tree species distribution. Costs were estimated using cost functions adapted to the dataset features by
means of specific factors derived for each descriptive category.
Results. Six descriptive categories were formulated, covering 80% of the analysed NCM-area in the dataset. The
most frequent category was old coniferous forests. Even though all categories could be found in all regions of the
country, NCM-stands categorized as close to human activities and close to water were more common in the
southern part of the country and even more frequent in densely populated southern regions. Depending on the
intensity of the thinning removal, NCM was found to be possible on 40-60% of the area in the dataset without
exceeding the legal requirements on minimum forest stocks. The preliminary results indicate large variations in
profitability and that the more categories the stand fits into, the lower the profitability of management.
Conclusions. A major challenge in forestry is to carry out an initial sorting among all stands in order to point out
areas of interest for NCM. The method applied in this study used basic forest characteristics and publicly
available data to categorize forests identified for NCM. The used method could be potentially applied to all forests
in the country and it could be complemented by a multi-criteria analysis able of weighing the descriptive
categories In this study it is shown that the management of NCM forests where fewer criteria are met can be
profitable, while an increasing amount of conservation values reduces profitability. Therefore, subsidies aimed at
promoting this kind of management should be especially directed toward forests with high values where the
current management is mostly unprofitable.
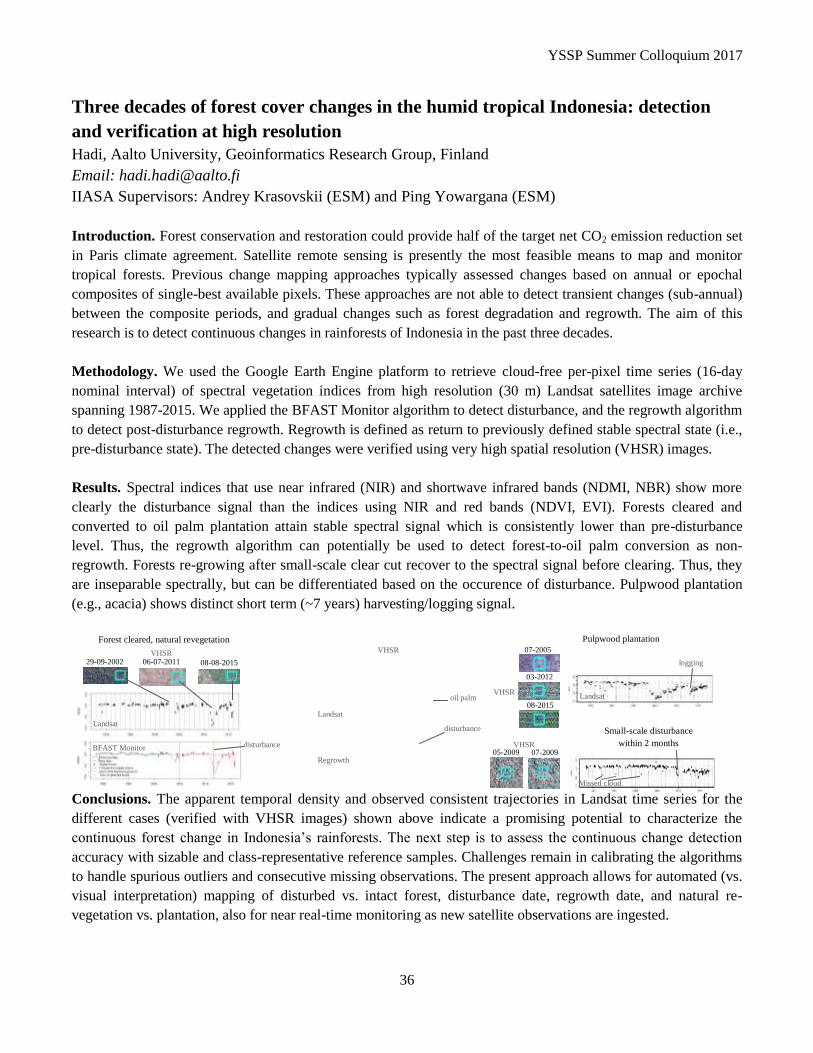
YSSP Summer Colloquium 2017
36
Three decades of forest cover changes in the humid tropical Indonesia: detection
and verification at high resolution
Hadi, Aalto University, Geoinformatics Research Group, Finland
Email: [email protected]
IIASA Supervisors: Andrey Krasovskii (ESM) and Ping Yowargana (ESM)
Introduction. Forest conservation and restoration could provide half of the target net CO2 emission reduction set
in Paris climate agreement. Satellite remote sensing is presently the most feasible means to map and monitor
tropical forests. Previous change mapping approaches typically assessed changes based on annual or epochal
composites of single-best available pixels. These approaches are not able to detect transient changes (sub-annual)
between the composite periods, and gradual changes such as forest degradation and regrowth. The aim of this
research is to detect continuous changes in rainforests of Indonesia in the past three decades.
Methodology. We used the Google Earth Engine platform to retrieve cloud-free per-pixel time series (16-day
nominal interval) of spectral vegetation indices from high resolution (30 m) Landsat satellites image archive
spanning 1987-2015. We applied the BFAST Monitor algorithm to detect disturbance, and the regrowth algorithm
to detect post-disturbance regrowth. Regrowth is defined as return to previously defined stable spectral state (i.e.,
pre-disturbance state). The detected changes were verified using very high spatial resolution (VHSR) images.
Results. Spectral indices that use near infrared (NIR) and shortwave infrared bands (NDMI, NBR) show more
clearly the disturbance signal than the indices using NIR and red bands (NDVI, EVI). Forests cleared and
converted to oil palm plantation attain stable spectral signal which is consistently lower than pre-disturbance
level. Thus, the regrowth algorithm can potentially be used to detect forest-to-oil palm conversion as non-
regrowth. Forests re-growing after small-scale clear cut recover to the spectral signal before clearing. Thus, they
are inseparable spectrally, but can be differentiated based on the occurence of disturbance. Pulpwood plantation
(e.g., acacia) shows distinct short term (~7 years) harvesting/logging signal.
Conclusions. The apparent temporal density and observed consistent trajectories in Landsat time series for the
different cases (verified with VHSR images) shown above indicate a promising potential to characterize the
continuous forest change in Indonesia’s rainforests. The next step is to assess the continuous change detection
accuracy with sizable and class-representative reference samples. Challenges remain in calibrating the algorithms
to handle spurious outliers and consecutive missing observations. The present approach allows for automated (vs.
visual interpretation) mapping of disturbed vs. intact forest, disturbance date, regrowth date, and natural re-
vegetation vs. plantation, also for near real-time monitoring as new satellite observations are ingested.
07-2009 05-2009
07-2005
08-2015
Small-scale disturbance
within 2 months
Pulpwood plantation
06-07-2011 08-08-2015 29-09-2002
Missed cloud
Forest cleared, natural revegetation Forest cleared, planted oil palm
03-2012 logging
oil palm
Landsat Landsat
Landsat
VHSR VHSR
VHSR
VHSR BFAST Monitor Regrowth
disturbance disturbance
YSSP Summer Colloquium 2017
37
The Rush for Foreign Land – Agro-ecological drivers of FDI in land
Cornelius Hirsch, Vienna University of Economics and Business, Austrian Institute of Economic
Research, Austria
Email: [email protected]
IIASA Supervisors: Tamás Krisztin (ESM) and Linda See (ESM)
Introduction. Given the increasing demand for agricultural products for human consumption, fuelled by a
growing world population and increasing per capita income, one strategy within the global agricultural sector has
become the long term leasing or purchasing of vast acres of land in other countries to expand production. These
foreign direct investments (FDI) in land are termed foreign land acquisitions (FLA) in the literature and have
simultaneously gained widespread media attention, becoming known in the public debate as “land grabbing”. Lay
and Nolte (2017) established significant differences between FLA and traditional FDI regarding the impact of
institutional quality in the host country, while Arezki et al. (2013) were puzzled by the insignificance of the “yield
gap” in the host country as a driving factor for increased land investments. We return to this question with a
significantly improved dataset for FLA-deals and agro-ecological data from biophysical models.
Methodology. Agro-ecological pull factors in the host countries of FLA deals are identified by means of a
regression analysis within a gravity-model. Analysing flows of FDI in land between country-pairs poses
estimation challenges, mainly due to the very high number of zero-flows, i.e. the absence of an investor-host-
country relation between most of the possible country-pairs. In the econometric literature, using a Pseudo-Poisson
maximum likelihood estimation has emerged as a best-practice approach for tackling this challenge. In the first
step, we constructed new variables for potential output from rainfed crop production, net-rainfall in rainfed crop-
production areas, soil and climate conditions from EPIC data and –following Arezki et al. (2013), but using data
from Mueller et al. (2012) – constructed a yield gap variable. We then regressed the sum of FLA-hectares of
country pairs on these explanatory variables. Simultaneously, we control for a set of relevant bilateral and
unilateral characteristics, to analyse which determinants have a significant impact on the sum of hectares of FLA-
investments between a country pair.
Results. Besides distance and cultural proximity, the results suggest that land abundance and net rainfall in
rainfed crop-production areas in the host countries have a strong positive and significant effect on the amount of
FLA. The coefficient for institutional instability is also positive, which together with the negative host-GDP
coefficient, underline the concentration of FLA deals in weaker economies, less stable countries of the global
south. As in previous studies, the yield gap variable leads to ambiguous results, suggesting that investors do not
appear to look for potential investment gaps to close but rather for areas where production can be expanded with
potentially lower costs for irrigation. The FLA-areas also tend to be significantly larger in countries with soil
characterized by moisture and clay content.
Conclusions. Our results support the established hypotheses about smaller economies and weaker governmental
institutions in host countries and contribute to the debate about the role of the yield gap as a pull factor for these
FLA-deals. The main outcome is the clear positive impact of potential rainfed crop production in the host
countries on their attractiveness for FLA. Overall, our results suggest that agricultural FLA location decisions are
primarily driven by agro-ecological factors and water availability for crop production, rather than a stable
business and investment environment.
References Lay J & Nolte K (2017). Determinants of foreign land acquisitions in low- and middle-income countries. Journal of Economic Geography:
doi: 10.1093/jeg/lbx011
Arezki R, Deininger K & Selod H (2013). What Drives the Global “Land Rush”?. The World Bank Economic Review 29/2: 207-233.
Mueller N, Gerber J, Johnston M, Ray D, Ramankutty N & Foley J (2012). Closing yield gaps through nutrient and water management.
Nature 490: 254-257.
YSSP Summer Colloquium 2017
38
Rural labor price and evolution of crop planting structure in China
Malan Huang, Huazhong Agricultural University, China
Email: [email protected]
IIASA Supervisors: Steffen Fritz (ESM), Juraj Balkovic (ESM), and Juan Carlos Laso Bayas (ESM)
Introduction. Crop planting structure in China have changed greatly since 1980, e.g. grain area decreased but
cash crops area increased sharply in recent years, mainly due to demographic evolution, agricultural technology
innovation, and market reform. With the rapid economic growth of the 1990’s, nonagricultural sectors have
increased their demand for rural labor, the higher urban wages stimulated a large transfer of rural labor toward
off-farm employment in urban areas, which has brought about a rapid increase in rural wages and opportunity
costs of farm labor. This project selected eight different crops aims to determine the impact of rural labor change
on crop structure in China.
Methodology. Exploratory Spatial Data Analysis (ESDA) was employed to analyze the spatial heterogeneity and
spatial autocorrelation of China’s main crops area in the province level, comprehensive consideration of driving
factors between various crops, Linear Mixed Model then was employed to analyze the relationship between crops
structure and potential drivers.
Results. Our results show that the impact of both rural labor price and agricultural labor migration level on crop
planting structure vary across provinces and crops. In general, both were positively related to cash crops area but
had a negative significant effect on traditional grain crops. Higher per capita GDP significantly increased the cash
crops area but decreased traditional grain crops and cotton area. However, the impact of agricultural subsidies on
crop planting structure was just the opposite against the per capita GDP. An increase in agricultural
mechanization was possible given the higher proportion of area to easily mechanized crops than a relatively less
to hardly mechanized crops. We found a positive impact of agrometeorological disaster on vegetable area but a
negative significance on wheat and corn area.
Conclusions. The study reveals there was significant spatial heterogeneity and spatial autocorrelation of China’s
main crop area in the province level, which showed significant agglomeration characteristics and formed a typical
center-periphery structure in space. It has significant spatial heterogeneity in various factors influencing crop-
planting structure, which showed that the same driving factors had an obvious regional difference across
provinces. The important factors influencing the crop planting structure are rural labor price, agricultural labor
migration level, agricultural mechanization and agricultural support subsidies.
References
Bayas, J. C. L., Marohn, C., Dercon, G., Dewi, S., et al. (2011). Influence of coastal vegetation on the 2004 tsunami wave impact in west
Aceh. Proceedings of the National Academy of Sciences, 108(46), 18612-18617.
YSSP Summer Colloquium 2017
39
Developing the first global scenarios for biological invasions in the 21st century
Bernd Lenzner, Vienna University, Botany and Biodiversity Department, Austria
Email: [email protected]
IIASA Supervisors: David Leclère (ESM) and Oskar Franklin (ESM)
Introduction. Human action has fundamentally altered the biotic and abiotic properties of the Earth resulting in
the emergence of a human-dominated era, the Anthropocene (Crutzen 2006). Anthropogenic behaviour has
affected any feature of the biophysical environment with the main threats on global biodiversity being
overexploitation, habitat destruction, alien species invasion and climate change (Maxwell et al. 2016). While most
of these are already assessed by existing scenario frameworks, long-term trajectories of alien species invasions
have not been addressed quantitatively yet. In an expert-based assessment, the first global alien species scenario
narratives (ASSN) have been developed. This project aims to i) relate these scenarios to the Shared
Socioeconomic Pathways (SSP) and ii) comprehensively assess existing datasets to establish first statistical
models of the drivers of future alien species richness projections.
Methodology. To match the alien species scenarios to the SSPs we constructed a matrix including the
assumptions for each scenario related to individual social, environmental and economic aspects captured in the
narratives that was then analysed in a Multi Correspondence Analysis (MCA). To assess dataset availability, a
literature search was conducted and already existing scenario initiatives and databases were consolidated. The
statistical models to investigate alien first records – driver relationships were constructed in a Generalized
Additive Mixed Effects Model (GAMM) framework.
Results. The MCA analysis clusters narratives based on their assumptions (e.g. demographic trends, global and
regional trade patterns). Our analysis shows that the ASSNs line up well with the SSPs suggesting that
assumptions derived under the ASSNs can be interpreted in a SSP context. The database assessment lead to the
collection of comprehensive datasets for Land Use and Land Cover (Land Use Harmonization dataset, Hurtt et al.
2011), Demography (Wittgenstein Centre, HYDE Klein Goldewijk 2011) and Biodiversity (following de Baan et
al. 2013). Other drivers without sufficiently long historic datasets for statistical model construction are discussed
qualitatively. The aforementioned drivers show significant relationships with the number of first records of
established alien species and thus provide a solid basis for further model development.
Conclusions. The study successfully links the ASSNs to the SSPs. This way analysis conducted and conclusions
drawn within the framework of the ASSN can utilize SSP-based datasets and can be interpreted in a wider context
which strengthens the relevance for other international scenario frameworks. Additionally, for the first time we
provide a comprehensive overview on variables capturing the relevant drivers for biological invasions. Most
drivers provide sufficiently long historic records to assess statistic relationships across a large temporal scale.
Others (lacking sufficient data) are discussed in a comprehensive way providing insights into relevant indicators
which high potential as input variables for models investigating future alien species richness projections.
References
Crutzen, PJ. (2006) The Anthropocene. In: Ehlers E., Krafft, T. (eds) Earth System Science in the Anthropocene. Springer, Berlin.
De Baan, et al. (2011) Environmental Science and Technology, 47: 9281-9290.
Hurtt GC et al. (2011) Climate Change, 109: 117-161.
Klein Goldewijk, K., Beusen A., de Vos M. & van Drecht G. (2011) Global Ecology and Biogeography, 20: 73-86.
Maxwell et al. (2016) Nature, 536: 143-145.
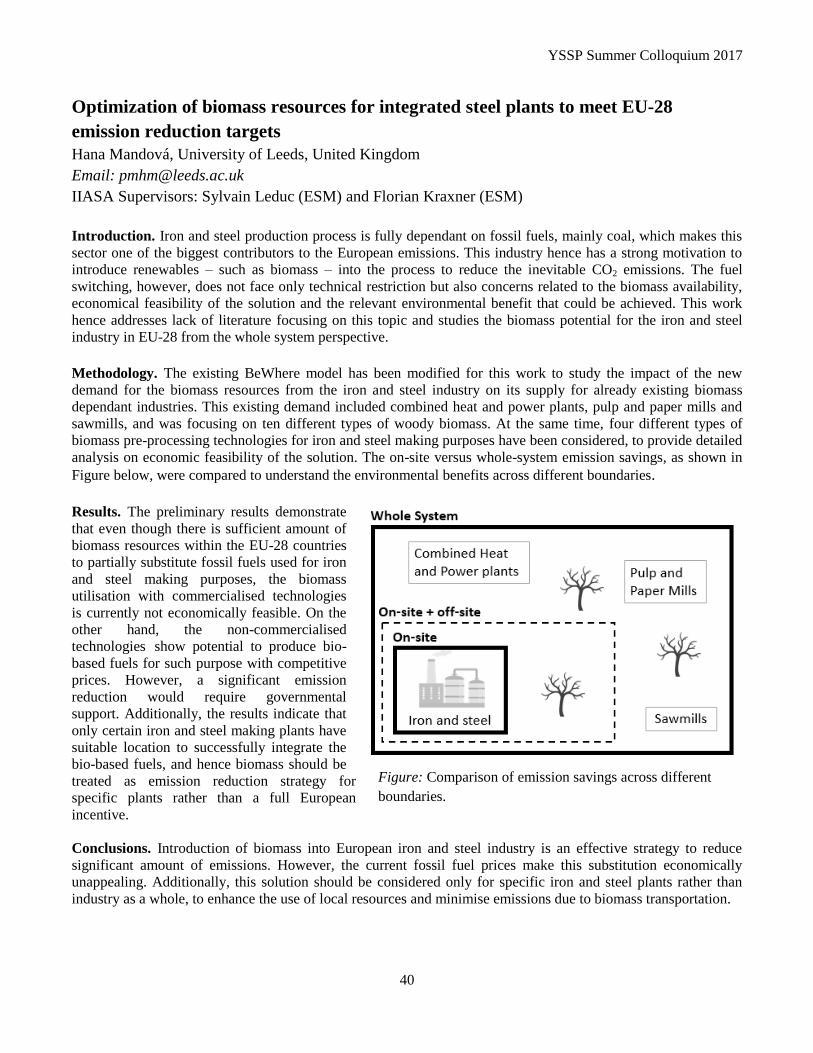
YSSP Summer Colloquium 2017
40
Optimization of biomass resources for integrated steel plants to meet EU-28
emission reduction targets
Hana Mandová, University of Leeds, United Kingdom
Email: [email protected]
IIASA Supervisors: Sylvain Leduc (ESM) and Florian Kraxner (ESM)
Introduction. Iron and steel production process is fully dependant on fossil fuels, mainly coal, which makes this
sector one of the biggest contributors to the European emissions. This industry hence has a strong motivation to
introduce renewables – such as biomass – into the process to reduce the inevitable CO2 emissions. The fuel
switching, however, does not face only technical restriction but also concerns related to the biomass availability,
economical feasibility of the solution and the relevant environmental benefit that could be achieved. This work
hence addresses lack of literature focusing on this topic and studies the biomass potential for the iron and steel
industry in EU-28 from the whole system perspective.
Methodology. The existing BeWhere model has been modified for this work to study the impact of the new
demand for the biomass resources from the iron and steel industry on its supply for already existing biomass
dependant industries. This existing demand included combined heat and power plants, pulp and paper mills and
sawmills, and was focusing on ten different types of woody biomass. At the same time, four different types of
biomass pre-processing technologies for iron and steel making purposes have been considered, to provide detailed
analysis on economic feasibility of the solution. The on-site versus whole-system emission savings, as shown in
Figure below, were compared to understand the environmental benefits across different boundaries.
Results. The preliminary results demonstrate
that even though there is sufficient amount of
biomass resources within the EU-28 countries
to partially substitute fossil fuels used for iron
and steel making purposes, the biomass
utilisation with commercialised technologies
is currently not economically feasible. On the
other hand, the non-commercialised
technologies show potential to produce bio-
based fuels for such purpose with competitive
prices. However, a significant emission
reduction would require governmental
support. Additionally, the results indicate that
only certain iron and steel making plants have
suitable location to successfully integrate the
bio-based fuels, and hence biomass should be
treated as emission reduction strategy for
specific plants rather than a full European
incentive.
Conclusions. Introduction of biomass into European iron and steel industry is an effective strategy to reduce
significant amount of emissions. However, the current fossil fuel prices make this substitution economically
unappealing. Additionally, this solution should be considered only for specific iron and steel plants rather than
industry as a whole, to enhance the use of local resources and minimise emissions due to biomass transportation.
Figure: Comparison of emission savings across different
boundaries.
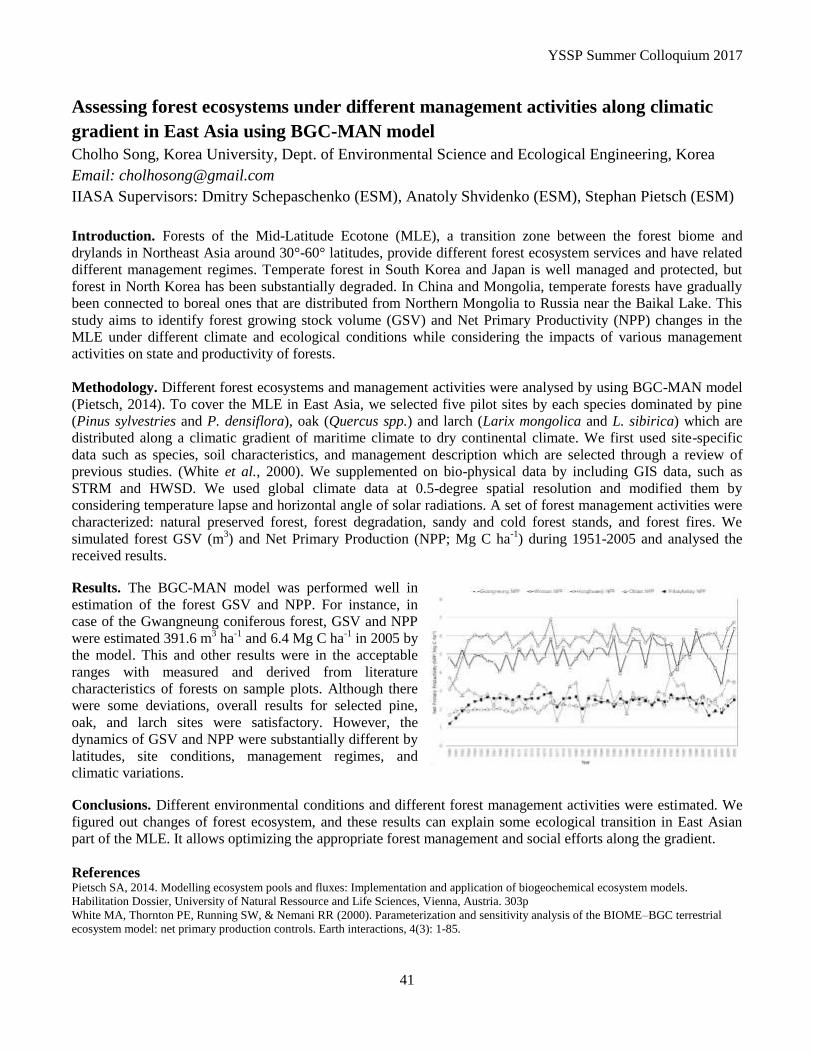
YSSP Summer Colloquium 2017
41
Assessing forest ecosystems under different management activities along climatic
gradient in East Asia using BGC-MAN model
Cholho Song, Korea University, Dept. of Environmental Science and Ecological Engineering, Korea
Email: [email protected]
IIASA Supervisors: Dmitry Schepaschenko (ESM), Anatoly Shvidenko (ESM), Stephan Pietsch (ESM)
Introduction. Forests of the Mid-Latitude Ecotone (MLE), a transition zone between the forest biome and
drylands in Northeast Asia around 30°-60° latitudes, provide different forest ecosystem services and have related
different management regimes. Temperate forest in South Korea and Japan is well managed and protected, but
forest in North Korea has been substantially degraded. In China and Mongolia, temperate forests have gradually
been connected to boreal ones that are distributed from Northern Mongolia to Russia near the Baikal Lake. This
study aims to identify forest growing stock volume (GSV) and Net Primary Productivity (NPP) changes in the
MLE under different climate and ecological conditions while considering the impacts of various management
activities on state and productivity of forests.
Methodology. Different forest ecosystems and management activities were analysed by using BGC-MAN model
(Pietsch, 2014). To cover the MLE in East Asia, we selected five pilot sites by each species dominated by pine
(Pinus sylvestries and P. densiflora), oak (Quercus spp.) and larch (Larix mongolica and L. sibirica) which are
distributed along a climatic gradient of maritime climate to dry continental climate. We first used site-specific
data such as species, soil characteristics, and management description which are selected through a review of
previous studies. (White et al., 2000). We supplemented on bio-physical data by including GIS data, such as
STRM and HWSD. We used global climate data at 0.5-degree spatial resolution and modified them by
considering temperature lapse and horizontal angle of solar radiations. A set of forest management activities were
characterized: natural preserved forest, forest degradation, sandy and cold forest stands, and forest fires. We
simulated forest GSV (m3) and Net Primary Production (NPP; Mg C ha
-1) during 1951-2005 and analysed the
received results.
Results. The BGC-MAN model was performed well in
estimation of the forest GSV and NPP. For instance, in
case of the Gwangneung coniferous forest, GSV and NPP
were estimated 391.6 m3 ha
-1 and 6.4 Mg C ha
-1 in 2005 by
the model. This and other results were in the acceptable
ranges with measured and derived from literature
characteristics of forests on sample plots. Although there
were some deviations, overall results for selected pine,
oak, and larch sites were satisfactory. However, the
dynamics of GSV and NPP were substantially different by
latitudes, site conditions, management regimes, and
climatic variations.
Conclusions. Different environmental conditions and different forest management activities were estimated. We
figured out changes of forest ecosystem, and these results can explain some ecological transition in East Asian
part of the MLE. It allows optimizing the appropriate forest management and social efforts along the gradient.
References Pietsch SA, 2014. Modelling ecosystem pools and fluxes: Implementation and application of biogeochemical ecosystem models.
Habilitation Dossier, University of Natural Ressource and Life Sciences, Vienna, Austria. 303p
White MA, Thornton PE, Running SW, & Nemani RR (2000). Parameterization and sensitivity analysis of the BIOME–BGC terrestrial
ecosystem model: net primary production controls. Earth interactions, 4(3): 1-85.
YSSP Summer Colloquium 2017
42
Assessment of Policy Impacts on Carbon Capture Sequestration and Bioenergy for
U.S. Coal and Natural Gas Power Plants Kasparas Spokas, Princeton University, USA
Email: [email protected]
IIASA Supervisors: Florian Kraxner (ESM) and Sylvain Leduc (ESM)
Introduction. Reducing electricity-sector emissions relies heavily on countries’ ability to either transition away
from carbon-intensive energy generation or to sequester its resultant emissions with carbon capture and storage
(CCS) technologies. The use of biomass energy technologies in conjunction with carbon capture and sequestration
(BECCS) presents the opportunity for net reductions in atmospheric carbon dioxide (Fuss et al., 2014). The use of
BECCS technologies is required in almost all scenarios that have a greater than 66% probability of limiting global
average temperatures below 2oC (IPCC, 2014). In this study, we investigate the limitations of several common
policy mechanisms to incentivize the deployment of BECCS using the techno-economic spatial optimization
model BeWhere.
Methodology. We consider a set of coal and natural gas electricity power plants in the United States (U.S.)
selected using a screening process that considers capacity, boiler age and capacity factor from the EPA 2014
eGRID database. The set makes up 470 GW of generation, and produces 8,400 PJ and 2.07 GTCO2 annually. We
consider co-firing up to 15% for coal power plants and CCS for all plants. Co-firing is restricted to woody-
biomass residues sourced from certified and managed U.S. forests obtained from the G4M (www.iiasa.ac.at/g4m)
and GeoWiki (www.geo-wiki.org) databases. We consider the development of carbon dioxide pipelines along the
existing natural gas pipelines infrastructure. Lastly, geologic storage is considered with injectivity, geomechanical
pressure, and storage capacity limitations to ensure safe and adequate storage. Total system costs are then
minimized under several policy mechanisms or emission targets.
Results. Costs are minimized under two policy mechanisms: a carbon tax and geologic sequestration credits, such
as the Q45 credits. Results show that the carbon tax scenario incentivizes co-firing at low to medium carbon taxes,
but is replaced by CCS at higher tax values. Carbon taxes do not strongly incentivize BECCS, as negative
emissions associated with sequestering biomass carbon content are not accounted as revenue. On the other hand,
carbon credit scenarios result in significant CCS deployment, but lack any incentive for co-firing. These results
are compared to emission target optimizations where the deployment of BECCS is doubled to match similar
emissions reductions compared to the carbon tax and geologic sequestration credit scenarios.
Conclusions. Current proposed policies to decarbonized the U.S. fossil fuel electricity fleet, such as the Q45
geologic sequestration credits, do not incentivize the deployment of co-firing and BECCS technologies. Although
carbon taxes do incentivize co-firing technology for coal power plants, U.S. policies will also need to compensate
for negative emissions caused by the sequestration of biomass carbon that would have been emitted without
interference to incentivize the development of BECCS.
References IPCC (2014). Climate Change 2014: Mitigation of Climate Change. Contribution of Working Group III to the Fifth Assessment Report of
the Intergovernmental Panel on Climate Change.
Fuss, S., Canadell, J.G, Peters, G.P., Tavoni, M., Andrew, R.M., Ciais, P., Jackson, R.B., Jones, C.D., Kraxner, F., Nakicenovic, N., Le
Quere, C., Raupach, M.R., Sharifi, A., Smith, P, and Yamagata, Y. (2014). Betting on Negative Emissions. Nature Climate Change
Opinions, 4, 850-853.
YSSP Summer Colloquium 2017
43
Modeling dynamics of South American rangelands to climate variability and human
impact
Radost Stanimirova, Boston University, USA
Email: [email protected]
IIASA Supervisors: Myroslava Lesiv (ESM) and Victor Maus (ESM)
Introduction. The combined pressures of climate change and shifting dietary preferences are creating an urgent
need to improve understanding of how climate and land management are jointly affecting the sustainability of
rangelands (Steinfeld & Gerber, 2010). In particular, our ability to effectively manage rangelands in a manner that
satisfies increasing demand for meat and dairy while reducing environmental impact depends on the sensitivity of
rangelands to perturbations from both climate (e.g., drought, fire) and land use (e.g., grazing) (Archer et al.,
2004).
Methodology. To characterize the sensitivity of rangeland vegetation to variation in climate, we analyzed gridded
time series of satellite and climate data at 0.05-degree spatial resolution from 2003 to 2016 for rangeland
ecosystems in South America. We used panel regression and per-pixel OLS to analyze the relationship between
time series of enhanced vegetation index (EVI) derived from NASA’s Moderate Spatial Resolution Imaging
Spectroradiometer (MODIS) and gridded precipitation data from the Climate Hazards Group InfraRed
Precipitation with Station data (CHIRPS). To quantify the degree to which livestock management explains
geographic variation of EVI, we used global livestock distribution (FAO) and feed requirements data from the
Global Biosphere Management Model (GLOBIOM). Because rangeland ecosystems are sensitive to changes in
meteorological variables at different time scales, we evaluated the strength of coupling between anomalies in EVI
and anomalies in temperature and precipitation at 1-6 month lags.
Results and conclusions. Results reveal geographically extensive patterns of EVI variability suggesting a joint
variation in ecosystem and climate across a range of time scales. Pixel-wise OLS regressions only show a few
geographic clusters of coefficients that are statistically different from zero for precipitation, temperature and their
squared terms. However, the coefficients estimated from the panel regression for the precipitation term and the
lagged precipitation term are statistically different from zero, suggesting that between group variation is a crucial
component to explain the variability of EVI to these climate variables. Our results show statistically significant
relationships between EVI and precipitation during summer, fall, and winter in both rangeland-based and mixed
rainfed livestock production systems in South America. Further, lagged precipitation effects, which reflect
memory in the system, explain significant variance in winter EVI anomalies. While precipitation emerges as the
dominant driver of variability in rangeland greenness, we find evidence of a management-induced signal as well.
Further research is on-going.
References.
Archer E.R.M. (2004) Beyond the “climate versus grazing” impasse: using remote sensing to investigate the effects of grazing system
choice on vegetation cover in the eastern Karoo. Journal of Arid Environments 57: 381-408
Steinfeld, H. and Pierre Gerber (2010) Livestock production and the global environment: Consume less or produce better? PNAS 107, 43:
18237-18238
YSSP Summer Colloquium 2017
44
Effectively controlling phosphorus emission from agricultural fields under an
uncertain climate: a dynamic stochastic agricultural phosphorus management
model Shaohui Tang, The Ohio State University, Department of Agricultural, Environmental and Development
Economics, USA
Email: [email protected]
IIASA Supervisors: Michael Obersteiner (ESM), Tatiana Ermolieva (ESM), Matthias Wildemeersch
(ASA), and Juraj Balkovic (ESM)
Introduction. A fundamental drawback of many studies on integrated ecological and economic modeling of
eutrophication is the implicit assumption that the ecosystem is deterministic and the social planner/farmer face no
uncertainties (Goetz and Zilberman 2000). While convenient, these assumptions may lead to overly simplistic
representations of reality, given that ecosystems are inherently stochastic (Warmink, et al. 2010). Uncertainty may
be particularly important to capture in coupled human-natural systems. There is some concern that deterministic
models calibrated with average/median parameter values may lead to suboptimal policy recommendations (Crost
and Traeger 2013). To address this issue, this study examines how weather uncertainties affect optimal choices of
best management practices (BMPs) over adaptation by building on the soil-lake model of optimal phosphorus (P)
management (Tang and Sohngen 2016) and combine it with methods in robust decision making under uncertainty.
Methodology. This study develops a dynamic stochastic optimization agricultural P management model by
building on Tang and Sohngen (2016) and combining it with methods of nonsmooth stochastic optimization
(Ermoliev and Norkin 1997) for robust decision making. The environmental security constraints are introduced in
the form of quantile-based probabilistic constraints, which define a nonconvex and possibly highly discontinuous
optimization model. The probabilistic constraints are then introduced into the objective function via nonsmooth
risk functions, which are ultimately converted to linear ones via auxiliary variables. The general model is then
applied to the Western Lake Erie basin, with the bioeconomic components of the model specifically calibrated for
this region.
Results. The robust solutions, compared with its scenario-based deterministic counterpart, indicate that more
stringent P abatement measures should be taken to meet the target loading. Specifically, about 16% reduction in P
fertilizer application and earlier and longer periods of cover crops adoption are warranted under the stochastic
model compared to its deterministic counterpart. The widely promoted BMP—conservation tillage, has shown to
be short-term practice which should be reduced eventually. Even more stringent control strategies should be put
into practice if climate change is taken into account.
Conclusions. This article develops an integrated dynamic stochastic model to show how different BMPs should
be used for controlling agricultural P emissions, in the face of stochastic weather events. Though specially
calibrated for a particular study area in the numerical analysis, the model developed in this paper is of generic
interest, which can be readily modified to provide location-specific policy prescriptions. A simple comparison
with its deterministic counterpart shows that incorporating stochasticity into the model can have qualitatively
different policy recommendations for the optimal BMPs adoption path.
References Crost, B., and C.P. Traeger. Economics Letters 120 (2013):552-8.
Goetz, R.U., and D. Zilberman. Journal of Economic Dynamics and Control 24 (2000):143-63.
Tang, S., and B. Sohngen. 5th Annual Summer Conference, June 9-11, 2016, Breckenridge, Colorado.
Warmink, J.J., J. Janssen, M.J. Booij, and M.S. Krol. Environmental modelling & software 25 (2010):1518-27
Ermoliev and V. Norkin. European Journal of Operations Research 9(1) (1997): 230:244.
YSSP Summer Colloquium 2017
45
Co-firing biomass with coal for power generation in Vietnam: Where, when and
how much
An Ha Truong, University of Science and Technology of Hanoi, Energy Department, Vietnam
Email: [email protected]
IIASA Supervisors: Sylvain Leduc (ESM) and Piera Patrizio (ESM)
Introduction. Vietnam is committed to cut down the greenhouse gas emissions of the nation by 8% compared to
the Business As Usual (BAU) scenario by 2030 as in its Intended Nationally Determined Contributions (INDC).
The country, however, approved the latest Power Development Plan, which will extend the share of coal from
25% to 53% in total electricity generation to satisfy the growing electricity demand. According to the plan, an
additional of 43 GW of coal power will be added to the existing 15 GW and thus increase the greenhouse gas
emission from coal power plants from 90 MtCO2eq/year to 350 MtCO2eq/year. The question is how Vietnam will
achieve these two conflicting goals. In this study, we explore co-firing, a technology that allows partial
substitution of coal by biomass, as a potential pathway to reduce the carbon emissions from the fast growing
Vietnamese coal sector.
Methodology. We adapted the existing BeWhere model (www.iiasa.ac.at/bewhere) for the case of co-firing in
Vietnam by making it recursive dynamic until from 2015 to 2030 with a yearly time step. Four co-firing
technologies are considered, two types of biomass and the spatial location of the planned coal power capacity. We
use GAMS to identify the optimal choice of the co-firing technology for each coal plant using domestic biomass
resource from rice residue. The objective function minimizes electricity production cost, which also includes the
emission cost in term of carbon price. Two scenarios for co-firing to be used are with carbon credit and with
emission target. In each scenario, we try to find out when the coal power plant will do co-firing, how much
biomass will be needed, how much emission reduction can be achieved and what the associated cost will be.
Results. When the carbon price is set below 6 $/tCO2eq the co-firing technology is not economically feasible.
Started from this carbon price, one third of the 96 coal plants is selected for co-firing with direct and separate
injection technology at 15% mixing ratio, which helps reduce emission by 9.5 MtCO2eq by 2030 (account for
2.6% of BAU scenario). When the carbon price reaches 30 $/tCO2eq, almost all coal power plants will retrofit for
co-firing, which results in 17 MtCO2eq emission reduction (4.7% of BAU scenario). In case emission target is set
up for each year, co-firing could not help the coal power plant to achieve the target even with 8% emission cut.
This is because in the first year the existing power plants will install cheaper co-firing technology with lower co-
firing rate, which end up in lower emission reduction while ensuring the emission target is met. Then from the
previous year, the new plants will face stricter emission reduction target that could not be achieved by co-firing
even with the highest mixing rate technology.
Conclusions. Incentive such as carbon price is very important to adopt co-firing technology. This will help to
compensate for the investment cost and operation cost of retrofitting existing plants for co-firing. Implementing
co-firing could result in emissions reduction of about 5% compare to the BAU scenario when all planned coal
power plants retrofitted for co-firing. It is not feasible to achieve 8% or 25% emission cut compared to BAU with
co-firing alone when using emission target for coal power plants for each year. To achieve these target one option
is to consider negative emission technologies such as carbon capture and sequestration.

YSSP Summer Colloquium 2017
46
Exploratory Special Projects
(ESP)
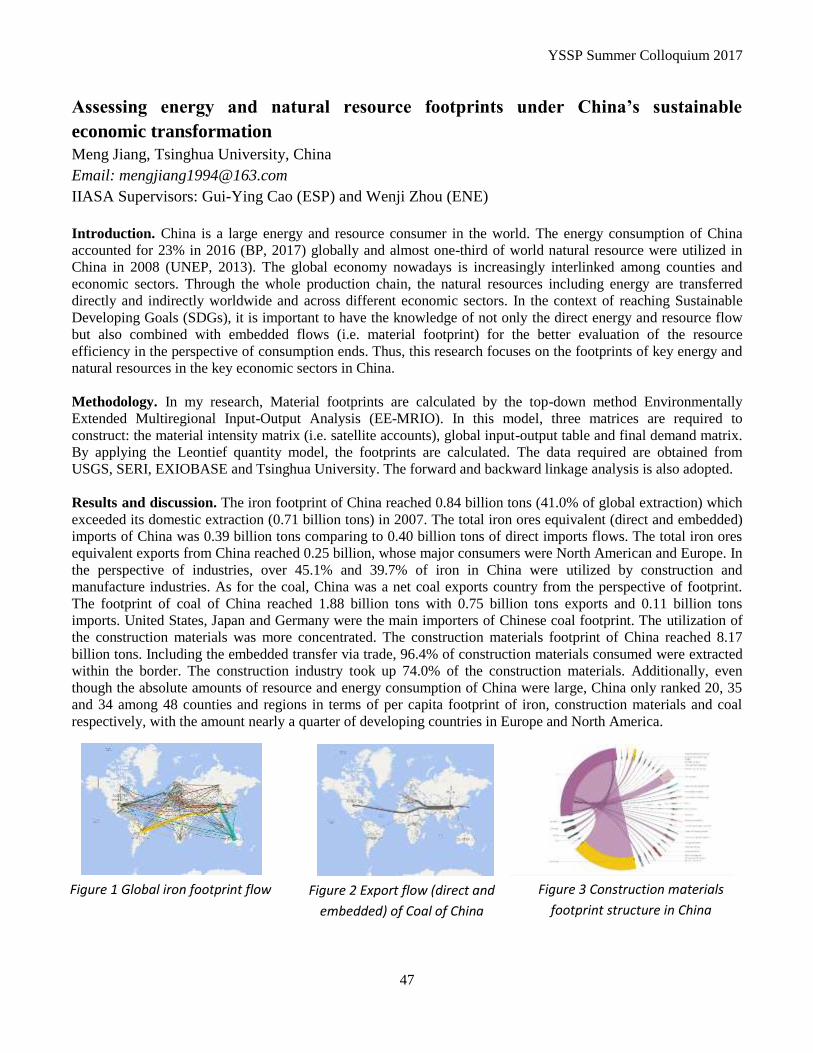
YSSP Summer Colloquium 2017
47
Assessing energy and natural resource footprints under China’s sustainable
economic transformation
Meng Jiang, Tsinghua University, China
Email: [email protected]
IIASA Supervisors: Gui-Ying Cao (ESP) and Wenji Zhou (ENE)
Introduction. China is a large energy and resource consumer in the world. The energy consumption of China
accounted for 23% in 2016 (BP, 2017) globally and almost one-third of world natural resource were utilized in
China in 2008 (UNEP, 2013). The global economy nowadays is increasingly interlinked among counties and
economic sectors. Through the whole production chain, the natural resources including energy are transferred
directly and indirectly worldwide and across different economic sectors. In the context of reaching Sustainable
Developing Goals (SDGs), it is important to have the knowledge of not only the direct energy and resource flow
but also combined with embedded flows (i.e. material footprint) for the better evaluation of the resource
efficiency in the perspective of consumption ends. Thus, this research focuses on the footprints of key energy and
natural resources in the key economic sectors in China.
Methodology. In my research, Material footprints are calculated by the top-down method Environmentally
Extended Multiregional Input-Output Analysis (EE-MRIO). In this model, three matrices are required to
construct: the material intensity matrix (i.e. satellite accounts), global input-output table and final demand matrix.
By applying the Leontief quantity model, the footprints are calculated. The data required are obtained from
USGS, SERI, EXIOBASE and Tsinghua University. The forward and backward linkage analysis is also adopted.
Results and discussion. The iron footprint of China reached 0.84 billion tons (41.0% of global extraction) which
exceeded its domestic extraction (0.71 billion tons) in 2007. The total iron ores equivalent (direct and embedded)
imports of China was 0.39 billion tons comparing to 0.40 billion tons of direct imports flows. The total iron ores
equivalent exports from China reached 0.25 billion, whose major consumers were North American and Europe. In
the perspective of industries, over 45.1% and 39.7% of iron in China were utilized by construction and
manufacture industries. As for the coal, China was a net coal exports country from the perspective of footprint.
The footprint of coal of China reached 1.88 billion tons with 0.75 billion tons exports and 0.11 billion tons
imports. United States, Japan and Germany were the main importers of Chinese coal footprint. The utilization of
the construction materials was more concentrated. The construction materials footprint of China reached 8.17
billion tons. Including the embedded transfer via trade, 96.4% of construction materials consumed were extracted
within the border. The construction industry took up 74.0% of the construction materials. Additionally, even
though the absolute amounts of resource and energy consumption of China were large, China only ranked 20, 35
and 34 among 48 counties and regions in terms of per capita footprint of iron, construction materials and coal
respectively, with the amount nearly a quarter of developing countries in Europe and North America.
Figure 2 Export flow (direct and
embedded) of Coal of China
Figure 1 Global iron footprint flow Figure 3 Construction materials
footprint structure in China

YSSP Summer Colloquium 2017
48
World Population
(POP)
YSSP Summer Colloquium 2017
49
Adult children’s education and their parents’ health status in the Philippines
Jeofrey B. Abalos, Australian National University, School of Demography, Australia
Email: [email protected]
IIASA Supervisors: Daniela Weber (POP), Anne Goujon (POP), and Nadia Steiber (POP)
Introduction. This research examines the association between children’s education and the health status of their
parents. It also investigates whether this association (or lack thereof) is consistent across a series of health
indicators, representing different health dimensions. There are various mechanisms by which children’s education
could influence parental health, including provision of better instrumental support, and transfer of both material
and non-material resources (Torssander, 2013). For example, well-educated children are more likely to give better
care to their parents because they have more resources and have more flexible jobs that enable them to provide
assistance to their parents. They are also more knowledgeable about health-related information and are more
comfortable in navigating the health care system, which comes to play when children give health-related advice to
their parents or when they decide how to address the health problems of their parents (Friedman and Mare, 2014;
Torssander, 2013; 2014). Highly educated children also tend to adopt healthier behavior and lifestyle, which in
turn, can influence the health behaviors of their parents.
Methodology. Data are drawn from the 2007 Philippine Study on Aging (PSA), a nationally representative survey
of older Filipinos aged 60 years and over. We examine the characteristics of the most highly educated child in
relation to the older person’s health status, thus only respondents with at least one living child are included in the
analysis. Four health indicators are the main outcome variables in this study, including difficulty in activities of
daily living (ADL), instrumental activities of daily living (IADL), mobility limitations and grip strength. Logistic
regression and quantile regression models are used in the multivariate analyses.
Results. Children’s education is significantly associated with the health status of their parents. Specifically, older
Filipinos whose children have a tertiary education have lower odds of reporting unfavorable health status
compared to their counterparts whose children have less than a tertiary education, controlling for the confounding
effects of other established factors. However, contrary to most findings, the influence of parental education is not
always significantly associated with their own health status. Other significant factors associated with health status
of older Filipinos include age, place of residence, perceived income adequacy and religiosity.
Conclusions. Results of the study support the contention that education is not only an individual resource, but
could be a household or family resource that could benefit other family members (Torssander, 2012; Yang et al,
2016; Zimmer et al, 2007). Although the exact mechanisms of how children’s education influence the health
status of their parents remain to be explored, the current study demonstrates that investments in human capital of
younger generations also confers benefits to older generations (De Neve and Harling, 2017; Friedman and Mare,
2014; Yahirun et al, 2016).
References De Neve, J. & Harling, G. (2017). South Africa. Social Science and Medicine, 176, 149-157.
Friedman, E. M., & Mare, R. D. (2014). Demography, 51, 1271–1293.
Torssander, J. (2013). Demography, 50, 637–659.
Torssander, J. (2014). Social Science & Medicine 122, 148-156
Yahirun, J. J., Sheehan, C. M., & Hayward, M. D. (2016). Research on Aging, 38(3), 322-345.
Yang, L., Martikainen, P., & Silventoinen, K. (2016). Journal of Epidemiology, 26(11), 602-609.
Zimmer, Z., Martin, L. G., Ofstedal, M. B., & Chuang, Y.-L. (2007). Demography, 44, 289–305.
YSSP Summer Colloquium 2017
50
Dependency on use of solid fuel in the household and under-five mortality rate in
Nigeria
Samuel Olugbemisola Wuraola, Covenant University, Ota, Nigeria
Email: [email protected]
IIASA Supervisors: Samir KC (POP) and Marcus Wurzer (POP)
Introduction. Children exposed to smoke from solid fuel are likely to suffer from Lower Respiratory Infections
(Samuel et.al, 2016). Despite the U-5 mortality rate of 128 deaths per 1000 live births in Nigeria, 70 percent of
households in the country still use solid fuel for cooking; hence, children in such homes are exposed to emissions
of harmful biomass smoke (Olisaekee, 2014). Therefore, this study identify types of cooking fuel used within the
households, factors influencing it and the extent to which the use of such fuel had contributed to under-five
mortality rate in Nigeria. Lastly, socioeconomic differences in the use of solid fuel as it implied on under-five
mortality was examined.
Methodology. The 2013 Nigeria Demographic and Health Survey dataset was used for analyses in this study. The
analyses were using done using Cross tabulation method and Binary Logistic Regression technique on STATA
version 13.
Results. From the result, 70 percent of households in Nigeria used firewood for cooking. The bivariate
relationship shows that, the proportion of deaths was higher for children living in homes where solid fuel was
used for cooking than children living in homes where non-solid fuel was used. Hence, there is a significant
bivariate association between use of solid fuel and under-five mortality (P<0.01). Findings from the study
established that level of education, wealth status, place of residence and region are factors influencing the use of
solid fuel in the household. Finally, the odds of dying increases for children whose mothers have primary or no
education when compared with their counterparts whose mothers have higher education (OR= 1.69; P = 0.007).
Similarly, the odds of dying declined among children living in rich homes compared to those living in poor homes
(OR= 1.28; P =0.029).
Matrix showing Odds of dying Wealth Status Level of Education
0.134 0.119 0.096 0.077
0.097 0.086 0.069 0.056
0.087 0.078 0.063 0.053
Conclusions. Wealth status and educational attainment of mothers remained highly significant determinants of
under-five mortality in Nigeria. The standard of living in the household and the level of education of the mother
determines the type of cooking fuel used in the household and eventually the chances of deaths among under-five
children.
References National Population Commission (NPC) [Nigeria] & ICF International. 2014. Nigeria Demographic and Health Survey 2013. Abuja,
Nigeria, and Rockville, Maryland, USA: NPC and ICF International.
Olisakee,G.O., (2014). Energy Poverty and Under-five Mortality in Nigeria: Is there a link? Nigeria/Africa.
Samuel, G.W, Ajayi, M. P, Idowu, E. A. & Ogundipe, O. M., (2016). Levels and Trends in Household Source of Cooking Fuel in Nigeria:
Implications on Under-five Mortality. Health Science Journal 10:4.
WHO, (2016). Household Air Pollution and Health. Fact sheet N°292.
YSSP Summer Colloquium 2017
51
The impact of education and age on attitude toward immigration in contemporary
Europe
Karen Umansky, Tel Aviv University, Israel
Email: [email protected]
IIASA Supervisor: Wolfgang Lutz (POP)
Introduction. Migration is an inherent part of contemporary Western societies, particularly in the EU. A vast
block of literature examines public views toward immigrants focusing on an ethno-racial component; however,
the research on attitudes to immigration as a phenomenon is quite scarce (Meuleman et al. 2009). Moreover, the
scholarship could be enriched by investigating formation of attitudes toward immigration utilizing panel data
(Ceobanu and Escandell 2010). This paper aims to shed light on the current state of affairs and understand the
heterogeneity in the population by evaluating the effects of education, age and cohort on attitudes toward
immigration in European countries over the span of twelve years.
Methodology. This micro-level, panel, cross-sectional research examines the change in general, cultural and
economic aspects of attitude toward immigration in 16 European countries between 2002 and 2014. Data from the
European Social Survey (ESS) was obtained to measure individual-level parameters, while data from the Eurostat
was used to account for macro-level parameters, such as migration rate. The empirical framework here tests the
hypotheses that level of educational attainment will have a positive effect on the above-mentioned aspects of
attitude toward immigration, while the effect of age and cohort will be negative. Furthermore, respondents with a
higher level of education are expected to retain a positive attitude toward immigration even at an older age.
Results. The results at the country level coincide with the general trend of the full sample and show that
respondents tend to have a more positive attitude toward immigration in its cultural than in general and economic
aspects. While older age groups showed a consistent decline in positive attitude toward immigration in all three
aspects being in line with findings for older cohorts regardless of the year of survey, the effect of level of
education was positive, significant, and almost linear. Respondents with tertiary education were found roughly
three times more likely to favor immigration in cultural and economic aspects than respondents with lower than
secondary education, while being twice more likely to have a pro-immigration sentiment in general aspect.
Moreover, respondents with higher level of educational attainment retained a more positive attitude toward
immigration within most age groups, except for the 75-year-old age group, within which it declined in all three
aspects.
Conclusions. Examining heterogeneity in the population is key to understanding attitudes to immigration. This
research attempted to assess the effect of level of educational attainment on general, cultural and economic
attitudes to immigration, while disentangling the age and cohort effects. The effect of the level of educational
attainment on positive attitude toward immigration was found significant and consistent on both aggregated and
individual-country levels.
References
Ceobanu AM & Escandell X (2010). Annual Review of Sociology 36: 309-28.
Meuleman B, Davidov E & Billiet J (2009). Social Science Research 38: 352-65.

YSSP Summer Colloquium 2017
52
Risk and Resilience
(RISK)
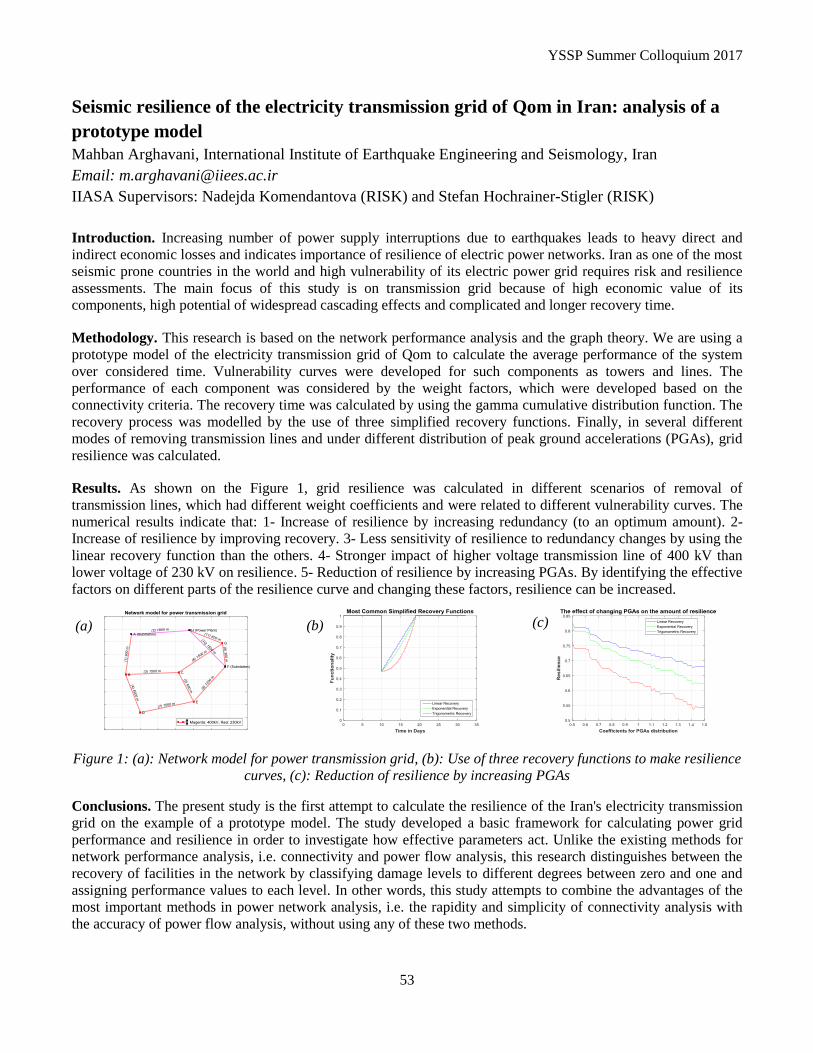
YSSP Summer Colloquium 2017
53
Seismic resilience of the electricity transmission grid of Qom in Iran: analysis of a
prototype model
Mahban Arghavani, International Institute of Earthquake Engineering and Seismology, Iran
Email: [email protected]
IIASA Supervisors: Nadejda Komendantova (RISK) and Stefan Hochrainer-Stigler (RISK)
Introduction. Increasing number of power supply interruptions due to earthquakes leads to heavy direct and
indirect economic losses and indicates importance of resilience of electric power networks. Iran as one of the most
seismic prone countries in the world and high vulnerability of its electric power grid requires risk and resilience
assessments. The main focus of this study is on transmission grid because of high economic value of its
components, high potential of widespread cascading effects and complicated and longer recovery time.
Methodology. This research is based on the network performance analysis and the graph theory. We are using a
prototype model of the electricity transmission grid of Qom to calculate the average performance of the system
over considered time. Vulnerability curves were developed for such components as towers and lines. The
performance of each component was considered by the weight factors, which were developed based on the
connectivity criteria. The recovery time was calculated by using the gamma cumulative distribution function. The
recovery process was modelled by the use of three simplified recovery functions. Finally, in several different
modes of removing transmission lines and under different distribution of peak ground accelerations (PGAs), grid
resilience was calculated.
Results. As shown on the Figure 1, grid resilience was calculated in different scenarios of removal of
transmission lines, which had different weight coefficients and were related to different vulnerability curves. The
numerical results indicate that: 1- Increase of resilience by increasing redundancy (to an optimum amount). 2-
Increase of resilience by improving recovery. 3- Less sensitivity of resilience to redundancy changes by using the
linear recovery function than the others. 4- Stronger impact of higher voltage transmission line of 400 kV than
lower voltage of 230 kV on resilience. 5- Reduction of resilience by increasing PGAs. By identifying the effective
factors on different parts of the resilience curve and changing these factors, resilience can be increased.
Figure 1: (a): Network model for power transmission grid, (b): Use of three recovery functions to make resilience
curves, (c): Reduction of resilience by increasing PGAs
Conclusions. The present study is the first attempt to calculate the resilience of the Iran's electricity transmission
grid on the example of a prototype model. The study developed a basic framework for calculating power grid
performance and resilience in order to investigate how effective parameters act. Unlike the existing methods for
network performance analysis, i.e. connectivity and power flow analysis, this research distinguishes between the
recovery of facilities in the network by classifying damage levels to different degrees between zero and one and
assigning performance values to each level. In other words, this study attempts to combine the advantages of the
most important methods in power network analysis, i.e. the rapidity and simplicity of connectivity analysis with
the accuracy of power flow analysis, without using any of these two methods.
(a) (b) (c)
YSSP Summer Colloquium 2017
54
Drought impacts and risks on agricultural production in the Bolivian altiplano Claudia Canedo Rosso, Lund University, Water Resources Department, Sweden
Email: [email protected]
IIASA Supervisors: Stefan Hochrainer-Stigler (RISK) and Georg Pflug (RISK)
Introduction. The South American Altiplano is besides Tibet the largest high plateau in the world. Climate
variability in the Altiplano is associated to the El Niño Southern Oscillation (ENSO), and droughts have being
mainly driven byEl Niño phases (Thompson et al., 1984; Francou, 1985; Tapley and Waylen, 1990; Garreaud and
Aceituno, 2001). One constrain to study drought occurrence in the Altiplano is the uneven and scarce distribution
of weather and crop related ground data. To this aim, a new framework for timely warning of droughts at an inter-
annual time scale was developed for the Bolivian Altiplano, using a combination of ground and satellite imagery
data.
Methodology. Precipitation, temperature, vegetation and ENSO monthly time series from July 1981 to June 2016
were statistically analysed to detect trend changes and interrelationships. Additionally, two crops, namely quinoa
and potato crop yields for the same period were looked at. In a first step, data quality analysis was applied to
diminish the observational errors and cloud/snow noise of the satellite data. In a second step, the validation of
satellite rainfall products was applied and contrasted to the ground data weather stations. Furthermore, a linear
regression of vegetation with temperature and precipitation data was applied to better understand their
relationship. Additionally, precipitation variation during the ENSO events as well as crop production was
evaluated. Finally, crop production was related with vegetation variability under drought events based on normal
and ENSO years. Differences in risk as well as climate signals of ENSO years were afterwards determined.
Results. From the 68 weather stations only a third could be used for statistical investigations. Major data gaps
were filled using mean monthly values. At first, the relationship between rain satellite and ground data showed
significant correlation along the 23 data sets. Additionally, the Normalized Difference Vegetation Index (NDVI)
indicated significant relationships with precipitation and temperature variables, showing that vegetation is very
much affected by climate variables. Also precipitation varied during the ENSO years, and as a consequence we
confirmed that precipitation significantly decreases in El Niño phases. Finally a relationship between NDVI and
crop yield was shown. To summarize, ENSO warm phase (El Niño) has a negative effect on precipitation that
impacts the vegetation, and in consequence also affects crop production. The differences in risk can be used for
estimating possible management strategies and costs, such as government funding for assistance during drought
periods.
Conclusions. The impact of droughts on crop production could be in principle mitigated by early warning
mechanisms. Consequently, a better understanding of potato and quinoa yield variation was developed based on
its relationship with precipitation and temperature. Therefore, considering that El Nino phase generally drives a
drought event, it is possible to evaluate the crop production impact, based on the relations with the vegetation and
climate indicators. Satellite data is an important source of information particularly in regions where observed data
is limited. The suggested framework can be used as a blueprint how early warning based financing could be
established for drought events in the Altiplano.
References Francou B. 1985. ‘El Nino’ and the drought in the High Central Andes of Peru and Bolivia. Bull. Inst. Fr. Etudes Andin. 14: 1–18.
Garreaud R, Aceituno P. 2001. Interannual rainfall variability over the South American Altiplano. J. Clim. 14(12): 2779–2789.
Thompson LG, Mosley-Thompson E, Arnao BM. 1984. ElNiño-Southern Oscillation events recorded in the stratigraphy of the tropical
Quelccaya ice cap, Peru. Science 226: 50–53.
Tapley TD Jr, Waylen PR. 1990. Spatial variability of annual precipitation and ENSO events in western Peru. Hydrol. Sci. 35: 429–446.
YSSP Summer Colloquium 2017
55
Risk of multiple failures in electrical grids due to natural hazards in the Eurasian
Economic Union
Dmitrii Iakubovskii, Melentiev Energy Systems Institute Siberian Branch of the Russian Academy of
Sciences, Russia
Email: [email protected], [email protected]
IIASA Supervisors: Nadejda Komendantova (RISK) and Elena Rovenskaya (ASA)
Introduction. Electricity transmission grid is a complex system that is sensitive to power outages, which, inter
alia, can be caused by different natural hazards such as earthquakes. Power outages can spark cascade accidents
leading to huge damages and costs. Therefore, it is important to investigate the reliability of energy power
systems (EPS). This study focuses on three countries of the Eurasian Economic Union, the Russian Federation
with six united power systems (UPS), the Republic of Kazakhstan, which is divided into three energy regions and
the Kyrgyz Republic, which has a single EPS.
Methodology. The methodology of this research is based on six steps. The first step is the overlapping of maps of
seismic zones and EPS schemes for Russia, Kazakhstan and Kyrgyzstan. The second step is the identification of
the information about each power plant in the three above mentioned countries and each interconnection between
them. These power plants and interconnections could be dislocated in seismic area with defined earthquake
intensity score according to seismic resistance parameter of each element by information about which intensive
score of seismic could impact to different types of power plants or lines and could provoke the degradation or
devastation of this element. The main goal of this step is to define the probability of failure for each element. The
probability of earthquake with a high intensity score, which must be higher or equal to resistance parameters of
the components of the grid, was applied. The third step is to apply the power optimization model in order to
identify potential power shortage. The programing efforts are based on C++ 11. With the help of programming we
generate states for this model with dependence only for elements with the probability higher than 0 by the criteria
(n-1 is without one working element etc.; n-2; n-3). Then each of this state is optimized by the gradient method.
The results of this optimization show deficits in EPS. During the final step we make two distributions for each
working and not working lines (deficit and probability of accident). The results show importance of different lines
in terms of interconnectivity. Results & conclusions.
During this program we are investigated the methodology and got results. The probability of failure on current
interconnections was determined from six investigated approaches. Current methodology was explored and
defined from three different ways. The special seismic zone maps were found for each country and the data were
unified regarding to consultation with research institutes of these countries. Also information about each elements
included to UPS were found on the schemes maps and checked by official public information of energy
corporations reports for last year. The information and maps were combined to database and each investigated
element (206 stations and 98 lines) got its probability of failure caused by earthquake. Based on this data we
already found six high-capacity lines between Kyrgyzstan and Kazakhstan that could be damaged by frequency
earthquakes in this area. In addition, we have found two lines between south and north regions of Kazakhstan, one
line between north Kazakhstan and UPS of Siberia (Russia) and three lines between west Kazakhstan and UPS of
middle Volga (Russia) which placed in seismic regions with high intensive score. As well as the program for
calculating results was developed and tested. We got 695681 states by different criteria and deficits for each state.
In conclusion, we will check each of suspect line by distributions and T-test for take the more clarify results.
YSSP Summer Colloquium 2017
56
Auctions for renewable energy – risks and opportunities Liv Lundberg, Chalmers University of Technology, Department of Space, Earth and Environment,
Sweden
Email: [email protected]
IIASA Supervisors: Junko Mochizuki (RISK) and Nikita Strelkovsky (ASA)
Introduction. At the end of 2016, 176 countries had targets for renewable energy (REN21, 2016). In reaching
these goals, policies for renewable energy plays a crucial role. The last years, there has been a trend to transition,
from feed-in policies towards auctions for renewable energy. Between 2005 and 2016 the number of countries
that had employed auctions grew from 5 to 67 (IRENA, 2017). Auctions allow the government to control the
amount of new installed capacity and competitive auctions can help decrease the cost of producing electricity
from renewable energy. There are however concerns about the efficiency and fairness of auctions. This work aims
to study risks and opportunities with an auction design that promotes small scale actors, which is currently used in
Germany.
Methodology. Two methods are utilised in this project: a serious game and agent-based modelling. In the serious
game, developed in this project, players take on the role of power companies and citizens. Both power companies
and citizens can choose between investing in a “safe” option and submitting a bid to the renewable energy
auction. Citizens have higher costs for preparing bids, and can only submit one bid to the auction while companies
can submit two. To compensate for these disadvantages, citizens that win in the auction will not be paid their bid,
but the highest accepted bid (also known as a uniform auction). Companies that win will, on the other hand, be
paid according to their submitted bid (also known as a discriminatory auction). The game was played on two
occasions, with seven players the first time and nine players the second time, for four, respectively five rounds.
The agent-based model is structured similarly to the game. There are two types of agents: citizens and power
companies. The power company agents can choose between investing in a gas or coal power plant or to take part
in the auction. At this point, the power company agents are using profit maximising to decided what to invest in.
Citizens agents take part in the auction and bid their break-even cost (a dominant strategy for uniform auctions).
In future work, the agent-based model will be modified with behaviours observed in the game.
Results. The preliminary results from the game show that players initially are sceptical towards the auction. This
lead to high bids being accepted in the first round, which gave players who took part in the auction this round
highly lucrative contracts. When the remaining players realised this, the auction participation rose significantly in
the following rounds. The increased number of bids drove down the highest accepted bid, which decreased the
revenues for the auction participants. Both times the game was played, the highest accepted bid in the auction in
the last round was just above the level that was enough to recover investment costs. With the design of the
auction, citizens were incentivised to place very low bids (some were below the level of recovering costs), which
also led citizens to dominate the auction. To compete with this, companies started to bid increasingly aggressive.
Conclusions. These findings suggest that with an auction design combining uniform and discriminatory
payments, small-scale actors may not be at a disadvantage (this was also seen in the latest auction for wind power
in Germany, (Wehrmann & Wettengel, 2017)), but that the design in itself may increase the risk of overly
aggressive bidding.
References. IRENA. (2017). Renewable Energy Auctions: Analysing 2016. REN21. (2016). Renewables 2016 Global Status Report.
Wehrmann, B., & Wettengel, J. (2017, May 19). Citizens' energy "big winner" of first German onshore wind auction.
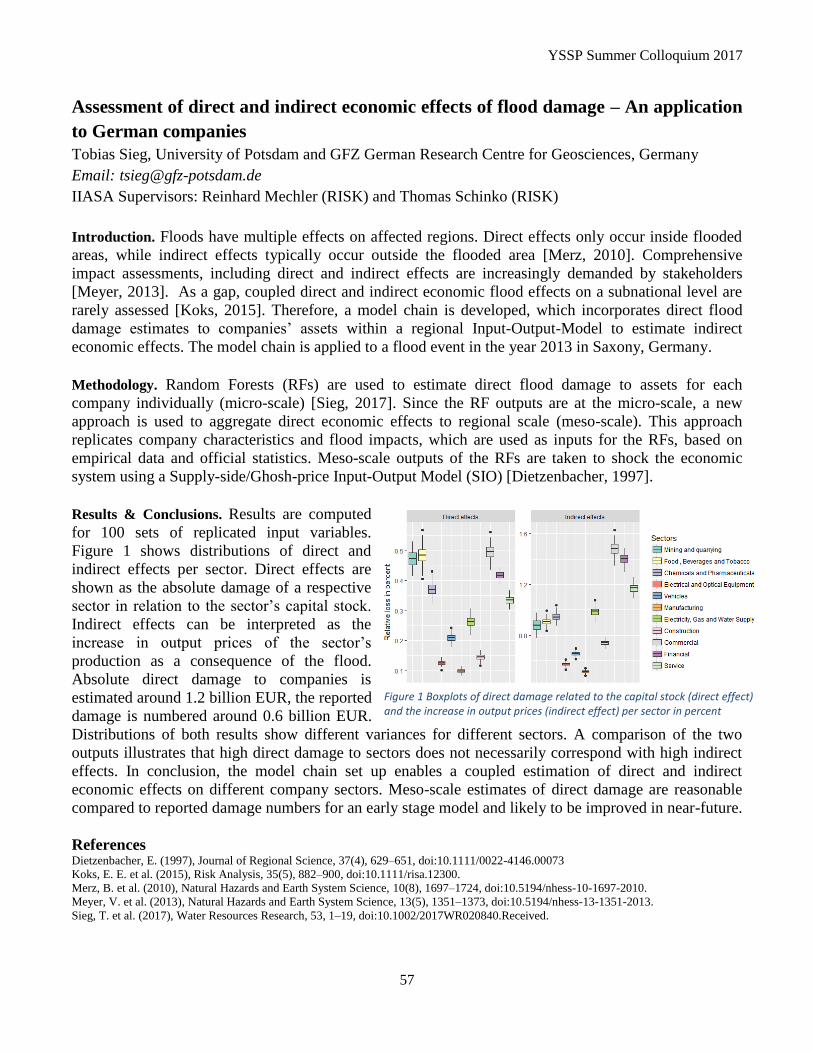
YSSP Summer Colloquium 2017
57
Assessment of direct and indirect economic effects of flood damage – An application
to German companies
Tobias Sieg, University of Potsdam and GFZ German Research Centre for Geosciences, Germany
Email: [email protected]
IIASA Supervisors: Reinhard Mechler (RISK) and Thomas Schinko (RISK)
Introduction. Floods have multiple effects on affected regions. Direct effects only occur inside flooded
areas, while indirect effects typically occur outside the flooded area [Merz, 2010]. Comprehensive
impact assessments, including direct and indirect effects are increasingly demanded by stakeholders
[Meyer, 2013]. As a gap, coupled direct and indirect economic flood effects on a subnational level are
rarely assessed [Koks, 2015]. Therefore, a model chain is developed, which incorporates direct flood
damage estimates to companies’ assets within a regional Input-Output-Model to estimate indirect
economic effects. The model chain is applied to a flood event in the year 2013 in Saxony, Germany.
Methodology. Random Forests (RFs) are used to estimate direct flood damage to assets for each
company individually (micro-scale) [Sieg, 2017]. Since the RF outputs are at the micro-scale, a new
approach is used to aggregate direct economic effects to regional scale (meso-scale). This approach
replicates company characteristics and flood impacts, which are used as inputs for the RFs, based on
empirical data and official statistics. Meso-scale outputs of the RFs are taken to shock the economic
system using a Supply-side/Ghosh-price Input-Output Model (SIO) [Dietzenbacher, 1997].
Results & Conclusions. Results are computed
for 100 sets of replicated input variables.
Figure 1 shows distributions of direct and
indirect effects per sector. Direct effects are
shown as the absolute damage of a respective
sector in relation to the sector’s capital stock.
Indirect effects can be interpreted as the
increase in output prices of the sector’s
production as a consequence of the flood.
Absolute direct damage to companies is
estimated around 1.2 billion EUR, the reported
damage is numbered around 0.6 billion EUR.
Distributions of both results show different variances for different sectors. A comparison of the two
outputs illustrates that high direct damage to sectors does not necessarily correspond with high indirect
effects. In conclusion, the model chain set up enables a coupled estimation of direct and indirect
economic effects on different company sectors. Meso-scale estimates of direct damage are reasonable
compared to reported damage numbers for an early stage model and likely to be improved in near-future.
References Dietzenbacher, E. (1997), Journal of Regional Science, 37(4), 629–651, doi:10.1111/0022-4146.00073
Koks, E. E. et al. (2015), Risk Analysis, 35(5), 882–900, doi:10.1111/risa.12300.
Merz, B. et al. (2010), Natural Hazards and Earth System Science, 10(8), 1697–1724, doi:10.5194/nhess-10-1697-2010.
Meyer, V. et al. (2013), Natural Hazards and Earth System Science, 13(5), 1351–1373, doi:10.5194/nhess-13-1351-2013.
Sieg, T. et al. (2017), Water Resources Research, 53, 1–19, doi:10.1002/2017WR020840.Received.
Figure 1 Boxplots of direct damage related to the capital stock (direct effect) and the increase in output prices (indirect effect) per sector in percent
YSSP Summer Colloquium 2017
58
Vulnerability is dynamic: Approaching the emerging challenges of coastal tourism
Jillian Student, Wageningen University, Netherlands
Email: [email protected]
IIASA Supervisors: Wei Liu (RISK) and Asjad Naqvi (RISK)
Introduction. Tourism is one of the largest sectors in the world, contributing to 10% of global GDP. While an
important contributor to economic prosperity, tourism is both a driver of and at risk to global (environmental)
changes. Coastal tourism is especially dependent on local environmental resources and occurs in vulnerability hot
spot areas for environmental changes. Vulnerability is dynamic and we need a new lens for understanding how
vulnerability emerges in coastal tourism systems. My research operationalizes a dynamic approach to analyzing
coastal (tourism) vulnerabilities, exposure to new hazards, and the emergence of vulnerabilities through exploring
socio-ecological interactions and feedbacks. The main objectives of my YSSP study are to demonstrate an
innovative transdisciplinary approach to study coastal tourism systems and to develop an agent-based model
(ABM) for exploring dynamics and emergence of vulnerability under various scenarios.
Methodology. Empirical data was collected on two Caribbean islands: Barbados and Curaçao. The dynamic
approach involves mixed methods and stakeholder participation. The mixed methods include: semi-structured
interviews, focus groups, simulation-aided interviews, simulation sessions, and agent-based modeling. Semi-
structured interview questions employ the ARDI framework to better conceptualize the actors, resources,
dynamics and impacts in the coastal system (Étienne et al. 2011). The development of the simulation and ABM
was informed by the Companion Modelling approach (Étienne (Ed.) 2013).
Preliminary Results. Using simulations and agent-based modeling, my approach operationalizes the concept that
vulnerability is dynamic and emerges from complex interactions between humans and the environment. The
approach itself is dynamic, iterative and involves stakeholders in problem definition, design, and evaluation of
emerging vulnerabilities in the coastal system. This approach thereby offers a number of advantages over more
conventional methodologies that are often conducted in a top-down and static manner. A coastal tourism system
ABM is being developed using data from both interviews and simulation observations. In its current form, the
ABM includes the major actors: nearshore operators, boat operators, hoteliers, beach vendors, dive operators, and
tourists; and the environmental resources: beach, sea, sand, coral reefs, sea turtles, fish, and mangroves. The
tourism demand side’s creation of waste and revenue are in preliminary stages while the supply side’s decision
mechanism for operational inputs are under development. Further interactions among stakeholders and
environmental feedbacks will be added. Multiple environmental and tourism scenarios can be included and tested
once the endogenous mechanisms are in place. Overall, this general approach with mixed methods can be adjusted
and applied for understanding emerging vulnerabilities in coastal tourism and beyond.
References Étienne M, Du Toit DR & Pollard S (2011) ARDI: A co-construction method for participatory modelling in natural resource management.
Ecology and Society, vol 16, 1: 44 [online]
Étienne M. (Ed.). (2013). Companion modelling: a participatory approach to support sustainable development. Springer Science &
Business Media.
YSSP Summer Colloquium 2017
59
A Global Analysis of Wildlife Damage Risk Financing
Ziyun Zhu, Peking University, China
Email: [email protected]
IIASA Supervisors: Susanne Hanger (RISK), Wei Liu (RISK), and Oskar Franklin (ESM)
Introduction. While large mammals play a pivotal role in maintaining ecosystem functioning and provision of
ecosystem services, their conflicts with humans are becoming common and intensive problems worldwide and
cause billions of dollars of economic losses annually (Nyhus, 2016). Wildlife damage financing is a major tool of
human-wildlife conflict (HWC) mitigation strategies, usually in the form of direct compensation, which often
fails. Damage insurance recently emerged as a new financial instrument, but the key factors and necessary
enabling environment for an effective wildlife damage insurance scheme are unclear. In my YSSP research I try
to investigate the role of wildlife damage risk financing in HWC mitigation and to identify the key characteristics
and enablers of effective wildlife risk financing schemes.
Methodology. I conducted systematic review and critical comparative analyses of 13 wildlife damage risk
financing cases, covering a range of global geographic regions, wildlife taxa, and countries at different
development stages. The Social-Ecological Systems Framework (McGinnis et al, 2014), originally proposed by
Elinor Ostrom, was employed as the analytical framework to diagnose and compare the cases in a structured
manner and to identify key factors of successful HWC risk financing schemes. Institutional analysis was applied
to the cases to further explore their similarities and difference in terms of risk financing administration procedures
and the roles of different actors.
Results and Conclusions. The results show that wildlife damage financing, both compensation and insurance, in
developed countries generally work well, although insurance premium in these countries is often heavily
subsidized by governments. Risk financing is likely most useful when wildlife damage occurs with high intensity
and low frequency and damage risk mitigation is often too costly. Viable insurance and compensation programs,
especially those in developing countries, often involves some levels of decentralization with hybrid rule-making
organization. The overall program often exhibits some polycentric governance structures, in which some public,
private, civil society and community groups simultaneously work together and sometimes end up with novel
institution setting and rules. In such these polycentric governance setting, both transaction costs and moral
hazards are substantially reduced.
References
Nyhus, Philip J. "Human–Wildlife Conflict and Coexistence." Annual Review of Environment and Resources 41 (2016): 143-171.
McGinnis, Michael, and Elinor Ostrom. "Social-ecological system framework: initial changes and continuing challenges." Ecology and
Society 19.2 (2014).

YSSP Summer Colloquium 2017
60
Transitions to New Technologies
(TNT)
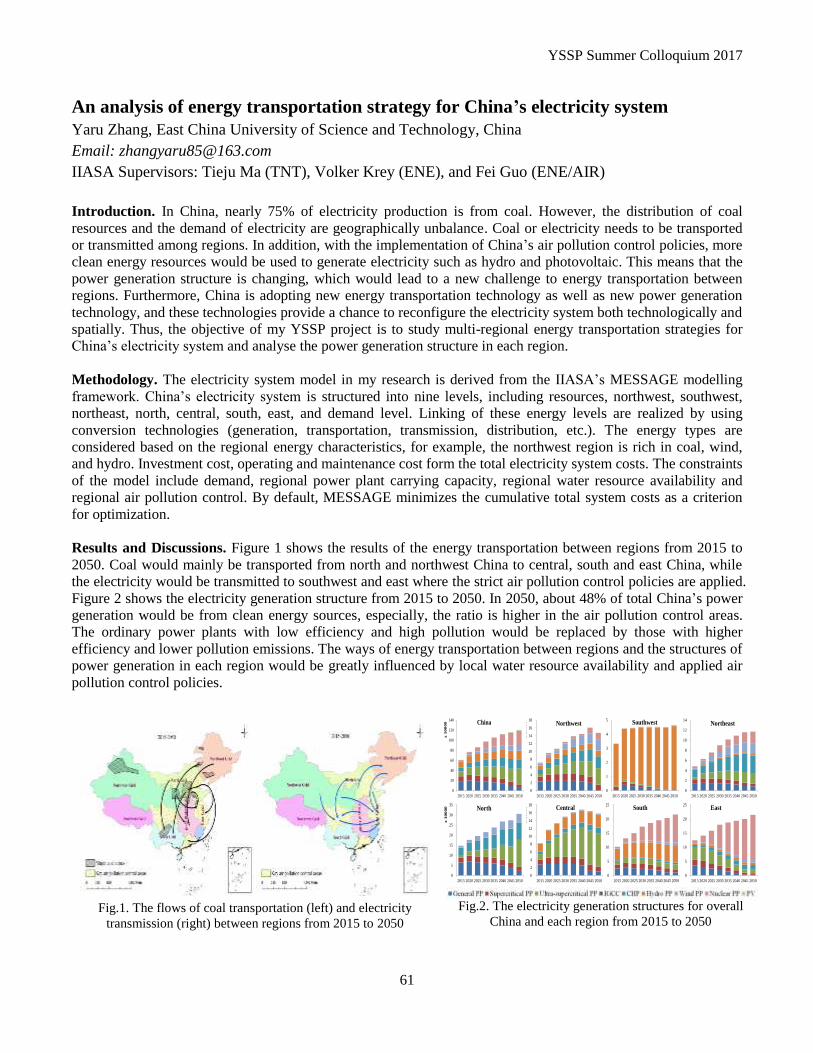
YSSP Summer Colloquium 2017
61
Fig.1. The flows of coal transportation (left) and electricity
transmission (right) between regions from 2015 to 2050
An analysis of energy transportation strategy for China’s electricity system
Yaru Zhang, East China University of Science and Technology, China
Email: [email protected]
IIASA Supervisors: Tieju Ma (TNT), Volker Krey (ENE), and Fei Guo (ENE/AIR)
Introduction. In China, nearly 75% of electricity production is from coal. However, the distribution of coal
resources and the demand of electricity are geographically unbalance. Coal or electricity needs to be transported
or transmitted among regions. In addition, with the implementation of China’s air pollution control policies, more
clean energy resources would be used to generate electricity such as hydro and photovoltaic. This means that the
power generation structure is changing, which would lead to a new challenge to energy transportation between
regions. Furthermore, China is adopting new energy transportation technology as well as new power generation
technology, and these technologies provide a chance to reconfigure the electricity system both technologically and
spatially. Thus, the objective of my YSSP project is to study multi-regional energy transportation strategies for
China’s electricity system and analyse the power generation structure in each region.
Methodology. The electricity system model in my research is derived from the IIASA’s MESSAGE modelling
framework. China’s electricity system is structured into nine levels, including resources, northwest, southwest,
northeast, north, central, south, east, and demand level. Linking of these energy levels are realized by using
conversion technologies (generation, transportation, transmission, distribution, etc.). The energy types are
considered based on the regional energy characteristics, for example, the northwest region is rich in coal, wind,
and hydro. Investment cost, operating and maintenance cost form the total electricity system costs. The constraints
of the model include demand, regional power plant carrying capacity, regional water resource availability and
regional air pollution control. By default, MESSAGE minimizes the cumulative total system costs as a criterion
for optimization.
Results and Discussions. Figure 1 shows the results of the energy transportation between regions from 2015 to
2050. Coal would mainly be transported from north and northwest China to central, south and east China, while
the electricity would be transmitted to southwest and east where the strict air pollution control policies are applied.
Figure 2 shows the electricity generation structure from 2015 to 2050. In 2050, about 48% of total China’s power
generation would be from clean energy sources, especially, the ratio is higher in the air pollution control areas.
The ordinary power plants with low efficiency and high pollution would be replaced by those with higher
efficiency and lower pollution emissions. The ways of energy transportation between regions and the structures of
power generation in each region would be greatly influenced by local water resource availability and applied air
pollution control policies.
0
2
4
6
8
10
12
14
2015 2020 2025 2030 2035 2040 2045 2050
x 1
00
00 Northeast
0
1
2
3
4
5
2015 2020 2025 2030 2035 2040 2045 2050
x 1
00
00 Southwest
0
2
4
6
8
10
12
14
16
18
2015 2020 2025 2030 2035 2040 2045 2050
x 1
00
00 Northwest
0
5
10
15
20
25
2015 2020 2025 2030 2035 2040 2045 2050
x 1
00
00 East
0
5
10
15
20
25
2015 2020 2025 2030 2035 2040 2045 2050
x 1
00
00 South
0
2
4
6
8
10
12
14
16
18
2015 2020 2025 2030 2035 2040 2045 2050
x 1
00
00 Central
0
5
10
15
20
25
30
35
2015 2020 2025 2030 2035 2040 2045 2050
x 1
00
00 North
0
20
40
60
80
100
120
140
2015 2020 2025 2030 2035 2040 2045 2050
x 1
00
00 China
Fig.2. The electricity generation structures for overall
China and each region from 2015 to 2050

YSSP Summer Colloquium 2017
62
Water
(WAT)
YSSP Summer Colloquium 2017
63
Investigation of drought adaptation options using an integrated hydrological and
agent-based model
Xiaogang He, Princeton University, USA
Email: [email protected]
IIASA Supervisors: Yoshihide Wada (WAT) and Sebastian Poledna (ASA/RISK)
Introduction. California has endured a record-breaking drought since the winter 2011 and will likely experience
more severe and persistent droughts in the coming decades under changing climate. At the same time, human
water management practices can also affect the drought characteristics including frequency and intensity (He et
al., 2017), which underscores the importance of human behaviour in effective drought adaptation and mitigation.
Currently, although a few large-scale hydrological and water resources models (e.g., PCR-GLOBWB) consider
human water use and management practices (e.g., irrigation, reservoir operation, groundwater pumping), none of
them includes the dynamic feedbacks between local human behaviours/decisions and the natural hydrological
system. It is, therefore, vital to integrate social and human behavioural dimensions into current hydrological
modelling framework in order to better understand the mechanisms of human-water interface.
Methodology. This study uses the agent-based modelling (ABM) approach and couples it with a large scale
hydrological model (i.e., Community Water Model, CWatM) (Burek et al., 2016) in order to have a realistic
representation of social, environmental and economic factors and a more dynamic representation of the bi-
directional interactions and feedbacks in the coupled human and natural water system. For a case study, we focus
on drought management in California and consider two types of agents, which are (group of) farmers and
government agencies. We assume that their corresponding objectives are to maximize the net crop profit and to
minimize water scarcity, respectively. Farmers’ behaviours are linked with local agricultural practices such as
cropping patterns and deficit irrigation. More precisely, farmers’ decisions are incorporated into the ABM-
CWatM framework across different time scales in terms of daily irrigation amount, seasonal/annual decisions on
crop types and irrigated areas.
Results and Conclusions. As the first step, we apply an evolutionary algorithm and use observed daily discharge
data during the period 1991-2010 to calibrate CWatM. After the calibration, Kling-Gupta efficiency (KGE) values
reach to 0.83 and 0.91 at daily and monthly timescale respectively, indicating that CWatM produces a reliable
representation of the terrestrial hydrological cycle in California. We then incorporate a key parameter into this
calibrated model, which characterizes farmers’ management practice to soil water deficit towards crop water
stress. Model simulations with and without considerations of parameter show significant differences of
streamflow and groundwater depletion. Additional simulations with regionally heterogeneous highlight the
crucial role of spatial heterogeneity on the system-level dynamics. Scenario analysis with different water
management practices and associated drought adaptation options shows the necessity of including individual’s (or
group’s) behaviours as an additional source of uncertainty when modelling the large-scale human-natural systems.
References He X, Wada Y, Wanders N & Sheffield J (2017). Intensification of hydrological drought in California by human water management.
Geophysical Research Letters 44: 1777-1785.
Burek P, Satoh Y, Fischer G, Kahil MT, Scherzer A, Tramberend S, Nava LF, Wada Y, et al. (2016). Development of the CWatM
(Community Water Model) – A high resolution hydrological model for regional and global assessment of integrated water management
options (in preparation). Available at: https://cwatm.github.io/index.html
YSSP Summer Colloquium 2017
64
Aquatic ecosystem status of Lake Vombsjön, Sweden
Jing Li, Lund University, Engineering Faculty, Water Resources Engineering, Sweden
Email: [email protected]
IIASA Supervisors: Peter Burek (WAT) and Yoshihide Wada (WAT)
Introduction. As cyanobacterial blooms, which are also called Harmful Algae Blooms (HAB), have become one
of the most critical concerns for drinking water supply when using surface water as resources, their growth
mechanisms, especially interaction with nutrients such as nitrogen (N) and phosphorus (P), need to be well
understood to develop sound control measures. This study aimed to investigate ecosystem status of Lake
Vombsjön in southern Sweden for its HAB control.
Methodology. Data from 1990 to 2016 was used to investigate potential historical changes in concentrations of N,
P, and N:P ratio. N:P ratio is an important factor as when the ratio of N:P is low, N availability is limiting other
species to grow except some cyanobacteria (blue green algae) that are able to fix atmospheric nitrogen (N2),
giving them a competitive advantage. Previous N:P ratio models were used to evaluate changes in the risk of
cyanobacterial blooms (Smith et al. 1995, Horne and Commins, 1987). The temporal trend of cyanobacterial
biomass was evaluated based on field data in 1989-2002, 2005, 2009, 2010 and 2016. Although not all bloom-
forming cyanobacteria are toxic. As precaution, cyanobacterial blooms should be considered toxic, as evidence
shows that up to 75% of blooms are toxic (WHO, 2015).
Results. Lake Vombsjön is still at eutrophic to hypertrophic status, which means rich nutrient condition for algae
growth. One possible reason of high nutrient level in the lake might be due to cyanobacteria as potential drivers of
N and P cycling through assimilating N from air and P from the lake bottom (Cottingham, et.al, 2015). The
temporal changes of N:P ratios have large amplitudes in the past decades from less than 5 to above 200. N:P
empirical models showed that N:P ratio below 22 favours cyanobacteria growth and particularly N2-fixing
species. Observations confirmed this as more than 80% of samples were dominated by cyanobacteria (≥ 50%).
Wind speed and gust have strong correlation with cyanobacterial biomass (r2=0.86 and 0.85), likely indicating that
wind and improved mass transfer in the surface water might speed nitrogen assimilation process. There was no
clear temporal trend of cyanobacteria biomass, except for increased number of toxic species.
Conclusions. Firstly, Lake Vombsjön has evolved towards a more unstable ecosystem with enlarged N:P ratios.
Secondly, cyanobacteria might behave as biological drivers maintaining eutrophication status, increasing the
number of toxic species. Lastly, only P control is not sufficient to turn lake to a good status, external factors such
as N:P ratio, wind speed, gust, internal phosphorus load in the lake sediment and cyanobacteria as biological
drivers should also be considered.
References Cottingham, K. L., H. A. Ewing, M. L. Greer, C. C. Carey, and K. C. Weathers. 2015. Cyanobacteria as biological drivers of lake nitrogen
and phosphorus cycling. Ecosphere 6(1):1. http://dx.doi.org/10.1890/ES14-00174.1
Horne A.J., Commins M.L. Macronutrient controls on nitrogen fixation in planktonic cyanobacterial populations. New Zealand Journal of
Marine and Freshwater Research, 21 (1987), pp. 423-433
Smith V.H., Bierman V.J., Jones B.L., Havens K.E. (1995) Historical trends in the Lake Okeechobee ecosystem IV. Nitrogen:phosphorus
ratios, cyanobacterial dominance, and nitrogen fixation potential Archiv für Hydrobiologie, Monographische Beitrage, 107, pp. 71-88
WHO 2015: http://www.who.int/water_sanitation_health/publications/cyanobacteria_in_drinking-water/en/
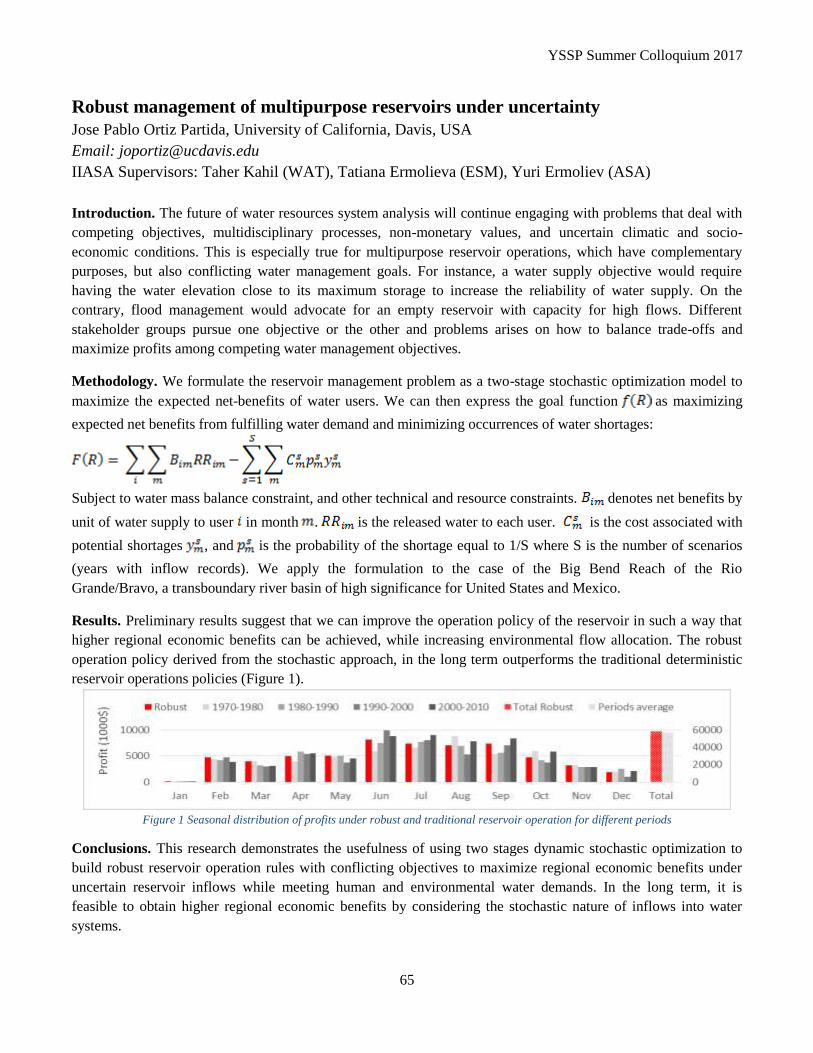
YSSP Summer Colloquium 2017
65
Robust management of multipurpose reservoirs under uncertainty
Jose Pablo Ortiz Partida, University of California, Davis, USA
Email: [email protected]
IIASA Supervisors: Taher Kahil (WAT), Tatiana Ermolieva (ESM), Yuri Ermoliev (ASA)
Introduction. The future of water resources system analysis will continue engaging with problems that deal with
competing objectives, multidisciplinary processes, non-monetary values, and uncertain climatic and socio-
economic conditions. This is especially true for multipurpose reservoir operations, which have complementary
purposes, but also conflicting water management goals. For instance, a water supply objective would require
having the water elevation close to its maximum storage to increase the reliability of water supply. On the
contrary, flood management would advocate for an empty reservoir with capacity for high flows. Different
stakeholder groups pursue one objective or the other and problems arises on how to balance trade-offs and
maximize profits among competing water management objectives.
Methodology. We formulate the reservoir management problem as a two-stage stochastic optimization model to
maximize the expected net-benefits of water users. We can then express the goal function as maximizing
expected net benefits from fulfilling water demand and minimizing occurrences of water shortages:
Subject to water mass balance constraint, and other technical and resource constraints. denotes net benefits by
unit of water supply to user in month . is the released water to each user. is the cost associated with
potential shortages , and is the probability of the shortage equal to 1/S where S is the number of scenarios
(years with inflow records). We apply the formulation to the case of the Big Bend Reach of the Rio
Grande/Bravo, a transboundary river basin of high significance for United States and Mexico.
Results. Preliminary results suggest that we can improve the operation policy of the reservoir in such a way that
higher regional economic benefits can be achieved, while increasing environmental flow allocation. The robust
operation policy derived from the stochastic approach, in the long term outperforms the traditional deterministic
reservoir operations policies (Figure 1).
Figure 1 Seasonal distribution of profits under robust and traditional reservoir operation for different periods
Conclusions. This research demonstrates the usefulness of using two stages dynamic stochastic optimization to
build robust reservoir operation rules with conflicting objectives to maximize regional economic benefits under
uncertain reservoir inflows while meeting human and environmental water demands. In the long term, it is
feasible to obtain higher regional economic benefits by considering the stochastic nature of inflows into water
systems.
YSSP Summer Colloquium 2017
66
Can a water crisis be averted in Mexico City? The effectiveness of water use permits
in promoting sustainable water use
Francine van den Brandeler, University of Amsterdam, Netherlands
Email: [email protected]
IIASA Supervisors: Sylvia Tramberend (WAT) and Simon Langan (WAT)
Introduction. Megacities such as Mexico City increasingly struggle to meet the demand for water. Over-
exploitation of local water resources and the import of water from other basins has contributed to land subsidence,
unequal access to water, ecosystem degradation and conflicts between users and basins (Oswald Spring 2015).
Furthermore, projections for 2030 show decreasing rates of water availability per capita for Mexico City and its
surrounding basin. This research aims to assess whether water use permits, the main policy instrument for
restoring the water balance, can contribute to more sustainable water use behavior.
Methodology. We use data on water availability and use published by the National Water Commission to analyze
the state of local river basins and aquifers, and the characteristics and evolution of water uses across the region.
Semi-structured interviews were conducted with 60 key actors in Mexico to examine their perception on the
effectiveness of water use permits for fostering sustainable water use. To compare the institutional goals to the
(perceived) outcomes of the water use reforms, we developed a performance analysis based on Oran Young’s
framework of institutional analysis for environmental change (Young 2008).
Results. Although water users face many restrictions, these are not adequately enforced. Water resources are
over-allocated, meters are absent and there are widespread irregular uses of water. In addition, there are issues of
reliability regarding data on water availability and use, and the methodologies employed are not always
transparent. The regional water resources management office has insufficient capacity to monitor all water users.
Sanctions and fees for water abstractions are inconsistently applied, and users have few incentives to comply with
regulations. While the structure of decentralized and participatory river basin and aquifer organizations exists,
these lack autonomy and mandates to hold users accountable and enforce water use permits.
Conclusions. Water use remains unsustainable as users resort to informal practices and water imports rather than
to curbing overall use. Enhancing participatory water resources management at lower scales may increase water
user accountability and environmental and social considerations. Because of limited results of the currently
employed water use regulations, alternative measures for addressing water demand and supply need more
emphasis: Increasing water use efficiency, reducing leaks, harvesting rainwater and reusing wastewater are
practices that have already been developed but remain small scale and piece-meal. Shifting from a linear (take-
use-discharge) model of water use to a sustainable, circular model will require a paradigm shift among water users
and managers.
References Oswald Spring, Ú. (2015). “Managing water resource in Mexico in the context of climate change”, in: Shrestha, Sangam; Anal, Anil K.;
Salam, P. Abdul; van der Valk, Michael (Eds.), Managing Water Resources under Climate Uncertainty. Examples from Asia, Europe,
Latin America and Australia (Cham: Springer): 377-404.
Young, O. R., L. A. King, and H. Schroeder, Eds., (2008). Institutions and Environmental Change: Principal Findings, Applications, and
Research Frontiers. The MIT Press, Boston, MA, 400 pp.
YSSP Summer Colloquium 2017
67
Drought risk, water demand and maize yields under climate change in the
Northeast Farming Region of China
Hanqing Xu, Shanghai Institute of Technology, China
Email: [email protected]
IIASA Supervisors: Gunther Fischer (WAT) and Laixiang Sun (WAT)
Introduction. Maize is the number one cereal crop in China and together with wheat and rice has played a
leading role in guaranteeing national food and feed security. Because of the increasing temperature and uncertain
rainfall in recent years, drought risk has been the main limiting factor for maize production in the Northeast
Farming Region of China (NFR). Given the importance of the NFR in China’s maize production, we performed
crop model simulations to investigate how drought risk potentially affects irrigation water demand during
different maize growth stages. We estimated across the NFR the spatial and temporal variation of soil moisture
conditions and irrigation water demand during the main crop development stages for historical observed weather
and under different future climate projections.
Methodology. In order to improve the overall performance of crop simulations, we coupled two well-known
models that capture different key agricultural processes. These models are the process-based and site-specific
Decision Support System for Agro-Technology Transfer (DSSAT) model, and the cropping zone centered Agro-
Ecological Zone (AEZ) model. We first simulate by the DSSAT model the performance of the maize for selected
agricultural observation stations according to the available observation data of crop growth, development data and
crop management. We then transfer these verified site results into the AEZ model. Finally, we apply the updated
AEZ model to the geo-spatial database of the NFR to provide a robust and reliable probabilistic assessment of
climate change impacts on irrigation water demand and yield of maize.
Results. The AEZ simulation results show that drought risk in different growth stages reduces maize yield and
estimated crop water deficit was better than other indicators of drought stress for explaining maize yield
variability. During 1981-2010, average soil moisture deficit and irrigation water demand was higher in the
western NFR in all growth stages due to an observed decrease in annual precipitation occurring from east to west.
The drought risk for maize was particularly high in the crop development and mid-season stages. Average
irrigation water demand was highest in the vegetative period (crop development stage), especially in the western
parts of Jilin province. The lowest irrigation water demand was found in the late stage from maturity until after
harvest. For future climate change, the simulations using a range of 20 climate change scenarios from five
different climate models and for four RCPs (for average thirty year periods of the 2050s and 2080s) provide an
uncertainty assessment of future water demand in each growth stage. Results compiled for the observation sites
show: (i) an overall increase in irrigation water demand by 2050s compared to the baseline (1981-2010), and (ii)
the irrigation water demand will likely decline during the stage of crop development but increase in the yield-
sensitive mid-season stage.
Conclusions. Drought risk will continue to be a critical factor for maize production in the NFR. Due to climatic
gradients, soil moisture deficits and hence irrigation water demand is higher in the western NFR in all maize
growth stages. Drought risk mitigation measures should focus especially on the crop development and mid-season
stages. Climate change will affects soil moisture conditions and irrigation water demand in all crop growth stages.
The ensemble of future climate projections indicates an increasing frequency and rising amount of irrigation water
requirements in the mid-season stage when the maize plant is most sensitive to water deficits and which should be
given priority for soil moisture monitoring and irrigation. References
Fischer G., F. N. Tubiello, H. Van Velthuizen, et al. (2007). Technological Forecasting and Social Change 74(7): 1083-1107. Tian Z., H. Zhong, L. Sun, et al. (2014). Ecological Modelling 290: 155-164.

YSSP Summer Colloquium 2017
68
Index
An Ha Truong ......................................................... 45
Andrew Fang .......................................................... 11
Bernd Lenzner ........................................................ 39
Catalina Chaparro Pedraza ..................................... 22
Cécile Godde .......................................................... 34
Cholho Song ........................................................... 41
Claudia Canedo Rosso ............................................ 54
Cornelius Hirsch ..................................................... 37
Daniel Cooney ........................................................ 23
Dmitrii Iakubovskii ................................................ 55
Esperanza González ................................................ 28
Francine van den Brandeler .................................... 66
Gibran Vita ............................................................. 30
Hadi ........................................................................ 36
Hana Mandová........................................................ 40
Hanqing Xu ............................................................ 67
Jeofrey B. Abalos ................................................... 49
Jillian Student ......................................................... 58
Jing Li ..................................................................... 64
Jose Pablo Ortiz Partida .......................................... 65
Karen Umansky ...................................................... 51
Karl Seltzer ............................................................. 12
Karl-Kiên Cao ........................................................ 27
Kasparas Spokas ..................................................... 42
Lavinia Perumal ...................................................... 17
Leila Niamir ............................................................13
Liv Lundberg ..........................................................56
Mahban Arghavani .................................................53
Maisa Nevalainen ..................................................... 9
Malan Huang ..........................................................38
Meng Jiang .............................................................47
Milton Aurelio Uba de Andrade Junior ..................33
Ming Ren ................................................................18
Nannan Zhang .........................................................14
Nemi Vora ..............................................................19
Örjan Grönlund .......................................................35
Radost Stanimirova .................................................43
Ryan Hanna ............................................................29
Saige Wang .............................................................20
Samuel Olugbemisola Wuraola ..............................50
Sara L. Loo .............................................................24
Shaohui Tang ..........................................................44
Takuji Oba ..............................................................25
Tobias Sieg .............................................................57
Vanessa Haller ........................................................16
Xiaogang He ...........................................................63
Yaoping Wang ........................................................31
Yaru Zhang .............................................................61
Ziyun Zhu ...............................................................59
Related Documents


