WORKSHOP REPORT Proceedings of the SERDP Coral Reef Monitoring & Assessment Workshop DECEMBER 2009 Dr. Pamela Reid Dr. Diego Lirman Art Gleason Brooke Gintert Meghan Dick Rosenstiel School of Marine and Atmospheric Sciences (RSMAS), University of Miami Dr. Max Gorbunov Dr. Paul Falkowski Rutgers University Dr. Nuno Gracias University of Girona Cheryl Ann Kurtz Bill Wild Space and Naval Warfare Systems Center Pacific This document has been approved for public release.

Welcome message from author
This document is posted to help you gain knowledge. Please leave a comment to let me know what you think about it! Share it to your friends and learn new things together.
Transcript
WORKSHOP REPORT Proceedings of the SERDP Coral Reef Monitoring &
Assessment Workshop
DECEMBER 2009
Dr. Pamela Reid Dr. Diego Lirman Art Gleason Brooke Gintert Meghan Dick Rosenstiel School of Marine and Atmospheric Sciences (RSMAS), University of Miami Dr. Max Gorbunov Dr. Paul Falkowski Rutgers University Dr. Nuno Gracias University of Girona Cheryl Ann Kurtz Bill Wild Space and Naval Warfare Systems Center Pacific This document has been approved for public release.
Report Documentation Page Form ApprovedOMB No. 0704-0188
Public reporting burden for the collection of information is estimated to average 1 hour per response, including the time for reviewing instructions, searching existing data sources, gathering andmaintaining the data needed, and completing and reviewing the collection of information. Send comments regarding this burden estimate or any other aspect of this collection of information,including suggestions for reducing this burden, to Washington Headquarters Services, Directorate for Information Operations and Reports, 1215 Jefferson Davis Highway, Suite 1204, ArlingtonVA 22202-4302. Respondents should be aware that notwithstanding any other provision of law, no person shall be subject to a penalty for failing to comply with a collection of information if itdoes not display a currently valid OMB control number.
1. REPORT DATE DEC 2009
2. REPORT TYPE N/A
3. DATES COVERED -
4. TITLE AND SUBTITLE Proceedings of the SERDP Coral Reef Monitoring & Assessment Workshop
5a. CONTRACT NUMBER
5b. GRANT NUMBER
5c. PROGRAM ELEMENT NUMBER
6. AUTHOR(S) 5d. PROJECT NUMBER
5e. TASK NUMBER
5f. WORK UNIT NUMBER
7. PERFORMING ORGANIZATION NAME(S) AND ADDRESS(ES) Rosenstiel School of Marine and Atmospheric Sciences (RSMAS),University of Miami
8. PERFORMING ORGANIZATIONREPORT NUMBER
9. SPONSORING/MONITORING AGENCY NAME(S) AND ADDRESS(ES) 10. SPONSOR/MONITOR’S ACRONYM(S)
11. SPONSOR/MONITOR’S REPORT NUMBER(S)
12. DISTRIBUTION/AVAILABILITY STATEMENT Approved for public release, distribution unlimited
13. SUPPLEMENTARY NOTES The original document contains color images.
14. ABSTRACT
15. SUBJECT TERMS
16. SECURITY CLASSIFICATION OF: 17. LIMITATION OF ABSTRACT
SAR
18. NUMBEROF PAGES
353
19a. NAME OFRESPONSIBLE PERSON
a. REPORT unclassified
b. ABSTRACT unclassified
c. THIS PAGE unclassified
Standard Form 298 (Rev. 8-98) Prescribed by ANSI Std Z39-18
This report was prepared under contract to the Department of Defense Strategic Environmental Research and Development Program (SERDP). The publication of this report does not indicate endorsement by the Department of Defense, nor should the contents be construed as reflecting the official policy or position of the Department of Defense. Reference herein to any specific commercial product, process, or service by trade name, trademark, manufacturer, or otherwise, does not necessarily constitute or imply its endorsement, recommendation, or favoring by the Department of Defense.
FORWARD These proceedings summarize the SERDP Coral Reef Monitoring and Assessment Workshop and reflect the opinions and views of workshop participants, not necessarily those of the Department of Defense (DoD). This document will be available in PDF format at www.serdp.org.
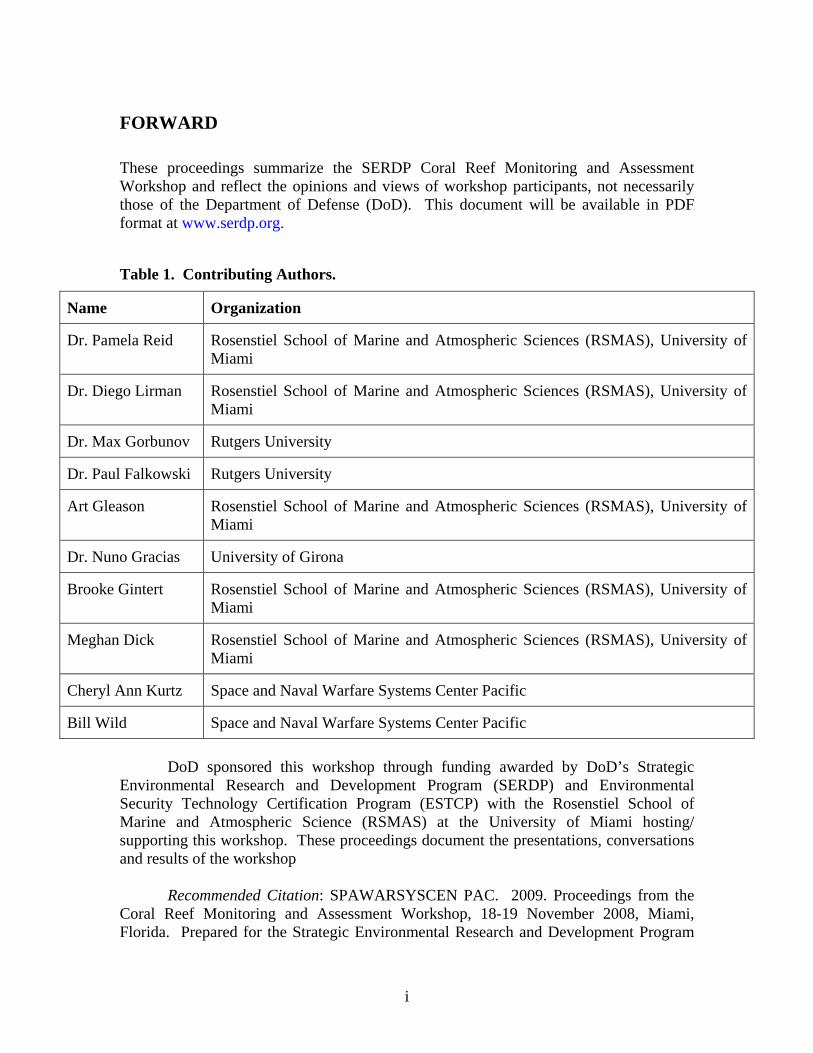
Table 1. Contributing Authors.
Name Organization
Dr. Pamela Reid Rosenstiel School of Marine and Atmospheric Sciences (RSMAS), University of Miami
Dr. Diego Lirman Rosenstiel School of Marine and Atmospheric Sciences (RSMAS), University of Miami
Dr. Max Gorbunov Rutgers University
Dr. Paul Falkowski Rutgers University
Art Gleason Rosenstiel School of Marine and Atmospheric Sciences (RSMAS), University of Miami
Dr. Nuno Gracias University of Girona
Brooke Gintert Rosenstiel School of Marine and Atmospheric Sciences (RSMAS), University of Miami
Meghan Dick Rosenstiel School of Marine and Atmospheric Sciences (RSMAS), University of Miami
Cheryl Ann Kurtz Space and Naval Warfare Systems Center Pacific
Bill Wild Space and Naval Warfare Systems Center Pacific DoD sponsored this workshop through funding awarded by DoD’s Strategic Environmental Research and Development Program (SERDP) and Environmental Security Technology Certification Program (ESTCP) with the Rosenstiel School of Marine and Atmospheric Science (RSMAS) at the University of Miami hosting/ supporting this workshop. These proceedings document the presentations, conversations and results of the workshop Recommended Citation: SPAWARSYSCEN PAC. 2009. Proceedings from the Coral Reef Monitoring and Assessment Workshop, 18-19 November 2008, Miami, Florida. Prepared for the Strategic Environmental Research and Development Program
i
and Rosenstiel School of Marine and Atmospheric Sciences by SPAWARSYSCEN PAC, San Diego, California.
ii
EXECUTIVE SUMMARY From 2003 to 2009, SERDP funded the development of two technologies for
assessing and monitoring coral reef health: 1) high-resolution (millimeter scale) video-mosaicing technology, capable of rapidly surveying and providing a permanent visual record for benthic areas over 100s of square meters in size (University of Miami) and 2) advanced bio-optical techniques for non-destructive assessment of selective natural and anthropogenic stresses using fluorescence induction and relaxation sensors (Rutgers University).
A SERDP-sponsored workshop was held at the Rosenstiel School of Marine and Atmospheric Science, University of Miami Nov 18-19, 2008. The goals for the workshop were to: (1) understand the DoD client perspective on benthic community/coral reef assessment and monitoring needs; (2) understand other potential user perspectives (i.e., in addition to DoD) regarding their coral reef monitoring and assessment needs and how the two SERDP-developed technologies may help address those needs; and (3) identify how the two approaches/technologies are complementary to each other and how they might be integrated to meet end-user needs.
Presentations by DoD personnel, representatives from governmental and non-governmental organizations/offices actively involved in coral reef management and research, and the research teams from the University of Miami and Rutgers were interspersed with active discussion. Key findings include the following:
1) Federal policy mandates that DoD characterize, assess, and monitor underwater benthic communities at Air Force, Army, Marine Corps and Navy bases in order to document compliance with national policy and to ensure that DoD operations do not lead to natural resource degradation, particularly with respect to coral reefs. DoD is looking for technologies and methodologies that will enable the collection of coral reef data with less dive time, that have the ability to reproduce data collection transects reliably year after year and provide a rapid deployment capability to document coral reef groundings. DoD is also interested in exploring how emerging technologies may foster new opportunities to develop productive partnerships between the Navy and other organizations.
2) Workshop participants were in agreement that metrics collected by current monitoring and assessment strategies conducted by the agencies are, in general, adequate to meet present mandates. However, there was also consensus that present methods of data collection are time consuming, labor intensive, and not standardized, thereby limiting the number of sites that can be monitored, comparison between studies, and the speed with which data can be provided to coral reef managers. There was also broad interest from all agencies in developing methodologies that reduce dive time, improve cost efficiency and provide repeatable data specifically from those agencies involved in field monitoring and assessment of coral reefs. Specific challenges and needs expressed by the agencies include developing capabilities for detailed mapping with improved capabilities (resolution and accuracy) and in-situ testing of physiological health of coral organisms. The improved methodologies would support expanded coral reef ecosystem level monitoring, monitoring of deep reefs, studies of infection patterns of coral disease
iii
iv
and non-destructive methods for determining coral reef physiological status and prospective health assessments of coral reefs.
3) There was consensus regarding the usefulness of landscape mosaics and FIRe technologies for advancing coral reef monitoring and assessment practices. The mosaicing technique offers potential for more efficient methods of monitoring coral cover, colony size, mortality, bleaching and disease, population structure, extent of injury and recovery patterns, and documentation of coral reef ecosystem metrics. There was consensus that the FIRe technique also provides capability for in-situ monitoring for sublethal effects from stressors and for identifying the cause(s) of detrimental change. There was also agreement that the transition of both technologies to the end-user community would be valuable and should be pursued.
4) The overall consensus was that the two technologies are complementary, but not necessarily synergistic, to each other. Integration of the two technologies onto a single platform could be useful in the future to some in the user community, but, in the short term, integration would not be necessary to benefit from the capabilities of the separate technologies when deployed separately
5) It was suggested that the developed technologies, in particular the FIRe fluorometry, be employed and validated at a non-DoD test site with a known stressor environment. As an example, the NOAA site(s) in Puerto Rico might be used for this purpose.
6) Based on widespread participant interest for using mosaics, paths for commercialization of the technology were discussed. Two strategies were considered: 1) licensing the technology to a commercial software company such that individuals could buy software to produce their own mosaics; and 2) commercializing a service under which mosaics would be produced on a fee-per-mosaic basis. Participants generally seemed to favor Option 2, but recognized that an informed decision would require a cost benefit analysis.
SERDP Coral Reef Monitoring and Assessment Workgroup
v
TABLE OF CONTENTS
FORWARD i
EXECUTIVE SUMMARY iii
LIST OF ACRONYMS vii
ACKNOWLEDGEMENTS viii
BACKGROUND 1
Program Overview - Dr. John Hall, OSD: SERDP/ESTCP 1
DoD/Navy Perspective - Ms. Lorri Schwartz, NAVFAC HQ 2
Minerals Management Service - Mr. James Sinclair 3
National Park Service- Dr. Benjamin Ruttenberg 3
U.S. Fish & Wildlife Service – Mr. Bret Wolfe 4
U.S. Environmental Protection Agency - Dr. William Fisher 4
NOAA Southeast Fisheries Science Center- Dr. Margaret Miller 5
NOAA Center for Coastal Monitoring & Assessment - Mr. Robert Warner 5
NOAA Marine Sanctuaries – Mr. Bill Goodwin 6
NOAA Damage Assessment and Restoration - Mr. Bill Precht 6
The Nature Conservancy- Mr. Chris Bergh 7
SERDP TECHNOLOGY DESCRIPTIONS AND DEMONSTRATIONS 7
Mosaicing- University of Miami - Dr. Pamela Reid, RSMAS 7
Mosaicing Demonstrations- University of Miami Team - Dr. Nuno Gracias 8
FIRe technology - Rutgers University - Dr. Max Gorbunov and Dr. Paul Falkowski 9
Integration of the Two Systems (FIRe and Mosaics) 11
GROUP DISCUSSION 12
Current Practices (Agency presentations) 12
POTENTIAL COLLABORATIONS WITH OTHER AGENCIES 16
SUMMARY and RESULTS 18
APPENDICES 20
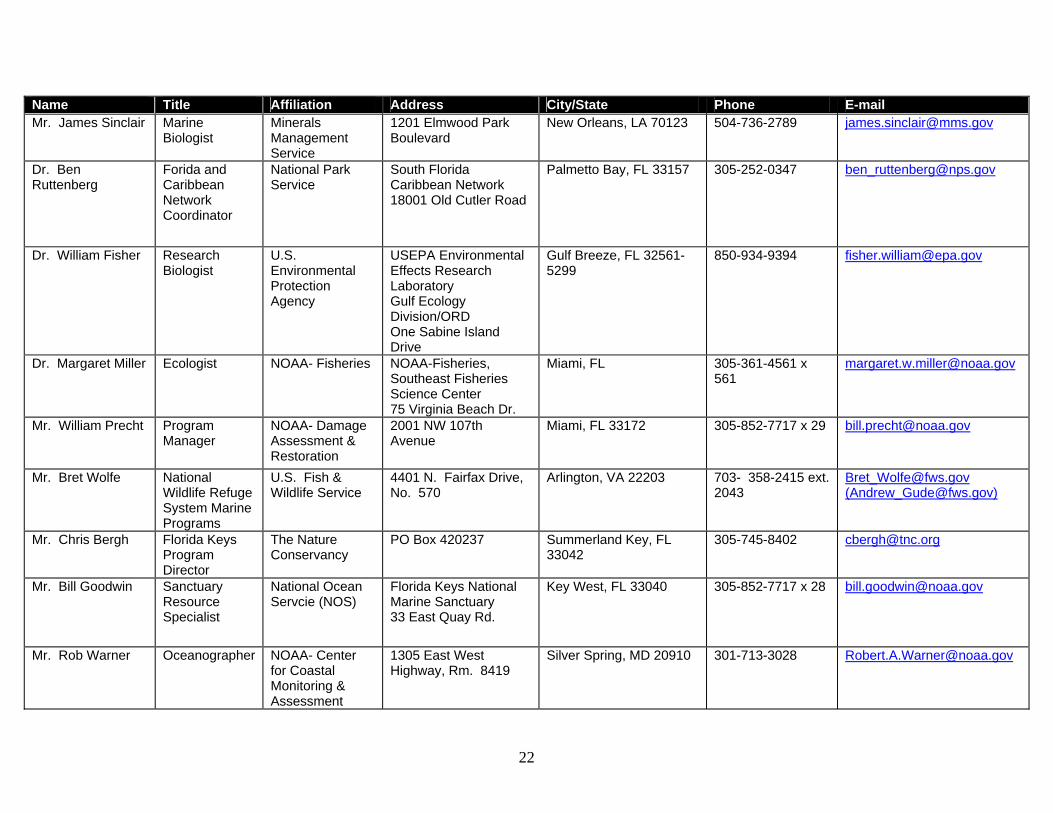
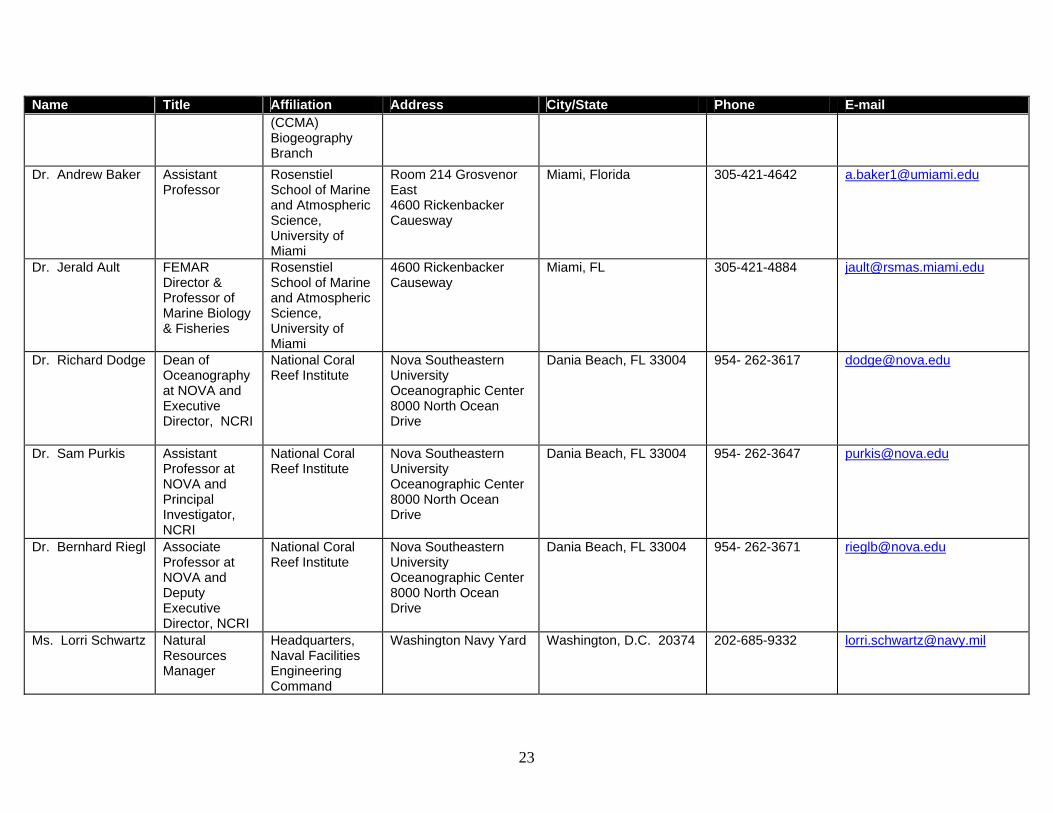
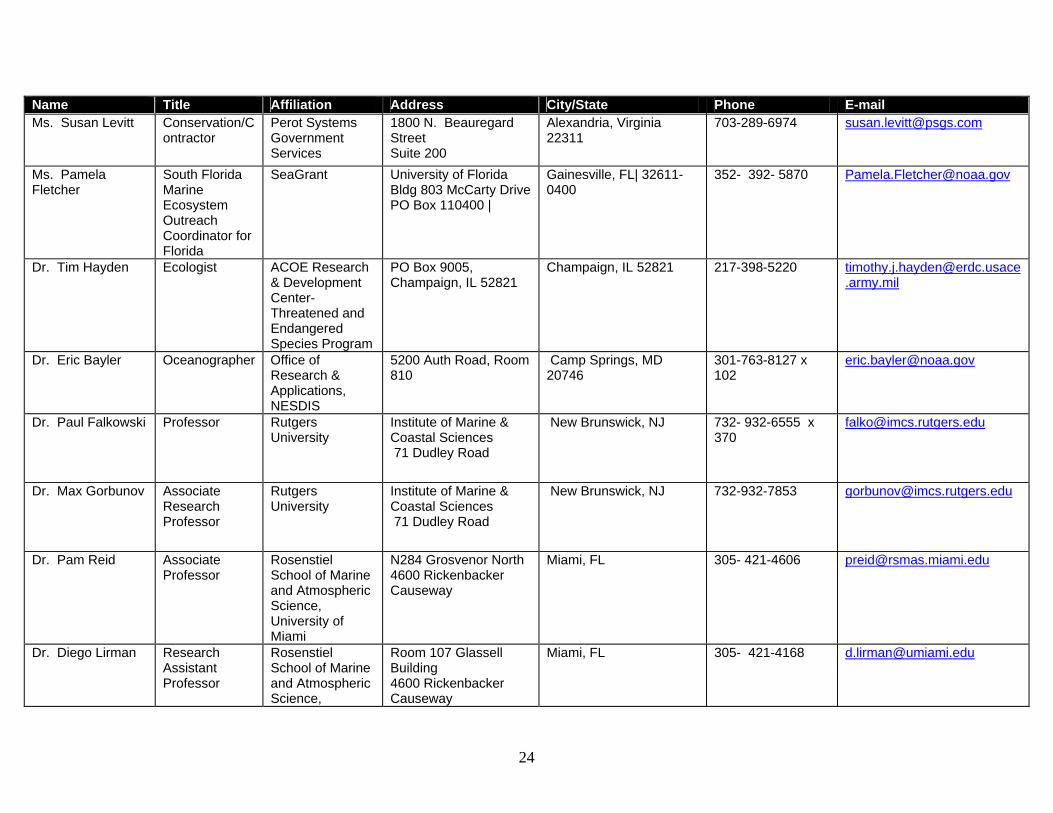
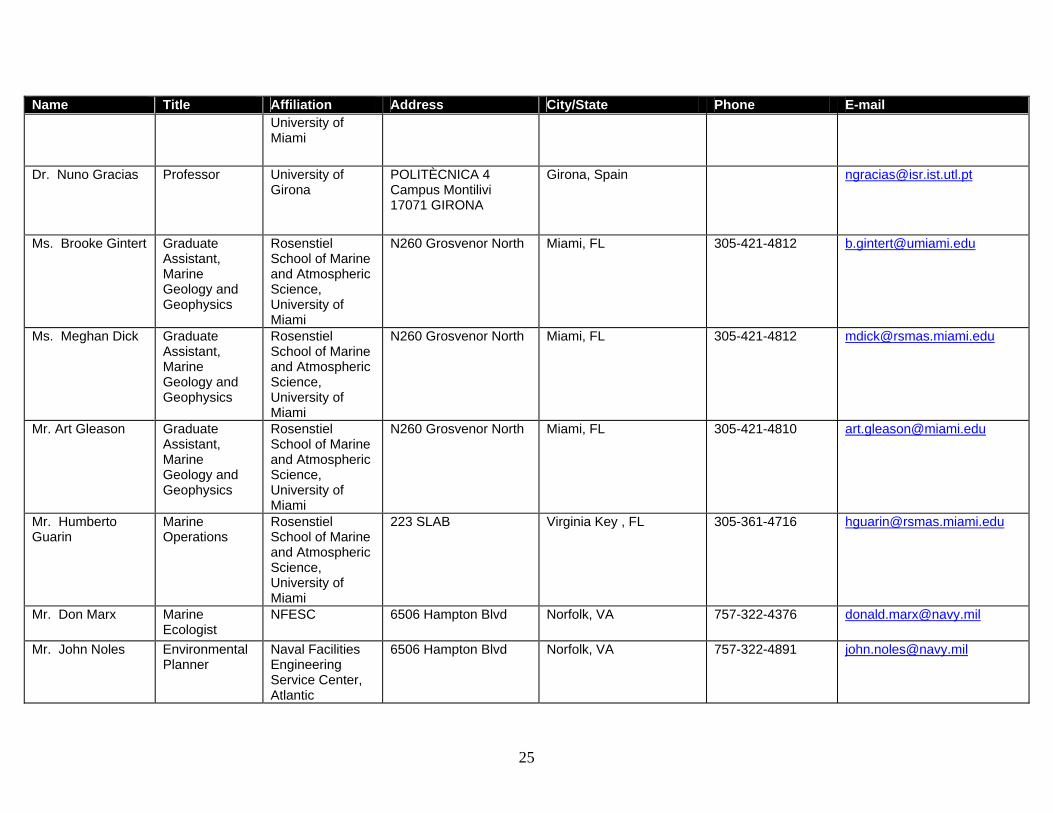
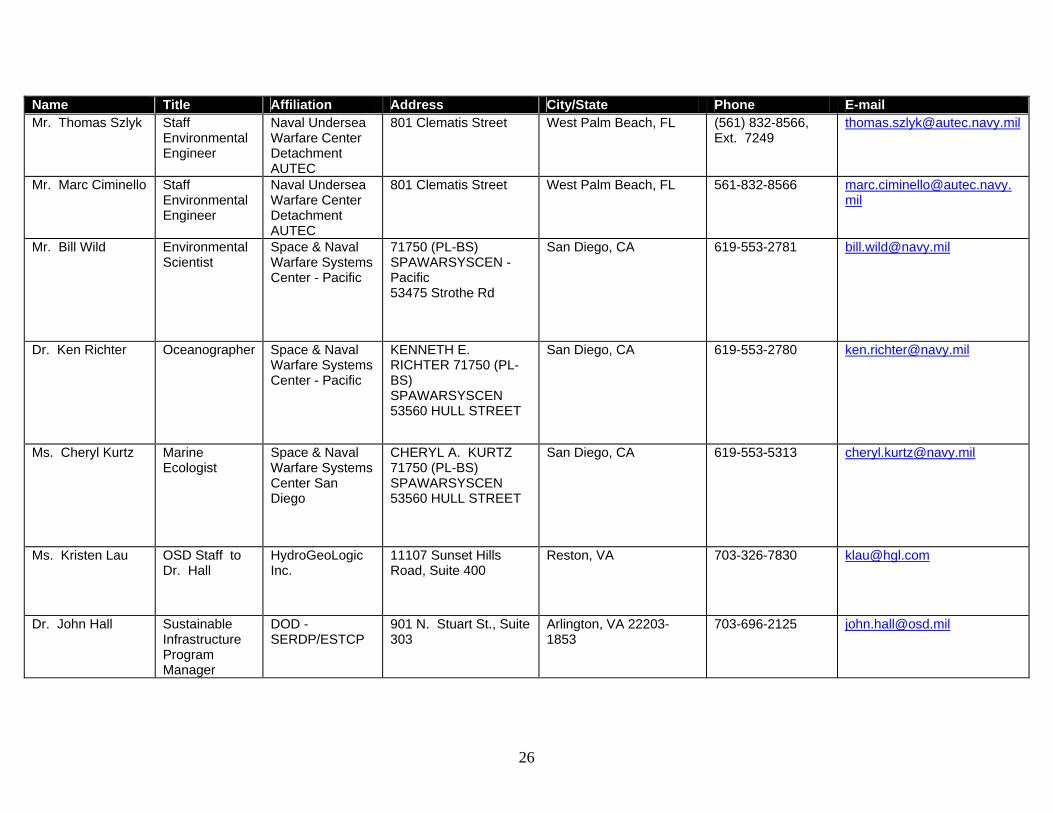
Appendix A- List of Participants 21
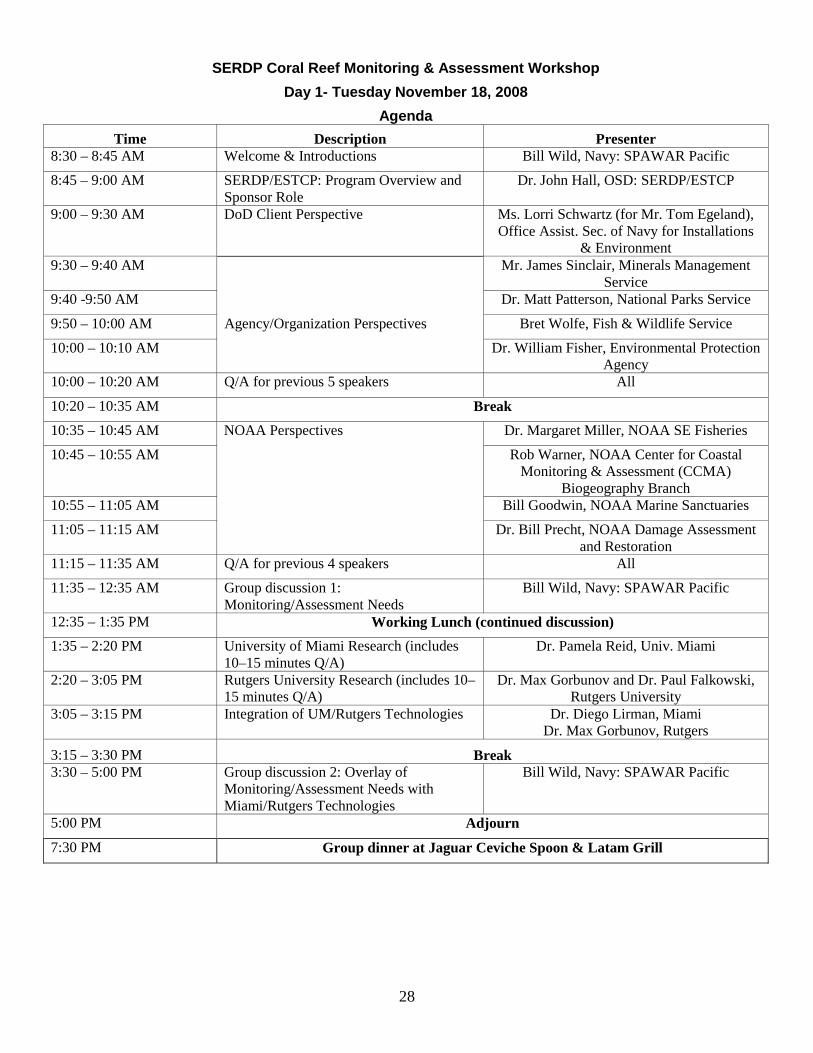
Appendix B - Final Agenda 27
Appendix C - Agency Perspective Presentations 31
Appendix D - Technology Integration Matrix 32
Appendix E - White Papers 35
vi
LIST OF ACRONYMS CREMP Coral Reef Evaluation and Monitoring Project DoD Department of Defense DoN Department of Navy DIDSON Dual Frequency Identification Sonar EPA Environmental Protection Agency ESTCP Environmental Security Technology Certification Program FIRe Fluorescence Induction and Relaxation technique Fo Minimum quantum yield of fluorescence Fm Maximum quantum yield of fluorescence (Fv/Fm) Photosynthetic efficiency GPS Global positioning system MMS Minerals Management Service NEPA National Environmental Policy Act NMFS National Marine Fisheries Service NOAA National Oceanic and Atmospheric Administration NPS National Park Service NWR National Wildlife Refuge RSMAS Rosenstiel School of Marine and Atmospheric Science SERDP Strategic Environmental Research and Development Program TNC The Nature Conservancy
vii
viii
ACKNOWLEDGEMENTS The Coral Reef Monitoring and Assessment Workshop sponsors wish to thank the RSMAS and Rutgers Teams who helped formulate the agenda, identify appropriate participants, and determine priorities. Special thanks to Dr. Pamela Reid and her team for hosting the workshop, and to Ms. Cheryl Kurtz for keeping the minutes and drafting the workshop proceedings. The sponsors would like to acknowledge Ms. Meghan Dick and Ms. Brooke Gintert for the logistical and onsite support provided and their dedication in organizing the field trip of Emerald Reef (cancelled due to large swell conditions). Finally, the sponsors wish to thank all the event’s participants (Appendix A- List of Participants), without whom this workshop would not have taken place.
INTRODUCTION From 2003 to 2008, SERDP funded the development of two technologies for assessing and monitoring coral reef health: (1) high-resolution (millimeter scale) video-mosaicing technology, capable of rapidly surveying and providing a permanent visual record for benthic areas over 100s of square meters in size (University of Miami); and (2) advanced bio-optical techniques for non-destructive assessment of selective natural and anthropogenic stresses using fluorescence induction and relaxation sensors (FIRe, Rutgers University). A SERDP-sponsored workshop was held at the Rosenstiel School of Marine and Atmospheric Science, University of Miami, Nov 18-19, 2008. The goals of the workshop were to: (1) understand the DoD client perspective on reef assessment and monitoring needs; (2) understand other potential user perspectives (i.e., in addition to DoD) regarding their coral reef monitoring and assessment needs and how the two SERDP-developed technologies may help address those needs; and (3) identify how the two SERDP approaches/technologies might be complementary to each other and how they might be integrated to meet end-user needs. This report summarizes the workshop activities, including: (1) background presentations by SERDP (DoD) and DoN presenting the Navy perspective; (2) other agency perspectives on coral reef monitoring practices; (3) descriptions and demonstrations of SERDP-funded technologies; (4) group discussion of current practices, evaluation of SERDP-developed technologies, and potential overlay of SERDP technologies on current practices and needs; and (5) summary and results.
BACKGROUND
Program Overview - Dr. John Hall, OSD: SERDP/ESTCP SERDP is DoD’s environmental science and technology program, planned and executed in partnership with the Department of Energy and the Environmental Protection Agency, with participation by numerous other federal and non-federal organizations. To address the highest priority issues confronting the Military Services, SERDP focuses on cross-service requirements and pursues high-risk/high-payoff solutions to DoD’s most intractable environmental problems. SERDP’s investments range from basic through applied research to exploratory development needs in the areas of Environmental Restoration, Munitions Management, Sustainable Infrastructure, and Weapons Systems and Platforms. SERDP’s Sustainable Infrastructure initiative supports research and development (R&D) efforts to (1) sustain the use of DoD’s lands, estuaries, ocean space, and air space; (2) protect its valuable natural, cultural, and infrastructure resources for future generations; (3) comply with legal requirements; and (4) provide compatible multiple uses of its resources. ESTCP is DoD’s environmental technology demonstration and validation program. ESTCP seeks to promote the use of innovative, cost-effective environmental technologies that target DoD’s most urgent environmental needs, including range
1
sustainment, through demonstrations at DoD facilities and sites. ESTCP selects lab-proven technologies with broad DoD application for rigorous field trials. These demonstrations document the cost, performance, and market potential of the technology. ESTCP technology demonstrations address DoD environmental needs in the Environmental Restoration, Munitions Management, Sustainable Infrastructure, and Weapons Systems and Platforms focus areas. These technologies provide a return on investment through improved environmental performance, reduced liability, and direct cost savings, while supporting and maintaining military readiness. Successful technologies supported by ESTCP often have commercial applicability.
DoD/Navy Perspective - Ms. Lorri Schwartz, NAVFAC HQ DoD is authorized to manage natural resources on property under its control. Major drivers are the Sikes Act, Clean Water Act, Clean Air Act, Marine Mammal Protection Act, Endangered Species Act, and various Executive Orders including EO 13089 for Coral Reef Protection. Currently, 46 military facilities and ranges are located in areas with coral reef resources within DoD’s jurisdiction. Additional Navy marine resource protection projects include: • Artificial reef creation - sinking the retired aircraft carrier ex-ORISKANY • Clean up of tires from the failed Osborne artificial reef • Reference database for Natural Resource Managers containing scientific literature
about DoD coral reef sites • Beach clean-up projects in Hawaii • Active reef ecosystem protection through NEPA, assessment, monitoring, and
research/demonstration SERDP/ESTCP plays a role in assisting in natural resource management by supporting the development of novel technologies for the assessment of benthic habitats, supporting routine activity planning, and providing high-quality data to support compliance requirements. The Navy is looking for technologies and methodologies that will enable the collection of data needed to support its mandate with: (1) reduction of costly field and dive time; (2) increased reproducibility and reliability year after year; and (3) flexibility to modify assessment plans based upon an expert’s evaluation of site conditions at the time of survey. Moreover, to meet DoD needs, sampling method and data verification procedures need to be widely accepted by both the resource management agencies and the scientific community. DoD is also need of a rapid deployment capability to document coral reef groundings. DoD is also interested in exploring how emerging technologies may foster new opportunities to develop productive partnerships between the Navy and other organizations. The two coral reef assessment technologies presently funded by SERDP (video/image mosaics and coral fluorescence) are examples of the potential for developing these types of partnerships. Both of these projects have previously interacted with Navy (e.g., AUTEC) and other partners (e.g., NOAA) to start development of joint coral monitoring programs for the efficient and effective assessment of coral status and trends. Finally, upcoming DoD projects that will likely influence coral reef status in the affected jurisdictions and may potentially benefit from the application of these SERDP-funded projects include the installation of the Fort Kamehameha Sewer Outfall in Hawaii and marine infrastructure projects in Guam.
2
AGENCY PERSPECTIVES To obtain a better understanding of the work currently being done in coral reef monitoring and assessment, presenters were chosen from a variety of governmental and non-governmental organizations/offices actively involved in coral reef management and research and asked to prepare a presentation covering the following information:
1. What is your agency’s mandate with respect to reef monitoring and assessment? 2. How are coral reef monitoring and assessment activities structured within your
agency (e.g., offices, groups)? 3. Who are your most common partners (e.g., other agencies, academics)? 4. What methods and technologies are currently used in your agency for coral reef
monitoring? 5. What currently limits your ability to fulfill your mandate? 6. What future reef monitoring and assessment activities are planned by your
agency?
Minerals Management Service - Mr. James Sinclair Mineral Management Service (MMS, Under the Dept. of Interior) focuses primarily on offshore resource recovery (oil, gas, sand, sulfur and alternative energy sources). MMS is a resource regulation agency, with a focus on the impacts of resource recovery (oil, gas, sand) on natural habitats. MMS takes an active role in the protection of coral reefs and fish communities in the habitats impacted by resource extraction (e.g., Flower Garden Banks, northwest Gulf of Mexico). The types of habitats and communities protected by MMS include: live bottoms (coral reefs, soft-sediment communities, hard-bottom), potentially sensitive biological features, topographic features, and chemosynthetic communities. Methods that MMS currently uses to assess coral reefs and associated communities include video transects, photo quadrats, colony growth surveys, visual fish/urchin/lobster surveys, and water-quality surveys. In the future, MMS hopes to identify areas within their governance that need additional protection and characterize their baseline characteristics to be used for future impact analyses.
National Park Service- Dr. Benjamin Ruttenberg National Park Service (NPS, under the Dept. of Interior) conducts status and trends assessments of coral reef habitats in support of the management responsibilities of individual National Parks in the U.S. that have coral reefs within their jurisdictions. Biscayne National Park, the Dry Tortugas, and U.S. Virgin Island parks at St. John and Buck Island (St. Croix) are primary focal points for coral reef assessments conducted by the NPS. The Florida/Caribbean Office (FLACO) is the only NPS office that supports monitoring efforts in the Florida and Caribbean regions. The office has no regulatory oversight over the parks; the data collected are provided directly to the Parks and regulators for their use. Typical methodology for reef assessment within NPS includes: visual surveys, video transect surveys, and photo surveys. Surveys are conducted at both random (Index) and permanent (Extensive) sites. The main indicator of coral reef condition recorded is percent cover of the main benthic organisms (corals, sponges, and
3
algae). These methods used have been shown to be repeatable and statistically robust, and can be used to generate habitat maps. In the future, NPS desires to look at deep-water corals at sites like Buck Island National Monument and Salt River Canyon, St. Croix). This expanded effort will require modified methods (e.g., mixed gas, ROVs) due to the logistic challenges associated with deep diving. In addition, NPS would like to expand its mapping capabilities (habitat and bathymetry); conduct circulation modeling w/larval transport information; and conduct research on coral diseases, ocean acidification, and lionfish eradication. NPS is presently working on a new, integrated standard coral reef monitoring protocol for coral reefs, fish, and seagrass communities. Some of the new techniques that NPS would like to integrate into its protocol include LIDAR, high-definition videography and drop cameras for monitoring deep water sites.
U.S. Fish & Wildlife Service – Mr. Bret Wolfe U.S. Fish and Wildlife Service (also under the Dept. of Interior and in conjunction with the National Wildlife Refuge Systems) enforces the Endangered Species Act (ESA) and the continued protection of listed species. Jurisdictions with coral reef resources include: Great White Heron NWR and Key West NWR, Navassa Island (Haiti), Midway Atoll NWR, Hawaiian Islands NWR, Guam NWR, Johnson Island NWR, Baker Island, Howard island, Jarvis island, Kingman Island, Palmyra Atoll, and Rose Atoll. USFWS partners with the U.S. EPA Water Quality Program, NOAA, USGS, and the Moore Foundation on several coral reef projects. Current methods used to assess coral reefs are diver-towed visual surveys, photo quadrats, video surveys, and visual fish surveys. In the future, USFWS would like to see improved monitoring technologies, develop more partnerships, conduct more research cruises (especially at remote refuges), improve present understanding of invasive species, and find better ways to enforce fishing regulations and stop illegal fishing.
U.S. Environmental Protection Agency - Dr. William Fisher The EPA’s Office of Research and Development (ORD) is focusing on biocriteria development and ecosystem services research. Biocriteria are authorized by the Clean Water Act and allow states to define the expected condition of aquatic resources (such as coral reefs) and enforce changes in watershed management if those expectations are not met (impairment). ORD is conducting research to assist states and jurisdictions in the development of biological indicators and long-term bioassessment monitoring programs to support implementation of regulatory biocriteria. Their most recent research on coral reefs has resulted in the drafting of the EPA Coral Reef Rapid Bioassessment Protocol, which focuses on stony corals. The proposed survey methodology relies on visual surveys conducted by trained divers who collect three core measurements (species identification of coral colonies, size, and percent living tissue). These metrics are combined to calculate multiple indicators that are sensitive to human disturbance such as total live coral cover and surface rugosity. Indicators for regulatory purposes must respond to human disturbance and be detectable beyond natural variation. ORD is now beginning to look into other assemblages, such as soft corals, sponges, fish, and invertebrates for responsive indicators. In a separate but related program, EPA is developing a strategy to incorporate coral reef ecosystem services into local management and regional policy decisions. All too often, decisions in coastal zones and watershed
4
areas are made without considering the effects of these decisions on coral reef communities and the many services the reefs provide (e.g., shoreline protection, tourism, fisheries). The new program will work toward the valuation of reef ecosystem services and tools to ensure that the value of these services is included in the decision equation. The ultimate purpose of the research is to better inform decision-makers of the system-wide consequences of different options (trade-offs).
NOAA Southeast Fisheries Science Center- Dr. Margaret Miller NOAA SE Fisheries Science Center (under the Dept. of Commerce) is responsible for monitoring of coral reef fish and invertebrates, coral condition, and coral population dynamics, as well as assessing the status of protected species, and conducting reef restoration activities. Dr. Miller’s research focuses on coral population status and coral restoration. Techniques commonly used by SE Fisheries are: stationary visual censuses yielding multi-species/size/abundance data for reef fish; coral surveys using visual and photographic methods; reef habitat characterization using acoustic techniques; visual surveys of mangroves; surveys of mangrove fish populations using sonar (DIDSON) and photo-video sampling. The metrics of coral reef condition commonly recorded include coral cover, colony sizes, partial mortality, abundance of coral predators, and prevalence of diseases and bleaching. Limitations that hamper SE Fisheries’ ability to conduct reef assessments are classical trade-offs between in-water time/effort and data quality, spatial and temporal coverage, and sampling frequency. Moreover, visual and photographic methods provide limited ability to census coral recruits (1 mm), resulting in a general lack of information on recruitment, and growth and mortality of the early life stages of corals. Finally, an overall challenge in the field of coral conservation is the lack of coral health/disease diagnostic techniques.
NOAA Center for Coastal Monitoring & Assessment - Mr. Robert Warner NOAA’s Center for Coastal Monitoring and Assessment (CCMA) is composed of two branches, the Biogeography Branch (BIOGEO), headed by Dr. Mark Monaco, and the Coastal and Oceanographic Assessment, Status and Trends Branch (COAST) headed by Dr. John Christensen. CCMA involvement in coastal monitoring is diverse, with projects that assess estuarine and coral reef resources in Florida and the Caribbean, and the assessment of Marine Protected Areas. This office also administers the U.S. Mussel Watch Program, and evaluates environmental contamination throughout the nation’s coastal regions. Working in close collaboration with partners, the Biogeography Branch maps and monitors coral reefs residing within United States jurisdiction. Techniques and methods used by the Biogeography group to map and monitor status and trends of submerged resources include visual fish surveys, visual/photo quadrats, and remote sensing methods. Some of the tools commonly used include photogrammetry, imaging spectroscopy, collection and analyses of IKONOS Imagery, LIDAR, and multi-beam acoustic data. In constantly seeking ways to improve, CCMA is interested in such areas as new benthic characterization tools; improved underwater positioning systems; acoustic methods for fish surveys; and AUV platforms/sensor payloads. NOAA's Coral Reef Conservation Program (CRCP) has recently refined its focus to three topics involving the impacts to coral reefs from fishing, land-based pollution, and climate change. CCMA's
5
two branches are currently working closely on projects, with their partners, to assess the effects of chemical contamination on the health of coral reefs in the Caribbean.
NOAA Marine Sanctuaries – Mr. Bill Goodwin NOAA – Marine Sanctuaries manages the Florida Keys National Marine Sanctuary (FKNMS) in accordance with the Marine Sanctuaries Act. The physical damage caused by vessel impacts on shallow habitats is a major source of mortality to benthic resources. The Damage Assessment and Restoration Program of the FKNMS also performs detailed mapping, assessment, and monitoring of injured areas (usually related to vessel groundings) within the Sanctuary and uses these data to develop detailed coral restoration and rehabilitation programs. After restoration is complete, long-term (five-year) monitoring efforts are performed to determine the success and efficacy (or failure) of these restoration efforts. This office investigates 500-600 vessel groundings per year on coral reef and seagrass habitats within the FKNMS. The Coral 312 Program, consists of assessing damage to reefs by ships and providing technical information on adjudicated responsibility/liability against the person/company who damaged the benthic resources. This office also conducts emergency triage for damaged coral and on-site restoration, which is funded by proceeds from successful litigation related to the damage. The type of equipment/methods used to assess damage and rehabilitate corals are: visual, photo and video surveys and diver measurements of damage patterns. Damage patterns are quantified by divers and through using aerial imagery, surface (National Geodetic Survey’s Shallow Water Positioning System) and underwater (CobraTac/AquaMap) GPS surveys. Video mosaics of the reef resources monitored have been developed using the commercial software RavenView. However, this product only creates strip mosaics with limited spatial accuracy. In the future, the restoration office wants to improve the efficiency of in-water surveys and the quality of the products produced for damage recovery and monitoring purposes.
NOAA Damage Assessment and Restoration - Mr. Bill Precht Under the Marine Sanctuaries Act, NOAA's Florida Keys National Marine Sanctuary, collects data on the health of coral reefs and uses these data to support managerial and policy decisions on reef and fisheries conservation. Information on the Threatened Acropora species is of specific concern. The FKNMS currently partners with academia, other governmental entities, and NGO's, including but not limited to the University of North Carolina, Wilmington, RSMAS; other NOAA groups and sanctuary monitoring groups; Florida Marine Research Institute’s Coral Reef Evaluation and Monitoring Project (FMRI CREMP); Mote Marine Laboratory, Dauphin Island Sea Lab/Florida Institute of Oceanography; and the Nature Conservancy. Monitoring techniques vary from group to group and program to program. The UNCW rapid reef survey methodology consists of trained observers using stationary diver surveys to identify, count, and measure reef fish populations. In addition, trained divers survey the benthic community and mobile invertebrates using visual, photo, and video methods. The metrics collected include abundance, diversity, condition (partial mortality), and size of all benthic invertebrates and macroalgae, as well as reef rugosity. This program is based on a stratified random survey design and has conducted surveys at over 900 sites Sanctuary-wide within the last decade.
6
The CREMP reef survey protocol consists of collecting point-count data from permanent sites throughout the FKNMS and more recently Dade and Broward Counties. This project has been on-going since 1996. The biggest limitation of the CREMP effort is that field campaigns occur only once a year, limiting the ability to make interpretations on the impacts of acute disturbances such as bleaching events, hurricanes, and disease outbreaks. Mote Marine Lab, in collaboration with the FKNMS, collects information on bleaching patterns using visual surveys and satellite information. Researchers from FIO/Dauphin Island Sea Lab conduct visual coral monitoring and develop population trend models in Sanctuary Preservation Areas (SPAs). The Nature Conservancy is currently using monitoring data as the basis for developing reef resilience strategies within the Sanctuary.
The Nature Conservancy- Mr. Chris Bergh The Nature Conservancy coordinates the Florida Reef Resilience Program (FRRP) and the FRRP’s Disturbance Response Monitoring (DRM) effort for shallow coral reefs of the Florida Keys and southeast Florida. TNC is concerned with the conservation of coral reefs and the impact of declining reef health on other natural and human communities. The focus is on resilience of the reefs to bleaching/disease events. Their work is facilitated through partnerships with collaborators such as NOAA, Florida Department of Environmental Protection, Florida Fish and Wildlife Conservation Commission, Universities (University of Miami, Nova Southeastern University, Florida Institute of Technology), Mote Marine Laboratory, and World Wildlife Fund. The FRRP methodology is based on a stratified random allocation of sampling sites in unique subregions and zones of the Florida reef ecosystem that are surveyed yearly at the peak of the summer high temperatures (August-September). Coral communities are surveyed by trained divers using visual methods (line and belt transects). The information collected includes coral cover, colony sizes, partial mortality, and prevalence of bleaching and diseases. The data collected are archived in an on-line database for report generation. The largest limitation that TNC has to contend with is that surveys need to be designed to respond to disturbances other than bleaching and disease (e.g., algal blooms, hurricanes and coldwater events). TNC is planning workshops in 2009 to address program shortcomings. (Full presentations can be found in Appendix C.)
SERDP TECHNOLOGY DESCRIPTIONS AND DEMONSTRATIONS
Mosaicing- University of Miami - Dr. Pamela Reid, RSMAS Efficient survey methodologies that provide comprehensive assessment of reef condition are fundamental to coral reef monitoring. Current state-of-the-art techniques in coral reef assessment rely on highly trained scientific divers to measure indices of reef health (e.g., substrate cover, species richness, coral size, coral mortality). First-generation video mosaics developed by Reid’s team were an innovative survey technology that provided large-scale (up to 400 m2), spatially accurate, high-resolution
7
images of the reef benthos without extensive survey times or a need for scientific divers. Despite these advances, the first-generation mosaic products were insufficient for species-level identification of many benthic taxa, thereby limiting the monitoring potential of the technique. Therefore, a second-generation mosaic survey technology was developed by Reid’s team, integrating high-resolution still-image acquisition with high-definition video surveys of the reef benthos. The second-generation mosaic products have sub-millimeter benthic resolution, allowing for species identification of coral colonies as small as 3 cm, identification of macroalgal genera, and increased information on coral colony health and small scale competitive interactions. This advanced survey technology allows users to collect imagery on both a landscape and colony level over 100’s of square meters in under an hour of in-water dive time. The resulting product has excellent archive potential and is a superior tool for tracking changes over time.
Mosaicing Demonstrations- University of Miami Team - Dr. Nuno Gracias A fundamental building block of the mosaic creation process is image matching, which corresponds to detecting the same area of the benthos in two different images. Image matching allows for estimating the relative displacement of one image with respect to the other. The mosaicing algorithm starts by performing image matching over the sequence of images in temporal order, since time consecutive images have maximum overlap. Next, an attempt is made to match images that are not sequential in time. Each successful image match provides a geometric constraint between two images. If enough constraints are found, then a set of images can be geometrically arranged to form a mosaic. The information from all image matches is used in a non-linear least square algorithm which finds the joint displacement of all images that best fits all the geometric constraints. Finally the images are blended to create a large composite view of the sea floor. The current software uses the MATLAB computing environment, and can create mosaics of thousands of images with minimal user intervention and effort. User input is handled with easy-to-use graphical user interfaces. The software consists of the following modules:
1. Image extraction and correction – Allows for retrieving images from a video and correcting for lens and housing distortion.
2. Global matching – Performs image matching and estimates registration for all frames.
3. Manual inspection and correction – Allows for detailed inspection and additional user input on image registration for difficult images.
4. Image blending - Combines registered frames into a single mosaic. 5. Mosaic viewing - Allows point and click access to individual frames.
In addition to the basic mosaic creation capability, four enhanced capabilities have been created and demonstrated previously at a proof-of-concept level. These four capabilities have been streamlined and integrated into the mosaic software package:
8
1. Combining video with high resolution still photos - Increases spatial resolution of
the mosaics, thereby improving taxonomic resolution; 2. Using additional positioning information – Improves geometric accuracy of the
mosaics specially over high topography areas; 3. Improved blending – Reduces the visibility of the seams among neighboring
images when rendering the final mosaics; 4. Removing refracted sunlight – Strongly attenuates or eliminates the disruptive
patterns of refracted sunlight for very shallow water surveys. The most practical approach for transitioning the mosaicing technology to end users is under consideration. One approach would be to publish the existing MATLAB code and user manuals. The limitation of this method is that there is no infrastructure in place to provide the pre-release software engineering (bug testing, error reports, unified GUI, installation scripts, etc.) or the customer service support that would be expected if this product were to become a fully developed commercial software package. A second approach would be to run a service bureau to produce mosaics for end users. Under this model, users would submit their imagery to a central facility and receive a mosaic in return; the software itself would not be released as a product. The limitation of this method is that a certain minimum demand for mosaics would be needed to sustain the facilities of a service bureau.
FIRe technology - Rutgers University - Dr. Max Gorbunov and Dr. Paul Falkowski Development of advanced technologies for environmental monitoring and assessment of coral reef communities requires an understanding of how different environmental factors affect the key elements of the ecosystems and the selection of specific monitoring protocols that are most appropriate for the identification and quantification of particular stressors. The Rutgers team developed a Fluorescence Induction and Relaxation (FIRe) technique for assessing the health and viability of corals. The FIRe instrument illuminates an organic tissue with precisely controlled flashes of light and measures the amount of fluorescence response that comes back. The fluorescence levels can vary, based on environmental conditions and the presence or absence of a stressor(s), thus acting as an indicator of the health of the organism. The FIRe-retrieved physiological parameters include the quantum yields of fluorescence at the minimum and maximum levels (Fo and Fm, respectively), the efficiencies of photosynthetic energy conversion (Fv/Fm), the functional absorption cross section of Photosystem II, the rates of photosynthetic electron transport, photosynthetic turnover time, and coefficients of photochemical and non-photochemical quenching. Because the technique records an extensive suite of physiological parameters, there is a possibility to identify what stressor is involved and to distinguish between common natural stresses (e.g, thermal stress or photoinhibition) and anthropogenic stressors, such as metal toxicities. The measurements are sensitive, fast, non-destructive, can be done in real time and in situ.
9
The Rutgers team has designed and developed a set of FIRe instruments, including a bench-top FIRe fluorometer, diver-operated fluorometer, and moorable fluorometer. This instrumentation is used together with standard laboratory methods (lipid and protein analysis, molecular biology, microscopy, and fluorescence spectroscopy) and provides a comprehensive physiological diagnostic tool. The FIRe technology has been employed for basic research of the physiological responses of coral to natural stresses (thermal stress, photoinhibition, nutrient load) and to selected anthropogenic stressors such as metal toxicity. The research revealed that the developed diagnostics are very sensitive to changes in the coral physiology and records detrimental changes at early stages of the stress development - before any visible changes in coral coloration appear. On this background, algorithms are developed for identification of environmental stressors. The photosynthetic efficiency (Fv/Fm) is the primary stress indicator. Healthy corals have Fv/Fm of about 0.50. Stressors usually lead to a decrease in Fv/Fm, with the exception of nutrient load that may increase Fv/Fm. Thermal stress is triggered by a 1-2 oC increase in temperature above its normal maximum and varies greatly between coral species. Research has revealed that the coral sensitivity to thermal stress is controlled by the lipid composition of photosynthetic membranes. Specifically, thermally resilient clones have a lower relative content of the major polyunsaturated fatty acid that simultaneously reduces the susceptibility of the membrane lipids to attack by Reactive Oxygen Species. The thermal stress leads to a characteristic decrease in both Fv/Fm and the rates of photosynthetic electron transport down Photosystem II (PSII). Photoinhibition also leads to a decrease in Fv/Fm ratio, but has no effect on the photosynthetic electron transport in PSII reaction centers. The target of thermal stress and photoinhibition is the primary photosynthetic reactions in PSII. Metal toxicity analyses have shown that metals (copper, zinc, lead, and tin) inhibit growth rates but do not change the efficiency of the primary photosynthetic reactions at early stages of the stress development. Metals do, however, affect the photosynthetic turnover times and the maximum rates of photosynthetic electron transport. Therefore, secondary photosynthetic reactions are affected, but not the primary photosynthetic reactions, that is in striking contrast to common natural stressors. Metal poisoning also causes an increase in caspase activity (an indicator of program cell death) and tissue degenerations, thus suggesting damage to both coral host and algal symbionts. FIRe Demonstration– Rutgers Team The FIRe technology records the dynamics of fluorescence yields on the micro- to millisecond time scale, with the overall time of a single measurement of about 1 second. Because coral communities are non-uniform and show a high degree of spatial variability, even within a single colony, several readings on the same corals are taken, at different spots on a particular coral head. Acceptable repeatability is achieved with this technique. In the field, several readings on the same corals are taken, at different spots on a particular coral head. The prototype diver-operated system has a viewing screen so that the diver can determine in real-time if the fluorescence value is outside the normal range
10
of response. The diver then can take a sample for further analysis during that collection opportunity. For example, this technique can result in a reduction in cost when studying heavy metal contamination and impact and also can realize a reduction in the number of sites needing to be sampled. The FIRe onboard computer conducts the measurements in fully automatic regime and performs initial data analysis in real time. The data are stored and downloaded after a dive. The dedicated data analysis software package fits the fluorescence profiles to a bio-physical model to retrieve physiological parameters of the organism. Rutgers has established a database of fluorescence response baseline data for corals from various locations in the Carribbean and Indo-Pacific regions. Also there is baseline data for a variety of stressors, such as copper, zinc, lead, and temperature. In the future, the Rutgers Team plans on writing algorithms to relate stress levels with the database of known stressors.
Integration of the Two Systems (FIRe and Mosaics) One of the goals of this workshop was to gather information and identify how the two SERDP approaches/technologies might be complementary to each other and/or how they might be integrated to meet end-user needs. The challenge for the integration of the video mosaics and the FIRe technology is the different spatial scales at which these two systems presently work. The FIRe instrument collects physiological information at the cm-scale while the video mosaics, even with sub-mm pixel resolution, provide information at the plot scale (up to 500 m2). Moreover, the data for the FIRe system are presently collected at short distance (< 5 cm from the surface of the target), while the video data required to build video mosaics are collected at 1.5 - 2 meters above the surface of the reefs. The future integration of these two systems will depend on the development of a FIRe instrument that is able to sample at larger distances from the surface of the reef and a system that synchronizes the collection of physiological and video data so that each fluorescence measurement is correlated spatially and visually with a position and organism within the landscape mosaic. Although these technical challenges will remain in place until the technologies are further developed, the potential benefits of an integrated system were outlined in the workshop. The added benefit of combining both methods in a single platform would be the identification of areas mosaiced within wide scale plots of reefs that are subject to declining coral health and may be moving toward future mortality or reduced growth. This would help concentrate efforts on areas with higher risk of mortality and document resilient patches within communities. A joint platform would also enhance the ability to survey deeper reefs with reduced dive time.
11
GROUP DISCUSSION
Current Practices (Agency presentations) Discussion based on Agency Presentations indicated a consensus that current monitoring and assessment strategies conducted by the agencies are, in general, adequate to meet present mandates with regards to coral reef monitoring. Desired capabilities that would expand present survey methodologies and specific challenges were also discussed. The issue of the high cost and safety related to field operations (e.g., boats, trained divers, deep diving) is of concern to all parties involved in coral monitoring. Therefore, development of streamlined and efficient survey methodologies that reduce dive and field time was recognized as a significant need. The need for techniques providing repeatable data acceptable to all agencies involved was also emphasized. Limitations that constrain current monitoring as assessment efforts were discussed, and include the following:
1) Limited sampling frequency that precludes the assessment of cause and effect relationships of coral decline patterns
2) A lack of coordination and inconsistency of methodologies that precludes data from being fully shared by programs and agencies
3) Various agencies which are charged with the monitoring and protection of multiple habitats and jurisdictions, spreading the resources dedicated to coral reefs very thin.
4) A large degree of redundancy with several agencies surveying the same areas with limited communication.
5) A lack of uniform methods and sharing of resources leading to a general lack of efficiency.
6) A lack of explicit monitoring and assessment needs and a priori goals resulting in inadequate data being collected (data that do not answer the questions posed by the programs).
7) Monitoring and assessment requirements that have not been well-defined before the methods and the survey technology are chosen.
8) The idea that monitoring and assessment are two different topics and should not necessarily be considered unified efforts.
9) The need for a methodology that minimizes time-at-site while providing a wide range of detailed coral health metrics.
10) Different agencies have different goals/missions (drivers), therefore it would be difficult for one or even two technologies to fit all programs.
11) Science does not presently drive management policies with respect to coral reefs. A science-based approach is needed to address the optimal integration of survey methods and technologies.
12) A report card framework for coral reefs is needed, focusing overall ecosystem assessment, the role of reefs, and consequences of reef degradation.
13) The lack of forecasting tools, such as what might be addressed in part by the FIRe technology, also is a limitation of current practices. Development and implementation of technologies for assessing the physiological status of coral
12
with capabilities to detect detrimental change to the coral health at early stages should be an important component of coral monitoring programs.
Potential Utility of SERDP Technologies Participants were in agreement regarding the potential usefulness of both the mosaicing and the FIRe technologies for advancing monitoring and assessment practices of the coral reef community. There was consensus that transition of both technologies to the end-user community would be valuable. Specific comments and suggestions included the following:
Mosaics offer unique opportunities for collecting and analyzing long-term monitoring data, developing new indicators of reef health, and contributing to other applications such as use in UXO munitions management and public outreach efforts. Future generations of still cameras will offer even higher-image capture rates that may enable mosaicing without the use of video cameras. One limitation of the mosaicing technology are that the cameras are downward looking, so objects under overhanging features will be obscured. In addition, the current resolution of the mosaics limits species identification to corals larger than 2 cm. However, there was general agreement that the mosaicing technology was ready for transition to the user community.
Participants were enthusiastic about the potential application of FIRe technology for identifying coral stressors. The suggestion was made that it would be useful to develop libraries to aid interpretation of the FIRe data, and to conduct lab work to determine inter and intra species variability, and diel fluctuations with the FIRe system. There was also interest in looking at the differences within a single colony based on the position of the light and probe. The participants were polled to find out what kind of stressors the users thought would be important to explore next. Coral diseases and petrochemicals were suggested, participants also pointed out a need to investigate signals from a combination of stressors. The intent was to focus on petrochemicals as the last specified Navy stressor of interest and (2) based on workshop participant input and concern about the synergistic/canceling effect of multiple stressors evaluate a mixed stressor signal (e.g, nutrient load in combination with thermal stress). Consensus was also reached that the two technologies are indeed complementary and that integration could be implemented in the short term with existing (but separate platform) capabilities of the individual projects. Further joint development should be undertaken if system limitations relating to the differences in distance at which data is collected and spatial recording of the FIRe data within a mosaic can be overcome. Mr. Precht suggested conducting large-scale surveys with FIRe and mosaics aimed at detecting spatial stressor “hot spots”. It was noted that the FIRe technology would benefit from further field demonstration before it is put on a platform alongside the mosaicing cameras. Technology Overlay and Potential Collaborations The potential for the two SERDP technologies to augment and enhance the specific reef monitoring and assessment activities of the participating agencies was
13
14
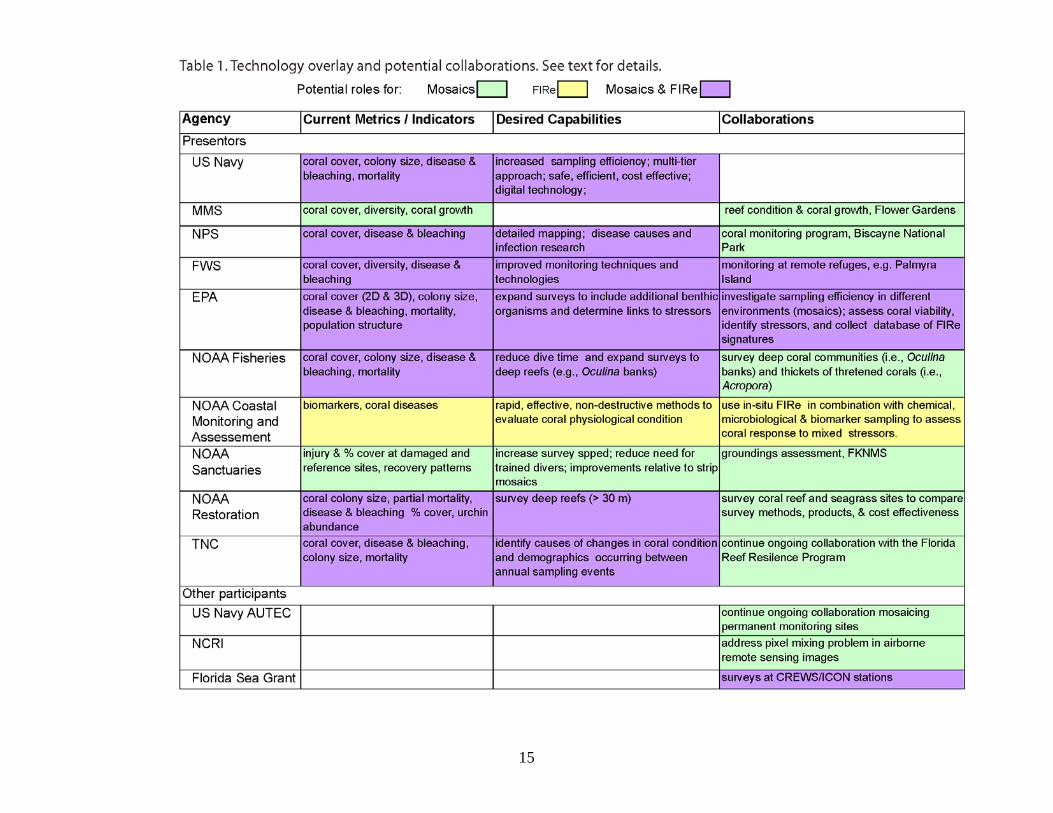
discussed at length. Agency-specific input is outlined below and summarized in Table 1. Column 1 of Table 1 lists the Governmental and Non Governmental Agencies represented by workshop presenters and other participants. Columns 2, 3 and 4 are color coded to indicate potential contributions of mosaics (green), FIRe (yellow) or both technologies (purple) to augment or enhance monitoring of present metrics (Column 2), enable new desired capabilities (Column 3), or provide new opportunities for partnerships (Column 4). Text in Column 2 identifies indices of reef health presently monitored by each agency that could benefit from the use of mosaics and/or FIRe. Text in Column 3 identifies desired enhanced monitoring capabilities that could be accomplished using mosaics and/or FIRe. Column 4 summarizes potential collaborations using mosaics and/or FIRe. Appendix D contains the details of the information provided by presenters at the SERDP Coral Monitoring Workshop.
15
.
POTENTIAL COLLABORATIONS WITH OTHER AGENCY PRESENTERS Minerals Management Service: Mr. Sinclair expressed interest in the SERDP-funded video mosaicing technology because of its high resolution capability, the ability to survey deeper communities with reduced dive time, and the capability of providing a permanent visual record (i.e., high-resolution maps of the bottom). Potential collaboration to use video mosaics to evaluate coral reef condition and colony growth in the Flower Gardens was discussed. National Park Service: Dr. Ruttenberg indicated that both the video mosaics (mapping, assessment) and fluorescence (disease and bleaching impacts) were potentially useful techniques that could be incorporated into a comprehensive coral reef monitoring program by NPS. Video mosaics were collected by the University of Miami team at St. Croix in collaboration with NPS staff in 2007. The potential for future integration of video mosaics in the coral monitoring program at Biscayne National Park was mentioned. U.S. Fish & Wildlife Service: Dr. Wolfe indicated that FWS does not conduct its own monitoring and relies on partnerships with other agencies to fulfill its coral reef monitoring mandate. Potential collaborations with the SERDP-funded technologies would have to be conducted through FWS’ partners (EPA, NOAA, USGS, etc.). Interest was expressed in conducting joint surveys incorporating mosaics and FIRe in remote refuges such as Palmyra Island. U.S. Environmental Protection Agency: Dr. Fisher pointed out the potential for using mosaics to conduct statistical power analyses to determine sampling efficiency and change-detection levels in different environments. The University of Miami team has previously worked with Dr. Fisher and the EPA to conduct parallel surveys at one site surveyed regularly by a EPA coral disease research group to determine if the metrics obtained from both surveys were similar. Dr. Fisher also identified the FIRe technology as a potentially useful tool to develop early-warning indicators of reef degradation in watersheds affected by multiple stressors. He expressed interest in working with Rutgers to use FIRe for assessing coral viability and stressor identification and suggested monitoring rates of benthic primary production in lab experiments and in the field. Dr. Fisher also expressed interest to use FIRe technology for monitoring other organisms including macroalgae and phytoplankton. NOAA Southeast Fisheries Science Center: Dr. Miller and other researchers from NOAA SEFSC have collaborated extensively with the University of Miami team, using video mosaics in the assessment of disturbance patterns to populations of the threatened coral Acropora palmata in the Florida Keys. Dr. Miller also recognized the potential for utilizing the FIRe method as an early warning indicator of coral diseases and bleaching impacts. Dr. Miller suggested further collaboration using mosaics for joint surveys of deep coral communities (i.e., Oculina banks), with a possible CRTF proposal. NOAA Center for Coastal Monitoring & Assessment: Mr. Warner highlighted the potential benefits of including the FIRe technique in the assessment of chemical pollution and early impacts on exposed corals. He invited the Rutgers team to participate in a field campaign that involves fine-scale sampling of a well characterized coral reef ecosystem. Mr. Warner suggested using in-situ FIRe measurements in combination with chemical, microbiological and biomarker sampling to assess how corals respond to a mix of
16
environmental stressors, including thermal stress. Mr. Warner also discussed the potential enefits of incorporating video mosaics as a survey and mapping tool.
ry). Dr.
b NOAA Marine Sanctuaries: Mr. Goodwin indicated that the University of Miami team has collaborated with NOAA on the survey of a vessel grounding scar in Biscayne National Park and that future joint assessments are planned to incorporate the video mosaic technique into the assessment of groundings within the FKNMS. NOAA Damage Assessment and Restoration: Mr. Precht discussed the potential for using video mosaic capabilities for CREMP permanent sites and collaborating with the FKNMS in the monitoring the status and trends of threatened Acropora population using both video mosaics and FIRE techniques. He suggested performing a side-by-side comparison of survey methods, products, and cost effectiveness between NOAA and University of Miami groups. The Nature Conservancy: In 2008, TNC established a collaboration with the University of Miami team to use video mosaics to monitor and map coral colonies within permanent sites. The data to be collected at these permanent sites will be used to quantify the impacts of bleaching and diseases on coral populations. Mr. Bergh and Dr. Kramer indicated interest in continuing collaboration between University of Miami and the Florida Reef Resilience Program. Additional Workshop Participants AUTEC: Mr. Tom Szlyk from the Navy’s AUTEC Range indicated that The Atlantic and Gulf Rapid Reef Assessment (AGRRA) protocol has been used on a yearly basis in the recent past to assess the status and trends of coral reef communities at Andros Island. This methodology uses visual surveys conducted by trained divers to record cover of benthic organisms, colony sizes, partial mortality patterns, prevalence of bleaching and diseases, abundance of urchins, and surface topography. In the past several years, the SERDP-funded mosaic technology has been integrated into the reef survey protocol at Andros and mosaics have been used to map and monitor coral communities at more than twenty permanent sites around the AUTEC base. Mr. Szlyk indicated that due to the sampling interval (once a year) disturbance events such as disease outbreak and bleaching may be missed. The University of Miami team will continue ongoing collaboration at AUTEC with Mr. Szlyk and Mr. Marc Cimenello. Mr. Don Marx (NAVFAC ESC) brought up the importance of making sure that any data produced by the technologies developed under SERDP would be accepted by regulatory agencies. NOVA Southeastern University/NCRI Center. Researchers from NOVA conduct regular assessment of reefs in Broward County Florida using a combination of visual surveys and remote sensing technologies (LIDAR, Multibeam, Satellite ImagePurkis identified the mosaic technology as a potential methodology for providing accurate ground-truthing of satellite imagery for the development of benthic habitat maps and to address the issue of within-pixel mixing of satellite imagery. A potential collaboration with the University of Miami group was discussed within the context of surveying dense patches of the threatened coral Acropora cervicornis in Broward County.
17
Florida SeaGrant. Ms. Fletcher indicated that the mosaicing and FIRe technologies are both potentially beneficial for assessing the status and trends of deep coral reefs and ultural resources (e.g., coral communities on ship wrecks, archeological digs). As a
egradation, particularly with respect to coral reefs. As a
rvey. DoD is need of a rapid deployment capability to ocument coral reef groundings. DoD is also interested in exploring how emerging
nities to develop productive partnerships between
ere introduced to
cscience outreach coordinator, Ms. Fletcher also recognized the tremendous potential of using landscape video mosaics as display and education tools. Potential collaborations using mosaics and FIRe were suggested for sites in Florida and La Parguera, PR where CREWS/ICON stations are deployed.
SUMMARY and RESULTS The workshop defined the DoD client perspective on coral reef assessment and monitoring needs. Federal policy mandates that DoD characterize, assess, and monitor underwater benthic communities at Air Force, Army, and Navy facilites and ranges in order to document compliance with national policy and to ensure that DoD operations do not lead to natural resource dparticipant in the U.S. Coral Reef Task Force (CRTF), DoD is interested in developing efficient survey methodologies that provide a comprehensive assessment of reef conditions. Specifically, the Navy is looking for technologies and methodologies that will enable the collection of data with less dive time, reproduce data collection transects reliably year after year, and retain flexibility to be modified based on expert evaluation of site conditions at the time of the sudtechnologies may foster new opportuthe Department of the Navy and other organizations.
The workshop also examined methodologies and needs of other agencies with mandates for coral reef monitoring and assessment. Participants were in agreement that current monitoring and assessment strategies conducted by the agencies are, in general, currently adequate to meet present mandates. There was broad interest from all agencies in developing methodologies that reduce dive time, increase cost efficiency and provide repeatable data. Specific challenges and enhanced capabilities that would expand present methodologies were also discussed, especially a projected need to expand coral reefing monitoring to the ecosystem level, highlighting detailed mapping with improved accuracy compared to strip (1D) mosaics, monitoring deep reefs, assessing cause and infection patterns of coral disease, providing non destructive methods for determining coral physiology and support for preemptive risk evaluation of coral reef health.
The two recently developed techniques for coral reef monitoring, landscape osaics and fluorescence induction relaxation techniques (FIRe), wm
project participants. Presentations and demonstrations outlined the capabilities of these techniques, and the potential integration of the two technologies. Workshop participants were in agreement regarding the potential usefulness of both technologies for advancing monitoring and assessment practices of the coral reef community. In particular, consensus was reached that both techniques offer potential for more efficient methods of monitoring coral cover, colony size, mortality, bleaching and disease, population structure, extent of injury and recovery patterns, and documentation of coral reef ecosystem metrics. There was also consensus that transition of both technologies to the end-user community would be valuable.
18
19
ercialization were discussed. One strategy under consideration is to license the technology to a commercial software company such that
roduce their own mosaics. An alternative plan would
Participants expressed opinions that mosaics offer unique opportunities for collecting and analyzing long-term monitoring data and for developing new indicators of coral reef health. The mosaics were considered superior tools for damage assessment and public outreach efforts. It was also suggested that the mosaicing could play an important role in the issue of shallow water munitions management for unexploded ordnance. There was also general agreement that the mosaicing technology is ready for transition to the user community and paths for comm
individuals could buy software to pbe to commercialize a service under which mosaics would be produced on a fee-per-mosaic basis. Participants generally seemed to favor Option 2, but recognized that an informed decision would require a cost benefit analysis.
Participants were enthusiastic about the potential application of FIRe technology for identifying coral stresses. Suggestions were made regarding the need to develop libraries to aid in the interpretation of the FIRe data and to conduct lab work to determine inter and intra species variability, diel fluctuations and looking at the differences within a single colony based on position of the probe and light when using the FIRe technology. It has also been suggested that the FIRe technology could be employed and validated at non-DoD test sites with a known stressor environment, e.g., at a NOAA sites in Puerto Rico. Follow-on work for the FIRe technology will consist of focusing on petrochemicals as the last specified Navy stressor of interest and investigating the synergistic/canceling effect of multiple stressors, e.g. nutrient load and thermal stress. Participants also indicated that regulatory stakeholder agencies would have to agree that this technology possesses the potential to become a mutually acceptable component of their surveys, as both technologies are different from what is currently being accepted as the standard. Coinciding with that challenge is the matter of making technologies as user-friendly as possible or at least providing a practical ability for general field marine ecologists to learn and operate the system(s). Regulatory acceptance could be addressed through the ESTCP Program by involving regulators in field demonstrations.
The overall consensus was that the two technologies are complementary, but not necessarily synergistic, to each other. Integration of the two technologies onto a single platform could be useful in the future to some in the user community, but, in the short te ntegration would not be necessary to benefit from the capabilities of the separate rm, itechnologies when deployed separately. Future integration efforts would benefit from additional lab/field work to develop libraries to aid the interpretation of the FIRe data. There was commentary that separate system development may be as useful as integrated system development.
A matrix was developed based on workshop presentations and discussion illustrating how user-defined coral reef monitoring and assessment needs can be met by the two SERDP-developed technologies (Appendix D). This matrix indicates the potential contributions of mosaics, FIRe, or both technologies to facilitate or improve present monitoring methodologies, enable new capabilities, and provide opportunities for new partnerships.

20
APPENDICES
Appendix A- List o
f Participants
21
22
Name Title Affiliation Address City/State Phone E-mail Mr. James Sinclair Marine
Biologist Minerals Management Service
1201 Elmwood Park Boulevard
New Orleans, LA 70123 504-736-2789 [email protected]
Dr. Ben Ruttenberg
Forida and Caribbean Network Coordinator
National Park Service
South Florida Caribbean Network 18001 Old Cutler Road
Palmetto Bay, FL 33157 305-252-0347 ben_ruttenb nps.goverg@
Dr. William Fisher Research Biologist
U.S. Environmental Protection Agency
USEPA Environmental Effects Research Laboratory Gulf Ecology Division/ORD One Sabine Island Drive
Gulf Breeze, FL 32561-5299
850-934-9394 fisher.william a.gov @ep
Dr. Margaret Miller Ecologist NOAA- Fisheries NOAA-Fisheries, Southeast Fisheries Science Center 75 Virginia Beach Dr.
Miami, FL 305-361-4561 x 561
margaret.w. @noaa.govmiller
Mr. William Precht Program Manager
NOAA- Damage Assessment & Restoration
2001 NW 107th Avenue
Miami, FL 33172 305-852-7717 x 29 [email protected]
Mr. Bret Wolfe National Wildlife Refuge System Marine Programs
U.S. Fish & Wildlife Service
4401 N. Fairfax Drive, No. 570
Arlington, VA 22203 703- 358-2415 ext. 2043
[email protected] ([email protected])
Mr. Chris Bergh Florida Keys Program Director
The Nature Conservancy
PO Box 420237 Summerland Key, FL 33042
305-745-8402 [email protected]
Mr. Bill Goodwin Sanctuary Resource Specialist
National Ocean Servcie (NOS)
Florida Keys National Marine Sanctuary 33 East Quay Rd.
Key West, FL 33040 305-852-7717 x 28 [email protected]
Mr. Rob Warner Oceanographer NOAA- Center for Coastal Monitoring & Assessment
1305 East West Highway, Rm. 8419
Silver Spring, MD 20910 301-713-3028 [email protected]
Name Title Affiliation Address City/State Phone E-mail (CCMA) Biogeography Branch
Dr. Andrew Baker f Marine
and Atmospheric Science, University of Miami
svenor Assistant Professor
Rosenstiel School o
Room 214 GroEast 4600 Rickenbacker Cauesway
Miami, Florida 305-421-4642 [email protected]
Dr. Jerald Ault FEMAR Director & Professor of Marine Biology & Fisheries
pheric
University of Miami
Rosenstiel School of Marine and AtmosScience,
4600 Rickenbacker Causeway
Miami, FL 305-421-4884 [email protected]
Dr. Richard Dodge phy
at NOVA and Executive Director, NCRI
n ch, FL 33004 Dean of Oceanogra
National Coral Reef Institute
Nova SoutheasterUniversity Oceanographic Center 8000 North Ocean Drive
Dania Bea 954- 262-3617 [email protected]
Dr. Sam Purkis Professor at
astern University
h Ocean Drive
Dania Beach, FL 33004 954- 262-3647 [email protected]
NOVA and Principal Investigator, NCRI
National Coral Reef Institute
Nova Southe
Oceanographic Center 8000 Nort
Dr. Bernhard Riegl at d
CRI
ral rn University Oceanographic Center
4 Associate ProfessorNOVA anDeputy Executive Director, N
National CoReef Institute
Nova Southeaste
8000 North Ocean Drive
Dania Beach, FL 3300 954- 262-3671 [email protected]
Ms. Lorri Schwartz Natural Headquarters, Washington Navy Yard Washington, D.C. 20374 202-685-9332 [email protected] Resources Manager
Naval Facilities Engineering Command
23
Name Title Affiliation Address City/State Phone E-mail Ms. Susan Levitt Conservation/C
ontractor stems 1800 N. Beauregard
Street Suite 200
Alexandria, Virginia 22311
703-289-6974 [email protected] SyGovernment Services
su
Ms. Pamela Fletcher
South FlorMarine Ecosystem
ida
Outreach Coordinator for Florida
32611- .govSeaGrant University of Florida Bldg 803 McCarty Drive PO Box 110400 |
Gainesville, FL|0400
352- 392- 5870 Pamela.Fletcher@noaa
Dr. Tim Hayden earch
ram
1 , IL 52821 saceEcologist ACOE Res
& Development Center- Threatened and Endangered Species Prog
PO Box 9005, Champaign, IL 5282
Champaign 217-398-5220 [email protected]
Dr. Eric Bayler Oceanographer
NESDIS
om
ovOffice of Research & Applications,
5200 Auth Road, Ro810
Camp Springs, MD 20746
301-763-8127 x102
Dr. Paul Falkowski Rutgers University
Coastal Sciences
New Brunswick, NJ 732- 932-6555 x 370
[email protected] Professor Institute of Marine &
71 Dudley Road
Dr. Max Gorbunov
Rutgers University
dley Road
New Brunswick, NJ 732-932-7853 [email protected] Associate ResearchProfessor
Institute of Marine & Coastal Sciences 71 Du
Dr. Pam Reid Associate Professor
Rosenstiel School of Marine and Atmospheric Science, University of Miami
N284 Grosvenor North 4600 Rickenbacker Causeway
Miami, FL 305- 421-4606 [email protected]
Dr. Diego Lirman Research Assistant Professor
Rosenstiel School of Marine and AtmosphScience,
eric Building 4600 Rickenbacker Causeway
Room 107 Glassell Miami, FL 305- 421-4168 [email protected]
24
Name Title Affiliation Address City/State Phone E-mail University of Miami
Dr. Nuno Gracias of Professor University Girona
POLITÈCNICA 4 Campus Montilivi 17071 GIRONA
Girona, Spain [email protected]
Ms. Brooke Gintert ,
Geology and Geophysics
Rosenstiel School of Marine
N260 Grosvenor North Miami, FL 305-421-4812 [email protected] Graduate AssistantMarine and Atmospheric
Science, University of Miami
Ms. Meghan Dick Graduate Assistant,
Geology and Geophysics
spheric
N260 Grosvenor North Miami, FL 305-421-4812 [email protected]
Marine
Rosenstiel School of Marine and AtmoScience, University of Miami
Mr. Art Gleason Graduate Assistant, Marine Geology and
s
tiel arine
and Atmospheric Science,
y of
h
Geophysic
RosensSchool of M
UniversitMiami
N260 Grosvenor Nort Miami, FL 305-421-4810 [email protected]
Mr. Humberto Guarin School of Marine
and Atmospheric
Virginia Key , FL 305-361-4716 [email protected] Marine Operations
Rosenstiel
Science, University of Miami
223 SLAB
Mr. Don Marx Marine Ecologist
6506 Hampton Blvd Norfolk, VA 757-322-4376 [email protected]
Mr. John Noles EnvironmePlanner
ntal ities A Naval FacilEngineering Service Center, Atlantic
6506 Hampton Blvd Norfolk, V 757-322-4891 [email protected]
25
Name Title Affiliation Address City/State Phone E-mail Mr. Thomas Szlyk Staff
Environmental Engineer
ea er
chment AUTEC
801 Clematis Street West Palm Beach, FL (561) 832-8566, Ext. 7249
[email protected] UndersWarfare CentDeta
thomas.
Mr. Marc Ciminello Staff Environmental Engineer
rsea rfare Center
Detachment AUTEC
et lm Beach, FL 561-832-8566 avy.Naval UndeWa
801 Clematis Stre West Pa [email protected]
Mr. Bill Wild EnvironmeScientist
ntal val
Pacific 53475 Strothe Rd
CA Space & NaWarfare Systems Center - Pacific
71750 (PL-BS) SPAWARSYSCEN -
San Diego, 619-553-2781 [email protected]
Dr. Ken Richter Oceanographer RICHTER 71750 (PL-BS) SPAWARSYSCEN 53560 HULL STREET
o, CA Space & Naval Warfare Systems Center - Pacific
KENNETH E. San Dieg 619-553-2780 [email protected]
Ms. Cheryl Kurtz st
CHERYL A. KURTZ 71750 (PL-BS) SPAWARSYSCEN 53560 HULL STREET
San Diego, CA 619-553-5313 [email protected] Ecologi
Space & Naval Warfare Systems Center San Diego
c
Ms. Kristen Lau Dr. Hall
11107 Sunset Hills Road, Suite 400
Reston, VA 703-326-7830 [email protected] Staff to HydroGeoLogic Inc.
Dr. John Hall SustainaInfrastruc
ble ture
SERDP/ESTCP 303 3-
1853 Program Manager
DOD - 901 N. Stuart St., Suite Arlington, VA 2220 703-696-2125 [email protected]
26

27
A ndix B- F l Agendas
ppe ina
28
SERDP Coral Reef Monitoring & Assessment Workshop
Time
Day 1- Tuesday November 18, 2008
Description Presenter Agenda
8:30 – 8:45 AM elcome & Introductions Bill Wild, Navy: SPAWAR Pacific W
8:45 – 9:00 AM SERDP/ESTCP: Program Overview and Sponsor Role
Dr. John Hall, OSD: SERDP/ESTCP
9:00 – 9:30 AM DoD Client Perspective Ms. Lorri Schwartz (for Mr. Tom Egeland), Office Assist. Sec. of Navy for Installations
& Environment 9:30 – 9:40 AM Mr. James Sinclair, Minerals Management
Service 9:40 -9:50 AM Dr. Matt Patterson, National Parks Service
9:50 – 10:00 AM Agency/Organization Perspectives Bret Wolfe, Fish & Wildlife Service
10:00 – 10:10 AM Dr. William Fisher, Environmental Protection Agency
10:00 – 10:20 AM Q/A for previous 5 speakers All
10:20 – 10:35 AM Break 10:35 – 10:45 AM NOAA Perspectives Dr. Margaret Miller, NOAA SE Fisheries
10:45 – 10:55 AM Rob Warner, NOAA Center for Coastal Monitoring & Assessment (CCMA)
Biogeography Branch 10:55 – 11:05 AM Bill Goodwin, NOAA Marine Sanctuaries
11:05 – 11:15 AM Dr. Bill Precht, NOAA Damage Assessment and Restoration
11:15 – 11:35 AM Q/A for previous 4 speakers All
11:35 – 12:35 AM Group discussion 1: Monitoring/Assessment Needs
Bill Wild, Navy: SPAWAR Pacific
12:35 – 1:35 PM Working Lunch (continued discussion) 1:35 – 2:20 PM University of Miami Research (includes
10–15 minutes Q/A) Dr. Pamela Reid, Univ. Miami
2:20 – 3:05 PM Rutgers University Research (includes 10–15 minutes Q/A)
Dr. Max Gorbunov and Dr. Paul Falkowski, Rutgers University
3:05 – 3:15 PM Integration of UM/Rutgers Technologies Dr. Diego Lirman, Miami Dr. Max Gorbunov, Rutgers
3:15 – 3:30 PM Break 3:30 – 5:00 PM Group discussion 2: Overlay of
Monitoring/Assessment Needs with Miami/Rutgers Technologies
Bill Wild, Navy: SPAWAR Pacific
5:00 PM Adjourn
7:30 PM Group dinner at Jaguar Ceviche Spoon & Latam Grill
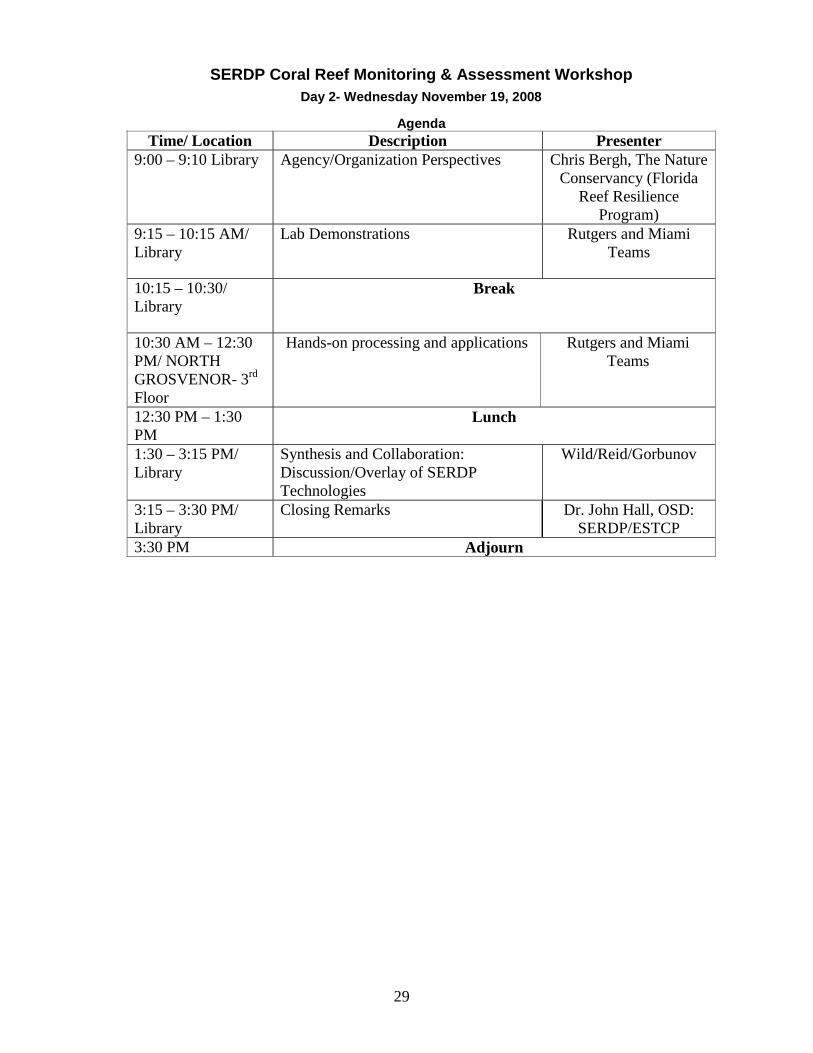
29
SERDP Coral Reef Monitoring & Assessment Workshop
Time/ Loc
Day 2- Wednesday November 19, 2008
Agenda ation Description Presenter
9:00 – 9:10 Library Agency/Organization Perspectives Chris Bergh, The Nature Conservancy (Florida
Reef Resilience Program)
9:15 – 10:15 AM/ Library
Lab Demonstrations Rutgers and Miami Teams
10:15 – 10:30/ Library
Break
10:30 AMPM/ NORTGROSVENORFloor
– 12:30 H
- 3rd
Hands-on processing and applications Rutgers and Miami Teams
12:30 PM – 1:30 PM
Lunch
1:30 – 3:15 PM/ Library
Synthesis and Collaboration: Discussion/Overlay of SERDP Technologies
Wild/Reid/Gorbunov
3:15 – 3:30 PM/ Library
Closing Remarks Dr. John Hall, OSD: SERDP/ESTCP
3:30 PM Adjourn

30
SERDP Coral Reef Monitoring & Assessment Workshop
Time/ Loc
Day 2- Wednesday November 19, 2008
Agenda ation Description Presenter
9:00 – 9:10 Library Agency/Organization Perspectives Chris Bergh, The Nature Conservancy (Florida
Reef Resilience Program)
9:15 – 10:15 AM/ Library
Lab Demonstrations Rutgers and Miami Teams
10:15 – 10:30/ Library
Break
10:30 AMPM/ NORTGROSVENORFloor
– 12:30 H
- 3rd
Hands-on processing and applications Rutgers and Miami Teams
12:30 PM – 1:30 PM
Lunch
1:30 – 3:15 PM/ Library
Synthesis and Collaboration: Discussion/Overlay of SERDP Technologies
Wild/Reid/Gorbunov
3:15 – 3:30 PM/ Library
Closing Remarks Dr. John Hall, OSD: SERDP/ESTCP
3:30 PM Adjourn

Appendix C - Agency Perspective Presentations
31
Strategic Environmental Research and Development Program
Coral Reef WorkshopUniversity of Miami
RSMAS18-19 Nov, 2008
Systems CenterPACIFIC
Two New Developmental Efforts
• University of Miami– High Resolution Landscape Mosaics for
Coral Reef Mapping and Monitoring • Rutgers University
– Analysis of Biophysical, Optical and Genetic Diversity of Coral Reef Communities using Advanced Fluorescence and Molecular Biology Techniques
Group Discussion #1 Monitoring/Assessment Needs
• Overlaps and gaps– What are the methodologies and technologies
currently being used by the speakers and what technology gaps/limitations do they face?
• Summarizing and Prioritizing the assessment needs– How do these organizations foresee
themselves conducting coral reef monitoring in the future?
Group Discussion #2 Overlay of Monitoring/Assessment
Needs with Technologies • Summary spread sheet of agency input
– data collected: geo Location; spatial extent; depth range; temporal frequency; metrics / indicators; gaps / limitations.
• Overlay of SERDP technologies– shows how the mosaics, fluorescence, and the
integration of these two will help fulfill the user needs.
• Application of integrated mosaic- fluorescence data– where can the integrated technology be used?– potential demonstration sites
GROUP DISCUSSION #3 Synthesis and Collaboration:
• Understanding the DoD client perspective on assessment and monitoring needs
• Understanding other potential user perspectives (i.e., in addition to DoD) on what their coral reef monitoring and assessment needs are and how these two SERDP-developed technologies may help address those needs
• Identifying how the two approaches/technologies are complementary to each other and how they can be integrated to meet end-user needs.
SERDP/ESTCP Program Overview and Sponsor Role
Dr. John A. HallSustainable Infrastructure Program Manager
SERDP/ESTCP
SERDP Coral Reef Monitoring & Assessment WorkshopNovember 18, 2008
2
Strategic Environmental Research and Development Program (SERDP)
●
Established by FY 1991 Defense Authorization ActDoD, DOE, and EPA partnership
●
SERDP is a requirements driven program that:Responds directly to user requirements generated by the ServicesIdentifies high‐priority, DoD environmental science and technology needs or investment opportunities that address these requirements
3
Environmental Security Technology Certification Program (ESTCP)
●
Established in 1995●
Demonstrate innovative and cost‐effective environmental methodologies and technologies
Capitalize on past investmentsTransition methods and technology out of the lab and fieldValidate operational cost and performance
●
Promote implementationIdentify DoD user communitySatisfy users by direct application at a DoD facility/siteGain regulatory acceptanceMay lead to technology transfer outside of DoD
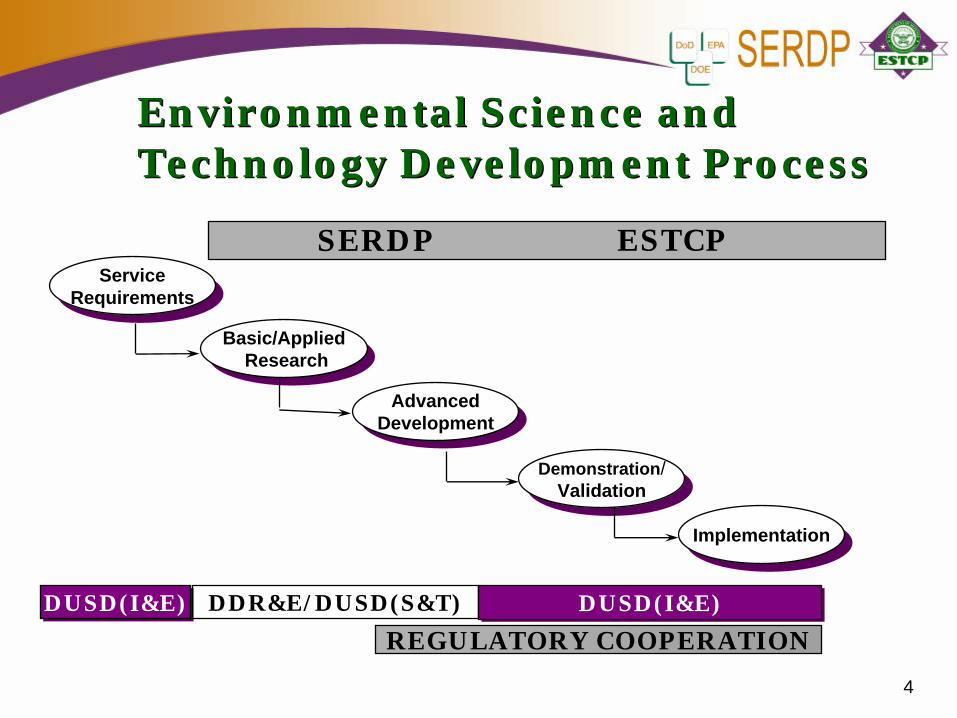
4
Environmental Science and Technology Development Process Environmental Science and Technology Development Process
DUSD(I&E)DUSD(I&E)
SERDP ESTCP
DDR&E/DUSD(S&T)
ServiceRequirements
ServiceRequirements
Basic/AppliedResearch
Basic/AppliedResearch
ImplementationImplementation
AdvancedDevelopmentAdvanced
Development
REGULATORY COOPERATION
Demonstration/Validation
Demonstration/Validation
DUSD(I&E)DUSD(I&E)
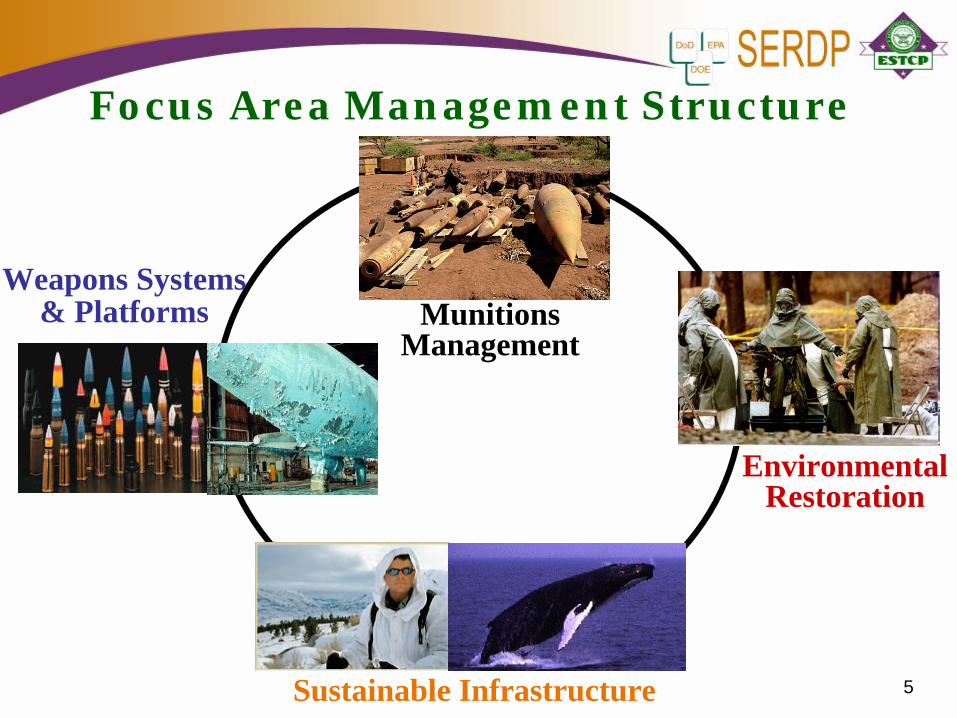
5
Focus Area Management Structure
Sustainable Infrastructure
EnvironmentalRestoration
Weapons Systems& Platforms Munitions
Management
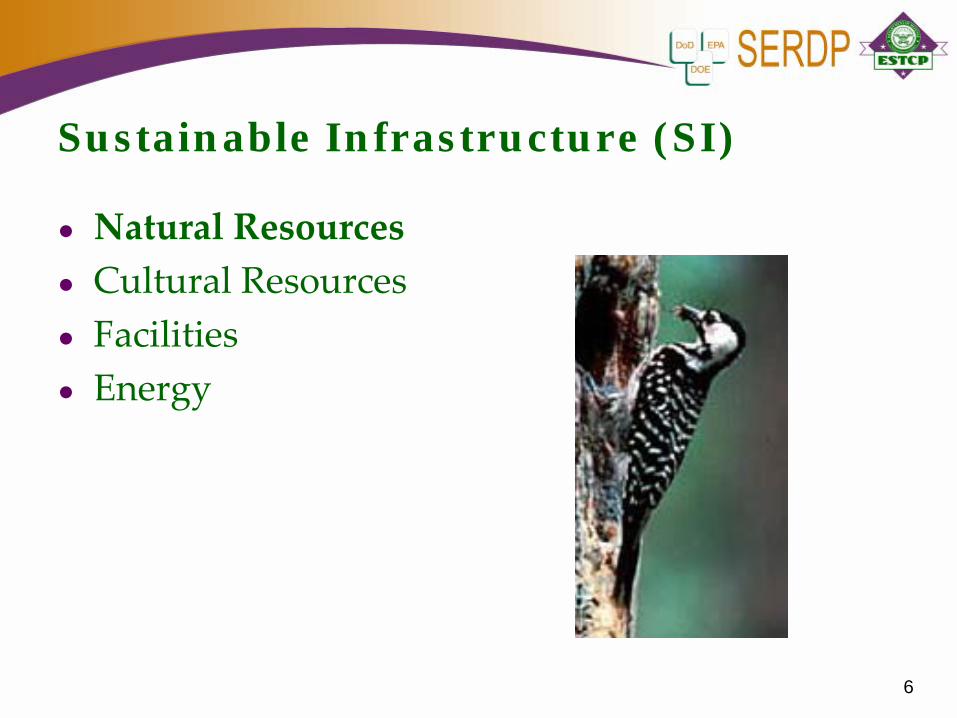
6
Sustainable Infrastructure (SI)
●
Natural Resources●
Cultural Resources●
Facilities●
Energy
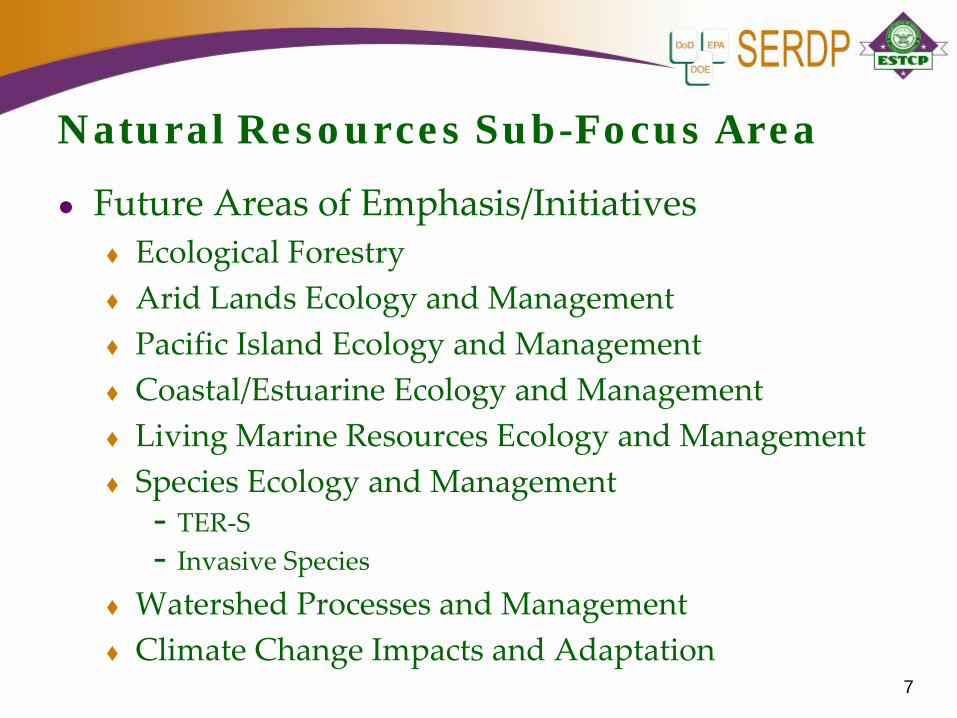
7
Natural Resources Sub-Focus Area
●
Future Areas of Emphasis/InitiativesEcological ForestryArid Lands Ecology and ManagementPacific Island Ecology and ManagementCoastal/Estuarine Ecology and ManagementLiving Marine Resources Ecology and ManagementSpecies Ecology and Management- TER‐S- Invasive Species
Watershed Processes and ManagementClimate Change Impacts and Adaptation
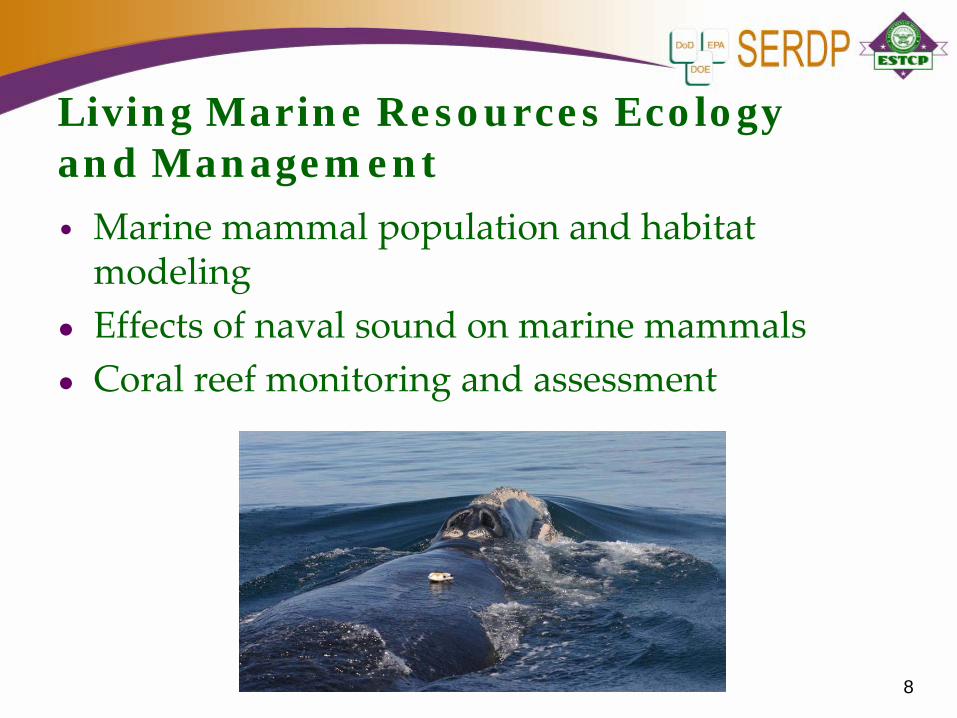
8
Living Marine Resources Ecology and Management
•
Marine mammal population and habitat modeling
●
Effects of naval sound on marine mammals ●
Coral reef monitoring and assessment
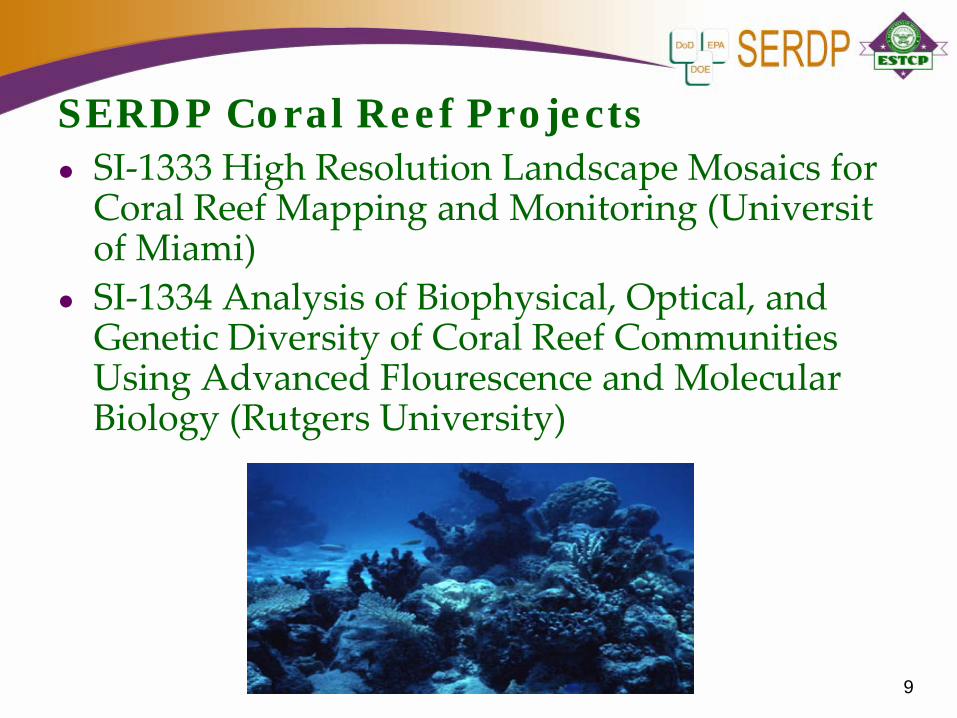
9
SERDP Coral Reef Projects●
SI‐1333 High Resolution Landscape Mosaics for Coral Reef Mapping and Monitoring (Universit
of Miami)●
SI‐1334 Analysis of Biophysical, Optical, and Genetic Diversity of Coral Reef Communities Using Advanced Flourescence
and Molecular
Biology (Rutgers University)
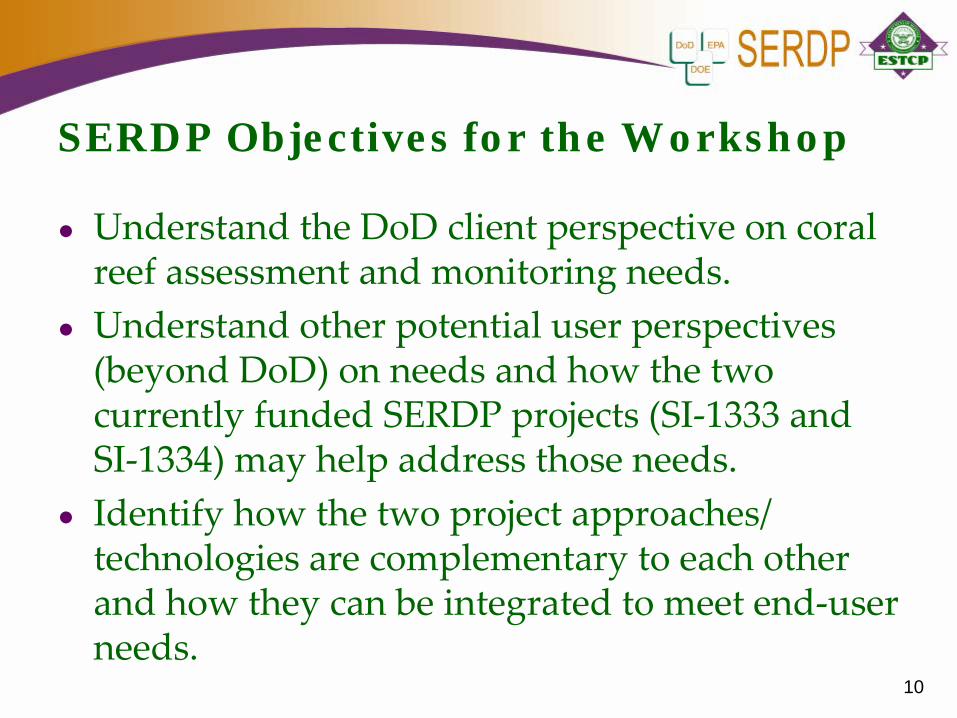
10
SERDP Objectives for the Workshop
●
Understand the DoD client perspective on coral reef assessment and monitoring needs.
●
Understand other potential user perspectives (beyond DoD) on needs and how the two
currently funded SERDP projects (SI‐1333 and SI‐1334) may help address those needs.
●
Identify how the two project approaches/ technologies are complementary to each other
and how they can be integrated to meet end‐user needs.
11
SERDP Solicitation Process
●
Annual Solicitations to Meet DoD NeedsTwo Solicitations (Core and SEED)Open to All: Government, Academia, Industry
●
Competitive AwardExternal Peer ReviewInternal and Scientific Advisory Board Review
●
Transition to Demonstration/Validation
12
ESTCP Solicitation Process
●
Annual SolicitationsTopic areas (BAA) for non‐DoD leadsMature methodologies and technologies for DoD leadsNatural resource and energy topic areas started in FY08Identify DoD liaison for BAA proposals
●
Competitive ProcessPre‐proposalFull proposalOral presentationProgram Office and ESTCP Technical Committee review/down‐selects throughout
13
General Solicitation Timelines
●
SERDPAnnual Solicitation ‐ November “SEED” Solicitation – NovemberSelection in June/JulySAB Reviews in September/October
●
ESTCPAnnual Solicitation ‐ JanuarySelection in September
14
Getting the Details
●
SERDP: www.serdp.org●
ESTCP: www.estcp.org●
Online Library: http://docs.serdp‐estcp.org/Final ReportsFact SheetsCost and Performance Reports
●
TER‐S Regional Workshopswww.serdp.org/tes
DoD Client Perspective DoD Client Perspective Mr. Tom EgelandMr. Tom Egeland
ODASN (E)ODASN (E)
SERDP Coral Reef Monitoring and SERDP Coral Reef Monitoring and Assessment WorkshopAssessment Workshop
November 18 and 19, 2008
DoD Mission & PolicyDoD Mission & Policy
Mission: To provide the military forces needed to deter war and to protect the security of our country.
Policy: Sustain healthy natural resources for future generations while fulfilling the mission.
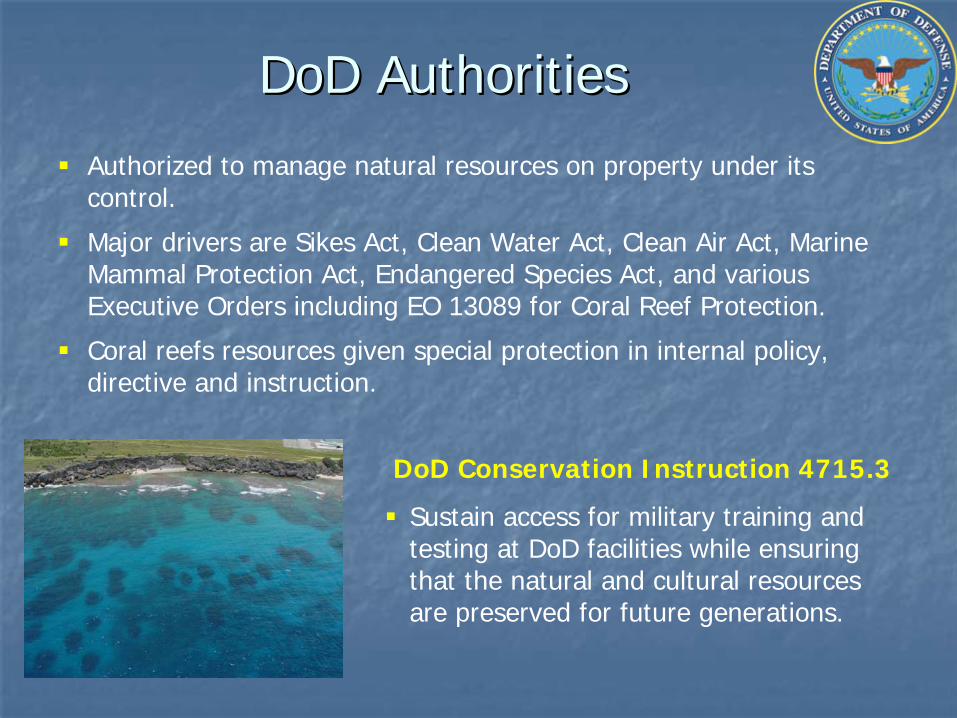
Authorized to manage natural resources on property under its control.
Major drivers are Sikes Act, Clean Water Act, Clean Air Act, Marine Mammal Protection Act, Endangered Species Act, and various Executive Orders including EO 13089 for Coral Reef Protection.
Coral reefs resources given special protection in internal policy, directive and instruction.
DoD AuthoritiesDoD Authorities
DoD Conservation Instruction 4715.3
Sustain access for military training and testing at DoD facilities while ensuring that the natural and cultural resources are preserved for future generations.
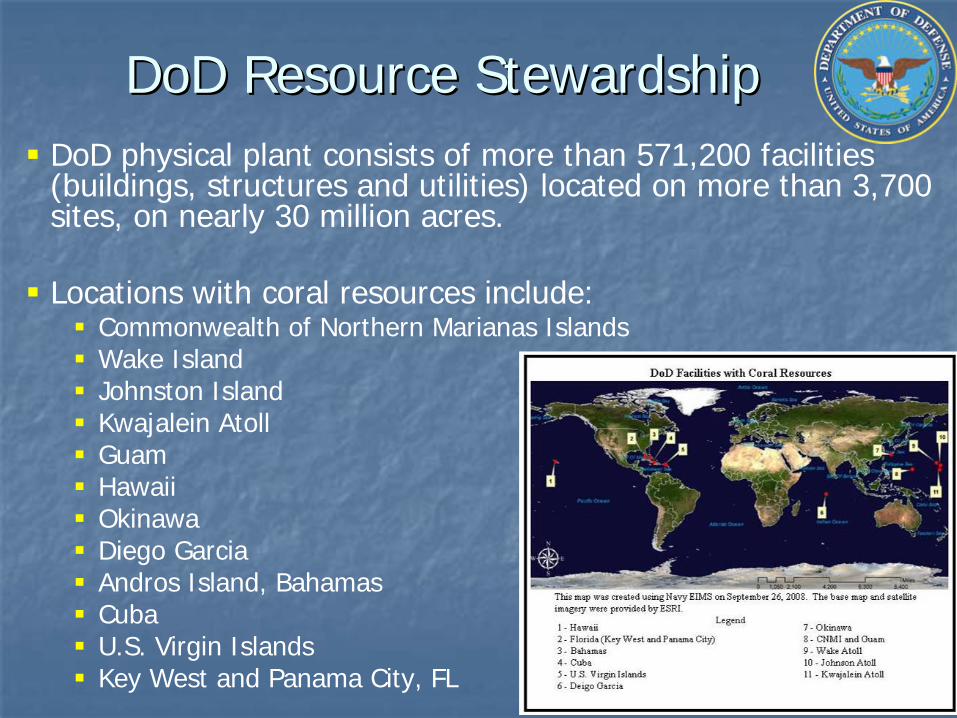
DoD physical plant consists of more than 571,200 facilities (buildings, structures and utilities) located on more than 3,700sites, on nearly 30 million acres.
Locations with coral resources include: Commonwealth of Northern Marianas IslandsWake IslandJohnston IslandKwajalein AtollGuamHawaiiOkinawa Diego Garcia Andros Island, BahamasCubaU.S. Virgin Islands Key West and Panama City, FL
DoD Resource StewardshipDoD Resource Stewardship
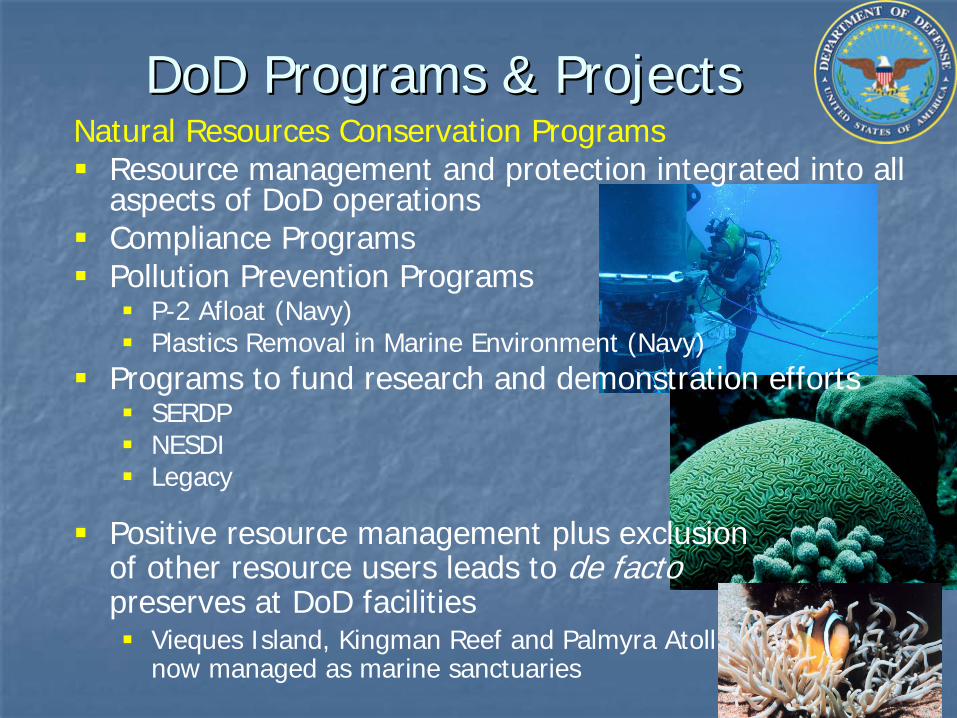
DoD Programs & ProjectsDoD Programs & Projects
Positive resource management plus exclusion of other resource users leads to de factopreserves at DoD facilities
Vieques Island, Kingman Reef and Palmyra Atoll now managed as marine sanctuaries
Natural Resources Conservation ProgramsResource management and protection integrated into all aspects of DoD operations Compliance ProgramsPollution Prevention Programs
P-2 Afloat (Navy)Plastics Removal in Marine Environment (Navy)
Programs to fund research and demonstration effortsSERDP NESDI Legacy
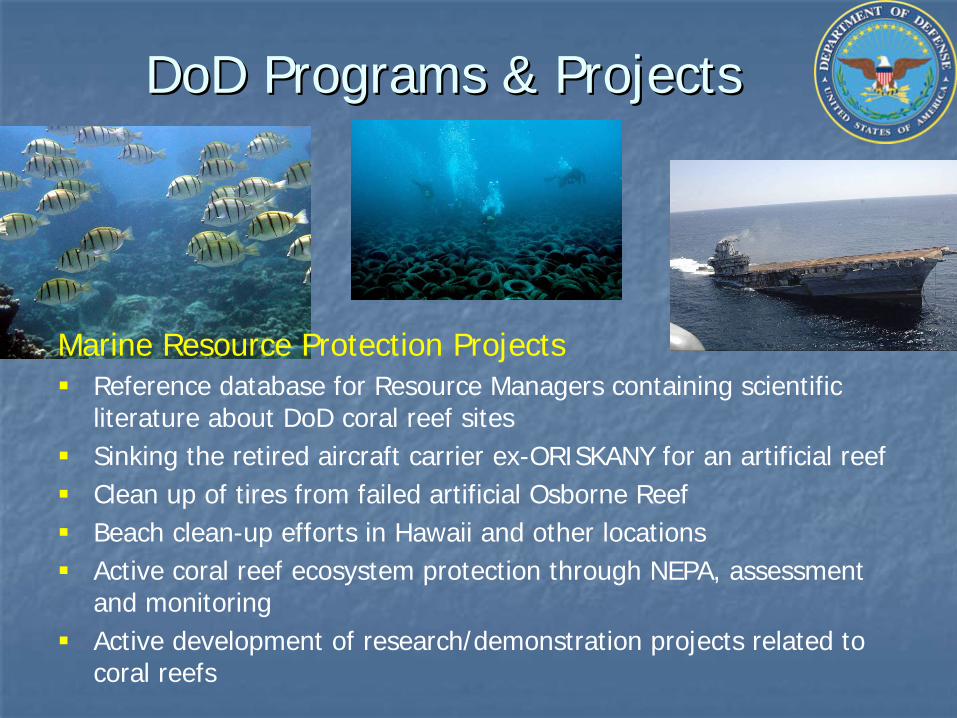
DoD Programs & ProjectsDoD Programs & Projects
Marine Resource Protection ProjectsReference database for Resource Managers containing scientific literature about DoD coral reef sitesSinking the retired aircraft carrier ex-ORISKANY for an artificial reefClean up of tires from failed artificial Osborne ReefBeach clean-up efforts in Hawaii and other locationsActive coral reef ecosystem protection through NEPA, assessment and monitoringActive development of research/demonstration projects related tocoral reefs
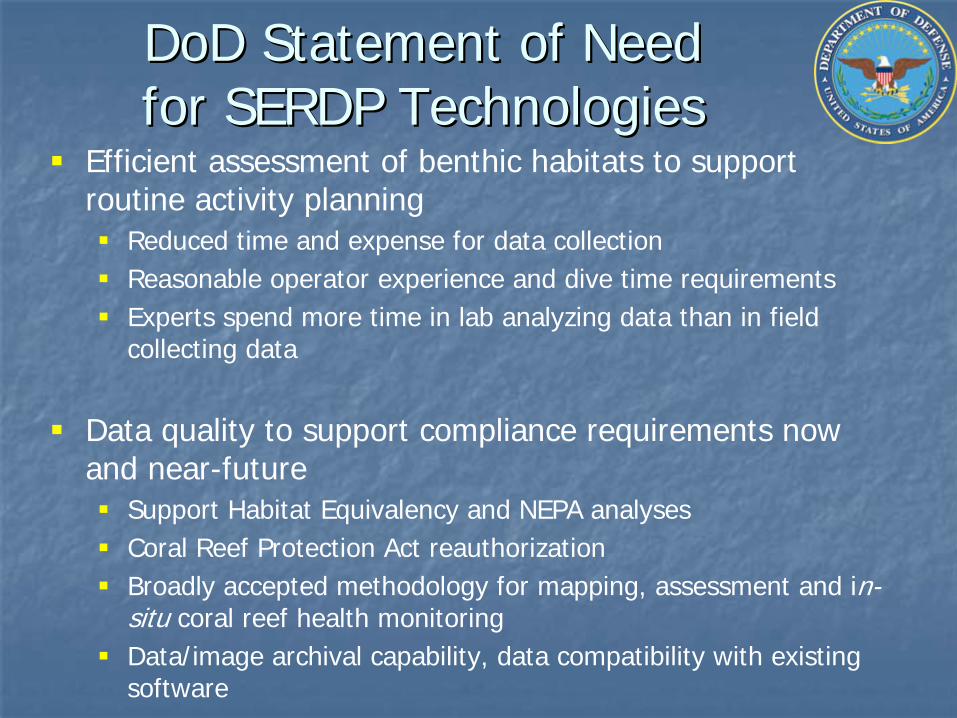
Efficient assessment of benthic habitats to support routine activity planning
Reduced time and expense for data collectionReasonable operator experience and dive time requirementsExperts spend more time in lab analyzing data than in field collecting data
Data quality to support compliance requirements now and near-future
Support Habitat Equivalency and NEPA analysesCoral Reef Protection Act reauthorizationBroadly accepted methodology for mapping, assessment and in-situ coral reef health monitoringData/image archival capability, data compatibility with existingsoftware
DoD Statement of Need DoD Statement of Need for SERDP Technologies for SERDP Technologies
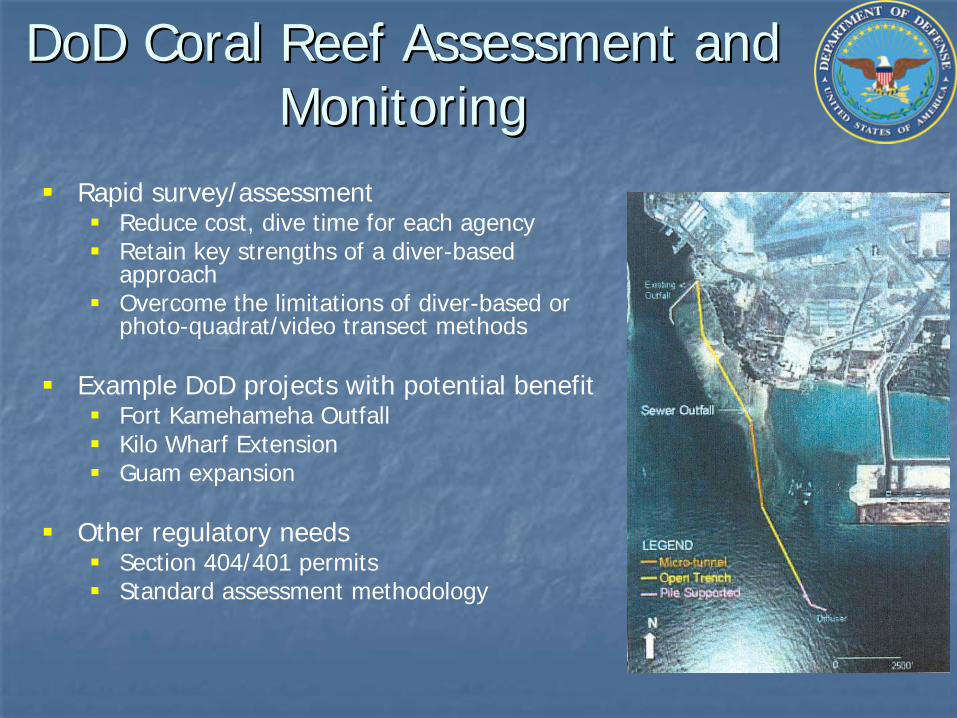
Rapid survey/assessmentReduce cost, dive time for each agencyRetain key strengths of a diver-based approachOvercome the limitations of diver-based or photo-quadrat/video transect methods
Example DoD projects with potential benefitFort Kamehameha OutfallKilo Wharf ExtensionGuam expansion
Other regulatory needsSection 404/401 permitsStandard assessment methodology
DoD Coral Reef Assessment and DoD Coral Reef Assessment and Monitoring Monitoring
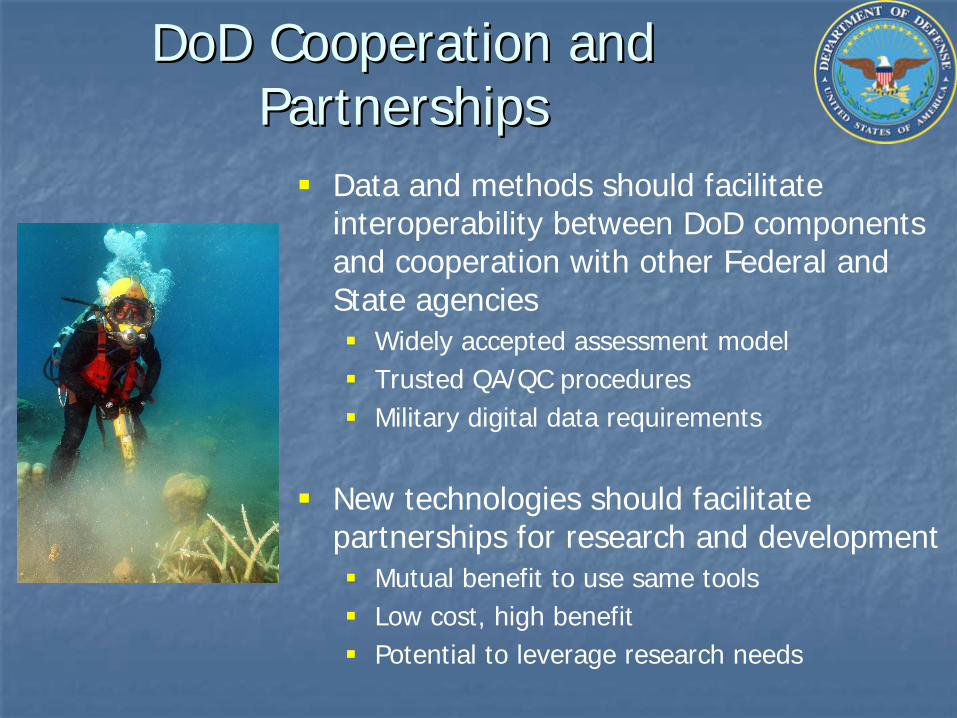
Data and methods should facilitate interoperability between DoD components and cooperation with other Federal and State agencies
Widely accepted assessment modelTrusted QA/QC proceduresMilitary digital data requirements
New technologies should facilitate partnerships for research and development
Mutual benefit to use same toolsLow cost, high benefitPotential to leverage research needs
DoD Cooperation and DoD Cooperation and PartnershipsPartnerships
DoD Client PerspectiveDoD Client Perspective
Questions?
U.S. Department of the InteriorU.S. Department of the Interior Minerals Management ServiceMinerals Management Service
Protection and Monitoring Protection and Monitoring of Reef Communities of Reef Communities in the Gulf of Mexicoin the Gulf of Mexico
James Sinclair, Marine Biologist, MMS Gulf of MexicoJames Sinclair, Marine Biologist, MMS Gulf of Mexico
MM
SSe
curin
g O
cean
Ene
rgy
&
Econ
omic
Val
ue fo
r Am
eric
a
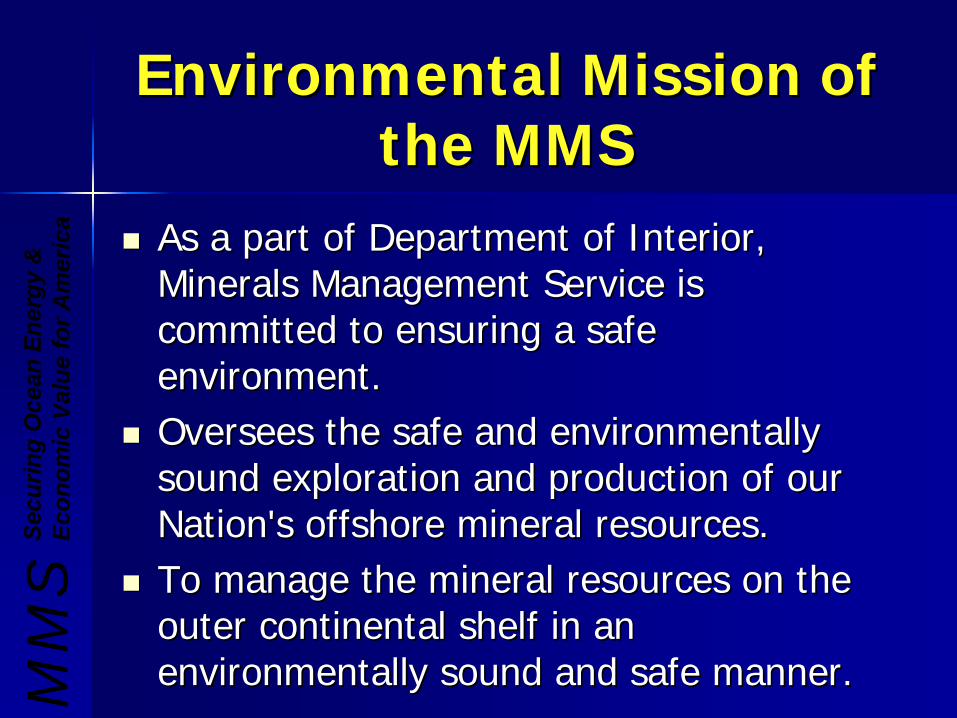
Environmental Mission of Environmental Mission of the MMSthe MMS
As a part of Department of Interior, As a part of Department of Interior, Minerals Management Service is Minerals Management Service is committed to ensuring a safe committed to ensuring a safe environment. environment. Oversees the safe and environmentally Oversees the safe and environmentally sound exploration and production of our sound exploration and production of our Nation's offshore mineral resources. Nation's offshore mineral resources. To manage the mineral resources on the To manage the mineral resources on the outer continental shelf in an outer continental shelf in an environmentally sound and safe manner. environmentally sound and safe manner. M
MS
Secu
ring
Oce
an E
nerg
y &
Ec
onom
ic V
alue
for A
mer
ica
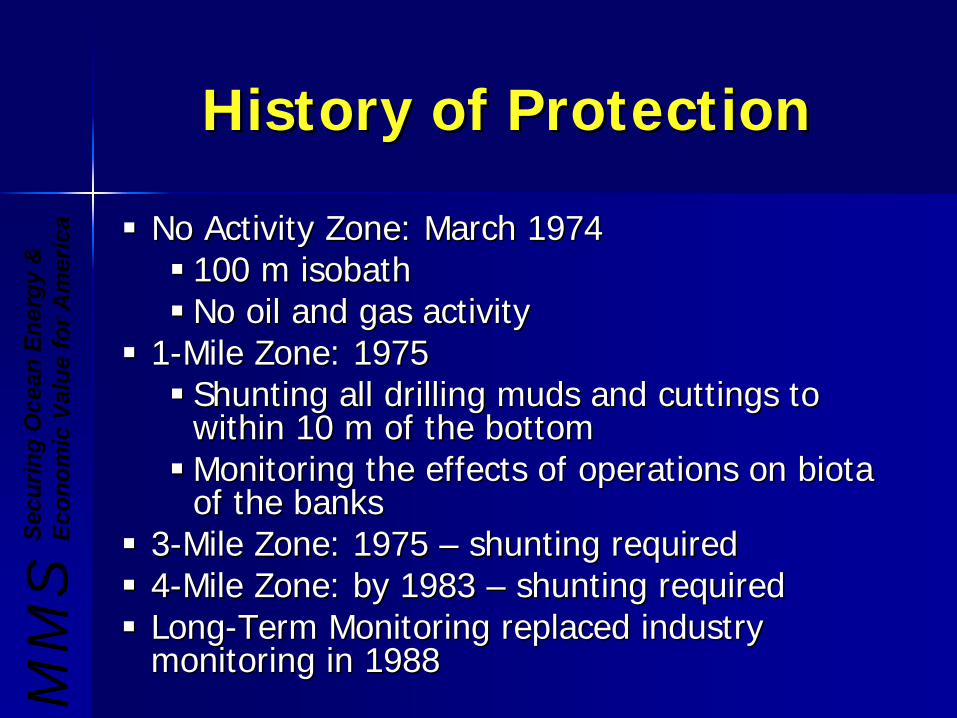
History of ProtectionHistory of Protection
No Activity Zone: March 1974No Activity Zone: March 1974100 m isobath100 m isobathNo oil and gas activityNo oil and gas activity
11--Mile Zone: 1975Mile Zone: 1975Shunting all drilling muds and cuttings to Shunting all drilling muds and cuttings to within 10 m of the bottomwithin 10 m of the bottomMonitoring the effects of operations on biota Monitoring the effects of operations on biota of the banksof the banks
33--Mile Zone: 1975 Mile Zone: 1975 –– shunting requiredshunting required44--Mile Zone: by 1983 Mile Zone: by 1983 –– shunting requiredshunting requiredLongLong--Term Monitoring replaced industry Term Monitoring replaced industry monitoring in 1988monitoring in 1988
MM
SSe
curin
g O
cean
Ene
rgy
&
Econ
omic
Val
ue fo
r Am
eric
a
The MMS Role in The MMS Role in Protecting ReefsProtecting Reefs
Regulation of oil and gas Regulation of oil and gas activities on the outer activities on the outer continental shelfcontinental shelfFederal watersFederal watersConnected infrastructure and Connected infrastructure and supportsupport
MM
SSe
curin
g O
cean
Ene
rgy
&
Econ
omic
Val
ue fo
r Am
eric
a
Regulations to Protect Regulations to Protect ReefsReefs
Live BottomsLive Bottoms–– Low ReliefLow Relief–– Pinnacle TrendPinnacle TrendPotentially Sensitive Biological Potentially Sensitive Biological Features (PSBF’s)Features (PSBF’s)Topographic FeaturesTopographic FeaturesChemosynthetic CommunitiesChemosynthetic Communities
MM
SSe
curin
g O
cean
Ene
rgy
&
Econ
omic
Val
ue fo
r Am
eric
a
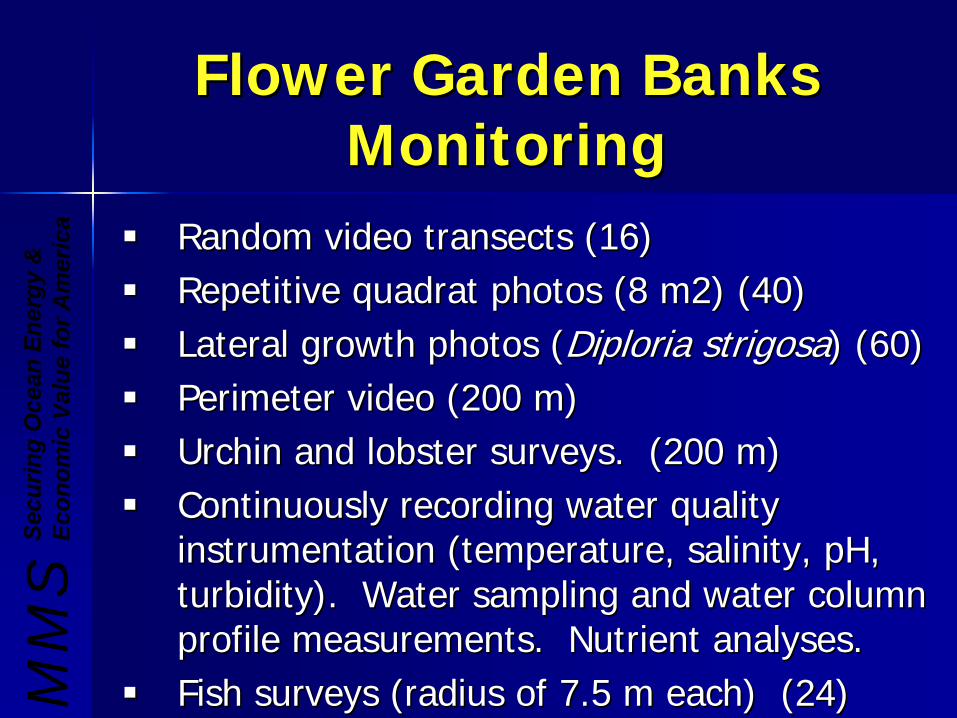
Flower Garden Banks Flower Garden Banks MonitoringMonitoring
Random video transects (16)Random video transects (16)Repetitive quadrat photos (8 m2) (40)Repetitive quadrat photos (8 m2) (40)Lateral growth photos (Lateral growth photos (Diploria strigosaDiploria strigosa) (60)) (60)Perimeter video (200 m)Perimeter video (200 m)Urchin and lobster surveys. (200 m)Urchin and lobster surveys. (200 m)Continuously recording water quality Continuously recording water quality instrumentation (temperature, salinity, pH, instrumentation (temperature, salinity, pH, turbidity). Water sampling and water column turbidity). Water sampling and water column profile measurements. Nutrient analyses. profile measurements. Nutrient analyses. Fish surveys (radius of 7.5 m each) (24)Fish surveys (radius of 7.5 m each) (24)M
MS
Secu
ring
Oce
an E
nerg
y &
Ec
onom
ic V
alue
for A
mer
ica
Monitoring NeedsMonitoring Needs
Mapping to identify Mapping to identify habitatshabitatsCharacterize habitatsCharacterize habitatsUpdated baseline dataUpdated baseline data
MM
SSe
curin
g O
cean
Ene
rgy
&
Econ
omic
Val
ue fo
r Am
eric
a

U.S. Department of the InteriorU.S. Department of the Interior Minerals Management ServiceMinerals Management Service
[email protected]@mms.govMM
SSe
curin
g O
cean
Ene
rgy
&
Econ
omic
Val
ue fo
r Am
eric
a
South Florida and Caribbean Perspectives to Coral Reef Monitoring and Assessment
Matt Patterson, NPS SFCN Network Coordinator Dr. Benjamin Ruttenberg, SFCN Marine Ecologist
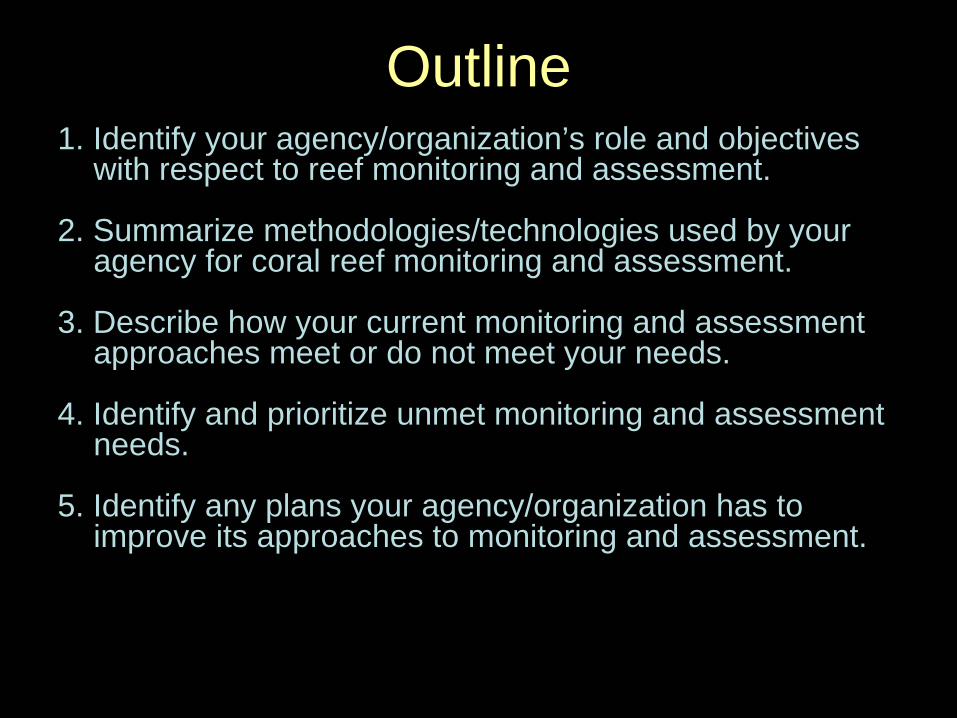
Outline1. Identify your agency/organization’s role and objectives
with respect to reef monitoring and assessment.
2. Summarize methodologies/technologies used by your agency for coral reef monitoring and assessment.
3. Describe how your current monitoring and assessment approaches meet or do not meet your needs.
4. Identify and prioritize unmet monitoring and assessment needs.
5. Identify any plans your agency/organization has to improve its approaches to monitoring and assessment.
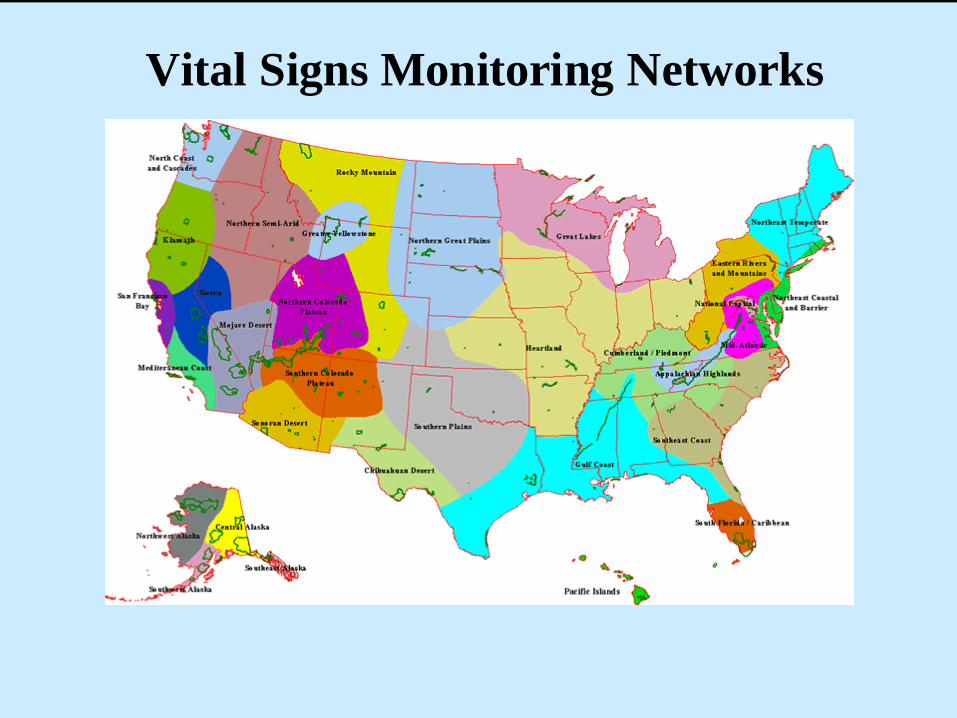
Vital Signs Monitoring Networks
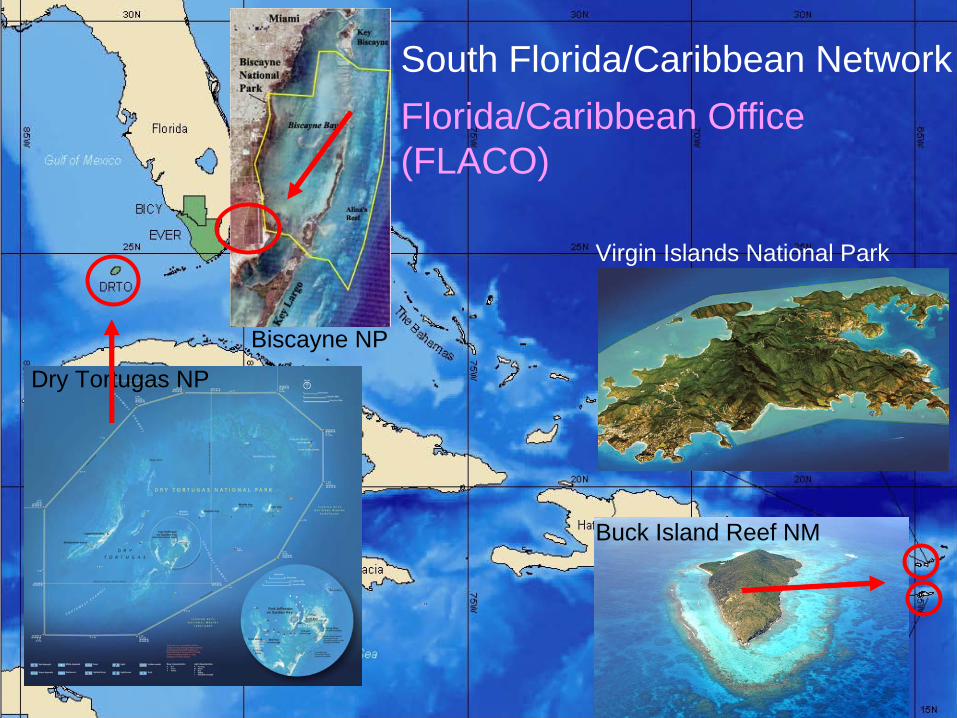
Dry Tortugas NP
Buck Island Reef NM
Virgin Islands National Park
Biscayne NP
South Florida/Caribbean NetworkFlorida/Caribbean Office(FLACO)
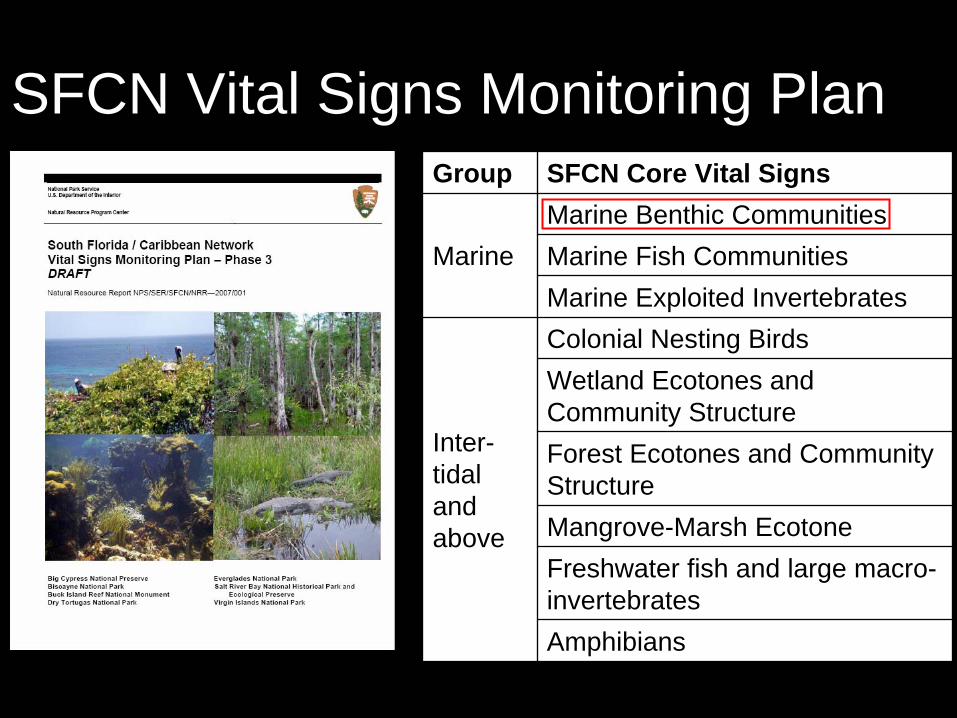
SFCN Vital Signs Monitoring PlanGroup SFCN Core Vital Signs
MarineMarine Benthic CommunitiesMarine Fish CommunitiesMarine Exploited Invertebrates
Inter- tidal and above
Colonial Nesting BirdsWetland Ecotones and Community StructureForest Ecotones and Community StructureMangrove-Marsh EcotoneFreshwater fish and large macro- invertebratesAmphibians
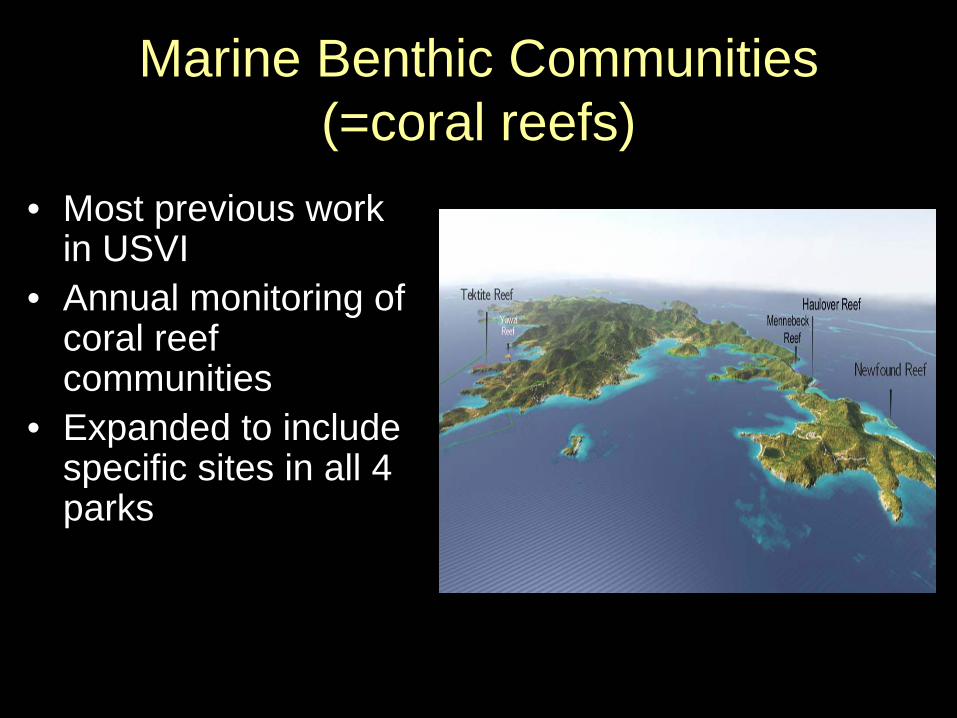
Marine Benthic Communities (=coral reefs)
• Most previous work in USVI
• Annual monitoring of coral reef communities
• Expanded to include specific sites in all 4 parks
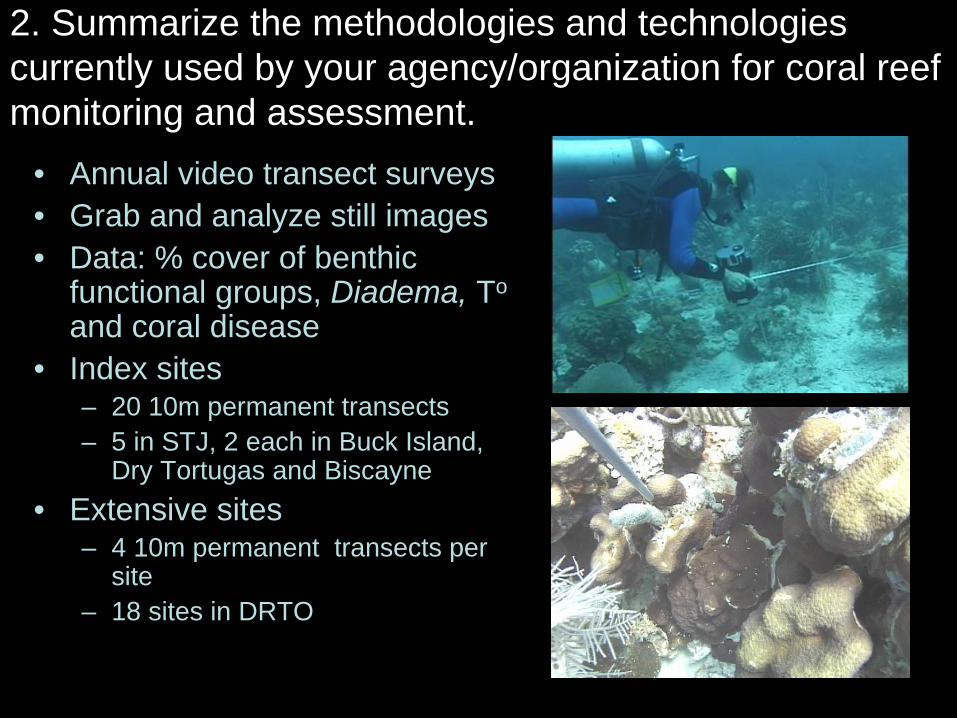
2. Summarize the methodologies and technologies currently used by your agency/organization for coral reef monitoring and assessment.
• Annual video transect surveys• Grab and analyze still images• Data: % cover of benthic
functional groups, Diadema, To
and coral disease• Index sites
– 20 10m permanent transects– 5 in STJ, 2 each in Buck Island,
Dry Tortugas and Biscayne• Extensive sites
– 4 10m permanent transects per site
– 18 sites in DRTO
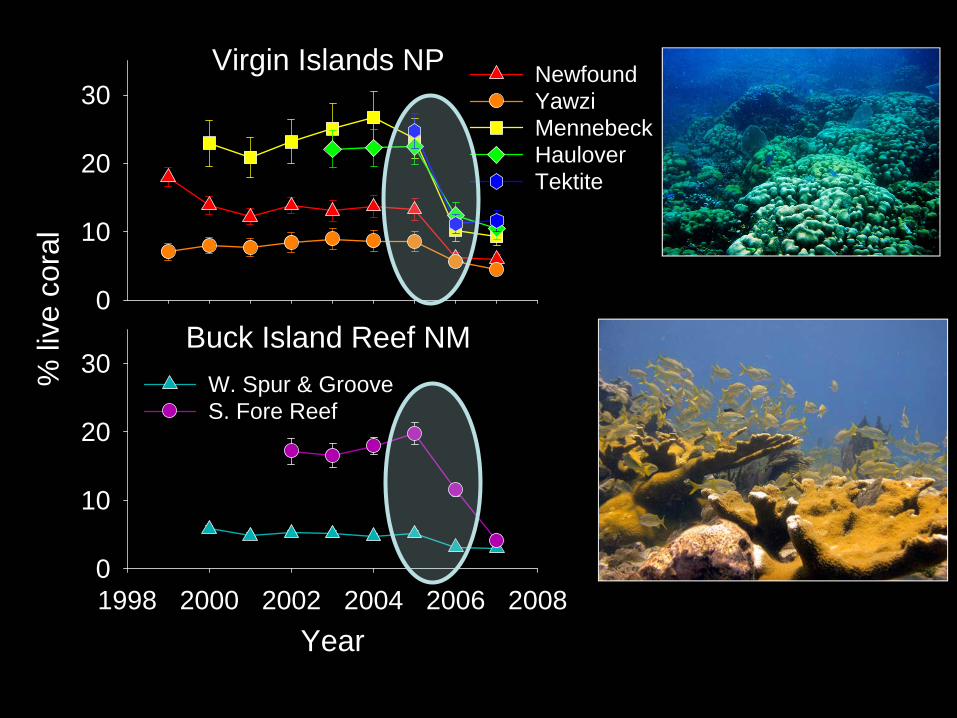
Virgin Islands NP%
live
cor
al
0
10
20
30Newfound Yawzi Mennebeck Haulover Tektite
Buck Island Reef NM
Year1998 2000 2002 2004 2006 20080
10
20
30W. Spur & GrooveS. Fore Reef
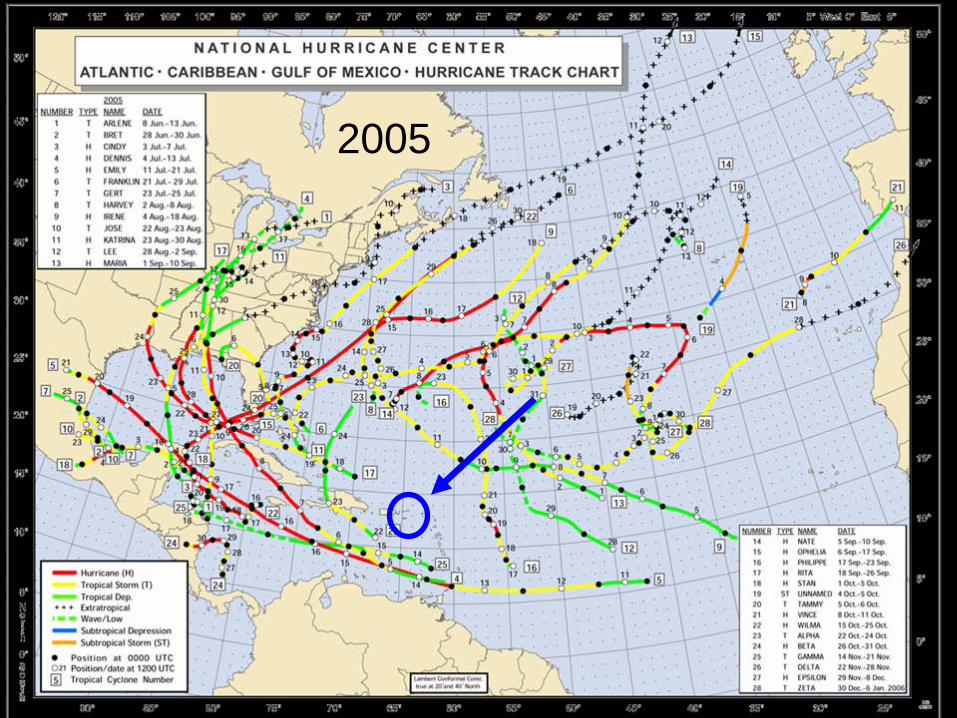
2005
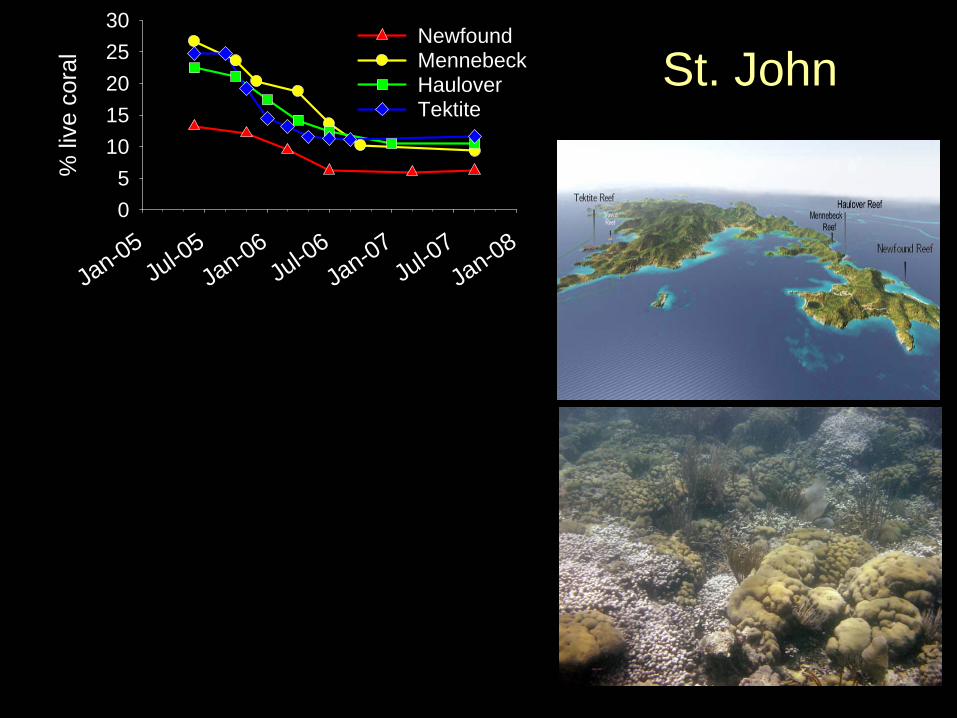
% li
ve c
oral
05
1015202530
NewfoundMennebeckHauloverTektite
Jan-05
Jul-05
Jan-06
Jul-06
Jan-07
Jul-07
Jan-08
St. John
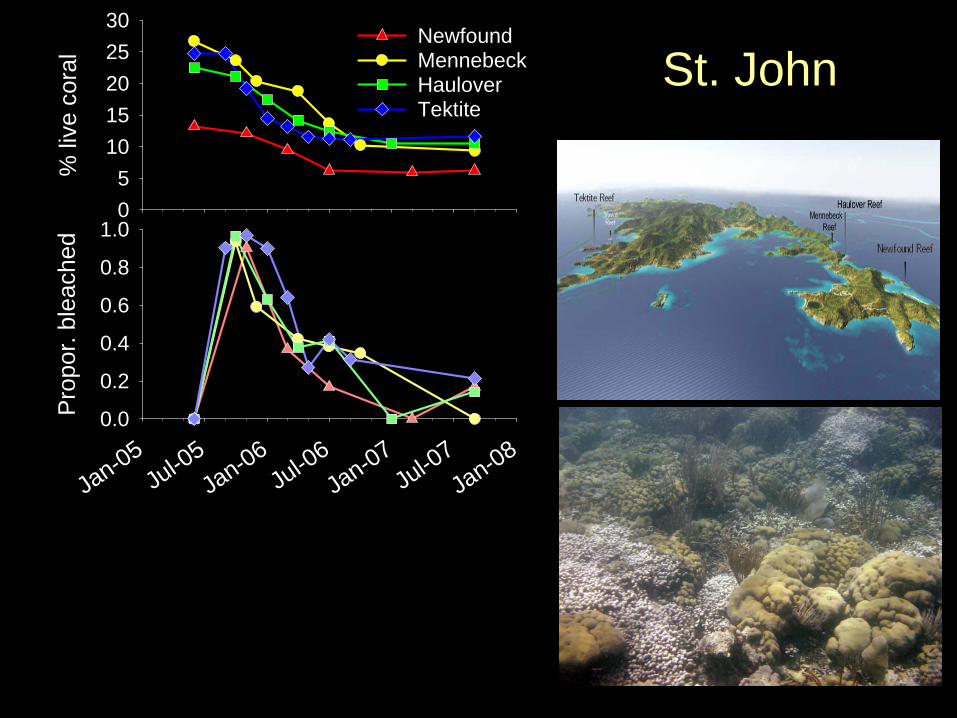
% li
ve c
oral
05
1015202530
NewfoundMennebeckHauloverTektite
Pro
por.
blea
ched
0.0
0.2
0.4
0.6
0.8
1.0
Jan-05
Jul-05
Jan-06
Jul-06
Jan-07
Jul-07
Jan-08
St. John
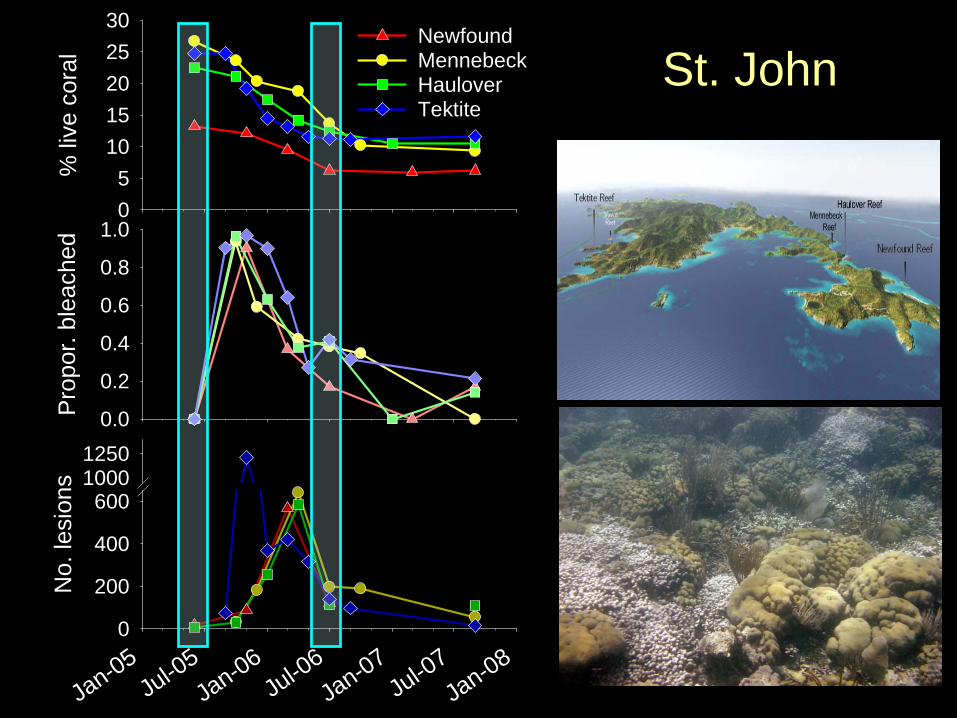
% li
ve c
oral
05
1015202530
NewfoundMennebeckHauloverTektite
Pro
por.
blea
ched
0.0
0.2
0.4
0.6
0.8
1.0
Jan-05
Jul-05
Jan-06
Jul-06
Jan-07
Jul-07
Jan-08
No.
lesi
ons
0
200
400
60010001250
St. John
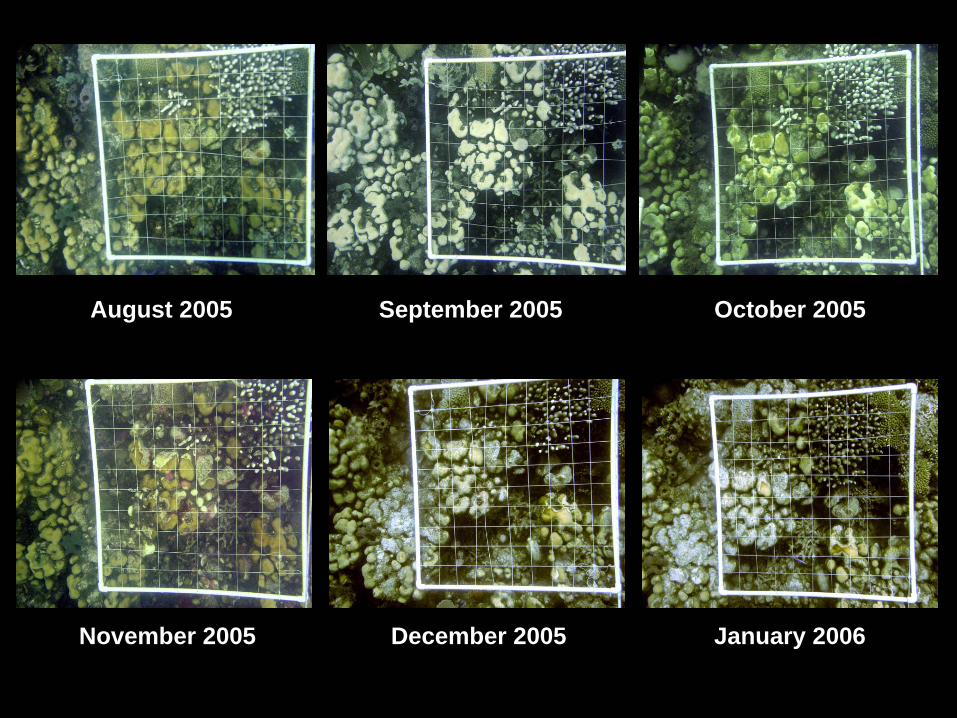
August 2005 September 2005 October 2005
November 2005 December 2005 January 2006
Photo by NPS
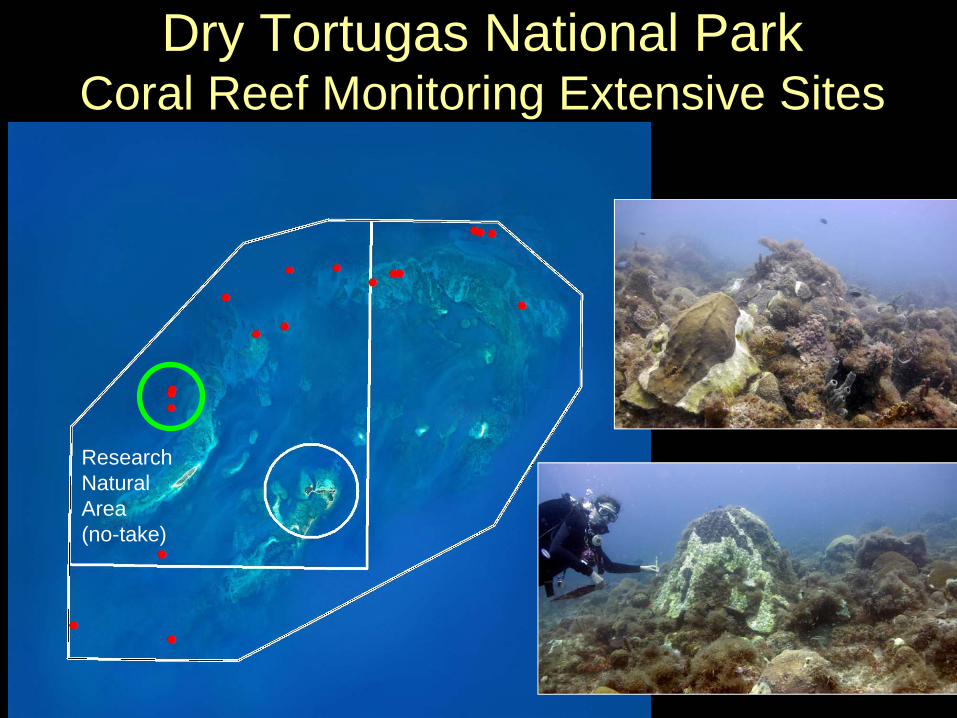
Dry Tortugas National Park Coral Reef Monitoring Extensive Sites
Research Natural Area(no-take)
South Florida/Caribbean Network I&M Program
Rapid Response to Disease Event1. June 19, 2008 - Contact CDHC (Cheryl Woodley) describing the
outbreak
2. June 20-22 – Initial Response: photos, prevalence and spatial extent of outbreak.
3. July 10, 2008 - International Coral Reef Symposium meeting to plan for a rapid response cruise to DRTO the following week
4. July 16-18, 2008 - NPS provided logistical support to George Mason Univ. (Drs. Bob Jonas, Geoff Cook). Collected samples of diseased corals. CDHC provides support for analysis of samples collected (biomarkers, histology, and bacteria culture).
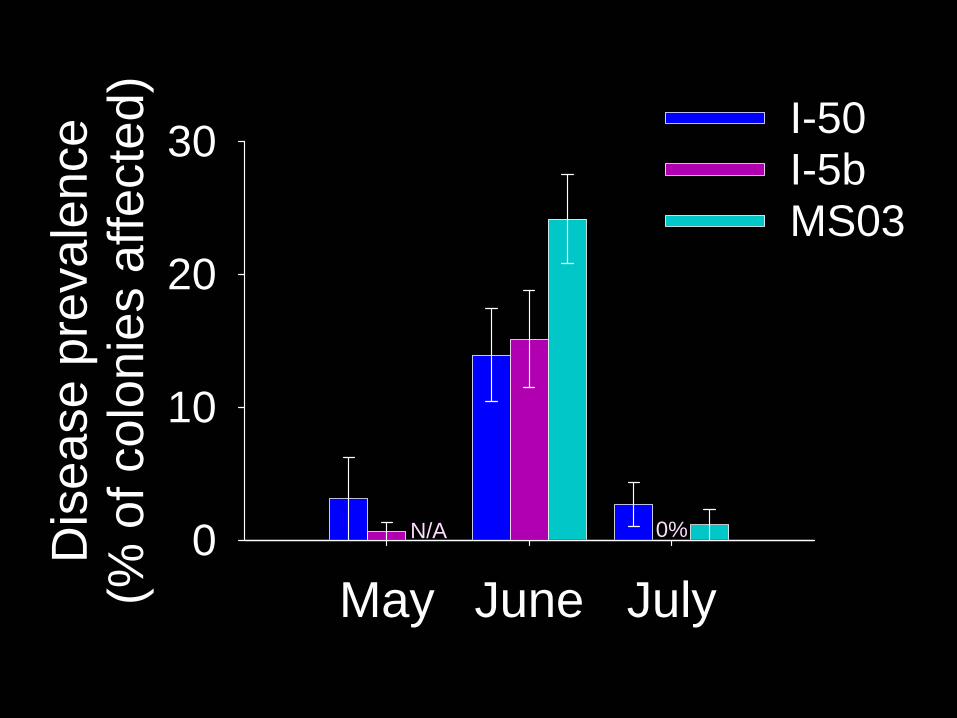
May June July
Dis
ease
pre
vale
nce
(% o
f col
onie
s af
fect
ed)
0
10
20
30 I-50I-5bMS03
N/A 0%
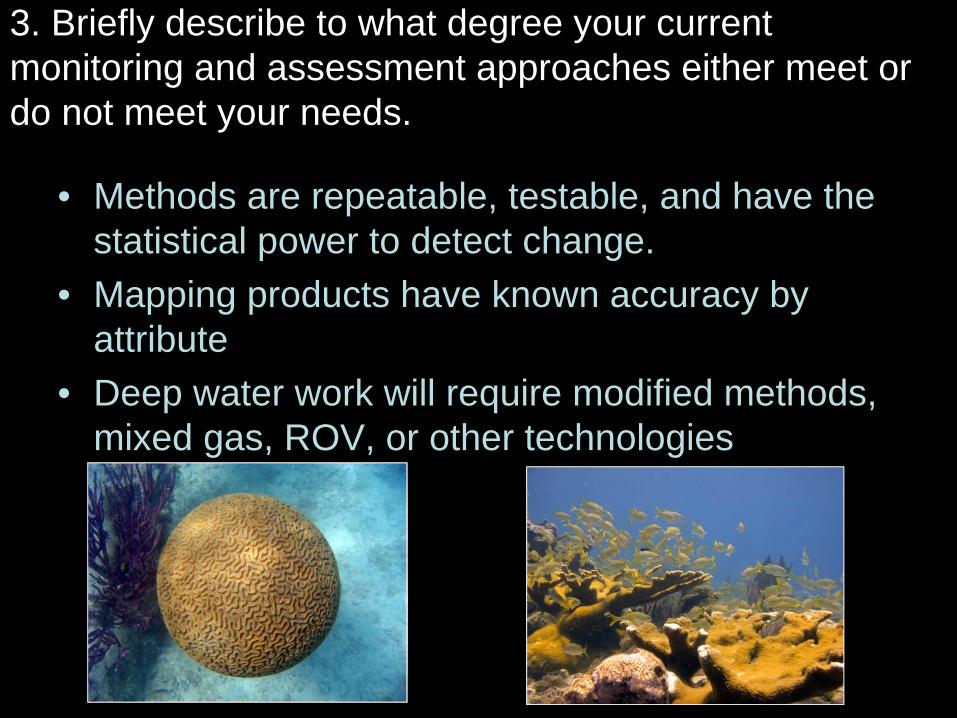
3. Briefly describe to what degree your current monitoring and assessment approaches either meet or do not meet your needs.
• Methods are repeatable, testable, and have the statistical power to detect change.
• Mapping products have known accuracy by attribute
• Deep water work will require modified methods, mixed gas, ROV, or other technologies
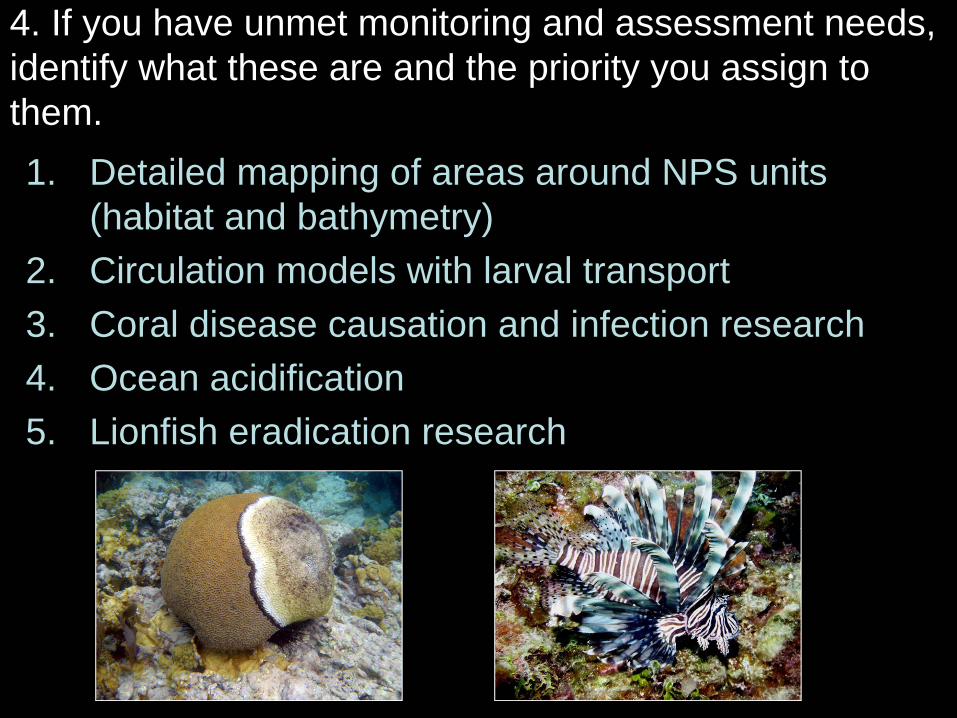
4. If you have unmet monitoring and assessment needs, identify what these are and the priority you assign to them.1. Detailed mapping of areas around NPS units
(habitat and bathymetry)2. Circulation models with larval transport3. Coral disease causation and infection research4. Ocean acidification5. Lionfish eradication research
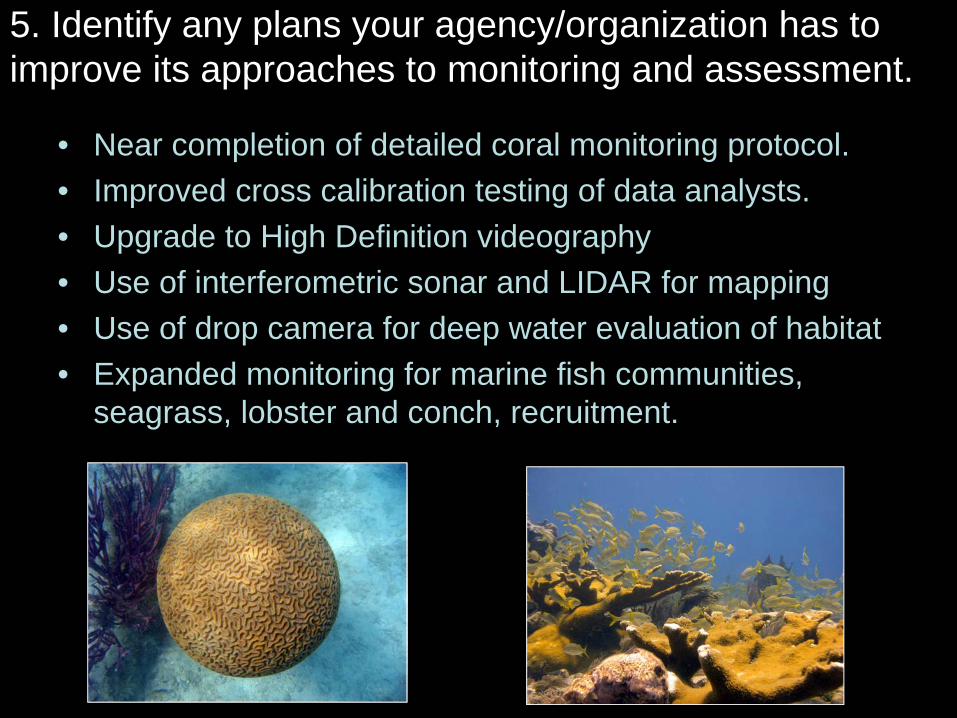
5. Identify any plans your agency/organization has to improve its approaches to monitoring and assessment.
• Near completion of detailed coral monitoring protocol.• Improved cross calibration testing of data analysts.• Upgrade to High Definition videography• Use of interferometric sonar and LIDAR for mapping• Use of drop camera for deep water evaluation of habitat• Expanded monitoring for marine fish communities,
seagrass, lobster and conch, recruitment.
Acknowledgements
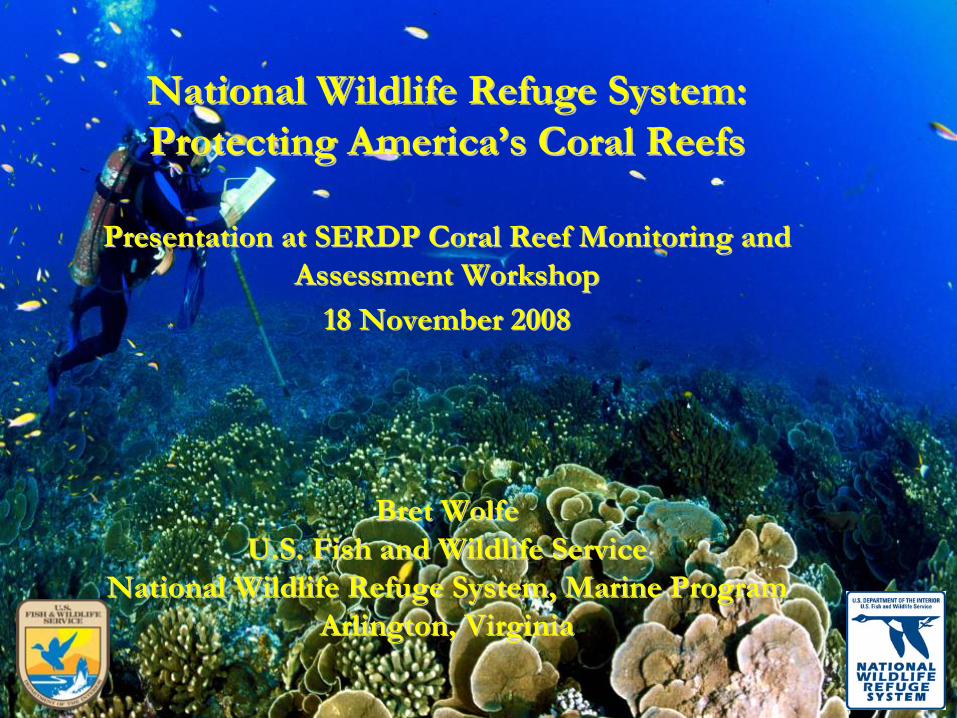
National Wildlife Refuge System:National Wildlife Refuge System:Protecting America’s Coral ReefsProtecting America’s Coral Reefs
Presentation at SERDP Coral Reef Monitoring and Presentation at SERDP Coral Reef Monitoring and Assessment WorkshopAssessment Workshop
18 November 200818 November 2008
Bret WolfeBret WolfeU.S. Fish and Wildlife ServiceU.S. Fish and Wildlife Service
National Wildlife Refuge System, Marine ProgramNational Wildlife Refuge System, Marine ProgramArlington, VirginiaArlington, Virginia
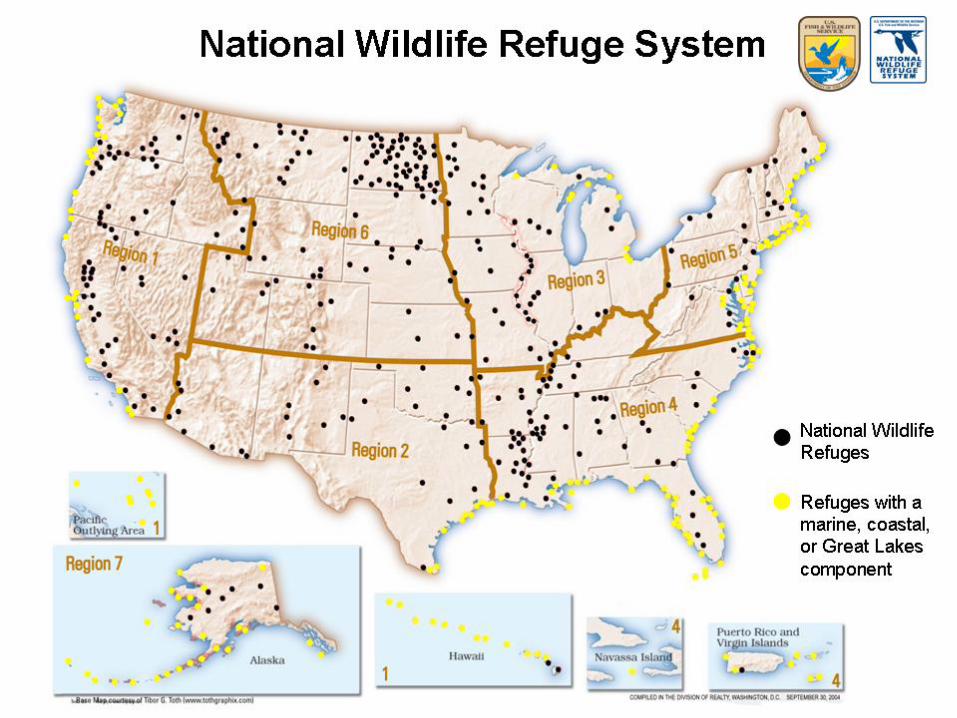
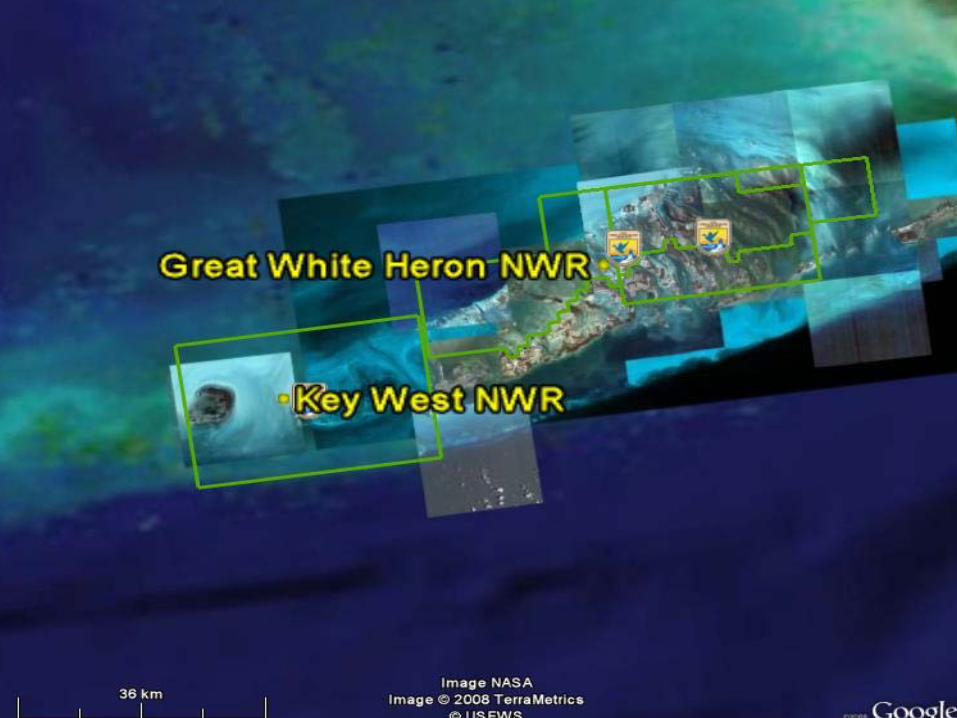
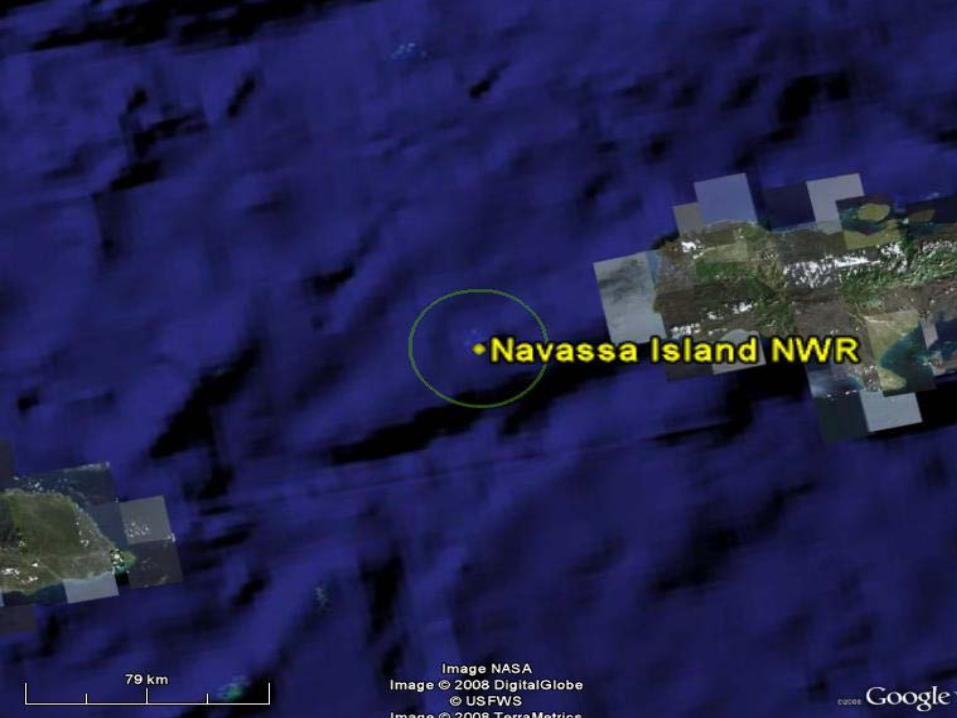

2731
SERD
P Coral R
eef Monitoring &
Assessment W
orkshop
Tim
e
Day 1- Tuesday N
ovember 18, 2008
Description
Presenter A
genda
8:30 – 8:45 AM
elcom
e & Introductions
Bill W
ild, Navy: SPA
WA
R Pacific
W
8:45 – 9:00 AM
SER
DP/ESTC
P: Program O
verview and
Sponsor Role
Dr. John H
all, OSD
: SERD
P/ESTCP
9:00 – 9:30 AM
D
oD C
lient Perspective M
s. Lorri Schwartz (for M
r. Tom Egeland),
Office A
ssist. Sec. of Navy for Installations
& Environm
ent 9:30 – 9:40 A
M
M
r. James Sinclair, M
inerals Managem
ent Service
9:40 -9:50 AM
Dr. M
att Patterson, National Parks Service
9:50 – 10:00 AM
A
gency/Organization Perspectives
Bret W
olfe, Fish & W
ildlife Service
10:00 – 10:10 AM
Dr. W
illiam Fisher, Environm
ental Protection A
gency 10:00 – 10:20 A
M
Q/A
for previous 5 speakers A
ll
10:20 – 10:35 AM
B
reak 10:35 – 10:45 A
M
NO
AA
Perspectives D
r. Margaret M
iller, NO
AA
SE Fisheries
10:45 – 10:55 AM
Rob W
arner, NO
AA
Center for C
oastal M
onitoring & A
ssessment (C
CM
A)
Biogeography B
ranch 10:55 – 11:05 A
M
B
ill Goodw
in, NO
AA
Marine Sanctuaries
11:05 – 11:15 AM
Dr. B
ill Precht, NO
AA
Dam
age Assessm
ent and R
estoration 11:15 – 11:35 A
M
Q/A
for previous 4 speakers A
ll
11:35 – 12:35 AM
G
roup discussion 1: M
onitoring/Assessm
ent Needs
Bill W
ild, Navy: SPA
WA
R Pacific
12:35 – 1:35 PM
Working L
unch (continued discussion) 1:35 – 2:20 PM
U
niversity of Miam
i Research (includes
10–15 minutes Q
/A)
Dr. Pam
ela Reid, U
niv. Miam
i
2:20 – 3:05 PM
Rutgers U
niversity Research (includes 10–
15 minutes Q
/A)
Dr. M
ax Gorbunov and D
r. Paul Falkowski,
Rutgers U
niversity 3:05 – 3:15 PM
Integration of U
M/R
utgers Technologies D
r. Diego Lirm
an, Miam
i D
r. Max G
orbunov, Rutgers
3:15 – 3:30 PM
Break
3:30 – 5:00 PM
Group discussion 2: O
verlay of M
onitoring/Assessm
ent Needs w
ith M
iami/R
utgers Technologies
Bill W
ild, Navy: SPA
WA
R Pacific
5:00 PM
Adjourn
7:30 PM
Group dinner at Jaguar C
eviche Spoon & L
atam G
rill
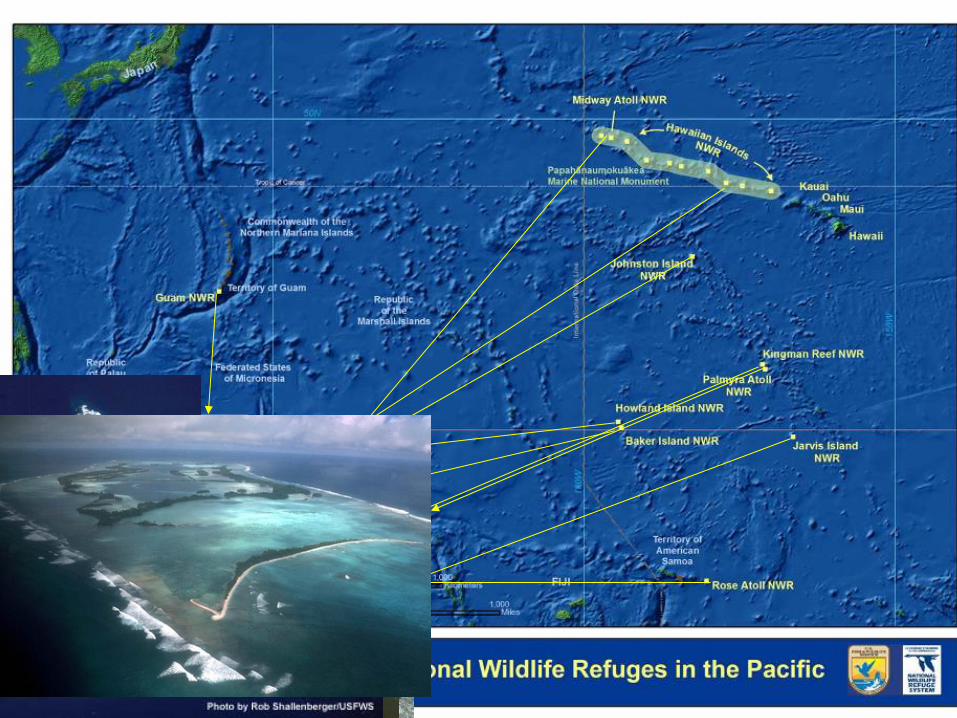
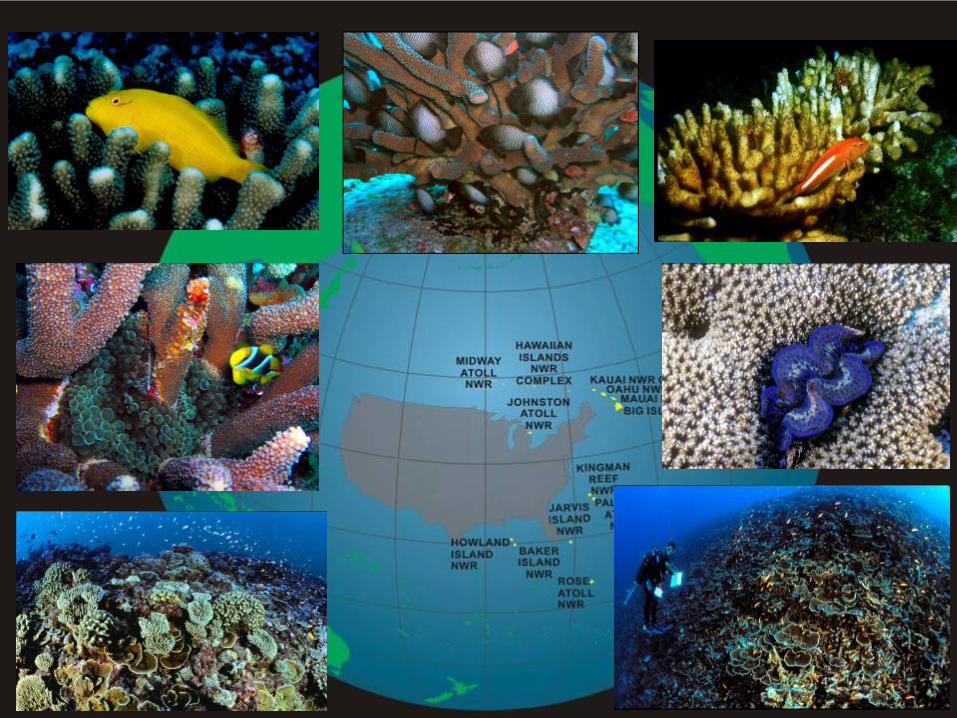
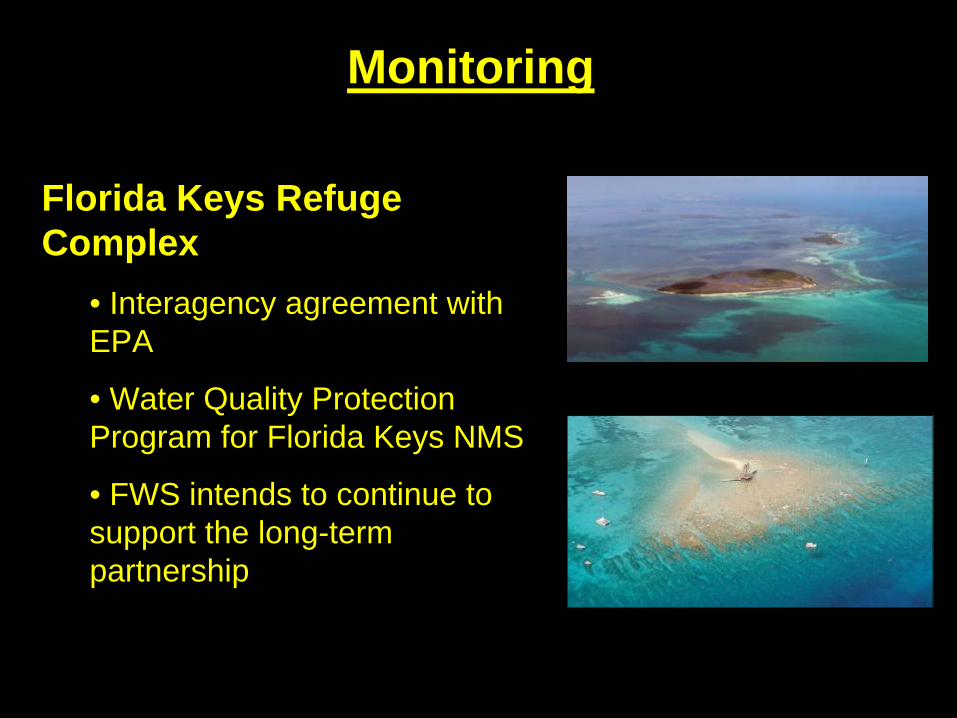
Monitoring
Florida Keys Refuge Complex
• Interagency agreement with EPA
• Water Quality Protection Program for Florida Keys NMS
• FWS intends to continue to support the long-term partnership
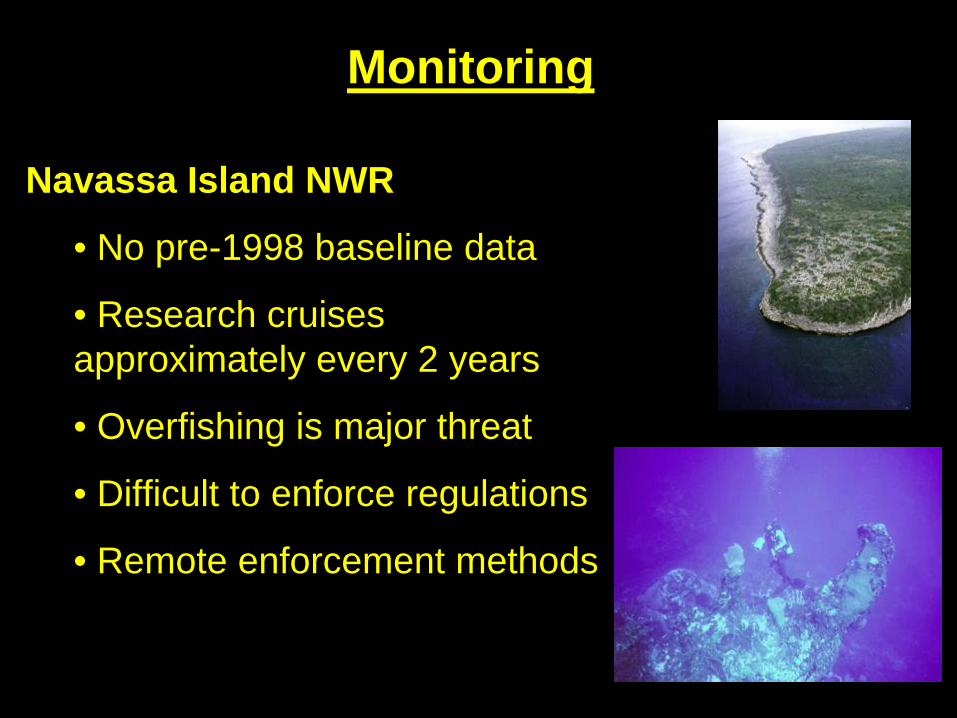
Monitoring
Navassa Island NWR
• No pre-1998 baseline data
• Research cruises approximately every 2 years
• Overfishing is major threat
• Difficult to enforce regulations
• Remote enforcement methods
Monitoring
• Coral monitoring at permanent sites since 2000
• Northwestern Hawaiian Island Reef Assessment and Monitoring Program
• Numerous fisheries monitoring programs
• Permitted research by UC-Santa Cruz
Hawaiian Islands and Midway Atoll NWRs
Monitoring
Remote Pacific Refuge Complex
• Annual and biennial research cruises
• Towed diver surveys (2 km in length)
• REAs covering between 1000-5000 m2
• Photo-quadrat/video surveys at permanently marked 50-100 m transects
• Recruitment studies
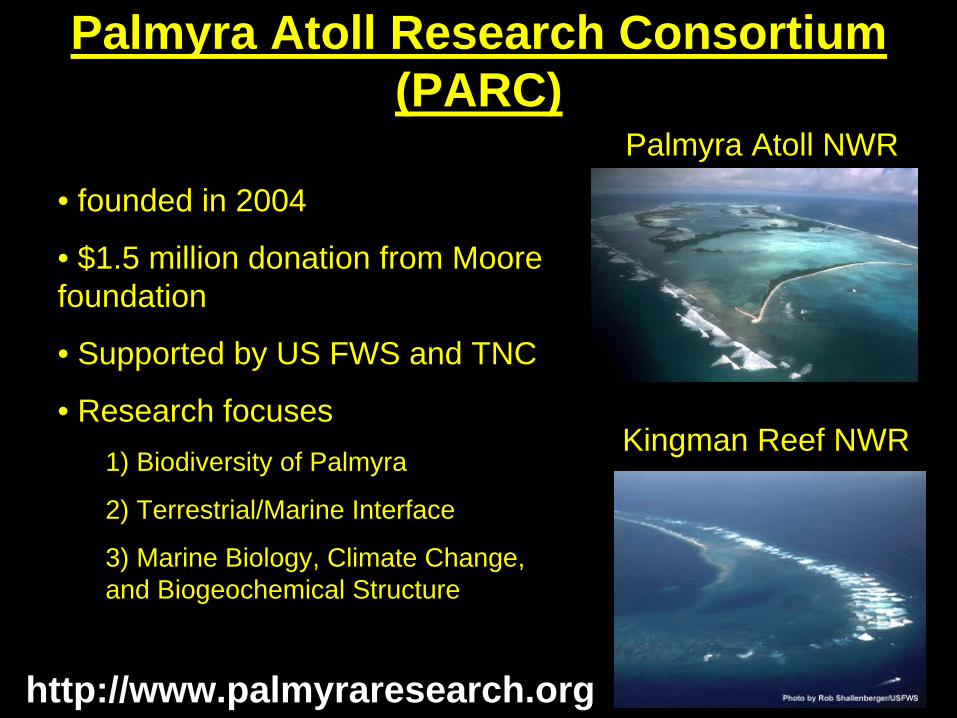
Palmyra Atoll Research Consortium (PARC)
Palmyra Atoll NWR
Kingman Reef NWR
• founded in 2004
• $1.5 million donation from Moore foundation
• Supported by US FWS and TNC
• Research focuses 1) Biodiversity of Palmyra
2) Terrestrial/Marine Interface
3) Marine Biology, Climate Change, and Biogeochemical Structure
http://www.palmyraresearch.org
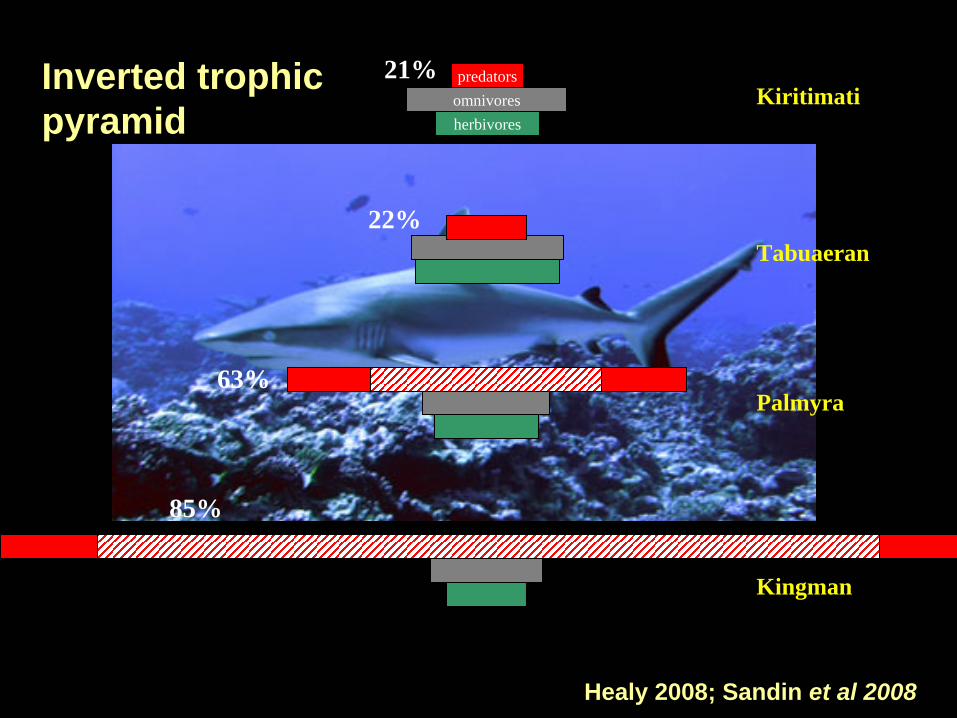
herbivoresomnivorespredators
Kingman
Palmyra
85%
21%
63%
22%Tabuaeran
KiritimatiInverted trophic pyramid
Healy 2008; Sandin et al 2008
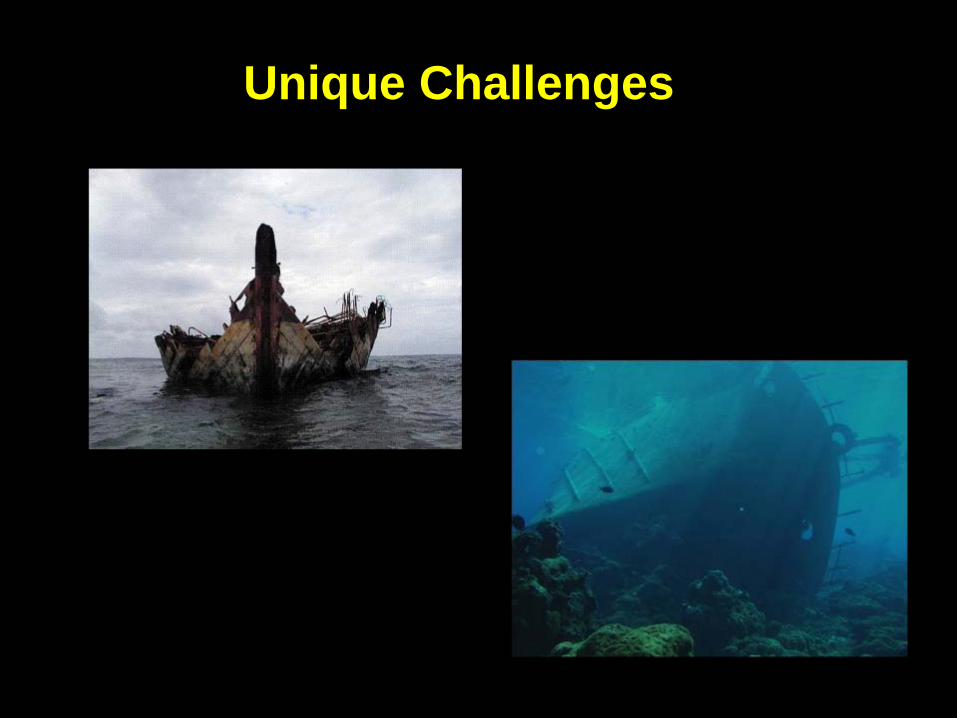
Unique Challenges
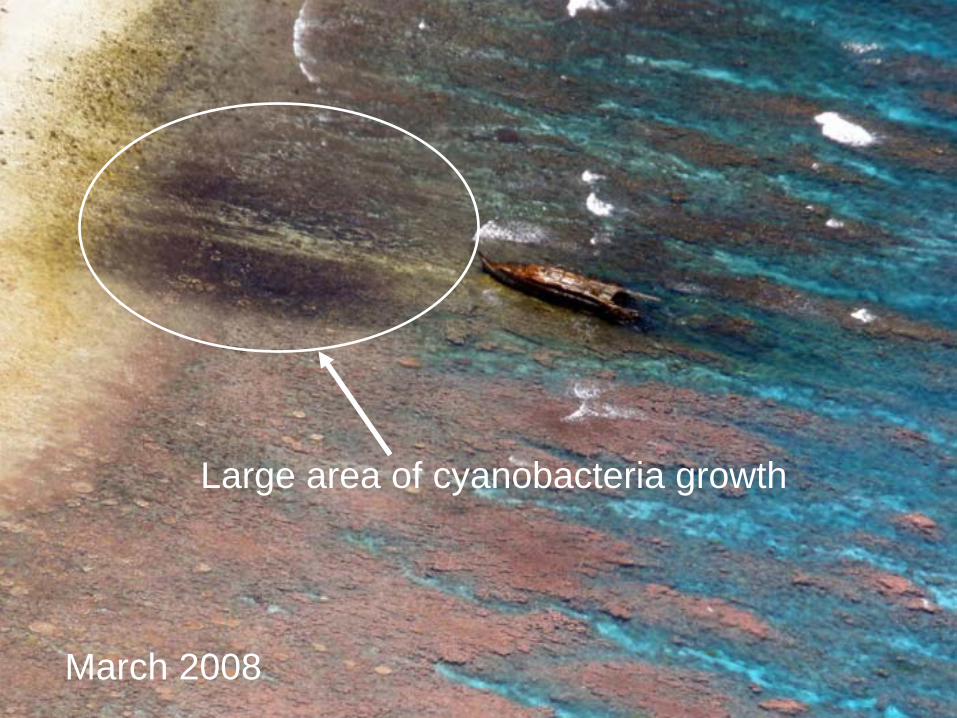
Large area of cyanobacteria growth
March 2008
Large area of cyanobacteria growth
March 2008
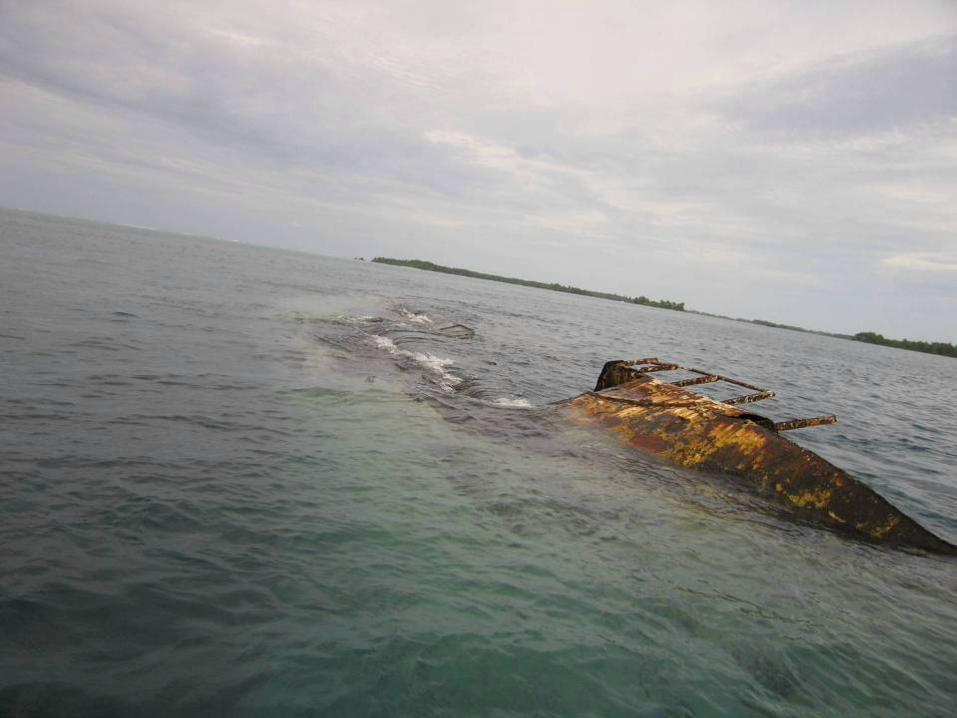
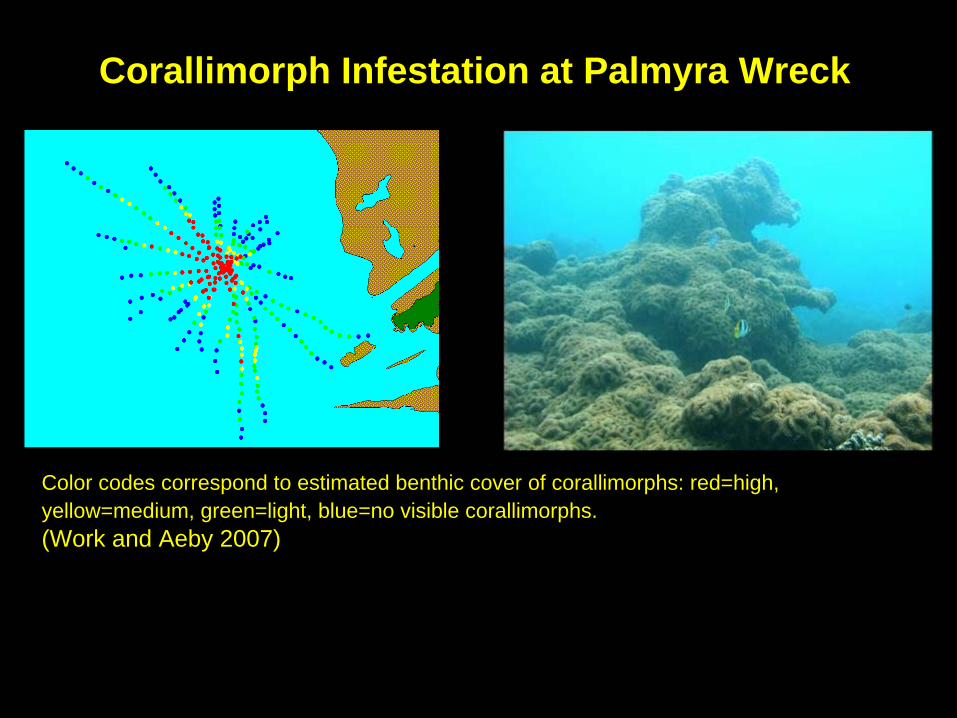
Color codes correspond to estimated benthic cover of corallimorphs: red=high, yellow=medium, green=light, blue=no visible corallimorphs.(Work and Aeby 2007)
Corallimorph Infestation at Palmyra Wreck
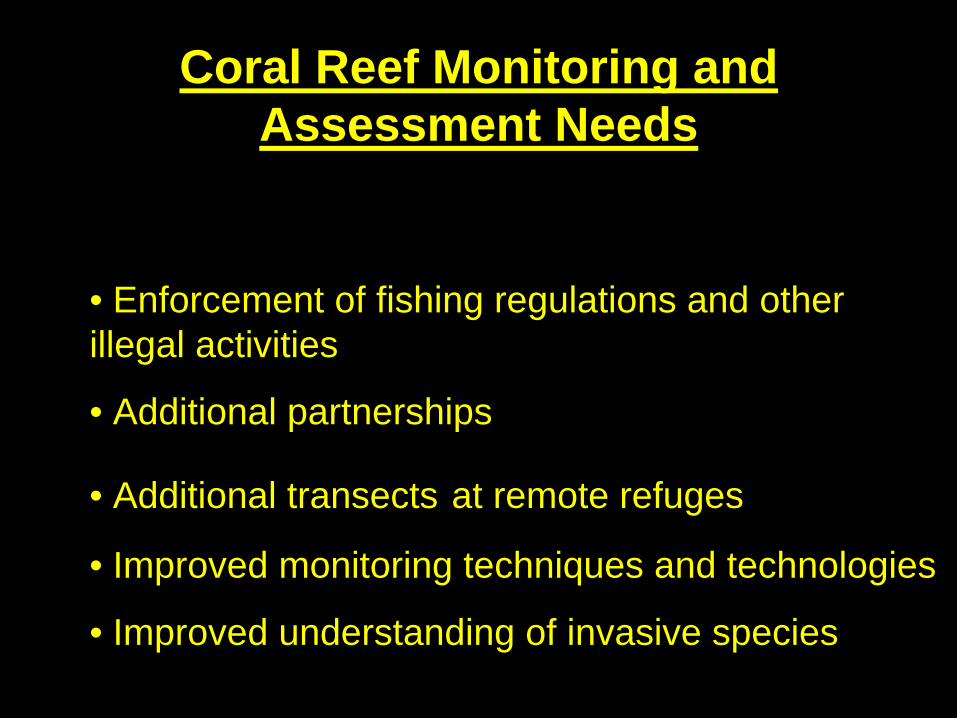
Coral Reef Monitoring and Assessment Needs
• Enforcement of fishing regulations and other illegal activities
• Additional partnerships
• Additional transects at remote refuges
• Improved monitoring techniques and technologies
• Improved understanding of invasive species
Coral gardens at Palmyra Atoll NWR
Contact Info:
Bret WolfeNational Wildlife Refuge System, Marine [email protected]
Jim Maragos, Ph.D. Coral Reef BiologistPacific/Remote Islands National Wildlife Refuge [email protected]
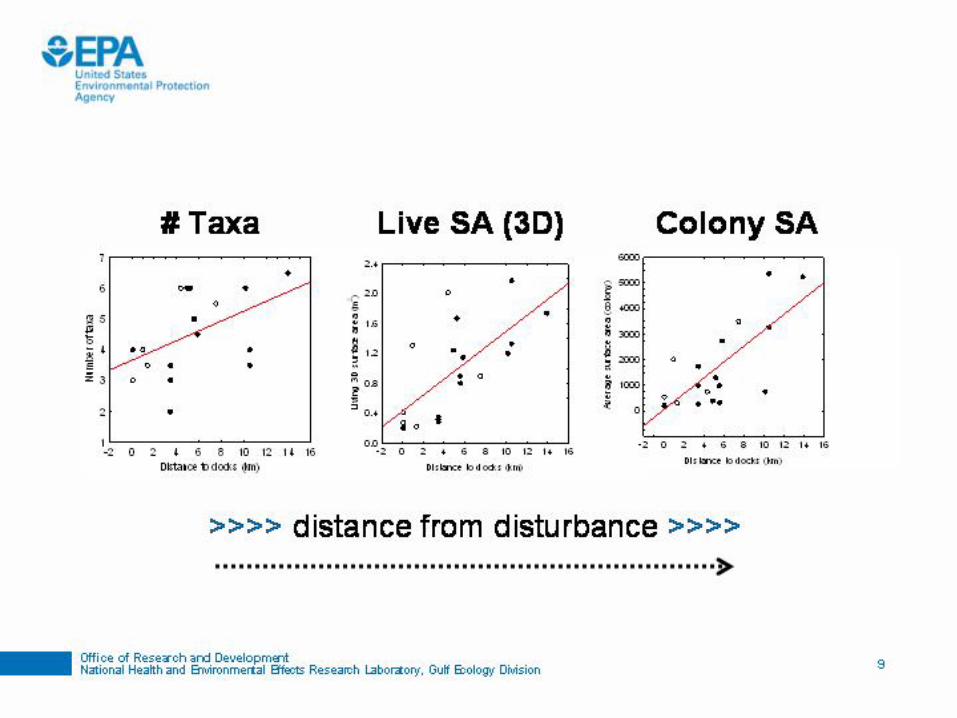
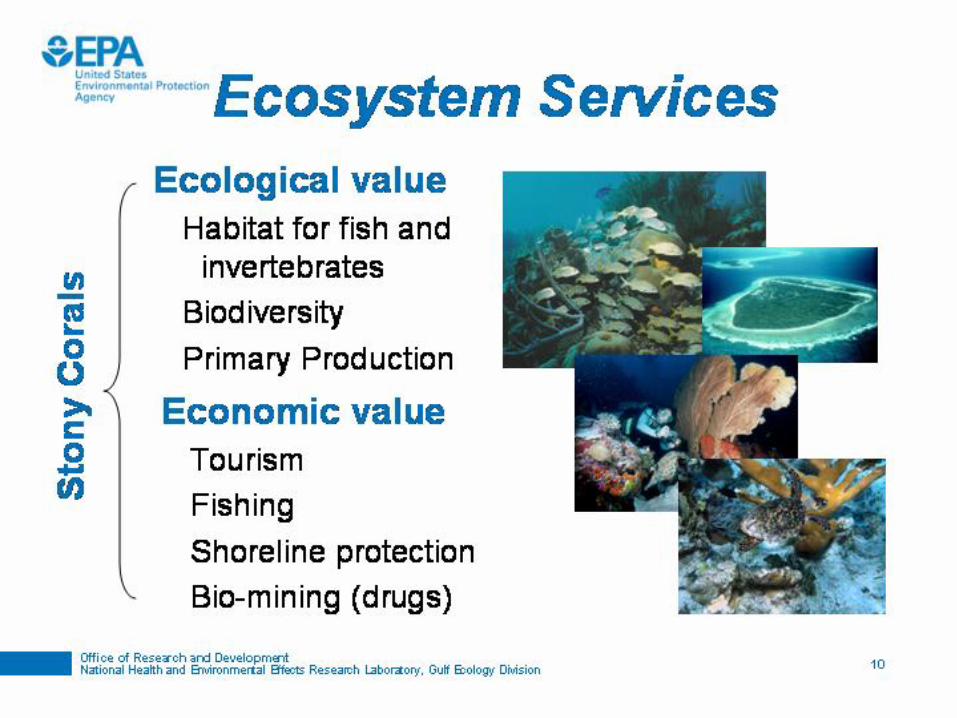
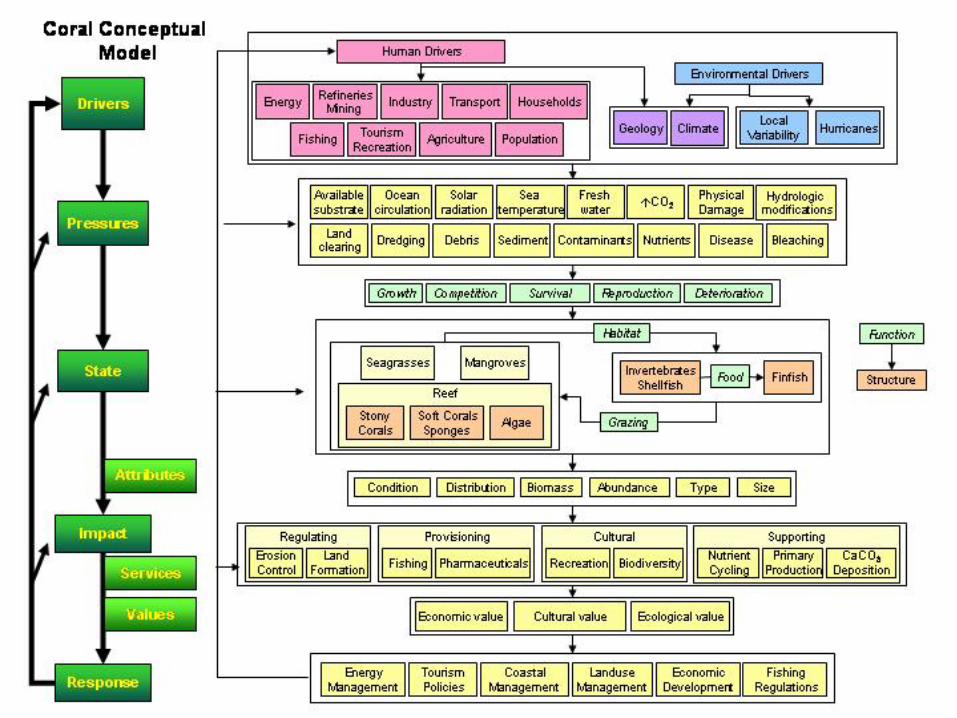
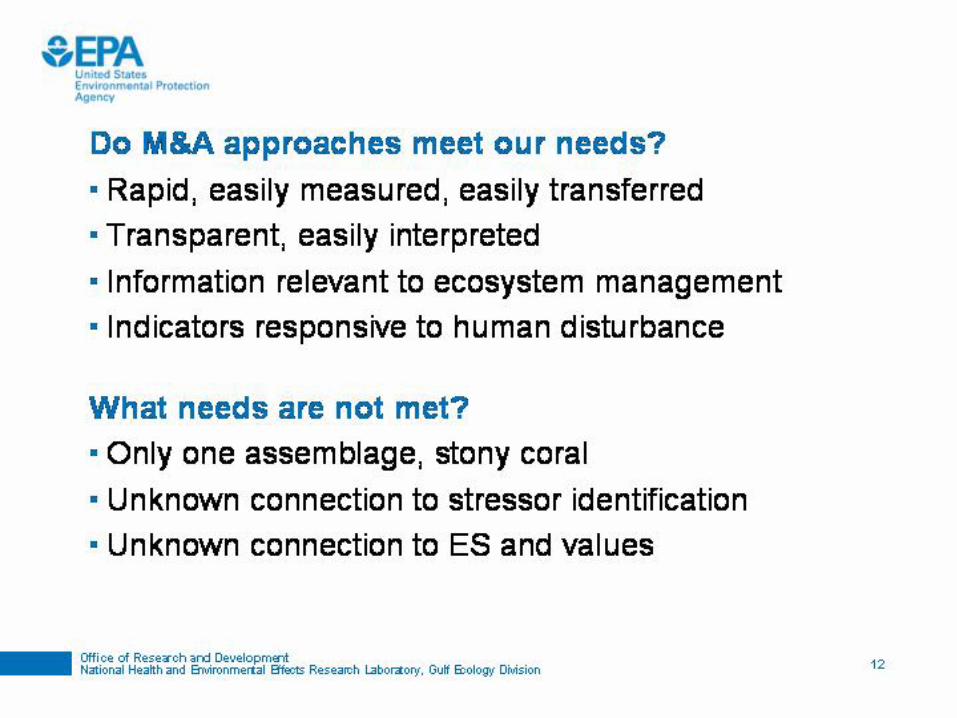
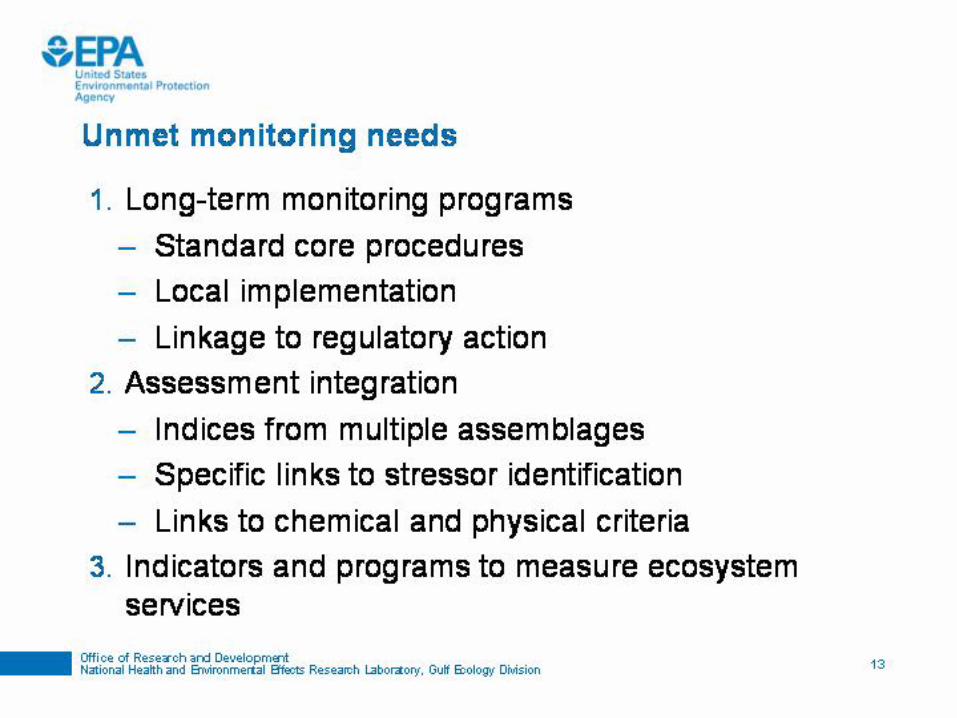
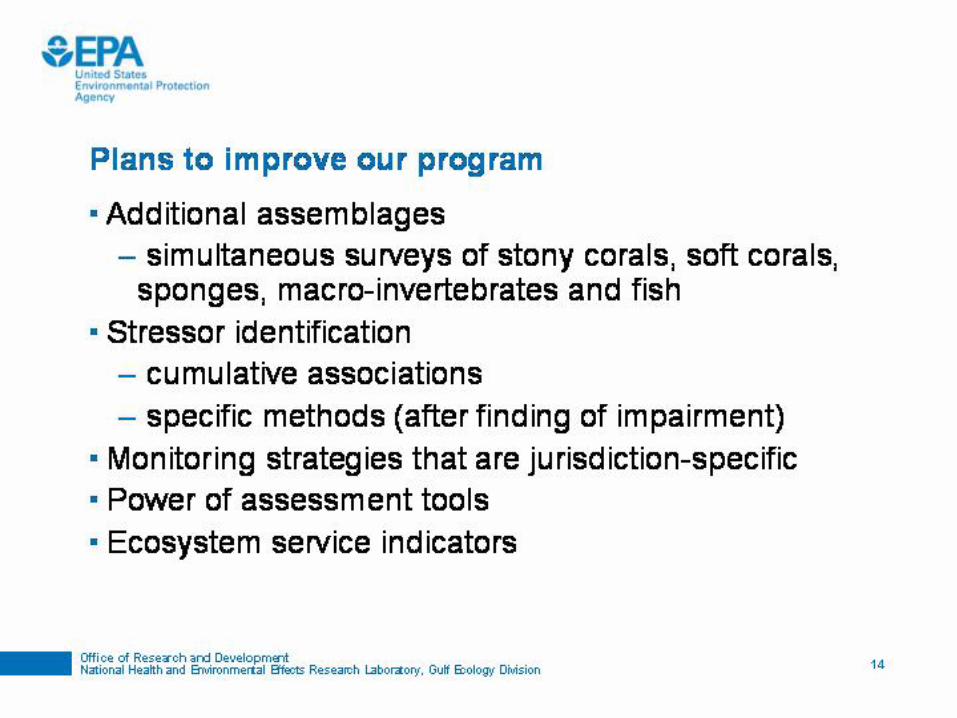
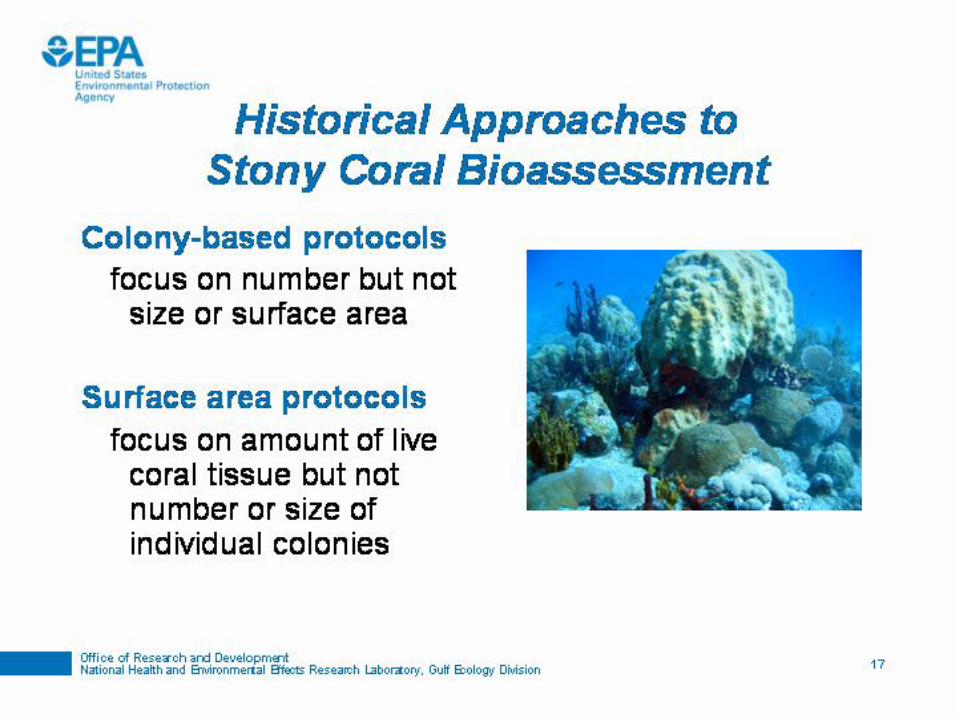
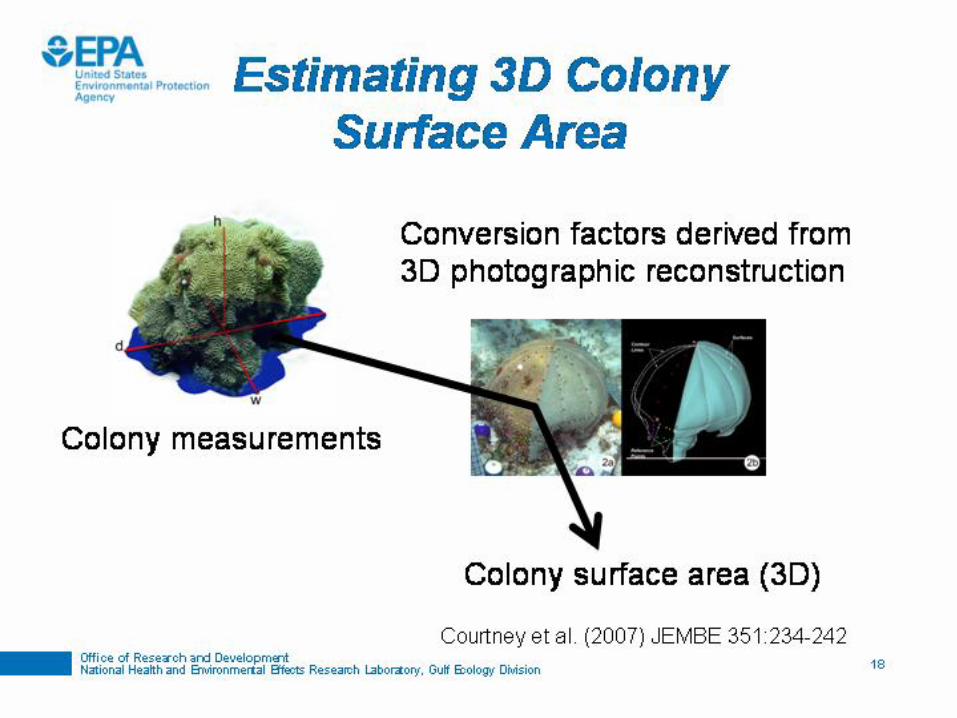
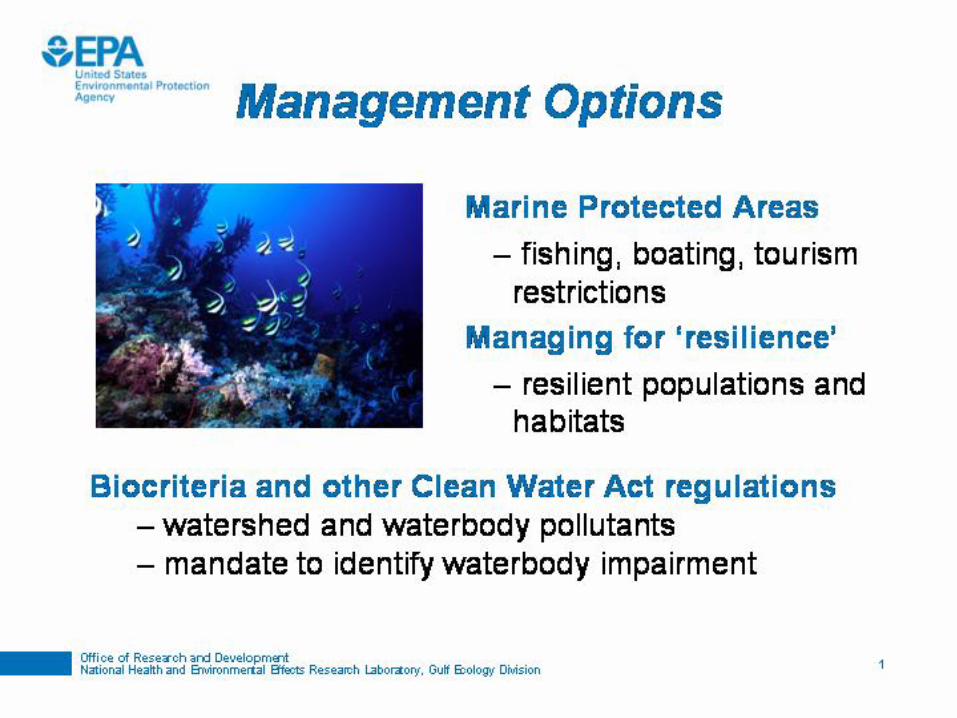
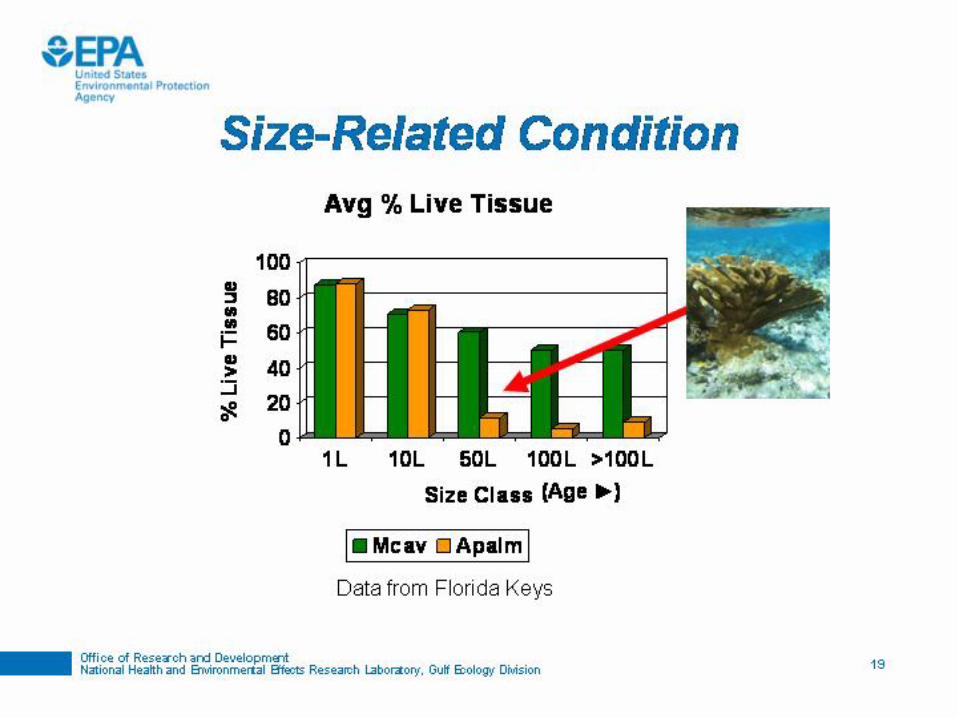
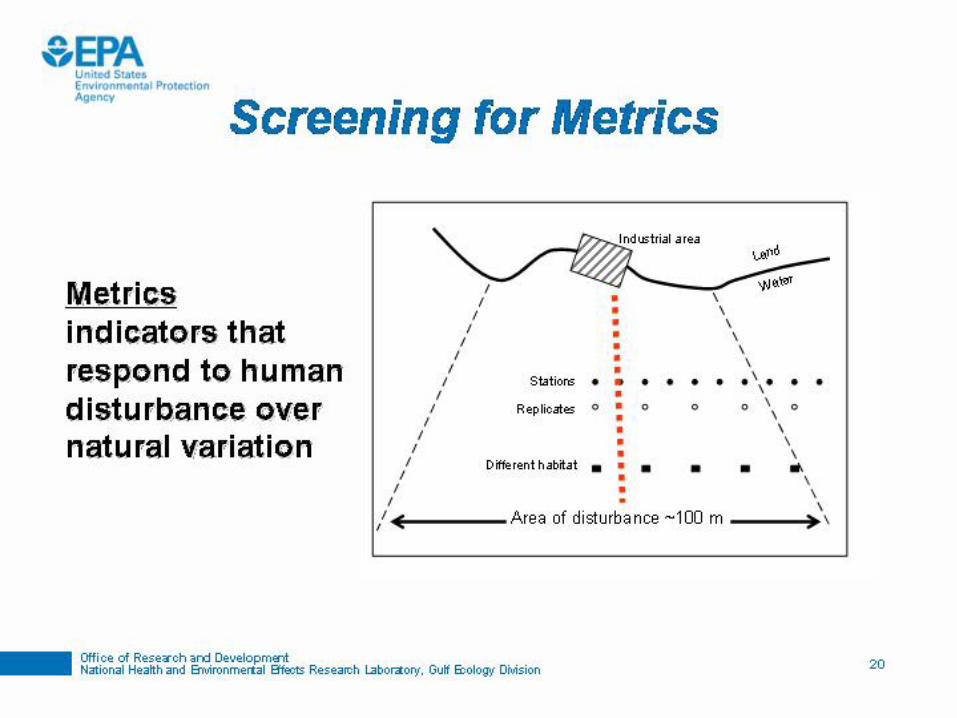
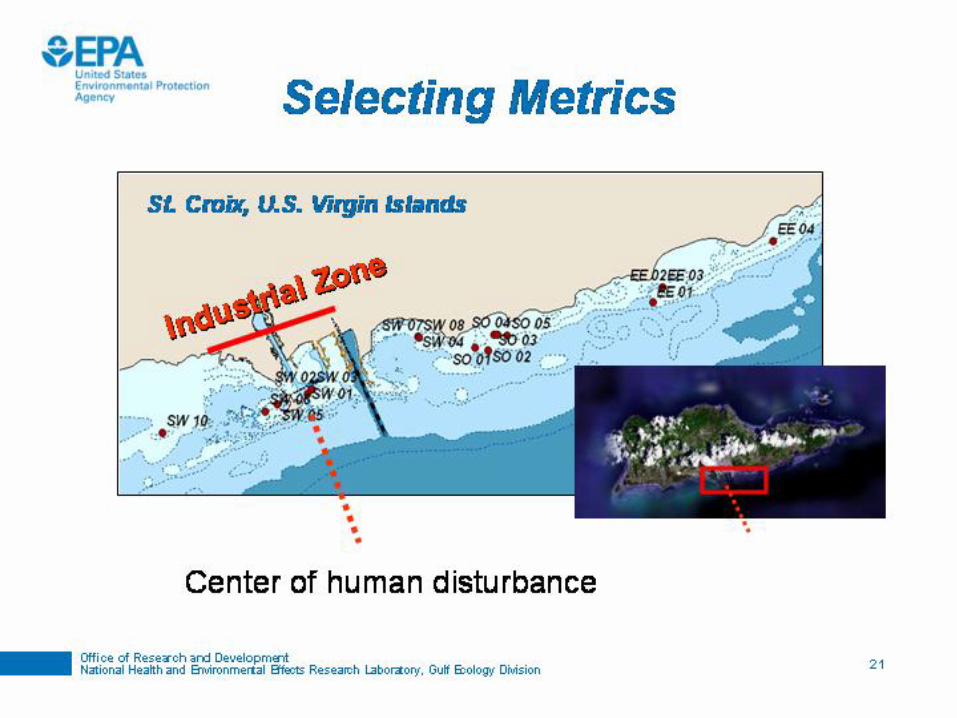
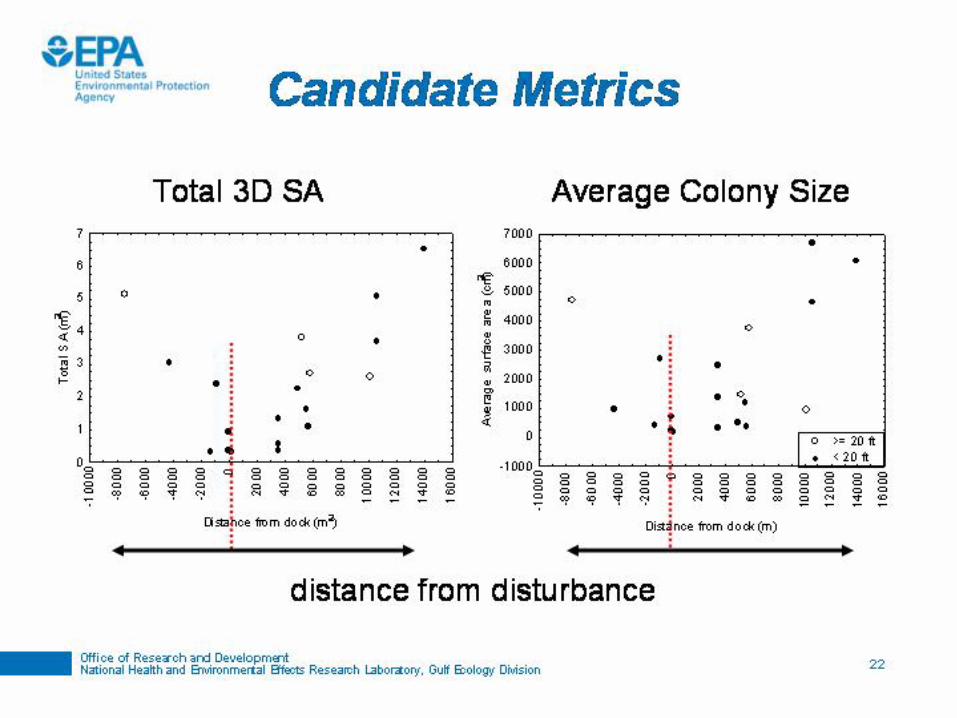
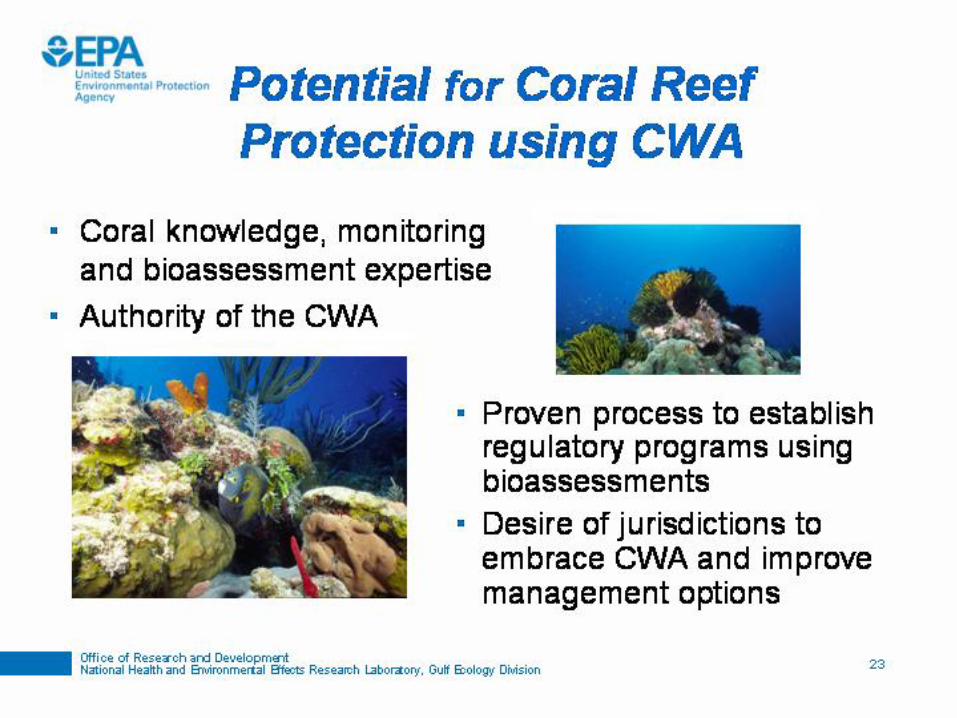
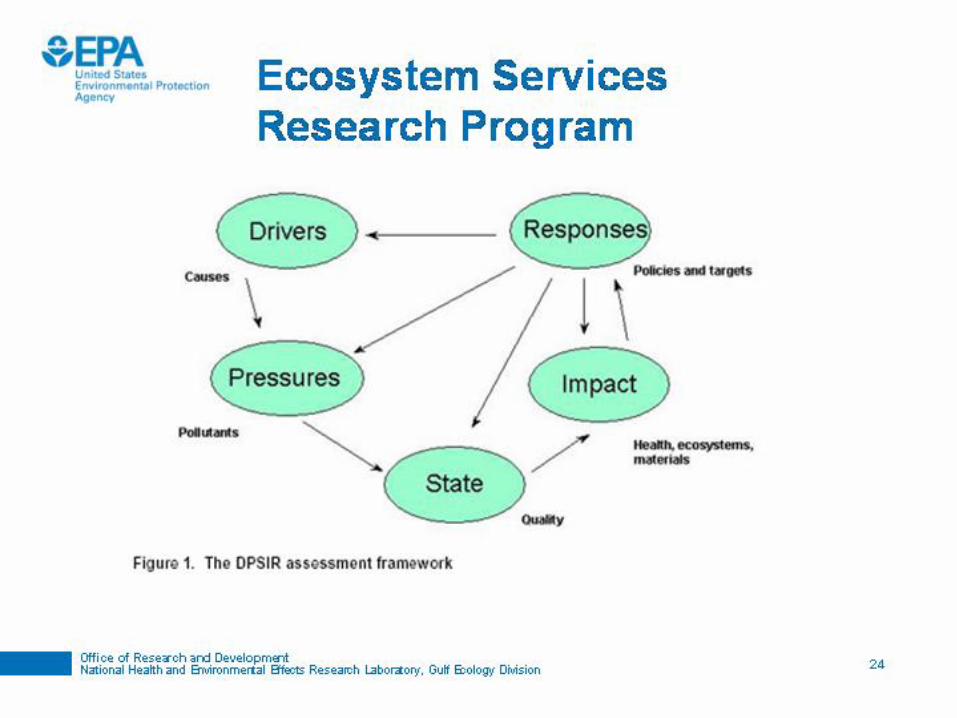
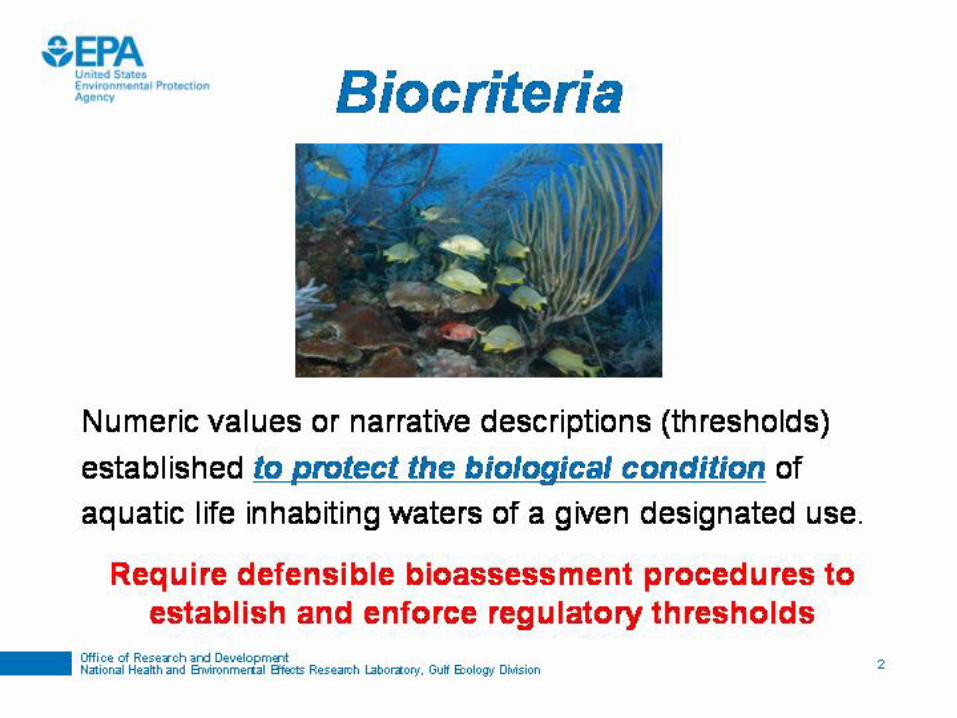
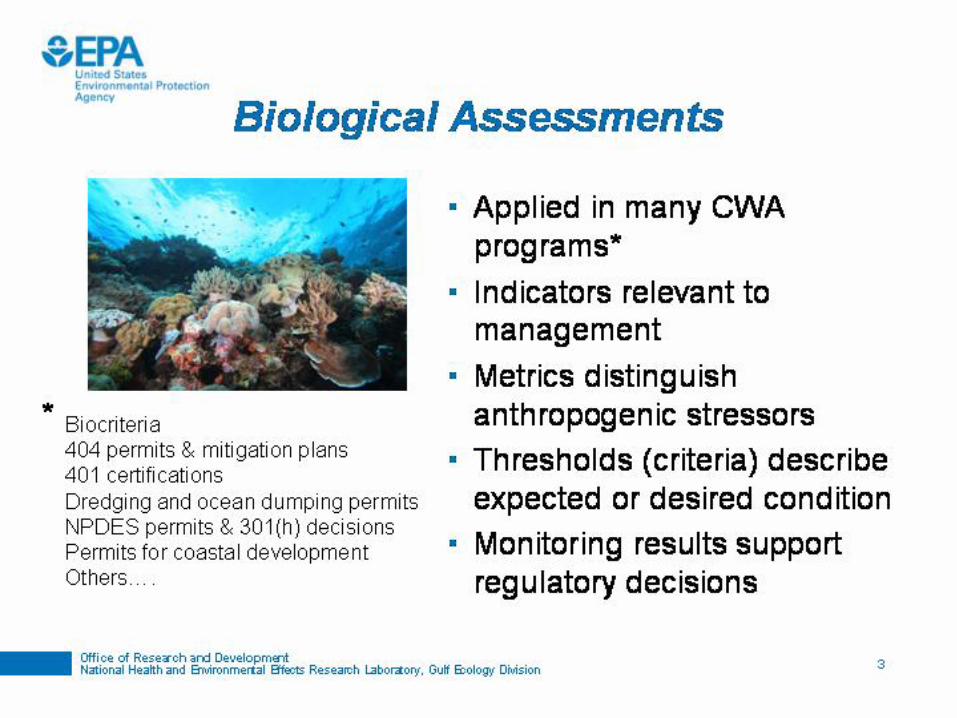
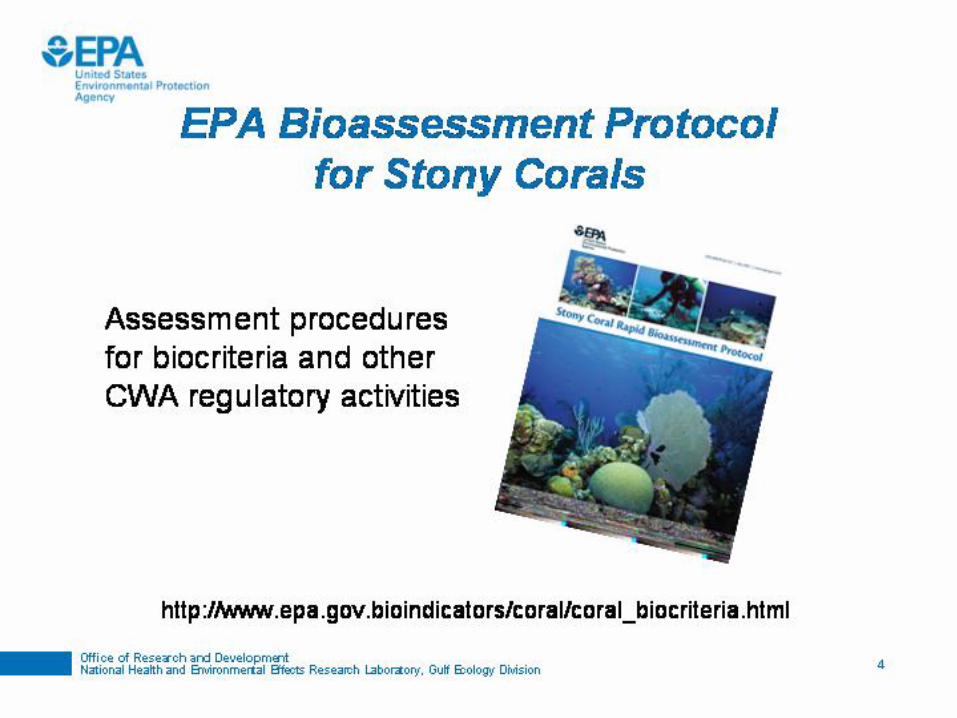
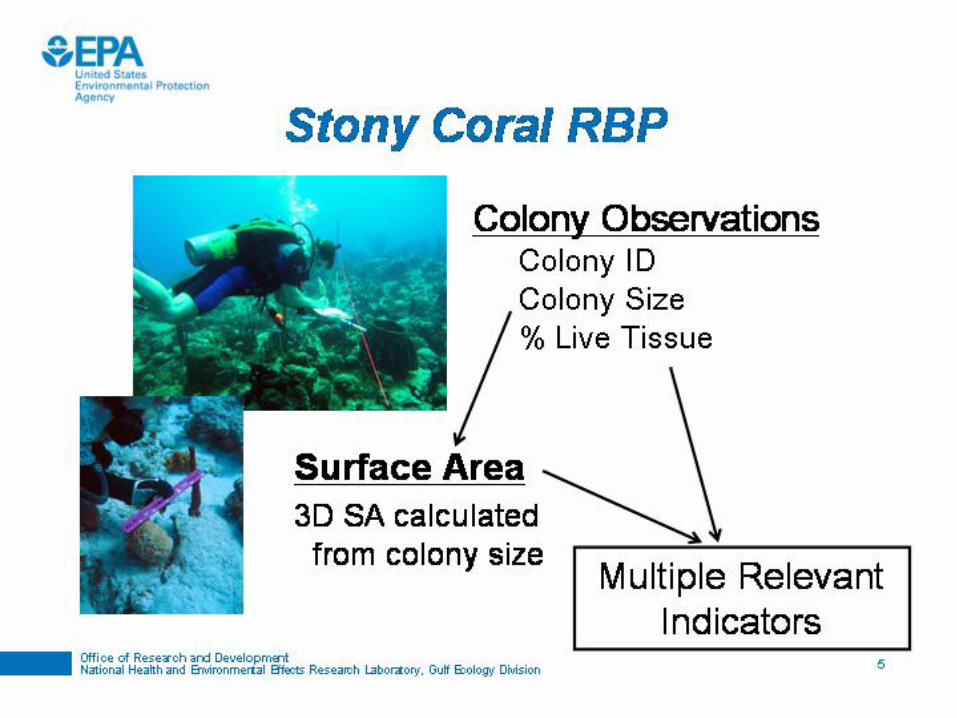
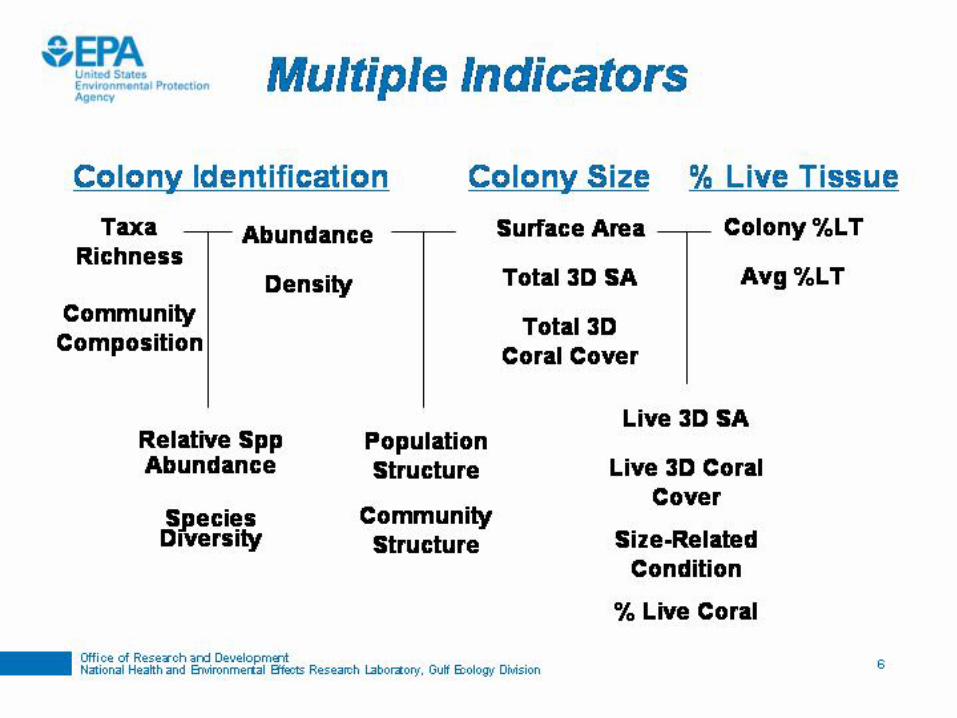
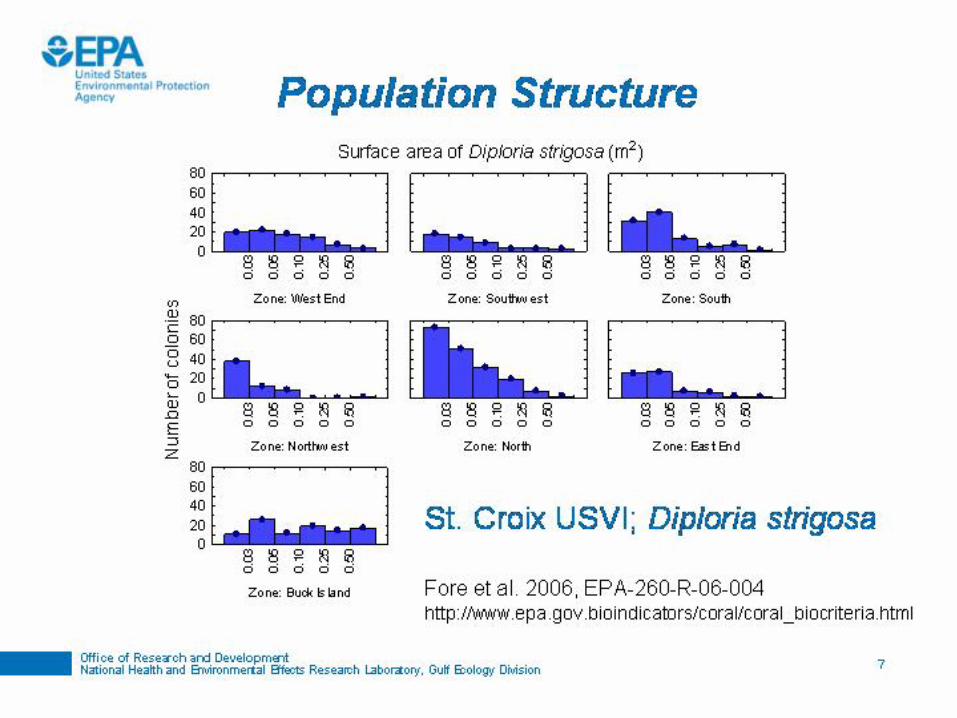
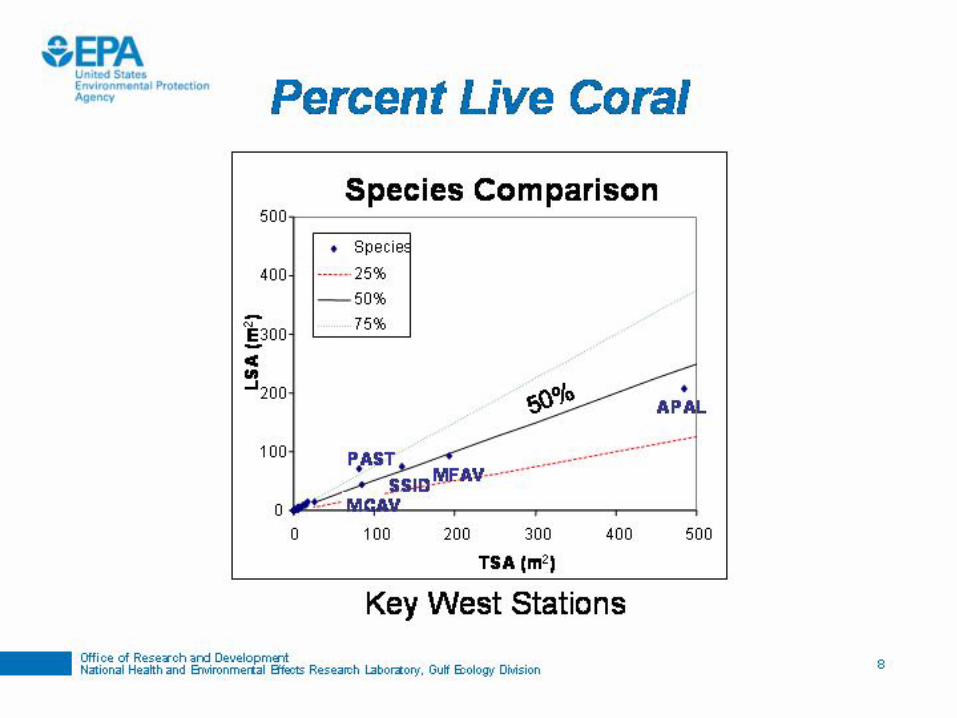
Coral and Coral Reef Monitoring
Southeast Fisheries Science CenterMargaret Miller
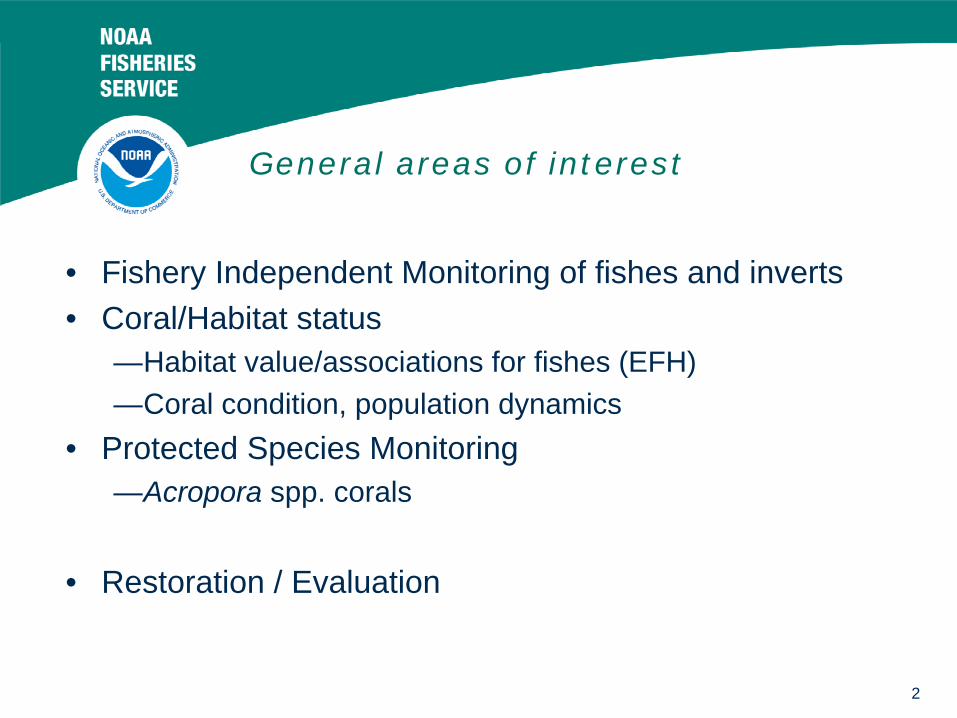
2
General areas of interest
• Fishery Independent Monitoring of fishes and inverts• Coral/Habitat status
—Habitat value/associations for fishes (EFH)—Coral condition, population dynamics
• Protected Species Monitoring—Acropora spp. corals
• Restoration / Evaluation
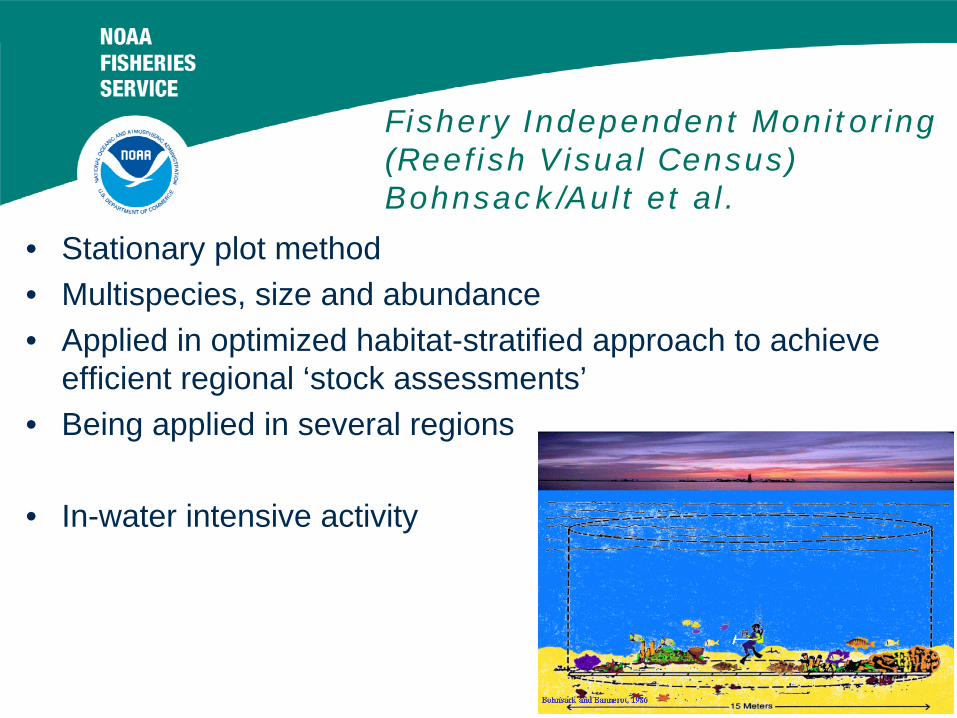
3
Fishery Independent Monitoring (Reefish Visual Census) Bohnsack/Ault et al.
• Stationary plot method• Multispecies, size and abundance• Applied in optimized habitat-stratified approach to achieve
efficient regional ‘stock assessments’• Being applied in several regions
• In-water intensive activity
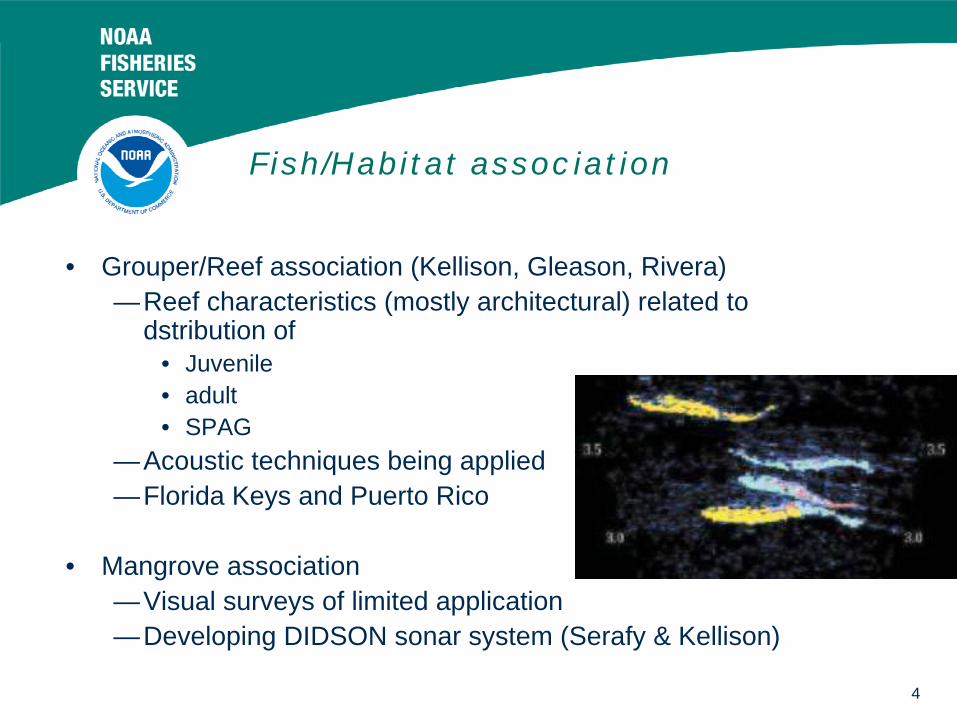
4
Fish/Habitat association
• Grouper/Reef association (Kellison, Gleason, Rivera)—Reef characteristics (mostly architectural) related to
dstribution of• Juvenile • adult • SPAG
—Acoustic techniques being applied—Florida Keys and Puerto Rico
• Mangrove association—Visual surveys of limited application—Developing DIDSON sonar system (Serafy & Kellison)
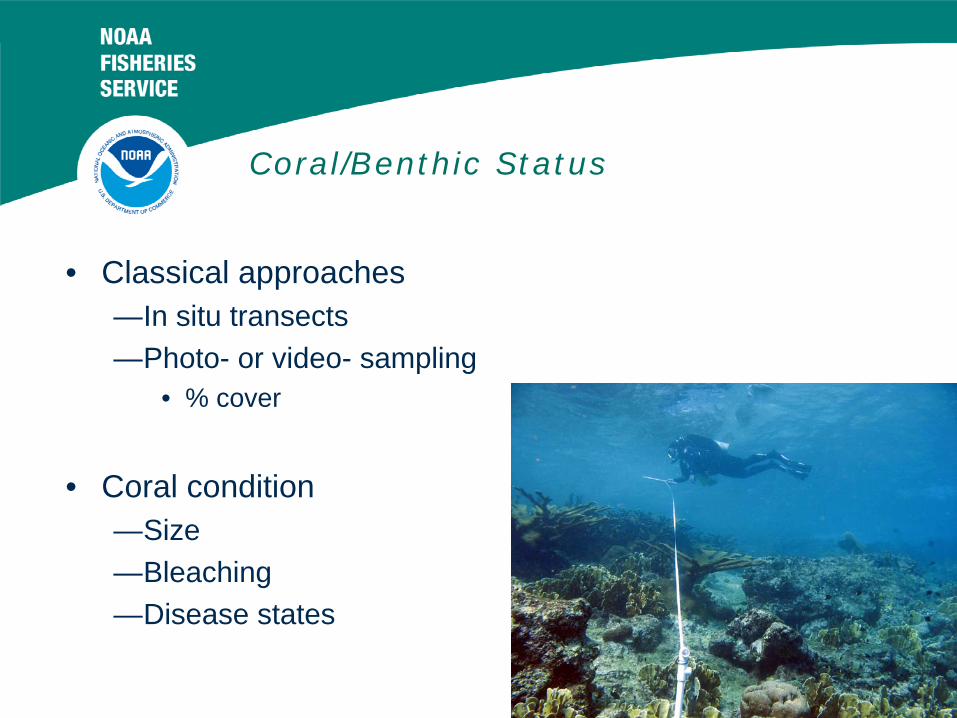
5
Coral/Benthic Status
• Classical approaches—In situ transects—Photo- or video- sampling
• % cover
• Coral condition—Size—Bleaching—Disease states
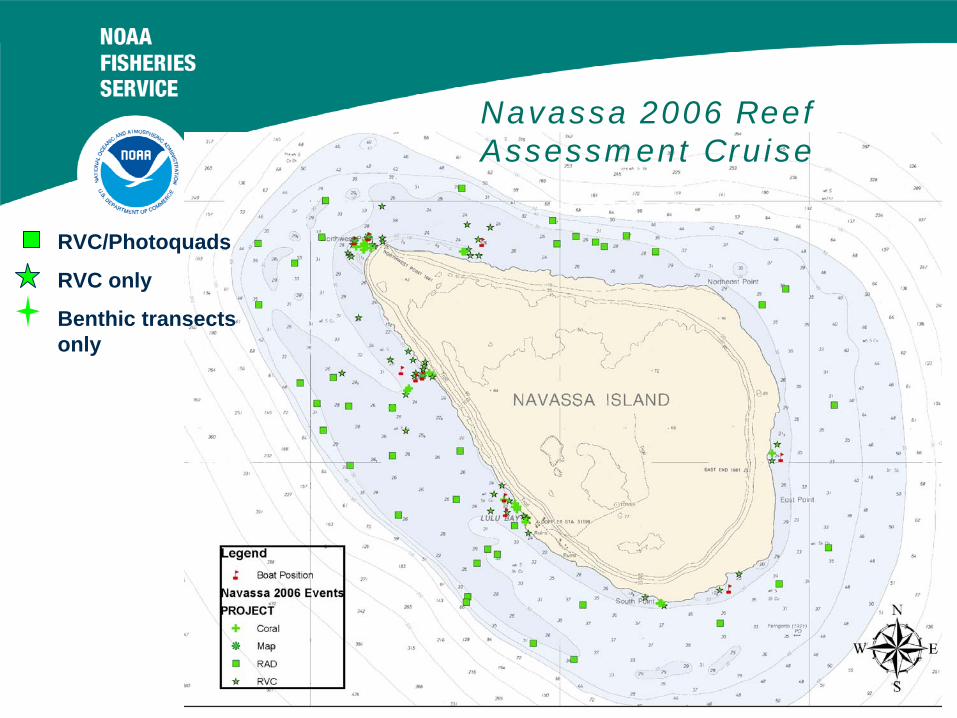
6
RVC/Photoquads
RVC only
Benthic transects only
Navassa 2006 Reef Assessment Cruise
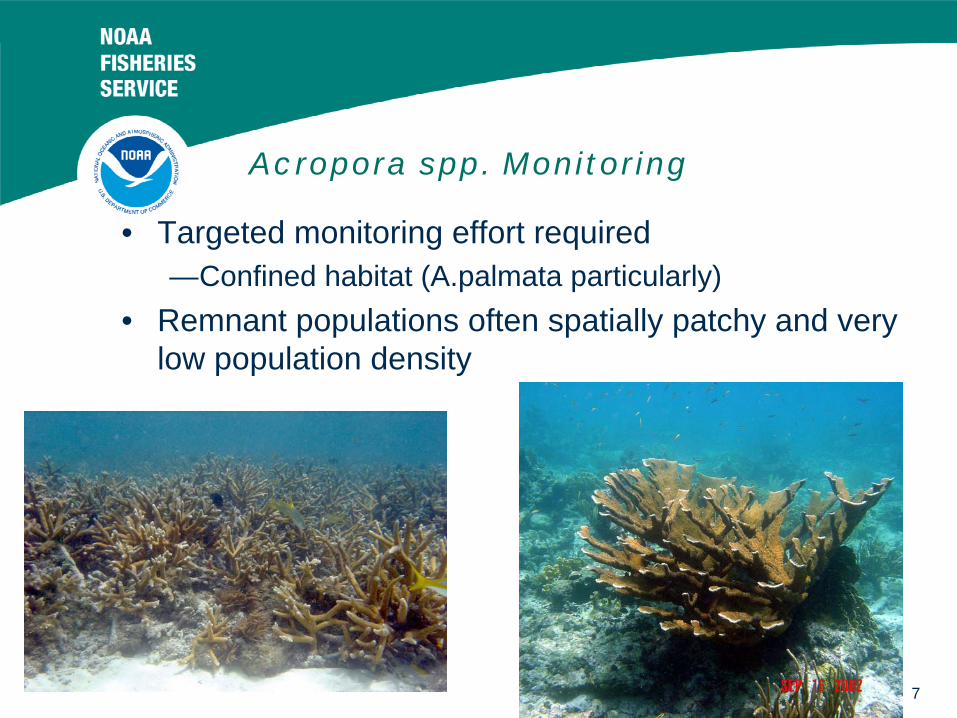
7
Acropora spp. Monitoring
• Targeted monitoring effort required—Confined habitat (A.palmata particularly)
• Remnant populations often spatially patchy and very low population density
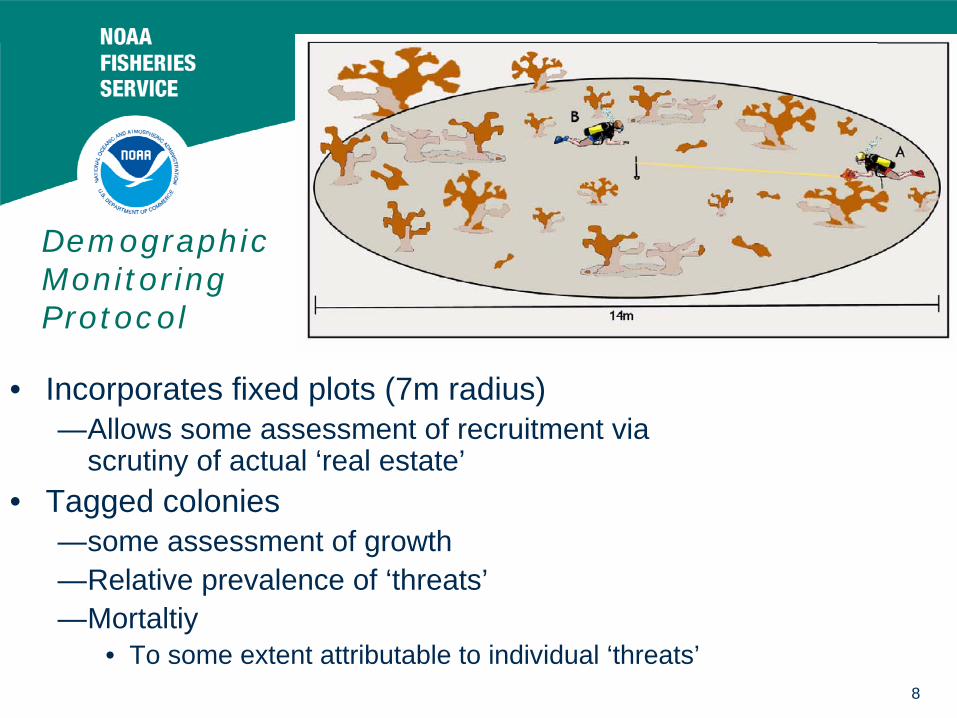
8
Demographic Monitoring Protocol
• Incorporates fixed plots (7m radius)—Allows some assessment of recruitment via
scrutiny of actual ‘real estate’• Tagged colonies
—some assessment of growth—Relative prevalence of ‘threats’—Mortaltiy
• To some extent attributable to individual ‘threats’
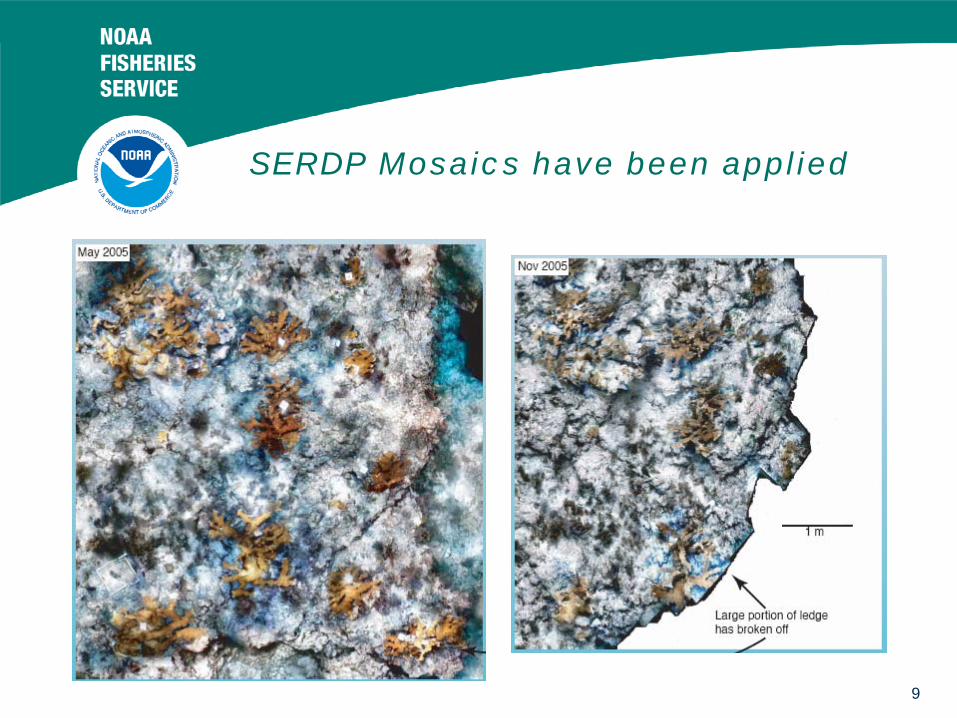
9
SERDP Mosaics have been applied
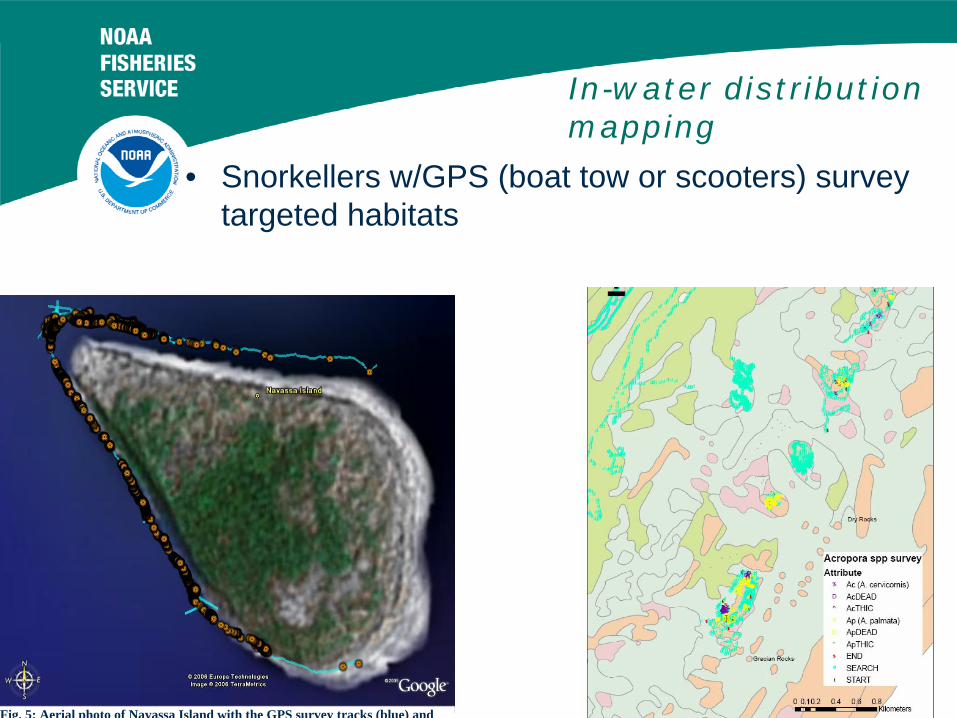
10Fig. 5: Aerial photo of Navassa Island with the GPS survey tracks (blue) and
In-water distribution mapping
• Snorkellers w/GPS (boat tow or scooters) survey targeted habitats
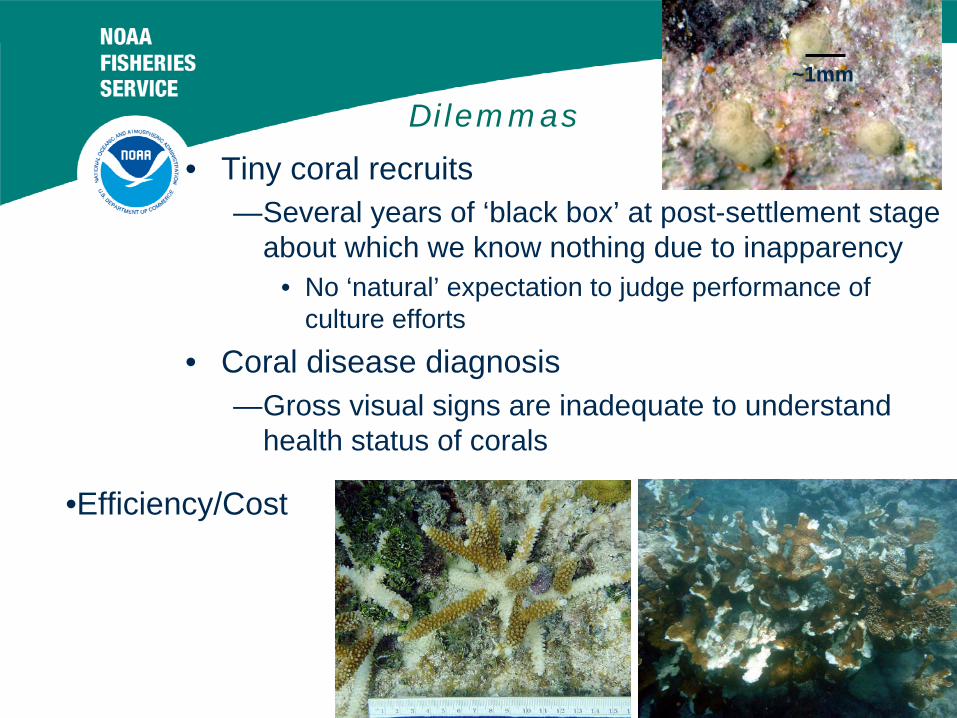
11
Dilemmas
• Tiny coral recruits—Several years of ‘black box’ at post-settlement stage
about which we know nothing due to inapparency• No ‘natural’ expectation to judge performance of
culture efforts
• Coral disease diagnosis—Gross visual signs are inadequate to understand
health status of corals
~1mm
•Efficiency/Cost
CCMA MISSIONTo assess and forecast coastal and marine ecosystem
conditions through research and monitoring
http://ccma.nos.noaa.gov/
Coral Reef Monitoring and Assessment Workshop
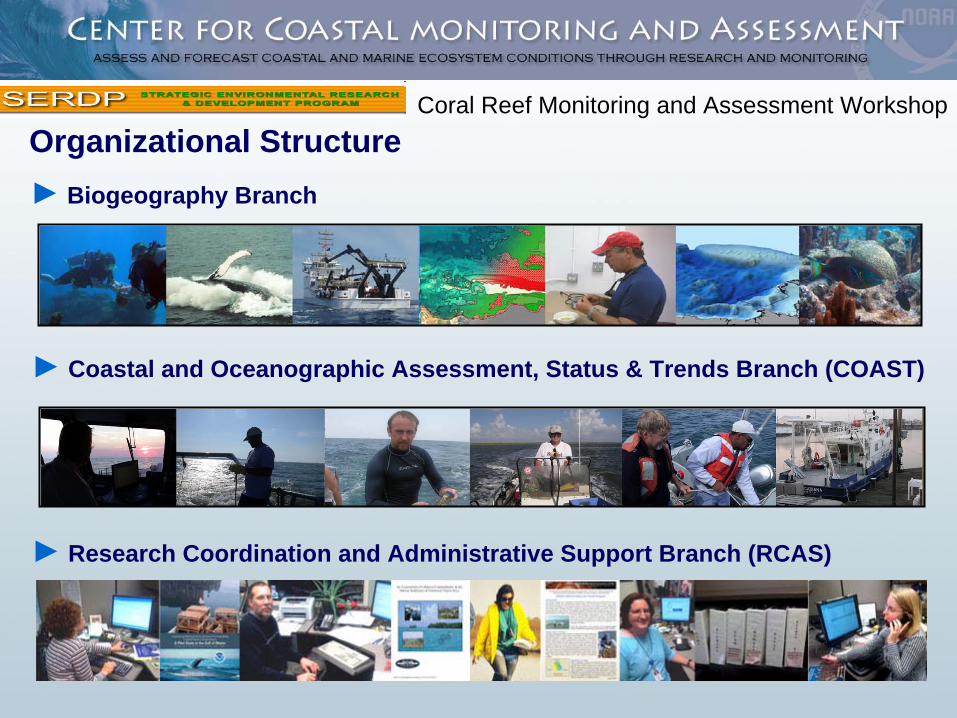
► Biogeography Branch
► Coastal and Oceanographic Assessment, Status & Trends Branch (COAST)
► Research Coordination and Administrative Support Branch (RCAS)
Organizational Structure Coral Reef Monitoring and Assessment Workshop
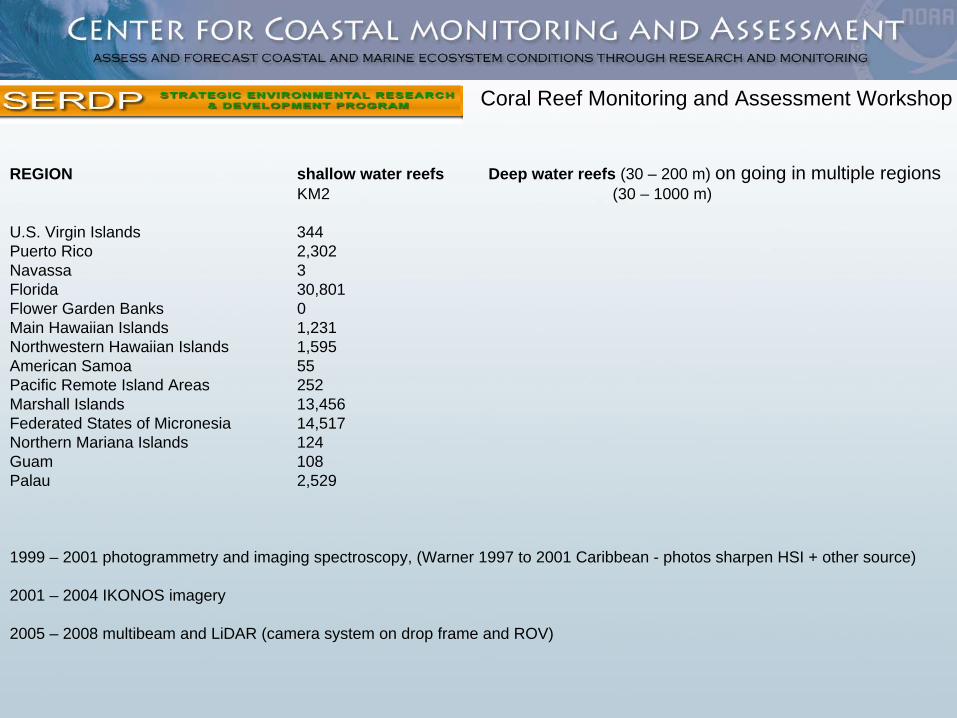
Coral Reef Monitoring and Assessment Workshop
REGION shallow water reefs Deep water reefs (30 –
200 m) on going in multiple regionsKM2 (30 –
1000 m)
U.S. Virgin Islands 344 Puerto Rico 2,302 Navassa 3 Florida 30,801 Flower Garden Banks 0 Main Hawaiian Islands 1,231 Northwestern Hawaiian Islands 1,595American Samoa 55 Pacific Remote Island Areas 252 Marshall Islands 13,456 Federated States of Micronesia 14,517 Northern Mariana Islands 124 Guam 108 Palau
2,529
1999 –
2001 photogrammetry and imaging spectroscopy, (Warner 1997 to 2001 Caribbean -
photos sharpen HSI + other source)
2001 –
2004 IKONOS imagery
2005 –
2008 multibeam and LiDAR (camera system on drop frame and ROV)
► Address National Issues with Local Approach
► Support Diverse, Collaborative Partnerships
► Provide Science & Research to Directly Support Management and Policy Decisions
► Integrate Research Across Scientific Disciplines
► Serve as a Link Between Science Conducted in Academia and Specific Needs of Coastal Decision-Makers
Guiding PrinciplesCoral Reef Monitoring and Assessment Workshop
► AssessmentsCoral Reef EcosystemsMarine Protected AreasEutrophication & Nutrients
► Integrated Ecosystem Modeling & Mapping
► Coastal Contamination, Status & Trends
► Oceanographic Remote Sensing
► Harmful Algal Bloom Detection & Forecasting
► Biogeography & Spatial Ecology
CCMA scientists conduct field observations on regional and national scales to provide the best available scientific information for resource managers and researchers, and to
provide technical advice, and accessibility to data.
Center Capability Highlights Coral Reef Monitoring and Assessment Workshop
Enhancing Cooperative Research Partnerships► Federal, State, Regional, Local Governments► Academic Institutions► Non-Governmental Organizations► Tribes
Roles of Partners► Collaborative Work with CCMA► Project Planning, Execution, and Product
Development► Technical expertise► Local Knowledge
“The shortage of human and logistical infrastructure in Southwest Alaska makes field work here challenging and expensive. Partnering with NOAA’s Center for Coastal Monitoring and Assessment makes vital water quality
monitoring feasible here that would be difficult if not impossible otherwise."-
Bristol Bay Native Association
Strength Through Partnership Coral Reef Monitoring and Assessment Workshop
Ecosystem-based Research
EstuariesEstuaries Marine Protected AreasMarine Protected Areas
Coral ReefsCoral Reefs Coastal OceanCoastal Ocean
Coral Reef Monitoring and Assessment Workshop
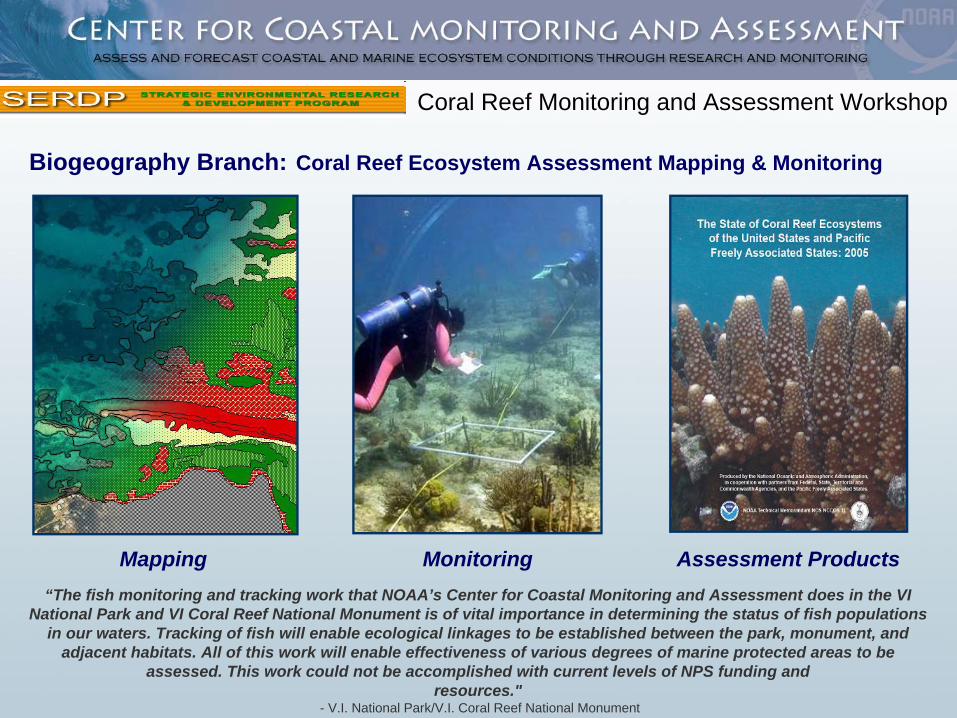
Biogeography Branch: Coral Reef Ecosystem Assessment Mapping & Monitoring
MonitoringMapping Assessment Products“The fish monitoring and tracking work that NOAA’s Center for Coastal Monitoring and Assessment does in the VI
National Park and VI Coral Reef National Monument is of vital importance in determining the status of fish populations in our waters. Tracking of fish will enable ecological linkages to be established between the park, monument, and
adjacent habitats. All of this work will enable effectiveness of various degrees of marine protected areas to be assessed. This work could not be accomplished with current levels of NPS funding and
resources."-
V.I. National Park/V.I. Coral Reef National Monument
Coral Reef Monitoring and Assessment Workshop
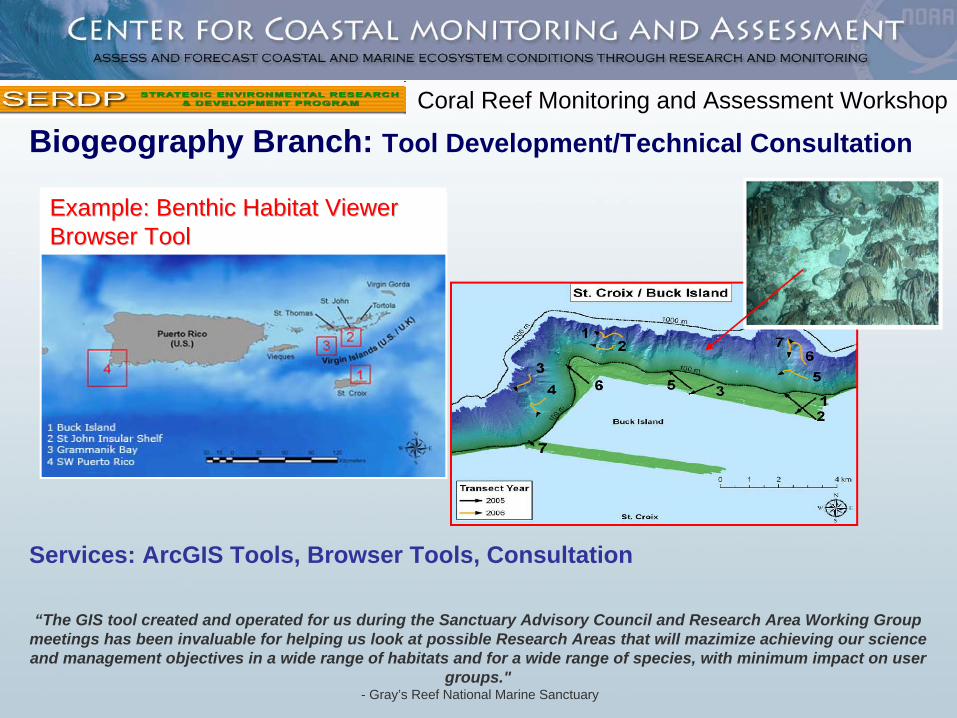
Services: ArcGIS Tools, Browser Tools, Consultation
Example: Benthic Habitat Viewer Example: Benthic Habitat Viewer Browser ToolBrowser Tool
“The GIS tool created and operated for us during the Sanctuary Advisory Council and Research Area Working Group meetings has been invaluable for helping us look at possible Research Areas that will mazimize achieving our science and management objectives in a wide range of habitats and for a wide range of species, with minimum impact on user
groups."-
Gray’s Reef National Marine Sanctuary
Biogeography Branch: Tool Development/Technical ConsultationCoral Reef Monitoring and Assessment Workshop
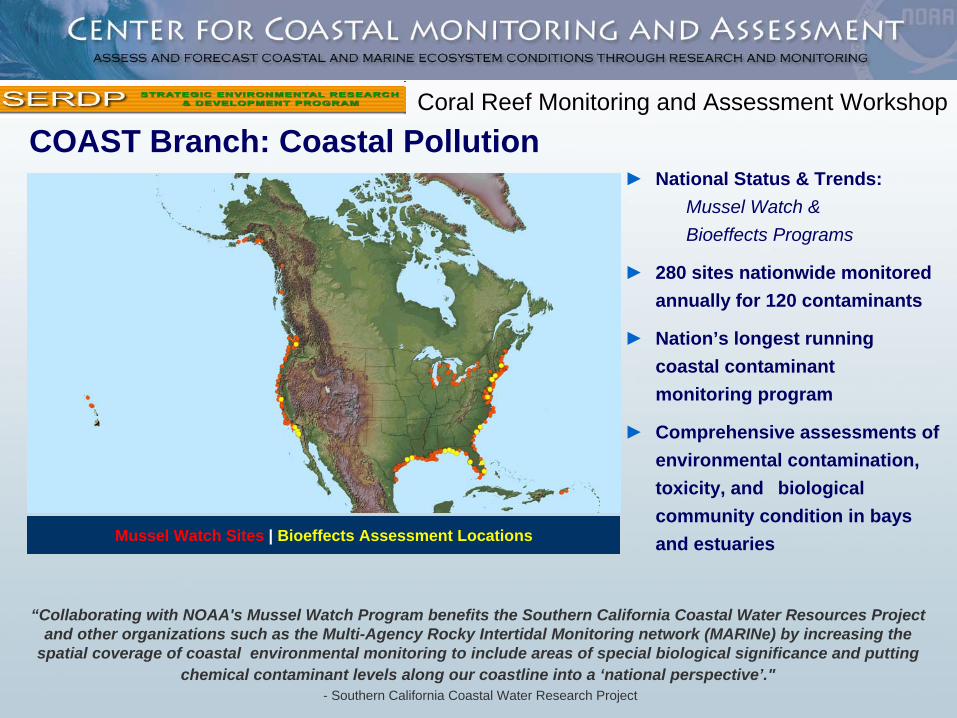
► National Status & Trends: Mussel Watch & Bioeffects Programs
►
280 sites nationwide monitored annually for 120 contaminants
►
Nation’s longest running coastal contaminant monitoring program
►
Comprehensive assessments of environmental contamination, toxicity, and biological community condition in bays and estuaries
“Collaborating with NOAA's Mussel Watch Program benefits the Southern California Coastal Water Resources Project and other organizations such as the Multi-Agency Rocky Intertidal Monitoring network (MARINe) by increasing the
spatial coverage of coastal environmental monitoring to include areas of special biological significance and putting chemical contaminant levels along our coastline into a ‘national perspective’."
-
Southern California Coastal Water Research Project
COAST Branch: Coastal Pollution
Mussel Watch Sites | Bioeffects Assessment Locations
Coral Reef Monitoring and Assessment Workshop
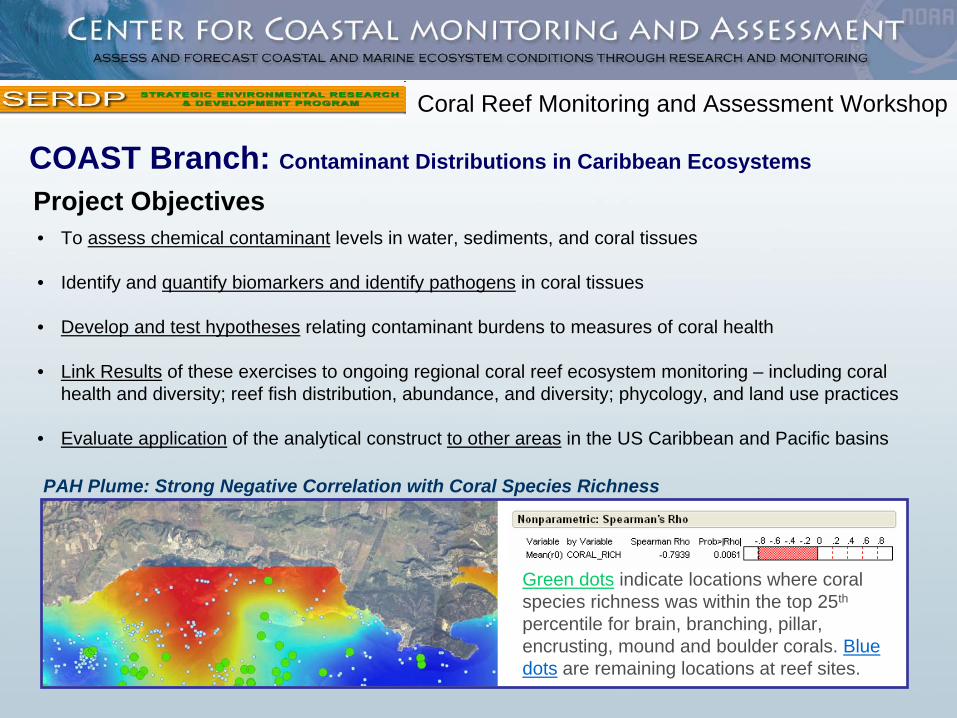
COAST Branch: Contaminant Distributions in Caribbean Ecosystems
Project Objectives•
To assess chemical contaminant
levels in water, sediments, and coral tissues
•
Identify and quantify biomarkers and identify pathogens
in coral tissues
•
Develop and test hypotheses
relating contaminant burdens to measures of coral health
•
Link Results
of these exercises to ongoing regional coral reef ecosystem monitoring –
including coral health and diversity; reef fish distribution, abundance, and diversity; phycology, and land use practices
•
Evaluate application
of the analytical construct to other areas
in the US Caribbean and Pacific basins
PAH Plume: Strong Negative Correlation with Coral Species Richness
Green dots
indicate locations where coral species richness was within the top 25th
percentile for brain, branching, pillar, encrusting, mound and boulder corals.
Blue dots
are remaining locations at reef sites.
Coral Reef Monitoring and Assessment Workshop
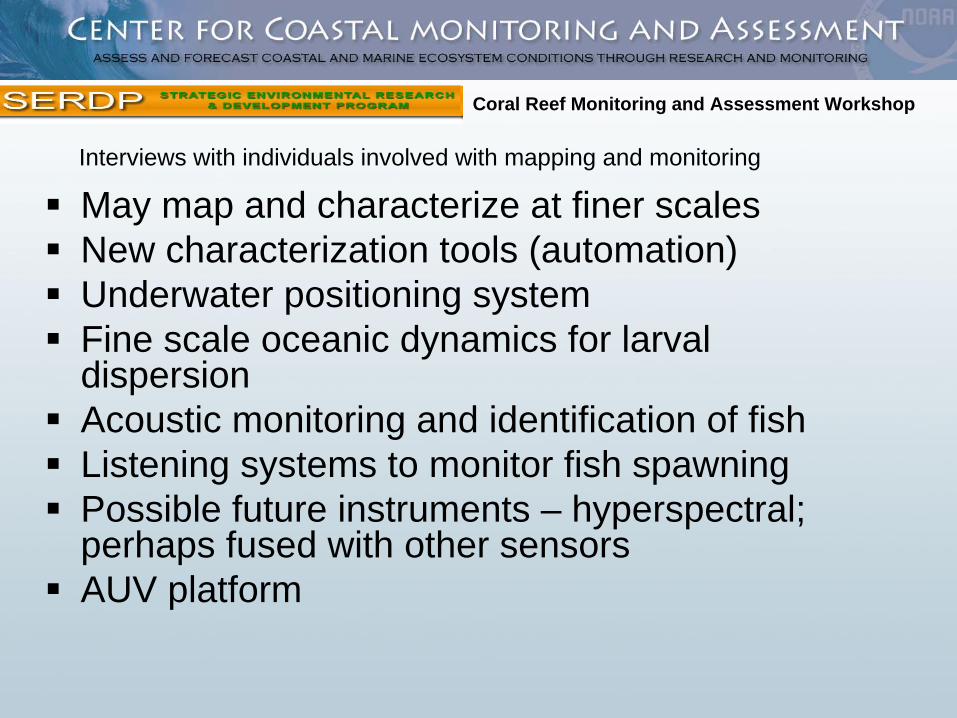
Interviews with individuals involved with mapping and monitoring
May map and characterize at finer scalesNew characterization tools (automation)Underwater positioning systemFine scale oceanic dynamics for larval dispersion Acoustic monitoring and identification of fishListening systems to monitor fish spawningPossible future instruments – hyperspectral; perhaps fused with other sensorsAUV platform
Coral Reef Monitoring and Assessment Workshop
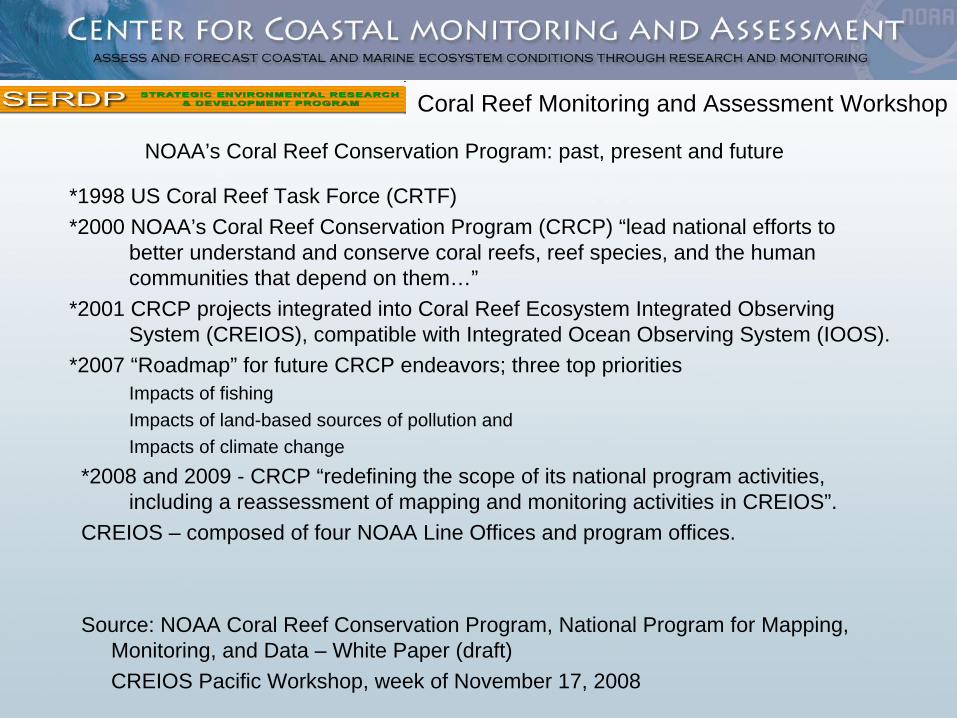
NOAA’s Coral Reef Conservation Program: past, present and future
*1998 US Coral Reef Task Force (CRTF)*2000 NOAA’s Coral Reef Conservation Program (CRCP) “lead national efforts to
better understand and conserve coral reefs, reef species, and the human communities that depend on them…”
*2001 CRCP projects integrated into Coral Reef Ecosystem Integrated Observing System (CREIOS), compatible with Integrated Ocean Observing System (IOOS).
*2007 “Roadmap”
for future CRCP endeavors; three top priorities Impacts of fishingImpacts of land-based sources of pollution andImpacts of climate change
*2008 and 2009 -
CRCP “redefining the scope of its national program activities, including a reassessment of mapping and monitoring activities in
CREIOS”.CREIOS –
composed of four NOAA Line Offices and program offices.
Source: NOAA Coral Reef Conservation Program, National Program for Mapping, Monitoring, and Data –
White Paper (draft)CREIOS Pacific Workshop, week of November 17, 2008
Coral Reef Monitoring and Assessment Workshop
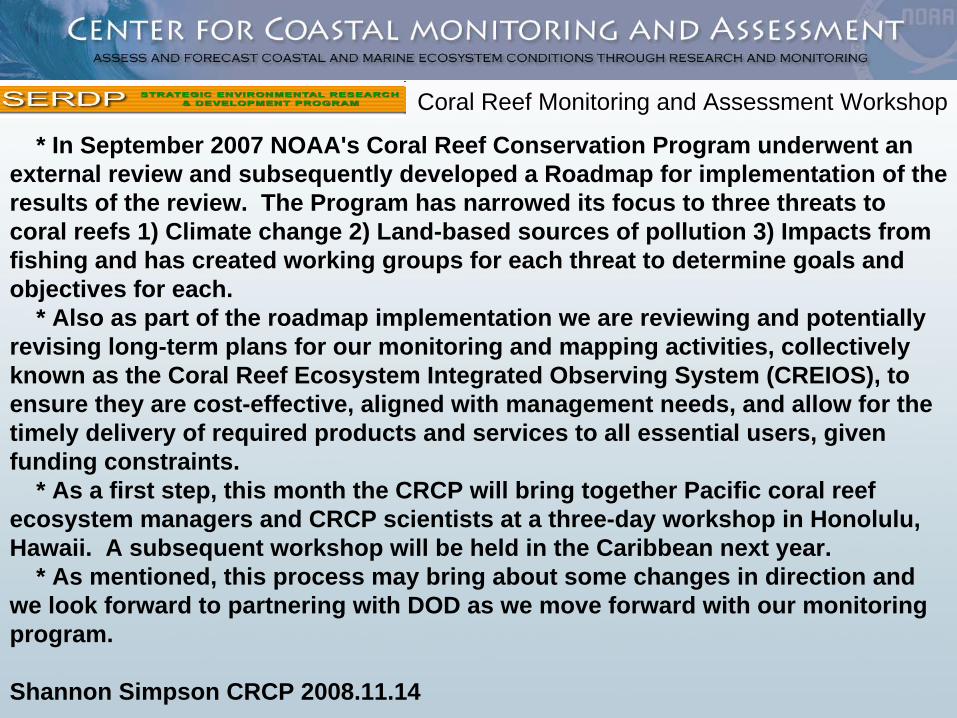
* In September 2007 NOAA's Coral Reef Conservation Program underwent an external review and subsequently developed a Roadmap for implementation of the results of the review. The Program has narrowed its focus to three threats to coral reefs 1) Climate change 2) Land-based sources of pollution 3) Impacts from fishing and has created working groups for each threat to determine goals and objectives for each.
* Also as part of the roadmap implementation we are reviewing and potentially revising long-term plans for our monitoring and mapping activities, collectively known as the Coral Reef Ecosystem Integrated Observing System (CREIOS), to ensure they are cost-effective, aligned with management needs, and allow for the timely delivery of required products and services to all essential users, given funding constraints.
* As a first step, this month the CRCP will bring together Pacific coral reef ecosystem managers and CRCP scientists at a three-day workshop in Honolulu, Hawaii. A subsequent workshop will be held in the Caribbean next year.
* As mentioned, this process may bring about some changes in direction and we look forward to partnering with DOD as we move forward with our monitoring program.
Shannon Simpson CRCP 2008.11.14
Coral Reef Monitoring and Assessment Workshop
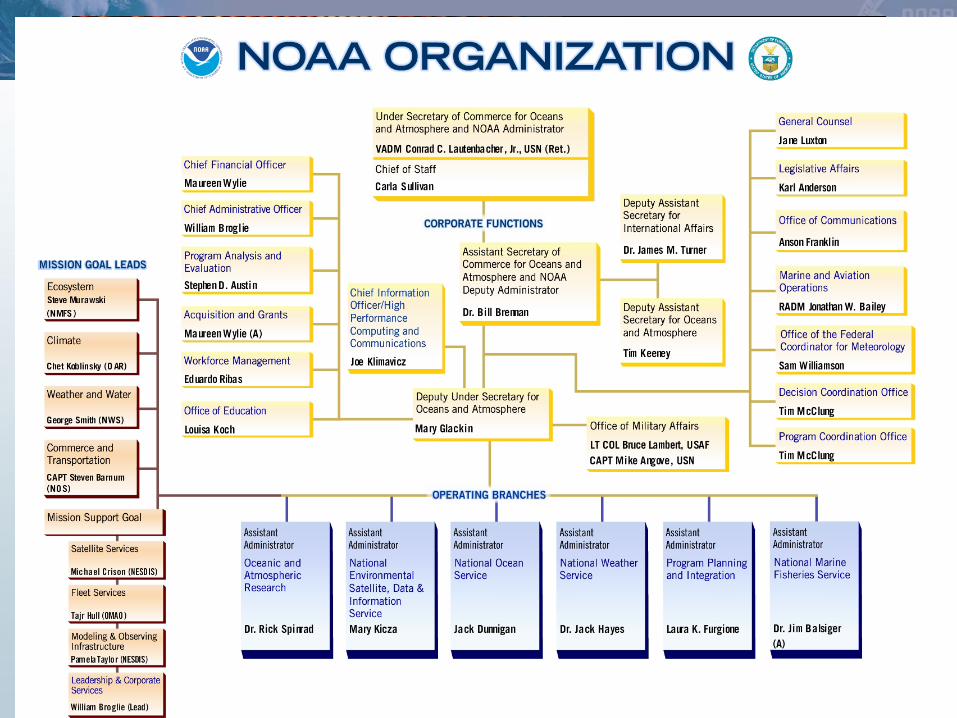
Coral Reef Monitoring and Assessment Workshop
Bill GoodwinSanctuary Resources Manager
FKNMS
Injury Assessment and Restoration Monitoring on Coral Reefs within the Florida Keys National Marine Sanctuary
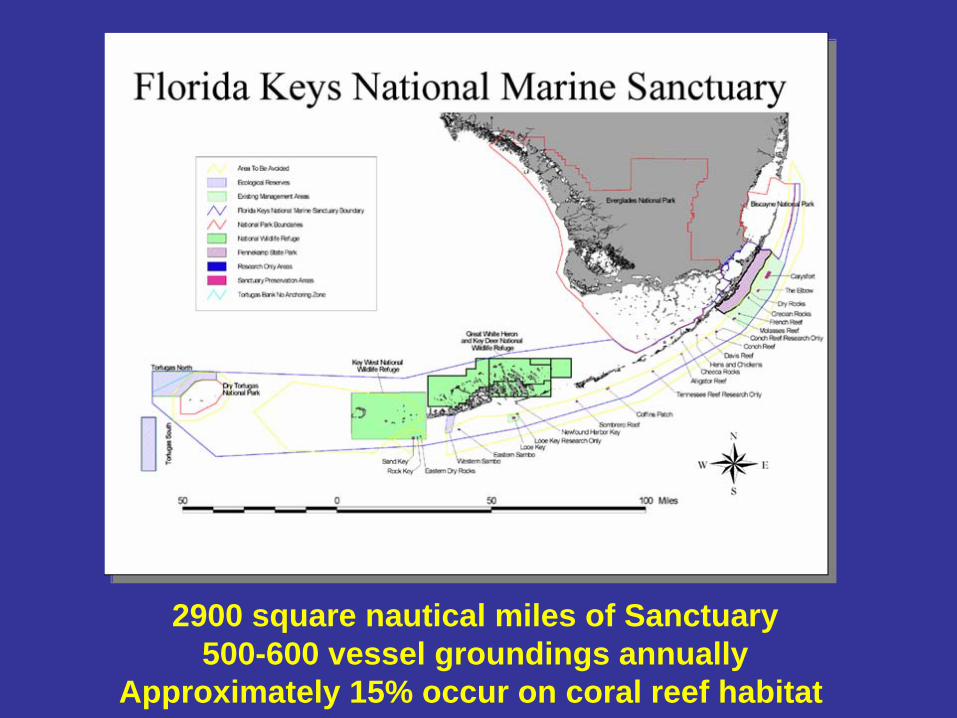
2900 square nautical miles of Sanctuary500-600 vessel groundings annually
Approximately 15% occur on coral reef habitat
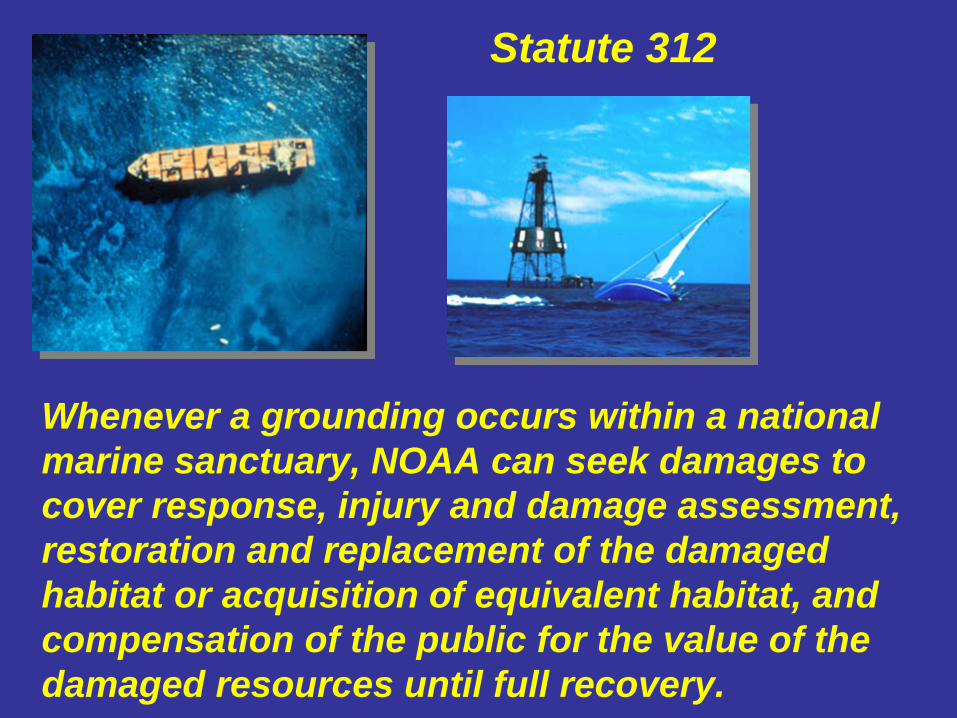
Whenever a grounding occurs within a national marine sanctuary, NOAA can seek damages to cover response, injury and damage assessment, restoration and replacement of the damaged habitat or acquisition of equivalent habitat, and compensation of the public for the value of the damaged resources until full recovery.
Statute 312
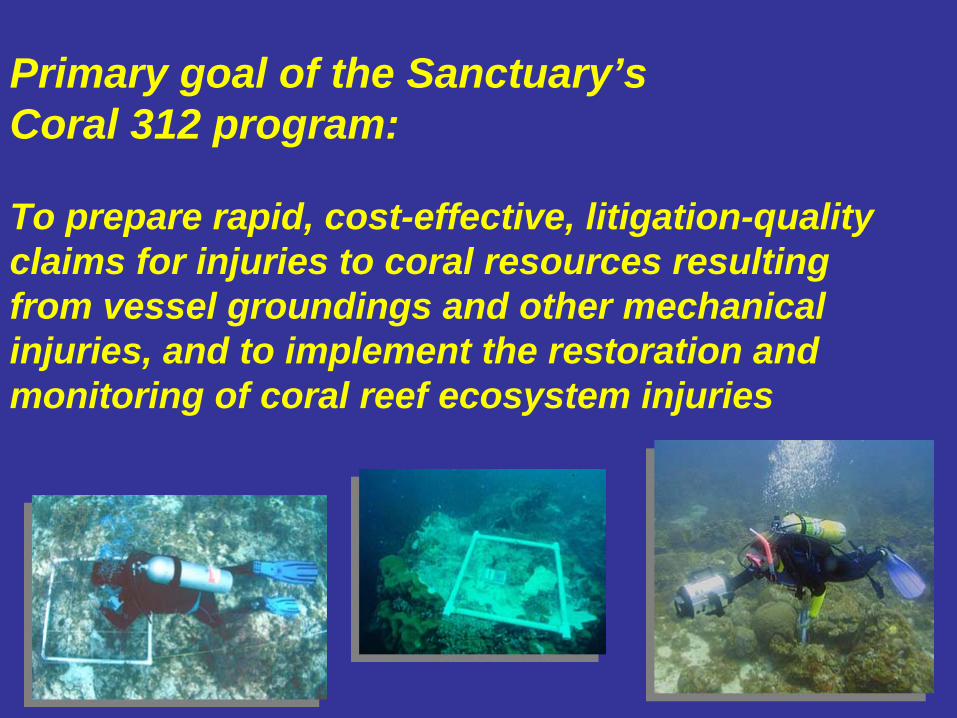
Primary goal of the Sanctuary’s Coral 312 program:
To prepare rapid, cost-effective, litigation-quality claims for injuries to coral resources resulting from vessel groundings and other mechanical injuries, and to implement the restoration and monitoring of coral reef ecosystem injuries
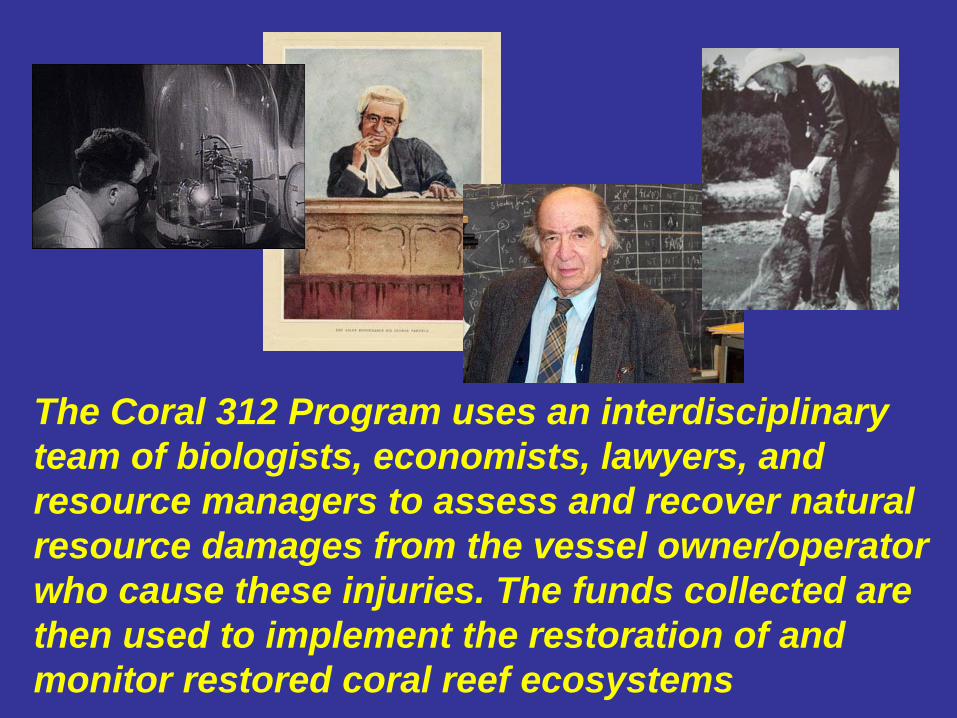
The Coral 312 Program uses an interdisciplinaryteam of biologists, economists, lawyers, and resource managers to assess and recover naturalresource damages from the vessel owner/operatorwho cause these injuries. The funds collected are then used to implement the restoration of and monitor restored coral reef ecosystems
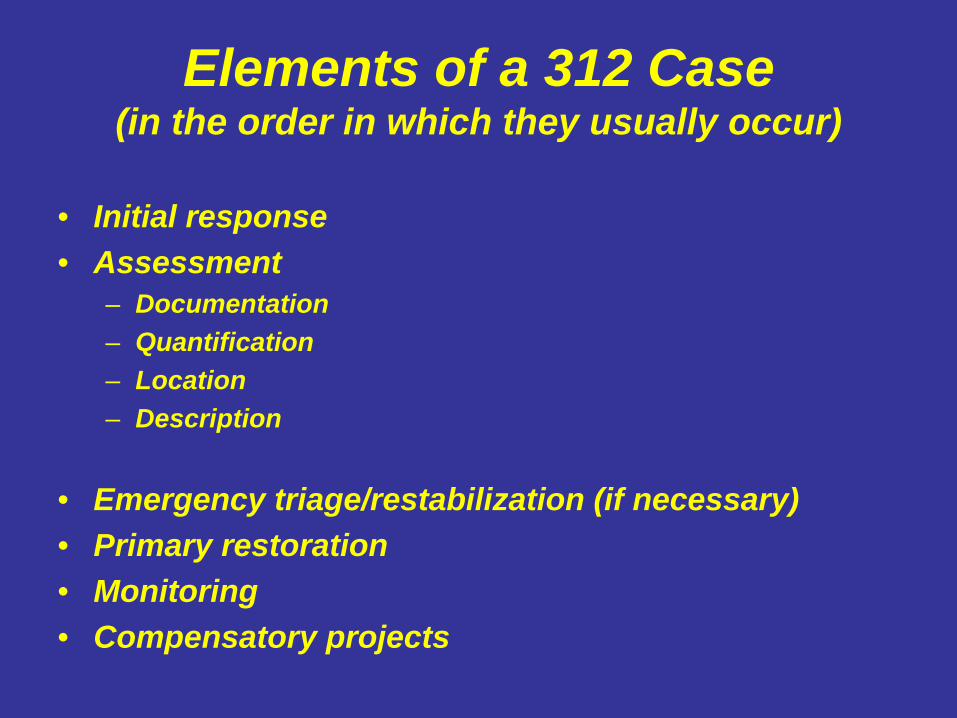
Elements of a 312 Case (in the order in which they usually occur)
• Initial response• Assessment
– Documentation– Quantification– Location– Description
• Emergency triage/restabilization (if necessary)• Primary restoration• Monitoring• Compensatory projects
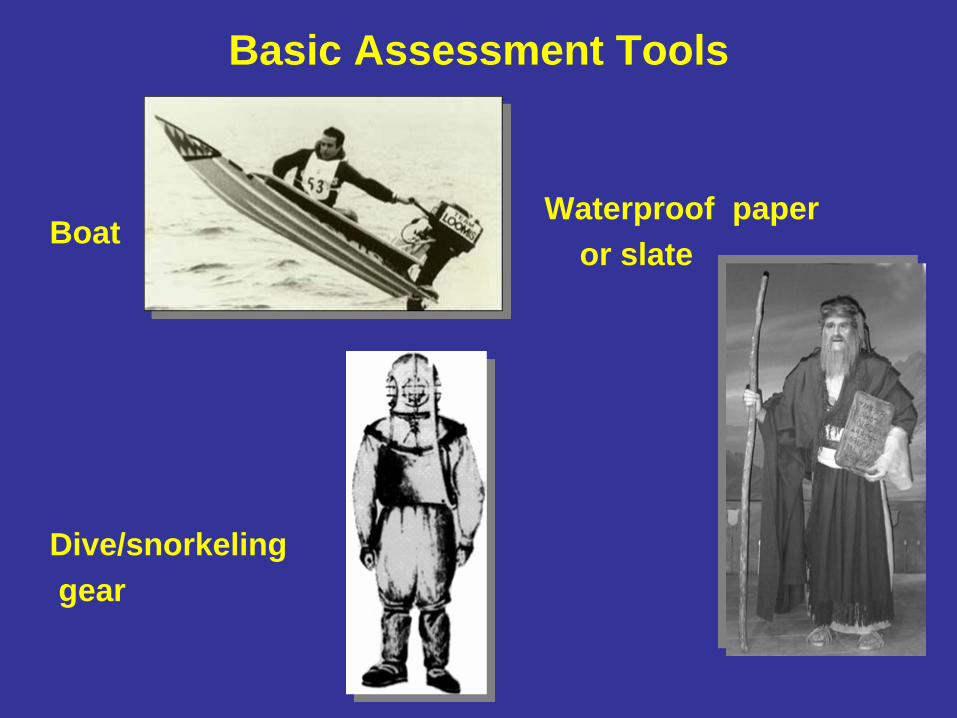
Basic Assessment Tools
Dive/snorkelinggear
Waterproof paper or slateBoat
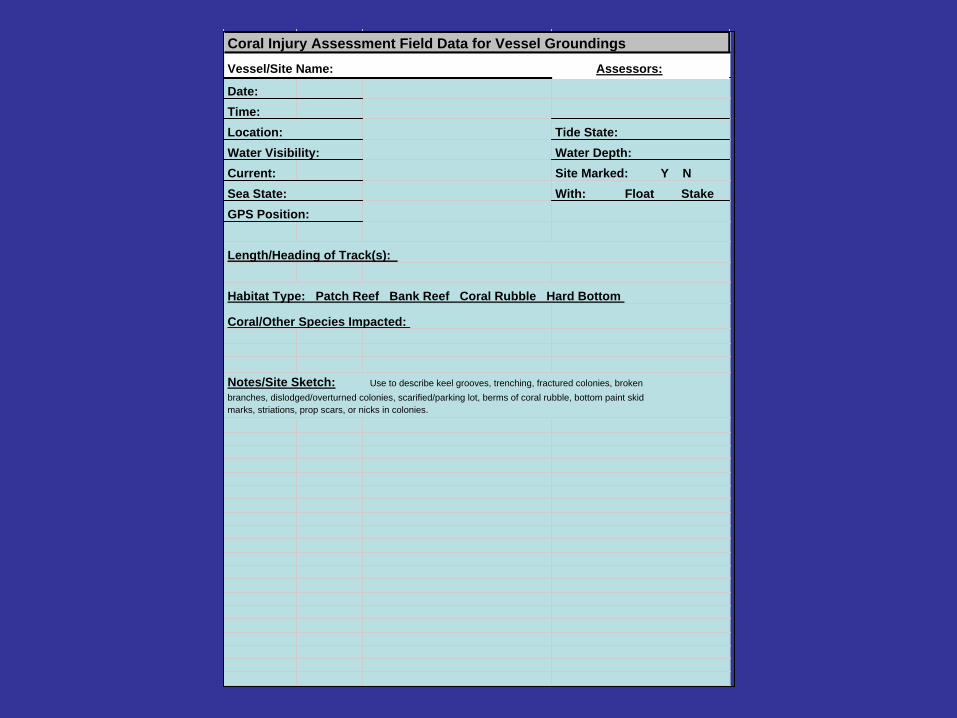
Coral Injury Assessment Field Data for Vessel GroundingsVessel/Site Name: Assessors:
Date: Time: Location: Tide State:Water Visibility: Water Depth:Current: Site Marked: Y N Sea State: With: Float StakeGPS Position:
Habitat Type: Patch Reef Bank Reef Coral Rubble Hard Bottom
Coral/Other Species Impacted:
Length/Heading of Track(s):
Notes/Site Sketch: Use to describe keel grooves, trenching, fractured colonies, broken branches, dislodged/overturned colonies, scarified/parking lot, berms of coral rubble, bottom paint skid marks, striations, prop scars, or nicks in colonies.
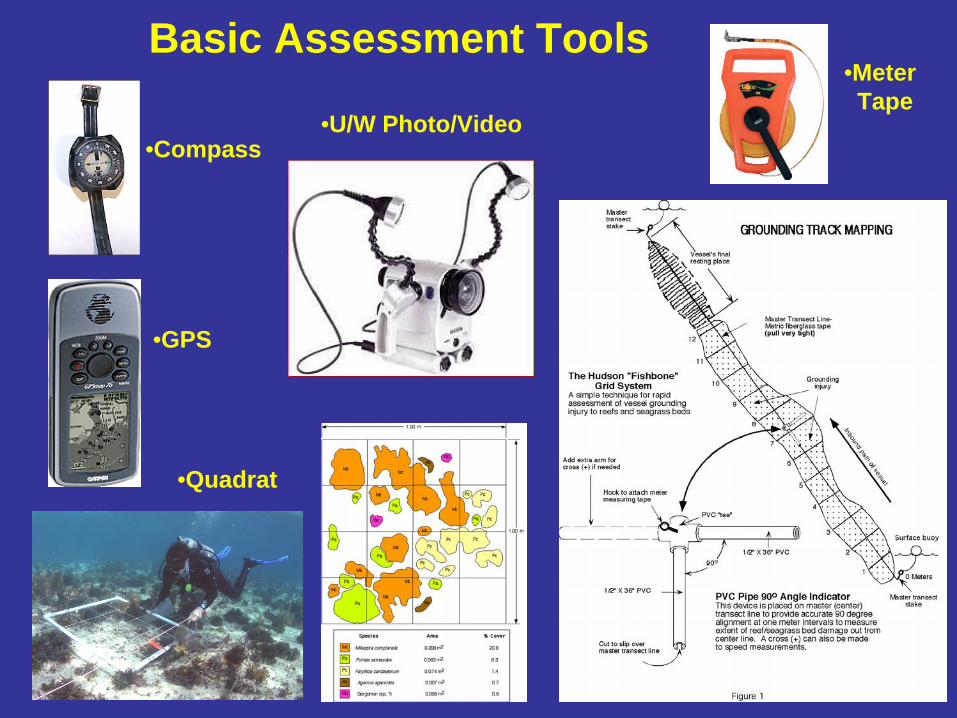
•Compass•U/W Photo/Video
•MeterTape
•GPS
•Quadrat
Basic Assessment Tools
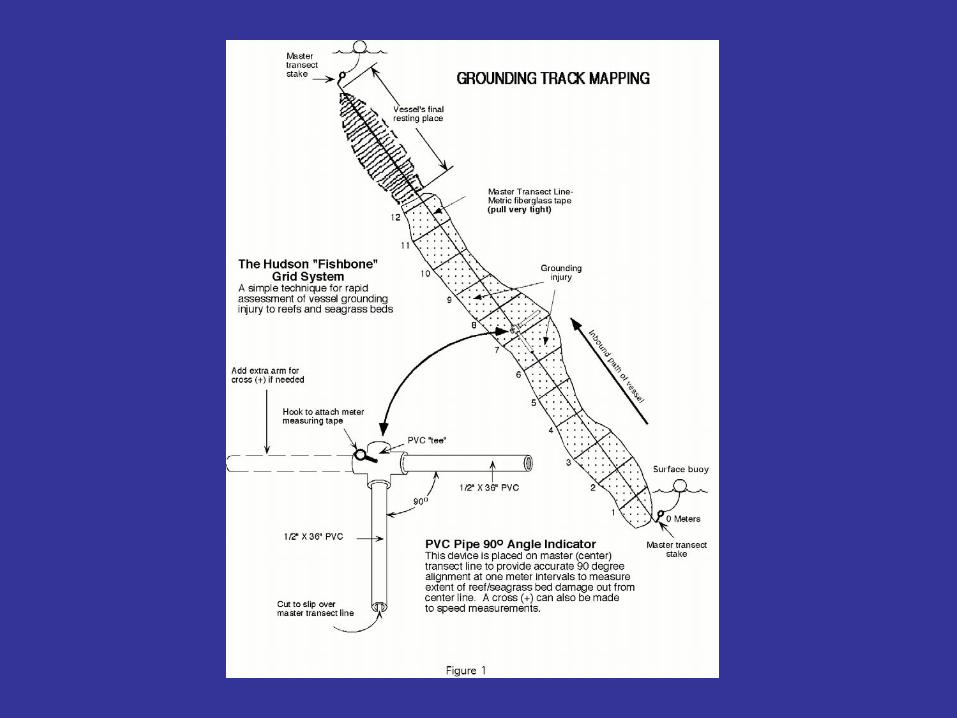
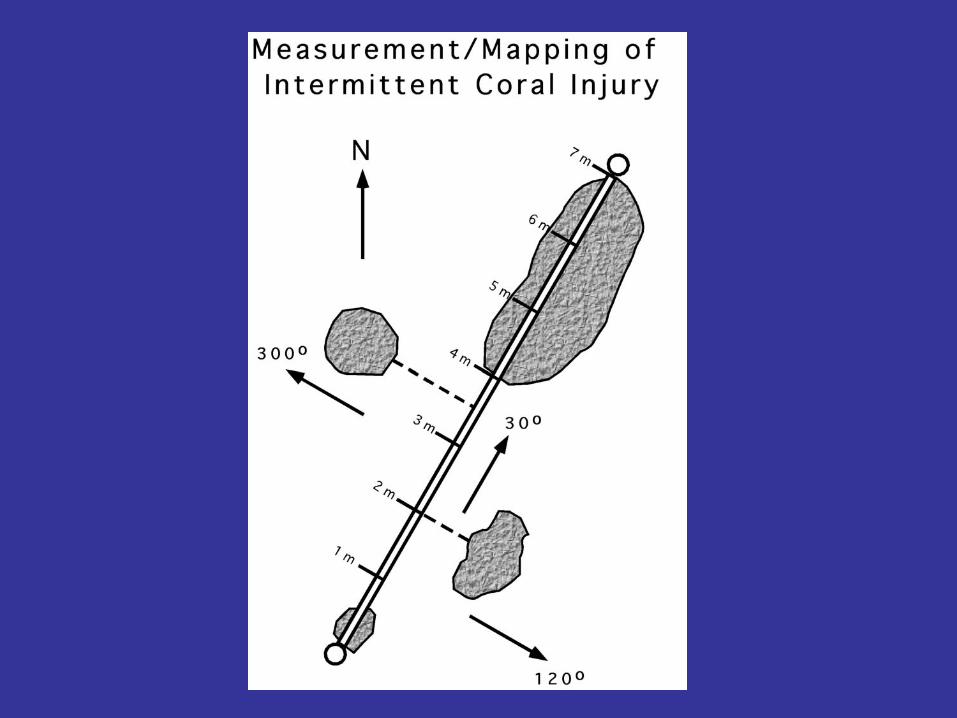
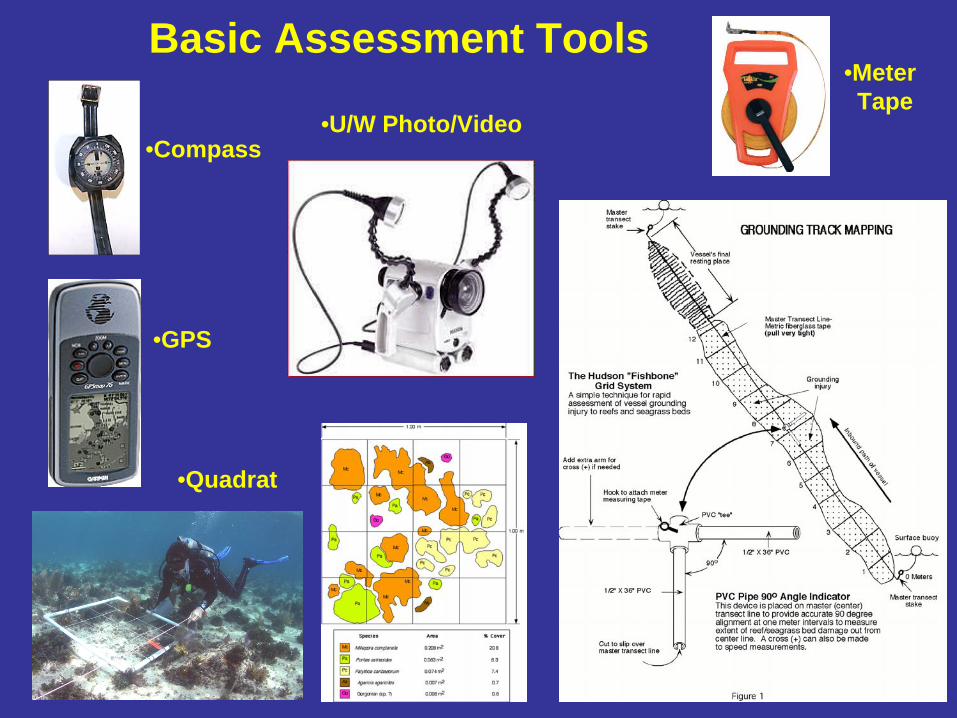
•Compass•U/W Photo/Video
•MeterTape
•GPS
•Quadrat
Basic Assessment Tools
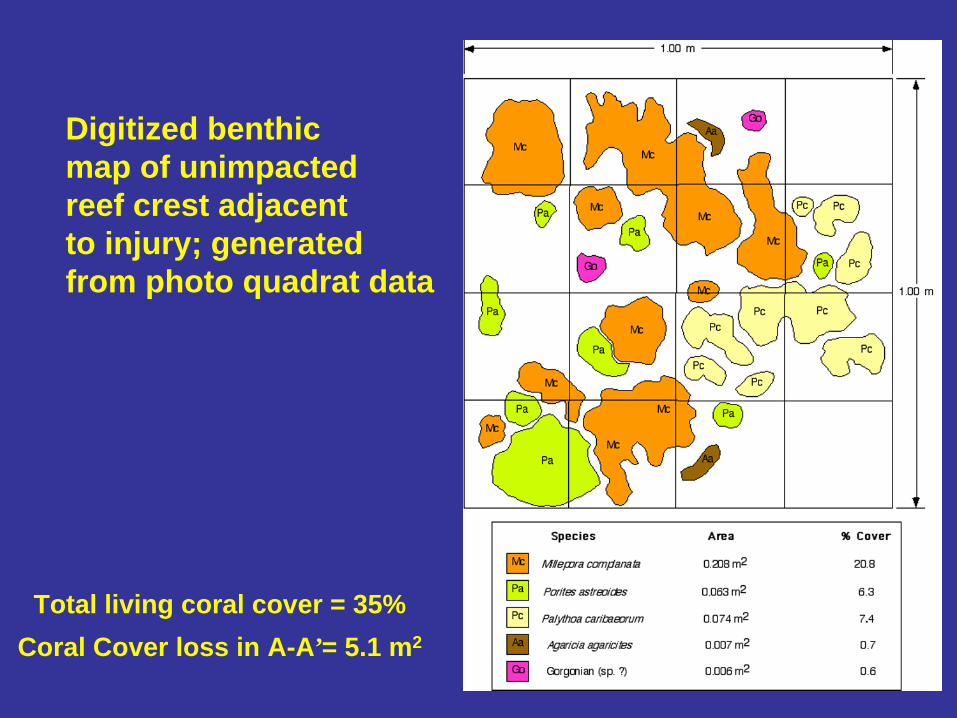
Digitized benthic map of unimpactedreef crest adjacent to injury; generatedfrom photo quadrat data
Total living coral cover = 35%Coral Cover loss in A-A’= 5.1 m2
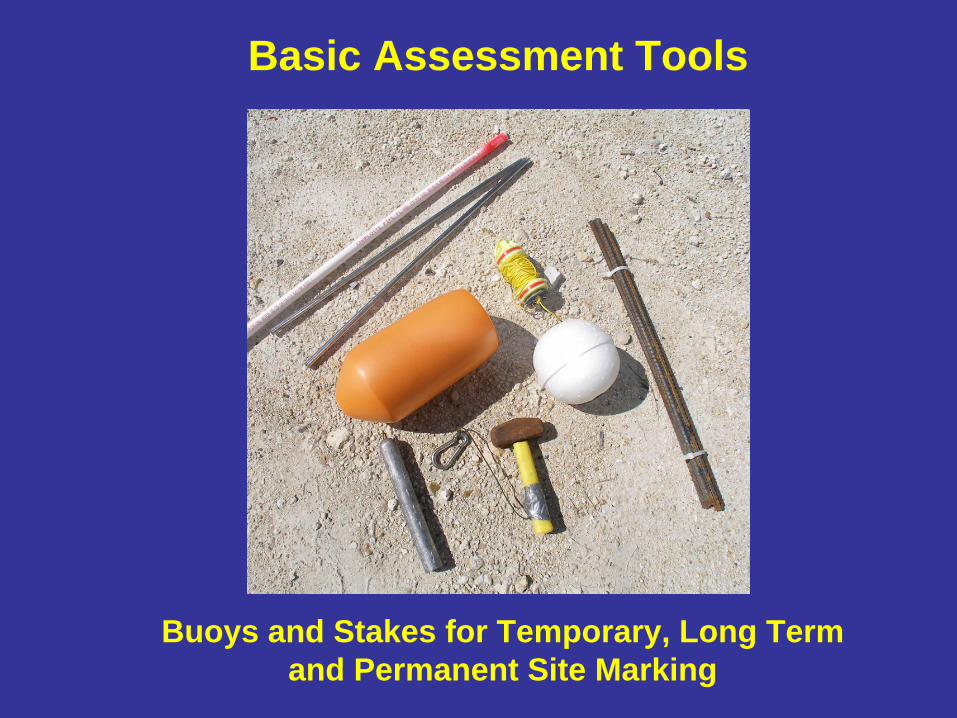
Buoys and Stakes for Temporary, Long Term and Permanent Site Marking
Basic Assessment Tools
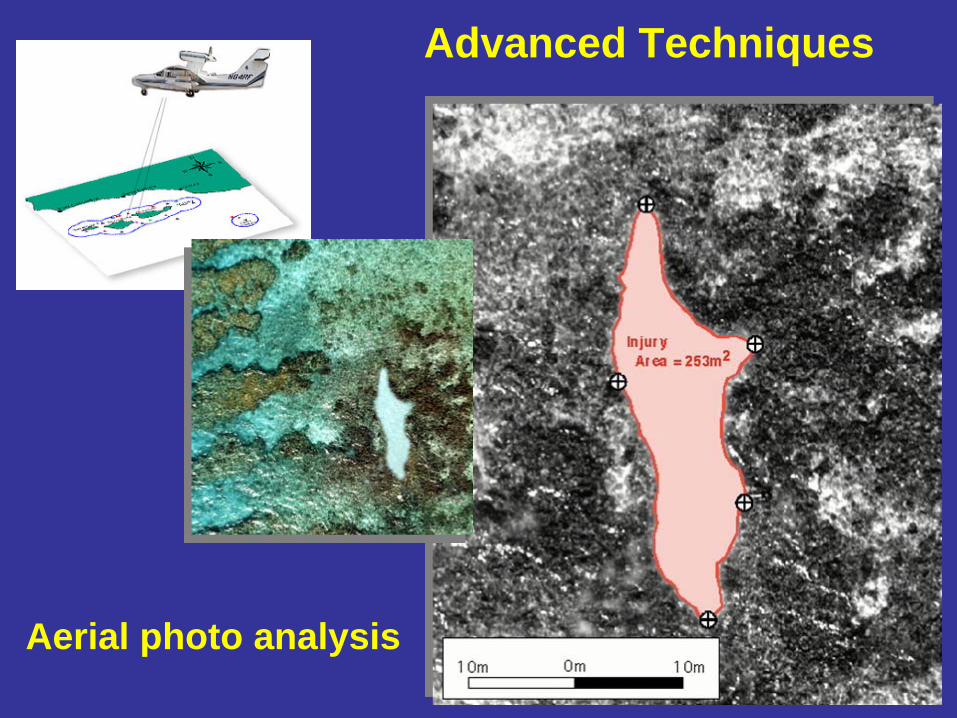
Aerial photo analysis
Advanced Techniques
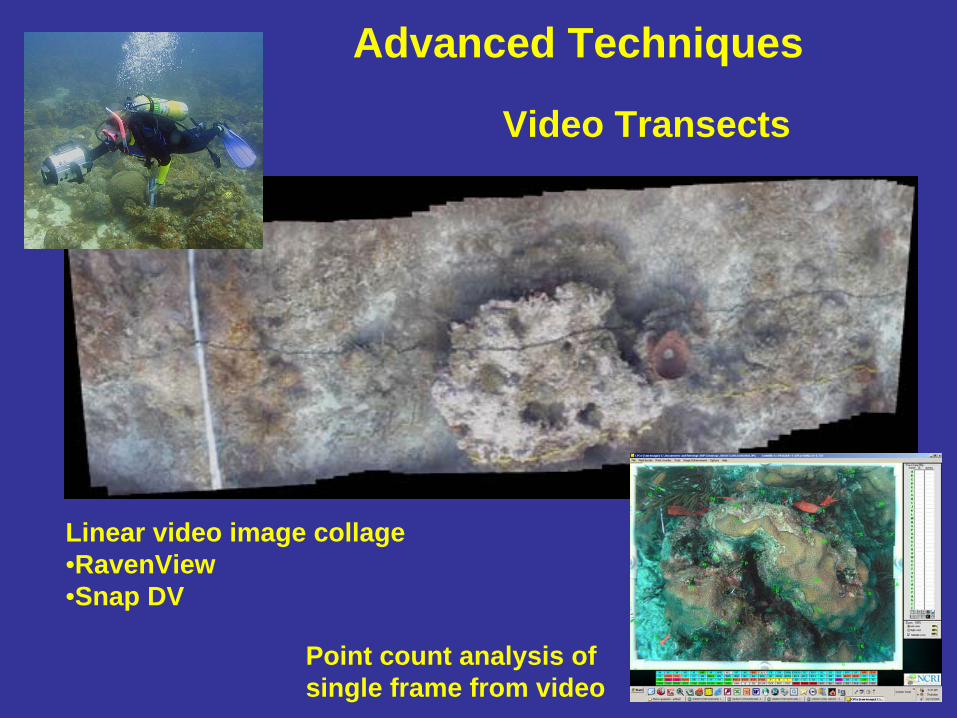
Video Transects
Linear video image collage•RavenView•Snap DV
Point count analysis of single frame from video
Advanced Techniques
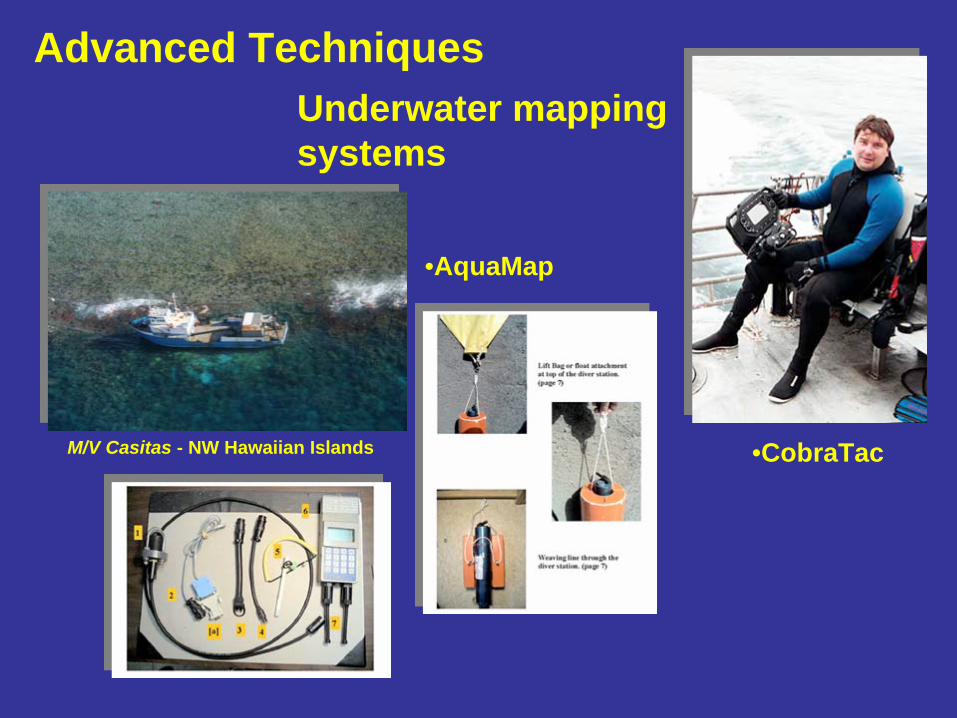
Underwater mappingsystems
•AquaMap
M/V Casitas - NW Hawaiian Islands •CobraTac
Advanced Techniques
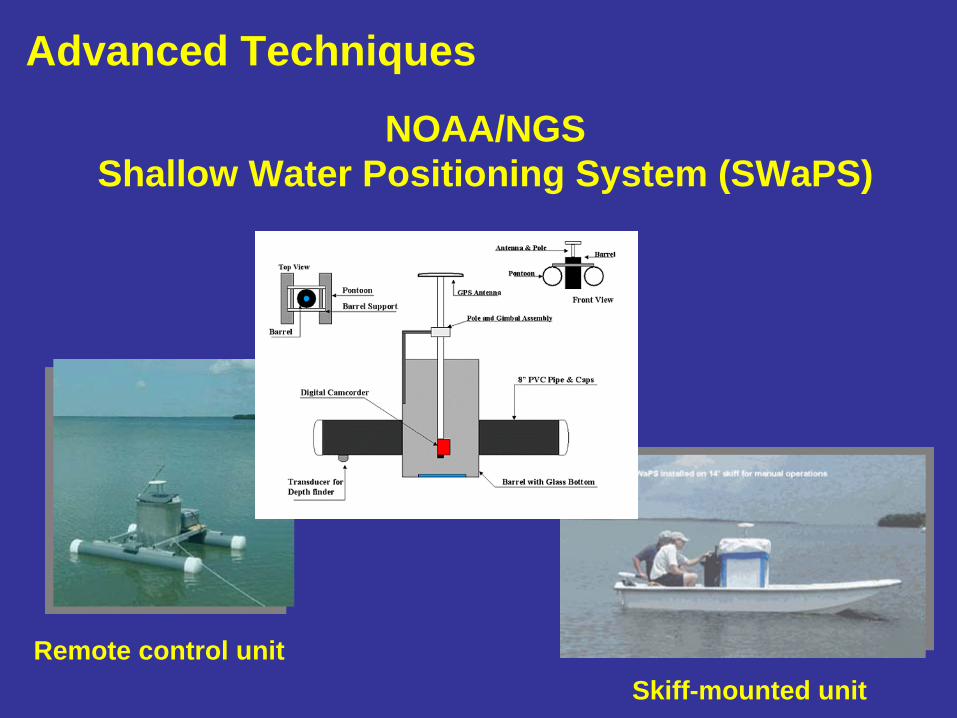
NOAA/NGSShallow Water Positioning System (SWaPS)
Remote control unitSkiff-mounted unit
Advanced Techniques
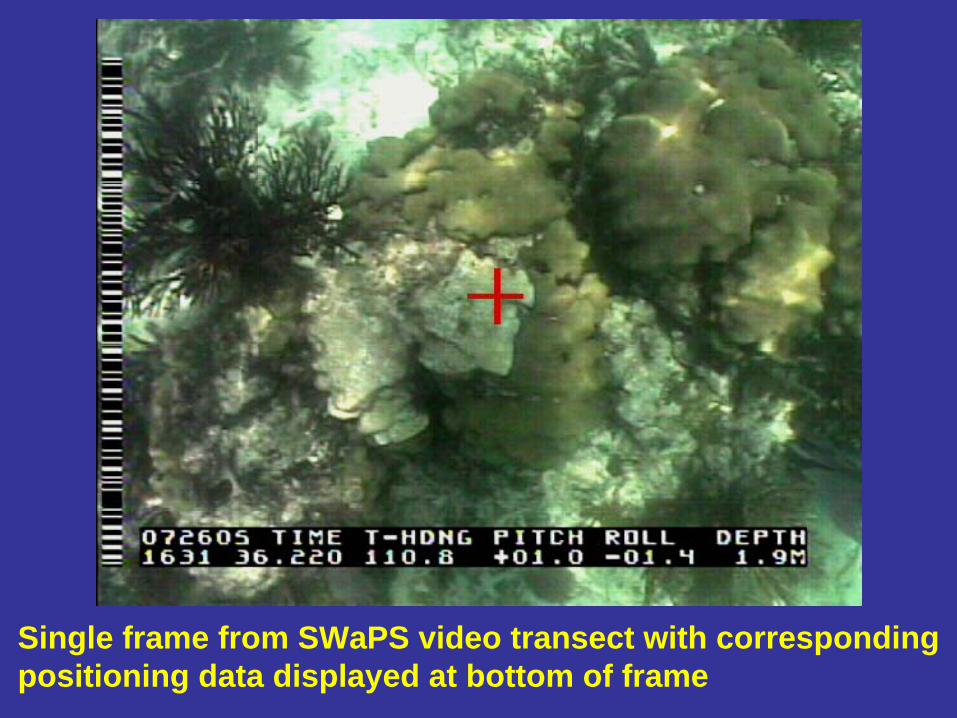
Single frame from SWaPS video transect with corresponding positioning data displayed at bottom of frame
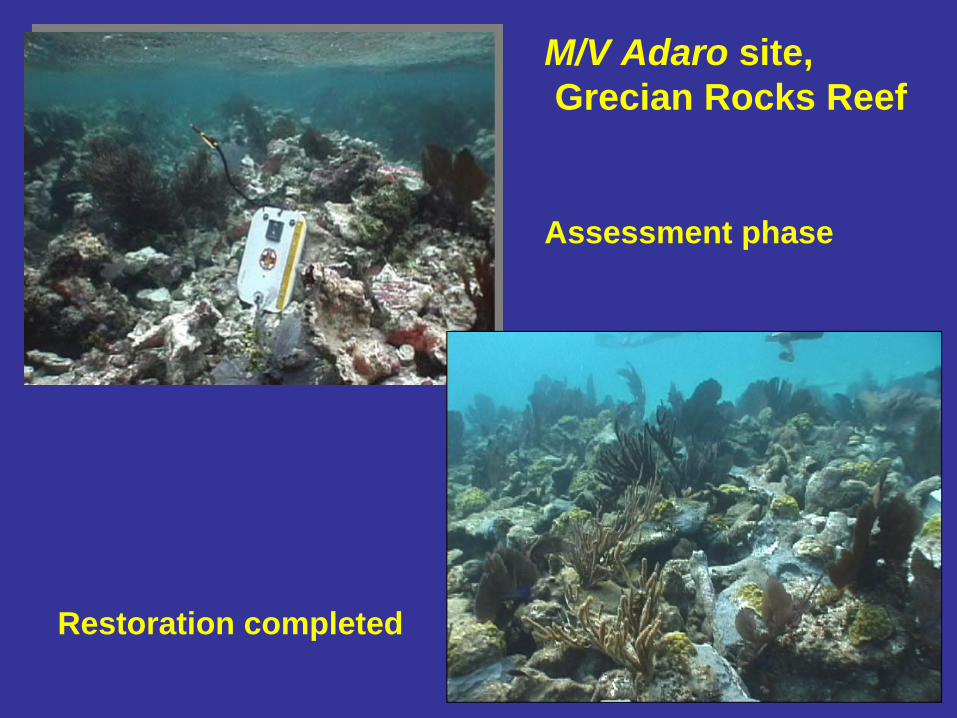
M/V Adaro site,Grecian Rocks Reef
Assessment phase
Restoration completed
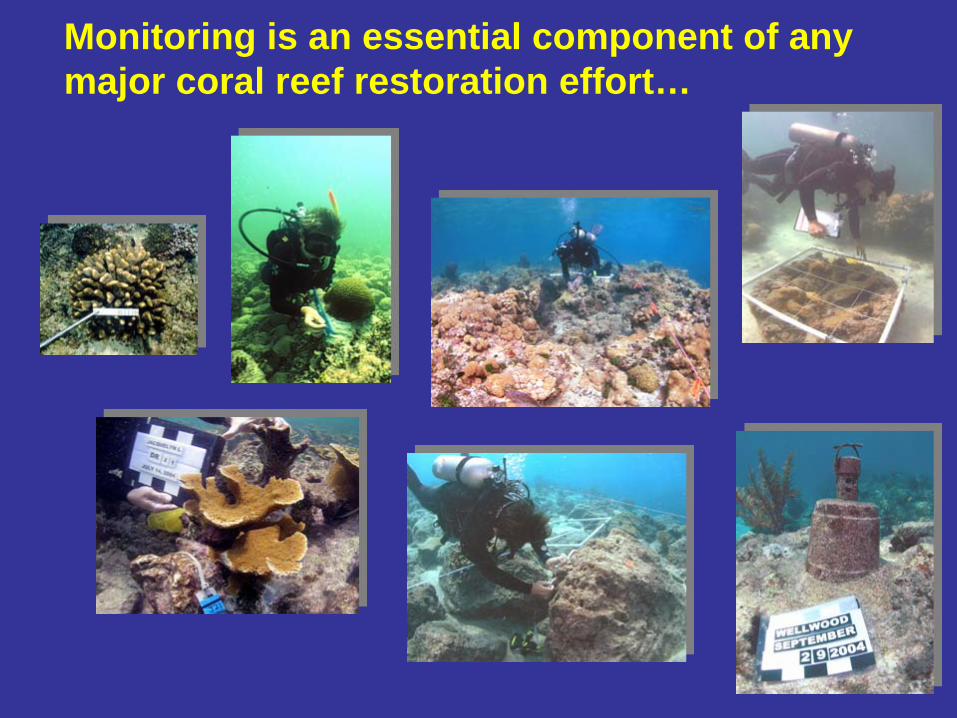
Monitoring is an essential component of any major coral reef restoration effort…
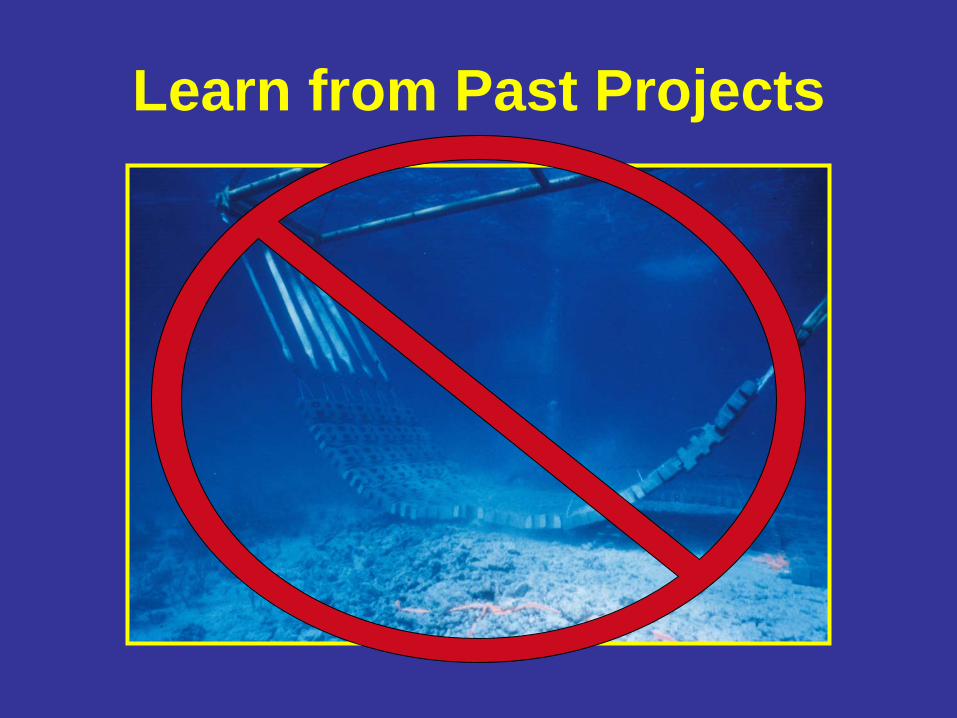
Learn from Past Projects
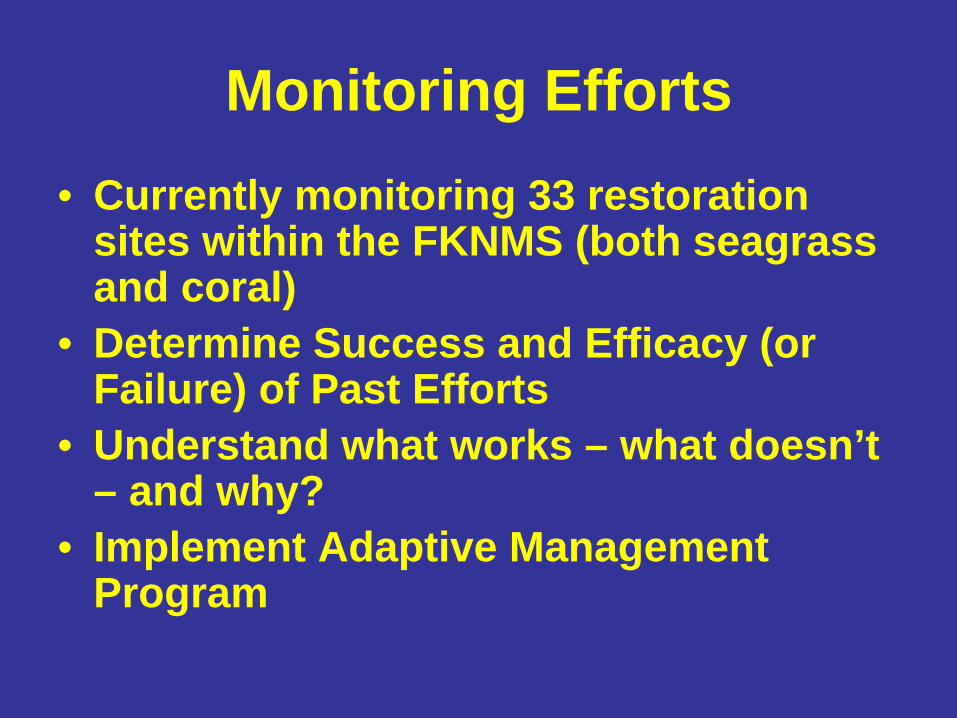
Monitoring Efforts• Currently monitoring 33 restoration
sites within the FKNMS (both seagrass and coral)
• Determine Success and Efficacy (or Failure) of Past Efforts
• Understand what works – what doesn’t – and why?
• Implement Adaptive Management Program
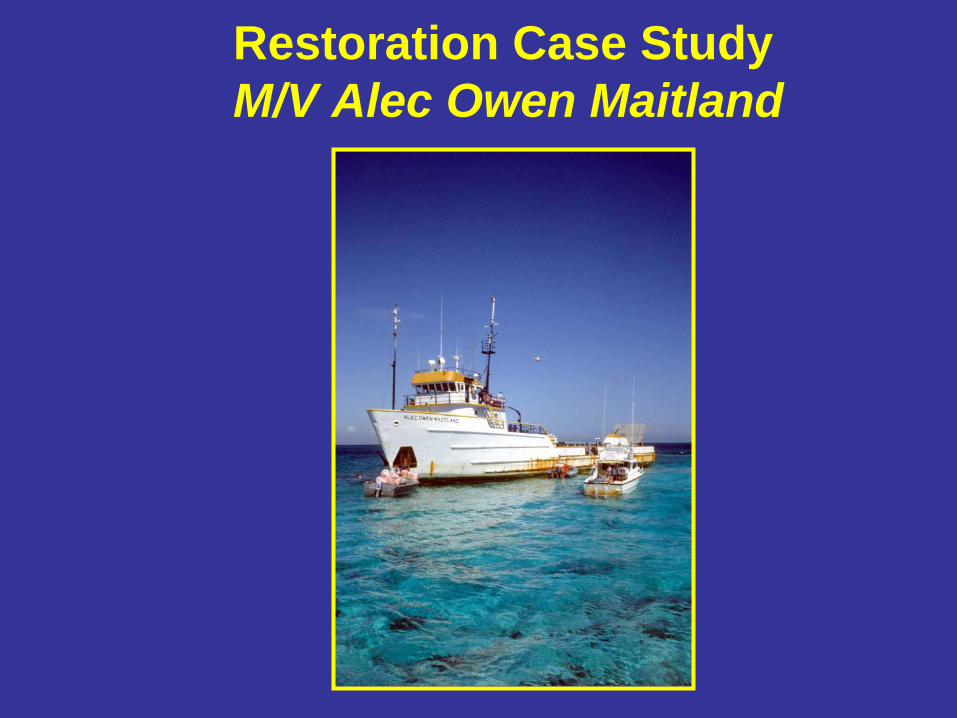
Restoration Case StudyM/V Alec Owen Maitland
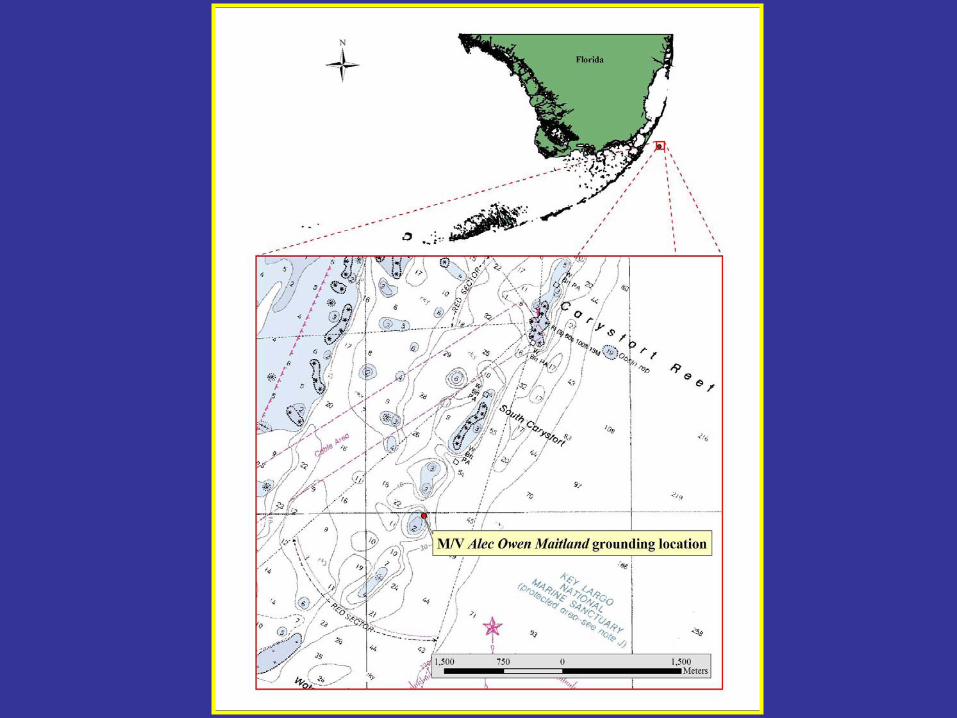
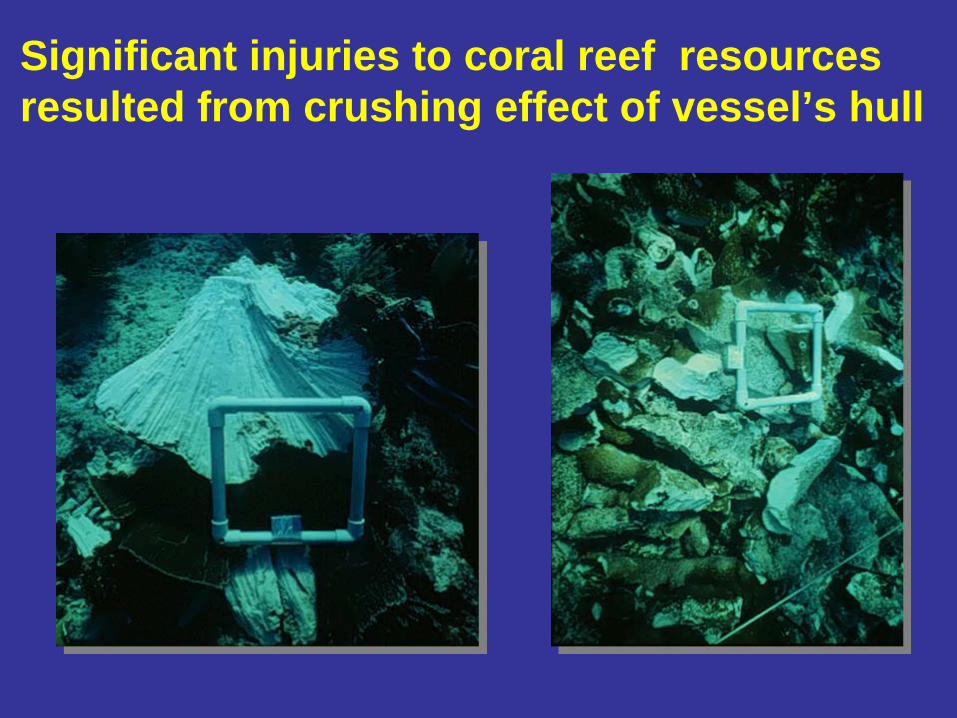
Significant injuries to coral reef resources resulted from crushing effect of vessel’s hull
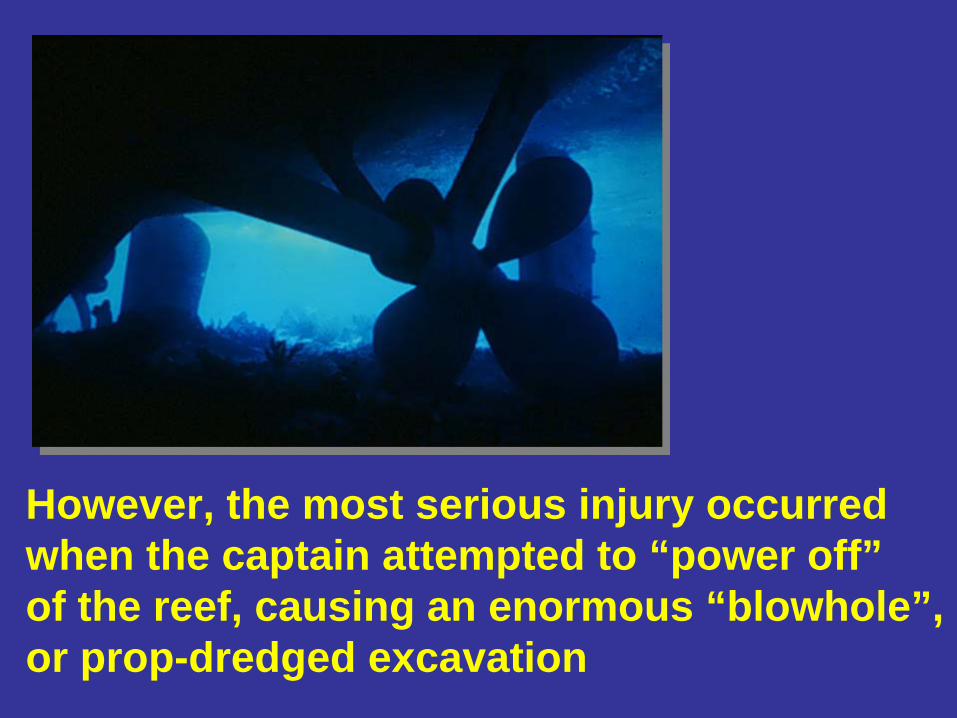
However, the most serious injury occurred when the captain attempted to “power off”of the reef, causing an enormous “blowhole”, or prop-dredged excavation
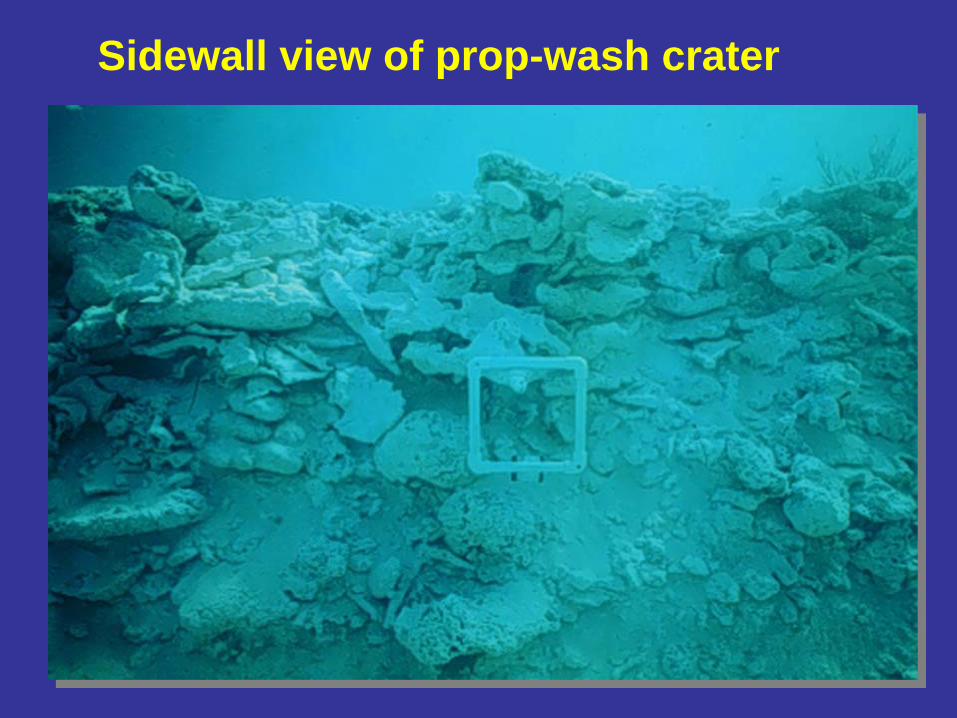
Sidewall view of prop-wash crater
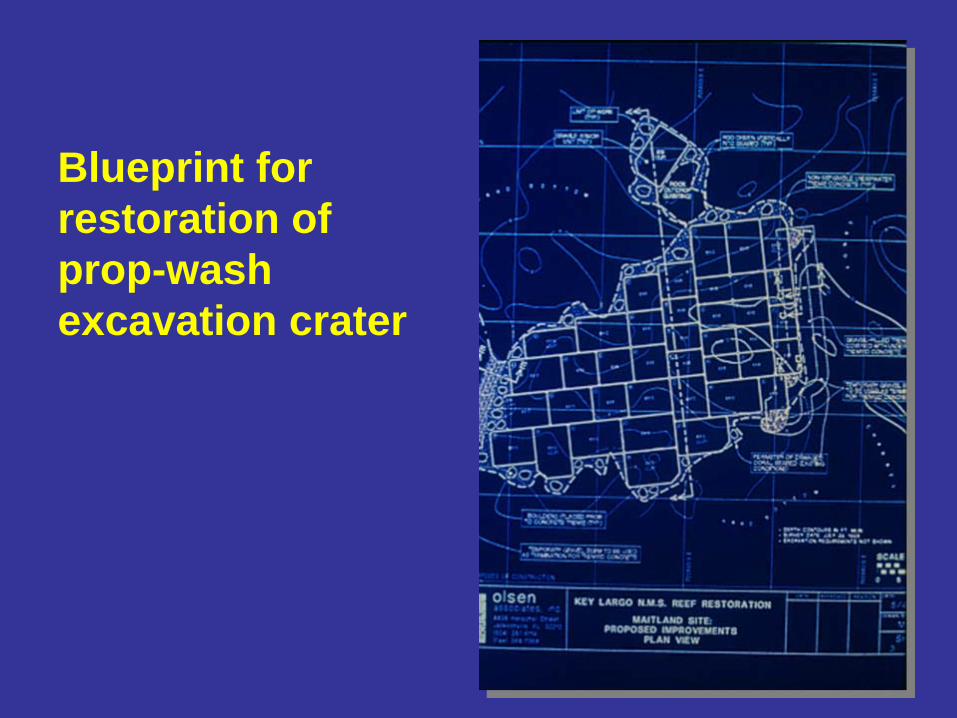
Blueprint forrestoration of prop-wash excavation crater
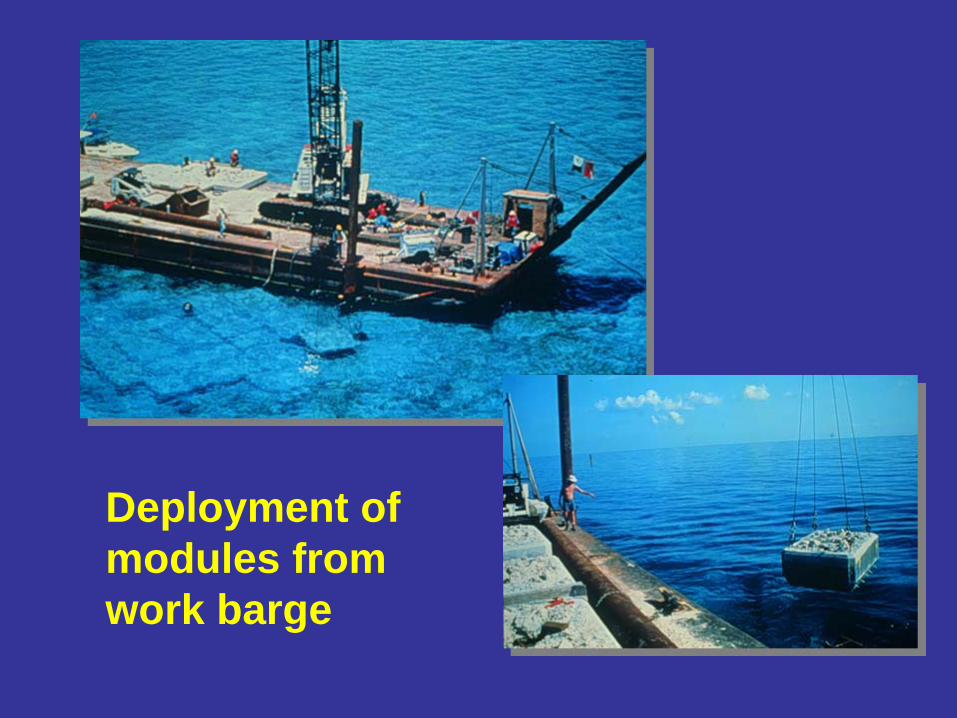
Deployment of modules from work barge
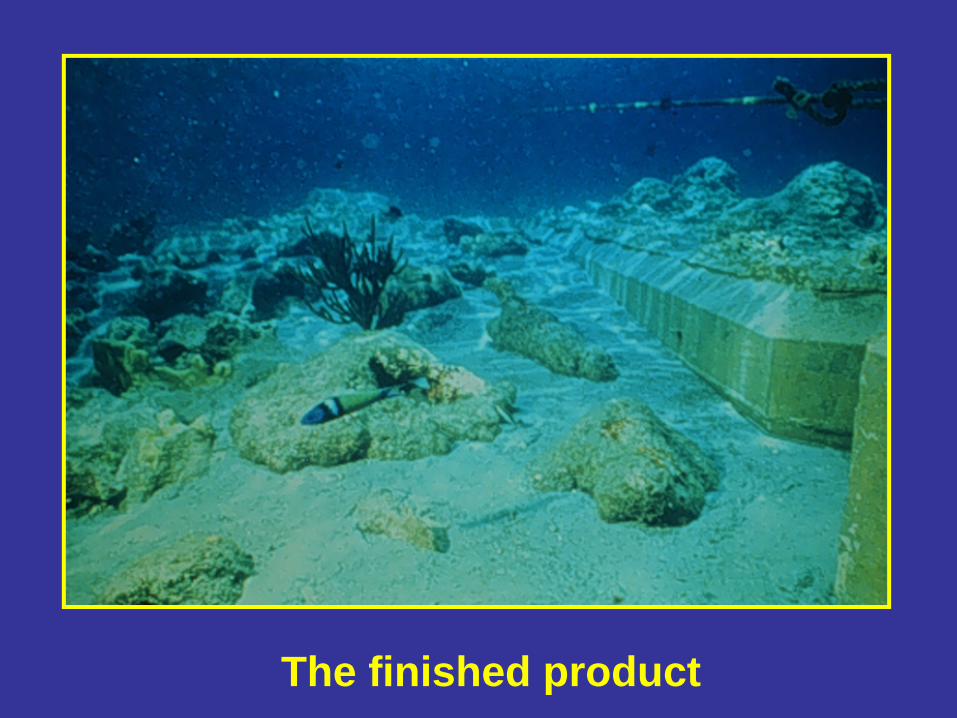
The finished product
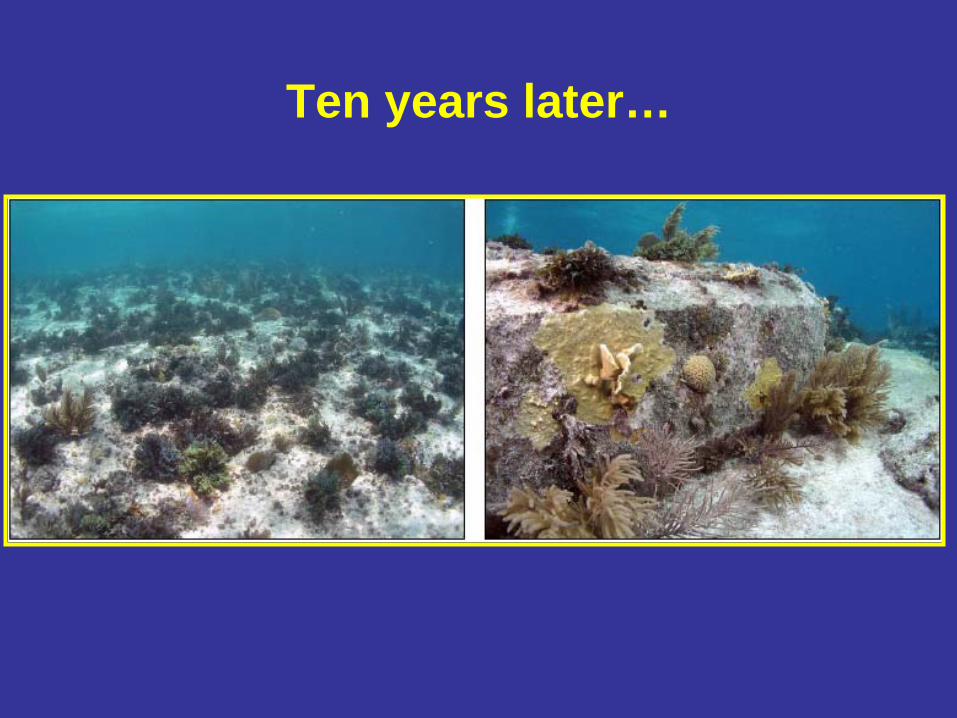
Ten years later…
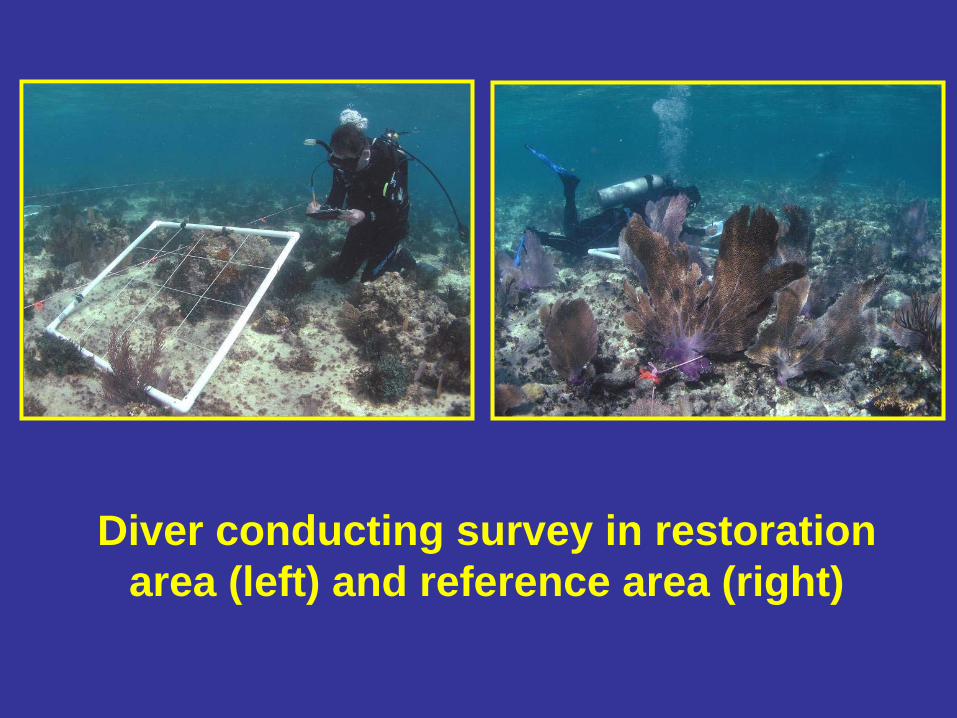
Diver conducting survey in restoration area (left) and reference area (right)
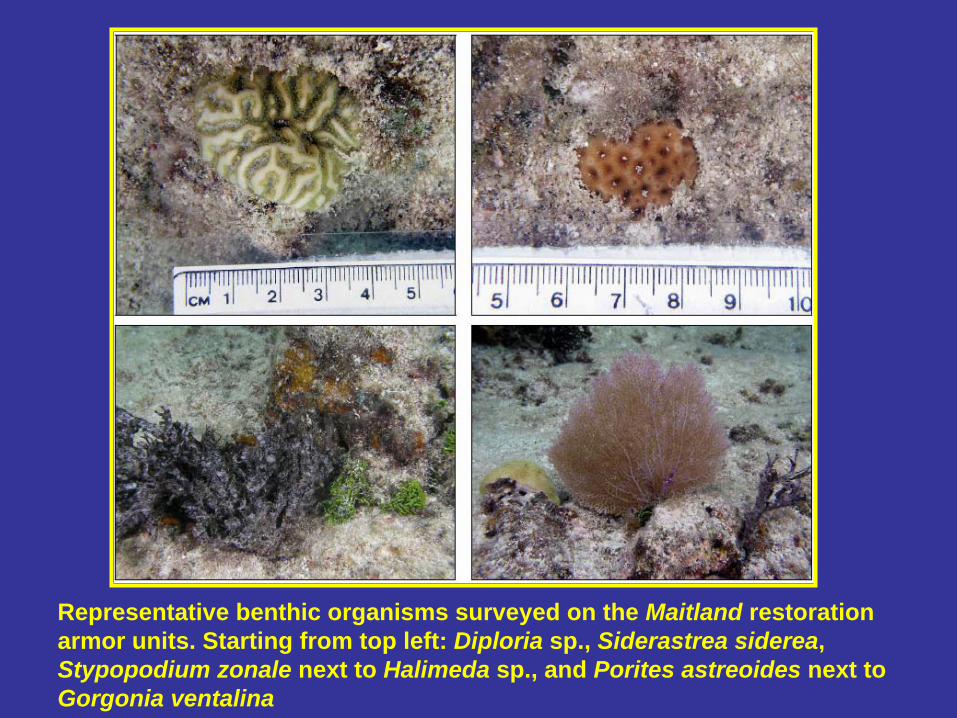
Representative benthic organisms surveyed on the Maitland restoration armor units. Starting from top left: Diploria sp., Siderastrea siderea, Stypopodium zonale next to Halimeda sp., and Porites astreoides next to Gorgonia ventalina
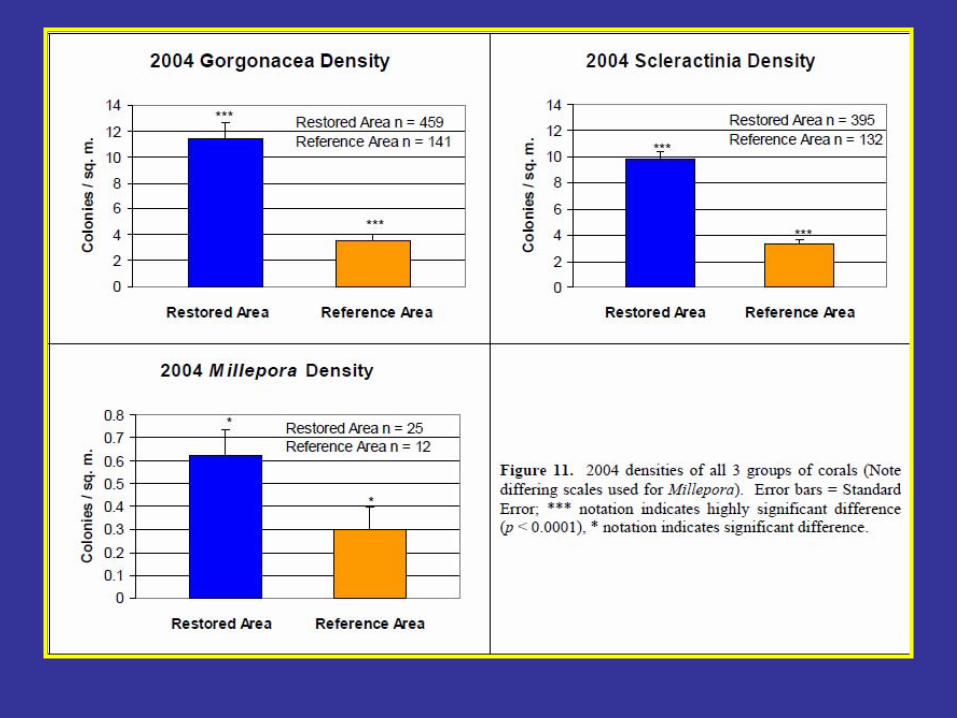
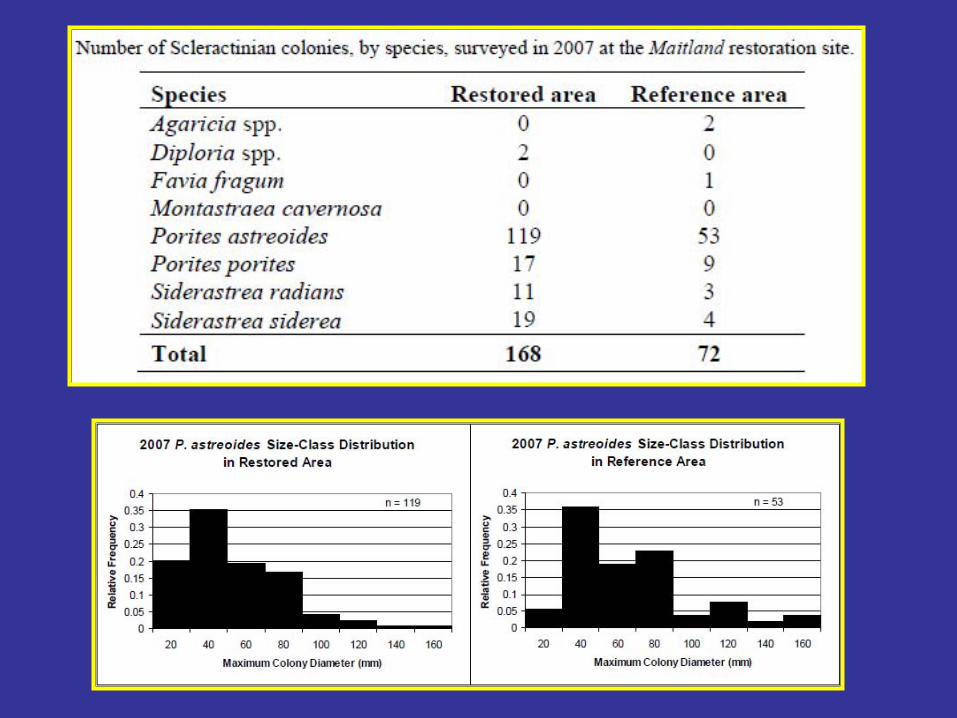
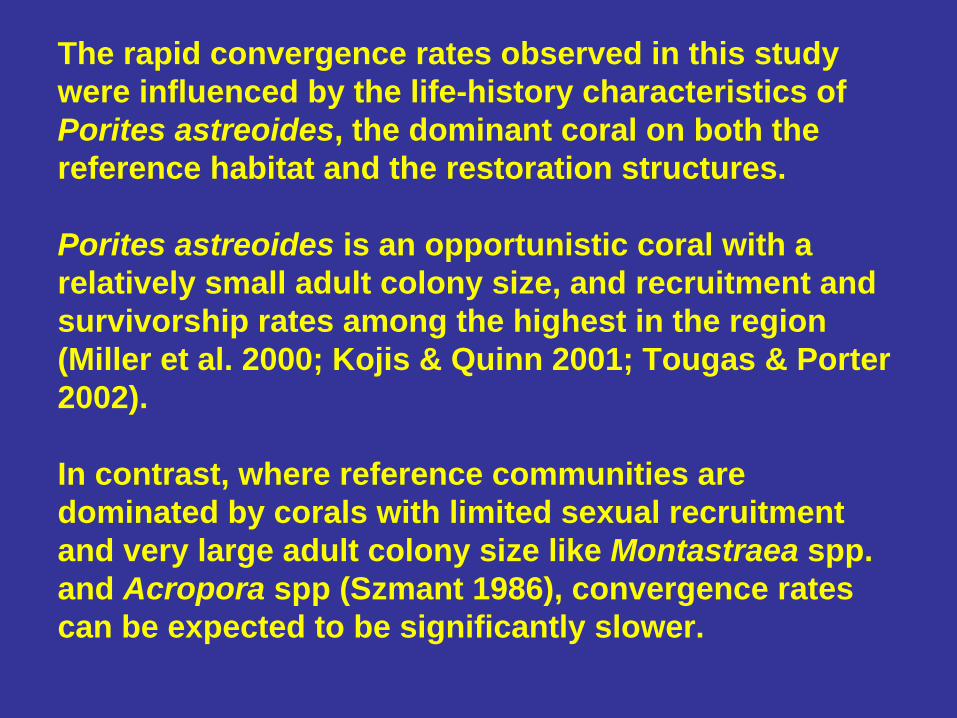
The rapid convergence rates observed in this study were influenced by the life-history characteristics of Porites astreoides, the dominant coral on both the reference habitat and the restoration structures.
Porites astreoides is an opportunistic coral with a relatively small adult colony size, and recruitment and survivorship rates among the highest in the region (Miller et al. 2000; Kojis & Quinn 2001; Tougas & Porter 2002).
In contrast, where reference communities are dominated by corals with limited sexual recruitment and very large adult colony size like Montastraea spp. and Acropora spp (Szmant 1986), convergence rates can be expected to be significantly slower.
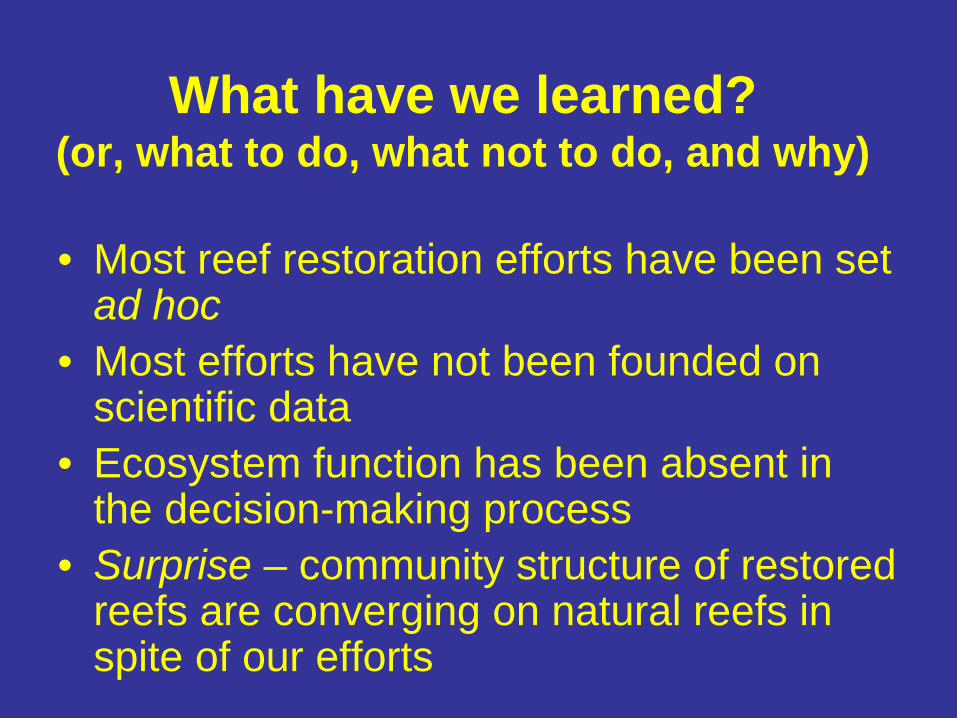
What have we learned? (or, what to do, what not to do, and why)
• Most reef restoration efforts have been set ad hoc
• Most efforts have not been founded on scientific data
• Ecosystem function has been absent in the decision-making process
• Surprise – community structure of restored reefs are converging on natural reefs in spite of our efforts
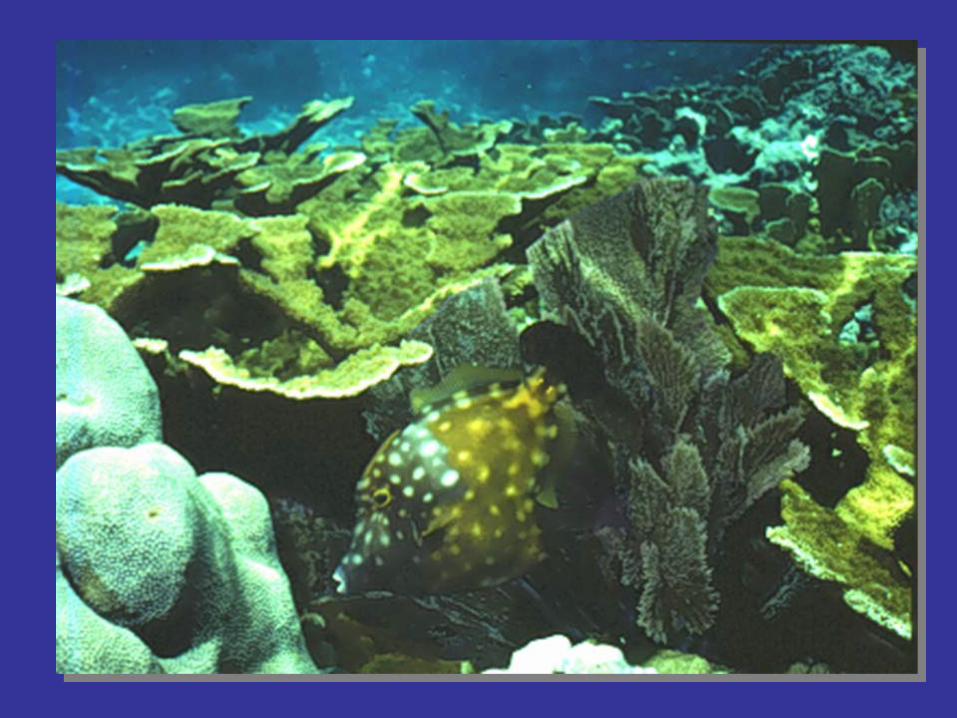
SERDP Coral Reef Monitoring and Assessment Workshop
William F. PrechtNOAA –
Florida Keys National Marine Sanctuary
Surveys of coral reef and hard- bottom habitats
FKNMS
Several monitoring activities that are ongoing in the FKNMS have been
modified slightly to become part of the three‐level FKNMS Zone
Monitoring Program. The FKNMS Zone Monitoring Program began in 1997.
Rapid assessment and monitoring of coral reef habitats in the Florida Keys National Marine Sanctuary
Principal Investigator:
Steven L. Miller, Center for Marine Science, University of North
Carolina at Wilmington (UNCW)
Project Team:
Mark Chiappone, Center for Marine Science, University of North Carolina at Wilmington
Leanne M. Rutten, Center for Marine Science, University of North Carolina at Wilmington
Dione
W. Swanson, Division of Marine Biology and Fisheries, Rosenstiel
School of Marine and Atmospheric Science, University of Miami
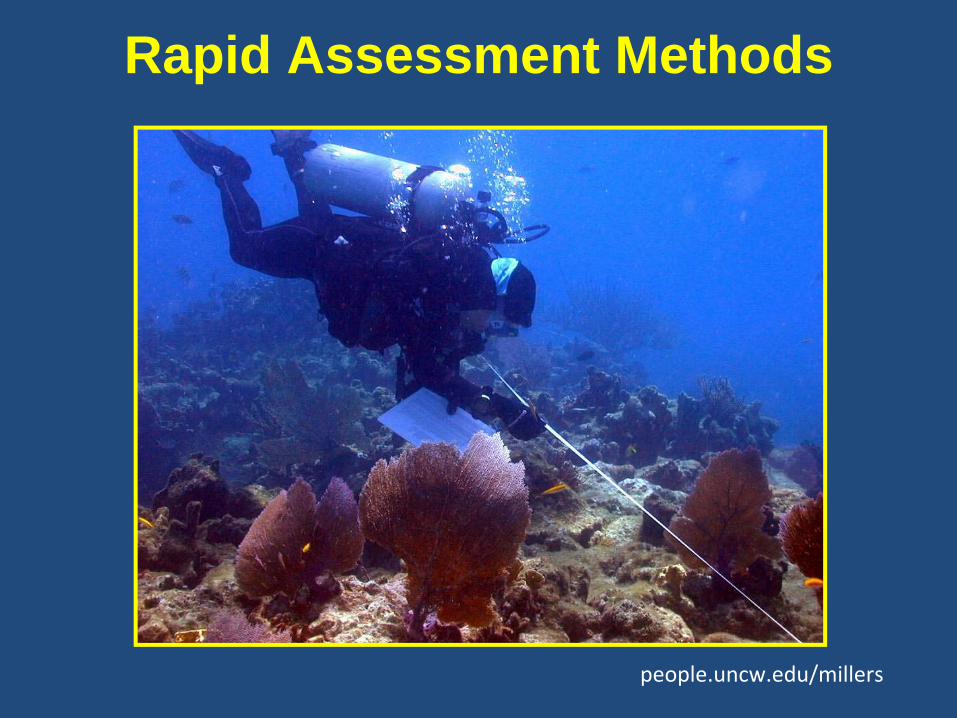
Rapid Assessment Methods
people.uncw.edu/millers
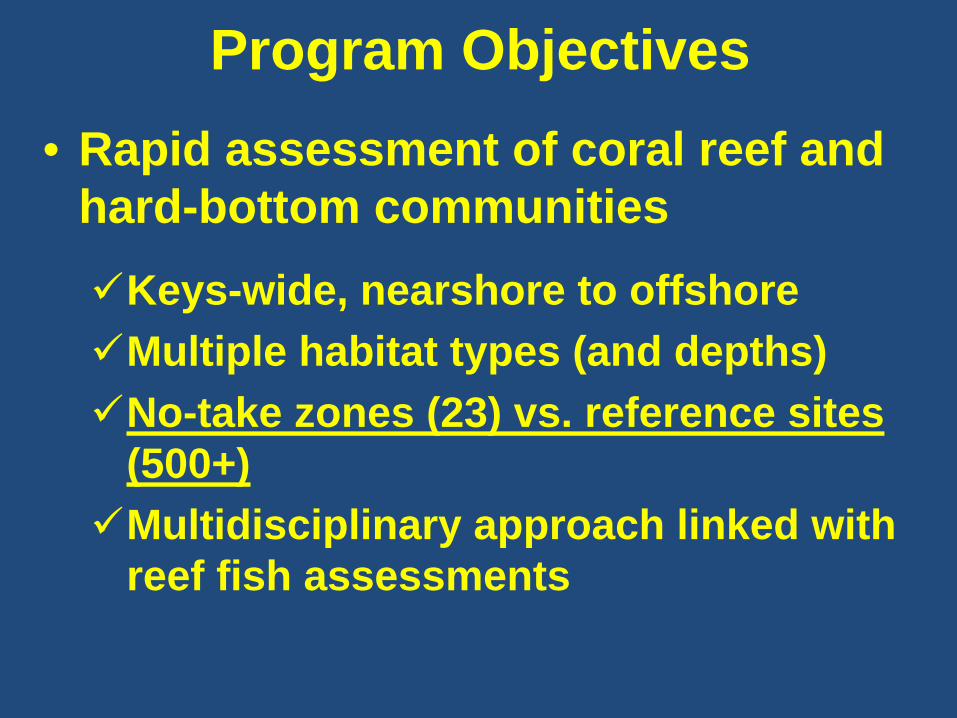
Program Objectives•
Rapid assessment of coral reef and hard-bottom communities
Keys-wide, nearshore to offshoreMultiple habitat types (and depths)No-take zones (23) vs. reference sites (500+)Multidisciplinary approach linked with reef fish assessments
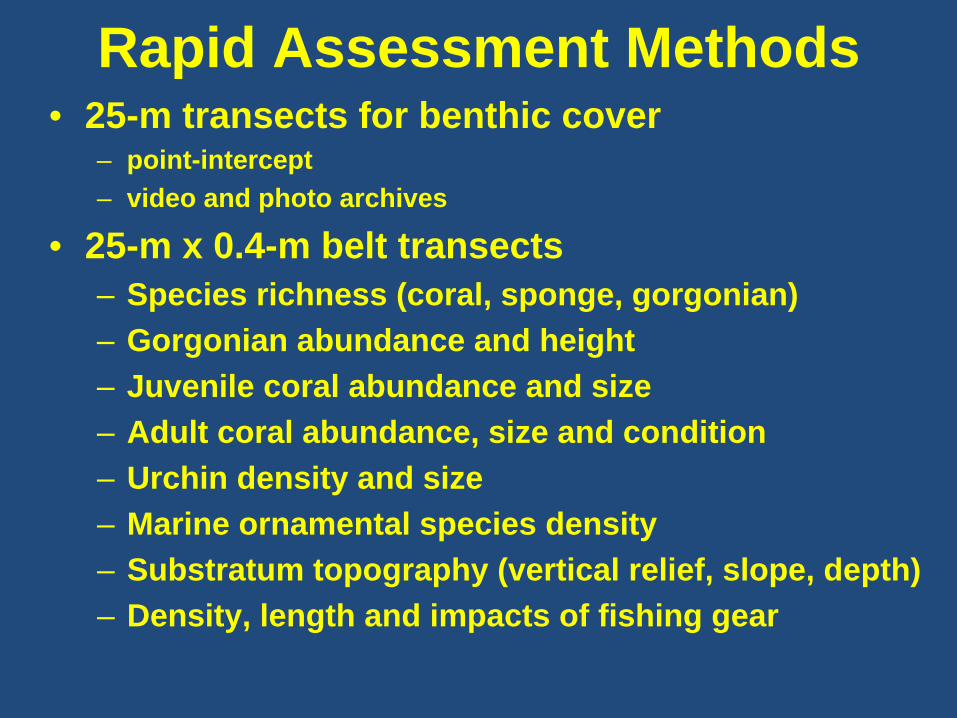
Rapid Assessment Methods•
25-m transects for benthic cover–
point-intercept–
video and photo archives
•
25-m x 0.4-m belt transects–
Species richness (coral, sponge, gorgonian)
–
Gorgonian abundance and height–
Juvenile coral abundance and size
–
Adult coral abundance, size and condition–
Urchin density and size
–
Marine ornamental species density–
Substratum topography (vertical relief, slope, depth)
–
Density, length and impacts of fishing gear
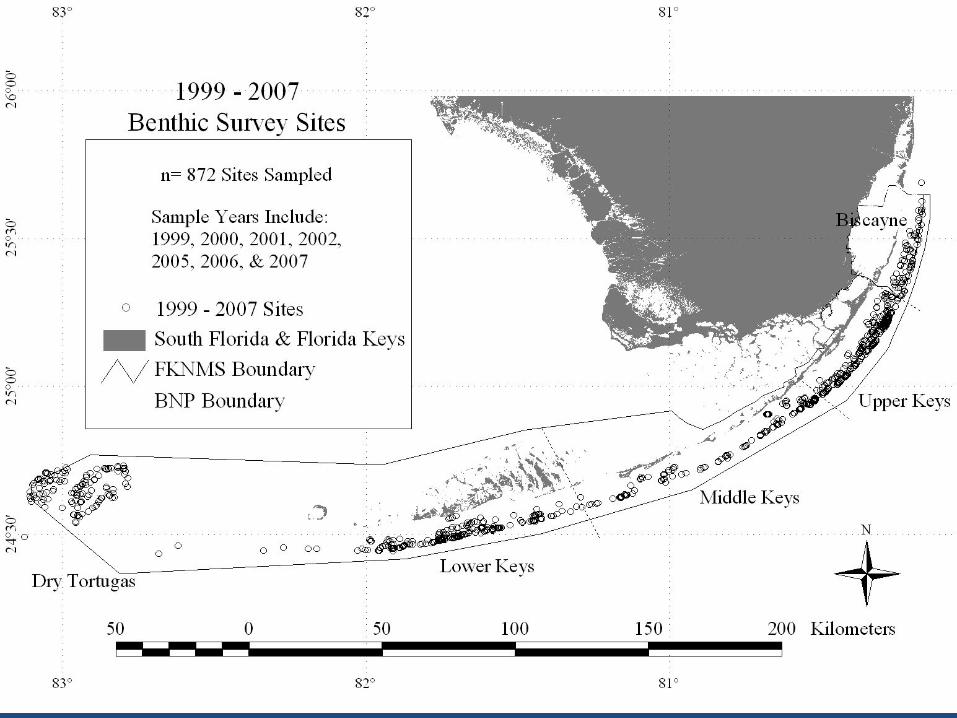
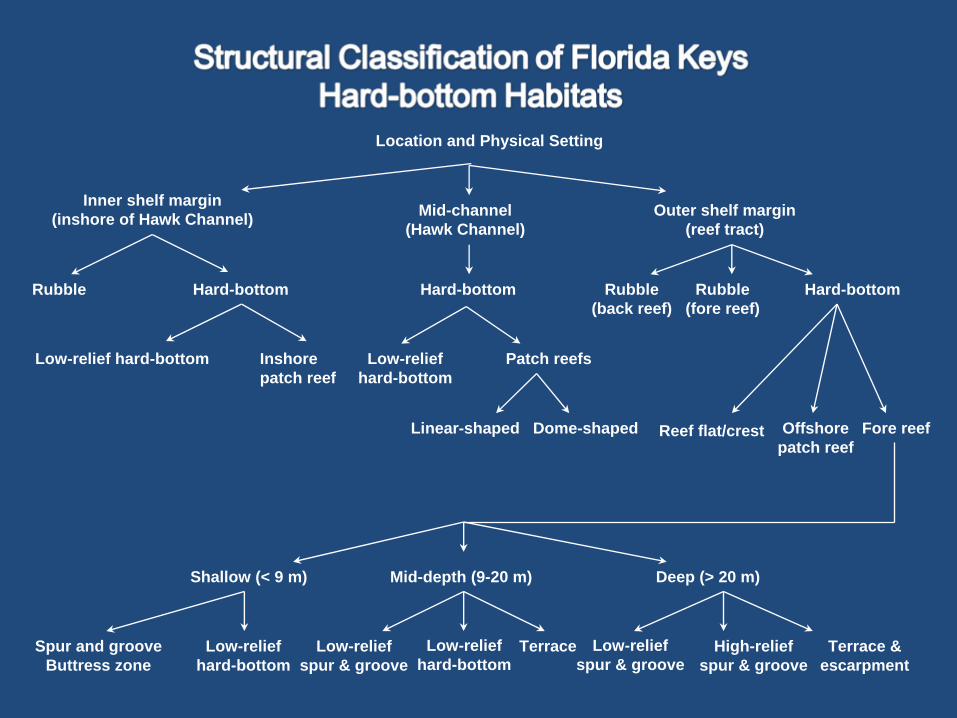
Rubble
Location and Physical Setting
Hard-bottom
Inner shelf margin(inshore of Hawk Channel) Outer shelf margin
(reef tract)Mid-channel
(Hawk Channel)
Hard-bottom
Low-relief hard-bottom Inshorepatch reef
Rubble(back reef)
Hard-bottom
Patch reefsLow-reliefhard-bottom
Linear-shaped Dome-shaped
Shallow (< 9 m)
Reef flat/crest Fore reef
Mid-depth (9-20 m) Deep (> 20 m)
Low-reliefhard-bottom
Spur and grooveButtress zone
Low-reliefspur & groove
Low-reliefhard-bottom
Low-reliefspur & groove
Terrace High-reliefspur & groove
Terrace &escarpment
Offshorepatch reef
Rubble(fore reef)
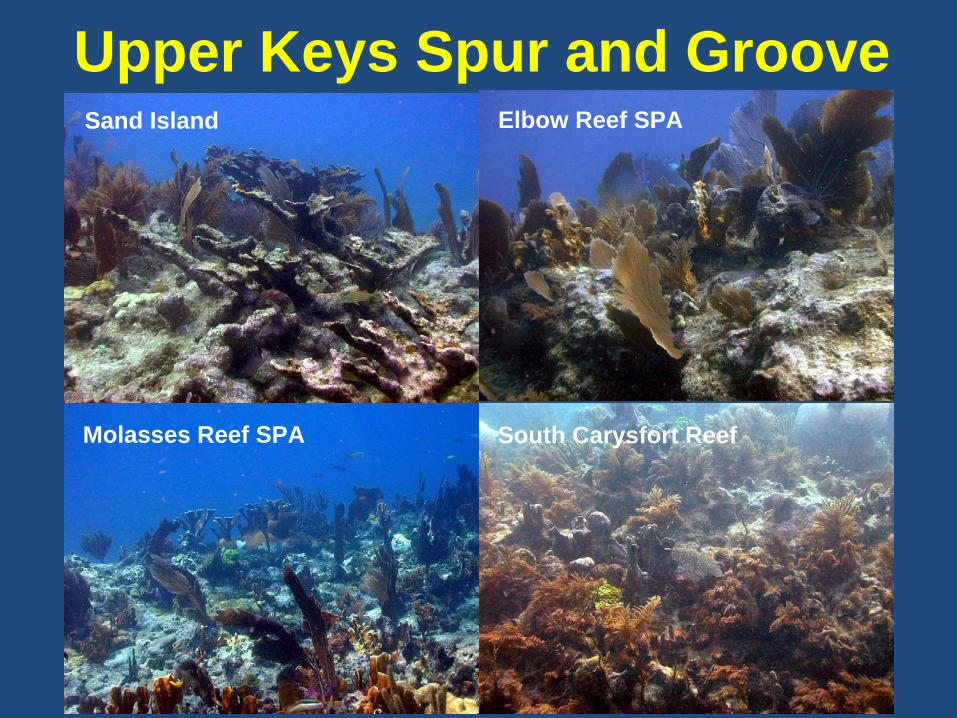
Upper Keys Spur and Groove
Molasses Reef SPA South Carysfort Reef
Sand Island Elbow Reef SPA
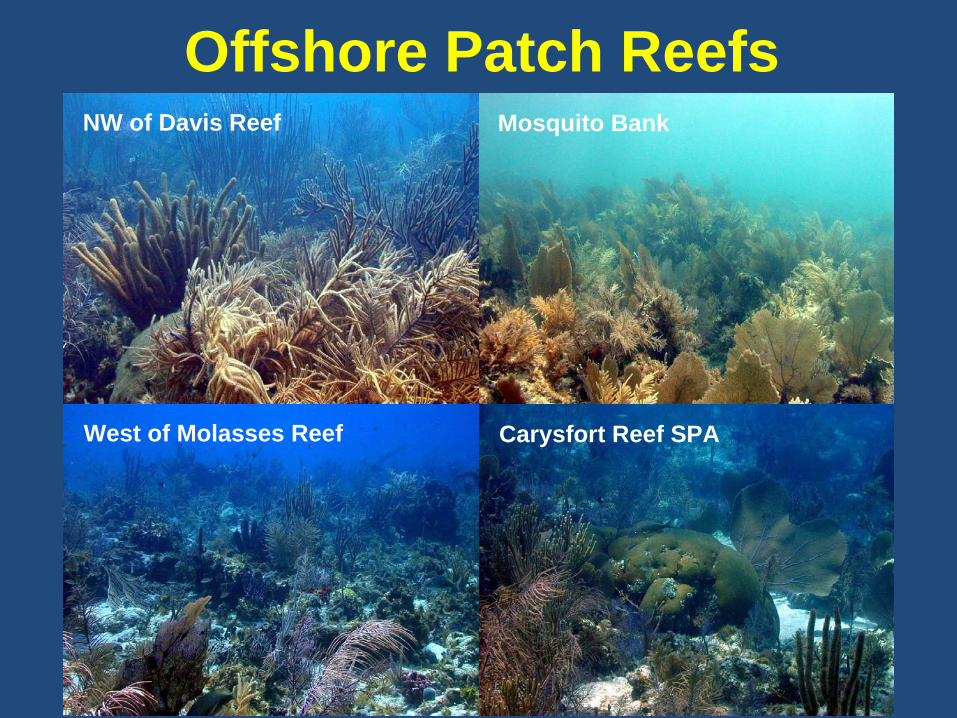
Offshore Patch ReefsNW of Davis Reef Mosquito Bank
Carysfort Reef SPAWest of Molasses Reef
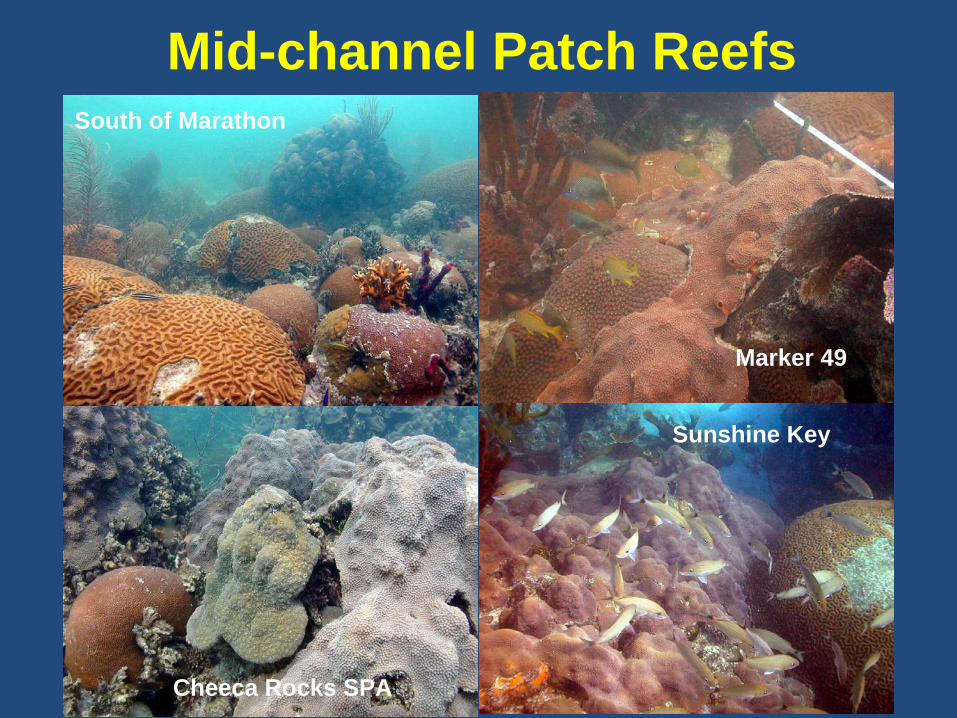
Mid-channel Patch Reefs
Cheeca Rocks SPA
Marker 49
South of Marathon
Sunshine Key
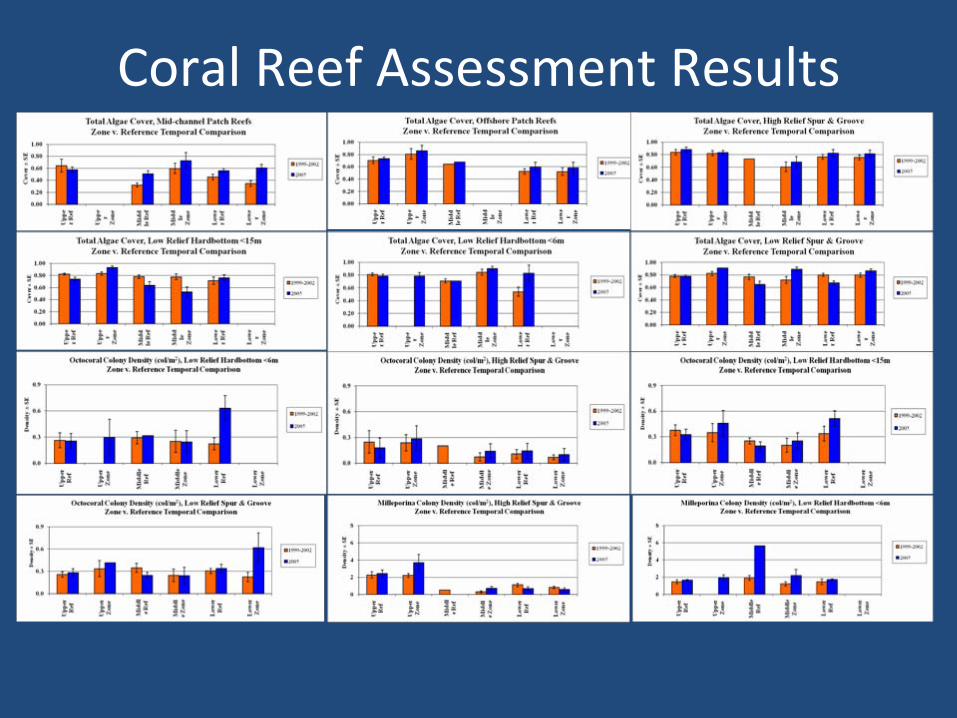
Coral Reef Assessment Results
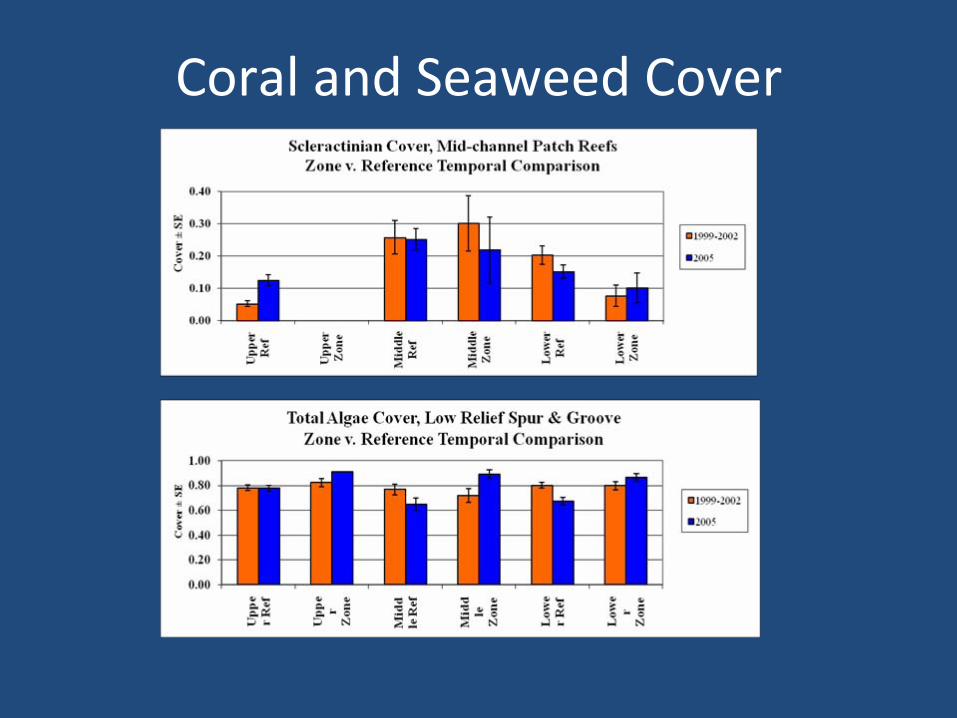
Coral and Seaweed Cover
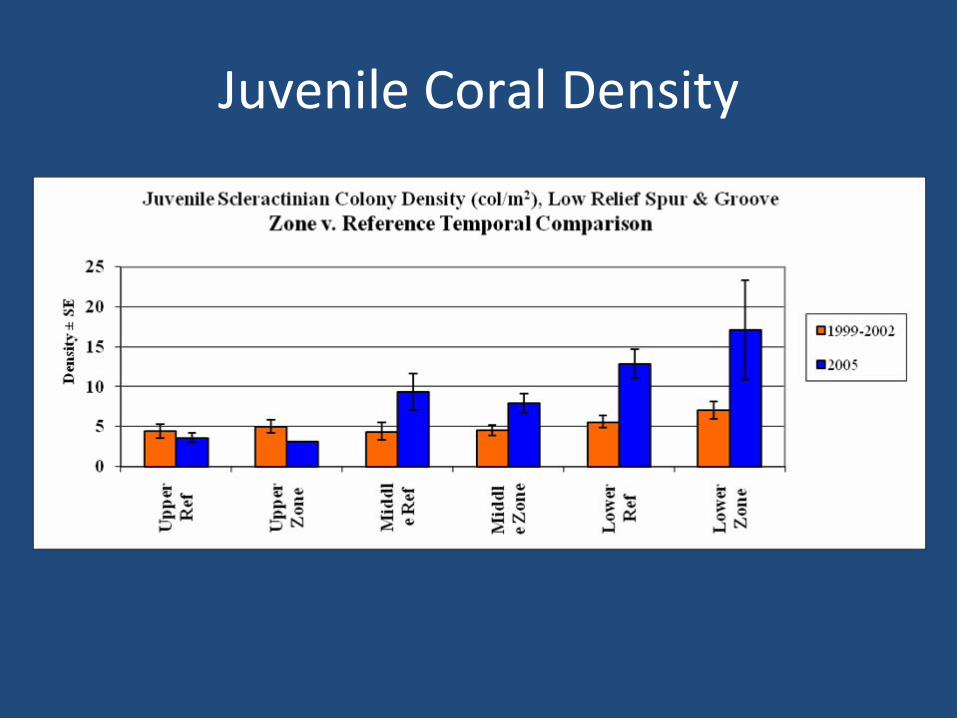
Juvenile Coral Density
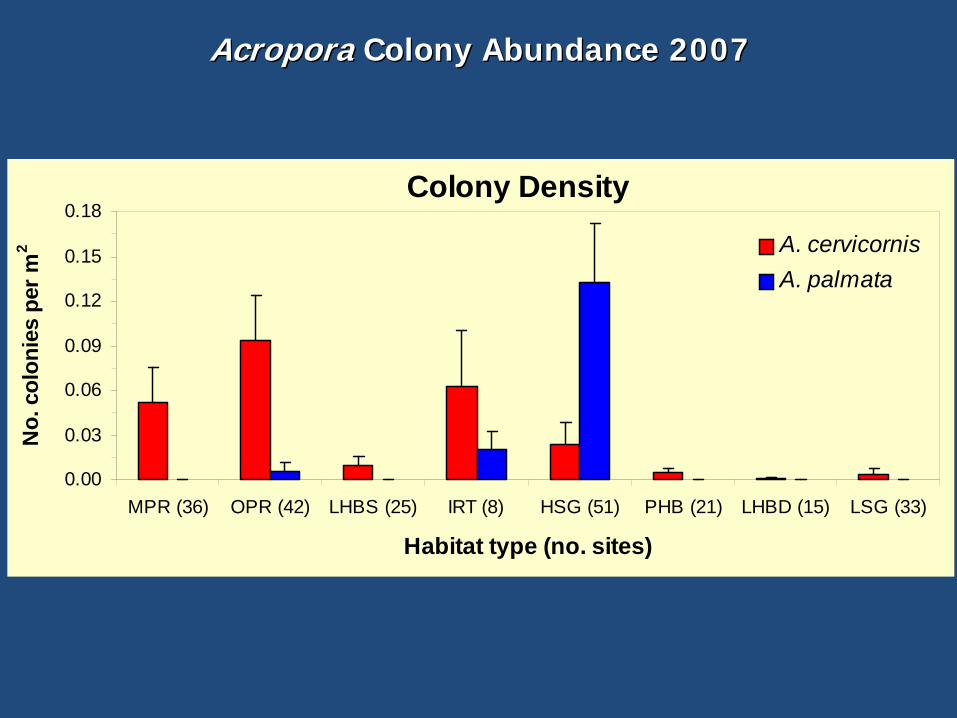
Acropora Acropora Colony Abundance 2007Colony Abundance 2007
Colony Density
0.00
0.03
0.06
0.09
0.12
0.15
0.18
MPR (36) OPR (42) LHBS (25) IRT (8) HSG (51) PHB (21) LHBD (15) LSG (33)
Habitat type (no. sites)
No.
col
onie
s pe
r m2 A. cervicornis
A. palmata
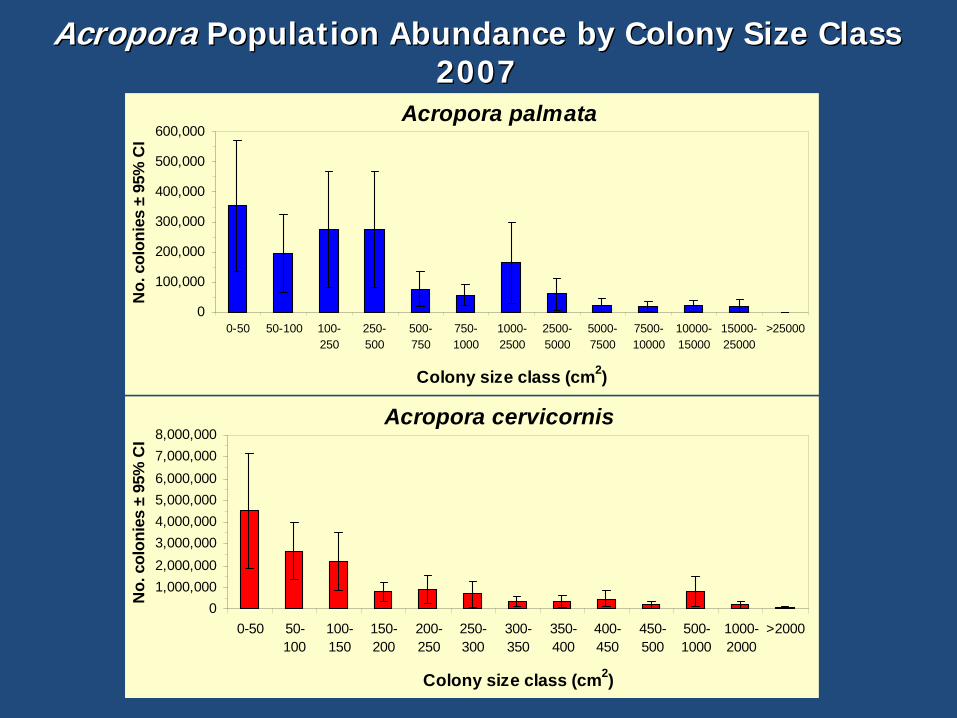
Acropora Acropora Population Abundance by Colony Size ClassPopulation Abundance by Colony Size Class 20072007
Acropora cervicornis
01,000,0002,000,0003,000,0004,000,0005,000,0006,000,0007,000,0008,000,000
0-50 50-100
100-150
150-200
200-250
250-300
300-350
350-400
400-450
450-500
500-1000
1000-2000
>2000
Colony size class (cm2)
No.
col
onie
s ±
95%
CI
Acropora palmata
0
100,000
200,000
300,000
400,000
500,000
600,000
0-50 50-100 100-250
250-500
500-750
750-1000
1000-2500
2500-5000
5000-7500
7500-10000
10000-15000
15000-25000
>25000
Colony size class (cm2)
No.
col
onie
s ±
95%
CI
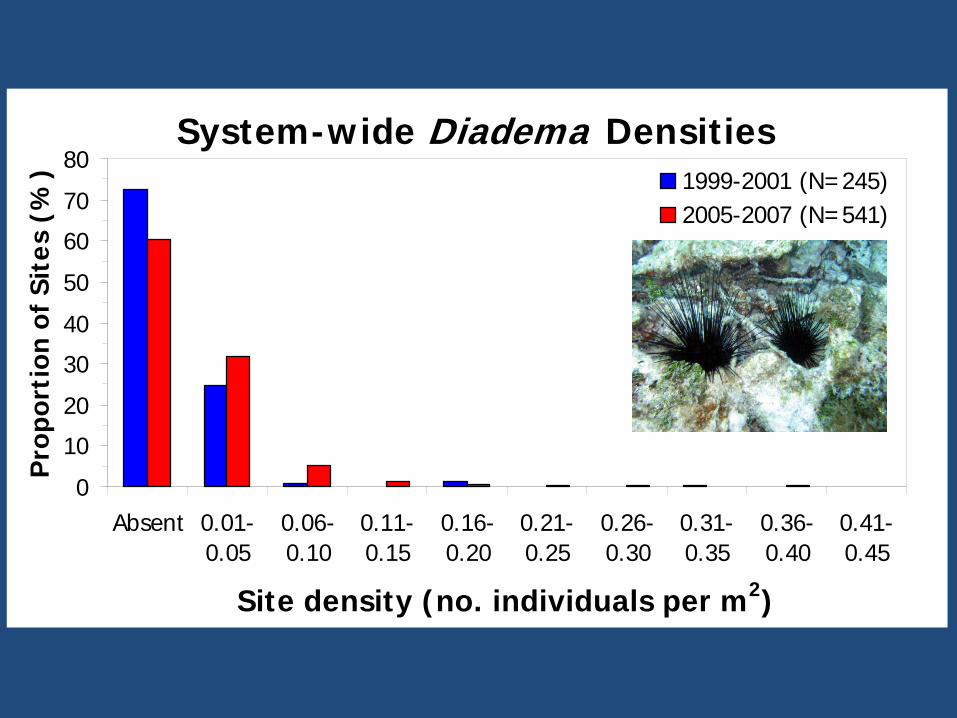
System-wide Diadema Densities
0
10
20
30
40
50
60
70
80
Absent 0.01-0.05
0.06-0.10
0.11-0.15
0.16-0.20
0.21-0.25
0.26-0.30
0.31-0.35
0.36-0.40
0.41-0.45
Site density (no. individuals per m2)
Pro
port
ion
of S
ites
(%
) 1999-2001 (N=245)2005-2007 (N=541)
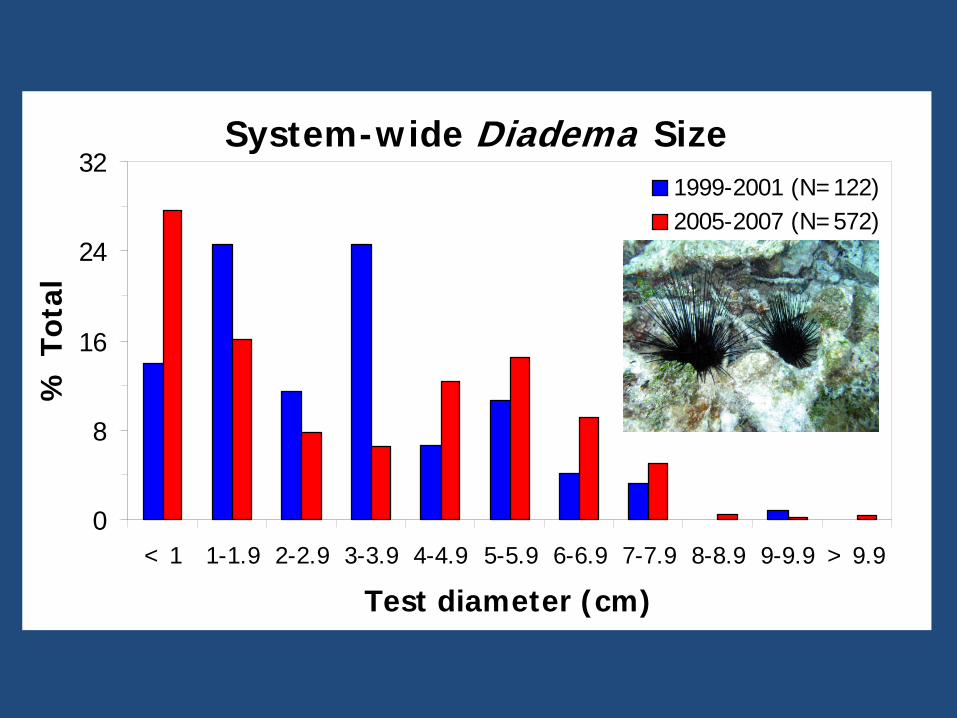
System-wide Diadema Size
0
8
16
24
32
< 1 1-1.9 2-2.9 3-3.9 4-4.9 5-5.9 6-6.9 7-7.9 8-8.9 9-9.9 > 9.9
Test diameter (cm)
% T
otal
1999-2001 (N=122)2005-2007 (N=572)
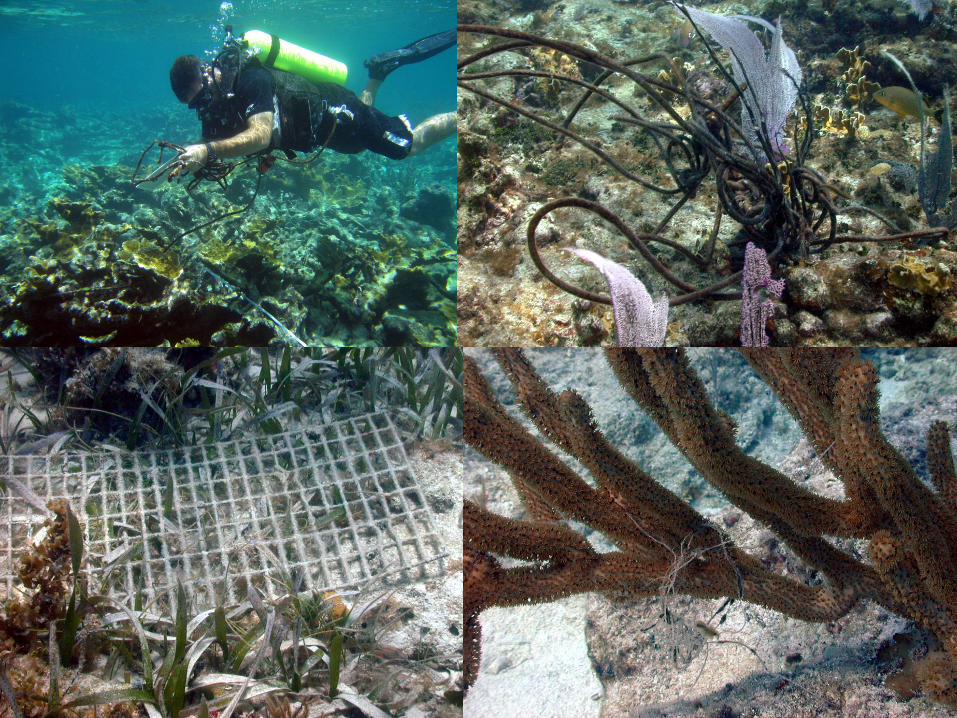
Florida Keys National Marine Sanctuary Coral Reef Evaluation
and Monitoring Project
The Florida Keys National Marine Sanctuary Coral Reef Evaluation
and
Monitoring Project (FKNMS CREMP) sampling sites and stations were
selected and installed in 1995. Originally 40 sites and 160 stations were
selected for monitoring. The original 40 CREMP sampling sites were selected
using a stratified, or layered, random sampling procedure based on the U.S.
Environmental Protection Agency's (EPA) Environmental Mapping and
Assessment Program (EMAP). Stratification, or the arrangement of the layers,
was based on habitat type, with four main habitat types defined:
nearshore
hardbottom, patch reefs, offshore shallow reefs (roughly 10 to 20 feet of
depth), and offshore deep reefs (about 30 or 50 feet deep). While sampling
sites were selected in a random matter, stations were installed with the
intention of monitoring specific aspects of the selected habitats. In 1999
three sites totaling 12 stations were installed and sampled in the Dry
Tortugas as part of the FKNMS CREMP monitoring, for a total of 43 sites and
172 stations.
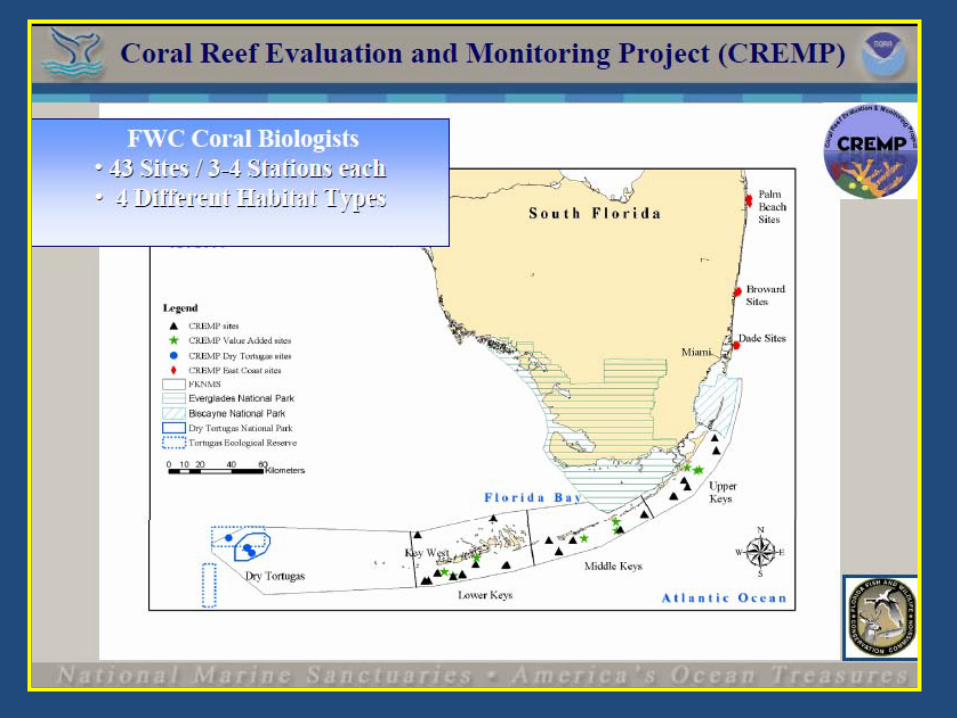
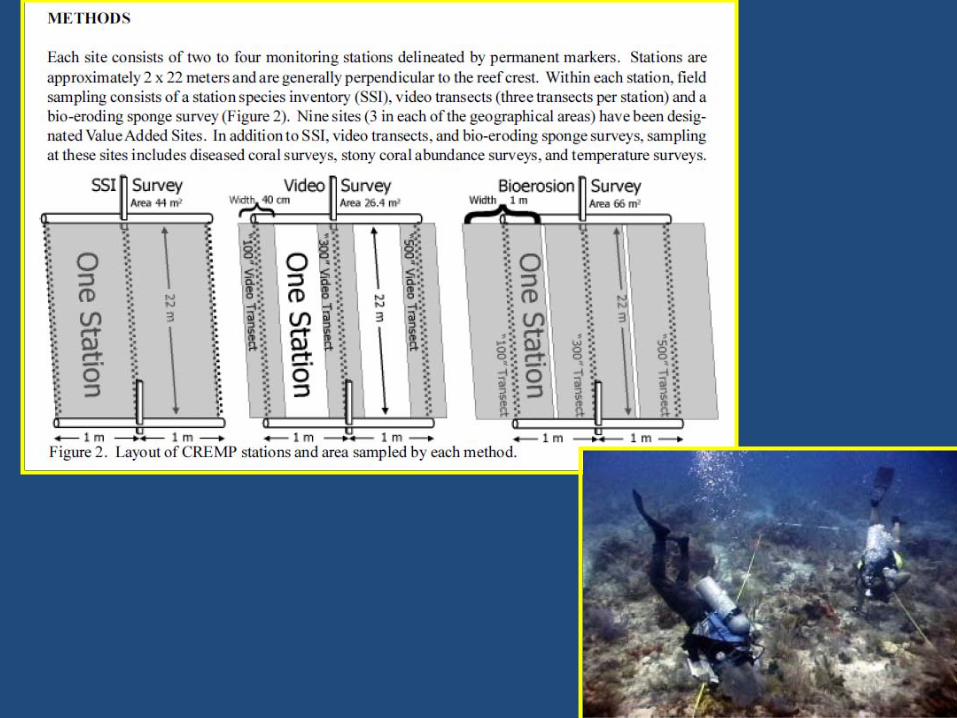
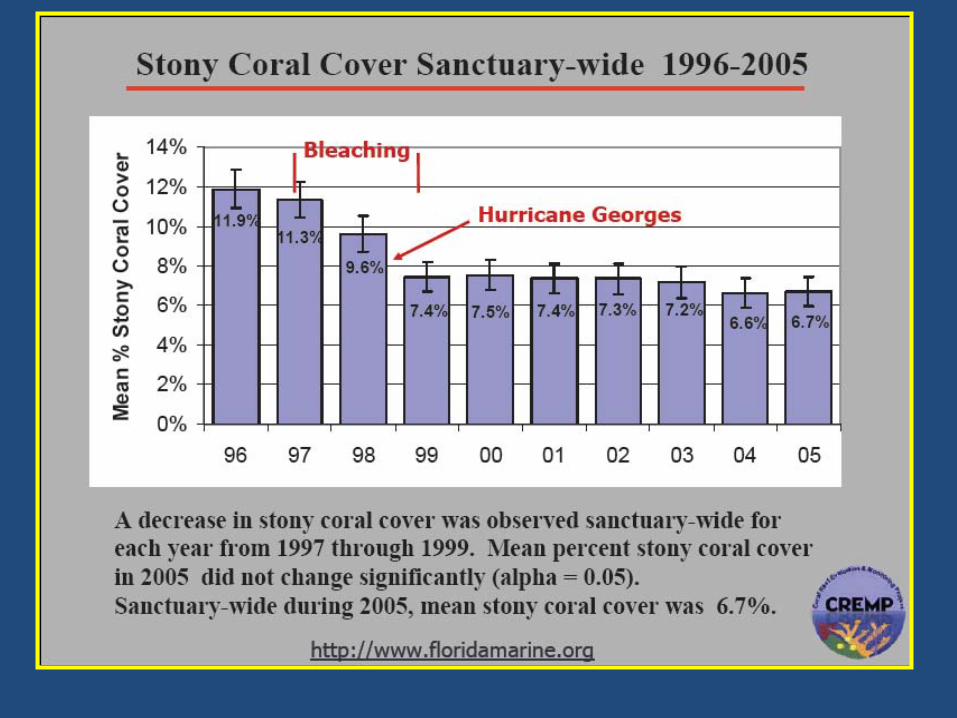
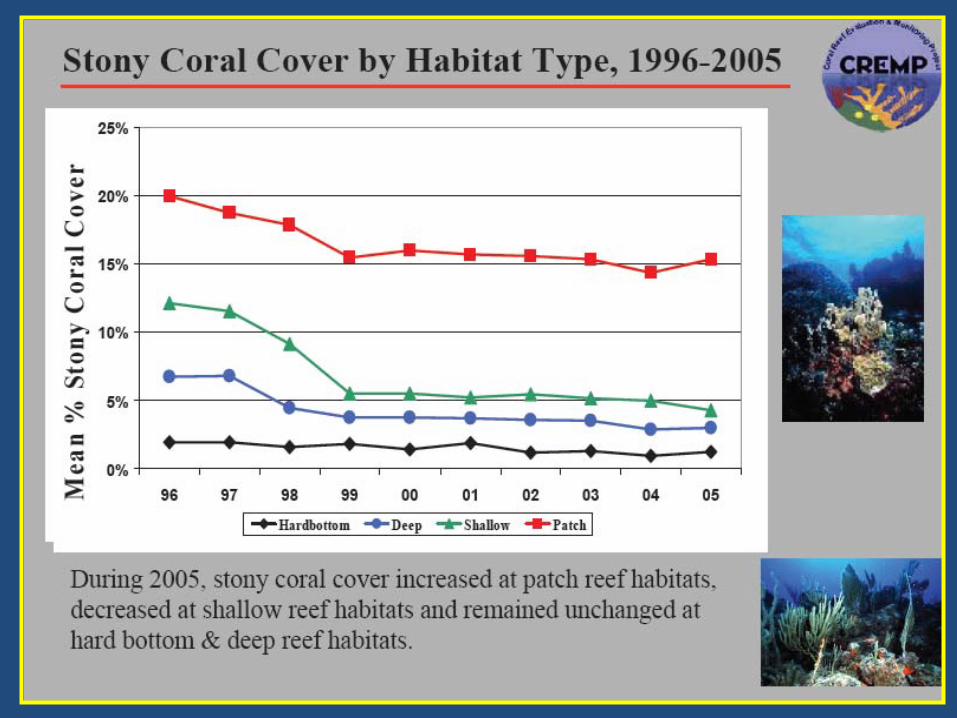
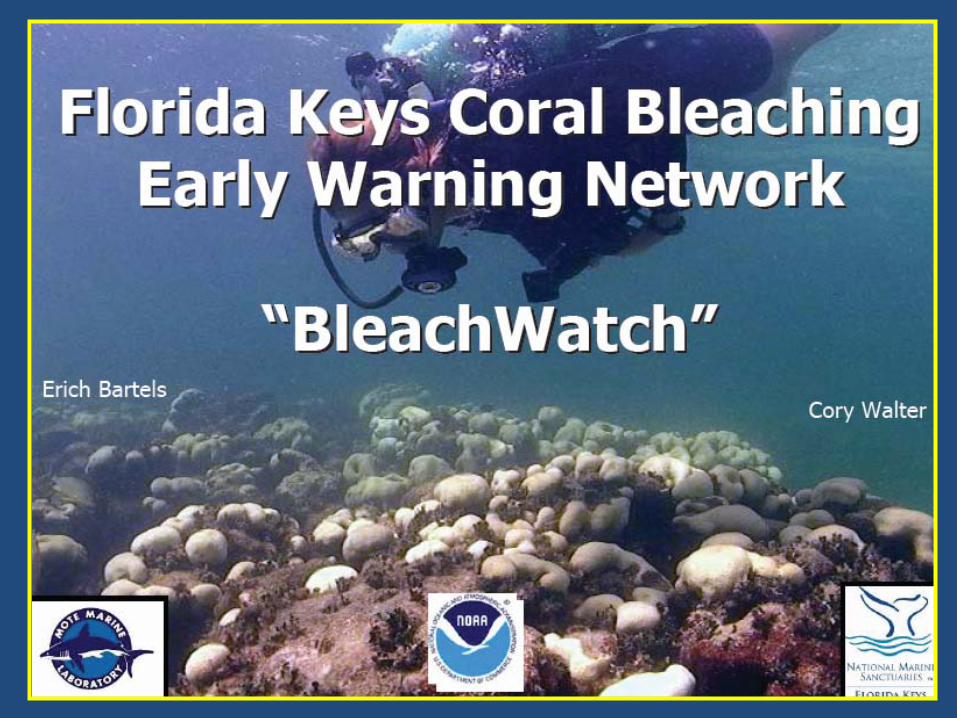
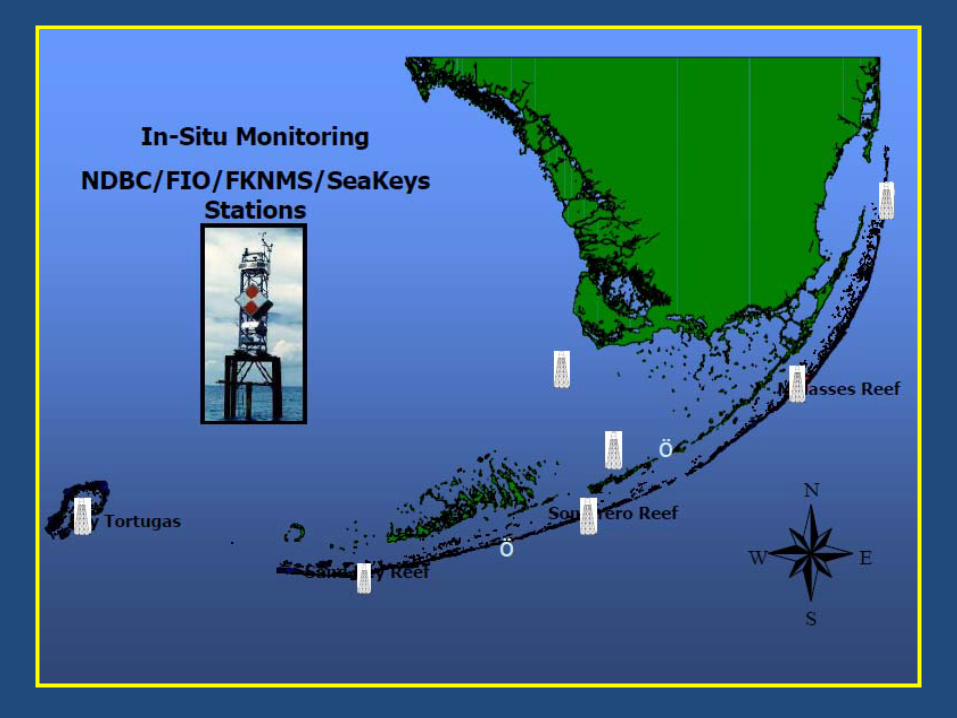
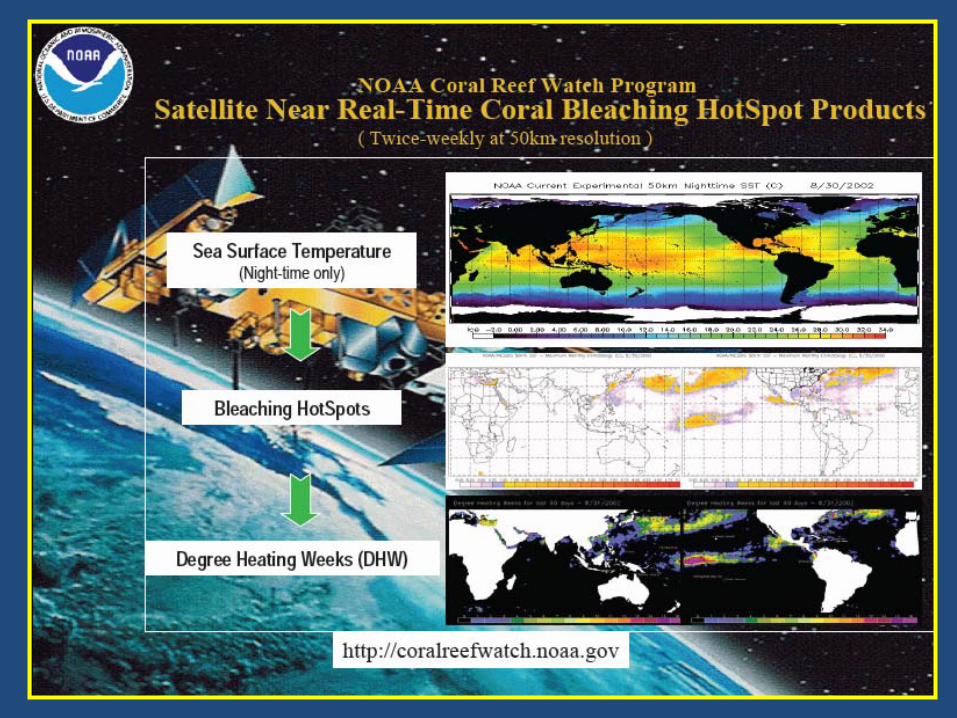
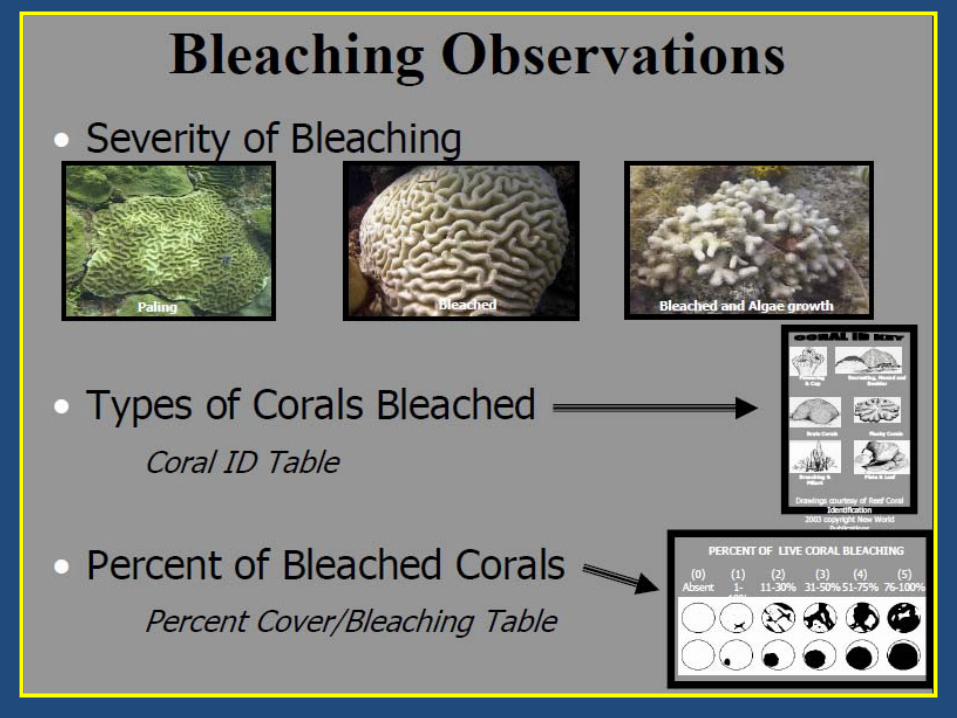
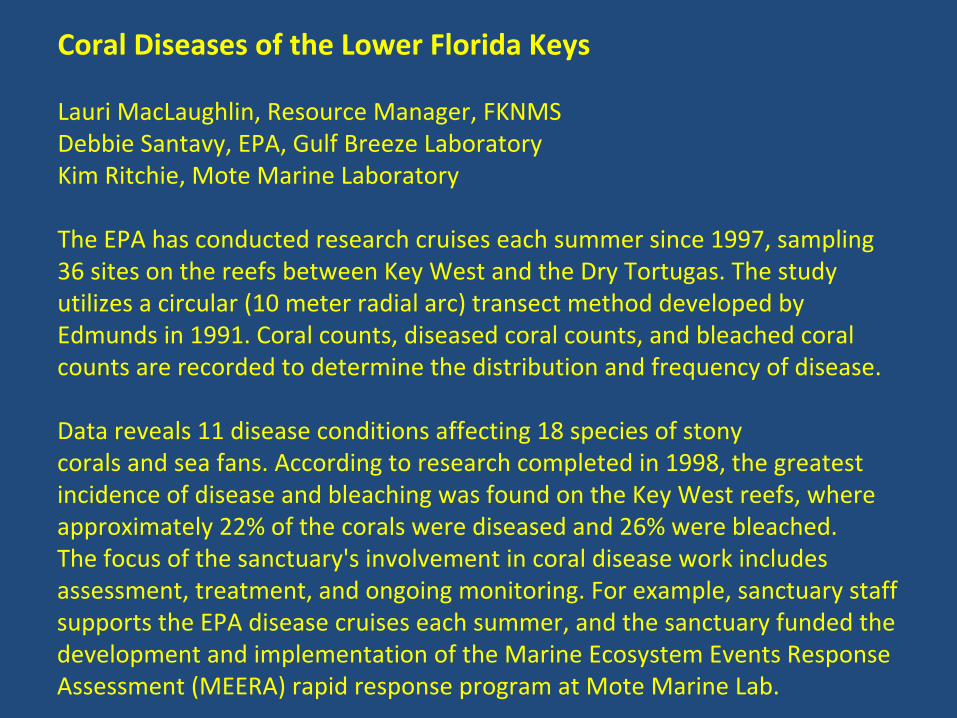
Coral Diseases of the Lower Florida Keys
Lauri
MacLaughlin, Resource Manager, FKNMS
Debbie Santavy, EPA, Gulf Breeze Laboratory
Kim Ritchie, Mote Marine Laboratory
The EPA has conducted research cruises each summer since 1997, sampling
36 sites on the reefs between Key West and the Dry Tortugas. The
study
utilizes a circular (10 meter radial arc) transect method developed by
Edmunds in 1991. Coral counts, diseased coral counts, and bleached coral
counts are recorded to determine the distribution and frequency of disease.
Data reveals 11 disease conditions affecting 18 species of stony
corals and sea fans. According to research completed in 1998, the greatest
incidence of disease and bleaching was found on the Key West reefs, where
approximately 22% of the corals were diseased and 26% were bleached.
The focus of the sanctuary's involvement in coral disease work includes
assessment, treatment, and ongoing monitoring. For example, sanctuary staff
supports the EPA disease cruises each summer, and the sanctuary funded the
development and implementation of the Marine Ecosystem Events Response
Assessment (MEERA) rapid response program at Mote Marine Lab.
Resilience of coral reef benthic communities in the Fully Protected Zones of the Florida Keys
Struan R. Smith Biology Dept.
Georgia State University Atlanta GA
Richard B. Aronson
Dauphin Island Sea Lab Dauphin Island AL
John C. Ogden
Florida Institute of Oceanography St. Petersburg, FL
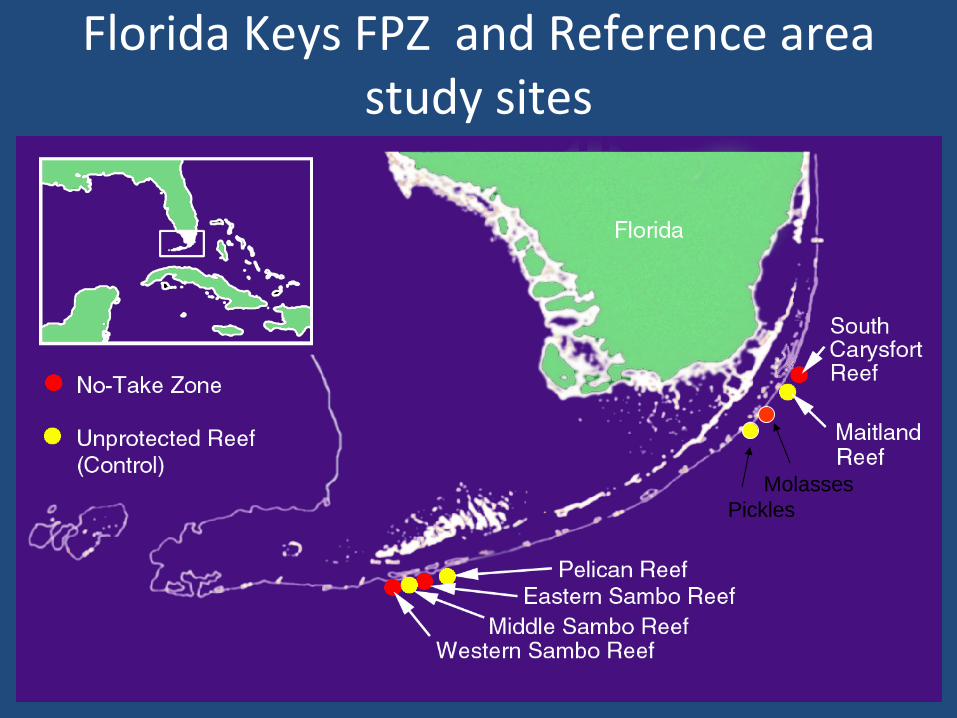
Florida Keys FPZ and Reference area study sites
MolassesPickles
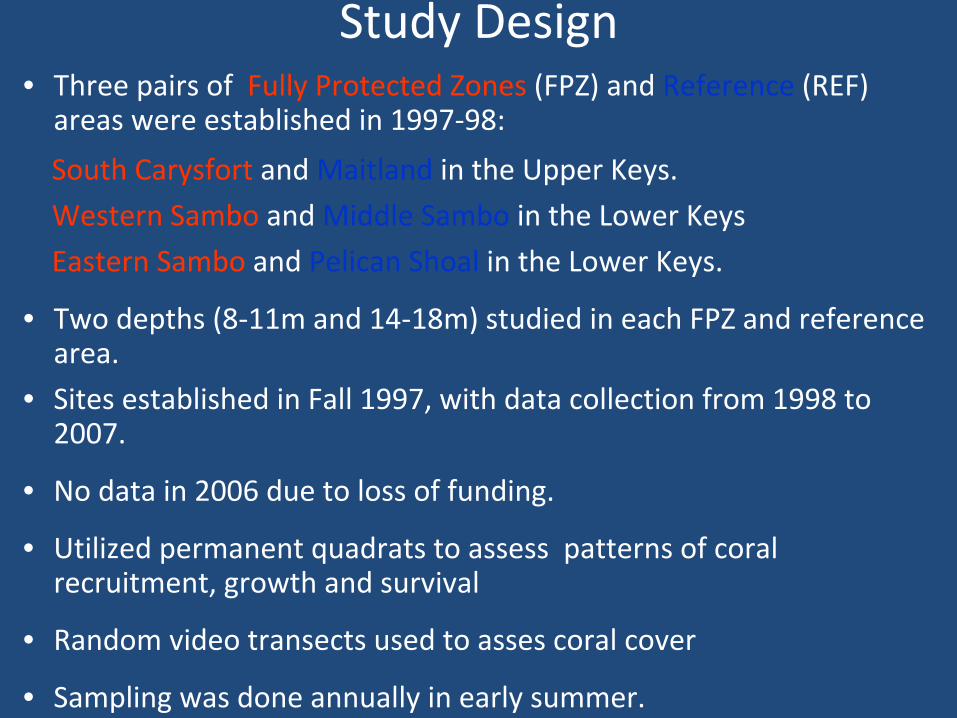
Study Design•
Three pairs of Fully Protected Zones
(FPZ) and Reference
(REF)
areas were established in 1997‐98:
South Carysfort
and Maitland
in the Upper Keys.
Western Sambo
and Middle Sambo
in the Lower Keys
Eastern Sambo
and Pelican Shoal
in the Lower Keys.
•
Two depths (8‐11m and 14‐18m) studied in each FPZ and reference
area.
•
Sites established in Fall 1997, with data collection from 1998 to
2007.
•
No data in 2006 due to loss of funding.
•
Utilized permanent quadrats
to assess patterns of coral
recruitment, growth and survival
•
Random video transects used to asses coral cover
•
Sampling was done annually in early summer.
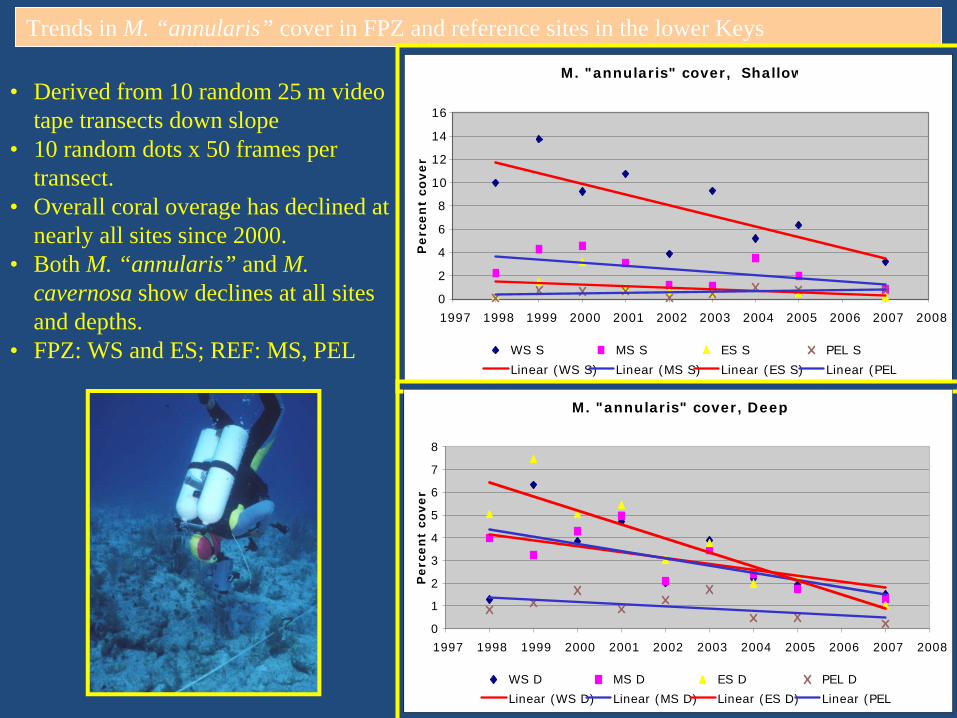
• Derived from 10 random 25 m video tape transects down slope
• 10 random dots x 50 frames per transect.
• Overall coral overage has declined at nearly all sites since 2000.
• Both M. “annularis” and M. cavernosa show declines at all sites and depths.
• FPZ: WS and ES; REF: MS, PEL
Trends in M. “annularis” cover in FPZ and reference sites in the lower Keys
M. "annularis" cover, Shallow
0
2
4
6
8
10
12
14
16
1997 1998 1999 2000 2001 2002 2003 2004 2005 2006 2007 2008
Perc
en
t co
ver
WS S MS S ES S PEL S
Linear (WS S) Linear (MS S) Linear (ES S) Linear (PEL
M. "annularis" cover, Deep
0
1
2
3
4
5
6
7
8
1997 1998 1999 2000 2001 2002 2003 2004 2005 2006 2007 2008
Perc
en
t co
ver
WS D MS D ES D PEL D
Linear (WS D) Linear (MS D) Linear (ES D) Linear (PEL
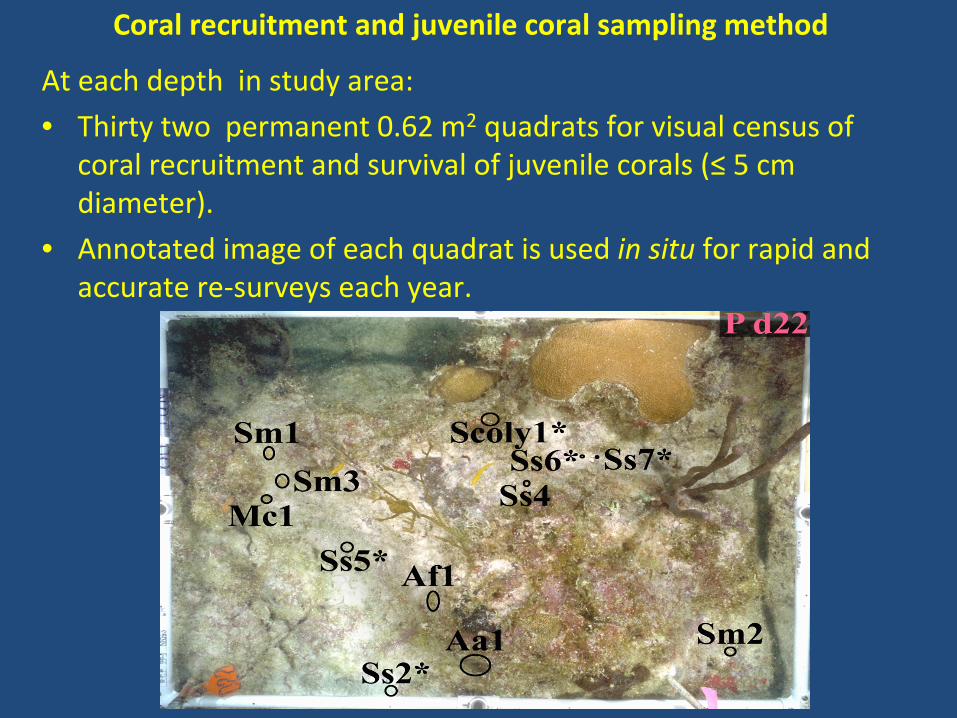
Coral recruitment and juvenile coral sampling method
At each depth in study area:
•
Thirty two permanent 0.62 m2
quadrats
for visual census of
coral recruitment and survival of juvenile corals (≤
5 cm
diameter).
•
Annotated image of each quadrat
is used in situ
for rapid and
accurate re‐surveys each year.
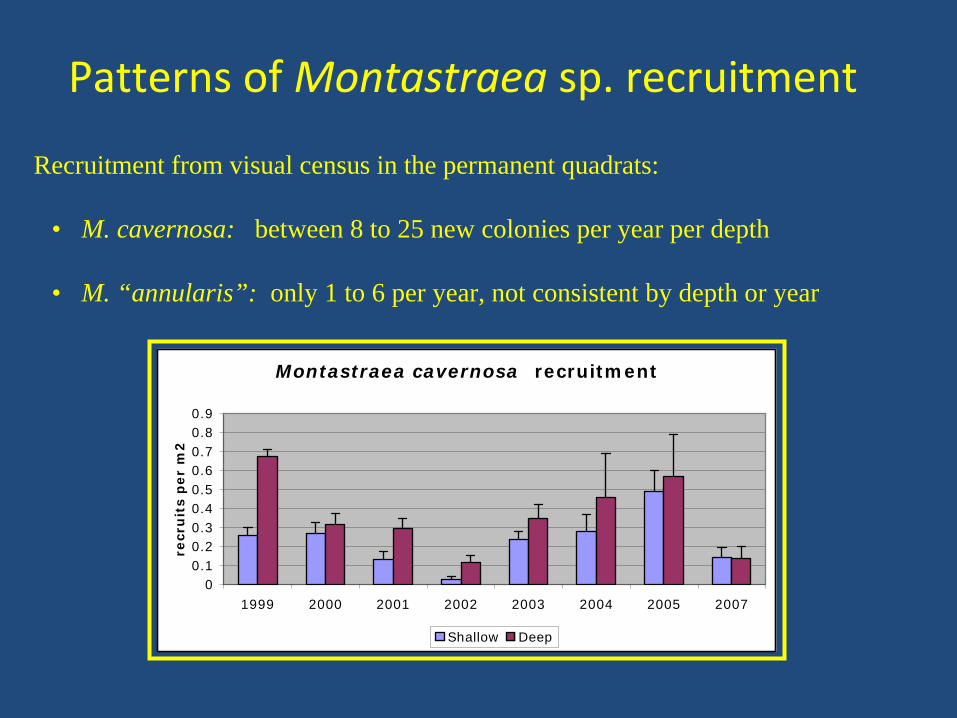
Patterns of Montastraea
sp. recruitment
Recruitment from visual census in the permanent quadrats:
• M. cavernosa: between 8 to 25 new colonies per year per depth
• M. “annularis”: only 1 to 6 per year, not consistent by depth or year
Montastraea cavernosa recruitment
00.10.20.30.40.50.60.70.80.9
1999 2000 2001 2002 2003 2004 2005 2007
recr
uit
s p
er
m2
Shallow Deep
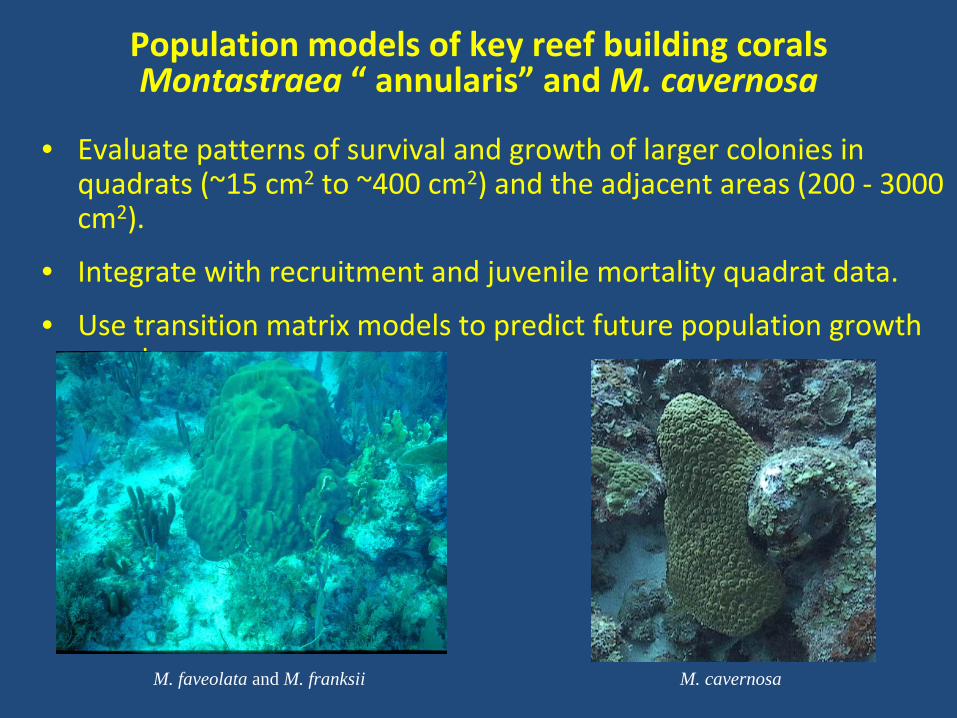
Population models of key reef building corals Montastraea
“
annularis”
and M. cavernosa
•
Evaluate patterns of survival and growth of larger colonies in
quadrats
(~15 cm2
to ~400 cm2) and the adjacent areas (200 ‐
3000
cm2).
•
Integrate with recruitment and juvenile mortality quadrat
data.
•
Use transition matrix models to predict future population growth
trends.
M. faveolata and M. franksii M. cavernosa
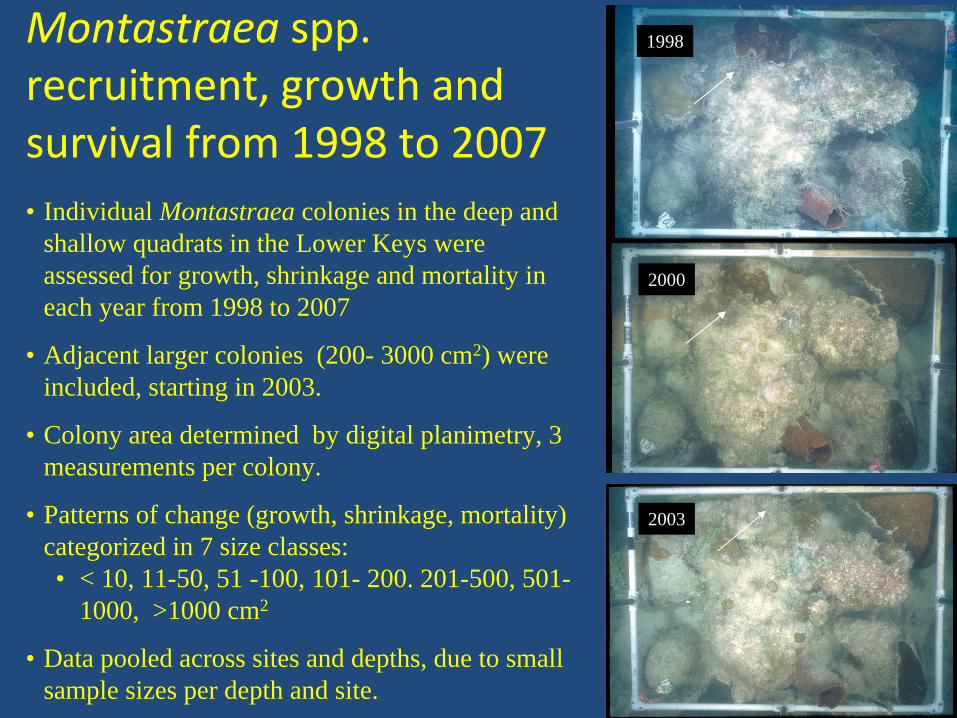
Montastraea
spp. recruitment, growth and
survival from 1998 to 2007• Individual Montastraea colonies in the deep and
shallow quadrats in the Lower Keys were assessed for growth, shrinkage and mortality in each year from 1998 to 2007
• Adjacent larger colonies (200- 3000 cm2) were included, starting in 2003.
• Colony area determined by digital planimetry, 3 measurements per colony.
• Patterns of change (growth, shrinkage, mortality) categorized in 7 size classes:• < 10, 11-50, 51 -100, 101- 200. 201-500, 501-
1000, >1000 cm2
• Data pooled across sites and depths, due to small sample sizes per depth and site.
1998
2000
2003
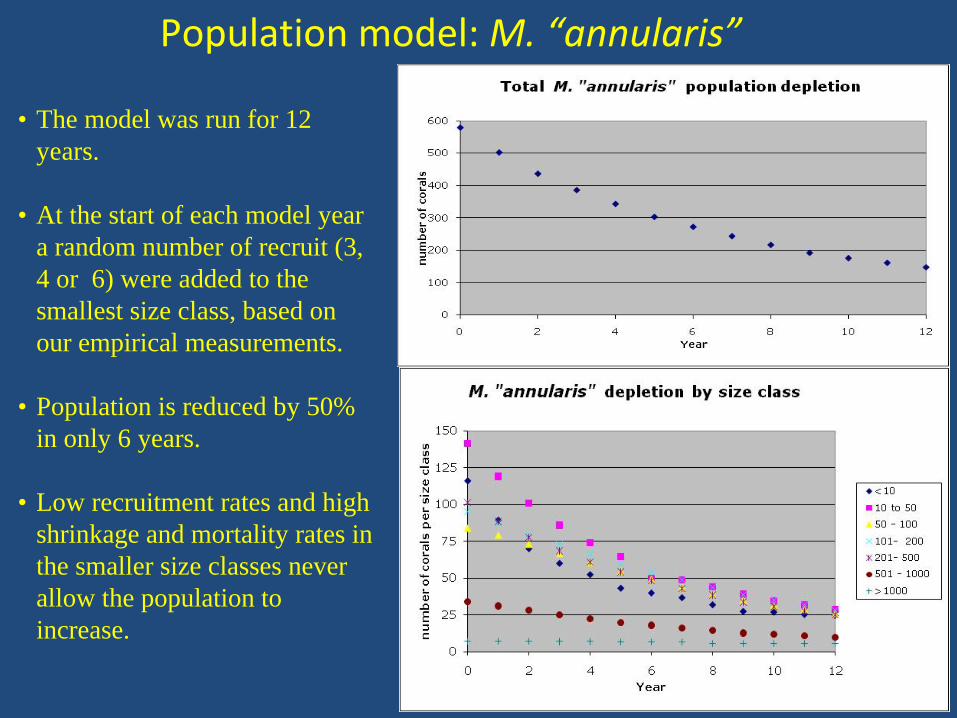
Population model: M. “annularis”
• The model was run for 12 years.
• At the start of each model year a random number of recruit (3, 4 or 6) were added to the smallest size class, based on our empirical measurements.
• Population is reduced by 50% in only 6 years.
• Low recruitment rates and high shrinkage and mortality rates in the smaller size classes never allow the population to increase.
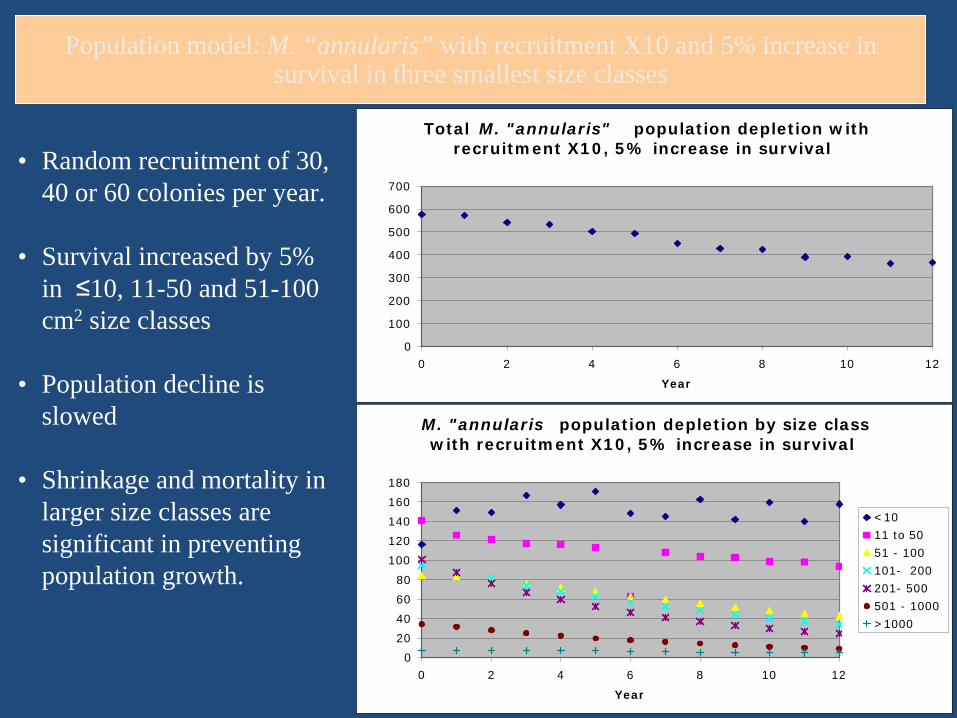
Population model: M. “annularis” with recruitment X10 and 5% increase in survival in three smallest size classes
Total M. "annularis" population depletion with recruitment X10, 5% increase in survival
0
100
200
300
400
500
600
700
0 2 4 6 8 10 12
Year
• Random recruitment of 30, 40 or 60 colonies per year.
• Survival increased by 5% in ≤10, 11-50 and 51-100 cm2 size classes
• Population decline is slowed
• Shrinkage and mortality in larger size classes are significant in preventing population growth.
M. "annularis population depletion by size class with recruitment X10, 5% increase in survival
0
20
40
60
80
100
120
140
160
180
0 2 4 6 8 10 12
Year
<10
11 to 50
51 - 100
101- 200
201- 500
501 - 1000
>1000
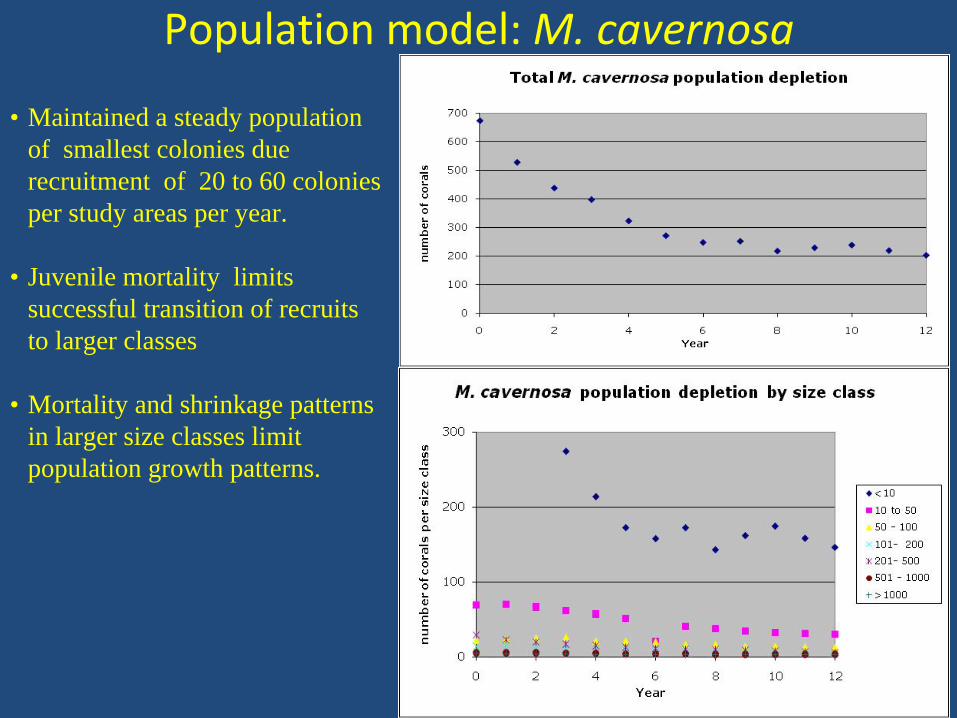
• Maintained a steady population of smallest colonies due recruitment of 20 to 60 colonies per study areas per year.
• Juvenile mortality limits successful transition of recruits to larger classes
• Mortality and shrinkage patterns in larger size classes limit population growth patterns.
Population model: M. cavernosa
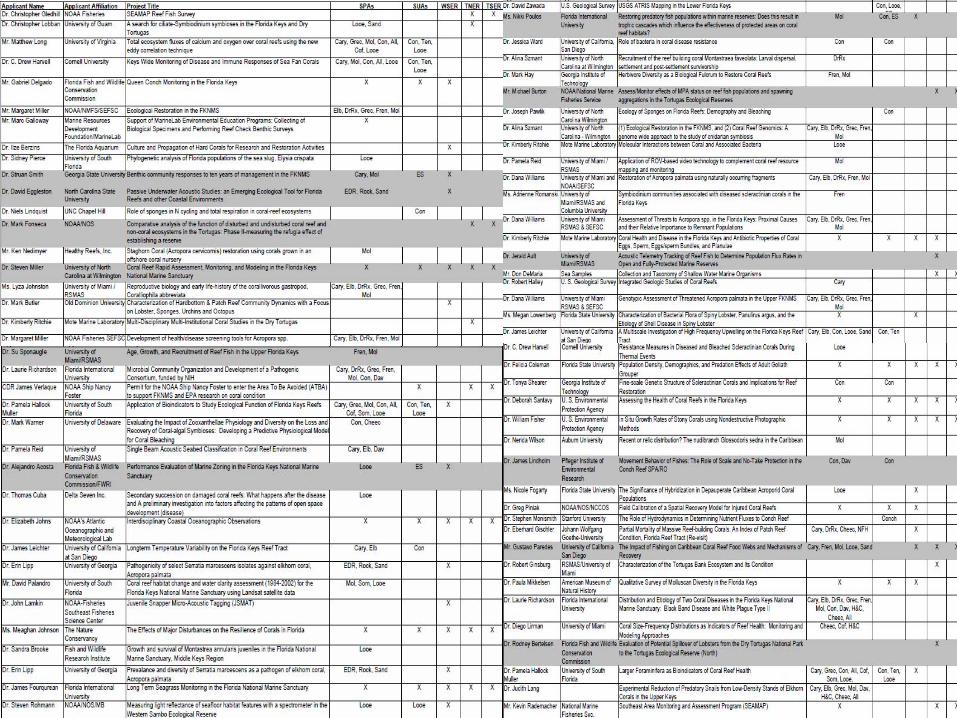
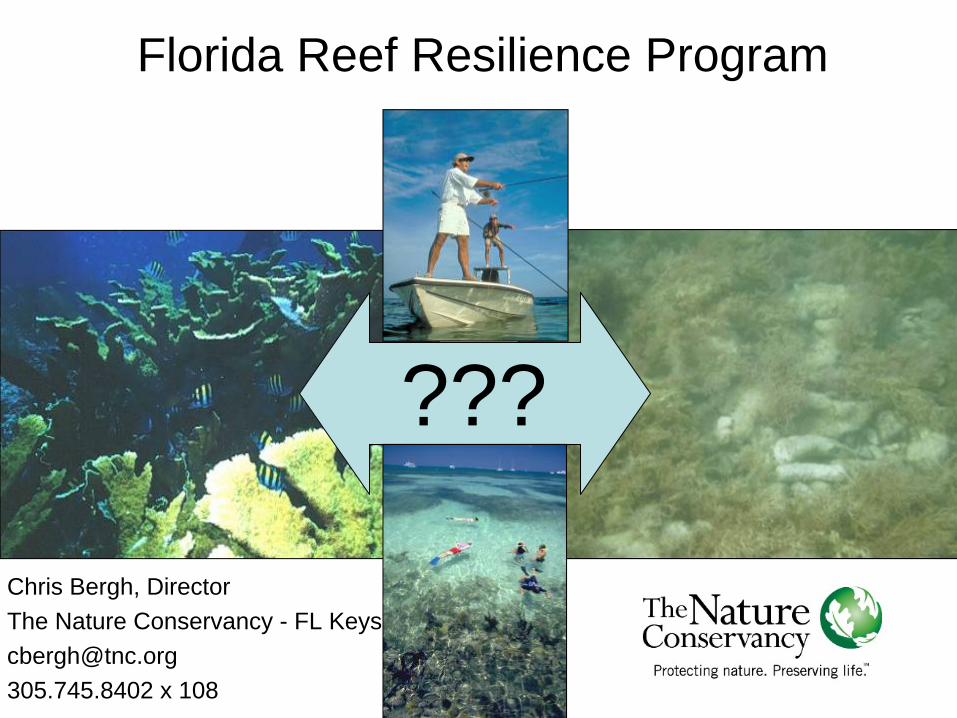
???
Chris Bergh, DirectorThe Nature Conservancy - FL [email protected] x 108
Florida Reef Resilience Program
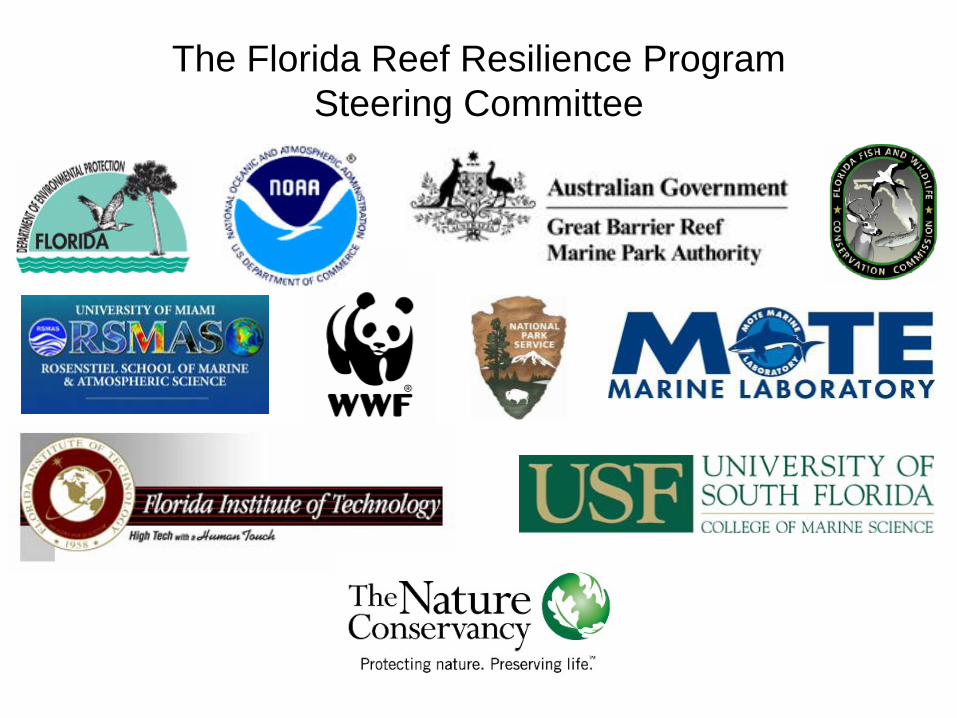
The Florida Reef Resilience ProgramSteering Committee
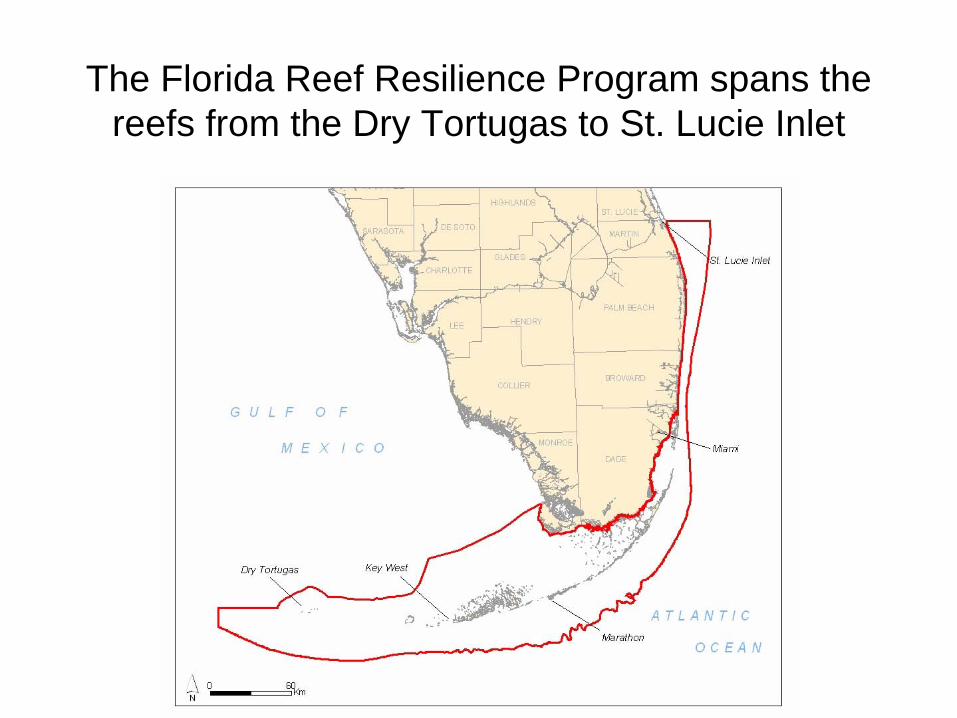
The Florida Reef Resilience Program spans the reefs from the Dry Tortugas to St. Lucie Inlet
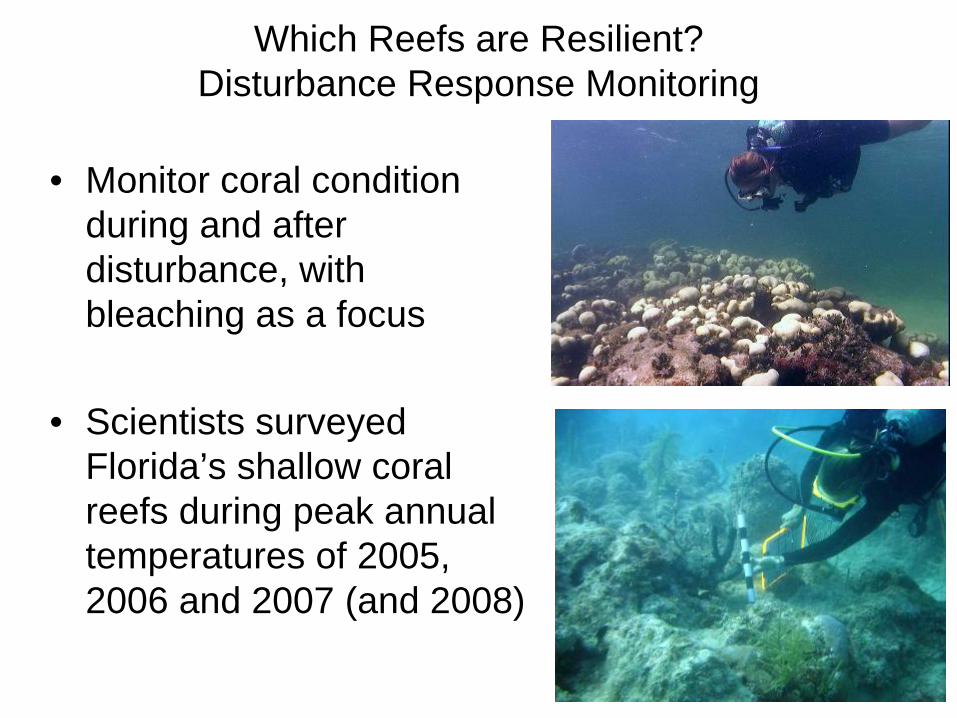
Which Reefs are Resilient? Disturbance Response Monitoring
• Monitor coral condition during and after disturbance, with bleaching as a focus
• Scientists surveyed Florida’s shallow coral reefs during peak annual temperatures of 2005, 2006 and 2007 (and 2008)
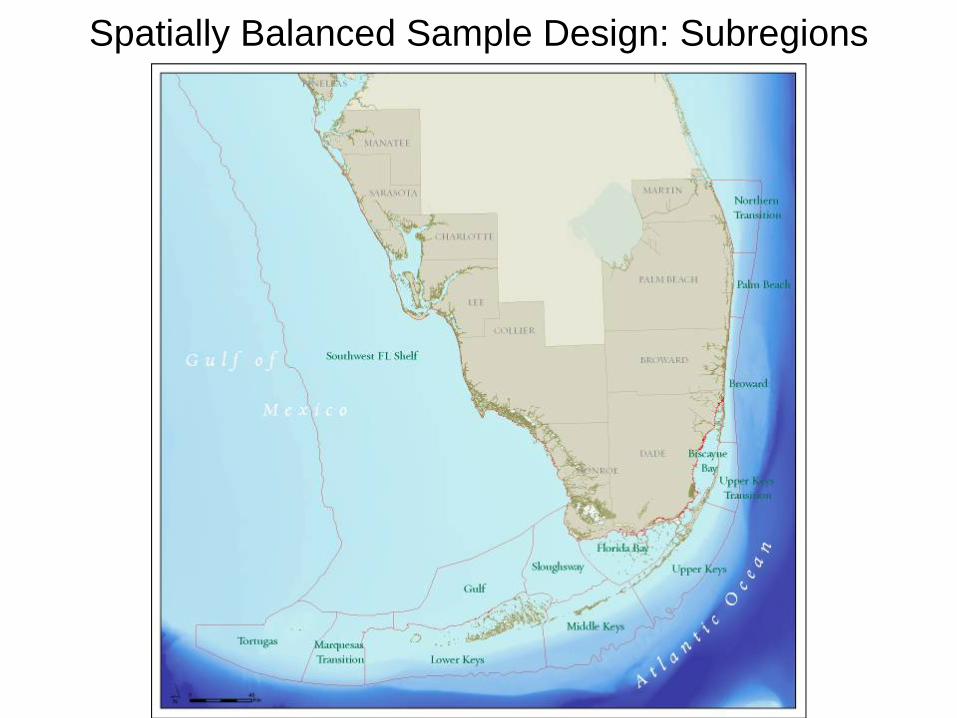
Spatially Balanced Sample Design: Subregions
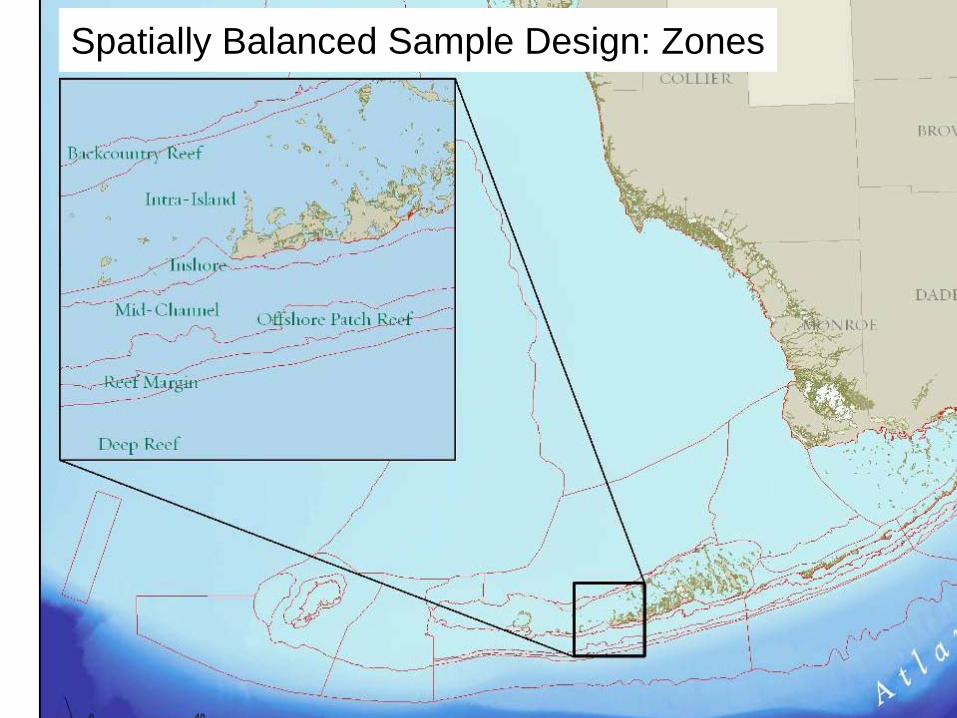
Spatially Balanced Sample Design: Zones
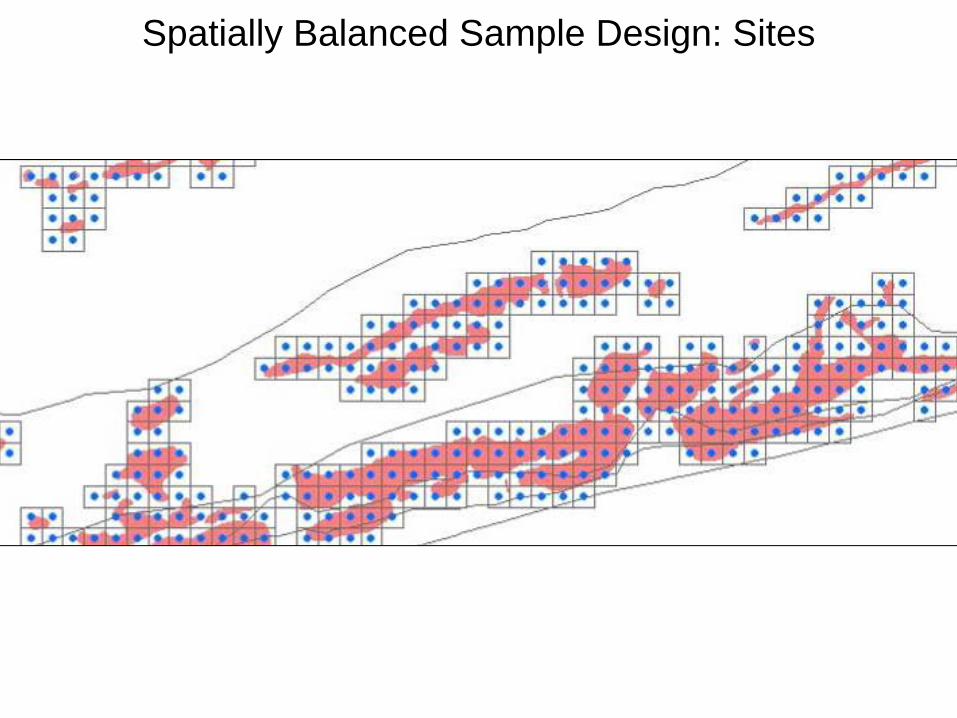
Spatially Balanced Sample Design: Sites
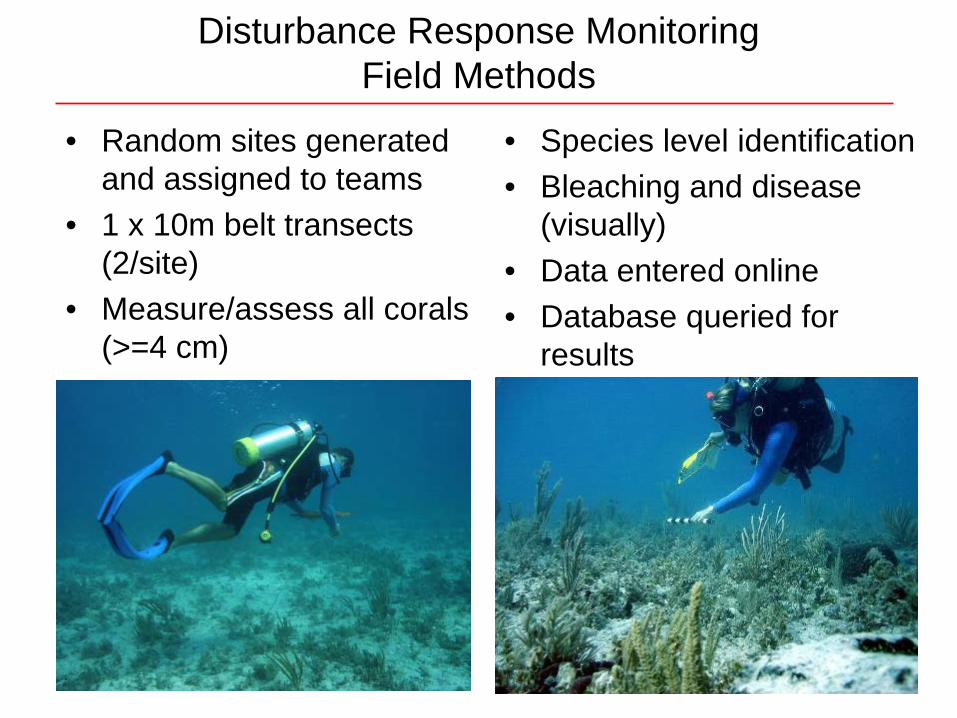
Disturbance Response Monitoring Field Methods
• Random sites generated and assigned to teams
• 1 x 10m belt transects (2/site)
• Measure/assess all corals (>=4 cm)
• Species level identification• Bleaching and disease
(visually)• Data entered online • Database queried for
results
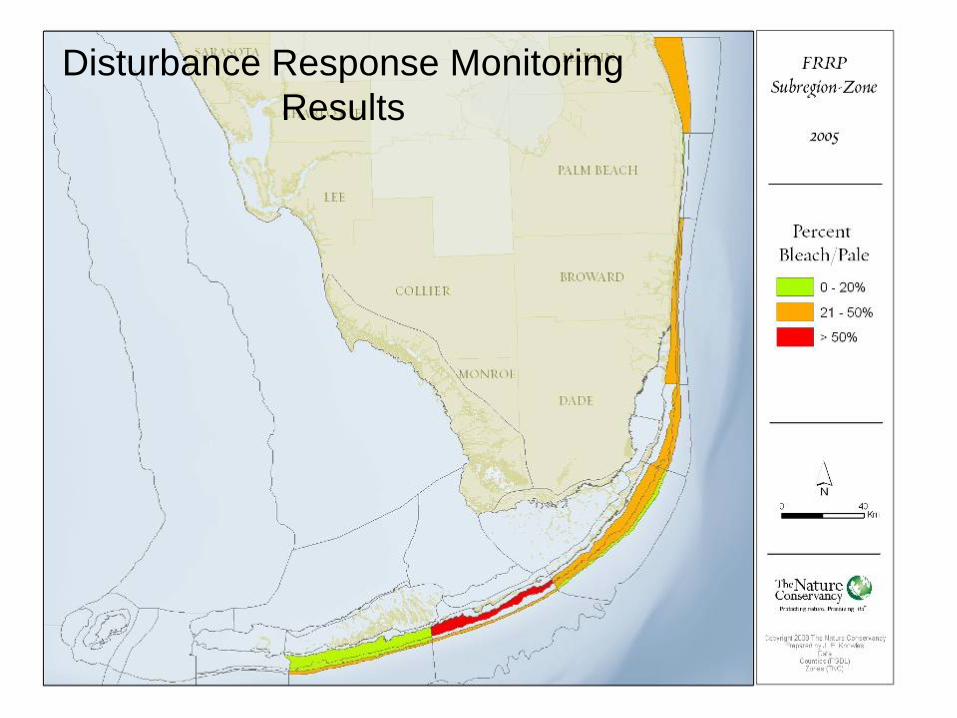
Disturbance Response Monitoring Results
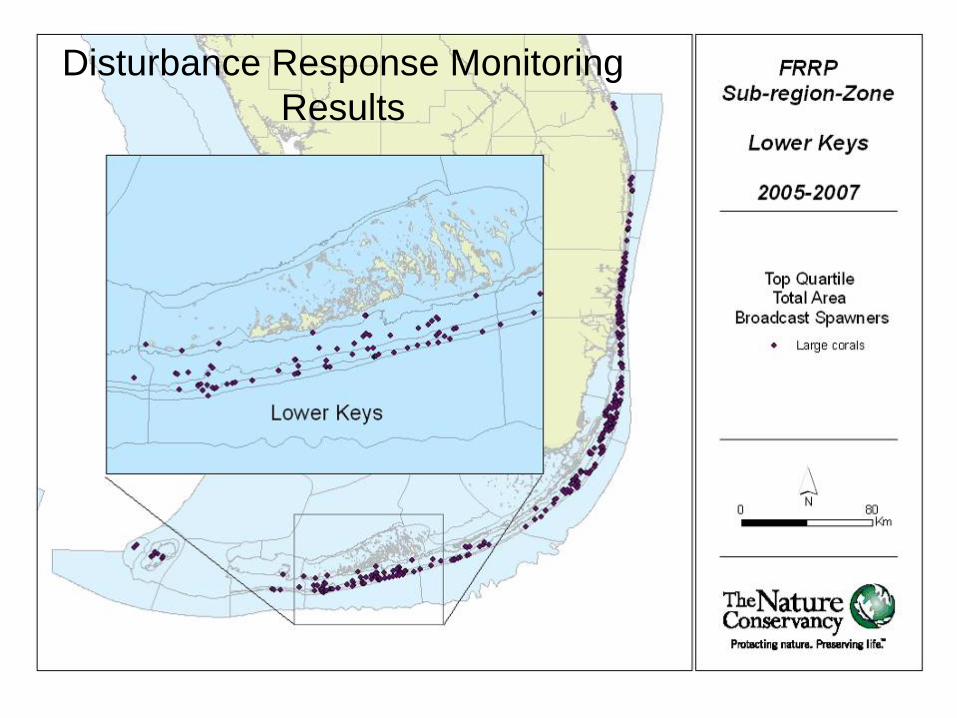
Disturbance Response Monitoring Results
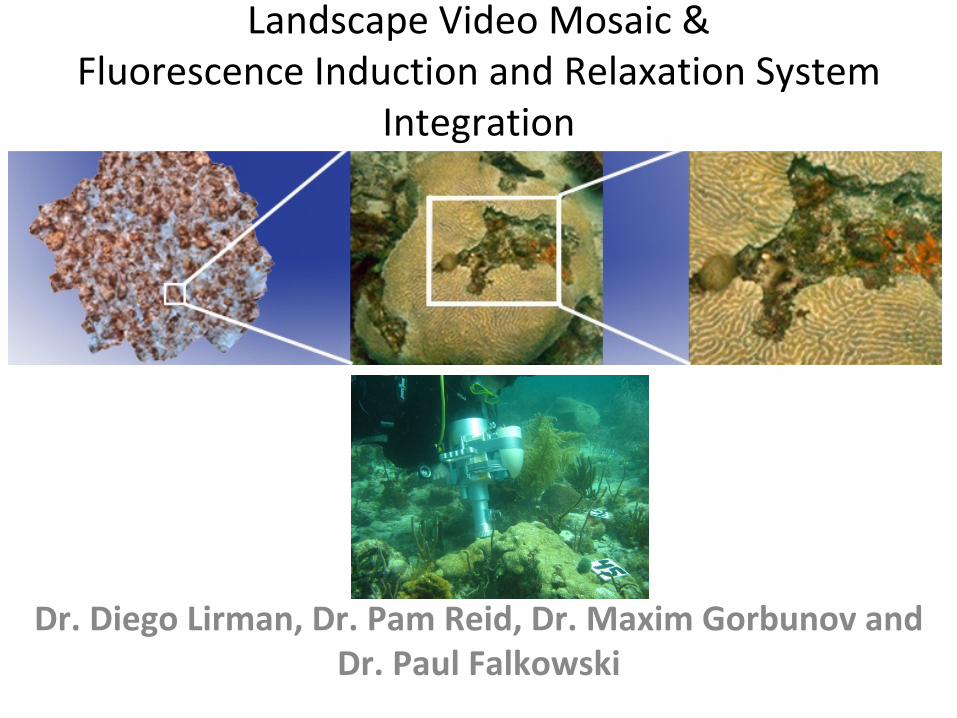
Landscape Video Mosaic & Fluorescence Induction and Relaxation System
Integration
Dr. Diego Lirman, Dr. Pam Reid, Dr. Maxim Gorbunov and Dr. Paul Falkowski
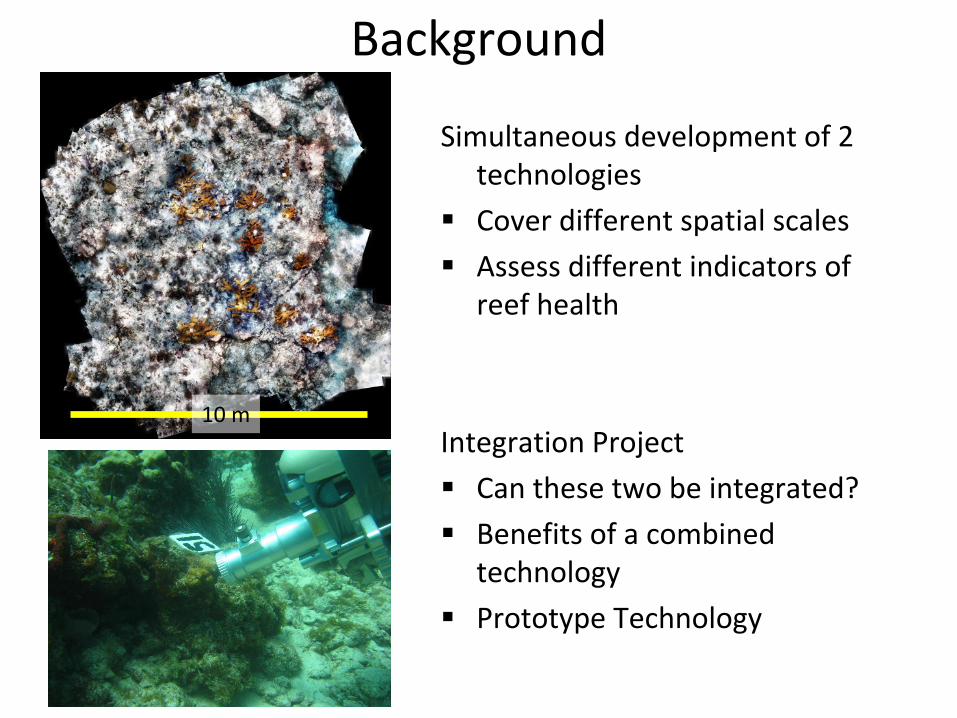
Background
10 m
Simultaneous development of 2
technologies
Cover different spatial scales
Assess different indicators of reef health
Integration Project
Can these two be integrated?
Benefits of a combined technology
Prototype Technology
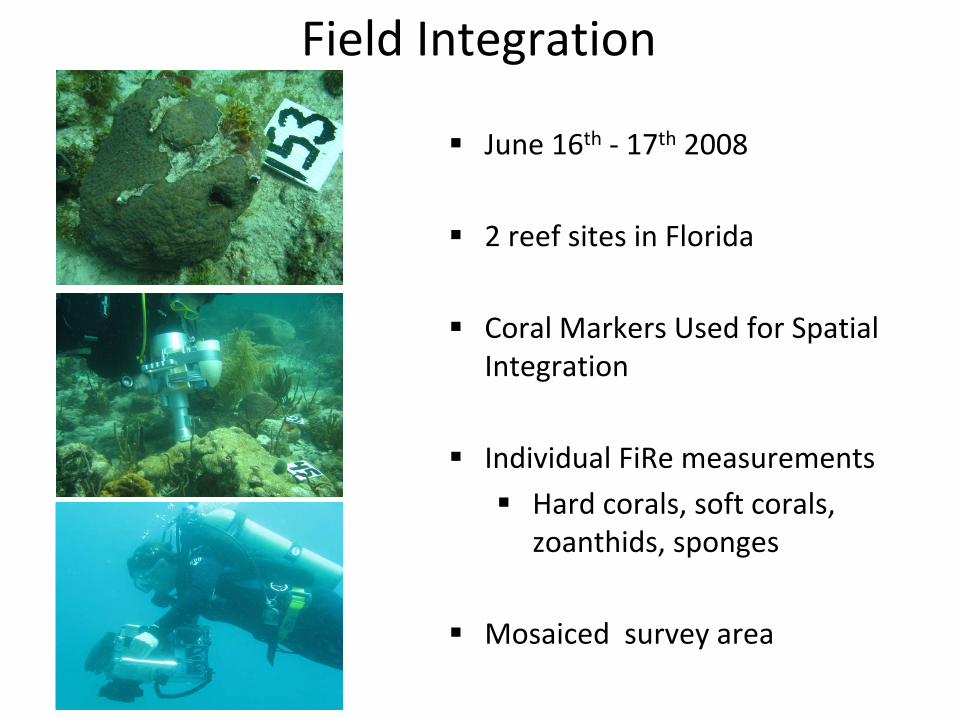
Field Integration
June 16th ‐ 17th 2008
2 reef sites in Florida
Coral Markers Used for Spatial Integration
Individual FiRe measurements
Hard corals, soft corals, zoanthids, sponges
Mosaiced survey area
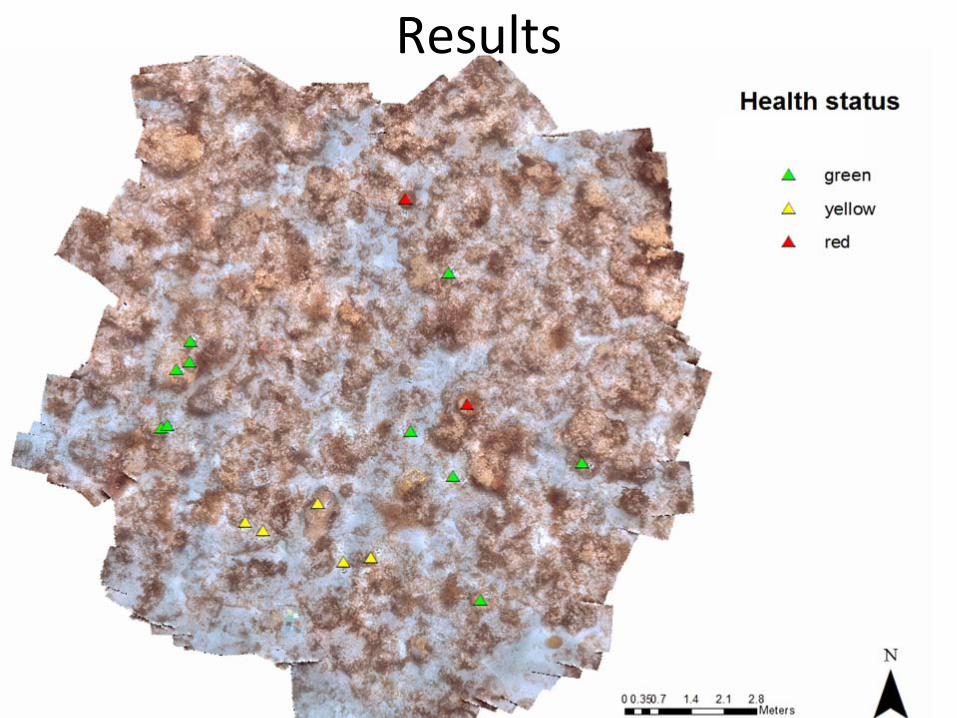
Results
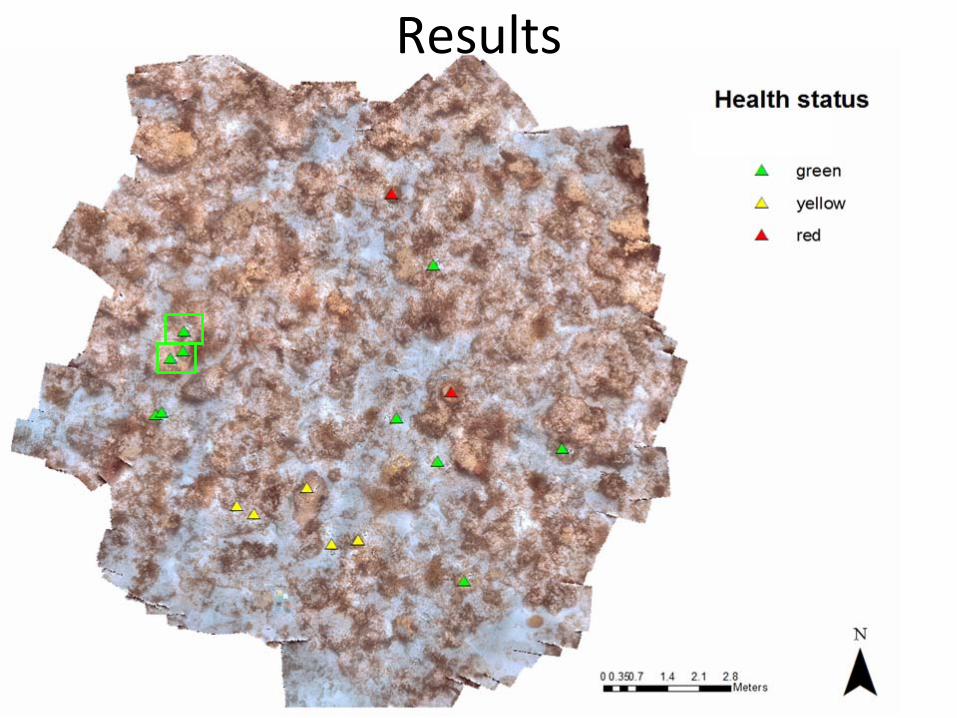
Results
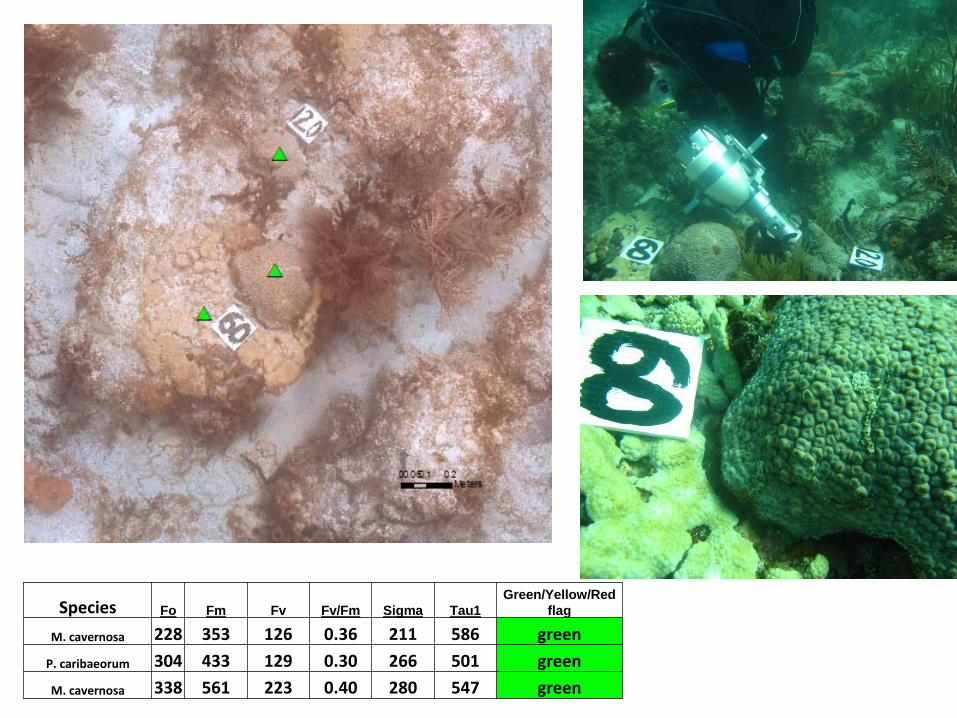
Species Fo Fm Fv Fv/Fm Sigma Tau1Green/Yellow/Red
flag
M. cavernosa 228 353 126 0.36 211 586 green
P. caribaeorum 304 433 129 0.30 266 501 green
M. cavernosa 338 561 223 0.40 280 547 green
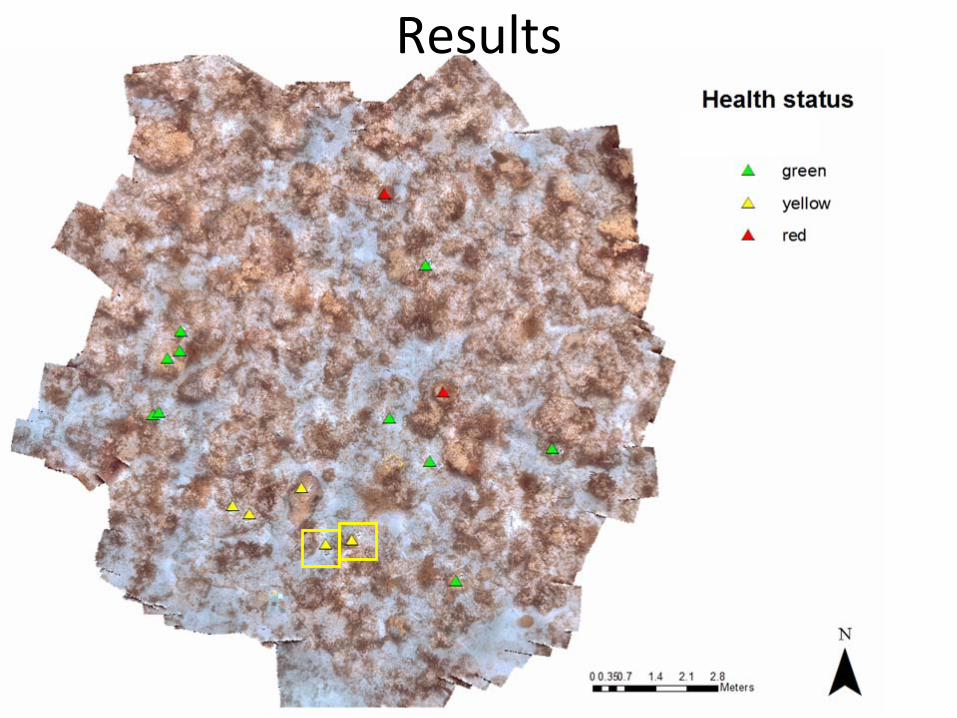
Results
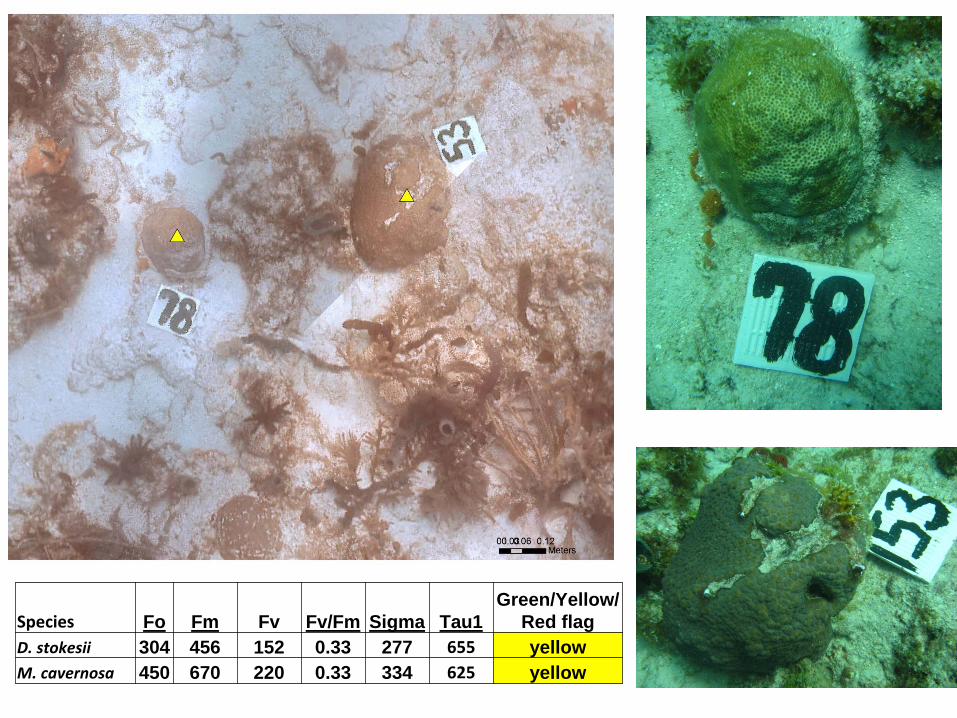
Species Fo Fm Fv Fv/Fm Sigma Tau1Green/Yellow/
Red flagD. stokesii 304 456 152 0.33 277 655 yellowM. cavernosa 450 670 220 0.33 334 625 yellow
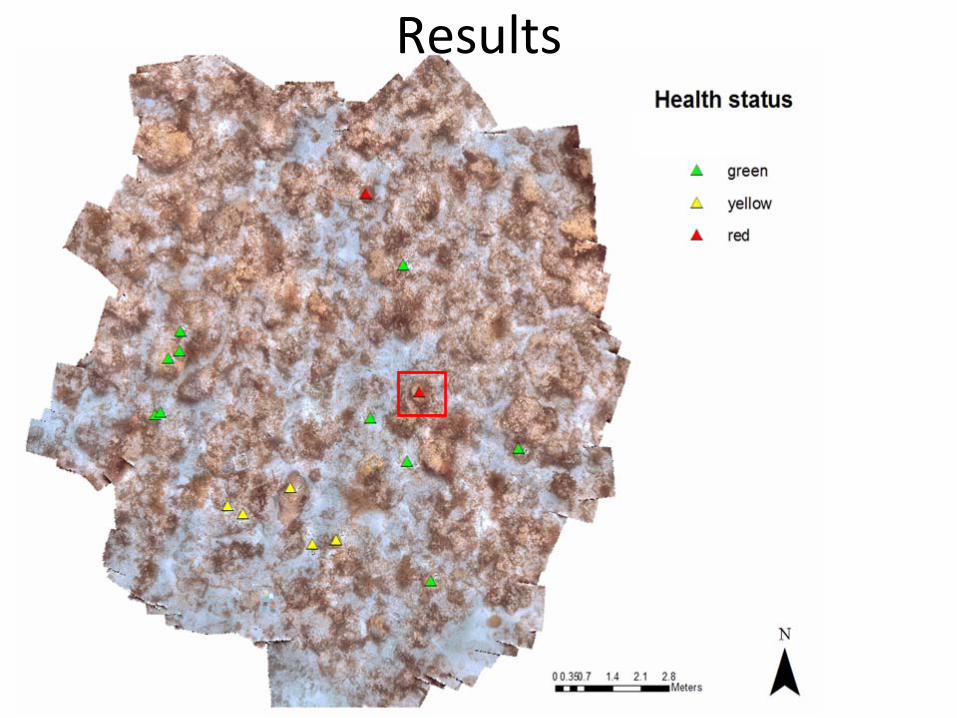
Results
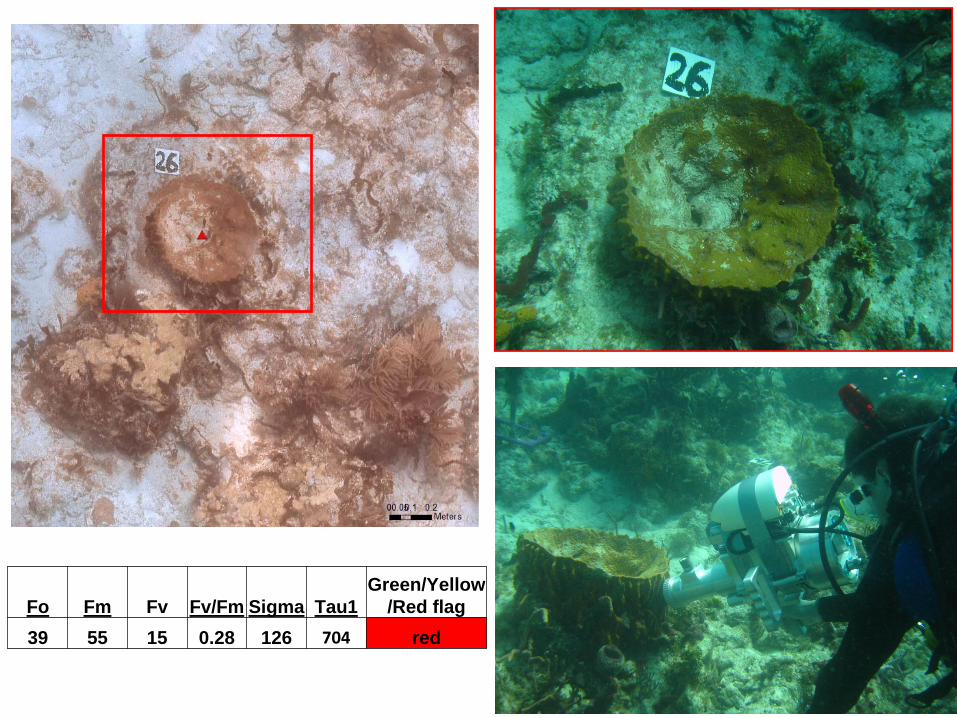
Fo Fm Fv Fv/Fm Sigma Tau1Green/Yellow
/Red flag39 55 15 0.28 126 704 red
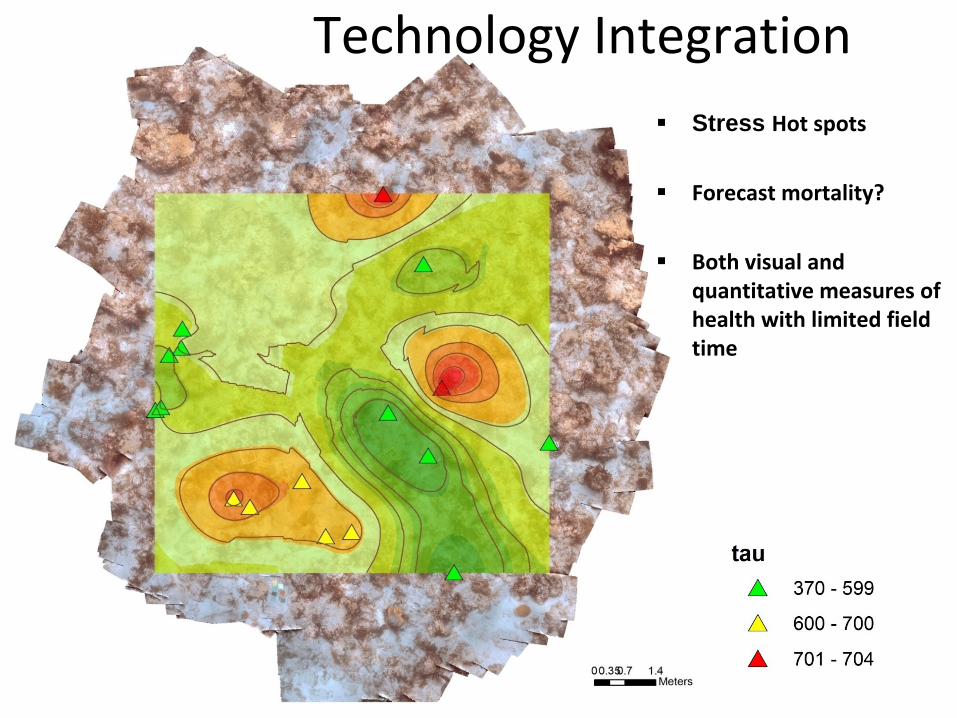
Stress Hot spots
Forecast mortality?
Both visual and quantitative measures of health with limited field time
Technology Integration
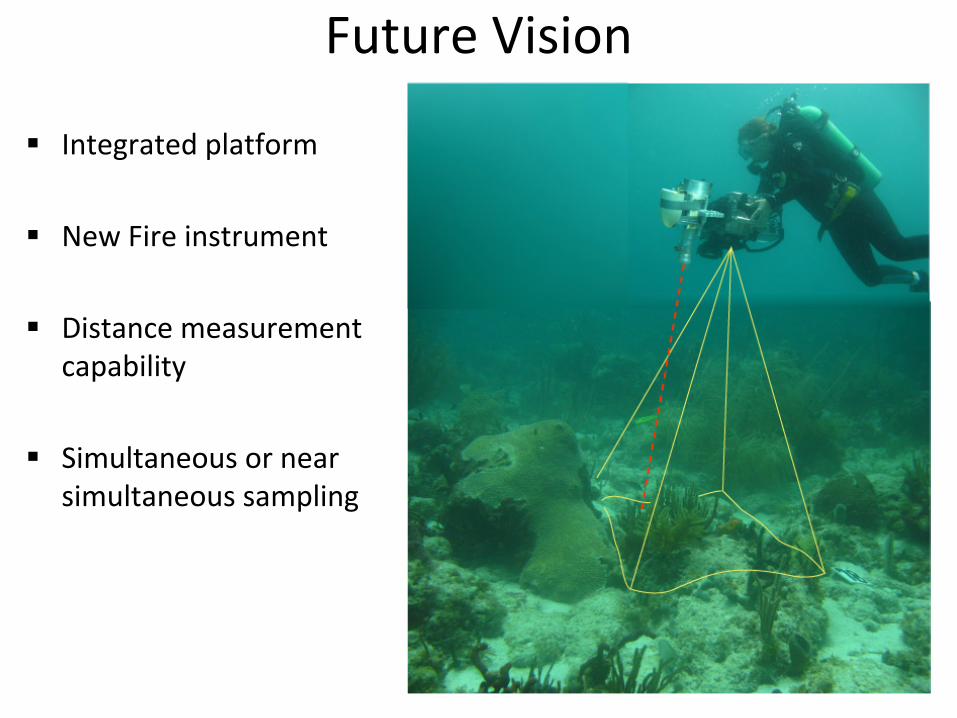
Future Vision
Integrated platform
New Fire instrument
Distance measurement capability
Simultaneous or near simultaneous sampling
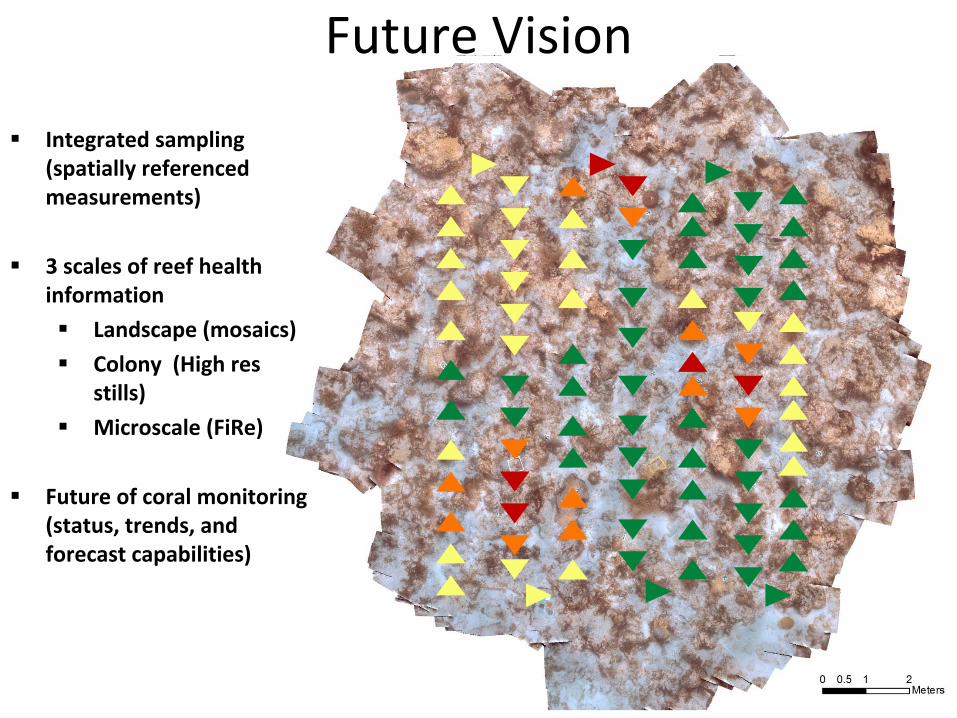
Future Vision
Integrated sampling (spatially referenced measurements)
3 scales of reef health information
Landscape (mosaics)
Colony (High res stills)
Microscale (FiRe)
Future of coral monitoring (status, trends, and forecast capabilities)
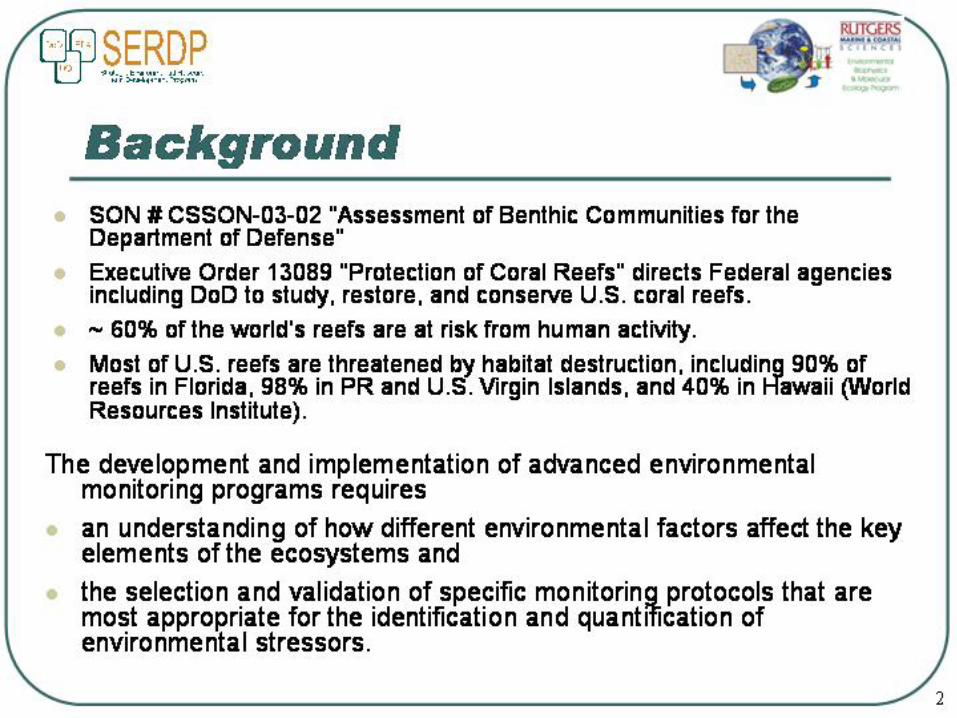
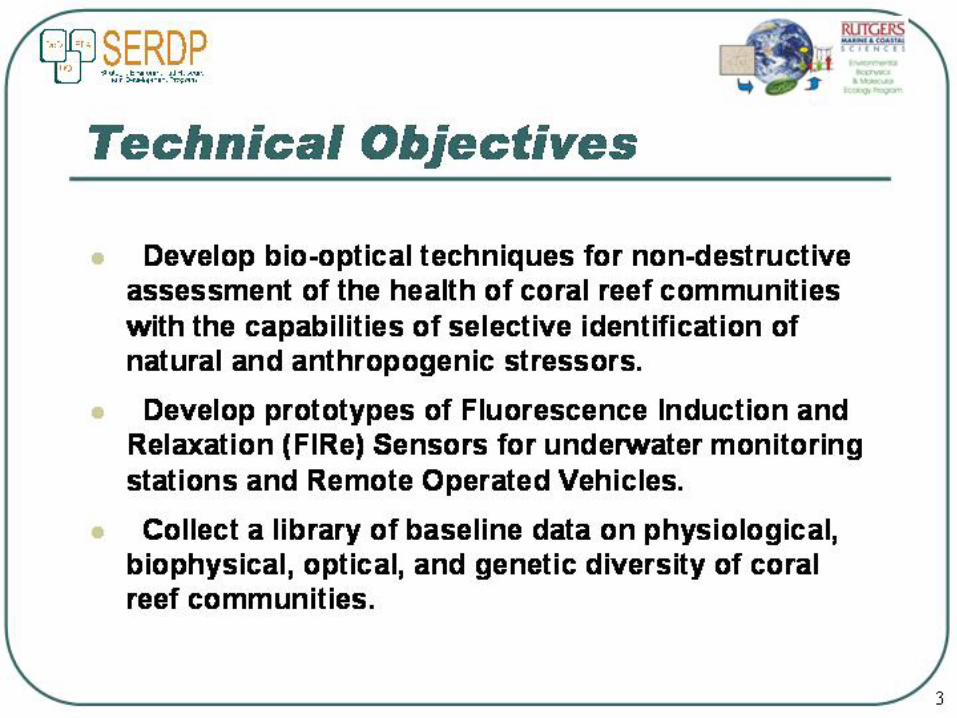
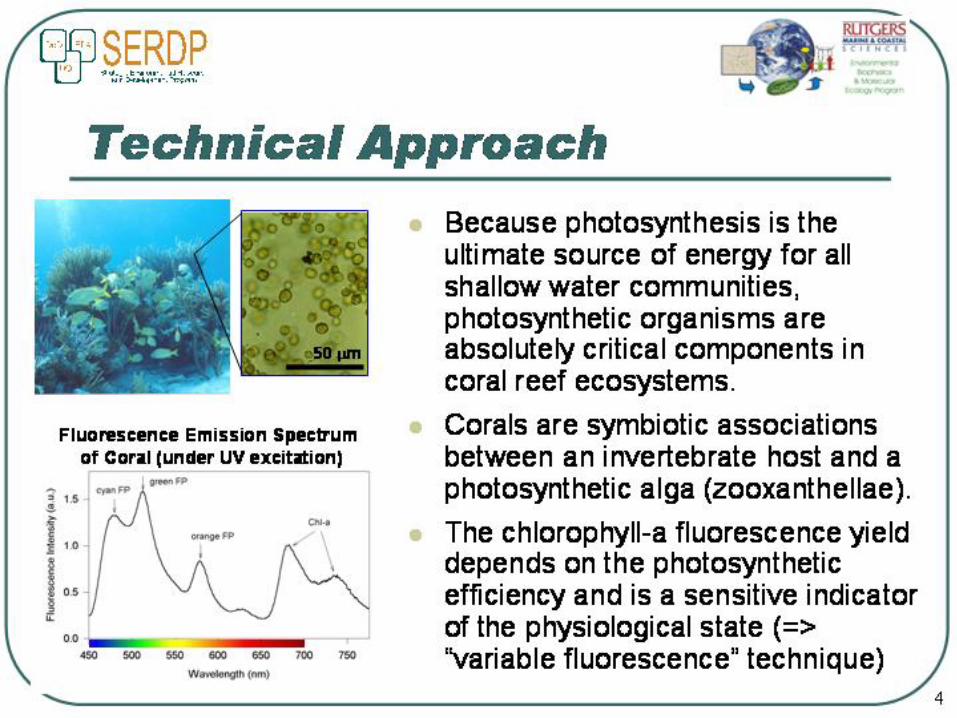
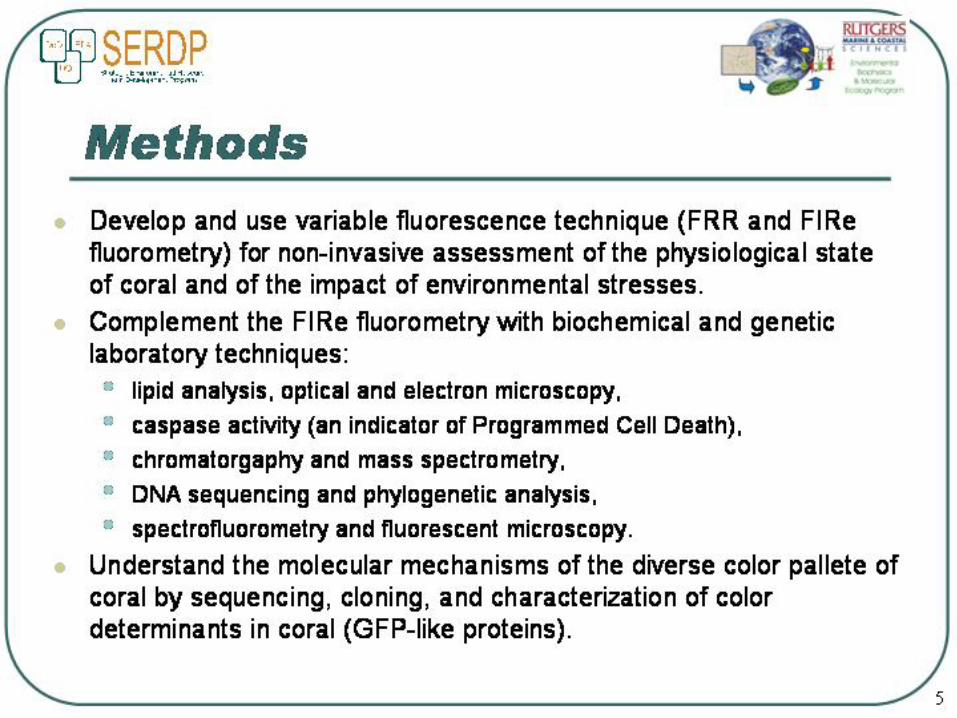
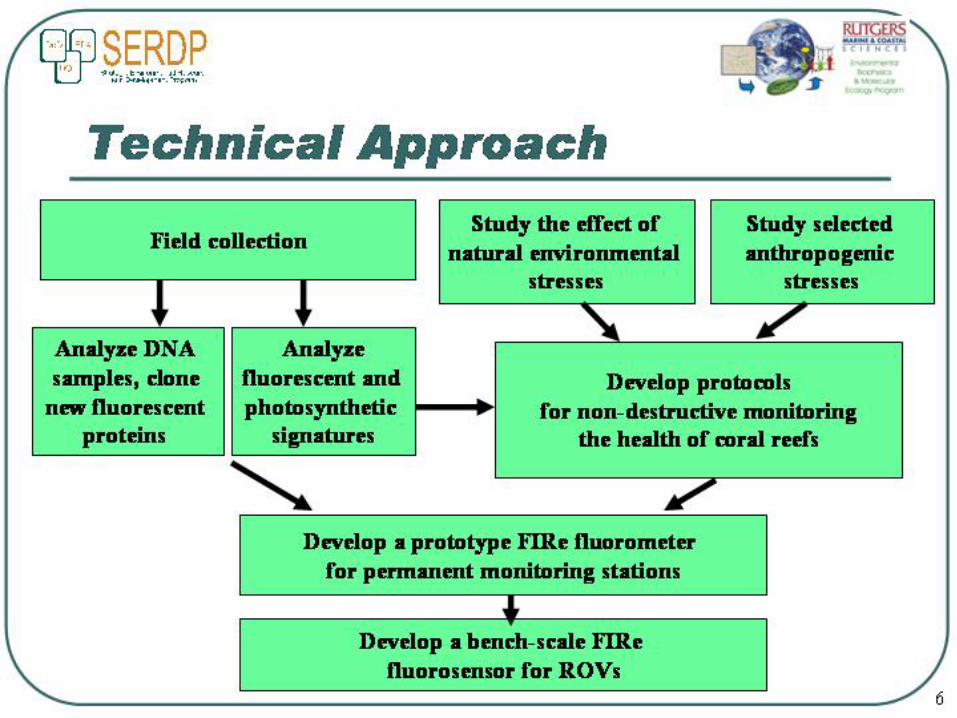
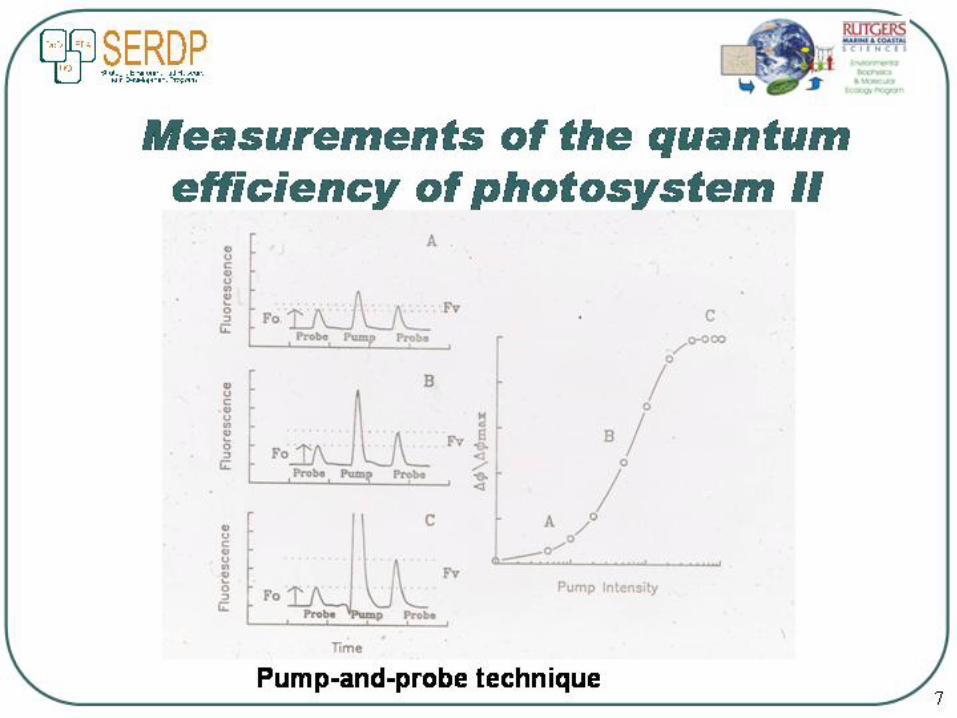
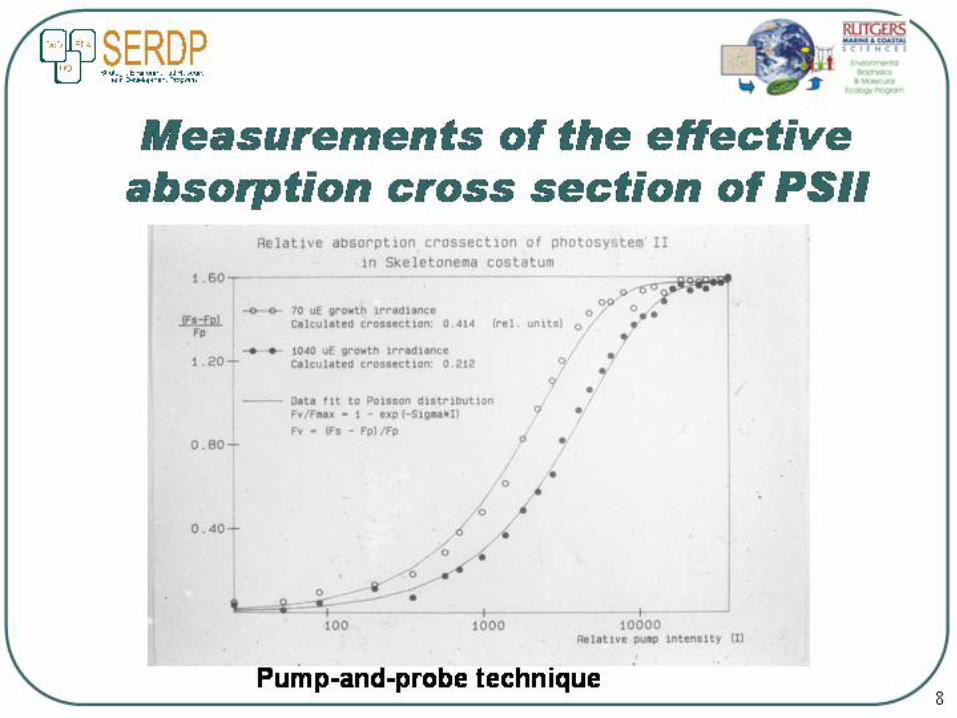

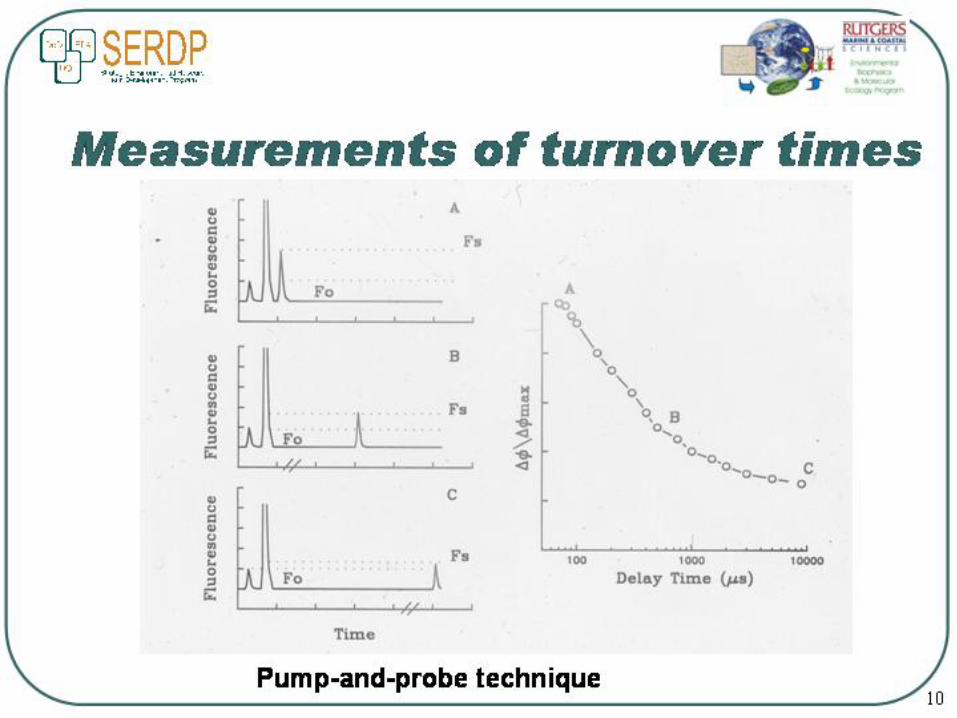
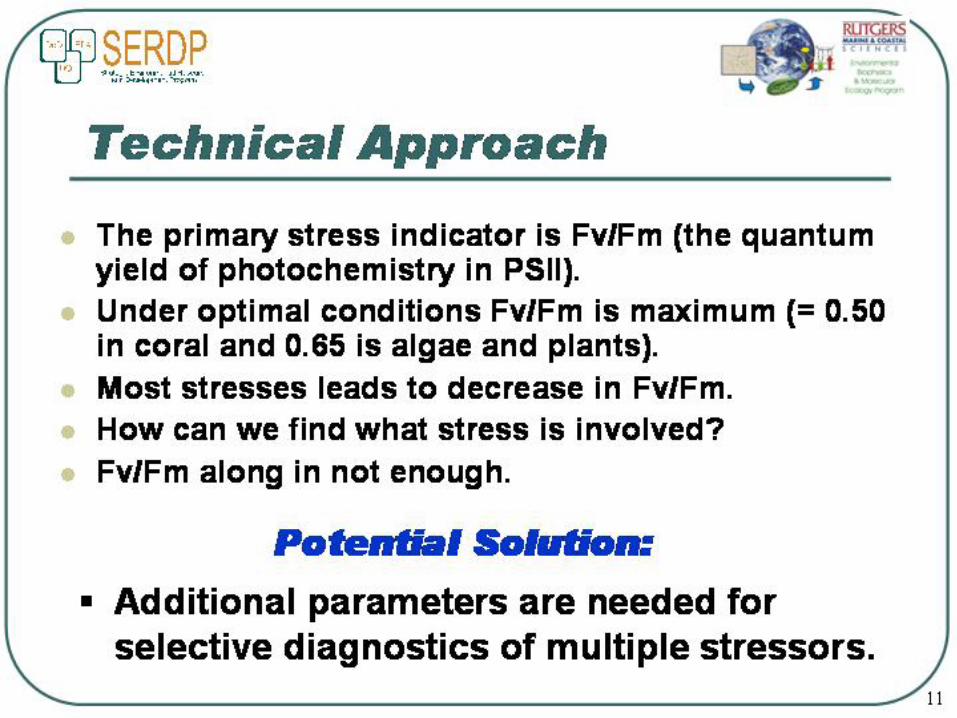
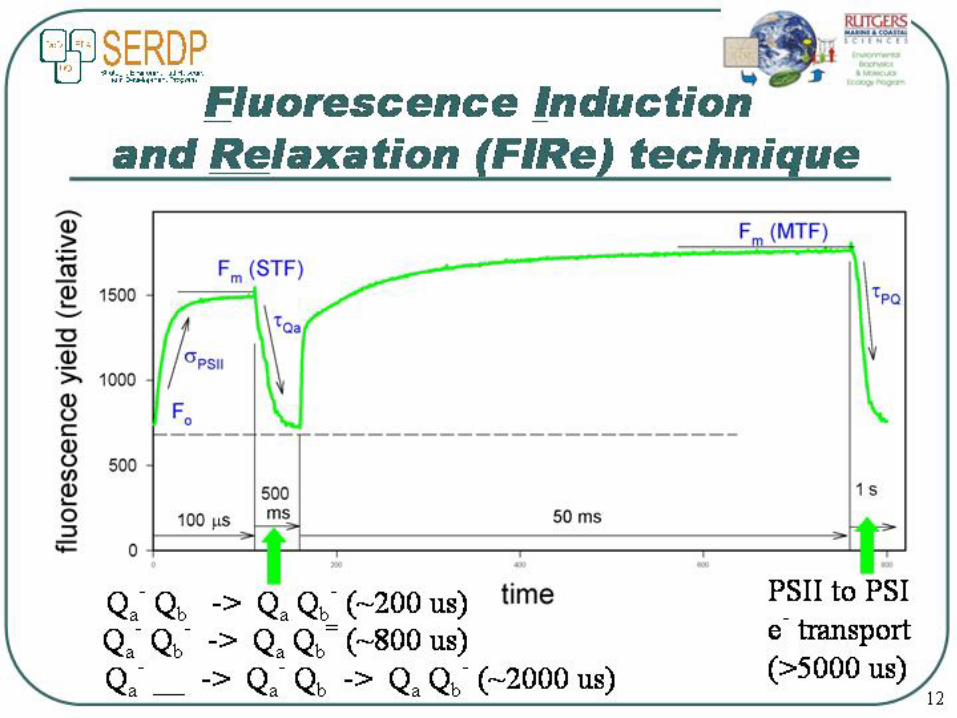
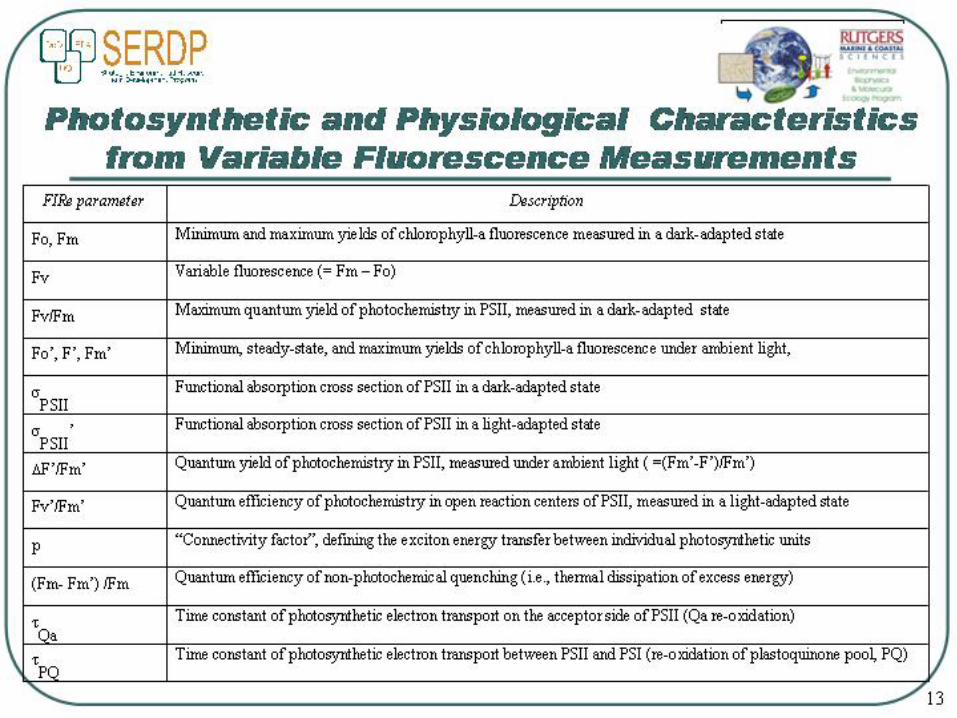
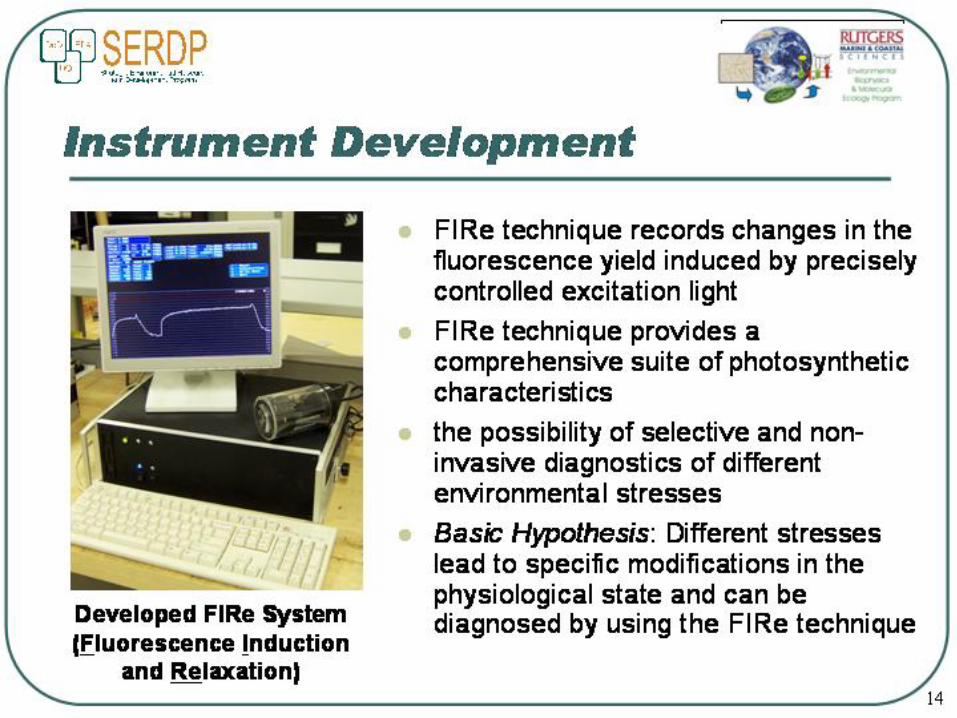
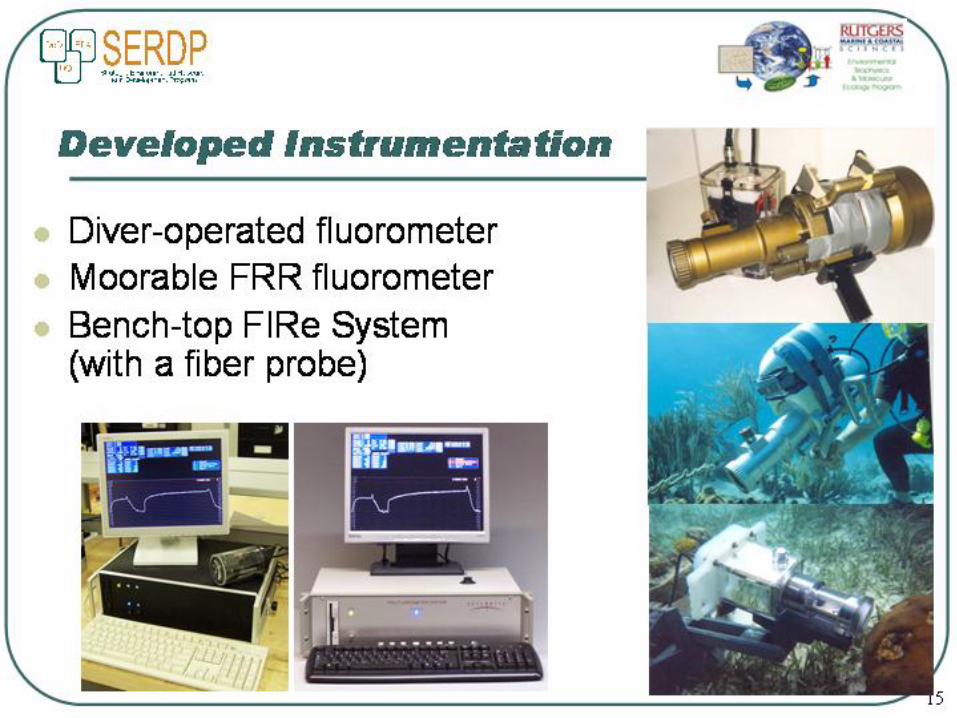
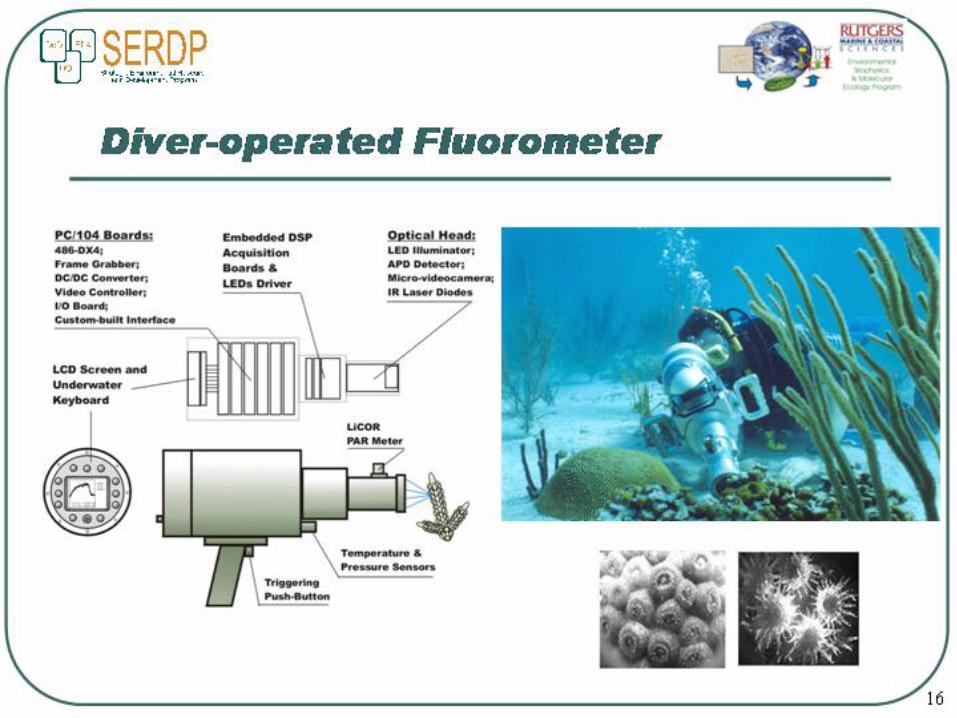
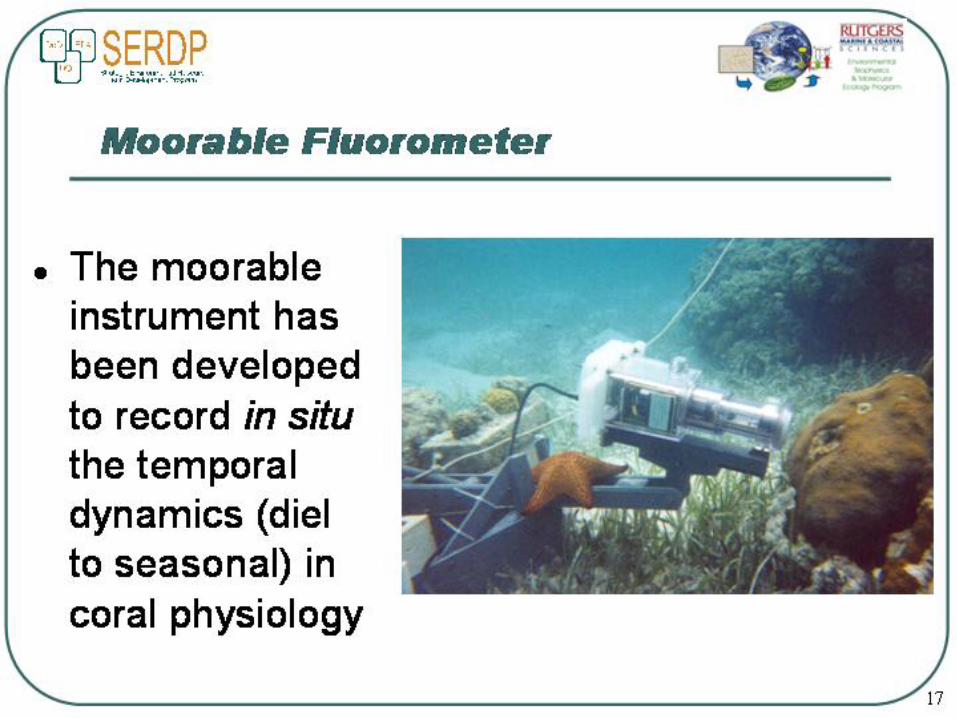
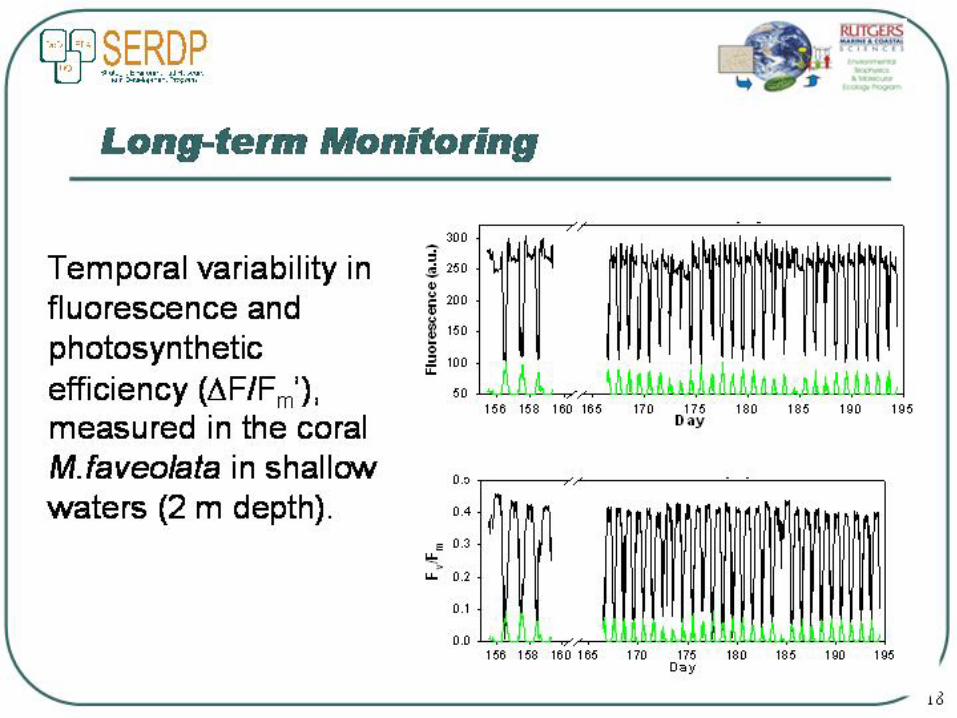
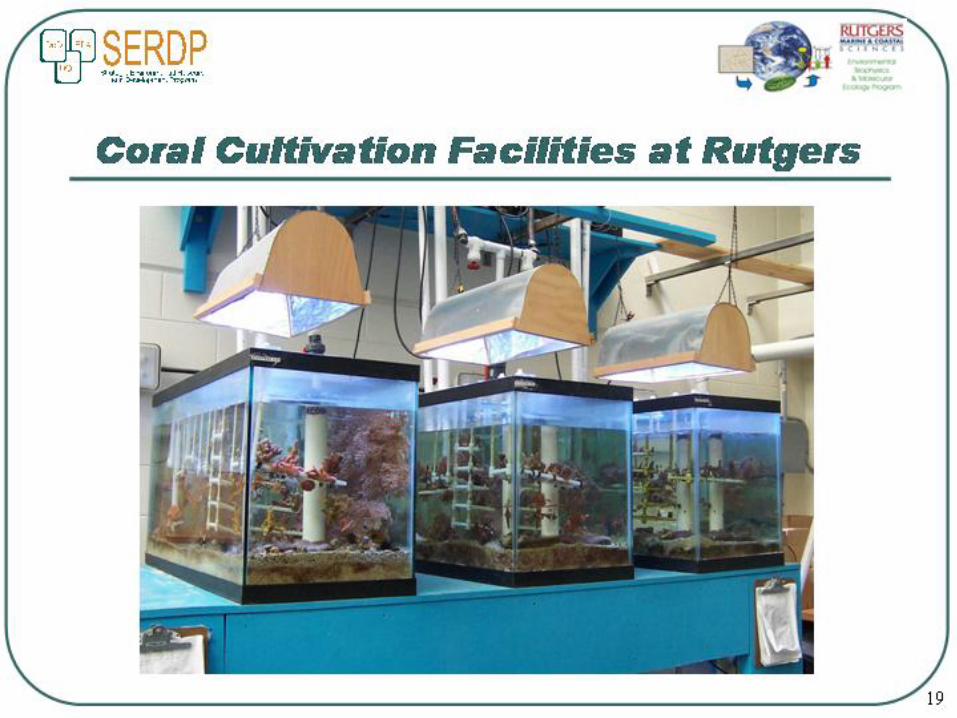
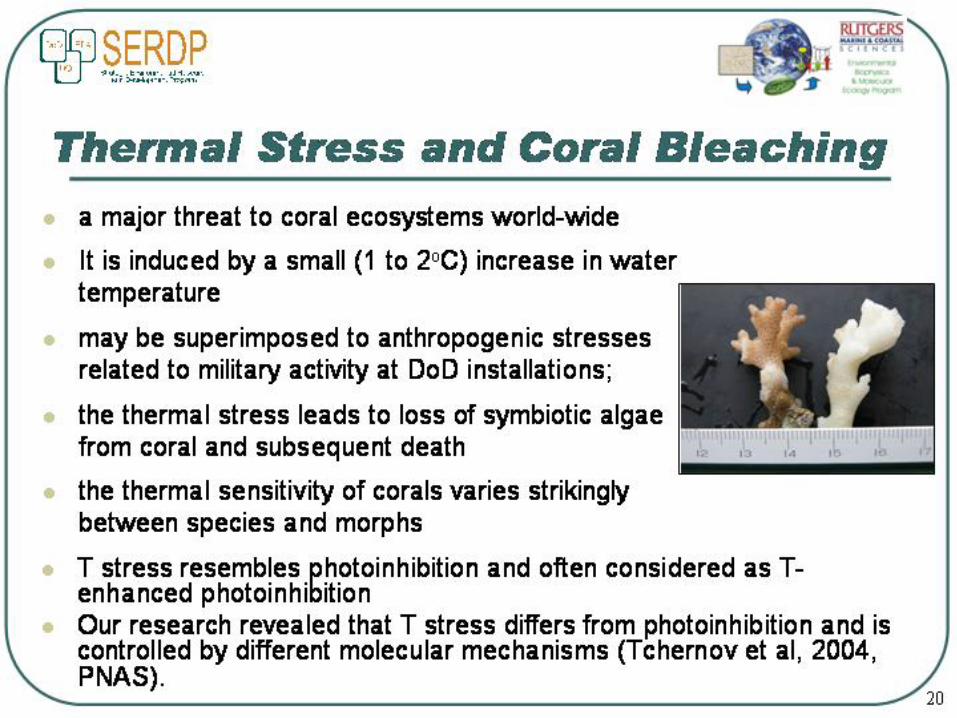
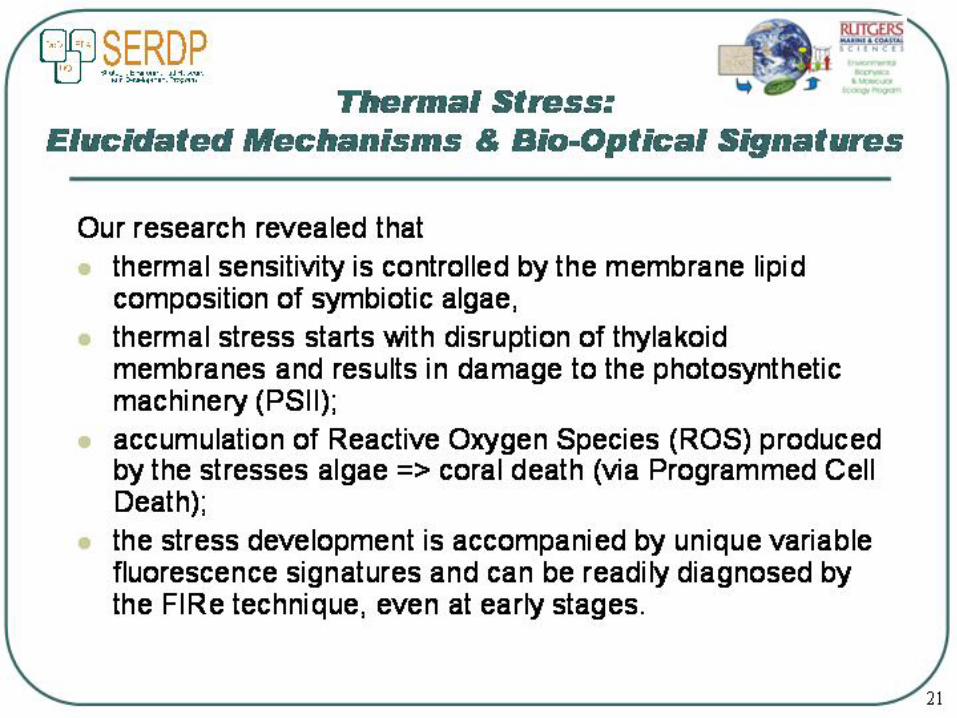
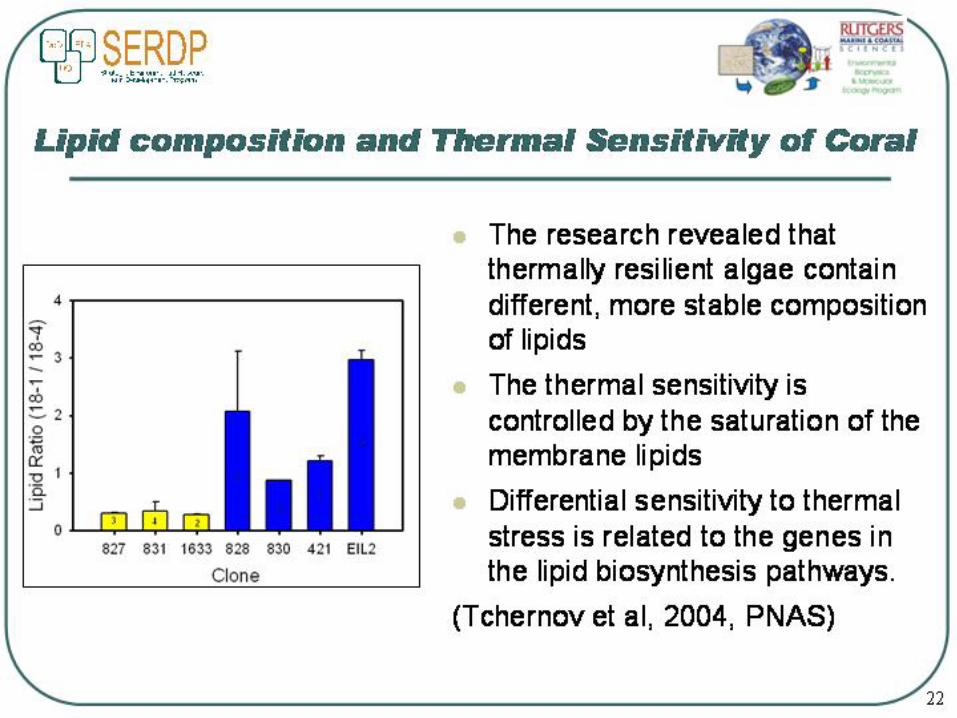
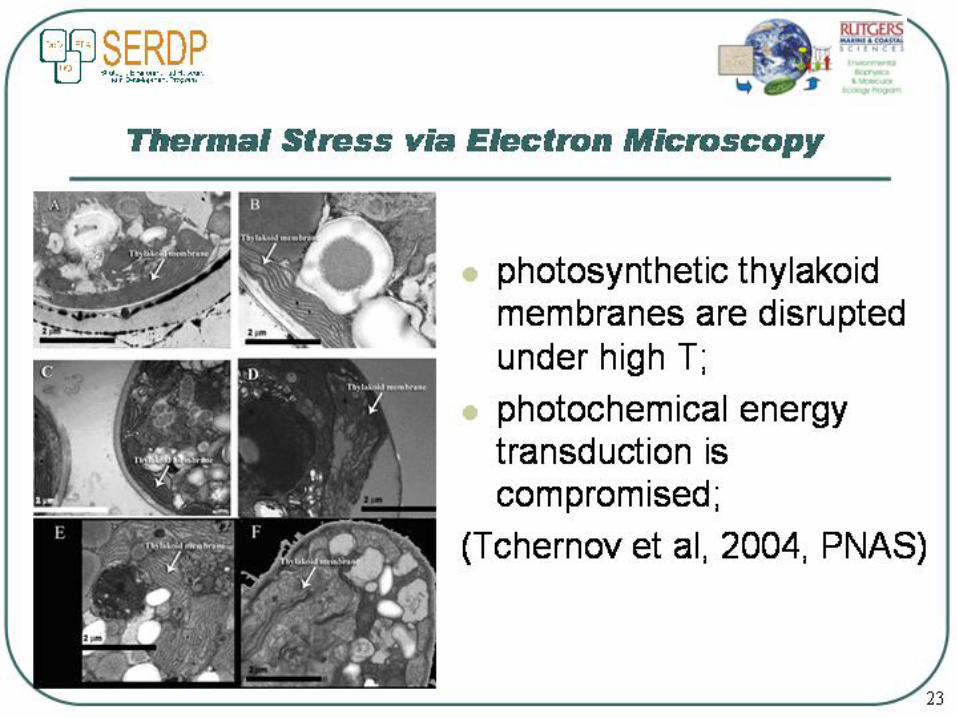
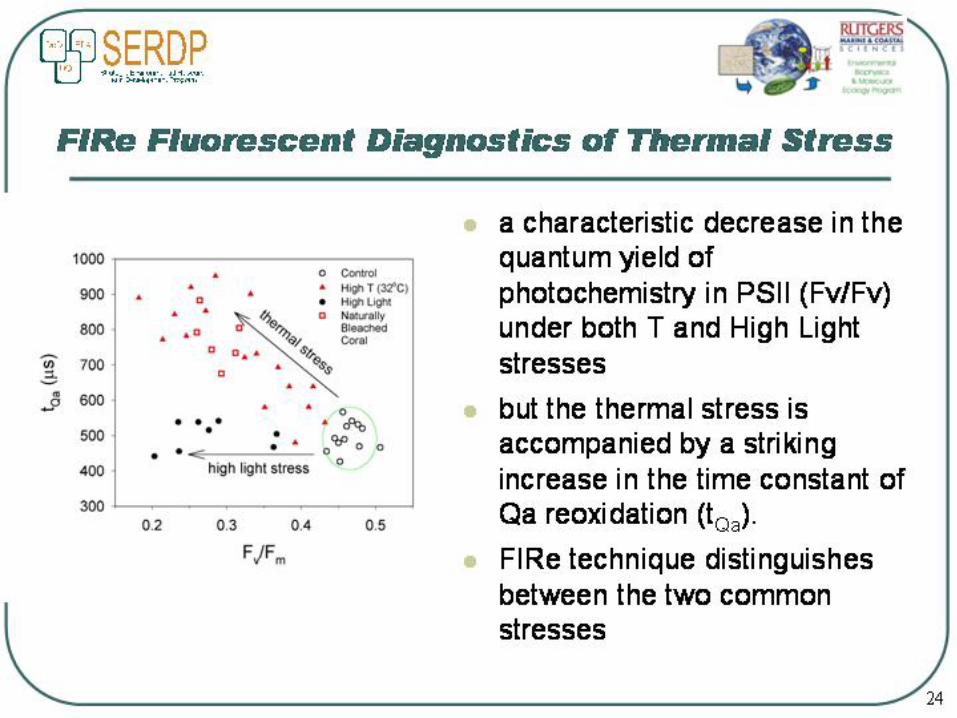
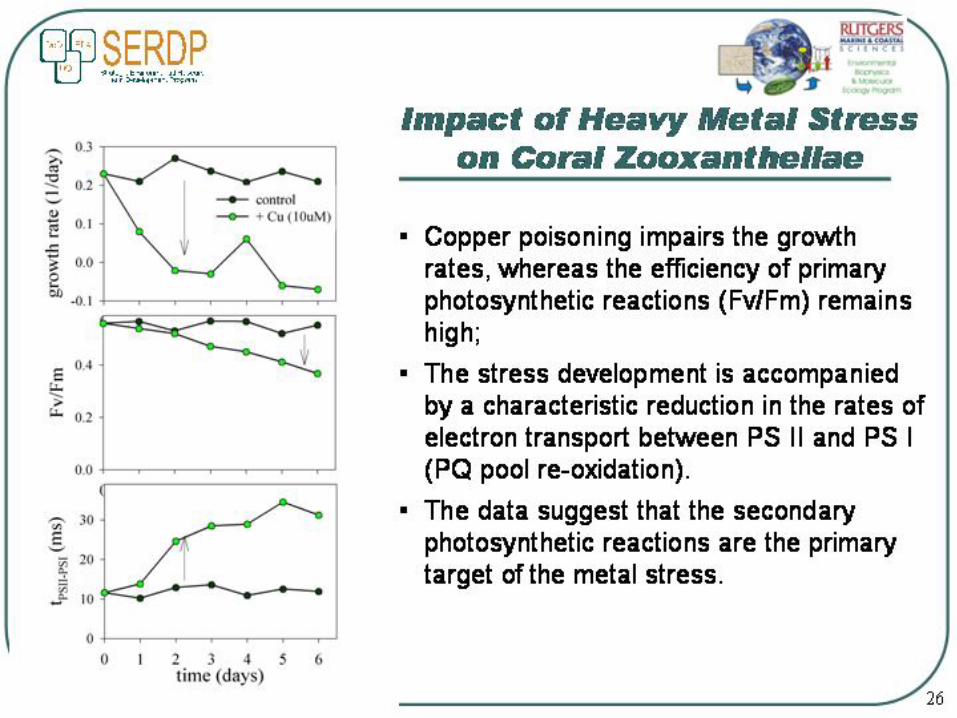
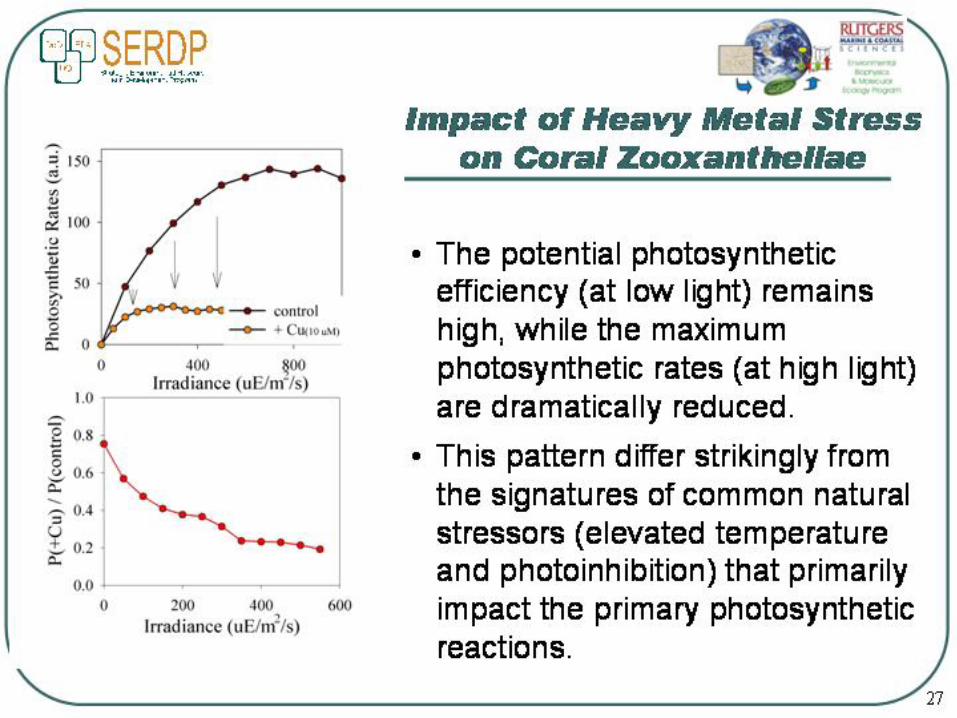
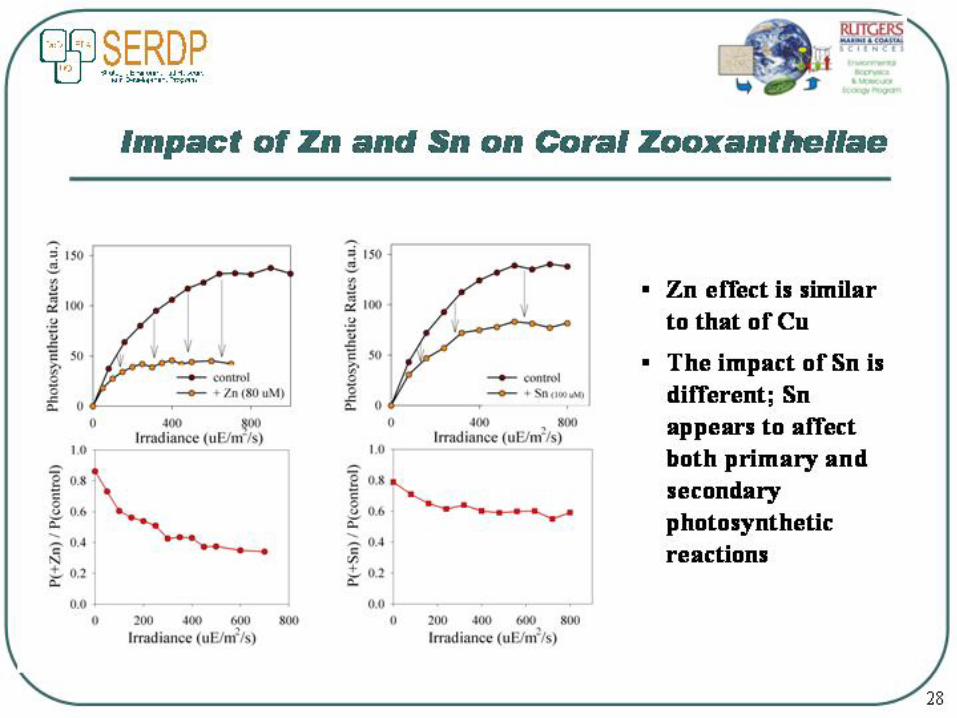
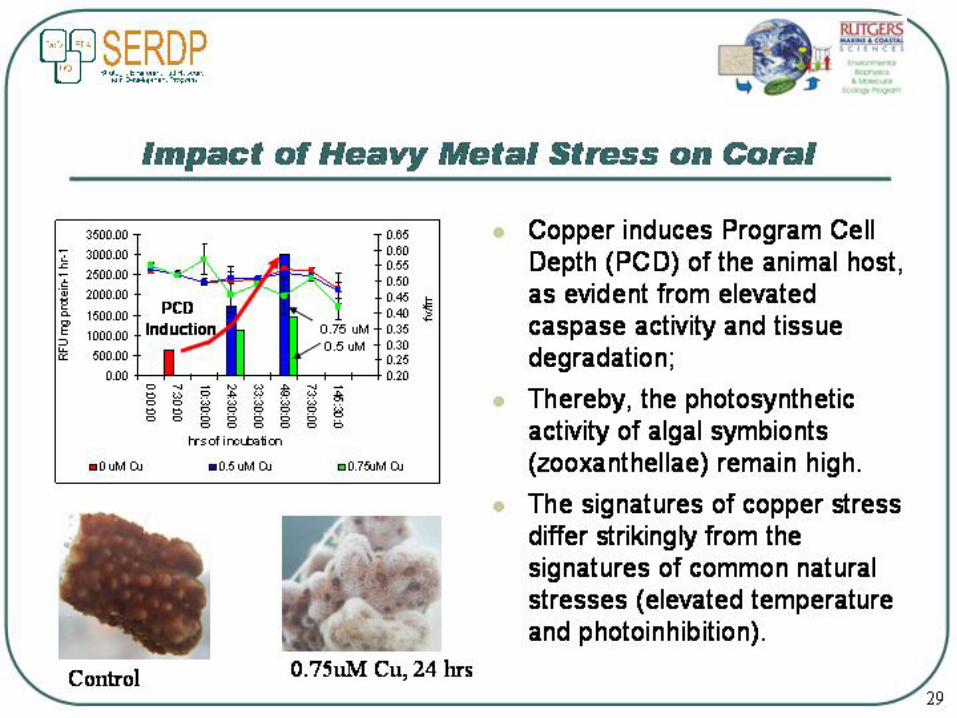
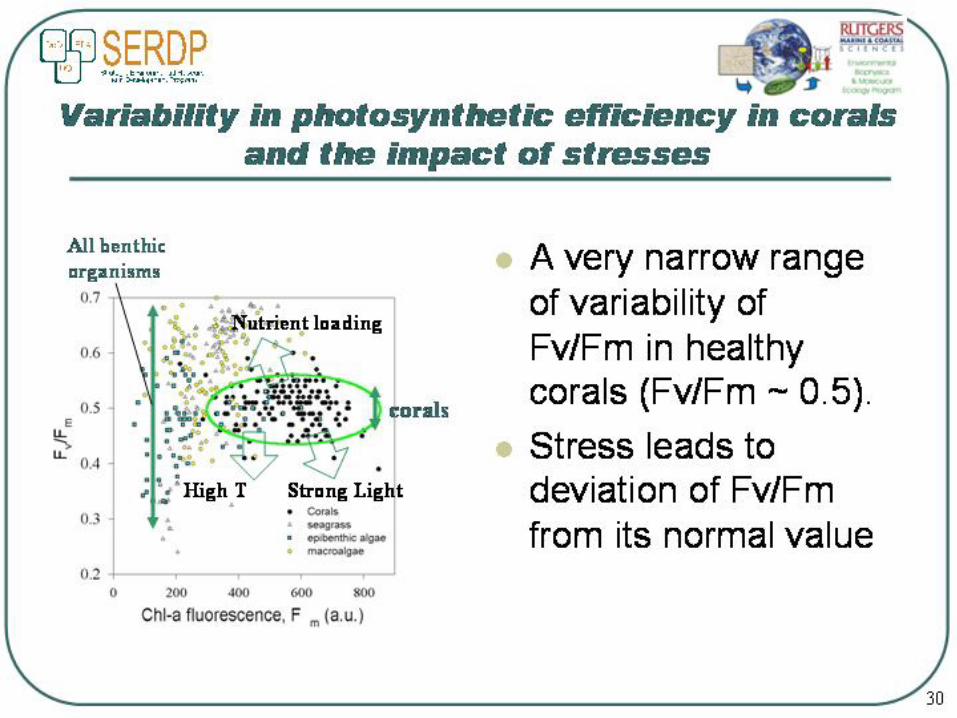
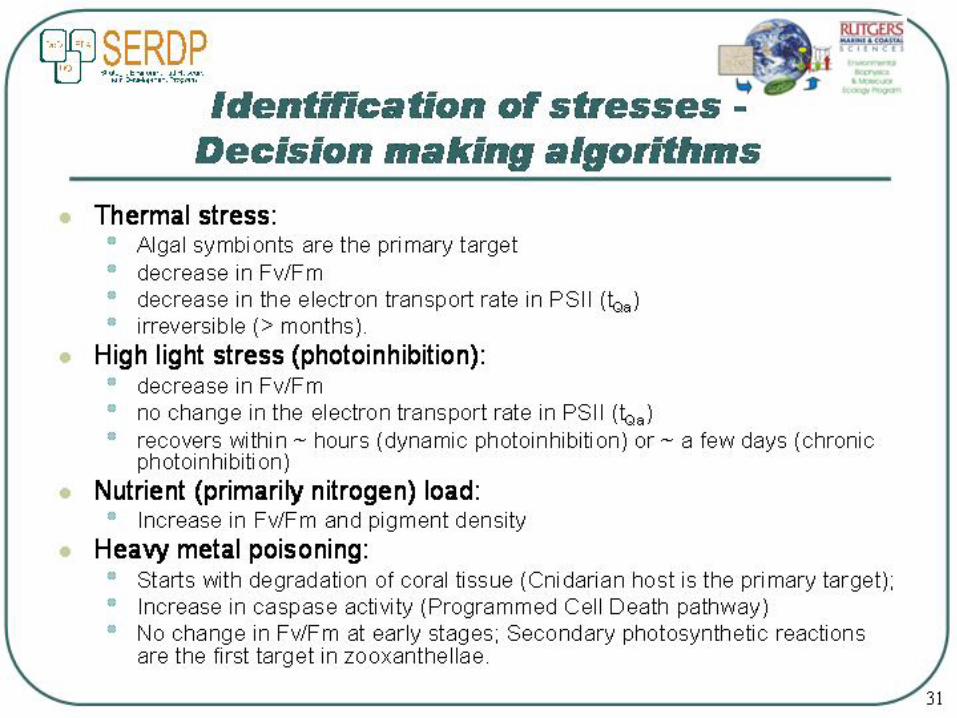
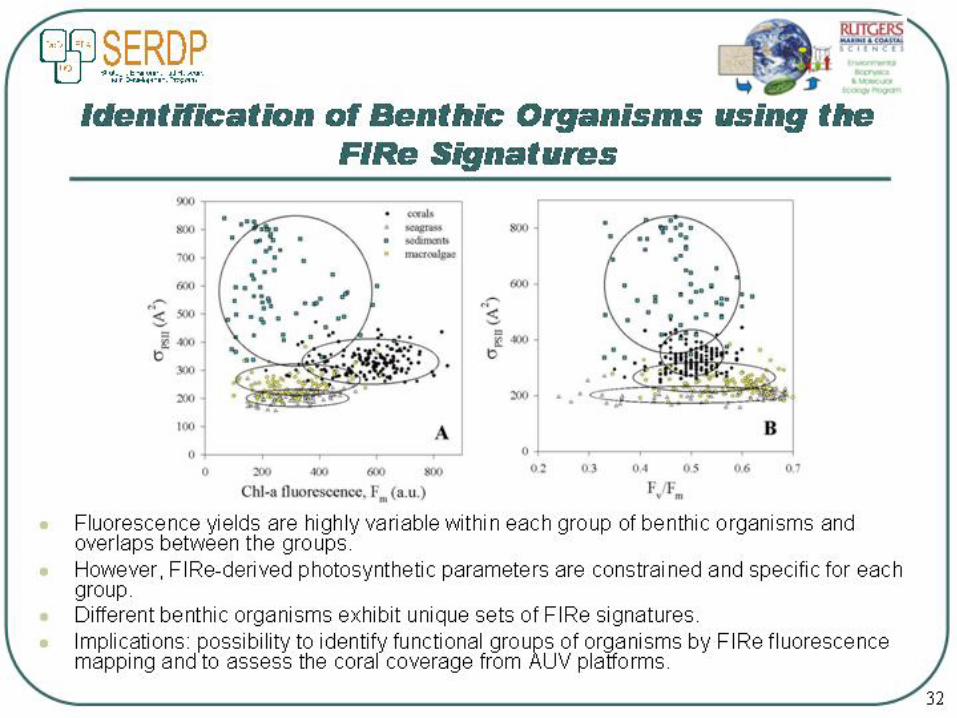
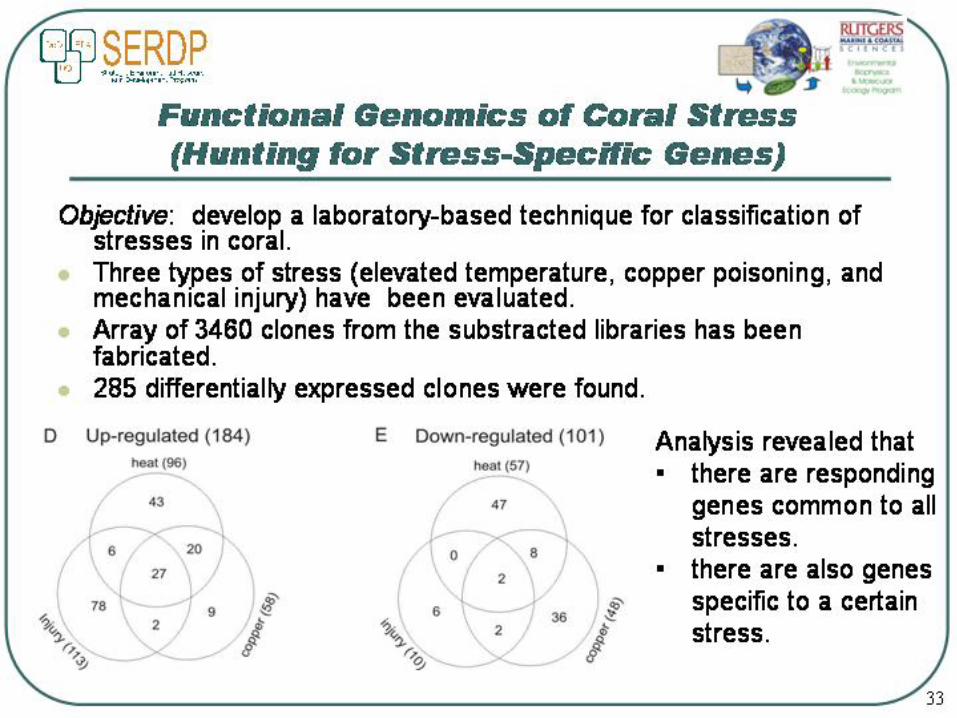
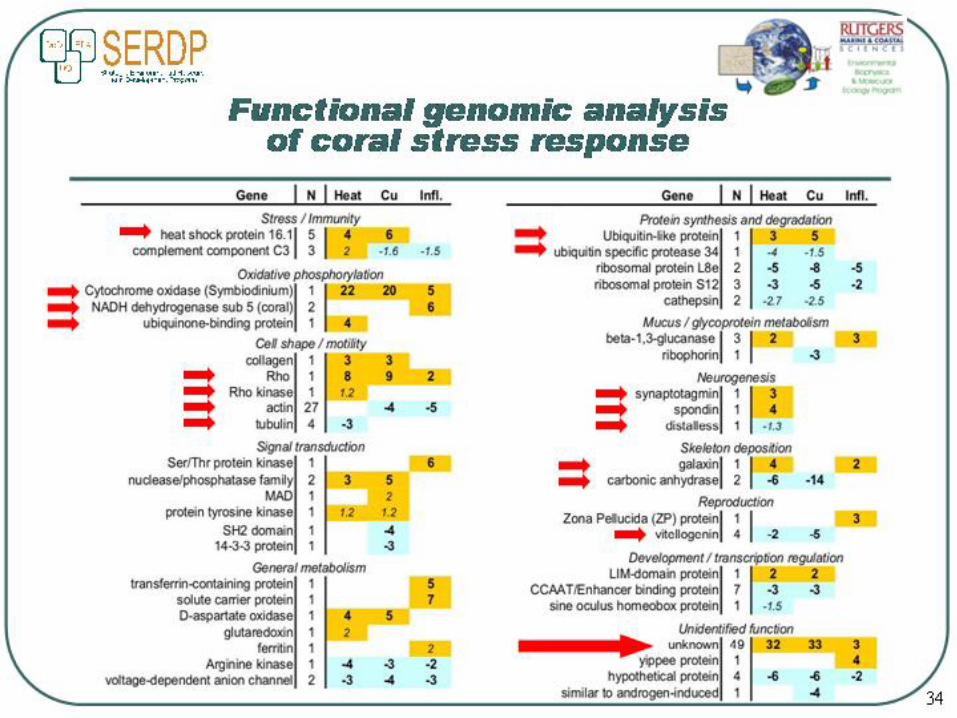
32
Appendix D- Technology Integration Matrix
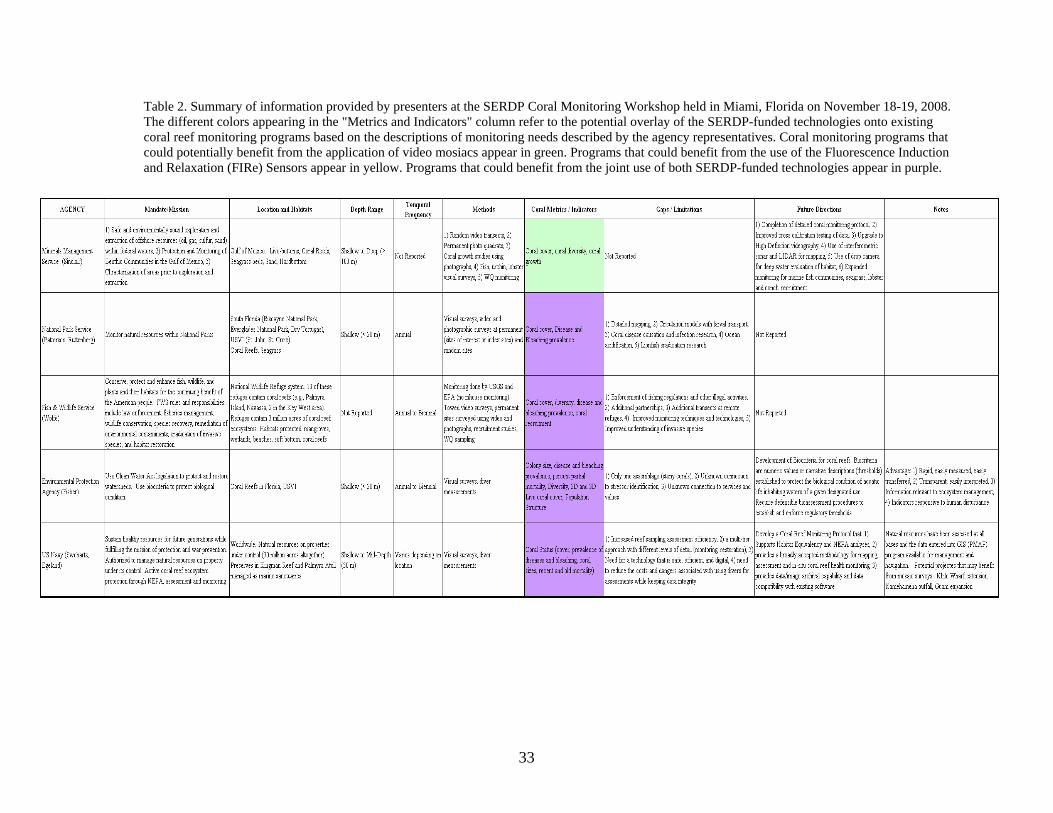
Table 2. Summary of information provided by presenters at the SERDP Coral Monitoring Workshop held in Miami, Florida on November 18-19, 2008. s" column refer to the potential overlay of the SERDP-funded technologies onto existing monitoring needs described by the agency representatives. Coral monitoring programs that
could potentially benefit from the application of video mosiacs appear in green. Programs that could benefit from the use of the Fluorescence Induction and Relaxation (FIRe) Sensors appear in yellow. Programs that could benefit from the joint use of both SERDP-funded technologies appear in purple.
The different colors appearing in the "Metrics and Indicatorcoral reef monitoring programs based on the descriptions of
33
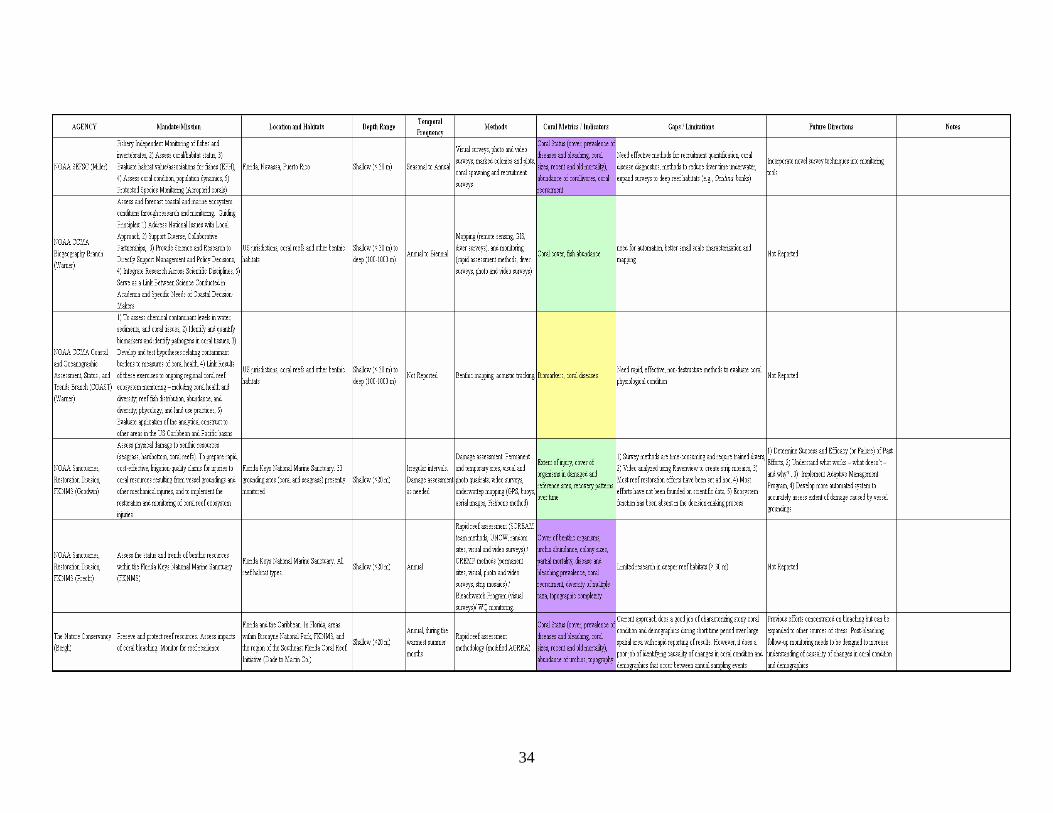
34

Appendix E- White Papers
35
DEPARTM ORY, AND A RINE COMMUNITIES
The Department of Defense (DoD) needs to inventory, identify, document and assess benthic reef communities and other benthic habitats in order to have baseline information to comply with regulations and resource management requirements in proximity to installations and operational areas. DoD utilizes tools such as Habitat Equivalency Analysis for performing analysis of potential impacts for construction activities. Additionally, DoD needs to conduct monitoring of benthic habitats in order to fulfill NEPA or permit mitigation, Trustee obligations or other conservation commitments. The benthic reef community includes corals, algae, and other sessile and mobile invertebrates and associated substrates. Technologies fulfilling these needs will provide operators and natural resources personnel with comprehensive knowledge of benthic habitats and coral reef communities under DoD purview. This information is necessary for operational and environmental planning and provides decision-makers with crucial information needed to maintain compliance with statutes, regulations, and executive orders directly related to operations conducted in benthic areas, including: • Clean Water Act (33 USC §1251 et seq.) • Coastal Zone Management Act of 1972(16 USC §§1451-1465) • Comprehensive Environmental Response, Compensation, and Liability Act (42 USC Chapter 103) • Coral Reef Conservation Act of 2000 (16 USC §6401 et seq.) • Magnuson-Stevens Fisheries Conservation and Management Act (16 USC §§1801- 1882) • Marine Protection, Research and Sanctuaries Act (16 USC §§1431-1445a) • National Environmental Policy Act as amended (42 USC §§4321-4347) • Oil Pollution Act of 1990, 33 USC §2701 • Rivers and Harbors Act (33 USC §403) • Sikes Act Improvement Act of 1997 (16 USC §670a-o) • Executive Order 13089, Coral Reef Protection • Executive Order 12114, Environmental Effect Abroad • Executive Order 12777, Oil Pollution Act Implementation • Executive Order 13158, Marine Protected Areas Obtaining baseline ecological data is an important element not only for Federal coastal management of protected resources but also to provide a foundation for environmental documentation necessary to conduct operations. Such documentation requires the assessment of environmental conditions prior to any incidents possibly resulting in damage to or loss of habitat. Successful and legally defensible documentation requires the assessment of environmental conditions prior to conducting operations and implementation of mitigation measures. Assessment information is also necessary in resolving Federal trustee matters related to damage assessments. Legally defensible data is necessary to communicate and negotiate all regulatory actions in the marine environment.
ENT OF DEFENSE NEEDS FOR MAPPING, INVENTSSESSMENT OF BENTHIC MA
36
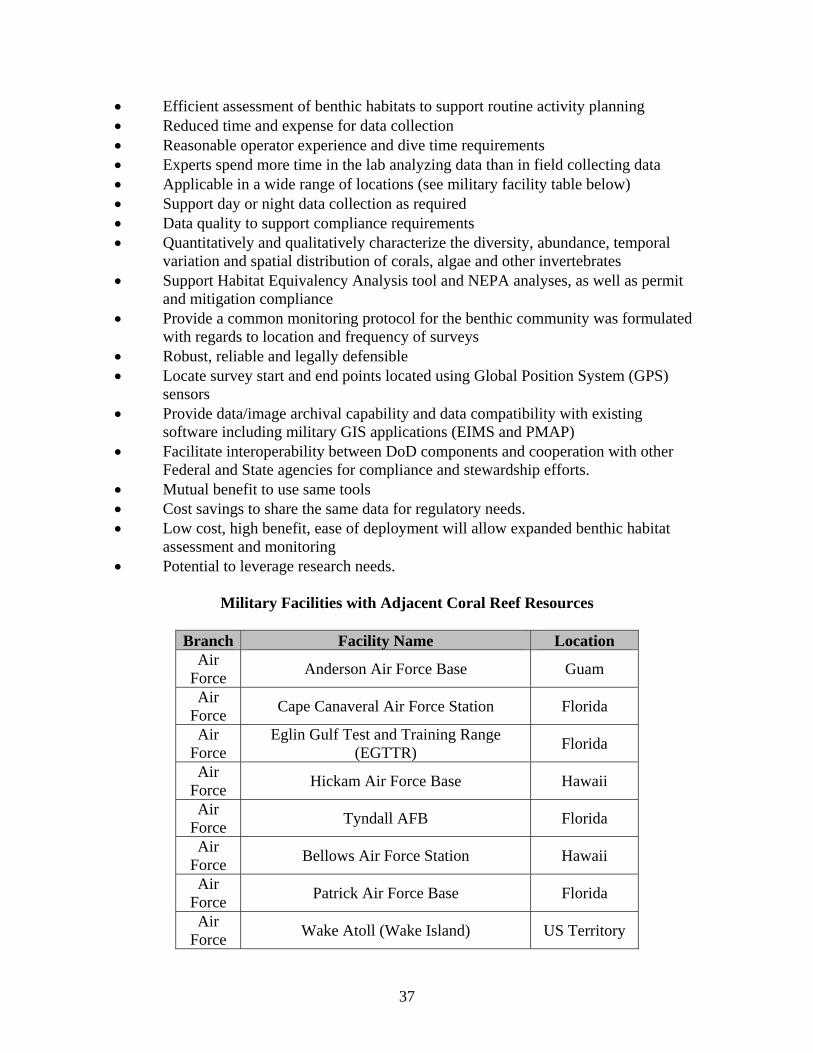
• • Reduced Reasonable operator experience and dive time requirements
the benthic community was formulated
applications (EIMS and PMAP) mponents and cooperation with other
ts.
e the same data for regulatory needs. d benthic habitat
verage research needs.
Efficient assessment of benthic habitats to support routine activity planning time and expense for data collection
•• Experts spend more time in the lab analyzing data than in field collecting data • Applicable in a wide range of locations (see military facility table below) • Support day or night data collection as required • Data quality to support compliance requirements • Quantitatively and qualitatively characterize the diversity, abundance, temporal variation and spatial distribution of corals, algae and other invertebrates • Support Habitat Equivalency Analysis tool and NEPA analyses, as well as permit and mitigation compliance Provide a common monitoring protocol for •
with regards to location and frequency of surveys • Robust, reliable and legally defensible • Locate survey start and end points located using Global Position System (GPS) sensors • Provide data/image archival capability and data compatibility with existing software including military GIS• Facilitate interoperability between DoD co Federal and State agencies for compliance and stewardship effor• Mutual benefit to use same tools • Cost savings to shar• Low cost, high benefit, ease of deployment will allow expande assessment and monitoring • Potential to le
Military Facilities with Adjacent Coral Reef Resources
Branch Facility Name Location
Air Anderson Air Force Base Guam Force Air Cape Canaveral Air Force Station Florida Force Air
Force Eglin Gulf Test and Training Ra
(EGTTR) nge Florida
Air Force Hickam Air Force Base Hawaii
Air Force Tyndall AFB Florida
Air Force Bellows Air Force Station Hawaii
Air Force Patrick Air Force Base Florida
Air Force Wake Atoll (Wake Island) US Territory
37
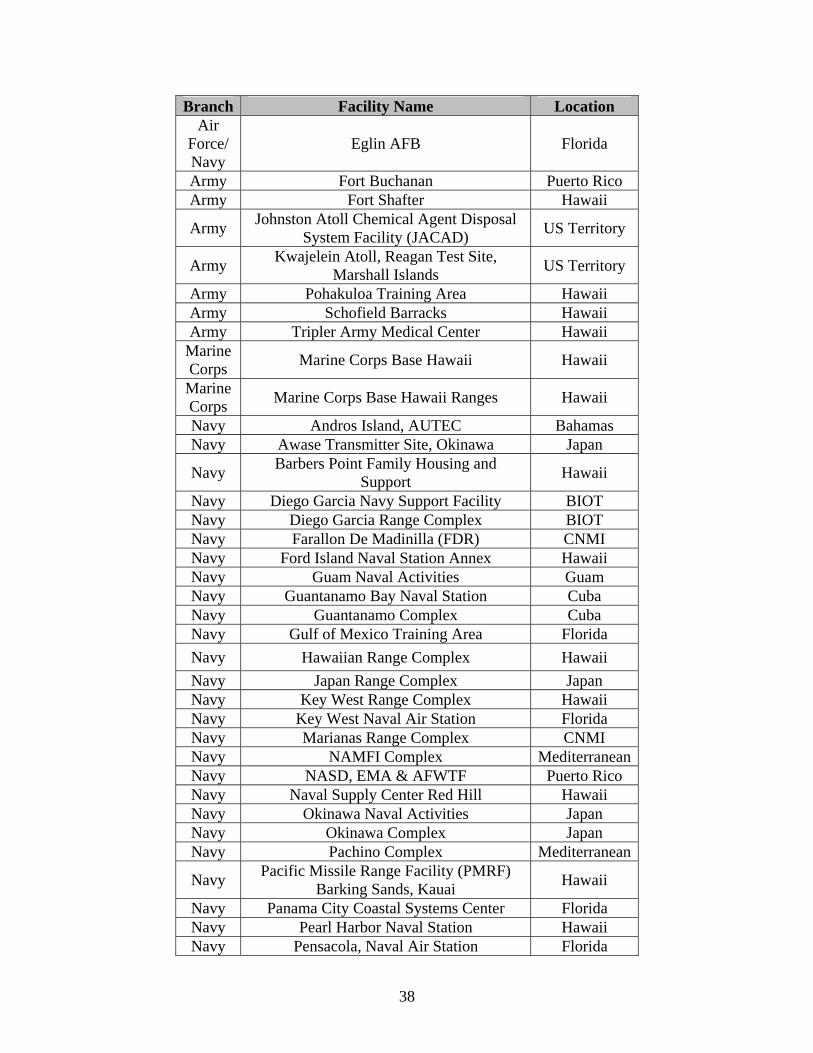
Branch Facility Name Location Air
Force/ Eglin AFB Florida Navy Army Fort Buchanan Puerto Rico Army Fort Shafter Hawaii
Army Johnston Atoll Chemical Agent Disposal US Territory System Facility (JACAD)
Army Kwajelein Atoll, Reagan Test Site, US Territory Marshall Islands Army Pohakuloa Training Area Hawaii Army Schofield Barracks Hawaii Army Tripler Army Medical Center Hawaii
Marine Marine Corps BasCorps e Hawaii Hawaii
Marine Corps Marine Corps Base Hawaii Ranges Hawaii
Navy Andros Island, AUTEC Bahamas Navy Awase Transmitter Site, Okinawa Japan
Navy Barbers Point Family Housing and pport Hawaii Su
Navy Diego Garcia Navy Support Facility BIOT Navy Diego Garcia Range Complex BIOT Navy Farallon De Madinilla (FDR) CNMI Navy Ford Island Naval Station Annex Hawaii Navy Guam Naval Activities Guam Nav y Guantanamo Bay Naval Station CubaNavy Guantanamo Complex Cuba Navy Gulf of Mexico Training Area Florida Navy Hawaiian Range Complex Hawaii Navy Japan Range Complex Japan Navy Key West Range Complex Hawaii Navy Key West Naval Air Station Florida Navy Marianas Range Complex CNMI Navy NA lex Mediterranean MFI CompNavy N Puerto Rico ASD, EMA & AFWTF Navy Naval Supply Center Red Hill Hawaii Navy Okinawa Naval Activities Japan Navy Okinawa Complex Japan Navy Pachino Complex Mediterranean
Navy Pacific Missile Range Facility (PMRF) Hawaii Barking Sands, Kauai Navy Panama City Coastal Systems Center Florida Navy Pearl Harbor Naval Station Hawaii Navy Pensacola, Naval Air Station Florida
38

39
Branch Facility Name Location Navy Tinian Island, Military Leased Areas CNMI Navy White Beach Naval Facility, Okinawa Japan
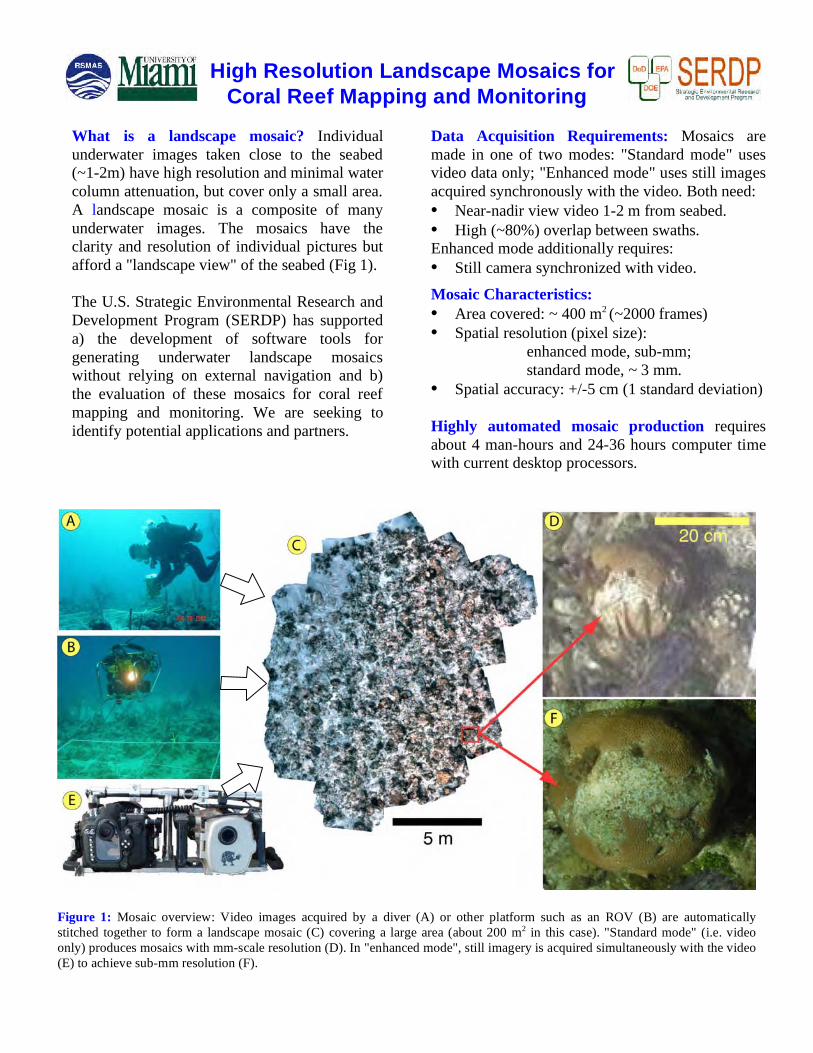
High Resolution Landscape Mosaics for Coral Reef Mapping and Monitoring
What is a landscape mosaic? Individual underwater images taken close to the seabed (~1-2m) have high resolution and minimal water column attenuation, but cover only a small area. A landscape mosaic is a composite of many underwater images. The mosaics have the clarity and resolution of individual pictures but afford a "landscape view" of the seabed (Fig 1). The U.S. Strategic Environmental Research and Development Program (SERDP) has supported a) the development of software tools for generating underwater landscape mosaics without relying on external navigation and b) the evaluation of these mosaics for coral reef mapping and monitoring. We are seeking to identify potential applications and partners.
Data Acquisition Requirements: Mosaics are made in one of two modes: "Standard mode" uses video data only; "Enhanced mode" uses still images acquired synchronously with the video. Both need: • Near-nadir view video 1-2 m from seabed. • High (~80%) overlap between swaths. Enhanced mode additionally requires: • Still camera synchronized with video. Mosaic Characteristics: • Area covered: ~ 400 m2 (~2000 frames) • Spatial resolution (pixel size):
enhanced mode, sub-mm; standard mode, ~ 3 mm.
• Spatial accuracy: +/-5 cm (1 standard deviation) Highly automated mosaic production requires about 4 man-hours and 24-36 hours computer time with current desktop processors.
Figure 1: Mosaic overview: Video images acquired by a diver (A) or other platform such as an ROV (B) are automatically stitched together to form a landscape mosaic (C) covering a large area (about 200 m2 in this case). "Standard mode" (i.e. video only) produces mosaics with mm-scale resolution (D). In "enhanced mode", still imagery is acquired simultaneously with the video (E) to achieve sub-mm resolution (F).
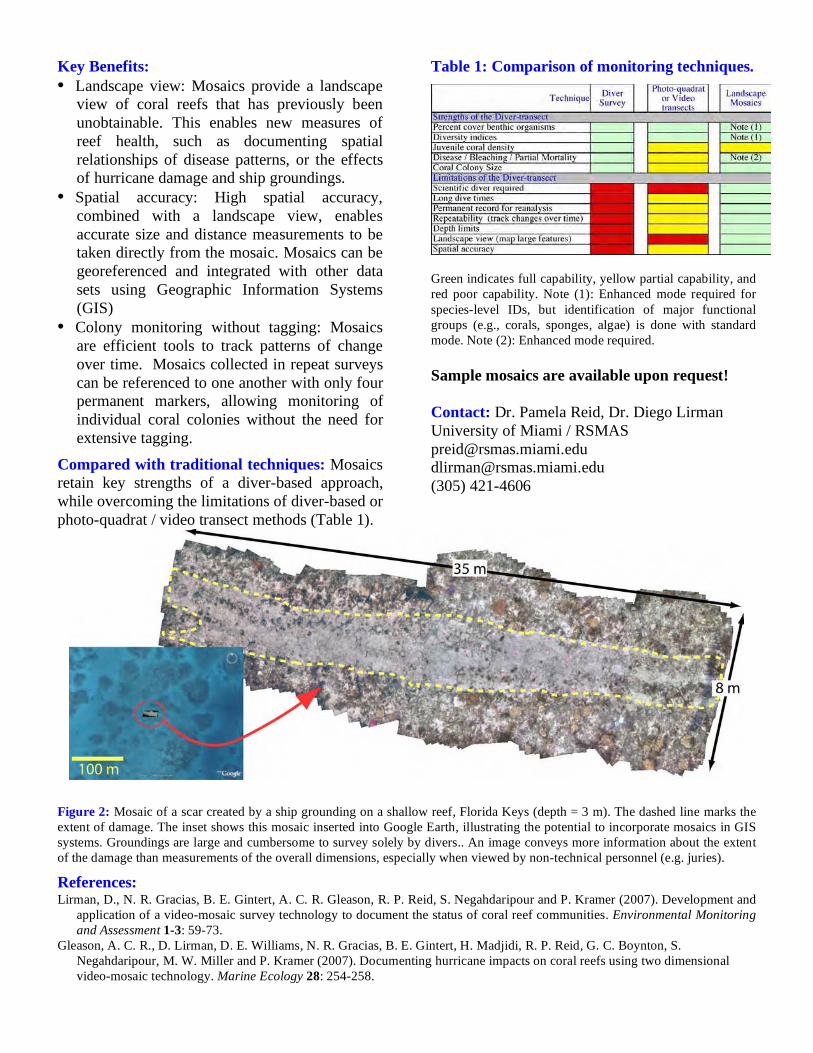
Key Benefits: • Landscape view: Mosaics provide a landscape
view of coral reefs that has previously been unobtainable. This enables new measures of reef health, such as documenting spatial relationships of disease patterns, or the effects of hurricane damage and ship groundings.
• Spatial accuracy: High spatial accuracy, combined with a landscape view, enables accurate size and distance measurements to be taken directly from the mosaic. Mosaics can be georeferenced and integrated with other data sets using Geographic Information Systems (GIS)
• Colony monitoring without tagging: Mosaics are efficient tools to track patterns of change over time. Mosaics collected in repeat surveys can be referenced to one another with only four permanent markers, allowing monitoring of individual coral colonies without the need for extensive tagging.
Compared with traditional techniques: Mosaics retain key strengths of a diver-based approach, while overcoming the limitations of diver-based or photo-quadrat / video transect methods (Table 1).
Table 1: Comparison of monitoring techniques.
Green indicates full capability, yellow partial capability, and red poor capability. Note (1): Enhanced mode required for species-level IDs, but identification of major functional groups (e.g., corals, sponges, algae) is done with standard mode. Note (2): Enhanced mode required. Sample mosaics are available upon request! Contact: Dr. Pamela Reid, Dr. Diego Lirman University of Miami / RSMAS [email protected] [email protected] (305) 421-4606
Figure 2: Mosaic of a scar created by a ship grounding on a shallow reef, Florida Keys (depth = 3 m). The dashed line marks the extent of damage. The inset shows this mosaic inserted into Google Earth, illustrating the potential to incorporate mosaics in GIS systems. Groundings are large and cumbersome to survey solely by divers.. An image conveys more information about the extent of the damage than measurements of the overall dimensions, especially when viewed by non-technical personnel (e.g. juries). References: Lirman, D., N. R. Gracias, B. E. Gintert, A. C. R. Gleason, R. P. Reid, S. Negahdaripour and P. Kramer (2007). Development and
application of a video-mosaic survey technology to document the status of coral reef communities. Environmental Monitoring and Assessment 1-3: 59-73.
Gleason, A. C. R., D. Lirman, D. E. Williams, N. R. Gracias, B. E. Gintert, H. Madjidi, R. P. Reid, G. C. Boynton, S. Negahdaripour, M. W. Miller and P. Kramer (2007). Documenting hurricane impacts on coral reefs using two dimensional video-mosaic technology. Marine Ecology 28: 254-258.
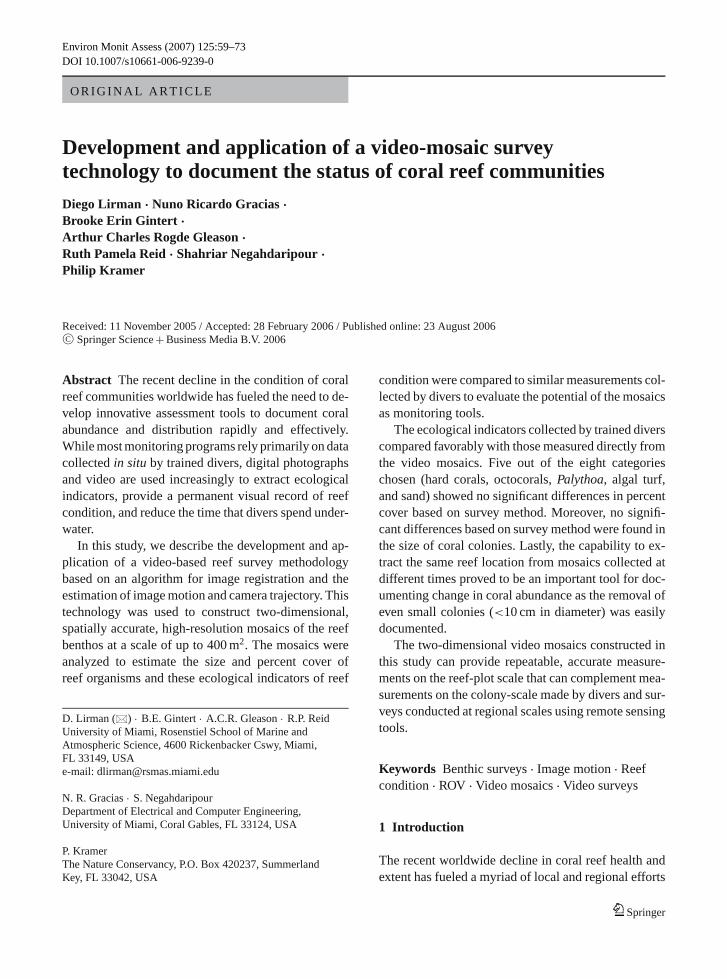
Environ Monit Assess (2007) 125:59–73
DOI 10.1007/s10661-006-9239-0
O R I G I N A L A R T I C L E
Development and application of a video-mosaic surveytechnology to document the status of coral reef communitiesDiego Lirman · Nuno Ricardo Gracias ·Brooke Erin Gintert ·Arthur Charles Rogde Gleason ·Ruth Pamela Reid · Shahriar Negahdaripour ·Philip Kramer
Received: 11 November 2005 / Accepted: 28 February 2006 / Published online: 23 August 2006C© Springer Science + Business Media B.V. 2006
Abstract The recent decline in the condition of coral
reef communities worldwide has fueled the need to de-
velop innovative assessment tools to document coral
abundance and distribution rapidly and effectively.
While most monitoring programs rely primarily on data
collected in situ by trained divers, digital photographs
and video are used increasingly to extract ecological
indicators, provide a permanent visual record of reef
condition, and reduce the time that divers spend under-
water.
In this study, we describe the development and ap-
plication of a video-based reef survey methodology
based on an algorithm for image registration and the
estimation of image motion and camera trajectory. This
technology was used to construct two-dimensional,
spatially accurate, high-resolution mosaics of the reef
benthos at a scale of up to 400 m2. The mosaics were
analyzed to estimate the size and percent cover of
reef organisms and these ecological indicators of reef
D. Lirman (�) · B.E. Gintert · A.C.R. Gleason · R.P. ReidUniversity of Miami, Rosenstiel School of Marine andAtmospheric Science, 4600 Rickenbacker Cswy, Miami,FL 33149, USAe-mail: [email protected]
N. R. Gracias · S. NegahdaripourDepartment of Electrical and Computer Engineering,University of Miami, Coral Gables, FL 33124, USA
P. KramerThe Nature Conservancy, P.O. Box 420237, SummerlandKey, FL 33042, USA
condition were compared to similar measurements col-
lected by divers to evaluate the potential of the mosaics
as monitoring tools.
The ecological indicators collected by trained divers
compared favorably with those measured directly from
the video mosaics. Five out of the eight categories
chosen (hard corals, octocorals, Palythoa, algal turf,
and sand) showed no significant differences in percent
cover based on survey method. Moreover, no signifi-
cant differences based on survey method were found in
the size of coral colonies. Lastly, the capability to ex-
tract the same reef location from mosaics collected at
different times proved to be an important tool for doc-
umenting change in coral abundance as the removal of
even small colonies (<10 cm in diameter) was easily
documented.
The two-dimensional video mosaics constructed in
this study can provide repeatable, accurate measure-
ments on the reef-plot scale that can complement mea-
surements on the colony-scale made by divers and sur-
veys conducted at regional scales using remote sensing
tools.
Keywords Benthic surveys . Image motion . Reef
condition . ROV . Video mosaics . Video surveys
1 Introduction
The recent worldwide decline in coral reef health and
extent has fueled a myriad of local and regional efforts
Springer
60 Environ Monit Assess (2007) 125:59–73
aimed at collecting comprehensive monitoring data
that can be used to evaluate the present condition of
reef communities as well as to provide a baseline
against which future changes can be accurately gauged
(Gardner et al., 2003; Kramer, 2003; Wilkinson, 2004).
While sampling design and survey approaches dif-
fer among monitoring programs, the use of plot (e.g.,
quadrats) and line-based (e.g., line intercept) meth-
ods to estimate the percent cover of benthic organ-
isms prevail as important components of these efforts
(Hodgson, 1999; Kramer and Lang, 2003). Coral cover
has historically been the predominant indicator of reef
condition but recent studies have also highlighted the
importance of the size-structure of coral populations
as a powerful but often underused status indicator (Bak
and Meesters, 1998, 1999). In response to these studies,
plot and line-based methods are now commonly sup-
plemented by colony-based methods that document the
size and condition of individual coral colonies (Lang,
2003).
The rapid patterns of reef decline have also prompted
the design of innovative assessment tools to document
coral abundance, distribution, and condition rapidly
and effectively (Solan et al., 2003; Fisher et al., 2005).
With the development of better and more affordable
photography and videography techniques and equip-
ment, many programs routinely complement diver-
based measurements with digital images of the bottom
that are later analyzed using image analysis software
(Riegl et al., 2001; Porter et al., 2002). These digital
tools improve survey efficiency by: (1) reducing the
time that divers need to spend underwater by shifting
data capture away from the field and into the lab; and (2)
providing a permanent visual record of reef condition.
The use of digital video provides the added benefit of
capturing a large number of digital frames in a limited
amount of time.
Digital photographs and video frames provide two-
dimensional images of the bottom that can be analyzed
with the same methods commonly used by divers to es-
timate percent cover in situ. These methods include: (1)
the point intercept method where a number of points are
randomly placed over each image and the identity of the
benthic organisms immediately under each point is de-
termined; and (2) the area estimation method where the
boundary of each organism is delineated. In both cases,
the proportion of the total number of points or total reef
area occupied by each organism is used to measure per-
cent cover. While these methods provide an effective
estimate of the areal coverage of benthic organisms,
they provide only limited size-estimation capabilities
because sizes can be measured only for organisms that
fall completely within an image. This limitation is espe-
cially manifested in reef habitats with large corals and
high topographical relief where individual colonies are
rarely captured wholly within frames or video transects.
The goals of the present study are to: (1) describe the
development and application of a novel, video-based
reef survey methodology that provides a powerful and
efficient alternative to existing photography and video-
based approaches; and (2) evaluate whether the video
mosaic method could provide the type of ecological
information related to coral reef condition commonly
obtained by trained divers in situ. This technique, based
on a recently developed algorithm for image registra-
tion, is used to construct spatially accurate mosaics of
the reef benthos that can be analyzed to estimate not
only the percent cover of organisms but also their size
and spatial distribution and arrangement patterns. This
flexible mosaicing algorithm allows the technique to be
used in a variety of applications from low cost surveys
with handheld underwater video cameras to mapping
deep reefs with remotely operated vehicles (ROV). A
reef site in the Florida Keys, U.S., was surveyed using
these two platforms and the community attributes ob-
tained by analyzing the video mosaics are compared to
similar indicators collected by trained divers to provide
a direct comparison between methods.
2 Materials and methods
2.1 Video mosaic creation
2.1.1 Video acquisition
The field activities for this study were conducted at
Brooke’s Reef (25◦40.508′N, 80◦5.908′W, depth =7–10 m), a patch reef located in the northernmost sec-
tion of the Florida Reef Tract, just offshore of Key
Biscayne, Florida. A square plot (3 m × 3 m) was es-
tablished at this site using aluminum pipes cemented
to the bottom to provide a permanent reference lo-
cation for video surveys. Three video mosaics of
the same reef area were created using different sur-
vey platforms (Table 1). For the first mosaic (June,
2004), video footage was acquired by a diver using a
Sony TRV900 DV camcorder placed in an underwater
Springer
Environ Monit Assess (2007) 125:59–73 61
Table 1 Description of the three different mosaics constructed in this study based on digital video collected at a reef in the northernFlorida reef tract (depth = 7–10 m)
Survey Date Survey platform (Camera resolution) Altitude Area covered Ground resolution
1 June 04 Diver (720 × 530 pixels) 2 m 53 m2 3.0 mm/pixel
2 April 05 ROV (1024 × 768 pixels) 2.5 m 400 m2 2.5–3.0 mm/pixel
3 April 05 ROV (1024 × 768 pixels) 1.5 m 45 m2 1.4 mm/pixel
camera housing. This first survey is included to illus-
trate that the mosaicing algorithm can produce geo-
metrically accurate mosaics from a standard, low-cost,
handheld camera. For the second and third mosaics
(April, 2005), video was collected using a Flea digital
camera mounted on a Phantom XTL remotely oper-
ated vehicle (ROV) (Xu, 2000) representing high and
low altitude data sets from which ecological indices
were assessed. The cameras were internally calibrated
to reduce image distortion from the lens and housing
(Bouguet, 2002). The frame resolution is 720 × 530
pixels for the handheld camcorder and 1024 × 768 pix-
els for the Flea camera. On all occasions, the camera
followed a lawnmower’s pattern of side-by-side strips,
complemented by the same pattern rotated 90◦ to en-
sure full coverage of the area and high superposition
among the strips.
2.1.2 Mosaic algorithm
The mosaic-creation algorithm used in this study stems
from previous work on underwater video mosaicing by
Gracias and Santos-Victor (2000, 2001). The method
comprises four major stages. The first stage consists of
the sequential estimation of the image motion, using a
subset of the captured images. The set of resulting con-
secutive homographies (i.e., coordinate mapping be-
tween two image projections of the same 3D plane)
is cascaded to infer the approximate trajectory of the
camera. The trajectory information is then used to pre-
dict the areas of image overlap from non-consecutive
images (i.e., neighboring video strips). To reduce the
algorithmic complexity and memory requirements, a
set of key frames are selected based on an image super-
position criterion (typically 65–80%). Only such key
frames are used in the following optimization steps.
In the second stage, a global alignment is performed
where the overall camera trajectory is refined by ex-
ecuting the following two steps iteratively: (1) point
correspondences are established between non-adjacent
pairs of images that present enough overlap; and (2) the
trajectory is updated by searching for the set of homo-
graphies that minimizes the overall sum of distances in
the point matches.
In the third stage, high registration accuracy is ob-
tained by re-estimating the camera trajectory using a
general parameterization for the homographies. This
parameterization has six degrees of freedom (DOF)
for the pose and is capable of modeling the effects of
general camera rotation and translation. The essential
building block of this step consists of the registration
of pairs of images done as follows: (1) a set of point
features corresponding to textured areas are extracted
from one of the images using the Harris corner detector
method (Harris and Stephens, 1988); and (2) for each
feature (defined as a small square image patch centered
at the detected corner location), a prospective match
is found in the other image using normalized cross-
correlation. We assume that prior information exists on
the expected image motion (typically in the form of a
homography). This information is used to: (1) estab-
lish the location of the correlation window center; and
(2) define the required warping of the image feature
so that the search over the other image becomes es-
sentially a translation (2D) search. This allows for the
use of area-correlation for heavily rotated or slanted
images. Finally, a robust estimation technique is used
to remove outliers using a Least Median of Squares
criterion based on a planar motion model.
The final stage of the mosaicing process consists
of blending the images (i.e., choosing representative
pixels from the spatially registered images to render
the mosaic image). The mosaic is created by choosing
the contributing pixels that are closest to the center of
their frames. The image rendering method used in this
study compares favorably to other traditional render-
ing methods, such as the average or the median, by: (1)
preserving the texture of the benthic objects; (2) reduc-
ing artifacts due to registration misalignments of 3D
structure; and (3) allowing for an efficient implemen-
tation in terms of memory requirements and execution
speed. However, in the presence of strong illumination
Springer
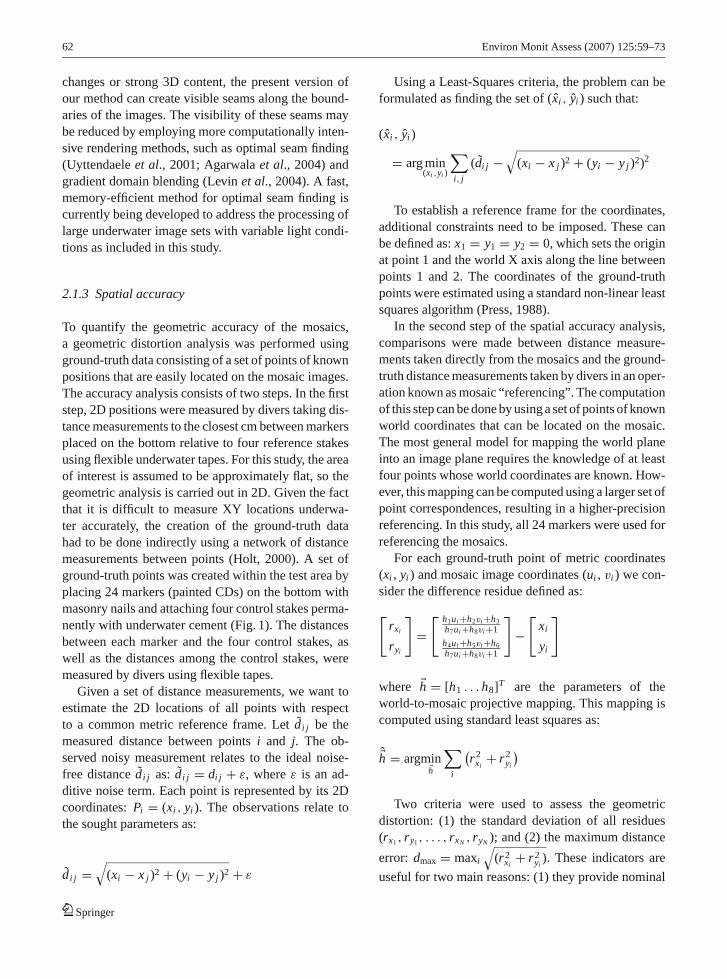
62 Environ Monit Assess (2007) 125:59–73
changes or strong 3D content, the present version of
our method can create visible seams along the bound-
aries of the images. The visibility of these seams may
be reduced by employing more computationally inten-
sive rendering methods, such as optimal seam finding
(Uyttendaele et al., 2001; Agarwala et al., 2004) and
gradient domain blending (Levin et al., 2004). A fast,
memory-efficient method for optimal seam finding is
currently being developed to address the processing of
large underwater image sets with variable light condi-
tions as included in this study.
2.1.3 Spatial accuracy
To quantify the geometric accuracy of the mosaics,
a geometric distortion analysis was performed using
ground-truth data consisting of a set of points of known
positions that are easily located on the mosaic images.
The accuracy analysis consists of two steps. In the first
step, 2D positions were measured by divers taking dis-
tance measurements to the closest cm between markers
placed on the bottom relative to four reference stakes
using flexible underwater tapes. For this study, the area
of interest is assumed to be approximately flat, so the
geometric analysis is carried out in 2D. Given the fact
that it is difficult to measure XY locations underwa-
ter accurately, the creation of the ground-truth data
had to be done indirectly using a network of distance
measurements between points (Holt, 2000). A set of
ground-truth points was created within the test area by
placing 24 markers (painted CDs) on the bottom with
masonry nails and attaching four control stakes perma-
nently with underwater cement (Fig. 1). The distances
between each marker and the four control stakes, as
well as the distances among the control stakes, were
measured by divers using flexible tapes.
Given a set of distance measurements, we want to
estimate the 2D locations of all points with respect
to a common metric reference frame. Let d i j be the
measured distance between points i and j. The ob-
served noisy measurement relates to the ideal noise-
free distance d i j as: d i j = di j + ε, where ε is an ad-
ditive noise term. Each point is represented by its 2D
coordinates: Pi = (xi , yi ). The observations relate to
the sought parameters as:
d i j =√
(xi − x j )2 + (yi − y j )2 + ε
Using a Least-Squares criteria, the problem can be
formulated as finding the set of (xi , yi ) such that:
(xi , yi )
= arg min(xi ,yi )
∑i, j
(di j −√
(xi − x j )2 + (yi − y j )2)2
To establish a reference frame for the coordinates,
additional constraints need to be imposed. These can
be defined as: x1 = y1 = y2 = 0, which sets the origin
at point 1 and the world X axis along the line between
points 1 and 2. The coordinates of the ground-truth
points were estimated using a standard non-linear least
squares algorithm (Press, 1988).
In the second step of the spatial accuracy analysis,
comparisons were made between distance measure-
ments taken directly from the mosaics and the ground-
truth distance measurements taken by divers in an oper-
ation known as mosaic “referencing”. The computation
of this step can be done by using a set of points of known
world coordinates that can be located on the mosaic.
The most general model for mapping the world plane
into an image plane requires the knowledge of at least
four points whose world coordinates are known. How-
ever, this mapping can be computed using a larger set of
point correspondences, resulting in a higher-precision
referencing. In this study, all 24 markers were used for
referencing the mosaics.
For each ground-truth point of metric coordinates
(xi , yi ) and mosaic image coordinates (ui , vi ) we con-
sider the difference residue defined as:[rxi
ryi
]=
[ h1ui +h2vi +h3
h7ui +h8vi +1
h4ui +h5vi +h6
h7ui +h8vi +1
]−
[xi
yi
]
where �h = [h1 . . . h8]T are the parameters of the
world-to-mosaic projective mapping. This mapping is
computed using standard least squares as:
�h = argmin�h
∑i
(r2
xi+ r2
yi
)Two criteria were used to assess the geometric
distortion: (1) the standard deviation of all residues
(rx1, ry1
, . . . , rxN , ryN ); and (2) the maximum distance
error: dmax = maxi
√(r2
xi+ r2
yi). These indicators are
useful for two main reasons: (1) they provide nominal
Springer
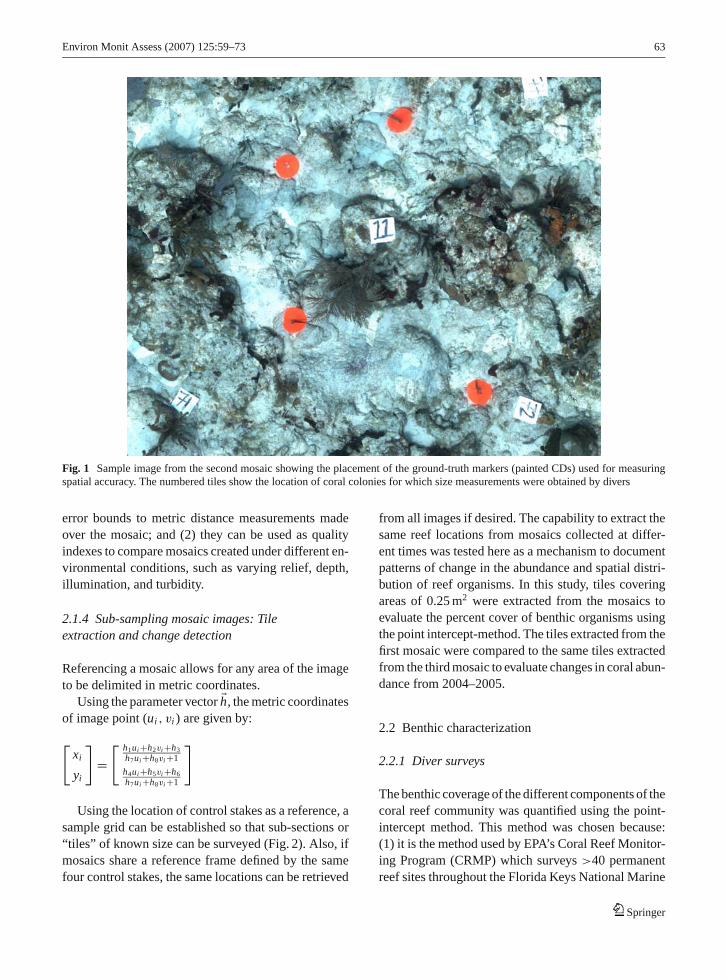
Environ Monit Assess (2007) 125:59–73 63
Fig. 1 Sample image from the second mosaic showing the placement of the ground-truth markers (painted CDs) used for measuringspatial accuracy. The numbered tiles show the location of coral colonies for which size measurements were obtained by divers
error bounds to metric distance measurements made
over the mosaic; and (2) they can be used as quality
indexes to compare mosaics created under different en-
vironmental conditions, such as varying relief, depth,
illumination, and turbidity.
2.1.4 Sub-sampling mosaic images: Tileextraction and change detection
Referencing a mosaic allows for any area of the image
to be delimited in metric coordinates.
Using the parameter vector �h, the metric coordinates
of image point (ui , vi ) are given by:[xi
yi
]=
[ h1ui +h2vi +h3
h7ui +h8vi +1
h4ui +h5vi +h6
h7ui +h8vi +1
]
Using the location of control stakes as a reference, a
sample grid can be established so that sub-sections or
“tiles” of known size can be surveyed (Fig. 2). Also, if
mosaics share a reference frame defined by the same
four control stakes, the same locations can be retrieved
from all images if desired. The capability to extract the
same reef locations from mosaics collected at differ-
ent times was tested here as a mechanism to document
patterns of change in the abundance and spatial distri-
bution of reef organisms. In this study, tiles covering
areas of 0.25 m2 were extracted from the mosaics to
evaluate the percent cover of benthic organisms using
the point intercept-method. The tiles extracted from the
first mosaic were compared to the same tiles extracted
from the third mosaic to evaluate changes in coral abun-
dance from 2004–2005.
2.2 Benthic characterization
2.2.1 Diver surveys
The benthic coverage of the different components of the
coral reef community was quantified using the point-
intercept method. This method was chosen because:
(1) it is the method used by EPA’s Coral Reef Monitor-
ing Program (CRMP) which surveys >40 permanent
reef sites throughout the Florida Keys National Marine
Springer
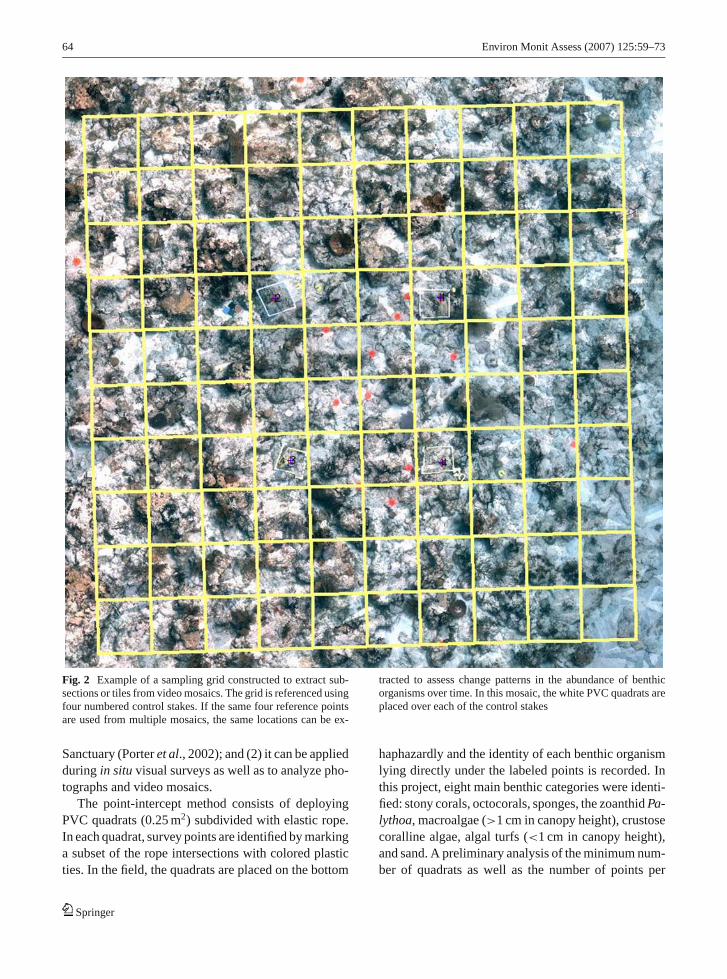
64 Environ Monit Assess (2007) 125:59–73
Fig. 2 Example of a sampling grid constructed to extract sub-sections or tiles from video mosaics. The grid is referenced usingfour numbered control stakes. If the same four reference pointsare used from multiple mosaics, the same locations can be ex-
tracted to assess change patterns in the abundance of benthicorganisms over time. In this mosaic, the white PVC quadrats areplaced over each of the control stakes
Sanctuary (Porter et al., 2002); and (2) it can be applied
during in situ visual surveys as well as to analyze pho-
tographs and video mosaics.
The point-intercept method consists of deploying
PVC quadrats (0.25 m2) subdivided with elastic rope.
In each quadrat, survey points are identified by marking
a subset of the rope intersections with colored plastic
ties. In the field, the quadrats are placed on the bottom
haphazardly and the identity of each benthic organism
lying directly under the labeled points is recorded. In
this project, eight main benthic categories were identi-
fied: stony corals, octocorals, sponges, the zoanthid Pa-lythoa, macroalgae (>1 cm in canopy height), crustose
coralline algae, algal turfs (<1 cm in canopy height),
and sand. A preliminary analysis of the minimum num-
ber of quadrats as well as the number of points per
Springer
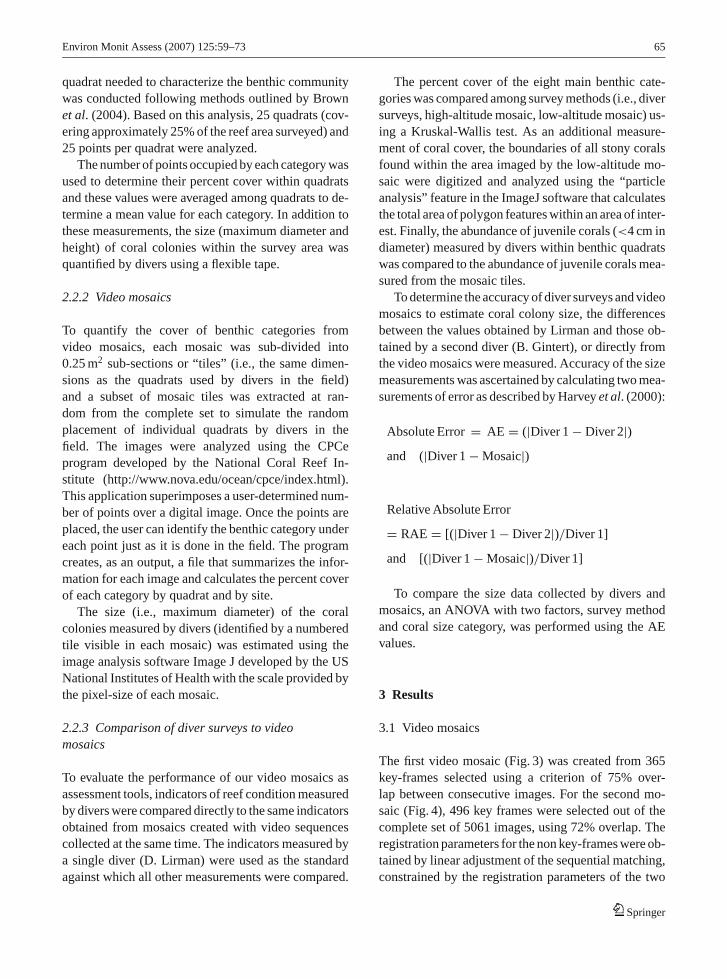
Environ Monit Assess (2007) 125:59–73 65
quadrat needed to characterize the benthic community
was conducted following methods outlined by Brown
et al. (2004). Based on this analysis, 25 quadrats (cov-
ering approximately 25% of the reef area surveyed) and
25 points per quadrat were analyzed.
The number of points occupied by each category was
used to determine their percent cover within quadrats
and these values were averaged among quadrats to de-
termine a mean value for each category. In addition to
these measurements, the size (maximum diameter and
height) of coral colonies within the survey area was
quantified by divers using a flexible tape.
2.2.2 Video mosaics
To quantify the cover of benthic categories from
video mosaics, each mosaic was sub-divided into
0.25 m2 sub-sections or “tiles” (i.e., the same dimen-
sions as the quadrats used by divers in the field)
and a subset of mosaic tiles was extracted at ran-
dom from the complete set to simulate the random
placement of individual quadrats by divers in the
field. The images were analyzed using the CPCe
program developed by the National Coral Reef In-
stitute (http://www.nova.edu/ocean/cpce/index.html).
This application superimposes a user-determined num-
ber of points over a digital image. Once the points are
placed, the user can identify the benthic category under
each point just as it is done in the field. The program
creates, as an output, a file that summarizes the infor-
mation for each image and calculates the percent cover
of each category by quadrat and by site.
The size (i.e., maximum diameter) of the coral
colonies measured by divers (identified by a numbered
tile visible in each mosaic) was estimated using the
image analysis software Image J developed by the US
National Institutes of Health with the scale provided by
the pixel-size of each mosaic.
2.2.3 Comparison of diver surveys to videomosaics
To evaluate the performance of our video mosaics as
assessment tools, indicators of reef condition measured
by divers were compared directly to the same indicators
obtained from mosaics created with video sequences
collected at the same time. The indicators measured by
a single diver (D. Lirman) were used as the standard
against which all other measurements were compared.
The percent cover of the eight main benthic cate-
gories was compared among survey methods (i.e., diver
surveys, high-altitude mosaic, low-altitude mosaic) us-
ing a Kruskal-Wallis test. As an additional measure-
ment of coral cover, the boundaries of all stony corals
found within the area imaged by the low-altitude mo-
saic were digitized and analyzed using the “particle
analysis” feature in the ImageJ software that calculates
the total area of polygon features within an area of inter-
est. Finally, the abundance of juvenile corals (<4 cm in
diameter) measured by divers within benthic quadrats
was compared to the abundance of juvenile corals mea-
sured from the mosaic tiles.
To determine the accuracy of diver surveys and video
mosaics to estimate coral colony size, the differences
between the values obtained by Lirman and those ob-
tained by a second diver (B. Gintert), or directly from
the video mosaics were measured. Accuracy of the size
measurements was ascertained by calculating two mea-
surements of error as described by Harvey et al. (2000):
Absolute Error = AE = (|Diver 1 − Diver 2|)and (|Diver 1 − Mosaic|)
Relative Absolute Error
= RAE = [(|Diver 1 − Diver 2|)/Diver 1]
and [(|Diver 1 − Mosaic|)/Diver 1]
To compare the size data collected by divers and
mosaics, an ANOVA with two factors, survey method
and coral size category, was performed using the AE
values.
3 Results
3.1 Video mosaics
The first video mosaic (Fig. 3) was created from 365
key-frames selected using a criterion of 75% over-
lap between consecutive images. For the second mo-
saic (Fig. 4), 496 key frames were selected out of the
complete set of 5061 images, using 72% overlap. The
registration parameters for the non key-frames were ob-
tained by linear adjustment of the sequential matching,
constrained by the registration parameters of the two
Springer
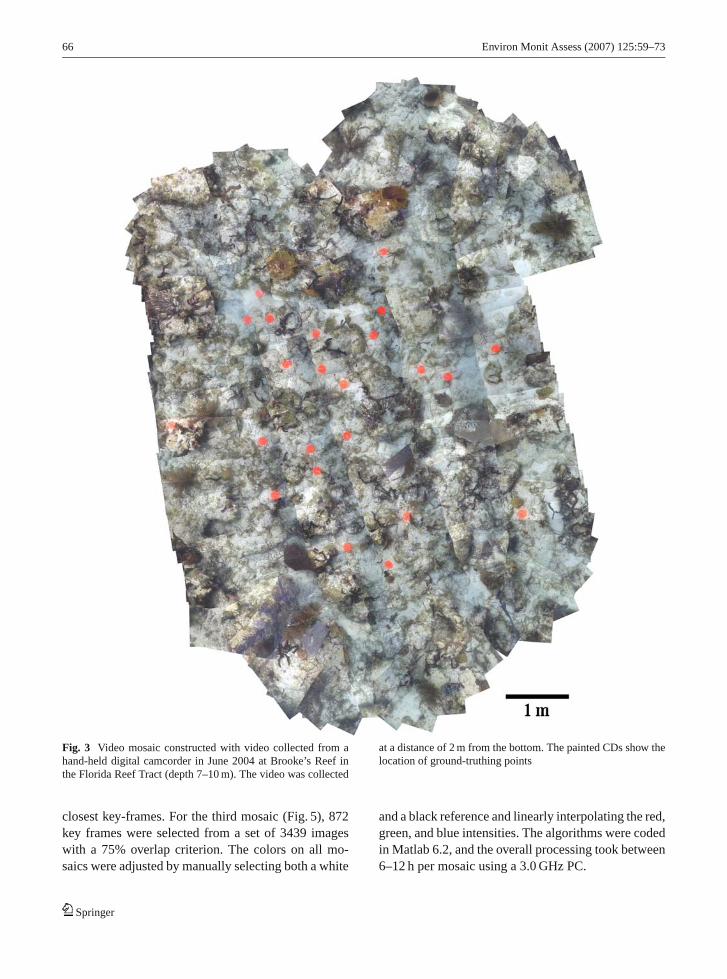
66 Environ Monit Assess (2007) 125:59–73
Fig. 3 Video mosaic constructed with video collected from ahand-held digital camcorder in June 2004 at Brooke’s Reef inthe Florida Reef Tract (depth 7–10 m). The video was collected
at a distance of 2 m from the bottom. The painted CDs show thelocation of ground-truthing points
closest key-frames. For the third mosaic (Fig. 5), 872
key frames were selected from a set of 3439 images
with a 75% overlap criterion. The colors on all mo-
saics were adjusted by manually selecting both a white
and a black reference and linearly interpolating the red,
green, and blue intensities. The algorithms were coded
in Matlab 6.2, and the overall processing took between
6–12 h per mosaic using a 3.0 GHz PC.
Springer
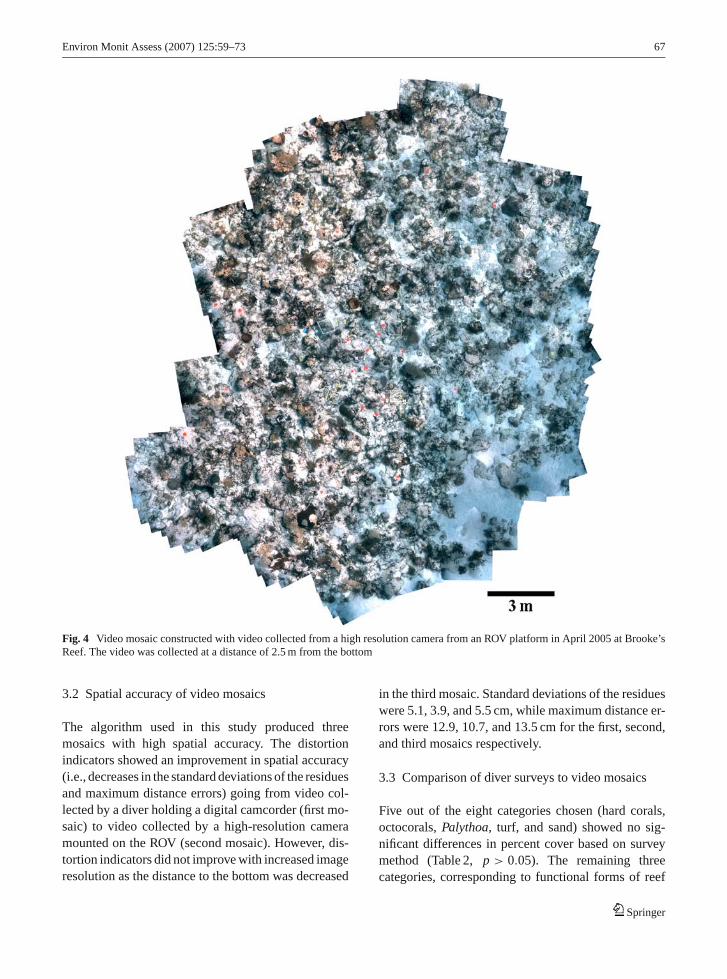
Environ Monit Assess (2007) 125:59–73 67
Fig. 4 Video mosaic constructed with video collected from a high resolution camera from an ROV platform in April 2005 at Brooke’sReef. The video was collected at a distance of 2.5 m from the bottom
3.2 Spatial accuracy of video mosaics
The algorithm used in this study produced three
mosaics with high spatial accuracy. The distortion
indicators showed an improvement in spatial accuracy
(i.e., decreases in the standard deviations of the residues
and maximum distance errors) going from video col-
lected by a diver holding a digital camcorder (first mo-
saic) to video collected by a high-resolution camera
mounted on the ROV (second mosaic). However, dis-
tortion indicators did not improve with increased image
resolution as the distance to the bottom was decreased
in the third mosaic. Standard deviations of the residues
were 5.1, 3.9, and 5.5 cm, while maximum distance er-
rors were 12.9, 10.7, and 13.5 cm for the first, second,
and third mosaics respectively.
3.3 Comparison of diver surveys to video mosaics
Five out of the eight categories chosen (hard corals,
octocorals, Palythoa, turf, and sand) showed no sig-
nificant differences in percent cover based on survey
method (Table 2, p > 0.05). The remaining three
categories, corresponding to functional forms of reef
Springer
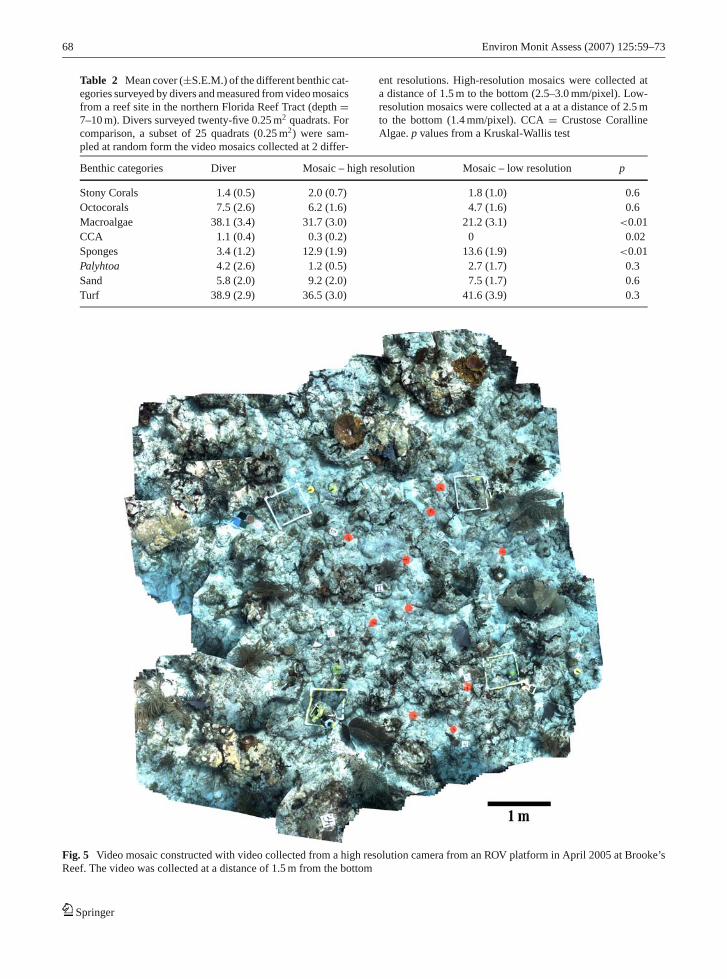
68 Environ Monit Assess (2007) 125:59–73
Table 2 Mean cover (±S.E.M.) of the different benthic cat-egories surveyed by divers and measured from video mosaicsfrom a reef site in the northern Florida Reef Tract (depth =7–10 m). Divers surveyed twenty-five 0.25 m2 quadrats. Forcomparison, a subset of 25 quadrats (0.25 m2) were sam-pled at random form the video mosaics collected at 2 differ-
ent resolutions. High-resolution mosaics were collected ata distance of 1.5 m to the bottom (2.5–3.0 mm/pixel). Low-resolution mosaics were collected at a at a distance of 2.5 mto the bottom (1.4 mm/pixel). CCA = Crustose CorallineAlgae. p values from a Kruskal-Wallis test
Benthic categories Diver Mosaic – high resolution Mosaic – low resolution p
Stony Corals 1.4 (0.5) 2.0 (0.7) 1.8 (1.0) 0.6
Octocorals 7.5 (2.6) 6.2 (1.6) 4.7 (1.6) 0.6
Macroalgae 38.1 (3.4) 31.7 (3.0) 21.2 (3.1) <0.01
CCA 1.1 (0.4) 0.3 (0.2) 0 0.02
Sponges 3.4 (1.2) 12.9 (1.9) 13.6 (1.9) <0.01
Palyhtoa 4.2 (2.6) 1.2 (0.5) 2.7 (1.7) 0.3
Sand 5.8 (2.0) 9.2 (2.0) 7.5 (1.7) 0.6
Turf 38.9 (2.9) 36.5 (3.0) 41.6 (3.9) 0.3
Fig. 5 Video mosaic constructed with video collected from a high resolution camera from an ROV platform in April 2005 at Brooke’sReef. The video was collected at a distance of 1.5 m from the bottom
Springer
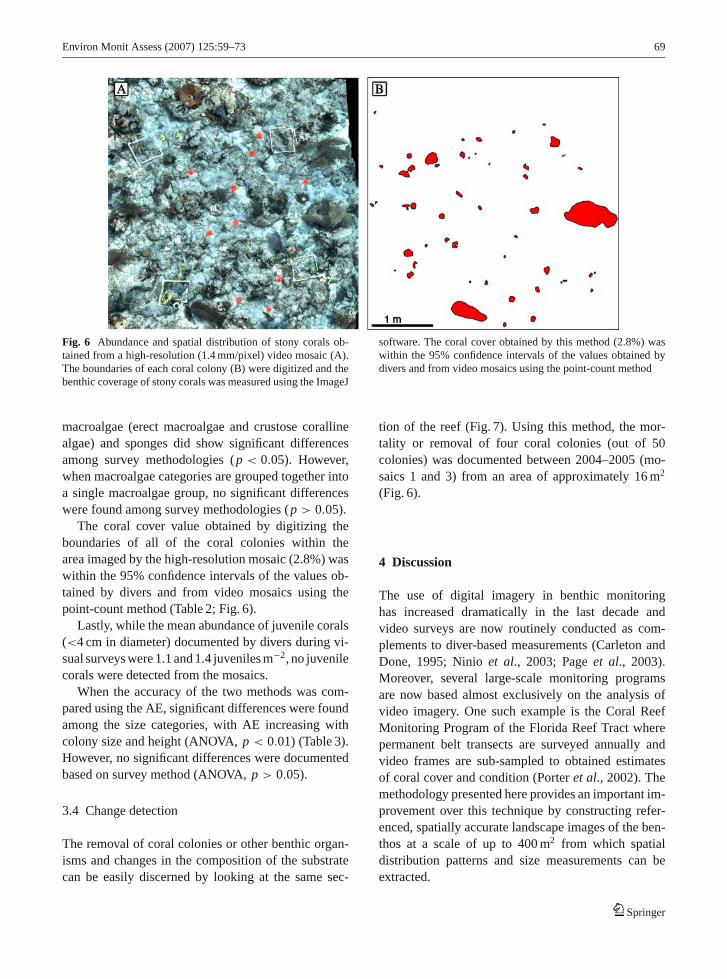
Environ Monit Assess (2007) 125:59–73 69
Fig. 6 Abundance and spatial distribution of stony corals ob-tained from a high-resolution (1.4 mm/pixel) video mosaic (A).The boundaries of each coral colony (B) were digitized and thebenthic coverage of stony corals was measured using the ImageJ
software. The coral cover obtained by this method (2.8%) waswithin the 95% confidence intervals of the values obtained bydivers and from video mosaics using the point-count method
macroalgae (erect macroalgae and crustose coralline
algae) and sponges did show significant differences
among survey methodologies (p < 0.05). However,
when macroalgae categories are grouped together into
a single macroalgae group, no significant differences
were found among survey methodologies (p > 0.05).
The coral cover value obtained by digitizing the
boundaries of all of the coral colonies within the
area imaged by the high-resolution mosaic (2.8%) was
within the 95% confidence intervals of the values ob-
tained by divers and from video mosaics using the
point-count method (Table 2; Fig. 6).
Lastly, while the mean abundance of juvenile corals
(<4 cm in diameter) documented by divers during vi-
sual surveys were 1.1 and 1.4 juveniles m−2, no juvenile
corals were detected from the mosaics.
When the accuracy of the two methods was com-
pared using the AE, significant differences were found
among the size categories, with AE increasing with
colony size and height (ANOVA, p < 0.01) (Table 3).
However, no significant differences were documented
based on survey method (ANOVA, p > 0.05).
3.4 Change detection
The removal of coral colonies or other benthic organ-
isms and changes in the composition of the substrate
can be easily discerned by looking at the same sec-
tion of the reef (Fig. 7). Using this method, the mor-
tality or removal of four coral colonies (out of 50
colonies) was documented between 2004–2005 (mo-
saics 1 and 3) from an area of approximately 16 m2
(Fig. 6).
4 Discussion
The use of digital imagery in benthic monitoring
has increased dramatically in the last decade and
video surveys are now routinely conducted as com-
plements to diver-based measurements (Carleton and
Done, 1995; Ninio et al., 2003; Page et al., 2003).
Moreover, several large-scale monitoring programs
are now based almost exclusively on the analysis of
video imagery. One such example is the Coral Reef
Monitoring Program of the Florida Reef Tract where
permanent belt transects are surveyed annually and
video frames are sub-sampled to obtained estimates
of coral cover and condition (Porter et al., 2002). The
methodology presented here provides an important im-
provement over this technique by constructing refer-
enced, spatially accurate landscape images of the ben-
thos at a scale of up to 400 m2 from which spatial
distribution patterns and size measurements can be
extracted.
Springer
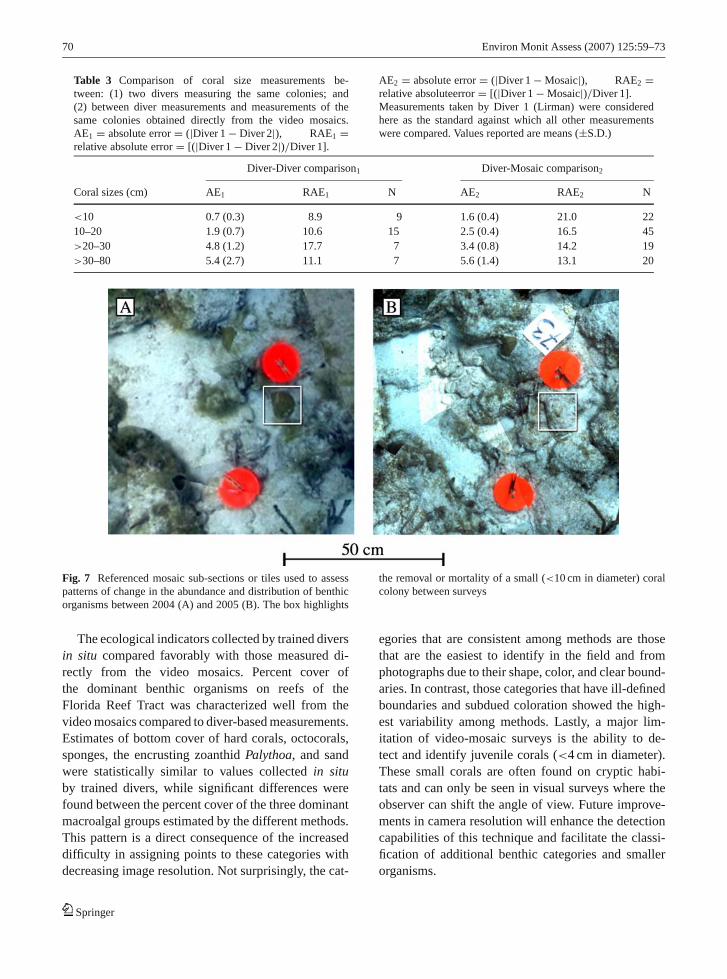
70 Environ Monit Assess (2007) 125:59–73
Table 3 Comparison of coral size measurements be-tween: (1) two divers measuring the same colonies; and(2) between diver measurements and measurements of thesame colonies obtained directly from the video mosaics.AE1 = absolute error = (|Diver 1 − Diver 2|), RAE1 =relative absolute error = [(|Diver 1 − Diver 2|)/Diver 1].
AE2 = absolute error = (|Diver 1 − Mosaic|), RAE2 =relative absoluteerror = [(|Diver 1 − Mosaic|)/Diver 1].Measurements taken by Diver 1 (Lirman) were consideredhere as the standard against which all other measurementswere compared. Values reported are means (±S.D.)
Diver-Diver comparison1 Diver-Mosaic comparison2
Coral sizes (cm) AE1 RAE1 N AE2 RAE2 N
<10 0.7 (0.3) 8.9 9 1.6 (0.4) 21.0 22
10–20 1.9 (0.7) 10.6 15 2.5 (0.4) 16.5 45
>20–30 4.8 (1.2) 17.7 7 3.4 (0.8) 14.2 19
>30–80 5.4 (2.7) 11.1 7 5.6 (1.4) 13.1 20
Fig. 7 Referenced mosaic sub-sections or tiles used to assesspatterns of change in the abundance and distribution of benthicorganisms between 2004 (A) and 2005 (B). The box highlights
the removal or mortality of a small (<10 cm in diameter) coralcolony between surveys
The ecological indicators collected by trained divers
in situ compared favorably with those measured di-
rectly from the video mosaics. Percent cover of
the dominant benthic organisms on reefs of the
Florida Reef Tract was characterized well from the
video mosaics compared to diver-based measurements.
Estimates of bottom cover of hard corals, octocorals,
sponges, the encrusting zoanthid Palythoa, and sand
were statistically similar to values collected in situby trained divers, while significant differences were
found between the percent cover of the three dominant
macroalgal groups estimated by the different methods.
This pattern is a direct consequence of the increased
difficulty in assigning points to these categories with
decreasing image resolution. Not surprisingly, the cat-
egories that are consistent among methods are those
that are the easiest to identify in the field and from
photographs due to their shape, color, and clear bound-
aries. In contrast, those categories that have ill-defined
boundaries and subdued coloration showed the high-
est variability among methods. Lastly, a major lim-
itation of video-mosaic surveys is the ability to de-
tect and identify juvenile corals (<4 cm in diameter).
These small corals are often found on cryptic habi-
tats and can only be seen in visual surveys where the
observer can shift the angle of view. Future improve-
ments in camera resolution will enhance the detection
capabilities of this technique and facilitate the classi-
fication of additional benthic categories and smaller
organisms.
Springer
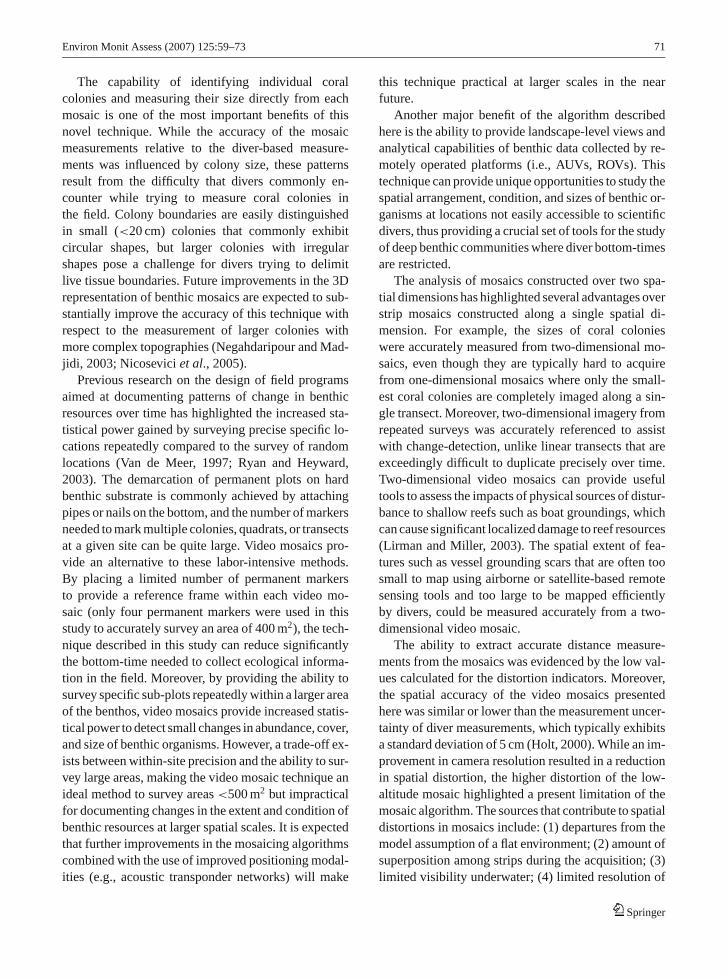
Environ Monit Assess (2007) 125:59–73 71
The capability of identifying individual coral
colonies and measuring their size directly from each
mosaic is one of the most important benefits of this
novel technique. While the accuracy of the mosaic
measurements relative to the diver-based measure-
ments was influenced by colony size, these patterns
result from the difficulty that divers commonly en-
counter while trying to measure coral colonies in
the field. Colony boundaries are easily distinguished
in small (<20 cm) colonies that commonly exhibit
circular shapes, but larger colonies with irregular
shapes pose a challenge for divers trying to delimit
live tissue boundaries. Future improvements in the 3D
representation of benthic mosaics are expected to sub-
stantially improve the accuracy of this technique with
respect to the measurement of larger colonies with
more complex topographies (Negahdaripour and Mad-
jidi, 2003; Nicosevici et al., 2005).
Previous research on the design of field programs
aimed at documenting patterns of change in benthic
resources over time has highlighted the increased sta-
tistical power gained by surveying precise specific lo-
cations repeatedly compared to the survey of random
locations (Van de Meer, 1997; Ryan and Heyward,
2003). The demarcation of permanent plots on hard
benthic substrate is commonly achieved by attaching
pipes or nails on the bottom, and the number of markers
needed to mark multiple colonies, quadrats, or transects
at a given site can be quite large. Video mosaics pro-
vide an alternative to these labor-intensive methods.
By placing a limited number of permanent markers
to provide a reference frame within each video mo-
saic (only four permanent markers were used in this
study to accurately survey an area of 400 m2), the tech-
nique described in this study can reduce significantly
the bottom-time needed to collect ecological informa-
tion in the field. Moreover, by providing the ability to
survey specific sub-plots repeatedly within a larger area
of the benthos, video mosaics provide increased statis-
tical power to detect small changes in abundance, cover,
and size of benthic organisms. However, a trade-off ex-
ists between within-site precision and the ability to sur-
vey large areas, making the video mosaic technique an
ideal method to survey areas <500 m2 but impractical
for documenting changes in the extent and condition of
benthic resources at larger spatial scales. It is expected
that further improvements in the mosaicing algorithms
combined with the use of improved positioning modal-
ities (e.g., acoustic transponder networks) will make
this technique practical at larger scales in the near
future.
Another major benefit of the algorithm described
here is the ability to provide landscape-level views and
analytical capabilities of benthic data collected by re-
motely operated platforms (i.e., AUVs, ROVs). This
technique can provide unique opportunities to study the
spatial arrangement, condition, and sizes of benthic or-
ganisms at locations not easily accessible to scientific
divers, thus providing a crucial set of tools for the study
of deep benthic communities where diver bottom-times
are restricted.
The analysis of mosaics constructed over two spa-
tial dimensions has highlighted several advantages over
strip mosaics constructed along a single spatial di-
mension. For example, the sizes of coral colonies
were accurately measured from two-dimensional mo-
saics, even though they are typically hard to acquire
from one-dimensional mosaics where only the small-
est coral colonies are completely imaged along a sin-
gle transect. Moreover, two-dimensional imagery from
repeated surveys was accurately referenced to assist
with change-detection, unlike linear transects that are
exceedingly difficult to duplicate precisely over time.
Two-dimensional video mosaics can provide useful
tools to assess the impacts of physical sources of distur-
bance to shallow reefs such as boat groundings, which
can cause significant localized damage to reef resources
(Lirman and Miller, 2003). The spatial extent of fea-
tures such as vessel grounding scars that are often too
small to map using airborne or satellite-based remote
sensing tools and too large to be mapped efficiently
by divers, could be measured accurately from a two-
dimensional video mosaic.
The ability to extract accurate distance measure-
ments from the mosaics was evidenced by the low val-
ues calculated for the distortion indicators. Moreover,
the spatial accuracy of the video mosaics presented
here was similar or lower than the measurement uncer-
tainty of diver measurements, which typically exhibits
a standard deviation of 5 cm (Holt, 2000). While an im-
provement in camera resolution resulted in a reduction
in spatial distortion, the higher distortion of the low-
altitude mosaic highlighted a present limitation of the
mosaic algorithm. The sources that contribute to spatial
distortions in mosaics include: (1) departures from the
model assumption of a flat environment; (2) amount of
superposition among strips during the acquisition; (3)
limited visibility underwater; (4) limited resolution of
Springer
72 Environ Monit Assess (2007) 125:59–73
the imaging sensors; and (5) limited accuracy of the im-
age matching algorithm. The higher distortion recorded
for the third mosaic, collected closest to the bottom, can
be likely attributed to the fact that the scene’s surface
planarity assumptions were clearly violated at the low
altitude at which the video sequence was collected and
indicates that further testing is needed to determine the
minimum distance to the bottom for which the 2D mo-
saicing algorithm can produce useful results.
In conclusion, two-dimensional video mosaics
could be widely adopted as a component of reef mon-
itoring and damage assessment programs. The flexible
mosaicing algorithm developed for this study allows
this technique to be used in a variety of applications
from low cost surveys with handheld video cameras to
mapping of deep reefs with ROV-based platforms. Two-
dimensional video mosaics can fill an information gap
for scientists and resource managers by providing re-
peatable, accurate measurements on the reef-plot scale
that can complement measurements on the colony-
scale made by divers as well as surveys conducted over
regional scales from remote sensing platforms.
Acknowledgements Funding for this project was provided bythe US Department of Defense (SERDP Program, Award CS1333 to Reid et al.), NOAA’s National Undersea Research Cen-ter at the University of North Carolina at Wilmington (AwardNA03OAR00088 to D. Lirman), and the Portuguese Foundationfor the Science and Technology (Award BPD/14602/2003 to N.Gracias). Field assistance was provided by D. Doolittle and E.Martinez.
References
Agarwala, A., Dontcheva, M., Agrawala, M., Drucker, S.,Colburn, A., Curless, B., Salesin, D., & Cohen, M. (2004).Interactive digital photomontage. In: Proceedings of SIG-GRAPH04, Los Angeles, California, USA.
Bak, R.P.M., & Meesters, E.H. (1998). Coral population struc-ture: the hidden information of colony size-frequency distri-butions. Marine Ecological Progress Series, 162, 301–306.
Bak, R.P.M., & Meesters, E.H. (1999). Population structure as aresponse of coral communities to global change. AmericanZoology, 39, 56–65.
Bouguet, J.Y. (2002). Matlab camera calibration toolbox.(http://www.vision.caltech.edu/bouguetj/calib doc/).
Brown, E., Cox, E., Jokiel, P., Rodgers, K., Smith, W., Tissot,B., Coles, S.L., & Hultquist, J. (2004). Development ofbenthic sampling methods for the coral reef Assessment andMonitoring Program (CRAMP) in Hawai’i. Pacific Science,58, 145–158.
Carleton, J.H., & Done, T.J. (1995). Quantitative video samplingof coral reef benthos: large scale application. Coral Reefs,14, 35–46.
Fisher, W.S., Davis, W.P., Quarles, R.L., Patrick, J., Campbell,J.G., Harris, P.S., Hemmer, B.L., & Parsons, M. (2005).Characterizing coral condition using estimates of three-dimensional colony surface area. Environmental Monnitar-ing Assessment., (in review).
Gardner, T., Cote, I.M., Gill, J.A., Grant, A., & Watkinson,A.R. (2003). Long-term region-wide declines in Caribbeancorals. Science, 301, 958–960.
Gracias, N., & Santos-Victor, J. (2000). Underwater video mo-saics as visual navigation maps. Computer Vision and ImageUnderstanding, 79, 66–91.
Gracias, N., & Santos-Victor, J. (2001). Underwater mosaicingand trajectory reconstruction using global alignment. In:Proceedings of the Oceans 2001 Conference, pp. 2557–2563. Honolulu, Hawaii, USA.
Harris, C., & Stephens, M. (1988). A combined corner andedge detector. In: Proceedings of the Alvey Conference.Manchester, UK.
Harvey, E., Fletcher, D., & Shortis, M. (2001). A compari-son of the precision and accuracy of estimates of reef-fishlengths determined visually by divers with estimates pro-duced by a stereo-video system. Fisheries Bulletin, 99, 63–71.
Hodgson, G. (1999). A global assessment of human ef-fects on coral reefs. Marine Pollution Bulletin, 38, 345–355.
Holt, P. (2000). The site surveyor guide to surveying underwater.Technical Report, 3H Consulting Ltd.
Kramer, P.A. (2003). Synthesis of coral reef health indica-tors for the Western Atlantic: results of the AGRRAprogram (1997–2000). Atoll Research Bulletin, 496, 1–57.
Kramer, P.R., & Lang, J.C. (2003). The Atlantic and Gulf RapidReef Assessment protocols: former version 2.2. Atoll Re-search Bulletin, 496, 611–624.
Lang, J.C. (Ed.) (2003). Status of coral reefs in the WesternAtlantic. Results of initial surveys, Atlantic and Gulf RapidReef Assessment (AGRRA) Program. Atoll Research Bul-letin, 496, 629.
Levin, S.P.A., Zomet, A., & Weiss, Y. (2004). Seamless imagestitching in the gradient domain. In: Proceedings of theEuropean Conference on Computer Vision. Prague, CzechRepublic.
Lirman, D., & Miller, M. (2003). Modeling and monitoring toolsto assess recovery status and convergence rates betweenrestored and undisturbed coral reef habitats. Rest. Ecology,11, 448–456.
Negahdaripour, S., & Madjidi, H. (2003). Stereovision imag-ing on submersible platforms for 3-D mapping of benthichabitats and sea floor structures. IEEE Journal Ocean En-gineering, 28, 625–650.
Nicosevici, T., Negahdaripour, S., & Garcia, R. (2005).Monocular-based 3-D sea floor reconstruction and ortho-mosaicing by piecewise planar representation. In Pro-ceedings of the MTS/IEEE Oceans 2005 Conference.Washington, DC, USA.
Ninio, R., Delean, S., Osborne, K., & Sweatman, H. (2003).Estimating cover of benthic organisms from underwater
Springer
Environ Monit Assess (2007) 125:59–73 73
video images: variability associated with multiple ob-servers. Marine Ecological Progress Series, 265, 107–116.
Page, C., Coleman, G., Ninio, R., & Osborne, K. (2001). Long-term Monitoring of the Great Barrier Reef. In StandardOperational Procedure No. 7, 45 pp. Australian Instituteof Marine Science, Townsville, Australia.
Porter, J.W., Kosmynin, V., Patterson, K.L., Jaap, W.C., Wheaton,J.L., Hackett, K., et al. (2002). Detection of coral reefchange in the Florida Keys Coral Reef Monitoring Project.In: J.W. Porter, & K.G. Porter (Eds.), The Everglades,Florida Bay, and Coral Reefs of the Florida Keys: AnEcosystem Sourcebook, pp. 749–769. Boca Raton, Florida:CRC Press.
Press, W., Teukolsky, S., Vetterling, W., & Flannery, B. (1988).Numerical Recipes in C: The Art of Scientific Computing.Cambridge University Press.
Riegl, B, Korrubel, J.L., & Martin, C. (2001). Mapping and mon-itoring of coral communities and their spatial patterns usinga surface-based video method from a vessel. Bulletin of Ma-rine Science, 69, 869–880.
Ryan, D.A.J., & Heyward, A. (2003). Improving the precisionof longitudinal ecological surveys using precisely definedobservational units. Environmetrics, 14, 283–293.
Sawhney, H., & Kumar, R. (1997). True multi-image alignmentand its application to mosaicing and lens distortion correc-tion. In Proceedings of the IEEE Conference on ComputerVision and Pattern Recognition, Puerto Rico, USA.
Solan, M., Germano, J.D., Rhoads, D.C., Smith, C., Michaud,E., Parry, D., et al. (2003). Towards a greater understandingof pattern, scale and process in marine benthic systems: apicture is worth a thousand worms. Journal of ExperimentalMarine Biology and Ecology, 285, 313–338.
Uyttendaele, M., Eden, A., & Szeliski, R. (2001). Eliminat-ing ghosting and exposure artifacts in image mosaics.In Proceedings of the International Conference on Com-puter Vision and Pattern Recognition. Kauai, Hawaii,USA.
Van der Meer, J. (1997). Sampling design of monitoring pro-grammes for marine benthos: a comparison between theuse of fixed versus randomly selected stations. J. Sea. Res.,3, 167–179.
Wilkinson, C.R. (Ed.) (2004). Status of Coral Reefs of theWorld: 2004, 557 pp. Australian Institute of Marine Sci-ence, Townsville, Australia.
Xu, X. (2000). Vision-based ROV System. PhD thesis, Universityof Miami, Coral Gables, Florida.
Springer
SHORT COMMUNICATION
Documenting hurricane impacts on coral reefs using two-dimensional video-mosaic technologyArthur C. R. Gleason1, Diego Lirman1, Dana Williams1,2, Nuno R. Gracias3, Brooke E. Gintert1,Hossein Madjidi3, R. Pamela Reid1, G. Chris Boynton4, Shahriar Negahdaripour3, Margaret Miller2
& Philip Kramer5
1 Rosenstiel School of Marine and Atmospheric Science, University of Miami, Miami, FL, USA
2 NOAA-Fisheries, Southeast Fisheries Science Center, Miami, FL, USA
3 Department of Electrical and Computer Engineering, University of Miami, Coral Gables, FL, USA
4 Department of Physics, University of Miami, Coral Gables, FL, USA
5 The Nature Conservancy, Summerland Key, FL, USA
Problem
During the summer of 2005, an unprecedented sequence
of four hurricanes impacted the reefs of the Florida Keys.
Damage patterns to coral reefs are commonly influenced
by the strength, path, and duration of each storm event
(Harmelin-Vivien 1994; Lirman & Fong 1997; Lirman
2000). In the case of sequential storms, damage patterns
can be also determined by storm frequency and prior dis-
turbance history (Witman 1992). When the time required
for live coral fragments to re-attach to the bottom and
for loose rubble to stabilize exceeds the interval between
storms, physical impacts can be compounded as loose
pieces of coral rubble are mobilized by subsequent storms
(Lirman & Fong 1997). The impacts of storms on coral
colonies are often influenced by colony morphology, and
the branching morphology of corals like Acropora spp.
makes them especially susceptible to physical disturbance
(Woodley et al. 1981). In fact, hurricane damage and
coral diseases have been identified as the main source of
mortality to acroporids in the Caribbean region, where
this taxon has undergone such a drastic decline in abun-
dance that the U.S. NOAA Fisheries Service has proposed
listing Acropora palmata and A. cervicornis as ‘threatened’
species under the U.S. Endangered Species Act (Bruckner
2002; Oliver 2005; Precht et al. 2005).
The cumulative effects of the 2005 storms on one of
the last remaining populations of A. palmata in the nor-
thern Florida Reef Tract were assessed with a newly devel-
oped survey methodology that is used to construct
spatially accurate, high-resolution landscape mosaics of
the reef benthos. Video-mosaics provide a complement to
Keywords
Acropora palmata; Florida; hurricane damage;
reef framework damage; video-mosaics.
Correspondence
Arthur Gleason, Rosenstiel School of Marine
and Atmospheric Science, University of
Miami, 4600 Rickenbacker Cswy, Miami,
FL 33149, USA.
E-mail: [email protected]
Accepted: 20 November 2006
doi:10.1111/j.1439-0485.2006.00140.x
Abstract
Four hurricanes impacted the reefs of Florida in 2005. In this study, we evalu-
ate the combined impacts of hurricanes Dennis, Katrina, Rita, and Wilma on a
population of Acropora palmata using a newly developed video-mosaic meth-
odology that provides a high-resolution, spatially accurate landscape view of
the reef benthos. Storm damage to A. palmata was surprisingly limited; only 2
out of 19 colonies were removed from the study plot at Molasses Reef. The net
tissue losses for those colonies that remained were only 10% and mean diam-
eter of colonies decreased slightly from 88.4 to 79.6 cm. In contrast, the dam-
age to the reef framework was more severe, and a large section (6 m in
diameter) was dislodged, overturned, and transported to the bottom of the reef
spur. The data presented here show that two-dimensional video-mosaic tech-
nology is well-suited to assess the impacts of physical disturbance on coral reefs
and can be used to complement existing survey methodologies.
Marine Ecology. ISSN 0173-9565
254 Marine Ecology 28 (2007) 254–258 ª 2006 The Authors. Journal compilation ª 2006 Blackwell Publishing Ltd
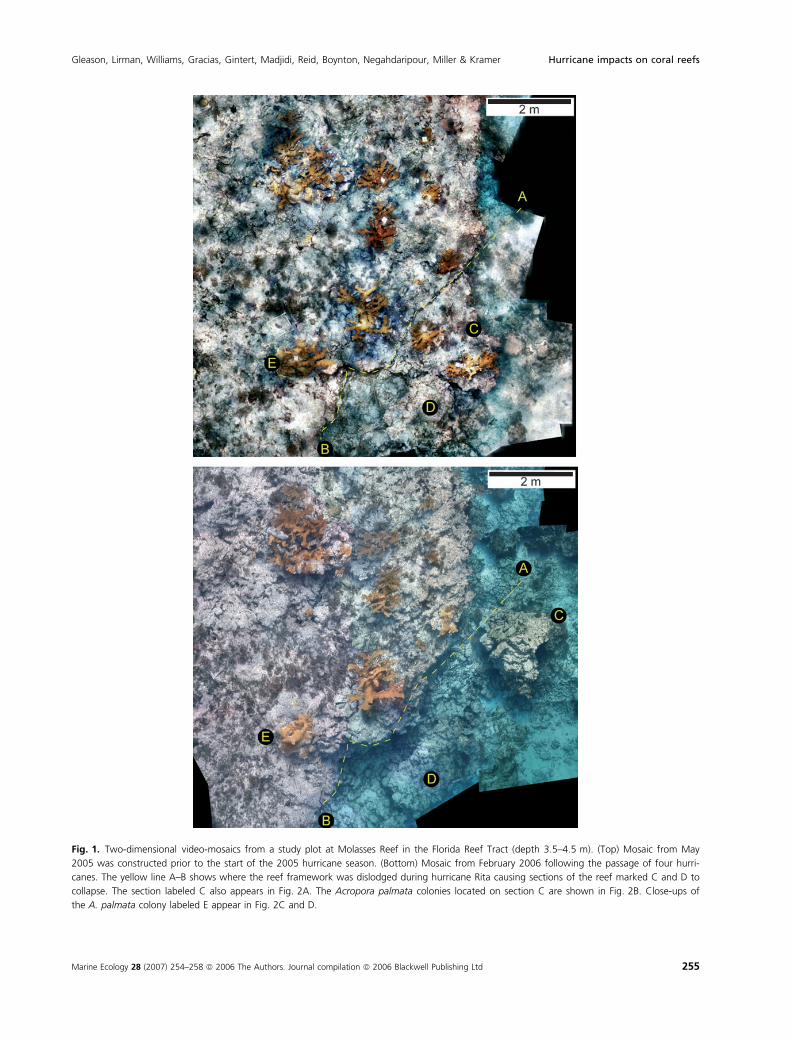
Fig. 1. Two-dimensional video-mosaics from a study plot at Molasses Reef in the Florida Reef Tract (depth 3.5–4.5 m). (Top) Mosaic from May
2005 was constructed prior to the start of the 2005 hurricane season. (Bottom) Mosaic from February 2006 following the passage of four hurri-
canes. The yellow line A–B shows where the reef framework was dislodged during hurricane Rita causing sections of the reef marked C and D to
collapse. The section labeled C also appears in Fig. 2A. The Acropora palmata colonies located on section C are shown in Fig. 2B. Close-ups of
the A. palmata colony labeled E appear in Fig. 2C and D.
Gleason, Lirman, Williams, Gracias, Gintert, Madjidi, Reid, Boynton, Negahdaripour, Miller & Kramer Hurricane impacts on coral reefs
Marine Ecology 28 (2007) 254–258 ª 2006 The Authors. Journal compilation ª 2006 Blackwell Publishing Ltd 255
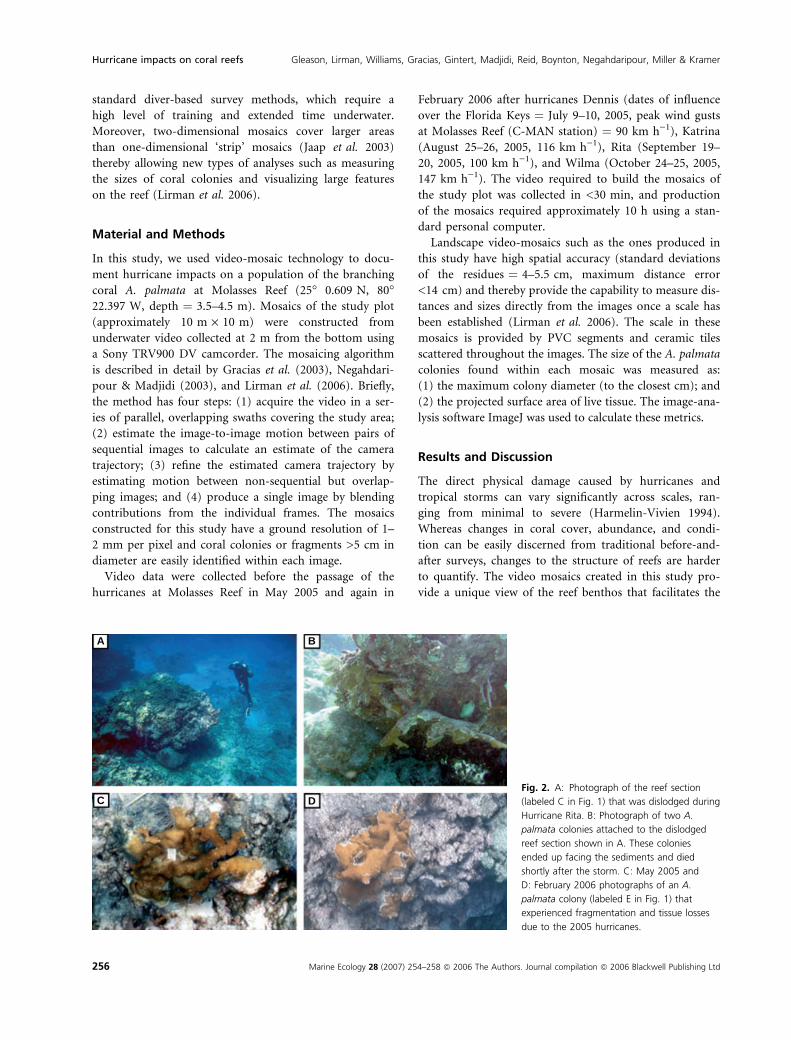
standard diver-based survey methods, which require a
high level of training and extended time underwater.
Moreover, two-dimensional mosaics cover larger areas
than one-dimensional ‘strip’ mosaics (Jaap et al. 2003)
thereby allowing new types of analyses such as measuring
the sizes of coral colonies and visualizing large features
on the reef (Lirman et al. 2006).
Material and Methods
In this study, we used video-mosaic technology to docu-
ment hurricane impacts on a population of the branching
coral A. palmata at Molasses Reef (25� 0.609 N, 80�22.397 W, depth ¼ 3.5–4.5 m). Mosaics of the study plot
(approximately 10 m · 10 m) were constructed from
underwater video collected at 2 m from the bottom using
a Sony TRV900 DV camcorder. The mosaicing algorithm
is described in detail by Gracias et al. (2003), Negahdari-
pour & Madjidi (2003), and Lirman et al. (2006). Briefly,
the method has four steps: (1) acquire the video in a ser-
ies of parallel, overlapping swaths covering the study area;
(2) estimate the image-to-image motion between pairs of
sequential images to calculate an estimate of the camera
trajectory; (3) refine the estimated camera trajectory by
estimating motion between non-sequential but overlap-
ping images; and (4) produce a single image by blending
contributions from the individual frames. The mosaics
constructed for this study have a ground resolution of 1–
2 mm per pixel and coral colonies or fragments >5 cm in
diameter are easily identified within each image.
Video data were collected before the passage of the
hurricanes at Molasses Reef in May 2005 and again in
February 2006 after hurricanes Dennis (dates of influence
over the Florida Keys ¼ July 9–10, 2005, peak wind gusts
at Molasses Reef (C-MAN station) ¼ 90 km h)1), Katrina
(August 25–26, 2005, 116 km h)1), Rita (September 19–
20, 2005, 100 km h)1), and Wilma (October 24–25, 2005,
147 km h)1). The video required to build the mosaics of
the study plot was collected in <30 min, and production
of the mosaics required approximately 10 h using a stan-
dard personal computer.
Landscape video-mosaics such as the ones produced in
this study have high spatial accuracy (standard deviations
of the residues ¼ 4–5.5 cm, maximum distance error
<14 cm) and thereby provide the capability to measure dis-
tances and sizes directly from the images once a scale has
been established (Lirman et al. 2006). The scale in these
mosaics is provided by PVC segments and ceramic tiles
scattered throughout the images. The size of the A. palmata
colonies found within each mosaic was measured as:
(1) the maximum colony diameter (to the closest cm); and
(2) the projected surface area of live tissue. The image-ana-
lysis software ImageJ was used to calculate these metrics.
Results and Discussion
The direct physical damage caused by hurricanes and
tropical storms can vary significantly across scales, ran-
ging from minimal to severe (Harmelin-Vivien 1994).
Whereas changes in coral cover, abundance, and condi-
tion can be easily discerned from traditional before-and-
after surveys, changes to the structure of reefs are harder
to quantify. The video mosaics created in this study pro-
vide a unique view of the reef benthos that facilitates the
A B
C DFig. 2. A: Photograph of the reef section
(labeled C in Fig. 1) that was dislodged during
Hurricane Rita. B: Photograph of two A.
palmata colonies attached to the dislodged
reef section shown in A. These colonies
ended up facing the sediments and died
shortly after the storm. C: May 2005 and
D: February 2006 photographs of an A.
palmata colony (labeled E in Fig. 1) that
experienced fragmentation and tissue losses
due to the 2005 hurricanes.
Hurricane impacts on coral reefs Gleason, Lirman, Williams, Gracias, Gintert, Madjidi, Reid, Boynton, Negahdaripour, Miller & Kramer
256 Marine Ecology 28 (2007) 254–258 ª 2006 The Authors. Journal compilation ª 2006 Blackwell Publishing Ltd
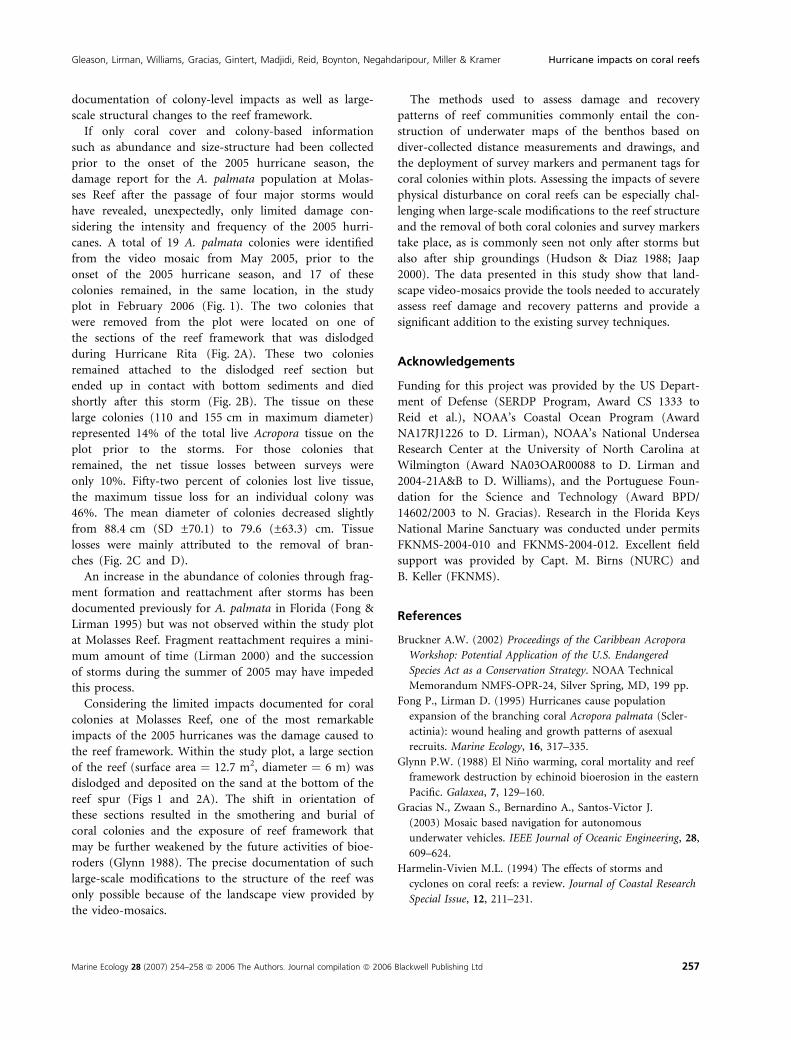
documentation of colony-level impacts as well as large-
scale structural changes to the reef framework.
If only coral cover and colony-based information
such as abundance and size-structure had been collected
prior to the onset of the 2005 hurricane season, the
damage report for the A. palmata population at Molas-
ses Reef after the passage of four major storms would
have revealed, unexpectedly, only limited damage con-
sidering the intensity and frequency of the 2005 hurri-
canes. A total of 19 A. palmata colonies were identified
from the video mosaic from May 2005, prior to the
onset of the 2005 hurricane season, and 17 of these
colonies remained, in the same location, in the study
plot in February 2006 (Fig. 1). The two colonies that
were removed from the plot were located on one of
the sections of the reef framework that was dislodged
during Hurricane Rita (Fig. 2A). These two colonies
remained attached to the dislodged reef section but
ended up in contact with bottom sediments and died
shortly after this storm (Fig. 2B). The tissue on these
large colonies (110 and 155 cm in maximum diameter)
represented 14% of the total live Acropora tissue on the
plot prior to the storms. For those colonies that
remained, the net tissue losses between surveys were
only 10%. Fifty-two percent of colonies lost live tissue,
the maximum tissue loss for an individual colony was
46%. The mean diameter of colonies decreased slightly
from 88.4 cm (SD ±70.1) to 79.6 (±63.3) cm. Tissue
losses were mainly attributed to the removal of bran-
ches (Fig. 2C and D).
An increase in the abundance of colonies through frag-
ment formation and reattachment after storms has been
documented previously for A. palmata in Florida (Fong &
Lirman 1995) but was not observed within the study plot
at Molasses Reef. Fragment reattachment requires a mini-
mum amount of time (Lirman 2000) and the succession
of storms during the summer of 2005 may have impeded
this process.
Considering the limited impacts documented for coral
colonies at Molasses Reef, one of the most remarkable
impacts of the 2005 hurricanes was the damage caused to
the reef framework. Within the study plot, a large section
of the reef (surface area ¼ 12.7 m2, diameter ¼ 6 m) was
dislodged and deposited on the sand at the bottom of the
reef spur (Figs 1 and 2A). The shift in orientation of
these sections resulted in the smothering and burial of
coral colonies and the exposure of reef framework that
may be further weakened by the future activities of bioe-
roders (Glynn 1988). The precise documentation of such
large-scale modifications to the structure of the reef was
only possible because of the landscape view provided by
the video-mosaics.
The methods used to assess damage and recovery
patterns of reef communities commonly entail the con-
struction of underwater maps of the benthos based on
diver-collected distance measurements and drawings, and
the deployment of survey markers and permanent tags for
coral colonies within plots. Assessing the impacts of severe
physical disturbance on coral reefs can be especially chal-
lenging when large-scale modifications to the reef structure
and the removal of both coral colonies and survey markers
take place, as is commonly seen not only after storms but
also after ship groundings (Hudson & Diaz 1988; Jaap
2000). The data presented in this study show that land-
scape video-mosaics provide the tools needed to accurately
assess reef damage and recovery patterns and provide a
significant addition to the existing survey techniques.
Acknowledgements
Funding for this project was provided by the US Depart-
ment of Defense (SERDP Program, Award CS 1333 to
Reid et al.), NOAA’s Coastal Ocean Program (Award
NA17RJ1226 to D. Lirman), NOAA’s National Undersea
Research Center at the University of North Carolina at
Wilmington (Award NA03OAR00088 to D. Lirman and
2004-21A&B to D. Williams), and the Portuguese Foun-
dation for the Science and Technology (Award BPD/
14602/2003 to N. Gracias). Research in the Florida Keys
National Marine Sanctuary was conducted under permits
FKNMS-2004-010 and FKNMS-2004-012. Excellent field
support was provided by Capt. M. Birns (NURC) and
B. Keller (FKNMS).
References
Bruckner A.W. (2002) Proceedings of the Caribbean Acropora
Workshop: Potential Application of the U.S. Endangered
Species Act as a Conservation Strategy. NOAA Technical
Memorandum NMFS-OPR-24, Silver Spring, MD, 199 pp.
Fong P., Lirman D. (1995) Hurricanes cause population
expansion of the branching coral Acropora palmata (Scler-
actinia): wound healing and growth patterns of asexual
recruits. Marine Ecology, 16, 317–335.
Glynn P.W. (1988) El Nino warming, coral mortality and reef
framework destruction by echinoid bioerosion in the eastern
Pacific. Galaxea, 7, 129–160.
Gracias N., Zwaan S., Bernardino A., Santos-Victor J.
(2003) Mosaic based navigation for autonomous
underwater vehicles. IEEE Journal of Oceanic Engineering, 28,
609–624.
Harmelin-Vivien M.L. (1994) The effects of storms and
cyclones on coral reefs: a review. Journal of Coastal Research
Special Issue, 12, 211–231.
Gleason, Lirman, Williams, Gracias, Gintert, Madjidi, Reid, Boynton, Negahdaripour, Miller & Kramer Hurricane impacts on coral reefs
Marine Ecology 28 (2007) 254–258 ª 2006 The Authors. Journal compilation ª 2006 Blackwell Publishing Ltd 257
Hudson J.H., Diaz R. (1988) Damage survey and restoration
of the M/V Wellwood grounding site, Molasses Reef, Key
Largo National Marine Sanctuary, Florida. Proceedings 6th
International Coral Reef Symposium, 2, 231–236.
Jaap W.C. (2000) Coral reef restoration. Ecological Engineering,
15, 345–364.
Jaap W.C., Porter J.W., Wheaton J., Beaver C.R., Hackett K.,
Lybolt M., Callahan M.K., Kidney J., Kupfner S., Torres C.,
Sutherland K. (2003) EPA/NOAA Coral Reef Evaluation and
Monitoring Project. 2002 Executive Summary. Florida Fish
and Wildlife Conservation Commission Report, 28 pp.
Lirman D. (2000) Fragmentation in the branching coral Acro-
pora palmata (Lamarck): growth, survivorship, and repro-
duction of colonies and fragments. Journal of Experimental
Marine Biology and Ecology, 251, 41–57.
Lirman D., Fong P. (1997) Susceptibility of coral communities
to storm intensity, duration and frequency. Proceedings 8th
International Coral Reef Symposium, 1, 561–566.
Lirman D., Gracias R.N., Gintert B.E., Gleason A.C.R.,
Negahdaripour S., Kramer P., Reid R.P. (2006) Develop-
ment and application of a video-mosaic survey technology
to document the status of coral reef communities. Environ-
mental Monitoring and Assessment (in press). doi: 10.1007/
s10661-006-9239-0
Negahdaripour S., Madjidi H. (2003) Stereovision imaging on
submersible platforms for 3-d mapping of benthic habitats
and sea floor structures. IEEE Journal of Oceanic Engineering,
28, 625–650.
Oliver J. (2005) Endangered and threatened species; proposed
threatened status for elkhorn coral and staghorn coral.
Federal Register, 70(88), 24359–24365.
Precht W.F., Robbart M.L., Aronson R.B. (2005) The potential
listing of Acropora species under the US Endangered Species
Act. Marine Pollution Bulletin, 49, 534–536.
Witman J.D. (1992) Physical disturbance and community
structure of exposed and protected reefs: a case study.
American Zoologist, 32, 641–654.
Woodley J.D., Chornesky E.A., Clifford P.A., Jackson J.B.C.,
Kaufman L.S., Knowlton N., Lang J.C., Pearson M.P.,
Porter J.W., Rooney M.C., Rylaarsdam K.W.,
Tunnicliffe V.J., Wahle C.M., Wulff J.L., Curtis A.S.G.,
Dallmeyer M.D., Jupp B.D., Koehl M.A.R., Niegel J.,
Sides E.M. (1981) Hurricane Allen’s impact on Jamaican
coral reefs. Science, 214, 749–755.
Hurricane impacts on coral reefs Gleason, Lirman, Williams, Gracias, Gintert, Madjidi, Reid, Boynton, Negahdaripour, Miller & Kramer
258 Marine Ecology 28 (2007) 254–258 ª 2006 The Authors. Journal compilation ª 2006 Blackwell Publishing Ltd
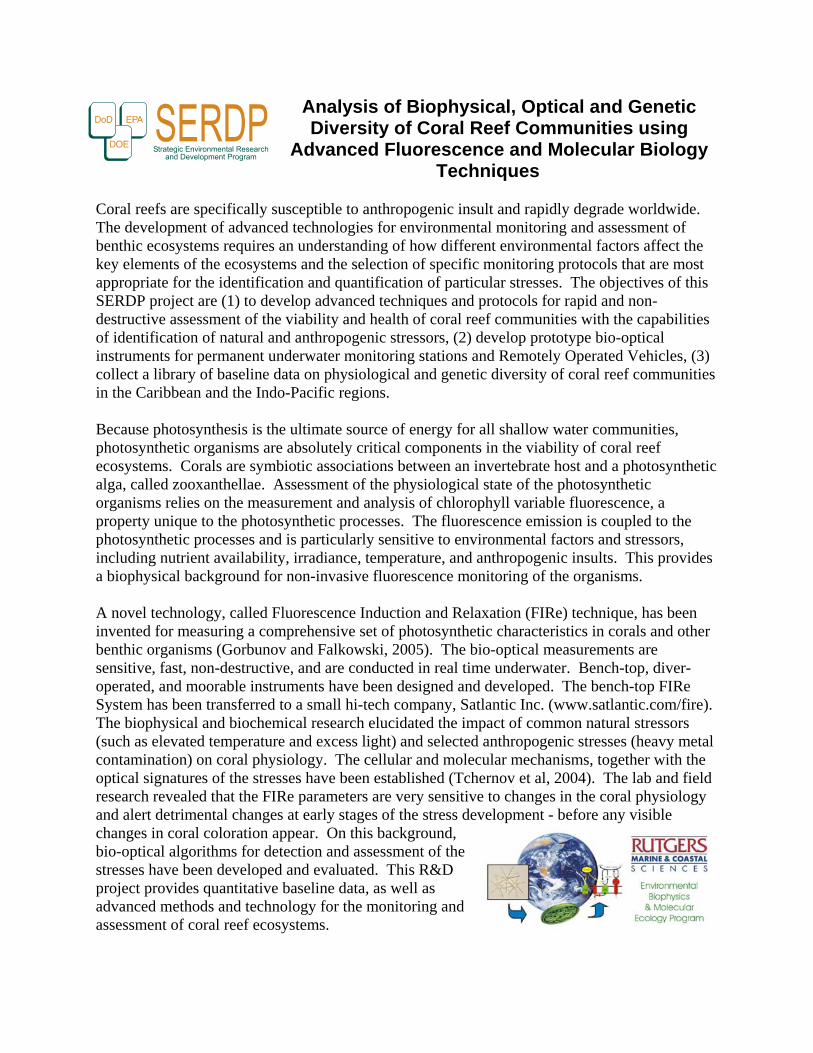
Analysis of Biophysical, Optical and Genetic Diversity of Coral Reef Communities using
Advanced Fluorescence and Molecular Biology Techniques
Coral reefs are specifically susceptible to anthropogenic insult and rapidly degrade worldwide. The development of advanced technologies for environmental monitoring and assessment of benthic ecosystems requires an understanding of how different environmental factors affect the key elements of the ecosystems and the selection of specific monitoring protocols that are most appropriate for the identification and quantification of particular stresses. The objectives of this SERDP project are (1) to develop advanced techniques and protocols for rapid and non-destructive assessment of the viability and health of coral reef communities with the capabilities of identification of natural and anthropogenic stressors, (2) develop prototype bio-optical instruments for permanent underwater monitoring stations and Remotely Operated Vehicles, (3) collect a library of baseline data on physiological and genetic diversity of coral reef communities in the Caribbean and the Indo-Pacific regions. Because photosynthesis is the ultimate source of energy for all shallow water communities, photosynthetic organisms are absolutely critical components in the viability of coral reef ecosystems. Corals are symbiotic associations between an invertebrate host and a photosynthetic alga, called zooxanthellae. Assessment of the physiological state of the photosynthetic organisms relies on the measurement and analysis of chlorophyll variable fluorescence, a property unique to the photosynthetic processes. The fluorescence emission is coupled to the photosynthetic processes and is particularly sensitive to environmental factors and stressors, including nutrient availability, irradiance, temperature, and anthropogenic insults. This provides a biophysical background for non-invasive fluorescence monitoring of the organisms. A novel technology, called Fluorescence Induction and Relaxation (FIRe) technique, has been invented for measuring a comprehensive set of photosynthetic characteristics in corals and other benthic organisms (Gorbunov and Falkowski, 2005). The bio-optical measurements are sensitive, fast, non-destructive, and are conducted in real time underwater. Bench-top, diver-operated, and moorable instruments have been designed and developed. The bench-top FIRe System has been transferred to a small hi-tech company, Satlantic Inc. (www.satlantic.com/fire). The biophysical and biochemical research elucidated the impact of common natural stressors (such as elevated temperature and excess light) and selected anthropogenic stresses (heavy metal contamination) on coral physiology. The cellular and molecular mechanisms, together with the optical signatures of the stresses have been established (Tchernov et al, 2004). The lab and field research revealed that the FIRe parameters are very sensitive to changes in the coral physiology and alert detrimental changes at early stages of the stress development - before any visible changes in coral coloration appear. On this background, bio-optical algorithms for detection and assessment of the stresses have been developed and evaluated. This R&D project provides quantitative baseline data, as well as advanced methods and technology for the monitoring and assessment of coral reef ecosystems.
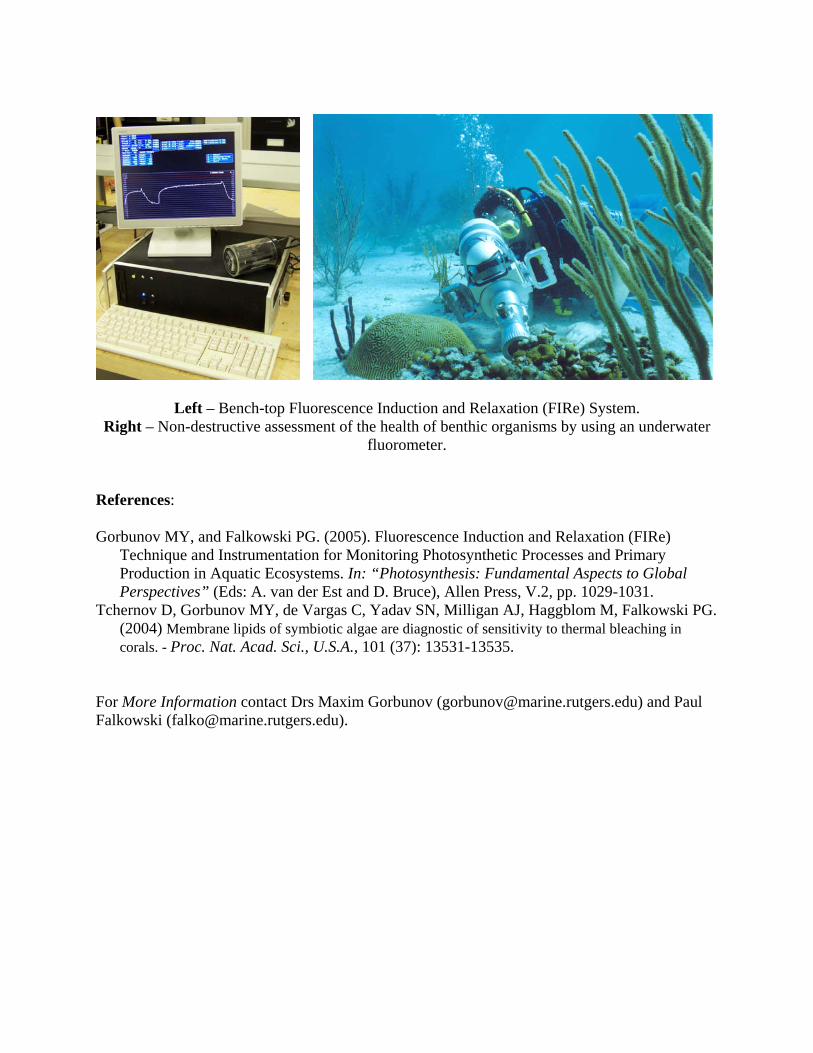
Left – Bench-top Fluorescence Induction and Relaxation (FIRe) System. Right – Non-destructive assessment of the health of benthic organisms by using an underwater
fluorometer. References: Gorbunov MY, and Falkowski PG. (2005). Fluorescence Induction and Relaxation (FIRe)
Technique and Instrumentation for Monitoring Photosynthetic Processes and Primary Production in Aquatic Ecosystems. In: “Photosynthesis: Fundamental Aspects to Global Perspectives” (Eds: A. van der Est and D. Bruce), Allen Press, V.2, pp. 1029-1031.
Tchernov D, Gorbunov MY, de Vargas C, Yadav SN, Milligan AJ, Haggblom M, Falkowski PG. (2004) Membrane lipids of symbiotic algae are diagnostic of sensitivity to thermal bleaching in corals. - Proc. Nat. Acad. Sci., U.S.A., 101 (37): 13531-13535.
For More Information contact Drs Maxim Gorbunov ([email protected]) and Paul Falkowski ([email protected]).
FLUORESCENCE INDUCTION AND
RELAXATION (FIRE) TECHNIQUE AND
INSTRUMENTATION FOR MONITORING
PHOTOSYNTHETIC PROCESSES AND
PRIMARY PRODUCTION IN
AQUATIC ECOSYSTEMS
Maxim Y. Gorbunov1,2, Paul G. Falkowski1. 1Environmental
Biophysics and Molecular Ecology Program, Institute of Marine
and Coastal Sciences, Rutgers University, 71 Dudley Road, New
Brunswick, New Jersey 08901, USA. 2Satlantic Inc., Richmond
Terminal, Pier 9, 3481 North Marginal Road, Halifax, NS, B3K
5X8, Canada
Keywords: variable fluorescence, primary production, chlorophyll,
phytoplankton, electron transport
INTRODUCTION
Over the last decade, the Fast Repetition Rate Fluorometry (FRRF,
see Kolber et al 1998, Gorbunov et al 1999, 2000) provided tremen-
dous insight into the factors controlling phytoplankton distribu-
tions and primary production in the ocean (e.g., Behrenfeld et al
1996, Boyd et al 2000, Falkowski & Kolber 1995, Kolber et al 1994,
2001). The use of the FRRF became an integral part of many
biological oceanographic programs, but its broader use is limited by
complexity and high cost of the available instrumentation. We have
designed and built a new instrument, called Fluorescence Induction
and Relaxation (FIRe) System, to measure a comprehensive suite of
photosynthetic characteristics in phytoplankton, benthic organisms
(macrophytes, corals, seagrass), and higher plants. The FIRe tech-
nique is based on similar biophysical principles as the FRRF and
provides the same physiological characteristics. But the optical design
has been improved, the electronic circuitries simplified, and the oper-
ational protocols extended. This permitted for the sensitivity to be
enhanced and the production cost to be greatly reduced. A bench-top
version of the FIRe System is used for measurements on phytoplank-
ton or leaves. The compact design, low power consumption, and
network capability of a submersible version of the FIRe System
make it a robust sensor for long-termmonitoring programs in coastal
zones and the open ocean. Here we report the design of the FIRe
System and present its first applications to study photosynthetic
processes in phytoplankton and corals.
MATERIALS AND METHODS
The FIRe technique relies on active stimulation and highly resolved
detection of the induction and subsequent relaxation of chlorophyll
fluorescence yields on micro- and millisecond time scales (Fig. 1). To
accommodate efficient excitation of diverse functional groups within
phytoplankton communities including a variety of cyanobacteria, we
have developed a multicolor excitation source. This source uses high
luminosity blue (450 nm and 480 nm, each with 30 nm bandwidth)
and green (500 nm and 530 nm, each with 30 nm bandwidth) light-
emitting diodes (LEDs) to excite chlorophyll and bacteriochlorophyll
fluorescence in vivo. A computer-controlled LED driver circuitry
generates pulses with the duration varied from 0.5ms to 50ms. Each
LED generate up to 1W/cm2 of peak optical power density in the
sample chamber or at the leaf surface to ensure fast saturation of PSII
within the single photosynthetic turnover (less than 50 ms).
The fluorescence signal is isolated by red (680 nm or 730 nm, each
with 20 nm bandwidth, for Chl-a fluorescence) or infra-red (880 nm
with 50 nm bandwidth, for BChl-a fluorescence) interference filters
and detected by a sensitive avalanche photodiode module. A small
portion of the excitation light is recorded by a PIN photodiode as a
reference signal. Both the fluorescence and reference signals are
amplified and digitized by 12-bit analog-to-digital converters at
1MHz sampling rate by a custom-designed data acquisition board.
To accommodate a wide range of Chl-a concentrations (0.01 to
100mg/m3) in natural phytoplankton and laboratory cultures, the
gain of the detector unit is automatically adjusted over the range of
three orders of magnitudes. An embedded low-power Pentium-based
board controls the excitation protocols and data acquisition and
performs the real-time data analysis using a custom analysis toolbox.
An example of the FIRe protocol incorporating both Single (STF)
andMultiple Turnover Flashes (MTF) is shown in Fig. 1. Analysis of
fluorescence induction on microsecond time scales (Fig. 1, Phase 1)
provides the minimum (Fo) and maximum (Fm) fluorescence yields,
the quantum efficiency of photochemistry in PSII (Fv/Fm), the func-
tional absorption cross-section of PSII (sPSII), and the energy trans-
fer between PSII units (‘connectivity factor’, p). The recorded
relaxation kinetics of fluorescence yields reflects the rates of electron
transport on the acceptor side of PSII and between PSII and PSI. The
photosynthetic electron transport rates as a function of irradiance,
together with coefficients of photochemical and non-photochemical
quenching are measured using an incorporated source of background
light. The design of the electronic circuitries and operational software
are extremely flexible and permit for additional excitation protocols
to be implemented, including classical Kautsky induction, the FRR,
pump-and-probe, pulse amplitude modulation, and potentially other
protocols. The bench-top FIRe System permits the user to perform
measurements on phytoplankton (on discrete samples or in flow-
throw) and benthic organisms and higher plants (by using a fiber-
based extension probe).
RESULTS AND DISCUSSION
The FIRe System was employed during two oceanographic cruises in
the Sargasso Sea (June–August 2004) to study the impact of meso-
scale eddies on primary production and the export of carbon into the
ocean interior (see Bibby et al 2004 for detail). The results revealed
that the cyclonic eddy-induced isopicnal displacement (i.e., upwell-
ing of cold nutrient-rich waters) increases both Chl-a and photo-
synthetic efficiency in the euphotic zone (Fig. 2). The eddy-induced
upwelling produced minute, but readily detectable changes in Fv/Fm
(Fig. 2B). Although the eddy upwelling increases the concentra-
tion of major nutrients only at depth (�100m and deeper), the
increase in Fv/Fm was significant even at the surface (Fig. 2B). This
pattern was consistently observed at most of the stations (N¼ 40)
and suggests the sustained flux of nutrients into the surface layers,
but the underlying physical mechanisms and the biogeochemical
implications remain to be elucidated.
The development of submersible FIRe fluorosensors is conducted
within the framework of the Strategic Environmental Research and
� 2005 by the International Society of Photosynthesis 1029
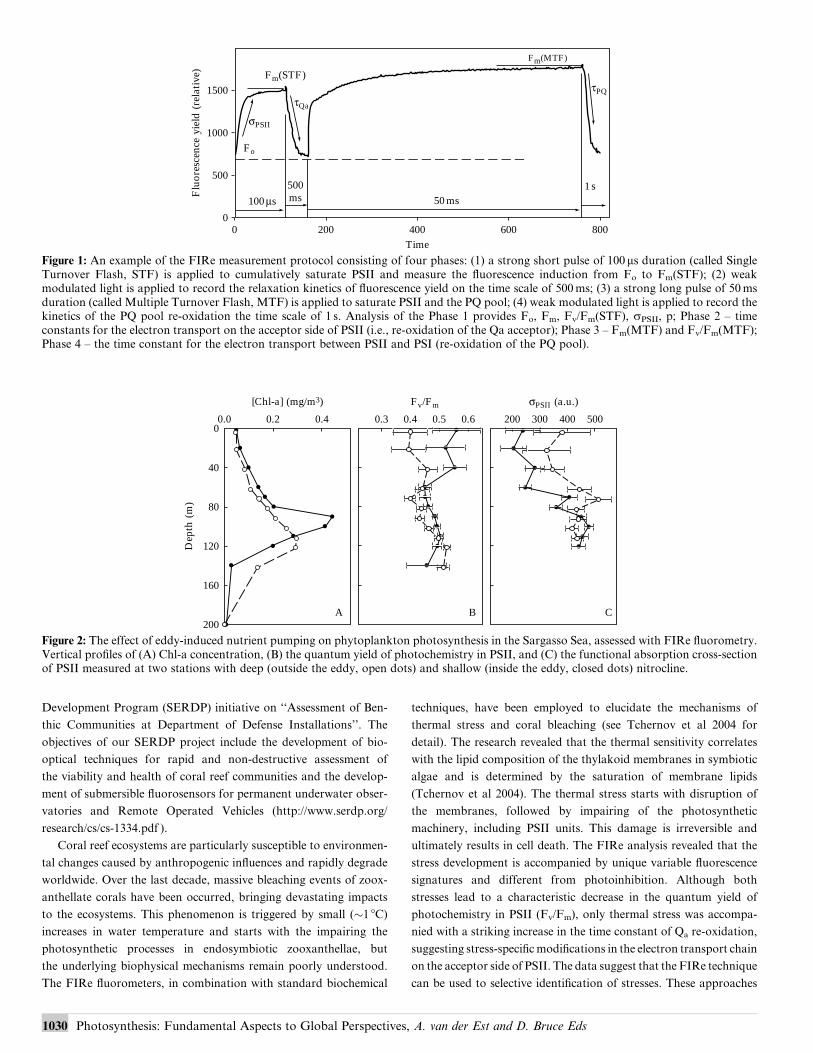
Development Program (SERDP) initiative on ‘‘Assessment of Ben-
thic Communities at Department of Defense Installations’’. The
objectives of our SERDP project include the development of bio-
optical techniques for rapid and non-destructive assessment of
the viability and health of coral reef communities and the develop-
ment of submersible fluorosensors for permanent underwater obser-
vatories and Remote Operated Vehicles (http://www.serdp.org/
research/cs/cs-1334.pdf ).
Coral reef ecosystems are particularly susceptible to environmen-
tal changes caused by anthropogenic influences and rapidly degrade
worldwide. Over the last decade, massive bleaching events of zoox-
anthellate corals have been occurred, bringing devastating impacts
to the ecosystems. This phenomenon is triggered by small (�1 8C)increases in water temperature and starts with the impairing the
photosynthetic processes in endosymbiotic zooxanthellae, but
the underlying biophysical mechanisms remain poorly understood.
The FIRe fluorometers, in combination with standard biochemical
techniques, have been employed to elucidate the mechanisms of
thermal stress and coral bleaching (see Tchernov et al 2004 for
detail). The research revealed that the thermal sensitivity correlates
with the lipid composition of the thylakoid membranes in symbiotic
algae and is determined by the saturation of membrane lipids
(Tchernov et al 2004). The thermal stress starts with disruption of
the membranes, followed by impairing of the photosynthetic
machinery, including PSII units. This damage is irreversible and
ultimately results in cell death. The FIRe analysis revealed that the
stress development is accompanied by unique variable fluorescence
signatures and different from photoinhibition. Although both
stresses lead to a characteristic decrease in the quantum yield of
photochemistry in PSII (Fv/Fm), only thermal stress was accompa-
nied with a striking increase in the time constant of Qa re-oxidation,
suggesting stress-specificmodifications in the electron transport chain
on the acceptor side of PSII. The data suggest that the FIRe technique
can be used to selective identification of stresses. These approaches
1500
1000Fo
σPSII
500
200 400Time
50ms
600 8000
0
100 µs
500ms
1 s
Fm(STF)
Fm(MTF)
τPQ
τQa
Flu
ores
cenc
e yi
eld
(rel
ativ
e)
Figure 1: An example of the FIRe measurement protocol consisting of four phases: (1) a strong short pulse of 100 ms duration (called SingleTurnover Flash, STF) is applied to cumulatively saturate PSII and measure the fluorescence induction from Fo to Fm(STF); (2) weakmodulated light is applied to record the relaxation kinetics of fluorescence yield on the time scale of 500ms; (3) a strong long pulse of 50msduration (called Multiple Turnover Flash, MTF) is applied to saturate PSII and the PQ pool; (4) weak modulated light is applied to record thekinetics of the PQ pool re-oxidation the time scale of 1 s. Analysis of the Phase 1 provides Fo, Fm, Fv/Fm(STF), sPSII, p; Phase 2 – timeconstants for the electron transport on the acceptor side of PSII (i.e., re-oxidation of the Qa acceptor); Phase 3 – Fm(MTF) and Fv/Fm(MTF);Phase 4 – the time constant for the electron transport between PSII and PSI (re-oxidation of the PQ pool).
0.00
40
80
120
160
200
0.2 0.4 0.3 0.4 0.5 0.6 200
σPSII (a.u.)
300 400 500
Dep
th (
m)
Fv/Fm[Chl-a] (mg/m3)
A B C
Figure 2: The effect of eddy-induced nutrient pumping on phytoplankton photosynthesis in the Sargasso Sea, assessed with FIRe fluorometry.Vertical profiles of (A) Chl-a concentration, (B) the quantum yield of photochemistry in PSII, and (C) the functional absorption cross-sectionof PSII measured at two stations with deep (outside the eddy, open dots) and shallow (inside the eddy, closed dots) nitrocline.
1030 Photosynthesis: Fundamental Aspects to Global Perspectives, A. van der Est and D. Bruce Eds
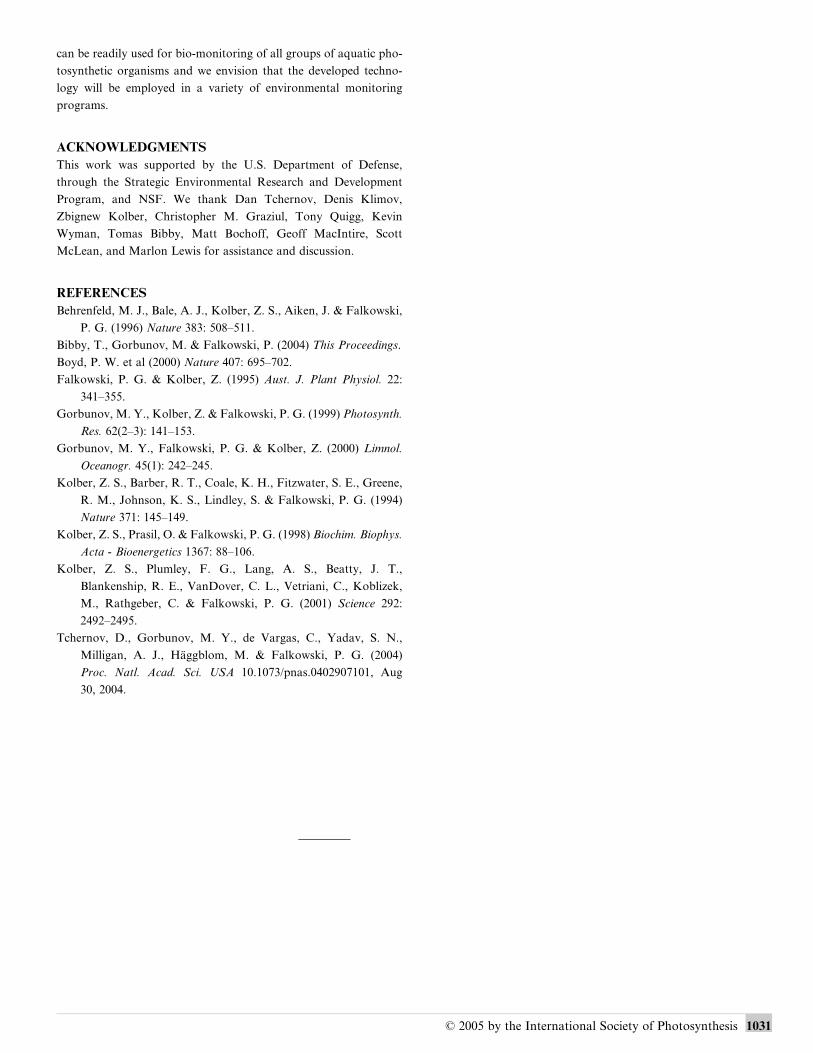
can be readily used for bio-monitoring of all groups of aquatic pho-
tosynthetic organisms and we envision that the developed techno-
logy will be employed in a variety of environmental monitoring
programs.
ACKNOWLEDGMENTS
This work was supported by the U.S. Department of Defense,
through the Strategic Environmental Research and Development
Program, and NSF. We thank Dan Tchernov, Denis Klimov,
Zbignew Kolber, Christopher M. Graziul, Tony Quigg, Kevin
Wyman, Tomas Bibby, Matt Bochoff, Geoff MacIntire, Scott
McLean, and Marlon Lewis for assistance and discussion.
REFERENCES
Behrenfeld, M. J., Bale, A. J., Kolber, Z. S., Aiken, J. & Falkowski,
P. G. (1996) Nature 383: 508–511.
Bibby, T., Gorbunov, M. & Falkowski, P. (2004) This Proceedings.
Boyd, P. W. et al (2000) Nature 407: 695–702.
Falkowski, P. G. & Kolber, Z. (1995) Aust. J. Plant Physiol. 22:
341–355.
Gorbunov, M. Y., Kolber, Z. & Falkowski, P. G. (1999) Photosynth.
Res. 62(2–3): 141–153.
Gorbunov, M. Y., Falkowski, P. G. & Kolber, Z. (2000) Limnol.
Oceanogr. 45(1): 242–245.
Kolber, Z. S., Barber, R. T., Coale, K. H., Fitzwater, S. E., Greene,
R. M., Johnson, K. S., Lindley, S. & Falkowski, P. G. (1994)
Nature 371: 145–149.
Kolber, Z. S., Prasil, O. & Falkowski, P. G. (1998) Biochim. Biophys.
Acta - Bioenergetics 1367: 88–106.
Kolber, Z. S., Plumley, F. G., Lang, A. S., Beatty, J. T.,
Blankenship, R. E., VanDover, C. L., Vetriani, C., Koblizek,
M., Rathgeber, C. & Falkowski, P. G. (2001) Science 292:
2492–2495.
Tchernov, D., Gorbunov, M. Y., de Vargas, C., Yadav, S. N.,
Milligan, A. J., Haggblom, M. & Falkowski, P. G. (2004)
Proc. Natl. Acad. Sci. USA 10.1073/pnas.0402907101, Aug
30, 2004.
� 2005 by the International Society of Photosynthesis 1031
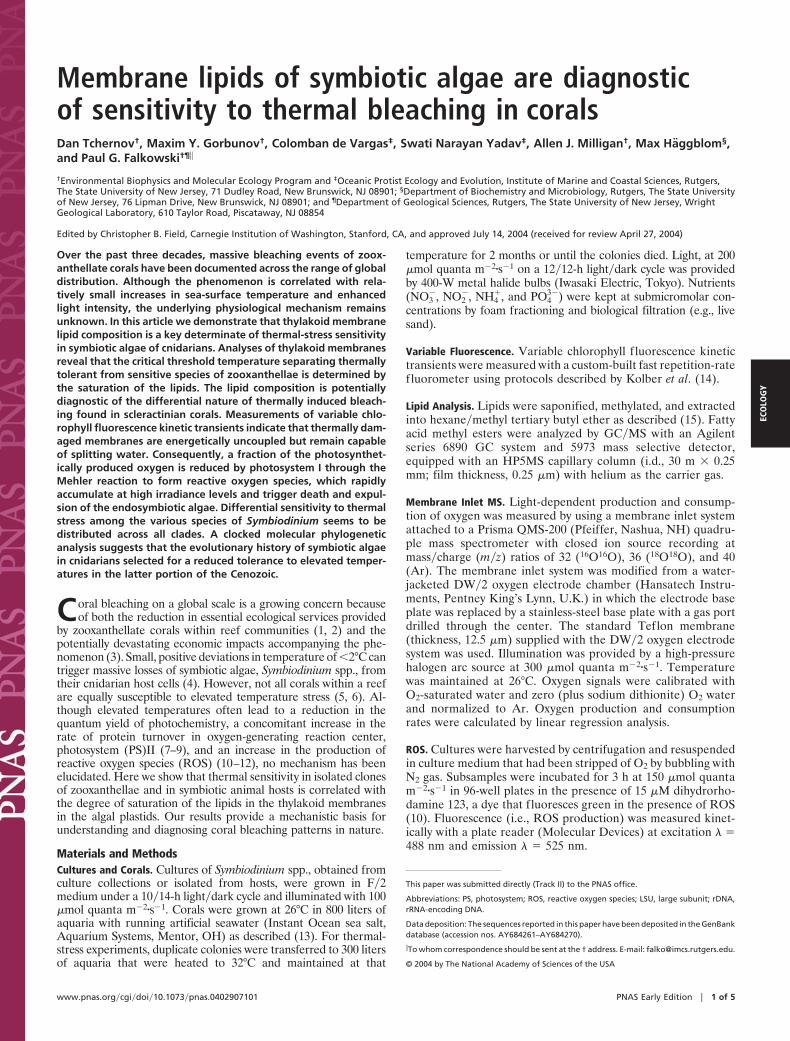
Membrane lipids of symbiotic algae are diagnosticof sensitivity to thermal bleaching in coralsDan Tchernov†, Maxim Y. Gorbunov†, Colomban de Vargas‡, Swati Narayan Yadav‡, Allen J. Milligan†, Max Haggblom§,and Paul G. Falkowski†¶�
†Environmental Biophysics and Molecular Ecology Program and ‡Oceanic Protist Ecology and Evolution, Institute of Marine and Coastal Sciences, Rutgers,The State University of New Jersey, 71 Dudley Road, New Brunswick, NJ 08901; §Department of Biochemistry and Microbiology, Rutgers, The State Universityof New Jersey, 76 Lipman Drive, New Brunswick, NJ 08901; and ¶Department of Geological Sciences, Rutgers, The State University of New Jersey, WrightGeological Laboratory, 610 Taylor Road, Piscataway, NJ 08854
Edited by Christopher B. Field, Carnegie Institution of Washington, Stanford, CA, and approved July 14, 2004 (received for review April 27, 2004)
Over the past three decades, massive bleaching events of zoox-anthellate corals have been documented across the range of globaldistribution. Although the phenomenon is correlated with rela-tively small increases in sea-surface temperature and enhancedlight intensity, the underlying physiological mechanism remainsunknown. In this article we demonstrate that thylakoid membranelipid composition is a key determinate of thermal-stress sensitivityin symbiotic algae of cnidarians. Analyses of thylakoid membranesreveal that the critical threshold temperature separating thermallytolerant from sensitive species of zooxanthellae is determined bythe saturation of the lipids. The lipid composition is potentiallydiagnostic of the differential nature of thermally induced bleach-ing found in scleractinian corals. Measurements of variable chlo-rophyll fluorescence kinetic transients indicate that thermally dam-aged membranes are energetically uncoupled but remain capableof splitting water. Consequently, a fraction of the photosynthet-ically produced oxygen is reduced by photosystem I through theMehler reaction to form reactive oxygen species, which rapidlyaccumulate at high irradiance levels and trigger death and expul-sion of the endosymbiotic algae. Differential sensitivity to thermalstress among the various species of Symbiodinium seems to bedistributed across all clades. A clocked molecular phylogeneticanalysis suggests that the evolutionary history of symbiotic algaein cnidarians selected for a reduced tolerance to elevated temper-atures in the latter portion of the Cenozoic.
Coral bleaching on a global scale is a growing concern becauseof both the reduction in essential ecological services provided
by zooxanthellate corals within reef communities (1, 2) and thepotentially devastating economic impacts accompanying the phe-nomenon (3). Small, positive deviations in temperature of �2°C cantrigger massive losses of symbiotic algae, Symbiodinium spp., fromtheir cnidarian host cells (4). However, not all corals within a reefare equally susceptible to elevated temperature stress (5, 6). Al-though elevated temperatures often lead to a reduction in thequantum yield of photochemistry, a concomitant increase in therate of protein turnover in oxygen-generating reaction center,photosystem (PS)II (7–9), and an increase in the production ofreactive oxygen species (ROS) (10–12), no mechanism has beenelucidated. Here we show that thermal sensitivity in isolated clonesof zooxanthellae and in symbiotic animal hosts is correlated withthe degree of saturation of the lipids in the thylakoid membranesin the algal plastids. Our results provide a mechanistic basis forunderstanding and diagnosing coral bleaching patterns in nature.
Materials and MethodsCultures and Corals. Cultures of Symbiodinium spp., obtained fromculture collections or isolated from hosts, were grown in F�2medium under a 10�14-h light�dark cycle and illuminated with 100�mol quanta m�2�s�1. Corals were grown at 26°C in 800 liters ofaquaria with running artificial seawater (Instant Ocean sea salt,Aquarium Systems, Mentor, OH) as described (13). For thermal-stress experiments, duplicate colonies were transferred to 300 litersof aquaria that were heated to 32°C and maintained at that
temperature for 2 months or until the colonies died. Light, at 200�mol quanta m�2�s�1 on a 12�12-h light�dark cycle was providedby 400-W metal halide bulbs (Iwasaki Electric, Tokyo). Nutrients(NO3
�, NO2�, NH4
�, and PO43�) were kept at submicromolar con-
centrations by foam fractioning and biological filtration (e.g., livesand).
Variable Fluorescence. Variable chlorophyll f luorescence kinetictransients were measured with a custom-built fast repetition-ratefluorometer using protocols described by Kolber et al. (14).
Lipid Analysis. Lipids were saponified, methylated, and extractedinto hexane�methyl tertiary butyl ether as described (15). Fattyacid methyl esters were analyzed by GC�MS with an Agilentseries 6890 GC system and 5973 mass selective detector,equipped with an HP5MS capillary column (i.d., 30 m � 0.25mm; film thickness, 0.25 �m) with helium as the carrier gas.
Membrane Inlet MS. Light-dependent production and consump-tion of oxygen was measured by using a membrane inlet systemattached to a Prisma QMS-200 (Pfeiffer, Nashua, NH) quadru-ple mass spectrometer with closed ion source recording atmass�charge (m�z) ratios of 32 (16O16O), 36 (18O18O), and 40(Ar). The membrane inlet system was modified from a water-jacketed DW�2 oxygen electrode chamber (Hansatech Instru-ments, Pentney King’s Lynn, U.K.) in which the electrode baseplate was replaced by a stainless-steel base plate with a gas portdrilled through the center. The standard Teflon membrane(thickness, 12.5 �m) supplied with the DW�2 oxygen electrodesystem was used. Illumination was provided by a high-pressurehalogen arc source at 300 �mol quanta m�2�s�1. Temperaturewas maintained at 26°C. Oxygen signals were calibrated withO2-saturated water and zero (plus sodium dithionite) O2 waterand normalized to Ar. Oxygen production and consumptionrates were calculated by linear regression analysis.
ROS. Cultures were harvested by centrifugation and resuspendedin culture medium that had been stripped of O2 by bubbling withN2 gas. Subsamples were incubated for 3 h at 150 �mol quantam�2�s�1 in 96-well plates in the presence of 15 �M dihydrorho-damine 123, a dye that fluoresces green in the presence of ROS(10). Fluorescence (i.e., ROS production) was measured kinet-ically with a plate reader (Molecular Devices) at excitation � �488 nm and emission � � 525 nm.
This paper was submitted directly (Track II) to the PNAS office.
Abbreviations: PS, photosystem; ROS, reactive oxygen species; LSU, large subunit; rDNA,rRNA-encoding DNA.
Data deposition: The sequences reported in this paper have been deposited in the GenBankdatabase (accession nos. AY684261–AY684270).
�To whom correspondence should be sent at the † address. E-mail: [email protected].
© 2004 by The National Academy of Sciences of the USA
www.pnas.org�cgi�doi�10.1073�pnas.0402907101 PNAS Early Edition � 1 of 5
ECO
LOG
Y
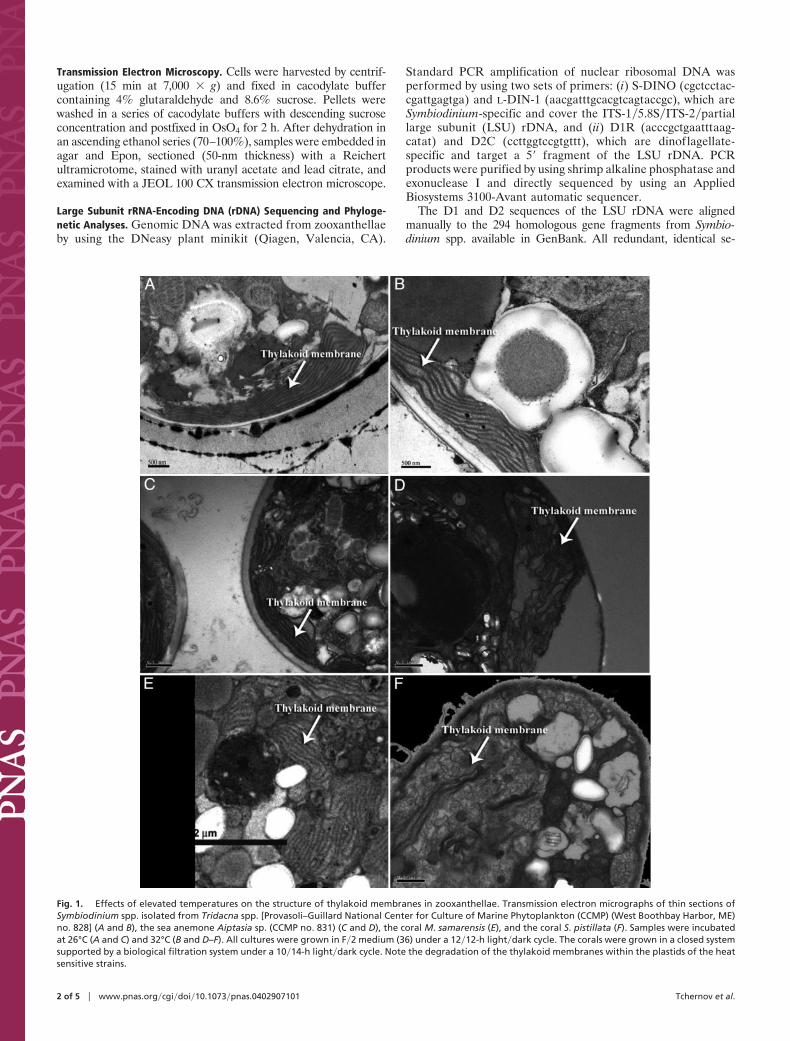
Transmission Electron Microscopy. Cells were harvested by centrif-ugation (15 min at 7,000 � g) and fixed in cacodylate buffercontaining 4% glutaraldehyde and 8.6% sucrose. Pellets werewashed in a series of cacodylate buffers with descending sucroseconcentration and postfixed in OsO4 for 2 h. After dehydration inan ascending ethanol series (70–100%), samples were embedded inagar and Epon, sectioned (50-nm thickness) with a Reichertultramicrotome, stained with uranyl acetate and lead citrate, andexamined with a JEOL 100 CX transmission electron microscope.
Large Subunit rRNA-Encoding DNA (rDNA) Sequencing and Phyloge-netic Analyses. Genomic DNA was extracted from zooxanthellaeby using the DNeasy plant minikit (Qiagen, Valencia, CA).
Standard PCR amplification of nuclear ribosomal DNA wasperformed by using two sets of primers: (i) S-DINO (cgctcctac-cgattgagtga) and L-DIN-1 (aacgatttgcacgtcagtaccgc), which areSymbiodinium-specific and cover the ITS-1�5.8S�ITS-2�partiallarge subunit (LSU) rDNA, and (ii) D1R (acccgctgaatttaag-catat) and D2C (ccttggtccgtgttt), which are dinoflagellate-specific and target a 5� fragment of the LSU rDNA. PCRproducts were purified by using shrimp alkaline phosphatase andexonuclease I and directly sequenced by using an AppliedBiosystems 3100-Avant automatic sequencer.
The D1 and D2 sequences of the LSU rDNA were alignedmanually to the 294 homologous gene fragments from Symbio-dinium spp. available in GenBank. All redundant, identical se-
Fig. 1. Effects of elevated temperatures on the structure of thylakoid membranes in zooxanthellae. Transmission electron micrographs of thin sections ofSymbiodinium spp. isolated from Tridacna spp. [Provasoli–Guillard National Center for Culture of Marine Phytoplankton (CCMP) (West Boothbay Harbor, ME)no. 828] (A and B), the sea anemone Aiptasia sp. (CCMP no. 831) (C and D), the coral M. samarensis (E), and the coral S. pistillata (F). Samples were incubatedat 26°C (A and C) and 32°C (B and D–F). All cultures were grown in F�2 medium (36) under a 12�12-h light�dark cycle. The corals were grown in a closed systemsupported by a biological filtration system under a 10�14-h light�dark cycle. Note the degradation of the thylakoid membranes within the plastids of the heatsensitive strains.
2 of 5 � www.pnas.org�cgi�doi�10.1073�pnas.0402907101 Tchernov et al.
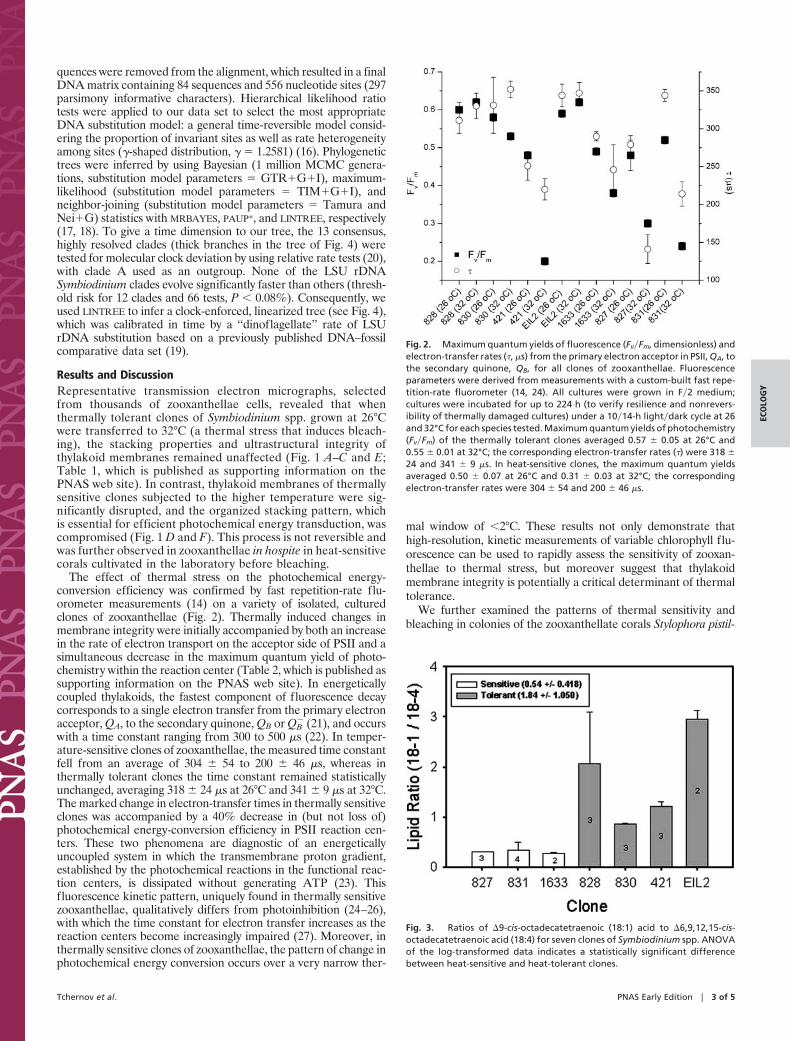
quences were removed from the alignment, which resulted in a finalDNA matrix containing 84 sequences and 556 nucleotide sites (297parsimony informative characters). Hierarchical likelihood ratiotests were applied to our data set to select the most appropriateDNA substitution model: a general time-reversible model consid-ering the proportion of invariant sites as well as rate heterogeneityamong sites (�-shaped distribution, � � 1.2581) (16). Phylogenetictrees were inferred by using Bayesian (1 million MCMC genera-tions, substitution model parameters � GTR�G�I), maximum-likelihood (substitution model parameters � TIM�G�I), andneighbor-joining (substitution model parameters � Tamura andNei�G) statistics with MRBAYES, PAUP*, and LINTREE, respectively(17, 18). To give a time dimension to our tree, the 13 consensus,highly resolved clades (thick branches in the tree of Fig. 4) weretested for molecular clock deviation by using relative rate tests (20),with clade A used as an outgroup. None of the LSU rDNASymbiodinium clades evolve significantly faster than others (thresh-old risk for 12 clades and 66 tests, P � 0.08%). Consequently, weused LINTREE to infer a clock-enforced, linearized tree (see Fig. 4),which was calibrated in time by a ‘‘dinoflagellate’’ rate of LSUrDNA substitution based on a previously published DNA–fossilcomparative data set (19).
Results and DiscussionRepresentative transmission electron micrographs, selectedfrom thousands of zooxanthellae cells, revealed that whenthermally tolerant clones of Symbiodinium spp. grown at 26°Cwere transferred to 32°C (a thermal stress that induces bleach-ing), the stacking properties and ultrastructural integrity ofthylakoid membranes remained unaffected (Fig. 1 A–C and E;Table 1, which is published as supporting information on thePNAS web site). In contrast, thylakoid membranes of thermallysensitive clones subjected to the higher temperature were sig-nificantly disrupted, and the organized stacking pattern, whichis essential for efficient photochemical energy transduction, wascompromised (Fig. 1 D and F). This process is not reversible andwas further observed in zooxanthellae in hospite in heat-sensitivecorals cultivated in the laboratory before bleaching.
The effect of thermal stress on the photochemical energy-conversion efficiency was confirmed by fast repetition-rate flu-orometer measurements (14) on a variety of isolated, culturedclones of zooxanthellae (Fig. 2). Thermally induced changes inmembrane integrity were initially accompanied by both an increasein the rate of electron transport on the acceptor side of PSII and asimultaneous decrease in the maximum quantum yield of photo-chemistry within the reaction center (Table 2, which is published assupporting information on the PNAS web site). In energeticallycoupled thylakoids, the fastest component of fluorescence decaycorresponds to a single electron transfer from the primary electronacceptor, QA, to the secondary quinone, QB or QB
� (21), and occurswith a time constant ranging from 300 to 500 �s (22). In temper-ature-sensitive clones of zooxanthellae, the measured time constantfell from an average of 304 � 54 to 200 � 46 �s, whereas inthermally tolerant clones the time constant remained statisticallyunchanged, averaging 318 � 24 �s at 26°C and 341 � 9 �s at 32°C.The marked change in electron-transfer times in thermally sensitiveclones was accompanied by a 40% decrease in (but not loss of)photochemical energy-conversion efficiency in PSII reaction cen-ters. These two phenomena are diagnostic of an energeticallyuncoupled system in which the transmembrane proton gradient,established by the photochemical reactions in the functional reac-tion centers, is dissipated without generating ATP (23). Thisfluorescence kinetic pattern, uniquely found in thermally sensitivezooxanthellae, qualitatively differs from photoinhibition (24–26),with which the time constant for electron transfer increases as thereaction centers become increasingly impaired (27). Moreover, inthermally sensitive clones of zooxanthellae, the pattern of change inphotochemical energy conversion occurs over a very narrow ther-
mal window of �2°C. These results not only demonstrate thathigh-resolution, kinetic measurements of variable chlorophyll flu-orescence can be used to rapidly assess the sensitivity of zooxan-thellae to thermal stress, but moreover suggest that thylakoidmembrane integrity is potentially a critical determinant of thermaltolerance.
We further examined the patterns of thermal sensitivity andbleaching in colonies of the zooxanthellate corals Stylophora pistil-
Fig. 2. Maximum quantum yields of fluorescence (Fv�Fm, dimensionless) andelectron-transfer rates (�, �s) from the primary electron acceptor in PSII, QA, tothe secondary quinone, QB, for all clones of zooxanthellae. Fluorescenceparameters were derived from measurements with a custom-built fast repe-tition-rate fluorometer (14, 24). All cultures were grown in F�2 medium;cultures were incubated for up to 224 h (to verify resilience and nonrevers-ibility of thermally damaged cultures) under a 10�14-h light�dark cycle at 26and 32°C for each species tested. Maximum quantum yields of photochemistry(Fv�Fm) of the thermally tolerant clones averaged 0.57 � 0.05 at 26°C and0.55 � 0.01 at 32°C; the corresponding electron-transfer rates (�) were 318 �24 and 341 � 9 �s. In heat-sensitive clones, the maximum quantum yieldsaveraged 0.50 � 0.07 at 26°C and 0.31 � 0.03 at 32°C; the correspondingelectron-transfer rates were 304 � 54 and 200 � 46 �s.
Fig. 3. Ratios of �9-cis-octadecatetraenoic (18:1) acid to �6,9,12,15-cis-octadecatetraenoic acid (18:4) for seven clones of Symbiodinium spp. ANOVAof the log-transformed data indicates a statistically significant differencebetween heat-sensitive and heat-tolerant clones.
Tchernov et al. PNAS Early Edition � 3 of 5
ECO
LOG
Y
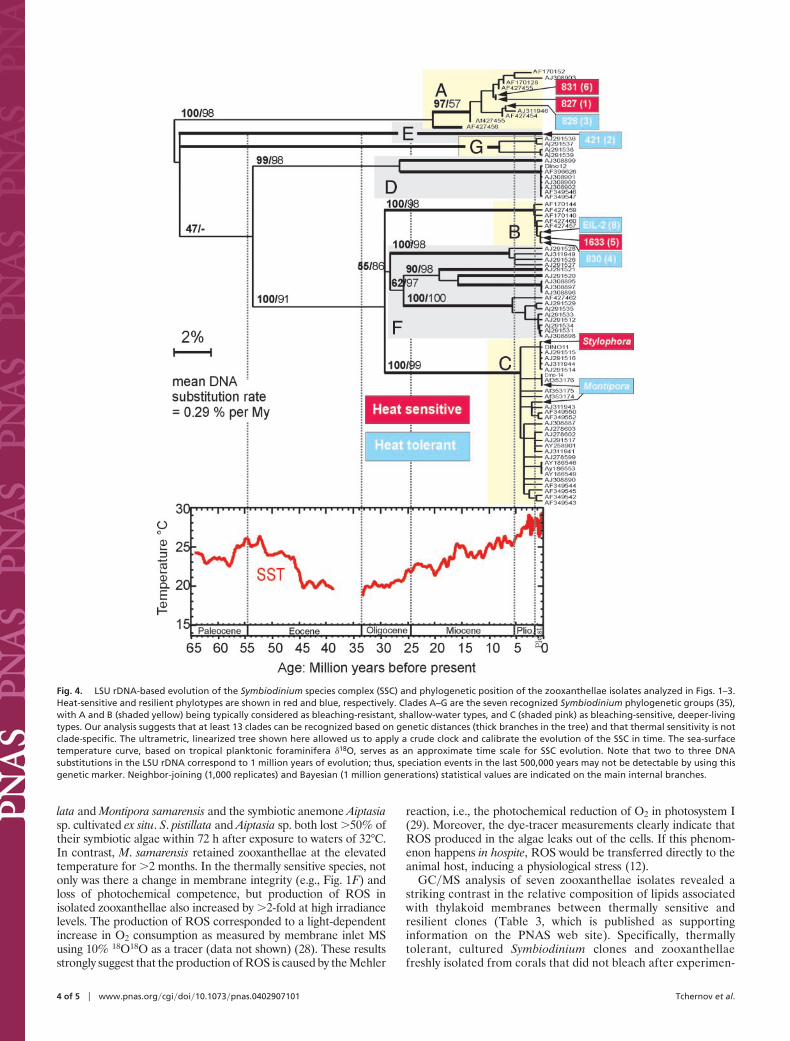
lata and Montipora samarensis and the symbiotic anemone Aiptasiasp. cultivated ex situ. S. pistillata and Aiptasia sp. both lost 50% oftheir symbiotic algae within 72 h after exposure to waters of 32°C.In contrast, M. samarensis retained zooxanthellae at the elevatedtemperature for 2 months. In the thermally sensitive species, notonly was there a change in membrane integrity (e.g., Fig. 1F) andloss of photochemical competence, but production of ROS inisolated zooxanthellae also increased by 2-fold at high irradiancelevels. The production of ROS corresponded to a light-dependentincrease in O2 consumption as measured by membrane inlet MSusing 10% 18O18O as a tracer (data not shown) (28). These resultsstrongly suggest that the production of ROS is caused by the Mehler
reaction, i.e., the photochemical reduction of O2 in photosystem I(29). Moreover, the dye-tracer measurements clearly indicate thatROS produced in the algae leaks out of the cells. If this phenom-enon happens in hospite, ROS would be transferred directly to theanimal host, inducing a physiological stress (12).
GC�MS analysis of seven zooxanthellae isolates revealed astriking contrast in the relative composition of lipids associatedwith thylakoid membranes between thermally sensitive andresilient clones (Table 3, which is published as supportinginformation on the PNAS web site). Specifically, thermallytolerant, cultured Symbiodinium clones and zooxanthellaefreshly isolated from corals that did not bleach after experimen-
Fig. 4. LSU rDNA-based evolution of the Symbiodinium species complex (SSC) and phylogenetic position of the zooxanthellae isolates analyzed in Figs. 1–3.Heat-sensitive and resilient phylotypes are shown in red and blue, respectively. Clades A–G are the seven recognized Symbiodinium phylogenetic groups (35),with A and B (shaded yellow) being typically considered as bleaching-resistant, shallow-water types, and C (shaded pink) as bleaching-sensitive, deeper-livingtypes. Our analysis suggests that at least 13 clades can be recognized based on genetic distances (thick branches in the tree) and that thermal sensitivity is notclade-specific. The ultrametric, linearized tree shown here allowed us to apply a crude clock and calibrate the evolution of the SSC in time. The sea-surfacetemperature curve, based on tropical planktonic foraminifera �18O, serves as an approximate time scale for SSC evolution. Note that two to three DNAsubstitutions in the LSU rDNA correspond to 1 million years of evolution; thus, speciation events in the last 500,000 years may not be detectable by using thisgenetic marker. Neighbor-joining (1,000 replicates) and Bayesian (1 million generations) statistical values are indicated on the main internal branches.
4 of 5 � www.pnas.org�cgi�doi�10.1073�pnas.0402907101 Tchernov et al.
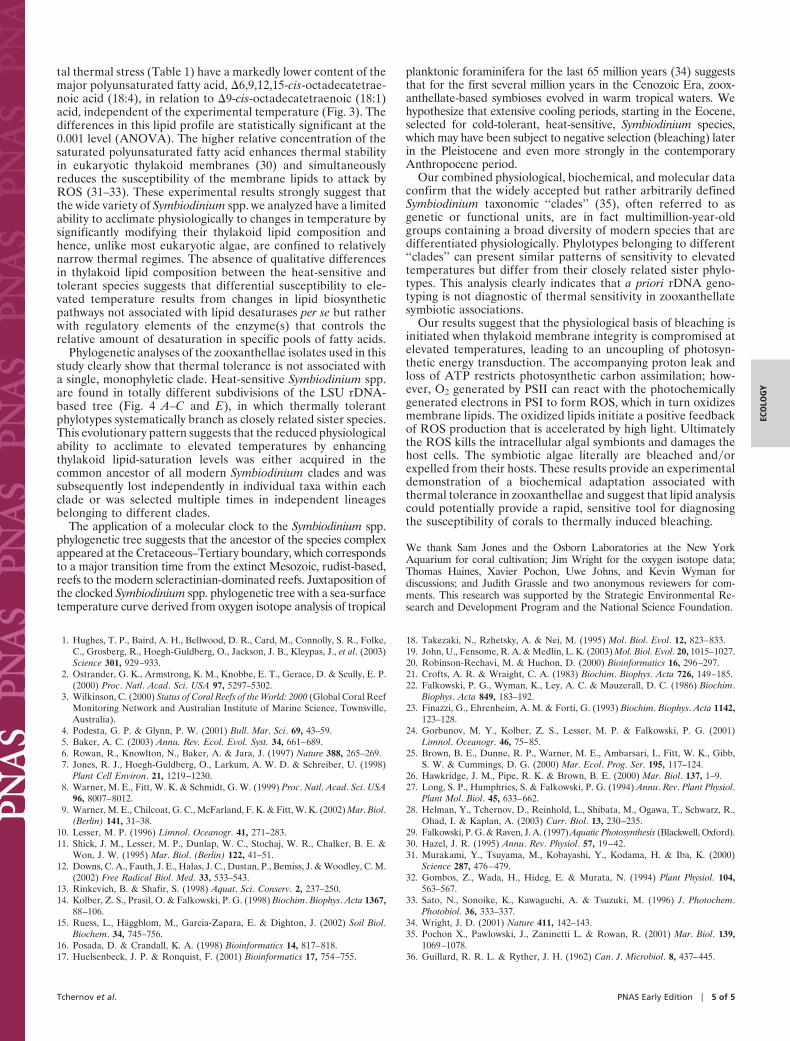
tal thermal stress (Table 1) have a markedly lower content of themajor polyunsaturated fatty acid, �6,9,12,15-cis-octadecatetrae-noic acid (18:4), in relation to �9-cis-octadecatetraenoic (18:1)acid, independent of the experimental temperature (Fig. 3). Thedifferences in this lipid profile are statistically significant at the0.001 level (ANOVA). The higher relative concentration of thesaturated polyunsaturated fatty acid enhances thermal stabilityin eukaryotic thylakoid membranes (30) and simultaneouslyreduces the susceptibility of the membrane lipids to attack byROS (31–33). These experimental results strongly suggest thatthe wide variety of Symbiodinium spp. we analyzed have a limitedability to acclimate physiologically to changes in temperature bysignificantly modifying their thylakoid lipid composition andhence, unlike most eukaryotic algae, are confined to relativelynarrow thermal regimes. The absence of qualitative differencesin thylakoid lipid composition between the heat-sensitive andtolerant species suggests that differential susceptibility to ele-vated temperature results from changes in lipid biosyntheticpathways not associated with lipid desaturases per se but ratherwith regulatory elements of the enzyme(s) that controls therelative amount of desaturation in specific pools of fatty acids.
Phylogenetic analyses of the zooxanthellae isolates used in thisstudy clearly show that thermal tolerance is not associated witha single, monophyletic clade. Heat-sensitive Symbiodinium spp.are found in totally different subdivisions of the LSU rDNA-based tree (Fig. 4 A–C and E), in which thermally tolerantphylotypes systematically branch as closely related sister species.This evolutionary pattern suggests that the reduced physiologicalability to acclimate to elevated temperatures by enhancingthylakoid lipid-saturation levels was either acquired in thecommon ancestor of all modern Symbiodinium clades and wassubsequently lost independently in individual taxa within eachclade or was selected multiple times in independent lineagesbelonging to different clades.
The application of a molecular clock to the Symbiodinium spp.phylogenetic tree suggests that the ancestor of the species complexappeared at the Cretaceous–Tertiary boundary, which correspondsto a major transition time from the extinct Mesozoic, rudist-based,reefs to the modern scleractinian-dominated reefs. Juxtaposition ofthe clocked Symbiodinium spp. phylogenetic tree with a sea-surfacetemperature curve derived from oxygen isotope analysis of tropical
planktonic foraminifera for the last 65 million years (34) suggeststhat for the first several million years in the Cenozoic Era, zoox-anthellate-based symbioses evolved in warm tropical waters. Wehypothesize that extensive cooling periods, starting in the Eocene,selected for cold-tolerant, heat-sensitive, Symbiodinium species,which may have been subject to negative selection (bleaching) laterin the Pleistocene and even more strongly in the contemporaryAnthropocene period.
Our combined physiological, biochemical, and molecular dataconfirm that the widely accepted but rather arbitrarily definedSymbiodinium taxonomic ‘‘clades’’ (35), often referred to asgenetic or functional units, are in fact multimillion-year-oldgroups containing a broad diversity of modern species that aredifferentiated physiologically. Phylotypes belonging to different‘‘clades’’ can present similar patterns of sensitivity to elevatedtemperatures but differ from their closely related sister phylo-types. This analysis clearly indicates that a priori rDNA geno-typing is not diagnostic of thermal sensitivity in zooxanthellatesymbiotic associations.
Our results suggest that the physiological basis of bleaching isinitiated when thylakoid membrane integrity is compromised atelevated temperatures, leading to an uncoupling of photosyn-thetic energy transduction. The accompanying proton leak andloss of ATP restricts photosynthetic carbon assimilation; how-ever, O2 generated by PSII can react with the photochemicallygenerated electrons in PSI to form ROS, which in turn oxidizesmembrane lipids. The oxidized lipids initiate a positive feedbackof ROS production that is accelerated by high light. Ultimatelythe ROS kills the intracellular algal symbionts and damages thehost cells. The symbiotic algae literally are bleached and�orexpelled from their hosts. These results provide an experimentaldemonstration of a biochemical adaptation associated withthermal tolerance in zooxanthellae and suggest that lipid analysiscould potentially provide a rapid, sensitive tool for diagnosingthe susceptibility of corals to thermally induced bleaching.
We thank Sam Jones and the Osborn Laboratories at the New YorkAquarium for coral cultivation; Jim Wright for the oxygen isotope data;Thomas Haines, Xavier Pochon, Uwe Johns, and Kevin Wyman fordiscussions; and Judith Grassle and two anonymous reviewers for com-ments. This research was supported by the Strategic Environmental Re-search and Development Program and the National Science Foundation.
1. Hughes, T. P., Baird, A. H., Bellwood, D. R., Card, M., Connolly, S. R., Folke,C., Grosberg, R., Hoegh-Guldberg, O., Jackson, J. B., Kleypas, J., et al. (2003)Science 301, 929–933.
2. Ostrander, G. K., Armstrong, K. M., Knobbe, E. T., Gerace, D. & Scully, E. P.(2000) Proc. Natl. Acad. Sci. USA 97, 5297–5302.
3. Wilkinson, C. (2000) Status of Coral Reefs of the World: 2000 (Global Coral ReefMonitoring Network and Australian Institute of Marine Science, Townsville,Australia).
4. Podesta, G. P. & Glynn, P. W. (2001) Bull. Mar. Sci. 69, 43–59.5. Baker, A. C. (2003) Annu. Rev. Ecol. Evol. Syst. 34, 661–689.6. Rowan, R., Knowlton, N., Baker, A. & Jara, J. (1997) Nature 388, 265–269.7. Jones, R. J., Hoegh-Guldberg, O., Larkum, A. W. D. & Schreiber, U. (1998)
Plant Cell Environ. 21, 1219–1230.8. Warner, M. E., Fitt, W. K. & Schmidt, G. W. (1999) Proc. Natl. Acad. Sci. USA
96, 8007–8012.9. Warner, M. E., Chilcoat, G. C., McFarland, F. K. & Fitt, W. K. (2002) Mar. Biol.
(Berlin) 141, 31–38.10. Lesser, M. P. (1996) Limnol. Oceanogr. 41, 271–283.11. Shick, J. M., Lesser, M. P., Dunlap, W. C., Stochaj, W. R., Chalker, B. E. &
Won, J. W. (1995) Mar. Biol. (Berlin) 122, 41–51.12. Downs, C. A., Fauth, J. E., Halas, J. C., Dustan, P., Bemiss, J. & Woodley, C. M.
(2002) Free Radical Biol. Med. 33, 533–543.13. Rinkevich, B. & Shafir, S. (1998) Aquat. Sci. Conserv. 2, 237–250.14. Kolber, Z. S., Prasil, O. & Falkowski, P. G. (1998) Biochim. Biophys. Acta 1367,
88–106.15. Ruess, L., Haggblom, M., Garcia-Zapara, E. & Dighton, J. (2002) Soil Biol.
Biochem. 34, 745–756.16. Posada, D. & Crandall, K. A. (1998) Bioinformatics 14, 817–818.17. Huelsenbeck, J. P. & Ronquist, F. (2001) Bioinformatics 17, 754–755.
18. Takezaki, N., Rzhetsky, A. & Nei, M. (1995) Mol. Biol. Evol. 12, 823–833.19. John, U., Fensome, R. A. & Medlin, L. K. (2003) Mol. Biol. Evol. 20, 1015–1027.20. Robinson-Rechavi, M. & Huchon, D. (2000) Bioinformatics 16, 296–297.21. Crofts, A. R. & Wraight, C. A. (1983) Biochim. Biophys. Acta 726, 149–185.22. Falkowski, P. G., Wyman, K., Ley, A. C. & Mauzerall, D. C. (1986) Biochim.
Biophys. Acta 849, 183–192.23. Finazzi, G., Ehrenheim, A. M. & Forti, G. (1993) Biochim. Biophys. Acta 1142,
123–128.24. Gorbunov, M. Y., Kolber, Z. S., Lesser, M. P. & Falkowski, P. G. (2001)
Limnol. Oceanogr. 46, 75–85.25. Brown, B. E., Dunne, R. P., Warner, M. E., Ambarsari, I., Fitt, W. K., Gibb,
S. W. & Cummings, D. G. (2000) Mar. Ecol. Prog. Ser. 195, 117–124.26. Hawkridge, J. M., Pipe, R. K. & Brown, B. E. (2000) Mar. Biol. 137, 1–9.27. Long, S. P., Humphries, S. & Falkowski, P. G. (1994) Annu. Rev. Plant Physiol.
Plant Mol. Biol. 45, 633–662.28. Helman, Y., Tchernov, D., Reinhold, L., Shibata, M., Ogawa, T., Schwarz, R.,
Ohad, I. & Kaplan, A. (2003) Curr. Biol. 13, 230–235.29. Falkowski, P. G. & Raven, J. A. (1997) Aquatic Photosynthesis (Blackwell, Oxford).30. Hazel, J. R. (1995) Annu. Rev. Physiol. 57, 19–42.31. Murakami, Y., Tsuyama, M., Kobayashi, Y., Kodama, H. & Iba, K. (2000)
Science 287, 476–479.32. Gombos, Z., Wada, H., Hideg, E. & Murata, N. (1994) Plant Physiol. 104,
563–567.33. Sato, N., Sonoike, K., Kawaguchi, A. & Tsuzuki, M. (1996) J. Photochem.
Photobiol. 36, 333–337.34. Wright, J. D. (2001) Nature 411, 142–143.35. Pochon X., Pawlowski, J., Zaninetti L. & Rowan, R. (2001) Mar. Biol. 139,
1069–1078.36. Guillard, R. R. L. & Ryther, J. H. (1962) Can. J. Microbiol. 8, 437–445.
Tchernov et al. PNAS Early Edition � 5 of 5
ECO
LOG
Y
Related Documents