Welcome message from author
This document is posted to help you gain knowledge. Please leave a comment to let me know what you think about it! Share it to your friends and learn new things together.
Transcript

To use this Table of Contents. Scroll down or use the bookmarks in the left-hand frame to move to a differentlocation in this index. Click on a blue paper title below to view that paper. To return to this Table of Contents, clickthe "PREVIOUS MENU" Bookmark in the left frame.
TABLE OF CONTENTS
Proceedings of the 10th American Waterjet Conference
Session R1: Jet Material Interaction
1. "Influence of Abrasive Waterjet Cutting on the Fatigue Properties of Extra High-StrengthSteel," by G. Holmqvist, K.M.C. Öjmertz, Y. Bergengren, and M. Fronzaroli
2. "Non-Linear Dynamics in Modeling of Cutting Edge Geometry," by T. Ditzinger, R. Friedrich,
A. Henning, and G. Radons
3. "Modeling the Waterjet Contact/Impact on Target Material," by Z. Guo, M. Ramulu, and
M.G. Jenkins
4. "Neural Network Model of Waterjet Depainting Process," by K. Babets, E.S. Geskin, and
B. Chaudhuri
Session R2: Modeling Studies
5. "Finite Element Modeling of Crack Propagation in PCC Slabs Slotted with Abrasive WaterJet," by R. Mohan and R. Kovacevic
6. "Fuzzy Logic Model of Waterjet Depainting: Grapho-Analytical Approach," by K. Babets and
E.S. Geskin
7. "Modeling of Flow Modulation Following the Electrical Discharge in a Nozzle," by M.M. Vijay,
A.H. Makomaski, W. Yan, A. Tieu and C. Bai
8. "Analytical Investigations of Hydraulic Breaking Coefficient of Coal Seams," by B.V. Radjko
Session R3: Pressure Effects
9. "Hyper Pressure Waterjet and Abrasive Waterjet Cutting," by J. Xu, K. Otterstatter, M. Harkess,
R. Sacquitne, and J. Lague
10. "Cutting and Drilling at 690-MPa Pressure," by M. Hashish
11. "Characterization of Low Pressure AWJ Cutting," by D. Taggart, M. Nanduri, and T. Kim
12. "Modeling and Simulation of Pressure Fluctuations in High Pressure Waterjets,"by M. Tremblay and M. Ramulu
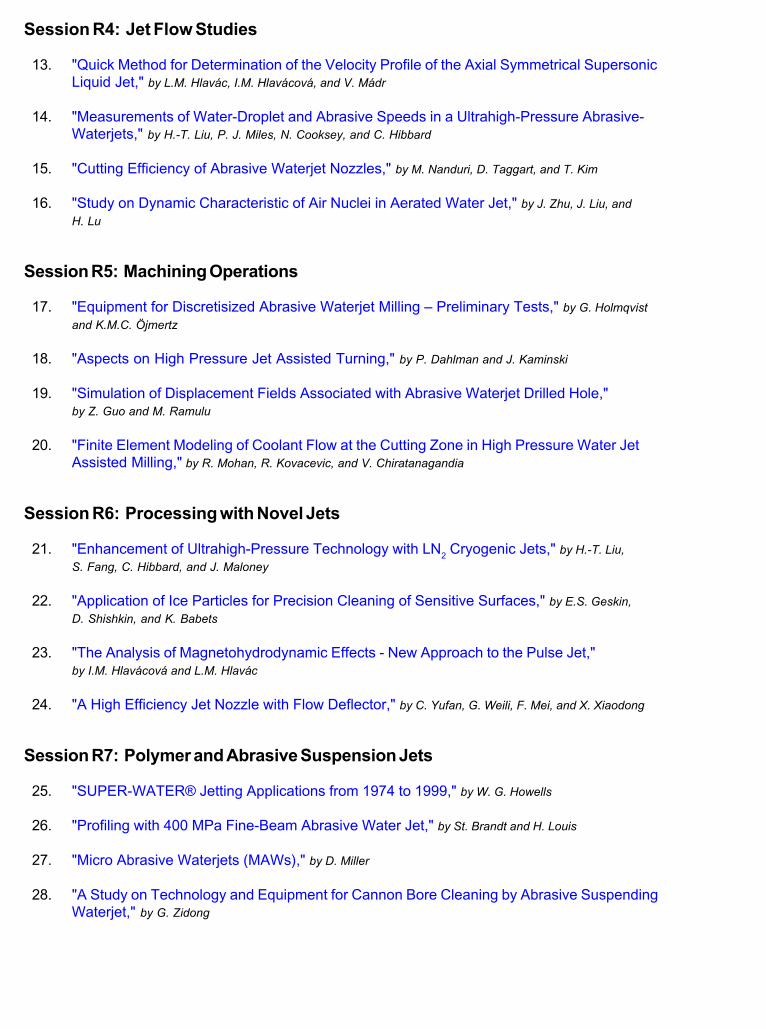
Session R4: Jet Flow Studies
13. "Quick Method for Determination of the Velocity Profile of the Axial Symmetrical SupersonicLiquid Jet," by L.M. Hlavác, I.M. Hlavácová, and V. Mádr
14. "Measurements of Water-Droplet and Abrasive Speeds in a Ultrahigh-Pressure Abrasive-Waterjets," by H.-T. Liu, P. J. Miles, N. Cooksey, and C. Hibbard
15. "Cutting Efficiency of Abrasive Waterjet Nozzles," by M. Nanduri, D. Taggart, and T. Kim
16. "Study on Dynamic Characteristic of Air Nuclei in Aerated Water Jet," by J. Zhu, J. Liu, and
H. Lu
Session R5: Machining Operations
17. "Equipment for Discretisized Abrasive Waterjet Milling – Preliminary Tests," by G. Holmqvist
and K.M.C. Öjmertz
18. "Aspects on High Pressure Jet Assisted Turning," by P. Dahlman and J. Kaminski
19. "Simulation of Displacement Fields Associated with Abrasive Waterjet Drilled Hole,"by Z. Guo and M. Ramulu
20. "Finite Element Modeling of Coolant Flow at the Cutting Zone in High Pressure Water JetAssisted Milling," by R. Mohan, R. Kovacevic, and V. Chiratanagandia
Session R6: Processing with Novel Jets
21. "Enhancement of Ultrahigh-Pressure Technology with LN2 Cryogenic Jets," by H.-T. Liu,
S. Fang, C. Hibbard, and J. Maloney
22. "Application of Ice Particles for Precision Cleaning of Sensitive Surfaces," by E.S. Geskin,
D. Shishkin, and K. Babets
23. "The Analysis of Magnetohydrodynamic Effects - New Approach to the Pulse Jet,"by I.M. Hlavácová and L.M. Hlavác
24. "A High Efficiency Jet Nozzle with Flow Deflector," by C. Yufan, G. Weili, F. Mei, and X. Xiaodong
Session R7: Polymer and Abrasive Suspension Jets
25. "SUPER-WATER® Jetting Applications from 1974 to 1999," by W. G. Howells
26. "Profiling with 400 MPa Fine-Beam Abrasive Water Jet," by St. Brandt and H. Louis
27. "Micro Abrasive Waterjets (MAWs)," by D. Miller
28. "A Study on Technology and Equipment for Cannon Bore Cleaning by Abrasive SuspendingWaterjet," by G. Zidong
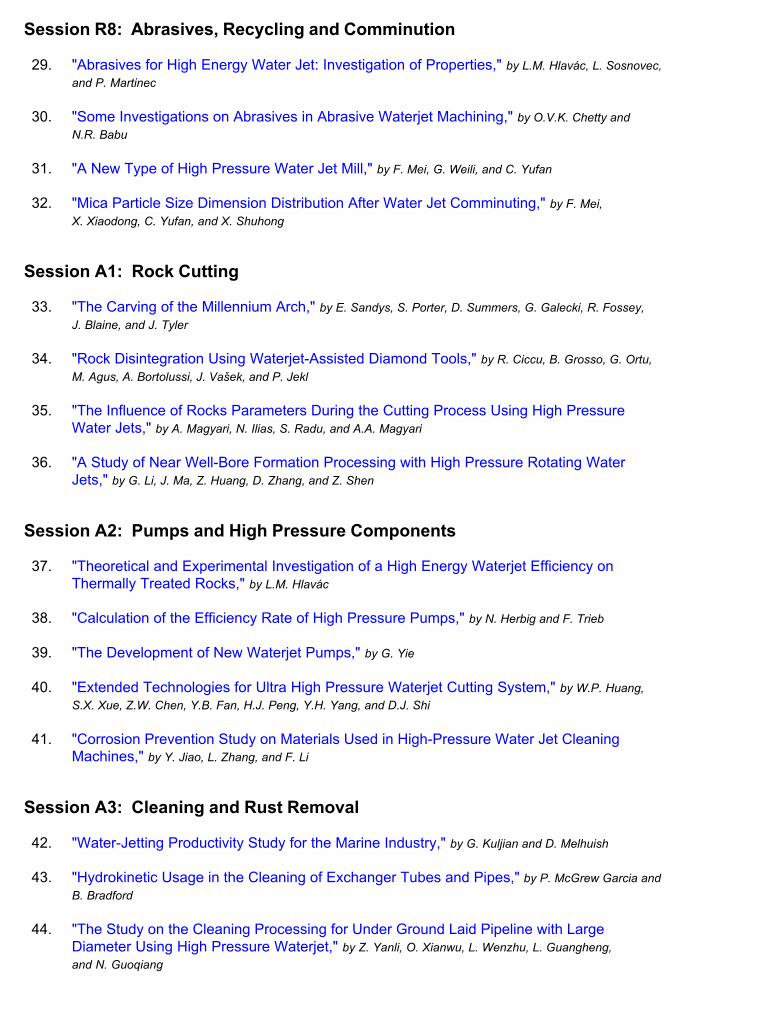
Session R8: Abrasives, Recycling and Comminution
29. "Abrasives for High Energy Water Jet: Investigation of Properties," by L.M. Hlavác, L. Sosnovec,
and P. Martinec
30. "Some Investigations on Abrasives in Abrasive Waterjet Machining," by O.V.K. Chetty and
N.R. Babu
31. "A New Type of High Pressure Water Jet Mill," by F. Mei, G. Weili, and C. Yufan
32. "Mica Particle Size Dimension Distribution After Water Jet Comminuting," by F. Mei,
X. Xiaodong, C. Yufan, and X. Shuhong
Session A1: Rock Cutting
33. "The Carving of the Millennium Arch," by E. Sandys, S. Porter, D. Summers, G. Galecki, R. Fossey,
J. Blaine, and J. Tyler
34. "Rock Disintegration Using Waterjet-Assisted Diamond Tools," by R. Ciccu, B. Grosso, G. Ortu,
M. Agus, A. Bortolussi, J. Vasek, and P. Jekl
35. "The Influence of Rocks Parameters During the Cutting Process Using High PressureWater Jets," by A. Magyari, N. Ilias, S. Radu, and A.A. Magyari
36. "A Study of Near Well-Bore Formation Processing with High Pressure Rotating WaterJets," by G. Li, J. Ma, Z. Huang, D. Zhang, and Z. Shen
Session A2: Pumps and High Pressure Components
37. "Theoretical and Experimental Investigation of a High Energy Waterjet Efficiency onThermally Treated Rocks," by L.M. Hlavác
38. "Calculation of the Efficiency Rate of High Pressure Pumps," by N. Herbig and F. Trieb
39. "The Development of New Waterjet Pumps," by G. Yie
40. "Extended Technologies for Ultra High Pressure Waterjet Cutting System," by W.P. Huang,
S.X. Xue, Z.W. Chen, Y.B. Fan, H.J. Peng, Y.H. Yang, and D.J. Shi
41. "Corrosion Prevention Study on Materials Used in High-Pressure Water Jet CleaningMachines," by Y. Jiao, L. Zhang, and F. Li
Session A3: Cleaning and Rust Removal
42. "Water-Jetting Productivity Study for the Marine Industry," by G. Kuljian and D. Melhuish
43. "Hydrokinetic Usage in the Cleaning of Exchanger Tubes and Pipes," by P. McGrew Garcia and
B. Bradford
44. "The Study on the Cleaning Processing for Under Ground Laid Pipeline with LargeDiameter Using High Pressure Waterjet," by Z. Yanli, O. Xianwu, L. Wenzhu, L. Guangheng,
and N. Guoqiang
ˇ
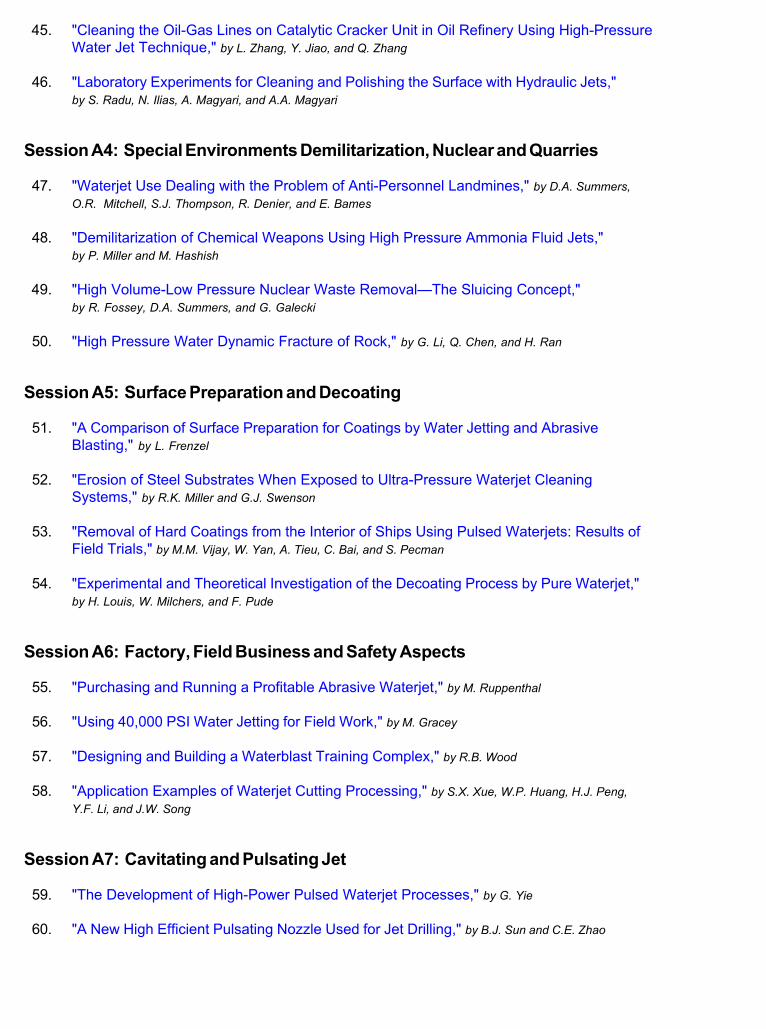
45. "Cleaning the Oil-Gas Lines on Catalytic Cracker Unit in Oil Refinery Using High-PressureWater Jet Technique," by L. Zhang, Y. Jiao, and Q. Zhang
46. "Laboratory Experiments for Cleaning and Polishing the Surface with Hydraulic Jets,"by S. Radu, N. Ilias, A. Magyari, and A.A. Magyari
Session A4: Special Environments Demilitarization, Nuclear and Quarries
47. "Waterjet Use Dealing with the Problem of Anti-Personnel Landmines," by D.A. Summers,
O.R. Mitchell, S.J. Thompson, R. Denier, and E. Bames
48. "Demilitarization of Chemical Weapons Using High Pressure Ammonia Fluid Jets,"by P. Miller and M. Hashish
49. "High Volume-Low Pressure Nuclear Waste Removal—The Sluicing Concept,"by R. Fossey, D.A. Summers, and G. Galecki
50. "High Pressure Water Dynamic Fracture of Rock," by G. Li, Q. Chen, and H. Ran
Session A5: Surface Preparation and Decoating
51. "A Comparison of Surface Preparation for Coatings by Water Jetting and AbrasiveBlasting," by L. Frenzel
52. "Erosion of Steel Substrates When Exposed to Ultra-Pressure Waterjet CleaningSystems," by R.K. Miller and G.J. Swenson
53. "Removal of Hard Coatings from the Interior of Ships Using Pulsed Waterjets: Results ofField Trials," by M.M. Vijay, W. Yan, A. Tieu, C. Bai, and S. Pecman
54. "Experimental and Theoretical Investigation of the Decoating Process by Pure Waterjet,"by H. Louis, W. Milchers, and F. Pude
Session A6: Factory, Field Business and Safety Aspects
55. "Purchasing and Running a Profitable Abrasive Waterjet," by M. Ruppenthal
56. "Using 40,000 PSI Water Jetting for Field Work," by M. Gracey
57. "Designing and Building a Waterblast Training Complex," by R.B. Wood
58. "Application Examples of Waterjet Cutting Processing," by S.X. Xue, W.P. Huang, H.J. Peng,
Y.F. Li, and J.W. Song
Session A7: Cavitating and Pulsating Jet
59. "The Development of High-Power Pulsed Waterjet Processes," by G. Yie
60. "A New High Efficient Pulsating Nozzle Used for Jet Drilling," by B.J. Sun and C.E. Zhao

61. "Development of High Erosivity Cavitating and Acoustically Enhanced Water Jets for WellScale Removal," by K.M. Kalumuck, G.L. Chahine, G.S. Frederick, and P.D. Aley
62. "An Experimental Research on a New Type of High Pressure Cavitating Waterjet Device,"by J. Liu, J. Zhu, and H. Lu
Session A8: Advances in Machining
63. "Modelling of Turning Operation for Abrasive Waterjets," by A. Henning
64. "Status and Potential of Waterjet Machining of Composites," by M. Hashish
65. "The Abrasive Waterjet as a Precision Metal Cutting Tool," by J. Zeng, J. Olsen and C. Olsen
66. "On the Development of an Intelligent Abrasive Waterjet Cutting System Software,"by P. Singh, G. Mort and I. Kain
Session C1: Cost and Safety
67. "Abrasive Waterjet Cutting—Lowering Your Operating Cost While Increasing Your TotalProfit," by D. Chisum (presentation only)
68. "A Comprehensive Waterblast Health & Safety Process," by M. Zustra
Session C2: Hazards Issue
69. "Factors Influencing the Leakage Characteristics of NPT and NPTF Threaded Connectors,"by W. Lees and P. Crofton
70. "Fluid Jet Ignition Hazards Safety Analysis," by P. Miller
Session C3: Surface Preparation
71. "Ultra High Pressure Waterjetting for Coating Removal," by R. Schmid
72. "Surface Preparation of Concrete and Metal with High Pressure & Ultra High PressureWater," by T. Kupscznak
Session C4: Rotary Nozzles
73. "Nozzle Performance in Rotary Applications," by D. Wright, J. Wolgamott, and G. Zink
74. "Mathematical Modeling of Thick Wall Tubing," by T. Thrash and C. Britton
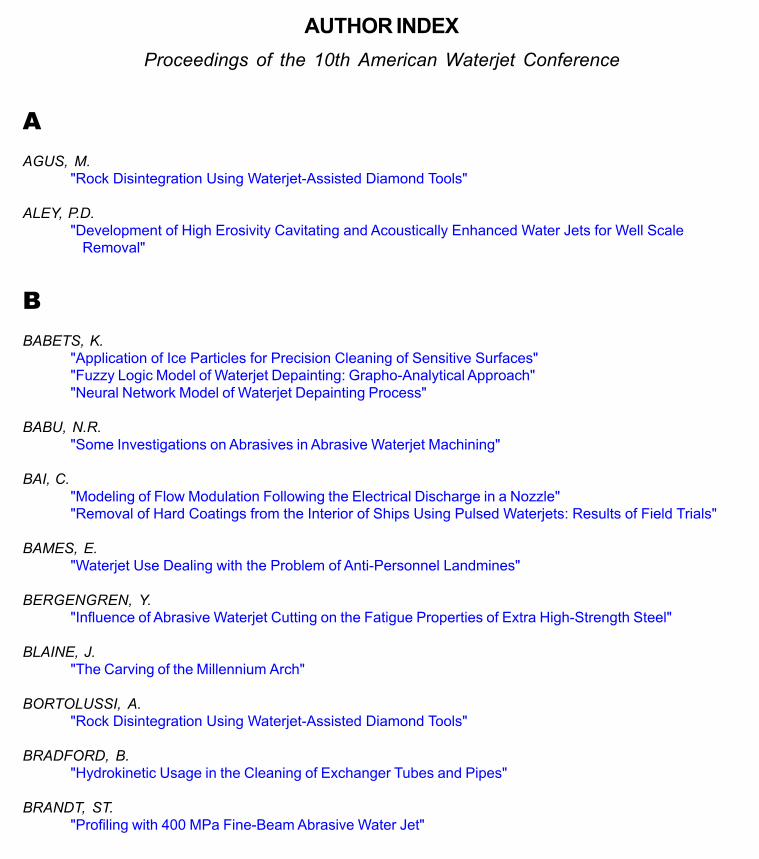
AUTHOR INDEX
Proceedings of the 10th American Waterjet Conference
A
AGUS, M."Rock Disintegration Using Waterjet-Assisted Diamond Tools"
ALEY, P.D."Development of High Erosivity Cavitating and Acoustically Enhanced Water Jets for Well Scale
Removal"
B
BABETS, K."Application of Ice Particles for Precision Cleaning of Sensitive Surfaces""Fuzzy Logic Model of Waterjet Depainting: Grapho-Analytical Approach""Neural Network Model of Waterjet Depainting Process"
BABU, N.R."Some Investigations on Abrasives in Abrasive Waterjet Machining"
BAI, C."Modeling of Flow Modulation Following the Electrical Discharge in a Nozzle""Removal of Hard Coatings from the Interior of Ships Using Pulsed Waterjets: Results of Field Trials"
BAMES, E."Waterjet Use Dealing with the Problem of Anti-Personnel Landmines"
BERGENGREN, Y."Influence of Abrasive Waterjet Cutting on the Fatigue Properties of Extra High-Strength Steel"
BLAINE, J."The Carving of the Millennium Arch"
BORTOLUSSI, A."Rock Disintegration Using Waterjet-Assisted Diamond Tools"
BRADFORD, B."Hydrokinetic Usage in the Cleaning of Exchanger Tubes and Pipes"
BRANDT, ST."Profiling with 400 MPa Fine-Beam Abrasive Water Jet"
To use this Index of Authors: Scroll down or use the bookmarks in the left-hand frame to move to a different locationin this index. Click on a blue paper title below to view that paper. To return to this Author Index, click the "PREVIOUSMENU" bookmark in the left frame.
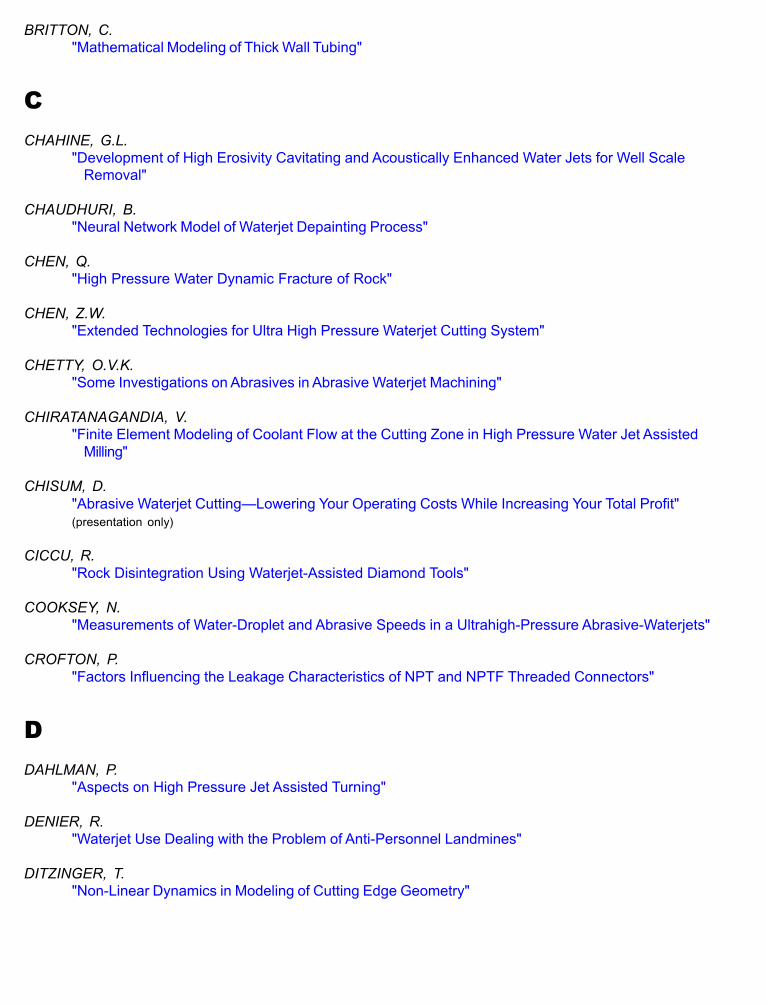
BRITTON, C."Mathematical Modeling of Thick Wall Tubing"
C
CHAHINE, G.L."Development of High Erosivity Cavitating and Acoustically Enhanced Water Jets for Well Scale
Removal"
CHAUDHURI, B."Neural Network Model of Waterjet Depainting Process"
CHEN, Q."High Pressure Water Dynamic Fracture of Rock"
CHEN, Z.W."Extended Technologies for Ultra High Pressure Waterjet Cutting System"
CHETTY, O.V.K."Some Investigations on Abrasives in Abrasive Waterjet Machining"
CHIRATANAGANDIA, V."Finite Element Modeling of Coolant Flow at the Cutting Zone in High Pressure Water Jet Assisted
Milling"
CHISUM, D."Abrasive Waterjet Cutting—Lowering Your Operating Costs While Increasing Your Total Profit"(presentation only)
CICCU, R."Rock Disintegration Using Waterjet-Assisted Diamond Tools"
COOKSEY, N."Measurements of Water-Droplet and Abrasive Speeds in a Ultrahigh-Pressure Abrasive-Waterjets"
CROFTON, P."Factors Influencing the Leakage Characteristics of NPT and NPTF Threaded Connectors"
D
DAHLMAN, P."Aspects on High Pressure Jet Assisted Turning"
DENIER, R."Waterjet Use Dealing with the Problem of Anti-Personnel Landmines"
DITZINGER, T."Non-Linear Dynamics in Modeling of Cutting Edge Geometry"
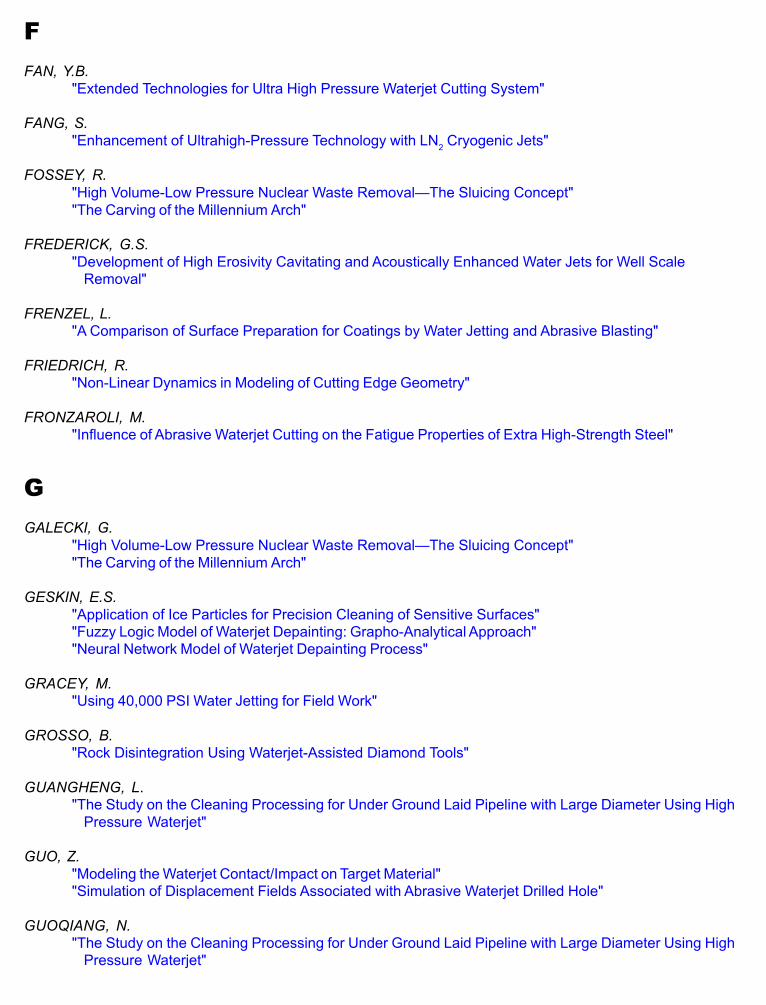
F
FAN, Y.B."Extended Technologies for Ultra High Pressure Waterjet Cutting System"
FANG, S."Enhancement of Ultrahigh-Pressure Technology with LN
2 Cryogenic Jets"
FOSSEY, R."High Volume-Low Pressure Nuclear Waste Removal—The Sluicing Concept""The Carving of the Millennium Arch"
FREDERICK, G.S."Development of High Erosivity Cavitating and Acoustically Enhanced Water Jets for Well Scale
Removal"
FRENZEL, L."A Comparison of Surface Preparation for Coatings by Water Jetting and Abrasive Blasting"
FRIEDRICH, R."Non-Linear Dynamics in Modeling of Cutting Edge Geometry"
FRONZAROLI, M."Influence of Abrasive Waterjet Cutting on the Fatigue Properties of Extra High-Strength Steel"
G
GALECKI, G."High Volume-Low Pressure Nuclear Waste Removal—The Sluicing Concept""The Carving of the Millennium Arch"
GESKIN, E.S."Application of Ice Particles for Precision Cleaning of Sensitive Surfaces""Fuzzy Logic Model of Waterjet Depainting: Grapho-Analytical Approach""Neural Network Model of Waterjet Depainting Process"
GRACEY, M."Using 40,000 PSI Water Jetting for Field Work"
GROSSO, B."Rock Disintegration Using Waterjet-Assisted Diamond Tools"
GUANGHENG, L."The Study on the Cleaning Processing for Under Ground Laid Pipeline with Large Diameter Using High
Pressure Waterjet"
GUO, Z."Modeling the Waterjet Contact/Impact on Target Material""Simulation of Displacement Fields Associated with Abrasive Waterjet Drilled Hole"
GUOQIANG, N."The Study on the Cleaning Processing for Under Ground Laid Pipeline with Large Diameter Using High
Pressure Waterjet"
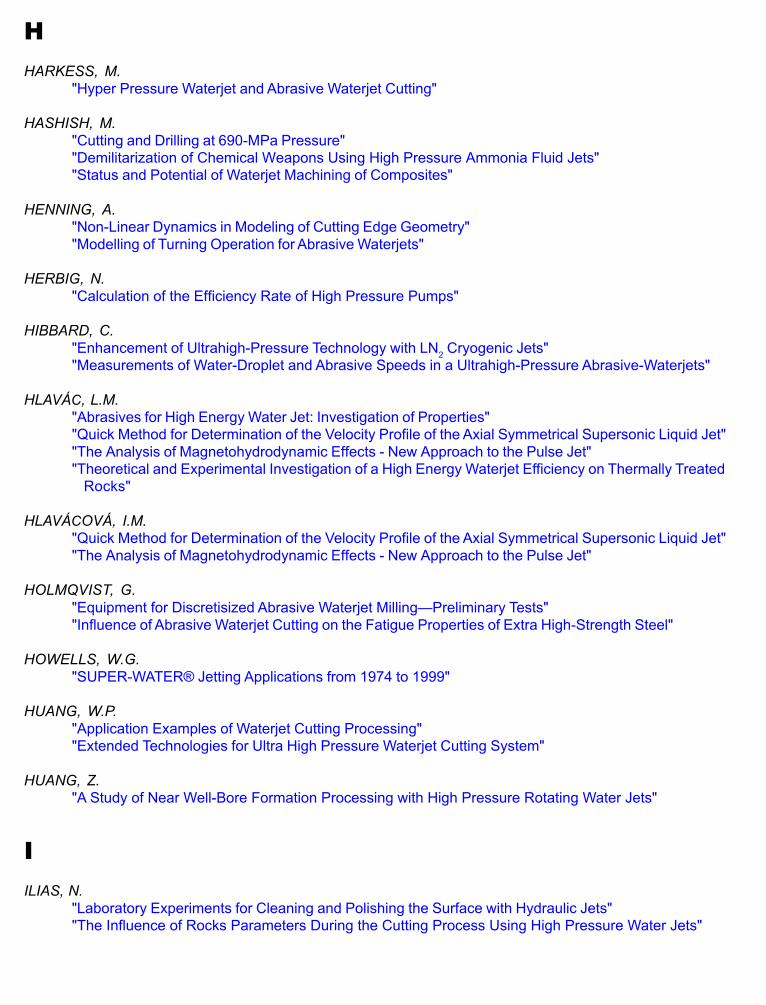
H
HARKESS, M."Hyper Pressure Waterjet and Abrasive Waterjet Cutting"
HASHISH, M."Cutting and Drilling at 690-MPa Pressure""Demilitarization of Chemical Weapons Using High Pressure Ammonia Fluid Jets""Status and Potential of Waterjet Machining of Composites"
HENNING, A."Non-Linear Dynamics in Modeling of Cutting Edge Geometry""Modelling of Turning Operation for Abrasive Waterjets"
HERBIG, N."Calculation of the Efficiency Rate of High Pressure Pumps"
HIBBARD, C."Enhancement of Ultrahigh-Pressure Technology with LN
2 Cryogenic Jets"
"Measurements of Water-Droplet and Abrasive Speeds in a Ultrahigh-Pressure Abrasive-Waterjets"
HLAVÁC, L.M."Abrasives for High Energy Water Jet: Investigation of Properties""Quick Method for Determination of the Velocity Profile of the Axial Symmetrical Supersonic Liquid Jet""The Analysis of Magnetohydrodynamic Effects - New Approach to the Pulse Jet""Theoretical and Experimental Investigation of a High Energy Waterjet Efficiency on Thermally Treated
Rocks"
HLAVÁCOVÁ, I.M."Quick Method for Determination of the Velocity Profile of the Axial Symmetrical Supersonic Liquid Jet""The Analysis of Magnetohydrodynamic Effects - New Approach to the Pulse Jet"
HOLMQVIST, G."Equipment for Discretisized Abrasive Waterjet Milling—Preliminary Tests""Influence of Abrasive Waterjet Cutting on the Fatigue Properties of Extra High-Strength Steel"
HOWELLS, W.G."SUPER-WATER® Jetting Applications from 1974 to 1999"
HUANG, W.P."Application Examples of Waterjet Cutting Processing""Extended Technologies for Ultra High Pressure Waterjet Cutting System"
HUANG, Z."A Study of Near Well-Bore Formation Processing with High Pressure Rotating Water Jets"
I
ILIAS, N."Laboratory Experiments for Cleaning and Polishing the Surface with Hydraulic Jets""The Influence of Rocks Parameters During the Cutting Process Using High Pressure Water Jets"
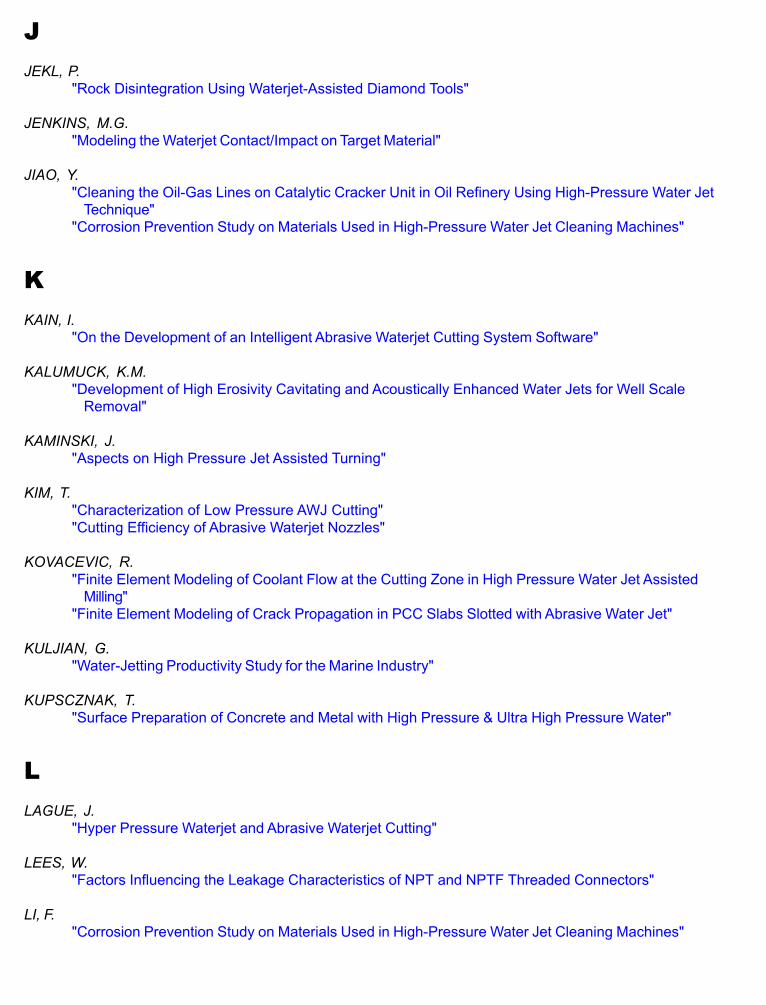
J
JEKL, P."Rock Disintegration Using Waterjet-Assisted Diamond Tools"
JENKINS, M.G."Modeling the Waterjet Contact/Impact on Target Material"
JIAO, Y."Cleaning the Oil-Gas Lines on Catalytic Cracker Unit in Oil Refinery Using High-Pressure Water Jet
Technique""Corrosion Prevention Study on Materials Used in High-Pressure Water Jet Cleaning Machines"
K
KAIN, I."On the Development of an Intelligent Abrasive Waterjet Cutting System Software"
KALUMUCK, K.M."Development of High Erosivity Cavitating and Acoustically Enhanced Water Jets for Well Scale
Removal"
KAMINSKI, J."Aspects on High Pressure Jet Assisted Turning"
KIM, T."Characterization of Low Pressure AWJ Cutting""Cutting Efficiency of Abrasive Waterjet Nozzles"
KOVACEVIC, R."Finite Element Modeling of Coolant Flow at the Cutting Zone in High Pressure Water Jet Assisted
Milling""Finite Element Modeling of Crack Propagation in PCC Slabs Slotted with Abrasive Water Jet"
KULJIAN, G."Water-Jetting Productivity Study for the Marine Industry"
KUPSCZNAK, T."Surface Preparation of Concrete and Metal with High Pressure & Ultra High Pressure Water"
L
LAGUE, J."Hyper Pressure Waterjet and Abrasive Waterjet Cutting"
LEES, W."Factors Influencing the Leakage Characteristics of NPT and NPTF Threaded Connectors"
LI, F."Corrosion Prevention Study on Materials Used in High-Pressure Water Jet Cleaning Machines"
LI, G."A Study of Near Well-Bore Formation Processing with High Pressure Rotating Water Jets""High Pressure Water Dynamic Fracture of Rock"
LI, Y.F."Application Examples of Waterjet Cutting Processing"
LIU, H.-T."Enhancement of Ultrahigh-Pressure Technology with LN
2 Cryogenic Jets"
"Measurements of Water-Droplet and Abrasive Speeds in a Ultrahigh-Pressure Abrasive-Waterjets"
LIU, J."An Experimental Research on a New Type of High Pressure Cavitating Waterjet Device""Study on Dynamic Characteristic of Air Nuclei in Aerated Water Jet"
LOUIS, H."Experimental and Theoretical Investigation of the Decoating Process by Pure Waterjet""Profiling with 400 MPa Fine-Beam Abrasive Water Jet"
LU, H."An Experimental Research on a New Type of High Pressure Cavitating Waterjet Device""Study on Dynamic Characteristic of Air Nuclei in Aerated Water Jet"
M
MA, J."A Study of Near Well-Bore Formation Processing with High Pressure Rotating Water Jets"
MÁDR, V."Quick Method for Determination of the Velocity Profile of the Axial Symmetrical Supersonic Liquid Jet"
MAGYARI, A."Laboratory Experiments for Cleaning and Polishing the Surface with Hydraulic Jets""The Influence of Rocks Parameters During the Cutting Process Using High Pressure Water Jets"
MAGYARI, A.A."Laboratory Experiments for Cleaning and Polishing the Surface with Hydraulic Jets""The Influence of Rocks Parameters During the Cutting Process Using High Pressure Water Jets"
MAKOMASKI, A.H."Modeling of Flow Modulation Following the Electrical Discharge in a Nozzle"
MALONEY, J."Enhancement of Ultrahigh-Pressure Technology with LN
2 Cryogenic Jets"
MARTINEC, P."Abrasives for High Energy Water Jet: Investigation of Properties"
MCGREW GARCIA, P."Hydrokinetic Usage in the Cleaning of Exchanger Tubes and Pipes"
MEI, F."A High Efficiency Jet Nozzle with Flow Deflector""A New Type of High Pressure Water Jet Mill""Mica Particle Size Dimension Distribution After Water Jet Comminuting"
MELHUISH, D."Water-Jetting Productivity Study for the Marine Industry"
MILCHERS, W."Experimental and Theoretical Investigation of the Decoating Process by Pure Waterjet"
MILES, P.J."Measurements of Water-Droplet and Abrasive Speeds in a Ultrahigh-Pressure Abrasive-Waterjets"
MILLER, D."Micro Abrasive Waterjets (MAWs)"
MILLER, P."Demilitarization of Chemical Weapons Using High Pressure Ammonia Fluid Jets""Fluid Jet Ignition Hazards Safety Analysis"
MILLER, R.K."Erosion of Steel Substrates When Exposed to Ultra-Pressure Waterjet Cleaning Systems"
MITCHELL, O.R."Waterjet Use Dealing with the Problem of Anti-Personnel Landmines"
MOHAN, R."Finite Element Modeling of Coolant Flow at the Cutting Zone in High Pressure Water Jet Assisted
Milling""Finite Element Modeling of Crack Propagation in PCC Slabs Slotted with Abrasive Water Jet"
MORT, G."On the Development of an Intelligent Abrasive Waterjet Cutting System Software"
N
NANDURI, M."Characterization of Low Pressure AWJ Cutting""Cutting Efficiency of Abrasive Waterjet Nozzles"
O
ÖJMERTZ, K.M.C."Equipment for Discretisized Abrasive Waterjet Milling—Preliminary Tests""Influence of Abrasive Waterjet Cutting on the Fatigue Properties of Extra High-Strength Steel"
OLSEN, C."The Abrasive Waterjet as a Precision Metal Cutting Tool"
OLSEN, J."The Abrasive Waterjet as a Precision Metal Cutting Tool"
ORTU, G."Rock Disintegration Using Waterjet-Assisted Diamond Tools"
OTTERSTATTER, K."Hyper Pressure Waterjet and Abrasive Waterjet Cutting"
P
PECMAN, S."Removal of Hard Coatings from the Interior of Ships Using Pulsed Waterjets: Results of Field Trials"
PENG, H.J."Application Examples of Waterjet Cutting Processing""Extended Technologies for Ultra High Pressure Waterjet Cutting System"
PORTER, S."The Carving of the Millennium Arch"
PUDE, F."Experimental and Theoretical Investigation of the Decoating Process by Pure Waterjet"
R
RADJKO, B.V."Analytical Investigations of Hydraulic Breaking Coefficient of Coal Seams"
RADONS, G."Non-Linear Dynamics in Modeling of Cutting Edge Geometry"
RADU, S."Laboratory Experiments for Cleaning and Polishing the Surface with Hydraulic Jets""The Influence of Rocks Parameters During the Cutting Process Using High Pressure Water Jets"
RAMULU, M."Modeling and Simulation of Pressure Fluctuations in High Pressure Waterjets""Modeling the Waterjet Contact/Impact on Target Material""Simulation of Displacement Fields Associated with Abrasive Waterjet Drilled Hole"
RAN, H."High Pressure Water Dynamic Fracture of Rock"
RUPPENTHAL, M."Purchasing and Running a Profitable Abrasive Waterjet"
S
SACQUITNE, R."Hyper Pressure Waterjet and Abrasive Waterjet Cutting"
SANDYS, E."The Carving of the Millennium Arch"
SCHMID, R."Ultra High Pressure Waterjetting for Coating Removal"
SHEN, Z."A Study of Near Well-Bore Formation Processing with High Pressure Rotating Water Jets"
SHI, D.J."Extended Technologies for Ultra High Pressure Waterjet Cutting System"
SHISHKIN, D."Application of Ice Particles for Precision Cleaning of Sensitive Surfaces"
SHUHONG, X."Mica Particle Size Dimension Distribution After Water Jet Comminuting"
SINGH, P."On the Development of an Intelligent Abrasive Waterjet Cutting System Software"
SONG, J.W."Application Examples of Waterjet Cutting Processing"
SOSNOVEC, L."Abrasives for High Energy Water Jet: Investigation of Properties"
SUMMERS, D.A."High Volume-Low Pressure Nuclear Waste Removal—The Sluicing Concept""The Carving of the Millennium Arch""Waterjet Use Dealing with the Problem of Anti-Personnel Landmines"
SUN, B.J."A New High Efficient Pulsating Nozzle Used for Jet Drilling"
SWENSON, G.J."Erosion of Steel Substrates When Exposed to Ultra-Pressure Waterjet Cleaning Systems"
T
TAGGART, D."Characterization of Low Pressure AWJ Cutting""Cutting Efficiency of Abrasive Waterjet Nozzles"
THOMPSON, S.J."Waterjet Use Dealing with the Problem of Anti-Personnel Landmines"
THRASH, T."Mathematical Modeling of Thick Wall Tubing"
TIEU, A."Modeling of Flow Modulation Following the Electrical Discharge in a Nozzle""Removal of Hard Coatings from the Interior of Ships Using Pulsed Waterjets: Results of Field Trials"
TREMBLAY, M."Modeling and Simulation of Pressure Fluctuations in High Pressure Waterjets"
TRIEB, F."Calculation of the Efficiency Rate of High Pressure Pumps"
TYLER, J."The Carving of the Millennium Arch"
V
VASEK, J."Rock Disintegration Using Waterjet-Assisted Diamond Tools"
VIJAY, M.M."Modelling of Flow Modulation Following the Electrical Discharge in a Nozzle""Removal of Hard Coatings from the Interior of Ships Using Pulsed Waterjets: Results of Field Trials"
W
WEILI, G."A High Efficiency Jet Nozzle with Flow Deflector""A New Type of High Pressure Water Jet Mill"
WENZHU, L."The Study on the Cleaning Processing for Under Ground Laid Pipeline with Large Diameter Using High
Pressure Waterjet"
WOLGAMOTT, J."Nozzle Performance in Rotary Applications"
WOOD, R.B."Designing and Building a Waterblast Training Complex"
WRIGHT, D."Nozzle Performance in Rotary Applications"
X
XIANWU, O."The Study on the Cleaning Processing for Under Ground Laid Pipeline with Large Diameter Using High
Pressure Waterjet"
XIAODONG, X."A High Efficiency Jet Nozzle with Flow Deflector""Mica Particle Size Dimension Distribution After Water Jet Comminuting"
XU, J."Hyper Pressure Waterjet and Abrasive Waterjet Cutting"
XUE, S.X."Application Examples of Waterjet Cutting Processing""Extended Technologies for Ultra High Pressure Waterjet Cutting System"
ˇ
Y
YAN, W."Modeling of Flow Modulation Following the Electrical Discharge in a Nozzle""Removal of Hard Coatings from the Interior of Ships Using Pulsed Waterjets: Results of Field Trials"
YANG, Y.H."Extended Technologies for Ultra High Pressure Waterjet Cutting System"
YANLI, Z."The Study on the Cleaning Processing for Under Ground Laid Pipeline with Large Diameter Using High
Pressure Waterjet"
YIE, G."The Development of High-Power Pulsed Waterjet Processes""The Development of New Waterjet Pumps"
YUFAN, C."A High Efficiency Jet Nozzle with Flow Deflector""A New Type of High Pressure Water Jet Mill""Mica Particle Size Dimension Distribution After Water Jet Comminuting"
Z
ZENG, J."The Abrasive Waterjet as a Precision Metal Cutting Tool"
ZHANG, D."A Study of Near Well-Bore Formation Processing with High Pressure Rotating Water Jets"
ZHANG, L."Cleaning the Oil-Gas Lines on Catalytic Cracker Unit in Oil Refinery Using High-Pressure Water Jet
Technique""Corrosion Prevention Study on Materials Used in High-Pressure Water Jet Cleaning Machines"
ZHANG, Q."Cleaning the Oil-Gas Lines on Catalytic Cracker Unit in Oil Refinery Using High-Pressure Water Jet
Technique"
ZHAO, C.E."A New High Efficient Pulsating Nozzle Used for Jet Drilling"
ZHU, J."An Experimental Research on a New Type of High Pressure Cavitating Waterjet Device""Study on Dynamic Characteristic of Air Nuclei in Aerated Water Jet"
ZIDONG, G."A Study on Technology and Equipment for Cannon Bore Cleaning by Abrasive Suspending Waterjet"
ZINK, G."Nozzle Performance in Rotary Applications"
ZUSTRA, M."A Comprehensive Waterblast Health & Safety Process"
10th American Waterjet ConferenceAugust 14-17, 1999: Houston, Texas
Paper 1
INFLUENCE OF ABRASIVE WATERJET CUTTING ON THE FATIGUE
PROPERTIES OF EXTRA HIGH-STRENGTH STEEL
G. Holmqvist and K.M.C. ÖjmertzChalmers University of Technology
Göteborg, Sweden
Y. Bergengren and M. FronzaroliSSAB Oxelösund ABOxelösund, Sweden
ABSTRACT
The erosion based material removal processes active in abrasive waterjet (AWJ) cutting hasvirtually no thermal impact on the material and produce none or minor residual stresses. Theprocess is therefore an interesting alternative for machining of fatigue exposed structures. Thepresent study presents results from fatigue testing of abrasive waterjet cut specimens in extrahigh-strength steel. The tested material is a quenched and tempered steel having a yield strengthof more than 1100 MPa. The main applications for these extra high strength steels are in heavyconstruction equipment, cranes, offshore equipment and other highly stressed applications. Manyof these applications are fatigue loaded, and thermally cut surfaces are usually the second mostcommon initiation site for fatigue cracks, after weldments. In the study three different AWJ cutqualities were tested. The results show that the cut quality does not significantly affect the fatiguelife. Further, the results show a large scatter. Possible reasons for this scatter are discussed. Eventhough the scatter is large, all test specimens showed a fatigue life longer than what is specifiedin a widespread design guideline covering thermal processes.
Organized and Sponsored by the WaterJet Technology Association
1. INTRODUCTION
1.1 Background
The modern high-strength materials emerging during the last decades have posed an importantchallenge to the steel industry, and considerable efforts have been made to increase the strengthand the general applicability of steel. In the business segment of "heavy plate", with dimensionsof 5 mm and thicker, this has led to the development of quenched and tempered martensiticstructural steel grades with yield strengths of more than 1100 N/mm2.
The advantage of using these new steels is the possibility to build extremely light constructionsusing conventional production methods. Typical applications of the 1100 N/mm2 yield strengthstructural steel so far have been in mobile cranes and mobile bridges.
There are two major challenges of using these new structural steels. Firstly, they are not yetcovered explicitly by design codes and standards. This leaves many decisions to be made by anexperienced design engineer. Secondly, it is a well-known fact that control of the fatiguephenomenon becomes increasingly more important in light-weight structures, due to the higherstresses in the structure.
Preliminary tests performed previously have shown that AWJ cut surfaces can show a relativelygood fatigue performance, especially when compared to other cutting methods such as flamecutting. The aim of the present paper has been to study the fatigue performance of AWJ cutsurfaces and to try to correlate with existing fatigue design guidelines. Moreover, an effort hasbeen made to evaluate the influence on fatigue performance related to the chosen cutting speed.
Apart from the supposed increased fatigue performance of AWJ cut surfaces, AWJ also presentsother advantages in cutting of these steel grades. In comparison with flame cutting, there is norisk of thermally induced hydrogen cracking. Also, the risk of softening of small details cut fromplates in these grades is eliminated.
1.2 Alternative Cutting Methods Used for Cutting Extra High-Strength Steels
The most common method for cutting of extra high strength steels today is ordinary flamecutting. However, methods like plasma cutting and laser cutting are increasingly used. All thesemethods have some disadvantages, since they produce a heat affected zone (HAZ) at the cutsurface. This HAZ is typically 4-10 mm for flame cutting, depending on the thickness of theplate. For plasma cut surfaces, the HAZ is less, typically 2-5 mm. Laser cutting gives the leastHAZ, 0.4-3 mm. This soft HAZ is disadvantageous in some applications.
Flame cut surfaces are known to give relatively poor fatigue strength, which is attributed to theroughness of the surface, microcracks in the cut surface and the loss of material strength in theHAZ. Moreover tensile residual stresses below the surface also enhance the initiation and furthergrowth of fatigue cracks, even though the residual stress in the superficial surface layer iscompressive. The poor fatigue performance of flame cut surfaces is recognized in fatigue design
standards and guidelines for steel structures, as for instance in the guidelines of the InternationalInstitute of Welding, IIW (Hobbacher, 1996). These standards and guidelines do not distinguishbetween flame cutting, plasma cutting and laser cutting, the design fatigue strength is the same.These standards and guidelines do not cover abrasive water jet cutting.
For a high strength steel, having a fatigue limit given as stress range of 350 MPa (σmin≈0,σmax=350 MPa), the fatigue design strength at long lives may be as low as 60 MPa for a manuallyflame cut surface.
2. EXPERIMENTAL PLAN AND EQUIPMENT
As the surface integrity has an important influence on fatigue properties, different AWJ cutqualities were tested. Fatigue test specimens in three different surface qualities were tested.Surface measurements were made on test specimens prior to fatigue testing.
2.1 Strategy and Test Set-up for AWJ Cutting
A standard venturi cutting head for abrasive waterjet cutting being traversed by a 2½-axis gantryrobot manipulator was used for cutting the test specimens. Abrasives were gravity fed into thecutting head and high-pressure water was supplied from a commercially available intensifierpump unit.
To predict adequate traverse rates for the three qualities to be cut, the empirical cutting model(eq. 1), presented by Zeng and Kim (1993), was used.
uN P m m
C q h Dm w w=
⋅ ⋅ ⋅⋅ ⋅ ⋅
1 25 0 687 0 343
0 618
1 15, , ,
,
,
(1)
where: Nm = machinability number; h = depth of cut [mm]; D = mixing tube diameter [mm];u = traverse rate [mm/s]; Pw = water pressure [MPa]; mw = water mass flow [l/min.];ma = abrasive mass flow [g/sec]; q is the quality index, where q=5 is a smooth surface finish and
q=1 corresponds to the maximum cutting speed for the present depth of cut (thickness) h. Forsuch a model to be reliable, care must be taken to ensure that the model is used under conditionssimilar to those under which it was established. According to Singh and Munoz (1993) therecommended range of parameter values for validity of the model in eq. 1 is as follows: Pw = 240to 375 MPa; dn = 0.18 to 0.45 mm (orifice diameter); D/dn = 2.5 to 4.5; ma/ mw =0.12 to 0.25.
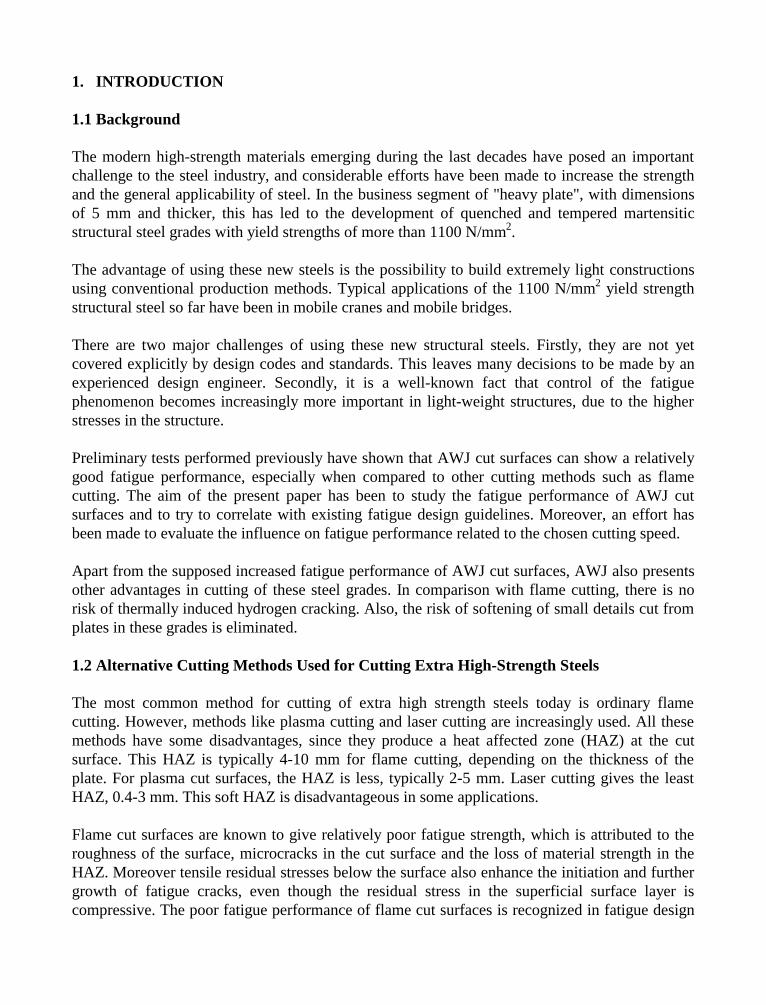
The material's machinability number was determined by milling a slot using a known parametersetting. The depth of the slot, h, was probed by a thin 30 mm wide metal sheet, whichconsequently indicates at what plate thickness full penetration would have occurred along theprobed path. The machinability number was determined using eq. 1 setting the quality index to 1.A series of cut qualities, from q=1 to 5 in steps of 0.5, was subsequently produced in thematerial. By visual inspection, qualities 1, 2 and 3 were chosen as being of greatest industrial
relevance, and they were consequently the selected grades for cutting of the fatigue testspecimens (figure 1). Table 1 shows the cutting parameters used.
2.2 Mechanical Properties of Steel Used for Specimens
The steel used for the tests throughout this paper had the following chemical composition1:
C*max(%)
Si*max(%)
Mn*max(%)
Pmax(%)
Smax(%)
B*max(%)
Nb*max(%)
Cr*max(%)
V*max(%)
Cu*max(%)
Ti*max(%)
Al*totalmin(%)
Mo*max(%)
Ni*max(%)
Nmax(%)
CEVtypicalvalue(%)
0,21 0,50 1,20 0,10 0,20 0,005 0,04 0,80 0,08 0,30 0,02 0,02 0,70 3,0 0,015 0,70
*) Intentional alloying elements
The material has the following guaranteed mechanical properties:
Yield strength
Rp 0,2 min
[N/mm2]
Tensile strength
Rm
[N/mm2]
Elongation A)
A5 min
[%]
Toughness B), transverse
Charpy-V test pieces
10*10 mm C), min. [J]
1100 1200-1500 10 (12) 27 at -40°CA. The value is valid for test pieces transverse to the rolling direction. For longitudinal pieces the values are 2 units higher.B. Average impact energy of three tests. Single value min. 70% of specified average.C. For plate thickness under 12 mm subsize Charpy-V specimens are used. The specified minimum value is then proportional
to specimen cross section.
The specimens used in this paper were taken from a 10 mm WELDOX 1100E plate with thefollowing mechanical properties:
Yield strength
Rp 0,2 min
[N/mm2]
Tensile strength
Rm
[N/mm2]
Elongation
A5
[%]
Toughness, transverse.
Subsize Charpy-V test
pieces 7,5*10 mm, [J]
1261 1386 11 37 at -40°C
2.3 Experimental Details
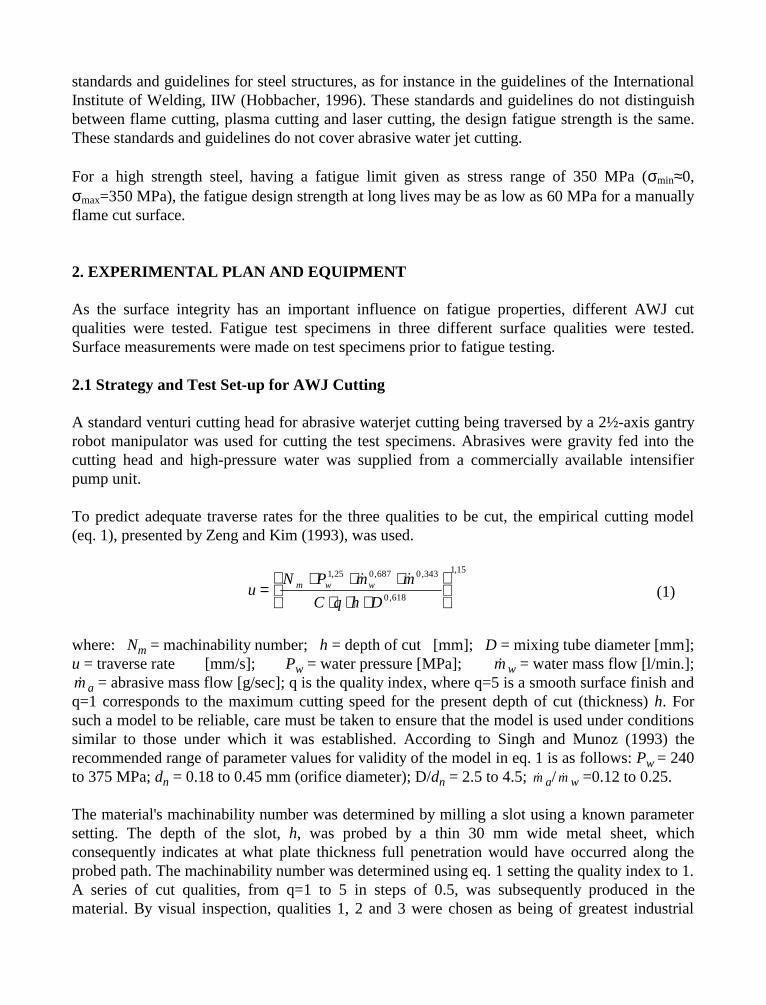
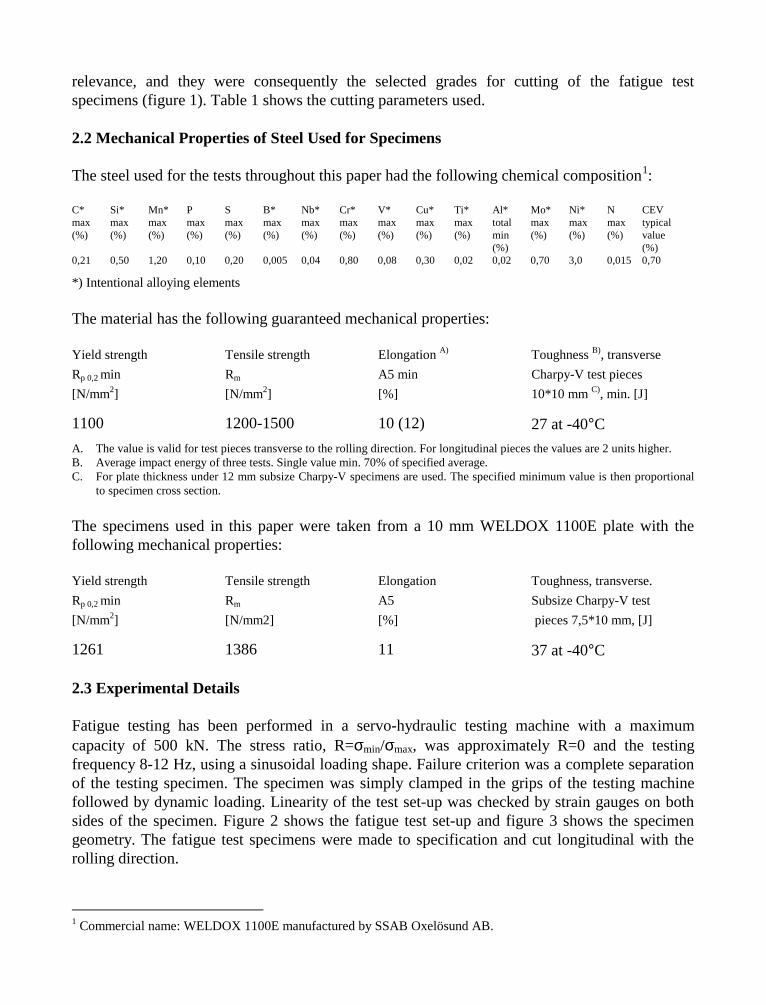
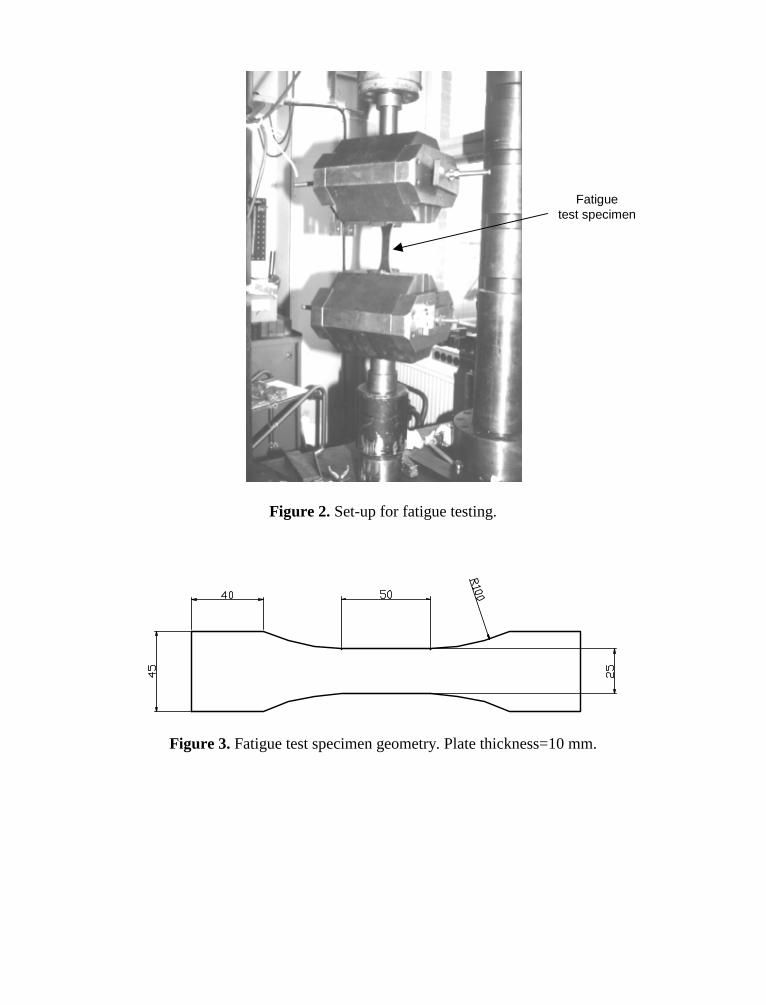
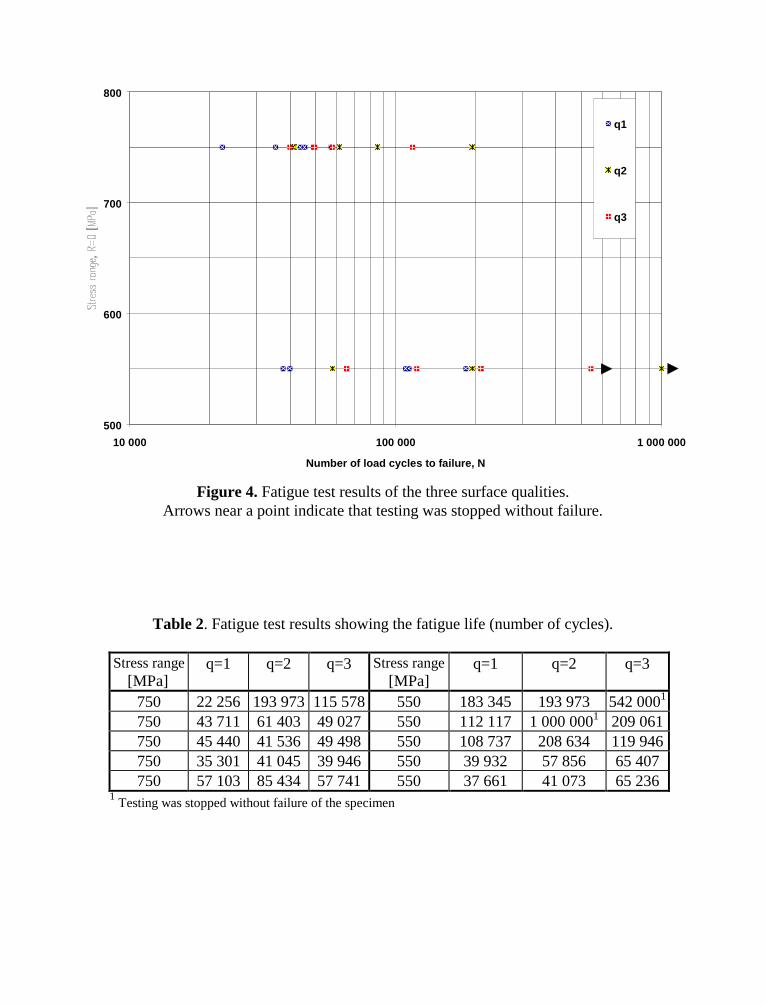
Fatigue testing has been performed in a servo-hydraulic testing machine with a maximumcapacity of 500 kN. The stress ratio, R=σmin/σmax, was approximately R=0 and the testingfrequency 8-12 Hz, using a sinusoidal loading shape. Failure criterion was a complete separationof the testing specimen. The specimen was simply clamped in the grips of the testing machinefollowed by dynamic loading. Linearity of the test set-up was checked by strain gauges on bothsides of the specimen. Figure 2 shows the fatigue test set-up and figure 3 shows the specimengeometry. The fatigue test specimens were made to specification and cut longitudinal with therolling direction.
1 Commercial name: WELDOX 1100E manufactured by SSAB Oxelösund AB.
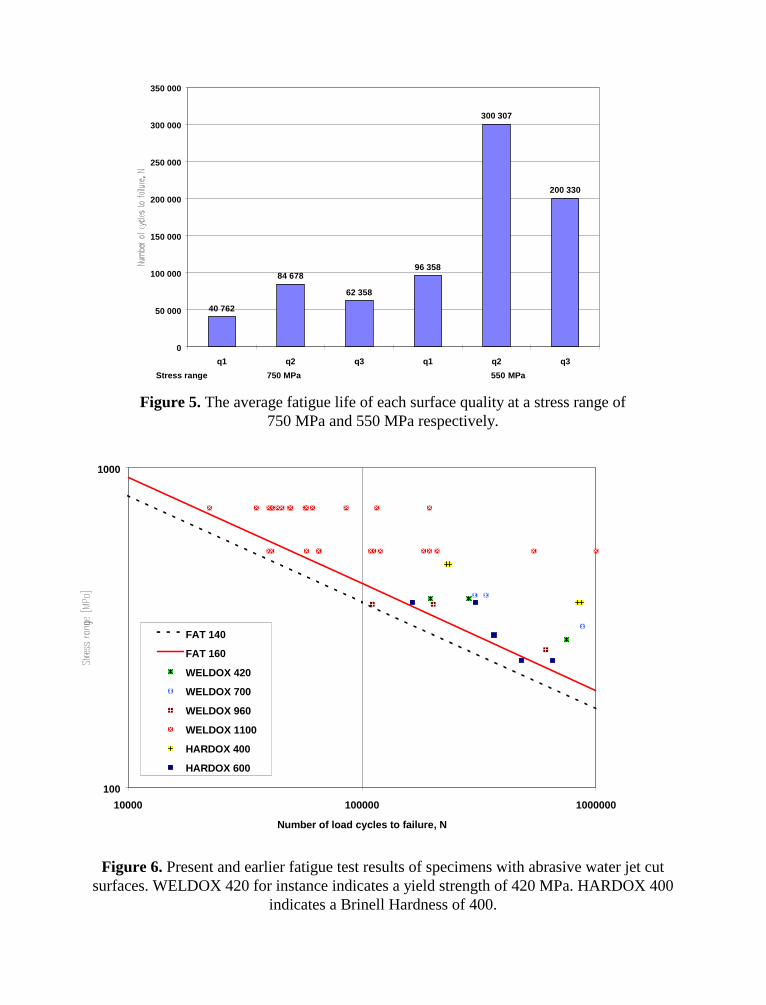
Fatigue testing has been performed at two stress range levels, ∆σ=750 MPa and ∆σ=550 MPa. Inthis way, the number of loads can be plotted versus the stress level in a log-log diagram, wherethe resulting curve is known as the S-N curve (in some literature the Wöhler curve). Thus, theslope of the S-N curve can be determined. Five specimens of each cut surface quality, q=1, q=2and q=3, were tested at each level.
The original plate surface of the specimens was machine ground prior to testing, to avoidinitiation at this position. The edges (corners) of the specimens were not removed, to haverealistic testing conditions.
For surface measurements an interference microscope was used. This measuring technique hasthe advantage of being a quick and non-contacting method. Its main disadvantage is that thepossible measuring area is comparatively limited. The interference microscope used was a WykoRST plus. This is a white light vertical scanning instrument that works with one or severalexchangeable magnification objectives. The vertical measurement range is 0.5 mm with aresolution better than 10 nm. Three test specimens of each quality were chosen for themeasurements. On each test specimen, measurements were made at 2 different locations, eachreplicated 3 times, close to the top and bottom edge. Measurement areas as large as possible werechosen. The measured area was 2.6x1.9 mm at the bottom edge of the surfaces and at the topedge 1.2x0.9 mm.
3. RESULTS
The fatigue test results are summarized in figure 4 and table 2. As seen in the figure there is alarge scatter in the fatigue test result for all three surface qualities. For instance, the fatigue life ata stress range of 550 MPa ranges from 41000 to 1 million load cycles for surface quality q=2.This is considered as an extraordinarily large scatterband.
The average fatigue life for each surface quality is given in figure 5. The average fatigue life waslowest for the surface quality q=1, having the roughest surface. Somewhat surprising is that theintermediate surface quality q=2 shows the highest average fatigue life of the three. Thesmoothest surface, q=3, gives higher average fatigue life than q=1 but lower than q=2. However,the large scatter in test results makes conclusions difficult. Obviously, there is a trend towardslonger fatigue life with the smoother surface qualities, but individual specimens give rather shortfatigue lives.
For design purposes it may therefore be advantageous to put the result of the three surface qualityindexes together and compare with so called FAT classes for structural steels (Hobbacher, 1996).The FAT class is defined as the fatigue strength at 2 million load cycles. (Consequently, e. g.FAT 140 means a fatigue strength of 140 MPa at 2 million cycles). Together with the slope,given by the factor m, the full design fatigue curve can be established. The fatigue strength
corresponding to a certain life, N, can then be calculated using eq. 2, which is valid for the linearpart of the S-N curve, that is fatigue lives of less than 5 million load cycles.
∆σ = ⋅⋅ −
FATN
m( )2 106 1
(2)
In figure 6, the present test results (WELDOX 1100) have been plotted with results frompreviously performed tests on other steel grades and compared with different FAT classes. Theprevious test results represent a surface quality index of approximately q=2. These test specimensdiffered from those presently used, in that the original plate surface was not ground, and in thatcorners were removed. The steel grades tested were structural steels with different yieldstrengths. Two abrasion resistant steel plates have also been tested with hardness of 400 HB and600 HB, respectively. The thickness of the plates were 8-15 mm. FAT class 140 together withm=3 has been used as a reference, which corresponds to the highest FAT class for machine flamecut or sheared surfaces. In this class is generally required that corners are removed, no cracks orimperfections are discernible by inspection. Also, FAT 160 with m=3 is shown in the diagram.For comparison, a manually flame cut surface corresponds to a FAT class of approximately 100.
As shown in figure 6 all data are above the FAT 140 design curve with m=3. Therefore using thisclass may be recommended for design of components cut with abrasive waterjet cutting.
Studies of the fracture surfaces by optical stereo microscopy showed that the fatigue cracks of allspecimens tested at a stress range of 750 MPa are initiated not at a corner, but on the AWJ cutsurface. For surface index q=1, the fatigue cracks are initiated at the striated part of the cutsurface. This behavior is not as apparent for surface indexes q=2 and q=3, but fatigue cracks areinitiated on the cut surface.
For specimens tested at a stress range of 550 MPa, the majority of the fatigue cracks are initiatedat the corner of the specimen. However it was noted that, on the specimens showing the shortestfatigue lives of surface index q=2 and q=3, the fatigue cracks were instead initiated on the cutsurface. This indicates that on some specimens there might be relatively rare irregularities orimperfections that act as initiation sites and thereby reduce the fatigue life.
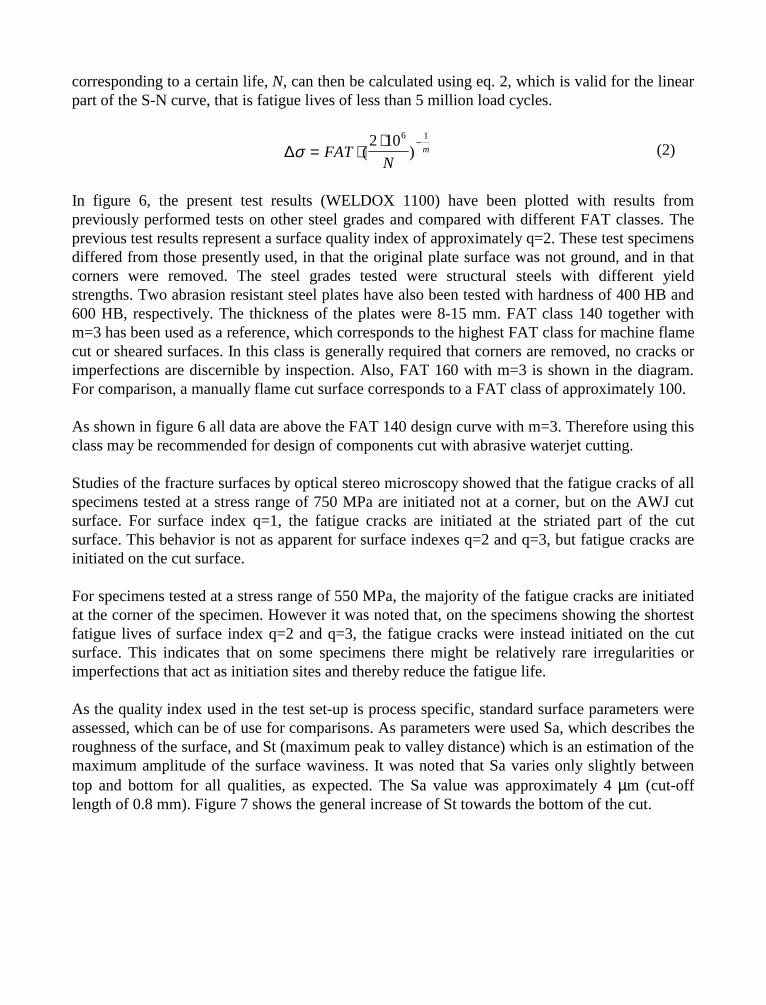
As the quality index used in the test set-up is process specific, standard surface parameters wereassessed, which can be of use for comparisons. As parameters were used Sa, which describes theroughness of the surface, and St (maximum peak to valley distance) which is an estimation of themaximum amplitude of the surface waviness. It was noted that Sa varies only slightly betweentop and bottom for all qualities, as expected. The Sa value was approximately 4 µm (cut-offlength of 0.8 mm). Figure 7 shows the general increase of St towards the bottom of the cut.
4. DISCUSSION
For design purposes, this study shows that abrasive waterjet cut surfaces may show large scatterin fatigue strength, implying that test results on few specimens should be used with care.
The large scatter in the fatigue test result for each surface quality makes it difficult to link thefatigue life to the major surface geometry features that are produced in different cut qualities. It isgenerally known that abrasive particles from AWJ cutting may be embedded in the surface.Singh and Jain (1995) has indicated that these may cause a wedge effect introducing tensilestresses that in turn initiate fatigue cracks. As this phenomenon applies to all surfaces this effectcould be an explanation why no clear correlation between the fatigue strength and the surfacequality was found. This is a topic for further investigations on fractured specimens from thisstudy.
Moreover, a scanning electron microscopy (SEM) study may show what kind of surfaceirregularities that are critical for the fatigue life. This information may be used for more detailedsurface studies, focusing on the critical irregularities.
A further study on the impact of AWJ parameters such as abrasive type, grain size and feed ratewould yield important information for optimizing cutting parameters for producing elements forfatigue exposed structures.
5. CONCLUSIONS
1. The present results indicate that a class of FAT 140 with a slope of the S-N curve given bym=3 can be used for design of components with abrasive water jet cut surfaces.
2. Fatigue test results show a large scatter. The practical consequence of this is that thesurface quality index has little importance for the lower bound fatigue strength. It alsoimplies that test results on few specimens should be used with care.
3. Looking at the average fatigue life, a trend is seen in that the intermediate surfaces qualityq=2 shows the longest fatigue life, while the roughest surface quality index q=1 producesthe shortest fatigue life.
4. Surface measurements indicate a correlation with the fatigue testing result for surfacequality q=1, that is the roughest surface produces the shortest fatigue life. For the twosurface qualities with smoother surface, q=2 and q=3, there is no major difference insurface roughness.
5. A large scatter in result indicates either inconsistent surface quality of individual specimensor a low density of sharp irregularities in the cut surfaces that will influence the fatigue lifesignificantly.
6. ACKNOWLEDGMENTS
The authors wish to thank the Swedish National Board for Industrial and Technical Development(NUTEK), ABB I-R Waterjet Systems AB, GANEX AB, Kimblad Technology AB, Projet AB,SAAB AB and Waterjet Service AB for their support. We also thank Mr. Henrik Westberg at theDept. of Production Engineering at Chalmers University of Technology for performing thesurface measurements.
7. REFERENCES
Hobbacher, A.: "IIW Fatigue design of welded joints and components", Abington publishing, 1996.
Singh, P.J. and J. Munoz: ”Cost Optimization of Abrasive Waterjet Cutting Systems”, Proc. 7th American Water Jet Conference, WJTA, St Louis, MO, USA, pp. 191-204, 1993.
Singh, J. and Jain S. C.: "Mechanical Issues in Laser and Abrasive Water Jet Cutting", JOM, The Minerals, Metals and Materials Society, Volume 47, Number 1, January, pp. 28-30, 1995.
Zeng, J. and Kim, T.J.: ”Parameter Prediction and Cost Analysis in Abrasive Waterjet Cutting Operations”, Proc. 7th American Water Jet Conference, WJTA, St Louis, MO, USA, pp. 175-190, 1993.
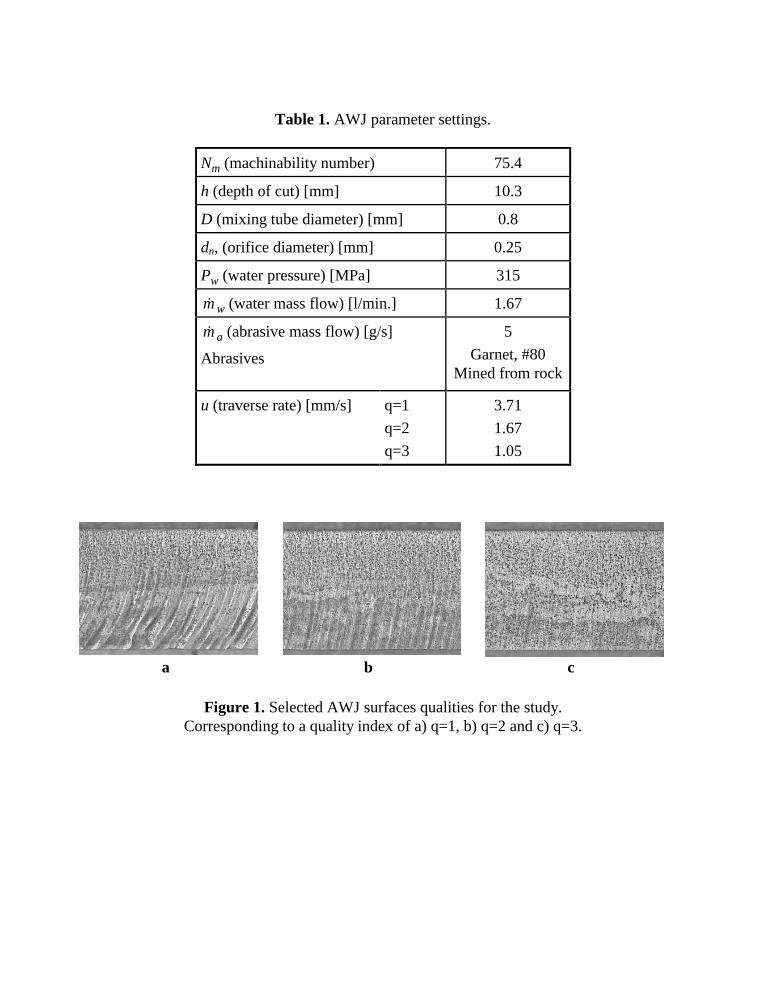
Table 1. AWJ parameter settings.
Nm (machinability number) 75.4
h (depth of cut) [mm] 10.3
D (mixing tube diameter) [mm] 0.8
dn, (orifice diameter) [mm] 0.25
Pw (water pressure) [MPa] 315
mw (water mass flow) [l/min.] 1.67
ma (abrasive mass flow) [g/s]
Abrasives
5
Garnet, #80Mined from rock
u (traverse rate) [mm/s] q=1
q=2
q=3
3.71
1.67
1.05
a b c
Figure 1. Selected AWJ surfaces qualities for the study.Corresponding to a quality index of a) q=1, b) q=2 and c) q=3.
Fatiguetest specimen
Figure 2. Set-up for fatigue testing.
Figure 3. Fatigue test specimen geometry. Plate thickness=10 mm.
500
600
700
800
10 000 100 000 1 000 000
Number of load cycles to failure, N
q1
q2
q3
Figure 4. Fatigue test results of the three surface qualities.Arrows near a point indicate that testing was stopped without failure.
Table 2. Fatigue test results showing the fatigue life (number of cycles).
Stress range[MPa]
q=1 q=2 q=3 Stress range[MPa]
q=1 q=2 q=3
750 22 256 193 973 115 578 550 183 345 193 973 542 0001
750 43 711 61 403 49 027 550 112 117 1 000 0001 209 061750 45 440 41 536 49 498 550 108 737 208 634 119 946750 35 301 41 045 39 946 550 39 932 57 856 65 407750 57 103 85 434 57 741 550 37 661 41 073 65 236
1 Testing was stopped without failure of the specimen
40 762
84 678
62 358
96 358
300 307
200 330
0
50 000
100 000
150 000
200 000
250 000
300 000
350 000
q1 q2 q3 q1 q2 q3
Stress range 750 MPa 550 MPa
Figure 5. The average fatigue life of each surface quality at a stress range of750 MPa and 550 MPa respectively.
100
1000
10000 100000 1000000
Number of load cycles to failure, N
FAT 140
FAT 160
WELDOX 420
WELDOX 700
WELDOX 960
WELDOX 1100
HARDOX 400
HARDOX 600
Figure 6. Present and earlier fatigue test results of specimens with abrasive water jet cutsurfaces. WELDOX 420 for instance indicates a yield strength of 420 MPa. HARDOX 400
indicates a Brinell Hardness of 400.
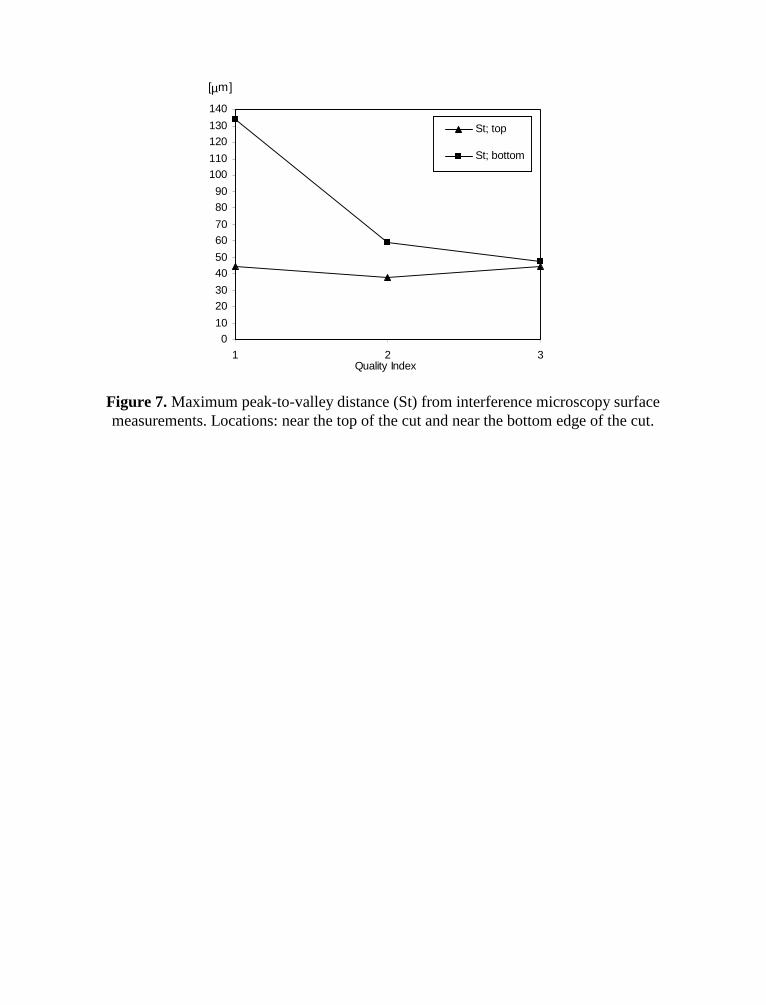
Figure 7. Maximum peak-to-valley distance (St) from interference microscopy surfacemeasurements. Locations: near the top of the cut and near the bottom edge of the cut.
0
10
20
30
40
50
60
70
80
90
100
110
120
130
140
1 2 3Quality Index
[µm]
St; top
St; bottom
10th American Waterjet ConferenceAugust 14-17, 1999: Houston, Texas
Paper 2
NON-LINEAR DYNAMICS IN MODELING
OF CUTTING EDGE GEOMETRY
T. Ditzinger, R. FriedrichInstitute for Theoretical Physics III
University of StuttgartStuttgart, Germany
A. Henning, G. RadonsFraunhofer Institute
Production Engineering and AutomationStuttgart, Germany
ABSTRACT
Abrasive waterjet cutting has already been established in many fields of industrial production.Yet limited cutting performance and cutting edge quality hinder a wider distribution of abrasivecutting systems. As a major limiting factor process immanent step propagation in the cuttingfront and thus striation formation can be spotted. In this work we present new nonlinearapproaches to the instability problem. In the simplest approximation the front dynamic isdescribed by a first order nonlinear partial differential equation (PDE) of Hamilton-Jacobi type.The relevant solutions typically develop shock structures within finite time. These are understoodby considering the evolution of associated Lagrangian manifolds in phase space. On this levelonly the time-averaged behavior of the cutting front but no instability is found. The inclusion ofhigher order derivatives in the PDE, however, can explain the observed ripple formation. This isshown by numerical simulations of the resulting PDE, which is related to the Kuramoto-Sivashinsky equation known from other erosion phenomena. Our simulations are compared withedge cutting experiments where multiple reflections of the waterjet are avoided. Theseapproaches provide a better understanding of the involved processes, which ultimately shouldresult in a reduction of striations and a better cutting performance.
Organized and Sponsored by the WaterJet Technology Association
1. INTRODUCTION
The water jet technology has already today many industrial applications. Especially when cuttinghard-to-machine materials and complex geometry conventional manufacturing processes can bereplaced or completed using the high flexibility and universality of this process. For a furtherspreading of this innovative technology, also in new applications, however both the precision,and the attainable cutting performance must be improved. Therefore profound investigations arenecessary for the improvement of the knowledge of the process as well as for its optimization[WES98, HEN98d].
The attainable precision of the cutting process, however, is strongly limited by structureformation at the bottom cutting edge surface. With higher feed-rates unwanted grooves andstriations occur at the surface. To avoid these structures sub-optimal cutting velocities are usedpresently. The small attainable cutting performance thereby leads to high costs of this process.Despite of high costs the procedure finds increasing spreading in the industry already today dueto its process specific advantages. By a better control of the process and avoidance or reductionof structure formation at the cutting edge the economic disadvantages could to a large extend becompensated and a spreading of this innovative technique could be supported [WES99].
In this paper the formation of surface structures during the cutting process is analyzed usingmethods of non-linear dynamic modeling on the basis of the physical behavior of the process.The major object of these modeling approaches is to gain better understanding of themechanisms of surface formation at the cutting edge. With the identification and intelligentvariation of significant factors striation formation may be better controlled and both cuttingperformance and quality may be improved.
2. CONVENTIONAL PROCESS MODELLING
Modeling of the process behavior plays an important role for the industrial use of the technique.With the gained information jet parameters can be chosen and adapted to the actual cutting task.Also for integration in CAM systems process modeling is necessary [HEN98a]. With the stronglygrowing distribution of this technique and demands for higher precision and performance thecontrol of the process and the knowledge of geometry which can be expected become more andmore important. Because of the very complex and often nonlinear behavior of the cutting contourthe modeling of the cutting process is mostly reduced to few significant parameters with limitedrange. There are three basic approaches to modeling of the cutting contour: functional, analytical,and phenomenological.
Existing approaches of modeling are limited, however, almost exclusively to an experimentallydetermined correlation between the parameters and processing factors e.g. the maximal cuttingdepth. Here different factors and materials are considered. The semi-empirical models therebyreduce the process to a functional correlation between the cutting depth and the handlingparameters with empirically determined exponents and constants. Thereby their validity is oftenlimited to a small parameter ranges and special boundary conditions (material, abrasives etc.).
Examples of such models are found in the literature among others in Zeng and Kim [ZEN92],Hashish [HAS88] and Blickwedel [BLI90].
Analytic approaches describe the qualitative effect of individual abrasive particle impacts at theworkpiece. From hydraulic parameters the energy distribution and thus the erosion effect ofparticles is calculated (e.g. [RAJ93, NIU97, FUK95]). With this complex system however onlyfew of the relevant parameters are considered. With the help of time discrete simulations theerosion process is represented qualitatively and adapted quantitatively with respect to processingand material constants (e.g. [NIU97, KOV96]). The qualitative description could be improved bythe use of a continuous energy model [SAW97]; nonlinear and stochastic effects however werenot considered.
First descriptions of the dynamic process were given by phenomenological models [HAS88,BLI90, GUO94]. According to those the quasi-stable and approximately cyclic progress of thecutting process the cutting surface is formed by step propagation. By the use of high-speedcameras first detailed information about the process and the step propagation could be gathered(e.g. [HAS95, OHL95]). Similar process phases could be identified also by evaluation of impactsound signals [MOM95d, MOH95]) and by gravimetric measurements (e.g. [FEK94, OHL94]).Due to the pure two-dimensional photometric analysis, however, no predicates about the fullspatio-temporal behavior of the cutting front could be obtained.
The three dimensional structures occurring at the cutting surface could not be explainedcompletely by a considering the process in the cutting plane alone. Especially in the rough cuttingzone spatial effects in the form of grooves and striations are found. Also the curvature of thecutting front leads to spatial effects of the kerf when cutting a complex geometry. Existinganalytic or semi-empirical modeling approaches focus mainly on the two dimensional behaviorof the process and therefore cannot describe these effects. In most modeling approaches only thetopology of the surface was measured and described by characteristic values (e.g. [CHA95,KOV91b, TAN86]). Zeng describes in [ZEN92] the surface on base of semi-empirical models bydefining surface quality areas. The reduction of the process to only few parameters reduces thecomplexity of the process significantly. For the end user this makes control of the process mucheasier but makes no statement about the real spatio-temporal processes and the formation ofstriation structures.
Guo [GUO94] describes a spatial behavior of the cutting process transverse to the cutting plane.As the abrasive jet leaves the workpiece it shows a complex spatial and temporal behaviorindicating a coupled longitudinal and transversal motion and a temporally inhomogeneousadvancement of the cutting front. Similar to Guo, also Zeng [ZEN97] and Chao [CHA95] useFourier analysis for the description of the occurring striation at the surface. So significantwavelengths in different quality areas (i.e. workpiece depths) could be detected. The results ofthese investigations thereby reach from the identification of an individual significant oscillation[CHA95] up to purely stochastic behavior [ZEN97]. Not only different significant jet parametersbut also noise sources like machine vibrations during the process might lead to significantmodifications in the development of the surface texture [CHA95]. One conclusion from theseinvestigations is that inference of the process dynamics from a characterization of the static
striation patterns is feasible only to a limited extent. First approaches to a more completedynamical description of the process including coupling of topological and dynamicalinformation is given for example by Ohlsen [OHL95] via photometric and gravimetric signalaccommodation. So far these were applied exclusively for the description of the two-dimensionalprocess. Beyond that only linear methods were used in modeling approaches. New fundamentalinformation can be gained using dynamic modeling with nonlinear methods. With this not onlythe description of structure formation at the cutting edge can be improved but also a betterunderstanding of the underlying process can be expected.
3. NONLINEAR MODELING
In the last years processes of pattern formation were studied in many physical, chemical andbiological systems. This was done within the framework of nonlinear dynamics and synergetics[HAK78, BUS89]. Here especially instabilities e.g. of hydrodynamical processes were examined.Starting point is an averaged respectively a coarse-grained description of the system. Dependingon the considered system the coarse-graining is over microscopic structures such as atoms,molecules, or grains, and temporal events (e.g. particle collisions or impacts). Mathematically theresulting continuum theories are specified by one or several nonlinear partial differentialequations (PDE).
3.1 Experimental Setup
A description of the cutting dynamics by a PDE is based on the assumption of local interactionsof the abrasive particles with the workpiece. From waterjet cutting experiments as in [HAS88] or[GUO94], however, we known that the abrasive particles are reflected elastically or inelasticallyseveral times as they move along the momentary cutting front. This amounts to a non-localinteraction process since e.g. the effect of a secondary impact of abrasive grains at one locationdepends on the primary impact and the momentary cutting surface at some other location of thecutting front. This leads to the well-known striation patterns as in Figure 1a, where a typicalripple has a diameter (ripple wavelength) of the same order as the waterjet diameter, but hasextensions (jet lag) in the feed direction much larger than the diameter of the incoming waterjet.In addition multiple reflections in the transverse direction lead to overhangs at the bottom of theREFcutting zone [GUO94]. Such a situation is mathematically difficult to describe since it needsthe inclusion of non-local effects. Presumably this is also the reason why the origin of thestructure formation is still not really understood.
In order to reduce the complexity of the experimental situation and to avoid these effects wedesigned and carried out experiments where multiple impacts of particles are largely avoided.This was done to gain information about effects of the primary erosion process at the first particleimpact. The abrasive water jet was placed at the very edge of the material (Figure 1b-d). Withthis setup the incoming particles are reflected away from the workpiece edge after the first impactand do not erode other parts of the material by secondary impacts. Even with this reducedcomplexity of the experiment structures and ripple patterns were found. When the jet was placed
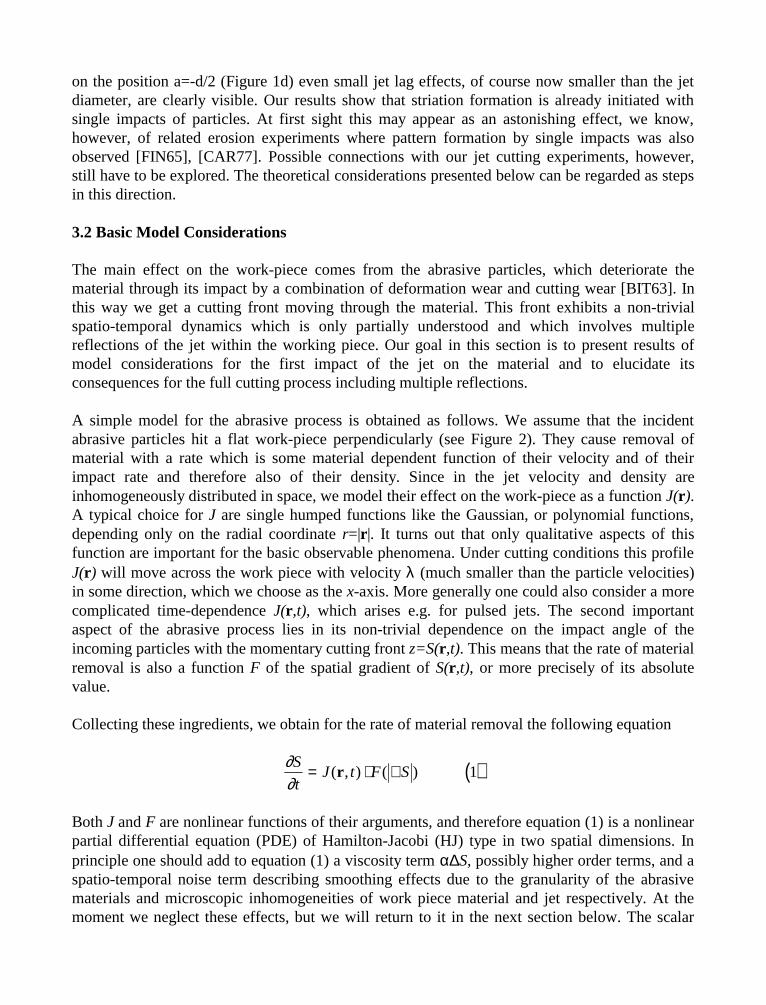
on the position a=-d/2 (Figure 1d) even small jet lag effects, of course now smaller than the jetdiameter, are clearly visible. Our results show that striation formation is already initiated withsingle impacts of particles. At first sight this may appear as an astonishing effect, we know,however, of related erosion experiments where pattern formation by single impacts was alsoobserved [FIN65], [CAR77]. Possible connections with our jet cutting experiments, however,still have to be explored. The theoretical considerations presented below can be regarded as stepsin this direction.
3.2 Basic Model Considerations
The main effect on the work-piece comes from the abrasive particles, which deteriorate thematerial through its impact by a combination of deformation wear and cutting wear [BIT63]. Inthis way we get a cutting front moving through the material. This front exhibits a non-trivialspatio-temporal dynamics which is only partially understood and which involves multiplereflections of the jet within the working piece. Our goal in this section is to present results ofmodel considerations for the first impact of the jet on the material and to elucidate itsconsequences for the full cutting process including multiple reflections.
A simple model for the abrasive process is obtained as follows. We assume that the incidentabrasive particles hit a flat work-piece perpendicularly (see Figure 2). They cause removal ofmaterial with a rate which is some material dependent function of their velocity and of theirimpact rate and therefore also of their density. Since in the jet velocity and density areinhomogeneously distributed in space, we model their effect on the work-piece as a function J(r) .A typical choice for J are single humped functions like the Gaussian, or polynomial functions,depending only on the radial coordinate r=|r|. It turns out that only qualitative aspects of thisfunction are important for the basic observable phenomena. Under cutting conditions this profileJ(r) will move across the work piece with velocity λ (much smaller than the particle velocities)in some direction, which we choose as the x-axis. More generally one could also consider a morecomplicated time-dependence J(r,t), which arises e.g. for pulsed jets. The second importantaspect of the abrasive process lies in its non-trivial dependence on the impact angle of theincoming particles with the momentary cutting front z=S(r ,t). This means that the rate of materialremoval is also a function F of the spatial gradient of S(r ,t), or more precisely of its absolutevalue.
Collecting these ingredients, we obtain for the rate of material removal the following equation
( )∂∂S
tJ t F S= ⋅ ∇( , ) ( )r 1
Both J and F are nonlinear functions of their arguments, and therefore equation (1) is a nonlinearpartial differential equation (PDE) of Hamilton-Jacobi (HJ) type in two spatial dimensions. Inprinciple one should add to equation (1) a viscosity term α∆S, possibly higher order terms, and aspatio-temporal noise term describing smoothing effects due to the granularity of the abrasivematerials and microscopic inhomogeneities of work piece material and jet respectively. At themoment we neglect these effects, but we will return to it in the next section below. The scalar
function F is material dependent. For brittle material such as glass the wear is dominated bydeformation wear and therefore the removal rate decreases monotonically from its maximum atθ=0 (perpendicular impact) for increasing impact angles θ (measured with respect to the surfacenormal). For ductile material such as aluminum the maximum is obtained for some intermediatenon-zero angle due to enhanced cutting wear [BIT63]. A sketch of these typical θ-dependenciesis plotted in Figure 3.
With the relationship |grad S(r ,t)|=tan(θ) the θ-dependence of the wear determines the function F.As an example, assuming for the erosion rate the functional form ~cos²θ, which is appropriate forbrittle material, one obtains
( )( )F S
S( )∇ =
+ ∇1
12
2
Assuming that at t=0 one starts the process with a flat, horizontally mounted work piece, we haveto solve the Cauchy problem for Equation (1) with initial condition S(r ,t=0)=0.
Due to the connection between HJ equations and Hamiltonian dynamics in phase space[LAN86], [ARN78], one can alternatively consider Hamilton's canonical equations of motion
d
dtH t a
d
dtH t b
rp
r p
pr
r p
=
= −
∂∂
∂∂
( , , ) ( )
( , , ) ( )
3
3
with HamiltonianH t J t F( , , ) ( , ) ( ) ( )r p r p= − ⋅ 4
Hamilton's equations (3) have to be solved for all initial points lying on the surface p=0 in phasespace (r ,p) according to the correspondence p(r ,t=0)=grad S(r ,t=0) yielding the evolution of thisLagrangian surface p(r ,t) in phase space [ARN78]. The function S(r ,t), which in a classicalmechanics context has the meaning of an action, may either be obtained by integrating p(r ,t)along suitable paths in coordinate space, or by solving in addition to equations (3a,b) theequation
)5(),,( tHdt
d
dt
dSpr
rp −⋅=
Equations (3) and (5) are the characteristic equations of the first order PDE (1) (see e.g.[LOG94]).
The solutions of the characteristic equations can be very complicated. This is due to thenonlinearities, which may even lead to chaotic trajectories in phase space [LIC83]. Furthermorethe functions p(r ,t) or S(r ,t) become typically multi-valued after a finite time [ARN78]. This

multi-valuedness is resolved by the insertion of shocks by invoking some version of the entropycondition [WHI74], [LEV92], [ARN78], which has its origin in problems of gas dynamics. Theimportance and generality of these so-called viscosity solutions of HJ equations has beenestablished only recently [CRA83]. They allow for a countable number of discontinuities in itsderivatives known as shock waves, which identify them as generalized solution of the PDE.These solutions arise in the limit of vanishing viscosity terms in equations like Equation (1), i.e.in cases where curvature dependencies in the governing PDE are very small. A well-known andparticularly simple example is the inviscid Burgers equation treated in many textbook on PDEsand its numerical solutions (see e.g. [WHI74], [LEV92]), which corresponds to the free particleHamiltonian H=p²/2.
In order to demonstrate some essential features we will in the following concentrate on thesimpler two-dimensional case, where one neglects degrees of freedom transversal to the cuttingdirection x, and discuss its implications for the full three -dimensional problems later. Fordefiniteness we assume for J a spatial variation of the following form J(x)=(x²-1)² in the region ofthe jet –1< x <+1, and zero otherwise. Let us consider first the case of water jet drilling, i.e. thecase λ=0. Then Equation (1) with the above-introduced brittle material characteristic (seeEquation (2)) reads
( ))6(
1
12
22
p
x
t
S
+−=
∂∂
Constant prefactors on the r.h.s. of this equation are absorbed in the time variable t and determineits scale. The dynamical evolution of the ''hole'' S(x,t) (starting from a flat surface at time t=0)according to equation (3) and (5) and the evolution of the corresponding curve p(x,t) in phasespace is found numerically and is shown for several instants in Figure 4 and Figure 5.
The phase portrait of the associated Hamiltonian flow is basically that of a one-dimensionalanharmonic oscillator. It consists of an elliptic fixed point at the origin (x,p)=(0,0) and of twolines of parabolic fixed points (for definitions see e.g. [LIC83]) at p=+1 and p=-1. Theinhomogeneous rotation in phase space around the elliptic fixed point explains the evolution ofthe curve p(x,t) from an initially flat curve p(x,t=0)=0. For later times as e.g. in Figure 5 thefunction p(x,t) becomes multi-valued due to the continuing rotation in phase space. This leadsalso to a multi-valued S(x,t) (with the typical ‘swallow tail’ singularities [ARN78]) if the initialpoints in phase space (endowed with initial values S=0) are evolved according to thecharacteristic equations (3) and (5). The correct branches are obtained e.g. by integrating the PDE(1) with an upwind method [LEV92] or other shock capturing schemes, which are known toapproximate the correct viscosity solution. The latter is provided by the two lower branches ofS(x,t) in Figure 5 (left), i.e. the swallow tail S>1 is cut off. For the curve p(x,t) Figure 5 (right)this implies a jump discontinuity from a positive p to –p along the line x=0, i.e. lobes of equalarea to the left and right of x=0 are cut off as in a Maxwell construction (equal area rule, entropycondition, see e.g. [ARN78], [LEV92], [WHI74]).
For even later times further tails in S(x,t) and convolutions in p(x,t) develop. These, however,also have to be removed according to the entropy condition implying that the front does no
longer exhibit qualitative changes: The edge of S(x,t) at x=0 simply moves to ever increasingvalues, while at the same time the jump discontinuity of p(x,t) increases.
The given results should provide an intuitive connection between the shape of the cutting ordrilling front and the phase space structures of the associated Hamiltonian system. A morecomprehensive presentation of this connection, also for cutting conditions and other jet andmaterial characteristics, can be found elsewhere [RAD99]. Here we briefly indicate the mainresults:
For ductile material and drilling conditions (feed λ=0) the phase portrait of the associatedHamiltonian shows a hyperbolic fixed point at (0,0) and two symmetric elliptic fixed pointsinstead of the only elliptic fixed point for brittle material. As a consequence the drilling front ismore complicated at intermediate times where it exhibits two slope discontinuities (shocks),which finally merge into one at large times resulting in a shape similar to the brittle case. Aneven more complicated behavior is obtained if the unimodal jet profile is replaced by a bimodalcharacteristic. This may lead to phase space structures e.g. with 4 hyperbolic and 5 elliptic fixedpoints, resulting in three shocks at intermediate times, again merging into one at large times.
Under cutting conditions, i.e. for a non-zero feed λ, we find a very different behavior. The reasonis the moving profile J=J(r - λext), where ex denotes the unit vector in x-direction, the directionof the feed. In a co-moving frame this gives rise to a Hamiltonian, which is modified by theaddition of a convective term, i.e. H=H0(r ,p)-λpx, where H0(r ,p) is the Hamiltonian without feed.One consequence of this is that also the Hamiltonian flow field in phase space gets an additionalcomponent -λex. This implies that all phase space structures of H0(r ,p) which are localized incoordinate space to the region of the impinging jet, are typically relevant only for times of theorder O(1/λ). This provides an understanding for the fact that the cutting or kerf depth is also ofthe order O(1/λ). A further important and new finding, most easily understood in one spatialdimension, is the occurrence of a transition from a cutting front with a co-moving shock for lowcutting speeds, to one without such a shock at high feed rates. This phenomenon, which isassociated with an inverse saddle-node bifurcation in the Hamiltonian flow, may be a possiblemechanism for the nucleation of the kink-like structures (step formation) observedexperimentally. In any case such shock structures appear to be relevant also for a more completemodeling of the dynamics of the waterjet-cutting front.
A further important conclusion from this section is the fact that the experimentally observedripples and the associated temporal oscillations cannot be explained on the level of our first orderPDE. This can easily be inferred from the evolution of the relevant Lagrangian manifolds thatturn out to be asymptotically stationary in the region of the waterjet. This implies that we alwaysget a stationary cutting front for long times as is most easily seen in the 2-d case. The same holdsfor the full 3-d problem, at least for a cylinder-symmetric waterjet since for the latter theassociated Hamiltonian system is also integrable [LIC83] (due to the existence of an additionalinvariant, an angular momentum). The resulting stationary cutting fronts, with or without shocks,should therefore roughly be interpreted as time-averaged fronts.
3.3 Models for Ripple Formation
The fact that modeling on the basis of a first order PDE cannot explain instabilities and thereforepattern formation has been recognized already by Finnie and Kabil [FIN65] in a similar context.In that work it is also argued that higher order derivatives have to be included. We must note,however, that from the experimental and also from the theoretical side not much is known aboute.g. curvature dependent properties of cutting or wear processes. In the following we derive amodel for the formation of the striation patterns during the abrasive waterjet cutting process. Theresulting equation, which is of Kuramoto-Sivashinsky [SIV77] type, can explain the observedinstabilities.
In a co-moving coordinate system the temporal evolution of the surface S(x,y,t) is assumed toobey the equation [FRI99]
)7(),(),(
.)..),,(),,(,),(()(),( 2 tg
x
tStststsFJ
t
tSr
rrrrr
r +∂
∂−∆∆∇⋅=∂
∂ λ
This equation has basically the same structure as the equations of the previous section with thedifference that the term F of equation (1) is now allowed to depend on higher order spatialderivatives such as the curvature ∆S(r ,t) of the cutting front.EMBED The λ-dependent term isthe convective contribution originating from the transformation to the co-moving frame, whichled in the previous section to the contribution -λpx in the Hamiltonian. For completeness a noiseterm g(r ,t) is included in equation (7) describing smoothing effects e.g. due to granularity ormicroscopic inhomogeneities of the abrasive materials and workpiece, but which is neglected inthe following.
One may perform a Taylor expansion to fourth order of the term F leading to
( )x
tStSStSS
tSJ
t
tS
∂∂−
∆∇+∆∇+
∇+⋅=
∂∂ ),(
),(),()()),((1
1)(
),( 22
rrr
rr
r λβα (8)
with uneven terms neglected due to symmetry reasons [FRI99]. For λ=0, constant J, α, and β,and a quadratic gradient dependence this becomes exactly the Kuramoto-Sivashinsky [SIV77]equation, which has already been investigated also in the context of pattern formation fromerosion phenomena (see e.g. [ROS95] and refs. therein). The stationary front solution of equation(8), S0(r ), and its stability can be calculated by means of a stability analysis. Therefore weconsider small deviations w(r ,t) from the stationary front, S(r ,t)=S0(r )+w(r ,t). It can be shownanalytically and numerically, that the deviations become unstable in good agreement with thecutting experiments.
The properties of the proposed model can be analyzed by numerical simulations using a semi-implicit hopscotch method. We have neglected the dependency of the parameters α,β on thegradient Sx(r ,t) and we have assumed a gaussian profile for the jet characterizing function J(r ).
Let us first indicate results for the two-dimensional problem. Figure 6a exhibits the surface S(x,t)as a function of x for a small feed rate at 6 consecutive time instants.
The instability of the cutting front is evident. Like in the real cutting process cusps evolve in timeat a certain spatial distance from the leading edge traveling down the cutting front. Since theinstability only can grow in the jet region the surface behind the jet is modulated periodically inspace.
In order to study the impact of the feed rate λ the results of the cutting simulation for a higherfeed rate is shown in Figure 6b for the same six time instants as in Figure 6a. As can be seen adifferent spatio-temporal behavior arises. The unstable disturbances are convected out of theregion under the jet before gaining a reasonable size. This stabilizing influence of higher feedrates to the cutting ground topology can be found in measurements, too ([LAU95], [MOM97]).As can also be seen the feed rate λ influences the cutting depth dc. Higher feed rates areassociated with lower depths as in the simpler model of the previous section and as in the realcutting process [MOM97].
In the following we study the three-dimensional problem, i.e. the case of a surface S(x,y,t). InFigure 7 the results of a numerical simulation of the cutting process are shown. The calculatedsurface S(x,y,t) of the workpiece is plotted versus spatial coordinates x and y at 4 different times.In the unstable situation the same wavelike structures evolve as in the two-dimensional case.Furthermore, kerfs similar to the ones in the experiment can be seen at the bottom of the cuttingline. At the cutting edge inhomogeneities in the surface evolve in close analogy to striationformation observed in the experiment (Figure 1d).
4. CONCLUSION
Abrasive waterjet cutting has found many applications in various industries because of its greatprocess immanent advantages. So far precision and performance are limited by striationstructures that occur at the cutting edge. With better control and reduction of ripple formationgreat advantages could be gained.
In this paper a new approach to understanding the mechanism of structure formation waspresented. Based on modeling approaches from nonlinear dynamics we were able to reproduceand understand the development of the spatio-temporal instabilities which cause the ripplepatterns at the cutting edge. A deeper analysis of the obtained nonlinear partial differentialequations in combination with data driven methods of nonlinear dynamics should enable us todevelop new strategies for controlling striation formation resulting in improved cuttingperformance and quality.

5. ACKNOWLEDGEMENT
We gratefully acknowledge support from the Volkswagen Foundation within the program“Untersuchung nichtlinear-dynamischer Effekte in productions technician Systemen”. G.R.thanks R. Grauer and J. Krug for illuminating discussions.
6. REFERENCES
[ARN78] Arnold, V.I.; Mathematical Methods of Classical Mechanics, Springer-Verlag, 1978.
[BIT63] Bitter, J.G.A.; A Study of Erosion Phenomena, Part I \& II, Wear 6, 5-21, 169-190 (1963).
[BUS89] Busse, F.U.; Kramer, L.; Nonlinear Evolution of Spatio-Temporal Structures in DissipativeContiuous Systems ; Plenum Press ; 1989.
[CAR77] Carter, G. et al., Ion Bombardment Induced Ripple Topography on Amorphous Solids, Radiation Effects 33, 65-73 (1977).
[CHA95] Choa, J.; Zhou, G. ; Leu, M.C. ; Geskin, E.; Characteristics of Abrasive Waterjet Generated Surfaces and Effects of Cutting Parameters and Structure Vibration ; Transaction of the ASME ; Vol. 117 ; November 1995.
[CRA83] Crandall, M.G.; Lions, P.-L.; Viscosity Solutions of Hamilton Jacobi Equations, Trans. Amer. Math. Soc. 277, 1-42 (1983).
[FEK94] Fekaier, A.; Guinot, J.C. ; Schmitt, A. ; Houssaye, G.; Optimization of the abrasive jet cutting surface quality by the workpiece reaction forces analysis ; 12th International Conference on Jet Cutting Technology ; Oct. 25-27 ; 1994 ; Rouen, France.
[FIN65] Finnie, I.; Habil, Y.H.; On the formation of surface ripples during erosion, Wear 8, 60-69 (1965).
[FÖH89] Föhl, J.; Untersuchungen der Werkstoffreaktion bei Einzelstoß mit harten Partikeln zur Vertiefung des Verständnisses von Erosionsverschleiß. Zeitschrift für Metallkunde, Bd 80, H 10, 1989.
[FRI99] Friedrich, R.; Ditzinger, T.; Radons, G.; Henning, A.: A model for the spatio-temporal instability in abrasive waterjet cutting, preprint, 1999.
[FUK95] Fukunishi, Y. et. al.; Numerical simulation of striation formations on waterjet cutting surface in Proceedings of the 8th American Waterjet Conference 1995, Houston Texas.
[GUO94] Guo, N.S., Schneidprozeß und Schnittqualität beim Wasserabrasivstrahlschneiden. VDI-Fortschritt-Berichte, Reihe 2, Nr. 328, Düsseldorf: VDI-Verlag, 1994.
[HAK78] Haken, H.; Synergetics ; An Introduction ; Springer-Verlag ; 1978.
[HAS84] Hashish, M; On the modeling of abrasive waterjet cutting, in Proceedings of 7th International Symposium on Jet Cutting Technology 1984, Ottawa Canada, pp. 249-265.
[HAS88] Hashish, M; Visualization of the abrasive waterjet cutting processes, Experimental mechanics, Jun. 1988, pp. 159-169.
[HAS91] Hashish, M.; Characteristics of surfaces machined with abrasive-waterjets, Transactions ofthe ASME ; Vol. 113 ; July 1991.
[HEN98a] Henning, A.; Cutting edge quality improvements through geometrical modeling, 14th International Conference on Jetting Technology in 1998, Brugge Belgium.
[HEN98d] Henning, A.; Anders, S; Integration der Wasserstrahltechnik in die Fertigung, VDI-Z 140 (1998), Nr.3/4. S. 54-56.
[KOV96] Kovacevic, R. ; Yong, Z.; Modeling of 3D abrasive waterjet machining; 13th International Conference on Jetting Technology; Oct. 29-31, 1996 ; Sardinia, Italy.
[LAN86] Lanczos, C.; The Variational Principles of Mechanics, 4. ed. (Dover Publ., 1986).
[LAU95] Laurinat, A; Abtragen mit Abrasiv-Druckwasserstrahlen-Hinweise zur Prozessoptimierung. Bautechnik 68 (1995) pp. 242-249.
[LEV92] LeVeque, R.L.; Numerical Methods for Conservation Laws. (Birkhäuser, Basel, 1992).
[LIC83] Lichtenberg, A.J.; Lichtenberg, M.A.; Regular and Stochastic Motion.; Springer, 1983.
[LOG94] Logan, J.D.; An Introduction to Nonlinear Partial Differential Equations. (Wiley,-Interscience, New York, 1994).
[MOH95] Mohan, R.S., Momber, A.W., Kovacevic, R.; Detection of energy absorption durcing abrasive water jet machining using acoustic emission technique; Manufacturing Science and Engineering; 1995, pp. 69 - 84.
[MOM95d] Momber, A.W., Mohan, R.S., Kovacevic, R.; Acoustic Emission Measurements on Brittle Materials During Abrasive Waterjet Cutting; 1st International Machining and Grinding Conference; 1995; pp. 439 - 458.
[MOM97] Momber A, Kovacevic R; Principles of Abrasive Water Jet Machining, Springer, 1997.
[NIU97] Niu, M. ; Fukunishi, Y. ; Kobayashi, R.; Experimental and numerical studies on the mechanism of abrasive jet cutting ; 9th American Waterjet Conference ; August 23-26 ; 1997; Dearborn, Michigan.
[OHL94] Ohlsson, L. ; Powell, J. ; Magnusson, C.; Mechanisms of striation formation in abrasive water jet cutting ; 12th International Conference on Jet Cutting Technology ; Oct. 25-27 ; 1994 ; Rouen, France.
[RAD99] Radons, G.; Hamiltonian Phase Space Dynamics and Shock Structures in FrontPropagation Problems, preprint, (1999).
[RAJ93] Rajy, S.P.; Ramulu, M.; A transient model for material removal in the abrasive waterjet machining process, in Proceedings of the 7th American Water Jet Conference 1993, SeattleWashington.
[ROS95] Rost, M., Krug, J.; Anisotropic Kuramoto-Sivashinsky Equation for Surface Growth and Erosion, Phys. Rev. Lett. 75, 3894-3897 (1995).
[SAW97] Sawamura, T.; Fukunishi, Y. ; Konbayashi, R.; Three dimensional model for waterjet cutting simulation ; 9th American Waterjet Conference ; August 23-26 ; 1997 ; Dearborn.
[SIV77] Sivashinsky G; Nonlinear analysis of hydrodynamical instability in laminar flames. Part I. Derivation of basic equations. Acta Astronautica 4: 1177.
[TAN86] Tan, D.K.M.; A model for surface finish in abrasive waterjet cutting. Proc. 8th Int. Symp. on Jet Cutting Technology (Durham, 1986), BHRA, Cranfield, UK, 1986, S. 309-313.
[WES98] Westkämper, E.;Henning, A.; Gottwald, B.; Intelligent means of process control during thehigh pressure water jet cutting, IEEE98, Aachen, Germany.
[WES99] Westkämper, E; Henning; Radons; Friedrich, R, Ditzinger, T; Nonlinear dynamic modeling of the abrasive waterjet process. In: Investigation of Nonlinear Dynamic Effects in Production Systems, 2nd international Symposium, 25.-26.2.99, Aachen, Germany.
[WHI74] Whitham, G.B.; Linear and Nonlinear Waves. (Wiley, New York, 1974).
[WHT89] Whittaker, E.T.; A Treatise of Analytical Dynamics of Particles and Rigid Bodies, 4.ed., reissued, reprinted (Cambridge Univ. Pr., Cambridge, 1989).
[ZEN92] Zeng, J.; T. Kim; Development of an abrasive waterjet kerf cutting model for brittle materials, in Proceedings of the 11th International Conference on Jet Cutting Technology 1992, pp. 483-501.
[ZEN97] Zeng, J. ; Munoz, J.; Surface finish evaluation for abrasive waterjet cutting ; 9th American Waterjet Conference ; August 23-26 ; 1997 ; Dearborn, Michigan.
7. FIGURES
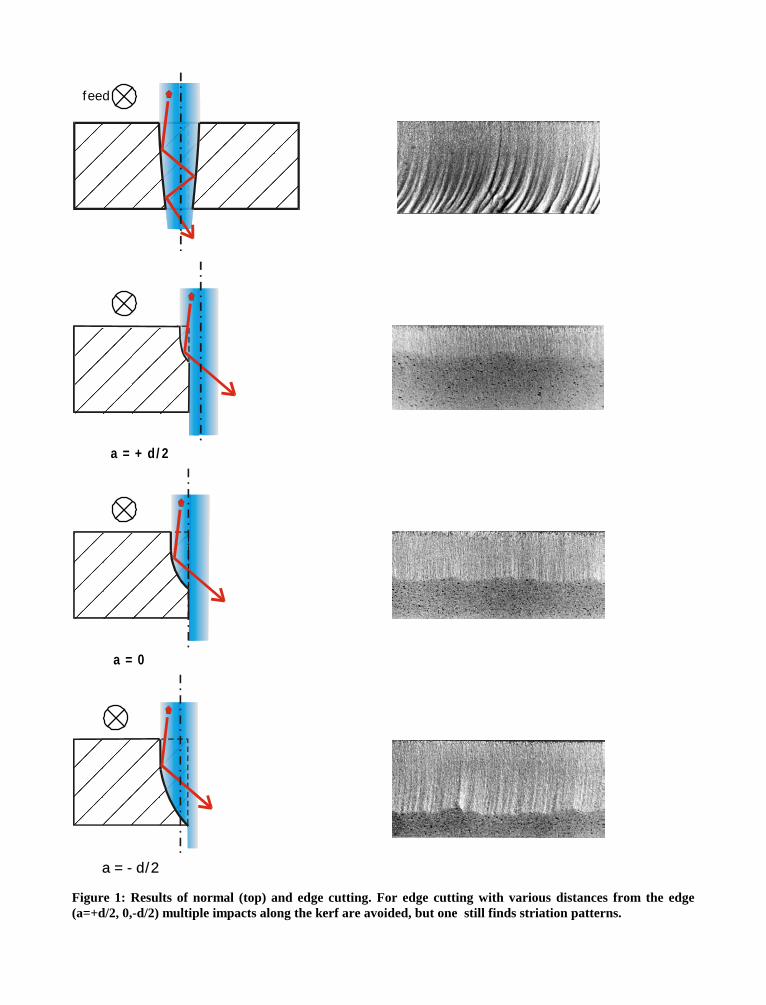
feed
a = + d/2
a = 0
a = - d/2
Figure 1: Results of normal (top) and edge cutting. For edge cutting with various distances from the edge(a=+d/2, 0,-d/2) multiple impacts along the kerf are avoided, but one still finds striation patterns.
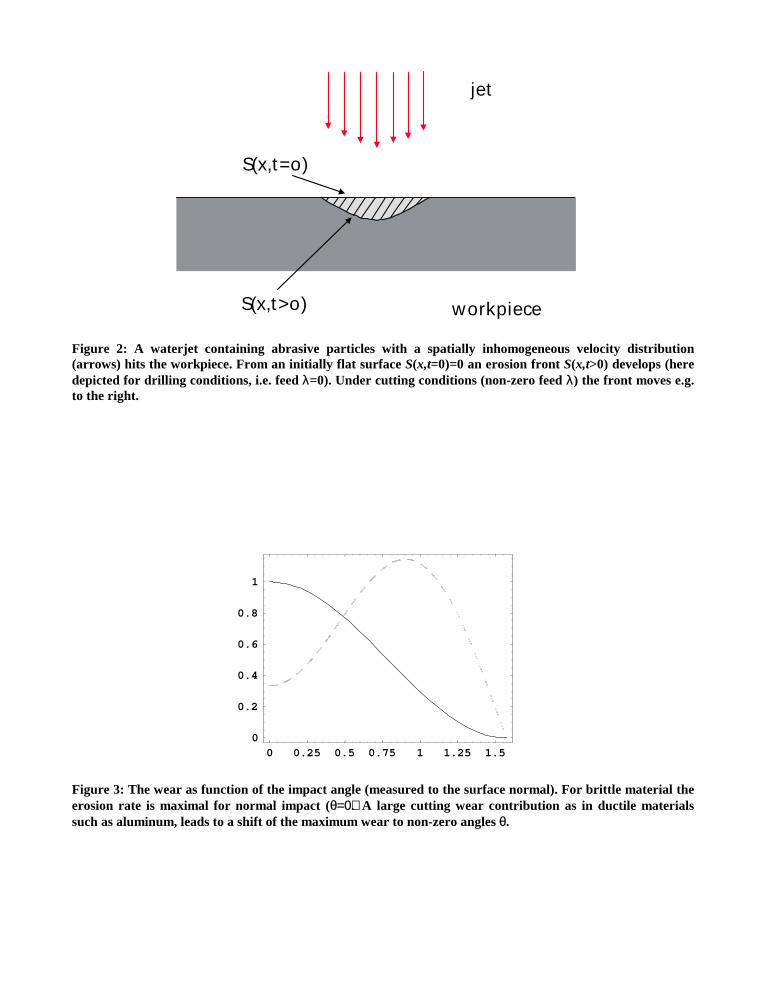
workpiece
jet
S(x,t=o)
S(x,t>o)
Figure 2: A waterjet containing abrasive particles with a spatially inhomogeneous velocity distribution(arrows) hits the workpiece. From an initially flat surface S(x,t=0)=0 an erosion front S(x,t>0) develops (heredepicted for drilling conditions, i.e. feed λ=0). Under cutting conditions (non-zero feed λ) the front moves e.g.to the right.
0 0.25 0.5 0.75 1 1.25 1.50
0.2
0.4
0.6
0.8
1
Figure 3: The wear as function of the impact angle (measured to the surface normal). For brittle material theerosion rate is maximal for normal impact (θ=0). A large cutting wear contribution as in ductile materialssuch as aluminum, leads to a shift of the maximum wear to non-zero angles θ.
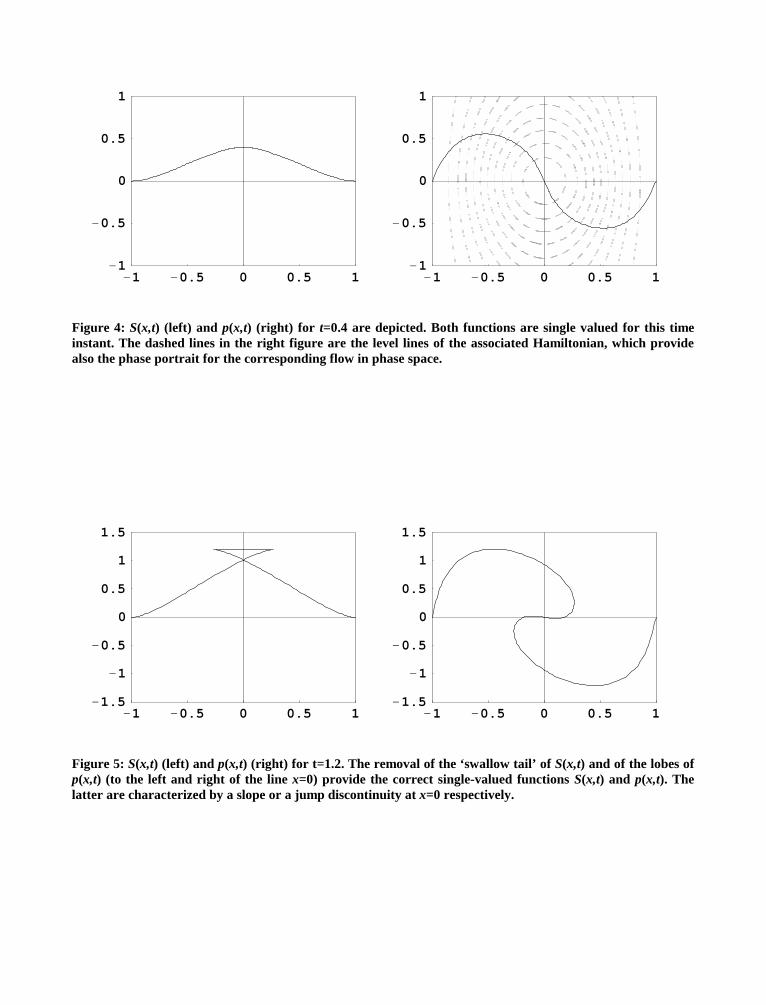
- 1 - 0.5 0 0.5 1- 1
- 0.5
0
0.5
1
- 1 - 0.5 0 0.5 1- 1
- 0.5
0
0.5
1
Figure 4: S(x,t) (left) and p(x,t) (right) for t=0.4 are depicted. Both functions are single valued for this timeinstant. The dashed lines in the right figure are the level lines of the associated Hamiltonian, which providealso the phase portrait for the corresponding flow in phase space.
- 1 - 0.5 0 0.5 1- 1.5
- 1
- 0.5
0
0.5
1
1.5
- 1 - 0.5 0 0.5 1- 1.5
- 1
- 0.5
0
0.5
1
1.5
Figure 5: S(x,t) (left) and p(x,t) (right) for t=1.2. The removal of the ‘swallow tail’ of S(x,t) and of the lobes ofp(x,t) (to the left and right of the line x=0) provide the correct single-valued functions S(x,t) and p(x,t). Thelatter are characterized by a slope or a jump discontinuity at x=0 respectively.
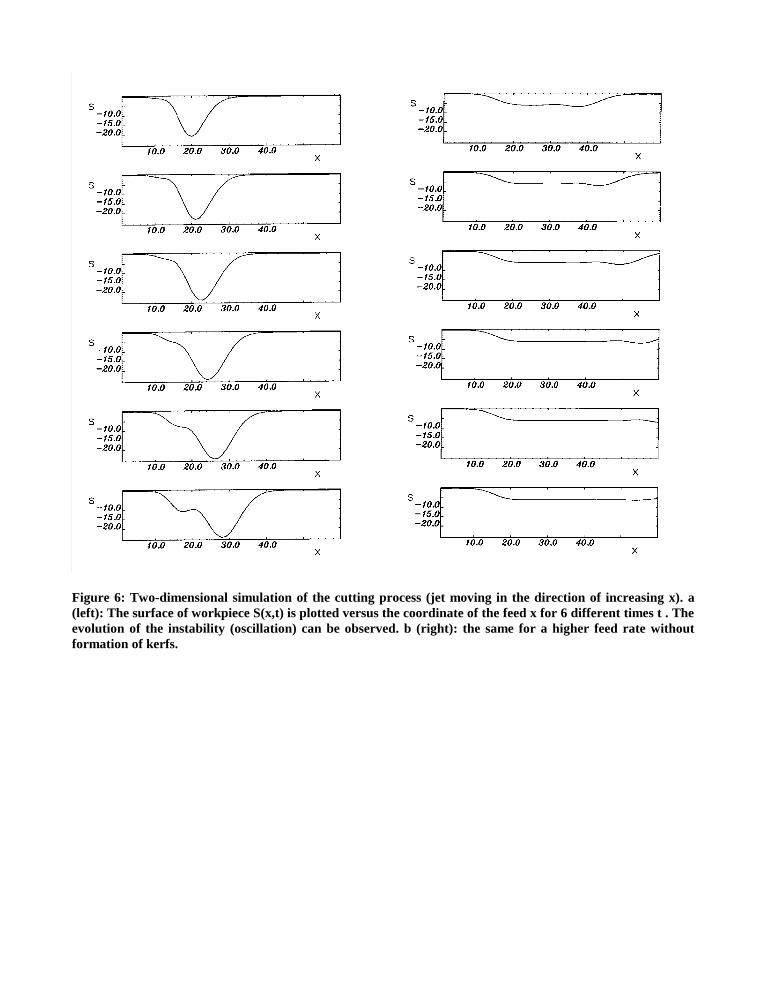
Figure 6: Two-dimensional simulation of the cutting process (jet moving in the direction of increasing x). a(left): The surface of workpiece S(x,t) is plotted versus the coordinate of the feed x for 6 different times t . Theevolution of the instability (oscillation) can be observed. b (right): the same for a higher feed rate withoutformation of kerfs.
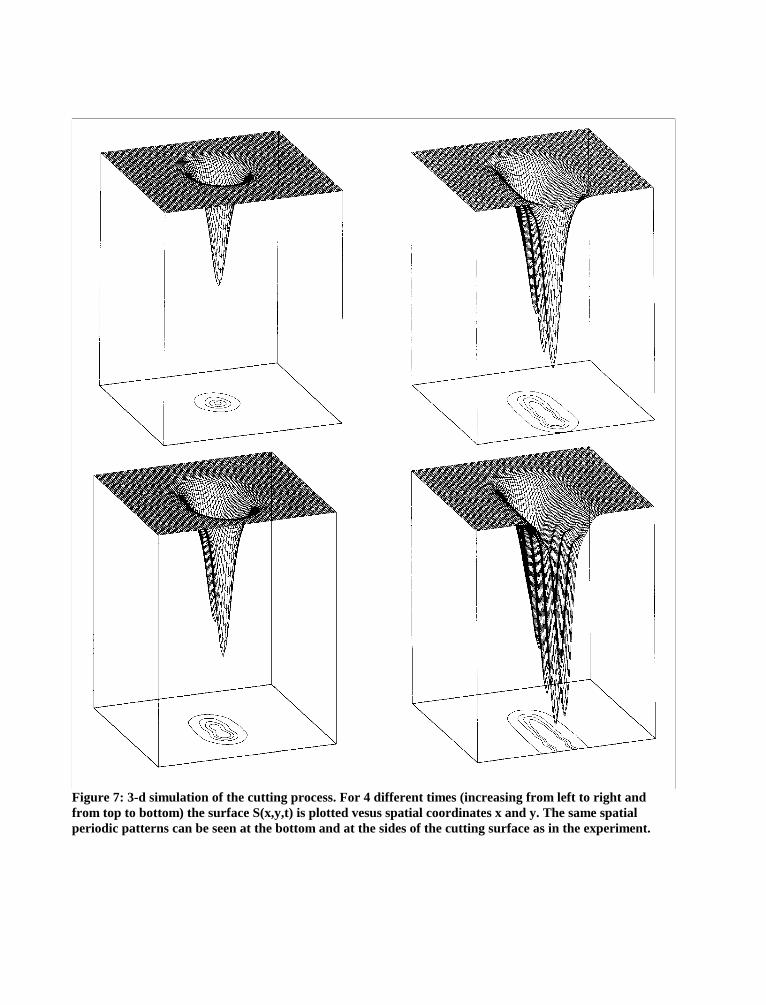
Figure 7: 3-d simulation of the cutting process. For 4 different times (increasing from left to right andfrom top to bottom) the surface S(x,y,t) is plotted vesus spatial coordinates x and y. The same spatialperiodic patterns can be seen at the bottom and at the sides of the cutting surface as in the experiment.
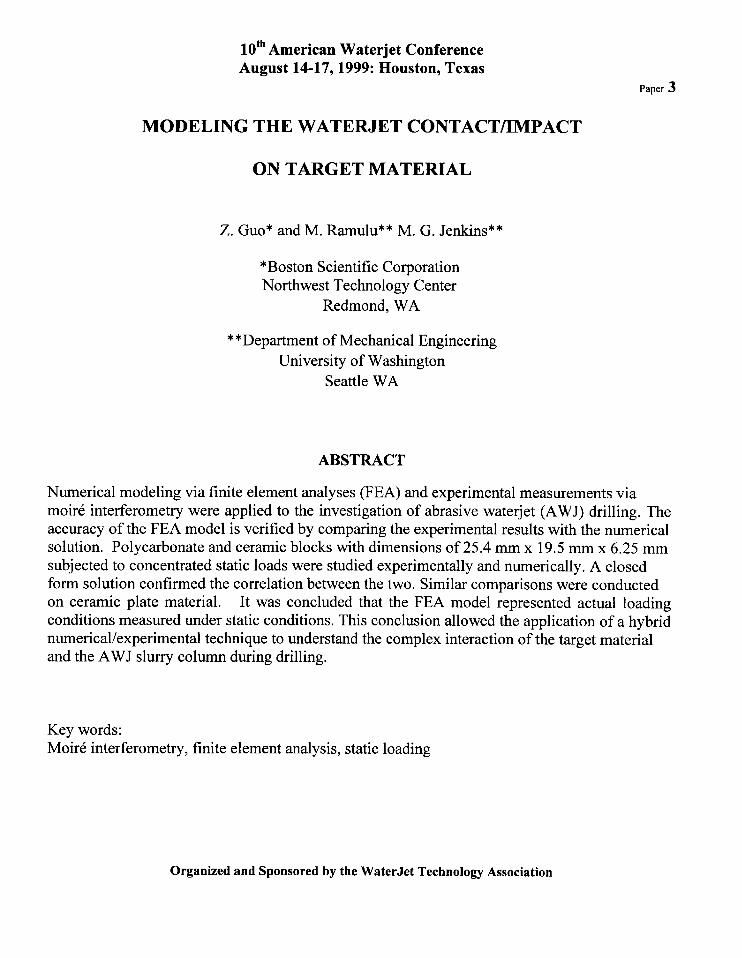
10thAmerican Waterjet ConferenceAugust 14-17, 1999: Houston, Texas
Paper 3
MODELING THE WATERJET CONTACT/IMPACT
ON TARGET MATERIAL
Z. GUO* and M. Ramulu** M. G. Jenkins**
*Boston Scientific CorporationNorthwest Technology Center
Redmond, WA
**Department of Mechanical Engineering
University of Washington
Seattle WA
ABSTRACT
Numerical modeling via finite element analyses (FEA) and experimental measurements viamoir~ interferometry were applied to the investigation of abrasive waterjet (AWJ) drilling. Theaccuracy of the FEA model is verified by comparing the experimental results with the numericalsolution. Polycarbonate and ceramic blocks with dimensions of 25.4 mm x 19.5 mm x 6.25 mmsubjected to concentrated static loads were studied experimentally and numerically. A closedform solution confirmed the correlation between the two. Similar comparisons were conductedon ceramic plate material. It was concluded that the FEA model represented actual loadingconditions measured under static conditions. This conclusion allowed the application of a hybridnumerical/experimental technique to understand the complex interaction of the target materialand the AWJ slurry column during drilling.
Key words:Moir& interferometry, finite element analysis, static loading
Organized and Sponsored by the WaterJet Technology Association
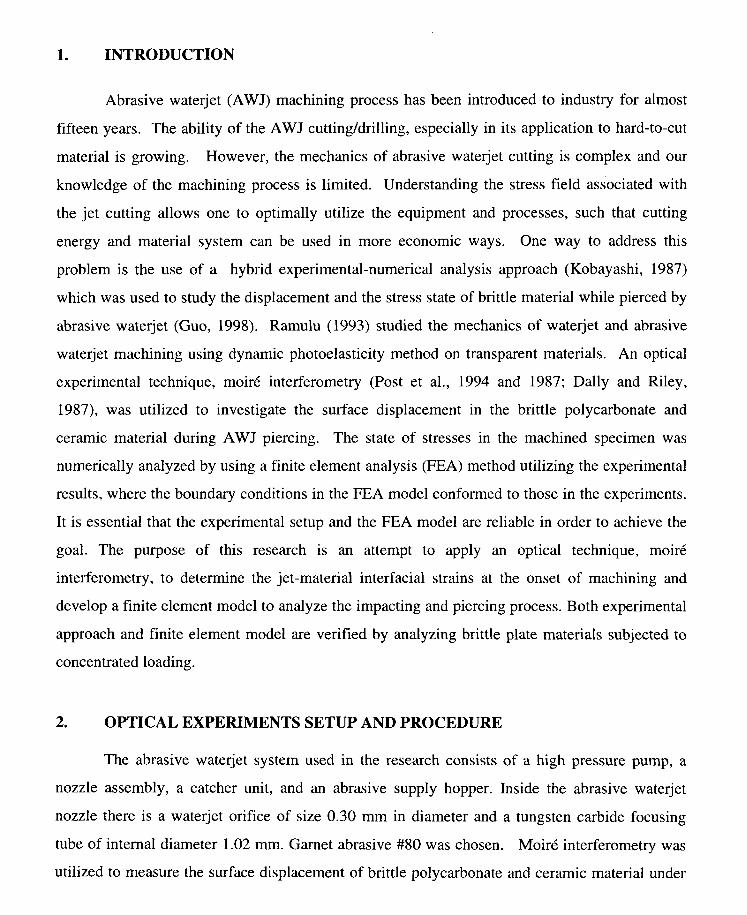
1. INTRODUCTION
Abrasive waterjet (AWJ) machining process has been introduced to industry for almost
fifteen years. The ability of the AWJ cutting/drilling, especially in its application to hard-to-cut
material is growing. However, the mechanics of abrasive waterjet cutting is complex and our
knowledge of the machining process is limited. Understanding the stress field associated with
the jet cutting allows one to optimally utilize the equipment and processes, such that cutting
energy and material system can be used in more economic ways. One way to address this
problem is the use of a hybrid experimental-numerical analysis approach (Kobayashi, 1987)
which was used to study the displacement and the stress state of brittle material while pierced by
abrasive waterjet (Guo, 1998). Ramulu (1993) studied the mechanics of waterjet and abrasive
waterjet machining using dynamic photoelasticity method on transparent materials. An optical
experimental technique, moir6 interferometry (Post et al., 1994 and 1987; Dally and Riley,
1987), was utilized to investigate the surface displacement in the brittle polycarbonate and
ceramic material during AWJ piercing. The state of stresses in the machined specimen was
numerically analyzed by using a finite element analysis (FEA) method utilizing the experimental
results, where the boundary conditions in the FEA model conformed to those in the experiments.
It is essential that the experimental setup and the FEA model are reliable in order to achieve the
goal. The purpose of this research is an attempt to apply an optical technique, moir~
interferometry, to determine the jet-material interracial strains at the onset of machining and
develop a finite element model to analyze the impacting and piercing process. Both experimental
approach and finite element model are verified by analyzing brittle plate materials subjected to
concentrated loading.
2. OPTICAL EXPERIMENTS SETUP AND PROCEDURE
The abrasive waterjet system used in the research consists of a high pressure pump, a
nozzle assembly, a catcher unit, and an abrasive supply hopper. Inside the abrasive waterjet
nozzle there is a waterjet orifice of size 0.30 mm in diameter and a tungsten carbide focusing
tube of internal diameter 1.02 mm. Garnet abrasive #80 was chosen. Moir6 interferometry was
utilized to measure the surface displacement of brittle polycarbonate and ceramic material under
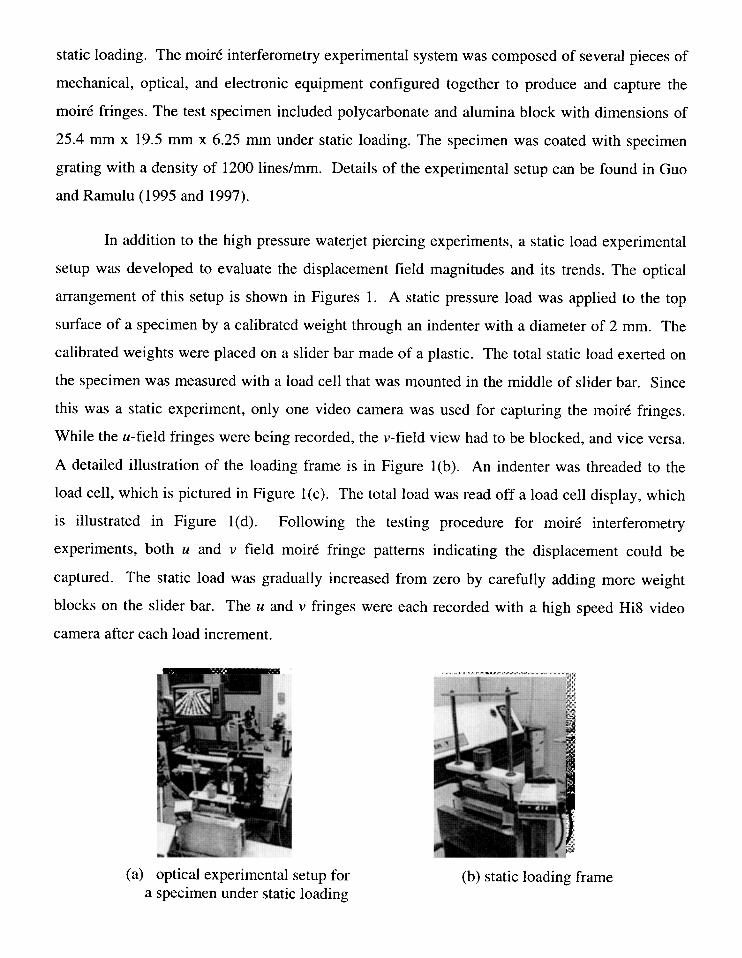
static loading. The moir& interferometry experimental system was composed of several pieces of
mechanical, optical, and electronic equipment configured together to produce and capture the
moir6 fringes. The test specimen included polycarbonate and alumina block with dimensions of
25.4 mm x 19.5 mm x 6.25 mm under static loading. The specimen
grating with a density of 1200 lines/mm. Details of the experimental
and Ramulu (1995 and 1997).
In addition to the high pressure waterjet piercing experiments,
was coated with specimen
setup can be found in Guo
a static load experimental
setup was developed to evaluate the displacement field magnitudes and its trends. The optical
arrangement of this setup is shown in Figures 1. A static pressure load was applied to the top
surface of a specimen by a calibrated weight through an indenter with a diameter of 2 mm. The
calibrated weights were placed on a slider bar made of a plastic. The total static load exerted on
the specimen was measured with a load cell that was mounted in the middle of slider bar. Since
this was a static experiment, only one video camera was used for capturing the moir6 fringes.
While the u-field fringes were being recorded, the v-field view had to be blocked, and vice versa.
A detailed illustration of the loading frame is in Figure 1(b). An indenter was threaded to the
load cell, which is pictured in Figure 1(c). The total load was read off a load cell display, which
is illustrated in Figure 1(d). Following the testing procedure for moir6 interferometry
experiments, both u and v field moir~ fringe patterns indicating the displacement could be
captured. The static load was gradually increased from zero by carefully adding more weight
blocks on the slider bar. The u and v fringes were each recorded with a high speed Hi8 video
camera after each load increment.
(a) optical experimental setup for (b) static loading framea specimen under static loading
3 FINITE ELEMENT MODELING
A commercial FEA code was used in this study. In the finite element analysis, the
indenter was modeled as a solid cylinder with a diameter of 2 mm. Taking advantage of the
symmetry of both load and geometry, a quarter volume for the specimen and the indenter was
modeled. During the experimental testing, the bottom surface of the test specimen was adhered
using an epoxy to the base bar. Figure 2 is a typical meshed finite element model, which has
2,548 nodes and 1,863 elements. Figure 2(b) shows the enlarged view of the meshed indenter.
A three dimensional structural solid element (SOLID45) was used for both the test specimen
body and the indenter. The interface between the indenter and the test specimen was modeled
with a contact element, (CONTACT49). These displacement fields modeled by the FEA meshes
only represent half of the frontal surface of the specimen.
4 RESULTS AND DISCUSSION
Figure 3 shows the moir6 fringe patterns in both u and v fields for the polycarbonate
specimen for increasing static load from O N to 44.5 N. Note that both u and v fields have initial
fringes at O N load condition. However, moird fringes in both u and v fields are relatively
symmetric with respect to the loading line. The number of moir6 fringes increased as the load
increased. This was especially the case for the v field, as shown in Figure 3(b). Figure 4 shows
the moir~ fringes recorded for the alumina specimen in both u and v fields, as the loads were
increased from O N to 62.3 N. It appears that there were 2 initial fringes in the u field and 3
initial fringes in the v field. As the loads were increased, the moir~ fringes in both fields only
shifted within the picture frames. There was no increase in moir6 fringes for the alumina.
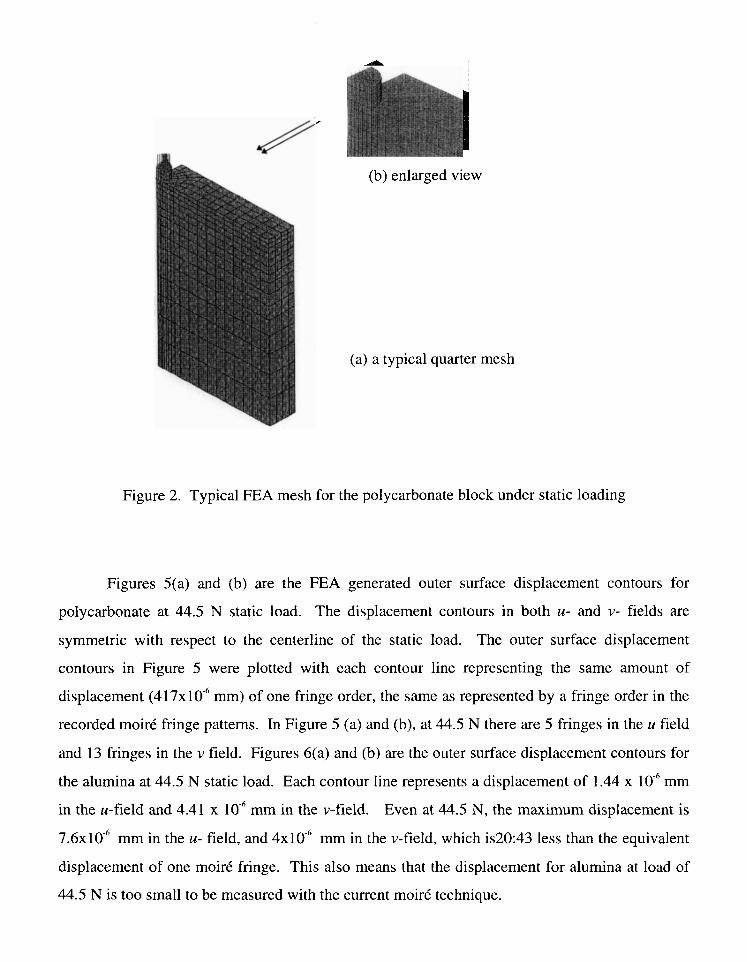
/ m.-.(b) enlarged view
(a) a typical quarter mesh
Figure 2. Typical FEA mesh for the polycarbonate block under static loading
Figures 5(a) and (b) are the FEA generated outer surface displacement contours for
polycarbonate at 44.5 N static load. The displacement contours in both u- and v- fields are
symmetric with respect to the centerline of the static load. The outer surface displacement
contours in Figure 5 were plotted with each contour line representing the same amount of
displacement (417x 10-’ mm) of one fringe order, the same as represented by a fringe order in the
recorded moir6 fringe patterns. In Figure 5 (a) and (b), at 44.5 N there are 5 fringes in the u field
and 13 fringes in the v field. Figures 6(a) and (b) are the outer surface displacement contours for
the alumina at 44.5 N static load. Each contour line represents a displacement of 1.44 x 10“’mm
in the u-field and 4.41 x 10-f mm in the v-field. Even at 44.5 N, the maximum displacement is
7.6x 10-’ mm in the u- field, and 4x 10-’ mm in the v-field, which is20:43 less than the equivalent
displacement of one moir6 fringe. This also means that the displacement for alumina at load of
44.5 N is too small to be measured with the current moir6 technique.
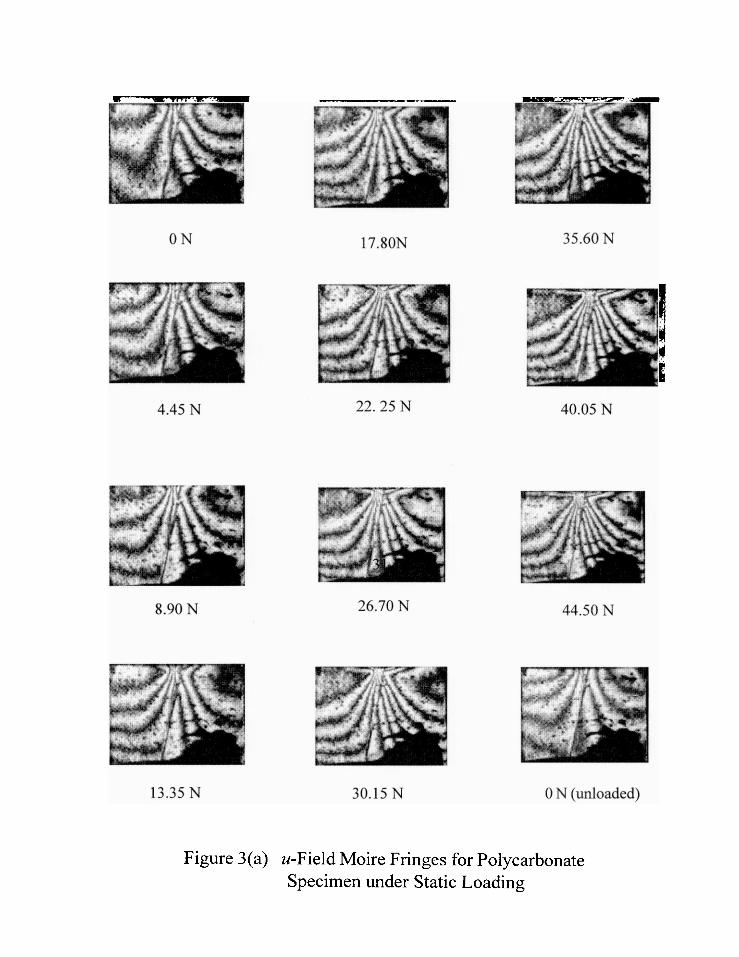
8.90 N 26.70 N 44.50 N
Figure 3(a) u-Field Moire Fringes for Polycarbonate
Specimen under Static Loading
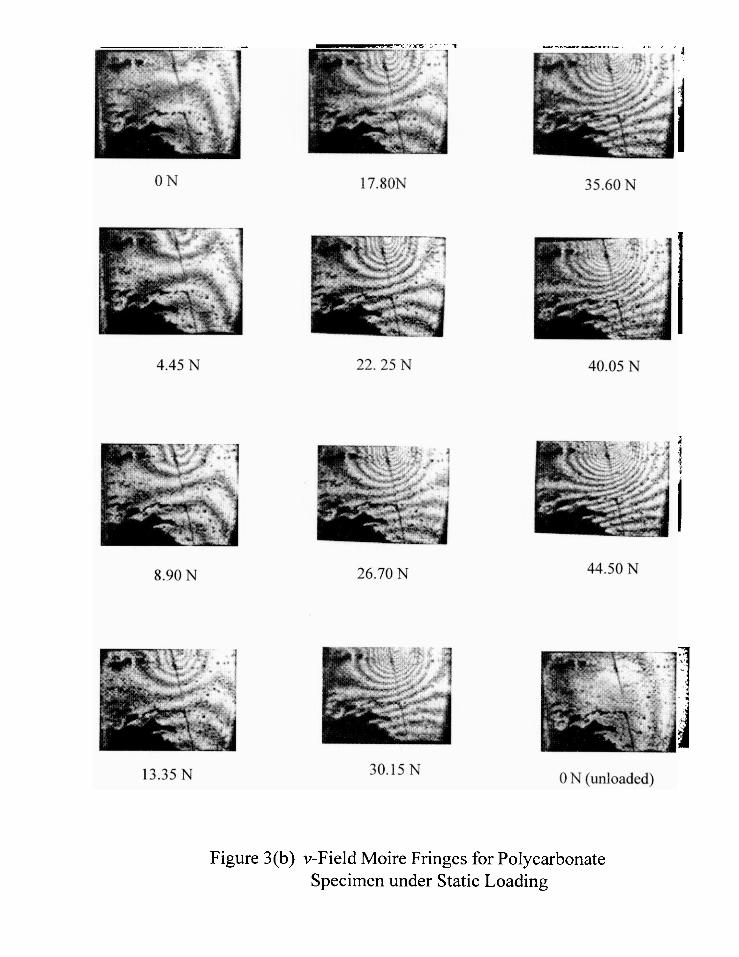
Figure 3(b) v-Field Moire Fringes for Polycarbonate
Specimen under Static Loading
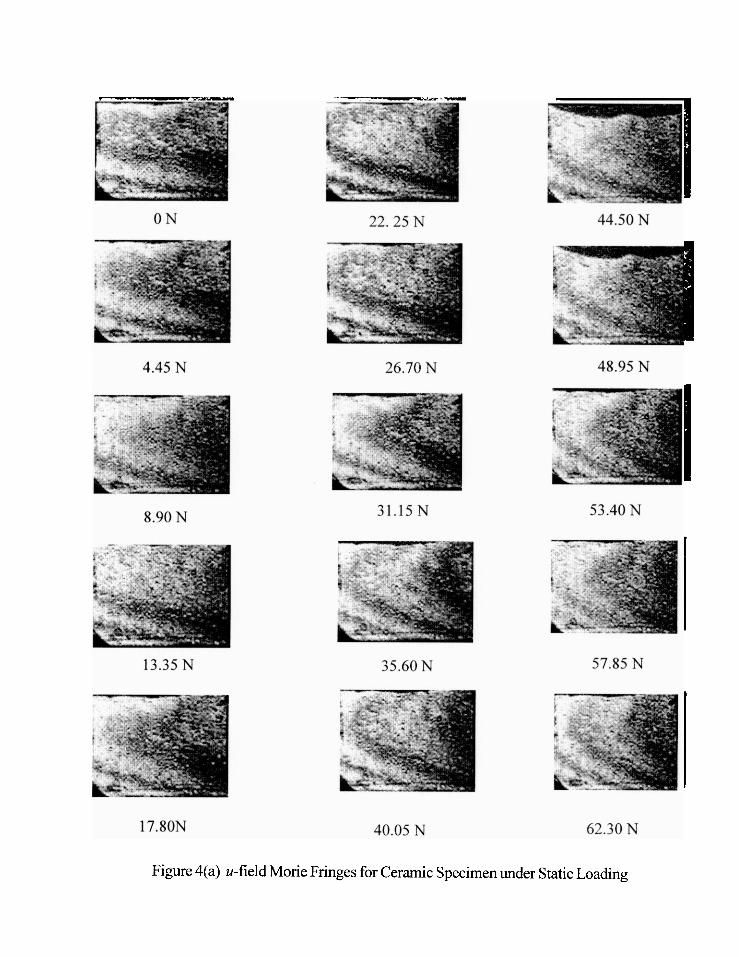
Figure 4(a) u-field Morie Fringes for Ceramic Specimen under Static Loading
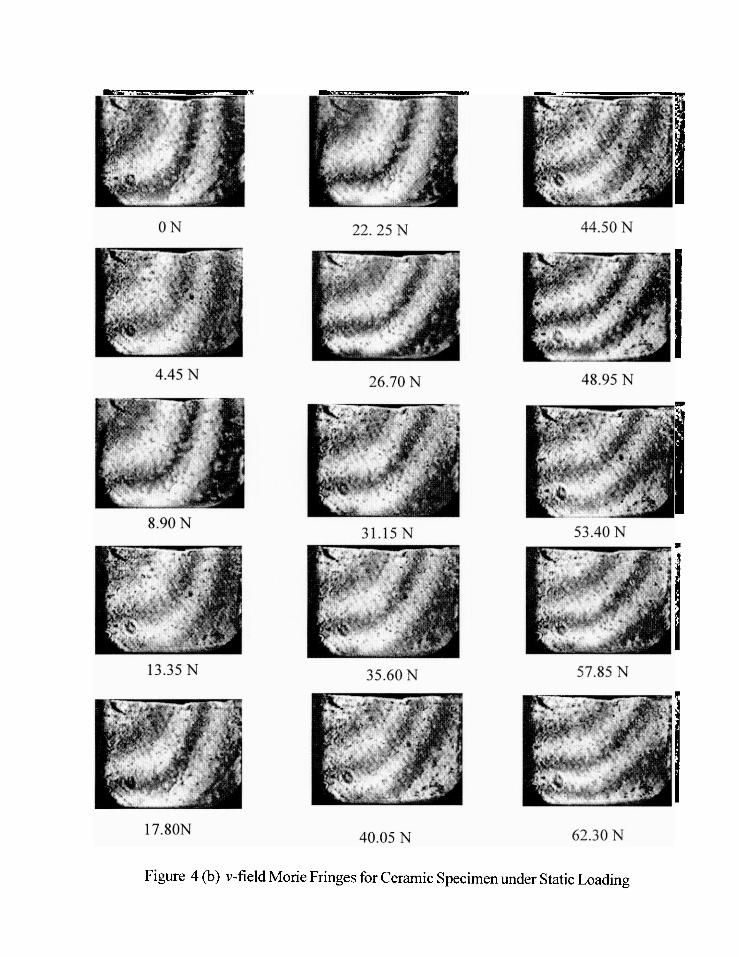
Figure 4 (b) v-field Morie Fringes for Ceramic Specimen under Static Loading
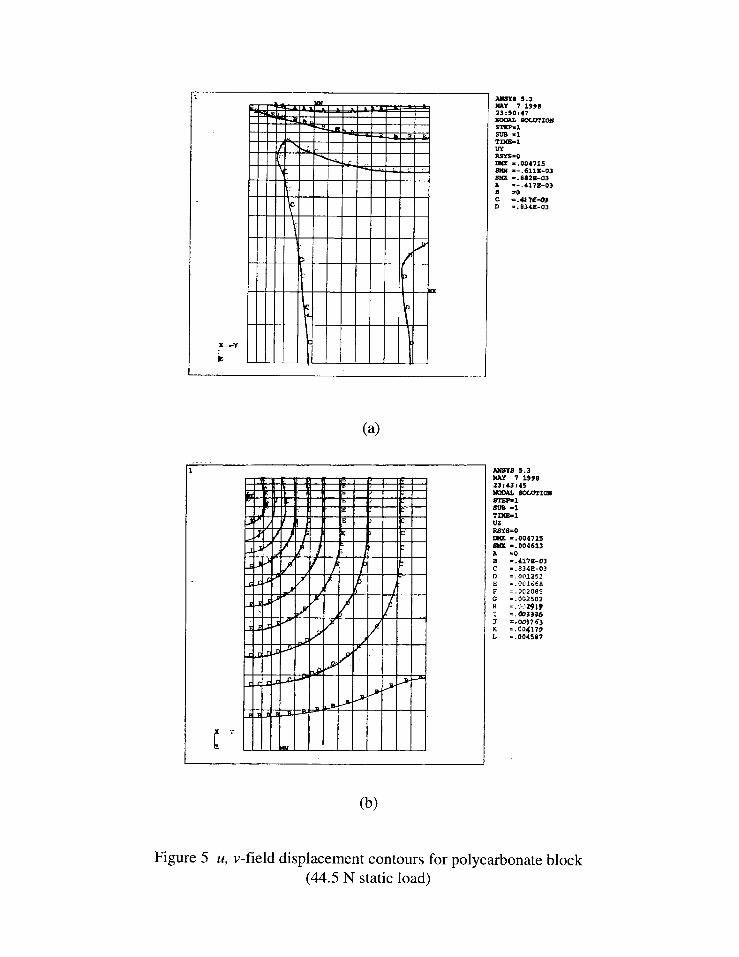
(a)
.,,
A319YS 5.3MAY 7 199013:50:47WEAL sOu?T1ci#STEP. 1SUB .1‘mm-lLrrRsYs.o~ =.004715QQ? =-. 611X-03S(X =.0828-03A --.4178-03B dc. =: u 71?+3D .. E34E-03
AmY9 5.36mY 7 199023,43,453rcmL mun’lm3TEP-1Sm .1T1603-1U3R37s.omu -.004715= = .004613
(b)
Figure 5 u, v-field displacement contours for polycarbonate
(44.5 N static load)
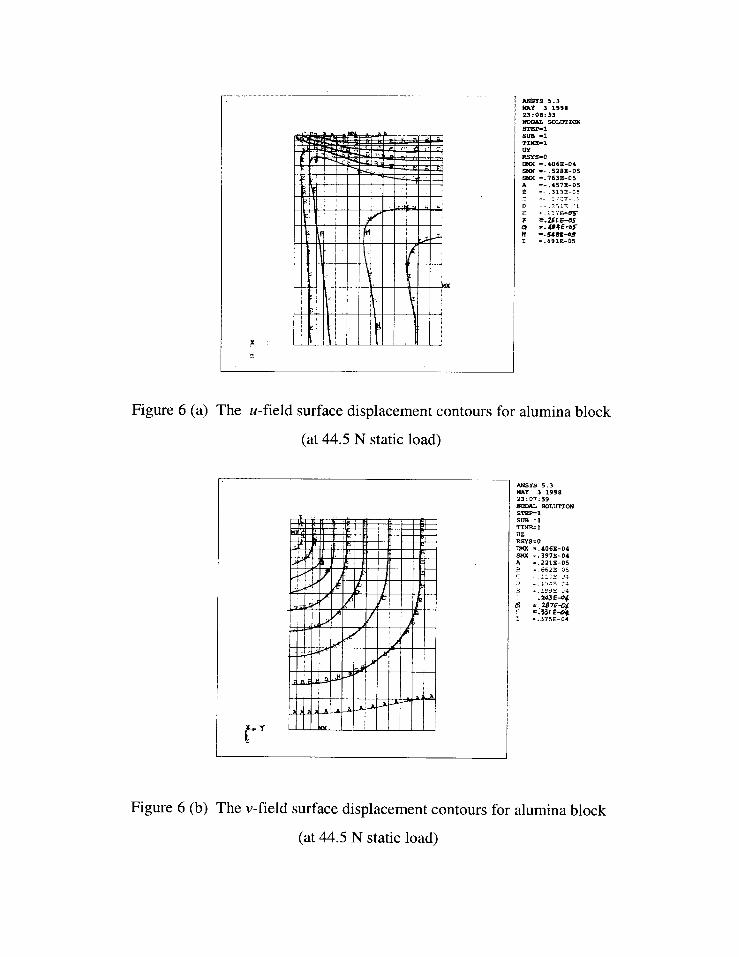
,x
TIME- 1wRsYs- 0H =.406E-o&S= -- .528E.05SUX =.7633! -05A .-.457E-03e . . .313 E.’j5
H1
Figure 6 (a) The u-field surface displacement contours for alumina block
(at 44.5 N static load)
f--’..
ANws 5.3NAY 3 199823:07:59_ 50LUT1WSTEW-1sun =1T1~ 102RsYs=o= = 406E-046?SX=.397E-04A =.221E-05E ..e62z-05~
3
s
i
Figure 6 (b) The v-field surface displacement contours for alumina block
(at 44.5 N static load)
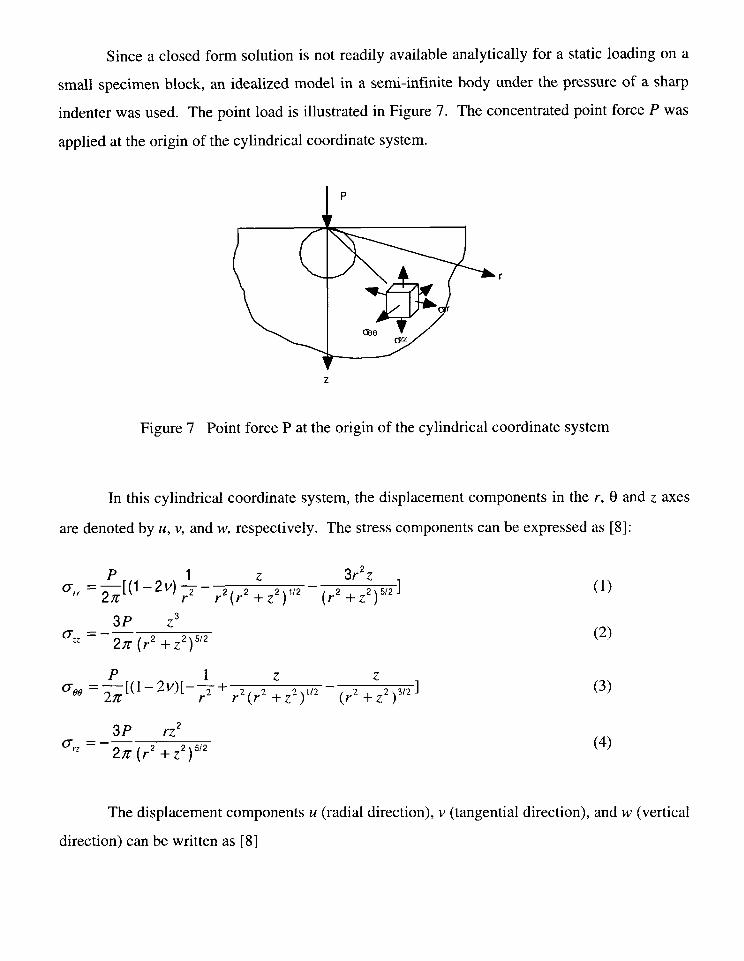
Since a closed form solution is not readily available analytically for a static loading on a
small specimen block, an idealized model in a semi-infinite body under the pressure of a sharp
indenter was used. The point load is illustrated in Figure 7. The concentrated point force P was
applied at the origin of the cylindrical coordinate system.
I P
z
Figure 7 Point force P at the origin of the cylindrical coordinate system
In this cylindrical coordinate system, the displacement components in the r, 6 and z axes
are denoted by u, v, and w, respectively. The stress components can be expressed as [8]:
P‘[(1-+- ~,(r, :22),/2 - (r2:::)5/21 (1)
‘“ = 27r
3P 230= =–—
27r (r2 +22)5’2(2)
~;[(l–2v)[–~+ ~2(r2 :22)1/2 – ~r2 +;2)3/21Croo = — (3)
3P rz2
“z ‘–2Z (r2 +22)5’2(4)
The displacement components u (radial direction), v (tangential direction), and w (vertical
direction) can be written as [8]
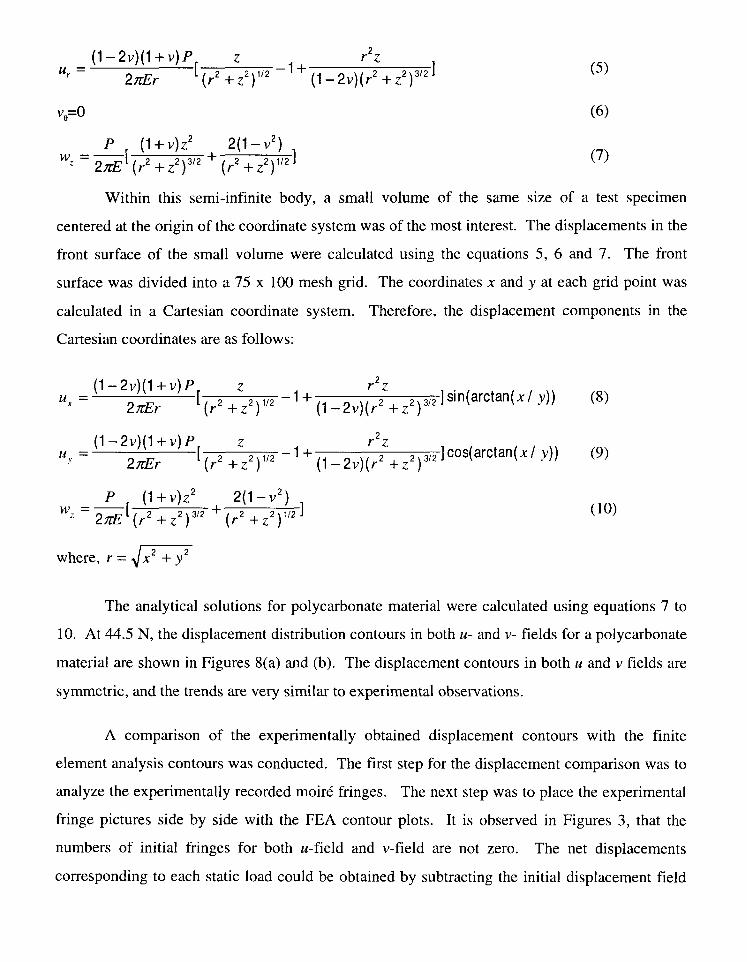
(1 -2V)(1 +V)P zu, =
2xEr[(r2+z2)l/2 -
2
‘ +(1 -2v)[r;+z2)3’21
ve=()
P . (1+ V)Z2 2(1– V2)——
[ ‘2 ; 3,2 + (r; +z2);/21‘Z–2ZE (r +.2 )
(5)
(6)
(7)
Within this semi-infinite body, a small volume of the same size of a test specimen
centered at the origin of the coordinate system was of the most interest. The displacements in the
front surface of the small volume were calculated using the equations 5, 6 and 7. The front
surface was divided into a 75 x 100 mesh grid. The coordinates x and y at each grid point was
calculated in a Cartesian coordinate system. Therefore, the displacement components in the
Cartesian coordinates are as follows:
(1 -2V)(1 +V)P2
u, =2xEr
‘ ,,2 ]sin(arctan(x/y))‘(r2 +~2)1/2“+(1 -2v)~r2z+z ) (8)
(1 -2V)(1 +V)P2
Uy =2nEr
$r2 +:2)1/2 ‘1+(1 _pv);r2z+z2 )3/2] cos(arctan(x/ y)) (9)
P (1+V)Z2 2(1-V2)——[ z 2 3/2 ‘(r2+z’ )1/2‘Z–2?ZE (r +Z )
1 (lo)
rwhere, r = x + y
The analytical solutions for polycarbonate material were calculated using equations 7 to
10. At 44.5 N, the displacement distribution contours in both u- and v- fields for a polycarbonate
material are shown in Figures t3(a) and (b). The displacement contours in both u and v fields are
symmetric, and the trends are very similar to experimental observations.
A comparison of the experimentally obtained displacement contours with the finite
element analysis contours was conducted. The first step for the displacement comparison was to
analyze the experimentally recorded moir~ fringes. The next step was to place the experimental
fringe pictures side by side with the FEA contour plots. It is observed in Figures 3, that the
numbers of initial fringes for both u-field and v-field are not zero. The net displacements
corresponding to each static load could be obtained by subtracting the initial displacement field
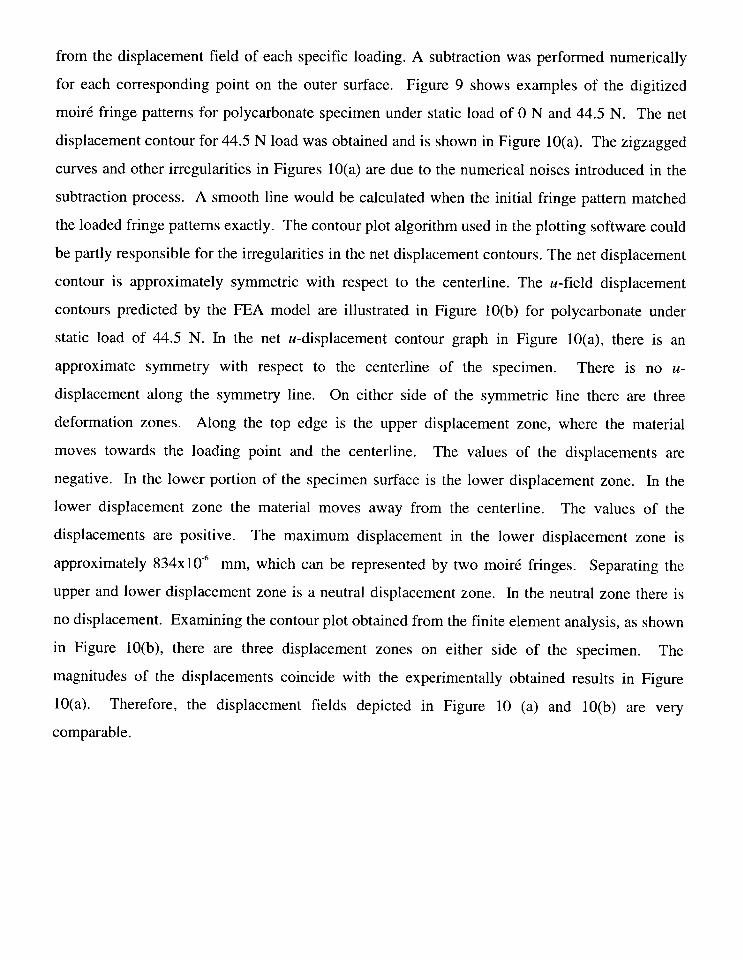
from the displacement field of each specific loading. A subtraction was performed numerically
for each corresponding point on the outer surface. Figure 9 shows examples of the digitized
moir& fringe patterns for polycarbonate specimen under static load of O N and 44.5 N. The net
displacement contour for 44.5 N load was obtained and is shown in Figure 10(a). The zigzagged
curves and other irregularities in Figures 10(a) are due to the numerical noises introduced in the
subtraction process. A smooth line would be calculated when the initial fringe pattern matched
the loaded fringe patterns exactly. The contour plot algorithm used in the plotting software could
be partly responsible for the irregularities in the net displacement contours. The net displacement
contour is approximately symmetric with respect to the centerline. The u-field displacement
contours predicted by the FEA model are illustrated in Figure 10(b) for polycarbonate under
static load of 44.5 N. In the net u-displacement contour graph in Figure 10(a), there is an
approximate symmetry with respect to the centerline of the specimen. There is no u-
displacement along the symmetry line. On either side of the symmetric line there are three
deformation zones. Along the top edge is the upper displacement zone, where the material
moves towards the loading point and the centerline. The values of the displacements are
negative. In the lower portion of the specimen surface is the lower displacement zone. In the
lower displacement zone the material moves away from the centerline. The values of the
displacements are positive. The maximum displacement in the lower displacement zone is
approximately 834x 10-c mm, which can be represented by two moir6 fringes. Separating the
upper and lower displacement zone is a neutral displacement zone. In the neutral zone there is
no displacement. Examining the contour plot obtained from the finite element analysis, as shown
in Figure 10(b), there are three displacement zones on either side of the specimen. The
magnitudes of the displacements coincide with the experimentally obtained results in Figure
10(a). Therefore, the displacement fields depicted in Figure 10 (a) and 10(b) are very
comparable.
20 I
“d-i+L
20
18
16
14
-12.5-10.0-7.5 -5.0 -2.5 0.0 2.5 5.0 7.5 10.0 12.5
Width (mm)
(a) u-field displacement contour (~)
-12.5-10.0-7.5-5.0-2.5 0.0 2.5 5.0 7.5 10.012.5
Width (mm)
(b) v-field displacement contour (mm)
Figure8 C1osedfom solutions ofdisplacement contours under apoint1oad
,..
/18~’
16
14
12 ~ \
-F1O Ig%
8
I. ~
6
4
2 \- .
0 Io 5 10 15 20. 25
x (mm)
a) Static Load ON). . .
18
16
14
12
Zlo.E_%
‘o 5 10 15 20 25x (mm)
(b)Static Load44.5N)
Figure 9 Digitized u-field displacement contours for
polycarbonate specimen under static loads
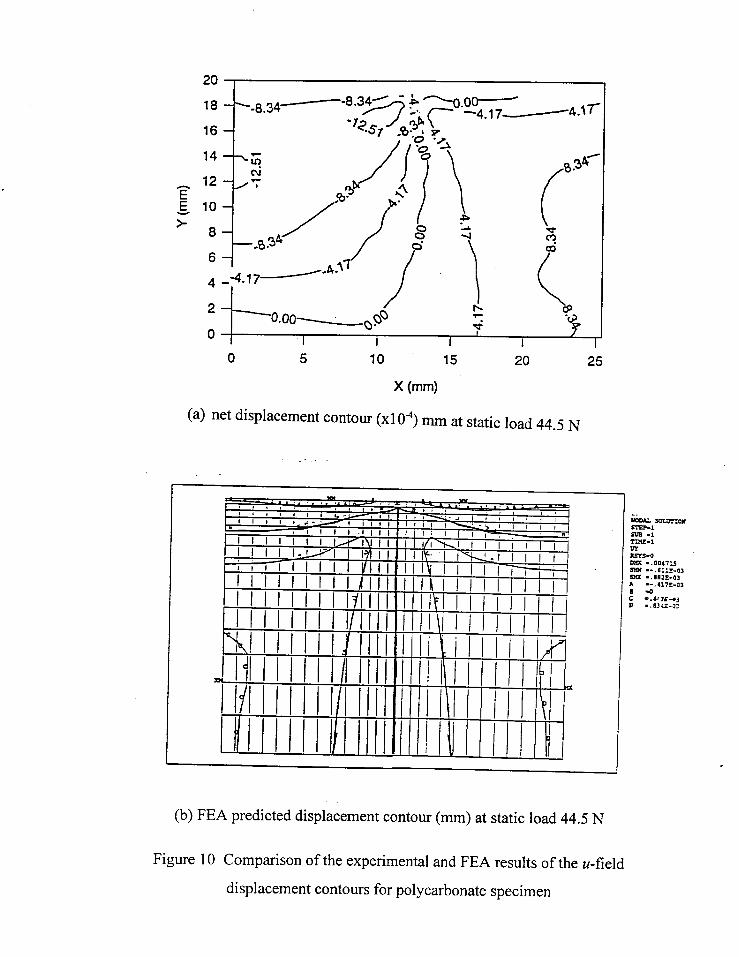
,.I
20 I
18
16
14
6
4
2
0
o 5 10 15 20 25
X (mm)
(a) net displacement contour (xl 04) mm at static load 44.5 N
i%.L ~omSTEP-lsun .1‘rxM.E.1
(b) FEA predicted displacement contour (mm) at static load 44.5 N
Figure 10 Comparison of the experimental and FEA results of the u-field
displacement contours for polycarbonate specimen
A similar comparison was made for the v-field displacement contours between the
experimental results and the FEA results for the polycarbonate specimen. The net result of the v-
field displacement contour after subtraction is shown in Figure 11(a), and the FEA predicted
contour is shown in Figure 11(b). There is a general symmetry in the v-displacement field with
respect to the centerline of the specimen, which is the case for the FEA v-displacement contour
plot in Figure 11(b). Along the lower edge the v-displacement is zero. The maximum v-
displacement is at the loading point, or the center point of the upper edge. The maximum
displacements from both experimental and FEA are approximately 5000x10-’ mm. There is an
apparent close match between the experimental results and the finite element prediction in the v-
displacement field also. The above comparison in both u- and v- fields demonstrates that the
results from the experiments agree with that of FEA results.
Figures 8 are the contour plots from the analytical solutions described in Equations 1 to
10. The contour plots represent the u- and v- displacement for a small block of material in a
semi-infinite body. Comparing displacement contours in the u and v fields from the analytical
solution in Figures 8, with those from FEA and experiments in Figures 6(a) and (b), it is obvious
that the displacement contour trends are very similar. However, the magnitude of the
displacements of the analytical solution is smaller than the FEA contour indicated, and smaller
than the experimentally recorded displacements at their corresponding locations. The analytical
u-field displacements in Figure 8(a) are about 1/7 of those from the FEA or experiments in
Figure 11. The analytical v-field displacements in Figure 8(b) are about 1/4 to 1/5 of those from
the FEA or experiments in Figure 6(b). The differences in the displacements in both u- and v-
fields are probably due to the different boundary condition between the semi-infinite body and
those in the FEA model and experiment. For example, in the experimental setup and FEA
model, both sides of the specimen were free of support. In the semi-infinite model, the specimen
volume is supported by the adjacent materials, and the adjacent material prevents the material
deform freely in the v-direction. Thus smaller displacement was observed in the analytical
solutions. Another important factor that is attributed to the differences is that the applied load in
the analytical model is a concentrated force at the center of the block volume instead of a blunt
pressure load, as is the case in experimental and FEA models.
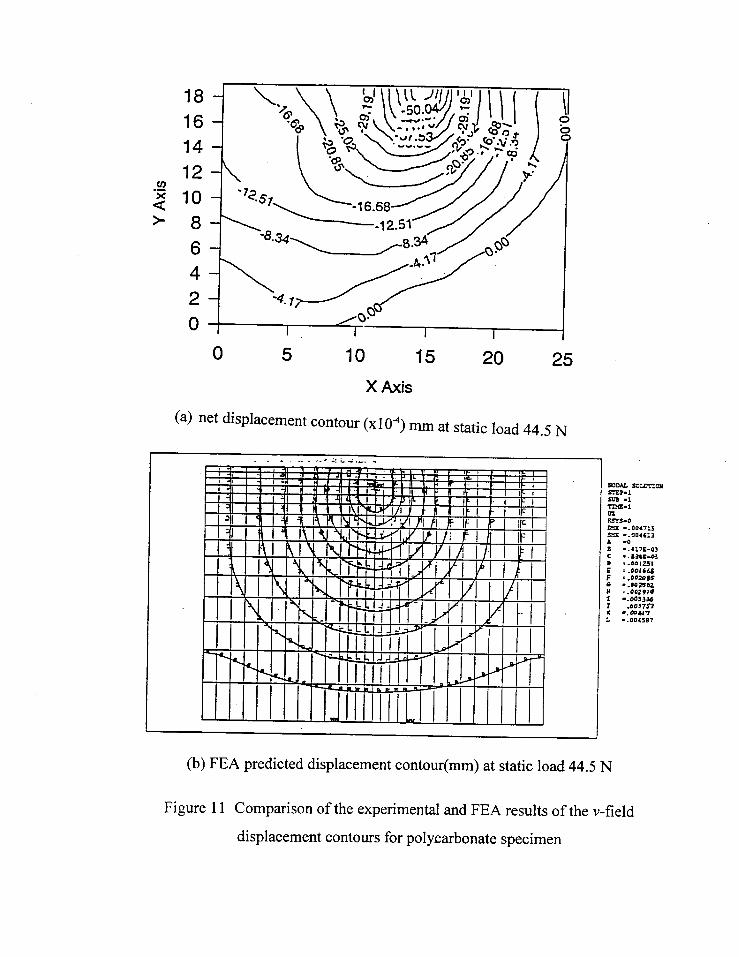
18161412
$ 10
20
I)
)>
0 5 10 15 20 25
X Axis
(a) net displacement contour (X104) mm at static load 44.5 N
I .. . ...--A::._.—.. (
- s0LcTm31STEP-15U3 -1Tncs.102RsY6-o~ ..00471s~ -.004611A .0B -. 417E-03
..s34.s43: ..001,?51
=.00166s: =.002085a ..002502# ~.0az914z -.0033361 .0037~
..Mu-r: ..0045B7
(b) FEA predicted displacement contour at static load 44.5 N
Figurell Compmison of theexperimentil and FEAresults of thev-field
displacement contours for polycarbonate specimen
The optical experimental and FEA results for alumina were studied and are also
compared here. Figures 4(a) and 4(b) are the moir6 fringes pictures from the experiments in u-
and v- displacement fields respectively. Figures 6(a) and 6(b) are the contour plots obtained
from finite element analysis for the alumina material. As can be seen in the experimental results
shown in Figures 4(a) and Figure 4(b), the number of moir& fringes nearly remained constant in
both u- and v- fields as the static loads were increased from O N load to 62 N in both u- and v-
fields. Checking the FEA contours in the v fields, as illustrated in Figure 5(b), the maximum
displacement at static load of 44.5 N is 3.97x1 O”’mm, which is still less than that represented by
one moir6 fringe 417x 1O-d. In the v fields, as illustrated in Figure 5(a), the maximum u-
displacement at static load of 44.5 N is 7x10-’ mm, is also less than the moir6 fringe value. The
comparison between the FEA results and experimental results in u-and v- field displacements
equally demonstrates that the experimentally obtained displacements agree with those predicted
by FEA for the alumina material. From these comparisons, it is obvious that the maximum
displacement in both u- and v- fields at static load of 44.5 N on a polycarbonate is quite different
from those of alumina. The displacements for ceramic are much smaller than the polymer
because the ceramic is a much stiffer material than that of polycarbonate. Therefore, the
displacements for the ceramic under the limited static loads could not be measured by moir6
fringes.
6 SUMMARY AND CONCLUSIONS
The surface displacements of polycarbonate and alumina specimens under concentrated
static loading were determined by using moire interferometry experiments and through the finite
element analysis models. The boundary conditions for both experimental and numerical studies
were the same. The surface displacements were also analyzed using a closed form solution.
These results are presented in terms of moir6 fringes and contour plots. The experimental
findings and the FEA results were compared for the polycarbonate and ceramic specimens under
static loading. The patterns of the displacement distribution were similar. In the polycarbonate
specimens, the moirg interferometry results were in good agreement with the finite element
analysis results. For ceramic specimen the number of moircl fringes did not change as the load
was increased from 1 to 62 N. This was due to the high stiffness of the ceramic material. The
good correlation between the FEA modeling and the experiments of the static loading on
polycarbonate and alumina demonstrates that the FEA modeling is able to predict the
displacement distribution for both polycarbonate and alumina under static loading.
References
Dally, J. W. and Riley, W. F., “Experimental Stress Analysis,” 3rd Edition, McGraw-
Hill, New York, 1991.
Guo, Z., “Experimental and Numerical Analysis of Abrasive Waterjet Drilling of BrittleMaterials,” a PhD Dissertation Submitted to University of Washington, 1998.
Z. Guo and M. Ramulu, “Measurement of Strains Associated with Abrasive WaterjetDrilling of Ceramics,” Proceedings of 8th American Waterjet Technology
Conference, Paper 66, VO1.H, August, 1995, pp. 895-905.
Kobayashi, A. S., “Hybrid Experimental-Numerical Stress Analysis,” Handbook on
Experimental Mechanics, ed. A. S. Kobayashi, Prentice-Hall, 1987, pp. 739-767.
Post, D., Han, B., Ifju, P., “High Sensitivity Moir6 Experimental Analysis for Mechanicsand Materials,” Springer- Verlag, New York, Inc. 1994.
Post, D., “Moir6 Interferometry,” Handbook on Experimental Mechanics, ed. A. S.Kobayashi, Prentice-Hall, pp. 314-387, 1987
Ramulu, M., “Dynamic Photoelastic Investigation on the Mechanics of Waterjet andAbrasive Waterjet Machining,” Optics and Lasers in Engineering, 19, 1993, pp.43-65.
10th American Waterjet ConferenceAugust 14-17, 1999: Houston, Texas
Paper 4
NEURAL NETWORK MODEL OF WATERJET DEPAINTING PROCESS
K. BabetsE.S. Geskin
Waterjet Laboratory, Mechanical Engineering DepartmentNewark, NJ, USA
B. ChaudhuriParticle Technology Research CenterMechanical Engineering Department
Newark, NJ, USA
ABSTRACT
Current study is concerned with numerical modeling of waterjet depainting process. As amodeling tool a simple neural network with backpropagation of error was applied. After thenetwork was “trained” and verified to perform satisfactory it was used for prediction of theoutput variable- the strip width once the set of input parameters (water pressure, traverse rate,stand-off distance) was specified, for sensitivity analysis and for the process optimization. Theaverage relative error of prediction was 2.4%. Found sensitivity coefficients show how differentinput parameters influence the output parameter. The water pressure coefficient was found to bealways positive, which proved that the increase in water pressure results in increase in a cleaningwidth. The traverse rate coefficient was always negative. The coefficient for standoff distancestarts with positive values, then slowly decreases to zero (as cleaning width reaches itsmaximum) and takes negative values. The optimization scheme based on the Zoutendijk’smethod of feasible directions with slight modifications was used to find the set of optimalprocess parameters.
Organized and Sponsored by the WaterJet Technology Association
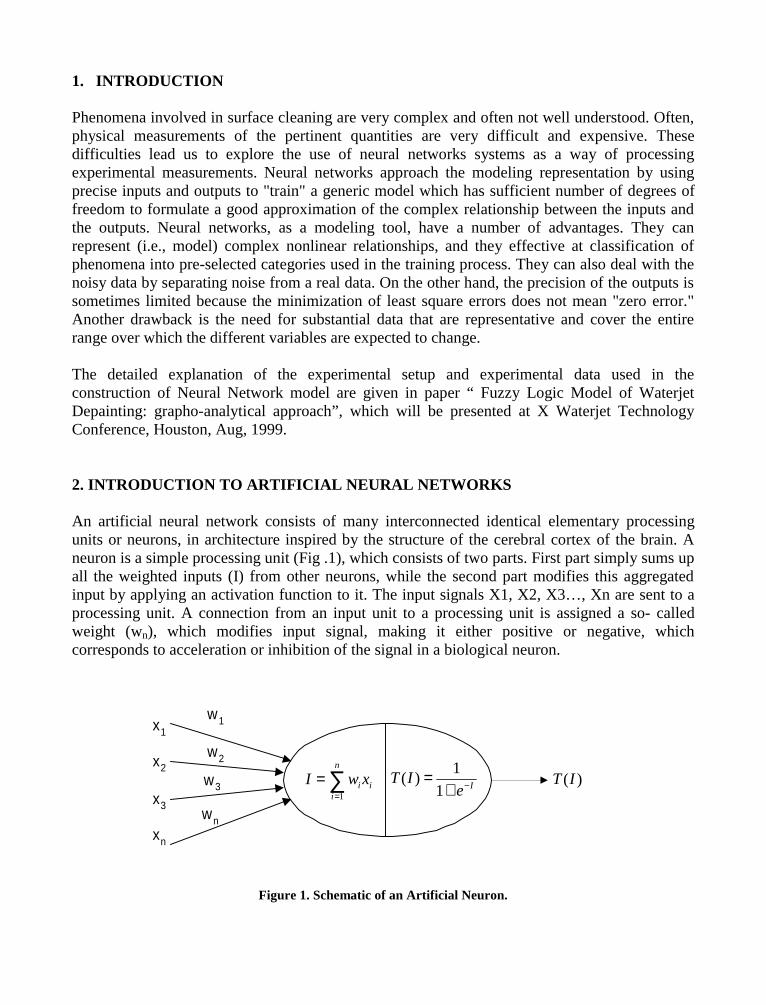
1. INTRODUCTION
Phenomena involved in surface cleaning are very complex and often not well understood. Often,physical measurements of the pertinent quantities are very difficult and expensive. Thesedifficulties lead us to explore the use of neural networks systems as a way of processingexperimental measurements. Neural networks approach the modeling representation by usingprecise inputs and outputs to "train" a generic model which has sufficient number of degrees offreedom to formulate a good approximation of the complex relationship between the inputs andthe outputs. Neural networks, as a modeling tool, have a number of advantages. They canrepresent (i.e., model) complex nonlinear relationships, and they effective at classification ofphenomena into pre-selected categories used in the training process. They can also deal with thenoisy data by separating noise from a real data. On the other hand, the precision of the outputs issometimes limited because the minimization of least square errors does not mean "zero error."Another drawback is the need for substantial data that are representative and cover the entirerange over which the different variables are expected to change.
The detailed explanation of the experimental setup and experimental data used in theconstruction of Neural Network model are given in paper “ Fuzzy Logic Model of WaterjetDepainting: grapho-analytical approach”, which will be presented at X Waterjet TechnologyConference, Houston, Aug, 1999.
2. INTRODUCTION TO ARTIFICIAL NEURAL NETWORKS
An artificial neural network consists of many interconnected identical elementary processingunits or neurons, in architecture inspired by the structure of the cerebral cortex of the brain. Aneuron is a simple processing unit (Fig .1), which consists of two parts. First part simply sums upall the weighted inputs (I) from other neurons, while the second part modifies this aggregatedinput by applying an activation function to it. The input signals X1, X2, X3…, Xn are sent to aprocessing unit. A connection from an input unit to a processing unit is assigned a so- calledweight (wn), which modifies input signal, making it either positive or negative, whichcorresponds to acceleration or inhibition of the signal in a biological neuron.
Figure 1. Schematic of an Artificial Neuron.
∑=
=n
iii xwI
1Ie
IT −+=
1
1)(
w1
w2
w3
wn
)(IT
x1
x2
x3
xn
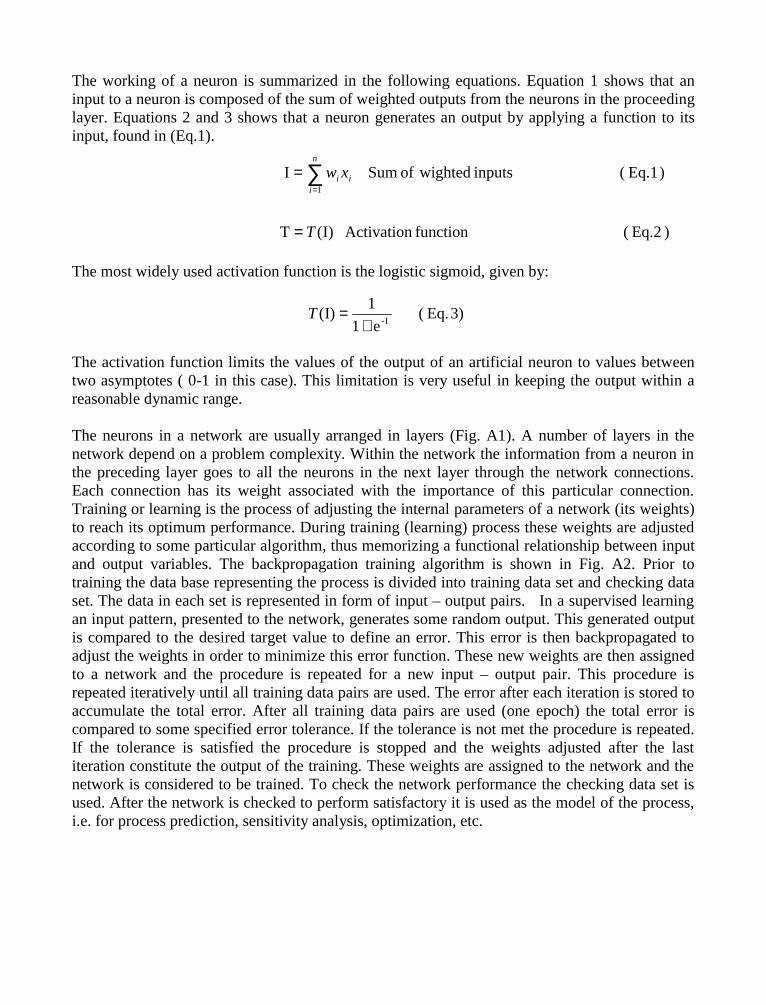
The working of a neuron is summarized in the following equations. Equation 1 shows that aninput to a neuron is composed of the sum of weighted outputs from the neurons in the proceedinglayer. Equations 2 and 3 shows that a neuron generates an output by applying a function to itsinput, found in (Eq.1).
The most widely used activation function is the logistic sigmoid, given by:
The activation function limits the values of the output of an artificial neuron to values betweentwo asymptotes ( 0-1 in this case). This limitation is very useful in keeping the output within areasonable dynamic range.
The neurons in a network are usually arranged in layers (Fig. A1). A number of layers in thenetwork depend on a problem complexity. Within the network the information from a neuron inthe preceding layer goes to all the neurons in the next layer through the network connections.Each connection has its weight associated with the importance of this particular connection.Training or learning is the process of adjusting the internal parameters of a network (its weights)to reach its optimum performance. During training (learning) process these weights are adjustedaccording to some particular algorithm, thus memorizing a functional relationship between inputand output variables. The backpropagation training algorithm is shown in Fig. A2. Prior totraining the data base representing the process is divided into training data set and checking dataset. The data in each set is represented in form of input – output pairs. In a supervised learningan input pattern, presented to the network, generates some random output. This generated outputis compared to the desired target value to define an error. This error is then backpropagated toadjust the weights in order to minimize this error function. These new weights are then assignedto a network and the procedure is repeated for a new input – output pair. This procedure isrepeated iteratively until all training data pairs are used. The error after each iteration is stored toaccumulate the total error. After all training data pairs are used (one epoch) the total error iscompared to some specified error tolerance. If the tolerance is not met the procedure is repeated.If the tolerance is satisfied the procedure is stopped and the weights adjusted after the lastiteration constitute the output of the training. These weights are assigned to the network and thenetwork is considered to be trained. To check the network performance the checking data set isused. After the network is checked to perform satisfactory it is used as the model of the process,i.e. for process prediction, sensitivity analysis, optimization, etc.
3) Eq. ( e1
1I)(
I-+=T
) Eq.2 ( function Activation )I(T
) Eq.1 ( inputs wightedof Sum I 1
T
xwn
iii
=
= ∑=
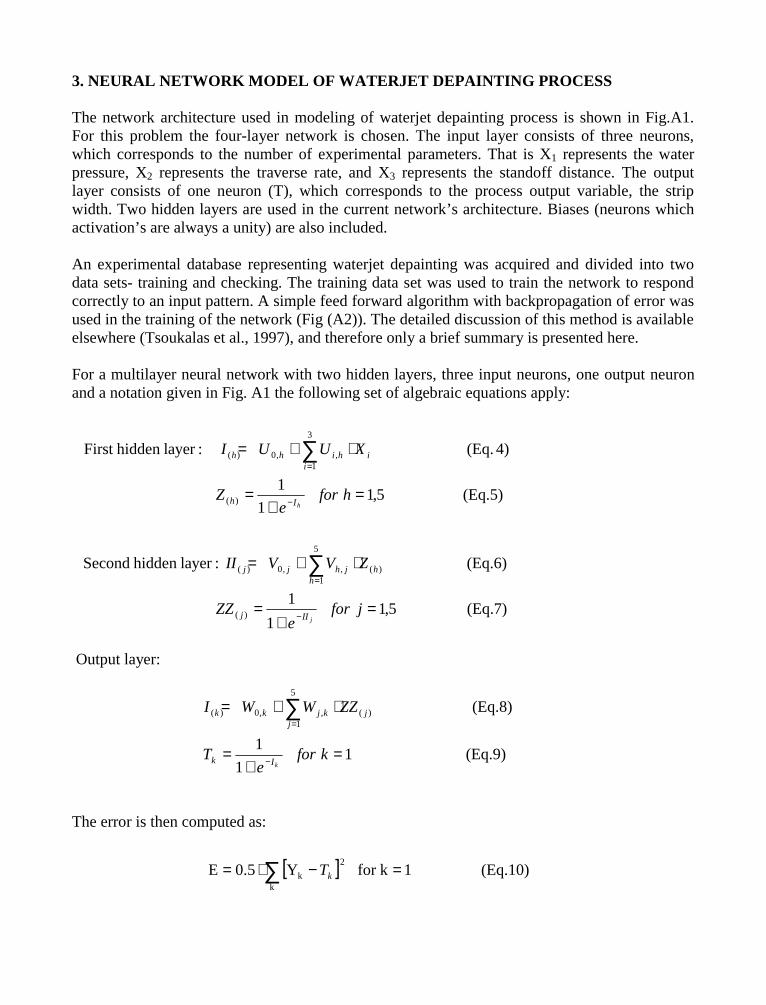
3. NEURAL NETWORK MODEL OF WATERJET DEPAINTING PROCESS
The network architecture used in modeling of waterjet depainting process is shown in Fig.A1.For this problem the four-layer network is chosen. The input layer consists of three neurons,which corresponds to the number of experimental parameters. That is X1 represents the waterpressure, X2 represents the traverse rate, and X3 represents the standoff distance. The outputlayer consists of one neuron (T), which corresponds to the process output variable, the stripwidth. Two hidden layers are used in the current network’s architecture. Biases (neurons whichactivation’s are always a unity) are also included.
An experimental database representing waterjet depainting was acquired and divided into twodata sets- training and checking. The training data set was used to train the network to respondcorrectly to an input pattern. A simple feed forward algorithm with backpropagation of error wasused in the training of the network (Fig (A2)). The detailed discussion of this method is availableelsewhere (Tsoukalas et al., 1997), and therefore only a brief summary is presented here.
For a multilayer neural network with two hidden layers, three input neurons, one output neuronand a notation given in Fig. A1 the following set of algebraic equations apply:
Output layer:
The error is then computed as:
(Eq.9) 1 1
1
(Eq.8) 5
1)(,,0)(
=+
=
⋅+=
−
=∑
kfore
T
ZZWWI
kIk
jjkjkk
[ ] (Eq.10) 1kfor Y0.5E2
kk =−⋅= ∑ kT
(Eq.7) 5,1 1
1
(Eq.6) :layerhidden Second
(Eq.5) 5,1 1
1
4) (Eq. :layerhidden First
)(
5
1)(,,0)(
)(
3
1,,0)(
=+
=
⋅+=
=+
=
⋅+=
−
=
−
=
∑
∑
jfore
ZZ
ZVVII
hfore
Z
XUUI
j
h
IIj
hhjhjj
Ih
iihihh
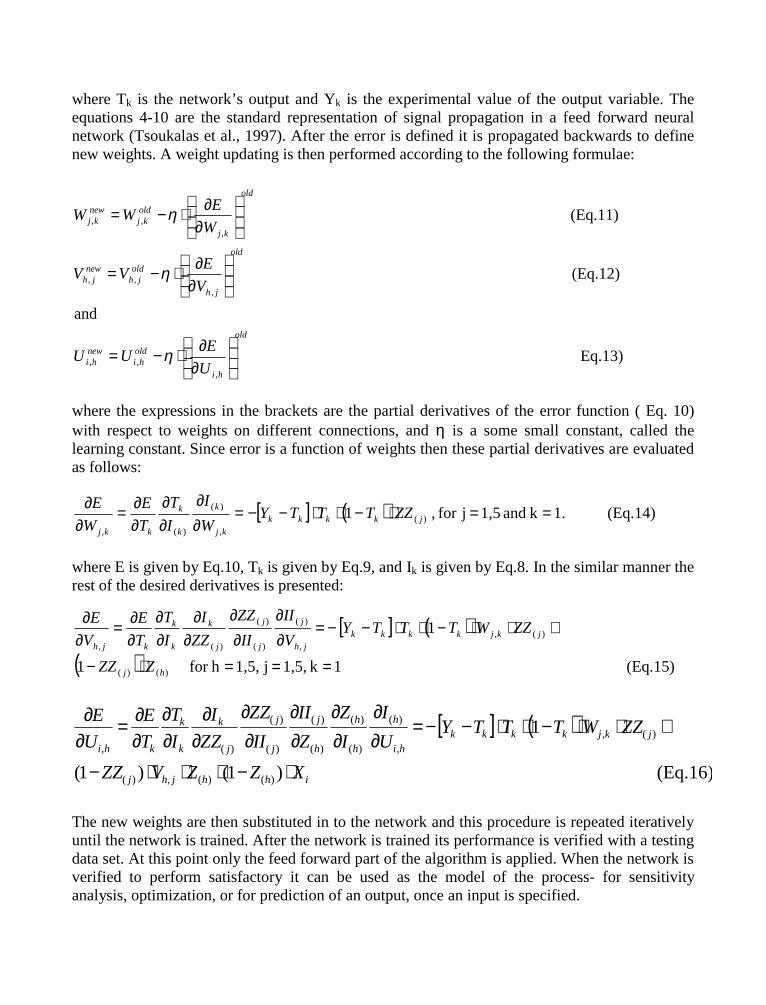
where Tk is the network’s output and Yk is the experimental value of the output variable. Theequations 4-10 are the standard representation of signal propagation in a feed forward neuralnetwork (Tsoukalas et al., 1997). After the error is defined it is propagated backwards to definenew weights. A weight updating is then performed according to the following formulae:
where the expressions in the brackets are the partial derivatives of the error function ( Eq. 10)with respect to weights on different connections, and η is a some small constant, called thelearning constant. Since error is a function of weights then these partial derivatives are evaluatedas follows:
where E is given by Eq.10, Tk is given by Eq.9, and Ik is given by Eq.8. In the similar manner therest of the desired derivatives is presented:
The new weights are then substituted in to the network and this procedure is repeated iterativelyuntil the network is trained. After the network is trained its performance is verified with a testingdata set. At this point only the feed forward part of the algorithm is applied. When the network isverified to perform satisfactory it can be used as the model of the process- for sensitivityanalysis, optimization, or for prediction of an output, once an input is specified.
Eq.13)
and
(Eq.12)
(Eq.11)
,,,
,,,
,,,
old
hi
oldhi
newhi
old
jh
oldjh
newjh
old
kj
oldkj
newkj
U
EUU
V
EVV
W
EWW
∂∂⋅−=
∂∂⋅−=
∂
∂⋅−=
η
η
η
[ ] ( ) (Eq.14) 1.k and 1,5jfor , 1 )(,
)(
)(,
==⋅−⋅⋅−−=∂∂
∂∂
∂∂=
∂∂
jkkkkkj
k
k
k
kkj
ZZTTTYW
I
I
T
T
E
W
E
[ ] ( )
( ) (Eq.15) 1k 1,5,j 1,5,hfor 1
1
)()(
)(,,
)(
)(
)(
)(,
===⋅−
⋅⋅⋅−⋅⋅−−=∂∂
∂∂
∂∂
∂∂
∂∂=
∂∂
hj
jkjkkkkjh
j
j
j
j
k
k
k
kjh
ZZZ
ZZWTTTYV
II
II
ZZ
ZZ
I
I
T
T
E
V
E
[ ] ( )
(Eq.16) )1()1(
1
)()(,)(
)(,,
)(
)(
)(
)(
)(
)(
)(
)(,
ihhjhj
jkjkkkkhi
h
h
h
h
j
j
j
j
k
k
k
khi
XZZVZZ
ZZWTTTYU
I
I
Z
Z
II
II
ZZ
ZZ
I
I
T
T
E
U
E
⋅−⋅⋅⋅−
⋅⋅⋅−⋅⋅−−=∂∂
∂∂
∂∂
∂∂
∂∂
∂∂
∂∂=
∂∂
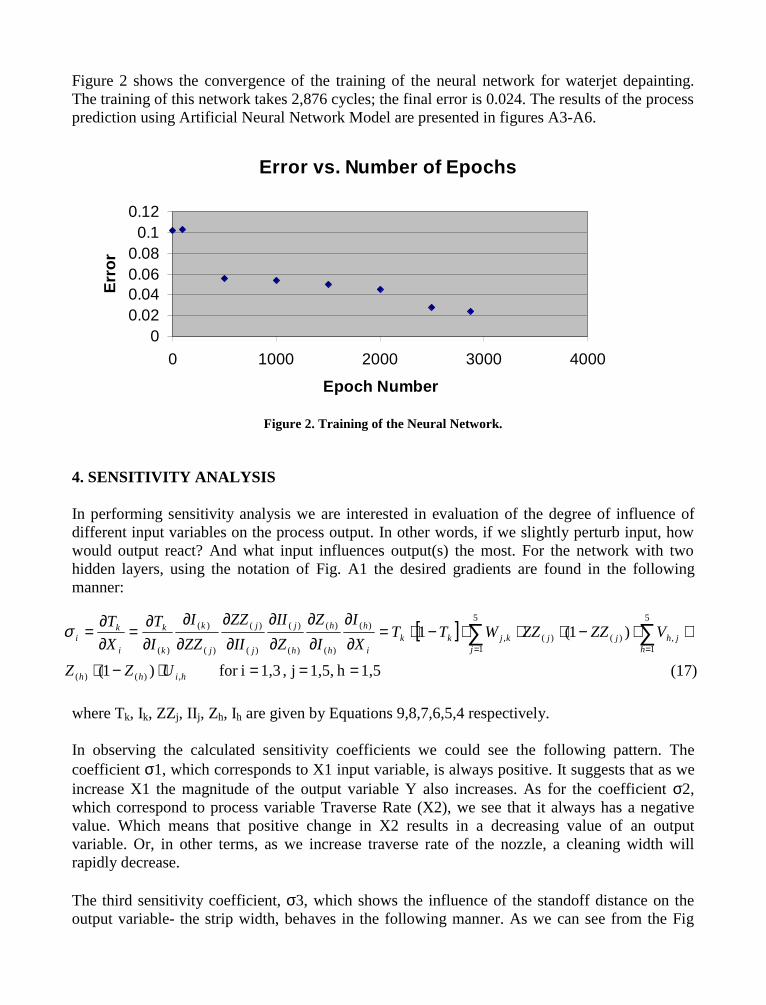
Figure 2 shows the convergence of the training of the neural network for waterjet depainting.The training of this network takes 2,876 cycles; the final error is 0.024. The results of the processprediction using Artificial Neural Network Model are presented in figures A3-A6.
Figure 2. Training of the Neural Network.
4. SENSITIVITY ANALYSIS
In performing sensitivity analysis we are interested in evaluation of the degree of influence ofdifferent input variables on the process output. In other words, if we slightly perturb input, howwould output react? And what input influences output(s) the most. For the network with twohidden layers, using the notation of Fig. A1 the desired gradients are found in the followingmanner:
where Tk, Ik, ZZj, IIj, Zh, Ih are given by Equations 9,8,7,6,5,4 respectively.
In observing the calculated sensitivity coefficients we could see the following pattern. Thecoefficient σ1, which corresponds to X1 input variable, is always positive. It suggests that as weincrease X1 the magnitude of the output variable Y also increases. As for the coefficient σ2,which correspond to process variable Traverse Rate (X2), we see that it always has a negativevalue. Which means that positive change in X2 results in a decreasing value of an outputvariable. Or, in other terms, as we increase traverse rate of the nozzle, a cleaning width willrapidly decrease.
The third sensitivity coefficient, σ3, which shows the influence of the standoff distance on theoutput variable- the strip width, behaves in the following manner. As we can see from the Fig
Error vs. Number of Epochs
00.020.040.060.08
0.10.12
0 1000 2000 3000 4000
Epoch Number
Err
or
[ ]
(17) 1,5h 1,5,j , 1,3ifor )1(
)1(1
,)()(
5
1
5
1,)()(,
)(
)(
)(
)(
)(
)(
)(
)(
)(
)(
===⋅−⋅
⋅⋅−⋅⋅⋅−⋅=∂∂
∂∂
∂∂
∂∂
∂∂
∂∂
=∂∂
= ∑ ∑= =
hihh
j hjhjjkjkk
i
h
h
h
h
j
j
j
j
k
k
k
i
ki
UZZ
VZZZZWTTX
I
I
Z
Z
II
II
ZZ
ZZ
I
I
T
X
Tσ
A3, strip width increases with increasing standoff distance, until the optimum standoff distanceis reached, beyond which the further increase in standoff distance results in decrease in the stripwidth. The coefficient σ3 starts with positive values, reduce to zero at the point of extremum,and proceeds with negative values.
5. PROCESS OPTIMIZATION
In any cleaning operation we are interested in finding a set of waterjet parameters whichproduces the highest cleaning rate. The cleaning rate is given by:
Cleaning Rate = Nozzle Traverse Rate * Width of Strip (Eq. 18)
Thus the optimization problem is to determine the set of waterjet parameters which maximize theobjective function given as product of Nozzle Traverse Rate (X2) and Width of Strip (T) subjectto some process constrains. These constrains limit the waterjet pressure to a chosen range (67MPa - 276 MPa) and Nozzle Traverse Rate (635 mm/min – 8890 mm/min) since any value ofthese parameters beyond these ranges will result either in incomplete paint removal or substratadamage. Thus the optimization problem is:
The neural network model of the waterjet depainting is a set of algebraic equations. Thus, theproblem of determining the set of waterjet parameters for optimal process productivity is aconstrained optimization problem for which a number of standard methods can be utilized. Inthis work the optimization scheme based on the Zoutendijk’s method of feasible directions withslight modifications was used. In general all gradient descent methods require calculation ofgradient of the objective function with respect to control variables. For the objective functiongiven by equation 19, the desired gradients can be expressed as:
The evaluation of the gradient d(output)/d(input) is given by Eq.17.
width.strip the-output process
theis T and rate traversenozzle is X pressure, waterjet is X ,perfomance ofindex is IP where
,
:subject to
(Eq.19) 2max
21
max22min2max11min1 XXXXXX
TXIP
≤≤≤≤
⋅=
( )
2.i if unity, toequal and 2,i if zero toequal is ,obviously
(Eq.20) 1,2,3ifor
2
22
2
=≠∂∂
=∂∂
+∂∂=
∂⋅∂
=∂∂
i
iiii
X
X
X
XT
X
TX
X
TX
X
IP
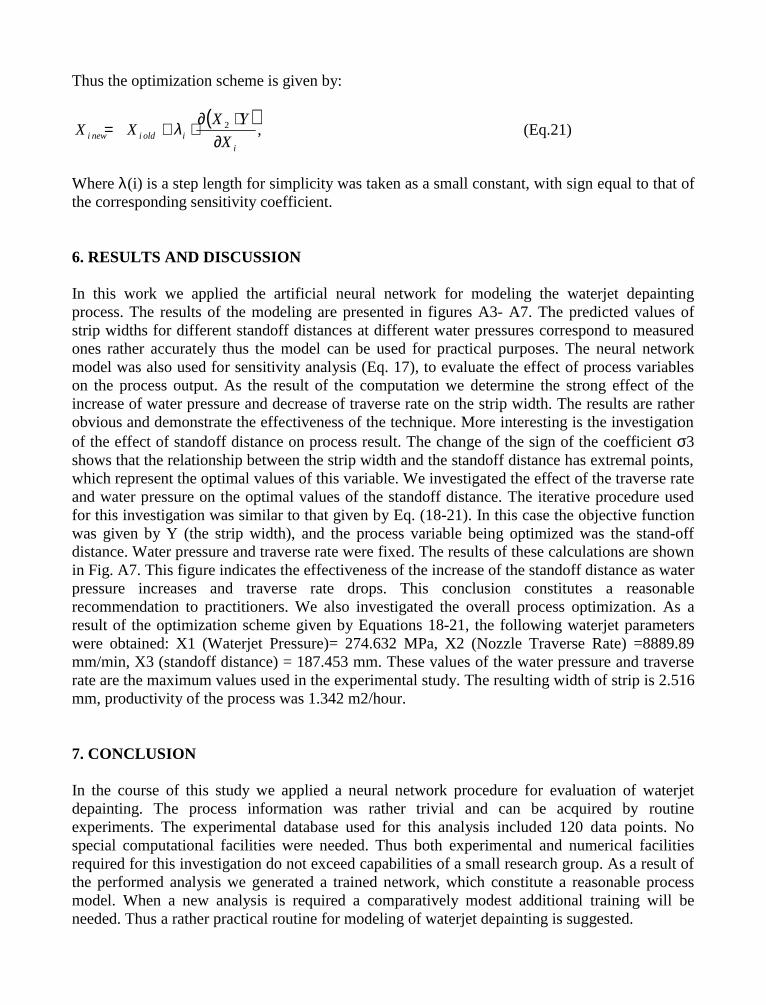
Thus the optimization scheme is given by:
Where λ(i) is a step length for simplicity was taken as a small constant, with sign equal to that ofthe corresponding sensitivity coefficient.
6. RESULTS AND DISCUSSION
In this work we applied the artificial neural network for modeling the waterjet depaintingprocess. The results of the modeling are presented in figures A3- A7. The predicted values ofstrip widths for different standoff distances at different water pressures correspond to measuredones rather accurately thus the model can be used for practical purposes. The neural networkmodel was also used for sensitivity analysis (Eq. 17), to evaluate the effect of process variableson the process output. As the result of the computation we determine the strong effect of theincrease of water pressure and decrease of traverse rate on the strip width. The results are ratherobvious and demonstrate the effectiveness of the technique. More interesting is the investigationof the effect of standoff distance on process result. The change of the sign of the coefficient σ3shows that the relationship between the strip width and the standoff distance has extremal points,which represent the optimal values of this variable. We investigated the effect of the traverse rateand water pressure on the optimal values of the standoff distance. The iterative procedure usedfor this investigation was similar to that given by Eq. (18-21). In this case the objective functionwas given by Y (the strip width), and the process variable being optimized was the stand-offdistance. Water pressure and traverse rate were fixed. The results of these calculations are shownin Fig. A7. This figure indicates the effectiveness of the increase of the standoff distance as waterpressure increases and traverse rate drops. This conclusion constitutes a reasonablerecommendation to practitioners. We also investigated the overall process optimization. As aresult of the optimization scheme given by Equations 18-21, the following waterjet parameterswere obtained: X1 (Waterjet Pressure)= 274.632 MPa, X2 (Nozzle Traverse Rate) =8889.89mm/min, X3 (standoff distance) = 187.453 mm. These values of the water pressure and traverserate are the maximum values used in the experimental study. The resulting width of strip is 2.516mm, productivity of the process was 1.342 m2/hour.
7. CONCLUSION
In the course of this study we applied a neural network procedure for evaluation of waterjetdepainting. The process information was rather trivial and can be acquired by routineexperiments. The experimental database used for this analysis included 120 data points. Nospecial computational facilities were needed. Thus both experimental and numerical facilitiesrequired for this investigation do not exceed capabilities of a small research group. As a result ofthe performed analysis we generated a trained network, which constitute a reasonable processmodel. When a new analysis is required a comparatively modest additional training will beneeded. Thus a rather practical routine for modeling of waterjet depainting is suggested.
( )(Eq.21) ,2
iioldinewi X
YXXX
∂⋅∂
⋅+= λ
8. REFERENCES
Earl Cox, “The Fuzzy Systems Handbook: a Practitioner’s Guide to Building, Using, andMaintaining Fuzzy Systems,” AP Professional, 1994.
Mohammed Hashish, “Prediction Models for AWJ Machining Operations,” Proceedings of the7thAmerican Water Jet Conference, pp. 205-216, Seattle, Washington, 1993.
Spencer T. Johnson, “Advances in Cleaning and Coating Removal Using Ultra-High PressureWater Jet Technology,” Proceedings of the 7thAmerican Water Jet Conference, pp. 607-610, Seattle, Washington, 1993.
H. Louis, W. Schicorr, “Fundamental Aspects in Cleaning with High Speed Water Jets,”Proceedings of the 6th International Symposium on Jet Cutting Technology, pp. 217-228,BHRA, Guildford, England, 1982.
P. Meng, “Experimental and Analytical Investigation of Water Jet Cleaning Process,” Ph.D.Thesis, New Jersey Institute of Technology, 1996.
P. Meng, E. Geskin, L. Tismenetskiy, “Cleaning with High Pressure Directed Waterjets,”Proceedings of Japan-USA Symposium on Flexible Automation, Boston, MA, 1996.
Leftery H. Tsoukalas, Robert E. Uhrig, “Fuzzy and Neural Approaches in Engineering,” John Wiley & Sons, 1997.
Jeffrey D. Watson, “Thermal Spray Removal with Ultrahigh-Velocity Waterjets,” Proceedingsof the 7thAmerican Water Jet Conference, pp. 583-595, Seattle, Washington, 1993.
Samuel S. Wu & Thomas J. Kim, “An Application Study of Plain Waterjet Process for CoatingRemoval,” Proceedings of the 8th American Water Jet Conference, pp.779-792, Houston,Texas, 1995.
9. NOMENCLATURE
X - input signal
Y - target value (experimental)
T(I) - output signal
I - the sum of the weighted inputs to the neurons in the first hidden layer
II - the sum of the weighted inputs to the neurons in the second hidden layer

Z - output of the neurons of the first hidden layer
ZZ - output of the neurons of the second hidden layer
U - the weights on connections to the first hidden layer
V - the weights on connections to the second hidden layer
W - the weights on connections to the output layer
E - error function
σ - sensitivity coefficient
IP – index of performance
η- learning constant
λ - optimization step size
subscripts:
i =1,n – index of the input neurons
h=1,p – index of the first hidden layer neurons
j=1,q – index of the second hidden layer neurons
k= 1 – index of the output layer neurons
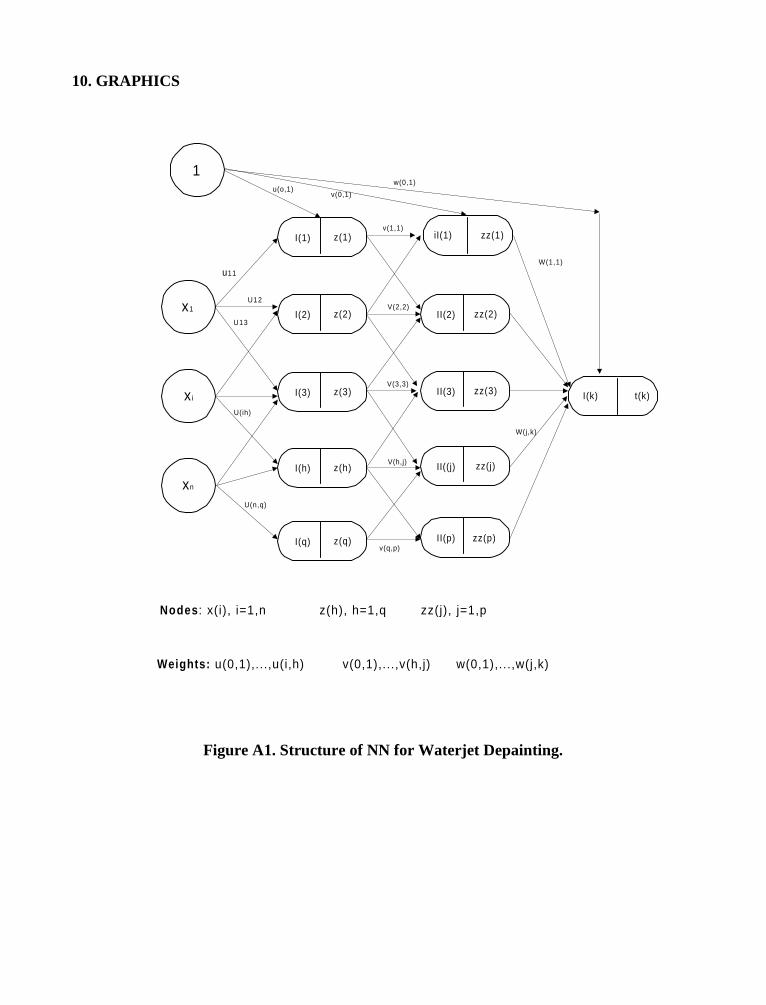
10. GRAPHICS
Figure A1. Structure of NN for Waterjet Depainting.
I(1) z(1) iI(1) zz(1)
I(2) z(2) II(2) zz(2)
I(3) z(3) II(3) zz(3)
I(h) z(h) II((j) zz(j)
I(q) z(q) II(p)
I(k) t(k)
x1
xi
xn
zz(p)
1
u11
U12
U13
U(ih)
U(n,q)
v(q,p)
V(h,j)
v(1,1)
V(2,2)
V(3,3)
W(1,1)
W(j,k)
Nodes : x(i), i=1,n z(h), h=1,q zz(j), j=1,p
Weights: u(0,1),...,u(i,h) v(0,1),...,v(h,j) w(0,1),...,w(j,k)
u(o,1)v(0,1)
w(0,1)
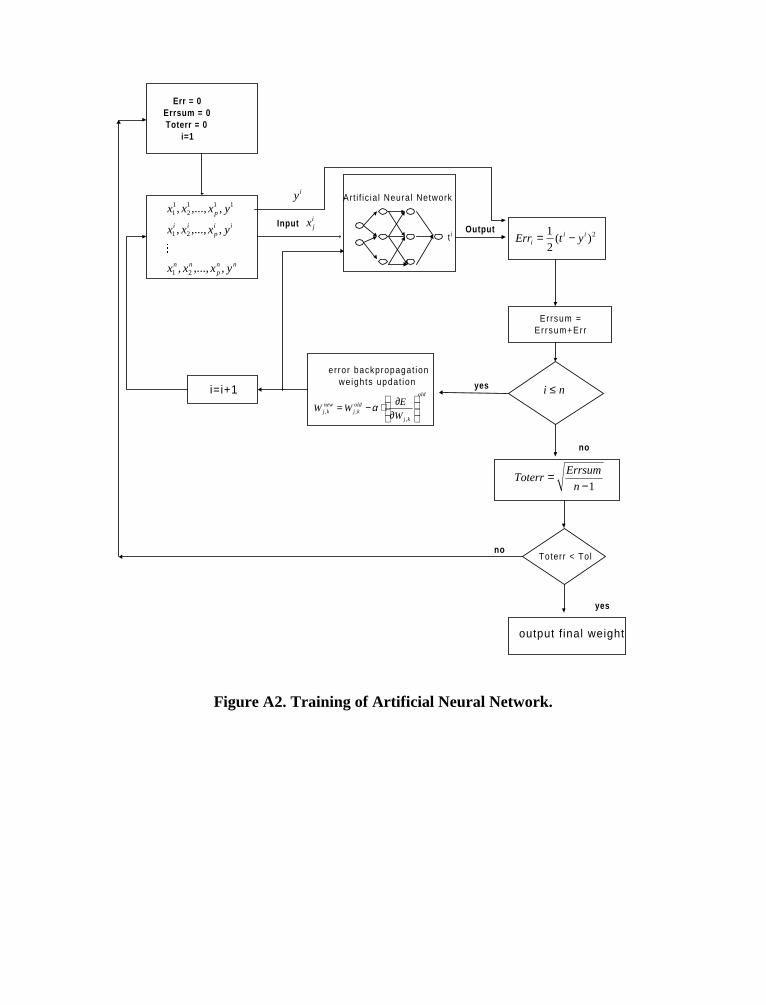
Figure A2. Training of Artificial Neural Network.
error backpropagat ionweights updat ion
Err = 0Errsum = 0Toterr = 0
i=1
nnp
nn
iip
ii
p
yxxx
yxxx
yxxx
,,...,,
,,...,,
,,...,,
21
21
1112
11
Input
Art i f ic ia l Neural Network
Output2)(
2
1 iii ytErr −=
Errsum =Er rsum+Err
yes
1−=
n
ErrsumToterr
no
,
,,
old
kj
oldkj
newkj
W
EWW
∂
∂⋅−= α
i=i+1
Toterr < Tolno
yes
output f inal weight
ti
ijx
iy
ni ≤
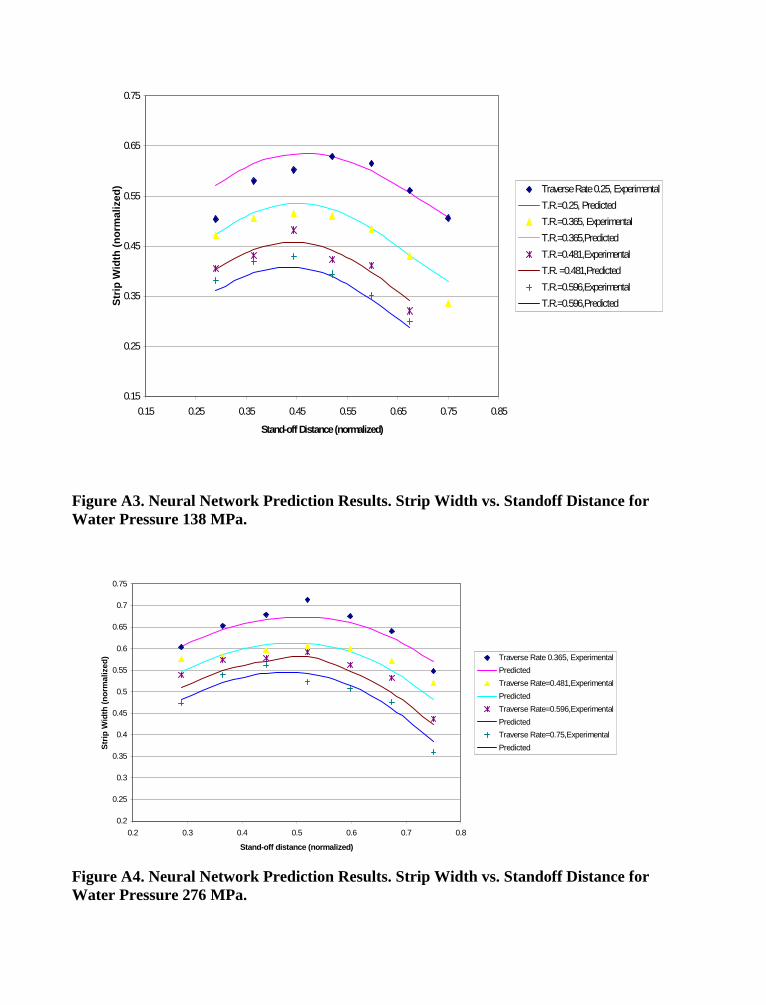
Figure A3. Neural Network Prediction Results. Strip Width vs. Standoff Distance forWater Pressure 138 MPa.
Figure A4. Neural Network Prediction Results. Strip Width vs. Standoff Distance forWater Pressure 276 MPa.
0.15
0.25
0.35
0.45
0.55
0.65
0.75
0.15 0.25 0.35 0.45 0.55 0.65 0.75 0.85
Stand-off Distance (normalized)
Str
ip W
idth
(no
rmal
ized
) Traverse Rate 0.25, Experimental
T.R.=0.25, Predicted
T.R.=0.365, Experimental
T.R.=0.365,Predicted
T.R.=0.481,Experimental
T.R. =0.481,Predicted
T.R.=0.596,Experimental
T.R.=0.596,Predicted
0.2
0.25
0.3
0.35
0.4
0.45
0.5
0.55
0.6
0.65
0.7
0.75
0.2 0.3 0.4 0.5 0.6 0.7 0.8
Stand-off distance (normalized)
Str
ip W
idth
(no
rmal
ized
)
Traverse Rate 0.365, Experimental
Predicted
Traverse Rate=0.481,Experimental
Predicted
Traverse Rate=0.596,Experimental
Predicted
Traverse Rate=0.75,Experimental
Predicted
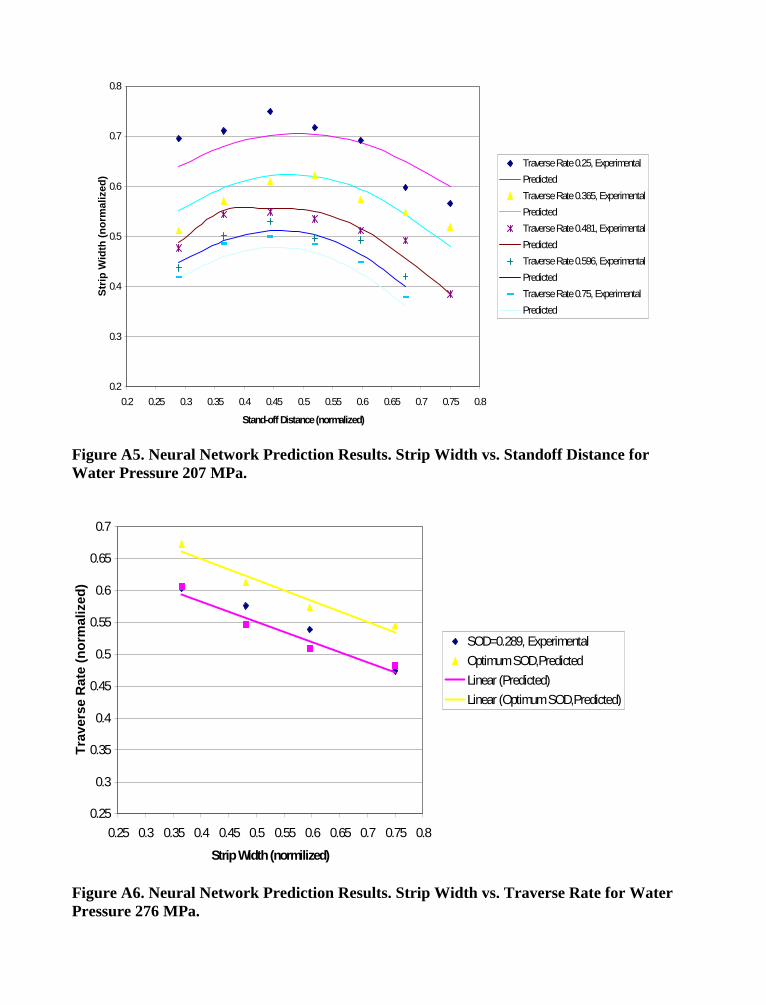
Figure A5. Neural Network Prediction Results. Strip Width vs. Standoff Distance forWater Pressure 207 MPa.
Figure A6. Neural Network Prediction Results. Strip Width vs. Traverse Rate for WaterPressure 276 MPa.
0.2
0.3
0.4
0.5
0.6
0.7
0.8
0.2 0.25 0.3 0.35 0.4 0.45 0.5 0.55 0.6 0.65 0.7 0.75 0.8
Stand-off Distance (normalized)
Str
ip W
idth
(no
rmal
ized
)
Traverse Rate 0.25, Experimental
Predicted
Traverse Rate 0.365, Experimental
Predicted
Traverse Rate 0.481, Experimental
Predicted
Traverse Rate 0.596, Experimental
Predicted
Traverse Rate 0.75, Experimental
Predicted
0.25
0.3
0.35
0.4
0.45
0.5
0.55
0.6
0.65
0.7
0.25 0.3 0.35 0.4 0.45 0.5 0.55 0.6 0.65 0.7 0.75 0.8
Strip Width (normilized)
Tra
vers
e R
ate
(nor
mal
ized
)
SOD=0.289, Experimental
Optimum SOD,Predicted
Linear (Predicted)
Linear (Optimum SOD,Predicted)
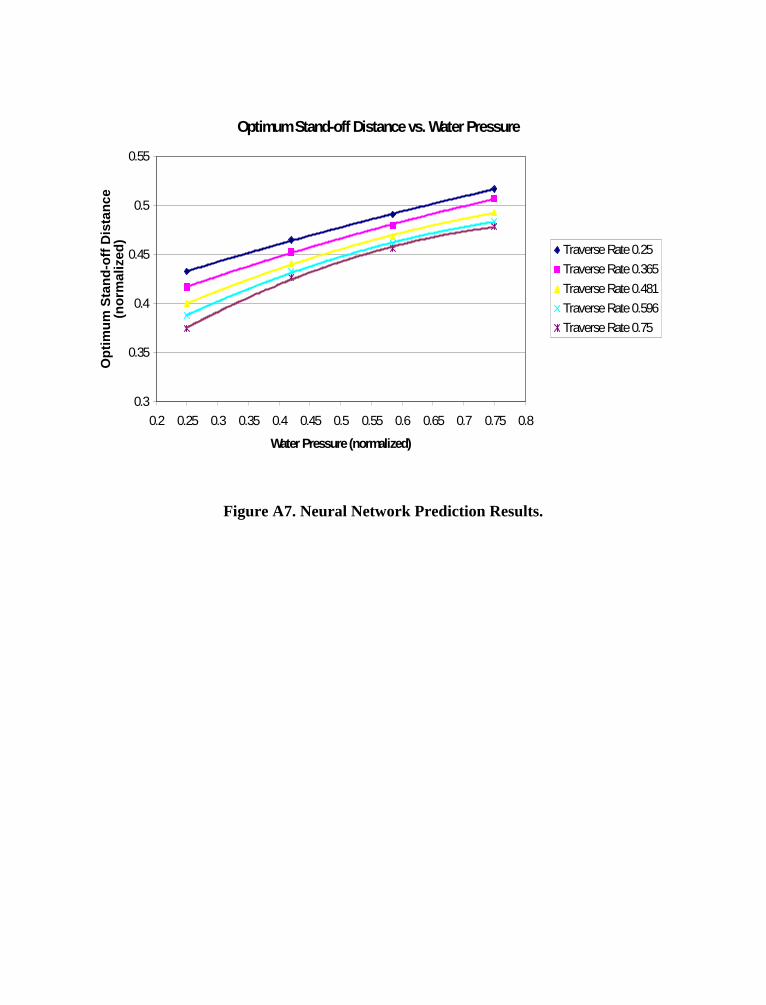
Figure A7. Neural Network Prediction Results.
Optimum Stand-off Distance vs. Water Pressure
0.3
0.35
0.4
0.45
0.5
0.55
0.2 0.25 0.3 0.35 0.4 0.45 0.5 0.55 0.6 0.65 0.7 0.75 0.8
Water Pressure (normalized)
Opt
imum
Sta
nd-o
ff D
ista
nce
(nor
mal
ized
) Traverse Rate 0.25
Traverse Rate 0.365
Traverse Rate 0.481
Traverse Rate 0.596
Traverse Rate 0.75
10th American Waterjet ConferenceAugust 14-17, 1999: Houston, Texas
Paper 5
FINITE ELEMENT MODELING OF CRACK PROPAGATION IN
PCC SLABS SLOTTED WITH ABRASIVE WATER JET
Ram S. MohanThe University of TulsaTulsa, Oklahoma U.S.A.
Radovan KovacevicSouthern Methodist University
Dallas, Texas U.S.A.
ABSTRACT
In order to circumvent the disadvantages of the conventional cracking and seating technique a newapproach is proposed for rehabilitation of Portland cement concrete (PCC) pavements usingabrasive water jet. This approach focuses on controlled and uniform fragmentation of the PCCpavement substrate initiated by previously cut slots using abrasive water jet (AWJ). Initially aparametric study is conducted in order to quantify the influence of the AWJ cutting parameters onthe depth of cut on the PCC slabs. Subsequently, detailed investigation of the virtual crackpropagation in the PCC slab slotted with abrasive water jet is conducted using finite elementmodeling technique to evaluate the best geometry of slotting. The stress distribution and nature ofcrack initiation and crack propagation with varying loads for several depths of slots are evaluatedfor different slot geometries and compared with that of a concrete slab without any prior slots. Theresults indicate that diagonal slots not only provide uniform size fragments and crack patternsextending through the entire thickness, eliminating spalling, crack fanning and shattering, butalso, preserve the structural strength of the substrate.
Organized and Sponsored by the Waterjet Technology Association
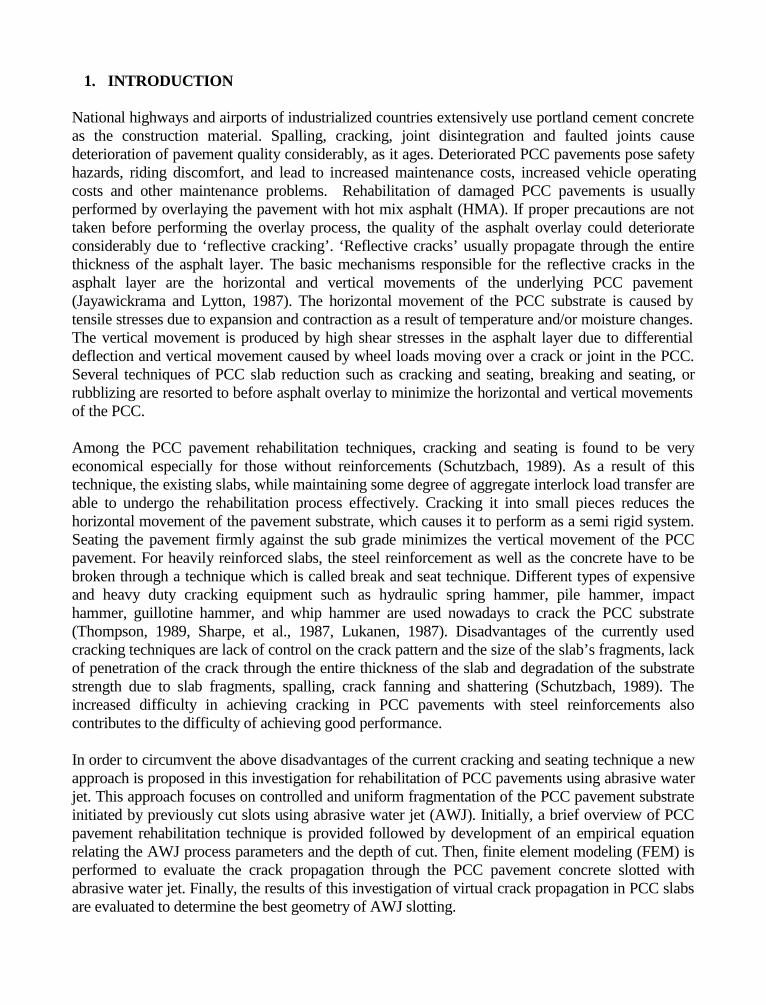
1. INTRODUCTION
National highways and airports of industrialized countries extensively use portland cement concreteas the construction material. Spalling, cracking, joint disintegration and faulted joints causedeterioration of pavement quality considerably, as it ages. Deteriorated PCC pavements pose safetyhazards, riding discomfort, and lead to increased maintenance costs, increased vehicle operatingcosts and other maintenance problems. Rehabilitation of damaged PCC pavements is usuallyperformed by overlaying the pavement with hot mix asphalt (HMA). If proper precautions are nottaken before performing the overlay process, the quality of the asphalt overlay could deteriorateconsiderably due to ‘reflective cracking’. ‘Reflective cracks’ usually propagate through the entirethickness of the asphalt layer. The basic mechanisms responsible for the reflective cracks in theasphalt layer are the horizontal and vertical movements of the underlying PCC pavement(Jayawickrama and Lytton, 1987). The horizontal movement of the PCC substrate is caused bytensile stresses due to expansion and contraction as a result of temperature and/or moisture changes.The vertical movement is produced by high shear stresses in the asphalt layer due to differentialdeflection and vertical movement caused by wheel loads moving over a crack or joint in the PCC.Several techniques of PCC slab reduction such as cracking and seating, breaking and seating, orrubblizing are resorted to before asphalt overlay to minimize the horizontal and vertical movementsof the PCC.
Among the PCC pavement rehabilitation techniques, cracking and seating is found to be veryeconomical especially for those without reinforcements (Schutzbach, 1989). As a result of thistechnique, the existing slabs, while maintaining some degree of aggregate interlock load transfer areable to undergo the rehabilitation process effectively. Cracking it into small pieces reduces thehorizontal movement of the pavement substrate, which causes it to perform as a semi rigid system.Seating the pavement firmly against the sub grade minimizes the vertical movement of the PCCpavement. For heavily reinforced slabs, the steel reinforcement as well as the concrete have to bebroken through a technique which is called break and seat technique. Different types of expensiveand heavy duty cracking equipment such as hydraulic spring hammer, pile hammer, impacthammer, guillotine hammer, and whip hammer are used nowadays to crack the PCC substrate(Thompson, 1989, Sharpe, et al., 1987, Lukanen, 1987). Disadvantages of the currently usedcracking techniques are lack of control on the crack pattern and the size of the slab’s fragments, lackof penetration of the crack through the entire thickness of the slab and degradation of the substratestrength due to slab fragments, spalling, crack fanning and shattering (Schutzbach, 1989). Theincreased difficulty in achieving cracking in PCC pavements with steel reinforcements alsocontributes to the difficulty of achieving good performance.
In order to circumvent the above disadvantages of the current cracking and seating technique a newapproach is proposed in this investigation for rehabilitation of PCC pavements using abrasive waterjet. This approach focuses on controlled and uniform fragmentation of the PCC pavement substrateinitiated by previously cut slots using abrasive water jet (AWJ). Initially, a brief overview of PCCpavement rehabilitation technique is provided followed by development of an empirical equationrelating the AWJ process parameters and the depth of cut. Then, finite element modeling (FEM) isperformed to evaluate the crack propagation through the PCC pavement concrete slotted withabrasive water jet. Finally, the results of this investigation of virtual crack propagation in PCC slabsare evaluated to determine the best geometry of AWJ slotting.
2. ROLE OF ABRASIVE WATER JET IN PCC PAVEMENT REHABILITATION
Although cracking and seating has become very popular for PCC pavement rehabilitation, thecurrent techniques used for cracking have several disadvantages as stated above. It is impossible toachieve optimal crack patterns, especially vertical cracks, which are adequate to eliminate thermallyrelated reflective cracking. The size of the fragments has a direct impact on the designconsiderations as well as long-term performance of the overlay (Crawford, 1989). Also, the crackpattern depends on the impact equipment, energy of impact, slab temperature, inherent stresses inthe slab, and sub grade condition. The jackhammers, which are used for the cracking and seatingtechnique are slow, noisy, dusty and labor intensive (Sharpe, et al., 1987). While using them, it isimpossible to avoid removing the good concrete along with the bad or damaged reinforcing steel(Sugiyama and Tabata, 1988). Often times, it is also necessary to remove the existing asphaltoverlays prior to cracking in order to verify the crack pattern.
Rehabilitation of PCC pavements assisted with abrasive water jets is a viable alternative to prolongthe service life of the overlays and decrease the future maintenance costs. The advantages of thistechnique (Mohan and Kovacevic, 1998) are:
1. The shape and size of the PCC fragments could be controlled. Instead of square or rectangular shaped PCC fragments, any desired shape, which is appropriate for cracking, could be produced.
2. Transverse and longitudinal cracks in the PCC pavements, which have a detrimental effect, could be eliminated.
3. Structural strength of the PCC pavement could be preserved.4. Spalling, crack fanning and shattering could be eliminated.5. The crack pattern does not depend upon the impacting force, slab temperature, the residual
stresses in the slab, or the sub grade condition.6. It is relatively easy to cut the reinforcement as well as the asphalt overlay. It is also easy to
verify the presence of the crack pattern even when the asphalt overlays are present.
In order to capitalize on the advantages offered by AWJ in PCC pavement rehabilitation, the currentinvestigation is aimed at exploring the feasibility of replacing the existing methods of cracking andseating by notching and seating assisted with AWJ. The efficiency and economy of application ofthe AWJ in PCC pavement rehabilitation could be improved considerably by an optimum choice ofthe process parameters and the geometry of slotting. There have been several investigations dealingwith concrete cutting with water jet and abrasive water jet (Sugiyama and Tabata, 1988, Fairhurstand Spencer, 1985, Arasawa, et al., 1986, and Schmid, 1989). Investigations of Arasawa et al.(1986) indicated that it is more effective to remove the concrete first and the cut the reinforcementsafterwards while cutting reinforced concrete slabs with AWJ. Kokaji et al. (1988) investigated theeffect of abrasives on the cutting performance of concrete and concluded that garnet abrasive hasthe highest cutting performance and that there is no correlation between the grade of garnet and thecutting depth. The present authors conducted a feasibility study (Kovacevic, et al., 1993, Mohan andKovacevic, 1998) on concrete pavement rehabilitation using abrasive water jet. There have alsobeen few investigations on numerical modeling of crack propagation and fracture in concrete(Gerstle and Xie, 1992, Ingraffea and Saouma, 1984, Swartz and Taha, 1990 and Swenson andIngraffea, 1988). These investigations highlighted the merits of numerical modeling techniques forpredicting the material failure mechanisms in concrete. Current investigation focuses on the usage
of finite element modeling techniques for quantifying the effect of different slot geometry on thecrack propagation and material failure pattern. A brief description of the experimental set up andprocedure is given below.
3. EXPERIMENTAL SET UP AND PROCEDURE
A schematic of the abrasive water jet cutting system used for this investigation is shown in Fig. 1.The system consists of a high-pressure intensifier pump, AWJ cutting head, abrasive metering anddelivery system, catcher tank and an X-Y-Z positioning system. The water is pressurized in theintensifier pump and sent to the cutting head where the high-pressure water is converted to highvelocity water as it flows through the sapphire orifice assembly. The high velocity water jet ismixed with the abrasive particles in the mixing chamber and the slurry consisting of the abrasivewater jet mixture flows through the AWJ nozzle and cuts the work piece. The position of the cuttinghead could be manipulated by the X-Y-Z positioning system equipped with a CNC controller.
Initially a parametric study is conducted based on 24 composite factorial design to quantify theeffect of the AWJ cutting parameters namely water pressure, abrasive flow rate, traverse speed andstandoff distance, on the depth of penetration. The workpiece material used was Portland cementconcrete (PCC) of 15 years age, size 1.8 m X 0.30 m X 0.30 m and an average compressive strengthof 34.4 Mpa.
In the second phase of the investigation, crack propagation through concrete slabs previously slottedwith abrasive water jet is investigated using finite element modeling technique. Concrete slabs areslotted at different geometries such as longitudinal (case B), transverse (case C) and diagonal (caseD). The stress distribution and nature of crack initiation and crack propagation with varying loadsfor different depths of slots are investigated for each of the above cases and compared with that of aconcrete slab without any prior slots (case A). Finite element modeling software, ANSYS was usedfor the investigation. The element type was defined as STIF65 (DeSalvo and Gorman, 1989) whichis primarily a non-linear 3D non-reinforced concrete element with cracking and crushing capabilityat integration points. STIF65 has also the capability to accommodate temperature sensitive stressdistribution. This element type was adopted, as it is capable of treating cracking (in three orthogonaldirections) during tension, crushing during compression, plastic deformation and creep. Eachelement was defined by 8 nodes with 3 degrees of freedom per node and the loading was performedgradually to avoid crushing at integration points. The work piece geometry of 1.8 M X 30 cm X 30cm was adopted and a symmetry boundary condition about the X-axis and Y-axis was assumed.Analysis type KAN,0 (static) was adopted for the investigation. An overview of the results of thisinvestigation followed by a brief discussion is provided below.
4. RESULTS AND DISCUSSION
4.1 Influence of Process Parameters on the Depth of Cut
In order to quantify the role of each process parameter on the depth of penetration, detailedexperiments were conducted based on a 24 central composite factorial design of experiments. Theparameters investigated were: water pressure (P), abrasive flow rate (Q), jet traverse speed (V) and
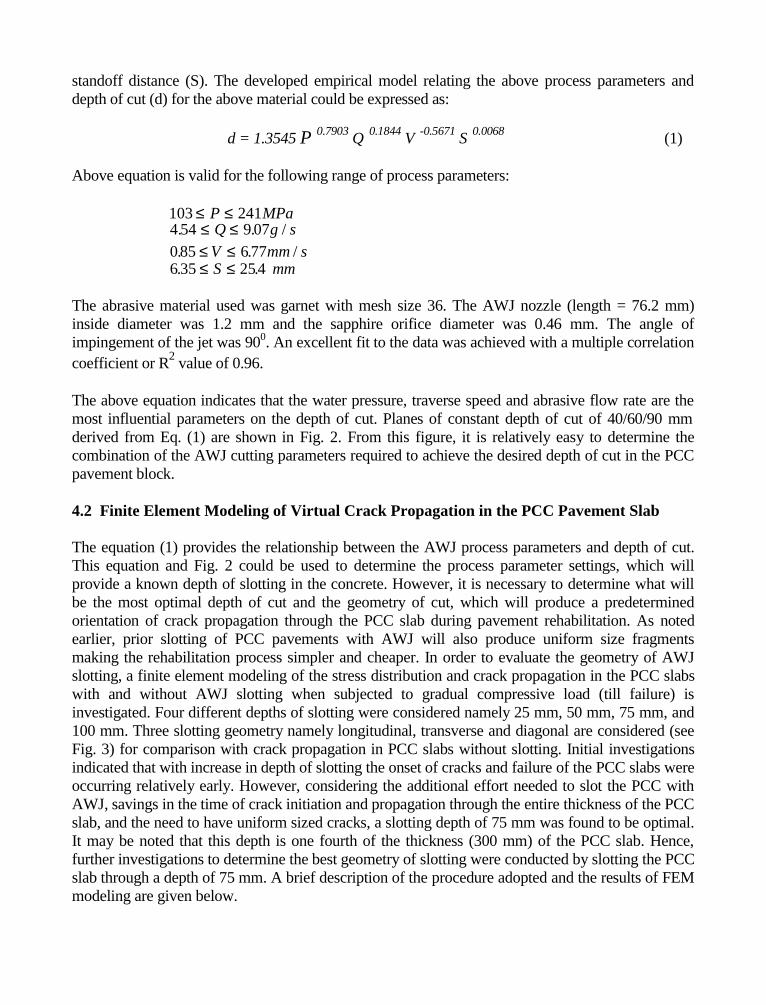
standoff distance (S). The developed empirical model relating the above process parameters anddepth of cut (d) for the above material could be expressed as:
d = 1.3545 P 0.7903 Q 0.1844 V -0.5671 S 0.0068 (1)
Above equation is valid for the following range of process parameters:
103 241≤ ≤P MPa4 54 9 07. . /≤ ≤Q g s
085 6 77. . /≤ ≤V mm s6 35 254. .≤ ≤S mm
The abrasive material used was garnet with mesh size 36. The AWJ nozzle (length = 76.2 mm)inside diameter was 1.2 mm and the sapphire orifice diameter was 0.46 mm. The angle ofimpingement of the jet was 900. An excellent fit to the data was achieved with a multiple correlationcoefficient or R2 value of 0.96.
The above equation indicates that the water pressure, traverse speed and abrasive flow rate are themost influential parameters on the depth of cut. Planes of constant depth of cut of 40/60/90 mmderived from Eq. (1) are shown in Fig. 2. From this figure, it is relatively easy to determine thecombination of the AWJ cutting parameters required to achieve the desired depth of cut in the PCCpavement block.
4.2 Finite Element Modeling of Virtual Crack Propagation in the PCC Pavement Slab
The equation (1) provides the relationship between the AWJ process parameters and depth of cut.This equation and Fig. 2 could be used to determine the process parameter settings, which willprovide a known depth of slotting in the concrete. However, it is necessary to determine what willbe the most optimal depth of cut and the geometry of cut, which will produce a predeterminedorientation of crack propagation through the PCC slab during pavement rehabilitation. As notedearlier, prior slotting of PCC pavements with AWJ will also produce uniform size fragmentsmaking the rehabilitation process simpler and cheaper. In order to evaluate the geometry of AWJslotting, a finite element modeling of the stress distribution and crack propagation in the PCC slabswith and without AWJ slotting when subjected to gradual compressive load (till failure) isinvestigated. Four different depths of slotting were considered namely 25 mm, 50 mm, 75 mm, and100 mm. Three slotting geometry namely longitudinal, transverse and diagonal are considered (seeFig. 3) for comparison with crack propagation in PCC slabs without slotting. Initial investigationsindicated that with increase in depth of slotting the onset of cracks and failure of the PCC slabs wereoccurring relatively early. However, considering the additional effort needed to slot the PCC withAWJ, savings in the time of crack initiation and propagation through the entire thickness of the PCCslab, and the need to have uniform sized cracks, a slotting depth of 75 mm was found to be optimal.It may be noted that this depth is one fourth of the thickness (300 mm) of the PCC slab. Hence,further investigations to determine the best geometry of slotting were conducted by slotting the PCCslab through a depth of 75 mm. A brief description of the procedure adopted and the results of FEMmodeling are given below.
Material characteristics for failure due to cracking/crushing in the ANSYS program are based on anenhanced version of the five parameter William and Warnke (1975) failure model. With theWilliam and Warnke algorithm as incorporated in the ANSYS program, concrete behavior can bemodelled with a minimum of two parameters, namely ultimate tensile strength and ultimatecompressive strength. Other three parameters that could be input are experimental values for bi-axial crushing stress, bi-axial crushing under ambient hydrostatic stress and uni-axial crushingstress. Temperature-based non-linearity could be taken into account by inputting parameter values atsix temperature conditions. Shear friction between the cracked faces is accounted for by usercontrolled shear transfer coefficients for both opened and closed crack conditions during crackinganalyses. The element theory is based upon a formulation, which includes modified extradisplacement shapes. A 2x2x2 lattice of integration points were used with the numerical (Gaussian)integration procedure.
As plasticity problems are non-linear, an iteration procedure based on incremental Newton-Raphsonmethod was adopted for analyzing the plasticity effects. For plasticity analysis, plasticincompressibility assumption was adopted where the tensile and compressive yield stresses arerelated by the consistency equation:
σ σσ σ
σ σσ σ
σ σσ σ
+ −
+ −
+ −
+ −
+ −
+ −
−+
−+
−=x x
x x
y y
y y
z z
z z
0 (2)
where, σ+ i is the magnitude of the tensile yield stress in direction i, and σ− i is the magnitude of thecompressive yield stress. The yield stress must also define a closed yield surface, which ismathematically given as:
M M M M M M M M Mxx yy zz xx yy yy zz zz xx2 2 2 2 0+ + − + + <( ) (3)
which should always be true, where Mii = ( ) / ( )σ σ σ σ+ − − +x x i i . Creep was also handled by theincremental technique of Newton-Raphson Method. The combined effect of primary creep andsecondary creep were used for analysis. Kohnke (1989) may be consulted for further details.
Typical printouts of stress distribution for different types of slotting and various loading conditionsare shown in Figs. 4 - 10 for the following cases:
Case A: PCC slab without slottingCase B: PCC slab with longitudinal slotsCase C: PCC slab with transverse slotsCase D: PCC slab with diagonal slots
The stress distribution and the failure state for each of the above cases are described below.
4.2.1 Case A: PCC Slab Without Slotting
The Fig. 4 shows the PCC slab before crack initiation and Fig. 5 shows the PCC slab after failure.From these figures, it can be seen that failure of the PCC slab is due to localized crushing ratherthan uniform cracking which is very undesirable for pavement concrete as it will cause excessive
loss of structural strength, non uniform and uncontrollable cracking pattern, and will lead toreflective cracking due to the vertical movement of the pavement slab. Fig. 11 shows the appliedpressure in the Z-direction at the point of initiation of the cracking and after complete failure. It canbe noted that the cracking is initiated at a pressure of about 26 Mpa and the material completely fails(in this case, due to crushing) at a pressure of about 36 Mpa. As can be intuitively expected,relatively larger pressure is required in the case of PCC slab without slotting for crack initiation andfailure.
4.2.2 Case B: PCC Slab With Longitudinal Slots
Figure 6 shows the stress distribution in the PCC slab along a plane 75 mm below the Z-axis (wherethe kerf bottom of the longitudinal slots is present). This figure corresponds to the condition prior tocrack initiation. It can be noted that the stress concentrations are along the slotted directions.Analysis of the PCC slab stress distribution after failure indicated that the concrete failure isprimarily due to crushing of the slotted top layer rather than induced cracks. From Fig. 11, it can beseen that compared to the PCC slab without slot, lesser load is required to cause crack initiation andmaterial failure for PCC slabs with longitudinal slots.
4.2.3 Case C: PCC Slab With Transverse Slots
In order to clearly visualize the failure mechanisms in the PCC slab with transverse slots, the stressdistribution at the plane (Z = -150 mm) before failure for lead step 5 is plotted in Fig. 7. In this case,it can be noted that the stress concentrations are not oriented along the directions of the slots. Failureis due to localized crushing instead of cracking. The transverse slots do not seem to have muchinfluence in reducing the cracking effort or deciding the crack pattern. Even though lesser load isrequired for causing crack initiation and material failure for PCC with transverse slots as indicatedby Fig. 11, the failure mode of crushing is undesirable.
4.2.4 Case D: PCC Slab With Diagonal Slots
Stress concentration, cracks induced and material failure pattern in the PCC slab with diagonal slotsat the initial stage of loading is shown in Fig. 8. A bisected view of the PCC slab, which shows thedetails of the internal cracks and stress concentration before complete material failure, is shown inFig. 9 to visualize the failure pattern. Fig. 10 shows the crack pattern of the PCC slab after completematerial failure. From these figures, it can be seen that the stress concentrations are along the slottedgeometry as well as parallel to them. Cracks are clearly seen along the stress concentrations. FromFig. 10, it could be noted that the material failure is primarily due to internal cracking (which is themost desirable) rather than crushing. Fig. 11 indicates that relatively less load needs to be applied onPCC slabs with diagonal slots for causing crack initiation and material failure.
A schematic of the proposed slotting and seating procedure for PCC pavement rehabilitationassisted with abrasive water jet is shown in Fig. 12. Instead of using the currently available crackingequipment, diagonally oriented slots are initially created in the PCC pavement at appropriate depthsusing AWJ. Subsequently, the notched PCC pavement is subjected to seating process using heavypneumatic tired rollers. As a result, a diagonal cracking pattern is induced in the PCC pavement,which is ideal for effective pavement rehabilitation. As these cracks propagate through the entirethickness of the pavement slab, all the fragments will be in contact with the supporting base or sub
grade, eliminating voids in the PCC structure. Important conclusions from this investigation arebriefly given below.
5. CONCLUSIONS
PCC pavement rehabilitation assisted with high-pressure abrasive water jet is a viable alternative tothe conventional cracking and seating procedure. This technique could be used for rehabilitation ofPCC pavements with and without reinforcements. It offers some unique advantages in terms ofuniform fragment size, controlled cracking along predetermined directions, elimination of spalling,crack fanning and shattering, and preserving the structural strength of the pavement.
It is demonstrated that slots of predetermined depth could be cut in the PCC slab using thedeveloped empirical model relating the AWJ process parameters namely water pressure, traversespeed, abrasive flow rate and stand-off distance to the depth of cut. Detailed investigations of thevirtual crack propagation in the PCC slab slotted with AWJ using finite element modeling techniqueindicated that diagonal slots provided uniform-size fragments and crack patterns extending throughthe entire thickness. Relatively lesser load is sufficient for causing crack initiation and crackpropagation in PCC slabs with diagonal slots. Also, diagonal slots ensure material failure due tointernal cracking which is the most desirable to preserve the substrate strength.
6. ACKNOWLEDGEMENTS
The authors would like to thank The University of Tulsa, the Center for Robotics andManufacturing Systems, University of Kentucky and Flow International Inc., Kent, Washington, forproviding the necessary financial / experimental support.
7. REFERENCES
Arasawa, H. et al., "Controlled Cutting of Concrete Structure with Abrasive Water jet,"Proceedings of the 8th Int'l Symposium on Jet Cutting Technology, Cranfield, U.K, 1986.
Crawford, C., "Cracking and Seating of PCC Pavements Prior to Overlaying With Hot MixAsphalt," National Asphalt Pavement Association, U.S., Inf. Series, 98/89, 1989.
DeSalvo, G.J., and Gorman, R.W., "ANSYS Engineering Analysis System User’s Manual (Vol. I)",Swanson Analysis Systems, Inc., Houston, PA, USA, 1989.
Fairhurst, R.M., and Spencer, S.L., "Abrasive Jet Cutting of High Strength Reinforced Concrete,"BHRA Report, No. RR 2470, August 1985.
Gerstle, W.H., and Xie, M., "FEM Modeling of Fictitious Crack Propagation in Concrete," Journalof Engineering Mechanics, Vol. 118, No. 2, February, pp. 416-434, 1992.
Ingraffea, A.R., and Saouma, V., "Numerical Modeling of Discrete Crack Propagation inReinforced and Plain Concrete," Fracture Mechanics of Concrete: Structural Applicationand Numerical Calculation, G.Sih, and DiTommaso, eds., Martinus Nijhoff, Hingham,Mass., pp. 171-225, 1984.
Jayawickrama, R. W., and Lytton, R.L., "Methodology for Predicting Asphalt Concrete OverlayLife Against Reflection Cracking," Sixth International Conference on Structural Design ofAsphalt Pavements, Ann Arbor, MI, 1987.
Kohnke, P., "ANSYS Engineering Analysis System User’s Manual (Vol. IV-Theory)," SwansonAnalysis Systems, Inc., Houston, PA, USA, 1989.
Kokaji, C., Sakashita, F., Oura, S., and Sato, M., "Effects of Abrasives on Concrete Cutting," Proc.9th Int'l Symposium on Jet Cutting Technology, Japan, pp. 571-580. Oct 4-6, 1988.
Kovacevic, R., Mohan, R., and Hirscher, J., "Rehabilitation of Concrete Pavements Assisted withAbrasive Water jets," Jet Cutting Technology, (ISBN No. 0-7923-1979-6), ed.Lichtarowicz, Kluwer Academic/ Dordrecht/ Boston, pp.425-434, 1993.
Lukanen, D.E., "Structural Evaluation of Cracked and Seated PCC Pavements for Overlaying withHot Mix Asphalt," National Asphalt Pavement Association, U.S., Inf. Series, 100/87, 1987.
Mohan, R. and Kovacevic, R., "Pavement Rehabilitation Using High Pressure Abrasive WaterJets," Water Jet Applications in Construction Engineering, (ISBN No. 90-5410-698-0),ed. A. W. Momber, A.A. Balkema, Rotterdam, pp.121-148, 1998.
Schmid, R.F., "High Pressure Hydromilling of Concrete Surfaces," Proceedings of the 5th AmericanWater jet Conference, pp.157-163, Aug. 29-31, 1989.
Schutzbach, A.M., "The Crack and Seat Method of Pavement Rehabilitation," Public Works, pp.52-55, November, 1989.
Sharpe, G.W., Anderson, M., and Deen, R.C., "Breaking and Seating of Rigid Pavement," ResearchReport, UKTRP-87-26, Lexington, KY, 1987.
Sugiyama, H., and Tabata, A., "Abrasive Water jet Method for Effective Cutting of ReinforcedConcrete Members (On Vibration Properties when Cutting)," Proceedings of the 9th Int'lSymposium on Jet Cutting Technology, Japan, pp. 581-589. Oct 4-6, 1988.
Swartz, S.E. and Taha, N.M., "Mixed Mode Crack Propagation and Fracture in Concrete,"Engineering Fracture Mechanics, Vol. 35(1/2/3), pp.137-144, 1990.
Swenson, D.V., and Ingraffea, A.R., "Modeling Mixed Mode Dynamic Crack Propagation UsingFinite Elements: Theory and Applications, 3.," Computational Mechanics, 3, pp.381-397,1988.
Thompson, R.M., "Breaking/Cracking and Seating Concrete Pavements," NCHRP Synthesis ofHighway Practice, 144, March 1989.
William, K.J., and Warnke, E.D., "Constitutive Model for the Triaxial Behavior of Concrete,"Proceedings of the International Association for Bridge and Structural Engineering, Vol.19, ISMES, Bergamo, Italy, p.174, 1975.
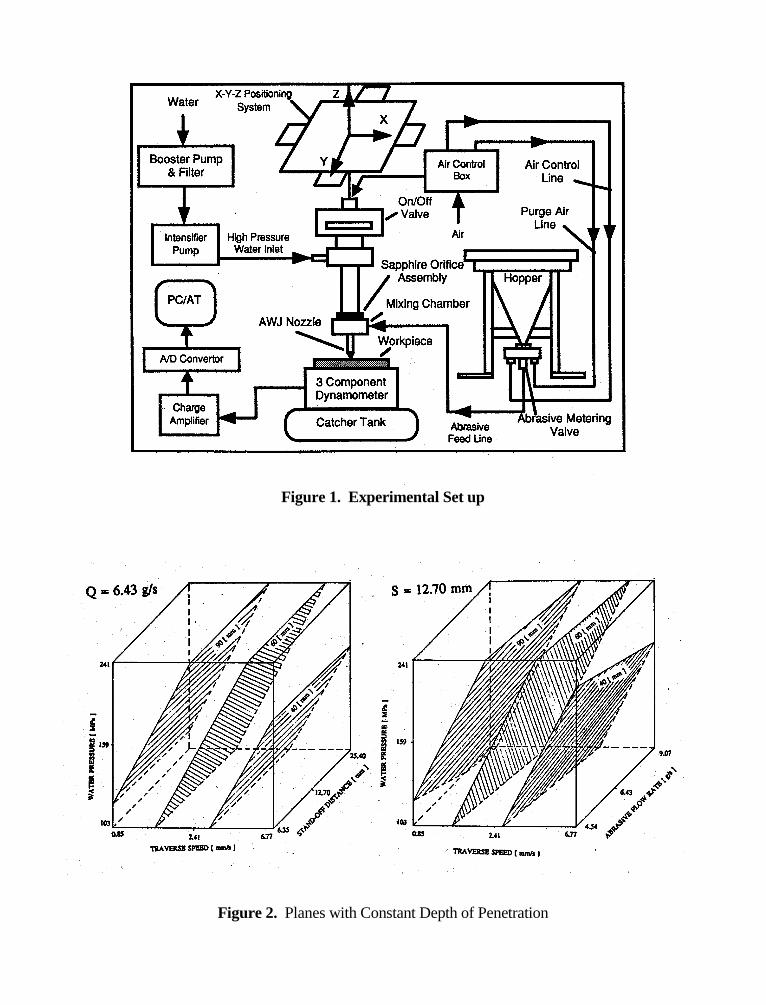
Figure 1. Experimental Set up
Figure 2. Planes with Constant Depth of Penetration
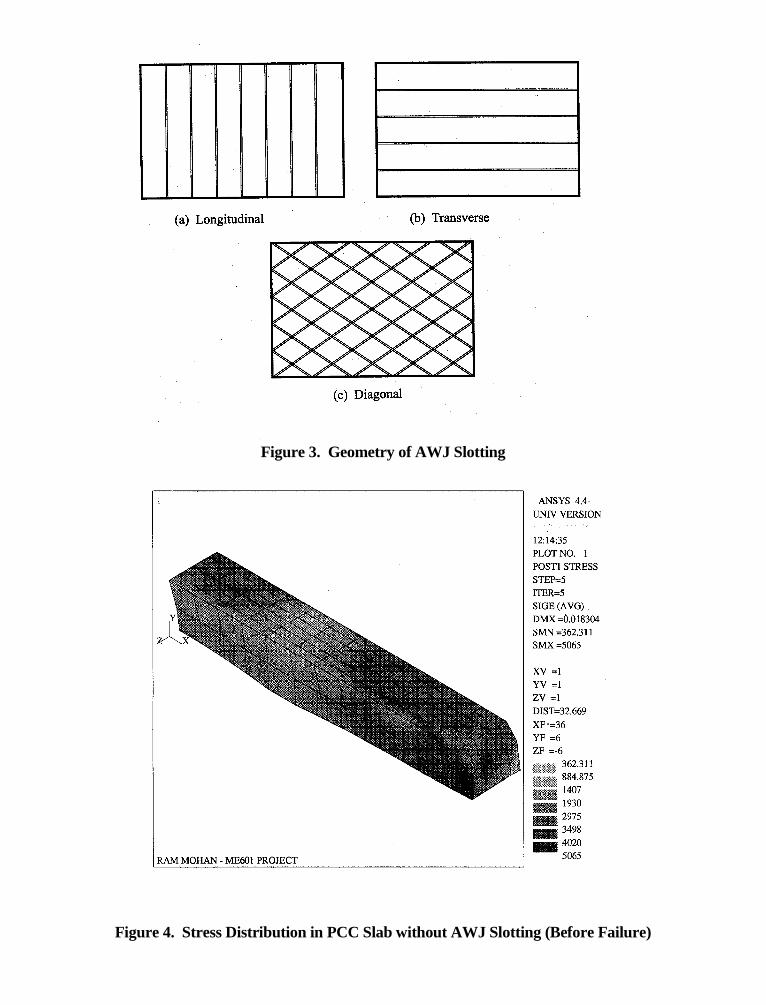
Figure 3. Geometry of AWJ Slotting
Figure 4. Stress Distribution in PCC Slab without AWJ Slotting (Before Failure)
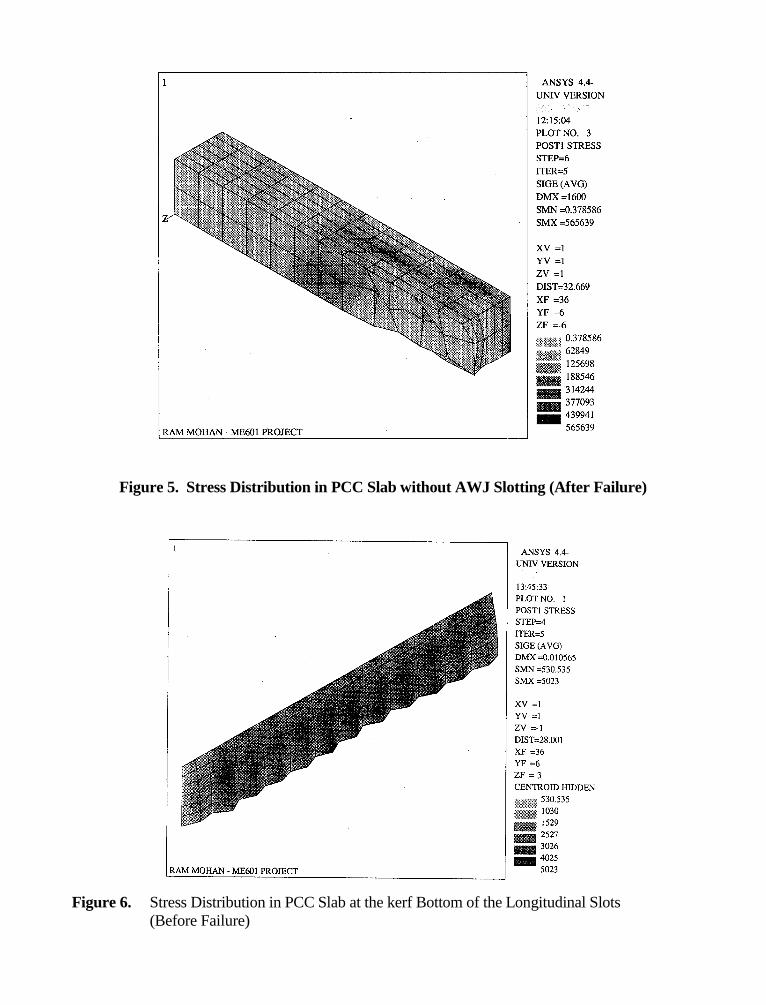
Figure 5. Stress Distribution in PCC Slab without AWJ Slotting (After Failure)
Figure 6. Stress Distribution in PCC Slab at the kerf Bottom of the Longitudinal Slots(Before Failure)
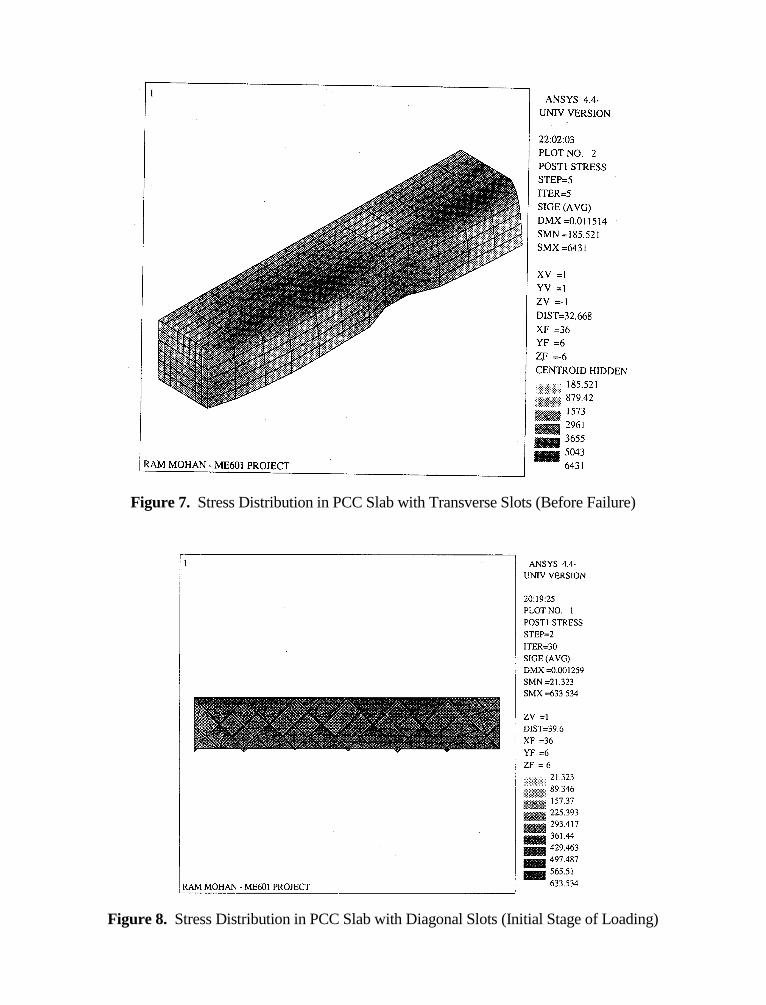
Figure 7. Stress Distribution in PCC Slab with Transverse Slots (Before Failure)
Figure 8. Stress Distribution in PCC Slab with Diagonal Slots (Initial Stage of Loading)
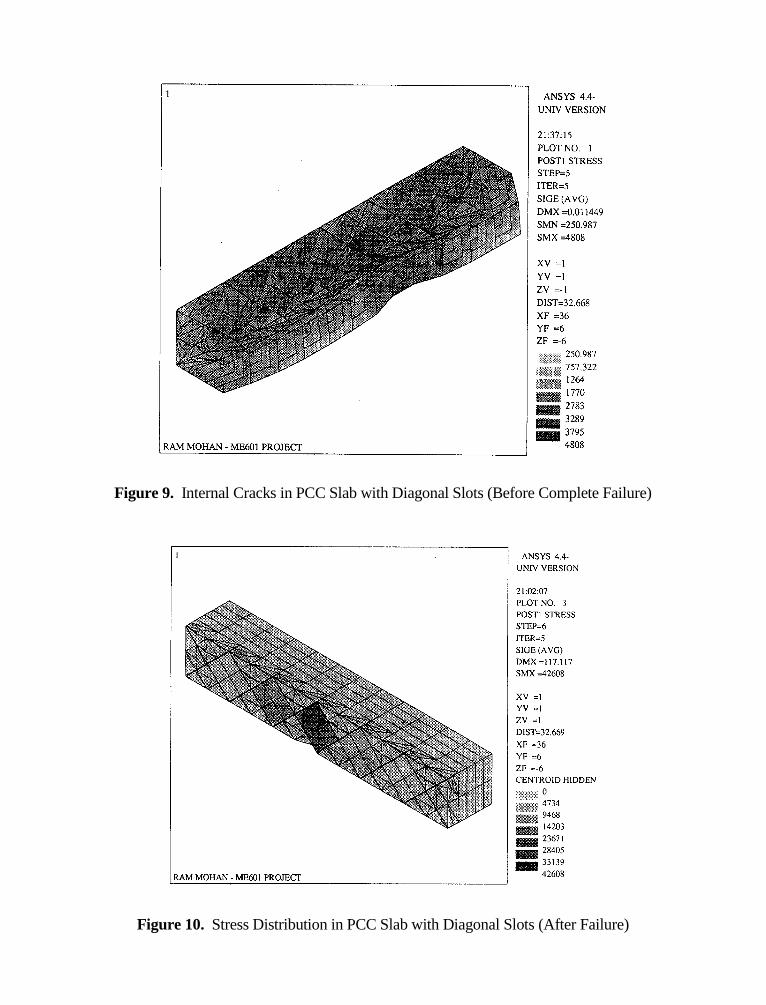
Figure 9. Internal Cracks in PCC Slab with Diagonal Slots (Before Complete Failure)
Figure 10. Stress Distribution in PCC Slab with Diagonal Slots (After Failure)
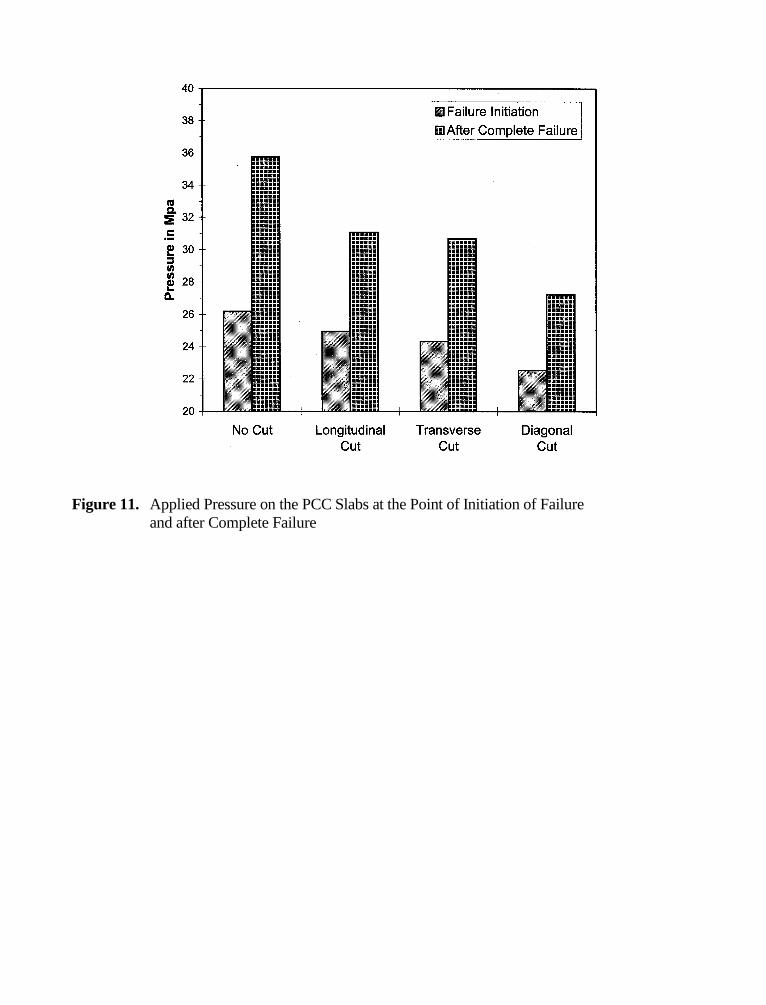
Figure 11. Applied Pressure on the PCC Slabs at the Point of Initiation of Failureand after Complete Failure
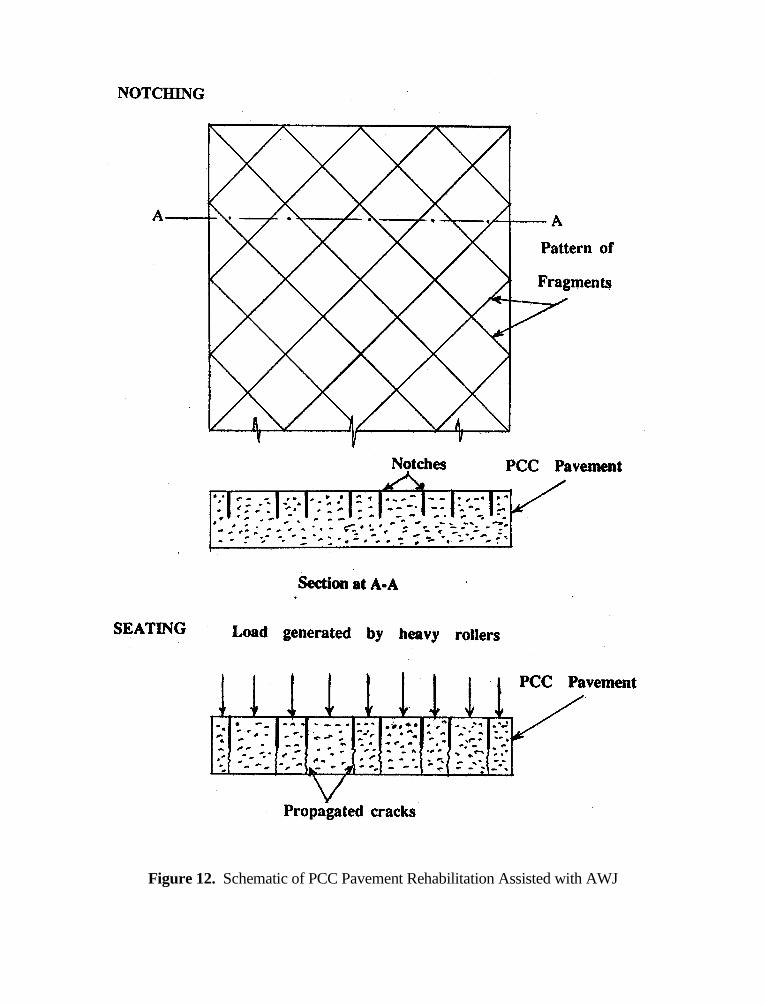
Figure 12. Schematic of PCC Pavement Rehabilitation Assisted with AWJ
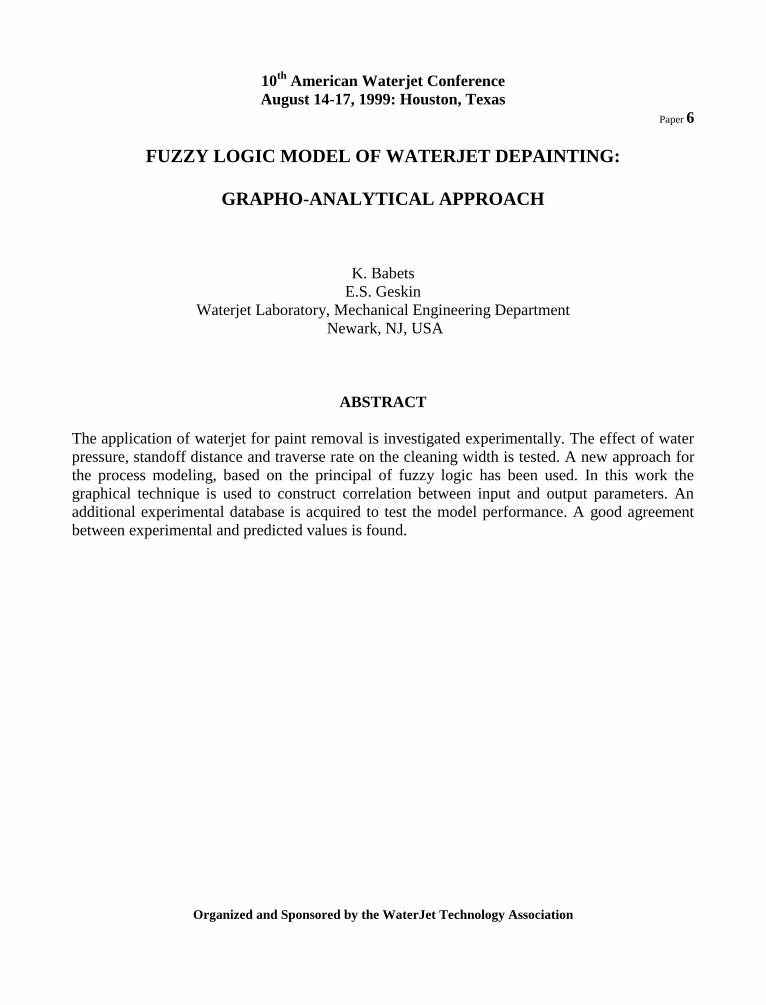
10th American Waterjet ConferenceAugust 14-17, 1999: Houston, Texas
Paper 6
FUZZY LOGIC MODEL OF WATERJET DEPAINTING:
GRAPHO-ANALYTICAL APPROACH
K. BabetsE.S. Geskin
Waterjet Laboratory, Mechanical Engineering Department Newark, NJ, USA
ABSTRACT
The application of waterjet for paint removal is investigated experimentally. The effect of waterpressure, standoff distance and traverse rate on the cleaning width is tested. A new approach forthe process modeling, based on the principal of fuzzy logic has been used. In this work thegraphical technique is used to construct correlation between input and output parameters. Anadditional experimental database is acquired to test the model performance. A good agreementbetween experimental and predicted values is found.
Organized and Sponsored by the WaterJet Technology Association
1. INTRODUCTION
This paper is concerned with numerical modeling of surface decoating. Paint and other coatingsare applied to surfaces to enhance corrosion resistance, improve appearance, or both. Often thecoatings need to be removed as part of the manufacturing operation. The need for paint removalalso occurs later in equipment life as the paint becomes soiled, worn, or damaged with use. Inmany cases, particularly in the aircraft industry, paint must be removed to allow inspection of theunderlying parts. Although decoating can bring about the improvement of the surface inquestion, at the very least paint removal should cause no damage of the substrate surface. In caseof an aircraft and number of other industries this requirement is paramount. The solution to paintremoval operations that usually is explored first is not to paint the part and thus avoid the need tostrip it. Some airlines have tried polished aluminum skins and report that the appearance isacceptable and the life-cycle cost is lower than painting with periodic removal to allowinspections. However, for most applications, the painting improves appearance or performanceor both and must still be used.
The most common way of depainting is the use of solvents. Solvent strippers have been widelyused for industrial coating removal for many years. Solvent strippers consist mainly ofmethylene chloride that typically constitutes 60% to 65% of the formulation. Other ingredientssuch as activators, corrosion inhibitors, thickeners, and evaporation retarders are used tosupplement the methylene chloride to improve coating removal performance. Thirty one percentof methyline chloride produced is consumed for paint stripping, and eleven percents are used formetal degreasing. Use of solvent strippers generates organic vapors, sludge containing solventsand metals. Increasing environmental and health concerns call for the reduced use of solventstrippers.
Cleaner technologies based on physical coating removal are commercially available or are beingdeveloped to replace solvent strippers. Physical coating removal technologies take advantage ofdifferences in physical properties between the coating and the substrate to destroy the bondingand/or abrade the coating from the underlying substrate.
Among a number of available paint removing techniques the most attractive ones appear to beblasting technologies. Plastic particles, wheat starch, crushed nut shells, sodium bicarbonate, etc.accelerated by water or air streams, are the basic blasting technologies. The most promisingtechnology, however, is the water blasting. Water droplets accelerated up to the sufficientvelocity constitute an effective material removal media, that is an addition of solid particlesbecomes unnecessary. Water is readily available, comparatively inexpensive, induces no damageto environment. The complete separation of water and debris and thus a material recovery andpollution prevention are feasible. Despite all its advantages, however, waterjet depainting did notfind sufficient applications. One of the reasons of the slow advance of waterjet blasting is apossibility of a substrate damage. The possibility of the damage can be completely eliminated bythe reduction of the droplet velocity at the impingement zone. This however, reduces processproductivity. If the droplet velocity falls below a critical value, depainting becomes impossible.It is necessary to find a range of process variables, which assures both competitive cost andquality of depainting. A practical technique is necessary for identification of this range. Thedevelopment of such a technique is the objective of this study.
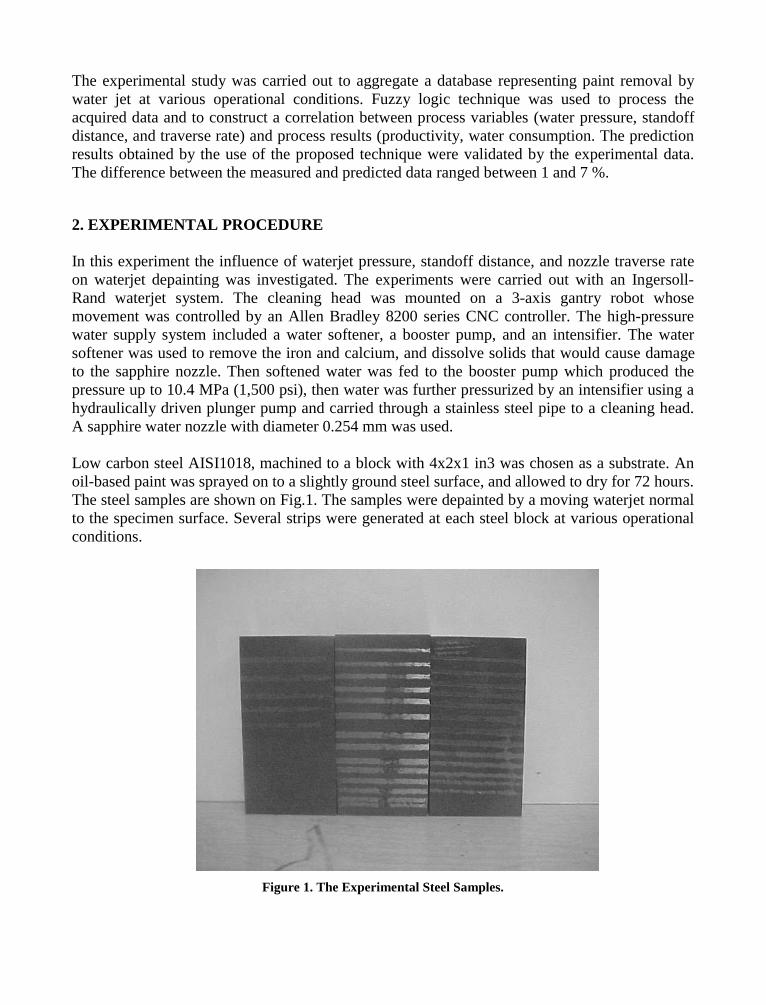
The experimental study was carried out to aggregate a database representing paint removal bywater jet at various operational conditions. Fuzzy logic technique was used to process theacquired data and to construct a correlation between process variables (water pressure, standoffdistance, and traverse rate) and process results (productivity, water consumption. The predictionresults obtained by the use of the proposed technique were validated by the experimental data.The difference between the measured and predicted data ranged between 1 and 7 %.
2. EXPERIMENTAL PROCEDURE
In this experiment the influence of waterjet pressure, standoff distance, and nozzle traverse rateon waterjet depainting was investigated. The experiments were carried out with an Ingersoll-Rand waterjet system. The cleaning head was mounted on a 3-axis gantry robot whosemovement was controlled by an Allen Bradley 8200 series CNC controller. The high-pressurewater supply system included a water softener, a booster pump, and an intensifier. The watersoftener was used to remove the iron and calcium, and dissolve solids that would cause damageto the sapphire nozzle. Then softened water was fed to the booster pump which produced thepressure up to 10.4 MPa (1,500 psi), then water was further pressurized by an intensifier using ahydraulically driven plunger pump and carried through a stainless steel pipe to a cleaning head.A sapphire water nozzle with diameter 0.254 mm was used.
Low carbon steel AISI1018, machined to a block with 4x2x1 in3 was chosen as a substrate. Anoil-based paint was sprayed on to a slightly ground steel surface, and allowed to dry for 72 hours.The steel samples are shown on Fig.1. The samples were depainted by a moving waterjet normalto the specimen surface. Several strips were generated at each steel block at various operationalconditions.
Figure 1. The Experimental Steel Samples.
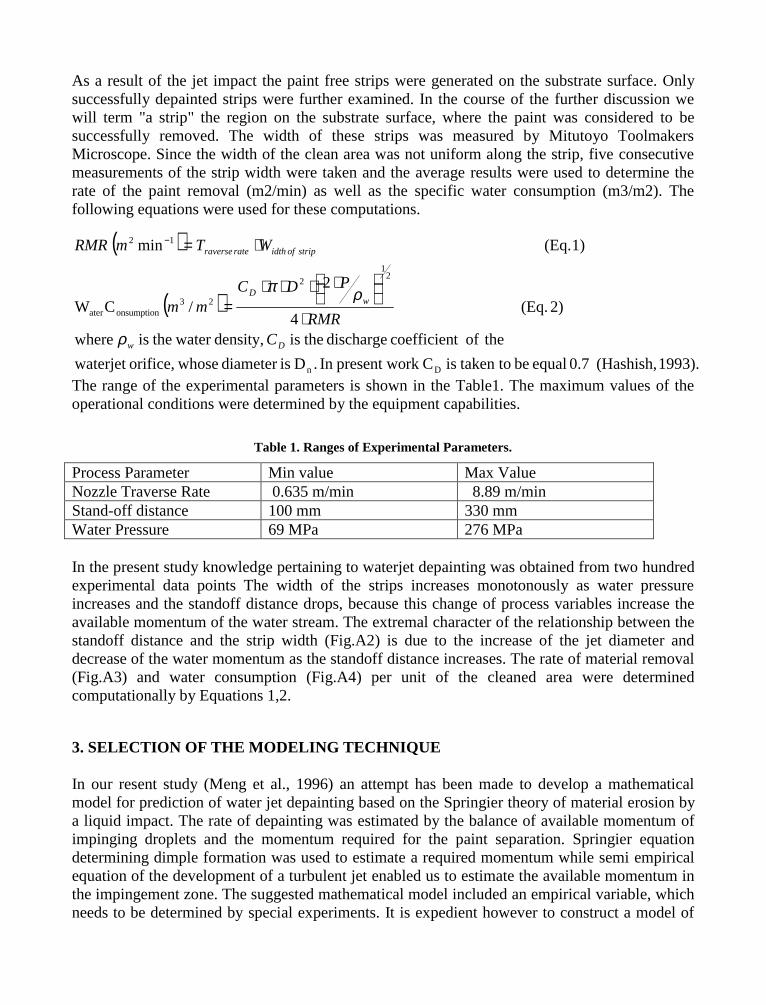
As a result of the jet impact the paint free strips were generated on the substrate surface. Onlysuccessfully depainted strips were further examined. In the course of the further discussion wewill term "a strip" the region on the substrate surface, where the paint was considered to besuccessfully removed. The width of these strips was measured by Mitutoyo ToolmakersMicroscope. Since the width of the clean area was not uniform along the strip, five consecutivemeasurements of the strip width were taken and the average results were used to determine therate of the paint removal (m2/min) as well as the specific water consumption (m3/m2). Thefollowing equations were used for these computations.
The range of the experimental parameters is shown in the Table1. The maximum values of theoperational conditions were determined by the equipment capabilities.
Table 1. Ranges of Experimental Parameters.
Process Parameter Min value Max ValueNozzle Traverse Rate 0.635 m/min 8.89 m/minStand-off distance 100 mm 330 mmWater Pressure 69 MPa 276 MPa
In the present study knowledge pertaining to waterjet depainting was obtained from two hundredexperimental data points The width of the strips increases monotonously as water pressureincreases and the standoff distance drops, because this change of process variables increase theavailable momentum of the water stream. The extremal character of the relationship between thestandoff distance and the strip width (Fig.A2) is due to the increase of the jet diameter anddecrease of the water momentum as the standoff distance increases. The rate of material removal(Fig.A3) and water consumption (Fig.A4) per unit of the cleaned area were determinedcomputationally by Equations 1,2.
3. SELECTION OF THE MODELING TECHNIQUE
In our resent study (Meng et al., 1996) an attempt has been made to develop a mathematicalmodel for prediction of water jet depainting based on the Springier theory of material erosion bya liquid impact. The rate of depainting was estimated by the balance of available momentum ofimpinging droplets and the momentum required for the paint separation. Springier equationdetermining dimple formation was used to estimate a required momentum while semi empiricalequation of the development of a turbulent jet enabled us to estimate the available momentum inthe impingement zone. The suggested mathematical model included an empirical variable, whichneeds to be determined by special experiments. It is expedient however to construct a model of
( )
( )
1993). (Hashish, 0.7 equal be taken tois Crk present woIn .D isdiameter whoseorifice,waterjet
theoft coefficien discharge theis density, water theis where
2) (Eq. 4
2
/CW
1) (Eq. min
Dn
21
2
23onsumptionater
12
Dw
wD
stripofidthrateraverse
CRMR
PDCmm
WTmRMR
ρ
ρπ
⋅
⋅⋅⋅⋅=
⋅=−
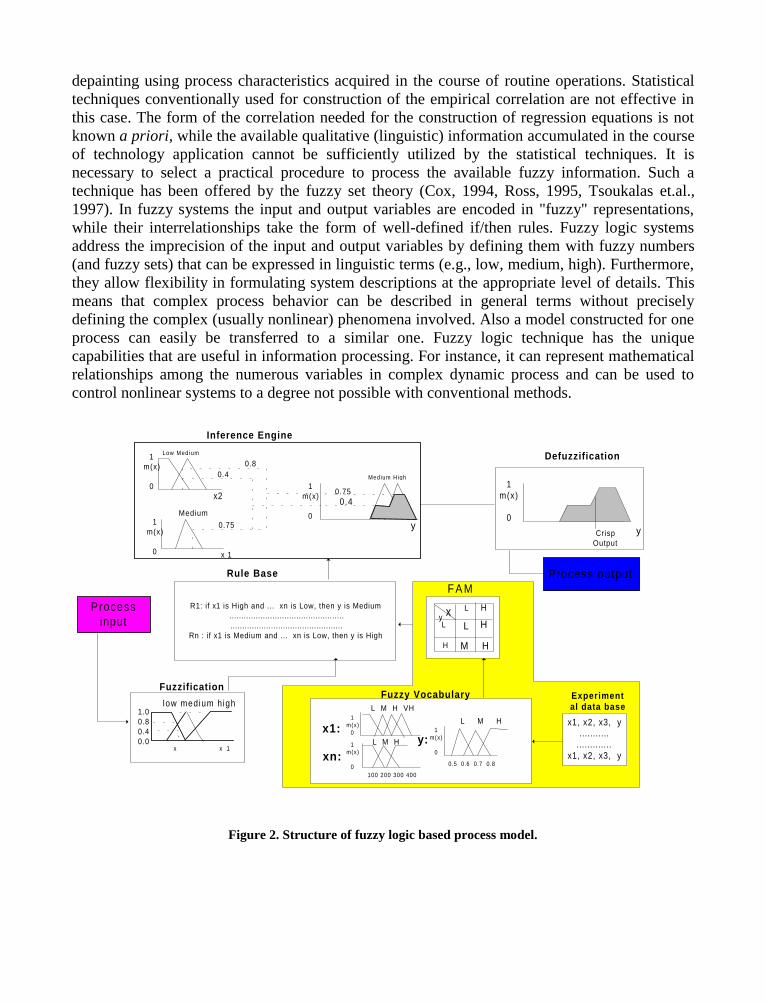
depainting using process characteristics acquired in the course of routine operations. Statisticaltechniques conventionally used for construction of the empirical correlation are not effective inthis case. The form of the correlation needed for the construction of regression equations is notknown a priori, while the available qualitative (linguistic) information accumulated in the courseof technology application cannot be sufficiently utilized by the statistical techniques. It isnecessary to select a practical procedure to process the available fuzzy information. Such atechnique has been offered by the fuzzy set theory (Cox, 1994, Ross, 1995, Tsoukalas et.al.,1997). In fuzzy systems the input and output variables are encoded in "fuzzy" representations,while their interrelationships take the form of well-defined if/then rules. Fuzzy logic systemsaddress the imprecision of the input and output variables by defining them with fuzzy numbers(and fuzzy sets) that can be expressed in linguistic terms (e.g., low, medium, high). Furthermore,they allow flexibility in formulating system descriptions at the appropriate level of details. Thismeans that complex process behavior can be described in general terms without preciselydefining the complex (usually nonlinear) phenomena involved. Also a model constructed for oneprocess can easily be transferred to a similar one. Fuzzy logic technique has the uniquecapabilities that are useful in information processing. For instance, it can represent mathematicalrelationships among the numerous variables in complex dynamic process and can be used tocontrol nonlinear systems to a degree not possible with conventional methods.
Figure 2. Structure of fuzzy logic based process model.
low medium h igh1.00.80.40.0
x x 1
Fuzzification
R1: if x1 is High and ... xn is Low, then y is Medium...............................................................................................
Rn : if x1 is Medium and ... xn is Low, then y is High
Rule Base
1m(x)
0
0.75
x 1
Medium
0.40.8
1m(x)
0
Low Medium
x2
y
1m(x)
0
Medium High
0.750.4
Inference Engine
CrispOutput
y
1m(x)
0
Defuzzification
1m(x)
0
1m(x)
0
1m(x)
0
x1:
xn:y:
L M H VH
L M H
L M H
100 200 300 400
0.5 0.6 0.7 0.8
Fuzzy Vocabulary
Process output
Processinput
x1, x2, x3, y...........
.............x1, x2, x3, y
Experimental data base
L H
L
H
xyL H
M H
F A M

4. ARCHITECTURE OF FUZZY LOGIC MODELING
In general a fuzzy logic modeling consists of the Fuzzy Preprocessing and Fuzzy Processingmodules. Fuzzy preprocessing involves representation of all available information in a formsuitable for application of fuzzy logic technique. In fuzzy preprocessing module the knowledgepertaining to the process is obtained from various sources, such as experimental and empiricaldata, expert knowledge, linguistic formulation, etc. is utilized for process representation. Thismodule consists of three independent modules:
- Knowledge acquisition module- Fuzzy vocabulary- Fuzzy associative memory (FAM).
The knowledge acquisition module constitutes a bank of all available pertinent information, crispor linguistic, which can be stored in a computer memory. There is always a wealth of knowledgethat cannot be formalized but nevertheless provides a significant insight about a process. In factone of the major advantages of the fuzzy logic technique is its ability to utilize this knowledge.The fuzzy vocabulary module enables us to represent all available crisp information in a formacceptable by the fuzzy logic technique. In short, a crisp value of a process variable is replacedby a fuzzy set. The acquired knowledge is translated into a fuzzy language using the followingfew steps. The first step is identification of the ranges of the change of input and outputvariables. Then the interval of the change of each variable is divided into a set of subintervalsand each of the subintervals is assigned a membership function, and is given an appropriatelinguistic name. This combination of a subinterval, its membership function, and its linguisticname constitutes a fuzzy set. Fuzzy sets of one particular variable usually overlap. The degree ofoverlap reflects fuzziness in the definition of fuzzy sets. The aggregation of all subintervals ofone process variable on a single coordinate axis is called the Universe of Discourse of thatvariable. It is clear, that construction of the fuzzy vocabulary involve in addition to theinformation acquired in the memory also a knowledge which cannot be stored, for example, anexpert opinion.
Finally, the fuzzy logical equations or fuzzy rules relating variables defined by the fuzzyvocabulary are constructed in the FAM module. The fuzzy vocabulary provides justrepresentation of the process variables. The relationships themselves are constructed on the baseof all available information, stored in the computer memory or provided by an expert. In the fieldof fuzzy logic the most common way to express human knowledge is to form it into naturallanguage expressions of the type:
IF premise (antecedent), THEN conclusion (consequent)
This form is commonly referred to as IF-THEN rule-based form. It represents the inference suchthat if we know the antecedent then the consequent can be inferred or derived. The constructedIF-THEN equations relate process variables stored in the fuzzy vocabulary. At the same timethese equations express empirical or heuristic knowledge, derived from sources such asexperiments or human experience, linguistically in this rule- based format. FAM contains a set of
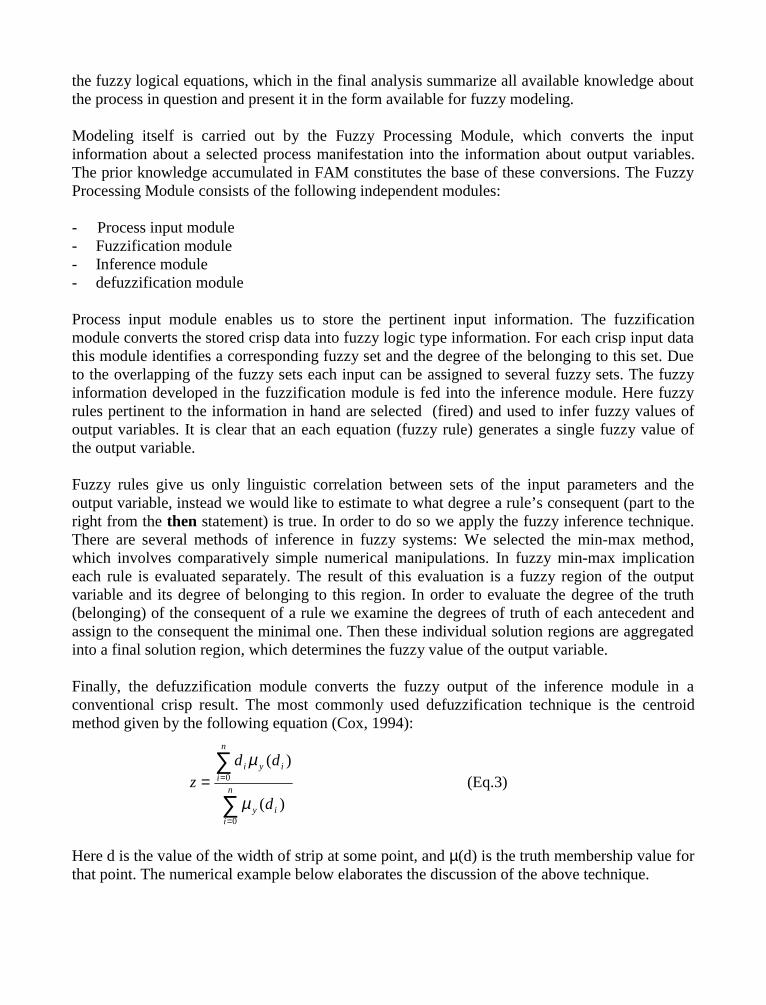
the fuzzy logical equations, which in the final analysis summarize all available knowledge aboutthe process in question and present it in the form available for fuzzy modeling.
Modeling itself is carried out by the Fuzzy Processing Module, which converts the inputinformation about a selected process manifestation into the information about output variables.The prior knowledge accumulated in FAM constitutes the base of these conversions. The FuzzyProcessing Module consists of the following independent modules:
- Process input module- Fuzzification module- Inference module- defuzzification module
Process input module enables us to store the pertinent input information. The fuzzificationmodule converts the stored crisp data into fuzzy logic type information. For each crisp input datathis module identifies a corresponding fuzzy set and the degree of the belonging to this set. Dueto the overlapping of the fuzzy sets each input can be assigned to several fuzzy sets. The fuzzyinformation developed in the fuzzification module is fed into the inference module. Here fuzzyrules pertinent to the information in hand are selected (fired) and used to infer fuzzy values ofoutput variables. It is clear that an each equation (fuzzy rule) generates a single fuzzy value ofthe output variable.
Fuzzy rules give us only linguistic correlation between sets of the input parameters and theoutput variable, instead we would like to estimate to what degree a rule’s consequent (part to theright from the then statement) is true. In order to do so we apply the fuzzy inference technique.There are several methods of inference in fuzzy systems: We selected the min-max method,which involves comparatively simple numerical manipulations. In fuzzy min-max implicationeach rule is evaluated separately. The result of this evaluation is a fuzzy region of the outputvariable and its degree of belonging to this region. In order to evaluate the degree of the truth(belonging) of the consequent of a rule we examine the degrees of truth of each antecedent andassign to the consequent the minimal one. Then these individual solution regions are aggregatedinto a final solution region, which determines the fuzzy value of the output variable.
Finally, the defuzzification module converts the fuzzy output of the inference module in aconventional crisp result. The most commonly used defuzzification technique is the centroidmethod given by the following equation (Cox, 1994):
Here d is the value of the width of strip at some point, and µ(d) is the truth membership value forthat point. The numerical example below elaborates the discussion of the above technique.
(Eq.3) )(
)(
0
0
∑
∑
=
==n
iiy
n
iiyi
d
ddz
µ
µ
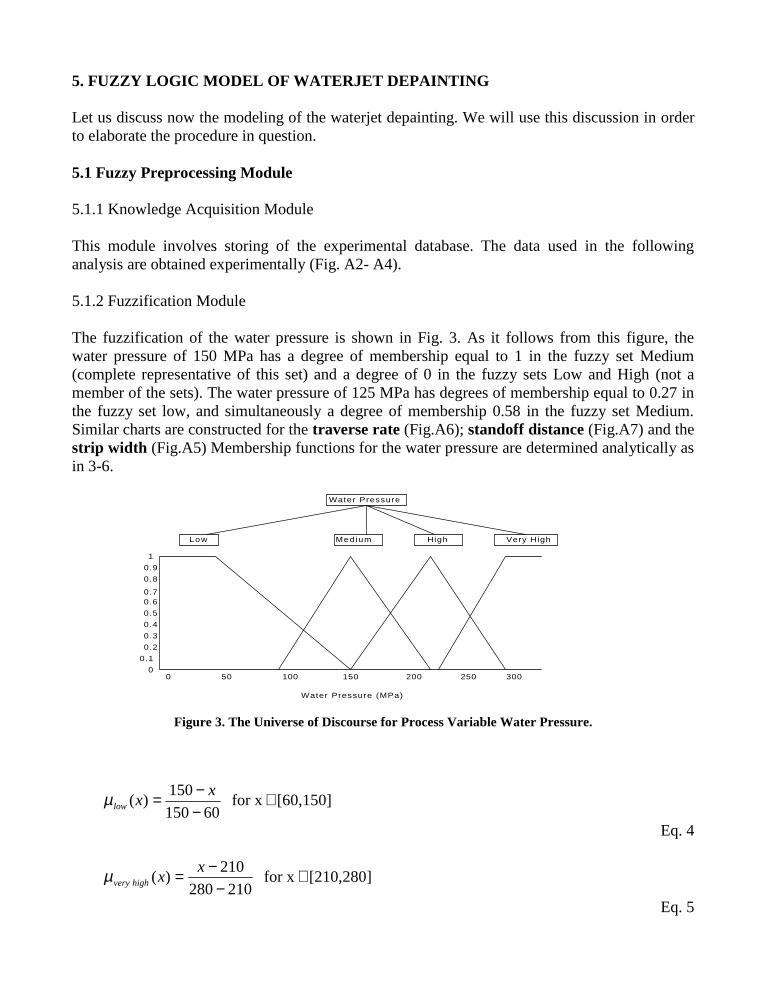
5. FUZZY LOGIC MODEL OF WATERJET DEPAINTING
Let us discuss now the modeling of the waterjet depainting. We will use this discussion in orderto elaborate the procedure in question.
5.1 Fuzzy Preprocessing Module
5.1.1 Knowledge Acquisition Module
This module involves storing of the experimental database. The data used in the followinganalysis are obtained experimentally (Fig. A2- A4).
5.1.2 Fuzzification Module
The fuzzification of the water pressure is shown in Fig. 3. As it follows from this figure, thewater pressure of 150 MPa has a degree of membership equal to 1 in the fuzzy set Medium(complete representative of this set) and a degree of 0 in the fuzzy sets Low and High (not amember of the sets). The water pressure of 125 MPa has degrees of membership equal to 0.27 inthe fuzzy set low, and simultaneously a degree of membership 0.58 in the fuzzy set Medium.Similar charts are constructed for the traverse rate (Fig.A6); standoff distance (Fig.A7) and thestrip width (Fig.A5) Membership functions for the water pressure are determined analytically asin 3-6.
Figure 3. The Universe of Discourse for Process Variable Water Pressure.
Eq. 4
Eq. 5
0 50 100 150 200 250 300
Low Medium High Very High
0.70.6
0.5
0.4
0.3
0.2
0.1
0.8
0.9
1
0
Water Pressure (MPa)
Water Pressure
[210,280] for x 210280
210)( ∈
−−= x
xhighveryµ
[60,150] for x 60150
150)( ∈
−−= x
xlowµ
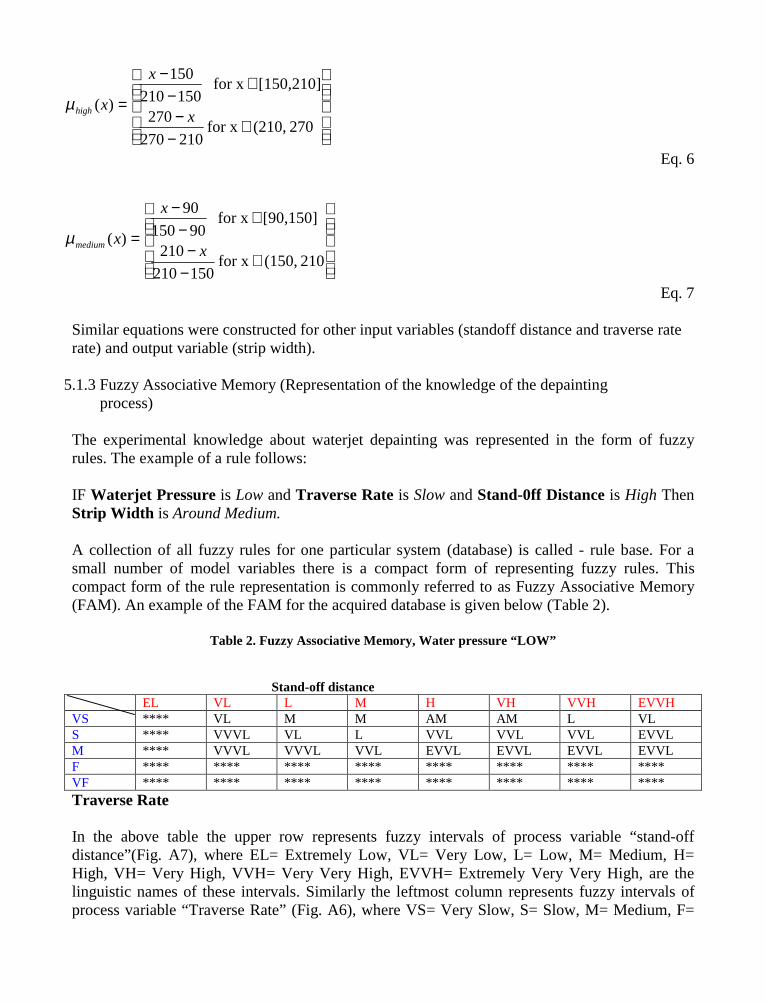
Eq. 6
Eq. 7
Similar equations were constructed for other input variables (standoff distance and traverse raterate) and output variable (strip width).
5.1.3 Fuzzy Associative Memory (Representation of the knowledge of the depainting process)
The experimental knowledge about waterjet depainting was represented in the form of fuzzyrules. The example of a rule follows:
IF Waterjet Pressure is Low and Traverse Rate is Slow and Stand-0ff Distance is High ThenStrip Width is Around Medium.
A collection of all fuzzy rules for one particular system (database) is called - rule base. For asmall number of model variables there is a compact form of representing fuzzy rules. Thiscompact form of the rule representation is commonly referred to as Fuzzy Associative Memory(FAM). An example of the FAM for the acquired database is given below (Table 2).
Table 2. Fuzzy Associative Memory, Water pressure “LOW”
Stand-off distanceEL VL L M H VH VVH EVVH
VS **** VL M M AM AM L VLS **** VVVL VL L VVL VVL VVL EVVLM **** VVVL VVVL VVL EVVL EVVL EVVL EVVLF **** **** **** **** **** **** **** ****VF **** **** **** **** **** **** **** ****Traverse Rate
In the above table the upper row represents fuzzy intervals of process variable “stand-offdistance”(Fig. A7), where EL= Extremely Low, VL= Very Low, L= Low, M= Medium, H=High, VH= Very High, VVH= Very Very High, EVVH= Extremely Very Very High, are thelinguistic names of these intervals. Similarly the leftmost column represents fuzzy intervals ofprocess variable “Traverse Rate” (Fig. A6), where VS= Very Slow, S= Slow, M= Medium, F=
∈−−
∈−
−
=210 (150, for x
150210
210
[90,150] for x 90150
90
)(x
x
xmediumµ
∈−−
∈−
−
=270 (210, for x
210270
270
[150,210] for x 150210
150
)(x
x
xhighµ
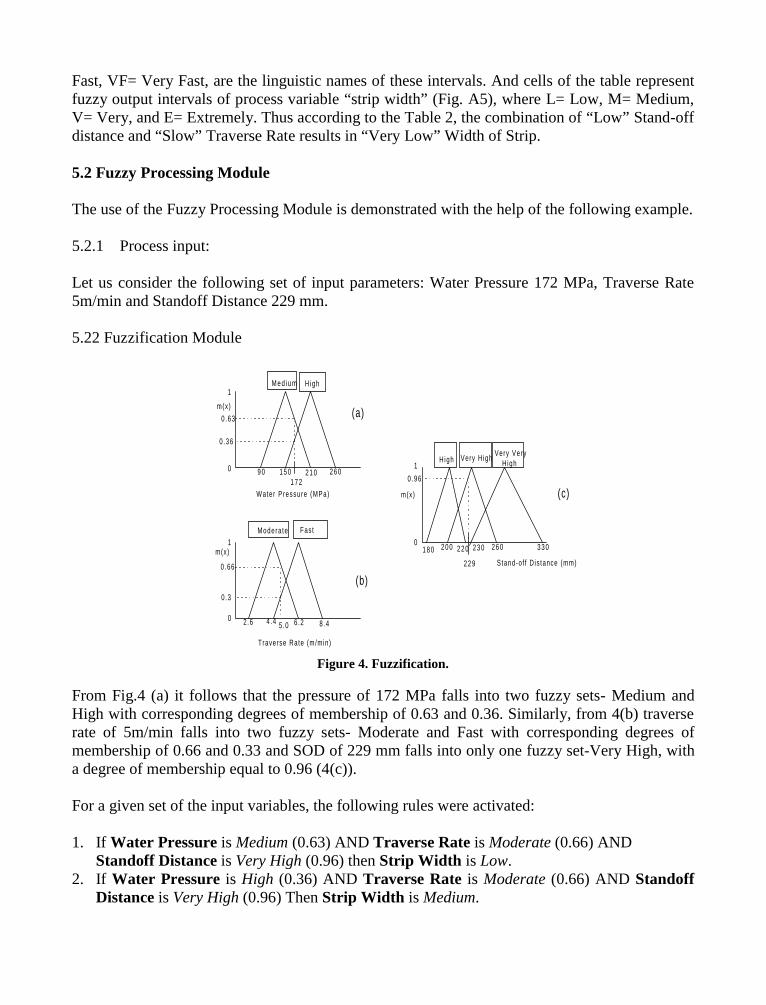
Fast, VF= Very Fast, are the linguistic names of these intervals. And cells of the table representfuzzy output intervals of process variable “strip width” (Fig. A5), where L= Low, M= Medium,V= Very, and E= Extremely. Thus according to the Table 2, the combination of “Low” Stand-offdistance and “Slow” Traverse Rate results in “Very Low” Width of Strip.
5.2 Fuzzy Processing Module
The use of the Fuzzy Processing Module is demonstrated with the help of the following example.
5.2.1 Process input:
Let us consider the following set of input parameters: Water Pressure 172 MPa, Traverse Rate5m/min and Standoff Distance 229 mm.
5.22 Fuzzification Module
Figure 4. Fuzzification.
From Fig.4 (a) it follows that the pressure of 172 MPa falls into two fuzzy sets- Medium andHigh with corresponding degrees of membership of 0.63 and 0.36. Similarly, from 4(b) traverserate of 5m/min falls into two fuzzy sets- Moderate and Fast with corresponding degrees ofmembership of 0.66 and 0.33 and SOD of 229 mm falls into only one fuzzy set-Very High, witha degree of membership equal to 0.96 (4(c)).
For a given set of the input variables, the following rules were activated:
1. If Water Pressure is Medium (0.63) AND Traverse Rate is Moderate (0.66) AND Standoff Distance is Very High (0.96) then Strip Width is Low.2. If Water Pressure is High (0.36) AND Traverse Rate is Moderate (0.66) AND Standoff
Distance is Very High (0.96) Then Strip Width is Medium.
9 0 2 1 01 5 0 2 6 01 7 2
Water Pressure (MPa)
1
m(x)
0 .63
0 .36
0
M e d i u m High
1
0
0 .66
0.3
m(x)
2 .6 6 .24 .4 5 .0 8 .4
Traverse Rate (m/min)
Modera te Fas t
1
0 .96
m(x)
01 8 0 2 2 02 0 0 2 6 02 3 0 3 3 0
2 2 9 Stand-o f f D is tance (mm)
H igh Very H ighVery Very
H igh
(a)
(b)
(c)
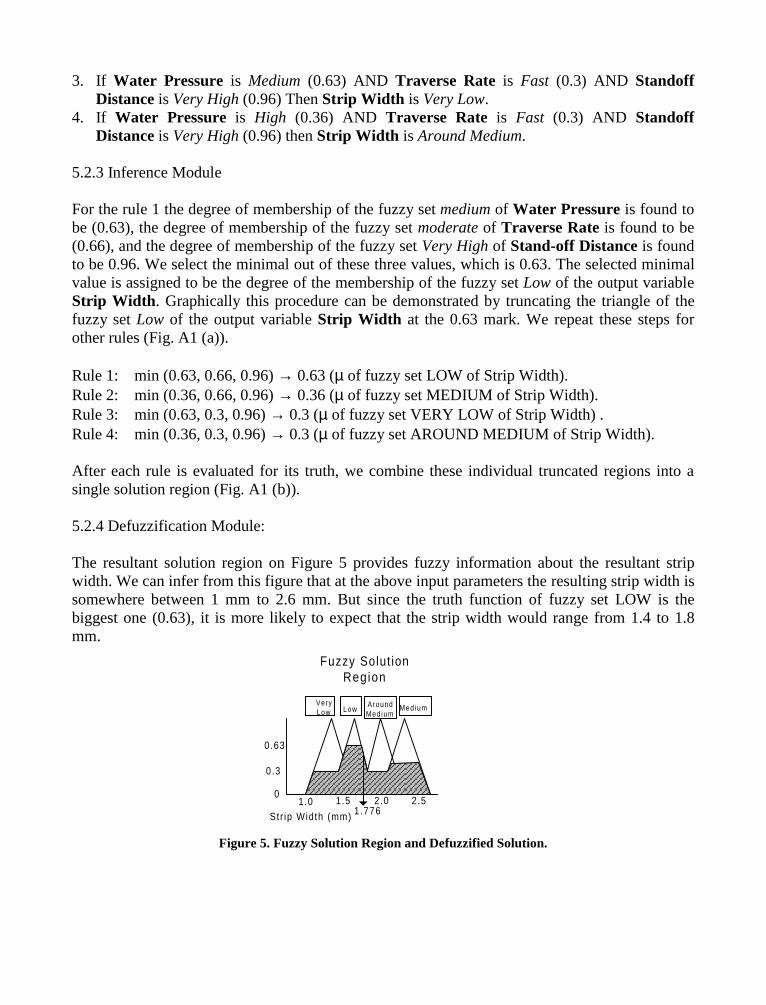
3. If Water Pressure is Medium (0.63) AND Traverse Rate is Fast (0.3) AND StandoffDistance is Very High (0.96) Then Strip Width is Very Low.
4. If Water Pressure is High (0.36) AND Traverse Rate is Fast (0.3) AND StandoffDistance is Very High (0.96) then Strip Width is Around Medium.
5.2.3 Inference Module
For the rule 1 the degree of membership of the fuzzy set medium of Water Pressure is found tobe (0.63), the degree of membership of the fuzzy set moderate of Traverse Rate is found to be(0.66), and the degree of membership of the fuzzy set Very High of Stand-off Distance is foundto be 0.96. We select the minimal out of these three values, which is 0.63. The selected minimalvalue is assigned to be the degree of the membership of the fuzzy set Low of the output variableStrip Width. Graphically this procedure can be demonstrated by truncating the triangle of thefuzzy set Low of the output variable Strip Width at the 0.63 mark. We repeat these steps forother rules (Fig. A1 (a)).
Rule 1: min (0.63, 0.66, 0.96) → 0.63 (µ of fuzzy set LOW of Strip Width).Rule 2: min (0.36, 0.66, 0.96) → 0.36 (µ of fuzzy set MEDIUM of Strip Width).Rule 3: min (0.63, 0.3, 0.96) → 0.3 (µ of fuzzy set VERY LOW of Strip Width) .Rule 4: min (0.36, 0.3, 0.96) → 0.3 (µ of fuzzy set AROUND MEDIUM of Strip Width).
After each rule is evaluated for its truth, we combine these individual truncated regions into asingle solution region (Fig. A1 (b)).
5.2.4 Defuzzification Module:
The resultant solution region on Figure 5 provides fuzzy information about the resultant stripwidth. We can infer from this figure that at the above input parameters the resulting strip width issomewhere between 1 mm to 2.6 mm. But since the truth function of fuzzy set LOW is thebiggest one (0.63), it is more likely to expect that the strip width would range from 1.4 to 1.8mm.
Figure 5. Fuzzy Solution Region and Defuzzified Solution.
1.0 1.5 2.0 2.5
0.3
0.63
VeryLow Low
AroundMed ium
Med ium
0
Str ip Width (mm)
Fuzzy Solut ionRegion
1.776
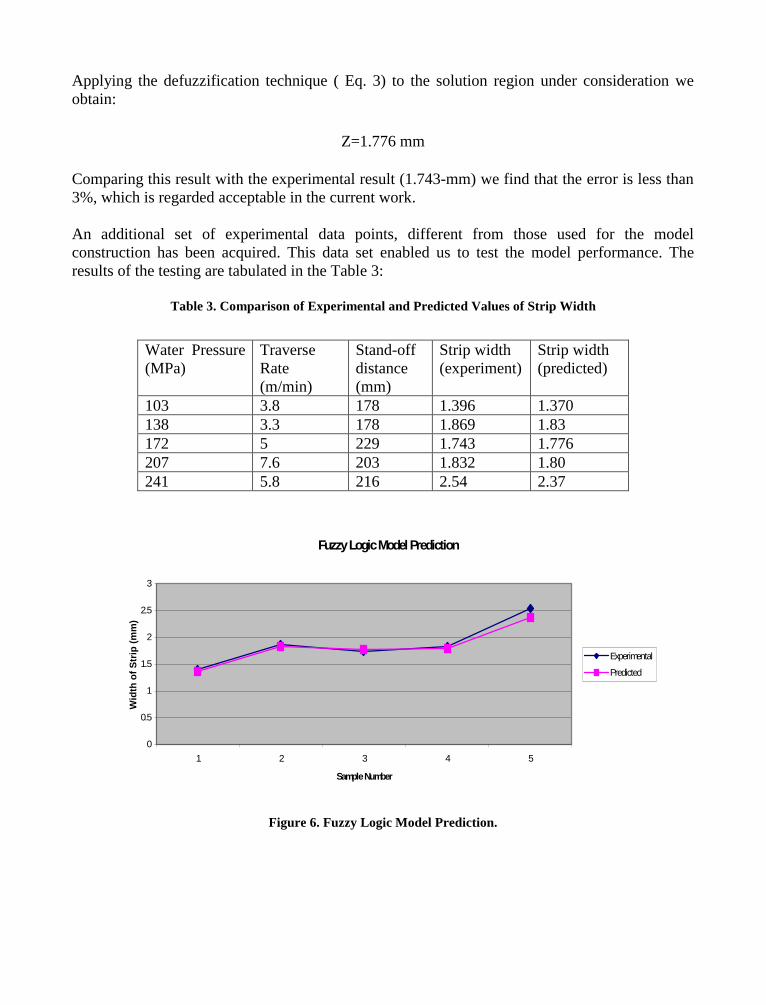
Applying the defuzzification technique ( Eq. 3) to the solution region under consideration weobtain:
Z=1.776 mm
Comparing this result with the experimental result (1.743-mm) we find that the error is less than3%, which is regarded acceptable in the current work.
An additional set of experimental data points, different from those used for the modelconstruction has been acquired. This data set enabled us to test the model performance. Theresults of the testing are tabulated in the Table 3:
Table 3. Comparison of Experimental and Predicted Values of Strip Width
Water Pressure(MPa)
TraverseRate(m/min)
Stand-offdistance(mm)
Strip width(experiment)
Strip width(predicted)
103 3.8 178 1.396 1.370138 3.3 178 1.869 1.83172 5 229 1.743 1.776207 7.6 203 1.832 1.80241 5.8 216 2.54 2.37
Figure 6. Fuzzy Logic Model Prediction.
Fuzzy Logic Model Prediction
0
0.5
1
1.5
2
2.5
3
1 2 3 4 5
Sample Number
Wid
th o
f Str
ip (
mm
)
Experimental
Predicted

6. DISCUSSION OF RESULTS
Presented results show the feasibility of construction of a numerical model of water jetdepainting process using fuzzy logic principals. The procedure involved acquisition of theexperimental database, fuzzification of the input and output variables, construction of the fuzzyrule representing the acquired database, evaluation of the fuzzy distribution of the output variablefor the selected sets of the input variables and evaluation of the crisp value of the output variable.The routines involved in the transformation above are comparatively simple. The error in thepredicted results for experimental data different from that used for the construction of the modelrange between 1-7%. This accuracy is acceptable at the first stage of the process investigationand will be improved, as additional database will be generated. The main advantage of thesuggested approach is that it can be easily expanded as new process information is acquired, ornew process variables are introduced.
In the presented study the process result is characterized by the strip width, which constitutes theonly directly measured output variable. Actual process characteristics (productivity and waterconsumption) can be readily determined using Equations 1,2. The result of the presented analysisprovides guidance to the optimization of the waterjet depainting. Particularly, it is shown that theprocess effectiveness increases if the water pressure will be taken maximum (276 MPa in thisstudy), along with maximal traverse rate (8.89 m/min). The standoff distance should rangebetween 0.15 and 0.25 m. Analysis was carried out at a constant nozzle diameter of 0.254 mm.The procedure of the model construction can be readily modified to account for this and otherprocess variables.
7. CONCLUDING REMARKS
The approach used in our study is not unique. There several efficient techniques that enable us toreduce database to a compressed process description. Numerical process description can beobtained using well-understood and documented regression analysis. Fuzzy logic techniquehowever has a number of advantages. First of all, there is no limitation on the form of the model.Fuzzy logic can account for any form of process nonlinearity. The inaccuracy (fuzziness) ofinput information effects the final result much less then that in the case of regression analysis.Model improvement using new acquired information is rather simple. Thus, the use of fuzzylogic will improve the planning and control of the waterjet depainting. Although this study isconcerned with prediction of the results of paint stripping, with some modifications it can beapplied to other surface processing technologies. In our following work we will show how toexpend a model constructed for the existing database for a similar system at a limited initialinformation.
8. REFERENCES
Earl Cox, “The Fuzzy Systems Handbook: A Practitioner’s Guide to Building, Using, AndMaintaining Fuzzy Systems,” AP Professional, 1994.
Mohamed Hashish, “Prediction Models for AWJ Machining Operations”, Proceedings of the7thAmerican Water Jet Conference, pp. 205-216,Seattle, Washington, 1993.
Spencer T. Johnson, “Advances in Cleaning and Coating Removal Using Ultra-High PressureWater Jet Technology”, Proceedings of the 7thAmerican Water Jet Conference, pp.607-610, Seattle, Washington, 1993.
S. Kang, T. Retiree, G., Carlson, “Target Response to the Impact of High-Velocity Non AbrasiveWaterjet,” Proceedings of 7th American Water Jet Conference, Seattle, Washington,1993.
H. Louis, W. Schicorr, “Fundamental Aspects in Cleaning with High Speed Water Jets”,Proceedings of the 6th International Symposium on Jet Cutting Technology, pp. 217-228,BHRA, Guildford, England, 1982.
P. Meng, Experimental and Analytical Investigation of Water Jet Cleaning Process, Ph.D.Thesis, New Jersey Institute of Technology, (1996).
P. Meng, E. Geskin, L. Tismenetskiy, “Cleaning with High Pressure Directed Waterjets,”Proceedings of Japan-USA Symposium on Flexible Automation, Boston, MA, 1996.
Timothy J. Ross, “Fuzzy Logic With Engineering Applications,” McGraw-Hill, 1995.
P.J. Singh, J. Munoz, W.L. Chen, “Ultra-High Pressure Waterjet Removal of Thermal SprayCoatings,” Proceedings of 11th International Symposium on Jet Cutting Technology, pp.461- 480, BHRA, Dordrecht, Netherlands, 1992.
Leftery H. Tsoukalas, Robert E. Uhrig, “Fuzzy and Neural Approaches in Engineering,” JohnWiley & Sons, 1997.
Jeffrey D. Watson, “Thermal Spray Removal with Ultrahigh-Velocity Waterjets,” Proceedingsof the 7thAmerican Water Jet Conference, pp. 583-595, Seattle, Washington, 1993.
Samuel S. Wu & Thomas J. Kim,” An Application Study of Plain Waterjet Process for CoatingRemoval”, Proceedings of the 8th American Water Jet Conference, pp.779-792, Houston,Texas, 1995.
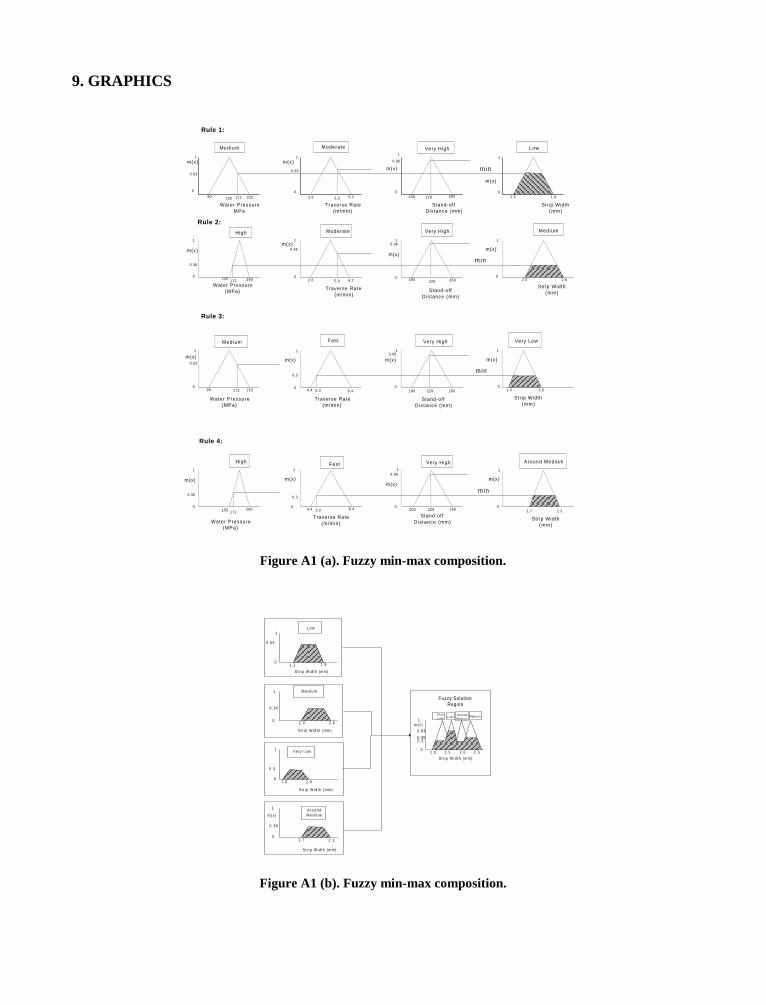
9. GRAPHICS
Figure A1 (a). Fuzzy min-max composition.
Figure A1 (b). Fuzzy min-max composition.
Rule 1:
Water PressureMPa
Traverse Rate(m/min)
Stand-offDistance (mm)
Strip Width(mm)
0.630.66
0.96
150 172 5.0
Medium Moderate Very High
229
Low
minm(x) m(x)
111
1
0000
m(x)
High1
0
0.36
m(x)
Moderate Very High Medium
172Water Pressure
(MPa)
5.0 229
Traverse Rate (m/min)
Stand-offDistance (mm)
Strip Width(mm)
1.3 1.9
m(x)
2.62.0
1m(x)
m(x)m(x)
1 1
000
0.660.96
m in
200 260
200 260
Rule 2:
90 210
260150
2.6 6.2
2.6 6.2
90 210172
0.63
1
m(x)
0
Water Pressure(MPa)
Medium
4.4 8.45.0
1
0
0.3
m(x)
Fast
Traverse Rate(m/min)
1
m(x)0.96
0200 229 260
Stand-offDistance (mm)
Very High
1.0 1.6
Strip Width(mm)
Very Low
Rule 3:
min
1
0
m(x)
1
0
m(x)
150 260172
0.36
High
Water Pressure(MPa)
1
0
m(x)
1.7 2.3
Around Medium
min
Strip Width(mm)
Stand-offDistance (mm)
Traverse Rate(m/min)
Fast Very High1
0.96
0
m(x)
1
m(x)
0.3
0
Rule 4:
4.4 5.0 8.4 200 229 260
1 . 0 1 . 5 2 . 0 2 . 5
0 . 30 . 3 6
0 . 6 3
VeryL o w L o w
AroundMedium
Medium1
0
m(x)
1
0
0 . 6 3
L o w
S t r i p W i d t h ( m m )
S t r i p W i d t h ( m m )
S t r i p W i d t h ( m m )
S t r i p W i d t h ( m m )
1
0
m(x)
1
0
1
0
0 . 3 6
M e d i u m
Very Low
0 . 3
0 . 3 6
A r o u n dM e d i u m
1 . 7 2 . 3
1 . 0 1 . 6
2 . 0 2 . 6
1 . 3 1 . 9
S t r i p W i d t h ( m m )
Fuzzy SolutionRegion
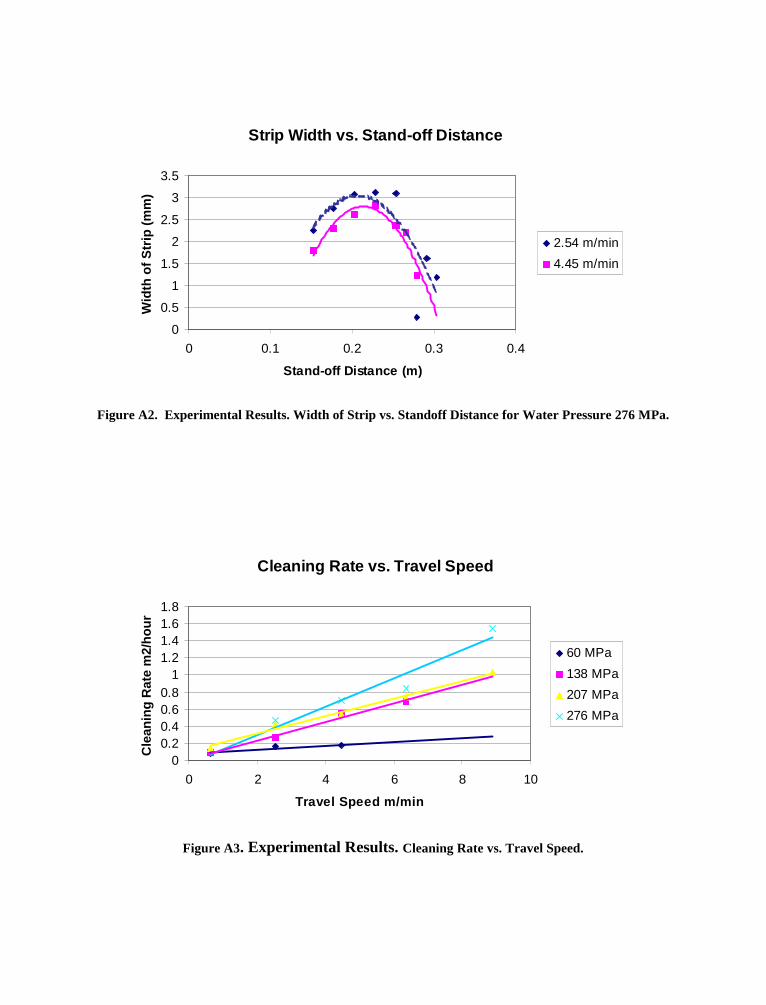
Figure A2. Experimental Results. Width of Strip vs. Standoff Distance for Water Pressure 276 MPa.
Figure A3. Experimental Results. Cleaning Rate vs. Travel Speed.
Strip Width vs. Stand-off Distance
0
0.5
1
1.5
2
2.5
3
3.5
0 0.1 0.2 0.3 0.4
Stand-off Distance (m)
Wid
th o
f Str
ip (
mm
)
2.54 m/min
4.45 m/min
Cleaning Rate vs. Travel Speed
00.20.40.60.8
11.21.41.61.8
0 2 4 6 8 10
Travel Speed m/min
Cle
anin
g R
ate
m2/
hour
60 MPa
138 MPa
207 MPa
276 MPa
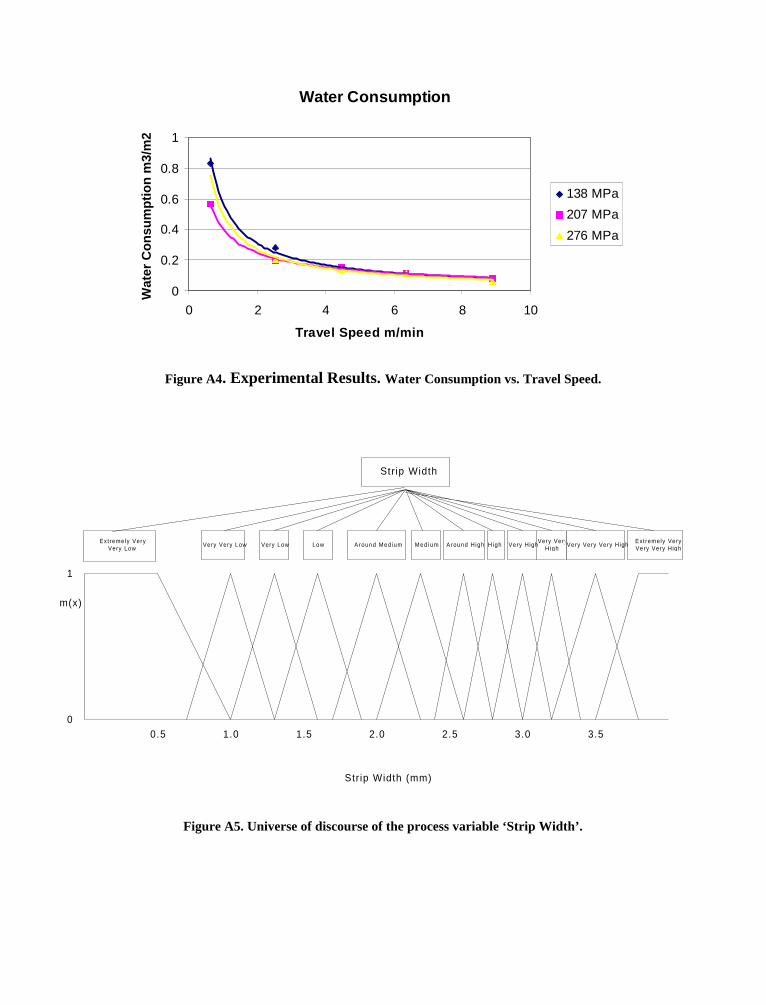
Figure A4. Experimental Results. Water Consumption vs. Travel Speed.
Figure A5. Universe of discourse of the process variable ‘Strip Width’.
Water Consumption
0
0.2
0.4
0.6
0.8
1
0 2 4 6 8 10
Travel Speed m/min
Wat
er C
onsu
mpt
ion
m3/
m2
138 MPa
207 MPa
276 MPa
0.5 1.0 1.5 2.0 2.5 3.0 3.5
Str ip Width (mm)
1
m(x)
0
Extremely VeryVery Low
Very Very Low Very Low Low Around Med ium Med ium Around High High Very HighVery Very
HighVery Very Very High
Ext remely VeryVery Very High
Str ip Width
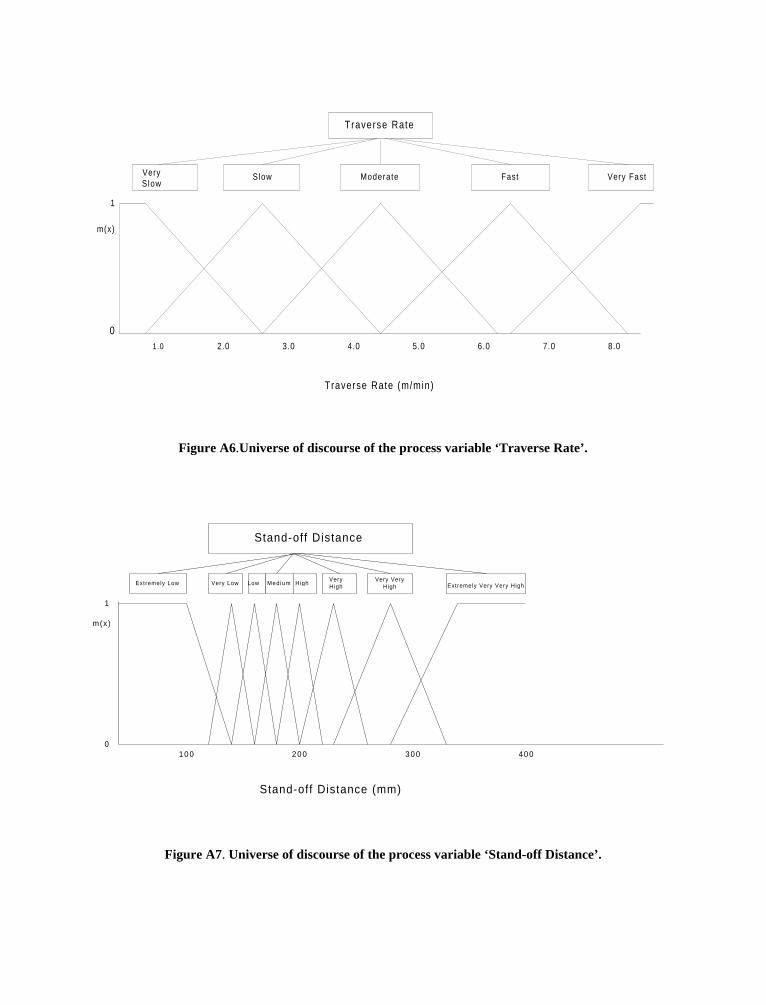
Figure A6.Universe of discourse of the process variable ‘Traverse Rate’.
Figure A7. Universe of discourse of the process variable ‘Stand-off Distance’.
100 200 300 400
1
m(x)
0
Extremely Low Very Low Low Medium HighVeryHigh
Very VeryHigh Extremely Very Very High
Stand-off Distance (mm)
Stand-off Distance
1.0 2.0 3.0 4.0 5.0 6.0 7.0 8.0
Traverse Rate (m/min)
1
m(x)
0
VerySlow
Slow Moderate Fast Very Fast
Traverse Rate
10 American Waterjet Conferenceth
August 14-17, 1999: Houston, Texas Paper 7
MODELING OF FLOW MODULATION FOLLOWING THE
ELECTRICAL DISCHARGE IN A NOZZLE
M. M. Vijay, A.H. Makomaski , W. Yan, A. Tieu and C.Bai*
L Advanced Technologies, Inc.VN
Gloucester, ON., Canada Consultant to VLN*
ABSTRACT
Work is in progress on the design and fabrication of a pre-commercial electro-discharge machine forgenerating low-frequency (0.3 Hz) ultra-high energy pulsed water jets. The machine consists of a100 kJ capacitor bank, a fairly low pressure (34.5 MPa; 5,000 psi) pump, a nozzle-electrodeassembly and other accessories. The pulsed waterjet is generated by the rapid discharge of storedelectrical energy in the bank between the electrodes in the nozzle. In order to design an efficient,robust and reliable nozzle, it is very important to understand the complex processes that occur afterthe discharge. This is accomplished by numerical modeling by developing a 2-D axi-symmetricLagrangian code. The code can employ a variable grid along the axis to elaborate the region of theplasma and the plasma itself.
In the paper, results predicted by the numerical modelling are presented. Details of the shockformation and propagation are discussed. It is shown that modulation of the flow at 34.5 MPa bythe rapid electrical discharge generates ultra-high (2,000 MPa) impact pressures on the target. Themagnitude of such high pressures was observed to depend on the rate of electrical energy release andthe standoff distance.
Organized and Sponsored by the WaterJet Technology Association
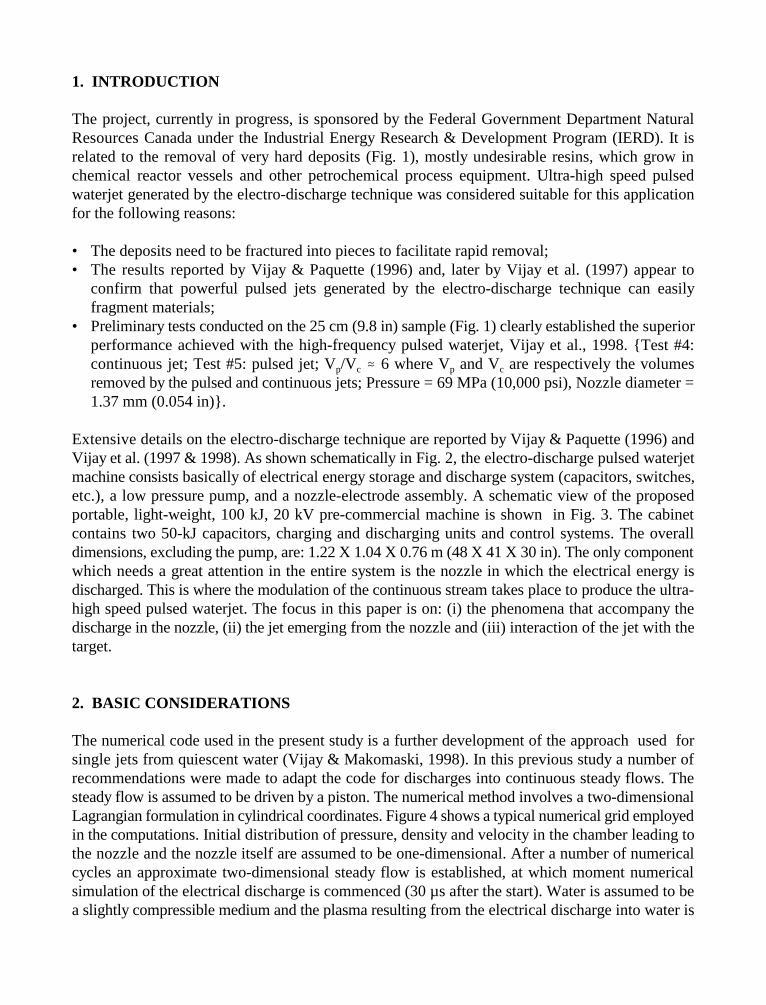
1. INTRODUCTION
The project, currently in progress, is sponsored by the Federal Government Department NaturalResources Canada under the Industrial Energy Research & Development Program (IERD). It isrelated to the removal of very hard deposits (Fig. 1), mostly undesirable resins, which grow inchemical reactor vessels and other petrochemical process equipment. Ultra-high speed pulsedwaterjet generated by the electro-discharge technique was considered suitable for this applicationfor the following reasons:
• The deposits need to be fractured into pieces to facilitate rapid removal;• The results reported by Vijay & Paquette (1996) and, later by Vijay et al. (1997) appear to
confirm that powerful pulsed jets generated by the electro-discharge technique can easilyfragment materials;
• Preliminary tests conducted on the 25 cm (9.8 in) sample (Fig. 1) clearly established the superiorperformance achieved with the high-frequency pulsed waterjet, Vijay et al., 1998. Test #4:continuous jet; Test #5: pulsed jet; V /V 6 where V and V are respectively the volumesp c p c
removed by the pulsed and continuous jets; Pressure = 69 MPa (10,000 psi), Nozzle diameter =1.37 mm (0.054 in).
Extensive details on the electro-discharge technique are reported by Vijay & Paquette (1996) andVijay et al. (1997 & 1998). As shown schematically in Fig. 2, the electro-discharge pulsed waterjetmachine consists basically of electrical energy storage and discharge system (capacitors, switches,etc.), a low pressure pump, and a nozzle-electrode assembly. A schematic view of the proposedportable, light-weight, 100 kJ, 20 kV pre-commercial machine is shown in Fig. 3. The cabinetcontains two 50-kJ capacitors, charging and discharging units and control systems. The overalldimensions, excluding the pump, are: 1.22 X 1.04 X 0.76 m (48 X 41 X 30 in). The only componentwhich needs a great attention in the entire system is the nozzle in which the electrical energy isdischarged. This is where the modulation of the continuous stream takes place to produce the ultra-high speed pulsed waterjet. The focus in this paper is on: (i) the phenomena that accompany thedischarge in the nozzle, (ii) the jet emerging from the nozzle and (iii) interaction of the jet with thetarget.
2. BASIC CONSIDERATIONS
The numerical code used in the present study is a further development of the approach used forsingle jets from quiescent water (Vijay & Makomaski, 1998). In this previous study a number ofrecommendations were made to adapt the code for discharges into continuous steady flows. Thesteady flow is assumed to be driven by a piston. The numerical method involves a two-dimensionalLagrangian formulation in cylindrical coordinates. Figure 4 shows a typical numerical grid employedin the computations. Initial distribution of pressure, density and velocity in the chamber leading tothe nozzle and the nozzle itself are assumed to be one-dimensional. After a number of numericalcycles an approximate two-dimensional steady flow is established, at which moment numericalsimulation of the electrical discharge is commenced (30 µs after the start). Water is assumed to bea slightly compressible medium and the plasma resulting from the electrical discharge into water is
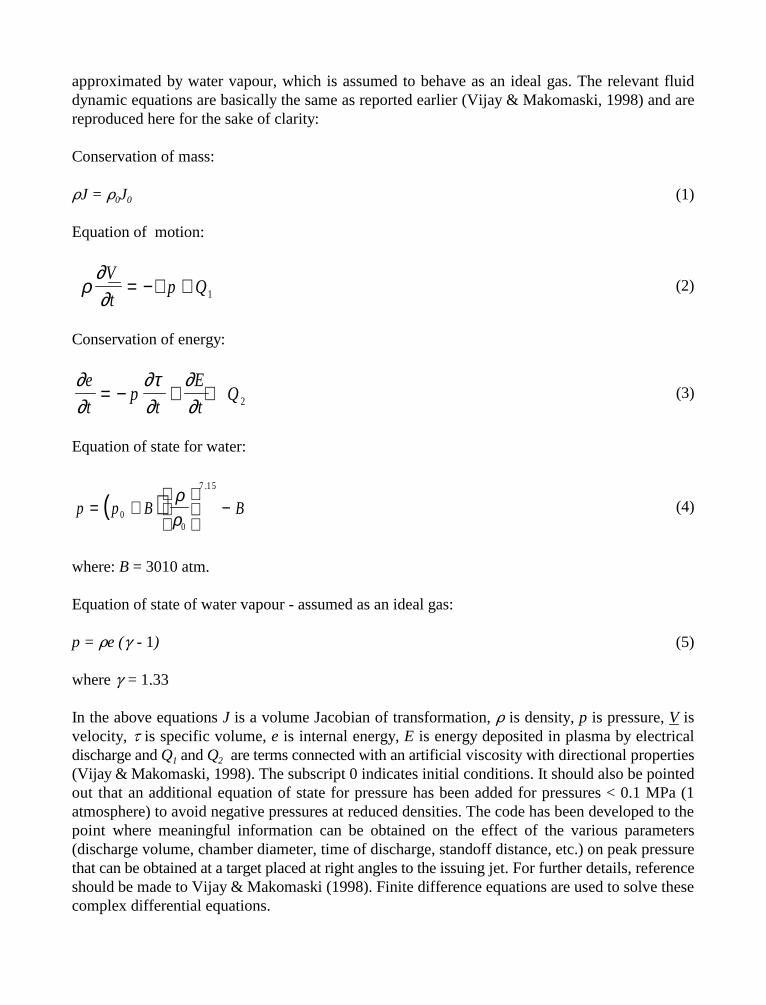
ρ∂∂V
tp Q= −∇ + 1
∂∂
∂τ∂
∂∂
e
tp
t
E
tQ= − + + 2
( )p p B B= +
−00
7 15ρρ
.
approximated by water vapour, which is assumed to behave as an ideal gas. The relevant fluiddynamic equations are basically the same as reported earlier (Vijay & Makomaski, 1998) and arereproduced here for the sake of clarity:
Conservation of mass:
'J = ' J (1)0 0
Equation of motion:
(2)
Conservation of energy:
(3)
Equation of state for water:
(4)
where: B = 3010 atm.
Equation of state of water vapour - assumed as an ideal gas:
p = 'e ( - 1) (5)
where = 1.33
In the above equations J is a volume Jacobian of transformation, ' is density, p is pressure, V isvelocity, - is specific volume, e is internal energy, E is energy deposited in plasma by electricaldischarge and Q and Q are terms connected with an artificial viscosity with directional properties1 2
(Vijay & Makomaski, 1998). The subscript 0 indicates initial conditions. It should also be pointedout that an additional equation of state for pressure has been added for pressures < 0.1 MPa (1atmosphere) to avoid negative pressures at reduced densities. The code has been developed to thepoint where meaningful information can be obtained on the effect of the various parameters(discharge volume, chamber diameter, time of discharge, standoff distance, etc.) on peak pressurethat can be obtained at a target placed at right angles to the issuing jet. For further details, referenceshould be made to Vijay & Makomaski (1998). Finite difference equations are used to solve thesecomplex differential equations.
3. NUMERICAL RESULTS
Several important results have been obtained from the analysis which will be very useful in thedesign of the nozzle and to minimize the experimental work.
3.1 X-T Diagram
The sequence of physical events can be followed on distance - time (T) plot for the region near theaxis of symmetry. This is shown in Fig. 5 for a chamber and converging nozzle of total length about8 cm. The target is placed at a standoff distance of 5 cm, pressure at the inlet is about 34.5 MPa(5,000 psi) and the nozzle diameter is 2.16 mm (0.085 in). Steady flow is maintained by a ‘piston’in the inlet plane, whose speed is such as to maintain the flow at 49 litre/min.
The electrical discharge is assumed to commence at the time of 30 µs at a distance of about 3 cmfrom the inlet. It is assumed that 20 kJ of electrical energy is discharged in 20 µs.
It is seen that for t > 30 µs, the plasma (represented here by high temperature water vapour) expands,sending shock waves towards the nozzle (S1) and towards the inlet (S2). Shock S1 leaves the nozzleat approximately 50 µs and forms a high-speed wave (W1) which accelerates the front F1 (of theoriginal steady jet) to F2. The front F2 impacts on the target at 78.2 µs producing a peak pressureof 2388 MPa (346,000 psi) at 81.2 µs (see Fig. 8). This pressure is a result of a particular calculationand the four-figure resolution does not indicate the accuracy with which such peak pressures can becalculated. In general, the accuracy of calculations of peak pressures will improve with the reductionof cell sizes and numerical time increments.
Figure 5 also shows the importance of reflecting shock S2 back towards the nozzle. With theassumed ‘piston’ in the inlet plane, shock S2 is reflected as shock S3. This shock on passing throughthe plasma emerges as shock S4 and ultimately causes another high-speed wave W2 in the jetimpacting at 104 µs. Shortly afterwards, two pressure peaks, 1704 MPa (246,900 psi) and 1713 MPa(248,300 psi) are created. These results give strong encouragement not to rely exclusively on theprimary shock S1, but to seek some arrangement to reflect the shock S2, even if it can be done onlypartially.
3.2 Contours of Pressure
The contours of constant pressure in the chamber and the nozzle for times 35, 40, 45, 50, 55, 60 and65 µs from the start of the calculations are shown in Fig. 6. They show clearly the formation ofshock wave S1 (the intensity is indicated by the change in colour of the contours; typical values ofpressure for each colour are shown in Fig. 8, although the magnitudes vary from one frame toanother). As discussed by Vijay & Makomaski (1998), the electro-discharge nozzle, in many ways,is similar to the shock tube except for the varying geometry. Immediately after discharge, the shockwaves detach themselves from the surface of the plasma bubble (termed ‘black hat’ here) and racetowards the exit of the nozzle and the inlet plane, the moving ‘piston’ (Fig. 6A). As expected thepressure increases behind the shock. Subsequently, as the shock wave propagates at high speed, thetransient wave phenomena, wave structure and wave interactions become quite complex as shown
in Figs. 6(B) to 6(G). For instance, Fig. 6(B) shows the reflection of the incident wave from thenozzle wall. While Fig. 6(C) shows the wave downstream of the plasma racing toward nozzle exit,Fig. 6(D) shows the wave racing towards the inlet. Figures 6(E) to (G) show continued multipleinteractions. The incident shock becomes gradually stronger as it moves through the converging partto the nozzle exit and sets up the motion of the high-speed wave (at times 55, 60 and 65 µs) in thejet. This is indicated by the slight bulges at the tips of the jet in Figs. 6(E), (F) and (G). The ‘blackhat’ in Fig. 6 in an outline of the plasma bubble. It is seen in Fig. 5 that its size increases rapidlyafter 30 µs when the addition of energy commences. The energy deposition ends at 50 µs and at thatmoment the bubble begins to oscillate. It appears that these oscillations are associated with shockwave reflections at the bubble.
3.3 Jet in the Vicinity of the Target
Figure 7 shows the magnified views of the jet in the vicinity of the target for times 79, 80 and 81 µs.The contours show the approaching front followed by the high-speed wave characterized by a‘bulge’. As already mentioned, the jet impact occurs at 78.2 µs and the jet begins to ‘pile’ upcreating high pressures (white areas). A peak average pressure of 2388 MPa occurs at the target atthe time of 81.2 µs. The pressure distribution at that instance is shown in Fig. 8 where, pressurelevels (in MPa) are indicated by a color bar.
As discussed before, the average peak pressures are based on pressures in numerical cells adjourningthe target and will be lower than the theoretical spikes in negligible volumes adjoining the target.The results are nonetheless useful for determining the relative effects of the various parameters. Thisapproach is adequate for the purpose of optimizing the proposed experimental arrangement.
3.4 Effect of Energy Release on the Impact Pressure
Very useful trends regarding the effects of energy and rate of energy discharge are shown in Fig. 9.These results were obtained for a volume of discharge (volume between the electrodes) of 0.266 cm3
and at a standoff distance of 5 cm. The figure clearly shows that for a given energy level, the rate ofenergy release is very important to achieve higher pressures on the target. For instance, for an energyinput of 50 kJ, increasing the rate of release from 0.5 kJ/µs to 1.25 kJ/µs increases the pressure ofimpact from 2,000 to 3,000 MPa (289,800 to 434,700 psi). These observations indicate thatduration of discharge is quite important, that is, one should reduce it to the minimum achievable inpractice.
3.5 Effect of Standoff Distance on the Impact Pressure
Figure 10 shows the effect of standoff distance on the impact pressure on the target. The rate ofenergy release for this case is 1.0 kJ/µs. The figure shows that for a given energy input, higherimpact pressures are achieved at larger standoff distances. This observation seems to confirm theexperimental results reported by Vijay et al. (1997) where steel samples placed at several standoffdistances up to a maximum of 87 cm were completely ruptured. The standoff distance has to bechosen carefully for high energies (and hence large discharge times), so that all pressure pulse fromthe discharge have the time to reach the target to maximize the effect.
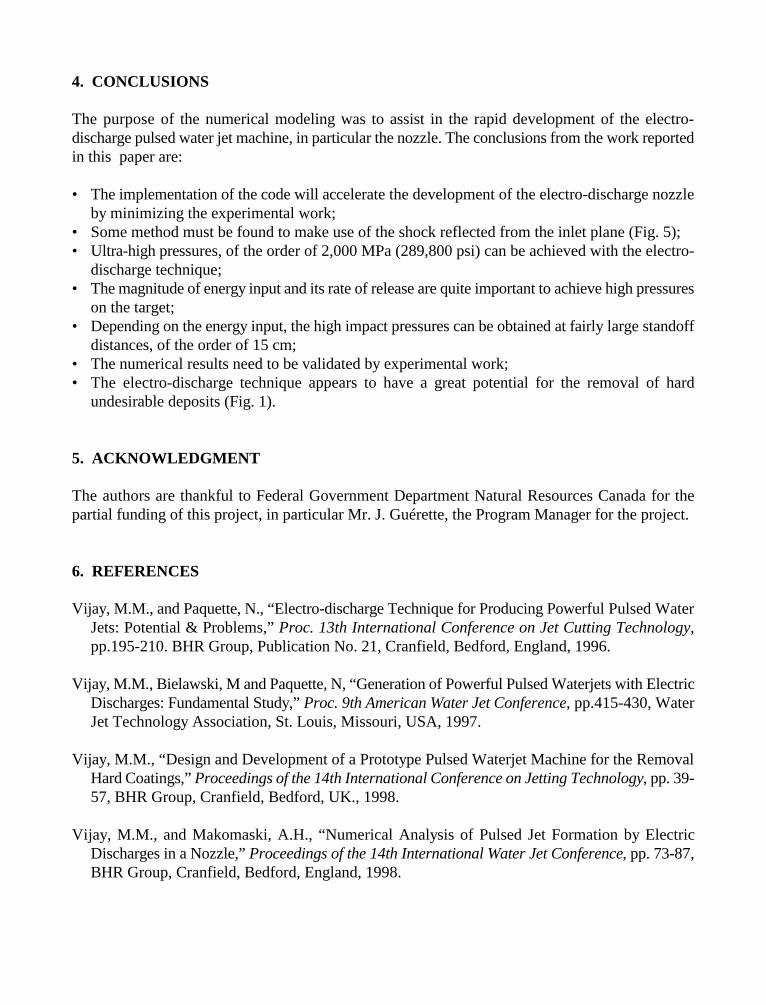
4. CONCLUSIONS
The purpose of the numerical modeling was to assist in the rapid development of the electro-discharge pulsed water jet machine, in particular the nozzle. The conclusions from the work reportedin this paper are:
• The implementation of the code will accelerate the development of the electro-discharge nozzleby minimizing the experimental work;
• Some method must be found to make use of the shock reflected from the inlet plane (Fig. 5);• Ultra-high pressures, of the order of 2,000 MPa (289,800 psi) can be achieved with the electro-
discharge technique;• The magnitude of energy input and its rate of release are quite important to achieve high pressures
on the target;• Depending on the energy input, the high impact pressures can be obtained at fairly large standoff
distances, of the order of 15 cm;• The numerical results need to be validated by experimental work;• The electro-discharge technique appears to have a great potential for the removal of hard
undesirable deposits (Fig. 1).
5. ACKNOWLEDGMENT
The authors are thankful to Federal Government Department Natural Resources Canada for thepartial funding of this project, in particular Mr. J. Guérette, the Program Manager for the project.
6. REFERENCES
Vijay, M.M., and Paquette, N., “Electro-discharge Technique for Producing Powerful Pulsed WaterJets: Potential & Problems,” Proc. 13th International Conference on Jet Cutting Technology,pp.195-210. BHR Group, Publication No. 21, Cranfield, Bedford, England, 1996.
Vijay, M.M., Bielawski, M and Paquette, N, “Generation of Powerful Pulsed Waterjets with ElectricDischarges: Fundamental Study,” Proc. 9th American Water Jet Conference, pp.415-430, WaterJet Technology Association, St. Louis, Missouri, USA, 1997.
Vijay, M.M., “Design and Development of a Prototype Pulsed Waterjet Machine for the RemovalHard Coatings,” Proceedings of the 14th International Conference on Jetting Technology, pp. 39-57, BHR Group, Cranfield, Bedford, UK., 1998.
Vijay, M.M., and Makomaski, A.H., “Numerical Analysis of Pulsed Jet Formation by ElectricDischarges in a Nozzle,” Proceedings of the 14th International Water Jet Conference, pp. 73-87,BHR Group, Cranfield, Bedford, England, 1998.
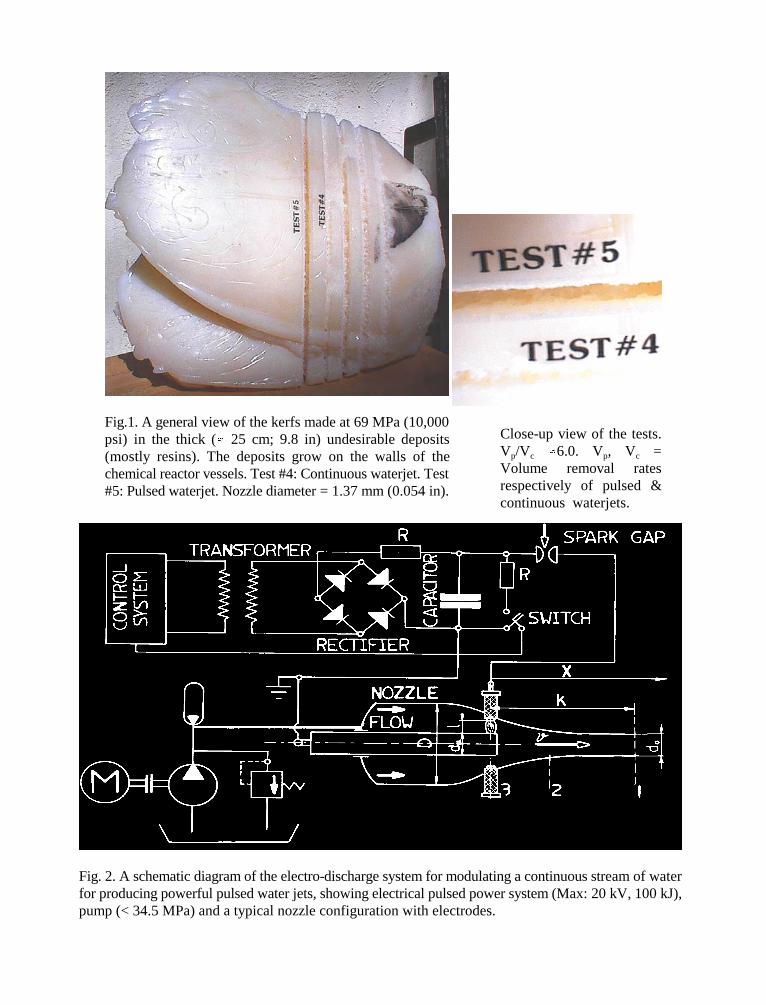
Fig. 2. A schematic diagram of the electro-discharge system for modulating a continuous stream of waterfor producing powerful pulsed water jets, showing electrical pulsed power system (Max: 20 kV, 100 kJ),pump (< 34.5 MPa) and a typical nozzle configuration with electrodes.
Fig.1. A general view of the kerfs made at 69 MPa (10,000psi) in the thick ( 25 cm; 9.8 in) undesirable deposits(mostly resins). The deposits grow on the walls of thechemical reactor vessels. Test #4: Continuous waterjet. Test#5: Pulsed waterjet. Nozzle diameter = 1.37 mm (0.054 in).
Close-up view of the tests.V /V 6.0. V , V =p c p c
Volume removal ratesrespectively of pulsed &continuous waterjets.
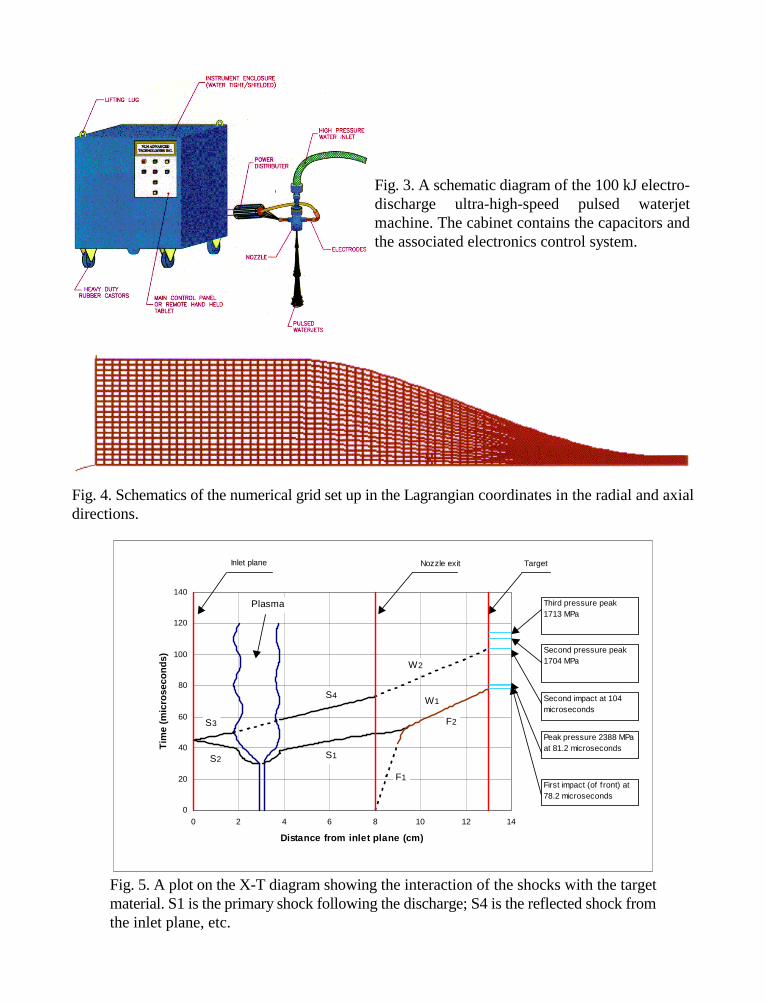
0
20
40
60
80
100
120
140
0 2 4 6 8 10 12 14
Distance from inlet plane (cm)
Tim
e (m
icro
seco
nds)
Inlet plane Nozzle exit Target
First impact (of f ront) at 78.2 microseconds
Peak pressure 2388 MPa at 81.2 microseconds
Second impact at 104 microseconds
Second pressure peak 1704 MPa
Third pressure peak 1713 MPa
Plasma
S1S2
S3
S4
W2
F1
F2
W1
Fig. 3. A schematic diagram of the 100 kJ electro-discharge ultra-high-speed pulsed waterjetmachine. The cabinet contains the capacitors andthe associated electronics control system.
Fig. 5. A plot on the X-T diagram showing the interaction of the shocks with the targetmaterial. S1 is the primary shock following the discharge; S4 is the reflected shock fromthe inlet plane, etc.
Fig. 4. Schematics of the numerical grid set up in the Lagrangian coordinates in the radial and axialdirections.
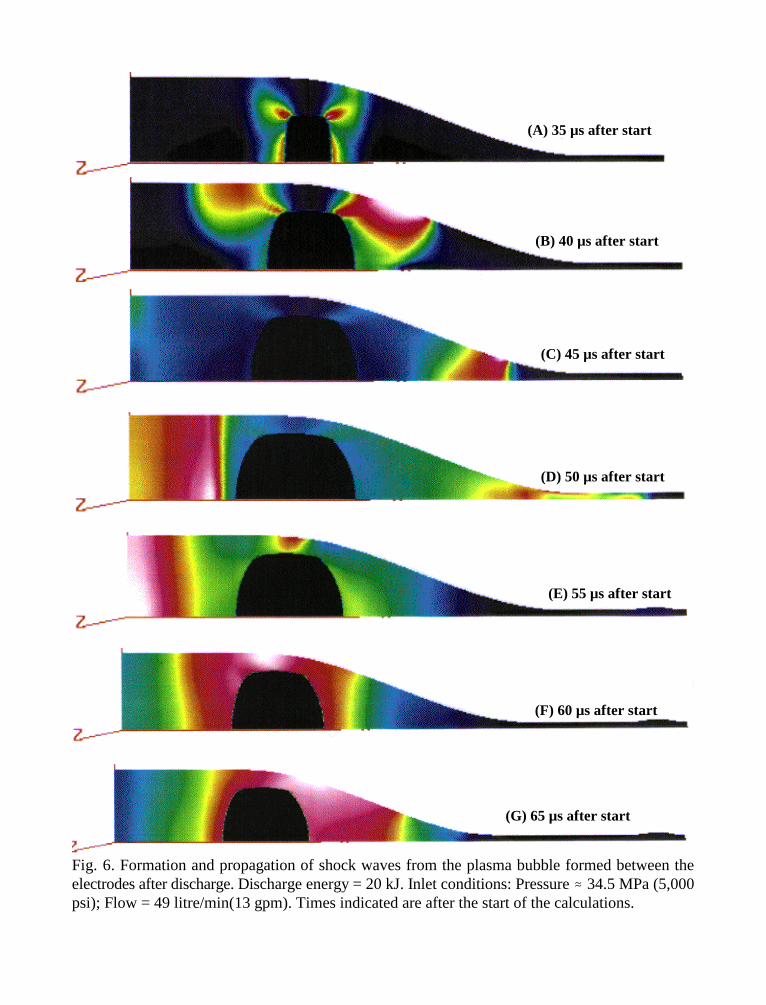
(A) 35 µs after start
(G) 65 µs after start
(F) 60 µs after start
(E) 55 µs after start
(D) 50 µs after start
(C) 45 µs after start
(B) 40 µs after start
Fig. 6. Formation and propagation of shock waves from the plasma bubble formed between theelectrodes after discharge. Discharge energy = 20 kJ. Inlet conditions: Pressure 34.5 MPa (5,000psi); Flow = 49 litre/min(13 gpm). Times indicated are after the start of the calculations.
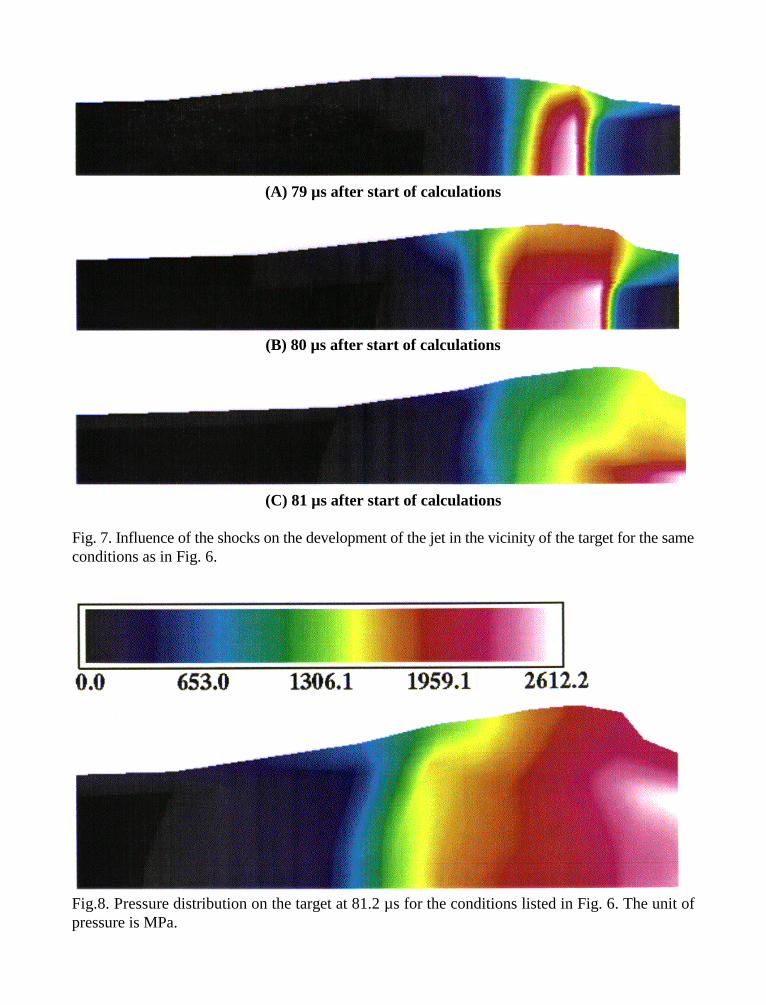
Fig.8. Pressure distribution on the target at 81.2 µs for the conditions listed in Fig. 6. The unit ofpressure is MPa.
(A) 79 µs after start of calculations
(C) 81 µs after start of calculations
Fig. 7. Influence of the shocks on the development of the jet in the vicinity of the target for the sameconditions as in Fig. 6.
(B) 80 µs after start of calculations
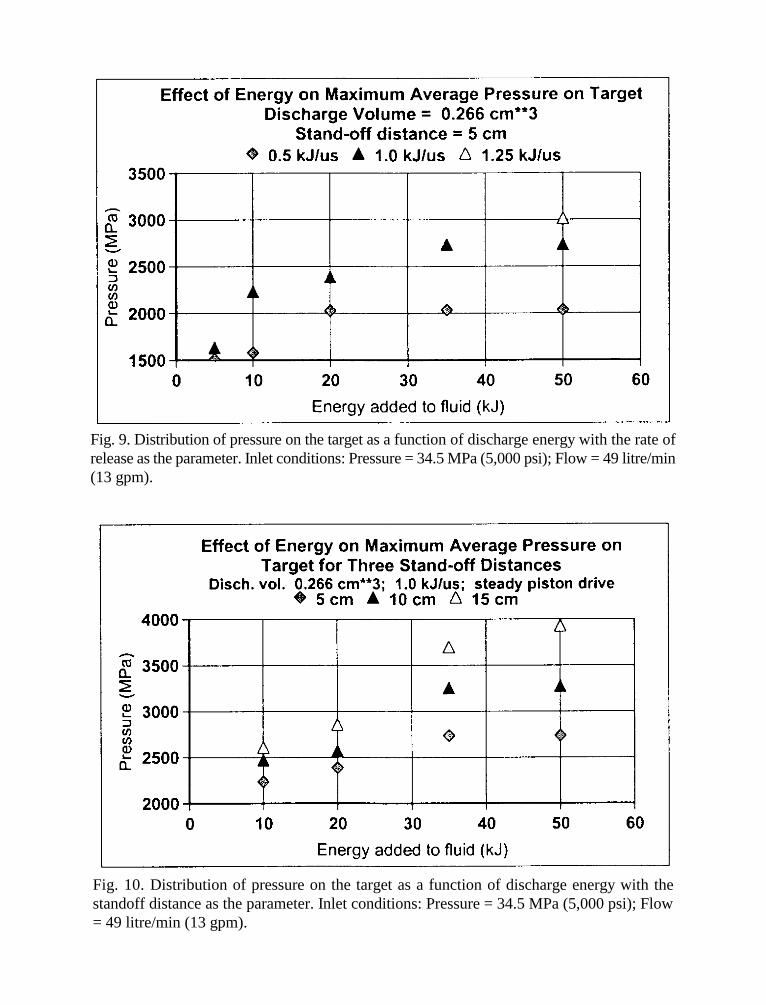
Fig. 9. Distribution of pressure on the target as a function of discharge energy with the rate ofrelease as the parameter. Inlet conditions: Pressure = 34.5 MPa (5,000 psi); Flow = 49 litre/min(13 gpm).
Fig. 10. Distribution of pressure on the target as a function of discharge energy with thestandoff distance as the parameter. Inlet conditions: Pressure = 34.5 MPa (5,000 psi); Flow= 49 litre/min (13 gpm).
10th American Waterjet ConferenceAugust 14-17, 1999: Houston, Texas
Paper 8
ANALYTICAL INVESTIGATIONS OF HYDRAULIC
BREAKING COEFFICIENT OF COAL SEAMS
B.V.RadjkoLIETS, Eastukrainian State University
Lugansk, Ukraine
ABSTRACT
This paper presents the analytical method to discover the character of influence a number offactors on the hydraulic breaking coefficient of coal seams with plain water jets. It is adduced tothe characters of twofold dependencies of the hydraulic breaking coefficient on such factors asdip angle of coal seams, depth of mining, gas concentration and ash share in coal seams, volatilematter of coal and duration of the hydraulic breaking process. The character of these twofolddependencies have been used to construct the empirio-analytical model of the hydraulic breakingcoefficient of coal seams with plain water jets to project hydraulic breaking productivity of coalin Donetsk basin hydromines (Ukraine).
It is given the general equation of hydraulic breaking process of solids with plain water jets andanalytical model of the hydraulic breaking coefficient of coal seams too.
Organized and Sponsored by the WaterJet Technology Association
1. INTRODUCTION
The author worked out the empirio-analytical method of the statistical data investigations. Itgives possibility to increase a precision of the project calculations in comparison with theprobability method.
The principal statements of the empirio-analytical investigation method were published before(Radjko et al., 1995).
This method was used to construct an empirio-analytical model of coal seams hydraulic breakingwith the plain water jets. It consist of the general analytical equation of hydraulic breakingprocess of solids with plain water jets and multifactorous empirio-analytical model of hydraulicbreaking coefficient of coal seams.
The analytical model of the hydraulic breaking coefficient (component of empirio-analyticalmodel) was made the way of discovering twofold dependencies and combining them inmultifactorous equation. Numeral parameters of twofold dependencies were calculated usingstatistical data.
Further it is stated analytical method discovering character of dependent variable (hydraulicbreaking coefficient of coal seams) on different factors.
2. MECHANISM OF STATISTICAL DATA FORMING
Investigations show that three reasons take part in forming statistical data characterisinghydraulic breaking process of coal seams with plain water jets. They are as follows: determinateinfluence of factors in force, nature indeterminacy and errors of measurements (observations).
Determinate influence of active factors upon value of statistical data (hydraulic breakingcoefficient of coal seams in our case) is realised in different ways: through number of factorstaken into account, influence force each of them, peculiarities of interaction between the factorsand combinations of their values in the concrete conditions.
A number of factors taken into account play impotent role. It is supposed that the more suchfactors are the higher is precision of the project calculations. But theoretically precision ofcalculations is limited by value of nature indeterminacy. Besides, there are errors ofmeasurements, which reduce precision of calculations too. Therefore, it is impossible to get highprecision of project calculations only apply to quantity of factors taken into account.
It is so that precision of the project calculations grows with increasing number of factors. Butvariable curve of calculation precision from number of factors has a form of overturnedhyperbola that draws near his limit and never cross it. The more factors taken into account theless is addition of calculation precision. The volume of getting, preparing and processingstatistical data grows fast but increasing of calculation precision becomes slow down. Therefore,it is not advisable to take into account a lot of factors.
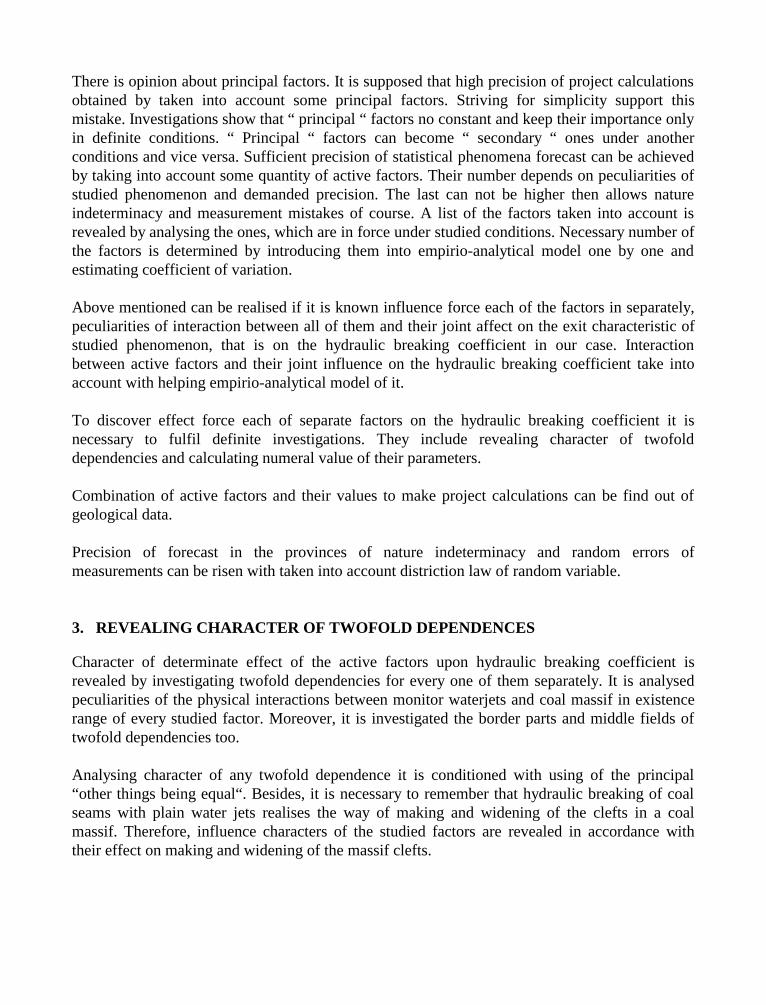
There is opinion about principal factors. It is supposed that high precision of project calculationsobtained by taken into account some principal factors. Striving for simplicity support thismistake. Investigations show that “ principal “ factors no constant and keep their importance onlyin definite conditions. “ Principal “ factors can become “ secondary “ ones under anotherconditions and vice versa. Sufficient precision of statistical phenomena forecast can be achievedby taking into account some quantity of active factors. Their number depends on peculiarities ofstudied phenomenon and demanded precision. The last can not be higher then allows natureindeterminacy and measurement mistakes of course. A list of the factors taken into account isrevealed by analysing the ones, which are in force under studied conditions. Necessary number ofthe factors is determined by introducing them into empirio-analytical model one by one andestimating coefficient of variation.
Above mentioned can be realised if it is known influence force each of the factors in separately,peculiarities of interaction between all of them and their joint affect on the exit characteristic ofstudied phenomenon, that is on the hydraulic breaking coefficient in our case. Interactionbetween active factors and their joint influence on the hydraulic breaking coefficient take intoaccount with helping empirio-analytical model of it.
To discover effect force each of separate factors on the hydraulic breaking coefficient it isnecessary to fulfil definite investigations. They include revealing character of twofolddependencies and calculating numeral value of their parameters.
Combination of active factors and their values to make project calculations can be find out ofgeological data.
Precision of forecast in the provinces of nature indeterminacy and random errors ofmeasurements can be risen with taken into account distriction law of random variable.
3. REVEALING CHARACTER OF TWOFOLD DEPENDENCES
Character of determinate effect of the active factors upon hydraulic breaking coefficient isrevealed by investigating twofold dependencies for every one of them separately. It is analysedpeculiarities of the physical interactions between monitor waterjets and coal massif in existencerange of every studied factor. Moreover, it is investigated the border parts and middle fields oftwofold dependencies too.
Analysing character of any twofold dependence it is conditioned with using of the principal“other things being equal“. Besides, it is necessary to remember that hydraulic breaking of coalseams with plain water jets realises the way of making and widening of the clefts in a coalmassif. Therefore, influence characters of the studied factors are revealed in accordance withtheir effect on making and widening of the massif clefts.
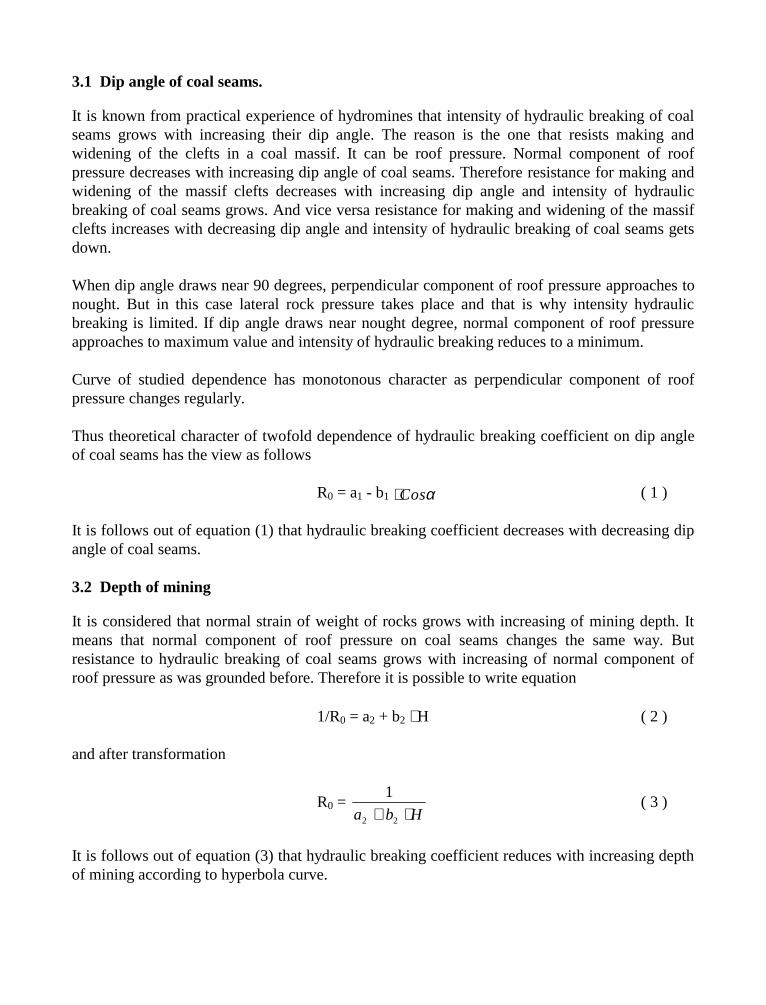
3.1 Dip angle of coal seams.
It is known from practical experience of hydromines that intensity of hydraulic breaking of coalseams grows with increasing their dip angle. The reason is the one that resists making andwidening of the clefts in a coal massif. It can be roof pressure. Normal component of roofpressure decreases with increasing dip angle of coal seams. Therefore resistance for making andwidening of the massif clefts decreases with increasing dip angle and intensity of hydraulicbreaking of coal seams grows. And vice versa resistance for making and widening of the massifclefts increases with decreasing dip angle and intensity of hydraulic breaking of coal seams getsdown.
When dip angle draws near 90 degrees, perpendicular component of roof pressure approaches tonought. But in this case lateral rock pressure takes place and that is why intensity hydraulicbreaking is limited. If dip angle draws near nought degree, normal component of roof pressureapproaches to maximum value and intensity of hydraulic breaking reduces to a minimum.
Curve of studied dependence has monotonous character as perpendicular component of roofpressure changes regularly.
Thus theoretical character of twofold dependence of hydraulic breaking coefficient on dip angleof coal seams has the view as follows
R0 = a1 - b1 αCos⋅ ( 1 )
It is follows out of equation (1) that hydraulic breaking coefficient decreases with decreasing dipangle of coal seams.
3.2 Depth of mining
It is considered that normal strain of weight of rocks grows with increasing of mining depth. Itmeans that normal component of roof pressure on coal seams changes the same way. Butresistance to hydraulic breaking of coal seams grows with increasing of normal component ofroof pressure as was grounded before. Therefore it is possible to write equation
1/R0 = a2 + b2 ⋅ H ( 2 )
and after transformation
R0 = Hba ⋅+ 22
1 ( 3 )
It is follows out of equation (3) that hydraulic breaking coefficient reduces with increasing depthof mining according to hyperbola curve.
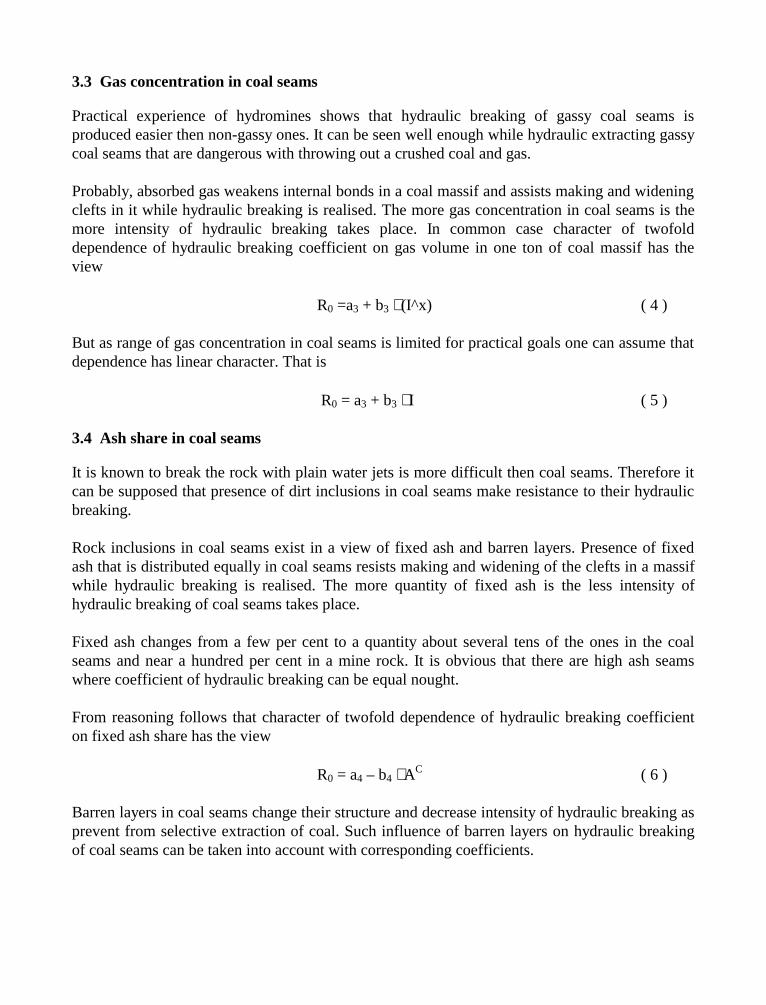
3.3 Gas concentration in coal seams
Practical experience of hydromines shows that hydraulic breaking of gassy coal seams isproduced easier then non-gassy ones. It can be seen well enough while hydraulic extracting gassycoal seams that are dangerous with throwing out a crushed coal and gas.
Probably, absorbed gas weakens internal bonds in a coal massif and assists making and wideningclefts in it while hydraulic breaking is realised. The more gas concentration in coal seams is themore intensity of hydraulic breaking takes place. In common case character of twofolddependence of hydraulic breaking coefficient on gas volume in one ton of coal massif has theview
R0 =a3 + b3 ⋅ (I^x) ( 4 )
But as range of gas concentration in coal seams is limited for practical goals one can assume thatdependence has linear character. That is
R0 = a3 + b3 ⋅ I ( 5 )
3.4 Ash share in coal seams
It is known to break the rock with plain water jets is more difficult then coal seams. Therefore itcan be supposed that presence of dirt inclusions in coal seams make resistance to their hydraulicbreaking.
Rock inclusions in coal seams exist in a view of fixed ash and barren layers. Presence of fixedash that is distributed equally in coal seams resists making and widening of the clefts in a massifwhile hydraulic breaking is realised. The more quantity of fixed ash is the less intensity ofhydraulic breaking of coal seams takes place.
Fixed ash changes from a few per cent to a quantity about several tens of the ones in the coalseams and near a hundred per cent in a mine rock. It is obvious that there are high ash seamswhere coefficient of hydraulic breaking can be equal nought.
From reasoning follows that character of twofold dependence of hydraulic breaking coefficienton fixed ash share has the view
R0 = a4 – b4 ⋅ AC ( 6 )
Barren layers in coal seams change their structure and decrease intensity of hydraulic breaking asprevent from selective extraction of coal. Such influence of barren layers on hydraulic breakingof coal seams can be taken into account with corresponding coefficients.
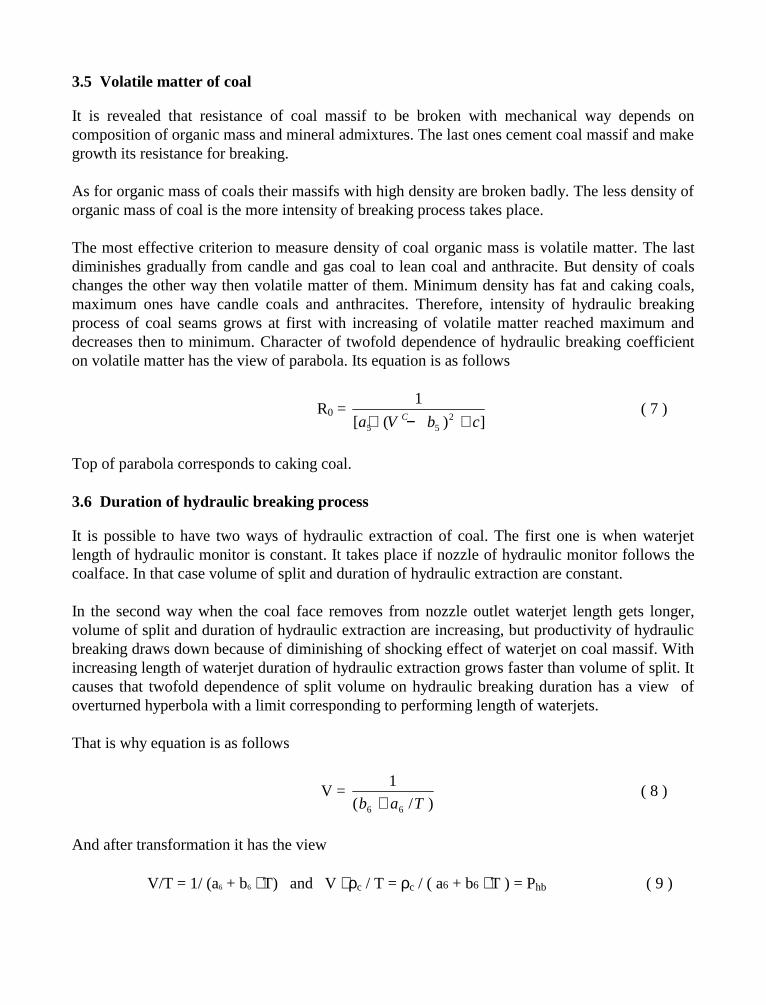
3.5 Volatile matter of coal
It is revealed that resistance of coal massif to be broken with mechanical way depends oncomposition of organic mass and mineral admixtures. The last ones cement coal massif and makegrowth its resistance for breaking.
As for organic mass of coals their massifs with high density are broken badly. The less density oforganic mass of coal is the more intensity of breaking process takes place.
The most effective criterion to measure density of coal organic mass is volatile matter. The lastdiminishes gradually from candle and gas coal to lean coal and anthracite. But density of coalschanges the other way then volatile matter of them. Minimum density has fat and caking coals,maximum ones have candle coals and anthracites. Therefore, intensity of hydraulic breakingprocess of coal seams grows at first with increasing of volatile matter reached maximum anddecreases then to minimum. Character of twofold dependence of hydraulic breaking coefficienton volatile matter has the view of parabola. Its equation is as follows
R0 = ])([
12
55 cbVa C +−⋅ ( 7 )
Top of parabola corresponds to caking coal.
3.6 Duration of hydraulic breaking process
It is possible to have two ways of hydraulic extraction of coal. The first one is when waterjetlength of hydraulic monitor is constant. It takes place if nozzle of hydraulic monitor follows thecoalface. In that case volume of split and duration of hydraulic extraction are constant.
In the second way when the coal face removes from nozzle outlet waterjet length gets longer,volume of split and duration of hydraulic extraction are increasing, but productivity of hydraulicbreaking draws down because of diminishing of shocking effect of waterjet on coal massif. Withincreasing length of waterjet duration of hydraulic extraction grows faster than volume of split. Itcauses that twofold dependence of split volume on hydraulic breaking duration has a view ofoverturned hyperbola with a limit corresponding to performing length of waterjets.
That is why equation is as follows
V = )/(
1
66 Tab + ( 8 )
And after transformation it has the view
V/T = 1/ (a6 + b6 ⋅ T) and V ⋅ ρc / T = ρc / ( a6 + b6 ⋅ T ) = Phb ( 9 )
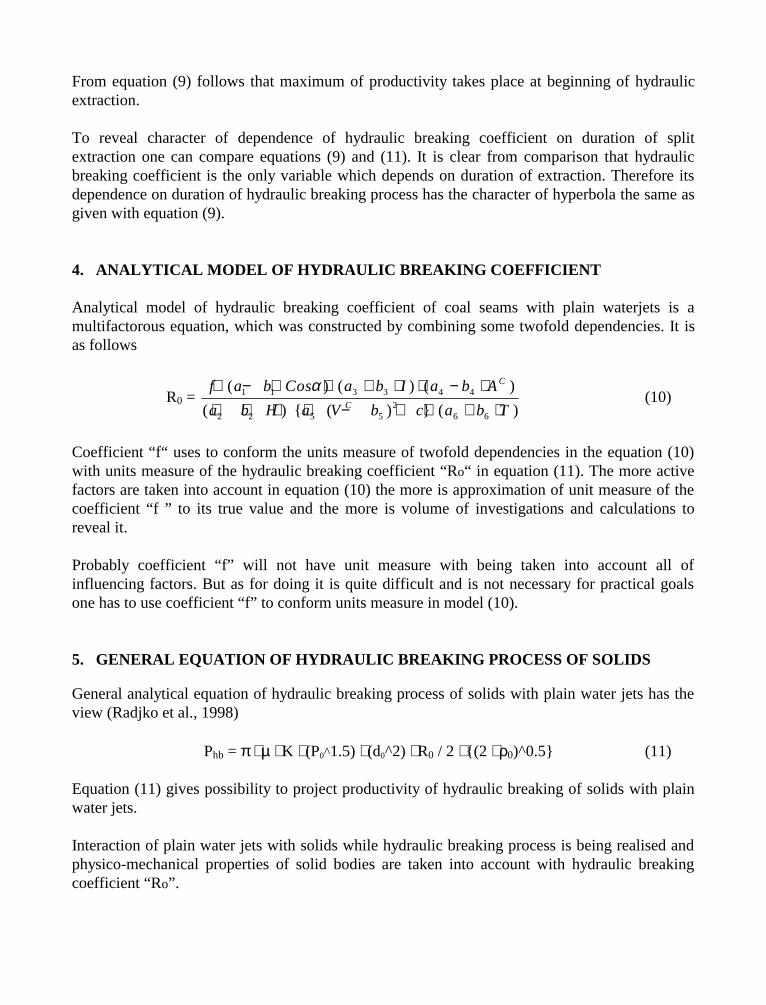
From equation (9) follows that maximum of productivity takes place at beginning of hydraulicextraction.
To reveal character of dependence of hydraulic breaking coefficient on duration of splitextraction one can compare equations (9) and (11). It is clear from comparison that hydraulicbreaking coefficient is the only variable which depends on duration of extraction. Therefore itsdependence on duration of hydraulic breaking process has the character of hyperbola the same asgiven with equation (9).
4. ANALYTICAL MODEL OF HYDRAULIC BREAKING COEFFICIENT
Analytical model of hydraulic breaking coefficient of coal seams with plain waterjets is amultifactorous equation, which was constructed by combining some twofold dependencies. It isas follows
R0 = )()()(
)()()(
662
5522
443311
TbacbVaHba
AbaIbaCosbafC
C
⋅+⋅+−⋅⋅⋅+⋅−⋅⋅+⋅⋅−⋅ α
(10)
Coefficient “f“ uses to conform the units measure of twofold dependencies in the equation (10)with units measure of the hydraulic breaking coefficient “Ro“ in equation (11). The more activefactors are taken into account in equation (10) the more is approximation of unit measure of thecoefficient “f ” to its true value and the more is volume of investigations and calculations toreveal it.
Probably coefficient “f” will not have unit measure with being taken into account all ofinfluencing factors. But as for doing it is quite difficult and is not necessary for practical goalsone has to use coefficient “f” to conform units measure in model (10).
5. GENERAL EQUATION OF HYDRAULIC BREAKING PROCESS OF SOLIDS
General analytical equation of hydraulic breaking process of solids with plain water jets has theview (Radjko et al., 1998)
Phb = π ⋅ µ ⋅ K ⋅ (P0^1.5) ⋅ (d0^2) ⋅ R0 / 2 ⋅ (2 ⋅ ρ0)^0.5 (11)
Equation (11) gives possibility to project productivity of hydraulic breaking of solids with plainwater jets.
Interaction of plain water jets with solids while hydraulic breaking process is being realised andphysico-mechanical properties of solid bodies are taken into account with hydraulic breakingcoefficient “Ro”.
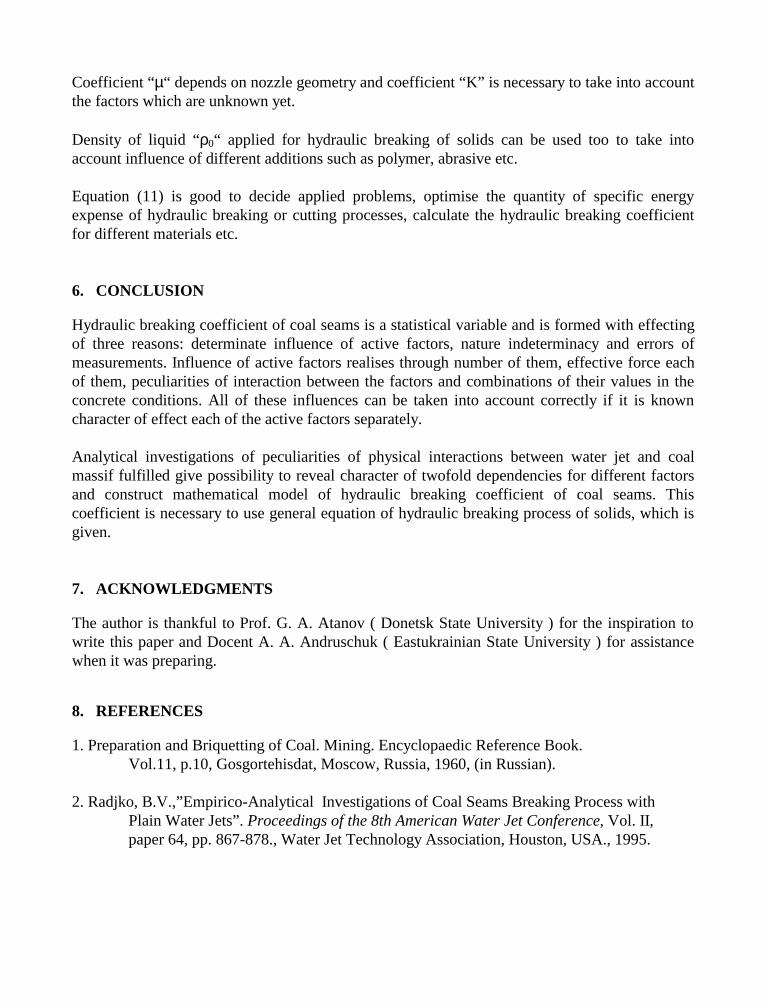
Coefficient “µ“ depends on nozzle geometry and coefficient “K” is necessary to take into accountthe factors which are unknown yet.
Density of liquid “ρ0“ applied for hydraulic breaking of solids can be used too to take intoaccount influence of different additions such as polymer, abrasive etc.
Equation (11) is good to decide applied problems, optimise the quantity of specific energyexpense of hydraulic breaking or cutting processes, calculate the hydraulic breaking coefficientfor different materials etc.
6. CONCLUSION
Hydraulic breaking coefficient of coal seams is a statistical variable and is formed with effectingof three reasons: determinate influence of active factors, nature indeterminacy and errors ofmeasurements. Influence of active factors realises through number of them, effective force eachof them, peculiarities of interaction between the factors and combinations of their values in theconcrete conditions. All of these influences can be taken into account correctly if it is knowncharacter of effect each of the active factors separately.
Analytical investigations of peculiarities of physical interactions between water jet and coalmassif fulfilled give possibility to reveal character of twofold dependencies for different factorsand construct mathematical model of hydraulic breaking coefficient of coal seams. Thiscoefficient is necessary to use general equation of hydraulic breaking process of solids, which isgiven.
7. ACKNOWLEDGMENTS
The author is thankful to Prof. G. A. Atanov ( Donetsk State University ) for the inspiration towrite this paper and Docent A. A. Andruschuk ( Eastukrainian State University ) for assistancewhen it was preparing.
8. REFERENCES
1. Preparation and Briquetting of Coal. Mining. Encyclopaedic Reference Book.Vol.11, p.10, Gosgortehisdat, Moscow, Russia, 1960, (in Russian).
2. Radjko, B.V.,”Empirico-Analytical Investigations of Coal Seams Breaking Process withPlain Water Jets”. Proceedings of the 8th American Water Jet Conference, Vol. II,paper 64, pp. 867-878., Water Jet Technology Association, Houston, USA., 1995.
3. Radjko, B.V.,”General Equation of Hydraulic Breaking Process of Solids with PlainWater Jets, Proceedings of 5th Pacific Rim International Conference on Water JetTechnology, paper 60, New Delhi, India, 1998.
9. NOMENCLATURE
a1, a2, ...a6; b1, b2, ...b6; c — parameters of twofold dependenciesAc — ash content in coal seams, p.c.α — dip angle of coal seams, deg.do — nozzle outlet diameter, mf , K, µ — empirical coefficientH — depth of mining, mI — gas concentration in coal seams, m3 / (103)kgPhb — hydraulic breaking productivity of solid, kg / sPo — water jet pressure near nozzle outlet, Paρc — coal density, kg / m3
ρ0 — water density, kg / m3
Ro — hydraulic breaking coefficient, m / NT — duration of hydraulic breaking process, HV — volume of split, m3
Vc — volatile matter of coal, p. c.
10th American Waterjet ConferenceAugust 14-17, 1999: Houston, Texas
Paper 9
HYPER PRESSURE WATERJET
AND ABRASIVE WATERJET CUTTING
John Xu, Kevin Otterstatter, Mark Harkess, Reynold Sacquitne, Jude LagueJet Edge
Minneapolis, Minnesota
ABSTRACT
An intensifier pump was developed by Jet Edge to operate at a pressure of 75,000 psi (520 MPa)for waterjet cutting. Using this intensifier, tests were conducted to examine what influence thehigher operating pressure had on cutting speed and edge quality for various materials andthickness’. It was found that a significant improvement was seen in cutting speed whencompared to cuts made at 55,000 psi (380 MPa). Tests were conducted using both straight waterand abrasive waterjets. The results and analysis found in the testing are presented in this paper.
Organized and Sponsored by the WaterJet Technology Association
1. INTRODUCTION
Waterjet cutting uses a jet of water so powerful that it cuts cleanly and precisely through materialin a single pass without shredding or crushing. In the formation of the jet stream, water ispressurized up to 75,000 psi (520 MPa) by a Jet Edge hydraulically driven intensifier pump. Theoperating pressure currently commercially available is 55,000 psi (380MPa), which is the mostcommon pressure for most waterjet and abrasive waterjet cutting applications. The pressurizedwater passes through an attenuator, which stabilizes the jet stream. The waterjet cutting actiontakes place as a result of the ultra-high pressure water being forced through a pre-mountedsapphire orifice as small as .002 in (.051 mm) in diameter. The pressurized water exits the orificeat extremely high velocities as a coherent waterjet stream that produces a clean cut.
Waterjet cutting with water increases production rates on paper products, woven or non-woventextiles and similar materials without shredding or the damage associated with conventionalprocessing methods. The waterjet stream cuts flexible materials quickly and accurately andprevents distortion encountered from compression during conventional die cutting. Waterjetcutting is used in the cutting of materials such as: plastics, corrugated cardboard, insulation,rubber, foods, paper, automotive carpeting and headliners.
Abrasivejet cutting systems use a combination of water and garnet to cut through materialsconsidered "unmachineable" by conventional cutting methods. Using small amounts of water toeliminate the friction caused by tool-to-part contact, abrasivejet cutting avoids thermal damagethat can adversely affect metallurgic properties in materials being cut. The ability to piercethrough material also eliminates the need and cost of drilling starter holes. Abrasivejet can cutthrough materials ranging from 1/16 inch (1.6 mm) to 12 inches (305 mm) with an accuracy of ±0.005 inches (0.13 mm). Abrasivejet is excellent for the cutting of complex shapes and in fragilematerials such as glass. The high failure rate due to breakage and chipping of corners duringconventional processing is virtually eliminated. Abrasivejet cutting is used in the cutting ofmaterials such as: titanium, brass, aluminum, stone, inconel, any steel, glass, and composites.
Whatever the industrial need, waterjet and abrasivejet are accurate, flexible, and efficient cuttingsystems. Because waterjet cuts with a narrow kerf, parts can be tightly nested together thusmaximizing material usage. The compact, lightweight cutting head is designed for reliability inhigh cycle, on/off applications. When coupled with a suitable motion control system, waterjetcutting provides extremely accurate cuts with a high degree of repeatability over a wide range ofmaterials and shapes.
Whether or not a customer decides to purchase an ultra-high pressure waterjet system for theircutting application is based upon many factors including performance, capability, operationaleffectiveness, maintainability, reliability, and cost. In cutting operation cost, abrasive waterjetusers have found that the abrasive consumption is the most costly item.
2. DEVELOPMENT OF THE HYPER PRESSURE WATERJET INTENSIFIER
Figure 1 shows the schematic of the intensifier developed for this test program. The intensifieracts as an amplifier as it converts the energy from the low-pressure hydraulic fluid into hyperpressure water. The intensification ratio is 25.4. The maximum pressure is 80,000 psi (553 MPa)with an operating pressure of 75,000 psi (520 MPa). A limit switch, located at each end of thepiston travel, signals the PLC to shift the directional control valve and reciprocate the pistonmovement.
Testing has been completed on the 50 horsepower (37 kWh) and 100 horsepower (74 kWh)intensifier pumps (Figure 2). The pumps were operated to see how running at the hyper pressurewould affect the entire structure of the Jet Edge pump and UHP components. These UHPcomponents include the attenuator, high-pressure cylinders, check tubes, backup disks, high-pressure seals, as well as the center piston assembly. These parts have been examined withrespect to life expectancy and maintenance considerations. Extensive research was performed onthe hyper pressure components as an aspect of the fatigue life, metallurgical, and specialprocesses. The reliability of this hyper pressure intensifier has been improved to a level that canbe accepted by users in this industry.
3. CUTTING TEST AND RESULTS
Cutting tests were performed to see what advantages the new hyper pressure intensifier pumpcan offer. Various materials and thickness’ were cut to get a good feel for the capabilities of thehigher pressure. From this testing it can be seen that there is a potential for the new line of hyperpressure pumps. During the test, the CNC table manufactured by Jet Edge was used for themotion and speed control.
3.1. Abrasive Cutting System
During test cuts the patented Permalign II cutting head and abrasive delivery system were used(Figure 3 and 4). The design of this cutting head ensures orifice and nozzle alignment. For thesolid phase abrasive delivery system, a pressurized hopper is used to force abrasive into asecondary hopper. The secondary hopper has a pneumatically actuated slide gate and dial wheelthat provides accurate metering and reliable on/off control of the abrasive through the CNCcontroller (Figure 5).
3.2. Cutting Data
For the cutting tests, each material was cut at both 55,000 psi (380 MPa) and 75,000 psi (520MPa). The feed rate was measured to see how much faster the cutting head could operate andstill obtain the same quality of separation. For some materials the pressure was kept at 75,000psi (520 MPa) with the abrasive flow rate reduced to obtain the same cutting speed as that of the55,000 psi (380 MPa) test. This allowed an examination of how little abrasive could be usedwhen operating at the higher pressure. The results of the cutting tests are shown in Tables 1 to 3.From this data, an average 40-50% increase in feed rate can be obtained by operating at 75,000
psi (520 MPa) vs. 55,000 psi (380 MPa) with an orifice diameter/nozzle diameter 0.010/0.030inch (0.25/0.76 mm) combination. Cutting through a 14 inch (355 mm) thick forged steel alloyblock with a 0.015/0.045 inch (0.38/1.14 mm) combination was also tested.
From these results it looks as though there could be a potential for a pump operating at hyperpressures. If faster cutting speed or less abrasive use were desired, this pump would seem to be apossible solution.
4. COST ANALYSIS
The cost analysis includes pump operation cost and cutting cost (Table 4). During the test at75,000 psi (520Mpa) operating pressure, there did not appear to be a tremendous increase inpump operating costs. Utilization of cutting water and cooling water as well as power usageshowed minor increases compared to the 55,000 psi (380 MPa) test operating at the samehorsepower. Cutting costs include abrasive and consumable parts. Since cutting speed increasesat 75,000 psi (520 MPa) pressure, costs dramatically decrease. It can be seen that, as anexample, the cutting cost decreased 42% when cutting 2.625 inch 4140 Steel.
5. CONCLUSIONS
It has been observed that there is a significant benefit in operating hyper pressure 75,000 psi (520MPa) waterjet and abrasive waterjet systems over ultra-high pressure 55,000 psi (380 MPa)systems in terms of cutting cost reduction and the capability to cut thicker materials.
6. REFERENCE
Shunk, J.F. "Waterjet Cost Effectiveness: Case Studies in Cutting and Coating Removal” 8thAmerican Waterjet Conference, August 26-29, 1995, Houston, Texas.
Summers, D.A. "Waterjetting Technology" E & F N Spon, 1995.
7. TABLES AND FIGURES
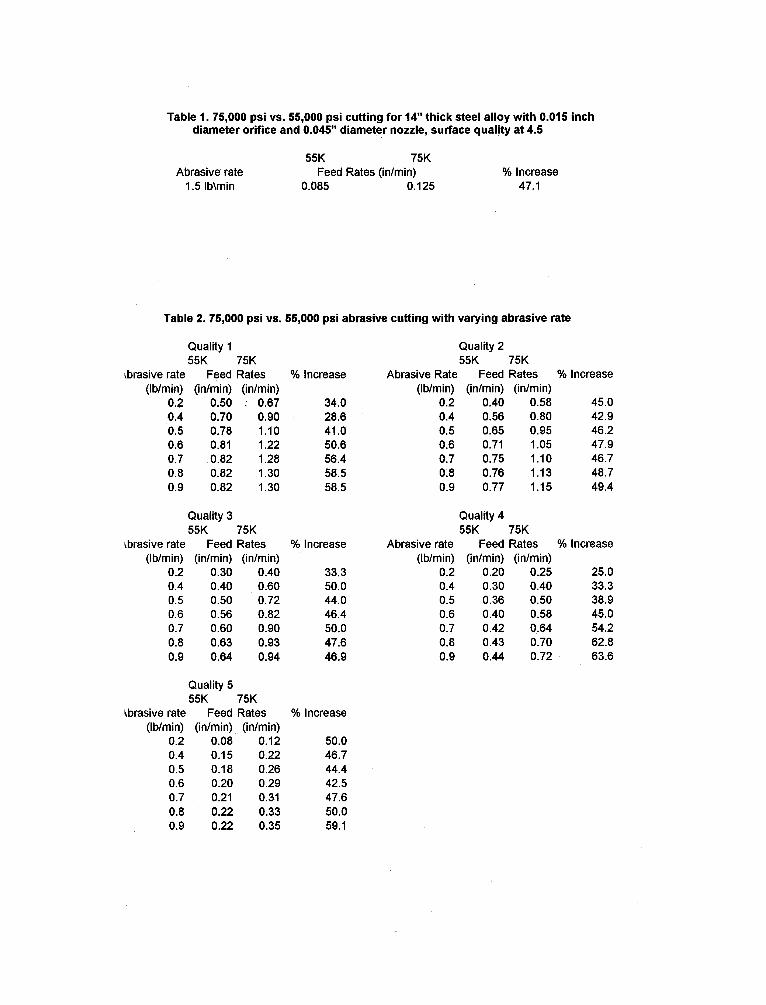
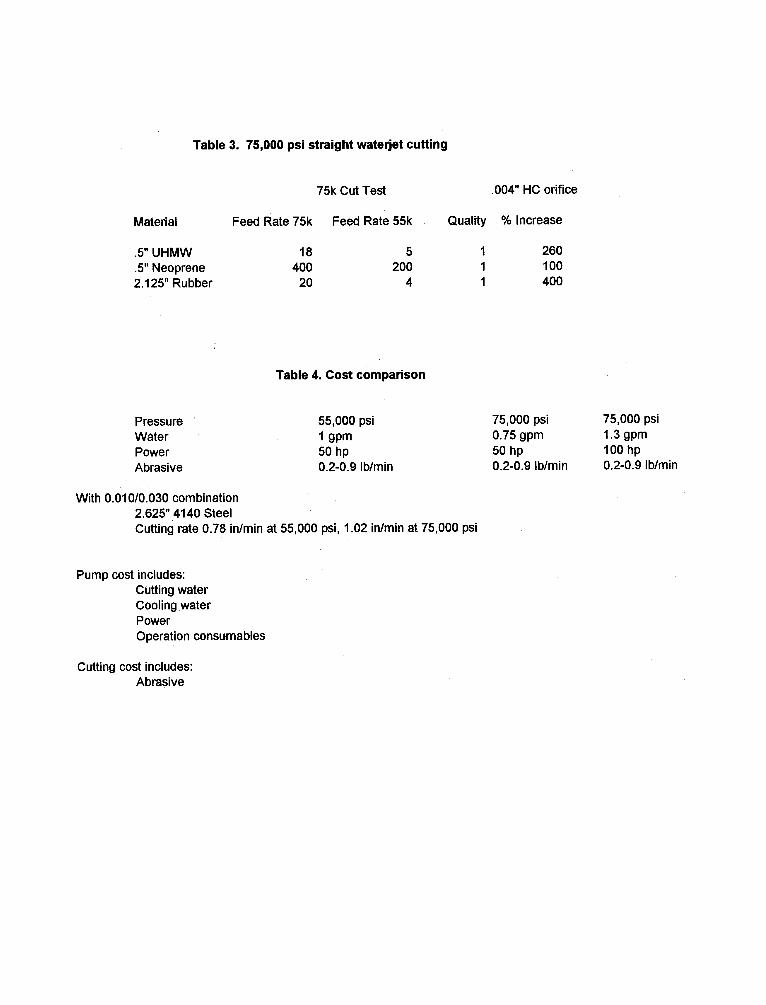
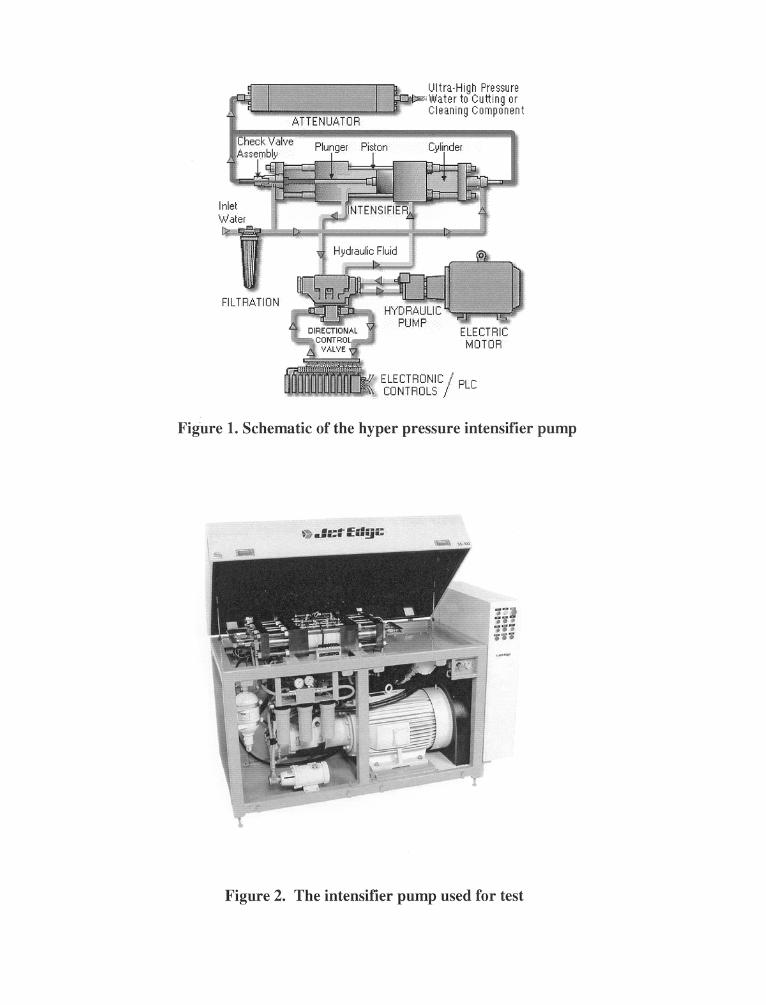
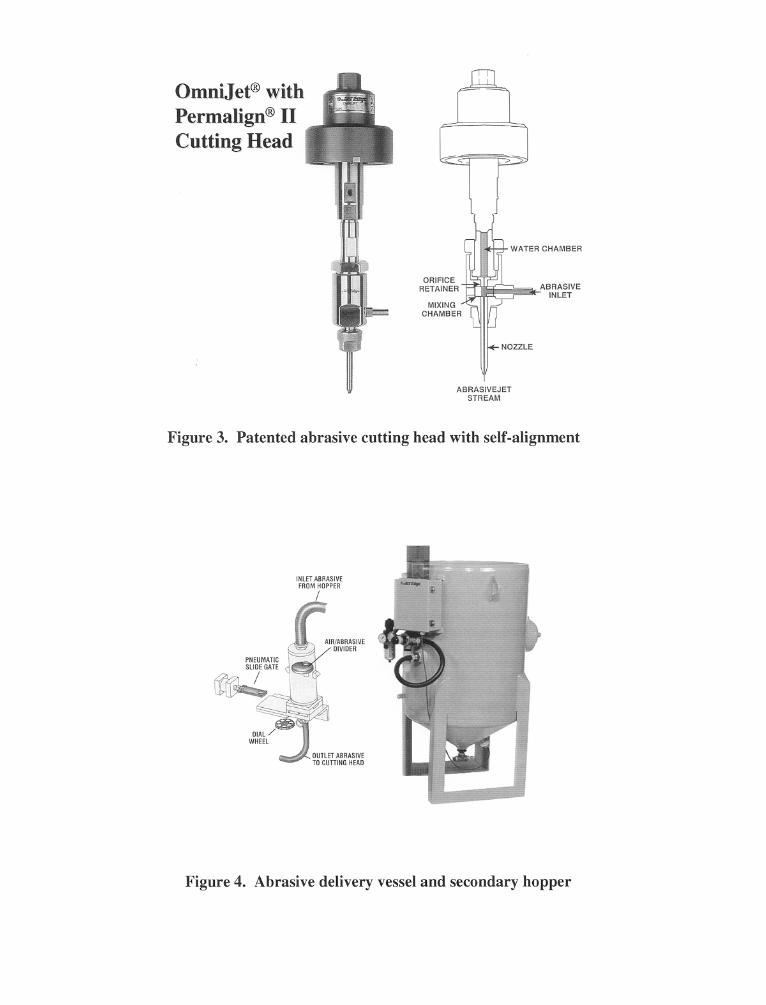
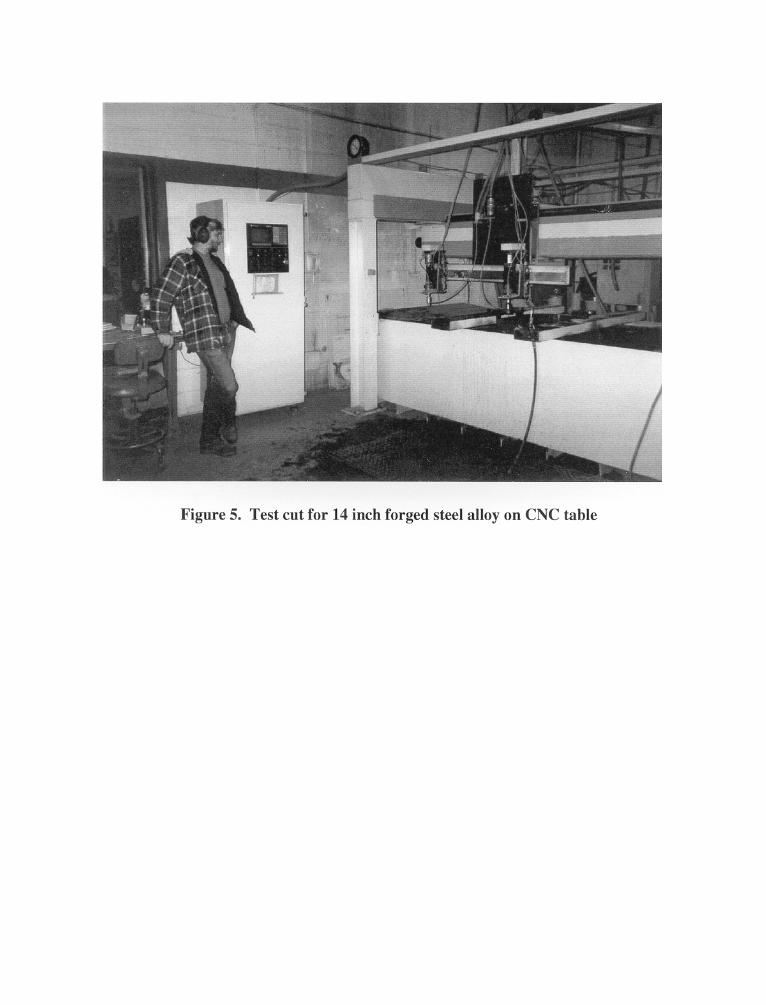
10th American Waterjet ConferenceAugust 14-17, 1999: Houston, Texas
Paper 10
CUTTING AND DRILLING AT 690-MPa PRESSURE
Mohamed HashishFlow International Corporation
Kent, Washington
ABSTRACT
The rational for extending the pressure range of waterjet cutting technology is discussed in thispaper. The effects of waterjet (WJ) and abrasive-waterjet (AWJ) parameters on cutting ofseveral metals are discussed. From the results of WJ cutting tests, it is observed that the specificpower required for cutting is reduced as the pressure increases. Thin sheet metal can be cuteffectively with waterjets. However, the cut surfaces are typically rough and deformed. Thequality of cut surfaces improves as the pressure increases or small amounts of abrasives areadded. Increasing the standoff distance has been observed to increase the cutting speed; this isattributed to the droplet impact effect that becomes dominant at large standoff distances. Thecutting test results with 690-MPa AWJs confirmed the linear trend of the effect of pressure oncutting rate. Most importantly, the abrasive consumption was significantly reduced as thepressure was increased. Tests were also conducted to drill small holes in several metals andcomposites. It was found that pressure ramping yields better drilling results.
Organized and Sponsored by the WaterJet Technology Association
1. INTRODUCTION
Waterjets were commercially introduced for industrial cutting applications in the early 1970s.This was primarily due to the development of 414-MPa (60-ksi) intensifier pumps capable ofpowering high-velocity waterjets with flow rates of a few liters per minute. This has openedgreat markets for waterjet technology. Prior to their use at these relatively high pressure levels,waterjets were limited to cleaning surfaces and mining relatively soft formations. High flowrates were mainly used for washing out rather than for material separation. Increasing pressuresbeyond 414 MPa promises the following advantages:
• More cutting capabilities (composites, thin metals)• Increased efficiency (specific energy may improve)• Lower abrasive usage (when using an AWJ)
There has been no change in the peak operating pressure of intensifier pumps (380 MPa) over thelast 30 years. Although higher pressures (over 1000 MPa) can easily be generated in the industrytoday, these units are not intended for continuous operation but for static applications. In thispaper, we present data on the potential improvement in cutting and drilling performance whenpressures are increased up to 690 MPa.
2. 690-MPa INTENSIFIER PUMPS
The output pressure from any intensifier pump is determined by the inlet hydraulic oil pressureand the pressure intensification ratio. This ratio can be defined as the area of the oil-side pistondivided by the area of the pressurized water-side plunger. Increasing the pressure from 380 to690 MPa can be achieved by altering the oil pressure or the intensification ratio, or by alteringboth. Typical high-pressure pumps operate with 21-MPa oil and an intensification ratio of 20.Accordingly, producing 690 MPa would require an oil system operating at 35 MPa. Thisoperating pressure would be at the upper limit for typical off-the-shelf oil hydraulic components,and it brings significant increases in wear rates and mechanical loads, with accompanyingdecreases in design safety factors. For our tests, an intensification ratio of 33 was used. Figure 1shows a 690-MPa intensifier used to construct pumps for food processing systems.
Another pump concept was identified using multistage intensification featuring two or moreintensifiers operating in a series to raise the water pressure in steps. This design capitalizes onthe success of the current 690-MPa systems by retaining as much of the current design aspossible. With two intensifiers in a series, the first would be a standard production unit thatoperates in its design mode, using 21-MPa oil to generate 345-MPa outlet water pressure. Thiswould be supplied to the inlet of the second intensifier, which would be a standard unit with theexception of an inlet check valve body built to handle 345 MPa and a modified high-pressurecylinder (to withstand 690 MPa). The second intensifier would use the same 21-MPa oil-sidehydraulics to boost the pressure from 345 MPa to 690 MPa. This concept offers the advantage ofidentical intensification ratios and check valve differential pressures to those presently used in345-MPa pumps. Also, with a multistage intensifier, lower alternating stresses will beencountered in the 690-MPa stage.
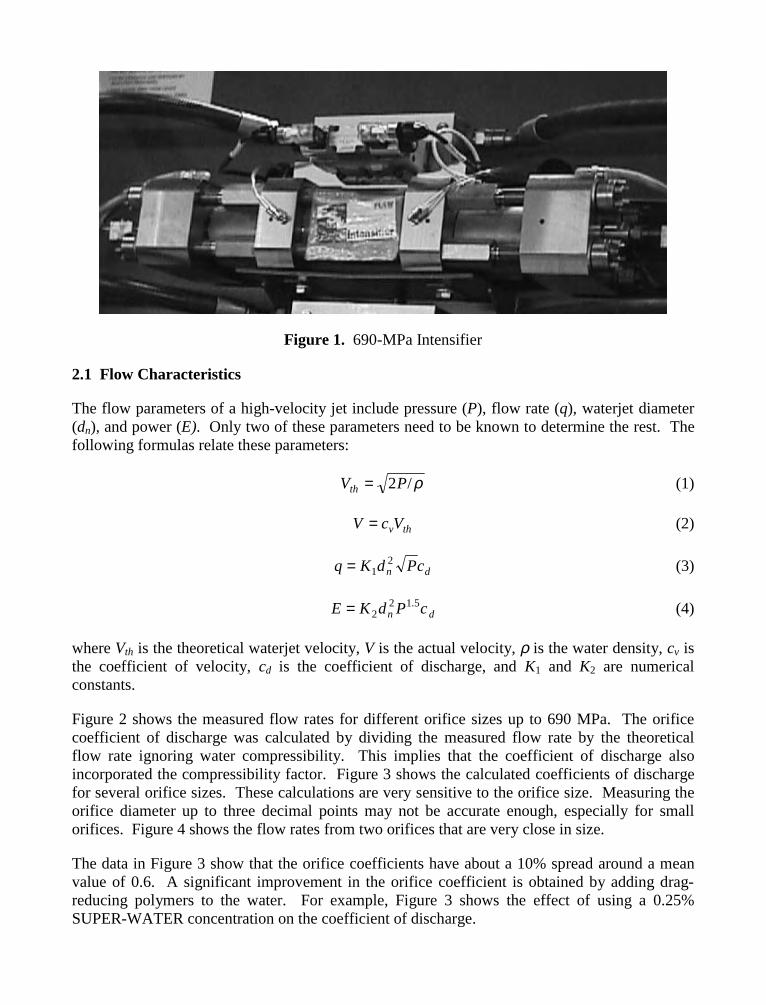
Figure 1. 690-MPa Intensifier
2.1 Flow Characteristics
The flow parameters of a high-velocity jet include pressure (P), flow rate (q), waterjet diameter(dn), and power (E). Only two of these parameters need to be known to determine the rest. Thefollowing formulas relate these parameters:
ρ/2PVth = (1)
thvVcV = (2)
dn cPdKq 21= (3)
dn cPdKE 5.122= (4)
where Vth is the theoretical waterjet velocity, V is the actual velocity, ρ is the water density, cv isthe coefficient of velocity, cd is the coefficient of discharge, and K1 and K2 are numericalconstants.
Figure 2 shows the measured flow rates for different orifice sizes up to 690 MPa. The orificecoefficient of discharge was calculated by dividing the measured flow rate by the theoreticalflow rate ignoring water compressibility. This implies that the coefficient of discharge alsoincorporated the compressibility factor. Figure 3 shows the calculated coefficients of dischargefor several orifice sizes. These calculations are very sensitive to the orifice size. Measuring theorifice diameter up to three decimal points may not be accurate enough, especially for smallorifices. Figure 4 shows the flow rates from two orifices that are very close in size.
The data in Figure 3 show that the orifice coefficients have about a 10% spread around a meanvalue of 0.6. A significant improvement in the orifice coefficient is obtained by adding drag-reducing polymers to the water. For example, Figure 3 shows the effect of using a 0.25%SUPER-WATER concentration on the coefficient of discharge.
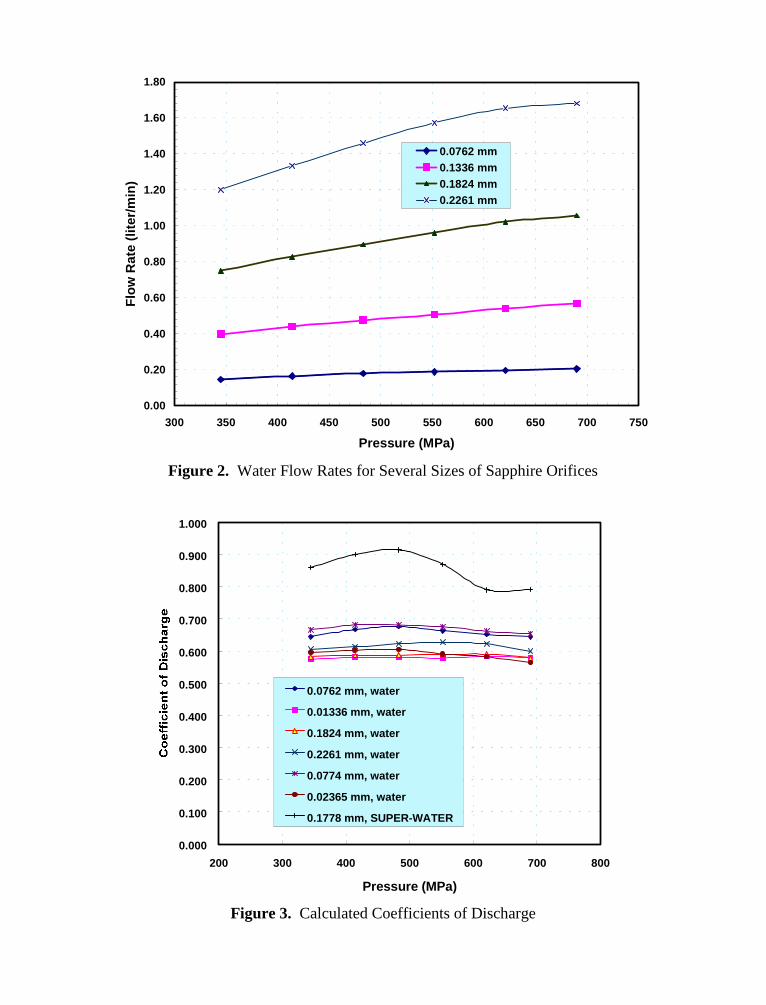
0.00
0.20
0.40
0.60
0.80
1.00
1.20
1.40
1.60
1.80
300 350 400 450 500 550 600 650 700 750
Pressure (MPa)
Flo
w R
ate
(lite
r/m
in)
0.0762 mm0.1336 mm0.1824 mm0.2261 mm
Figure 2. Water Flow Rates for Several Sizes of Sapphire Orifices
0.000
0.100
0.200
0.300
0.400
0.500
0.600
0.700
0.800
0.900
1.000
200 300 400 500 600 700 800
Pressure (MPa)
0.0762 mm, water
0.01336 mm, water
0.1824 mm, water
0.2261 mm, water
0.0774 mm, water
0.02365 mm, water
0.1778 mm, SUPER-WATER
Figure 3. Calculated Coefficients of Discharge
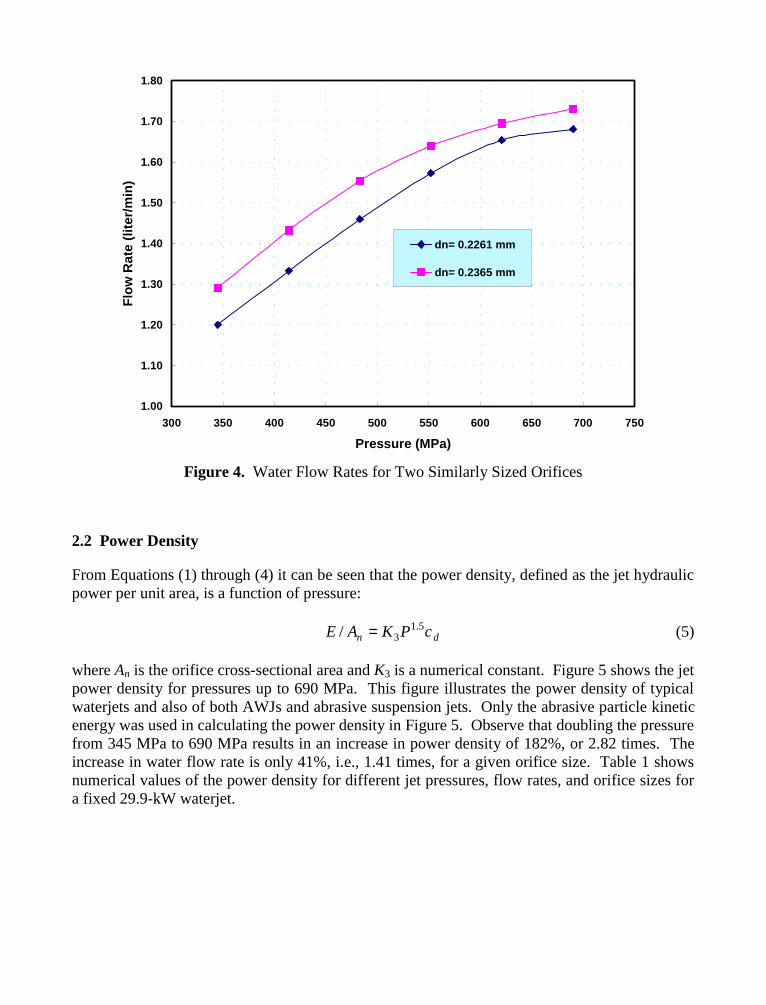
1.00
1.10
1.20
1.30
1.40
1.50
1.60
1.70
1.80
300 350 400 450 500 550 600 650 700 750
Pressure (MPa)
Flo
w R
ate
(lite
r/m
in)
dn= 0.2261 mm
dn= 0.2365 mm
Figure 4. Water Flow Rates for Two Similarly Sized Orifices
2.2 Power Density
From Equations (1) through (4) it can be seen that the power density, defined as the jet hydraulicpower per unit area, is a function of pressure:
dn cPKAE 5.13/ = (5)
where An is the orifice cross-sectional area and K3 is a numerical constant. Figure 5 shows the jetpower density for pressures up to 690 MPa. This figure illustrates the power density of typicalwaterjets and also of both AWJs and abrasive suspension jets. Only the abrasive particle kineticenergy was used in calculating the power density in Figure 5. Observe that doubling the pressurefrom 345 MPa to 690 MPa results in an increase in power density of 182%, or 2.82 times. Theincrease in water flow rate is only 41%, i.e., 1.41 times, for a given orifice size. Table 1 showsnumerical values of the power density for different jet pressures, flow rates, and orifice sizes fora fixed 29.9-kW waterjet.
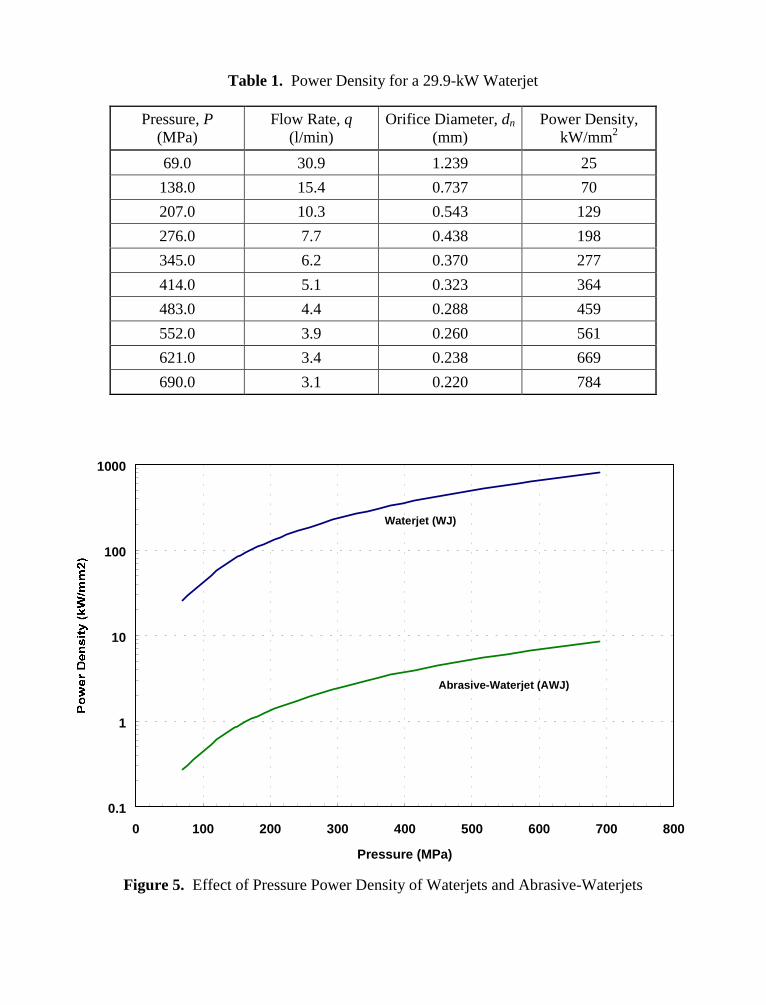
Table 1. Power Density for a 29.9-kW Waterjet
Pressure, P(MPa)
Flow Rate, q(l/min)
Orifice Diameter, dn(mm)
Power Density,kW/mm2
69.0 30.9 1.239 25
138.0 15.4 0.737 70
207.0 10.3 0.543 129
276.0 7.7 0.438 198
345.0 6.2 0.370 277
414.0 5.1 0.323 364
483.0 4.4 0.288 459
552.0 3.9 0.260 561
621.0 3.4 0.238 669
690.0 3.1 0.220 784
0.1
1
10
100
1000
0 100 200 300 400 500 600 700 800
Pressure (MPa)
Waterjet (WJ)
Abrasive-Waterjet (AWJ)
Figure 5. Effect of Pressure Power Density of Waterjets and Abrasive-Waterjets
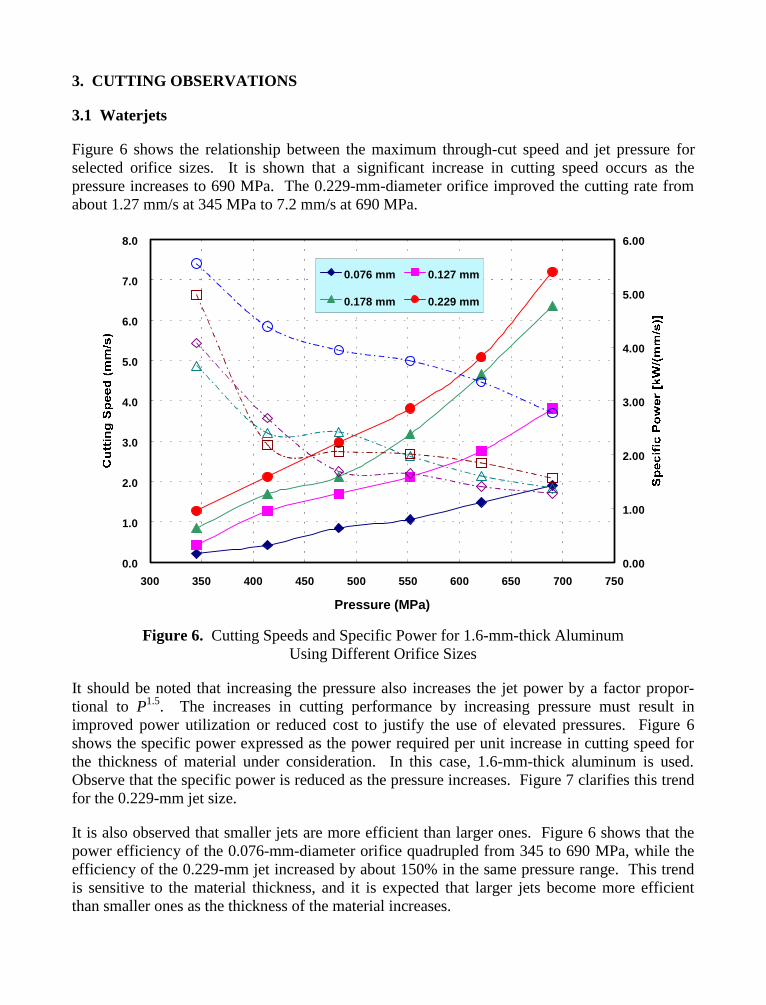
3. CUTTING OBSERVATIONS
3.1 Waterjets
Figure 6 shows the relationship between the maximum through-cut speed and jet pressure forselected orifice sizes. It is shown that a significant increase in cutting speed occurs as thepressure increases to 690 MPa. The 0.229-mm-diameter orifice improved the cutting rate fromabout 1.27 mm/s at 345 MPa to 7.2 mm/s at 690 MPa.
0.0
1.0
2.0
3.0
4.0
5.0
6.0
7.0
8.0
300 350 400 450 500 550 600 650 700 750
Pressure (MPa)
0.00
1.00
2.00
3.00
4.00
5.00
6.00
0.076 mm 0.127 mm
0.178 mm 0.229 mm
Figure 6. Cutting Speeds and Specific Power for 1.6-mm-thick AluminumUsing Different Orifice Sizes
It should be noted that increasing the pressure also increases the jet power by a factor propor-tional to P1.5. The increases in cutting performance by increasing pressure must result inimproved power utilization or reduced cost to justify the use of elevated pressures. Figure 6shows the specific power expressed as the power required per unit increase in cutting speed forthe thickness of material under consideration. In this case, 1.6-mm-thick aluminum is used.Observe that the specific power is reduced as the pressure increases. Figure 7 clarifies this trendfor the 0.229-mm jet size.
It is also observed that smaller jets are more efficient than larger ones. Figure 6 shows that thepower efficiency of the 0.076-mm-diameter orifice quadrupled from 345 to 690 MPa, while theefficiency of the 0.229-mm jet increased by about 150% in the same pressure range. This trendis sensitive to the material thickness, and it is expected that larger jets become more efficientthan smaller ones as the thickness of the material increases.
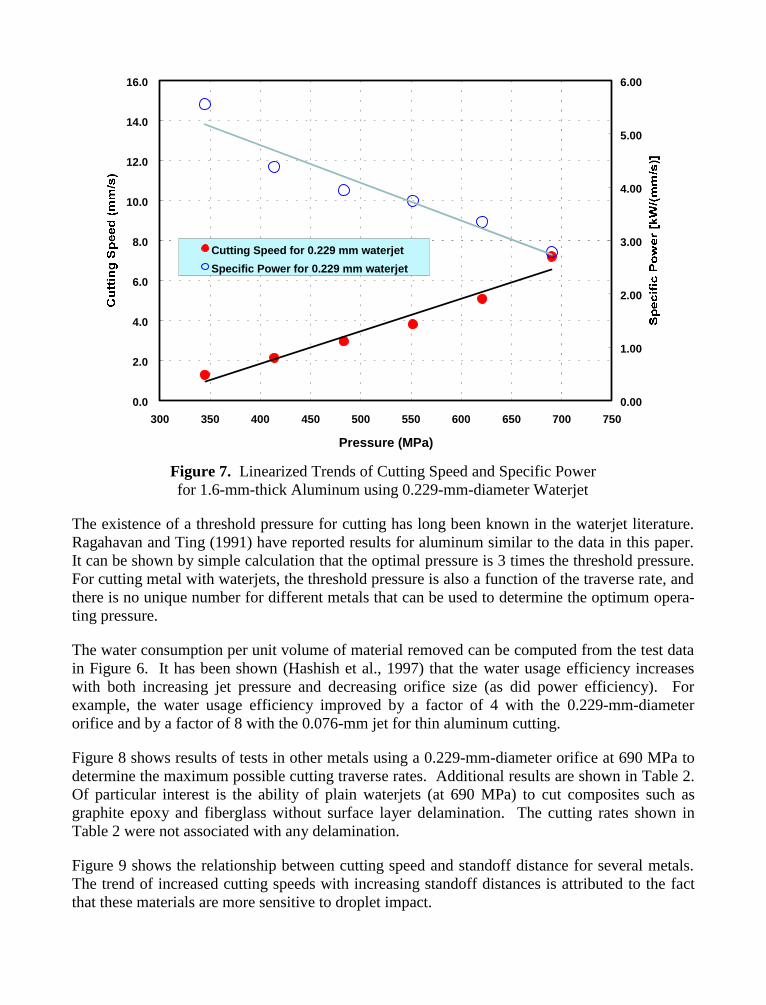
0.0
2.0
4.0
6.0
8.0
10.0
12.0
14.0
16.0
300 350 400 450 500 550 600 650 700 750
Pressure (MPa)
0.00
1.00
2.00
3.00
4.00
5.00
6.00
Cutting Speed for 0.229 mm waterjet
Specific Power for 0.229 mm waterjet
Figure 7. Linearized Trends of Cutting Speed and Specific Powerfor 1.6-mm-thick Aluminum using 0.229-mm-diameter Waterjet
The existence of a threshold pressure for cutting has long been known in the waterjet literature.Ragahavan and Ting (1991) have reported results for aluminum similar to the data in this paper.It can be shown by simple calculation that the optimal pressure is 3 times the threshold pressure.For cutting metal with waterjets, the threshold pressure is also a function of the traverse rate, andthere is no unique number for different metals that can be used to determine the optimum opera-ting pressure.
The water consumption per unit volume of material removed can be computed from the test datain Figure 6. It has been shown (Hashish et al., 1997) that the water usage efficiency increaseswith both increasing jet pressure and decreasing orifice size (as did power efficiency). Forexample, the water usage efficiency improved by a factor of 4 with the 0.229-mm-diameterorifice and by a factor of 8 with the 0.076-mm jet for thin aluminum cutting.
Figure 8 shows results of tests in other metals using a 0.229-mm-diameter orifice at 690 MPa todetermine the maximum possible cutting traverse rates. Additional results are shown in Table 2.Of particular interest is the ability of plain waterjets (at 690 MPa) to cut composites such asgraphite epoxy and fiberglass without surface layer delamination. The cutting rates shown inTable 2 were not associated with any delamination.
Figure 9 shows the relationship between cutting speed and standoff distance for several metals.The trend of increased cutting speeds with increasing standoff distances is attributed to the factthat these materials are more sensitive to droplet impact.
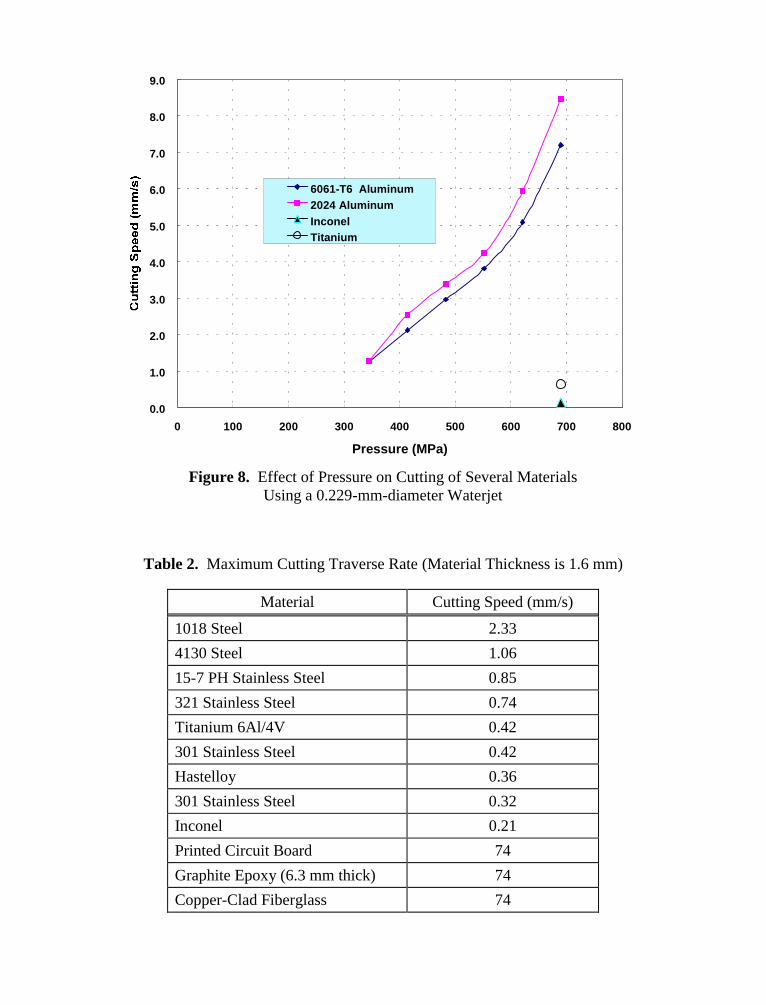
0.0
1.0
2.0
3.0
4.0
5.0
6.0
7.0
8.0
9.0
0 100 200 300 400 500 600 700 800
Pressure (MPa)
6061-T6 Aluminum2024 AluminumInconelTitanium
Figure 8. Effect of Pressure on Cutting of Several MaterialsUsing a 0.229-mm-diameter Waterjet
Table 2. Maximum Cutting Traverse Rate (Material Thickness is 1.6 mm)
Material Cutting Speed (mm/s)
1018 Steel 2.33
4130 Steel 1.06
15-7 PH Stainless Steel 0.85
321 Stainless Steel 0.74
Titanium 6Al/4V 0.42
301 Stainless Steel 0.42
Hastelloy 0.36
301 Stainless Steel 0.32
Inconel 0.21
Printed Circuit Board 74
Graphite Epoxy (6.3 mm thick) 74
Copper-Clad Fiberglass 74
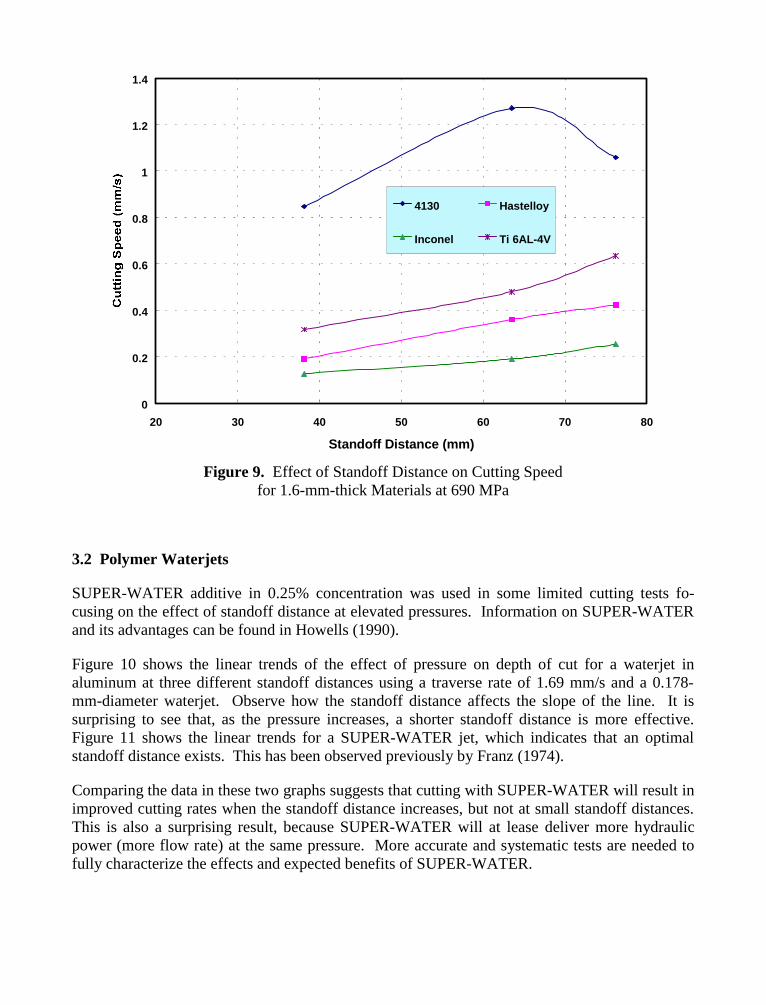
0
0.2
0.4
0.6
0.8
1
1.2
1.4
20 30 40 50 60 70 80
Standoff Distance (mm)
4130 Hastelloy
Inconel Ti 6AL-4V
Figure 9. Effect of Standoff Distance on Cutting Speedfor 1.6-mm-thick Materials at 690 MPa
3.2 Polymer Waterjets
SUPER-WATER additive in 0.25% concentration was used in some limited cutting tests fo-cusing on the effect of standoff distance at elevated pressures. Information on SUPER-WATERand its advantages can be found in Howells (1990).
Figure 10 shows the linear trends of the effect of pressure on depth of cut for a waterjet inaluminum at three different standoff distances using a traverse rate of 1.69 mm/s and a 0.178-mm-diameter waterjet. Observe how the standoff distance affects the slope of the line. It issurprising to see that, as the pressure increases, a shorter standoff distance is more effective.Figure 11 shows the linear trends for a SUPER-WATER jet, which indicates that an optimalstandoff distance exists. This has been observed previously by Franz (1974).
Comparing the data in these two graphs suggests that cutting with SUPER-WATER will result inimproved cutting rates when the standoff distance increases, but not at small standoff distances.This is also a surprising result, because SUPER-WATER will at lease deliver more hydraulicpower (more flow rate) at the same pressure. More accurate and systematic tests are needed tofully characterize the effects and expected benefits of SUPER-WATER.
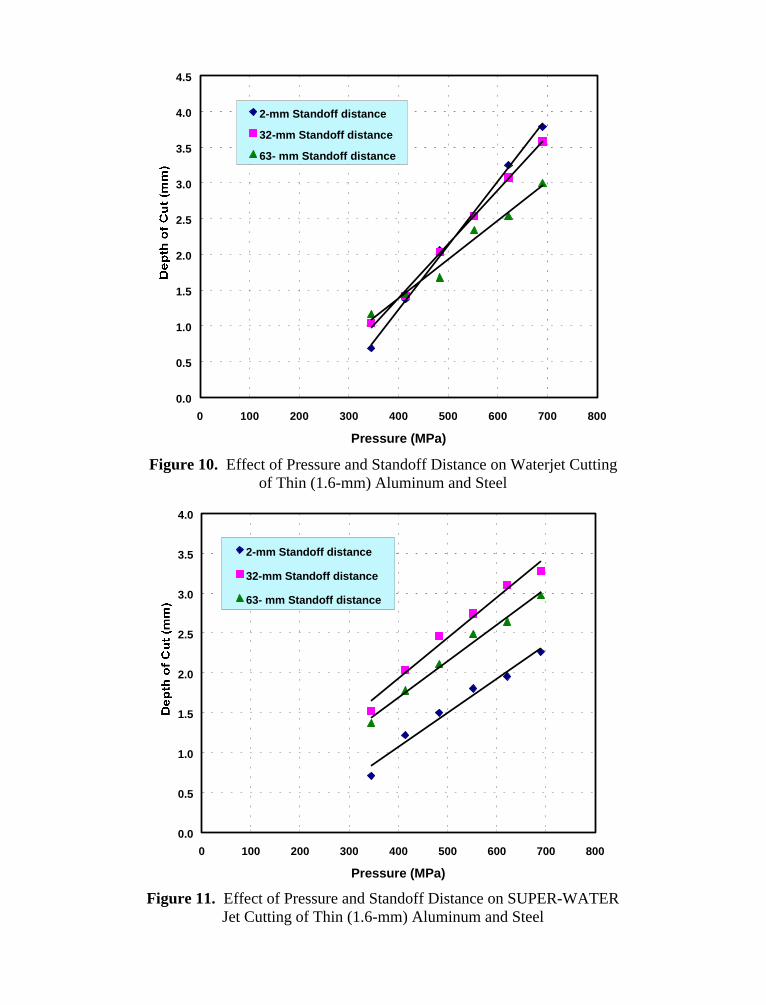
0.0
0.5
1.0
1.5
2.0
2.5
3.0
3.5
4.0
4.5
0 100 200 300 400 500 600 700 800
Pressure (MPa)
2-mm Standoff distance
32-mm Standoff distance
63- mm Standoff distance
Figure 10. Effect of Pressure and Standoff Distance on Waterjet Cuttingof Thin (1.6-mm) Aluminum and Steel
0.0
0.5
1.0
1.5
2.0
2.5
3.0
3.5
4.0
0 100 200 300 400 500 600 700 800
Pressure (MPa)
2-mm Standoff distance
32-mm Standoff distance
63- mm Standoff distance
Figure 11. Effect of Pressure and Standoff Distance on SUPER-WATERJet Cutting of Thin (1.6-mm) Aluminum and Steel
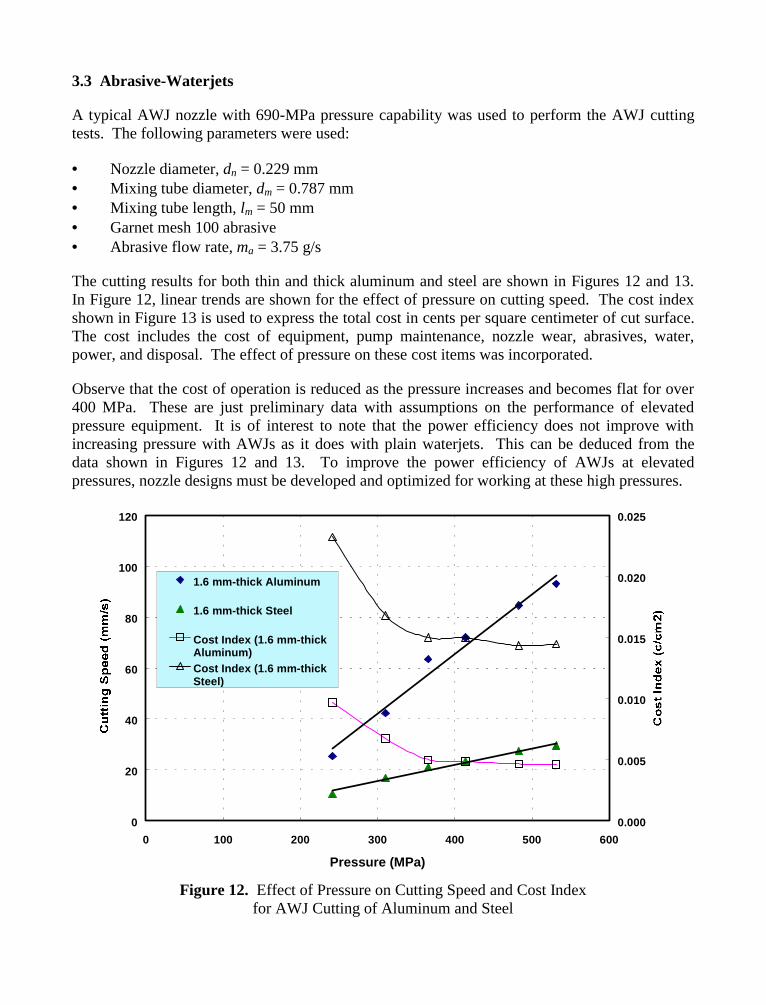
3.3 Abrasive-Waterjets
A typical AWJ nozzle with 690-MPa pressure capability was used to perform the AWJ cuttingtests. The following parameters were used:
• Nozzle diameter, dn = 0.229 mm• Mixing tube diameter, dm = 0.787 mm• Mixing tube length, lm = 50 mm• Garnet mesh 100 abrasive• Abrasive flow rate, ma = 3.75 g/s
The cutting results for both thin and thick aluminum and steel are shown in Figures 12 and 13.In Figure 12, linear trends are shown for the effect of pressure on cutting speed. The cost indexshown in Figure 13 is used to express the total cost in cents per square centimeter of cut surface.The cost includes the cost of equipment, pump maintenance, nozzle wear, abrasives, water,power, and disposal. The effect of pressure on these cost items was incorporated.
Observe that the cost of operation is reduced as the pressure increases and becomes flat for over400 MPa. These are just preliminary data with assumptions on the performance of elevatedpressure equipment. It is of interest to note that the power efficiency does not improve withincreasing pressure with AWJs as it does with plain waterjets. This can be deduced from thedata shown in Figures 12 and 13. To improve the power efficiency of AWJs at elevatedpressures, nozzle designs must be developed and optimized for working at these high pressures.
0
20
40
60
80
100
120
0 100 200 300 400 500 600
Pressure (MPa)
0.000
0.005
0.010
0.015
0.020
0.025
1.6 mm-thick Aluminum
1.6 mm-thick Steel
Cost Index (1.6 mm-thickAluminum)Cost Index (1.6 mm-thickSteel)
Figure 12. Effect of Pressure on Cutting Speed and Cost Indexfor AWJ Cutting of Aluminum and Steel
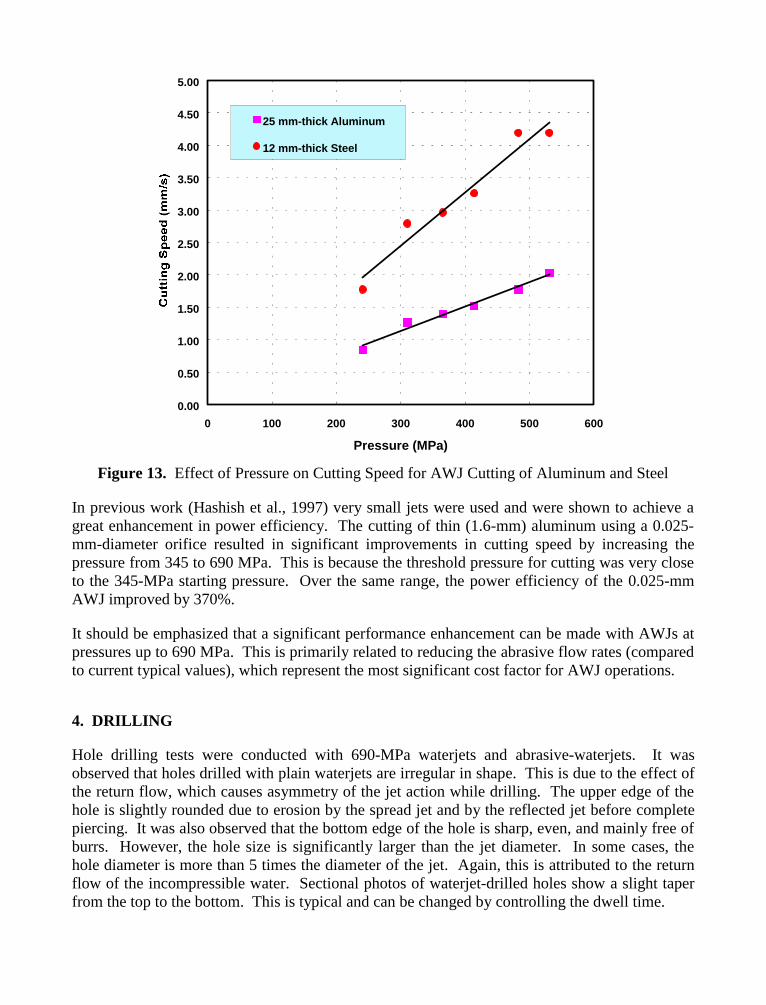
0.00
0.50
1.00
1.50
2.00
2.50
3.00
3.50
4.00
4.50
5.00
0 100 200 300 400 500 600
Pressure (MPa)
25 mm-thick Aluminum
12 mm-thick Steel
Figure 13. Effect of Pressure on Cutting Speed for AWJ Cutting of Aluminum and Steel
In previous work (Hashish et al., 1997) very small jets were used and were shown to achieve agreat enhancement in power efficiency. The cutting of thin (1.6-mm) aluminum using a 0.025-mm-diameter orifice resulted in significant improvements in cutting speed by increasing thepressure from 345 to 690 MPa. This is because the threshold pressure for cutting was very closeto the 345-MPa starting pressure. Over the same range, the power efficiency of the 0.025-mmAWJ improved by 370%.
It should be emphasized that a significant performance enhancement can be made with AWJs atpressures up to 690 MPa. This is primarily related to reducing the abrasive flow rates (comparedto current typical values), which represent the most significant cost factor for AWJ operations.
4. DRILLING
Hole drilling tests were conducted with 690-MPa waterjets and abrasive-waterjets. It wasobserved that holes drilled with plain waterjets are irregular in shape. This is due to the effect ofthe return flow, which causes asymmetry of the jet action while drilling. The upper edge of thehole is slightly rounded due to erosion by the spread jet and by the reflected jet before completepiercing. It was also observed that the bottom edge of the hole is sharp, even, and mainly free ofburrs. However, the hole size is significantly larger than the jet diameter. In some cases, thehole diameter is more than 5 times the diameter of the jet. Again, this is attributed to the returnflow of the incompressible water. Sectional photos of waterjet-drilled holes show a slight taperfrom the top to the bottom. This is typical and can be changed by controlling the dwell time.
Drilling with AWJs was found to be much more controllable, especially with the use ofcomputer-controlled pressure ramping. With pressure ramping, the pressure never reaches 690MPa before the material is penetrated. Drilling with 690 MPa jets will likely be limited to veryhard materials where hole geometry is not critical.
5. CONCLUSIONS
• Cutting with plain waterjets at elevated pressures is highly promising for composites andthin sheet metal.
• The specific power, expressed as the power per unit increase in cutting speed, with plainwaterjets improves significantly with increasing pressure for relatively thin materials.
• Polymer additives may greatly enhance the performance of 690-MPa waterjets, especiallyfor large standoff distances.
• Elevated-pressure AWJs promise cost reduction, but power efficiency needs to be im-proved. Cutting with AWJs up to 690 MPa will minimize abrasive usage and reduce kerfwidth.
• It has been confirmed that there is an optimal standoff distance for metal cutting with plainwaterjets.
• Hole drilling is best accomplished by pressure ramping if the quality of the hole geometryis important. Drilling with 690-MPa waterjets does not result in a rounded hole; furtherwork is needed to improve the process.
6. ACKNOWLEDGMENTS
Some of the work presented in this paper was performed under funding from the National Centerfor Manufacturing Sciences (contract number NCMS-89-MPM-2) at Waterjet Technology, Inc.(previously Flow Research, then QUEST Integrated). Work on the 690-MPa pump and someAWJ cutting tests were conducted at Flow International. The author is grateful for this support.Thanks also to Hammond Publications for editing this paper.
7. REFERENCES
Franz, N. C., “The Influence of Standoff Distance on Cutting with High Velocity Fluid Jets,”Proceedings of the Second International Symposium on Jet Cutting Technology, pp. B3-37– B3-46, BHRA Fluid Engineering, Cambridge, England, 1974.
Hashish, M., Steele, D. E., and Bothell, D. H., “Machining with Super-Pressure (690 MPa)Waterjets,” Int. J. Mach. Tools Manufact., Vol. 37, No. 4, pp. 465-479, 1997.
Howells, W. G., “Polymerblasting with SUPER-WATER® from 1974 to 1989: A Review,”International Journal of Waterjet Technology, Vol. 1, No. 1, pp. 1-15, 1990.
Raghaven, C., and Ting, E., “Hyper Pressure Waterjet Cutting of Thin Sheet Metal,”Proceedings of the 6th American Water Jet Conference, pp. 493-504, Houston, Texas,Water Jet Technology Association, 1991.

8. NOMENCLATURE
An orifice cross-sectional area
cd coefficient of discharge
cv coefficient of velocity
dm mixing tube diameter
dn waterjet diameter
E power
K1, K2, K3 numerical constants
lm mixing tube length
ma abrasive flow rate
P pressure
q flow rate
V actual velocity
Vth theoretical waterjet velocity
ρ water density
10th American Waterjet ConferenceAugust 14-17, 1999: Houston, Texas
Paper 11
CHARACTERIZATION OF LOW PRESSURE AWJ CUTTING
David G. Taggart, Madhusarathi Nanduri and Thomas J. KimUniversity of Rhode Island
Kingston, RI U.S.A.
ABSTRACT
In recent years, advances in entrainment based abrasive waterjet (AWJ) technology have led tocommercial systems which operate at increasingly high water pressures. The motivation for theseimproved systems is higher cutting speeds for manufacturing applications. For certain applications,parameters such as overall system size, weight, cost and consumption parameters such as water andabrasive consumption take precedent over cutting speed. For example, for materials which arerelatively easy to machine, adequate cutting speeds may be achieved using low pressure, and hencelow cost, AWJ cutting systems. Similarly, portable AWJ systems require minimum system size andweight. For applications where abrasive and water contamination is an issue, minimization of theabrasive and water consumption rates is critical. In this study, the performance of entrainmentbased AWJ cutting at low pressures in the range of 35-140 MPa is evaluated. Conditions whichprovide abrasive entrainment are identified. A series of trials are performed to determine the depthof cut in mild steel as a function of various AWJ parameters. An empirical cutting model isdeveloped. Finally, the effect of standoff distance, multiple passes and abrasive type on cuttingperformance is evaluated.
Organized and Sponsored by WaterJet Technology Association
618.0866.0
343.0687.025.1
ns
awm
duC
mmPNh =
oda
PACQ ρ2=
1. INTRODUCTION
In typical industrial applications of entrainment based AWJ machining, maximized cutting speedis desired. For these applications, commercial AWJ systems which operate at water pressures of200-420 MPa are commonly used. For certain specialized applications, however, cutting speedmay be less important than other factors. Examples of such applications include portable cuttingsystems requiring lightweight pumps and low volume applications where the capital costassociated with high pressure pumps can be prohibitive. For portable systems, abrasive andwater consumption rates can be critical if the consumables need to be transported. Similarly,abrasive and water consumption is critical in applications where abrasive and water disposal isrequired for environmental reasons.
In this study, the cutting performance and abrasive and water consumption rates for low pressure(35-140 MPa) AWJ cutting are characterized. An empirical parametric model is developed toprovide predictive data for use in configuring an AWJ system for particular applications. Thisparametric model development parallels similar work by Zeng (1992) and Zeng and Kim (1993).In Zeng's model, developed for pressures in the range 140-280 MPa, the depth of cut is given by
(1)
where h is the depth of cut in mm, Nm is the material machinability number (Nm=87.6 for mildsteel), P is the water pressure in MPa, mw is the water flow rate in liter/min, ma is the abrasiveflow rate in g/s, Cs is a constant (=8800), u is the jet traverse speed in mm/s and dn is the nozzlediameter in mm. This parametric model provides a tool for determining the relation betweenwater pressure, abrasive consumption, water consumption and cutting performance. Note thatthe water consumption, Q, can be computed from the orifice cross-sectional area, A, and thewater pressure, P, using the relation (Hashish, 1989)
(2)
where Cda is the orifice coefficient of discharge and ρo is the ambient density of water.Appropriate orifice coefficients of discharge have been determined experimentally (Hashish,1989) to be in the range of 0.65-0.75. Unfortunately, since Zeng's model (Eq. 1) was developedat water pressures in the range 140-280 MPa, its application to pressures in the range 35-140MPa is expected to give unreliable predictions. Therefore, development of a low pressureparametric model is required and provides the motivation for the study described in this paper.
2. EXPERIMENTAL PROCEDURES
In the first phase of this study, a Taguchi based experimental design was implemented to quicklyassess the cutting performance of a wide range of experimental parameters. These results were
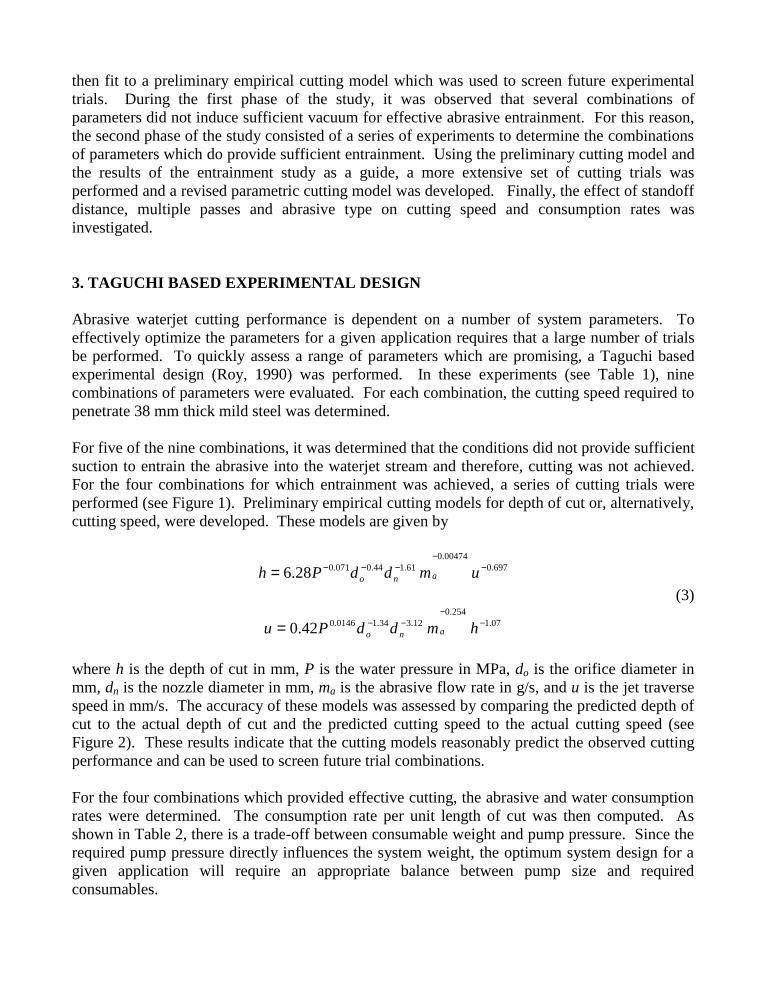
then fit to a preliminary empirical cutting model which was used to screen future experimentaltrials. During the first phase of the study, it was observed that several combinations ofparameters did not induce sufficient vacuum for effective abrasive entrainment. For this reason,the second phase of the study consisted of a series of experiments to determine the combinationsof parameters which do provide sufficient entrainment. Using the preliminary cutting model andthe results of the entrainment study as a guide, a more extensive set of cutting trials wasperformed and a revised parametric cutting model was developed. Finally, the effect of standoffdistance, multiple passes and abrasive type on cutting speed and consumption rates wasinvestigated.
3. TAGUCHI BASED EXPERIMENTAL DESIGN
Abrasive waterjet cutting performance is dependent on a number of system parameters. Toeffectively optimize the parameters for a given application requires that a large number of trialsbe performed. To quickly assess a range of parameters which are promising, a Taguchi basedexperimental design (Roy, 1990) was performed. In these experiments (see Table 1), ninecombinations of parameters were evaluated. For each combination, the cutting speed required topenetrate 38 mm thick mild steel was determined.
For five of the nine combinations, it was determined that the conditions did not provide sufficientsuction to entrain the abrasive into the waterjet stream and therefore, cutting was not achieved.For the four combinations for which entrainment was achieved, a series of cutting trials wereperformed (see Figure 1). Preliminary empirical cutting models for depth of cut or, alternatively,cutting speed, were developed. These models are given by
697.000474.0
61.144.0071.028.6 −−
−−−= umddPh ano
(3)
07.1254.0
12.334.10146.042.0 −−
−−= hmddPu ano
where h is the depth of cut in mm, P is the water pressure in MPa, do is the orifice diameter inmm, dn is the nozzle diameter in mm, ma is the abrasive flow rate in g/s, and u is the jet traversespeed in mm/s. The accuracy of these models was assessed by comparing the predicted depth ofcut to the actual depth of cut and the predicted cutting speed to the actual cutting speed (seeFigure 2). These results indicate that the cutting models reasonably predict the observed cuttingperformance and can be used to screen future trial combinations.
For the four combinations which provided effective cutting, the abrasive and water consumptionrates were determined. The consumption rate per unit length of cut was then computed. Asshown in Table 2, there is a trade-off between consumable weight and pump pressure. Since therequired pump pressure directly influences the system weight, the optimum system design for agiven application will require an appropriate balance between pump size and requiredconsumables.
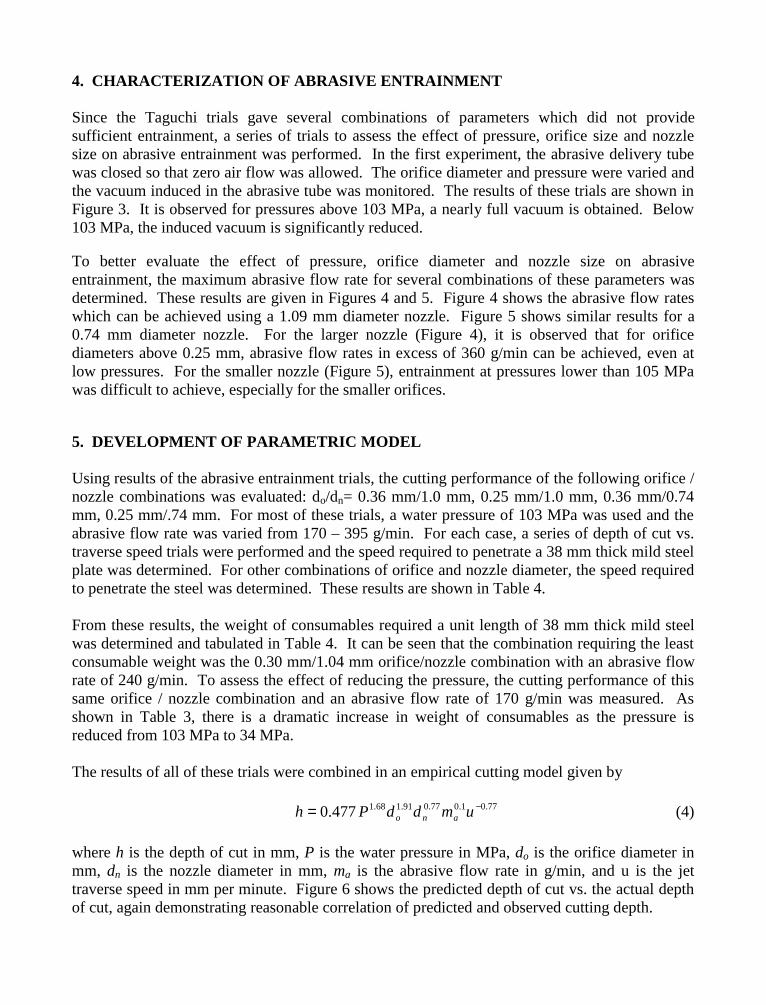
4. CHARACTERIZATION OF ABRASIVE ENTRAINMENT
Since the Taguchi trials gave several combinations of parameters which did not providesufficient entrainment, a series of trials to assess the effect of pressure, orifice size and nozzlesize on abrasive entrainment was performed. In the first experiment, the abrasive delivery tubewas closed so that zero air flow was allowed. The orifice diameter and pressure were varied andthe vacuum induced in the abrasive tube was monitored. The results of these trials are shown inFigure 3. It is observed for pressures above 103 MPa, a nearly full vacuum is obtained. Below103 MPa, the induced vacuum is significantly reduced.
To better evaluate the effect of pressure, orifice diameter and nozzle size on abrasiveentrainment, the maximum abrasive flow rate for several combinations of these parameters wasdetermined. These results are given in Figures 4 and 5. Figure 4 shows the abrasive flow rateswhich can be achieved using a 1.09 mm diameter nozzle. Figure 5 shows similar results for a0.74 mm diameter nozzle. For the larger nozzle (Figure 4), it is observed that for orificediameters above 0.25 mm, abrasive flow rates in excess of 360 g/min can be achieved, even atlow pressures. For the smaller nozzle (Figure 5), entrainment at pressures lower than 105 MPawas difficult to achieve, especially for the smaller orifices.
5. DEVELOPMENT OF PARAMETRIC MODEL
Using results of the abrasive entrainment trials, the cutting performance of the following orifice /nozzle combinations was evaluated: do/dn= 0.36 mm/1.0 mm, 0.25 mm/1.0 mm, 0.36 mm/0.74mm, 0.25 mm/.74 mm. For most of these trials, a water pressure of 103 MPa was used and theabrasive flow rate was varied from 170 – 395 g/min. For each case, a series of depth of cut vs.traverse speed trials were performed and the speed required to penetrate a 38 mm thick mild steelplate was determined. For other combinations of orifice and nozzle diameter, the speed requiredto penetrate the steel was determined. These results are shown in Table 4.
From these results, the weight of consumables required a unit length of 38 mm thick mild steelwas determined and tabulated in Table 4. It can be seen that the combination requiring the leastconsumable weight was the 0.30 mm/1.04 mm orifice/nozzle combination with an abrasive flowrate of 240 g/min. To assess the effect of reducing the pressure, the cutting performance of thissame orifice / nozzle combination and an abrasive flow rate of 170 g/min was measured. Asshown in Table 3, there is a dramatic increase in weight of consumables as the pressure isreduced from 103 MPa to 34 MPa.
The results of all of these trials were combined in an empirical cutting model given by
77.01.077.091.168.1477.0 −= umddPh ano (4)
where h is the depth of cut in mm, P is the water pressure in MPa, do is the orifice diameter inmm, dn is the nozzle diameter in mm, ma is the abrasive flow rate in g/min, and u is the jettraverse speed in mm per minute. Figure 6 shows the predicted depth of cut vs. the actual depthof cut, again demonstrating reasonable correlation of predicted and observed cutting depth.
6. EFFECT OF STANDOFF DISTANCE, MULTIPLE PASSES AND ABRASIVE TYPE
The final series of trials were designed to provide an assessment of the effect of standoffdistance, multiple passes, abrasive size and abrasive type on cutting performance. For thesetrials, the 0.30 mm/1.04 mm orifice/nozzle combination was used. The water pressure was 103MPa . For the standoff distance trials, garnet #80 abrasive at a flow rate of 240 g/min was used.As seen in Figure 7, there is little variation in cutting depth for standoff distances less than about4 mm. There is a slight reduction in cutting performance if the standoff distance is increased to13 mm.
The effect of multiple passes on cutting performance is shown in Figure 8. In this plot, the totaltime required to penetrate 38 mm mild steel was determined for the 0.30 mm/1.04 mmorifice/nozzle combination, a water pressure of 103 MPa, a standoff distance of 1.0 mm and agarnet #80 abrasive at a flow rate of 240 g/min. It is seen that the most effective cutting mode isa single pass. This is believed to be due to the reduction in cutting performance with standoffdistance, particularly for the final passes where the standoff distance is large.
The effects of abrasive type and size on cutting performance are shown in Fig. 10. Two abrasivematerials, garnet and aluminum oxide (Al2O3) and two sizes #80 and #120 were evaluated. Asshown in Figure 9, there is little effect on cutting performance, with garnet #120 providing aslightly higher cutting depth.
7. CONCLUSIONS
In this study, AWJ cutting of mild steel at low pressures was investigated. A Taguchi basedexperimental design was implemented to identify combinations of parameters which provideeffective cutting. Another series of trials was performed to identify parameters which provideadequate abrasive entrainment. It was found that for a given orifice/nozzle combination, acritical pressure exists, below which abrasive entrainment is difficult to achieve. A parametriccutting model was developed and applied to identify cutting conditions which minimize abrasiveand water consumption. A study of standoff distance demonstrated that cutting performance isindependent of standoff distance for standoff distances less than about 4 mm. It was also shownthat multiple passes at higher speeds did not improve performance as compared to slower singlepass cutting. Finally, it was shown that abrasive materials garnet and aluminum oxide andabrasive mesh sizes #80 and #120 gave comparable cutting performance.
8. ACKNOWLEDGEMENTS
Financial support from the Office of Special Technology is gratefully acknowledged. Theauthors would also like to thank Russell C. Ide and Jose Almeida for their assistance in preparingthe figures.
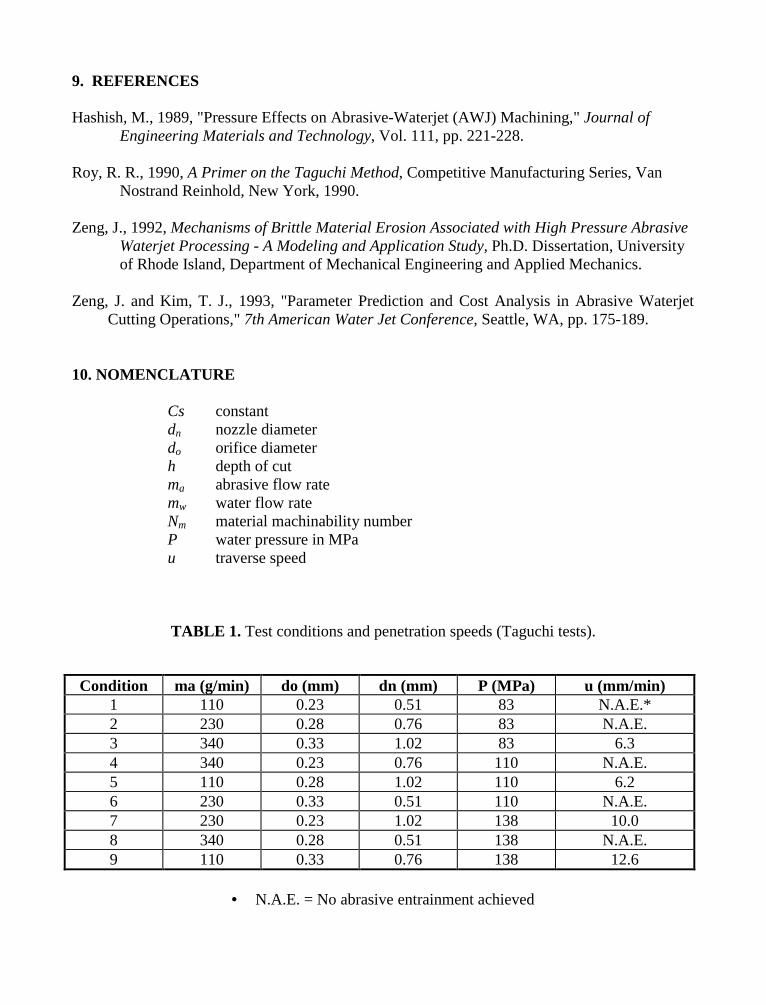
9. REFERENCES
Hashish, M., 1989, "Pressure Effects on Abrasive-Waterjet (AWJ) Machining," Journal ofEngineering Materials and Technology, Vol. 111, pp. 221-228.
Roy, R. R., 1990, A Primer on the Taguchi Method, Competitive Manufacturing Series, VanNostrand Reinhold, New York, 1990.
Zeng, J., 1992, Mechanisms of Brittle Material Erosion Associated with High Pressure AbrasiveWaterjet Processing - A Modeling and Application Study, Ph.D. Dissertation, Universityof Rhode Island, Department of Mechanical Engineering and Applied Mechanics.
Zeng, J. and Kim, T. J., 1993, "Parameter Prediction and Cost Analysis in Abrasive WaterjetCutting Operations," 7th American Water Jet Conference, Seattle, WA, pp. 175-189.
10. NOMENCLATURE
Cs constantdn nozzle diameterdo orifice diameterh depth of cutma abrasive flow ratemw water flow rateNm material machinability numberP water pressure in MPau traverse speed
TABLE 1. Test conditions and penetration speeds (Taguchi tests).
Condition ma (g/min) do (mm) dn (mm) P (MPa) u (mm/min)1 110 0.23 0.51 83 N.A.E.*2 230 0.28 0.76 83 N.A.E.3 340 0.33 1.02 83 6.34 340 0.23 0.76 110 N.A.E.5 110 0.28 1.02 110 6.26 230 0.33 0.51 110 N.A.E.7 230 0.23 1.02 138 10.08 340 0.28 0.51 138 N.A.E.9 110 0.33 0.76 138 12.6
• N.A.E. = No abrasive entrainment achieved
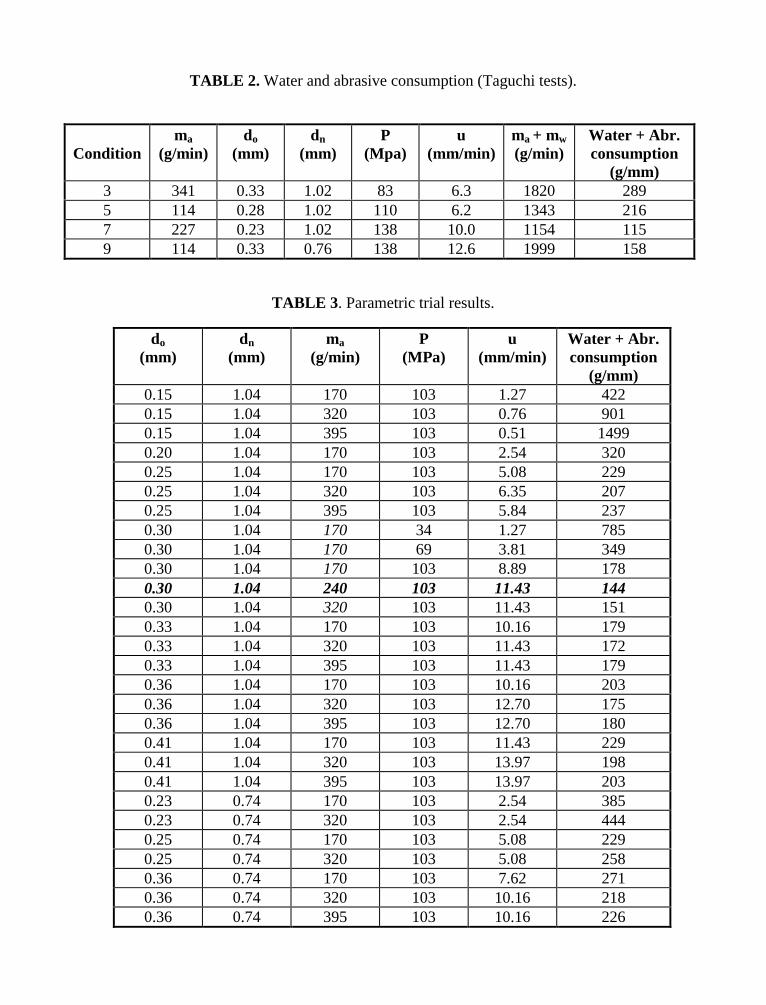
TABLE 2. Water and abrasive consumption (Taguchi tests).
Conditionma
(g/min)do
(mm)dn
(mm)P
(Mpa)u
(mm/min)ma + mw
(g/min)Water + Abr.consumption
(g/mm)3 341 0.33 1.02 83 6.3 1820 2895 114 0.28 1.02 110 6.2 1343 2167 227 0.23 1.02 138 10.0 1154 1159 114 0.33 0.76 138 12.6 1999 158
TABLE 3 . Parametric trial results.
do
(mm)dn
(mm)ma
(g/min)P
(MPa)u
(mm/min)Water + Abr.consumption
(g/mm)0.15 1.04 170 103 1.27 4220.15 1.04 320 103 0.76 9010.15 1.04 395 103 0.51 14990.20 1.04 170 103 2.54 3200.25 1.04 170 103 5.08 2290.25 1.04 320 103 6.35 2070.25 1.04 395 103 5.84 2370.30 1.04 170 34 1.27 7850.30 1.04 170 69 3.81 3490.30 1.04 170 103 8.89 1780.30 1.04 240 103 11.43 1440.30 1.04 320 103 11.43 1510.33 1.04 170 103 10.16 1790.33 1.04 320 103 11.43 1720.33 1.04 395 103 11.43 1790.36 1.04 170 103 10.16 2030.36 1.04 320 103 12.70 1750.36 1.04 395 103 12.70 1800.41 1.04 170 103 11.43 2290.41 1.04 320 103 13.97 1980.41 1.04 395 103 13.97 2030.23 0.74 170 103 2.54 3850.23 0.74 320 103 2.54 4440.25 0.74 170 103 5.08 2290.25 0.74 320 103 5.08 2580.36 0.74 170 103 7.62 2710.36 0.74 320 103 10.16 2180.36 0.74 395 103 10.16 226
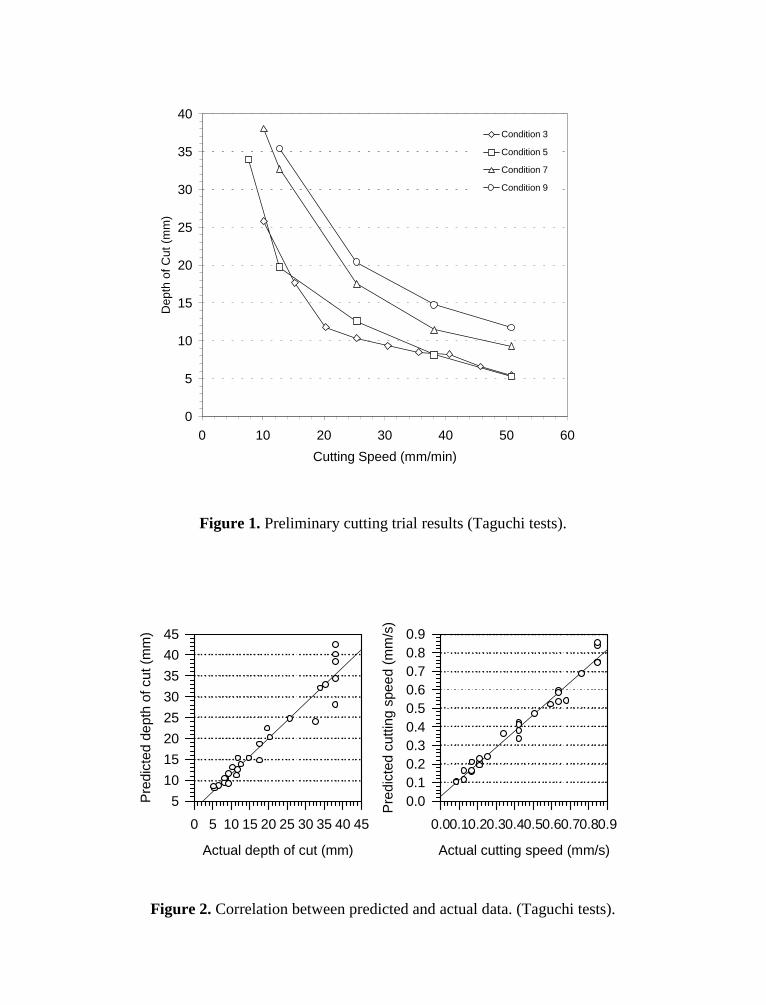
Figure 1. Preliminary cutting trial results (Taguchi tests).
Actual depth of cut (mm)
0 5 10 15 20 25 30 35 40 45
Pre
dict
ed d
epth
of c
ut (
mm
)
5
10
15
20
25
30
35
40
45
Actual cutting speed (mm/s)
0.00.10.20.30.40.50.60.70.80.9
Pre
dict
ed c
uttin
g sp
eed
(mm
/s)
0.00.10.20.30.40.50.60.70.80.9
Figure 2. Correlation between predicted and actual data. (Taguchi tests).
0
5
10
15
20
25
30
35
40
0 10 20 30 40 50 60
Cutting Speed (mm/min)
Dep
th o
f Cut
(m
m)
Condition 3
Condition 5
Condition 7
Condition 9
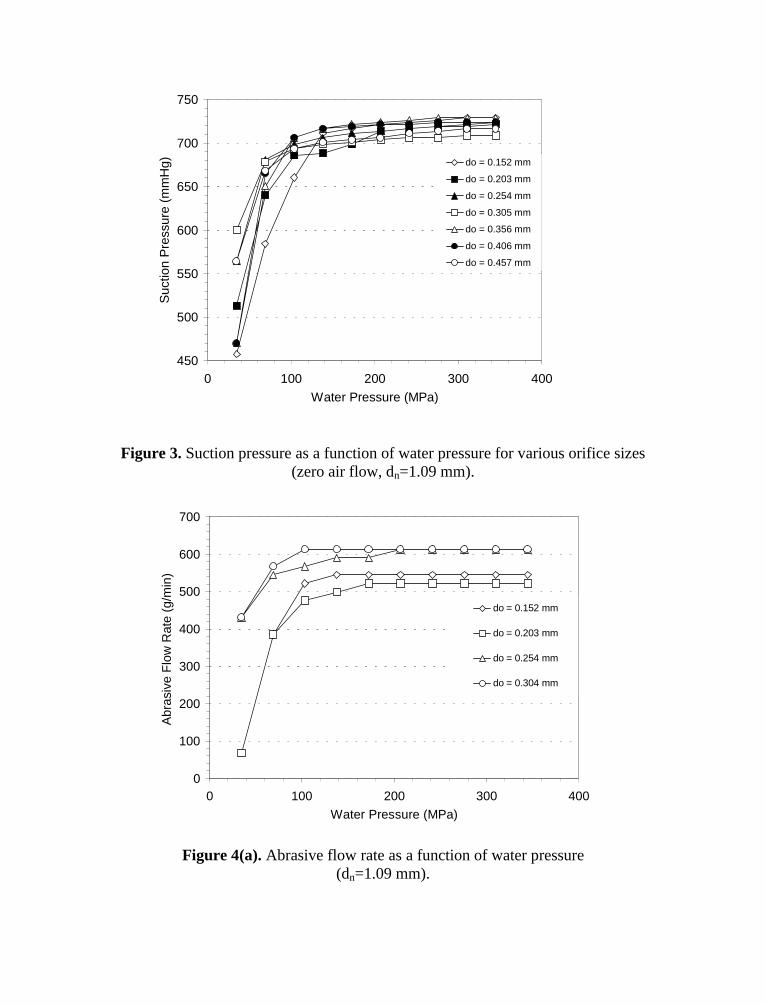
Figure 3. Suction pressure as a function of water pressure for various orifice sizes(zero air flow, dn=1.09 mm).
Figure 4(a). Abrasive flow rate as a function of water pressure(dn=1.09 mm).
450
500
550
600
650
700
750
0 100 200 300 400
Water Pressure (MPa)
Suc
tion
Pre
ssur
e (m
mH
g) do = 0.152 mm
do = 0.203 mm
do = 0.254 mm
do = 0.305 mm
do = 0.356 mm
do = 0.406 mm
do = 0.457 mm
0
100
200
300
400
500
600
700
0 100 200 300 400
Water Pressure (MPa)
Abr
asiv
e F
low
Rat
e (g
/min
)
do = 0.152 mm
do = 0.203 mm
do = 0.254 mm
do = 0.304 mm
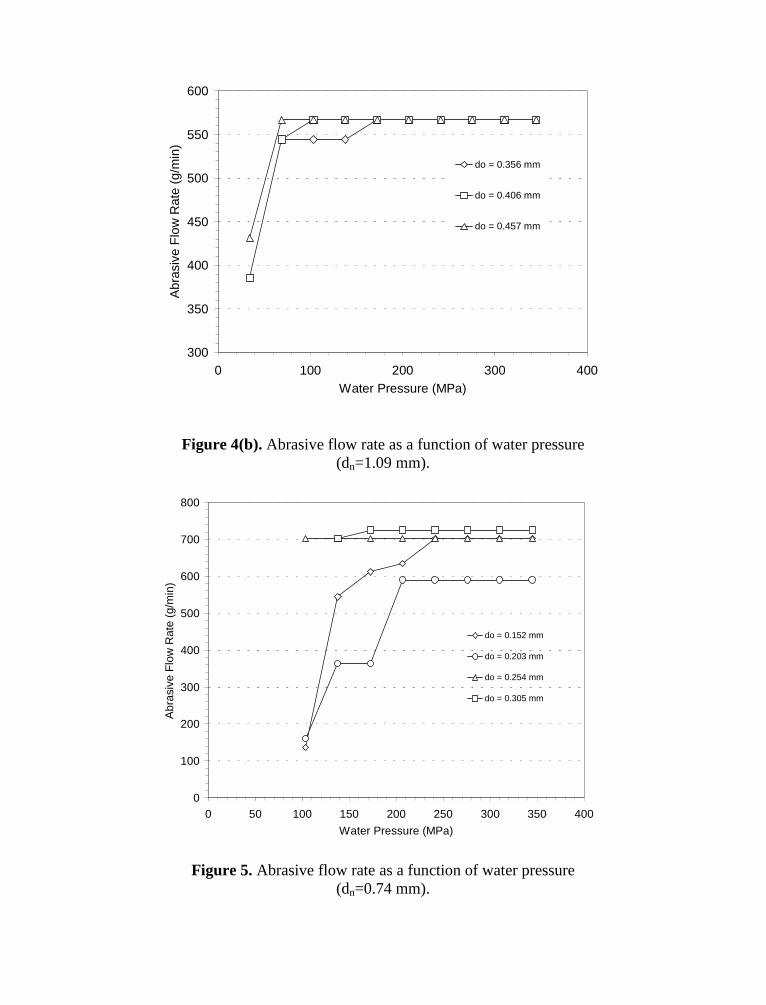
Figure 4(b). Abrasive flow rate as a function of water pressure(dn=1.09 mm).
Figure 5. Abrasive flow rate as a function of water pressure(dn=0.74 mm).
300
350
400
450
500
550
600
0 100 200 300 400Water Pressure (MPa)
Abr
asiv
e F
low
Rat
e (g
/min
)do = 0.356 mm
do = 0.406 mm
do = 0.457 mm
0
100
200
300
400
500
600
700
800
0 50 100 150 200 250 300 350 400
Water Pressure (MPa)
Abr
asiv
e F
low
Rat
e (g
/min
)
do = 0.152 mm
do = 0.203 mm
do = 0.254 mm
do = 0.305 mm
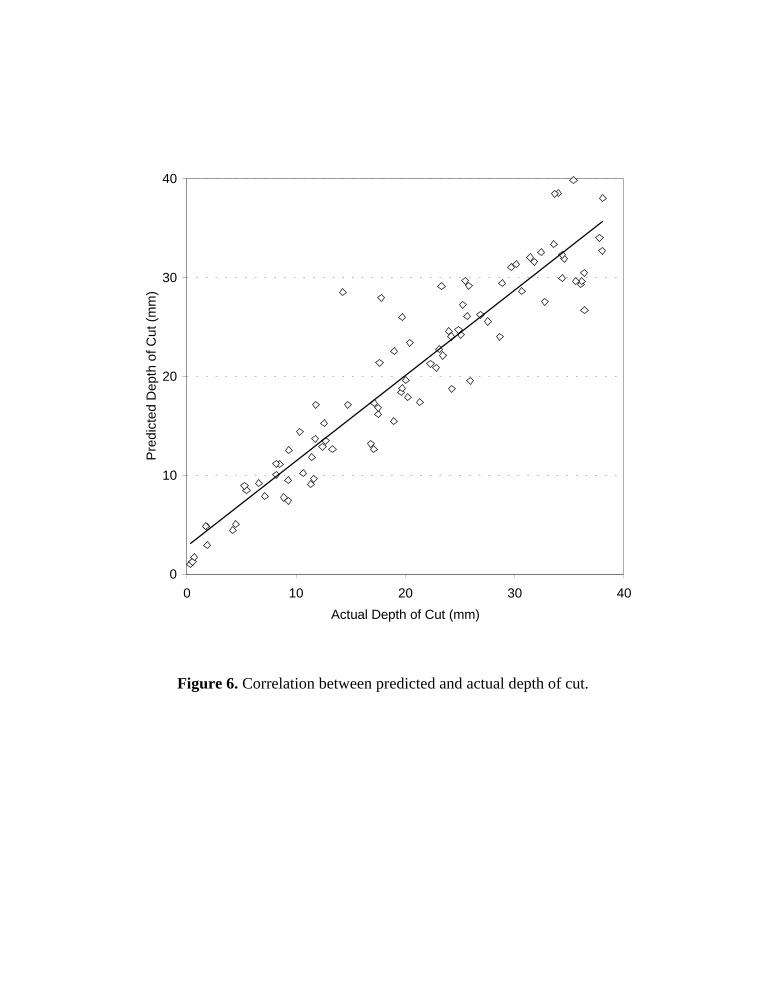
Figure 6. Correlation between predicted and actual depth of cut.
0
10
20
30
40
0 10 20 30 40
Actual Depth of Cut (mm)
Pre
dict
ed D
epth
of C
ut (
mm
)
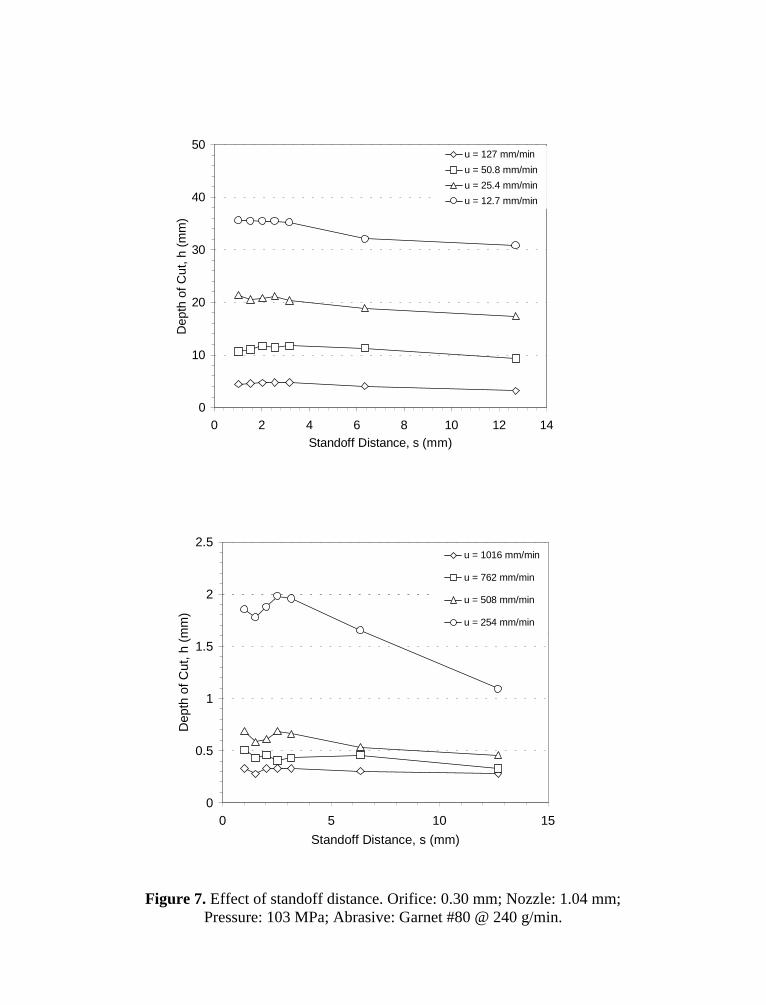
Figure 7. Effect of standoff distance. Orifice: 0.30 mm; Nozzle: 1.04 mm;Pressure: 103 MPa; Abrasive: Garnet #80 @ 240 g/min.
0
10
20
30
40
50
0 2 4 6 8 10 12 14Standoff Distance, s (mm)
Dep
th o
f Cut
, h (
mm
)
u = 127 mm/min
u = 50.8 mm/min
u = 25.4 mm/min
u = 12.7 mm/min
0
0.5
1
1.5
2
2.5
0 5 10 15
Standoff Distance, s (mm)
Dep
th o
f Cut
, h (
mm
)
u = 1016 mm/min
u = 762 mm/min
u = 508 mm/min
u = 254 mm/min
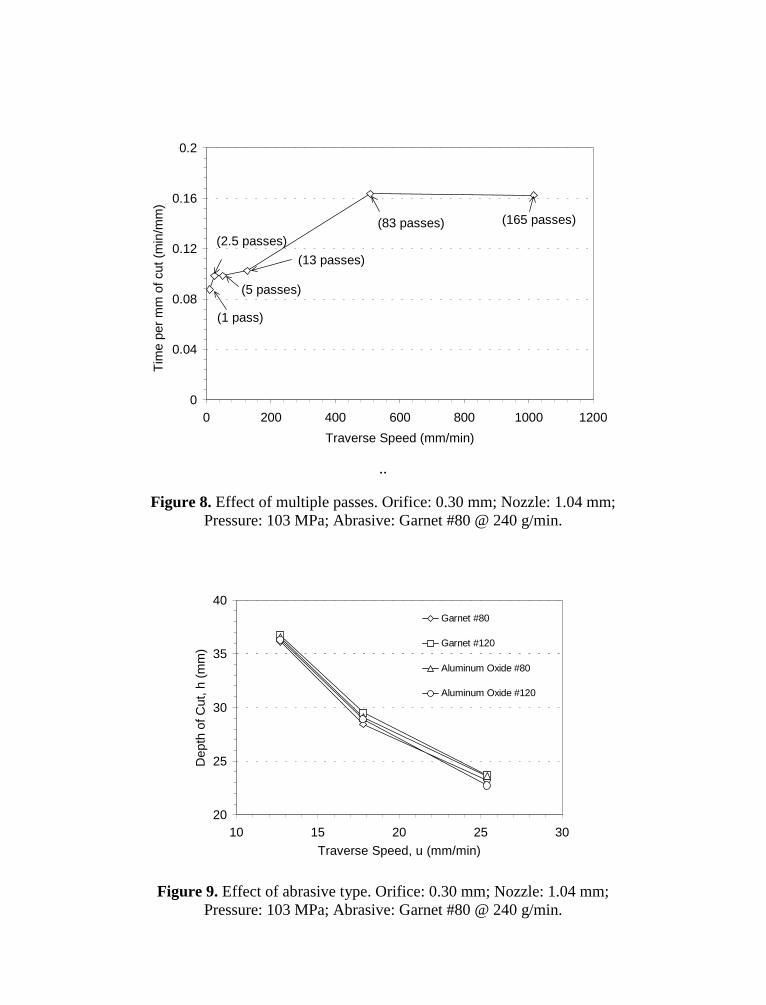
..
Figure 8. Effect of multiple passes. Orifice: 0.30 mm; Nozzle: 1.04 mm;Pressure: 103 MPa; Abrasive: Garnet #80 @ 240 g/min.
Figure 9. Effect of abrasive type. Orifice: 0.30 mm; Nozzle: 1.04 mm;Pressure: 103 MPa; Abrasive: Garnet #80 @ 240 g/min.
20
25
30
35
40
10 15 20 25 30
Traverse Speed, u (mm/min)
Dep
th o
f Cut
, h (
mm
)
Garnet #80
Garnet #120
Aluminum Oxide #80
Aluminum Oxide #120
0
0.04
0.08
0.12
0.16
0.2
0 200 400 600 800 1000 1200
Traverse Speed (mm/min)
Tim
e pe
r m
m o
f cut
(m
in/m
m)
(1 pass)
(2.5 passes)
(5 passes)
(13 passes)
(83 passes) (165 passes)
10th American Waterjet ConferenceAugust 14-17, 1999: Houston, Texas
Paper 12
MODELING AND SIMULATION OF PRESSURE FLUCTUATIONS
IN HIGH PRESSURE WATERJETS
M. Tremblay and M. RamuluDepartment of Mechanical Engineering,
University of Washington, Seattle
ABSTRACT
The pressure fluctuations within a waterjet machine were investigated through a computersimulation and experimental analysis. A mathematical model accounting for the compressibilityof water at high pressures was derived. The variation of the water properties at high pressuresand the acceleration and stagnation motion of the piston were also incorporated in the model inorder to determine which system parameters influenced the pressure fluctuations the most.Simulation and experimental results were compared and observations were made regarding thetime history of the discharge pressure. It was found that the motion of the piston and theoperating pressure condition greatly influenced the magnitude of the pressure fluctuations.Furthermore, it was noted that increasing the bulk modulus and/or decreasing the density of thewater resulted in a pressure fluctuation increase.
Organized and Sponsored by the WaterJet Technology Association
1. INTRODUCTION
Over the past few years, waterjetting technology has drawn a lot of attention in industry as wellas in academia. Waterjets are a versatile, non-traditional machining tool that are currently usedin many different industrial operations. Waterjet machines have found there way into a varietyof applications [1]. Considerable waterjet research has focused on understanding the mechanicsof material removal due to the impingement of a high pressure water jet. Work has also beendone in equipment development to reduce pressure fluctuations within the waterjet andoptimize the cutting process. Research has shown that pressure and flow variations are highlyundesirable, especially in high precision cutting applications. For these applications, anyvariations in jet quality can lead to unacceptable surface finish. These undesirable fluctuationshave also been found to cause a reduction in the life of many waterjet system components. Forinstance, the nozzle life can be as low as a few hundred hours. Frequent replacement of thenozzle makes this cutting technique expensive and leads to costly downtime. The pressurepulsations in reciprocating pumps can also result in valve failures (due to cavitation) and fluidpulsations in the pipes. Furthermore, the pressure fluctuations are often a constraining factorthat limits the applications where the waterjet machine can be used.
Better understanding of the important system parameters that cause these fluctuations is neededin order to design a machine that could eliminate the pressure pulsations occurring throughoutthe waterjet system. This would allow the waterjet machine to perform more accurately in highprecision applications and increase the achievable cutting tolerance.
Recently, several investigators [4,5] have used computer models to simulate intensifier pumpdynamics. Most of the research in this field was driven by the modeling of the pressurefluctuations in order to better understand their origin and effects on the pump efficiency andquality of cut. This lead to various alternative intensifier designs that attempted to alleviate thepressure fluctuation problem [2,3]. Although these designs effectively reduce the amount offluctuation, there is still room for improvement and analysis of the system. The work done indetermining the pressure fluctuations falls under three categories: mathematical modeling [7,8],computer simulation [4,5] and experimental analysis [6]. It should be mentioned that the authorswho focused on theoretically solving the problem at hand through modeling also includedexperimental data to corroborate their findings. However, not much emphasis was put on theexperimental analysis and the methods used to arrive at the experimental data were not wellconveyed. Only two papers [2,6] presented on-line experimental data of the system pressurevariations. Ideally, the three types of analysis could be combined to obtain a clear picture of thesystem dynamics that cause the pressure fluctuations. The purpose of this research is to obtain abetter understanding of the system characteristics that lead to these unwanted pulsations.Therefore, an attempt is made to develop a computer simulation that accounts for thereciprocating pump dynamics in order to predict the pressure fluctuations observed throughexperimentation.
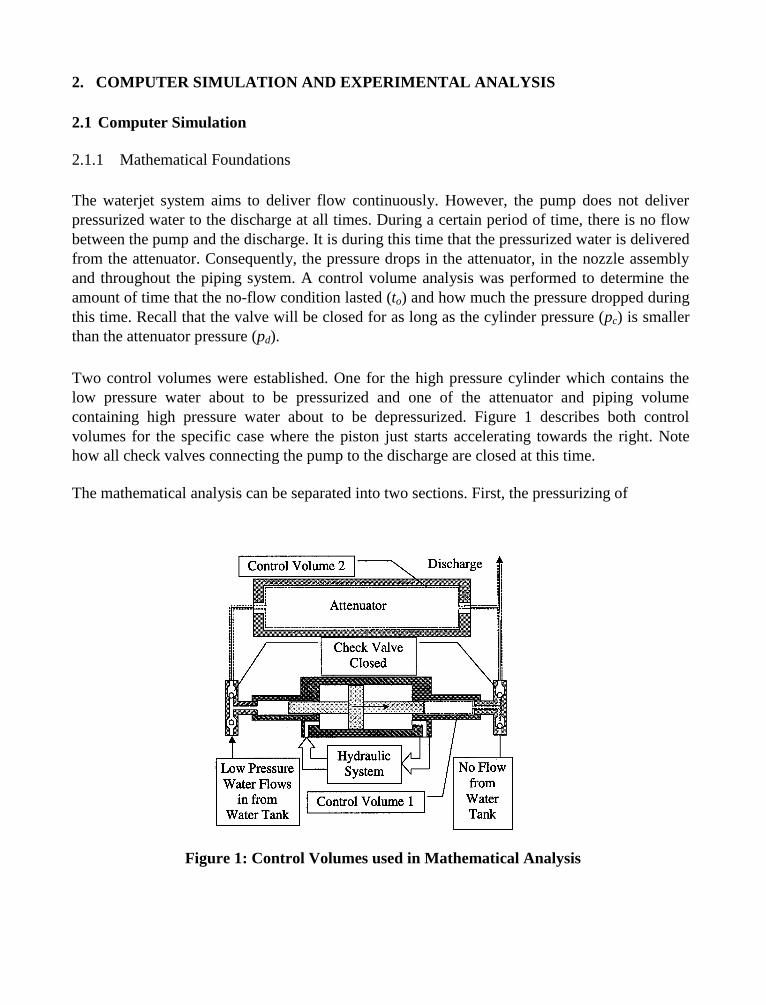
2. COMPUTER SIMULATION AND EXPERIMENTAL ANALYSIS
2.1 Computer Simulation
2.1.1 Mathematical Foundations
The waterjet system aims to deliver flow continuously. However, the pump does not deliverpressurized water to the discharge at all times. During a certain period of time, there is no flowbetween the pump and the discharge. It is during this time that the pressurized water is deliveredfrom the attenuator. Consequently, the pressure drops in the attenuator, in the nozzle assemblyand throughout the piping system. A control volume analysis was performed to determine theamount of time that the no-flow condition lasted (to) and how much the pressure dropped duringthis time. Recall that the valve will be closed for as long as the cylinder pressure (pc) is smallerthan the attenuator pressure (pd).
Two control volumes were established. One for the high pressure cylinder which contains thelow pressure water about to be pressurized and one of the attenuator and piping volumecontaining high pressure water about to be depressurized. Figure 1 describes both controlvolumes for the specific case where the piston just starts accelerating towards the right. Notehow all check valves connecting the pump to the discharge are closed at this time.
The mathematical analysis can be separated into two sections. First, the pressurizing of
Figure 1: Control Volumes used in Mathematical Analysis
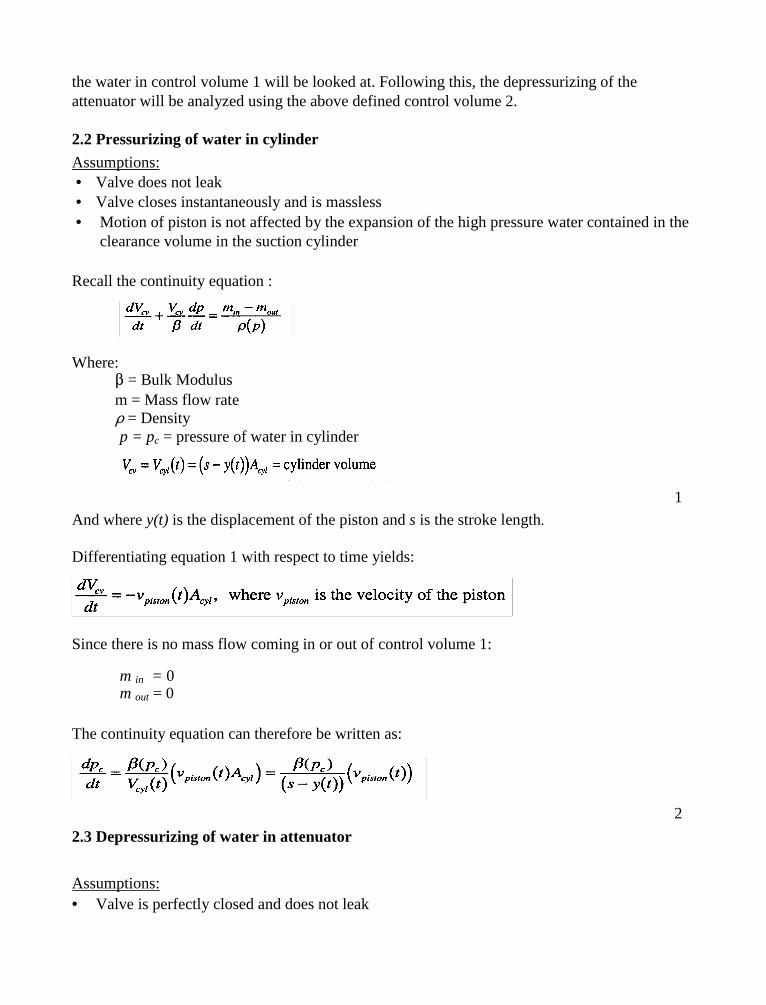
the water in control volume 1 will be looked at. Following this, the depressurizing of theattenuator will be analyzed using the above defined control volume 2.
2.2 Pressurizing of water in cylinder
Assumptions:• Valve does not leak• Valve closes instantaneously and is massless• Motion of piston is not affected by the expansion of the high pressure water contained in the
clearance volume in the suction cylinder
Recall the continuity equation :
Where: = Bulk Modulusm = Mass flow rate' = Densityp = pc = pressure of water in cylinder
1
And where y(t) is the displacement of the piston and s is the stroke length.
Differentiating equation 1 with respect to time yields:
Since there is no mass flow coming in or out of control volume 1:
m in = 0m out = 0
The continuity equation can therefore be written as:
2
2.3 Depressurizing of water in attenuator
Assumptions:• Valve is perfectly closed and does not leak
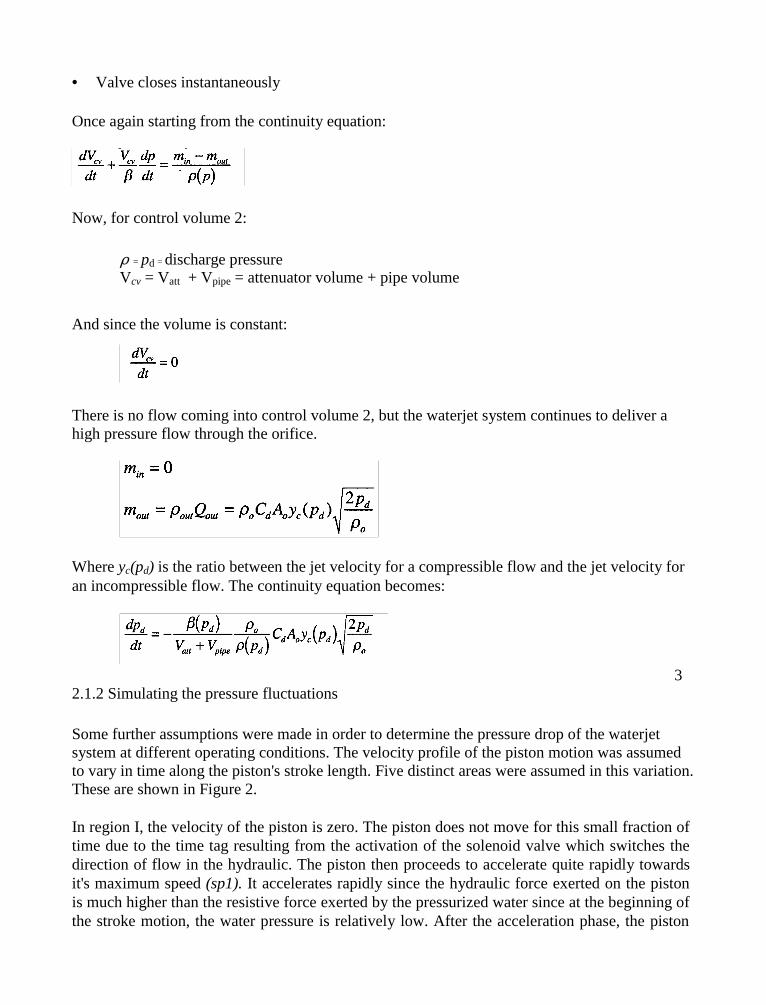
• Valve closes instantaneously
Once again starting from the continuity equation:
Now, for control volume 2:
' = pd = discharge pressureVcv = Vatt + Vpipe = attenuator volume + pipe volume
And since the volume is constant:
There is no flow coming into control volume 2, but the waterjet system continues to deliver ahigh pressure flow through the orifice.
Where yc(pd) is the ratio between the jet velocity for a compressible flow and the jet velocity foran incompressible flow. The continuity equation becomes:
32.1.2 Simulating the pressure fluctuations
Some further assumptions were made in order to determine the pressure drop of the waterjetsystem at different operating conditions. The velocity profile of the piston motion was assumedto vary in time along the piston's stroke length. Five distinct areas were assumed in this variation.These are shown in Figure 2.
In region I, the velocity of the piston is zero. The piston does not move for this small fraction oftime due to the time tag resulting from the activation of the solenoid valve which switches thedirection of flow in the hydraulic. The piston then proceeds to accelerate quite rapidly towardsit's maximum speed (sp1). It accelerates rapidly since the hydraulic force exerted on the pistonis much higher than the resistive force exerted by the pressurized water since at the beginning ofthe stroke motion, the water pressure is relatively low. After the acceleration phase, the piston
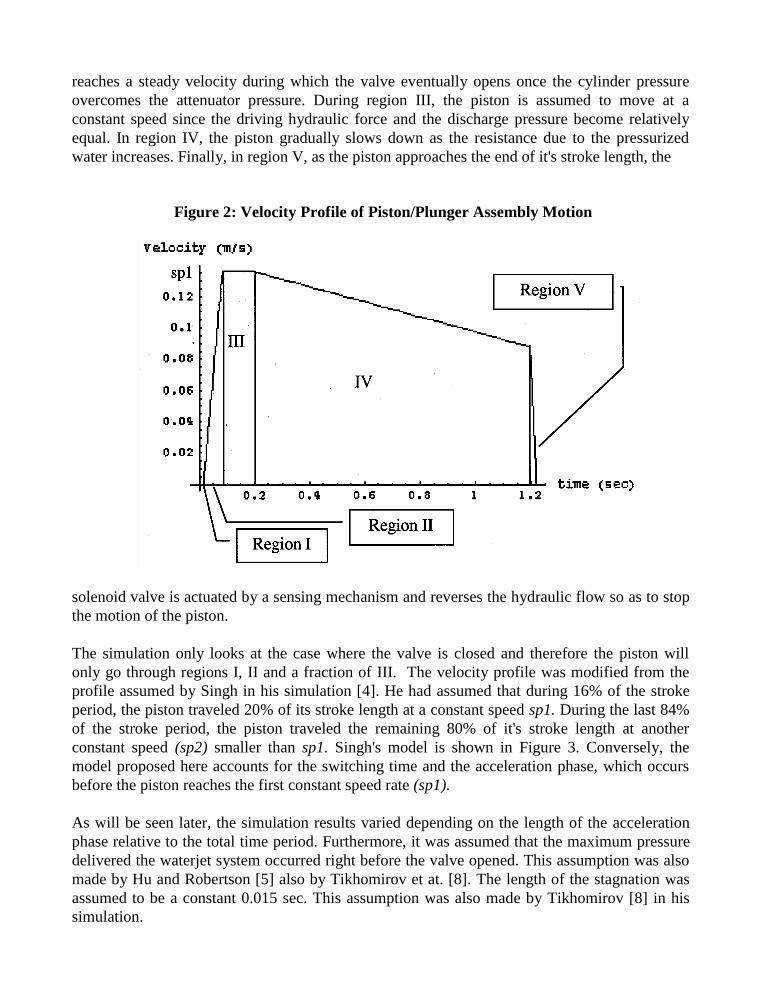
reaches a steady velocity during which the valve eventually opens once the cylinder pressureovercomes the attenuator pressure. During region III, the piston is assumed to move at aconstant speed since the driving hydraulic force and the discharge pressure become relativelyequal. In region IV, the piston gradually slows down as the resistance due to the pressurizedwater increases. Finally, in region V, as the piston approaches the end of it's stroke length, the
Figure 2: Velocity Profile of Piston/Plunger Assembly Motion
solenoid valve is actuated by a sensing mechanism and reverses the hydraulic flow so as to stopthe motion of the piston.
The simulation only looks at the case where the valve is closed and therefore the piston willonly go through regions I, II and a fraction of III. The velocity profile was modified from theprofile assumed by Singh in his simulation [4]. He had assumed that during 16% of the strokeperiod, the piston traveled 20% of its stroke length at a constant speed sp1. During the last 84%of the stroke period, the piston traveled the remaining 80% of it's stroke length at anotherconstant speed (sp2) smaller than sp1. Singh's model is shown in Figure 3. Conversely, themodel proposed here accounts for the switching time and the acceleration phase, which occursbefore the piston reaches the first constant speed rate (sp1).
As will be seen later, the simulation results varied depending on the length of the accelerationphase relative to the total time period. Furthermore, it was assumed that the maximum pressuredelivered the waterjet system occurred right before the valve opened. This assumption was alsomade by Hu and Robertson [5] also by Tikhomirov et at. [8]. The length of the stagnation wasassumed to be a constant 0.015 sec. This assumption was also made by Tikhomirov [8] in hissimulation.
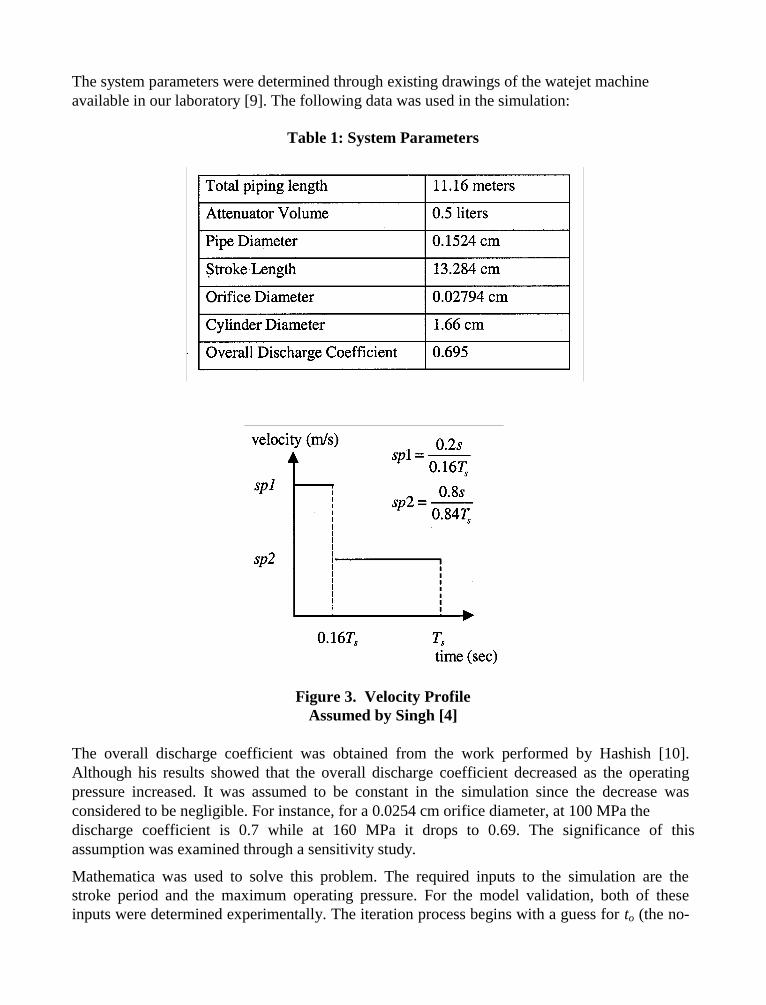
The system parameters were determined through existing drawings of the watejet machineavailable in our laboratory [9]. The following data was used in the simulation:
Table 1: System Parameters
Figure 3. Velocity ProfileAssumed by Singh [4]
The overall discharge coefficient was obtained from the work performed by Hashish [10].Although his results showed that the overall discharge coefficient decreased as the operatingpressure increased. It was assumed to be constant in the simulation since the decrease wasconsidered to be negligible. For instance, for a 0.0254 cm orifice diameter, at 100 MPa thedischarge coefficient is 0.7 while at 160 MPa it drops to 0.69. The significance of thisassumption was examined through a sensitivity study.
Mathematica was used to solve this problem. The required inputs to the simulation are thestroke period and the maximum operating pressure. For the model validation, both of theseinputs were determined experimentally. The iteration process begins with a guess for to (the no-
flow time) and the value of to is incremented in steps of 0.001 sec until the cylinder pressure attime to is greater or equal to the attenuator pressure. The pressure fluctuation is thereforecalculated as the maximum operating pressure minus the pressure of the attenuator at time to.
2.2 Experimental Analysis
2.2.1 Experimental Set-up
The objective of the experiment was to measure the pressure fluctuations of the pressurizedwater at the entry of the waterjet nozzle. It is very difficult to capture the pressure fluctuationswithin the nozzle itself due to its geometry and design. To adequately measure the variation ofstatic pressure, the pipe carrying the high pressure water needed to be tapped into withoutdisrupting the water flow. The pressure waveform that was obtained corresponded to that of theflow right before the nozzle orifice.
The existing pipe connecting the waterjet's on/off valve to the orifice was removed and replacedby a new pipe that had a connecting tee in it. The tee was located approximately at 17 cm fromthe orifice assembly. Swagelok's Sno-Trik connectors were used for this purpose. The branchingtube was connected to an adapter on which a pressure transducer was mounted. The adapter wasspecifically machined for this application. To obtain an accurate depiction of the pressurevariations, the system needed to be leak proof and precautions were taken in this regard. Figure4 shows the experimental set-up used to determine the pressure fluctuations.
A PCB Piezotronics pressure transducer (Model 119A11) was used to capture the pressurefluctuations. The charge output signal of the transducer was then conditioned by a chargeamplifier (PCB Model 462A). The resulting voltage signal was sent to a Tektronix digitaloscilloscope (TDS 420A). This allowed visualization of the time history of the pressurewaveform, which was then downloaded to a computer. The piezoelectric transducer did not yieldthe absolute value of pressure since it is a dynamic sensor and the steady-state componentgradually bleeds off to zero. So when the operating pressure reaches an operating pressure of200MPa, the new output voltage will bleed out the static component and the 200MPa willcorrespond zero. All measurements are therefore taken about this new zero. The transducer waswell suited for the intended application since it captured the high frequency components of thepressure waveform. These high frequency components needed to be considered since they areindicative of the sharp pressure surges and drops seen in the pressure time history results. Toobtain an absolute pressure reading, another transducer that only reads the static component
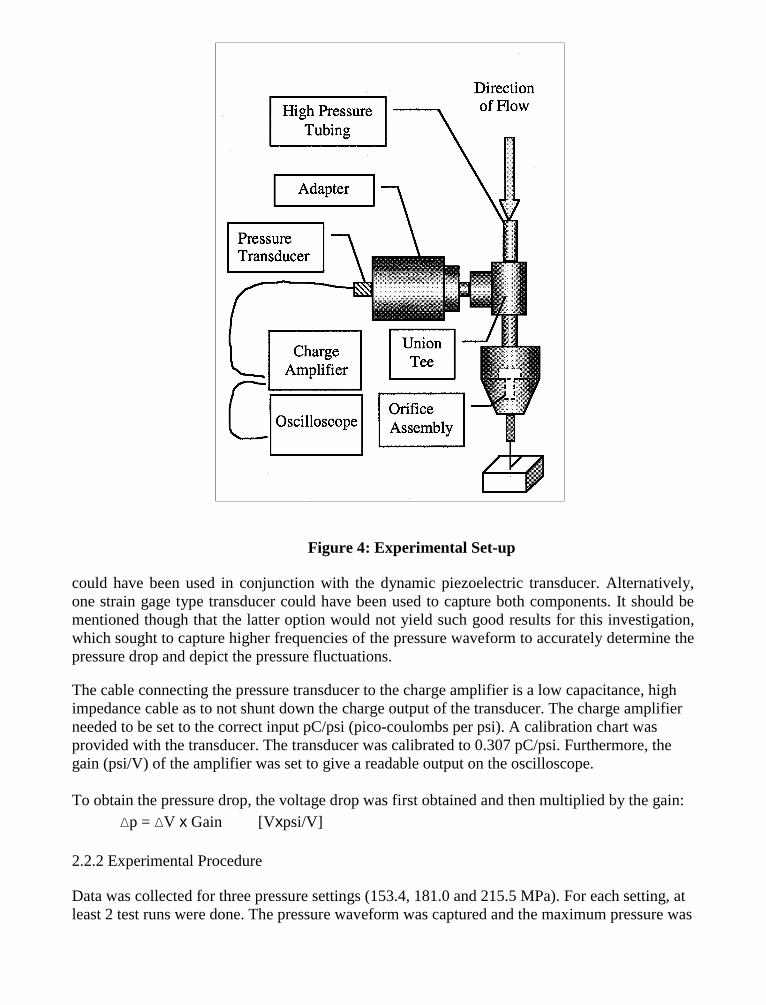
Figure 4: Experimental Set-up
could have been used in conjunction with the dynamic piezoelectric transducer. Alternatively,one strain gage type transducer could have been used to capture both components. It should bementioned though that the latter option would not yield such good results for this investigation,which sought to capture higher frequencies of the pressure waveform to accurately determine thepressure drop and depict the pressure fluctuations.
The cable connecting the pressure transducer to the charge amplifier is a low capacitance, highimpedance cable as to not shunt down the charge output of the transducer. The charge amplifierneeded to be set to the correct input pC/psi (pico-coulombs per psi). A calibration chart wasprovided with the transducer. The transducer was calibrated to 0.307 pC/psi. Furthermore, thegain (psi/V) of the amplifier was set to give a readable output on the oscilloscope.
To obtain the pressure drop, the voltage drop was first obtained and then multiplied by the gain:p = V x Gain [Vxpsi/V]
2.2.2 Experimental Procedure
Data was collected for three pressure settings (153.4, 181.0 and 215.5 MPa). For each setting, atleast 2 test runs were done. The pressure waveform was captured and the maximum pressure was
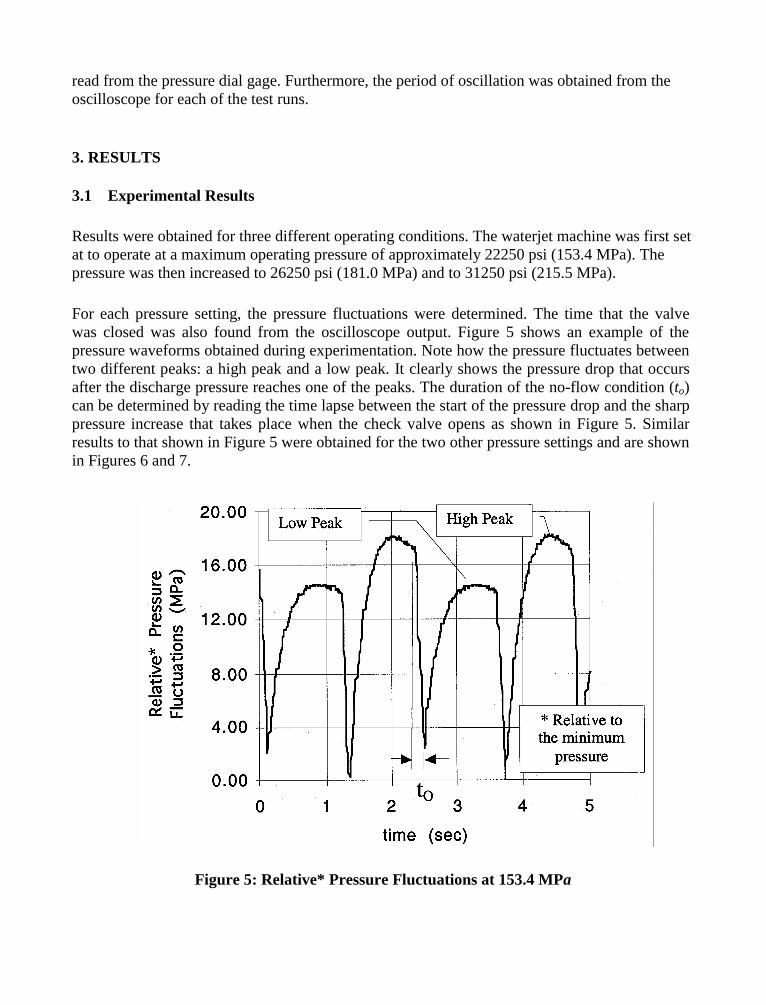
read from the pressure dial gage. Furthermore, the period of oscillation was obtained from theoscilloscope for each of the test runs.
3. RESULTS
3.1 Experimental Results
Results were obtained for three different operating conditions. The waterjet machine was first setat to operate at a maximum operating pressure of approximately 22250 psi (153.4 MPa). Thepressure was then increased to 26250 psi (181.0 MPa) and to 31250 psi (215.5 MPa).
For each pressure setting, the pressure fluctuations were determined. The time that the valvewas closed was also found from the oscilloscope output. Figure 5 shows an example of thepressure waveforms obtained during experimentation. Note how the pressure fluctuates betweentwo different peaks: a high peak and a low peak. It clearly shows the pressure drop that occursafter the discharge pressure reaches one of the peaks. The duration of the no-flow condition (to)can be determined by reading the time lapse between the start of the pressure drop and the sharppressure increase that takes place when the check valve opens as shown in Figure 5. Similarresults to that shown in Figure 5 were obtained for the two other pressure settings and are shownin Figures 6 and 7.
Figure 5: Relative* Pressure Fluctuations at 153.4 MPa
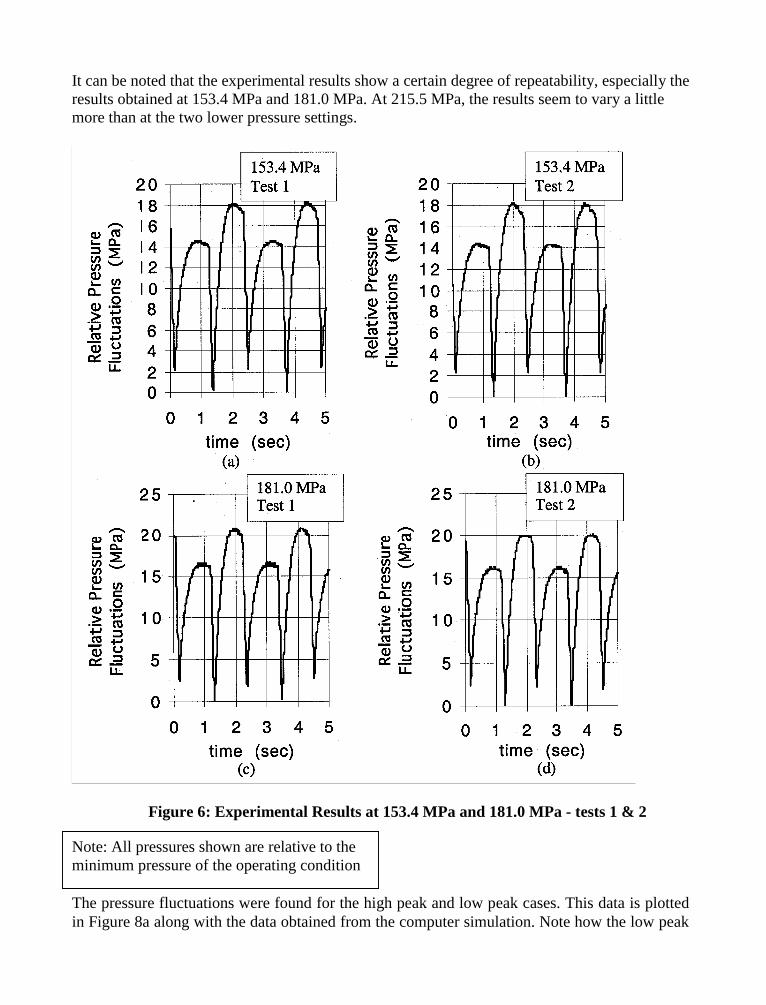
It can be noted that the experimental results show a certain degree of repeatability, especially theresults obtained at 153.4 MPa and 181.0 MPa. At 215.5 MPa, the results seem to vary a littlemore than at the two lower pressure settings.
Figure 6: Experimental Results at 153.4 MPa and 181.0 MPa - tests 1 & 2
Note: All pressures shown are relative to theminimum pressure of the operating condition
The pressure fluctuations were found for the high peak and low peak cases. This data is plottedin Figure 8a along with the data obtained from the computer simulation. Note how the low peak
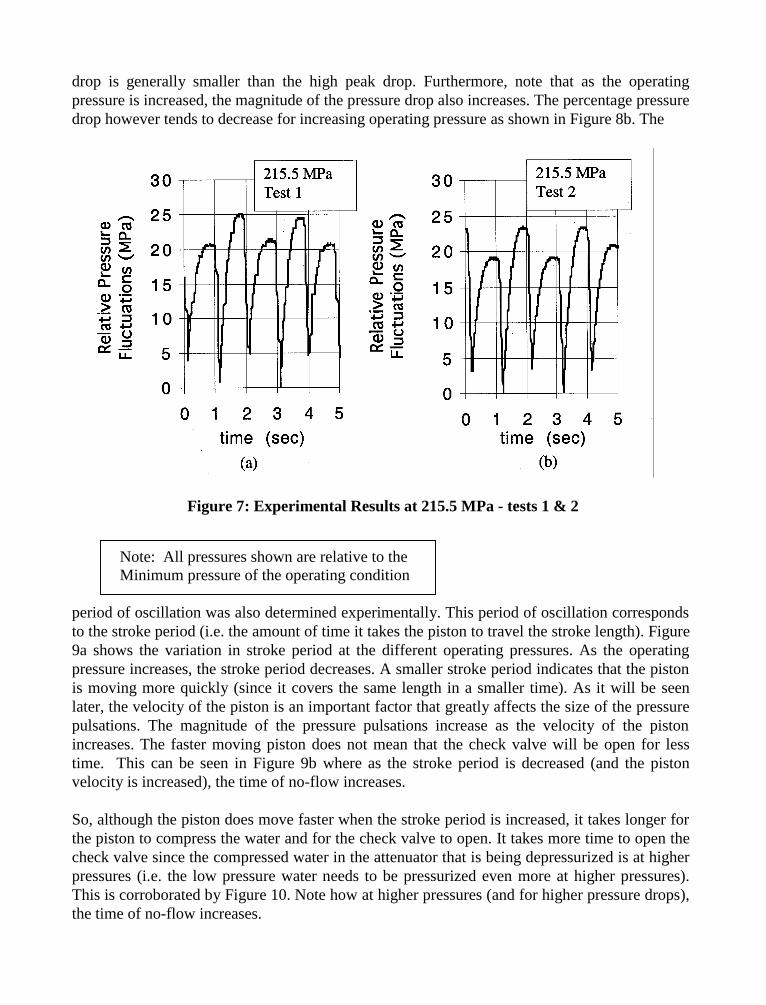
drop is generally smaller than the high peak drop. Furthermore, note that as the operatingpressure is increased, the magnitude of the pressure drop also increases. The percentage pressuredrop however tends to decrease for increasing operating pressure as shown in Figure 8b. The
Figure 7: Experimental Results at 215.5 MPa - tests 1 & 2
Note: All pressures shown are relative to theMinimum pressure of the operating condition
period of oscillation was also determined experimentally. This period of oscillation correspondsto the stroke period (i.e. the amount of time it takes the piston to travel the stroke length). Figure9a shows the variation in stroke period at the different operating pressures. As the operatingpressure increases, the stroke period decreases. A smaller stroke period indicates that the pistonis moving more quickly (since it covers the same length in a smaller time). As it will be seenlater, the velocity of the piston is an important factor that greatly affects the size of the pressurepulsations. The magnitude of the pressure pulsations increase as the velocity of the pistonincreases. The faster moving piston does not mean that the check valve will be open for lesstime. This can be seen in Figure 9b where as the stroke period is decreased (and the pistonvelocity is increased), the time of no-flow increases.
So, although the piston does move faster when the stroke period is increased, it takes longer forthe piston to compress the water and for the check valve to open. It takes more time to open thecheck valve since the compressed water in the attenuator that is being depressurized is at higherpressures (i.e. the low pressure water needs to be pressurized even more at higher pressures).This is corroborated by Figure 10. Note how at higher pressures (and for higher pressure drops),the time of no-flow increases.
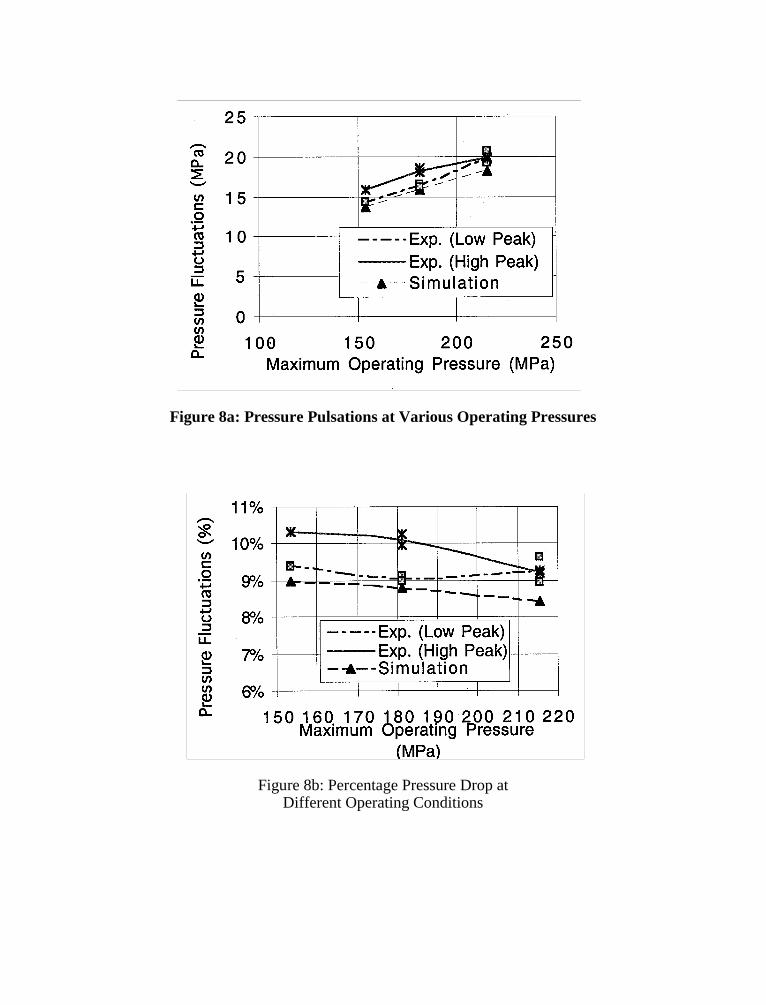
Figure 8a: Pressure Pulsations at Various Operating Pressures
Figure 8b: Percentage Pressure Drop atDifferent Operating Conditions
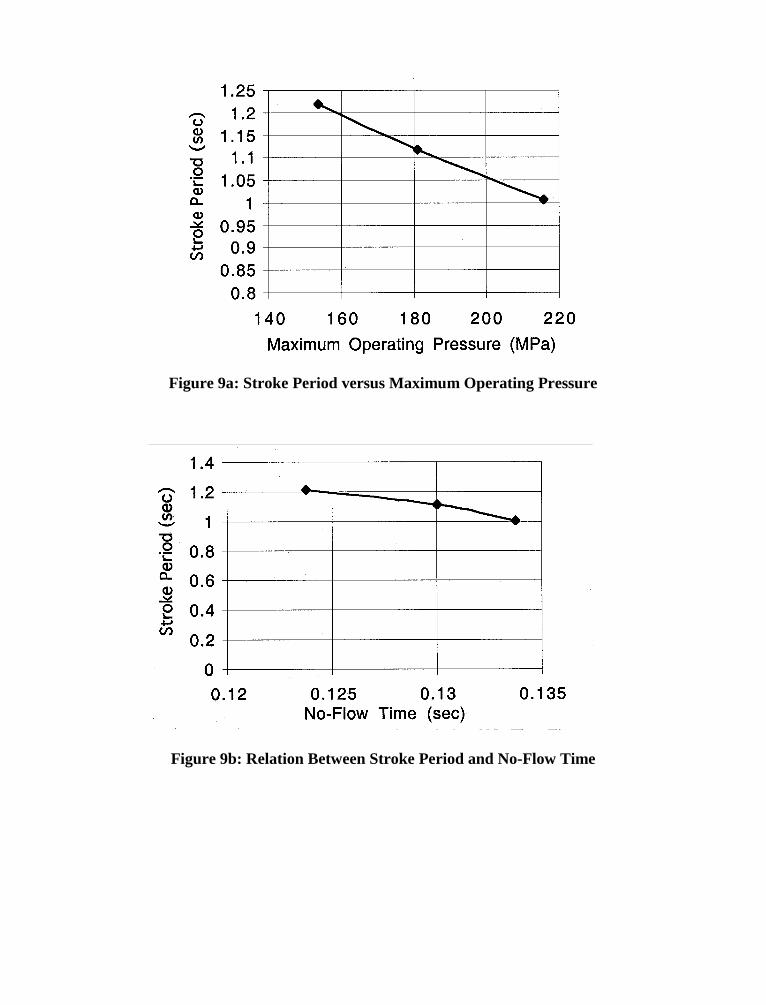
Figure 9a: Stroke Period versus Maximum Operating Pressure
Figure 9b: Relation Between Stroke Period and No-Flow Time
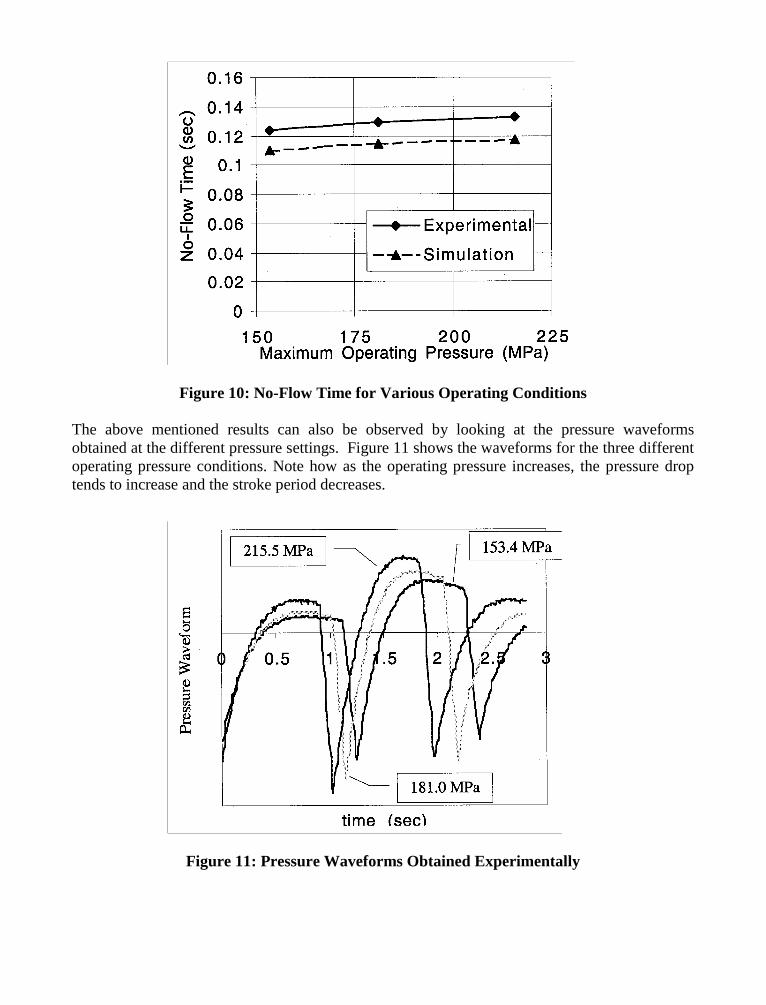
Figure 10: No-Flow Time for Various Operating Conditions
The above mentioned results can also be observed by looking at the pressure waveformsobtained at the different pressure settings. Figure 11 shows the waveforms for the three differentoperating pressure conditions. Note how as the operating pressure increases, the pressure droptends to increase and the stroke period decreases.
Figure 11: Pressure Waveforms Obtained Experimentally
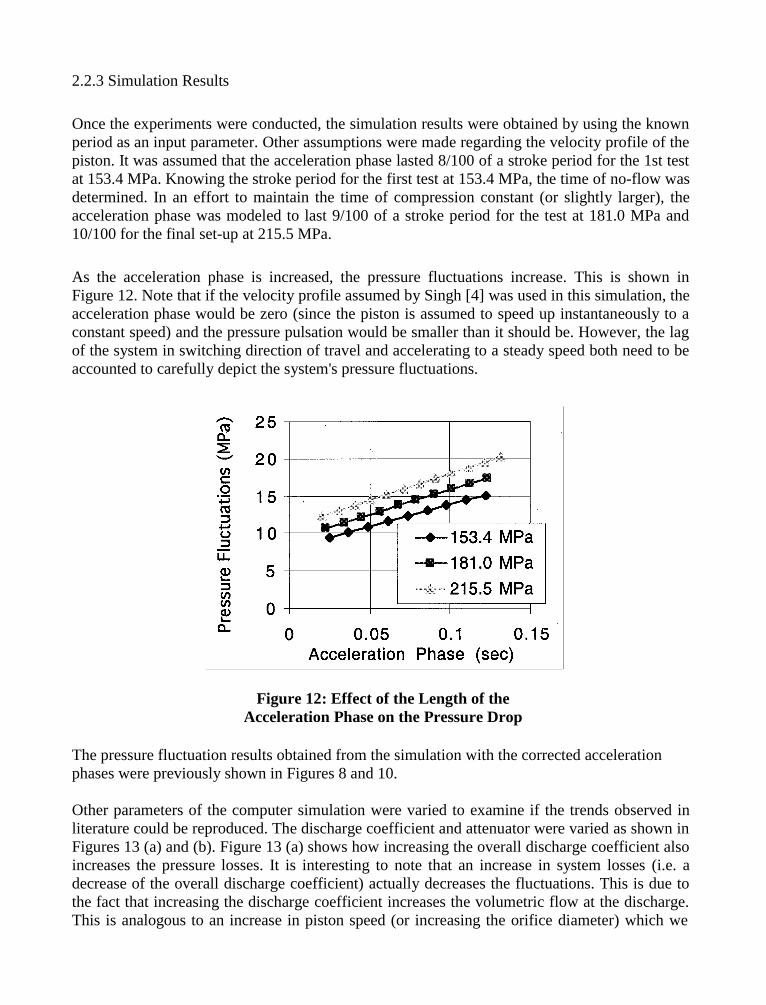
2.2.3 Simulation Results
Once the experiments were conducted, the simulation results were obtained by using the knownperiod as an input parameter. Other assumptions were made regarding the velocity profile of thepiston. It was assumed that the acceleration phase lasted 8/100 of a stroke period for the 1st testat 153.4 MPa. Knowing the stroke period for the first test at 153.4 MPa, the time of no-flow wasdetermined. In an effort to maintain the time of compression constant (or slightly larger), theacceleration phase was modeled to last 9/100 of a stroke period for the test at 181.0 MPa and10/100 for the final set-up at 215.5 MPa.
As the acceleration phase is increased, the pressure fluctuations increase. This is shown inFigure 12. Note that if the velocity profile assumed by Singh [4] was used in this simulation, theacceleration phase would be zero (since the piston is assumed to speed up instantaneously to aconstant speed) and the pressure pulsation would be smaller than it should be. However, the lagof the system in switching direction of travel and accelerating to a steady speed both need to beaccounted to carefully depict the system's pressure fluctuations.
Figure 12: Effect of the Length of theAcceleration Phase on the Pressure Drop
The pressure fluctuation results obtained from the simulation with the corrected accelerationphases were previously shown in Figures 8 and 10.
Other parameters of the computer simulation were varied to examine if the trends observed inliterature could be reproduced. The discharge coefficient and attenuator were varied as shown inFigures 13 (a) and (b). Figure 13 (a) shows how increasing the overall discharge coefficient alsoincreases the pressure losses. It is interesting to note that an increase in system losses (i.e. adecrease of the overall discharge coefficient) actually decreases the fluctuations. This is due tothe fact that increasing the discharge coefficient increases the volumetric flow at the discharge.This is analogous to an increase in piston speed (or increasing the orifice diameter) which we
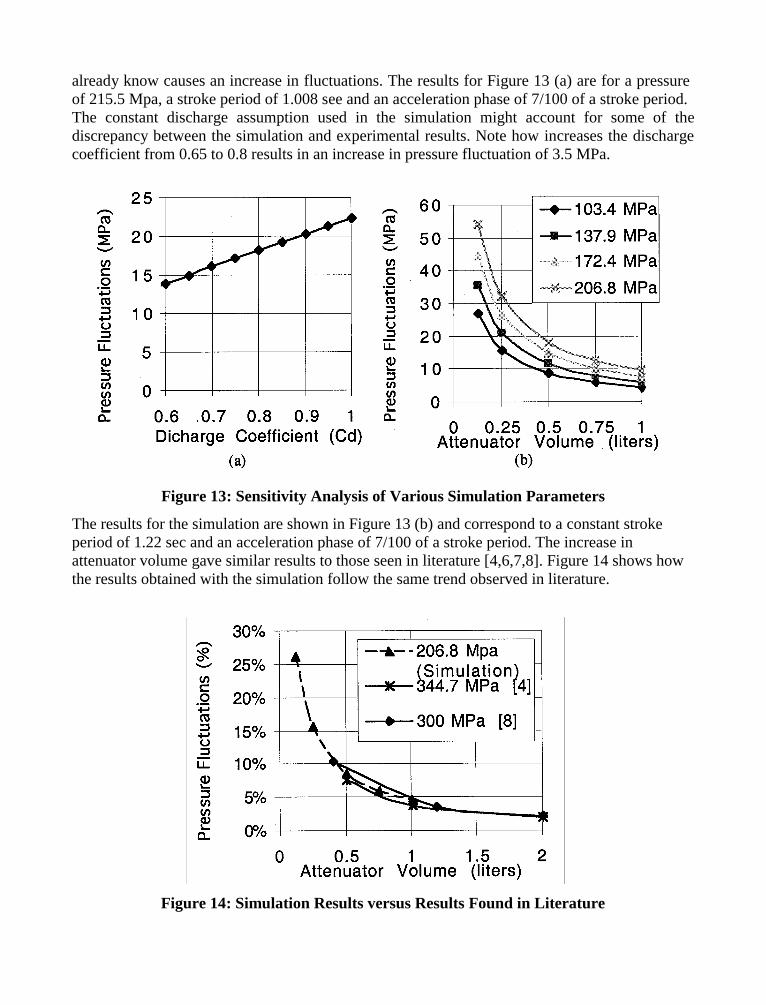
already know causes an increase in fluctuations. The results for Figure 13 (a) are for a pressureof 215.5 Mpa, a stroke period of 1.008 see and an acceleration phase of 7/100 of a stroke period.The constant discharge assumption used in the simulation might account for some of thediscrepancy between the simulation and experimental results. Note how increases the dischargecoefficient from 0.65 to 0.8 results in an increase in pressure fluctuation of 3.5 MPa.
Figure 13: Sensitivity Analysis of Various Simulation Parameters
The results for the simulation are shown in Figure 13 (b) and correspond to a constant strokeperiod of 1.22 sec and an acceleration phase of 7/100 of a stroke period. The increase inattenuator volume gave similar results to those seen in literature [4,6,7,8]. Figure 14 shows howthe results obtained with the simulation follow the same trend observed in literature.
Figure 14: Simulation Results versus Results Found in Literature
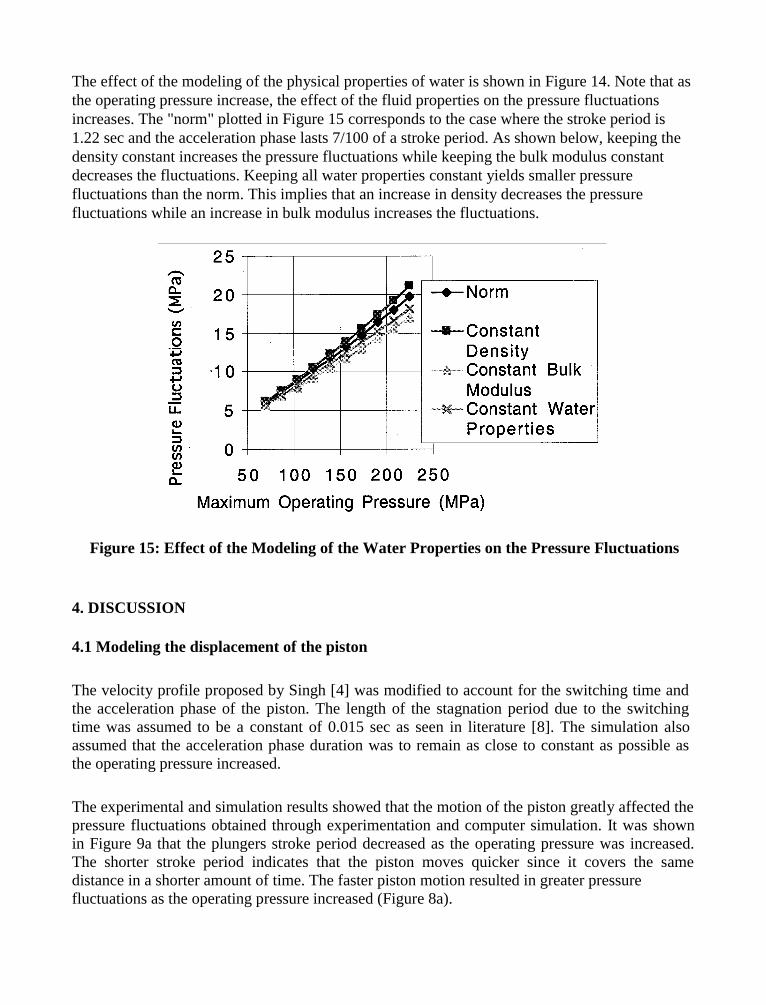
The effect of the modeling of the physical properties of water is shown in Figure 14. Note that asthe operating pressure increase, the effect of the fluid properties on the pressure fluctuationsincreases. The "norm" plotted in Figure 15 corresponds to the case where the stroke period is1.22 sec and the acceleration phase lasts 7/100 of a stroke period. As shown below, keeping thedensity constant increases the pressure fluctuations while keeping the bulk modulus constantdecreases the fluctuations. Keeping all water properties constant yields smaller pressurefluctuations than the norm. This implies that an increase in density decreases the pressurefluctuations while an increase in bulk modulus increases the fluctuations.
Figure 15: Effect of the Modeling of the Water Properties on the Pressure Fluctuations
4. DISCUSSION
4.1 Modeling the displacement of the piston
The velocity profile proposed by Singh [4] was modified to account for the switching time andthe acceleration phase of the piston. The length of the stagnation period due to the switchingtime was assumed to be a constant of 0.015 sec as seen in literature [8]. The simulation alsoassumed that the acceleration phase duration was to remain as close to constant as possible asthe operating pressure increased.
The experimental and simulation results showed that the motion of the piston greatly affected thepressure fluctuations obtained through experimentation and computer simulation. It was shownin Figure 9a that the plungers stroke period decreased as the operating pressure was increased.The shorter stroke period indicates that the piston moves quicker since it covers the samedistance in a shorter amount of time. The faster piston motion resulted in greater pressurefluctuations as the operating pressure increased (Figure 8a).
It was also experimentally determined that at larger operating pressures, the time of no- flowwas increased (Figure 10). Although the piston moved faster to compress the low pressurewater, it needed more time to complete the pressurizing process since the system was operatingat a higher pressure. Obviously, as the operating pressure increases, the water needs to becompressed to a higher level and this takes a significant amount of time. So a larger and largerfraction of the stroke length is spent compressing the water. Therefore, it can be stated that theacceleration phase also increases in length since it takes longer and longer for the piston to reachits maximum speed. The length of the acceleration phase is very important and can significantlyaffect the resulting pressure fluctuation result (Figure 12).
A better model would therefore incorporate the hydraulic system dynamics in conjunction withthe waterjet dynamics analysis. These two systems are coupled by the motion of the piston, andas indicated by the results, it would be preferable to model the waterjet system this way.Obtaining the accurate velocity profile of the piston would also allow the modeling of thedischarge pressure throughout the entire piston stroke period. This would allow the correctcalculation of the time at which the maximum pressure occurs. Recall that the simulationassumed that the maximum pressure occurred when the piston reached the end of the its strokelength. However, experimental results (Figure 6 and 7) showed that the actual maximumpressure occurred as the piston approached the middle of its stroke length. Therefore, theassumption made by the simulation did not characterize the pressure time history as well as itcould have.
The velocity profile affects the discharge pressure throughout the entire stroke length. Theexperimental results show that as the piston reaches the end of its stroke length, it deceleratesbefore stopping. This can be seen in Figure 5. Note that before the sharp pressure drop occurs(i.e. before the no-flow condition is initiated), the pressure decreases at a slower rate. The slightrounding off of the "steady-state" maximum pressure condition observed could be due to therapid deceleration that the piston undergoes at the end of its stroke period.
4.2 Modeling the water properties
The equation of density was in accordance with Tait's Equation. The secant bulk modulusdefinition was used to depict the variation of bulk modulus at high pressures. The waterproperties at high pressures were shown to affect the pressure fluctuations significantly (Figure15). Note how increasing the bulk modulus results in an increase in pressure fluctuations andthat an increase in pressure fluctuations can also be achieved by decreasing the water density.
By assuming constant density (i.e. at atmospheric conditions), the mass of the water flowingthrough the system is reduced at high pressures since the density was modeled to increase withpressure. Note that in the pressurizing process governed by Equation 2, there is no density term.Therefore, the pressurizing process is not affected by assuming constant density. Since there isless mass to discharge from the system, the depressurizing process occurs more rapidly and theconsequent pressure drop rate is increased. Assuming constant bulk modulus affects the elasticproperties of the fluid. Once again, the bulk modulus was modeled to increase with pressure.Physically, this means that it gets harder and harder to compress the water as the pressureincreases. If the bulk modulus is smaller, the water is more compressible, the depressurizing and
the pressurizing process are decelerated. Recall that the attenuator uses the fact that water tendsto decompress and expand during the no-flow condition and this alleviates the pressurefluctuations. So a lower bulk modulus will allow it to work better since the water will tend toexpand more. Mathematically, a constant bulk modulus assumption reduces the numerator ofboth Equation 2 and Equation 3, which consequently also reduces the pressure drop.
The simulation results obtained were consistently lower than the experimental results (Figures 8and 10 ). The difference between the simulated and experimental results ranged from 1.9 to 2.7MPa. This could be due to an underestimation of the actual value of the bulk modulus.Therefore, the assumption of the secant bulk modulus definition accurately depicted thevariation of water properties at high pressure is questioned. It is believed that the tangent bulkmodulus would overestimate the actual value of the fluctuations and that the true value of a liesbetween the value found for the tangent bulk modulus and the value determined for the secantbulk modulus. The bulk modulus of the water in the system is believed to be lower than the bulkmodulus of pure water (the tangent bulk modulus) since the presence of bubbles in the systemwould diminish the value of the waters bulk modulus considerably.
4.3 Computer Simulations
The simulation presented in this paper attempted to incorporate the following system parametersso as to properly predict the pressure fluctuations of a waterjet system observed throughexperimentation:• The change in fluid properties of water at high pressures• The stagnation and acceleration phases of the piston• The switching time of the solenoid valve• The fluid jet compressibility
The model assumed:• A constant overall discharge coefficient• A modified bilinear velocity profile of the piston• The time required to compress the water remained constant as the operating pressure
increased• The bulk modulus varied according to the secant bulk modulus definition at high operating
pressures• The maximum discharge pressure occurred at the end of the stroke length
Experimental results were found to be generally slightly larger than the simulation results. It isbelieved that this discrepancy is partly due to the approximate velocity profile used in thesimulation and the bulk modulus variation at high pressures.
Through the computer simulation results, it was seen how the water properties at high pressuresaffected the pressure fluctuations in the system. The computer model also calculated the time ofno-flow. These results were compared with experimental results. As the operating pressureincreased, it was found that the duration of the time of no-flow increase d while the strokeperiod decreased.
5. SUMMARY AND CONCLUSIONS
The pressure fluctuations in a waterjet system were investigated through modeling, simulationand experimental efforts. The modeling and simulation attempted to solve for the time of no-flow and the pressure fluctuation for a given stroke period and maximum pressure. The fluid jetcompressibility, overall discharge coefficient of the system were accounted for as well as thevariation of the water properties at high pressures. The motion of the piston was based on thebilinear profile assumed by Singh [4], however it was modified to also incorporate thestagnation and acceleration phases of the piston motion. To validate the model, the simulationresults were compared to experimental results for the same operating conditions. The strokeperiod and the maximum pressure were determined experimentally and used in the simulation todetermine the theoretical pressure fluctuations.
It was found that the pressure fluctuations increased as:• The stroke period decreased• The acceleration phase increased• The time of no-flow increased• The attenuator volume decreased• The bulk modulus of the water increased• The density of the water decreased• The discharge coefficient increased
The following observations were made from the experimental results:• The non-symmetric design results in high and low pressure peaks• The maximum pressure occurs as the piston reaches the middle of its stroke length• The magnitude of the pressure drop increases as the operating pressure condition increases
since the time of no-flow also increases
5. REFERENCES
1. Summers, D., Waterjetting Technology. E&FN Spon, 1995.
2. Singh, P. and Benson, D., "Development of Phased Intensifier for Waterjet Cutting",Proceedings of the I Ith International Conference on Jet Cutting Technology, St- Andrews, Scotland, September, 1992, pp 305-318.
3. Yie, G.G., "A pulsation-free fluid pressure intensifier", Proceedings of the 9th American Waterjet Conference, Dearborn, Michigan, August 23-26, 1997, pp 365- 369.
4. Singh, P., "Computer Simulation of Intensifiers and intensifier systems", Proceedings of the 9th American Waterjet Conference, Dearborn, Michigan, August 23-26, 1997, pp 397-413.

5. Hu, F. and Robertson, J., "Simulation and control of discharge pressure fluctuation of ultrahigh-pressure waterjet pump", Proceedings of the 7th American Waterjet Conference,Seattle, Washington, August 28-31, 1993, pp 337-349.
6. Chalmers, E., "Pressure Fluctuation and Operating Efficiency of Intensifier Pumps",Proceedings of the 7th American Waterjet Conference, Seattle, Washington, August 28-31, 1993, pp 327-336.
7. Susan-Resiga, R., "Attenuator's Volume Influence on High Pressure's Pulsations in a Jet cutting unit", Proceedings of the Ilth International Conference on Jet Cutting Technology, St-Andrews, Scotland, September, 1992, pp 37-45.
8. Tikhomirov, R.A. and al., High-Pressure Jetcutting. ASME Press, 1992, pp l2l-129.
9. Maintenance Manual Powerjet Model 20-55, Powerjet Inc.
10. Hashish, M., "Pressure Effects in Abrasive-Waterjet (AWJ) Machining", Journal of Engineering Materials and Technology, 11 1, 1989, pp 221-228.
11. Singh, P., and Madavan, N., "Complete Analysis and Simulation of Reciprocating Pumps Including System Piping", Proceedings of the 4th International pump Symposium,
1987, pp 55-73.
10 American Waterjet Conferenceth
August 14-17, 1999: Houston, Texas Paper 13
QUICK METHOD FOR DETERMINATION OF THE VELOCITY
PROFILE OF THE AXIAL SYMMETRICAL SUPERSONIC LIQUID JET
L.M. Hlavág, I.M. Hlavágová, V. MádrVŠB - Technical University
Ostrava, Czech Republic
ABSTRACT
To be able to apply the theoretical model of abrasive jet for calculations essential in real-timecontrol, it is necessary to find out very quick and precise method for description of the liquid streamstructure. The simplified model was derived to determine the liquid jet attenuation in the mediumoutside the nozzle. The relationships for description of the equivalent jet structure evolution providedthe presumption of the jet axial symmetry were derived. Taking into account, the well-knownprinciples of hydrodynamics and some unorthodox views of the liquid jet formation inside thenozzle, the set of equations for the calculation of the cross-sectional velocity field inside jet wasderived. The set of equations is useful for determination of both the attenuation and the jet structuredevelopment in the medium surrounding the nozzle. The derivation of analytical relationships iscompleted by experimental results obtained in the Institute of Geonics. The experimental data weremeasured using a special sensor developed for the jet structure investigation. The theory was alsocompared with summarised results of foreign authors dealing with the jet structure problems boththeoretically and experimentally. All presented results (both theoretical and experimental) wereobtained in air, but the theoretical relationships are appropriately valid in other media, e.g. in liquids.
Organized and Sponsored by the WaterJet Technology Association
12'ov2
µpo(1 po) (1)
1. INTRODUCTION
During investigation of the liquid jet effect on material the velocity profile of jet flow after leavingthe nozzle appears to be a very important parameter. Its structure can be determined by means ofvarious theories describing the jet flow development by the system of partial differential equationswith boundary conditions. These methods are, however, rather time consuming even if the efficientcomputers are used. If only approximate knowledge of the velocity flow development is necessary,moreover with minimum time requirements, as far as it represents a small part of calculation ina complex control program for automated technology process, these ways of velocity profiledetermination appear to be unreasonable. Therefore it was necessary to derive the model presentedhere which enables to determine the cross-sectional velocity profile of high energy jet anddevelopment of this profile as a function of the distance from the nozzle outlet with minimumrequirements on the computer equipment efficiency. The model enables very effective andsufficiently exact determination of a velocity profile and therefore it is appropriate for incorporationinto the software for control of automated technology units with high energy liquid jets.
2. THE BASIC CONDITIONS FOR THEORETICAL DESCRIPTION OF THE HIGHENERGY JET OUTLET FROM THE NOZZLE
The specific energy is an important quantity in evaluation of the efficiency of technology using thehigh energy liquid jet (HELJ). As far as the specific energy must not depend on the pump efficiency,its determination is based on the jet kinetic energy find out from the Bernoulli equation as presentedNoskievig (1987). Some terms can be neglected in this equation, as far as the analysed processes arecharacterised by the following physical conditions: the pressure in the high pressure unit is manytimes higher than the possible hydrostatic pressure; the pressure of the medium into which the liquidflow penetrates is substantially lower than the pressure of liquid in the pumping unit; the restpressure in the liquid flow is negligible in comparison with the pressure in the pumping unit. As faras the liquids cannot be considered as ideal ones in the operating conditions, two correctionparameters were introduced into the Bernoulli equation: the pressure depending parameter precisingliquid density and parameter specifying energy dissipation by friction and contraction of liquid insidethe nozzle. The Bernoulli equation modified according to the presented assumptions and conditionshas the following form
The equation (1) enables to determine the maximum velocity of the liquid flowing out from thenozzle outlet. However, this value of velocity can be expected only in the vicinage of the flow axis.In order to use the relationship (1) for calculation of the out flowing liquid velocity, it is necessaryto determine the compressibility of the liquid compressed by pressure p and the nozzle dischargeo
coefficient µ, which in fact defines the nozzle quality. The dependence of water compressibility onthe compressive state is given by a regression formula based on the experimental data presented in
vid 2po'1o (1 po)
Re 2
2do'ovid
1
voc voa 12rdo
log(Re 1)
(2)
(3)
(4)
physical tables prepared by BroÓ et al. (1980). The relationships describing the flow inside a nozzlewere used for derivation of the relationship for the nozzle discharge coefficient.
3. ANALYTIC DESCRIPTION OF THE JET OUTLET FROM THE NOZZLE
The theoretical maximum velocity of the compressible liquid in the nozzle can be also determinedfrom the Bernoulli equation provided the term characterizing liquid compressibility is considered.Apart from the compressibility another factor starts to play role during the liquid outlet, namely thefriction (intrinsic friction of the liquid and the friction with the nozzle walls). Considering thefriction, the velocity is not unique throughout the cross-section of the flow. It starts from zero by thenozzle walls and grows up in the direction of the flow middle. The liquid moves with the maximumvelocity near round the flow axis. In the case of small friction and contraction losses the maximumvalue of velocity approaches to the ideal velocity of the compressible liquid without friction that isdetermined by the following relationship
The liquid velocity in the nozzle varies from the original input value, which approaches zero, to themaximum value at the outlet from the nozzle into the free space. Therefore instead of the classicalvalue of the Reynolds’ number defined for the flow with small velocity fluctuation the ”effectivevalue” of the Reynolds’ number in the nozzle is determined.
The velocity profile at the nozzle outlet can be determined using the formula derived to satisfy theexperimental results in the broadest possible range of Reynolds’ numbers (from very low values upto very high ones). This semiempirical relationship was prepared during analyses of the high energyliquid outflow from the nozzle performed by Hlavág (1995).
The formula (4) makes possible to determine the velocity profile of the symmetrical liquid flowwithin the stable borders and therefore it is possible to use it for the determination of the velocityprofile at the nozzle outlet. The original anticipation was not verified, however, that this relationshipshould be used for description of the high velocity jet after its outflow into surrounding environmenteven though the borders of the liquid flow are not stable. Comparison with the experimental dataobtained for high energy water jet was performed especially by Hlavág (1995) and Sitek & Vala
µ c (1 0.184 Re0.2 lo)
Ldisp 2µpo'1o (1 po)
do
2ve
(5)
(6)
(1995). It was found out that the character of the velocity profile far from the nozzle outletapproaches to the Gaussian distribution which corresponds with theoretical and experimental resultsof Yanaida (1974), Yanaida & Ohashi (1978, 1980), Wang & duPlessis (1973) and Przyklenk &Schlatter (1986).
The discharge coefficient µ is a product of the nozzle contraction and velocity coefficients. Thecontraction coefficient seems to be sufficiently defined by nozzle geometry and for a certain shapeit is practically a constant. Contrary to it the velocity coefficient depends on many factors - the input-output pressure difference, nozzle wall roughness, length of the cylindrical part of the nozzle outlet,nozzle diameter, dynamic viscosity and density of the used liquid. Majority of them project into thefriction coefficient which can be calculated from the relationships derived by Blasius as presentedby Noskievig (1987). As far as the Reynolds’ number in the case of practical applications of liquidjet technology typically varies within the range 4 × 10 and 1.6 × 10 , the following formula for4 5
discharge coefficient was determined
During derivation of this relationship the formula for friction of the turbulent flow in pipes withsmooth walls derived by Blasius was used, namely in the form which is valid very exactly forReynolds’ numbers exceeding 8 × 10 . For the interval of Reynolds’ number between 4 × 10 and4 4
8 × 10 , however, it is possible to use more precise relationship also derived by Blasius.4
Nevertheless, the difference between values determined by the more precise relationship and theones determined using relationship that is valid more exactly for Reynolds’ numbers between 8 × 10⁴
and 1.6 × 10 , is no more than 1% at worst case. But that case lies in fact outside the area determined5
by the common usage of the technology; the Reynolds’ number approaches the value 4 × 10 . There4
is no reason to introduce more precise relationship even for a less important part of the interval ofReynolds’ numbers determined for limit cases used in practice (4 × 10 and 1.6 × 10 ) because the4 5
relationships for jet structure calculation should be to no purpose more complicated and respectivecalculations more time consuming.
In order to describe the jet development outside the nozzle, it was necessary to deal with theexpansion of the compressed liquid at the nozzle outlet as well. The minimum jet dispersion lengthcan be calculated using the relationship
in which v is the jet expansion velocity after the flow loses the borderse
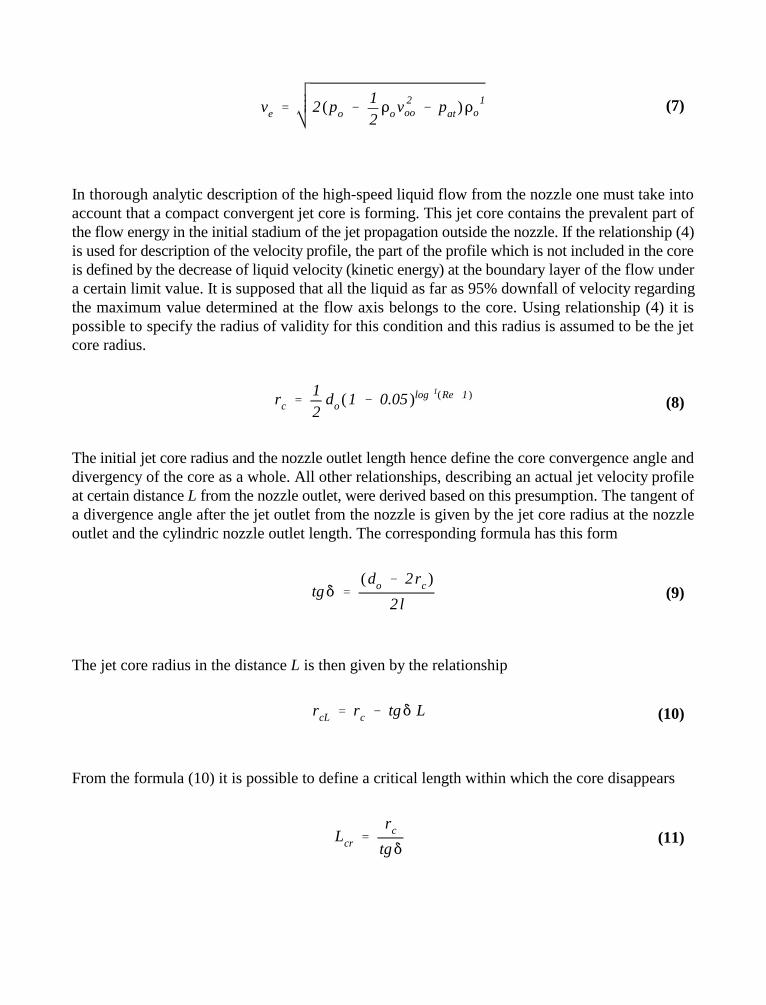
ve 2(po 12'ov2
oo pat)'1o
rc 12
do(1 0.05)log1(Re1)
tg
(do 2rc)
2l
rcL rc tg L
Lcr rc
tg
(7)
(8)
(9)
(10)
(11)
In thorough analytic description of the high-speed liquid flow from the nozzle one must take intoaccount that a compact convergent jet core is forming. This jet core contains the prevalent part ofthe flow energy in the initial stadium of the jet propagation outside the nozzle. If the relationship (4)is used for description of the velocity profile, the part of the profile which is not included in the coreis defined by the decrease of liquid velocity (kinetic energy) at the boundary layer of the flow undera certain limit value. It is supposed that all the liquid as far as 95% downfall of velocity regardingthe maximum value determined at the flow axis belongs to the core. Using relationship (4) it ispossible to specify the radius of validity for this condition and this radius is assumed to be the jetcore radius.
The initial jet core radius and the nozzle outlet length hence define the core convergence angle anddivergency of the core as a whole. All other relationships, describing an actual jet velocity profileat certain distance L from the nozzle outlet, were derived based on this presumption. The tangent ofa divergence angle after the jet outlet from the nozzle is given by the jet core radius at the nozzleoutlet and the cylindric nozzle outlet length. The corresponding formula has this form
The jet core radius in the distance L is then given by the relationship
From the formula (10) it is possible to define a critical length within which the core disappears
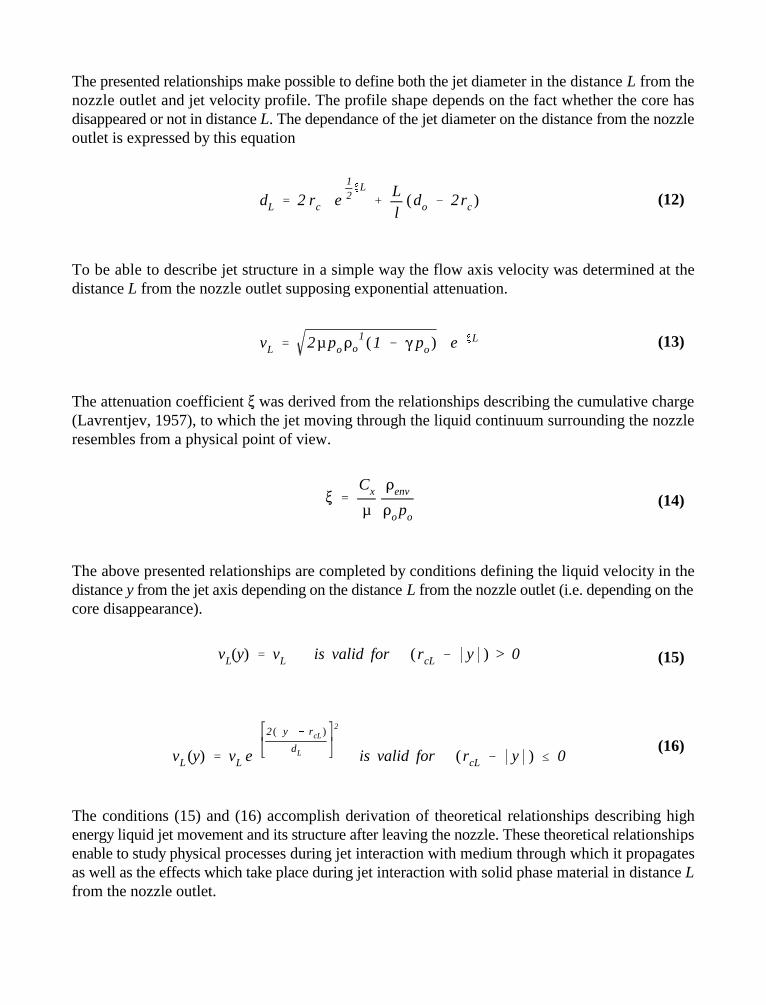
dL 2 rc e12!L
Ll
(do 2rc)
vL 2µpo'1o (1 po) e!L
!
Cx
µ
'env
'opo
vL(y) vL is valid for ( rcL y ) > 0
vL (y) vL e
2( y rcL)
dL
2
is valid for ( rcL y ) 0
(12)
(13)
(14)
(15)
(16)
The presented relationships make possible to define both the jet diameter in the distance L from thenozzle outlet and jet velocity profile. The profile shape depends on the fact whether the core hasdisappeared or not in distance L. The dependance of the jet diameter on the distance from the nozzleoutlet is expressed by this equation
To be able to describe jet structure in a simple way the flow axis velocity was determined at thedistance L from the nozzle outlet supposing exponential attenuation.
The attenuation coefficient ! was derived from the relationships describing the cumulative charge(Lavrentjev, 1957), to which the jet moving through the liquid continuum surrounding the nozzleresembles from a physical point of view.
The above presented relationships are completed by conditions defining the liquid velocity in thedistance y from the jet axis depending on the distance L from the nozzle outlet (i.e. depending on thecore disappearance).
The conditions (15) and (16) accomplish derivation of theoretical relationships describing highenergy liquid jet movement and its structure after leaving the nozzle. These theoretical relationshipsenable to study physical processes during jet interaction with medium through which it propagatesas well as the effects which take place during jet interaction with solid phase material in distance Lfrom the nozzle outlet.
4. COMPARISON OF THEORY AND EXPERIMENTAL DATA
The comparison of presented theory with results of experimental studies was performed in twophases. The first one was a comparison of jet velocity profile development determined according tothe above presented theory with the shape determined from experimental results and theoriesprepared by Yanaida (1974), Yanaida & Ohashi (1978, 1980), Wang & duPlessis (1973) andPrzyklenk & Schlatter (1986). Based on these publications a scheme of the jet development afterleaving the nozzle was prepared in the Institute of Geonics in Ostrava. The scheme was publishedin studies aimed at the jet structure investigation made by Hlavág (1995) and Sitek & Vala (1995).It is presented in the Fig. 1. It represents demonstration of velocity field development of symmetricalflow obtained by compilation of published results into one complex. The graph in the Fig. 2represents velocity profile development determined according to the presented theory. Comparisonof the profiles in the Fig. 2 and Fig. 1 leads to the conclusion that they correlate very well.
The second comparison is based on the experiments made in the Institute of Geonics in Ostrava. Themeasuring method and the experimental device described by Sitek & Vala (1994) enable to obtaininformation not only about forces caused by the jet impact on the solid plate but also about the flowstructure. The measuring procedure was described in detail particularly by Vala & Sitek (1995). Theexperimental results, however, need an additional treatment as far as the direct output of theexperiment represents only force records on the sensor and holes shot through the metal plate servingas a separator of the active and non-active part of the jet. The active part makes a hole of therespective diameter and causes the force registered by sensor while the non-active part is shaded bythe unbroken part of the plate. Extending the jet impact time, it is possible to increase the jet partpassing through the shield. Dividing the measured force by area of the orifice made in the separationplate the medium pressure caused by flowing liquid can be determined in certain concentric circlesround the jet axis. The corresponding average velocity was determined then from this pressureaccording to the simplified Bernoulli equation. The experimental results gained by this way werecompared with velocity profiles determined from the presented theory in Fig. 3. The figure showsthat correlation between the theoretical curves and the experimental data is very good.
5. CONCLUSIONS
Theoretical description of a liquid stream outlet from the nozzle and conformable velocity profiledevelopment during the jet expansion through the environment between the nozzle and the materialis in very good correlation with results obtained by other theories. The correlation of the theoreticalhigh-velocity water jet profile and results calculated from measurement of the dynamic forces madein the Institute of Geonics also shows that presented simplified theory of jet structure developmentis sufficiently accurate. Therefore, the theoretical model is considered to be suitable for quick andacceptable exact determination of the liquid jet structure in the software for on-line control of thewaterjet technology. The theoretical description of the liquid jet presented here was used formodelling of disintegration of abrasive particles in the mixing chamber during analysis of theinjection abrasive liquid jet origin.
6. ACKNOWLEDGEMENTS
The authors are grateful to the Grant Agency of the Czech Republic for support of the presentedwork by grant No. 106/98/1354.
7. REFERENCES
BroÓ, J., Roskovec, V., and Valouch, M.: “Physical and Mathematical Tables,” SNTL, Praha, 1980.
Hlavág, L.M.: “Diagnostics of the High-Velocity Liquid Jet Structure,” Proceedings of theInternational Scientific Conference VŠB-TU, pp.37-42, Ostrava, Czech Republic, 1995.
Lavrentjev, M.A.: “Cumulative Charge and Principles of Its Work,” Achievements in Mathematics,Volume 12, Number 4, pp.41-56, 1957. (in Russian)
Przyklenk, K., and Schlatter, M.: “Simulation of the Cutting Process in Water Jetting with the FiniteElement Method,” Proceedings of the 8th International Symposium on Jet CuttingTechnology, pp.125-135, BHRA, Durham, England, 1986.
Noskievig, J., and team: “Fluid Mechanics,” SNTL, Praha, 1987. (in Czech)
Sitek, L., and Vala, M.: “Contribution to Continuous High-Velocity Non-Flooded Water Jet VelocityProfile Determination,” Proceedings of the National Scientific Conference with InternationalParticipation Engineering Mechanics '95, pp.457-462, Svratka, Czech Republic, 1995. (inCzech)
Vala, M., and Sitek, L.: “The Method and Equipment for Measurement of Small Dynamic PressureForces from High-Velocity Fluid Flow Stopping,” Proceedings of the 33rd ConferenceEAN '95, pp.219-224, Teš», Czech Republic, 1995. (in Czech)
Wang, R.L., and duPlessis, M.P.: “An Explicit Numerical Method for the Solution of Jet Flows,”Transactions of the ASME - Journal of Fluids Engineering, March, pp.38-52, 1973.
Yanaida, K.: ”Flow Characteristics of Water Jets,” Proceedings of the 2nd International Symposiumon Jet Cutting Technology, paper A2: pp.19-32, BHRA, Cambridge, England, 1974.
Yanaida, K., and Ohashi, A.: “Flow Characteristics of Water Jets in Air,” Proceedings of the 4thInternational Symposium on Jet Cutting Technology, paper A3: pp.39-54, BHRA,Canterbury, England, 1978.
Yanaida, K., and Ohashi, A.: “Flow Characteristics of Water Jets in Air,” Proceedings of the 5thInternational Symposium on Jet Cutting Technology, pp.33-44, BHRA, England, 1980.
8. NOMENCLATURE
nozzle contraction coefficientc
compressibility of the liquid under the pressure p [MPa]o
C coefficient of resistance of the environmental continuum to the jetx
angle of flow divergence [rad]d water nozzle diameter [m]o
d diameter of the liquid jet in distance L from the nozzle outlet [m]L
dynamic liquid viscosity [N.s.m ]-2
l length of the cylindrical part of the nozzle outlet [m]l length of the cylindrical part of the nozzle outlet in multiples of do o
L distance from the nozzle outlet [m]distance from the nozzle outlet where the jet core disappears [m]Lc
L minimum distance from the nozzle outlet where the expansion of the pressurized liquiddisp
comes to an effect [m]! coefficient of attenuation of jet caused by resistance of the medium between nozzle and
material [m ]-1
p liquid pressure before the nozzle inlet [Pa]o
p atmospheric pressure [Pa]at
' liquid density in noncompressed state [kg.m ]o-3
' density of the medium outside the nozzle outlet [kg.m ]env-3
r radius of the elemental annulus of the jet cross-section [m]Re Reynolds' numberv velocity [m.s ]-1
v jet velocity on the axis at the nozzle outlet [m.s ]oa-1
v jet core profile velocity at the nozzle outlet [m.s ]oc-1
v velocity of the compressed liquid expansion [m.s ]e-1
v ideal jet velocity at the nozzle outlet [m.s ]id-1
v jet velocity at the distance L from the nozzle outlet [m.s ]L-1
y coordinate in the radial direction perpendicular to the jet axis [m]
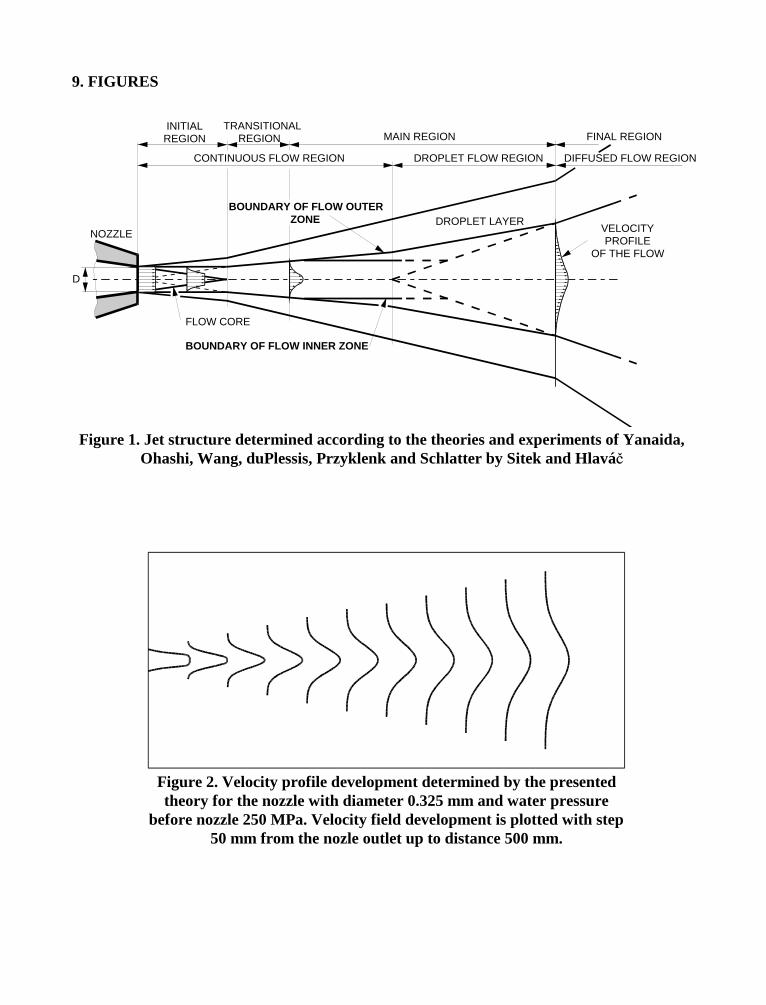
INITIALREGION MAIN REGION FINAL REGION
CONTINUOUS FLOW REGION DROPLET FLOW REGION DIFFUSED FLOW REGION
NOZZLEDROPLET LAYER
BOUNDARY OF FLOW OUTERZONE
VELOCITYPROFILE
OF THE FLOW
BOUNDARY OF FLOW INNER ZONE
D
FLOW CORE
TRANSITIONALREGION
Figure 1. Jet structure determined according to the theories and experiments of Yanaida,Ohashi, Wang, duPlessis, Przyklenk and Schlatter by Sitek and Hlavág
Figure 2. Velocity profile development determined by the presentedtheory for the nozzle with diameter 0.325 mm and water pressure
before nozzle 250 MPa. Velocity field development is plotted with step50 mm from the nozle outlet up to distance 500 mm.
9. FIGURES
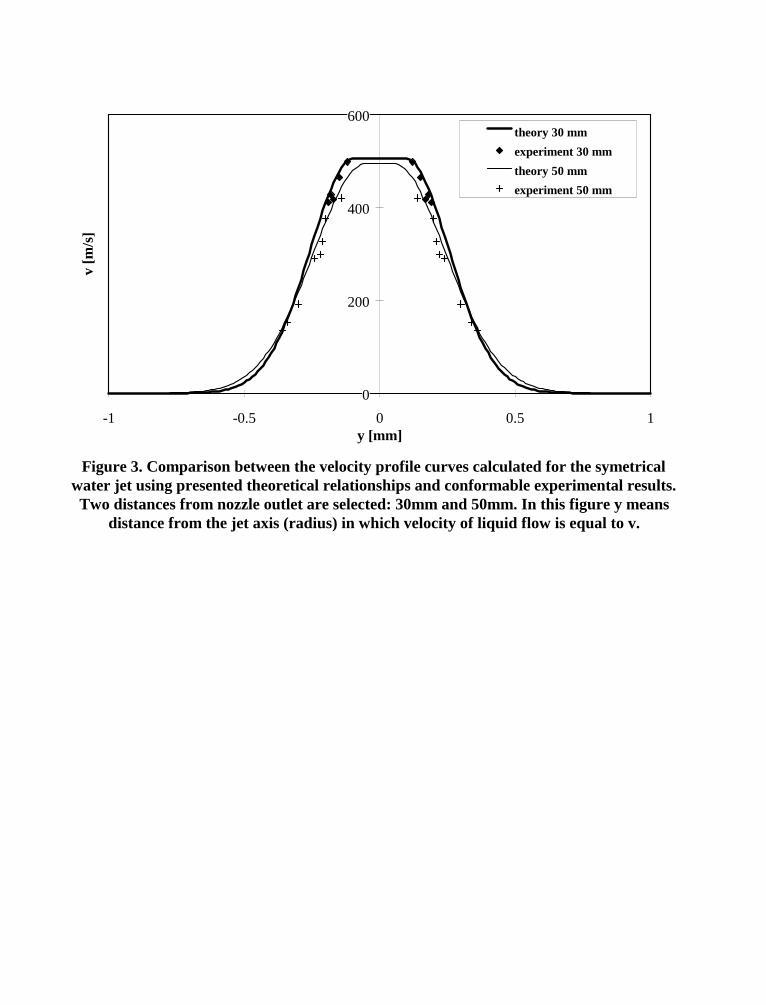
0
200
400
600
-1 -0.5 0 0.5 1y [mm]
v [m
/s]
theory 30 mm
experiment 30 mm
theory 50 mm
experiment 50 mm
Figure 3. Comparison between the velocity profile curves calculated for the symetricalwater jet using presented theoretical relationships and conformable experimental results.Two distances from nozzle outlet are selected: 30mm and 50mm. In this figure y means
distance from the jet axis (radius) in which velocity of liquid flow is equal to v.
10th American Waterjet ConferenceAugust 14-17, 1999: Houston, Texas
Paper 14
MEASUREMENTS OF WATER-DROPLET AND ABRASIVE SPEEDS
IN A ULTRAHIGH-PRESSURE ABRASIVE-WATERJETS
H.-T. Liu, P. J. Miles, N. Cooksey, and C. HibbardWaterjet Technology, Inc.
Kent, Washington
ABSTRACT
A dual-disc apparatus, based on the time of flight principle, was upgraded for measuring thespeed of water droplets and abrasive particles exiting an abrasive-waterjet (AWJ) nozzle. Theapparatus consists of two coaxially rotating discs with a fixed separation. A set of narrow slots180° or 90° apart was machined on the upper disc. A third disc made of different materialspinned to the lower disc was used as the "write-once" data recorder. Speed measurements wereconducted by shooting an AWJ perpendicularly toward the discs, with the AWJ traversingradially inward. Water droplets and/or abrasives passed through the slots and produced erosionmarks on the data disc. The displacement angles between the radially oriented erosion marks andthe leading edges of the slots were used to derive the speeds of the water droplets and/or theabrasives. With the use of data discs made of Lexan, aluminum, and stainless steel, thresholdspeeds below which no erosion mark was produced by the waterjet (WJ) and/or the AWJ weredetermined. Test results show that the threshold speeds of the WJ for Lexan and for metals(aluminum and stainless steel) are about 600 m/s and greater than 820 m/s, respectively; theformer is about 3 times that of the abrasives – Barton 220 mesh. The erosion marks produced bythe WJ were very narrow, indicating the WJ was well collimated and that only the speedsexceeding the threshold speed were recorded. In other words, the droplet speed is biased to thehigh values. On the other hand, the erosion marks produced by the abrasives were considerablywide spread, indicating a broad distribution in the abrasive speed. The measured water-dropletspeed of the WJ with the feed port closed agreed well with the Bernoulli speed; the speed was 3to 7 % lower when the feed port was open. For the AWJ, both the water droplets and theabrasives produced their own erosion marks for abrasive mass concentration, Ca, below 40%.From the widely spreading erosion marks, the maximum and minimum abrasive speeds and theiraverage values were derived. The abrasive speeds decreased hyperbolically with increasing Ca.
Organized and Sponsored by the WaterJet Technology Association
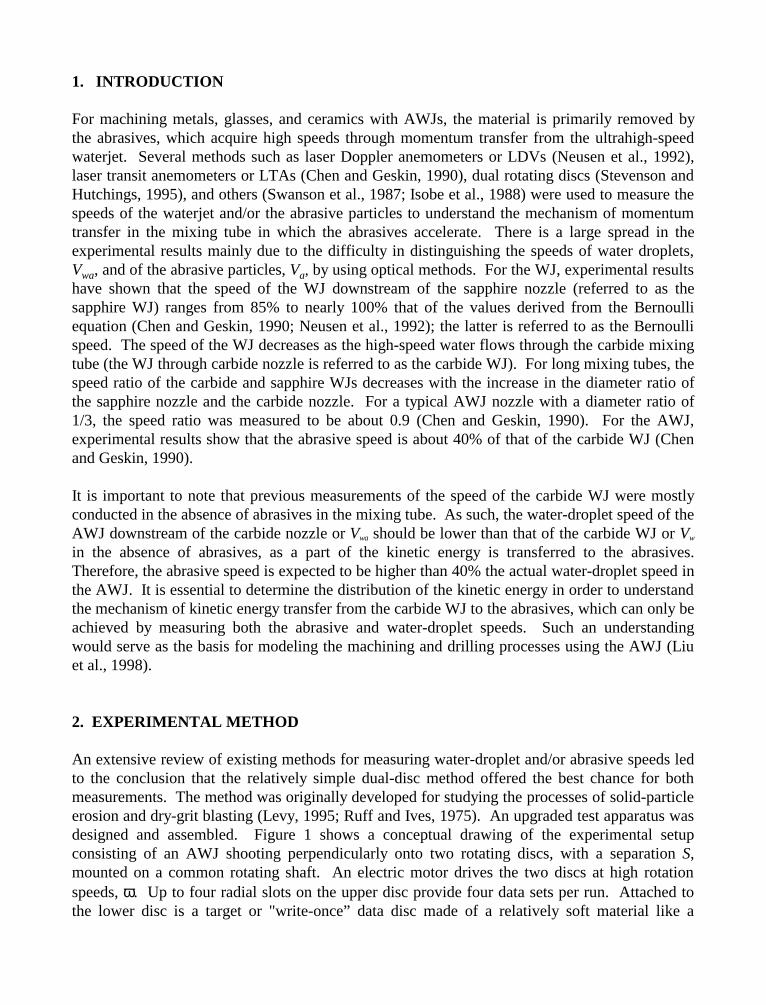
1. INTRODUCTION
For machining metals, glasses, and ceramics with AWJs, the material is primarily removed bythe abrasives, which acquire high speeds through momentum transfer from the ultrahigh-speedwaterjet. Several methods such as laser Doppler anemometers or LDVs (Neusen et al., 1992),laser transit anemometers or LTAs (Chen and Geskin, 1990), dual rotating discs (Stevenson andHutchings, 1995), and others (Swanson et al., 1987; Isobe et al., 1988) were used to measure thespeeds of the waterjet and/or the abrasive particles to understand the mechanism of momentumtransfer in the mixing tube in which the abrasives accelerate. There is a large spread in theexperimental results mainly due to the difficulty in distinguishing the speeds of water droplets,Vwa, and of the abrasive particles, Va, by using optical methods. For the WJ, experimental resultshave shown that the speed of the WJ downstream of the sapphire nozzle (referred to as thesapphire WJ) ranges from 85% to nearly 100% that of the values derived from the Bernoulliequation (Chen and Geskin, 1990; Neusen et al., 1992); the latter is referred to as the Bernoullispeed. The speed of the WJ decreases as the high-speed water flows through the carbide mixingtube (the WJ through carbide nozzle is referred to as the carbide WJ). For long mixing tubes, thespeed ratio of the carbide and sapphire WJs decreases with the increase in the diameter ratio ofthe sapphire nozzle and the carbide nozzle. For a typical AWJ nozzle with a diameter ratio of1/3, the speed ratio was measured to be about 0.9 (Chen and Geskin, 1990). For the AWJ,experimental results show that the abrasive speed is about 40% of that of the carbide WJ (Chenand Geskin, 1990).
It is important to note that previous measurements of the speed of the carbide WJ were mostlyconducted in the absence of abrasives in the mixing tube. As such, the water-droplet speed of theAWJ downstream of the carbide nozzle or Vwa should be lower than that of the carbide WJ or Vw
in the absence of abrasives, as a part of the kinetic energy is transferred to the abrasives.Therefore, the abrasive speed is expected to be higher than 40% the actual water-droplet speed inthe AWJ. It is essential to determine the distribution of the kinetic energy in order to understandthe mechanism of kinetic energy transfer from the carbide WJ to the abrasives, which can only beachieved by measuring both the abrasive and water-droplet speeds. Such an understandingwould serve as the basis for modeling the machining and drilling processes using the AWJ (Liuet al., 1998).
2. EXPERIMENTAL METHOD
An extensive review of existing methods for measuring water-droplet and/or abrasive speeds ledto the conclusion that the relatively simple dual-disc method offered the best chance for bothmeasurements. The method was originally developed for studying the processes of solid-particleerosion and dry-grit blasting (Levy, 1995; Ruff and Ives, 1975). An upgraded test apparatus wasdesigned and assembled. Figure 1 shows a conceptual drawing of the experimental setupconsisting of an AWJ shooting perpendicularly onto two rotating discs, with a separation S,mounted on a common rotating shaft. An electric motor drives the two discs at high rotationspeeds, ω. Up to four radial slots on the upper disc provide four data sets per run. Attached tothe lower disc is a target or "write-once” data disc made of a relatively soft material like a
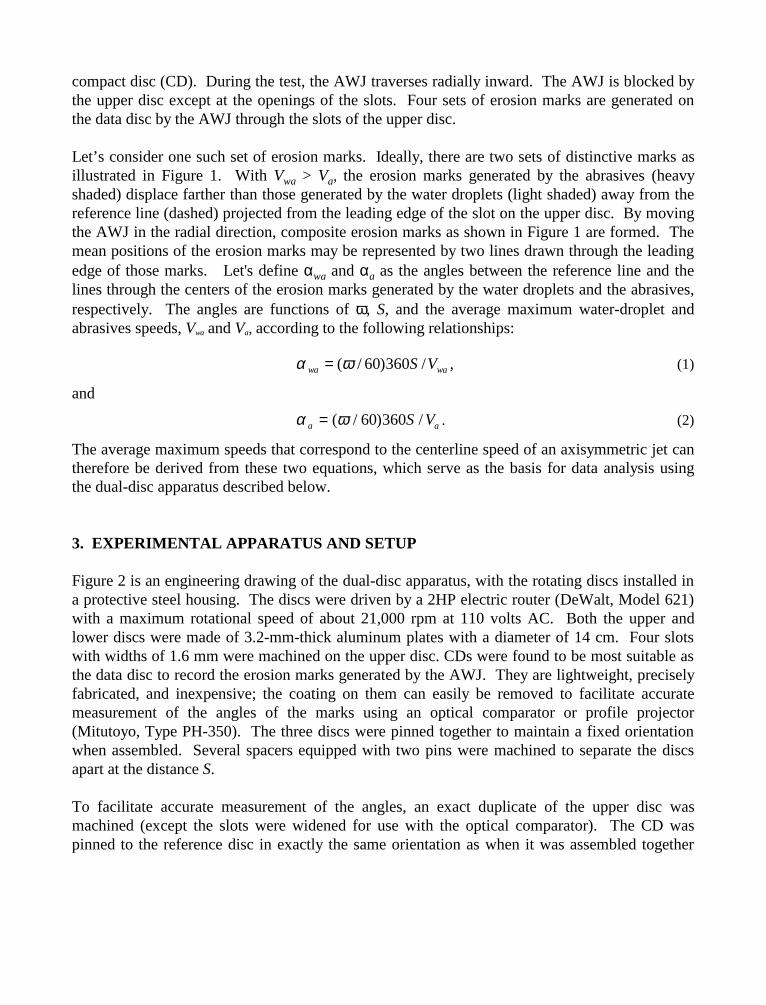
compact disc (CD). During the test, the AWJ traverses radially inward. The AWJ is blocked bythe upper disc except at the openings of the slots. Four sets of erosion marks are generated onthe data disc by the AWJ through the slots of the upper disc.
Let’s consider one such set of erosion marks. Ideally, there are two sets of distinctive marks asillustrated in Figure 1. With Vwa > Va, the erosion marks generated by the abrasives (heavyshaded) displace farther than those generated by the water droplets (light shaded) away from thereference line (dashed) projected from the leading edge of the slot on the upper disc. By movingthe AWJ in the radial direction, composite erosion marks as shown in Figure 1 are formed. Themean positions of the erosion marks may be represented by two lines drawn through the leadingedge of those marks. Let's define αwa and αa as the angles between the reference line and thelines through the centers of the erosion marks generated by the water droplets and the abrasives,respectively. The angles are functions of ω, S, and the average maximum water-droplet andabrasives speeds, Vwa and Va, according to the following relationships:
α ωwa waS V= ( / ) / ,60 360 (1)
and
α ωa aS V= ( / ) /60 360 . (2)
The average maximum speeds that correspond to the centerline speed of an axisymmetric jet cantherefore be derived from these two equations, which serve as the basis for data analysis usingthe dual-disc apparatus described below.
3. EXPERIMENTAL APPARATUS AND SETUP
Figure 2 is an engineering drawing of the dual-disc apparatus, with the rotating discs installed ina protective steel housing. The discs were driven by a 2HP electric router (DeWalt, Model 621)with a maximum rotational speed of about 21,000 rpm at 110 volts AC. Both the upper andlower discs were made of 3.2-mm-thick aluminum plates with a diameter of 14 cm. Four slotswith widths of 1.6 mm were machined on the upper disc. CDs were found to be most suitable asthe data disc to record the erosion marks generated by the AWJ. They are lightweight, preciselyfabricated, and inexpensive; the coating on them can easily be removed to facilitate accuratemeasurement of the angles of the marks using an optical comparator or profile projector(Mitutoyo, Type PH-350). The three discs were pinned together to maintain a fixed orientationwhen assembled. Several spacers equipped with two pins were machined to separate the discsapart at the distance S.
To facilitate accurate measurement of the angles, an exact duplicate of the upper disc wasmachined (except the slots were widened for use with the optical comparator). The CD waspinned to the reference disc in exactly the same orientation as when it was assembled together
with the dual-disc apparatus during the tests. The erosion marks and the corresponding leadingedges were projected simultaneously on the screen of the comparator. The angles of the four datasets recorded on each disc were measured, and the average angle was derived.
The AWJ consisted of a WTI Intelligent Nozzle with a 0.18-mm-diameter sapphire orifice and a0.51-mm-diameter mixing tube 6.4 cm long. The UHP pumps consisted of a bank of sixintensifier pumps operating in parallel with a maximum flow rate of 22.7 liters/min at 380 MPa.Barton 220-mesh garnet abrasives were used for the tests. The abrasives were fed from a hopperequipped with a precision metering gauge.
The AWJ was mounted on an ASI manipulator with a 5-axis capability and a FANUC controller.The ASI manipulator has a computer-controlled high-pressure pumping system and a workingenvelope of 3 × 2.4 × 0.9 m (10 × 8 × 3 ft) and is mounted on an isolated concrete foundation forprecision machining applications of large and small structures. During the tests, the manipulatortraversed the AWJ radially inward across the CD.
Before each test, the AWJ nozzle was moved to its starting position just outside the outer edge ofthe discs. The bottom of the steel housing below the AWJ nozzle was protected by a carbideplate. Experiments were conducted following the procedure described below.
1. Turn on the power and adjust the pressure to the predetermined value.2. Open the valve upstream of the AWJ nozzle to stabilize the jet pressure.3. Turn on the motor of the dual-disc apparatus and measure the rotational speed of the discs
with an optical tachometer (Cole-Parmer, Model E-08203-20).4. Open the abrasive feed valve for the AWJ runs.5. Traverse the AWJ nozzle across the discs radially inward at predetermined speeds, which
increase with the jet pressure to ensure that distinct erosion marks are generated on the datadiscs to facilitate accurate measurements of the displacement angles.
6. Turn off both the AWJ and the traverse as soon as the AWJ passes the ends of the slots.7. Remove the CD from the assembly and replace with a new one for the next run.
The erosion marks were visualized using a PC-based imaging system. The video camera (CohuModel 8400) was equipped with a zoom objective (Titan tool) to magnify the views of interest.The imaging system also consisted of a PCI bus mastering image acquisition plug-in board(National Instruments Model PCI-1408) and several imaging processing packages (e.g., ImagePro Plus by Media Cybernetics and IMAQ Vision by National Instruments). Both the top andcross-sectional views were captured with the imaging system. For the cross-sectional view, theCD was cut perpendicular to its surface and to the erosion mark. The marks were illuminatedwith a white light source equipped with a fiber-optic guide.
4. EXPERIMENTAL RESULTS
Preliminary tests were conducted to optimize the performance of the dual-disc apparatus, theexperimental procedure, and the method of data analysis. During the test period, severalrevisions were implemented:
• Increased the rotation speed of the discs from 21,000 rpm to 23,800 rpm by using a Variactransformer that increased the AC voltage from 110 to 140 volts.
• Reduced the experimental error by increasing the separation between the top surfaces of theupper discs and the CDs to 6.39 cm.
• Develop and implement the method for accurate measurements of the displaced angles of theerosion marks on the CD.
• Develop the technique for visualizing and quantifying the profiles of the erosion marks.
A series of experiments was subsequently conducted to measure the maximum water-dropletspeed of UHP WJs without using abrasives, with the abrasive feed port closed and open,respectively. Finally, the same experiments were repeated using the AWJ. For a free WJ, themaximum water-droplet speed always takes place along the jet centerline (Yanaida, 1974). In theabsence of abrasives and with the abrasive feed port closed, the presence of the 0.51-mm ID and6.4-cm-long mixing tube has little effect on the WJ exiting the 0.18-mm-diameter sapphirenozzle, provided the WJ is aligned properly with the centerline of the tube. In other words, theWJ is essentially a sapphire WJ that does not touch the sidewall of the mixing tube as it passesthrough the tube. For the same WJ with the abrasive feed port open, on the other hand, theentrained garnet abrasives through the port tend to break up the WJ into fine droplets. The WJexpands rapidly and is confined by the sidewall of the mixing tube. As a result, the WJ assumesthe properties of a carbide WJ. For the above scenarios, the measured maximum water-dropletspeeds, Vw and Vwa, and the maximum abrasive speed, Va, at large x/D correspond to thecenterline speed of these axisymmetric jets.
4.1 Erosion Patterns
Figure 3 illustrates the overall erosion marks generated on the CD by the WJ at p = 345 MPa.There are four sets of erosion marks corresponding to the four sets of slots machined on the topdisc. Also shown, just counterclockwise to the marks, are the leading edges of the slots on thereference disc pinned to the CD. As shown in Figure 1, the angles αw of the four erosion markswere measured with respect to these leading edges. Note that the lines drawn through theaverage leading edges of the opposite erosion marks go through the center of the disc.
Figures 4a and 4b show the top views of the erosion marks generated by the 345-MPa WJ, withthe abrasive feed port closed and open, respectively. The bright and dark regions correspond tothe eroded and original surfaces of the CD; the left edges coincide with the leading edges of themarks. From the scale (1 mm/division) shown on the bottom of the figures, the maximum widthsof the marks generated by the WJs with the port closed and open were measured to beapproximately 1.3 and 1.0 mm, respectively. It is evident that the WJ is more powerful with itsport closed than open, as expected. The evidence is even more convincing when the cross-sectional views of the two cases are compared in Figures 5a and 5b. In the figures, the camera is
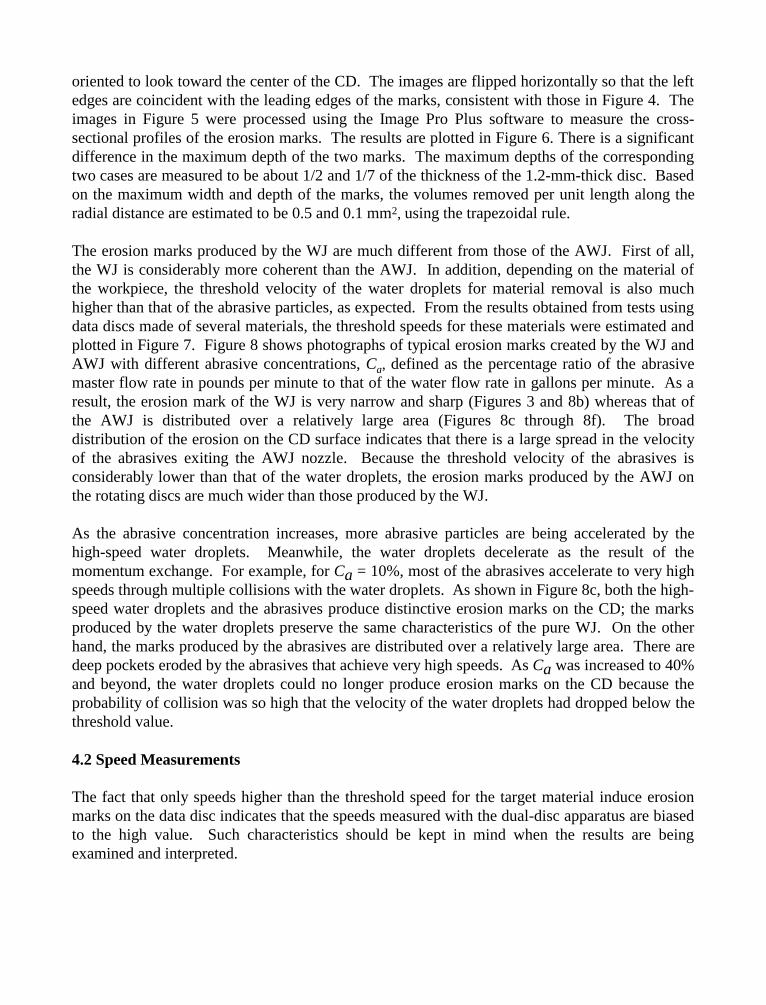
oriented to look toward the center of the CD. The images are flipped horizontally so that the leftedges are coincident with the leading edges of the marks, consistent with those in Figure 4. Theimages in Figure 5 were processed using the Image Pro Plus software to measure the cross-sectional profiles of the erosion marks. The results are plotted in Figure 6. There is a significantdifference in the maximum depth of the two marks. The maximum depths of the correspondingtwo cases are measured to be about 1/2 and 1/7 of the thickness of the 1.2-mm-thick disc. Basedon the maximum width and depth of the marks, the volumes removed per unit length along theradial distance are estimated to be 0.5 and 0.1 mm2, using the trapezoidal rule.
The erosion marks produced by the WJ are much different from those of the AWJ. First of all,the WJ is considerably more coherent than the AWJ. In addition, depending on the material ofthe workpiece, the threshold velocity of the water droplets for material removal is also muchhigher than that of the abrasive particles, as expected. From the results obtained from tests usingdata discs made of several materials, the threshold speeds for these materials were estimated andplotted in Figure 7. Figure 8 shows photographs of typical erosion marks created by the WJ andAWJ with different abrasive concentrations, Ca, defined as the percentage ratio of the abrasivemaster flow rate in pounds per minute to that of the water flow rate in gallons per minute. As aresult, the erosion mark of the WJ is very narrow and sharp (Figures 3 and 8b) whereas that ofthe AWJ is distributed over a relatively large area (Figures 8c through 8f). The broaddistribution of the erosion on the CD surface indicates that there is a large spread in the velocityof the abrasives exiting the AWJ nozzle. Because the threshold velocity of the abrasives isconsiderably lower than that of the water droplets, the erosion marks produced by the AWJ onthe rotating discs are much wider than those produced by the WJ.
As the abrasive concentration increases, more abrasive particles are being accelerated by thehigh-speed water droplets. Meanwhile, the water droplets decelerate as the result of themomentum exchange. For example, for Ca = 10%, most of the abrasives accelerate to very highspeeds through multiple collisions with the water droplets. As shown in Figure 8c, both the high-speed water droplets and the abrasives produce distinctive erosion marks on the CD; the marksproduced by the water droplets preserve the same characteristics of the pure WJ. On the otherhand, the marks produced by the abrasives are distributed over a relatively large area. There aredeep pockets eroded by the abrasives that achieve very high speeds. As Ca was increased to 40%and beyond, the water droplets could no longer produce erosion marks on the CD because theprobability of collision was so high that the velocity of the water droplets had dropped below thethreshold value.
4.2 Speed Measurements
The fact that only speeds higher than the threshold speed for the target material induce erosionmarks on the data disc indicates that the speeds measured with the dual-disc apparatus are biasedto the high value. Such characteristics should be kept in mind when the results are beingexamined and interpreted.
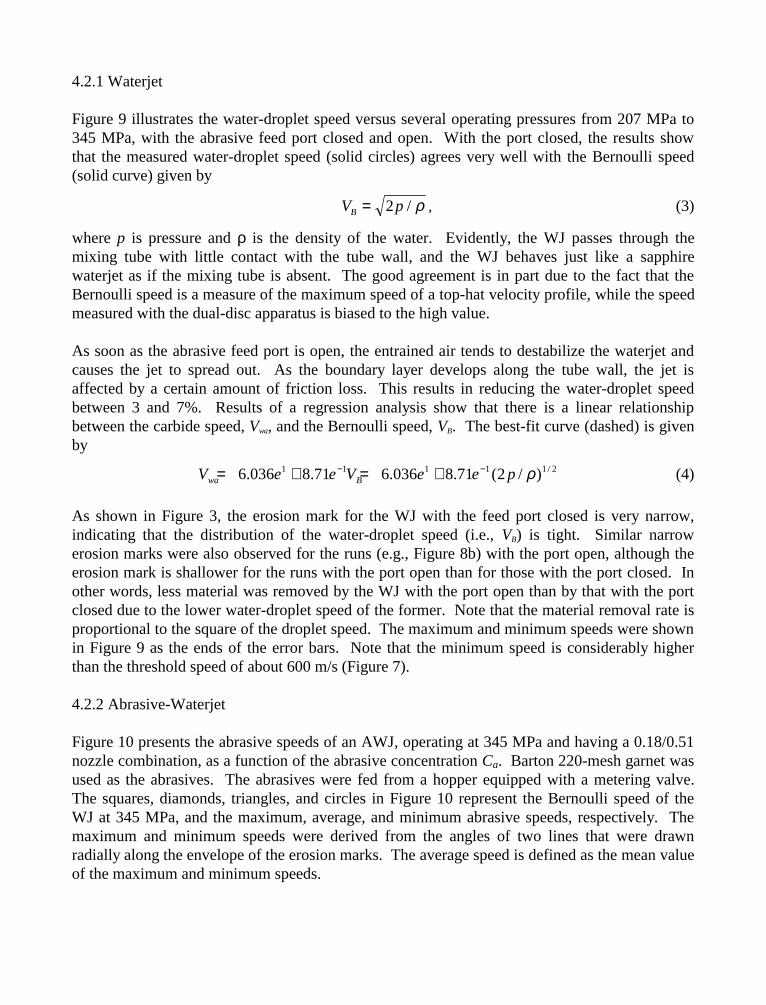
4.2.1 Waterjet
Figure 9 illustrates the water-droplet speed versus several operating pressures from 207 MPa to345 MPa, with the abrasive feed port closed and open. With the port closed, the results showthat the measured water-droplet speed (solid circles) agrees very well with the Bernoulli speed(solid curve) given by
V pB = 2 / ρ , (3)
where p is pressure and ρ is the density of the water. Evidently, the WJ passes through themixing tube with little contact with the tube wall, and the WJ behaves just like a sapphirewaterjet as if the mixing tube is absent. The good agreement is in part due to the fact that theBernoulli speed is a measure of the maximum speed of a top-hat velocity profile, while the speedmeasured with the dual-disc apparatus is biased to the high value.
As soon as the abrasive feed port is open, the entrained air tends to destabilize the waterjet andcauses the jet to spread out. As the boundary layer develops along the tube wall, the jet isaffected by a certain amount of friction loss. This results in reducing the water-droplet speedbetween 3 and 7%. Results of a regression analysis show that there is a linear relationshipbetween the carbide speed, Vwa, and the Bernoulli speed, VB. The best-fit curve (dashed) is givenby
2/11111 )/2(71.8036.671.8036.6 ρpeeVeeV Bwa−− +=+= (4)
As shown in Figure 3, the erosion mark for the WJ with the feed port closed is very narrow,indicating that the distribution of the water-droplet speed (i.e., VB) is tight. Similar narrowerosion marks were also observed for the runs (e.g., Figure 8b) with the port open, although theerosion mark is shallower for the runs with the port open than for those with the port closed. Inother words, less material was removed by the WJ with the port open than by that with the portclosed due to the lower water-droplet speed of the former. Note that the material removal rate isproportional to the square of the droplet speed. The maximum and minimum speeds were shownin Figure 9 as the ends of the error bars. Note that the minimum speed is considerably higherthan the threshold speed of about 600 m/s (Figure 7).
4.2.2 Abrasive-Waterjet
Figure 10 presents the abrasive speeds of an AWJ, operating at 345 MPa and having a 0.18/0.51nozzle combination, as a function of the abrasive concentration Ca. Barton 220-mesh garnet wasused as the abrasives. The abrasives were fed from a hopper equipped with a metering valve.The squares, diamonds, triangles, and circles in Figure 10 represent the Bernoulli speed of theWJ at 345 MPa, and the maximum, average, and minimum abrasive speeds, respectively. Themaximum and minimum speeds were derived from the angles of two lines that were drawnradially along the envelope of the erosion marks. The average speed is defined as the mean valueof the maximum and minimum speeds.
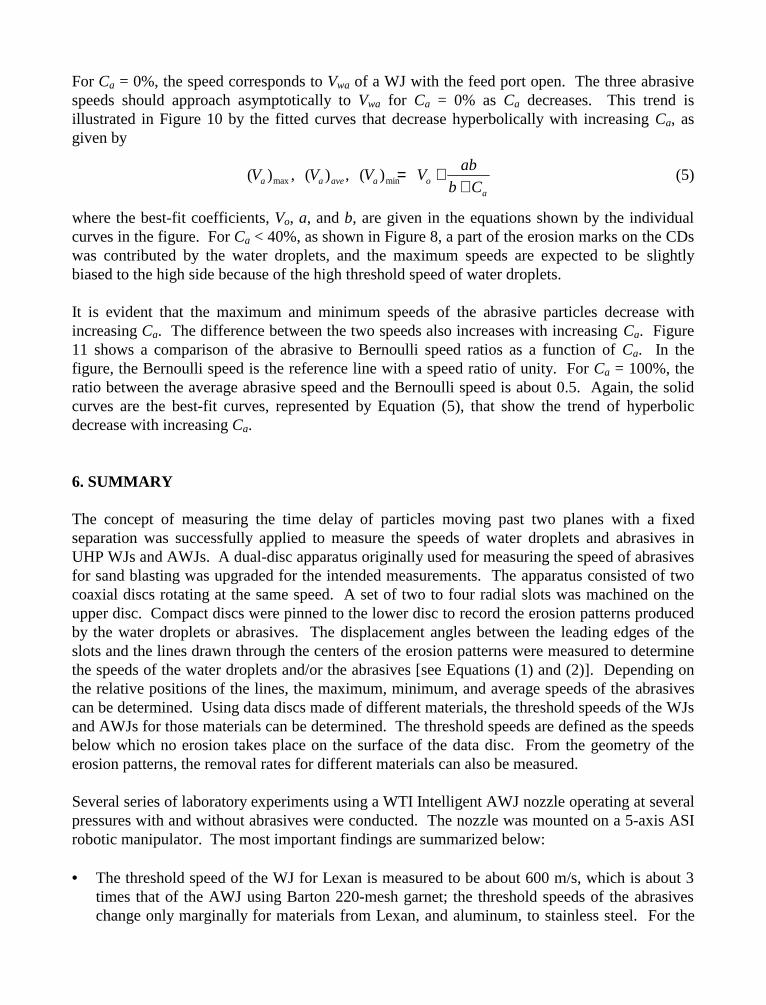
For Ca = 0%, the speed corresponds to Vwa of a WJ with the feed port open. The three abrasivespeeds should approach asymptotically to Vwa for Ca = 0% as Ca decreases. This trend isillustrated in Figure 10 by the fitted curves that decrease hyperbolically with increasing Ca, asgiven by
aoaaveaa Cb
abVVVV
++=minmax )(,)(,)( (5)
where the best-fit coefficients, Vo, a, and b, are given in the equations shown by the individualcurves in the figure. For Ca < 40%, as shown in Figure 8, a part of the erosion marks on the CDswas contributed by the water droplets, and the maximum speeds are expected to be slightlybiased to the high side because of the high threshold speed of water droplets.
It is evident that the maximum and minimum speeds of the abrasive particles decrease withincreasing Ca. The difference between the two speeds also increases with increasing Ca. Figure11 shows a comparison of the abrasive to Bernoulli speed ratios as a function of Ca. In thefigure, the Bernoulli speed is the reference line with a speed ratio of unity. For Ca = 100%, theratio between the average abrasive speed and the Bernoulli speed is about 0.5. Again, the solidcurves are the best-fit curves, represented by Equation (5), that show the trend of hyperbolicdecrease with increasing Ca.
6. SUMMARY
The concept of measuring the time delay of particles moving past two planes with a fixedseparation was successfully applied to measure the speeds of water droplets and abrasives inUHP WJs and AWJs. A dual-disc apparatus originally used for measuring the speed of abrasivesfor sand blasting was upgraded for the intended measurements. The apparatus consisted of twocoaxial discs rotating at the same speed. A set of two to four radial slots was machined on theupper disc. Compact discs were pinned to the lower disc to record the erosion patterns producedby the water droplets or abrasives. The displacement angles between the leading edges of theslots and the lines drawn through the centers of the erosion patterns were measured to determinethe speeds of the water droplets and/or the abrasives [see Equations (1) and (2)]. Depending onthe relative positions of the lines, the maximum, minimum, and average speeds of the abrasivescan be determined. Using data discs made of different materials, the threshold speeds of the WJsand AWJs for those materials can be determined. The threshold speeds are defined as the speedsbelow which no erosion takes place on the surface of the data disc. From the geometry of theerosion patterns, the removal rates for different materials can also be measured.
Several series of laboratory experiments using a WTI Intelligent AWJ nozzle operating at severalpressures with and without abrasives were conducted. The nozzle was mounted on a 5-axis ASIrobotic manipulator. The most important findings are summarized below:
• The threshold speed of the WJ for Lexan is measured to be about 600 m/s, which is about 3times that of the AWJ using Barton 220-mesh garnet; the threshold speeds of the abrasiveschange only marginally for materials from Lexan, and aluminum, to stainless steel. For the
WJs, only water droplets that have acquired speeds exceeding the threshold speed for thetarget material would remove the material from the data disc. In other words, for a CD madeof Lexan, a portion of the kinetic energy of the water droplets in a UHP WJ is being wastedsimply because of the high threshold speed. When Barton 220-mesh garnet is fed into theWJ, those particles acquiring speeds higher than 180 m/s will begin to remove materialeffectively from the disc. This is one of the main reasons that the AWJ is more powerfulthan the WJ.
• The material removal rate of the WJ drops noticeably when the abrasive feed port of the AWJnozzle is open. Air drawn through the feed port tends to destabilize the WJ, causing the WJto spread and interact with the sidewall of the mixing tube.
• The speed of water droplets exiting an AWJ nozzle with the abrasive feed port closed, Vw,agrees well with the Bernoulli speed, VB, derived from the Bernoulli equation [Equation (3)].Note that the speeds measured by the dual-disc apparatus are generally biased to the highvalue because only speeds higher than the threshold speed for the target material induceerosion marks that facilitate the speed measurement. On the other hand, the Bernoulli speedis a measure of the maximum speed of a top-hat velocity profile of the WJ. This explains inpart the excellent agreement between Vw and VB.
• Opening the feed port reduces the speed of the water droplets, Vwa, by 3 to 7%. A linearrelationship between Vwa and Vw or VB has been established [Equation (4)]. The materialremoval rate drops even further as it is proportional to the kinetic energy of the WJ or thesquare of the droplet speed (Figures 4 through 6).
• The dimensional and dimensionless abrasive speeds decrease hyperbolically with increasingCa [Equation (5)]. On the other hand, the difference between the maximum and minimumabrasive speeds increases with increasing Ca. For Ca = 100% and p = 345 MPa, the averageabrasive speed reduces to about 400 m/s, which is about one half of the Bernoulli speed but isstill considerably higher than the threshold speed for stainless steel (≈ 230 m/s). Thereduction in the material removal rate due to the drop in Va is compensated for by theincrease in the number of abrasive particles. For each application and experimental setup;there is an optimum value of Ca at which the material removal rate peaks. This optimumvalue is yet to be determined.
6. ACKNOWLEDGMENTS
This work is sponsored by a U.S. Army SBIR Contract No. DAAJ02-97-C-0025 and by internalfunding for Waterjet Technology, Inc. The authors wish to thank Mr. Bob Legaspi for carryingout the measurements.
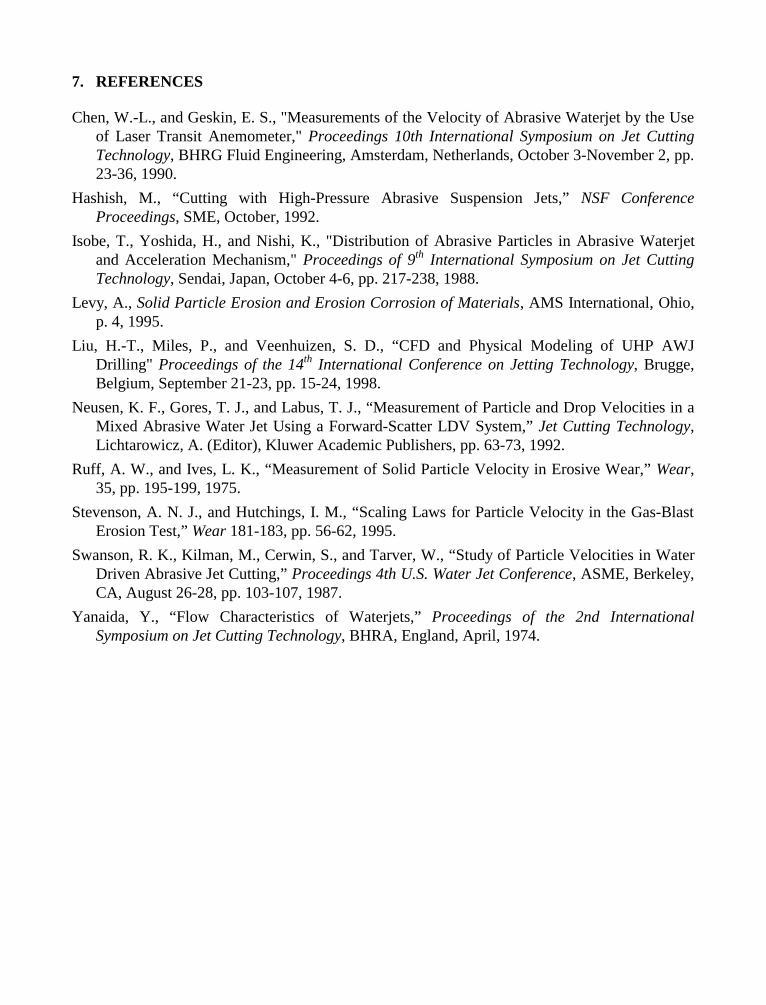
7. REFERENCES
Chen, W.-L., and Geskin, E. S., "Measurements of the Velocity of Abrasive Waterjet by the Useof Laser Transit Anemometer," Proceedings 10th International Symposium on Jet CuttingTechnology, BHRG Fluid Engineering, Amsterdam, Netherlands, October 3-November 2, pp.23-36, 1990.
Hashish, M., “Cutting with High-Pressure Abrasive Suspension Jets,” NSF ConferenceProceedings, SME, October, 1992.
Isobe, T., Yoshida, H., and Nishi, K., "Distribution of Abrasive Particles in Abrasive Waterjetand Acceleration Mechanism," Proceedings of 9th International Symposium on Jet CuttingTechnology, Sendai, Japan, October 4-6, pp. 217-238, 1988.
Levy, A., Solid Particle Erosion and Erosion Corrosion of Materials, AMS International, Ohio,p. 4, 1995.
Liu, H.-T., Miles, P., and Veenhuizen, S. D., “CFD and Physical Modeling of UHP AWJDrilling" Proceedings of the 14th International Conference on Jetting Technology, Brugge,Belgium, September 21-23, pp. 15-24, 1998.
Neusen, K. F., Gores, T. J., and Labus, T. J., “Measurement of Particle and Drop Velocities in aMixed Abrasive Water Jet Using a Forward-Scatter LDV System,” Jet Cutting Technology,Lichtarowicz, A. (Editor), Kluwer Academic Publishers, pp. 63-73, 1992.
Ruff, A. W., and Ives, L. K., “Measurement of Solid Particle Velocity in Erosive Wear,” Wear,35, pp. 195-199, 1975.
Stevenson, A. N. J., and Hutchings, I. M., “Scaling Laws for Particle Velocity in the Gas-BlastErosion Test,” Wear 181-183, pp. 56-62, 1995.
Swanson, R. K., Kilman, M., Cerwin, S., and Tarver, W., “Study of Particle Velocities in WaterDriven Abrasive Jet Cutting,” Proceedings 4th U.S. Water Jet Conference, ASME, Berkeley,CA, August 26-28, pp. 103-107, 1987.
Yanaida, Y., “Flow Characteristics of Waterjets,” Proceedings of the 2nd InternationalSymposium on Jet Cutting Technology, BHRA, England, April, 1974.
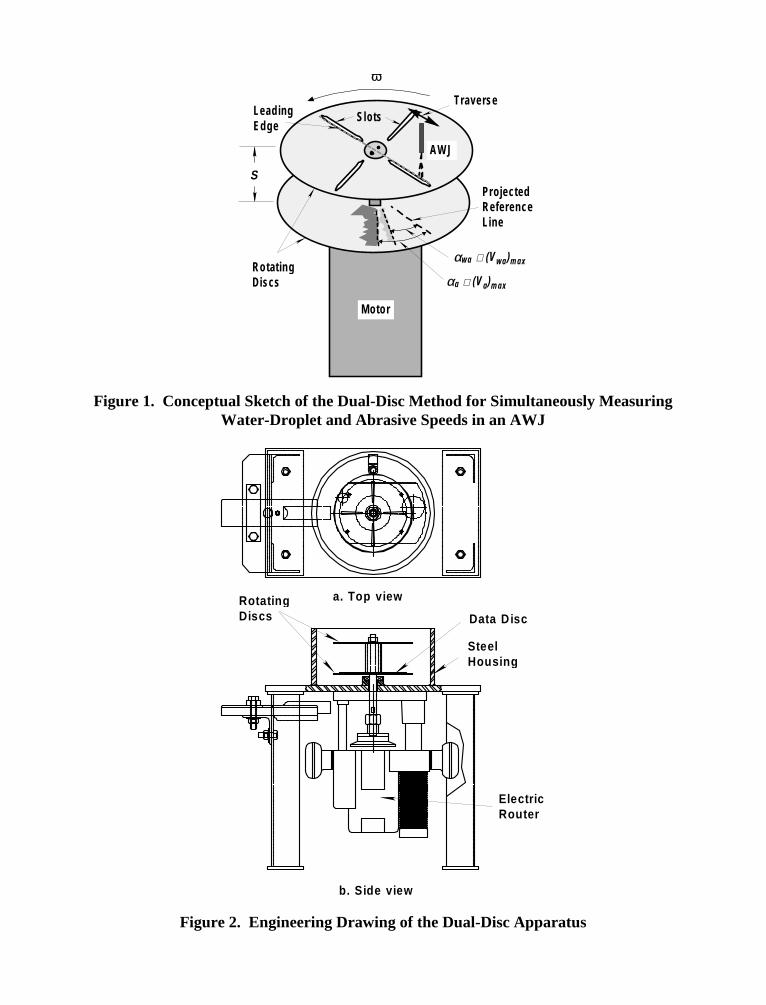
ω
ααwa ∝ (V wa)m ax
ααa ∝ (V a)m ax
RotatingDiscs
M otor
Slots
AW J
SProjected ReferenceLine
TraverseLeadingEdge
Figure 1. Conceptual Sketch of the Dual-Disc Method for Simultaneously MeasuringWater-Droplet and Abrasive Speeds in an AWJ
a. To p view
b. Side view
ElectricRouter
Data D isc
SteelHousin g
Rotatin gDiscs
Figure 2. Engineering Drawing of the Dual-Disc Apparatus
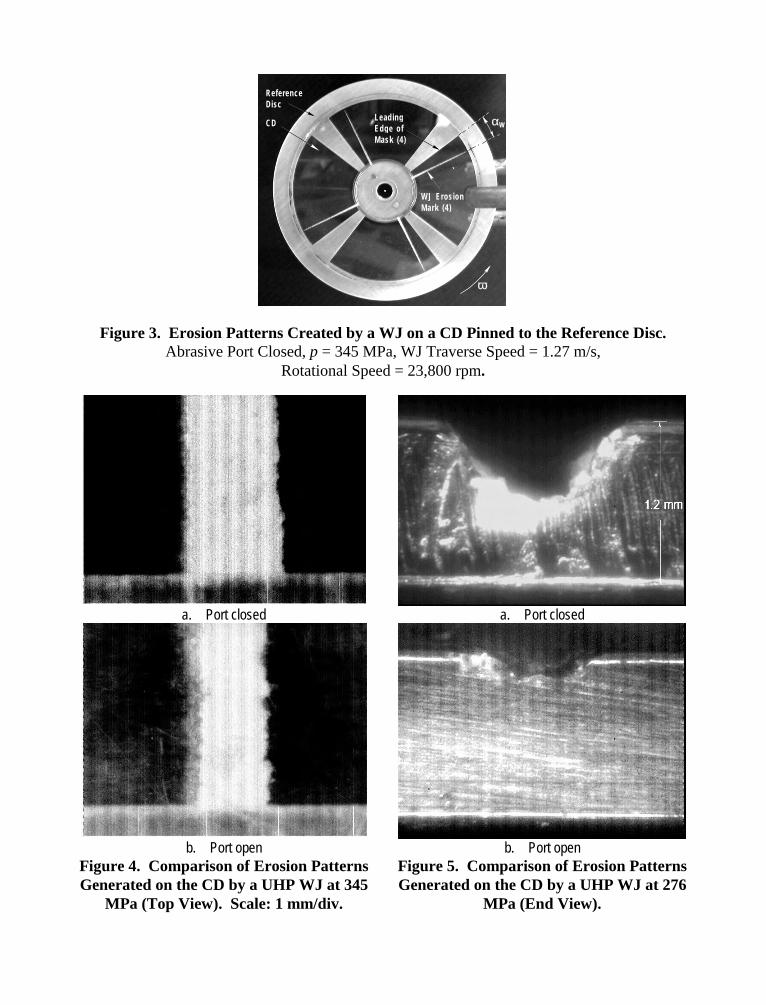
LeadingEdge ofMask (4)
W J ErosionMark (4)
ReferenceDisc
CD
ω
αw
Figure 3. Erosion Patterns Created by a WJ on a CD Pinned to the Reference Disc.Abrasive Port Closed, p = 345 MPa, WJ Traverse Speed = 1.27 m/s,
Rotational Speed = 23,800 rpm.
a. Port closed a. Port closed
b. Port open b. Port openFigure 4. Comparison of Erosion PatternsGenerated on the CD by a UHP WJ at 345
MPa (Top View). Scale: 1 mm/div.
Figure 5. Comparison of Erosion PatternsGenerated on the CD by a UHP WJ at 276
MPa (End View).
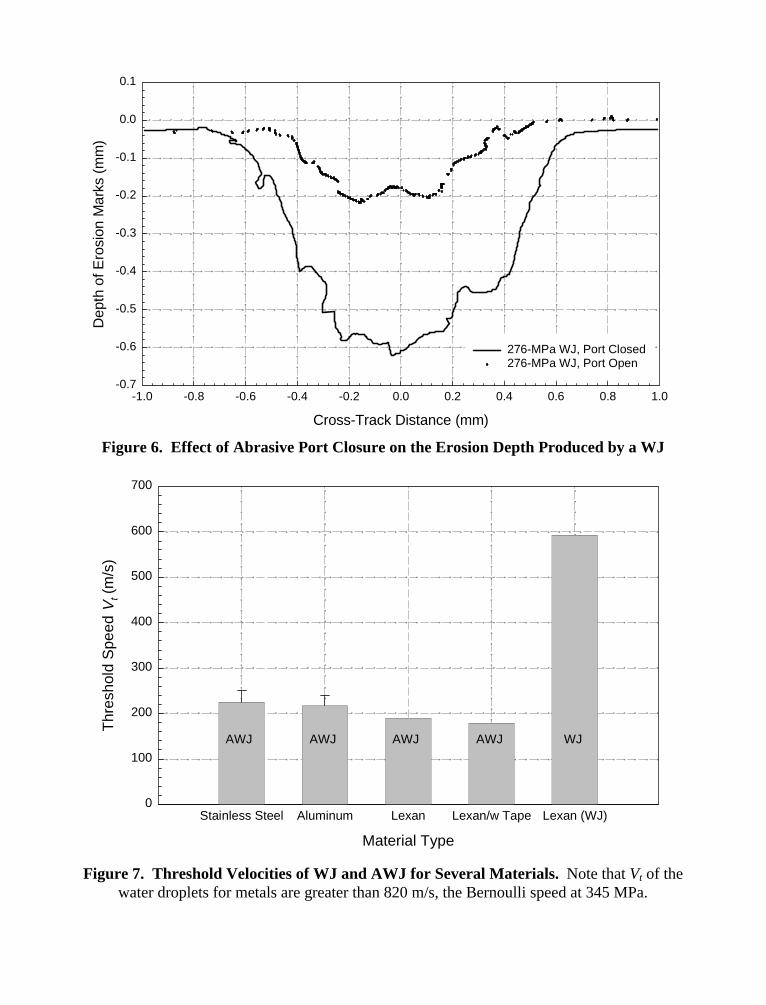
Cross-Track Distance (mm)
-1.0 -0.8 -0.6 -0.4 -0.2 0.0 0.2 0.4 0.6 0.8 1.0
Dep
th o
f Ero
sion
Mar
ks (
mm
)
-0.7
-0.6
-0.5
-0.4
-0.3
-0.2
-0.1
0.0
0.1
276-MPa WJ, Port Closed276-MPa WJ, Port Open
Figure 6. Effect of Abrasive Port Closure on the Erosion Depth Produced by a WJ
Material Type
Stainless Steel Aluminum Lexan Lexan/w Tape Lexan (WJ)
Thr
esho
ld S
peed
Vt (
m/s
)
0
100
200
300
400
500
600
700
AWJ AWJ AWJ AWJ WJ
Figure 7. Threshold Velocities of WJ and AWJ for Several Materials. Note that Vt of thewater droplets for metals are greater than 820 m/s, the Bernoulli speed at 345 MPa.
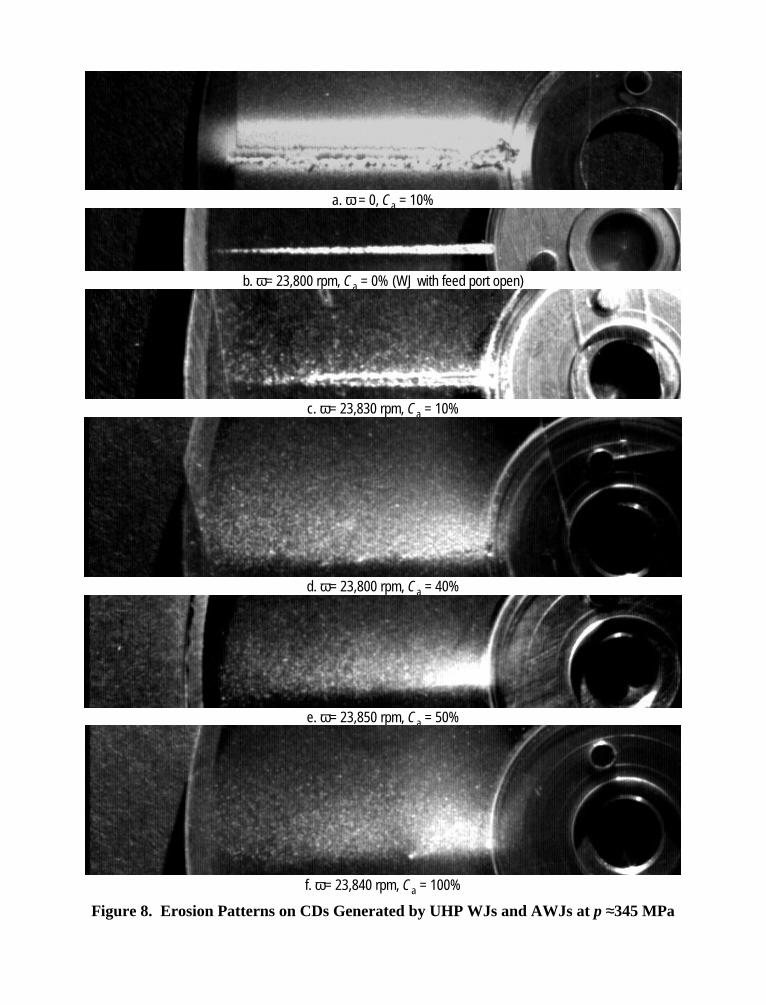
a. ω = 0, Ca = 10%
b. ω= 23,800 rpm, Ca = 0% (WJ with feed port open)
c. ω= 23,830 rpm, Ca = 10%
d. ω= 23,800 rpm, Ca = 40%
e. ω= 23,850 rpm, Ca = 50%
f. ω= 23,840 rpm, Ca = 100%
Figure 8. Erosion Patterns on CDs Generated by UHP WJs and AWJs at p ≈345 MPa
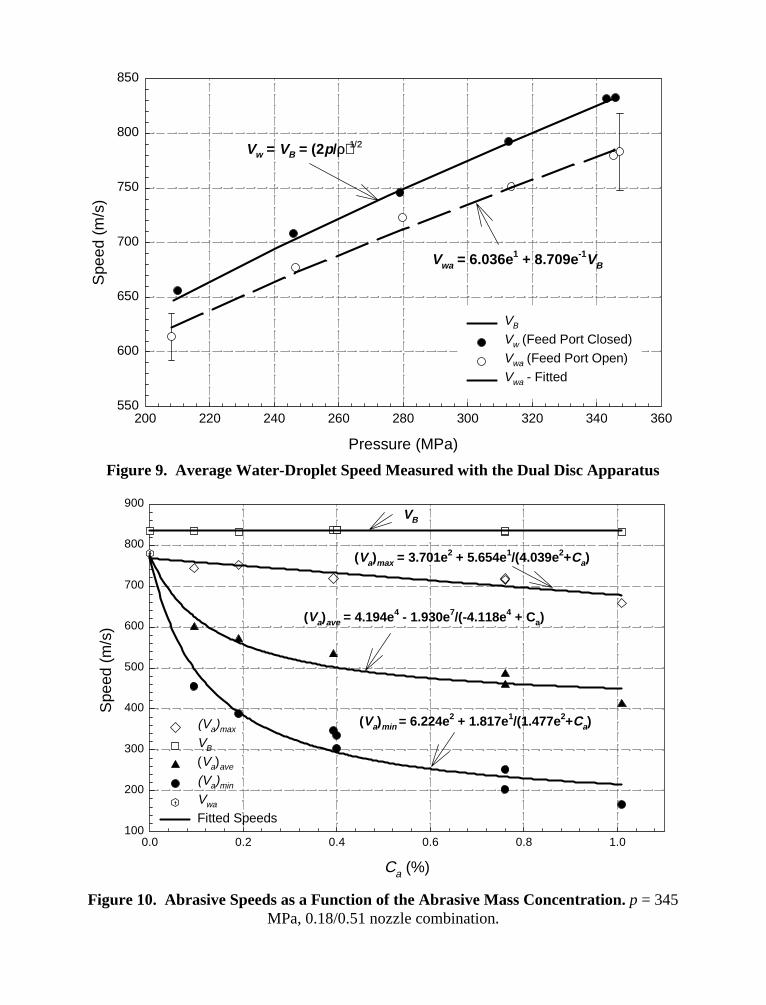
Pressure (MPa)
200 220 240 260 280 300 320 340 360
Spe
ed (
m/s
)
550
600
650
700
750
800
850
VB
Vw (Feed Port Closed)Vwa (Feed Port Open)Vwa - Fitted
Vw = VB = (2p/ρ)1/2
Vwa = 6.036e1 + 8.709e-1VB
Figure 9. Average Water-Droplet Speed Measured with the Dual Disc Apparatus
Ca (%)
0.0 0.2 0.4 0.6 0.8 1.0
Spe
ed (
m/s
)
100
200
300
400
500
600
700
800
900
(Va)max
VB (Va)ave
(Va)min
Vwa
Fitted Speeds
VB
(Va)max = 3.701e2 + 5.654e1/(4.039e2+Ca)
(Va)min = 6.224e2 + 1.817e1/(1.477e2+Ca)
(Va)ave = 4.194e4 - 1.930e7/(-4.118e4 + Ca)
Figure 10. Abrasive Speeds as a Function of the Abrasive Mass Concentration. p = 345MPa, 0.18/0.51 nozzle combination.
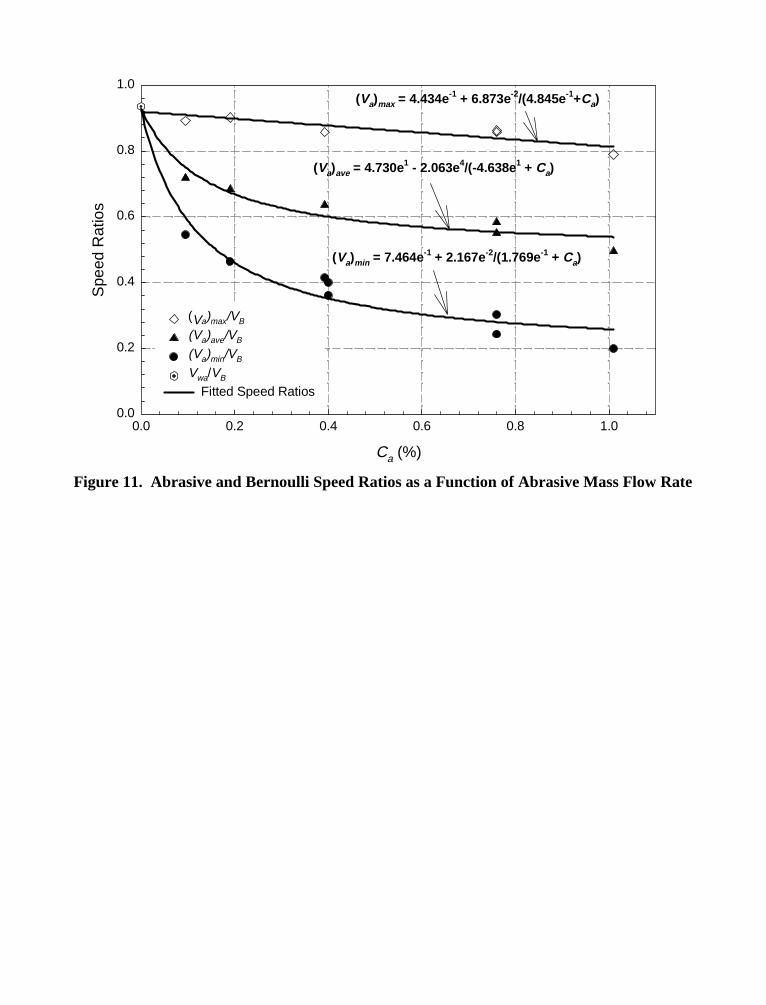
Ca (%)
0.0 0.2 0.4 0.6 0.8 1.0
Spe
ed R
atio
s
0.0
0.2
0.4
0.6
0.8
1.0
(Va)max/VB
(Va)ave/VB
(Va)min/VB
Vwa/VB
Fitted Speed Ratios
(Va)max = 4.434e-1 + 6.873e-2/(4.845e-1+Ca)
(Va)ave = 4.730e1 - 2.063e4/(-4.638e1 + Ca)
(Va)min = 7.464e-1 + 2.167e-2/(1.769e-1 + Ca)
Figure 11. Abrasive and Bernoulli Speed Ratios as a Function of Abrasive Mass Flow Rate
10th American Waterjet ConferenceAugust 14-17, 1999: Houston, Texas
Paper 15
CUTTING EFFICIENCY OF ABRASIVE
WATERJET NOZZLES
Madhusarathi Nanduri, David G. Taggart, Thomas J. KimUniversity of Rhode Island
Kingston, RI U.S.A.
ABSTRACT
The cutting efficiency of abrasive waterjet nozzles was investigated in conjunction with nozzlewear. It was observed that the cutting efficiency of the nozzle deteriorates as it wears. There is acorrelation between wear and cutting efficiency. The operating conditions that produce the mostefficient jets also cause the most wear in the nozzle.
Organized and Sponsored by the WaterJet Technology Association
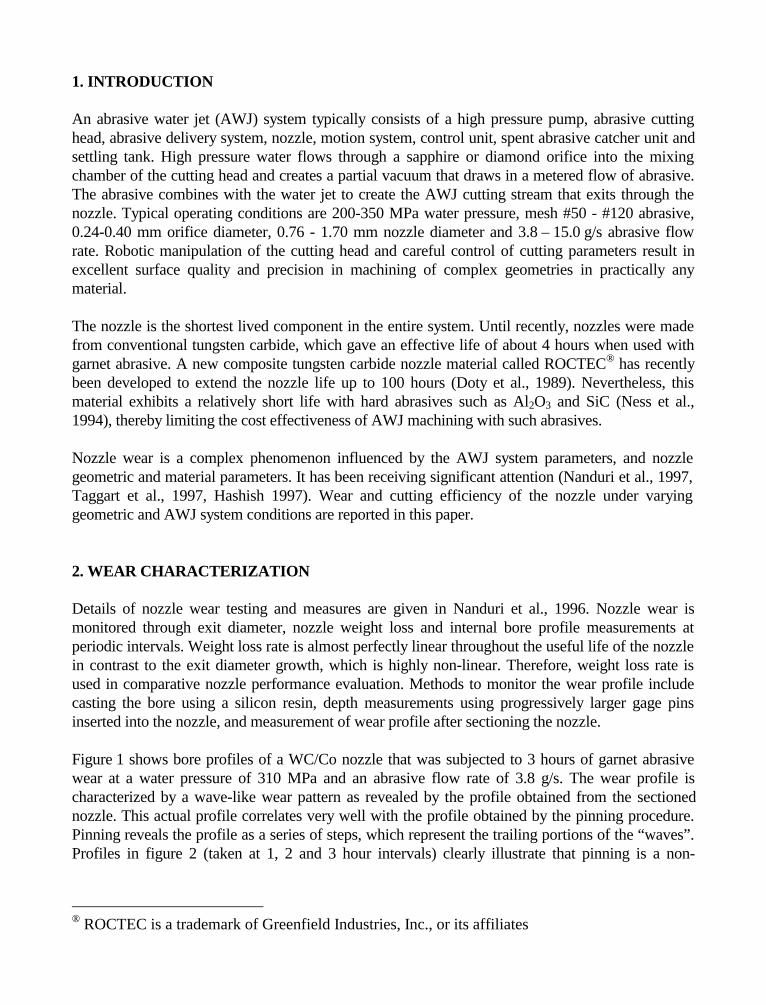
1. INTRODUCTION
An abrasive water jet (AWJ) system typically consists of a high pressure pump, abrasive cuttinghead, abrasive delivery system, nozzle, motion system, control unit, spent abrasive catcher unit andsettling tank. High pressure water flows through a sapphire or diamond orifice into the mixingchamber of the cutting head and creates a partial vacuum that draws in a metered flow of abrasive.The abrasive combines with the water jet to create the AWJ cutting stream that exits through thenozzle. Typical operating conditions are 200-350 MPa water pressure, mesh #50 - #120 abrasive,0.24-0.40 mm orifice diameter, 0.76 - 1.70 mm nozzle diameter and 3.8 – 15.0 g/s abrasive flowrate. Robotic manipulation of the cutting head and careful control of cutting parameters result inexcellent surface quality and precision in machining of complex geometries in practically anymaterial.
The nozzle is the shortest lived component in the entire system. Until recently, nozzles were madefrom conventional tungsten carbide, which gave an effective life of about 4 hours when used withgarnet abrasive. A new composite tungsten carbide nozzle material called ROCTEC® has recentlybeen developed to extend the nozzle life up to 100 hours (Doty et al., 1989). Nevertheless, thismaterial exhibits a relatively short life with hard abrasives such as Al2O3 and SiC (Ness et al.,1994), thereby limiting the cost effectiveness of AWJ machining with such abrasives.
Nozzle wear is a complex phenomenon influenced by the AWJ system parameters, and nozzlegeometric and material parameters. It has been receiving significant attention (Nanduri et al., 1997,Taggart et al., 1997, Hashish 1997). Wear and cutting efficiency of the nozzle under varyinggeometric and AWJ system conditions are reported in this paper.
2. WEAR CHARACTERIZATION
Details of nozzle wear testing and measures are given in Nanduri et al., 1996. Nozzle wear ismonitored through exit diameter, nozzle weight loss and internal bore profile measurements atperiodic intervals. Weight loss rate is almost perfectly linear throughout the useful life of the nozzlein contrast to the exit diameter growth, which is highly non-linear. Therefore, weight loss rate isused in comparative nozzle performance evaluation. Methods to monitor the wear profile includecasting the bore using a silicon resin, depth measurements using progressively larger gage pinsinserted into the nozzle, and measurement of wear profile after sectioning the nozzle.
Figure 1 shows bore profiles of a WC/Co nozzle that was subjected to 3 hours of garnet abrasivewear at a water pressure of 310 MPa and an abrasive flow rate of 3.8 g/s. The wear profile ischaracterized by a wave-like wear pattern as revealed by the profile obtained from the sectionednozzle. This actual profile correlates very well with the profile obtained by the pinning procedure.Pinning reveals the profile as a series of steps, which represent the trailing portions of the “waves”.Profiles in figure 2 (taken at 1, 2 and 3 hour intervals) clearly illustrate that pinning is a non-
® ROCTEC is a trademark of Greenfield Industries, Inc., or its affiliates
destructive measuring technique that provides an excellent description of nozzle wear. Theseprofiles reveal that as wear progresses, the wave-like structure grows in magnitude and propagatesdown the nozzle bore.
Accelerated wear test procedures were used to conduct parametric studies on nozzle wear andcutting efficiency quickly and cost effectively. The procedures use standard AWJ operatingparameters and a hard abrasive (aluminum oxide) to accelerate the wear process. The validity ofthis procedure was demonstrated by conducting a series of long term wear tests using garnetabrasive and comparing the results with accelerated test results (Taggart et al., 1997). The trendsobserved in volume loss and exit bore growth in both short and long term data were similar.
3. CUTTING EFFICIENCY CHARACTERIZATION
Cutting efficiency tests conducted included depth of cut measurement on wedge shaped anduniformly thick samples (at constant speed), traverse speed to fully separate a specific thickness ofmaterial, and specific material removal rate. These tests revealed an excellent correlation betweenthe different methods. In AWJ kerf cutting, minor changes in operating parameters affect thetraverse speed to fully cut through a specified thickness, which limits the accuracy of measurement.This leads to the determination of a small range in cutting speed instead of a specific value. Thedepth of cut obtained on wedge shaped samples is also very sensitive to operating conditions.However, the target specific volume loss, defined as the volume of material removed per unitvolume of abrasive, is a fairly repeatable value and easy to measure. The jet is traversed at a highspeed to avoid complete penetration of the specimen. This ensures complete usage of jet energy formaterial removal. Specific volume loss is computed using specimen weight loss, specimen density,jet traverse time and abrasive flow rate, which are known quantities.
4. EXPERIMENTATION
Cutting efficiency and nozzle wear tests were conducted at the University of Rhode Island WaterjetLaboratory. In a typical wear test, the nozzle is installed in the cutting head and the jet stream isaligned. The abrasive flow rate and water pressure are adjusted. During the test, the jet is allowedto impinge on the steel balls in the catcher tank to dissipate its energy. The test is stopped atpredetermined intervals for exit diameter, weight loss and bore profile measurements. A standardcutting efficiency test protocol was developed that has excellent reproducibility and accuracy.Cutting efficiency tests were conducted during the wear test measurement intervals. The duration ofa cutting efficiency test was about 15 seconds, which was accounted for in the time segments of thewear test. Thus, during the tests, wear and cutting efficiency as a function of time as well as nozzleexit diameter, are simultaneously monitored. The cutting efficiency tests were repeated to averageout any noise. Average depths of the randomly selected samples were used to confirm the trendsobserved.
The parameters investigated were nozzle length, inlet angle, nozzle diameter, orifice diameter,water pressure and abrasive flow rate. Accelerated wear tests (using aluminum oxide mesh #80
abrasive) were performed varying each parameter independently to understand its effect on nozzlewear. Tests were conducted using WC/Co nozzles with 60° inlet angles. Test and typical values ofthe parameters are given in table 1. The inlet angle tests were conducted using ROCTEC 100nozzles with 1.0 mm bore diameter, 0.33 mm diameter orifice, 310 MPa water pressure, and anabrasive flow rate of 7.6 g/s.
To determine the cutting efficiency, grooving tests were conducted by traversing the abrasivewaterjet across 50 mm long stainless steel samples (type SS 304) 6.4 mm thick at a constant rate of17 mm/s. The standoff distance was kept constant at 1.2 mm. In reporting the results, exit diameterincrease rate is expressed in %/min and weight loss rate in g/min. Cutting efficiency is expressed asthe weight loss of the sample per gram of abrasive. The cutting efficiency of the nozzles testedremained essentially constant with less than 10% variation as long as the exit diameter growth waslimited to within 10% of the initial diameter. Therefore, the cutting efficiency reported in most plotsis an average value of cutting efficiencies obtained from nozzles whose exit diameter increased upto 10% of the initial diameter.
5. RESULTS AND DISCUSSION
5.1 Inlet Angle
A general trend of reduced exit bore growth with increasing inlet angle was observed in short (15min) duration tests as shown in figure 3. However, longer duration tests on different inlet anglenozzles revealed identical nozzle lives (Nanduri 1997). A significant difference in the bore profilesof different inlet angle nozzles is the proportion of wear along the length of the nozzle. As the inletangle increases, the profile becomes more “wavy”. Uniform bore profiles lead to uniform exitdiameter growth. Therefore, smaller inlet angle nozzles exhibit superior linearity in exit diametergrowth compared to larger inlet angle nozzles. Cutting efficiencies of the 10° and 30° nozzles areshown in figure 4. The cutting efficiency of the 10° nozzle at equivalent exit bore size is alwayssuperior to that of the 30° nozzle. The figure also shows there is a direct correlation betweenpercent exit diameter increase and percent reduction in cutting efficiency. The lower inlet angleresults in a much more focused stream and increases the momentum transfer efficiency. The jetstream emanating from the 10° nozzle was much more coherent from visual observations during thewear tests. The kerf edge and surface quality of the cut was always superior with the 10° nozzle.The depth of cut was also more uniform. Figures 5 and 6 show the bore profiles of the 10° and 30°nozzles. The profiles show that undulations occur much earlier in time and are more pronounced inthe 30° nozzle when compared to the 10° nozzle, which causes non-linear exit bore growth. Theincreased non-linearity of the bore profiles also results in reduced cutting efficiency. The moreuniform internal profile of the 10° nozzle clearly increases its cutting efficiency.
5.2 Nozzle Length
Exit bore growth decreases with an increase in nozzle length as shown in figure 7. Nozzle weightloss rate increases with increasing nozzle length as expected. If nozzle weight loss rate isnormalized and plotted as grams per minute per unit length, it shows the same decreasing trend as
the exit diameter wear rate curve. Bore profiles of nozzles with different lengths show that althoughthe internal profiles develop identically, nozzle length has a direct influence on the exit bore growthby delaying the developing wear profile from reaching the exit. The flow pattern upstream withinthe nozzle is unaffected by an increase in nozzle length. The effect of nozzle length on cuttingefficiency is shown in figure 8. As the length increases the transverse velocity of the abrasiveparticles decreases and the particles are better aligned with the flow resulting in increased cuttingefficiency. It is clear from figure 8 that beyond a certain length the cutting efficiency does notincrease any further and the added manufacturing and material costs may not be justified.
5.3 Nozzle Diameter
Figure 9 shows the exit bore growth (%/min) and weight loss rate (g/min) as a function of nozzlediameter. The exit wear curve suggests that for a particular orifice/nozzle combination, nozzle wearwould reach a maximum. It is known that keeping the ratio, Ro, of orifice diameter to nozzlediameter around 0.3-0.4 (all other process parameters remaining constant) will result in optimummixing conditions. Cutting efficiency results (figure 10) indicate that mixing conditions resulting inmost efficient momentum transfer to the abrasive particles not only enhance the cuttingperformance but also increase nozzle wear.
The bore profiles of the 0.79 mm nozzle reveal a flow that is choked excessively resulting ininefficient transfer of momentum from the water to the abrasive. There is excessive localization ofwear in the upper portion of the nozzle that leads to increased weight loss of the nozzle. On thecontrary, the 1.63 mm diameter nozzle is too large to provide efficient momentum transfer. Bothcases result in reduced exit wear. A 1.14 mm diameter nozzle (Ro = 0.33) results in typical mixingconditions and exhibits nominal exit wear.
5.4 Orifice Diameter
Figures 11 and 12 summarize the effect of orifice diameter on nozzle wear and cutting efficiency.The correlation between cutting efficiency and nozzle wear is again evident. The cutting efficiencyincreases with increase in orifice size. Figure 11(b) indicates a drop in nozzle weight loss rate athigh water flow rates (larger orifices). As the water flow rate increases, the abrasive-to-water massratio (R) decreases and there is improved transfer of momentum to the abrasive particles. However,velocity measurements (Chen and Geskin 1991) indicate that the acceleration of abrasive particlesis dependent on the rebound effect, which is a function of distance between the jet's core and thesurrounding nozzle wall. The distance between the jet and the nozzle wall decreases withincreasing Ro, therefore, an optimum condition (a maximum) is expected. This suggests that thecutting efficiency may not improve beyond a limit.
5.5 Abrasive Flow Rate
The effect of abrasive flow rate on nozzle wear and cutting efficiency is summarized in figures 13and 14. Particle velocity tends to decrease with an increase in abrasive flow rate (Chen and Geskin1991). Conversely as the mass flow decreases, velocity increases, and as the flow rate tends to zero,the velocity tends to equal the waterjet velocity. In the range of flow rates tested, it was observed
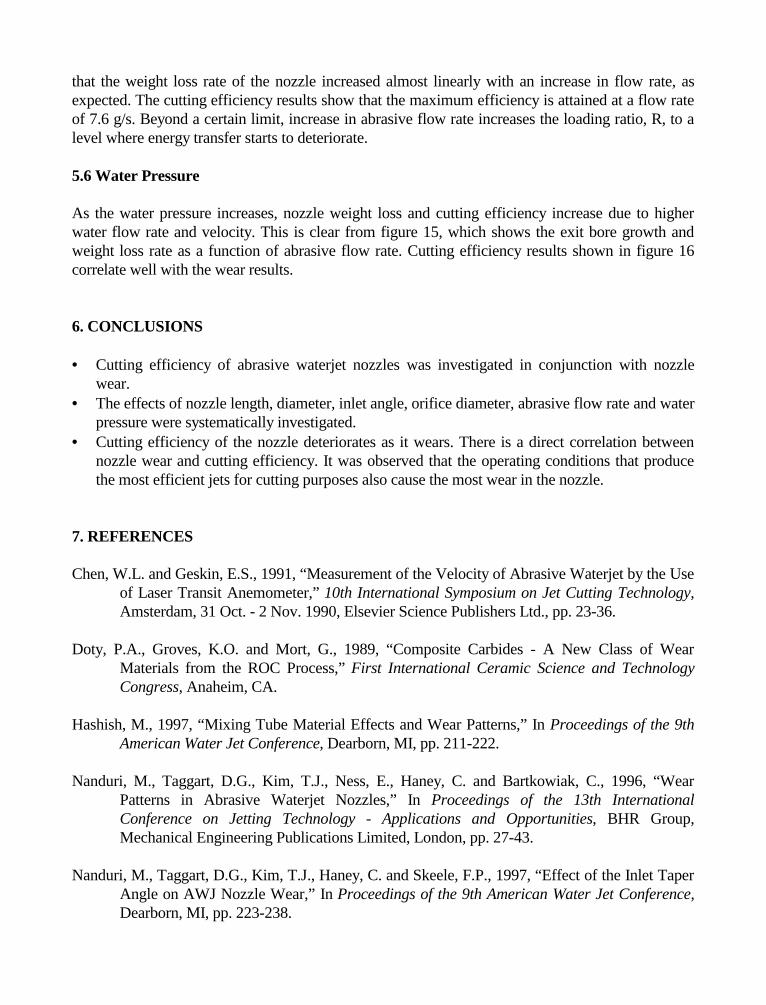
that the weight loss rate of the nozzle increased almost linearly with an increase in flow rate, asexpected. The cutting efficiency results show that the maximum efficiency is attained at a flow rateof 7.6 g/s. Beyond a certain limit, increase in abrasive flow rate increases the loading ratio, R, to alevel where energy transfer starts to deteriorate.
5.6 Water Pressure
As the water pressure increases, nozzle weight loss and cutting efficiency increase due to higherwater flow rate and velocity. This is clear from figure 15, which shows the exit bore growth andweight loss rate as a function of abrasive flow rate. Cutting efficiency results shown in figure 16correlate well with the wear results.
6. CONCLUSIONS
• Cutting efficiency of abrasive waterjet nozzles was investigated in conjunction with nozzlewear.
• The effects of nozzle length, diameter, inlet angle, orifice diameter, abrasive flow rate and waterpressure were systematically investigated.
• Cutting efficiency of the nozzle deteriorates as it wears. There is a direct correlation betweennozzle wear and cutting efficiency. It was observed that the operating conditions that producethe most efficient jets for cutting purposes also cause the most wear in the nozzle.
7. REFERENCES
Chen, W.L. and Geskin, E.S., 1991, “Measurement of the Velocity of Abrasive Waterjet by the Useof Laser Transit Anemometer,” 10th International Symposium on Jet Cutting Technology,Amsterdam, 31 Oct. - 2 Nov. 1990, Elsevier Science Publishers Ltd., pp. 23-36.
Doty, P.A., Groves, K.O. and Mort, G., 1989, “Composite Carbides - A New Class of WearMaterials from the ROC Process,” First International Ceramic Science and TechnologyCongress, Anaheim, CA.
Hashish, M., 1997, “Mixing Tube Material Effects and Wear Patterns,” In Proceedings of the 9thAmerican Water Jet Conference, Dearborn, MI, pp. 211-222.
Nanduri, M., Taggart, D.G., Kim, T.J., Ness, E., Haney, C. and Bartkowiak, C., 1996, “WearPatterns in Abrasive Waterjet Nozzles,” In Proceedings of the 13th InternationalConference on Jetting Technology - Applications and Opportunities, BHR Group,Mechanical Engineering Publications Limited, London, pp. 27-43.
Nanduri, M., Taggart, D.G., Kim, T.J., Haney, C. and Skeele, F.P., 1997, “Effect of the Inlet TaperAngle on AWJ Nozzle Wear,” In Proceedings of the 9th American Water Jet Conference,Dearborn, MI, pp. 223-238.

Ness, E.A., Dubensky, E., Haney, C., Mort, G. and Singh, P.J., 1994, “New Developments inROCTEC Composite Carbides for Use in Abrasive Waterjet Applications,” Proceedings ofthe 12th International Conference on Jet Cutting Technology, Rouen, France, pp.195-211.
Taggart, D.G., Nanduri, M., Kim, T.J., and Skeele, F.P., 1997, “Evaluation of an accelerated weartest for AWJ nozzles,” In Proceedings of the 9th American Water Jet Conference,Dearborn, MI, pp.239-250.
8. ACKNOWLEDGEMENTS
The authors would like to acknowledge Boride Products for providing the nozzles used in thisstudy.
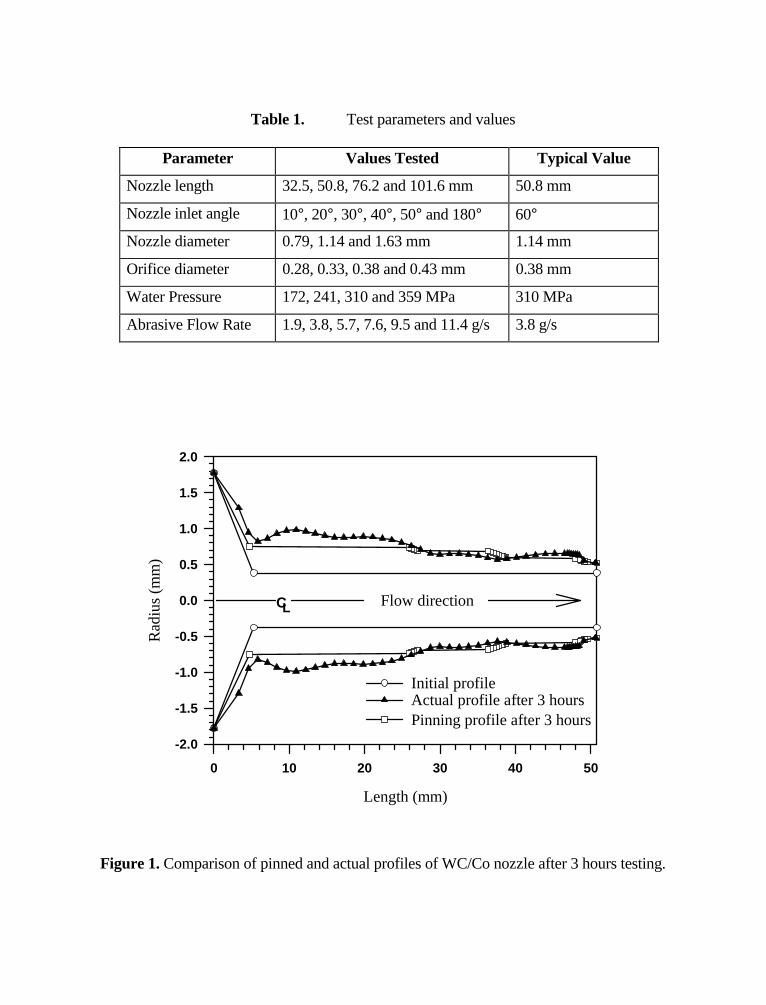
Table 1. Test parameters and values
Parameter Values Tested Typical Value
Nozzle length 32.5, 50.8, 76.2 and 101.6 mm 50.8 mm
Nozzle inlet angle 10°, 20°, 30°, 40°, 50° and 180° 60°
Nozzle diameter 0.79, 1.14 and 1.63 mm 1.14 mm
Orifice diameter 0.28, 0.33, 0.38 and 0.43 mm 0.38 mm
Water Pressure 172, 241, 310 and 359 MPa 310 MPa
Abrasive Flow Rate 1.9, 3.8, 5.7, 7.6, 9.5 and 11.4 g/s 3.8 g/s
Length (mm)
0 10 20 30 40 50
Rad
ius
(mm
)
-2.0
-1.5
-1.0
-0.5
0.0
0.5
1.0
1.5
2.0
Initial profile
Pinning profile after 3 hoursActual profile after 3 hours
Flow directionCL
Figure 1. Comparison of pinned and actual profiles of WC/Co nozzle after 3 hours testing.
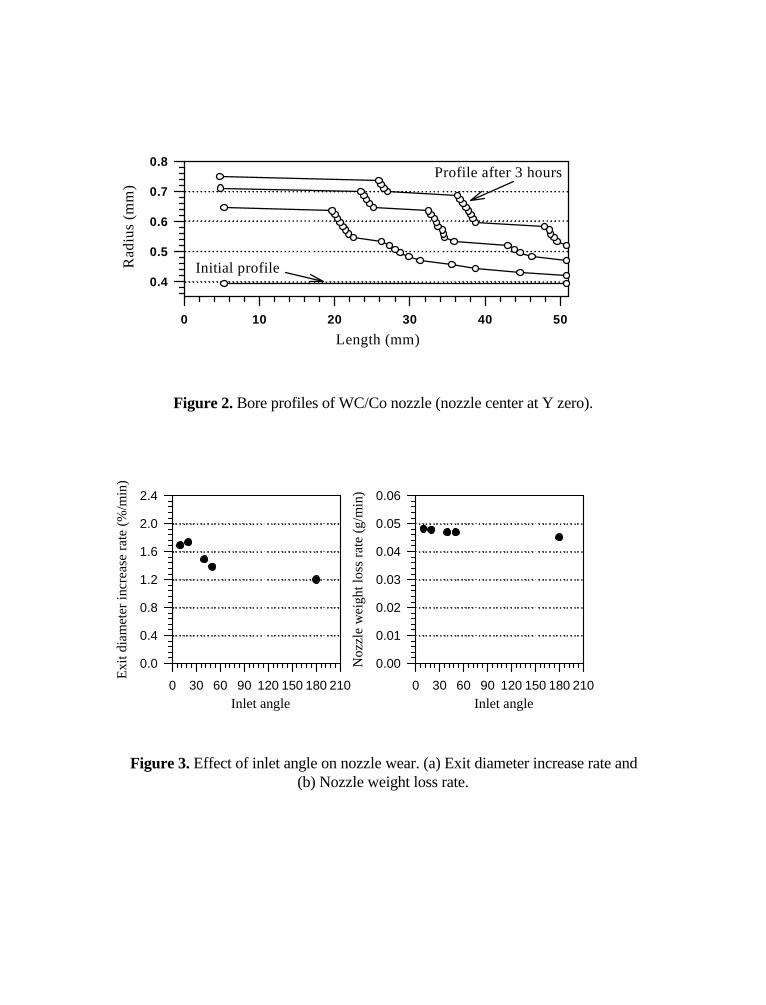
Length (mm)0 10 20 30 40 50
Ra
diu
s (m
m)
0.4
0.5
0.6
0.7
0.8Profile after 3 hours
Initial profile
Figure 2. Bore profiles of WC/Co nozzle (nozzle center at Y zero).
Inlet angle0 30 60 90 120 150 180 210
Exi
t dia
met
er in
cre
ase
ra
te (
%/m
in)
0.0
0.4
0.8
1.2
1.6
2.0
2.4
Inlet angle0 30 60 90 120 150 180 210
No
zzle
we
igh
t lo
ss r
ate
(g
/min
)
0.00
0.01
0.02
0.03
0.04
0.05
0.06
Figure 3. Effect of inlet angle on nozzle wear. (a) Exit diameter increase rate and(b) Nozzle weight loss rate.
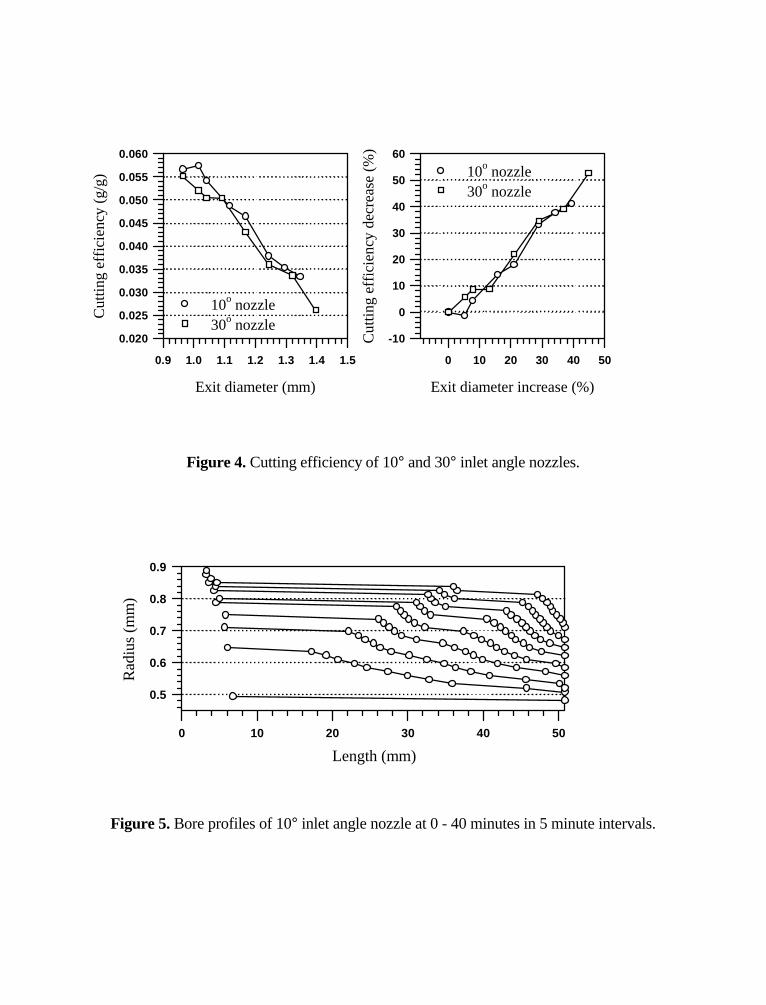
Exit diameter (mm)
0.9 1.0 1.1 1.2 1.3 1.4 1.5
Cut
ting
effic
ienc
y (g
/g)
0.020
0.025
0.030
0.035
0.040
0.045
0.050
0.055
0.060
10o nozzle30o nozzle
Exit diameter increase (%)
0 10 20 30 40 50C
uttin
g ef
ficie
ncy
decr
ease
(%
)
-10
0
10
20
30
40
50
60
10o nozzle30o nozzle
Figure 4. Cutting efficiency of 10° and 30° inlet angle nozzles.
Length (mm)
0 10 20 30 40 50
Rad
ius
(mm
)
0.5
0.6
0.7
0.8
0.9
Figure 5. Bore profiles of 10° inlet angle nozzle at 0 - 40 minutes in 5 minute intervals.
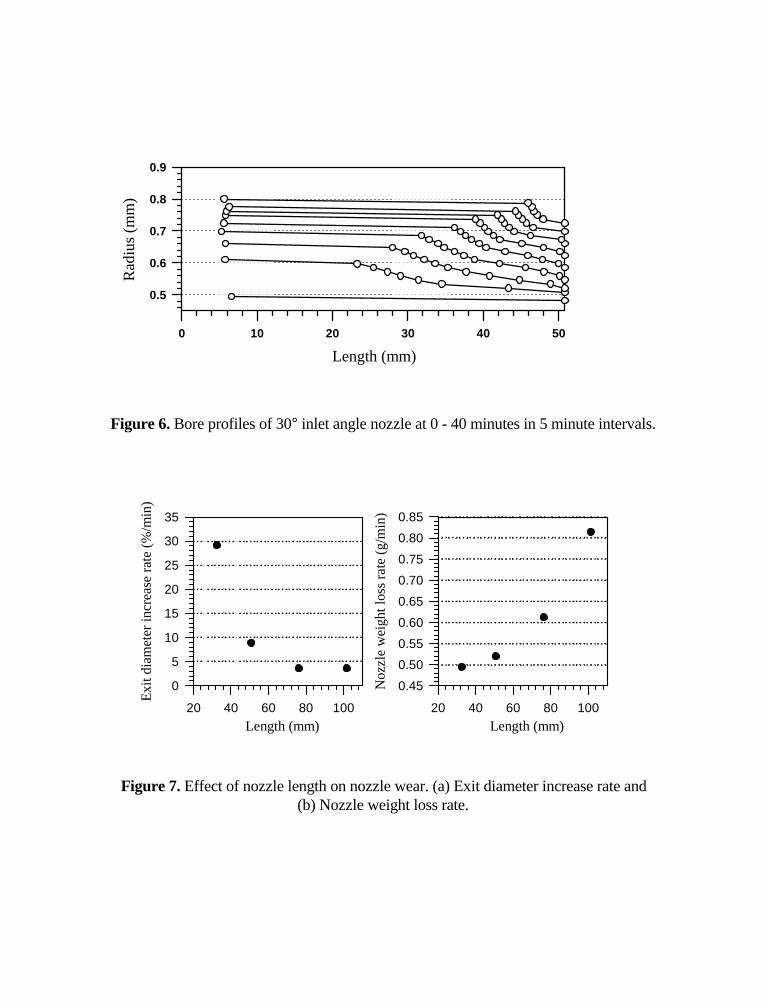
Length (mm)
0 10 20 30 40 50
Rad
ius
(mm
)
0.5
0.6
0.7
0.8
0.9
Figure 6. Bore profiles of 30° inlet angle nozzle at 0 - 40 minutes in 5 minute intervals.
Length (mm)20 40 60 80 100
Exi
t dia
met
er in
crea
se r
ate
(%/m
in)
0
5
10
15
20
25
30
35
Length (mm)20 40 60 80 100
Noz
zle
wei
ght l
oss
rate
(g/
min
)
0.45
0.50
0.55
0.60
0.65
0.70
0.75
0.80
0.85
Figure 7. Effect of nozzle length on nozzle wear. (a) Exit diameter increase rate and(b) Nozzle weight loss rate.
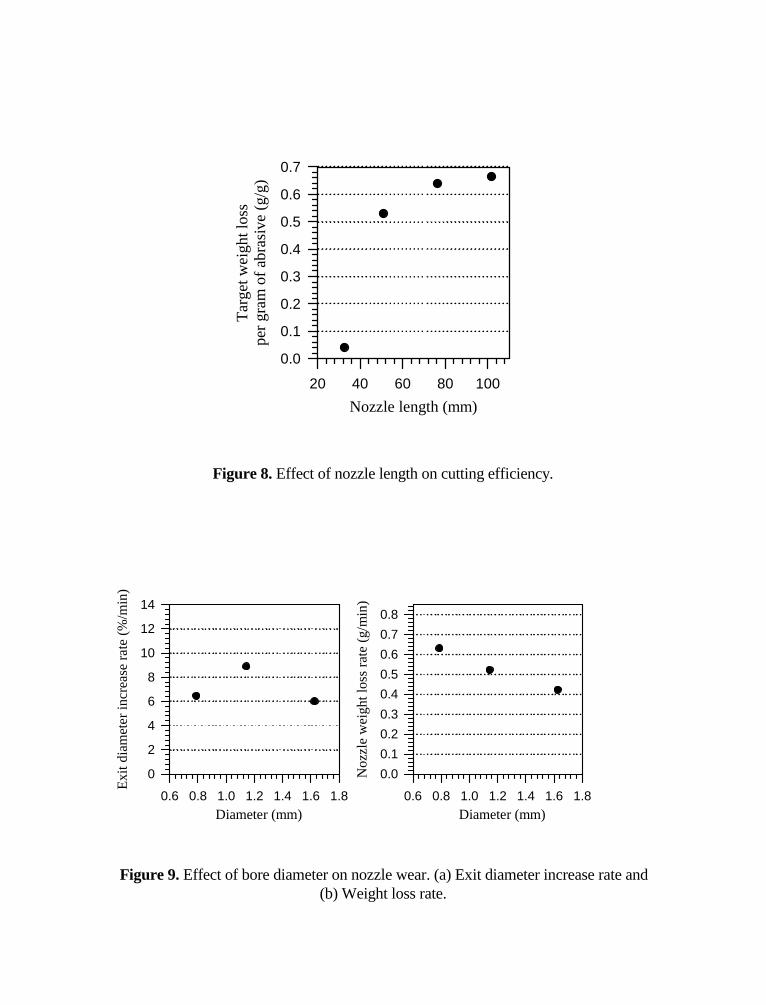
Nozzle length (mm)
20 40 60 80 100
Tar
get w
eigh
t los
spe
r gr
am
of a
bra
sive
(g/
g)
0.0
0.1
0.2
0.3
0.4
0.5
0.6
0.7
Figure 8. Effect of nozzle length on cutting efficiency.
Diameter (mm)0.6 0.8 1.0 1.2 1.4 1.6 1.8
Exi
t di
amet
er
incr
ease
ra
te (
%/m
in)
0
2
4
6
8
10
12
14
Diameter (mm)0.6 0.8 1.0 1.2 1.4 1.6 1.8
Noz
zle
wei
ght
loss
rat
e (
g/m
in)
0.0
0.1
0.2
0.3
0.4
0.5
0.6
0.7
0.8
Figure 9. Effect of bore diameter on nozzle wear. (a) Exit diameter increase rate and(b) Weight loss rate.
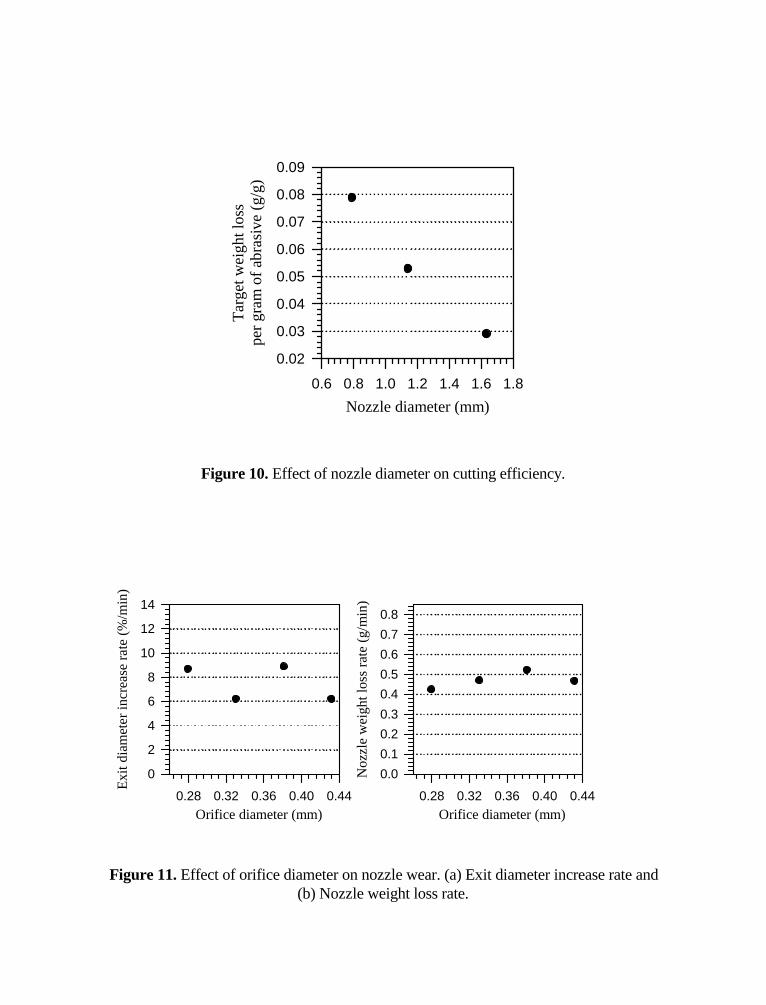
Nozzle diameter (mm)
0.6 0.8 1.0 1.2 1.4 1.6 1.8
Tar
get w
eigh
t los
spe
r gr
am
of a
bra
sive
(g/
g)
0.02
0.03
0.04
0.05
0.06
0.07
0.08
0.09
Figure 10. Effect of nozzle diameter on cutting efficiency.
Orifice diameter (mm)0.28 0.32 0.36 0.40 0.44
Exi
t di
amet
er
incr
ease
ra
te (
%/m
in)
0
2
4
6
8
10
12
14
Orifice diameter (mm)0.28 0.32 0.36 0.40 0.44
Noz
zle
wei
ght
loss
rat
e (
g/m
in)
0.0
0.1
0.2
0.3
0.4
0.5
0.6
0.7
0.8
Figure 11. Effect of orifice diameter on nozzle wear. (a) Exit diameter increase rate and(b) Nozzle weight loss rate.
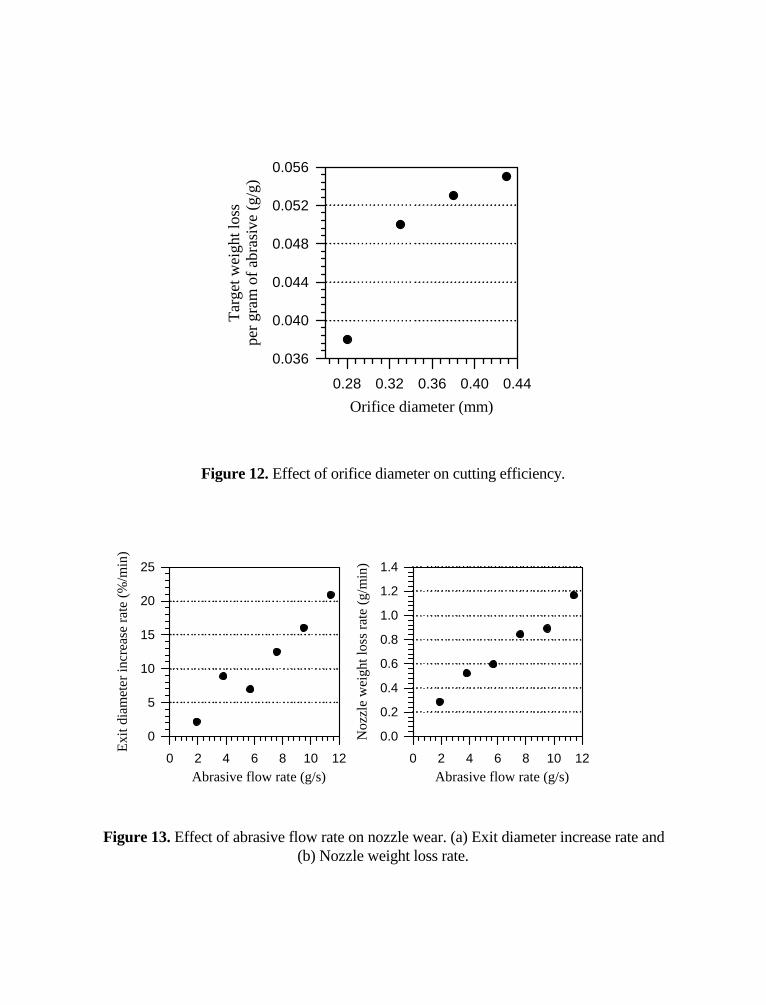
Orifice diameter (mm)
0.28 0.32 0.36 0.40 0.44
Tar
get w
eigh
t los
spe
r gr
am
of a
bra
sive
(g/
g)
0.036
0.040
0.044
0.048
0.052
0.056
Figure 12. Effect of orifice diameter on cutting efficiency.
Abrasive flow rate (g/s)0 2 4 6 8 10 12
Exi
t di
amet
er
incr
ease
ra
te (
%/m
in)
0
5
10
15
20
25
Abrasive flow rate (g/s)0 2 4 6 8 10 12
Noz
zle
wei
ght
loss
rat
e (
g/m
in)
0.0
0.2
0.4
0.6
0.8
1.0
1.2
1.4
Figure 13. Effect of abrasive flow rate on nozzle wear. (a) Exit diameter increase rate and(b) Nozzle weight loss rate.
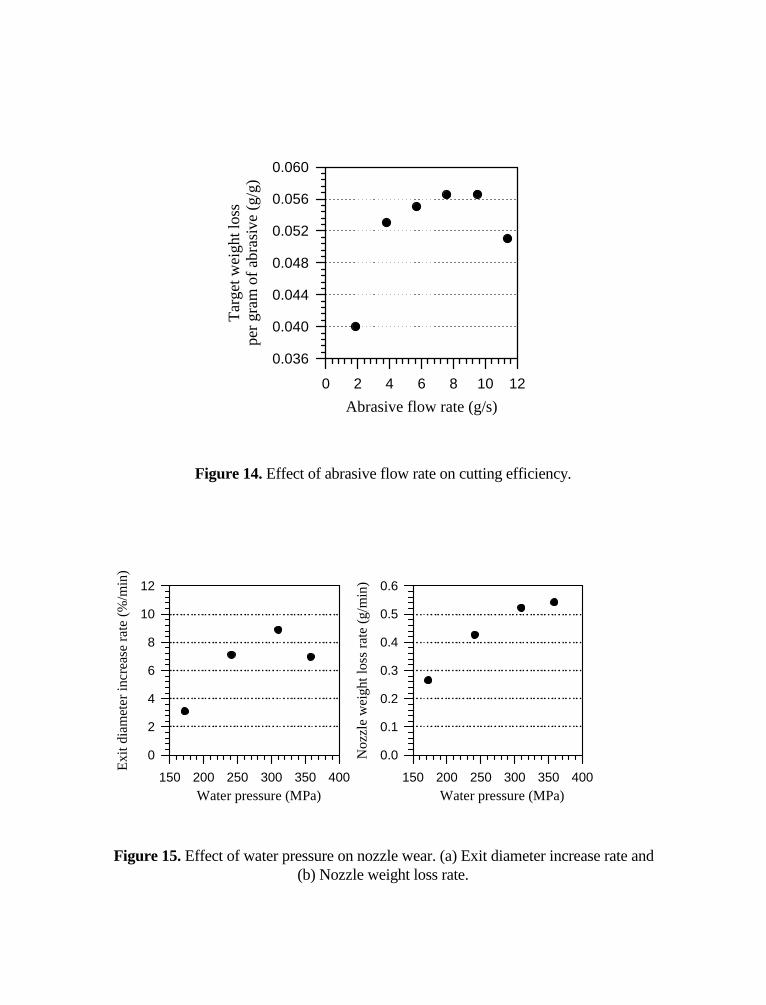
Abrasive flow rate (g/s)
0 2 4 6 8 10 12
Tar
get w
eigh
t los
spe
r gr
am
of a
bra
sive
(g/
g)
0.036
0.040
0.044
0.048
0.052
0.056
0.060
Figure 14. Effect of abrasive flow rate on cutting efficiency.
Water pressure (MPa)150 200 250 300 350 400
Exi
t di
amet
er
incr
ease
ra
te (
%/m
in)
0
2
4
6
8
10
12
Water pressure (MPa)150 200 250 300 350 400
Noz
zle
wei
ght
loss
rat
e (
g/m
in)
0.0
0.1
0.2
0.3
0.4
0.5
0.6
Figure 15. Effect of water pressure on nozzle wear. (a) Exit diameter increase rate and(b) Nozzle weight loss rate.
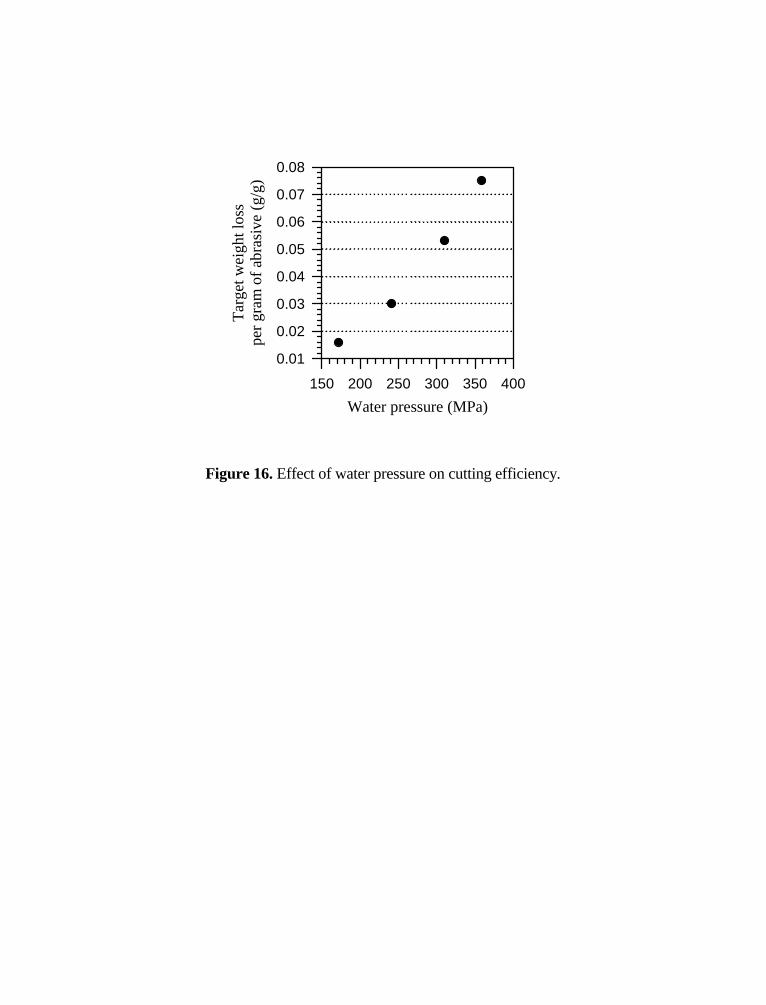
Water pressure (MPa)
150 200 250 300 350 400
Tar
get w
eigh
t los
spe
r gr
am
of a
bra
sive
(g/
g)
0.01
0.02
0.03
0.04
0.05
0.06
0.07
0.08
Figure 16. Effect of water pressure on cutting efficiency.
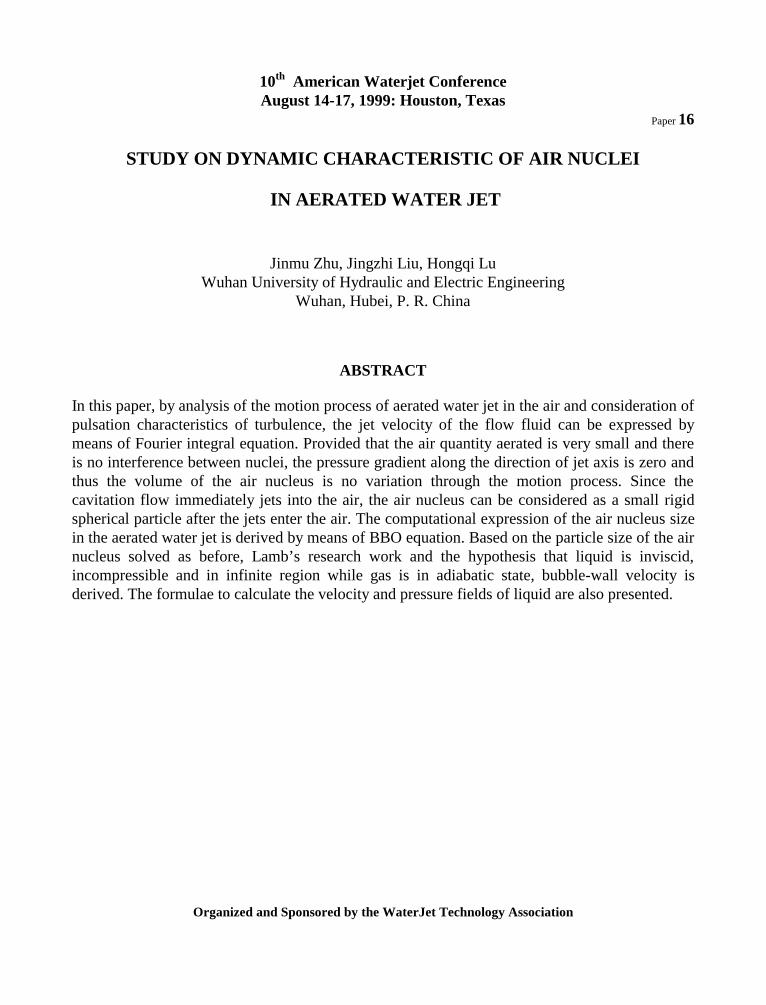
10th American Waterjet ConferenceAugust 14-17, 1999: Houston, Texas
Paper 16
STUDY ON DYNAMIC CHARACTERISTIC OF AIR NUCLEI
IN AERATED WATER JET
Jinmu Zhu, Jingzhi Liu, Hongqi LuWuhan University of Hydraulic and Electric Engineering
Wuhan, Hubei, P. R. China
ABSTRACT
In this paper, by analysis of the motion process of aerated water jet in the air and consideration ofpulsation characteristics of turbulence, the jet velocity of the flow fluid can be expressed bymeans of Fourier integral equation. Provided that the air quantity aerated is very small and thereis no interference between nuclei, the pressure gradient along the direction of jet axis is zero andthus the volume of the air nucleus is no variation through the motion process. Since thecavitation flow immediately jets into the air, the air nucleus can be considered as a small rigidspherical particle after the jets enter the air. The computational expression of the air nucleus sizein the aerated water jet is derived by means of BBO equation. Based on the particle size of the airnucleus solved as before, Lamb’s research work and the hypothesis that liquid is inviscid,incompressible and in infinite region while gas is in adiabatic state, bubble-wall velocity isderived. The formulae to calculate the velocity and pressure fields of liquid are also presented.
Organized and Sponsored by the WaterJet Technology Association
1. INTRODUCTION
Cavitation has a powerful destructive action on material. The attention is paid to takingadvantage of this destructive action to clean or cut by more and more researchers. If properquantity of the air is aerated in waterjet, cavitation occurrence will be speeded up, which isconducive to cleaning or cutting. Liu Jingzhi et al. (1993) has developed a type of cavitatingwaterjet spray head as seen in Figure 1. It is mainly composed of waterjet nozzle, suctionchamber and throat pipe. The high-pressure water jets out of water nozzle and entrains the air inthe suction chamber, then enters the throat pipe together. In the throat pipe, the air entrained isbroken up into micro-bubble by waterjet. Since advisable quantity of the air is entrained, thequantity of foreign matter in water increases and reduces tensile strength of water. Cavitationoccurrence is accelerated (Knapp et al., 1970). The micro-bubble and cavitating bubbles (both arecalled air nuclei) evenly mix with waterjet, which forms cavitating waterjet in the air that jets outof the exit of the throat pipe.
After the jets enter the air, the bigger air nuclei will escape from waterjet or collapse and perishbefore they reach material surface; the smaller will dissolve in water directly. These two types ofair nuclei have not destructive action on material and thus do not achieve the goal of cutting.Only have the air nuclei which do not escape from waterjet and not dissolve in water and are ableto follow waterjet destructive action on material. When these air nuclei reach the surface ofmaterial, because of the action of bumping pressure, they abruptly collapse and perish, andmeanwhile powerful pressure produces so as to cut or clean
Obviously, the action of the cavitation waterjet on the material is related to the flow field aroundthe air nucleus after and before it collapses and perishes. The size of the air nucleus before theburst of it has a significantly influence on the flow field structure after the burst of the airnucleus. In this paper, by analysis of the motion process of aerated water jet in the air andconsideration of pulsation characteristics of turbulence, the jet velocity of the flow fluid can beexpressed by means of Fourier integral equation. The computational expression of the air nucleussize in the aerated water jet is derived by means of BBO equation. The flow fields when the airnucleus collapses is also analyzed.
2. DETERMINATION OF THE SIZE OF THE AIR NUCLEI
2.1 Unsteady Phenomenon of Jet
The consideration of water spraying into the air is taken into. When the flow rate is large enough,the surface of jet will take on wave because of disturbance, which is unsteady phenomenon of jet.It is reasonable to express the turbulent velocity of jet by means of Fourier integral equation, i.e.,
∫∞
∞−
−= ωω ω deEu ti)( (1)
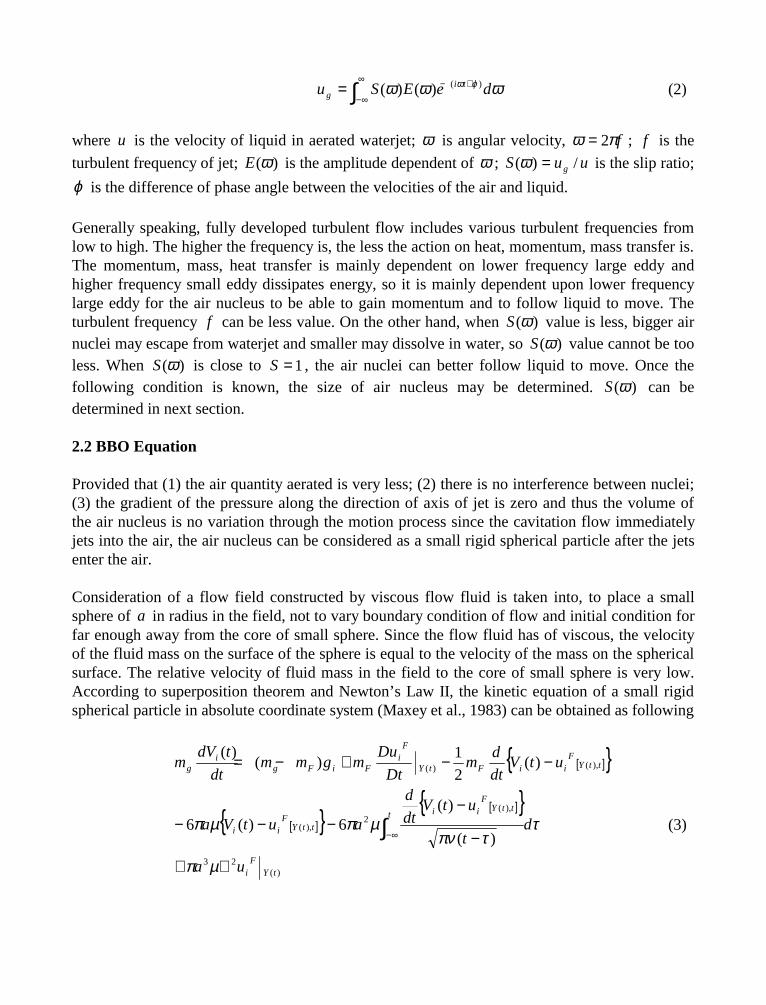
∫∞
∞−
+−= ωωω ϕω deESu tig
)()()( (2)
where u is the velocity of liquid in aerated waterjet; ω is angular velocity, fπω 2= ; f is the
turbulent frequency of jet; )(ωE is the amplitude dependent of ω ; uuS g /)( =ω is the slip ratio;
ϕ is the difference of phase angle between the velocities of the air and liquid.
Generally speaking, fully developed turbulent flow includes various turbulent frequencies fromlow to high. The higher the frequency is, the less the action on heat, momentum, mass transfer is.The momentum, mass, heat transfer is mainly dependent on lower frequency large eddy andhigher frequency small eddy dissipates energy, so it is mainly dependent upon lower frequencylarge eddy for the air nucleus to be able to gain momentum and to follow liquid to move. Theturbulent frequency f can be less value. On the other hand, when )(ωS value is less, bigger airnuclei may escape from waterjet and smaller may dissolve in water, so )(ωS value cannot be tooless. When )(ωS is close to 1=S , the air nuclei can better follow liquid to move. Once thefollowing condition is known, the size of air nucleus may be determined. )(ωS can bedetermined in next section.
2.2 BBO Equation
Provided that (1) the air quantity aerated is very less; (2) there is no interference between nuclei;(3) the gradient of the pressure along the direction of axis of jet is zero and thus the volume ofthe air nucleus is no variation through the motion process since the cavitation flow immediatelyjets into the air, the air nucleus can be considered as a small rigid spherical particle after the jetsenter the air.
Consideration of a flow field constructed by viscous flow fluid is taken into, to place a smallsphere of a in radius in the field, not to vary boundary condition of flow and initial condition forfar enough away from the core of small sphere. Since the flow fluid has of viscous, the velocityof the fluid mass on the surface of the sphere is equal to the velocity of the mass on the sphericalsurface. The relative velocity of fluid mass in the field to the core of small sphere is very low.According to superposition theorem and Newton’s Law II, the kinetic equation of a small rigidspherical particle in absolute coordinate system (Maxey et al., 1983) can be obtained as following
[ ]
[ ] [ ]
)(23
),(2
),(
),()(
)(
)(6)(6
)(2
1)(
)(
tYF
i
tttY
Fii
ttYF
ii
ttYF
iiFtY
Fi
FiFgi
g
ua
dt
utVdt
d
autVa
utVdt
dm
Dt
Dumgmm
dt
tdVm
∇+
−
−−−−
−−+−=
∫ ∞−
µπ
ττπν
µπµπ (3)
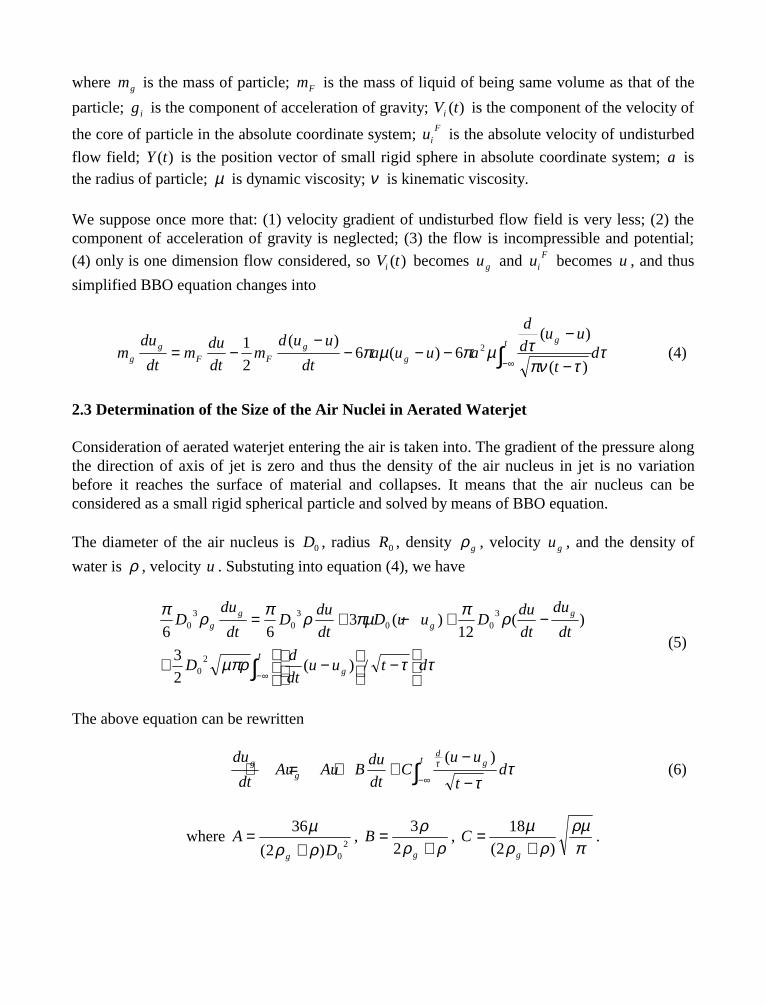
where gm is the mass of particle; Fm is the mass of liquid of being same volume as that of the
particle; ig is the component of acceleration of gravity; )(tVi is the component of the velocity of
the core of particle in the absolute coordinate system; Fiu is the absolute velocity of undisturbed
flow field; )(tY is the position vector of small rigid sphere in absolute coordinate system; a isthe radius of particle; µ is dynamic viscosity; ν is kinematic viscosity.
We suppose once more that: (1) velocity gradient of undisturbed flow field is very less; (2) thecomponent of acceleration of gravity is neglected; (3) the flow is incompressible and potential;
(4) only is one dimension flow considered, so )(tVi becomes gu and Fiu becomes u , and thus
simplified BBO equation changes into
ττπν
τµπµπ dt
uud
d
auuadt
uudm
dt
dum
dt
dum
t g
gg
FFg
g ∫ ∞− −
−−−−
−−=
)(
)(6)(6
)(
2
1 2 (4)
2.3 Determination of the Size of the Air Nuclei in Aerated Waterjet
Consideration of aerated waterjet entering the air is taken into. The gradient of the pressure alongthe direction of axis of jet is zero and thus the density of the air nucleus in jet is no variationbefore it reaches the surface of material and collapses. It means that the air nucleus can beconsidered as a small rigid spherical particle and solved by means of BBO equation.
The diameter of the air nucleus is 0D , radius 0R , density gρ , velocity gu , and the density of
water is ρ , velocity u . Substuting into equation (4), we have
∫ ∞−
−
−+
−+−+=
t
g
gg
gg
dtuudt
dD
dt
du
dt
duDuuD
dt
duD
dt
duD
ττµπρ
ρππµρπρπ
/)(2
3
)(12
)(366
20
300
30
30
(5)
The above equation can be rewritten
∫ ∞− −
−++=+
t gd
gg d
t
uuC
dt
duBAuAu
dt
duτ
ττ )(
(6)
where 2
0)2(
36
DA
g ρρµ
+= ,
ρρρ+
=g
B2
3,
πρµ
ρρµ
)2(
18
+=
g
C .
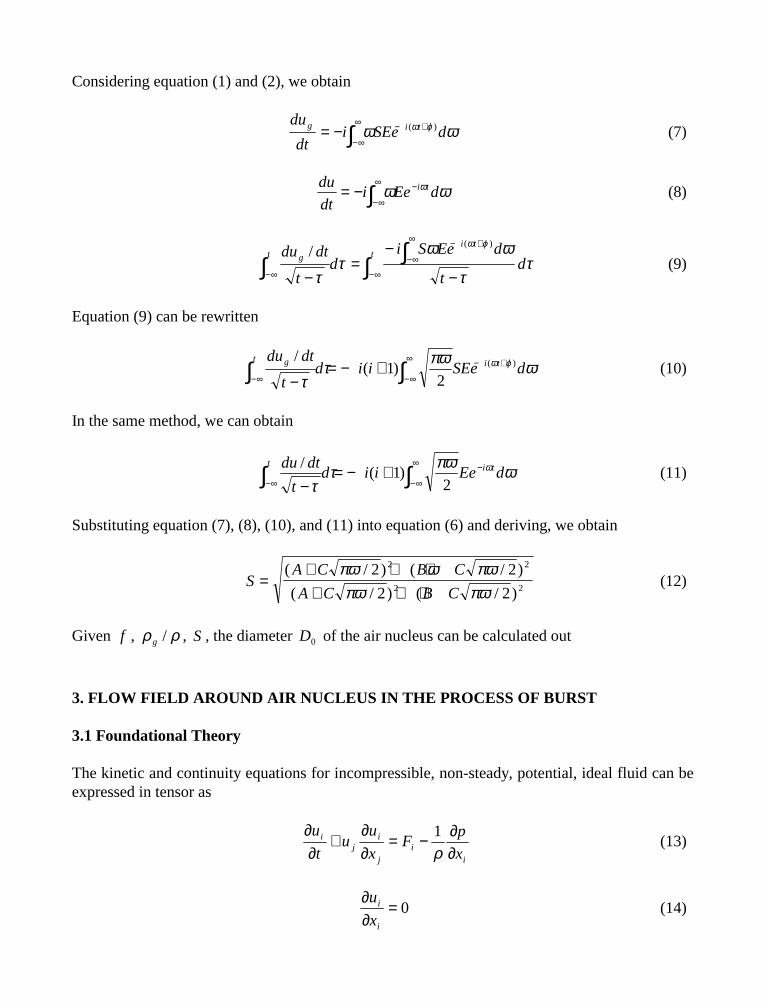
Considering equation (1) and (2), we obtain
∫∞
∞−
+−−= ωω ϕω dSEeidt
dutig )( (7)
∫∞
∞−
−−= ωω ω dEeidt
du ti (8)
∫ ∫∫ ∞−
∞
∞−
+−
∞− −
−=
−
tti
t g dt
dEeSid
t
dtduτ
τ
ωωτ
τ
ϕω )(/
(9)
Equation (9) can be rewritten
ωπωττ
ϕω dSEeiidt
dtdutit g )(
2)1(
/ +−∞
∞−∞− ∫∫ +−=−
(10)
In the same method, we can obtain
ωπωττ
ω dEeiidt
dtdu tit −∞
∞−∞− ∫∫ +−=− 2
)1(/
(11)
Substituting equation (7), (8), (10), and (11) into equation (6) and deriving, we obtain
SA C B C
A C B C=
+ + ++ + +
( / ) ( / )
( / ) ( / )
πω ω πωπω πω
2 2
2 2
2 2
2 2 (12)
Given f , ρρ /g , S , the diameter 0D of the air nucleus can be calculated out
3. FLOW FIELD AROUND AIR NUCLEUS IN THE PROCESS OF BURST
3.1 Foundational Theory
The kinetic and continuity equations for incompressible, non-steady, potential, ideal fluid can beexpressed in tensor as
ii
j
ij
i
x
pF
x
uu
t
u
∂∂−=
∂∂
+∂
∂ρ1
(13)
0=∂∂
i
i
x
u (14)
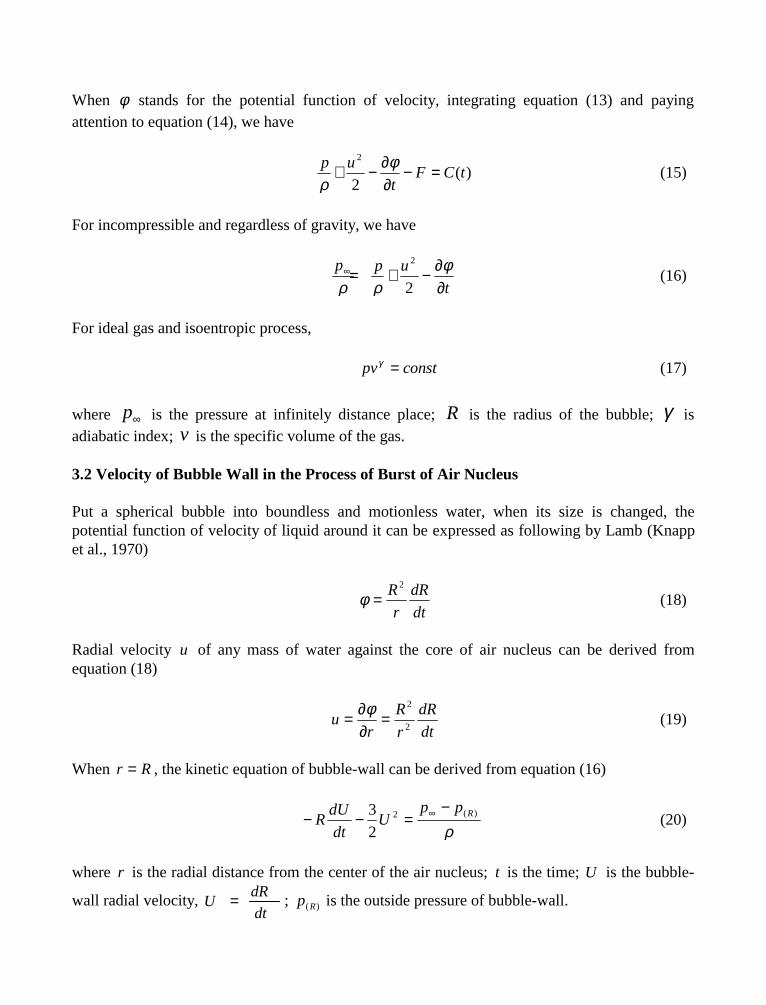
When φ stands for the potential function of velocity, integrating equation (13) and payingattention to equation (14), we have
)(2
2
tCFt
up =−∂∂−+ φ
ρ (15)
For incompressible and regardless of gravity, we have
t
upp
∂∂−+=∞ φ
ρρ 2
2
(16)
For ideal gas and isoentropic process,
constpv =γ (17)
where ∞p is the pressure at infinitely distance place; R is the radius of the bubble; γ isadiabatic index; v is the specific volume of the gas.
3.2 Velocity of Bubble Wall in the Process of Burst of Air Nucleus
Put a spherical bubble into boundless and motionless water, when its size is changed, thepotential function of velocity of liquid around it can be expressed as following by Lamb (Knappet al., 1970)
dt
dR
r
R2
=φ (18)
Radial velocity u of any mass of water against the core of air nucleus can be derived fromequation (18)
dt
dR
r
R
ru
2
2
=∂∂= φ
(19)
When Rr = , the kinetic equation of bubble-wall can be derived from equation (16)
ρ)(2
2
3 RppU
dt
dUR
−=−− ∞ (20)
where r is the radial distance from the center of the air nucleus; t is the time; U is the bubble-
wall radial velocity, dt
dRU = ; )(Rp is the outside pressure of bubble-wall.
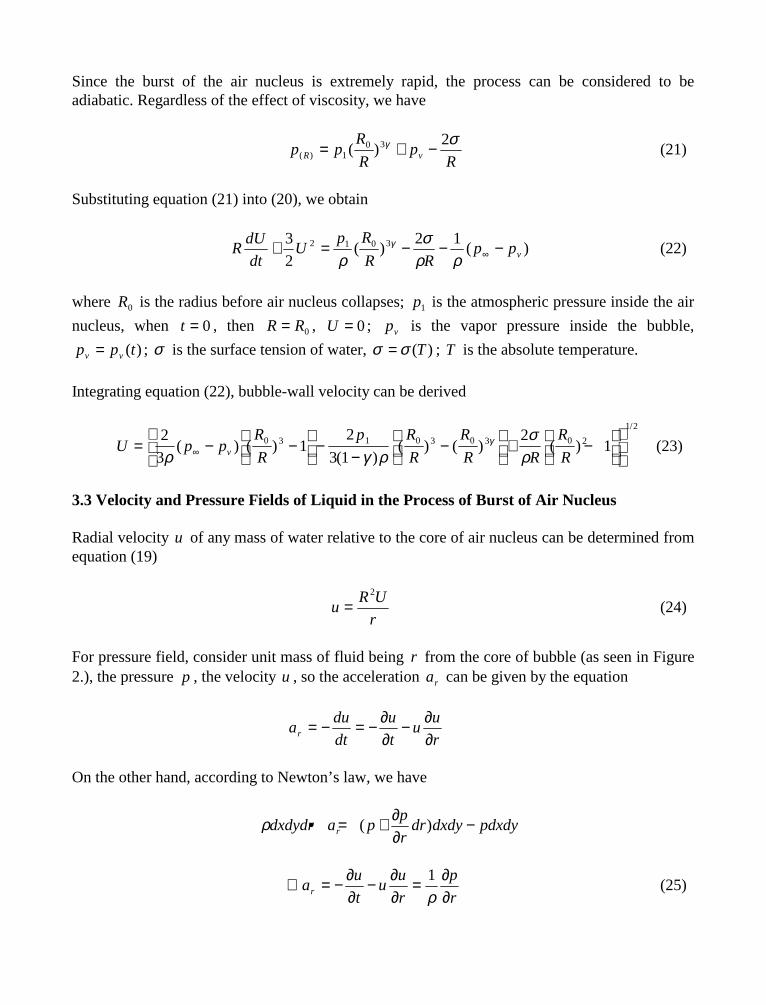
Since the burst of the air nucleus is extremely rapid, the process can be considered to beadiabatic. Regardless of the effect of viscosity, we have
Rp
R
Rpp vR
σγ 2)( 30
1)( −+= (21)
Substituting equation (21) into (20), we obtain
)(12
)(2
3 3012vpp
RR
RpU
dt
dUR −−−=+ ∞ρρ
σρ
γ (22)
where 0R is the radius before air nucleus collapses; 1p is the atmospheric pressure inside the air
nucleus, when 0=t , then 0RR= , 0=U ; vp is the vapor pressure inside the bubble,
)(tpp vv = ; σ is the surface tension of water, )(Tσσ = ; T is the absolute temperature.
Integrating equation (22), bubble-wall velocity can be derived
U p pR
R
p R
R
R
R R
R
Rv= − −
−−
−
+ −
∞
2
31
2
3 1
210 3 1 0 3 0 3 0 2
1 2
ρ γ ρσ
ργ( ) ( )
( )( ) ( ) ( )
/
(23)
3.3 Velocity and Pressure Fields of Liquid in the Process of Burst of Air Nucleus
Radial velocity u of any mass of water relative to the core of air nucleus can be determined fromequation (19)
r
URu
2
= (24)
For pressure field, consider unit mass of fluid being r from the core of bubble (as seen in Figure2.), the pressure p , the velocity u , so the acceleration ra can be given by the equation
r
uu
t
u
dt
duar ∂
∂−∂∂−=−=
On the other hand, according to Newton’s law, we have
pdxdydxdydrr
ppadxdydr r −
∂∂+=• )(ρ
r
p
r
uu
t
uar ∂
∂=∂∂−
∂∂−=∴
ρ1
(25)
Substituting equation (19) into (25) and integrating it, we obtain
∞∞ +−−= p
rR
RpU
r
R
r
Rp
202
4
4
)2
2( ρ (26)
Substituting equation (23) into the above equation, we can calculate the pressure value of anypoint at any instant.
4. CONCLUDED REMARKS
Liu et al. (1993) has studied on the flow field around the air nucleus before burst of it for aeratedwaterjet in the air, but the size of the air nucleus and the flow fields around it in the process ofburst have not been studied. In this paper, the author probes into these problems. From the airnucleus producing to perishing, the change of its size is quite complicated. Since the pressuregradient along the direction of jet axis is equal to zero, and thus the volume of the air nucleus isno variation through the motion process. The air nucleus can be considered as a small rigidsphere after the jets enter the air and its size can be calculated out by means of BBO equation,which is a prerequisite to figuring out flow fields at the air nucleus surroundings.
5. REFERENCES
Liu, J. Z. and Zhu, J. M., “Theoretical Study on Flow Characteristic of Cavitating Waterjet,”Journal of Water Resources (in Chinese), Vol. 201, No.10, pp. 33-38, 1993.
Knapp, R. T., Daily, J. W. and Hammitt, “Cavitation,” McGraw-Hill, New York, 1970.
Maxey, M. R. and Riley, J. J., “Equation of Motion for a Small Rigid Sphere in a Non-uniformFlow,” Phys. Fluids, Vol. 28, No. 4, pp. 883-889, 1983.
Xie, X. C., “Theory and Calculation of Turbulent Jet,” Publishing House of Science (in Chinese),1975.
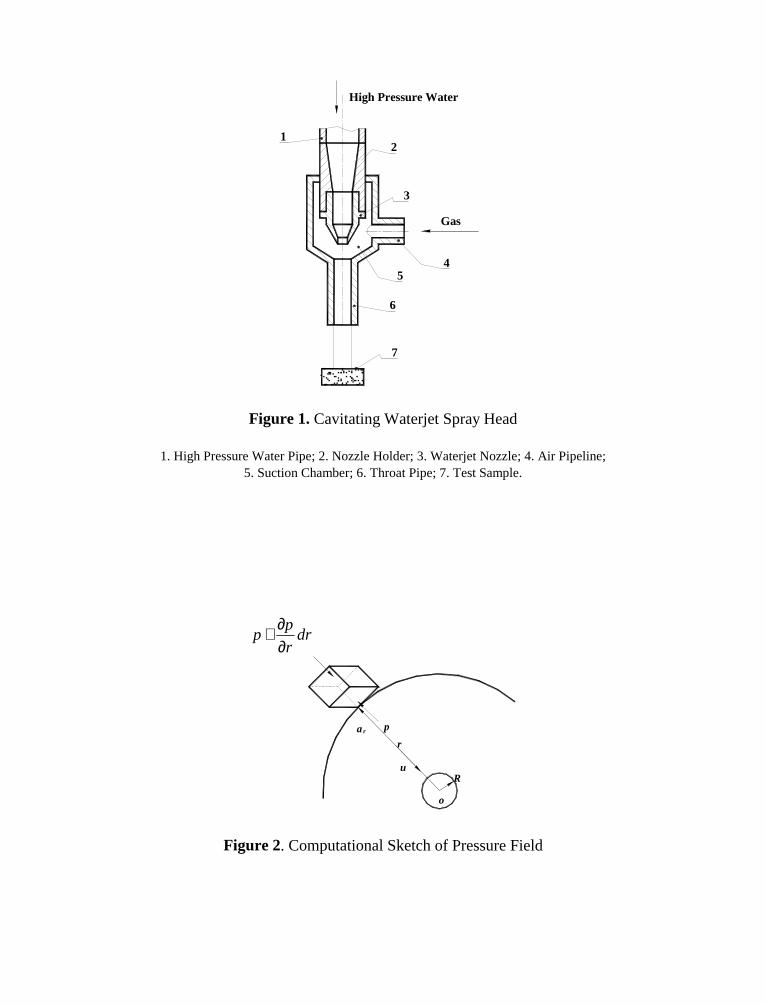
4
3
21
5
6
7
High Pressure Water
Gas
Figure 1. Cavitating Waterjet Spray Head
1. High Pressure Water Pipe; 2. Nozzle Holder; 3. Waterjet Nozzle; 4. Air Pipeline;5. Suction Chamber; 6. Throat Pipe; 7. Test Sample.
drr
pp
∂∂+
o
par
r
uR
Figure 2. Computational Sketch of Pressure Field
10th American Waterjet ConferenceAugust 14-17, 1999: Houston, Texas
Paper 17
EQUIPMENT FOR DISCRETISIZED ABRASIVE
WATERJET MILLING – PRELIMINARY TESTS
G. Holmqvist and K.M.C. ÖjmertzChalmers University of Technology
Göteborg, Sweden
ABSTRACT
This study addresses the development of a viable abrasive waterjet milling process. It constitutesa continuation of previous studies in which a discrete approach has been suggested anddeveloped. The creation of the high pressure required for machining is accomplished by a high-voltage electrical discharge in a small water-filled chamber. Tests of the experimental equipmentindicate a successful water jet/slug formation. It is shown that the jet is powerful enough to createindentation marks on metal sheets and penetration of softer materials. No effort to optimize theenergy transfer has been made so far. Experiences of a practical nature are presented anddiscussed. Problems associated with the present design are discussed, and improvements aresuggested. This includes a strategy for assuring that the electrical discharge takes place betweenthe electrodes in the water filled discharge chamber. Furthermore, discharge voltage and powercharacteristics are analyzed. An important characteristic of the process for the application, theexpelled volume, is quantified and analyzed.
Organized and Sponsored by the WaterJet Technology Association
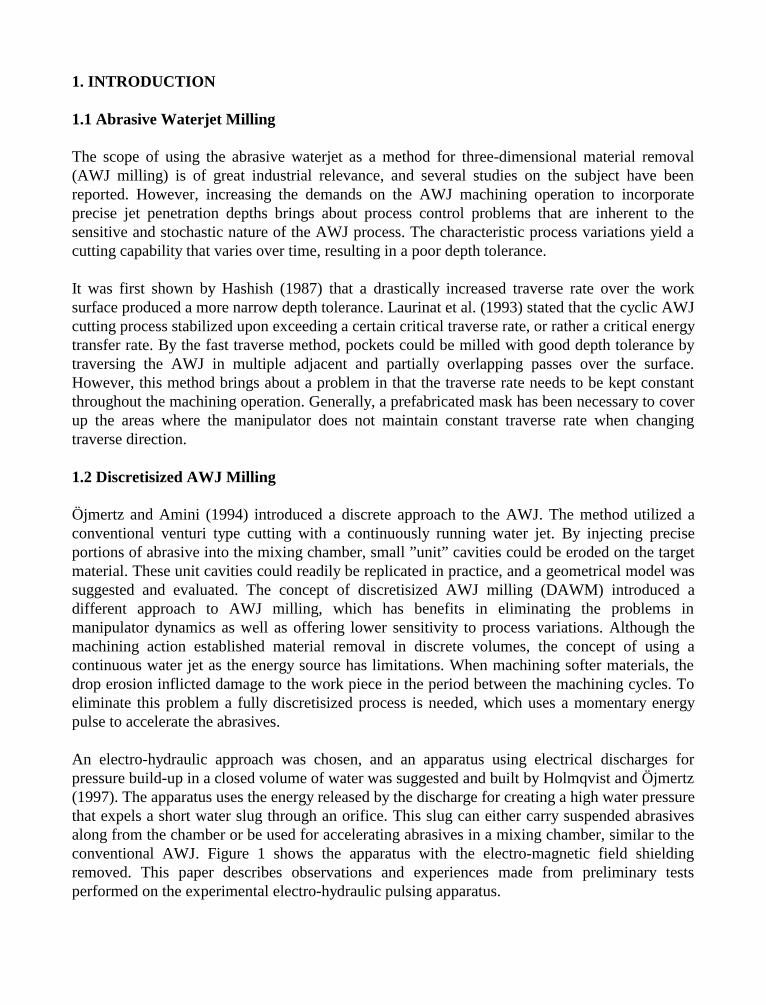
1. INTRODUCTION
1.1 Abrasive Waterjet Milling
The scope of using the abrasive waterjet as a method for three-dimensional material removal(AWJ milling) is of great industrial relevance, and several studies on the subject have beenreported. However, increasing the demands on the AWJ machining operation to incorporateprecise jet penetration depths brings about process control problems that are inherent to thesensitive and stochastic nature of the AWJ process. The characteristic process variations yield acutting capability that varies over time, resulting in a poor depth tolerance.
It was first shown by Hashish (1987) that a drastically increased traverse rate over the worksurface produced a more narrow depth tolerance. Laurinat et al. (1993) stated that the cyclic AWJcutting process stabilized upon exceeding a certain critical traverse rate, or rather a critical energytransfer rate. By the fast traverse method, pockets could be milled with good depth tolerance bytraversing the AWJ in multiple adjacent and partially overlapping passes over the surface.However, this method brings about a problem in that the traverse rate needs to be kept constantthroughout the machining operation. Generally, a prefabricated mask has been necessary to coverup the areas where the manipulator does not maintain constant traverse rate when changingtraverse direction.
1.2 Discretisized AWJ Milling
Öjmertz and Amini (1994) introduced a discrete approach to the AWJ. The method utilized aconventional venturi type cutting with a continuously running water jet. By injecting preciseportions of abrasive into the mixing chamber, small ”unit” cavities could be eroded on the targetmaterial. These unit cavities could readily be replicated in practice, and a geometrical model wassuggested and evaluated. The concept of discretisized AWJ milling (DAWM) introduced adifferent approach to AWJ milling, which has benefits in eliminating the problems inmanipulator dynamics as well as offering lower sensitivity to process variations. Although themachining action established material removal in discrete volumes, the concept of using acontinuous water jet as the energy source has limitations. When machining softer materials, thedrop erosion inflicted damage to the work piece in the period between the machining cycles. Toeliminate this problem a fully discretisized process is needed, which uses a momentary energypulse to accelerate the abrasives.
An electro-hydraulic approach was chosen, and an apparatus using electrical discharges forpressure build-up in a closed volume of water was suggested and built by Holmqvist and Öjmertz(1997). The apparatus uses the energy released by the discharge for creating a high water pressurethat expels a short water slug through an orifice. This slug can either carry suspended abrasivesalong from the chamber or be used for accelerating abrasives in a mixing chamber, similar to theconventional AWJ. Figure 1 shows the apparatus with the electro-magnetic field shieldingremoved. This paper describes observations and experiences made from preliminary testsperformed on the experimental electro-hydraulic pulsing apparatus.
2. ELECTRO-HYDRAULIC PULSING
The concept of creating a pulsed water jet through the use of high voltage discharges is oftenreferred to as electro-hydraulic pulsing. The main parts of an equipment for the purpose consistof a capacitor bank for energy storage and a pair of electrodes mounted in a water filled pressurechamber. The capacitors are charged by a high voltage supply, after which the circuit is closedwith a fast switch, releasing the energy in the water filled electrode gap. The discharge creates aquickly developing and expanding plasma. As the inertia of the water resists the expansion, highpressures are created.
Several studies on the phenomenon described above can been found. Naydan and Aker (1972)patented a design incorporating a spark chamber, electrodes and a nozzle. Sandia laboratories(1976) investigated the electrical requirements of an electro-hydraulic equipment for use indrilling in limestone and sandstone. Huff and McFall (1977) tested the technique experimentally.In a study by Hawrylewicz et al. (1986), later on continued by Vijay and Paquette (1996), theelectrical discharge was used to interrupt a continuous flow of water, and momentarily intensifythe pressure by the pressure pulse created. This equipment proved to be capable of breaking largeblocks of granite. In another study, Vijay et al. showed that jet speeds of up to 500 m/s could beachieved at an overall energy efficiency of 20% (1997). Vijay and Makomaski performed anumerical analysis of the jet formation (1998), showing the importance of electrode location, andindicated the occurrence of jet precursors. In a study by Ilias et al. (1994), the mechanical designincorporated a small encapsulated water volume, a check valve through which water was fed at alow pressure (450 kPa), and a nozzle body. In the paper, pressure levels up to 650 MPa arereported, using a discharge voltage of 30 kV.
High-voltage electrical discharges and the consequent formation of plasma are often explained asfollows (Khalifa, 1990): Affected by an electric field, electrons are emitted from the negativeelectrode (the cathode). The electrons will travel along the electric field lines, which generallystart perpendicular to a surface. On their way to the anode, the electrons collide with moleculesknocking off electrons, which creates an avalanche effect as the number of free traveling particlesrapidly increases, which causes an accelerated ionization in the electrode gap. Depending on thegeometry, the electric field is normally non-uniform. With a shorter distance from cathode toanode and at small radii, the field becomes stronger, causing more electrons to travel andgenerate. Thus, in this direction the flow of particles will establish first, and then a so-calledplasma streamer is developed. The instant when this occurs is referred to as breakdown. Thisstreamer will expand if the available energy is sufficiently high or if the current is high enough.The process is mainly thermodynamic. A result of the expansion is also that the resistance in theelectrode gap will diminish. The expansion of the plasma channel is so fast that an impulsepressure, a shock wave, is developed, followed by a relief portion of declining pressure (Murr,1988). The expanding plasma causes a displacement effect, which could also produce ahydrostatic pressure if the plasma volume is not too small in relation to the water volume. Thepressure created can be used to expel a slug of water through a nozzle.
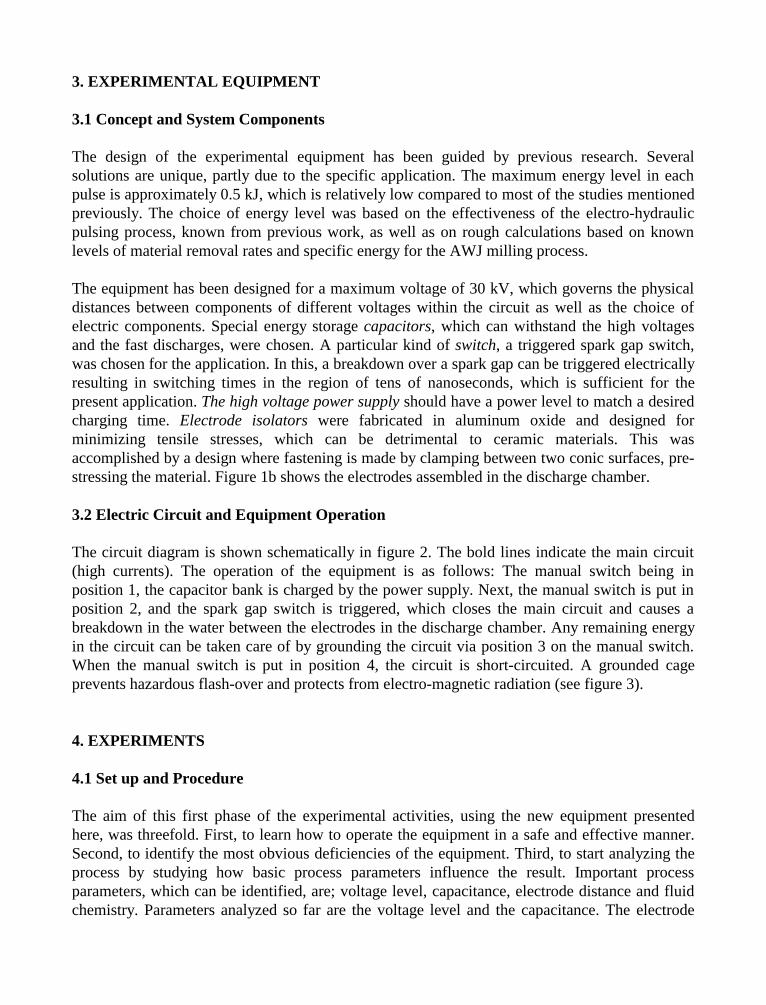
3. EXPERIMENTAL EQUIPMENT
3.1 Concept and System Components
The design of the experimental equipment has been guided by previous research. Severalsolutions are unique, partly due to the specific application. The maximum energy level in eachpulse is approximately 0.5 kJ, which is relatively low compared to most of the studies mentionedpreviously. The choice of energy level was based on the effectiveness of the electro-hydraulicpulsing process, known from previous work, as well as on rough calculations based on knownlevels of material removal rates and specific energy for the AWJ milling process.
The equipment has been designed for a maximum voltage of 30 kV, which governs the physicaldistances between components of different voltages within the circuit as well as the choice ofelectric components. Special energy storage capacitors, which can withstand the high voltagesand the fast discharges, were chosen. A particular kind of switch, a triggered spark gap switch,was chosen for the application. In this, a breakdown over a spark gap can be triggered electricallyresulting in switching times in the region of tens of nanoseconds, which is sufficient for thepresent application. The high voltage power supply should have a power level to match a desiredcharging time. Electrode isolators were fabricated in aluminum oxide and designed forminimizing tensile stresses, which can be detrimental to ceramic materials. This wasaccomplished by a design where fastening is made by clamping between two conic surfaces, pre-stressing the material. Figure 1b shows the electrodes assembled in the discharge chamber.
3.2 Electric Circuit and Equipment Operation
The circuit diagram is shown schematically in figure 2. The bold lines indicate the main circuit(high currents). The operation of the equipment is as follows: The manual switch being inposition 1, the capacitor bank is charged by the power supply. Next, the manual switch is put inposition 2, and the spark gap switch is triggered, which closes the main circuit and causes abreakdown in the water between the electrodes in the discharge chamber. Any remaining energyin the circuit can be taken care of by grounding the circuit via position 3 on the manual switch.When the manual switch is put in position 4, the circuit is short-circuited. A grounded cageprevents hazardous flash-over and protects from electro-magnetic radiation (see figure 3).
4. EXPERIMENTS
4.1 Set up and Procedure
The aim of this first phase of the experimental activities, using the new equipment presentedhere, was threefold. First, to learn how to operate the equipment in a safe and effective manner.Second, to identify the most obvious deficiencies of the equipment. Third, to start analyzing theprocess by studying how basic process parameters influence the result. Important processparameters, which can be identified, are; voltage level, capacitance, electrode distance and fluidchemistry. Parameters analyzed so far are the voltage level and the capacitance. The electrode
distance has been 4 mm in all tests. For evaluating the energy transfer, the possibility to machineor deform different materials has been tested. For analyzing the circuit performance, the voltagebetween the electrodes as a function of the time, Ud(t), and the volume of water expelled fromthe discharge chamber were used as parameters.
4.2 Practical Considerations and Problems
A problem identified was that flash-over occurred, not as supposed between the electrodes, butinstead from the high voltage electrode to the discharge chamber wall. This was discovered bysmall spark erosion marks on the chamber internal walls. The reason is believed to be the sharpedge of the rear end of the electrode tip, where the electric field could concentrate. Changing thegeometry of the electrode tip was not easily accomplished. Instead the problem was solved byelectrically connecting the discharge chamber at an electrical potential in between the highvoltage and the ground level, resulting in a larger voltage difference between the electrodes thanbetween the electrodes and the chamber wall. The present circuit can be seen in figure 4.
When raising the voltage level over 20 kV, mechanical failure of the electrode isolators occurred.The fracture had in both cases appeared at the same location, at the base of the ”neck” of theisolator. This part is not pre-stressed, which can be observed in figure 1b. However, the dischargeproduces a shock wave, which will propagate further into the neck of the isolator, where otherstress conditions prevail, whereby a critical tensile stress can be exceeded. This is believed tohave caused the failure.
4.3 Experimental Results
4.3.1 Evidence of Jet Formation
Experiments so far have been made with a pure waterjet only. The very first experiment wascarried out at the minimum energy level for which the equipment was designed. Parametersettings were: Voltage 12 kV (which is the minimum voltage at which the spark gap switch canbe operated), and capacitance of 0.3 µF, resulting in an input energy level of 22 J. The water wasallowed to escape through the end opening of a 3.2 mm pipe. The result was encouraging, sincethe expelled slug of water penetrated the cardboard paper placed in front of the tube opening.
In the following experiments, when standard waterjet nozzles were used, clear indentation markson metal sheets were observed. Figure 5 shows some resulting marks from slugs produced with a0.5 mm diameter waterjet-nozzle striking copper sheet surface. In addition to the indentationmarks, a bending edge on the surface can be seen. The latter being due to a supporting edge.
4.3.2 Expelled Volume
The water volume expelled is an important feature of the apparatus to be effective for use indiscretisized abrasive waterjet milling. As a first step, the influence of capacitance and voltage onthe expelled volume was investigated. The expelled volume was determined by measuring thewater level in the outlet pipe. (The discharge chamber assembly was turned upside down during
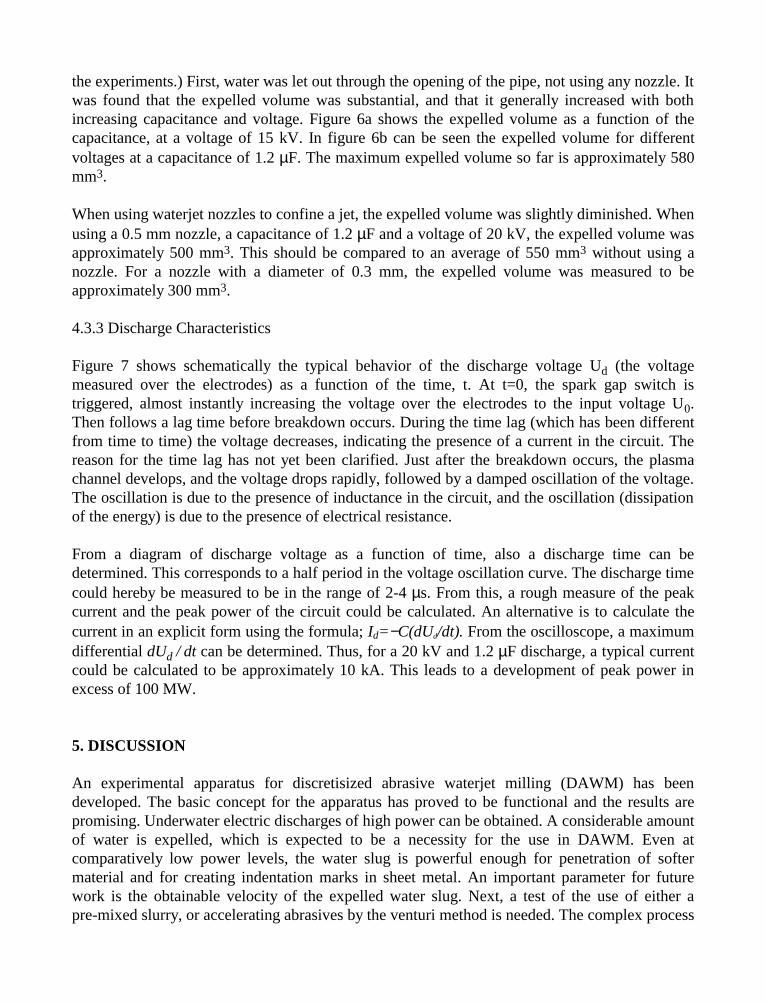
the experiments.) First, water was let out through the opening of the pipe, not using any nozzle. Itwas found that the expelled volume was substantial, and that it generally increased with bothincreasing capacitance and voltage. Figure 6a shows the expelled volume as a function of thecapacitance, at a voltage of 15 kV. In figure 6b can be seen the expelled volume for differentvoltages at a capacitance of 1.2 µF. The maximum expelled volume so far is approximately 580mm3.
When using waterjet nozzles to confine a jet, the expelled volume was slightly diminished. Whenusing a 0.5 mm nozzle, a capacitance of 1.2 µF and a voltage of 20 kV, the expelled volume wasapproximately 500 mm3. This should be compared to an average of 550 mm3 without using anozzle. For a nozzle with a diameter of 0.3 mm, the expelled volume was measured to beapproximately 300 mm3.
4.3.3 Discharge Characteristics
Figure 7 shows schematically the typical behavior of the discharge voltage Ud (the voltagemeasured over the electrodes) as a function of the time, t. At t=0, the spark gap switch istriggered, almost instantly increasing the voltage over the electrodes to the input voltage U0.Then follows a lag time before breakdown occurs. During the time lag (which has been differentfrom time to time) the voltage decreases, indicating the presence of a current in the circuit. Thereason for the time lag has not yet been clarified. Just after the breakdown occurs, the plasmachannel develops, and the voltage drops rapidly, followed by a damped oscillation of the voltage.The oscillation is due to the presence of inductance in the circuit, and the oscillation (dissipationof the energy) is due to the presence of electrical resistance.
From a diagram of discharge voltage as a function of time, also a discharge time can bedetermined. This corresponds to a half period in the voltage oscillation curve. The discharge timecould hereby be measured to be in the range of 2-4 µs. From this, a rough measure of the peakcurrent and the peak power of the circuit could be calculated. An alternative is to calculate thecurrent in an explicit form using the formula; Id=−C(dUd/dt). From the oscilloscope, a maximumdifferential dUd / dt can be determined. Thus, for a 20 kV and 1.2 µF discharge, a typical currentcould be calculated to be approximately 10 kA. This leads to a development of peak power inexcess of 100 MW.
5. DISCUSSION
An experimental apparatus for discretisized abrasive waterjet milling (DAWM) has beendeveloped. The basic concept for the apparatus has proved to be functional and the results arepromising. Underwater electric discharges of high power can be obtained. A considerable amountof water is expelled, which is expected to be a necessity for the use in DAWM. Even atcomparatively low power levels, the water slug is powerful enough for penetration of softermaterial and for creating indentation marks in sheet metal. An important parameter for futurework is the obtainable velocity of the expelled water slug. Next, a test of the use of either apre-mixed slurry, or accelerating abrasives by the venturi method is needed. The complex process
of pressure build-up needs to be addressed in this context. A low overall efficiency of energytransfer can be anticipated to be an obstacle to overcome. This can be achieved by a developmentof the geometrical features of the chamber and outlet.
An important problem observed, namely flash-over occurring from one electrode to the chamberwall, was eliminated. The development work is far from being completed for an industrial use ofthe technique. New phenomena are continuously found during the course of experimentation. Animportant matter to continuously keep in mind is the safety of operating the equipment.
The total cost of the experimental components has so far not exceeded 25 % of that of anordinary intensifier pump unit. As the pressurizing unit may be incorporated with the cuttinghead, the technique will significantly reduce the need for expensive high-pressure components.Components that today restrain a high machining rate are to be found in the high voltage powersupply system. The filling of water may also be a problem for a high frequency pulsing. If thefilling is not made in a controlled manner, there is a risk of entrapped air in the dischargechamber.
Allowing oneself to take a visionary view, several advantages of the discretisized AWJ techniquemay be envisioned. At the same time, this discussion points out directions in which furtherdevelopment is needed. If developed into a high frequency machining unit, such an apparatusmay become a viable as well as an economical tool. The unit cavities may be made smaller, thusenhancing the ”milling resolution” in favor of better machining tolerances, combined withacceptable material removal rates.
6. ACKNOWLEDGEMENTS
The authors wish to thank Mr. Sture Johansson at the Dept. of Production Engineering atChalmers University of Technology for vital support regarding the design of the electricalcircuits presented in this paper. Also, we thank Mr. Dick Olofsson at the Dept. of ProductionEngineering at Chalmers University of Technology for support in fabrication of mechanical partsfor the new apparatus.
7. REFERENCES 1. Hashish, M.: ”Milling with Abrasive-Waterjets - A Preliminary Investigation”, Proc. 4th
U.S. Water Jet Conference, WJTA, St. Louis, MO, USA, pp. 1-10, 1987. 2. Laurinat, A., Louis, H., Meier-Wiechert, G.: ”A Model for Milling with Abrasive Water
Jets”, Proc. 7th American Water Jet Conference, WJTA, St. Louis, MO, USA, pp. 119-139,1993.
3. Öjmertz, K.M.C. and Amini, N.: ”A Discrete Approach to the Abrasive Waterjet MillingProcess”, Proc. 12th Int’l Conference on Jet Cutting Technology, BHRG, Cranfield, UK,pp. 425-434, 1994.
4. Holmqvist, G. and Öjmertz K.M.C.: ”Process Development and Apparatus for
Discretisized Abrasive Waterjet Milling”, Proc. 9th American Waterjet Conference, WJTA,St. Louis, MO, USA, pp. 77-91, 1997.
5. Naydan, T. and Aker, W.W.: ”Process and Apparatus for the Production of Hydroelectric
Pulsed Liquid Jets”, U.S. Patent No. 3700169, 1972. 6. Sandia Laboratories: ”Drilling Research on the Electrical Detonation and Subsequent
Cavitation in a Liquid Technique (Spark Drilling)”, Sandia Report No. SAND 76-0086,50 p., 1976.
7. Huff, C.F. and McFall, A.L.: ”Investigation into the Effects of an Arc Discharge on a High
Velocity Liquid Jet”, Sandia Laboratory Report No. SAND-77-1135C, 27 p., 1977. 8. Hawrylewicz, H.M., Puchala R.J., Vijay M.M.: ”Generation of Pulsed or Cavitating Jets by
Electric Discharges in High Speed Continuous Water Jets”, Proc. 8th Int’l Symposium onJet Cutting Technology, BHRA, Cranfield, UK, pp. 345-352, 1986.
9. Vijay, M. and Paquette, N.: ”Electro-discharge Technique for Producing Powerful Pulsed
Water Jets: Potential and Problems”, Proc. 13th Int’l Conference on Jetting Technology,BHRG, Cranfield, UK, pp. 195-209, 1996.
10. Vijay, M.M., Bielawski, M., Paquette, V.: ”Generating Powerful Pulsed Water Jets with
Electric Discharges: Fundamental Study”, Proc. 9th American Waterjet Conference, WJTA,St. Louis, MO, USA, pp. 415-430, 1997.
11. Vijay, M.M., Makomaski, A.H.: “Numerical Analysis of Pulsed Jet Formation by ElectricDischarge in a Nozzle”, Proc. 14th Int’l Conference on Jetting Technology, BHRG,Cranfield, UK, pp. 73-87, 1998.
12. Ilias, N., Magyari, A., Radu, S., Achim, M.: ”Research Concerning Water Jets Rock
Cutting and Water Jets Assisted Rock Cutting”, Proc. 12th Int’l Conference on Jet CuttingTechnology, BHRG, Cranfield, UK, pp. 265-280, 1994.
13. Khalifa M.: ”High Voltage Engineering, Theory and Practice”, Marcel Dekker Inc., New
York, USA, 524 p., 1990. 14. Murr, L.E.: ”Shock Waves for Industrial Applications”, Noyes Publications, Park Ridge,
New Jersey, USA, 533 p., 1988.
a)
b)
Check valve
Isolator
Electrode
Abrasive flow
Cutting head
Figure 1. a) Apparatus for discretisized abrasive waterjet milling, shown without the electro-magnetic shielding: 1) Manual switch, 2) Resistors, 3) Capacitors, 4) Spark gap switch,
5) Discharge chamber, 6) Trigger generator. b) Discharge chamber, shown with an attached AWJ cutting head.
5
4
6
3
1
2
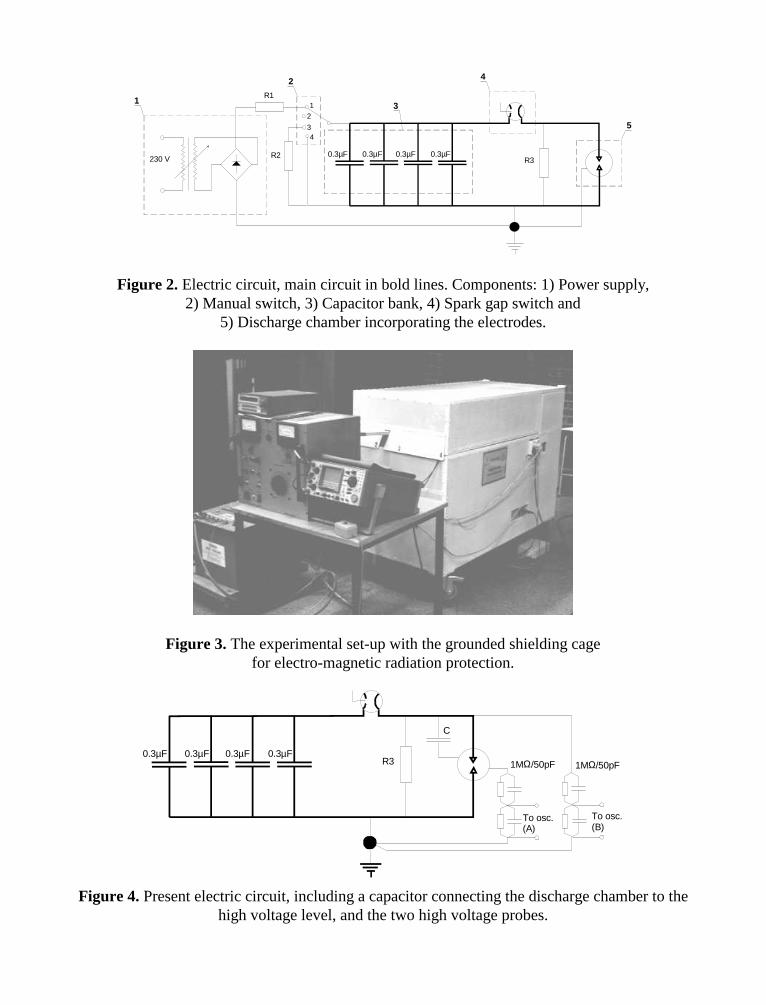
230 V
R1
R3R2 0.3µF0.3µF 0.3µF0.3µF
1
2
34
13
4
5
2
Figure 2. Electric circuit, main circuit in bold lines. Components: 1) Power supply,2) Manual switch, 3) Capacitor bank, 4) Spark gap switch and
5) Discharge chamber incorporating the electrodes.
Figure 3. The experimental set-up with the grounded shielding cage for electro-magnetic radiation protection.
R30.3µF
C
0.3µF 0.3µF0.3µF1MΩ/50pF 1MΩ/50pF
To osc.(A)
To osc.(B)
Figure 4. Present electric circuit, including a capacitor connecting the discharge chamber to thehigh voltage level, and the two high voltage probes.
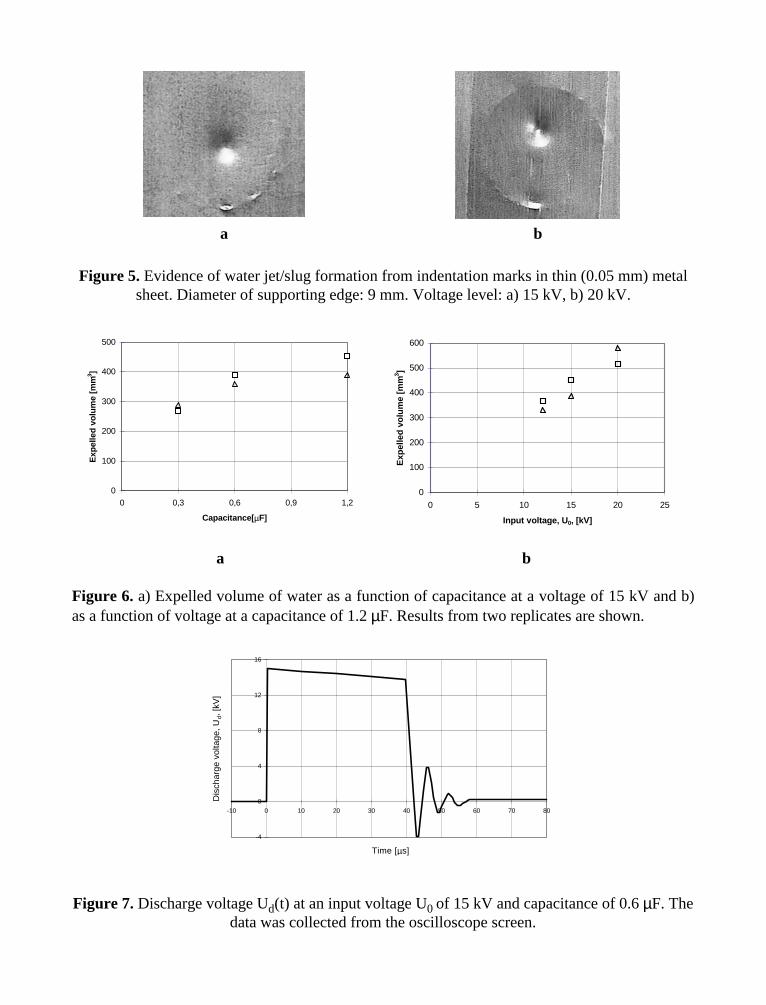
a b
Figure 5. Evidence of water jet/slug formation from indentation marks in thin (0.05 mm) metalsheet. Diameter of supporting edge: 9 mm. Voltage level: a) 15 kV, b) 20 kV.
0
100
200
300
400
500
0 0,3 0,6 0,9 1,2
Capacitance[ µF]
Exp
elle
d vo
lum
e [m
m3 ]
0
100
200
300
400
500
600
0 5 10 15 20 25
Input voltage, U 0, [kV]
Exp
elle
d vo
lum
e [m
m3 ]
a b
Figure 6. a) Expelled volume of water as a function of capacitance at a voltage of 15 kV and b)as a function of voltage at a capacitance of 1.2 µF. Results from two replicates are shown.
-4
0
4
8
12
16
-10 0 10 20 30 40 50 60 70 80
Time [µs]
Dis
char
ge v
olta
ge, U
d, [k
V]
Figure 7. Discharge voltage Ud(t) at an input voltage U0 of 15 kV and capacitance of 0.6 µF. Thedata was collected from the oscilloscope screen.
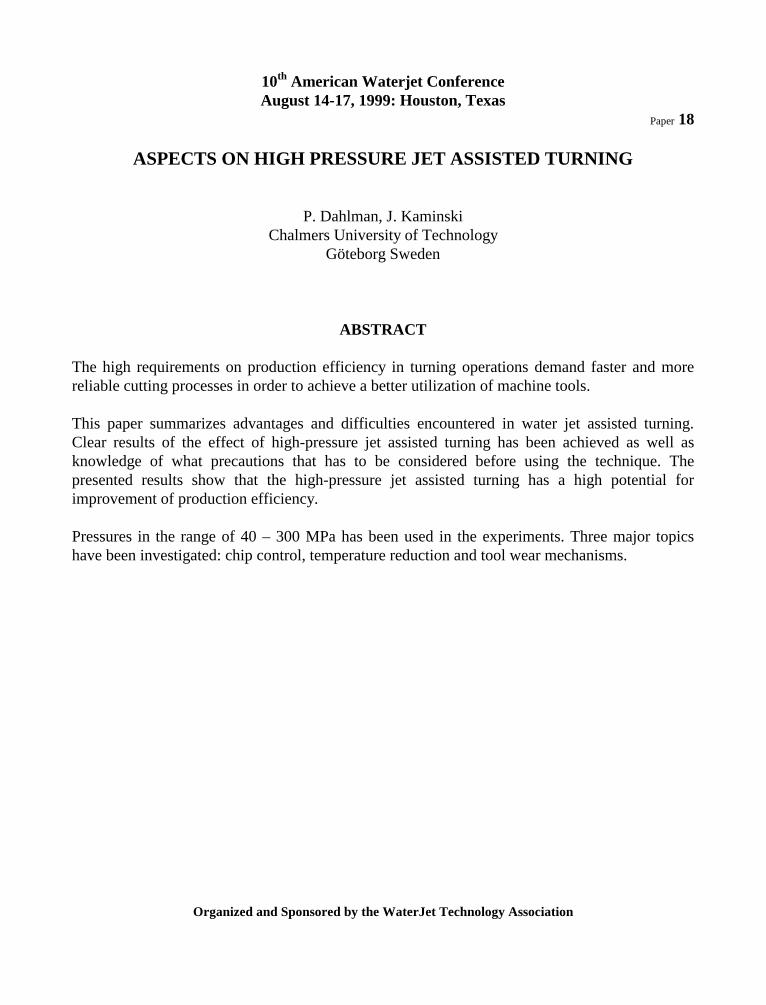
10th American Waterjet ConferenceAugust 14-17, 1999: Houston, Texas
Paper 18
ASPECTS ON HIGH PRESSURE JET ASSISTED TURNING
P. Dahlman, J. KaminskiChalmers University of Technology
Göteborg Sweden
ABSTRACT
The high requirements on production efficiency in turning operations demand faster and morereliable cutting processes in order to achieve a better utilization of machine tools.
This paper summarizes advantages and difficulties encountered in water jet assisted turning.Clear results of the effect of high-pressure jet assisted turning has been achieved as well asknowledge of what precautions that has to be considered before using the technique. Thepresented results show that the high-pressure jet assisted turning has a high potential forimprovement of production efficiency.
Pressures in the range of 40 – 300 MPa has been used in the experiments. Three major topicshave been investigated: chip control, temperature reduction and tool wear mechanisms.
Organized and Sponsored by the WaterJet Technology Association
1. INTRODUCTION
One of the most important pre-requisitions in metal cutting is a total chip control with respect tochip form, flow and breaking. It is well known that a good chip control has a great influence onthe tool life, machined surface quality, cutting forces, reliability of the machining process etc.Also the productivity is heavily influenced since in cutting operations with poor chip control themachine must be frequently stopped and chips must be removed manually from the working area.This is especially important when turning smaller inner diameters of products since the limitedspace fast can be filled with chips and damage the machined surfaces.
Commonly, a “partial” chip control is achieved using indexable inserts equipped with variouschip former configurations. Up to now, research concerning chip control mainly wasconcentrated on development of new, more effective chip formers. Hundreds of different chipformer shapes are available on the market. They are specially developed to meet requirements inspecific operations. Depending on the profile geometry on the tool rake face it is possible toattain chips with different shapes. The familiar limitation for the various moulded insert shapes isthe limited cutting data region for chip breaking. Commonly, the tool manufacturers recommenda region in cutting depth – feed rate diagram, in which a good chip breaking/control is possible.If one or both of the two parameters is out of range, there is an obvious risk that the chip controlmay be totally lost. This can be clearly observed in profile turning with varying cutting depth.
The problem concerning chip braking and chip control is so important that an extensive summaryof the research on chip control was made by I. S. Jawahir and C.A. van Luttervelt in CIRPKeynote paper “Recent developments in Chip Control Research and Applications”, 1993, [2].Many other interesting papers have also been published [3,4,5,6].
The general trend in manufacturing is dry machining. However, many modern materials can notbe machined dry even with the latest coated tools, due to the high temperatures in the cuttingzone. Materials like austenitic stainless steel, high-temperature alloys, titanium, and hardenedsteel demand cutting fluids. It has been shown in our research [2], and by others [3,4] that HighPressure Cooling (HPC) of cutting tools is a very effective method, which can drasticallyincrease the production economy in workshops. By applying a high pressure fluid jet, it ispossible to achieve advantages, such as significantly decreased temperature in the cutting zone,increased tool life in certain cases up to several hundred percent, lower forces due to betterfrictional conditions between the tool face and the chip, and lower levels of vibrations. Thisresults in improved surface integrity and better dimensional accuracy of the produced parts.Nevertheless water jet assisted machining also induces some new precautions to be made beforeusing the technique. Today insert geometries and grades are not developed for this applicationand the choice of a regular recommended insert can actually cause lower productivity with waterjet assisted machining than with conventional cooling.
The above mentioned effects do not only depend on the effective heat dissipation, but also onreduction of the contact length between the chip and the rake face. Since the high-pressure jetpartially penetrates the tool/chip interface a hydro-wedge is created which provides a
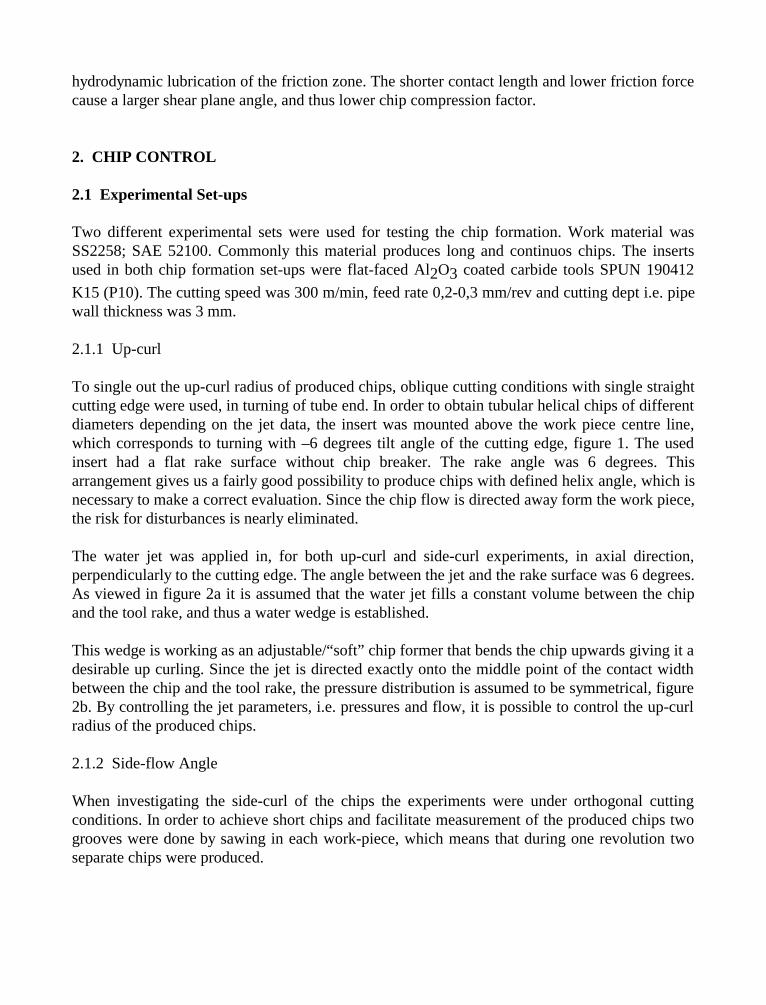
hydrodynamic lubrication of the friction zone. The shorter contact length and lower friction forcecause a larger shear plane angle, and thus lower chip compression factor.
2. CHIP CONTROL
2.1 Experimental Set-ups
Two different experimental sets were used for testing the chip formation. Work material wasSS2258; SAE 52100. Commonly this material produces long and continuos chips. The insertsused in both chip formation set-ups were flat-faced Al2O3 coated carbide tools SPUN 190412
K15 (P10). The cutting speed was 300 m/min, feed rate 0,2-0,3 mm/rev and cutting dept i.e. pipewall thickness was 3 mm.
2.1.1 Up-curl
To single out the up-curl radius of produced chips, oblique cutting conditions with single straightcutting edge were used, in turning of tube end. In order to obtain tubular helical chips of differentdiameters depending on the jet data, the insert was mounted above the work piece centre line,which corresponds to turning with –6 degrees tilt angle of the cutting edge, figure 1. The usedinsert had a flat rake surface without chip breaker. The rake angle was 6 degrees. Thisarrangement gives us a fairly good possibility to produce chips with defined helix angle, which isnecessary to make a correct evaluation. Since the chip flow is directed away form the work piece,the risk for disturbances is nearly eliminated.
The water jet was applied in, for both up-curl and side-curl experiments, in axial direction,perpendicularly to the cutting edge. The angle between the jet and the rake surface was 6 degrees.As viewed in figure 2a it is assumed that the water jet fills a constant volume between the chipand the tool rake, and thus a water wedge is established.
This wedge is working as an adjustable/“soft” chip former that bends the chip upwards giving it adesirable up curling. Since the jet is directed exactly onto the middle point of the contact widthbetween the chip and the tool rake, the pressure distribution is assumed to be symmetrical, figure2b. By controlling the jet parameters, i.e. pressures and flow, it is possible to control the up-curlradius of the produced chips.
2.1.2 Side-flow Angle
When investigating the side-curl of the chips the experiments were under orthogonal cuttingconditions. In order to achieve short chips and facilitate measurement of the produced chips twogrooves were done by sawing in each work-piece, which means that during one revolution twoseparate chips were produced.
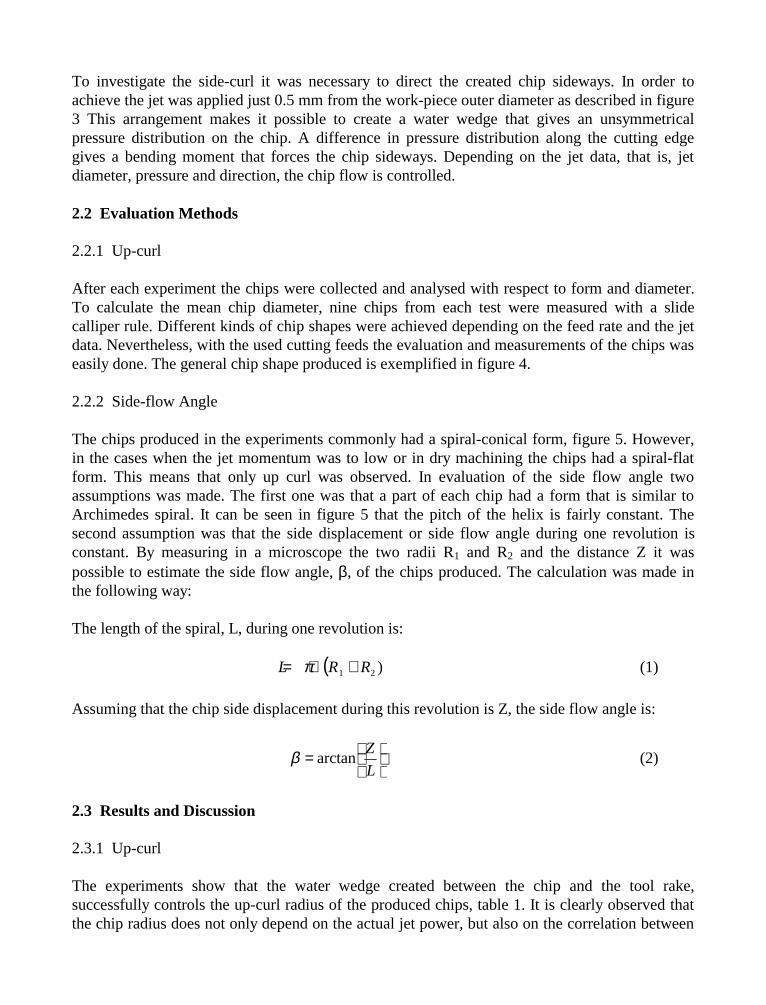
To investigate the side-curl it was necessary to direct the created chip sideways. In order toachieve the jet was applied just 0.5 mm from the work-piece outer diameter as described in figure3 This arrangement makes it possible to create a water wedge that gives an unsymmetricalpressure distribution on the chip. A difference in pressure distribution along the cutting edgegives a bending moment that forces the chip sideways. Depending on the jet data, that is, jetdiameter, pressure and direction, the chip flow is controlled.
2.2 Evaluation Methods
2.2.1 Up-curl
After each experiment the chips were collected and analysed with respect to form and diameter.To calculate the mean chip diameter, nine chips from each test were measured with a slidecalliper rule. Different kinds of chip shapes were achieved depending on the feed rate and the jetdata. Nevertheless, with the used cutting feeds the evaluation and measurements of the chips waseasily done. The general chip shape produced is exemplified in figure 4.
2.2.2 Side-flow Angle
The chips produced in the experiments commonly had a spiral-conical form, figure 5. However,in the cases when the jet momentum was to low or in dry machining the chips had a spiral-flatform. This means that only up curl was observed. In evaluation of the side flow angle twoassumptions was made. The first one was that a part of each chip had a form that is similar toArchimedes spiral. It can be seen in figure 5 that the pitch of the helix is fairly constant. Thesecond assumption was that the side displacement or side flow angle during one revolution isconstant. By measuring in a microscope the two radii R1 and R2 and the distance Z it waspossible to estimate the side flow angle, β, of the chips produced. The calculation was made inthe following way:
The length of the spiral, L, during one revolution is:
( )21 RRL +⋅= π (1)
Assuming that the chip side displacement during this revolution is Z, the side flow angle is:
=
L
Zarctanβ (2)
2.3 Results and Discussion
2.3.1 Up-curl
The experiments show that the water wedge created between the chip and the tool rake,successfully controls the up-curl radius of the produced chips, table 1. It is clearly observed thatthe chip radius does not only depend on the actual jet power, but also on the correlation between
water pressure and flow. This means that for a constant power, for example 2 kW, a lower chipradius will be achieved if a high flow, 4,75 l/min, and low pressure, 25,1 MPa, are used. Flowhas greater influence on the chip radius than the jet pressure. This implies that there is anotherparameter that better discriminate the relation between the up-curl radius and the water jet beam.It has been shown by Crafoord et al (1999) [1] that a more suited parameter is the water jet’smomentum. The water jet momentum is described as follows:
ρ⋅⋅= qvF (3) Where v is the jet velocity and q is the density. This expression integrates both the jet flow andthe jet pressure. The equation above expresses the force acting on the orifice. As mentionedearlier, the actual force acting on the chip is more difficult to calculate. This since the geometrywhere the control volume is acting is not completely known and it yields only the resultant forcenot the point where it is acting. But still, this relationship gives the “potential” force and it is acomprehensive parameter to use. It was shown that the up-curl relationship with jet momentumcould be calculated as described in figure 6.
As presented above the chip up-curl radius can be controlled. However to achieve good chipcontrol this is not enough. In order to obtain chip breakage, in materials that produce longcontinuos chips, it is important to bend the chip into an obstacle e.g. unmachined material or ontothe tool.
2.3.2 Side-flow Angle
The experimental results show that it is fully possible to control the chip flow direction, and thatit is not only the jet momentum but also the jet diameter, which together influence the chip sideflow angle. An important factor to be considered is the shape of the pressure distribution surface.Depending on the jet diameter (nozzle diameter), pressure and impact position the pressuredistribution is controlled. Using equation 3 the force caused by the water wedge created betweenthe chip and rake surface can be described as the integral over the pressure distribution asdescribed in equation 4. To make the pressure non-dimensional the pchip is divided with thestagnation pressure po.
∫⋅=A
chipchip dAyx
p
ppF ),(
00 (4)
It is clearly observed, see figure 7, that the jet momentum influences the side-flow anglesignificantly. It is also observed that the smallest nozzle (0,6 mm in diameter) gives the highestside-flow angle while nozzle 0,8 mm the lowest angle. However, the angle is relatively small thatis between 0,5 and 2,5 degrees, the discharge of chips from the cutting area is changeddramatically. Depending on the jet impact position along the cutting depth, the discharge of chipsis controlled outwards or inwards the pipe. This is of great importance in longitudinal turning.
The chips can be controlled in a direction that they will not damage the already machinedworkpiece surface.
It should be noted that to obtain the same level of force on the chip by using a smaller nozzle it isnecessary to use a higher pressure. This means that the pressure distribution surface will bedifferent than when using a large nozzle diameter, see figure 8. In the first case (figure 8a), theappearance of a high pressure peak makes the centre of gravity for the pressure distribution tomove to the left, that is to the outer diameter of the workpiece. This induces a strong torquewhich forces the chip sideways, giving the chip a desired side flow angle. When using nozzleswith a larger diameter the pressure distribution will be wider and have a lower pressure peak(figure 8b). The centre of gravity will then move towards the centre of the cutting depth, thusmaking the torque smaller, than when using a small nozzle and a high pressure.
When combining the knowledge from up-curl and side-curl radius control a big step has beentaken to enable modeling chip control in water jet assisted turning. Ongoing research in this areais using the knowledge from flat faced tools tests together with inserts with moulded chipforming geometries. The goal is the develop knowledge for modeling of chip flow direction inorder to predict and control optimal chip breaking.
3. TEMPERATURE
3.1 Experimental Set-up
Two high-pressure pumps were used in the experiments. The first one was an intensifier of thetype used in water jet cutting systems. This intensifier gives water pressures in the range of 70and 360 MPa and volumes up to 1.9 l/min. The second one was a piston pump with pressureranging from 5 to 74 MPa and significantly higher fluid volumes, that is up to 24 l/min.
The tests were carried out with Al2O3 coated Sandvik Coromant carbide inserts SPUN 19 04 12,
3015 K15 (P10) and on alloyed steel SS2541-03 as workpiece material. The inserts have a flatrake surface without chip breaker. The corner radius was 1.2 mm. The selected cutting data werecutting speed= 150, 225 and 300 m/min, cutting depth= 3 mm, and feed rate= 0.3 mm/rev.
Temperature in the cutting zone has been measured using a new method where thermocouples,placed on the clearance surface, are integrated with the insert. The thermocouples aremanufactured using a thick-film technique and are placed directly on the insert coating (Al2O3),
which constitutes an electrical insulating layer, [4, 5, 6]. A more thoroughly description ispresented in Kaminski, Alvelid (1997) [7].
By applying two thermocouples on the clearance surface, it is possible to measure temperaturesin two points very close to the cutting edge. The first thermo-element was located just 0,5 mmbelow the cutting edge and the second one 1 mm. This gives information about the temperaturedistribution in the vicinity of the cutting zone. An example showing two registered signalscorresponding to temperatures at two thermo-elements is shown in figure 9. We can observe that
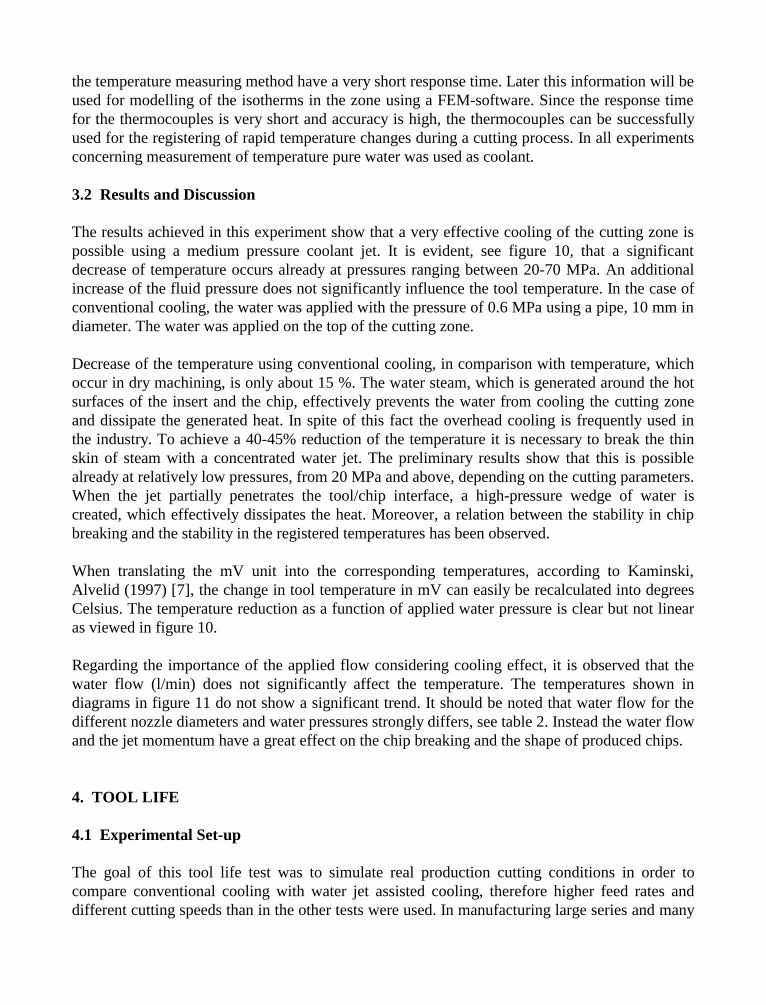
the temperature measuring method have a very short response time. Later this information will beused for modelling of the isotherms in the zone using a FEM-software. Since the response timefor the thermocouples is very short and accuracy is high, the thermocouples can be successfullyused for the registering of rapid temperature changes during a cutting process. In all experimentsconcerning measurement of temperature pure water was used as coolant.
3.2 Results and Discussion
The results achieved in this experiment show that a very effective cooling of the cutting zone ispossible using a medium pressure coolant jet. It is evident, see figure 10, that a significantdecrease of temperature occurs already at pressures ranging between 20-70 MPa. An additionalincrease of the fluid pressure does not significantly influence the tool temperature. In the case ofconventional cooling, the water was applied with the pressure of 0.6 MPa using a pipe, 10 mm indiameter. The water was applied on the top of the cutting zone.
Decrease of the temperature using conventional cooling, in comparison with temperature, whichoccur in dry machining, is only about 15 %. The water steam, which is generated around the hotsurfaces of the insert and the chip, effectively prevents the water from cooling the cutting zoneand dissipate the generated heat. In spite of this fact the overhead cooling is frequently used inthe industry. To achieve a 40-45% reduction of the temperature it is necessary to break the thinskin of steam with a concentrated water jet. The preliminary results show that this is possiblealready at relatively low pressures, from 20 MPa and above, depending on the cutting parameters.When the jet partially penetrates the tool/chip interface, a high-pressure wedge of water iscreated, which effectively dissipates the heat. Moreover, a relation between the stability in chipbreaking and the stability in the registered temperatures has been observed.
When translating the mV unit into the corresponding temperatures, according to Kaminski,Alvelid (1997) [7], the change in tool temperature in mV can easily be recalculated into degreesCelsius. The temperature reduction as a function of applied water pressure is clear but not linearas viewed in figure 10.
Regarding the importance of the applied flow considering cooling effect, it is observed that thewater flow (l/min) does not significantly affect the temperature. The temperatures shown indiagrams in figure 11 do not show a significant trend. It should be noted that water flow for thedifferent nozzle diameters and water pressures strongly differs, see table 2. Instead the water flowand the jet momentum have a great effect on the chip breaking and the shape of produced chips.
4. TOOL LIFE
4.1 Experimental Set-up
The goal of this tool life test was to simulate real production cutting conditions in order tocompare conventional cooling with water jet assisted cooling, therefore higher feed rates anddifferent cutting speeds than in the other tests were used. In manufacturing large series and many
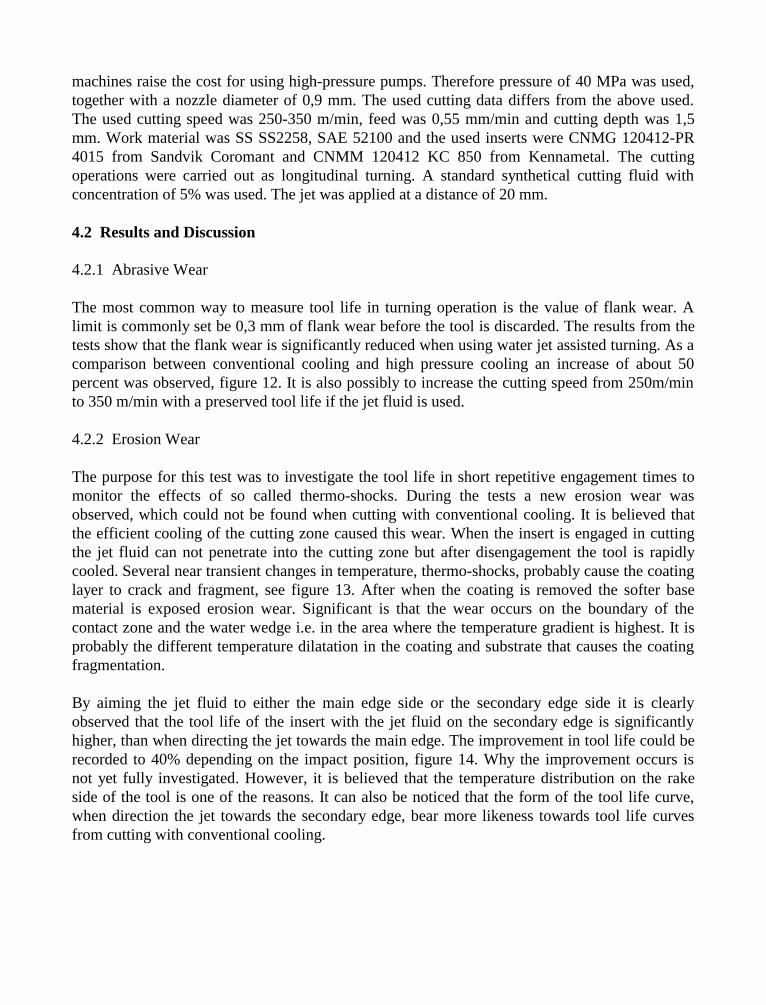
machines raise the cost for using high-pressure pumps. Therefore pressure of 40 MPa was used,together with a nozzle diameter of 0,9 mm. The used cutting data differs from the above used.The used cutting speed was 250-350 m/min, feed was 0,55 mm/min and cutting depth was 1,5mm. Work material was SS SS2258, SAE 52100 and the used inserts were CNMG 120412-PR4015 from Sandvik Coromant and CNMM 120412 KC 850 from Kennametal. The cuttingoperations were carried out as longitudinal turning. A standard synthetical cutting fluid withconcentration of 5% was used. The jet was applied at a distance of 20 mm.
4.2 Results and Discussion
4.2.1 Abrasive Wear
The most common way to measure tool life in turning operation is the value of flank wear. Alimit is commonly set be 0,3 mm of flank wear before the tool is discarded. The results from thetests show that the flank wear is significantly reduced when using water jet assisted turning. As acomparison between conventional cooling and high pressure cooling an increase of about 50percent was observed, figure 12. It is also possibly to increase the cutting speed from 250m/minto 350 m/min with a preserved tool life if the jet fluid is used.
4.2.2 Erosion Wear
The purpose for this test was to investigate the tool life in short repetitive engagement times tomonitor the effects of so called thermo-shocks. During the tests a new erosion wear wasobserved, which could not be found when cutting with conventional cooling. It is believed thatthe efficient cooling of the cutting zone caused this wear. When the insert is engaged in cuttingthe jet fluid can not penetrate into the cutting zone but after disengagement the tool is rapidlycooled. Several near transient changes in temperature, thermo-shocks, probably cause the coatinglayer to crack and fragment, see figure 13. After when the coating is removed the softer basematerial is exposed erosion wear. Significant is that the wear occurs on the boundary of thecontact zone and the water wedge i.e. in the area where the temperature gradient is highest. It isprobably the different temperature dilatation in the coating and substrate that causes the coatingfragmentation.
By aiming the jet fluid to either the main edge side or the secondary edge side it is clearlyobserved that the tool life of the insert with the jet fluid on the secondary edge is significantlyhigher, than when directing the jet towards the main edge. The improvement in tool life could berecorded to 40% depending on the impact position, figure 14. Why the improvement occurs isnot yet fully investigated. However, it is believed that the temperature distribution on the rakeside of the tool is one of the reasons. It can also be noticed that the form of the tool life curve,when direction the jet towards the secondary edge, bear more likeness towards tool life curvesfrom cutting with conventional cooling.
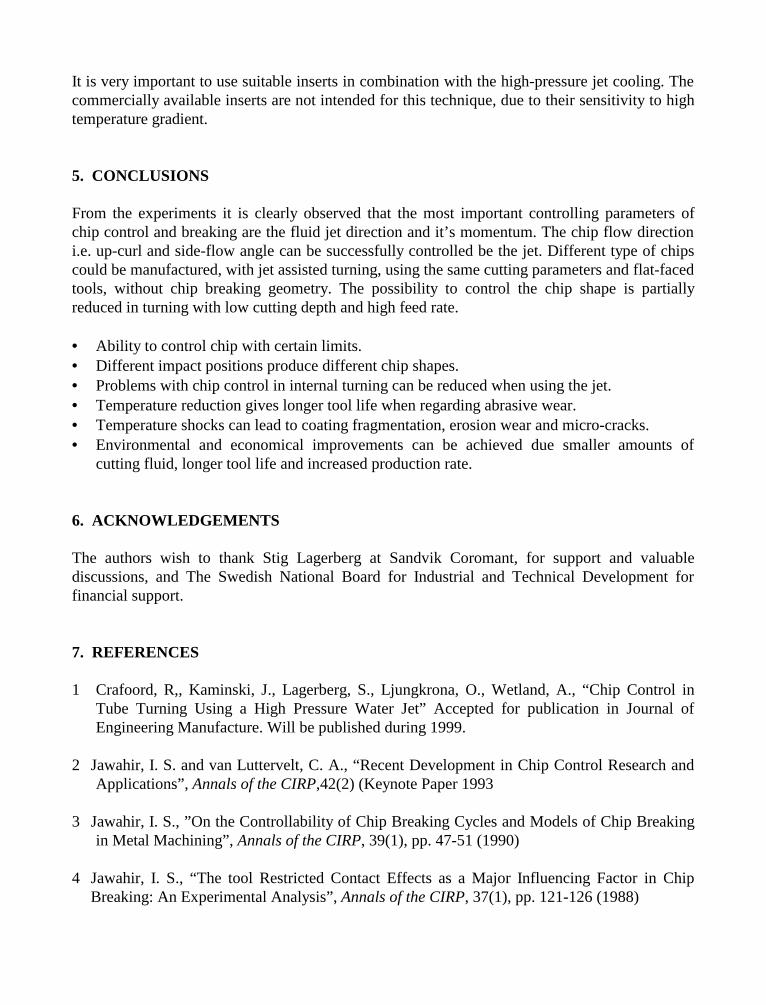
It is very important to use suitable inserts in combination with the high-pressure jet cooling. Thecommercially available inserts are not intended for this technique, due to their sensitivity to hightemperature gradient.
5. CONCLUSIONS
From the experiments it is clearly observed that the most important controlling parameters ofchip control and breaking are the fluid jet direction and it’s momentum. The chip flow directioni.e. up-curl and side-flow angle can be successfully controlled be the jet. Different type of chipscould be manufactured, with jet assisted turning, using the same cutting parameters and flat-facedtools, without chip breaking geometry. The possibility to control the chip shape is partiallyreduced in turning with low cutting depth and high feed rate.
• Ability to control chip with certain limits.• Different impact positions produce different chip shapes.• Problems with chip control in internal turning can be reduced when using the jet.• Temperature reduction gives longer tool life when regarding abrasive wear.• Temperature shocks can lead to coating fragmentation, erosion wear and micro-cracks.• Environmental and economical improvements can be achieved due smaller amounts of
cutting fluid, longer tool life and increased production rate.
6. ACKNOWLEDGEMENTS
The authors wish to thank Stig Lagerberg at Sandvik Coromant, for support and valuablediscussions, and The Swedish National Board for Industrial and Technical Development forfinancial support.
7. REFERENCES
1 Crafoord, R,, Kaminski, J., Lagerberg, S., Ljungkrona, O., Wetland, A., “Chip Control inTube Turning Using a High Pressure Water Jet” Accepted for publication in Journal ofEngineering Manufacture. Will be published during 1999.
2 Jawahir, I. S. and van Luttervelt, C. A., “Recent Development in Chip Control Research andApplications”, Annals of the CIRP,42(2) (Keynote Paper 1993
3 Jawahir, I. S., ”On the Controllability of Chip Breaking Cycles and Models of Chip Breakingin Metal Machining”, Annals of the CIRP, 39(1), pp. 47-51 (1990)
4 Jawahir, I. S., “The tool Restricted Contact Effects as a Major Influencing Factor in ChipBreaking: An Experimental Analysis”, Annals of the CIRP, 37(1), pp. 121-126 (1988)
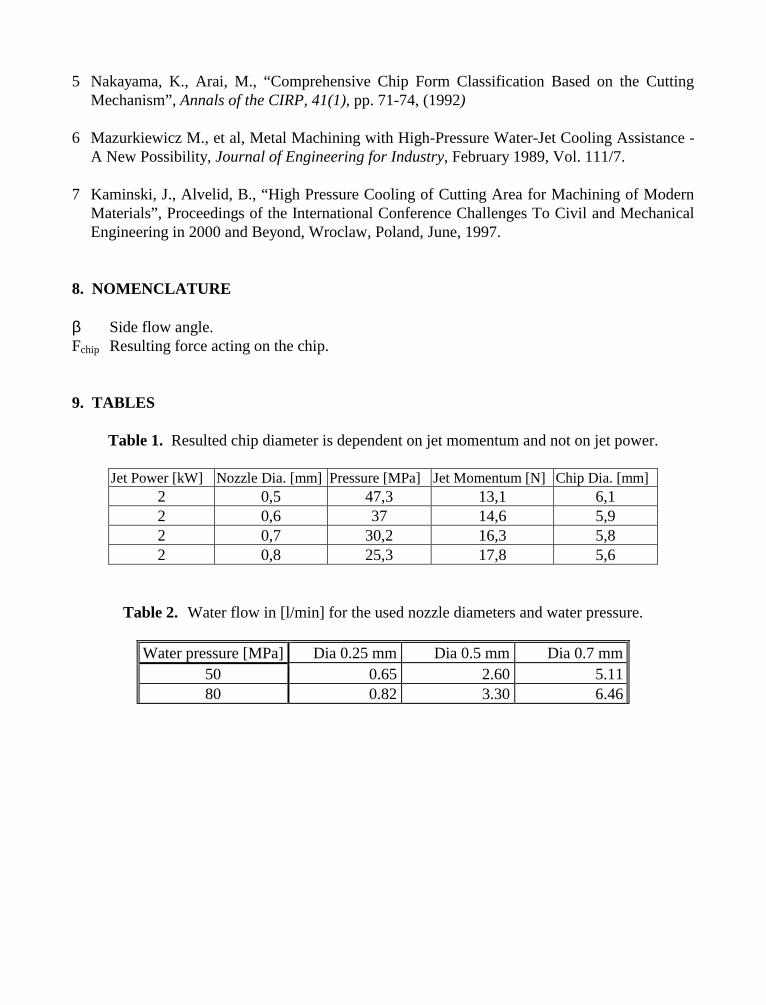
5 Nakayama, K., Arai, M., “Comprehensive Chip Form Classification Based on the CuttingMechanism”, Annals of the CIRP, 41(1), pp. 71-74, (1992)
6 Mazurkiewicz M., et al, Metal Machining with High-Pressure Water-Jet Cooling Assistance -A New Possibility, Journal of Engineering for Industry, February 1989, Vol. 111/7.
7 Kaminski, J., Alvelid, B., “High Pressure Cooling of Cutting Area for Machining of ModernMaterials”, Proceedings of the International Conference Challenges To Civil and MechanicalEngineering in 2000 and Beyond, Wroclaw, Poland, June, 1997.
8. NOMENCLATURE
β Side flow angle.Fchip Resulting force acting on the chip.
9. TABLES
Table 1. Resulted chip diameter is dependent on jet momentum and not on jet power.
Jet Power [kW] Nozzle Dia. [mm] Pressure [MPa] Jet Momentum [N] Chip Dia. [mm]2 0,5 47,3 13,1 6,12 0,6 37 14,6 5,92 0,7 30,2 16,3 5,82 0,8 25,3 17,8 5,6
Table 2. Water flow in [l/min] for the used nozzle diameters and water pressure.
Water pressure [MPa] Dia 0.25 mm Dia 0.5 mm Dia 0.7 mm50 0.65 2.60 5.1180 0.82 3.30 6.46
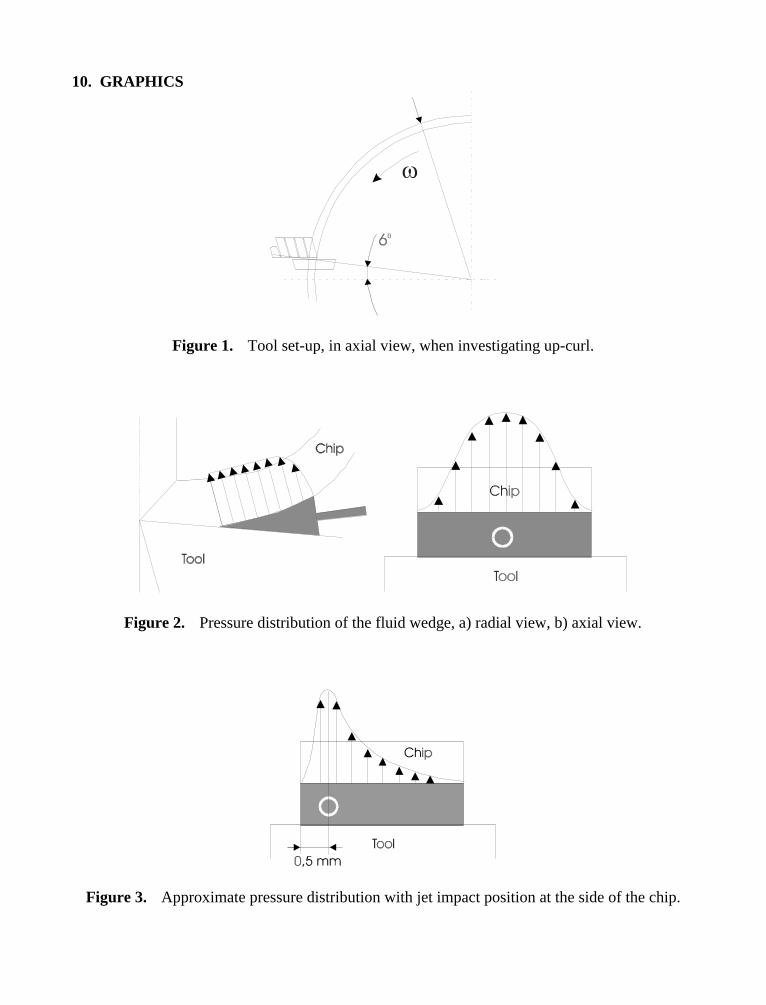
10. GRAPHICS
Figure 1. Tool set-up, in axial view, when investigating up-curl.
Figure 2. Pressure distribution of the fluid wedge, a) radial view, b) axial view.
Figure 3. Approximate pressure distribution with jet impact position at the side of the chip.
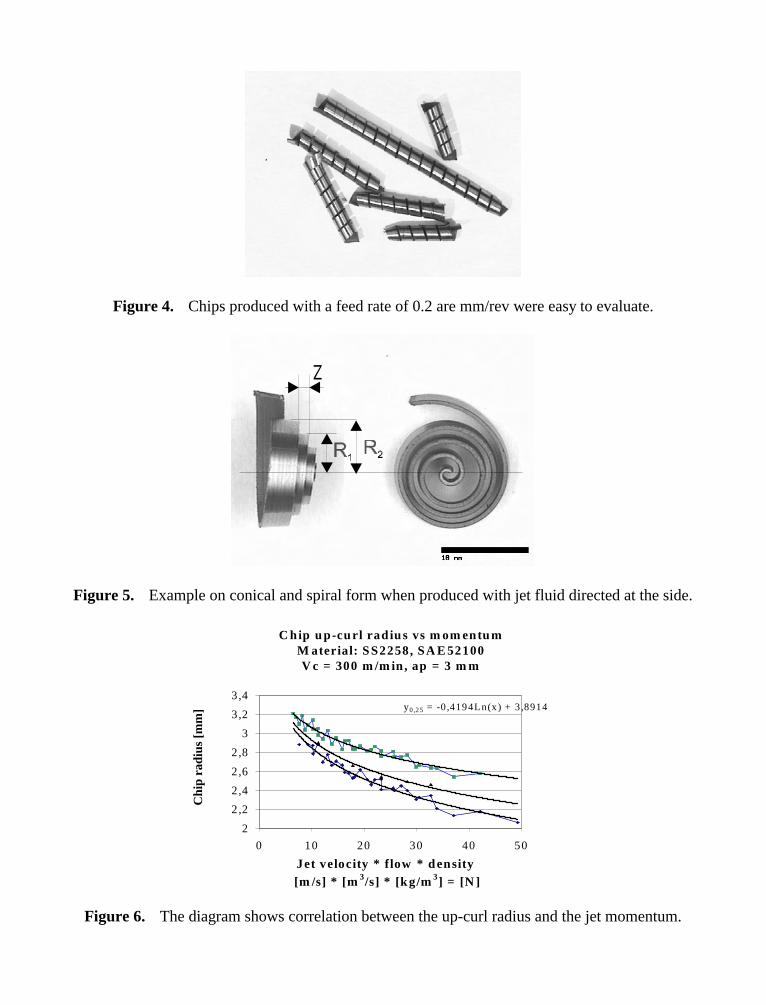
Figure 4. Chips produced with a feed rate of 0.2 are mm/rev were easy to evaluate.
Figure 5. Example on conical and spiral form when produced with jet fluid directed at the side.
C hip up-cu rl rad ius vs m om entumM aterial: SS2258, SA E 52100V c = 300 m /m in, ap = 3 m m
y0,25 = -0,4194Ln(x) + 3,8914
2
2,2
2,4
2,6
2,8
3
3,2
3,4
0 10 20 30 40 50
Jet velocity * f low * density [m /s] * [m 3/s] * [kg/m 3] = [N ]
Chi
p ra
dius
[mm
]
Figure 6. The diagram shows correlation between the up-curl radius and the jet momentum.
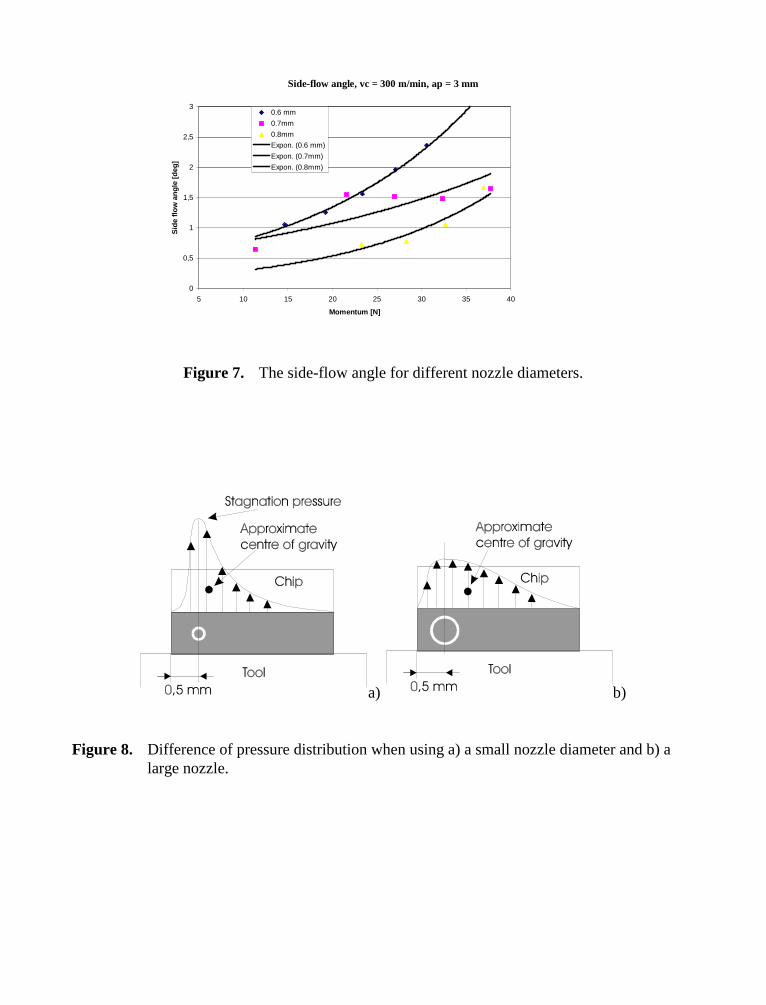
Side-flow angle, vc = 300 m/min, ap = 3 mm
0
0,5
1
1,5
2
2,5
3
5 10 15 20 25 30 35 40
Momentum [N]
Sid
e flo
w a
ngle
[deg
]
0.6 mm
0.7mm
0.8mm
Expon. (0.6 mm)
Expon. (0.7mm)
Expon. (0.8mm)
Figure 7. The side-flow angle for different nozzle diameters.
a) b)
Figure 8. Difference of pressure distribution when using a) a small nozzle diameter and b) alarge nozzle.
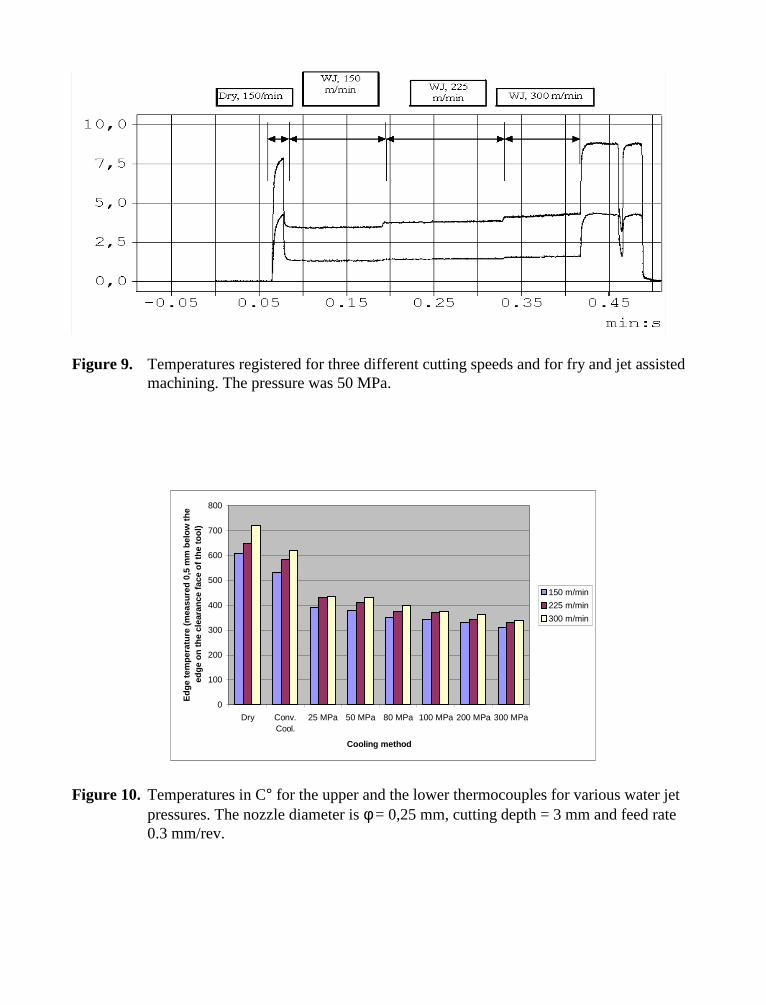
Figure 9. Temperatures registered for three different cutting speeds and for fry and jet assistedmachining. The pressure was 50 MPa.
0
100
200
300
400
500
600
700
800
Dry Conv.Cool.
25 MPa 50 MPa 80 MPa 100 MPa 200 MPa 300 MPa
Cooling method
Edg
e te
mpe
ratu
re (
mea
sure
d 0,
5 m
m b
elow
the
edge
on
the
clea
ranc
e fa
ce o
f the
tool
)
150 m/min
225 m/min
300 m/min
Figure 10. Temperatures in C° for the upper and the lower thermocouples for various water jetpressures. The nozzle diameter is φ = 0,25 mm, cutting depth = 3 mm and feed rate0.3 mm/rev.
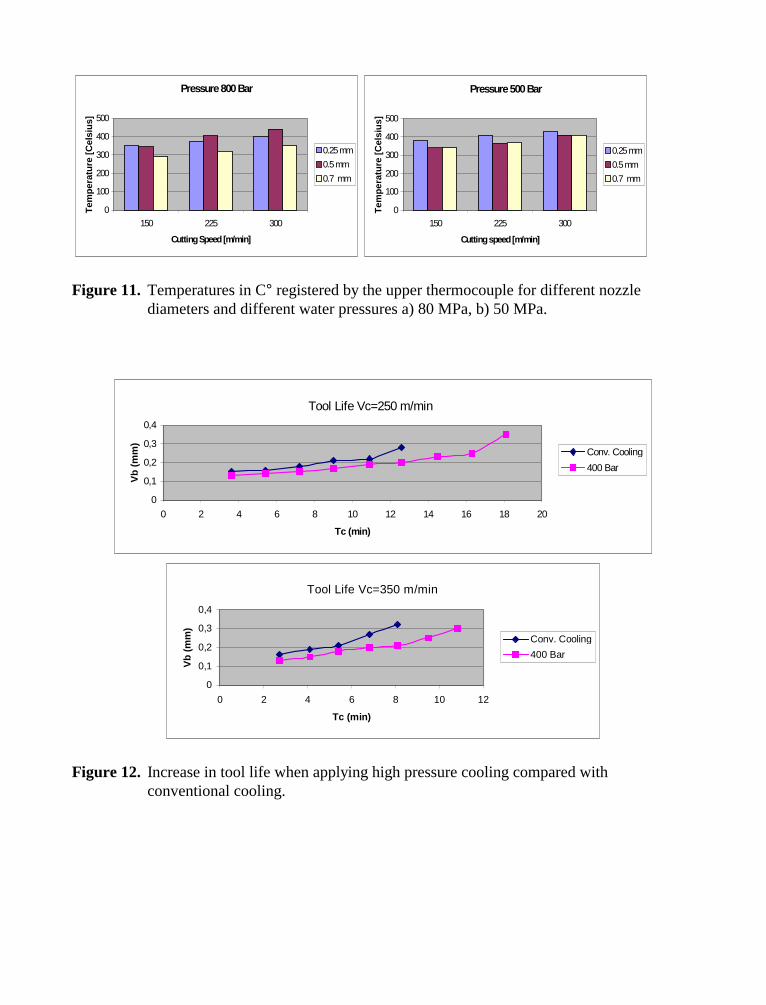
Pressure 800 Bar
0
100
200
300
400
500
150 225 300
Cutting Speed [m/min]
Tem
pera
ture
[Cel
sius
]
0.25 mm
0.5 mm
0.7 mm
Pressure 500 Bar
0
100
200
300
400
500
150 225 300
Cutting speed [m/min]
Tem
pera
ture
[Cel
sius
]
0.25 mm
0.5 mm
0.7 mm
Figure 11. Temperatures in C° registered by the upper thermocouple for different nozzlediameters and different water pressures a) 80 MPa, b) 50 MPa.
Tool Life Vc=250 m/min
0
0,1
0,2
0,3
0,4
0 2 4 6 8 10 12 14 16 18 20
Tc (min)
Vb
(mm
)
Conv. Cooling
400 Bar
Tool Life Vc=350 m/min
0
0,1
0,2
0,3
0,4
0 2 4 6 8 10 12
Tc (min)
Vb
(mm
)
Conv. Cooling
400 Bar
Figure 12. Increase in tool life when applying high pressure cooling compared withconventional cooling.
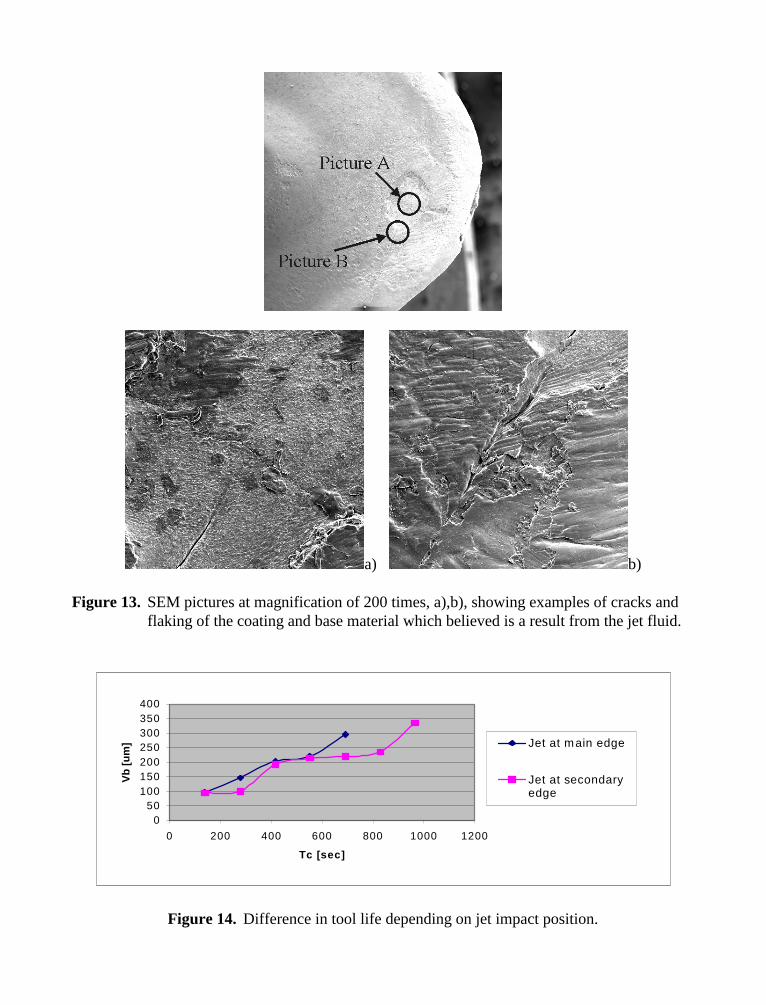
a) b)
Figure 13. SEM pictures at magnification of 200 times, a),b), showing examples of cracks andflaking of the coating and base material which believed is a result from the jet fluid.
050
100150200250300350400
0 200 400 600 800 1000 1200
Tc [sec]
Vb
[um
] Jet at main edge
Jet at secondaryedge
Figure 14. Difference in tool life depending on jet impact position.
10th American Waterjet ConferenceAugust 14-17, 1999: Houston, Texas
Paper 19
SIMULATION OF DISPLACEMENT FIELDS
ASSOCIATED WITH ABRASIVE WATERJET DRILLED HOLE
Z. (ho* and M. Ramuh* *
*Boston Scientific Corporation
Northwest Technology CenterRedmond WA
**Department of Mechanical EngineeringUniversity of Washington
Seattle WA
ABSTRACT
In this paper, the displacement fields associated with abrasive waterjet drilling process issimulated by finite element method. It was assumed that the pressure load in the abrasivewaterj et can be resolved into three pressure load components, such as impact jet pressure, shearand normal pressure. The effect of these three pressure loads and their magnitudes on the surfacedisplacement were investigated as a finction of the depth of hole. It was found that the shearcontributes the most in shaping the displacement contours patterns and the jet pressure does notplay a dominant role in determining the u-field displacement. A uniform shear along the kerfproves to render distribution contour that is closest to the experimental observations. Theassumed pressure components and their magnitude found from this study can be used fornumerical modeling of the AWJ drilling more accurately.
Key words:Moir6 interferometry, finite element analysis, numerical simulation
1 INTRODUCTION
High Pressure abrasive waterjet (AWJ) has been widely used in the industries for
machining hard-to-cut materials. As an alternative tool, it is also applied in the field of milling,
turning, drilling and polishing. In abrasive waterjet machining, high-velocity water is used to
entrain and accelerate abrasive particles, such as garnet or silica sand, to achieve the performance
needed for machining of metals, ceramics and composites. AWJ machining is cost effective and
produces reasonable quality surfaces. However, the abrasive waterjet machining mechanism has
not been entirely known to date.
Many investigators have attempted to study the interaction between the abrasive waterjet
and the workpiece with various techniques. Using a photoelasticity experimentation, Ramulu
investigated the material removal process during abrasive waterjet machining process (Ramulu,
1993 and Guo, 1998). It was concluded that the process is very complex and consists of
microcrack initiation, micromachining and erosion (Ramulu, 1993). Photoelasticity
experimental technique was used to measure the stresses in an AWJ drilled specimen and to
study the AWJ machining mechanisms (Ramulu and Wong, 1991). In an experimental work
conducted by the authors (Guo and Ramulu, 1991), moir6 interferometry technique was utilized
to measure the surface displacement during AWJ drilling process. Numerical modeling is a new
tool that people have utilized in studying the AWJ machining process. The process was modeled
with finite element method under certain assumed loading conditions in order to obtain the
associated stress and strain distributions in the machining zone. However, the jet impact load
distribution within the cavity created by the abrasive waterjet drilling is unknown to formulate
the material removal model.
The purpose of this paper is to seek the most reasonable loading conditions in the
abrasive waterjet impingement zone for finite element simulation, as well as to better understand
the relationship among the jet induced pressure loads and the material responses. The numerical
experiments were executed to study the effects of these loads on the displacement distribution as
a function of the depth of AWJ drilled hole. The feasibility of using finite element model is also
verified by comparing moir6 interferometry experimental results with the numerical results.
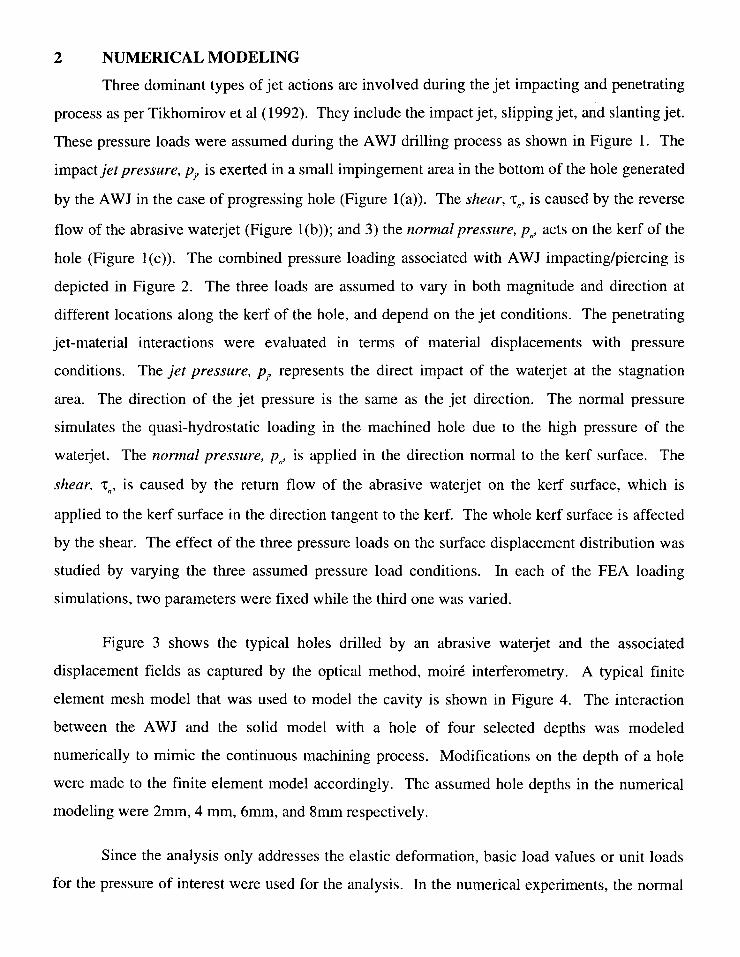
2 NUMERICAL MODELING
Three dominant types of jet actions are involved during the jet impacting and penetrating
process as per Tikhomirov et al (1992). They include the impact jet, slipping jet, and slanting jet.
These pressure loads were assumed during the AWJ drilling process as shown in Figure 1. The
impact jet pressure, p,, is exerted in a small impingement area in the bottom of the hole generated
by the AWJ in the case of progressing hole (Figure 1(a)). The shear, Tn, is caused by the reverse
flow of the abrasive waterjet (Figure 1(b)); and 3) the normal pressure, pn, acts on the kerf of the
hole (Figure 1(c)). The combined pressure loading associated with AWJ impacting/piercing is
depicted in Figure 2. The three loads are assumed to vary in both magnitude and direction at
different locations along the kerf of the hole, and depend on the jet conditions. The penetrating
jet-material interactions were evaluated in terms of material displacements with pressure
conditions. The jet pressure, pj, represents the direct impact of the waterjet at the stagnation
area. The direction of the jet pressure is the same as the jet direction. The normal pressure
simulates the quasi-hydrostatic loading in the machined hole due to the high pressure of the
waterjet. The normal pressure, pn, is applied in the direction normal to the kerf surface. The
shear, Tn, is caused by the return flow of the abrasive waterjet on the kerf surface, which is
applied to the kerf surface in the direction tangent to the kerf. The whole kerf surface is affected
by the shear. The effect of the three pressure loads on the surface displacement distribution was
studied by varying the three assumed pressure load conditions. In each of the FEA loading
simulations, two parameters were fixed while the third one was varied.
Figure 3 shows the typical holes drilled by an abrasive waterjet and the associated
displacement fields as captured by the optical method, moir6 interferometry. A typical finite
element mesh model that was used to model the cavity is shown in Figure 4. The interaction
between the AWJ and the solid model with a hole of four selected depths was modeled
numerically to mimic the continuous machining process. Modifications on the depth of a hole
were made to the finite element model accordingly. The assumed hole depths in the numerical
modeling were 2mm, 4 mm, 6mm, and 8mm respectively.
Since the analysis only addresses the elastic deformation, basic load values or unit loads
for the pressure of interest were used for the analysis. In the numerical experiments, the normal
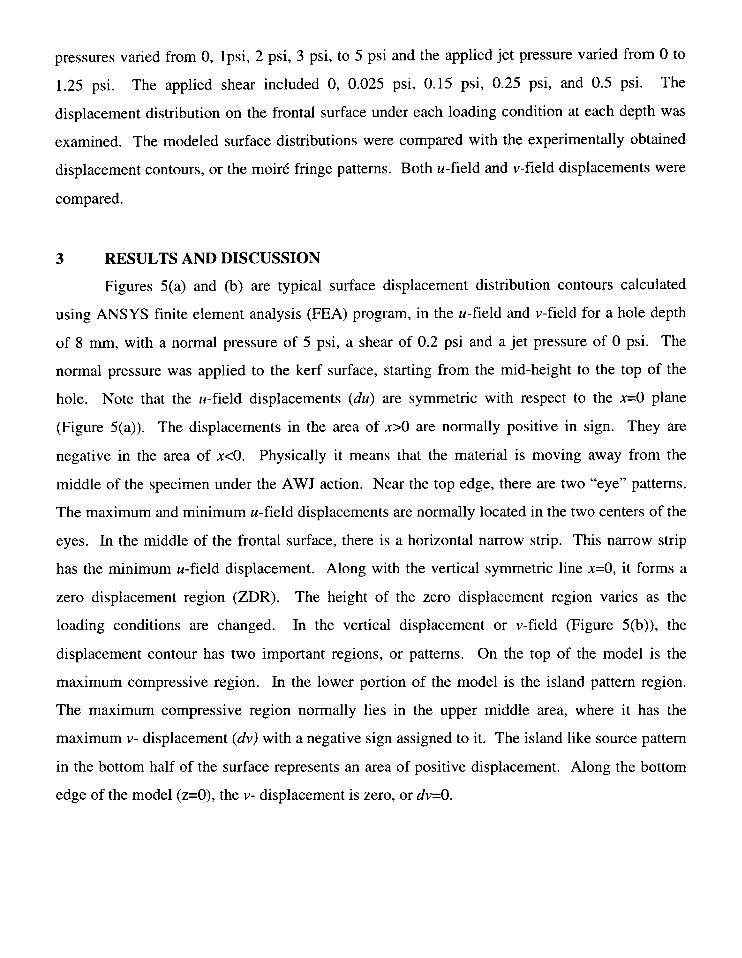
pressures varied from O, lpsi, 2 psi, 3 psi, to 5 psi and the applied jet pressure varied from O to
1.25 psi. The applied shear included O, 0.025 psi, 0.15 psi, 0.25 psi, and 0.5 psi. The
displacement distribution on the frontal surface under each loading condition at each depth was
examined. The modeled surface distributions were compared with the experimentally obtained
displacement contours, or the moir6 fringe patterns. Both u-field and v-field displacements were
compared.
3 RESULTS AND DISCUSSION
Figures 5(a) and (b) are typical surface displacement distribution contours calculated
using ANSYS finite element analysis (FEA) program, in the u-field and v-field for a hole depth
of 8 mm, with a normal pressure of 5 psi, a shear of 0.2 psi and a jet pressure of O psi. The
normal pressure was applied to the kerf surface, starting from the mid-height to the top of the
hole. Note that the u-field displacements (du) are symmetric with respect to the x=O plane
(Figure 5(a)). The displacements in the area of x>O are normally positive in sign. They are
negative in the area of x<O. Physically it means that the material is moving away from the
middle of the specimen under the AWJ action. Near the top edge, there are two “eye” patterns.
The maximum and minimum u-field displacements are normally located in the two centers of the
eyes. In the middle of the frontal surface, there is a horizontal narrow strip. This narrow strip
has the minimum u-field displacement. Along with the vertical symmetric line x=O, it forms a
zero displacement region (ZDR). The height of the zero displacement region varies as the
loading conditions are changed. In the vertical displacement or v-field (Figure 5(b)), the
displacement contour has two important regions, or patterns. On the top of the model is the
maximum compressive region. In the lower portion of the model is the island pattern region.
The maximum compressive region normally lies in the upper middle area, where it has the
maximum v- displacement (dv) with a negative sign assigned to it. The island like source pattern
in the bottom half of the surface represents an area of positive displacement. Along the bottom
edge of the model (z=O), the v- displacement is zero, or dv=O.
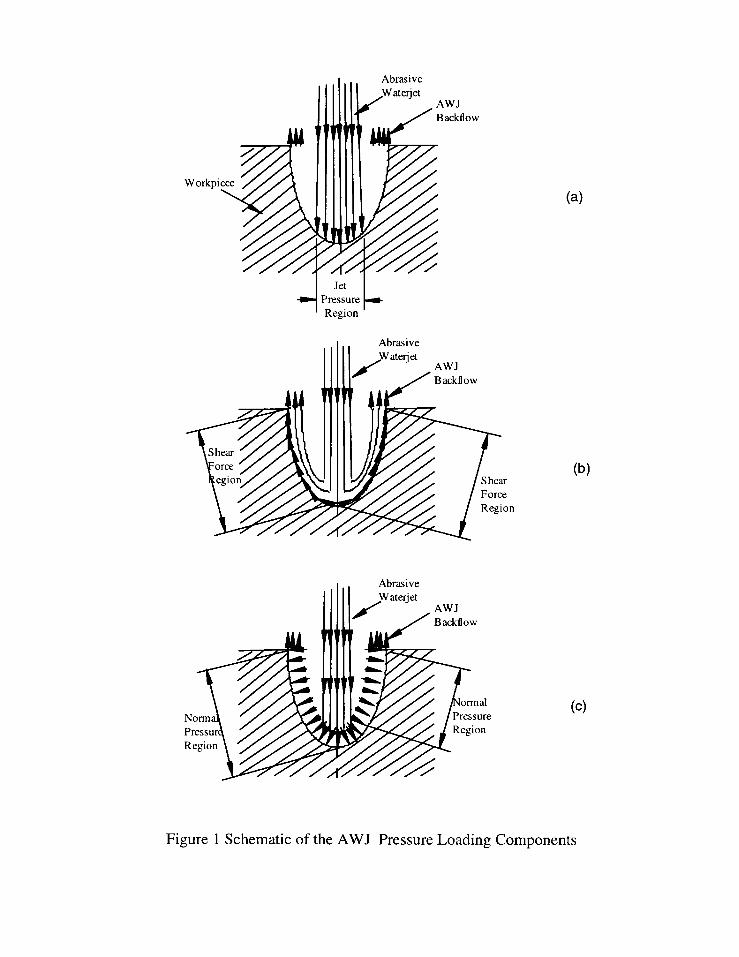
WJ
ackfl o w
W orkpi
n
(a)
(b)
(c)
Figure 1 Schematic of the AWJ Pressure Loading Components
/“Wotkpic.m
-i
la Pressurt _Rqion
Figure 2 Schematic of the combined AWJ Pressure Loading
Figure 3 Typical AWJ Drilled Hole and Moir6 Fringe Patterns
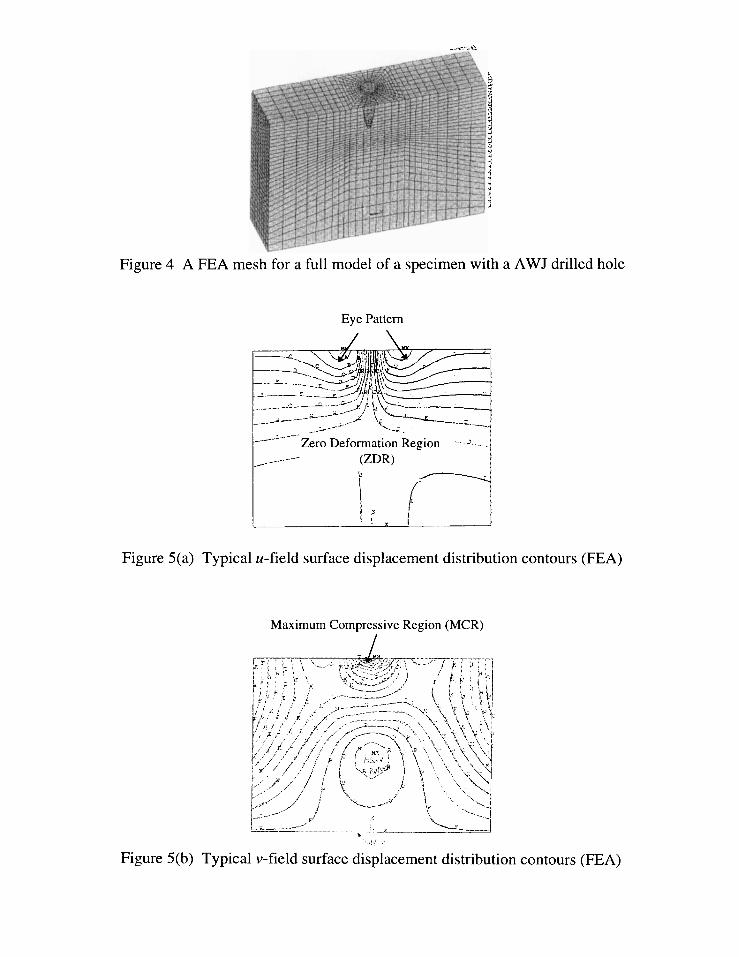
Figure 4 A FEA mesh for a full model of a specimen with a AWJ drilled hole
Eye Pattern
tZero Deformation Region
----../----”
.=
(ZDR) -
1 [- “~z/’-,, 1
Figure 5(a)
Figure 5(b)
Typical u-field surface displacement distribution contours (FEA)
Maximum Compressive Region (MCR)
/
Typical v-field surface displacement distribution contours (FEA)
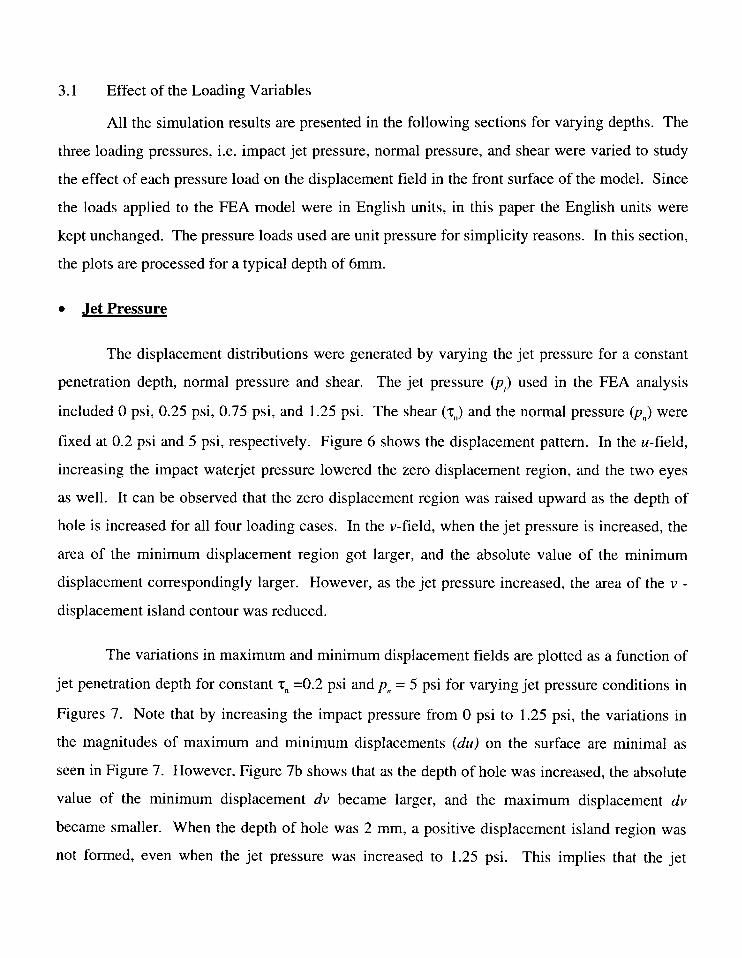
3.1 Effect of the Loading Variables
All the simulation results are presented in the following sections for varying depths. The
three loading pressures, i.e. impact jet pressure, normal pressure, and shear were varied to study
the effect of each pressure load on the displacement field in the front surface of the model. Since
the loads applied to the FEA model were in English units, in this paper the English units were
kept unchanged. The pressure loads used are unit pressure for simplicity reasons. In this section,
the plots are processed for a typical depth of 6mm.
Jet Pressure
The displacement distributions were generated by varying the jet pressure for a constant
penetration depth, normal pressure and shear. The jet pressure (pj) used in the FEA analysis
included O psi, 0.25 psi, 0.75 psi, and 1.25 psi. The shear (~n) and the normal pressure @n) were
fixed at 0.2 psi and 5 psi, respectively. Figure 6 shows the displacement pattern. In the u-field,
increasing the impact waterjet pressure lowered the zero displacement region, and the two eyes
as well. It can be observed that the zero displacement region was raised upward as the depth of
hole is increased for all four loading cases. In the v-field, when the jet pressure is increased, the
area of the minimum displacement region got larger, and the absolute value of the minimum
displacement correspondingly larger. However, as the jet pressure increased, the area of the v -
displacement island contour was reduced.
The variations in maximum and minimum displacement fields are plotted as a function of
jet penetration depth for constant ~n=0.2 psi and pn = 5 psi for varying jet pressure conditions in
Figures 7. Note that by increasing the impact pressure from O psi to 1.25 psi, the variations in
the magnitudes of maximum and minimum displacements (du) on the surface are minimal as
seen in Figure 7. However, Figure 7b shows that as the depth of hole was increased, the absolute
value of the minimum displacement dv became larger, and the maximum displacement dv
became smaller. When the depth of hole was 2 mm, a positive displacement island region was
not formed, even when the jet pressure was increased to 1.25 psi. This implies that the jet
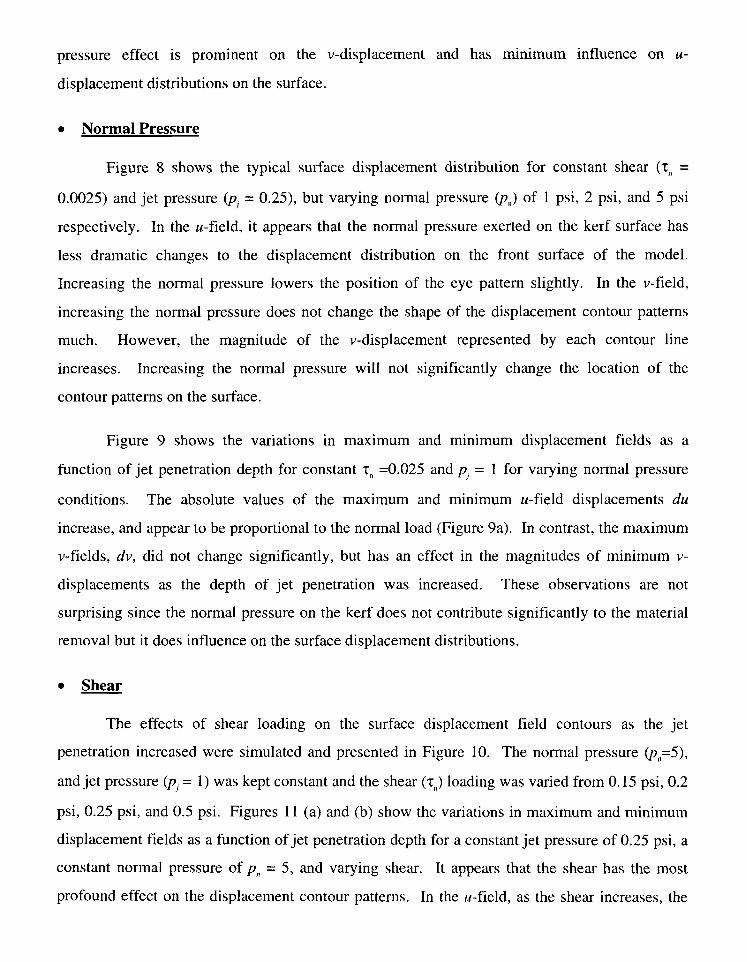
pressure effect is prominent on the v-displacement and has minimum influence on u-
displacement distributions on the surface.
. Normal Pressure
Figure 8 shows the typical surface displacement distribution for constant shear (zn =
0.0025) and jet pressure (pj = 0.25), but varying normal pressure (pm)of 1 psi, 2 psi, and 5 psi
respectively. In the u-field, it appears that the normal pressure exerted on the kerf surface has
less dramatic changes to the displacement distribution on the front surface of the model.
Increasing the normal pressure lowers the position of the eye pattern slightly. In the v-field,
increasing the normal pressure does not change the shape of the displacement contour patterns
much. However, the magnitude of the v-displacement represented by each contour line
increases. Increasing the normal pressure will not significantly change the location of the
contour patterns on the surface.
Figure 9 shows the variations in maximum and minimum displacement fields as a
function of jet penetration depth for constant ~n =0.025 and p, = 1 for varying normal pressure
conditions. The absolute values of the maximum and minimum u-field displacements du
increase, and appear to be proportional to the normal load (Figure 9a). In contrast, the maximum
v-fields, dv, did not change significantly, but has an effect in the magnitudes of minimum v-
displacements as the depth of jet penetration was increased. These observations are not
surprising since the normal pressure on the kerf does not contribute significantly to the material
removal but it does influence on the surface displacement distributions.
. Shear
The effects of shear loading on the surface displacement field contours as the jet
penetration increased were simulated and presented in Figure 10. The normal pressure (pn=5),
and jet pressure (pj = 1) was kept constant and the shear (~n)loading was varied from 0.15 psi, 0.2
psi, 0.25 psi, and 0.5 psi. Figures 11 (a) and (b) show the variations in maximum and minimum
displacement fields as a function of jet penetration depth for a constant jet pressure of 0.25 psi, a
constant normal pressure of p“ = 5, and varying shear. It appears that the shear has the most
profound effect on the displacement contour patterns. In the u-field, as the shear increases, the
zero displacement zone is raised upward, and the “eye” pattern is reduced in size. The absolute
value of the maximum and minimum displacement also increases. When all three loads were
kept the same and depth of hole was varied, the zero displacement region also moved upward.
At shear of 0.5 psi, the “eyes” almost disappear.
The compressive displacement contours dominate the full field of the front surface.
When shear remains at 0.2 psi, the compressive area becomes smaller and smaller as the depth of
hole increases. An island of positive v-displacement is formed. The position of this positive
island is lowered as the depth of hole increase. In the v-field, the area of the negative
displacement region is reduced if the shear is increased. Eventually the negative displacement
region will disappear when the shear load is increased to a certain level. The island contour
pattern, representing the positive displacement region, is formed and raised. The deeper the hole,
the higher the zero displacement region in the u-field, and vise versa. The depth of hole does not
have a significant effect on the displacement distribution in the v-field with the shear at 0.025 psi,
normal pressure at 5 psi, and jet pressure at 1 psi.
3.2 Loading Non-uniformity along the Depth of Hole
In the above parametric numerical analysis, the impact jet pressure, normal pressure, and
shear were applied to the kerf surface with the same magnitude. In this section, the effect of the
non-uniformity of these loading variables was investigated. Figure 12 is an illustration of the
loading non-uniformity applied in finite element analysis. The normal pressure is divided into
two sections along the kerf surface. The magnitudes of the normal pressure in the upper portion
and the lower portion are different. Similarly, the magnitudes of the shear in the upper portion
and the lower portion are also different, as illustrated in Figure 12 by the length of the arrows. In
all the cases studied, the jet pressure was kept constant at 0.25 psi. Figure 13 is the typical
parametric FEA results, and their corresponding loads are printed in the bottom of each graph..
It appears that greater normal pressure in the lower portion of the kerf than in the upper portion
reduces the size of island pattern in the v-displacement field. Increasing the shear in the top
portion of the kerf moves the island pattern upward. The results of this parametric study
demonstrate that a uniform shear along the kerf surface of the hole produces the best
displacement distribution contours matching the experimental moir6 fringe pattern.
4 DISCUSSIONS
For numerical modeling, the displacement distribution contours in both u- and v- fields
under various assumed loading conditions were shown in Figures 6, 8 and 10. In the above
parametric numerical analysis, the displacement contour patterns changed as the loading
conditions were changed. The maximum and minimum displacements under each loading
condition are analyzed to help better understand the loading effect. The maximum and minimum
displacements as a function of hole depth are depicted in Figures 7, 9 and 11 for different, jet
pressures, normal pressure and shear respectively. As can be seen from Figures 7a, 9a and 11a,
the maximum and minimum displacements are symmetric with respect to the vertical axial.
Their corresponding u-displacements are equal in value and opposite in signs. This means that
all u-displacement contours are symmetric with respect to the x=O plane.
Figures 7b, 9b and 1lb show the v-field displacements and these curves demonstrate that
the v-displacement is not linearly related to the magnitude of the shear applied to the kerf surface.
At jet pressure of 0.25 psi and normal pressure of 5 psi, if the shear is very small (for example, at
0.025 psi), the maximum v-field displacement is almost zero, while the minimum displacement
possesses the largest absolute value. When the shear forces are larger, (for example, 0.5 psi), the
maximum value is the largest, and the minimum value is the smallest among all cases studied.
For shear of 0.2 psi, normal pressure of 5 psi, the differences in u-field displacements for the
impact jet pressure from O psi to 1.25 psi are very small. This means that the jet pressure does
not significantly affect the u-field displacements.
Figure 3 is a typical moir~ fringe pattern recorded during an abrasive waterjet drilling
process using moir~ interferometry experimentation. The moir6 fringes illustrated the
displacement distribution in the frontal surface of a specimen during AWJ drilling. A
comparison of the experimental displacement distributions with the numerically modeled
displacement distributions indicated that the results in Figures 3 and 6 are very similar to those
recorded from the experiments. Especially when the normal pressure is at 5 psi, the jet impact
pressure at 0.25 psi and the shear at 0.2, the displacement contours from the FEA are the closest
to the experimentally recorded. In Figure 6 the shear was 0.025 psi and is a relatively small
value. The displacement contours do not like realistic even wen the normal pressure was varied
at 1 psi to 5 psi. Then three pressure loads were applied to the kerf surfaces, the displacement
distributions shown in Figure 13 looks very odd. This is an indication that the pressures exerted
on the kerf surfaces by AWJ is somewhat uniform. From the analyses for the maximum and
minimum displacement as a function of the hole depth, it is obvious that the surface
displacements are symmetric with respect to the jet if the specimen is also symmetric to the jet.
5. SUMMARY AND CONCLUSIONS
It is concluded that finite element analysis can be used to simulated the AWJ drilling.
The assumption of three pressure loads, such as normal pressure, jet pressure, and shear, are
reasonable. The three loading parameters are very important in determining the displacement
distributions of a specimen under AWJ drilling. It was found that the shear contributes the most
in shaping the displacement contours patterns and the jet pressure does not play a dominant role
in determining the u-field displacement. A uniform shear along the kerf proves to render
distribution contours that are closest to the experimental observations.
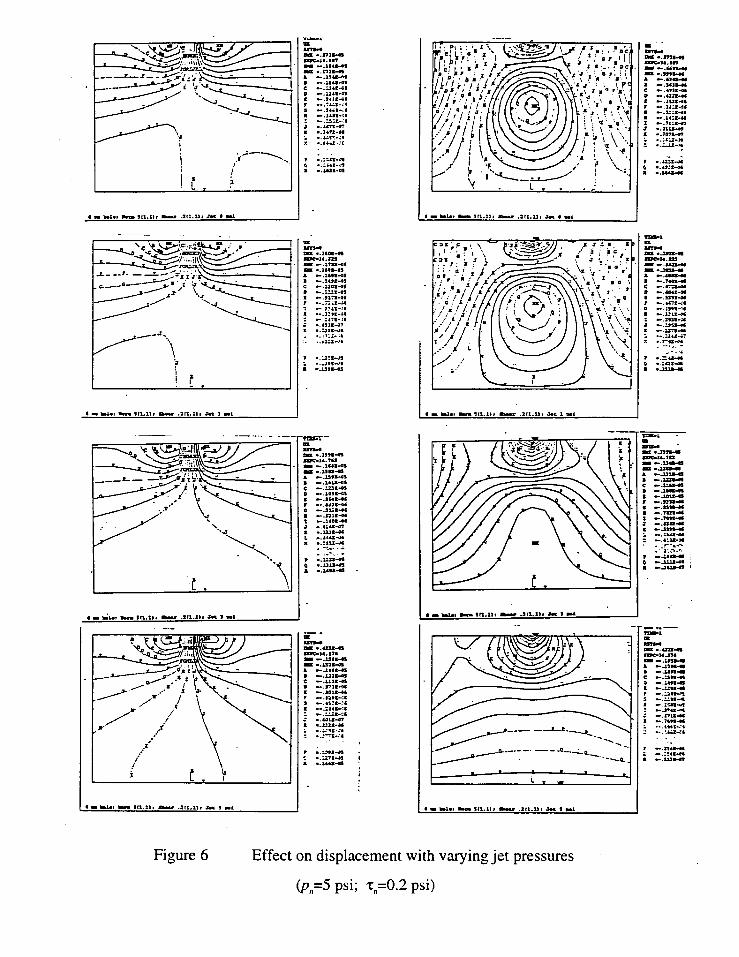
. .
I-La———_
——
—.
..s’”.../.4
I - -, - ,,1.,,, - .2,,.,, , J.t , m,
Figure (j
, ;.::A3c .. :,41--a ..2”, -03
7 ..2,X-JY: .. J,*-.,,1 .. MSI-OS
I
I m W., * 111.1,, - .111.;s, .7.. x “1
—.—
I J
.. ., ...GX44
j .. L,X-9C1 ..—
Effect on displacement with varying jet pressures
@n=5 psi; ~n=0.2 psi)
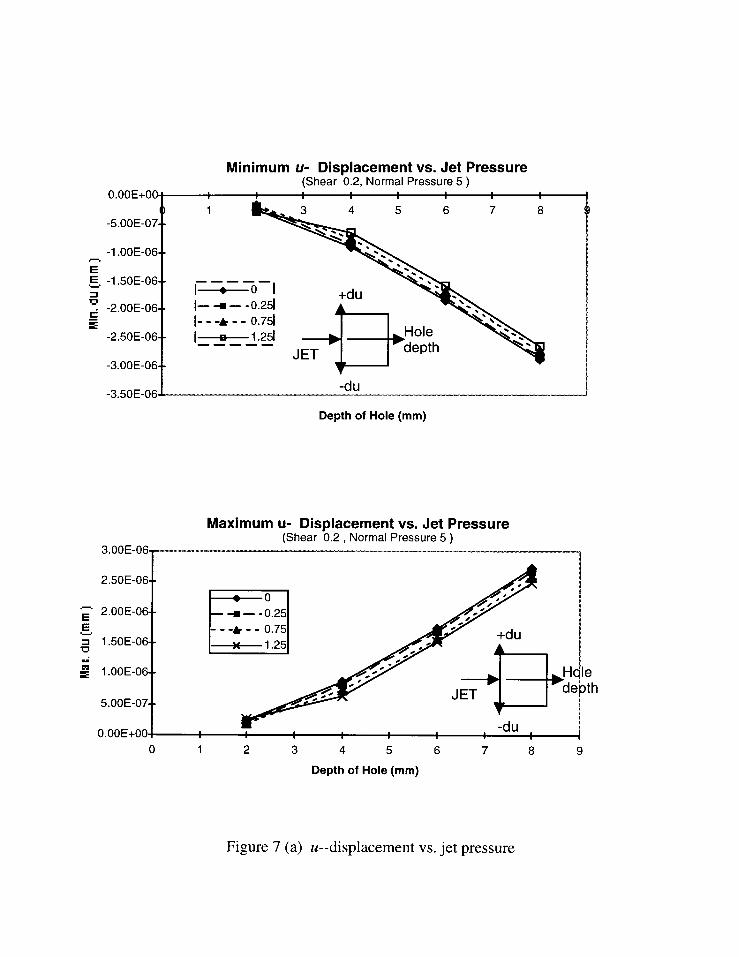
Minimum u- Displacement vs. Jet Pressure(Shear 0.2, Normal Pressure 5 )
-5.00E-07I
-1 .00E-06
: -1 .50E-f)fj 1
: -2.00E-06==
-2.50E-06
-3.00E-061
1 8
——— ——1~ L. ‘\
-.
h-.
‘.— — — — — w aepm.
JET
Depth of Hole (mm)
Maximum u- Displacement vs. Jet Pressure(Shear 0.2, Normal Pressure 5 )
3.00 E-06>
2.50E-06- -
: n
~o~ 2,00E-06 —-9-- 0.25g k--- --0.75= 1.50E-06v ~ 1.25m~ 1.00E-06- -
5.00E-07- -
0.00E+OO ,
0 1 2 3 4 5 6 7 8 9
Depth of Hole (mm)
Figure 7 (a) u--displacement vs. jet pressure
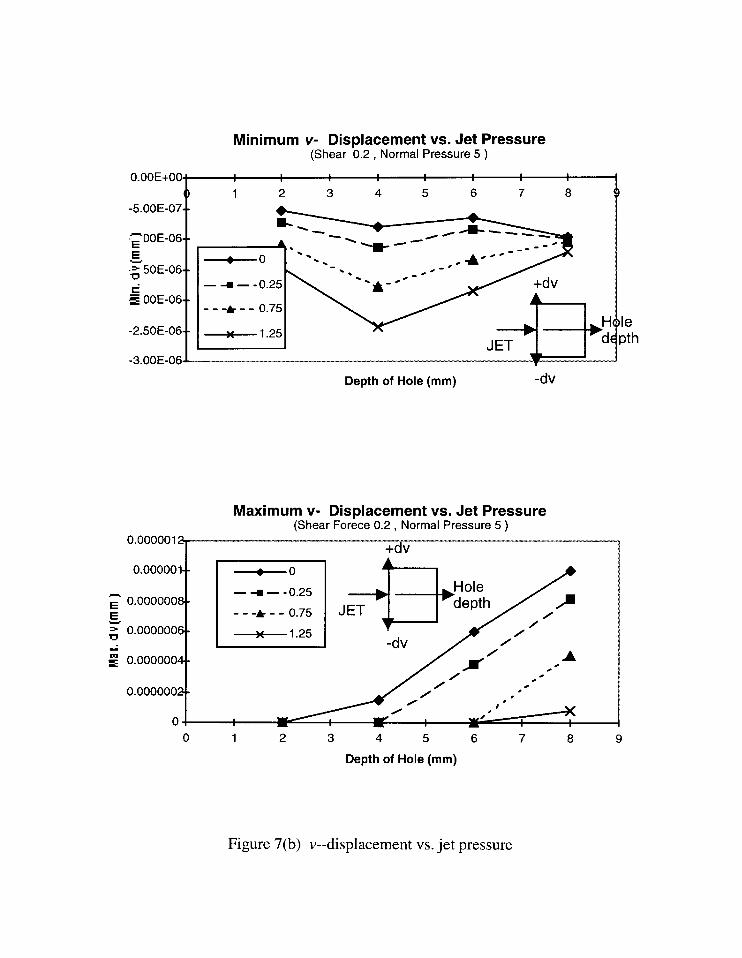
Minimum v- Displacement vs. Jet Pressure(Shear 0.2, Normal Pressure 5 )
0.00E+OO
() 1 2 3 4 5 6 7 8 “-5.00E-07- -
k.;ooE-06- -
=- ----4
-%‘F-”
.~ ‘.<
~o.$ 50E-06- -
—-9-- 0.25E ooE-06- -
-- -k --0.75H Ie
-2.50E-06- - ~1.25JET
‘d pth
-3.00 E-06- W
Depth of Hole (mm) -dv
Maximum v- Displacement vs. Jet Pressure(Shear Forece 0.2, Normal Pressure 5 )
0.000001+dv
0.000001t
~ 0.000000
g
; 0.000000
ug 0.000000
i0.000000
?
~o
—-m -- 0.25
-- -k --0.75
~1.25+BHole
JET depth
-dv
o0 1 2 3 4 5 6 7 8 9
Depth of Hole (mm)
Figure 7(b) v--displacement vs. jet pressure
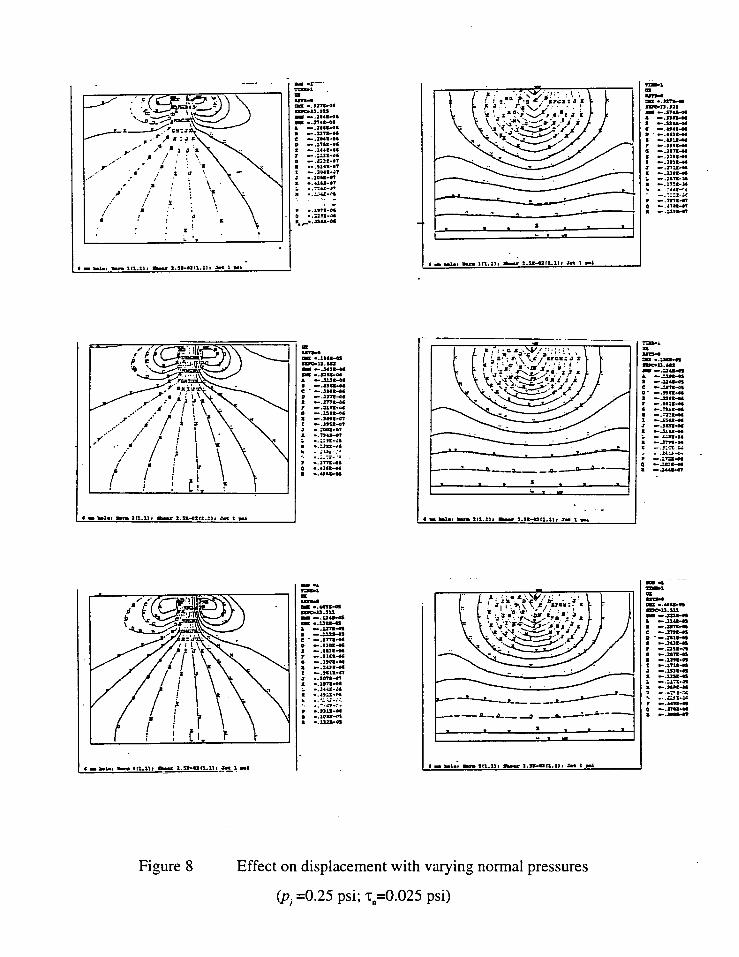
.—.
. .. -, . .,,’?*.,.0 . .:1=-*
( / =---
* - -1., M ltl. xl# - 2.1 E4111 .:1, * 1 “1
Figure 8
11-” ”~- ””;
t-- ~—--.— .L—---J-- +
.y -—--——L___----’1--- “-s ---—&_&_ - _-&— --l
Effect on displacement with varying normal pressures
(p, =0.25 psi; ~n=0.025 psi)
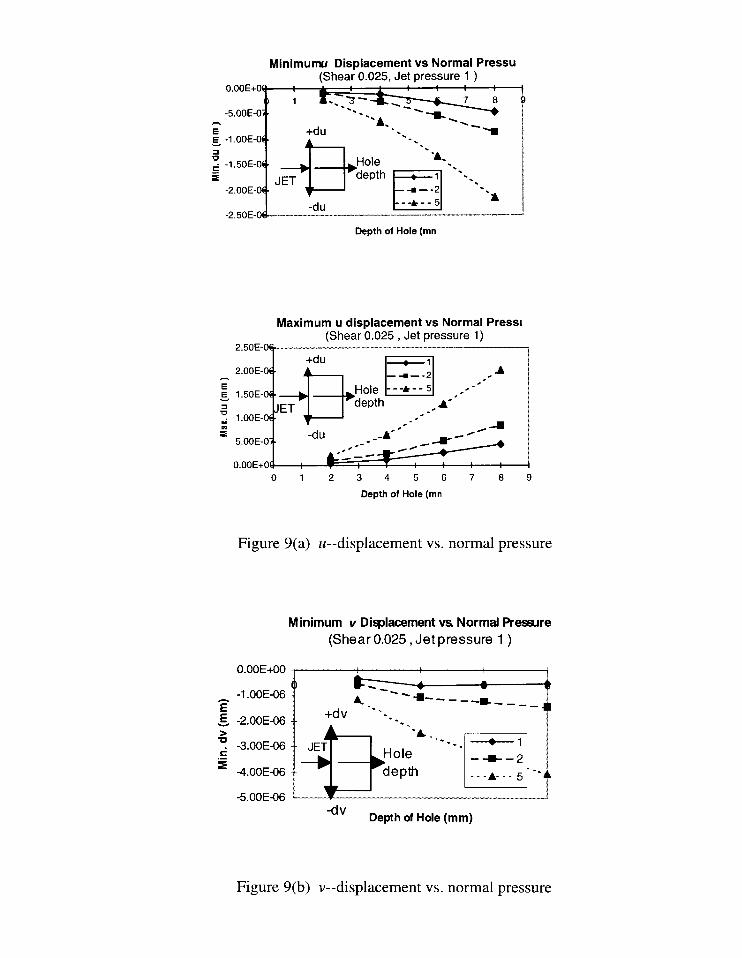
Minimunw Displacement vs Normal Pressu(Shear 0.025, Jet pressure 1 )
0.00E+OQ) 1
-5.00E-Oi -
+du ‘.:-1 .00E-O
: :+
-.‘.
3 -.
: -1,50E-O Hole A.‘.
E JETdepth
1 ----
-2.00E-O —4—- 2 -.---k --5 i
-du
Depth of Hole (mn
Maximum u displacement vs Normal Press~(Shear 0.025, Jet pressure 1)
2.50E-OEi+du
2.00E-O
~ 1.50E-O3: 1.00E-O
s
0123456 789
Depth of Hole (mn
Figure 9(a) u--displacement vs. normal pressure
Minimum v Displacement vs Normal pressure
(Shear O.025, Jet pressure 1 )
0.00E+OO
-1.00E-06-z-& -2.ooEQ6
: -3.00E416.-
= 4.00E46
-5.00E-06
() & A
-. .
k-. ----=––---m____+dv . .‘.
41-’-A ---
JET
n~
--- ~1Hole -+–2
‘ ‘1 fde’~ --- A---5 --~
-dvDepth of Hofe (mm)
Figure 9(b) v--displacement vs. normal pressure
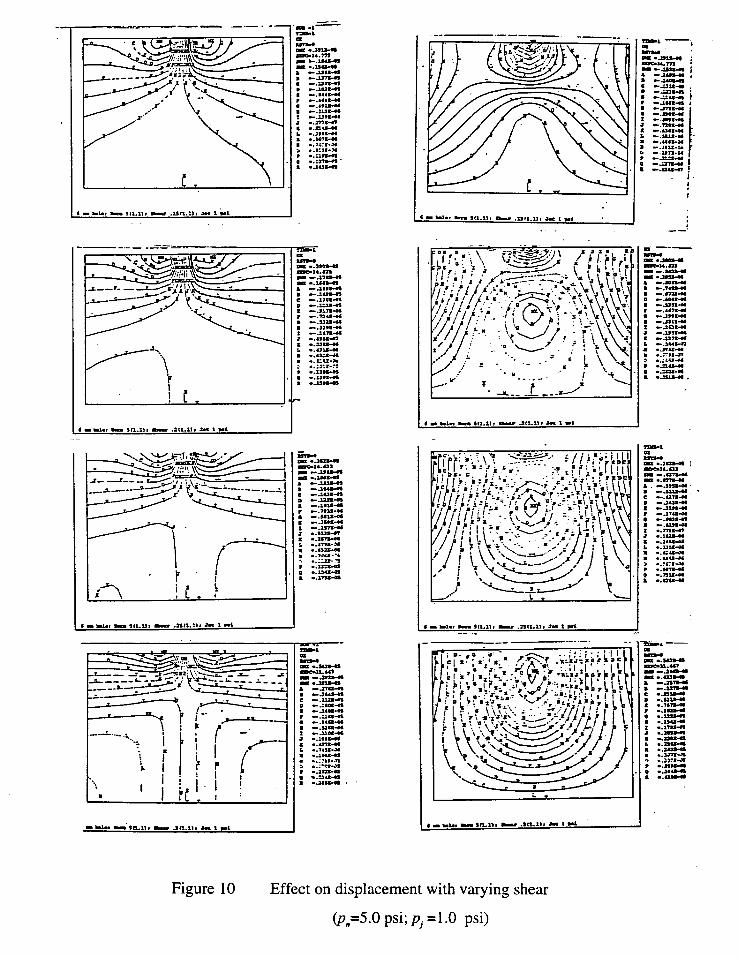
.-
1 -bu, - S,I.,,, - .ISm.n, * i A
1 - u., - sm.;), - .21X.11, * 1 “i J
-r-
- —------- ._ -_-:
~“I r—
i-n ‘;”! .:L!
I - M.. 9M sm.:>r - .xsta.nr J- : d I. -—
Figure 10 Effect on displacement with varying shear
(pn=5.0 psi; pj =1.0 psi)
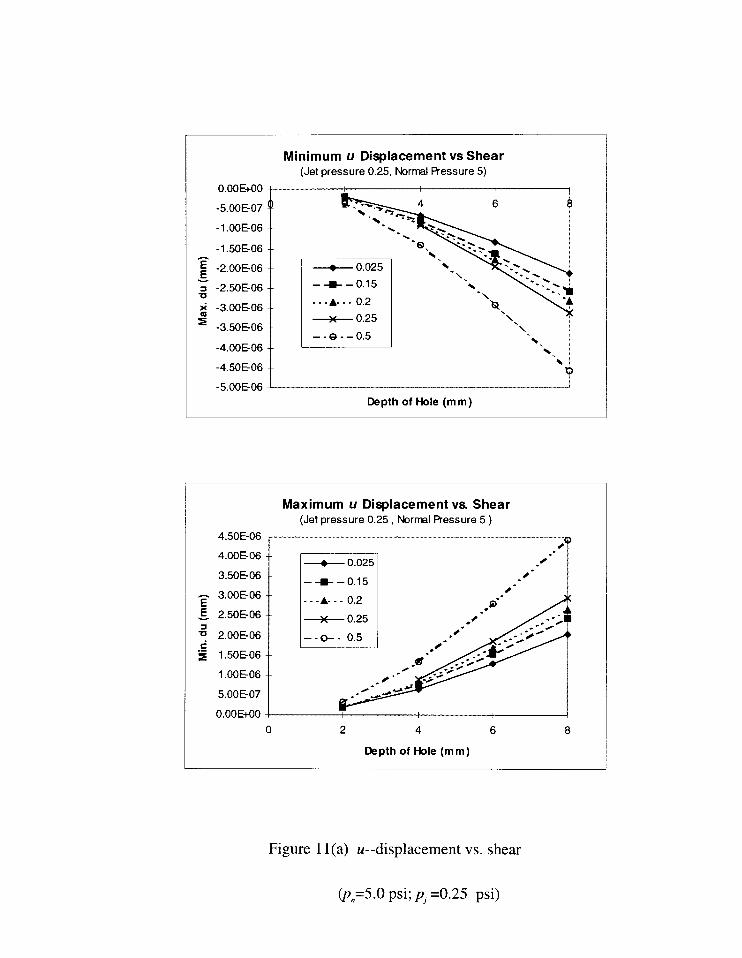
0.00E+OO
-5.001307
-1 .00E06
-1 .501S06
F -2.00!S06.E_
a -2.50E-06u# -3.00E-06
= -3.50E-06
-4.00S06
-4.50E-06
Minimum u Displacement vs Shear(Jet pressure 0.25, Normal Pressure 5)
+
~ 0.025
–+–0.15
--- A---2.2
~ 0.25
-. @--0.5
-5.00E-06
Depth of Hole (mm) I
4.50E06
4.00E06
3.50E-06
~ 3.00E-06
& 2.50S06
; 2.00E-06
.= 1.50E-06
1.00E-06
5.00E07
0.00E+OO
Maximum u Displacement vs Shear(Jet pressure 0.25, Normel Pressure 5 )
0 2 4 6 8
Depth of Hole (mm)
Figure 11(a) u--displacement vs. shear
(pn=5.0 psi; p, =0.25 psi)
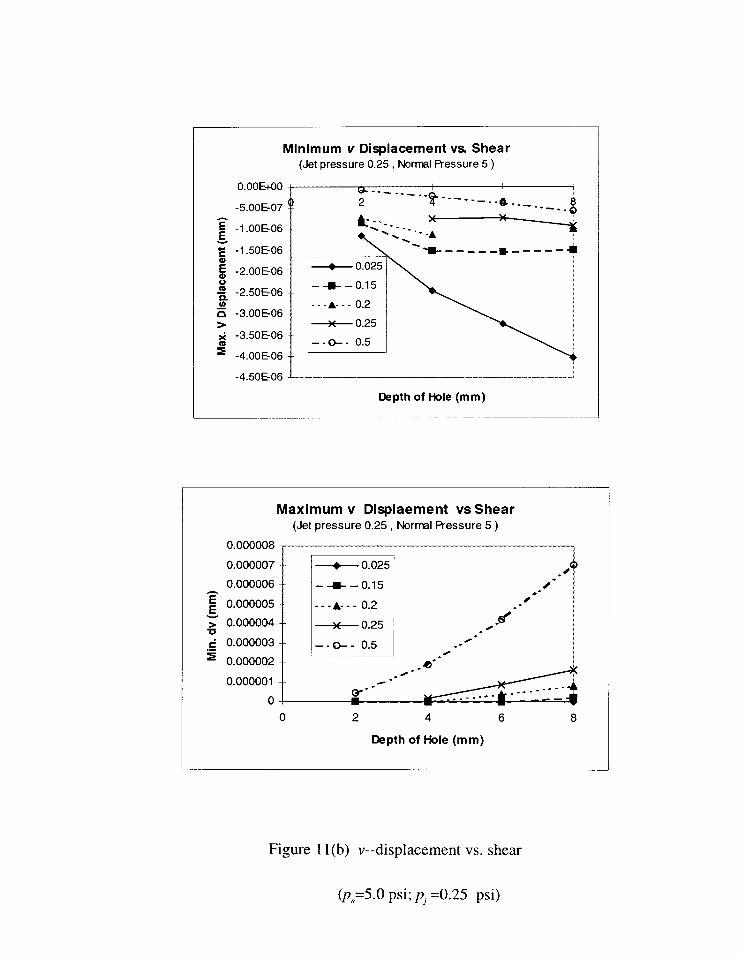
Minimum v Displacement vs Shear
0.00E+OO
-5.00E-07
>“ -3.50S06
:
= -4.00E06
(Jet pressure 0.25, Nwmsl F7essure 5 )
2
~.._.. *..*.. --. _..i ------ [
-e
~ 0.025
–+–0.15
---A--- 0.2
~ 0.25
–-*- 0.5
-4.50E-06
Depth of Hole (mm)
0.000008
0.000007
0.000006
~ 0.000005
: 0.000004
& 0.000003
.= 0.000002
0.000001
0
Maximum v Displacement vs Shear(Jet pressure 0.25, F&wrral Fressure 5 )
~ 0.025
-+-0.15
--- --- 0.2A
~ 0.25
–-*- 0.5
-- e----
w--.0 2 4 6 8
Depth of Hole (mm)
Figure 11(b) v--displacement vs. shear
(pn=5.0 psi; pj =0.25 psi)
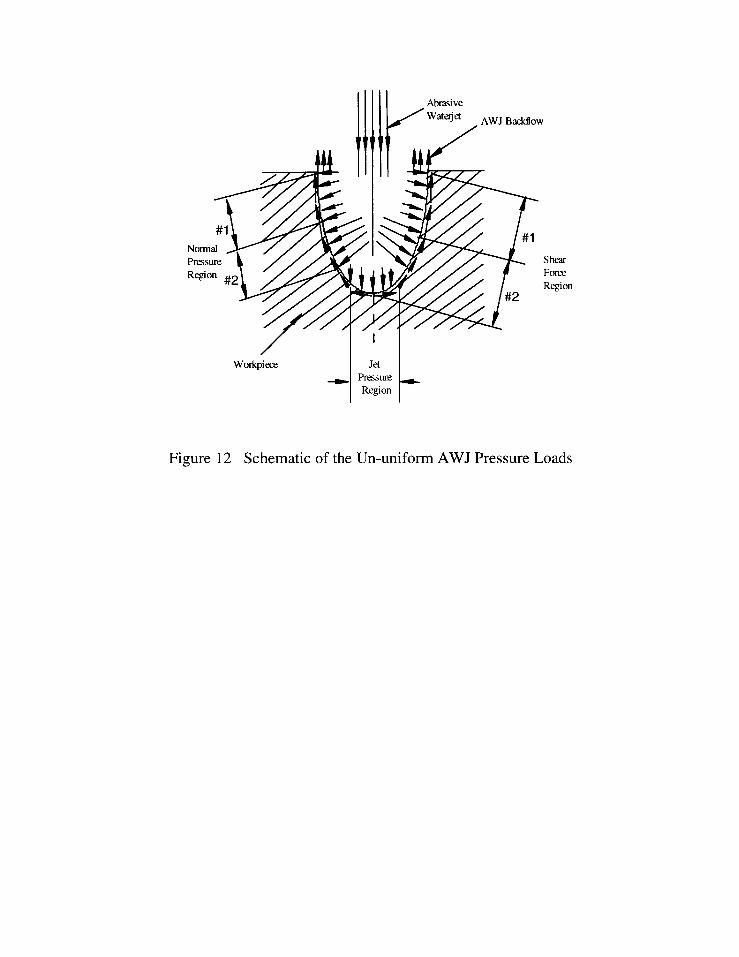
. .U. -. .-
/ Wataj.AWJ Bddow
Workpiece lJeil
7#1
Z7 ShearForm
Region
/. #2
-1
Figure 12 Schematic of the Un-uniform AWJ Pressure Loads
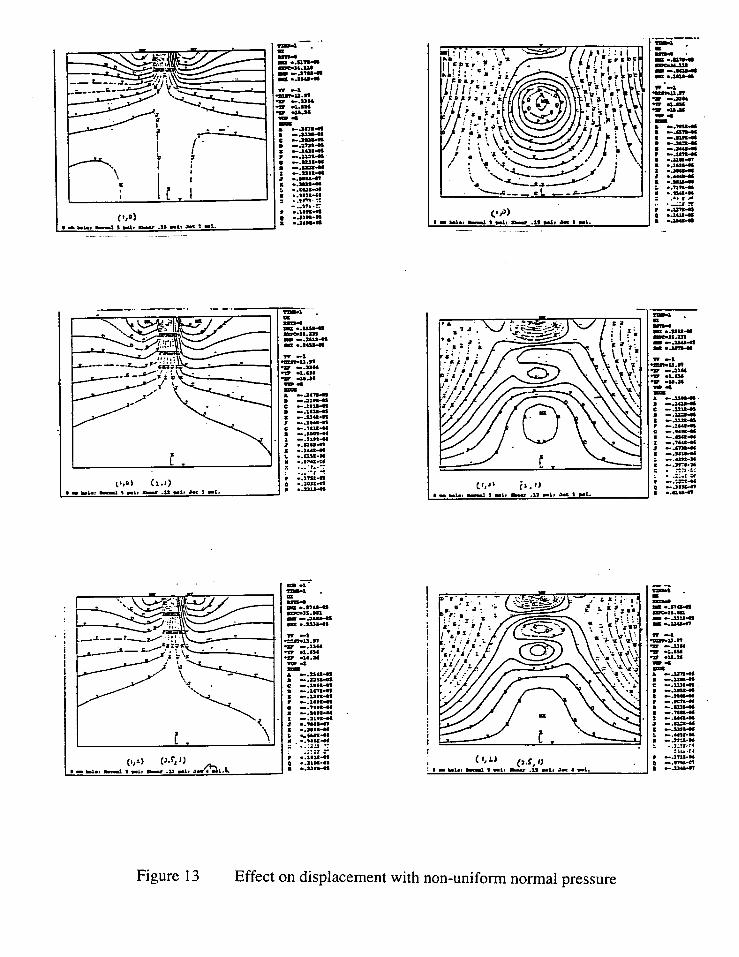
B-a !ii-(,,8) 1
. ....., ..zim
8 - -1.# -1 s w, - .11 “i, .lat% -1.a -.x-”
V’”’v.k!i!ill,,D)(1.1)
i --- ‘..:m.ai: :San*-mI=x -1-18- .Za”l, arl m-l.
-.E
= . .ssss4-JLZIS. ----R ..—
w .4-U.*w ..Su-a .X-CM- -I&x
W- .
A -.s-n -.aus--C -.lxa-n -----E -S.n-nr -.:-1-30 -.---a, -.1s--06x - .*UE4* .-.mt41 - .Sus-M% -.41W-3C, -.. arc-x: . :: :7.2:: . .:..1 x* .- .-= C-M0 -.am%-S .. LaU-n
Figure 13 Effect on displacement with non-uniform normal pressure
REFERENCES
Guo, Z., “Experimental and Numerical Analysis of Abrasive Waterjet Drilling of Brittle
Materials,” Ph. D Dissertation, UniversiQ of Washington, 1998.
Guo, Z., and Ramulu, M., “Surface Displacement Measurement with Moir6 InterferometryTechnique,” S’hAmerican Waterjet Confe, Aug., 1996; Houston, TX
Ramulu, M., and Wong, K., P., “Preliminary Investigations of Abrasive Waterjet Piercing 1987Process by Dynamic Photoelasticity,” International Journal of Water Jet Technology, vol.1, no. 2, Sept. 1991, pp. 53-63.
Ramulu, M., “Dynamic Photoelastic Investigation on the Mechanics of Waterjet and AbrasiveWaterjet Machining,” Optics and Lasers in Engineering, 1993, pp. 43-65
Tikhomirov, et al., “High-pressure Jetting,” ASME Press Translations, 1992.
10th American Waterjet ConferenceAugust 14-17, 1999: Houston, Texas
Paper 20
FINITE ELEMENT MODELING OF COOLANT FLOW AT
THE CUTTING ZONE IN HIGH PRESSURE
WATER JET ASSISTED MILLING
Ram S. Mohan, Ph.D.The University of Tulsa
Tulsa, OK
Radovan Kovacevic, Ph.D.Southern Methodist University
Dallas, TX
V. Chiratanagandia, M.S.Case CorporationEast Moline, IL
ABSTRACT
In metal machining, material removal in the form of chips takes place due to shearing action caused bythe relative motion between the tool and the workpiece. The resulting friction and plastic deformation atthe cutting zone lead to higher energy consumption and heat generation. This causes an increase in thefrictional forces, workburn, tool wear, chip burn and poor surface quality. These detrimental effects canbe reduced if the thermal/frictional conditions at the cutting zone are controlled. Cutting fluids have beentraditionally used as an external means for heat removal and lubrication.
A coolant/lubricant system is developed here for face milling operations based on high pressure waterjet(up to 380 MPa) in order to improve the process performance. The coolant is injected through the rakeface of the tool so that it can reduce the secondary shear, lower the interface temperatures and thetemperature of the insert itself. The design consists of a high-pressure intensifier pump, a rotary swivel,main flow channel, radially extending feed channels, sapphire orifice and an insert with EDM driller hole.In this investigation, the fluid flow in the cutting zone is numerically simulated in order to visualize theeffect of jet orientation, location of the EDM drilled hole, and change in volume flow rate for optimumperformance of the coolant/lubricant system. Properly oriented jet not only dissipate the heat generatedand provide good lubrication at the cutting zone but also create fluid pressure at the tool-chip interfaceimproving the wettability. The high-pressure water jet was simulated at micro-level to better understandthe pressure distribution and quantitatively estimate the interface fluid velocity.
Detailed experiments of the developed system indicate that due to the improved effectiveness of the jetlateral flow in reducing the tool-chip contact area, the cutting forces are reduced by 30% to 50% withincrease in coolant flow rate. The decrease in tool wear caused by the high pressure coolant leads toabout 50% improvement in Ra. Also the chips produced by high pressure water jet cooling were small,without any burrs, folded over and were having bright surfaces indicating improved thermal/frictionalconditions existing at the tool-chip interface.
Organized and Sponsored by the WaterJet Technology Association
10th American Waterjet ConferenceAugust 14-17, 1999: Houston, Texas
Paper 21
ENHANCEMENT OF ULTRAHIGH-PRESSURE
TECHNOLOGY WITH LN 2 CRYOGENIC JETS
H.-T. Liu, S. Fang, C. Hibbard, and J. MaloneyWaterjet Technology, Inc.Kent, Washington, U.S.A.
ABSTRACT
Laboratory tests have demonstrated that an ultrahigh-pressure (UHP) abrasive cryogenic jet(ACJ) using liquid nitrogen (LN2) as the working fluid has about the same material removalcapability as a UHP abrasive-waterjet (AWJ) under similar operating conditions. Further studieshave demonstrated that the performances of the two jets differ considerably because of thefundamental differences in the physical and thermodynamic properties of the two working fluids.Understanding the differences between the waterjet (WJ) and the cryogenic jet (CJ) would helpoptimum selection of one jet versus the other for various applications. This paper examinesimportant differences in the two jets and discusses their advantages and disadvantages forselected applications. Preliminary test results are presented to demonstrate performancesuperiority of the CJ/ACJ to the WJ/AWJ for a number of applications in which the latter hasshown marginal to unsatisfactory performance. The CJ/ACJ and WJ/AWJ complement eachother, greatly enhancing the versatility and performance of UHP technology as a whole.Maturity of the CJ/ACJ technology would further promote UHP technology for a wide range ofmachining services and surface preparation, completing favorably with other technologies.
Organized and Sponsored by the WaterJet Technology Association
1. INTRODUCTION
The UHP WJ and AWJ have gone through significant technological advancement since theywere pioneered at Waterjet Technology, Inc., or WTI (then Flow Industries, Inc.) during the1970s and 1980s. The advancement is multi-faceted, including but not limited to improvementsin hardware reliability, material removal rate, user friendliness, operational safety, surface andkerf quality, and process efficiency and precision. For example, the AWJ has been appliedsuccessfully for milling light weighting aerospace components and large optic structures (Miles,1998) and for drilling small-diameter and large-aspect-ratio holes on high-performance aircraftengine components (Liu et al., 1998). An abrasive suspension or slurry jet (ASJ) has recentlybeen developed and applied for near-net shaping of three-dimensional optical components (Liu,1998). For surface preparation, WJ/AWJ has been established as an effective alternate forconventional dry-grit blasting, which is being phased out due to environmental concerns andinadequate performance. In particular, a Newjet nozzle (patent pending) was successfullyintroduced by Surface Protection, Inc. (SPI) to replace dry-grit blasting. Field results haveshown that the Newjet is faster (2 to 3 times), cheaper (30%), better (white-metal surface finish),and safer (no airborne dust) compared to dry-grit blasting.
Nowadays, UHP WJ/AWJ has been widely accepted as one of the mainstream machining andsurface preparation tools. The WJ/AWJ has been competing on an equal basis with conventionaltools and modern technologies such as the laser, EDM, diamond turning, and chemical stripping,etc. One of the advantages of the WJ/AWJ over the laser and EDM is that the WJ/AWJ ismaterial independent with only few exceptions. Being a cold process that induces the minimumthermal (high-temperature) and mechanical stresses to the workpiece, the WJ/AWJ is superior tothe laser and EDM for processing materials that are susceptible to thermal damage. Undercertain circumstances, the laser and EDM may induce recast on the materials; recast is one of thesources for initiating surface and subsurface cracks that significantly weaken the strength of thematerials. For precision machining, the laser is incapable of drilling straight holes because of the“hour-glass” waist at the focal point. On the other hand, EDM is not suitable for machining thatrequires removing large amount of materials. In particular, the AWJ is superior to the laser andEDM for drilling small-diameter and large-aspect-ratio holes.
The WJ/AWJ is however not suitable for applications that are incompatible with the use of wateror wet abrasives. Such applications include processing hygroscopic and chemically reactivematerials and, in some cases, jobs performed in close proximity to high-voltage, toxic, andradioactive sources. For processing toxic and radioactive materials, spent water and abrasivesbecome contaminated and are difficult and expensive to be treated and disposed of. As acontinued effort in advancing UHP technology and broadening its application base, WTI hassuccessfully developed a UHP cryogenic technology to complement its water-based counterpart.
This paper examines and discusses the differences between the CJ/ACJ and WJ/AWJ.Applications that take advantage of their differences are investigated, with emphasis on those inwhich the WJ/AWJ cannot produce satisfactory results. Sample test results are presented todemonstrate the superiority of the CJ/ACJ to its water-based counterpart for those applications.
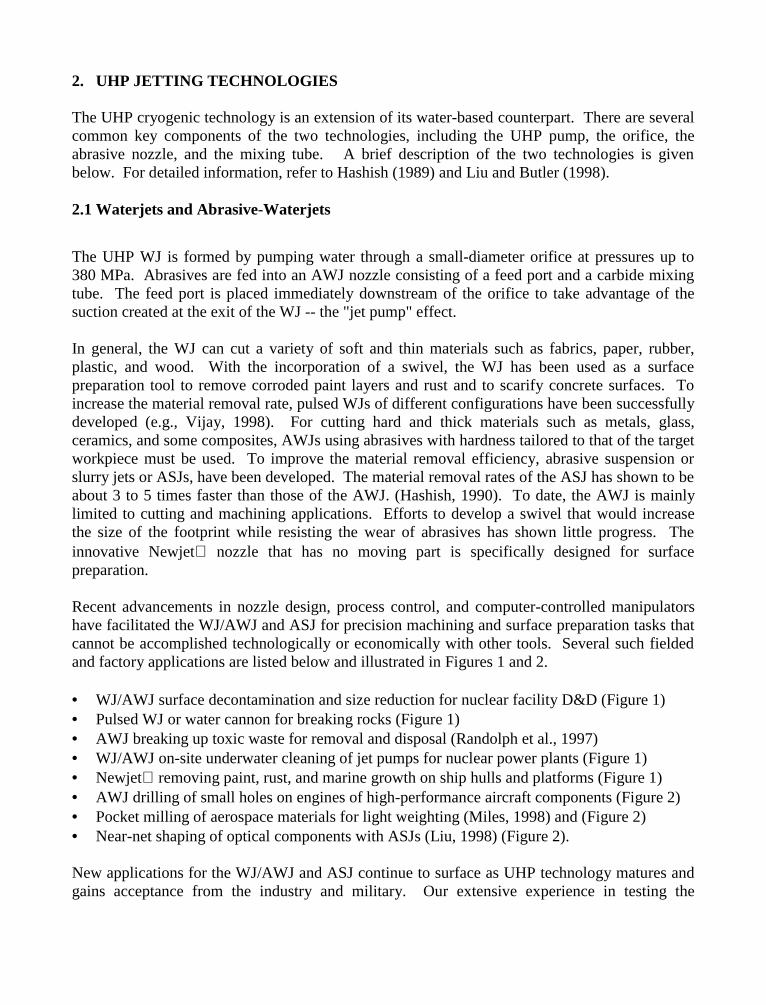
2. UHP JETTING TECHNOLOGIES
The UHP cryogenic technology is an extension of its water-based counterpart. There are severalcommon key components of the two technologies, including the UHP pump, the orifice, theabrasive nozzle, and the mixing tube. A brief description of the two technologies is givenbelow. For detailed information, refer to Hashish (1989) and Liu and Butler (1998).
2.1 Waterjets and Abrasive-Waterjets
The UHP WJ is formed by pumping water through a small-diameter orifice at pressures up to380 MPa. Abrasives are fed into an AWJ nozzle consisting of a feed port and a carbide mixingtube. The feed port is placed immediately downstream of the orifice to take advantage of thesuction created at the exit of the WJ -- the "jet pump" effect.
In general, the WJ can cut a variety of soft and thin materials such as fabrics, paper, rubber,plastic, and wood. With the incorporation of a swivel, the WJ has been used as a surfacepreparation tool to remove corroded paint layers and rust and to scarify concrete surfaces. Toincrease the material removal rate, pulsed WJs of different configurations have been successfullydeveloped (e.g., Vijay, 1998). For cutting hard and thick materials such as metals, glass,ceramics, and some composites, AWJs using abrasives with hardness tailored to that of the targetworkpiece must be used. To improve the material removal efficiency, abrasive suspension orslurry jets or ASJs, have been developed. The material removal rates of the ASJ has shown to beabout 3 to 5 times faster than those of the AWJ. (Hashish, 1990). To date, the AWJ is mainlylimited to cutting and machining applications. Efforts to develop a swivel that would increasethe size of the footprint while resisting the wear of abrasives has shown little progress. Theinnovative Newjet nozzle that has no moving part is specifically designed for surfacepreparation.
Recent advancements in nozzle design, process control, and computer-controlled manipulatorshave facilitated the WJ/AWJ and ASJ for precision machining and surface preparation tasks thatcannot be accomplished technologically or economically with other tools. Several such fieldedand factory applications are listed below and illustrated in Figures 1 and 2.
• WJ/AWJ surface decontamination and size reduction for nuclear facility D&D (Figure 1)• Pulsed WJ or water cannon for breaking rocks (Figure 1)• AWJ breaking up toxic waste for removal and disposal (Randolph et al., 1997)• WJ/AWJ on-site underwater cleaning of jet pumps for nuclear power plants (Figure 1)• Newjet removing paint, rust, and marine growth on ship hulls and platforms (Figure 1)• AWJ drilling of small holes on engines of high-performance aircraft components (Figure 2)• Pocket milling of aerospace materials for light weighting (Miles, 1998) and (Figure 2)• Near-net shaping of optical components with ASJs (Liu, 1998) (Figure 2).
New applications for the WJ/AWJ and ASJ continue to surface as UHP technology matures andgains acceptance from the industry and military. Our extensive experience in testing the
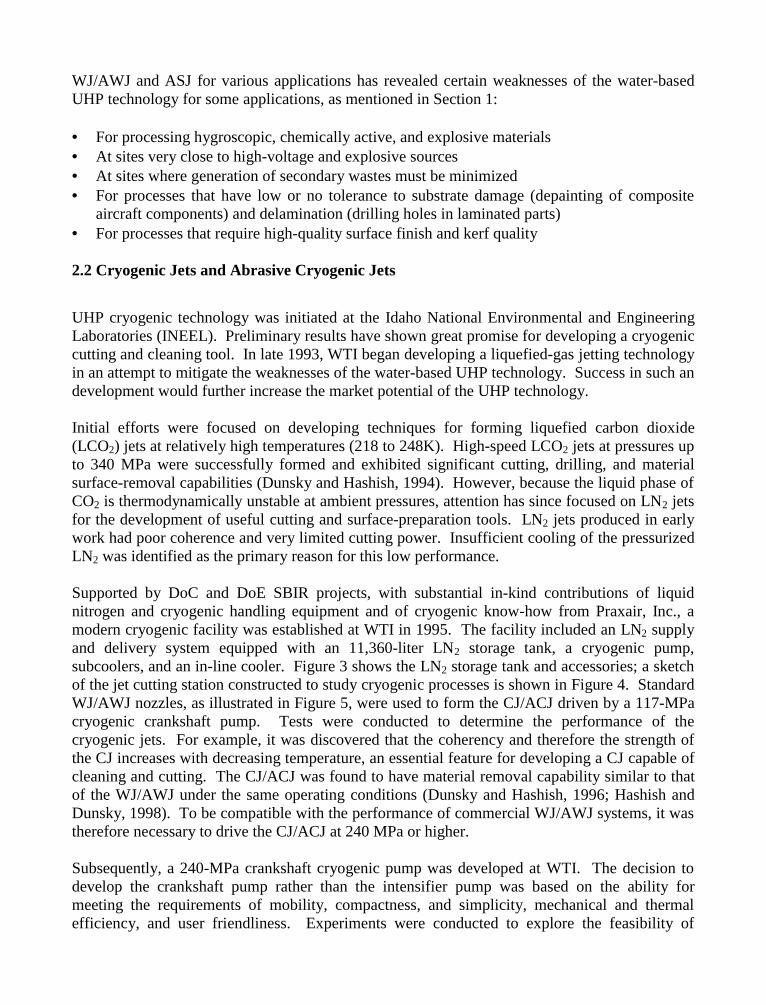
WJ/AWJ and ASJ for various applications has revealed certain weaknesses of the water-basedUHP technology for some applications, as mentioned in Section 1:
• For processing hygroscopic, chemically active, and explosive materials• At sites very close to high-voltage and explosive sources• At sites where generation of secondary wastes must be minimized• For processes that have low or no tolerance to substrate damage (depainting of composite
aircraft components) and delamination (drilling holes in laminated parts)• For processes that require high-quality surface finish and kerf quality
2.2 Cryogenic Jets and Abrasive Cryogenic Jets
UHP cryogenic technology was initiated at the Idaho National Environmental and EngineeringLaboratories (INEEL). Preliminary results have shown great promise for developing a cryogeniccutting and cleaning tool. In late 1993, WTI began developing a liquefied-gas jetting technologyin an attempt to mitigate the weaknesses of the water-based UHP technology. Success in such andevelopment would further increase the market potential of the UHP technology.
Initial efforts were focused on developing techniques for forming liquefied carbon dioxide(LCO2) jets at relatively high temperatures (218 to 248K). High-speed LCO2 jets at pressures upto 340 MPa were successfully formed and exhibited significant cutting, drilling, and materialsurface-removal capabilities (Dunsky and Hashish, 1994). However, because the liquid phase ofCO2 is thermodynamically unstable at ambient pressures, attention has since focused on LN2 jetsfor the development of useful cutting and surface-preparation tools. LN2 jets produced in earlywork had poor coherence and very limited cutting power. Insufficient cooling of the pressurizedLN2 was identified as the primary reason for this low performance.
Supported by DoC and DoE SBIR projects, with substantial in-kind contributions of liquidnitrogen and cryogenic handling equipment and of cryogenic know-how from Praxair, Inc., amodern cryogenic facility was established at WTI in 1995. The facility included an LN2 supplyand delivery system equipped with an 11,360-liter LN2 storage tank, a cryogenic pump,subcoolers, and an in-line cooler. Figure 3 shows the LN2 storage tank and accessories; a sketchof the jet cutting station constructed to study cryogenic processes is shown in Figure 4. StandardWJ/AWJ nozzles, as illustrated in Figure 5, were used to form the CJ/ACJ driven by a 117-MPacryogenic crankshaft pump. Tests were conducted to determine the performance of thecryogenic jets. For example, it was discovered that the coherency and therefore the strength ofthe CJ increases with decreasing temperature, an essential feature for developing a CJ capable ofcleaning and cutting. The CJ/ACJ was found to have material removal capability similar to thatof the WJ/AWJ under the same operating conditions (Dunsky and Hashish, 1996; Hashish andDunsky, 1998). To be compatible with the performance of commercial WJ/AWJ systems, it wastherefore necessary to drive the CJ/ACJ at 240 MPa or higher.
Subsequently, a 240-MPa crankshaft cryogenic pump was developed at WTI. The decision todevelop the crankshaft pump rather than the intensifier pump was based on the ability formeeting the requirements of mobility, compactness, and simplicity, mechanical and thermalefficiency, and user friendliness. Experiments were conducted to explore the feasibility of
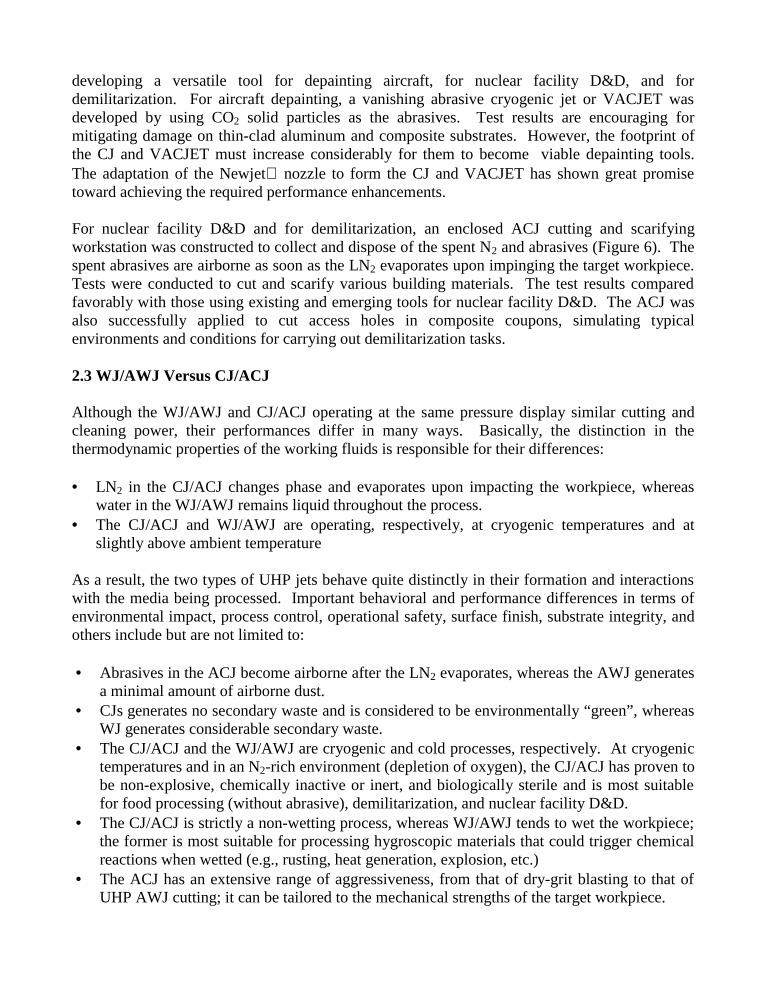
developing a versatile tool for depainting aircraft, for nuclear facility D&D, and fordemilitarization. For aircraft depainting, a vanishing abrasive cryogenic jet or VACJET wasdeveloped by using CO2 solid particles as the abrasives. Test results are encouraging formitigating damage on thin-clad aluminum and composite substrates. However, the footprint ofthe CJ and VACJET must increase considerably for them to become viable depainting tools.The adaptation of the Newjet nozzle to form the CJ and VACJET has shown great promisetoward achieving the required performance enhancements.
For nuclear facility D&D and for demilitarization, an enclosed ACJ cutting and scarifyingworkstation was constructed to collect and dispose of the spent N2 and abrasives (Figure 6). Thespent abrasives are airborne as soon as the LN2 evaporates upon impinging the target workpiece.Tests were conducted to cut and scarify various building materials. The test results comparedfavorably with those using existing and emerging tools for nuclear facility D&D. The ACJ wasalso successfully applied to cut access holes in composite coupons, simulating typicalenvironments and conditions for carrying out demilitarization tasks.
2.3 WJ/AWJ Versus CJ/ACJ
Although the WJ/AWJ and CJ/ACJ operating at the same pressure display similar cutting andcleaning power, their performances differ in many ways. Basically, the distinction in thethermodynamic properties of the working fluids is responsible for their differences:
• LN2 in the CJ/ACJ changes phase and evaporates upon impacting the workpiece, whereaswater in the WJ/AWJ remains liquid throughout the process.
• The CJ/ACJ and WJ/AWJ are operating, respectively, at cryogenic temperatures and atslightly above ambient temperature
As a result, the two types of UHP jets behave quite distinctly in their formation and interactionswith the media being processed. Important behavioral and performance differences in terms ofenvironmental impact, process control, operational safety, surface finish, substrate integrity, andothers include but are not limited to:
• Abrasives in the ACJ become airborne after the LN2 evaporates, whereas the AWJ generatesa minimal amount of airborne dust.
• CJs generates no secondary waste and is considered to be environmentally “green”, whereasWJ generates considerable secondary waste.
• The CJ/ACJ and the WJ/AWJ are cryogenic and cold processes, respectively. At cryogenictemperatures and in an N2-rich environment (depletion of oxygen), the CJ/ACJ has proven tobe non-explosive, chemically inactive or inert, and biologically sterile and is most suitablefor food processing (without abrasive), demilitarization, and nuclear facility D&D.
• The CJ/ACJ is strictly a non-wetting process, whereas WJ/AWJ tends to wet the workpiece;the former is most suitable for processing hygroscopic materials that could trigger chemicalreactions when wetted (e.g., rusting, heat generation, explosion, etc.)
• The ACJ has an extensive range of aggressiveness, from that of dry-grit blasting to that ofUHP AWJ cutting; it can be tailored to the mechanical strengths of the target workpiece.
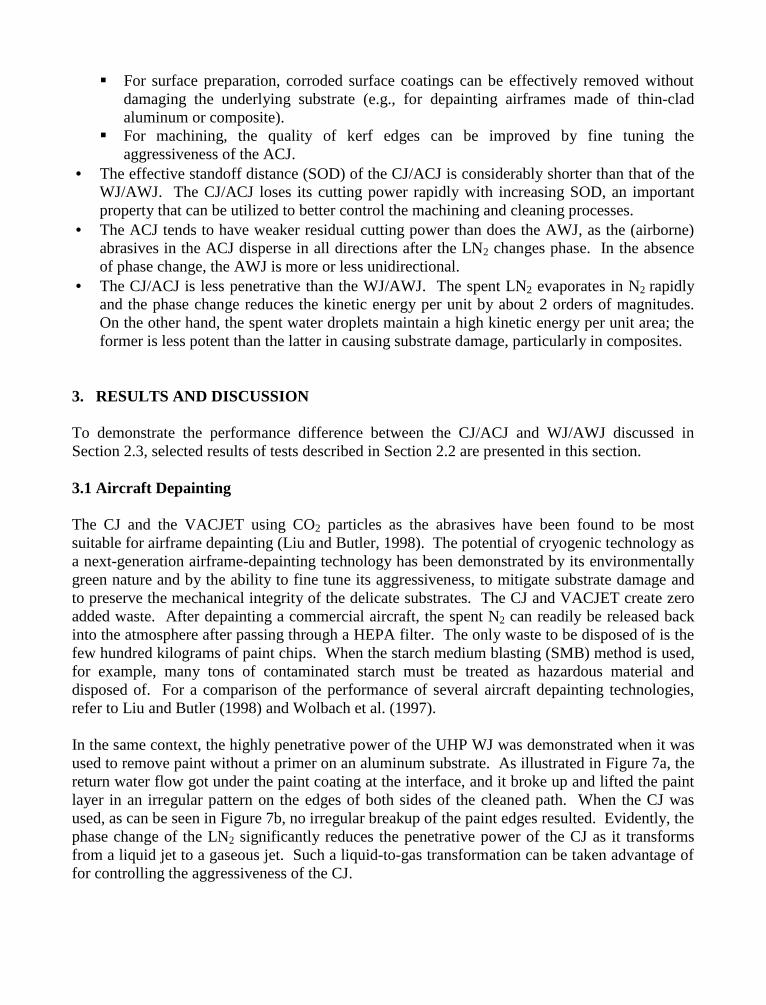
For surface preparation, corroded surface coatings can be effectively removed withoutdamaging the underlying substrate (e.g., for depainting airframes made of thin-cladaluminum or composite).
For machining, the quality of kerf edges can be improved by fine tuning theaggressiveness of the ACJ.
• The effective standoff distance (SOD) of the CJ/ACJ is considerably shorter than that of theWJ/AWJ. The CJ/ACJ loses its cutting power rapidly with increasing SOD, an importantproperty that can be utilized to better control the machining and cleaning processes.
• The ACJ tends to have weaker residual cutting power than does the AWJ, as the (airborne)abrasives in the ACJ disperse in all directions after the LN2 changes phase. In the absenceof phase change, the AWJ is more or less unidirectional.
• The CJ/ACJ is less penetrative than the WJ/AWJ. The spent LN2 evaporates in N2 rapidlyand the phase change reduces the kinetic energy per unit by about 2 orders of magnitudes.On the other hand, the spent water droplets maintain a high kinetic energy per unit area; theformer is less potent than the latter in causing substrate damage, particularly in composites.
3. RESULTS AND DISCUSSION
To demonstrate the performance difference between the CJ/ACJ and WJ/AWJ discussed inSection 2.3, selected results of tests described in Section 2.2 are presented in this section.
3.1 Aircraft Depainting
The CJ and the VACJET using CO2 particles as the abrasives have been found to be mostsuitable for airframe depainting (Liu and Butler, 1998). The potential of cryogenic technology asa next-generation airframe-depainting technology has been demonstrated by its environmentallygreen nature and by the ability to fine tune its aggressiveness, to mitigate substrate damage andto preserve the mechanical integrity of the delicate substrates. The CJ and VACJET create zeroadded waste. After depainting a commercial aircraft, the spent N2 can readily be released backinto the atmosphere after passing through a HEPA filter. The only waste to be disposed of is thefew hundred kilograms of paint chips. When the starch medium blasting (SMB) method is used,for example, many tons of contaminated starch must be treated as hazardous material anddisposed of. For a comparison of the performance of several aircraft depainting technologies,refer to Liu and Butler (1998) and Wolbach et al. (1997).
In the same context, the highly penetrative power of the UHP WJ was demonstrated when it wasused to remove paint without a primer on an aluminum substrate. As illustrated in Figure 7a, thereturn water flow got under the paint coating at the interface, and it broke up and lifted the paintlayer in an irregular pattern on the edges of both sides of the cleaned path. When the CJ wasused, as can be seen in Figure 7b, no irregular breakup of the paint edges resulted. Evidently, thephase change of the LN2 significantly reduces the penetrative power of the CJ as it transformsfrom a liquid jet to a gaseous jet. Such a liquid-to-gas transformation can be taken advantage offor controlling the aggressiveness of the CJ.
The weaker penetrative power of the spent N2 gas than that of the water thus demonstrated wouldhave important impact on scarifying contaminated layers from porous materials such as concrete.Such impact will be discussed later in this section.
3.2 Access Holes Cutting
The ACJ was also applied to cut 6.4-mm-diameter access holes on the bottom metal skin of four-layer composite coupons. The coupons consisted of a 9.5-mm-thick aluminum top skin, a 3.2-mm-thick stainless steel second layer, a 10.2-cm-thick hygroscopic filler made of plaster ofParis, and a 3.2-mm-thick stainless steel bottom skin. Cutting was conducted by mounting thecoupons on a turntable with the nozzle mounted on a two-axis linear traverse inside the enclosedACJ cutting and scarifying workstation (Figure 6). Figure 8 displays four snapshots of a coupontaken during one of the cutting sequences. To gain access to the bottom skin, 7.6-cm-diameterholes were first cut in the top three layers (Figures 8a through 8c). The filler core was eitherpulled out manually or scarified away by moving the nozzle toward the rotational center.Finally, the nozzle was lowered close to the bottom stainless steel skin to cut out the 6.4-mm-diameter hole (Figure 8d).
Four coupons were processed with the ACJ operating at pressures between 138 and 241 MPa.As illustrated in Figure 9, the ACJ successfully cut out the access holes in the top three layerswithout disturbing the remainder of the hygroscopic filler. During cutting, the filler layer chilledby the LN2 and by the latent heat absorption was frozen solid, greatly enhancing its structuralstability. The ACJ and AWJ are dry and wet processes, respectively. If an AWJ is used, thespent water trapped in the cavity of the coupon will be absorbed by the filler material, potentiallyleading to considerable swelling of the filler material. Soaking of the filler material by the spentwater could cause the side wall to collapse or trigger a strong chemical reaction provided thefiller material is strongly acidic or alkaline. The most difficult step when an AWJ is used is tokeep the spent water from leaking through the bottom access hole after it is drilled through. Forcertain demilitarization applications, even a small amount of water leakage below the skin layerscould be disastrous. The ACJ process creates an N2-rich cavity at cryogenic temperatures,greatly minimizing hazards when operating in an explosive environment.
Table 1 shows the results of the coupon cutting tests. When the ACJ pressure was increasedfrom 138 to 241 MPa, the speed of cutting individual layers was increased by more than 4 times.The overall process time was 2 times faster, decreasing from 16 min at 138 MPa to 6.8 min at241 MPa. The total processing time can be further minimized through hardware and processoptimization.
3.3 Nuclear Facility D&D
For nuclear facility D&D, the CJ/ACJ is currently being tested for cutting and/or scarifying avariety of building and specialty materials in order to demonstrate the advantages of the CJ/ACJover the WJ/AWJ. For D&D processes that are incompatible with water, the CJ/ACJ has a clearadvantage, especially for processing materials that are hygroscopic or reactive to wetting.
As discussed in Section 2.3, the CJ/ACJ is expected to minimize secondary-waste generation andmitigate disastrous wetting of radioactive components. Depending on the mechanical propertiesof the materials, either a CJ or ACJ can be used. Because the CJ generates the least amount ofsecondary waste that can be effectively removed using HEPA filters, it is the preferred tool fornuclear facility D&D whenever applicable. Table 2 lists the results of selected constructionmaterials cut with a CJ at 207 MPa. Figure 10 illustrates several such samples processed withthe CJ. Tests conducted so far have indicated that the CJ has about the same material removalpower as the WJ/AWJ for cutting relatively soft and thin materials or removing thin coatings.The depth of cut is generally shallower for the CJ than for the WJ because the effective standoffdistance is considerably shorter for the former. For some applications, the short standoffdistance of the CJ could be advantageous over the WJ when fine control of the amount ofmaterial removal is called for.
A large number of nuclear facility D&D applications involve dismantlement and size reductionof contaminated equipment made of materials that must be processed with an ACJ rather than aCJ. As discussed in Section 3.2, the capability of cutting metal plates has been demonstrated.Therefore, the ACJ can be readily applied to process most contaminated equipment because theACJ or AWJ process is material independent, as stated in Section 1. Both the spent abrasivesand N2 are contaminated and must be treated and disposed of. The secondary wastes generatedby the ACJ are, however, considerably less than those generated by the AWJ. The spentabrasives (common to both ACJ and AWJ) after treatment must be disposed of as low-levelradioactive waste. Because the spent abrasives generated by the ACJ are dry, it may be lesscostly and/or more efficient to treat these spent abrasives than it would be to treat the wet onesgenerated by the AWJ. The spent N2 generated by the ACJ can be readily released back into theatmosphere after passing through highly efficient HEPA filters (> 99.9%), whereas, thecontaminated water generated by the AWJ is difficult and expensive to be treated and disposedof because mechanical filters for water are less efficient than HEPA filters are for gas. Time-consuming and expensive evaporative methods are often used to decontaminate the spent waterin order to meet the requirements for disposal of the treated water as uncontaminated waste.
For decontamination of concrete slabs or other porous materials by scarifying the contaminatedsurface layers exposed to long-term radiation, it is speculated that the high-speed water dropletsin the AWJ could drive surface contaminants farther into the otherwise uncontaminated interior.As a result, more materials must be removed and therefore disposed of to reach a certain level ofdecontamination. On the other hand, the use of the ACJ would minimize the penetration ofcontaminants into the interior because the LN2 changes phase upon impinging the target surfaceand loses most of its penetrative power. In other words, the high-speed abrasives alone in theACJ are responsible for scarifying the contaminated layers. The absence of a strong liquidcoflow with the abrasives in the ACJ makes it unlikely that surface contaminants would bedriven into the interior of porous structures. To achieve the same level of decontamination,therefore, less material removal would be required when the ACJ rather than the AWJ is used.
Another advantage of the ACJ over the AWJ pertains to secondary waste treatment and disposal,as mentioned above. In the long run, the higher costs of using LN2 as the working fluid in theACJ are expected to be compensated for by the added time, effort, and costs required fortreatment and disposal of the contaminated water in the AWJ.
Experiments to scarify concrete slabs are planned using both the WJ/AWJ and CJ/ACJ toinvestigate this particular issue of interest. A Newjet nozzle (patent pending) will be adoptedfor the ACJ to increase the footprint and the material removal rate for the scarifying tests. Theresults will provide the necessary information to compare the overall performance of the ACJand AWJ as a scarifying tool for nuclear facility D&D.
4. SUMMARY
Supported by DoE and DoC and with substantial in-kind contributions from Praxair, WTIsuccessfully launched in late 1993 a research program on developing UHP cryogenic technologyto complement and broaden the applications of UHP technology as a whole. Although the water-based UHP technology pioneered at WTI two decades ago has matured and gained acceptance bythe industry as one of the main machining and surface preparation tools, there are severalapplications in which the WJ/AWJ has shown marginal to unsatisfactory performance. Suchapplications include but are not limited to the following situations:
• Materials incompatible with water or wet abrasivesHygroscopic (some light-weight honeycomb cores)Chemically active when wet (strongly acidic, basic, and explosive materials)
• Environment incompatible with water or wet abrasivesClose proximity to high-voltage and explosive sources
• Generation of harmful byproductsDifficult treatment and costly disposal of spent water contaminated with toxic andradioactive wastes (depletion of disposal sites for secondary wastes)
• Excessive aggressiveness of the WJ/AWJSurface/subsurface damage to laminated and/or composite partsForcing surface contaminants to penetrate farther into interior of porous structures
Using the non-wetting, chemically inert, and cryogenic LN2 as the working fluid, the CJ/ACJ isexpected to work well for applications in which its water-based counterpart fails. In particular,the potential of a strong chemical reaction or explosion is minimized as the ambient air isreplaced by the spent N2 at cryogenic temperatures. Test results of cutting various buildingmaterials and cutting access holes on composite coupons have largely confirmed the superiorityof the CJ/ACJ to the WJ/AWJ for these applications. For surface preparation, the footprint of theCJ/ACJ generated by standard WJ/AWJ nozzles is too small to be useful as effective scarifyingtools. The cryogenic conditions have made the use mechanical swivels impractical. Currently, arotating nozzle without the use of a swivel is under development. Furthermore, the Newjetnozzle which has no moving part is currently being adopted for the ACJ nozzle to increase boththe footprint and the materials’ removal rate. For aircraft depainting, a VACJET using solid CO2
particles as the abrasives has shown promise for enhancing the depainting rate of the CJ withoutinflicting damage to underlying thin-clad aluminum and composite airframe skins.
Experiments are being prepared to compare the performance of the ACJ and AWJ for scarifyingconcrete slabs. Emphasis will be made to determine whether the considerable difference in the
penetrative power of the two working fluids would indeed lead to differences in the penetrationof surface contaminants into the interior of the concrete slabs.
5. ACKNOWLEDGMENT
This work is supported by contracts from Lawrence Livermore National Laboratory (B501537),DoE (DE-FG03-98ER82711), DoC (50-DKNB-6-90162), and from a WTI internal fund.
6. REFERENCES
Dunsky, C. M., and Hashish, M., “Feasibility Study of Machining with High-Pressure LiquefiedCO2 Jets,” Proceedings of Symposium on Nontraditional Manufacturing Processes in the1990s, Chicago, ASME, 1994.
Dunsky, C. M., and Hashish, M., “Observations of Cutting with Abrasive-Cryogenic Jets,”Proceedings of the 13th International Conference on Jetting Technology, Sardinia, Italy,October,. 1996.
Hashish, M., “Advanced Machining with Abrasive-Waterjets - Theory and Applications,”Proceedings of the Nontraditional Machining Conference, SME Conference Reading,Orlando, Florida, October 30-November 2, 1989.
Hashish, M., “Entrainment Versus Direct Pumping Abrasive-Fluid Machining Systems,”Proceedings of the 10th International Symposium on Jet Cutting Technology, BHRA,Amsterdam, Netherlands, October 31-November 2, 1990.
Hashish, M., and Dunsky, C. M., “The Formation of Cryogenic and Abrasive-Cryogenic Jets” InProceedings of the 14th International Conference on Jetting Technology, Brugge, Belgium,September 21-23, 1998.
Liu, H.-T. and Butler, T., “ A Vanishing Abrasive Cryogenic Jet for Airframe Depainting,” InProceedings Of the 14th International Conference on Jetting Technology, Brugge, Belgium,pp. 519-533, pp. 329-343, September 21–23, 1998.
Liu, H.-T., “Near-Net Shaping of Optical Surfaces with Abrasive Suspension Jets,” ProceedingsOf the 14th International Conference on Jetting Technology, Brugge, Belgium, September 21– 23, pp. 285-294, 1998.
Liu, H.-T., Miles, P., and Veenhuizen, S. D., “CFD and Physical Modeling of UHP AWJDrilling" Proceedings Of the 14th International Conference on Jetting Technology, Brugge,Belgium, September 21–23, pp. 15-24, 1998.
Miles, P. J., “Light weighting Large Optics with Abrasive Waterjets,” Proceedings of the SPIE,Vol. 3430, pp. 304-312, July 20-21, 1998.
Randolph, J. D., Burks, B. L., Rinker, M., Summers, D., Blank, J., Lloyd, P. D., Johnson, M. A.,Mullen, D., and Alberts, D., “Development of a Waste Dislodging and Retrieval System forUse in the Oak Ridge National Laboratory Gunite Tanks,” Proceedings of the AmericanNuclear Society 7th Topical Meeting on Robotics and Remote Systems, April, 1997.
Vijay, M. M., “Design and Development of a Prototype Pulsed Waterjet Machine for theRemoval of Hard Coatings,” Proceedings Of the 14th International Conference on JettingTechnology, Brugge, Belgium, pp. 39-57, September 21–23, 1998.
Wolbach, C. D., Venkatesh, S., and Wander, J., “Current Status of Large Aircraft Frame PaintStripping Technologies,” Proceedings of the DOD/Industry Aerospace Coatings Conference,Las Vegas, Nevada, May 13-15, 1997.
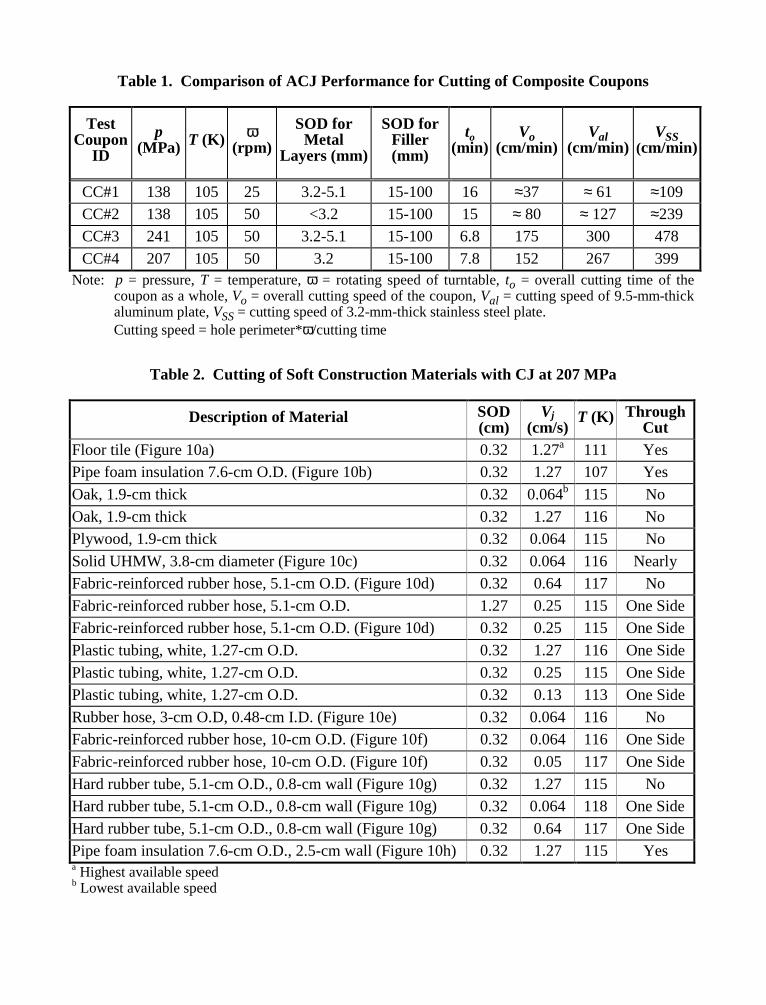
Table 1. Comparison of ACJ Performance for Cutting of Composite Coupons
TestCoupon
ID
p(MPa) T (K) ω
(rpm)
SOD forMetal
Layers (mm)
SOD forFiller(mm)
to(min)
Vo(cm/min)
Val(cm/min)
VSS(cm/min)
CC#1 138 105 25 3.2-5.1 15-100 16 ≈37 ≈ 61 ≈109CC#2 138 105 50 <3.2 15-100 15 ≈ 80 ≈ 127 ≈239CC#3 241 105 50 3.2-5.1 15-100 6.8 175 300 478
CC#4 207 105 50 3.2 15-100 7.8 152 267 399Note: p = pressure, T = temperature, ω = rotating speed of turntable, to = overall cutting time of the
coupon as a whole, Vo = overall cutting speed of the coupon, Val = cutting speed of 9.5-mm-thickaluminum plate, VSS = cutting speed of 3.2-mm-thick stainless steel plate.Cutting speed = hole perimeter*ω/cutting time
Table 2. Cutting of Soft Construction Materials with CJ at 207 MPa
Description of Material SOD(cm)
Vj(cm/s)
T (K) ThroughCut
Floor tile (Figure 10a) 0.32 1.27a 111 YesPipe foam insulation 7.6-cm O.D. (Figure 10b) 0.32 1.27 107 Yes
Oak, 1.9-cm thick 0.32 0.064b 115 No
Oak, 1.9-cm thick 0.32 1.27 116 NoPlywood, 1.9-cm thick 0.32 0.064 115 No
Solid UHMW, 3.8-cm diameter (Figure 10c) 0.32 0.064 116 NearlyFabric-reinforced rubber hose, 5.1-cm O.D. (Figure 10d) 0.32 0.64 117 No
Fabric-reinforced rubber hose, 5.1-cm O.D. 1.27 0.25 115 One SideFabric-reinforced rubber hose, 5.1-cm O.D. (Figure 10d) 0.32 0.25 115 One Side
Plastic tubing, white, 1.27-cm O.D. 0.32 1.27 116 One Side
Plastic tubing, white, 1.27-cm O.D. 0.32 0.25 115 One SidePlastic tubing, white, 1.27-cm O.D. 0.32 0.13 113 One Side
Rubber hose, 3-cm O.D, 0.48-cm I.D. (Figure 10e) 0.32 0.064 116 NoFabric-reinforced rubber hose, 10-cm O.D. (Figure 10f) 0.32 0.064 116 One Side
Fabric-reinforced rubber hose, 10-cm O.D. (Figure 10f) 0.32 0.05 117 One Side
Hard rubber tube, 5.1-cm O.D., 0.8-cm wall (Figure 10g) 0.32 1.27 115 NoHard rubber tube, 5.1-cm O.D., 0.8-cm wall (Figure 10g) 0.32 0.064 118 One Side
Hard rubber tube, 5.1-cm O.D., 0.8-cm wall (Figure 10g) 0.32 0.64 117 One SidePipe foam insulation 7.6-cm O.D., 2.5-cm wall (Figure 10h) 0.32 1.27 115 Yesa Highest available speedb Lowest available speed
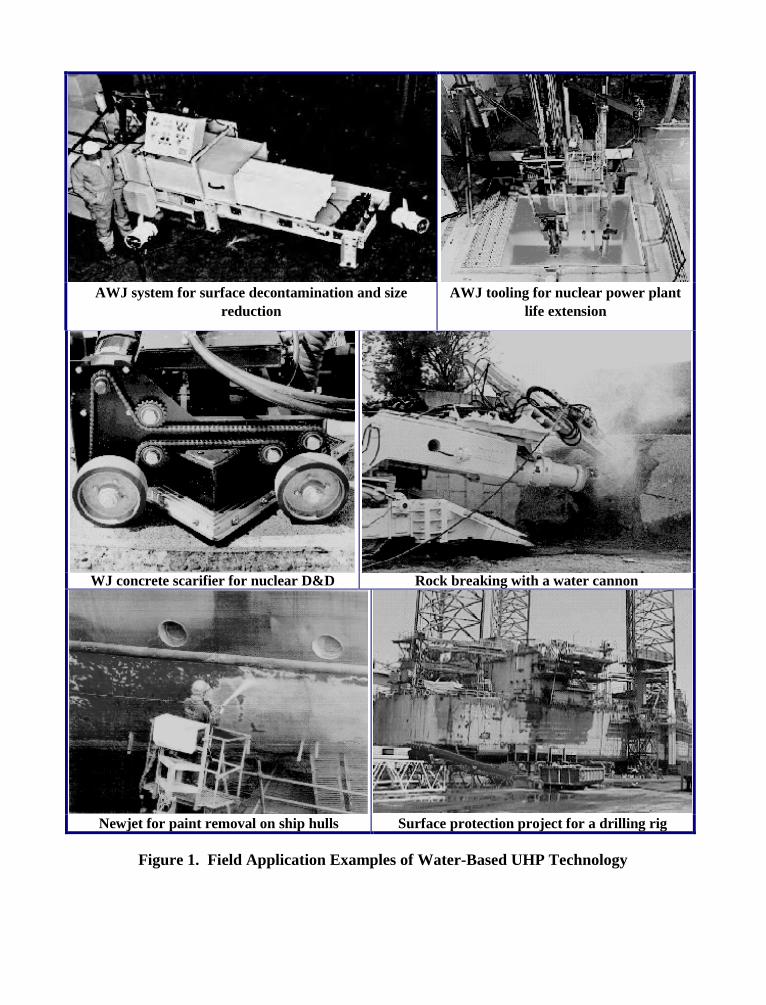
AWJ system for surface decontamination and sizereduction
AWJ tooling for nuclear power plantlife extension
WJ concrete scarifier for nuclear D&D Rock breaking with a water cannon
Newjet for paint removal on ship hulls Surface protection project for a drilling rig
Figure 1. Field Application Examples of Water-Based UHP Technology
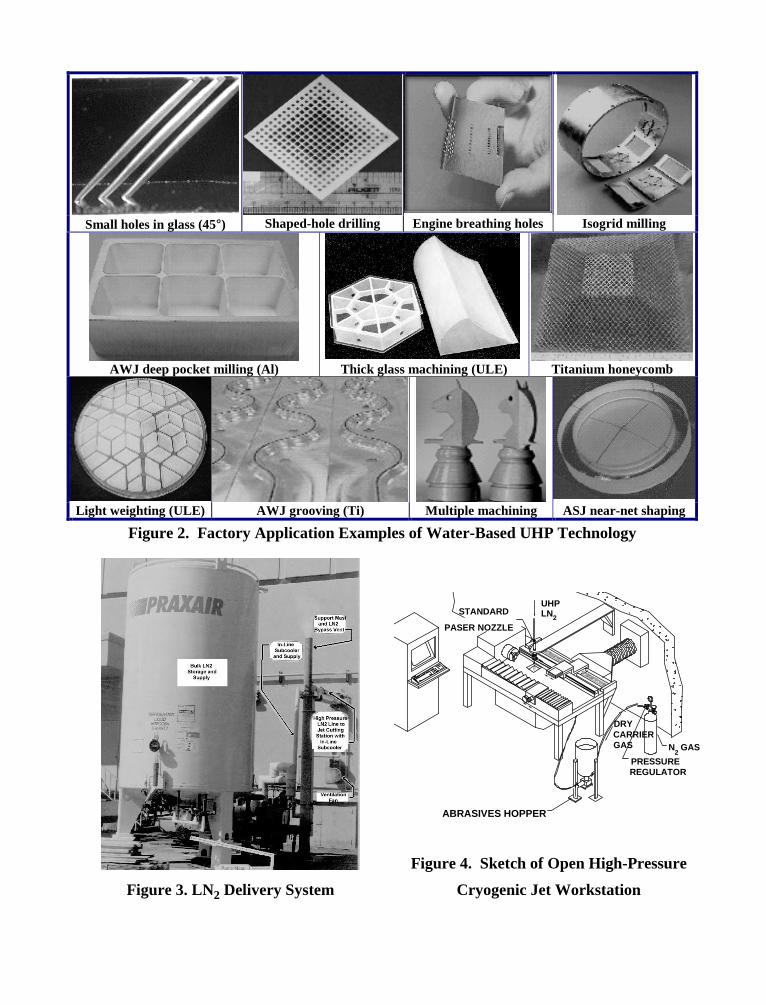
Small holes in glass (45°) Shaped-hole drilling Engine breathing holes Isogrid milling
AWJ deep pocket milling (Al) Thick glass machining (ULE) Titanium honeycomb
Light weighting (ULE) AWJ grooving (Ti) Multiple machining ASJ near-net shaping
Figure 2. Factory Application Examples of Water-Based UHP Technology
UHPLN 2
ABRASIVES HOPPER
PRESSUREREGULATOR
STANDARD
PASER NOZZLE
N GAS2
DRYCARRIERGAS
Figure 4. Sketch of Open High-Pressure
Figure 3. LN2 Delivery System Cryogenic Jet Workstation
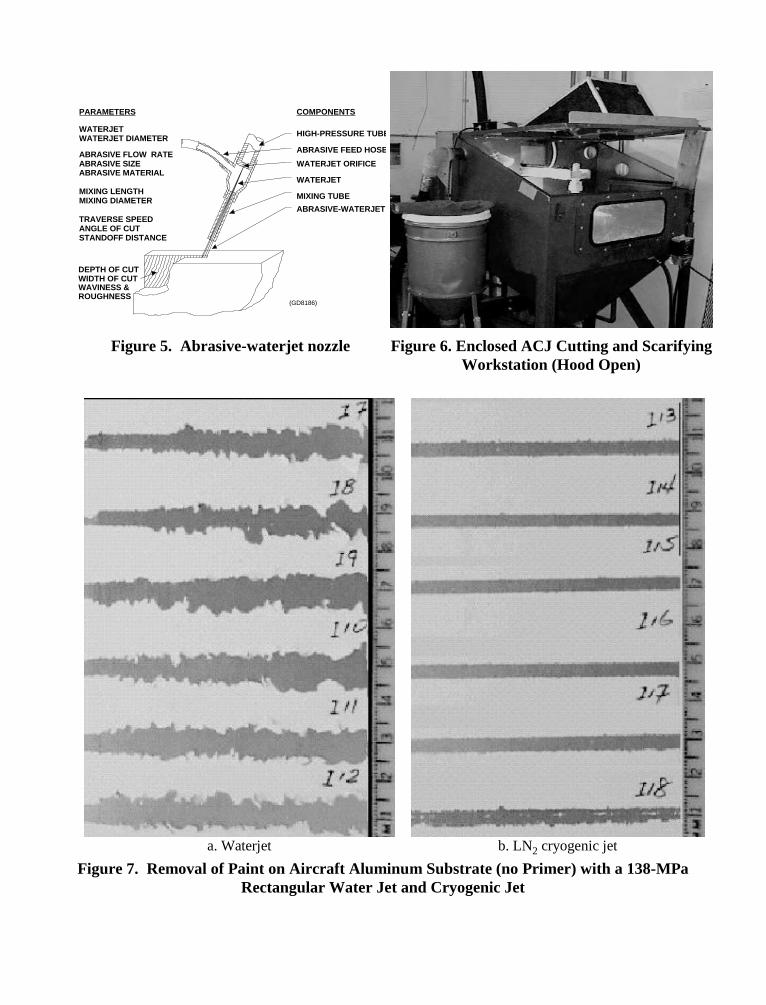
(GD8186)
PARAMETERS
WATERJETWATERJET DIAMETER
ABRASIVE FLOW RATEABRASIVE SIZEABRASIVE MATERIAL
MIXING LENGTHMIXING DIAMETER
TRAVERSE SPEEDANGLE OF CUTSTANDOFF DISTANCE
COMPONENTS
HIGH-PRESSURE TUBE
ABRASIVE FEED HOS E
WATERJET ORIFICE
WATERJET
MIXING TUBE
ABRASIVE-WATERJET
DEPTH OF CUTWIDTH OF CUTWAVINESS &ROUGHNESS
Figure 5. Abrasive-waterjet nozzle Figure 6. Enclosed ACJ Cutting and ScarifyingWorkstation (Hood Open)
a. Waterjet b. LN2 cryogenic jet
Figure 7. Removal of Paint on Aircraft Aluminum Substrate (no Primer) with a 138-MPaRectangular Water Jet and Cryogenic Jet
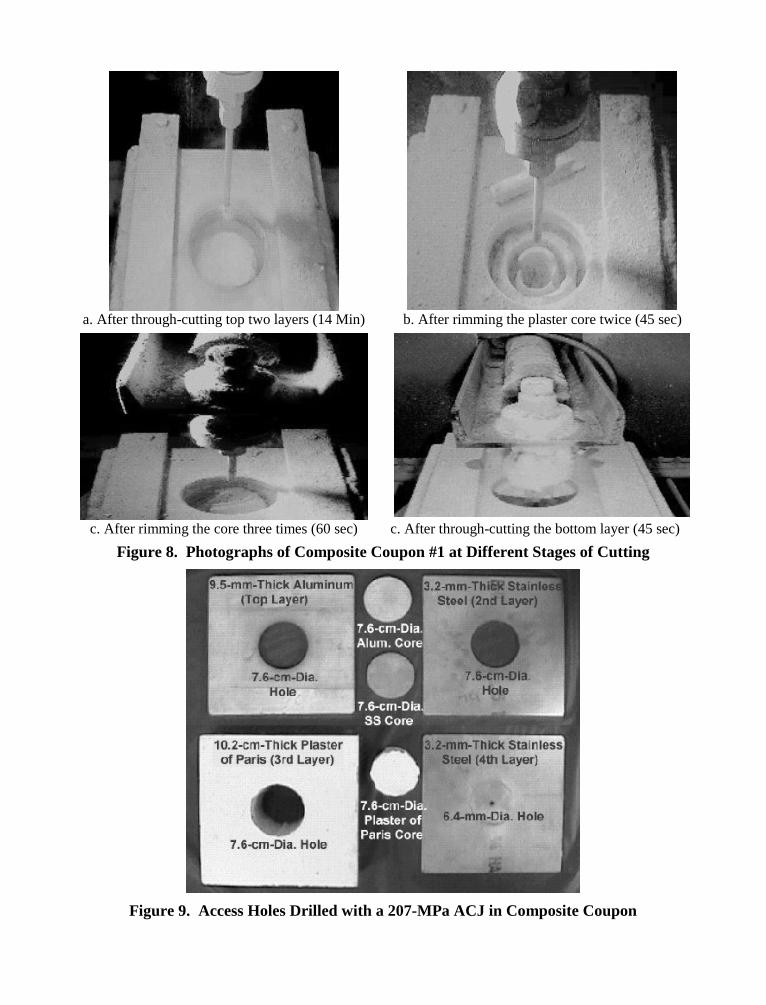
a. After through-cutting top two layers (14 Min) b. After rimming the plaster core twice (45 sec)
c. After rimming the core three times (60 sec) c. After through-cutting the bottom layer (45 sec)
Figure 8. Photographs of Composite Coupon #1 at Different Stages of Cutting
Figure 9. Access Holes Drilled with a 207-MPa ACJ in Composite Coupon
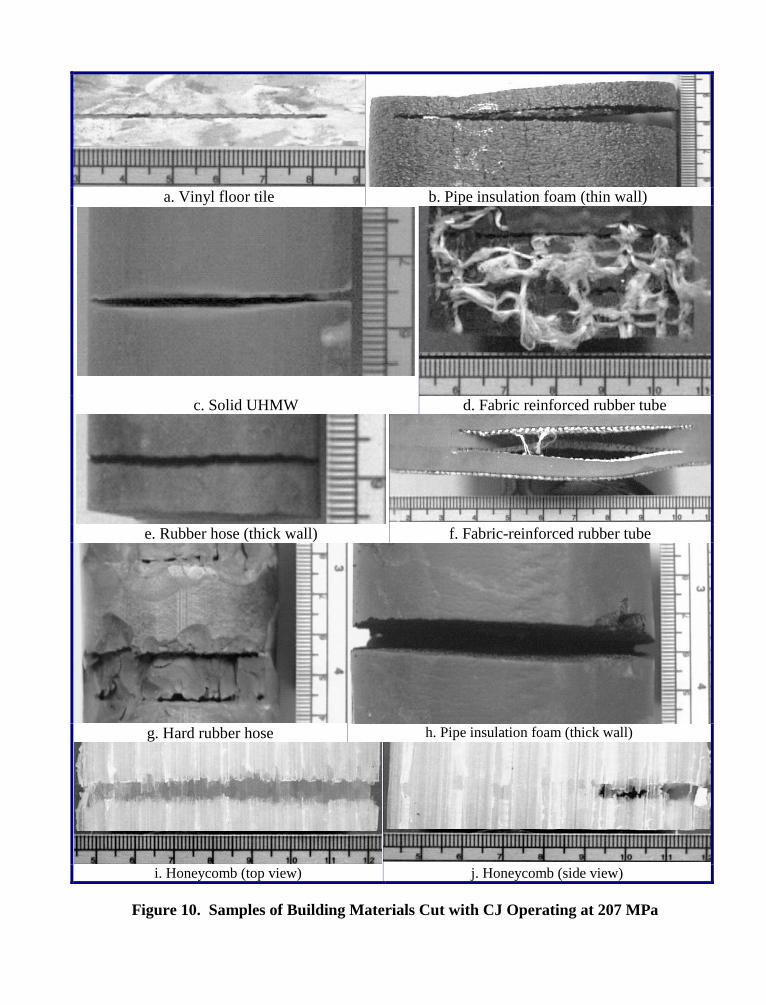
a. Vinyl floor tile b. Pipe insulation foam (thin wall)
c. Solid UHMW d. Fabric reinforced rubber tube
e. Rubber hose (thick wall) f. Fabric-reinforced rubber tube
g. Hard rubber hose h. Pipe insulation foam (thick wall)
i. Honeycomb (top view) j. Honeycomb (side view)
Figure 10. Samples of Building Materials Cut with CJ Operating at 207 MPa
10th American Waterjet ConferenceAugust 14-17, 1999: Houston, Texas
Paper 22
APPLICATION OF ICE PARTICLES FOR PRECISION
CLEANING OF SENSITIVE SURFACES
E. S. Geskin, D. Shishkin, K. BabetsLaboratory of Waterjet Technology, ME Department
New Jersey Institute of TechnologyNewark, NJ
ABSTRACT
Entrainment of the ice particles by the waterjet and particles formation within the water streamwas investigated. FIDAP package was used to determine probability of particles surviving in thecourse of the jet formation. Another part of the study was concerned with the use of the ice-airjet. It was demonstrated that at the optimal range of process conditions this jet constitutes aprecision tool for selective material removal operations. Number of experiments was carried outin order to demonstrate this technology. Various electronic devices (computers, calculators,electronic games and watches) were disassembled and electronic boards were contaminated bygrease and metal powder. Then the boards were cleaned and reassembled. The computer,calculators and watches worked normally. Other experiments involved degreasing, depaintingand deicing of liquid crystals, polished metals, optical glass, fabric, removal emulsion from afilm, etc. The feasibility of the damage free and pollution free decontamination of highlysensitive, highly countered surfaces was demonstrated. A low cost of ice-air cleaning will enableus to use it for processing large surfaces at a high rate. On-line degreasing of metal in the courseof rolling or prior to machining illustrates this application. A generic environmentally friendlysurface processing technology is emerging as the result of the presented study.
Organized and Sponsored by the WaterJet Technology Association
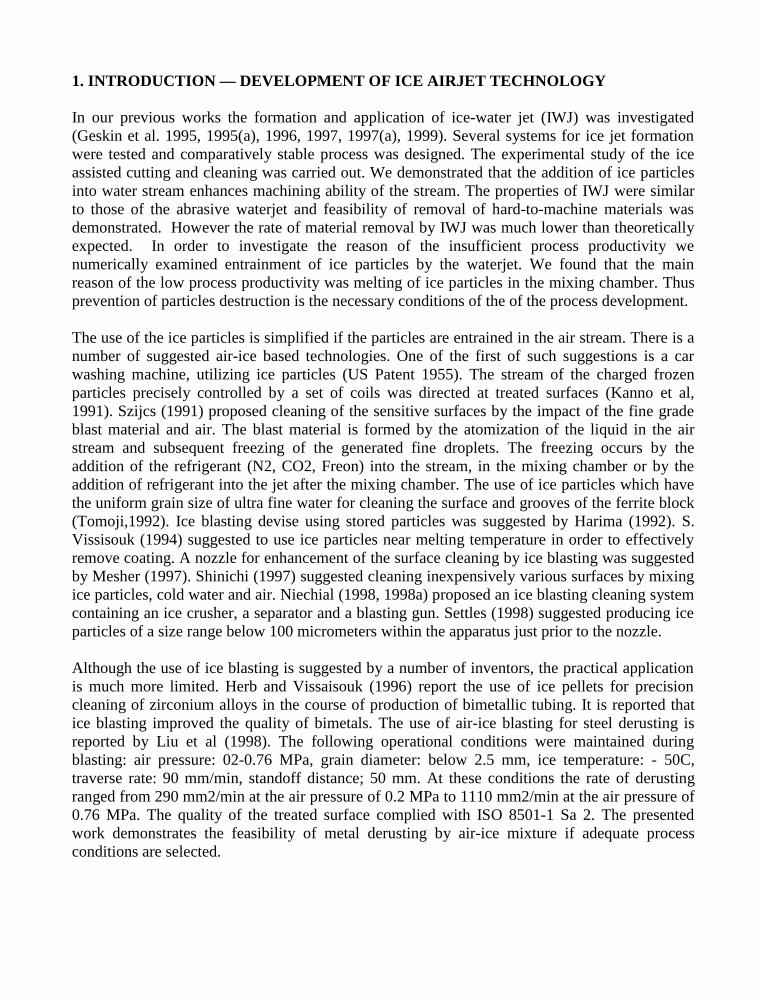
1. INTRODUCTION — DEVELOPMENT OF ICE AIRJET TECHNOLOGY
In our previous works the formation and application of ice-water jet (IWJ) was investigated(Geskin et al. 1995, 1995(a), 1996, 1997, 1997(a), 1999). Several systems for ice jet formationwere tested and comparatively stable process was designed. The experimental study of the iceassisted cutting and cleaning was carried out. We demonstrated that the addition of ice particlesinto water stream enhances machining ability of the stream. The properties of IWJ were similarto those of the abrasive waterjet and feasibility of removal of hard-to-machine materials wasdemonstrated. However the rate of material removal by IWJ was much lower than theoreticallyexpected. In order to investigate the reason of the insufficient process productivity wenumerically examined entrainment of ice particles by the waterjet. We found that the mainreason of the low process productivity was melting of ice particles in the mixing chamber. Thusprevention of particles destruction is the necessary conditions of the of the process development.
The use of the ice particles is simplified if the particles are entrained in the air stream. There is anumber of suggested air-ice based technologies. One of the first of such suggestions is a carwashing machine, utilizing ice particles (US Patent 1955). The stream of the charged frozenparticles precisely controlled by a set of coils was directed at treated surfaces (Kanno et al,1991). Szijcs (1991) proposed cleaning of the sensitive surfaces by the impact of the fine gradeblast material and air. The blast material is formed by the atomization of the liquid in the airstream and subsequent freezing of the generated fine droplets. The freezing occurs by theaddition of the refrigerant (N2, CO2, Freon) into the stream, in the mixing chamber or by theaddition of refrigerant into the jet after the mixing chamber. The use of ice particles which havethe uniform grain size of ultra fine water for cleaning the surface and grooves of the ferrite block(Tomoji,1992). Ice blasting devise using stored particles was suggested by Harima (1992). S.Vissisouk (1994) suggested to use ice particles near melting temperature in order to effectivelyremove coating. A nozzle for enhancement of the surface cleaning by ice blasting was suggestedby Mesher (1997). Shinichi (1997) suggested cleaning inexpensively various surfaces by mixingice particles, cold water and air. Niechial (1998, 1998a) proposed an ice blasting cleaning systemcontaining an ice crusher, a separator and a blasting gun. Settles (1998) suggested producing iceparticles of a size range below 100 micrometers within the apparatus just prior to the nozzle.
Although the use of ice blasting is suggested by a number of inventors, the practical applicationis much more limited. Herb and Vissaisouk (1996) report the use of ice pellets for precisioncleaning of zirconium alloys in the course of production of bimetallic tubing. It is reported thatice blasting improved the quality of bimetals. The use of air-ice blasting for steel derusting isreported by Liu et al (1998). The following operational conditions were maintained duringblasting: air pressure: 02-0.76 MPa, grain diameter: below 2.5 mm, ice temperature: - 50C,traverse rate: 90 mm/min, standoff distance; 50 mm. At these conditions the rate of derustingranged from 290 mm2/min at the air pressure of 0.2 MPa to 1110 mm2/min at the air pressure of0.76 MPa. The quality of the treated surface complied with ISO 8501-1 Sa 2. The presentedwork demonstrates the feasibility of metal derusting by air-ice mixture if adequate processconditions are selected.
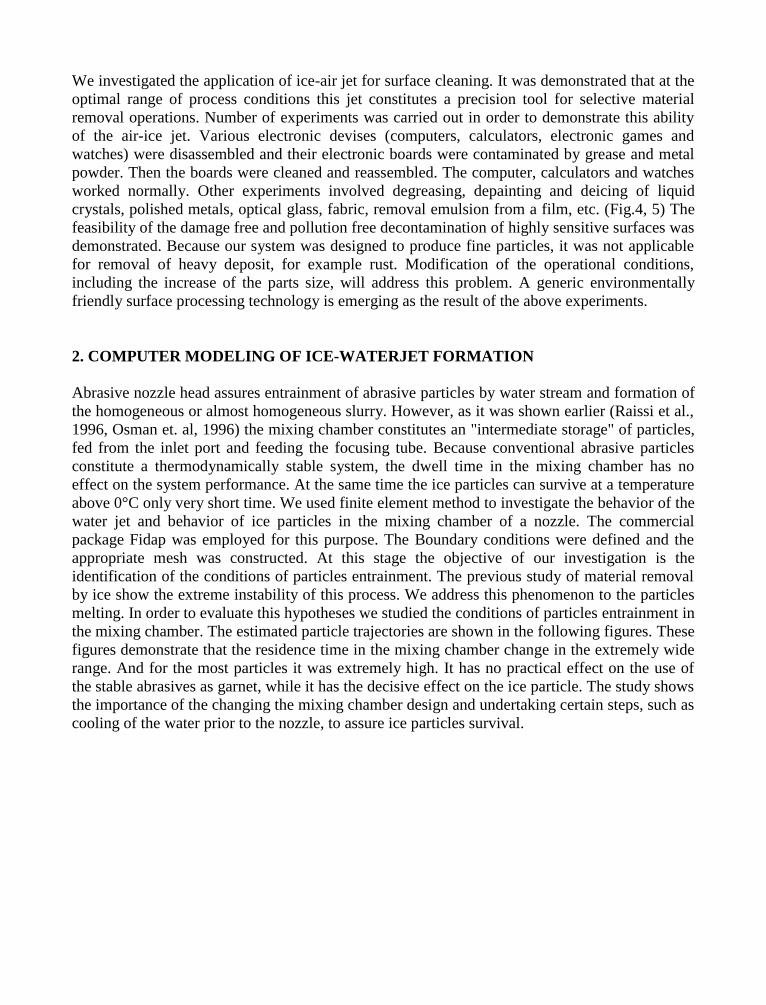
We investigated the application of ice-air jet for surface cleaning. It was demonstrated that at theoptimal range of process conditions this jet constitutes a precision tool for selective materialremoval operations. Number of experiments was carried out in order to demonstrate this abilityof the air-ice jet. Various electronic devises (computers, calculators, electronic games andwatches) were disassembled and their electronic boards were contaminated by grease and metalpowder. Then the boards were cleaned and reassembled. The computer, calculators and watchesworked normally. Other experiments involved degreasing, depainting and deicing of liquidcrystals, polished metals, optical glass, fabric, removal emulsion from a film, etc. (Fig.4, 5) Thefeasibility of the damage free and pollution free decontamination of highly sensitive surfaces wasdemonstrated. Because our system was designed to produce fine particles, it was not applicablefor removal of heavy deposit, for example rust. Modification of the operational conditions,including the increase of the parts size, will address this problem. A generic environmentallyfriendly surface processing technology is emerging as the result of the above experiments.
2. COMPUTER MODELING OF ICE-WATERJET FORMATION
Abrasive nozzle head assures entrainment of abrasive particles by water stream and formation ofthe homogeneous or almost homogeneous slurry. However, as it was shown earlier (Raissi et al.,1996, Osman et. al, 1996) the mixing chamber constitutes an "intermediate storage" of particles,fed from the inlet port and feeding the focusing tube. Because conventional abrasive particlesconstitute a thermodynamically stable system, the dwell time in the mixing chamber has noeffect on the system performance. At the same time the ice particles can survive at a temperatureabove 0°C only very short time. We used finite element method to investigate the behavior of thewater jet and behavior of ice particles in the mixing chamber of a nozzle. The commercialpackage Fidap was employed for this purpose. The Boundary conditions were defined and theappropriate mesh was constructed. At this stage the objective of our investigation is theidentification of the conditions of particles entrainment. The previous study of material removalby ice show the extreme instability of this process. We address this phenomenon to the particlesmelting. In order to evaluate this hypotheses we studied the conditions of particles entrainment inthe mixing chamber. The estimated particle trajectories are shown in the following figures. Thesefigures demonstrate that the residence time in the mixing chamber change in the extremely widerange. And for the most particles it was extremely high. It has no practical effect on the use ofthe stable abrasives as garnet, while it has the decisive effect on the ice particle. The study showsthe importance of the changing the mixing chamber design and undertaking certain steps, such ascooling of the water prior to the nozzle, to assure ice particles survival.
Figure 1. Fidap modeling of particles motion in the mixing chamber. Notice extended dwelltime of particles in the mixing chamber.
Figure 2. Particles distribution in the mixing chamber and focusing tube. Excessiveresidence time in the mixing chamber brings about disappearance of ice particles.
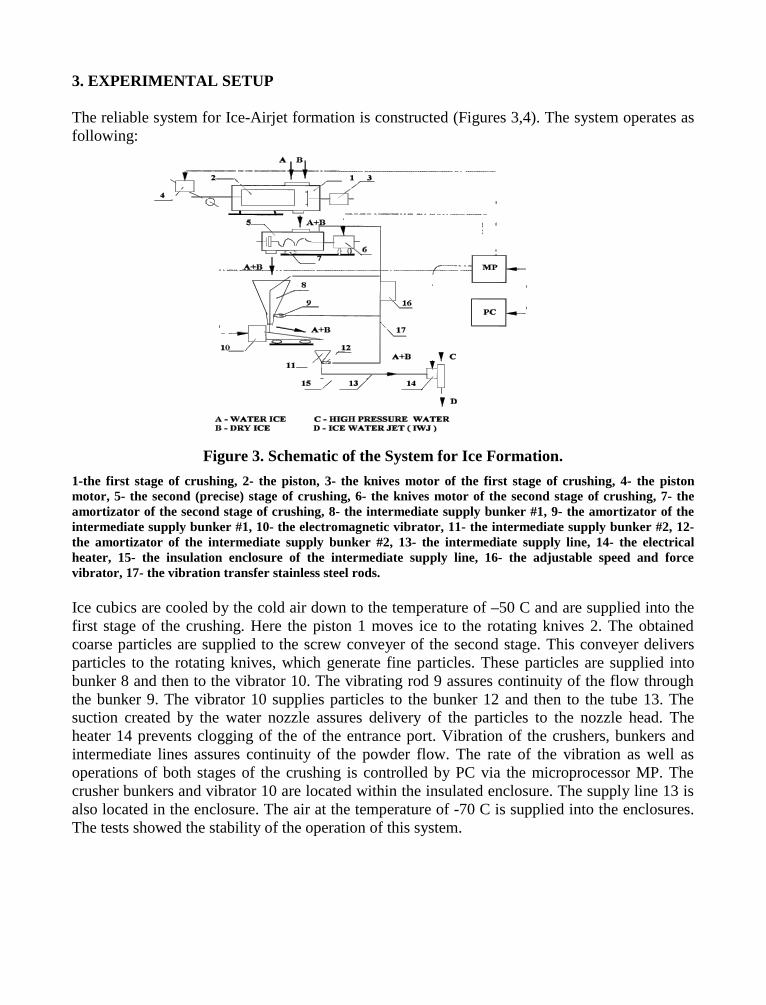
3. EXPERIMENTAL SETUP
The reliable system for Ice-Airjet formation is constructed (Figures 3,4). The system operates asfollowing:
Figure 3. Schematic of the System for Ice Formation.
1-the first stage of crushing, 2- the piston, 3- the knives motor of the first stage of crushing, 4- the pistonmotor, 5- the second (precise) stage of crushing, 6- the knives motor of the second stage of crushing, 7- theamortizator of the second stage of crushing, 8- the intermediate supply bunker #1, 9- the amortizator of theintermediate supply bunker #1, 10- the electromagnetic vibrator, 11- the intermediate supply bunker #2, 12-the amortizator of the intermediate supply bunker #2, 13- the intermediate supply line, 14- the electricalheater, 15- the insulation enclosure of the intermediate supply line, 16- the adjustable speed and forcevibrator, 17- the vibration transfer stainless steel rods.
Ice cubics are cooled by the cold air down to the temperature of –50 C and are supplied into thefirst stage of the crushing. Here the piston 1 moves ice to the rotating knives 2. The obtainedcoarse particles are supplied to the screw conveyer of the second stage. This conveyer deliversparticles to the rotating knives, which generate fine particles. These particles are supplied intobunker 8 and then to the vibrator 10. The vibrating rod 9 assures continuity of the flow throughthe bunker 9. The vibrator 10 supplies particles to the bunker 12 and then to the tube 13. Thesuction created by the water nozzle assures delivery of the particles to the nozzle head. Theheater 14 prevents clogging of the of the entrance port. Vibration of the crushers, bunkers andintermediate lines assures continuity of the powder flow. The rate of the vibration as well asoperations of both stages of the crushing is controlled by PC via the microprocessor MP. Thecrusher bunkers and vibrator 10 are located within the insulated enclosure. The supply line 13 isalso located in the enclosure. The air at the temperature of -70 C is supplied into the enclosures.The tests showed the stability of the operation of this system.
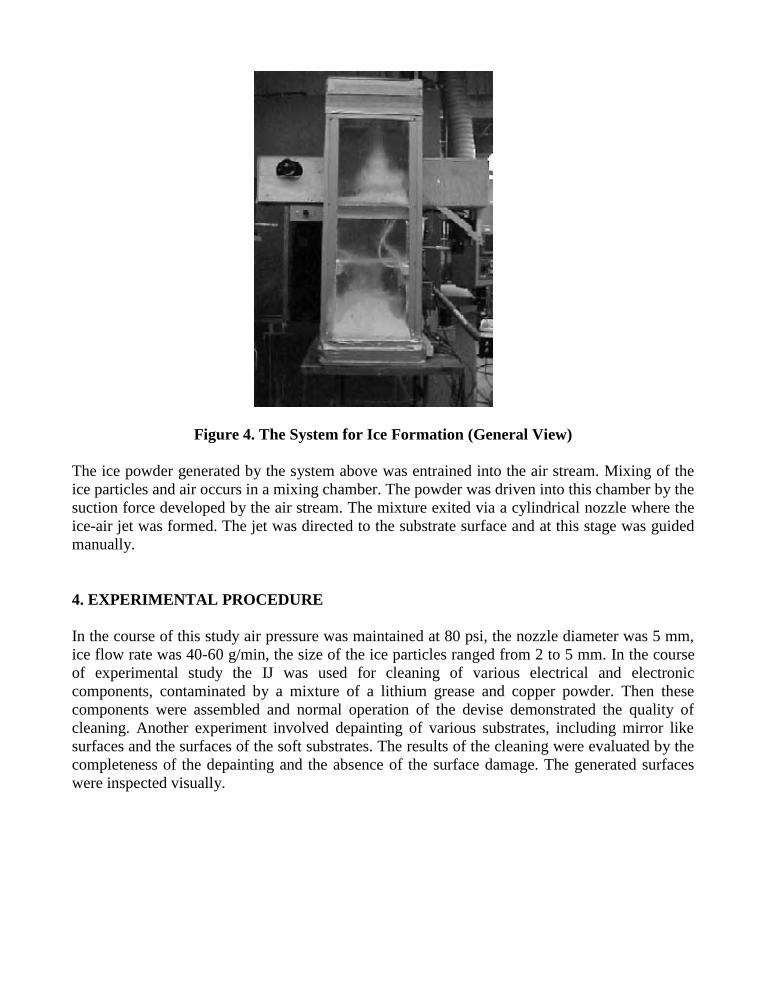
Figure 4. The System for Ice Formation (General View)
The ice powder generated by the system above was entrained into the air stream. Mixing of theice particles and air occurs in a mixing chamber. The powder was driven into this chamber by thesuction force developed by the air stream. The mixture exited via a cylindrical nozzle where theice-air jet was formed. The jet was directed to the substrate surface and at this stage was guidedmanually.
4. EXPERIMENTAL PROCEDURE
In the course of this study air pressure was maintained at 80 psi, the nozzle diameter was 5 mm,ice flow rate was 40-60 g/min, the size of the ice particles ranged from 2 to 5 mm. In the courseof experimental study the IJ was used for cleaning of various electrical and electroniccomponents, contaminated by a mixture of a lithium grease and copper powder. Then thesecomponents were assembled and normal operation of the devise demonstrated the quality ofcleaning. Another experiment involved depainting of various substrates, including mirror likesurfaces and the surfaces of the soft substrates. The results of the cleaning were evaluated by thecompleteness of the depainting and the absence of the surface damage. The generated surfaceswere inspected visually.
5. EXPERIMENTAL RESULTS AND DISCUSSION
A series of experiments were carried out in order to evaluate the potential of the application of IJfor the surface processing. The description of these experiments is given below.
5.1 Cleaning of Electronic Boards
A TV set was disassembled (Fig.A1 (a)) and electronic boards covered by heavy dust. Then theboards were decontaminated by IJ and reassembled. The TV set performed normally (Fig.A1(b)). The architecture of the boards in question was extremely complex and contained a numberof very sensitive sites, like electrical contacts. Any damage to the board components, forexample weakening the contacts or removal of breaking wire will result in the distortion of theset operation. It is obvious that the ice-air stream induced no damage. More difficult taskhowever, was the complete grease removal. Even small portion of the grease remaining at hiddenpockets will distort the set performance. It is clear that the jet was able to remove soil from alldifficult to reach pockets.
Another experiment involved decontamination of the computer boards. Various devises (PC,electronic watches, computer games, etc) were disassembled. The boards were covered by themixture of the lithium grease and then decontaminated by the IJ. Clean boards were reassembledand tested. All devises with no exception worked perfectly. Some of the devises above were usedfor several tests. No deviation in the computer operation was noticed. The boards above werepopulated by a large amount of rather fragile components such as chips, connectors, etc. Anydamage to any of these components, as well as any presence of grease on the board will disablethe devise. In all performed experiments the deposit was removed completely and no damagewas induced to the board components. The examples of the boards decontaminated in the courseof these experiments are shown in Figs. A2 (a) and A2 (b).
5.2. Decoating of Sensitive Surfaces
The experiments involved depainting of a compact disc (CD). The disk was painted. Then thispaint as well as two layers of the coating originally deposited on the disk were removed (Figs.A3 (a) and A3 (b)). The layers were removed separately with no damage to the underliningsurface. Another experiment involved painting and subsequent depainting of the mirror likesurface of the stainless steel (Fig. A4 (a)). No change in the surface topography was noticed.Further experiments involved depainting of china (Fig. A4 (b)), egg (Fig. A5 (a)), and glasslining of pharmaceutical reactors (Fig.A5 (b)). The most representative experiments, however,involved depainting of LC display (Fig.A6 (a)) and degreasing of the optical glass A6 (b).
5.3. Decoating of Soft Substrate
These experiments involved depainting of a soft plastic (Fig.A7 (a)) and fabric (Fig. A7 (b)).Decoating of a substrate having mechanical strength inferior to that of the coat constitutes achallenging task. IJ is able to perform this task.
5.4. Restoration of Electromechanical Devises
A solenoid valve (Fig.A8 (a)) and DC motor (Fig.A8 (b)) were completely disabled by paintingof all contacts. After IJ cleaning the devises performed normally.
5.5. Removal of Highly Adhesive Surface Layer
An aluminum plate was covered by a heavy layer of the tar. Then the tar was removedmechanically from the part of the plate. However, a highly adhesive thin layer remained on thesurface. It was not possible to remove it using mechanical means. The layer was removedcompletely by the ice-airjet (Fig. A9 (a)).
5.6. Etching applications.
An emulsion of a photo film was removed with no damage to the substrate (Fig. A9 (b)). Thisdemonstrates the feasibility of the use of IJ as an etching agent.
6. CONCLUSION
Although the ice waterjet constitutes an effective material removal tool, it is necessary toimprove conditions of the jet formation in order to assure its adoption by the practice. However,the ice-airjet is suitable for immediate application. It can be used for decontamination of verydemanding and complex surfaces as well for such manufacturing applications as etching.Simplicity and complete absence of environmental damage constitute the main advantages of thisprocess. The further development of ice-air surface processing will involve improvement of thecontrol of particles properties and enhancement of material removal by ice particles acceleratedby the air. This enhancement will enable us to modify material polishing, surface modification,and, perhaps, grinding.
7. ACKNOWLEDGEMENT
This study was supported by NSF Grants DDM931758 and DDM931280.
8. REFERENCES
E. S. Geskin, L. Tismenetskiy, E. Bakhromi, F. Li, “Investigation of Ice Jet Machining,”Proceedings of International Symposium on Electric Machining, pp. 833-890,Lausanne, Switzerland, 1995.
E. Geskin, Tismenetskiy, E. Bakhromi, F. Li, “Investigation of Icejet Machining”, Proceedingsof 1995 NSF Design and Manufacturing Grantees Conference, San Diego,CA,1995.
E. Geskin, Tismenetskiy, E. F. Li, “Investigation of Icejet Machining”, Proceedings of 1996NSF Design and Manufacturing Grantees Conference, Albuquerque, NM,1996.
E. Geskin, Tismenetskiy, E. F. Li, D. Shishkin, “Investigation of Icejet Machining,”Proceedings of 1997 NSF Design and Manufacturing Grantees Conference, Seattle,WA, 1997.
E.S. Geskin, L. Tismenetskiy, F. Li, P. Meng and D. Shishkin, “Investigation of IcejetMachining,” Proceedings of 9th American Waterjet Conference, pp. 281-290,Houston, TX, 1997.
E. Geskin, D. Shishkin, K. Babets, “Investigation of Icejet Machining,” Proceedings of 1999NSF Design and Manufacturing Grantees Conference, Long Beach, 1999.
Harima, “Ice Blasting Device and Manufacture of Ice Blasting Ice Grain,” Japanece Patent04360766 A, 1992
B. Herb and S. Visaisouk, “Ice Blast Technology for Precision Cleaning,” Precision Cleaning,pp. 172-179,Witter Publishing Company, Anaheim CA, 1996.
Kanno et al, “Cleaning Device Using Fine Frozen Particles, “ US Patent 5,074,083, 1991.
O.D. Liao, X.D. Zhao and T.Y. Long, “Prediction of Turbulent Flow Field for Dilute PolymerSolution Jets,” Proceedings of 5th American Waterjet Conference, pp. 367-377,Toronto, 1989.
R. Lombardi, “Ultra-High Pressure Non-Abrasive Polymer Jetting, A Production EnvironmentImplementation,” Proceedings of 9th American Waterjet Conference, Dirborn,August, 1997.
F. Li, E. S Geskin, and L. Tismenetskiy, “Development of Icejet Machining Technology,”Proceedings of 8th American Water Jet Conference, pp.671-680, Houston, 1995.
F. Li, E.S. Geskin, L. Tismenetskiy, “Development of Icejet Machining Technology”,Proceeding of XIII International Symposium on Waterjet Technology, pp. 725-734,BHRA, Sardinia, 1996.
W.S. Melvin, and J. Graham, “Method to Demilitarize, Extract and Recover AmmoniumPerchlorate, Composite Propellant Using Liquid Ammonia”, US Patent4854982,1993.
W.S. Melvin, “Method to extract and Recover Nitramine Oxidizers from Solid Propellants UsingLiquid Ammonia,” US Patent 5284995, 1994.
T. Mesher, “Fluidized Stream Acceleration And Pressurizer Apparatus,” US Patent 5,607,478,1997.

R. Niechcial, “Ice Blasting Cleaning System and Method of Blasting,” Inernarnational Patent,Publication, WO 98/36230,1998.
R. Niechcial, “Ice Blasting Cleaning System,” US Patent 5,820,447, 1998.
G. Settles, “Supersonic Abrasive Ice Blasting Apparatus,” US Patent 5,785,581,1998.
H. Shinichi, “Surface Cleaning Method and Device,” Japanese Patent 09225830 A, 1997.
J. Szijcs, “A Method for Cleaning Surfaces,” European Patent 0 509 132 B1, 1991.
M. Tomoji, “A Precision Cleaning Method,” Japanese Patent 04078477, 1990.
S. Vissisouk and S Vixaysouk, “Particles Blasting Using Crystalline Ice,” US Patent 5,367,838,1994.
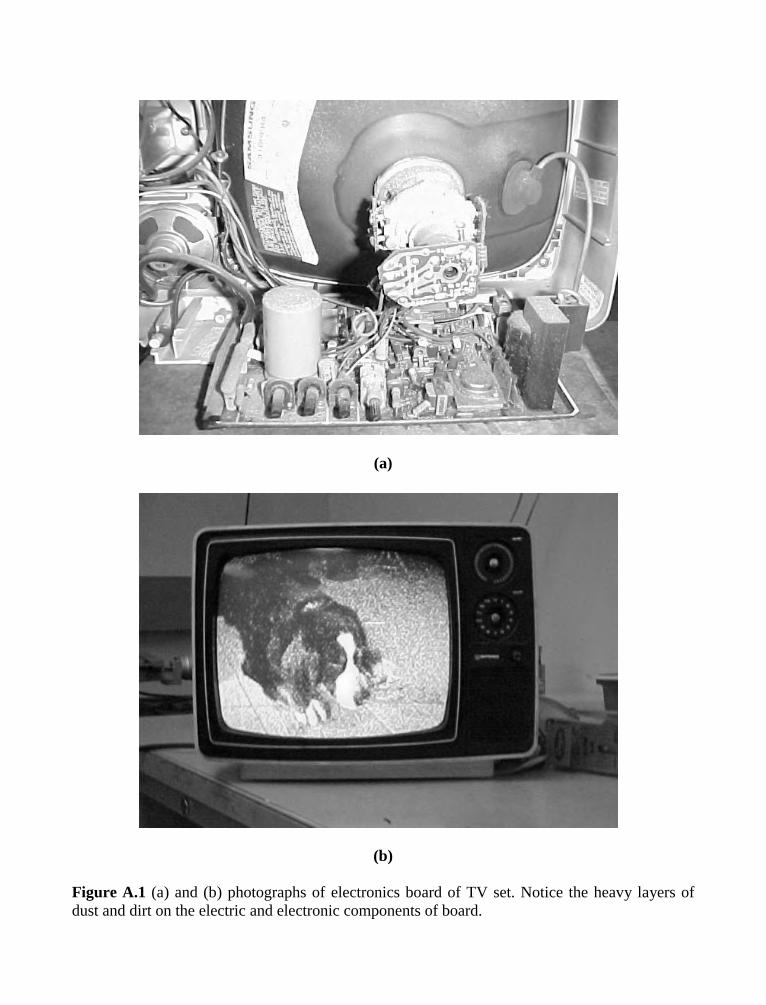
(a)
(b)
Figure A.1 (a) and (b) photographs of electronics board of TV set. Notice the heavy layers ofdust and dirt on the electric and electronic components of board.
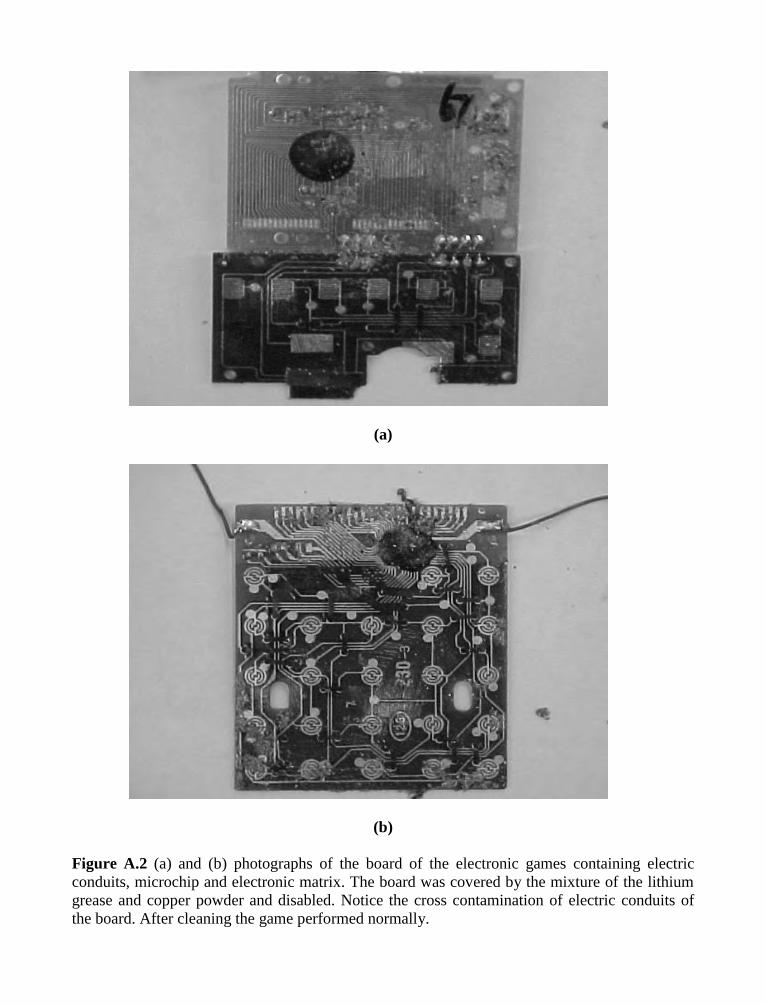
(a)
(b)
Figure A.2 (a) and (b) photographs of the board of the electronic games containing electricconduits, microchip and electronic matrix. The board was covered by the mixture of the lithiumgrease and copper powder and disabled. Notice the cross contamination of electric conduits ofthe board. After cleaning the game performed normally.
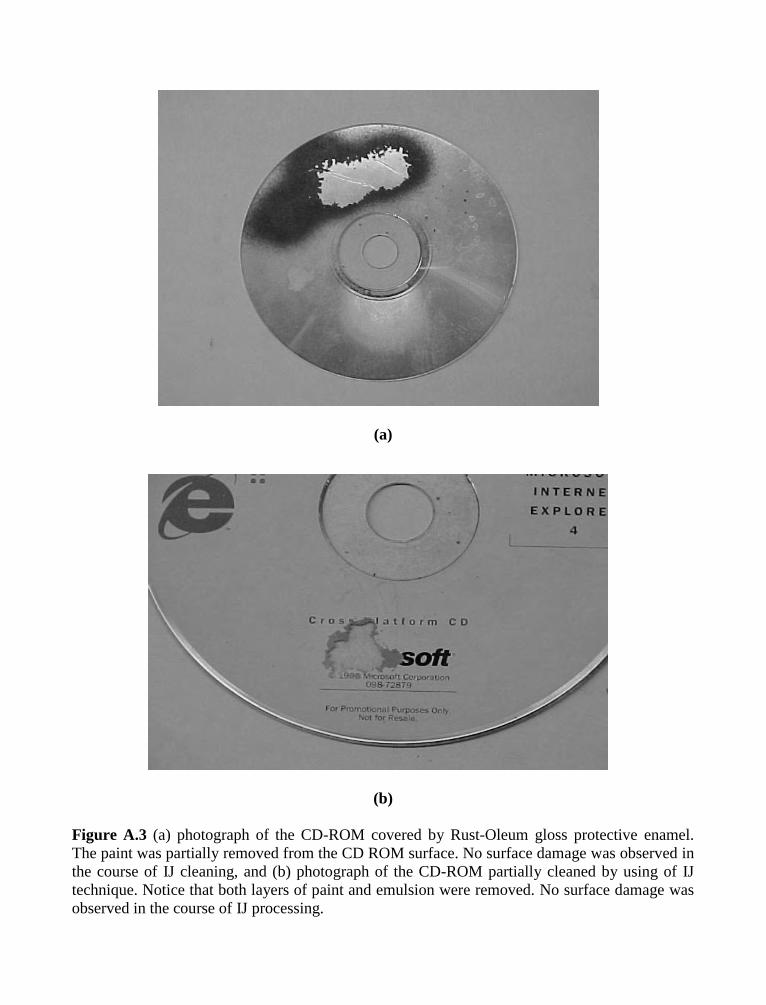
(a)
(b)
Figure A.3 (a) photograph of the CD-ROM covered by Rust-Oleum gloss protective enamel.The paint was partially removed from the CD ROM surface. No surface damage was observed inthe course of IJ cleaning, and (b) photograph of the CD-ROM partially cleaned by using of IJtechnique. Notice that both layers of paint and emulsion were removed. No surface damage wasobserved in the course of IJ processing.
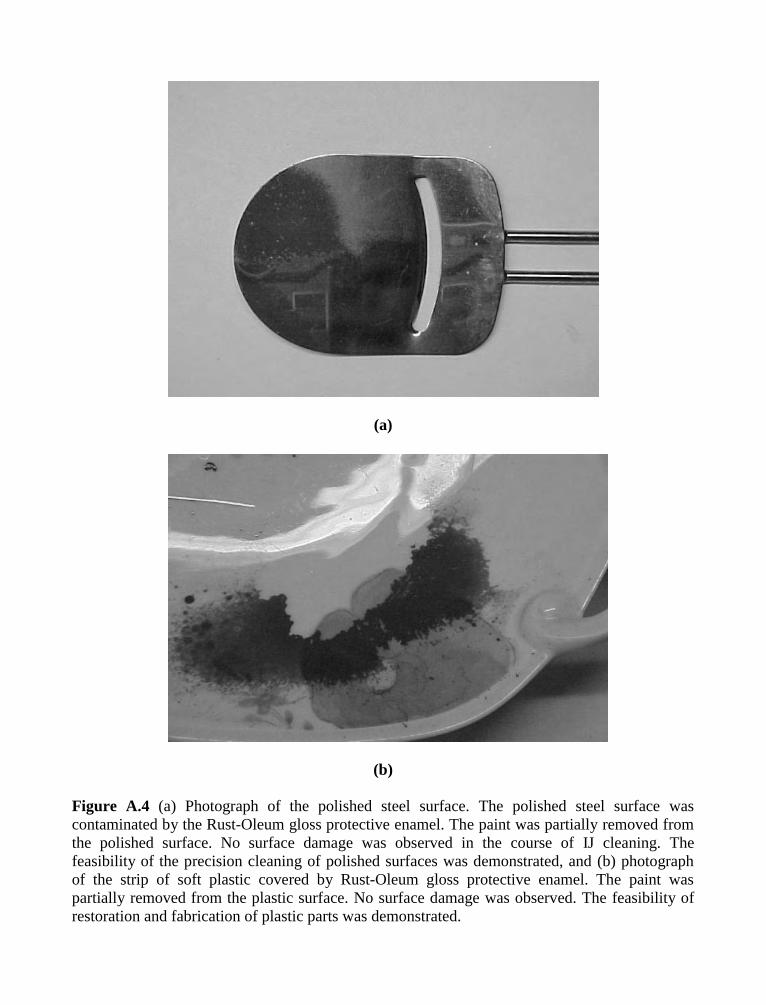
(a)
(b)
Figure A.4 (a) Photograph of the polished steel surface. The polished steel surface wascontaminated by the Rust-Oleum gloss protective enamel. The paint was partially removed fromthe polished surface. No surface damage was observed in the course of IJ cleaning. Thefeasibility of the precision cleaning of polished surfaces was demonstrated, and (b) photographof the strip of soft plastic covered by Rust-Oleum gloss protective enamel. The paint waspartially removed from the plastic surface. No surface damage was observed. The feasibility ofrestoration and fabrication of plastic parts was demonstrated.
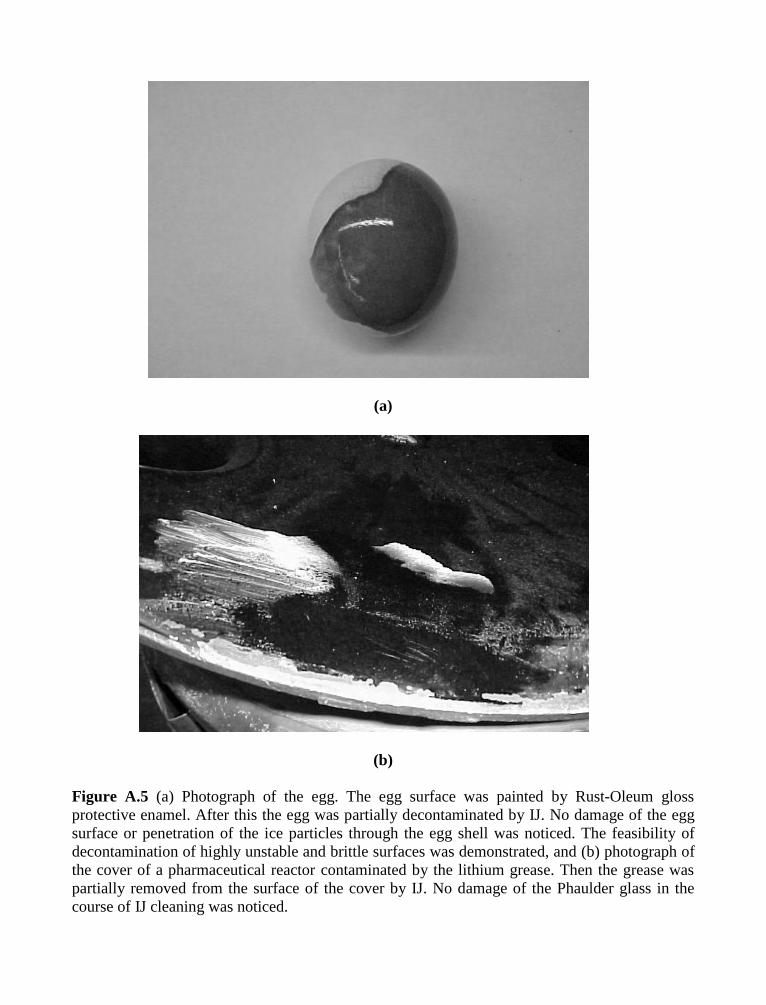
(a)
(b)
Figure A.5 (a) Photograph of the egg. The egg surface was painted by Rust-Oleum glossprotective enamel. After this the egg was partially decontaminated by IJ. No damage of the eggsurface or penetration of the ice particles through the egg shell was noticed. The feasibility ofdecontamination of highly unstable and brittle surfaces was demonstrated, and (b) photograph ofthe cover of a pharmaceutical reactor contaminated by the lithium grease. Then the grease waspartially removed from the surface of the cover by IJ. No damage of the Phaulder glass in thecourse of IJ cleaning was noticed.
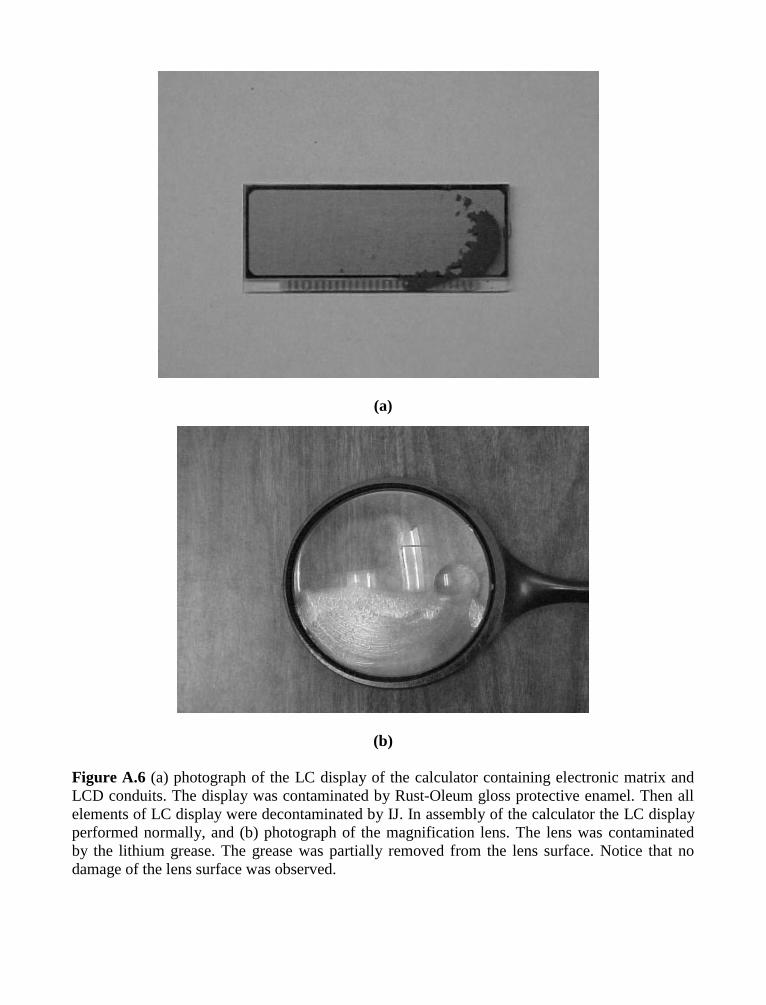
(a)
(b)
Figure A.6 (a) photograph of the LC display of the calculator containing electronic matrix andLCD conduits. The display was contaminated by Rust-Oleum gloss protective enamel. Then allelements of LC display were decontaminated by IJ. In assembly of the calculator the LC displayperformed normally, and (b) photograph of the magnification lens. The lens was contaminatedby the lithium grease. The grease was partially removed from the lens surface. Notice that nodamage of the lens surface was observed.
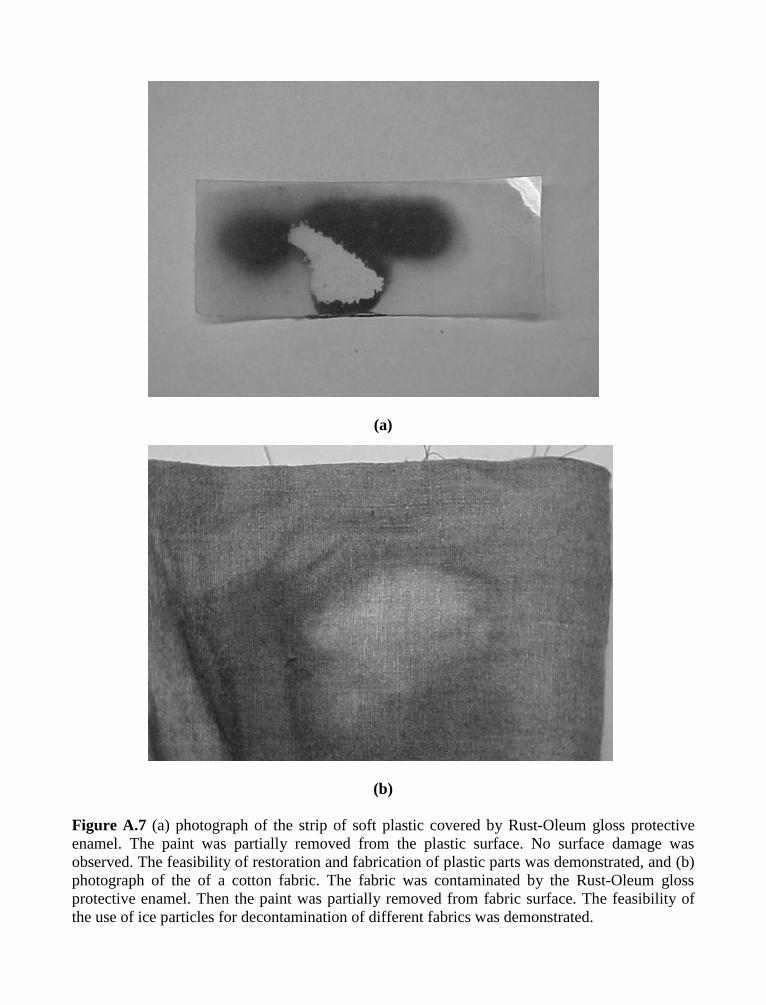
(a)
(b)
Figure A.7 (a) photograph of the strip of soft plastic covered by Rust-Oleum gloss protectiveenamel. The paint was partially removed from the plastic surface. No surface damage wasobserved. The feasibility of restoration and fabrication of plastic parts was demonstrated, and (b)photograph of the of a cotton fabric. The fabric was contaminated by the Rust-Oleum glossprotective enamel. Then the paint was partially removed from fabric surface. The feasibility ofthe use of ice particles for decontamination of different fabrics was demonstrated.
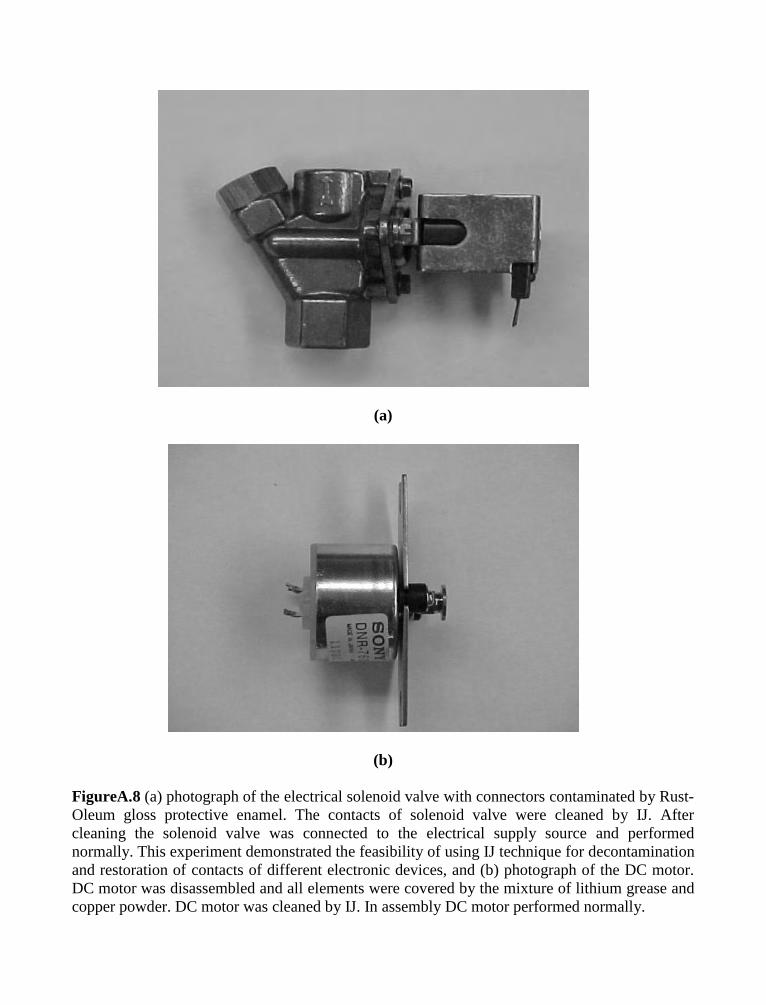
(a)
(b)
FigureA.8 (a) photograph of the electrical solenoid valve with connectors contaminated by Rust-Oleum gloss protective enamel. The contacts of solenoid valve were cleaned by IJ. Aftercleaning the solenoid valve was connected to the electrical supply source and performednormally. This experiment demonstrated the feasibility of using IJ technique for decontaminationand restoration of contacts of different electronic devices, and (b) photograph of the DC motor.DC motor was disassembled and all elements were covered by the mixture of lithium grease andcopper powder. DC motor was cleaned by IJ. In assembly DC motor performed normally.
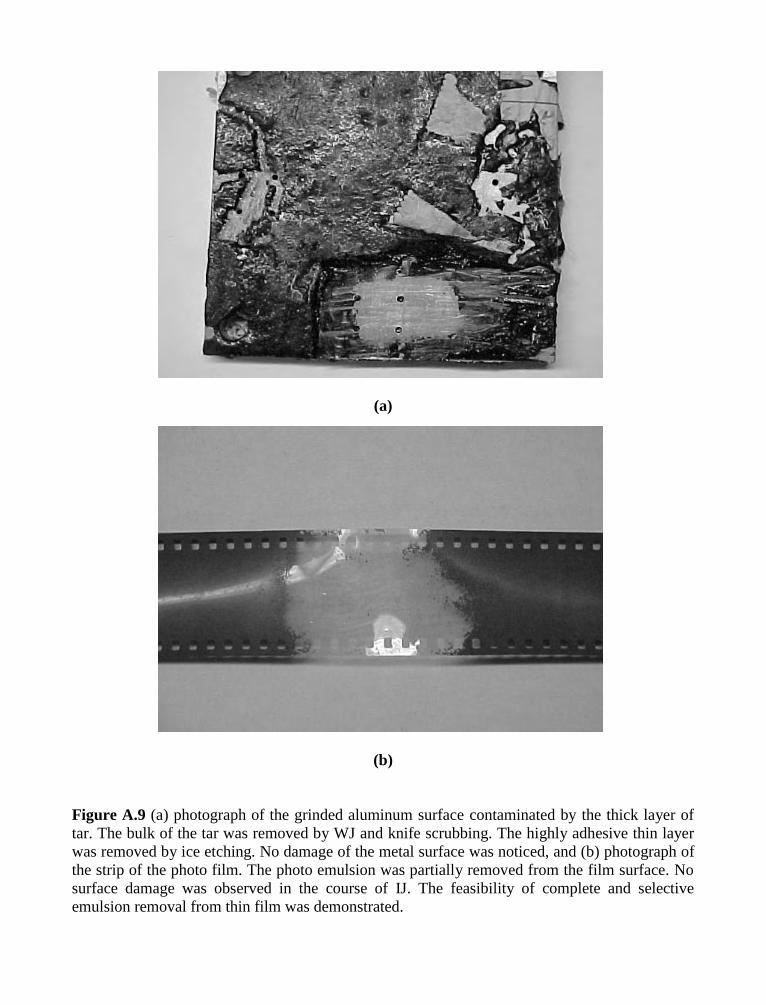
(a)
(b)
Figure A.9 (a) photograph of the grinded aluminum surface contaminated by the thick layer oftar. The bulk of the tar was removed by WJ and knife scrubbing. The highly adhesive thin layerwas removed by ice etching. No damage of the metal surface was noticed, and (b) photograph ofthe strip of the photo film. The photo emulsion was partially removed from the film surface. Nosurface damage was observed in the course of IJ. The feasibility of complete and selectiveemulsion removal from thin film was demonstrated.
10 American Waterjet Conferenceth
August 14-17, 1999: Houston, Texas Paper 23
THE ANALYSIS OF MAGNETOHYDRODYNAMIC
EFFECTS - NEW APPROACH TO THE PULSE JET
I.M. Hlavágová, L.M. HlavágVŠB - Technical University
Ostrava, Czech Republic
ABSTRACT
The improvement of water jet efficiency is required in civil engineering, mining and quarrying.Pulsing jets can contribute to solving of the problems as it was proved many times. However, thereis still a lot to improve in the range of designing of devices producing pulsing jets. It is necessary toreduce strong dependence of pulse jet efficiency on stand-off distance. To make pulse jets workeffectively within a large domain round the optimum stand-off distance the new approaches to thepulse jet generation need to be studied. The magnetohydrodynamics is one of them because it canbe utilised even for control or automation. The theoretical investigation of the liquid streambehaviour provided influenced by hydrodynamic effects is the topic of the paper. The main effortwas aimed at a theoretical derivation of proper parameters triggering such modulation in a liquidstream that amplitude of velocity oscillation downstream is at least five percent of the correspondingunmodulated stream. Results of physical analysis are discussed and they are also used for designingof a device located upstream the resonator generating pulsing jet.
Organized and Sponsored by the WaterJet Technology Association
1. INTRODUCTION
Intensification of liquid jet energy utilization for rock material disintegration has been studied forfew years. The continuous jets have been studied first. Their interaction with rock material has beendescribed by theoretical relationships based on the physics of the inherent processes. Nevertheless,from the point of view of industries like mining, quarrying or civil engineering the efficiency ofcontinuous jets is quite low even when liquid pressure in a pump exceeds 300 MPa. It is supposedthat no further resounding success can be expected regarding the increase of efficiency obtained byspecial treatment of water or use of better nozzles. Studies of abrasive water jets, both injection onesand the ones with direct pumping of slurry, proved that they are not convenient for purposes neededby potential customers from the range of mining, quarrying and civil engineering. It is causedspecially by the fact that maximum traverse rates resulting from the physical substance of theinherent processes are still very low compared with required ones. Pulsing water jets, on the contrary,seem to have some possibilities to eliminate mentioned disadvantages of continuous water jets andabrasive water jets.
This assumption is based on the analysis of effects of the jet impact on material. The theoretical andexperimental studies proved that the jet effect is not steady in time. Analyses of the impact timeevolution show that the initial part of the jet impingement is the most effective period of thedisintegration process on the material surface. This period can be characterized by very rapid growthof the pressure on the contact area. It was proved by Rochester & Brunton (1972), Huang et al.(1972), Daniel et al. (1974), Reinecke (1974), Lesser & Field(1974), and others that the pressurepeak appears several times exceeding the pressure of the liquid jet acting constantly with unalterableparameters if the physical behaviour of the liquid and solid round the contact zone is studied.Therefore, the idea appeared to replace a continuous jet by a pulsing one in which the initial impactshould form much greater part of the interaction time Sami & Ansari (1981), Chahine & Conn(1983), Puchala & Vijay (1984), etc. Thus the effectiveness of the liquid jet should significantlyincrease and it is supposed that it may extend the range of commercial use in above mentionedindustrial spheres. However, the problem is to prepare such a device producing pulsing jets that willbe sufficiently small and simple, easy to manufacture, shockproof and stable in function. TheHelmholtz type resonator is an element that should comply with such conditions provided itproduces sufficient modulation of water jet.
Our effort is aimed at generation of fluctuations in flow. It is related to the up to date studies of theproblems concerning modulated and subsequent pulsing jets because the two basic approaches totheir generation can be mentioned as the most significant ones. One of them is to create interruptionsor changes in liquid flow speed by mechanical tool (e.g. a vibrating tip near the nozzle inlet). Thesecond one is to amplify liquid velocity fluctuations by some type of acoustic resonator (Helmholtzresonator). The second way seems to have some advantages. The question may be, however, to gainadequate initial velocity fluctuations. In this paper an idea is adumbrated and discussed to use anelectromagnetic field for generation of definite perturbances of velocity as preliminary fluctuationsfor the reason that Helmholtz resonator can produce pulsing water jet of required parameters evenfor liquid pressures higher than 300 MPa and nozzle diameters between 0.1 and 0.5 mm.
lo
vm
%mfm
lo
vm
4mfm
vm vo
2µnopo
'
(1)
(2)
(3)
2. THEORY OF PULSING JETS
Generation of pulsing jet means that liquid jet should break due to inherent fluctuations into separatedrops in a certain distance l from a nozzle outlet. This distance ought to be quite short and it can beo
determined from relationships derived by Sami & Ansari (1981) or Chahine & Conn (1983) providedjet fluctuations can be described within the range of their presumptions. They presumed that jetvelocity fluctuates round an average value v with frequency f and amplitude v. Resultingm m
relationships of their analyses slightly differ from each other. Equation derived by Sami & Ansari(1981) has the following shape.
Chahine & Conn (1983) derived the equation with different constant.
Evidently there is no explicit relationship between distance necessary for pulsing jet formation andthe nozzle diameter. Nevertheless, both modulation ratio m and frequency f depend on it.m
Theoretical analysis of relationship (1) has been made regarding influence of water pressure,modulation ratio and frequency and results are presented in Fig. 1 through 3. Limiting the distanceof jet breakage l by demands of practice, it is considered to be an independent variable in theo
derivation of resonator parameters. The average jet velocity is determined by water pressure. Theaverage jet velocity is calculated from equation (3).
v is the medium outlet velocity of a liquid stream core. Parameter µ depends on the nozzle outleto n
diameter. Using equations (1) and (3) the range of parameters m and f can be determined form
pressures p and distances l resulting from practical demands. Typical breakage length l , necessaryo o o
for practice, lies between 20 and 100 mm. The respective modulation ratio decreases fromapproximately 0.65 to 0.13 within the mentioned scope of l for frequency 15 kHz and pressureo
350 MPa (see Fig. 2). Calculations of necessary modulation frequency for pressure 350 MPa,provided the modulation ratio is close to 0.15 (Fig. 3), yield values decreasing from approximately100 to 13 kHz for appropriate breakage length. Such high frequencies can be quite sufficientlygenerated by electric field. Thus the idea originated to premodulate the liquid stream by influenceof magnetohydrodynamic effects in flowing liquid.
L pqw
w
4
fp
pqwcw
4L
fr
cs
2%dr
di
Lr
1/2
cs 1
po'o
(4)
(5)
(6)
(7)
3. BRIEF THEORY OF RESONATORS
Basic common condition for length of a resonator similar to organ-pipe (the resonator with an openend) is determined by equation
Knowing the wave speed in medium inside the resonator, the equation (4) can be transformed forcalculation of preferable frequency into the equation (5) provided the parameter p is number ofquarter-wavelengths
The physical relationships described by equations (4) and (5) are valid for all types of resonators.However, Shen Zhong Hou & Wang Zhi Ming (1988) derived another equation. Their equation isto describe further conditions for frequency of Helmholtz resonators.
The parameters c , f , L can be determined from liquid properties and demands on resonator size.s r r
Nevertheless, it is necessary to consider the conclusions obtained during analyses of equation (1).Studying graphs shown in Fig. 1 through 3 we can realise that frequency for generation of pulsingjet ranges between 20 and 100 kHz according to equations presented in section 2, assuming themodulation ratio could be approximately 0.1, water pressure is 350 MPa and jet breakage length liesbetween 20 and 100 mm. Demand of practice is to minimize geometrical size of device producingpulsing jets. Therefore the presumption can be made that length of the resonator L is close tor
10 mm. Using equation (5) the frequency for assumed resonator length, medium pressure inside theresonator and number of quarter-wavelength p can be determined provided the relationship betweenliquid compressibility and sound speed c is known.po s
The relationship between liquid compressibility and equivalent sound speed is expressed by equation
po po.1014
f e 'eE j ×B 12JoE2
/Jr 12
µoH 2/µr
12Jo/ E2
0Jr
0''
12
µo/ H 20µr
0''
f e 'eE j ×B
(8)
(9)
(10)
Supposing the liquid is pure water the equation (7) can be completed by equation derived forrelationship between liquid pressure and compressibility by regression of experimental data tabledby BroÓ et al. (1980).
Changes of compressibility regarding water pressure are graphically expressed in Fig. 4. Changesof sound speed in compressed water are shown in Fig. 5. Using equations (5), (7) and (8) thefrequency approximately 48 kHz is determined for longitudinal waves in the resonator with thelength 10 mm provided only one quarter-wavelength is present in a resonator. Calculation was madefor water pressurized to 350 MPa. Nevertheless, the modulation ratio for this pressure and breakagelength between 20 mm and 100 mm need to range within 0.2 and 0.04 respectively. Supposing themodulation ratio about 0.1 has to be achieved by common resonator with gain near 10 we need tointroduce fluctuations about 0.01 of the average velocity into flow upstream the resonator.Fluctuations of velocity with such a high frequency are supposed to be excited using variable electricand magnetic fields.
4. THEORETICAL DESCRIPTION OF THE PROBLEM
The derivation is based on the physical phenomenon that moving charges change their directionsunder the influence of the magnetic field having non-zero component perpendicular to the velocityvector. This phenomenon is usually described subsequently. A conducting fluid moving througha magnetic field may induce an electric field and consequently a current that interacts in turn withthe magnetic field to produce a body force on the fluid. This behaviour is caused by free chargesinside conducting fluid moving inside magnetic field thus subjected to an influence of the Lorentzforce. The complete electromagnetic body force in a conducting fluid may be derived, microscopically,from the Coulomb law, or by a virtual work and energy method. The body force density in the restframe is given by
In magnetohydrodynamics only the first two terms are important. These two terms are covariant, i.e.the expressions hold in any frame of reference, so that
fi 0Tij
0xi
0gi
0 t
Tij 12
(D #E B #D ) ij Di Ej bi Hj
1 12
H #B, 2 3 12
H #B
(11)
(12)
(13)
Alternative description is given by the electromagnetic stress tensor. The body force density is givenby relationship expressed by equation
where g is the electromagnetic momentum flux vector. The electromagnetic stress tensor T (if thei ij
striction effects are neglected) is expressed by
For all practical purposes the term 0g /0t is negligible and it is of no concern in problems related toi
magnetohydrodynamics. We can diagonalize the stress tensor thus determining the principal stresses.To simplify the equations (9) through (12) some basic assumptions which are valid inmagnetohydrodynamic problems were introduced:
the electric terms in the stress tensor are negligible (as the electric field is of order v × B and Efields involved are induced or of the order of the induced field);
B and H are collinear (we are dealing with nonrelativistic speeds, all velocities are smallcompared to that of light, so that the term v /c « 1.).2 2
The result for the three principal stresses obtained using presented approach isi
and the three principal axes are oriented so that is a tension along the magnetic field lines and 1 2
and represent a compression normal to the field lines. We can say that there is a hydrostatic3
compression of H#B/2 with a tension of H#B (along the field lines) superposed on the hydrostaticcompression. This body force, however, is not a physical tension or pressure in the fluid, but it entersinto a momentum equation as a body force and consequently may generate mechanical stresses. Instatic equilibrium, the pressure gradient must be balanced out by the tensor divergence of theelectromagnetic stress tensor, which physically is a body force.
The basic equations of magnetohydrodynamics can then be written as the Maxwell equations, Ohm’slaw, the equation of continuity, the equation of motion with the j × B body force (the Maxwellequation / × B = j + D’ was used together with the fact that D’ is negligible) and the energy equationwith Joule heating. In all magnetohydrodynamic problems, even in unsteady ones, it is supposed thatspace charge transport is negligible compared to j. We must also use nonrelativistic Lorentztransformations.
/×H j
/#B 0
/×E 0B0 t
0
/# j 0
j ) (E v × B )
j z ) (Ez uBo)
'0v0 t
(v#/ )v /p /#- j × B '/5
(14)
(15)
(16)
(17)
The complete solution of a real problem would be rather complicated but the analysis of a simplifiedproblem (known as the Hartmann’s problem) may be sufficient for the rough estimation whether itwould be possible to use magnetohydrodynamic effects for high energy liquid jet modulation.
Let us discuss a steady flow of an electrically conducting, viscous, incompressible fluid betweenparallel plates with an applied transverse magnetic field. We assume the flow to be fully developedso that only pressure varies in the x direction. Velocity of the fluid can be written as v = (u,v,w) andfrom the equation of continuity v = w = 0.
The channel extent in the z direction is much greater than in the y direction so that no variationsoccur with z. The electrodes are assumed to be perfect conductors, and the fluid has conductivity ).The applied magnetic field B is steady and uniform. We can list all the equations for this problem:o
Maxwell equations:
From / # j = 0 we conclude that j must only depend on y and so thez
Ohm’s law
would take form
Equation of motion
where 5 is the gravitational potential (which can be neglected) and - is the mechanical stress tensor.For a Newtonian fluid it is assumed that the stress tensor is linearly related to the strain rate tensore defined by the following equationsij
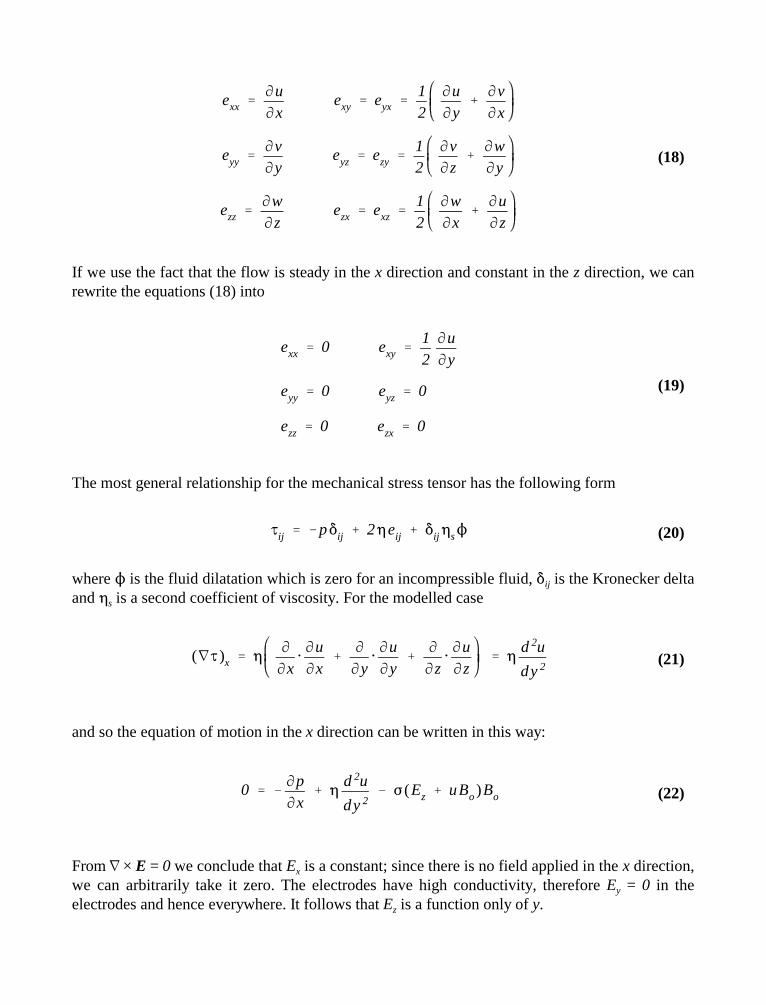
exx 0u0x
exy eyx 12
0u0y
0v0x
eyy 0v0y
eyz ezy 12
0v0z
0w0y
ezz 0w0z
ezx exz 12
0w0x
0u0z
exx 0 exy 120u0y
eyy 0 eyz 0
ezz 0 ezx 0
-ij p ij 2eij ij s1
(/- )x 0
0x#0u0x
0
0y#0u0y
0
0z#0u0z
d2u
dy2
0 0p0x
d2u
dy2 ) (Ez uBo)Bo
(18)
(19)
(20)
(21)
(22)
If we use the fact that the flow is steady in the x direction and constant in the z direction, we canrewrite the equations (18) into
The most general relationship for the mechanical stress tensor has the following form
where 1 is the fluid dilatation which is zero for an incompressible fluid, is the Kronecker deltaij
and is a second coefficient of viscosity. For the modelled cases
and so the equation of motion in the x direction can be written in this way:
From / × E = 0 we conclude that E is a constant; since there is no field applied in the x direction,x
we can arbitrarily take it zero. The electrodes have high conductivity, therefore E = 0 in they
electrodes and hence everywhere. It follows that E is a function only of y. z

u 1
)B2o
#0p0x
Ez
Bo
cosh Bo)
y
cosh Bo)
yo
1
M B2o y2
o)
j z )Ez
cosh M yyo
coshM
yo
M)
0p0x
cosh M yyo
coshM 1
dHx
dy j z )Ez
cosh M yyo
coshM
yo
M)
0p0x
cosh M yyo
coshM 1
Hx
y2o
M)
0p0x
yyo
y2
M)
0p0x
I
2L
sinh Myyo
sinhM
(23)
(24)
(25)
(26)
(27)
The boundary conditions u = 0 and y = ± y give solution in the form 0
Introducing the Hartmann’s number M
and putting the solution into the Ohm’s law, we can find j asz
It is possible to determine the induced magnetic field H now, using the Maxwell equation / × H = jx
which after integration gives
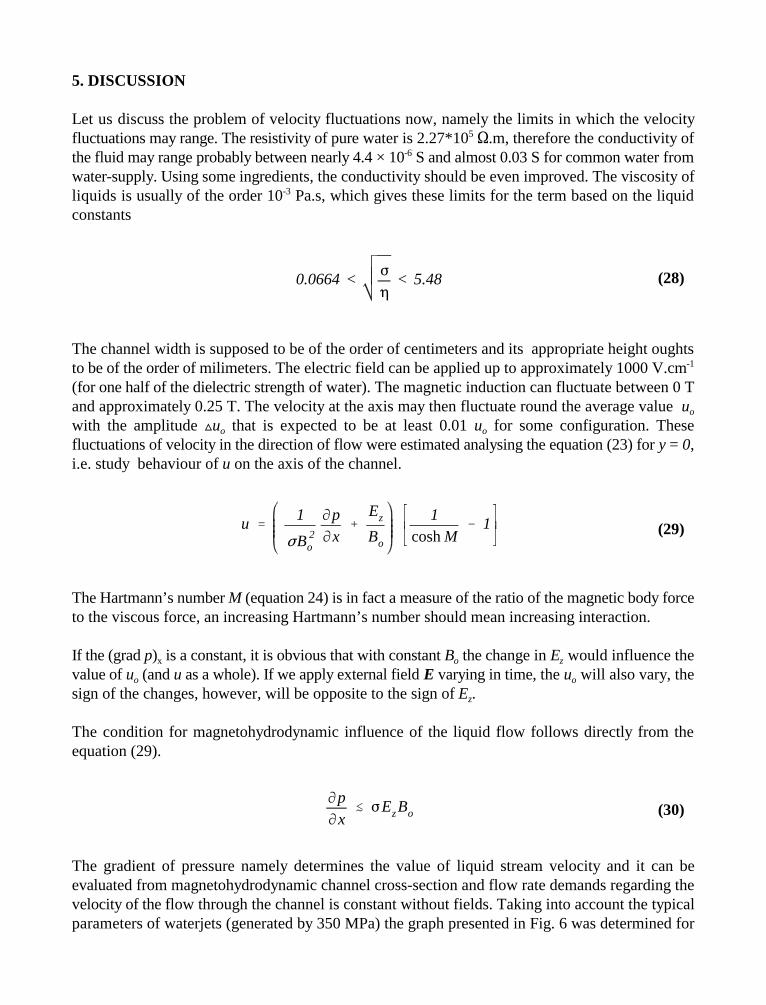
0.0664<)
< 5.48
u 1
)B2o
0p0x
Ez
Bo
1coshM
1
0p0x
)EzBo
(28)
(29)
(30)
5. DISCUSSION
Let us discuss the problem of velocity fluctuations now, namely the limits in which the velocityfluctuations may range. The resistivity of pure water is 2.27*10 6.m, therefore the conductivity of5
the fluid may range probably between nearly 4.4 × 10 S and almost 0.03 S for common water from-6
water-supply. Using some ingredients, the conductivity should be even improved. The viscosity ofliquids is usually of the order 10 Pa.s, which gives these limits for the term based on the liquid-3
constants
The channel width is supposed to be of the order of centimeters and its appropriate height oughtsto be of the order of milimeters. The electric field can be applied up to approximately 1000 V.cm-1
(for one half of the dielectric strength of water). The magnetic induction can fluctuate between 0 Tand approximately 0.25 T. The velocity at the axis may then fluctuate round the average value uo
with the amplitude u that is expected to be at least 0.01 u for some configuration. Theseo o
fluctuations of velocity in the direction of flow were estimated analysing the equation (23) for y = 0,i.e. study behaviour of u on the axis of the channel.
The Hartmann’s number M (equation 24) is in fact a measure of the ratio of the magnetic body forceto the viscous force, an increasing Hartmann’s number should mean increasing interaction.
If the (grad p) is a constant, it is obvious that with constant B the change in E would influence thex o z
value of u (and u as a whole). If we apply external field E varying in time, the u will also vary, theo o
sign of the changes, however, will be opposite to the sign of E .z
The condition for magnetohydrodynamic influence of the liquid flow follows directly from theequation (29).
The gradient of pressure namely determines the value of liquid stream velocity and it can beevaluated from magnetohydrodynamic channel cross-section and flow rate demands regarding thevelocity of the flow through the channel is constant without fields. Taking into account the typicalparameters of waterjets (generated by 350 MPa) the graph presented in Fig. 6 was determined for
the relationship between a magnetic field induction and potential modulation ratio of the velocityprovided the electric field of specified parameters is applied. The channel dimensions are10×10×2 mm and the voltage is 1000 V. It is evident that such a configuration of parameters existsthat the fluctuations exceeding 0.01 of the maximum velocity value are induced. These fluctuationsare supposed to be sufficiently intensified by Helmholtz resonator.
Theoretical studies of the physical relationships in Helmholtz resonators indicate, however, thatdesigning of this type of resonator for very high pressures is a great problem. It is caused especiallyby the fact that the diameter of the resonant cavity has to be very small (as it follows up directly fromequation 6). It is even questionable if the resonant cavity can be considered a resonator of Helmholtztype because resulting cavities are very similar to a shallow cavity. Nevertheless, this knowledgecorresponds with Rockwell & Naudascher (1978) who classed the Helmholtz resonator with shallowcavities. However, a very precious accuracy of all dimensions is needed because small differencesyield large changes in output behaviour of produced jet. Therefore, it is necessary to determine theinitial parameters and demands exactly. Anyway many configurations need to be theoreticallyanalysed before choosing the most suitable one. Nevertheless, designing the Helmholtz resonator forproducing of pulsing jets, it is necessary to keep in mind that the breakage length should be suitablefor practice. This demand helps to limit the range for product of modulation ratio and frequency. Thepractical demands help to prescribe also some cavity dimensions, e.g. cavity length and diameter ofthe outlet nozzle. The criterion of manufacturing ability is the decisive one and gives the limits tothis type of pulse jet generation from highly pressurized water (p 300 MPa).o
6. CONCLUSIONS
The most important results of the presented theoretical analysis aimed at magnetohydrodynamicinfluence of a liquid stream as an element creating primary fluctuations with determined frequencyfor Helmholtz resonators can be summarized in the following few remarks:d the frequency of modulation must be higher than 20 kHz for water pressures exceeding 300 MPa;d the modulation ratio of the outlet velocity of the jet, for breakage length closed to practice, lies
between 0.04 and 0.4, depending on frequency of modulation for water pressures higher than300 MPa;
d the magnetohydrodynamic phenomenon can be utilized for generation of the primary fluctuationsof determined frequency and amplitude;
d the dimensions of elements, resulting from presented theoretical analyses, seem to be workablein practice.
7. ACKNOWLEDGEMENTS
The authors are grateful to the Grant Agency of the Czech Republic for supporting the workpresented in this paper by project 106/98/1354.
8. REFERENCES
BroÓ, J., Roskovec, V., Valouch, M., "Physical and mathematical tables," SNTL, Prague, 1980.
Chahine, G.L., and Conn, A.F., "Passively-Interrupted Impulsive Water Jets," Proceedings of the 6thInternational Conference on Erosion by Liquid and Solid Impact, pp. 34:1-9, Cambridge,England, 1983.
Daniel, I.M., Rowlands, R.E., and Labus, T.J.: “Photoelastic Study of Water Jet Impact,”Proceedings of the 2nd International Symposium on Jet Cutting Technology, Paper A1,BHRA, Cranfield, Bedford, England, 1974.
Huang, Y.C., Hammitt, F.C., and Yang, W.J.: “Mathematical Modelling of Normal Impact Betweena Finite Cylindrical Liquid Jet and Non-Slip, Flat Rigid Surface,” Proceedings of the 1stInternational Symposium on Jet Cutting Technology, Paper A4: pp. 57-68, BHRA, Cranfield,Bedford, England, 1972.
Lesser, M.B., and Field, J.E.: “The Fluid Mechanics of Compressible Liquid Impact,” Proceedingsof the 4th International Conference on Rain Erosion and Associated Phenomena, pp. 235-269, RAE, Farnborough, United Kingdom, 1974.
Puchala, R.J., and Vijay, M.M.: “Study of an Ultrasonically Generated Cavitating or Interrupted Jet:Aspects of Design,” Proceedings of the 7th International Symposium on Jet CuttingTechnology, Paper B2: pp. 69-82, BHRA, Cranfield, Bedford, England, 1984.
Reinecke, W.G.: “Rain Erosion at High Speeds,” Proceedings of the 4th International Conferenceon Rain Erosion and Associated Phenomena, pp. 209-234, RAE, Farnborough, UnitedKingdom, 1974.
Rochester, M.C., Brunton, J.H.: “High Speed Impact of Liquid Jets on Solids,” Proceedings of the1st International Symposium on Jet Cutting Technology, Paper A1: pp. 1-24, BHRA,Cranfield, Bedford, England, 1972.
Rockwell, D., Naudascher, E., "Review - Self-Sustaining Oscillations of Flow Past Cavities,"Transactions of the ASME - Journal of Fluids Engineering, Vol. 100, pp. 152-165, 1978.
Sami, S., and Ansari, H., "Governing Equations in a Modulated Liquid Jet," Proceedings of the 1stU.S. Water Jet Symposium, pp. I-2.1-9, Water Jet Technology Association, St. Louis,Missouri, 1981.
Shen Zhong Hou, and Wang Zhi Ming, "Theoretical analysis of a jet-driven Helmholtz resonator andeffect of its configuration on the water jet cutting property," Proceedings of the 9thInternational Symposium on Jet Cutting Technology, pp. 189-201, BHRA, Cranfield,Bedford, England, 1988.
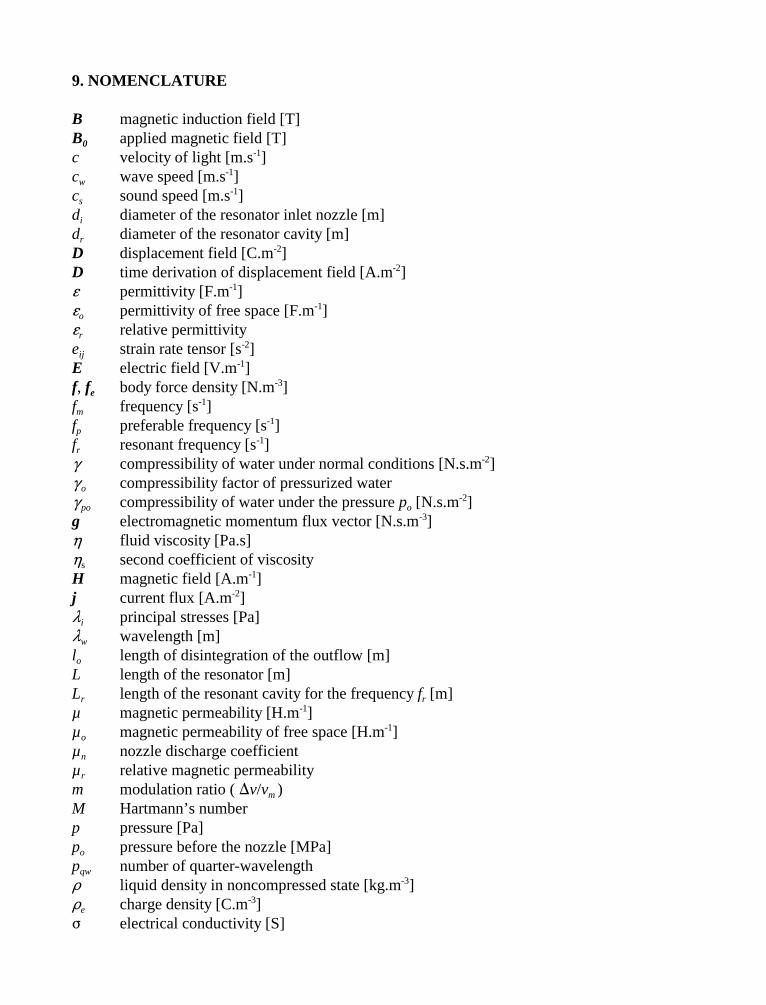
9. NOMENCLATURE
B magnetic induction field [T]B applied magnetic field [T]0
c velocity of light [m.s ]-1
c wave speed [m.s ]w-1
c sound speed [m.s ]s-1
d diameter of the resonator inlet nozzle [m]i
d diameter of the resonator cavity [m]r
D displacement field [C.m ]-2
D time derivation of displacement field [A.m ]-2
J permittivity [F.m ]-1
J permittivity of free space [F.m ]o-1
J relative permittivityr
e strain rate tensor [s ]ij-2
E electric field [V.m ]-1
f, f body force density [N.m ]e-3
f frequency [s ]m-1
f preferable frequency [s ]p-1
f resonant frequency [s ]r-1
compressibility of water under normal conditions [N.s.m ]-2
compressibility factor of pressurized watero
compressibility of water under the pressure p [N.s.m ]po o-2
g electromagnetic momentum flux vector [N.s.m ]-3
fluid viscosity [Pa.s] second coefficient of viscositys
H magnetic field [A.m ]-1
j current flux [A.m ]-2
principal stresses [Pa]i
wavelength [m]w
l length of disintegration of the outflow [m]o
L length of the resonator [m]L length of the resonant cavity for the frequency f [m]r r
µ magnetic permeability [H.m ]-1
µ magnetic permeability of free space [H.m ]o-1
µ nozzle discharge coefficientn
µ relative magnetic permeabilityr
m modulation ratio ( v/v )m
M Hartmann’s numberp pressure [Pa]p pressure before the nozzle [MPa]o
p number of quarter-wavelengthqw
' liquid density in noncompressed state [kg.m ]-3
' charge density [C.m ]e-3
) electrical conductivity [S]

t time [s]T electromagnetic stress tensor [Pa]ij
- mechanical stress tensor [Pa]ij
u x component of velocity [m.s ]-1
v y component of velocity [m.s ]-1
v velocity vector [m.s ]-1
v medium velocity of modulated jet [m.s ]m-1
v outlet velocity of the resonator [m.s ]o-1
w z component of velocity [m.s ]-1
5 gravitational potential [m.s ]-2
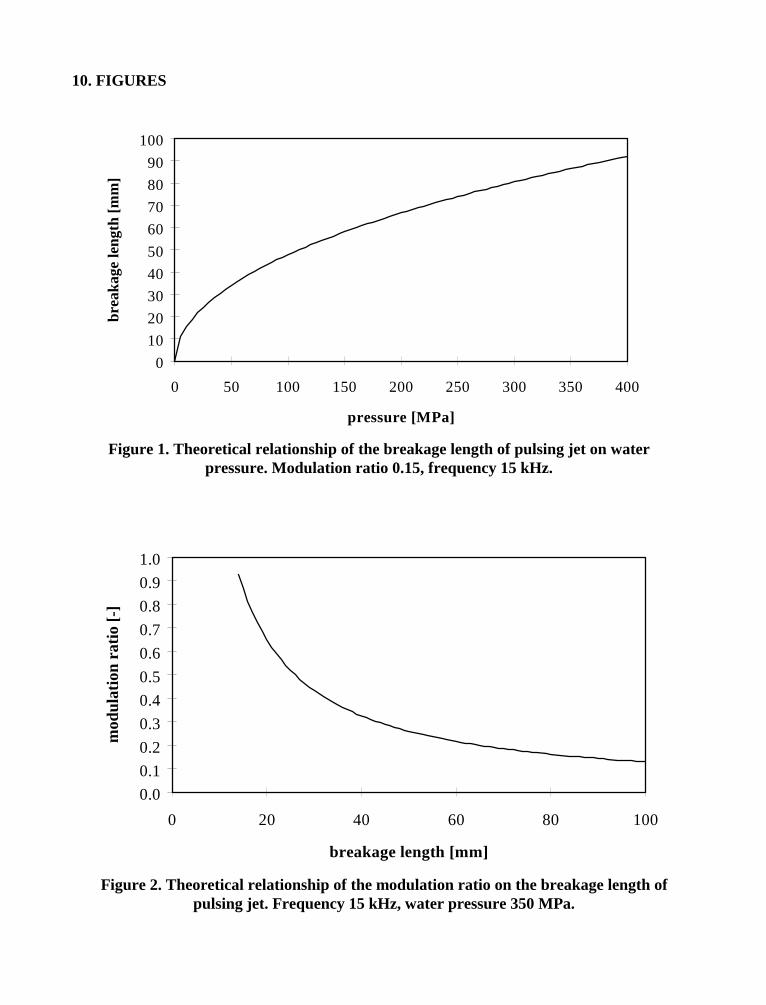
0
10
20
30
40
50
60
70
80
90
100
0 50 100 150 200 250 300 350 400
pressure [MPa]
brea
kage
leng
th [m
m]
0.0
0.1
0.2
0.3
0.4
0.5
0.6
0.7
0.8
0.9
1.0
0 20 40 60 80 100
breakage length [mm]
mod
ulat
ion
ratio
[-]
Figure 1. Theoretical relationship of the breakage length of pulsing jet on waterpressure. Modulation ratio 0.15, frequency 15 kHz.
Figure 2. Theoretical relationship of the modulation ratio on the breakage length ofpulsing jet. Frequency 15 kHz, water pressure 350 MPa.
10. FIGURES
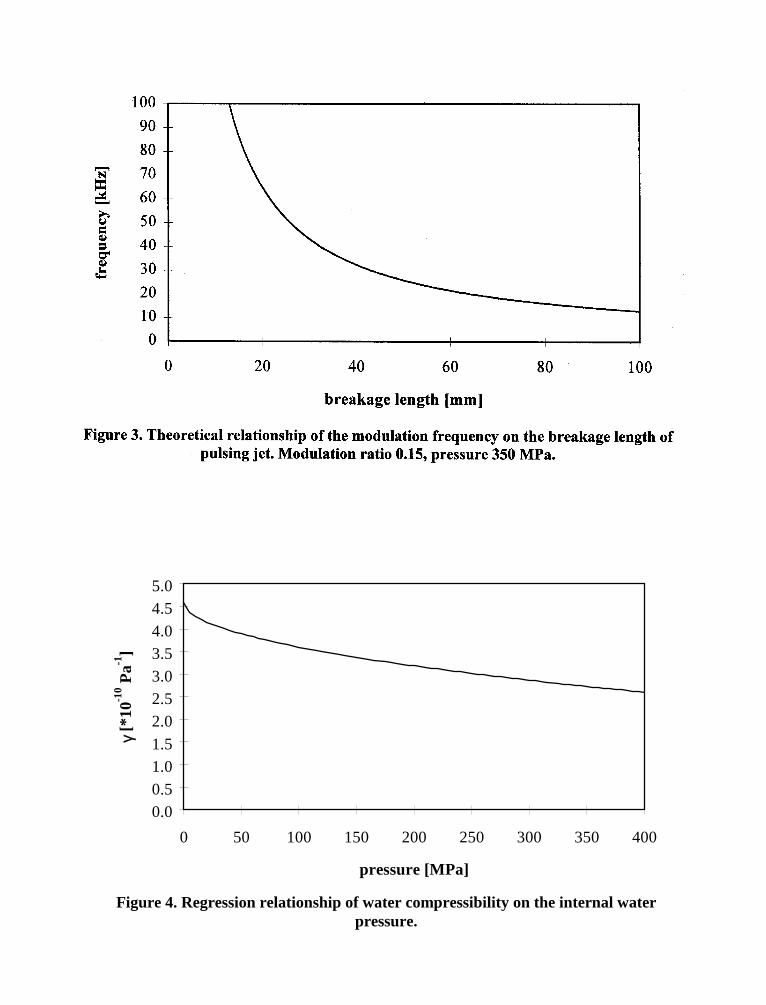
0.00.51.01.5
2.02.53.03.54.04.55.0
0 50 100 150 200 250 300 350 400
pressure [MPa]
γ [*
10-1
0 Pa-1
]
Figure 4. Regression relationship of water compressibility on the internal waterpressure.
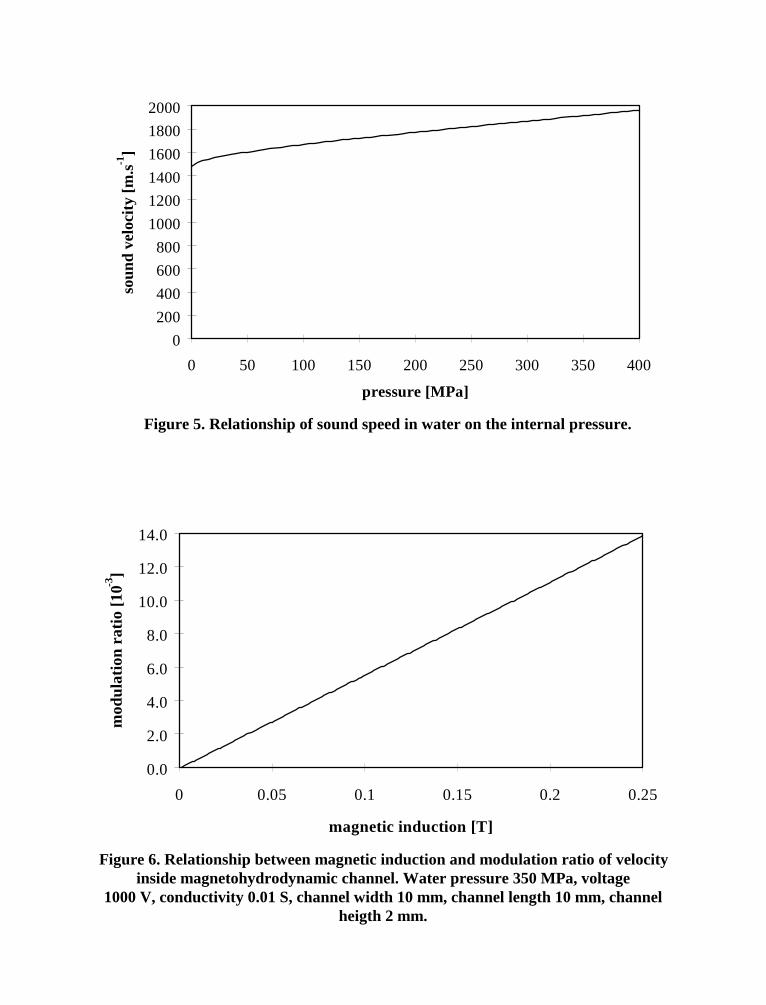
0
200
400
600
800
1000
1200
1400
1600
1800
2000
0 50 100 150 200 250 300 350 400
pressure [MPa]
soun
d ve
loci
ty [m
.s-1]
0.0
2.0
4.0
6.0
8.0
10.0
12.0
14.0
0 0.05 0.1 0.15 0.2 0.25
magnetic induction [T]
mod
ulat
ion
ratio
[10-3
]
Figure 5. Relationship of sound speed in water on the internal pressure.
Figure 6. Relationship between magnetic induction and modulation ratio of velocityinside magnetohydrodynamic channel. Water pressure 350 MPa, voltage
1000 V, conductivity 0.01 S, channel width 10 mm, channel length 10 mm, channelheigth 2 mm.
10th American Waterjet ConferenceAugust 14-17, 1999: Houston, Texas
Paper 24
A HIGH EFFICIENCY JET NOZZLE WITH FLOW DEFLECTOR
Chen YufanBeijing JieJing Pipeline-Cleaning Institute
Beijing, P.R. China
Gong Weili, Fang Mei, Xu XiaodongSchool of Resources Engineering,
University of Science & Technology BeijingBeijing, P.R. China
ABSTRACT
The high-pressure water jet cleaning technique has been grown in application. The jet nozzle is akey component in the complete sets of high-pressure water jet cleaning equipment. In order toenhance the jetting efficiency of the jet nozzle, a new type of jet nozzle with flow deflector isproposed in this paper. In the presence of the flow deflector, the generating of the vortices andthe separating of the shear layer are avoided thereby the energy loss of the jet nozzle is reducedconsiderably. The theoretical analyses and experimental study are carried out. The obtainedresults indicate that the jet nozzle with flow deflector is highly efficient in cleaning operation.Both lab tests and on-site application demonstrate that the jetting efficiency of the jet nozzle withflow deflector is much higher than that of the nozzle without flow deflector. And the informationacquired in this study is expected to be useful in the design of the jet nozzle for developing high-pressure water jet cleaning equipment.
Organized and Sponsored by the WaterJet Technology Association
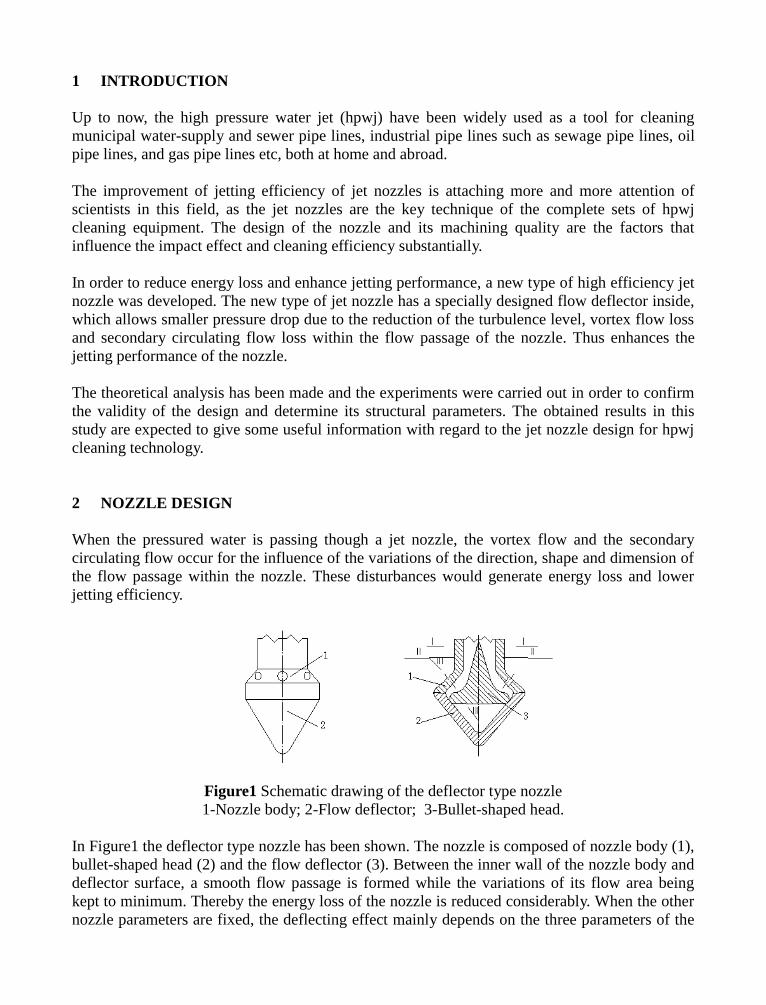
1 INTRODUCTION
Up to now, the high pressure water jet (hpwj) have been widely used as a tool for cleaningmunicipal water-supply and sewer pipe lines, industrial pipe lines such as sewage pipe lines, oilpipe lines, and gas pipe lines etc, both at home and abroad.
The improvement of jetting efficiency of jet nozzles is attaching more and more attention ofscientists in this field, as the jet nozzles are the key technique of the complete sets of hpwjcleaning equipment. The design of the nozzle and its machining quality are the factors thatinfluence the impact effect and cleaning efficiency substantially.
In order to reduce energy loss and enhance jetting performance, a new type of high efficiency jetnozzle was developed. The new type of jet nozzle has a specially designed flow deflector inside,which allows smaller pressure drop due to the reduction of the turbulence level, vortex flow lossand secondary circulating flow loss within the flow passage of the nozzle. Thus enhances thejetting performance of the nozzle.
The theoretical analysis has been made and the experiments were carried out in order to confirmthe validity of the design and determine its structural parameters. The obtained results in thisstudy are expected to give some useful information with regard to the jet nozzle design for hpwjcleaning technology.
2 NOZZLE DESIGN
When the pressured water is passing though a jet nozzle, the vortex flow and the secondarycirculating flow occur for the influence of the variations of the direction, shape and dimension ofthe flow passage within the nozzle. These disturbances would generate energy loss and lowerjetting efficiency.
Figure1 Schematic drawing of the deflector type nozzle1-Nozzle body; 2-Flow deflector; 3-Bullet-shaped head.
In Figure1 the deflector type nozzle has been shown. The nozzle is composed of nozzle body (1),bullet-shaped head (2) and the flow deflector (3). Between the inner wall of the nozzle body anddeflector surface, a smooth flow passage is formed while the variations of its flow area beingkept to minimum. Thereby the energy loss of the nozzle is reduced considerably. When the othernozzle parameters are fixed, the deflecting effect mainly depends on the three parameters of the
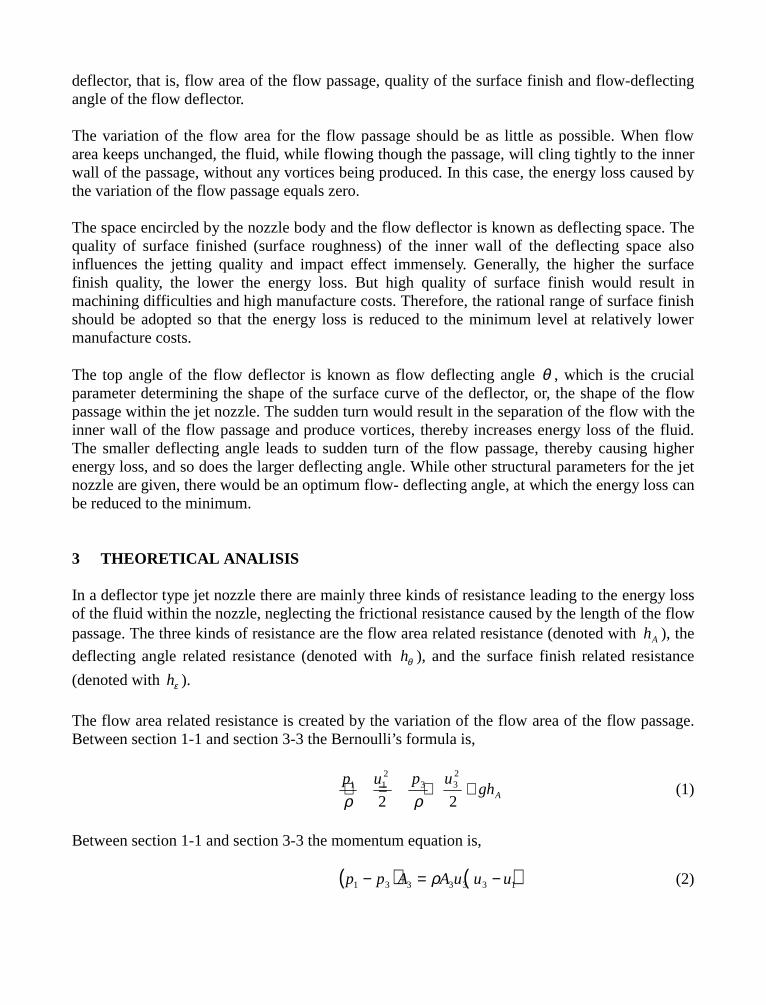
deflector, that is, flow area of the flow passage, quality of the surface finish and flow-deflectingangle of the flow deflector.
The variation of the flow area for the flow passage should be as little as possible. When flowarea keeps unchanged, the fluid, while flowing though the passage, will cling tightly to the innerwall of the passage, without any vortices being produced. In this case, the energy loss caused bythe variation of the flow passage equals zero.
The space encircled by the nozzle body and the flow deflector is known as deflecting space. Thequality of surface finished (surface roughness) of the inner wall of the deflecting space alsoinfluences the jetting quality and impact effect immensely. Generally, the higher the surfacefinish quality, the lower the energy loss. But high quality of surface finish would result inmachining difficulties and high manufacture costs. Therefore, the rational range of surface finishshould be adopted so that the energy loss is reduced to the minimum level at relatively lowermanufacture costs.
The top angle of the flow deflector is known as flow deflecting angle θ , which is the crucialparameter determining the shape of the surface curve of the deflector, or, the shape of the flowpassage within the jet nozzle. The sudden turn would result in the separation of the flow with theinner wall of the flow passage and produce vortices, thereby increases energy loss of the fluid.The smaller deflecting angle leads to sudden turn of the flow passage, thereby causing higherenergy loss, and so does the larger deflecting angle. While other structural parameters for the jetnozzle are given, there would be an optimum flow- deflecting angle, at which the energy loss canbe reduced to the minimum.
3 THEORETICAL ANALISIS
In a deflector type jet nozzle there are mainly three kinds of resistance leading to the energy lossof the fluid within the nozzle, neglecting the frictional resistance caused by the length of the flowpassage. The three kinds of resistance are the flow area related resistance (denoted with Ah ), the
deflecting angle related resistance (denoted with θh ), and the surface finish related resistance
(denoted with εh ).
The flow area related resistance is created by the variation of the flow area of the flow passage.Between section 1-1 and section 3-3 the Bernoulli’s formula is,
Aghupup
++=+22
233
211
ρρ(1)
Between section 1-1 and section 3-3 the momentum equation is,
( ) ( )1333331 uuuAApp −=− ρ (2)
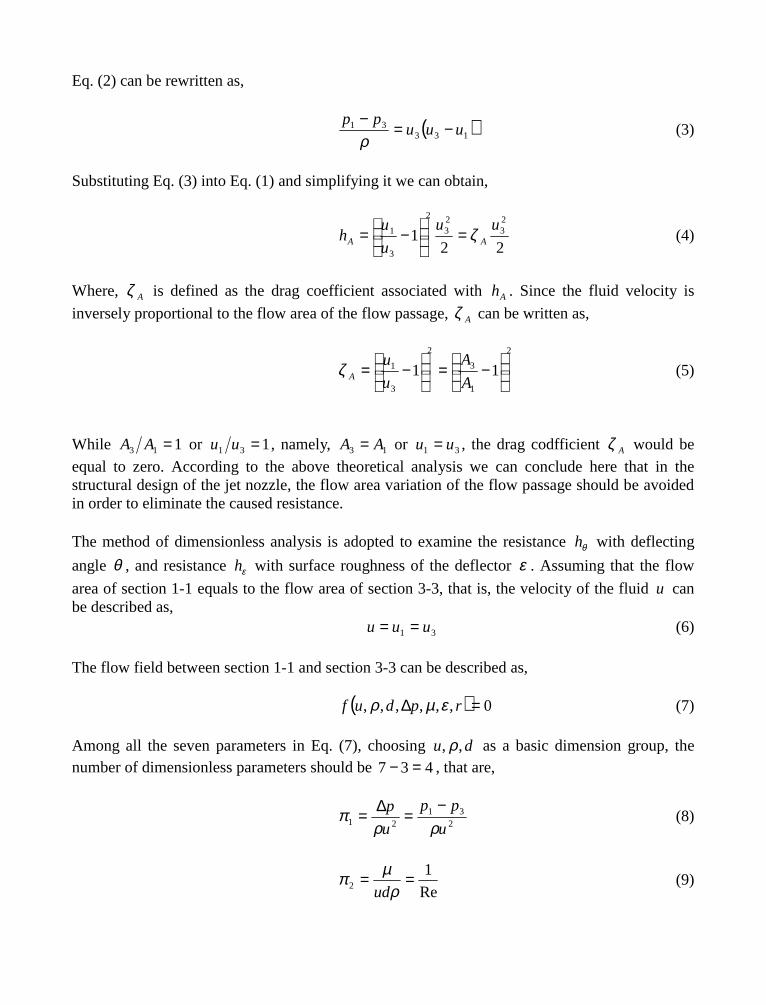
Eq. (2) can be rewritten as,
( )13331 uuu
pp−=
−ρ
(3)
Substituting Eq. (3) into Eq. (1) and simplifying it we can obtain,
221
23
23
2
3
1 uu
u
uh AA ζ=
−= (4)
Where, Aζ is defined as the drag coefficient associated with Ah . Since the fluid velocity is
inversely proportional to the flow area of the flow passage, Aζ can be written as,
2
1
3
2
3
1 11
−=
−=
A
A
u
uAζ (5)
While 113 =AA or 131 =uu , namely, 13 AA = or 31 uu = , the drag codfficient Aζ would be
equal to zero. According to the above theoretical analysis we can conclude here that in thestructural design of the jet nozzle, the flow area variation of the flow passage should be avoidedin order to eliminate the caused resistance.
The method of dimensionless analysis is adopted to examine the resistance θh with deflecting
angle θ , and resistance εh with surface roughness of the deflector ε . Assuming that the flow
area of section 1-1 equals to the flow area of section 3-3, that is, the velocity of the fluid u canbe described as,
31 uuu == (6)
The flow field between section 1-1 and section 3-3 can be described as,
( ) 0,,,,,, =∆ rpduf εµρ (7)
Among all the seven parameters in Eq. (7), choosing du ,,ρ as a basic dimension group, thenumber of dimensionless parameters should be 437 =− , that are,
231
21u
pp
u
p
ρρπ −
=∆= (8)
Re
12 ==
ρµπ
ud(9)
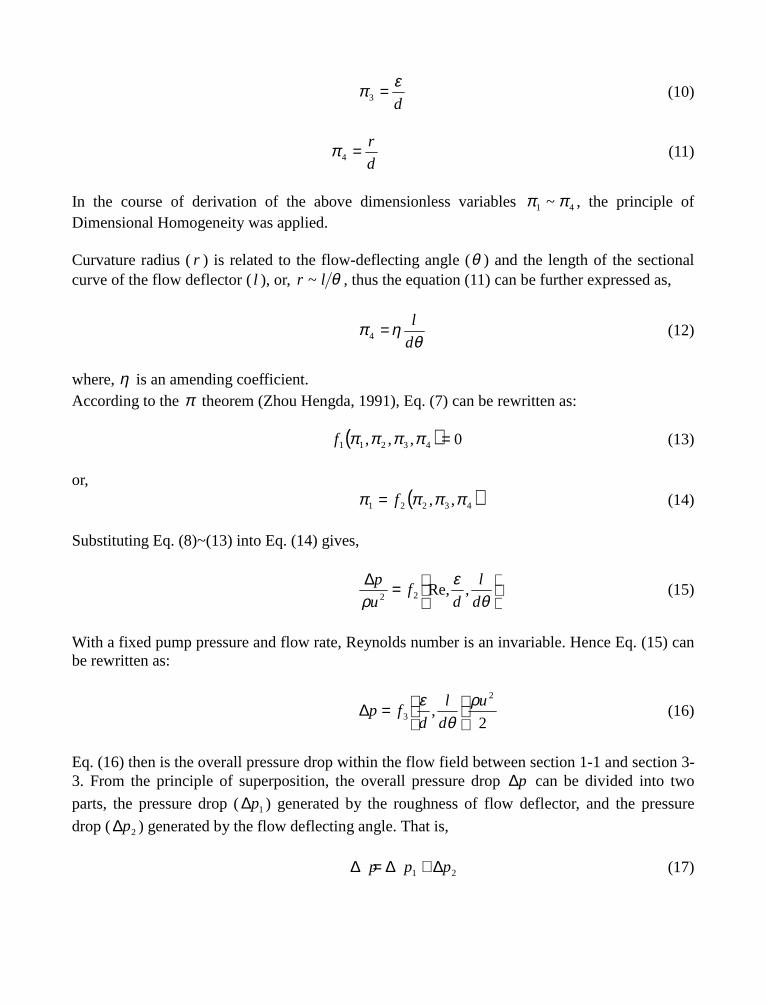
d
επ =3 (10)
d
r=4π (11)
In the course of derivation of the above dimensionless variables 41 ~ ππ , the principle ofDimensional Homogeneity was applied.
Curvature radius (r ) is related to the flow-deflecting angle (θ ) and the length of the sectionalcurve of the flow deflector (l ), or, θlr ~ , thus the equation (11) can be further expressed as,
θηπ
d
l=4 (12)
where, η is an amending coefficient.According to the π theorem (Zhou Hengda, 1991), Eq. (7) can be rewritten as:
( ) 0,,, 43211 =ππππf (13)
or,( )43221 ,, ππππ f= (14)
Substituting Eq. (8)~(13) into Eq. (14) gives,
=∆
θε
ρ d
l
df
u
p,Re,22
(15)
With a fixed pump pressure and flow rate, Reynolds number is an invariable. Hence Eq. (15) canbe rewritten as:
2,
2
3
u
d
l
dfp
ρθ
ε
=∆ (16)
Eq. (16) then is the overall pressure drop within the flow field between section 1-1 and section 3-3. From the principle of superposition, the overall pressure drop p∆ can be divided into two
parts, the pressure drop (1p∆ ) generated by the roughness of flow deflector, and the pressure
drop ( 2p∆ ) generated by the flow deflecting angle. That is,
21 ppp ∆+∆=∆ (17)
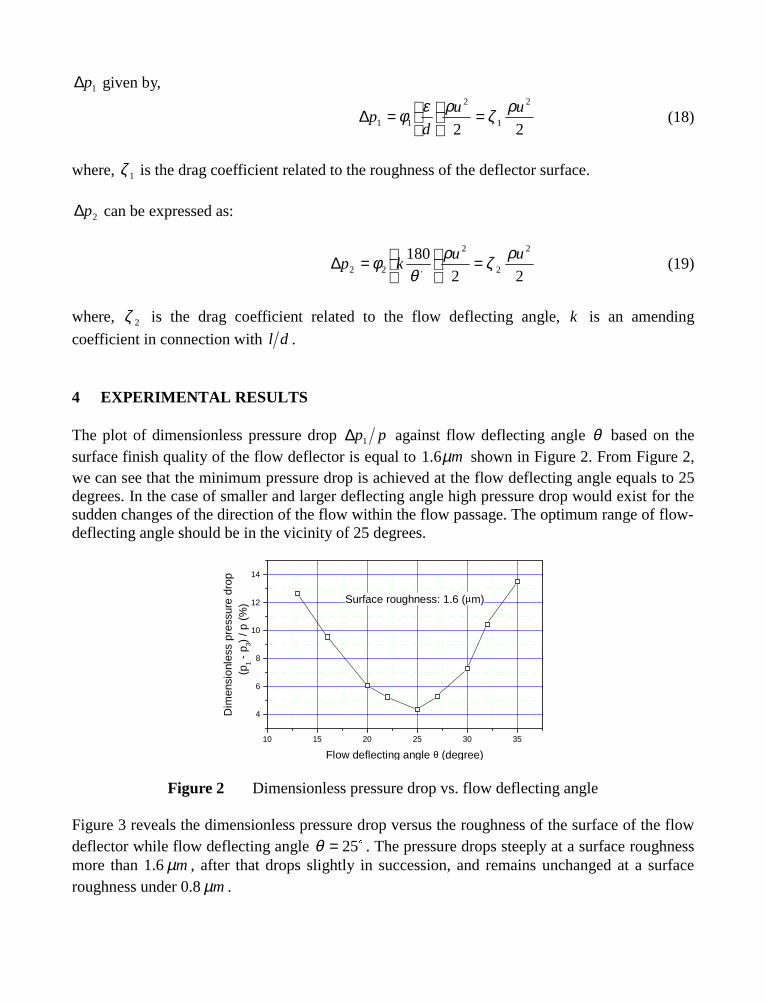
1p∆ given by,
22
2
1
2
11
uu
dp
ρζρεφ =
=∆ (18)
where, 1ζ is the drag coefficient related to the roughness of the deflector surface.
2p∆ can be expressed as:
22
180 2
2
2
22
uukp
ρζρθ
φ =
=∆
$
(19)
where, 2ζ is the drag coefficient related to the flow deflecting angle, k is an amending
coefficient in connection with dl .
4 EXPERIMENTAL RESULTS
The plot of dimensionless pressure drop pp1∆ against flow deflecting angle θ based on thesurface finish quality of the flow deflector is equal to mµ6.1 shown in Figure 2. From Figure 2,we can see that the minimum pressure drop is achieved at the flow deflecting angle equals to 25degrees. In the case of smaller and larger deflecting angle high pressure drop would exist for thesudden changes of the direction of the flow within the flow passage. The optimum range of flow-deflecting angle should be in the vicinity of 25 degrees.
10 15 20 25 30 35
4
6
8
10
12
14
Surface roughness: 1.6 (µm)
Dim
ensi
onle
ss p
ress
ure
drop
(
p 1 - p
3) /
p (%
)
Flow deflecting angle θ (degree)
Figure 2 Dimensionless pressure drop vs. flow deflecting angle
Figure 3 reveals the dimensionless pressure drop versus the roughness of the surface of the flowdeflector while flow deflecting angle $25=θ . The pressure drops steeply at a surface roughnessmore than 1.6mµ , after that drops slightly in succession, and remains unchanged at a surfaceroughness under 0.8mµ .
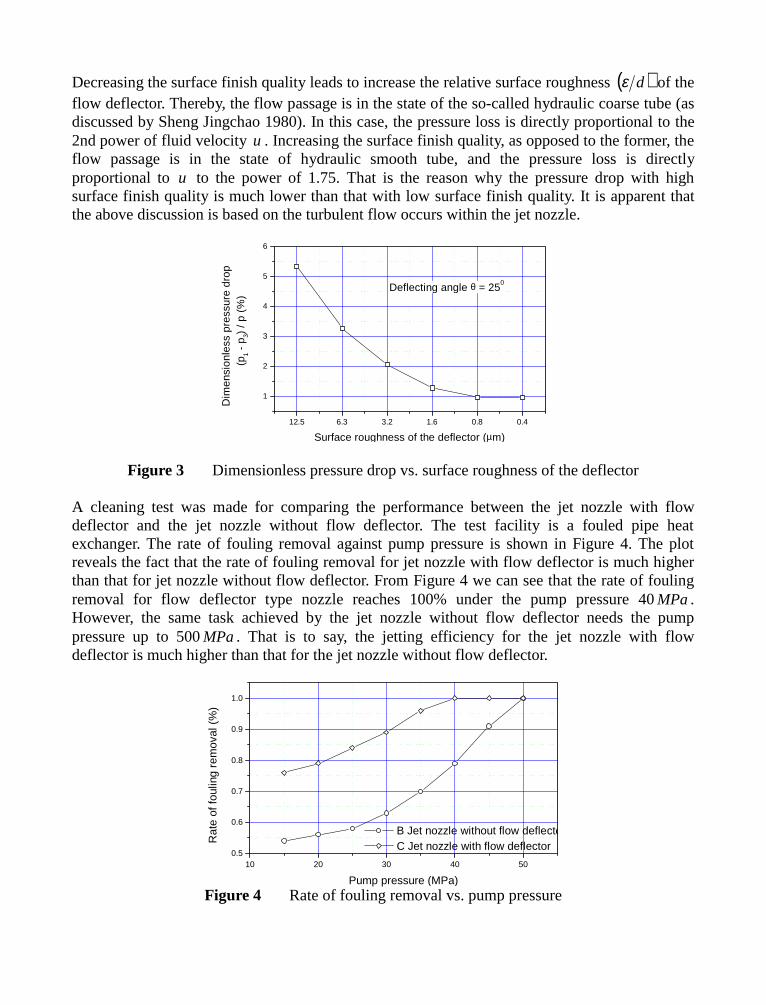
Decreasing the surface finish quality leads to increase the relative surface roughness ( )dε of theflow deflector. Thereby, the flow passage is in the state of the so-called hydraulic coarse tube (asdiscussed by Sheng Jingchao 1980). In this case, the pressure loss is directly proportional to the2nd power of fluid velocity u . Increasing the surface finish quality, as opposed to the former, theflow passage is in the state of hydraulic smooth tube, and the pressure loss is directlyproportional to u to the power of 1.75. That is the reason why the pressure drop with highsurface finish quality is much lower than that with low surface finish quality. It is apparent thatthe above discussion is based on the turbulent flow occurs within the jet nozzle.
12.5 6.3 3.2 1.6 0.8 0.4
1
2
3
4
5
6
Deflecting angle θ = 250
Dim
ensi
onle
ss p
ress
ure
drop
(
p 1 -
p 3) /
p (%
)
Surface roughness of the deflector (µm)
Figure 3 Dimensionless pressure drop vs. surface roughness of the deflector
A cleaning test was made for comparing the performance between the jet nozzle with flowdeflector and the jet nozzle without flow deflector. The test facility is a fouled pipe heatexchanger. The rate of fouling removal against pump pressure is shown in Figure 4. The plotreveals the fact that the rate of fouling removal for jet nozzle with flow deflector is much higherthan that for jet nozzle without flow deflector. From Figure 4 we can see that the rate of foulingremoval for flow deflector type nozzle reaches 100% under the pump pressure 40MPa.However, the same task achieved by the jet nozzle without flow deflector needs the pumppressure up to 500MPa. That is to say, the jetting efficiency for the jet nozzle with flowdeflector is much higher than that for the jet nozzle without flow deflector.
10 20 30 40 500.5
0.6
0.7
0.8
0.9
1.0
B Jet nozzle without flow deflecto C Jet nozzle with flow deflector
Rat
e of
foul
ing
rem
oval
(%
)
Pump pressure (MPa)
Figure 4 Rate of fouling removal vs. pump pressure
5 CONCLUSION
The theoretical analysis and the experimental study as well as the subsequent practicalapplication in cleaning projects demonstrate that the jet nozzle with flow deflector has higherjetting efficiency than the jet nozzle without flow deflector. The information can be summarizedas:z The variations of the flow area should be avoided.z The optimum flow-deflecting angle is in the vicinity of 25 degrees.z The surface roughness might be under/equal to 1.6mµ .
6 REFERENCES
Sheng Jingchao, “Hydraulic Fluid Mechanics,” pp.125-132, Mechanical Industry Publishing House, Beijing, 1980.
Zhou Hengda, “Engineering hydromechanics,” pp. 196-197, Metallurgical Industry Publishing House, Beijing, 1991.
7 NOMENCLATURE
Abbreviations
hpwj high pressure water jet
Symbols
θ flow deflecting angle of the flow deflectoru velocity of the fluid within the flow field of the jet nozzle
1u velocity of the fluid at the section 1-1
3u velocity of the fluid at the section 3-3
1A flow area at section 1-1
3A flow area at section 3-3
ρ density of the fluidd inlet diameter of the flow deflector type jet nozzle
p∆ overall pressure drop, 31 ppp −=∆µ dynamic viscosityε roughness, or surface finish degree of the flow deflectorr curvature radius of the sectional curve of the flow deflector surface,Re Reynolds numberl length of the sectional curve of the flow deflectorη amending coefficient concerning r , l and θ
Ah resistance created by the variation of the flow area for the flow passage
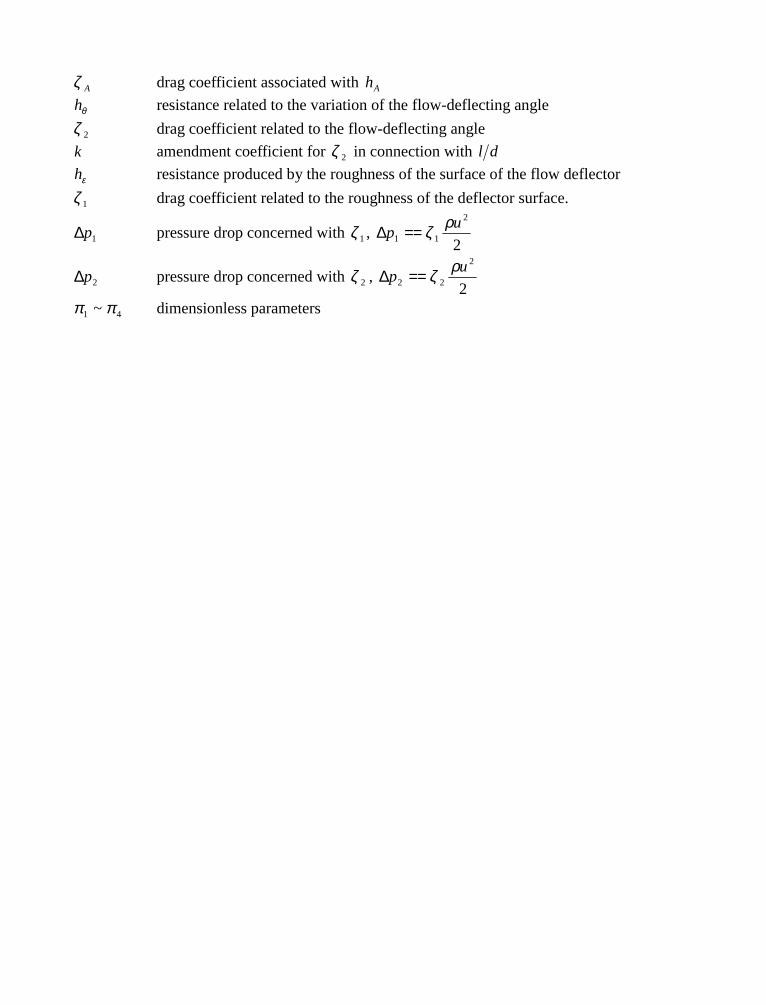
Aζ drag coefficient associated with Ah
θh resistance related to the variation of the flow-deflecting angle
2ζ drag coefficient related to the flow-deflecting angle
k amendment coefficient for 2ζ in connection with dl
εh resistance produced by the roughness of the surface of the flow deflector
1ζ drag coefficient related to the roughness of the deflector surface.
1p∆ pressure drop concerned with 1ζ , 2
2
11
up
ρζ==∆
2p∆ pressure drop concerned with 2ζ , 2
2
22
up
ρζ==∆
41 ~ ππ dimensionless parameters
10th American Waterjet ConferenceAugust 14-17, 1999: Houston, Texas
Paper 25
SUPER-WATER® JETTING APPLICATIONS FROM 1974 TO 1999
W. Glenn Howells
ABSTRACT
SUPER-WATER® concentrated industrial water blasting additive (abbreviated to S-W®,developed in 1974, was first used to clean hard intractable deposits from ISOMAXHydroprocessing reactor exchangers in 24-hours instead of the 3-months taken by previousmethods. The mechanism and general applicability of S-W® to clean hard deposits at nominalpressures and flow rates of 10,000 psi and 10 gpm will be described.
Later it was determined that S-W® was equally effective at lower pressures and for use inpressure washers (i.e. less than 6,000 psi) and could be equally well applied to "soft" materials.The successful removal of epoxy-bound rubber from space shuttle booster motors ultimately leadto ultra-high pressure jet cutting of shoe soles at 50,000 psi and then of use for an entire rangeof rubber and related products from semi-liquid Vistanex to 90 Durometer material.
S-W® has been used for slotting and drilling granite and concrete and more recently in theabrasive suspension jet (ASJ technique for precision cutting of "soft" metals, e.g. lead (Mohs'hardness 1.5) to hard ceramics (Mohs' hardness >9). It increases the effectiveness of the standardabrasive water jet (AWJ) by producing narrower kerf widths and reducing abrasive consumptionby 50%.
Future methods of using S-W® with abrasives will be discussed as well as submergedapplications with or without abrasives. New, more efficient and far less costly techniques ofinjecting S-W® into intensifier cutting and hydroblasting cleaners are now available and in useworldwide.
Finally the availability of companies providing contract cutting evaluations of S-W® with andwithout abrasives are listed together with safety and environmental considerations.
Organized and Sponsored by the WaterJet Technology Association
1. OBJECTIVE
A description will be given of the many advantages that are obtained across the full range ofwaterjet applications by using SUPER-WATER®, a water-soluble polymer.
A previous review (1) has detailed the applications achieved from 1974 to 1989.
2. BACKGROUND
SUPER-WATER® concentrated industrial water blasting additive (abbreviated here to S-W®was first used in 1974 to clean Chevron USA ISOMAX Hydroprocessing reactor exchangers inapproximately 24-hours in contrast to previous methods which took 3-months (2).
The polymer, a linear macromolecular partially hydrolyzed polyacrylamide (with a molecularweight of 16 to 18 million), was found to increase cleaning efficiency from 2 to 50 timesdepending on the material being removed (2). This technique has since been used for cleaning ina very wide range of industries (1, 3).
The 1500 U-shaped tubes of the Chevron ISOMAX unit were clogged with extremely harddeposits of fused coke but these were readily removed with S-W [RI. Consequently initialapplications of S-W® tended to concentrate on removal of hard materials. in large measure thisderived from Chevron USA's knowledge that Russian workers had reported (4) they could cause"destruction of metallic obstacles (sic) by a jet of dilute polymer solution".
The Russians used:
(i) submerged jets(ii) centrifugal pumping and(iii) recirculated the dilute polymer solution.
Each of these conditions has relevance in using S-W® and will be further discussed below.
3. MECHANISM OF S-W® APPLICATIONS
As detailed previously (1, 3) there are three steps which result in S-W® being more effectivethan plain waterblasting. They are:
(a) Drag reduction
For liquids flowing through a hose or pipe this results in nozzle pressures more closely matchingthe pump pressures.
(b) Jet focusing
This provides increased power density on the target.
(c) Macromolecular bombardment
As indicated above S-W® molecules have a molecular weight ranging from 16 to 18 million andat supersonic velocities they behave as though they are rigid. This greatly enhances the effect ofbombardment on a substrate (1, 3).
"All molecules undergo varying degrees of intramolecular vibration. It is possible to envisageintramolecular stretching, bending, and twisting and to appreciate that the larger the molecule,the greater will be the time frames of these motions. During high-pressure polymerblasting withjets often impacting at supersonic speeds, the S-W® macromolecules and their associatedaggregates of water do not have sufficient time for complete stretching, bending or twisting. As aresult, the jet's effectiveness on the target is enhanced by bombardment with molecules that are"rigid" (1, 3). The Deborah number, D, is related to this effect. D is defined as the ratio betweena polymer aggregate's relaxation time and the characteristic time scale during which the fluidstream undergoes deceleration. It is predicted that when D is greater than unity, "solid-like"behavior is exhibited because the polymer aggregate has an inadequate opportunity to adjust(relax) to its changing environment (5)."
The S-W® polymer functions by imparting more structure to water and it does so by hydrogenbonding large aggregates of water molecules to itself.
It is well known that the hydrogen bond plays a critical role in a wide array of chemical functionsand activities.
In the liquid phase water molecules do not exist as individual entities. For example, two adjacentmolecules of water are hydrogen bonded to one another. The partial positive charge of ahydrogen atom on one molecule is electrostatically attracted to the partial negative charge on theoxygen atom of the other molecule. There is substantial evidence that water moleculesspontaneously form multi-molecular aggregates and this tendency has been found to beespecially prevalent in situations where water molecules exist adjacent to water-wet surfaces.
Because the individual monomeric acrylamide and acrylic acid groups of S-W® arethemselves each capable of hydrogen bonding 13 to 14 water molecules (6), extendedaggregates are formed.
(These have been likened to a series of spinal columns, or polymer backbones within the bulk ofa volume of water, as well as to the reinforcement bars used in concrete structures to developoverall strength).
Such longitudenal structures result in cylindrically oriented water sheaths around the linear S-W® macromolecules (3). The presence of such extended or macrostructures would be expectedto promote or stabilize laminar-flow (7) and decrease turbulence or the formation of vortices inboundary layers: this could be the basis for drag reduction.
Furthermore the hydrogen bonding of water molecules to S-W® and, on a molecular level, anextended macrostructure, is retained after emergence from the nozzle. This is manifested as awell collimated or focused jet (8) as seen in FIGURE 1.
Under conditions where S-W® jets are traveling at supersonic speeds, it is tempting to regard theS-W® molecules and their associated aggregates of water as being linearly aligned in the
direction of flow (3). Such an assumption, however, is not altogether necessary because on amolecular level, cordoned (9), helical (10), or any ordered or extended macrostructure couldbring about the observed jet focusing. The important feature is that structure is imparted to thewater (3).
4. APPLICATIONS AT 10,000 PSI AND 10 GPM
Early successes in cleaning or removing hard deposits with S-W® in the mid 1970's mostly usednominal pressures and flow rates of 10,000 psi and 10 gpm respectively. For reasons - usually ofconfidentiality - most of these applications were not reported in the open literature until muchlater (2, 11).
At Chevron USA's Richmond, California refinery, a 20-inch natural gas line that develops veryhard sulfur deposits and is cleaned once per year during the annual shutdown was first handled in1974 in a considerable shorter time with S-W® (2).
Fiberboard Company's vertical evaporators in Antioch, California were cleaned in 4-days during3 x 8-hour shifts with S-W®. Plain waterblasting was totally ineffective and the evaporators(each with 700 x 1 1/4-inch OD x 40-feet stainless steel tubes) were previously replaced (andburied on-site!) on a regular basis (11).
Coke was removed from 40-foot pipes of 12-inch ID (Chevron USA, El Segundo, California)with plain water at 5-feet in 12-hours. S-W® effected removal at 30-feet in 4-hours - 18 times asfast (11).
Other hard deposits removed more effectively with S-W® than with plain water included (2):hard coke following a refinery fire, plugged second stage urea decomposer tubes, coke fromcokers and gas effluent overhead, coke - from discharge headers of coke gas compressors, - fromcoke heater barrels and - from vapor lines, calcium carbonate and slurry deposits from boilerslagging slurry lines, calcium carbonate and dense magnesium salts from boiler tubes, hard scalefrom Benson sulfur recovery systems, calcium and iron fluorides from hydrofluoric acidalkylation plants and plastic, at large standoff distances, from batch reactors.
This last-listed application was followed, at a plastics plant, by the cleaning of a 100-foot sectionof 10-inch drain line plugged with phenolic resin. Goldsmith (12) used a self-propelled sewerlance (with multiple jets: 2 forward, 10 back at 10,000 psi) with plain water but only succeededin making a 2-inch to 3-inch diameter hole in the bottom of the pipe. The first time the pipe wascleaned with S-W®, 5 x 55-gallon drums of crumbled resin (like stones) were removed. The S-W® totally cleaned the 10-inch pipe all the way to the skin.
Other successes achieved by Goldsmith included (12):
(a) removal of polyester resin from a reactor,
(b) removal of refractory slag from a coal-fired power plant,
(c) installation of vents and pipes in 10-inch concrete walls,
(d) paint removal from a block building and
(e) the cleaning of pulverized coal slag and ice from a 12-inch pipe about 1200-feet in length.
5. APPLICATIONS AT LESS THAN 10,000 PSI
Somewhat later a decision was made to use S-W® at lower pressures as exemplified by thefollowing applications.
(a) Sewer cleaning at 3,900 psi
In 1980 at a Redwood City, California construction site of the South Bay Systems Authority,concrete had been inadvertently poured into a combination sewer line resulting in total plugging.The sewer line consisted of an 11-foot down pipe with a 90° bend leading into a 20-foothorizontal section. Jetting with plain water proved to be ineffective.
However using a 0.3% aqueous solution of S-W® the concrete from the two sewer lines, whichhad internal diameters of 5-inches and 10-inches was removed. One pun unit delivered the S-W®on the target material while another was used for back flushing out the removed concrete with a6-jet nozzle (13).
(b) Nuclear power plant cleaning at 5,600 psi
In 1990, S-W® was used to remove "sludge" (consisting of magnetite, metallic copper andoxides of copper) with a compressive strength of 15,000 psi from the tube sheets of nuclearpower steam generators at the Ontario (Canada) Hydro Bruce Power Plant (14). In this instance,where once again plain water was ineffective, the pump pressure used was 5,600 psi.
Ontario Hydro had no limitations on the pressure capabilities of the pumps used. But it wasdetermined that "no tube damage could be detected when lancing at pressures up to 15,.000 psi.However, when using S-W® at 8,500 psi the jet cut through a tube in about 5 minutes."
The Ontario Hydro report (14) at one and the same time indicates the "potency" of S-W® andvividly confirmed the findings of the Russian workers referred to previously (4).
Somewhat later Goldsmith (15), who has used S-W® in waterblasting (i.e. 10,000 psi and 10gpm), started to apply the product under "pressure washer conditions", arbitrarily assigned hereas being at or less than 6,000 psi.
One example from Goldsmith's work involves cleaning badly weathered cedar siding from acommercial building. The siding was marred by dead oxidized wood and algae and was strippeddown to give a new-looking wood finish. In this case, compared to plain water, the productionrate was easily doubled using 0.3% S-W® at 3,000 psi and 5 gpm (15).
Similar results were obtained by Goldsmith (15) in:
(a) stripping failing paint from windows and facia trim of homes,
(b) cleaning the exterior of buildings and concrete floors and walls with accumulated grease anddirt,
(c) cleaning out plugged sewer lines in homes,
(d) cleaning aluminum/metal sidings to remove oxidized paint that was faded and stained withmildew,
(e) cleaning dirt from large earth moving-, trenching- and farming-equipment,
(f) cleaning concrete walls and concrete floors,
and lastly and perhaps of widest applicability because, in the absence of satisfactory coatings, itneeds to be done annually
(g) cleaning wooden decks (that have weathered and are coated with dead oxidized wood) andrestoring them to new-looking wood.
6. APPLICATIONS OF S-W® TO "SOFT" MATERIALS
In 1978 (16), a trivial assessment of polymerblasting "to clean" at 9,,000 psi and 12 gpm wasobtained by "cutting" the following materials under controlled conditions: block salt, red brick,fire brick, oolitic Indiana limestone, block ice, rubber sheeting, concrete slab, plywood, volcanicrock and asphalt.
In each case S-W® improved the cutting, as determined by the depth and incisiveness of thecuts.
One significant conclusion, already discussed, was that S-W® was effective with respect to hardmaterials, e.g. oolitic Indiana limestone, concrete and volcanic rock. With the volcanic rock, forexample, a plain waterjet merely discolored the surface. In contrast S-W® cut a 1-inch deep slot.
The second conclusion was that it was similarly effective on "soft" material such as rubber.
During this study in 1978 (16), S-W® completely cut a canvas-backed rubber mud flap undercontrolled conditions (i.e. 9,000 psi, 12 gpm, 9-inch standoff distance, traversal rate of 1-foot/second). By contrast plain water merely "reshaped" the rubber and wetted the canvas. Thisresult showed rubber materials were amenable to cutting by S-W®.
7. S-W® FOR REMOVING RUBBER COATINGS
S-W® is used in many industries (1,3,16) but of especial significance was that in the spaceshuttle program, S-W® removed residual carbonized epoxy-bound rubber-based propellant (17)from the booster motors of the Titan and Challenger rockets. These motors were located atUnited Technology, Coyote Hills, California and Morton Thiokol, Brigham City, Utah,respectively and nominal conditions of 10,000 psi and 10 gpm were used. This applicationprompted much of the following work although they are achieved at ultra-high pressures, i.e.>40,000 psi.
8. CUTTING RUBBER MATERIALS WITH S-W®
1. Cutting shoe soles
In 1988 (1), Imlay used S-W® to cut clay rubber composite material in the manufacture of shoesoles at the U.S Shoe Company (Crothersville, Indiana).
Cuts were far more precise with S-W® than with plain water (1) and resulted in the absence ofstriations which is a frequent feature of plain water jet cutting. The production rate was 15%higher and lower pressure was required (50,000 psi versus 55,000 psi with plain water).
The drag reduction of S-W® results in lubricity and as a result the Ingersoll-Rand intensifiersand nozzles experienced less wear. For intensifiers this translates to a 38% reduction in operatingand maintenance costs (18) and for diamond nozzles a lifetime extension of 2.8-6.0 (U.S. ShoeCompany data). These advantages cost 58¢/hour for the S-W®.
2. Additional rubber cutting applications
S-W® is effective in precision cutting a wide range of rubber type products from those that are"very soft", such as Vistanex LM-MH, to those that are "hard" such as 1-inch thick 4-ply 90Durometer rubber (17).
Plain water jets by contrast, as described below, in most cases are slower and yield less welldefined cuts. Before describing the specific applications given in (a) through (h) below, generalcomments on the use of S-W® for cutting rubber products are appropriate.
Because S-W® cuts are smooth and without striations, good surfaces are provided forsubsequent adhesion processes.
Another distinct advantage of this technique includes the absence of a heat affected zone (HAZ)and related mechanical distortion as occurs with many mechanical cutting methods. Thepresence of a HAZ can also bring about chemical degradation or in some instancesdepolymerization of a substrate. To be able to carry out processes and procedures withoutproducing an HAZ could offer important advantages for a tire manufacturer (17).
Also, while it is obvious that ultra-high pressure equipment inevitably has operating andmaintenance costs, use of a S-W® jet, as noted above, reduces these costs by 38% (18) andextends nozzle lifetime by 2.8-6.0 times.
a) Vistanex LM-MH (a product of Exxon Chemical derived from iso-butylene) is a soft,very viscous (Brookfield Viscosity @ 350°F : 47,500-68,500 cps), permanently tacky,clear yellow to water-white semi-liquid. It is used in a wide range of applications suchas asphalt blends, chewing gum base, grease and oil additives, emulsions, and solventrelease caulks.
Plain water cuts only half-way through 15-cm thick Vistanex LM-MH. The partially cutmaterial must then be broken by hand (19) which is inconvenient and labor intensive.
However S-W® completely cuts 15-cm thick Vistanex LM-MH without any striations.This result suggests that S-W® cutting of low durometer rubber materials in generalwould prove extremely useful.
(b) Foam rubber cutting with S-W [R] has been more completely studied (20) than mostother rubber substrates. Summers (20) used a factorial design experimental series inwhich, for foam rubber (as well as polystyrene foam and soft Polyurethane foam), fiveparameters were varied including: traverse speed, pump pressure, the diameter of thewaterjet nozzle, the concentration of S-W® and the foam density. Equations weredeveloped interrelating these five parameters.
The important conclusions were that for foam rubber (density 66 Kg/cubic meter) thedepth of cut increased with increasing S-W® concentration and the quality of cut wasmuch superior over the entire depth of up to 15-inches.
Both of these factors are important because the studies were targeted at determining theideal way of cutting foam rubber used in packaging U.S. Navy stores to be shippedaround the world: consequently tight tolerances were essential to ensure a close fit.
(c) Silicone rubber (1 1/4-inch thick) is cut with a 0.1% solution of S-W® at 48,000 psi, withidentical cut quality, but 60% faster (80-inches/minute) than with plain water (50-inches/minute). This costs 36¢/hour for S-W® (21).
(d) Similarly, increased cutting speeds are obtained for rubber gaskets and 1/2-inch thick silicone rubber as well as 10-inch thick polyurethane foam (22).
(e) Nylatron (Nylon with added molybdenum sulfide) has been cut more precisely withS-W® than with plain water using an intensifier at 40,000 psi, a flow of 0.33 gpm, anozzle diameter of 0.15-mm and a standoff distance of 4-mm (16).
(f) Nitrile rubber, natural rubber, styrene-butadiene rubber and neoprene are being cut withintensifiers operating at 48,000 - 49,000 psi using a 0.1% solution of S-W® with adiamond nozzle (diameter 0.007-Inch) at a standoff distance of 1/2 to 3/4-inch (17).
The author observed that S-W® reduces the wetting of substrates (1), as would be expected froma jet in air, characterized as shown in Figure 1, by distinct coherence and an essential absence ofspray. The diameters and lengths of the jets and nozzle housing shown in Figure 1 are 34% lessthan actual size. Thus the orifice container is 1.125-inches in diameter, the inset diamond nozzlehas an internal diameter of 0.01-inch and the photographed length of both jets is actually 6.9-inches.
Because of the absence of spray there is a diminished tendency for a S-W® jet to wet substrates.In the case of multi-levels of substrate, this lack of wetting precludes fluid entering the spacebetween adjacent layers. Consequently there is no fluid between the layers that, on evaporation,would give rise to water spotting.
The following example can be used to appreciate this decrease in wetting by a S-W® jet:
With its incisive cutting ability, S-W® successfully removed 20,000 sq. ft. of adhesive-attachedcork from a concrete ceiling. By contrast plain waterjet fluid, with its inevitable associatedspray, was completely absorbed by the 8-inch thick layer of cork which was virtually unaffectedand remained in place (1, 12).
Similarly the extent of coherence of a S-W® jet, as shown in Figure 1, may be gained from thefollowing examples:
Tree bark is removed at 10,000 psi and 10 gpm at a standoff distance of 40-feet with a 0.06-inchnozzle (1).
A 1-inch hole is drilled in 5/8-inch thick plywood in 5-8 seconds at a standoff distance of 10-feet using 9,000 psi, 12 gpm and a 0.067-inch nozzle. A plain water jet merely wets theplywood.
(g) Rubber (90 Durometer) (4-ply and 1-inch thick) can be cut at 39-inches/minute with a plainwaterjet (0.22 gpm at 48,500 psi) and a 0.007-inch nozzle at a standoff distance of 1/16-inch.The cuts produced however have very marked striations (17).
When the same conditions are used with a solution of 0.3% S-W® cutting can be conductedat an increased speed of 49-inches/minute with a virtual absence of striations (17).
(h) The descriptions given of cutting of gaskets and various other thin sheets of rubber materialsis achieved with accuracy and speed. These two factors could be crucial in cutting all rubberproducts especially where current methods have a tendency to bring about deformation.
3. Detailed Study Of S-W®’s Cost Effectiveness In Cutting
Cost effectiveness in precision cutting at 40,000-45,000 psi has been very accurately determinedover a period of 3-years by Lombari (23) using typical intensifiers. His results parallel those forprecision cutting of the materials listed above.
Lombari found that relative to plain water, S-W®:
(a) Improves the quality of cut: i.e. no subsequent sanding is required saving $15,000annually in labor costs (24, 25).
(b) Increases cutting speed by 30%-200% giving an estimated annual production increase of$420,000 in receivables (24, 25).
(c) Reduces intensifier operating and maintenance costs by 38%. (From $11.12/hr in 1993 to$6.86/hr in 1996 is a reduction of $4.26/hr). The annual operating savings are $1,025 (24,25).
Lombari (25) reports that for an annual expenditure of $200.00 for S-W®, Decoustics, Toronto,Canada achieves a return on investment (ROI) of >2,000 to 1. This application, which is forcutting fiberglass acoustic panels ranging from 1/8-inch (3.2-millimeters) to 4-inches (101.6-millimeters) thick, gives an unambiguous demonstration of the economic advantages of usingS-W® in ultra-high pressure waterjet cutting.
9. SLOTTING AND DRILLING WITH S-W ®
(a) Spinning waterjets can cut slots in massive structures
The half-scale model of Stonehenge at the University of Missouri - Rolla (1) (named by theNational Society of Professional Engineers as one of the "Ten Outstanding Engineering
Achievements in the United States in the 19th Annual Competition in 1984") was made fromgranite by Professor David A. Summers and his co-workers using waterjets. Conditions usedwere; pump pressure 15,000 psi, water flow 10 gallons/minute, dual nozzles (0.032- inch ID)spaced 1.5-inches apart with an included angle of 30°, rotating at 100 rpm at a standoff distanceof 1-2 inches and a traversal rate of 10 feet/minute.
S-W® was used for cutting-along the granite grain.
(b) Spinning waterjets can drill precise holes.
Following the California Loma Prieta earthquake on October 17, 1989, the Oakland-SanFrancisco Bridge partially collapsed as did many other concrete structures. It was realized thatextensive retrofitting was needed to increase the stability of bridges and overpasses to withstandfuture seismic activity. One possible way of stabilizing structures involved installing additionalsteel reinforcement bars. Such installation required precision drilling of holes in the variousconcrete structures. In a model study using S-W®, Raether (13) was able to precisely drill 3-inchdiameter holes through a concrete block (3-ft x 3-ft x 3-ft) with a compressive strength of 5,000-6,000 psi,. at angles normal to the block and at oblique angles, at a rate of 10 inches/minute.Conditions used were: S-W® at 3,000 ppm, pressure 35,000 psi, flow rate 3 gallons/minute,"zero" standoff distance using two proprietary spinning nozzles. Very significantly the cost ofdrilling with S-W® was $6/foot compared to the more conventional diamond bit drilling whichcosts between $50/foot and $100/foot (13).
10. S-W®/ABRASIVE CUTTING (ABRASIVE SUSPENSION JET - ASJ)
In 1983, at the Second American Water Jet Conference (Rolla, Missouri) the topic possiblydiscussed more than most others was the use of abrasives in waterjetting.
When noting that this combination had first been used in the 1960's, Griffiths (26) explained:"........ because of the pressure limitation of existing pumps and ancillaries, particularly hose(maximum pressure usually 5 - 8,000 psi), a method of enhancing the cleaning power of thewater jet was sought, and the answer appeared to be the addition of abrasives into the water jetstream".
It was obvious that S-W® would be used with abrasives and this combination was studied in1984 by Yie and Howells (1).
In 1989 Hollinger et al. (27) described "Precision Cutting with a Low Pressure, CoherentAbrasive Suspension Jet" using S-W® at 1.5% concentration in which garnet abrasive (diameter:75-106 micrometer) was suspended. Hollinger gave examples of the abrasive suspension jet(ASJ) for cutting aluminum, mild steel, plate glass, yellow brass and lead at moderate pressures(5,000-7,500 psi). Using this technique at 7,500 psi furnished superior cuts (with smaller kerfwidths i.e. < 0.79 mm versus 1.6 mm), and consumed 86% less power and 62% less abrasivethan an abrasive waterjet (AWJ) operating at 30,000 psi.
Hollinger gave an example of cutting composite material in which parallel microcuts (width0.08-0.10 mm) were made only 0.3-mm apart in gold-coated quartz wafers (thickness 0.15-mm).
It was pointed out that "closer cuts can be made depending upon the precision of the positioningmechanism".
Hollinger's paper, followed by another paper on the same topic (28) - which received the bestpaper award of the 8th American Water Jet Technology Conference (Houston, Texas, 1991) -ushered in a new era of precision cutting. In his 1991 publication Hollinger (28) pointed out thatfor success of the ASJ technique the viscoelastic component of S-W® solutions was acontrolling parameter for jet penetration and cut width.
Enormous potential exists for application of the high power density of the ASJ. For example,Hashish (29) reports that the ASJ achieves fast thin-kerf cutting of metals (steel, aluminum, lead,titanium, stainless steel, tungsten and Inconel), cuts hard materials such as carbides (siliconcarbide, alumina-reinforced silicon carbide) and a wide range of other commercially availablecarbides e.g. ROCTEC 100.
Hashish's studies (29) were very detailed and included examination of the following abrasivesuspension parameters: S-W® concentration, abrasive type, abrasive size, abrasiveconcentration, nozzle length, nozzle diameter, pressure, standoff distance, traverse rate and angleof cutting.
Hashish concluded (29) that S-W® can yield a viable suspension for automated suspensionpreparation based on stability and ease of preparation, can cut a wide variety of metals from lead(Mohs' hardness of 1.5) to tungsten, as well as carbides (Mohs' value of >9.0) and ceramics.
Liu (30) reports that the ASJ gives "Up to fivefold improvements in cutting rates over AWJ'sobserved with this approach under identical hydraulic and abrasive conditions. Current andfuture development efforts for the ASJ system are addressing specific hardware components suchas check valves, pressure vessels, and nozzles". Because ROCTEC 100 is the most resistant tocutting it suggests it may be the best candidate for ASJ carbide nozzle material (29).
11. S-W®/VENTURI-INDUCTED ABRASIVES (AWJ)
The ASJ technique has lived up to the expectations expressed by many participants at the 6thAmerican Water Jet Conference held in Houston in 1991 - namely that it would be the mostsignificant advance in waterjetting of the 1990's.
However the 1990's are about to end and so in the interim, while awaiting ASJ commercialdevelopment, other methods of combining S-W® and abrasives are being used.
Venturi-inducted/aspirated/educted/suctioned abrasive waterjetting (AWJ) is the current"standard" in the industry. Three separate phases exist in the AWJ process - one solid, one liquidand one gaseous. As pointed out previously (22) this "standard" method suffers from having tobring about effective momentum exchange between a liquid and an abrasive in the presence of agas phase.
However distinct improvements result (22) when S-W® is used instead of plain water in thestandard AWJ method.
(a) For example S-W®, used with 100 grit copper slag as an abrasive, cuts laminated glass(13/16-inch thick), aluminum (1/4-inch thick) and stainless steel (up to 1-inch inthickness) 20% faster than with copper slag/plain water. This higher production costs90¢/hour for the S-W® (22).
Weber (31) has determined that S-W® used in the "standard" Venturi abrasive techniqueprovides a better quality of cut and a narrower kerf. It also substantially reduces abrasiveconsumption when cutting either 304 L stainless steel or aluminum.
(b) 304 L stainless steel (10-millimeters thickness) can be cut at 143-mm/per minute with 80 mesh (Australian) Barton abrasive. (Pressure: 43,000 psi, fluid flow rate: 1.85 L/minute,nozzle diameter: 0.25-mm, standoff: 4-mm). 16 Kg/hour of abrasive was used with 0.3%S-W® but plain water required 30 Kg/hour of abrasive. This 47% decrease in abrasiveconsumption was accompanied by a smaller kerf and better cut quality (31).
(c) An aluminum (thickness 25-mm) is cut at 67.5-mm/minute with 80 mesh QualityGANEX. (Pressure: 50,400 psi, fluid flow rate: 1.80 L/minute, sapphire nozzle: 0.25-mm,focusing tube diameter: 1.05-mm, standoff distance: 3 mm). 200/250 grams/minute ofabrasive was used with 0.3% S-W® but plain water required 400/500 grams per minute.This 50% decrease in abrasive consumption was accompanied by a better cut quality(31).
(d) More recently Weber has reported that Baccarat crystal is drilled more precisely with 120mesh abrasive and S-W® than with abrasive and plain water at 43,000 psi and at astandoff distance of 5-mm using a nozzle of 0.8-mm diameter (16).
12. FUTURE METHOD FOR USING S-W® WITH ABRASIVES
As noted Howells (22) and others have pointed out the less than satisfactory situation of havingto bring about effective momentum exchange between a solid and a liquid in the presence of agaseous phase. It was suggested (22) that, if the abrasive were to be introduced into the"standard" Venturi system as a suspension in S-W®, it might prove possible to increase theefficiency of the momentum exchange. Additionally this approach could yield results moreclosely matching the ASJ results (22).
This modified Venturi approach (termed the Lombari technique (16)) for which a patent is nowpending, is under development.
13. SUBMERGED APPLICATIONS-OF S-W®
As noted above, the Russian publication (4) presented data from experiments conducted undersubmerged conditions, employing centrifugal pumping and recirculation of the polymer solution.
The inappropriateness of centrifugal pumping and recirculation of S-W® have both beendiscussed previously (1). These procedures bring about elongational shearing of themacromolecules, which results in a reduction in molecular weight and a parallel reduction ineffectiveness.
The flow characteristics of submerged polymer solutions (containing dye) were first described byGadd (32). In 1977, prompted in part by Gadd's results, it was determined in conjunction withChevron USA at Taft, California, that S-W® under submerged conditions increased the effectivestandoff distance of waterjetting by 15 to 30 times over that achieved by plain water (1,3).
This led to further studies by Zublin (1,33) and Cobb and Zublin (34). They confirmed theincrease in effective standoff distance using S-W® under submerged conditions and showed themarked improvements obtained in cleaning oil-well liners.
They also presented a graph of power (percentage of power at the target) versus standoff distancecomparing plain water to S-W®. This graph was eventually reproduced (without error) inChemical Processing (11) and vividly shows the advantage of using S-W® under submergedconditions.
14. APPLICATIONS OF THE ASJ UNDER SUBMERGED CONDITIONS
The combination of the Russian paper (4), Gadd's work (32), Zublin and Cobb’s findingsZublin and Cobb's findings (33, 34), and Hollinger's ASJ technique provides a criticalbackground for the later work of Alberts and Hashish (35).
These workers, using hyperbaric chambers to simulate deep ocean conditions, cut stainless steelwith an ASJ S-W® jet at pressures equivalent to depths of 6,000 meters (35).
This depth is very significant because, apart from the deep trenches (e.g. the Mariana - maximumdepth of 11,033 meters at Challenge Deep, the Peru Chile trench - maximum depth of 8,064meters), the dominant portions of the worlds oceans have depths of 6,000 meters or less.Consequently a method (for cutting rock and metal, and for coring) by deployment fromremotely operated vehicles is now available for worldwide oceanic applications.
15. CRITICAL IMPORTANCE OF S-W® INJECTION SYSTEMS
S-W®, as sold, is in the form of a water-in-oil emulsion. The internal water phase contains thepolyacrylamide. In order to use the product, the emulsion has to be broken or - more exactly -inverted to an oil-in-water emulsion. This absolutely necessitates use of specific types ofinjection systems which, placed after the filter, accurately meter the requisite amount of S-W® ,into the water stream.
(Filters also cause elongational shearing of macromolecules leading to a reduction in molecularweight and a parallel reduction in effectiveness (1).
A brief description of the meaning of "elongational shearing" might be useful. In solution themacromolecular molecules of S-W® and their associated aggregates of water are coiled althoughthey might adopt some measure of linearity under conditions of flow. During centrifugalpumping or in passage through filters the hydrogen-bonded aggregates of water would be"stripped away" exposing the carbon-carbon backbone. The backbone whilst being elongatedwould be readily accessible and shearing by carbon-carbon bond scission will occur (1).
The diluted S-W® then flows through a static mixer - in which complete and uniform emulsioninversion is ensured - to the main stream of the waterjetting fluid. Prior to use, S-W® requires 5to 6 minutes to become fully hydrated. The active ingredients in S-W® are, as mentionedpreviously, macromolecular with a molecular weight ranging from 16 to 18 million, so thebonding of water molecules (or hydration) takes a finite time. This is because each monomericunit of polyacrylic acids and of polyacrylamides bonds 13 to 14 molecules of water (6).Obviously this aggregation of polymer and water can not take place instantaneously because itmust proceed by formation of sequential layers of the 13 to 14 water molecules.
The hydration can be achieved in either a holding tank or a length of low pressure tubing.
16. SAFETY AND ENVIRONMENTAL CONSIDERATIONS
The usual safety precautions employed during hydroblasting (often called waterblasting and incountries, other than the U.S.A., hydrablasting) (36) are appropriate for ultra-high pressureprecision cutting with S-W®.
Because of its incisive cutting ability, S-W® must be handled with very great care both from thestandpoint of the equipment being used and operator exposure.
The OSHA Material Safety Data Sheet for S-W® describes general precautions but it should benoted that upon appropriate dilution (i.e. 0.1-0.3%) the properties, apart from flowcharacteristics, closely approach those of water.
Neither polyacrylamide nor polyacrylic acid, or combinations, are listed in the EPA ConsentDecree (37), and neither are they in the list of chemicals described as being carcinogenic (38).
(a) S-W® is biodegradeable and does not foul oxidation ponds (3).
(b) The chemical oxygen demand of S-W® is 706 g/L (at a use concentration of 0.1% it is 0.7g/L) and the biological oxygen demand is 87 g/L (at 0.1% it is 0.09 g/L).
(c) The LC 50/96 hr is 53 ppm (Rainbow Trout) and 84 ppm (Blue Gill Sunfish). The acute oraltoxicity (rat) is >10 ml/Kg and the dermal toxicity LC 50 (rabbit) is also >10 ml/Kg.
(d) Code of Federal Register Conformations. S-W® conforms to the Federal Food, Drug andCosmetic Act as amended in 1958 and 1960, specifically Chapter 21 CFR, Section 176.110as a component of paper and paperboard in contact with food and Section 175.105 as acomponent of adhesives in contact with food. Other S-W® components conform to CFR 21,Sections 178.3400 and 178.3650 (39).
(e) Because S-W® is a "non-regulated material, liquid, cleaning compound, NMFC 48580 class55", it is shipped by truck, ship, and air - including UPS.
17. ACKNOWLEDGEMENTS
The author appreciates and gratefully acknowledges the contributions to this paper provided byMessrs. Vincent L. and Adam H. Imlay of Water Jet, Inc., Seymour, Indiana, Mr. RenatoLombari, Soheil Mosun Ltd., Toronto, Canada, Mr. Jim Price, Biltrite Corporation, Ripley,Mississippi, Dr. David A. Summers, Curator's Professor of Mining Engineering and Director ofthe High Pressure Waterjet Laboratory at the University of Missouri-Rolla, Missouri and M.Daniel Weber, Weber Lubrifiants Rixheim, Cedex France.
18. REFERENCES
1. W. G. Howells, "Polymerblasting with SUPER-WATER® from 1974-1989: a Review"International Journal of Water Jet Technology, Volume 1, Number 1, (March 1990), pp. 1-16.
2. D. Alexander and J. T. Regan, "Polymer blasting eliminates hard deposits in refinery heatexchangers", Chemical Processing, May 1984.
3. W. G. Howells, "Polymerblasting - a Chemist's Point of view", Proceedings of the SecondUS Water Jet Conference, (Rolla, Missouri, USA: May 24-26, 1983), pp. 443-447.
4. A. M. Kudin, G. I. Barenblatt, V. N. Kalashnikov, S. A. Vlasov and V. S. Belokon, Nature,Vol. 245, 95, 1973.
5. Private communication between Berkeley Chemical Research, Inc. and Professor M. C.Williams, University of California at Berkeley, California, June 1978.
6. S. Majumdar, S. H. Holay and R. P. Singh, European Pblymer journal, 16, p. 1201.
7. A. White and J.A.G. Hemmings, "Drag Reduction by Additives" Review andBibliography, BHRA Fluid Engineering, Cranfield, Bedfordshire, U.K. 1976.
8. Brochures on "SUPER-WATER® concentrated industrial water blasting additive",published by Berkeley Chemical Research, Inc., P. 0. Box 9264, Berkeley, California94709. Also references 1, 2, 3 and website:http://www.berkchem.qpg.com
9. Chemical Week, May 24, 1 969.
10. B. Maijgren, Paper presented at EUROMECH 82, Royal Institute of Technology, Sweden,August 27-30, 1974.
11. A. E. Hodel, "New ideas, tried-and-true methods boost cleaning efficiency", ChemicalProcessing, March 1993.
12. R. Goldsmith, Letters to the Editor, Jet News*, June 1990.
13. W. G. Howells, "Enhancing waterjetting by use of water soluble additives", in Water JetApplications in Construction Engineering, Editor A. W. Momber, published by A. A.Balkema, Rotterdam, Netherlands, 1998, (ISBN 90 5410 698 0).
14. J. Malaugh, S. Ryder and D. St. Louis, "Bruce NGS-A Support Plate Inspection andWaterlancing", Proceedings of the 10th International Symposium on Jet CuttingTechnology (Amsterdam, Holland: August 31 - September 2, 1990), pp. 449-471.
15. W. G. Howells, "Increasing Waterjet Efficiency by Use of Water Soluble Additives",published in "Cleaner", November 1998, pp. 70-71, by Cole Publishing Inc., 1720 MapleLake Dam Road, P.O. Box 220, Three Lakes, Wisconsin 54561.
16. W. G. Howells, Vincent L. Imlay, Renato Lombari and Daniel Weber, "Ultra-highpressure precision jet cutting using SUPER-WATER®", Proceedings of the InternationalComposites EXPO 99, Cincinnati, Ohio, May 10, 1999.
17. W. G. Howells, " SUPER-WATER® provides precision cutting of rubber", Rubber &Plastics News, May 31, 1999.
18. R. Lombari, letter to the Editor, ..."the longevity of our consumable jet components due tothe lubricity of SUPER-WATER ®", Jet News*, November 1996, pp. 2 and 11.
19. D. Weber, letter to the.Editor, Jet News*, December 1997, pp. 7 and 8.
20. S. Yazici and D. A. Summers, "The Use of High Pressure Waterjets in Cutting Foam","Proceedings of the 4th American Conference, (Berkeley, California, August 26-28, 1987),pp. 11-18.
21. W. G. Howells. Unpublished data obtained during demonstration at the 7th AmericanWater Jet Conference (Seattle, Washington, August 28-31, 1993).
22. W. G. Howells, "Additive Improves Abrasive Jet Cutting" Jet News*, December 1995, pp.5 and 10.
23. R. Lombari, "Ultra-High Pressure Non-Abrasive Polymer Jetting: a ProductionImplementation," Proceedings of the 9th American Waterjet Conference, (Dearborn,Michigan, August 23-26, 1997), Paper 17, pp. 251-266.
24. R. Lombari, "Cutting Fiberglass Accoustical Panels", Jet News*, December 1997, p. 7.
25. R. Lombari, letter to the Editor, . . .”Dear Jet News”, Jet News*, December 1997, pp. 8 and10.
26. N. J. Griffiths, Proceedings of the Second US Water Jet Conference, (Rolla, Missouri,USA: May 24-26, 1983), pp. 423-432.
27. R. H. Hollinger, W. D. Perry and R. K. Swanson, Proceedings of the Fifth American WaterJet Conference, (Toronto, Canada, August 1989), pp. 245-252.
28. R. H. Hollinger and R. J. Mannheimer, Proceedings of the Sixth American Water JetConference, (Houston, Texas, August, 1991), pp. 515-528.
29. M. Hashish, Proceedings of the Ninth American Water Jet Conference, (Detroit, Michigan,August, 1997), pp. 267- 280.
30. H-T. Liu, "Near-net shaping of optical surfaces with UHP abrasive suspension jets",Proceedings of the 14th International Conference on Jetting Technology, Brugge,Belgium, 21-23 September 1998.
31. D. Weber, letter to the Editor, Jet News*, February 1997, p. 12.
32. G. E. Gadd, Nature, 1966, Vol. 212 (No. 5065), 874-877, November 1966.
33. C. W. Zublin, Proceedings of the Second US Water Jet Conference, (Rolla, Missouri,USA: May 24-26, 1983), pp. 159-166.
34. C.C. Cobb and C.W. Zublin, Petroleum Engineers International, pp. 56-66, October 1985.
35. A. Alberts and M. Hashish, "Observations of Submerged Abrasive-Suspension Jet Cuttingfor Deep Ocean Applications" Proceedings of the 8th American Water Jet Conference,Houston, Texas, August 1995, pp. 735-749.
36. See, for example, "Recommended Practices for the Use of Manually operated High-Pressure Water jet Equipment" issued by the Water Jet Technology Association, St. Louis,Missouri.
37. Q. B. Stork et al., Journal of Chromatographic Science, Vol. 18, November 1980.
38. Second Annual,Report on Carcinogens, December 1981, U.S. Department of Health &Human Services, Public Health Services (National Toxicology Program).
39. A complete description of the relevant Chapter 21 CFR conformations is available fromBerkeley Chemical Research, Inc.
* Jet News is a bimonthly publication of the Water Jet Technology Association, St. Louis, Missouri, U.S.A.
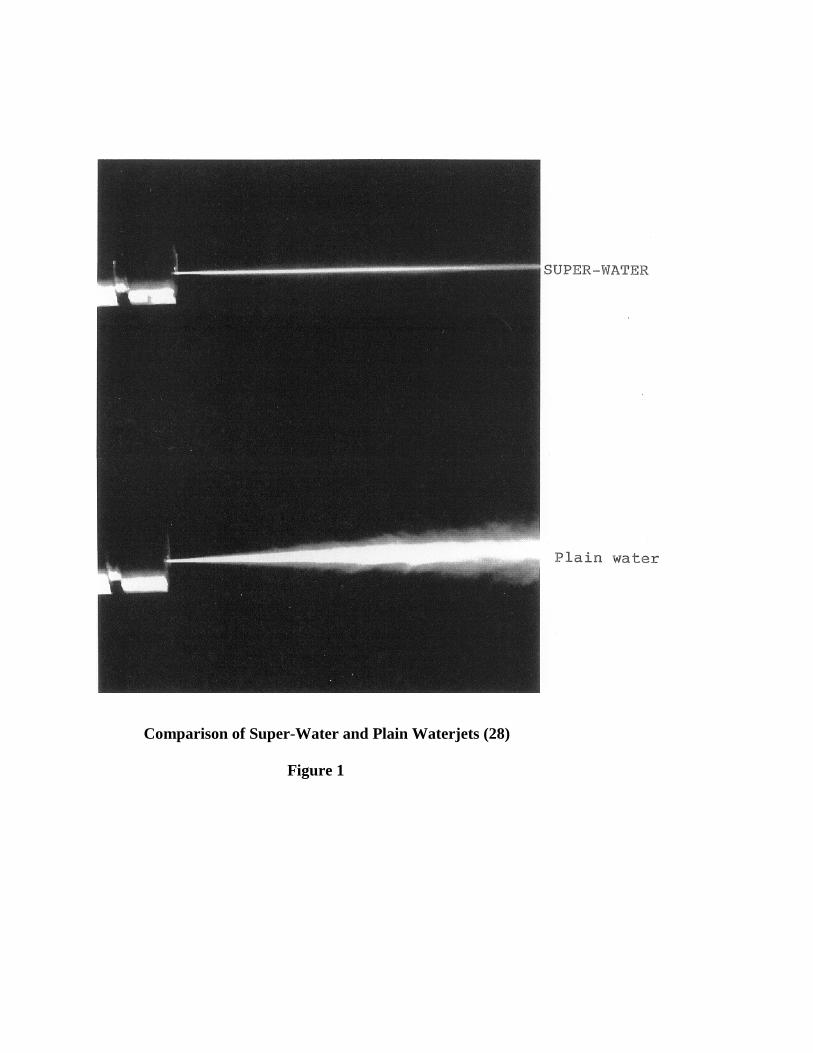
Comparison of Super-Water and Plain Waterjets (28)
Figure 1
10th American Waterjet ConferenceAugust 14-17, 1999: Houston, Texas
Paper 26
PROFILING WITH 400 MPA FINE-BEAM ABRASIVE WATER JET
St. Brandt, H. LouisInstitute of Material Science,
Hannover, Germany
ABSTRACT
Suspension jets are established in decommissioning, on- and offshore technology but not inmanufacturing industry. The development of a 400 MPa suspension jet system to generateFine-Beam Abrasive Water Jets for manufacturing industry is part of a BriteEuram-Projectfunded by the European Commission. Goal of the project is to decrease the kerf width to0.3 mm or smaller by exploitation of the potential of the suspension jet technology.
Organized and Sponsored by the WaterJet Technology Association
1. INTRODUCTION
The development of Abrasive Water Suspensions Jets started in the early 60’s with directpumping systems for off-shore application with a system pressure of 69 MPa as mentioned byLancaster, J. C. 1994. Since this time the development of AWSJs preceded. Today AWSJs areinserted in cleaning, decommissioning, demilitarisation etc. with pressures up to 200 MPa asstate of the art.
The industrial insert of AWSJ as a manufacturing tool is not very high. As commercialapplications are mentioned the cutting of armored metal sheets and ceramics. Researchinvestigations have been started to use the AWSJ as a tool for polishing diamonds (Hashish etal. 1993) and near-net shaping of optical glasses (Liu et al. 1998).
The most important goal of a AWSJ-system as a manufacturing tool should be the reduction ofthe generated width of kerf smaller than 0.3 mm. The state of the art of todays AWSJ-systemsand the development of a 400 MPa-Fine Beam Abrasive Water Jet System will be described inthe next chapters.
2. STATE OF THE ART
Abrasive Water Suspension Jets are generated in three principles, see figure 1. First principle isto pump the premixed suspension directly through a nozzle, this method is called “directpumping”. This principle has only been realised for assistance of exploration in oil and gasindustry. From today’s state of art, such a system can be build up with pressures up to 100MPa by using membrane pumps and “soft” abrasives.
The second principle is called “indirect pumping”. Main part of this system is an abrasivestorage vessel with an isolator inside. The high pressure water from the pump is used to movethe isolator downwards, so that the premixed suspension is pumped towards the suspensionnozzle. Due to the particle sedimentation the using of polymers is required. In addition thechange of abrasive concentration during the cutting process is not possible with this system.
The third principle, which is called “bypass-principle”, is one of today’s commercial systemsand has also been used for the presented cutting experiments. It follows basically the DIAJET-principle developed by BHR Group, U.K. in 1984, Bloomfield et al. 1984. The water stream,delivered by the pump, is divided into a main water stream and the so called bypass stream.The bypass stream is used to feed the abrasive particles out of the vessel into the plain waterstream in a special mixing unit. The resulting suspension is pumped through a flexible hosetowards the nozzle. A restriction valve is used to control the water flow rate in the bypass lineand hereby to regulate the abrasive loading ratio of the jet.
The first Bypass-AWSJ system has been operated at a maximum pressure of 15 MPa. In 1986a 34.5 MPa system was developed. In 1988 the first two vessel system also with 34.5 MPa wasdesigned to allow a continuous cutting operation. In 1990 a two vessel 69 MPa system waspresented. Since than the development work focused on the reliability of the system and the
adaptation to different applications (Brandt, C. et al. 1996). Today pressures up to 200 MPa arestate of the art and have been successfully applied for dismantling nuclear power plants(Brandt, C. et al. 1998).
Investigations have been started on system pressures higher than 200 MP. Hashish (1991)presented the capacity of suspension jets generated by an indirect pumping system, with apressure of 345 MPa.
The development of this technology for manufacturing application will be described in thenext chapter.
3. REQUIREMENTS FOR 400 MPA-SYSTEM
Main goals of development of a Fine-Beam Abrasive Water Jet System are:
¾ Reduction of width of kerf < 0.3 mm
¾ Increase of traverse speed
¾ Control of mass flow rate
To reduce the width of kerf below 0.3 mm, the outlet diameter of the nozzle has to bedecreased below 0.25 mm. By using constant pressure the reduction of the diameter leads to areduction of flow rate and to a reduction of hydraulic power. To allow the increase of traversespeed the pressure has to be raised up.
The small nozzle diameter requires small abrasive particles below 100 µm. Flow behaviourand settling velocity of particles changes by decreasing the diameter. In a low pressure perspextest unit the flow behaviour of small abrasive particles has been investigated. To investigatethe discharge behaviour of small abrasive particles a flat storage vessel model has been used. Itcould be shown that in the centre of the mass a dynamic channel is built by abrasive particlesin motion. The diameter of the channel increases in direction of the suspension surface. On topof the suspension surface a cone with an angle of 60° is formed during the discharge process.This cone consists until the suspension surface reaches the bottom of the storage vessel. As aresult of these investigations the bottom of the storage vessel was designed with a cone of 60°to support the flow out of suspension. At the perspex unit the ratio between bypass flow rateand mass flow rate has been investigated, too. By weighing the discharged suspension every 10seconds during constant bypass flow rate it could be shown that there is a linear ratio, figure 2.
When stopping the cutting process by closing the bypass valve, the depressurisation and bythis the transportation of highly concentrated suspension out of the storage vessel as well as bygravitation has to be avoided. The typical design of AWSJ-bypass-systems shows a valveunder the storage vessel to avoid settling of particles after finishing the cutting process, seefigure 3, left. Until yet, suspension-valves to switch the suspension during cutting process arenot developed for pressures higher than 70 MPa. At the low pressure test rig a new design was
tested by installing the mixture unit above of the top of the storage vessel. This design allowsto reduce the number of valves and it allows to switch off the bypass flow rate and with thisthe mass flow rate, see figure 3, right.
4. DESIGN
To run a 400 MPa-AWSJ-system, a high-pressure intensifier was adapted. At the WaterjetLaboratory Hannover (WLH) a Böhler Hochdrucktechnik-intensifier is installed. Thisintensifier delivers a pressure up to 400 MPa and a maximum flow rate of 4 l/min. This leadsto a limitation of maximum nozzle diameter to 0.3 mm. The aim of a AWSJ-system as amanufacturing tool should be the decreasing of the generated kerf width to becomecompetitive against other cutting technologies like laser.
Former research work at the Institute of Material Science on nozzle design (Brandt, C. et al.,1998) has lead to a special nozzle shape for 70 MPa-systems. An optimal nozzle, resultingfrom the experiences, with a long inlet curve and a long cylindrical part to get a coherent jet,was designed for the 400 MPa-system with a diameter of 0.25 mm, figure 4. The nozzle isfixed by a special nozzle holder.
Figure 5 - 6 shows the 400 MPa-system in the Waterjet Laboratory Hannover. Figure 5 showsthe storage vessel and the control valves in the main stream and in the bypass stream. The flowrates are measured by turbine flow meters. The 2.5 l-storage vessel from BöhlerHochdrucktechnik will be filled, under environmental pressure, through two pipes, fixed at thetop of the vessel. A membrane pump delivers the high concentrated suspension into the vesseland presses the same volume of water out of the vessel. The bypass flow is lead through a thirdtube into the vessel.
After the mixing process of the main flow stream and bypass flow stream carrying a highconcentrated suspension the mixture of this suspension flows through a flexible hose to thenozzle, which is connected to a XY-table. The construction of the XY-table allows to cut on airand under water. The advantages of cutting under water are the reduction of noise and reducingthe forces acting at the work pieces and the work piece holder.
The next chapter will describe the first trials to generate a fine-beam.
5. TRIALS
The first cut was carried out at 150 MPa with a 0.25 mm-nozzle. The result has shown the bigpotential of such a system. The test lead to a width of kerf of 0.3 mm and a surface roughness(Ra) of 1.8 µm, figure 7.
Following cutting tests have shown periodical striation marks on the cutting edge. By variationof the traverse speed it could be shown that there is a relationship between the frequency of theintensifier and the generated marks on the cutting edge. Further investigations by varying the
mass flow rate have shown the possibility to decrease the influence of the pressure pulsationby increasing the mass flow rate. Another way to eliminate the marks could be the installationof an accumulator. Figure 8 shows two work pieces which were cut with a pressure of 300MPa and with a mass flow rate of 0.5 g/s (left) respectively with 1.6 g/s (right). The effect onthe cutting edge is visible.
Figure 9 shows a cut in aluminium (thickness 20 mm) with a pressure of 400 MPa and atraverse speed of 200 mm/min.
6. CONCLUSION
A 400 MPa-Abrasive Water Suspension Jet System has been built up successfully.
First tests have shown the high potential of high-pressure Abrasive Water Suspension Jets.
Future activities will be focused on cutting and kerf tests to show the potential of a 400-MPa-suspension jet system regarding the traverse speed, the material thickness, the very small widthof kerf and the high quality of the surface.
The process-safety has to be investigated regarding a control of the cut quality by monitoringvolume flow rate, mass flow rate etc..
The possibility to profile almost all materials with Fine-Beam Abrasive Water Jets will opennew possibilities for manufacturing applications.
7. ACKNOWLEDGEMENT
Main parts of this paper are based on a research program with the project number BE96-3622sponsored by the European Union. The authors are member of the ArbeitskreisWasserstrahltechnologie (AWT), Germany.
8. REFERENCESLancester, J. C.: “Underwater jetting: exploring new frontiers.” Cleaner Times 6 (1994), No. 3,
pp. 18/20.
Hashish, M., Bothell, D., “Diamond Polishing with Abrasive Suspension Jets,” Proceedings ofthe 7th American Water Jet Conference, Volume 2 pp 793/800, Water Jet TechnologyAssociation, St. Louis, Missouri, 1993.
Liu, H-T: “Near-net shaping of optical surfaces with UHP abrasive suspension jets,” 14thInternational Conference on Jetting Technology, pp. 285-294, Bury St Edmunds,London: Professional Engineering Publishing Limited, 1998.
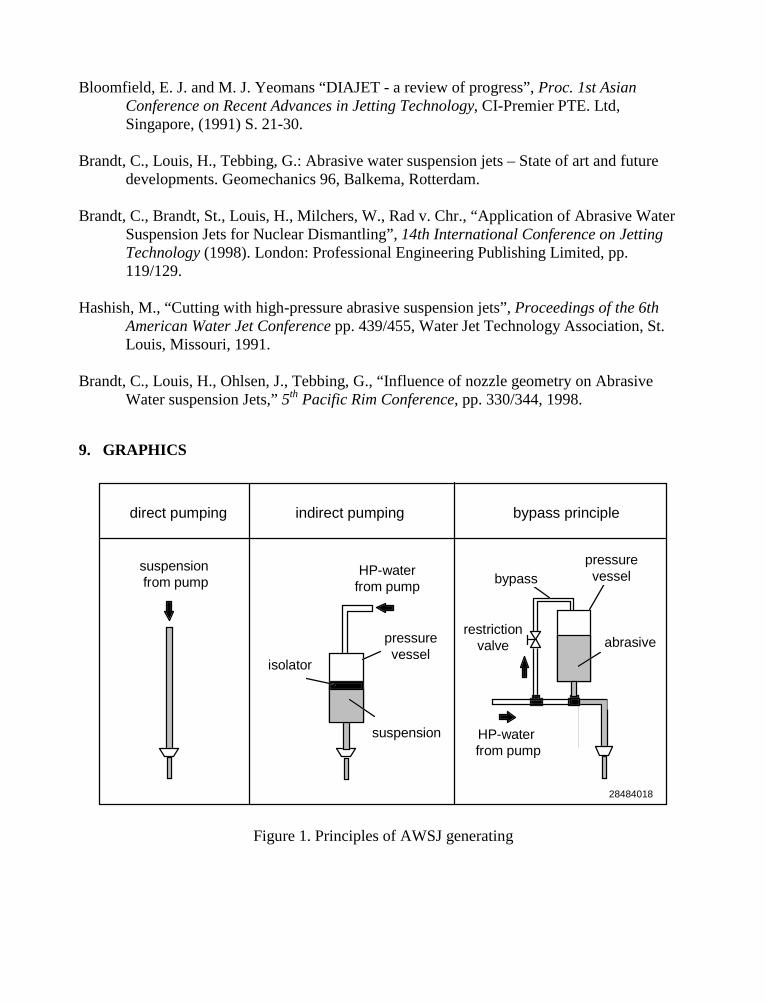
Bloomfield, E. J. and M. J. Yeomans “DIAJET - a review of progress”, Proc. 1st AsianConference on Recent Advances in Jetting Technology, CI-Premier PTE. Ltd,Singapore, (1991) S. 21-30.
Brandt, C., Louis, H., Tebbing, G.: Abrasive water suspension jets – State of art and futuredevelopments. Geomechanics 96, Balkema, Rotterdam.
Brandt, C., Brandt, St., Louis, H., Milchers, W., Rad v. Chr., “Application of Abrasive WaterSuspension Jets for Nuclear Dismantling”, 14th International Conference on JettingTechnology (1998). London: Professional Engineering Publishing Limited, pp.119/129.
Hashish, M., “Cutting with high-pressure abrasive suspension jets”, Proceedings of the 6thAmerican Water Jet Conference pp. 439/455, Water Jet Technology Association, St.Louis, Missouri, 1991.
Brandt, C., Louis, H., Ohlsen, J., Tebbing, G., “Influence of nozzle geometry on AbrasiveWater suspension Jets,” 5th Pacific Rim Conference, pp. 330/344, 1998.
9. GRAPHICS
28484018
suspension from pump
direct pumping indirect pumping bypass principle
isolator
pressurevessel
abrasive
HP-water from pump
restrictionvalve
bypass
suspension
pressurevessel
HP-waterfrom pump
Figure 1. Principles of AWSJ generating
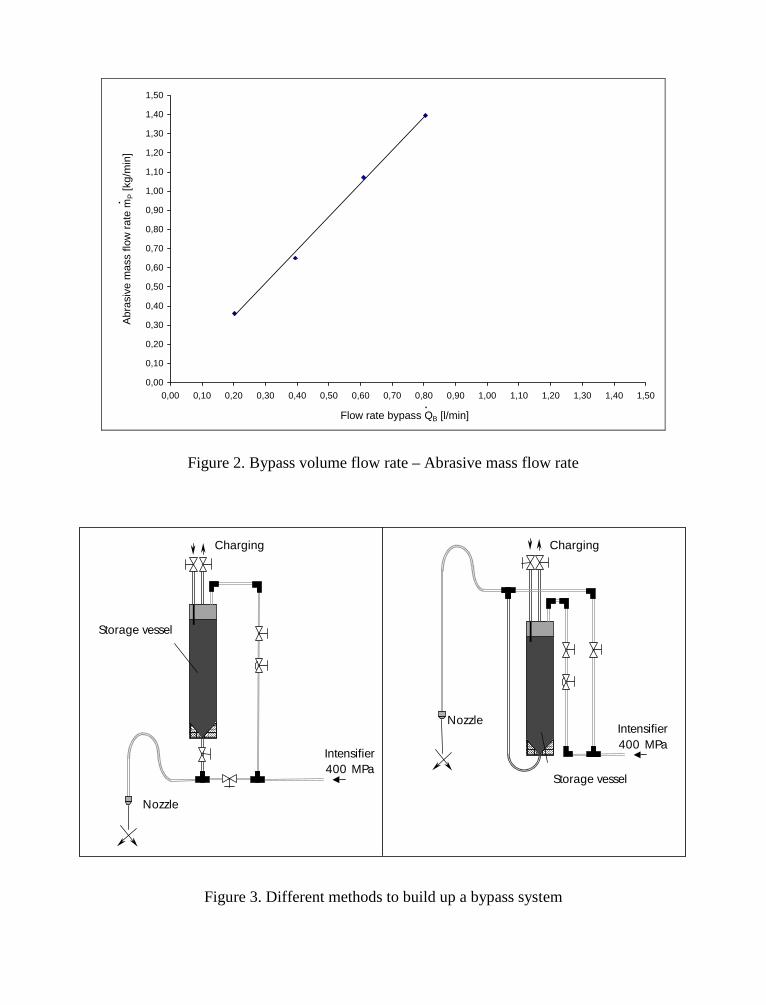
0,00
0,10
0,20
0,30
0,40
0,50
0,60
0,70
0,80
0,90
1,00
1,10
1,20
1,30
1,40
1,50
0,00 0,10 0,20 0,30 0,40 0,50 0,60 0,70 0,80 0,90 1,00 1,10 1,20 1,30 1,40 1,50
Flow rate bypass QB [l/min]
Abr
asiv
e m
ass
flow
rat
e m
P [k
g/m
in]
.
.
Figure 2. Bypass volume flow rate – Abrasive mass flow rate
Charging
Intensifier400 MPa
Storage vessel
Nozzle
Charging
Storage vessel
Nozzle
Intensifier400 MPa
Figure 3. Different methods to build up a bypass system
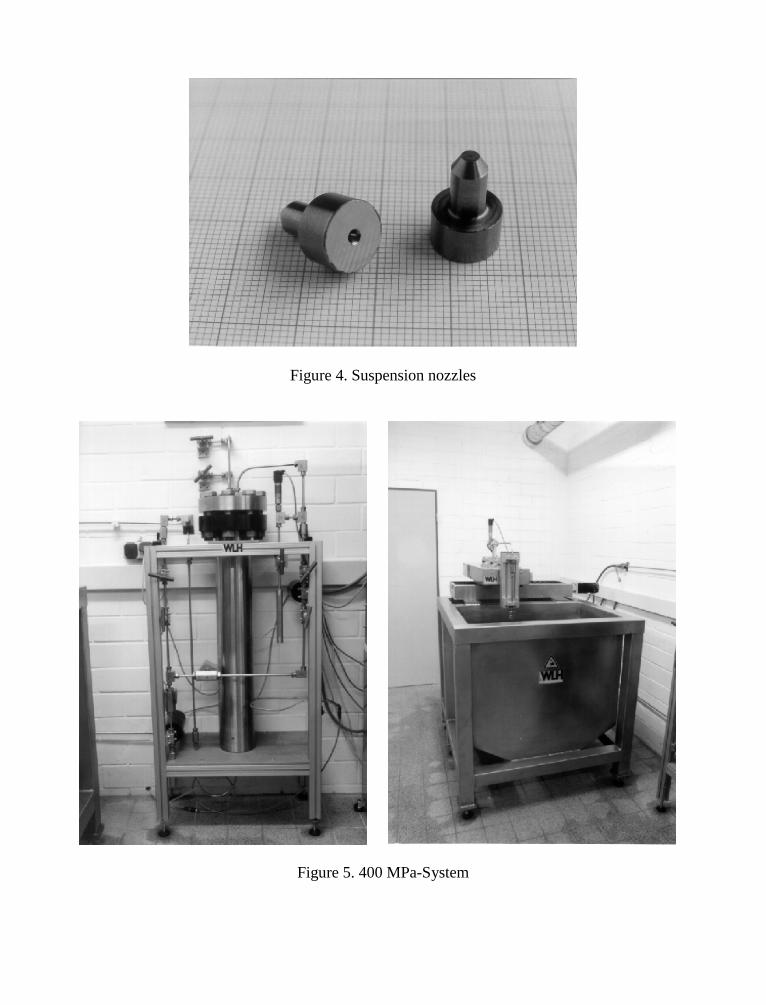
Figure 4. Suspension nozzles
Figure 5. 400 MPa-System
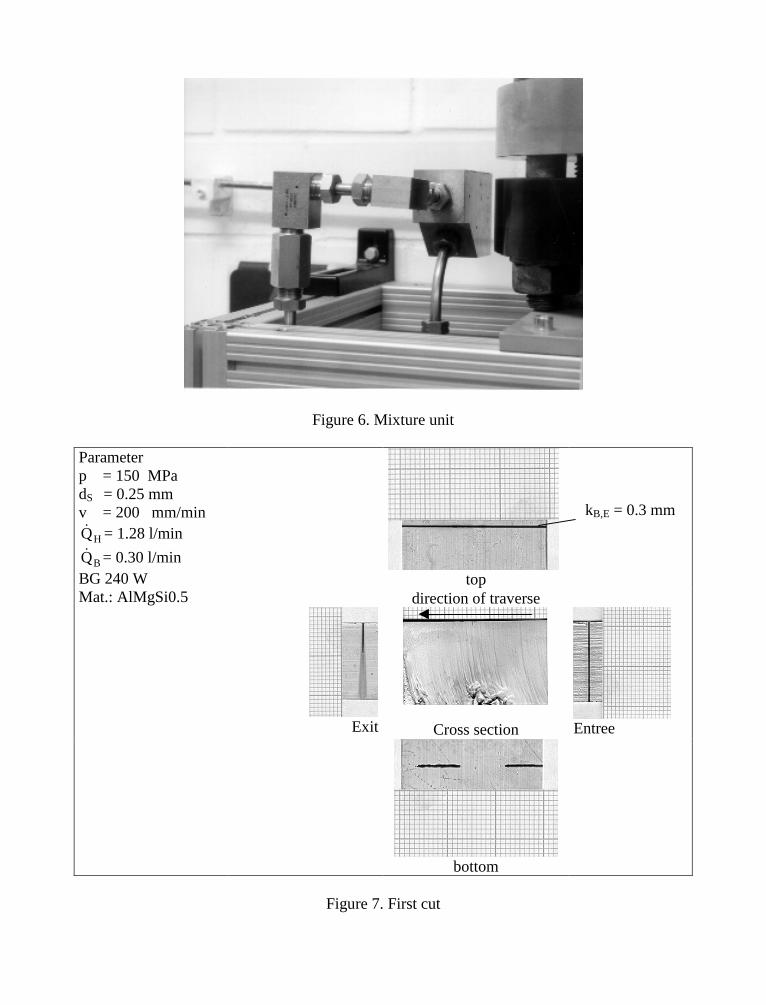
Figure 6. Mixture unit
top
Exit
direction of traverse
Cross section Entree
Parameterp = 150 MPadS = 0.25 mmv = 200 mm/min
HQ = 1.28 l/min
BQ = 0.30 l/minBG 240 WMat.: AlMgSi0.5
bottom
Figure 7. First cut
kB,E = 0.3 mm
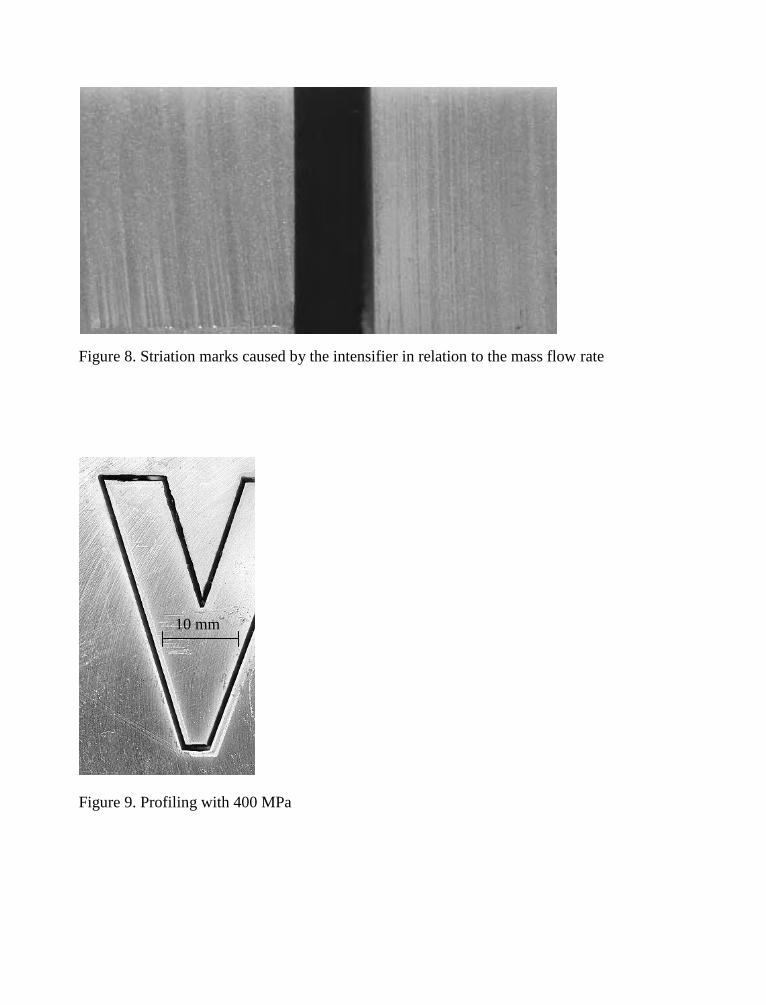
Figure 8. Striation marks caused by the intensifier in relation to the mass flow rate
Figure 9. Profiling with 400 MPa
10 mm
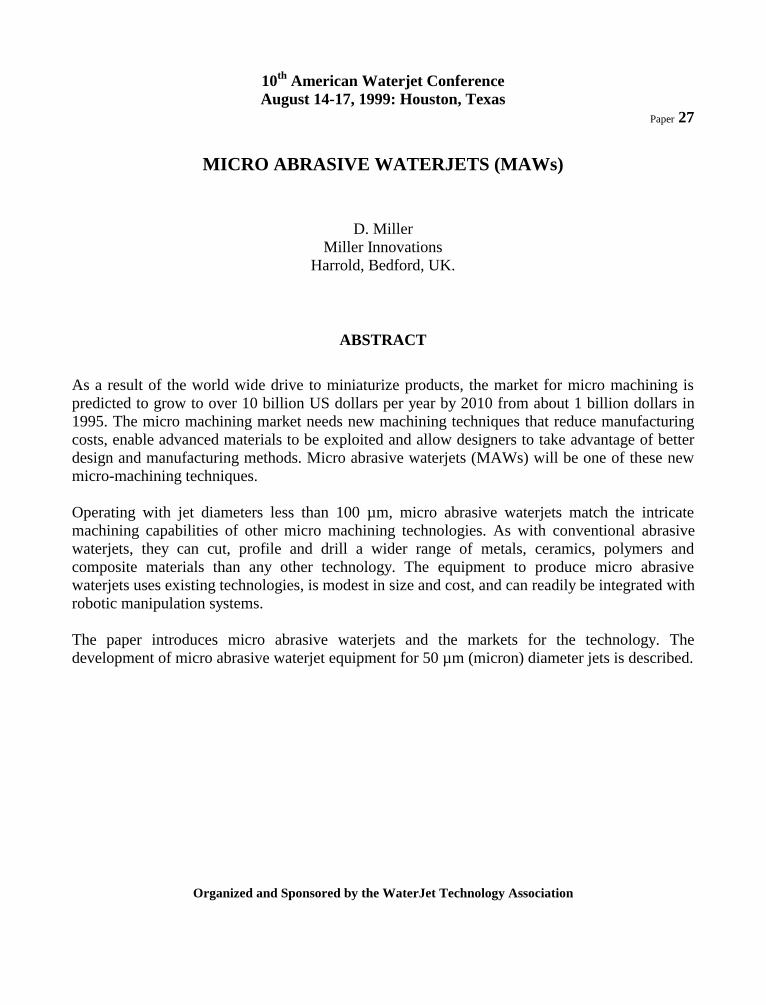
10th American Waterjet ConferenceAugust 14-17, 1999: Houston, Texas
Paper 27
MICRO ABRASIVE WATERJETS (MAWs)
D. MillerMiller Innovations
Harrold, Bedford, UK.
ABSTRACT
As a result of the world wide drive to miniaturize products, the market for micro machining ispredicted to grow to over 10 billion US dollars per year by 2010 from about 1 billion dollars in1995. The micro machining market needs new machining techniques that reduce manufacturingcosts, enable advanced materials to be exploited and allow designers to take advantage of betterdesign and manufacturing methods. Micro abrasive waterjets (MAWs) will be one of these newmicro-machining techniques.
Operating with jet diameters less than 100 µm, micro abrasive waterjets match the intricatemachining capabilities of other micro machining technologies. As with conventional abrasivewaterjets, they can cut, profile and drill a wider range of metals, ceramics, polymers andcomposite materials than any other technology. The equipment to produce micro abrasivewaterjets uses existing technologies, is modest in size and cost, and can readily be integrated withrobotic manipulation systems.
The paper introduces micro abrasive waterjets and the markets for the technology. Thedevelopment of micro abrasive waterjet equipment for 50 µm (micron) diameter jets is described.
Organized and Sponsored by the WaterJet Technology Association
1. INTRODUCTION
The remarkable success of the abrasive waterjet (AWJ) industry reflects its commercial drive andthe unique machining capabilities of AWJs. This paper outlines the potential for the AWJindustry to use its commercial drive to break into the micro machining market, a market thatneeds the unique machining capabilities of AWJs. To enable the industry to do this, microabrasive waterjet (MAW) technology and equipment is being developed for exploitation.
It is useful to start with a few details about micro abrasive waterjet equipment to power a 50-µmnozzle at 700 bar water pressure. Water consumption is 2 liters per hour and abrasiveconsumption 200 grams per hour. The pumping unit consists of two 6 mm diameter plungerpumps installed within 80 mm diameter pneumatic cylinders. A compressor powered by a singlephase, 2 kW electric motor is sufficient to drive the pumps.
MAW equipment is small compared to conventional AWJ equipment, with water and abrasiveflow rates that can be less than 1 percent of conventional AWJ equipment. However, cuttingenergy densities of the jets are the same as conventional AWJs, which means jets will cut thesame materials as conventional AWJs, albeit through thinner sections.
Micro machining markets and their requirements from new machining technologies, are outlinedin Section 2. Methods of generating MAWs are considered in Section 3. After discussing inSection 4 the factors that limit the minimum diameters of abrasive waterjets, the strategy fordevelopment of MAW equipment is presented in Section 5. Details of the flow circuit andcomponents for MAW equipment is given in Section 6, and information on initial trials with 50µm diameter jets in Section 7. Future developments are considered in Section 8, followed byconclusions in Section 9.
2. THE MICRO MACHINING MARKET
A key characteristic of the current industrial revolution is the miniaturization of products andprocesses. Device and component manufacturers require smaller and smaller features to bemachined, with increasingly tighter tolerances, on a growing range of high technology, oftendifficult to machine materials. Japan’s Micro Machine Centre estimated that the world widemicro machining market will reach over $10 billion dollars by 2010 (Weiss, 1995).
To support their industries, governments in the major industrialized countries are fundingresearch into new micro machining methods. Most of this research is directed at photonictechniques, such as lasers. Little research currently appears to be directed to micro machiningwith abrasive waterjets. This is unfortunate as AWJs could become the preferred micromachining technique in a wide range of applications.
Technologies for micro machining include: high performance lasers; electron beams; wire EDM;chemical etching; high speed routers; fine pressing; diamond tooling. Each of these techniqueshas advantages and limitations compared to each other and to micro abrasive waterjets. Theestablished advantages and disadvantages of conventional AWJs, relative to other machiningtechniques, extend down to MAWs. For instance, compared to lasers, the cutting speeds of AWJs
are much lower for materials that are suitable for laser cutting but AWJs can machine a muchwider range of materials and provide better cut edge qualities, free of heat affected zones.
Three examples will illustrate the kind of application where micro abrasive waterjets couldbecome the machining method of first choice.
2.1 Manufacturing
A company produces a wide range of flat springs, small enclosures and other fine pressings froma wide variety of metals in strip form. The company needs to be able to rapidly produceprototypes and small batches of components, without the cost of tooling. Currently prototypes areproduced by hand using fly presses. This can take several hours, depending on componentcomplexity. The process is error prone. Laser profiling is not acceptable because of crackingfrom heat affected zones and problems with cutting copper based alloys such as berylliumcopper. This is a good application for a MAW mounted on a small X-Y table.
2.2 Job Shop
A job shop with a number of conventional AWJ cutting systems receives a steady stream ofrequests from customers to profile small intricate components but the components cannot beprofiled on its existing machines. A MAW profiling system, using the same software and controlsystems that the company currently uses, would provide the required intricate machiningcapability with minimum investment.
2.3 Electronics
One of the products of an advanced materials manufacturer is a light weight, high conductivity,metal matrix composite for heat sinks in aerospace electronic applications. The compositeconsists of ceramic particles in an aluminum matrix and is produced in the form of small plates.The material cannot be profiled with conventional tooling or lasers because of the ceramicparticles. The machining detail required is beyond the capability of conventional AWJs. Thecurrent method of profiling is to diamond drill starter holes and sub contract the rest of themachining to a wire EDM job shop. This is an expensive process with time penalties. AWJs cutand drill the material as if it were aluminum. A small MAW profiling system would be a costeffective solution.
3. METHODS OF GENERATING AWJs
There are 3 methods for generating abrasive waterjets:
3.1 Entrainment Method
AWJs for precision machining use a high velocity water jet to entrain air laden with abrasiveparticles into a ceramic focusing tube. In the focusing tube energy is transferred from the water tothe abrasive particles to produce a cutting beam. As focusing tube bore diameters are decreasedbelow 0.5 mm the entrainment process begins to break down and the transport of abrasive
particles to the focusing tube becomes problematic. Modifications to the entrainment process,due to Hashish et al. (1990), allows entrainment cutting heads to function with focusing tubediameters down to 0.25 mm. The entrainment method cannot be used for micro machining.
3.2 Suspension Method
The suspension method involves using an additive to suspend abrasive particles in water. Highpressure water is used to displace the abrasive suspension out of a vessel and through a cuttingnozzle. Extensive research work has been carried out on the suspension method, particularly bythe Southwest Research Institute, (Hollinger et al., 1990) and Quest Integrated (Kovacevic et al.,1997). Commercial systems based on the suspension method have not been developed because offormidable technical problems posed by the complexity of the flow circuits and with valves. Thesuspension method is at present ruled out for MAWs because of these technical problems.
3.3 Carrier Method
In the carrier method a percentage of the high pressure water flow to a cutting nozzle is divertedthrough an abrasive storage vessel. On leaving the storage vessel the diverted water carriesabrasive particles out of the vessel and into the main water flow before it reaches the cuttingnozzle. The originators and main developers of carrier fluid technology are BHR Group in theUK under the name DIAJET. BHR Group has produced equipment with cutting jet diametersranging from 0.5 mm to 2.8 mm. This equipment has been extensively used for on sitedemolition and the cutting up of munitions to recycle or to destroy explosives and propellants.BHR Group have also produced precision machining systems.
For the same cutting performance, carrier fluid systems can operate at about 25 percent of thepressure required by entrainment systems but the equipment to produce carrier jets is morecomplicated. For the same power input and operating pressure a carrier system would produceover four times the cut surface area per minute as an entrainment system. Development of thecarrier method for precision machining started 10 years after the commercialization of theentrainment method. The carrier method faces a long uphill struggle to become established in theprecision machining market in the face of the proven and highly successful entrainment method.It is likely to be some time before the market situation is such that the higher cutting speedsoffered by the carrier method will become sufficiently attractive for main stream AWJ companiesto exploit the technology. Carrier fluid technology is well suited to the generation of MAWs.
4. LIMITATIONS ON THE MINIMUM SIZE OF MAWs
Micron and sub micron abrasive particles are used in many machining operations. For instance,drilling the bore of ceramic nozzles for MAWs may be carried out using micron sized diamondparticles applied in a fluid to rotating tooling. It is known that about 80 percent of abrasiveparticles break up in the focusing tubes of entrainment AWJs. This breakup results in theformation of millions of micron and sub micron particle per second. These particles areresponsible for a significant part of the cutting action of entrainment abrasive waterjets. Based on
the above observations, it can be reasoned that abrasive waterjets with diameters under 10 µmwould cut if it were possible to generate such jets.
Practical limits on how small abrasive waterjets can be made are due to:
a) As nozzle diameters are decreased water flows in fluid circuits becomes laminar, rather thanturbulent, and inter particle forces on fine abrasive particles causes the particles to becomemore cohesive. As yet it is not known what limitations these physical phenomena will placeon minimum jet diameters. For 50 µm diameter jets, the Reynolds Number (ratio of inertia toviscous forces) is sufficiently high to maintain turbulent flow in critical components andinter particle forces do not appear to be a serious problem.
b) The ability to drill and shape nozzle bores in very hard materials. Proven methods areavailable for drilling nozzles with bore diameters down to 50 µm. Nozzle bore diametersdown to 10 µm are possible with existing technologies but research is needed to establishwhether hole quality and manufacturing costs are acceptable.
c) A fall off in the cut surface area generated per minute as jet diameter is decreased. Settingaside effects due to viscosity, surface tension, particle size and other physical phenomena,then for a given water pressure and abrasive concentration, the cut surface generated perminute varies linearly with jet diameter, as does the thickness of material that can be cut.This linear relationship is known to apply for jet diameters from 2 mm down to 200 µm butthere are indications of departures from a linear relationship by 50 µm jet diameter.
It can be concluded that there are no serious restrictions on producing MAWs with diametersdown to 50 µm but research and development is needed to be able to operate substantiallysmaller diameter jets.
5. STRATEGY FOR EQUIPMENT DEVELOPMENT
Micro abrasive waterjets are defined as abrasive waterjets with diameters between 100 µm and 1µm. A 50 µm jet diameter has been selected for initial equipment development, with thecapability to scale the equipment to operate with smaller and larger diameter jets. The carrierfluid method, discussed in Section 3, is used to generate the abrasive in water flow at the cuttingnozzle.
The success of conventional AWJ equipment owes a lot to the simplicity of its high pressurewater circuit and the small number of mechanical components in the circuit. Companies havebeen able to concentrate developments on these components to achieve high equipmentreliability. Conventional equipment is easy to understand, to trouble shoot and to service and ithas a good safety record. The word dependable is appropriate to describe AWJ equipmentprovided by the leading suppliers. The same level of dependability must be achieved by MAWequipment.
The following strategy has been adopted to maximize the opportunities of MAW equipmentachieving good dependability early on in the product development cycle:
a) A simple water flow circuit has been devised.
b) The water flow circuit is made up of a small number of mechanically simple components.
c) Abrasive is loaded into the equipment in sealed cartridges to prevent contamination of theabrasive. This simplifies the equipment as there is no need for an abrasive replenishmentsystem.
d) Pumping units are based on standard pneumatic components and control systems, withplunger pumps driven by pneumatic cylinders.
e) The cutting nozzles are made from the same ceramics used for entrainment focusing tubes.Because nozzle wear is linked to the cutting energy density of an abrasive jet, the energydensity in MAW nozzles needs to be limited to those of entrainment jets in order to havesimilar nozzle wear rates. A MAW operating at 700 bar water pressure has roughly the samecutting energy density as that of an entrainment AWJ operating at 3000 bar. An operatingpressure of 700 bar has been selected for initial MAW equipment developments.
f) The normal mode of operation for the equipment is with the water flow permanently on. Thisallows rapid on/off cutting action to be achieved by starting and stopping the abrasive flow,rather than the alternative of starting and stopping both the abrasive and the water flow. Withan operating water pressure of 700 bar most engineering materials are not marked by thewater jet and the water flow is only 2 liters per hour, for a 50 µm diameter jet.
6. FLOW CIRCUIT AND COMPONENTS
The basic flow circuit, which is the subject of a patent application (Miller. 1999), is shown inFigure 1. Referring to Figure 1, pressurised water from the pump is fed to a flow controller. Theflow controller has two main modes of operation:
1. It directs all of water flow from the pump towards the cutting nozzle. In this mode ofoperation the controller also applies suction to the top of the abrasive storage vessel shown infigure 1. The suction stops the flow of abrasive particles from the bottom of the vessel.
Or
2. It directs a percentage of the water flow from the pump to the top of the abrasive storagevessel. Water flowing into the top of the vessel displaces abrasive particles and water out ofthe bottom of the vessel, into the main water flow on its way to the nozzle.
Figure 2 shows the twin, synchronized pumps, used for development trials. The pumps, whichare the subject of a patent application, are incorporated in proprietary compact pneumaticcylinders. Control of the pumps is by a small programmable logic controller (PLC).
The abrasive storage vessel shown in Figure 1 can either contain abrasive in a cartridge orabrasive can be transferred to the vessel from a cartridge. Figures 3 and 4 show the abrasivestorage vessel with and without the vessel barrel in place. Without the barrel the removablecartridge containing abrasive can seen. Cartridges contain enough abrasive for one hours cuttingwith a 50 µm diameter jet.
A 50 µm bore nozzle design in silicon carbide has been developed. The nozzles are proving to beeffective with the prospect of similar operating lives to those achieved by entrainment AWJfocusing tubes.
7. CUTTING WITH 50 MICRON DIAMETER JETS
It is likely that most MAW machining systems will have a working area under 500 X 500 mmand have a motion system made up of a combination of linear ball screw actuators that have arepeatability better than 10 µm. There is great flexibility in how actuators are configured toform an X-Y table. A 300 X 300 mm table, Figure 5, is being used for profiling trials and toinvestigate table configurations.
Referring to Figure 5, the abrasive storage vessel along with the cutting nozzle assembly can bemounted directly on the X axis, or the storage vessel can be located remotely and abrasive andwater fed to the nozzle through tubing. Provision has also been made for mounting the pumpingunit, flow controller and other flow circuit components on the X axis. Work pieces are carried onthe Y axis, with a linear jet catcher tank under the X axis. Alternatively the jet catcher tank canbe built into the Y axis.
At the time of writing, commissioning of the equipment is underway with the first trialsconfirming that MAWs will cut the same range of materials as conventional AWJs. 50 µmdiameter jets have successfully cut plastic, aluminum, mild steel, high alloy steel and glass usingBarton Mines garnet abrasive.
8. FUTURE DEVELOPMENTS
In order to provide a firm base for the exploitation of MAWs, effort is currently directed atproviding dependable systems for cutting operations with 50 µm diameter jets. In thedevelopment processes it has become clear that MAWs have additional capabilities toconventional AWJs. These capabilities are associated with:
1. The coherent nature of MAWs.
2. The speed with which the cutting action can be turned on and off. In the longer term, itshould be possible to start and stop the cutting action several hundred times per second.
Coherent abrasive waterjets that can be rapidly turned on and off can be used to mark surfaces,mill features into surfaces and remove material by percussion drilling. The research needed to
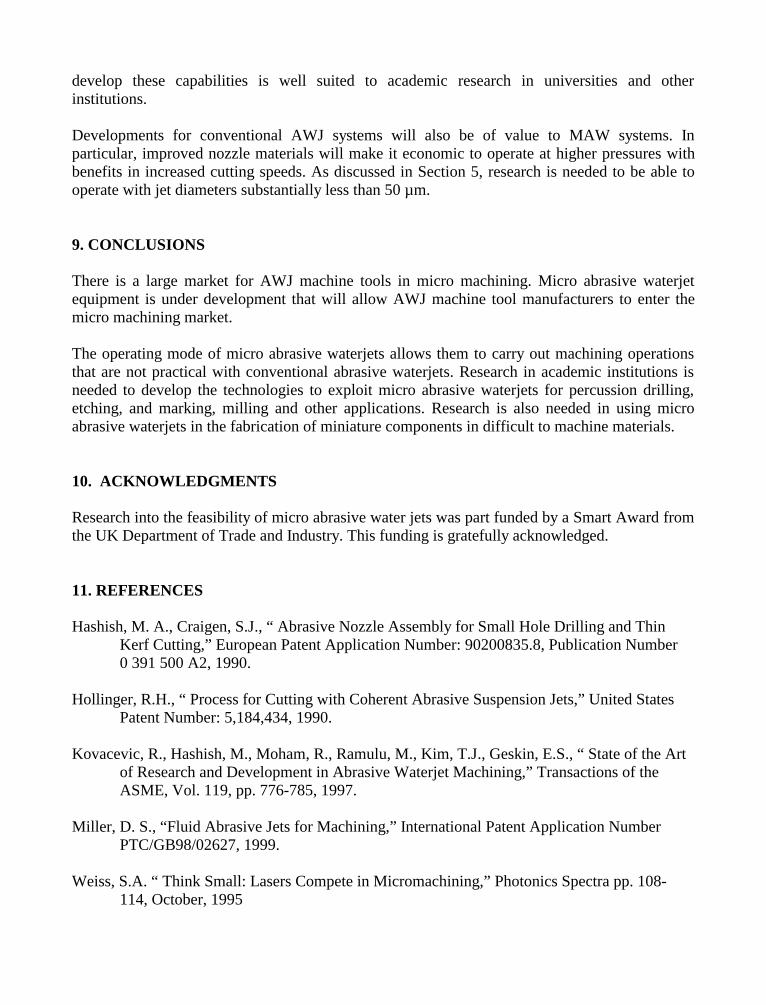
develop these capabilities is well suited to academic research in universities and otherinstitutions.
Developments for conventional AWJ systems will also be of value to MAW systems. Inparticular, improved nozzle materials will make it economic to operate at higher pressures withbenefits in increased cutting speeds. As discussed in Section 5, research is needed to be able tooperate with jet diameters substantially less than 50 µm.
9. CONCLUSIONS
There is a large market for AWJ machine tools in micro machining. Micro abrasive waterjetequipment is under development that will allow AWJ machine tool manufacturers to enter themicro machining market.
The operating mode of micro abrasive waterjets allows them to carry out machining operationsthat are not practical with conventional abrasive waterjets. Research in academic institutions isneeded to develop the technologies to exploit micro abrasive waterjets for percussion drilling,etching, and marking, milling and other applications. Research is also needed in using microabrasive waterjets in the fabrication of miniature components in difficult to machine materials.
10. ACKNOWLEDGMENTS
Research into the feasibility of micro abrasive water jets was part funded by a Smart Award fromthe UK Department of Trade and Industry. This funding is gratefully acknowledged.
11. REFERENCES
Hashish, M. A., Craigen, S.J., “ Abrasive Nozzle Assembly for Small Hole Drilling and Thin Kerf Cutting,” European Patent Application Number: 90200835.8, Publication Number0 391 500 A2, 1990.
Hollinger, R.H., “ Process for Cutting with Coherent Abrasive Suspension Jets,” United States Patent Number: 5,184,434, 1990.
Kovacevic, R., Hashish, M., Moham, R., Ramulu, M., Kim, T.J., Geskin, E.S., “ State of the Art of Research and Development in Abrasive Waterjet Machining,” Transactions of the ASME, Vol. 119, pp. 776-785, 1997.
Miller, D. S., “Fluid Abrasive Jets for Machining,” International Patent Application Number PTC/GB98/02627, 1999.
Weiss, S.A. “ Think Small: Lasers Compete in Micromachining,” Photonics Spectra pp. 108-114, October, 1995
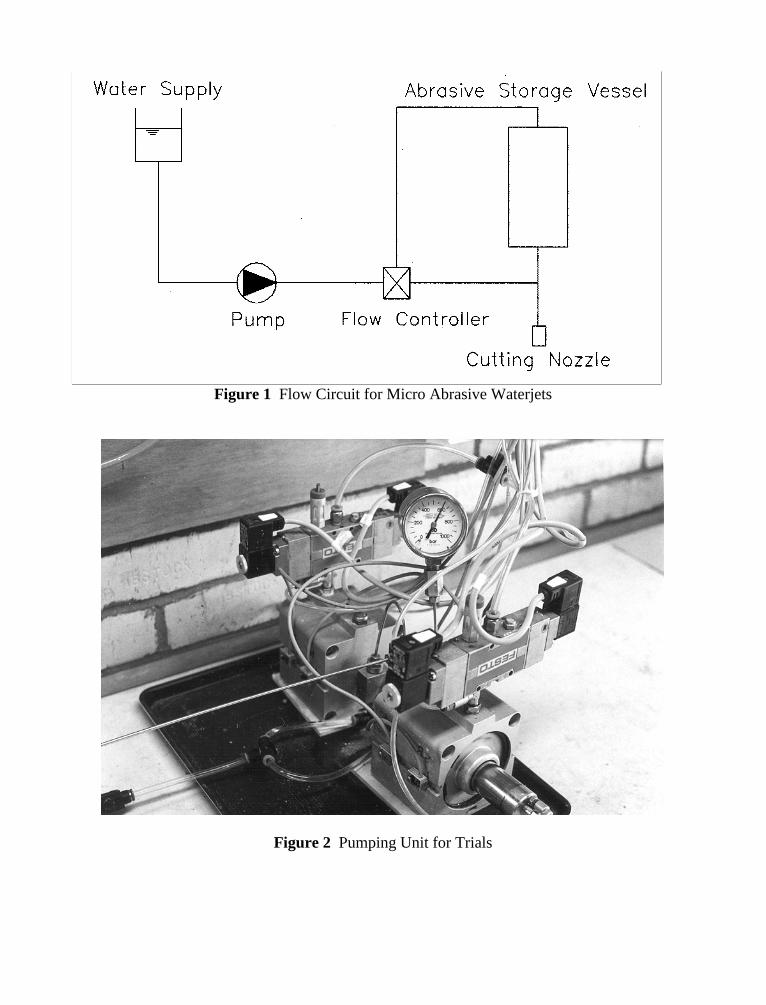
Figure 1 Flow Circuit for Micro Abrasive Waterjets
Figure 2 Pumping Unit for Trials
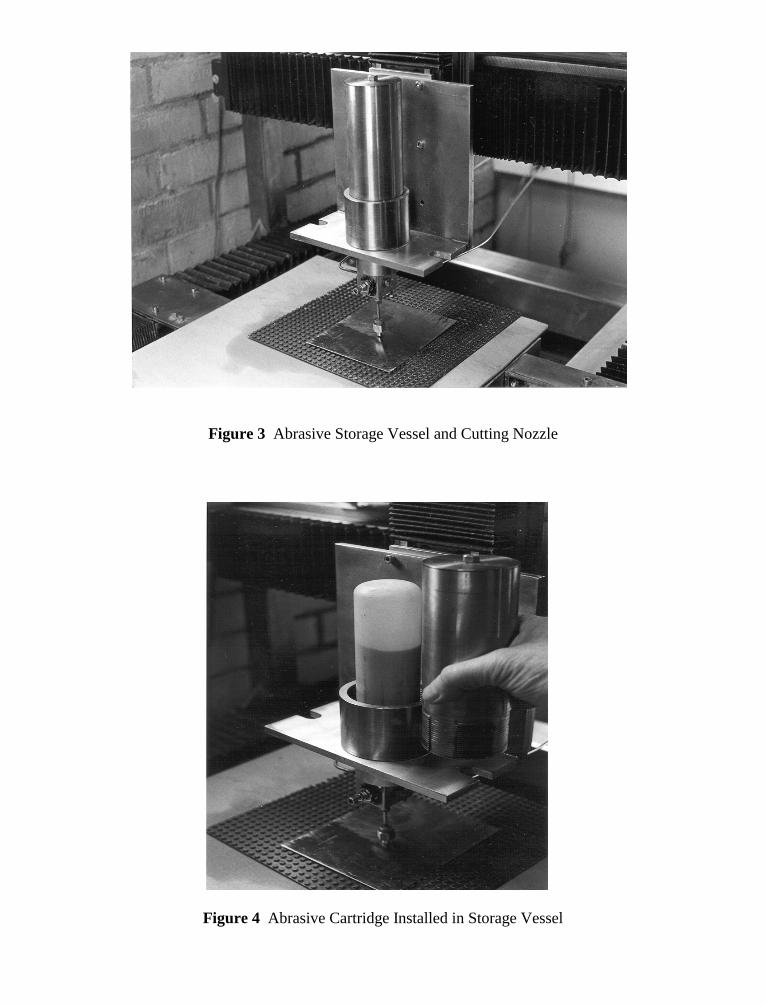
Figure 3 Abrasive Storage Vessel and Cutting Nozzle
Figure 4 Abrasive Cartridge Installed in Storage Vessel
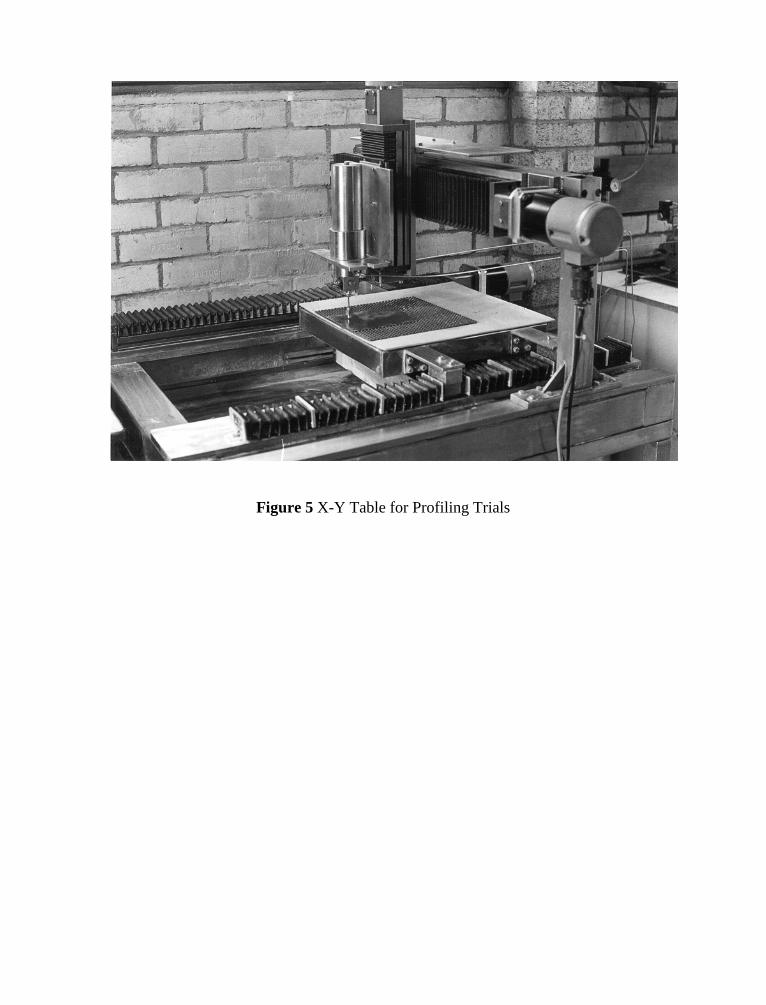
Figure 5 X-Y Table for Profiling Trials
10th American Waterjet ConferenceAugust 14-17, 1999: Houston, Texas
Paper 28
A STUDY ON TECHNOLOGY AND EQUIPMENT FOR CANNON
BORE CLEANING BY ABRASIVE SUSPENDING WATERJET
Gao ZidongChangsha Institute of Mining Research
Changsha 410012, Hunan Province, The People's Republic of China
ABSTRACT
In order to clean all adhesives, produced by shooting, in various cannon bores, some feasibilitytests for both high pressure waterjet and abrasive waterjet cleaning were made, and a kind oftechnology and equipment for cannon bore cleaning with the abrasive suspending waterjet wasdeveloped successfully. This paper describes the preparation and recycle use of the abrasivesuspending liquid, and presents the general structure, working principle and main performanceparameters of this cleaning equipment.
Organized and Sponsored by the WaterJet Technology Association
1. INTRODUCTION
The cannon which uses the gunpowder as power to shoot a bullet is generally called as artillerysuch as field -shipboard -, tank - and antiaircraft - artillery etc. Most of artillery are called as rifleartillery also, because there are many spiral lines, which are called as rifling, beingcorrespondingly laid out on the faces evenly in the cannon bore. The cross section of this gunbarrel is similar to an internal gear shown in Fig.1-b. At the moment of shooting a bullet, thebullet is momentarily put out the cannon bore by high temperature and pressure generated bygunpowder burning. While in a high speed friction of bullet, especially the bearing band ofbullet, with the cannon bore, there remain some such adhesives as copper, aluminum and nylonetc on all faces in the cannon bore (Fig.1-a). Meanwhile, the cannon bore is polluted bygunpowder burning also, that is to say, the carbon deposit is generated in it. These pollutedadhesives are more difficult to be cleaned out, because they adhere firmly to the cannon bore.The more the bullets are shot, the thicker the adhesives are deposited, which has a direct effecton the precision of cannon bore and the accuracy of shooting, so it is necessary to often cleanthese adhesives in time.
2. FEASIBILITY TESTS
The aim is to make an approach to the feasibility which the high pressure waterjet or the abrasivewaterjet is used to clean the adhesives in the cannon bore, from which whether or not a kind ofequipment for cannon bore cleaning can be developed.
2.1 Pure Waterjet Tests
This test was one for which the waterjet cutting machine was used. Under the condition ofconstant flow rate, the pressure was divided into several rating from high to low, then the testswere made rating by rating. When the pressure was increased to > 140MPa, the adhesives in thecannon bore were cleaned out but slowly. If the cleaning time is shortened, the flow rate shouldbe increased to > 100l/min. At that time, this pump with high flow rate and pressure was difficultto be available commercially, so it was not suitable to use the pure waterjet for cleaning.
2.2 Abrasive Waterjet Tests
In order to find a suitable abrasive material and its matching size, many tests for such abrasivematerials as saw dust, walnut shell, talcum powder, garnet and pearl stone etc were made early orlate, under the condition of same/different water pressure and flow rate. Obviously, the cleaningeffects of the light and soft abrasive materials was not best, while the heavy and hard abrasivematerials cleaned out the adhesives quickly but did the damage to cannon bore matrix. Based onall aspects of requirements, the comparison and choose were made. It was considered that pearlstone used as an abrasive material was more ideal. Used as the abrasive waterjet, such anabrasive material as pearl stone can clean out the adhesives in the cannon bore at 25MPa. Thedensity and Moh's hardness of pearl stone were 2.35 0.1% (lighter) and 5.5 0.5% (softer)
respectively. Pearl stone contained SiO2 (70~73%), Al2O3 (11~13%), Na2O (2.6~4.1%),K2O(2.5~4.5%) and CaO (1~1.5%) in main and a little amount of MgO and Fe2O3, with stablechemical property. And it can be available at any time.
However, the abrasive waterjet has some such disadvantages as higher consumption of abrasivematerial, uneasy control of abrasive-water ratio, more difficult and complicated recycle use ofabrasive material and so on.
2.3 Abrasive Suspending Waterjet Tests
In order to find suitable pressure and flow rate, pearl stone abrasive was mixed with water in thecertain proportion, then stirred in the stirring tank into an abrasive suspending liquid and directlypumped to the nozzle where the abrasive suspending waterjet was formed to make a cleaning testfor the cannon bore. Meanwhile, the dynamic characteristics of this solid-liquid two phase flow,the critical velocity of homogeneous suspending of abrasive material and the effects of abrasiveconcentration and size etc were determined. Also, the effects of this abrasive suspending liquidon the pump and its important parts were checked. In addition, some approaches to the structuralmodel of nozzle were made. Based on these tests and inspections, it was considered that usingthe pearl stone abrasive suspending waterjet to clean the cannon bore was feasible, and therecycle use of abrasive suspending liquid was easy made.
3. DEVELOPMENT OF ABRASIVE SUSPENDING WATERJET CLEANING MACHINE FOR CANNON BORE
3.1 Requirements for Technical Performances
The main requirements for technical performances put forward by users in the contract were asfollows:
(1) All artillery with 25~155mm in bore size can be cleaned.
(2) The longest cleaning time for the artillery which is the most difficult to be cleaned is notmore than 2hrs.
(3) After cleaning, any remnant adhesives can not exist in the cannon bore; meanwhile, thedamage to the cannon bore is not allowed.
(4) The recycle use of abrasive suspending liquid can be made, and this liquid can be complemented or renewed periodically.
(5) This cleaning machine is safe and reliable, and can be operated by one cleaning worker.
3.2 Components and Working Principles
A complete set of equipment is consisted of abrasive suspending liquid feeding system,pressurized delivery system, cleaning system, electric control system and abrasive suspendingliquid recycling system etc.
As shown in Fig.2, according to the specified weight ratio, pearl stone abrasive and water instirring tank (19) are stirred into an abrasive suspending liquid, then this liquid is pressurized bypump (23) and delivered to ejecting head (14) by feeding rod (5) along high-pressure hose (1); inthis time, the abrasive suspending waterjet ejects. Driven by rotary mechanism (2), the ejectinghead and the feeding rod can make a forward or reversal rotation. Hauled by chain (3), the rotarymechanism goes forward or backward along guide rail (4) together with the feeding rod and theejecting head, and its distance of travel is controlled by over travel limit switch (10), by cleaningrequest. The chain is driven by drive chain wheel (7). The waterjet from the ejecting headimpacts on the cannon bore (12), then along the bore flows into covered hopper (11) to storage(17). Recovery pump (16) is controlled automatically by liquid-level controller (15) installed onthe storage, its flow rate is more than that of pump (23), and pumped the abrasive suspendingliquid in the storage into the stirring tank to make a recycle use. Filter (18) is installed on thestirring tank. In the process of cleaning, pearl stone abrasive and water in the stirring tank arestirred continuously, while the ejecting head ejects, rotates and goes forward or backward at thesame time in the cannon bore repeatedly till cleaning out. Afterwards, close valve (20) valve—(21) is closed also, open intermediate valve (22), start pump (23) and use the pure water to cleanthe pump, pipeline, ejecting head and cannon bore to avoid the abrasive material depositing inthe equipment. In this time, water is not allowed to enter the stirring tank to avoid the abrasivematerial reducing its concentration.
According to amount of adhesives in the cannon bore and the extent of cleaning difficulty orsimplicity, the reciprocal cleaning times is preset. The rotation, going forward or backward,travel length and reciprocal times of ejecting head are controlled automatically. As for theartillery with various bore sizes, the sizes of ejecting head and guide device are different. Tens ofnozzles are laid out evenly on the ejecting head, whose distribution is like as radiation. As for therifle artillery, in order to clean out the two sides of rifle simultaneously, the nozzle should meetat the certain intersection angle to radial to increase an impacting force of waterjet on the riflesides.
In order to ensure the smooth operating of feeding rod and avoid it bending, floating support (8)is added on the guide rail, and guide device (13) is installed on the feeding rod near the locationof ejecting head to make the feeding rod and ejecting head situate always on the intermediateaxle line of cannon bore. According to diameter and length, the feeding rods are divided intothree types and used for the cannon bores in three-kind bore sizes respectively.
The biggest and longest feeding rod is connected with several short rods. However, this extendedrod must meet the following requirements:
(1) The rod is hollow, with an adequate rigidity.
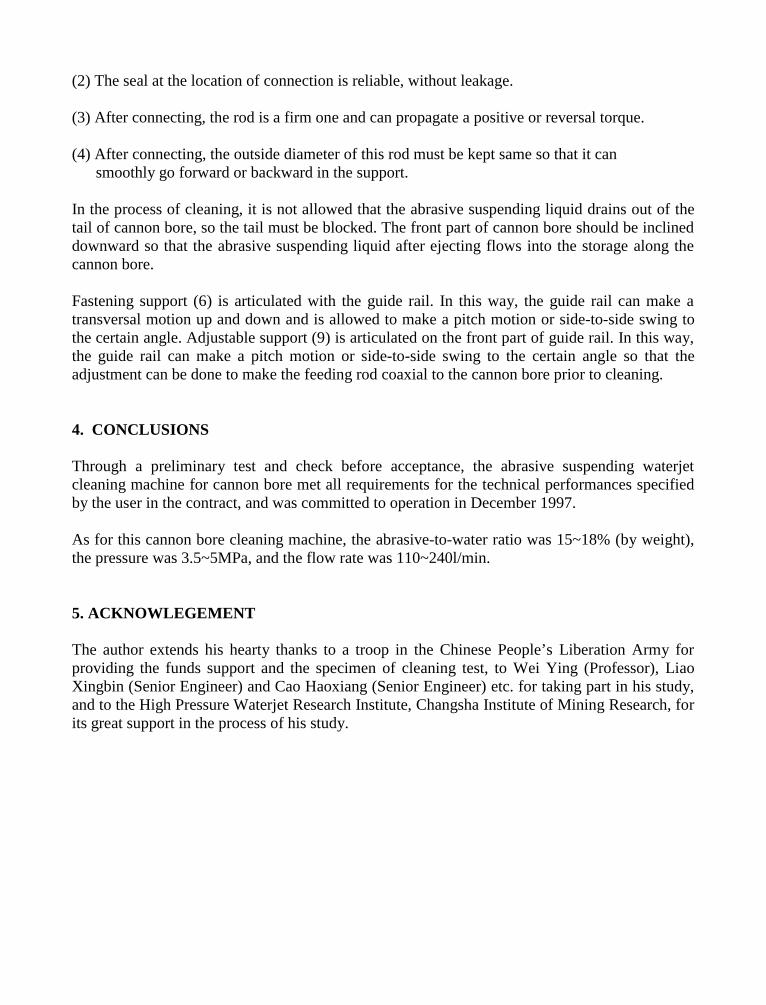
(2) The seal at the location of connection is reliable, without leakage.
(3) After connecting, the rod is a firm one and can propagate a positive or reversal torque.
(4) After connecting, the outside diameter of this rod must be kept same so that it cansmoothly go forward or backward in the support.
In the process of cleaning, it is not allowed that the abrasive suspending liquid drains out of thetail of cannon bore, so the tail must be blocked. The front part of cannon bore should be inclineddownward so that the abrasive suspending liquid after ejecting flows into the storage along thecannon bore.
Fastening support (6) is articulated with the guide rail. In this way, the guide rail can make atransversal motion up and down and is allowed to make a pitch motion or side-to-side swing tothe certain angle. Adjustable support (9) is articulated on the front part of guide rail. In this way,the guide rail can make a pitch motion or side-to-side swing to the certain angle so that theadjustment can be done to make the feeding rod coaxial to the cannon bore prior to cleaning.
4. CONCLUSIONS
Through a preliminary test and check before acceptance, the abrasive suspending waterjetcleaning machine for cannon bore met all requirements for the technical performances specifiedby the user in the contract, and was committed to operation in December 1997.
As for this cannon bore cleaning machine, the abrasive-to-water ratio was 15~18% (by weight),the pressure was 3.5~5MPa, and the flow rate was 110~240l/min.
5. ACKNOWLEGEMENT
The author extends his hearty thanks to a troop in the Chinese People’s Liberation Army forproviding the funds support and the specimen of cleaning test, to Wei Ying (Professor), LiaoXingbin (Senior Engineer) and Cao Haoxiang (Senior Engineer) etc. for taking part in his study,and to the High Pressure Waterjet Research Institute, Changsha Institute of Mining Research, forits great support in the process of his study.
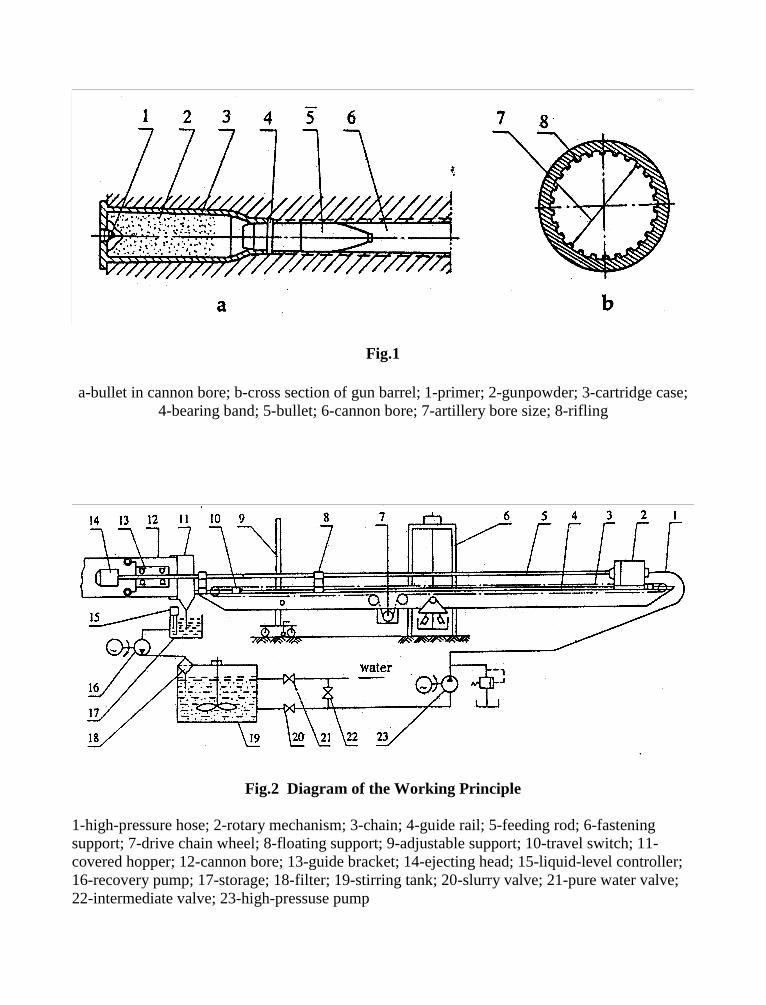
Fig.1
a-bullet in cannon bore; b-cross section of gun barrel; 1-primer; 2-gunpowder; 3-cartridge case;4-bearing band; 5-bullet; 6-cannon bore; 7-artillery bore size; 8-rifling
Fig.2 Diagram of the Working Principle
1-high-pressure hose; 2-rotary mechanism; 3-chain; 4-guide rail; 5-feeding rod; 6-fasteningsupport; 7-drive chain wheel; 8-floating support; 9-adjustable support; 10-travel switch; 11-covered hopper; 12-cannon bore; 13-guide bracket; 14-ejecting head; 15-liquid-level controller;16-recovery pump; 17-storage; 18-filter; 19-stirring tank; 20-slurry valve; 21-pure water valve;22-intermediate valve; 23-high-pressuse pump
10 American Waterjet Conferenceth
August 14-17, 1999: Houston, TexasPaper 29
ABRASIVES FOR HIGH ENERGY WATER JET:
INVESTIGATION OF PROPERTIES
L.M. Hlavág, L. SosnovecVŠB - Technical University
Ostrava, Czech Republic
P. MartinecInstitute of Geonics, Academy of Sciences
Ostrava, Czech Republic
ABSTRACT
The analyses of physical properties of several abrasive materials are the topic of the paper. The greateffort was devoted to the studies of processes leading to the abrasive grain damage during injectionabrasive jet formation. Few important parameters substantially influencing the amount of abrasivematerial damage were determined and studied in correlation between theory and experiment.Resulting values of specific energy for surface enlargement are compared with the ones obtained bycalculations based on energy of the atomic bonds and the lattice parameters. All characteristics areutilised for completing of the prediction program JETCUT. Knowledge of relationships amongparameters makes possible to recalculate a material parameter determined from the testing cut madeon material using specific type of abrasive to any type of abrasive with different parameters,characteristics and level of damage. The results are discussed and compared with experiments.
Organized and Sponsored by the WaterJet Technology Association
ESS 8EM
3NAl 2B
ETR12
CD PkL ao c 1
(1)
(2)
1. INTRODUCTION
The specific energy necessary for enlargement of the new free surface (rising during process ofbreaking of material) is a basic parameter to be determined for abrasives provided the theoreticalmodelling of interaction processes should be studied. In past several papers were devoted to theproblem of abrasive particles breaking during mixing process namely Hlavág et al. (1995), Hlavág(1996), Hlavág & Sochor (1997) and Hlavág & Martinec (1998). Nevertheless, all experimentalattempts to determine the specific energy for generation of a new free surface fell flat yet. Usingtheoretical formulae presented, e.g. by Hlavág & Martinec (1998), however, the specific energy forsurface enlargement can be determined provided the parameters characterizing the amount of internaldamage, disorders and failures in material are determined with appropriate accuracy. Determinationof the specific surface energy from lattice parameters and from experimental results aimed atdisintegration of the abrasive material during mixing processes typical for injection abrasive jetgeneration is the topic of the work partly presented in this paper.
2. THEORETICAL BACKGROUND
The theoretical studies started when we tried to find out the appropriate values of specific surfaceenergy for garnets in various publications. The estimations made according to Davidge (1979) yieldvalues of the specific surface energy for rocks from about 20 up to roughly 60 J.m . Moreover, his-2
conclusions indicate decreasing trend for relationship of the specific energy on the rock materialgrain size. We tried to approximate the value of the specific surface energy using the molar energyof almandine published by Keller (1954). The area of disintegration can be expressed using atomicradii and the number of particles in 1 mol of matter. The consistent equation for the specific surfaceenergy can be expressed using a respective average atomic bond length calculated from atomic radiiof elements in material:
This expression also yields specific surface energy values of the order of the tenths of Joules persquare meter. Nevertheless, such value did not correlate with specific surface energies equivalentto the amount of disintegration caused by high energy water jet during mixing process provided theenergy transmissions from water jet to the abrasive particle was determined only by drag forcecoefficient as it was presented by Hlavág (1995).
The transmitted energy and respective specific surface energy determined from experimental databy relationships derived by Hlavág et al. (1995) and filled in by new definition of norm settingconstant by Hlavág & Martinec (1998) yield values from about ten times higher up to approximately
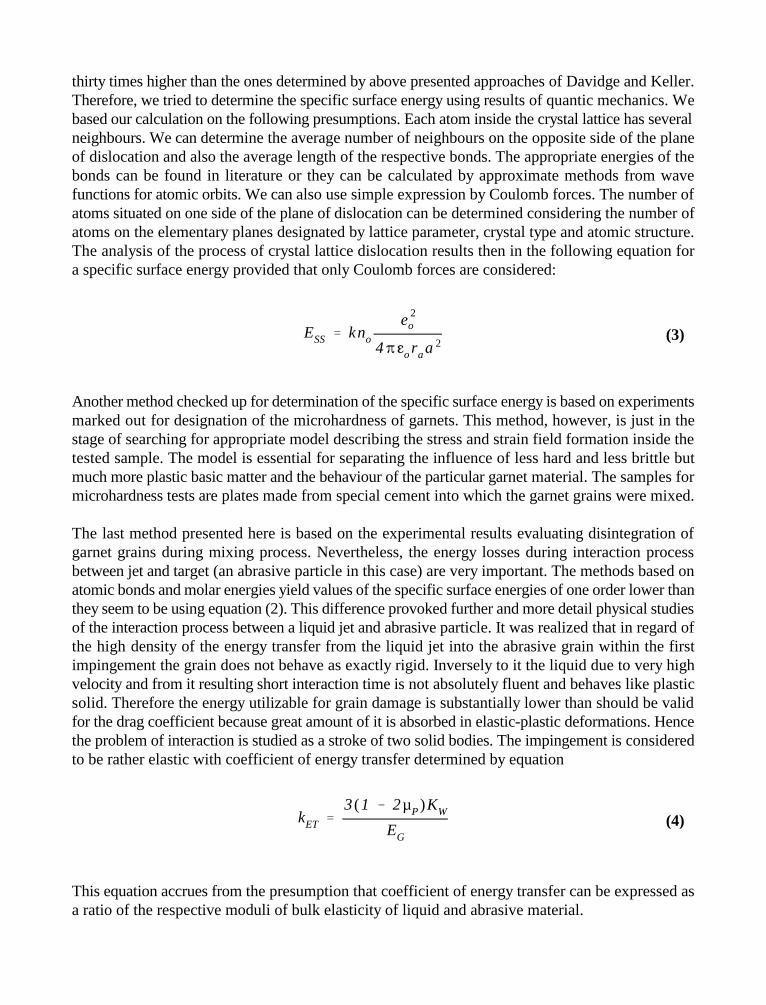
ESS kno
e2o
4%Joraa2
kET
3(1 2µP)KW
EG
(3)
(4)
thirty times higher than the ones determined by above presented approaches of Davidge and Keller.Therefore, we tried to determine the specific surface energy using results of quantic mechanics. Webased our calculation on the following presumptions. Each atom inside the crystal lattice has severalneighbours. We can determine the average number of neighbours on the opposite side of the planeof dislocation and also the average length of the respective bonds. The appropriate energies of thebonds can be found in literature or they can be calculated by approximate methods from wavefunctions for atomic orbits. We can also use simple expression by Coulomb forces. The number ofatoms situated on one side of the plane of dislocation can be determined considering the number ofatoms on the elementary planes designated by lattice parameter, crystal type and atomic structure.The analysis of the process of crystal lattice dislocation results then in the following equation fora specific surface energy provided that only Coulomb forces are considered:
Another method checked up for determination of the specific surface energy is based on experimentsmarked out for designation of the microhardness of garnets. This method, however, is just in thestage of searching for appropriate model describing the stress and strain field formation inside thetested sample. The model is essential for separating the influence of less hard and less brittle butmuch more plastic basic matter and the behaviour of the particular garnet material. The samples formicrohardness tests are plates made from special cement into which the garnet grains were mixed.
The last method presented here is based on the experimental results evaluating disintegration ofgarnet grains during mixing process. Nevertheless, the energy losses during interaction processbetween jet and target (an abrasive particle in this case) are very important. The methods based onatomic bonds and molar energies yield values of the specific surface energies of one order lower thanthey seem to be using equation (2). This difference provoked further and more detail physical studiesof the interaction process between a liquid jet and abrasive particle. It was realized that in regard ofthe high density of the energy transfer from the liquid jet into the abrasive grain within the firstimpingement the grain does not behave as exactly rigid. Inversely to it the liquid due to very highvelocity and from it resulting short interaction time is not absolutely fluent and behaves like plasticsolid. Therefore the energy utilizable for grain damage is substantially lower than should be validfor the drag coefficient because great amount of it is absorbed in elastic-plastic deformations. Hencethe problem of interaction is studied as a stroke of two solid bodies. The impingement is consideredto be rather elastic with coefficient of energy transfer determined by equation
This equation accrues from the presumption that coefficient of energy transfer can be expressed asa ratio of the respective moduli of bulk elasticity of liquid and abrasive material.
PN
14
NA lB3
2lB
ETR
3(1 2µP)KW
EG
CD
%a2o
4µpoRv
ao
c
(5)
(6)
3. THEORETICAL AND EXPERIMENTAL RESULTS
Using the approach presented by Keller (1954) to the calculation of the bond energy we can obtainthe value 133,44 kJ.mol for garnet almandine (Fe Al Si O ). The average distance between atoms-1
3 2 3 12
is the weighted average of the bond length determined from the atomic radii of the atoms in thelattice structure: Fe , Al , Si and O . The resulting value is 0.192 nm. The atomic radii were taken2+ 3+ 4+ 2-
from tables compiled by BroÓ et al. (1980). Dividing one mole of almandine into two layers oftetrahedrons with an edge equal to the average bond length the total free surface originated isdetermined by equation
The specific surface energy 27.76 J.m is calculated from molar energy of almandine mentioned-2
above and the originated total free surface of one mole of almandine provided the bond length isa weighted average of bond lengths for all possible combinations of atoms.
The equation (3) enables to calculate the specific surface energy directly from the parameters of thecrystal lattice. It was determined for garnet almandine that average number of broken off atomicbonds is four. The number of atoms with broken bonds per elementary plane determined by latticeparameter is eight. The average energy of one atomic bond was determined from the electrostaticCoulomb force acting between two elementary inverse charges outlying distance determined fromthe lattice parameters an average atomic radius. Using the lattice parameter of almandine 1.154 nm,presented by Martinec (1994), the value of the average atomic radius is 0.204 nm. The equation (3)then yields the value of the specific surface energy 27.17 J.m .-2
The last presented method of determination of the specific surface energy is based on utilization ofthe theory presented by Hlavág et al. (1995) and filled in by Hlavág and Martinec (1998). The energytransferred from the liquid jet into an abrasive particle is determined by equation (6) involving thecoefficient of energy transfer expressed by equation (4)
The calculation of the average surface of grains before mixing and after it from experimentallydetermined average grain sizes and jet parameters was made both for spherical grains and for cubicones. The appropriate specific surface energies were determined for 10 individual garnet sampleseach tested by 10 different liquid pressures (i.e. from 100 values). They were determined providedthat the grain shape is either spherical or cubic. Another value of the specific surface energy wasdetermined from graphic correlation between theory and experiment. The respective values of thespecific surface energies determined by equation (6) from the experimental data and parameters were
39.74 J.m , 20.81 J.m and 20.38 J.m . The average of the three values of the specific surface-2 –2 –2
energy taken out processing experimental data is then 26.98 J.m .–2
4. DISCUSSION
All presented methods of calculation used for specific surface energy of garnet almandine lead to theaverage value round about 27 J.m . The values obtained from experimental data were compared–2
with the ones evaluated by theory from either molar energy or energy of atomic bonds. It is necessaryto point out that the value of specific surface energy determined from experimental data for sphericalshape of grains is higher than theoretical one. Contrary to it the value determined for cubic grainsis lower than theoretical one. If the value of the specific surface energy is calculated for percentagestatements of spherical shape, the value corresponding to the 70% of a spherical pattern is very closeto the value determined by theories. The specific surface energy corresponding to this grain shapeis 27.82 J.m . The cube shows similarity to the spherical pattern only 52.36%. The result implies–2
that the shape of grain corresponding to the specific surface energy determined from theories is closeto the polyhedron. This is in a good agreement with experimental results published by Martinec(1994).
Contrary to values determined from theories and suitable for polyhedron approaching to sphere from70% the value 20.38 J.m was determined by optimizing process correlating the theoretical curves–2
for the average grain size after mixing process and respective experimental data. This energy isalmost the same as the one acquired for cubic shape of grains, 20.81 J.m . Considering these results,–2
we could conclude that in the injection mixing process both the input grains and the output ones arecubic. Nevertheless, this conclusion should ignore the establishment of previous experimental worksshowing that usually a great amount of internal damage is present inside each grain just beforemixing process.
Comparing the specific surface energy determined from mentioned optimizing process correlatingtheory and experiment and the average one calculated from various theories we can establish thatinternal damage reduces the specific surface energy to the 75% of its average theoretical value. Itmeans that abrasive grains contain such amounts of damage reducing their strength as if 25% ofgrains are destroyed or 25% of each grain is destroyed. This discovery is in a very good agreementwith experimental results got by Martinec (1994).
The results of the theoretical research were used for calculation of the garnet damage inside mixingchamber and mixing tube. The coefficient of energy transfer was expressed by equation (3).Theoretical results and experimental data are compared through graphic presentation in Fig. 1through 3. Specific surface energies determined by explicit methods are summarized in Table 1.
5. CONCLUSIONS
Comparing the results acquired by presented methods of calculation for the specific surface energyof rock materials it is possible to make the following conclusions: specific surface energies determined by all presented methods are almost equal; comparison of the value of the specific surface energy calculated from experimental results of
abrasive material damage in mixing chamber and mixing tube and the one determined frommolar energy of the rock or energy of atomic bonds and appropriate average atomic bond lengthscan yield information about initial grain damage or shape provided the complementary parameterof them is known;
specific surface energy determined from molar energy of matter or energy of atomic bonds andappropriate average atomic bond lengths can be used for evaluation of the abrasive graindisintegration provided the amount of initial damage of grains and their shape is known.
6. ACKNOWLEDGEMENTS
The authors are grateful to the Grant Agency of the Czech Republic for support of the workpresented in this paper by grants No. 205/96/0931 and 106/98/1354.
7. REFERENCES
BroÓ, J., Roskovec, V., and Valouch, M.: “Physical and Mathematical Tables,” SNTL, Praha, 1980.
Davidge, R.W.: “Mechanical Behaviour of Ceramics,” Cambridge University Press, Cambridge,England, 1979.
Hlavág, L., Sochor, T., Sitek, L., Martinec, P., and Vala, M.: “Physical Study of a High EnergyLiquid Jet as a Milling Tool,” Proceedings of the 4th Pacific Rim International Conferenceon Water Jet Technology, pp. 449-456, Kajima Institute Publishing Co.,Ltd., 1995.
Hlavág, L.M.: “Physical Analysis of the Energy Balance of the High Energy Liquid Jet Collisionwith Brittle Non-Homogeneous Material,” Proceedings of the 8th American Water JetConference, pp. 681-697, Water Jet Technology Association, St. Louis, Missouri, 1995.
Hlavág, L.M.: “Interaction of Grains with Water Jet - the Base of the Physical Derivation ofComplex Equation for Jet Cutting of Rock Materials,” Proceedings of the 13th InternationalConference on Jetting Technology, pp. 471-485, BHR Group, Prof. Eng. Pub. Ltd., BuryStEdmunds and London, 1996.
Hlavág, L.M. and Sochor, T.: ”Mineral Grain Destruction During the Process of Material Disinte-gration by Abrasive Water Jet,“ Geomechanics 96, pp. 351-354, Rotterdam, Balkema, 1997.
Hlavág, L.M. and Martinec, P.: “Almandine Garnets as Abrasive Material in High-Energy Waterjet- Physical Modelling of Interaction, Experiment, and Prediction,” Proceedings of the 14th

International Conference on Jetting Technology, pp. 211-223, BHR Group, Prof. Eng. Pub.Ltd., Bury StEdmunds/London, 1998.
Keller, W.D.: “The Bonding Energies of Some Silicate Minerals,” American Mineralogist, Vol. 39,pp. 783-793, 1954.
8. NOMENCLATURE
a lattice parameter [m]a size of a material element - grain [m]o
compressibility factorR
c sound velocity [m.s ]-1
C drag coefficient D
J absolute dielectric constant (dielectric constant for vacuum)o
e unite charge (charge of proton)o
E Young’s modulus of elasticity for garnet [Pa]G
E total energy of atomic bonds for 1 mol of matter [J.mol ]M-1
E specific surface energy [J.m ]SS-2
E energy transferred to the target object [J]TR
k average number of broken bonds per atom k coefficient of energy transfer ET
l length of the atomic bond in material [m]B
µ nozzle discharge coefficient µ Poisson’s ratio P
n number of atoms on the basic area cell of material lattice o
N Avogadro’s number (number of particles in 1 mol of matter)A
p liquid pressure before the nozzle inlet [Pa]o
P power of the jet at the distance L from nozzle outlet [W]kL
r radius of the atom [m]a
v jet velocity [m.s ]-1
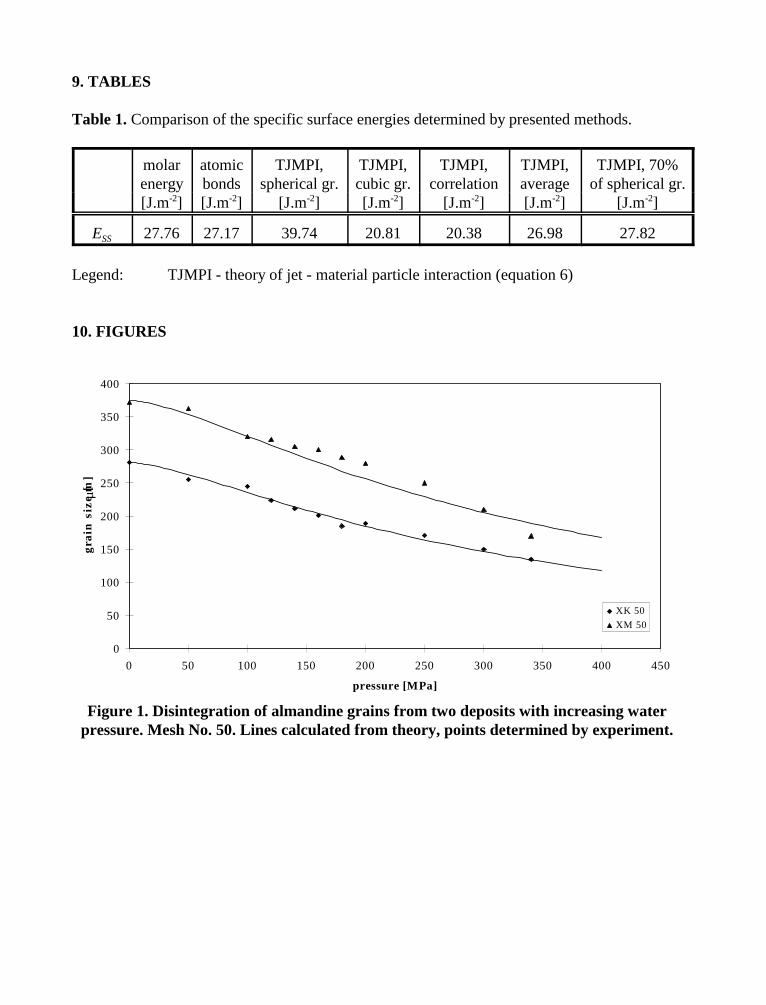
0
50
100
150
200
250
300
350
400
0 50 100 150 200 250 300 350 400 450
pressure [MPa]
grai
n s
ize
[µm
]
XK 50XM 50
Figure 1. Disintegration of almandine grains from two deposits with increasing waterpressure. Mesh No. 50. Lines calculated from theory, points determined by experiment.
9. TABLES
Table 1. Comparison of the specific surface energies determined by presented methods.
molar atomic TJMPI, TJMPI, TJMPI, TJMPI, TJMPI, 70%energy bonds spherical gr. cubic gr. correlation average of spherical gr.[J.m ] [J.m ] [J.m ] [J.m ] [J.m ] [J.m ] [J.m ]-2 -2 -2 -2 -2 -2 -2
E 27.76 27.17 39.74 20.81 20.38 26.98 27.82SS
Legend: TJMPI - theory of jet - material particle interaction (equation 6)
10. FIGURES
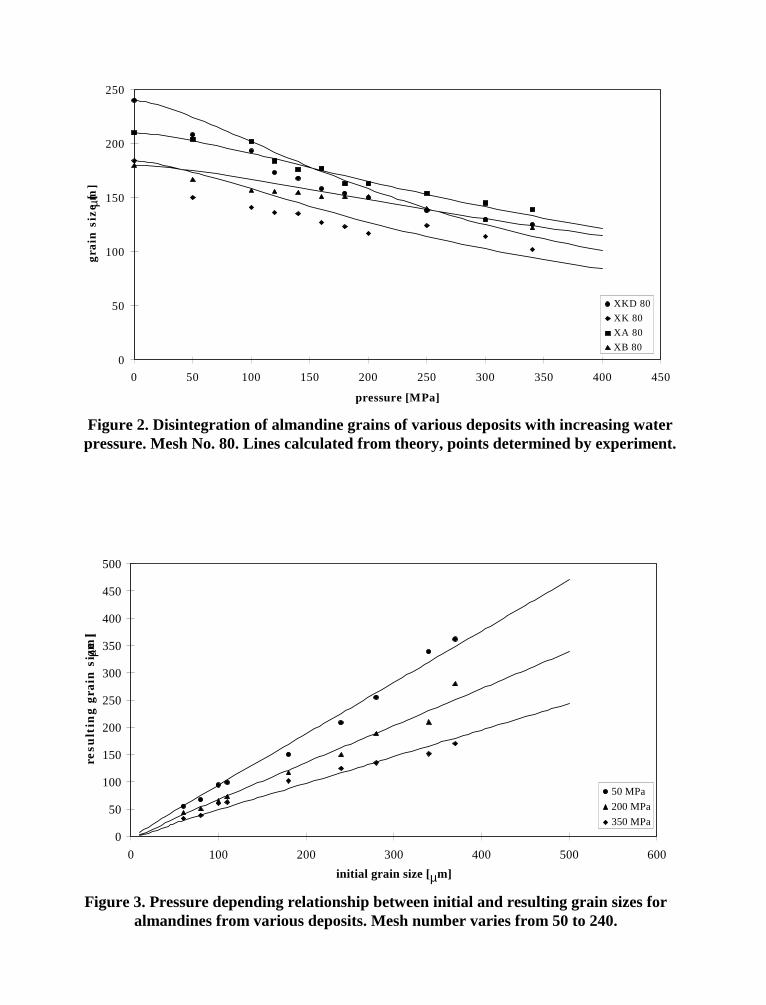
0
50
100
150
200
250
0 50 100 150 200 250 300 350 400 450
pressure [MPa]
grai
n s
ize
[µm
]
XKD 80XK 80XA 80XB 80
0
50
100
150
200
250
300
350
400
450
500
0 100 200 300 400 500 600
initial grain size [µm]
resu
ltin
g gr
ain
siz
e [
µm]
50 MPa200 MPa350 MPa
Figure 2. Disintegration of almandine grains of various deposits with increasing waterpressure. Mesh No. 80. Lines calculated from theory, points determined by experiment.
Figure 3. Pressure depending relationship between initial and resulting grain sizes foralmandines from various deposits. Mesh number varies from 50 to 240.
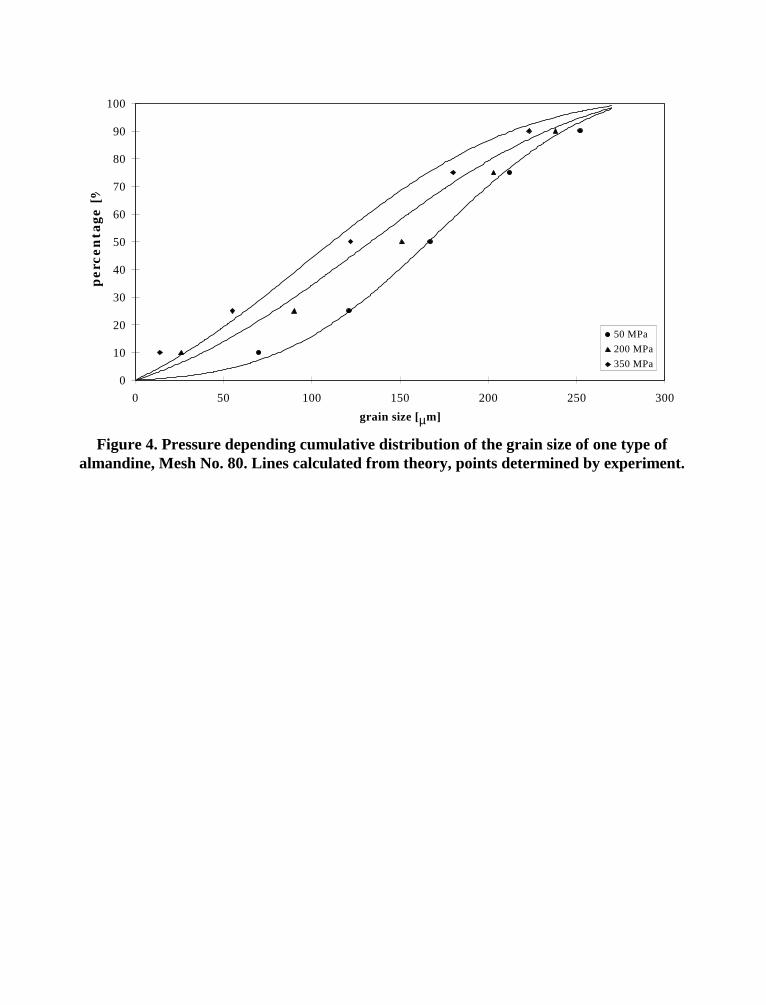
0
10
20
30
40
50
60
70
80
90
100
0 50 100 150 200 250 300
grain size [µm]
per
cen
tage
[%
50 MPa
200 MPa
350 MPa
Figure 4. Pressure depending cumulative distribution of the grain size of one type ofalmandine, Mesh No. 80. Lines calculated from theory, points determined by experiment.
10th American Waterjet ConferenceAugust 14-17, 1999: Houston, Texas
Paper 30
SOME INVESTIGATIONS ON ABRASIVES IN
ABRASIVE WATERJET MACHINING
O.V.Krishnaiah Chetty and N.Ramesh BabuIndian Institute of Technology Madras,
Chennai, 600 036, INDIA
ABSTRACT
Abrasive particles in Abrasive Waterjet Machining play a dominant role in controlling the qualityof the final product and economy in production. This paper deals with the results of preliminaryinvestigations conducted on locally available garnet abrasives and validation of an empiricalmodel. The influence of the particle distribution, combined with process parameters, on the taperof cut and the finish of the cut surface of black granite using garnet abrasives are also reported.Studies on recycling of this locally available garnet on the recovery and cutting efficiency arepresented.
Organized and Sponsored by the WaterJet Technology Association
1. INTRODUCTION
Waterjet cutting technology has found a variety of applications world over as it offers wideranging benefits. The utilization of this technology in India is at the low ebb. The recentexposures of manufacturers, academicians, researchers and managers in India to a series ofseminars and conferences highlighting this technology has given fillip to the activities (this hasalso provided a momentum, specially for research). The research group at this institute has doneconsiderable work in granite cutting using Abrasive Waterjet Machining (AWJM). Indigenouslyavailable garnet abrasives have been tested for their suitability. Elaborate experimentation provedtheir efficiency of cutting on par with imported abrasives. The findings related to cutting of avariety of granites are reported in Chakravarthy et al. (1998). Further studies on local abrasivesare being continued.
Economical production must focus on cost reduction. One of the factors contributing to theproduction cost in AWJM is the cost of abrasives. The type of abrasive used in AWJM can havea large impact on the performance of cutting. The more difficult the cut, the more important theabrasive selection becomes.
The natural characteristics like hardness, shape, specific gravity of abrasives will affect theireffectiveness in cutting. Also man-made characteristics resulting out of production of abrasivesnamely; purity, and particle size will influence cutting (Ohman, 1993). Desired rate of cutting,and surface quality of cut surface, influence the selection of abrasives. Cost of operation ofAWJM will be influenced by abrasives. High quality abrasives cost more but must be weighedagainst the performance. In his analysis, Ohman (1993) found that a very low cost abrasive maysuccessfully cut a metal but at higher total costs; while higher performance abrasives savesconsiderable amount of money by its superior performance. The depth of cut achieved varieswidely and seem to be independent of mineral type; however, damaged grains may be a keyfactor (Vasek et al., 1993). Different sized particles cut at different speeds. A consistent particlesize distribution is essential for even cutting performance. A good waterjet abrasive should haveconsistency, both in its distribution and its range (Ohman, 1993). Their detailed investigationsare limited in literature. Momber et al. (1996) found that depth distribution and surfaceroughness are very sensitive to the abrasive grain size distribution, where as average depth ofkerf is not influenced significantly.
One of the restrictions to the AWJM in the field of industrial production seem to emanate fromthe high costs of abrasives, handling and disposal of used abrasives (Guo et al., 1994). Recyclingof abrasives seems to be a good plan to minimize use of abrasives (Guo et al., 1992; Knapp andOhlsen, 1994 ). A model of disintegration of abrasives to study the particle size distribution hasbeen proposed by Guo et al. (1994). Such a model is expected to reduce extensiveexperimentation. An analysis of disintegration by Guo et al. (1994) infers that mixing andaccelerating process in the focusing tube leads to tremendous disintegration. Quality cut causesless disintegration than rough-cuts and the size of the particle has an influence on the degree ofdisintegration. While increase in pressure or cutting rate leads to increased disintegration,increase in abrasive flow rate is found to have no significant influence. Under the experimentalconditions reported by Martinee (1994), garnet abrasives under 100 µm have exhibited a stable
chip like shape regardless of the nature of process of disintegration. General experience hasshown that through recycling of abrasives, tool and running costs may be reduced by about 25percent (Knapp and Ohlsen, 1994).
1.1 Scope of Present Work
The present paper discusses the preliminary studies on the influence of locally available garnetabrasives in cutting black granite. The validity of an empirical model developed using multi-regression analysis to predict depth of cut is presented. The influence of distribution of localgarnet abrasive along with the AWJM parameters in cutting black granite. Studies are confined tokerf width, taper of cut and finish of cut surface. Considering the importance of recycling ofabrasives, cutting efficiency and finish of cut surface with recycled abrasives are reported.
2. EXPERIMENTAL
The details of equipment used for experimentation are shown below.
2.1 Equipment
• Abrasive Waterjet Machining System: M/S WOMA, AustriaHigh pressure intensifier pump type : IP236-22Discharge pressure : 360 MPaVibratory abrasive feeding systemCNC work cell with two axis control : Zinser CNC type 500/35/92Primary Nozzle Diameter : 0.25 mmSecondary Nozzle : 0.8 mm
• Surface Finish Measuring Equipment : Perthometer S5P• British Standard Sieves Scanning Electron Microscope : JEOL JSM-5300• Local Abrasive - Garnet [Fe3Al2(SiO4)3] Sp. gravity : 3.8• Work Material: Black Granite (Kfeldspar and quartz)
Sp. gravity : 3.6• Angle of jet : 900
• Stand off distance : 3 mm• Special Screening Cloth
2.2 Experimental Procedure
The procedure used for investigations are presented in three parts; preliminary investigations,effect of distribution of abrasives and AWJM parameters, and studies on recycling of abrasives.
2.2.1 Preliminary Investigations
Preliminary experimentation is done to study the influences of Waterjet Pressure, Jet TraverseRate and Abrasive Flow Rate on the depth of cut in cutting black granite with local abrasive. Anempirical model to determine the depth of cut has been developed based on multi-regressionanalysis, the details of which are available in Gowrisankar (1998). This model is tested with theexperimental results shown in Figure 1.
2.2.1.1 Observations/Discussions
The capabilities of the local abrasive in cutting black granite are available in Figure 1 and can beused to select the process parameters in cutting operations. It can be seen from this figure that thedepth of cut with the local abrasives behaves in the expected fashion. Increase in waterjetpressure leads to increased depth of cut while increase in the jet traverse rate has the oppositeeffect. Increase in abrasive flow rate beyond 50 gms/min has not significantly influenced thedepth of cut. The multi-regression model of Gowrisankar (1998) predicts the depth of cut withinan error of 10 to 18%.
2.2.2 Effect of Distribution of Abrasives and AWJM Parameters
In order to study the effect of distribution of abrasive particles, samples of abrasives areformulated to have close fineness numbers. Standard sieve analysis is used to provideinformation on the fineness number of the local garnet abrasives. By definition, fineness numberis the average grain size, and corresponds to the sieve number whose opening would just pass allthe particles if all were of the same size. This number is convenient means of describing therelative fineness of abrasives. A standard set of sieves are used to sieve a dried 500 gm. sample.The particles retained on each sieve and the bottom pan are weighed and their percentages tototal sample are determined. The percentage retained on each sieve is multiplied by a factor,which is the mesh number of the sieve, which allowed these particles to pass through. Averagegrain fineness number is equal to the sum of these products to the total percentage retained on allthe sieves and the bottom pan.
In the present case, three sample types have been prepared by selectively adding particle sizes.These samples have almost same fineness numbers in the range of 52 to 54.56 as detailed inTable 1. Sample type 1 has abrasives retained on one mesh while sample 2 has those retained onthree meshes and sample three has those of four meshes. In sample types 1 and 2 the quantityretained on a single mesh number dominates. Sample type 3 has particles retained on two meshesdominating. These sample types are chosen to have distribution varied. Orthogonal ArrayDesign L9 shown in Table 2 has been employed to study the influence of the AWJM processparameters namely, waterjet pressure, and traverse rate, on the behavior of these samples. Thetop kerf width, bottom kerf width and finish of cut surface are measured. Taper of cut iscalculated which is usually defined as a non-dimensional ratio between the top cut-width andbottom cut-width (10).
2.2.2.1 Experimental Conditions
The details of the parameters, fixed and variable, are as follows.
Angle of jet: 900
Stand off distance: 3 mmWork Material thickness: 20 mmLength of cut: 25 mmVariables: Waterjet Pressure,
Traverse rate, and Sample of abrasive.
The results obtained are shown in Table 3. The response graphs are shown in Figure 2.
2.2.2.2 Observations/Discussions
The influence of distribution of local abrasives along with the process parameters are shown inFigure 2. It can be observed that lower traverse rates produce decreased taper of cut. Whileabrasive samples 1 and 2 (containing a large proportion of single mesh size abrasive) producebetter taper of cut; sample 3 produced inferior taper of cut where two mesh sizes dominate.Pressure at level 2 has produced minimum taper of cut. Surface finish produced is better atmedium pressure and low traverse rates. The sample containing single mesh size (sample 1)produced improved finish. The surface profiles obtained in the tests are shown in Figure 3.Further studies are contemplated.
2.2.3 Procedure for Studies on Recycling
Black granite of 105 mm thick with a trapezoidal cross section had been cut to study theinfluence of AWJM process parameters. Cutting efficiency and surface finish of the cut surfacehave been analyzed. The fineness number of fresh garnet abrasives has been 55.18. Studiesinclude the influence of three parameters; waterjet pressure, transverse rate and abrasive massflow rate. The ranges for parameters are selected so as to avoid through cut of material of 105mm.
The debris obtained is collected from the catcher tank using a special net that can withstand theresidual energy of the used waterjet. This net also restricts further damage of abrasives. Thecloseness of properties of abrasives and black granite makes it difficult to separate effectively.Washing, settling and drying has been employed. The percentage of retrieved material fromdebris is determined. The recycled abrasives have been used to cut the granite at the same levelsof parameters to determine their cutting efficiency. The finish obtainable on cut surface withfresh and recycled abrasives is then compared. Scanning electron microscope analysis has carriedout to qualitatively study the angularities and size of the abrasives.
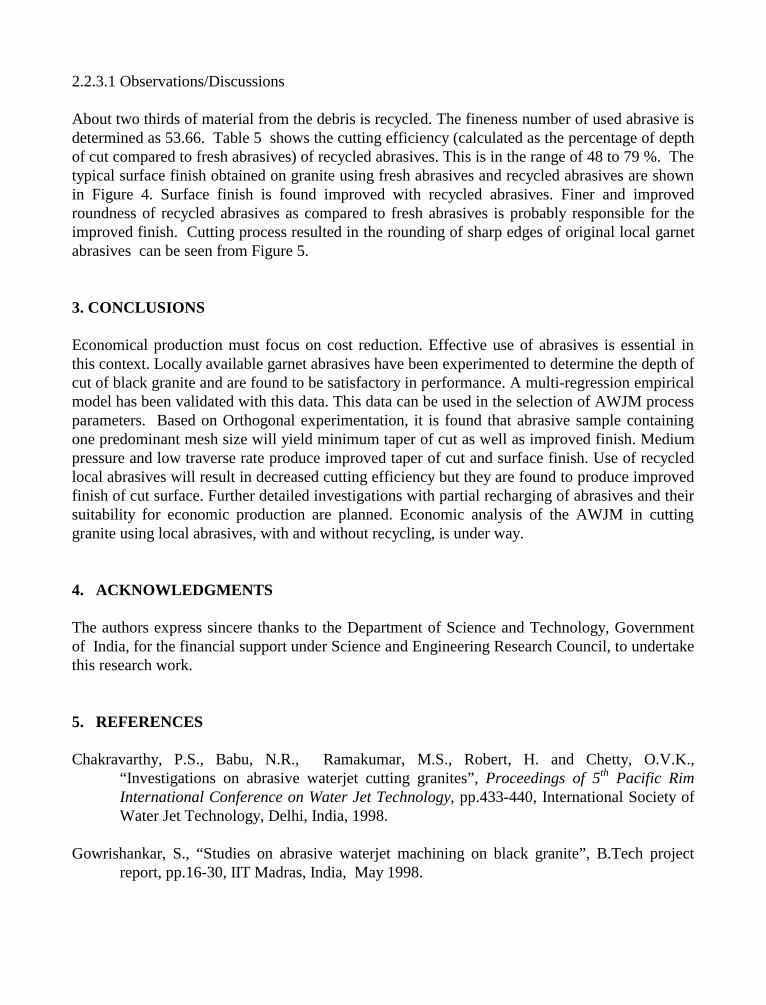
2.2.3.1 Observations/Discussions
About two thirds of material from the debris is recycled. The fineness number of used abrasive isdetermined as 53.66. Table 5 shows the cutting efficiency (calculated as the percentage of depthof cut compared to fresh abrasives) of recycled abrasives. This is in the range of 48 to 79 %. Thetypical surface finish obtained on granite using fresh abrasives and recycled abrasives are shownin Figure 4. Surface finish is found improved with recycled abrasives. Finer and improvedroundness of recycled abrasives as compared to fresh abrasives is probably responsible for theimproved finish. Cutting process resulted in the rounding of sharp edges of original local garnetabrasives can be seen from Figure 5.
3. CONCLUSIONS
Economical production must focus on cost reduction. Effective use of abrasives is essential inthis context. Locally available garnet abrasives have been experimented to determine the depth ofcut of black granite and are found to be satisfactory in performance. A multi-regression empiricalmodel has been validated with this data. This data can be used in the selection of AWJM processparameters. Based on Orthogonal experimentation, it is found that abrasive sample containingone predominant mesh size will yield minimum taper of cut as well as improved finish. Mediumpressure and low traverse rate produce improved taper of cut and surface finish. Use of recycledlocal abrasives will result in decreased cutting efficiency but they are found to produce improvedfinish of cut surface. Further detailed investigations with partial recharging of abrasives and theirsuitability for economic production are planned. Economic analysis of the AWJM in cuttinggranite using local abrasives, with and without recycling, is under way.
4. ACKNOWLEDGMENTS
The authors express sincere thanks to the Department of Science and Technology, Governmentof India, for the financial support under Science and Engineering Research Council, to undertakethis research work.
5. REFERENCES
Chakravarthy, P.S., Babu, N.R., Ramakumar, M.S., Robert, H. and Chetty, O.V.K.,“Investigations on abrasive waterjet cutting granites”, Proceedings of 5th Pacific RimInternational Conference on Water Jet Technology, pp.433-440, International Society ofWater Jet Technology, Delhi, India, 1998.
Gowrishankar, S., “Studies on abrasive waterjet machining on black granite”, B.Tech projectreport, pp.16-30, IIT Madras, India, May 1998.
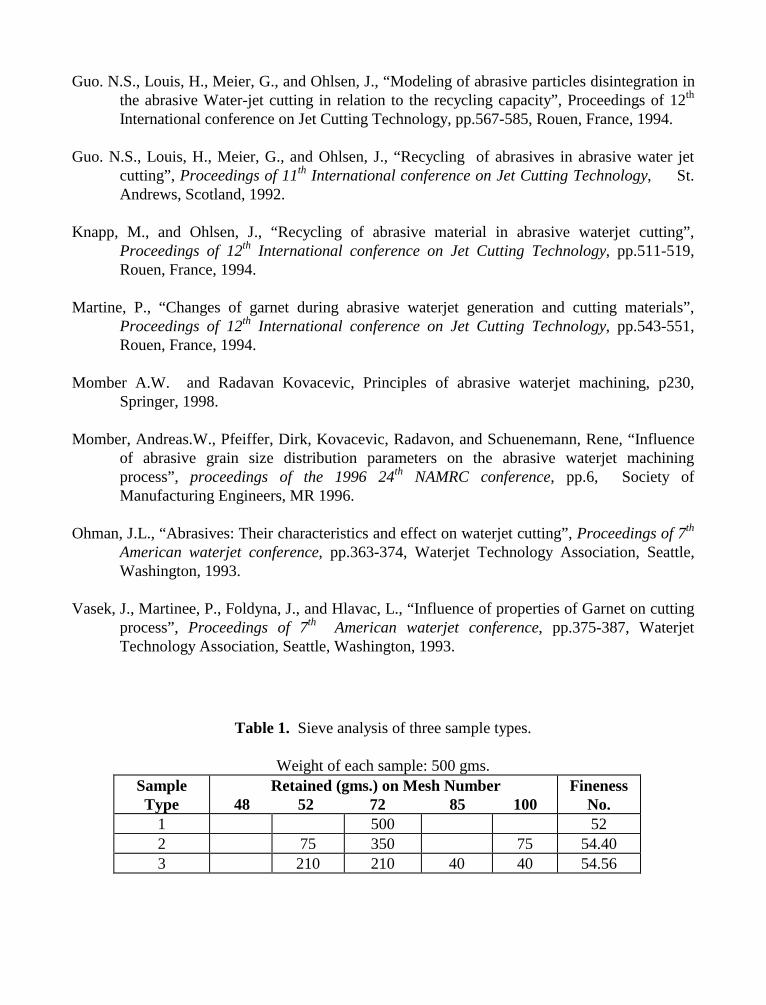
Guo. N.S., Louis, H., Meier, G., and Ohlsen, J., “Modeling of abrasive particles disintegration inthe abrasive Water-jet cutting in relation to the recycling capacity”, Proceedings of 12th
International conference on Jet Cutting Technology, pp.567-585, Rouen, France, 1994.
Guo. N.S., Louis, H., Meier, G., and Ohlsen, J., “Recycling of abrasives in abrasive water jetcutting”, Proceedings of 11th International conference on Jet Cutting Technology, St.Andrews, Scotland, 1992.
Knapp, M., and Ohlsen, J., “Recycling of abrasive material in abrasive waterjet cutting”,Proceedings of 12th International conference on Jet Cutting Technology, pp.511-519,Rouen, France, 1994.
Martine, P., “Changes of garnet during abrasive waterjet generation and cutting materials”,Proceedings of 12th International conference on Jet Cutting Technology, pp.543-551,Rouen, France, 1994.
Momber A.W. and Radavan Kovacevic, Principles of abrasive waterjet machining, p230,Springer, 1998.
Momber, Andreas.W., Pfeiffer, Dirk, Kovacevic, Radavon, and Schuenemann, Rene, “Influenceof abrasive grain size distribution parameters on the abrasive waterjet machiningprocess”, proceedings of the 1996 24th NAMRC conference, pp.6, Society ofManufacturing Engineers, MR 1996.
Ohman, J.L., “Abrasives: Their characteristics and effect on waterjet cutting”, Proceedings of 7th
American waterjet conference, pp.363-374, Waterjet Technology Association, Seattle,Washington, 1993.
Vasek, J., Martinee, P., Foldyna, J., and Hlavac, L., “Influence of properties of Garnet on cuttingprocess”, Proceedings of 7th American waterjet conference, pp.375-387, WaterjetTechnology Association, Seattle, Washington, 1993.
Table 1. Sieve analysis of three sample types.
Weight of each sample: 500 gms.SampleType
Retained (gms.) on Mesh Number 48 52 72 85 100
FinenessNo.
1 500 522 75 350 75 54.403 210 210 40 40 54.56
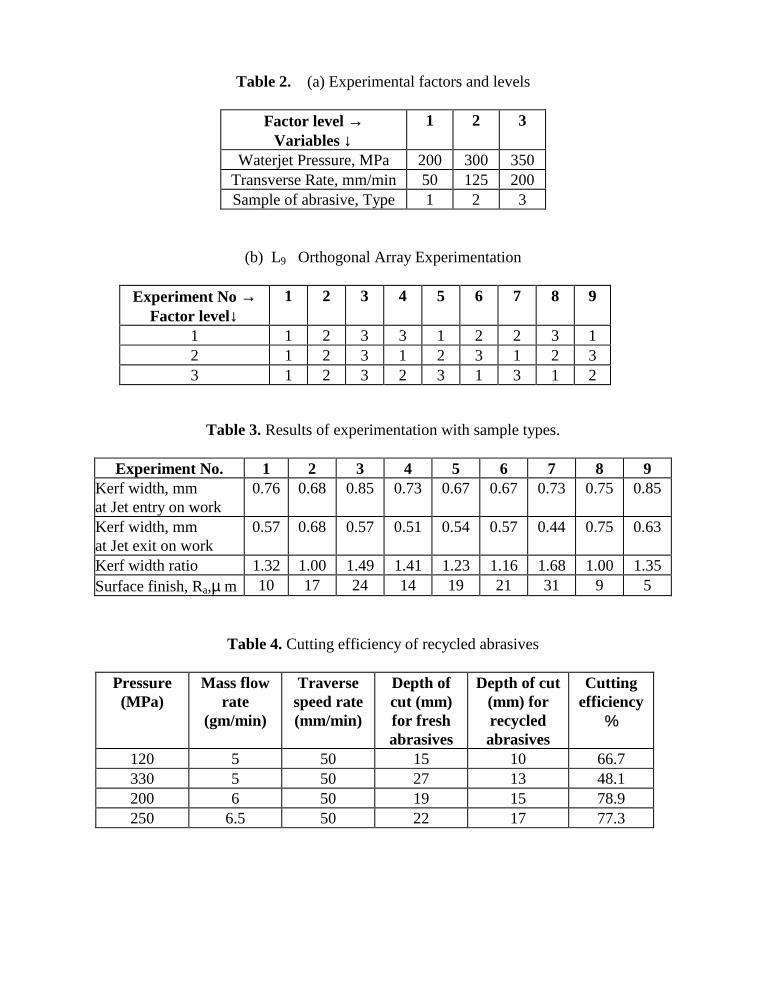
Table 2. (a) Experimental factors and levels
Factor level →Variables ↓
1 2 3
Waterjet Pressure, MPa 200 300 350Transverse Rate, mm/min 50 125 200Sample of abrasive, Type 1 2 3
(b) L9 Orthogonal Array Experimentation
Experiment No →Factor level↓
1 2 3 4 5 6 7 8 9
1 1 2 3 3 1 2 2 3 12 1 2 3 1 2 3 1 2 33 1 2 3 2 3 1 3 1 2
Table 3. Results of experimentation with sample types.
Experiment No. 1 2 3 4 5 6 7 8 9Kerf width, mmat Jet entry on work
0.76 0.68 0.85 0.73 0.67 0.67 0.73 0.75 0.85
Kerf width, mmat Jet exit on work
0.57 0.68 0.57 0.51 0.54 0.57 0.44 0.75 0.63
Kerf width ratio 1.32 1.00 1.49 1.41 1.23 1.16 1.68 1.00 1.35Surface finish, Ra,µ m 10 17 24 14 19 21 31 9 5
Table 4. Cutting efficiency of recycled abrasives
Pressure(MPa)
Mass flowrate
(gm/min)
Traversespeed rate(mm/min)
Depth ofcut (mm)for freshabrasives
Depth of cut(mm) forrecycledabrasives
Cuttingefficiency
%
120 5 50 15 10 66.7330 5 50 27 13 48.1200 6 50 19 15 78.9250 6.5 50 22 17 77.3
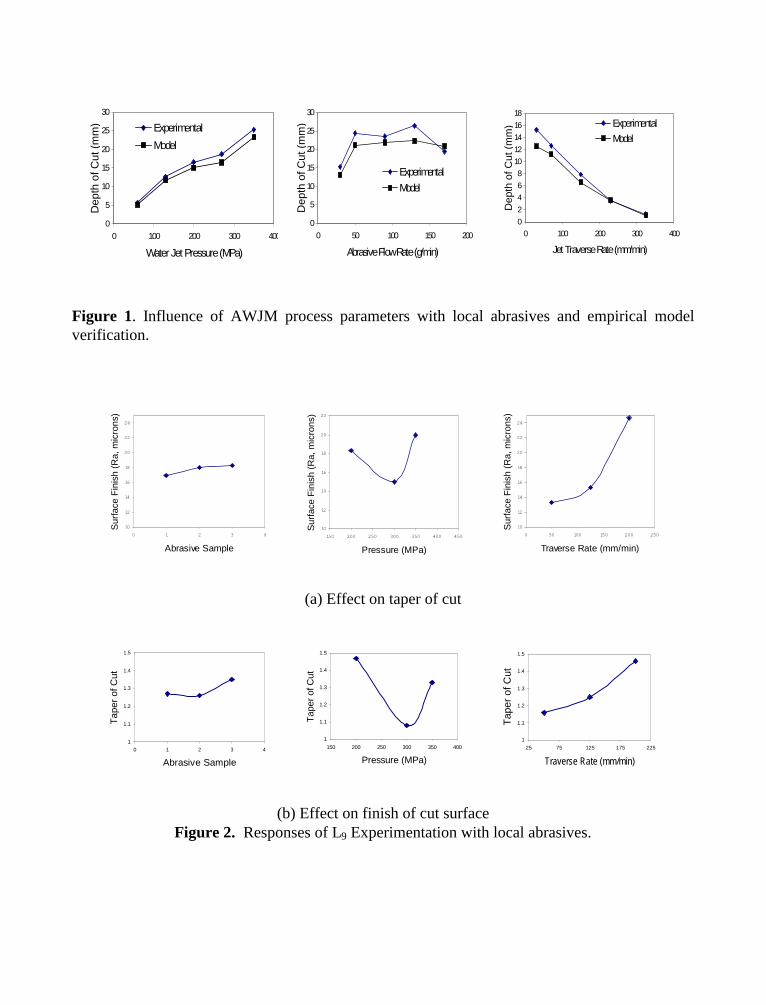
0
5
10
15
20
25
30
0 100 200 300 400
Water Jet Pressure (MPa)
Dep
th o
f Cut
(m
m) Experimental
Model
0
5
10
15
20
25
30
0 50 100 150 200
Abrasive Flow Rate (g/min)
Dep
th o
f Cut
(m
m)
Experimental
Model
0
2
4
6
8
10
12
14
16
18
0 100 200 300 400
Jet Traverse Rate (mm/min)
Dep
th o
f Cut
(m
m) Experimental
Model
Figure 1. Influence of AWJM process parameters with local abrasives and empirical modelverification.
10
12
14
16
18
20
22
24
0 1 2 3 4
Abrasive Sample
Sur
face
Fin
ish
(Ra,
mic
rons
)
10
12
14
16
18
20
22
150 200 250 300 350 400 450
Pressure (MPa)
Sur
face
Fin
ish
(Ra,
mic
rons
)
10
12
14
16
18
20
22
24
0 50 100 150 200 250
Traverse Rate (mm/min)
Sur
face
Fin
ish
(Ra,
mic
rons
)
(a) Effect on taper of cut
1
1.1
1.2
1.3
1.4
1.5
0 1 2 3 4
Abrasive Sample
Tap
er o
f Cut
1
1.1
1.2
1.3
1.4
1.5
150 200 250 300 350 400
Pressure (MPa)
Tap
er o
f Cut
1
1.1
1.2
1.3
1.4
1.5
25 75 125 175 225
Traverse Rate (mm/min)
Tap
er o
f Cut
(b) Effect on finish of cut surfaceFigure 2. Responses of L9 Experimentation with local abrasives.
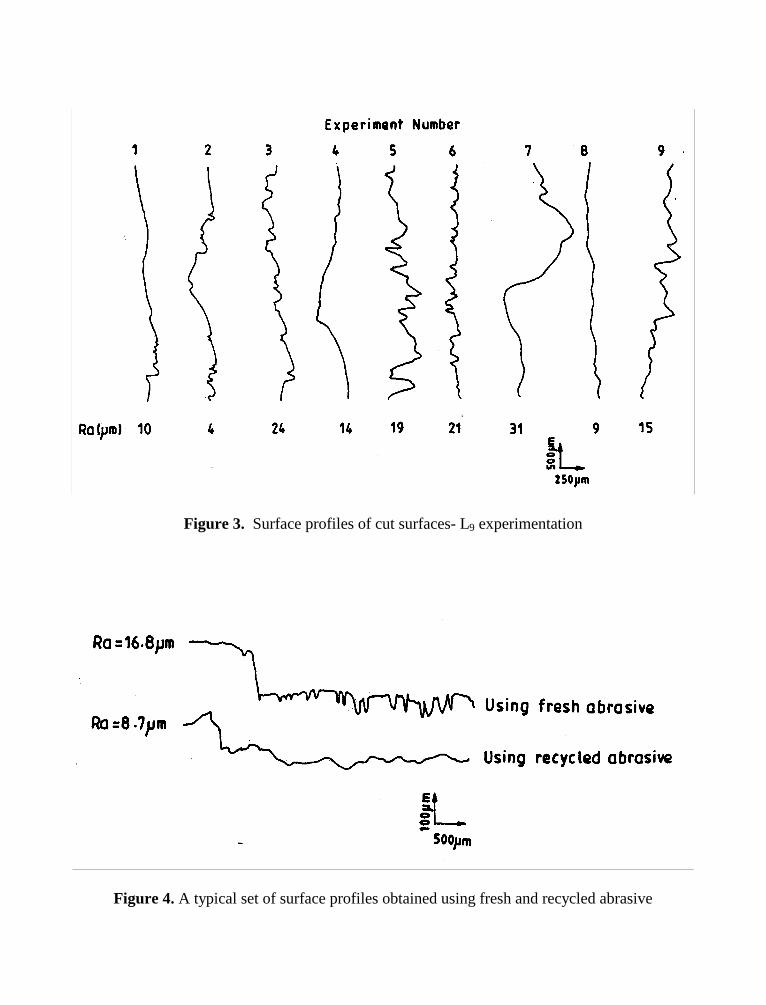
Figure 3. Surface profiles of cut surfaces- L9 experimentation
Figure 4. A typical set of surface profiles obtained using fresh and recycled abrasive
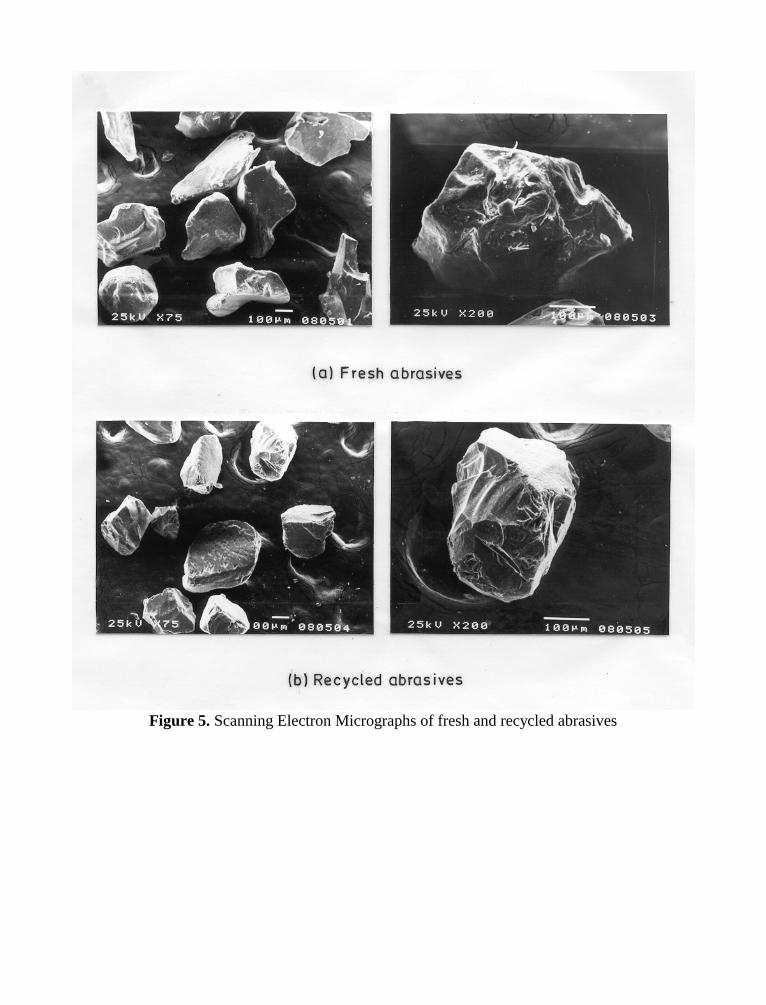
Figure 5. Scanning Electron Micrographs of fresh and recycled abrasives
10th American Waterjet ConferenceAugust 14-17, 1999: Houston, Texas
Paper 31
A NEW TYPE OF HIGH PRESSURE WATER JET MILL
Fang Mei, Gong Weili, Chen YufanSchool of Resources Engineering
University of Science & Technology BeijingBeijing, P.R. China
ABSTRACT
The bright prospects for material disintegration with high-pressure water jet have been proved ina great deal of investigations undertaken by many scholars. The existing water jet mills are farfrom being satisfactory for extensive application in industries. A new type of water jet mill,based on the principle of self-resonating and the abrasive entrained water jet, is proposed in thepaper. The self-resonating water jet mill is expected to be of high grinding efficiency and lessenergy consumption with low primary costs, continuous operation and long service life. A seriesof experiments were conducted for optimization of the structural parameters of this new water jetmill, as well as testing its performance. The obtained experimental results show that the newwater jet mill is advantageous over the existing ones. The study indicates very good potentialsfor the practical application of the self-resonating water jet mill in material ultra-finecomminution.
Organized and Sponsored by the WaterJet Technology Association
1 INTRODUCTION
The high-pressure water-jet (hpwj) as a tool for cutting, cleaning and excavating operations iswell known and well accepted by many industries. The hpwj application for materialscomminution, however, is an ultrafine comminution technology newly developed in the pastdozen years.
Mazurkiewicz et al. (1992) introduced their study on hpwj application for materialsdisintegration, involving in wood pulping, waste paper pulping, municipal solid waste recycling,as well as their outstanding invention of dual-disc water jet mill for coal and mineralscomminution, starting new chapter of hpwj technology. The dual-disc hpwj mill, in combinationwith the existing mechanical mill, can be regarded as the first set of water jet mill based onstraight water jet.
Another type of water jet mill is based on the principle of DIAjet, conventionally referred to as ahigh-pressure homogenizer. A number of companies and institutions develop and produce high-pressure homogenizer such as AKW (Germany), APVRASNNIEA/S (Denmark), and CUMT (P.R. China). The third type of water jet mill is based on the principle of abrasive entrained waterjet (AWJ). Its typical model is the target-type water jet mill developed at USTB (Fang Mei et al.,1997, P. R. China), having been put into industrial application for ultra-fine mica comminution.
In comparison with conventional ultra-fine grinding equipments, the water jet mills has theadvantages of high grinding efficiency, less energy consumption, simple structure and substantialsavings with regard to the manufacture costs, as well as low maintenance and spacerequirements. However, they still have some drawbacks in techniques. For instance, the dual-dischpwj mill has mechanical moving parts and not made full use of the jet energy. DIA jet basedmill is most energy efficient, but its application is severely limited for its complicated structure,high manufacture costs and inaccessibility to continuous operation. The target-type water jet millis very simple in structure, easy to operate, but is inefficient in use of the jet energy due to itsabrasive entraining mechanism, which makes the abrasive particles unable to be well mixed withjet stream and fully accelerated.
In principle, both straight water jet and abrasive water jet on which the existing water jet millsare based all belong to continuous water jets. Among various kinds of water jets, cavitating jetsand pulsating jets are new types, which are of high efficiency. As far as the means to createcavitating jets and pulsating jets were concerned, the self-resonating is an advanced one, whichfeatures with simple structure and high reliability. Combining abrasive entrained water jet withself-excited oscillator forms a new type of water jet that can be noted as “Self-ResonatingAbrasive Water Jet (SRAWJ)”. The SRAWJ is a kind of abrasive water jet pulsed and cavitatedby the built-in Helmholtz resonator, thus the jet performance was greatly enhanced.
A new type of water jet mill based on the principle of SRAWJ is proposed, referred to as self-resonating water jet mill (SR water jet mill). In the presence of SRAWJ, the structure of SRwater jet mill is as simple as that of the target-type water jet mill, meanwhile, the energyefficiency is nearly the same as the DIAjet mill. The study introduced in this paper involves in
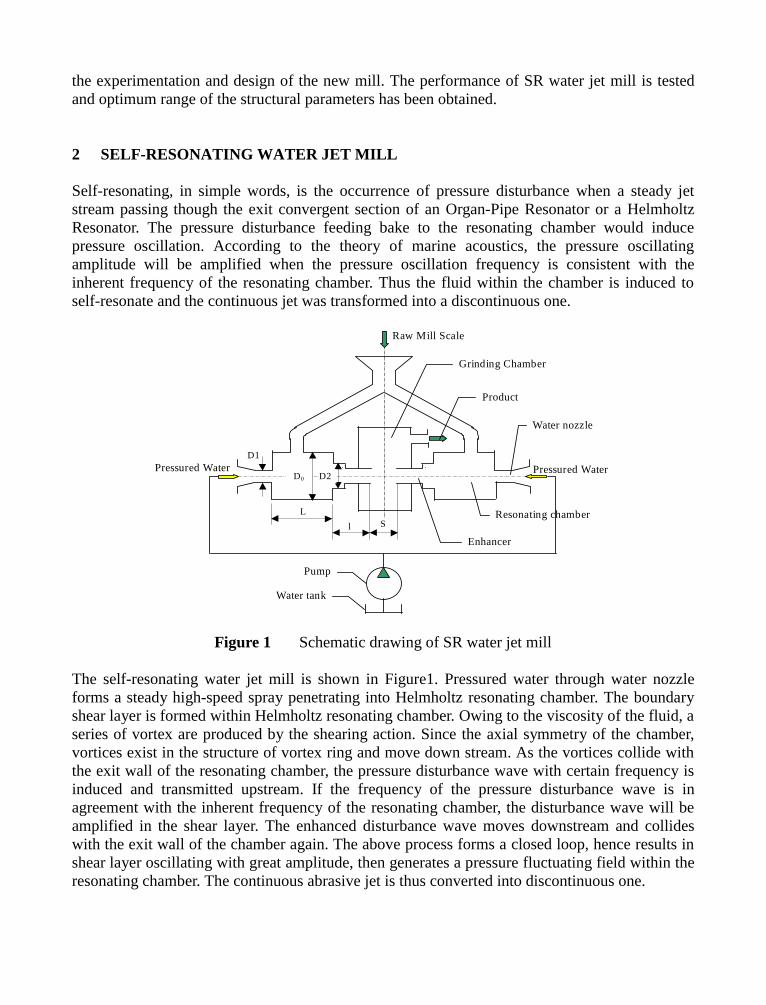
the experimentation and design of the new mill. The performance of SR water jet mill is testedand optimum range of the structural parameters has been obtained.
2 SELF-RESONATING WATER JET MILL
Self-resonating, in simple words, is the occurrence of pressure disturbance when a steady jetstream passing though the exit convergent section of an Organ-Pipe Resonator or a HelmholtzResonator. The pressure disturbance feeding bake to the resonating chamber would inducepressure oscillation. According to the theory of marine acoustics, the pressure oscillatingamplitude will be amplified when the pressure oscillation frequency is consistent with theinherent frequency of the resonating chamber. Thus the fluid within the chamber is induced toself-resonate and the continuous jet was transformed into a discontinuous one.
D1
LSl
Pressured Water
Raw Mill Scale
Water nozzle
Resonating chamber
Enhancer
Grinding Chamber
Pump
Pressured WaterD2D0
Product
Water tank
Figure 1 Schematic drawing of SR water jet mill
The self-resonating water jet mill is shown in Figure1. Pressured water through water nozzleforms a steady high-speed spray penetrating into Helmholtz resonating chamber. The boundaryshear layer is formed within Helmholtz resonating chamber. Owing to the viscosity of the fluid, aseries of vortex are produced by the shearing action. Since the axial symmetry of the chamber,vortices exist in the structure of vortex ring and move down stream. As the vortices collide withthe exit wall of the resonating chamber, the pressure disturbance wave with certain frequency isinduced and transmitted upstream. If the frequency of the pressure disturbance wave is inagreement with the inherent frequency of the resonating chamber, the disturbance wave will beamplified in the shear layer. The enhanced disturbance wave moves downstream and collideswith the exit wall of the chamber again. The above process forms a closed loop, hence results inshear layer oscillating with great amplitude, then generates a pressure fluctuating field within theresonating chamber. The continuous abrasive jet is thus converted into discontinuous one.
Large vortex structure will promote cavitating effect as discussed by Li Gensheng et al. (1992).If the SR water jet mill were properly designed, the low-pressure zones in the center of thevortices would be low enough to generate gas bubbles in the fluid within the chamber. Inaddition, while materials are drawn into the resonating chamber, air along with material particlesis entrained into the chamber altogether. The spreading of the entrained air to the cavitationzones of the fluid will produce large number of gas core. This is the relationship between thefluid pressure in the resonating chamber (dp ) and the water jet stream pressure (up ) that can be
simplified to the ratio of chamber pressure to jet pressure. The equation should also include thefluid vapor pressure (vp ) in a form that generates a term known as the cavitation index (σ )
given by the relationship (David A. Summers, 1995),
vu
vd
pp
pp
−−
=σ (1)
The vapor pressure vp increases and the chamber pressure dp decreases when the entrained air
enter into the chamber. Consequently, the cavitation number decreases and the cavitation actionis enhanced. Hence, the abrasive water jet modulated by the self-resonating oscillation is apulsating abrasive jet with plenty of bubbles inside.
The vacuum is produced by the self-resonating oscillation of the fluid within the resonatingchamber, causing the existence of the pressure difference between the feed bin located directlyabove the jet mill and the resonating chamber. The feed materials are transported pneumaticallyfrom the feed bin into the chamber by the joint action of its gravitation and the pressuredifference.
The material particles entrained are whirled into the center of jet stream by the huge vorticesproduced within the chamber, which enables these particles to be well mixed with the stream.The enhancer fully accelerates the entrained particles. Finally form is a pulsed and cavitated jetcolumn consisting of three phases, liquid, gas, and solid particles. Since transient velocity ofpulsating jet is much higher than that of the continuous jets, being accelerated by the pulsating,the particles in SRAWJ gain greater speed than in AWJ. Furthermore, the vortex-whirledentraining mechanism of SRAWJ enhances the entraining ability and increases the entrainingrate of the feed material. Based on these features mentioned, SR water jet mill is much efficientin utilizing jet energy and in comminuting material.
Inside the grinding chamber, the material particles counter-spraying from the two enhancerscollide with each other and comminuted into very fine particles by the joint action of cavitatingpressure and water hammer pressure. The product is discharged though the outlet of the grindingchamber.
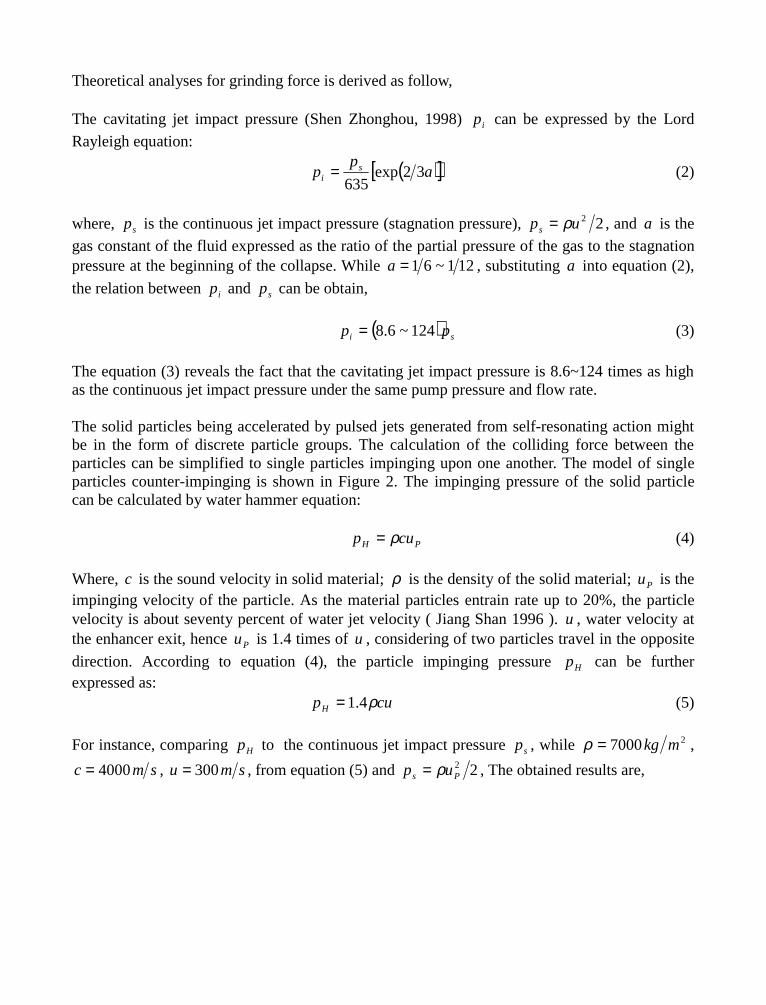
Theoretical analyses for grinding force is derived as follow,
The cavitating jet impact pressure (Shen Zhonghou, 1998) ip can be expressed by the Lord
Rayleigh equation:
( )[ ]ap
p si 32exp
635= (2)
where, sp is the continuous jet impact pressure (stagnation pressure), 22ups ρ= , and a is the
gas constant of the fluid expressed as the ratio of the partial pressure of the gas to the stagnationpressure at the beginning of the collapse. While 121~61=a , substituting a into equation (2),
the relation between ip and sp can be obtain,
( ) si pp 124~6.8= (3)
The equation (3) reveals the fact that the cavitating jet impact pressure is 8.6~124 times as highas the continuous jet impact pressure under the same pump pressure and flow rate.
The solid particles being accelerated by pulsed jets generated from self-resonating action mightbe in the form of discrete particle groups. The calculation of the colliding force between theparticles can be simplified to single particles impinging upon one another. The model of singleparticles counter-impinging is shown in Figure 2. The impinging pressure of the solid particlecan be calculated by water hammer equation:
PH cup ρ= (4)
Where, c is the sound velocity in solid material; ρ is the density of the solid material; Pu is theimpinging velocity of the particle. As the material particles entrain rate up to 20%, the particlevelocity is about seventy percent of water jet velocity ( Jiang Shan 1996 ). u , water velocity atthe enhancer exit, hence Pu is 1.4 times of u , considering of two particles travel in the opposite
direction. According to equation (4), the particle impinging pressure Hp can be furtherexpressed as:
cupH ρ4.1= (5)
For instance, comparing Hp to the continuous jet impact pressure sp , while 27000 mkg=ρ ,
smc 4000= , smu 300= , from equation (5) and 22Ps up ρ= , The obtained results are,
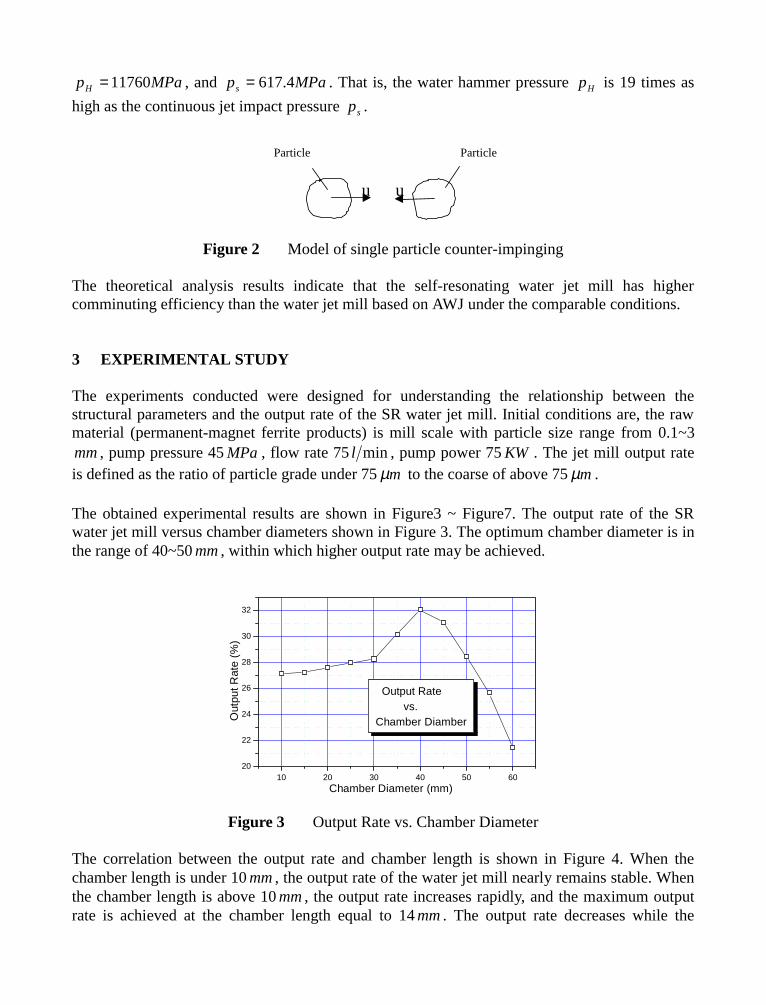
MPapH 11760= , and MPaps 4.617= . That is, the water hammer pressure Hp is 19 times as
high as the continuous jet impact pressure sp .
u u
ParticleParticle
Figure 2 Model of single particle counter-impinging
The theoretical analysis results indicate that the self-resonating water jet mill has highercomminuting efficiency than the water jet mill based on AWJ under the comparable conditions.
3 EXPERIMENTAL STUDY
The experiments conducted were designed for understanding the relationship between thestructural parameters and the output rate of the SR water jet mill. Initial conditions are, the rawmaterial (permanent-magnet ferrite products) is mill scale with particle size range from 0.1~3mm, pump pressure 45MPa , flow rate 75 minl , pump power 75KW . The jet mill output rateis defined as the ratio of particle grade under 75mµ to the coarse of above 75mµ .
The obtained experimental results are shown in Figure3 ~ Figure7. The output rate of the SRwater jet mill versus chamber diameters shown in Figure 3. The optimum chamber diameter is inthe range of 40~50mm, within which higher output rate may be achieved.
10 20 30 40 50 6020
22
24
26
28
30
32
Output Rate vs.Chamber DiamberO
utpu
t Rat
e (%
)
Chamber Diameter (mm)
Figure 3 Output Rate vs. Chamber Diameter
The correlation between the output rate and chamber length is shown in Figure 4. When thechamber length is under 10mm, the output rate of the water jet mill nearly remains stable. Whenthe chamber length is above 10mm, the output rate increases rapidly, and the maximum outputrate is achieved at the chamber length equal to 14mm. The output rate decreases while the
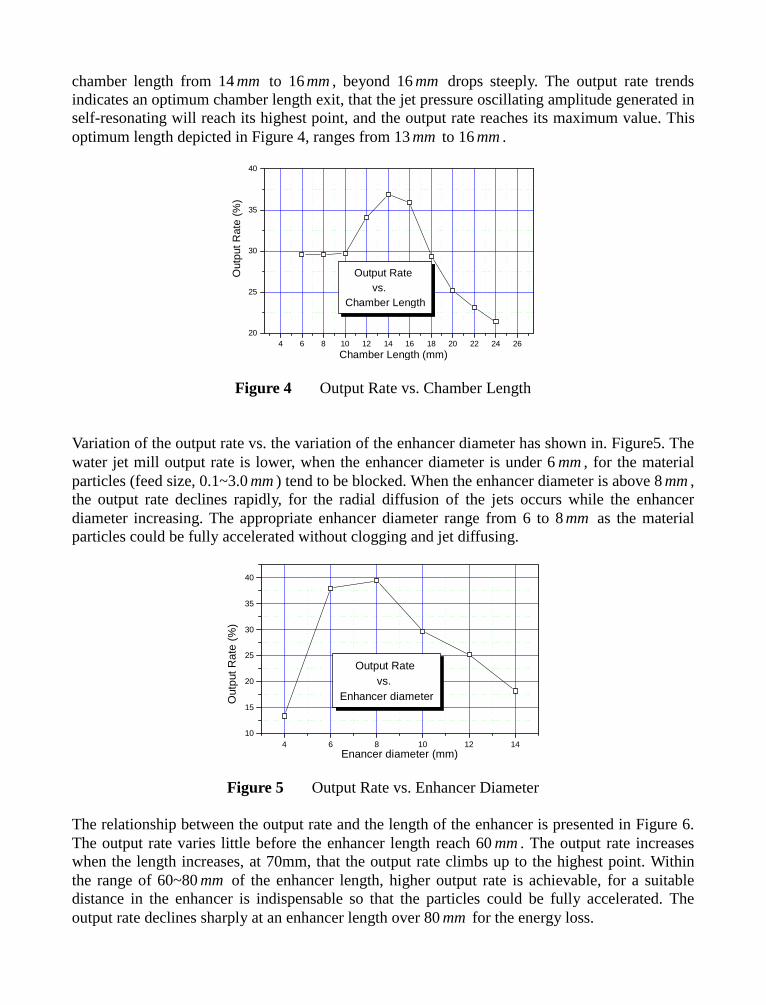
chamber length from 14mm to 16mm, beyond 16mm drops steeply. The output rate trendsindicates an optimum chamber length exit, that the jet pressure oscillating amplitude generated inself-resonating will reach its highest point, and the output rate reaches its maximum value. Thisoptimum length depicted in Figure 4, ranges from 13mm to 16mm.
4 6 8 10 12 14 16 18 20 22 24 2620
25
30
35
40
Output Rate vs. Chamber Length
Out
put R
ate
(%)
Chamber Length (mm)
Figure 4 Output Rate vs. Chamber Length
Variation of the output rate vs. the variation of the enhancer diameter has shown in. Figure5. Thewater jet mill output rate is lower, when the enhancer diameter is under 6mm, for the materialparticles (feed size, 0.1~3.0mm) tend to be blocked. When the enhancer diameter is above 8mm,the output rate declines rapidly, for the radial diffusion of the jets occurs while the enhancerdiameter increasing. The appropriate enhancer diameter range from 6 to 8mm as the materialparticles could be fully accelerated without clogging and jet diffusing.
4 6 8 10 12 1410
15
20
25
30
35
40
Output Rate vs. Enhancer diameterO
utpu
t Rat
e (%
)
Enancer diameter (mm)
Figure 5 Output Rate vs. Enhancer Diameter
The relationship between the output rate and the length of the enhancer is presented in Figure 6.The output rate varies little before the enhancer length reach 60mm. The output rate increaseswhen the length increases, at 70mm, that the output rate climbs up to the highest point. Withinthe range of 60~80mm of the enhancer length, higher output rate is achievable, for a suitabledistance in the enhancer is indispensable so that the particles could be fully accelerated. Theoutput rate declines sharply at an enhancer length over 80mm for the energy loss.
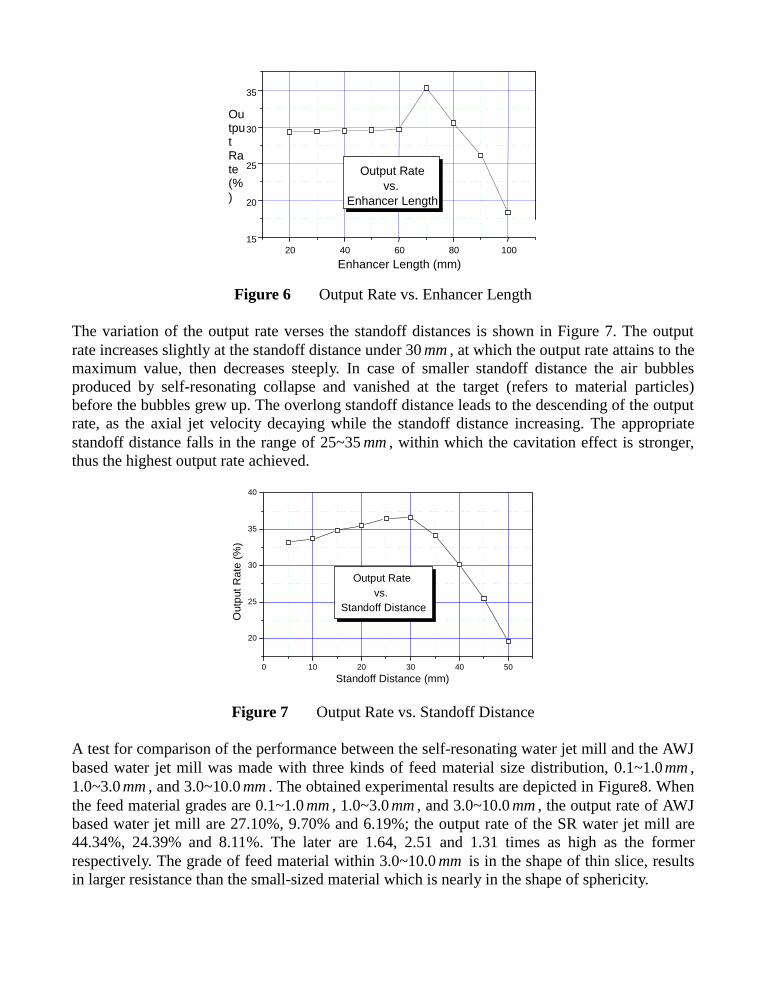
20 40 60 80 10015
20
25
30
35
Output Rate vs.Enhancer Length
OutputRate(%)
Enhancer Length (mm)
Figure 6 Output Rate vs. Enhancer Length
The variation of the output rate verses the standoff distances is shown in Figure 7. The outputrate increases slightly at the standoff distance under 30 mm , at which the output rate attains to themaximum value, then decreases steeply. In case of smaller standoff distance the air bubblesproduced by self-resonating collapse and vanished at the target (refers to material particles)before the bubbles grew up. The overlong standoff distance leads to the descending of the outputrate, as the axial jet velocity decaying while the standoff distance increasing. The appropriatestandoff distance falls in the range of 25~35 mm , within which the cavitation effect is stronger,thus the highest output rate achieved.
0 10 20 30 40 50
20
25
30
35
40
Output Rate vs.Standoff Distance
Out
put R
ate
(%)
Standoff Distance (mm)
Figure 7 Output Rate vs. Standoff Distance
A test for comparison of the performance between the self-resonating water jet mill and the AWJbased water jet mill was made with three kinds of feed material size distribution, 0.1~1.0mm ,1.0~3.0 mm , and 3.0~10.0 mm . The obtained experimental results are depicted in Figure8. Whenthe feed material grades are 0.1~1.0 mm , 1.0~3.0 mm , and 3.0~10.0 mm , the output rate of AWJbased water jet mill are 27.10%, 9.70% and 6.19%; the output rate of the SR water jet mill are44.34%, 24.39% and 8.11%. The later are 1.64, 2.51 and 1.31 times as high as the formerrespectively. The grade of feed material within 3.0~10.0 mm is in the shape of thin slice, resultsin larger resistance than the small-sized material which is nearly in the shape of sphericity.
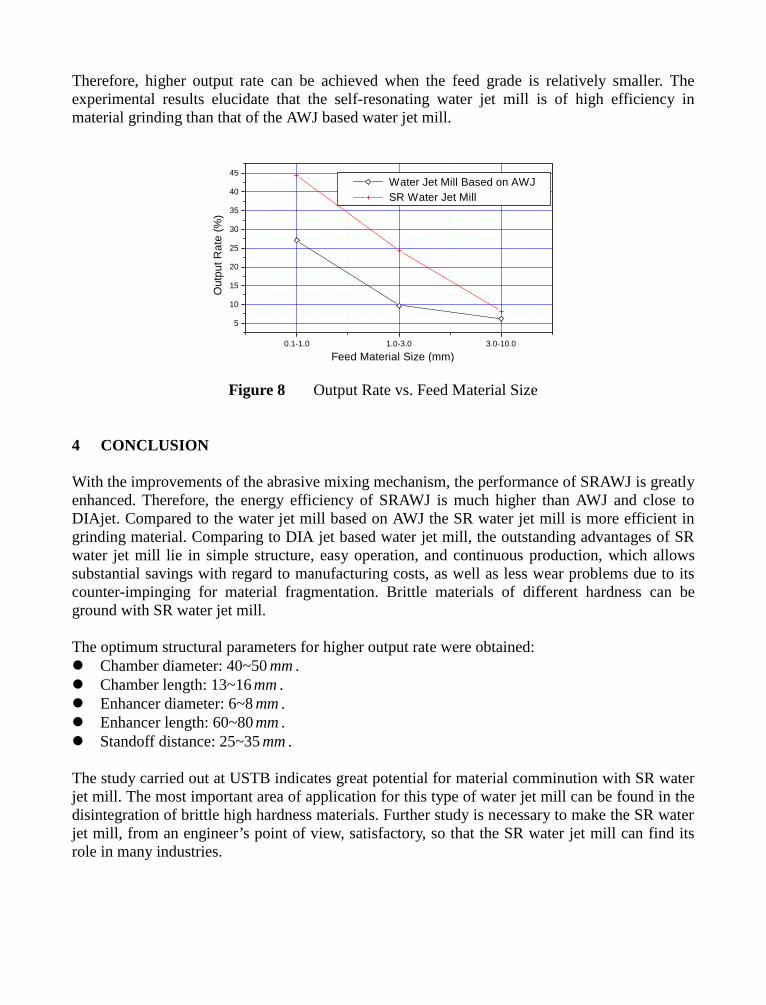
Therefore, higher output rate can be achieved when the feed grade is relatively smaller. Theexperimental results elucidate that the self-resonating water jet mill is of high efficiency inmaterial grinding than that of the AWJ based water jet mill.
0.1-1.0 1.0-3.0 3.0-10.0
5
10
15
20
25
30
35
40
45 Water Jet Mill Based on AWJ SR Water Jet Mill
Out
put R
ate
(%)
Feed Material Size (mm)
Figure 8 Output Rate vs. Feed Material Size
4 CONCLUSION
With the improvements of the abrasive mixing mechanism, the performance of SRAWJ is greatlyenhanced. Therefore, the energy efficiency of SRAWJ is much higher than AWJ and close toDIAjet. Compared to the water jet mill based on AWJ the SR water jet mill is more efficient ingrinding material. Comparing to DIA jet based water jet mill, the outstanding advantages of SRwater jet mill lie in simple structure, easy operation, and continuous production, which allowssubstantial savings with regard to manufacturing costs, as well as less wear problems due to itscounter-impinging for material fragmentation. Brittle materials of different hardness can beground with SR water jet mill.
The optimum structural parameters for higher output rate were obtained:z Chamber diameter: 40~50mm.z Chamber length: 13~16mm.z Enhancer diameter: 6~8mm.z Enhancer length: 60~80mm.z Standoff distance: 25~35mm.
The study carried out at USTB indicates great potential for material comminution with SR waterjet mill. The most important area of application for this type of water jet mill can be found in thedisintegration of brittle high hardness materials. Further study is necessary to make the SR waterjet mill, from an engineer’s point of view, satisfactory, so that the SR water jet mill can find itsrole in many industries.
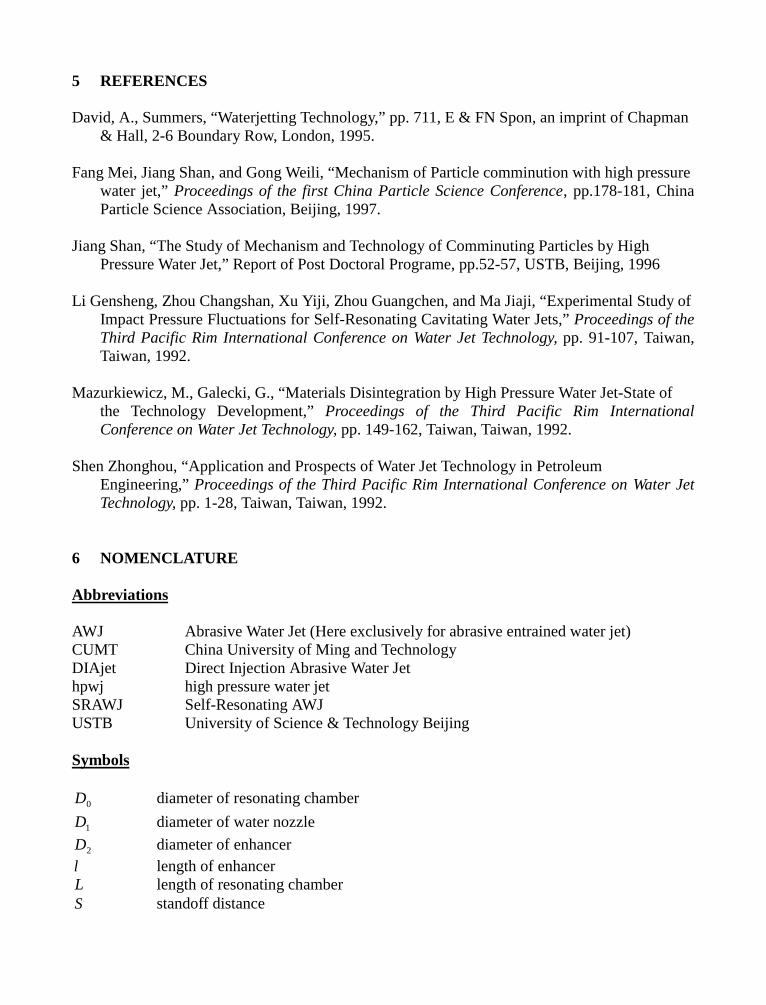
5 REFERENCES
David, A., Summers, “Waterjetting Technology,” pp. 711, E & FN Spon, an imprint of Chapman& Hall, 2-6 Boundary Row, London, 1995.
Fang Mei, Jiang Shan, and Gong Weili, “Mechanism of Particle comminution with high pressurewater jet,” Proceedings of the first China Particle Science Conference, pp.178-181, ChinaParticle Science Association, Beijing, 1997.
Jiang Shan, “The Study of Mechanism and Technology of Comminuting Particles by HighPressure Water Jet,” Report of Post Doctoral Programe, pp.52-57, USTB, Beijing, 1996
Li Gensheng, Zhou Changshan, Xu Yiji, Zhou Guangchen, and Ma Jiaji, “Experimental Study ofImpact Pressure Fluctuations for Self-Resonating Cavitating Water Jets,” Proceedings of theThird Pacific Rim International Conference on Water Jet Technology, pp. 91-107, Taiwan,Taiwan, 1992.
Mazurkiewicz, M., Galecki, G., “Materials Disintegration by High Pressure Water Jet-State ofthe Technology Development,” Proceedings of the Third Pacific Rim InternationalConference on Water Jet Technology, pp. 149-162, Taiwan, Taiwan, 1992.
Shen Zhonghou, “Application and Prospects of Water Jet Technology in PetroleumEngineering,” Proceedings of the Third Pacific Rim International Conference on Water JetTechnology, pp. 1-28, Taiwan, Taiwan, 1992.
6 NOMENCLATURE
Abbreviations
AWJ Abrasive Water Jet (Here exclusively for abrasive entrained water jet)CUMT China University of Ming and TechnologyDIAjet Direct Injection Abrasive Water Jethpwj high pressure water jetSRAWJ Self-Resonating AWJUSTB University of Science & Technology Beijing
Symbols
0D diameter of resonating chamber
1D diameter of water nozzle
2D diameter of enhancerl length of enhancerL length of resonating chamberS standoff distance
10th American Waterjet ConferenceAugust 14-17, 1999: Houston, Texas
Paper 32
MICA PARTICLE SIZE DIMENSION DISTRIBUTION
AFTER WATER JET COMMINUTING
Fang Mei, Xu Xiaodong, Chen YufanSchool of Resources Engineering
University of Science & Technology BeijingBeijing, P.R. China
Xu ShuhongBeijing Information Technology Institute
Beijing, P.R. China
ABSTRACT
Evaluating the quality of various kind of comminuting results needs to study the comminutedproduct distribution, and also has to find an accurate way to describe the distributionmathematically. In this article, according to the fractal geometry theory, the author regarded thecomminuting process as a kind of fractal formation, and set up the model of mica comminutingparticle size, and deduced the distribution function from the fractal model accorded with G-Sdistribution function. The author also deduced the relation between the index of particle sizedistribution α and the fractal distribution dimension number D is α =E-D. (E means the topologydimension). The comminuted particle size distribution can be described and predicted by thedistribution dimension. The experiments of mica comminuting with high-pressure water-jetproved that the expected fractal distribution of the mica particle product. Additionally, therelation between comminuting pressure, nozzle diameter and fractal distribution dimension isregard as, D is directly proportional to the water pressure, while inversely proportional to thenozzle diameter, and the value of D is between 2.005-2.445.
Organized and Sponsored by the WaterJet Technology Association
1 INTRODUCTION
The earlier study was concerned with the calculation of specific surface area and the averageparticle size by using the particle size characteristic function, and concerned with the formuladeduction on how to calculate the partial sieving efficiency. Recently, both the calculation andthe deduction were related to particle size distribution and energy consumption of comminutingprocess. As to the particle size distribution of the comminuted product (Xu Xiaohe, et al. 1994),they may be divided into two categories, i.e. G-S and R-R distribution.
2 MATHEMATICAL DESCRIPTION OF PARTICLE SIZE CHARACTERISTIC
G-S Particle Size Distribution Function (PSDF) is regarded as:
( )y x Rn n= α(1)
where, yn Accumulated percentage product of screen under-flow, xn Particle size, R Particle size mode (i.e. the particle size in contrast with yn =100%), α Distribution mode , a constant concerned with the material features.
P. Rosin and E. Rammler deduced the R-R PSDF based on the coal particle comminuting.
( )[ ]y x kn n
m= − −1 exp (2)
where, xn Particle size,yn Weighted percentage of screen underflow (mesh size equals to xn ),m a constant relevant with the material features,k a constant concerned with the breakage pattern.
According to the statistic theory, Benett acquired the PSDF of single breakage, and it is similar tothe R-R distribution function.
( )[ ]B y ab= − −1 exp (3)
where, B --- weight percentage of screen underflow (mesh size equals to y), however, Bennett didnot endow parameters a and b with any definite physical meaning, consequently, a and b have tobe fixed by experiments.
Broadbent and Collcott have discussed the particle size distribution under the condition of stepby step (progressive) breakage with the method of Matrix algebra, they found that
( )[ ] ( )[ ]B y x= − ⋅ − −1 1 1exp exp (4)
A.M. Gaudin and T. P. Meloy studied the Mineral Particle Size Distribution Function of singlebreakage with the theory of probability, and they deduced the following formula
( ) ( )γ00 11 xxMxM −−= (5)
where , M 0 total weight of the crushed mineral, M(x) weight of screen underflow (particle diameter equals to x), x0 input mineral particle diameter, γ the breakage ratio in engineering.
R. R. Klimped and L. G. Austin got the result as follow,
( ) ( )[ ] ( )[ ] ( )[ ]B y x y x y x y xl s v
= − − ⋅ − ⋅ −1 1 1 12 3γ γ γ
(6)
where, y characteristic dimension of the crushed particle, x characteristic dimension of the particle before crush, γγγ vsl ,, parameters related to linear defect, surface defect, and volume defect.
Tanaka and Zhu Yi et al deduced the following equation with damage theory and probabilityanalysis,
( ) ( ) ( )[ ]y x k x j x in n n n= − − − −12 3
exp (7)
where, k, i, j are all constants,
Kolmogrov logarithm normal distribution function is:
( )[ ]y x kn n
m= Φ ln (8)
where, yn , xn , m, k the same meaning with that of R-R Distribution Function, Φ Gauss function .
Generally speaking, logarithm normal distribution is suitable for fine grinding, especially forsuper-fine grinding mineral product, most other kinds subtle powder material, such as crystalstructure, sediment material and so on are fit for Logarithm Normal Distribution Function.
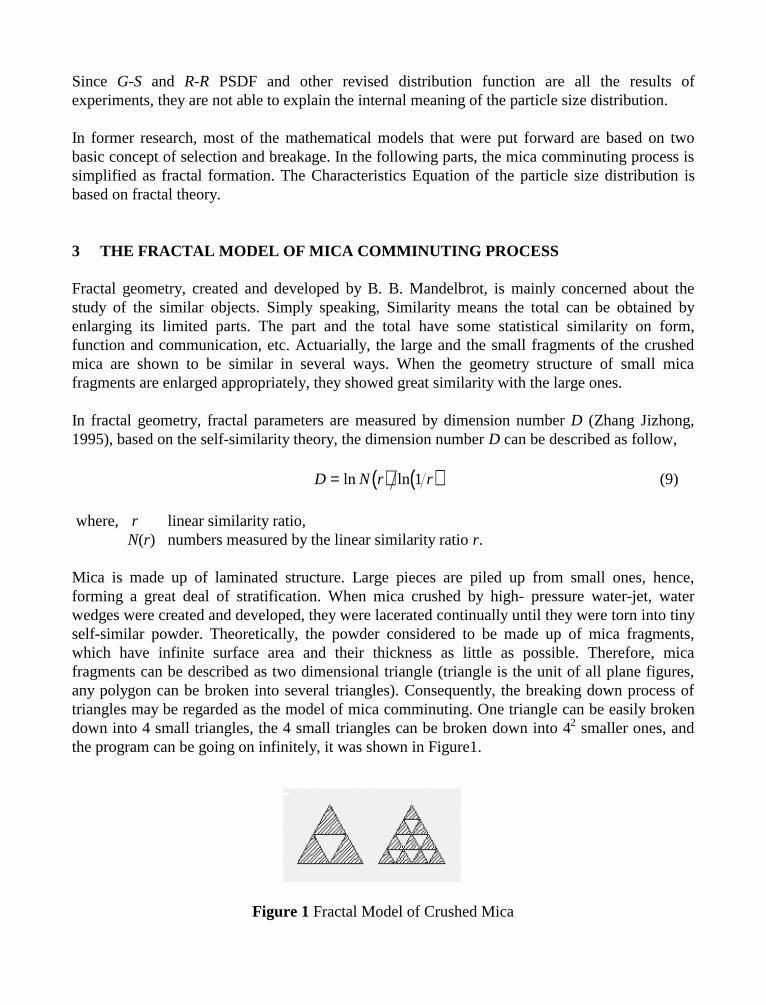
Since G-S and R-R PSDF and other revised distribution function are all the results ofexperiments, they are not able to explain the internal meaning of the particle size distribution.
In former research, most of the mathematical models that were put forward are based on twobasic concept of selection and breakage. In the following parts, the mica comminuting process issimplified as fractal formation. The Characteristics Equation of the particle size distribution isbased on fractal theory.
3 THE FRACTAL MODEL OF MICA COMMINUTING PROCESS
Fractal geometry, created and developed by B. B. Mandelbrot, is mainly concerned about thestudy of the similar objects. Simply speaking, Similarity means the total can be obtained byenlarging its limited parts. The part and the total have some statistical similarity on form,function and communication, etc. Actuarially, the large and the small fragments of the crushedmica are shown to be similar in several ways. When the geometry structure of small micafragments are enlarged appropriately, they showed great similarity with the large ones.
In fractal geometry, fractal parameters are measured by dimension number D (Zhang Jizhong,1995), based on the self-similarity theory, the dimension number D can be described as follow,
( ) ( )D N r r= ln ln 1 (9)
where, r linear similarity ratio, N(r) numbers measured by the linear similarity ratio r.
Mica is made up of laminated structure. Large pieces are piled up from small ones, hence,forming a great deal of stratification. When mica crushed by high- pressure water-jet, waterwedges were created and developed, they were lacerated continually until they were torn into tinyself-similar powder. Theoretically, the powder considered to be made up of mica fragments,which have infinite surface area and their thickness as little as possible. Therefore, micafragments can be described as two dimensional triangle (triangle is the unit of all plane figures,any polygon can be broken into several triangles). Consequently, the breaking down process oftriangles may be regarded as the model of mica comminuting. One triangle can be easily brokendown into 4 small triangles, the 4 small triangles can be broken down into 42 smaller ones, andthe program can be going on infinitely, it was shown in Figure1.
Figure 1 Fractal Model of Crushed Mica
During the comminuting process, the form of those broken pieces are the reduced pattern of theformer total one, This process just satisfied the condition of self-similarity in fractal geometry.
For this fractal geometry model, each side of the triangle can be divided equally by 2, 4, 8 etc.After each crushing, each side of the triangle is 1/2, 1/4, 1/8 ... of those of the former ones.
According to the definition of partial dimension, r = 1/2, 1/4, ... N=4.So that, D = ln N(r) / ln(1/r) = 2, 1, 0.67, ... 0.
Assuming the largest length of the source mica is k, xn means the length of the particle size aftern times crushing, then, based on fractal formation theory, the particle size is reducedcontinuously according to the linear similarity ratio r,
x r knn= ⋅ (10)
Hence, ( )n x k rn= ln ln (11)
For ( )N Nn x k rn= ln ln ( ) ( )= −x kn
n rln ln 1
from equation (10), we can get: ( )N x knn
D= −
so that ( )y x kn n
E D= − (12)
where, E means the topology dimension.
From above, we may get the result that, mica particle size complied with a certain fractaldistribution law during its comminuting process. In contrast with the equation (2) and (12), Itshows that the fractal model of mica comminuting process satisfied the G-S partial sizedistribution rule, and to a deeper degree, we got the geometry meaning of the particle distributionindex α in the comminuted product. The relation of α and the partial dimension number D is asfollow,
α = −E D (13)
From the equation (12), It is safe to say, if k and D are known, the particle size distribution ruleof mica are successfully determined. While k can be calculated statistically by the large particles,the largest length of the particles, and the distribution dimension number D can be calculatednumerically.
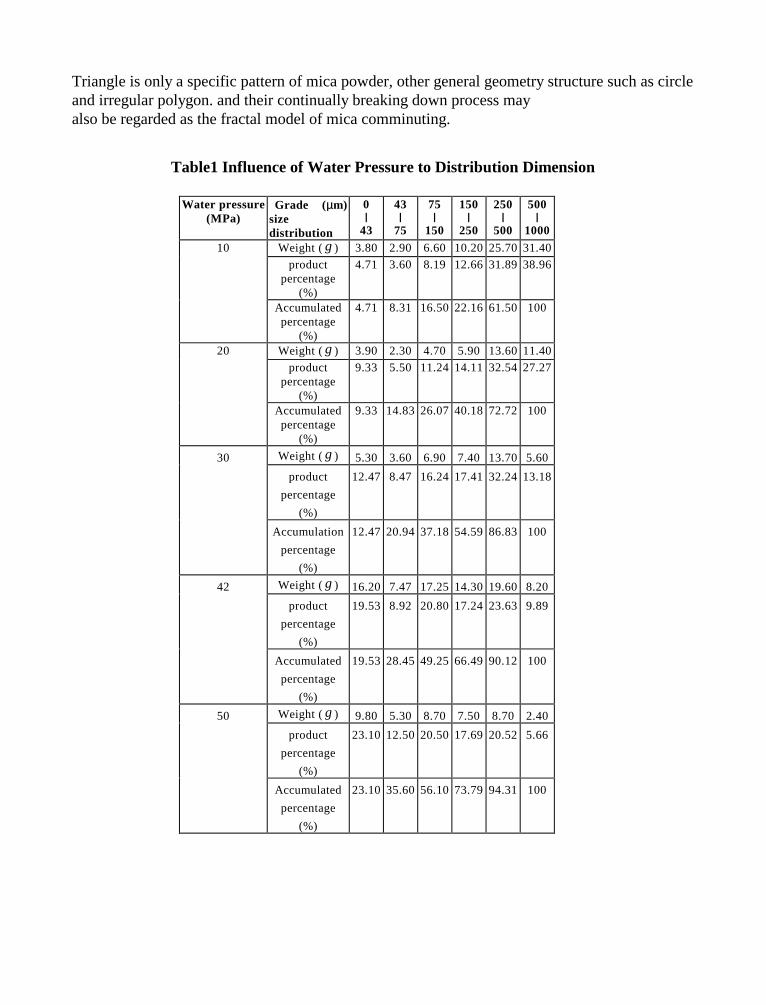
Triangle is only a specific pattern of mica powder, other general geometry structure such as circleand irregular polygon. and their continually breaking down process mayalso be regarded as the fractal model of mica comminuting.
Table1 Influence of Water Pressure to Distribution Dimension
Water pressure(MPa)
Grade (µm)sizedistribution
0|43
43|75
75|
150
150|
250
250|
500
500|
1000
Weight (g ) 3.80 2.90 6.60 10.20 25.70 31.40
productpercentage
(%)
4.71 3.60 8.19 12.66 31.89 38.96
10
Accumulatedpercentage
(%)
4.71 8.31 16.50 22.16 61.50 100
Weight (g ) 3.90 2.30 4.70 5.90 13.60 11.40
productpercentage
(%)
9.33 5.50 11.24 14.11 32.54 27.27
20
Accumulatedpercentage
(%)
9.33 14.83 26.07 40.18 72.72 100
Weight (g ) 5.30 3.60 6.90 7.40 13.70 5.60
product
percentage
(%)
12.47 8.47 16.24 17.41 32.24 13.18
30
Accumulation
percentage
(%)
12.47 20.94 37.18 54.59 86.83 100
Weight (g ) 16.20 7.47 17.25 14.30 19.60 8.20
product
percentage
(%)
19.53 8.92 20.80 17.24 23.63 9.89
42
Accumulated
percentage
(%)
19.53 28.45 49.25 66.49 90.12 100
Weight (g ) 9.80 5.30 8.70 7.50 8.70 2.40
product
percentage
(%)
23.10 12.50 20.50 17.69 20.52 5.66
50
Accumulated
percentage
(%)
23.10 35.60 56.10 73.79 94.31 100
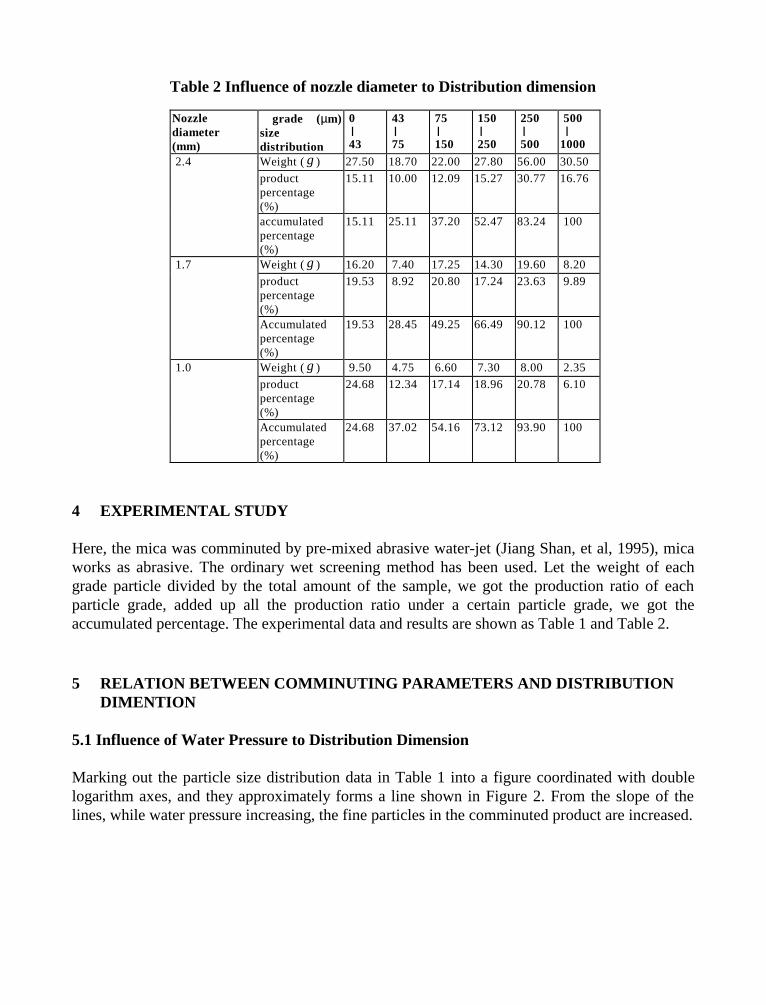
Table 2 Influence of nozzle diameter to Distribution dimension
4 EXPERIMENTAL STUDY
Here, the mica was comminuted by pre-mixed abrasive water-jet (Jiang Shan, et al, 1995), micaworks as abrasive. The ordinary wet screening method has been used. Let the weight of eachgrade particle divided by the total amount of the sample, we got the production ratio of eachparticle grade, added up all the production ratio under a certain particle grade, we got theaccumulated percentage. The experimental data and results are shown as Table 1 and Table 2.
5 RELATION BETWEEN COMMINUTING PARAMETERS AND DISTRIBUTION DIMENTION
5.1 Influence of Water Pressure to Distribution Dimension
Marking out the particle size distribution data in Table 1 into a figure coordinated with doublelogarithm axes, and they approximately forms a line shown in Figure 2. From the slope of thelines, while water pressure increasing, the fine particles in the comminuted product are increased.
Nozzlediameter(mm)
grade (µm)sizedistribution
0 | 43
43 | 75
75 | 150
150 | 250
250 | 500
500 |1000
Weight (g ) 27.50 18.70 22.00 27.80 56.00 30.50
productpercentage(%)
15.11 10.00 12.09 15.27 30.77 16.76
2.4
accumulatedpercentage(%)
15.11 25.11 37.20 52.47 83.24 100
Weight (g ) 16.20 7.40 17.25 14.30 19.60 8.20
productpercentage(%)
19.53 8.92 20.80 17.24 23.63 9.89
1.7
Accumulatedpercentage(%)
19.53 28.45 49.25 66.49 90.12 100
Weight (g ) 9.50 4.75 6.60 7.30 8.00 2.35
productpercentage(%)
24.68 12.34 17.14 18.96 20.78 6.10
1.0
Accumulatedpercentage(%)
24.68 37.02 54.16 73.12 93.90 100
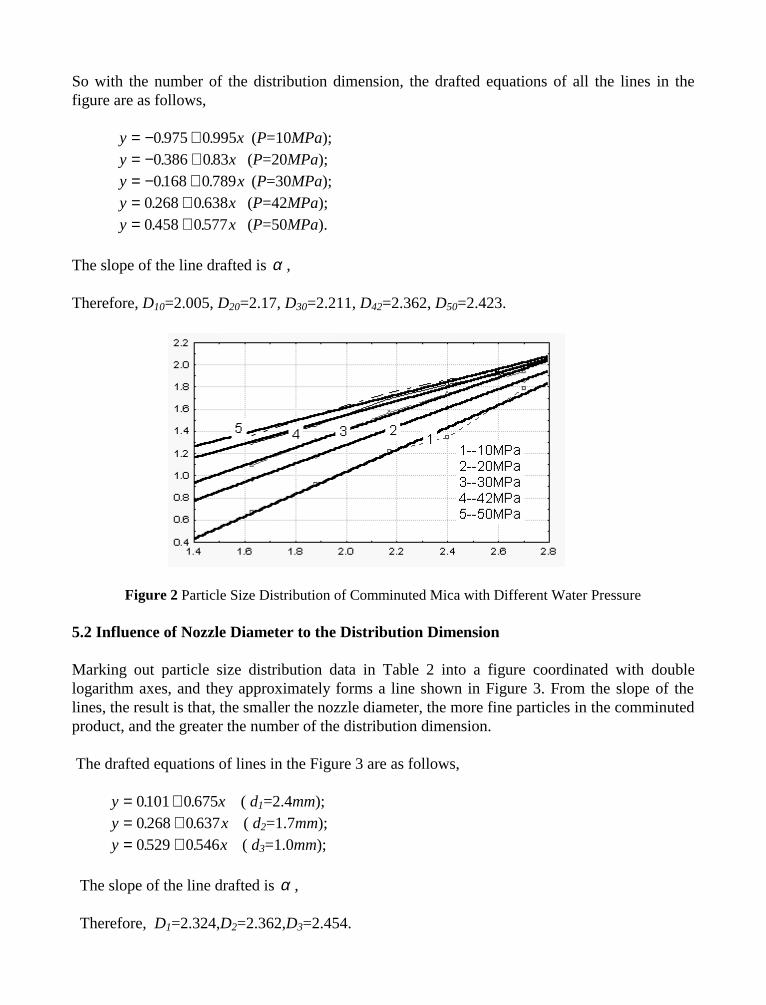
So with the number of the distribution dimension, the drafted equations of all the lines in thefigure are as follows,
y x= − +0 975 0 995. . (P=10MPa); y x= − +0 386 083. . (P=20MPa); y x= − +0168 0 789. . (P=30MPa); y x= +0 268 0 638. . (P=42MPa); y x= +0 458 0577. . (P=50MPa).
The slope of the line drafted is α ,
Therefore, D10=2.005, D20=2.17, D30=2.211, D42=2.362, D50=2.423.
Figure 2 Particle Size Distribution of Comminuted Mica with Different Water Pressure
5.2 Influence of Nozzle Diameter to the Distribution Dimension
Marking out particle size distribution data in Table 2 into a figure coordinated with doublelogarithm axes, and they approximately forms a line shown in Figure 3. From the slope of thelines, the result is that, the smaller the nozzle diameter, the more fine particles in the comminutedproduct, and the greater the number of the distribution dimension.
The drafted equations of lines in the Figure 3 are as follows,
y x= +0101 0 675. . ( d1=2.4mm); y x= +0 268 0 637. . ( d2=1.7mm); y x= +0529 0546. . ( d3=1.0mm);
The slope of the line drafted is α ,
Therefore, D1=2.324,D2=2.362,D3=2.454.
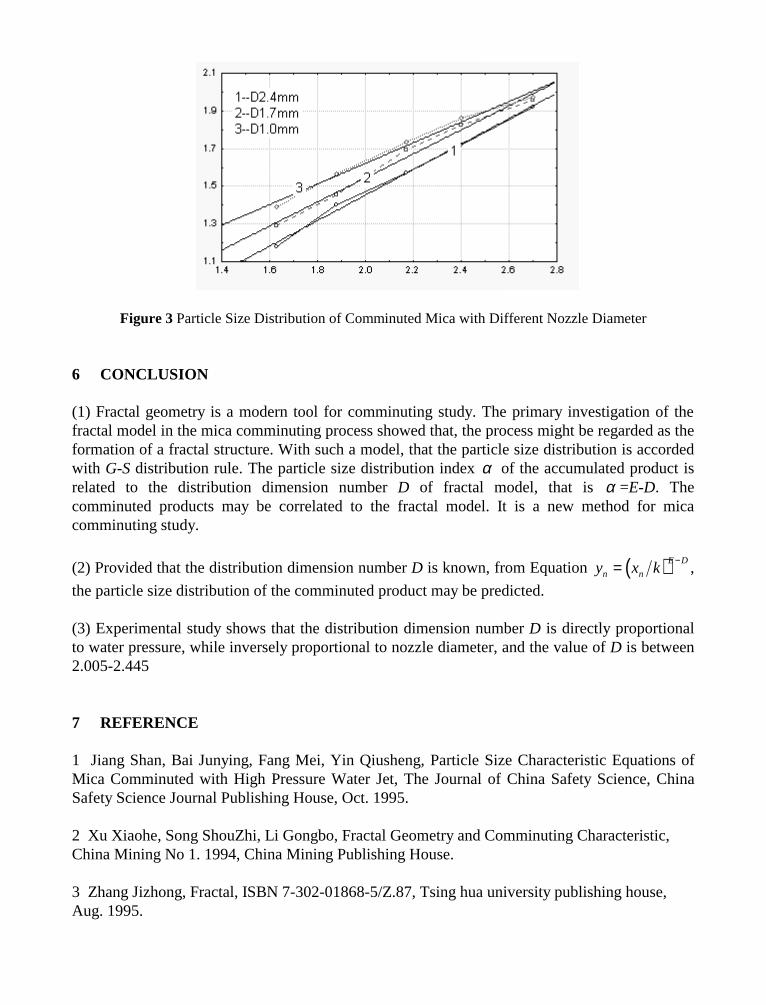
Figure 3 Particle Size Distribution of Comminuted Mica with Different Nozzle Diameter
6 CONCLUSION
(1) Fractal geometry is a modern tool for comminuting study. The primary investigation of thefractal model in the mica comminuting process showed that, the process might be regarded as theformation of a fractal structure. With such a model, that the particle size distribution is accordedwith G-S distribution rule. The particle size distribution index α of the accumulated product isrelated to the distribution dimension number D of fractal model, that is α =E-D. Thecomminuted products may be correlated to the fractal model. It is a new method for micacomminuting study.
(2) Provided that the distribution dimension number D is known, from Equation ( )y x kn n
E D= −,
the particle size distribution of the comminuted product may be predicted.
(3) Experimental study shows that the distribution dimension number D is directly proportionalto water pressure, while inversely proportional to nozzle diameter, and the value of D is between2.005-2.445
7 REFERENCE
1 Jiang Shan, Bai Junying, Fang Mei, Yin Qiusheng, Particle Size Characteristic Equations ofMica Comminuted with High Pressure Water Jet, The Journal of China Safety Science, ChinaSafety Science Journal Publishing House, Oct. 1995.
2 Xu Xiaohe, Song ShouZhi, Li Gongbo, Fractal Geometry and Comminuting Characteristic,China Mining No 1. 1994, China Mining Publishing House.
3 Zhang Jizhong, Fractal, ISBN 7-302-01868-5/Z.87, Tsing hua university publishing house,Aug. 1995.
8 NOMENCLATURE
B weight percentage of screen underflow (mesh size equals to y),D the partial dimension number,E the topology dimension,i, j constants,k a constant concerned with the breakage pattern,m a constant relevant with the material features,M 0 total weight of the crushed mineral,M(x) weight of screen underflow (particle diameter equals to x),N(r) numbers measured by the linear similarity ratio r,R particle size mode (i.e. the particle size in contrast with yn =100%),r linear similarity ratio,x characteristic dimension of the particle before crush,x0 input mineral particle diameter,xn particle size,y characteristic dimension of the crushed particle,yn weight percentage of screen underflow (mesh size equals to xn ),yn accumulated percentage product of screen under-flow,α distribution mode ,(a constant concerned with the material features),γ breakage ratio in engineering.γ l parameter related to linear defect,
γ s parameter related to surface defect,
γ v parameter related to volume defect,
Φ Gauss function.
10th American Waterjet ConferenceAugust 14-17, 1999: Houston, Texas
Paper 33
THE CARVING OF THE MILLENNIUM ARCH
E. SandysARBS
New York, NY, U.S.A
S. PorterOPHIR RF
Los Angeles, CA, U.S.A
D. Summers, G. Galecki, R. Fossey, J. Blaine, J. TylerUniversity of Missouri-Rolla
Rolla, Missouri, U.S.A.
ABSTRACT
The University of Missouri-Rolla has received the gift of a major sculpture by the internationalartist, Edwina Sandys. The work comprises five pieces of rock carved from an initial set of threegranite blocks weighing 100 tons. As completed the sculpture will be in two parts, an initialthree part assembly forming an arch and two figures, standing separately. The two figures arecarved from the vertical members of the three-part arch and are polished, while the outersurfaces of the original rock are left unfinished.
The blocks for the assembly are trimmed using a high-pressure waterjet lance operated on acutting table measuring 6m by 2.4m and able to cut to a depth of 2.4m. The figures themselvesare then cut from the trimmed blocks, using the same table.
The development of the technology for cutting the figures is described, as are the developmentand final cutting of the figures. An initial 1/12th scale model was first cut using an abrasivewaterjet system on a smaller cutting table. This was followed by the cutting of a half-scalemodel before the final shapes were cut. Options for the different stages of the cutting arereviewed with an explanation as to the choices that were made for the different cuttingoperations. Problems, and their solutions, are described.
Organized and Sponsored by the WaterJet Technology Association
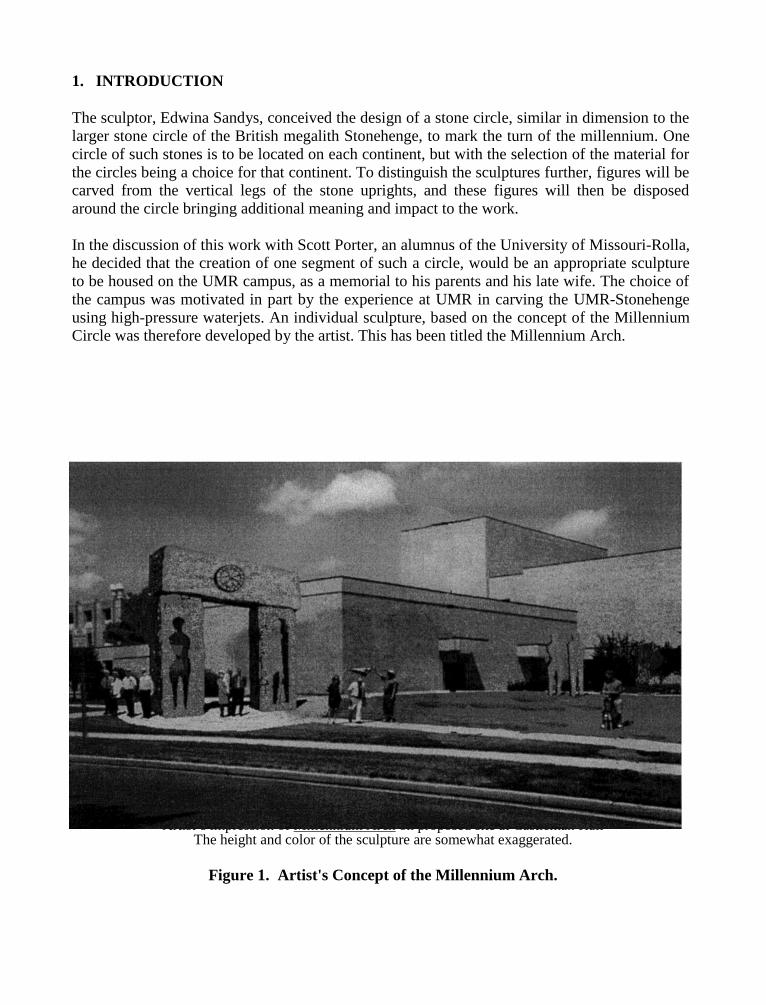
1. INTRODUCTION
The sculptor, Edwina Sandys, conceived the design of a stone circle, similar in dimension to thelarger stone circle of the British megalith Stonehenge, to mark the turn of the millennium. Onecircle of such stones is to be located on each continent, but with the selection of the material forthe circles being a choice for that continent. To distinguish the sculptures further, figures will becarved from the vertical legs of the stone uprights, and these figures will then be disposedaround the circle bringing additional meaning and impact to the work.
In the discussion of this work with Scott Porter, an alumnus of the University of Missouri-Rolla,he decided that the creation of one segment of such a circle, would be an appropriate sculptureto be housed on the UMR campus, as a memorial to his parents and his late wife. The choice ofthe campus was motivated in part by the experience at UMR in carving the UMR-Stonehengeusing high-pressure waterjets. An individual sculpture, based on the concept of the MillenniumCircle was therefore developed by the artist. This has been titled the Millennium Arch.
Artist’s impression of Millennium Arch on proposed site at Castleman HallThe height and color of the sculpture are somewhat exaggerated.
Figure 1. Artist's Concept of the Millennium Arch.
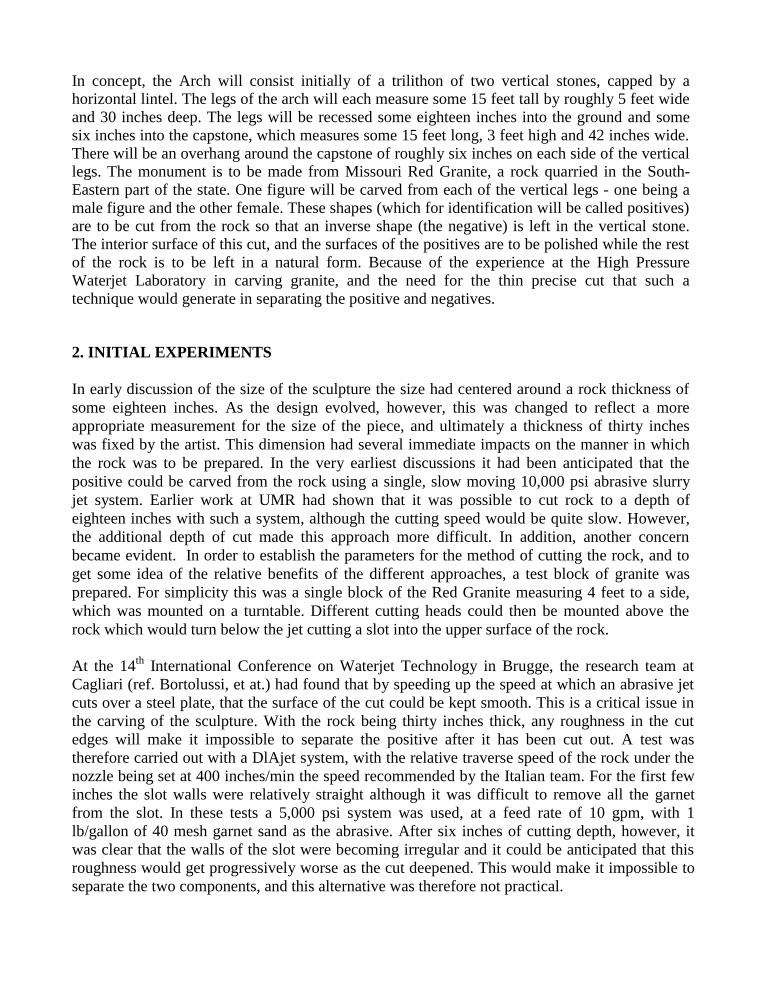
In concept, the Arch will consist initially of a trilithon of two vertical stones, capped by ahorizontal lintel. The legs of the arch will each measure some 15 feet tall by roughly 5 feet wideand 30 inches deep. The legs will be recessed some eighteen inches into the ground and somesix inches into the capstone, which measures some 15 feet long, 3 feet high and 42 inches wide.There will be an overhang around the capstone of roughly six inches on each side of the verticallegs. The monument is to be made from Missouri Red Granite, a rock quarried in the South-Eastern part of the state. One figure will be carved from each of the vertical legs - one being amale figure and the other female. These shapes (which for identification will be called positives)are to be cut from the rock so that an inverse shape (the negative) is left in the vertical stone.The interior surface of this cut, and the surfaces of the positives are to be polished while the restof the rock is to be left in a natural form. Because of the experience at the High PressureWaterjet Laboratory in carving granite, and the need for the thin precise cut that such atechnique would generate in separating the positive and negatives.
2. INITIAL EXPERIMENTS
In early discussion of the size of the sculpture the size had centered around a rock thickness ofsome eighteen inches. As the design evolved, however, this was changed to reflect a moreappropriate measurement for the size of the piece, and ultimately a thickness of thirty incheswas fixed by the artist. This dimension had several immediate impacts on the manner in whichthe rock was to be prepared. In the very earliest discussions it had been anticipated that thepositive could be carved from the rock using a single, slow moving 10,000 psi abrasive slurryjet system. Earlier work at UMR had shown that it was possible to cut rock to a depth ofeighteen inches with such a system, although the cutting speed would be quite slow. However,the additional depth of cut made this approach more difficult. In addition, another concernbecame evident. In order to establish the parameters for the method of cutting the rock, and toget some idea of the relative benefits of the different approaches, a test block of granite wasprepared. For simplicity this was a single block of the Red Granite measuring 4 feet to a side,which was mounted on a turntable. Different cutting heads could then be mounted above therock which would turn below the jet cutting a slot into the upper surface of the rock.
At the 14th International Conference on Waterjet Technology in Brugge, the research team atCagliari (ref. Bortolussi, et at.) had found that by speeding up the speed at which an abrasive jetcuts over a steel plate, that the surface of the cut could be kept smooth. This is a critical issue inthe carving of the sculpture. With the rock being thirty inches thick, any roughness in the cutedges will make it impossible to separate the positive after it has been cut out. A test wastherefore carried out with a DlAjet system, with the relative traverse speed of the rock under thenozzle being set at 400 inches/min the speed recommended by the Italian team. For the first fewinches the slot walls were relatively straight although it was difficult to remove all the garnetfrom the slot. In these tests a 5,000 psi system was used, at a feed rate of 10 gpm, with 1lb/gallon of 40 mesh garnet sand as the abrasive. After six inches of cutting depth, however, itwas clear that the walls of the slot were becoming irregular and it could be anticipated that thisroughness would get progressively worse as the cut deepened. This would make it impossible toseparate the two components, and this alternative was therefore not practical.
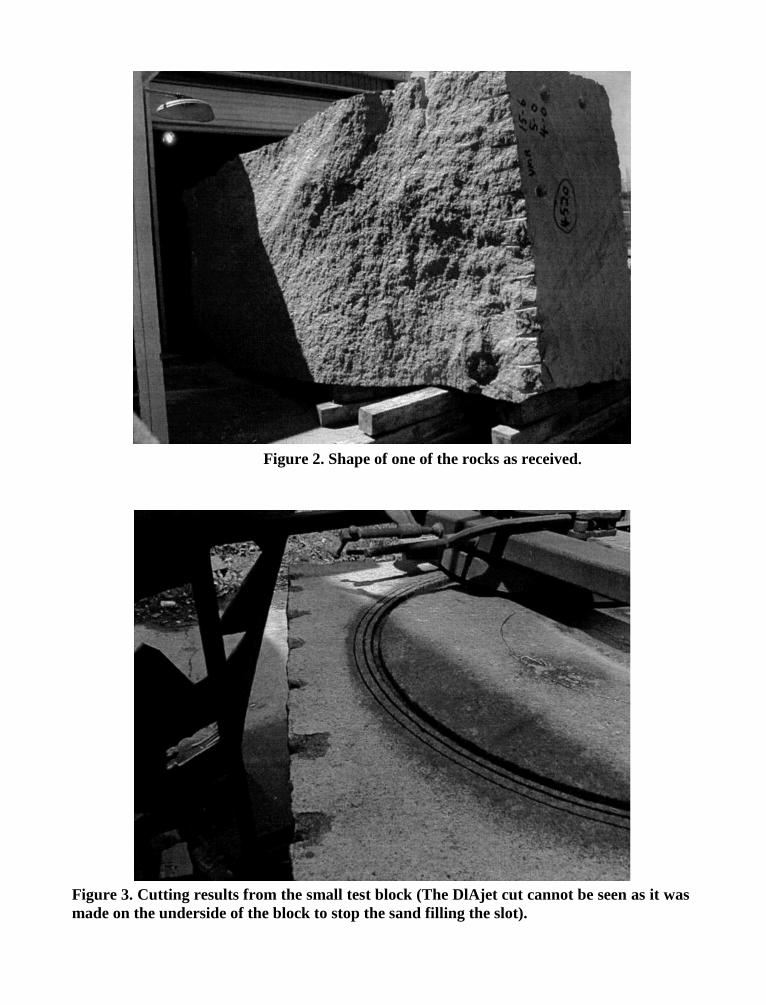
Figure 2. Shape of one of the rocks as received.
Figure 3. Cutting results from the small test block (The DlAjet cut cannot be seen as it wasmade on the underside of the block to stop the sand filling the slot).
Further consideration of the use of conventional abrasive jet techniques also raised similarconcerns. In a normal abrasive cut the nozzle does not advance into the cut, which is made atroughly three times the width of the cutting nozzle orifice. Thus, a jet coming from a nozzle0.06 inches in diameter would have a minimum width of around 0. 1 8 inches. Any processwhich would cut a very thin slot would also incur the risk that the positive could not be easilyseparated after the cut. (This apart from the normal logistic problems of raising one 15 ton stonefrom the center of another.)
A wider cut was, therefore, judged to be necessary, and this would allow the nozzle to enter thecut. This would improve cutting efficiency, since the energy loss between the nozzle and thecutting point would be minimized. Two alternative processes could be considered, the sameplain high-pressure waterjet technique used for carving the original UMR Stonehenge and analternative system developed by George Savanick at the US Bureau of Mines which used anabrasive injection technique. It was decided, for simplicity and utility to use the plain waterjetsystem for the initial part of the work. This is partly described herein and relates to the initialshaping of the rough blocks to the overall dimensions required for the sculpture. As an initialstarting point the same concepts used for the carving of the earlier monument were to be used,although the driving system would need to be changed.
3. SELECTION OF THE CUTTING TABLE
When the first granite sculpture was carved at Rolla, the cuts were made as simple straight cutsdown the sides of the blocks. The mechanism to move the lance could, therefore, be made in avery simple manner. It consisted of a lightweight support beam (made from a section of radioantenna mast) on which the lance platform was moved backwards and forwards using afractional hydraulic motor to drive a bicycle chain attached to the platform. The lance platformwas made up of a vertical plate with the lance mounted on a second plate which also held ahydraulic motor which rotated the lance assembly. The lance then could be lowered (typically1/4 to 1/3 inch) after each pass using a third hydraulic motor attached to a lead screw betweenthe two platforms. A similar vertical drive was, therefore, built for this work.
In contrast with the earlier model, the cutting was to be carried out inside a building. This was toallow cutting to proceed during the winter months, but it imposed a limitation on the cuttingsystem. This is because the first rock to be cut was roughly 7 feet high and the cutting lanceassembly would need to begin the cut with the lance extended above the rock surface. With thebuilding being less than 15 feet high this was not enough space to fit the lance and the cutswere, therefore, made with three separate lance lengths each of which took a cut of some 30inches.
The complex geometry of the positive shapes also meant that the lance platform would need tobe driven with an X-Y table, rather than with simple linear motion. Some time was spent inexamining the options for making such a table, which had to be able to cut in a space measuring20 feet by 8 feet with an 8 foot depth of cut. The initial thought was to use precision lead screwsand build a very stable, but heavy table. However, the reaction forces from the lance would besmall, and a much lighter table, using drive belts rather than the screw feed was chosen. Inaddition, the initial decision to use bellows to protect the guide rails proved to be expensive and
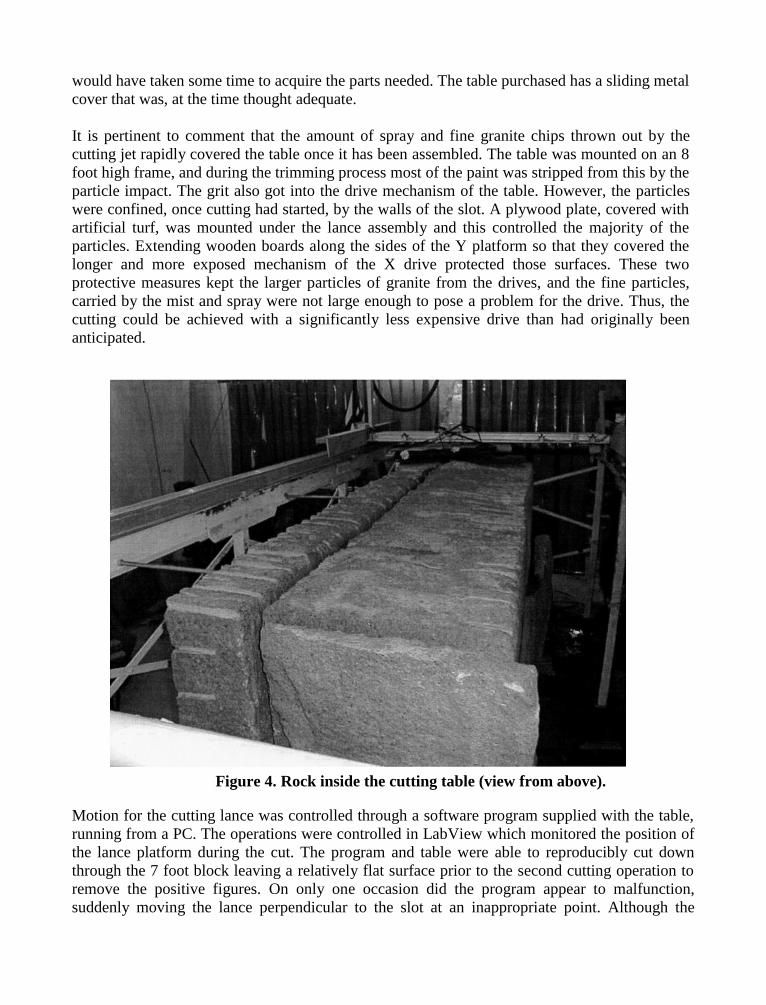
would have taken some time to acquire the parts needed. The table purchased has a sliding metalcover that was, at the time thought adequate.
It is pertinent to comment that the amount of spray and fine granite chips thrown out by thecutting jet rapidly covered the table once it has been assembled. The table was mounted on an 8foot high frame, and during the trimming process most of the paint was stripped from this by theparticle impact. The grit also got into the drive mechanism of the table. However, the particleswere confined, once cutting had started, by the walls of the slot. A plywood plate, covered withartificial turf, was mounted under the lance assembly and this controlled the majority of theparticles. Extending wooden boards along the sides of the Y platform so that they covered thelonger and more exposed mechanism of the X drive protected those surfaces. These twoprotective measures kept the larger particles of granite from the drives, and the fine particles,carried by the mist and spray were not large enough to pose a problem for the drive. Thus, thecutting could be achieved with a significantly less expensive drive than had originally beenanticipated.
Figure 4. Rock inside the cutting table (view from above).
Motion for the cutting lance was controlled through a software program supplied with the table,running from a PC. The operations were controlled in LabView which monitored the position ofthe lance platform during the cut. The program and table were able to reproducibly cut downthrough the 7 foot block leaving a relatively flat surface prior to the second cutting operation toremove the positive figures. On only one occasion did the program appear to malfunction,suddenly moving the lance perpendicular to the slot at an inappropriate point. Although the
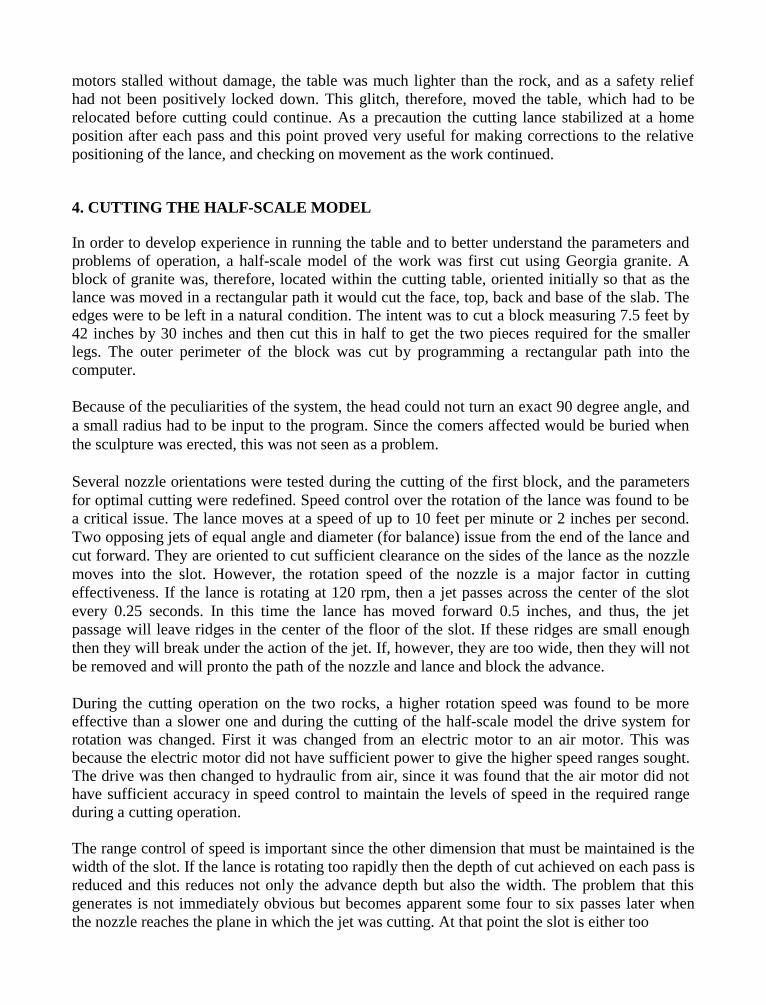
motors stalled without damage, the table was much lighter than the rock, and as a safety reliefhad not been positively locked down. This glitch, therefore, moved the table, which had to berelocated before cutting could continue. As a precaution the cutting lance stabilized at a homeposition after each pass and this point proved very useful for making corrections to the relativepositioning of the lance, and checking on movement as the work continued.
4. CUTTING THE HALF-SCALE MODEL
In order to develop experience in running the table and to better understand the parameters andproblems of operation, a half-scale model of the work was first cut using Georgia granite. Ablock of granite was, therefore, located within the cutting table, oriented initially so that as thelance was moved in a rectangular path it would cut the face, top, back and base of the slab. Theedges were to be left in a natural condition. The intent was to cut a block measuring 7.5 feet by42 inches by 30 inches and then cut this in half to get the two pieces required for the smallerlegs. The outer perimeter of the block was cut by programming a rectangular path into thecomputer.
Because of the peculiarities of the system, the head could not turn an exact 90 degree angle, anda small radius had to be input to the program. Since the comers affected would be buried whenthe sculpture was erected, this was not seen as a problem.
Several nozzle orientations were tested during the cutting of the first block, and the parametersfor optimal cutting were redefined. Speed control over the rotation of the lance was found to bea critical issue. The lance moves at a speed of up to 10 feet per minute or 2 inches per second.Two opposing jets of equal angle and diameter (for balance) issue from the end of the lance andcut forward. They are oriented to cut sufficient clearance on the sides of the lance as the nozzlemoves into the slot. However, the rotation speed of the nozzle is a major factor in cuttingeffectiveness. If the lance is rotating at 120 rpm, then a jet passes across the center of the slotevery 0.25 seconds. In this time the lance has moved forward 0.5 inches, and thus, the jetpassage will leave ridges in the center of the floor of the slot. If these ridges are small enoughthen they will break under the action of the jet. If, however, they are too wide, then they will notbe removed and will pronto the path of the nozzle and lance and block the advance.
During the cutting operation on the two rocks, a higher rotation speed was found to be moreeffective than a slower one and during the cutting of the half-scale model the drive system forrotation was changed. First it was changed from an electric motor to an air motor. This wasbecause the electric motor did not have sufficient power to give the higher speed ranges sought.The drive was then changed to hydraulic from air, since it was found that the air motor did nothave sufficient accuracy in speed control to maintain the levels of speed in the required rangeduring a cutting operation.
The range control of speed is important since the other dimension that must be maintained is thewidth of the slot. If the lance is rotating too rapidly then the depth of cut achieved on each pass isreduced and this reduces not only the advance depth but also the width. The problem that thisgenerates is not immediately obvious but becomes apparent some four to six passes later whenthe nozzle reaches the plane in which the jet was cutting. At that point the slot is either too
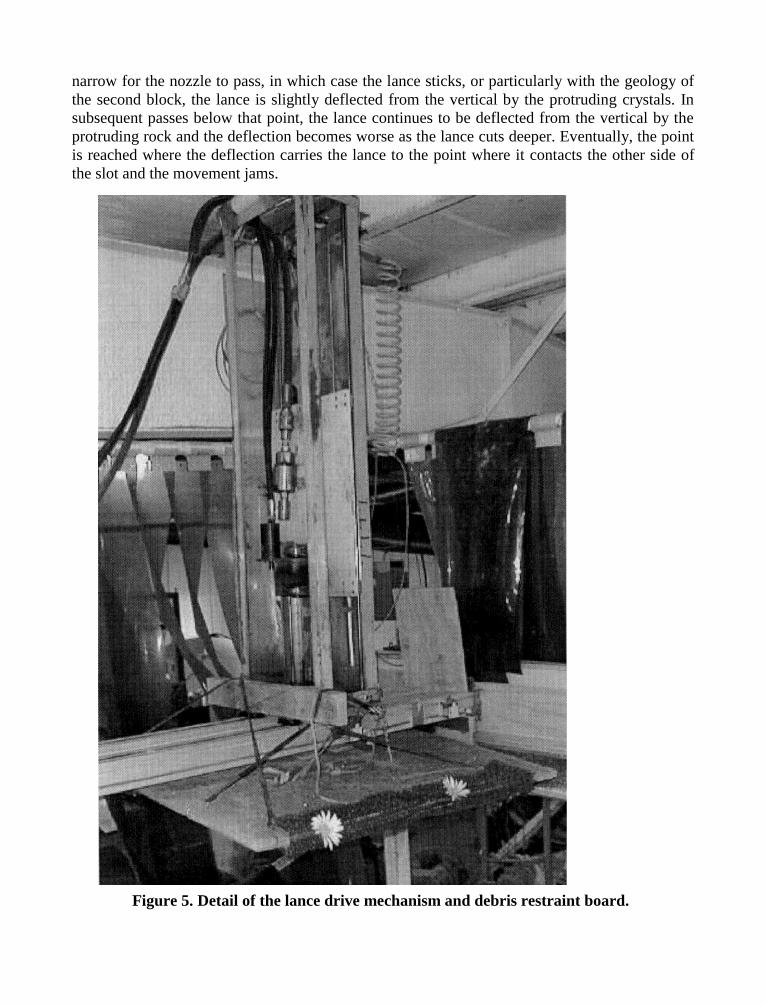
narrow for the nozzle to pass, in which case the lance sticks, or particularly with the geology ofthe second block, the lance is slightly deflected from the vertical by the protruding crystals. Insubsequent passes below that point, the lance continues to be deflected from the vertical by theprotruding rock and the deflection becomes worse as the lance cuts deeper. Eventually, the pointis reached where the deflection carries the lance to the point where it contacts the other side ofthe slot and the movement jams.
Figure 5. Detail of the lance drive mechanism and debris restraint board.
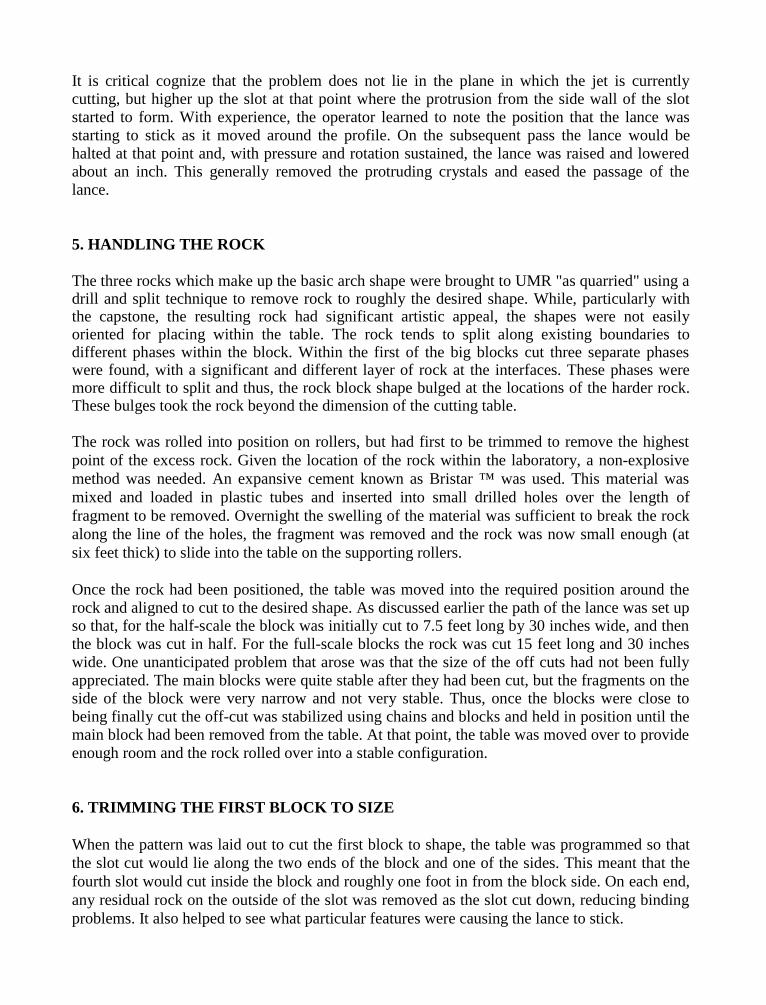
It is critical cognize that the problem does not lie in the plane in which the jet is currentlycutting, but higher up the slot at that point where the protrusion from the side wall of the slotstarted to form. With experience, the operator learned to note the position that the lance wasstarting to stick as it moved around the profile. On the subsequent pass the lance would behalted at that point and, with pressure and rotation sustained, the lance was raised and loweredabout an inch. This generally removed the protruding crystals and eased the passage of thelance.
5. HANDLING THE ROCK
The three rocks which make up the basic arch shape were brought to UMR "as quarried" using adrill and split technique to remove rock to roughly the desired shape. While, particularly withthe capstone, the resulting rock had significant artistic appeal, the shapes were not easilyoriented for placing within the table. The rock tends to split along existing boundaries todifferent phases within the block. Within the first of the big blocks cut three separate phaseswere found, with a significant and different layer of rock at the interfaces. These phases weremore difficult to split and thus, the rock block shape bulged at the locations of the harder rock.These bulges took the rock beyond the dimension of the cutting table.
The rock was rolled into position on rollers, but had first to be trimmed to remove the highestpoint of the excess rock. Given the location of the rock within the laboratory, a non-explosivemethod was needed. An expansive cement known as Bristar ™ was used. This material wasmixed and loaded in plastic tubes and inserted into small drilled holes over the length offragment to be removed. Overnight the swelling of the material was sufficient to break the rockalong the line of the holes, the fragment was removed and the rock was now small enough (atsix feet thick) to slide into the table on the supporting rollers.
Once the rock had been positioned, the table was moved into the required position around therock and aligned to cut to the desired shape. As discussed earlier the path of the lance was set upso that, for the half-scale the block was initially cut to 7.5 feet long by 30 inches wide, and thenthe block was cut in half. For the full-scale blocks the rock was cut 15 feet long and 30 incheswide. One unanticipated problem that arose was that the size of the off cuts had not been fullyappreciated. The main blocks were quite stable after they had been cut, but the fragments on theside of the block were very narrow and not very stable. Thus, once the blocks were close tobeing finally cut the off-cut was stabilized using chains and blocks and held in position until themain block had been removed from the table. At that point, the table was moved over to provideenough room and the rock rolled over into a stable configuration.
6. TRIMMING THE FIRST BLOCK TO SIZE
When the pattern was laid out to cut the first block to shape, the table was programmed so thatthe slot cut would lie along the two ends of the block and one of the sides. This meant that thefourth slot would cut inside the block and roughly one foot in from the block side. On each end,any residual rock on the outside of the slot was removed as the slot cut down, reducing bindingproblems. It also helped to see what particular features were causing the lance to stick.
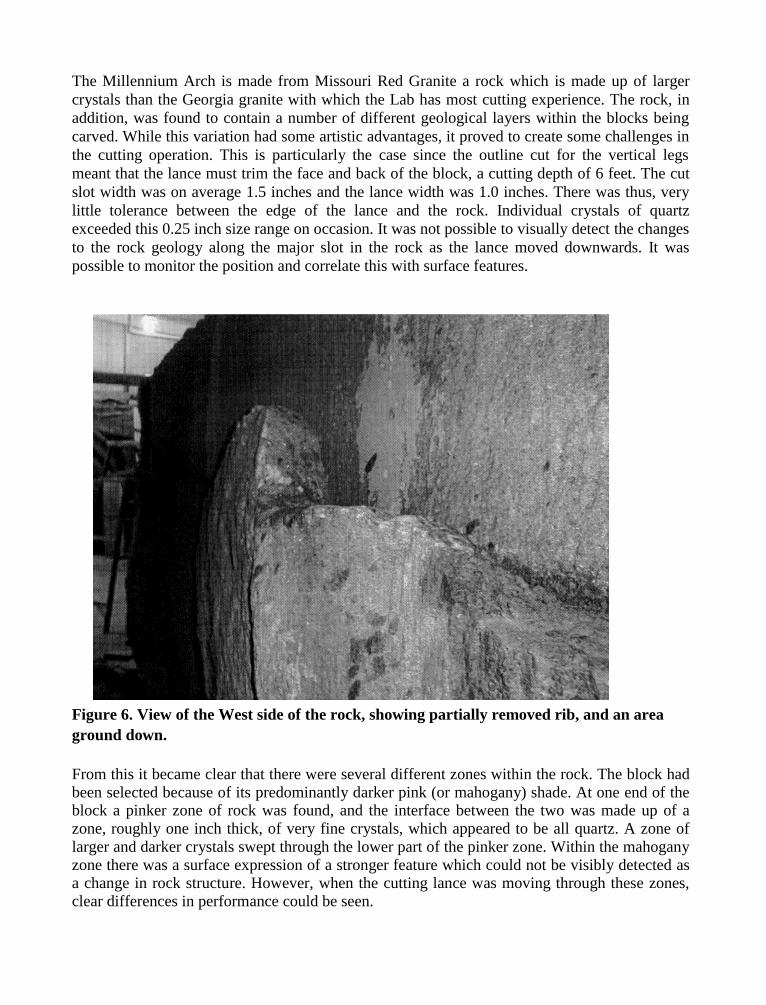
The Millennium Arch is made from Missouri Red Granite a rock which is made up of largercrystals than the Georgia granite with which the Lab has most cutting experience. The rock, inaddition, was found to contain a number of different geological layers within the blocks beingcarved. While this variation had some artistic advantages, it proved to create some challenges inthe cutting operation. This is particularly the case since the outline cut for the vertical legsmeant that the lance must trim the face and back of the block, a cutting depth of 6 feet. The cutslot width was on average 1.5 inches and the lance width was 1.0 inches. There was thus, verylittle tolerance between the edge of the lance and the rock. Individual crystals of quartzexceeded this 0.25 inch size range on occasion. It was not possible to visually detect the changesto the rock geology along the major slot in the rock as the lance moved downwards. It waspossible to monitor the position and correlate this with surface features.
Figure 6. View of the West side of the rock, showing partially removed rib, and an areaground down.
From this it became clear that there were several different zones within the rock. The block hadbeen selected because of its predominantly darker pink (or mahogany) shade. At one end of theblock a pinker zone of rock was found, and the interface between the two was made up of azone, roughly one inch thick, of very fine crystals, which appeared to be all quartz. A zone oflarger and darker crystals swept through the lower part of the pinker zone. Within the mahoganyzone there was a surface expression of a stronger feature which could not be visibly detected asa change in rock structure. However, when the cutting lance was moving through these zones,clear differences in performance could be seen.
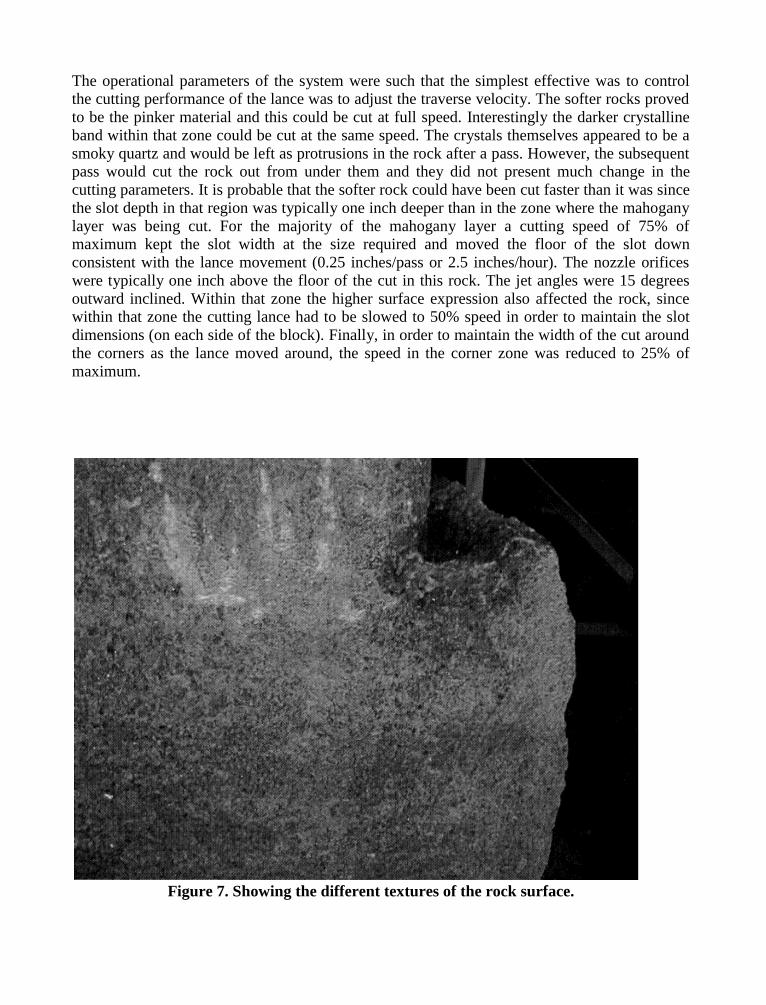
The operational parameters of the system were such that the simplest effective was to controlthe cutting performance of the lance was to adjust the traverse velocity. The softer rocks provedto be the pinker material and this could be cut at full speed. Interestingly the darker crystallineband within that zone could be cut at the same speed. The crystals themselves appeared to be asmoky quartz and would be left as protrusions in the rock after a pass. However, the subsequentpass would cut the rock out from under them and they did not present much change in thecutting parameters. It is probable that the softer rock could have been cut faster than it was sincethe slot depth in that region was typically one inch deeper than in the zone where the mahoganylayer was being cut. For the majority of the mahogany layer a cutting speed of 75% ofmaximum kept the slot width at the size required and moved the floor of the slot downconsistent with the lance movement (0.25 inches/pass or 2.5 inches/hour). The nozzle orificeswere typically one inch above the floor of the cut in this rock. The jet angles were 15 degreesoutward inclined. Within that zone the higher surface expression also affected the rock, sincewithin that zone the cutting lance had to be slowed to 50% speed in order to maintain the slotdimensions (on each side of the block). Finally, in order to maintain the width of the cut aroundthe corners as the lance moved around, the speed in the corner zone was reduced to 25% ofmaximum.
Figure 7. Showing the different textures of the rock surface.
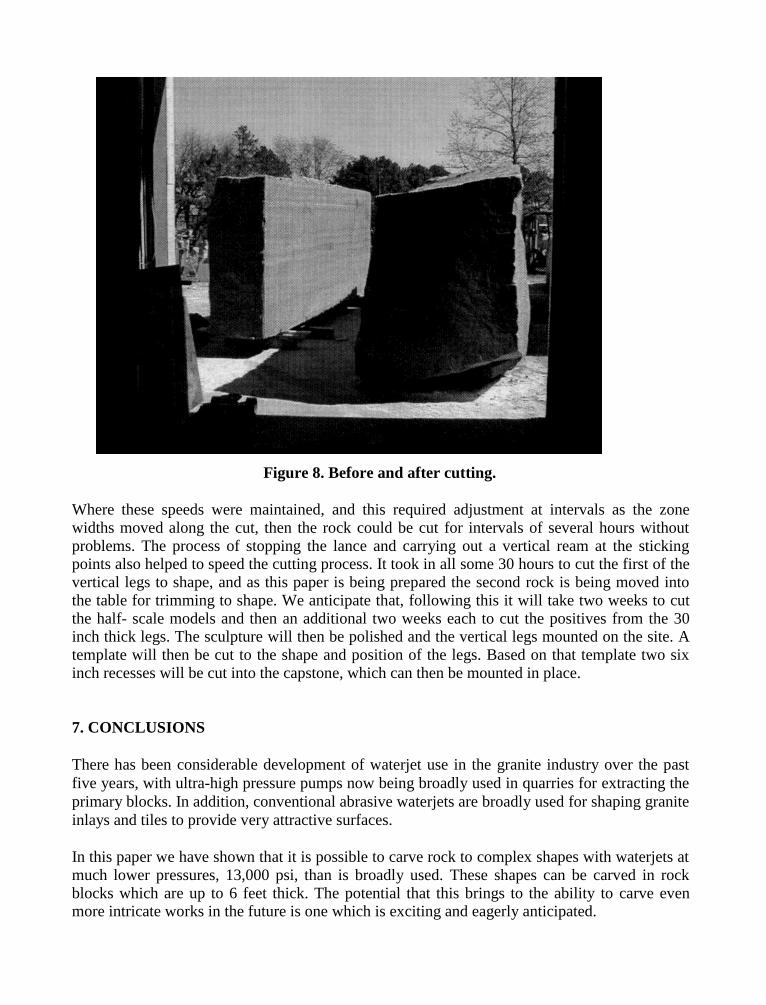
Figure 8. Before and after cutting.
Where these speeds were maintained, and this required adjustment at intervals as the zonewidths moved along the cut, then the rock could be cut for intervals of several hours withoutproblems. The process of stopping the lance and carrying out a vertical ream at the stickingpoints also helped to speed the cutting process. It took in all some 30 hours to cut the first of thevertical legs to shape, and as this paper is being prepared the second rock is being moved intothe table for trimming to shape. We anticipate that, following this it will take two weeks to cutthe half- scale models and then an additional two weeks each to cut the positives from the 30inch thick legs. The sculpture will then be polished and the vertical legs mounted on the site. Atemplate will then be cut to the shape and position of the legs. Based on that template two sixinch recesses will be cut into the capstone, which can then be mounted in place.
7. CONCLUSIONS
There has been considerable development of waterjet use in the granite industry over the pastfive years, with ultra-high pressure pumps now being broadly used in quarries for extracting theprimary blocks. In addition, conventional abrasive waterjets are broadly used for shaping graniteinlays and tiles to provide very attractive surfaces.
In this paper we have shown that it is possible to carve rock to complex shapes with waterjets atmuch lower pressures, 13,000 psi, than is broadly used. These shapes can be carved in rockblocks which are up to 6 feet thick. The potential that this brings to the ability to carve evenmore intricate works in the future is one which is exciting and eagerly anticipated.
8. ACKNOWLEDGEMENTS
This work could not have been carried out without the gracious financial contribution andcontinuing involved interest of Scott Porter. Equally, without the artistic talents of EdwinaSandys we would have been nowhere. It is a considerable pleasure to recognize their efforts forthe university and in working to inspire us to carry out this project.
9. REFERENCES
Bortolussi, A., and Ciccu, R., "Contour Cutting of Thick Steel Plates," 14'h InternationalConference on Jetting Technology, Brugge, Belgium, 1998, pp. 273-284.
10th American Waterjet ConferenceAugust 14-17, 1999: Houston, Texas
Paper 34
ROCK DISINTEGRATION USING WATERJET-ASSISTED
DIAMOND TOOLS
R. Ciccu, B. Grosso, G. OrtuDepartment of Geoengineering and Environmental Technologies
University of Cagliari, Italy
M. Agus, A. BortolussiMineral Science Study Centre of C.N.R., Cagliari, Italy
J. Vašek, P. JeklInstitute of Geonics, Ostrava, Academy of Sciences of the Czech Republic
ABSTRACT
Mechanical excavation of hard rocks using conventional tools is not yet viable from both thetechnical and economic point of view due to the poor performance of the equipment in terms ofexcavation rate and specific energy as well as to the high wear rate of the mechanical instrumentif the rock is also abrasive. A new opportunity is opened by the development of tools withspecial design coated with a layer of polycrystalline diamond. However they are very delicate tohandle because of the fragility to impact of the active tip which is also sensitive to the high-temperature heat generated by the contact with the rock. The assistance of a water jet in front ofthe tool is the only way for efficient cooling as well as for supporting the mechanical action inthe initiation and propagation of fractures.
Linear grooving experiments have been carried out at the Waterjet Laboratory of the Universityof Cagliari in the frame of a bilateral programme involving the National Research Council ofItaly and the Academy of Science of Czech Republic. Data of forces and displacement as afunction of time have been recorded and processed by means of a computer in order to monitorthe tool performance in real time. Tests have been carried out on two rock samples with differenttoughness by varying the vertical load (pushing force) and the features of the water jet (pressureand flowrate). Performance has been evaluated in terms of specific energy (mechanical andhydraulic) and wear has been assessed with high-resolution optical fibre microscopy.
The paper describes the laboratory set-up used for the tests and illustrates the results obtainedoutlining the prospects of the technology.
Organized and Sponsored by the WaterJet Technology Association
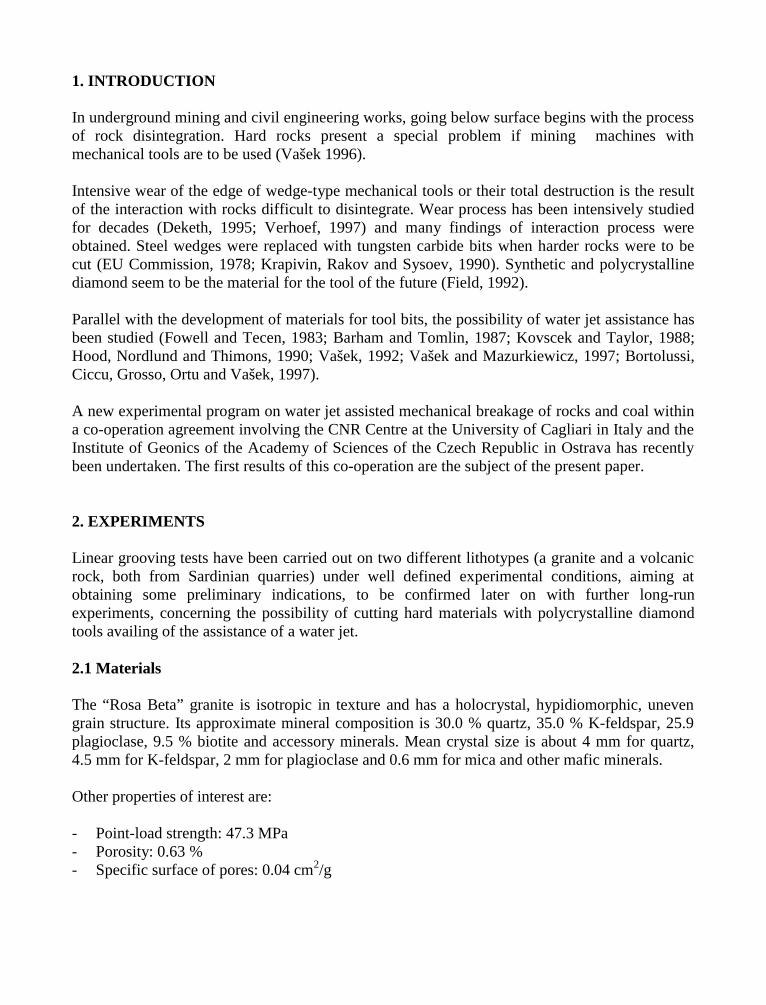
1. INTRODUCTION
In underground mining and civil engineering works, going below surface begins with the processof rock disintegration. Hard rocks present a special problem if mining machines withmechanical tools are to be used (Vašek 1996).
Intensive wear of the edge of wedge-type mechanical tools or their total destruction is the resultof the interaction with rocks difficult to disintegrate. Wear process has been intensively studiedfor decades (Deketh, 1995; Verhoef, 1997) and many findings of interaction process wereobtained. Steel wedges were replaced with tungsten carbide bits when harder rocks were to becut (EU Commission, 1978; Krapivin, Rakov and Sysoev, 1990). Synthetic and polycrystallinediamond seem to be the material for the tool of the future (Field, 1992).
Parallel with the development of materials for tool bits, the possibility of water jet assistance hasbeen studied (Fowell and Tecen, 1983; Barham and Tomlin, 1987; Kovscek and Taylor, 1988;Hood, Nordlund and Thimons, 1990; Vašek, 1992; Vašek and Mazurkiewicz, 1997; Bortolussi,Ciccu, Grosso, Ortu and Vašek, 1997).
A new experimental program on water jet assisted mechanical breakage of rocks and coal withina co-operation agreement involving the CNR Centre at the University of Cagliari in Italy and theInstitute of Geonics of the Academy of Sciences of the Czech Republic in Ostrava has recentlybeen undertaken. The first results of this co-operation are the subject of the present paper.
2. EXPERIMENTS
Linear grooving tests have been carried out on two different lithotypes (a granite and a volcanicrock, both from Sardinian quarries) under well defined experimental conditions, aiming atobtaining some preliminary indications, to be confirmed later on with further long-runexperiments, concerning the possibility of cutting hard materials with polycrystalline diamondtools availing of the assistance of a water jet.
2.1 Materials
The “Rosa Beta” granite is isotropic in texture and has a holocrystal, hypidiomorphic, unevengrain structure. Its approximate mineral composition is 30.0 % quartz, 35.0 % K-feldspar, 25.9plagioclase, 9.5 % biotite and accessory minerals. Mean crystal size is about 4 mm for quartz,4.5 mm for K-feldspar, 2 mm for plagioclase and 0.6 mm for mica and other mafic minerals.
Other properties of interest are:
- Point-load strength: 47.3 MPa- Porosity: 0.63 %- Specific surface of pores: 0.04 cm2/g
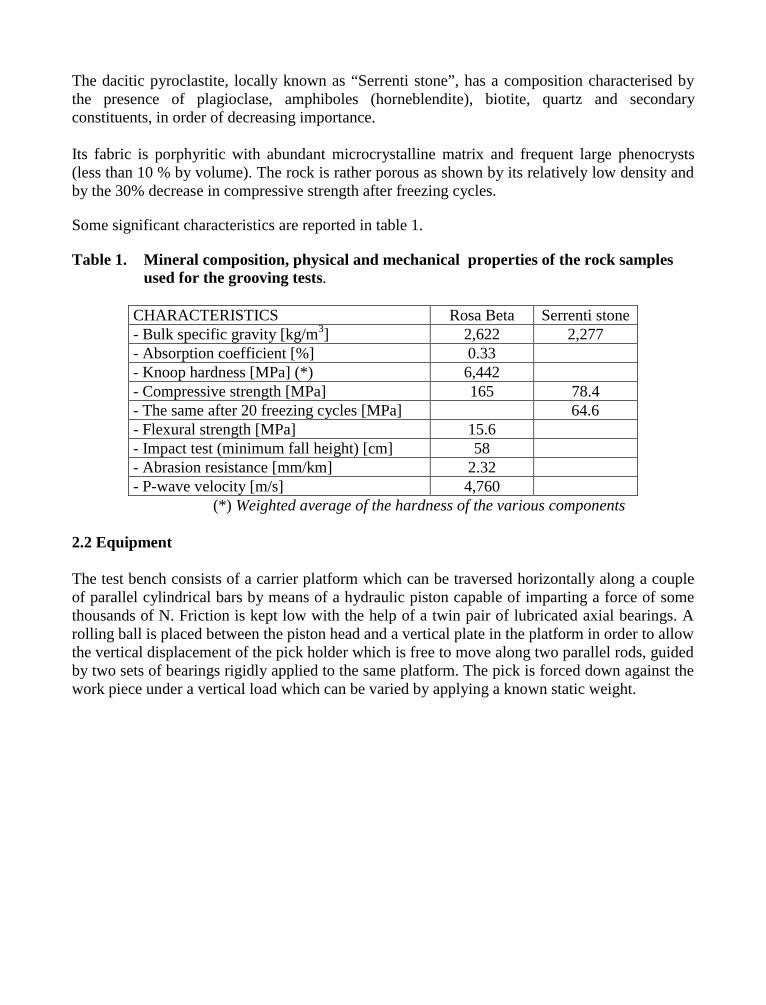
The dacitic pyroclastite, locally known as “Serrenti stone”, has a composition characterised bythe presence of plagioclase, amphiboles (horneblendite), biotite, quartz and secondaryconstituents, in order of decreasing importance.
Its fabric is porphyritic with abundant microcrystalline matrix and frequent large phenocrysts(less than 10 % by volume). The rock is rather porous as shown by its relatively low density andby the 30% decrease in compressive strength after freezing cycles.
Some significant characteristics are reported in table 1.
Table 1. Mineral composition, physical and mechanical properties of the rock samples used for the grooving tests.
CHARACTERISTICS Rosa Beta Serrenti stone- Bulk specific gravity [kg/m3] 2,622 2,277- Absorption coefficient [%] 0.33- Knoop hardness [MPa] (*) 6,442- Compressive strength [MPa] 165 78.4- The same after 20 freezing cycles [MPa] 64.6- Flexural strength [MPa] 15.6- Impact test (minimum fall height) [cm] 58- Abrasion resistance [mm/km] 2.32- P-wave velocity [m/s] 4,760
(*) Weighted average of the hardness of the various components
2.2 Equipment
The test bench consists of a carrier platform which can be traversed horizontally along a coupleof parallel cylindrical bars by means of a hydraulic piston capable of imparting a force of somethousands of N. Friction is kept low with the help of a twin pair of lubricated axial bearings. Arolling ball is placed between the piston head and a vertical plate in the platform in order to allowthe vertical displacement of the pick holder which is free to move along two parallel rods, guidedby two sets of bearings rigidly applied to the same platform. The pick is forced down against thework piece under a vertical load which can be varied by applying a known static weight.
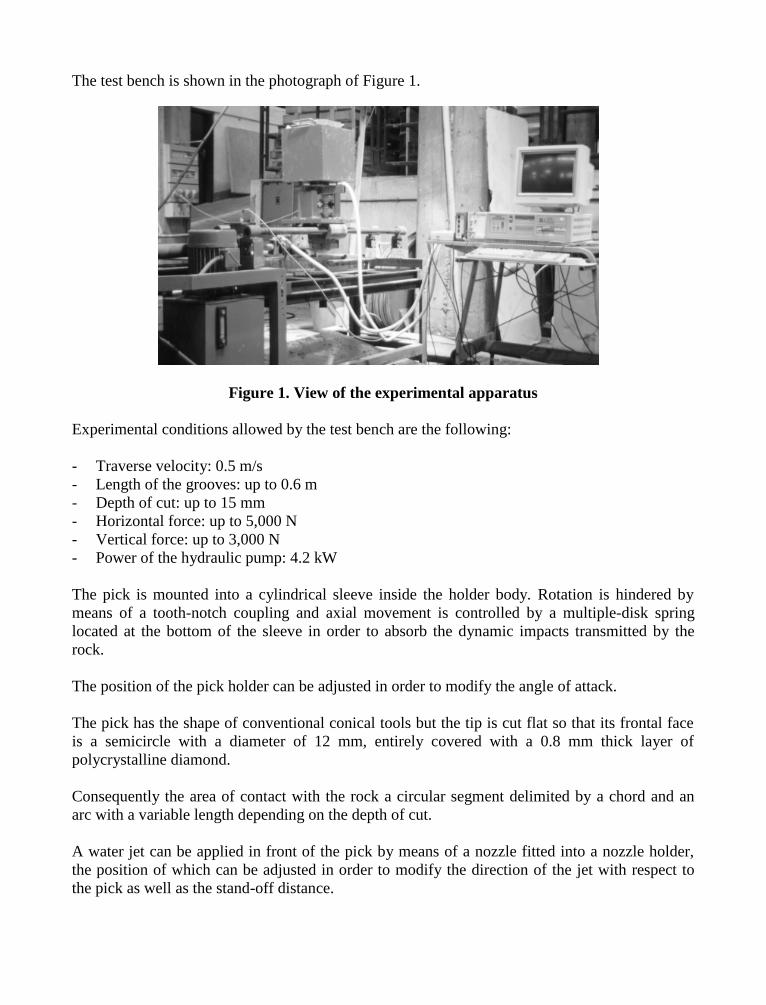
The test bench is shown in the photograph of Figure 1.
Figure 1. View of the experimental apparatus
Experimental conditions allowed by the test bench are the following:
- Traverse velocity: 0.5 m/s- Length of the grooves: up to 0.6 m- Depth of cut: up to 15 mm- Horizontal force: up to 5,000 N- Vertical force: up to 3,000 N- Power of the hydraulic pump: 4.2 kW
The pick is mounted into a cylindrical sleeve inside the holder body. Rotation is hindered bymeans of a tooth-notch coupling and axial movement is controlled by a multiple-disk springlocated at the bottom of the sleeve in order to absorb the dynamic impacts transmitted by therock.
The position of the pick holder can be adjusted in order to modify the angle of attack.
The pick has the shape of conventional conical tools but the tip is cut flat so that its frontal faceis a semicircle with a diameter of 12 mm, entirely covered with a 0.8 mm thick layer ofpolycrystalline diamond.
Consequently the area of contact with the rock a circular segment delimited by a chord and anarc with a variable length depending on the depth of cut.
A water jet can be applied in front of the pick by means of a nozzle fitted into a nozzle holder,the position of which can be adjusted in order to modify the direction of the jet with respect tothe pick as well as the stand-off distance.
Water is supplied via a flexible high-pressure hose connected to a plunger pump capable ofdelivering a maximum flow rate of 10 l/min under a pressure of 50 MPa.
A detail of the pick assisted by a water jet is shown by the photograph of Figure 2.
Figure 2. The waterjet-assisted diamond tool used for the experiments
2.3 Tests
Cutting tests have been carried out on each lithotype using two new picksThe vertical loads applied were the following:
- For the dacite: 1.6 kN- For the granite: 2.0 kN
In the tests with waterjet assistance the working pressure was kept around 30 MPa at the 0.3 mmnozzle, while in the tests without waterjet the tool was cooled by a spray of tap water.
The tests with the first pick enabled to put into light the wear behaviour of the tool withoutwaterjet assistance.
A first series of 32 grooves were made on the dacite stone reaching a total length of about 20 mwithout observing any major damage except for some occasional chipping near the bottom of thecontact arc of the pick.
A second series of 16 grooves with the same pick was made on granite but after 8 tests(corresponding to a total length of less than 5 m) a considerable damage occurred, so that thesubsequent 8 grooves were produced with a much lower depth of cut and a considerable loss ofefficiency since the pick tended to slide over the rock with reduced penetration.
The tests with the second pick were aimed at putting into evidence the advantage of using awater jet placed in front of the tool.
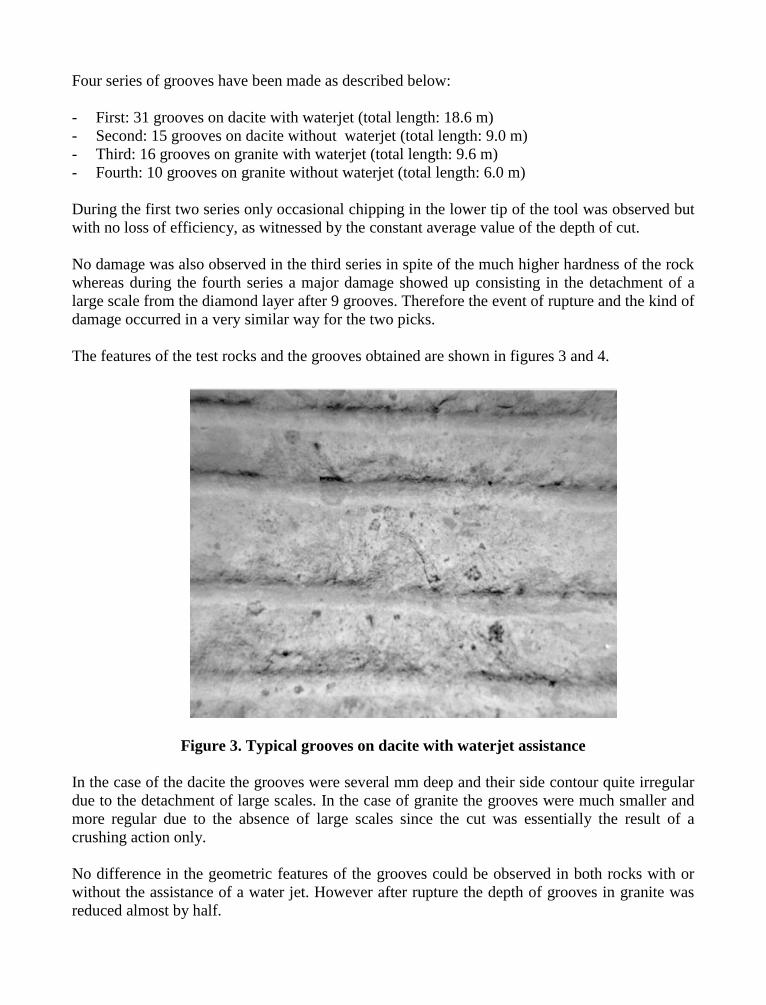
Four series of grooves have been made as described below:
- First: 31 grooves on dacite with waterjet (total length: 18.6 m)- Second: 15 grooves on dacite without waterjet (total length: 9.0 m)- Third: 16 grooves on granite with waterjet (total length: 9.6 m)- Fourth: 10 grooves on granite without waterjet (total length: 6.0 m)
During the first two series only occasional chipping in the lower tip of the tool was observed butwith no loss of efficiency, as witnessed by the constant average value of the depth of cut.
No damage was also observed in the third series in spite of the much higher hardness of the rockwhereas during the fourth series a major damage showed up consisting in the detachment of alarge scale from the diamond layer after 9 grooves. Therefore the event of rupture and the kind ofdamage occurred in a very similar way for the two picks.
The features of the test rocks and the grooves obtained are shown in figures 3 and 4.
Figure 3. Typical grooves on dacite with waterjet assistance
In the case of the dacite the grooves were several mm deep and their side contour quite irregulardue to the detachment of large scales. In the case of granite the grooves were much smaller andmore regular due to the absence of large scales since the cut was essentially the result of acrushing action only.
No difference in the geometric features of the grooves could be observed in both rocks with orwithout the assistance of a water jet. However after rupture the depth of grooves in granite wasreduced almost by half.
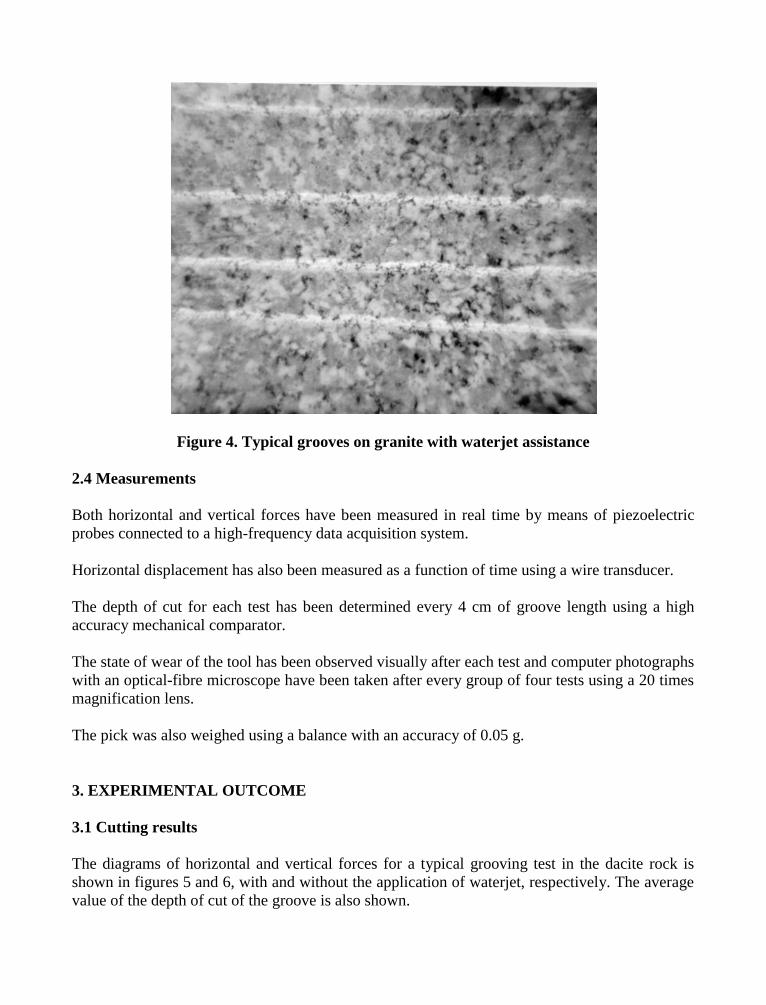
Figure 4. Typical grooves on granite with waterjet assistance
2.4 Measurements
Both horizontal and vertical forces have been measured in real time by means of piezoelectricprobes connected to a high-frequency data acquisition system.
Horizontal displacement has also been measured as a function of time using a wire transducer.
The depth of cut for each test has been determined every 4 cm of groove length using a highaccuracy mechanical comparator.
The state of wear of the tool has been observed visually after each test and computer photographswith an optical-fibre microscope have been taken after every group of four tests using a 20 timesmagnification lens.
The pick was also weighed using a balance with an accuracy of 0.05 g.
3. EXPERIMENTAL OUTCOME
3.1 Cutting results
The diagrams of horizontal and vertical forces for a typical grooving test in the dacite rock isshown in figures 5 and 6, with and without the application of waterjet, respectively. The averagevalue of the depth of cut of the groove is also shown.
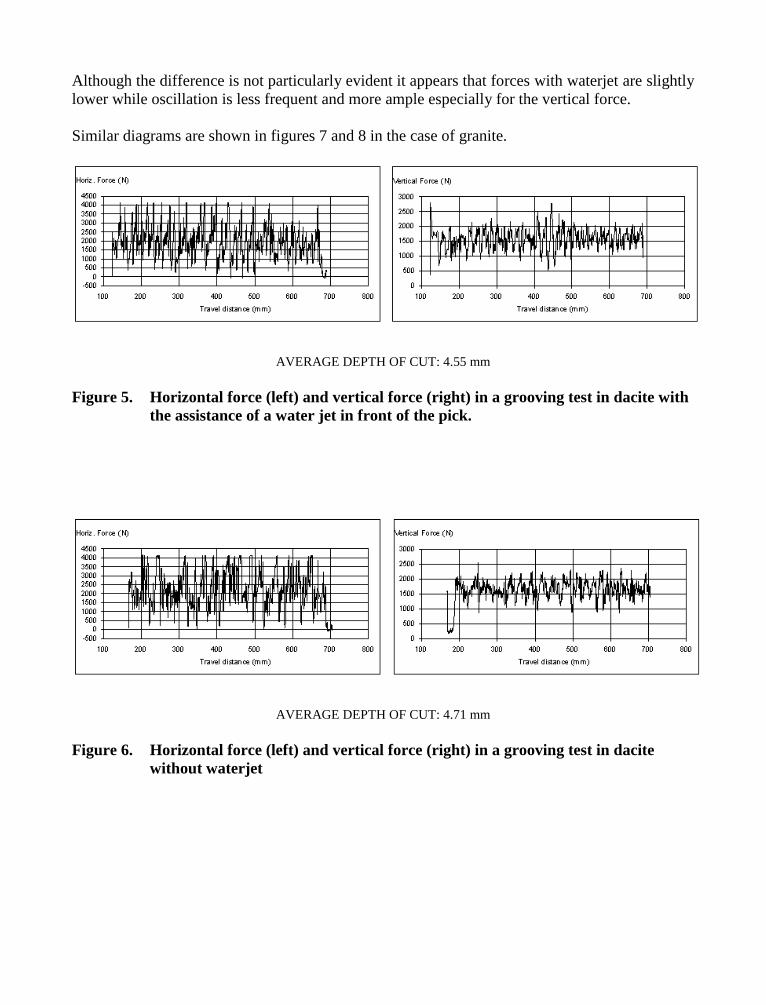
Although the difference is not particularly evident it appears that forces with waterjet are slightlylower while oscillation is less frequent and more ample especially for the vertical force.
Similar diagrams are shown in figures 7 and 8 in the case of granite.
AVERAGE DEPTH OF CUT: 4.55 mm
Figure 5. Horizontal force (left) and vertical force (right) in a grooving test in dacite with the assistance of a water jet in front of the pick.
AVERAGE DEPTH OF CUT: 4.71 mm
Figure 6. Horizontal force (left) and vertical force (right) in a grooving test in dacite without waterjet
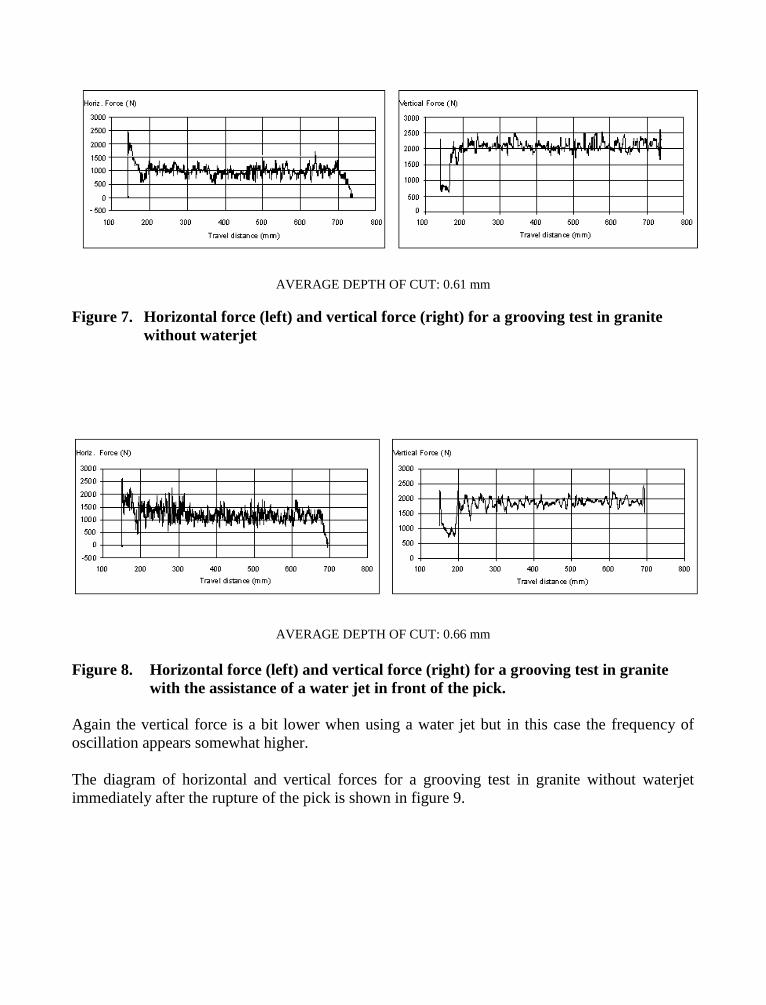
AVERAGE DEPTH OF CUT: 0.61 mm
Figure 7. Horizontal force (left) and vertical force (right) for a grooving test in granite without waterjet
AVERAGE DEPTH OF CUT: 0.66 mm
Figure 8. Horizontal force (left) and vertical force (right) for a grooving test in granite with the assistance of a water jet in front of the pick.
Again the vertical force is a bit lower when using a water jet but in this case the frequency ofoscillation appears somewhat higher.
The diagram of horizontal and vertical forces for a grooving test in granite without waterjetimmediately after the rupture of the pick is shown in figure 9.
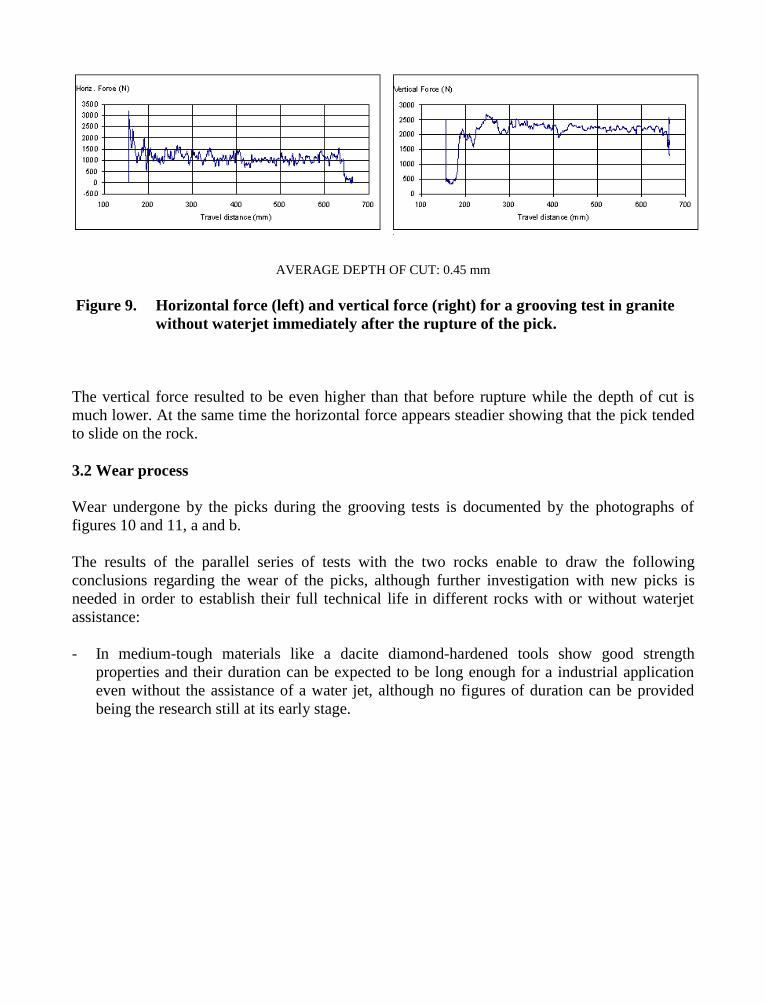
AVERAGE DEPTH OF CUT: 0.45 mm
Figure 9. Horizontal force (left) and vertical force (right) for a grooving test in granite without waterjet immediately after the rupture of the pick.
The vertical force resulted to be even higher than that before rupture while the depth of cut ismuch lower. At the same time the horizontal force appears steadier showing that the pick tendedto slide on the rock.
3.2 Wear process
Wear undergone by the picks during the grooving tests is documented by the photographs offigures 10 and 11, a and b.
The results of the parallel series of tests with the two rocks enable to draw the followingconclusions regarding the wear of the picks, although further investigation with new picks isneeded in order to establish their full technical life in different rocks with or without waterjetassistance:
- In medium-tough materials like a dacite diamond-hardened tools show good strengthproperties and their duration can be expected to be long enough for a industrial applicationeven without the assistance of a water jet, although no figures of duration can be providedbeing the research still at its early stage.
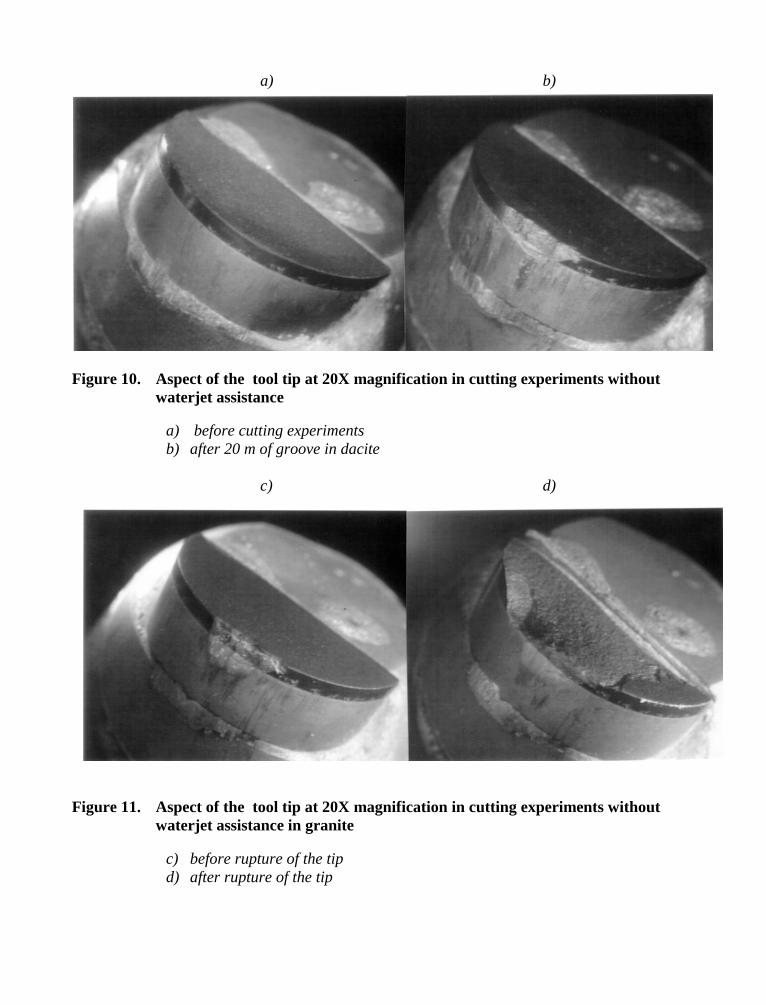
a) b)
Figure 10. Aspect of the tool tip at 20X magnification in cutting experiments without waterjet assistance
a) before cutting experimentsb) after 20 m of groove in dacite
c) d)
Figure 11. Aspect of the tool tip at 20X magnification in cutting experiments without waterjet assistance in granite
c) before rupture of the tipd) after rupture of the tip
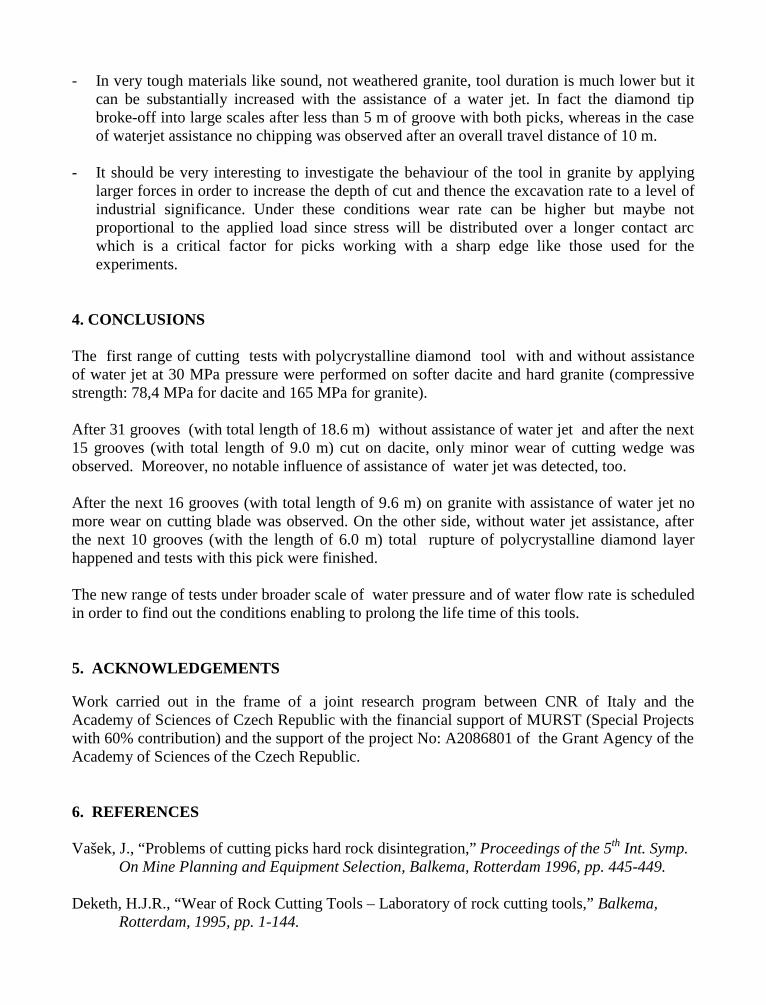
- In very tough materials like sound, not weathered granite, tool duration is much lower but itcan be substantially increased with the assistance of a water jet. In fact the diamond tipbroke-off into large scales after less than 5 m of groove with both picks, whereas in the caseof waterjet assistance no chipping was observed after an overall travel distance of 10 m.
- It should be very interesting to investigate the behaviour of the tool in granite by applyinglarger forces in order to increase the depth of cut and thence the excavation rate to a level ofindustrial significance. Under these conditions wear rate can be higher but maybe notproportional to the applied load since stress will be distributed over a longer contact arcwhich is a critical factor for picks working with a sharp edge like those used for theexperiments.
4. CONCLUSIONS
The first range of cutting tests with polycrystalline diamond tool with and without assistanceof water jet at 30 MPa pressure were performed on softer dacite and hard granite (compressivestrength: 78,4 MPa for dacite and 165 MPa for granite).
After 31 grooves (with total length of 18.6 m) without assistance of water jet and after the next15 grooves (with total length of 9.0 m) cut on dacite, only minor wear of cutting wedge wasobserved. Moreover, no notable influence of assistance of water jet was detected, too.
After the next 16 grooves (with total length of 9.6 m) on granite with assistance of water jet nomore wear on cutting blade was observed. On the other side, without water jet assistance, afterthe next 10 grooves (with the length of 6.0 m) total rupture of polycrystalline diamond layerhappened and tests with this pick were finished.
The new range of tests under broader scale of water pressure and of water flow rate is scheduledin order to find out the conditions enabling to prolong the life time of this tools.
5. ACKNOWLEDGEMENTS
Work carried out in the frame of a joint research program between CNR of Italy and theAcademy of Sciences of Czech Republic with the financial support of MURST (Special Projectswith 60% contribution) and the support of the project No: A2086801 of the Grant Agency of theAcademy of Sciences of the Czech Republic.
6. REFERENCES
Vašek, J., “Problems of cutting picks hard rock disintegration,” Proceedings of the 5th Int. Symp. On Mine Planning and Equipment Selection, Balkema, Rotterdam 1996, pp. 445-449.
Deketh, H.J.R., “Wear of Rock Cutting Tools – Laboratory of rock cutting tools,” Balkema, Rotterdam, 1995, pp. 1-144.
Verhoef, P.N.W., “Wear of Rock Cutting Tools – Implications for the site investigation of rock dredging projects,” Balkema, Rotterdam, 1997, pp. 1-327.
Krapivin, M.G., Rakov, I. J., Sysoev, N.I., Gornyje instrumenty, “ Nedra , Moskva, 1990, pp.1 - 256.
EU Commission, “Continuous Mining System: Stone and Stone/Coal Headings,” Final Report on ECSC Research Project 6220-AB/8/804, 1975, pp. 1 – 64.
Field, E.J., “The Properties of Natural and Synthetic Diamond,” Academic Press, London, 1992, pp. 1 – 710.
Fowell, J.R., Tecen, O. “Studies in Water Jet Assisted Drag Tool Excavation,” Proc. of the 5th
Int. Congress on Rock Mechanics, Melbourne, Australia, 1983.
Barham, K.D., Tomlin, G.M. , “High Pressure Water Assisted Rock and Coal Cutting with Boom–Type Roadheaders and Shearers,” Proc. of the 8th Int. Symp. On Jet Cutting Technology,Durham, 1986, pp. 57-70.
Kovscek, C.D., Taylor, D.C., Thimons, D.E. “Techniques to Increase Water Pressure for Improved Water-Jet-Assisted Cutting,” Bureau of Mines, RI 9201, 1988.
Hood, M., Nordlund, R., Thimons, D.E. “A Study of Rock Erosion Using High-Pressure Water Jets,” Int. J. of Rock Mech. Min. Sci. and Geomech. Abstr. ,1990, pp. 77-86.
Vašek, J., Mazurkiewicz, M. “Tool/Rock Interface Assisted By High Pressure Waterjets,” Proc. of the 9th American Waterjet Conf. , 1997, Vol. I, pp. 473-482.
Bortolussi, A., Ciccu, R., Grosso, B., Ortu, G., Vašek, J. “Waterjet-Assisted Rock Breakage withCutting Tools,” Proc. of 4th Int. Symp. On Mine Mechanisation and Automatisation, 1997, Vol. 1, pp. A4-21- A4-27.
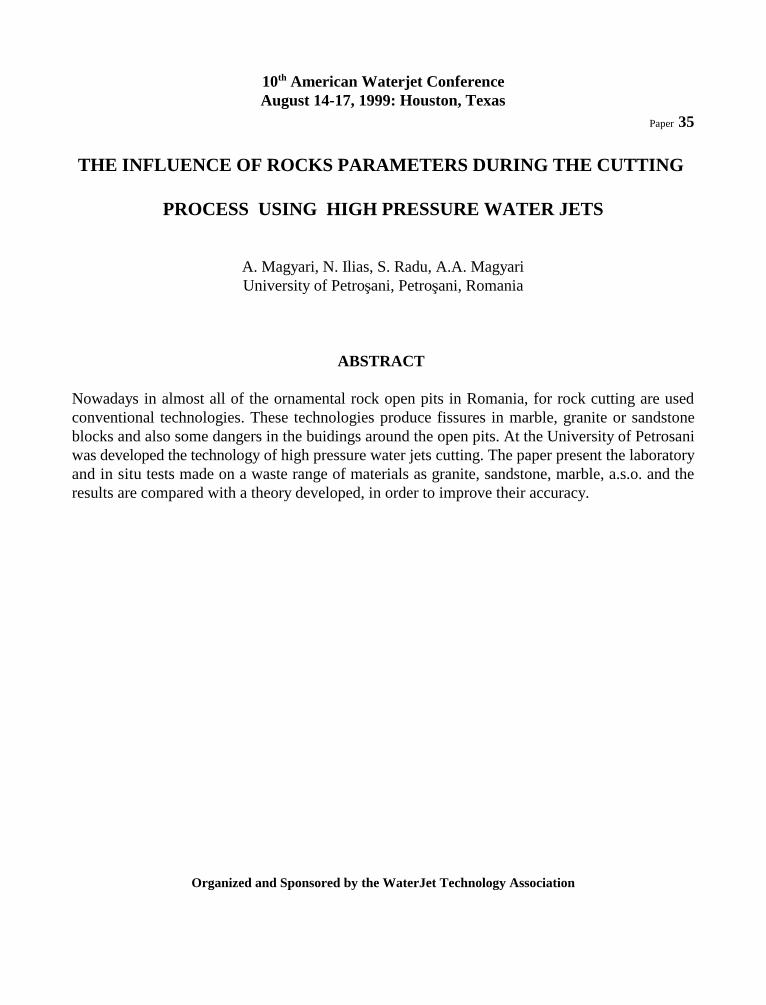
10 American Waterjet Conferenceth
August 14-17, 1999: Houston, TexasPaper 35
THE INFLUENCE OF ROCKS PARAMETERS DURING THE CUTTING
PROCESS USING HIGH PRESSURE WATER JETS
A. Magyari, N. Ilias, S. Radu, A.A. MagyariUniversity of Petro·ani, Petro·ani, Romania
ABSTRACT
Nowadays in almost all of the ornamental rock open pits in Romania, for rock cutting are usedconventional technologies. These technologies produce fissures in marble, granite or sandstoneblocks and also some dangers in the buidings around the open pits. At the University of Petrosaniwas developed the technology of high pressure water jets cutting. The paper present the laboratoryand in situ tests made on a waste range of materials as granite, sandstone, marble, a.s.o. and theresults are compared with a theory developed, in order to improve their accuracy.
Organized and Sponsored by the WaterJet Technology Association
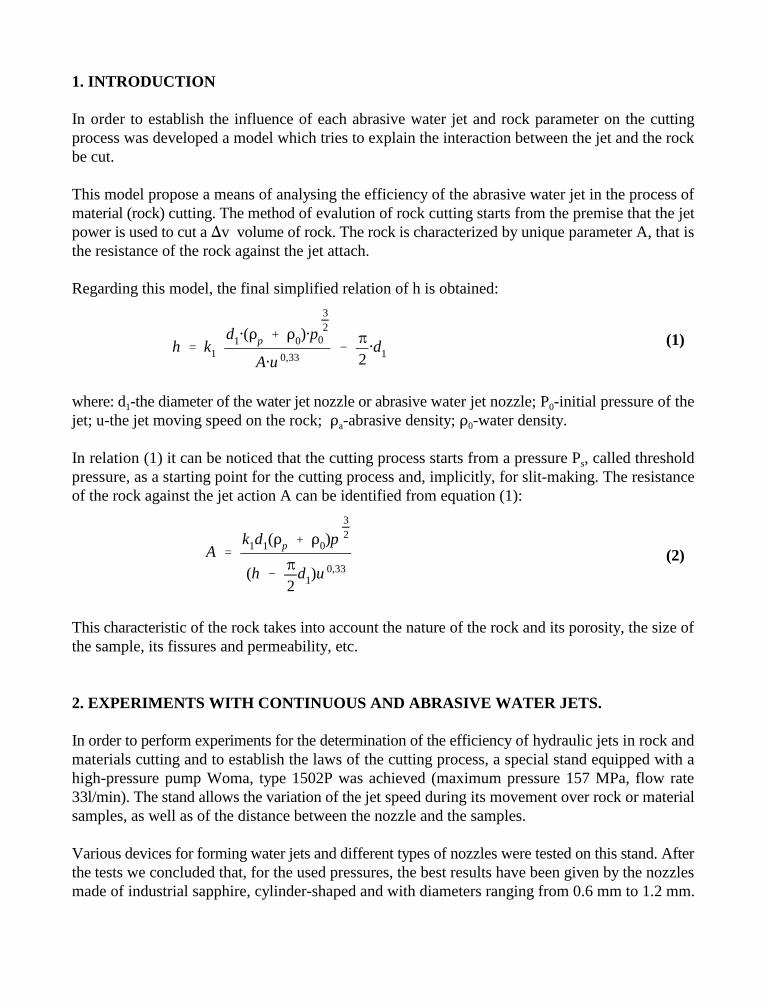
h k1
d1#('p '0)#p
32
0
A#u0,33
%
2#d1
A
k1d1('p '0)p32
(h %
2d1)u
0,33
(1)
(2)
1. INTRODUCTION
In order to establish the influence of each abrasive water jet and rock parameter on the cuttingprocess was developed a model which tries to explain the interaction between the jet and the rockbe cut.
This model propose a means of analysing the efficiency of the abrasive water jet in the process ofmaterial (rock) cutting. The method of evalution of rock cutting starts from the premise that the jetpower is used to cut a v volume of rock. The rock is characterized by unique parameter A, that isthe resistance of the rock against the jet attach.
Regarding this model, the final simplified relation of h is obtained:
where: d -the diameter of the water jet nozzle or abrasive water jet nozzle; P -initial pressure of the1 0
jet; u-the jet moving speed on the rock; ' -abrasive density; ' -water density.a 0
In relation (1) it can be noticed that the cutting process starts from a pressure P , called thresholds
pressure, as a starting point for the cutting process and, implicitly, for slit-making. The resistanceof the rock against the jet action A can be identified from equation (1):
This characteristic of the rock takes into account the nature of the rock and its porosity, the size ofthe sample, its fissures and permeability, etc.
2. EXPERIMENTS WITH CONTINUOUS AND ABRASIVE WATER JETS.
In order to perform experiments for the determination of the efficiency of hydraulic jets in rock andmaterials cutting and to establish the laws of the cutting process, a special stand equipped with ahigh-pressure pump Woma, type 1502P was achieved (maximum pressure 157 MPa, flow rate33l/min). The stand allows the variation of the jet speed during its movement over rock or materialsamples, as well as of the distance between the nozzle and the samples.
Various devices for forming water jets and different types of nozzles were tested on this stand. Afterthe tests we concluded that, for the used pressures, the best results have been given by the nozzlesmade of industrial sapphire, cylinder-shaped and with diameters ranging from 0.6 mm to 1.2 mm.
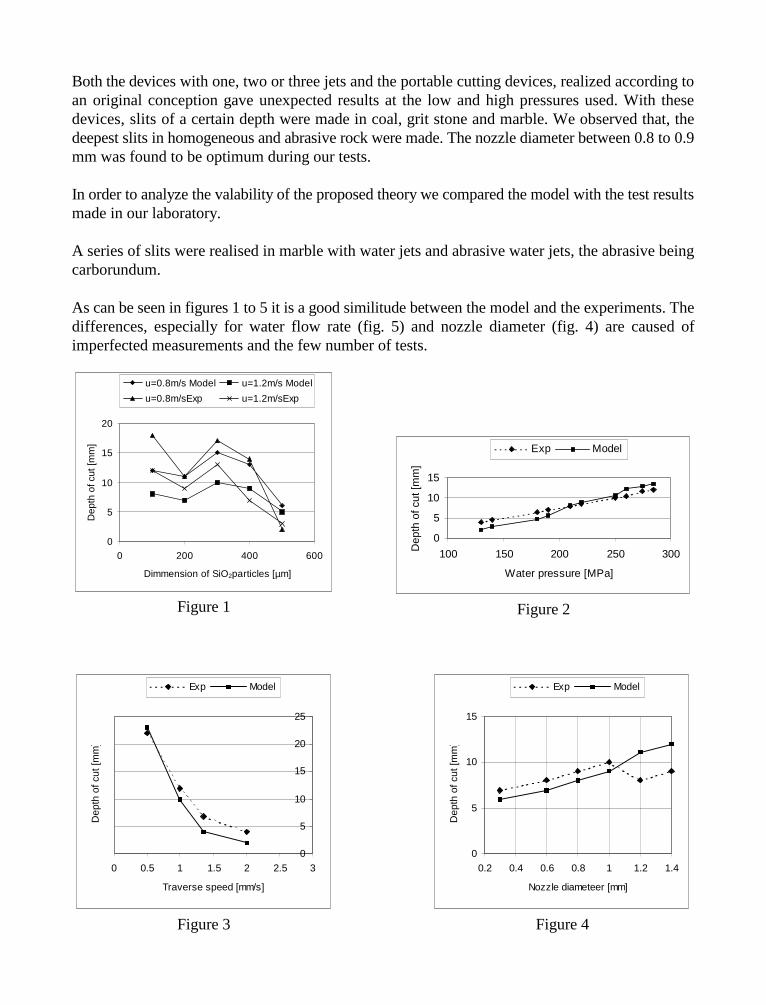
0
5
10
15
20
0 200 400 600
Dimmension of SiO2particles [µm]
Dep
th o
f cut
[mm
]
u=0.8m/s Model u=1.2m/s Model
u=0.8m/sExp u=1.2m/sExp
0
5
10
15
100 150 200 250 300
Water pressure [MPa]
Dep
th o
f cut
[mm
]
Exp Model
0
5
10
15
0.2 0.4 0.6 0.8 1 1.2 1.4
Nozzle diameteer [mm]
Dep
th o
f cut
[mm
]
Exp Model
0
5
10
15
20
25
0 0.5 1 1.5 2 2.5 3
Traverse speed [mm/s]
Dep
th o
f cut
[mm
]
Exp Model
Figure 1 Figure 2
Figure 4Figure 3
Both the devices with one, two or three jets and the portable cutting devices, realized according toan original conception gave unexpected results at the low and high pressures used. With thesedevices, slits of a certain depth were made in coal, grit stone and marble. We observed that, thedeepest slits in homogeneous and abrasive rock were made. The nozzle diameter between 0.8 to 0.9mm was found to be optimum during our tests.
In order to analyze the valability of the proposed theory we compared the model with the test resultsmade in our laboratory.
A series of slits were realised in marble with water jets and abrasive water jets, the abrasive beingcarborundum.
As can be seen in figures 1 to 5 it is a good similitude between the model and the experiments. Thedifferences, especially for water flow rate (fig. 5) and nozzle diameter (fig. 4) are caused ofimperfected measurements and the few number of tests.
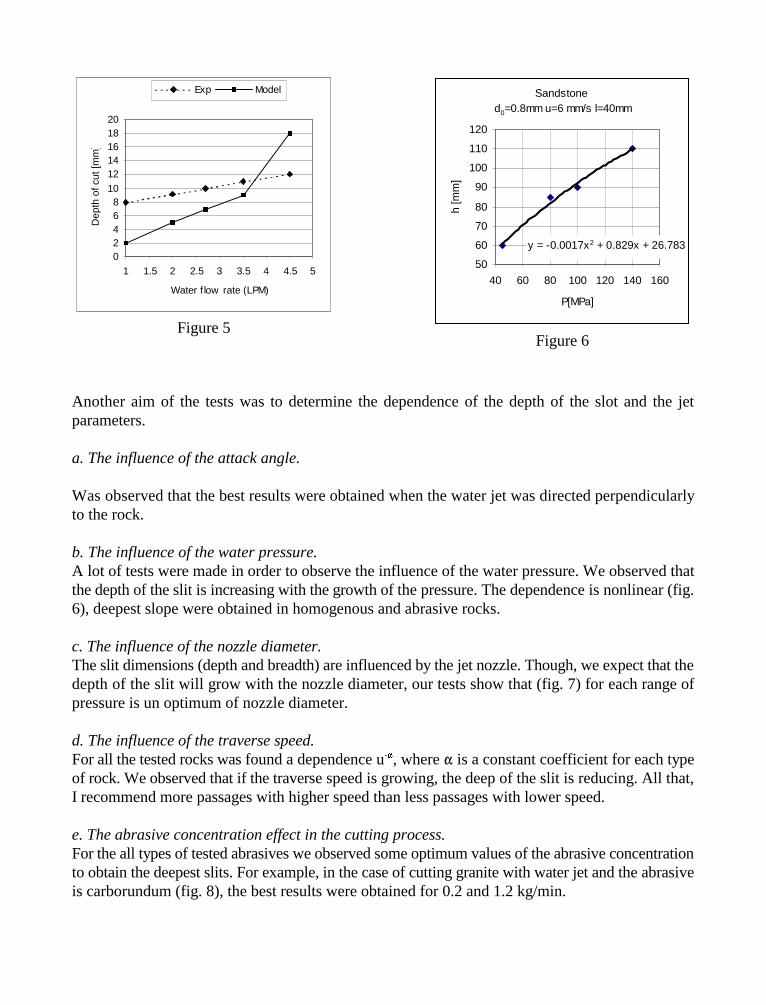
02468
101214161820
1 1.5 2 2.5 3 3.5 4 4.5 5
Water f low rate (LPM)
Dep
th o
f cut
[mm
]Exp Model Sandstone
d0=0.8mm u=6 mm/s l=40mm
y = -0.0017x2 + 0.829x + 26.783
50
60
70
80
90
100
110
120
40 60 80 100 120 140 160
P[MPa]
h [m
m]
Figure 5Figure 6
Another aim of the tests was to determine the dependence of the depth of the slot and the jetparameters.
a. The influence of the attack angle.
Was observed that the best results were obtained when the water jet was directed perpendicularlyto the rock.
b. The influence of the water pressure.A lot of tests were made in order to observe the influence of the water pressure. We observed thatthe depth of the slit is increasing with the growth of the pressure. The dependence is nonlinear (fig.6), deepest slope were obtained in homogenous and abrasive rocks.
c. The influence of the nozzle diameter.The slit dimensions (depth and breadth) are influenced by the jet nozzle. Though, we expect that thedepth of the slit will grow with the nozzle diameter, our tests show that (fig. 7) for each range ofpressure is un optimum of nozzle diameter.
d. The influence of the traverse speed.For all the tested rocks was found a dependence u , where is a constant coefficient for each type-
of rock. We observed that if the traverse speed is growing, the deep of the slit is reducing. All that,I recommend more passages with higher speed than less passages with lower speed.
e. The abrasive concentration effect in the cutting process.For the all types of tested abrasives we observed some optimum values of the abrasive concentrationto obtain the deepest slits. For example, in the case of cutting granite with water jet and the abrasiveis carborundum (fig. 8), the best results were obtained for 0.2 and 1.2 kg/min.
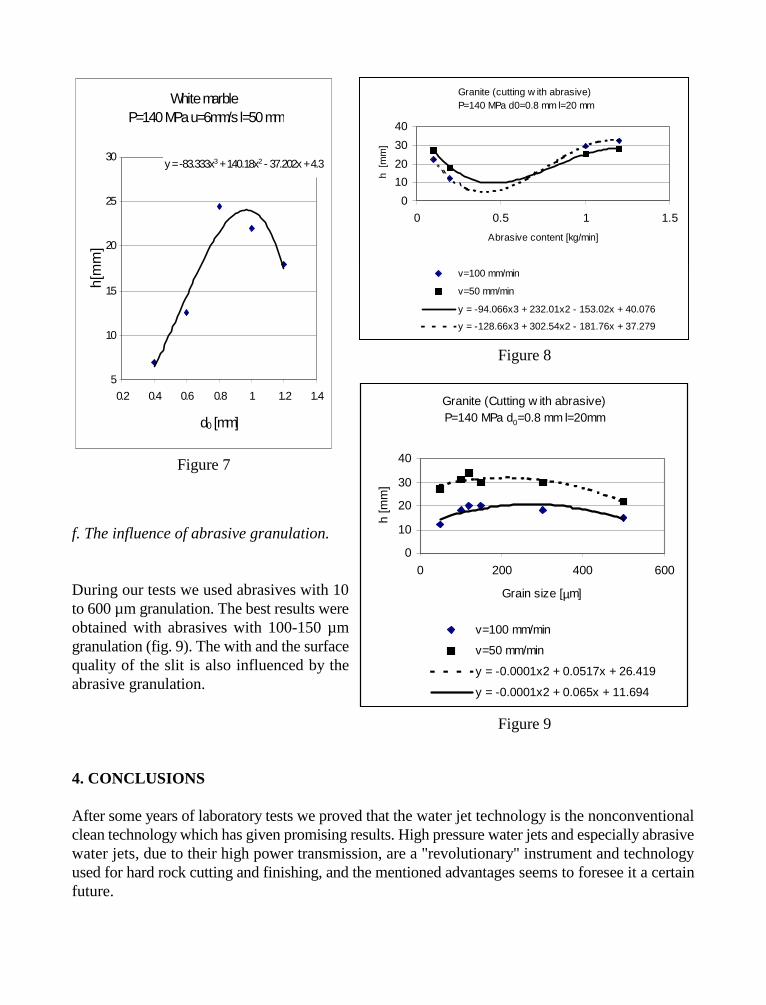
White marble P=140 MPa u=6mm/s l=50 mm
y = -83.333x3 + 140.18x2 - 37.202x + 4.3
5
10
15
20
25
30
0.2 0.4 0.6 0.8 1 1.2 1.4
d0 [mm]
h[m
m]
Granite (cutting w ith abrasive) P=140 MPa d0=0.8 mm l=20 mm
0
10
20
30
40
0 0.5 1 1.5
Abrasive content [kg/min]
h [m
m]
v=100 mm/min
v=50 mm/min
y = -94.066x3 + 232.01x2 - 153.02x + 40.076
y = -128.66x3 + 302.54x2 - 181.76x + 37.279
Granite (Cutting w ith abrasive)P=140 MPa d0=0.8 mm l=20mm
0
10
20
30
40
0 200 400 600
Grain size [µm]
h [m
m]
v=100 mm/min
v=50 mm/min
y = -0.0001x2 + 0.0517x + 26.419
y = -0.0001x2 + 0.065x + 11.694
Figure 7
Figure 8
Figure 9
f. The influence of abrasive granulation.
During our tests we used abrasives with 10to 600 µm granulation. The best results wereobtained with abrasives with 100-150 µmgranulation (fig. 9). The with and the surfacequality of the slit is also influenced by theabrasive granulation.
4. CONCLUSIONS
After some years of laboratory tests we proved that the water jet technology is the nonconventionalclean technology which has given promising results. High pressure water jets and especially abrasivewater jets, due to their high power transmission, are a "revolutionary" instrument and technologyused for hard rock cutting and finishing, and the mentioned advantages seems to foresee it a certainfuture.
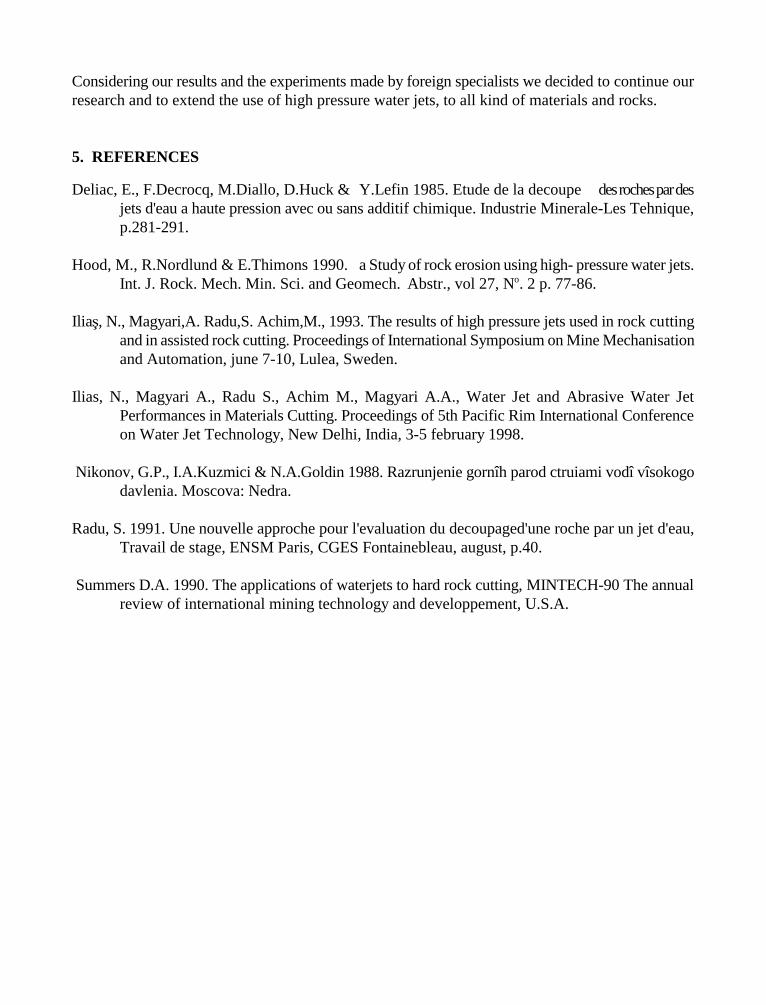
Considering our results and the experiments made by foreign specialists we decided to continue ourresearch and to extend the use of high pressure water jets, to all kind of materials and rocks.
5. REFERENCES
Deliac, E., F.Decrocq, M.Diallo, D.Huck & Y.Lefin 1985. Etude de la decoupe des roches par desjets d'eau a haute pression avec ou sans additif chimique. Industrie Minerale-Les Tehnique,p.281-291.
Hood, M., R.Nordlund & E.Thimons 1990. a Study of rock erosion using high- pressure water jets.Int. J. Rock. Mech. Min. Sci. and Geomech. Abstr., vol 27, N . 2 p. 77-86.o
Ilia·, N., Magyari,A. Radu,S. Achim,M., 1993. The results of high pressure jets used in rock cuttingand in assisted rock cutting. Proceedings of International Symposium on Mine Mechanisationand Automation, june 7-10, Lulea, Sweden.
Ilias, N., Magyari A., Radu S., Achim M., Magyari A.A., Water Jet and Abrasive Water JetPerformances in Materials Cutting. Proceedings of 5th Pacific Rim International Conferenceon Water Jet Technology, New Delhi, India, 3-5 february 1998.
Nikonov, G.P., I.A.Kuzmici & N.A.Goldin 1988. Razrunjenie gornîh parod ctruiami vodî vîsokogodavlenia. Moscova: Nedra.
Radu, S. 1991. Une nouvelle approche pour l'evaluation du decoupaged'une roche par un jet d'eau,Travail de stage, ENSM Paris, CGES Fontainebleau, august, p.40.
Summers D.A. 1990. The applications of waterjets to hard rock cutting, MINTECH-90 The annualreview of international mining technology and developpement, U.S.A.
10th American Waterjet ConferenceAugust 14-17, 1999: Houston, Texas
Paper 36
A STUDY OF NEAR WELL-BORE FORMATION PROCESSING
WITH HIGH PRESSURE ROTATING WATER JETS
G. Li, J. Ma, Z. Huang, D. Zhang, Z.ShenUniversity of Petroleum
Dongying, Shandong, P.R.China
ABSTRACT
High pressure water jet removing impurities in formations is a new way developed recently toincrease oil production and water-injection rates. This paper describes the basic principles ofhigh pressure rotating water jets removing impurities and the laws of the tool's rotating speeds,impact pressure and variations of impact pressure with stand-off distance. The field-test resultswere obtained from over 200 oil and water-injection wells in Liaohe, Shengli, Zhongyuan,Huabei etc., and indicate that this technology has such advantages as: simplicity of use, lowprices, high success rate, wide application, and significant effectiveness. From this, it isprofitable and promising to increase production in highly watercut oilfields.
Organized and Sponsored by the WaterJet Technology Association
1. INTRODUCTION
In order to keep production stable and decrease the production-reducing amplitude, the marginal,heavy oil, and low permeability reservoirs have been more developed recently; on the otherhand, various enhancing measures are being studied and applied in China and other countries.Generally speaking, there are two philosophies to enhance recovery: one, taking the wholereservoir into consideration (improving the sweeping area of injection water, the displacementefficiency, and increasing the percentage of residual oil); or consideration on a single well(taking physical, chemical and other methods to improve production). As far as a single well isconsidered, due to liquid pollution and impurities from plugging during drilling, completion,workover and water injecting, it is unavoidable that the near wellbore permeability becomereduced, even leading to non-production. In recent years, many physical and chemical measuresto deal with near wellbore formations have been developed (UUdf[bnjd et al, 1985; Guo,1995;Hu,1996), notably hydraulic resonation, ultrasonic wave, electric-hydraulic pulse, and artificialearthquakes etc. Although they have made some contributions, there are still problems such ascomplicated procedures, higher costs, limitations of bottomhole conditions, and reduction ofbottomhole energy, negating effectiveness.
In this technology, high pressure water jets (lower frequency) generated through controllablerotary head impacts the formations directly; at the same time, the nozzles can also generatehigher frequency oscillation waves, cavitating noise (ultrasonic wave) to remove impurities.Self-resonating cavitating jet is a new kind of technology developed in recent years(Johnson, etal, 1982), and much work has been done on its principles and functions(Li, et al,1991;1997).This shows that it has a more intense pressure oscillation and better rock erosion effectiveness.Its oscillation amplitude can reach 24%--37%; at the same pump pressure, its rock erosion rate istwo to four times higher than that of common jets (Shen, et al, 1991). Also, the cavitating actioncan generate transient pressure 8.6 to 124 times higher than jet impact pressure (Conn, et al,1976) accompanied with high frequency cavitating noise.
2. BASIC THEORY
The tool consists of filters, one-way valve, centralizer, rotary controller and self-oscillationnozzles (Fig 1). While working, the tool is connected to the tubings and down hole to theperforation intervals. Then, clean water (or water added to paraffin inhibitor, or expansioninhibitor or clay stabilizer) is pumped through the tubings, filters, one-way valve, rotary-jet-producing facilities to generate four jets, two of which are inclined to drive the head rotation. Itsrotary speed can be adjusted by the dampener. At the same time, the tubings are moved up anddown by the drawwork. There are four powerful jets at every circle impacting perforationsdirectly. Through calculation (Yuan, 1986), the jet impact force can reach over 250N and jetpower being over 130Kw. Fig 2 and Fig 3 are hydraulically pulsed curves and high frequency jetoscillating curves respectively.
The impurities in the perforations become loose and will be removed with the back flow. On theother hand, there will appear micro-fracture nets in the near wellbore formations under therepeated jet impacts. With the wave and micro-fracture spreading, the permeability increases
greatly. Furthermore, the oil molecular structure can be changed with the action of highfrequency oscillations and cavitating noise; as a result, the oil viscosity decreases while its flowability and recovery efficiency increases.
Jet impacting depths can reach over 600mm due to its directed and concentrated power; therotary speed can be adjusted from 0.5 to 400 rpm through changing pump pressure, jet deflectingangle and dampener. The whole sections of perforations can be dealt with by drawing the tool upand down, and the perforations and the surrounding formation receives three kinds of forces:direct hydraulic pulse impact, the cavitating thermal force and the ultrasonic waves. As a result,its processing effectiveness will be superior to that of single physical methods. So, thetechnology not only has the significant characteristics of addition simplicity, low costs,centralized energy, and deep processing depth, but jet pressure, rotary speed, processing intervaland processing time can be selected according to impurity type and degree of pollution. So, withthe advantages of good selection, wide applications, and easy connection with other processingmethods, this technology proves both feasible and beneficial.
3. EXPERIMENTAL FACILITIES AND MEASUREMENTS
The whole tool was experimented on the multi-function experiment rack for jets in the HighPressure Water Jet Research Center. The experimental system is shown in Fig 4.
The experiment rack mainly consists of the central pipe and the 7casing simulated wellbore.The central pipe can be driven by a motor up and down. The rotating head is installed at thebottom of the central pipe, and it will rotate while jacking in the wellbore. The height of thesimulated wellbore is 500 mm. There are two holes opposite one another in the middle of thewellbore wall. One is connected to pressure sensor; the other is to pressure gauge or corecontainer. The sensor and core container can be extended and extrapolated to simulate thedifferent perforation depths. When the rotary head is rotating, the jets from the nozzle aim at theholes. Then the core in the container is impacted, and the impacting signal also is detectedsimultaneously. The signal is analyzed by HP Dynamic Signal Analyzer and printed by printerand graph plotter.
The experiment medium is clean tap water, which is pressured by two triplex plunger pumps.The single pump rated pressure is 50 MPa. The rated displacement is 90 l/min, and the jetpressure is adjusted through regulation valve. The characteristics of rotating head and impactingpressure can be achieved by changing pump pressure.
4. RESULTS AND ANALYSIS OF LABORATORY EXPERIMENTS
4.1 Rotating Characteristics of Rotary Head
The rotation of the head is one of the critical points for impacting all of perforations. At thebeginning, the rotating head sealed with non-damping liquid-film was tested. However, therotary speed was too quick to be controlled and the hydraulic energy impacted into the
perforations was negated. Later, the damping liquid was used to control rotary speed through theequilibrium between rotary dynamic momentum and rotary resistance (including the seal friction,the damping-liquid resistance and so on). Under the condition of constant nozzle diameter withchanging the pump pressure and damping-liquid, the rotary speed can be detected throughmeasuring the pulse number. In this paper, the rotary speed was tested under 8 pump pressuresand 3 kinds of damping-liquids (their viscosity orders from low to high are liquid 1,liquid 2 andliquid 3). The results are shown in Fig 5, from which such results can be obtained that for thesame damping-liquid, rotary speed increases as the pump pressure increases apparently; atconstant pump pressure, the higher damping-liquid viscosity result in the lower the rotary speed;For the damping-liquid 3 with the highest viscosity, its speed is only 0.5 rpm ( pump pressurebeing 5.0 MPa), while for the damping-liquid 1, the highest rotary speed can reach 348 rpm(pump pressure being 20.0 MPa).
4.2 Relationship between Pump Pressure and Impact Pressure at Casing Surface
Fig 6 indicates the testing results of impact pressure at casing surface under different pumppressures. With the increase of pump pressure, the impact pressure at the casing surface willincrease linearly. When the pump pressure is 4.0MPa, the impact pressure is 3.2MPa; while thepump pressure is 20.0MPa, the value reaches 17.8 MPa. So, the impact pressure is about 80- 90per cent of pump pressure.
4.3 Relationship between Impact Pressure and Radial Distance
In order to test the processing depth to formations, the impact pressure at different radial distancewas measured under determined pump pressures of 10.0, 13.0 and 20.0 MPa respectively. Takingthe casing surface as the first point to be recorded, the measure point was extended to 50, 100,200, 300, 400, 500 and 600mm one by one; the results of which are shown in Fig 7. Under theconstant pump pressure, the impact pressure reduces gradually with the increase of radialdistance. Under pump pressure of 13.0 and 20.0 MPa, even the radial distance increases up to600mm; the impact pressures still reach 2.2 and 3.0 MPa respectively, which means, simulatingthe conditions at bottomhole, the jet impacting distance can get to over 600 mm.
5. FIELD EXPERIMENTS AND APPLICATION
5.1 Application Range and Well-Selecting Instructions
(1) Wells with high permeability and certain production capacity, but suffering fromproduction reduction or non-production due to formation pollution near wellbore.
(2) Wells with characteristics of acid sensitivity and water sensitivity, not easy to implementacidification and other methods.
(3) Well with thin pay zones and intervals, not easy to implement other remolding methods atrespective zones.
(4) Wells with low formation energy and impossible to drain after acidification.(5) Wells that are needed to adjust output sections; water-injection wells needed to adjust
injecting sections.
(6) As the pre-process before implementation of acidification, steam injection, polymerinjection, sand control, etc.
5.2 Operation Facilities and Requirements
(1) One drawwork, two 400-type cementing trucks, two water tank trucks both with 15m 3
capacity.(2) The implemented wells should be installed with wellhead self-seal assembly, and the
return water pipe line should be connected with a water storage pool.(3) The high pressure standing elbow, hose and tee connecting to the 400-type cementing
trucks, should be cleaned and well sealed.(4) According to the depth of perforations and pollution degree, the working pressure can be
controlled from 15 to 30 MPa and the flow rate at about 400 l/min.(5) The working medium is clean water. To ensure match between the working fluids and the
rocks and fluids bottommhole, such additives as expansion presenter, block-remover, claystabilizer, etc. should be added to the clean water according to the formationcharacteristics.
5.3 Operation Process and Procedure
(1) Flush well with clean water or additive water. Kill wells with expansion prevention fluid.Pullout the tubings and detect the surface for sand.
(2) Tubings should be cleaned and selected carefully according to perforation depth and itsinterval. The tool should be connected in this sequence: the first-filter+one-way valve +the second-filter + stabilizer + dampener +rotary head; then, the assembly is connected tothe tubings and sent to the well bottom 1 m above the top perforation section.
(3) Positively wash the well with clean water to displace the impurities in the tubings.(4) After above procedures, open up the well head to throw the ball into the tubing's to switch
off the one-way valve. Then connect the cementing trucks, adjust the pressure at to 15 to30 MPa, and pump liquid in positive circulation. At the same time, the tubings are drawnby the drawwork up and down (the slower the better) to impact all of perforations until 1m below the last perforation; then pull up and repeat. Such procedure should be repeatedfour to five times.
(5) When the work is over, the tool is put down to the wellbottom, and the surface flow lineshould be reversed to clean the perforation sections and carry the impurities out of thewell at large displacement in negative circulation for two to three cycles.
(6) Pull out all the tubings and clean the tool, lower oil well pump or water-injection tools asroutine to start production.
5.4 Field Applications
From early 1995 to May.1997, this technology had been tested and applied in over 200 wells inLiaohe, Shengli and Zhongyuan etc. oilfields.
Only in the year 1995, when the Jinzhou Oil Company of Liaohe Oilfield implemented thetechnology in 23 oil-producing wells and effectively in 21 wells, did the rate reach 91%. The
average increase amplitude per oil-well was 20 to 50% and the valid period was over 90 days. Inthat year, the net increase reached 8892t, and the economic benefit was 4.11million RMB. Forinstance, Jin2-14-02well was a producing well in Jin99 Block. In November 1993, its normalproduction was 6 t/d; in December this year, after checking pump due to pump leakage, nothingwas produced. Data analysis indicated that the liquid supply capacity of pay section was poor.Because of the workover pollution and wax deposition during the process of oil production, theperforations were blocked. After non-production, some other block removing measures weretaken, but nothing was effective. In Jan. 1995, the technology was implemented, and this wellwas processed by one 400-type cementing truck for about two hours. Then, the well's productioncapacity was recovered. During the early stage after usage of this technology, the oil productionwas 10 t/d. The highest production ever reached 18 t/d. In the year 1995, the accumulatedincrease production reached 3642t. The stimulation effectiveness of several typical wells in thisCompany is shown in Table 1.
From February 1996 to December 1996, the technology was implemented in 43 water-injectionwells of 7 units in Shengli Oil Company of Shengli Oil Field, and 38 wells were valid, so, theefficiency rate reached 88%. The average increase of injected-water for single wells was 30 to 90percent; the accumulated water volume was more than 300,000m3. In 1993, the measure ofchemically removing impurities was implemented in the well of 3-6-172 in Tuo-7 Block, whileits water intake capacity became poorer than before. In 1995, another measure of chemicalstimulating and hydraulic oscillations was tested in this well; its effectiveness was still poor andwas short either. In February 1996, the technology was used in this well and significanteffectiveness was made; the water-injection volume per day rose from 17 m3 to 300 m3. Thewindow of effectiveness had exceeded 200 days and the accumulated increase reached 56415 m3,greatly changed the injectivity index. The other typical wells are indicated in Table 2.
From May 1996 to April 1997, 42 wells in Zhongyuan Oilfield were implemented with thetechnology; 34 wells valid, the effective rate reached 94%. Among them, all of the 24 oil wellswere successful; the accumulated increase of oil was 2377.7 t. 18 water-injection wells wereimplemented, with 16 wells valid, and the effective rate reached 88.9%. The accumulatedincrease of injection-water was 62564 m3, and the average window of effectiveness was 157days.
6. CONCLUSIONS
6.1 The technology can generate powerful hydraulic pulses impacting against perforations atbottomhole. Simultaneously, it can produce high frequency oscillating jet, cavitatingthermal, and ultrasonic forces impacting the formation, effectively removing impurities nearwellbore.
6.2 Laboratory experiments indicate that, with the increase of pump pressure, the rotary speedand jet impacting pressure to the surface increase correspondingly. Under constant pumppressure, jet impacting pressure decreases gradually with the increase of distance. At20.MPa, the jets acting depth can reach over 600 mm.
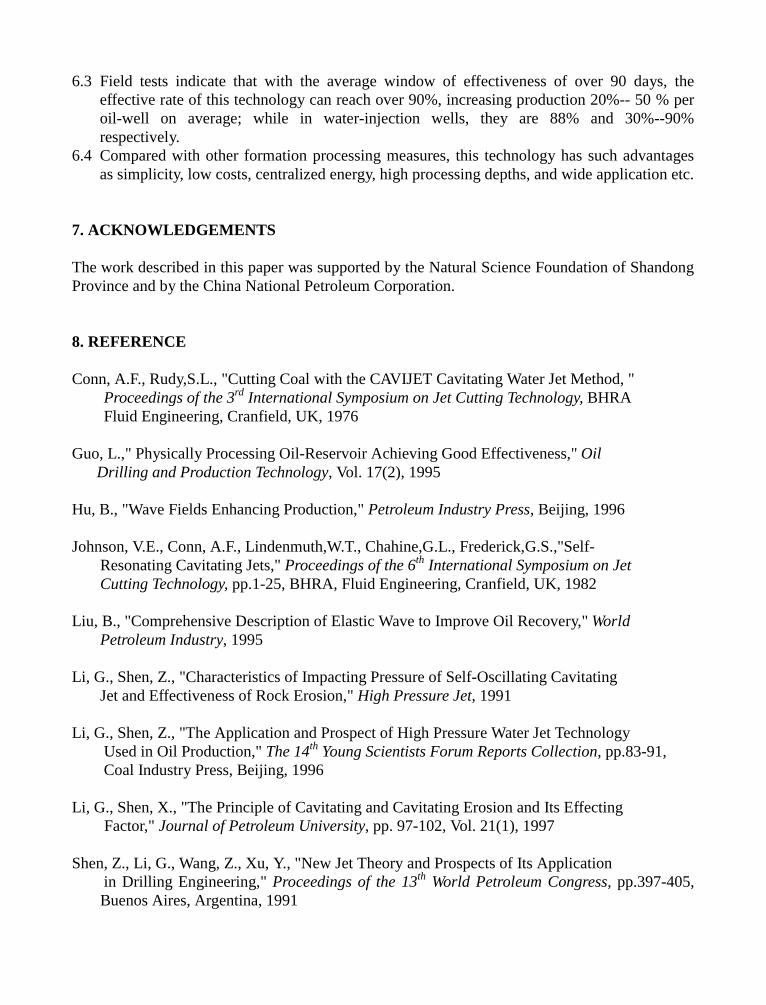
6.3 Field tests indicate that with the average window of effectiveness of over 90 days, theeffective rate of this technology can reach over 90%, increasing production 20%-- 50 % peroil-well on average; while in water-injection wells, they are 88% and 30%--90%respectively.
6.4 Compared with other formation processing measures, this technology has such advantagesas simplicity, low costs, centralized energy, high processing depths, and wide application etc.
7. ACKNOWLEDGEMENTS
The work described in this paper was supported by the Natural Science Foundation of ShandongProvince and by the China National Petroleum Corporation.
8. REFERENCE
Conn, A.F., Rudy,S.L., "Cutting Coal with the CAVIJET Cavitating Water Jet Method, "Proceedings of the 3rd International Symposium on Jet Cutting Technology, BHRAFluid Engineering, Cranfield, UK, 1976
Guo, L.," Physically Processing Oil-Reservoir Achieving Good Effectiveness," Oil Drilling and Production Technology, Vol. 17(2), 1995
Hu, B., "Wave Fields Enhancing Production," Petroleum Industry Press, Beijing, 1996
Johnson, V.E., Conn, A.F., Lindenmuth,W.T., Chahine,G.L., Frederick,G.S.,"Self-Resonating Cavitating Jets," Proceedings of the 6th International Symposium on JetCutting Technology, pp.1-25, BHRA, Fluid Engineering, Cranfield, UK, 1982
Liu, B., "Comprehensive Description of Elastic Wave to Improve Oil Recovery," World Petroleum Industry, 1995
Li, G., Shen, Z., "Characteristics of Impacting Pressure of Self-Oscillating Cavitating Jet and Effectiveness of Rock Erosion," High Pressure Jet, 1991
Li, G., Shen, Z., "The Application and Prospect of High Pressure Water Jet TechnologyUsed in Oil Production," The 14th Young Scientists Forum Reports Collection, pp.83-91,Coal Industry Press, Beijing, 1996
Li, G., Shen, X., "The Principle of Cavitating and Cavitating Erosion and Its Effecting Factor," Journal of Petroleum University, pp. 97-102, Vol. 21(1), 1997
Shen, Z., Li, G., Wang, Z., Xu, Y., "New Jet Theory and Prospects of Its Applicationin Drilling Engineering," Proceedings of the 13th World Petroleum Congress, pp.397-405,Buenos Aires, Argentina, 1991
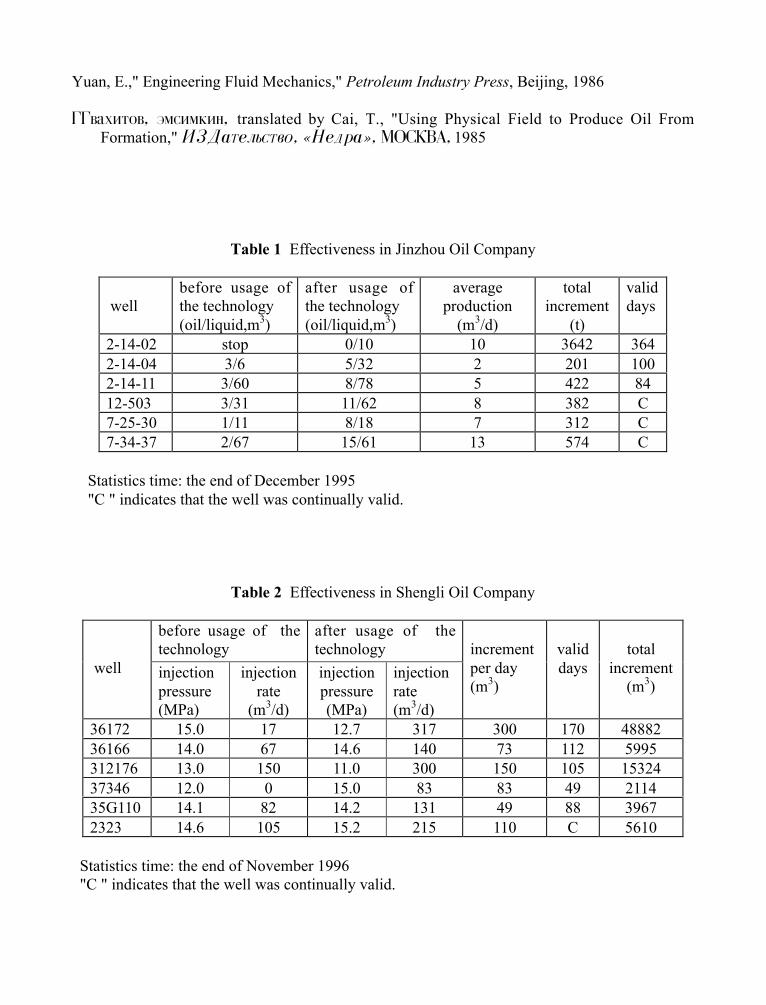
Yuan, E.," Engineering Fluid Mechanics," Petroleum Industry Press, Beijing, 1986
UUdf[bnjd› 'vcbvrby› translated by Cai, T., "Using Physical Field to Produce Oil FromFormation," BPLfNtkmcNdj› ^YtLhf&› VJCRDF› 1985
Table 1 Effectiveness in Jinzhou Oil Company
wellbefore usage ofthe technology(oil/liquid,m3)
after usage ofthe technology(oil/liquid,m3)
averageproduction
(m3/d)
totalincrement
(t)
validdays
2-14-02 stop 0/10 10 3642 3642-14-04 3/6 5/32 2 201 1002-14-11 3/60 8/78 5 422 8412-503 3/31 11/62 8 382 C7-25-30 1/11 8/18 7 312 C7-34-37 2/67 15/61 13 574 C
Statistics time: the end of December 1995 "C " indicates that the well was continually valid.
Table 2 Effectiveness in Shengli Oil Company
before usage of thetechnology
after usage of thetechnology
well injectionpressure(MPa)
injectionrate
(m3/d)
injectionpressure(MPa)
injectionrate(m3/d)
incrementper day(m3)
validdays
totalincrement
(m3)
36172 15.0 17 12.7 317 300 170 4888236166 14.0 67 14.6 140 73 112 5995312176 13.0 150 11.0 300 150 105 1532437346 12.0 0 15.0 83 83 49 211435G110 14.1 82 14.2 131 49 88 39672323 14.6 105 15.2 215 110 C 5610
Statistics time: the end of November 1996 "C " indicates that the well was continually valid.
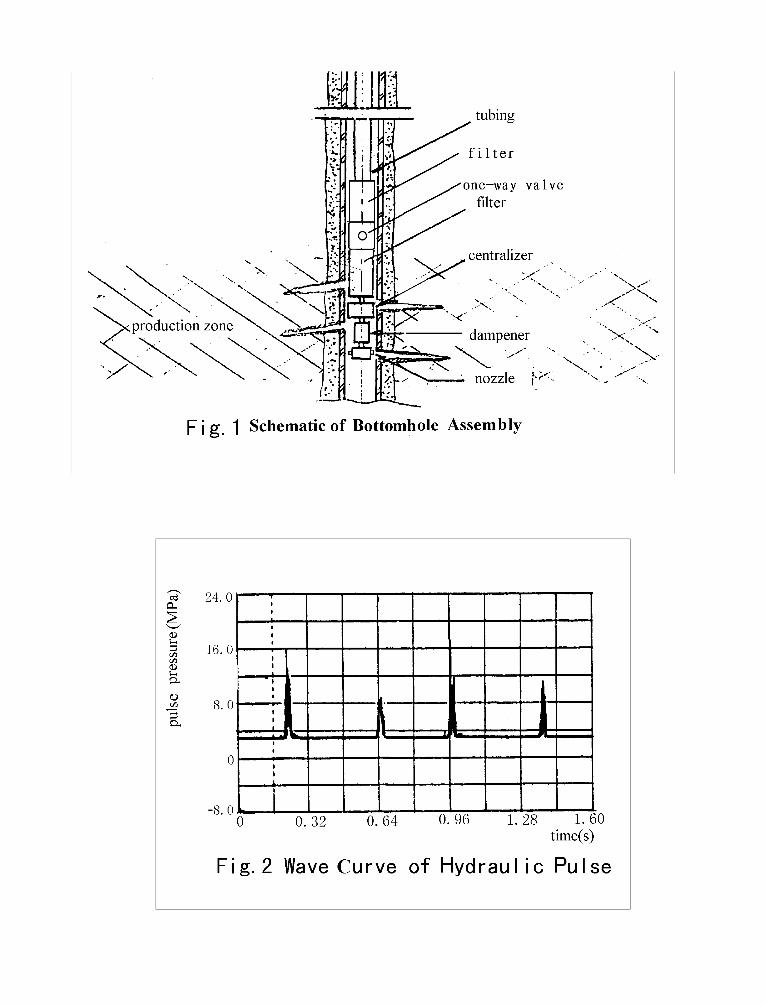
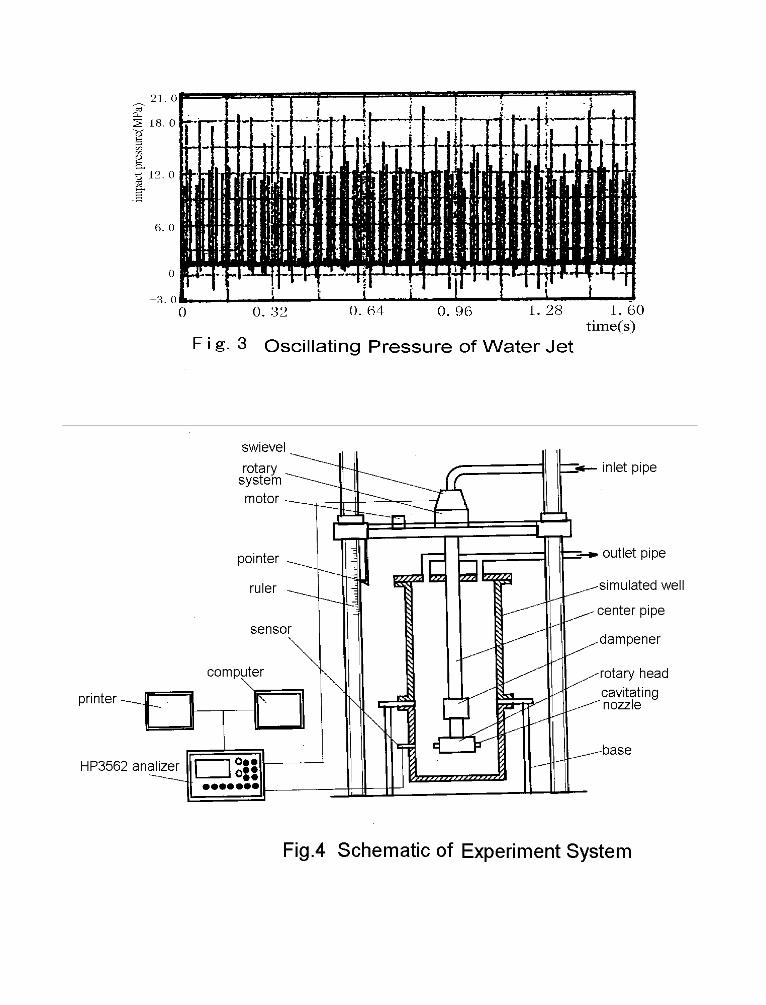
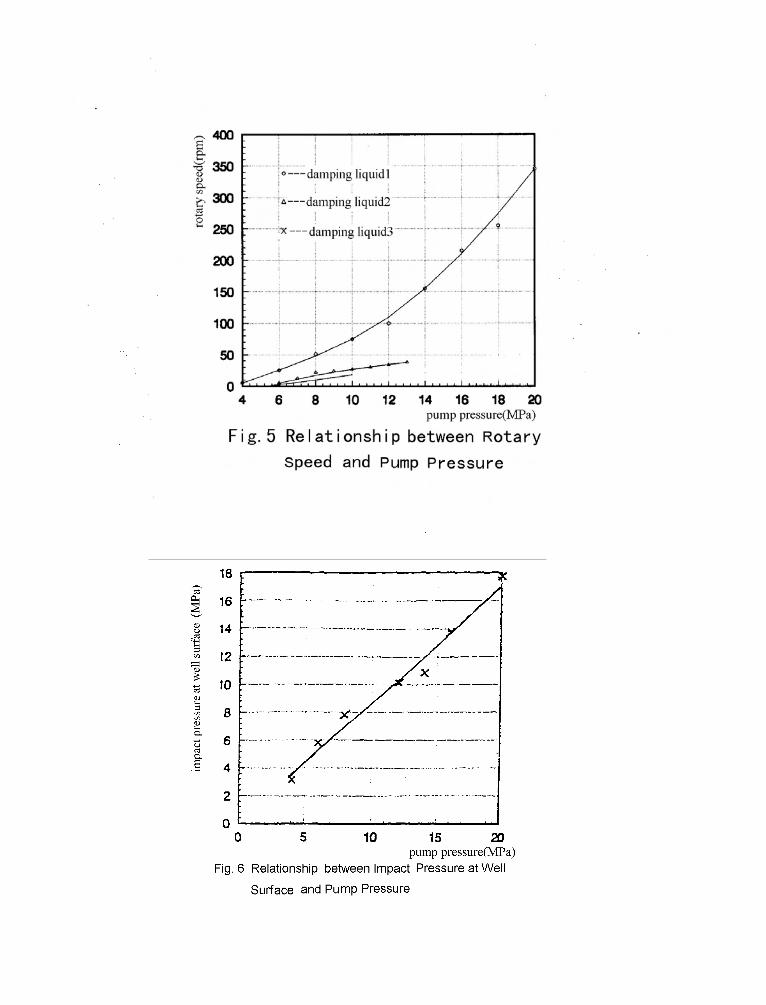
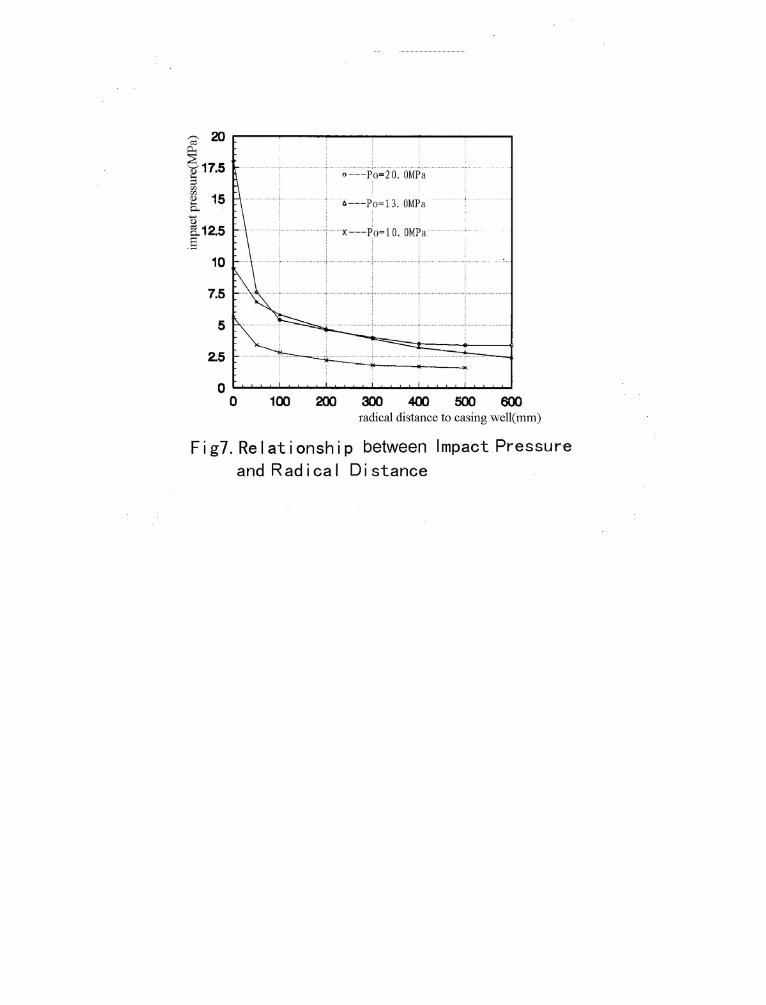

10 American Waterjet Conference th
August 14-17, 1999: Houston, Texas Paper 37
THEORETICAL AND EXPERIMENTAL INVESTIGATION
OF A HIGH ENERGY WATERJET EFFICIENCY ON
THERMALLY TREATED ROCKS
L. M. HlavágVŠB - Technical University
Ostrava, Czech Republic
ABSTRACT
Thermally treated rocks constitute a special group of materials with unusual not very commonproperties. Nevertheless, these materials grow to be of great interest in several industrial sectors aswell as in basic research. To be able to predict effects of water jet impact on such materials theappropriate properties of few representative rocks have been studied after thermal treatment. Thewater jet disintegration processes have been studied on heated rock samples (up to 900 C), on rock0
samples in usual air conditions after thermal treatment (normal air pressure, temperature duringcutting process about 20 C, former preheating of rock samples up to 1100 C) and on frozen rock0 0
samples (temperatures -10 C and -100 C). The most interesting results of both theoretical and0 0
experimental investigation of the problem are the topics of the paper. The preliminary experimentalresults are largely discussed and correlated with presented theory.
Organized and Sponsored by the WaterJet Technology Association
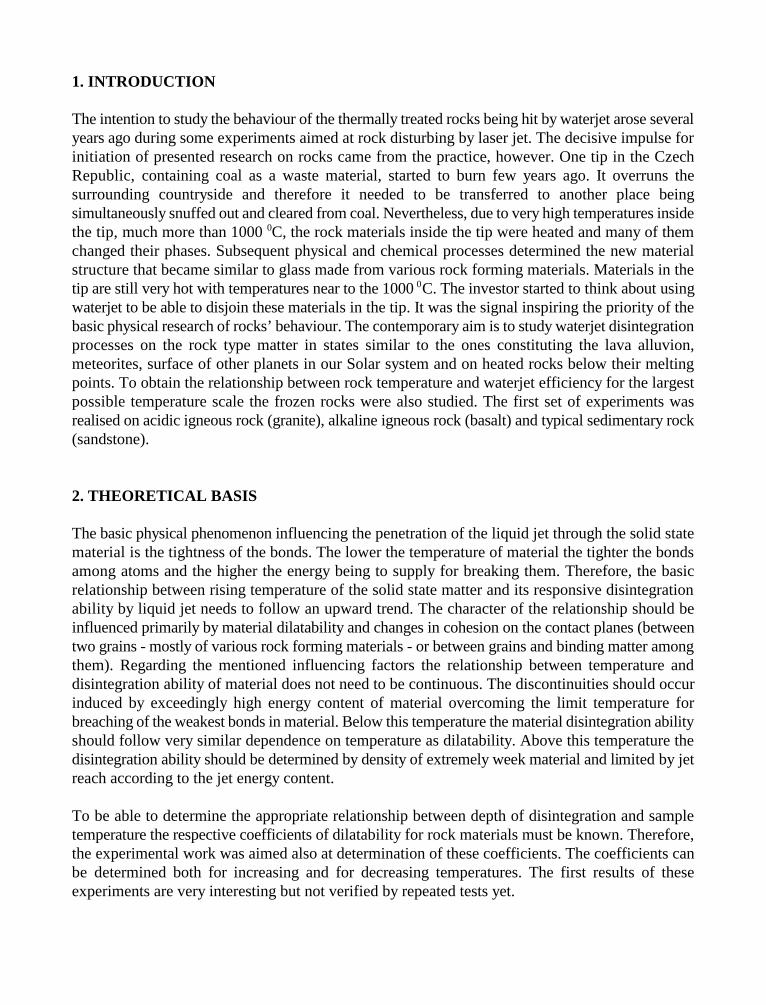
1. INTRODUCTION
The intention to study the behaviour of the thermally treated rocks being hit by waterjet arose severalyears ago during some experiments aimed at rock disturbing by laser jet. The decisive impulse forinitiation of presented research on rocks came from the practice, however. One tip in the CzechRepublic, containing coal as a waste material, started to burn few years ago. It overruns thesurrounding countryside and therefore it needed to be transferred to another place beingsimultaneously snuffed out and cleared from coal. Nevertheless, due to very high temperatures insidethe tip, much more than 1000 C, the rock materials inside the tip were heated and many of them0
changed their phases. Subsequent physical and chemical processes determined the new materialstructure that became similar to glass made from various rock forming materials. Materials in thetip are still very hot with temperatures near to the 1000 C. The investor started to think about using0
waterjet to be able to disjoin these materials in the tip. It was the signal inspiring the priority of thebasic physical research of rocks’ behaviour. The contemporary aim is to study waterjet disintegrationprocesses on the rock type matter in states similar to the ones constituting the lava alluvion,meteorites, surface of other planets in our Solar system and on heated rocks below their meltingpoints. To obtain the relationship between rock temperature and waterjet efficiency for the largestpossible temperature scale the frozen rocks were also studied. The first set of experiments wasrealised on acidic igneous rock (granite), alkaline igneous rock (basalt) and typical sedimentary rock(sandstone).
2. THEORETICAL BASIS
The basic physical phenomenon influencing the penetration of the liquid jet through the solid statematerial is the tightness of the bonds. The lower the temperature of material the tighter the bondsamong atoms and the higher the energy being to supply for breaking them. Therefore, the basicrelationship between rising temperature of the solid state matter and its responsive disintegrationability by liquid jet needs to follow an upward trend. The character of the relationship should beinfluenced primarily by material dilatability and changes in cohesion on the contact planes (betweentwo grains - mostly of various rock forming materials - or between grains and binding matter amongthem). Regarding the mentioned influencing factors the relationship between temperature anddisintegration ability of material does not need to be continuous. The discontinuities should occurinduced by exceedingly high energy content of material overcoming the limit temperature forbreaching of the weakest bonds in material. Below this temperature the material disintegration abilityshould follow very similar dependence on temperature as dilatability. Above this temperature thedisintegration ability should be determined by density of extremely week material and limited by jetreach according to the jet energy content.
To be able to determine the appropriate relationship between depth of disintegration and sampletemperature the respective coefficients of dilatability for rock materials must be known. Therefore,the experimental work was aimed also at determination of these coefficients. The coefficients canbe determined both for increasing and for decreasing temperatures. The first results of theseexperiments are very interesting but not verified by repeated tests yet.
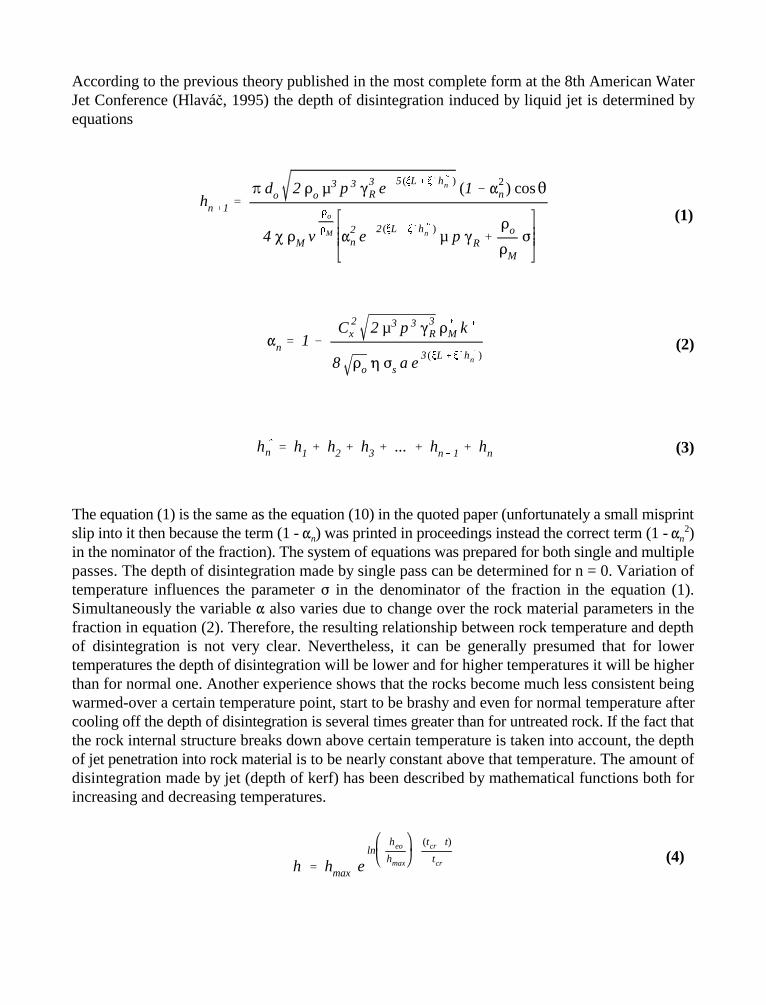
hn1 % do 2'o µ3 p3
3R e
5(!L !h
n )(1
2n) cos
43 'M v
'o
'M 2n e
2(!L !h
n )µ pR
'o
'M
)
n 1
C2x 2 µ3 p3
3R'
M k
8 'o )s a e3(!L !h
n )
h
n h1 h2 h3 ... hn 1 hn
h hmax eln
heo
hmax
(tcr t)
tcr
(1)
(2)
(3)
(4)
According to the previous theory published in the most complete form at the 8th American WaterJet Conference (Hlavág, 1995) the depth of disintegration induced by liquid jet is determined byequations
The equation (1) is the same as the equation (10) in the quoted paper (unfortunately a small misprintslip into it then because the term (1 - ) was printed in proceedings instead the correct term (1 - )n n
2
in the nominator of the fraction). The system of equations was prepared for both single and multiplepasses. The depth of disintegration made by single pass can be determined for n = 0. Variation oftemperature influences the parameter ) in the denominator of the fraction in the equation (1).Simultaneously the variable also varies due to change over the rock material parameters in thefraction in equation (2). Therefore, the resulting relationship between rock temperature and depthof disintegration is not very clear. Nevertheless, it can be generally presumed that for lowertemperatures the depth of disintegration will be lower and for higher temperatures it will be higherthan for normal one. Another experience shows that the rocks become much less consistent beingwarmed-over a certain temperature point, start to be brashy and even for normal temperature aftercooling off the depth of disintegration is several times greater than for untreated rock. If the fact thatthe rock internal structure breaks down above certain temperature is taken into account, the depthof jet penetration into rock material is to be nearly constant above that temperature. The amount ofdisintegration made by jet (depth of kerf) has been described by mathematical functions both forincreasing and decreasing temperatures.
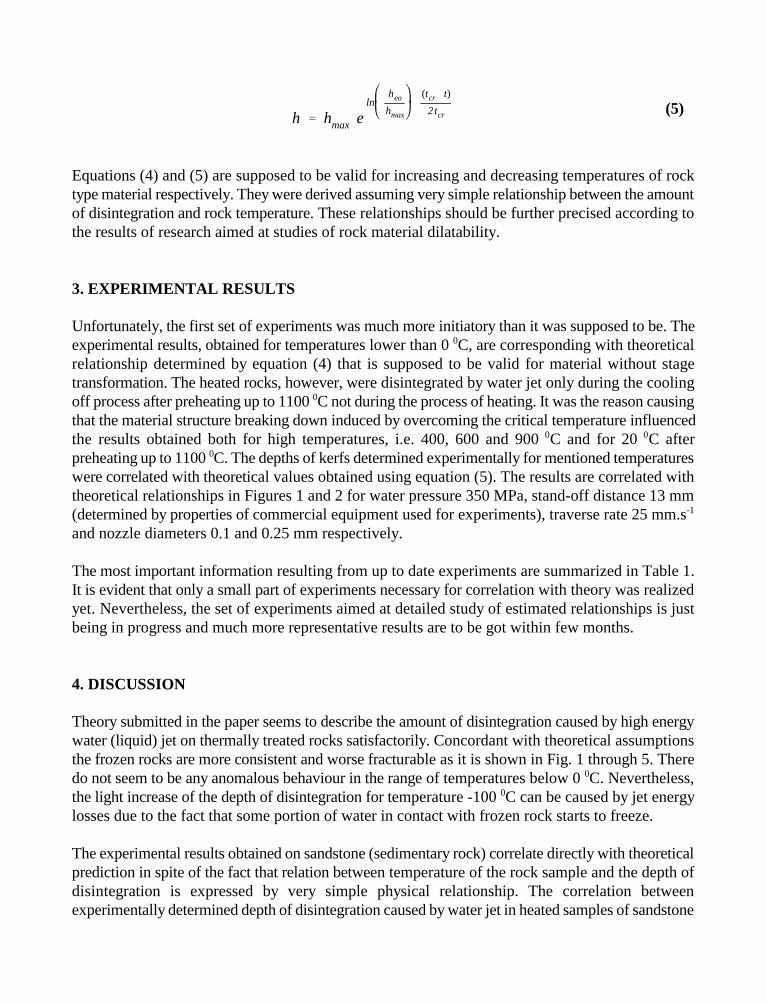
h hmax eln
heo
hmax
(tcr t)
2tcr (5)
Equations (4) and (5) are supposed to be valid for increasing and decreasing temperatures of rocktype material respectively. They were derived assuming very simple relationship between the amountof disintegration and rock temperature. These relationships should be further precised according tothe results of research aimed at studies of rock material dilatability.
3. EXPERIMENTAL RESULTS
Unfortunately, the first set of experiments was much more initiatory than it was supposed to be. Theexperimental results, obtained for temperatures lower than 0 C, are corresponding with theoretical0
relationship determined by equation (4) that is supposed to be valid for material without stagetransformation. The heated rocks, however, were disintegrated by water jet only during the coolingoff process after preheating up to 1100 C not during the process of heating. It was the reason causing0
that the material structure breaking down induced by overcoming the critical temperature influencedthe results obtained both for high temperatures, i.e. 400, 600 and 900 C and for 20 C after0 0
preheating up to 1100 C. The depths of kerfs determined experimentally for mentioned temperatures0
were correlated with theoretical values obtained using equation (5). The results are correlated withtheoretical relationships in Figures 1 and 2 for water pressure 350 MPa, stand-off distance 13 mm(determined by properties of commercial equipment used for experiments), traverse rate 25 mm.s-1
and nozzle diameters 0.1 and 0.25 mm respectively.
The most important information resulting from up to date experiments are summarized in Table 1.It is evident that only a small part of experiments necessary for correlation with theory was realizedyet. Nevertheless, the set of experiments aimed at detailed study of estimated relationships is justbeing in progress and much more representative results are to be got within few months.
4. DISCUSSION
Theory submitted in the paper seems to describe the amount of disintegration caused by high energywater (liquid) jet on thermally treated rocks satisfactorily. Concordant with theoretical assumptionsthe frozen rocks are more consistent and worse fracturable as it is shown in Fig. 1 through 5. Theredo not seem to be any anomalous behaviour in the range of temperatures below 0 C. Nevertheless,0
the light increase of the depth of disintegration for temperature -100 C can be caused by jet energy0
losses due to the fact that some portion of water in contact with frozen rock starts to freeze.
The experimental results obtained on sandstone (sedimentary rock) correlate directly with theoreticalprediction in spite of the fact that relation between temperature of the rock sample and the depth ofdisintegration is expressed by very simple physical relationship. The correlation betweenexperimentally determined depth of disintegration caused by water jet in heated samples of sandstone
and theoretical relationship is also very good (Fig. 1 and 2). The high correlation is evident eventhough the experimental results were obtained under conditions that are not in accordance withtypical experimental procedure. The theoretical relationship can be precised taking into accountgreater amount of the rock material properties and water (or other liquid) parameters. Nevertheless,the divergence between experiment and theory in the case of sandstone seems to be below error inmeasurement caused primarily by rock properties variation.
The situation is quite different in the case of basalt. The experimental results of the depth ofdisintegration determined for decreasing temperature using the small nozzle diameter (0.1 mm) veryclosely follow the curve calculated from theory for increasing temperature (Fig. 3). In spite of thefact that the quantity of results does not provide the chance to do definite conclusions, it can bepresupposed that this phenomenon can be caused by the fact that basalt is very compact rock materialwith elastic behaviour in wider range of parameters than other rocks (specially sandstone or granite).Nevertheless, the results obtained with the greater nozzle diameter (0.25 mm) show (Fig. 4) thatovercoming the critical (or characteristic) temperature the heated rock material may become lessconsistent than it is supposed in theory.
Behaviour of the granite is rather surprising. Overcoming the critical (characteristic) temperaturegranite becomes much weaker and this phenomenon has to be introduced into the theoreticalrelationship using temperature depending coefficient of weakening. The experimental results wereobtained only for the small nozzle diameter (0.1 mm) because dimensions of the rock samples werelimited by dimensions of the kiln and impact of water jet from the nozzle with the greater diameter(0.25 mm) caused breaking down of the granite samples by all temperatures except 20 C. Acquired0
experimental results are correlated with theory in Fig. 5.
The drop of disintegration depth observed for all studied rock materials by 900 C considering both0
respective theoretical values and experimental data obtained for 600 C is another phenomenon to0
be mentioned. It is supposed that the drop of the water jet efficiency is caused by the fact that thegradient of temperature inside the kerf (produced in a rock sample by water jet) overcomes a specificvalue limiting the heat transfer from rock to water during water jet penetration process. Overcomingthis value the heat transfer becomes enough for water evaporation before penetration into the depthcorresponding to maximum initial energy of the jet. The energy of a vaporized amount of water islost and therefore the total efficiency is lower than for lower temperatures.
5. CONCLUSIONS
The up-to-date conclusions of the presented theoretical and experimental investigation to theproblem of disintegration of heated rocks by water jet are as follows:
the depth of disintegration in sandstone is satisfactorily described by presented theory for thewhole range of tested temperatures;
the theoretical description of the jet impact onto heated rock must be based on more parametersfor better correlation with experimental results on rocks like basalt;
the implementation of the temperature depending coefficient of weakening seems to modify thetheory sufficiently for materials similar to granite;
the depths of disintegration made by water jet in frozen rocks without preheating aresatisfactorily described by presented theory;
the theoretical description of the energy losses caused by jet evaporation for highly heated rockshas to be added;
the set of experiments including tests on rocks for both increasing and decreasing temperatureis to be completed.
6. ACKNOWLEDGEMENTS
The author is grateful to the Grant Agency of the Czech Republic supporting the work by projectNo. 106/98/1354.
7. REFERENCES
Hlavág, L.M.: “Physical Analysis of the Energy Balance of the High Energy Liquid Jet Collisionwith Brittle Non-Homogeneous Material," Proceedings of the 8th American Water JetConference, pp. 681-697, Water Jet Technology Association, St. Louis, Missouri, 1995.
8. NOMENCLATURE
coefficient of losses in liquid jet velocity during interaction with materialn
compressibility factorR
C coefficient of resistance of material structure to the jet x
d water nozzle diameter [m]o
dynamic liquid viscosity [N.s.m ]-2
h depth of disintegration in material [m]h experimental depth of kerf for 0 C (it may be considered equal to the depth of kerf made byeo
0
20 C without any temperature treatment of the rock) [m]0
h maximum theoretical depth of kerf calculated from equation (1) for ) = 0 MPa [m] max
h depth of disintegration made in n-th pass of liquid jet, h = 0 [m]n o
h total depth of disintegration after n passes [m]n*
angle of an incidence of the jet measured between a normal line at the point of jet's axisprojection through material surface and jet axis [rad]
k dynamic material permeability [m ]* 2
L standoff distance [m]µ nozzle discharge coefficient ! coefficient of attenuation of jet caused by resistance of the medium between nozzle and
material [m ]-1
! coefficient of attenuation of jet caused by resistance of the medium in kerf made in material*
during previous passes [m ]-1
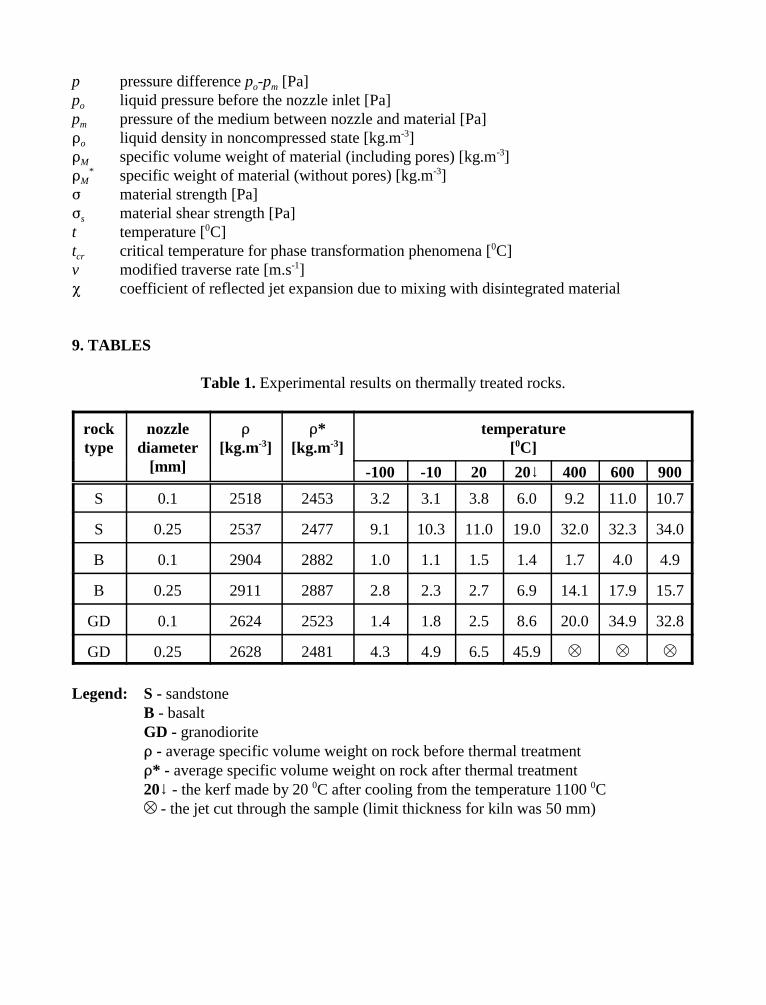
p pressure difference p -p [Pa]o m
p liquid pressure before the nozzle inlet [Pa]o
p pressure of the medium between nozzle and material [Pa]m
' liquid density in noncompressed state [kg.m ]o-3
' specific volume weight of material (including pores) [kg.m ]M-3
' specific weight of material (without pores) [kg.m ]M* -3
) material strength [Pa]) material shear strength [Pa]s
t temperature [ C]0
t critical temperature for phase transformation phenomena [ C]cr0
v modified traverse rate [m.s ]-1
3 coefficient of reflected jet expansion due to mixing with disintegrated material
9. TABLES
Table 1. Experimental results on thermally treated rocks.
rock nozzle ' '* temperaturetype diameter [kg.m ] [kg.m ] [ C]
[mm]
-3 -3 0
-100 -10 20 20 400 600 900
S 0.1 2518 2453 3.2 3.1 3.8 6.0 9.2 11.0 10.7
S 0.25 2537 2477 9.1 10.3 11.0 19.0 32.0 32.3 34.0
B 0.1 2904 2882 1.0 1.1 1.5 1.4 1.7 4.0 4.9
B 0.25 2911 2887 2.8 2.3 2.7 6.9 14.1 17.9 15.7
GD 0.1 2624 2523 1.4 1.8 2.5 8.6 20.0 34.9 32.8
GD 0.25 2628 2481 4.3 4.9 6.5 45.9
Legend: S - sandstoneB - basaltGD - granodiorite' - average specific volume weight on rock before thermal treatment'* - average specific volume weight on rock after thermal treatment20 - the kerf made by 20 C after cooling from the temperature 1100 C0 0
- the jet cut through the sample (limit thickness for kiln was 50 mm)
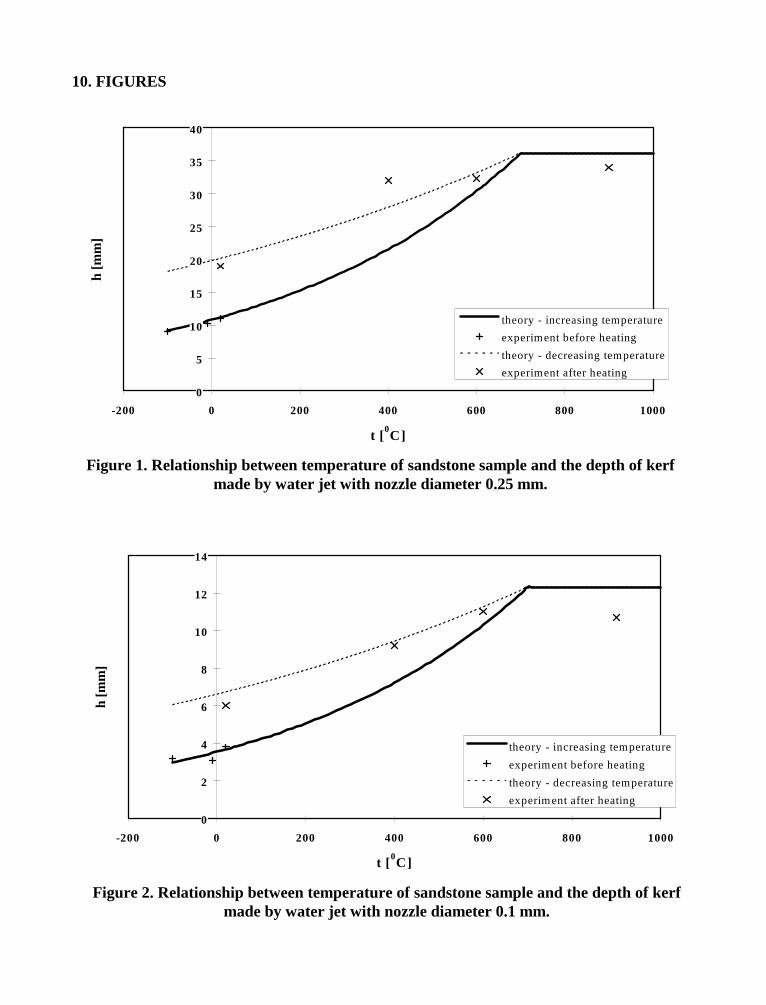
0
5
10
15
20
25
30
35
40
-200 0 200 400 600 800 1000
t [0C]
h [m
m]
theory - increasing temperature
experiment before heating
theory - decreasing temperature
experiment after heating
0
2
4
6
8
10
12
14
-200 0 200 400 600 800 1000
t [ 0C]
h [m
m]
theory - increasing temperature
experiment before heating
theory - decreasing temperature
experiment after heating
Figure 1. Relationship between temperature of sandstone sample and the depth of kerfmade by water jet with nozzle diameter 0.25 mm.
Figure 2. Relationship between temperature of sandstone sample and the depth of kerfmade by water jet with nozzle diameter 0.1 mm.
10. FIGURES
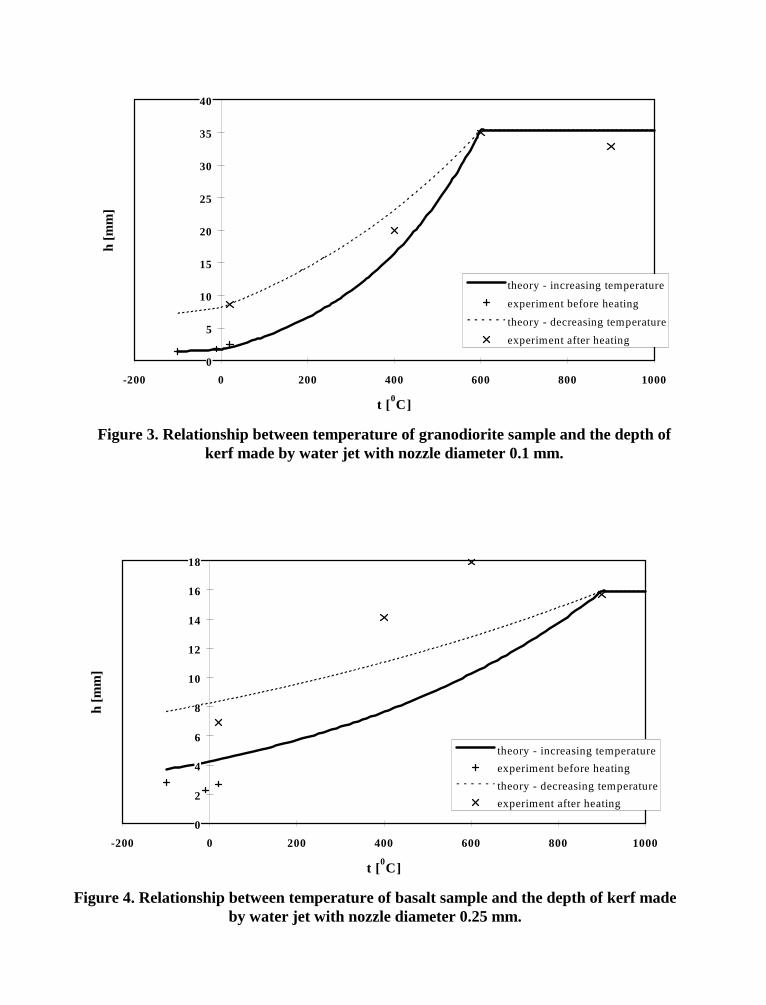
0
5
10
15
20
25
30
35
40
-200 0 200 400 600 800 1000
t [ 0C]
h [m
m]
theory - increasing temperature
experiment before heating
theory - decreasing temperature
experiment after heating
0
2
4
6
8
10
12
14
16
18
-200 0 200 400 600 800 1000
t [0C]
h [m
m]
theory - increasing temperature
experiment before heating
theory - decreasing temperature
experiment after heating
Figure 3. Relationship between temperature of granodiorite sample and the depth ofkerf made by water jet with nozzle diameter 0.1 mm.
Figure 4. Relationship between temperature of basalt sample and the depth of kerf madeby water jet with nozzle diameter 0.25 mm.
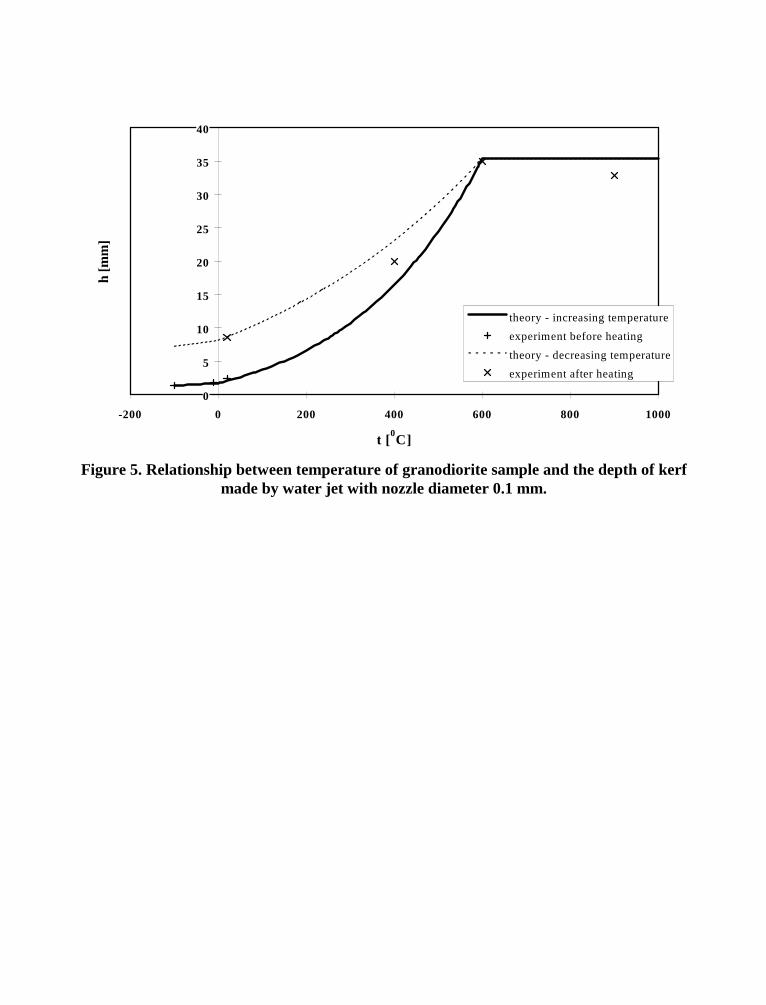
0
5
10
15
20
25
30
35
40
-200 0 200 400 600 800 1000
t [0C]
h [m
m]
theory - increasing temperature
experiment before heating
theory - decreasing temperature
experiment after heating
Figure 5. Relationship between temperature of granodiorite sample and the depth of kerfmade by water jet with nozzle diameter 0.1 mm.
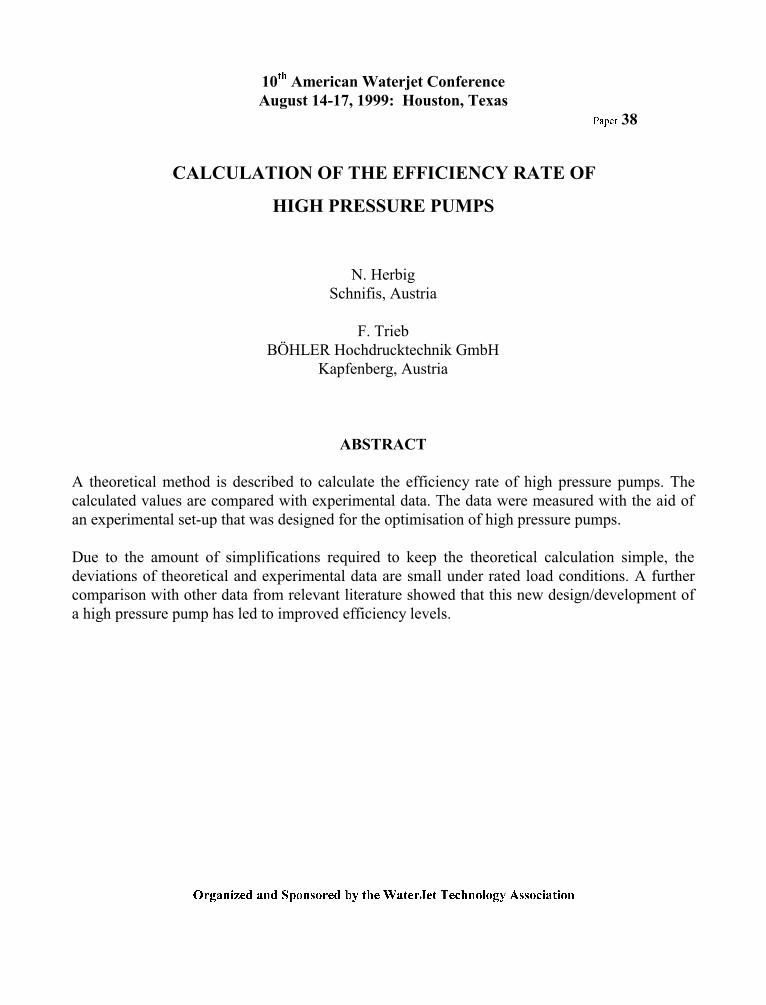
10th
American Waterjet Conference
August 14-17, 1999: Houston, Texas
Paper 38
CALCULATION OF THE EFFICIENCY RATE OF
HIGH PRESSURE PUMPS
N. HerbigSchnifis, Austria
F. TriebBÖHLER Hochdrucktechnik GmbH
Kapfenberg, Austria
ABSTRACT
A theoretical method is described to calculate the efficiency rate of high pressure pumps. Thecalculated values are compared with experimental data. The data were measured with the aid ofan experimental set-up that was designed for the optimisation of high pressure pumps.
Due to the amount of simplifications required to keep the theoretical calculation simple, thedeviations of theoretical and experimental data are small under rated load conditions. A furthercomparison with other data from relevant literature showed that this new design/development ofa high pressure pump has led to improved efficiency levels.
Organized and Sponsored by the WaterJet Technology Association
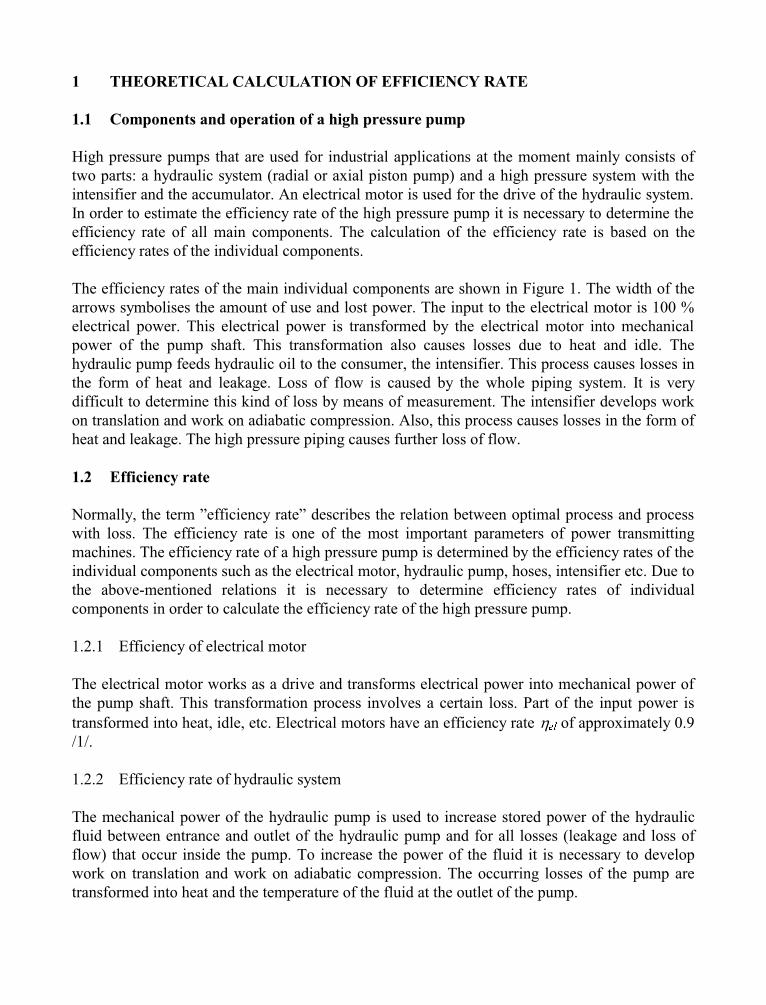
1 THEORETICAL CALCULATION OF EFFICIENCY RATE
1.1 Components and operation of a high pressure pump
High pressure pumps that are used for industrial applications at the moment mainly consists oftwo parts: a hydraulic system (radial or axial piston pump) and a high pressure system with theintensifier and the accumulator. An electrical motor is used for the drive of the hydraulic system.In order to estimate the efficiency rate of the high pressure pump it is necessary to determine theefficiency rate of all main components. The calculation of the efficiency rate is based on theefficiency rates of the individual components.
The efficiency rates of the main individual components are shown in Figure 1. The width of thearrows symbolises the amount of use and lost power. The input to the electrical motor is 100 %electrical power. This electrical power is transformed by the electrical motor into mechanicalpower of the pump shaft. This transformation also causes losses due to heat and idle. Thehydraulic pump feeds hydraulic oil to the consumer, the intensifier. This process causes losses inthe form of heat and leakage. Loss of flow is caused by the whole piping system. It is verydifficult to determine this kind of loss by means of measurement. The intensifier develops workon translation and work on adiabatic compression. Also, this process causes losses in the form ofheat and leakage. The high pressure piping causes further loss of flow.
1.2 Efficiency rate
Normally, the term efficiency rate describes the relation between optimal process and processwith loss. The efficiency rate is one of the most important parameters of power transmittingmachines. The efficiency rate of a high pressure pump is determined by the efficiency rates of theindividual components such as the electrical motor, hydraulic pump, hoses, intensifier etc. Due tothe above-mentioned relations it is necessary to determine efficiency rates of individualcomponents in order to calculate the efficiency rate of the high pressure pump.
1.2.1 Efficiency of electrical motor
The electrical motor works as a drive and transforms electrical power into mechanical power ofthe pump shaft. This transformation process involves a certain loss. Part of the input power istransformed into heat, idle, etc. Electrical motors have an efficiency rate hel of approximately 0.9/1/.
1.2.2 Efficiency rate of hydraulic system
The mechanical power of the hydraulic pump is used to increase stored power of the hydraulicfluid between entrance and outlet of the hydraulic pump and for all losses (leakage and loss offlow) that occur inside the pump. To increase the power of the fluid it is necessary to developwork on translation and work on adiabatic compression. The occurring losses of the pump aretransformed into heat and the temperature of the fluid at the outlet of the pump.
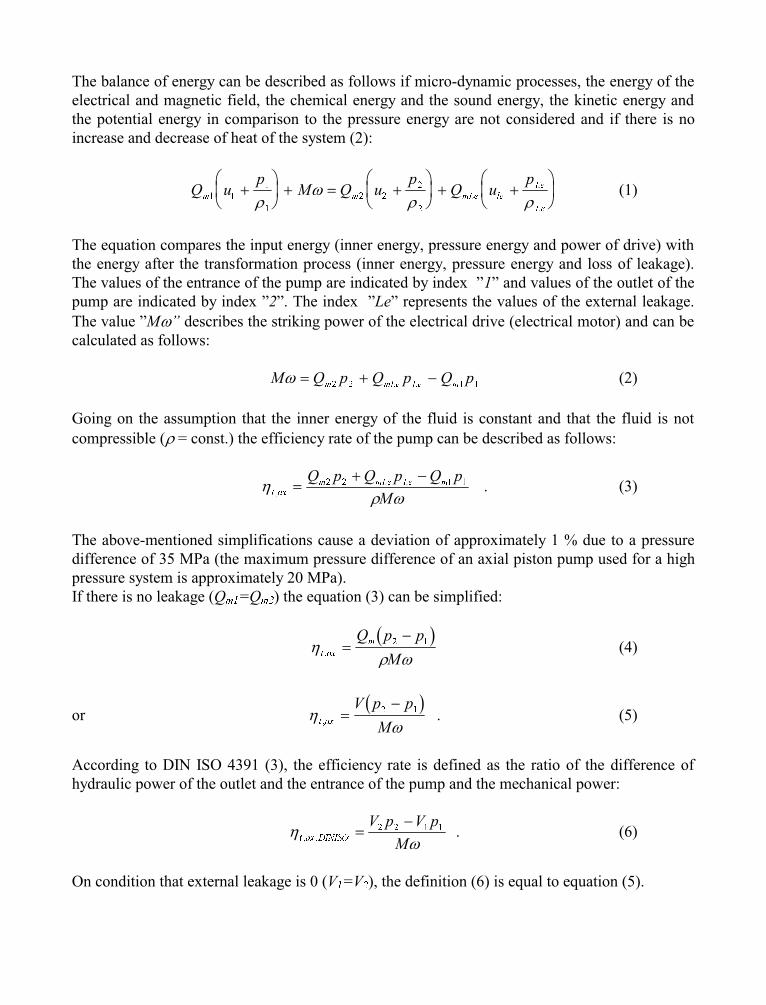
The balance of energy can be described as follows if micro-dynamic processes, the energy of theelectrical and magnetic field, the chemical energy and the sound energy, the kinetic energy andthe potential energy in comparison to the pressure energy are not considered and if there is noincrease and decrease of heat of the system (2):
Q up
M Q up
Q up
m m mLe le
Le
Le
1 1
1
1
2 2
2
2
+æ
èç
ö
ø÷ + = +
æ
èç
ö
ø÷ + +
æ
èç
ö
ø÷
rw
r r(1)
The equation compares the input energy (inner energy, pressure energy and power of drive) withthe energy after the transformation process (inner energy, pressure energy and loss of leakage).The values of the entrance of the pump are indicated by index 1 and values of the outlet of thepump are indicated by index 2. The index Le represents the values of the external leakage.The value Mw describes the striking power of the electrical drive (electrical motor) and can becalculated as follows:
M Q p Q p Q pm mLe Le m
w = + -2 2 1 1
(2)
Going on the assumption that the inner energy of the fluid is constant and that the fluid is notcompressible (r = const.) the efficiency rate of the pump can be described as follows:
hr w
t ax
m mLe Le mQ p Q p Q p
M,
=+ -
2 2 1 1 . (3)
The above-mentioned simplifications cause a deviation of approximately 1 % due to a pressuredifference of 35 MPa (the maximum pressure difference of an axial piston pump used for a highpressure system is approximately 20 MPa).If there is no leakage (Qm1=Qm2) the equation (3) can be simplified:
( )h
r wt ax
mQ p p
M,
=-
2 1 (4)
or( )
hw
t ax
V p p
M,
=-
2 1 . (5)
According to DIN ISO 4391 (3), the efficiency rate is defined as the ratio of the difference ofhydraulic power of the outlet and the entrance of the pump and the mechanical power:
hw
t ax DINISO
V p V p
M, ,
=-
2 2 1 1 . (6)
On condition that external leakage is 0 (V1=V2), the definition (6) is equal to equation (5).
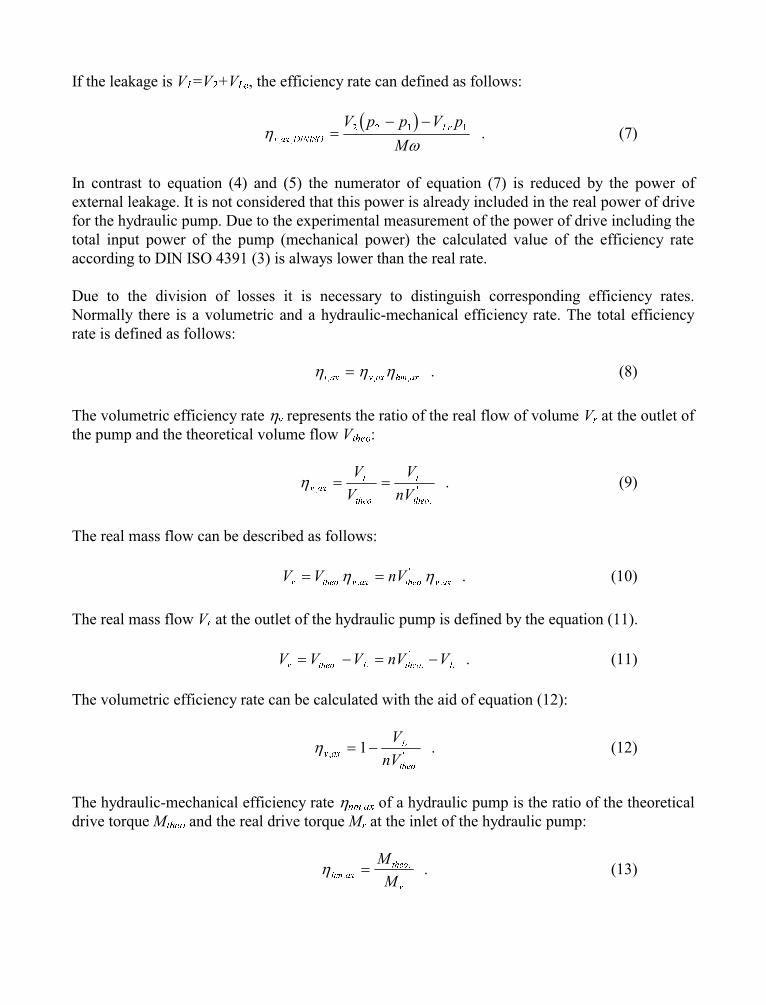
If the leakage is V1=V2+VLe, the efficiency rate can defined as follows:
( )h
wt ax DINISO
LeV p p V p
M, ,
=- -
2 2 1 1 . (7)
In contrast to equation (4) and (5) the numerator of equation (7) is reduced by the power ofexternal leakage. It is not considered that this power is already included in the real power of drivefor the hydraulic pump. Due to the experimental measurement of the power of drive including thetotal input power of the pump (mechanical power) the calculated value of the efficiency rateaccording to DIN ISO 4391 (3) is always lower than the real rate.
Due to the division of losses it is necessary to distinguish corresponding efficiency rates.Normally there is a volumetric and a hydraulic-mechanical efficiency rate. The total efficiencyrate is defined as follows:
h h ht ax v ax hm ax, , ,= . (8)
The volumetric efficiency rate hv represents the ratio of the real flow of volume Vr at the outlet ofthe pump and the theoretical volume flow Vtheo:
h v ax
r
theo
r
theo
V
V
V
nV,
. .
'= = . (9)
The real mass flow can be described as follows:
V V nVr theo v ax theo v ax= =. , .
'
,h h . (10)
The real mass flow Vr at the outlet of the hydraulic pump is defined by the equation (11).
V V V nV Vr theo L theo L= - = -. .
' . (11)
The volumetric efficiency rate can be calculated with the aid of equation (12):
h v ax
L
theo
V
nV,
.
'= -1 . (12)
The hydraulic-mechanical efficiency rate hnm,ax of a hydraulic pump is the ratio of the theoreticaldrive torque Mtheo and the real drive torque Mr at the inlet of the hydraulic pump:
h hm ax
theo
r
M
M,
.= . (13)
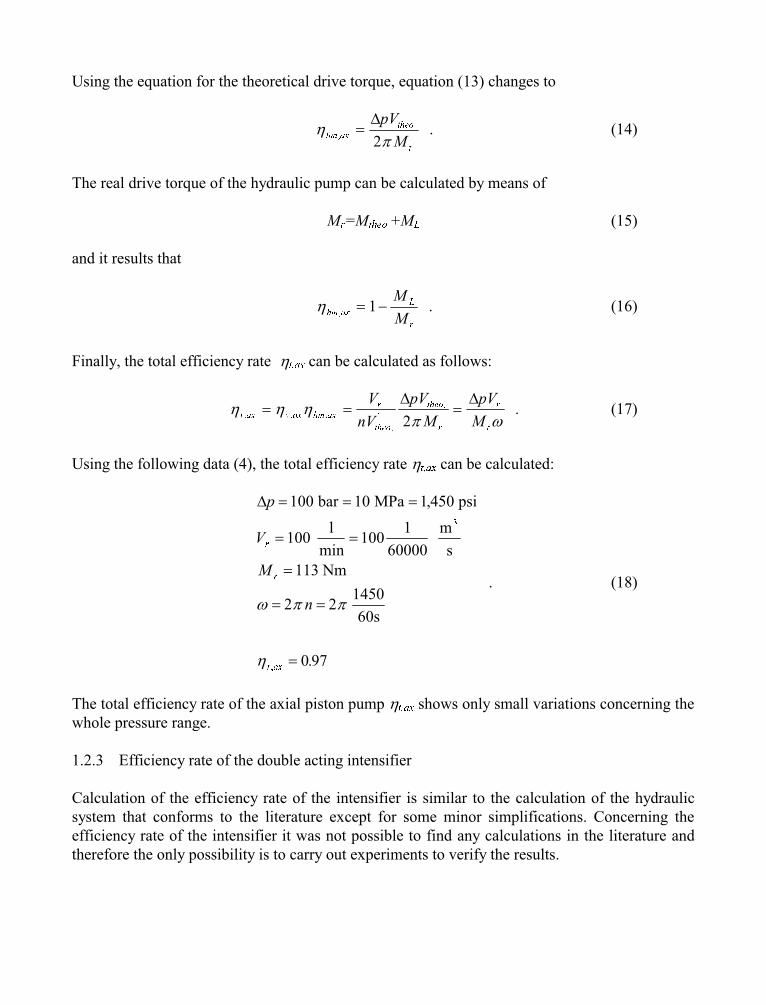
Using the equation for the theoretical drive torque, equation (13) changes to
hp
hm ax
theo
r
pV
M,
.=D
2 . (14)
The real drive torque of the hydraulic pump can be calculated by means of
Mr=Mtheo.+ML (15)
and it results that
h hm ax
L
r
M
M,
= -1 . (16)
Finally, the total efficiency rate ht,ax can be calculated as follows:
h h hp w
t ax v ax hm ax
r
theo
theo
r
r
r
V
nV
pV
M
pV
M, , ,
.
'
.= = =D D
2 . (17)
Using the following data (4), the total efficiency rate ht,ax can be calculated:
Dp
V
M
n
r
r
t ax
= = =
= =
=
= =
=
100 10 1 450
100 1001
60000113
2 2
0 97
bar MPa psi
l
min
m
s Nm
1450
60s
3
,
.,
w p p
h
. (18)
The total efficiency rate of the axial piston pump ht,ax shows only small variations concerning thewhole pressure range.
1.2.3 Efficiency rate of the double acting intensifier
Calculation of the efficiency rate of the intensifier is similar to the calculation of the hydraulicsystem that conforms to the literature except for some minor simplifications. Concerning theefficiency rate of the intensifier it was not possible to find any calculations in the literature andtherefore the only possibility is to carry out experiments to verify the results.
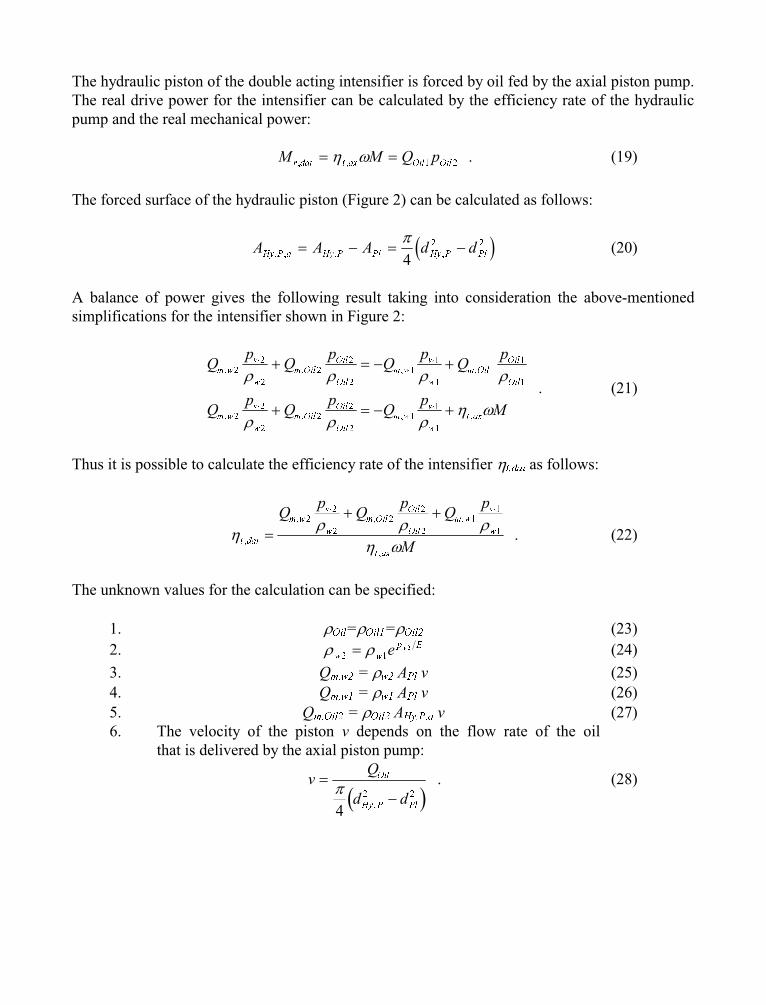
The hydraulic piston of the double acting intensifier is forced by oil fed by the axial piston pump.The real drive power for the intensifier can be calculated by the efficiency rate of the hydraulicpump and the real mechanical power:
M M Q pr dai t ax Oil Oil, ,= =h w
1 2 . (19)
The forced surface of the hydraulic piston (Figure 2) can be calculated as follows:
( )A A A d dHy P a Hy P Pl Hy P Pl. , . ,= - = -
p
42 2 (20)
A balance of power gives the following result taking into consideration the above-mentionedsimplifications for the intensifier shown in Figure 2:
Qp
Qp
Qp
Qp
Qp
Qp
Qp
M
m ww
w
m OilOil
Oil
m ww
w
m OilOil
Oil
m ww
w
m OilOil
Oil
m ww
w
t ax
, , , ,
, , , ,
2
2
2
2
2
2
1
1
1
1
1
1
2
2
2
2
2
2
1
1
1
r r r r
r r rh w
+ = - +
+ = - +
. (21)
Thus it is possible to calculate the efficiency rate of the intensifier ht,dai as follows:
hr r r
h wt dai
m ww
w
m OilOil
Oil
m ww
w
t ax
Qp
Qp
Qp
M,
, , ,
,
=
+ +2
2
2
22
2
11
1 . (22)
The unknown values for the calculation can be specified:
1. rOil=rOil1=rOil2 (23)
2. r rw w
p Ee w
2 12= (24)
3. Qm,w2 = rw2 APl v (25)4. Qm,w1 = rw1 APl v (26)5. Qm,Oil2 = rOil2 AHy.P,a v (27)6. The velocity of the piston v depends on the flow rate of the oil
that is delivered by the axial piston pump:
( )v
Q
d d
Oil
Hy P Pl
=-
p
42 2
,
. (28)
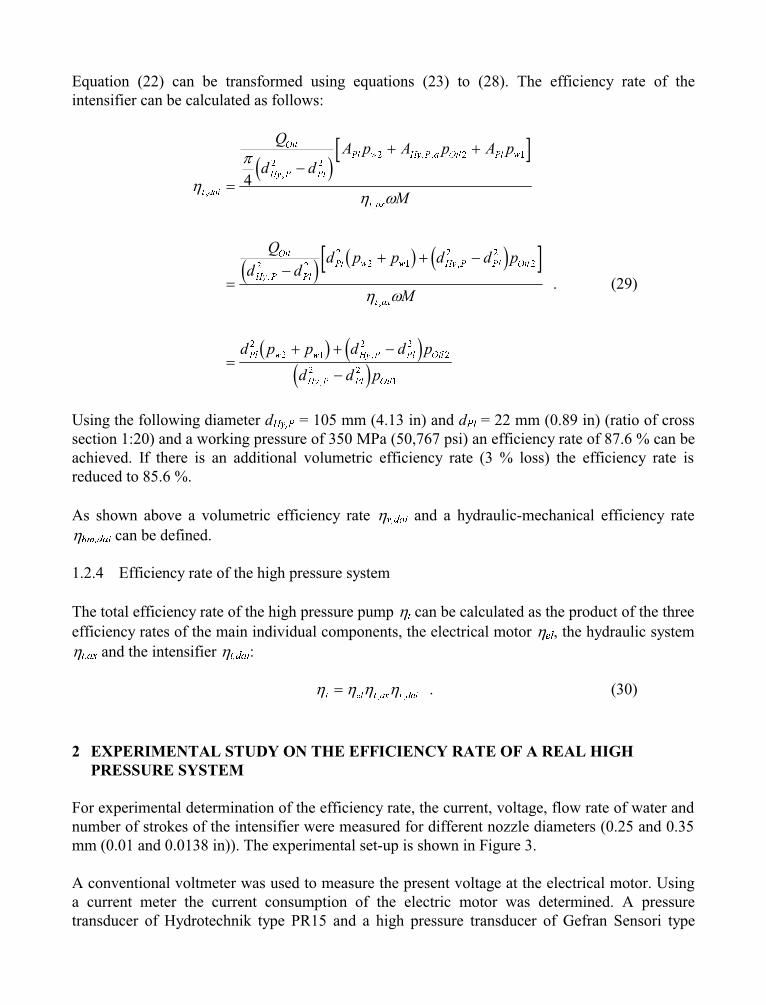
Equation (22) can be transformed using equations (23) to (28). The efficiency rate of theintensifier can be calculated as follows:
( )[ ]
( )( ) ( )[ ]
( ) ( )( )
h
p
h w
h w
t dai
Oil
Hy P Pl
Pl w Hy P a Oil Pl w
t ax
Oil
Hy P Pl
Pl w w Hy P Pl Oil
t ax
Pl w w Hy P Pl Oil
Hy P Pl Oil
Q
d d
A p A p A p
M
Q
d dd p p d d p
M
d p p d d p
d d p
,
,
. ,
,
,
,
,
,
,
=-
+ +
=-
+ + -
=+ + -
-
42 2
2 2 1
2 2
2
2 1
2 2
2
2
2 1
2 2
2
2 2
1
. (29)
Using the following diameter dHy,P = 105 mm (4.13 in) and dPl = 22 mm (0.89 in) (ratio of crosssection 1:20) and a working pressure of 350 MPa (50,767 psi) an efficiency rate of 87.6 % can beachieved. If there is an additional volumetric efficiency rate (3 % loss) the efficiency rate isreduced to 85.6 %.
As shown above a volumetric efficiency rate hv,dai and a hydraulic-mechanical efficiency ratehhm,dai can be defined.
1.2.4 Efficiency rate of the high pressure system
The total efficiency rate of the high pressure pump ht can be calculated as the product of the threeefficiency rates of the main individual components, the electrical motor hel, the hydraulic systemht,ax and the intensifier ht,dai:
h h h ht el t ax t dai=, ,
. (30)
2 EXPERIMENTAL STUDY ON THE EFFICIENCY RATE OF A REAL HIGH
PRESSURE SYSTEM
For experimental determination of the efficiency rate, the current, voltage, flow rate of water andnumber of strokes of the intensifier were measured for different nozzle diameters (0.25 and 0.35mm (0.01 and 0.0138 in)). The experimental set-up is shown in Figure 3.
A conventional voltmeter was used to measure the present voltage at the electrical motor. Usinga current meter the current consumption of the electric motor was determined. A pressuretransducer of Hydrotechnik type PR15 and a high pressure transducer of Gefran Sensori type
HPE 30 5M were used to measure the hydraulic pressure during the stroke. The electrical signalof the pressure transducer was recorder by a measuring computer of Dewetron and analysed withthe software DasyLap V2.0.
2.1 Electrical Power
The power consumed by the three phase electrical motor can by calculated using the measuredvalues voltage U and current I and with the aid of the following equation:
P U IIn = × × ×3 cosj (31)
Reactive independence of a circuit with alternating current causes a phase difference betweencurrent and voltage. The angle j occurs between the pointer of voltage U and current I in thediagram. In order to calculate the power, the real voltage and the active current (currentcomponent equal to polarity) are necessary. The factor cos j is called the power factor.
2.2 Flow rate power of the high pressure system
The flow rate of the high pressure systems depends on the working pressure and the nozzlediameter.The amount of water fed at a special working pressure can be determined by using a measuringglass as shown in Figure 3. The power Pout can be calculated using flow rate Q and generatedpressure p:
P V p p V pOut r r= × - = ×( )2 1(32)
P kW
p bar Vl
p MPa Vl
r r
[ ][ ]
min[ ]
min=
×é
ëêù
ûú =
×é
ëêù
ûú
600 60 . (33)
2.3 Efficiency rate
The total efficiency rate of the high pressure pump can be calculated using the measured data ofinput and output power:
h totalOut
In
P
P= . (34)
Figure 4 shows the dependence of electrical power and efficiency rate on hydraulic power. Thepressure range between 200 (29,010 psi) and 350 MPa (50,767 psi) (preferred pressure range fordifferent applications) shows efficiency rates between 25 and 70 %. The low efficiency rates atlow working pressures are mainly caused by the variation of the efficiency rate of the electricalmotor. Increasing hydraulic power by using increased nozzle diameters or higher workingpressures causes the ratio of input and output energy to change to higher values.
The fundamental result is equal to the results of Chalmers (5). His paper presents the results ofinvestigations concerning a high pressure pump with a drive power of 30 kW. The electricalpower required was determined for a special hydraulic power. The calculated efficiency rateincreases distinctly up to a hydraulic power of 10 kW and reaches a maximum value of 58 % at amaximum hydraulic power of 20 kW.
The calculated efficiency rates reach a maximum value of 70 % with increasing hydraulic power.The high electrical power required at low hydraulic power is caused by wasted power of themotor. The wasted power increases more severely when the further the motor is not operatedunder rated load conditions (1).
Due to the variation of the load the power factor also changes. For all calculations (equation 31) aconstant power factor was used that was given for rated load conditions for the electrical motor.
Considering the real power factor the graph of the electrical power in dependence on thehydraulic power would decrease between 10 and 20 % in the range of low loads. This is shown inFigure 5 by a broken line. This results in higher values for the efficiency rates (shown by dottedline in Figure 5).
3 COMPARISON OF THE EFFICIENCY RATES FROM THE EXPERIMENTAL
STUDIES AND THE THEORETICAL EFFICIENCY RATES
The theoretical efficiency rate of the high pressure system can by calculated by equations 17, 22and 30. Figure 6 shows the theoretical and the efficiency rates from the experiments independence on the working pressure for nozzle diameters 0.25 and 0.35 mm (0.01 and 0.0138in). The plotted graphs show that there is only a correspondence between theory and practice inthe range of high powers, that means for high working pressures and large nozzle diameters.
The theoretical efficiency rate is always above the experimental one. This is due to thesimplification that only the main components of the high pressure pump were considered. In thiscase transformation of power into heat by friction, losses due to flow conditions and leakage isnot considered by the given calculation. Furthermore, the data used for the components are onlyvalid for the rated load condition, but are used for all calculations. As discussed above theefficiency rate of the electrical motor differs extremely in dependence on the actual load. This isthe main reason for the deviation between theory and practice.
The transformation of pressure energy of the water to kinetic energy of the waterjet is not free oflosses. These losses were also not considered during calculation. Furthermore, thecompressibility of water is also neglected. This effect is important in the range of high pressures(> 200 MPa / 29,010 psi). This is a further reason for the fact that theoretical efficiency rates arehigher than experimental ones.
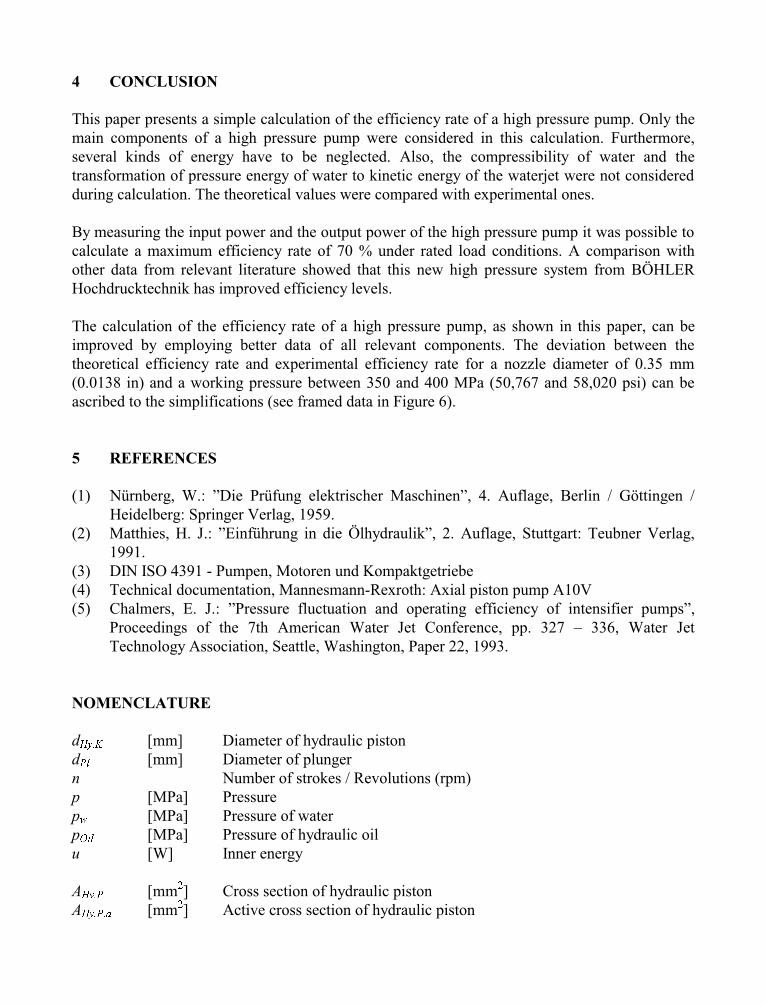
4 CONCLUSION
This paper presents a simple calculation of the efficiency rate of a high pressure pump. Only themain components of a high pressure pump were considered in this calculation. Furthermore,several kinds of energy have to be neglected. Also, the compressibility of water and thetransformation of pressure energy of water to kinetic energy of the waterjet were not consideredduring calculation. The theoretical values were compared with experimental ones.
By measuring the input power and the output power of the high pressure pump it was possible tocalculate a maximum efficiency rate of 70 % under rated load conditions. A comparison withother data from relevant literature showed that this new high pressure system from BÖHLERHochdrucktechnik has improved efficiency levels.
The calculation of the efficiency rate of a high pressure pump, as shown in this paper, can beimproved by employing better data of all relevant components. The deviation between thetheoretical efficiency rate and experimental efficiency rate for a nozzle diameter of 0.35 mm(0.0138 in) and a working pressure between 350 and 400 MPa (50,767 and 58,020 psi) can beascribed to the simplifications (see framed data in Figure 6).
5 REFERENCES
(1) Nürnberg, W.: Die Prüfung elektrischer Maschinen, 4. Auflage, Berlin / Göttingen /Heidelberg: Springer Verlag, 1959.
(2) Matthies, H. J.: Einführung in die Ölhydraulik, 2. Auflage, Stuttgart: Teubner Verlag,1991.
(3) DIN ISO 4391 - Pumpen, Motoren und Kompaktgetriebe(4) Technical documentation, Mannesmann-Rexroth: Axial piston pump A10V(5) Chalmers, E. J.: Pressure fluctuation and operating efficiency of intensifier pumps,
Proceedings of the 7th American Water Jet Conference, pp. 327 336, Water JetTechnology Association, Seattle, Washington, Paper 22, 1993.
NOMENCLATURE
dHy,K [mm] Diameter of hydraulic pistondPl [mm] Diameter of plungern Number of strokes / Revolutions (rpm)p [MPa] Pressurepw [MPa] Pressure of waterpOil [MPa] Pressure of hydraulic oilu [W] Inner energy
AHy.P [mm2] Cross section of hydraulic pistonAHy.P,a [mm2] Active cross section of hydraulic piston
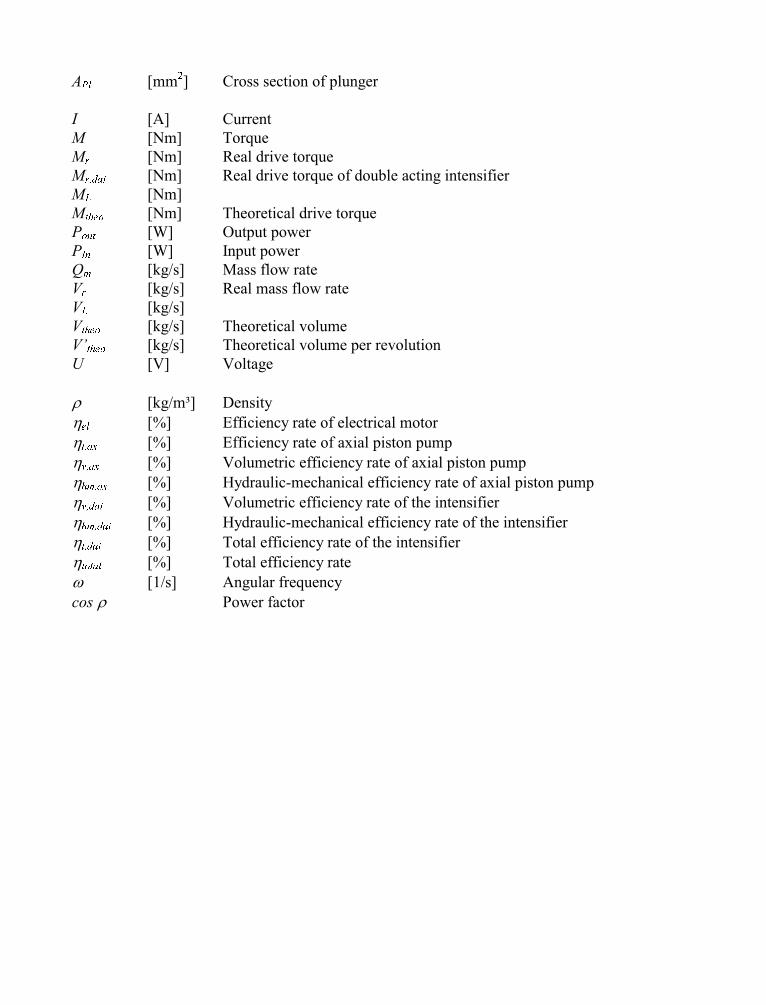
APl [mm2] Cross section of plunger
I [A] CurrentM [Nm] TorqueMr [Nm] Real drive torqueMr,dai [Nm] Real drive torque of double acting intensifierML [Nm]Mtheo [Nm] Theoretical drive torquePout [W] Output powerPIn [W] Input powerQm [kg/s] Mass flow rateVr [kg/s] Real mass flow rateVL [kg/s]Vtheo [kg/s] Theoretical volumeVtheo [kg/s] Theoretical volume per revolutionU [V] Voltage
r [kg/m³] Densityhel [%] Efficiency rate of electrical motorht,ax [%] Efficiency rate of axial piston pumphv,ax [%] Volumetric efficiency rate of axial piston pumphhm,ax [%] Hydraulic-mechanical efficiency rate of axial piston pumphv,dai [%] Volumetric efficiency rate of the intensifierhhm,dai [%] Hydraulic-mechanical efficiency rate of the intensifierht,dai [%] Total efficiency rate of the intensifierhtotal [%] Total efficiency ratew [1/s] Angular frequencycos r Power factor
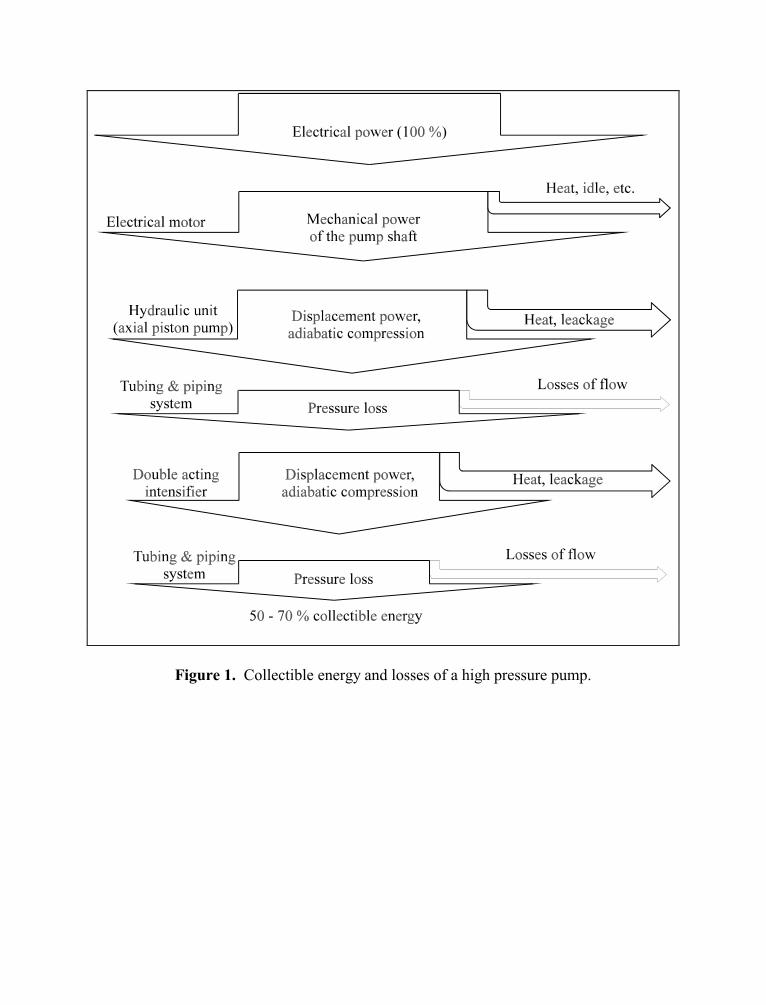
Figure 1. Collectible energy and losses of a high pressure pump.
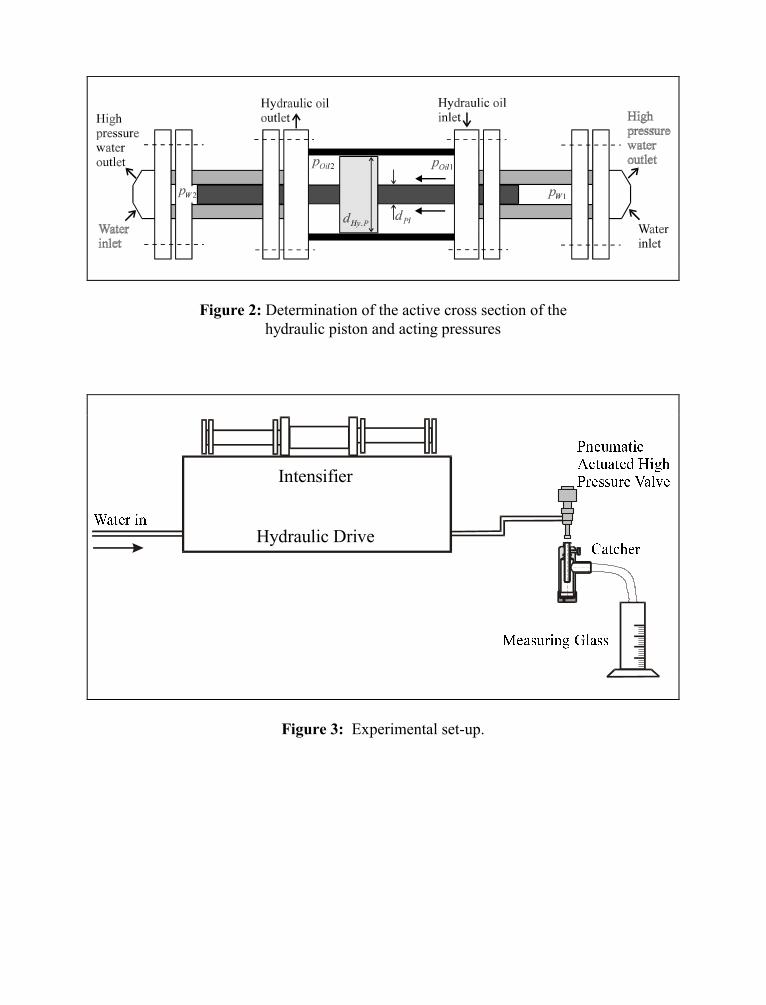
Figure 2: Determination of the active cross section of thehydraulic piston and acting pressures
Intensifier
Hydraulic DriveWater in
PneumaticActuated High
Pressure Valve
Catcher
Measuring Glass
Figure 3: Experimental set-up.
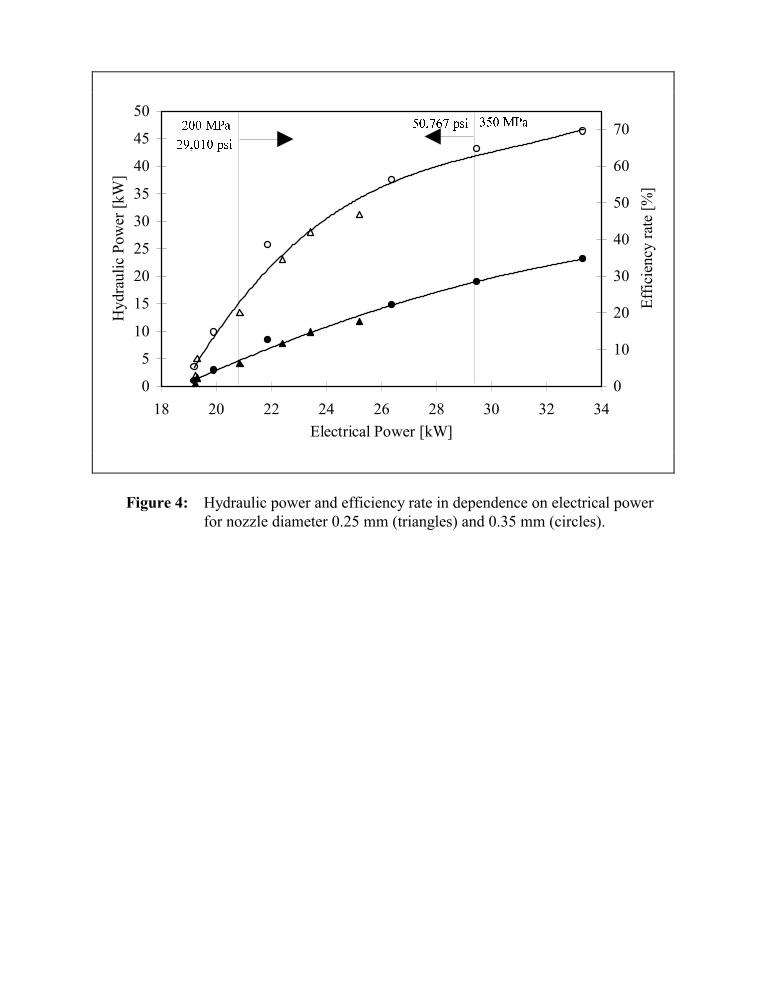
0
5
10
15
20
25
30
35
40
45
50
18 20 22 24 26 28 30 32 34
Electrical Power [kW]
Hyd
raul
ic P
ower
[kW
]
0
10
20
30
40
50
60
70
Eff
icie
ncy
rate
[%
]
200 MPa 350 MPa
29,010 psi
50,767 psi
Figure 4: Hydraulic power and efficiency rate in dependence on electrical powerfor nozzle diameter 0.25 mm (triangles) and 0.35 mm (circles).
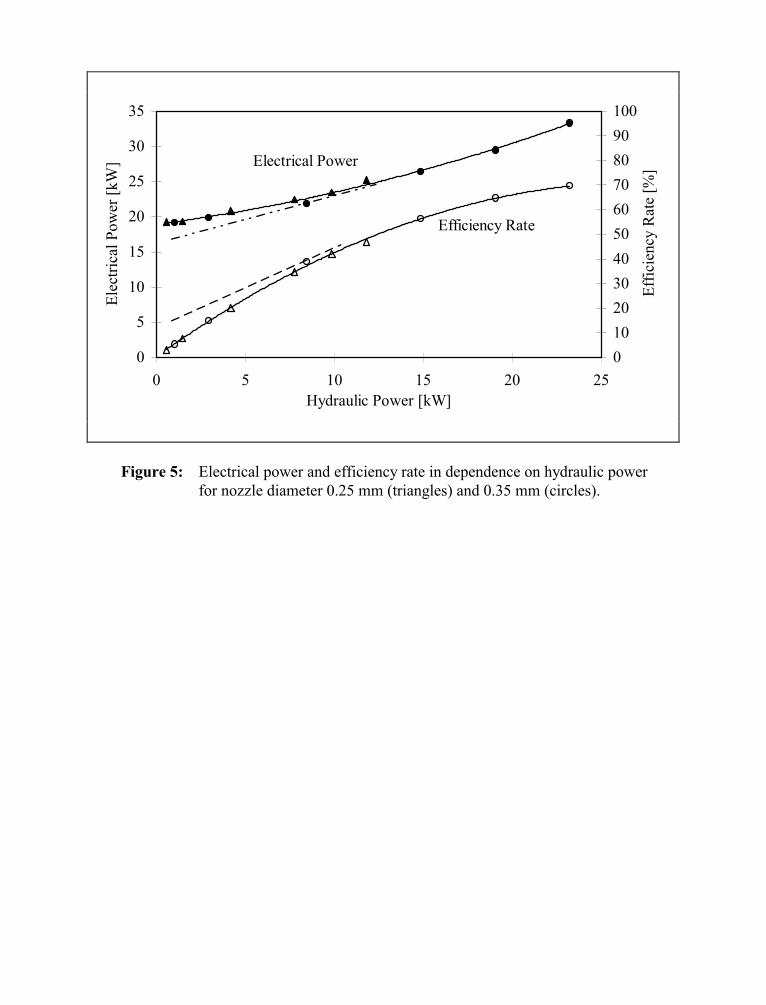
0
5
10
15
20
25
30
35
0 5 10 15 20 25Hydraulic Power [kW]
Ele
ctri
cal
Pow
er [
kW]
0
10
20
30
40
50
60
70
80
90
100
Eff
icie
ncy
Rat
e [%
]
Electrical Power
Efficiency Rate
Figure 5: Electrical power and efficiency rate in dependence on hydraulic powerfor nozzle diameter 0.25 mm (triangles) and 0.35 mm (circles).
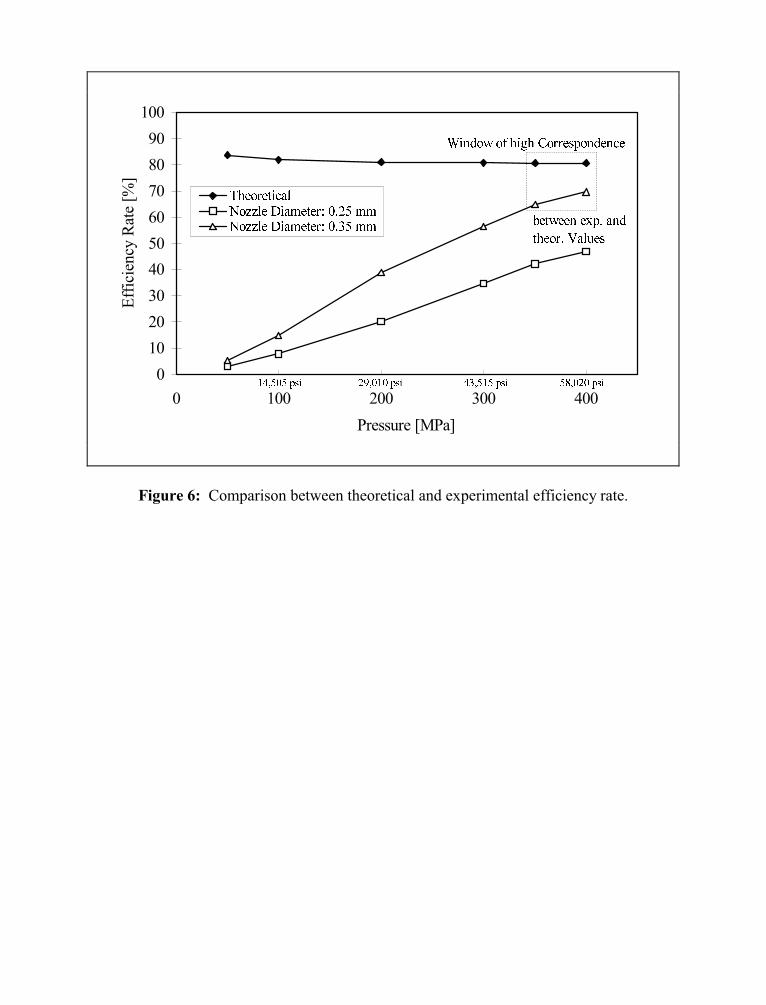
0
10
20
30
40
50
60
70
80
90
100
0 100 200 300 400
Pressure [MPa]
Eff
icie
ncy
Rat
e [%
]
Theoretical
Nozzle Diameter: 0.25 mmNozzle Diameter: 0.35 mm
Window of high Correspondence
between exp. and
theor. Values
14,505 psi 43,515 psi 58,020 psi29,010 psi
Figure 6: Comparison between theoretical and experimental efficiency rate.
10th American Waterjet ConferenceAugust 14-17, 1999: Houston, Texas
Paper 39
THE DEVELOPMENT OF NEW WATERJET PUMPS
Gene G. YieJetec Company
Auburn, Washington, U.S.A.
ABSTRACT
A pump is the heart of any fluid power systems. Waterjet processes in particular depend on theavailability of suitable pumps because of their uncommonly high pressures and flow rates involved.As the waterjet industry grows, the demands on pumps have also grown. Many new waterjettingapplications require that pump system be more powerful and yet more economical, more compactand yet more productive, more reliable and yet more versatile. These requirements are not being metsatisfactorily by the currently available pumps and fluid pressure intensifiers. Jetec Companyrecognized this situation and initiated the development of modern pumps and intensifiers. Byexploring new design concepts, Jetec has successfully conceived several new direct-drive pumps andpressure intensifiers that exhibit interesting capabilities. This paper discusses the many features ofthe direct-drive pumps that are under development at Jetec.
Organized and Sponsored by the WaterJet Technology Association
1. INTRODUCTION
The term $direct-drive# pump implies a pump that is driven directly by a motor or engine in contrastto a fluid pressure intensifier that is operated with a pressurized fluid such as compressed air orhydraulic oil. This distinction was necessary because intensifiers were commonly used in very highpressure applications while direct-drive pumps were not. However, this distinction is disappearingas many direct-drive pumps have been upgraded in their pressure capabilities and are invading theterritories traditionally occupied by intensifiers, such as in waterjetting applications.
A common direct-drive pump is the crankshaft pump, which is named after the crankshaft assemblyshared by all pumps of this type, much like that of automotive engines. It is called a triplex pumpwhen it has three pistons and three cylinders. It is called a quintuplex pump when it has five pistonsand five cylinders. They typically have a so-called $power end,# which is the crankcase that housesthe crankshaft assembly and the piston rods, and a $fluid end,# which houses the plungers and checkvalves for the system fluid. The power end is typically made of cast iron and contains lubricatingoil for the crankshaft, bearings, and piston rods. The fluid end generally consists of stainless-steelcylinders and a rectangular manifold assembly in which inlet and outlet fluid passages are bored.This type of pump has been extremely popular in agricultural and industrial operations for manyyears. The similarities between the crankshaft pumps and the automotive engines may havecontributed to the pump s popularity. On the plus side, crankshaft pumps are plentiful, ruggedlybuilt, relatively simple in construction, and reliable in their intended applications. On the minusside, crankshaft pumps are heavy, bulky, inflexible, and have relatively low pressure capability.
In industrial waterjetting applications, crankshaft pumps have been the main equipment to date. Fluid-operated intensifiers now occupy only a small high-pressure niche of the applications duepartly to their relatively high cost as they require the presence of a hydraulic power pack. As thewaterjetting applications become more popular, the operating pressure is raised steadily. As a result,the operating pressure of crankshaft pumps is pushed higher and higher although some of them arenot meant for such high pressures resulting in frequent breakdown. And yet there have not beenmany new pumps developed specially for high-pressure water applications. Jetec Company believedthat waterjet applications deserve new and improved pumps and proceeded to develop such pumps.This effort resulted in a new rotary pressure intensifier that possesses some unique capabilities (Yie,1997), and now a family of new direct-drive pumps.
2. AXIAL-PISTON PUMPS
Jetec s new pump is the type commonly referred to as $axial-piston# pump that has been very popularin hydraulic applications. Inside these pumps, there are multiple plungers that are parallel to eachother and to the center axis of a drive shaft. In most hydraulic pumps, the drive shaft is connectedto a drum that has cavities to accommodate the multiple plungers. On one end, these plungers arein contact with a disk, commonly referred to as a swash plate that can be set at an angle with thecenter axis. On the other end, the drum is in contact with a check valve disk having the inlet andoutlet ports. As the drum rotates, the plungers will rotate with the drum and will oscillate inside thedrum cavities by means of a retainer disk or bias springs. By virtue of the stationary check valve
disk positioned against the drum cavities, the oscillating motion of the plungers is synchronized withthe port operation such that fluid inside the cavities is pressurized and then pushed out. Mosthydraulic pumps have seven plungers and have a typical pressure capability of 2,000 to 5,000 psi;some special ones can go up to more than 10,000 psi.
This axial-piston pump design has many advantages. Those in hydraulic applications are noticeablymore compact and smooth in operation when compared to crankshaft pumps. The power transferfrom a prime mover to the pump pistons is direct and well balanced. However, their pressurecapability is relatively low due to the check valves involved and to some other design aspects. Jetecadopted this parallel-piston approach and added other features to expand its pressure capability andto improve its versatility to suit the waterjetting operations. In Jetec s pump design, the drum thathouses the plungers does not rotate; it is stationary. The drive shaft is connected to a slanted camdisk that abuts a set of plungers. The other end of these plungers is exposed to a bias force that couldbe from a spring or a pressurized fluid. When the cam disk rotates, each plunger will oscillate (androtate as well in some pumps) in respect to their cage. This motion is then utilized to pressurize asystem fluid in conjunction with suitable check valves. Several types of check valves wereincorporated and resulted in several types of pump, each having its own unique capabilities.
3. LOW-PRESSURE PUMPS
One family of direct-drive pumps under development at Jetec has multiple plungers that oscillate androtate against a slanted cam disk by virtue of the fact that plungers have one end matching that ofthe cam disk, as shown in Figure 1. The oscillating and rotating motion is utilized to provide inletand outlet check valves that are built into each plunger. As the plungers rise and fall and rotateinside their cavity, the inlet and outlet check valve slots carved around the plungers are in apredetermined relationship with the inlet and outlet ports drilled in the pump body. The system fluidwill flow in and out of each cavity in accordance with the plunger s motion, thus needing no separatecheck valves. There is a fluid inlet and a fluid outlet and a sealed chamber that houses the bearingsand the cam disk. The end result is a very simple and compact piston pump that is also a fluid motorif the direction of fluid flow is reversed.
This pump/motor is built to have either clockwise or counterclockwise rotation. Its flow capabilityis a function of plunger displacement and operating speed. It can have very high flow capability ifthere are many plungers and the pump is operating at a very high rpm. Its pressure capability is afunction of the fit of the plungers inside their cavities. It is estimated that a water pressure of 5,000psi (350 bar) may be attainable with this type of pump without any modification of the check valvesor the presence of any additional seals. A small 6-piston pump of this type is shown in a photographpresented in Figure 2; its internal piston chamber is shown in a photograph presented in Figure 3.This pump has six 0.312-inch-diameter axially-parallel pistons set to have 0.35-inch stroke, and canbe operated up to 3,000 rpm for a maximum flow rate of about 2.0 gpm. It is 1.75 inches in diameterand 6 inches in length, weighing 3 lbs.
This family of pumps is ideal for hydraulic applications where compactness and reversibility are ofvalue. They can be made to operate with water and other fluids if seals are incorporated to isolate
the bearings. The self-priming capability of this pump allows it to be used in fluid transferapplications as well. As a fluid-powered motor, it can generate considerable torque if the pressureof the working fluid is substantial. It is estimated that pump and motor of this type can attain amaximum pressure capability of about 5,000 psi. The motor s speed, however, will be relatively lowdue to its small rpm/displacement ratio. Because of its dual capabilities, two units tied together canfunction as a fluid pressure intensifier in which one functions as a motor and the other as a pump;the motor accepts the working fluid while the pump accepts the system fluid. However, the basicdesign approach can be employed to construct a dedicated fluid pressure intensifier having only oneset of pistons. It can also be used to construct unique fluid distribution valves, such as the one usedin Jetec s rotary intensifiers.
4. MEDIUM-PRESSURE PUMPS
When a pump of the type described earlier is modified by adding an outlet check valve, its pressurecapability can be significantly increased. The pump plungers can still have their built-in inlet checkvalve but will have separate outlet poppet-, disk-, or ball-type check valve. As a result, the pump spressure capability can be readily increased to 20,000 psi (1,400 bar) or higher. Once separate outletcheck valves are introduced, the pump is no longer reversible as a motor. A 8-piston pump of thistype in shown in a photograph presented in Figure 4 and its interior is shown in a photographpresented in Figure 5. This pump has 0.375-inch-diameter plungers, 0.4-inch stroke, and can beoperated at 2,500 rpm, indicating a peak flow rate of 3.8 gpm. It is only 2.5 inches square and 8inches long, weighing 12 lbs.
This family of axial-piston pumps is intended in the future for light- and medium-duty waterjetapplications at pressures up to perhaps 25,000 psi (1,700 bar). It is still quite simple in constructionbut does not have any convenience features such as pressure adjustment or flow shutoff. Its mainattraction will be compactness and relatively low cost. Jetec believes that it will be useful inconstructing fluid-jet thrusters or pulse-jet nozzle assemblies by connecting it directly to a hydraulicor electric motor.
5. HIGH-PRESSURE PUMPS
This type of pumps is currently receiving the bulk of attention at Jetec; it is intended to provide thefeatures desired by many current and future waterjetting processes. It is still the axial-piston typehaving multiple pistons that are positioned around a center axis and abut a slanted rotating cam disk.The pistons may rotate and oscillate in their cavities or may only oscillate. The check valves for thesystem fluid are no longer built into the pistons; they are conventional types. In Jetec s setup, eachpump piston assembly is treated as a module. There can be as many as fourteen piston modules ina single pump. These modules are divided to two groups and positioned in two concentric circles;each group is driven by a separate cam disk having its slanted face facing each other across the centeraxis, as shown in Figure 6. The purpose is to improve the force balance on the radial bearings of thecam disks.
Further, the pump piston modules are independent to each other; they share only the cam disks andfluid cavities. A working fluid, which could be a lubricating oil, the system fluid, or a third fluid,is introduced into each piston module to serve multiple purposes. Ideally, a lubricating oil havingits own power pack and a heat exchanger should be used as the working fluid. This fluid is thencirculated through the pump at a modest pressure of about 200 psi and is used to lubricate the pumpparts and to control the pump s operation. When the working fluid is at its full pressure and flow,the pump is operating at its peak capacity. When the working fluid is reduced in pressure and flow,the pump s output is reduced accordingly. When the working fluid is dumped, the pump s outputis stopped. Thus, this pump behaves much like a pressure-compensated hydraulic pump that itsoutput can be manipulated by an operator. Otherwise, it is truly a high-pressure, high-flow pumpthat can be powered directly by an electric or hydraulic motor, or an engine.
Figure 7 presents a side view of a direct-drive axial-piston pump of this type. It is 6 inches indiameter, 13 inches in overall length, 46 lbs. in weight, and is sized to accept a maximum powerinput of about 50 hp. This particular pump has10 piston modules positioned in two concentriccircles, each having five modules spaced 72 degrees apart. Each piston module is complete with itsown high-pressure cylinders, as shown in a photograph presented in Figure 8. Ultimately, one pumphousing will be able to accept several sets of piston modules, each having plungers of selecteddiameters and representing different power levels. For example, a set of ten piston modules having0.188-inch-diameter plungers will have a peak power capability of about 30 hp when the pump isoperated at 40,000 psi and is rotating at 1,800 rpm for a maximum flow output of about 1.3 gpm. Ifa set of ten piston modules having 0.250-inch-diameter plungers is installed, this pump will have amaximum power capability of 50 hp and a maximum flow rate of 2.3 gpm at 40,000 psi. It isapparent that this pump is very compact for its flow and power capabilities. It is estimated that a500-hp pump of this type will not be larger than 10 inches in diameter and could have 14 pistonmodules.
6. DISCUSSION
A pump is simply a device in which energy is transferred from a rotating shaft to a fluid. It is a goodpump if the energy is transferred safely and efficiently. There are no other major issues involved inthe pump s design. It is the same in waterjetting applications. There is no reason that waterjettingpumps need to be big and bulky since the flow rates involved are really very low when compared tomany other fluid processes. To provide a compact, high-flow waterjetting pump, there must bemultiple pistons operating at a reasonably high speed. Thus, packing the pistons in an axially-parallelgeometry appears to be logical and desirable. Since water is not a good lubricant, forced oillubrication must be applied to prolong the life of seals and plungers. Once a lubricating oil isinvolved, it is wise to use this oil for other purposes as well. Jetec followed these rules in thedevelopment of its high-flow, direct-drive pumps.
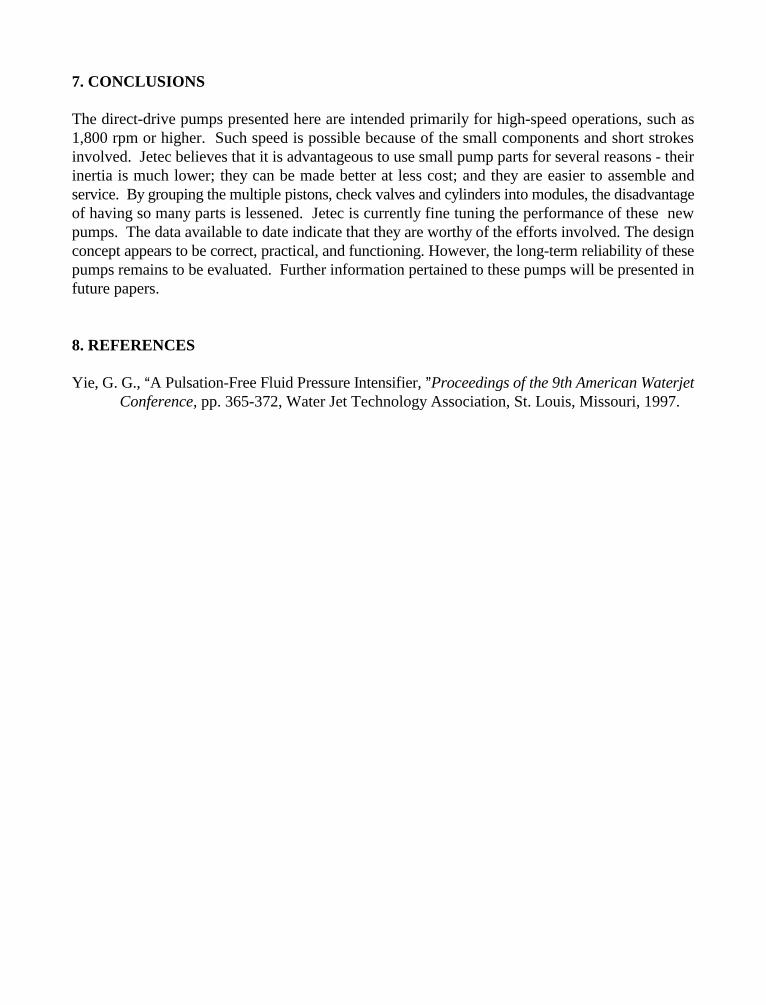
7. CONCLUSIONS
The direct-drive pumps presented here are intended primarily for high-speed operations, such as1,800 rpm or higher. Such speed is possible because of the small components and short strokesinvolved. Jetec believes that it is advantageous to use small pump parts for several reasons - theirinertia is much lower; they can be made better at less cost; and they are easier to assemble andservice. By grouping the multiple pistons, check valves and cylinders into modules, the disadvantageof having so many parts is lessened. Jetec is currently fine tuning the performance of these newpumps. The data available to date indicate that they are worthy of the efforts involved. The designconcept appears to be correct, practical, and functioning. However, the long-term reliability of thesepumps remains to be evaluated. Further information pertained to these pumps will be presented infuture papers.
8. REFERENCES
Yie, G. G., $A Pulsation-Free Fluid Pressure Intensifier, #Proceedings of the 9th American WaterjetConference, pp. 365-372, Water Jet Technology Association, St. Louis, Missouri, 1997.
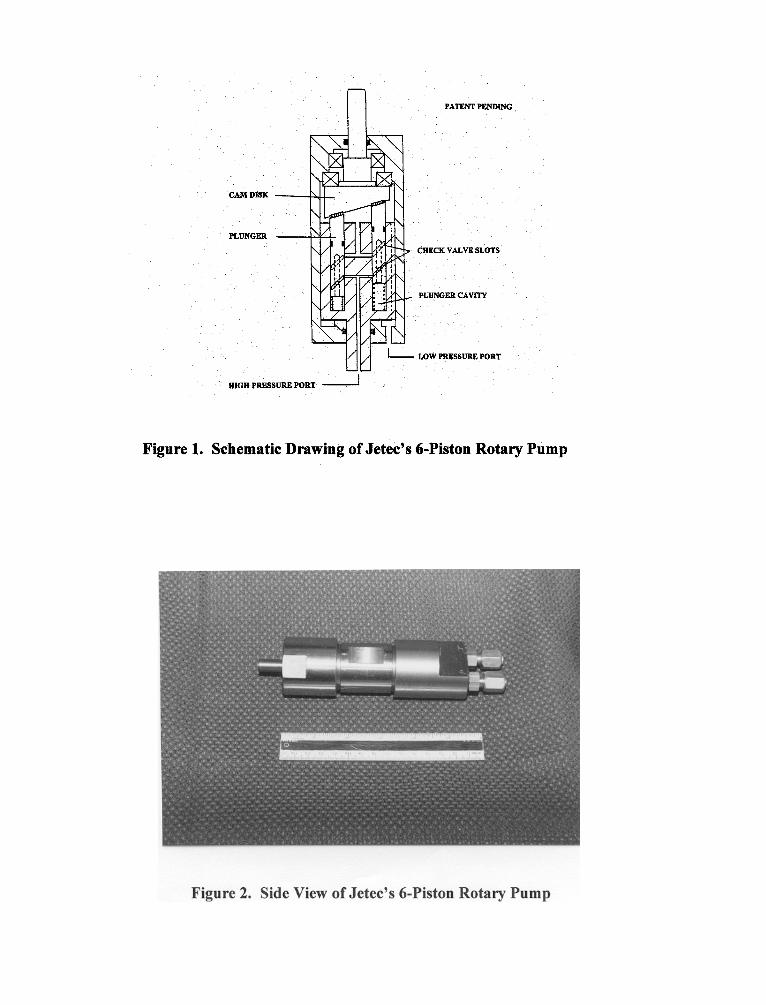
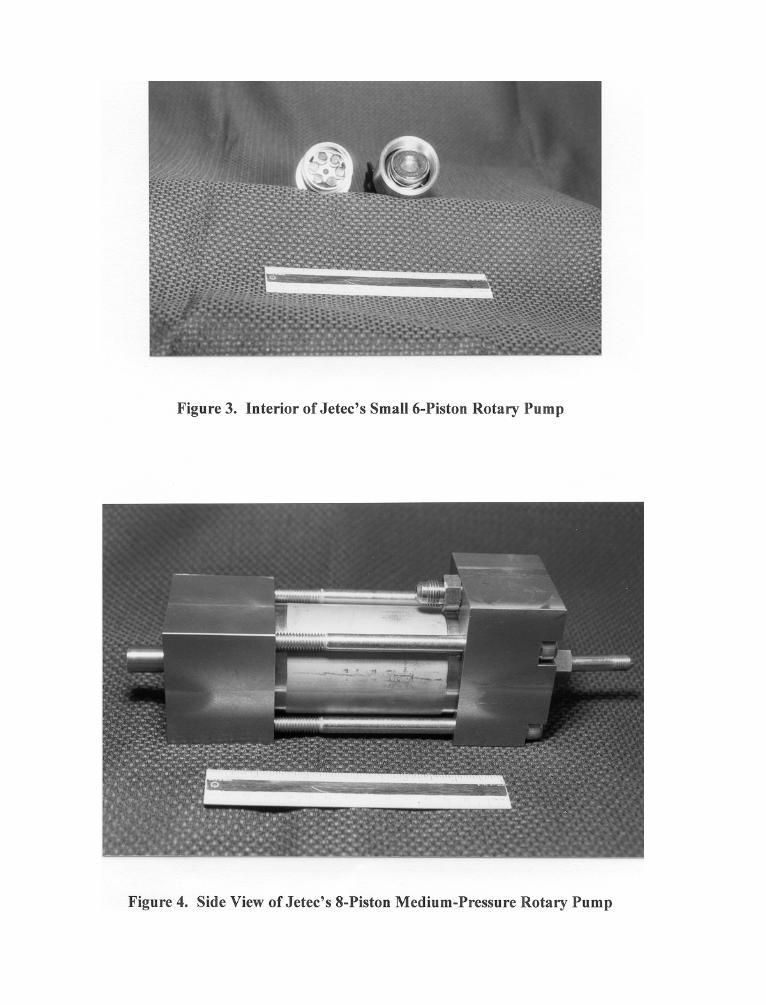
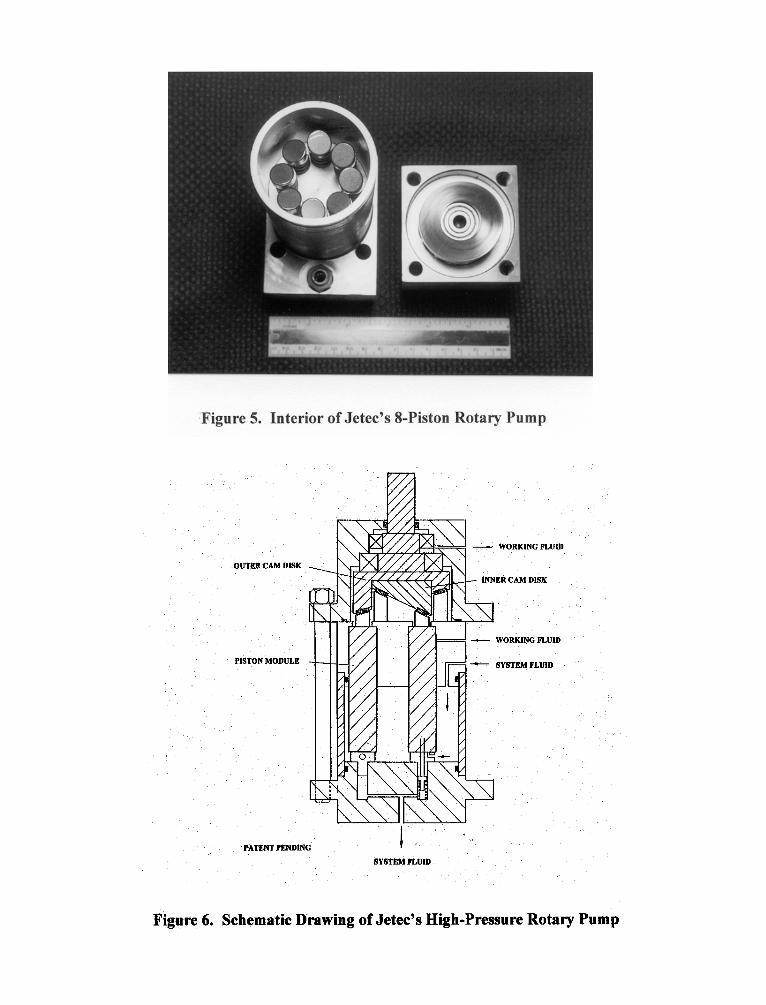
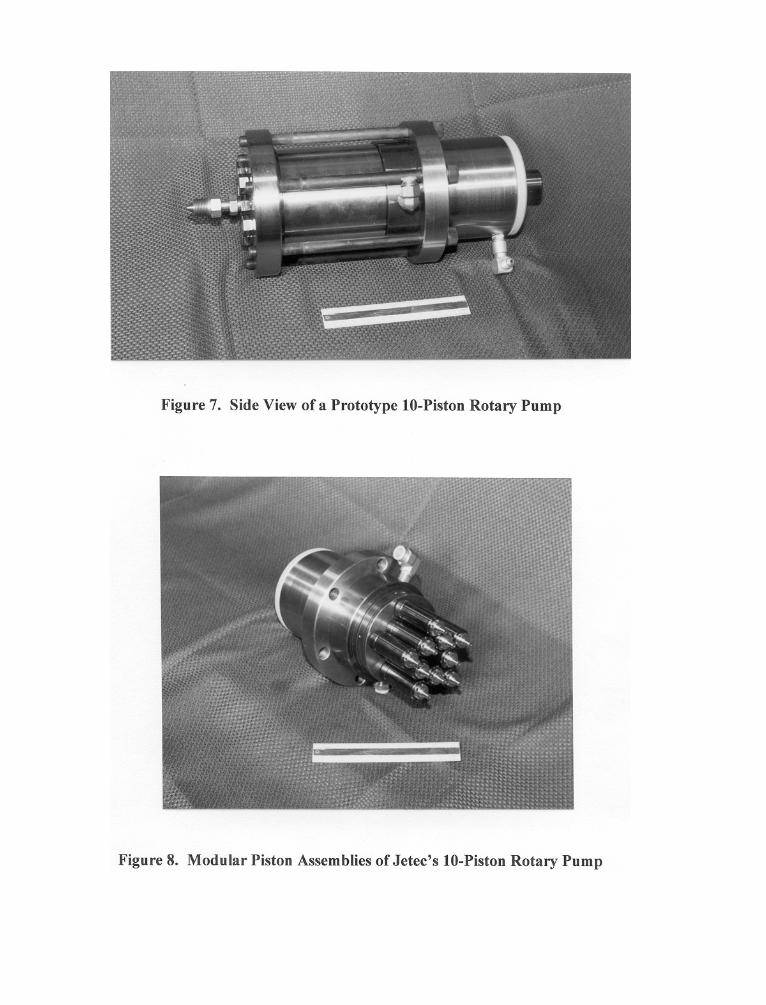
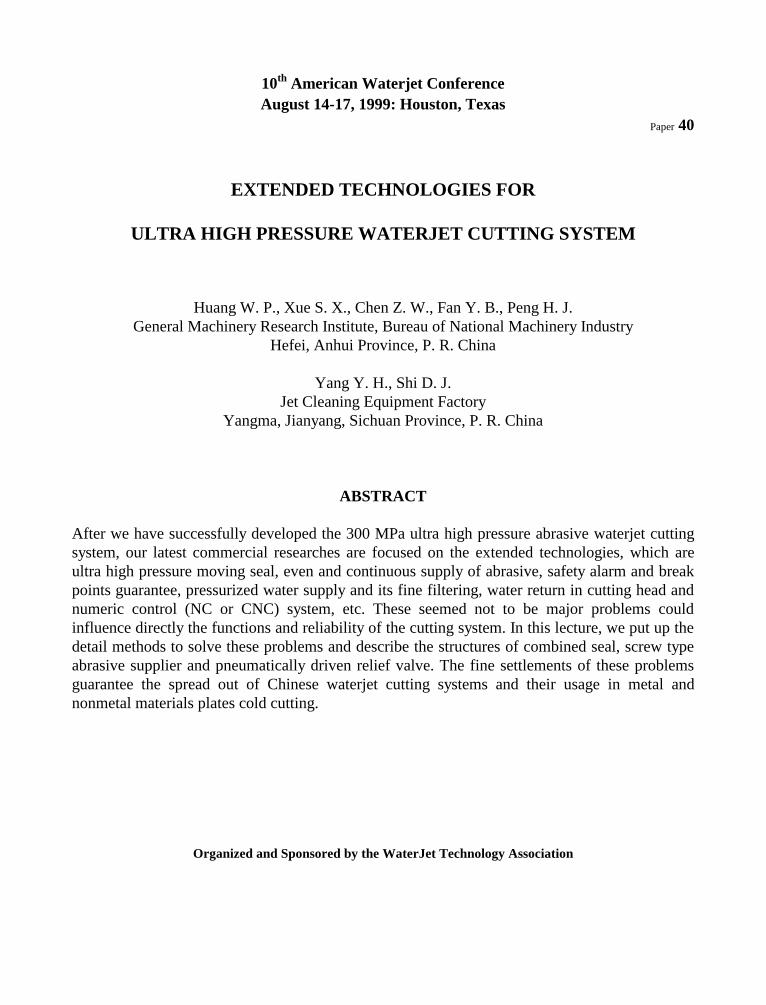
10th American Waterjet ConferenceAugust 14-17, 1999: Houston, Texas
Paper 40
EXTENDED TECHNOLOGIES FOR
ULTRA HIGH PRESSURE WATERJET CUTTING SYSTEM
Huang W. P., Xue S. X., Chen Z. W., Fan Y. B., Peng H. J.General Machinery Research Institute, Bureau of National Machinery Industry
Hefei, Anhui Province, P. R. China
Yang Y. H., Shi D. J.Jet Cleaning Equipment Factory
Yangma, Jianyang, Sichuan Province, P. R. China
ABSTRACT
After we have successfully developed the 300 MPa ultra high pressure abrasive waterjet cuttingsystem, our latest commercial researches are focused on the extended technologies, which areultra high pressure moving seal, even and continuous supply of abrasive, safety alarm and breakpoints guarantee, pressurized water supply and its fine filtering, water return in cutting head andnumeric control (NC or CNC) system, etc. These seemed not to be major problems couldinfluence directly the functions and reliability of the cutting system. In this lecture, we put up thedetail methods to solve these problems and describe the structures of combined seal, screw typeabrasive supplier and pneumatically driven relief valve. The fine settlements of these problemsguarantee the spread out of Chinese waterjet cutting systems and their usage in metal andnonmetal materials plates cold cutting.
Organized and Sponsored by the WaterJet Technology Association
1. INTRODUCTION
The abrasive waterjet cutting is a highly new technology concerned mainly with fluid mechanicscombined with other technologies like pump, valve, seal, material and automatic control. Eachset of ultra high pressure abrasive waterjet cutting system is consisted of the main pump orintensifier, flow control valve, pipeline and its connection, pressure regulating vessel, abrasivesupplier, cutting head, catcher, cutting table and control system, etc. (Shown in Figure 1). Keys toensure the steady work of ultra high pressure waterjet cutting system are listed as below:
• The ability to form a complete set of machine;• The service life of seal, valve, hydraulic head and piston;• The cutting ability of cutting head and service life of nozzles;• Even and continuous supply and control of abrasive;• Control of cutting head movement and total system working.
Because of ultra high pressure pump having the characteristic of its positive displacement, thereare many problems caused by the direct overflow in ultra high pressure and ramping raise ofpressure after overflowing in cutting system that uses ultra high pressure pump as pressurizedwater source, such as the block up of abrasive transportation pipe caused by abrasive wetted bywater return in cutting head, the transition period for pressure rising from low pressure to ratedpressure during start of cutting again after overflowing and setting of pausing time at initialcutting point.
2. STRUCTURE OF ULTRA HIGH PRESSURE RECIPROCATING SEAL
The reciprocating pump used for waterjet cutting has a small flow rate of 2∼3L/min. and worksunder ultra high pressure, so high reliability, long service life ultra high pressure reciprocatingseal becomes one of the keys to make cutting system work steadily. Under pressure up to 300MPa, single soft stuffing seal can not meet our needs. So we adopt the combined seal made ofboth soft stuffing and metal sleeve gasket instead of single soft seal. Its basic structure is shownin Figure 2.
Shape of sealing muff is the crux to form micro clearance needed. Outside of sleeve gasket bearshigh pressure and is elastically deformed, so the hard to machine micro clearance between pistonand gasket is formed. This clearance lets high pressure drop down gradually and achieves sealingpurpose. At the meaning, seal between gasket and cylinder can be solved by installing static sealusing a triangular washer. But in actual uses, serious leakage is often found. Answer to thisquestion lies on the floating characteristic of sleeve gasket. Micro swinging of gasket can resultin failure of triangular washer seal. This micro swinging is caused usually by the bad alignmentamong the axes of gasket, piston and cylinder. In serious condition, it may lead to holdingtogether of piston and gasket. So it needs to raise the precision of machining and assemblingthese three parts, let their axes be in good alignment to achieve better sealing effect. Since thecontact between sleeve gasket and piston belongs to metal to metal contact, we machine severalannular grooves on inner side wall of gasket to store the leakage water and use as cooling and
lubricating medium to prevent pump from overheating. This leakage can be blocked up by softstuffing seal after the metal sleeve gasket. This soft seal ensures that the clearance after metalgasket has a positive pressure to compensate the inadequacy of clearance seal and prevent the airfrom inhaling into sealing cavity in pump’s suction stroke.
Because that the clearance seal must have a small leakage to work normally and leakage quantitycan influence working pressure of system greatly, we use the frequency converter as powersupplier for electric motor to ensure that the system can work under steady pressure over a longperiod of time. When leakage quantity gets large and system pressure becomes falling down, theautomatic control system can increase pump’s rotation speed through converter so as to increaseworking flow rate and compensate for leakage. The converter can be operated manually orautomatically by feedback of pressure signal.
3. ABRASIVE SUPPLIER SYSTEM
Normal abrasive supplier system often uses vacuum sucker and small hole throttle to control theabrasive flow rate. There must be installed with abrasive valve to control abrasive pipelineopening or shutting off. This simple control pattern has the disadvantages of blocking of littlehole, uneven supply of abrasive and hard-to-controlled abrasive flow rate. The usual settlementsto these problems often make the abrasive supplier become much more complicate so that cost ofsystem becomes enlarged and total system becomes hard to spread out.
In our development, we solve these problems thoroughly in a different way by using the screwtype abrasive supplier. Its basic concept is shown in Figure 3.
In this supplier, the feed screw rod driven by micro electric motor makes abrasive fall frombarrel into transportation pipeline in a even and continuous flow. Abrasive enters cutting headthrough the sucking function of vacuum generated in mixing chamber of cutting head. If themicro motor is stopped, system stops supplying abrasive to cutting head at once so the abrasivevalve can be omitted.
The flow rate of abrasive is determined by shape and size of screw thread and rotation speed ofmotor. Their relationships are governed by the following equation:
Q = πDSnρNX10-3/cosγ g/min
where, D is the diameter of screw thread in mm; γ is the spiral angle, γ = arctg(P/πD), P is the thread pitch in mm; S is the area of screw thread in mm2; n is the rotation speed of micro motor; ρ is the heap density of abrasive in g/cm3; N is the number of spiral threads.
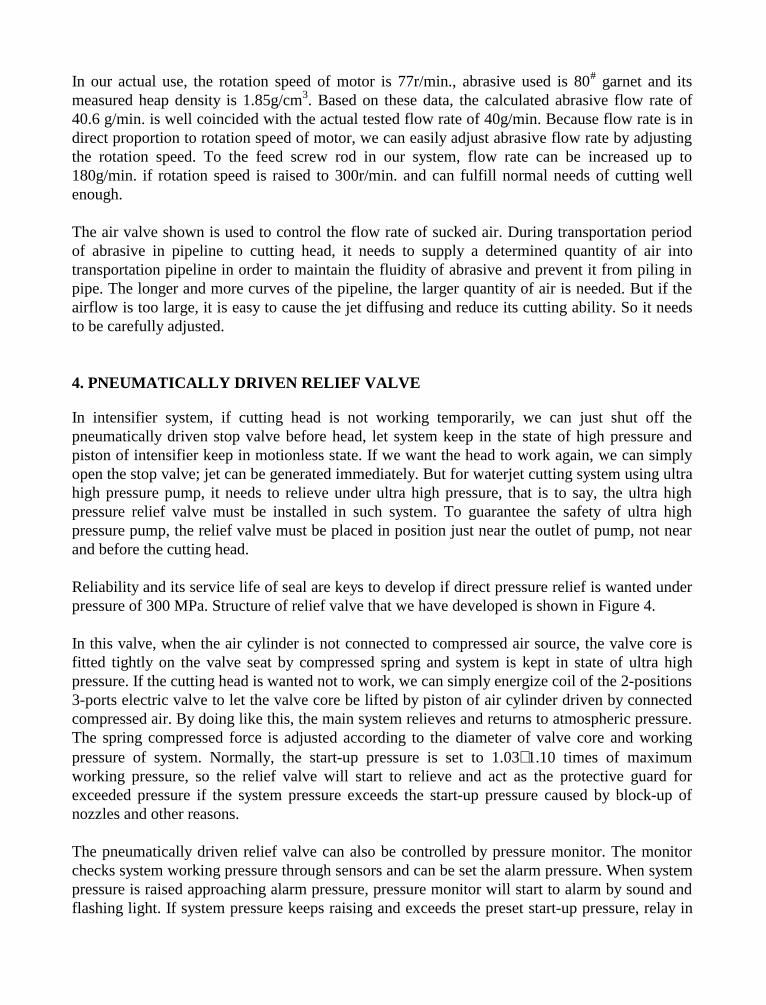
In our actual use, the rotation speed of motor is 77r/min., abrasive used is 80# garnet and itsmeasured heap density is 1.85g/cm3. Based on these data, the calculated abrasive flow rate of40.6 g/min. is well coincided with the actual tested flow rate of 40g/min. Because flow rate is indirect proportion to rotation speed of motor, we can easily adjust abrasive flow rate by adjustingthe rotation speed. To the feed screw rod in our system, flow rate can be increased up to180g/min. if rotation speed is raised to 300r/min. and can fulfill normal needs of cutting wellenough.
The air valve shown is used to control the flow rate of sucked air. During transportation periodof abrasive in pipeline to cutting head, it needs to supply a determined quantity of air intotransportation pipeline in order to maintain the fluidity of abrasive and prevent it from piling inpipe. The longer and more curves of the pipeline, the larger quantity of air is needed. But if theairflow is too large, it is easy to cause the jet diffusing and reduce its cutting ability. So it needsto be carefully adjusted.
4. PNEUMATICALLY DRIVEN RELIEF VALVE
In intensifier system, if cutting head is not working temporarily, we can just shut off thepneumatically driven stop valve before head, let system keep in the state of high pressure andpiston of intensifier keep in motionless state. If we want the head to work again, we can simplyopen the stop valve; jet can be generated immediately. But for waterjet cutting system using ultrahigh pressure pump, it needs to relieve under ultra high pressure, that is to say, the ultra highpressure relief valve must be installed in such system. To guarantee the safety of ultra highpressure pump, the relief valve must be placed in position just near the outlet of pump, not nearand before the cutting head.
Reliability and its service life of seal are keys to develop if direct pressure relief is wanted underpressure of 300 MPa. Structure of relief valve that we have developed is shown in Figure 4.
In this valve, when the air cylinder is not connected to compressed air source, the valve core isfitted tightly on the valve seat by compressed spring and system is kept in state of ultra highpressure. If the cutting head is wanted not to work, we can simply energize coil of the 2-positions3-ports electric valve to let the valve core be lifted by piston of air cylinder driven by connectedcompressed air. By doing like this, the main system relieves and returns to atmospheric pressure.The spring compressed force is adjusted according to the diameter of valve core and workingpressure of system. Normally, the start-up pressure is set to 1.03∼1.10 times of maximumworking pressure, so the relief valve will start to relieve and act as the protective guard forexceeded pressure if the system pressure exceeds the start-up pressure caused by block-up ofnozzles and other reasons.
The pneumatically driven relief valve can also be controlled by pressure monitor. The monitorchecks system working pressure through sensors and can be set the alarm pressure. When systempressure is raised approaching alarm pressure, pressure monitor will start to alarm by sound andflashing light. If system pressure keeps raising and exceeds the preset start-up pressure, relay in
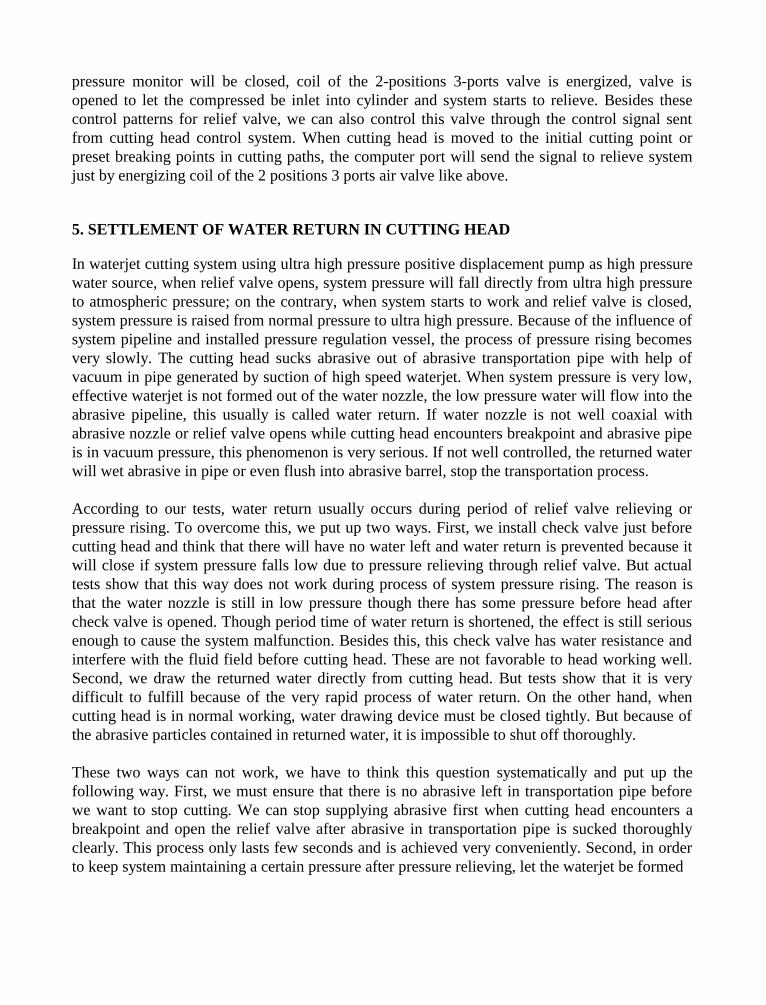
pressure monitor will be closed, coil of the 2-positions 3-ports valve is energized, valve isopened to let the compressed be inlet into cylinder and system starts to relieve. Besides thesecontrol patterns for relief valve, we can also control this valve through the control signal sentfrom cutting head control system. When cutting head is moved to the initial cutting point orpreset breaking points in cutting paths, the computer port will send the signal to relieve systemjust by energizing coil of the 2 positions 3 ports air valve like above.
5. SETTLEMENT OF WATER RETURN IN CUTTING HEAD
In waterjet cutting system using ultra high pressure positive displacement pump as high pressurewater source, when relief valve opens, system pressure will fall directly from ultra high pressureto atmospheric pressure; on the contrary, when system starts to work and relief valve is closed,system pressure is raised from normal pressure to ultra high pressure. Because of the influence ofsystem pipeline and installed pressure regulation vessel, the process of pressure rising becomesvery slowly. The cutting head sucks abrasive out of abrasive transportation pipe with help ofvacuum in pipe generated by suction of high speed waterjet. When system pressure is very low,effective waterjet is not formed out of the water nozzle, the low pressure water will flow into theabrasive pipeline, this usually is called water return. If water nozzle is not well coaxial withabrasive nozzle or relief valve opens while cutting head encounters breakpoint and abrasive pipeis in vacuum pressure, this phenomenon is very serious. If not well controlled, the returned waterwill wet abrasive in pipe or even flush into abrasive barrel, stop the transportation process.
According to our tests, water return usually occurs during period of relief valve relieving orpressure rising. To overcome this, we put up two ways. First, we install check valve just beforecutting head and think that there will have no water left and water return is prevented because itwill close if system pressure falls low due to pressure relieving through relief valve. But actualtests show that this way does not work during process of system pressure rising. The reason isthat the water nozzle is still in low pressure though there has some pressure before head aftercheck valve is opened. Though period time of water return is shortened, the effect is still seriousenough to cause the system malfunction. Besides this, this check valve has water resistance andinterfere with the fluid field before cutting head. These are not favorable to head working well.Second, we draw the returned water directly from cutting head. But tests show that it is verydifficult to fulfill because of the very rapid process of water return. On the other hand, whencutting head is in normal working, water drawing device must be closed tightly. But because ofthe abrasive particles contained in returned water, it is impossible to shut off thoroughly.
These two ways can not work, we have to think this question systematically and put up thefollowing way. First, we must ensure that there is no abrasive left in transportation pipe beforewe want to stop cutting. We can stop supplying abrasive first when cutting head encounters abreakpoint and open the relief valve after abrasive in transportation pipe is sucked thoroughlyclearly. This process only lasts few seconds and is achieved very conveniently. Second, in orderto keep system maintaining a certain pressure after pressure relieving, let the waterjet be formed
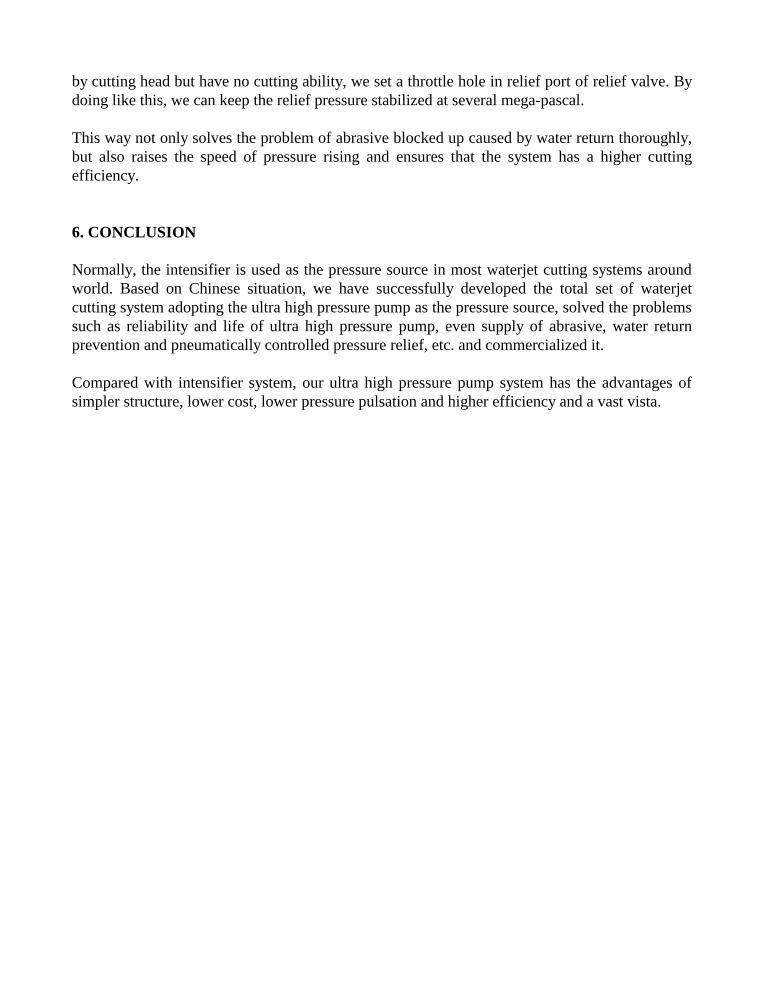
by cutting head but have no cutting ability, we set a throttle hole in relief port of relief valve. Bydoing like this, we can keep the relief pressure stabilized at several mega-pascal.
This way not only solves the problem of abrasive blocked up caused by water return thoroughly,but also raises the speed of pressure rising and ensures that the system has a higher cuttingefficiency.
6. CONCLUSION
Normally, the intensifier is used as the pressure source in most waterjet cutting systems aroundworld. Based on Chinese situation, we have successfully developed the total set of waterjetcutting system adopting the ultra high pressure pump as the pressure source, solved the problemssuch as reliability and life of ultra high pressure pump, even supply of abrasive, water returnprevention and pneumatically controlled pressure relief, etc. and commercialized it.
Compared with intensifier system, our ultra high pressure pump system has the advantages ofsimpler structure, lower cost, lower pressure pulsation and higher efficiency and a vast vista.
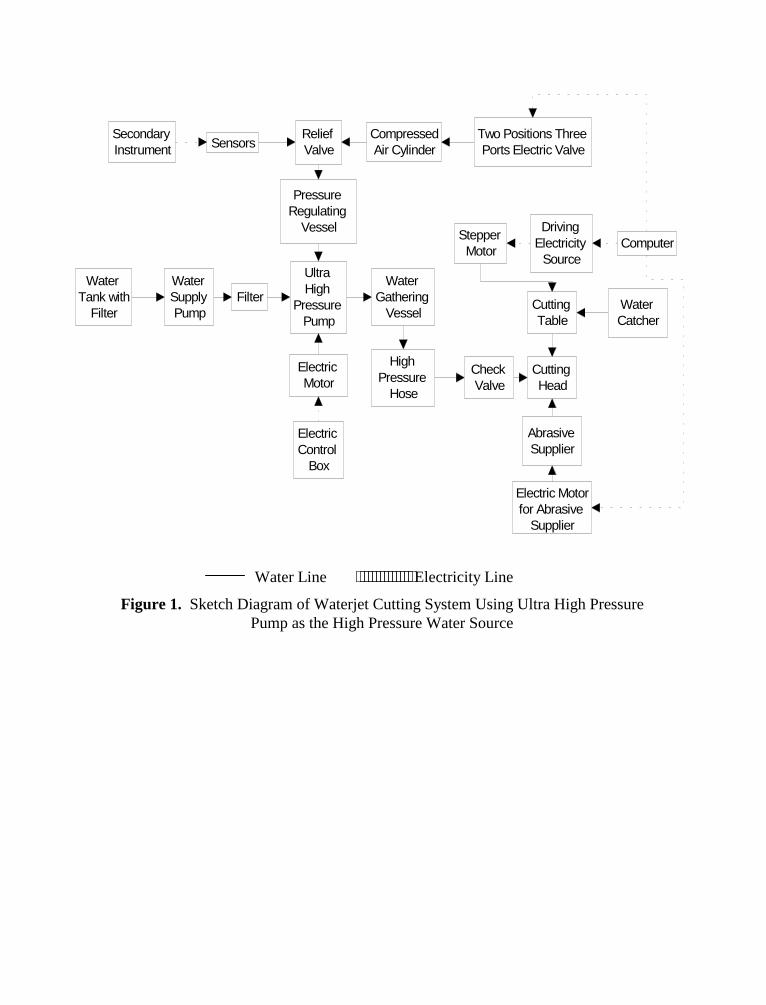
Water Line ⋅⋅⋅⋅⋅⋅⋅⋅⋅⋅⋅⋅⋅⋅ Electricity Line
Figure 1. Sketch Diagram of Waterjet Cutting System Using Ultra High PressurePump as the High Pressure Water Source
Secondary Instrument Sensors
Two Positions Three Ports Electric Valve
Relief Valve
Pressure Regulating
Vessel
Compressed Air Cylinder
Water Tank with
Filter
Water Supply Pump
Filter
Ultra High
Pressure Pump
Electric Motor
High Pressure
Hose
Stepper Motor
Water Gathering
Vessel
Check Valve
Cutting Head
Abrasive Supplier
Electric Motor for Abrasive
Supplier
Cutting Table
Water Catcher
Electric Control
Box
Driving Electricity
SourceComputer
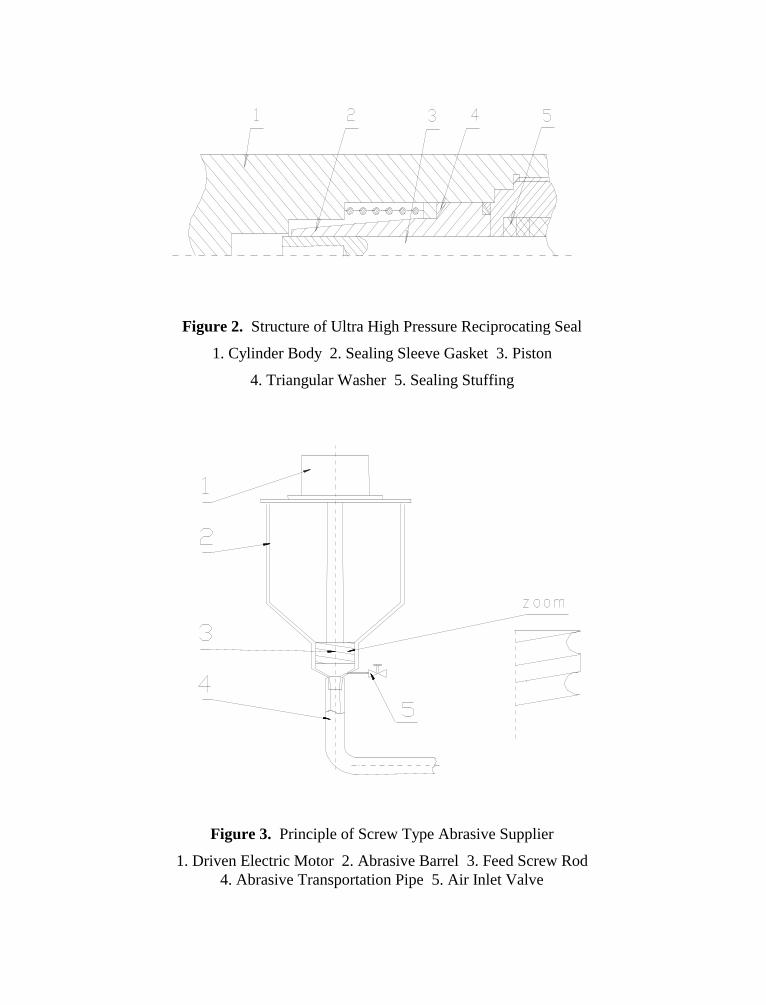
Figure 2. Structure of Ultra High Pressure Reciprocating Seal
1. Cylinder Body 2. Sealing Sleeve Gasket 3. Piston
4. Triangular Washer 5. Sealing Stuffing
Figure 3. Principle of Screw Type Abrasive Supplier
1. Driven Electric Motor 2. Abrasive Barrel 3. Feed Screw Rod4. Abrasive Transportation Pipe 5. Air Inlet Valve
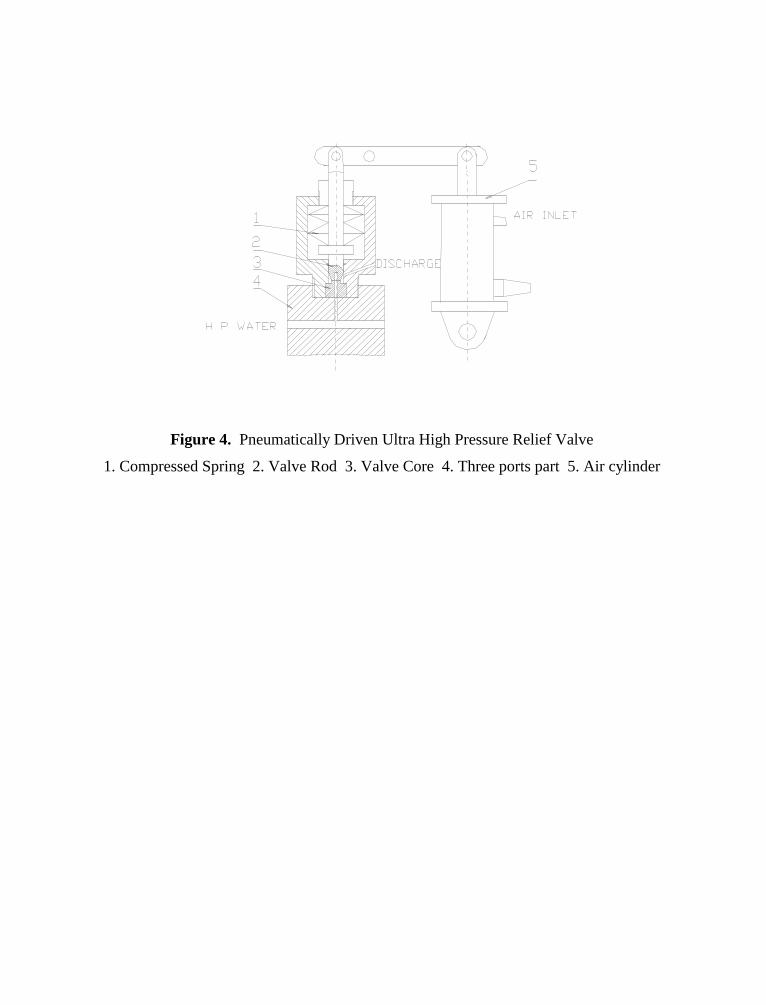
Figure 4. Pneumatically Driven Ultra High Pressure Relief Valve
1. Compressed Spring 2. Valve Rod 3. Valve Core 4. Three ports part 5. Air cylinder
10th American Waterjet ConferenceAugust 14-17, 1999: Houston, Texas
Paper 41
CORROSION PREVENTION STUDY ON MATERIALS USED IN
HIGH–PRESSURE WATER JET CLEANING MACHINES
Yang Jiao (Vice-Director), Leyao Zhang (Director)High-Pressure Water Jet Cleaning Technology Center of Beijing Yanshan
Petrochemical (Group) Co., Ltd.
Fanhua Li (General Manager)Beijing Duoke New Technology Development Co.
Beijing, China
ABSTRACT
The main components of high-pressure water jet cleaning machines and equipment are often cor-roded because of their constant contact with water and air. This is a relatively common, simplebut difficult problem, which not only reduces service lifetime and increases maintenance and op-eration costs but also reduces application efficiency of machines and equipment. In this paper,combined with working practice, corrosion-proof materials and technology commonly used areanalyzed. And through comparison with nickel-phosphorus plating, and by tests and industrialapplication, it is pointed out that the nickel-phosphorus plating of the main components can im-prove their chemical and physical properties and is, at present, a good methods to solve the cor-rosion prevention problem for high-pressure water jet cleaning machines and equipment.
Most components of high-pressure water jet cleaning machines are metallic materials, and theyare often in contact with water and air during operation and sometimes in contact with corrosionmedia, therefore the high-pressure water jet cleaning field has long been puzzled by the corro-sion problem. To solve this problem, commonly used methods include the application of corro-sion-proof materials such as stainless steel and copper etc., the adopting of surface treatmenttechnology such as chromium plating and galvanization etc., which are all found some shortageswith application results unsatisfactory.
Organized and Sponsored by the WaterJet Technology Association
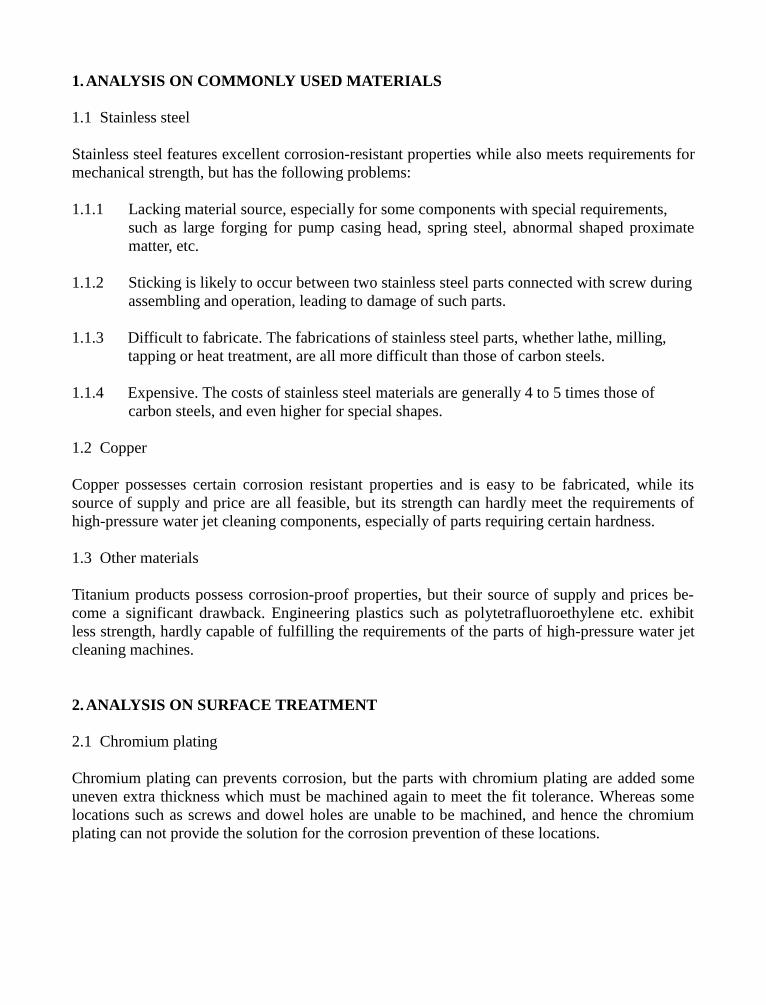
1. ANALYSIS ON COMMONLY USED MATERIALS
1.1 Stainless steel
Stainless steel features excellent corrosion-resistant properties while also meets requirements formechanical strength, but has the following problems:
1.1.1 Lacking material source, especially for some components with special requirements,such as large forging for pump casing head, spring steel, abnormal shaped proximatematter, etc.
1.1.2 Sticking is likely to occur between two stainless steel parts connected with screw duringassembling and operation, leading to damage of such parts.
1.1.3 Difficult to fabricate. The fabrications of stainless steel parts, whether lathe, milling, tapping or heat treatment, are all more difficult than those of carbon steels.
1.1.4 Expensive. The costs of stainless steel materials are generally 4 to 5 times those ofcarbon steels, and even higher for special shapes.
1.2 Copper
Copper possesses certain corrosion resistant properties and is easy to be fabricated, while itssource of supply and price are all feasible, but its strength can hardly meet the requirements ofhigh-pressure water jet cleaning components, especially of parts requiring certain hardness.
1.3 Other materials
Titanium products possess corrosion-proof properties, but their source of supply and prices be-come a significant drawback. Engineering plastics such as polytetrafluoroethylene etc. exhibitless strength, hardly capable of fulfilling the requirements of the parts of high-pressure water jetcleaning machines.
2. ANALYSIS ON SURFACE TREATMENT
2.1 Chromium plating
Chromium plating can prevents corrosion, but the parts with chromium plating are added someuneven extra thickness which must be machined again to meet the fit tolerance. Whereas somelocations such as screws and dowel holes are unable to be machined, and hence the chromiumplating can not provide the solution for the corrosion prevention of these locations.
2.2 Galvanization
Galvanization is a basic corrosion-prevention technique by which extra thickness is not added.But its corrosion-prevention capacity is rather small, which would quickly lose function underthe condition of friction and long time contact with water, air and corrosive media.
The above brief analyses on materials and surface treatments show that these are all failed tomeet the requirements of corrosion prevention for high-pressure water jet cleaning machines andequipment. Through these analyses, we realized that it is a good fortune for the high-pressurewater jet cleaning field if there is a surface treatment technology by which the parts do not addthickness, while possess enough hardness, abrasion resistance and corrosion resistance.
3. SELECTION OF NEW TECHNOLOGY
By years of efforts, we have found a new method, the chemical plating of nickel-phosphorus al-loy, which can basically meet these requirements. The chemical plating of nickel-phosphorus,developed by American scientist A. Brenner and GÃRiddel, is conducted through chemical reac-tion between plating liquid and part's surface, which results in a plating layer of non-crystallinenickel-phosphorus alloy. This technology is in the form of chemical penetrating, and hence doesnot add thickness to the parts treated, while the treated surface possesses very high hardness andabrasion resistance. On the basis of step tests, industrial application was conducted for manyparts and components, yielding good results. In practice, it is proved that this technology featuresthe following characteristics:
3.1 Even plating layer.
The plating layer is formed by catalytic redox reaction between the plating liquid and the surfaceof the parts treated, without edge and corner influence, and no limitation of geological shapes ofthe parts treated. Screws, narrow slots, small holes, and slits can all be plated satisfactorily withno burrs and without missing-plating.
3.2 The plating layer possesses high hardness and superior abrasion resistance.
The hardness of the plating layer is HRC 50~55, and after heat treatment, it reaches HRC 63~69.The non-crystalline state of the plating layer begins to change into micro-crystalline structure at atemperature of 300%C, increasing the hardness and abrasion resistance of the plating layer.
3.3 The plating layer has high bond.
It is formed by the penetration of plating liquid into the surface of the parts treated, and the plat-ing liquid has a thermal expansion coefficient similar to steel, therefore the plating layer pos-sesses good adhesion, 300~400 MPa, higher than that of electroplated chromium layer, andhence is unlikely to peel.
3.4 The plating layer possesses superior corrosion resistance.
Since the plating layer is in amorphous state (non-crystalline state), being no such crystal defectsas crystal boundary and grain boundary sliding etc., and its structure is monotonous and uniform,therefor galvanic corrosion is unlikely to occur, and corrosion resistance is superior. The porosityof the plating layer is low, and this provides ideal shielding layer to protect the base metal fromcorrosion. The corrosion resistance of such parts is superior to stainless steel when used in manymedia (see Table 1.)
Table 1. Comparison of Corrosion Conditions between the Plating Layer and 1Cr18Ni9TiCorrosion Rate, mm/a
No MediumConcentration
%Temperature
%%C Plating Layer 1Cr18Ni9Ti1 NaOH 20 Boiling 0.001 0.062 NaOH 40 Boiling 0.021 0.453 HCL 10 20 0.017 1.014 H2SO4 10 20 0.048 0.455 HF 40 30 0.0126 H3PO4 85 50 0.102 0.01257 H3PO4 50 20 0.002 0.01258 HNO3 40 20 0 0.0125
9 HCOOH 85 Boiling 0.12 1.3
3.5 Wide application.
This technology can be used to plate such materials as steel, iron, copper, aluminum and alloys.The friction factors between this plating layer and other friction pairs are relatively small. In ad-dition, both new and used parts can all be plated, and for corroded parts, this plating providesrestoration.
3.6 The chemical plating does not require high temperature, hence does not cause deformation.
3.7 Low cost. In consideration of material cost, fabrication difficulty, and assembling cost, thechemical plating technology has a great advantage in price.
Because of these characteristics, this technology is capable of satisfying the requirements of thehigh-pressure water jet cleaning field for corrosion prevention of some parts.
4. INDUSTRIAL APPLICATION
For years, we conducted industrial applications for different parts successively, and the resultsare satisfactory.
4.1 Pump casing is the most important component for high-pressure pump. Corrosion preventionof carbon steel pump casing is a difficult task. In order to prevent corrosion, the carbon steelpump casings after pump operation were blue-treated and painted each half-year, but failed to
prevent corrosion damages. Some pumps are used less than 3 years (operating time is less than 2years) when they are discarded because of corrosion. After chemical plating of nickel-phosphorous for the pump-casing head (Fig.1), the pump casing obtains the results of a stainlesssteel pump. It has no corrosion in 3 years, with all fitting surface as smooth as the original fine-ness (A, B, C…), and with screw holes (D, E…) convenient for assembling with bolts. And whatis even worth mention is that three used pump casings, after chemical nickel-phosphorous plat-ing, were operated again for more than 3 years instead of discarded.
Figure 1. High-Pressure Pump Casing
4.2 The cross head connection bar (Fig.2) of the high-pressure pump is the critical component ofthe dynamic sealing between the driving side and the outside. The lubrication oil inside and thedust and water outside should be separated here appropriately, otherwise oil leaks from here, re-sulting in lacking lubrication and hence in burning of bush, or dirt and water enter crankcase, re-sulting in emulsification of the lube and hence in burning of bush too. It is because of this, thefineness and the corrosion prevention of the cross head connection bar is of great significance.This component is often generally considered to be in contact with oil constantly and hence isunlikely to be corroded, and therefore carbon steel is selected. The actual condition is that thiscomponent is often in contact with water during operation because of the leakage of the plungerfiller, and exposes to air after operation, and therefor, rusty spots appear not a long time afterputting into service. In many pumps we used, the following phenomena occurred in the past: thelube in the crankcase of the pumps is emulsified under the condition of no other water leakage.After analysis, it is realized that this phenomenon is caused by the rusty sports. Because of theexistence of rusty spots, the tiny amount of water stayed in the pits of the rusty spots is broughtinto the crankcase in each stroke, and retained inside the crankcase when passing through the oilscriber of the oil sealing. Thus four-to-five hundreds' "brought-in" per second quickly makes thelube emulsified. After the cross head connection bar is plated with nickel-phosphorous layer, in-creasing its corrosion resistance, this phenomena never occurred again, solved the tough task ofcorrosion prevention for this component. What is even worth mention is that the hardness of thiscomponent increased drastically after plating, and its abrasion resistance is increased, thus itsservice life is increased greatly.
Figure 2. Cross-Head Connection
4.3 The body of the pedal valve is also an important component of the water cleaning equipment(Fig.3). There are screw holes on the valve body (A, B, C, and D), that serve as the flow channelfor the high-pressure water flowing in and out. Therefor it is required that the fitting gap of thescrew is small, and its precision and fineness is high. And the equipment is often dismountedduring routine maintenance. In the past, different type of stainless steels are chosen to be used asthe valve body and connections but screw sticking often occurs in the process of disassemblingand assembling, resulted in discarding of both the valve body and connection. After the valvebody is manufactured by using carbon steel and chemically penetrated with nickel-phosphorous,this sticking phenomena never occurred again, thus the problem of valve body sticking, discard-ing and the corrosion has solved.
Figure 3. The Body of Pedal Pressure-Regulating Valve
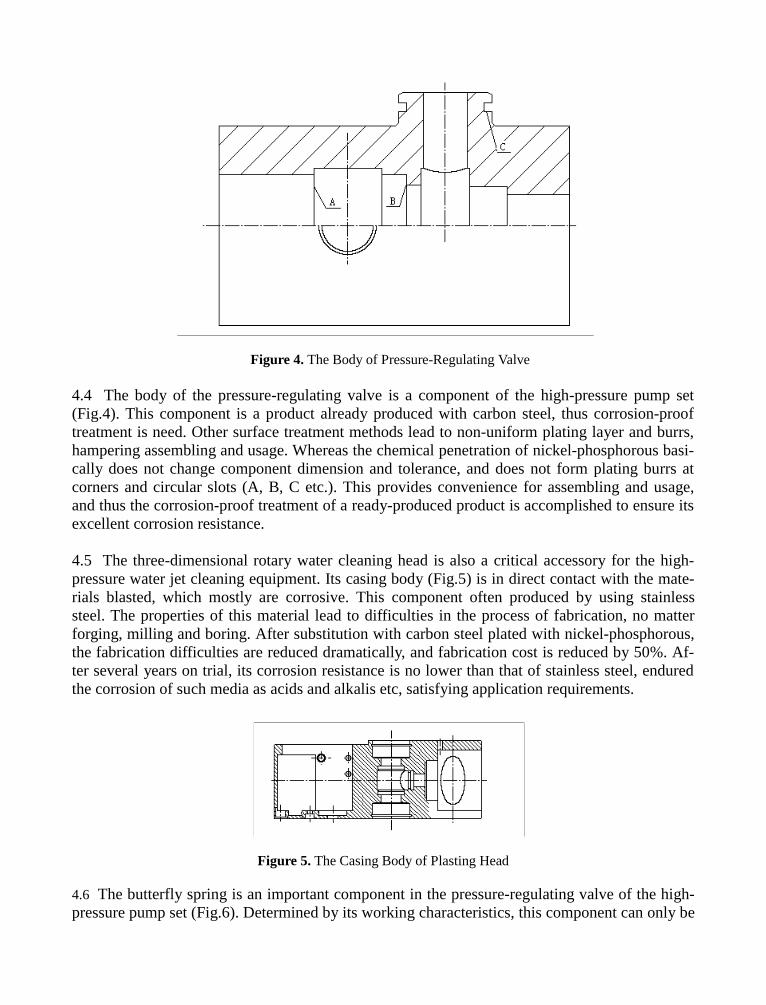
Figure 4. The Body of Pressure-Regulating Valve
4.4 The body of the pressure-regulating valve is a component of the high-pressure pump set(Fig.4). This component is a product already produced with carbon steel, thus corrosion-prooftreatment is need. Other surface treatment methods lead to non-uniform plating layer and burrs,hampering assembling and usage. Whereas the chemical penetration of nickel-phosphorous basi-cally does not change component dimension and tolerance, and does not form plating burrs atcorners and circular slots (A, B, C etc.). This provides convenience for assembling and usage,and thus the corrosion-proof treatment of a ready-produced product is accomplished to ensure itsexcellent corrosion resistance.
4.5 The three-dimensional rotary water cleaning head is also a critical accessory for the high-pressure water jet cleaning equipment. Its casing body (Fig.5) is in direct contact with the mate-rials blasted, which mostly are corrosive. This component often produced by using stainlesssteel. The properties of this material lead to difficulties in the process of fabrication, no matterforging, milling and boring. After substitution with carbon steel plated with nickel-phosphorous,the fabrication difficulties are reduced dramatically, and fabrication cost is reduced by 50%. Af-ter several years on trial, its corrosion resistance is no lower than that of stainless steel, enduredthe corrosion of such media as acids and alkalis etc, satisfying application requirements.
Figure 5. The Casing Body of Plasting Head
4.6 The butterfly spring is an important component in the pressure-regulating valve of the high-pressure pump set (Fig.6). Determined by its working characteristics, this component can only be
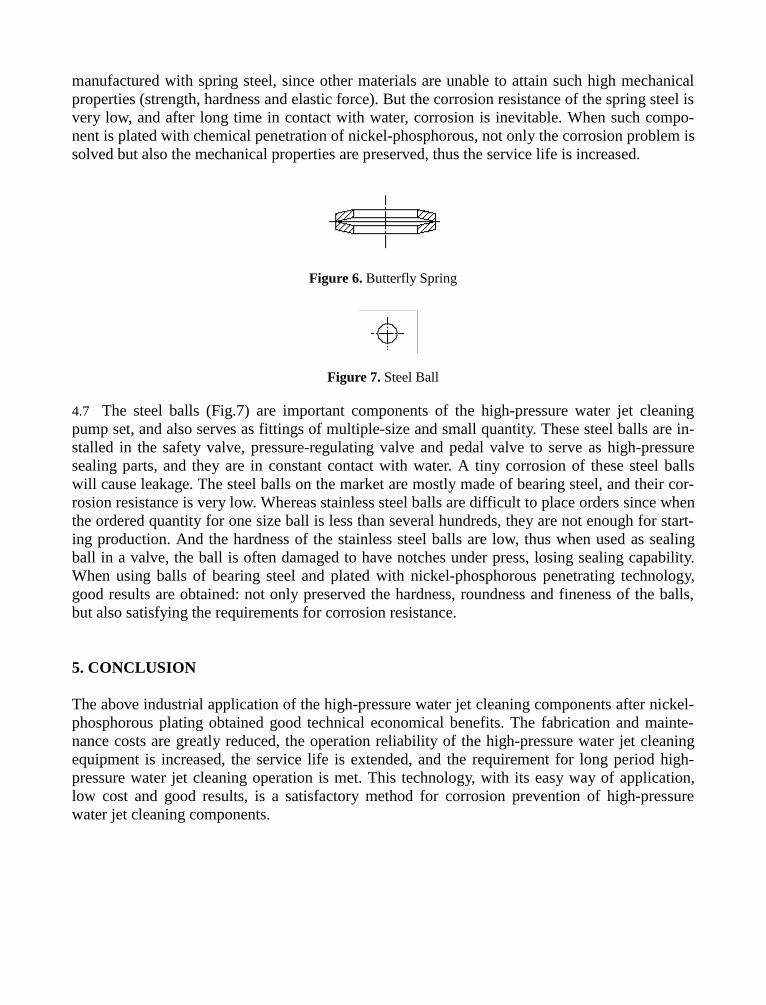
manufactured with spring steel, since other materials are unable to attain such high mechanicalproperties (strength, hardness and elastic force). But the corrosion resistance of the spring steel isvery low, and after long time in contact with water, corrosion is inevitable. When such compo-nent is plated with chemical penetration of nickel-phosphorous, not only the corrosion problem issolved but also the mechanical properties are preserved, thus the service life is increased.
Figure 6. Butterfly Spring
Figure 7. Steel Ball
4.7 The steel balls (Fig.7) are important components of the high-pressure water jet cleaningpump set, and also serves as fittings of multiple-size and small quantity. These steel balls are in-stalled in the safety valve, pressure-regulating valve and pedal valve to serve as high-pressuresealing parts, and they are in constant contact with water. A tiny corrosion of these steel ballswill cause leakage. The steel balls on the market are mostly made of bearing steel, and their cor-rosion resistance is very low. Whereas stainless steel balls are difficult to place orders since whenthe ordered quantity for one size ball is less than several hundreds, they are not enough for start-ing production. And the hardness of the stainless steel balls are low, thus when used as sealingball in a valve, the ball is often damaged to have notches under press, losing sealing capability.When using balls of bearing steel and plated with nickel-phosphorous penetrating technology,good results are obtained: not only preserved the hardness, roundness and fineness of the balls,but also satisfying the requirements for corrosion resistance.
5. CONCLUSION
The above industrial application of the high-pressure water jet cleaning components after nickel-phosphorous plating obtained good technical economical benefits. The fabrication and mainte-nance costs are greatly reduced, the operation reliability of the high-pressure water jet cleaningequipment is increased, the service life is extended, and the requirement for long period high-pressure water jet cleaning operation is met. This technology, with its easy way of application,low cost and good results, is a satisfactory method for corrosion prevention of high-pressurewater jet cleaning components.

6. REFERENCES
1. Weide Wang, Yanrong Hu "Investigations of Technology of Chemical Plating of Nickel-Phosphorous Alloy" Chemical Equipment Technology, Vol.18, No.4, 1997. (In Chinese.)
2. Cheng Zhang, "Analysis of Ni-P-Si3N4 Composite Chemical Plating Structure" Surface Technology, Vol. 27, No.1, 1998. (In Chinese.)
3. Wenqi Zhang, etc., "Corrosion Data" Metal Corrosion Handbook, Part IV, Chapter 35,1987. (In Chinese.)
10th American Waterjet ConferenceAugust 14-17, 1999: Houston, Texas
Paper 42
WATER-JETTING PRODUCTIVITY STUDY
FOR THE MARINE INDUSTRY
Gordon G. Kuljian, Senior EngineerDarren C. Melhuish, Staff Engineer
Corrpro Companies, Inc.West Chester, PA
ABSTRACT
The National Shipbuilding Research Program commissioned a two year study to investigate theproductivity of water jetting in the ship building and ship repair industry. Data will be presentedon production rates of coating removal from various freeboard, underwater hull, ballast tank, andnon-skid decking areas. Contamination removal efficiency, water-jetting’s impact on theadhesion of coatings, and worker productivity issues will also be presented.
Organized and Sponsored by the WaterJet Technology Association
1. INTRODUCTION
Recent developments in water-jetting equipment technology as well as coating technology havebrought water-jetting to the forefront of the coating industry as a means of surface preparation.Aside from the advancements of related water-jetting technologies, one inherent benefit ofwater-jetting is the clean surface left behind. Since the surface is thoroughly washed with highor ultra-high pressures of potable water, surface contamination levels are generally below theacceptable levels set by industry specifications.
In 1996, the National Shipbuilding Research Program’s (NSRP) Surface Preparation andCoatings Panel (panel SP-3) commissioned Corrpro to assess productivity of water-jetting whenused for coating removal in representative areas of a ship, such as the outer hull, inside tanks,non-skid weather decks. Over the course of the study, ten separate visits were made to variousships undergoing repair pier-side, in dry-dock, or in new construction and one visit was made toan offshore pumping station. During each visit the coated surfaces were evaluated prior towater-jetting to determine coating type, thickness, contamination, adhesion, and overallcondition. During the actual water-jetting, productivity data was gathered which includeddowntime for the production run. Information on equipment type, as well as operating pressuresand flow rates were collected. After the blasting was complete the blasted surface was againevaluated for adherence of remaining coatings (dependent on removal specification), resultantsurface contamination levels and overall effectiveness of the blast.
This report will serve to summarize the type and results of data collected for the NSRP. Apresentation of all data collected during the two year study would be too voluminous for theProceedings paper, however all data will be included in the Final NSRP report, due to be issuedin Fall 1998.
A summary of the visits (to both private ships and US Navy ships) is presented in Table 1. An“(O)” designates the process used “open-cycle” equipment, and a “(C)” designates the processused closed-cycle equipment. (Closed-cycle equipment is defined as where the process jettingwater is recovered, treated, and disposed of on-site and/or re-used as blasting media for theproject.)
2. PRODUCTION RATES
Over the course of various water-jetting visits, three types of coating removal specifications wereobserved; selective stripping, “spot and sweep” blasting, and complete blasting to bare metal.Selective stripping was the most common and highlights one of the unique advantages thatwater-jetting has over traditional abrasive blasting. Selective striping was often specified toremove top-layers of a coating system down to well-adhered primer or an intermediate coat,without damaging the undercoats. (In abrasive blasting situations, damage to underlying layerstypically results in untimely rework of areas effected by the sweep blast.) Another methodfrequently observed was sweep and spot blasting to bare metal. The intent of this removal was tostress the coating system by applying a sweep blast, which would allow only tightly adherentpaint to remain. With spot and sweep blasting, all corroded areas were spot blasted to bare
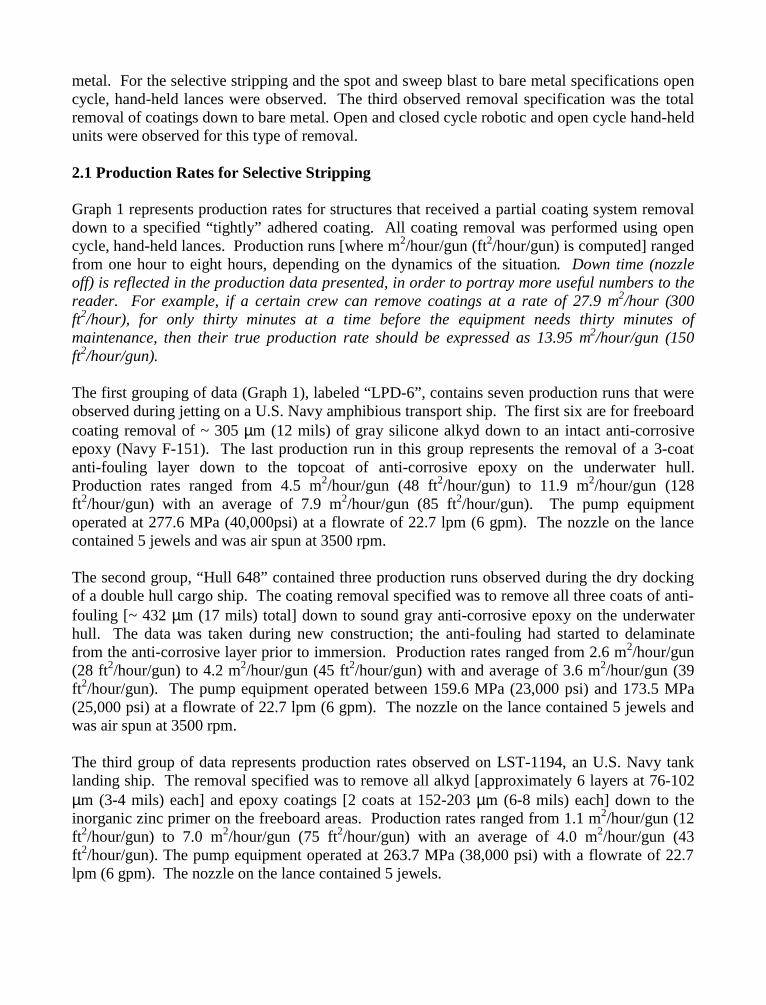
metal. For the selective stripping and the spot and sweep blast to bare metal specifications opencycle, hand-held lances were observed. The third observed removal specification was the totalremoval of coatings down to bare metal. Open and closed cycle robotic and open cycle hand-heldunits were observed for this type of removal.
2.1 Production Rates for Selective Stripping
Graph 1 represents production rates for structures that received a partial coating system removaldown to a specified “tightly” adhered coating. All coating removal was performed using opencycle, hand-held lances. Production runs [where m2/hour/gun (ft2/hour/gun) is computed] rangedfrom one hour to eight hours, depending on the dynamics of the situation. Down time (nozzleoff) is reflected in the production data presented, in order to portray more useful numbers to thereader. For example, if a certain crew can remove coatings at a rate of 27.9 m2/hour (300ft2/hour), for only thirty minutes at a time before the equipment needs thirty minutes ofmaintenance, then their true production rate should be expressed as 13.95 m2/hour/gun (150ft2/hour/gun).
The first grouping of data (Graph 1), labeled “LPD-6”, contains seven production runs that wereobserved during jetting on a U.S. Navy amphibious transport ship. The first six are for freeboardcoating removal of ~ 305 µm (12 mils) of gray silicone alkyd down to an intact anti-corrosiveepoxy (Navy F-151). The last production run in this group represents the removal of a 3-coatanti-fouling layer down to the topcoat of anti-corrosive epoxy on the underwater hull.Production rates ranged from 4.5 m2/hour/gun (48 ft2/hour/gun) to 11.9 m2/hour/gun (128ft2/hour/gun) with an average of 7.9 m2/hour/gun (85 ft2/hour/gun). The pump equipmentoperated at 277.6 MPa (40,000psi) at a flowrate of 22.7 lpm (6 gpm). The nozzle on the lancecontained 5 jewels and was air spun at 3500 rpm.
The second group, “Hull 648” contained three production runs observed during the dry dockingof a double hull cargo ship. The coating removal specified was to remove all three coats of anti-fouling [~ 432 µm (17 mils) total] down to sound gray anti-corrosive epoxy on the underwaterhull. The data was taken during new construction; the anti-fouling had started to delaminatefrom the anti-corrosive layer prior to immersion. Production rates ranged from 2.6 m2/hour/gun(28 ft2/hour/gun) to 4.2 m2/hour/gun (45 ft2/hour/gun) with and average of 3.6 m2/hour/gun (39ft2/hour/gun). The pump equipment operated between 159.6 MPa (23,000 psi) and 173.5 MPa(25,000 psi) at a flowrate of 22.7 lpm (6 gpm). The nozzle on the lance contained 5 jewels andwas air spun at 3500 rpm.
The third group of data represents production rates observed on LST-1194, an U.S. Navy tanklanding ship. The removal specified was to remove all alkyd [approximately 6 layers at 76-102µm (3-4 mils) each] and epoxy coatings [2 coats at 152-203 µm (6-8 mils) each] down to theinorganic zinc primer on the freeboard areas. Production rates ranged from 1.1 m2/hour/gun (12ft2/hour/gun) to 7.0 m2/hour/gun (75 ft2/hour/gun) with an average of 4.0 m2/hour/gun (43ft2/hour/gun). The pump equipment operated at 263.7 MPa (38,000 psi) with a flowrate of 22.7lpm (6 gpm). The nozzle on the lance contained 5 jewels.
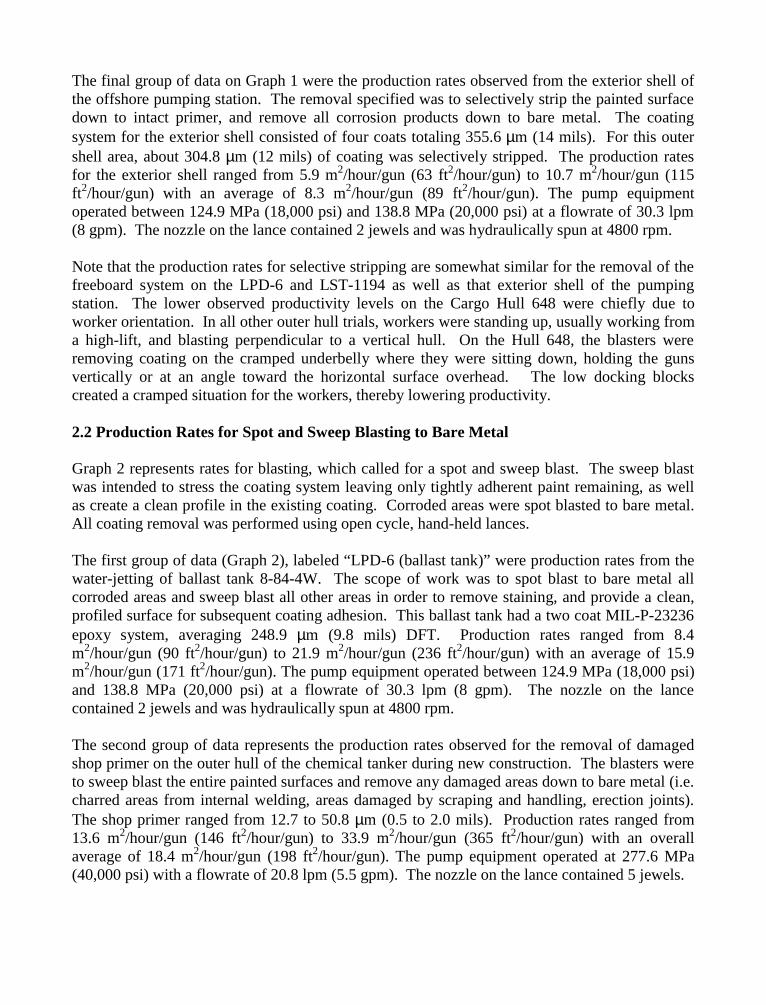
The final group of data on Graph 1 were the production rates observed from the exterior shell ofthe offshore pumping station. The removal specified was to selectively strip the painted surfacedown to intact primer, and remove all corrosion products down to bare metal. The coatingsystem for the exterior shell consisted of four coats totaling 355.6 µm (14 mils). For this outershell area, about 304.8 µm (12 mils) of coating was selectively stripped. The production ratesfor the exterior shell ranged from 5.9 m2/hour/gun (63 ft2/hour/gun) to 10.7 m2/hour/gun (115ft2/hour/gun) with an average of 8.3 m2/hour/gun (89 ft2/hour/gun). The pump equipmentoperated between 124.9 MPa (18,000 psi) and 138.8 MPa (20,000 psi) at a flowrate of 30.3 lpm(8 gpm). The nozzle on the lance contained 2 jewels and was hydraulically spun at 4800 rpm.
Note that the production rates for selective stripping are somewhat similar for the removal of thefreeboard system on the LPD-6 and LST-1194 as well as that exterior shell of the pumpingstation. The lower observed productivity levels on the Cargo Hull 648 were chiefly due toworker orientation. In all other outer hull trials, workers were standing up, usually working froma high-lift, and blasting perpendicular to a vertical hull. On the Hull 648, the blasters wereremoving coating on the cramped underbelly where they were sitting down, holding the gunsvertically or at an angle toward the horizontal surface overhead. The low docking blockscreated a cramped situation for the workers, thereby lowering productivity.
2.2 Production Rates for Spot and Sweep Blasting to Bare Metal
Graph 2 represents rates for blasting, which called for a spot and sweep blast. The sweep blastwas intended to stress the coating system leaving only tightly adherent paint remaining, as wellas create a clean profile in the existing coating. Corroded areas were spot blasted to bare metal.All coating removal was performed using open cycle, hand-held lances.
The first group of data (Graph 2), labeled “LPD-6 (ballast tank)” were production rates from thewater-jetting of ballast tank 8-84-4W. The scope of work was to spot blast to bare metal allcorroded areas and sweep blast all other areas in order to remove staining, and provide a clean,profiled surface for subsequent coating adhesion. This ballast tank had a two coat MIL-P-23236epoxy system, averaging 248.9 µm (9.8 mils) DFT. Production rates ranged from 8.4m2/hour/gun (90 ft2/hour/gun) to 21.9 m2/hour/gun (236 ft2/hour/gun) with an average of 15.9m2/hour/gun (171 ft2/hour/gun). The pump equipment operated between 124.9 MPa (18,000 psi)and 138.8 MPa (20,000 psi) at a flowrate of 30.3 lpm (8 gpm). The nozzle on the lancecontained 2 jewels and was hydraulically spun at 4800 rpm.
The second group of data represents the production rates observed for the removal of damagedshop primer on the outer hull of the chemical tanker during new construction. The blasters wereto sweep blast the entire painted surfaces and remove any damaged areas down to bare metal (i.e.charred areas from internal welding, areas damaged by scraping and handling, erection joints).The shop primer ranged from 12.7 to 50.8 µm (0.5 to 2.0 mils). Production rates ranged from13.6 m2/hour/gun (146 ft2/hour/gun) to 33.9 m2/hour/gun (365 ft2/hour/gun) with an overallaverage of 18.4 m2/hour/gun (198 ft2/hour/gun). The pump equipment operated at 277.6 MPa(40,000 psi) with a flowrate of 20.8 lpm (5.5 gpm). The nozzle on the lance contained 5 jewels.
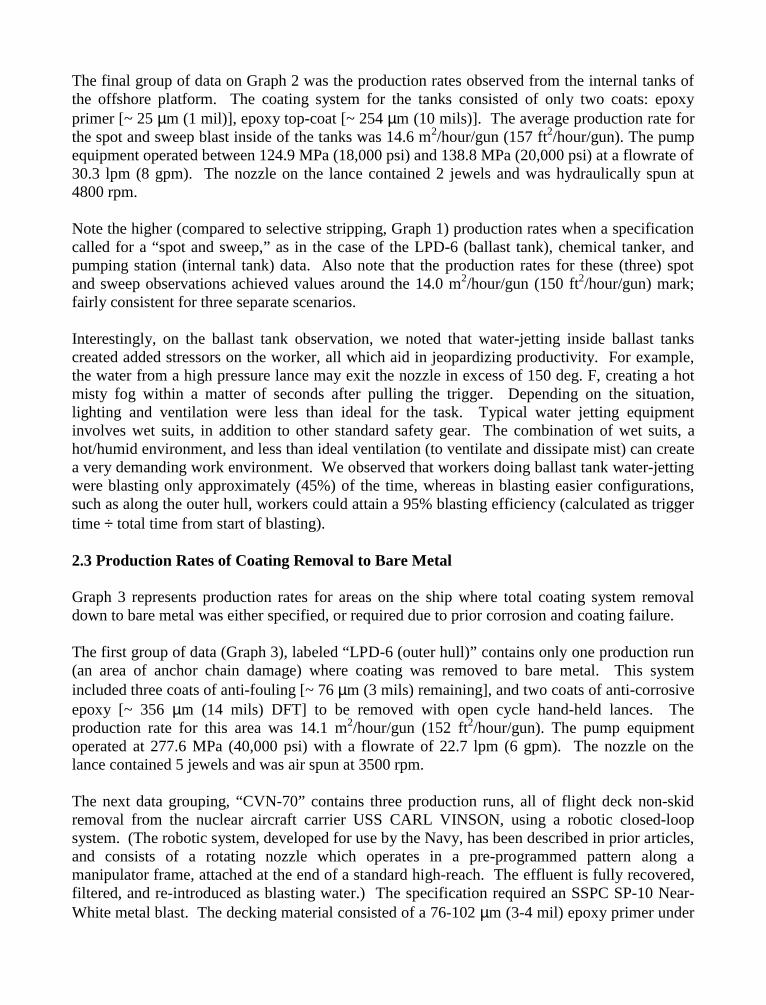
The final group of data on Graph 2 was the production rates observed from the internal tanks ofthe offshore platform. The coating system for the tanks consisted of only two coats: epoxyprimer [~ 25 µm (1 mil)], epoxy top-coat [~ 254 µm (10 mils)]. The average production rate forthe spot and sweep blast inside of the tanks was 14.6 m2/hour/gun (157 ft2/hour/gun). The pumpequipment operated between 124.9 MPa (18,000 psi) and 138.8 MPa (20,000 psi) at a flowrate of30.3 lpm (8 gpm). The nozzle on the lance contained 2 jewels and was hydraulically spun at4800 rpm.
Note the higher (compared to selective stripping, Graph 1) production rates when a specificationcalled for a “spot and sweep,” as in the case of the LPD-6 (ballast tank), chemical tanker, andpumping station (internal tank) data. Also note that the production rates for these (three) spotand sweep observations achieved values around the 14.0 m2/hour/gun (150 ft2/hour/gun) mark;fairly consistent for three separate scenarios.
Interestingly, on the ballast tank observation, we noted that water-jetting inside ballast tankscreated added stressors on the worker, all which aid in jeopardizing productivity. For example,the water from a high pressure lance may exit the nozzle in excess of 150 deg. F, creating a hotmisty fog within a matter of seconds after pulling the trigger. Depending on the situation,lighting and ventilation were less than ideal for the task. Typical water jetting equipmentinvolves wet suits, in addition to other standard safety gear. The combination of wet suits, ahot/humid environment, and less than ideal ventilation (to ventilate and dissipate mist) can createa very demanding work environment. We observed that workers doing ballast tank water-jettingwere blasting only approximately (45%) of the time, whereas in blasting easier configurations,such as along the outer hull, workers could attain a 95% blasting efficiency (calculated as triggertime ÷ total time from start of blasting).
2.3 Production Rates of Coating Removal to Bare Metal
Graph 3 represents production rates for areas on the ship where total coating system removaldown to bare metal was either specified, or required due to prior corrosion and coating failure.
The first group of data (Graph 3), labeled “LPD-6 (outer hull)” contains only one production run(an area of anchor chain damage) where coating was removed to bare metal. This systemincluded three coats of anti-fouling [~ 76 µm (3 mils) remaining], and two coats of anti-corrosiveepoxy [~ 356 µm (14 mils) DFT] to be removed with open cycle hand-held lances. Theproduction rate for this area was 14.1 m2/hour/gun (152 ft2/hour/gun). The pump equipmentoperated at 277.6 MPa (40,000 psi) with a flowrate of 22.7 lpm (6 gpm). The nozzle on thelance contained 5 jewels and was air spun at 3500 rpm.
The next data grouping, “CVN-70” contains three production runs, all of flight deck non-skidremoval from the nuclear aircraft carrier USS CARL VINSON, using a robotic closed-loopsystem. (The robotic system, developed for use by the Navy, has been described in prior articles,and consists of a rotating nozzle which operates in a pre-programmed pattern along amanipulator frame, attached at the end of a standard high-reach. The effluent is fully recovered,filtered, and re-introduced as blasting water.) The specification required an SSPC SP-10 Near-White metal blast. The decking material consisted of a 76-102 µm (3-4 mil) epoxy primer under
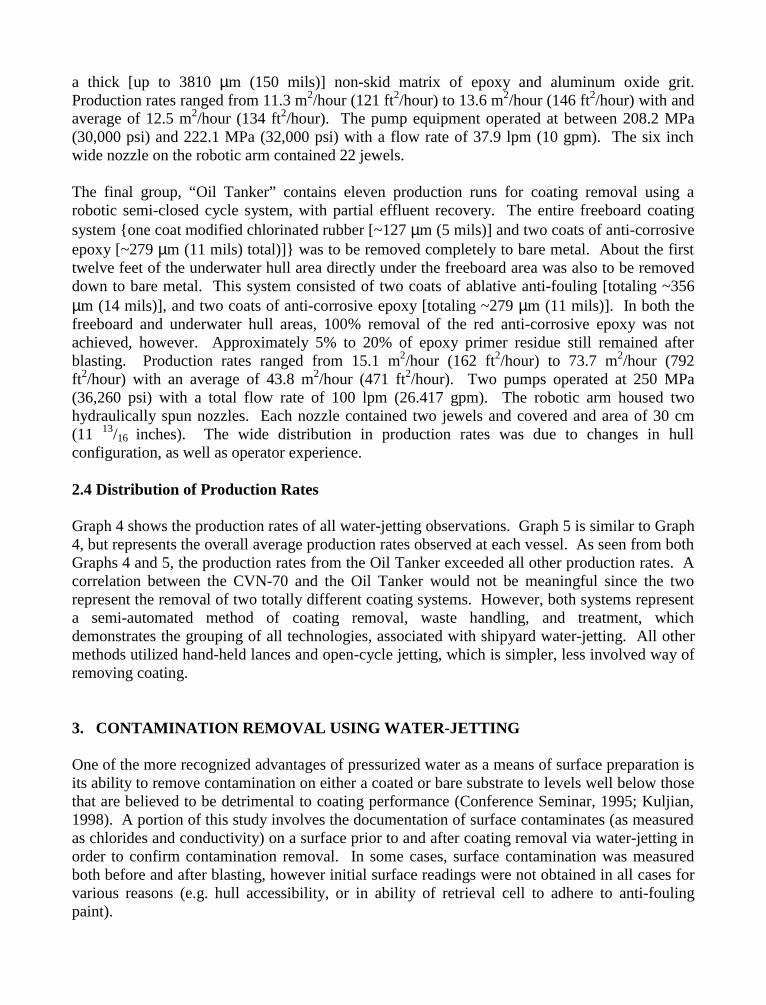
a thick [up to 3810 µm (150 mils)] non-skid matrix of epoxy and aluminum oxide grit.Production rates ranged from 11.3 m2/hour (121 ft2/hour) to 13.6 m2/hour (146 ft2/hour) with andaverage of 12.5 m2/hour (134 ft2/hour). The pump equipment operated at between 208.2 MPa(30,000 psi) and 222.1 MPa (32,000 psi) with a flow rate of 37.9 lpm (10 gpm). The six inchwide nozzle on the robotic arm contained 22 jewels.
The final group, “Oil Tanker” contains eleven production runs for coating removal using arobotic semi-closed cycle system, with partial effluent recovery. The entire freeboard coatingsystem one coat modified chlorinated rubber [~127 µm (5 mils)] and two coats of anti-corrosiveepoxy [~279 µm (11 mils) total)] was to be removed completely to bare metal. About the firsttwelve feet of the underwater hull area directly under the freeboard area was also to be removeddown to bare metal. This system consisted of two coats of ablative anti-fouling [totaling ~356µm (14 mils)], and two coats of anti-corrosive epoxy [totaling ~279 µm (11 mils)]. In both thefreeboard and underwater hull areas, 100% removal of the red anti-corrosive epoxy was notachieved, however. Approximately 5% to 20% of epoxy primer residue still remained afterblasting. Production rates ranged from 15.1 m2/hour (162 ft2/hour) to 73.7 m2/hour (792ft2/hour) with an average of 43.8 m2/hour (471 ft2/hour). Two pumps operated at 250 MPa(36,260 psi) with a total flow rate of 100 lpm (26.417 gpm). The robotic arm housed twohydraulically spun nozzles. Each nozzle contained two jewels and covered and area of 30 cm(11 13/16 inches). The wide distribution in production rates was due to changes in hullconfiguration, as well as operator experience.
2.4 Distribution of Production Rates
Graph 4 shows the production rates of all water-jetting observations. Graph 5 is similar to Graph4, but represents the overall average production rates observed at each vessel. As seen from bothGraphs 4 and 5, the production rates from the Oil Tanker exceeded all other production rates. Acorrelation between the CVN-70 and the Oil Tanker would not be meaningful since the tworepresent the removal of two totally different coating systems. However, both systems representa semi-automated method of coating removal, waste handling, and treatment, whichdemonstrates the grouping of all technologies, associated with shipyard water-jetting. All othermethods utilized hand-held lances and open-cycle jetting, which is simpler, less involved way ofremoving coating.
3. CONTAMINATION REMOVAL USING WATER-JETTING
One of the more recognized advantages of pressurized water as a means of surface preparation isits ability to remove contamination on either a coated or bare substrate to levels well below thosethat are believed to be detrimental to coating performance (Conference Seminar, 1995; Kuljian,1998). A portion of this study involves the documentation of surface contaminates (as measuredas chlorides and conductivity) on a surface prior to and after coating removal via water-jetting inorder to confirm contamination removal. In some cases, surface contamination was measuredboth before and after blasting, however initial surface readings were not obtained in all cases forvarious reasons (e.g. hull accessibility, or in ability of retrieval cell to adhere to anti-foulingpaint).
Note: In all cases, final surface contamination and chloride levels were measured within a fewhours after water-jetting, and do not necessarily represent the surface condition just prior tocoating. It is important to ensure the levels are low directly prior to painting, as well. The periodfrom when a surface is initially blasted to the time it is coated can be several days, during whichtime increased quantities of contaminants can settle on the cleaned surface, usually resulting invarying levels of flash rusting. Most contractors incorporate a “secondary cleaning” to removeresidual contaminants and flash rusting, to restore the surface to acceptable specifications.
3.1 Chlorides
Chloride contamination has been identified as a major contributor to premature coating defectscaused by ionic contamination. Therefore, surface chloride levels were measured prior to andafter water-jetting for comparison.
Graphs 6 and 7 depict all chloride data captured to-date. Graph 6 includes all visits in whichpotable water was used for jetting. In Graph 6, initial chloride contamination levels were quitelow (under 10 µg/cm2). All final readings were under 3 µg/cm2, with the majority of readingsunder 1 µg/cm2. Although initial readings were low in most cases, LPD-6 tank readings showthat water-jetting does reduce surface chlorides to below acceptable levels. The U.S. Navy hasidentified 3 µg/cm2 as the upper limit for acceptability for coating an immersed surface and 5µg/cm2 as the upper limit for coating an above-waterline surface (Kuljian, 1996). Realizing this,one can see that water-jetting is very effective in removing contaminants and producing a cleansurface for coating.
Graph 7 contains the chloride data from the offshore visit, where filtered seawater was used forblasting. The surfaces were next washed down with ~70 MPa (10,000 psi) potable water. Theinitial chloride levels on the pumping station were high (up to 40 µg/cm2), but these levels weresignificantly (78% to 97%) reduced after the secondary (fresh water) blast. As a test, chloridemeasurements were taken after the filtered seawater blast and prior to the fresh water rinse on theexterior shell only. For the exterior shell as noted in Graph 7, levels were quite high (70µg/cm2) confirming the necessity of the secondary fresh water blast.
The effectiveness of contamination removal for the offshore pumping station platform shouldonly be compared with itself. Comparisons of other “before” and of other “before and after”surface contamination numbers would not be meaningful since filtered seawater was used forjetting. All other water-jetting observations used a potable water source for blasting.
3.2 Conductivity
If contaminants other than (or in addition to) chloride are present, conductivity measurementsmay provide information if such substances can be detrimental to coating longevity.Conductivity samples were captured using 3 milliliter distilled, deionized water (typically 0-1µS/cm) injected into a blister patch. Results were normalized for a 5ml solution conductivity.Graphs 8 and 9 depict the conductivity data gathered to-date. Graph 8 includes all visits inwhich potable water was used for blasting. Graph 9 contains the data gathered on the offshore
visit which was blasted with filtered seawater, followed by a secondary fresh water blast [~70MPa (10,000 psi)].
In most cases, conductivity levels dropped significantly after water-jetting. On Graph 8, fifteenof twenty-two final conductivity readings were under 20 µS/cm and twenty-one of twenty-twowere under 40 µS/cm. (For reference, our experience has shown typical city tap water to rangein conductivity from 80 µS/cm to 130 µS/cm.) Although no standard currently exists foracceptable criteria for conductivity, these readings further confirm waterjetting’s ability toprovide a suitably clean surface for coating.
The data on Graph 9 shows that blasting with seawater with a secondary fresh water blast didsignificantly (77% to 92%) reduce the surface conductivity. However, the residual surfaceconductivity was still high compared with the final values achieved with potable water. As atest, conductivity measurements were taken after the filtered seawater blast and prior to the freshwaster rinse on the exterior shell only. For the exterior shell, as noted in Graph 9, conductivitylevels were quite high (960 µS/cm) confirming the necessity of the secondary fresh water blast.
4. OTHER FACTORS OF INTEREST
4.1 Surface Profile
As stated earlier, the high speed spinning action of the high and ultra-high pressure jetting waterimpacting on coatings can create a measurable surface profile in the existing coating. Theresulting profile aids in subsequent coating adhesion. Throughout the study, we measuredresultant “coating profile” and discovered that the waterjetting process, when using a spinningnozzle, can produce profiles in paint ranging from 43.2 to 111.8 µm (1.7 to 4.4 mils), asmeasured using ASTM D-4417, Method C.
4.2 Coating Adhesion
Where possible, tensile adhesion of the coating system, both prior to and after water-jetting, wasdetermined to assess any detrimental effects that waterjetting may have on remaining coating.The notion that during a “spot and sweep” blasting operation the high and ultra-high pressurewater impacting on aged coatings would, in some way, compromise existing adhesion wastested. Interestingly, similar tensile adhesion values (as measured by ASTM D-4940) to initialadhesion resulted after sweep water-jetting. Basically, if the coating’s adhesion wasquestionable, the high, or ultra-high pressure water would remove the weak coating. If theremaining coating was still intact and well adhered the jetting would merely profile the coatingand the coating would remain well adhered.
4.3 Factors Affecting Production Rates
Numerous factors can affect production rates in a water-jetting operation. The single mostimportant factor is a combination of existing coating type and condition, coupled with theexperience and organization of the crew. We noticed that experienced crews can work up to
twice as productive as inexperienced crews, performing identical work. Similarly, removal ofwell-adhered high-build deck coating will not proceed with the speed of a thirteen-year old,degraded epoxy in a tank. The working configuration also plays an important role in affectingproductivity. Jetting the cramped flat under-bottom of a ship is at least twice as slow asremoving the same coating system on the flat vertical side of an underwater hull. Similarly,maneuvering inside a heavily stiffened internal tank can certainly slow down an operation.
4.4 Flash Rusting
Flash rusting is a factor which must be dealt with on practically all jobs encountered. When acoating is removed to bare metal, the resultant moisture in the air, coupled with any othercontaminants that may settle on the surface, will create some degree of flash rusting. Dependingon a number of factors, this “rust bloom” may grow in intensity with time. In such cases, if thecoating specification requires it, the bloom will have to be removed with a secondary blast,followed immediately (after the surface dries) by coating. Inside tanks, the rusting problem canbe significantly reduced by properly sized and placed ventilation, and by the use ofdehumidification. A related problem exists with the use of common desiccant dehumidification,where the dry air is of significantly higher temperature of ambient, thereby adding to the heatstress of the workers. The use of refrigerant dehumidification should be explored in suchsituations.
With the closed loop machinery, the blast residue and water is vacuumed away immediately.Adding to this is an evaporative effect caused by the increased temperature of the substrate dueto the kinetic energy of the pressurized water impacting the substrate. Flash rusting is not anissue in such situations. In such scenarios, we have witnessed the substrate remaining rust-freefor several days, provided no rain or other contaminants foul the blasted surface.
Some coating systems will not tolerate rust blooming, whereas many are designed for be appliedover flash rusting. In all ballast tank scenarios, the entire surface was “sealed” with a penetratingsealer type coating (either a moisture-cured urethane or an epoxy-ester) followed by two coats ofbarrier coating. Well written specifications with clear guidance on acceptable limits of flashrusting, and, how to correct such occurrences if they occur, are key for water-jetting jobs toprogress smoothly. Education by all inspection parties, in interpreting flash rusting is alsoimperative.
5. CONCLUDING REMARKS
In recent years, water-jetting has been used more and more by ship builders and ship repairers asa means of preparing surfaces for repainting. As learned from this study, a wide variety ofsituations are ideal for water jetting, such as:
• touch-up and maintenance of underwater-hull coating systems• touch-up of internal tank systems• full removal of decking materials• full removal of coating systems
• selective (partial) removal of coating layers (such as anti-fouling, or freeboard coatings),leaving full intact coating layers
• preparation of pre-construction primer for re-coating (in new-construction)
As learned in the study, some localities even prohibit the use of open air abrasive blasting in theirshipyard activities, leaving water-jetting as the sole productive medium for coating removal.
The study also revealed that different means of coating removal (open cycle/closed cycle),different objectives of coating removal (selective stripping/full removal/spot and sweep), anddifferent types of coating being removed all play a determining role in the observed productionrate. Just as important, is the experience of the operator, and the configuration of the blaster(interior tank vs. flat hull), in determining production rate. All of the above factors are integralin determining production rates of any large-scale general coating removal process, such asabrasive grit blasting.
Differences in overall job productivity [as opposed to m2/hour (ft2/hour)] between water-jettingand other methods arise when considering other factors, such as equipment size andmaneuverability, the waste stream created, and impact on other trades. In this study, a welcomeadvantage of shipyard water-jetting versus traditional means was that water-jetting does allowthe work of other trades to proceed directly adjacent to water-jetting, a situation uncommonduring abrasive blasting.
It is the opinion of the authors that for large-scale, quick turn-around coating removal on a shipunderwater hull or free-board, the automated, or semi-automated robotic type machinery thatcontains all blasting water and effluent, represent the most promise for impacting the ship-repairindustry. These machines can efficiently remove coatings down to the original substrate withoutthe fear of flash rusting, and provide excellent surfaces for immediate re-coating.
6. REFERENCES
Conference Seminar – Water Jetting / Water Blasting; The Lydia Frenzel Conference Series, June 6, 1995, Virginia Beach, VA.
Kuljian, G., Parks, A.R., Kaznoff, A. “State-Of-The-Art Procedures for Ensuring Optimum Coating Longevity in Navy Tank Coatings Operations,” Presented at SSPC-96, Charlotte,NC, November 1996.
Kuljian, G., Holmes, B. “U.S. Navy Experiences with Water-Jetting,” Protective Coatings Europe, February 1998.
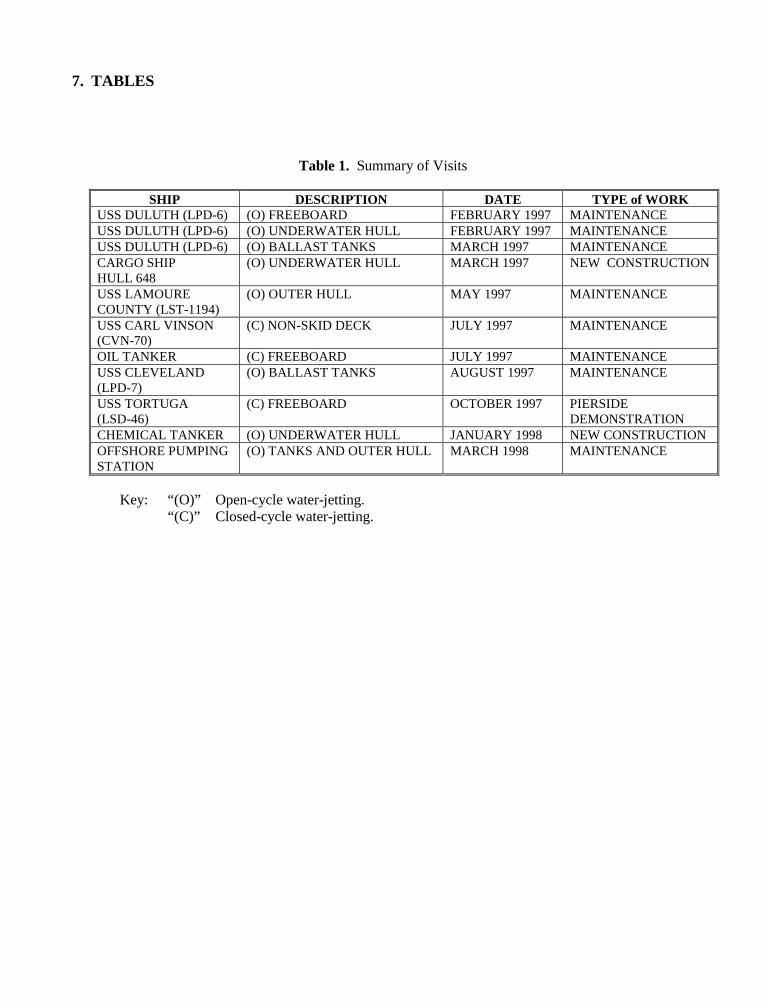
7. TABLES
Table 1. Summary of Visits
SHIP DESCRIPTION DATE TYPE of WORKUSS DULUTH (LPD-6) (O) FREEBOARD FEBRUARY 1997 MAINTENANCEUSS DULUTH (LPD-6) (O) UNDERWATER HULL FEBRUARY 1997 MAINTENANCEUSS DULUTH (LPD-6) (O) BALLAST TANKS MARCH 1997 MAINTENANCECARGO SHIPHULL 648
(O) UNDERWATER HULL MARCH 1997 NEW CONSTRUCTION
USS LAMOURECOUNTY (LST-1194)
(O) OUTER HULL MAY 1997 MAINTENANCE
USS CARL VINSON(CVN-70)
(C) NON-SKID DECK JULY 1997 MAINTENANCE
OIL TANKER (C) FREEBOARD JULY 1997 MAINTENANCEUSS CLEVELAND(LPD-7)
(O) BALLAST TANKS AUGUST 1997 MAINTENANCE
USS TORTUGA(LSD-46)
(C) FREEBOARD OCTOBER 1997 PIERSIDEDEMONSTRATION
CHEMICAL TANKER (O) UNDERWATER HULL JANUARY 1998 NEW CONSTRUCTIONOFFSHORE PUMPINGSTATION
(O) TANKS AND OUTER HULL MARCH 1998 MAINTENANCE
Key: “(O)” Open-cycle water-jetting.“(C)” Closed-cycle water-jetting.
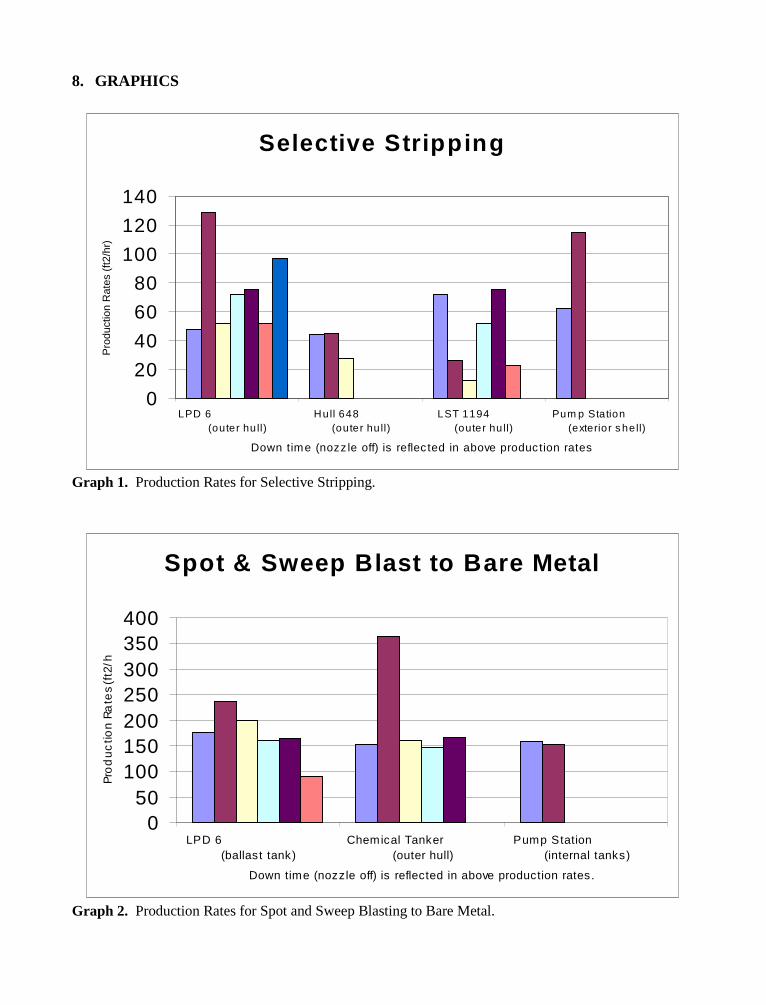
8. GRAPHICS
Graph 1. Production Rates for Selective Stripping.
Graph 2. Production Rates for Spot and Sweep Blasting to Bare Metal.
Selective Stripping
0
20
40
60
80
100
120
140
LPD 6 (outer hu ll)
Hull 648 (outer hu ll)
LST 1194 (outer hu ll)
Pum p Station (exterior s hell)
Down time (nozz le off) is reflec ted in above produc tion rates
Pro
duct
ion
Rat
es (
ft2/h
r)
Spot & Sweep Blast to Bare Metal
050
100150200250300350400
L P D 6 (ballas t tank)
Chemical T anker (outer hull)
P ump S tation (internal tanks )
Down time (nozzle off) is reflected in above production rates.
Pro
du
ctio
n R
ate
s (f
t2/h
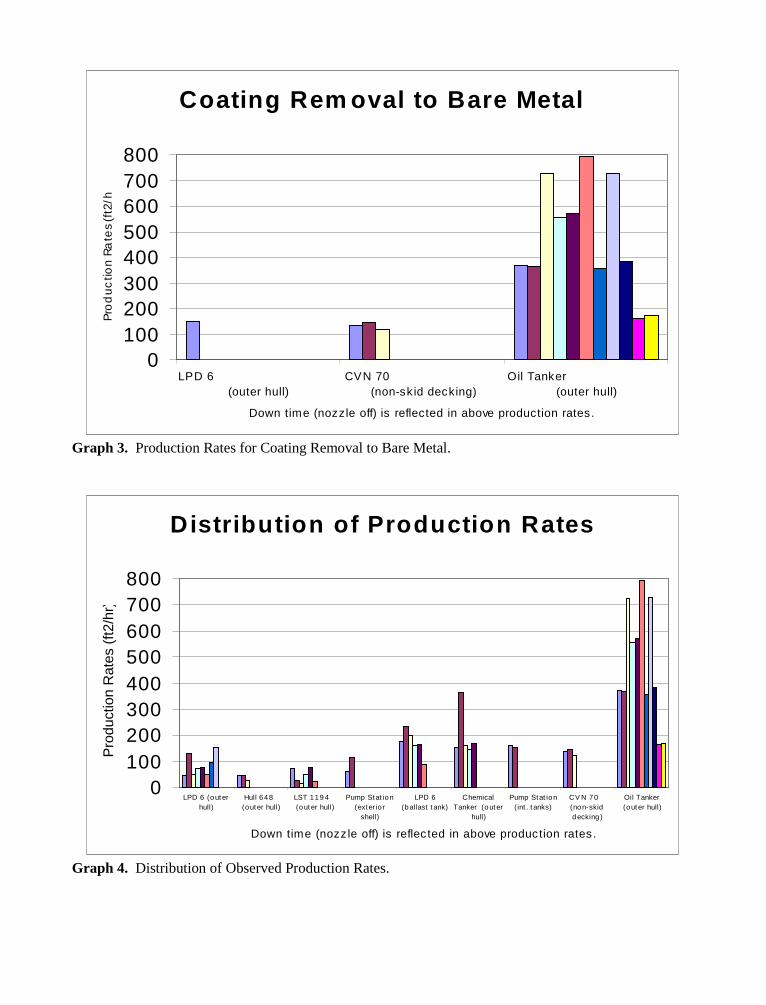
Graph 3. Production Rates for Coating Removal to Bare Metal.
Graph 4. Distribution of Observed Production Rates.
Coating Rem oval to Bare Metal
0100200300400500600700800
LPD 6 (outer hull)
CVN 70 (non-skid decking)
Oil Tanker (outer hull)
Down time (noz z le off) is reflected in above production rates .
Pro
du
ctio
n R
ate
s (f
t2/h
Distribution of Production Rates
0100200300400500600700800
LPD 6 (outerhull)
Hul l 648 (outer hull)
LS T 119 4 (outer hull)
Pump S tation(exter ior
s hell)
LPD 6(ballas t tank)
ChemicalT anker (outer
hull)
Pump S tation(int. tanks )
CV N 70 (non-s kiddecking)
Oil T anker (outer hull)
Down time (noz z le off) is reflected in above production rates .
Pro
duct
ion
Rat
es (
ft2/h
r)
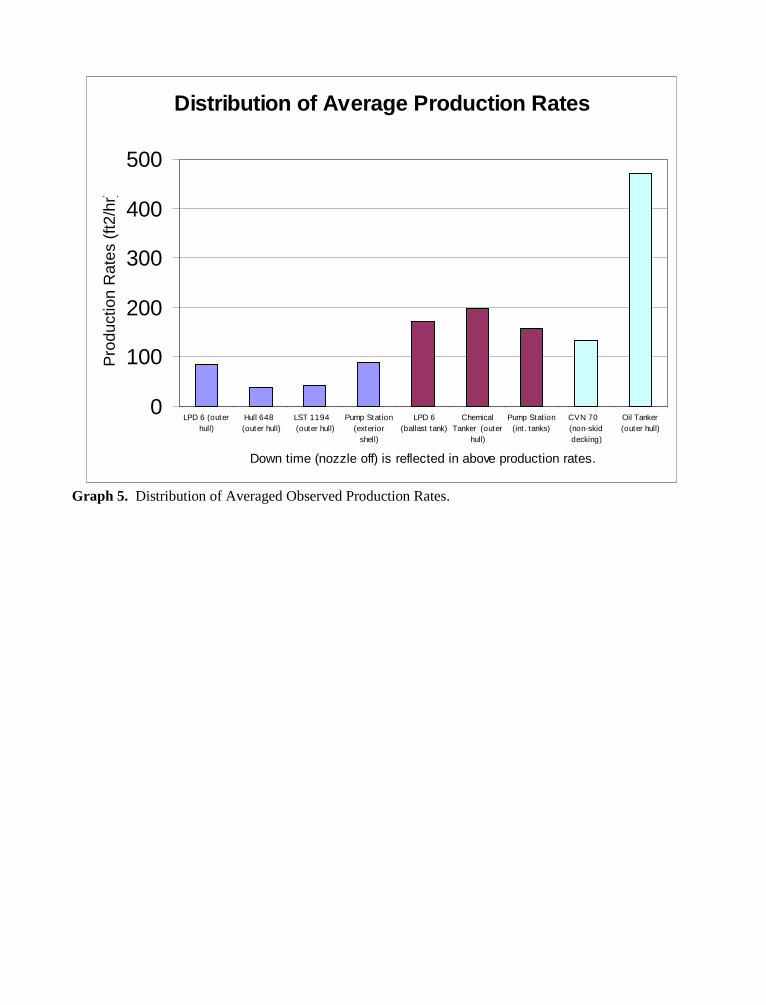
Graph 5. Distribution of Averaged Observed Production Rates.
Distribution of Average Production Rates
0
100
200
300
400
500
LPD 6 (outerhull)
Hull 648 (outer hull)
LST 1194 (outer hull)
Pump Station(exterior
shell)
LPD 6(ballast tank)
ChemicalT anker (outer
hull)
Pump Station(int. tanks)
CVN 70 (non-skiddecking)
Oil T anker (outer hull)
Down time (nozz le off) is reflected in above production rates .
Pro
duct
ion
Rat
es (
ft2/h
r)
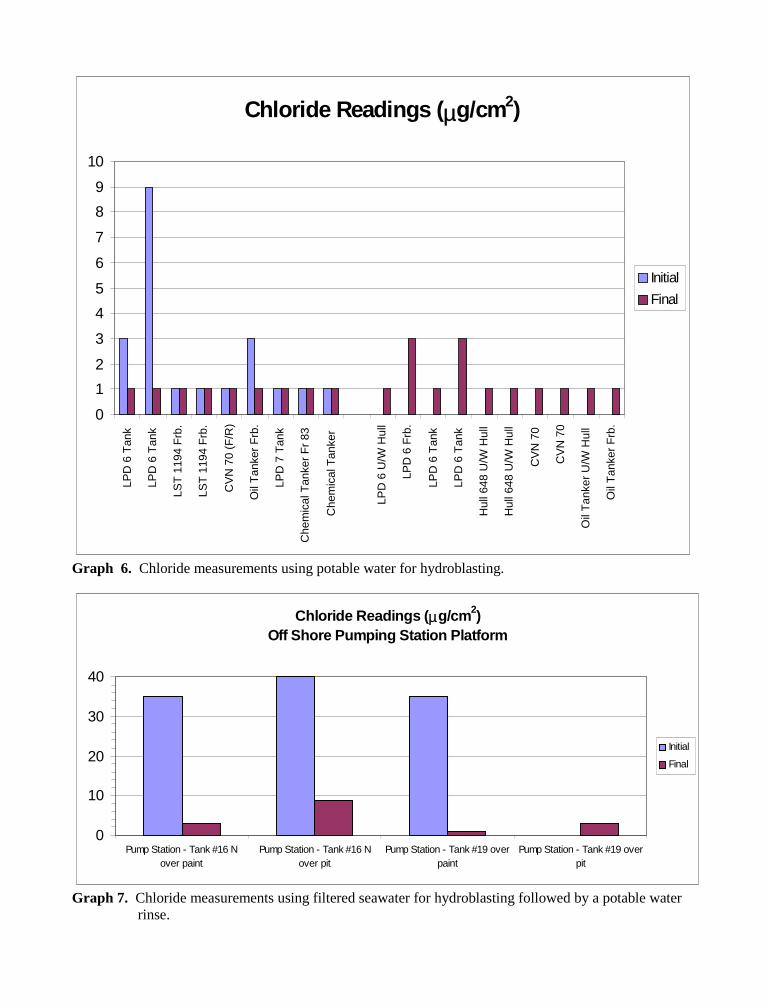
Graph 6. Chloride measurements using potable water for hydroblasting.
Graph 7. Chloride measurements using filtered seawater for hydroblasting followed by a potable waterrinse.
Chloride Readings ( µg/cm2)
0
1
2
3
4
5
6
7
8
9
10
LPD
6 T
ank
LPD
6 T
ank
LST
119
4 F
rb.
LST
119
4 F
rb.
CV
N 7
0 (F
/R)
Oil
Tan
ker
Frb
.
LPD
7 T
ank
Che
mic
al T
anke
r F
r 83
Che
mic
al T
anke
r
LPD
6 U
/W H
ull
LPD
6 F
rb.
LPD
6 T
ank
LPD
6 T
ank
Hul
l 648
U/W
Hul
l
Hul
l 648
U/W
Hul
l
CV
N 7
0
CV
N 7
0
Oil
Tan
ker
U/W
Hul
l
Oil
Tan
ker
Frb
.
Initial
Final
Chloride Readings ( µµg/cm2)Off Shore Pumping Station Platform
0
10
20
30
40
Pump Station - Tank #16 Nover paint
Pump Station - Tank #16 Nover pit
Pump Station - Tank #19 overpaint
Pump Station - Tank #19 overpit
Initial
Final
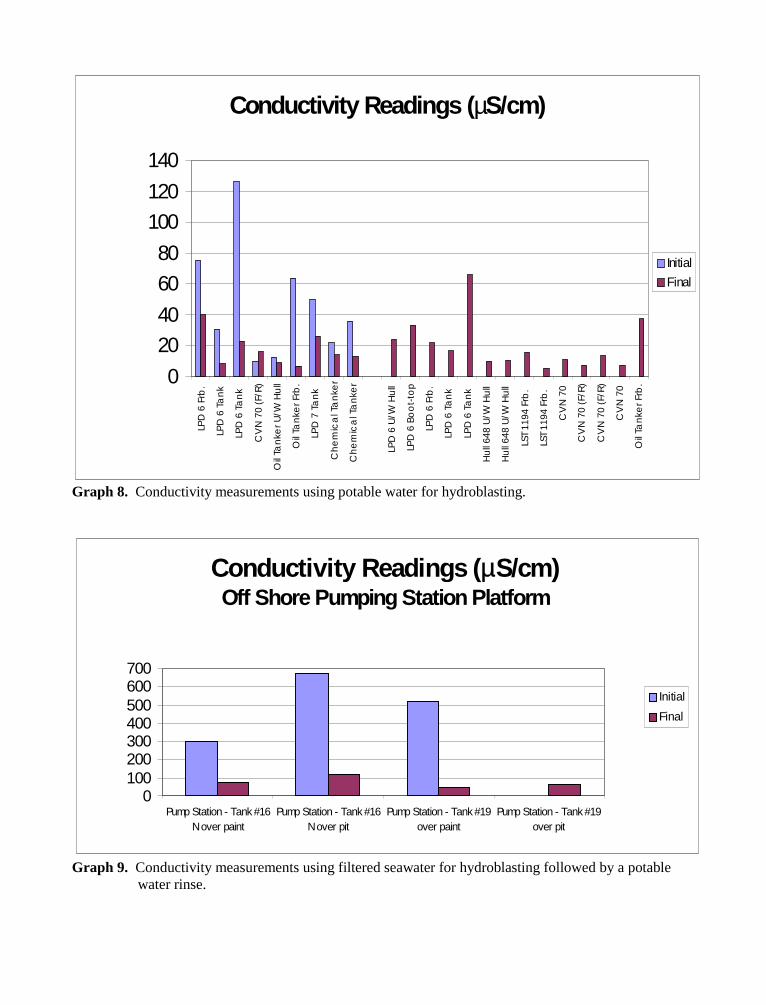
Graph 8. Conductivity measurements using potable water for hydroblasting.
Graph 9. Conductivity measurements using filtered seawater for hydroblasting followed by a potablewater rinse.
Conductivity Readin gs (µS/cm)
0
20
40
60
80
100
120
140
LPD
6 F
rb.
LPD
6 T
an
k
LPD
6 T
an
k
CV
N 7
0 (F
/R)
Oil
Tan
ker U
/W H
ull
Oil
Tan
ker F
rb.
LPD
7 T
an
k
Ch
em
ica
l Ta
nke
r
Ch
em
ica
l Ta
nke
r
LPD
6 U
/W H
ull
LPD
6 B
oo
t-to
p
LPD
6 F
rb.
LPD
6 T
an
k
LPD
6 T
an
k
Hu
ll 64
8 U
/W H
ull
Hu
ll 64
8 U
/W H
ull
LST
1194
Frb
.
LST
1194
Frb
.
CV
N 7
0
CV
N 7
0 (F
/R)
CV
N 7
0 (F
/R)
CV
N 7
0
Oil
Tan
ker F
rb.
Initial
Final
Conductivit y Readings (µS/cm)Off Shore Pumping Station Platform
0100200300400500600700
Pump Station - Tank #16N over paint
Pump Station - Tank #16N over pit
Pump Station - Tank #19over paint
Pump Station - Tank #19over pit
Initial
Final
10th American Waterjet ConferenceAugust 14-17, 1999: Houston, Texas
Paper 43
HYDROKINETIC USAGE IN THE CLEANING
OF EXCHANGER TUBES AND PIPES
Patricia McGrew GarciaAIMM Marketing
Houston, Texas, U.S.A.
Brooks Bradford, Sr.AIMM Technologies, Inc.LaMarque, Texas, U.S.A.
ABSTRACT
Hydrokinetics™ is a methodology for cleaning the interior diameter of pipes and tubes, such asthose found in heat exchangers, chillers and reboilers. The process induces resonant frequencyvibrations into a liquid stream at pressures far lower than normal hydroblasting pressures.Several engineering principles are involved, including hydraulic pressure, induced cavitation,off-frequency pulsation, resonant frequency and water jetting. The vibration transfers to themetal of the tube or pipe and also to the material that is fouling the interior of the tube or pipe.Due to the difference in the densities, the vibrations take place at different frequencies and thebond between the metal and the fouling material is broken. Once the bond is broken, the foulingmaterial flushes out in the same liquid stream. Tube or pipe configurations that are problematicfor hydroblasting, such as coils or tight-radius 180º turns, generally can be cleaned withHydrokinetics™. Fouling materials that respond poorly to erosion technologies often respondwell to Hydrokinetics™. This includes thin laminars of fouling material that may be bondedtightly to the interior wall and lengthy solid plugs. Hard scales or rubbery layers, which can beproblematic for hydroblasting, are also excellent applications for the use of Hydrokinetics™.
Organized and Sponsored by the WaterJet Technology Association
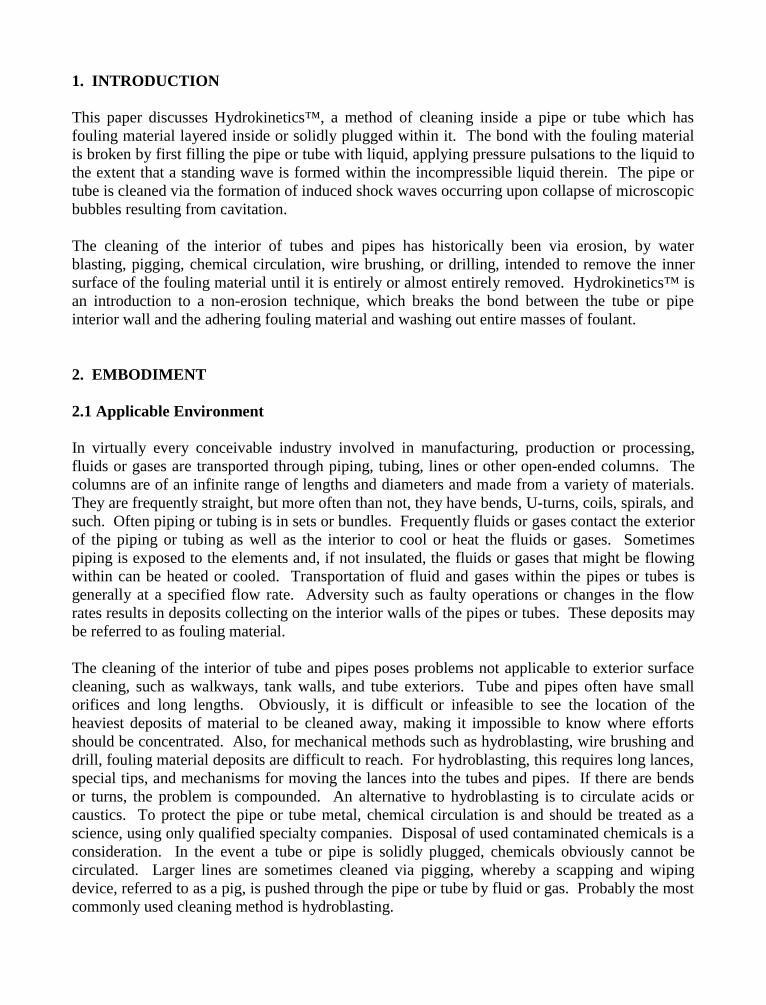
1. INTRODUCTION
This paper discusses Hydrokinetics™, a method of cleaning inside a pipe or tube which hasfouling material layered inside or solidly plugged within it. The bond with the fouling materialis broken by first filling the pipe or tube with liquid, applying pressure pulsations to the liquid tothe extent that a standing wave is formed within the incompressible liquid therein. The pipe ortube is cleaned via the formation of induced shock waves occurring upon collapse of microscopicbubbles resulting from cavitation.
The cleaning of the interior of tubes and pipes has historically been via erosion, by waterblasting, pigging, chemical circulation, wire brushing, or drilling, intended to remove the innersurface of the fouling material until it is entirely or almost entirely removed. Hydrokinetics™ isan introduction to a non-erosion technique, which breaks the bond between the tube or pipeinterior wall and the adhering fouling material and washing out entire masses of foulant.
2. EMBODIMENT
2.1 Applicable Environment
In virtually every conceivable industry involved in manufacturing, production or processing,fluids or gases are transported through piping, tubing, lines or other open-ended columns. Thecolumns are of an infinite range of lengths and diameters and made from a variety of materials.They are frequently straight, but more often than not, they have bends, U-turns, coils, spirals, andsuch. Often piping or tubing is in sets or bundles. Frequently fluids or gases contact the exteriorof the piping or tubing as well as the interior to cool or heat the fluids or gases. Sometimespiping is exposed to the elements and, if not insulated, the fluids or gases that might be flowingwithin can be heated or cooled. Transportation of fluid and gases within the pipes or tubes isgenerally at a specified flow rate. Adversity such as faulty operations or changes in the flowrates results in deposits collecting on the interior walls of the pipes or tubes. These deposits maybe referred to as fouling material.
The cleaning of the interior of tube and pipes poses problems not applicable to exterior surfacecleaning, such as walkways, tank walls, and tube exteriors. Tube and pipes often have smallorifices and long lengths. Obviously, it is difficult or infeasible to see the location of theheaviest deposits of material to be cleaned away, making it impossible to know where effortsshould be concentrated. Also, for mechanical methods such as hydroblasting, wire brushing anddrill, fouling material deposits are difficult to reach. For hydroblasting, this requires long lances,special tips, and mechanisms for moving the lances into the tubes and pipes. If there are bendsor turns, the problem is compounded. An alternative to hydroblasting is to circulate acids orcaustics. To protect the pipe or tube metal, chemical circulation is and should be treated as ascience, using only qualified specialty companies. Disposal of used contaminated chemicals is aconsideration. In the event a tube or pipe is solidly plugged, chemicals obviously cannot becirculated. Larger lines are sometimes cleaned via pigging, whereby a scapping and wipingdevice, referred to as a pig, is pushed through the pipe or tube by fluid or gas. Probably the mostcommonly used cleaning method is hydroblasting.
The removal of such fouling material generally takes place during a planned shutdown, a costlyloss of production added to the actual cost of maintenance. Additionally, cleaning of the interiorof the pipes or tubes may frequently be required when a shutdown is not scheduled but whenthere are signs of a need, such as when flow is impeded. In cases where piping or tubing isintended to cool or heat the interior or exterior fluids or gases, the buildup of fouling material canact as unwanted insulation and degrade the heat transfer. Pipes or tubes also logically need to becleaned if a different medium is processed. Where a unit is permanently dismantled, the pipesand tubes must be cleaned when the debris within them poses any environmental concern.
Typically at maintenance time, piping and tubing is dismantled and removed from the structure,entailing expensive pipefitting, crane work, etc. When piping or tubing with bends, flanges,valves, etc. is involved, additional work is needed to remove them, leaving only straight sectionsof piping or tubing, in order to ease conventional cleaning. Pipes and tubes that are bundledtogether are commonly left bundled together, but most bends and such are generally removed.
Hydrokinetics™ was originally conceived to provide an atmosphere in which workers were notexposed to chemicals or high pressure water, whereby all affluence would exit away from theworkers. In addition to the safety impact, it was learned during development that dismantlingwas not required, other than to provide an entrance and an exit to the pipes or tubes to becleaned. Bundles can be Hydrokinetically™ cleaned without removal from their structure.
2.2 The Science of Hydrokinetics™
Hydrokinetics™ is a multi-velocity based sonic system; whereby an induced sonic shock is usedto break the cohesion between the fouling material and the pipe or tube wall so the foulingmaterial is washed away in the liquid in the pipe or tube. Hydrokinetics™ generally removes avery high percentage of the fouling material even where it has several layers of buildup. It iseffective on any type of fouling material that will respond to the induced sonics. For instance, ina dairy, Hydrokinetics™ can remove butterfat buildup in lines, or in a plant using seawater,Hydrokinetics™ can remove muscles or clams clinging to the interior of the lines. Tests haveshown Hydrokinetics™ to be particularly effective for removing petrochemical-based deposits.Organic compounds are highly degraded in this environment, and inorganic compounds can beoxidized or reduced. In petrochemical plants, the system can remove monomers, co-polymers,water scale, etc., including soft, sticky fouling materials, hard, brittle fouling materials, andconsistencies in between. Further, Hydrokinetics™ can remove extremely thin films of foulingmaterials, solid plugs of fouling material, and all the degrees of buildup in between.
It is an important, but not necessarily essential, that the flow of the fluid stream from theHydrokinetics™ system be as streamlined or laminar as possible. This is opposed to a“boundary layer flow” in which the outer portion of the radius of the stream is slowed byfrictional drag and flows at a slower velocity than the inner portion of the stream, or turbulentflow. The fluid stream changes from laminar flow to boundary layer flow at the outlet of theHydrokinetic system. In the pipe or tube to be cleaned, which has been filled with static fluid, apulsating fluid stream, pumped into the center of the pipe, sets up a reflected shock wave andresultant standing wave in the column of fluid. The standing wave frequency will pass throughthe resonant frequencies of the fouling material. The fluid collapses bubbles during the low-
pressure pulse resulting, in cavitation. In addition to the breaking of the cohesion between thepipe or tube wall and the fouling material, loose or easily removed fouling material simplywashes out in the fluid stream along with the larger mass of fouling material broken from thepipe or tube wall.
2.3 Blockage Devices
Hydrokinetics™ induces a sonic, subsonic or supersonic resonance (hereinafter called sonics) ina tube or pipe for cleaning purposes. Hydrokinetics™ is not, but may first appear to be, pigging.No scrapping or wiping devices is used with Hydrokinetics™, but in instances where the pipe isnot completely blocked with fouling material, a blockage may be inserted in the pipe. Thisblockage is helpful for the induction of sonics. This blockage can be anything of sufficient sizeand texture to close off the interior diameter of the pipe or tube and may be compressible orincompressible, depending on the particular situation. In the event of a solidly fouled pipe ortube, no manually inserted blockage is necessary since the fouling material serves as theblockage. The blockage often is blown from the pipe or tube before or with the fouling material,rather than behind the fouling material as in a pigging process. The blockage device isproportioned to the size of the pump used. With a smaller pump, tighter clearance around theblockage is used. Due to the fluid flowing around it, the sonics affect is on the downstream edgeof the blockage. The blockage device does not violently contact the fouling material. However,the blockage device is often distorted when it exits the pipe or tube, due to the sonics and highvelocity to which it has been exposed. Grooves are often formed along the exterior of theblockage devices, and are cut from the back of the device to the front from the cavitation aroundthe blockage, as discussed herein.
2.4 Equipment
Hydrokinetics™ is based on slow filling of the pipe or tube via a multi-cylindered positivedisplacement pump, and then the releasing of high velocity fluid into the relatively static fluid inthe pipe or tube. The pump should have an odd number of cylinders or should feed a pulsatingdevice, and the pump should be equipped with an unloader valve. Hydrokinetics™ requires atleast two valves in addition to the unloader valve to induce resonance into the liquid in the pipeor tube. Via the proprietary Hydrokinetic™ equipment, sonics is induced in the liquid of thesystem upstream of the blockage, at the pump or pulse-generating device, and enhanced byvelocity accelerators.
This system cleans when the necessary frequency range does not exceed an augmentedfrequency range, such as the frequency range arrived at from the 120º pulsation of a triplex pumpwith the pump rotating at approximately 450 rpms and modulated through the unloader system ata pressure low enough to avoid structural damage to the fouled pipe or tube.
To induce a sonic wave into a pipe or tube via this system, a pump or other high-pressure fluidsource, an unloader valve, fluid accelerators(s), two or more valves, and a ram and nozzleassembly are needed. A lance is not a required part of Hydrokinetics™. The fluid source maybe smooth or pulsating, for example an odd-numbered, multi-cylinder positive displacementpump. The fluid source can connect to a pulsation source downstream to add pulsations to the
fluid flow. Hydrokinetics™ entails the delivery of a fluid stream from the pump or other fluidsource into pipes or tubes via apparatus that creates sound waves in the fluid system. Being ofdifferent materials, the resonance transfers to the pipe or tube and to the fouling material atdifferent rates, breaking the bond between the two. Once the bond is broken, the foulingmaterial washes out in the fluid stream. The system is not dependent upon erosion or scrappingas in conventional hydroblasting or pigging. There are instances when the time allowed forerosion technologies is limited as production is ceased for cleaning, a costly situation. In suchcases, Hydrokinetics™ can be used as the breaking of the bond and extrusion of the foulingmaterial is logically faster than the eroding away of such material.
When a pipe or tube is to be cleaned with Hydrokinetics™, it is first opened on both ends. Anozzle is mounted onto the pipe to close off the entry end, and a volume of fluid flows into thepipe or tube. When the tube or pipe is full, the obstruction caused by the fouling material or themanually inserted blockage will cause the pressure to suddenly increase. This increase initiatesthe cavitation and cleaning process. It is important that this pressure be compatible with the pipeor tube to assure its integrity. During pressure tests, the circumferential stress is not to exceed90% of the yield strength of the pipe or tube. Hydrokinetics™ uses pressure far less than thisand for shorter durations of time generally used in pressure testing. The Hydrokinetic™ pressureis calculated and pre-set on the aforementioned unloader valve.
2.5 Pressures
For tubing, such as in heat exchangers, coolers, chillers, etc., the pressure can be calculated viaBarlow’s Formula, a generally accepted engineering formula. As the tubes to be cleaned are notnew, the pressure arrived by the formula is reduced, often by 25%. Thus the formula forcleaning tubes would be calculated as:
P = (2t x S ÷ OD) - 25%
where P is the pressure, t is the tube wall thickness, S is the strength of the metal, and OD is theouter diameter of the tube.
When dealing with pipe, generally there are flanges, bolts and gaskets to be considered. Theseitems may be less strong than the pipe itself. Therefore, a separate formula, derived by Don E.Bray, Ph. D., P.E., is used for pipe, as follows:
P = (1.5t x Y) ÷ ID
where P is the pressure, t is the pipe wall thickness, Y is the standard minimum yield stress, andID is the inner diameter of the pipe. Depending on the age of the pipe, this calculation may bereduced by some percentage.
2.6 Hydrokinetic™ Cavitation
Referred to herein as cavitation, large bubbles or cavities, imploded by fluid pressure, are asource of vibrations. Intense ultrasound waves generate large alternating stresses within a liquid
by creating regions of positive and negative pressure. A cavity can form and grow during theepisodes of negative pressure but when the cavity attains a critical size, it implodes, generatingintense localized heat and tremendous pressure. Vibrations are due to the tremendous turbulence,heat and pressure of the imploding cavities, providing a unique environment for high-energyreactions.
Hydrokinetic™ cavitation can be generated by inducing intense sound waves in a liquid. Suchwaves create, alternately, compression and expansion, which in turn can form the bubbles subjectto implosive. Of course, compression cycles exert a pressure on the liquid molecules forcingthem together. Conversely, expansion cycles exert a negative pressure that pulls the moleculesaway from one another. During the expansion cycle, a sound wave of sufficient intensity cangenerate cavities. Bubbles in liquids are inherently unstable, as large ones tend to float to thesurface and small ones tend to re-dissolve into the liquid. Bubbles absorb energy with thecompression and expansion cycles of sonic waves. The growing cavity can eventually reach acritical size where it will most efficiently absorb energy from the sound wave. The critical sizedepends on the frequency of the sound wave. Once a cavity can no longer absorb energyefficiently, it can no longer sustain itself and the liquid rushed in and the cavity implodes. Aliquid is held together by attracting forces, which determine surface tension of a liquid. For acavity to form, a large negative pressure associated with the expansion cycle of the sound waveovercomes the liquid tensile strength. Less pure liquids have weaker tensile strengths. Thereforebastardizing fluid mediums, such as extremely pure water, with soda or a metalliferous liquid canenhance the cavitation. With such bastardized mediums, the pressure waves drive small particlesinto one another at high speeds with collisions so intense that the metal powders are melted at thepoint of impact. Further, the adhesive nature of a liquid is reduced when the liquid is cut with airor other gases, or when gas is dissolved in the liquid. When a gas-filled crevice is exposed to anegative pressure cycle from a sound wave, the reduced pressure makes the gas in the creviceexpand until a bubble is released into solution. Most liquids, such as plant water, are sufficientlycontaminated by small particles to enhance cavitation.
During implosion, the gases and vapors inside the cavity are compressed, generating intense heatthat raises the temperature of the surrounding liquid, creating a very small local hot spot thatdissipates quickly. However, at any given time, the temperature of the bulk of the liquid remainsunaffected. If the cavity forms near solid surface, such as the surface of the fouling material orpipe or tube interior wall, the implosion will be asymmetric, expelling a jet of liquid at roughly400 kph. The jet develops opposite from and moves toward the solid surface. The jet, as well asthe waves from the cavity implosion, erode solid surfaces, remove non-reactive coatings andfragment brittle powders. Reactions are further facilitated by high temperatures and pressuresassociated with cavity implosion near the surface. The Hydrokinetics™ system of resonating thefouling material and the pipe or tube wall at different frequencies, degradation of the foulingmaterial, and deep cleaning of the pipe or tube wall surface, is further impacted by thebombardment of high-speed jets of heat and energy for the imploding cavities. Hydrokinetics™is effective at clearing fouling material from pits in the pipe or tube walls. The intensity ofcavity implosion can be altered by changing frequency, acoustic intensity, temperature, staticpressure, choice of fluid, and choice of gas. Implosion proceeds more slowly as ambienttemperature increases so the fluid stream can be cooled or heated to enhance cleaning.
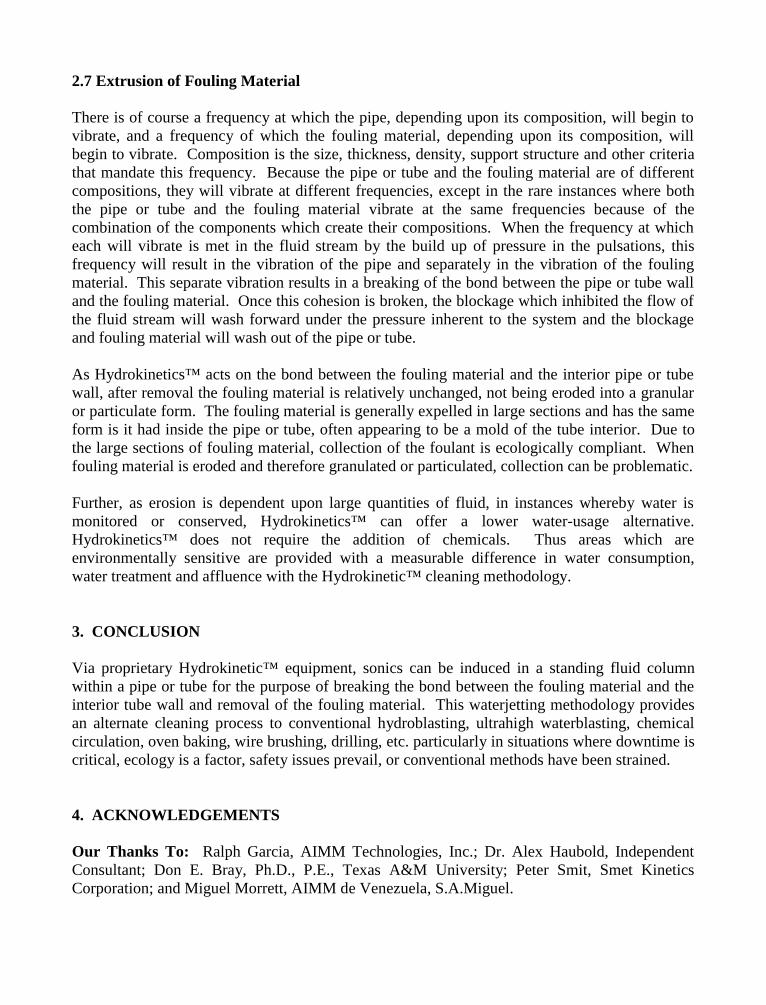
2.7 Extrusion of Fouling Material
There is of course a frequency at which the pipe, depending upon its composition, will begin tovibrate, and a frequency of which the fouling material, depending upon its composition, willbegin to vibrate. Composition is the size, thickness, density, support structure and other criteriathat mandate this frequency. Because the pipe or tube and the fouling material are of differentcompositions, they will vibrate at different frequencies, except in the rare instances where boththe pipe or tube and the fouling material vibrate at the same frequencies because of thecombination of the components which create their compositions. When the frequency at whicheach will vibrate is met in the fluid stream by the build up of pressure in the pulsations, thisfrequency will result in the vibration of the pipe and separately in the vibration of the foulingmaterial. This separate vibration results in a breaking of the bond between the pipe or tube walland the fouling material. Once this cohesion is broken, the blockage which inhibited the flow ofthe fluid stream will wash forward under the pressure inherent to the system and the blockageand fouling material will wash out of the pipe or tube.
As Hydrokinetics™ acts on the bond between the fouling material and the interior pipe or tubewall, after removal the fouling material is relatively unchanged, not being eroded into a granularor particulate form. The fouling material is generally expelled in large sections and has the sameform is it had inside the pipe or tube, often appearing to be a mold of the tube interior. Due tothe large sections of fouling material, collection of the foulant is ecologically compliant. Whenfouling material is eroded and therefore granulated or particulated, collection can be problematic.
Further, as erosion is dependent upon large quantities of fluid, in instances whereby water ismonitored or conserved, Hydrokinetics™ can offer a lower water-usage alternative.Hydrokinetics™ does not require the addition of chemicals. Thus areas which areenvironmentally sensitive are provided with a measurable difference in water consumption,water treatment and affluence with the Hydrokinetic™ cleaning methodology.
3. CONCLUSION
Via proprietary Hydrokinetic™ equipment, sonics can be induced in a standing fluid columnwithin a pipe or tube for the purpose of breaking the bond between the fouling material and theinterior tube wall and removal of the fouling material. This waterjetting methodology providesan alternate cleaning process to conventional hydroblasting, ultrahigh waterblasting, chemicalcirculation, oven baking, wire brushing, drilling, etc. particularly in situations where downtime iscritical, ecology is a factor, safety issues prevail, or conventional methods have been strained.
4. ACKNOWLEDGEMENTS
Our Thanks To: Ralph Garcia, AIMM Technologies, Inc.; Dr. Alex Haubold, IndependentConsultant; Don E. Bray, Ph.D., P.E., Texas A&M University; Peter Smit, Smet KineticsCorporation; and Miguel Morrett, AIMM de Venezuela, S.A.Miguel.
5. REFERENCES
“The Chemical Effects of Ultrasound”, Scientific American (February 1989)
“Hydrokinetics™ Pipe Cleaning”, Don E. Bray, Ph. D., P.E., (December 1998)
“Fluid Power & Electrical Control Designer’s Manual, 40th Edition”, Womack (1996)
“Flow of Fluids through Valves, Fittings, and Pipe, Technical Paper No. 410”, the Engineering Department of Crane Co. (1988)
ASME Code for Pressure Piping, B31, Process Piping, The American Society of Mechanical Engineers, 1996 Edition (1996)
U.S. Patent No. 5,423,917 “Method for Cleaning Heat Exchanger Tubes by Creating Shock Wave and Mixing the Liquid with Injected Air”, (February 1993)
U.S. Patent No. 5,674,323 “Method and Apparatus for Cleaning Columns by Inducing Vibrations in Fouling Material and the Column”, (June 1995)
6. NOMENCLATURE
Hydrokinetic™ and Hydrokinetics™ - The trademarked names used by AIMM Technologies, torefer to the patented process whereby resonant frequency vibration induced in a fluid is used toclean the interior diameter of pipes or tubes.
P - In formulas herein, the maximum pressure used for the Hydrokinetics™ processID - Interior diameter of a pipe or tubeOD - Outer or exterior diameter of a pipe or tubet - The thickness of the wall of a pipe or tubeS - The maximum strength of the pipe or tube materialY - The standard minimum yield stress of the pipe or tube material
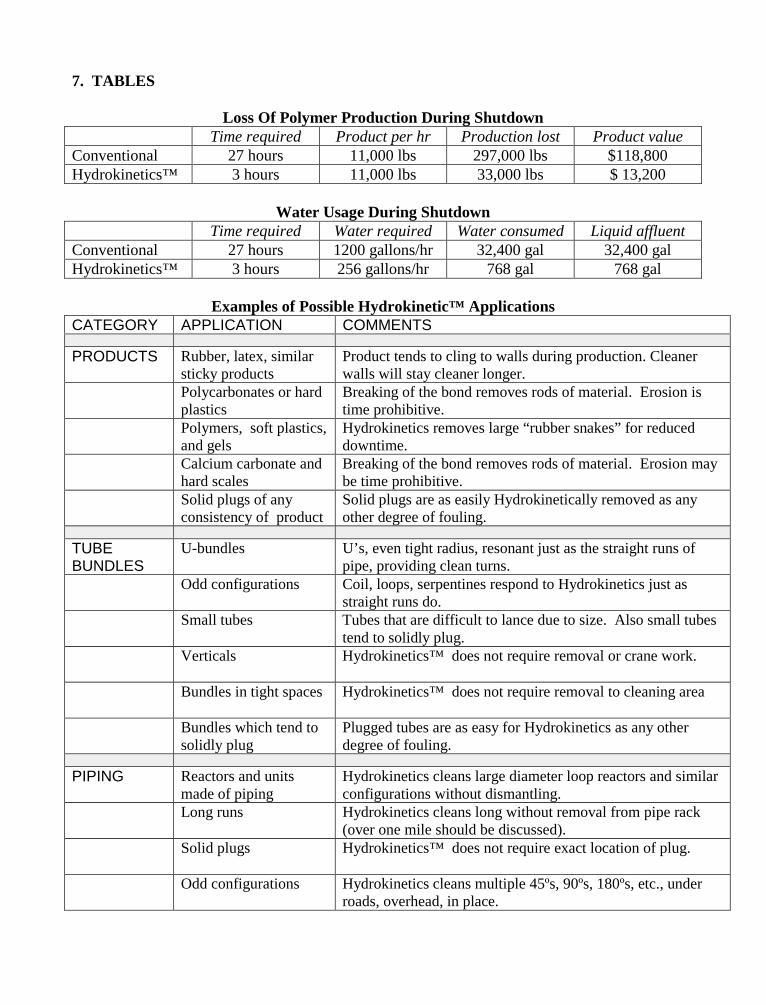
7. TABLES
Loss Of Polymer Production During ShutdownTime required Product per hr Production lost Product value
Conventional 27 hours 11,000 lbs 297,000 lbs $118,800Hydrokinetics™ 3 hours 11,000 lbs 33,000 lbs $ 13,200
Water Usage During ShutdownTime required Water required Water consumed Liquid affluent
Conventional 27 hours 1200 gallons/hr 32,400 gal 32,400 galHydrokinetics™ 3 hours 256 gallons/hr 768 gal 768 gal
Examples of Possible Hydrokinetic™ ApplicationsCATEGORY APPLICATION COMMENTS
PRODUCTS Rubber, latex, similarsticky products
Product tends to cling to walls during production. Cleanerwalls will stay cleaner longer.
Polycarbonates or hardplastics
Breaking of the bond removes rods of material. Erosion istime prohibitive.
Polymers, soft plastics,and gels
Hydrokinetics removes large “rubber snakes” for reduceddowntime.
Calcium carbonate andhard scales
Breaking of the bond removes rods of material. Erosion maybe time prohibitive.
Solid plugs of anyconsistency of product
Solid plugs are as easily Hydrokinetically removed as anyother degree of fouling.
TUBEBUNDLES
U-bundles U’s, even tight radius, resonant just as the straight runs ofpipe, providing clean turns.
Odd configurations Coil, loops, serpentines respond to Hydrokinetics just asstraight runs do.
Small tubes Tubes that are difficult to lance due to size. Also small tubestend to solidly plug.
Verticals Hydrokinetics™ does not require removal or crane work.
Bundles in tight spaces Hydrokinetics™ does not require removal to cleaning area
Bundles which tend tosolidly plug
Plugged tubes are as easy for Hydrokinetics as any otherdegree of fouling.
PIPING Reactors and unitsmade of piping
Hydrokinetics cleans large diameter loop reactors and similarconfigurations without dismantling.
Long runs Hydrokinetics cleans long without removal from pipe rack(over one mile should be discussed).
Solid plugs Hydrokinetics™ does not require exact location of plug.
Odd configurations Hydrokinetics cleans multiple 45ºs, 90ºs, 180ºs, etc., underroads, overhead, in place.
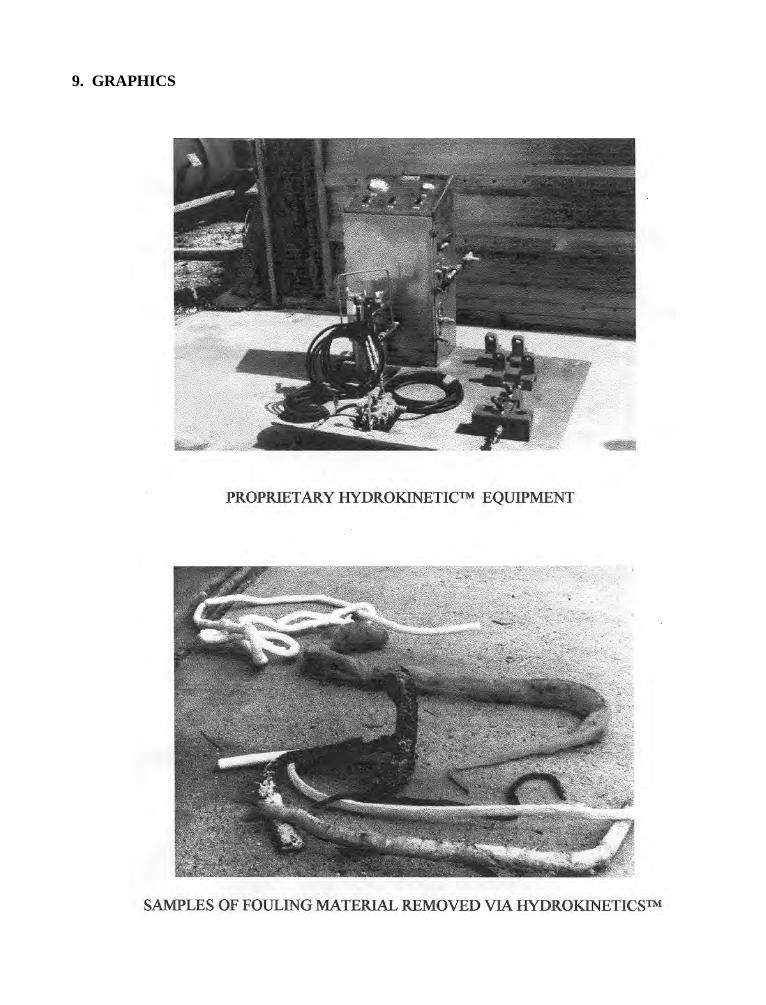
9. GRAPHICS
10th American Waterjet ConferenceAugust 14-17, 1999: Houston, Texas
Paper 44
THE STUDY ON THE CLEANING PROCESSING
FOR UNDER GROUND LAID PIPELINE WITH LARGE DIAMETER
USING HIGH PRESSURE WATERJET
Zeng Yanli, Ouyang Xianwu, Lu Wenzhu, Liu GuanghengShenyang Institute of Instrumentation Technology
Shengyang, P. R. China
Ning GuoqiangShenyang Huitian Thermoelectricity Co. Ltd.
Shengyang, P. R. China
ABSTRACT
It is presented in this paper the novel cleaning processing for defocusing on the interne wall ofthe pipeline (diameter 0 720mm) and blowing off the separated fouling matter to the mouth ofthe well (mouth distance 200m) using the high pressure water jet and elevating it ground upward.Field experiment results show, the above mentioned novel cleaning processing is possessed ofcertain significance for cleaning other pipelines like this.
Organized and Sponsored by the WaterJet Technology Association
1. INTRODUCTION
On the pipe wall of the long distance transmission pipeline with large diameter (φ350mm) somefouling and corroded matters can be deposited because of the foreign matters in the transmittedmedium and some reasons of the processing technology. The formation of the fouling matterswill make significant effects on the operation potency of the equipment and increase the energyloss and material loss. However this situation can be improved in certain degree through variousmeasures such as treating the water, adding the chemical agent, adopting rationally processingparameters etc., but it is still impossible, fully to avoid the fouling formation. Therefore thecorrectly choosing a method to clean the pipeline is an indispensable link.
The wax and naphthalene on the interne wall of the oil transmission pipeline and gastransmission pipeline can be removed with electronic pig and the result is good. But it is up tonow still lacking in the ideal cleaning processing for the long distance transmission waterpipeline with large diameter, the cleaning with chemical agent has although a certain effect, butthe cleaning processing is very complicated. It can contaminate the environment and corrode thepipeline. General speaking, it is not adopted. However the high pressure water jet cleaning canovercome the same problems caused by chemical cleaning, but the conventional water jetcleaning can not solve following problems: (1) well distance is long (200m) (2) pipeline is underground laid (Operator can not enter into) (3) separated fouling matter can not be quick and saferemoved out of the well after cleaning. These problems must be solved with special water jetcleaning processing and equipment.
2. NATURAL SITUATION OF THE EXPERIMENT PIPELINE
The experiment pipeline was laid in 1980. It is field heat supplying main pipeline laid underground in the channel. The transmitted medium is water at low temperature (<95 °C). Thediameter of the pipeline is φ720mm, pipe wall thickness is 8mm. The designed flow rate is5500t/h. (due to the increase of the load the practical flow rate is 6300t/h). The designed lifetimeof the pipeline is 15 years. Now, it is still in extended service. Because the water medium wasnot strictly deoxygenated and softened, the separated oxygen ion and calcium ion as well asmagnesium ion after heating made serious oxygen corrosion and fouling on the interne surface ofsteel pipe. Therefore there are much corroded pitting and hard deposited water scales (ca. 10mm)on the pipe wall and specific local remains only 3.1 mm thick. The interne surface roughness ofthe pipeline is reduced, the water flow area decreased, the water flow resistance increased, thewater operation of the heat supplying system deteriorated and the energy loss of the heatsupplying system increased, as well as the effect of the normal heat supplying influenced. Ifreplacing the old pipe with new pipe for one meter must be paid 10000 Yuan RMBcomprehensive cost. Because out of the investment capital, it is impossible to replace this manythousand meters pipeline. The service life of the pipeline can be extended only by the way tocoat anticorrosion layer after cleaning.
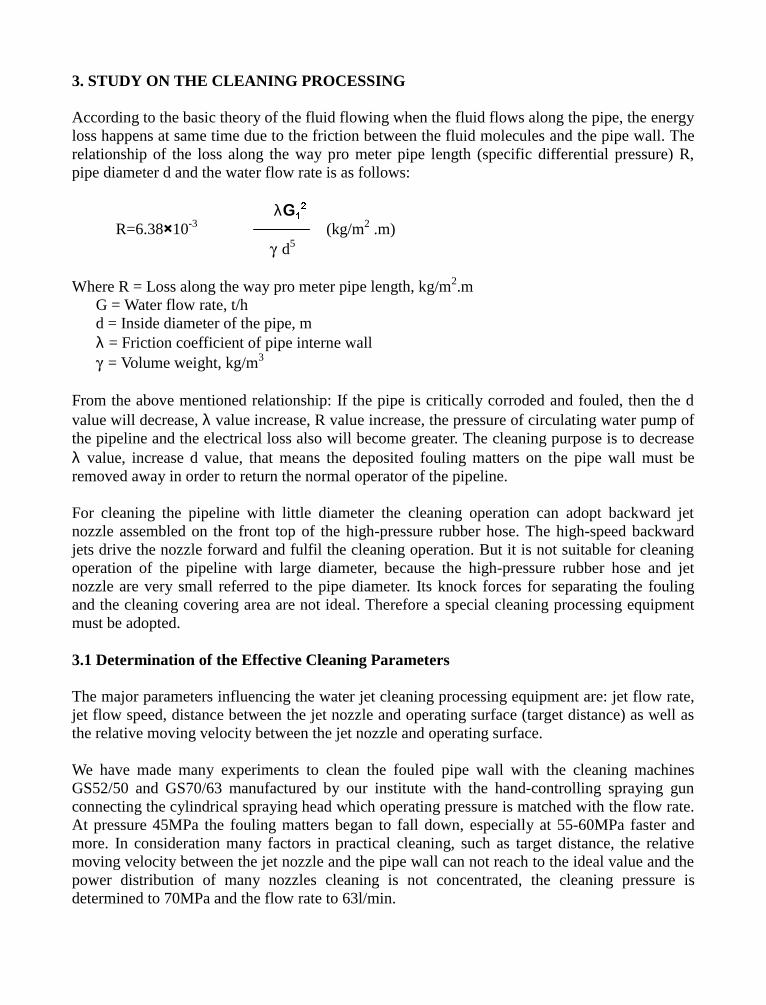
3. STUDY ON THE CLEANING PROCESSING
According to the basic theory of the fluid flowing when the fluid flows along the pipe, the energyloss happens at same time due to the friction between the fluid molecules and the pipe wall. Therelationship of the loss along the way pro meter pipe length (specific differential pressure) R,pipe diameter d and the water flow rate is as follows:
λ*
R=6.38ê10-3 (kg/m2 .m) J d5
Where R = Loss along the way pro meter pipe length, kg/m2.m G = Water flow rate, t/h d = Inside diameter of the pipe, m λ = Friction coefficient of pipe interne wall J = Volume weight, kg/m3
From the above mentioned relationship: If the pipe is critically corroded and fouled, then the dvalue will decrease, λ value increase, R value increase, the pressure of circulating water pump ofthe pipeline and the electrical loss also will become greater. The cleaning purpose is to decreaseλ value, increase d value, that means the deposited fouling matters on the pipe wall must beremoved away in order to return the normal operator of the pipeline.
For cleaning the pipeline with little diameter the cleaning operation can adopt backward jetnozzle assembled on the front top of the high-pressure rubber hose. The high-speed backwardjets drive the nozzle forward and fulfil the cleaning operation. But it is not suitable for cleaningoperation of the pipeline with large diameter, because the high-pressure rubber hose and jetnozzle are very small referred to the pipe diameter. Its knock forces for separating the foulingand the cleaning covering area are not ideal. Therefore a special cleaning processing equipmentmust be adopted.
3.1 Determination of the Effective Cleaning Parameters
The major parameters influencing the water jet cleaning processing equipment are: jet flow rate,jet flow speed, distance between the jet nozzle and operating surface (target distance) as well asthe relative moving velocity between the jet nozzle and operating surface.
We have made many experiments to clean the fouled pipe wall with the cleaning machinesGS52/50 and GS70/63 manufactured by our institute with the hand-controlling spraying gunconnecting the cylindrical spraying head which operating pressure is matched with the flow rate.At pressure 45MPa the fouling matters began to fall down, especially at 55-60MPa faster andmore. In consideration many factors in practical cleaning, such as target distance, the relativemoving velocity between the jet nozzle and the pipe wall can not reach to the ideal value and thepower distribution of many nozzles cleaning is not concentrated, the cleaning pressure isdetermined to 70MPa and the flow rate to 63l/min.
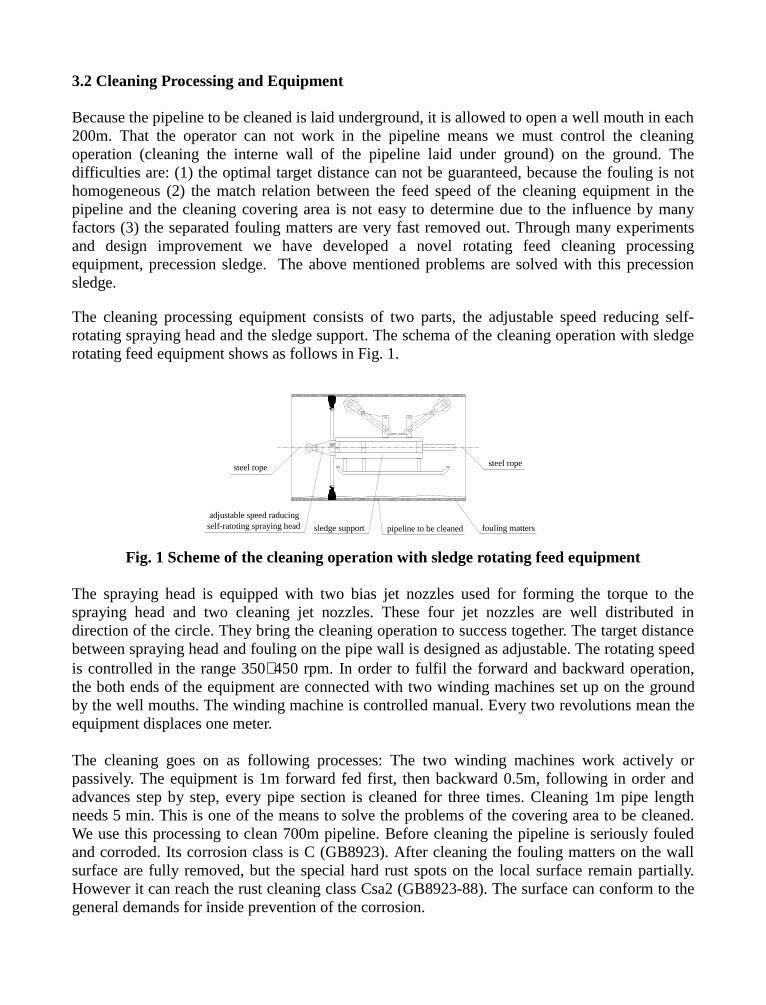
3.2 Cleaning Processing and Equipment
Because the pipeline to be cleaned is laid underground, it is allowed to open a well mouth in each200m. That the operator can not work in the pipeline means we must control the cleaningoperation (cleaning the interne wall of the pipeline laid under ground) on the ground. Thedifficulties are: (1) the optimal target distance can not be guaranteed, because the fouling is nothomogeneous (2) the match relation between the feed speed of the cleaning equipment in thepipeline and the cleaning covering area is not easy to determine due to the influence by manyfactors (3) the separated fouling matters are very fast removed out. Through many experimentsand design improvement we have developed a novel rotating feed cleaning processingequipment, precession sledge. The above mentioned problems are solved with this precessionsledge.
The cleaning processing equipment consists of two parts, the adjustable speed reducing self-rotating spraying head and the sledge support. The schema of the cleaning operation with sledgerotating feed equipment shows as follows in Fig. 1.
Fig. 1 Scheme of the cleaning operation with sledge rotating feed equipment
The spraying head is equipped with two bias jet nozzles used for forming the torque to thespraying head and two cleaning jet nozzles. These four jet nozzles are well distributed indirection of the circle. They bring the cleaning operation to success together. The target distancebetween spraying head and fouling on the pipe wall is designed as adjustable. The rotating speedis controlled in the range 350∼450 rpm. In order to fulfil the forward and backward operation,the both ends of the equipment are connected with two winding machines set up on the groundby the well mouths. The winding machine is controlled manual. Every two revolutions mean theequipment displaces one meter.
The cleaning goes on as following processes: The two winding machines work actively orpassively. The equipment is 1m forward fed first, then backward 0.5m, following in order andadvances step by step, every pipe section is cleaned for three times. Cleaning 1m pipe lengthneeds 5 min. This is one of the means to solve the problems of the covering area to be cleaned.We use this processing to clean 700m pipeline. Before cleaning the pipeline is seriously fouledand corroded. Its corrosion class is C (GB8923). After cleaning the fouling matters on the wallsurface are fully removed, but the special hard rust spots on the local surface remain partially.However it can reach the rust cleaning class Csa2 (GB8923-88). The surface can conform to thegeneral demands for inside prevention of the corrosion.
self-ratoting spraying head
steel ropesteel rope
adjustable speed raducing
sledge support pipeline to be cleaned fouling matters
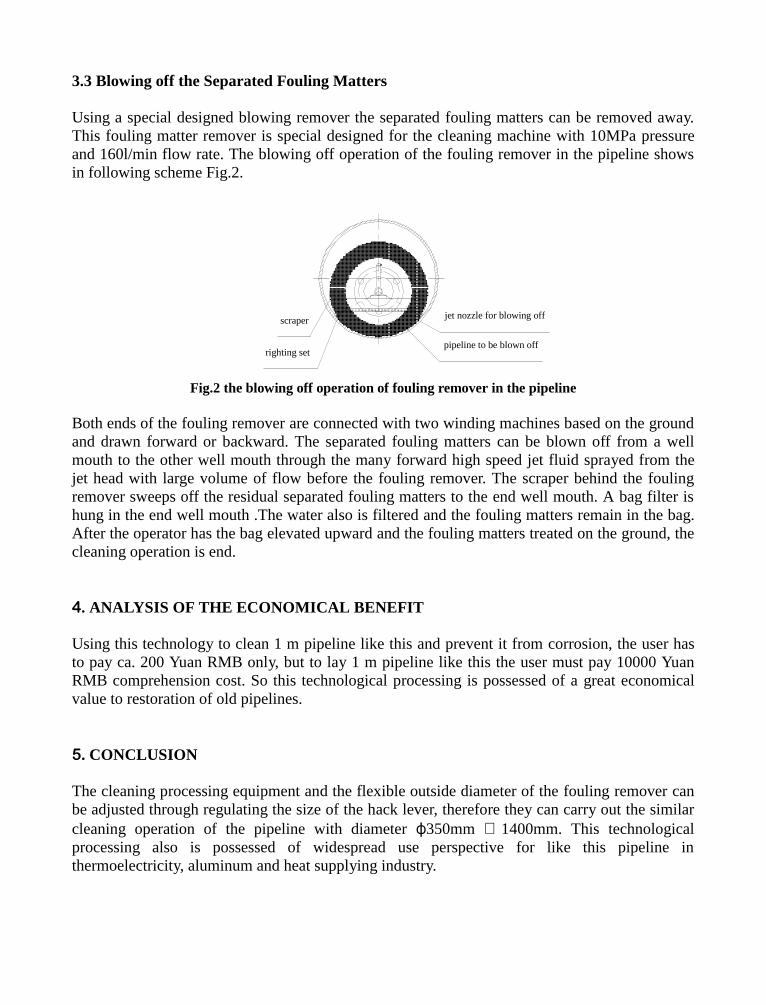
3.3 Blowing off the Separated Fouling Matters
Using a special designed blowing remover the separated fouling matters can be removed away.This fouling matter remover is special designed for the cleaning machine with 10MPa pressureand 160l/min flow rate. The blowing off operation of the fouling remover in the pipeline showsin following scheme Fig.2.
Fig.2 the blowing off operation of fouling remover in the pipeline
Both ends of the fouling remover are connected with two winding machines based on the groundand drawn forward or backward. The separated fouling matters can be blown off from a wellmouth to the other well mouth through the many forward high speed jet fluid sprayed from thejet head with large volume of flow before the fouling remover. The scraper behind the foulingremover sweeps off the residual separated fouling matters to the end well mouth. A bag filter ishung in the end well mouth .The water also is filtered and the fouling matters remain in the bag.After the operator has the bag elevated upward and the fouling matters treated on the ground, thecleaning operation is end.
. ANALYSIS OF THE ECONOMICAL BENEFIT
Using this technology to clean 1 m pipeline like this and prevent it from corrosion, the user hasto pay ca. 200 Yuan RMB only, but to lay 1 m pipeline like this the user must pay 10000 YuanRMB comprehension cost. So this technological processing is possessed of a great economicalvalue to restoration of old pipelines.
. CONCLUSION
The cleaning processing equipment and the flexible outside diameter of the fouling remover canbe adjusted through regulating the size of the hack lever, therefore they can carry out the similarcleaning operation of the pipeline with diameter 1350mm ∼ 1400mm. This technologicalprocessing also is possessed of widespread use perspective for like this pipeline inthermoelectricity, aluminum and heat supplying industry.
scraper
righting set
jet nozzle for blowing off
pipeline to be blown off

6. REFERENCES
1. Xue Shengxiong etc., The Technique and Application of the High Pressure Water Jet, Publishing house for machine-building industry, Beijing, Aug. 1998.
2. He Ping etc., Heat Supplying Engineering, Publishing house for architecture industry, Beijing, Sept. 1980.
10th American Waterjet ConferenceAugust 14-17, 1999: Houston, Texas
Paper 45
CLEANING THE OIL-GAS LINES ON CATALYTIC
CRACKER UNIT IN OIL REFINERY USING HIGH-PRESSURE WATER
JET TECHNIQUE
Leyao Zhang (Director), Yang Jiao (Vice-Director), Qizhuang Zhang (Deputy Director)High-Pressure Water Jet Cleaning Technology Center of
Beijing Yanshan Petrochemical (Group) Co., Ltd.
ABSTRACT
In recent years, the use of high-pressure water jet cleaning techniques to clean equipment ofmany types and in different media and work conditions becomes an increasingly wide acceptedpractice in petrochemical enterprises in order to meet the requirements of production andmaintenance. In this paper, the high-pressure water jet cleaning of the oil-gas line on the catalyticfacilities in oil refinery enterprises is introduced briefly in combination with the cleaning practicein this field. Our purpose is to further the study and discussion among domestic and foreignfriends of the same trade and to improve equipment step by step, optimize cleaning techniques soas to raise the efficiency and quality of the oil-gas pipeline cleaning to a new height.
Organized and Sponsored by the WaterJet Technology Association
1. INTRODUCTION
During overhauling petrochemical equipment the pressurizing water jet flow technique has beenrecognized as one of the new techniques for equipment management and application by ChinesePetrochemical General Corporation. Recently this technique has been well popularized,developed and advanced for its popularization and application because of trying to work hard onit. There are ordinarily few simple appliances and few workers doing the job as their second postin almost all the oil works and there are few full-time workers in few works do the cleaning bythemselves. These are suitable only for the individual equipment and common work condition.Its advantage is that the cleaning organization is simple and the operation is very fast, but thereare some disadvantages having worse cleaning quality and lower worker and equipmentutilization ratio. It cannot suit the needs of the cleaning very much when the complex workcondition, some difficulty and large working surface are occurred. Cleaning with specializationand socialization team and on a large scale is the best. The cleaning teams in society understanda few production technology, a few equipment construction and a few safety knowledge operatedin the condition of high temperature, high pressure, combustible and explosive. Theirconsciousness to safety and adaptability are not enough. However, if the workers of refinery dothe cleaning by themselves, all the disadvantages above can be overcome. They not only do thework very safe but also control and decrease the cost for overhaul. Pressurizing water jet flowtechnique has many advantages described above: It changes all the defects of other techniques. Itmakes improvement to the cleaning quality, efficiency, safety and environmental protectionbetter. It creates good factors for shortening the production set/equipment downtime andprolonging the operating time and for optimizing running. Certainly it occupies a dominantposition in the cleaning area. So this technique is very available to increase the economic andsocial effect.
2. BACKGROUND
When the catalytic sets in Yanhua Refinery was overhauled in March, 1990, the serious coke inthe oil-gas pipeline with diameter of 1120mm. (Fig.1) and between the settler and fractionatingcolumn was found and the coke thickness reached to 150-200 mm. (Fig.2). It should bethoroughly removed at once, otherwise it will not only affect the sets running on time, but alsotheir running for a long period.
Millions of dollars come when the catalytic cracker unit once operates. If the catalytic sets runearlier and/or for a more time, more than millions of dollars will be got, so it is very beneficial tothe enterprise and society to do so. Coke is always happened on the inner wall of the oil-gaspipelines due to the heavy oil produced, it should be removed at regular intervals for normalproduction, once the production is in unsteady running, coke will occur more easily, it isnecessary to clear away the coke in time. So, that is just the point which kind of technique forcleaning coke we shall adapt.
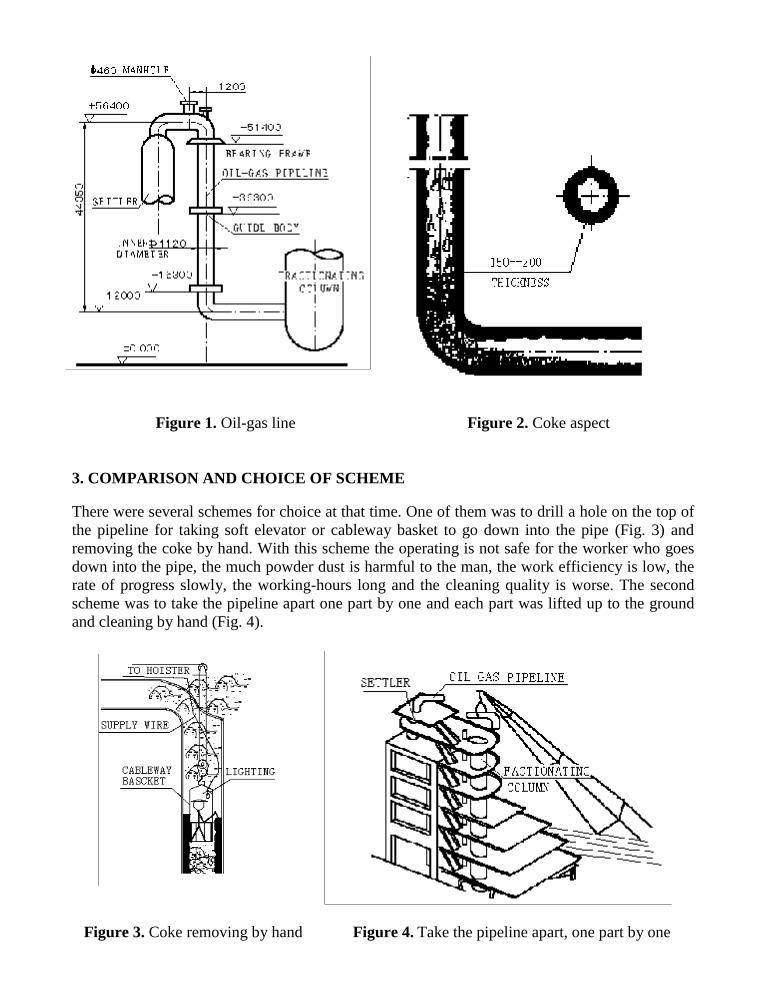
Figure 1. Oil-gas line Figure 2. Coke aspect
3. COMPARISON AND CHOICE OF SCHEME
There were several schemes for choice at that time. One of them was to drill a hole on the top ofthe pipeline for taking soft elevator or cableway basket to go down into the pipe (Fig. 3) andremoving the coke by hand. With this scheme the operating is not safe for the worker who goesdown into the pipe, the much powder dust is harmful to the man, the work efficiency is low, therate of progress slowly, the working-hours long and the cleaning quality is worse. The secondscheme was to take the pipeline apart one part by one and each part was lifted up to the groundand cleaning by hand (Fig. 4).
Figure 3. Coke removing by hand Figure 4. Take the pipeline apart, one part by one
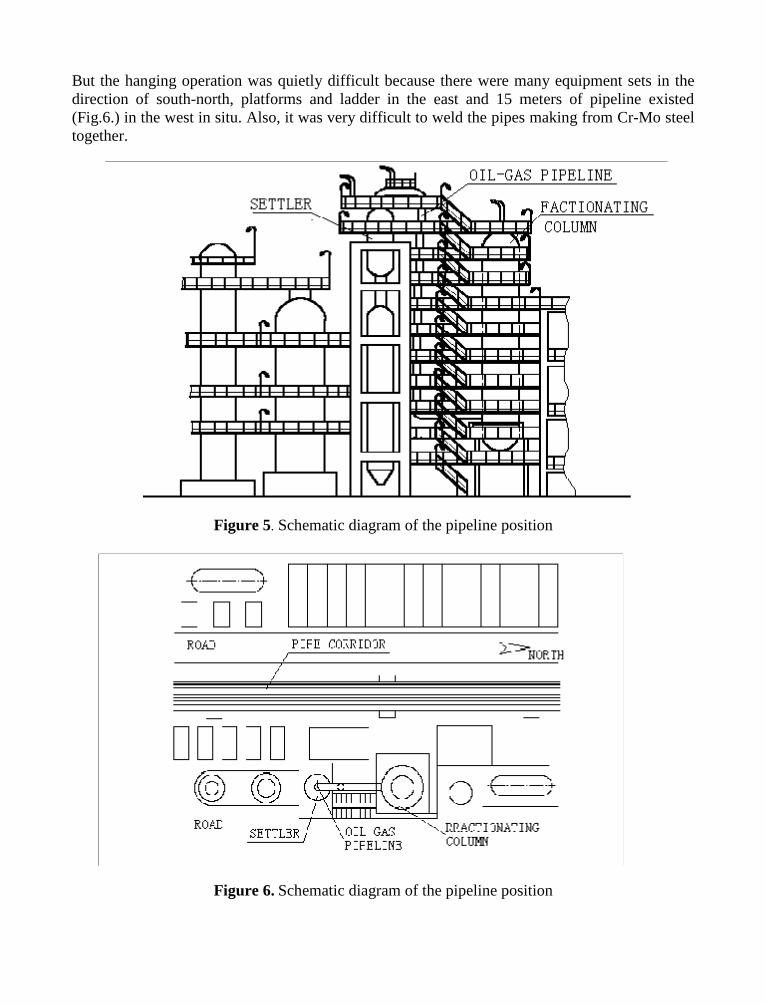
But the hanging operation was quietly difficult because there were many equipment sets in thedirection of south-north, platforms and ladder in the east and 15 meters of pipeline existed(Fig.6.) in the west in situ. Also, it was very difficult to weld the pipes making from Cr-Mo steeltogether.
Figure 5. Schematic diagram of the pipeline position
Figure 6. Schematic diagram of the pipeline position
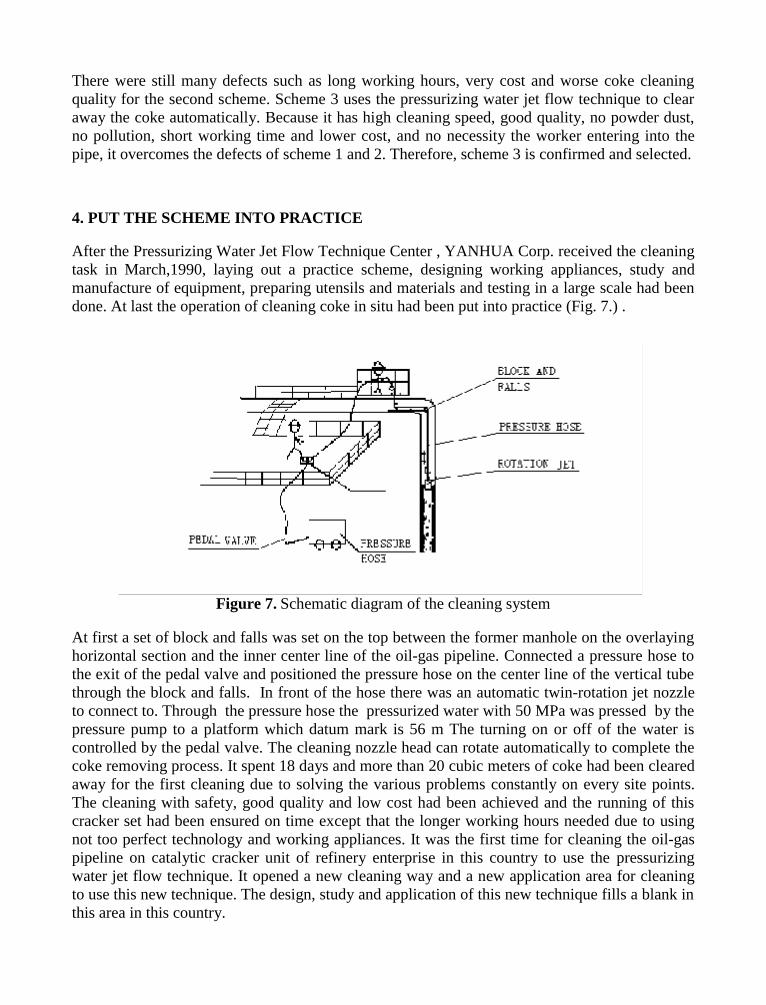
There were still many defects such as long working hours, very cost and worse coke cleaningquality for the second scheme. Scheme 3 uses the pressurizing water jet flow technique to clearaway the coke automatically. Because it has high cleaning speed, good quality, no powder dust,no pollution, short working time and lower cost, and no necessity the worker entering into thepipe, it overcomes the defects of scheme 1 and 2. Therefore, scheme 3 is confirmed and selected.
4. PUT THE SCHEME INTO PRACTICE
After thePressurizing Water Jet Flow Technique Center , YANHUA Corp. received the cleaningtask in March,1990, laying out a practice scheme, designing working appliances, study andmanufacture of equipment, preparing utensils and materials and testing in a large scale had beendone. At last the operation of cleaning coke in situ had been put into practice (Fig. 7.) .
Figure 7. Schematic diagram of the cleaning system
At first a set of block and falls was set on the top between the former manhole on the overlayinghorizontal section and the inner center line of the oil-gas pipeline. Connected a pressure hose tothe exit of the pedal valve and positioned the pressure hose on the center line of the vertical tubethrough the block and falls. In front of the hose there was an automatic twin-rotation jet nozzleto connect to. Through the pressure hose the pressurized water with 50 MPa was pressed by thepressure pump to a platform which datum mark is 56 m The turning on or off of the water iscontrolled by the pedal valve. The cleaning nozzle head can rotate automatically to complete thecoke removing process. It spent 18 days and more than 20 cubic meters of coke had been clearedaway for the first cleaning due to solving the various problems constantly on every site points.The cleaning with safety, good quality and low cost had been achieved and the running of thiscracker set had been ensured on time except that the longer working hours needed due to usingnot too perfect technology and working appliances. It was the first time for cleaning the oil-gaspipeline on catalytic cracker unit of refinery enterprise in this country to use thepressurizingwater jet flow technique. It opened a new cleaning way and a new application area for cleaningto use this new technique. The design, study and application of this new technique fills a blank inthis area in this country.
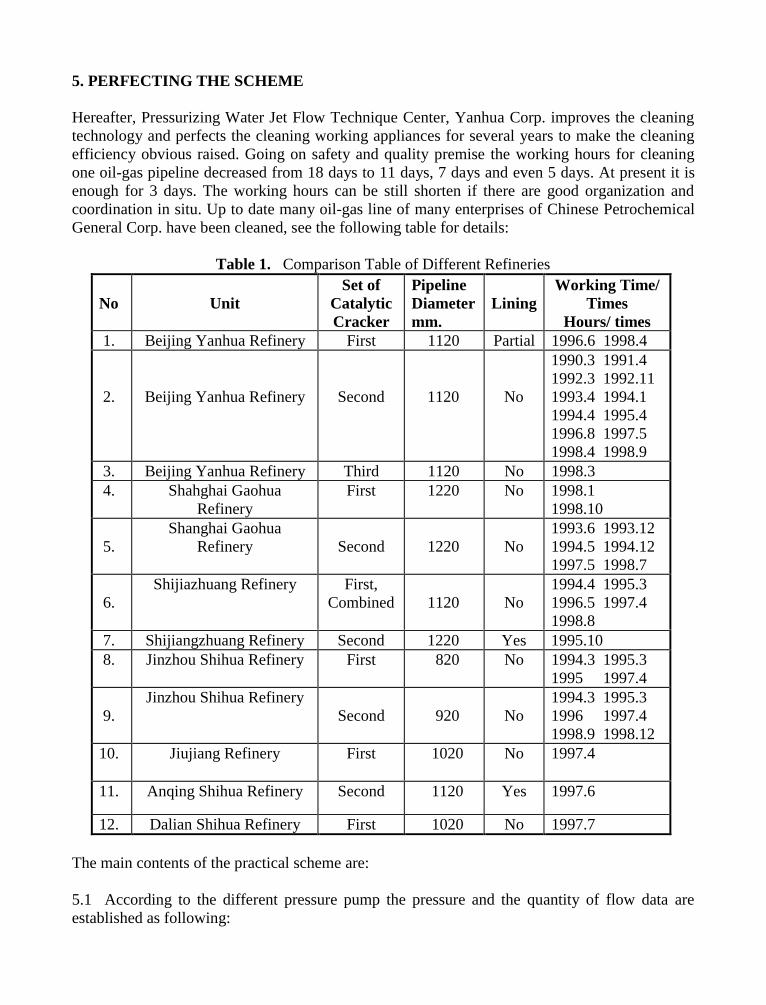
5. PERFECTING THE SCHEME
Hereafter, Pressurizing Water Jet Flow Technique Center, Yanhua Corp. improves the cleaningtechnology and perfects the cleaning working appliances for several years to make the cleaningefficiency obvious raised. Going on safety and quality premise the working hours for cleaningone oil-gas pipeline decreased from 18 days to 11 days, 7 days and even 5 days. At present it isenough for 3 days. The working hours can be still shorten if there are good organization andcoordination in situ. Up to date many oil-gas line of many enterprises of Chinese PetrochemicalGeneral Corp. have been cleaned, see the following table for details:
Table 1. Comparison Table of Different Refineries
No UnitSet of
CatalyticCracker
PipelineDiametermm.
LiningWorking Time/
TimesHours/ times
1. Beijing Yanhua Refinery First 1120 Partial 1996.6 1998.4
2. Beijing Yanhua Refinery Second 1120 No
1990.3 1991.41992.3 1992.111993.4 1994.11994.4 1995.41996.8 1997.51998.4 1998.9
3. Beijing Yanhua Refinery Third 1120 No 1998.3 4. Shahghai Gaohua
RefineryFirst 1220 No 1998.1
1998.10
5.Shanghai Gaohua
Refinery Second 1220 No1993.6 1993.121994.5 1994.121997.5 1998.7
6.Shijiazhuang Refinery First,
Combined 1120 No1994.4 1995.31996.5 1997.41998.8
7. Shijiangzhuang Refinery Second 1220 Yes 1995.10 8. Jinzhou Shihua Refinery First 820 No 1994.3 1995.3
1995 1997.4
9.Jinzhou Shihua Refinery
Second 920 No1994.3 1995.31996 1997.41998.9 1998.12
10. Jiujiang Refinery First 1020 No 1997.4
11. Anqing Shihua Refinery Second 1120 Yes 1997.6
12. Dalian Shihua Refinery First 1020 No 1997.7
The main contents of the practical scheme are:
5.1 According to the different pressure pump the pressure and the quantity of flow data areestablished as following:
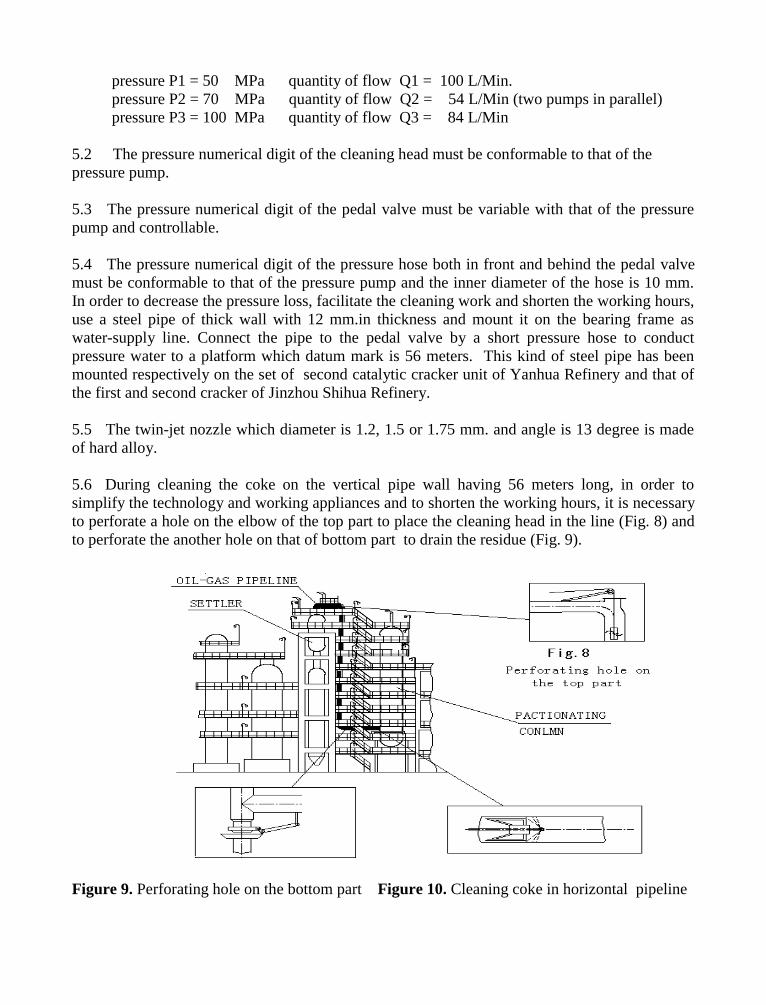
pressure P1 = 50 MPa quantity of flow Q1 = 100 L/Min.pressure P2 = 70 MPa quantity of flow Q2 = 54 L/Min (two pumps in parallel)pressure P3 = 100 MPa quantity of flow Q3 = 84 L/Min
5.2 The pressure numerical digit of the cleaning head must be conformable to that of thepressure pump.
5.3 The pressure numerical digit of the pedal valve must be variable with that of the pressurepump and controllable.
5.4 The pressure numerical digit of the pressure hose both in front and behind the pedal valvemust be conformable to that of the pressure pump and the inner diameter of the hose is 10 mm.In order to decrease the pressure loss, facilitate the cleaning work and shorten the working hours,use a steel pipe of thick wall with 12 mm.in thickness and mount it on the bearing frame aswater-supply line. Connect the pipe to the pedal valve by a short pressure hose to conductpressure water to a platform which datum mark is 56 meters. This kind of steel pipe has beenmounted respectively on the set of second catalytic cracker unit of Yanhua Refinery and that ofthe first and second cracker of Jinzhou Shihua Refinery.
5.5 The twin-jet nozzle which diameter is 1.2, 1.5 or 1.75 mm. and angle is 13 degree is madeof hard alloy.
5.6 During cleaning the coke on the vertical pipe wall having 56 meters long, in order tosimplify the technology and working appliances and to shorten the working hours, it is necessaryto perforate a hole on the elbow of the top part to place the cleaning head in the line (Fig. 8) andto perforate the another hole on that of bottom part to drain the residue (Fig. 9).
Figure 9. Perforating hole on the bottom part Figure 10. Cleaning coke in horizontal pipeline
5.7 Whether by hand or automatically by the special designing working appliances, it dependson the length of the pipe during cleaning all the horizontal pipes of the oil-gas pipeline (Fig. 10).
5.8 Hours in situ and the buck and boost (advancing and retreating) speed and distance of thecleaning head depends on the degree of difficulty for cleaning and the coke thickness andhardness.
6. SAFETY STEPS
Because the pressurizing water jet flow has a higher pressure (50-100 MPa) and a faster flowspeed (several times as long as the velocity of sound) and there is the special requirement forthe safe production and overhaul in petrochemical enterprise, it is quiet necessary to payattention to the safety when the oil-gas pipeline is cleaned by pressurizing water jet flow. Thesafety steps should be available and performed very seriously. The main points of the safetysteps are:
6.1 The pressure pump should be in good condition and its pressure gage should be calibratedwithin the standardizing measuring range; The control system should be sensitive for operation;The safety valve and the overflow valve should be effective and reliable.
6.2 The automatic cleaning head runs very flexibly; the control of pedal valve should bereliable; The pressure numerical digit of the pressure hose should be conform to standard and thehose should not be broken at all.
6.3 The cleaning operation must be performed according to cleaning technology seriously.
6.4 The enclosure or obvious mark should be built for the cleaning point including the hole fordraining residue, anybody who does not do the cleaning thing should not be permitted to enterinto the operation area and to move and use any cleaning equipment and appliance.
6.5 In general the pressure pump is not the anti-explosion machine, its starting in situ should beafter going through the procedure according to the regulation.
6.6 The materials in the oil-gas pipeline cleaned should be cleared away and replaced up tostandard, and isolated from the system. If necessary, treat it with blind plate.
6.7 Anybody who enters the pipeline for working appliance designing, quality inspecting orcleaning by hand should have the certificate for passing in and out.
6.8. Anybody who enters the pipeline must wear safety belt and be served by special guardian.
6.9 The coke scrap coming from the cleaning should be removed from the pipeline in time. Ifnecessary, pay attention to ventilation.
6.10 The contact between the operator who operates the pump and the pedal valve and thecleaning worker must be unblocked, fast, accurate and reliable.
6.11 There must be reliable safety measure during working in high altitude, in much wind, inrain, in very hot and cold day, in the night and continuously.
6.12 The other safety rules published by the Chinese Petrochemical General Corp. and thepetrochemical enterprises or by this branch of trade (this enterprise) and the related requirementof "The Safety Rules for the Pressurizing Water Jet Flow Cleaning" should still be conformed.
7. CONCLUSION
It cannot be avoided to coke in the oil-gas pipeline in production process. The pressurizingwater jet flow technique is, to date, the best effective method for coke cleaning. The pressurizingwater jet flow technique for coke cleaning has been more and more confirmed and welcome dueto a series of its advantages to the others. The inescapable responsibility and obligation of theengineering workers studying the pressurizing water jet flow technique is to do their best to servethe petrochemical enterprises and the other trades. Cleaning the oil-gas pipeline is a cleaningsubject under special condition. We wish the joint efforts must be made together with thedomestic and external colleagues, the leaders, engineers and workers in refinery enterprises tostudy this task more deeply, to solve the problem better and to contribute much more for thesociety.
8. REFERENCE
Leyao Zhang, Yang Jiao and Qizhuang Zhang, "Pressurizing Water Jet Flow under SpecialCondition in Petrochemical Enterprise", Theses Collection of the Forth Rim Pacific InternationalConference on Water Jet Flow Technique, April, 1995.
10th American Waterjet ConferenceAugust 14-17, 1999: Houston, Texas
Paper 46
LABORATORY EXPERIMENTS FOR CLEANING AND
POLISHING THE SURFACE WITH HYDRAULIC JETS
S. Radu, N. Ilias, A. Magyari, A. A. Magyari University of Petrosani, Romania
ABSTRACT
The recent experiments performed in the hydraulic cutting laboratory from the University ofPetrosani were based on cleaning the surfaces with continuous hydraulic jets of medium and highpressure. Using this procedure the sedimented slag from the furnace doors and the paint on themetallic objects have been cleaned. The paper also presents a cleaning equipment adaptable to anindustrial ievel. Another preoccupation is represented by polishing the roof glass with abrasivehydraulic jets, the abrasive being a special abrasive clay, the caolin, used not only by specialisedindustrial processes but also in manual polishing.
Organized and Sponsored by the WaterJet Technology Association
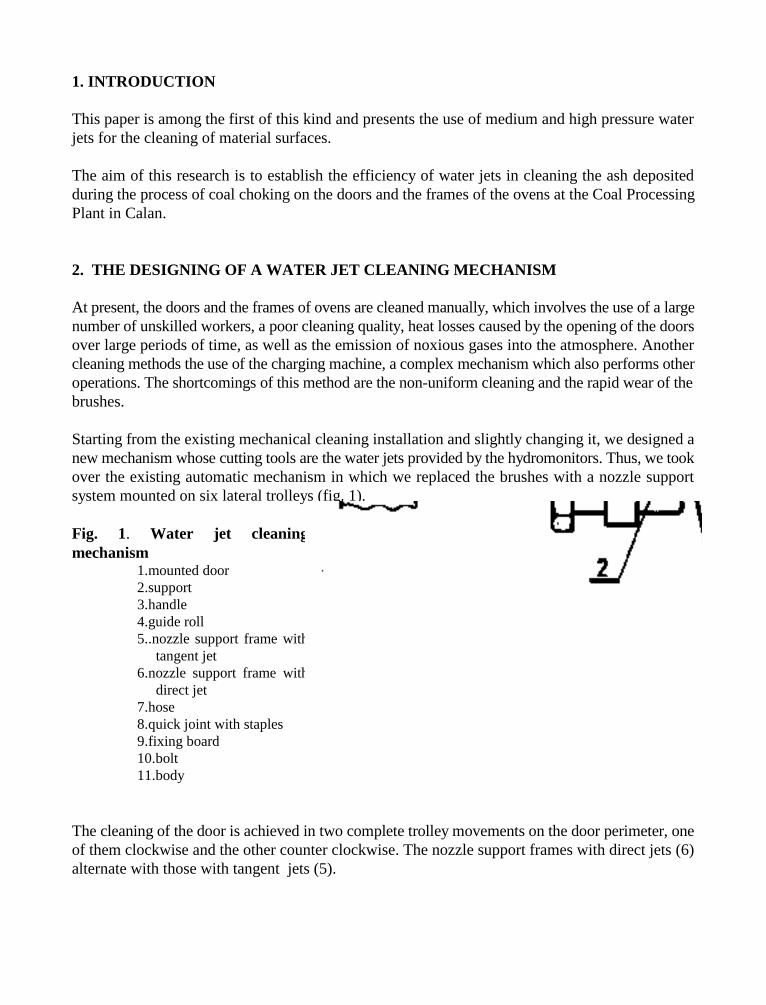
1. INTRODUCTION
This paper is among the first of this kind and presents the use of medium and high pressure waterjets for the cleaning of material surfaces.
The aim of this research is to establish the efficiency of water jets in cleaning the ash depositedduring the process of coal choking on the doors and the frames of the ovens at the Coal ProcessingPlant in Calan.
2. THE DESIGNING OF A WATER JET CLEANING MECHANISM
At present, the doors and the frames of ovens are cleaned manually, which involves the use of a largenumber of unskilled workers, a poor cleaning quality, heat losses caused by the opening of the doorsover large periods of time, as well as the emission of noxious gases into the atmosphere. Anothercleaning methods the use of the charging machine, a complex mechanism which also performs otheroperations. The shortcomings of this method are the non-uniform cleaning and the rapid wear of thebrushes.
Starting from the existing mechanical cleaning installation and slightly changing it, we designed anew mechanism whose cutting tools are the water jets provided by the hydromonitors. Thus, we tookover the existing automatic mechanism in which we replaced the brushes with a nozzle supportsystem mounted on six lateral trolleys (fig. 1).
Fig. 1. Water jet cleaningmechanism
1.mounted door2.support3.handle4.guide roll5..nozzle support frame with
tangent jet6.nozzle support frame with
direct jet7.hose8.quick joint with staples9.fixing board10.bolt11.body
The cleaning of the door is achieved in two complete trolley movements on the door perimeter, oneof them clockwise and the other counter clockwise. The nozzle support frames with direct jets (6)alternate with those with tangent jets (5).
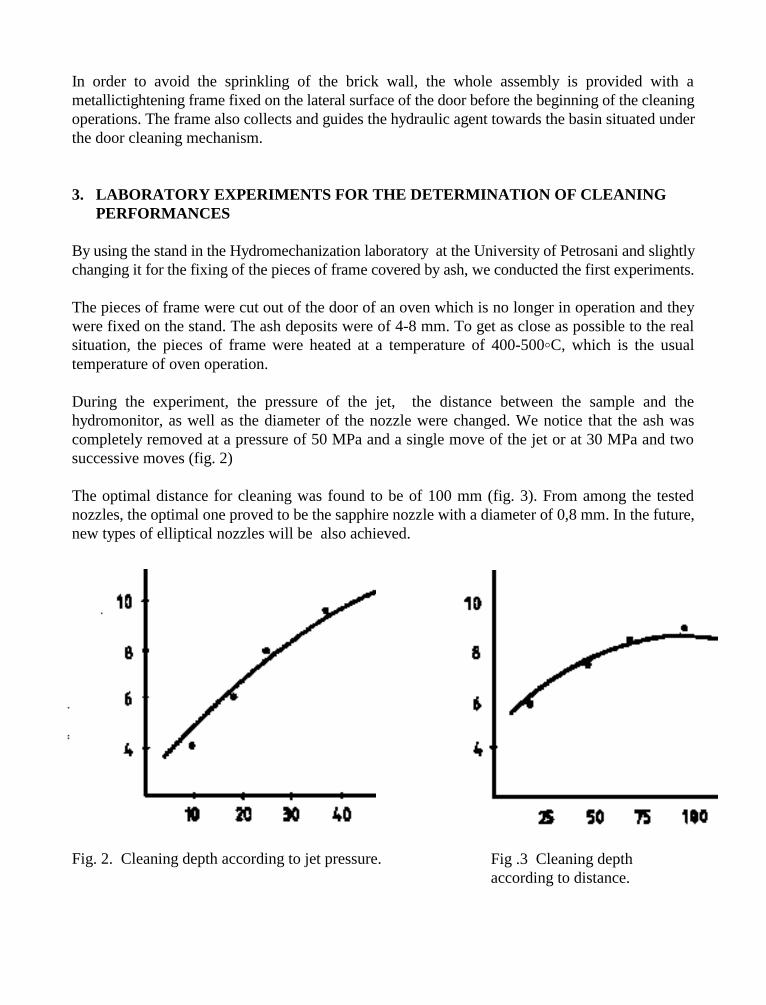
In order to avoid the sprinkling of the brick wall, the whole assembly is provided with ametallictightening frame fixed on the lateral surface of the door before the beginning of the cleaningoperations. The frame also collects and guides the hydraulic agent towards the basin situated underthe door cleaning mechanism.
3. LABORATORY EXPERIMENTS FOR THE DETERMINATION OF CLEANINGPERFORMANCES
By using the stand in the Hydromechanization laboratory at the University of Petrosani and slightlychanging it for the fixing of the pieces of frame covered by ash, we conducted the first experiments.
The pieces of frame were cut out of the door of an oven which is no longer in operation and theywere fixed on the stand. The ash deposits were of 4-8 mm. To get as close as possible to the realsituation, the pieces of frame were heated at a temperature of 400-500%C, which is the usualtemperature of oven operation.
During the experiment, the pressure of the jet, the distance between the sample and thehydromonitor, as well as the diameter of the nozzle were changed. We notice that the ash wascompletely removed at a pressure of 50 MPa and a single move of the jet or at 30 MPa and twosuccessive moves (fig. 2)
The optimal distance for cleaning was found to be of 100 mm (fig. 3). From among the testednozzles, the optimal one proved to be the sapphire nozzle with a diameter of 0,8 mm. In the future,new types of elliptical nozzles will be also achieved.
Fig. 2. Cleaning depth according to jet pressure. Fig .3 Cleaning depthaccording to distance.
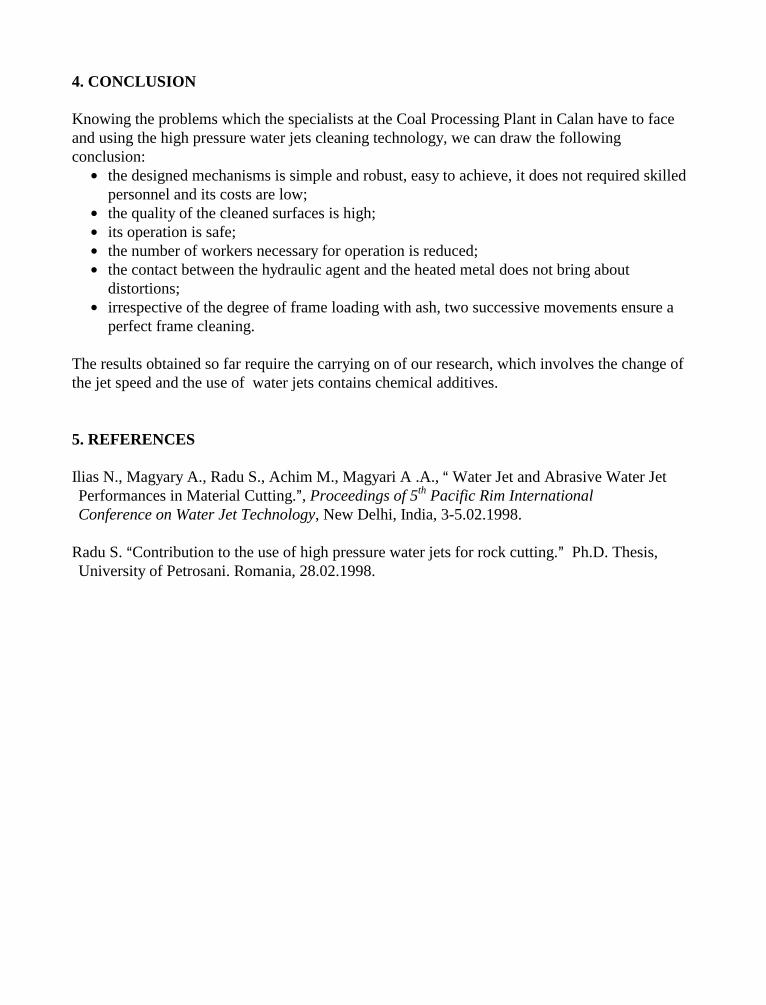
4. CONCLUSION
Knowing the problems which the specialists at the Coal Processing Plant in Calan have to faceand using the high pressure water jets cleaning technology, we can draw the followingconclusion:
the designed mechanisms is simple and robust, easy to achieve, it does not required skilledpersonnel and its costs are low;
the quality of the cleaned surfaces is high; its operation is safe; the number of workers necessary for operation is reduced; the contact between the hydraulic agent and the heated metal does not bring about
distortions; irrespective of the degree of frame loading with ash, two successive movements ensure a
perfect frame cleaning.
The results obtained so far require the carrying on of our research, which involves the change ofthe jet speed and the use of water jets contains chemical additives.
5. REFERENCES
Ilias N., Magyary A., Radu S., Achim M., Magyari A .A., $ Water Jet and Abrasive Water Jet Performances in Material Cutting.#, Proceedings of 5th Pacific Rim International Conference on Water Jet Technology, New Delhi, India, 3-5.02.1998.
Radu S. $Contribution to the use of high pressure water jets for rock cutting.# Ph.D. Thesis, University of Petrosani. Romania, 28.02.1998.
10th American Waterjet ConferenceAugust 14-17, 1999: Houston, Texas
Paper 47
WATERJET USE DEALING WITH THE PROBLEM OF
ANTI-PERSONNEL LANDMINES
D.A. Summers, O.R. Mitchell, S.J. Thompson, R. Denier, E. BamesUniversity of Missouri-Rolla
Rolla, Missouri, U.S.A.
ABSTRACT
The problems of locating and dealing with landmines have been an ongoing issue since beforethe time of the Second World War. While some mines can be effectively found using metaldetecting equipment, the move toward the use of plastic, particularly for anti-personnellandmines (APL) has made their detection more difficult.
At the same time the high rate of false alarms that are generated, particularly in areas that haveseen conflict, require an ability to examine the potential landmine so that its nature can beidentified. Given that most such targets lie within 20 cm of the surface, this requires an ability tosearch to this depth and to then uncover the item for visual inspection. As a third corollary tothis approach the ability to then neutralize the item remotely would significantly increase thespeed of operations, and the safety of the operators.
A method is described in which high-pressure waterjets can be used to locate the presence of aplastic APL using the acoustic response to waterjet impact. The mine is then uncovered using arotating high-pressure waterjet system, which includes a jet pump for soil removal. The mine isthen cut into parts by an abrasive waterjet stream, using the same flow rate and pressure as forthe first two parts of the process.
Refinements in the technology to improve performance, particularly in the detection phase of theoperation are described.
Organized and Sponsored by the WaterJet Technology Association
1. INTRODUCTION
The problems of locating and dealing with landmines have been an ongoing issue since the FirstWorld War because it is reported they continue to kill, maim, or cripple one hundred people perday every day of the year. The people that reside in the countries of former or current conflictsthat suffer the most are those that depend on agriculture for their livelihood. They have sufferedloss of both livestock and human life, which has resulted in them not being able to work theirland.
The search for mines has become increasingly more difficult with the advancement oftechnology and development of non-metallic materials. The use of wood, plastic and other non-metallic materials in both the case and firing mechanism components has made landminedetection increasingly difficult or impossible. Mines containing more than two grams of metalare easily detectable with state of the art metal detecting equipment depending on depth ofburial, orientation and technique of using a particular detector. Compliance with the most recentinternational treaties pertaining to delectability requires that all mines currently in productionmust contain eight grams of metal.
Most anti-personnel (AP) landmines are deployed on top of the ground or buried at variousdepths up to 20 cm. The current standard operating procedure (SOP) for non-mechanicaldemining requires a person to be exposed to life threatening circumstances during the entireprocess of unearthing and visually examining the mine/target for identification. The mostcommonly practiced procedure after identification is to Blow In Place (BIP) which prevents thedeminer from physically having to handle the mine however, they have to place the explosivecharges on the mine. This procedure is extremely time-consuming and yet must be applied foreach target because there is no way to differentiate a false positive from Unexploded Ordnance(UXO) until it is visually examined.
2. APPROACH
The problem of false positives is exacerbated in areas of previous conflict due to presence ofmetal fragments and unexploded sub-munitions, which requires the same systematicinterrogation of each target to determine the appropriate next actions.
The demining system being developed by the University of Missouri - Rolla (UMR) teamfeatures High Pressure Waterjet (HPW) technology as a prime sub-system on a platform that is;
• Remotely controlled• Operator friendly• Capable of detecting landmines to depths of 20 cm. minimum• Capable of exposing the mine for remote visual examination• Capable of remote hazard mitigation if required
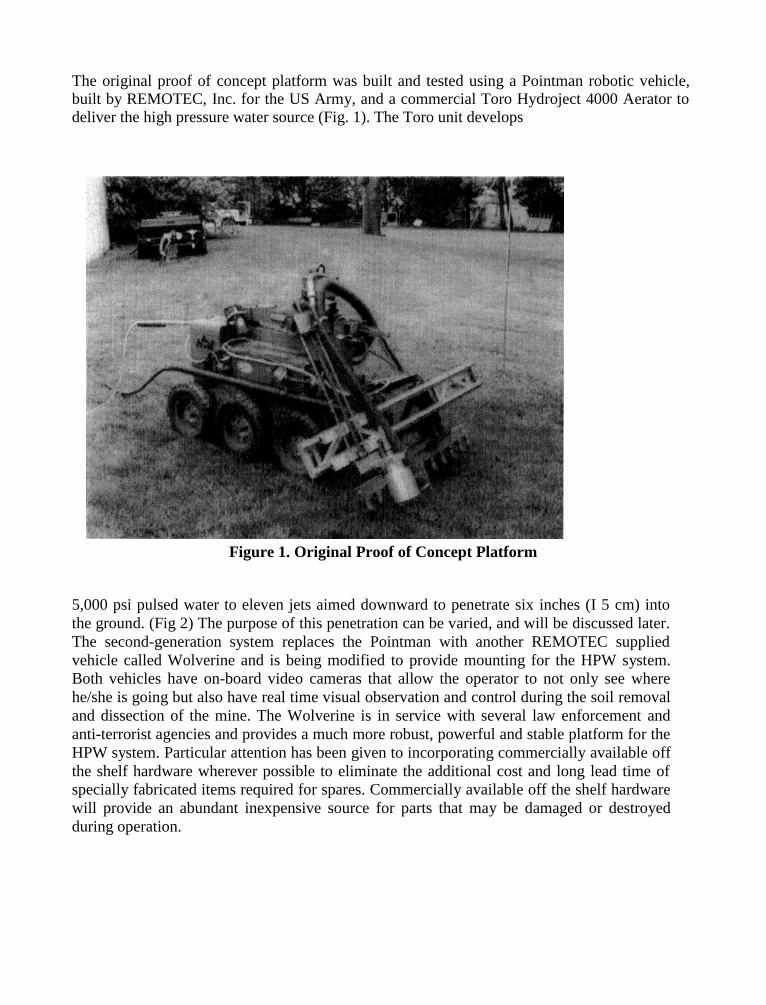
The original proof of concept platform was built and tested using a Pointman robotic vehicle,built by REMOTEC, Inc. for the US Army, and a commercial Toro Hydroject 4000 Aerator todeliver the high pressure water source (Fig. 1). The Toro unit develops
Figure 1. Original Proof of Concept Platform
5,000 psi pulsed water to eleven jets aimed downward to penetrate six inches (I 5 cm) intothe ground. (Fig 2) The purpose of this penetration can be varied, and will be discussed later.The second-generation system replaces the Pointman with another REMOTEC suppliedvehicle called Wolverine and is being modified to provide mounting for the HPW system.Both vehicles have on-board video cameras that allow the operator to not only see wherehe/she is going but also have real time visual observation and control during the soil removaland dissection of the mine. The Wolverine is in service with several law enforcement andanti-terrorist agencies and provides a much more robust, powerful and stable platform for theHPW system. Particular attention has been given to incorporating commercially available offthe shelf hardware wherever possible to eliminate the additional cost and long lead time ofspecially fabricated items required for spares. Commercially available off the shelf hardwarewill provide an abundant inexpensive source for parts that may be damaged or destroyedduring operation.
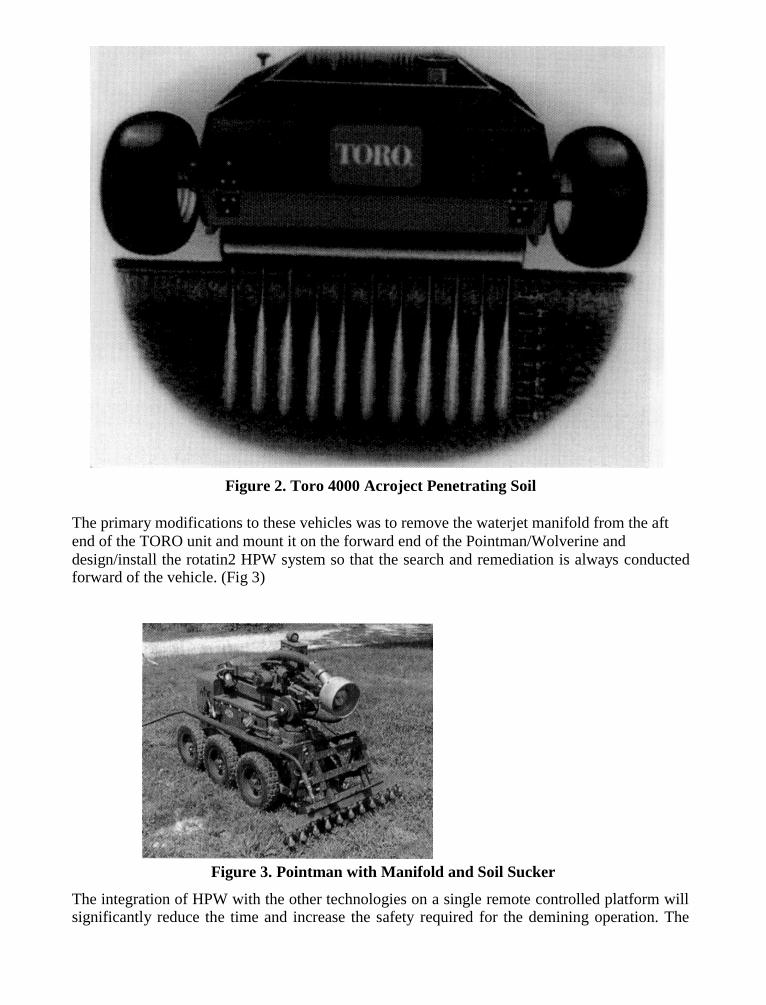
Figure 2. Toro 4000 Acroject Penetrating Soil
The primary modifications to these vehicles was to remove the waterjet manifold from the aftend of the TORO unit and mount it on the forward end of the Pointman/Wolverine anddesign/install the rotatin2 HPW system so that the search and remediation is always conductedforward of the vehicle. (Fig 3)
Figure 3. Pointman with Manifold and Soil Sucker
The integration of HPW with the other technologies on a single remote controlled platform willsignificantly reduce the time and increase the safety required for the demining operation. The
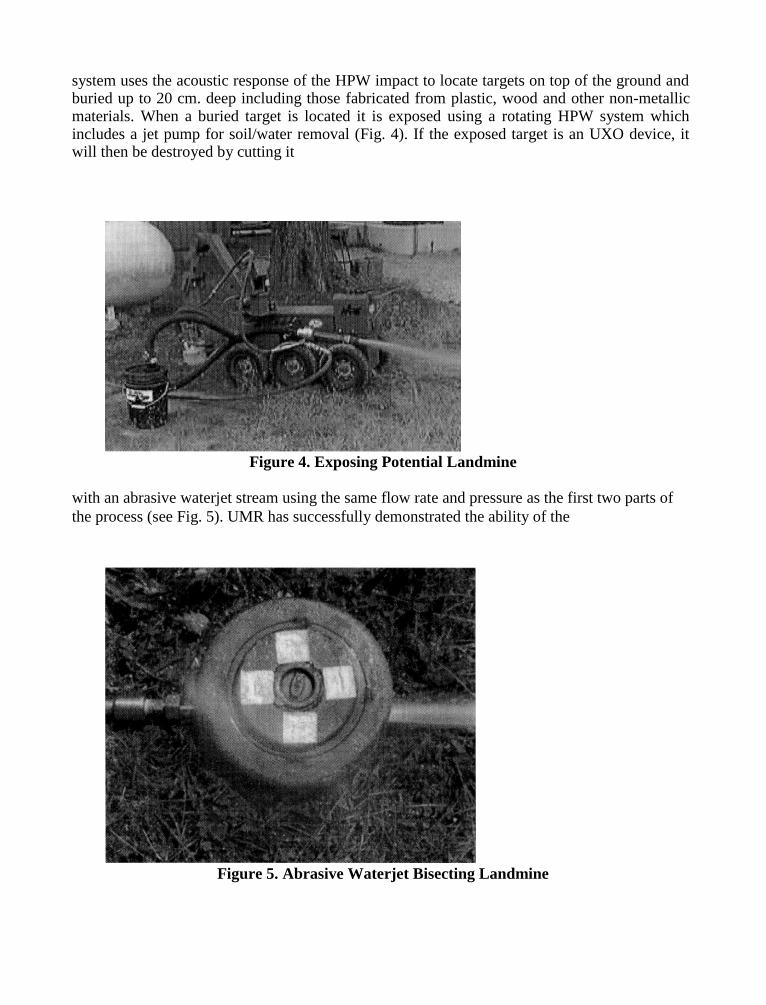
system uses the acoustic response of the HPW impact to locate targets on top of the ground andburied up to 20 cm. deep including those fabricated from plastic, wood and other non-metallicmaterials. When a buried target is located it is exposed using a rotating HPW system whichincludes a jet pump for soil/water removal (Fig. 4). If the exposed target is an UXO device, itwill then be destroyed by cutting it
Figure 4. Exposing Potential Landmine
with an abrasive waterjet stream using the same flow rate and pressure as the first two parts ofthe process (see Fig. 5). UMR has successfully demonstrated the ability of the
Figure 5. Abrasive Waterjet Bisecting Landmine
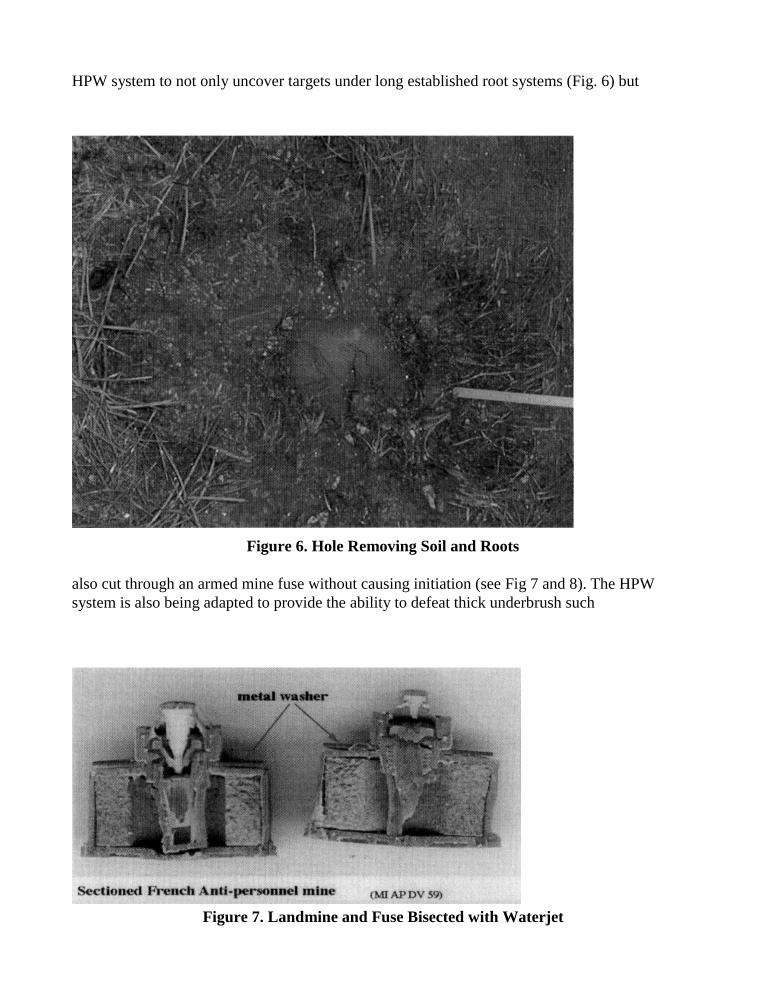
HPW system to not only uncover targets under long established root systems (Fig. 6) but
Figure 6. Hole Removing Soil and Roots
also cut through an armed mine fuse without causing initiation (see Fig 7 and 8). The HPWsystem is also being adapted to provide the ability to defeat thick underbrush such
Figure 7. Landmine and Fuse Bisected with Waterjet
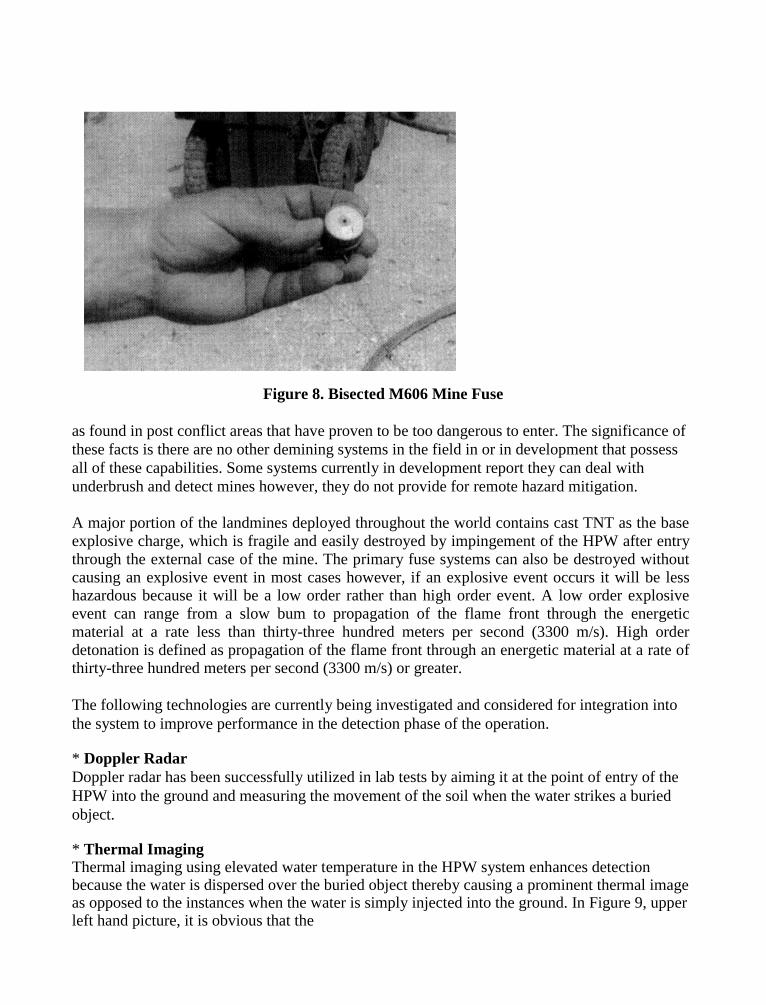
Figure 8. Bisected M606 Mine Fuse
as found in post conflict areas that have proven to be too dangerous to enter. The significance ofthese facts is there are no other demining systems in the field in or in development that possessall of these capabilities. Some systems currently in development report they can deal withunderbrush and detect mines however, they do not provide for remote hazard mitigation.
A major portion of the landmines deployed throughout the world contains cast TNT as the baseexplosive charge, which is fragile and easily destroyed by impingement of the HPW after entrythrough the external case of the mine. The primary fuse systems can also be destroyed withoutcausing an explosive event in most cases however, if an explosive event occurs it will be lesshazardous because it will be a low order rather than high order event. A low order explosiveevent can range from a slow bum to propagation of the flame front through the energeticmaterial at a rate less than thirty-three hundred meters per second (3300 m/s). High orderdetonation is defined as propagation of the flame front through an energetic material at a rate ofthirty-three hundred meters per second (3300 m/s) or greater.
The following technologies are currently being investigated and considered for integration intothe system to improve performance in the detection phase of the operation.
* Doppler RadarDoppler radar has been successfully utilized in lab tests by aiming it at the point of entry of theHPW into the ground and measuring the movement of the soil when the water strikes a buriedobject.
* Thermal ImagingThermal imaging using elevated water temperature in the HPW system enhances detectionbecause the water is dispersed over the buried object thereby causing a prominent thermal imageas opposed to the instances when the water is simply injected into the ground. In Figure 9, upperleft hand picture, it is obvious that the
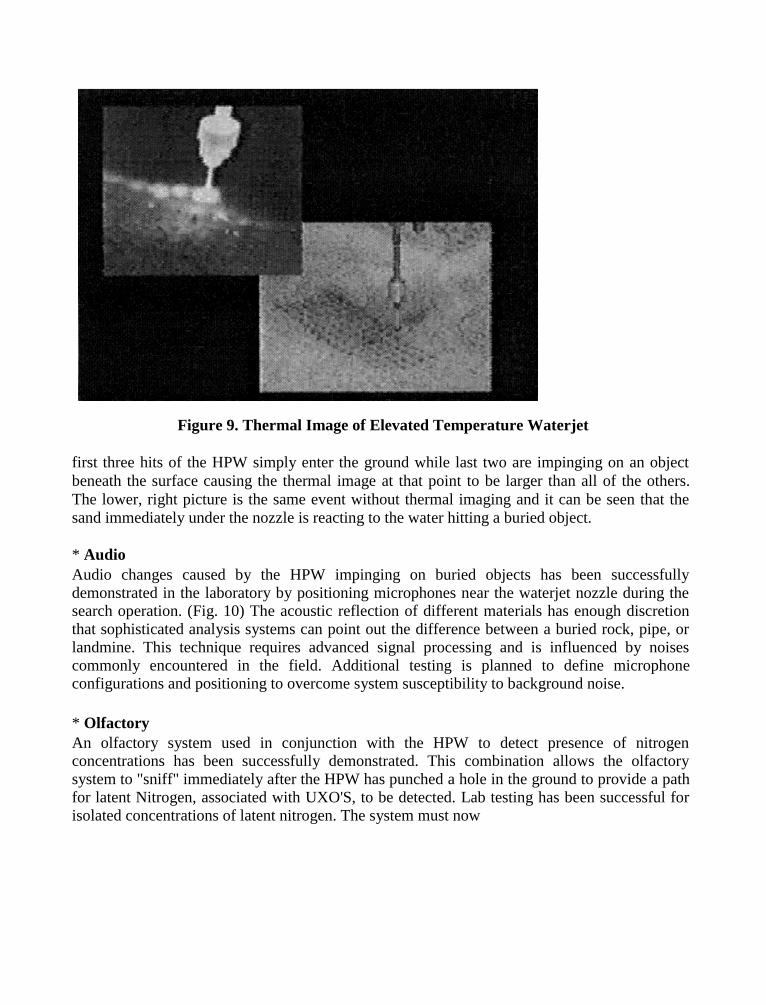
Figure 9. Thermal Image of Elevated Temperature Waterjet
first three hits of the HPW simply enter the ground while last two are impinging on an objectbeneath the surface causing the thermal image at that point to be larger than all of the others.The lower, right picture is the same event without thermal imaging and it can be seen that thesand immediately under the nozzle is reacting to the water hitting a buried object.
* AudioAudio changes caused by the HPW impinging on buried objects has been successfullydemonstrated in the laboratory by positioning microphones near the waterjet nozzle during thesearch operation. (Fig. 10) The acoustic reflection of different materials has enough discretionthat sophisticated analysis systems can point out the difference between a buried rock, pipe, orlandmine. This technique requires advanced signal processing and is influenced by noisescommonly encountered in the field. Additional testing is planned to define microphoneconfigurations and positioning to overcome system susceptibility to background noise.
* OlfactoryAn olfactory system used in conjunction with the HPW to detect presence of nitrogenconcentrations has been successfully demonstrated. This combination allows the olfactorysystem to "sniff" immediately after the HPW has punched a hole in the ground to provide a pathfor latent Nitrogen, associated with UXO'S, to be detected. Lab testing has been successful forisolated concentrations of latent nitrogen. The system must now
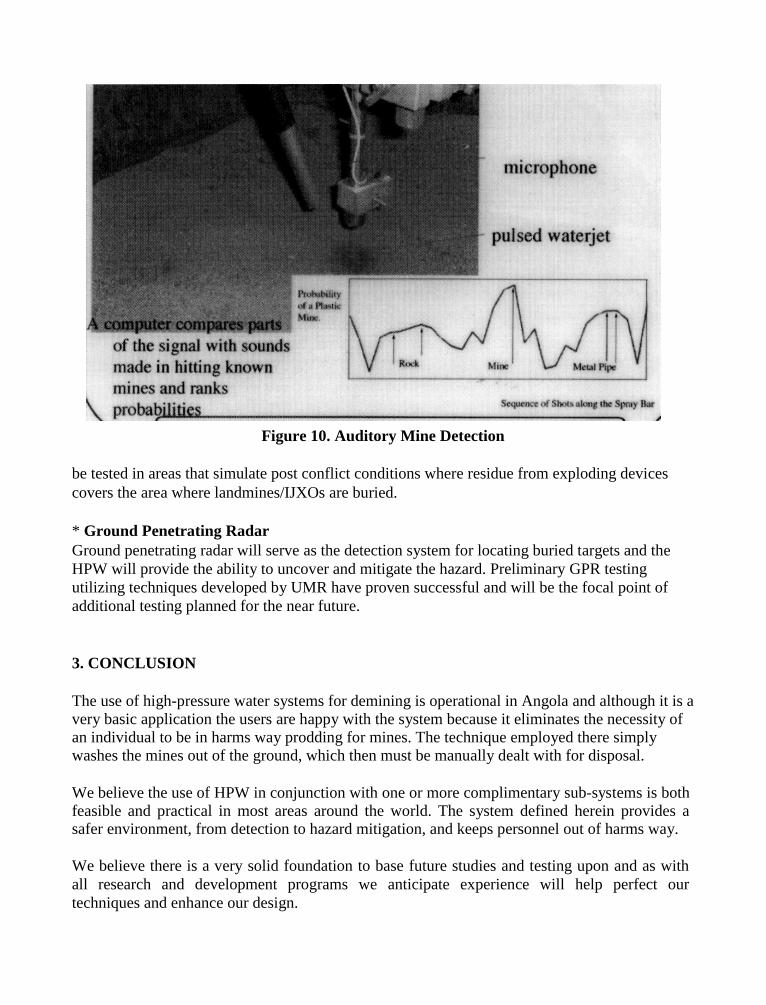
Figure 10. Auditory Mine Detection
be tested in areas that simulate post conflict conditions where residue from exploding devicescovers the area where landmines/IJXOs are buried.
* Ground Penetrating RadarGround penetrating radar will serve as the detection system for locating buried targets and theHPW will provide the ability to uncover and mitigate the hazard. Preliminary GPR testingutilizing techniques developed by UMR have proven successful and will be the focal point ofadditional testing planned for the near future.
3. CONCLUSION
The use of high-pressure water systems for demining is operational in Angola and although it is avery basic application the users are happy with the system because it eliminates the necessity ofan individual to be in harms way prodding for mines. The technique employed there simplywashes the mines out of the ground, which then must be manually dealt with for disposal.
We believe the use of HPW in conjunction with one or more complimentary sub-systems is bothfeasible and practical in most areas around the world. The system defined herein provides asafer environment, from detection to hazard mitigation, and keeps personnel out of harms way.
We believe there is a very solid foundation to base future studies and testing upon and as withall research and development programs we anticipate experience will help perfect ourtechniques and enhance our design.
10th American Waterjet ConferenceAugust 14-17, 1999: Houston, Texas
Paper 48
DEMILITARIZATION OF CHEMICAL WEAPONS
USING HIGH PRESSURE AMMONIA FLUID JETS
Paul L. MillerTeledyne Brown Engineering
Huntsville, Alabama
Mohamed HashishFlow International Corporation
Kent, Washington
ABSTRACT
Teledyne-Commodore has researched the use of high pressure 320 MPa (45,000 psi) liquidanhydrous ammonia as an alternative fluid for both abrasive fluid jet cutting of live chemicalwarfare munitions and fluid jet washout of chemical agents, explosives, and propellants. The useof anhydrous ammonia has numerous advantages over conventional water for chemical weapondemilitarization applications as was demonstrated in live testing at the U.S. Army’s RedstoneArsenal during 1998.
Organized and Sponsored by the WaterJet Technology Association
1. INTRODUCTION
As part of the chemical weapons reduction treaties signed by the United States, large stockpilesof chemical weapons are slated for disposal. Historical methods of chemical weapons disposal,such as ocean dumping, open burning, or open detonation (OB/OD), are no longer acceptablepractices. Chemical neutralization by either chlorination or hydrolysis was developed to allowfor the destruction of toxic chemical agents. These processes provided reasonable destructionefficiencies, but created larger quantities of toxic waste that had the potential for recombinationback to the original toxins. The government switched to chemical weapon incineration in aneffort to overcome the problems associated with caustic hydrolysis.
Incineration, however, is not considered an environmentally friendly destruction process by manyenvironmental groups. Local citizens’ concern for the proximity of these thermal processors topopulation centers energized many citizen action committees to vociferously challenge anyconstruction of chemical weapon incinerators. Currently, chemical weapon incineration has beenbanned by four states where chemical weapons are being stored.
Another major problem with current technologies for the destruction of chemical weapons is theprocess of mechanical disassembly in order to access the explosive materials and the chemicalagents. This reverse assembly process is complex and complicated by system deterioration anditems that were sealed during assembly. Corrosion of the chemical weapons further complicatesthe destruction technologies, as many of the explosive components are saturated with chemicalagent and may not be readily treated with a standard neutralization process.
In an effort to destroy the chemical weapons in an environmentally safe manner that would beacceptable to local communities, the U.S. Army Chemical and Biological Defense Command(CBDCOM) has pursued the development of alternative, non-thermal technologies. Teledyne-Commodore has developed and integrated both a non-thermal destruction technology and highpressure ammonia fluid jets to safely access these dangerous munitions and destroy their contentsin an environmentally safe manner.
2. FLUID JET OPERATIONS WITH A SUPERHEATED LIQUID
The use of anhydrous ammonia was chosen as the most appropriate fluid for the demilitarizationof the chemical weapons because of the ease with which fluid can be integrated into thesubsequent chemical process. The chemical process for the actual destruction of the chemicalagents uses alkali metals dissolved in anhydrous ammonia to form the aggressive SolvatedElectron Technology (SET) solution. Chemical agents and explosives treated by the SETsolution are completely destroyed within seconds. Melvin (1994) has also advocated the use ofanhydrous ammonia on high explosives, and his extensive research has shown the safety of usingthis liquid in such an application.
Melvin developed an ammonia washout process for the removal of rocket propellants through acombination of kinetic energy breakup of the propellant surface and utilization of the aggressivesolvent nature of the ammonia. Testing of Melvin’s operation began in 1993 at HerculesAerospace, which later became Alliant Techsystems’ Global Environmental Solutions (GES).Several tests were run on Melvin’s washout system at pressures up to 241 MPa (35 ksi) for veryshort durations. This system was later removed from GES and transferred to Redstone ArsenalTest Area 10 for final integration and testing. As part of their independent research, Teledyne-Commodore installed and tested their ammonia fluid jet system with Melvin’s assistance in thebuilding adjacent to Melvin’s at Redstone Arsenal.
The application of superheated liquid or liquefied gases in high pressure fluid jets is not a newtopic of research. Lienhard and Day (1970) as well as Dunsky and Hashish (1995) have exploredthe use of high pressure, superheated liquid or liquefied gases for specific applications. The useof high pressure, cryogenically liquefied nitrogen gas was developed and tested for the removalof military propellants at Tyndall Air Force Base, according to Savanick (1994).
Although much of the published fluid jet work is focused on cryogenically liquefied gases, theproperties of superheated liquids for the space and missile programs have also been well studied.For example, Lienhard and Day (1970) modeled the breakup of the superheated liquid jet streaminto an incoherent spray from either flashing of the liquid or aerodynamic instability in the late1960s. Other work by Huzel and Huang (1971) focused on both pumping of such liquids and jetformation during discharge. These aerospace pumps developed for large rocket motors producedalmost 14 MPa at 900 kg⋅sec-1. Teledyne-Commodore Brown combined several establishedconcepts to develop the ammonia fluid jet’s system based on the existing body of work and thesimplicity of system integration with the remainder of the chemical process.
2.1 Material Properties
Ammonia as a Process Fluid - Anhydrous ammonia is a pungent, colorless gas at roomtemperature. Although the aqueous solution of ammonia has been known since antiquity,ammonia has only been produced commercially in the anhydrous form for slightly over a 125years, according to Motz (1929). Ammonia is one of the largest volume commodity chemicalsproduced in the world today, with some 90 million metric tons produced and consumed each yearaccording to Lauriente (1995). The principal uses for ammonia are in the production of or use asa fertilizer and as a refrigerant gas. Fertilizer anhydrous ammonia is directly injected into theground and supplies the necessary nitrogen macronutrient. Ammonia is known to ASHRAE(1994) as Refrigerant 717 and has received renewed attention in recent years in the heating,ventilation, and air conditioning (HVAC) field due to the scheduled phaseout and increasing costof ozone-depleting chlorofluorcarbons (CFC) and halocarbons (HCFC).
The use of ammonia as a solvent for chemical processes is also extensively known in thechemical engineering field. Some typical properties of anhydrous ammonia as a process fluidare:
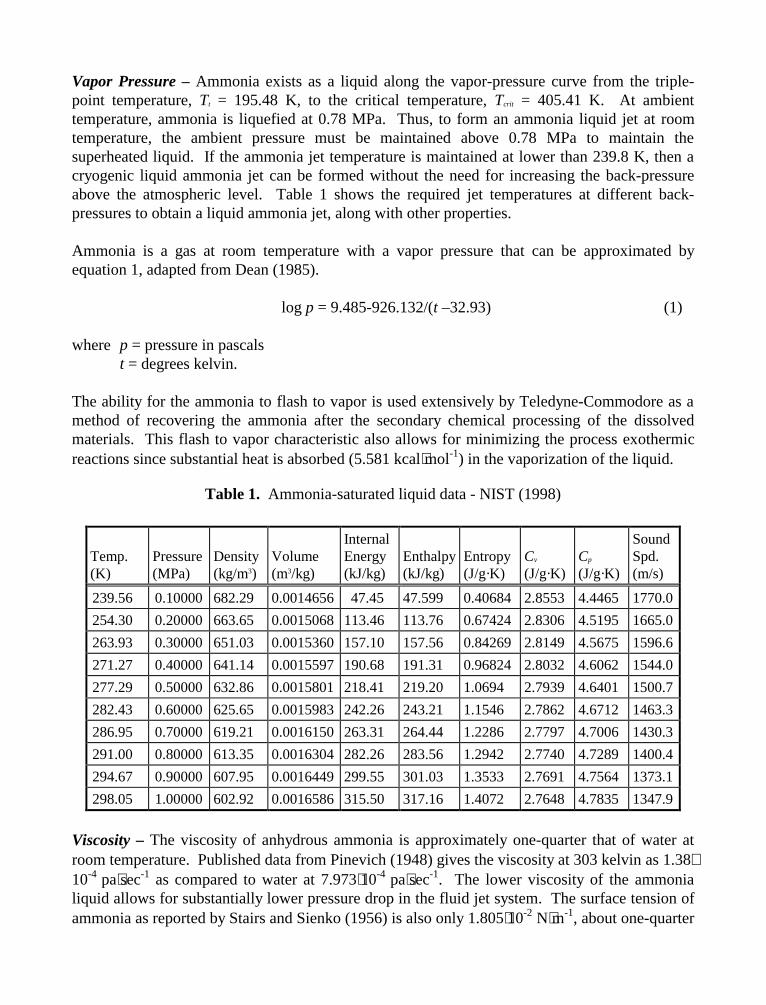
Vapor Pressure – Ammonia exists as a liquid along the vapor-pressure curve from the triple-point temperature, Tt = 195.48 K, to the critical temperature, Tcrit = 405.41 K. At ambienttemperature, ammonia is liquefied at 0.78 MPa. Thus, to form an ammonia liquid jet at roomtemperature, the ambient pressure must be maintained above 0.78 MPa to maintain thesuperheated liquid. If the ammonia jet temperature is maintained at lower than 239.8 K, then acryogenic liquid ammonia jet can be formed without the need for increasing the back-pressureabove the atmospheric level. Table 1 shows the required jet temperatures at different back-pressures to obtain a liquid ammonia jet, along with other properties.
Ammonia is a gas at room temperature with a vapor pressure that can be approximated byequation 1, adapted from Dean (1985).
log p = 9.485-926.132/(t –32.93) (1)
where p = pressure in pascalst = degrees kelvin.
The ability for the ammonia to flash to vapor is used extensively by Teledyne-Commodore as amethod of recovering the ammonia after the secondary chemical processing of the dissolvedmaterials. This flash to vapor characteristic also allows for minimizing the process exothermicreactions since substantial heat is absorbed (5.581 kcal⋅mol-1) in the vaporization of the liquid.
Table 1. Ammonia-saturated liquid data - NIST (1998)
Temp.(K)
Pressure(MPa)
Density(kg/m3)
Volume(m3/kg)
InternalEnergy(kJ/kg)
Enthalpy(kJ/kg)
Entropy(J/g·K)
Cv
(J/g·K)Cp
(J/g·K)
SoundSpd.(m/s)
239.56 0.10000 682.29 0.0014656 47.45 47.599 0.40684 2.8553 4.4465 1770.0
254.30 0.20000 663.65 0.0015068 113.46 113.76 0.67424 2.8306 4.5195 1665.0
263.93 0.30000 651.03 0.0015360 157.10 157.56 0.84269 2.8149 4.5675 1596.6
271.27 0.40000 641.14 0.0015597 190.68 191.31 0.96824 2.8032 4.6062 1544.0
277.29 0.50000 632.86 0.0015801 218.41 219.20 1.0694 2.7939 4.6401 1500.7
282.43 0.60000 625.65 0.0015983 242.26 243.21 1.1546 2.7862 4.6712 1463.3
286.95 0.70000 619.21 0.0016150 263.31 264.44 1.2286 2.7797 4.7006 1430.3
291.00 0.80000 613.35 0.0016304 282.26 283.56 1.2942 2.7740 4.7289 1400.4
294.67 0.90000 607.95 0.0016449 299.55 301.03 1.3533 2.7691 4.7564 1373.1
298.05 1.00000 602.92 0.0016586 315.50 317.16 1.4072 2.7648 4.7835 1347.9
Viscosity – The viscosity of anhydrous ammonia is approximately one-quarter that of water atroom temperature. Published data from Pinevich (1948) gives the viscosity at 303 kelvin as 1.38⋅10-4 pa⋅sec-1 as compared to water at 7.973⋅10-4 pa⋅sec-1. The lower viscosity of the ammonialiquid allows for substantially lower pressure drop in the fluid jet system. The surface tension ofammonia as reported by Stairs and Sienko (1956) is also only 1.805⋅10-2 N⋅m-1, about one-quarter
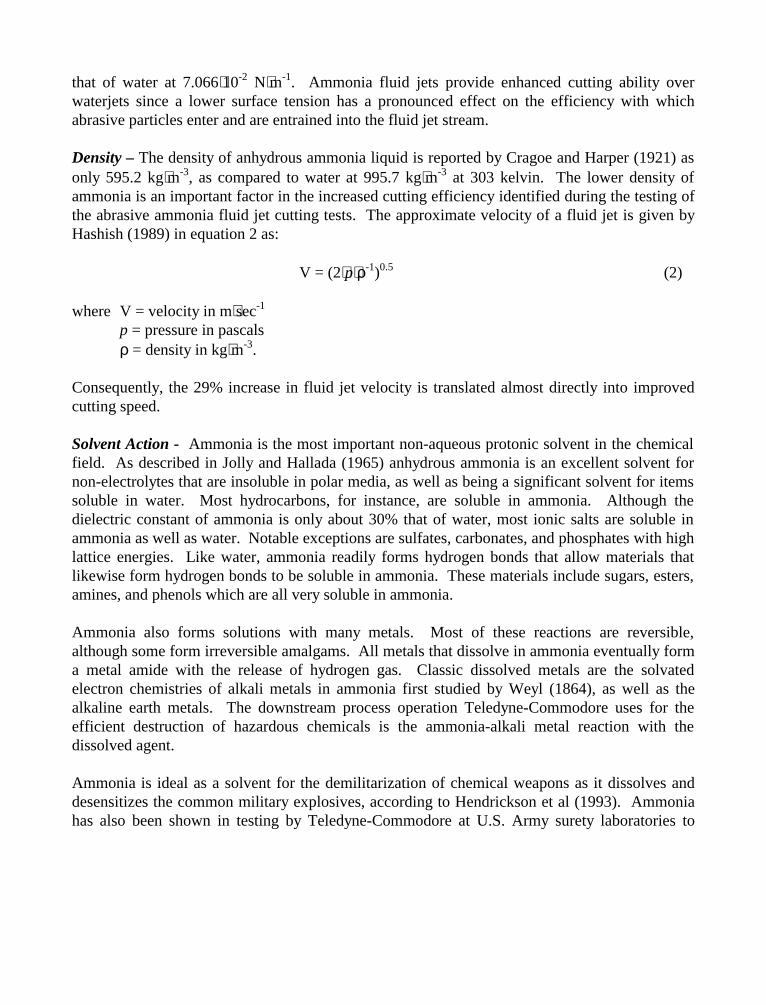
that of water at 7.066⋅10-2 N⋅m-1. Ammonia fluid jets provide enhanced cutting ability overwaterjets since a lower surface tension has a pronounced effect on the efficiency with whichabrasive particles enter and are entrained into the fluid jet stream.
Density – The density of anhydrous ammonia liquid is reported by Cragoe and Harper (1921) asonly 595.2 kg⋅m-3, as compared to water at 995.7 kg⋅m-3 at 303 kelvin. The lower density ofammonia is an important factor in the increased cutting efficiency identified during the testing ofthe abrasive ammonia fluid jet cutting tests. The approximate velocity of a fluid jet is given byHashish (1989) in equation 2 as:
V = (2⋅p⋅ρ-1)0.5 (2)
where V = velocity in m⋅sec-1
p = pressure in pascalsρ = density in kg⋅m-3.
Consequently, the 29% increase in fluid jet velocity is translated almost directly into improvedcutting speed.
Solvent Action - Ammonia is the most important non-aqueous protonic solvent in the chemicalfield. As described in Jolly and Hallada (1965) anhydrous ammonia is an excellent solvent fornon-electrolytes that are insoluble in polar media, as well as being a significant solvent for itemssoluble in water. Most hydrocarbons, for instance, are soluble in ammonia. Although thedielectric constant of ammonia is only about 30% that of water, most ionic salts are soluble inammonia as well as water. Notable exceptions are sulfates, carbonates, and phosphates with highlattice energies. Like water, ammonia readily forms hydrogen bonds that allow materials thatlikewise form hydrogen bonds to be soluble in ammonia. These materials include sugars, esters,amines, and phenols which are all very soluble in ammonia.
Ammonia also forms solutions with many metals. Most of these reactions are reversible,although some form irreversible amalgams. All metals that dissolve in ammonia eventually forma metal amide with the release of hydrogen gas. Classic dissolved metals are the solvatedelectron chemistries of alkali metals in ammonia first studied by Weyl (1864), as well as thealkaline earth metals. The downstream process operation Teledyne-Commodore uses for theefficient destruction of hazardous chemicals is the ammonia-alkali metal reaction with thedissolved agent.
Ammonia is ideal as a solvent for the demilitarization of chemical weapons as it dissolves anddesensitizes the common military explosives, according to Hendrickson et al (1993). Ammoniahas also been shown in testing by Teledyne-Commodore at U.S. Army surety laboratories to
dissolve the major chemical warfare agents used by the various nations since the First WorldWar. The agents that ammonia was tested on include:
• GA (Soman)• GB (Sarin)• GD (Tabun)• GF• HD (Distilled Mustard)• HT (Mustard)• L (Lewisite)• VX.
In a similar manner, high explosive materials are quite soluble in anhydrous ammonia.According to Melvin (1994) the common military explosives are all soluble with ammonia andreasonably stable. The exceptions are glycerol trinitrate (NG) and 2-methyl 1,3,5 trinitrobenzene(TNT) which decompose through ammonolysis.
Other energetic materials cited by Melvin (1994) that dissolve quite readily and are stable inammonia are hexahydro- 1,3,5-trinitro-, 1,3,5-triazine (RDX), octohydro- 1,3,5,7-tetranitro-,1,3,5,7-tetrazocine (HMX), ammonium picrate (Exp D), 1,3,5-trinitrophenol (PA), andammonium perchlorate (AP).
Melvin (1994) also showed that the dissolved energetic materials could be recovered from theammonia solution and reutilized for resource recovery and recycling.
2.2 Equipment Integration
Teledyne-Commodore contracted with Flow International to integrate ammonia into a fluid jetsystem utilizing refrigeration grade anhydrous ammonia fluid. The anhydrous ammonia waspumped in standard waterjet equipment that had minor modifications to the seals and to someinternal parts for higher reliability. The initial tests using a pair of 18.75 kWe Cougar pumpswere less than satisfactory and a larger 150 kWe 25XQ-A quad intensifier was substituted withexcellent results.
All testing was performed within a certified pressure vessel rated to 1.7 MPa and certified toASME pressure vessel standards. The fluid jet penetrations were all o-ring or graphite packingsealed to prevent the release of ammonia vapor to the work area. The pressure vessel was alsofitted with temperature, pressure, and process location instrumentation, which allowed the entireoperation to be performed from a remote control room located approximately 200 meters away.The use of ammonia did not require any special precautions and many inert operations wereattended by research personnel in close proximity to the equipment during test runs. During liveexplosive operations, all personnel were sequestered in the control room as required by militarysafety regulations.
Multiple high explosive filled training rockets were sectioned using the ammonia fluid jet as anabrasive fluid jet cutter operating at pressures to 320 MPa with 180 micron (80 mesh) abrasive.No abrasives were used for the washout of explosives and propellants as the combination of theerosive action of the high velocity ammonia liquid and the high solvent action was sufficient.
After the target materials were washed out and dissolved using the high pressure ammonia fluidjet, the solution was pumped to a secondary process chamber and the hazardous materialsdestroyed. At the conclusion of the process, the ammonia was recovered and recycled byevaporating the gas to a commercial refrigeration compressor and recompressing the gas to aliquid. The ammonia stream was then reusable and returned to the intensifier for further work.
3. CONCLUSION
The ammonia fluid jet process is a proven system based on conventional waterjet technologywith only minor modifications. The ammonia system has some unique capabilities of being ableto dissolve various materials that are insoluble with water or form emulsions. The use ofammonia in the fluid jet cutting process also allows for substantially higher process rates andprovides a rapid method of removing the process liquid through evaporation and recovery.
4. REFERENCES
ASHRAE Handbook, “System Practices for Ammonia Refrigeration”, Refrigeration, American Society of Heating, Refrigerating and Air Conditioning Engineers, 1994.
Cragoe, C., and Harper, D. Bur. Stds. Sc.Pp., Vol. 420, page 313, 1921, as cited in Jolly, W. L.,and Hallada, C. J., “Liquid Ammonia,” Non-Aqueous Solvent Systems, Waddington, T. C., ed., Academic Press, pages 1 – 45, 1965.
Dean, J. A., ed., Lange’s Handbook of Chemistry, 13th ed., pages 10-29, 1985.
Dunsky C. M. and Hashish, M., “Feasibility Study of the Use of Ultrahigh-Pressure LiquefiedGas Jets for Machining of Nuclear Fuel Pins,” Paper 35, 8th American Water JetConference, August 1995.
Hashish, M., “Pressure Effects in Abrasive-Waterjet Machining,” Trans. ASME J. Eng. Mat’l and Technology. Vol. III, page 221, July 1989.
Hendrickson, K. A., Losee, L. A., Stevens, P. M., and Mitchell, D. H.; “Materials Hazards Testing in Support of the Army Large Rocket Motor Demilitarization Pilot Plant Materials,” Hercules Aerospace Company, Magna, UT, Joint 1993 JANAF Propulsion Meeting and 30th JANAF Combustion Subcommittee Meeting, Monterey, CA, November 15-18, 1993. [Unclassified – Approved for Public Release; Unlimited Distribution.]
Huzel, D. K. and Huang, D. H., Design of Liquid Propellant Rocket Engines, 2nd ed., National Aeronautics and Space Administration, NASA SP-125, 1971.
Jolly, W. L., and Hallada, C. J., “Liquid Ammonia,” Non-Aqueous Solvent Systems, Waddington,T. C., ed., Academic Press, pages 1 – 45, 1965.
Lauriente, D. H., Chemical Economics Handbook, as cited in http.//www-cmrc.sri.com/CIN, 1995.
Lienhard, J. H. and Day, J. B., “The Breakup of Superheated Liquid Jets” Trans ASME Journal of Basic Engineering, pages 515-522, September 1970.
Melvin, W. S., Method to Extract and Recover Nitramine Oxidizers from Solid Propellants Using Liquid Ammonia, U.S. Patent #5,285,995, February 8, 1994.
Motz, W. H., Principles of Refrigeration, Nickerson and Collins, 1929.
National Institute of Standards and Technology (NIST), “Saturation Properties for Ammonia–Pressure Increments,” from NIST Standard Reference Database, NIST Chemistry WebBook, http://webbook.nist.gov/cgi, 1998.
Pinevich, G., Kholod. Tekh. Vol. 20, No. 3, page 30, 1948, as cited in Jolly, W. L., and Hallada, C. J., “Liquid Ammonia,” Non-Aqueous Solvent Systems, Waddington, T. C., ed., Academic Press, pages 1 – 45, 1965.
Stairs, R. A., and Sienko, M. J., J. Amer. Chem. Soc., Vol. 78, page 920, 1956, as cited in Jolly, W. L., and Hallada, C. J., “Liquid Ammonia,” Non-Aqueous Solvent Systems, Waddington, T. C., ed., Academic Press, pages 1 – 45, 1965.
Weyl, W., Annln Phys, Vol. 121, page 601, 1864, as cited in Jolly, W. L., and Hallada, C. J., “Liquid Ammonia,” Non-Aqueous Solvent Systems, Waddington, T. C., ed., Academic Press, pages 1 – 45, 1965.
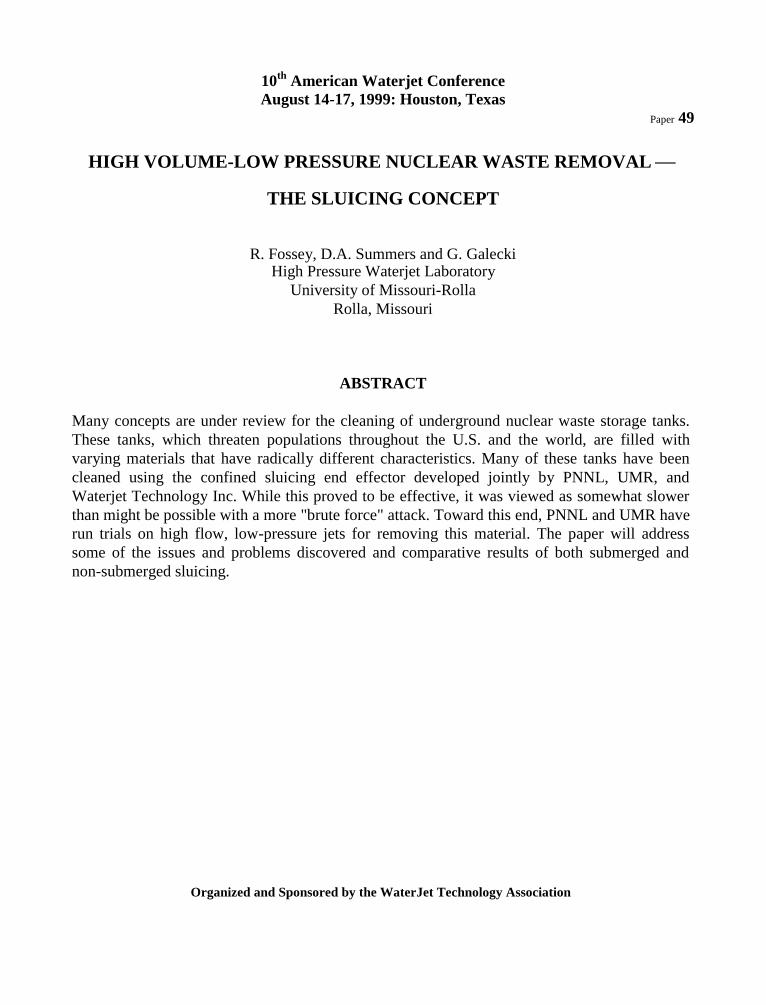
10th American Waterjet ConferenceAugust 14-17, 1999: Houston, Texas
Paper 49
HIGH VOLUME-LOW PRESSURE NUCLEAR WASTE REMOVAL
THE SLUICING CONCEPT
R. Fossey, D.A. Summers and G. GaleckiHigh Pressure Waterjet Laboratory
University of Missouri-RollaRolla, Missouri
ABSTRACT
Many concepts are under review for the cleaning of underground nuclear waste storage tanks.These tanks, which threaten populations throughout the U.S. and the world, are filled withvarying materials that have radically different characteristics. Many of these tanks have beencleaned using the confined sluicing end effector developed jointly by PNNL, UMR, andWaterjet Technology Inc. While this proved to be effective, it was viewed as somewhat slowerthan might be possible with a more "brute force" attack. Toward this end, PNNL and UMR haverun trials on high flow, low-pressure jets for removing this material. The paper will addresssome of the issues and problems discovered and comparative results of both submerged andnon-submerged sluicing.
Organized and Sponsored by the WaterJet Technology Association
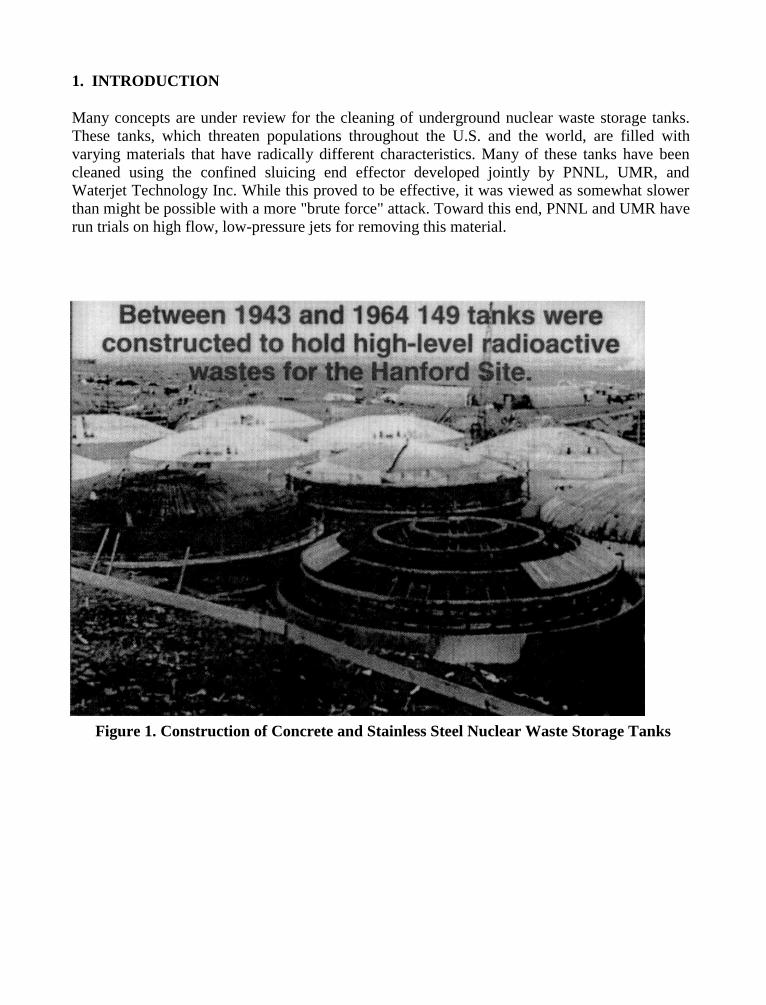
1. INTRODUCTION
Many concepts are under review for the cleaning of underground nuclear waste storage tanks.These tanks, which threaten populations throughout the U.S. and the world, are filled withvarying materials that have radically different characteristics. Many of these tanks have beencleaned using the confined sluicing end effector developed jointly by PNNL, UMR, andWaterjet Technology Inc. While this proved to be effective, it was viewed as somewhat slowerthan might be possible with a more "brute force" attack. Toward this end, PNNL and UMR haverun trials on high flow, low-pressure jets for removing this material.
Figure 1. Construction of Concrete and Stainless Steel Nuclear Waste Storage Tanks
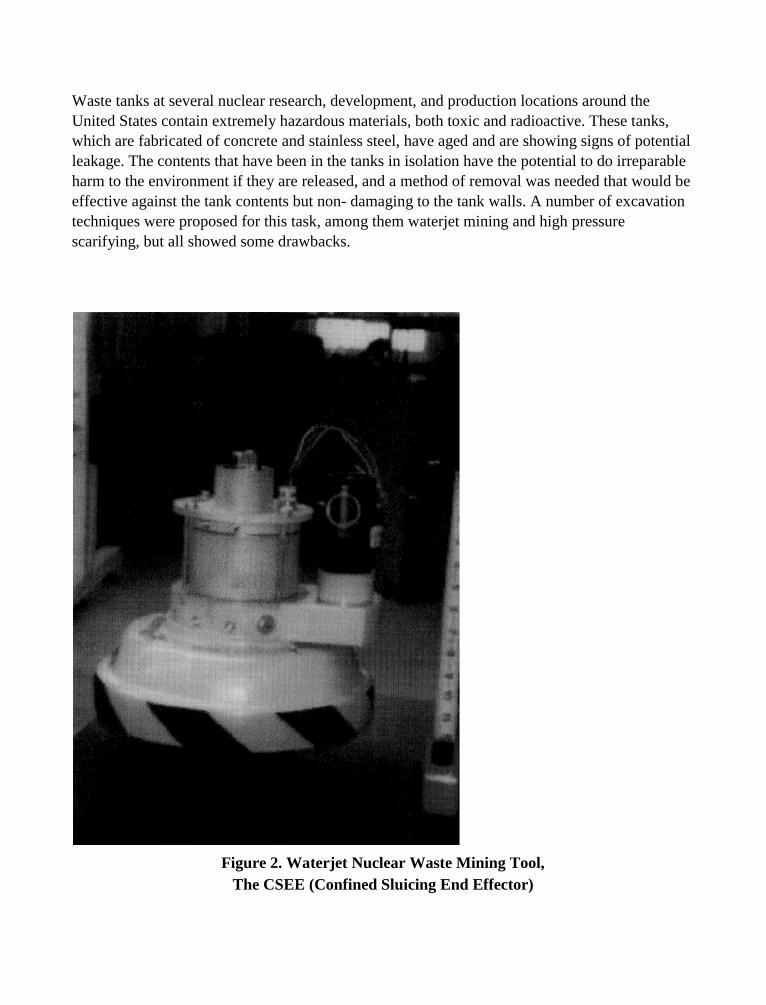
Waste tanks at several nuclear research, development, and production locations around theUnited States contain extremely hazardous materials, both toxic and radioactive. These tanks,which are fabricated of concrete and stainless steel, have aged and are showing signs of potentialleakage. The contents that have been in the tanks in isolation have the potential to do irreparableharm to the environment if they are released, and a method of removal was needed that would beeffective against the tank contents but non- damaging to the tank walls. A number of excavationtechniques were proposed for this task, among them waterjet mining and high pressurescarifying, but all showed some drawbacks.
Figure 2. Waterjet Nuclear Waste Mining Tool,The CSEE (Confined Sluicing End Effector)
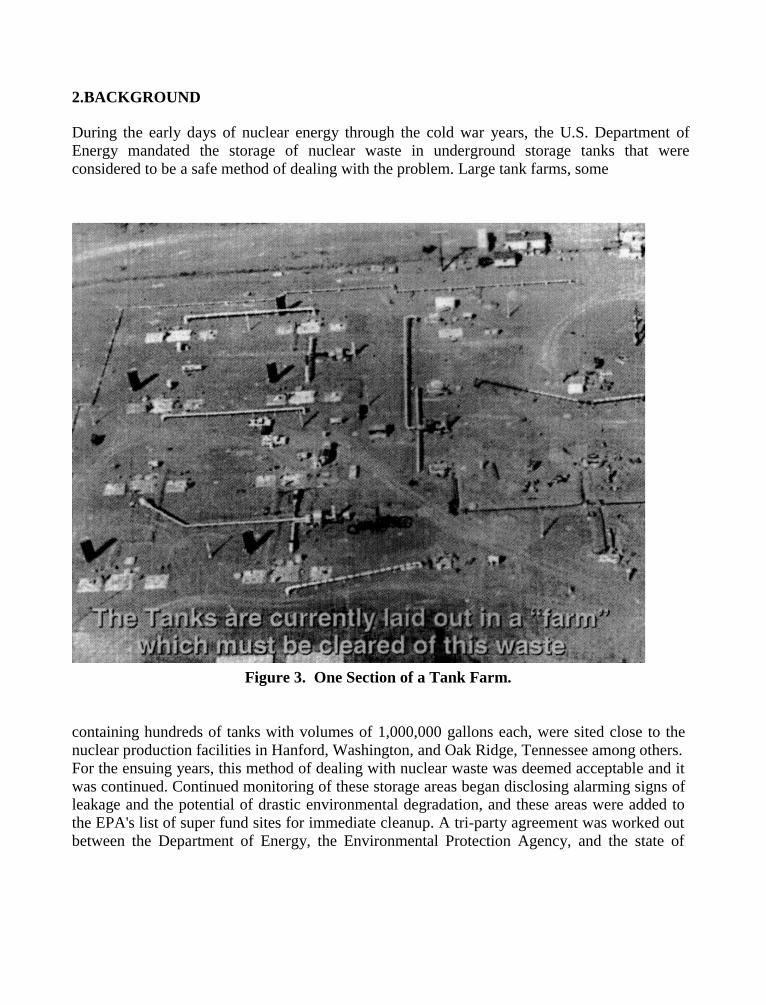
2.BACKGROUND
During the early days of nuclear energy through the cold war years, the U.S. Department ofEnergy mandated the storage of nuclear waste in underground storage tanks that wereconsidered to be a safe method of dealing with the problem. Large tank farms, some
Figure 3. One Section of a Tank Farm.
containing hundreds of tanks with volumes of 1,000,000 gallons each, were sited close to thenuclear production facilities in Hanford, Washington, and Oak Ridge, Tennessee among others.For the ensuing years, this method of dealing with nuclear waste was deemed acceptable and itwas continued. Continued monitoring of these storage areas began disclosing alarming signs ofleakage and the potential of drastic environmental degradation, and these areas were added tothe EPA's list of super fund sites for immediate cleanup. A tri-party agreement was worked outbetween the Department of Energy, the Environmental Protection Agency, and the state of
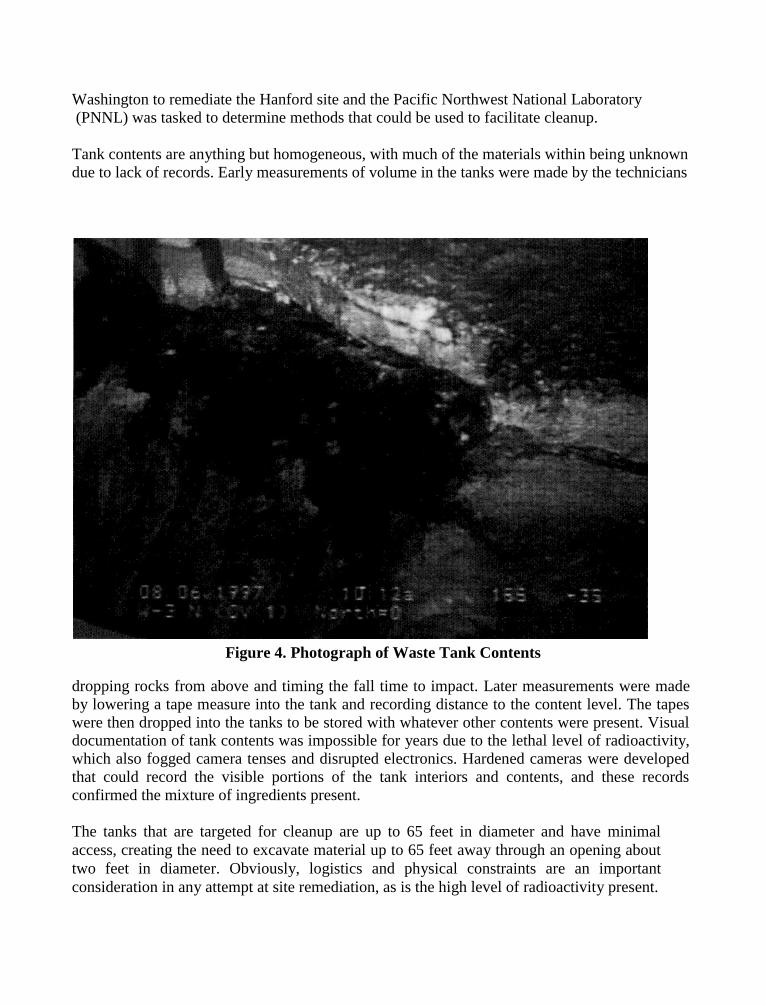
Washington to remediate the Hanford site and the Pacific Northwest National Laboratory (PNNL) was tasked to determine methods that could be used to facilitate cleanup.
Tank contents are anything but homogeneous, with much of the materials within being unknowndue to lack of records. Early measurements of volume in the tanks were made by the technicians
Figure 4. Photograph of Waste Tank Contents
dropping rocks from above and timing the fall time to impact. Later measurements were madeby lowering a tape measure into the tank and recording distance to the content level. The tapeswere then dropped into the tanks to be stored with whatever other contents were present. Visualdocumentation of tank contents was impossible for years due to the lethal level of radioactivity,which also fogged camera tenses and disrupted electronics. Hardened cameras were developedthat could record the visible portions of the tank interiors and contents, and these recordsconfirmed the mixture of ingredients present.
The tanks that are targeted for cleanup are up to 65 feet in diameter and have minimalaccess, creating the need to excavate material up to 65 feet away through an opening abouttwo feet in diameter. Obviously, logistics and physical constraints are an importantconsideration in any attempt at site remediation, as is the high level of radioactivity present.
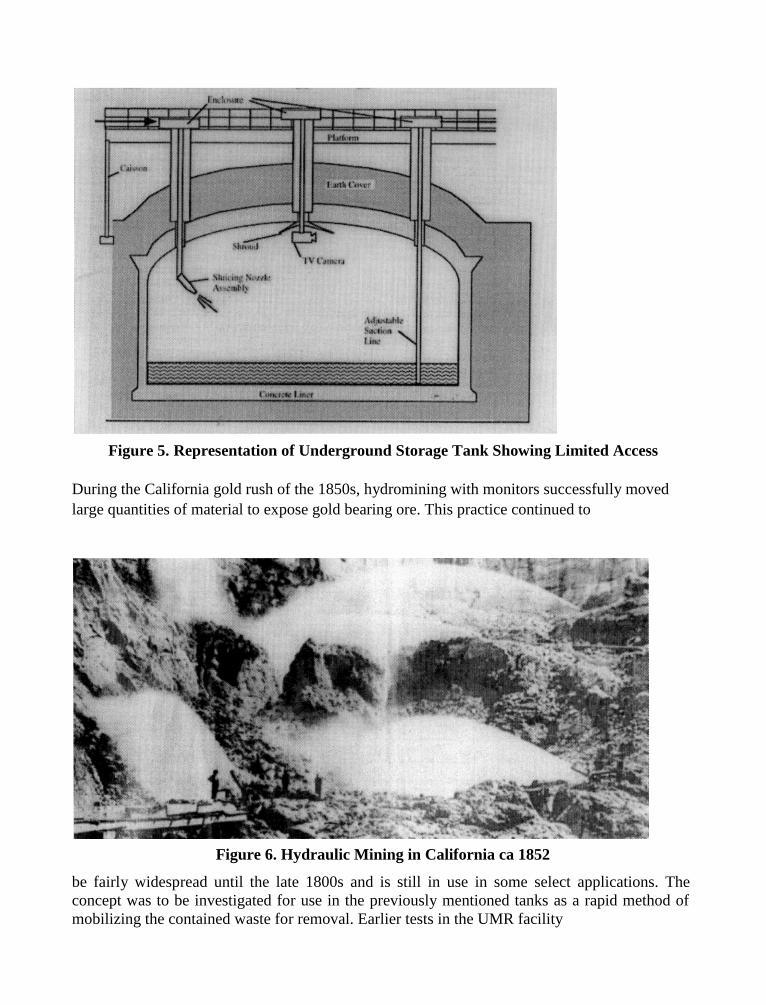
Figure 5. Representation of Underground Storage Tank Showing Limited Access
During the California gold rush of the 1850s, hydromining with monitors successfully movedlarge quantities of material to expose gold bearing ore. This practice continued to
Figure 6. Hydraulic Mining in California ca 1852
be fairly widespread until the late 1800s and is still in use in some select applications. Theconcept was to be investigated for use in the previously mentioned tanks as a rapid method ofmobilizing the contained waste for removal. Earlier tests in the UMR facility
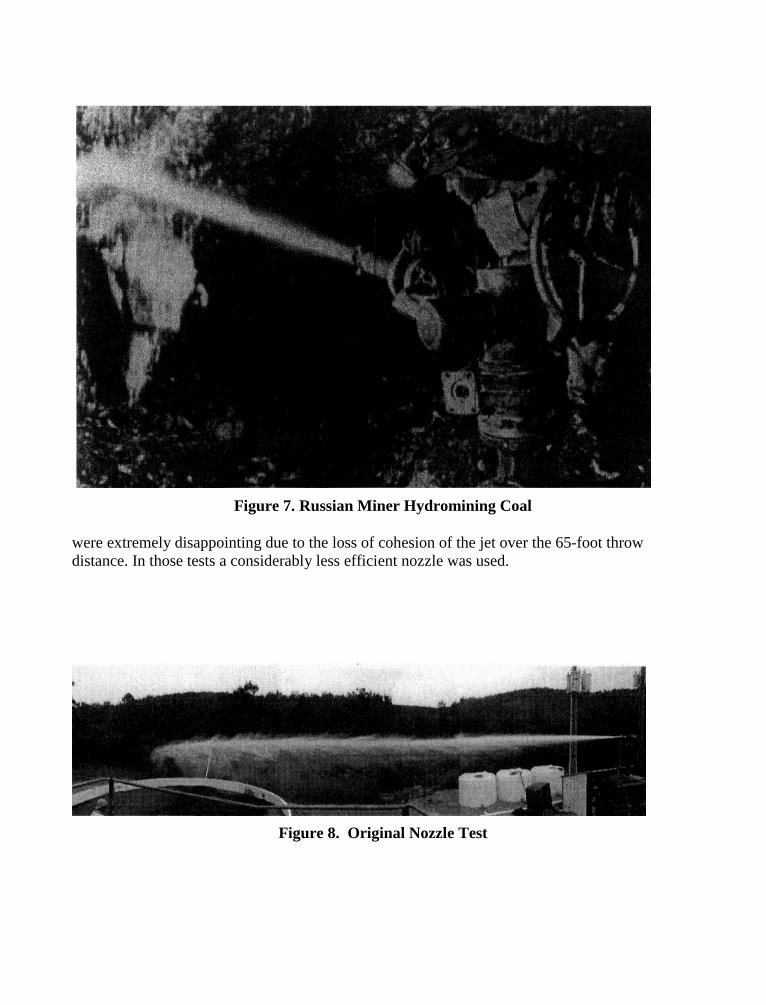
Figure 7. Russian Miner Hydromining Coal
were extremely disappointing due to the loss of cohesion of the jet over the 65-foot throwdistance. In those tests a considerably less efficient nozzle was used.
Figure 8. Original Nozzle Test
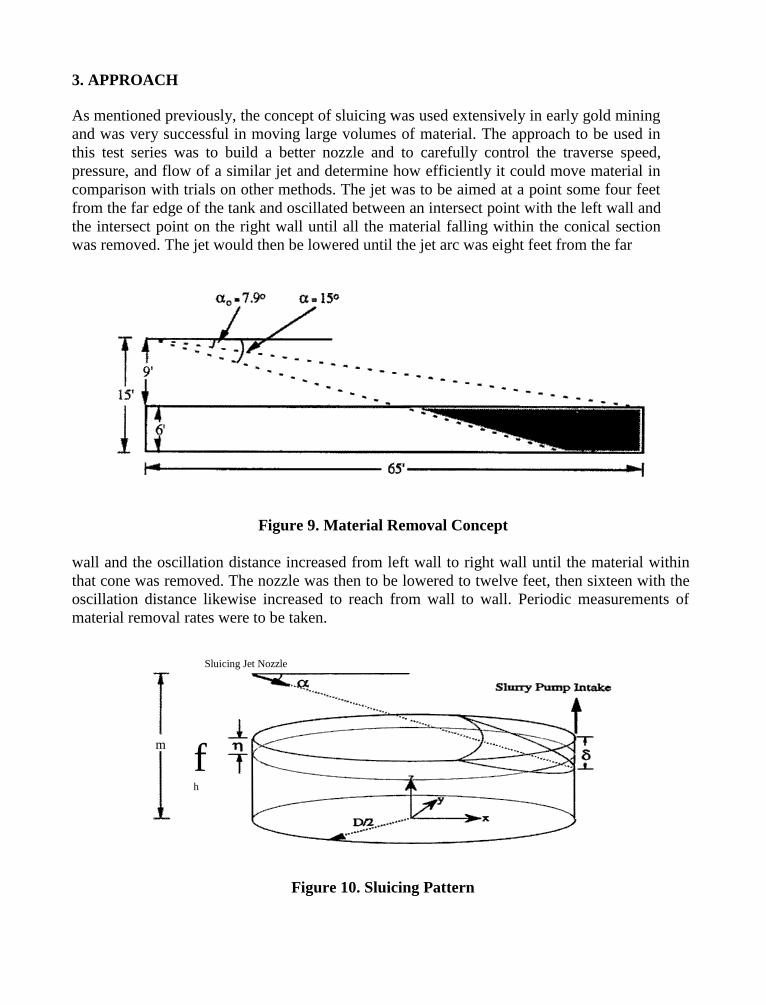
3. APPROACH
As mentioned previously, the concept of sluicing was used extensively in early gold miningand was very successful in moving large volumes of material. The approach to be used inthis test series was to build a better nozzle and to carefully control the traverse speed,pressure, and flow of a similar jet and determine how efficiently it could move material incomparison with trials on other methods. The jet was to be aimed at a point some four feetfrom the far edge of the tank and oscillated between an intersect point with the left wall andthe intersect point on the right wall until all the material falling within the conical sectionwas removed. The jet would then be lowered until the jet arc was eight feet from the far
Figure 9. Material Removal Concept
wall and the oscillation distance increased from left wall to right wall until the material withinthat cone was removed. The nozzle was then to be lowered to twelve feet, then sixteen with theoscillation distance likewise increased to reach from wall to wall. Periodic measurements ofmaterial removal rates were to be taken.
Figure 10. Sluicing Pattern
m
Sluicing Jet Nozzle
fh
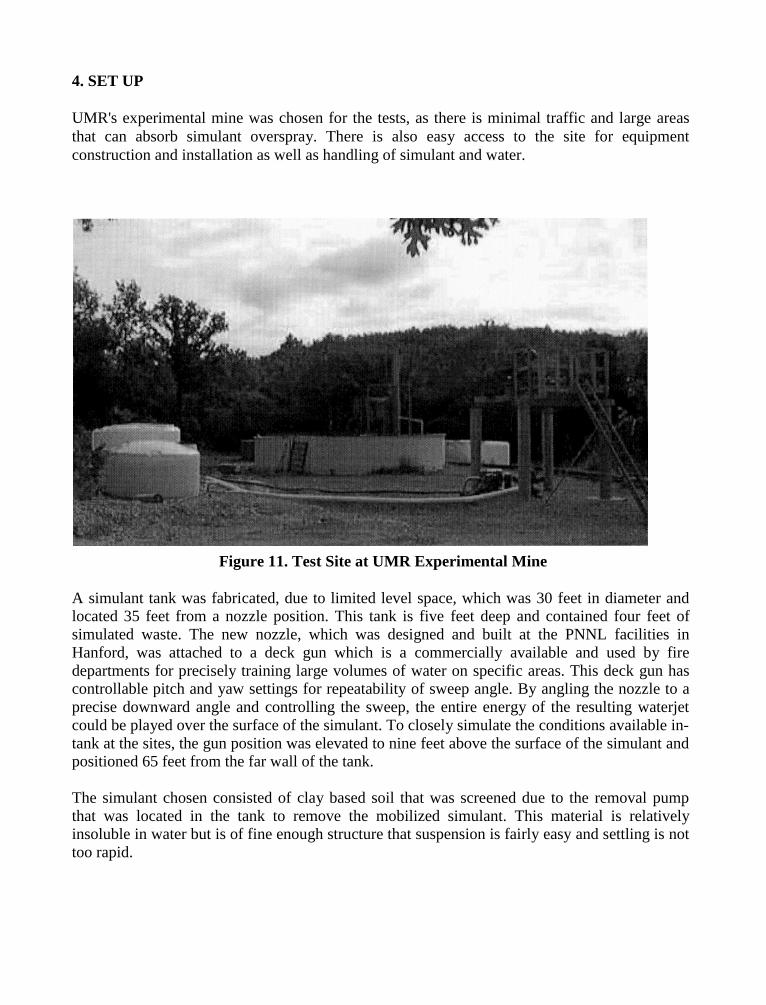
4. SET UP
UMR's experimental mine was chosen for the tests, as there is minimal traffic and large areasthat can absorb simulant overspray. There is also easy access to the site for equipmentconstruction and installation as well as handling of simulant and water.
Figure 11. Test Site at UMR Experimental Mine
A simulant tank was fabricated, due to limited level space, which was 30 feet in diameter andlocated 35 feet from a nozzle position. This tank is five feet deep and contained four feet ofsimulated waste. The new nozzle, which was designed and built at the PNNL facilities inHanford, was attached to a deck gun which is a commercially available and used by firedepartments for precisely training large volumes of water on specific areas. This deck gun hascontrollable pitch and yaw settings for repeatability of sweep angle. By angling the nozzle to aprecise downward angle and controlling the sweep, the entire energy of the resulting waterjetcould be played over the surface of the simulant. To closely simulate the conditions available in-tank at the sites, the gun position was elevated to nine feet above the surface of the simulant andpositioned 65 feet from the far wall of the tank.
The simulant chosen consisted of clay based soil that was screened due to the removal pumpthat was located in the tank to remove the mobilized simulant. This material is relativelyinsoluble in water but is of fine enough structure that suspension is fairly easy and settling is nottoo rapid.
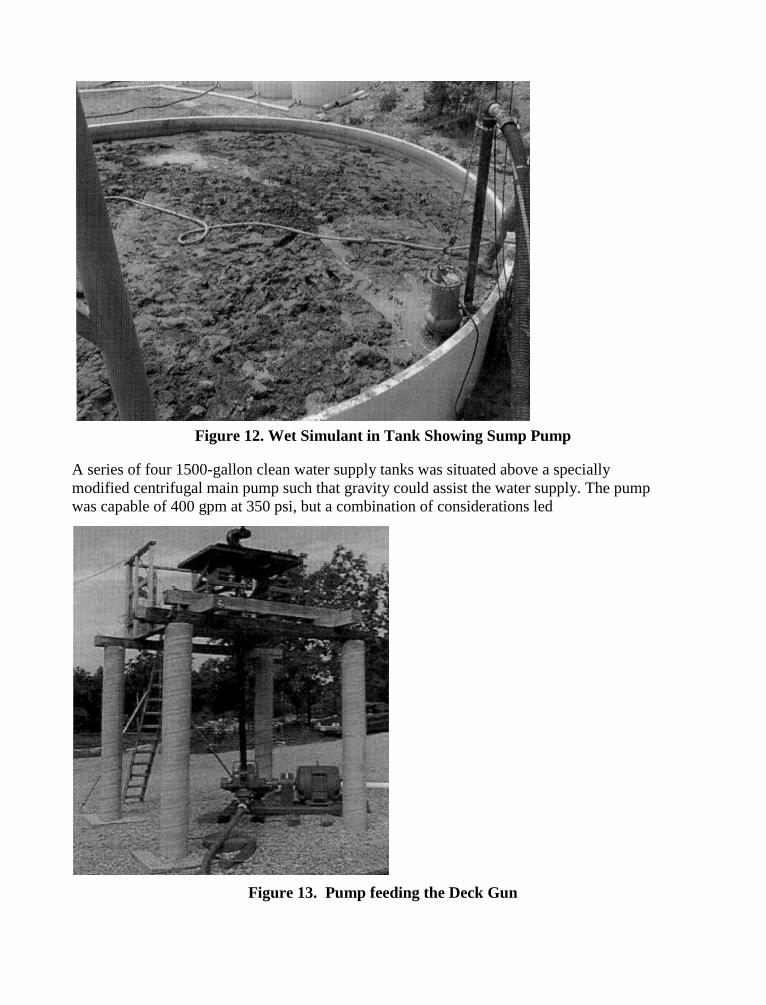
Figure 12. Wet Simulant in Tank Showing Sump Pump
A series of four 1500-gallon clean water supply tanks was situated above a speciallymodified centrifugal main pump such that gravity could assist the water supply. The pumpwas capable of 400 gpm at 350 psi, but a combination of considerations led
Figure 13. Pump feeding the Deck Gun
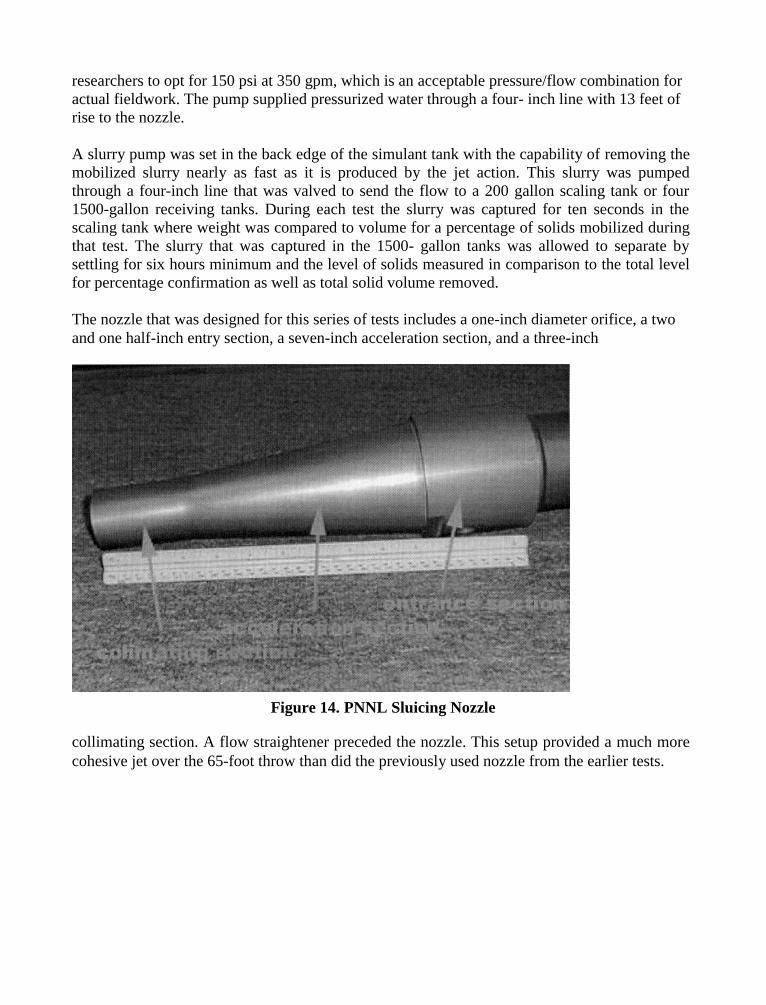
researchers to opt for 150 psi at 350 gpm, which is an acceptable pressure/flow combination foractual fieldwork. The pump supplied pressurized water through a four- inch line with 13 feet ofrise to the nozzle.
A slurry pump was set in the back edge of the simulant tank with the capability of removing themobilized slurry nearly as fast as it is produced by the jet action. This slurry was pumpedthrough a four-inch line that was valved to send the flow to a 200 gallon scaling tank or four1500-gallon receiving tanks. During each test the slurry was captured for ten seconds in thescaling tank where weight was compared to volume for a percentage of solids mobilized duringthat test. The slurry that was captured in the 1500- gallon tanks was allowed to separate bysettling for six hours minimum and the level of solids measured in comparison to the total levelfor percentage confirmation as well as total solid volume removed.
The nozzle that was designed for this series of tests includes a one-inch diameter orifice, a twoand one half-inch entry section, a seven-inch acceleration section, and a three-inch
Figure 14. PNNL Sluicing Nozzle
collimating section. A flow straightener preceded the nozzle. This setup provided a much morecohesive jet over the 65-foot throw than did the previously used nozzle from the earlier tests.
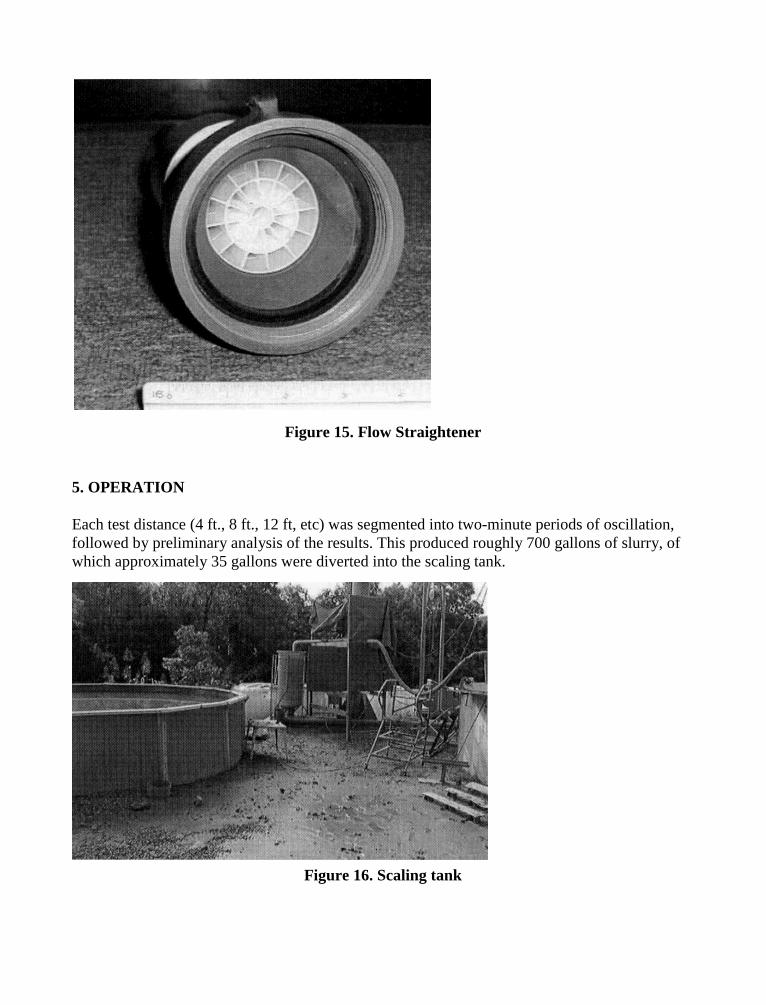
Figure 15. Flow Straightener
5. OPERATION
Each test distance (4 ft., 8 ft., 12 ft, etc) was segmented into two-minute periods of oscillation,followed by preliminary analysis of the results. This produced roughly 700 gallons of slurry, ofwhich approximately 35 gallons were diverted into the scaling tank.
Figure 16. Scaling tank
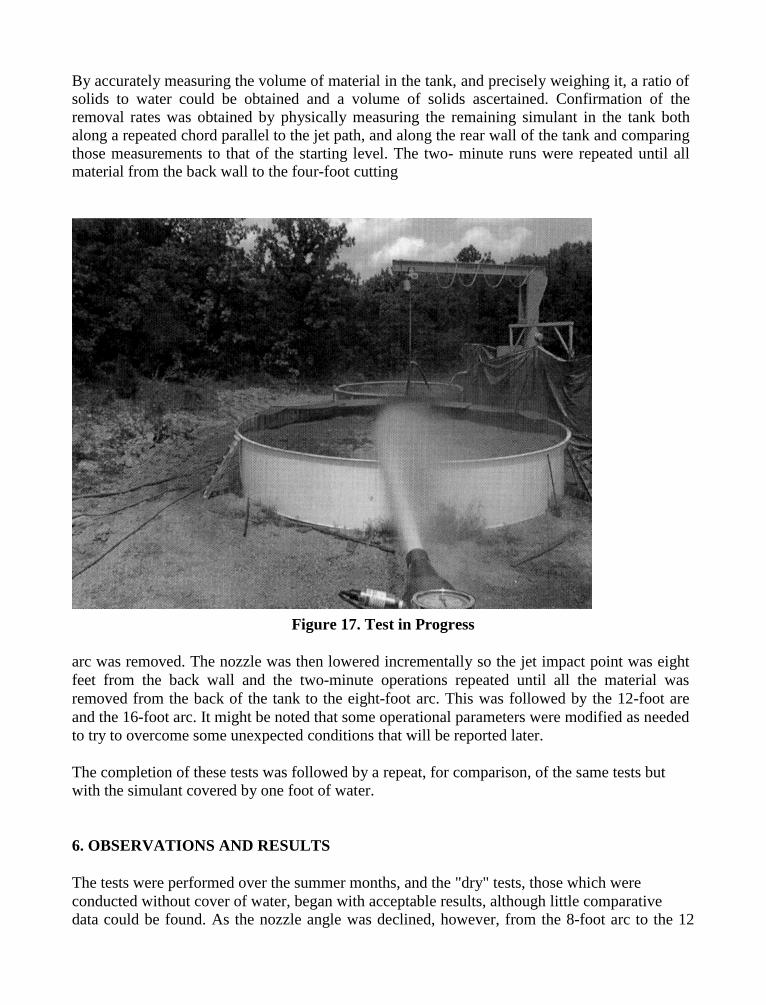
By accurately measuring the volume of material in the tank, and precisely weighing it, a ratio ofsolids to water could be obtained and a volume of solids ascertained. Confirmation of theremoval rates was obtained by physically measuring the remaining simulant in the tank bothalong a repeated chord parallel to the jet path, and along the rear wall of the tank and comparingthose measurements to that of the starting level. The two- minute runs were repeated until allmaterial from the back wall to the four-foot cutting
Figure 17. Test in Progress
arc was removed. The nozzle was then lowered incrementally so the jet impact point was eightfeet from the back wall and the two-minute operations repeated until all the material wasremoved from the back of the tank to the eight-foot arc. This was followed by the 12-foot areand the 16-foot arc. It might be noted that some operational parameters were modified as neededto try to overcome some unexpected conditions that will be reported later.
The completion of these tests was followed by a repeat, for comparison, of the same tests butwith the simulant covered by one foot of water.
6. OBSERVATIONS AND RESULTS
The tests were performed over the summer months, and the "dry" tests, those which wereconducted without cover of water, began with acceptable results, although little comparativedata could be found. As the nozzle angle was declined, however, from the 8-foot arc to the 12
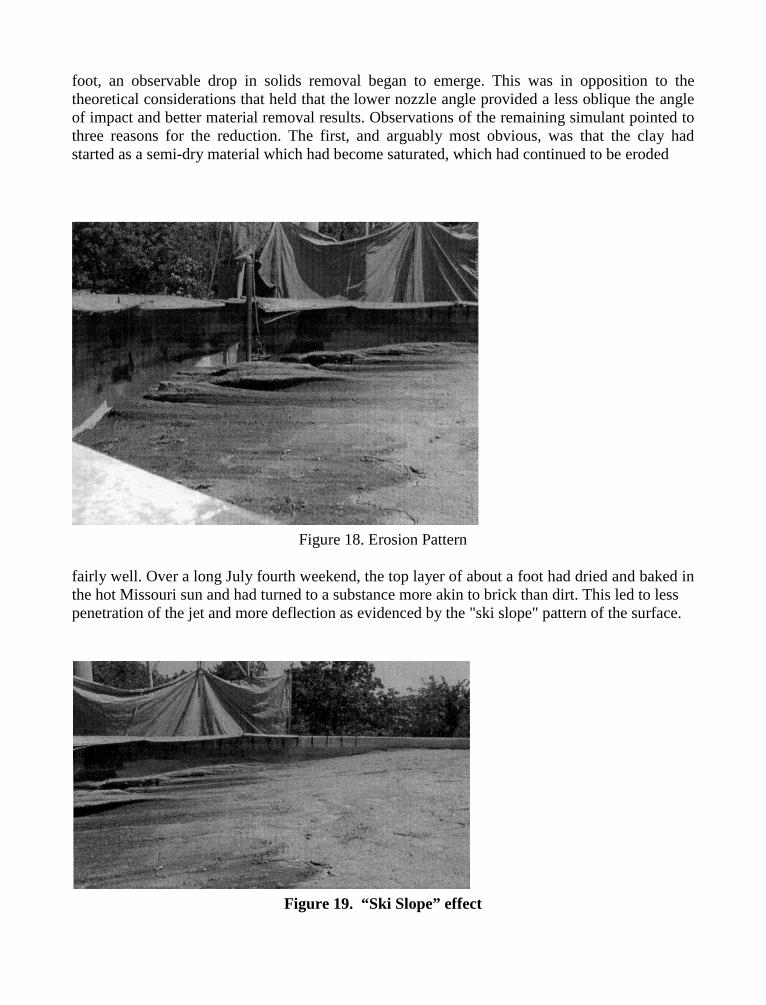
foot, an observable drop in solids removal began to emerge. This was in opposition to thetheoretical considerations that held that the lower nozzle angle provided a less oblique the angleof impact and better material removal results. Observations of the remaining simulant pointed tothree reasons for the reduction. The first, and arguably most obvious, was that the clay hadstarted as a semi-dry material which had become saturated, which had continued to be eroded
Figure 18. Erosion Pattern
fairly well. Over a long July fourth weekend, the top layer of about a foot had dried and baked inthe hot Missouri sun and had turned to a substance more akin to brick than dirt. This led to lesspenetration of the jet and more deflection as evidenced by the "ski slope" pattern of the surface.
Figure 19. “Ski Slope” effect
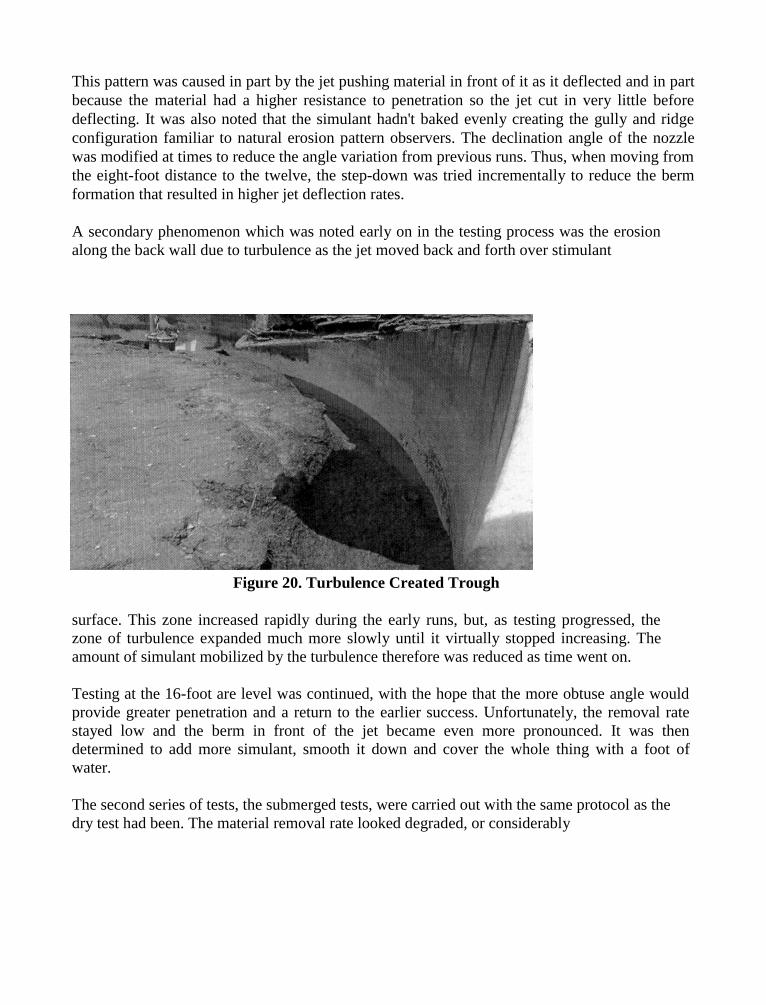
This pattern was caused in part by the jet pushing material in front of it as it deflected and in partbecause the material had a higher resistance to penetration so the jet cut in very little beforedeflecting. It was also noted that the simulant hadn't baked evenly creating the gully and ridgeconfiguration familiar to natural erosion pattern observers. The declination angle of the nozzlewas modified at times to reduce the angle variation from previous runs. Thus, when moving fromthe eight-foot distance to the twelve, the step-down was tried incrementally to reduce the bermformation that resulted in higher jet deflection rates.
A secondary phenomenon which was noted early on in the testing process was the erosionalong the back wall due to turbulence as the jet moved back and forth over stimulant
Figure 20. Turbulence Created Trough
surface. This zone increased rapidly during the early runs, but, as testing progressed, thezone of turbulence expanded much more slowly until it virtually stopped increasing. Theamount of simulant mobilized by the turbulence therefore was reduced as time went on.
Testing at the 16-foot are level was continued, with the hope that the more obtuse angle wouldprovide greater penetration and a return to the earlier success. Unfortunately, the removal ratestayed low and the berm in front of the jet became even more pronounced. It was thendetermined to add more simulant, smooth it down and cover the whole thing with a foot ofwater.
The second series of tests, the submerged tests, were carried out with the same protocol as thedry test had been. The material removal rate looked degraded, or considerably
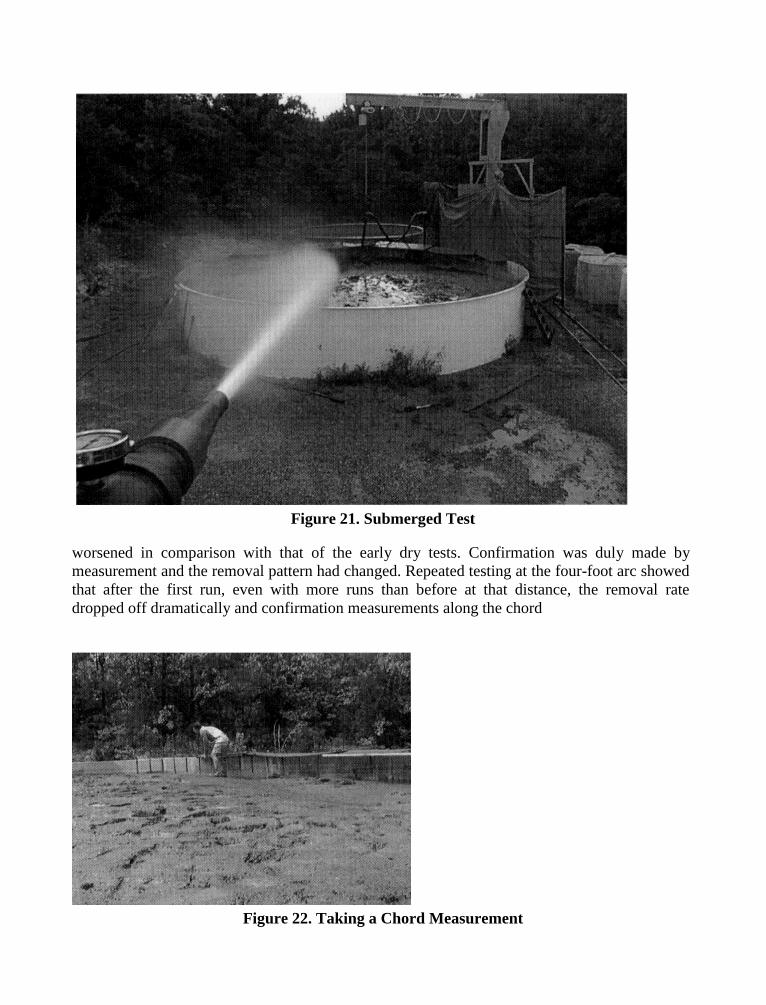
Figure 21. Submerged Test
worsened in comparison with that of the early dry tests. Confirmation was duly made bymeasurement and the removal pattern had changed. Repeated testing at the four-foot arc showedthat after the first run, even with more runs than before at that distance, the removal ratedropped off dramatically and confirmation measurements along the chord
Figure 22. Taking a Chord Measurement
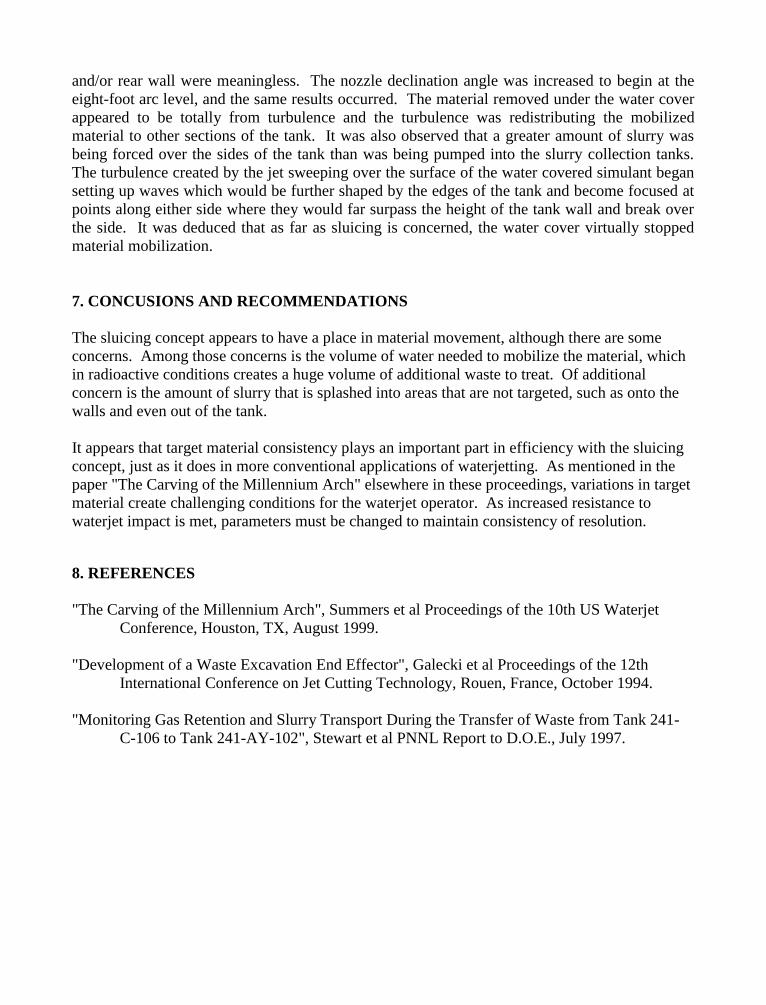
and/or rear wall were meaningless. The nozzle declination angle was increased to begin at theeight-foot arc level, and the same results occurred. The material removed under the water coverappeared to be totally from turbulence and the turbulence was redistributing the mobilizedmaterial to other sections of the tank. It was also observed that a greater amount of slurry wasbeing forced over the sides of the tank than was being pumped into the slurry collection tanks.The turbulence created by the jet sweeping over the surface of the water covered simulant begansetting up waves which would be further shaped by the edges of the tank and become focused atpoints along either side where they would far surpass the height of the tank wall and break overthe side. It was deduced that as far as sluicing is concerned, the water cover virtually stoppedmaterial mobilization.
7. CONCUSIONS AND RECOMMENDATIONS
The sluicing concept appears to have a place in material movement, although there are someconcerns. Among those concerns is the volume of water needed to mobilize the material, whichin radioactive conditions creates a huge volume of additional waste to treat. Of additionalconcern is the amount of slurry that is splashed into areas that are not targeted, such as onto thewalls and even out of the tank.
It appears that target material consistency plays an important part in efficiency with the sluicingconcept, just as it does in more conventional applications of waterjetting. As mentioned in thepaper "The Carving of the Millennium Arch" elsewhere in these proceedings, variations in targetmaterial create challenging conditions for the waterjet operator. As increased resistance towaterjet impact is met, parameters must be changed to maintain consistency of resolution.
8. REFERENCES
"The Carving of the Millennium Arch", Summers et al Proceedings of the 10th US Waterjet Conference, Houston, TX, August 1999.
"Development of a Waste Excavation End Effector", Galecki et al Proceedings of the 12th International Conference on Jet Cutting Technology, Rouen, France, October 1994.
"Monitoring Gas Retention and Slurry Transport During the Transfer of Waste from Tank 241-C-106 to Tank 241-AY-102", Stewart et al PNNL Report to D.O.E., July 1997.
10th American Waterjet ConferenceAugust 14-17, 1999: Houston, Texas
Paper 50
HIGH PRESSURE WATER DYNAMIC FRACTURE OF ROCK
Gongbo Li*Department of Mechanical Engineering & Applied Mechanics
University of Rhode IslandRhode Island
Qingshou Chen & Hengqian RanChina University of Geosciences
Beijing, P.R. China
ABSTRACT
A method and system for safe fracture of rock, concrete and other brittle solid materialsusing high pressure water is provided. Experiments in laboratory and field havedemonstrated that the system is capable of breaking rock and concrete with efficiencyand safety and its size is in small a scale.
------------------------*Current address of the first author: 4212 Fuller Hollow Rd, Vestal, NY13850, U.S.A
Organized and Sponsored by the WaterJet Technology Association
1. INTRODUCTION
The traditional way of breaking of rocks, and other brittle solid materials by explosiveblasting, while being able to fracturing the hardest of rocks at acceptable efficiencies, isenvironmentally unfriendly---the violent nature of explosive means people and machinesare withdraw from the vicinity of the rock mass when blasting operation takes place;tremendous shock wave, vibration and noise, overbreak, flying debris are obviouslydangerous.
A number of attempts have been made in the past to develop alternatives to conventionalrock breaking techniques, including hydraulic fracturing 1-3. Although 30 MPa which ismore than the tensile strength of most rock is easily obtained with conventionalhydraulic equipment, the large sizes of a hydraulic pump and power supply limitapplication of this method. Actually, a continuously static pressure provided by a pump isnot necessary. If a pressure pulse of a certain magnitude with sufficiently short rise timecould be produced in a hydraulic system by denoting a little explosive or propellant, ahigh pressure water system of quite small a scale for inducing rock fracturing would befeasible. Our work has led to the development of the hydraulic system capable ofgenerating rock fractures with ease, efficiency and safety.
The basic fuel and oxidizer ingredients of an explosive, upon detonation, are immediatelyconverted to high pressure, high temperature gases. The all hazards mentioned aboveresult from too quickly expanding gas. The use of water in blasting hole has been welldocumented by Denisart et al 4, in 1976. Who introduced the firing of steel pistons intoshallow water-filled holes, that energy in a blast could be fast redistributed with waterfilled in a hole for its less compressibility than that of air. A preliminary laboratory andfield research of us revealed that high pressure water in rock could give very efficient andsafe breakage with explosive. The object of our study was to minimize that part ofexplosive energy consumed in crushing and pulverizing the area immediately adjacent tothe borehole wall, to low initial peak pressures but average distributed pressure. The airin hole was considered a form of energy absorber, which first stored and later releasedenergy that produced noise, flying debris etc. When rock was broken. In contrast to airboreholes, a fluid of column water will efficiently transmit explosive pulse to themedium. It was this unique ability of water to change that hazards part of explosiveenergy into rock fragmentation.
In this paper, a method and apparatus for safe fracture of rock, concrete and other brittlesolid materials using high pressure water is provided. The apparatus comprises a firingchamber with a propellant cartridge and a reusable water seal assembly including a nut, aweal gum, wedges etc.. In the desired separation plane of rock mass, a moderately highpre-tensile stress zone is firstly established by sealing high pressure water in a row ofholes. A little explosive or other firearm ammunition in the firing chamber is ignited, theimpact pulses create a high water pressure in the boreholes sufficient to fracture rockwithout overbreak, which just causing the rock splitting. This method and apparatus maybe applied in construction, tunnel excavation, quarry mining, demolition of reinforcedconcrete foundations and so on.
2. EXPERIMENTAL PROCEDURES
The research program to develop and evaluate potential applications of high pressurewater dynamic fracture technique was primarily an experimental program, with testingconducted on two steps. Experiments first were designed to provide the data of stressdistribution along borehole. Experimental were conducted in homogeneous blacks ofrock or concrete in an explosive testing laboratory. Secondly, experiments on a fieldscale, comparable to the that which might be utilized in a commercial trending machine,were conducted in a quarry.
2.1 Laboratory Tests
To generate this water pressure pulse a small shock tube driven by explosive was built.Fig. 1 shows the overall design. The output of the setup is water pressure pulse that canbe measured in amplitude and duration by using strain gages bonded on the surface ofsteel tube. The amount of explosive driver is 10 g. Some material properties for graniteused in the tests are as follows: density 2.7G/cm3, compressive strength 300 MPa,modulus 6.9 GPa. The rock models were about 450*450*450mm. The concrete modelswas cylinder with 600mm in diameter and 450mm high. A 40mm diameter borehole wasdrilled in the center of block, normally to a depth of 50mm. The water was full of thetube. When the charge is detonated from one end of tube it will drive a water pulse.Table 1 gives a summary of the results obtained in this series of tests and figure 2 shownsome fracture patterns. A time history of a strain in typical point of steel tube wasdepicted in Fig.3. The noise present in the recording is due to sensitive to theaccelerations set up by water pressure pulse in the steel tube generated by the explosive.Based on the data measured from strain gages, the pulse wave velocity can be calculatedas V =distance between two strain gages / difference of arrival time for pulse
So v is 1126 m/s in average. The velocity decreases slightly along the steel tube from 1176 m/s to 1052m/s(see table 1). Fig.4 shows the water pressure perpendicular to the direction of pulse propagation. Formeasurement locations (1) and (2), the pressure is almost same during the initial compressive pulse.The pressure then begins to drop at the location (3) for absorption energy of water. There is somewhatincrease after location (3), due mostly to release of water expanding energy.
2.2 Experimental quarrying tests
All of the field-scale tests were carried out in the quarry located in suburb of Beijing.With the excellent improvement in rock breakage realized in the laboratory tests, a patentapparatus for safe fracture of rock was designed and manufactured (as shown in Fig. 5,6).A small drilling machine was employed to drill boreholes. Some apparatus with a loadedcartridge containing 8 g explosive were housed in the holes. And then locked in place byturning the nut with a wrench until the apparatus were secure. Water was filled into holes.Finally, ignition of explosive within the sealed hole created great water pressure resultingin the fracture of rock (see Fig.6).
This initial feasibility research revealed four significant features of high pressure waterdynamic fracture:
1. able to control the fracturing direction;2. non tremendous shock waves and noise;3. good fracturing capability with safety;4. size of system is of small a scale and economic, commercial.
3. CONCLUSION
Laboratory experiments have confirmed that more than 30 MPa water pressure can beinduced in a borehole with 10 g explosive, which is high enough to fragment rockmodels. Field applications of the hydraulic system have shown that the efficiency andsafety of rock fragmentation. In both testing, sealing water is important to obtainoptimum results. The system is established to meet commercial requirements for goodperformance in a broad variety of rock type and condition.
4. REFERENCES
1. Noma T., Murayama H., Kadota S., Ueda S., (1991):Development of Static-fracturingMethod of Rock Mass and Concrete Using Hydraulic Pressure, Proc. Japan Soc. Civ. Engrs, No.427, pp.203-211
2. Kolle J. J. & Fort J. A., (1988): Application of Dynamic Rock Fracture Mechanics to Non-explosive Excavation, Proceedings of the 29th U.S. Symposium on Rock Mechanics. pp.571-578
3. Gongbo L., Guodong J. & Xiaohe X., (1991): Theoretical Analysis on New Abrasive-water jet system, Proceedings of the Second International Conference on Measurement and Control of Granular Materials, Chengde, China, pp.283-287
4. Denisart at al, (1967): U.S. Patent, No. US3988037
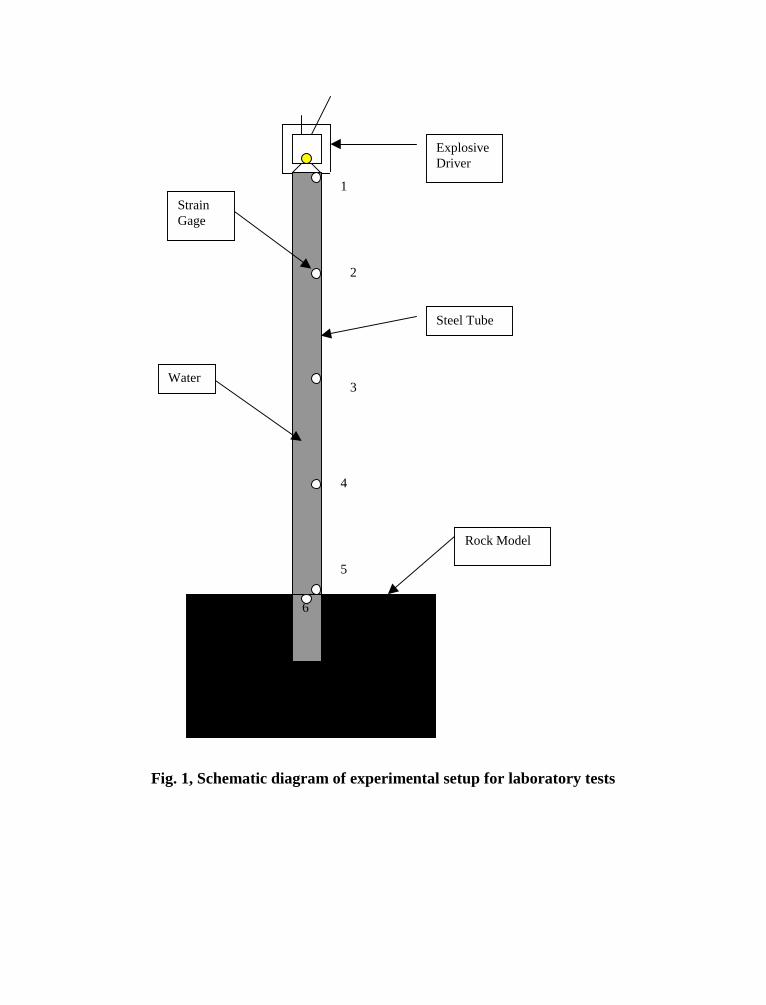
Fig. 1, Schematic diagram of experimental setup for laboratory tests
6
1
2
3
4
5
ExplosiveDriver
Steel Tube
Rock Model
Water
StrainGage
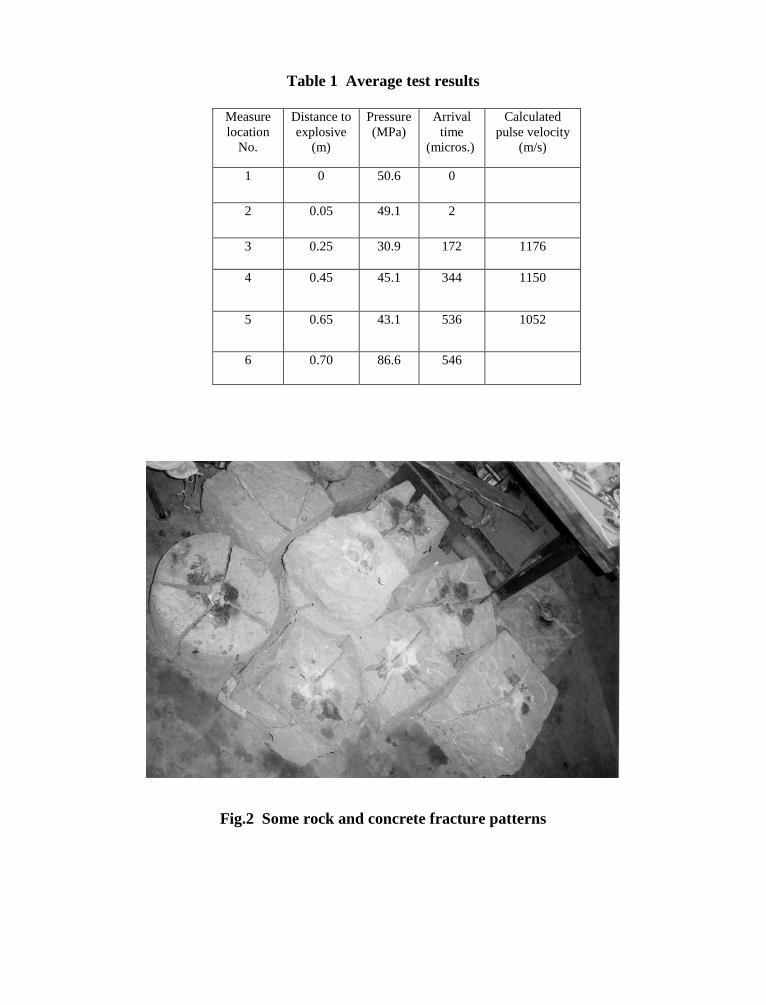
Table 1 Average test results
Measurelocation
No.
Distance toexplosive
(m)
Pressure(MPa)
Arrivaltime
(micros.)
Calculatedpulse velocity
(m/s)
1 0 50.6 0
2 0.05 49.1 2
3 0.25 30.9 172 1176
4 0.45 45.1 344 1150
5 0.65 43.1 536 1052
6 0.70 86.6 546
Fig.2 Some rock and concrete fracture patterns
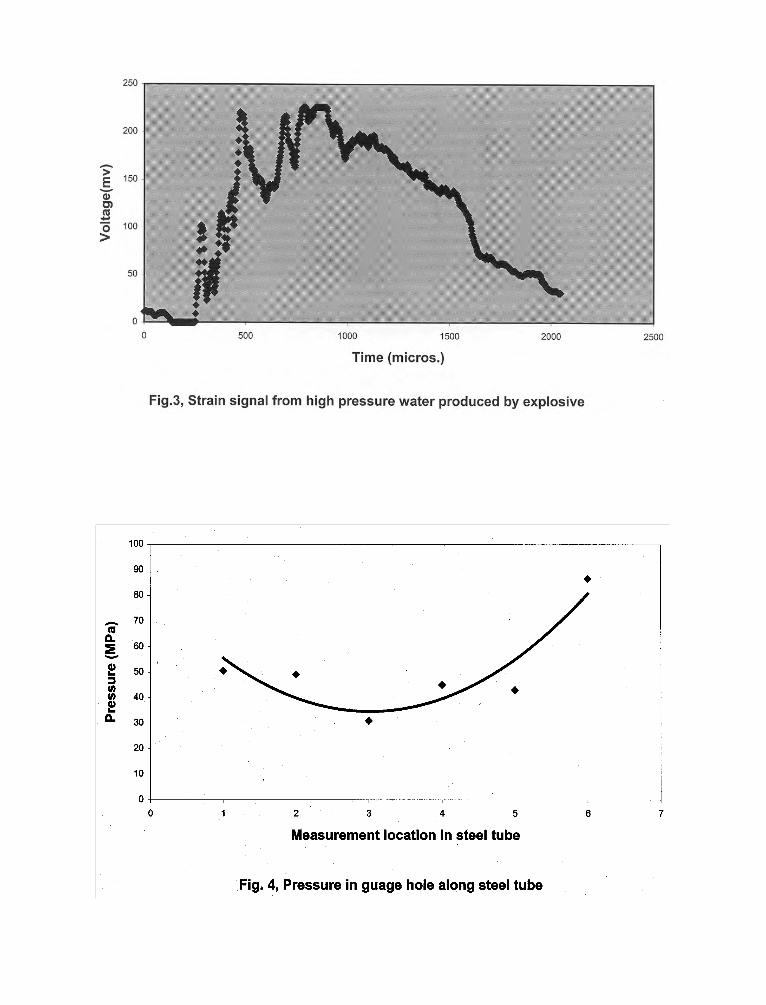
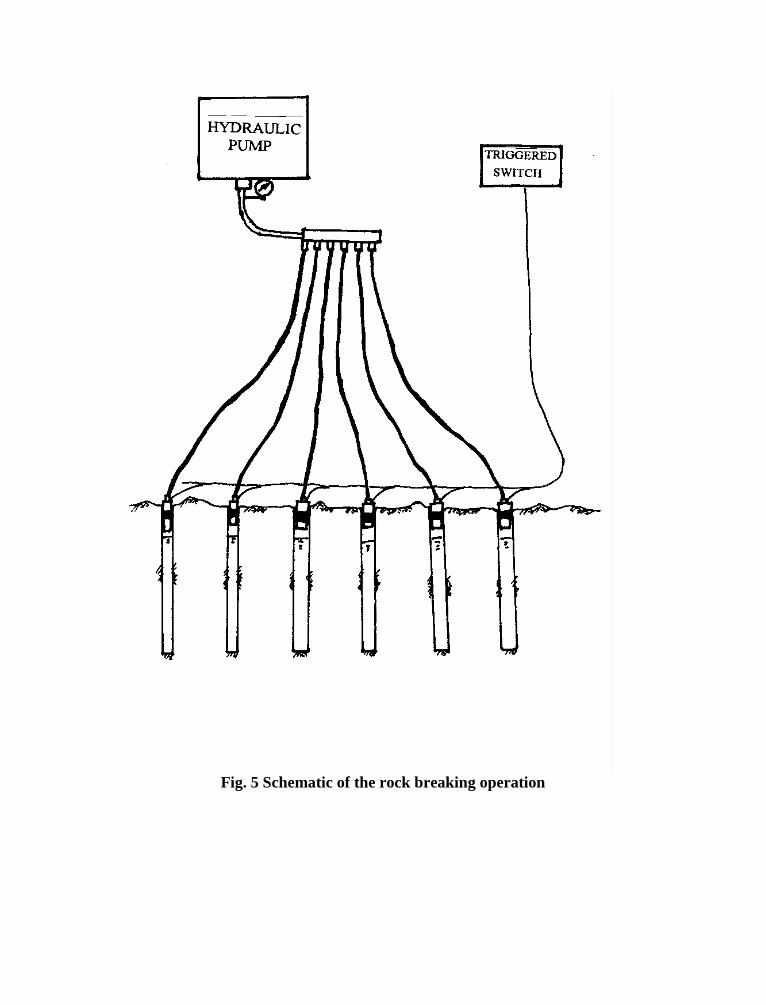
Fig. 5 Schematic of the rock breaking operation
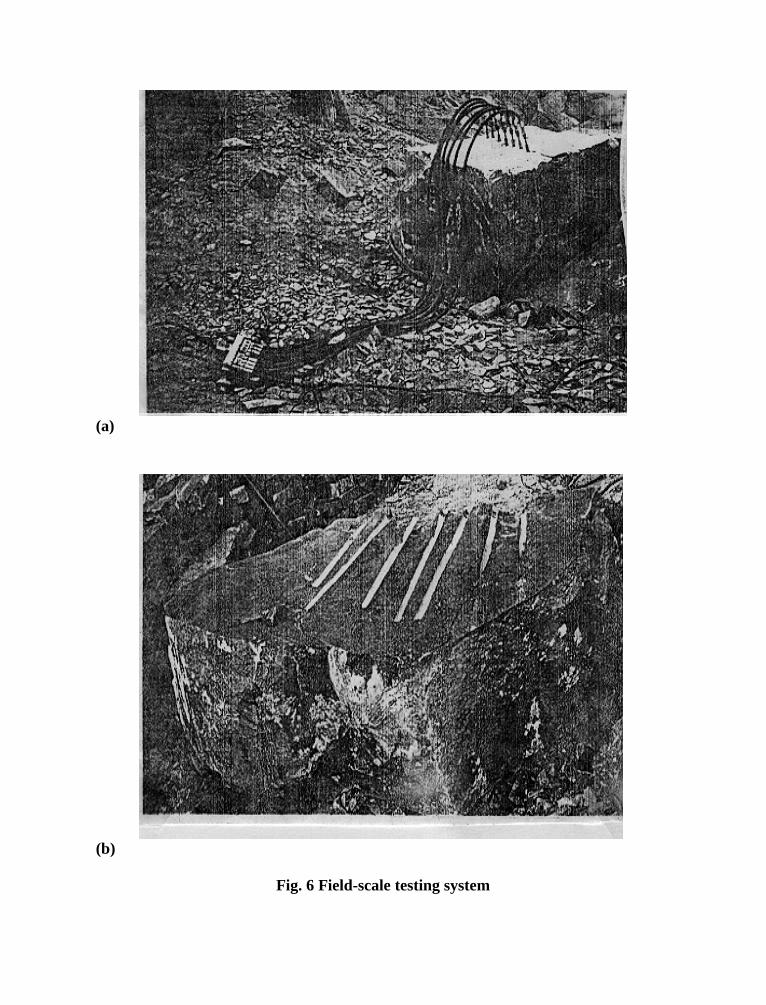
(a)
(b)
Fig. 6 Field-scale testing system
10th American Waterjet ConferenceAugust 14-17, 1999: Houston, Texas
Paper 51
A COMPARISON OF SURFACE PREPARATION FOR COATINGS BY
WATER JETTING AND ABRASIVE BLASTING
Lydia M. Frenzel, Ph.D.Advisory Council
San Marcos, Texas, U.S.A.
ABSTRACT
Water Jetting, with and without abrasive addition, continues to impact the maintenance industryand displace some of the traditional areas of dry abrasive blasting. This presentation focuses onthe similarities and differences in the visual reference photographs which are used in the globalindustry.
Keywords: waterjetting, surface preparation, hydroblasting, standards, water blasting, standards,metal, standards, specification, NACE, SSPC, ISO, paint.
Organized and Sponsored by the WaterJet Technology Association
1. INTRODUCTION AND BACKGROUND
Since 1985, the continued improvement in nozzles, seals, and pumps make it possible for reliableremoval of coatings and rust. Water jetting and wet abrasive blasting methods have gone from arare oddity to acceptance by the marine industry and becoming the preferred process for removalof lead based paint or asbestos. The Technology Publishing Company's (TPC) annual survey ofpainting contractors indicates that fifty percent (50%) of the identified painting contractors usesome type of high pressure or ultra-high pressure waterjetting or wet abrasive process. Oneindividual contracting firm says they have cleaned over 20 million square feet of surface.Coatings manufacturers, notably International Paint Co. (Akzo Nobel), Hempel's Paints, andJotun have produced videos, technical product literature, and visual reference photographs totrain their technical representatives and clients. Ameron, Bridge-Cote of Canada, Devoe, Euro-Navy, Sigma, W&J Leigh & Co., Watson Coatings, and Wasser Hi-Tech Coatings are additionalcoating manufacturing companies who actively embrace the use of water in surface preparation.
Organizations such as SSPC ( Society for Protective Coatings), NACE Int. ( NationalAssociation of Corrosion Engineers), and ISO ( International Standards Organization) providethe grounds for consensus documents, that is, documents which are defined as a “generalagreement” or a “majority of opinion.” Consensus recommended practices and technologyupdates provide a Common Language to describe problems. Every industry tends to define thesame problems in different terms. Adopting consensus language saves time and money.Environmental concerns are driving movement to include water. Water Jetting and WetAbrasive Blast Cleaning are displacing traditional abrasive blasting in certain areas. Adversarialpoints of views exist within the coatings industry. It took ten years to build a consensus andissue the first standard on the use of high pressure waterjetting jointly by NACE and SSPC in1995.3 NACE and SSPC have issued two other documents since that time.2,11 In 1998, ISO alsostarted work on a separate water jetting standard as they did not know the extent of the Americanactivities.
Over the years, European and American philosophies drifted apart in the adoption of consensuslanguage for abrasive blasted cleaned steel. In simplistic terms, the Americans use standardslanguage allowing a percentage coverage of stains, while the Europeans use a criteria of tightlyadherent material. The visual reference photographs for abrasive blast cleaning showedexamples of rusted steel, but not removal of coatings. Projects involving removal of coatings forrepainting often call for leaving sound, adherent coatings on the substrate, not removing all of itto leave slight stains. These pictures don't exist as consensus photographs. The development ofphotos for high pressure water jetting is bringing the European and American workingphilosophies together as we consider the maintenance practices on a global basis.
In the fall of 1998, Dr. Frenzel drafted a letter which was sent to ISO over Ken Tator's, as thedesignated U.S. country expert to ISO TC 35 SC 12, signature with full support of SSPC andNACE organizations.
" Dr. Lydia Frenzel, chair of the NACE and SSPC Joint Task Groups on water jetting and wetabrasive blast cleaning (TG D and TG I), and I would like to establish communication on aregular basis between the ISO working groups on surface preparation concerning water jetting
and the Joint Task Groups in a mutually beneficial manner. Dr. Frenzel and I meet on a regularbasis. We are concerned that the ISO groups may not fully aware of standards activities in theNorth America and wish to avoid conflict between working groups. We hope there will becommonality in standards development between the North American and the Europeancommunities. .........
We recognize that an independent set of photographs should be prepared so that coatingsmanufacturers do not have to refer customers to material originally prepared by a competitor.The U.S. National Shipbuilding Research Program funded the preparation of a set ofphotographs of surfaces prepared by water jetting specifically for standards preparation. Thesenew photographs have been released to SSPC and NACE for preparation of visual referencephotographs. ........
.....[we] hope that we can work together and provide a commonality to the water jetting and wetabrasive efforts."
Following this letter, ISO had a representative to the SSPC/NACE Task Group meeting inNovember, 1998, and members of the NACE/SSPC Task Group and the SSPC ExecutiveDirector, Dr. Bernard Appleman, met informally with ISO Working Group 2 on Water Jetting inMarch, 1999. Documents and working photos were exchanged. We opened communicationsand are currently working on development of new visual reference photographs for the WaterJetting of substrates, in particular steel, with the Europeans. This is vitally necessary as coatingssuppliers and contractors work globally.
The majority of the slides used in this presentation are proprietary to individual companies or areactual slides of the draft photos under consideration by the standards groups. As such, they arenot reproduced in this paper.
2. DEFINITIONS USED BY COATINGS INDUSTRY
The paper will be using definitions from SSPC and NACE technical reports and standards whichare closely aligned with the WJTA Recommended Practices for the Use of Manually OperatedHigh Pressure Water Jetting Equipment.1,2,3 The SSPC and NACE documents are used by thecoatings professionals. In these documents, the distinction is made that blast cleaning or blastinginvolves the use of solid abrasives whereas water cleaning or water jetting is the use of wateralone without abrasives. "Water Blasting" is such a generic and wide-spread term that it hasn'tbeen defined in the consensus process.
Wet Abrasive Blast Cleaning (WAB) covers procedures, equipment, and materials involved in avariety of air/water/abrasive, water/abrasive, and water-pressurized abrasive blast cleaningsystems. Air/water/abrasive blasting is the specific cleaning method in which water is injectedinto the air/abrasive stream generated by conventional air-pressurized abrasive blastingequipment. Water/abrasive blasting is a cleaning method in which abrasive is injected into thewater stream generated by conventional fluid pumps.
Other generic terms to describe specific air/water/abrasive blast cleaning methods are: WaterShroud or Wet-Head blasting, wet blasting, low volume water abrasive blasting, and slurryblasting. Other generic terms to describe specific water/abrasive blast cleaning methods are:slurry blasting, abrasive water jet (AWJ), or abrasive injected water jetting/blasting (AIWJ).
High Pressure Water Jetting (HP WJ) is cleaning performed at pressures from 70 to 216 MPa(10,000 to 30,000 psi). Ultrahigh Pressure Water Jetting (UHP WJ): cleaning performed atpressures above 216 MPa (,000 psi). Low Pressure Water Cleaning (LP WC) is cleaningperformed at pressures less than 34 MPa (5,000 psi) High Pressure Water Cleaning (HP WC) iscleaning performed at pressures from 34 to 70 MPa (5,000 to 10,000 psi).
The terms hydroblasting, hydrojetting, water blasting, and water jetting describe the process inwhich pressurized water is directed through a nozzle to impact a surface. However, it is notedthat the terms hydroblasting or water blasting is used generically to describe cleaning methodsthat range from low pressure water cleaning to ultrahigh pressure water jetting.
In the coatings industry, water jetting does not provide the primary anchor pattern. The use ofwater alone is primarily for recoating or relining projects for which there is an adequate,preexisting profile. Abrasive and water combinations can be used on older substrates or newprojects to establish a new profile or anchor pattern.
3. COATINGS FAILURES AND SURFACE PREPARATION
In the world of corrosion control and painting, it should be obvious to everyone that the job is toget the surface clean enough to accept the paint system. This process is called surfacepreparation. Surface Preparation is- creating the situation so that the coatings will performas expected. Remarks in this paper will be limited to processing metal substrates rather thanwood, concrete, or plastic and will not include chemical processes such as etching orphosphating.
If you don’t produce a clean surface so that the paint will adhere, the world will move elsewhere.DO a GOOD JOB, the world will beat a path to your door. Expectations for the quality ofsurface preparation in coatings have escalated in the past few years. Change increasesexponentially. This is the trend of the future. Preparing for change is preparing for the future.Using water in surface preparation, with and without abrasive, is part of the future. Think of thefuture of your business. If you adapt what you see and hear to your particular needs, you will bepart of the future.
It is frequently said that ninety percent (90%) of all coatings failures are the fault of the surfacepreparation. It is also said that "seventy-five percent (75%) of all coating failures are the fault ofthe contractor." There are many factors that influence the performance or lifetime of a coatingsystem in addition to the surface preparation, such as formulation, application, and serviceconditions. Lou Vincent examined failure modes of protective coatings in a presentation toSSPC in November, 1998 and identified twenty-two types.4 Three of those twenty-two failuremodes are directly related to surface preparation- adhesion loss, blisters, and delamination.
Those three failure modes accounted for 58% of the failures in 55 field case occurrences and46% of the failures in 101 literature articles occurrences. While this is not the 75-90% generallycited, adhesion loss, blisters, and delamination are clearly the primary failure modes. The other40-50% of the failures are spread between nineteen different types of failures.
The use of water in maintenance applications, not new steel construction, can have a verypositive increase of the adhesion of the coatings and can reduce the chance for blisters anddelamination. This positive benefit is why the use of water is the future evolution of surfacepreparation.
4. THREE ELEMENTS FOR A SUCCESSFUL PROJECT
People are driven to include water by environmental, safety, and economic considerations. Theyare not embracing water for the benefit of enhanced performance. To make water work in aproject, you have to understand that THREE viewpoints must converge in bid specifications andthey must all be represented in the negotiations and planning of a project.
The viewpoints of the owner/operator contractor and coatings manufacturermust all come together.
This may seem obvious but it is an often neglected principle. The guarantee for a good job isforced on the coatings manufacturer and contractor. The contractor may be prevented fromusing wet abrasive blasting (WAB)2 or water jetting (WJ)3 even though the coatingsmanufacturer and contractor both agree that WAB or WJ may be preferable to clean a surface ifthe client or owner only has knowledge or training in dry abrasive blast cleaning. Why?-because "the customer (in this case, the owner) is always right." If the customer only hasexperience in dry abrasive blasting, then the contractor and coating manufacturers workingtogether must overcome steep opposition and provide education.
People in the coatings and maintenance industry are afraid of change. There is a lot of resistancetowards change. It is easy to understand. Mistakes come back to haunt us. As an industry, weare to be blamed for slow acceptance-because we don’t talk to each other. Everybody isjealously guarding their secrets. If an engineer learns something that will give him lowermaintenance costs or an edge on the competition, he doesn't like to share that secret. The goal ofzero defects on every job is a slow, ongoing process. This presentation is part of education.Education is the key to understanding.
5. THREE COMPONENTS OF SURFACE PREPARATION
Surface Preparation- creating the situation so that the coatings will perform as expected.
There are three components to Surface Preparation - All are necessary even though the emphasisin the past has been only on visible cleanliness and anchor profile.
Visible Cleanliness Anchor Profile Invisible Contaminants
Everyone in the coating industry is trained on the visible requirements from day one. Thecoatings manufacturers control the anchor profile requirements. The third component, InvisibleContaminants, is one component that people are still unaware of even after at least fifteen yearsof education. All three components are all equally important. While all three are necessary forgood coatings performance, it is the last component, the invisible contaminants, that demandswater and which requires reform.
The addition of water in surface preparation evolution is occurring because coatingsmanufacturers have recognized the secret and success of water in dealing with invisible salts.The coatings manufacturers have really understood that water is the "True Grit of the 21stCentury." The coatings manufacturers have come forward with videos, pictures, and haverewritten their specifications so that surfaces can be cleaned with dry abrasive blasting and/orvarious water/abrasive methods.
One major obstacle of the acceptance of water in surface preparation is the appearance. Anothermajor obstacle is the formation of flash rust. Part of the maintenance industry will never acceptthe appearance of the surface when water is used in surface.
5.1 Anchor Profile
5.1.1 New Metal
First how does one create the profile on a new piece of metal? The profile or anchor pattern isspecified by the coating manufacturer. In simplistic terms, the profile of the substrate isgenerally considered to be the dominant factor in coating adhesion.
Water Jetting by itself is generally not used to create the initial profile even though creating asurface profile can be accomplished with water jetting alone on small objects with carefulcontrols. 5,6 Automated equipment must be used to control the depth, transverse rate, and stand-off distance. The process is too slow for large pieces. However, when the profile is produced bywater alone, the adhesion is greatly enhanced.5
The major surface profile on a metal substrate is defined by the abrasive and is typically formedby a dry, abrasive blast technique. Because of environmental restraints on visible dust, WetAbrasive Blasting (WAB) is finding a market in new steel construction. WAB covers techniqueswhich range from mostly abrasive, mixed with a little water to suppress the dust, to mostly waterwith a little abrasive. The pressure range of the water flow can be anywhere from 50 psi to40,000 psi.
The anchor profile, or pattern, on the substrate is specified by the coatings manufacturer to adepth, such as 0.002-0.003 inches (50-75 microns). Rounded particles such as steel shot give arounded, crater-like appearance where the width of the depression is greater than the depth. It isthought that hardened sharp angular abrasives tend to cut into the metal, leaving sharp edges,creating hackles (small slivers of steel standing perpendicular to the surface). Particles movingfaster will make a deeper indentation compared to the same particle moving slower.
An analogy is throwing a baseball at a mud flat. Throw a large softball relatively slow and youwill make a rounded impression with a lip. Throw a small hard ball relatively fast and you willmake a deeper rounded impression. Throw a sharpened pyramid at an angle, and you will createa ridge. Some of the mud will splatter off, but most of the mud gets shifted to the new profile.
Abrasives do not necessarily remove the metal because metal is malleable, but you are creatinga macroscopic pattern. This pattern may or may not remove existing corrosion cells.7 Thisinitial profile provides the cleaned nib to which the paint adheres.
5.1.2 Old Metal
There are many situations where abrasives are needed when older surfaces are being blasted.Abrasives are used in tight corners and for the back side of plates where the particles can berebound or ricochet. In marine areas, there is frequently a very tightly adherent black layer ofrust which is resistant to removal by water jetting alone. Addition of a little abrasive into thewater stream will speed the production rate and help break this brittle layer. Abrasives can beused to ricochet on all sides of a small compartment whereas it may be difficult to direct a jetstream of water towards all the surfaces.
Abrasives change the existing profile. Abrasives erodes or abrades the surface from the top. AUS Standard 100 mesh screen has openings for 125 micron particles. When the contractor iscleaning with 125 micron particles, contaminants which are in cracks or crevices or pits simplycannot be reached or removed. Crevices become filled with spent abrasive when a contractor istrying to remove pack rust between plates. Subsequently the paint gets applied over "clean"abrasive and fails prematurely. If there are invisible contaminants on the surface, abrasiveblasting can drive the contaminants into the surface or form a pocket of metal in which thecontaminant is buried.
Waterjetting can be described as a series of small droplets in the 5-10 micron range hitting thesurface at supersonic speeds. The droplets implode (cavitate) and drill through coatings or rust;then spread laterally and shear at the interface, much like ultrasonic cleaning, to lift materials. Aseries of microscopic “pock marks” form on the macro surface. The craters and pits get "deepcleaning."
The measured profile in gross terms, for example 0.002inch (50 microns), is still the same for asurface cleaned by abrasive and by water jetting, but the microscopic details are different. Theamount of surface area per square unit area is increased for the WJ cleaned surface. Figure 1 and2.
Abrasive blasting changes the surface from the top down; water cleans the surface fromthe bottom of the pits up. These two different types of actions lead to two distinct visualappearances. Waterjetting cleans the existing profile and opens it. Abrasive blastingignores the pits and cracks. There is a synergistic effect in using abrasives and waterbecause you can get the advantage of both processes.
In a direct comparison of UHP WJ with abrasive blasting, Materials Evaluation Laboratoriesconcluded “The pressurized water method was considered the best preparatory cleaning for non-destructive inspection. It offered a more authentic representation of the surface than the othermethods evaluated….Pressured water had minimal disturbance of micro-structural features. ”8
In a direct comparison of water blasting at 10,000 psi versus abrasive blasting for penstockrelining,9 Tom Aldinger reported that water blasting would give as good or better adhesion thanabrasive blast to SSPC SP10 (near-white) on 60 year-old pen stock. Water blasting produced aclean surface without rust and loose paint residues. Atlas Cell testing in deionized water at 140Deg. F was then used to compare immersion service performance for coatings on the water blastand abrasive blast surfaces. At the end of the Atlas Cell test, the investigators found a thin film ofwater and black rust under both the urethane and epoxy coatings on the abrasive blast surfacewith complete adhesion failure in the immersion zone. The water blast surface had coatingadhesion 3 times greater compared to the coating on the abrasive blast surface. Any substratecorrosion on the water blast surface was local without any underfilm spreading. Underfilmcorrosion has also been noted in cases where salt was deliberately added to the surface eventhough the paint was applied before any rust was present.10
“Adhesion begins at the bottom of the pits” said James Denny, Vice-President of InternationalCoatings at Corrosion96. Water Jetting cleans the bottom of the pits. It is the experience ofInternational Coatings and the marine industry that coatings adhere better and last longer onsurfaces which have been cleaned by Water Jetting. Coatings manufacturers understand thatwhen you use water for cleaning a profile you get better adhesion sometimes as much as twofold. Van Kuiken's patent illustrates this point. The micro profile is fractal for waterjetting. Lossof adhesion as a failure mode disappears.
5.2 Invisible Contaminants
Invisible contaminants such as oil and grease generally lead to delamination as a coating failure.Delamination also can be caused by a minimal substrate profile. Invisible contaminants such assalts, chemicals, or water soluble substances lead to osmotic blistering as a coating failure mode.The removal of the invisible contaminants leads to longer performance by the coating system.The ability to remove chemical contaminants (salts), particularly from badly pitted and corrodedsteel, is a major advantage of the water jetting process.11,12
WJ and WAB do such a good job of removing invisible contaminants from the surface, even ifintact coatings are left on, that blisters from chemical contaminants and delamination from oiland grease disappear.
5.3 Visible Appearance
If WJ and WAB are so good at surface preparation, why is there a resistance for its adoption?Surfaces cleaned by water alone do not look like surfaces modeled by abrasives. Flash rusting ona steel surface can occur very quickly as a result of the very fine, sharp edges. Most of theresistance is based on the visible appearance.
Contractors, inspectors, and coatings personnel use the SSPC/NACE and ISO written standardsand visual reference photographs for training and acceptance on jobs.
The written standards include:NACE NO. 5- SSPC SP-12 for water jettingSSPC SP-5 for abrasive blastingSSPC SP-10 for abrasive blastingSSPC SP-6 for abrasive blastingSSPC SP-7 for abrasive blasting
Visual reference Photographs include:Dry Methods
ISO 8501-1 for dry abrasive, hand-tool or power-tool cleaning, flame cleaningSSPC VIS-1 for dry abrasive blast cleaningSSPC VIS-3 for hand and power tool cleaning- This shows removal of coatings.
Wet MethodsInternational Paint For Water Jetting issued in 1994International Paint for Slurry Blasting (Wet Abrasive Blast cleaning)Hempel's Photo Reference for Steel Surfaces cleaned by Water JettingJotun Photo Reference for examples of flash rustingSchiffbautechnisch Gesellschaft No. 2222 Guide for water jettingSSPC- VIS 4 (I) NACE No. 7 Interim Guide and Visual Reference Photographs for SteelCleaned by Water Jetting- issued in 1998
Even though the visible references are for supplemental purposes in the US, in practicality,people use them as a primary standard. SSPC VIS-1 and ISO 8501-1 are the two visualreference photographs series used in training. They depict dry abrasive cleaned steel which havenot been painted. Emphasis is on uniformity. Inspectors and owners are just beginning to use theVIS-4 (I) Reference Photographs for Water Jetting ( which is the same set of photos asInternational Paint Water Jetting Standards. These also only depict unpainted steel.
As we go through the standards, keep in mind that visual reference photographs are designed tobe illustrative of the situation. Direct correlation to existing dry media blasting standards isinaccurate or inappropriate when describing the capabilities of waterjetting and the resultachieved with waterjetting as a process.
Abrasives hit from the top, erode the surface, provide plastic flow to the metals, tend to make thesurface look uniform and “erase” different areas. There is a tendency to drive existing
contaminants into the surface. Observers with an experienced eye tend to neglect the pits. Theytend to look at the top surface.
WJ stresses the adhesion between two materials. WJ retains the metallic surface profile, tendsto clean the pits first and leave material at the top peaks, and accentuate the non-uniformity of asurface. The experienced observer sees black stains on the top where heavy rust was present, orcoatings on the top of the surface- rather than stains in the bottom of the pits so the observer seesomething which is a new experience even though the pits are cleaned.
The visual photographs SSPC VIS-1 and ISO 8501 only depict the situations of rusted steel.Water jetting is used primarily in removal of coatings, where frequently the objective is to retainas much tightly adherent coating as possible. There was a need to address the question ofmaintenance in visual reference photographs.
The following phrase exists in all the written standards. “Acceptable variations in appearancethat do not affect surface cleanliness include variations caused by type of steel, original surfacecondition, thickness of the steel, weld metal, mill or fabrication marks, heat treating, heataffected zones, blasting abrasive, and difference in the blast pattern.” Figures 3 and 4 illustrateWJ-1 cleaning and the variation in appearance. That variation does not appear in the abrasivephotographs.
5.3.1 Clean to Bare Substrate- "White Metal"
NACE No. 5- SSPC - SP 12 WJ-1WJ-1 surface shall be free of all previously existing visible rust, coatings, mill scale, and foreignmatter and have a matte metal finish.
ISO 8501-1 Sa 3When viewed without magnification, the surface shall be free from visible oil, grease and dirt,and shall be free from mill scale, rust, paint coatings and foreign matter. It shall have a uniformmetallic color.
SSPC-SP 5 NACE 1When viewed without magnification, the surface shall be free of all visible oil, grease, dust, dirt,mill scale, rust, paint, oxides, corrosion products, and other foreign matter.
5.3.2 Very Thorough Cleaning, "Clean Almost to Bare Substrate"
NACE No. 5- SSPC SP-12 WJ-2WJ-2 surface shall be cleaned to a matte finish with at least 95 percent of the surface area free ofall previously existing visible residues and the remaining 5 percent containing only randomlydispersed stains of rust, coatings, and foreign matter.
SSPC SP 10 NACE No. 2 “Near White Blast Cleaned Surface”
RANDOM staining shall be limited to no more than 5 percent of each unit area of surface ... ,and may consist of light shadows, slight streaks, or minor discoloration caused by stains of rust,stains of mill scale, or stains of previously applied paint.
ISO 8501-1 Sa 2 1/2 Very Thorough Blast Cleaning:When viewed without magnification, the surface shall be free from visible oil, grease and dirt,and from mill scale, rust, paint coatings and foreign matter. Any remaining traces ofcontamination shall show only as slight stains in the form of spots or stripes.
HB 2.5 Very Thorough Hydroblast Cleaning (International Paint)When viewed without magnification, the surface shall be free from visible oil, grease, dirt, looserust, paint coatings and foreign matter. A brown-black discoloration of ferric oxide may remainas a lightly adherent thin film on corroded and pitted steel.
In conversations with major coatings manufacturers, Dr. Frenzel has come to understand that thecoating manufacturers' technical staff are not including the brown-black discoloration of ferricoxide as part of the staining criteria. They are looking for stains of material other than blackferric oxide. Thus a WJ-1 or WJ-2 may be extremely mottled if the steel surface has beenheavily corroded.
5.3.3 Thorough Cleaning, “Commercial Blast”
NACE No. 5- SSPC SP-12 WJ-3WJ-3 surface shall be cleaned to a matte finish with at least two-thirds of the surface free of allvisible residues (except mill scale), and the remaining one-third containing only randomlydispersed staining of previously existing rust, coatings, and foreign matter.
Notice that we are now including the idea that mill scale might remain on the surface. This isrecognition of the types of projects in which WJ is used. The language is for staining, not for thecoating itself. However, the marine industry is interpreting this to mean the coatings and foreignmatter can remain on if it is dispersed.
SSPC SP- 6, NACE No. 3 Commercial BlastRandom staining shall be limited to no more than 33 percent of each unit area of surface asdefined, and may consist of light shadows, slight streaks, or minor discoloration caused by stainsof rust, stains of mill scale, or stains of previously applied paint.
ISO 8501 Sa 2 Thorough Blast- CleaningWhen viewed without magnification, the surface shall be free from visible oil, grease and dirt,and from most of the mill scale, rust, paint coatings and foreign matter. Any residualcontamination shall be firmly adhering.
HB 2 Thorough Hydroblast Cleaning (International Paint)When viewed without magnification, the surface shall be free from visible oil, grease, dirt andfrom most of the rust, paint coatings and foreign matter. Any remaining contamination andstaining shall be firmly adherent.
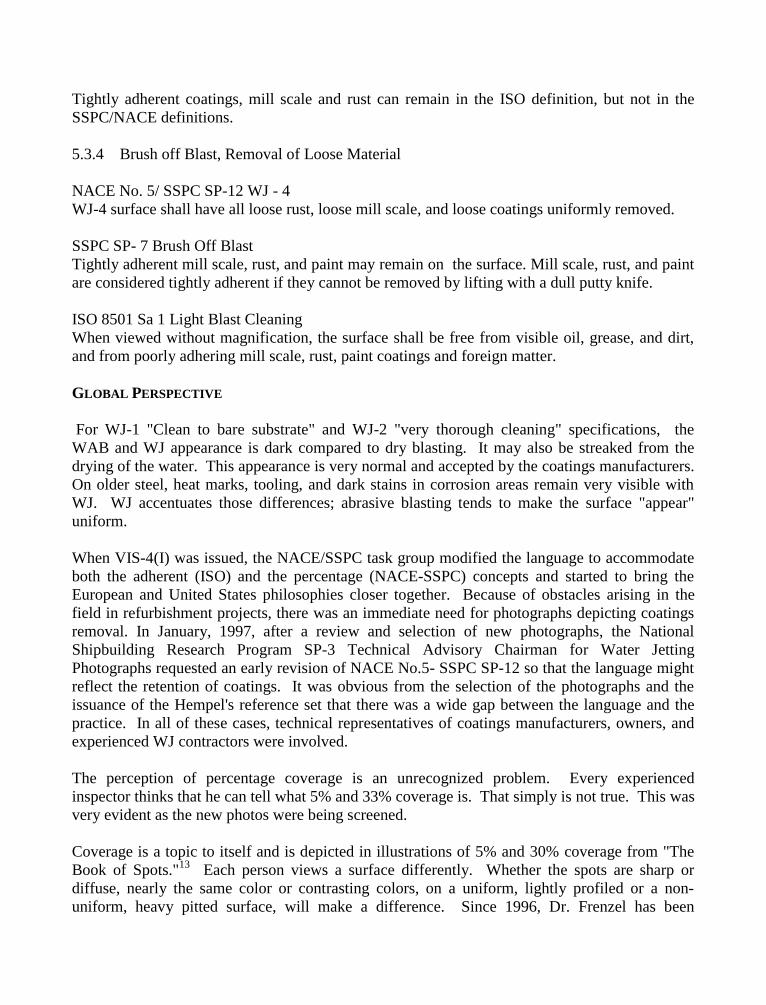
Tightly adherent coatings, mill scale and rust can remain in the ISO definition, but not in theSSPC/NACE definitions.
5.3.4 Brush off Blast, Removal of Loose Material
NACE No. 5/ SSPC SP-12 WJ - 4WJ-4 surface shall have all loose rust, loose mill scale, and loose coatings uniformly removed.
SSPC SP- 7 Brush Off BlastTightly adherent mill scale, rust, and paint may remain on the surface. Mill scale, rust, and paintare considered tightly adherent if they cannot be removed by lifting with a dull putty knife.
ISO 8501 Sa 1 Light Blast CleaningWhen viewed without magnification, the surface shall be free from visible oil, grease, and dirt,and from poorly adhering mill scale, rust, paint coatings and foreign matter.
GLOBAL PERSPECTIVE
For WJ-1 "Clean to bare substrate" and WJ-2 "very thorough cleaning" specifications, theWAB and WJ appearance is dark compared to dry blasting. It may also be streaked from thedrying of the water. This appearance is very normal and accepted by the coatings manufacturers.On older steel, heat marks, tooling, and dark stains in corrosion areas remain very visible withWJ. WJ accentuates those differences; abrasive blasting tends to make the surface "appear"uniform.
When VIS-4(I) was issued, the NACE/SSPC task group modified the language to accommodateboth the adherent (ISO) and the percentage (NACE-SSPC) concepts and started to bring theEuropean and United States philosophies closer together. Because of obstacles arising in thefield in refurbishment projects, there was an immediate need for photographs depicting coatingsremoval. In January, 1997, after a review and selection of new photographs, the NationalShipbuilding Research Program SP-3 Technical Advisory Chairman for Water JettingPhotographs requested an early revision of NACE No.5- SSPC SP-12 so that the language mightreflect the retention of coatings. It was obvious from the selection of the photographs and theissuance of the Hempel's reference set that there was a wide gap between the language and thepractice. In all of these cases, technical representatives of coatings manufacturers, owners, andexperienced WJ contractors were involved.
The perception of percentage coverage is an unrecognized problem. Every experiencedinspector thinks that he can tell what 5% and 33% coverage is. That simply is not true. This wasvery evident as the new photos were being screened.
Coverage is a topic to itself and is depicted in illustrations of 5% and 30% coverage from "TheBook of Spots."13 Each person views a surface differently. Whether the spots are sharp ordiffuse, nearly the same color or contrasting colors, on a uniform, lightly profiled or a non-uniform, heavy pitted surface, will make a difference. Since 1996, Dr. Frenzel has been
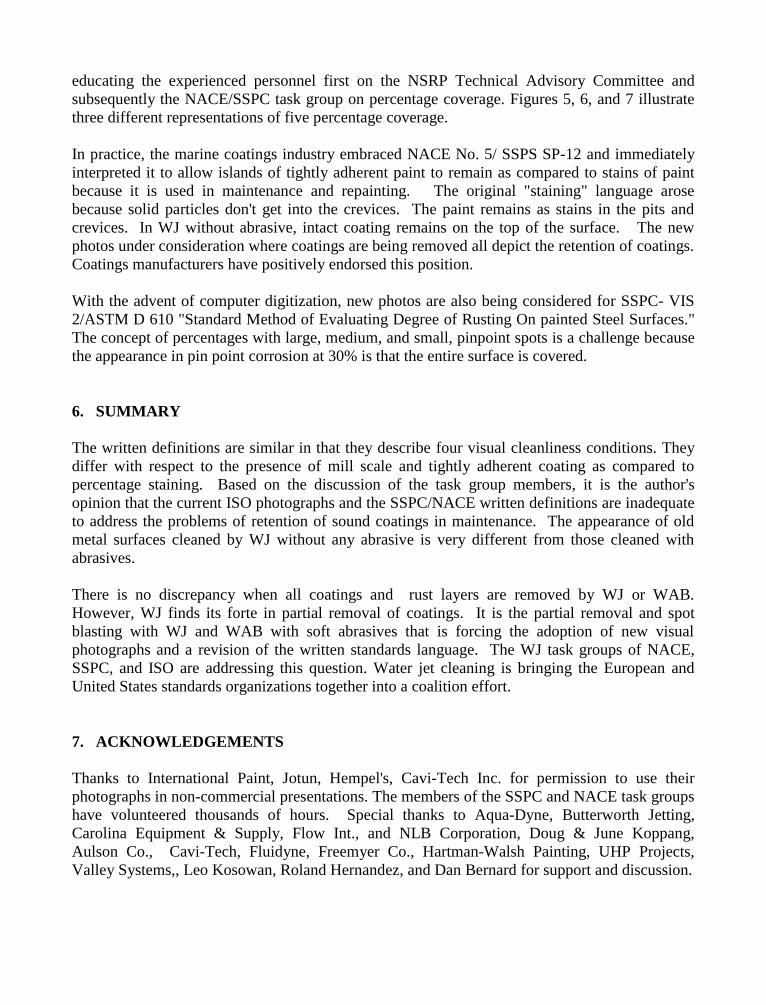
educating the experienced personnel first on the NSRP Technical Advisory Committee andsubsequently the NACE/SSPC task group on percentage coverage. Figures 5, 6, and 7 illustratethree different representations of five percentage coverage.
In practice, the marine coatings industry embraced NACE No. 5/ SSPS SP-12 and immediatelyinterpreted it to allow islands of tightly adherent paint to remain as compared to stains of paintbecause it is used in maintenance and repainting. The original "staining" language arosebecause solid particles don't get into the crevices. The paint remains as stains in the pits andcrevices. In WJ without abrasive, intact coating remains on the top of the surface. The newphotos under consideration where coatings are being removed all depict the retention of coatings.Coatings manufacturers have positively endorsed this position.
With the advent of computer digitization, new photos are also being considered for SSPC- VIS2/ASTM D 610 "Standard Method of Evaluating Degree of Rusting On painted Steel Surfaces."The concept of percentages with large, medium, and small, pinpoint spots is a challenge becausethe appearance in pin point corrosion at 30% is that the entire surface is covered.
6. SUMMARY
The written definitions are similar in that they describe four visual cleanliness conditions. Theydiffer with respect to the presence of mill scale and tightly adherent coating as compared topercentage staining. Based on the discussion of the task group members, it is the author'sopinion that the current ISO photographs and the SSPC/NACE written definitions are inadequateto address the problems of retention of sound coatings in maintenance. The appearance of oldmetal surfaces cleaned by WJ without any abrasive is very different from those cleaned withabrasives.
There is no discrepancy when all coatings and rust layers are removed by WJ or WAB.However, WJ finds its forte in partial removal of coatings. It is the partial removal and spotblasting with WJ and WAB with soft abrasives that is forcing the adoption of new visualphotographs and a revision of the written standards language. The WJ task groups of NACE,SSPC, and ISO are addressing this question. Water jet cleaning is bringing the European andUnited States standards organizations together into a coalition effort.
7. ACKNOWLEDGEMENTS
Thanks to International Paint, Jotun, Hempel's, Cavi-Tech Inc. for permission to use theirphotographs in non-commercial presentations. The members of the SSPC and NACE task groupshave volunteered thousands of hours. Special thanks to Aqua-Dyne, Butterworth Jetting,Carolina Equipment & Supply, Flow Int., and NLB Corporation, Doug & June Koppang,Aulson Co., Cavi-Tech, Fluidyne, Freemyer Co., Hartman-Walsh Painting, UHP Projects,Valley Systems,, Leo Kosowan, Roland Hernandez, and Dan Bernard for support and discussion.
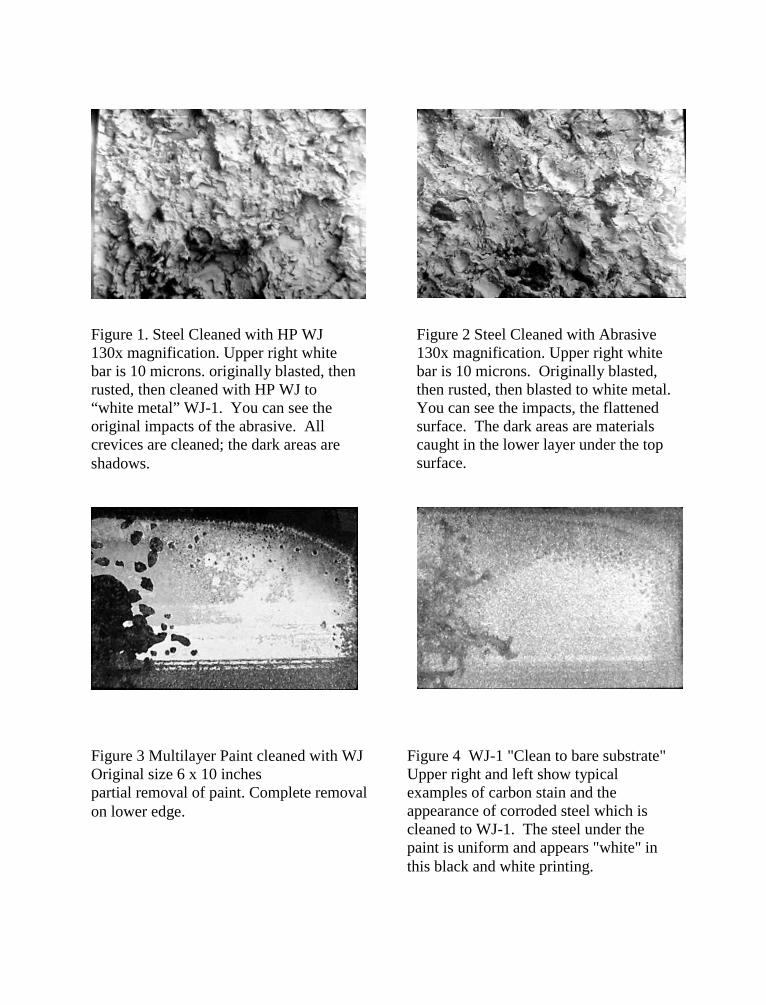
Figure 1. Steel Cleaned with HP WJ130x magnification. Upper right whitebar is 10 microns. originally blasted, thenrusted, then cleaned with HP WJ to“white metal” WJ-1. You can see theoriginal impacts of the abrasive. Allcrevices are cleaned; the dark areas areshadows.
Figure 2 Steel Cleaned with Abrasive130x magnification. Upper right whitebar is 10 microns. Originally blasted,then rusted, then blasted to white metal.You can see the impacts, the flattenedsurface. The dark areas are materialscaught in the lower layer under the topsurface.
Figure 3 Multilayer Paint cleaned with WJOriginal size 6 x 10 inchespartial removal of paint. Complete removalon lower edge.
Figure 4 WJ-1 "Clean to bare substrate"Upper right and left show typicalexamples of carbon stain and theappearance of corroded steel which iscleaned to WJ-1. The steel under thepaint is uniform and appears "white" inthis black and white printing.
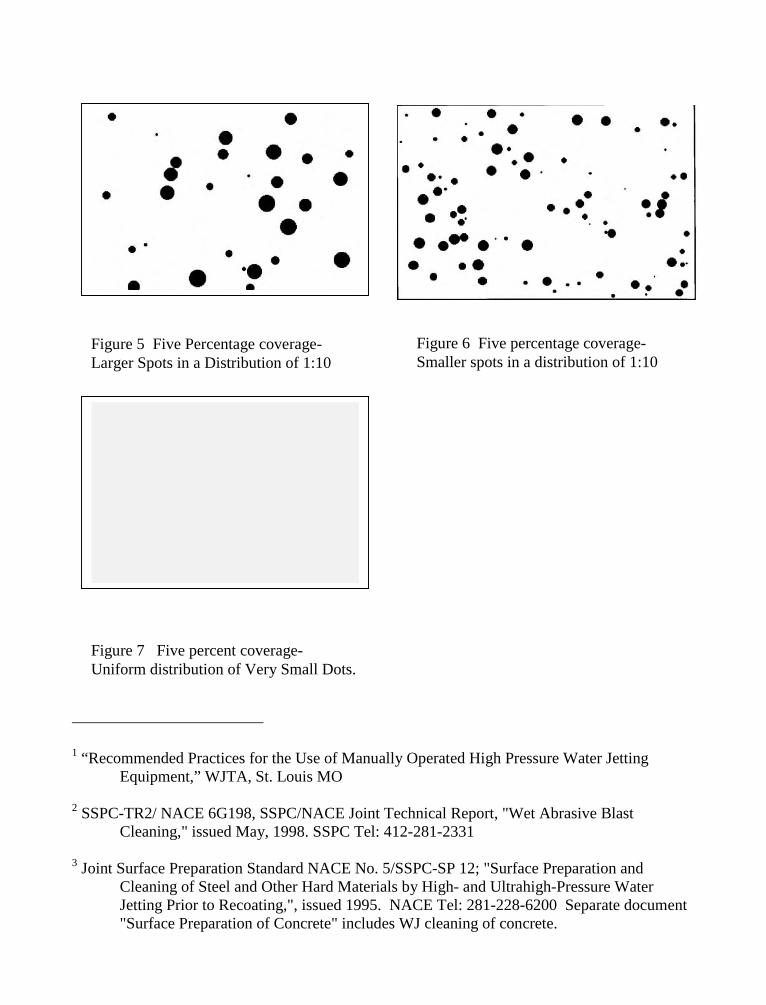
1 “Recommended Practices for the Use of Manually Operated High Pressure Water JettingEquipment,” WJTA, St. Louis MO
2 SSPC-TR2/ NACE 6G198, SSPC/NACE Joint Technical Report, "Wet Abrasive BlastCleaning," issued May, 1998. SSPC Tel: 412-281-2331
3 Joint Surface Preparation Standard NACE No. 5/SSPC-SP 12; "Surface Preparation andCleaning of Steel and Other Hard Materials by High- and Ultrahigh-Pressure WaterJetting Prior to Recoating,", issued 1995. NACE Tel: 281-228-6200 Separate document"Surface Preparation of Concrete" includes WJ cleaning of concrete.
Figure 6 Five percentage coverage-Smaller spots in a distribution of 1:10
Figure 7 Five percent coverage-Uniform distribution of Very Small Dots.
Figure 5 Five Percentage coverage-Larger Spots in a Distribution of 1:10
4 Vincent, L.D. , "Increasing the Value of Coatings", Proceedings of the SSPC 1998 Seminars,November, 1998, SSPC 98-11 "Failure Modes of Protective Coatings and Their Effect onManagement," p. 125-128.
5 VanKuiken, Jr., L.L., Byrnes, L.E., & Kramer, M.S., High Pressure Water Jet Method ofBlasting Low Density Metallic Surfaces, U.S. Patent 5,380,564, Issued Jan. 10, 1995
6 Taylor, Thomas A., "Surface Roughening of Metallic Substrates by High Pressure Waterjet,"Surface & Coatings Technology, Vol. 76-77 ( 1995), 95-100
7 Frenzel, Lydia M.; Nixon Jonell, "Surface Preparation using High Pressure Water Blasting,"NACE Corrosion89, paper No. 397, April, 1989
8 Materials Evaluation Laboratories, Claude Mount, January 1991, work performed for Shell OilCompany, Report number 9501
9 Aldinger, Tom (Bechtel), Viswanath, Bala (Pacific Gas and Electric), Dick Vass (VassIndustries), SSPC 1994 Conference, Industrial Maintenance Coatings- Current Trendsand Practices, “Water Blasting versus Abrasive Blasting for In situ Penstock Relining”
10 Morcillo, M. & Simancas, J., JPCL, Sept. 1997, p. 40 “effects of Soluble Salts on Coating Lifein Atmospheric Service" and G.C. Soltz., “The Effect of Substrate Contaminants on theLife of Epoxy Coatings Submerged in Sea Water,” National Shipbuilding ResearchProgram, March, 1991, task 3-89-2
11 SSPC-VIS 4(I) NACE No. 7 "Interim Guide and Visual Reference Photographs for SteelCleaned by Water Jetting, SSPC Pub. 98-07; NACE Item NO. 22016
12 Howlett, Jr., J.J. and Dupuy, R., Ultrahigh-Pressure Water Jetting for Deposit Removal andSurface Preparation, Materials Performance (MP), No.1, Jan, 1993, p. 38
13 Advisory Council, "The Book of Spots", depicting 1-30% coverage and 20% with differentrelative spot sizes. Computer generated to be exact.
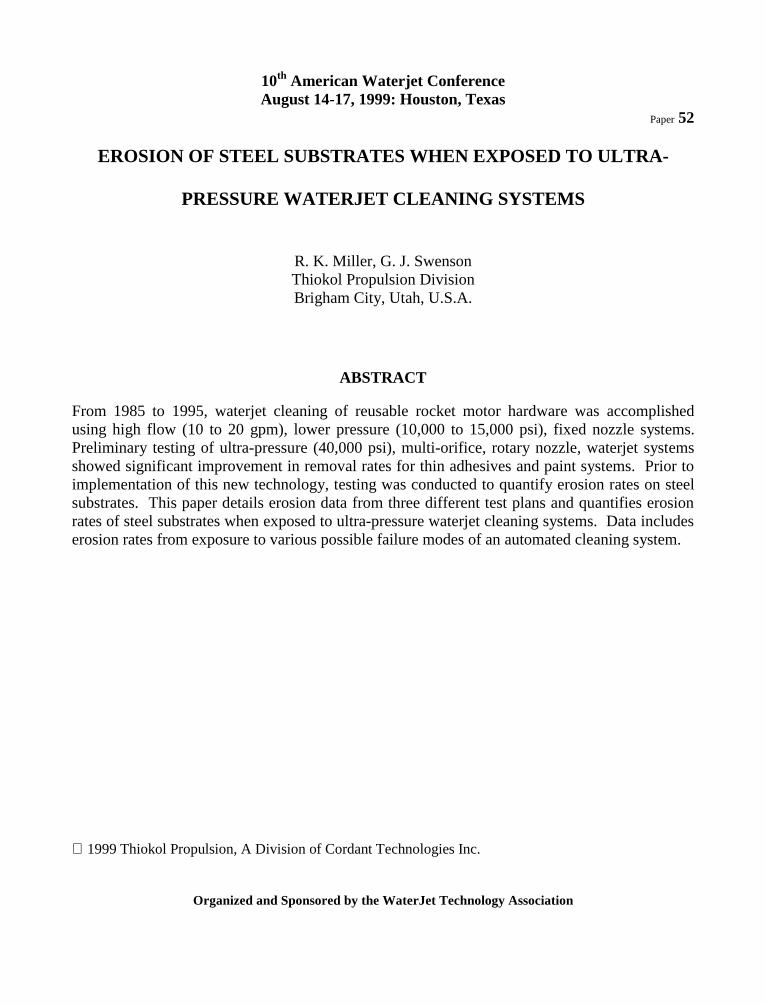
10th American Waterjet ConferenceAugust 14-17, 1999: Houston, Texas
Paper 52
EROSION OF STEEL SUBSTRATES WHEN EXPOSED TO ULTRA-
PRESSURE WATERJET CLEANING SYSTEMS
R. K. Miller, G. J. SwensonThiokol Propulsion DivisionBrigham City, Utah, U.S.A.
ABSTRACT
From 1985 to 1995, waterjet cleaning of reusable rocket motor hardware was accomplishedusing high flow (10 to 20 gpm), lower pressure (10,000 to 15,000 psi), fixed nozzle systems.Preliminary testing of ultra-pressure (40,000 psi), multi-orifice, rotary nozzle, waterjet systemsshowed significant improvement in removal rates for thin adhesives and paint systems. Prior toimplementation of this new technology, testing was conducted to quantify erosion rates on steelsubstrates. This paper details erosion data from three different test plans and quantifies erosionrates of steel substrates when exposed to ultra-pressure waterjet cleaning systems. Data includeserosion rates from exposure to various possible failure modes of an automated cleaning system.
1999 Thiokol Propulsion, A Division of Cordant Technologies Inc.
Organized and Sponsored by the WaterJet Technology Association
1. INTRODUCTION
Since the early 1980’s waterjet cleaning of reusable solid rocket motor hardware wasaccomplished using high flow (10 to 20 gpm), lower pressure (10,000 to 15,000 psi), fixednozzle systems. Preliminary testing of ultra-pressure (40,000 psi), multi-orifice, rotary nozzlewaterjet equipment showed significant improvement in removal rates for thin adhesives andpaint systems. However, the cleaning methods had to be relatively non-erosive in order to retainthe required component design safety factors. Testing was conducted to quantify erosion rateson steel substrates. Erosion data from three different studies are included. Data includes erosionrates from exposure to various possible failure modes of an automated cleaning system.
1.1 Background
The three tests followed the same basic format. Initial testing determined the optimum cleaningparameters for the particular waterjet equipment being used. After optimum paint/adhesiveremoval parameters were established and verified, erosion testing was conducted using thoseestablished parameters. Erosion testing was conducted using 2.0” x 2.0” x 0.25” D6AC steelcoupons, (D6AC is roughly equivalent to 4340, Hardness RC 43 – 48). The coupons wereweighed, using a calibrated 160-gram electronic balance, before and after waterjet exposure.Erosion rates were calculated based on weight loss, material specific weight, test coupon surfacearea and the number of exposure passes. These calculated erosion values assume even erosionover the entire surface of the coupon. Maximum erosion at any one location is dependent on thenozzle overlap pattern. Calculating erosion based on weight loss proved to be the only methodsensitive enough to detect the slight erosion of D6AC steel by the established waterjet cleaningprocess. All erosion testing was conducted on bare metal coupons to simulate a ‘worst casecondition’. In addition, machine failure mode testing was conducted using 8” x 12” x 0.5” steelpanels. Failure mode testing included zero nozzle rpm, zero sweep rate and combinations.
1.2 1992 Test Setup
The first test was conducted in 1992 using leased equipment, manufactured by Jet Edge, Inc.,Minneapolis Minnesota. The system used for this test consisted of a Jet Edge Model 536
Intensifier pump, a Gyro-jet nozzle rotator and a ten-jet modified ‘S’ pattern nozzle, using0.012 in. diameter sapphire orifices. Maximum adhesive removal rates were obtained, andsubsequent erosion testing was conducted, using the following parameters:
• Water Pressure: 36,000 psi (at the pump)• Nozzle Speed: 1,000 rpm• Nozzle Standoff: 1.0”• Nozzle Angle: Normal to the surface being cleaned• Sweep Rate: 70 inches per minute
1.3 1995 and 1998 Test Setup
The remaining tests were conducted using waterjet equipment manufactured by FlowInternational, Kent, Washington. The system used for these tests consisted of a FLOW EQ
Intensifier pump, a FLOW Model 2410 offset drive and a FLOW five-jet multi-radius housing,using 0.017 in. diameter sapphire orifices. Maximum adhesive removal rates were obtained, andsubsequent erosion testing was conducted, using the following parameters:
• Water Pressure: 40,000 psi (at the pump)• Nozzle Speed: 500 to 1,500 rpm (1,300 rpm nominal)• Nozzle Standoff: 1.0” to 2.5” (2.5” nominal)• Nozzle Angle: Normal to the surface being cleaned• Sweep Rate: 30 to 60 inches per minute (60 ipm nominal)
2. OBJECTIVES
2.1 1992 Testing
The initial testing completed in 1992 was conducted to determine the feasibility of using ultra-pressure, rotary nozzle waterjet technology in the refurbishment of rocket motor components.Contaminant removal rates, substrate erosion, surface finish effect and effect on downstreambonding processes were compared to the established cleaning processes at the time. Theseprocesses included lower pressure (10 – 15K) waterblast and zirconium silicate gritblast.
2.2 1995 Testing
The 1995 testing was conducted to qualify a new automated ultra-pressure, rotary nozzle,waterjet system for use on space shuttle flight hardware. Data from the testing verified that thenew system would safely and efficiently remove contaminants without damaging the hardware.This hardware was designed to be reused up to 20 times. Component wall thickness wasdesigned with the assumption that each refurbishment would remove up to 0.001 in. of materialfrom the steel substrate wall thickness.
2.3 1998 Testing
The 1998 testing qualified the same automated system for use on Minuteman III Stage 1hardware. The task of the Minuteman Propulsion Replacement Program (PRP) is to remove oldpropellant, insulation and adhesives from the steel hardware and then to reline and reload thehardware. The Minuteman hardware was not designed for reuse and therefore has minimalallowances for erosion of the steel substrate. This testing verified that the minimum allowableerosion of 0.0001 in. would not be exceeded during the cleaning process.
3. DISCUSSION
3.1 Normal Operating Parameters Erosion
The established normal operating parameters for D6AC steel waterblast cleaning are as follows:
• Water Pressure: 40,000 psi (at the pump)• Nozzle Speed: 500 to 1,500 rpm ( 1,300 rpm nominal)• Nozzle Standoff: 1.0 to 2.5 inch (2.5 inch nominal)• Nozzle Angle: Normal to the surface being cleaned• Sweep Rate: 30 to 60 ipm (60 ipm nominal)
The aforementioned test studies implemented testing from which data was collected to evaluatematerial (D6AC steel) erosion during typical waterjet refurbishment operations. Figure 1displays the average erosion calculated from the test data at varying number of exposure passesand also compares the erosion of waterjet cleaning methods to that of a previously usedzirconium silicate media gritblast paint removal method.
All normal operating parameter erosion testing was conducted using 2.0” x 2.0” x 0.25” D6ACsteel coupons. Each test coupon was weighed before and after exposure to the waterjet cleaningprocess. The erosion values obtained from the test data were determined by calculating theweight difference of each test sample (before and after waterjet exposure) and then dividing bythe material (D6AC steel) specific weight and coupon exposed surface area. Appropriateconversion factors were also implemented to determine the erosion (mils) of D6AC steel. Thefollowing equation was implemented:
( )milsErosionArea
W =×××∆1000
59.453
1
283.0
1
Where: ∆W = Test sample weight difference (grams)Area = Surface area exposed to waterjet (in.2)0.283 = Specific weight of D6AC steel (lb./in.3)453.59 = Conversion factor (grams/lb.)
Erosion testing conducted at the established normal operating parameters shows that the level oferosion of D6AC steel is minimal (< 0.02 mils). Also, in comparing the single pass waterjeterosion of 0.009 mils, which is typical of the current paint removal operation, to that of thezirconium silicate paint removal erosion of 0.7 mils, the level of material erosion is decreased byapproximately 98%.
Another interesting condition that was observed during the testing is presented in Figure 2. Therate of D6AC steel erosion (inches/pass) when exposed to the ultra-pressure waterjet cleaningprocess is not linear. The erosion rate is only slightly different between the first and secondexposures (~ 11%) while the third and subsequent exposures display a much larger variation inthe erosion rate. In fact, the data show that the initial exposure removed up to 88% morematerial than the subsequent exposures.
3.2 Failure Simulation Erosion
Ultra-pressure waterjet process failure simulation testing was conducted to evaluate the typicalerosion of D6AC steel during a specific process parameter failure and assess the need for criticalparameter control limits. Critical parameters are defined as those parameters that have thegreatest effect on material erosion. The critical parameters are identified as Water Pressure,Nozzle Rotation, Nozzle Standoff, and Sweep rate (Rate of material past the nozzle).
All failure simulation testing was conducted using 8” x 12” x 0.5” steel (D6AC) panels. Erosionvalues were determined by direct measurement of the depth of the eroded pit or groove (seeFigures 3, 4, and 5).
Dwell time testing was conducted to simulate complete failure of D6AC steel hardwaremovement during exposure to the ultra-pressure waterjet spray (0 rpm nozzle rotation, 0 ipmsweep rate). This simulated stall causes pits to be eroded in the surface of the steel hardware.Dwell testing was conducted during both the 1992 and 1998 tests. Figures 6 and 7 present dwelltesting erosion rates (inches/exposure time) for D6AC steel. Nozzle standoff was maintained atone inch for the testing conducted in 1992. During the 1998 testing the nozzle standoff wasvaried between 1 inch and 2.5 inches. The maximum erosion rate experienced was 0.0017in./sec.
Additional failure simulation was conducted to evaluate D6AC steel erosion when a singleprocess parameter failure is realized. Two such simulation tests were performed. The first was asimulation of sweep rate failure only by holding the sweep rate to 0 ipm and varying nozzlestandoff (1 to 2.5 inches) and nozzle rotation speed (500 to 1,500 rpm). Second, a simulation ofnozzle rotation failure only was performed by holding the nozzle rotation speed to 0 rpm andvarying the nozzle standoff (1 to 2.5 inches) and sweep rate (30 to 60 ipm). The erosion ratesresulting from the sweep rate failure simulation testing and the nozzle rotation failure simulationtesting are presented in Figures 8 and 9 respectively.
Based on the failure simulation testing erosion rates, any prolonged exposure of D6AC steel tothe ultra-pressure waterjet system will cause significant material erosion. Thus, it is imperativethat automated waterjet systems be designed with devices to control and monitor critical processparameters.
4. CONCLUSIONS
Erosion testing conducted at the established normal operating parameters shows that the level oferosion of D6AC steel is minimal (< 0.00002 inch). This level of erosion is 98% less than thatcaused by the zirconium silicate, dry abrasive, blast system previously used for paint andadhesive removal.
Multiple exposure testing showed that the erosion caused by the waterjet process is not linear.The data show that the initial exposure removed up to 88% more material than subsequentexposures.
Failure simulation testing shows that any prolonged exposure, at zero nozzle rpm and / or zerosweep rate, will cause significant material removal, (0.0017 in./sec.).
To prevent unacceptable erosion of steel substrates it is essential that automated systems bedesigned with devices to control and monitor the critical processing parameters. These systemsmust also be equipped with the means to automatically and immediately shut off the flow of highpressure water when established critical parameter limits are violated.
5. REFERENCES
Miller, R.K., “Evaluation of Erosion of D6AC Steel Using The High Pressure, Rotary NozzleWaterblast System At H-7 For Minuteman III Stage 1 Propulsion Replacement Program”,Thiokol Propulsion Division, Brigham, Utah, Document No. TR11407, December 14,1998.
Schiffman, R.L., “Final Report For CTP-0352, High Pressure Waterjet Cleaning Qualification”,Thiokol Propulsion Division, Brigham, Utah, Document No. TWR-66639, September 15,1995.
Swenson, G.J., “RSRM Paint and Chemlok Removal Using An Ultra-Pressure, Rotary NozzleWaterblast System; The Effect On Surface Finish, Erosion, And Bonding”, ThiokolPropulsion Division, Brigham, Utah, Document No. TWR-61757, March 1992.
6. NOMENCLATURE
gpm gallons per minutein. inchipm inches per minuteK 1,000lb. poundmil 1x10⁻³ inchespsi pounds per square inchrpm revolutions per minute
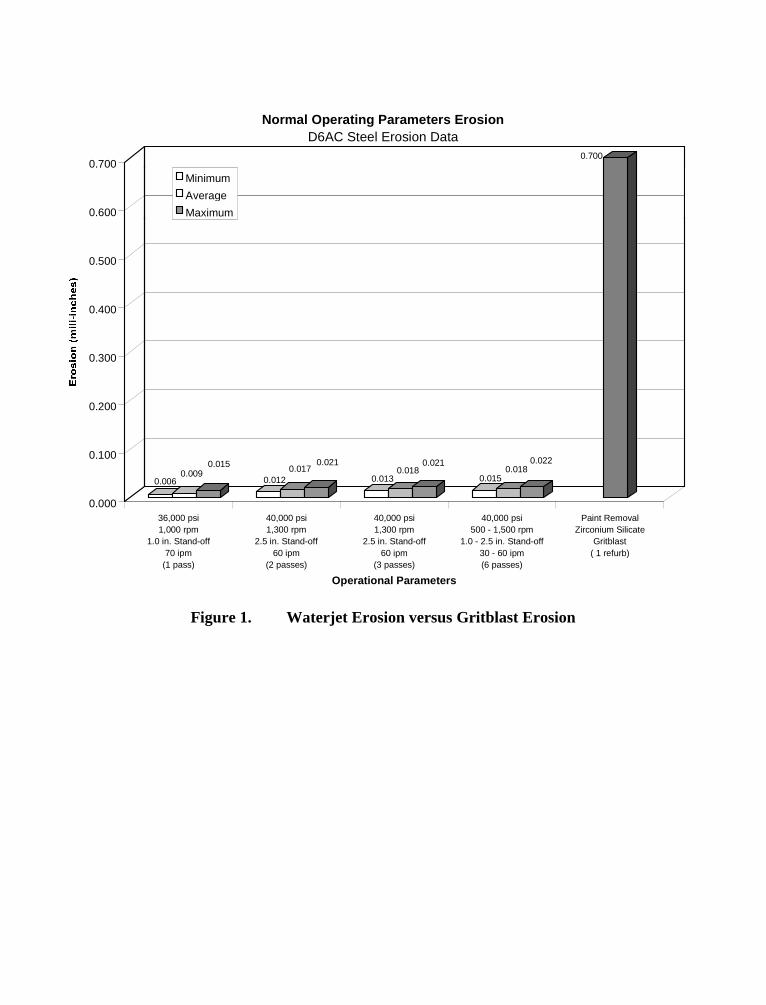
Figure 1. Waterjet Erosion versus Gritblast Erosion
0.0060.009
0.015
0.0120.017
0.021
0.0130.018
0.021
0.0150.018
0.022
0.700
0.000
0.100
0.200
0.300
0.400
0.500
0.600
0.700
36,000 psi1,000 rpm
1.0 in. Stand-off70 ipm
(1 pass)
40,000 psi1,300 rpm
2.5 in. Stand-off60 ipm
(2 passes)
40,000 psi1,300 rpm
2.5 in. Stand-off60 ipm
(3 passes)
40,000 psi500 - 1,500 rpm
1.0 - 2.5 in. Stand-off30 - 60 ipm(6 passes)
Paint RemovalZirconium Silicate
Gritblast( 1 refurb)
Operational Parameters
Normal Operating Parameters ErosionD6AC Steel Erosion Data
Minimum
Average
Maximum
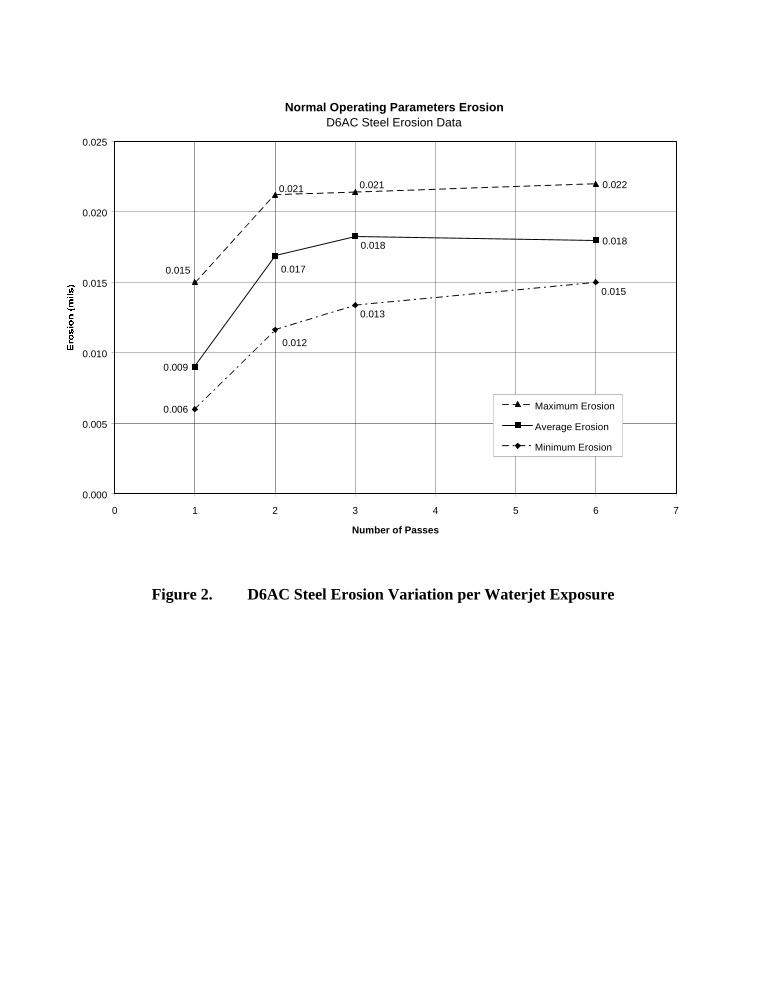
Figure 2. D6AC Steel Erosion Variation per Waterjet Exposure
Normal Operating Parameters ErosionD6AC Steel Erosion Data
0.022
0.018
0.0210.021
0.015
0.018
0.017
0.009
0.013
0.015
0.012
0.006
0.000
0.005
0.010
0.015
0.020
0.025
0 1 2 3 4 5 6 7
Number of Passes
Maximum Erosion
Average Erosion
Minimum Erosion
1998 Testing: 0 rpm nozzle rotation, 0 ipm sweep rate
Figure 3. Dwell Time Failure Simulation Test Panel
1998 Testing: 500-1,500 rpm nozzle rotation, 0 ipm sweep rate
Figure 4. Sweep Rate Failure Simulation Test Panel
0 rpm nozzle rotation, 30 – 60 ipm sweep rate
Figure 5. Nozzle Rotation Failure Simulation Test Panel
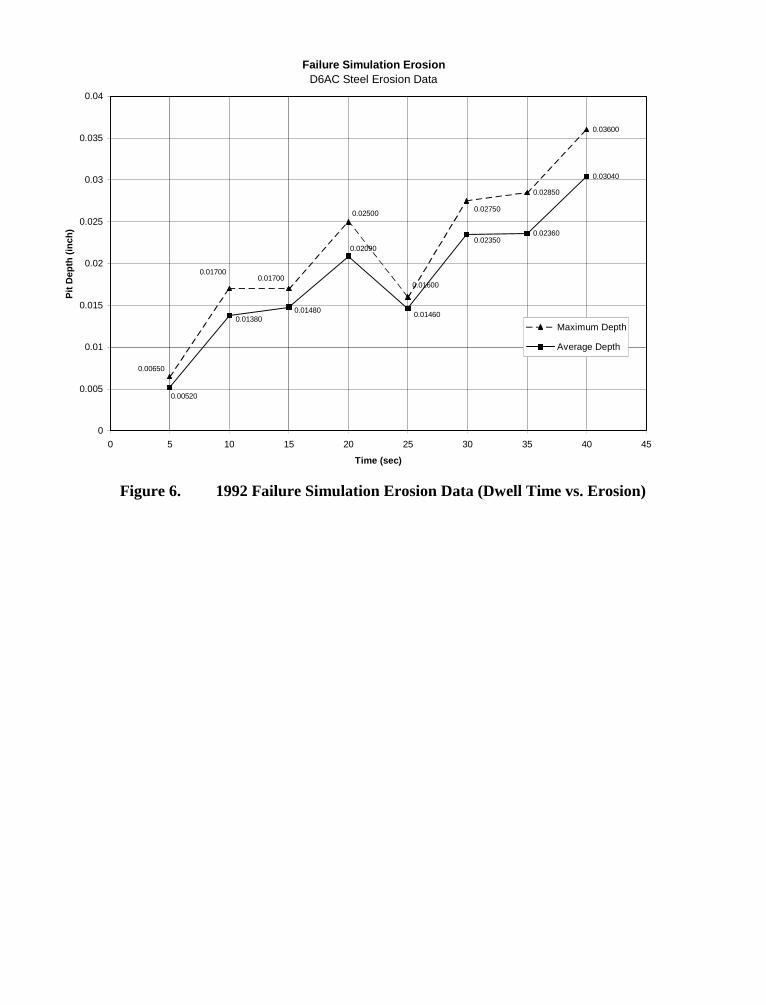
Figure 6. 1992 Failure Simulation Erosion Data (Dwell Time vs. Erosion)
Failure Simulation ErosionD6AC Steel Erosion Data
0.02850
0.03600
0.02360
0.03040
0.01600
0.02500 0.02750
0.01700
0.00650
0.01700
0.01460
0.020900.02350
0.01480
0.00520
0.01380
0
0.005
0.01
0.015
0.02
0.025
0.03
0.035
0.04
0 5 10 15 20 25 30 35 40 45
Time (sec)
Pit
Dep
th (
inch
)
Maximum Depth
Average Depth
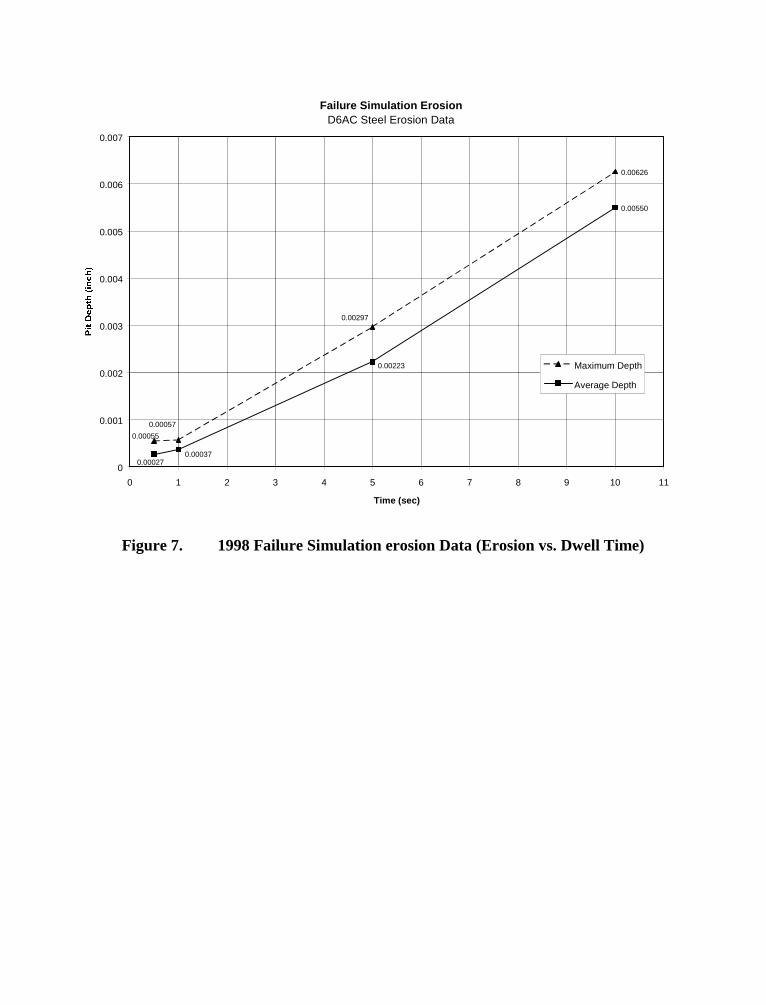
Figure 7. 1998 Failure Simulation erosion Data (Erosion vs. Dwell Time)
Failure Simulation ErosionD6AC Steel Erosion Data
0.00626
0.00550
0.00057
0.00055
0.00297
0.000370.00027
0.00223
0
0.001
0.002
0.003
0.004
0.005
0.006
0.007
0 1 2 3 4 5 6 7 8 9 10 11
Time (sec)
Maximum Depth
Average Depth
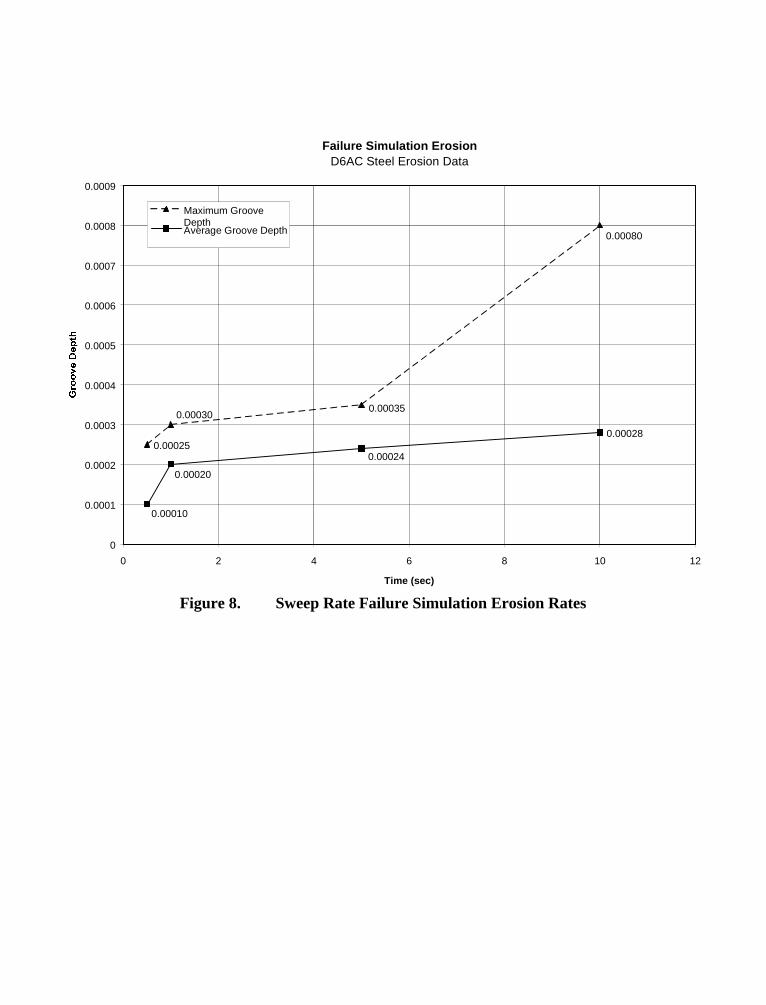
Figure 8. Sweep Rate Failure Simulation Erosion Rates
Failure Simulation ErosionD6AC Steel Erosion Data
0.000250.00028
0.000300.00035
0.00080
0.00024
0.00020
0.00010
0
0.0001
0.0002
0.0003
0.0004
0.0005
0.0006
0.0007
0.0008
0.0009
0 2 4 6 8 10 12
Time (sec)
Maximum GrooveDepthAverage Groove Depth
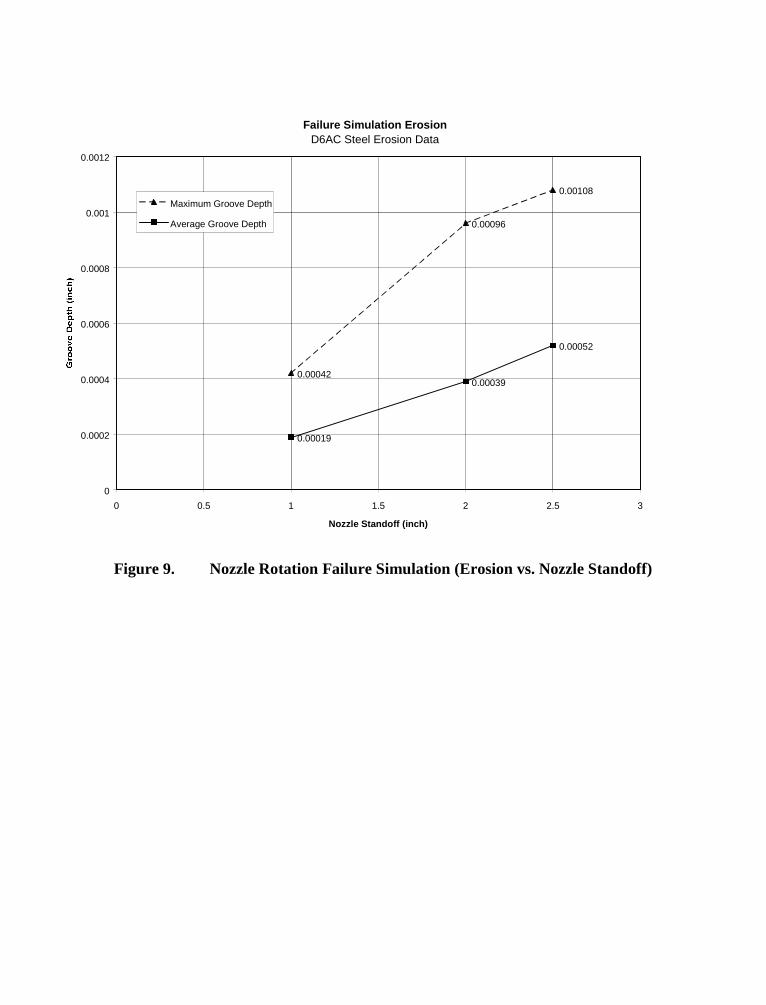
Figure 9. Nozzle Rotation Failure Simulation (Erosion vs. Nozzle Standoff)
Failure Simulation ErosionD6AC Steel Erosion Data
0.00042
0.00096
0.00108
0.00019
0.00039
0.00052
0
0.0002
0.0004
0.0006
0.0008
0.001
0.0012
0 0.5 1 1.5 2 2.5 3
Nozzle Standoff (inch)
Maximum Groove Depth
Average Groove Depth
10 American Waterjet Conferenceth
August 14-17, 1999: Houston, TexasPaper 53
REMOVAL OF HARD COATINGS FROM THE INTERIOR OF SHIPS
USING PULSED WATERJETS: RESULTS OF FIELD TRIALS
M. M. Vijay, W. Yan, A. Tieu and C.BaiL Advanced Technologies, Inc.V
N
Gloucester, ON., Canada
S. PecmanDepartment of National Defence
Hull, Quebec, Canada
ABSTRACT
A pre-commercial pulsed waterjet machine (FluidPulse ) was designed, manufactured and fieldTM
tested for the Department of National Defense (DND) of Canada. The purpose of the machine wasto remove several types of hard coatings (Alkyd Marine Enamel, Amercoat 68HS, InternationalIntertuf KTE, etc) from the interior of HMC (Her Majesty’s Canadian) naval ships. Prior tomanufacturing the machine, extensive work was conducted in the laboratory using ultrasonicallymodulated high-frequency (20 kHz) pulsed waterjets. In this paper, a brief summary of the design,laboratory work and, highlights of the field trials are presented. Field trials were conducted on theHMC ship “Halifax”, in dry dock at Halifax, Canada. Its potential was also demonstrated in a privatedockyard on the St-Lawrence Seaway at Les Mechins, Quebec, Canada. It is shown that the machinemet all the contractual requirements (portability, mobility, etc) and, achieved a removal rate of 3.2to 4.5 m /hr ( 34 - 48 ft /hr), in excess of the specified value. These results were achieved at a2 2
pressure and hydraulic power in the range respectively of 31 - 41 MPa ( 4,500 - 6,000 psi) and 12 -16 kW ( 16 - 21 hp). Problems encountered during the field trials are also reported.
Organized and Sponsored by the WaterJet Technology Association
1. INTRODUCTION
The front and rear views of the forced pulsed waterjet machine are shown in Figs. 1 and 2respectively. L Advanced Technologies obtained the contract to design, manufacture and field testV
N
the machine for the removal of hard coatings from the Department of National Defense (DND) inSeptember 1998. The contract was awarded based on the extensive previous work done in theWaterjet Laboratory of the National Research Council of Canada Puchala & Vijay (1984), Vijay(1992), Vijay, et. al. (1993), Vijay & Foldyna (1994), Vijay, et.al. (1995), Vijay, et.al. (1997), Vijay(1998a, 1998b). This work had consistently shown that low pressure (34.5 MPa), high-frequency(15- 20 kHz) forced pulsed waterjets can be used to cut metals Vijay & Foldyna (1994), rocks(Vijay, 1998a) and to remove several types of coatings Vijay, et.al. (1997, 1998b). The DNDissued a statement of work (SOW) based on “Requirements Definition” which is summarized inAppendix A. Prior to manufacturing the machine, arrangements were made to visit the HMC ship,“Iroqois” which was being refurbished at Lauzon, Quebec. During this visit, the operations that werein progress for removing the coatings from top deck to several areas in the bilge were observed andphotographed. Measurements of the doors in bulkheads and hatches were taken. “RequirementsDefinition” was developed based on the discussions held with several operators who were usingvarious techniques (needle guns, grinding wheels, etc.) to remove the deteriorated coatings and othertechnical staff.
In this paper the following topics are discussed: (i) description of the machine, (ii) laboratory testresults obtained with the ultrasonic gun, (iii) field trials and (iv) conclusions and recommendations.It should be pointed out that no discussion on: (a) the basics of the pulsed jet technique, (b)characteristics of the coatings, (c) mechanism of material removal, etc., are given in this paper asthese have already been reported by Vijay (1992), Vijay & Foldyna (1994), Vijay, et.al. (1993, 1995,1997) and Vijay (1998a, 1998b). However, for the sake of completeness, the basic configuration ofthe nozzle body used in the hand-held gun is shown in Fig. 3. As the water flows through the nozzle,the vibrating tip modulates the flow and generates high-frequency forced pulsed waterjets Vijay,et.al. (1995). All the variables indicated in Fig. 3 influence the performance of the machine Vijay& Foldyna (1994).
2. DESIGN AND DESCRIPTION OF THE MACHINE
The manufacture of the forced pulsed waterjet machine was completed in the 1st week of March1999. It was manufactured according to the contractual specifications summarized in Appendix A.
2.1 General Description
The machine, general views of which are illustrated in Figs. 1 and 2, basically consists of a pump,an ultrasonic power generator with a converter piezoelectric transducer; a magnetostrictivetransducer can also be used (see Vijay, 1998b), a high-pressure dump gun, a high-pressure hose andaccessories which ensure safety of the operator. The pump is rated to deliver a water flow rate of22.7 litre/min (6 usgpm) at a maximum pressure of 41.4 MPa (6000 psi). The ultrasonic powergenerator has a capacity of 1.5 kW of output at a resonant frequency of 20 kHz. All components,
except the gun, are enclosed in an aluminum cabinet. In order to comply with the “requirementsdefinition” (Appendix A), the components were selected carefully and tested before incorporationinto the machine
The water, air and electrical requirements are grouped into three major systems as input, output andcontrol. In order to ensure safety (that is, to avoid confusion), all inputs are located at the rear panel(Fig. 2) and the outputs at the front panel (Fig. 1) of the machine. The description of each, includingthe gun, is given in the following Sub-sections.
2.2 Inputs
The system requires a water source to provide a flow of 22.7 litre/min (6 usgpm). A city watersystem is adequate for this purpose. However, a source capable of supplying 30 litre/min (8 usgpm)of water is recommended in order to prevent damage due to cavitation in the inlet ports of the pump.The system also requires a compressed air source to provide air to cool the piezoelectric converter.Excessive temperature rise of the converter will deteriorate its operation or, damage it permanently.
As specified in the SOW, the machine requires a 3-ph, 440 V and 30 amp electrical power sourceto run the pump at its full capacity. All the three inputs are located in a recess at the bottom right ofthe rear panel of the machine (Fig. 2) and are provided with quick connects for ease of connectionand disconnection of the electrical cable, air and water supply hoses.
2.3 Outputs
The outputs consist of (a) high-pressure water up to 41.4 MPa and (b) a shielded coaxial cable,enclosed in an air hose. The fittings and adapters for these outputs are located in a recess at thebottom left corner of the front panel (Fig. 1) and, once again, are provided with quick connects asrequired by the SOW. The high-pressure water is transported through a high-pressure hose to the gunwhere the modulation of the stream to generate high-frequency pulses of water takes place (Fig. 3).Air, purified and dried through a filter system installed in the machine, flows in the annulus aroundthe coaxial cable in the hose. This cable-hose assembly is connected to the gun to provide air to coolthe converter. The shielded cable carries high-voltage, high-frequency electric pulses to the converterwhich in turn sets up mechanical oscillations in the nozzle.
2.4 Control Panel
The control panel is at the front of the machine and contains all the switches and the pilot lights toindicate whether a particular component is on or off (Fig. 1). The main switch supplies the electricpower to all the components. The pressure gauges for measuring the air pressure, water inlet pressureand the pump outlet pressure are also located on the front panel.
2.5 The Gun
As specified in the SOW, a hand-held gun was designed and manufactured for the removal of thecoatings by an experienced operator. It consists of a 1.22 m ( 4 ft) long barrel on which the
ultrasonic converter and the nozzle are mounted (see Fig. 11). It is in the nozzle that the modulationof the water stream takes place to produce the high-frequency pulsed waterjets (Fig. 3).
3. DESIGN CONSIDERATIONS
Right from the outset, in designing the machine all the requirements stated in the SOW, were takeninto account. The most significant feature of the machine is the safety considerations, of both theoperator and the machine itself. Other design features of the machine include ease of operation,transportation, mobility on the ship, etc. 3.1 Safety
One of the most important considerations in the design of any high-pressure waterjet equipment isthe safety of the operator. In designing the pulsed waterjet machine, the guidelines published by theUS Water Jet Technology Association (WJTA, 1994) were strictly followed. All high-pressure andelectrical components in the machine, if operated properly, were designed to fail safely. The locationof the clearly visible instrumentation cluster with the pilot lights at the front panel is an indicationof the concern for safety. As a further example, the ultrasonic system in the machine will not bepowered unless air supply is turned on and, the gun is pressurized with water. For this reasonpressure switches were incorporated to detect the air and water pressures. If the conditions for safeoperation are not met, the ultrasonic power generator would be turned off automatically.
3.2 Operating Considerations
Normally in high-pressure waterjet applications, generally presence of two individuals isrecommended (WJTA, 1994). However, the machine was designed so that it could be operated bya single, well-trained and well-experienced individual. The operator can rely on the instruments andpilot lights on the front panel to make any decision regarding the operation. Other hazard is thesplashing water. This can be prevented by the provision of an appropriate shield at the nozzle.
3.3 Transportation Considerations
Since the machine was specially designed for use in the interior of HMC ships, its size and weightfully met the specifications stated in the SOW. The dimensions and weight were such that it couldbe moved around the ship quite easily. The input and output fittings were all designed to be quickconnect so that when the machine is transported from one place to another, the hoses and cablescould be detached and transported separately. This facilitates its movement on board the ship fromdeck to deck or, from one location to another on the same deck.
3.4 Laboratory Investigation
The purpose of the laboratory investigation was to find the optimum combination of parameters foreach type of coating using the hand-held gun designed in parallel with the machine. The contractstipulated a removal rate of 2.32 m /hr (25 ft /hr) for all the coatings stated in the SOW (Appendix2 2
A). The coatings were on steel panels (30.5 X 30.5 X 0.32 cm) abrasive blasted to SSPC-SP10. Theaverage blast profile was 0.064 mm (2.5 mil).
The tests were conducted using a nozzle-piezoelectric converter assembly powered by an ultrasonicgenerator capable of delivering 3.0 kW. However, it was set to operate only up to 1.5 kW, the ratedpower of the unit in the machine. The diameter of the nozzle used in the gun was 1.37 mm.
Two kinds of tests were conducted in the laboratory: (a) using the X-Y gantry where standoffdistance and traverse speed could be set precisely (useful for robotic controlled operations) and, (b)hand-held tests. In each test, the area removal rate was calculated. As the rated pressure of themachine was 41.4 MPa (6,000 psi), most of the tests were conducted at this pressure note: in thefield, the pressure was only 31 MPa (4,500 psi).
Results obtained on all types of coated samples were almost similar see also, Vijay (1998b). Forthe sake of illustration, the area removal rates achieved for AMERCOAT 68HS are depicted in Fig.4. These results clearly show that: (i) the area removal rate depends strongly on the traverse speed,(ii) it is somewhat insensitive to variation in standoff distance in the range from 18 mm ( 0.7 in)to 32 mm ( 1.25 in). This is encouraging because in hand-held operations the operator may not beable to maintain a steady standoff distance and, (iii) the rates of removal achieved under controlledconditions (that is, using the X-Y gantry) exceeded the rates specified in the contract.
For all the samples tested, the quality of the substrate was also examined. The quality was consideredto be good when all layers of the paint, including the primer, were completely removed by the jet.It was deemed to be poor when some paint (or primer) was left or, the base metal was damaged. Fig.5 shows typical appearance of substrate of a panel from which all the three layers of coatings (1-GP-48, 1-GP-61 & 1-GP-61) were removed. Tests were conducted consecutively side-by-side at P = 30.6MPa ( 4,400 psi), V = 10 m/min and S = 38.1 mm (1.50 in). As can be seen clearly, a smoothtr
substrate was achieved with the pulsed waterjet. Also, an area removal rate of 3.2 m /hr ( 34 ft /hr)2 2
was achieved.
In preparation for the field trials, several tests were conducted by one of the staff members (notexperienced) using the hand-held gun. For the sake of illustration, a single photograph is shown inFig. 6 (non-skid AMERCOAT 68 HS). Although close to bare metal finish was achieved, somestreaks of top thick layer remained. The mean area removal rate was about 1.2 m /hr ( 13 ft /hr).2 2
It is believed, however, that once appropriate operating conditions are set, an experienced andskillful operator would achieve the specified rates of removal and the required surface finish withoutany difficulty.
In summary, the laboratory investigations indicated: (i) All coatings including the primer could beremoved with the pulsed waterjet at a pressure in the neighborhood of 34.5 MPa, (ii) The optimumstandoff distance was in the range of 18 to 32 mm which provides some flexibility to the operatorin hand-held operations, (iii) The maximum area removal rate including the primer was of the orderof 4.5 m /hr (48 ft /hr) and could be increased further by increasing the traverse speed, (iv) A2 2
favorable surface profile (0.064 mm; 2.5 mil) for strengthening the adhesion between the substrateand fresh coating could be achieved by employing appropriate operating parameters, (v) The pulsed
waterjet machine could remove several types of coatings with only minor variations in the operatingparameters, (vi) Operation at low pressures ( 34.5 MPa; 5,000 psi) would make it safe andeconomical compared to the ultra-high pressure continuous waterjet (NLB, 1997) and, (vii) Sinceonly pure (tap) water is used with no need of any agents to soften the coatings, toxic chemicals,abrasives, etc., it would be ecologically congenial.
4. FIELD TRIALS
4.1 General Remarks
The objectives of the field trials are stated in the SOW (Appendix A). Field trials were conductedat CFB Halifax, Nova Scotia, on the ship HMC Halifax Patrol Frigate. On the return trip to Ottawa,the potential of the machine was also demonstrated at a private dockyard at Les Mechins (VerreaultIndustries), Quebec. It should be pointed out that, due to bulkiness of the waste water collection andtreatment system (see Fig. 15), it was not transported along with the machine to Halifax. Instead, itwas deemed adequate to rent a wet vacuum system to collect the waste water for analysis later inOttawa.
4.2 Highlights of the Field Trials
4.2.1 Transportation
As the field trials were scheduled to take place on March 10 at Halifax, the machine was loaded ontoa F-250 Ford Pickup Truck (see Fig. 7) on the 8th. The outside temperature was -17 C with strongo
winds. Adverse weather conditions prevailed throughout the trip, varying from snow to freezing rain,sleet and torrential rain with strong winds. Nonetheless, it was possible to arrive at the docks inHalifax at 13.30 hrs on the 9th as required by the navy.
4.2.2 Loading the Machine on to the Ship
The weather at Halifax was also quite hostile with freezing rain on the 1st day and, downpour on theday of the trials with strong winds. While waiting for the fork lift, a tour of the Halifax Patrol Frigatewas made so that a work plan could be prepared. This was particularly important in view of the factthat the field operations were required to be conducted to the strict time schedules of the staff at thedock (crane operators worked till 15.00 hrs and the DND staff and contractors till 16.00 hrs). As thecrane operators were not available on the 9th, the machine was prepared to be loaded on to the deckon the 10th. At 8.00 hrs on the 10th, it was moved by a fork lift to a loading bay. After some delays,the machine was lifted relatively easily by a crane and placed on the main deck (Fig. 8). It was thenpushed through the door of the main hangar to the deck on the bow of the ship where the tests wereplanned to take place. Icy conditions remained on some parts of the deck.
4.2.3 Mobility
Figure 9 shows that the machine could be easily moved through the main hangar by only one person.
Figure 10 shows that it could be easily maneuvered through the doors in the bulkheads, with a littleassistance by a second person to push over the ramps (about 15 cm high). Figure 11 shows the finallocation of the machine ready to be connected to air, water and electric power supplies.
4.2.4 Electric Power Source
The electric motor required a source of 460V, 3ph, 30 amps for satisfactory operation. Initially,however, this was not available close to the machine. A 25 amp source was available, but it was notsatisfactory. As the electricians required more time to connect the machine to the right source ofpower, testing was delayed until 13.30 hrs. During this time, since the machine was on the opendeck, it was exposed to severe rain storm. When the machine was finally wired for running, it wasabout 13.45 hrs.
4.2.5 Trials
While waiting for the electrical power supply, a wet vacuum cleaner and a bale sorbent boom (tubesocks) were obtained from the local suppliers. The purpose of the tube socks was to prevent thewater from flowing over the edges of the deck on to the ground (see Figs. 12 and 13). Although anexperienced water blasting operator was standing by, most of the tests were conducted by a staffmember of VLN. The deck, which was in the process of being refurbished, had many areas coveredwith rust (Fig. 12). When the machine was started, rusty and loose paint skins were easily blastedoff in large chunks with the continuous jet at 31.0 MPa (4,500 psi). When the ultrasonic power wasturned on, for a few moments the pulsed jet removed the primer exposing the bare white metal (Fig.12). However, continued testing to remove larger areas showed that the jet was no longer pulsed, thatis, ultrasonic power was not reaching the tip in the nozzle. While attempts were in progress totroubleshoot the ultrasonic system, the Naval Officer in charge announced that the time allotted fortesting was over and, issued the instruction to pack up the machine. Therefore, the tests wereterminated. Although the removal rates could not be confirmed, the machine met all the otherrequirements specified in the SOW.
It should be remarked in passing that once off the ship, the machine was taken to a local electricalworkshop for troubleshooting. It was left there overnight for drying. On the next day, an electronictechnician conducted a few diagnostic tests and found, after drying the electrical plug whichconnected the ultrasonic generator to the main control panel, that it was functional. Short circuitingdue to the heavy and freezing rains was suspected to be the main cause of faulty function of theultrasonic unit.
4.2.6 Tests at Les Mechins
The machine was taken to this site hoping to accomplish the tasks which were not possible atHalifax. Even here the weather conditions were not favorable for conducting systematic tests. Thetests commenced at about 15.00 hrs after arriving at the site (see Fig. 7) at about 11.30 hrs on the12th. Here the tests were conducted outdoors, keeping the machine indoors in a shed. The curiousstaff of Verreault Industries placed a variety of coated components for testing (see Figs. 13 and 14).In this field demonstration, the main objective was simply to show the capability of pulsed waterjet,
not the removal rates. The demonstration was successful as the machine removed most of thecoatings as shown in Fig. 14.
4.2.7 Analysis of Waste Water
Due to incessant rain at Halifax, no waste water was collected during the trials. However, tests wererepeated at Ottawa using the waste water treatment system shown in Fig. 15. The system consistsof an electrically driven suction unit and two drums which could be easily disconnected to disposeof the waste. The first drum (to the right side of the electrical unit) collects the suspended particles(paint, etc). The second drum removes dissolved metallic components, oil, etc. Tap water and wastewater were given to a chemical laboratory for analysis. The results are summarized in Table. 1. Acomparison of these values to the values listed in the SOW (Appendix A) shows that the systemmet the requirements and, the treated water was considered to be safe for disposal into city sewers.
4.2.8 Discussion
The following observations are made from the field trials conducted at the two locations: (i) Themachine’s overall compact size, 0.787 X 0.838 X 1.40 m (31" X 33" X 55"), made it ideal for useon the ship, (ii) As the weight was well balanced, it could be maneuvered about the ship with relativeease; The tow bar was found to be very useful and, necessary not only for short distance hauling butalso, for long distance towing, (iii) Rubber casters, with swivels and locking features, were foundto be durable enough to withstand the weight and vibration of the machine; The wheel size wasfound to be satisfactory to roll over most lips and bumps with ease and control, (iv) Control panelbuttons were robust to withstand rough handling in industrial setting; Pilot lights were large andbright to be seen clearly from a reasonable distance, (v) Placing the inlet and outlet receptaclesrespectively on the rear and front of the machine and, having non-interchangeable fittings, eliminatedconfusion and thus enhanced safety and, (vi) If only the moisture in the electrical plug was theproblem for the faulty operation of the ultrasonic unit, wide variation in the temperature, did notappear to affect its performance.
The following lessons were learnt from the limited field trials: (i) The machine needs to be designedfor prolonged operations in the field under wet weather conditions including, high humidity, (ii) Toensure a long service life of the control panel, it should be shielded and sealed (using a gasket) withplexiglass to prevent problems that could be caused by moisture and, (iii) Wherever possible, themachine should be placed in a dry place, especially in view of the fact that almost 30.5 m (100 ft)long high-pressure hoses can be used to reach the working areas.
5. CONCLUSIONS FROM THE FIELD TRIALS
The main conclusion from the field trials was to recognize the shortcomings of the pre-commercialmachine and, to rectify them before putting it for regular use on the market. The field experience wasin fact a lesson for debugging the machine. Since then many modifications have been incorporatedto make it robust, reliable and user friendly for continual use.
6. REFERENCES
NLB Corp., “Surface Preparation with High-pressure and Ultra-high Pressure Water Jetting,” NLBCorp. Wixom, Michigan, USA, 1997.
Puchala, R. J. and Vijay, M.M., “Study of an Ultrasonically Generated Cavitating or Interrupted Jet:Aspects of Design,” Proceedings of the 7th International Symposium on Jet Cutting Technology,Paper B2: 69-82, BHR Group, Cranfield, Bedford, UK., 1984.
Vijay, M. M., “Ultrasonically Generated Cavitating or Interrupted Jet,” U. S. Patent No. 5,154,347,1992.
Vijay, M. M., Foldyna, J., and Remisz, J., “Ultrasonic Modulation of High-speed Waterjets,”Proceedings of the International Conference Geomechanics 93, pp. 327-332, A.A. Balkema,Rotterdam, Netherlands, 1994.
Vijay, M. M., Foldyna, J., “Ultrasonically Modulated Pulsed Jets: Basic Study,” Proceedings of the12th International Symposium on Jet Cutting Technology, pp. 15-35, BHR Group, Cranfield,Bedford, UK., 1994.
Vijay, M.M., Lai, M.K.Y., and Jiang, M., “Computational Fluid Dynamic Analysis and Visualizationof High Frequency Pulsed Waterjets,” Proceedings of the 8th American Water Jet Conference,pp. 557-572, Water Jet Technology Association, St. Louis, Missouri, USA, 1995.
Vijay, M.M., Debs, E., Paquette, N., Puchala, R.J., and Bielawski, M., “Removal of Coatings withLow Pressure Pulsed Waterjets,” Proceedings of the 9th American Water Jet Conference, pp. 563- 580, Water Jet Technology Association, St. Louis, Missouri, USA, 1997.
Vijay, M.M., “Pulsed Jets: Fundamentals and Applications,” Proceedings of the 5th Pacific RimInternational Conference on Water Jet Technology, pp. 610-627, International Society of WaterJet Technology, Ottawa, Canada, 1998a.
Vijay, M.M., “Design and Development of a Prototype Pulsed Waterjet Machine for the RemovalHard Coatings,” Proceedings of the 14th International Conference on Jetting Technology, pp. 39-57, BHR Group, Cranfield, Bedford, UK., 1998b.
WJTA, “Recommended Practices for the Use of Manually Operated High-pressure Water JettingEquipment,” Water Jet Technology Association, 1100, St. Louis, Missouri, USA, 1994.
7. ACKNOWLEDGMENTS
The authors are grateful to the Department of National Defense for the contract. Assistance renderedin the field trials by Mr. D. Larkin of the National Research Council of Canada is greatly appreciated.
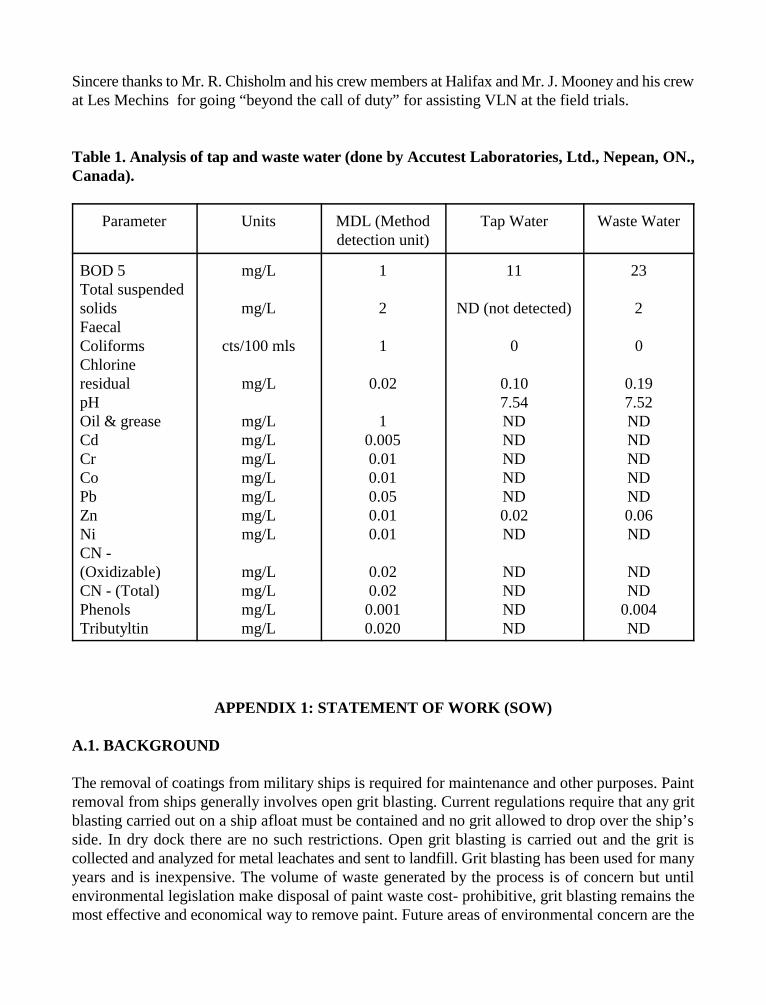
Sincere thanks to Mr. R. Chisholm and his crew members at Halifax and Mr. J. Mooney and his crewat Les Mechins for going “beyond the call of duty” for assisting VLN at the field trials.
Table 1. Analysis of tap and waste water (done by Accutest Laboratories, Ltd., Nepean, ON.,Canada).
Parameter Units MDL (Method Tap Water Waste Waterdetection unit)
BOD 5 mg/L 1 11 23Total suspendedsolids mg/L 2 ND (not detected) 2FaecalColiforms cts/100 mls 1 0 0Chlorineresidual mg/L 0.02 0.10 0.19pH 7.54 7.52Oil & grease mg/L 1 ND NDCd mg/L 0.005 ND NDCr mg/L 0.01 ND NDCo mg/L 0.01 ND NDPb mg/L 0.05 ND NDZn mg/L 0.01 0.02 0.06Ni mg/L 0.01 ND NDCN -(Oxidizable) mg/L 0.02 ND NDCN - (Total) mg/L 0.02 ND NDPhenols mg/L 0.001 ND 0.004Tributyltin mg/L 0.020 ND ND
APPENDIX 1: STATEMENT OF WORK (SOW)
A.1. BACKGROUND
The removal of coatings from military ships is required for maintenance and other purposes. Paintremoval from ships generally involves open grit blasting. Current regulations require that any gritblasting carried out on a ship afloat must be contained and no grit allowed to drop over the ship’sside. In dry dock there are no such restrictions. Open grit blasting is carried out and the grit iscollected and analyzed for metal leachates and sent to landfill. Grit blasting has been used for manyyears and is inexpensive. The volume of waste generated by the process is of concern but untilenvironmental legislation make disposal of paint waste cost- prohibitive, grit blasting remains themost effective and economical way to remove paint. Future areas of environmental concern are the
possible requirement to capture air borne debris during grit blasting. Scaffolds would be built aroundthe ship or area to be blasted and the entire area covered with plastic sheets. This is currently arequirement in many US shipyards. In Canada this type of air quality control regulations rests withlocal authorities or regions and the requirements could differ in each jurisdiction.
The Department of National Defence and Canadian Forces policy on the Environment PS/92 requiresthe Department to reduce the amount of hazardous waste generated by Defence activities. Alternativemeans for coatings removal is an area where waste generation could potentially be reduced. Pulsedwaterjet, a relatively low pressure waterjet, can be used for coatings removal. Since it uses onlywater, environmental problems are restricted to the disposal of the paint only. The reduction indust/air contaminant generation has additional benefits. During work in spaces such as machineryrooms, tanks and bilges, the requirement to seal openings against dust ingress is greatly reduced, asare the worker health and safety precautions required.
A.2. SCOPE
This document outlines the requirements for the construction and trial of an ultrasonically enhancedwaterjet coatings removal system for use on the interior of HMC Ships.
A.3. TECHNICAL REQUIREMENTS
A.3.1. System Description
The system shall be a manually operated portable ultrasonically enhanced water jet system for theremoval of coatings from the interior surfaces of HMC Ships. The waterjet removal system shallinclude a wet vacuum system to collect the coatings contaminated water and a separation system tofilter out the coatings and upgrade the water quality to allow for discharge to municipal waste. Theprototype shall include either a magnetostrictive or a piezoelectric transducer to generate the pulsedwaterjets.
A.3.2. Application
The system shall be designed to remove coatings normally used on and in HMC Ships. Theidentified coatings are:
1. Red oxide primer to Canadian General Standards Board (CGSB) Standard 1-GP-48 over coatedwith marine alkyd to CGSB standard CAN/CGSB-1.61-95;2. Zinc rich epoxy primer CGSB CAN/CGSB- l. l83-92 over coated with epoxy non slip deckcoating CGSB standard l-GP-l92;3. Low temperature curing epoxy coating CGSB CAN/CGSB-1.207-M91
A.3.3. Application Areas may include:
Internal and external decks, tanks (fresh water, bilge, fuel, waste water), void spaces and machineryrooms.
A.3.4. Performance
(a) Removal Rate: The performance of the water jet coating removal system shall be comparableto needle gun, hand held grinder or other manual methods for coatings removal in terms of rate ofremoval and quality of the resulting surface profile. The rate of removal is related to the age,condition and type of coating system, the material of the substrate and its preparation in addition tothe skill of the operator. A removal rate of not less than 25 ft /hour for removing the red oxide2
primer/marine alkyd coating system on a steel substrate that has been abrasively blasted to SSPC-SP10 (average blast profile 2.5 mil) shall be deemed satisfactory. The resultant steel surface shouldretain the profile at 2.5 mil and comply with NACE/SSPC WJ-l/SC-l. In order to achieve thespecified removal rate, the nozzle body for the prototype may be either multiple orifices or rotatingnozzles.
(b) Vacuum Collection and Effluent Treatment: The wet vacuum/separation system shall becapable of collecting all used water and removed coatings from all surfaces including flats, corners,crevices at a rate that will minimize the formation of rust haze. Effluent shall then be filtered toseparate coating residue from water. Waste water is intended to be discharged to sewer at apurification level acceptable for municipal waste water.
(c) Mobility: The water jet coatings removal system and the vacuum collection component shall bewheel or track mounted for ease of manual movement within the ship. Maximum dimensions mustpermit movement through doors. Door dimensions are typically 60" high and 32" wide. Means mustbe provided to man handle, without undue strain on the operator, the system over the 6" lip at eachhatch. Hatch dimensions are typically 36" square. The system must include built in lifting rings tofacilitate movement from one deck to another with tackle ordinarily available on board.
(d) Weight: Maximum: 318 kg (700 lbs). The nozzle assembly (nozzle, ultrasonic generator, wand,handle and trigger unit) shall be as compact as possible, to permit its use in confined spaces. Thepressure hose with power lines from the main unit to the nozzle assembly shall be not less than 15m (50 ft).
(e) Utilities: The power is to be obtained from universal 440V, 3 phase, 60 Hz outlets locatedthroughout the ship. The power cable is to be not less than 7.5 m (25 ft). Water: municipal potablewater; The water connection is to be quick connect.
(f) Design: The equipment shall be designed for effectiveness, ease of use and safety. System shallbe capable of being transported by light truck prudently driven at normal speeds over paved surfacesor equivalent without damage. Tie down rings shall be provided. Lifting rings capable of supportinga weight of 2.5 times the wet weight of the equipment (coatings removal and collection system, andfiltration system) shall be provided.
The system shall perform to specification at ambient temperatures between 2 and 40(C, with arelative humidity level of up to 100%. When not in use, the equipment shall be capable of beingstored in unheated covered storage at temperatures from -40 to +40(C, provided that all water and
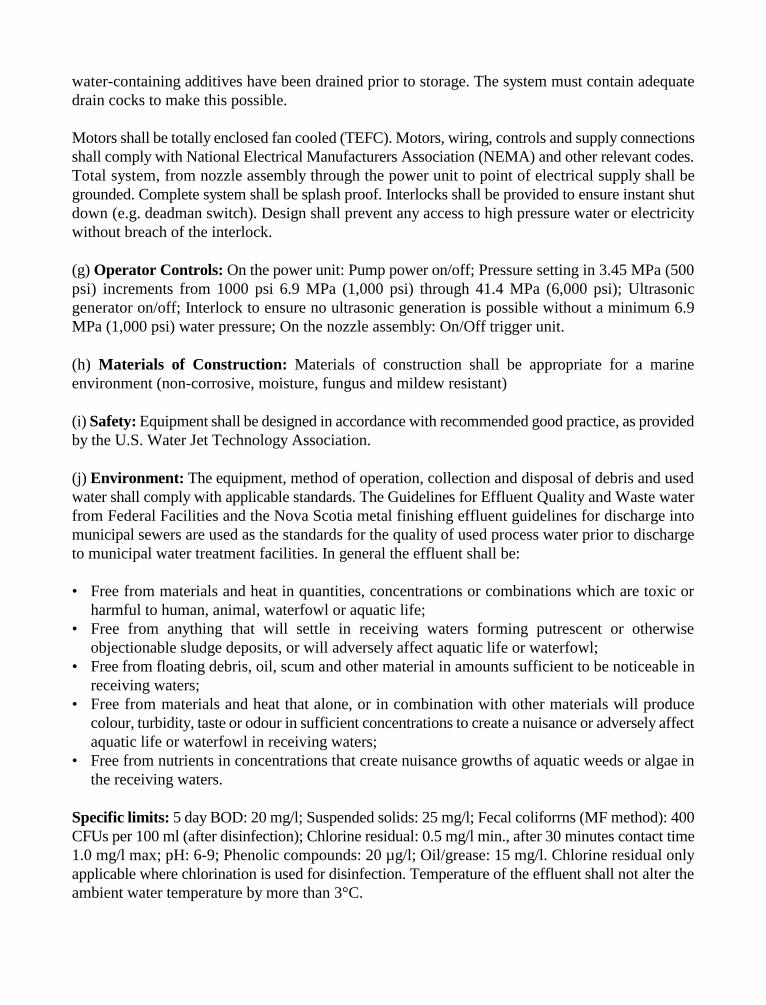
water-containing additives have been drained prior to storage. The system must contain adequatedrain cocks to make this possible.
Motors shall be totally enclosed fan cooled (TEFC). Motors, wiring, controls and supply connectionsshall comply with National Electrical Manufacturers Association (NEMA) and other relevant codes.Total system, from nozzle assembly through the power unit to point of electrical supply shall begrounded. Complete system shall be splash proof. Interlocks shall be provided to ensure instant shutdown (e.g. deadman switch). Design shall prevent any access to high pressure water or electricitywithout breach of the interlock.
(g) Operator Controls: On the power unit: Pump power on/off; Pressure setting in 3.45 MPa (500psi) increments from 1000 psi 6.9 MPa (1,000 psi) through 41.4 MPa (6,000 psi); Ultrasonicgenerator on/off; Interlock to ensure no ultrasonic generation is possible without a minimum 6.9MPa (1,000 psi) water pressure; On the nozzle assembly: On/Off trigger unit.
(h) Materials of Construction: Materials of construction shall be appropriate for a marineenvironment (non-corrosive, moisture, fungus and mildew resistant)
(i) Safety: Equipment shall be designed in accordance with recommended good practice, as providedby the U.S. Water Jet Technology Association.
(j) Environment: The equipment, method of operation, collection and disposal of debris and usedwater shall comply with applicable standards. The Guidelines for Effluent Quality and Waste waterfrom Federal Facilities and the Nova Scotia metal finishing effluent guidelines for discharge intomunicipal sewers are used as the standards for the quality of used process water prior to dischargeto municipal water treatment facilities. In general the effluent shall be:
• Free from materials and heat in quantities, concentrations or combinations which are toxic orharmful to human, animal, waterfowl or aquatic life;
• Free from anything that will settle in receiving waters forming putrescent or otherwiseobjectionable sludge deposits, or will adversely affect aquatic life or waterfowl;
• Free from floating debris, oil, scum and other material in amounts sufficient to be noticeable inreceiving waters;
• Free from materials and heat that alone, or in combination with other materials will producecolour, turbidity, taste or odour in sufficient concentrations to create a nuisance or adversely affectaquatic life or waterfowl in receiving waters;
• Free from nutrients in concentrations that create nuisance growths of aquatic weeds or algae inthe receiving waters.
Specific limits: 5 day BOD: 20 mg/l; Suspended solids: 25 mg/l; Fecal coliforrns (MF method): 400CFUs per 100 ml (after disinfection); Chlorine residual: 0.5 mg/l min., after 30 minutes contact time1.0 mg/l max; pH: 6-9; Phenolic compounds: 20 µg/l; Oil/grease: 15 mg/l. Chlorine residual onlyapplicable where chlorination is used for disinfection. Temperature of the effluent shall not alter theambient water temperature by more than 3°C.
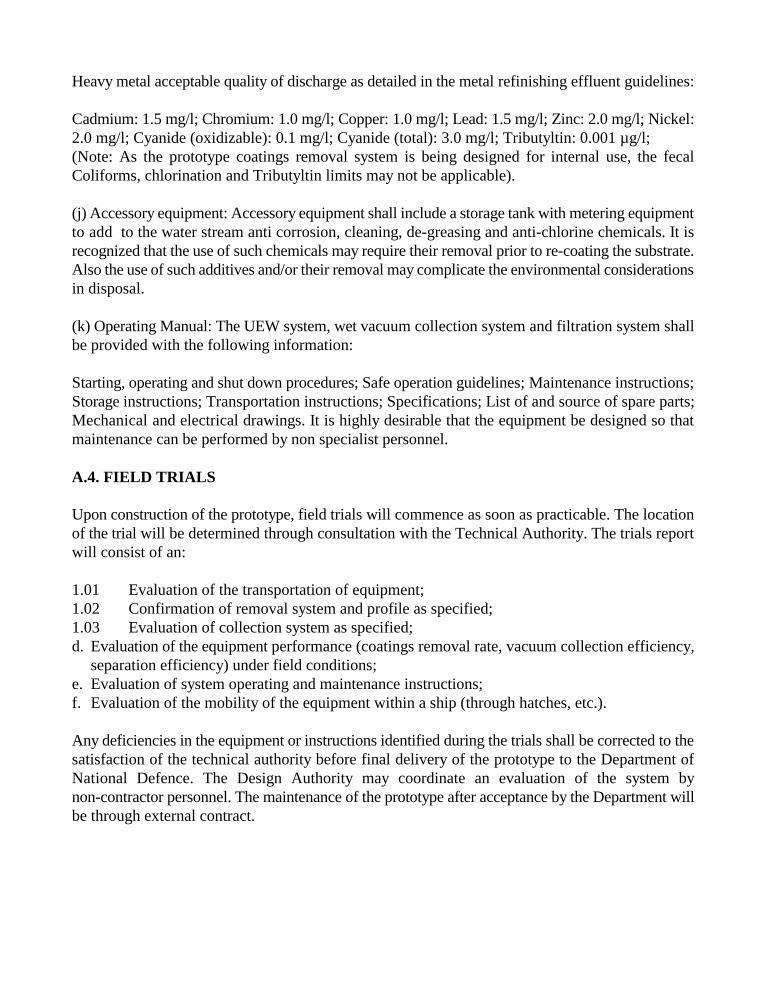
Heavy metal acceptable quality of discharge as detailed in the metal refinishing effluent guidelines:
Cadmium: 1.5 mg/l; Chromium: 1.0 mg/l; Copper: 1.0 mg/l; Lead: 1.5 mg/l; Zinc: 2.0 mg/l; Nickel:2.0 mg/l; Cyanide (oxidizable): 0.1 mg/l; Cyanide (total): 3.0 mg/l; Tributyltin: 0.001 µg/l;(Note: As the prototype coatings removal system is being designed for internal use, the fecalColiforms, chlorination and Tributyltin limits may not be applicable).
(j) Accessory equipment: Accessory equipment shall include a storage tank with metering equipmentto add to the water stream anti corrosion, cleaning, de-greasing and anti-chlorine chemicals. It isrecognized that the use of such chemicals may require their removal prior to re-coating the substrate.Also the use of such additives and/or their removal may complicate the environmental considerationsin disposal.
(k) Operating Manual: The UEW system, wet vacuum collection system and filtration system shallbe provided with the following information:
Starting, operating and shut down procedures; Safe operation guidelines; Maintenance instructions;Storage instructions; Transportation instructions; Specifications; List of and source of spare parts;Mechanical and electrical drawings. It is highly desirable that the equipment be designed so thatmaintenance can be performed by non specialist personnel.
A.4. FIELD TRIALS
Upon construction of the prototype, field trials will commence as soon as practicable. The locationof the trial will be determined through consultation with the Technical Authority. The trials reportwill consist of an:
1.01 Evaluation of the transportation of equipment; 1.02 Confirmation of removal system and profile as specified;1.03 Evaluation of collection system as specified;d. Evaluation of the equipment performance (coatings removal rate, vacuum collection efficiency,
separation efficiency) under field conditions;e. Evaluation of system operating and maintenance instructions;f. Evaluation of the mobility of the equipment within a ship (through hatches, etc.).
Any deficiencies in the equipment or instructions identified during the trials shall be corrected to thesatisfaction of the technical authority before final delivery of the prototype to the Department ofNational Defence. The Design Authority may coordinate an evaluation of the system bynon-contractor personnel. The maintenance of the prototype after acceptance by the Department willbe through external contract.
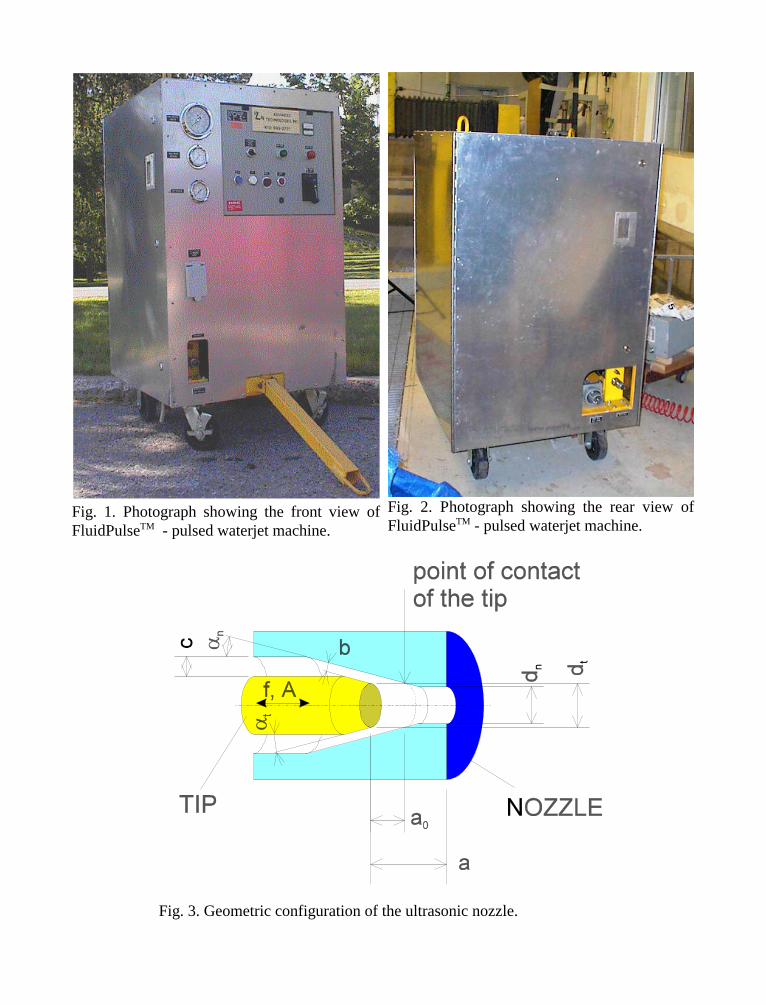
Fig. 3. Geometric configuration of the ultrasonic nozzle.
Fig. 1. Photograph showing the front view ofFluidPulseTM - pulsed waterjet machine.
Fig. 2. Photograph showing the rear view ofFluidPulseTM - pulsed waterjet machine.
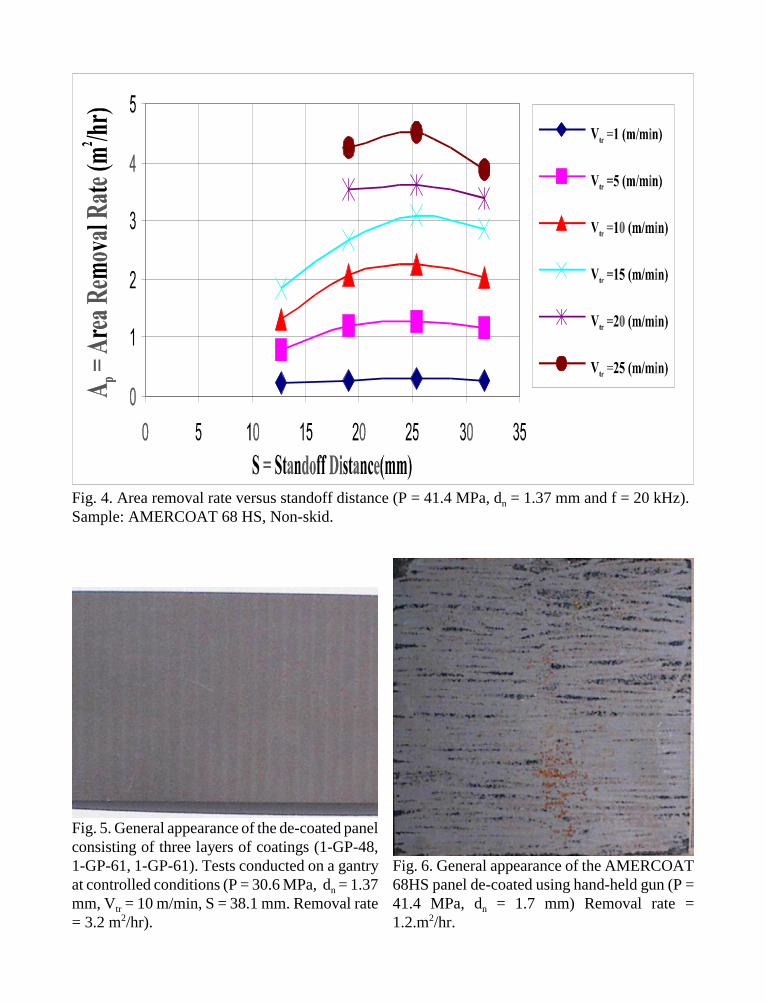
Fig. 6. General appearance of the AMERCOAT68HS panel de-coated using hand-held gun (P =41.4 MPa, dn = 1.7 mm) Removal rate =1.2.m2/hr.
Fig. 4. Area removal rate versus standoff distance (P = 41.4 MPa, dn = 1.37 mm and f = 20 kHz).Sample: AMERCOAT 68 HS, Non-skid.
Fig. 5. General appearance of the de-coated panelconsisting of three layers of coatings (1-GP-48,1-GP-61, 1-GP-61). Tests conducted on a gantryat controlled conditions (P = 30.6 MPa, dn = 1.37mm, Vtr = 10 m/min, S = 38.1 mm. Removal rate= 3.2 m2/hr).
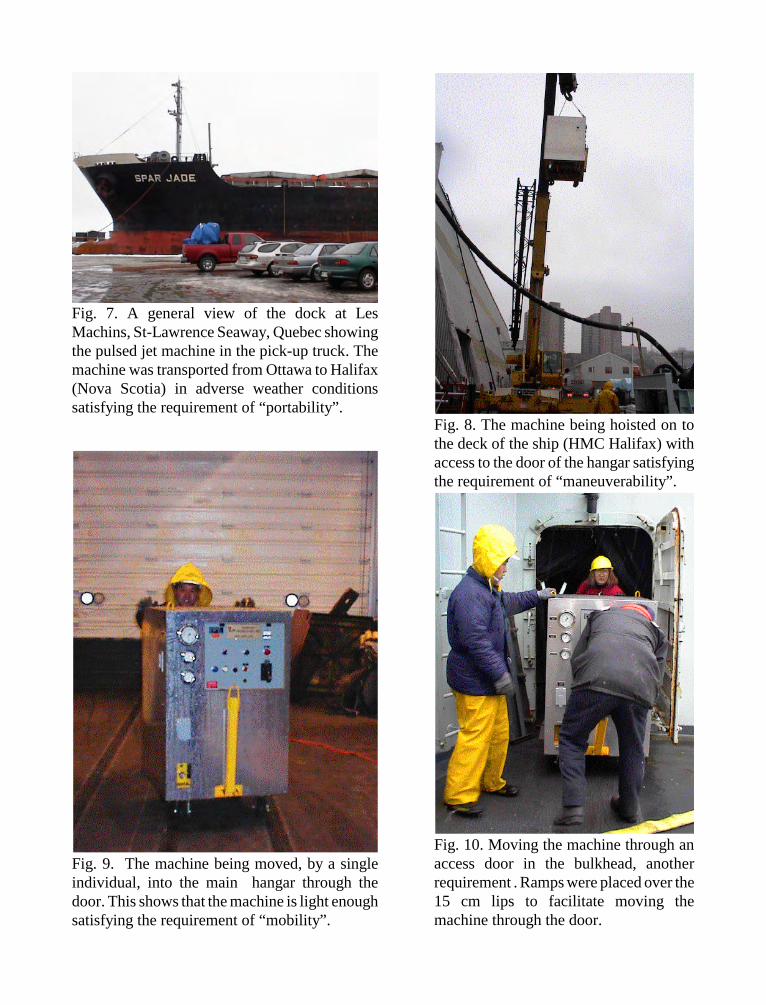
Fig. 7. A general view of the dock at LesMachins, St-Lawrence Seaway, Quebec showingthe pulsed jet machine in the pick-up truck. Themachine was transported from Ottawa to Halifax(Nova Scotia) in adverse weather conditionssatisfying the requirement of “portability”.
Fig. 8. The machine being hoisted on tothe deck of the ship (HMC Halifax) withaccess to the door of the hangar satisfyingthe requirement of “maneuverability”.
Fig. 10. Moving the machine through anaccess door in the bulkhead, anotherrequirement . Ramps were placed over the15 cm lips to facilitate moving themachine through the door.
Fig. 9. The machine being moved, by a singleindividual, into the main hangar through thedoor. This shows that the machine is light enoughsatisfying the requirement of “mobility”.
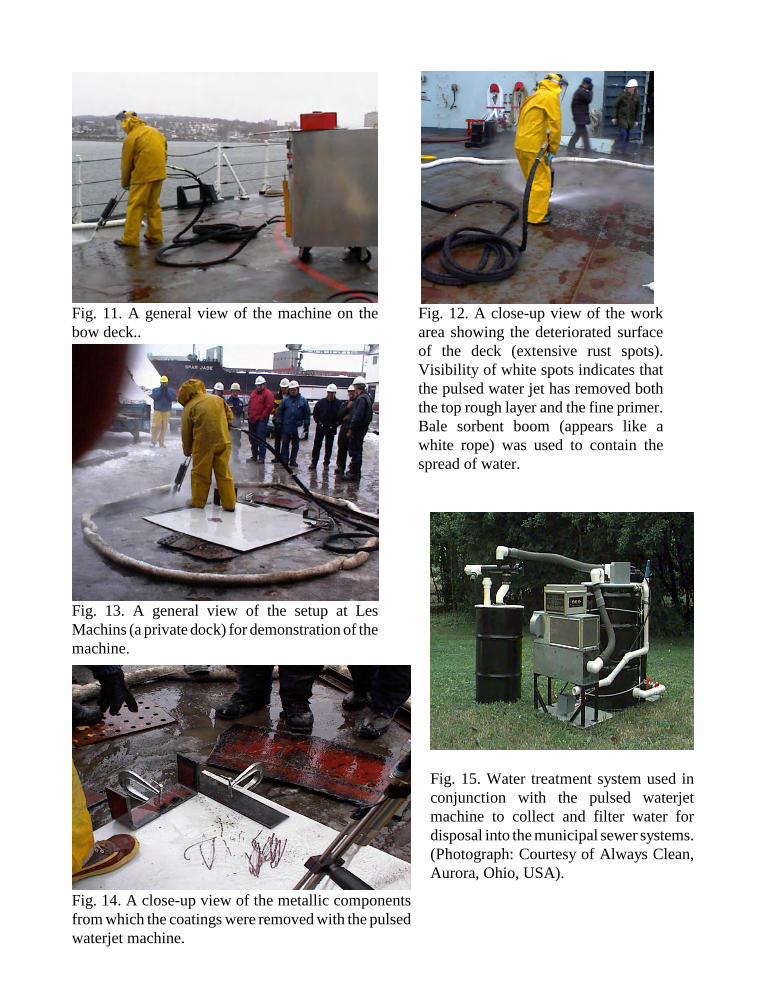
Fig. 15. Water treatment system used inconjunction with the pulsed waterjetmachine to collect and filter water fordisposal into the municipal sewer systems.(Photograph: Courtesy of Always Clean,Aurora, Ohio, USA).
Fig. 14. A close-up view of the metallic componentsfrom which the coatings were removed with the pulsedwaterjet machine.
Fig. 12. A close-up view of the workarea showing the deteriorated surfaceof the deck (extensive rust spots).Visibility of white spots indicates thatthe pulsed water jet has removed boththe top rough layer and the fine primer.Bale sorbent boom (appears like awhite rope) was used to contain thespread of water.
Fig. 11. A general view of the machine on thebow deck..
Fig. 13. A general view of the setup at LesMachins (a private dock) for demonstration of themachine.
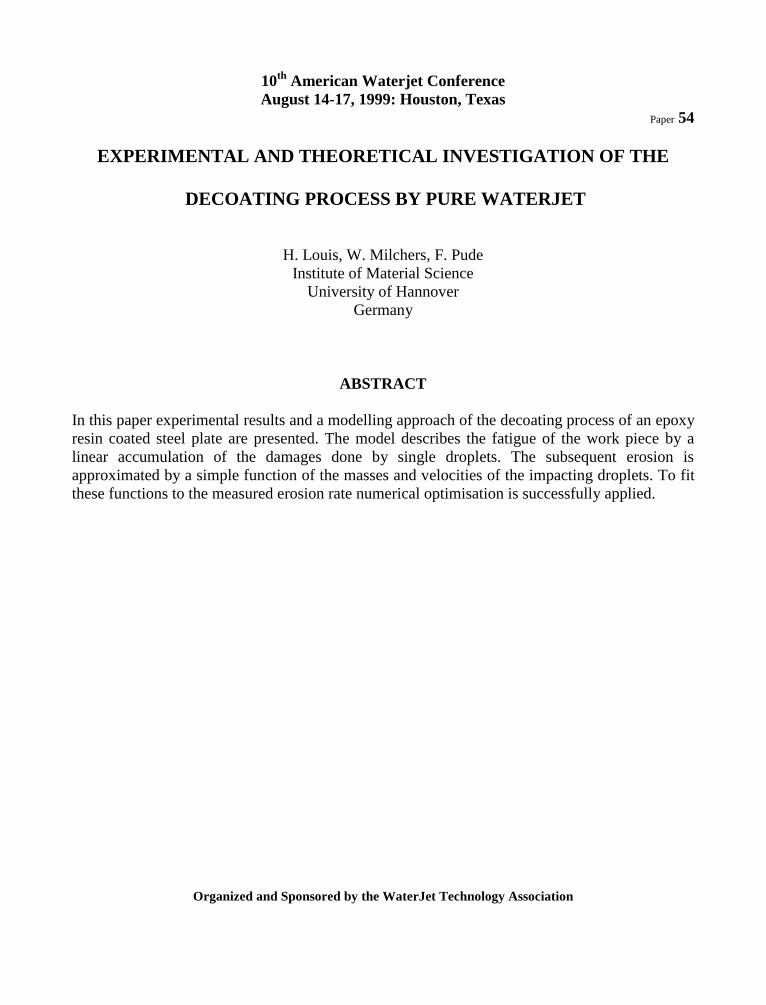
10th American Waterjet ConferenceAugust 14-17, 1999: Houston, Texas
Paper 54
EXPERIMENTAL AND THEORETICAL INVESTIGATION OF THE
DECOATING PROCESS BY PURE WATERJET
H. Louis, W. Milchers, F. PudeInstitute of Material Science
University of HannoverGermany
ABSTRACT
In this paper experimental results and a modelling approach of the decoating process of an epoxyresin coated steel plate are presented. The model describes the fatigue of the work piece by alinear accumulation of the damages done by single droplets. The subsequent erosion isapproximated by a simple function of the masses and velocities of the impacting droplets. To fitthese functions to the measured erosion rate numerical optimisation is successfully applied.
Organized and Sponsored by the WaterJet Technology Association
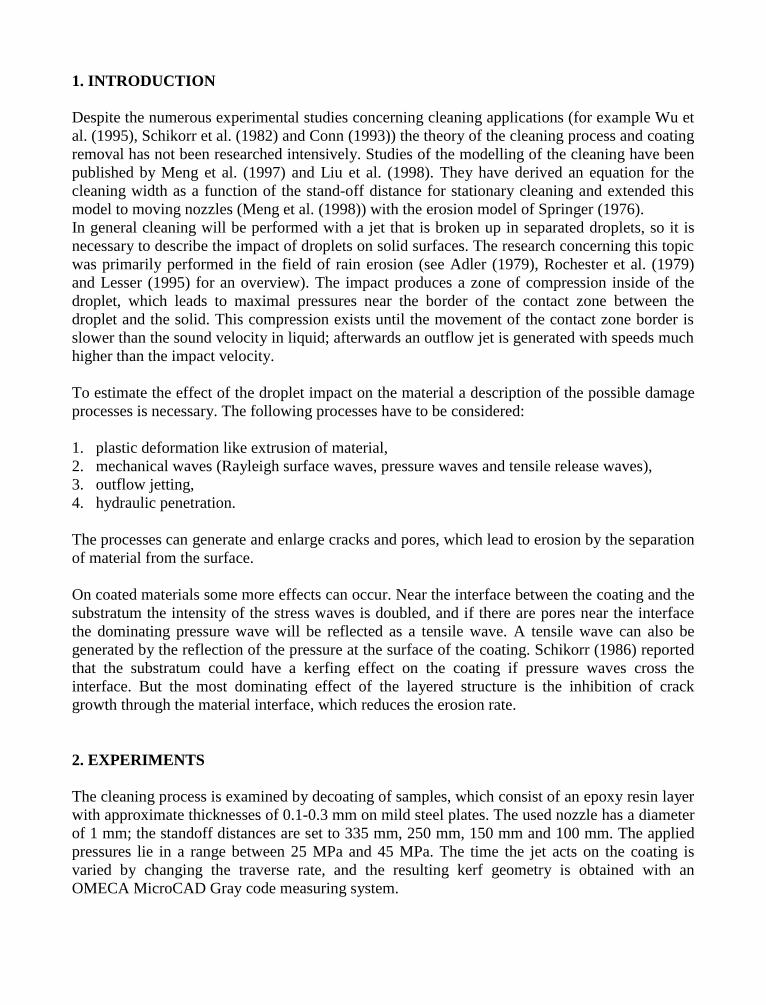
1. INTRODUCTION
Despite the numerous experimental studies concerning cleaning applications (for example Wu etal. (1995), Schikorr et al. (1982) and Conn (1993)) the theory of the cleaning process and coatingremoval has not been researched intensively. Studies of the modelling of the cleaning have beenpublished by Meng et al. (1997) and Liu et al. (1998). They have derived an equation for thecleaning width as a function of the stand-off distance for stationary cleaning and extended thismodel to moving nozzles (Meng et al. (1998)) with the erosion model of Springer (1976).In general cleaning will be performed with a jet that is broken up in separated droplets, so it isnecessary to describe the impact of droplets on solid surfaces. The research concerning this topicwas primarily performed in the field of rain erosion (see Adler (1979), Rochester et al. (1979)and Lesser (1995) for an overview). The impact produces a zone of compression inside of thedroplet, which leads to maximal pressures near the border of the contact zone between thedroplet and the solid. This compression exists until the movement of the contact zone border isslower than the sound velocity in liquid; afterwards an outflow jet is generated with speeds muchhigher than the impact velocity.
To estimate the effect of the droplet impact on the material a description of the possible damageprocesses is necessary. The following processes have to be considered:
1. plastic deformation like extrusion of material,2. mechanical waves (Rayleigh surface waves, pressure waves and tensile release waves),3. outflow jetting,4. hydraulic penetration.
The processes can generate and enlarge cracks and pores, which lead to erosion by the separationof material from the surface.
On coated materials some more effects can occur. Near the interface between the coating and thesubstratum the intensity of the stress waves is doubled, and if there are pores near the interfacethe dominating pressure wave will be reflected as a tensile wave. A tensile wave can also begenerated by the reflection of the pressure at the surface of the coating. Schikorr (1986) reportedthat the substratum could have a kerfing effect on the coating if pressure waves cross theinterface. But the most dominating effect of the layered structure is the inhibition of crackgrowth through the material interface, which reduces the erosion rate.
2. EXPERIMENTS
The cleaning process is examined by decoating of samples, which consist of an epoxy resin layerwith approximate thicknesses of 0.1-0.3 mm on mild steel plates. The used nozzle has a diameterof 1 mm; the standoff distances are set to 335 mm, 250 mm, 150 mm and 100 mm. The appliedpressures lie in a range between 25 MPa and 45 MPa. The time the jet acts on the coating isvaried by changing the traverse rate, and the resulting kerf geometry is obtained with anOMECA MicroCAD Gray code measuring system.
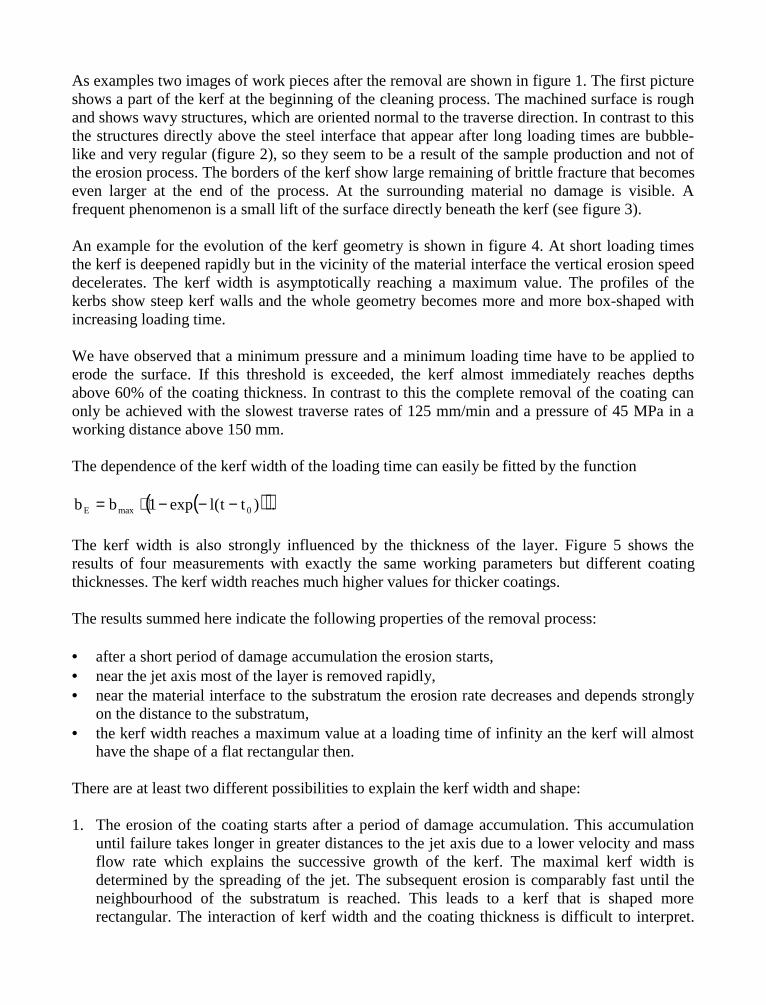
As examples two images of work pieces after the removal are shown in figure 1. The first pictureshows a part of the kerf at the beginning of the cleaning process. The machined surface is roughand shows wavy structures, which are oriented normal to the traverse direction. In contrast to thisthe structures directly above the steel interface that appear after long loading times are bubble-like and very regular (figure 2), so they seem to be a result of the sample production and not ofthe erosion process. The borders of the kerf show large remaining of brittle fracture that becomeseven larger at the end of the process. At the surrounding material no damage is visible. Afrequent phenomenon is a small lift of the surface directly beneath the kerf (see figure 3).
An example for the evolution of the kerf geometry is shown in figure 4. At short loading timesthe kerf is deepened rapidly but in the vicinity of the material interface the vertical erosion speeddecelerates. The kerf width is asymptotically reaching a maximum value. The profiles of thekerbs show steep kerf walls and the whole geometry becomes more and more box-shaped withincreasing loading time.
We have observed that a minimum pressure and a minimum loading time have to be applied toerode the surface. If this threshold is exceeded, the kerf almost immediately reaches depthsabove 60% of the coating thickness. In contrast to this the complete removal of the coating canonly be achieved with the slowest traverse rates of 125 mm/min and a pressure of 45 MPa in aworking distance above 150 mm.
The dependence of the kerf width of the loading time can easily be fitted by the function
( )( ))tt(lexp1bb 0maxE −−−⋅= .
The kerf width is also strongly influenced by the thickness of the layer. Figure 5 shows theresults of four measurements with exactly the same working parameters but different coatingthicknesses. The kerf width reaches much higher values for thicker coatings.
The results summed here indicate the following properties of the removal process:
• after a short period of damage accumulation the erosion starts,• near the jet axis most of the layer is removed rapidly,• near the material interface to the substratum the erosion rate decreases and depends strongly
on the distance to the substratum,• the kerf width reaches a maximum value at a loading time of infinity an the kerf will almost
have the shape of a flat rectangular then.
There are at least two different possibilities to explain the kerf width and shape:
1. The erosion of the coating starts after a period of damage accumulation. This accumulationuntil failure takes longer in greater distances to the jet axis due to a lower velocity and massflow rate which explains the successive growth of the kerf. The maximal kerf width isdetermined by the spreading of the jet. The subsequent erosion is comparably fast until theneighbourhood of the substratum is reached. This leads to a kerf that is shaped morerectangular. The interaction of kerf width and the coating thickness is difficult to interpret.
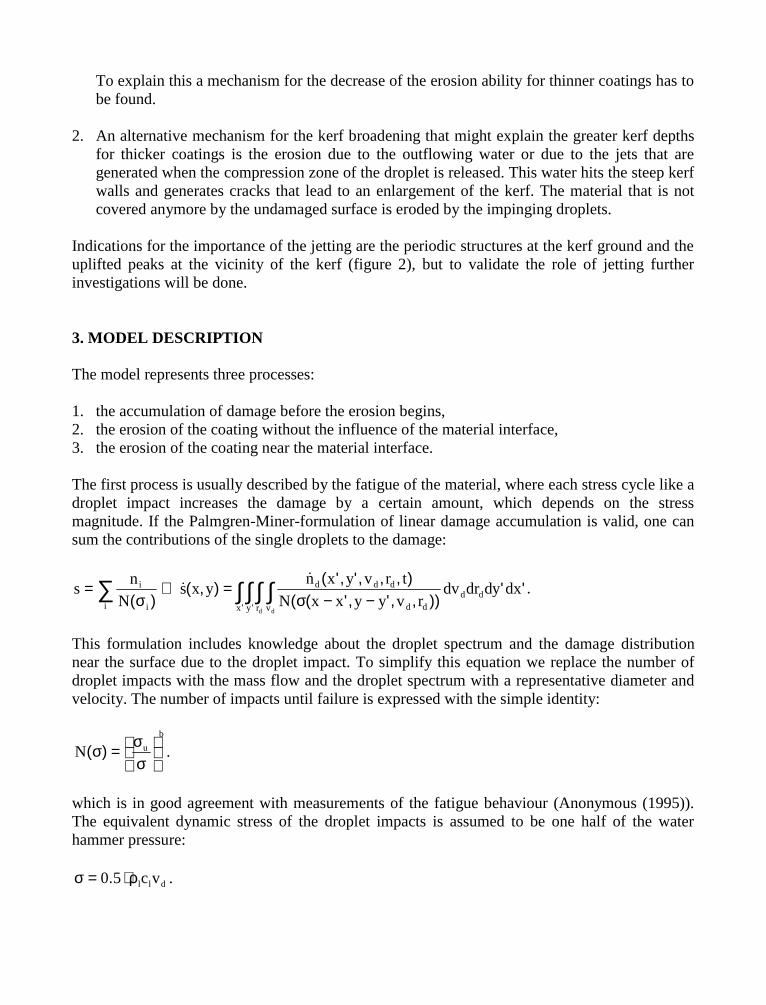
To explain this a mechanism for the decrease of the erosion ability for thinner coatings has tobe found.
2. An alternative mechanism for the kerf broadening that might explain the greater kerf depthsfor thicker coatings is the erosion due to the outflowing water or due to the jets that aregenerated when the compression zone of the droplet is released. This water hits the steep kerfwalls and generates cracks that lead to an enlargement of the kerf. The material that is notcovered anymore by the undamaged surface is eroded by the impinging droplets.
Indications for the importance of the jetting are the periodic structures at the kerf ground and theuplifted peaks at the vicinity of the kerf (figure 2), but to validate the role of jetting furtherinvestigations will be done.
3. MODEL DESCRIPTION
The model represents three processes:
1. the accumulation of damage before the erosion begins,2. the erosion of the coating without the influence of the material interface,3. the erosion of the coating near the material interface.
The first process is usually described by the fatigue of the material, where each stress cycle like adroplet impact increases the damage by a certain amount, which depends on the stressmagnitude. If the Palmgren-Miner-formulation of linear damage accumulation is valid, one cansum the contributions of the single droplets to the damage:
∫ ∫ ∫ ∫∑ −−σ=⇒
σ=
' '
'')),,','((
),,,','(),(
)( x y r v
dddd
ddd
i i
i
d d
dxdydrdvrvyyxxN
trvyxnyxs
N
ns
.
This formulation includes knowledge about the droplet spectrum and the damage distributionnear the surface due to the droplet impact. To simplify this equation we replace the number ofdroplet impacts with the mass flow and the droplet spectrum with a representative diameter andvelocity. The number of impacts until failure is expressed with the simple identity:
b
uN
σσ=σ)( .
which is in good agreement with measurements of the fatigue behaviour (Anonymous (1995)).The equivalent dynamic stress of the droplet impacts is assumed to be one half of the waterhammer pressure:
dll vc50 ρ⋅=σ . .
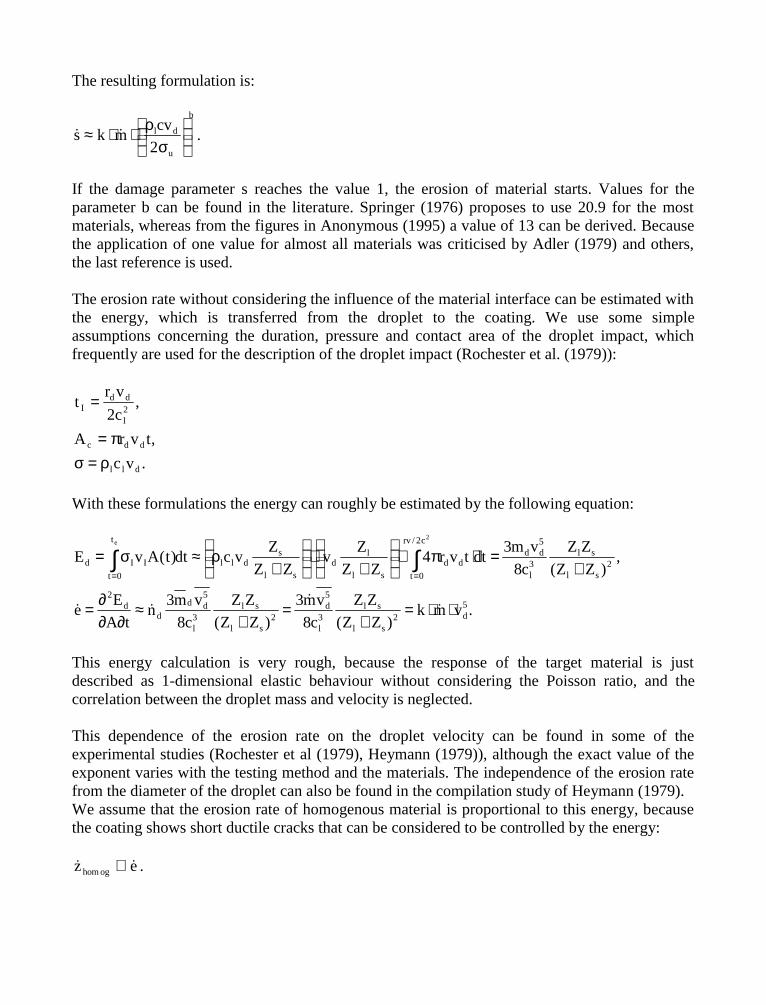
The resulting formulation is:
b
u
dl
2
cvmks
σ
ρ⋅⋅≈ .
If the damage parameter s reaches the value 1, the erosion of material starts. Values for theparameter b can be found in the literature. Springer (1976) proposes to use 20.9 for the mostmaterials, whereas from the figures in Anonymous (1995) a value of 13 can be derived. Becausethe application of one value for almost all materials was criticised by Adler (1979) and others,the last reference is used.
The erosion rate without considering the influence of the material interface can be estimated withthe energy, which is transferred from the droplet to the coating. We use some simpleassumptions concerning the duration, pressure and contact area of the droplet impact, whichfrequently are used for the description of the droplet impact (Rochester et al. (1979)):
.vc
,tvrA
,c2
vrt
dll
ddc
2l
ddI
ρ=σπ=
=
With these formulations the energy can roughly be estimated by the following equation:
.vmk)ZZ(
ZZ
c8
vm3
)ZZ(
ZZ
c8
vm3n
tA
Ee
,)ZZ(
ZZ
c8
vm3dttvr4
ZZ
Zv
ZZ
Zvcdt)t(AvE
5d2
sl
sl3l
5d
2sl
sl3l
5dd
dd
2
2sl
sl3l
5dd
c2/rv
0t
ddsl
ld
sl
sdll
t
0t
IId
2e
⋅⋅=+
=+
≈∂∂
∂=
+=⋅π⋅
+
⋅
+
ρ≈σ= ∫∫==
This energy calculation is very rough, because the response of the target material is justdescribed as 1-dimensional elastic behaviour without considering the Poisson ratio, and thecorrelation between the droplet mass and velocity is neglected.
This dependence of the erosion rate on the droplet velocity can be found in some of theexperimental studies (Rochester et al (1979), Heymann (1979)), although the exact value of theexponent varies with the testing method and the materials. The independence of the erosion ratefrom the diameter of the droplet can also be found in the compilation study of Heymann (1979).We assume that the erosion rate of homogenous material is proportional to this energy, becausethe coating shows short ductile cracks that can be considered to be controlled by the energy:
ez oghom ∝ .
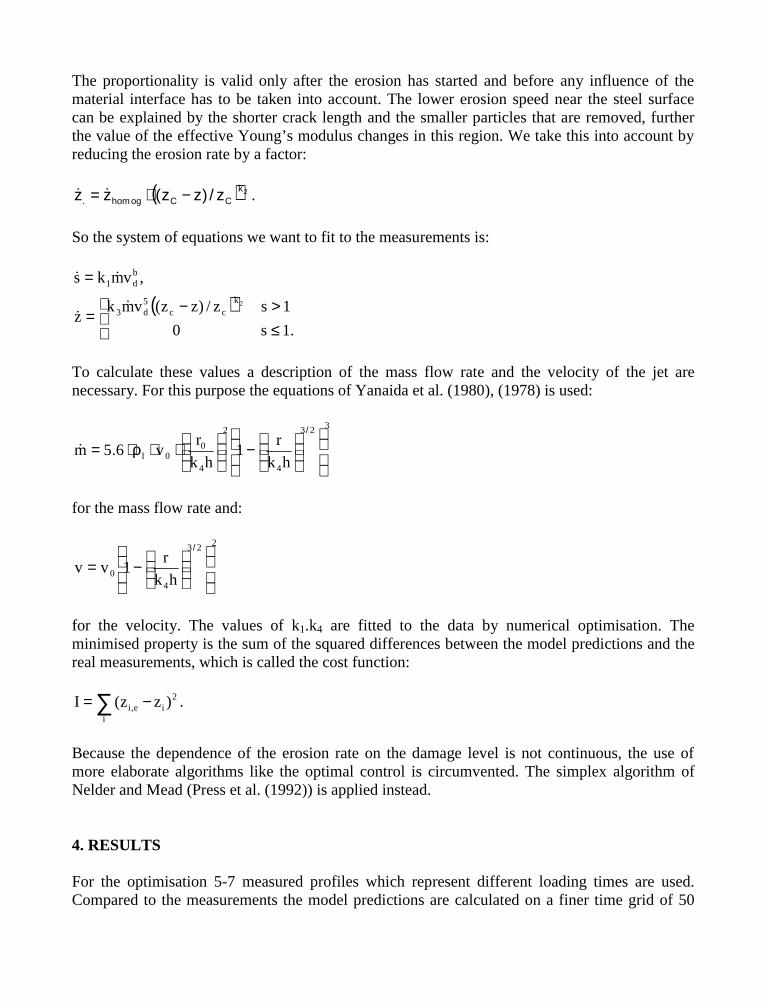
The proportionality is valid only after the erosion has started and before any influence of thematerial interface has to be taken into account. The lower erosion speed near the steel surfacecan be explained by the shorter crack length and the smaller particles that are removed, furtherthe value of the effective Young’s modulus changes in this region. We take this into account byreducing the erosion rate by a factor:
( ) 2kCCoghom. z/)zz(zz −⋅= .
So the system of equations we want to fit to the measurements is:
( )
≤>−=
=
.1s0
1sz/)zz(vmkz
,vmks
2kcc
5d3
bd1
To calculate these values a description of the mass flow rate and the velocity of the jet arenecessary. For this purpose the equations of Yanaida et al. (1980), (1978) is used:
323
4
2
4
00l hk
r1
hk
rv65m
−
⋅⋅ρ⋅=
/
.
for the mass flow rate and:
223
40 hk
r1vv
−=
/
for the velocity. The values of k1.k4 are fitted to the data by numerical optimisation. Theminimised property is the sum of the squared differences between the model predictions and thereal measurements, which is called the cost function:
2
iie,i )zz(I ∑ −= .
Because the dependence of the erosion rate on the damage level is not continuous, the use ofmore elaborate algorithms like the optimal control is circumvented. The simplex algorithm ofNelder and Mead (Press et al. (1992)) is applied instead.
4. RESULTS
For the optimisation 5-7 measured profiles which represent different loading times are used.Compared to the measurements the model predictions are calculated on a finer time grid of 50
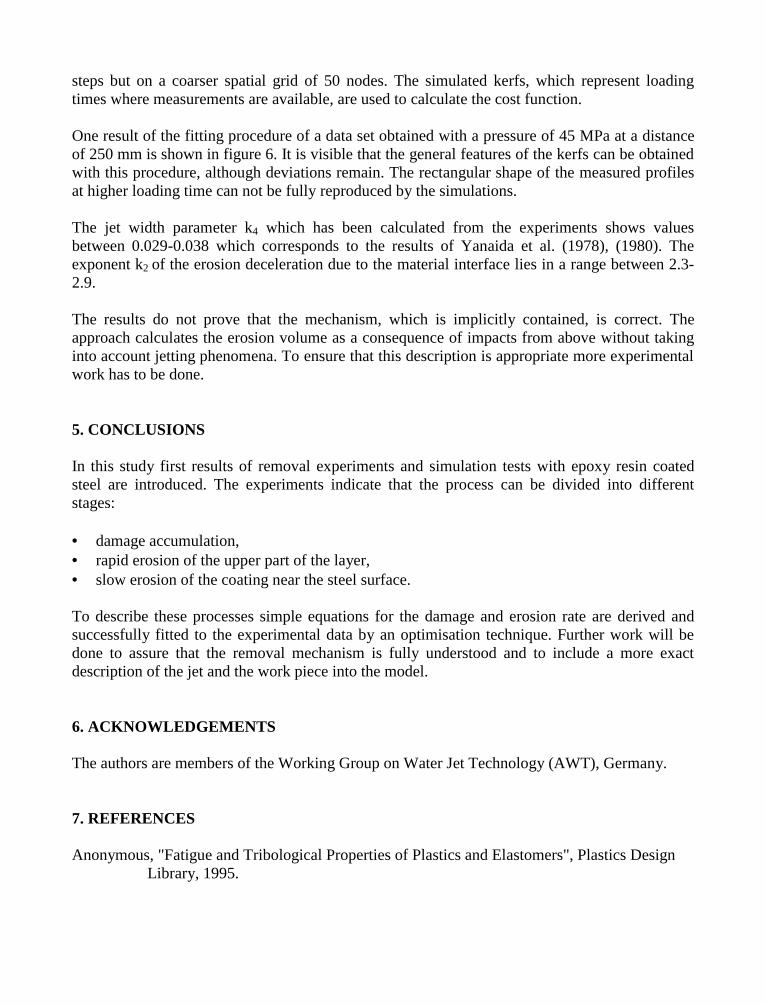
steps but on a coarser spatial grid of 50 nodes. The simulated kerfs, which represent loadingtimes where measurements are available, are used to calculate the cost function.
One result of the fitting procedure of a data set obtained with a pressure of 45 MPa at a distanceof 250 mm is shown in figure 6. It is visible that the general features of the kerfs can be obtainedwith this procedure, although deviations remain. The rectangular shape of the measured profilesat higher loading time can not be fully reproduced by the simulations.
The jet width parameter k4 which has been calculated from the experiments shows valuesbetween 0.029-0.038 which corresponds to the results of Yanaida et al. (1978), (1980). Theexponent k2 of the erosion deceleration due to the material interface lies in a range between 2.3-2.9.
The results do not prove that the mechanism, which is implicitly contained, is correct. Theapproach calculates the erosion volume as a consequence of impacts from above without takinginto account jetting phenomena. To ensure that this description is appropriate more experimentalwork has to be done.
5. CONCLUSIONS
In this study first results of removal experiments and simulation tests with epoxy resin coatedsteel are introduced. The experiments indicate that the process can be divided into differentstages:
• damage accumulation,• rapid erosion of the upper part of the layer,• slow erosion of the coating near the steel surface.
To describe these processes simple equations for the damage and erosion rate are derived andsuccessfully fitted to the experimental data by an optimisation technique. Further work will bedone to assure that the removal mechanism is fully understood and to include a more exactdescription of the jet and the work piece into the model.
6. ACKNOWLEDGEMENTS
The authors are members of the Working Group on Water Jet Technology (AWT), Germany.
7. REFERENCES
Anonymous, "Fatigue and Tribological Properties of Plastics and Elastomers", Plastics DesignLibrary, 1995.
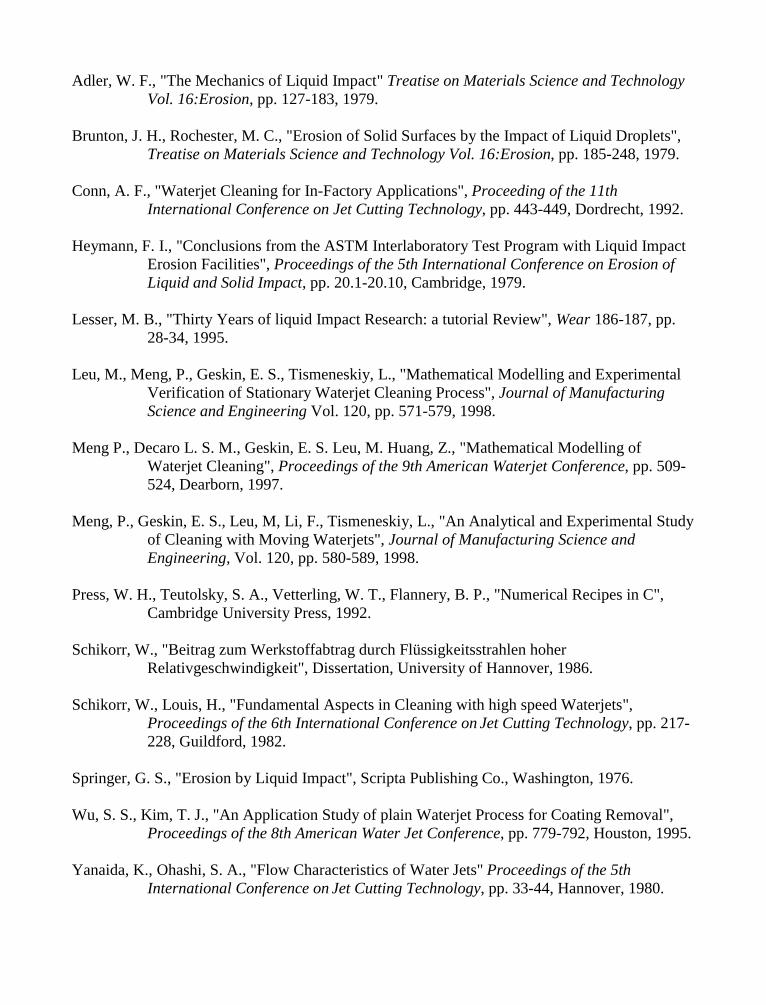
Adler, W. F., "The Mechanics of Liquid Impact" Treatise on Materials Science and TechnologyVol. 16:Erosion, pp. 127-183, 1979.
Brunton, J. H., Rochester, M. C., "Erosion of Solid Surfaces by the Impact of Liquid Droplets",Treatise on Materials Science and Technology Vol. 16:Erosion, pp. 185-248, 1979.
Conn, A. F., "Waterjet Cleaning for In-Factory Applications", Proceeding of the 11thInternational Conference on Jet Cutting Technology, pp. 443-449, Dordrecht, 1992.
Heymann, F. I., "Conclusions from the ASTM Interlaboratory Test Program with Liquid ImpactErosion Facilities", Proceedings of the 5th International Conference on Erosion ofLiquid and Solid Impact, pp. 20.1-20.10, Cambridge, 1979.
Lesser, M. B., "Thirty Years of liquid Impact Research: a tutorial Review", Wear 186-187, pp.28-34, 1995.
Leu, M., Meng, P., Geskin, E. S., Tismeneskiy, L., "Mathematical Modelling and ExperimentalVerification of Stationary Waterjet Cleaning Process", Journal of ManufacturingScience and Engineering Vol. 120, pp. 571-579, 1998.
Meng P., Decaro L. S. M., Geskin, E. S. Leu, M. Huang, Z., "Mathematical Modelling ofWaterjet Cleaning", Proceedings of the 9th American Waterjet Conference, pp. 509-524, Dearborn, 1997.
Meng, P., Geskin, E. S., Leu, M, Li, F., Tismeneskiy, L., "An Analytical and Experimental Studyof Cleaning with Moving Waterjets", Journal of Manufacturing Science andEngineering, Vol. 120, pp. 580-589, 1998.
Press, W. H., Teutolsky, S. A., Vetterling, W. T., Flannery, B. P., "Numerical Recipes in C",Cambridge University Press, 1992.
Schikorr, W., "Beitrag zum Werkstoffabtrag durch Flüssigkeitsstrahlen hoher Relativgeschwindigkeit", Dissertation, University of Hannover, 1986.
Schikorr, W., Louis, H., "Fundamental Aspects in Cleaning with high speed Waterjets",Proceedings of the 6th International Conference on Jet Cutting Technology, pp. 217-228, Guildford, 1982.
Springer, G. S., "Erosion by Liquid Impact", Scripta Publishing Co., Washington, 1976.
Wu, S. S., Kim, T. J., "An Application Study of plain Waterjet Process for Coating Removal",Proceedings of the 8th American Water Jet Conference, pp. 779-792, Houston, 1995.
Yanaida, K., Ohashi, S. A., "Flow Characteristics of Water Jets" Proceedings of the 5thInternational Conference on Jet Cutting Technology, pp. 33-44, Hannover, 1980.

Yanaida, K., Ohashi, S. A., "Flow Characteristics of Water Jets in Air", Proceedings of the 4thInternational Conference on Jet Cutting Technology, pp. 39-53, Canterbury, 1978.
8. NOMENCLATURE
A: areab: parameter of fatigue behaviourbE: kerf widthbmax: maximal kerf widthcl: speed of sound in liquidEd: energy of droplet impacte: energy per areah: stand-off distanceI: cost functionkx, l: empirically fitted parametersm: mass per areamd: droplet massnd: number of droplet impacts per areaN(σ): number of impacts until failureP: pressurerd: droplet radiusr: distance from the jet axisr0: nozzle radiuss: damaget: timevd: droplet velocityv0: jet velocity at nozzle exitv: traverse ratex,y: co-ordinatesz: kerf depthzc: coating thicknessze: experimental kerf depthZl,Zs: acoustic Impedance of liquid, solidρl: density of liquidσ: stressσu: ultimate tensile strength
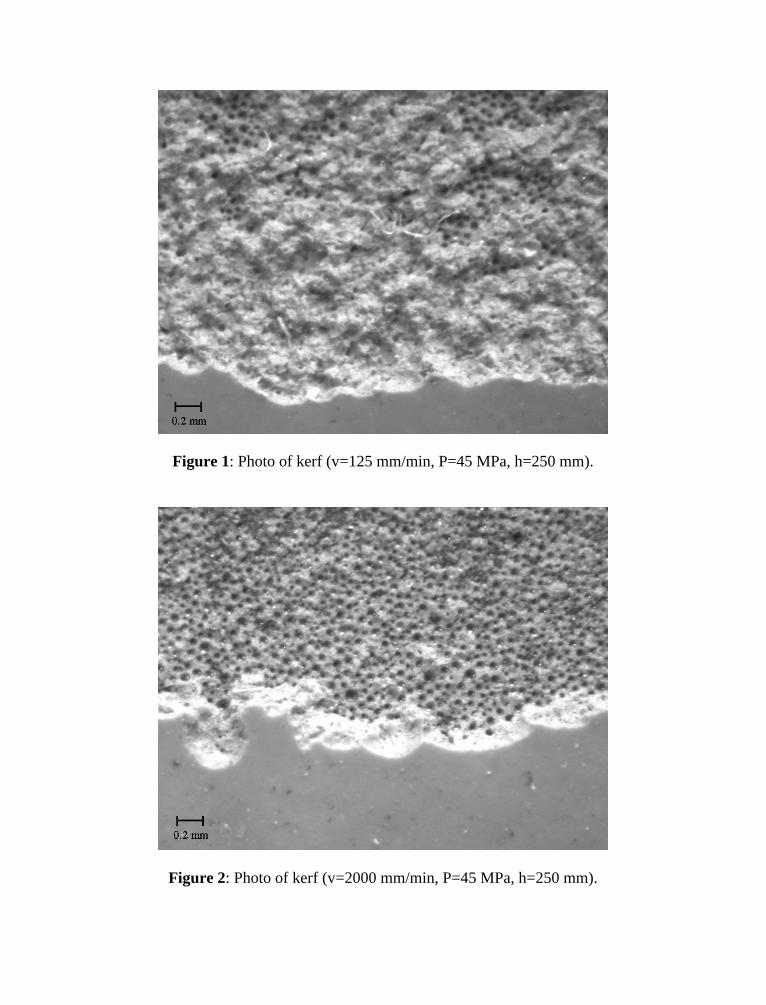
Figure 1: Photo of kerf (v=125 mm/min, P=45 MPa, h=250 mm).
Figure 2: Photo of kerf (v=2000 mm/min, P=45 MPa, h=250 mm).
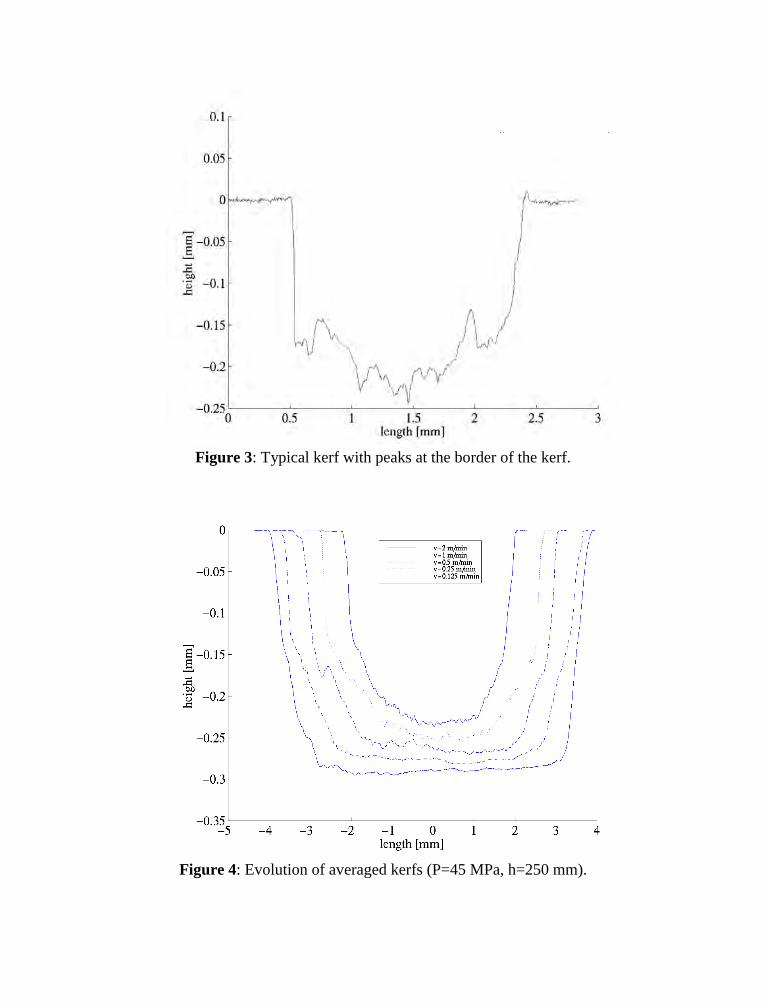
Figure 3: Typical kerf with peaks at the border of the kerf.
Figure 4: Evolution of averaged kerfs (P=45 MPa, h=250 mm).
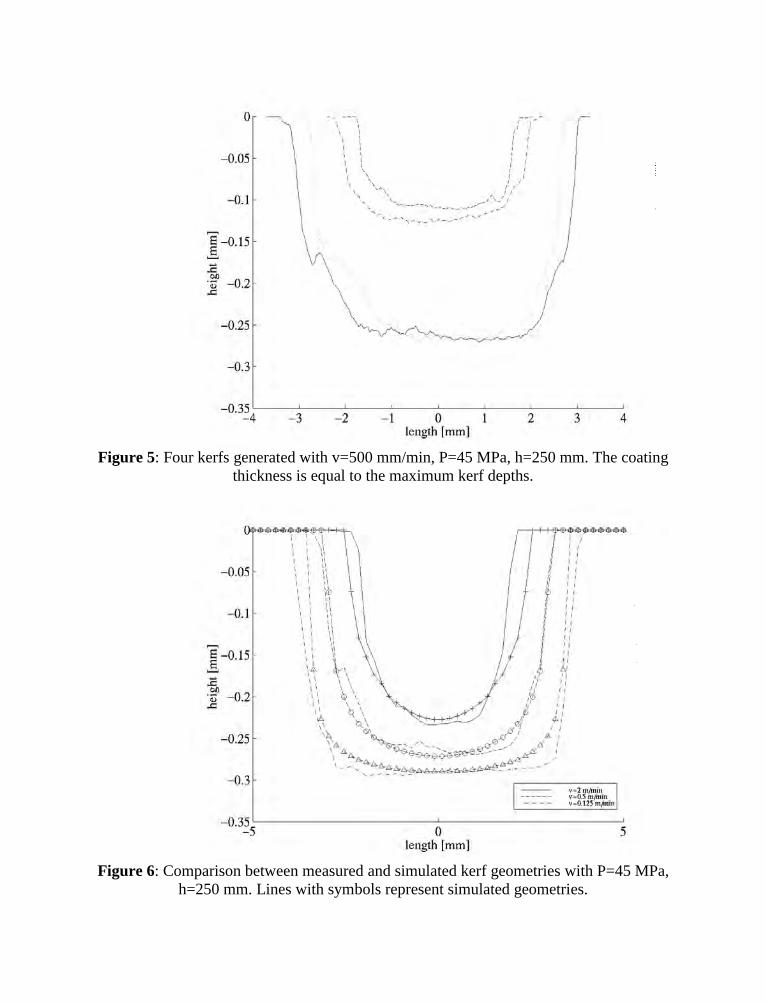
Figure 5: Four kerfs generated with v=500 mm/min, P=45 MPa, h=250 mm. The coatingthickness is equal to the maximum kerf depths.
Figure 6: Comparison between measured and simulated kerf geometries with P=45 MPa,h=250 mm. Lines with symbols represent simulated geometries.
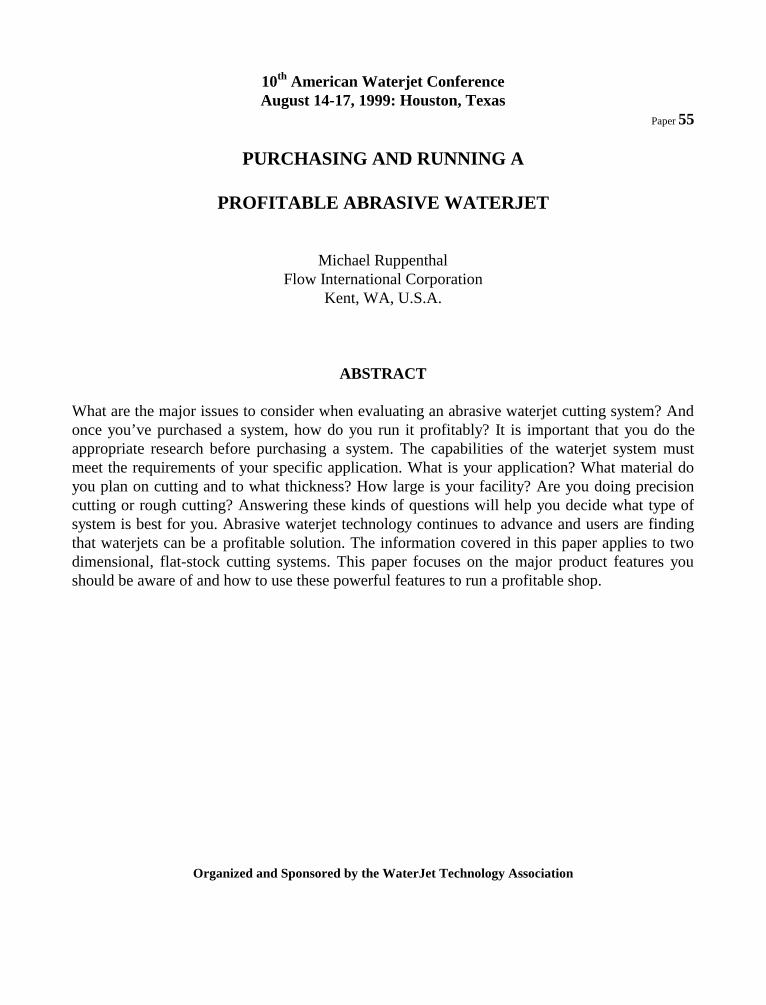
10th American Waterjet ConferenceAugust 14-17, 1999: Houston, Texas
Paper 55
PURCHASING AND RUNNING A
PROFITABLE ABRASIVE WATERJET
Michael RuppenthalFlow International Corporation
Kent, WA, U.S.A.
ABSTRACT
What are the major issues to consider when evaluating an abrasive waterjet cutting system? Andonce you’ve purchased a system, how do you run it profitably? It is important that you do theappropriate research before purchasing a system. The capabilities of the waterjet system mustmeet the requirements of your specific application. What is your application? What material doyou plan on cutting and to what thickness? How large is your facility? Are you doing precisioncutting or rough cutting? Answering these kinds of questions will help you decide what type ofsystem is best for you. Abrasive waterjet technology continues to advance and users are findingthat waterjets can be a profitable solution. The information covered in this paper applies to twodimensional, flat-stock cutting systems. This paper focuses on the major product features youshould be aware of and how to use these powerful features to run a profitable shop.
Organized and Sponsored by the WaterJet Technology Association
1. INTRODUCTION
There are several items that should be considered before purchasing an abrasive waterjet system.The first section of this paper, Keys to Purchasing an Abrasive Waterjet, will touch on how toevaluate the different product features offered by manufacturers, including the high pressurepump, table and catcher tank, cutting head, software and the service and support you shouldexpect from the manufacturer. Once you’ve made the decision to purchase and the system isinstalled on your floor, how do you run the machine to ensure that it is operating efficiently andcreating a profit for you? The second section of this paper, Running a Profitable AbrasiveWaterjet, will provide you with some insight on how to optimize the features of your waterjetsystem to create a profit for your shop.
2. KEYS TO PURCHASING AN ABRASIVE WATERJET
This section covers the major equipment features to research when evaluating an abrasivewaterjet system for purchase. These are some of the issues you should consider when researchingdifferent brands of equipment. Take a close look at your application to decide what features andoptions will work best for you.
2.1 Choosing the High Pressure Pump
The pump that is best for you is the one that optimizes cutting for your particular application(s).If you are cutting various metals of different thicknesses, a higher horsepower pump would berecommended. If you’re cutting thinner material, a lower horsepower pump is sufficient, howeverit may limit your cutting speed. Be sure to ask your sales representative about component life andmaintenance of the pump.
There are two main types of pumps: crankshafts and intensifiers. Crankshaft pumps use a crankcase and pistons while intensifiers use hydraulics. Crankshaft pumps generate a higherpercentage of horsepower to the nozzle. Intensifier pumps can generate pressures of up to 3793bar [55,000 psi]. Pressures can also be controlled and changed easily with both types of pumps.When cutting brittle materials such as marble or glass, the ability to decrease the pressure isadvantageous for preventing any unnecessary cracking or surface frosting. Both styles are easy tomaintain, with some having integrated sensors and common sense troubleshooting. Intensifierpumps are usually stand-alone pumps and must be controlled at the pump. They can bepositioned further away, with most users placing them within 6.1 meters [20 feet] of the cuttingtable. If you’re concerned about noise level in your shop, you may choose to put the pump in aseparate room.
Pump horsepower ranges from 25 to 200 or more. Which horsepower is best for yourapplication? You want to make sure that you maximize the horsepower of the pump. Forexample, if you’re running a 100 horsepower pump, your maximum flow rate is 7.57 liters perminute [2 gallons per minute]. This means that you can run up to a 0.51 mm [0.020 in] orifice. Ifyou’re only using one cutting head and a 0.25 mm [0.010 in] orifice, you are not maximizing the
horsepower of the pump. By running dual cutting heads with a 0.25 mm [0.010 in] orifice in eachhead, you would be maximizing the output of the pump. Make sure that the pump horsepoweryou choose will flow enough water to support your application.
2.2 Table and Catcher Tank Features
2.2.1 Table Size
Again, your specific application will help determine the table size that is best for you. Will thetable hold standard material sizes? How much space is available in your facility? How far willthe nozzle travel? These are a few of the questions you should consider. If you don’t have enoughspace in your facility, you obviously are not going to choose a larger table. Manufacturers usuallyoffer a wide range of sizes to fit your specific needs. If you’re cutting sheet metal, the tableshould be able to hold standard sheet sizes. For example, if your material is 1.21 m x 2.43 m [48in x 96 in], make sure that the work envelope is at least that large.
2.2.2 Rigidity
The rigidity of the table effects the accuracy of the finished part. Make sure that the system youare considering is rigid enough to support your application, especially if you plan on usingmultiple cutting heads. This extra weight may cause inaccuracies in your finished parts. Mostsystems which have been designed using finite element analysis (FEA) are engineered to handlewaterjet applications and have been properly tested for rigidity.
2.2.3 Accuracy and Repeatability
More often then not, you will want your parts to be highly accurate. But how accurate? Someindustries, such as stone and tile, do not require highly accurate parts. Most industries, however,do require high tolerance parts. Some machines can produce parts to ± 0.076 mm [± 0.003 in]. Anumber of waterjet machine tool companies manufacture different machine lines with differentaccuracy, one being slightly more accurate than the other. Higher accuracy machines will usuallyrequire a larger capital investment.
Most manufacturers will claim that a high precision machine has a positioning accuracy of ±0.076 mm [± 0.003 in]. Some machines are capable of cutting at even higher positioningaccuracy, but manufacturers are cautious when quoting finished part tolerances. Find out thedynamic accuracy measurements, making sure that these measurements were taken at a variety ofspeeds. Ask the manufacturer for documentation on accuracy and reliability. Many perform ball-bar tests on their machines, but just because they perform a ball-bar test does not guarantee thatthe machine is accurate. Be sure to learn what the ball-bar test actually means, and ask them toperform a bar-bar test at your facility once the machine is installed.
Repeatability is another important item to consider. Make sure that your parts can be cut with thesame tolerance time after time. If you cannot reproduce the parts to the same specifications, themachine does not have reliable repeatability and this could cost you money in the end. Have the
sales representative cut sample parts in different areas of the machine to ensure that the partscome out to specification each time.
2.2.4 Catcher Tank
The catcher tank is a critical aspect of the cutting system. You’ll want to look for individualmaterial support slats that can be quickly and easily removed for certain applications and forreplacement. Slats should be deep (i.e. 10 cm [4 in]) to provide long life as the jet will nick thetop of the slat during abrasive waterjet cutting. Often times you can even cut replacement slats onyour abrasive waterjet system. If you plan on cutting underwater, make sure that the catcher isequipped with water level control. Cutting underwater reduces noise and surface frosting. Makesure that the water level can be raised to at least 5 cm [2 in] above the work surface.
2.3 Cutting Head Alignment and Life
The most important thing to look for in the cutting head is precision tool alignment. Most cuttingheads are pre aligned. You should avoid manually aligned tooling as the potential for operatorerror is introduced. If the orifice is not aligned properly, the mixing tube may wear out faster andwill not wear cocentrically, as water will be hitting the side of the mixing tube instead of straightdown. The accuracy of your finished part may be compromised. You should be able to changeout the orifice and mixing tube quickly and easily (in just minutes). Also look for the ability tochange the abrasive nozzle out with a waterjet nozzle. This will give you the option to cut foam,rubber and other waterjet-only applications.
What is the average life of the orifice and mixing tube? You’ll probably find that mostmanufacturers will quote about the same mixing tube life. Wearing of the mixing tube will effectyou differently depending on your application. If you’re cutting precision parts, a worn mixingtube will effect your part more than if you’re doing rough work, in which case you will find that aworn mixing tube is not a concern.
Orifices are made from rubies, sapphires or diamonds. Diamonds are heavily used in purewaterjet cutting applications such as paper slitting, where the system is running 24 hours a day,365 days a year. In abrasive waterjet cutting, the cost per hour of when running with a diamondmay be higher than ruby or sapphire. It is recommended that you change out the orifice at thesame time that the mixing tube is replaced. For this reason, rubies and sapphires arerecommended since they generally have the same life as the mixing tube. Diamonds are moreexpensive, but also last longer. Manufacturers may offer some or all three orifice materials.
2.4 Powerful Software Capabilities
Two main types of control systems are available: CNC and PC controls. CNC controls are moretraditional and requires more training and experience than PC controls. PC controls are easy tolearn and are becoming more and more accepted in the industry. Many waterjets sold today areequipped with PC controls, with the exception of CNC controls used in 5-axis machining. Theeasier it is to program your parts, the better. If possible, have your part programmed and cut
while you watch. Companies can perform demonstrations which will help you get a feeling ofhow quick and easy it will be for you to reproduce that part on your floor.
There are many items to look for when evaluating software. Here are some questions you shouldask yourself. Can you control the sequence of entities that are to be cut first? What software isavailable to scan and convert artwork? Is there a nesting program available? Does the softwareautomatically tell the machine to speed up at straight lines and slow down at curves and corners?Is the controller capable of stationary and dynamic piercing? Can you stop cutting at anytime andresume from the point where you stopped? Does the controller compensate for tool wear? Canyou purchase additional seats of software for programming in your office?
Each of the above questions can be critical to your decision to purchase a waterjet. You shouldnot be limited by your software. Make sure that the software has all the capabilities that you willneed for your specific application. You could lose valuable production time and sacrifice thequality of your finished parts if the software you are using has limited capabilities.
2.5 Company Service and Support
How do you decide on which waterjet manufacturer to purchase from? Take a look at thecompany or companies that you are seriously considering purchasing from. You will probablyschedule a company visit at which time you will meet employees and possibly see themanufacturing facility. Learn all you can about the company and what aftermarket services andsupport are available. Are there service representatives close to your facility? What are hours ofoperation and how will they support you? What kind of support does the firm offer you once youhave purchased the machine? Is there training available and if so, what kinds of courses areoffered?
Another way to find out more about the company is to talk to a customer who owns the brand ofequipment you are considering. Ask them what their experience has been working with thecompany and especially with technical service and customer service. Do they enjoy working withthe company? Is the response timely and friendly? Did they run into any difficulties? One of thebest ways to find out more about a company is to talk to its customers first hand.
3. RUNNING A PROFITABLE ABRASIVE WATERJET
Now that you know what to look for before purchasing an abrasive waterjet system, let’s take alook at how to run that waterjet profitably. As abrasive waterjet technology continues to advance,increasing numbers of users are discovering how abrasive waterjets can run efficiently andprofitably. Abrasive waterjet technology continues to reach new levels of productivity and ismoving into applications previously not perceived to be within its capability throughimprovements in configuration options, cutting techniques, automation and accuracy.
3.1 Simple Setup and Fixturing
The goal of any job shop or production environment is to maximize the amount of time thewaterjet machine is cutting and minimize the time associated with loading and unloadingmaterial. Waterjets cut with little force and therefore save valuable time that is normally spent onfixturing. Cutting 6.35 mm [0.25 in] thick steel, for example, requires little to no fixturing. Forthose times when fixturing may be necessary, for instance, when cutting parts from a small pieceof material, fixturing must be fast and easy in order to maximize profitability. Fixturing can be assimple as using clamps and weights, using a positioning square, or an “L” shaped piece of metalto orient the work piece. In a production or in-house environment, waterjets lend flexibility.Since in-house production involves cutting the same parts, it may make sense to cut onededicated fixturing piece to use for all materials.
3.2 Stacking Material
Stacking sheets of material is another method for increasing the profitability of yourmanufacturing environment. An abrasive waterjet has the ability to cut stacks of materials up to2.5 cm [1 in] in total thickness while maintaining part tolerance. Although stacking may notimprove effective cutting speed in all applications, it will reduce material loading and related set-up time. This resulting time-savings can have a positive impact on part yield per hour. And byminimizing material unloading, the machine runs more continuously meaning more parts arecoming off your table.
3.3 Shuttle Tables Reduce Material Handling
Utilizing shuttle tables is another method to increase profitability and save valuable setup time.Shuttle tables are recommended for a production environment. Automatic shuttle tables andswivel columns allow an operator to load material on one table as the waterjet cuts material onthe second table. The table with the finished parts then rotates or “shuttles” out of the workenvelope, being replaced by the table just loaded with uncut material. This can also beaccomplished manually, by simply having an operator load the second table and slide thematerial into the work envelope. This sophisticated method of material handling and deliveryminimizes non-cut time and optimizes material throughput since the waterjet machine is alwayscutting. Minimizing the time spent handling material contributes to greater part yield per hourand thus more profit for your shop.
3.4 Operating at Peak Performance
Running your abrasive waterjet system at peak performance can contribute to significant costsavings. The key to achieving peak performance from an abrasive waterjet machine is using anappropriate sized orifice with the appropriate pump horsepower while flowing an appropriateamount of abrasive consistently. For example, if you’re cutting 6.35 mm [0.25 in] aluminum at3793 bar [55,000 psi], with a 50 horsepower pump, you would use an abrasive flow rate of 0.59kg/minute [1.3 lb./minute], water rate of 3.63 liters/minute [.96 gallons/minute], and anorifice/mixing tube combination of 0.36 mm x 1.02 mm [0.014 in/0.040 in]. Any variance in
these parameters, such as higher horsepower with a smaller orifice and you’re not maximizingyour horsepower and therefore wasting money. On the other hand, if you do not have enoughhorsepower and are trying to cut with a larger orifice, the system will not operate at all. You wantto make sure that you are optimizing the output of your pump.
3.5 Monitoring the Waterjet’s Performance
Historically, abrasive waterjet cutting systems have been somewhat operator intensive. That is,an operator needed to be at the machine continually to monitor tool wear, consistency of abrasiveflow, pump conditions, loading and unloading work material and refilling the abrasive hopper.The operator also had to periodically clean out the catcher tank, which can be a tedious, messy,and time-consuming task.
While there are some shops who still operate their machines this way, times have changed.Performance monitoring is a powerful feature that is now available. This feature takes theguesswork out of monitoring your machine’s performance by automatically ensuring that allparameters are in sync. While waterjets cannot be considered “lights out machines,” performancemonitors can allow operators to leave the machine unattended for periods of time, usually aboutone to two hours, to perform other tasks. Operators can use this extra time to program other parts,operate another machine, or prepare the next batch of material for setup. Some performancemonitoring systems feature electronic monitoring devices that detect unacceptable cuttingconditions and shut down the machine automatically when one or more of the operatingparameters is out of sync. These monitors constantly check tooling conditions during cuttingoperations and shut the machine down if any fluctuations or variations are detected. Performancemonitoring reduces the chance for scrapping material and optimizes tool life.
3.6 When To Use Multiple Cutting Heads
Multiple cutting heads can have a tremendous impact on the profitability of your shop. Abrasivewaterjets are typically equipped with a single cutting head. While appropriate for low-volumeand some high-volume work, a single cutting head may limit production capabilities. By addingone, two, three or even four cutting heads to an abrasive waterjet system, an operator cansubstantially increase output and sacrifice little in cut speed. Taking the two to four additionalparts per cutting cycle gained from the additional cutting heads, an operator can increaseeffective cutting speed per cycle and consequently part yield per hour.
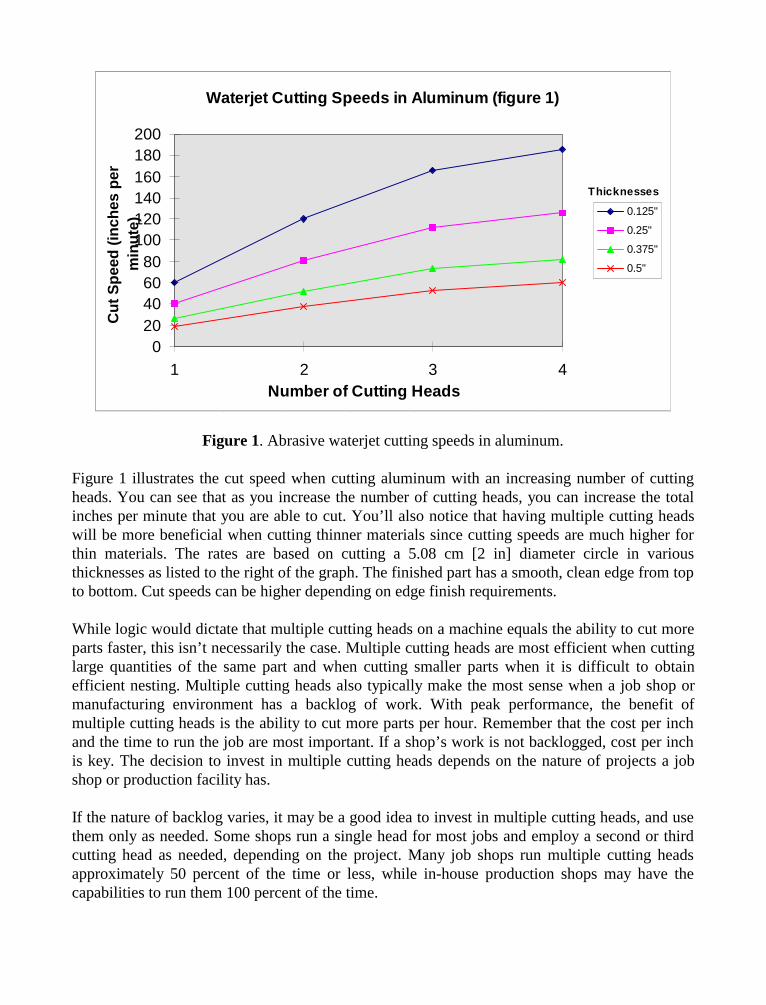
Waterjet Cutting Speeds in Aluminum (figure 1)
020406080
100120140160180200
1 2 3 4Number of Cutting Heads
Cut
Spe
ed (
inch
es p
er
min
ute)
0.125"
0.25"
0.375"
0.5"
Thicknesses
Figure 1. Abrasive waterjet cutting speeds in aluminum.
Figure 1 illustrates the cut speed when cutting aluminum with an increasing number of cuttingheads. You can see that as you increase the number of cutting heads, you can increase the totalinches per minute that you are able to cut. You’ll also notice that having multiple cutting headswill be more beneficial when cutting thinner materials since cutting speeds are much higher forthin materials. The rates are based on cutting a 5.08 cm [2 in] diameter circle in variousthicknesses as listed to the right of the graph. The finished part has a smooth, clean edge from topto bottom. Cut speeds can be higher depending on edge finish requirements.
While logic would dictate that multiple cutting heads on a machine equals the ability to cut moreparts faster, this isn’t necessarily the case. Multiple cutting heads are most efficient when cuttinglarge quantities of the same part and when cutting smaller parts when it is difficult to obtainefficient nesting. Multiple cutting heads also typically make the most sense when a job shop ormanufacturing environment has a backlog of work. With peak performance, the benefit ofmultiple cutting heads is the ability to cut more parts per hour. Remember that the cost per inchand the time to run the job are most important. If a shop’s work is not backlogged, cost per inchis key. The decision to invest in multiple cutting heads depends on the nature of projects a jobshop or production facility has.
If the nature of backlog varies, it may be a good idea to invest in multiple cutting heads, and usethem only as needed. Some shops run a single head for most jobs and employ a second or thirdcutting head as needed, depending on the project. Many job shops run multiple cutting headsapproximately 50 percent of the time or less, while in-house production shops may have thecapabilities to run them 100 percent of the time.
3.7 Using Software to Increase Profitability
There are a variety of waterjet software packages and PC-based control systems available tomaximize productivity. Many waterjet software packages seamlessly convert “G” code to PCcode with a simple point and click. PC-based software programs are easy to learn, easy to use,and easy to program, which reduces time spent training new employees on how to use thewaterjet system. Shops can also save money since there is no need to pay a special machinist orprogrammer to do the work. PC packages can scan a variety of intricate designs and artworkprovided by customers and can easily convert files from the CAD programs used by so many. Afew software packages available contain a cutting library of materials so operators can select thetype of material and thickness to quickly cut a single part or to cut the same shape out of differentmaterials. Another key feature of software programs is the job calculator function, in whichoperators can quickly calculate the cost of a particular project, which saves you time trying tofigure out how much a job is going to cost you. The job calculator function is beneficial for shopswhen quoting jobs.
Nesting packages are another valuable tool in which to further maximize productivity. There arenumerous nesting packages available. Some are compatible with any machine tool while othersare waterjet specific. A waterjet-specific nesting package is highly recommended. In evaluatingthe different waterjet-specific nesting packages available, remember that performance is key.Some software nesting packages can contain many features, which can make them difficult touse. The best application is a powerful yet simple nesting package that allows the operator tomultitask – programming the next part to cut while one job is still on the cutting table. PC-basedwaterjet software packages contain unique features that allow the waterjet to cut according to theparticular job. Waterjet specific software is very intelligent, recognizing when to cut faster (onstraight sections) and when to cut slower (on corners).
3.8 Selecting the Right Abrasive
When utilizing an abrasive waterjet system, selecting the right abrasive plays a key role inmaximizing cost per inch. There are many different types of abrasive, the two most commontypes being waterjet and sandblasting abrasive. You should always use waterjet abrasive, as it hasthe characteristics that optimize cutting for an abrasive waterjet. Waterjet abrasive, or garnet, hasbeen shown to cut up to 30 percent faster than sandblast abrasive due to the hardness,consistency, angularity, and friability of the garnet. Sandblast abrasive does not cut as well asgarnet since it tends to be softer and rounder.
When selecting abrasive, you want to choose an abrasive that has consistent shape, weight,hardness, and angularity. Consistency of abrasive particles provide a consistent flow rate, whichis an important factor in cutting high quality parts. Minimal dust is another advantage to usingwaterjet garnet, since excessive dust can have an adverse affect on both the machine and thework environment.

4. CONCLUSION
Thoroughly researching both the product and the company is critical to the purchase of anabrasive waterjet system. You want to make sure that the equipment will support yourapplication(s) and that you will receive the service and support that you need after the sale. Ifyou’ve made an investment in an abrasive waterjet system, you want to get the most out of thatinvestment. By utilizing the above techniques and technology, you can be on your way tomaximizing the profitability of your waterjet—and increasing your bottom line.
10th American Waterjet ConferenceAugust 14-17, 1999: Houston, Texas
Page 56
USING 40,000 PSI WATER JETTING FOR FIELD WORK
Michael T. Gracey, P.E.Industrial Pressure, Inc.Houston, Texas U.S.A.
ABSTRACT
40,000 PSI high-pressure water is being used on a project in a Mexican shipyard to removeexisting coating for re-application. This paper will discuss the hardware used such as positivedisplacement pumps, flow splitters, tumble boxes and rotating handguns. Pump flows, dischargepressures and the results of jobs in the field will also be discussed. Illustrations are includedshowing the surfaces being prepared with Ultra-High pressure water and the hardware beingused up to 40,000 PSI.
Organized and Sponsored by the WaterJet Technology Association
1. INTRODUCTION
In an article (Reference 1) written in 1996 entitled IS 40K KING? the question wasproposed “What happened to 30,000 psi”? There were also statements about how thepresent equipment has developed into dependable 30,000-psi and 40,000 psi versions. In arecent field application for 40,000 psi, there was good reason to re-think using 30,000 psiinstead of 40,000 psi as well as doubting whether the dependable stage has been reachedfor Ultra-High pressure equipment. A paper (Reference 2) given at the Society forProtective Coatings 1998 Seminars discusses several actual case studies in the use of Ultrahigh pressure water jetting. This paper discussed the advantages of eliminating the cost ofgrit and its disposal while allowing other work to continue adjacent to water jettingoperations. Standards for surface preparation using high-pressure water are beingdeveloped as described in a paper (Reference 3) given at the Waterjet Conference in 1997.Since that time, there has been progress in promoting the use of Ultra high-pressure waterand in developing standards, cost comparisons and the exchange of information.Also at the Waterjet 1997, a paper (Reference 4) was given tracing the acceptance of UHPwater jetting for surface preparation. Personally, I am all for water jetting and feel it has agreat future. The following is a case study from a slightly different perspective.
2. DESCRIPTION OF THE FIELD JOB
The customer called around April of 1998 with a request for a quotation on 40,000-psiequipment to remove coatings from an offshore rig. Of course the pump unit, accessories &spare parts had to be delivered within 3 weeks after receipt of order (this alwayscompounds the problems). A 40,000-psi pump was purchased, because the time was soshort and the process of getting the hose, guns, nozzles, flow splitters and tumble boxesready and tested before shipment to Mexico. All went surprisingly well and the systemwas assembled and tested for a few days before the truck arrived. Figure 1 shows theSemi-Submersible drilling rig at dockside in Mexico. The coating was to be removed forrepainting using two rotating hand held guns with multiple sapphire nozzles. Theequipment arrived safely and a start-up man was dispatched for on-site training. Figure 2shows the scaffolding and coating removal work progressing.
3. DESCRIPTION OF THE EQUIPMENT
The customer ordered a pump unit for operation at 40,000 psi and 8-gpm as shown inFigure 3. The pump was driven by a 200 H.P. diesel engine and skid mounted for the dockside work. Water quality was a concern, so a primary filtration package was built with asand filter and two bag filters sized to 10 Microns as show in Figure 4. The pump hadadditional filtration to 1 micron and a charge pump was added that maintained 40-psisuction pressure and adequate flow for the pump. Because the customer wanted a dual gunoperation, there were two flow splitters, two tumble boxes, four air hoses, interconnectinghose, eighteen sections of 40,000 psi hose (with heavy black hose cover) and two rotating
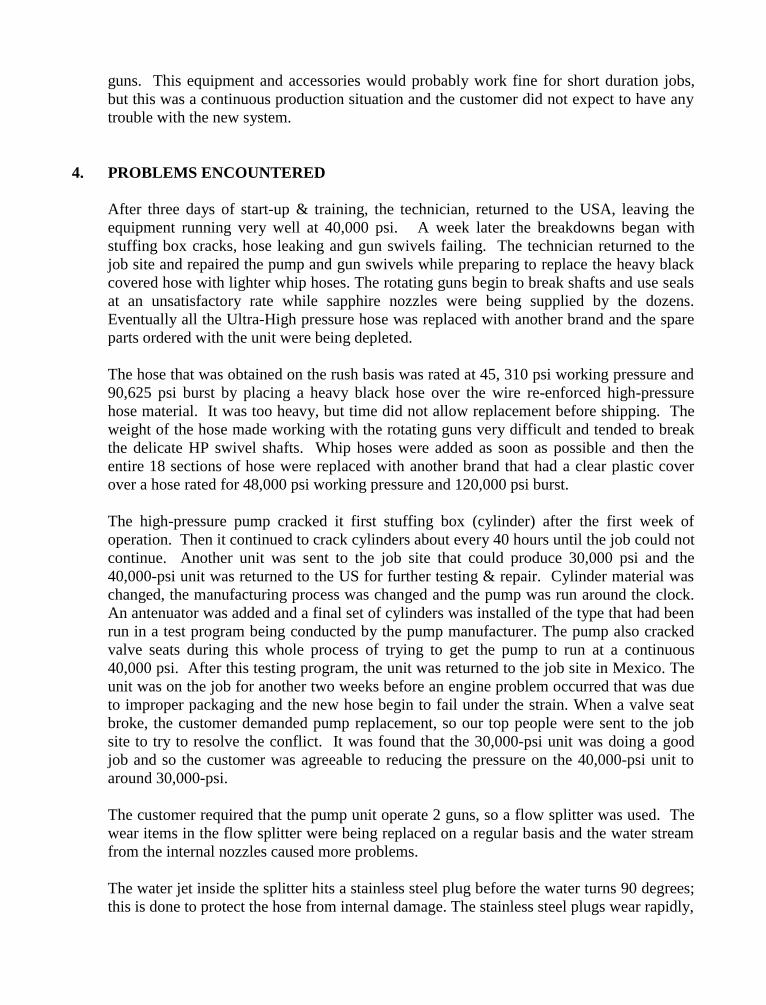
guns. This equipment and accessories would probably work fine for short duration jobs,but this was a continuous production situation and the customer did not expect to have anytrouble with the new system.
4. PROBLEMS ENCOUNTERED
After three days of start-up & training, the technician, returned to the USA, leaving theequipment running very well at 40,000 psi. A week later the breakdowns began withstuffing box cracks, hose leaking and gun swivels failing. The technician returned to thejob site and repaired the pump and gun swivels while preparing to replace the heavy blackcovered hose with lighter whip hoses. The rotating guns begin to break shafts and use sealsat an unsatisfactory rate while sapphire nozzles were being supplied by the dozens.Eventually all the Ultra-High pressure hose was replaced with another brand and the spareparts ordered with the unit were being depleted.
The hose that was obtained on the rush basis was rated at 45, 310 psi working pressure and90,625 psi burst by placing a heavy black hose over the wire re-enforced high-pressurehose material. It was too heavy, but time did not allow replacement before shipping. Theweight of the hose made working with the rotating guns very difficult and tended to breakthe delicate HP swivel shafts. Whip hoses were added as soon as possible and then theentire 18 sections of hose were replaced with another brand that had a clear plastic coverover a hose rated for 48,000 psi working pressure and 120,000 psi burst.
The high-pressure pump cracked it first stuffing box (cylinder) after the first week ofoperation. Then it continued to crack cylinders about every 40 hours until the job could notcontinue. Another unit was sent to the job site that could produce 30,000 psi and the40,000-psi unit was returned to the US for further testing & repair. Cylinder material waschanged, the manufacturing process was changed and the pump was run around the clock.An antenuator was added and a final set of cylinders was installed of the type that had beenrun in a test program being conducted by the pump manufacturer. The pump also crackedvalve seats during this whole process of trying to get the pump to run at a continuous40,000 psi. After this testing program, the unit was returned to the job site in Mexico. Theunit was on the job for another two weeks before an engine problem occurred that was dueto improper packaging and the new hose begin to fail under the strain. When a valve seatbroke, the customer demanded pump replacement, so our top people were sent to the jobsite to try to resolve the conflict. It was found that the 30,000-psi unit was doing a goodjob and so the customer was agreeable to reducing the pressure on the 40,000-psi unit toaround 30,000-psi.
The customer required that the pump unit operate 2 guns, so a flow splitter was used. Thewear items in the flow splitter were being replaced on a regular basis and the water streamfrom the internal nozzles caused more problems.
The water jet inside the splitter hits a stainless steel plug before the water turns 90 degrees;this is done to protect the hose from internal damage. The stainless steel plugs wear rapidly,
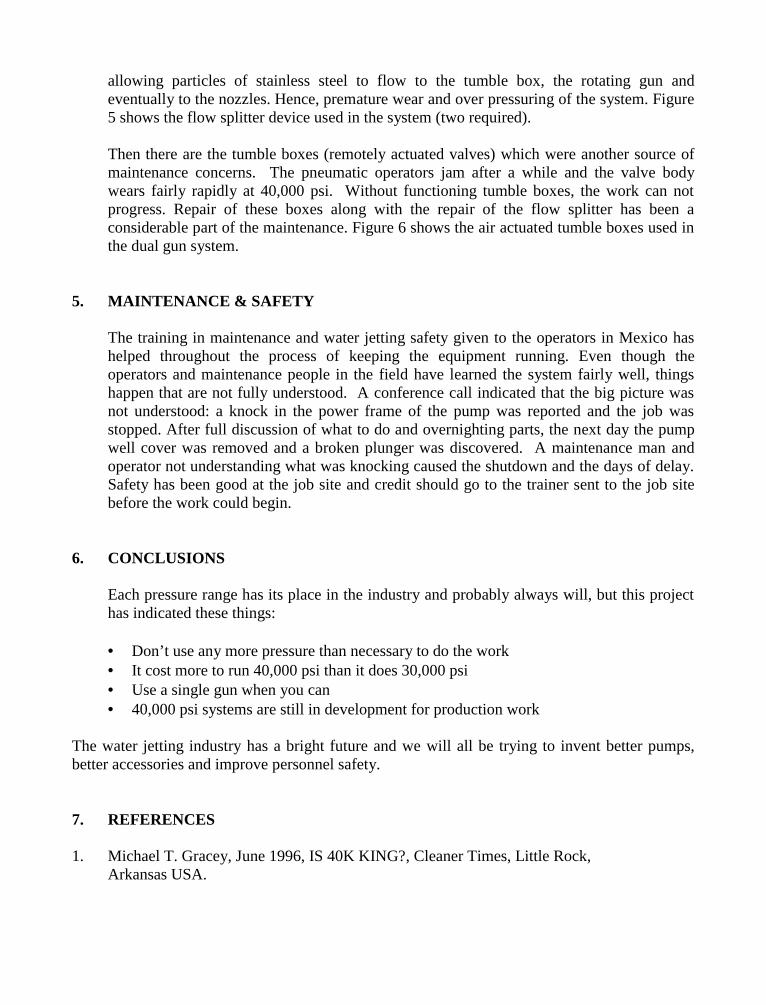
allowing particles of stainless steel to flow to the tumble box, the rotating gun andeventually to the nozzles. Hence, premature wear and over pressuring of the system. Figure5 shows the flow splitter device used in the system (two required).
Then there are the tumble boxes (remotely actuated valves) which were another source ofmaintenance concerns. The pneumatic operators jam after a while and the valve bodywears fairly rapidly at 40,000 psi. Without functioning tumble boxes, the work can notprogress. Repair of these boxes along with the repair of the flow splitter has been aconsiderable part of the maintenance. Figure 6 shows the air actuated tumble boxes used inthe dual gun system.
5. MAINTENANCE & SAFETY
The training in maintenance and water jetting safety given to the operators in Mexico hashelped throughout the process of keeping the equipment running. Even though theoperators and maintenance people in the field have learned the system fairly well, thingshappen that are not fully understood. A conference call indicated that the big picture wasnot understood: a knock in the power frame of the pump was reported and the job wasstopped. After full discussion of what to do and overnighting parts, the next day the pumpwell cover was removed and a broken plunger was discovered. A maintenance man andoperator not understanding what was knocking caused the shutdown and the days of delay.Safety has been good at the job site and credit should go to the trainer sent to the job sitebefore the work could begin.
6. CONCLUSIONS
Each pressure range has its place in the industry and probably always will, but this projecthas indicated these things:
• Don’t use any more pressure than necessary to do the work• It cost more to run 40,000 psi than it does 30,000 psi• Use a single gun when you can• 40,000 psi systems are still in development for production work
The water jetting industry has a bright future and we will all be trying to invent better pumps,better accessories and improve personnel safety.
7. REFERENCES
1. Michael T. Gracey, June 1996, IS 40K KING?, Cleaner Times, Little Rock, Arkansas USA.
2. Richard F. Schmid, November 15-19, 1998, ULTRA HIGH PRESSURE WATERJETTING FOR COATING REMOVAL, SSPC 1998 Seminars, Orlando, Florida USA.
3. Lydia M. Frenzel, Ph.D, August 23-26, 1997, CONTINUING IMPROVEMENTINITIATIVES OF SURFACE PREPARATION WITH WATERJETTING, 9th AmericanWaterjet Conference, Dearborn, Michigan USA.
4. Richard Schmid, August 23-26, 1997, UHP WATERJETTING GAINS ACCEPTANCEFOR SURFACE PREPARATION, 9th American Waterjet Conference, Dearborn MichiganUSA.
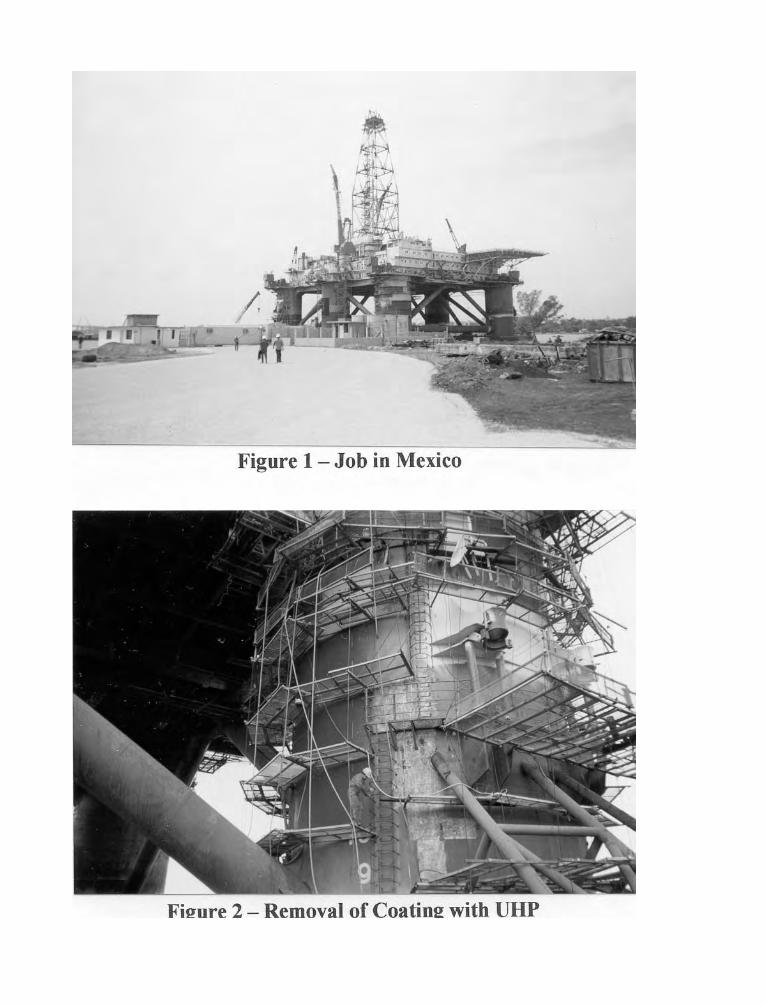
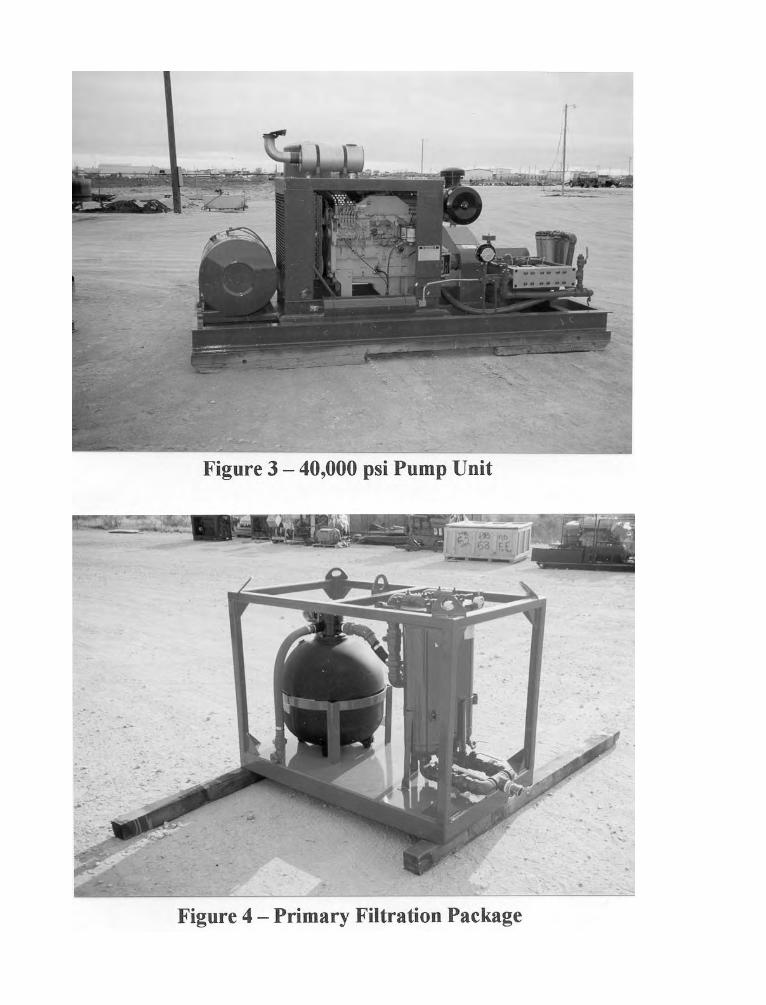
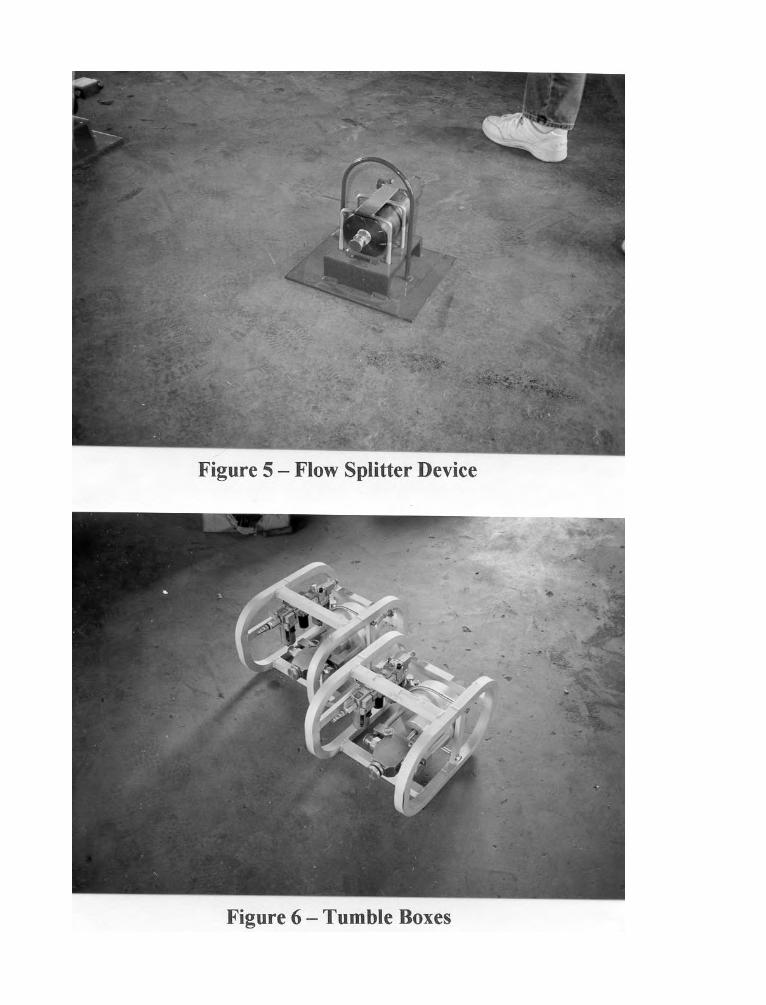
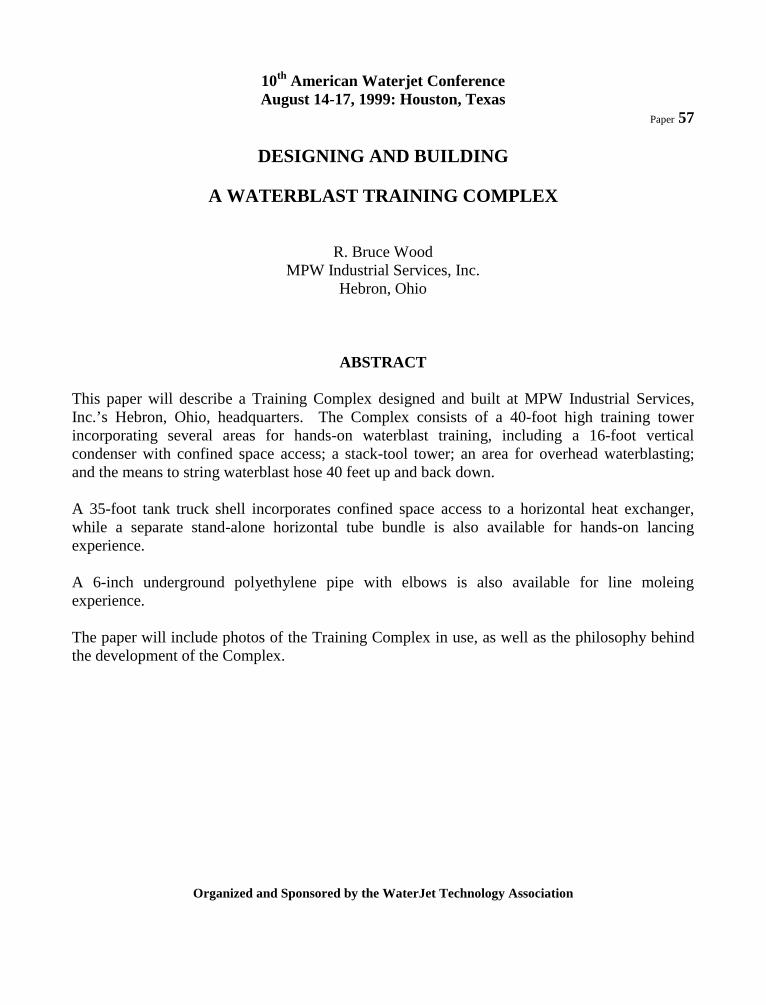
10th American Waterjet ConferenceAugust 14-17, 1999: Houston, Texas
Paper 57
DESIGNING AND BUILDING
A WATERBLAST TRAINING COMPLEX
R. Bruce WoodMPW Industrial Services, Inc.
Hebron, Ohio
ABSTRACT
This paper will describe a Training Complex designed and built at MPW Industrial Services,Inc.’s Hebron, Ohio, headquarters. The Complex consists of a 40-foot high training towerincorporating several areas for hands-on waterblast training, including a 16-foot verticalcondenser with confined space access; a stack-tool tower; an area for overhead waterblasting;and the means to string waterblast hose 40 feet up and back down.
A 35-foot tank truck shell incorporates confined space access to a horizontal heat exchanger,while a separate stand-alone horizontal tube bundle is also available for hands-on lancingexperience.
A 6-inch underground polyethylene pipe with elbows is also available for line moleingexperience.
The paper will include photos of the Training Complex in use, as well as the philosophy behindthe development of the Complex.
Organized and Sponsored by the WaterJet Technology Association
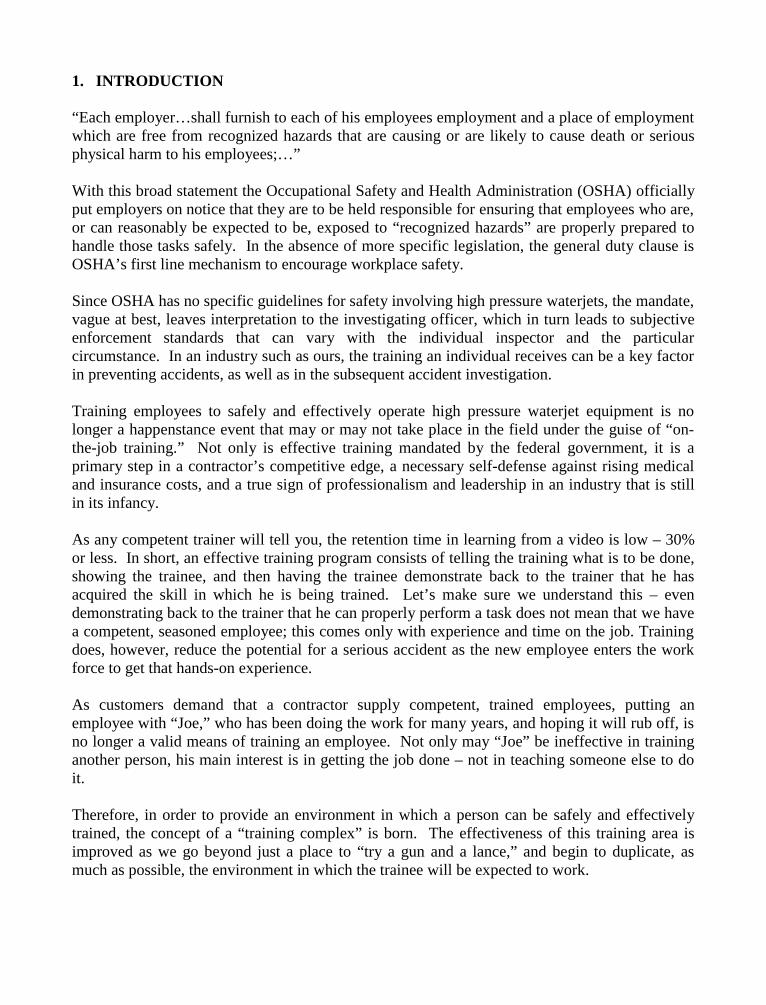
1. INTRODUCTION
“Each employer…shall furnish to each of his employees employment and a place of employmentwhich are free from recognized hazards that are causing or are likely to cause death or seriousphysical harm to his employees;…”
With this broad statement the Occupational Safety and Health Administration (OSHA) officiallyput employers on notice that they are to be held responsible for ensuring that employees who are,or can reasonably be expected to be, exposed to “recognized hazards” are properly prepared tohandle those tasks safely. In the absence of more specific legislation, the general duty clause isOSHA’s first line mechanism to encourage workplace safety.
Since OSHA has no specific guidelines for safety involving high pressure waterjets, the mandate,vague at best, leaves interpretation to the investigating officer, which in turn leads to subjectiveenforcement standards that can vary with the individual inspector and the particularcircumstance. In an industry such as ours, the training an individual receives can be a key factorin preventing accidents, as well as in the subsequent accident investigation.
Training employees to safely and effectively operate high pressure waterjet equipment is nolonger a happenstance event that may or may not take place in the field under the guise of “on-the-job training.” Not only is effective training mandated by the federal government, it is aprimary step in a contractor’s competitive edge, a necessary self-defense against rising medicaland insurance costs, and a true sign of professionalism and leadership in an industry that is stillin its infancy.
As any competent trainer will tell you, the retention time in learning from a video is low – 30%or less. In short, an effective training program consists of telling the training what is to be done,showing the trainee, and then having the trainee demonstrate back to the trainer that he hasacquired the skill in which he is being trained. Let’s make sure we understand this – evendemonstrating back to the trainer that he can properly perform a task does not mean that we havea competent, seasoned employee; this comes only with experience and time on the job. Trainingdoes, however, reduce the potential for a serious accident as the new employee enters the workforce to get that hands-on experience.
As customers demand that a contractor supply competent, trained employees, putting anemployee with “Joe,” who has been doing the work for many years, and hoping it will rub off, isno longer a valid means of training an employee. Not only may “Joe” be ineffective in traininganother person, his main interest is in getting the job done – not in teaching someone else to doit.
Therefore, in order to provide an environment in which a person can be safely and effectivelytrained, the concept of a “training complex” is born. The effectiveness of this training area isimproved as we go beyond just a place to “try a gun and a lance,” and begin to duplicate, asmuch as possible, the environment in which the trainee will be expected to work.
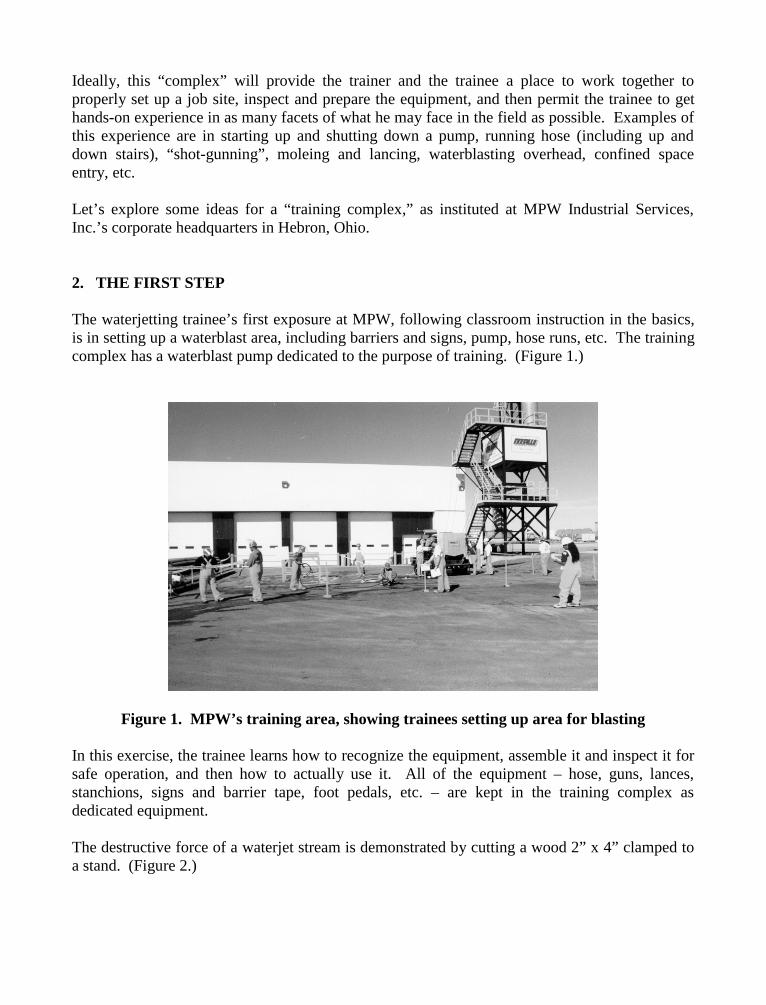
Ideally, this “complex” will provide the trainer and the trainee a place to work together toproperly set up a job site, inspect and prepare the equipment, and then permit the trainee to gethands-on experience in as many facets of what he may face in the field as possible. Examples ofthis experience are in starting up and shutting down a pump, running hose (including up anddown stairs), “shot-gunning”, moleing and lancing, waterblasting overhead, confined spaceentry, etc.
Let’s explore some ideas for a “training complex,” as instituted at MPW Industrial Services,Inc.’s corporate headquarters in Hebron, Ohio.
2. THE FIRST STEP
The waterjetting trainee’s first exposure at MPW, following classroom instruction in the basics,is in setting up a waterblast area, including barriers and signs, pump, hose runs, etc. The trainingcomplex has a waterblast pump dedicated to the purpose of training. (Figure 1.)
Figure 1. MPW’s training area, showing trainees setting up area for blasting
In this exercise, the trainee learns how to recognize the equipment, assemble it and inspect it forsafe operation, and then how to actually use it. All of the equipment – hose, guns, lances,stanchions, signs and barrier tape, foot pedals, etc. – are kept in the training complex asdedicated equipment.
The destructive force of a waterjet stream is demonstrated by cutting a wood 2” x 4” clamped toa stand. (Figure 2.)
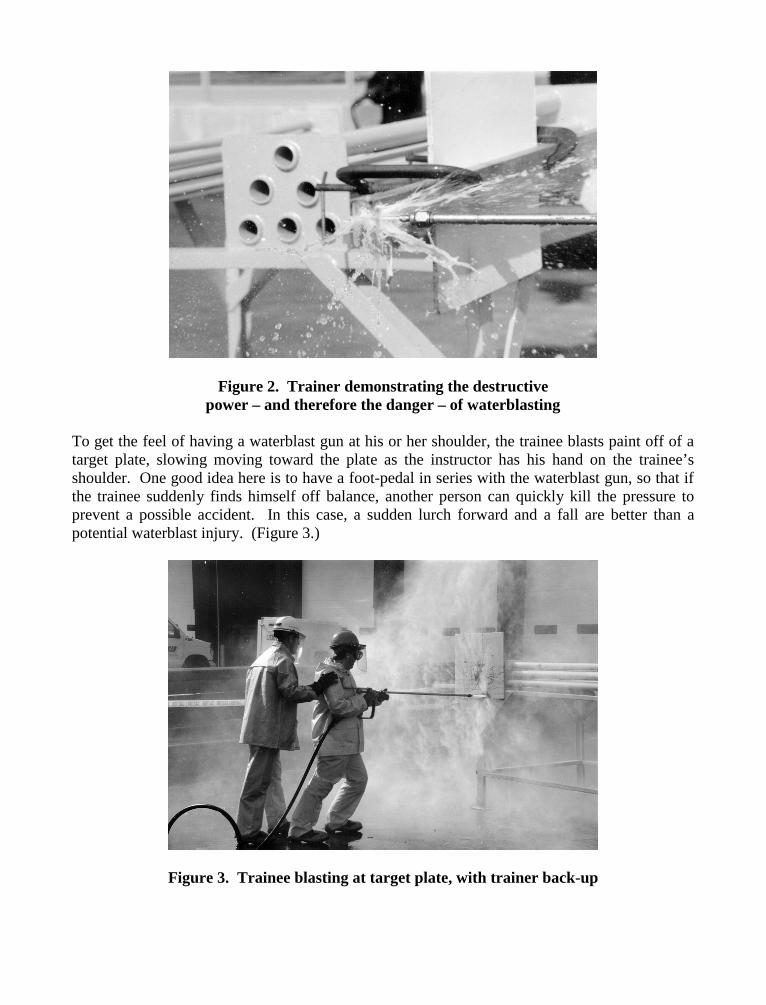
Figure 2. Trainer demonstrating the destructivepower – and therefore the danger – of waterblasting
To get the feel of having a waterblast gun at his or her shoulder, the trainee blasts paint off of atarget plate, slowing moving toward the plate as the instructor has his hand on the trainee’sshoulder. One good idea here is to have a foot-pedal in series with the waterblast gun, so that ifthe trainee suddenly finds himself off balance, another person can quickly kill the pressure toprevent a possible accident. In this case, a sudden lurch forward and a fall are better than apotential waterblast injury. (Figure 3.)
Figure 3. Trainee blasting at target plate, with trainer back-up
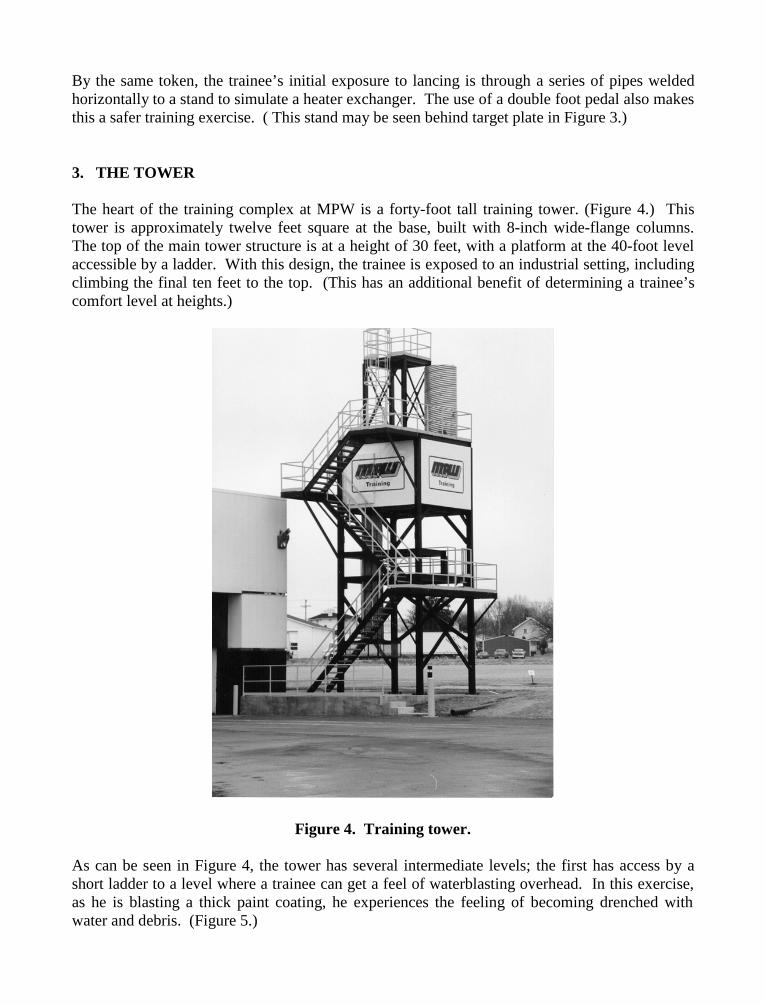
By the same token, the trainee’s initial exposure to lancing is through a series of pipes weldedhorizontally to a stand to simulate a heater exchanger. The use of a double foot pedal also makesthis a safer training exercise. ( This stand may be seen behind target plate in Figure 3.)
3. THE TOWER
The heart of the training complex at MPW is a forty-foot tall training tower. (Figure 4.) Thistower is approximately twelve feet square at the base, built with 8-inch wide-flange columns.The top of the main tower structure is at a height of 30 feet, with a platform at the 40-foot levelaccessible by a ladder. With this design, the trainee is exposed to an industrial setting, includingclimbing the final ten feet to the top. (This has an additional benefit of determining a trainee’scomfort level at heights.)
Figure 4. Training tower.
As can be seen in Figure 4, the tower has several intermediate levels; the first has access by ashort ladder to a level where a trainee can get a feel of waterblasting overhead. In this exercise,as he is blasting a thick paint coating, he experiences the feeling of becoming drenched withwater and debris. (Figure 5.)
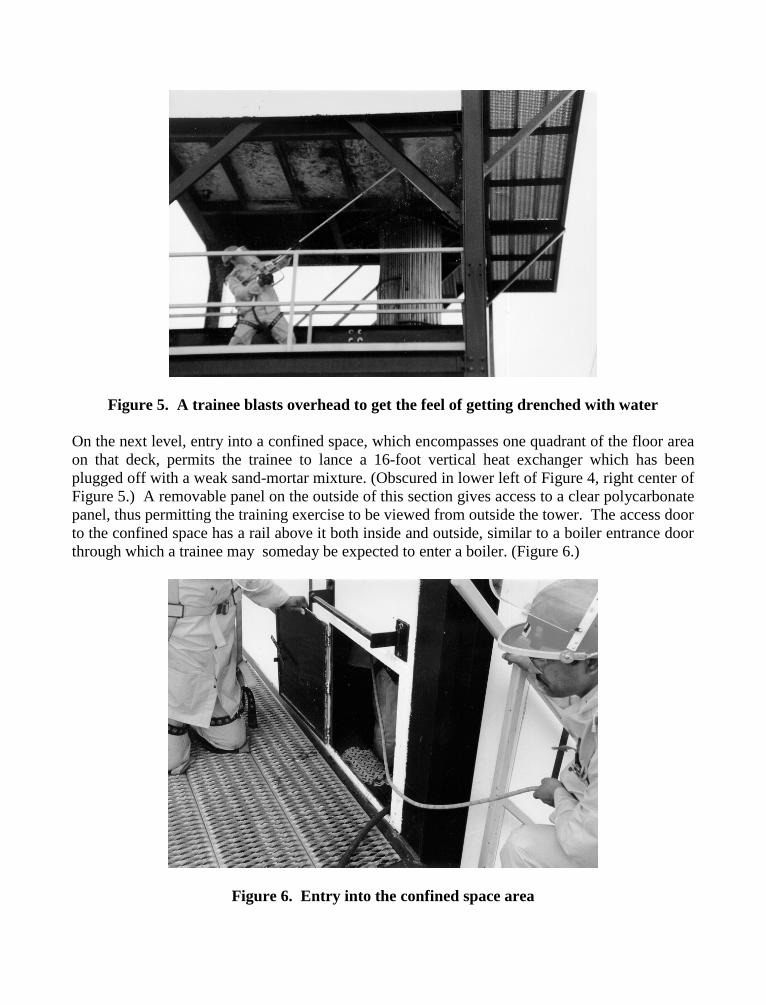
Figure 5. A trainee blasts overhead to get the feel of getting drenched with water
On the next level, entry into a confined space, which encompasses one quadrant of the floor areaon that deck, permits the trainee to lance a 16-foot vertical heat exchanger which has beenplugged off with a weak sand-mortar mixture. (Obscured in lower left of Figure 4, right center ofFigure 5.) A removable panel on the outside of this section gives access to a clear polycarbonatepanel, thus permitting the training exercise to be viewed from outside the tower. The access doorto the confined space has a rail above it both inside and outside, similar to a boiler entrance doorthrough which a trainee may someday be expected to enter a boiler. (Figure 6.)
Figure 6. Entry into the confined space area
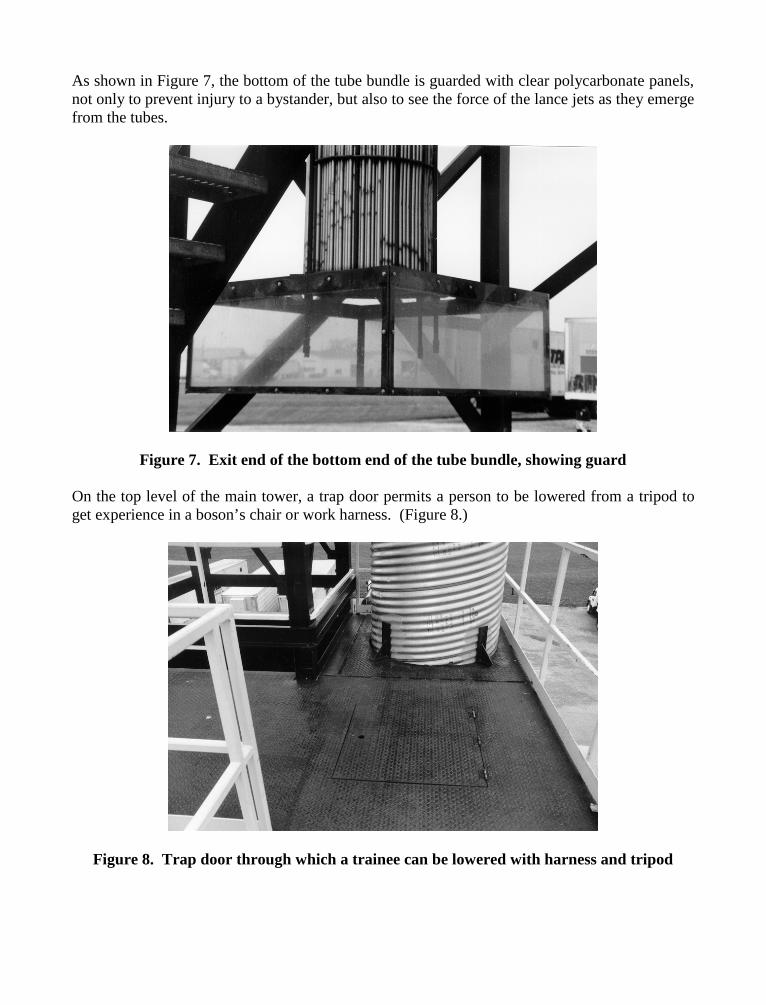
As shown in Figure 7, the bottom of the tube bundle is guarded with clear polycarbonate panels,not only to prevent injury to a bystander, but also to see the force of the lance jets as they emergefrom the tubes.
Figure 7. Exit end of the bottom end of the tube bundle, showing guard
On the top level of the main tower, a trap door permits a person to be lowered from a tripod toget experience in a boson’s chair or work harness. (Figure 8.)
Figure 8. Trap door through which a trainee can be lowered with harness and tripod
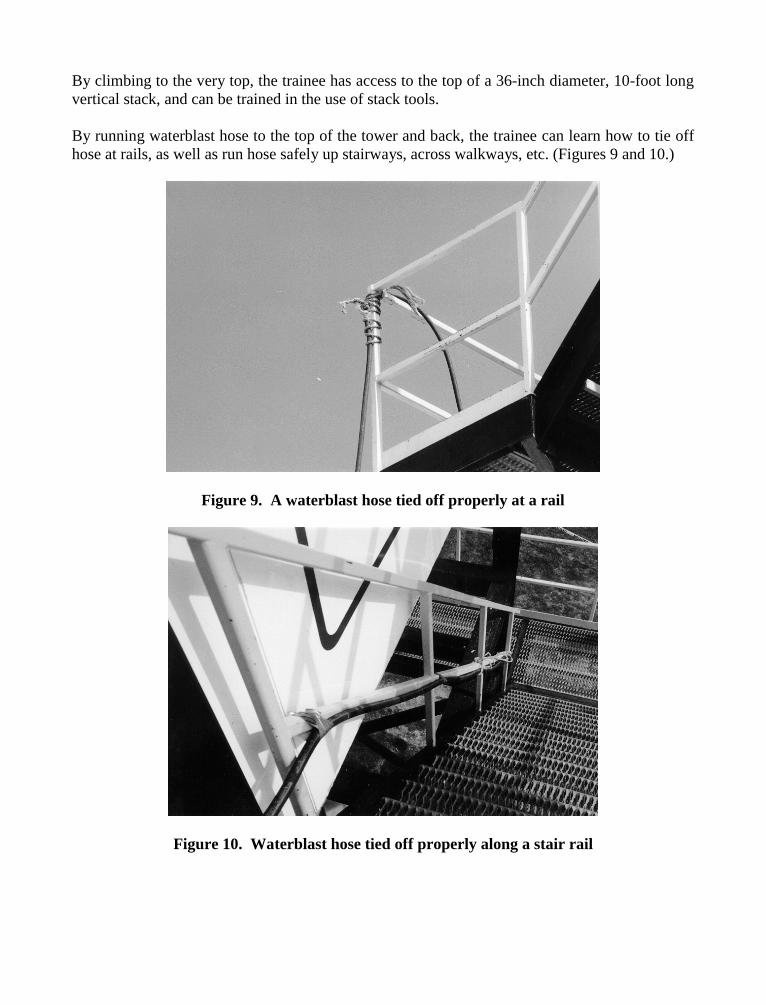
By climbing to the very top, the trainee has access to the top of a 36-inch diameter, 10-foot longvertical stack, and can be trained in the use of stack tools.
By running waterblast hose to the top of the tower and back, the trainee can learn how to tie offhose at rails, as well as run hose safely up stairways, across walkways, etc. (Figures 9 and 10.)
Figure 9. A waterblast hose tied off properly at a rail
Figure 10. Waterblast hose tied off properly along a stair rail
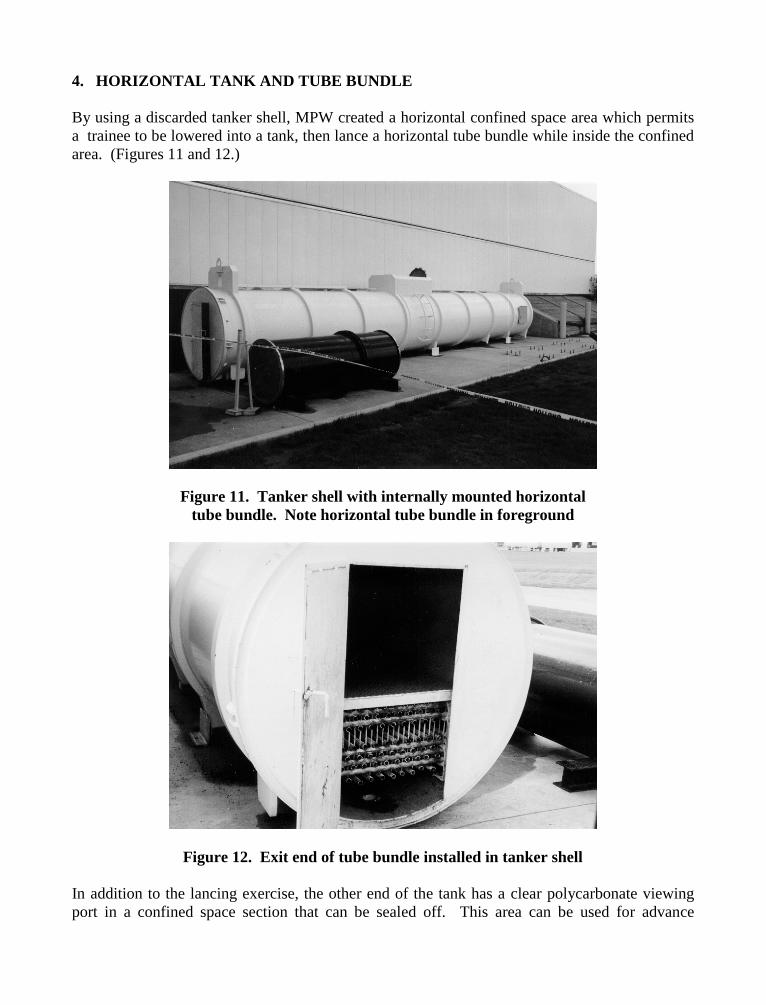
4. HORIZONTAL TANK AND TUBE BUNDLE
By using a discarded tanker shell, MPW created a horizontal confined space area which permitsa trainee to be lowered into a tank, then lance a horizontal tube bundle while inside the confinedarea. (Figures 11 and 12.)
Figure 11. Tanker shell with internally mounted horizontaltube bundle. Note horizontal tube bundle in foreground
Figure 12. Exit end of tube bundle installed in tanker shell
In addition to the lancing exercise, the other end of the tank has a clear polycarbonate viewingport in a confined space section that can be sealed off. This area can be used for advance
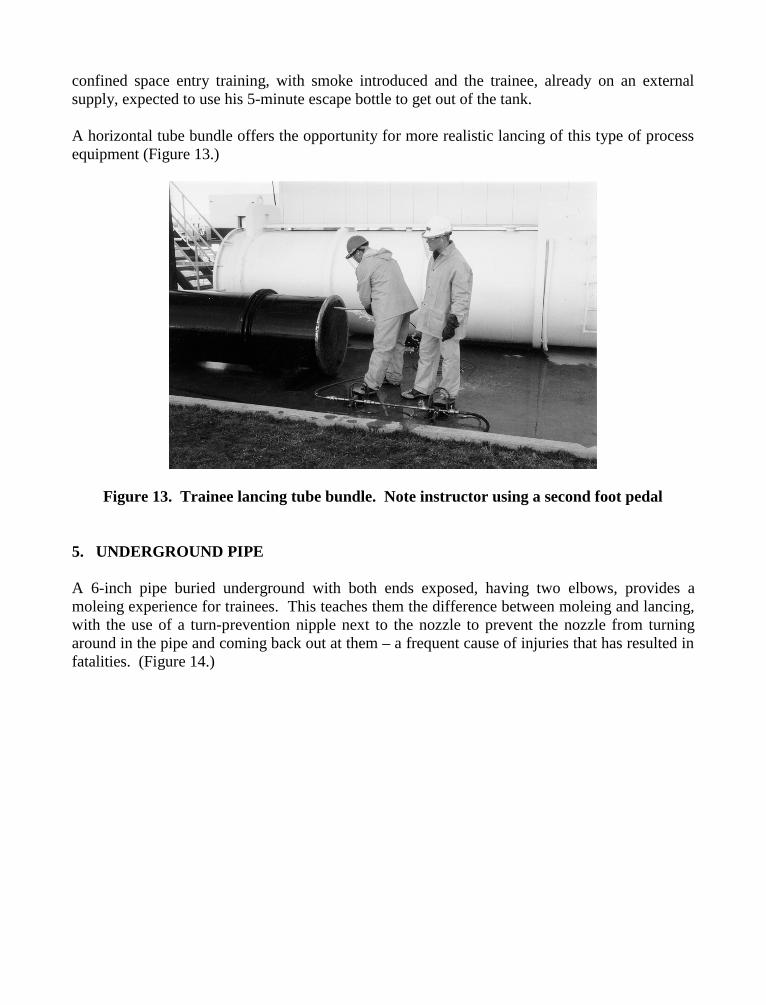
confined space entry training, with smoke introduced and the trainee, already on an externalsupply, expected to use his 5-minute escape bottle to get out of the tank.
A horizontal tube bundle offers the opportunity for more realistic lancing of this type of processequipment (Figure 13.)
Figure 13. Trainee lancing tube bundle. Note instructor using a second foot pedal
5. UNDERGROUND PIPE
A 6-inch pipe buried underground with both ends exposed, having two elbows, provides amoleing experience for trainees. This teaches them the difference between moleing and lancing,with the use of a turn-prevention nipple next to the nozzle to prevent the nozzle from turningaround in the pipe and coming back out at them – a frequent cause of injuries that has resulted infatalities. (Figure 14.)
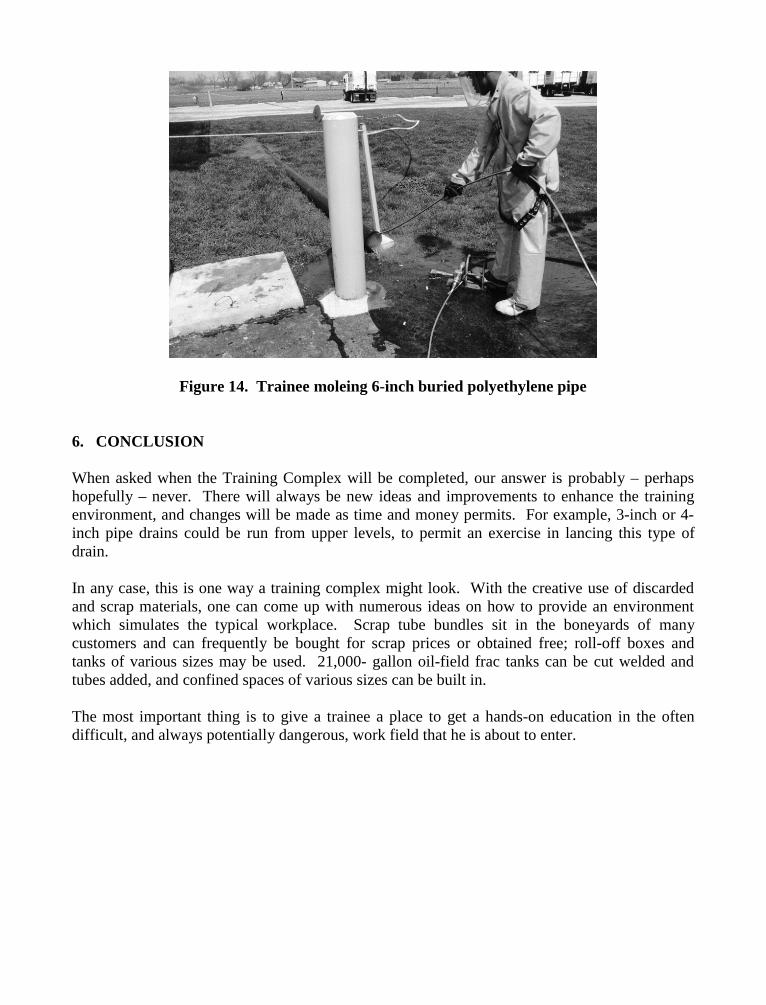
Figure 14. Trainee moleing 6-inch buried polyethylene pipe
6. CONCLUSION
When asked when the Training Complex will be completed, our answer is probably – perhapshopefully – never. There will always be new ideas and improvements to enhance the trainingenvironment, and changes will be made as time and money permits. For example, 3-inch or 4-inch pipe drains could be run from upper levels, to permit an exercise in lancing this type ofdrain.
In any case, this is one way a training complex might look. With the creative use of discardedand scrap materials, one can come up with numerous ideas on how to provide an environmentwhich simulates the typical workplace. Scrap tube bundles sit in the boneyards of manycustomers and can frequently be bought for scrap prices or obtained free; roll-off boxes andtanks of various sizes may be used. 21,000- gallon oil-field frac tanks can be cut welded andtubes added, and confined spaces of various sizes can be built in.
The most important thing is to give a trainee a place to get a hands-on education in the oftendifficult, and always potentially dangerous, work field that he is about to enter.
10th American Waterjet ConferenceAugust 14-17, 1999: Houston, Texas
Paper 58
APPLICATION EXAMPLES OF WATERJET CUTTING PROCESSING
Xue Sheng Xiong, Huang Wang Ping, Peng Hao JunGeneral Machinery Research Institute, Bureau of National Machinery Industry
Hefei, Anhui Province, P. R. China 230031
Li Yue Feng, Song Jing WeiHua Zhen Machinery Equipment Co., Ltd.
Guangzhou, Guangdong Province, P. R. China
ABSTRACT
The 300 MPa waterjet cutting system used for metal or nonmetal plates cutting has beencommercialized in China. In this paper, we introduce several waterjet cutting application basedon the waterjet cutting system developed by ourselves, which are: 1) cutting, putting together andadhering of polyhedron; 2) cutting through or semi-cutting through effect of entire patternachieved by using different cutting speed; 3) compensation for width of cutting seam; 4) highpower multi-heads waterjet cutting manufacturing line; 5) cutting effect of artificial multi-layercomposite plates and 6) robot waterjet cutting.
Organized and Sponsored by the WaterJet Technology Association
1. INTRODUCTION
In August 1998, the technical appraisal of 300 MPa waterjet cutting system managed and mainlydeveloped by the Hefei General Machinery Research Institute was passed by the NationalMachinery Industry Bureau of China. This marks that the ultra high pressure waterjet cuttingtechnology has entered its commercialized stage.
This set of ultra high pressure waterjet cutting system developed by writers adopts the threepistons ultra high pressure pump as source of high pressure water. Its power is 15∼30 kW. Itconsists of ultra high pressure pump, pressure regulation vessel, pneumatically driven reliefvalve, safety valve, X-Y two dimensional cutting table, abrasive supply system, cutting head,numeric control system and its software, etc. Sale price of total system is less than 100 thousandsdollars (Shown in Figure 1). In this paper, we mainly discuss the summarization of ourexperiences during period of product development and service after sale. To technologies used intotal set of system, please refer to our another paper titled “Extended Technologies for Ultra HighPressure Waterjet Cutting System”.
2. CUTTING OF POLYHEDRON
The local cutting of stereoscopic polyhedron can be accomplished by the two dimensional plaincutting system assisted with special designed jigs or clamps. After that, these cut pieces are puttogether using adhesive and the designed stereoscopic pattern is formed. This process is oftenused for cutting of symmetrical patterns such as pentagram or hollow hexahedral column and isvery fit for usage in architectural decoration.
To be an example, the cutting process of a stereoscopic pentagram is explained as following.First, we divide the pentagram into ten same triangular elements. Each element is tilted an αangle employing the side a coinciding with bottom plane as datum and a triangular wedge isformed. Second, we clamp raw cutting material on the triangular wedge, cut surface and a surfacec tilted an α angle to horizontal plane in sequence. Side b is always in vertical position tohorizontal plane and is not needed cutting. By adhering these cut elements together, thestereoscopic pentagram is formed. Its outline is always perpendicular to horizontal plane.Inlaying it into plane with a hollowed-cut pentagram and making upside of surface a be on anequal footing to up surface of plate, the effect of towering planes has much lingering charm asshown in Figure 2.
3. COMBINATION EFFECT OF CUTTING THROUGH AND SEMI-CUTTING THROUGH
As we also know, one of the advantages for waterjet cutting is that we can set breakpoint at anytime at our wish to machine complicated plane designed pattern. In waterjet cutting tests, it iseasy to regulate working conditions such as type of abrasive and its grain size and workingparameters of waterjet to achieve maximum cutting speed for a given thickness material. Under
that speed, the given material can be cut through. Meanwhile, it is obvious to find that if cuttingspeed exceeds that critical speed, the given material becomes unable to cut through, that is to say,it only can be semi-cut through. If we apply these two methods skillfully to cutting a complicatedplane pattern, make the cut through paths become outlines and semi-cut through paths becomelines, their combination forms a live drawing combined lines to surfaces. Figure 3 shows acopper plate drawing. The semi-cut through lines are made by applying two times cut throughspeed cutting. The added lines increase the vitality of entire drawing obviously.
4. COMPENSATION FOR WIDTH OF CUTTING SEAM
Usually, width of abrasive waterjet cutting seam is about 1 mm. Though this precision can fullymeet normal cutting demands, the 1 mm wide adhesive line is not able to show its fine art inhyper -critical male and female models piecing together. Especially to the piecing togetherformed by plates, it is hoped to have no such colored adhesive line left. That is to say, it isdemanded the width of cutting seam reaches near zero. This kind of seemed not be able to realizedemand is very easy to fulfill by software. We cut the different color male and female modelsseparately, expand their outlines half width of normal cutting seam respectively or keep one’soutline maintain the same as usual, just expand another’s outline width of normal cutting seam incontrol software. The compensation effect of zero cutting width is achieved by fitting the maleand female parts together. Of course, if you want to use the cut material for exchanged colorspiecing together, this compensation method wastes the material because the expanded material issmall to have no use. If gaps are allowed to be left between cut colored blocks, it is needless touse this compensation method. But if zero seam width is wanted, this kind of compensationmethod is must be used (Figure 4).
5. MULTI-HEAD WATERJET CUTTING MANUFACTURING LINE
During our participation in the 9th American Waterjet Technology Conference, our Chinesedelegation visited the multi-head waterjet cutting system in a U.S.A. company. In China, ourresearch on it is brought up by the needs of floor bricks manufacturers and their production lines.
As we have investigated, the last process in floor bricks manufacturing is trimming and grindingthe edge of bricks. This process first cuts the opposite two edges of brick at the same time usingdiamond grinder, then turns the brick round at an angle of 90° and cuts the other two edges. Themanufacturing quality standards require that diagonal error is less than 1 mm and defect is notallowed to exist in four edges. Before our research succeeds, the adopted process whosesubstance is milling used 4 or 5 pairs of grinding wheels whose diameters were 250 to 300 mm.driven by electric motors to trim and grind step by step. The rigid collision between grindingwheels and brick often make the rims collapse. Most bricks with lightly collapsed rim arerepaired by using another grinding head to mill and chamfer at the angle of 45°, some with badlycollapsed rim have to be cut smaller and become defectives or rejects. Reject rate of this processis around 5% and defective rate usually is 20%. These make it urgent for manufacturers to find
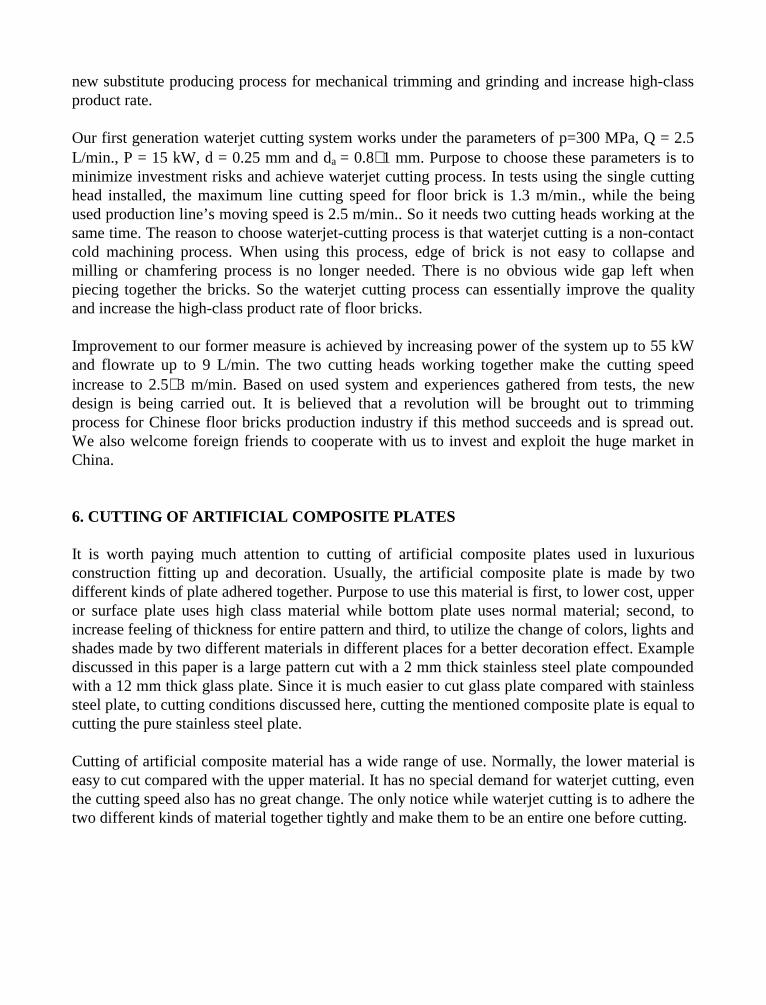
new substitute producing process for mechanical trimming and grinding and increase high-classproduct rate.
Our first generation waterjet cutting system works under the parameters of p=300 MPa, Q = 2.5L/min., P = 15 kW, d = 0.25 mm and da = 0.8∼1 mm. Purpose to choose these parameters is tominimize investment risks and achieve waterjet cutting process. In tests using the single cuttinghead installed, the maximum line cutting speed for floor brick is 1.3 m/min., while the beingused production line’s moving speed is 2.5 m/min.. So it needs two cutting heads working at thesame time. The reason to choose waterjet-cutting process is that waterjet cutting is a non-contactcold machining process. When using this process, edge of brick is not easy to collapse andmilling or chamfering process is no longer needed. There is no obvious wide gap left whenpiecing together the bricks. So the waterjet cutting process can essentially improve the qualityand increase the high-class product rate of floor bricks.
Improvement to our former measure is achieved by increasing power of the system up to 55 kWand flowrate up to 9 L/min. The two cutting heads working together make the cutting speedincrease to 2.5∼3 m/min. Based on used system and experiences gathered from tests, the newdesign is being carried out. It is believed that a revolution will be brought out to trimmingprocess for Chinese floor bricks production industry if this method succeeds and is spread out.We also welcome foreign friends to cooperate with us to invest and exploit the huge market inChina.
6. CUTTING OF ARTIFICIAL COMPOSITE PLATES
It is worth paying much attention to cutting of artificial composite plates used in luxuriousconstruction fitting up and decoration. Usually, the artificial composite plate is made by twodifferent kinds of plate adhered together. Purpose to use this material is first, to lower cost, upperor surface plate uses high class material while bottom plate uses normal material; second, toincrease feeling of thickness for entire pattern and third, to utilize the change of colors, lights andshades made by two different materials in different places for a better decoration effect. Examplediscussed in this paper is a large pattern cut with a 2 mm thick stainless steel plate compoundedwith a 12 mm thick glass plate. Since it is much easier to cut glass plate compared with stainlesssteel plate, to cutting conditions discussed here, cutting the mentioned composite plate is equal tocutting the pure stainless steel plate.
Cutting of artificial composite material has a wide range of use. Normally, the lower material iseasy to cut compared with the upper material. It has no special demand for waterjet cutting, eventhe cutting speed also has no great change. The only notice while waterjet cutting is to adhere thetwo different kinds of material together tightly and make them to be an entire one before cutting.
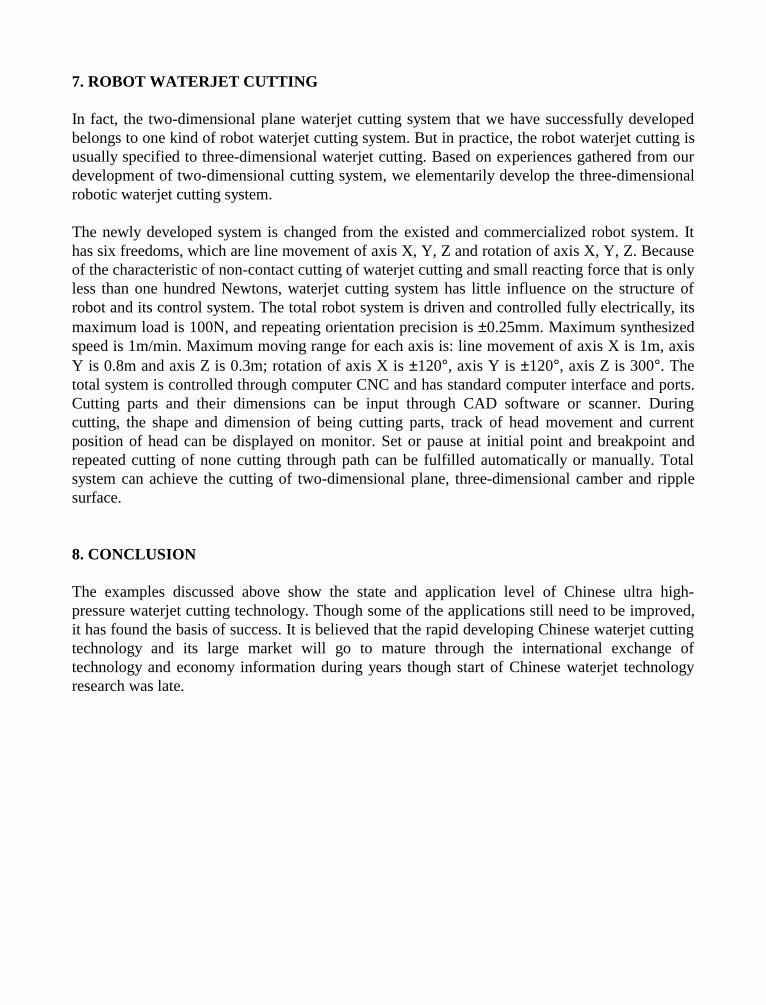
7. ROBOT WATERJET CUTTING
In fact, the two-dimensional plane waterjet cutting system that we have successfully developedbelongs to one kind of robot waterjet cutting system. But in practice, the robot waterjet cutting isusually specified to three-dimensional waterjet cutting. Based on experiences gathered from ourdevelopment of two-dimensional cutting system, we elementarily develop the three-dimensionalrobotic waterjet cutting system.
The newly developed system is changed from the existed and commercialized robot system. Ithas six freedoms, which are line movement of axis X, Y, Z and rotation of axis X, Y, Z. Becauseof the characteristic of non-contact cutting of waterjet cutting and small reacting force that is onlyless than one hundred Newtons, waterjet cutting system has little influence on the structure ofrobot and its control system. The total robot system is driven and controlled fully electrically, itsmaximum load is 100N, and repeating orientation precision is ±0.25mm. Maximum synthesizedspeed is 1m/min. Maximum moving range for each axis is: line movement of axis X is 1m, axisY is 0.8m and axis Z is 0.3m; rotation of axis X is ±120°, axis Y is ±120°, axis Z is 300°. Thetotal system is controlled through computer CNC and has standard computer interface and ports.Cutting parts and their dimensions can be input through CAD software or scanner. Duringcutting, the shape and dimension of being cutting parts, track of head movement and currentposition of head can be displayed on monitor. Set or pause at initial point and breakpoint andrepeated cutting of none cutting through path can be fulfilled automatically or manually. Totalsystem can achieve the cutting of two-dimensional plane, three-dimensional camber and ripplesurface.
8. CONCLUSION
The examples discussed above show the state and application level of Chinese ultra high-pressure waterjet cutting technology. Though some of the applications still need to be improved,it has found the basis of success. It is believed that the rapid developing Chinese waterjet cuttingtechnology and its large market will go to mature through the international exchange oftechnology and economy information during years though start of Chinese waterjet technologyresearch was late.
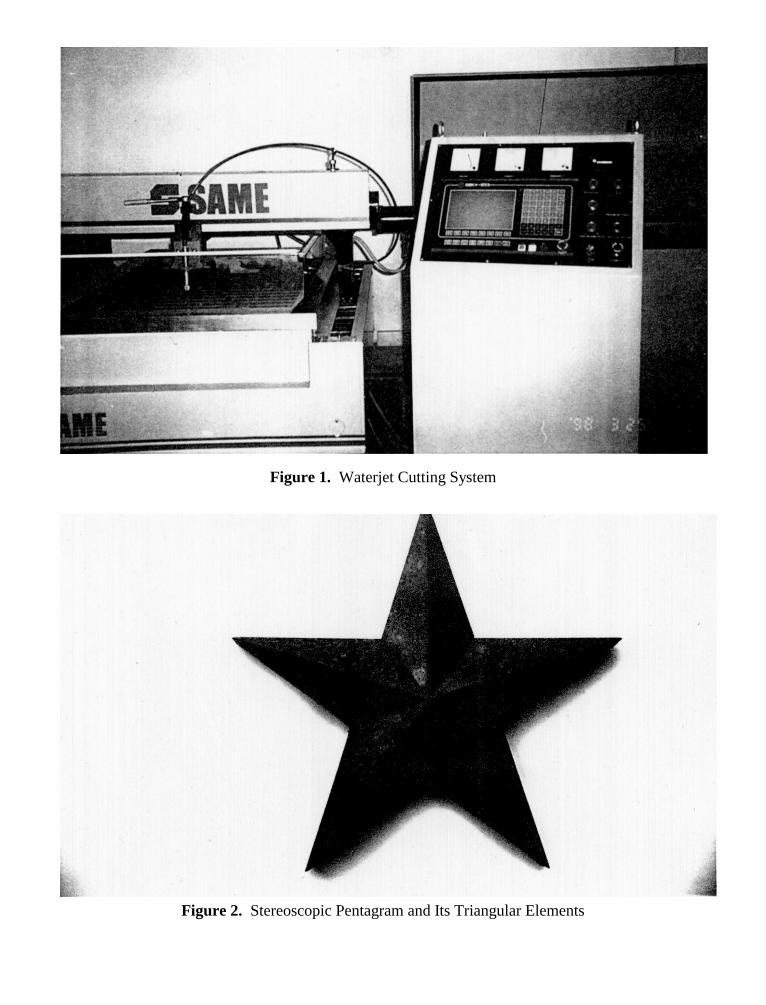
Figure 1. Waterjet Cutting System
Figure 2. Stereoscopic Pentagram and Its Triangular Elements
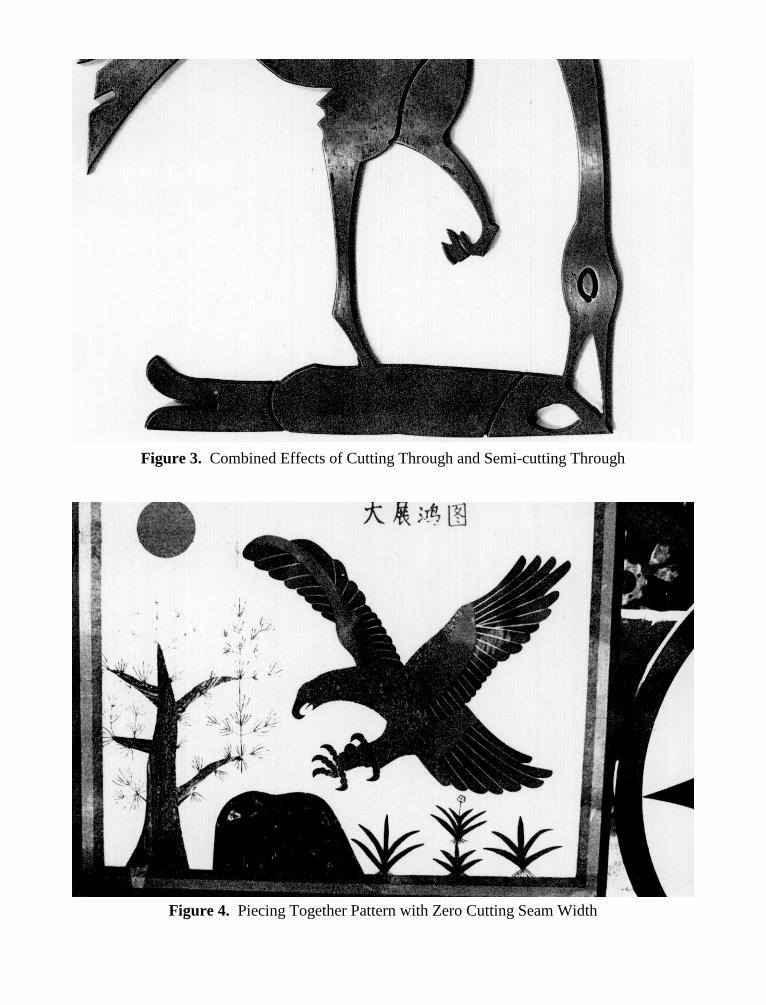
Figure 3. Combined Effects of Cutting Through and Semi-cutting Through
Figure 4. Piecing Together Pattern with Zero Cutting Seam Width
10th American Waterjet ConferenceAugust 14-17, 1999: Houston, Texas
Paper 59
THE DEVELOPMENT OF HIGH-POWER PULSED
WATERJET PROCESSES
Gene G. YieJetec Company
Auburn, Washington, U.S.A.
ABSTRACT
Pulsed waterjets have been known to have significant advantages over continuous waterjets in manyapplications. High-power pulsed waterjets in particular have intrigued many investigators duelargely to their potential in some tough jobs in mining and construction operations. The word $watercannon# has been synonymous to such pulsed waterjet equipment. Unfortunately, these early effortshave not been very successful due mainly to the difficulties in generating and controlling the requiredforce on water in these processes. This situation will be changed. Jetec Company has recentlydeveloped two processes for generating high-power pulsed waterjet that circumvented the previousdifficulties. These processes involve sending pressurized water from a pump, any pump, into anenergy storage device equipped with a unique on-off valve that allows unimpeded, fully-powered,high-speed water pulses to be generated at a downstream nozzle. By separating the pressurizationof water from the pulsing mechanism, a practical, versatile, and reliable pulsed waterjet process isrealized. By varying the water pressure, water flow rate, gas charge pressure, piston power ratio,valve timing, and nozzle diameter and geometry, pulsed waterjet of different characteristics can begenerated. This paper discusses the processes in more detail and presents a list of their manypotential applications.
Organized and Sponsored by the WaterJet Technology Association
1. INTRODUCTION
The word $waterjet# is now a common term; it is used to describe a high-speed, high-energy streamof water generated with special pumps and nozzles to perform a wide variety of work. Waterjets aregenerated today at a static pressure up to35,000 psi to clean industrial equipment, and at pressuresup to 60,000 psi to cut many different materials. With the addition of abrasive particles, waterjetsare used today to cut many hard materials such as glass, concrete, and metals in conjunction withtracking and robotic motion systems. These processes share the feature of having waterjets in theform of a continuous stream although on-off valves are used occasionally to interrupt the flow. These waterjet processes continue to grow and expand; new applications can be expected when newand improved tools are made available.
Pulsed waterjet, or pulsejet, is a different form of waterjet in which the flow of water is deliberatelyinterrupted and the water stream is in the form of discontinuous pulses or slugs. The size of thesepulses and their spacing in terms of time or distance may vary widely. The pulses could be smallslugs that appear to human eyes as a continuous stream but are discreet slugs in reality. They couldalso be individual powerful slugs, as in the case of water cannons that resemble cannon shells inaction. The objective for generating such waterjet pulses may also vary among various processes.In general, the main purpose is to enhance waterjet s cutting capabilities as pulsejets are known topack more impact energy and to have much less jet interference, among other benefits, whenimpacting a target.
A pulsejet could also be considered as a high-energy form of waterjet that is somewhat analogousto the capacitor discharge in electrical systems in which energy is stored to a high voltage and thendischarged abruptly. When water is pressurized, stored, and then released rapidly through a suitablenozzle, it can do work that continuous waterjet cannot do or doesn t do very well. Pulsed waterjetscan also be a way of performing big jobs with a small-capacity pump when large pumps are notavailable or not suitable. An example of such situation is in the application of waterjet inside oil orgas well casings that are too small for accommodating large pumps. A similar situation exists inremote drilling of rock with waterjet where the pump is preferably located near the cutting tools toavoid the use of long sections of high-pressure hose. There are also waterjet applications in whichonly a massive dose of high-speed waterjet can achieve the desired results; examples includefracturing concrete, ice, rock, and minerals with waterjets. Even in common waterjet cleaning andblasting operations, it has been well known that waterjet in discreet pulses can cut materials muchbetter than continuous waterjet. Thus, the desirability of pulsed waterjet technology of severaldifferent forms has been well known and accepted. Unfortunately, interrupting water flow at a veryhigh pressure is not an easy task and the development of viable pulse jet technologies has been slowand is very much at its infancy to date. Jetec Company has been pursuing the development ofimproved pulsejet processes for many years; it has finally developed two processes that appear tobe practical and useful.
2. BACKGROUND
2.1 High-Frequency Pulsejets
One form of pulsed waterjet is the high-frequency type in which the jet stream is obviously in slugor interrupted form; lawn sprinklers are example of this type. Another one is the very-high-frequency type in which the jet stream appears to be continuous to bare eyes but in reality consistsof many closely-spaced slugs such that the number of slugs per unit of time could be up to severalthousands per second. In between, there are other pulsejets in various forms mostly operating atrelatively low pressures.
There are many methods for generating pulsejets. Using a single-plunger pump will instantlygenerate pulsating waterjet. Even a triplex pump having three pistons will generate pulsejet if thehose or tube between the pump and the nozzle is not too long. In most waterjet operations, hosescannot be avoided and pressure and flow pulsations from a pump are mostly damped out. As aresult, special nozzles are used to modulate the water flow in order to generate pulsejets. The basicmethod involved in modulating the water flow may vary among different processes; it could bemechnical, fluidynamic, mechanical-fluidynamic, electro-mechanical, magnetic, or othercombinations. For example, rotating vans have been used in a nozzle to produce pulsejets. Piezoelectric tranducers have been used to modulate a fluid flow. Internal fluid resonance has beenapplied to construct pulsejet nozzles. And someday magneto-hydrodynamic principle may beapplicable to constructing nozzles or pumps for pulsejet applications. Until then, high-frequencypulsejet is mostly a nozzle affair and is limited to relatively low pressures and low power output aslarge pulsejet nozzles may have technical difficulties
2.2 Low-Frequency Pulsejets
There are processes that can produce pulsed waterjets only at very low frequencies. The equipmentinvolved is commonly referred to as $water cannon,# which implies high power capability. Thereare two basic processes; they differ on how the energy is applied to the water.
2.2.1 Impact-Piston Processes
The most intriguing method for generating high-power pulsejets is the impact-piston approach inwhich a column of water inside a cylinder is impacted with a high-speed piston of substantial mass. The kinetic energy of the piston is rapidly transferred to the water column. Being incompressible,a portion of the water will be ejected out of the cylinder through a nozzle, which must be of a specialdesign to facilitate the energy transmission and the generation of a high-speed pulsejet. Theimportant process design factors include the driving and cocking mechanism of the piston, theshaping and containment of the water column, and the nozzle geometry. In general, compressed gasis used for driving the piston and hydraulic oil is used for cocking the piston. There are manyvariations in driving and cocking the impact piston; some processes involved a self-oscillatory pistoncapable of high-frequency operations.
It has been reported that impact-piston process can produce pulsejet of extremely high velocity andtherefore very high impact pressure. In all cases, the impact of the piston on the water column is ofvery short time duration. Therefore, the water slugs generated by such water cannons are also ofshort duration and the efficiency of energy transfer during the piston-water impact is very importantto the effectiveness of the process. It can be very difficult to generate such pulsejets if the powerinvolved is very high, as the piston must be cocked against a compressed gas. The amount ofcompressed gas involved can be substantial such that valving and controlling the gas flow can betroublesome. Since the water is introduced at a very low pressure, it must be contained properlyprior to the impact. Thus, the timing of water fill, the cocking of the impact piston, and thetriggering must all be precisely controlled in order for the process to function properly. Thesedifficulties prevented the realization of commercially viable processes of the impact-piston typedespite that numerous promising results in breaking rock and concrete have been observed inlaboratory and field tests.
2.2.2 Pressure-Extrusion Processes
Another type of water cannons that has been investigated in the past is the so-called $pressure-extrusion# type, which implies that a column of water is pushed out of a cylinder under pressure bya moving piston. The term seems to imply that speed of the piston in this case is slower than thatof impact-piston processes. In actuality, the speed of the piston in both processes is determined bythe magnitude of the driving force involved, and the cocking and triggering method. In both cases,the piston must first be pushed with a fluid to store the driving energy in a gas, and then cocked ina ready position while the cocking fluid is being withdrawn. Then the piston is quickly released tomove toward the water column. If there is air between the piston and water, the piston willaccelerate in speed before impacting the water column and the process is referred to as an impact-piston process. If the piston is in contact with the water at all times and there is no air or gas inbetween, the piston serves only as the intermediate between the compressed gas and the water andthe process is referred to as pressure-extrusion type. Since the compressed gas is doing the pushingand the piston travel is generally quite short, the speed of the piston is mainly a function of the gasexpansion and therefore does not vary very much in the two processes. The contact time betweenthe piston and water, however, varies a great deal in these two processes.
The pressure-extrusion processes allow a much greater amount of water to be ejected through anozzle. Therefore, the total amount of energy that can be packed in each jet pulse is also muchgreater than that of impact processes. This aspect is of significant importance in some pulsejetapplications. The frequency of pulse generation in extrusion processes is determined mostly by thesize of the water cylinder and the method of operating the cannon. The speed of the jet pulses is afunction of the cannonV operating pressure, mode of piston drive, and the design of the nozzle. Inmost cannons, there will be a gas piston and a connected water plunger; their cross-sectional arearatio determines the force relationship inside the cannon. If hydraulic oil is employed for cockingthe gas piston, it must be introduced at a pressure greater than that of the stored gas on the other sideof the piston. While the power piston is being cocked, water enters into the water cylinder under aprecharge pressure. The power piston is then cocked by various means to allow the cocking oil tobe evacuated completely from the cocking chamber. The power piston is then released from itscocked position to push against the water. The water inside the cylinder is pressurized rapidly by
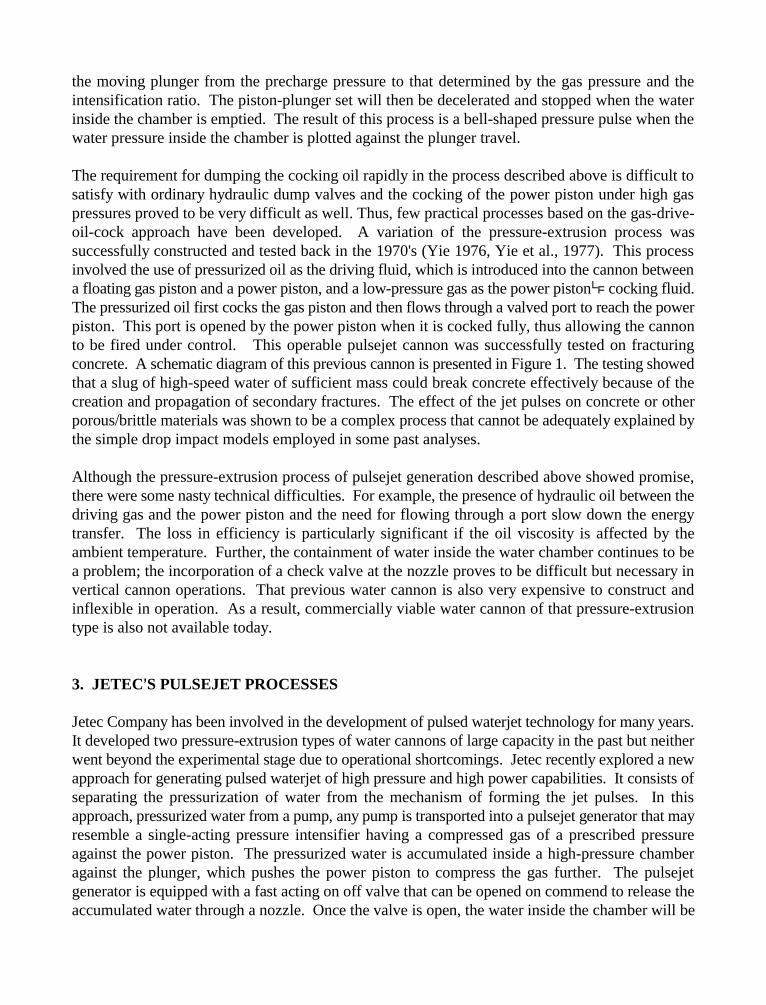
the moving plunger from the precharge pressure to that determined by the gas pressure and theintensification ratio. The piston-plunger set will then be decelerated and stopped when the waterinside the chamber is emptied. The result of this process is a bell-shaped pressure pulse when thewater pressure inside the chamber is plotted against the plunger travel.
The requirement for dumping the cocking oil rapidly in the process described above is difficult tosatisfy with ordinary hydraulic dump valves and the cocking of the power piston under high gaspressures proved to be very difficult as well. Thus, few practical processes based on the gas-drive-oil-cock approach have been developed. A variation of the pressure-extrusion process wassuccessfully constructed and tested back in the 1970's (Yie 1976, Yie et al., 1977). This processinvolved the use of pressurized oil as the driving fluid, which is introduced into the cannon betweena floating gas piston and a power piston, and a low-pressure gas as the power pistonV cocking fluid.The pressurized oil first cocks the gas piston and then flows through a valved port to reach the powerpiston. This port is opened by the power piston when it is cocked fully, thus allowing the cannonto be fired under control. This operable pulsejet cannon was successfully tested on fracturingconcrete. A schematic diagram of this previous cannon is presented in Figure 1. The testing showedthat a slug of high-speed water of sufficient mass could break concrete effectively because of thecreation and propagation of secondary fractures. The effect of the jet pulses on concrete or otherporous/brittle materials was shown to be a complex process that cannot be adequately explained bythe simple drop impact models employed in some past analyses.
Although the pressure-extrusion process of pulsejet generation described above showed promise,there were some nasty technical difficulties. For example, the presence of hydraulic oil between thedriving gas and the power piston and the need for flowing through a port slow down the energytransfer. The loss in efficiency is particularly significant if the oil viscosity is affected by theambient temperature. Further, the containment of water inside the water chamber continues to bea problem; the incorporation of a check valve at the nozzle proves to be difficult but necessary invertical cannon operations. That previous water cannon is also very expensive to construct andinflexible in operation. As a result, commercially viable water cannon of that pressure-extrusiontype is also not available today.
3. JETEC S PULSEJET PROCESSES
Jetec Company has been involved in the development of pulsed waterjet technology for many years.It developed two pressure-extrusion types of water cannons of large capacity in the past but neitherwent beyond the experimental stage due to operational shortcomings. Jetec recently explored a newapproach for generating pulsed waterjet of high pressure and high power capabilities. It consists ofseparating the pressurization of water from the mechanism of forming the jet pulses. In thisapproach, pressurized water from a pump, any pump is transported into a pulsejet generator that mayresemble a single-acting pressure intensifier having a compressed gas of a prescribed pressureagainst the power piston. The pressurized water is accumulated inside a high-pressure chamberagainst the plunger, which pushes the power piston to compress the gas further. The pulsejetgenerator is equipped with a fast acting on off valve that can be opened on commend to release theaccumulated water through a nozzle. Once the valve is open, the water inside the chamber will be
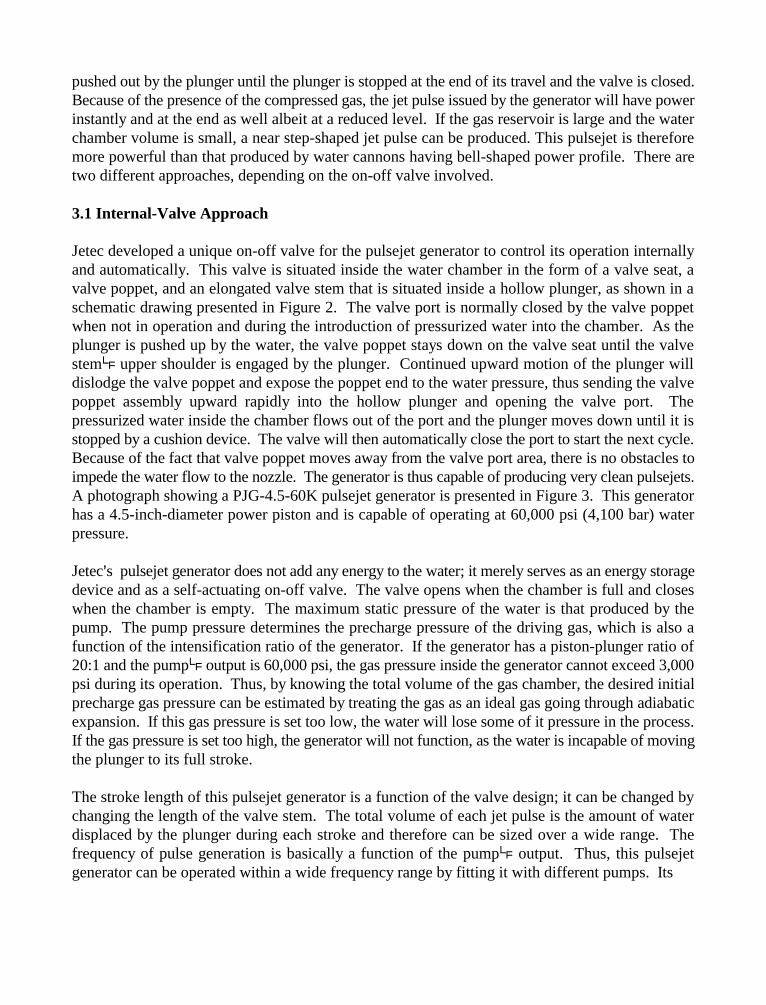
pushed out by the plunger until the plunger is stopped at the end of its travel and the valve is closed.Because of the presence of the compressed gas, the jet pulse issued by the generator will have powerinstantly and at the end as well albeit at a reduced level. If the gas reservoir is large and the waterchamber volume is small, a near step-shaped jet pulse can be produced. This pulsejet is thereforemore powerful than that produced by water cannons having bell-shaped power profile. There aretwo different approaches, depending on the on-off valve involved.
3.1 Internal-Valve Approach
Jetec developed a unique on-off valve for the pulsejet generator to control its operation internallyand automatically. This valve is situated inside the water chamber in the form of a valve seat, avalve poppet, and an elongated valve stem that is situated inside a hollow plunger, as shown in aschematic drawing presented in Figure 2. The valve port is normally closed by the valve poppetwhen not in operation and during the introduction of pressurized water into the chamber. As theplunger is pushed up by the water, the valve poppet stays down on the valve seat until the valvestemV upper shoulder is engaged by the plunger. Continued upward motion of the plunger willdislodge the valve poppet and expose the poppet end to the water pressure, thus sending the valvepoppet assembly upward rapidly into the hollow plunger and opening the valve port. Thepressurized water inside the chamber flows out of the port and the plunger moves down until it isstopped by a cushion device. The valve will then automatically close the port to start the next cycle.Because of the fact that valve poppet moves away from the valve port area, there is no obstacles toimpede the water flow to the nozzle. The generator is thus capable of producing very clean pulsejets.A photograph showing a PJG-4.5-60K pulsejet generator is presented in Figure 3. This generatorhas a 4.5-inch-diameter power piston and is capable of operating at 60,000 psi (4,100 bar) waterpressure.
Jetec s pulsejet generator does not add any energy to the water; it merely serves as an energy storagedevice and as a self-actuating on-off valve. The valve opens when the chamber is full and closeswhen the chamber is empty. The maximum static pressure of the water is that produced by thepump. The pump pressure determines the precharge pressure of the driving gas, which is also afunction of the intensification ratio of the generator. If the generator has a piston-plunger ratio of20:1 and the pumpV output is 60,000 psi, the gas pressure inside the generator cannot exceed 3,000psi during its operation. Thus, by knowing the total volume of the gas chamber, the desired initialprecharge gas pressure can be estimated by treating the gas as an ideal gas going through adiabaticexpansion. If this gas pressure is set too low, the water will lose some of it pressure in the process.If the gas pressure is set too high, the generator will not function, as the water is incapable of movingthe plunger to its full stroke.
The stroke length of this pulsejet generator is a function of the valve design; it can be changed bychanging the length of the valve stem. The total volume of each jet pulse is the amount of waterdisplaced by the plunger during each stroke and therefore can be sized over a wide range. Thefrequency of pulse generation is basically a function of the pumpV output. Thus, this pulsejetgenerator can be operated within a wide frequency range by fitting it with different pumps. Its
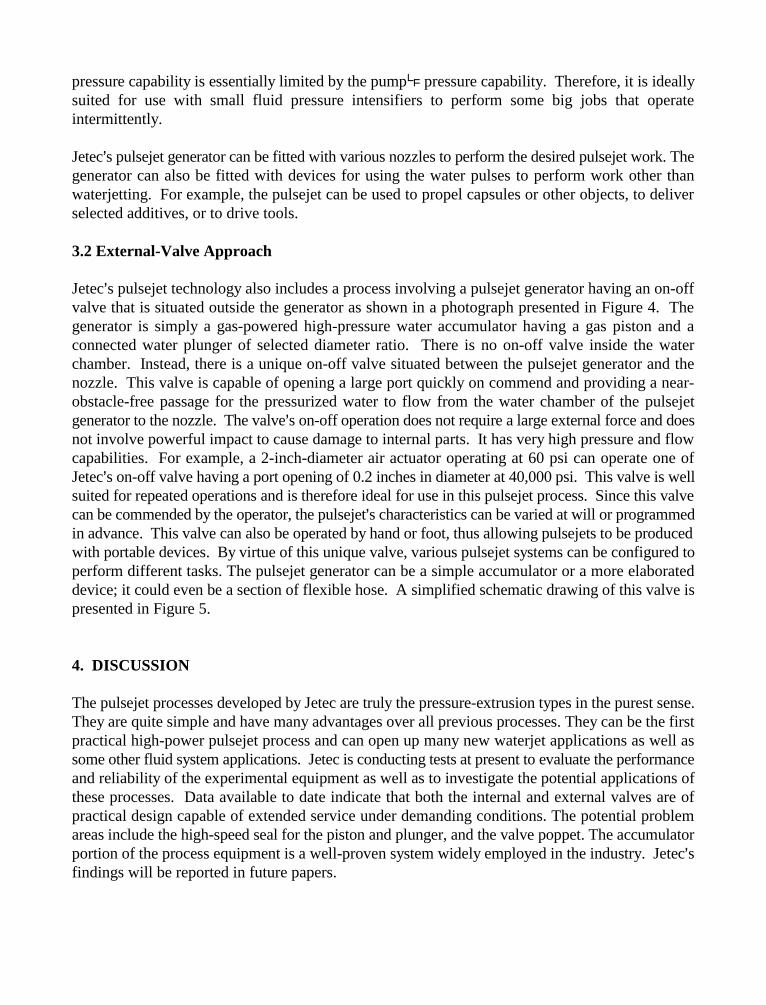
pressure capability is essentially limited by the pumpV pressure capability. Therefore, it is ideallysuited for use with small fluid pressure intensifiers to perform some big jobs that operateintermittently.
Jetec s pulsejet generator can be fitted with various nozzles to perform the desired pulsejet work. Thegenerator can also be fitted with devices for using the water pulses to perform work other thanwaterjetting. For example, the pulsejet can be used to propel capsules or other objects, to deliverselected additives, or to drive tools.
3.2 External-Valve Approach
Jetec s pulsejet technology also includes a process involving a pulsejet generator having an on-offvalve that is situated outside the generator as shown in a photograph presented in Figure 4. Thegenerator is simply a gas-powered high-pressure water accumulator having a gas piston and aconnected water plunger of selected diameter ratio. There is no on-off valve inside the waterchamber. Instead, there is a unique on-off valve situated between the pulsejet generator and thenozzle. This valve is capable of opening a large port quickly on commend and providing a near-obstacle-free passage for the pressurized water to flow from the water chamber of the pulsejetgenerator to the nozzle. The valve s on-off operation does not require a large external force and doesnot involve powerful impact to cause damage to internal parts. It has very high pressure and flowcapabilities. For example, a 2-inch-diameter air actuator operating at 60 psi can operate one ofJetec s on-off valve having a port opening of 0.2 inches in diameter at 40,000 psi. This valve is wellsuited for repeated operations and is therefore ideal for use in this pulsejet process. Since this valvecan be commended by the operator, the pulsejet s characteristics can be varied at will or programmedin advance. This valve can also be operated by hand or foot, thus allowing pulsejets to be producedwith portable devices. By virtue of this unique valve, various pulsejet systems can be configured toperform different tasks. The pulsejet generator can be a simple accumulator or a more elaborateddevice; it could even be a section of flexible hose. A simplified schematic drawing of this valve ispresented in Figure 5.
4. DISCUSSION
The pulsejet processes developed by Jetec are truly the pressure-extrusion types in the purest sense.They are quite simple and have many advantages over all previous processes. They can be the firstpractical high-power pulsejet process and can open up many new waterjet applications as well assome other fluid system applications. Jetec is conducting tests at present to evaluate the performanceand reliability of the experimental equipment as well as to investigate the potential applications ofthese processes. Data available to date indicate that both the internal and external valves are ofpractical design capable of extended service under demanding conditions. The potential problemareas include the high-speed seal for the piston and plunger, and the valve poppet. The accumulatorportion of the process equipment is a well-proven system widely employed in the industry. Jetec sfindings will be reported in future papers.
5. POTENTIAL APPLICATIONS
Jetec believes that its pulsejet processes can have many applications including the following:
5.1 Pure Waterjet Applications
These applications involve the use of pulsed waterjet to perform a task in which both the water andits energy are of value.
Industrial cleaning and blasting applications for improved effectiveness and conservation ofwater and power.
Excavation and hydrodemolition applications.
Remote geotechnical cutting, drilling, and blasting applications.
Fire-fighting applications.
Agricultural irrigation applications.
Underwater applications.
Pest-control applications.
Crowd-control applications.
Water-fountain display applications.
Manufacturing applications such as metal forming and hole punching.
5.2 Material-Delivery Applications
These applications involve the use of pulsejet energy to deliver a selected material and to performa task in which both the water and the delivered material are of value.
Abrasive-jet material cutting, drilling, punching, and demolishing applications.
Fire-fighting applications, in which selected fire-extinguishing materials are delivered withthe pulsed waterjet for greater power, distance, accuracy, and effectiveness.
Launching pellets, capsules, projectiles, or other objects for various purposes.
Injection of selected substances into soil, trees, wood, rock, foundations, and other substratesfor a wide variety of purposes.
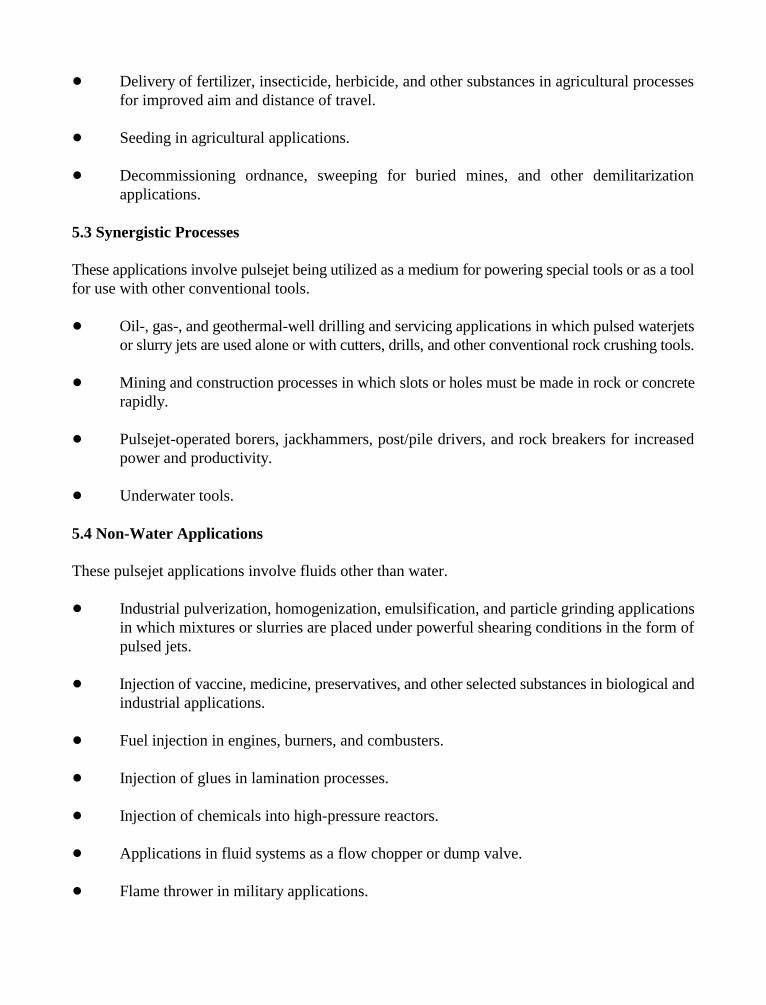
Delivery of fertilizer, insecticide, herbicide, and other substances in agricultural processesfor improved aim and distance of travel.
Seeding in agricultural applications.
Decommissioning ordnance, sweeping for buried mines, and other demilitarizationapplications.
5.3 Synergistic Processes
These applications involve pulsejet being utilized as a medium for powering special tools or as a toolfor use with other conventional tools.
Oil-, gas-, and geothermal-well drilling and servicing applications in which pulsed waterjetsor slurry jets are used alone or with cutters, drills, and other conventional rock crushing tools.
Mining and construction processes in which slots or holes must be made in rock or concreterapidly.
Pulsejet-operated borers, jackhammers, post/pile drivers, and rock breakers for increasedpower and productivity.
Underwater tools.
5.4 Non-Water Applications
These pulsejet applications involve fluids other than water.
Industrial pulverization, homogenization, emulsification, and particle grinding applicationsin which mixtures or slurries are placed under powerful shearing conditions in the form ofpulsed jets.
Injection of vaccine, medicine, preservatives, and other selected substances in biological andindustrial applications.
Fuel injection in engines, burners, and combusters.
Injection of glues in lamination processes.
Injection of chemicals into high-pressure reactors.
Applications in fluid systems as a flow chopper or dump valve.
Flame thrower in military applications.

6. REFERENCES
Yie, G. G., $A Pulsed Water-Jet Method for Breaking Concrete Pavement.# Institute of Gas Technology Report - Project 9508, Chicago, 1977.
Yie, G. G., Burns, D. J., and Mohaupt, U. H., $Performance of a High-Pressure Pulsed Water-Jet Device for Fracturing Concrete.# Proceedings of the 4th International Symposium on Jet Cutting Technology, pp.H6 67-86, BHRA Fluid Engineering, Cranfield, U.K., 1978.
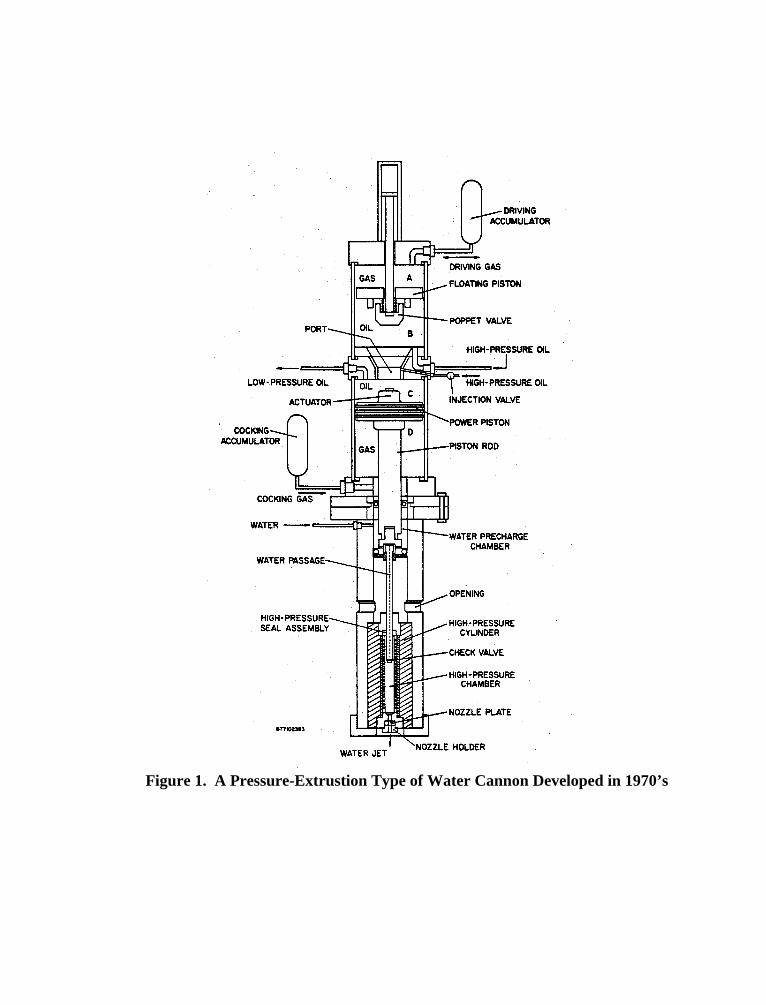
Figure 1. A Pressure-Extrustion Type of Water Cannon Developed in 1970’s
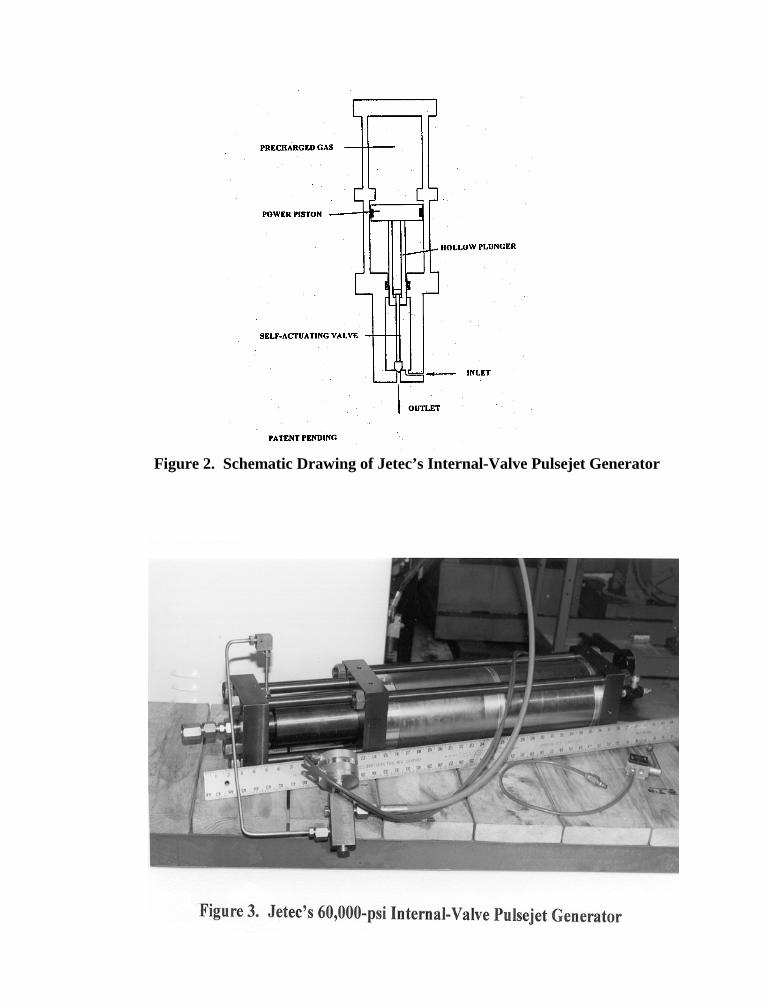
Figure 2. Schematic Drawing of Jetec’s Internal-Valve Pulsejet Generator
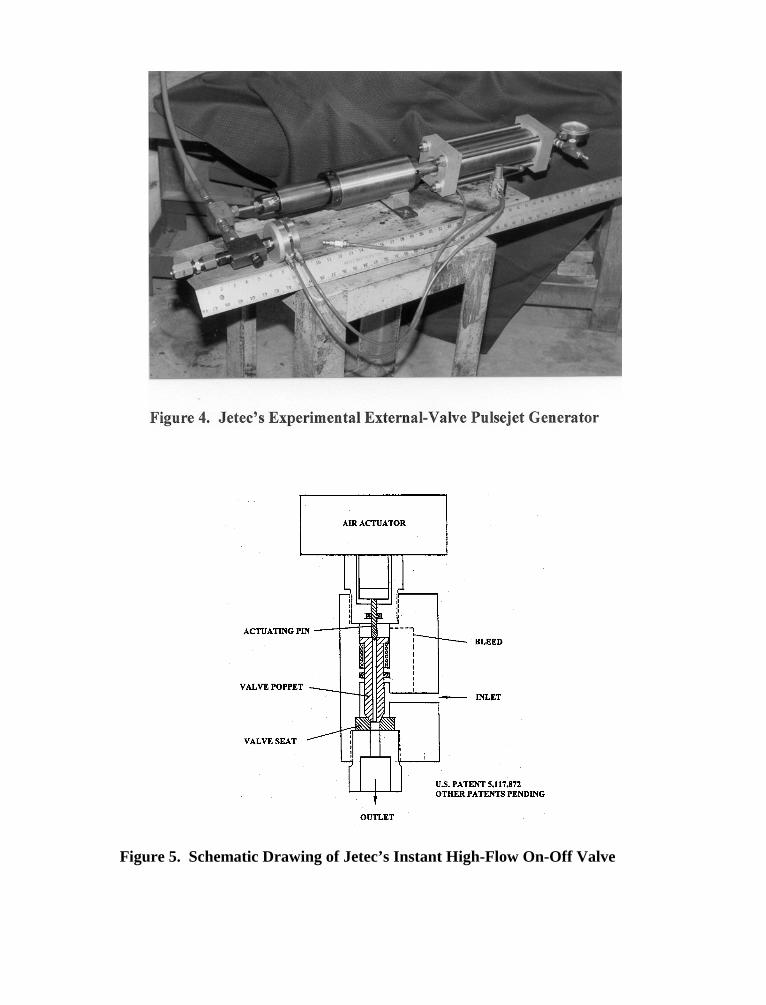
Figure 5. Schematic Drawing of Jetec’s Instant High-Flow On-Off Valve
10th American Waterjet ConferenceAugust 14-17, 1999: Houston, Texas
Paper 60
A NEW HIGH EFFICIENT PULSATING NOZZLE
USED FOR JET DRILLING
B. J. SunPetroleum University, China
Dongying, Shandong, P. R. C.
C. E. ZhaoDagang Petroleum and Natural Gas Corp.
Tianjin, P. R. C.
ABSTRACT
Except for cooling bit, a high- pressure water jet is applied to fracture rocks and clean outcuttings in the bottom of the oil well in jet drilling engineering. The paper gives a simpledescription on the design of the new organ-pipe type self-resonating pulsating jet with thepurpose of enhancing the jet erosion efficiency and prolonging the nozzle life span.Hydrodynamic impact pressure measurement experiment, rock erosion test and preliminaryprobation in drilling engineering were carried out using the new designed nozzles. The resultsshow that the new self-resonating pulsating nozzle jet has stronger erosion capability than thecone-type or conventional organ-pipe self-resonating nozzle jet. The field test results in drillingengineering on several oilfields also show that the outlets of the newly designed nozzles havestronger anti-scouring ability than conventional organ-pipe self-resonating nozzle.
Organized and sponsored by the WaterJet Technology Association
1. INTRODUCTION
Except for cooling bit, a high- pressure water jet is applied to fracture rocks and clean outcuttings in the bottom of the oil well in jet drilling engineering. This practice can reduce theprobability of re-fracturing of the rock debris by the drill bit, as well as to increase the drillingspeed. Mini-extended and extended nozzles are developed in order to reduce velocity attenuationand enhance the energy of the jet at the bottom of the well. They convert hydraulic pressure tokinetic fluid-flow energy with a minimum of flow disturbance, thereby focussing the stream offluid against the floor of the formation and across the cutting face of the bit (Smith, et al, 1987).Another new kind of highly efficient jet for erosion and cleaning is the organ-pipe self-resonatingpulsating jet whose high velocity stream fluctuates as it flows through the nozzle (Shen, et al,1987, 1891, 1992; Johnson, et al, 1982, 1984; Sun, et al, 1993, 1998). It has a higher pulsatingvelocity and transient impact force in comparison with the common jet. It was found that apulsating nozzle installed on drilling bits could generate a more highly efficient jet flow oftenneeded to fracture rocks and clean cuttings. The organ-pipe self-resonating pulsating nozzle has asimpler configuration and easier operation in drilling engineering. Experimental results (Johnson,et al, 1982) show that the organ pipe pulsating nozzle mounted on Smith F2-CE bits can enhancedrilling speed by about 1030 percent over a conventional nozzle. However, the walls of theoutlets of the nozzles are more easily eroded by high-speed fluid flow. One can increase the anti-scouring ability of the outlet of organ pipe nozzles by thickening their outlet parts; this willreduce the pulsating velocity and decrease the erosion characteristic of the jet (Sun, et al, 1994,1998; Shen, et al, 1987). Preliminary results indicate that the average life span of organ-pipe self-resonating nozzles will not usually exceed 80 hours (Shen et al, 1991) due to scouring problem inthe nozzle exits. Moreover, organ pipe pulsating nozzles have a section with sudden diameterreduction, which may create vortices at the exit and increase energy loss (Gerhart & Gross,1985). The mean purpose of this study is to develop a high efficient and long life span jet nozzle.
The new type organ-pipe self-resonating pulsating nozzle as described in the paper has lessenergy loss and stronger erosion ability for rocks. Moreover, the field test results in drillingengineering on several oilfields show that the outlets of the newly designed nozzles have stronganti-scouring ability compared with the conventional ogan-pipe pulsating nozzle.
2. THE DESIGN OF THE NEW NOZZLE AND TEST RESULTS
2.1 The design of the new self-resonating pulsating nozzle
Our purpose on the new nozzle design is to reduce the jet head loss and prolong the nozzle lifespan, which would be demonstrated by the jet erosion efficiency for rocks and increased realdrilling time of the new nozzle in engineering uses. The erosion effect for rocks of jet depends onmean impact pressure, and the peak and amplitude value of the pressure fluctuation. The meannozzle life span depends on the thickness b of the exit. However, the conventional organ-pipepulsating nozzle is composed of an upstream reduction section with a ratio of (Ds/D1)
2, and adownstream section with (D1/d1)
2 (Sun, et al 1993, 1998; Shen, et al, 1991). Such a rationchange would lead to large energy losses and would not make the outlet of these nozzles strong
enough, which can be known from the following analysis. On the principle of fluid mechanics,the energy loss can be represented by head loss
gkvhl 2/2= (1)
Where k is the head loss coefficient, and v is the jet velocity of the nozzle exit. An empiricalequation for the loss coefficient for a sudden diameter reduction is (Gerhart, et al, 1985)
])/(1[42.0 21 Ddk −≈ (2)
Based on our practical case, let d1=10mm, D=15mm, then k=0.23. If flow rate Q=7.2l/s, then thehead loss hl =98.7m, which is nearly 10 percent of the total pump head.
For a smooth contoured reduction, we can obtain the loss coefficient based on the data given byGerhart, et al (1985, pp489), so when d1/D = 0.6, the value of k for an abrupt reduction is 7 timesmore than that for smooth contoured reduction. From this datum, if we use smooth contouredreduction design, the nozzle energy loss maybe deduced.
A large number of experiments have been conducted in order to study the influence of the outletthickness on the erosion of organ-pipe nozzles (Sun, et al, 1994, Shen, et al, 1987). The resultsindicate that the erosion capability of the jet spray from an organ-pipe nozzle becomes greaterwith decreasing exit thickness. This decrease, of course, will also decrease the strength of thenozzle exit. In order to increase the anti-scouring capability of the nozzle outlet and decrease theenergy loss of the jet flow, the up stream reduction is designed as an exponent surface that cangenerate fluctuating pressure efficiently. The down stream reduction is designed as a streamlinedsurface which can feed back turbulent pressure and make the jet self-resonate efficiently asdemonstrated by experiment (Sun, et al, 1993, 1998), as show in fig.1.
Due to the complexity of turbulent flow we cannot design the new nozzle by a purely theoreticalequation alone. Acoustic analyses and experimental study together give the following equationto estimate the length of the organ-pipe (Sun, et al, 1993, 1998):
11 / dpMSHndL = , (3)
where H=0.50.55 is a constant, n is the mode number of the organ pipe, vfdSd /11 = is the
Strouhal number and M is the Mach number. This new configuration design makes the jet corebecome longer, and can generate a preferable pulsating jet (Sun, et al, 1993). The gradualreduction configuration makes the nozzle exit stronger and more able to withstand the scouringof high velocity jet flow.
Suppose there is a large number of axi-symmetrical vortices in the jet flow, whose axialpositions may be distributed at random, and whose vorticities concentrated in the central region
around the axis, neglecting the interferences among vortices. Let b represents the radius of avortex ring. The following result had been obtained (Shen, et al, 1992)
5.0tb ∝ (4)
The results show that the radius of the vortex ring becomes larger with t 0 5. law. If the radius ofthe vortex ring increases, a large pulsed velocity can be produced. For a thick outlet of a nozzle,some big vortices will be destroyed due to the “absorption” of the nozzle outlet wall (Sun, et al,1998). Experimental results indicate that the jet pulsation becomes larger and the jet erosioncapability becomes stronger if the thickness of the nozzle outlet is less. But the thinner nozzleoutlet can not bear strong scouring of high velocity jet. In order to prevent the vortex frombreaking down at the nozzle outlet due to “absorption”, we design the profile of the nozzle outletas a quarter circular arc, as show in fig.1. Another benefit of this design is to overcome the headloss due to sudden enlargement of the organ-pipe exit (Gerhart , et al, 1985). When the highvelocity jet spray leaves the exit, there is a large velocity difference between the jet and ambientfluid, it must cause acute fluid momentum exchange and vortex movement, all of which mustconsume the energy of the jet. So, the profile of the external expanding part of the nozzle plays avery important role in creating the self-resonating pulsation feature of the jet.
2.2 Experimental results in laboratory
The test equipment we used is shown in the paper of Shen, et al (1991) and Sun, et al (1993). Theliquid used in the test is tap water. All tests are conducted to simulate well bore just underatmospheric pressure and normal temperature. A rock specimen box can be mounted on thechassis in the erosion experiments. Mini-extended conventional cone and organ-pipe self-resonating nozzles are tested simultaneously with the newly designed mini-extended and the newself-resonating nozzle. The diameters of all tested nozzles are 10 mm.
The impact pressure measurement test along jet axes has been conducted (Sun, et al, 1993,1998). The same tests were conducted with cone and organ-pipe nozzle. The results showed thatthe new nozzle has the least energy loss among three kinds of tested nozzles. Therefore, moreenergy of the jet flow can concentrate on rock surface for its erosion. Moreover, it provides alarger pulsating pressure, which is beneficial for rock erosion. It is verified by the erosionexperiment results as described in the reference paper (Sun, et al, 1998). For the purpose ofcomparison, all tests were conducted under the same pump pressure conditions. Two parametersare adopted to compare jet erosion capability. The first is the volume erosion rate V, which is theerosion volume per second. The second is the depth erosion rate H that comes from the averageerosion depth per second. The rock specimen used was isotropic natural Zibo sandstone. Itsphysical characteristics measured before the experiments are shown in table 1. The results showthat the volume erosion rate of the new nozzle jet is 3.2 times greater than that of the organ-pipenozzle jet and 5.5 times greater than that of the cone nozzle jet. Similarly, it was demonstratedthat the average depth erosion rate of the new nozzle is almost 100% greater than that of theorgan-pipe nozzle jet and 1.8 times greater than that of the cone nozzle jet at their optimizing
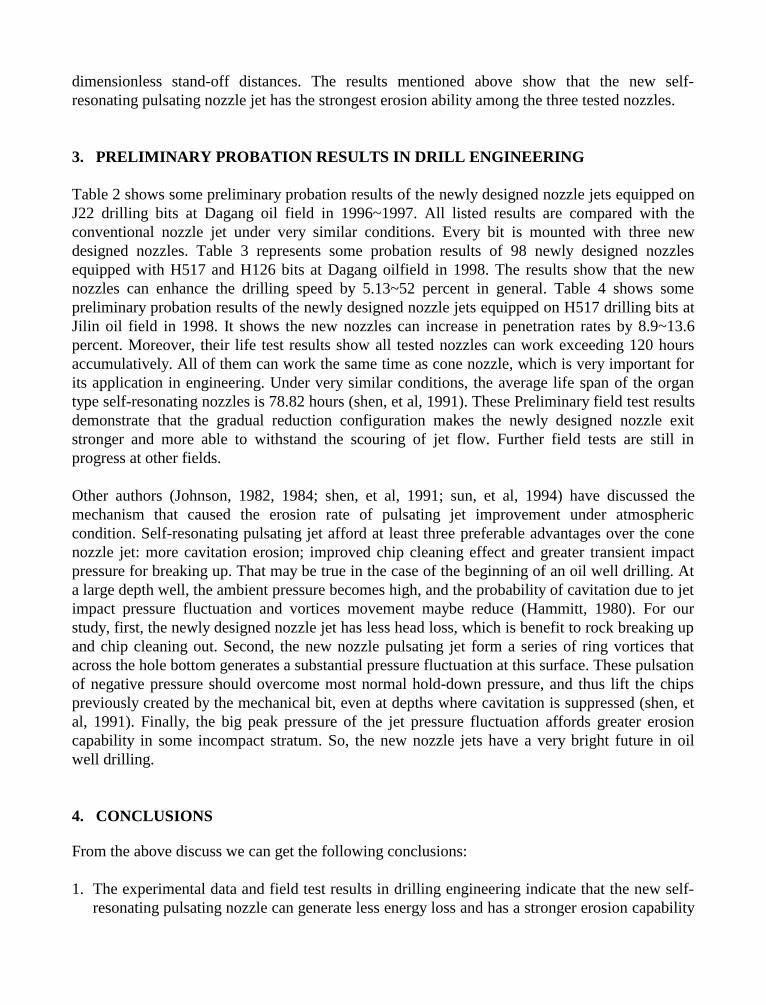
dimensionless stand-off distances. The results mentioned above show that the new self-resonating pulsating nozzle jet has the strongest erosion ability among the three tested nozzles.
3. PRELIMINARY PROBATION RESULTS IN DRILL ENGINEERING
Table 2 shows some preliminary probation results of the newly designed nozzle jets equipped onJ22 drilling bits at Dagang oil field in 1996~1997. All listed results are compared with theconventional nozzle jet under very similar conditions. Every bit is mounted with three newdesigned nozzles. Table 3 represents some probation results of 98 newly designed nozzlesequipped with H517 and H126 bits at Dagang oilfield in 1998. The results show that the newnozzles can enhance the drilling speed by 5.13~52 percent in general. Table 4 shows somepreliminary probation results of the newly designed nozzle jets equipped on H517 drilling bits atJilin oil field in 1998. It shows the new nozzles can increase in penetration rates by 8.9~13.6percent. Moreover, their life test results show all tested nozzles can work exceeding 120 hoursaccumulatively. All of them can work the same time as cone nozzle, which is very important forits application in engineering. Under very similar conditions, the average life span of the organtype self-resonating nozzles is 78.82 hours (shen, et al, 1991). These Preliminary field test resultsdemonstrate that the gradual reduction configuration makes the newly designed nozzle exitstronger and more able to withstand the scouring of jet flow. Further field tests are still inprogress at other fields.
Other authors (Johnson, 1982, 1984; shen, et al, 1991; sun, et al, 1994) have discussed themechanism that caused the erosion rate of pulsating jet improvement under atmosphericcondition. Self-resonating pulsating jet afford at least three preferable advantages over the conenozzle jet: more cavitation erosion; improved chip cleaning effect and greater transient impactpressure for breaking up. That may be true in the case of the beginning of an oil well drilling. Ata large depth well, the ambient pressure becomes high, and the probability of cavitation due to jetimpact pressure fluctuation and vortices movement maybe reduce (Hammitt, 1980). For ourstudy, first, the newly designed nozzle jet has less head loss, which is benefit to rock breaking upand chip cleaning out. Second, the new nozzle pulsating jet form a series of ring vortices thatacross the hole bottom generates a substantial pressure fluctuation at this surface. These pulsationof negative pressure should overcome most normal hold-down pressure, and thus lift the chipspreviously created by the mechanical bit, even at depths where cavitation is suppressed (shen, etal, 1991). Finally, the big peak pressure of the jet pressure fluctuation affords greater erosioncapability in some incompact stratum. So, the new nozzle jets have a very bright future in oilwell drilling.
4. CONCLUSIONS
From the above discuss we can get the following conclusions:
1. The experimental data and field test results in drilling engineering indicate that the new self-resonating pulsating nozzle can generate less energy loss and has a stronger erosion capability
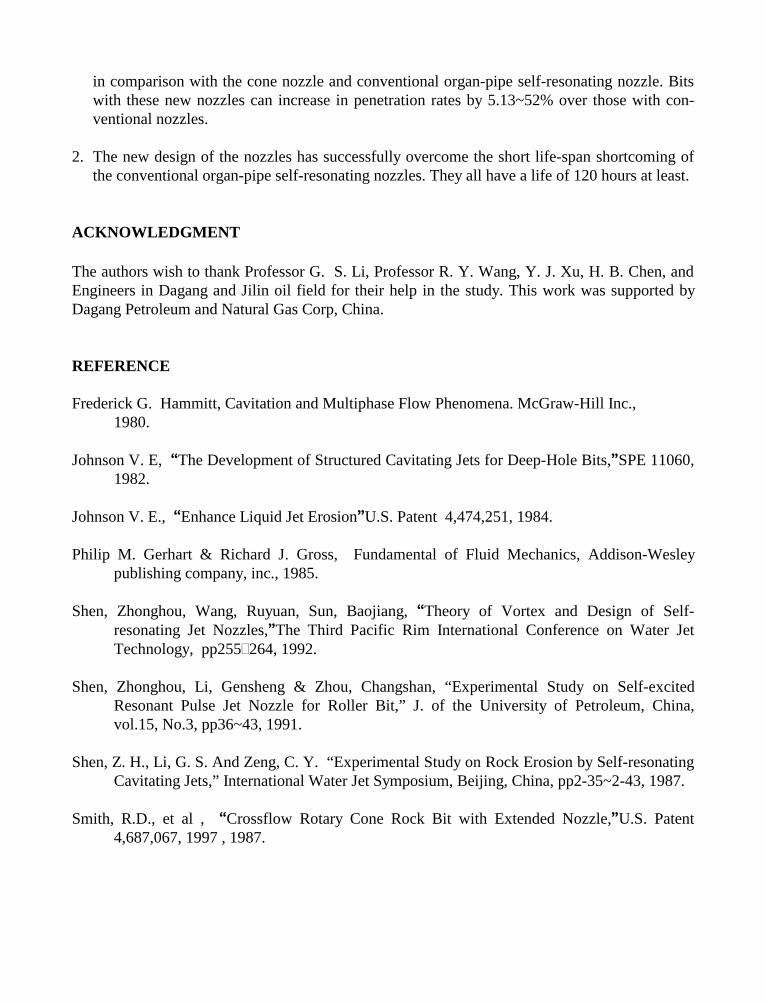
in comparison with the cone nozzle and conventional organ-pipe self-resonating nozzle. Bitswith these new nozzles can increase in penetration rates by 5.13~52% over those with con-ventional nozzles.
2. The new design of the nozzles has successfully overcome the short life-span shortcoming ofthe conventional organ-pipe self-resonating nozzles. They all have a life of 120 hours at least.
ACKNOWLEDGMENT
The authors wish to thank Professor G. S. Li, Professor R. Y. Wang, Y. J. Xu, H. B. Chen, andEngineers in Dagang and Jilin oil field for their help in the study. This work was supported byDagang Petroleum and Natural Gas Corp, China.
REFERENCE
Frederick G. Hammitt, Cavitation and Multiphase Flow Phenomena. McGraw-Hill Inc.,1980.
Johnson V. E, The Development of Structured Cavitating Jets for Deep-Hole Bits,µSPE 11060,1982.
Johnson V. E., ´Enhance Liquid Jet ErosionµU.S. Patent 4,474,251, 1984.
Philip M. Gerhart & Richard J. Gross, Fundamental of Fluid Mechanics, Addison-Wesleypublishing company, inc., 1985.
Shen, Zhonghou, Wang, Ruyuan, Sun, Baojiang, ´Theory of Vortex and Design of Self-resonating Jet Nozzles,µThe Third Pacific Rim International Conference on Water JetTechnology, pp255264, 1992.
Shen, Zhonghou, Li, Gensheng & Zhou, Changshan, “Experimental Study on Self-excitedResonant Pulse Jet Nozzle for Roller Bit,” J. of the University of Petroleum, China,vol.15, No.3, pp36~43, 1991.
Shen, Z. H., Li, G. S. And Zeng, C. Y. “Experimental Study on Rock Erosion by Self-resonatingCavitating Jets,” International Water Jet Symposium, Beijing, China, pp2-35~2-43, 1987.
Smith, R.D., et al , Crossflow Rotary Cone Rock Bit with Extended Nozzle,µU.S. Patent4,687,067, 1997 , 1987.

Sun, Baojiang, Wang, Ruyuan, Sheng, Zhonghou ´Discussion on High Efficient Pulse JetNozzle Used for Jet Drilling,µOil Drilling and Production Technology, vol. 15, pp1319,1993.
Sun, Baojiang, Wang, Ruyuan & Shen, Zhonghou, “Design of a New Type of Self-resonatingPulsating Nozzle,” J. of the University of Petroleum, China, vol.18, No.3, pp31~34, 1994.
Sun, Baojiang, Yan, Dachun. “A Study on Energy Concentration and Self-resonating Jet Nozzle andIts Application in Drilling Engineering”, The Third international conference on fluidmechanics, Beijing, pp565~570, July 7-10, 1998.
NOMENCLATURE
lh : head loss; k: head loss coefficient;
v: jet velocity; d1: the diameter of nozzle exit;D1: the diameter of organ-pipe; Ds: the diameter of inlet of the nozzle;Q: flow rate; Lp: the length of the organ-pipe;n: the mode number of the organ pipe ; H: constantM: Mach number; Sd: Struhal number;b: the radius of a vortex ring; t: time;f: resonating frequency of the jet.
Table 1 The physical characteristics of the isotropic natural Zibo sandstone
d en sity p o ro s ity e lastic itym o d u lu s
h ard n ess ten s ilestren g th
co m p ress iv estren g th
P o isso n’ sra tio
g ra ins ize
2 g /cm3 1 5 % 5ê1 07N /m 2 5 .1 N /m2 0 .0 2 5 N /m2 0 .5 4 5 N /m2 0 .3 4 0 .0 5 ~ 0 .3 m m
Table 2 . Some Probation results of new designed nozzles at Dagang oilfield in 1996~1997
BitsNo.
layers Drillpeed
(m/hr)
Improve rateof Drill Speed
Pump Pressure(Mpa)
DrillingDepth (m)
Bitsmodel
1 S2 2.94 40% 19 3062~32492 S3 8.17 52% 20 2085~23173 Ed 7.06 14% 19 2430~25704 S2 6.34 23% 17 2609~29665 S2 3.63 11.8% 17 2816~3014
J22
Table 3 Some Probation results of new designed nozzles at Dagang oilfield in 1998
layers bitnumber
bitsmodel
drill peed(m/hr)
increase inDrilling speed
pump Press-ure(Mpa)
footagem/per bit
Kongdiangroup
36 H517 4.76 14.7% 18 265.61
ES 23 H517 4.34 36.91% 20 270.56Ed 12 H517 6.16 8.64.1% 19 302.22Ng 10 H517 7.99 5.13% 17 474.03Nm 17 H126 15.36 9.64% 18 135.72
Table 4 . Some Probation results of new designed nozzles at Jilin oilfield in 1998
BitsNo.
layers Drill peed(m/hr)
Improve rateof Drill Speed
Pump Pres-sure(Mpa)
DrillingDepth(m)
Bitsmodel
1 Yuantougroup
5.2 10.5% 14 1300~1520
2 Dengloukugroup
3.13 13.6% 15 1520~1790
3 Dengloukugroup
3.06 8.9% 15 1562~1696
H517
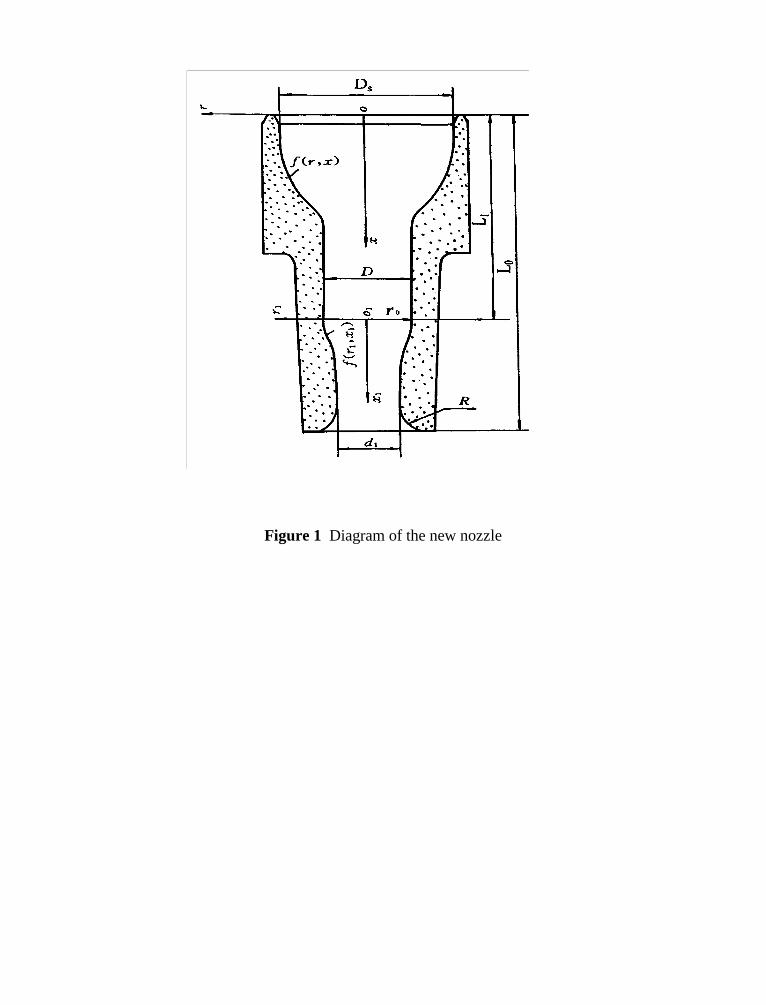
Figure 1 Diagram of the new nozzle
10th American Waterjet ConferenceAugust 14-17, 1999: Houston, Texas
Paper 61
DEVELOPMENT OF HIGH EROSIVITY CAVITATING AND
ACOUSTICALLY ENHANCED WATER JETS
FOR WELL SCALE REMOVAL
K. M. Kalumuck, G. L. Chahine, G. S. Frederick, and P. D. AleyDYNAFLOW, INC.
Fulton, MD
ABSTRACT
The walls of geothermal wells often experience rapid build up of scale deposits due to the highdissolved solids content of geothermal fluids. As the liquid is brought up from deep wells, itspressure drops, and the water flashes to steam resulting in precipitation of dissolved minerals.Existing means of addressing this problem such as chemical inhibitors, removal withconventional water jet blasting, drilling with a workover bit, or acids are costly and not alwayseffective, particularly with the harder scales such as silica. Our ongoing effort seeks to developcavitating and acoustically enhanced water jets for geothermal well scale removal. Thesetechnologies have been proven to enhance the erosive power of liquid jets by several fold invarious cutting, cleaning, and drilling applications particularly for hard materials and thuspromise to substantially enhance the performance of down-hole cleaning tools, particularly forthe removal of hard scale.
Initial results from laboratory experiments on cutting of both actual and simulated are presented.Experiments are reported under simulated down hole conditions over a range of ambientpressures and standoffs. Scale removal and cleaning rates are compared with those obtained fromconventional water jet nozzles, and the improvements presented.
Organized and Sponsored by the WaterJet Technology Association
1. INTRODUCTION
Build up of scale deposits on the walls of geothermal wells can occur rapidly due to the highdissolved solids content of geothermal fluids, e.g., up to 250,000 ppm in the Salton Seageothermal field (Glowka, 1997). Scale formation is a significant problem for both the well andfor surface heat transfer equipment. Geothermal brines contain a variety of dissolved saltsincluding carbonates, silicates, sulfates, and metal sulfides. Currently this is dealt with either bythe use of chemical additives to inhibit scale formation or the periodic removal of scale throughthe use of a workover rig drill bit, high pressure water jets, or acids. However, such proceduresare costly. Chemical inhibitors do not currently exist for silica scales (Glowka, 1997), and theiruse raises environmental concerns.
Scale in geothermal wells forms due to a decrease in solubility of dissolved minerals. This canbe due to temperature decrease or flashing of some of the water to steam. The latter often occursdue to depressurization of the geothermal fluid as it rises in the well. The depth range over whichscale forms varies with the geothermal site and the specific well at the site. As reported by Benoit(1987), scale formation investigated at seven Dixie Valley well bores was found at depthsbetween approximately 240 and 1300 m (800 and 4,300 ft). The local ambient pressures, Pa,corresponding to these depths varies between approximately 2.4 and 13 MPa (350 and 1,900 psi).
One technology recently proposed for scale removal is the use of an ultrasonic device. The recentAdvanced Geothermal Drilling Systems Workshop recommended further exploration of thisconcept. Cleaning occurs due to the excitation of the growth and collapse of cavitation bubblesby the high frequency acoustic waves. Physically, cleaning is achieved through cavitation. In thepresent effort we apply cavitation in a more direct manner by the use of acoustically enhancedcavitating water jets which can be made to be much more efficient and aggressive than ultrasonicdevices.
Cavitating and self-resonating jet technologies have been proven to enhance the erosive power ofliquid jets in a number of cutting, cleaning, and drilling applications. Removal of harder scales,such as calcium carbonate, barium sulfate, strontium sulfate, and silicates is a particularly goodarea of potential application for this technology as the relative improvement in erosivity ofcavitating and interrupted jets has been found to increase with target hardness. (See, forexample, Chahine et al., 1995). In this study we investigated two related technologies – one thatemploys cavitation and one that breaks the jet up into a series of slugs that produce waterhammer type pressures upon impact. These technologies enable operation in both submerged andnon-submerged conditions (such as when the well is blown down with compressed air).
2. DYNAJETS WATERJET TECHNOLOGIES
Cavitation is mainly known for its harmful effects, namely, loss of performance, erosion, andnoise. The usual procedure to prevent these deleterious effects is to avoid the phenomenon byproper design and by limiting the operating conditions. However, attempts to induce and harnesscavitation for useful purposes have been increasingly successful. Ultrasonic cavitation methods
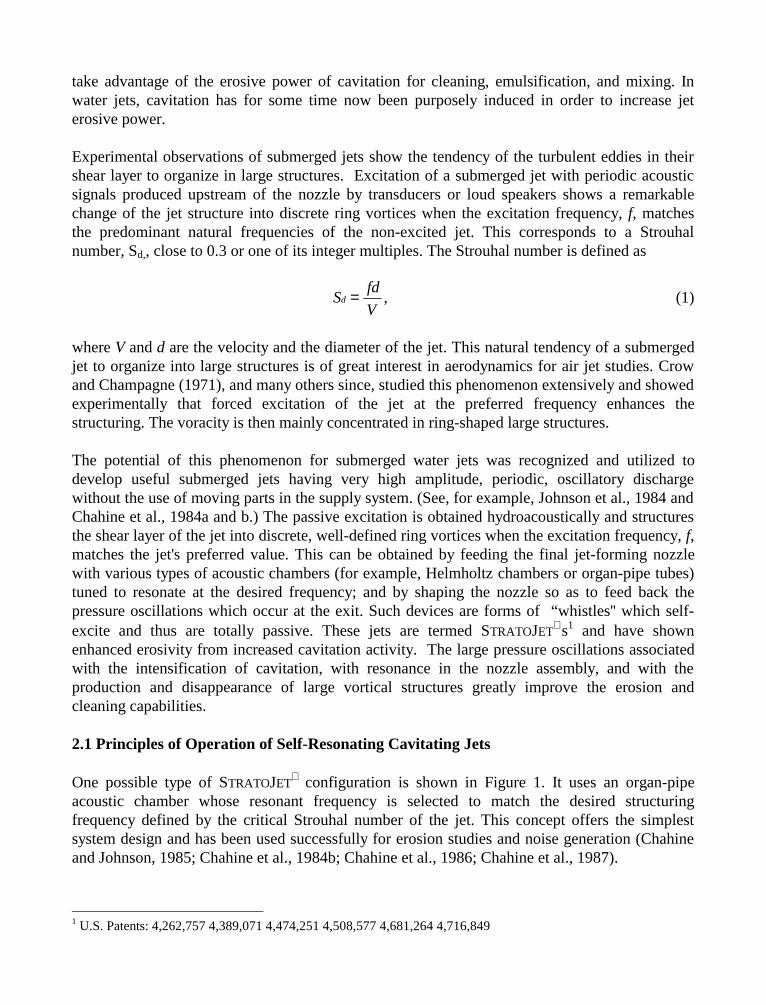
take advantage of the erosive power of cavitation for cleaning, emulsification, and mixing. Inwater jets, cavitation has for some time now been purposely induced in order to increase jeterosive power.
Experimental observations of submerged jets show the tendency of the turbulent eddies in theirshear layer to organize in large structures. Excitation of a submerged jet with periodic acousticsignals produced upstream of the nozzle by transducers or loud speakers shows a remarkablechange of the jet structure into discrete ring vortices when the excitation frequency, f, matchesthe predominant natural frequencies of the non-excited jet. This corresponds to a Strouhalnumber, Sd,, close to 0.3 or one of its integer multiples. The Strouhal number is defined as
Sfd
Vd = , (1)
where V and d are the velocity and the diameter of the jet. This natural tendency of a submergedjet to organize into large structures is of great interest in aerodynamics for air jet studies. Crowand Champagne (1971), and many others since, studied this phenomenon extensively and showedexperimentally that forced excitation of the jet at the preferred frequency enhances thestructuring. The voracity is then mainly concentrated in ring-shaped large structures.
The potential of this phenomenon for submerged water jets was recognized and utilized todevelop useful submerged jets having very high amplitude, periodic, oscillatory dischargewithout the use of moving parts in the supply system. (See, for example, Johnson et al., 1984 andChahine et al., 1984a and b.) The passive excitation is obtained hydroacoustically and structuresthe shear layer of the jet into discrete, well-defined ring vortices when the excitation frequency, f,matches the jet's preferred value. This can be obtained by feeding the final jet-forming nozzlewith various types of acoustic chambers (for example, Helmholtz chambers or organ-pipe tubes)tuned to resonate at the desired frequency; and by shaping the nozzle so as to feed back thepressure oscillations which occur at the exit. Such devices are forms of “whistles'' which self-excite and thus are totally passive. These jets are termed STRATOJET
s1 and have shownenhanced erosivity from increased cavitation activity. The large pressure oscillations associatedwith the intensification of cavitation, with resonance in the nozzle assembly, and with theproduction and disappearance of large vortical structures greatly improve the erosion andcleaning capabilities.
2.1 Principles of Operation of Self-Resonating Cavitating Jets
One possible type of STRATOJET configuration is shown in Figure 1. It uses an organ-pipe
acoustic chamber whose resonant frequency is selected to match the desired structuringfrequency defined by the critical Strouhal number of the jet. This concept offers the simplestsystem design and has been used successfully for erosion studies and noise generation (Chahineand Johnson, 1985; Chahine et al., 1984b; Chahine et al., 1986; Chahine et al., 1987).
1 U.S. Patents: 4,262,757 4,389,071 4,474,251 4,508,577 4,681,264 4,716,849
The principles of operation of an organ-pipe STRATOJET are schematically represented in Figure
1. Two predominant sources of pressure fluctuations can be distinguished in addition to theclassical unexcited turbulent shear layer between the jet and the surrounding liquid. One of thesesources corresponds to the volume fluctuations of the moving vortex bubble rings formed in thecenter of the large structures of the self-excited jet. The other source of pressure fluctuations ismore complex and relates to the exit area of the jet where high amplitude oscillations of the mainflow characteristics are interrelated with the shear layer-nozzle lip interaction. The acousticsignals from both areas are forcing functions to the resonating chamber in the nozzle assembly.These signals strongly interact; they are both fed back and amplified by the organ-pipe.
Acoustic resonance is achieved in the nozzle feed-tube assembly when a standing wave forms inthe “organ-pipe'' section (length: L, diameter: D). Peak resonance will occur when thefundamental frequency of the organ-pipe is near the preferred jet structuring frequency. The exactresonance frequency is dependent on the contractions at each end of the organ-pipe, and the firstmode resonance in the pipe will occur when the sound wavelength in the fluid is either two orfour times L.
2.2 Effects of Jet Structuring on Cavitation Inception
The dimensionless parameter characterizing cavitation is the cavitation number, σ,
σρ
= −P Pa v
V1 2 2/, (2)
where Pa is the ambient or far field pressure, Pv is the vapor pressure of the liquid, ρ is the liquiddensity, and V is the characteristic velocity - the jet mean velocity. In deep wells, the ambientpressure is hydrostatic and directly related to hole depth. In the case of high-pressure submergedjets, Pa >> Pv, and for well-designed nozzles 1/2ρV2 may be approximated by the pressure drop,∆P, across the nozzle. Thus
σ ≈ P
P
a
∆. (3)
The particular value at which cavitation is incipient is defined as
σiaP
P= ( )
∆ at inception. (4)
Thus if the operating conditions for a submerged jet are such that σ/σi < 1, cavitation will occur,and as σ/σi continues to decrease below unity the amount of cavitation will increase. When acavitating jet impinges against a surface, the cavities formed in the jet collapse on that surfaceand produce very high local pressures and very high speed microjets. The resulting pressures aremuch greater than the jet stagnation pressure (1/2ρV2), and the resulting cleaning or cuttingaction is substantially greater than when the jet is not cavitating. A great advantage of the
STRATOJET class of jets is an increase in σi over conventional jets by a factor of 3 with current
designs. The ability to achieve cavitation at high ambient pressures is of particular importance todeep well operations. Self resonating jets produce cavitation for much higher ambient pressuresthan conventional jets thus enabling operation at deeper depths and producing betterperformance at lower nozzle pressures than conventional jets.
The increase in σi is due to the decreased pressures at the core of the structured vorticesgenerated. For the scale depth conditions at Dixie Valley noted above, the cavitation numberranges between 0.07 and 0.38 for a jet operating pressure of ∆P = 34.5 MPa (5,000 psi).
2.3 Self-Resonating Pulsed Jet Technology
The SERVOJET jet system is also an acoustically self-resonating jet originally developed to
generate water “slugs” or drops at known frequencies and to operate in non-submergedconditions - i.e., in air. Interrupted liquid jets have been proven to be advantageous over steadyjets due to their large water hammer type impact pressures. Details of our development of self-resonating interrupted water jets can be found in Chahine et al. (1983). In a submerged condition,it operates similar to the STRATOJET
and structured cavitation is generated in the shear layercreated between the high speed water jet slugs and the surrounding liquid. However, theSTRATOJET
configuration is usually preferred since it involves fewer flow contractions andexpansions and thus less pressure losses and little interaction with the working fluid. In air jeterosivity is improved by jet interruption leading to slug and drop production.
3. EXPERIMENTAL SETUP AND PROCEDURES
3.1 Test Facility
Experiments were conducted in DYNAFLOW’s High Pressure Cell (HPC) capable of ambientpressures up to approximately 19.3 MPa (2800 psi). A photograph of the HPC is presented inFigure 2. The HPC is a cylindrical pressure vessel with inside dimensions of approximately 24cm (9.5 inch) diameter and 71 cm (28 inch) length with three quartz view ports circumferentiallyspaced and located near its mid length. Constructed for studies of deep hole drilling withcavitating jets, it includes a fixture in which rocks are placed and rotated at various speeds forcutting beneath the jet. Another fixture enables the rock to advance at a controlled rate towardsthe nozzle thus enabling actual drilling. The rock surface being cut is visible in the view ports.Ambient pressure is adjusted and maintained by a choke plate which acts as a back pressurevalve in the outflow line. The jet flow is driven by a Weatherford five piston positivedisplacement pump capable of up to 76 liters/min at 69 MPa (20 gpm at 10,000 psi) or 42liters/min at 138 MPa (11 gpm at 20,000 psi).
Nozzle acoustic resonance was checked with a Piezotronics 101-A04 pressure transducers (5mv/psi sensitivity) located in the HPC wall and used to measure the fluctuating component of thepressure, P′. The output of the transducer was monitored with both a digital rms meter to obtainthe rms value of the fluctuating pressure component and with a spectral analyzer to ascertain the
fluctuation frequency content and determine the peak (resonant) frequencies of the nozzles.These measurements were used to determine whether or not a particular self-resonating nozzlehas achieved good acoustic resonance - an important factor in achieving good performance. Theorgan-pipe length for the self-resonating nozzle was “tuned” to the jet exit velocity (i.e., to ∆P).
3.2 Target Materials and Characteristics
In order to carry out meaningful laboratory tests of scale removal, an appropriate target materialneeds to be employed. Ideally, actual scale should be used as the target material. This, however,has several problems associated with its use. It requires removal and transportation of the scalefrom its source – a geothermal well site – and storage under conditions that do not affect itsmechanical properties. This includes maintenance of a wet environment. In addition, actual fieldgenerated scale involves inherent sample to sample variability due to both potential localinhomogeneities and differences between samples taken from different locations and acquired atdifferent times. A similar problem arises in tests of rock cutting by water jets. Depending on therock type, substantial sample to sample variation can be found due to local composition variationand flaws as well as bedding plane orientation. For this reason, such samples are always tested inthe same orientation in which they were cut from the formation. We have found for rock that useof a more repeatable and uniform property material as a target material for initial developmentand screening of designs is desirable. We have utilized man-made simulated rock and aluminumplate (6061-T6) for this purpose with great success (Chahine et al., 1995).
In the current project, initial development and screening was conducted with simulants. A set ofsamples made of cement (sand, but no aggregate) was investigated. In order to assess the effectof cure time on the hardness of these simulants, a series of tests were conducted on 5.1 cm (2 in.)thick samples of both fiber-reinforced and quick-set cements. Repeated cuts of each sample wereperformed for a series of increasing cure times between 3 and 7 days. For these tests, the sampleswere submerged, and a 1.3 mm (0.053 in.) diameter conventional jet (Spraying Systems Washjet¼ MEG 0005) operating at 34.5 MPa and 21 liters/min (5,000 psi and 5.4 gpm) was translatedacross the surface at 2.5 cm/s (1 in/s) and at a 2.5 cm (1 in.) standoff. As can be seen in Figure 3,the results show a continuing decrease in measured cut depth with time indicating a continuedincrease in hardness that is significant. For the top of the fiber reinforced cement the cut depthvaried from 8 mm (0.31 in.) at 3 days cure to 2 mm (0.085 in.) for 7 days cure time. Similarvariations with cure time were found on the other sample surfaces tested. The top surface of thefiber-reinforced cement was found to be consistently the hardest. The cut depth in the fast setsample was approximately 40% greater than that in the bottom of the fiber reinforced indicatingan approximately 40% greater cutting resistance for the fiber reinforced cement. Based on theseresults, we determined that to achieve sample uniformity we needed to control and/or adjust forthe cure time. We thus endeavored to test samples with cure times of approximately 3 days andto conduct comparison tests head-to-head on the same samples.
Samples of silica and calcium carbonate geothermal scale were obtained from CalEnergyCompany, Inc. (Ridgecrest CA). We have performed cutting tests on these samples to comparethem under the same conditions with the various simulants. The comparison tests wereconducted with a 0.86 mm (0.034 in) diameter SERVOJET
operating at 34.5 MPa and 5.7
liters/min (5,000 psi, 1.5 gpm) and translating across the sample at various speeds between 1.3and 5.1 cm/s (0.5 and 2 in/s) at a standoff of 5.7 cm (2.25 in. or 66 diameters). The tests wereconducted submerged at atmospheric ambient pressure. The calcium carbonate experienced theonset of damage – a surface pecking - at 5.1 cm/s (2 in/s) while sustaining a cut 3.2 mm (0.125in) deep and 13 mm (0.5 in) wide at 1.3 cm/s (0.5 in/s). The harder silica exhibited no damage at5.1 and 2.5 cm/s (2 and 1 in/s) while sustaining the onset of damage at 1.3 cm/s (0.5 in/s).Similar results were produced in the top surfaces of a fast set and a fiber reinforced cement,respectively. At 1.3 cm/s (0.5 in./s), the fast set exhibited a cut 2.8 mm (0.11 in) deep cut 20 mm(0.78 in) wide while the fiber reinforced experienced the onset of erosion with a depth of about0.6 mm (0.025 in). Based on these data, the fiber reinforced cement (top surface) was selected tosimulate silica and the fast set cement selected to simulate calcium carbonate. The silica, beingthe harder scale, and its fiber reinforced cement simulant, were the primary focus of testing.
4. SIMULATED SCALE EROSION TEST RESULTS
In order to assess jet performance under downhole conditions, cutting tests were conducted in ourHigh Pressure Cell on samples of fiber reinforced cement. Three jet types designed to operate atcomparable flows and pressures were employed: a conventional jet, a self-resonating organ pipeSTRATOJET
®, and a self-resonating SERVOJET®.
In order to assess the best pressure at which to test the cavitating resonating STRATOJET®, the rms
pressure fluctuations were measured as the pressure drop was varied for a constant value of thecavitation number (σ = 0.3). The pressure fluctuations normalized by pressure drop across thenozzle showed a local maximum at a pressure drop of 41.4 MPa (6,000 psi).
Both cut depths, h, and diameters, w, were measured. Nominal volumes, F, were calculated byassuming a cylindrical cut hole whose volume is given by
F = πw2h/4. (5)
At a 2.5 cm standoff (Xso/do = 19) and Pa = 3.5 MPa (500 psi), ∆P was increased until the onsetof erosion of the sample. For the conventional jet, this occurred for 180 sec exposure at ∆P =34.5 MPa (5,000 psi) and 50 sec exposure at ∆P = 41 MPa (6,000 psi). A series of tests varyingthe ambient pressure, standoff, and exposure time was then conducted for the three jet types at∆P = 41.4 MPa. A similar evaluation was performed under non-submerged conditions – “in air”.
4.1 Influence of Ambient Pressure
Figures 4-6 present the measured cut depths, h, as functions of time for up to 120 sec exposurefor the three jet types at a 2.5 cm standoff (Xso/do = 19) and ambient pressures of 1, 2.1 and 3.5MPa (150, 300 and 500 psi; σ = 0.025, 0.05, 0.083). The strong influence of cavitation numberor ambient pressure is apparent with an order of magnitude variation in the cut depths betweenambient pressures of 1 and 3.5 MPa. The STRATOJET
® run at Pa = 1 MPa was stopped after only10 sec due to it cutting through nearly the entire 5.1 cm thickness of the sample. These data show
that the STRATOJET® significantly outperforms the other two nozzle types at all three ambient
pressures. The SERVOJET employed is better than the conventional jet at Pa = 1 MPa, about the
same at Pa = 2.1 MPa, and poorer at Pa = 3.5 MPa.
The corresponding average hole diameters, w, and nominal volumes, F, (as calculated fromrelation (5)) are presented in Figures 7 and 8. As can be seen, the variations in diameter andvolume are much less than the variations in depth. The diameters are also seen to change veryslowly with time after an initial period. The relative rankings of the three jet types are the samefor width and volume as for depth. The STRATOJET
® is clearly the best performer over the entirerange investigated. It should be noted that at Pa = 1 MPa, the SERVOJET
produces a cut volumeapproximately twice that of the conventional nozzle.
4.2 Influence of Standoff
Figures 9 and 10 present the influence of standoff at a Pa = 1 MPa (150 psi, σ=0.025). Again, theSTRATOJET
® has the largest cut depths at all three standoffs. This is followed by the SERVOJET
at 2.5 and 5.1 cm standoffs At a 7.6 cm. Standoff, neither the conventional nor the SERVOJET
produced a measurable cut depth after 120 sec. The STRATOJET® was also found to produce the
largest diameters and volumes (Figure 10) at all three standoffs. It is clearly the preferred jet foroperation at these conditions.
4.3 In-Air Tests
Figures 11 and 12 present, respectively, the cut depths and diameters, for operation of the threejet types in air (not submerged) at atmospheric pressure at standoffs of 2.5, 5.1, and 7.6 inches. Interms of depth, the STRATOJET
® at a 2.5 cm standoff is the best performer. There are three caseswith cut depths comparable to each other – the STRATOJET
® and SERVOJETat a 5.1 cm standoff
and the conventional jet at a 7.6 cm standoff. The best standoff for the conventional jet for cutdepth is 7.6 cm. It should also be noted that the SERVOJET
exhibits a cut depth at a 5.1 cmstandoff approximately twice as large as that cut at 1 or 3 in standoffs indicating an optimalstandoff of approximately 38 nozzle diameters. However, the SERVOJET
produces a cutdiameter significantly larger than either of the other two jets. At standoffs of 5.1 and 7.6 cm, itscut diameter is 3.5 times that of the conventional jet, while it is twice that of the conventional jetat a 2.5 cm standoff. The STRATOJET
® cut diameters fall in between those of the SERVOJET and
the conventional jet. This results in the largest volumes being created by the SERVOJET at 5.1
and 7.6 cm standoffs followed by the STRATOJET® at 2.5 cm standoff.
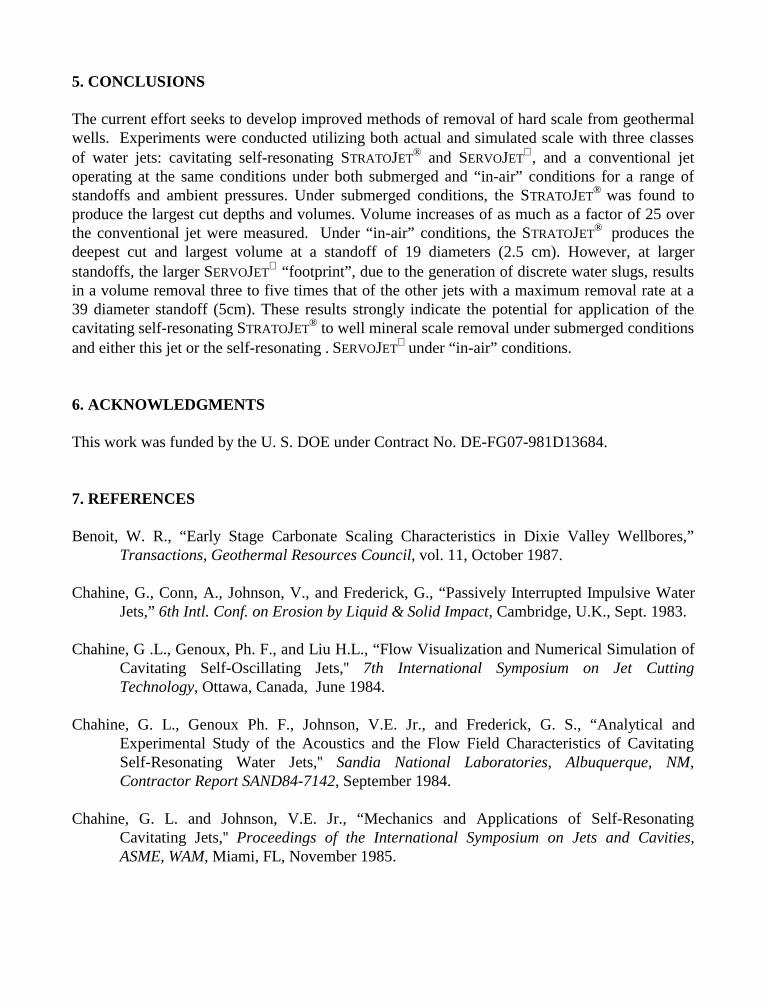
5. CONCLUSIONS
The current effort seeks to develop improved methods of removal of hard scale from geothermalwells. Experiments were conducted utilizing both actual and simulated scale with three classesof water jets: cavitating self-resonating STRATOJET
® and SERVOJET, and a conventional jet
operating at the same conditions under both submerged and “in-air” conditions for a range ofstandoffs and ambient pressures. Under submerged conditions, the STRATOJET
® was found toproduce the largest cut depths and volumes. Volume increases of as much as a factor of 25 overthe conventional jet were measured. Under “in-air” conditions, the STRATOJET
® produces thedeepest cut and largest volume at a standoff of 19 diameters (2.5 cm). However, at largerstandoffs, the larger SERVOJET
“footprint”, due to the generation of discrete water slugs, resultsin a volume removal three to five times that of the other jets with a maximum removal rate at a39 diameter standoff (5cm). These results strongly indicate the potential for application of thecavitating self-resonating STRATOJET
® to well mineral scale removal under submerged conditionsand either this jet or the self-resonating . SERVOJET
under “in-air” conditions.
6. ACKNOWLEDGMENTS
This work was funded by the U. S. DOE under Contract No. DE-FG07-981D13684.
7. REFERENCES
Benoit, W. R., “Early Stage Carbonate Scaling Characteristics in Dixie Valley Wellbores,”Transactions, Geothermal Resources Council, vol. 11, October 1987.
Chahine, G., Conn, A., Johnson, V., and Frederick, G., “Passively Interrupted Impulsive WaterJets,” 6th Intl. Conf. on Erosion by Liquid & Solid Impact, Cambridge, U.K., Sept. 1983.
Chahine, G .L., Genoux, Ph. F., and Liu H.L., “Flow Visualization and Numerical Simulation ofCavitating Self-Oscillating Jets,'' 7th International Symposium on Jet CuttingTechnology, Ottawa, Canada, June 1984.
Chahine, G. L., Genoux Ph. F., Johnson, V.E. Jr., and Frederick, G. S., “Analytical andExperimental Study of the Acoustics and the Flow Field Characteristics of CavitatingSelf-Resonating Water Jets,'' Sandia National Laboratories, Albuquerque, NM,Contractor Report SAND84-7142, September 1984.
Chahine, G. L. and Johnson, V.E. Jr., “Mechanics and Applications of Self-ResonatingCavitating Jets,'' Proceedings of the International Symposium on Jets and Cavities,ASME, WAM, Miami, FL, November 1985.
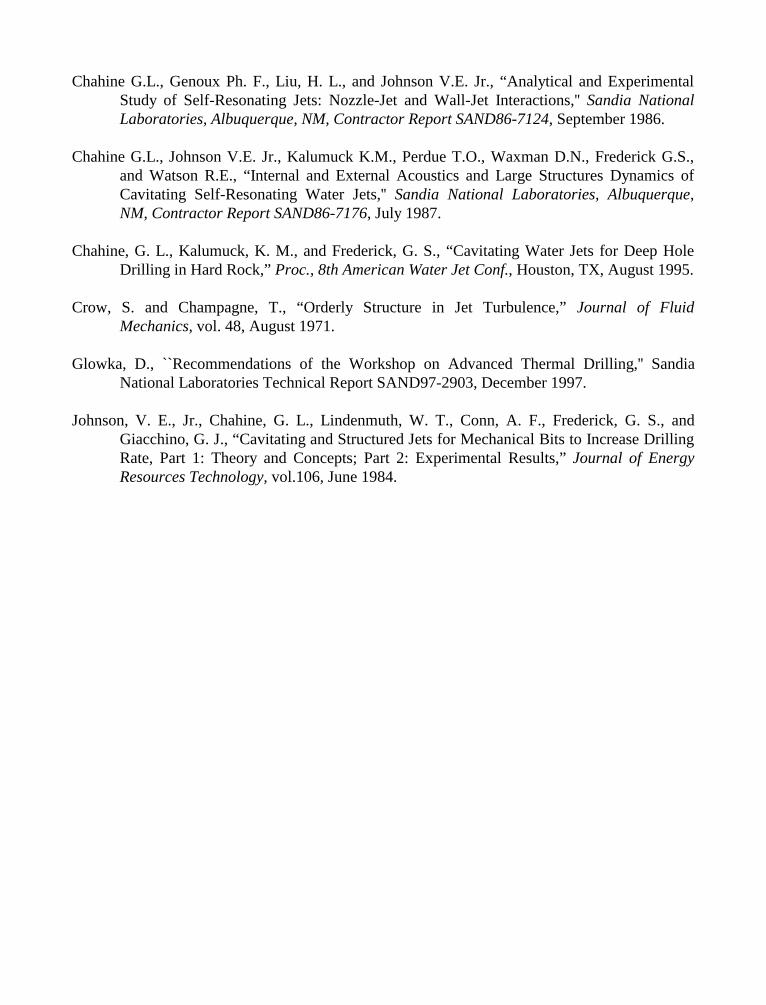
Chahine G.L., Genoux Ph. F., Liu, H. L., and Johnson V.E. Jr., “Analytical and ExperimentalStudy of Self-Resonating Jets: Nozzle-Jet and Wall-Jet Interactions,'' Sandia NationalLaboratories, Albuquerque, NM, Contractor Report SAND86-7124, September 1986.
Chahine G.L., Johnson V.E. Jr., Kalumuck K.M., Perdue T.O., Waxman D.N., Frederick G.S.,and Watson R.E., “Internal and External Acoustics and Large Structures Dynamics ofCavitating Self-Resonating Water Jets,'' Sandia National Laboratories, Albuquerque,NM, Contractor Report SAND86-7176, July 1987.
Chahine, G. L., Kalumuck, K. M., and Frederick, G. S., “Cavitating Water Jets for Deep HoleDrilling in Hard Rock,” Proc., 8th American Water Jet Conf., Houston, TX, August 1995.
Crow, S. and Champagne, T., “Orderly Structure in Jet Turbulence,” Journal of FluidMechanics, vol. 48, August 1971.
Glowka, D., ``Recommendations of the Workshop on Advanced Thermal Drilling,'' SandiaNational Laboratories Technical Report SAND97-2903, December 1997.
Johnson, V. E., Jr., Chahine, G. L., Lindenmuth, W. T., Conn, A. F., Frederick, G. S., andGiacchino, G. J., “Cavitating and Structured Jets for Mechanical Bits to Increase DrillingRate, Part 1: Theory and Concepts; Part 2: Experimental Results,” Journal of EnergyResources Technology, vol.106, June 1984.
8. GRAPHICS
D
FLOW
Acoustic Reflector
O rgan P ipe
Self Excite r
Volum e Oscilla tion
P iston-LikeO scillations
Vortex R ing Cavities
Figure 1. Schematic of Principles Figure 2. DYNAFLOW’s High Pressure Cell of Operation of an Organ- (HPC) Capable of Ambient Pressures Pipe STRATOJET
® Up to 19.3 MPa (2800 psi).
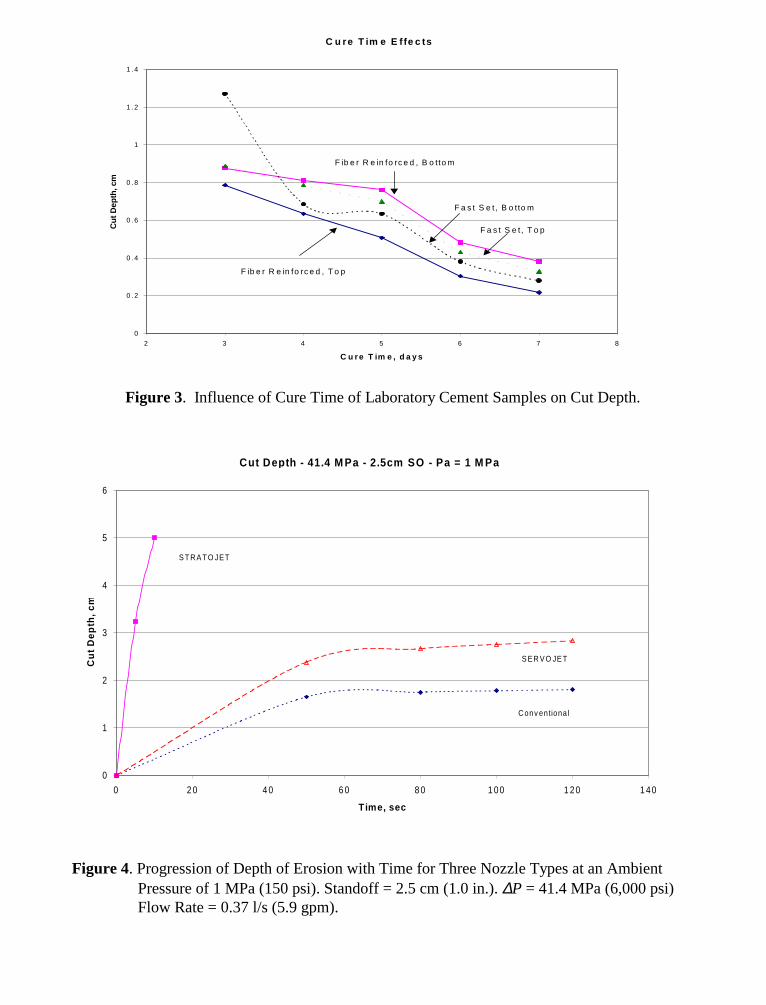
Figure 3. Influence of Cure Time of Laboratory Cement Samples on Cut Depth.
Figure 4. Progression of Depth of Erosion with Time for Three Nozzle Types at an AmbientPressure of 1 MPa (150 psi). Standoff = 2.5 cm (1.0 in.). ∆P = 41.4 MPa (6,000 psi)Flow Rate = 0.37 l/s (5.9 gpm).
C u re T im e E f fe c ts
0
0 .2
0 .4
0 .6
0 .8
1
1 .2
1 .4
2 3 4 5 6 7 8
C u r e T im e , d a y s
Cut
Dep
th, c
m
F a s t S e t , B o tto m
F a s t S e t , T o p
F ib e r R e in fo rc e d , T o p
F ib e r R e in fo rc e d , B o tto m
Cut De p th - 41.4 M Pa - 2.5cm SO - Pa = 1 M Pa
0
1
2
3
4
5
6
0 2 0 4 0 6 0 8 0 1 00 1 20 1 40
Time, sec
Cut
De
pth
, c
m
S T R A T O JET
S ER VO JE T
C onv entional
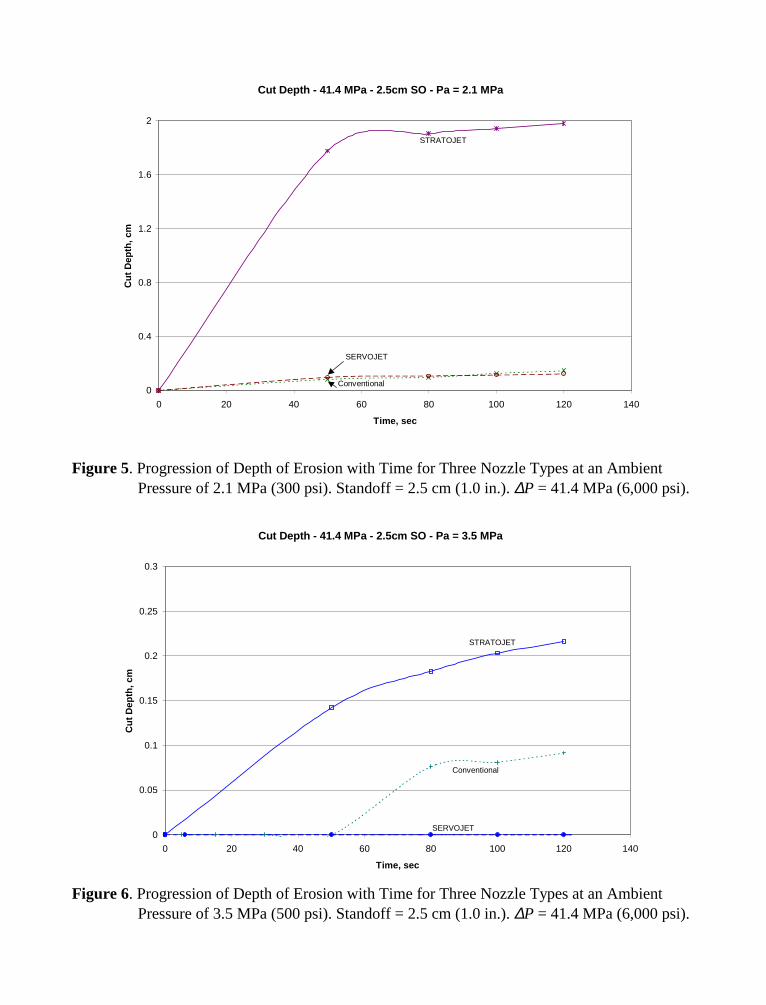
Figure 5. Progression of Depth of Erosion with Time for Three Nozzle Types at an AmbientPressure of 2.1 MPa (300 psi). Standoff = 2.5 cm (1.0 in.). ∆P = 41.4 MPa (6,000 psi).
Figure 6. Progression of Depth of Erosion with Time for Three Nozzle Types at an AmbientPressure of 3.5 MPa (500 psi). Standoff = 2.5 cm (1.0 in.). ∆P = 41.4 MPa (6,000 psi).
Cut Depth - 41.4 MPa - 2.5cm SO - Pa = 2.1 MPa
0
0.4
0.8
1.2
1.6
2
0 20 40 60 80 100 120 140
Time, sec
Cut
Dep
th, c
mSTRATOJET
SERVOJET
Conventional
Cut Depth - 41.4 MPa - 2.5cm SO - Pa = 3.5 MPa
0
0.05
0.1
0.15
0.2
0.25
0.3
0 20 40 60 80 100 120 140
Time, sec
Cut
Dep
th, c
m
STRATOJET
Conventional
SERVOJET
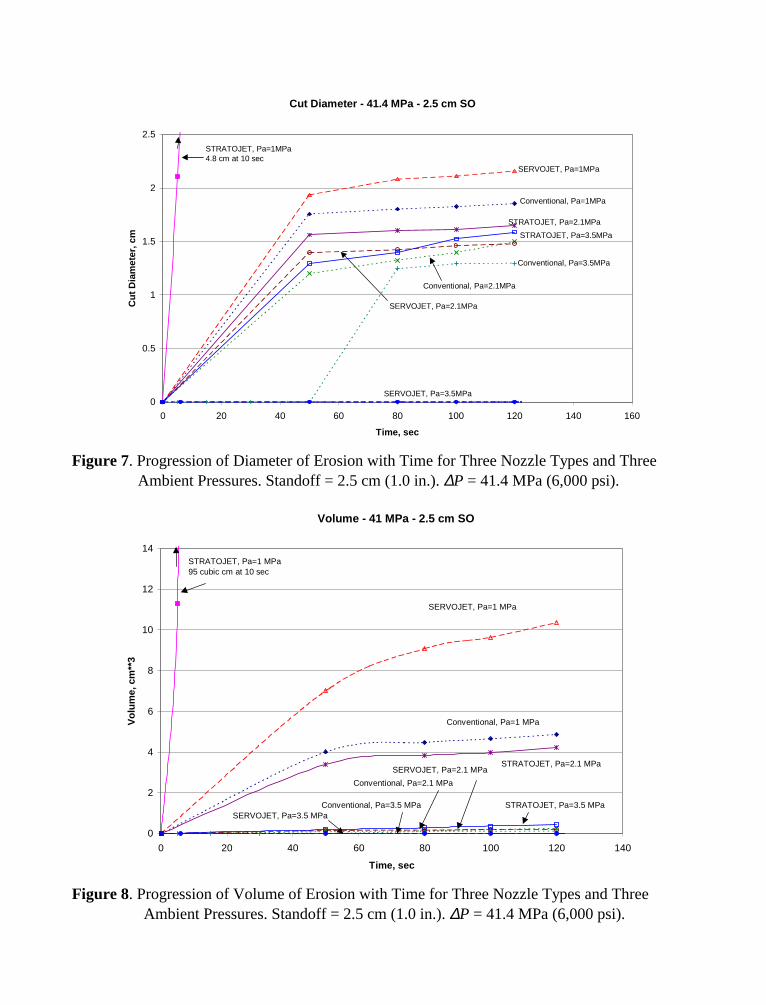
Figure 7. Progression of Diameter of Erosion with Time for Three Nozzle Types and ThreeAmbient Pressures. Standoff = 2.5 cm (1.0 in.). ∆P = 41.4 MPa (6,000 psi).
Figure 8. Progression of Volume of Erosion with Time for Three Nozzle Types and ThreeAmbient Pressures. Standoff = 2.5 cm (1.0 in.). ∆P = 41.4 MPa (6,000 psi).
Cut Diameter - 41.4 MPa - 2.5 cm SO
0
0.5
1
1.5
2
2.5
0 20 40 60 80 100 120 140 160
Time, sec
Cut
Dia
met
er, c
m
STRATOJET, Pa=1MPa4.8 cm at 10 sec
SERVOJET, Pa=1MPa
Conventional, Pa=1MPa
STRATOJET, Pa=2.1MPa
STRATOJET, Pa=3.5MPa
Conventional, Pa=3.5MPa
Conventional, Pa=2.1MPa
SERVOJET, Pa=2.1MPa
SERVOJET, Pa=3.5MPa
Volume - 41 MPa - 2.5 cm SO
0
2
4
6
8
10
12
14
0 20 40 60 80 100 120 140
Time, sec
Vol
ume,
cm
**3
STRATOJET, Pa=1 MPa95 cubic cm at 10 sec
SERVOJET, Pa=1 MPa
Conventional, Pa=1 MPa
STRATOJET, Pa=2.1 MPa
STRATOJET, Pa=3.5 MPa
SERVOJET, Pa=2.1 MPa
Conventional, Pa=2.1 MPa
Conventional, Pa=3.5 MPaSERVOJET, Pa=3.5 MPa
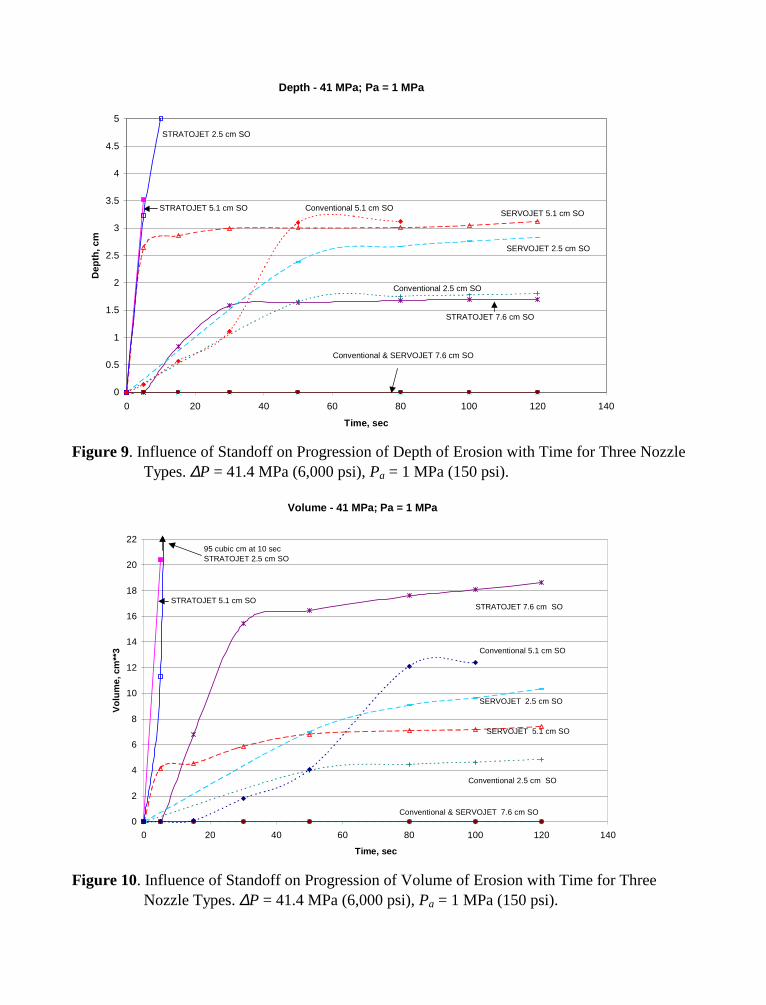
Figure 9. Influence of Standoff on Progression of Depth of Erosion with Time for Three NozzleTypes. ∆P = 41.4 MPa (6,000 psi), Pa = 1 MPa (150 psi).
Figure 10. Influence of Standoff on Progression of Volume of Erosion with Time for ThreeNozzle Types. ∆P = 41.4 MPa (6,000 psi), Pa = 1 MPa (150 psi).
Depth - 41 MPa; Pa = 1 MPa
0
0.5
1
1.5
2
2.5
3
3.5
4
4.5
5
0 20 40 60 80 100 120 140
Time, sec
Dep
th, c
m
STRATOJET 2.5 cm SO
STRATOJET 5.1 cm SOSERVOJET 5.1 cm SO
Conventional 5.1 cm SO
SERVOJET 2.5 cm SO
Conventional 2.5 cm SO
STRATOJET 7.6 cm SO
Conventional & SERVOJET 7.6 cm SO
Volume - 41 MPa; Pa = 1 MPa
0
2
4
6
8
10
12
14
16
18
20
22
0 20 40 60 80 100 120 140
Time, sec
Vol
ume,
cm
**3
95 cubic cm at 10 secSTRATOJET 2.5 cm SO
STRATOJET 5.1 cm SOSTRATOJET 7.6 cm SO
Conventional 5.1 cm SO
SERVOJET 2.5 cm SO
SERVOJET 5.1 cm SO
Conventional 2.5 cm SO
Conventional & SERVOJET 7.6 cm SO
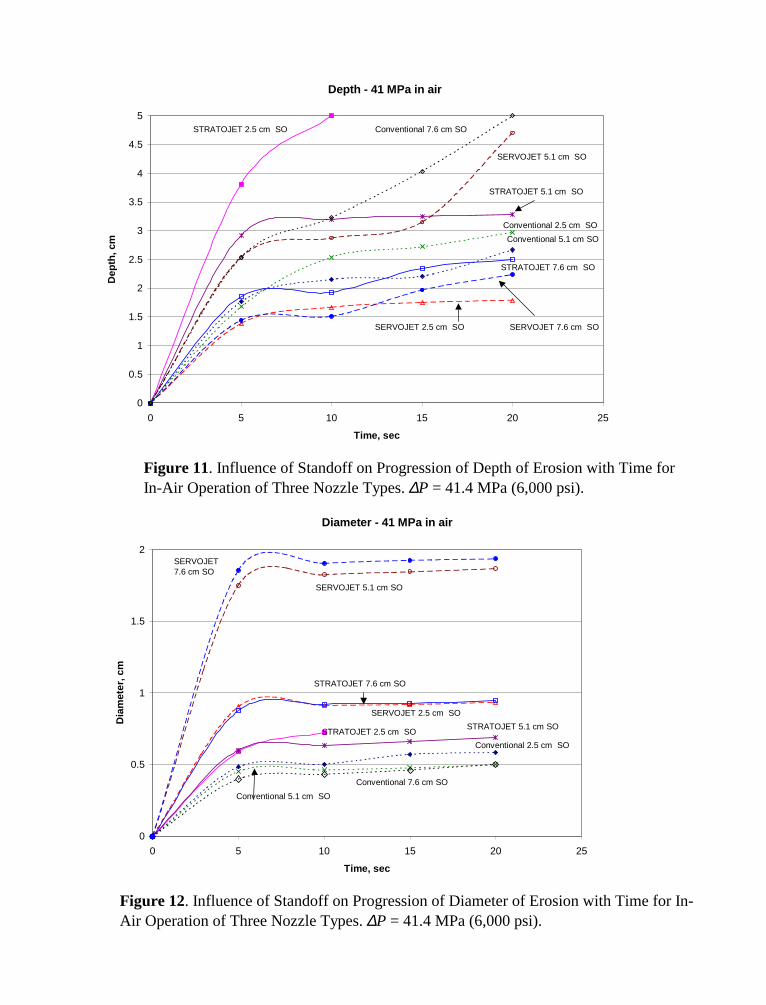
Figure 11. Influence of Standoff on Progression of Depth of Erosion with Time forIn-Air Operation of Three Nozzle Types. ∆P = 41.4 MPa (6,000 psi).
Figure 12. Influence of Standoff on Progression of Diameter of Erosion with Time for In-Air Operation of Three Nozzle Types. ∆P = 41.4 MPa (6,000 psi).
Depth - 41 MPa in air
0
0.5
1
1.5
2
2.5
3
3.5
4
4.5
5
0 5 10 15 20 25
Time, sec
Dep
th, c
m
STRATOJET 2.5 cm SO Conventional 7.6 cm SO
SERVOJET 5.1 cm SO
STRATOJET 5.1 cm SO
Conventional 5.1 cm SO
Conventional 2.5 cm SO
STRATOJET 7.6 cm SO
SERVOJET 7.6 cm SOSERVOJET 2.5 cm SO
Diameter - 41 MPa in air
0
0.5
1
1.5
2
0 5 10 15 20 25
Time, sec
Dia
met
er, c
m
SERVOJET 7.6 cm SO
SERVOJET 5.1 cm SO
STRATOJET 7.6 cm SO
SERVOJET 2.5 cm SO
STRATOJET 2.5 cm SOSTRATOJET 5.1 cm SO
Conventional 2.5 cm SO
Conventional 7.6 cm SO
Conventional 5.1 cm SO
10th American Waterjet ConferenceAugust 14-17, 1999: Houston, Texas
Paper 62
AN EXPERIMENTAL RESEARCH ON A NEW TYPE OF HIGH
PRESSURE CAVITATING WATERJET DEVICE
Jingzhi Liu, Jinmu Zhu, Hongqi LuWuhan University of Hydraulic and Electrical Engineering
Wuhan, Hubei, P. R. China
ABSTRACT
A high-pressure cavitating waterjet-cutting device, which is similar to a jet pump and can betterinduce cavitation, is presented. This new device is experimentally compared with conventionalsingle-nozzle cutting device in the case of non-submerged condition. Test results indicate that onthe same operating conditions the energy consumption of jet-pump type device is lower andcutting depth is deeper than that of conventional single-nozzle device. The optimum operatingparameters of this new device are put forward on the basis of test results.
Organized and Sponsored by the WaterJet Technology Association
1. INTRODUCTION
High-pressure waterjet technology has come into wide use in many fields, such as milling,cleaning and cutting of various metal and non-metal materials. Though high pressure waterjetcutting has many advantages, at present the operating pressure of conventional high pressurewaterjet cutting devices is very high for effective working, operating pressure for commoncleaning is about 30 MPa, and for cutting rock or metal materials above 300 MPa. So much highoperating pressure bring about many difficulties for materials, sealing and processing technologyof high pressure generators and increase of device cost. In addition, due to higher energyconsumption real application of this technique is greatly limited. So the principal problems needto be solved in high pressure waterjet cutting field are how to enhance cutting efficiency of highpressure water jet and how to reduce operating pressure in the same cutting effects.
At present study on high pressure waterjet is mainly concentrated on pulsed, abrasive andcavitating waterjet. Cavitating waterjet cutting is that when cavitating waterjet flows to the targetsurface a very high pressure concentrated on very small area of the target surface will occur dueto collapse of cavities contained in waterjet. It is combination of this collapse pressure andimpact pressure of speedy waterjet that causes a damage of material. So, in comparison to non-cavitating waterjet cavitating waterjet has higher cutting or cleaning efficiency in the sameoperating pressure.
In this paper a new type of high-pressure waterjet device i.e. jet-pump type waterjet cuttingdevice is presented. This device can induce formation of cavities in waterjet and enhance cuttingefficiency greatly.
2. EXPERIMENT
2.1 Working Principle of Jet-Pump Type Waterjet Cutting Device
It is well known that nuclei (gas or steam cavities) existed in liquid can change the tensilestrength of liquid. The quantity and size of nuclei in liquid has a great effect on formation,growing and collapse of cavities. Jet-pump waterjet device can draw proper amount of air intowaterjet and induce formation of cavitating waterjet.
Jet-pump type waterjet cutting device consists of first-stage nozzle, suction chamber, throat pipeand second-stage nozzle, as shown in Fig. 1. High-pressure water ejected from the first-stagenozzle form a speedy jet flow, in this process the pressure energy of main water becomes kineticenergy of jet flow. Because of adsorption of jet flow surface, air surrounding jet flow in suctionchamber is carried into suction chamber so as to make the pressure of suction chamber be lowerthan atmospheric pressure, thus air outside suction chamber will be drawn into suction chamber.
If the quantity of air drawn into suction chamber is artificially controlled, the pressure in suctionchamber will be very low, even equal to the vapor pressure of main water. As proper air is drawninto jet flow, the quantity and size of nuclei in jet flow increase and cavitation is induced. In thisprocess cavitation bubbles and jet water are mixed uniformly inside throat pipe to formcavitating flow, and cavitation bubbles are compressed and are in the critical state of collapse atthe front of throat outlet. Once the cavitating jet flow ejected from the second-stage nozzleimpacts on the target surface cavitation erosion of material will occur.
2.2 Experimental Installation
Experimental installation of high-pressure cavitating waterjet cutting is as shown in Fig. 2. Tapwater flows into water tank 1 through valve 15, high-pressure pump 3 sucks in water from thetank. High pressure water supplied from the pump is delivered to unloading valve 5, a part ofhigh pressure water out of the unloading valve is delivered to waterjet cutting device 9, the otherflows back to the water tank through turbine flowmeter 7. A circular specimen of alloyaluminum 11 is fixed on the top of screw located at carrier 12 which can be moved left or rightby a servo motor 13. The standoff distance (i.e. separation between the first-stage nozzle outletand specimen surface) can be set to any desired value by adjusting the screw.
In the experiments, rated pressure of high pressure pump is 35 MPa, rated flow rate issm /101 33−× , operating pressure of the first- stage nozzle is measured by pressure gauge /
transducer 8, and its flow rate is equal to the difference between discharge of high pressure pumpat a certain pressure and by-pass flow rate, the by-pass flow rate is measured by turbineflowmeter 7; the flow rate of suction air is measured by glass rotary flowmeter 10; erosionamount of specimen due to impact of waterjet is determined by weighing the specimen beforeand after test with a precision balance with minimal reading of 0.1 milligram.
3. ANALYSIS OF EXPERIMENTAL RESULTS
3.1 Main Parameters
3.1.1 Specific Energy sE
Assuming the specimen mass before and after test is 1m and 2m respectively, the eroded amount
m∆ of specimen due to impact of high-pressure waterjet is:
21 mmm −=∆ (1)
The mean kinetic energy unit time kE at the outlet of the first-stage nozzle may be calculated out
by following equation:
31
21
02
100 42
1
2
1u
duQEk
πρρ == (2)
The consumed mean kinetic energy for eroding unit mass of specimen is defined as specificenergy, that is:
mEE ks ∆= / (3)
Specific energy is an important index for judging cutting effect. Due to introduction of this indexit is possible to compare the cutting performance of different cutting devices in differentoperating pressure. Obviously the cutting device with lower specific energy has higher cuttingefficiency.
3.1.2 Dimensionless Standoff Distance x
The ratio of standoff distance x , which is the separation between outlet section of the first-stagenozzle and target surface, to the radius 1r of the first-stage nozzle outlet is called as
dimensionless standoff distance, that is:
1/ rxx = (4)
3.1.3 Area Ratio m
13 / ffm = (5)
Where 1f and 2f are the sectional area of the first-stage nozzle outlet and throat piperespectively.
3.2 Analysis of Experimental Results
An investigation of different area ratio, different length of throat pipe, different standoff distance,different nozzle type and different suction air amount for effect on eroded rate was made byexperiments.
(1) It can be seen by waterjet cutting tests at air that material erosion caused by waterjet impact ismainly the result of cavitation damage. Fig. 3 shows the configuration of jet flow field, where iY
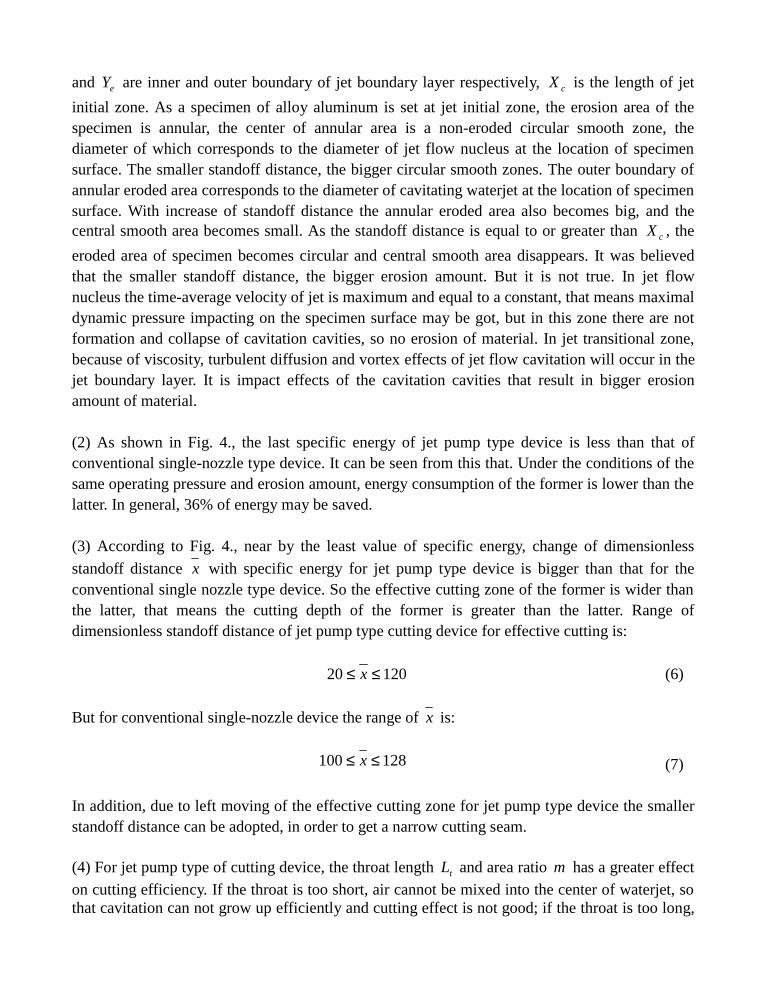
and eY are inner and outer boundary of jet boundary layer respectively, cX is the length of jet
initial zone. As a specimen of alloy aluminum is set at jet initial zone, the erosion area of thespecimen is annular, the center of annular area is a non-eroded circular smooth zone, thediameter of which corresponds to the diameter of jet flow nucleus at the location of specimensurface. The smaller standoff distance, the bigger circular smooth zones. The outer boundary ofannular eroded area corresponds to the diameter of cavitating waterjet at the location of specimensurface. With increase of standoff distance the annular eroded area also becomes big, and thecentral smooth area becomes small. As the standoff distance is equal to or greater than cX , the
eroded area of specimen becomes circular and central smooth area disappears. It was believedthat the smaller standoff distance, the bigger erosion amount. But it is not true. In jet flownucleus the time-average velocity of jet is maximum and equal to a constant, that means maximaldynamic pressure impacting on the specimen surface may be got, but in this zone there are notformation and collapse of cavitation cavities, so no erosion of material. In jet transitional zone,because of viscosity, turbulent diffusion and vortex effects of jet flow cavitation will occur in thejet boundary layer. It is impact effects of the cavitation cavities that result in bigger erosionamount of material.
(2) As shown in Fig. 4., the last specific energy of jet pump type device is less than that ofconventional single-nozzle type device. It can be seen from this that. Under the conditions of thesame operating pressure and erosion amount, energy consumption of the former is lower than thelatter. In general, 36% of energy may be saved.
(3) According to Fig. 4., near by the least value of specific energy, change of dimensionless
standoff distance x with specific energy for jet pump type device is bigger than that for theconventional single nozzle type device. So the effective cutting zone of the former is wider thanthe latter, that means the cutting depth of the former is greater than the latter. Range ofdimensionless standoff distance of jet pump type cutting device for effective cutting is:
12020 ≤≤ x (6)
But for conventional single-nozzle device the range of x is:
128100 ≤≤ x (7)
In addition, due to left moving of the effective cutting zone for jet pump type device the smallerstandoff distance can be adopted, in order to get a narrow cutting seam.
(4) For jet pump type of cutting device, the throat length tL and area ratio m has a greater effect
on cutting efficiency. If the throat is too short, air cannot be mixed into the center of waterjet, sothat cavitation can not grow up efficiently and cutting effect is not good; if the throat is too long,
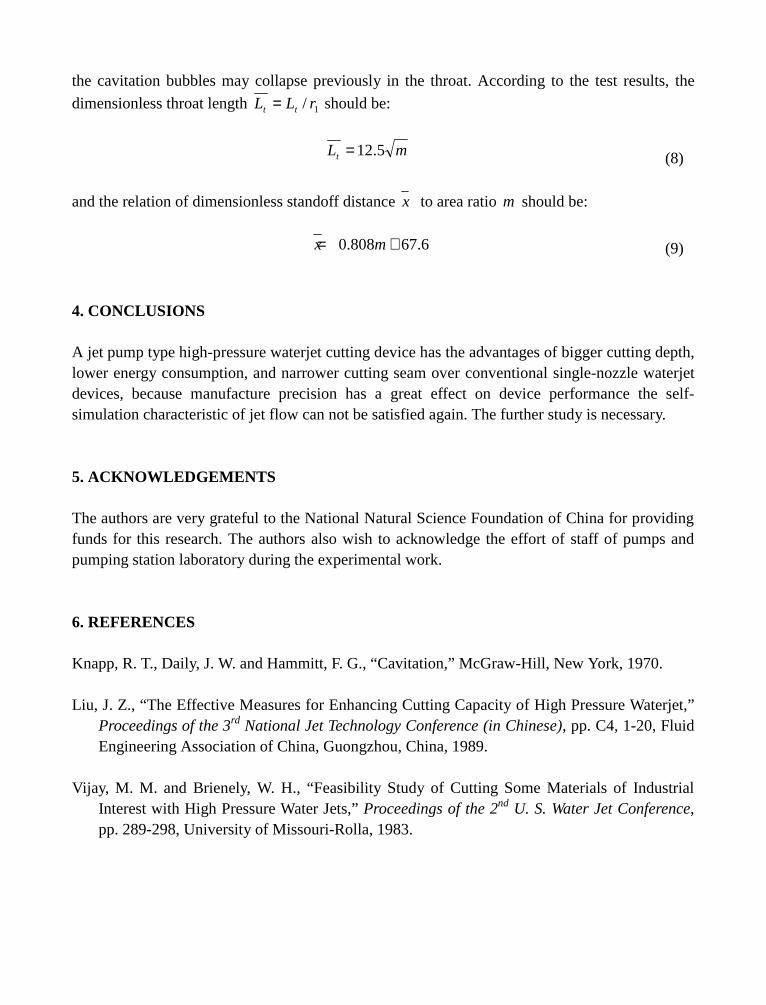
the cavitation bubbles may collapse previously in the throat. According to the test results, the
dimensionless throat length 1/ rLL tt = should be:
mLt 5.12= (8)
and the relation of dimensionless standoff distance x to area ratio m should be:
6.67808.0 += mx (9)
4. CONCLUSIONS
A jet pump type high-pressure waterjet cutting device has the advantages of bigger cutting depth,lower energy consumption, and narrower cutting seam over conventional single-nozzle waterjetdevices, because manufacture precision has a great effect on device performance the self-simulation characteristic of jet flow can not be satisfied again. The further study is necessary.
5. ACKNOWLEDGEMENTS
The authors are very grateful to the National Natural Science Foundation of China for providingfunds for this research. The authors also wish to acknowledge the effort of staff of pumps andpumping station laboratory during the experimental work.
6. REFERENCES
Knapp, R. T., Daily, J. W. and Hammitt, F. G., “Cavitation,” McGraw-Hill, New York, 1970.
Liu, J. Z., “The Effective Measures for Enhancing Cutting Capacity of High Pressure Waterjet,”Proceedings of the 3rd National Jet Technology Conference (in Chinese), pp. C4, 1-20, FluidEngineering Association of China, Guongzhou, China, 1989.
Vijay, M. M. and Brienely, W. H., “Feasibility Study of Cutting Some Materials of IndustrialInterest with High Pressure Water Jets,” Proceedings of the 2nd U. S. Water Jet Conference,pp. 289-298, University of Missouri-Rolla, 1983.

7. NOMENCLATURE
−kE mean kinetic energy unit time at the nozzle outlet;
−sE specific energy;
−tL length of throat;
−tL dimensionless length of throat;
−0p operating pressure of main water at the nozzle inlet;
−sp suction pressure of air;
−0Q flow rate of high pressure water;
−sQ flow rate of suction air;
−cX length of jet initial zone;
−eY outer boundary of jet boundary layer;
−iY inner boundary of jet boundary layer;
−1d diameter of first-stage nozzle outlet;
−1f sectional area of first-stage nozzle outlet;
−3f sectional area of throat pipe;
−m area ratio of jet pump type waterjet device;−1m specimen mass before test;
−2m specimen mass after test;
−∆m erosion amount of material;−1r radius of first-stage nozzle outlet;
−1u velocity at first-stage nozzle outlet;
−x standoff distance;
−x dimensionless standoff distance;−0ρ density of main water at nozzle outlet.
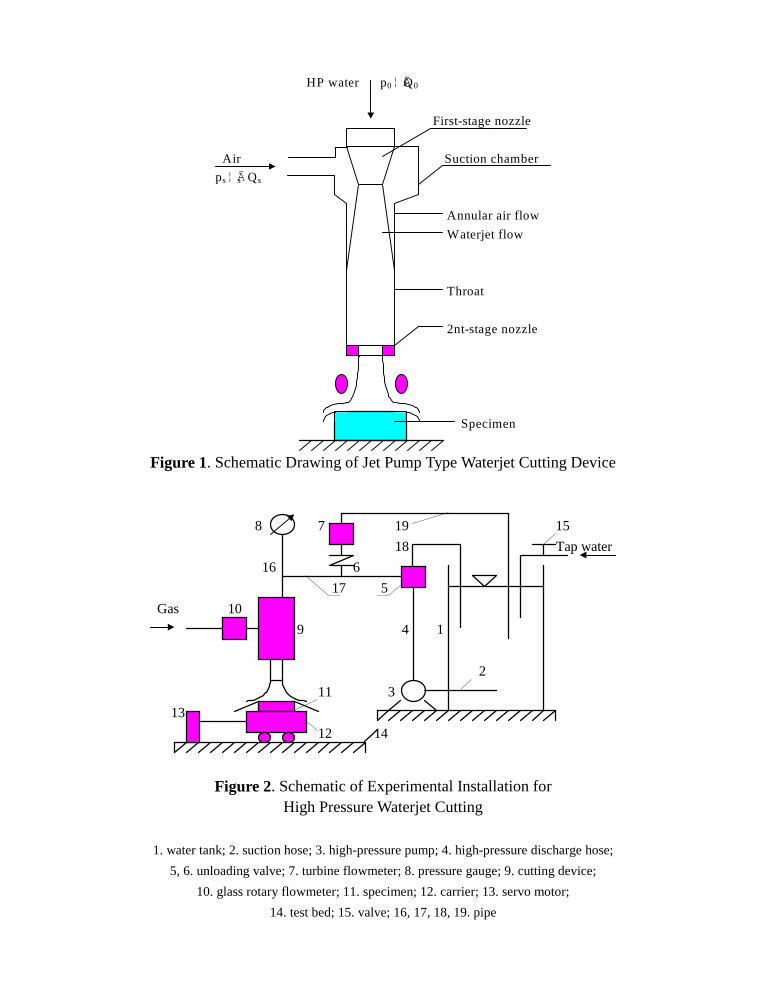
HP water p0¦ Ã £° Q0
First-stage nozzle
Air Suction chamber
ps¦ Ãs Qs
Annular air flow
Waterjet flow
Throat
2nt-stage nozzle
Specimen
Figure 1. Schematic Drawing of Jet Pump Type Waterjet Cutting Device
8 7 19 15
18 Tap water
16 6
17 5
Gas 10
9 4 1
2
11 3 p
13
12 14
Figure 2. Schematic of Experimental Installation forHigh Pressure Waterjet Cutting
1. water tank; 2. suction hose; 3. high-pressure pump; 4. high-pressure discharge hose;
5, 6. unloading valve; 7. turbine flowmeter; 8. pressure gauge; 9. cutting device;
10. glass rotary flowmeter; 11. specimen; 12. carrier; 13. servo motor;
14. test bed; 15. valve; 16, 17, 18, 19. pipe
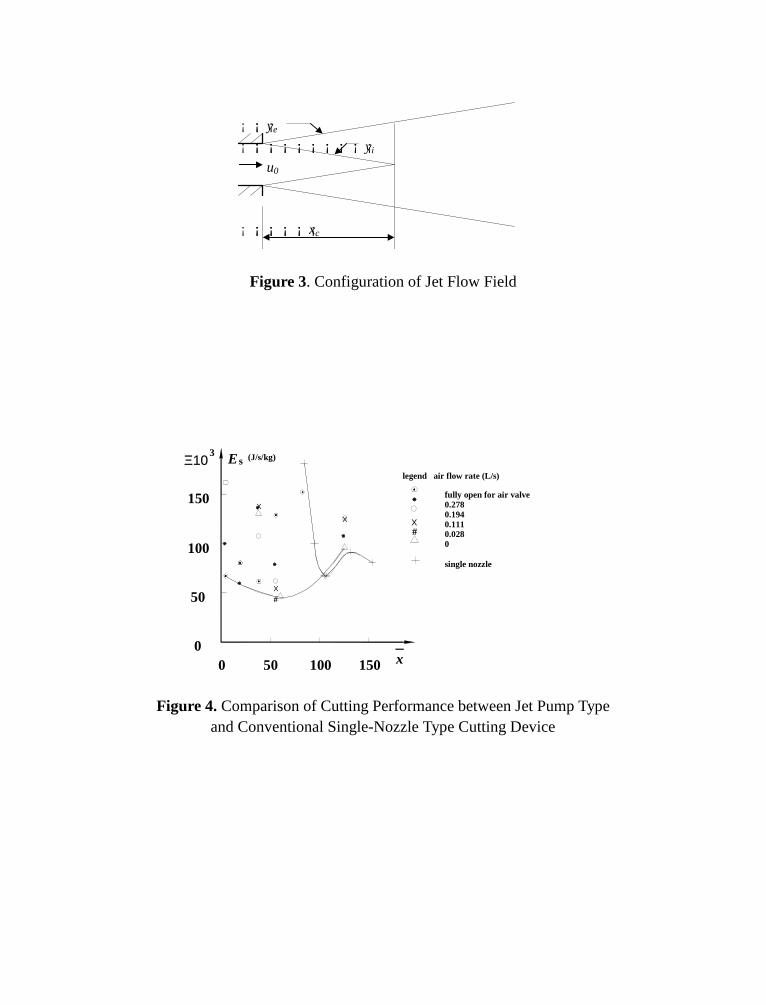
¡ ¡¡ ¡ ye
¡ ¡¡ ¡¡ ¡¡ ¡¡ ¡¡ ¡¡ ¡¡ ¡¡ ¡ yi
u0
¡ ¡¡ ¡¡ ¡¡ ¡¡ ¡ xc
Figure 3. Configuration of Jet Flow Field
50 100 150
#
#
Χ
Χ
Χ
0
50
100
150
0
Ξ103
s
fully open for air valve0.2780.1940.1110.0280
single nozzle
Χ
legend air flow rate (L/s)
(J/s/kg)
x
E
Figure 4. Comparison of Cutting Performance between Jet Pump Typeand Conventional Single-Nozzle Type Cutting Device
10th American Waterjet ConferenceAugust 14-17, 1999: Houston, Texas
Paper 63
MODELLING OF TURNING OPERATION
FOR ABRASIVE WATERJETS
A. HenningInstitute for Production Engineering and Automation
Fraunhofer SocietyStuttgart, Germany
ABSTRACT
New developments of innovative materials and higher requirements in industrial productioncreate needs for both flexible and universal machining methods. Especially when machining veryhard materials or compounds the abrasive waterjet qualifies as the tool of choice in manyapplications. So far industrial use of abrasive waterjet was focused on sheet cutting operations.With higher complexity of industrial product also geometrical requirements increase. Here theabrasive waterjet offers a wide range of possibilities for complete machining. Besides 5-axismachining also turning operations can be used for near net shaping with the same tool even fordifferent materials. So far adaptive control strategies for machining optimization were notavailable, though.
In this paper new empirical approaches to process modelling of the abrasive waterjet process aredeveloped. The turning operation is used here to obtain empirical information about the effect ofthe very particle impact. So better understanding of the abrasive waterjet process can be expectedresulting in control and optimization algorithms to improve quality and performance of theprocess.
Organized and Sponsored by the WaterJet Technology Association
1. INTRODUCTION
Waterjet techniques have been extensively explored and used for cutting processes. Here manymodels have been developed that describe the influence of jet parameters on the cutting outcomein different ways. These models yet cannot be directly transferred to milling or turning operationsince operating conditions are very different. Milling and turning processes however are of greatinterest for machining hard materials and for finishing operation (see Figure 1). Also incombination with cutting operation it can be used for complete machining and near net shapingof complex geometry’s [HAS98].
Turning operation with the abrasive waterjet have not found many applications yet because ofdifficulties with the control of the process. Other than in planar operation the process takes placeat an already machined surface with large variation of impact conditions. This makes predictionof the machining outcome very difficult.
In this paper a modelling approach for turning operation is presented. Taking the geometricconditions (i.e. the original profile) into account the outcome can be predicted calculation thevery effect of the particles. With this experimental setup also further information about the effectof very particles on the material can be obtained [HEN95].
2. ROTARY PROCESSES
In the literature so far several approaches for turning operation with abrasive water jets can befound (e.g. Ansari [ANS92], Hashish [HAS87], and Zeng [ZEN94]). The main focus of theseinvestigations was put on empirical and modelling studies for rotary cutting operation, though.As in planar operation also in rotary operation cutting and ablation processes can be found. Theprocesses can be distinguished by the characteristics of the machining parameters (e.g. highvelocity) and of the machining outcome (e.g. no striation structures).
2.1 Rotary Cutting Process
The rotary cutting process is characterized by cyclic step propagation with major wear at thefront surface of the turned part. The jet and the abrasive particles are reflected at this process inaxial direction (Figure 2a) [ANS93].
At rotary cutting the machining typically starts at the face of the shaft and propagates along theshaft-axis at a high feed rate. While moving along the axis with the workpiece turning cyclic stepformation is initiated. In accordance with planar cutting steps develop and propagate on theworkpiece surface at consequent revolutions through accumulation of the effects of multipleparticle impacts. Plateaus can not develop, though, because of the high velocity of the workpiecein the process zone. Due to jet lag effects the shape of the machined workpiece is characterizedby a curved shoulder (see Figure 2a) [ANS92]. The surface shows significant striation structuresmaking this a limiting factor for industrial usage of the process [HAS87]. With rotary cutting theabrasive jet is reflected in both radial and axial direction. Damages due to secondary wear of
axially reflecting particles also limit possibilities for machining complex three-dimensionalgeometry with a rotary cutting process.
2.2 Rotary Ablation Process
The rotary ablation process corresponds to a large extent with the stable planar milling processwithout striation formation. At every revolution of the workpiece a kerf is generated through theimpact of abrasive particles. Due to the high velocity of the workpiece in the process zone thegenerated kerf-depth very shallow. So the machining conditions and the impact situation of theparticles (especially the impact angle) is well defined by the process of the previous revolution.Different from cutting processes no discontinuous i.e. cyclic step formation processes can occurat rotary ablation. The process advances by accumulation of many well-defined particle impactsat the circumference of the workpiece.
When machining three-dimensional shapes the jet is moved in axial direction at a high feed ratein scanning mode. So machining conditions (i.e. impact angle) can be controlled closely and canbe adapted to the individual situation. Also axial reflection of the particles resulting in secondarywear at the workpiece are avoided (Figure 2b). This makes the rotary ablation process suitablefor generation of complex geometrical structures in turning operation.
For modeling of the particle impact this process suits very well. Other than in planar operationthe velocity in the process zone can be chosen freely reducing the effect of multiple impacts.Also machining conditions (esp. impact angle) can be varied in a wide range. With close controlof the current profile geometry very good conditions for empirical modeling can be found.
2.3 Nomenclature
For the exact description of the turning process it is necessary to define the geometricalparameters at the workpiece. Other than in planar operation where the process conditions areconstant i.e. the process propagates through an undamaged workpiece in turning operation theworkpiece geometry changes with progress of the process. With this progress the machiningconditions vary significantly. In Figure 3 relevant parameters are defined. The origin of thecoordinate system is situated in the axis of the workpiece.
The position x defines the fixed machining position of the abrasive jet over the workpiece. Themedium impact angle α, though, does vary within the process through reduction of the machiningradius:
)(cos
tr
x=α (1)
This medium impact angle, though, only gives a first approximation to the real impact angles thatvary over the kerf profile within the abrasive jet (Figure 4). For evaluation of the angle dependentablation potential this has to be taken into account.
The velocity f of the workpiece in the process zone also depends on the actual machiningsituation i.e. the current radius r(t) and the number of revolutions per minute n.
ntrf ⋅⋅⋅= π)(2 (2)
The result parameters as well correspond with the current machining situation and thus varywithin the process with changing machining geometry (Figure 3).
The depth of the kerf k represents a result parameter, which can be determined easily.
Kerf depth 21 rrk −= (3)
The depth of the kerf alone cannot describe the quantitative outcome of the process because thekerfing area AK and the ablated volume depend on the current radius r(t) as well.
)( 22
21 rrAK −⋅= π (4)
with r(t) = r1 ))(2( ktrkAKR −⋅⋅⋅= π (5)
Therefore the kerf-area depends on the current radius r(t) and the depth of the kerf k. With thisthe kerfing performance PK and the ablationrate QK can be defined as follows:
Kerfing performance kKK tAP = (6)
Ablation rate dtdVQ KK = (7)
with the ablated Volume VK
∫ ∫ ⋅⋅−=π
ϕ2
0
2
1
)),((y
y
K ddyytrrV (8)
3. RESULTS AND DISCUSSION
Very good control of machining parameters qualifies the rotary ablation process as a tool forempirical studies and modelling approaches. In this paper the effects of different machiningparameters on the turning outcome were to be evaluated. For the empirical study kerfs weregenerated at constant machining conditions and fixed position of the abrasive waterjet over theworkpiece using the rotary ablation process. The duration of the process was varied generatingdiscrete time-series of profiles.
In Figure 6 the time dependent development of the kerf profile can bee seen. The depth of thekerf increases with duration of the process while the width remains about constant. As expected
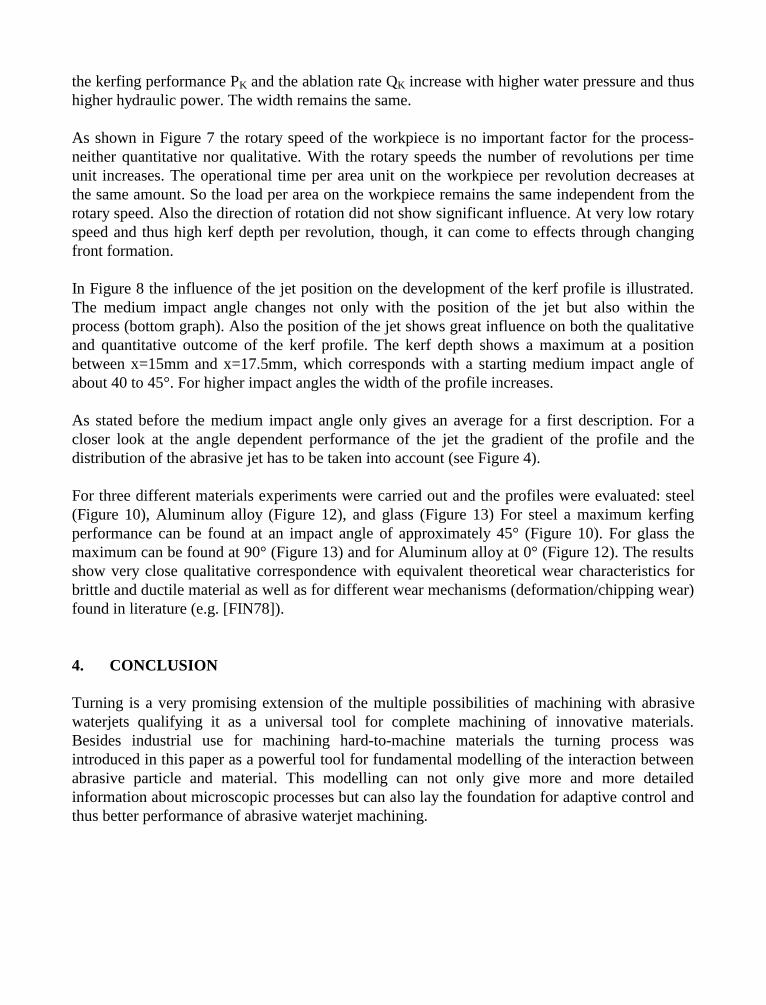
the kerfing performance PK and the ablation rate QK increase with higher water pressure and thushigher hydraulic power. The width remains the same.
As shown in Figure 7 the rotary speed of the workpiece is no important factor for the process-neither quantitative nor qualitative. With the rotary speeds the number of revolutions per timeunit increases. The operational time per area unit on the workpiece per revolution decreases atthe same amount. So the load per area on the workpiece remains the same independent from therotary speed. Also the direction of rotation did not show significant influence. At very low rotaryspeed and thus high kerf depth per revolution, though, it can come to effects through changingfront formation.
In Figure 8 the influence of the jet position on the development of the kerf profile is illustrated.The medium impact angle changes not only with the position of the jet but also within theprocess (bottom graph). Also the position of the jet shows great influence on both the qualitativeand quantitative outcome of the kerf profile. The kerf depth shows a maximum at a positionbetween x=15mm and x=17.5mm, which corresponds with a starting medium impact angle ofabout 40 to 45°. For higher impact angles the width of the profile increases.
As stated before the medium impact angle only gives an average for a first description. For acloser look at the angle dependent performance of the jet the gradient of the profile and thedistribution of the abrasive jet has to be taken into account (see Figure 4).
For three different materials experiments were carried out and the profiles were evaluated: steel(Figure 10), Aluminum alloy (Figure 12), and glass (Figure 13) For steel a maximum kerfingperformance can be found at an impact angle of approximately 45° (Figure 10). For glass themaximum can be found at 90° (Figure 13) and for Aluminum alloy at 0° (Figure 12). The resultsshow very close qualitative correspondence with equivalent theoretical wear characteristics forbrittle and ductile material as well as for different wear mechanisms (deformation/chipping wear)found in literature (e.g. [FIN78]).
4. CONCLUSION
Turning is a very promising extension of the multiple possibilities of machining with abrasivewaterjets qualifying it as a universal tool for complete machining of innovative materials.Besides industrial use for machining hard-to-machine materials the turning process wasintroduced in this paper as a powerful tool for fundamental modelling of the interaction betweenabrasive particle and material. This modelling can not only give more and more detailedinformation about microscopic processes but can also lay the foundation for adaptive control andthus better performance of abrasive waterjet machining.
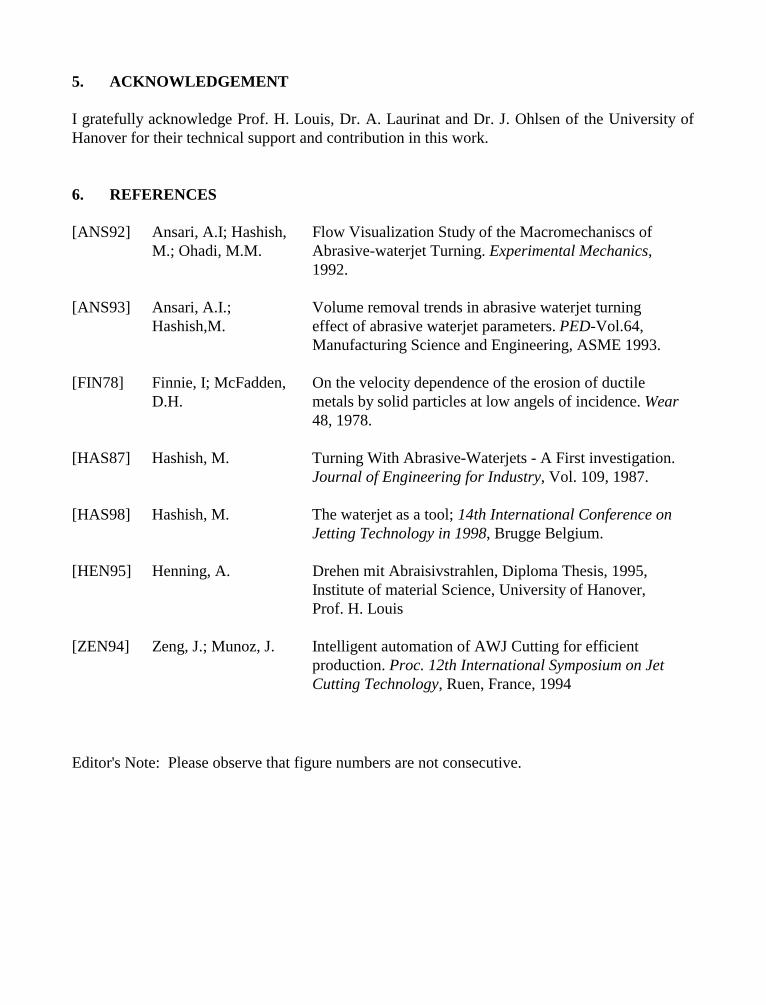
5. ACKNOWLEDGEMENT
I gratefully acknowledge Prof. H. Louis, Dr. A. Laurinat and Dr. J. Ohlsen of the University ofHanover for their technical support and contribution in this work.
6. REFERENCES
[ANS92] Ansari, A.I; Hashish,M.; Ohadi, M.M.
Flow Visualization Study of the Macromechaniscs ofAbrasive-waterjet Turning. Experimental Mechanics,1992.
[ANS93] Ansari, A.I.;Hashish,M.
Volume removal trends in abrasive waterjet turningeffect of abrasive waterjet parameters. PED-Vol.64,Manufacturing Science and Engineering, ASME 1993.
[FIN78] Finnie, I; McFadden,D.H.
On the velocity dependence of the erosion of ductilemetals by solid particles at low angels of incidence. Wear48, 1978.
[HAS87] Hashish, M. Turning With Abrasive-Waterjets - A First investigation.Journal of Engineering for Industry, Vol. 109, 1987.
[HAS98] Hashish, M. The waterjet as a tool; 14th International Conference onJetting Technology in 1998, Brugge Belgium.
[HEN95] Henning, A. Drehen mit Abraisivstrahlen, Diploma Thesis, 1995,Institute of material Science, University of Hanover,Prof. H. Louis
[ZEN94] Zeng, J.; Munoz, J. Intelligent automation of AWJ Cutting for efficientproduction. Proc. 12th International Symposium on JetCutting Technology, Ruen, France, 1994
Editor's Note: Please observe that figure numbers are not consecutive.
7. FIGURES
Figure 1: Machining Examples of Rotary Ablation [HEN95]
stepheight
stepw idthstepsfeed
a) Step formation at rotary cutting
feed
b) Radial reflection at rotary ablation /HEN95/
Figure 2: Comparison between Rotary Cutting (a) and Rotary Ablation (b)
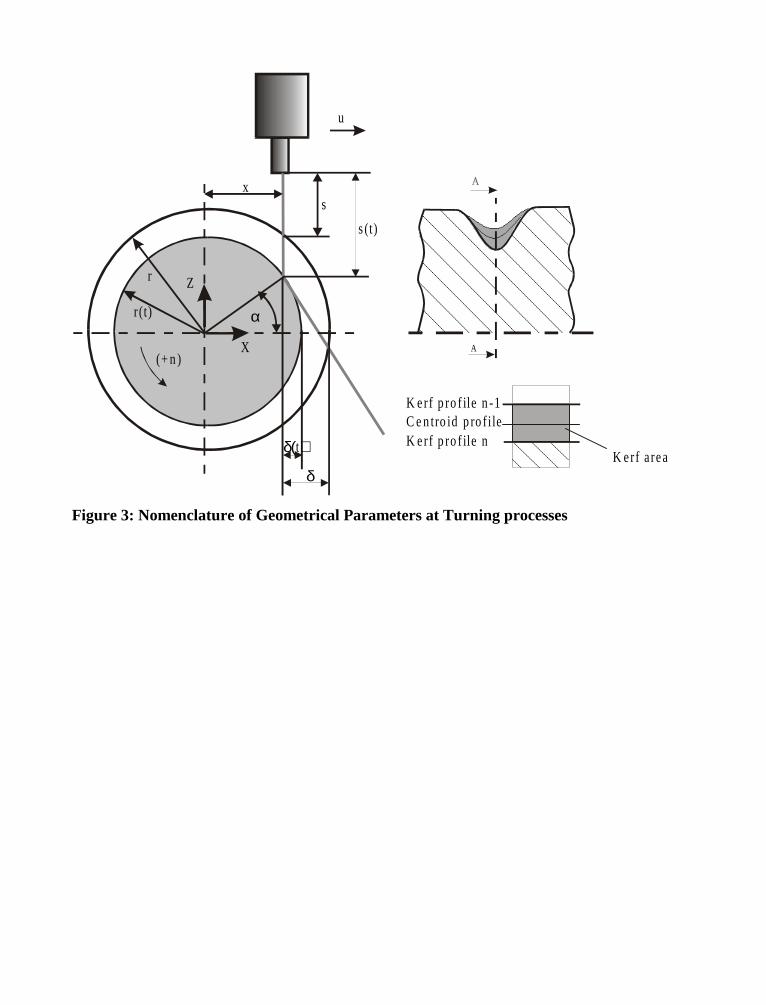
Z
X(+ n )
r(t)
r
δ
sx
s (t)
δ( )t
α
u
A
K erf area
K erf p ro f ile n -1C e n tro id p ro f i leK erf p ro f ile n
Figure 3: Nomenclature of Geometrical Parameters at Turning processes
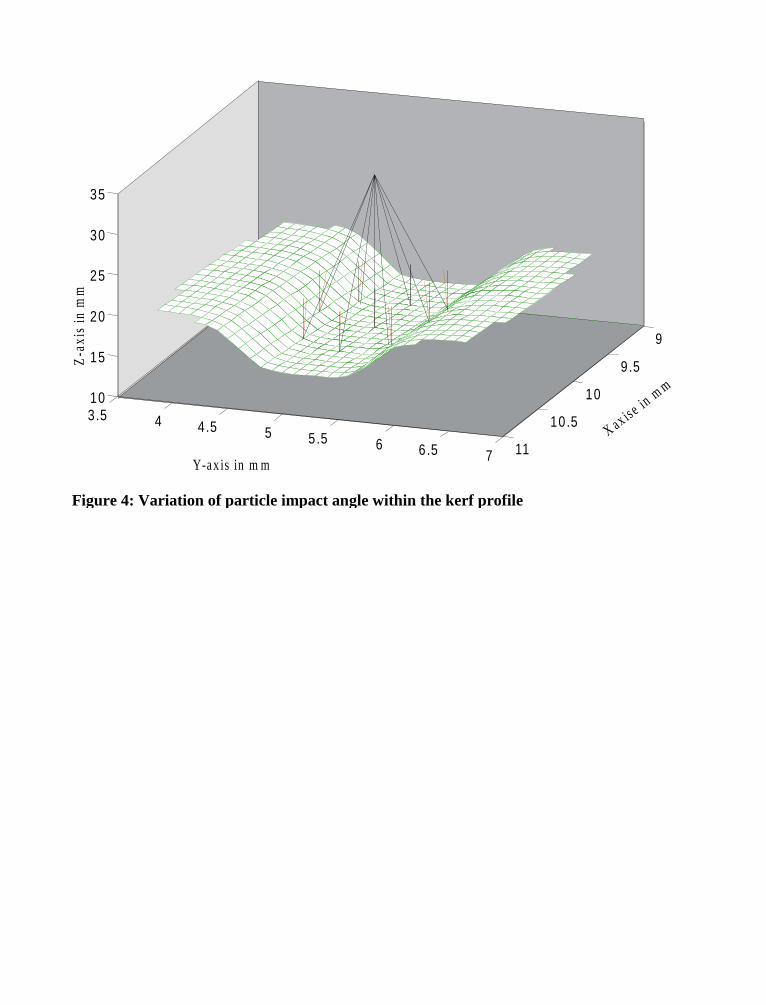
9
9.5
10
10.5
11
3.5 4 4.5 5 5.5 6 6.5 7
10
15
20
25
30
35
X ax ise in m
m
Y-ax is in m m
Z-a
xis
in m
m
Figure 4: Variation of particle impact angle within the kerf profile
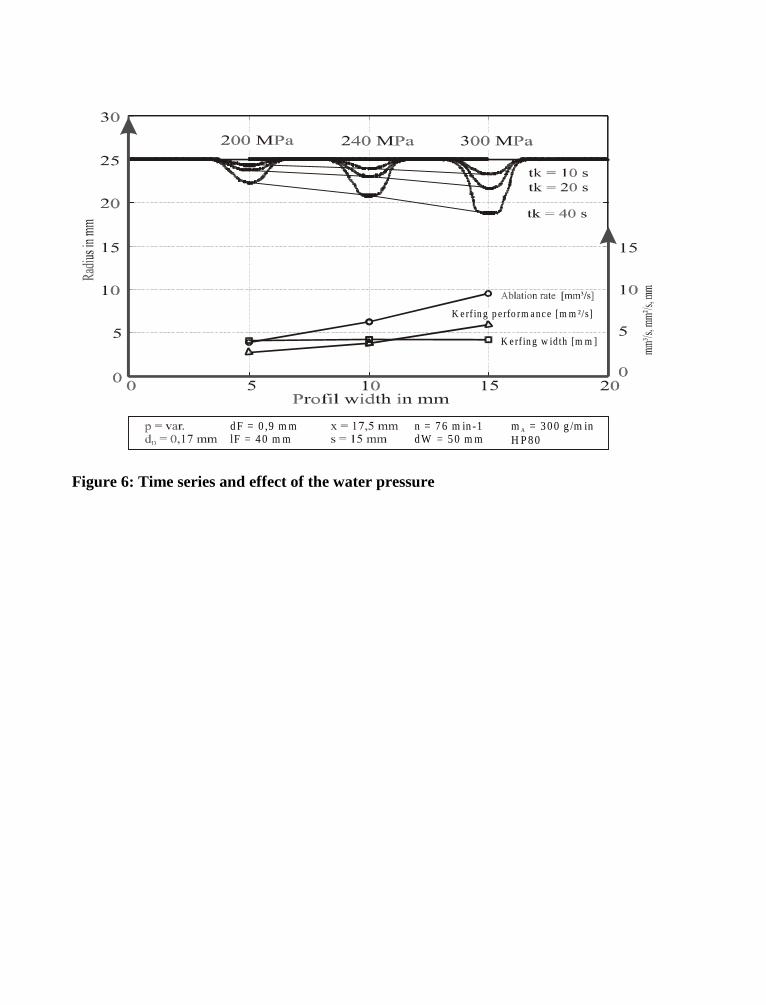
m = 300 g /m inH P 80
An = 76 m in -1dW = 50 m m
dF = 0 ,9 m mlF = 40 m m
K erf in g p erfo rm ance [m m ²/s]
K e rf in g w idth [m m ]
Figure 6: Time series and effect of the water pressure
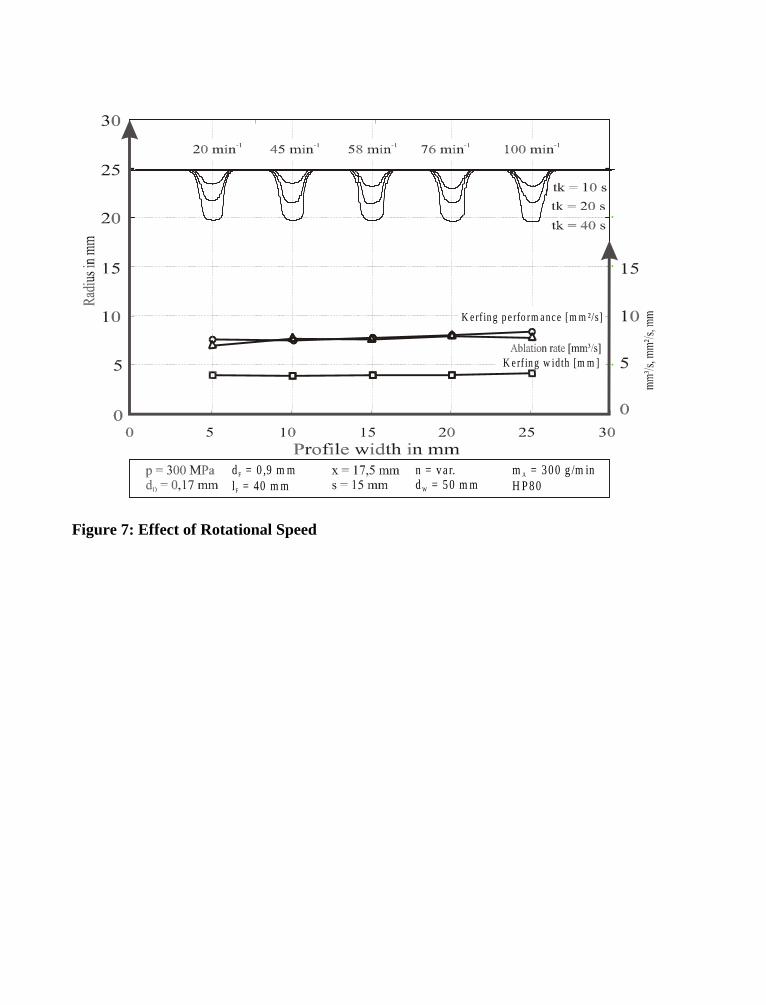
m = 300 g /m inH P 80
An = va r.d = 50 m mW
d = 0 ,9 m ml = 40 m m
F
F
K erf in g p e rfo rm ance [m m ²/s]
K e rf in g w idth [m m ]
Figure 7: Effect of Rotational Speed
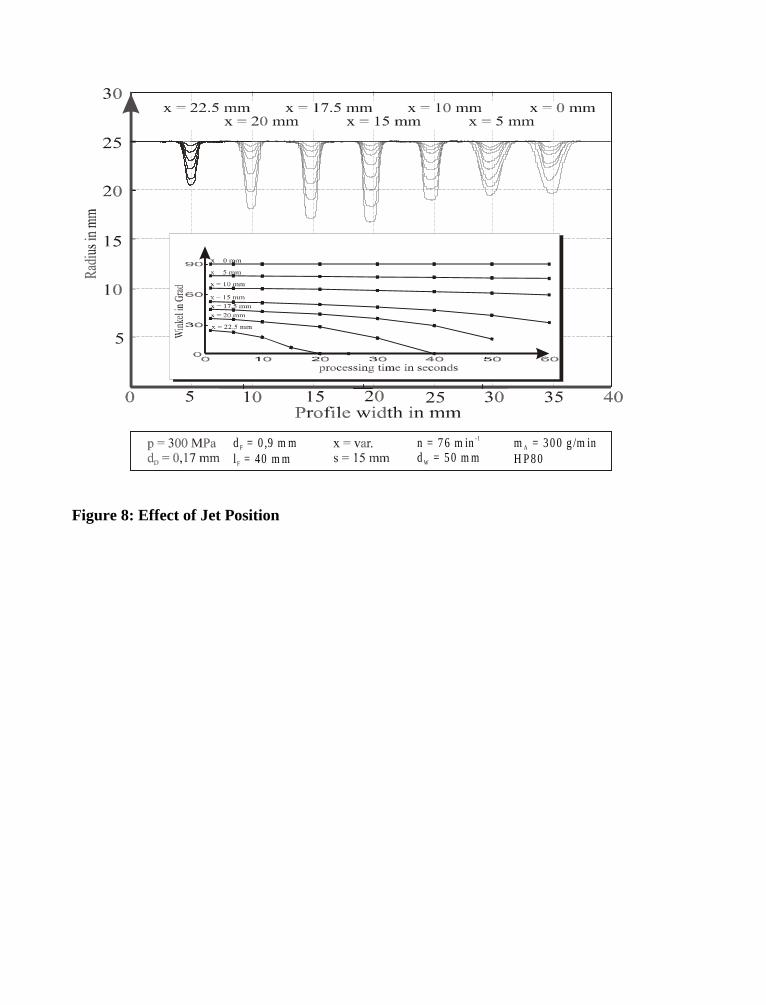
m = 300 g /m inH P 80
An = 76 m ind = 50 m m
-1
W
d = 0 ,9 m ml = 40 m m
F
F
Figure 8: Effect of Jet Position
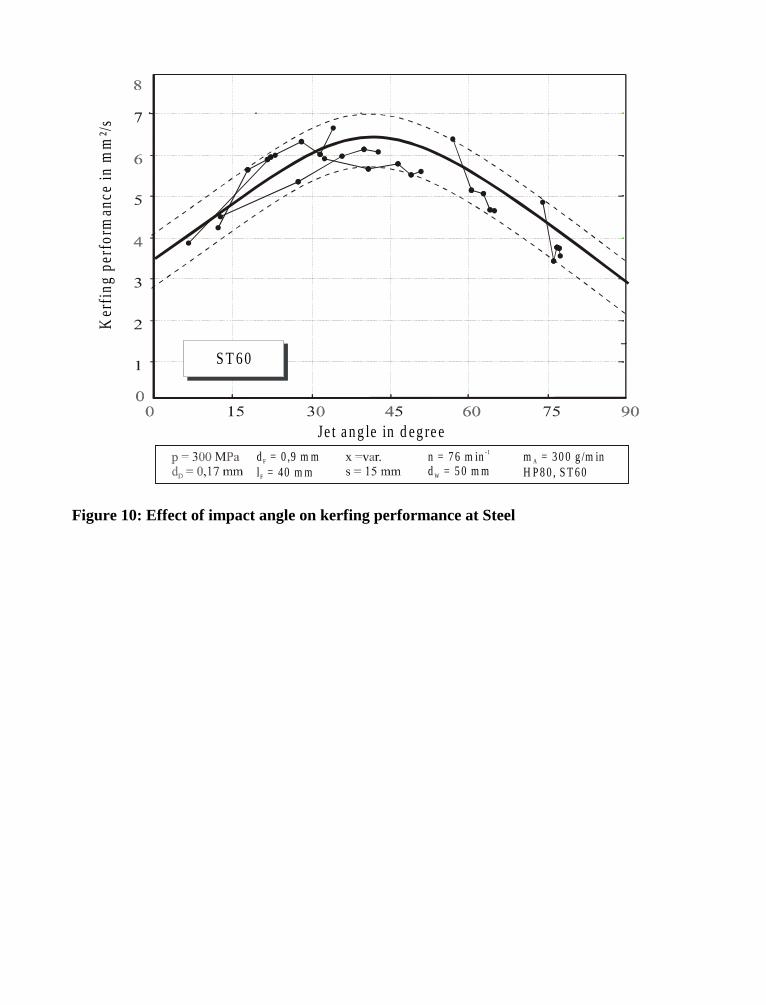
m = 3 0 0 g /m inH P 8 0 , S T 6 0
An = 7 6 m ind = 5 0 m m
-1
W
d = 0 ,9 m ml = 40 m m
F
F
Ker
fing
perf
orm
ance
in m
m²/
s
Je t a ng le in d eg re e
S T 60
Figure 10: Effect of impact angle on kerfing performance at Steel
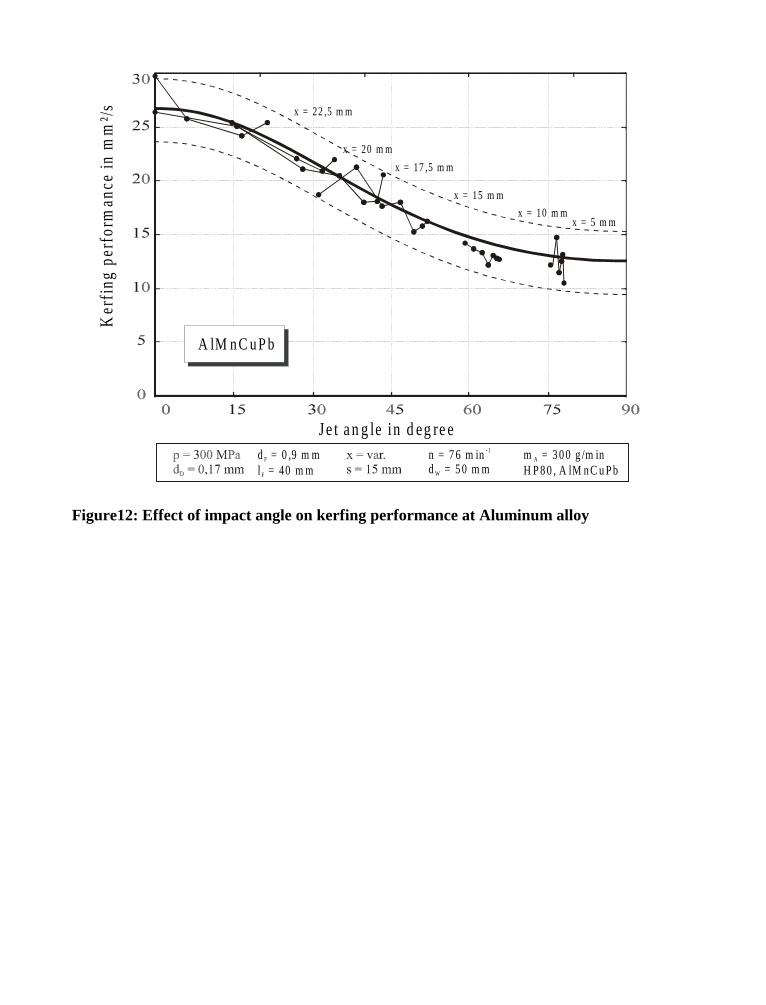
x = 22 ,5 m m
x = 20 m m
x = 17 ,5 m m
x = 15 m m
x = 10 m mx = 5 m m
m = 3 0 0 g /m inH P 8 0 , A lM n C u P b
An = 7 6 m ind = 5 0 m m
-1
W
d = 0 ,9 m ml = 40 m m
F
F
Ker
fing
perf
orm
ance
in m
m²/
s
J e t an g le in d eg re e
A lM nC uP b
Figure12: Effect of impact angle on kerfing performance at Aluminum alloy
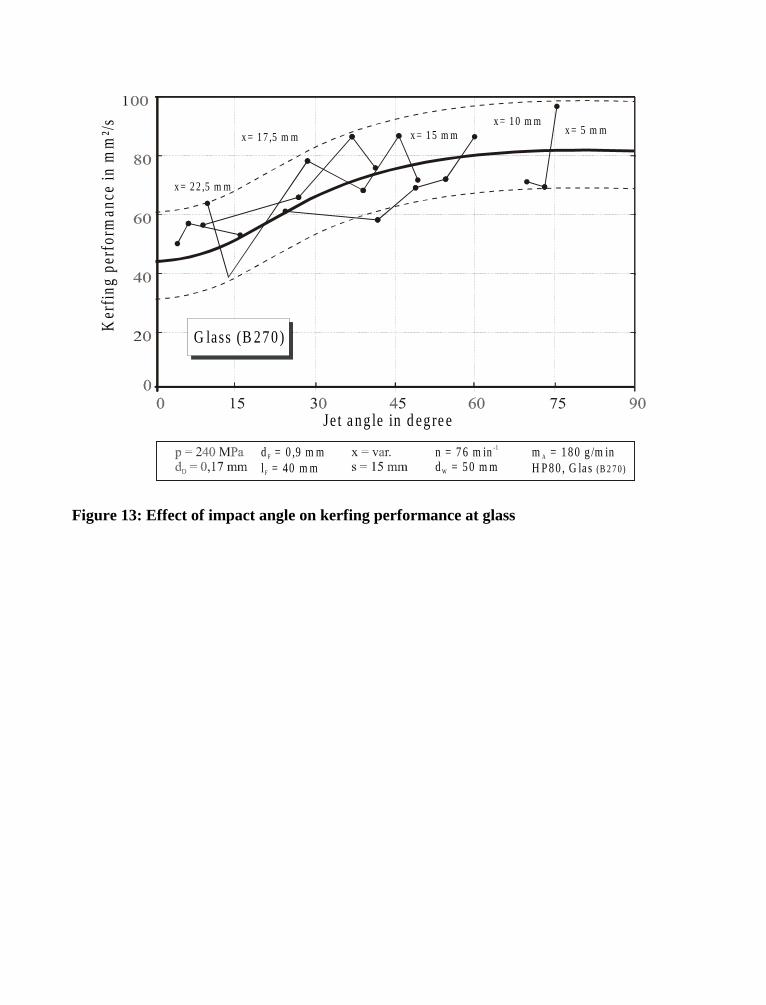
m = 180 g /m inH P 80 , G las
A
(B 2 7 0)
n = 76 m ind = 50 m m
-1
W
d = 0 ,9 m ml = 40 m m
F
F
Je t ang le in d egree
Ker
fing
perf
orm
ance
in m
m²/
s
x = 2 2 ,5 m m
x = 1 7 ,5 m m x = 1 5 m mx = 1 0 m m
x = 5 m m
G lass (B 270)
Figure 13: Effect of impact angle on kerfing performance at glass
10th American Waterjet ConferenceAugust 14-17, 1999: Houston, Texas
Paper 64
STATUS AND POTENTIAL OF WATERJET
MACHINING OF COMPOSITES
Mohamed HashishFlow International Corporation
Kent, Washington
ABSTRACT
Waterjets (WJs) and abrasive-waterjets (AWJs) have been accepted in the industry for manycomposite trimming applications. For example, the composite tail wing on the Boeing 777airplane is trimmed with an AWJ. The AWJ produces high-quality surfaces free from chippingand delamination. Generally, the morphology and geometrical features of cuts in composites,such as kerf taper or waviness, are similar to those observed in other monolithic materials.However, depending on the composite structure, micro and macro effects may be significantlydifferent. This paper presents data and observations on linear cutting, turning, drilling, milling,and repair of composites. In general, waterjet technology is an ideal fit for the machining ofcomposites. Precision machining can be accomplished using accurate manipulators andadvanced processing techniques, such as pressure ramping and lead angle implementation. Ma-chining accuracies of 0.025 mm have been demonstrated. Waterjet technology can potentially beused for near-complete component fabrication.
Organized and Sponsored by the WaterJet Technology Association
1. INTRODUCTION
The use of advanced materials such as composites has been escalating rapidly over the past twodecades, coincident with the introduction of AWJ technology to the marketplace. This paperdiscusses WJ/AWJ machining processes for composites. These processes include cutting,turning, drilling, and milling for part manufacturing or repair using waterjets, AWJs, abrasivesuspension jets, or cryogenic jets. Typical problems that have been encountered when ma-chining composite systems with these types of jets include:
• Delamination – Delamination may occur during piercing with a WJ or an AWJ or duringcutting if abrasives are interrupted. Although the piercing problem has been resolved inthe lab, starting holes are still being drilled with mechanical drills in the field.
• Reliability – Significant advances have been made on AWJ reliability. A need still exists,however, for improved robustness via enabling hardware. For example, a quick-actingon/off valve is needed to quickly stop the jet if the abrasive flow is interrupted.
• Edge quality – The AWJ produces high-quality edges for most composites, but the bottomedge accuracy and the quality of cuts in relatively thick honeycomb structures need to beimproved.
• Cost effectiveness – Waterjets have proven to be cost effective for a wide range ofcomposites. However, the cutting of hard CMCs and other hard composites is relativelyslow and not cost effective. These materials can be cut using hard abrasives such as SiC,but nozzles wear out rapidly.
In the following, Section 2 discusses current composite systems and applications, and Section 3reviews the work that has been done using WJ/AWJ technology for the machining of com-posites. Most industrial uses to date have applied the technology for trimming. Section 4discusses the application of waterjet technology for various machining processes and providessome performance data. Section 5 summarizes the conclusions of our discussion.
2. COMPOSITE SYSTEMS
Most of today’s composite materials are used in the aircraft, aerospace, marine, and automotiveindustries. Ongoing government and industry R&D programs are accelerating the use ofadvanced engineered materials such as organic, metal, and ceramic matrix composites (OMCs,MMCs, and CMCs) in jet aircraft engines. For example, the Integrated High PerformanceTurbine Engine Technology (IHPTET) program has as its goals the doubling of turbofan andturbojet thrust-to-weight ratios and the reduction of specific fuel consumption by 40% by theyear 2003. Much of this performance improvement is expected to be accomplished through theuse of these new materials. In general, the engine cold section will incorporate OMCs, MMCs,and intermetallics, while the hot section (combustors, turbines, exhaust) will require the high-temperature capabilities of some intermetallics, single-crystal superalloys, CMCs, or carbon/carbon composites. More specifically, lightweight cold-section OMC components may includefan frames, fan blades, inlet and outlet guide vanes, stator vanes, cases, and control housings.For example, the PMR polyimides developed at NASA Lewis in the 1970s were a major advancein high-temperature resins. Continuous service temperatures up to 288°C can be withstood bythese materials (Serafini, 1987). Graphite-PMR-15 structural parts are used on General Electric
Aircraft Engines such as the F110 and F404 military engines and in the Pratt and Whitney PW-1120 and 1130 turbojet and turbofan engines.
Metal matrix composites provide high specific strength and stiffness. MMC incorporation intosuch structures as fan blades, compressor rotors, impellers, shafts, cases, and frames is projected.Recently, the Air Force and ARPA launched the Titanium Matrix Composite Turbine EngineComponent Consortium (TMCTECC) in cooperation with several major engine manufacturers(Kandebo, 1994). The goal of this program is to establish an affordable MMC industrial base forthe 21st century, utilizing conventional Ti6-4 alloys for the matrix material and continuoussilicon carbide fibers as reinforcements. The first components selected for commercializationunder the TMCTECC project are fan frames and hollow core fan blades to replace the state-of-the-art hollow titanium wide-chord fan blades currently in use. In addition, Ti6-4/SiC MMCcompressor blings fabricated by Pratt & Whitney have already been tested in the Joint Tech-nology Demonstrator Engine.
Intermetallics may find use in moderate- to high-temperature engine components. Titaniumaluminides, specifically gamma TiAl, may be used for the last stages of the compressor, whilehigh-temperature intermetallics such as NiAl are candidates for turbine blades or vanes.
Ceramic matrix composites, using creep-resistant ceramic fibers, are anticipated for use in thehighest-temperature components, such as combustors, turbines, augmentors, and nozzles.Carbon/silicon carbide combustor liners and high-pressure turbine rotors have been fabricatedand rig tested. Other designs have incorporated SiC/SiC CMCs for these components andexhaust system components as well.
Jahanmir et al. (1998) have provided a comprehensive look at the state of the art of differentcomposite systems and methods used to machine them. In aircraft manufacturing, AWJs arenow used to cut a variety of composite structures to final dimensions. Boeing uses AWJs forfinal machining of the I-beam stiffeners used in the tail of the 777 and also for drilling of somecomposite parts. Honeycomb and other sandwich composite structures are the highest strength-to-weight and stiffness-to-weight materials systems available today. These highly efficientcomposites or laminates consist of a core (or core structure) bonded to an outer skin. AWJs areused to cut these materials for satellite applications in addition to a wide range of aircraft parts.
3. BRIEF REVIEW OF WJ/AWJ COMPOSITE MACHINING
Significant work has been done on the use of waterjets and abrasive-waterjets for the trimmingof composites. A study by Schwartz (1983) showed that waterjet trimming of molded and curedcomposites can increase productivity by 80%. The results of this study also indicated that thecutting of internal shapes with a waterjet required predrilled holes.
High-pressure plain waterjets operating at 414 MPa have been used for cutting a number ofepoxy composites (Hurlburt and Cheung, 1977). The cut edges are generally acceptable; how-ever, poor-quality cuts were observed in materials that contained hard fibers, such as boron.
A study on AWJ cutting of MMCs (Neusen et al., 1987) suggested that the aluminum matrices ofAl/SiC composites are smeared during the cutting process. Cut and broken silicon carbide
particles were found near the AWJ-cut surface. These observations have been contradicted byothers (Korican, 1987).
AWJ and diamond cutting of composites have been compared in a study using Al/SiC andAl2O3/SiC composite workpieces (Ramulu and Taya, 1988). It was shown that AWJ cutting isabout 20 times faster than diamond cutting, but surfaces are generally about 10 times rougher.
The AWJ was also used in experiments involving the cutting and piercing of TiB2/SiC andAl/SiC composites (Hamatani and Ramulu, 1988). The kerf and hole geometry and morphologywere then quantitatively studied. It was observed that surface softening occurred in the MMC,but no explanation was given. During the piercing of the CMC, high temperatures wereobserved, indicating that the penetration process may not be totally free from thermal effects. Itwas observed, however, that no thermal degradation occurred to composite surfaces. The jetthermal effect is then highly questionable, and more work is needed on cutting mechanics.
The authors also addressed surface and subsurface damage, which was found to be greater in theMMC than in the CMC. Ramulu and Arola (1997) observed that the material removal whenmachining graphite/epoxy occurs by a brittle shearing mechanism that fractures and micromachines the constituents of the composite material. Jenkins et al. (1997) indicated that AWJsdo not in any way degrade CFCC under elevated temperature conditions. AWJ-turningexperiments on Mg/B4C MMC have indicated that machining the MMC is only slightly moredifficult than machining the matrix material alone (Hashish, 1987). It was found that thereinforcement particles may contribute to the surface roughness of an MMC surface cut by anAWJ. The testing of turned specimens (Lavander and Smith, 1985) indicated that AWJmachining does not affect the mechanical properties of the material but generally produces arough surface.
Not much literature exists on developing special predictive models for waterjet cutting ofcomposite materials. Hoogstrate et al. (1998a) presented an approach to identify waterjetparameters using several experimental data, predictive models, and logical rules. Hoogstrate etal. (1998b) also addressed the cutting of hybrid laminated metal materials consisting of verydistinct basic materials such as aluminum and glass fibers. These materials are combined intoone material in such a way that a layered structure is formed in which each layer consists of oneof the basic materials. Machining such laminated materials introduces a new challenge, whichwas addressed by Hoogstrate et al. (1998b).
4. MACHINING OPERATIONS
Table 1 shows several different machining operations (linear cutting, drilling, milling, andturning) and lists the relevant machining parameters. In the following sections, these operationsare discussed with respect to their application for the machining of composites.
4.1 Linear Cutting
Plain waterjet cutting of composites is limited to thin sheets and relatively soft materials. Plainwaterjets tend to delaminate composites if they are thick, if they contain hard elements, or if
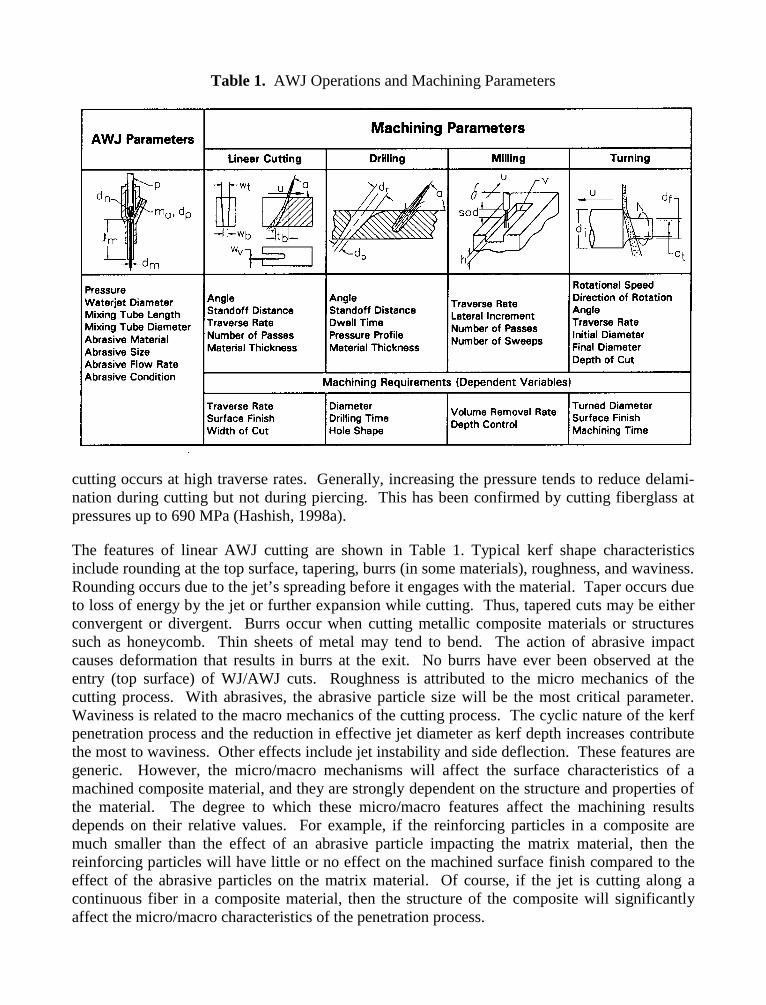
Table 1. AWJ Operations and Machining Parameters
cutting occurs at high traverse rates. Generally, increasing the pressure tends to reduce delami-nation during cutting but not during piercing. This has been confirmed by cutting fiberglass atpressures up to 690 MPa (Hashish, 1998a).
The features of linear AWJ cutting are shown in Table 1. Typical kerf shape characteristicsinclude rounding at the top surface, tapering, burrs (in some materials), roughness, and waviness.Rounding occurs due to the jet’s spreading before it engages with the material. Taper occurs dueto loss of energy by the jet or further expansion while cutting. Thus, tapered cuts may be eitherconvergent or divergent. Burrs occur when cutting metallic composite materials or structuressuch as honeycomb. Thin sheets of metal may tend to bend. The action of abrasive impactcauses deformation that results in burrs at the exit. No burrs have ever been observed at theentry (top surface) of WJ/AWJ cuts. Roughness is attributed to the micro mechanics of thecutting process. With abrasives, the abrasive particle size will be the most critical parameter.Waviness is related to the macro mechanics of the cutting process. The cyclic nature of the kerfpenetration process and the reduction in effective jet diameter as kerf depth increases contributethe most to waviness. Other effects include jet instability and side deflection. These features aregeneric. However, the micro/macro mechanisms will affect the surface characteristics of amachined composite material, and they are strongly dependent on the structure and properties ofthe material. The degree to which these micro/macro features affect the machining resultsdepends on their relative values. For example, if the reinforcing particles in a composite aremuch smaller than the effect of an abrasive particle impacting the matrix material, then thereinforcing particles will have little or no effect on the machined surface finish compared to theeffect of the abrasive particles on the matrix material. Of course, if the jet is cutting along acontinuous fiber in a composite material, then the structure of the composite will significantlyaffect the micro/macro characteristics of the penetration process.
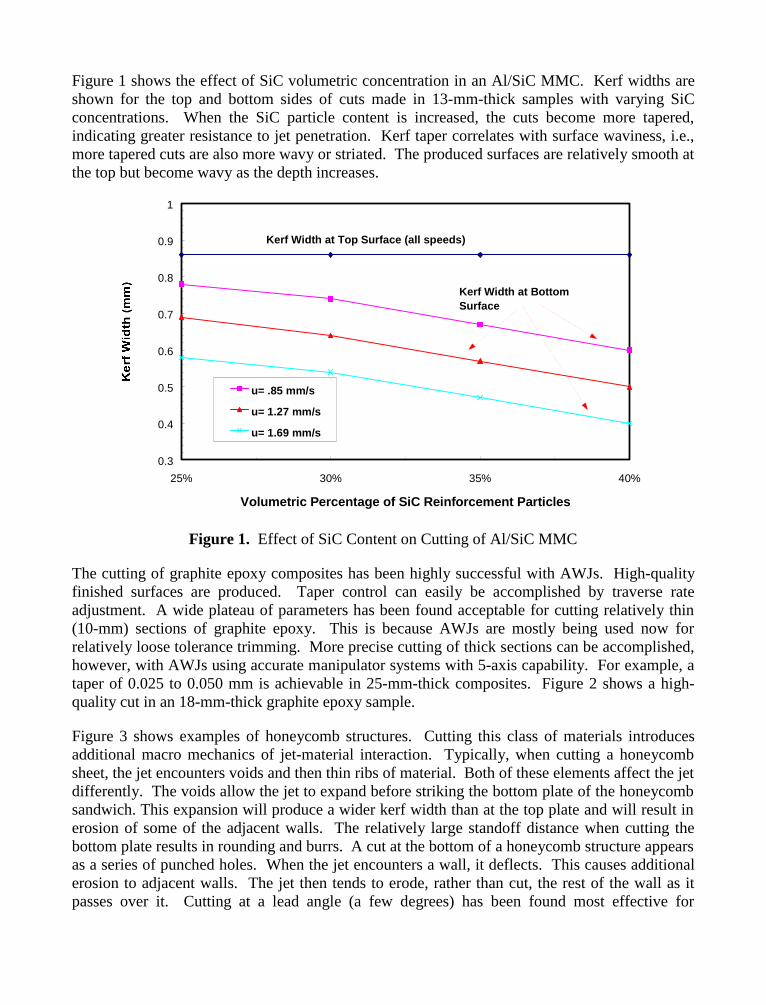
Figure 1 shows the effect of SiC volumetric concentration in an Al/SiC MMC. Kerf widths areshown for the top and bottom sides of cuts made in 13-mm-thick samples with varying SiCconcentrations. When the SiC particle content is increased, the cuts become more tapered,indicating greater resistance to jet penetration. Kerf taper correlates with surface waviness, i.e.,more tapered cuts are also more wavy or striated. The produced surfaces are relatively smooth atthe top but become wavy as the depth increases.
0.3
0.4
0.5
0.6
0.7
0.8
0.9
1
25% 30% 35% 40%
Volumetric Percentage of SiC Reinforcement Particles
u= .85 mm/s
u= 1.27 mm/s
u= 1.69 mm/s
Kerf Width at Top Surface (all speeds)
Kerf Width at Bottom Surface
Figure 1. Effect of SiC Content on Cutting of Al/SiC MMC
The cutting of graphite epoxy composites has been highly successful with AWJs. High-qualityfinished surfaces are produced. Taper control can easily be accomplished by traverse rateadjustment. A wide plateau of parameters has been found acceptable for cutting relatively thin(10-mm) sections of graphite epoxy. This is because AWJs are mostly being used now forrelatively loose tolerance trimming. More precise cutting of thick sections can be accomplished,however, with AWJs using accurate manipulator systems with 5-axis capability. For example, ataper of 0.025 to 0.050 mm is achievable in 25-mm-thick composites. Figure 2 shows a high-quality cut in an 18-mm-thick graphite epoxy sample.
Figure 3 shows examples of honeycomb structures. Cutting this class of materials introducesadditional macro mechanics of jet-material interaction. Typically, when cutting a honeycombsheet, the jet encounters voids and then thin ribs of material. Both of these elements affect the jetdifferently. The voids allow the jet to expand before striking the bottom plate of the honeycombsandwich. This expansion will produce a wider kerf width than at the top plate and will result inerosion of some of the adjacent walls. The relatively large standoff distance when cutting thebottom plate results in rounding and burrs. A cut at the bottom of a honeycomb structure appearsas a series of punched holes. When the jet encounters a wall, it deflects. This causes additionalerosion to adjacent walls. The jet then tends to erode, rather than cut, the rest of the wall as itpasses over it. Cutting at a lead angle (a few degrees) has been found most effective for
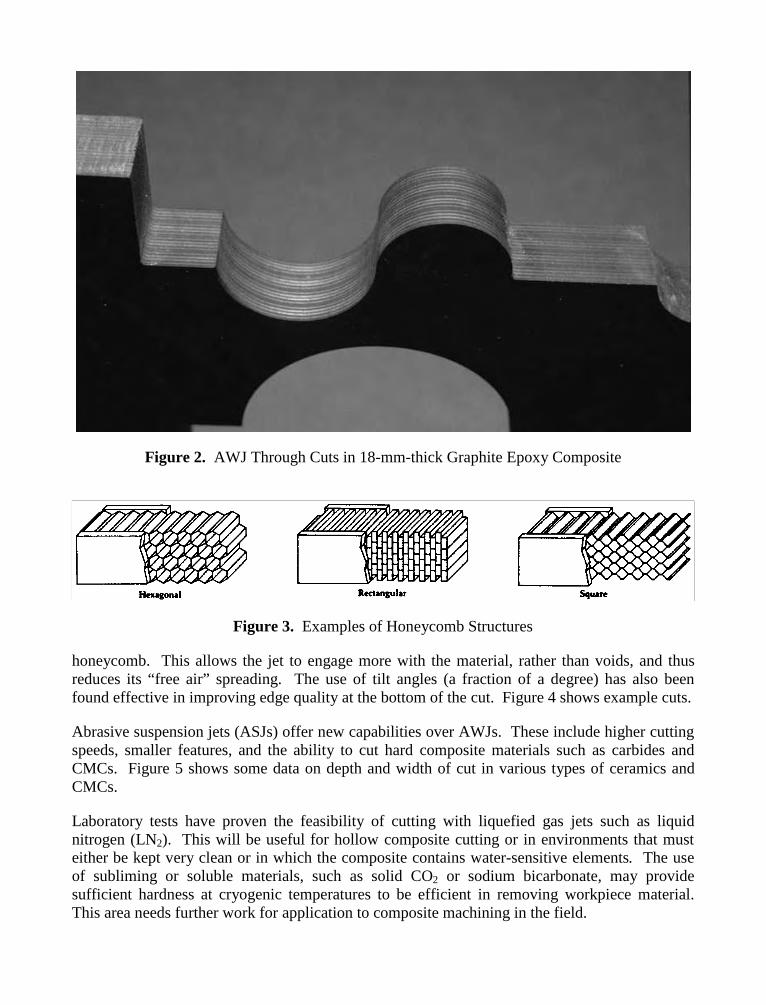
Figure 2. AWJ Through Cuts in 18-mm-thick Graphite Epoxy Composite
Figure 3. Examples of Honeycomb Structures
honeycomb. This allows the jet to engage more with the material, rather than voids, and thusreduces its “free air” spreading. The use of tilt angles (a fraction of a degree) has also beenfound effective in improving edge quality at the bottom of the cut. Figure 4 shows example cuts.
Abrasive suspension jets (ASJs) offer new capabilities over AWJs. These include higher cuttingspeeds, smaller features, and the ability to cut hard composite materials such as carbides andCMCs. Figure 5 shows some data on depth and width of cut in various types of ceramics andCMCs.
Laboratory tests have proven the feasibility of cutting with liquefied gas jets such as liquidnitrogen (LN2). This will be useful for hollow composite cutting or in environments that musteither be kept very clean or in which the composite contains water-sensitive elements. The useof subliming or soluble materials, such as solid CO2 or sodium bicarbonate, may providesufficient hardness at cryogenic temperatures to be efficient in removing workpiece material.This area needs further work for application to composite machining in the field.
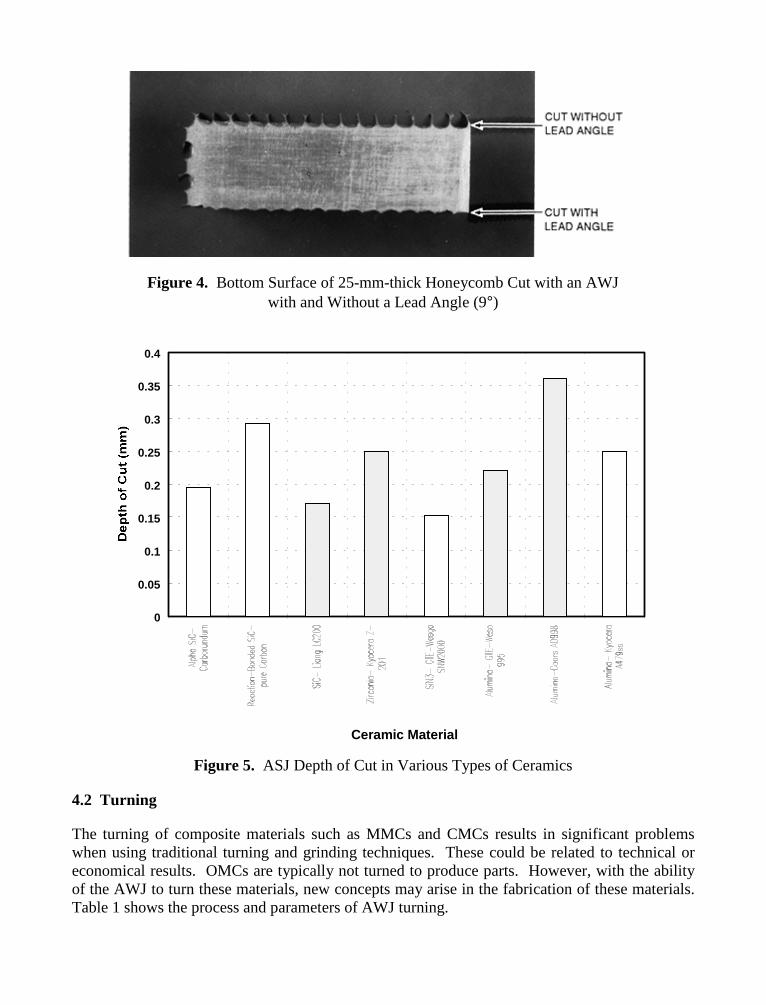
Figure 4. Bottom Surface of 25-mm-thick Honeycomb Cut with an AWJwith and Without a Lead Angle (9°)
0
0.05
0.1
0.15
0.2
0.25
0.3
0.35
0.4
Ceramic Material
Figure 5. ASJ Depth of Cut in Various Types of Ceramics
4.2 Turning
The turning of composite materials such as MMCs and CMCs results in significant problemswhen using traditional turning and grinding techniques. These could be related to technical oreconomical results. OMCs are typically not turned to produce parts. However, with the abilityof the AWJ to turn these materials, new concepts may arise in the fabrication of these materials.Table 1 shows the process and parameters of AWJ turning.
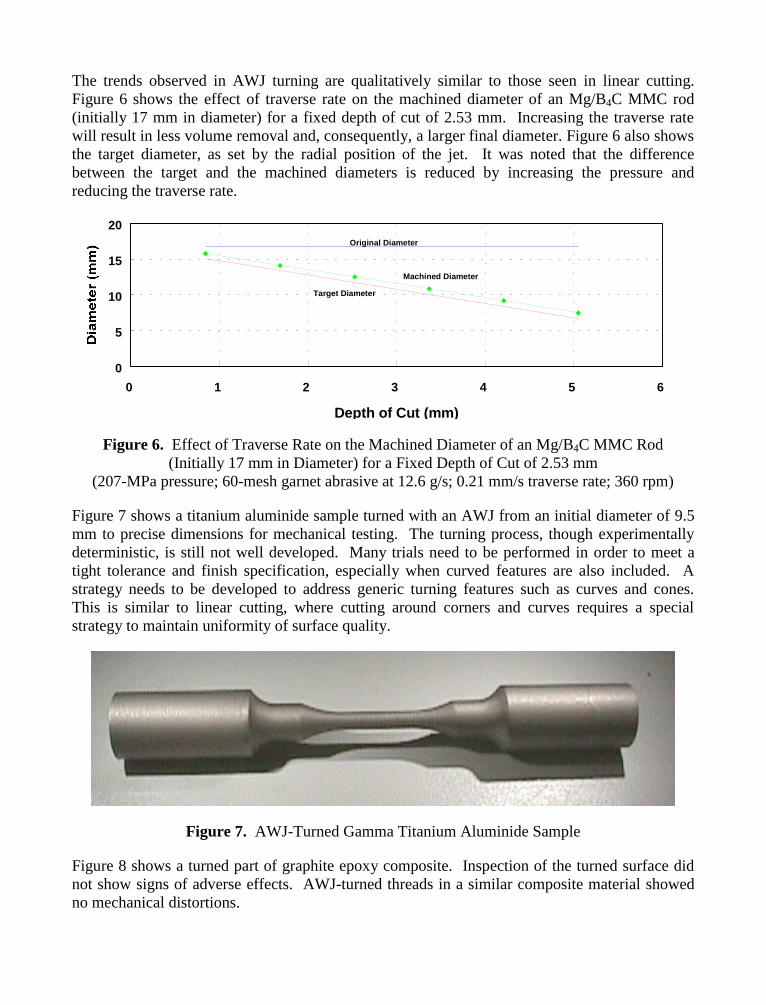
The trends observed in AWJ turning are qualitatively similar to those seen in linear cutting.Figure 6 shows the effect of traverse rate on the machined diameter of an Mg/B4C MMC rod(initially 17 mm in diameter) for a fixed depth of cut of 2.53 mm. Increasing the traverse ratewill result in less volume removal and, consequently, a larger final diameter. Figure 6 also showsthe target diameter, as set by the radial position of the jet. It was noted that the differencebetween the target and the machined diameters is reduced by increasing the pressure andreducing the traverse rate.
0
5
10
15
20
0 1 2 3 4 5 6
Depth of Cut (mm)
Target Diameter
Machined Diameter
Original Diameter
Figure 6. Effect of Traverse Rate on the Machined Diameter of an Mg/B4C MMC Rod(Initially 17 mm in Diameter) for a Fixed Depth of Cut of 2.53 mm
(207-MPa pressure; 60-mesh garnet abrasive at 12.6 g/s; 0.21 mm/s traverse rate; 360 rpm)
Figure 7 shows a titanium aluminide sample turned with an AWJ from an initial diameter of 9.5mm to precise dimensions for mechanical testing. The turning process, though experimentallydeterministic, is still not well developed. Many trials need to be performed in order to meet atight tolerance and finish specification, especially when curved features are also included. Astrategy needs to be developed to address generic turning features such as curves and cones.This is similar to linear cutting, where cutting around corners and curves requires a specialstrategy to maintain uniformity of surface quality.
Figure 7. AWJ-Turned Gamma Titanium Aluminide Sample
Figure 8 shows a turned part of graphite epoxy composite. Inspection of the turned surface didnot show signs of adverse effects. AWJ-turned threads in a similar composite material showedno mechanical distortions.
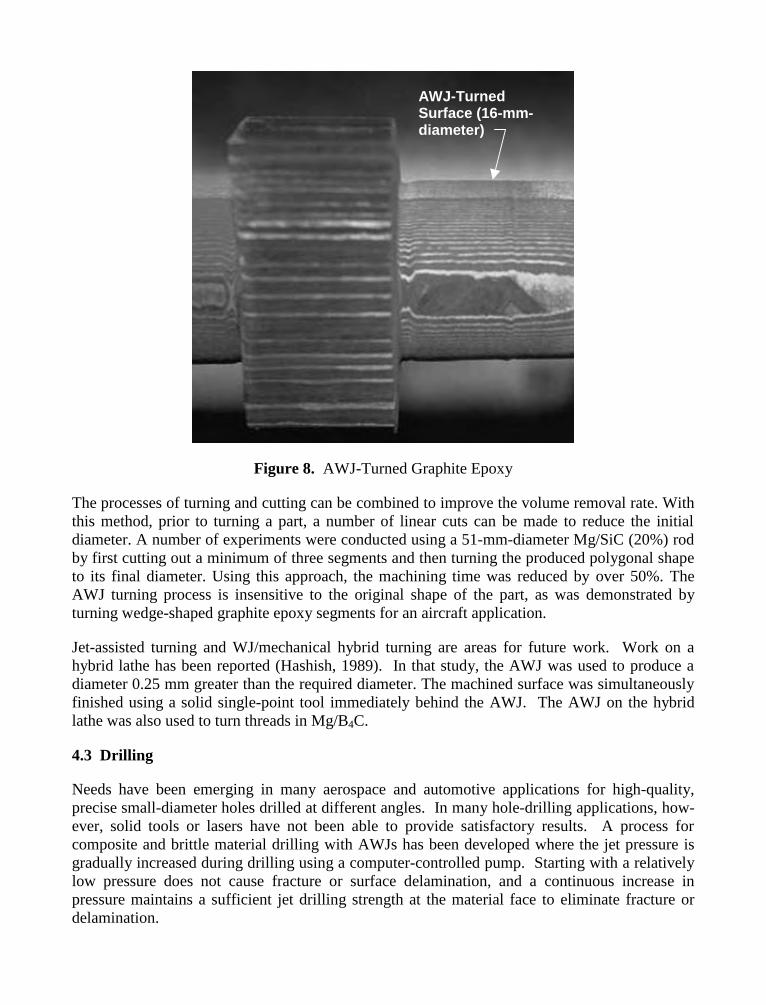
Figure 8. AWJ-Turned Graphite Epoxy
The processes of turning and cutting can be combined to improve the volume removal rate. Withthis method, prior to turning a part, a number of linear cuts can be made to reduce the initialdiameter. A number of experiments were conducted using a 51-mm-diameter Mg/SiC (20%) rodby first cutting out a minimum of three segments and then turning the produced polygonal shapeto its final diameter. Using this approach, the machining time was reduced by over 50%. TheAWJ turning process is insensitive to the original shape of the part, as was demonstrated byturning wedge-shaped graphite epoxy segments for an aircraft application.
Jet-assisted turning and WJ/mechanical hybrid turning are areas for future work. Work on ahybrid lathe has been reported (Hashish, 1989). In that study, the AWJ was used to produce adiameter 0.25 mm greater than the required diameter. The machined surface was simultaneouslyfinished using a solid single-point tool immediately behind the AWJ. The AWJ on the hybridlathe was also used to turn threads in Mg/B4C.
4.3 Drilling
Needs have been emerging in many aerospace and automotive applications for high-quality,precise small-diameter holes drilled at different angles. In many hole-drilling applications, how-ever, solid tools or lasers have not been able to provide satisfactory results. A process forcomposite and brittle material drilling with AWJs has been developed where the jet pressure isgradually increased during drilling using a computer-controlled pump. Starting with a relativelylow pressure does not cause fracture or surface delamination, and a continuous increase inpressure maintains a sufficient jet drilling strength at the material face to eliminate fracture ordelamination.
AWJ-TurnedSurface (16-mm-diameter)
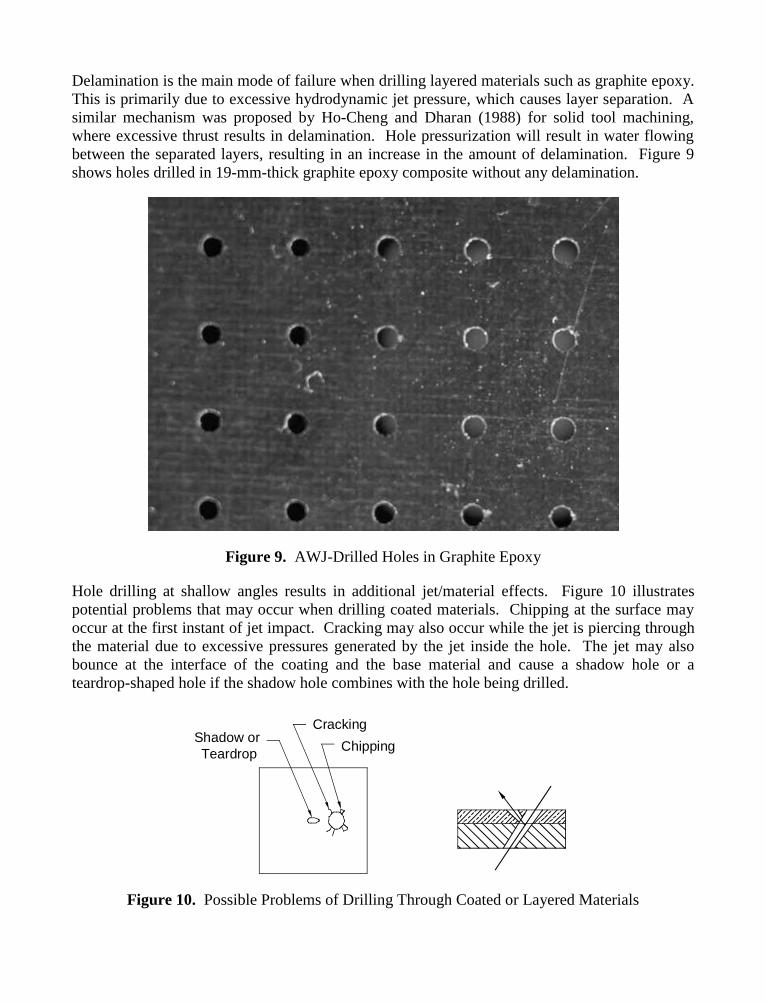
Delamination is the main mode of failure when drilling layered materials such as graphite epoxy.This is primarily due to excessive hydrodynamic jet pressure, which causes layer separation. Asimilar mechanism was proposed by Ho-Cheng and Dharan (1988) for solid tool machining,where excessive thrust results in delamination. Hole pressurization will result in water flowingbetween the separated layers, resulting in an increase in the amount of delamination. Figure 9shows holes drilled in 19-mm-thick graphite epoxy composite without any delamination.
Figure 9. AWJ-Drilled Holes in Graphite Epoxy
Hole drilling at shallow angles results in additional jet/material effects. Figure 10 illustratespotential problems that may occur when drilling coated materials. Chipping at the surface mayoccur at the first instant of jet impact. Cracking may also occur while the jet is piercing throughthe material due to excessive pressures generated by the jet inside the hole. The jet may alsobounce at the interface of the coating and the base material and cause a shadow hole or ateardrop-shaped hole if the shadow hole combines with the hole being drilled.
Shadow or Teardrop
Cracking
Chipping
Figure 10. Possible Problems of Drilling Through Coated or Layered Materials
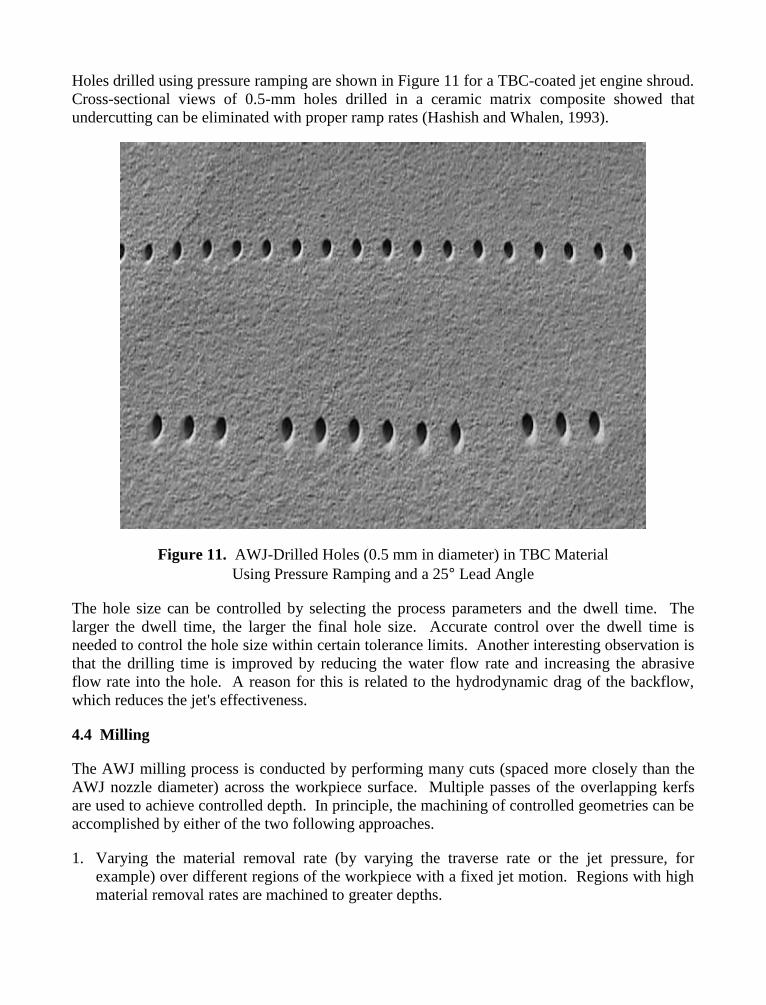
Holes drilled using pressure ramping are shown in Figure 11 for a TBC-coated jet engine shroud.Cross-sectional views of 0.5-mm holes drilled in a ceramic matrix composite showed thatundercutting can be eliminated with proper ramp rates (Hashish and Whalen, 1993).
Figure 11. AWJ-Drilled Holes (0.5 mm in diameter) in TBC MaterialUsing Pressure Ramping and a 25° Lead Angle
The hole size can be controlled by selecting the process parameters and the dwell time. Thelarger the dwell time, the larger the final hole size. Accurate control over the dwell time isneeded to control the hole size within certain tolerance limits. Another interesting observation isthat the drilling time is improved by reducing the water flow rate and increasing the abrasiveflow rate into the hole. A reason for this is related to the hydrodynamic drag of the backflow,which reduces the jet's effectiveness.
4.4 Milling
The AWJ milling process is conducted by performing many cuts (spaced more closely than theAWJ nozzle diameter) across the workpiece surface. Multiple passes of the overlapping kerfsare used to achieve controlled depth. In principle, the machining of controlled geometries can beaccomplished by either of the two following approaches.
1. Varying the material removal rate (by varying the traverse rate or the jet pressure, forexample) over different regions of the workpiece with a fixed jet motion. Regions with highmaterial removal rates are machined to greater depths.
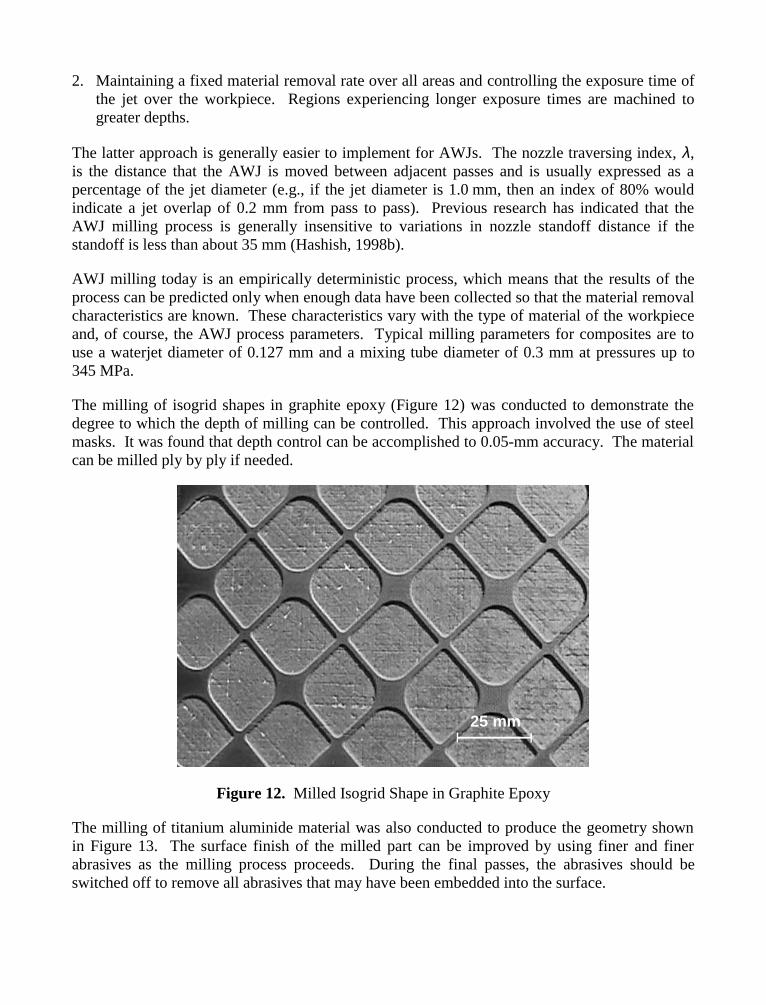
2. Maintaining a fixed material removal rate over all areas and controlling the exposure time ofthe jet over the workpiece. Regions experiencing longer exposure times are machined togreater depths.
The latter approach is generally easier to implement for AWJs. The nozzle traversing index, λ,is the distance that the AWJ is moved between adjacent passes and is usually expressed as apercentage of the jet diameter (e.g., if the jet diameter is 1.0 mm, then an index of 80% wouldindicate a jet overlap of 0.2 mm from pass to pass). Previous research has indicated that theAWJ milling process is generally insensitive to variations in nozzle standoff distance if thestandoff is less than about 35 mm (Hashish, 1998b).
AWJ milling today is an empirically deterministic process, which means that the results of theprocess can be predicted only when enough data have been collected so that the material removalcharacteristics are known. These characteristics vary with the type of material of the workpieceand, of course, the AWJ process parameters. Typical milling parameters for composites are touse a waterjet diameter of 0.127 mm and a mixing tube diameter of 0.3 mm at pressures up to345 MPa.
The milling of isogrid shapes in graphite epoxy (Figure 12) was conducted to demonstrate thedegree to which the depth of milling can be controlled. This approach involved the use of steelmasks. It was found that depth control can be accomplished to 0.05-mm accuracy. The materialcan be milled ply by ply if needed.
25 mm
Figure 12. Milled Isogrid Shape in Graphite Epoxy
The milling of titanium aluminide material was also conducted to produce the geometry shownin Figure 13. The surface finish of the milled part can be improved by using finer and finerabrasives as the milling process proceeds. During the final passes, the abrasives should beswitched off to remove all abrasives that may have been embedded into the surface.
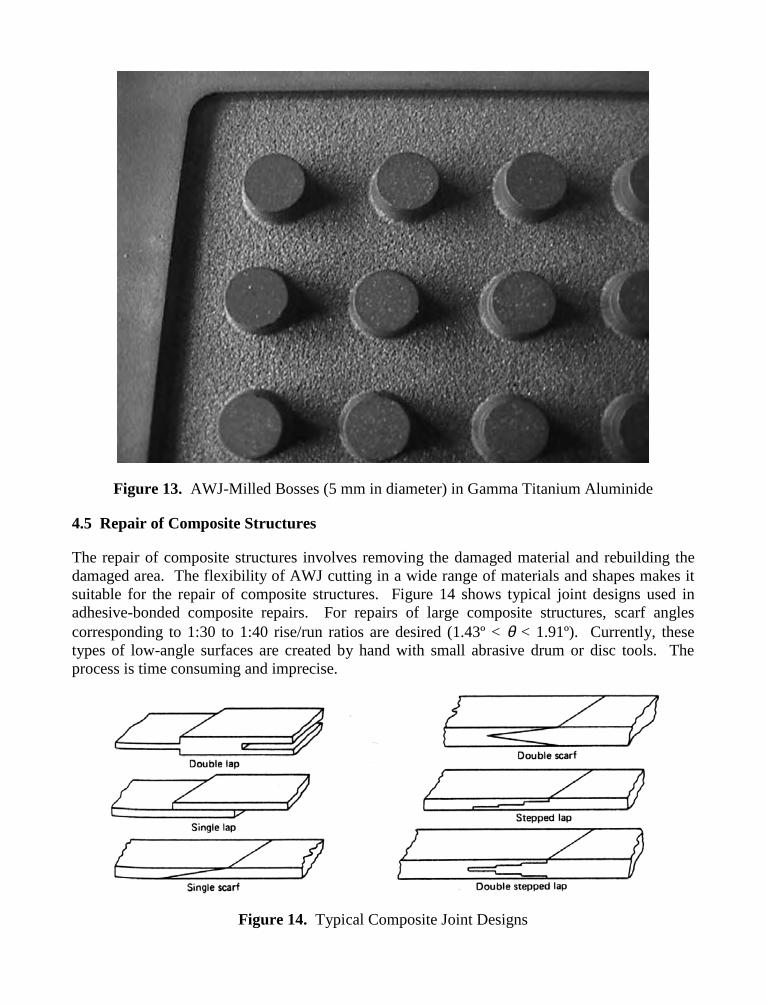
Figure 13. AWJ-Milled Bosses (5 mm in diameter) in Gamma Titanium Aluminide
4.5 Repair of Composite Structures
The repair of composite structures involves removing the damaged material and rebuilding thedamaged area. The flexibility of AWJ cutting in a wide range of materials and shapes makes itsuitable for the repair of composite structures. Figure 14 shows typical joint designs used inadhesive-bonded composite repairs. For repairs of large composite structures, scarf anglescorresponding to 1:30 to 1:40 rise/run ratios are desired (1.43º < θ < 1.91º). Currently, thesetypes of low-angle surfaces are created by hand with small abrasive drum or disc tools. Theprocess is time consuming and imprecise.
Figure 14. Typical Composite Joint Designs
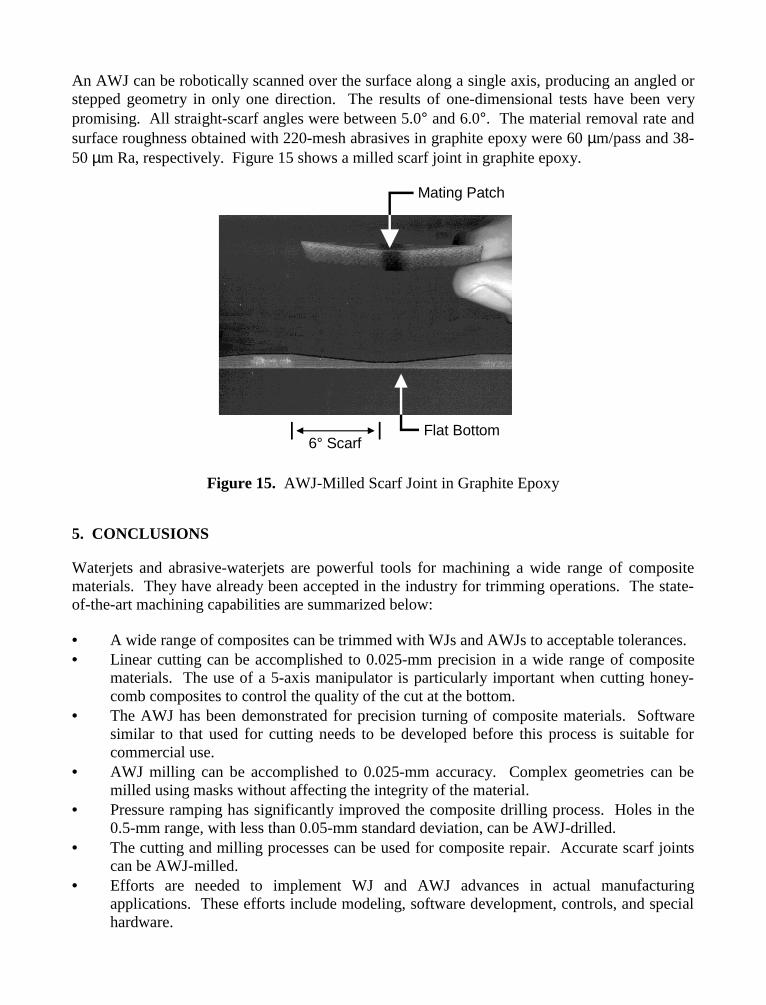
An AWJ can be robotically scanned over the surface along a single axis, producing an angled orstepped geometry in only one direction. The results of one-dimensional tests have been verypromising. All straight-scarf angles were between 5.0° and 6.0°. The material removal rate andsurface roughness obtained with 220-mesh abrasives in graphite epoxy were 60 µm/pass and 38-50 µm Ra, respectively. Figure 15 shows a milled scarf joint in graphite epoxy.
6° Scarf
Mating Patch
Flat Bottom
Figure 15. AWJ-Milled Scarf Joint in Graphite Epoxy
5. CONCLUSIONS
Waterjets and abrasive-waterjets are powerful tools for machining a wide range of compositematerials. They have already been accepted in the industry for trimming operations. The state-of-the-art machining capabilities are summarized below:
• A wide range of composites can be trimmed with WJs and AWJs to acceptable tolerances.• Linear cutting can be accomplished to 0.025-mm precision in a wide range of composite
materials. The use of a 5-axis manipulator is particularly important when cutting honey-comb composites to control the quality of the cut at the bottom.
• The AWJ has been demonstrated for precision turning of composite materials. Softwaresimilar to that used for cutting needs to be developed before this process is suitable forcommercial use.
• AWJ milling can be accomplished to 0.025-mm accuracy. Complex geometries can bemilled using masks without affecting the integrity of the material.
• Pressure ramping has significantly improved the composite drilling process. Holes in the0.5-mm range, with less than 0.05-mm standard deviation, can be AWJ-drilled.
• The cutting and milling processes can be used for composite repair. Accurate scarf jointscan be AWJ-milled.
• Efforts are needed to implement WJ and AWJ advances in actual manufacturingapplications. These efforts include modeling, software development, controls, and specialhardware.
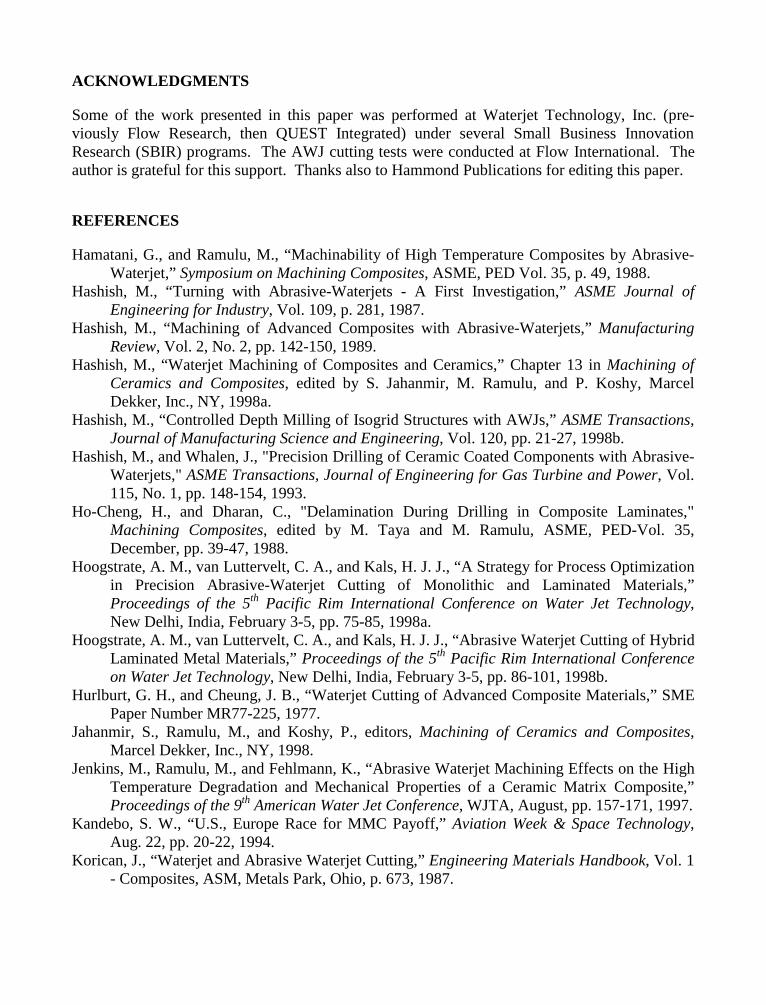
ACKNOWLEDGMENTS
Some of the work presented in this paper was performed at Waterjet Technology, Inc. (pre-viously Flow Research, then QUEST Integrated) under several Small Business InnovationResearch (SBIR) programs. The AWJ cutting tests were conducted at Flow International. Theauthor is grateful for this support. Thanks also to Hammond Publications for editing this paper.
REFERENCES
Hamatani, G., and Ramulu, M., “Machinability of High Temperature Composites by Abrasive-Waterjet,” Symposium on Machining Composites, ASME, PED Vol. 35, p. 49, 1988.
Hashish, M., “Turning with Abrasive-Waterjets - A First Investigation,” ASME Journal ofEngineering for Industry, Vol. 109, p. 281, 1987.
Hashish, M., “Machining of Advanced Composites with Abrasive-Waterjets,” ManufacturingReview, Vol. 2, No. 2, pp. 142-150, 1989.
Hashish, M., “Waterjet Machining of Composites and Ceramics,” Chapter 13 in Machining ofCeramics and Composites, edited by S. Jahanmir, M. Ramulu, and P. Koshy, MarcelDekker, Inc., NY, 1998a.
Hashish, M., “Controlled Depth Milling of Isogrid Structures with AWJs,” ASME Transactions,Journal of Manufacturing Science and Engineering, Vol. 120, pp. 21-27, 1998b.
Hashish, M., and Whalen, J., "Precision Drilling of Ceramic Coated Components with Abrasive-Waterjets," ASME Transactions, Journal of Engineering for Gas Turbine and Power, Vol.115, No. 1, pp. 148-154, 1993.
Ho-Cheng, H., and Dharan, C., "Delamination During Drilling in Composite Laminates,"Machining Composites, edited by M. Taya and M. Ramulu, ASME, PED-Vol. 35,December, pp. 39-47, 1988.
Hoogstrate, A. M., van Luttervelt, C. A., and Kals, H. J. J., “A Strategy for Process Optimizationin Precision Abrasive-Waterjet Cutting of Monolithic and Laminated Materials,”Proceedings of the 5th Pacific Rim International Conference on Water Jet Technology,New Delhi, India, February 3-5, pp. 75-85, 1998a.
Hoogstrate, A. M., van Luttervelt, C. A., and Kals, H. J. J., “Abrasive Waterjet Cutting of HybridLaminated Metal Materials,” Proceedings of the 5th Pacific Rim International Conferenceon Water Jet Technology, New Delhi, India, February 3-5, pp. 86-101, 1998b.
Hurlburt, G. H., and Cheung, J. B., “Waterjet Cutting of Advanced Composite Materials,” SMEPaper Number MR77-225, 1977.
Jahanmir, S., Ramulu, M., and Koshy, P., editors, Machining of Ceramics and Composites,Marcel Dekker, Inc., NY, 1998.
Jenkins, M., Ramulu, M., and Fehlmann, K., “Abrasive Waterjet Machining Effects on the HighTemperature Degradation and Mechanical Properties of a Ceramic Matrix Composite,”Proceedings of the 9th American Water Jet Conference, WJTA, August, pp. 157-171, 1997.
Kandebo, S. W., “U.S., Europe Race for MMC Payoff,” Aviation Week & Space Technology,Aug. 22, pp. 20-22, 1994.
Korican, J., “Waterjet and Abrasive Waterjet Cutting,” Engineering Materials Handbook, Vol. 1- Composites, ASM, Metals Park, Ohio, p. 673, 1987.
Lavander, C. A., and Smith, M. T., “Evaluation of Waterjet-Machined Metal Matrix CompositeTensile Specimens,” Report Number PNL-5858, Pacific Northwest Laboratory, Richland,WA, p.175, 1985.
Neusen, K. F., Rohatgi, P. K., Vaidyanathan, C., Alberts, D., “Abrasive Waterjet Cutting ofMetal Matrix Composites,” Proceedings of the 4th American Water Jet Conference,ASME, NY, pp. 175-181, 1987.
Ramulu, M., and Arola, D., “Abrasive-Waterjet Process Dependent Performance of PolymerComposites Under Static and Dynamic Loading,” Proceedings of the 9th American WaterJet Conference, WJTA, August, pp. 29-46, 1997.
Ramulu, M., and Taya, M., “An Investigation of the Machinability of High-TemperatureComposites,” Proceedings of the 12th Conference on Composite Materials and Structures,1988.
Schwartz, M. M., “Water Cuts Composite Aircraft Parts,” American Machines, Vol. 127, p. 103,1983.
Serafini, T., “High Temperature Applications,” in Engineered Materials Handbook, Vol. 1 -Composites, ASM International Handbook Committee, pp. 810-815, 1987.
10th American Waterjet ConferenceAugust 14-17, 1999: Houston, Texas
Paper 65
THE ABRASIVE WATERJET AS A PRECISION
METAL CUTTING TOOL
J. Zeng, J. Olsen, and C. OlsenOMAX Corporation
Auburn, Washington, U.S.A.
ABSTRACT
This article will provide a general description of the abrasive waterjet technology and anillustration of the concept of using it as a precision metal cutting tool. It will address theoperating principles, equipment and control, physical parameters of the process, metal removalrate, dimensional control, corner radii, taper, surface finish, possible surface damage, as well ashealth, safety, and environmental issues. Some examples of applications will be given. Itsadvantages and limitations, compared to other traditional and non-traditional machiningmethods, will be discussed.
Organized and Sponsored by the WaterJet Technology Association
1. INTRODUCTION
The idea of cutting with water could be as old as the Chinese phrase “dripping water penetratesrock”. In the modern waterjet technology, the “dripping water” is replaced by a high velocitywater stream, which penetrates rock in seconds. The modern waterjet technology was initiated byDr. Norman C. Franz in 1968, with the first patent for high-pressure waterjet cutting. The firstcommercial waterjet cutting system was built to cut laminated paper tubes in 1971. Since then,waterjet technology has experienced a steady growth. Advances in the automobile industry,material science, and space technology in 70’s and 80’s demanded and stimulated the outgrowthof new ideas and novel technologies in manufacturing. In the early 80’s, the idea of entrainingabrasive into waterjet was promoted by Hashish (1982) and commercial abrasive waterjet(“AWJ”) systems became available.
Due to the crudeness and unreliability of the early stage nozzle, abrasive waterjet was thought tobe a very imprecise process. It was tried only when other technologies could not handle the job.Early abrasive waterjet machines were made by simply hanging an abrasive waterjet nozzle on acrude X-Y table such as used for oxy-acetylene torch cutting. The controls were either opticaltracers which followed a line drawn on paper or crude versions of the CNC controllers used tocontrol machine tools. As nozzle technology improved it became apparent that greater precisioncould be obtained by moving the nozzle more precisely. More precise tables were introduced thatwere controlled by the same CNC controllers used in precision machine tools. Thanks to thepioneering materials development work of Boride Products Inc., we now have nozzles that keeptheir cutting properties constant over many hours of operation. In 1992 Zeng et al. published acomprehensive semi-empirical model of the abrasive waterjet cutting process. Olsen (1996)described how to incorporate this model into a PC based machine tool controller. With this typeof control, the user simply enters the material type, thickness and desired cutting quality. Thecomputer takes care of the rest. The precision and user-friendliness achieved through betternozzle and control technology has changed people’s perspectives about this technology. Modernmachine shops now use abrasive waterjet machines side by side with other traditional or non-traditional machine tools to cut 2D parts out of all kinds of materials and profit from the usebecause of their productivity, quick turn-around time, and relative low cost.
The purpose of this article is to provide a technology overview to the existing waterjetcommunity as well as potential users within the entire manufacturing community. The authorsbelieve that better understanding and better communication will promote awareness and furthergrowth of this technology.
2. OPERATING PRINCIPLES
An abrasive waterjet is formed by entraining abrasive particles into a high velocity water stream.The essence of abrasive waterjet machining is rapid erosion combined with rapid cooling. Inmost cases, water does not participate in material removal. It serves as an energy carrier as wellas a flushing medium. Bulk material removal is the result of accumulated micro-cutting effectsof individual abrasive particles as in conventional grinding. The individual abrasive particle
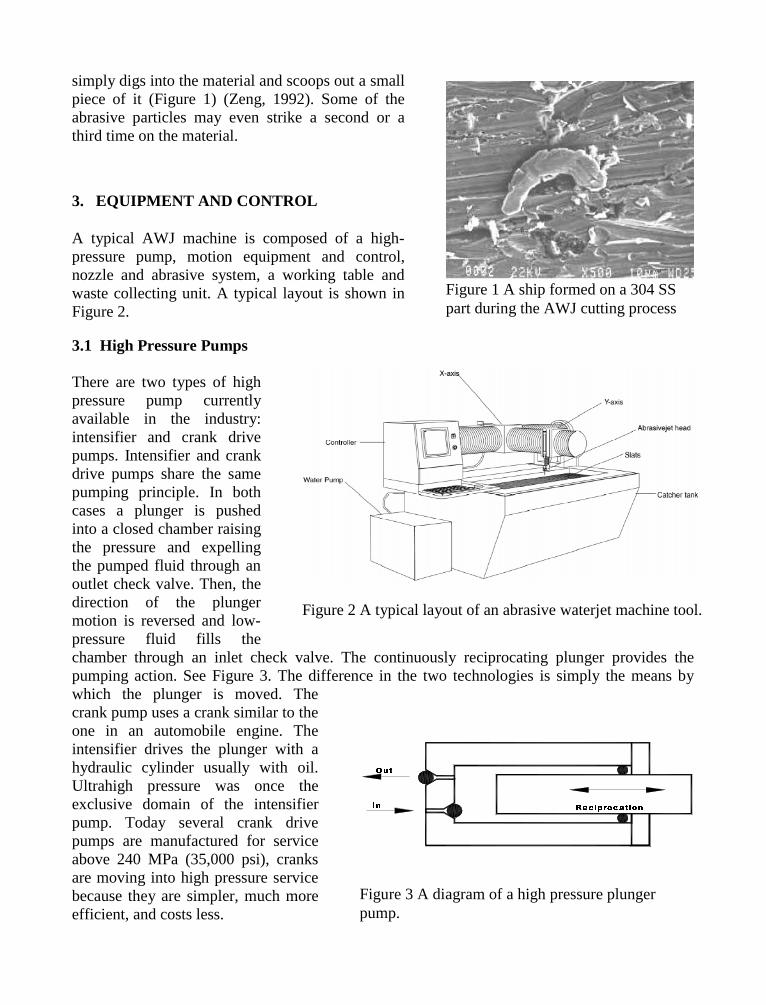
simply digs into the material and scoops out a smallpiece of it (Figure 1) (Zeng, 1992). Some of theabrasive particles may even strike a second or athird time on the material.
3. EQUIPMENT AND CONTROL
A typical AWJ machine is composed of a high-pressure pump, motion equipment and control,nozzle and abrasive system, a working table andwaste collecting unit. A typical layout is shown inFigure 2.
3.1 High Pressure Pumps
There are two types of highpressure pump currentlyavailable in the industry:intensifier and crank drivepumps. Intensifier and crankdrive pumps share the samepumping principle. In bothcases a plunger is pushedinto a closed chamber raisingthe pressure and expellingthe pumped fluid through anoutlet check valve. Then, thedirection of the plungermotion is reversed and low-pressure fluid fills thechamber through an inlet check valve. The continuously reciprocating plunger provides thepumping action. See Figure 3. The difference in the two technologies is simply the means bywhich the plunger is moved. Thecrank pump uses a crank similar to theone in an automobile engine. Theintensifier drives the plunger with ahydraulic cylinder usually with oil.Ultrahigh pressure was once theexclusive domain of the intensifierpump. Today several crank drivepumps are manufactured for serviceabove 240 MPa (35,000 psi), cranksare moving into high pressure servicebecause they are simpler, much moreefficient, and costs less.
Figure 1 A ship formed on a 304 SSpart during the AWJ cutting process
Figure 2 A typical layout of an abrasive waterjet machine tool.
5HFLSURFDWLRQ
2XW
,Q
Figure 3 A diagram of a high pressure plungerpump.
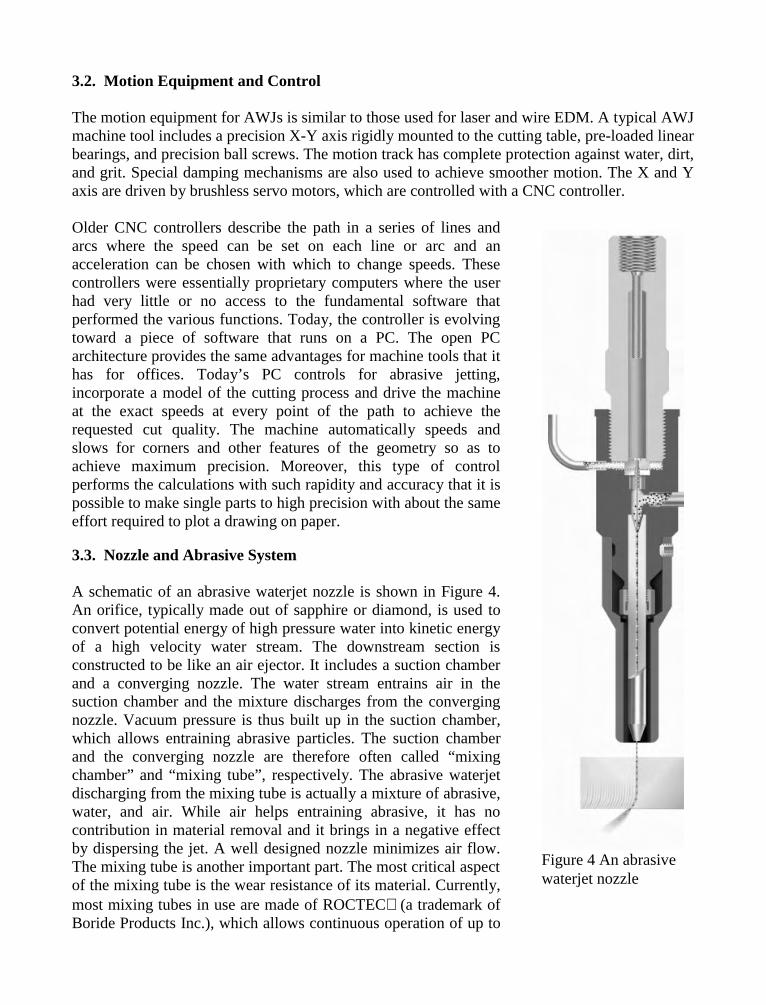
3.2. Motion Equipment and Control
The motion equipment for AWJs is similar to those used for laser and wire EDM. A typical AWJmachine tool includes a precision X-Y axis rigidly mounted to the cutting table, pre-loaded linearbearings, and precision ball screws. The motion track has complete protection against water, dirt,and grit. Special damping mechanisms are also used to achieve smoother motion. The X and Yaxis are driven by brushless servo motors, which are controlled with a CNC controller.
Older CNC controllers describe the path in a series of lines andarcs where the speed can be set on each line or arc and anacceleration can be chosen with which to change speeds. Thesecontrollers were essentially proprietary computers where the userhad very little or no access to the fundamental software thatperformed the various functions. Today, the controller is evolvingtoward a piece of software that runs on a PC. The open PCarchitecture provides the same advantages for machine tools that ithas for offices. Today’s PC controls for abrasive jetting,incorporate a model of the cutting process and drive the machineat the exact speeds at every point of the path to achieve therequested cut quality. The machine automatically speeds andslows for corners and other features of the geometry so as toachieve maximum precision. Moreover, this type of controlperforms the calculations with such rapidity and accuracy that it ispossible to make single parts to high precision with about the sameeffort required to plot a drawing on paper.
3.3. Nozzle and Abrasive System
A schematic of an abrasive waterjet nozzle is shown in Figure 4.An orifice, typically made out of sapphire or diamond, is used toconvert potential energy of high pressure water into kinetic energyof a high velocity water stream. The downstream section isconstructed to be like an air ejector. It includes a suction chamberand a converging nozzle. The water stream entrains air in thesuction chamber and the mixture discharges from the convergingnozzle. Vacuum pressure is thus built up in the suction chamber,which allows entraining abrasive particles. The suction chamberand the converging nozzle are therefore often called “mixingchamber” and “mixing tube”, respectively. The abrasive waterjetdischarging from the mixing tube is actually a mixture of abrasive,water, and air. While air helps entraining abrasive, it has nocontribution in material removal and it brings in a negative effectby dispersing the jet. A well designed nozzle minimizes air flow.The mixing tube is another important part. The most critical aspectof the mixing tube is the wear resistance of its material. Currently,most mixing tubes in use are made of ROCTEC(a trademark ofBoride Products Inc.), which allows continuous operation of up to
Figure 4 An abrasivewaterjet nozzle
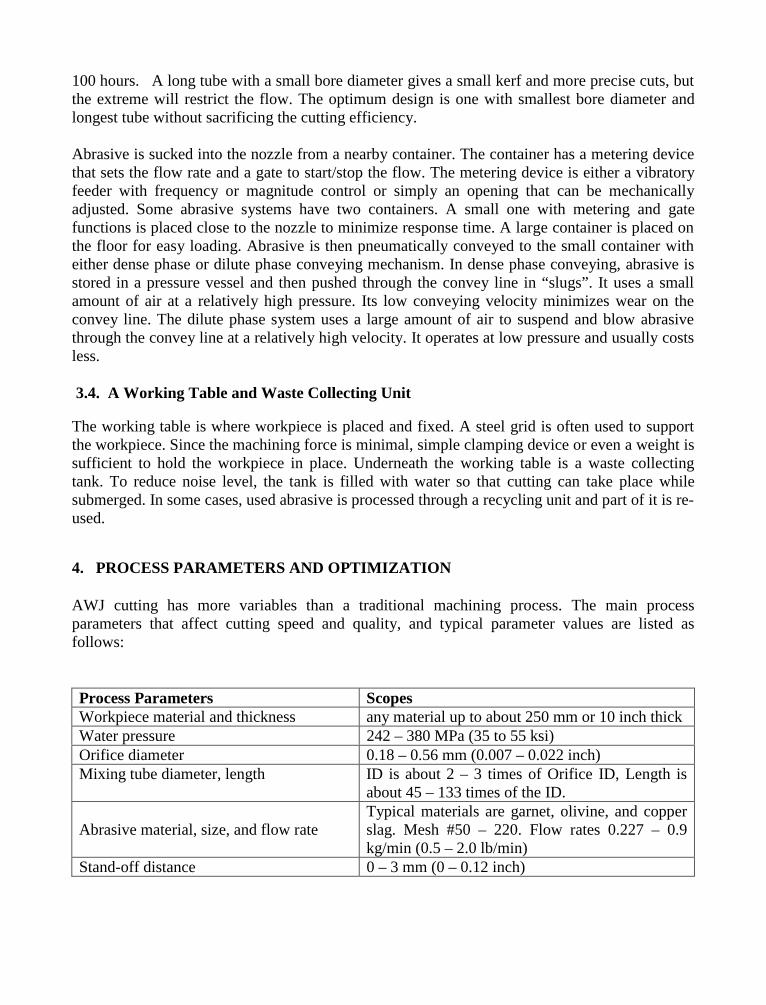
100 hours. A long tube with a small bore diameter gives a small kerf and more precise cuts, butthe extreme will restrict the flow. The optimum design is one with smallest bore diameter andlongest tube without sacrificing the cutting efficiency.
Abrasive is sucked into the nozzle from a nearby container. The container has a metering devicethat sets the flow rate and a gate to start/stop the flow. The metering device is either a vibratoryfeeder with frequency or magnitude control or simply an opening that can be mechanicallyadjusted. Some abrasive systems have two containers. A small one with metering and gatefunctions is placed close to the nozzle to minimize response time. A large container is placed onthe floor for easy loading. Abrasive is then pneumatically conveyed to the small container witheither dense phase or dilute phase conveying mechanism. In dense phase conveying, abrasive isstored in a pressure vessel and then pushed through the convey line in “slugs”. It uses a smallamount of air at a relatively high pressure. Its low conveying velocity minimizes wear on theconvey line. The dilute phase system uses a large amount of air to suspend and blow abrasivethrough the convey line at a relatively high velocity. It operates at low pressure and usually costsless.
3.4. A Working Table and Waste Collecting Unit
The working table is where workpiece is placed and fixed. A steel grid is often used to supportthe workpiece. Since the machining force is minimal, simple clamping device or even a weight issufficient to hold the workpiece in place. Underneath the working table is a waste collectingtank. To reduce noise level, the tank is filled with water so that cutting can take place whilesubmerged. In some cases, used abrasive is processed through a recycling unit and part of it is re-used.
4. PROCESS PARAMETERS AND OPTIMIZATION
AWJ cutting has more variables than a traditional machining process. The main processparameters that affect cutting speed and quality, and typical parameter values are listed asfollows:
Process Parameters ScopesWorkpiece material and thickness any material up to about 250 mm or 10 inch thickWater pressure 242 – 380 MPa (35 to 55 ksi)Orifice diameter 0.18 – 0.56 mm (0.007 – 0.022 inch)Mixing tube diameter, length ID is about 2 – 3 times of Orifice ID, Length is
about 45 – 133 times of the ID.
Abrasive material, size, and flow rateTypical materials are garnet, olivine, and copperslag. Mesh #50 – 220. Flow rates 0.227 – 0.9kg/min (0.5 – 2.0 lb/min)
Stand-off distance 0 – 3 mm (0 – 0.12 inch)
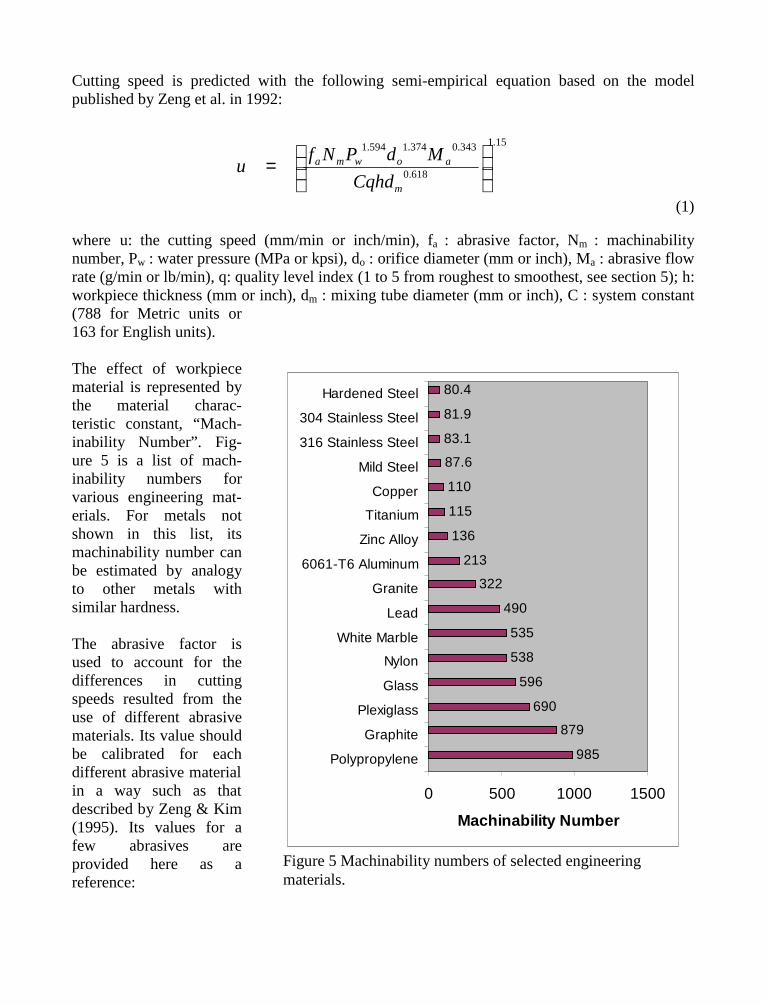
Cutting speed is predicted with the following semi-empirical equation based on the modelpublished by Zeng et al. in 1992:
(1)
where u: the cutting speed (mm/min or inch/min), fa : abrasive factor, Nm : machinabilitynumber, Pw : water pressure (MPa or kpsi), do : orifice diameter (mm or inch), Ma : abrasive flowrate (g/min or lb/min), q: quality level index (1 to 5 from roughest to smoothest, see section 5); h:workpiece thickness (mm or inch), dm : mixing tube diameter (mm or inch), C : system constant(788 for Metric units or163 for English units).
The effect of workpiecematerial is represented bythe material charac-teristic constant, “Mach-inability Number”. Fig-ure 5 is a list of mach-inability numbers forvarious engineering mat-erials. For metals notshown in this list, itsmachinability number canbe estimated by analogyto other metals withsimilar hardness.
The abrasive factor isused to account for thedifferences in cuttingspeeds resulted from theuse of different abrasivematerials. Its value shouldbe calibrated for eachdifferent abrasive materialin a way such as thatdescribed by Zeng & Kim(1995). Its values for afew abrasives areprovided here as areference:
15.1
618.0
343.0374.1594.1
=
m
aowma
Cqhd
MdPNfu
985
879
690
596
538
535
490
322
213
136
115
110
87.6
83.1
81.9
80.4
0 500 1000 1500
Polypropylene
Graphite
Plexiglass
Glass
Nylon
White Marble
Lead
Granite
6061-T6 Aluminum
Zinc Alloy
Titanium
Copper
Mild Steel
316 Stainless Steel
304 Stainless Steel
Hardened Steel
Machinability Number
Figure 5 Machinability numbers of selected engineeringmaterials.
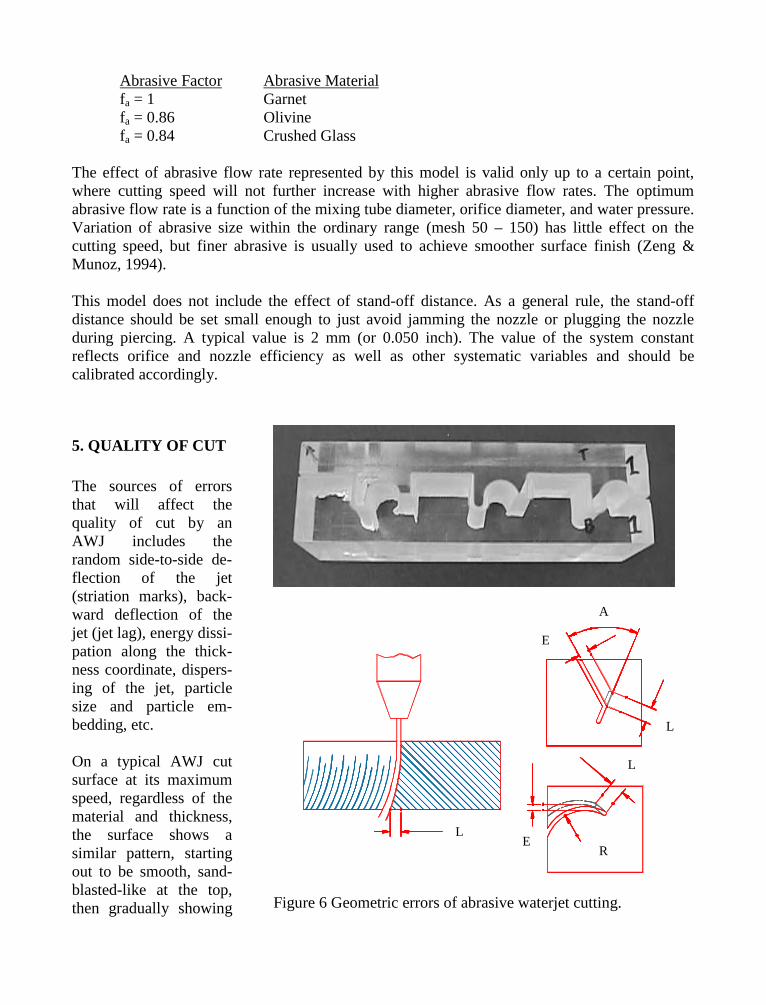
Abrasive Factor Abrasive Materialfa = 1 Garnetfa = 0.86 Olivinefa = 0.84 Crushed Glass
The effect of abrasive flow rate represented by this model is valid only up to a certain point,where cutting speed will not further increase with higher abrasive flow rates. The optimumabrasive flow rate is a function of the mixing tube diameter, orifice diameter, and water pressure.Variation of abrasive size within the ordinary range (mesh 50 – 150) has little effect on thecutting speed, but finer abrasive is usually used to achieve smoother surface finish (Zeng &Munoz, 1994).
This model does not include the effect of stand-off distance. As a general rule, the stand-offdistance should be set small enough to just avoid jamming the nozzle or plugging the nozzleduring piercing. A typical value is 2 mm (or 0.050 inch). The value of the system constantreflects orifice and nozzle efficiency as well as other systematic variables and should becalibrated accordingly.
5. QUALITY OF CUT
The sources of errorsthat will affect thequality of cut by anAWJ includes therandom side-to-side de-flection of the jet(striation marks), back-ward deflection of thejet (jet lag), energy dissi-pation along the thick-ness coordinate, dispers-ing of the jet, particlesize and particle em-bedding, etc.
On a typical AWJ cutsurface at its maximumspeed, regardless of thematerial and thickness,the surface shows asimilar pattern, startingout to be smooth, sand-blasted-like at the top,then gradually showing Figure 6 Geometric errors of abrasive waterjet cutting.
LE
R
L
L
E
A
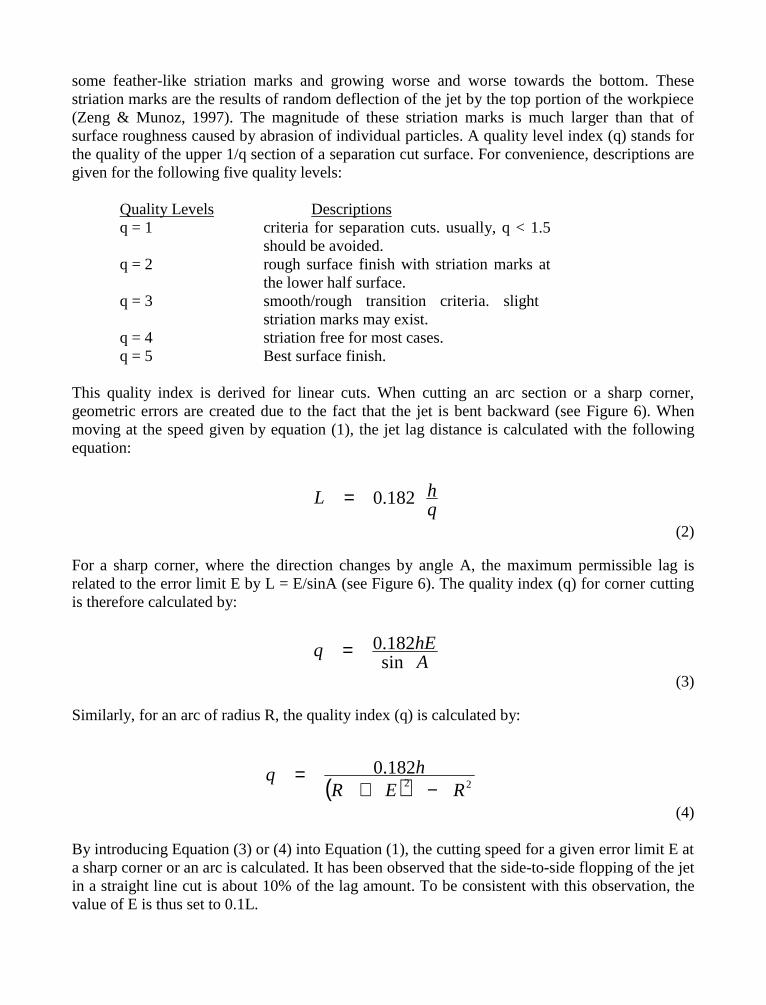
some feather-like striation marks and growing worse and worse towards the bottom. Thesestriation marks are the results of random deflection of the jet by the top portion of the workpiece(Zeng & Munoz, 1997). The magnitude of these striation marks is much larger than that ofsurface roughness caused by abrasion of individual particles. A quality level index (q) stands forthe quality of the upper 1/q section of a separation cut surface. For convenience, descriptions aregiven for the following five quality levels:
Quality Levels Descriptionsq = 1 criteria for separation cuts. usually, q < 1.5
should be avoided.q = 2 rough surface finish with striation marks at
the lower half surface.q = 3 smooth/rough transition criteria. slight
striation marks may exist.q = 4 striation free for most cases.q = 5 Best surface finish.
This quality index is derived for linear cuts. When cutting an arc section or a sharp corner,geometric errors are created due to the fact that the jet is bent backward (see Figure 6). Whenmoving at the speed given by equation (1), the jet lag distance is calculated with the followingequation:
(2)
For a sharp corner, where the direction changes by angle A, the maximum permissible lag isrelated to the error limit E by L = E/sinA (see Figure 6). The quality index (q) for corner cuttingis therefore calculated by:
(3)
Similarly, for an arc of radius R, the quality index (q) is calculated by:
(4)
By introducing Equation (3) or (4) into Equation (1), the cutting speed for a given error limit E ata sharp corner or an arc is calculated. It has been observed that the side-to-side flopping of the jetin a straight line cut is about 10% of the lag amount. To be consistent with this observation, thevalue of E is thus set to 0.1L.
qhL 182.0=
AhEq
sin182.0=
( ) 22182.0
RERhq
−+=
Even when speed limits based on desired quality are not exceeded, a large acceleration towardsthis speed limit will cause undesirable marks on the part. The spacial acceleration is related tovariation of the lag by:
(5)
By setting a limit to the rate of change of lag length with distance along the curve, dL/ds, themaximum spacial acceleration is determined. A typical value of dL/ds limit is 0.1.
By adjusting the cutting speed constantly, e.g., slowing down when approaching a sharp corneror a small arc, these geometry errors can be minimized. Implementation of this scheme is donewith the latest sophisticated controller and software.
Taper of the kerf is controlled by two opposite trends. The jet loses energy as it cuts deeper intothe workpiece and thus tends to form a “V”-shaped kerf. On the other hand, the natural shape ofthe jet is diverging, which tends to form a kerf of opposite shape. The actual kerf shape dependson the jet coherency and material hardness as well as thickness. The taper of the kerf isminimized by controlling (usually reducing) the cutting speed to balance these two trends.Sometimes, stand-off distance and mixing tube diameter are also used as controlling factors. Indie cutting application, taper becomes desirable and is achieved with the same methods.
Cutting of ductile materials tends to leave some small burrs at the bottom of kerf (Groppetti et al.1998). They are either caused by the shearing action of the jet when the remaining material isthin enough or by the chip forming action of individual abrasive particles. Burr is moresignificant on soft materials and less significant when low cutting speeds and fine abrasiveparticles are used.
Dispersing of the jet forms a radius and a frosting band on top of kerf (Groppetti et al. 1998).This radius tends to increase as the cutting speed decreases. It is controlled by any methods thatreduces the dispersing of the jet, including reducing stand-off distance, reducing air in-take, andimproving jet coherency with better orifice design and better alignment.
According to the study by Groppetti et al. (1998), the kerf surface is hardened by the AWJcutting process by up to 60% of the base material hardness. In AWJ cutting of soft materials suchas aluminum, particle embedding is occasionally found on the cut. A cleaning pass of the jetwithout abrasive is recommended if particle embedding becomes a concern.
6. HEALTH, SAFETY, AND ENVIRONMENTAL ISSUES
An exposed abrasive waterjet can generate a hazardous noise level (80-95 decibels) (Mason,1996). Hearing protection is required. Latest AWJ machine tools do most machining under
dsdL
huq
dsdu 32.6=
water, which reduces the noise to a pleasant level (under 75 decibels). Today’s machines areplaced right out on the shop floor rather than in the sound proof rooms of yesterday.
Silicosis of the lungs is another concern. Cutting with abrasives containing a large amount offree silica is discouraged. According to Martinec & Skoda (1998), the use of garnet is a saferchoice compared to quartz and other silicates. Machining under water also reduces airborne dustand splash, providing a safer and more comfortable working environment.
Water under pressure is only marginally compressible. In the case of breaking high-pressuretubing and other components, the pressure would quickly drop to a safe level. However,mechanical danger of high-pressure components does exist. The danger usually comes from badwork habits and designs. Maintenance under pressure should always be avoided. Eye protectionshould always be used when working around high-pressure equipment. High-pressurecomponents are designed with “weep holes” so that they will fail in a manner that causes them toleak in a safe manner. Special attention for safety is given to those systems equipped with high-pressure accumulators, which are used to even out pressure fluctuations. Although moderndesigns are quite safe, some accidents have occurred in the past. Pressure relief prior tocatastrophic failure should be a standard feature for such accumulators.
Of course, the jet being a cutting tool, can cut virtually anything including human parts. Due tothe high pressures used in abrasive waterjet machining, there is often a misconception that it isdangerous. An understanding of the process, however, reveals that this is not the case. It is nomore dangerous than any other machining process. Since the jet exposure is minimized to nearlyzero, it is even safer than a band saw.
The primary concern with environmental issues is what to do with the wastewater and solids.Secondary to that, but also of critical importance, is the water that goes into the system for bothcutting and cooling.
Modern pumps recycle cooling water. This provides for lower consumption, and less wastewatergenerated. The wastewater from cutting is usually around or less than 3.8 lpm (1 gpm), typicallytreated as gray water sewage, and dumped directly into the sewer. Alternately, it can be filteredand recycled in areas where water is scarce, or regulations are particularly strict. The quality ofwater entering the system is critical because it effects the life of high-pressure components.Dissolved solids in the water can accumulate on parts, such as the jewel, and reduceeffectiveness, and increase wear. Either fresh water or recycled water should be processed toremove dissolved or undissolved solids to an allowable level. Cost of doing so is currently themain factor that prevents standardization of recycling wastewater from cutting.
The solids generated (spent garnet and metal) can be used as landfill, unless there are high levelsof toxic metals left over from machining hazardous materials such as lead. Used abrasive can berecycled to save operating costs without sacrificing cutting efficiency and quality (Knaupp &Ohlsen, 1994). Abrasive recycling is getting more and more attention from the industry.
7. ADVANTAGES, LIMITATIONS AND APPLICATIONS
Abrasive jets are now being accepted as machine shop tools and are being integrated into theoverall production of parts in both job shops and production shops. Users have found strongfinancial incentives for their use.
Writing shop routes that include the use of AWJs requires a basic understanding of thecharacteristics of AWJ machining. The easiest way to understand what can be done with abrasivejets is to imagine what could be done with a very stiff strong 0.76 mm (.030”) diameter end mill50 mm (2”) long that can drill its own hole. The jet can be used for any type of profiling bothexternal and internal. Some traditional operations that are often replaced with abrasive jetmachining include: drilling, broaching, gear cutting, profile milling, blanking, punching, slotting,slitting, sawing, extrusion (for short pieces), and wire EDM (but lower precision).
Finished part tolerances to +/- 0.13 mm (0.005”) can be held in materials up to 50 mm (2”) thickwith tighter tolerances in thinner parts. A slight taper or even barrel shape may occur on themachined surface and this is the main error that causes the +/- 0.013 mm (0.005”) limit. Surfacefinish has a sandblasted appearance and second operations are required to produce a polishedsurface.
Material properties do not have a large effect on the process other than influencing the speed norare they degraded by the machining process. Insulating and highly reflective materials, whichraise problems for EDM and laser, machine well. No problems are encountered if the materialhas a layer of mill scale. Sandwiches of various materials and stacks of the same materialmachine well. There is no heat-affected zone or hard layer on the cut surface. Difficult tomachine materials such as Titanium, Inconel, hardened steel and even glass are easily machinedby the jet. Heat-treated parts with thin sections often distort during heat treat causing scrap. TheAWJ machining rates are not affected by the heat treatment, so the raw material can be hardened,the parts machined and then followed by a final grind if necessary. Precision hardened spurgears, blanking dies and a variety of other hardened parts can be produced in this manner.
Very thin (0.25 mm and less) parts may have a rolled edge, but in general very little burr isproduced. At the other extreme roughing thick parts to save conventional machining time ormaterial is often done even in up to 150 mm (6”) thickness.
The jet deflects if a grazing cut is attempted producing a very high taper. For high precision atleast 1.5 mm (.060”) should be removed from the surface. Machining the entire part from a plateis the most common operation and multiple parts can be nested to fully use the stock. The scrapthat is produced is in valuable chunks rather than oily chips. Odd shaped holes, slots andprofiling can be done as a second operation on parts started on a lathe or mill.
One of the very most important features is both obvious and overlooked. All machining is donewith a single tool. Any flat part from a spur gear to a plate with square holes to a complex artisticshape can be made without tool changing or qualifying a second tool. Setup requires only placingthe stock and setting the tool tip at the top surface. Very short runs or even a single piece areeconomical. In fact, abrasive jet machining is probably the lowest cost method for making anysingle flat part.
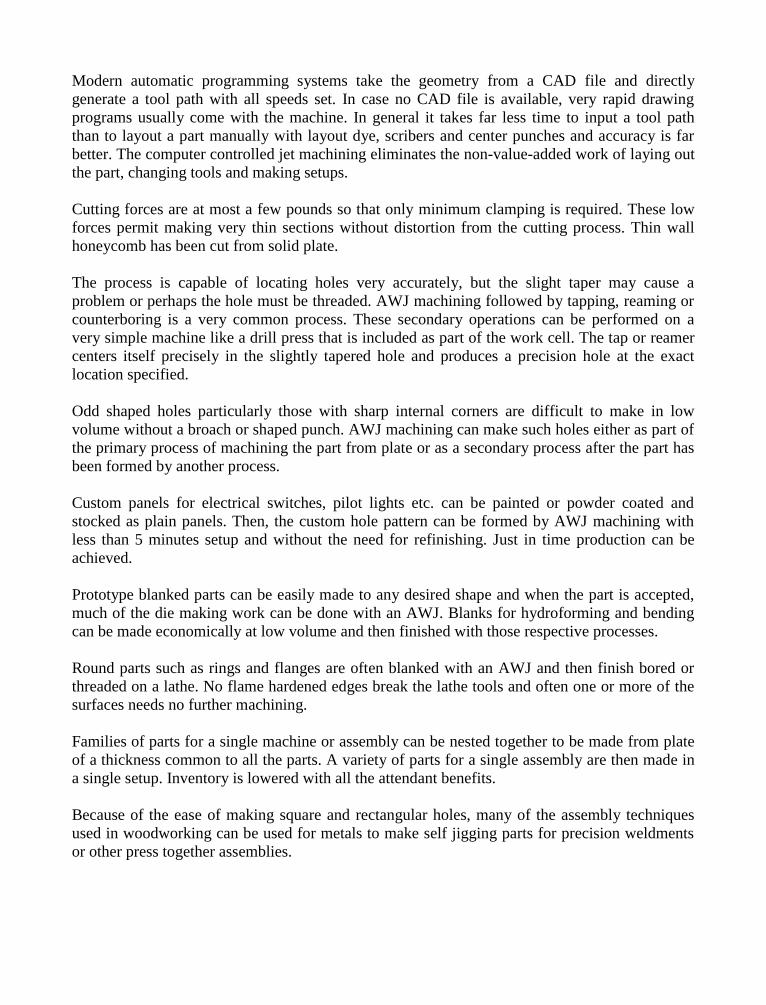
Modern automatic programming systems take the geometry from a CAD file and directlygenerate a tool path with all speeds set. In case no CAD file is available, very rapid drawingprograms usually come with the machine. In general it takes far less time to input a tool paththan to layout a part manually with layout dye, scribers and center punches and accuracy is farbetter. The computer controlled jet machining eliminates the non-value-added work of laying outthe part, changing tools and making setups.
Cutting forces are at most a few pounds so that only minimum clamping is required. These lowforces permit making very thin sections without distortion from the cutting process. Thin wallhoneycomb has been cut from solid plate.
The process is capable of locating holes very accurately, but the slight taper may cause aproblem or perhaps the hole must be threaded. AWJ machining followed by tapping, reaming orcounterboring is a very common process. These secondary operations can be performed on avery simple machine like a drill press that is included as part of the work cell. The tap or reamercenters itself precisely in the slightly tapered hole and produces a precision hole at the exactlocation specified.
Odd shaped holes particularly those with sharp internal corners are difficult to make in lowvolume without a broach or shaped punch. AWJ machining can make such holes either as part ofthe primary process of machining the part from plate or as a secondary process after the part hasbeen formed by another process.
Custom panels for electrical switches, pilot lights etc. can be painted or powder coated andstocked as plain panels. Then, the custom hole pattern can be formed by AWJ machining withless than 5 minutes setup and without the need for refinishing. Just in time production can beachieved.
Prototype blanked parts can be easily made to any desired shape and when the part is accepted,much of the die making work can be done with an AWJ. Blanks for hydroforming and bendingcan be made economically at low volume and then finished with those respective processes.
Round parts such as rings and flanges are often blanked with an AWJ and then finish bored orthreaded on a lathe. No flame hardened edges break the lathe tools and often one or more of thesurfaces needs no further machining.
Families of parts for a single machine or assembly can be nested together to be made from plateof a thickness common to all the parts. A variety of parts for a single assembly are then made ina single setup. Inventory is lowered with all the attendant benefits.
Because of the ease of making square and rectangular holes, many of the assembly techniquesused in woodworking can be used for metals to make self jigging parts for precision weldmentsor other press together assemblies.
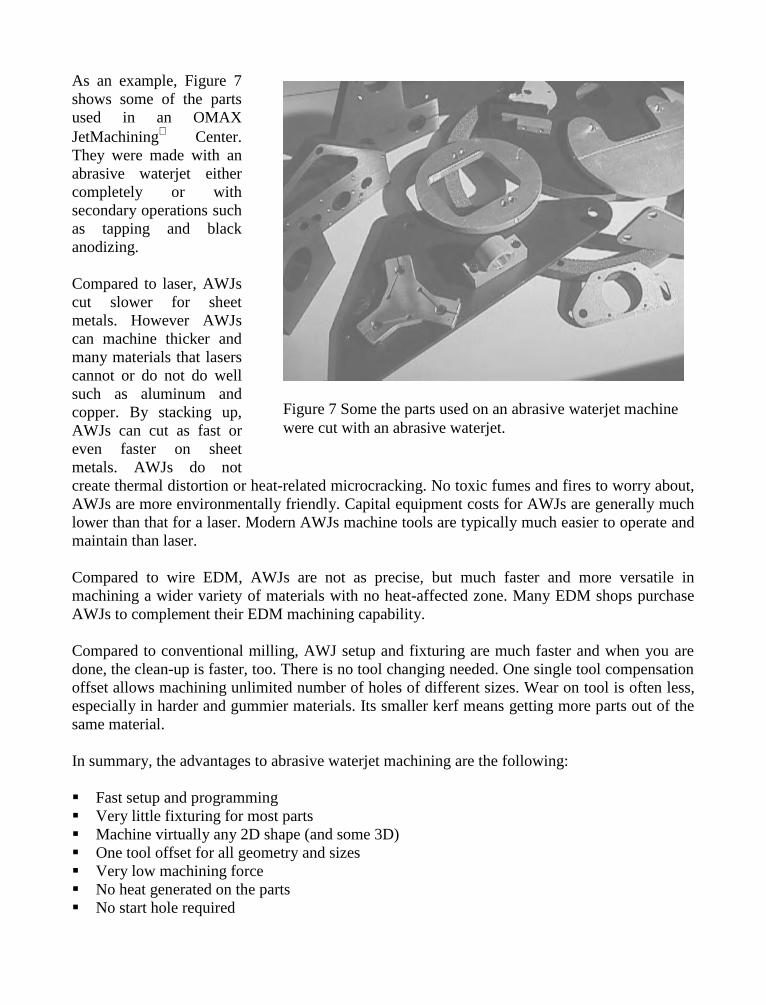
As an example, Figure 7shows some of the partsused in an OMAXJetMachining Center.They were made with anabrasive waterjet eithercompletely or withsecondary operations suchas tapping and blackanodizing.
Compared to laser, AWJscut slower for sheetmetals. However AWJscan machine thicker andmany materials that laserscannot or do not do wellsuch as aluminum andcopper. By stacking up,AWJs can cut as fast oreven faster on sheetmetals. AWJs do notcreate thermal distortion or heat-related microcracking. No toxic fumes and fires to worry about,AWJs are more environmentally friendly. Capital equipment costs for AWJs are generally muchlower than that for a laser. Modern AWJs machine tools are typically much easier to operate andmaintain than laser.
Compared to wire EDM, AWJs are not as precise, but much faster and more versatile inmachining a wider variety of materials with no heat-affected zone. Many EDM shops purchaseAWJs to complement their EDM machining capability.
Compared to conventional milling, AWJ setup and fixturing are much faster and when you aredone, the clean-up is faster, too. There is no tool changing needed. One single tool compensationoffset allows machining unlimited number of holes of different sizes. Wear on tool is often less,especially in harder and gummier materials. Its smaller kerf means getting more parts out of thesame material.
In summary, the advantages to abrasive waterjet machining are the following:
Fast setup and programming Very little fixturing for most parts Machine virtually any 2D shape (and some 3D) One tool offset for all geometry and sizes Very low machining force No heat generated on the parts No start hole required
Figure 7 Some the parts used on an abrasive waterjet machinewere cut with an abrasive waterjet.
Machine any materials including very hard and very tough ones in a wide thickness range Environmentally friendly Scrap is in the form of chunk, not chips and still valuable
Its limitations includes:
Jet lag causing geometric inaccuracy in small arcs and sharp corners In some cases, taper may be inevitable, particularly for thick pieces Cut slower than laser for sheet metals and less precise than EDM Initial investment and operating cost is higher than conventional machine tools
A quote from Frost & Sullivan’s market research report “World Special Machine Tools Markets”(1998) is used as the concluding remark:
“The waterjet machine tool market has emerged as the fastest growing marketsegment, with a growth rate forecast at 9.1 percent for the forecast period, saysFrost & Sullivan analyst Vinay Kaul. Both the waterjet machining process and thelaser machining process cut metals and several other materials. However, thewaterjet machines are less expensive than laser machines, and are functionallysuperior to conventional metal cutting machines. Waterjet technology has becomea viable solution for end users, due to the availability of sophisticated software.”
8. ACKNOWLEDGEMENTS
The authors are thankful to Ms. Rockie Ward for reviewing this article.
9. REFERENCES
Groppetti, R., Gutema T., and Lucchio, A. Di., “A Contribution to the Analysis of Some KerfQuality Attributes for Precision Abrasive Waterjet Cutting,” Proceedings of the 14th
International Conference on Jetting Technology, pp. 253-269, BHR Group, Brugge,Belgium, 1998.
Hashish, M., “Steel Cutting with Abrasive Waterjets,” Proceedings of the 6th InternationalConference on Jetting Technology, pp. 447-487, BHRA, University of Surry, U.K., 1982.
Knaupp, M., and Ohlsen, J., “Recycling of Abrasive Material in Abrasive Water Jet Cutting,”Proceedings of the 12th International Conference on Jet Cutting Technology, pp. 511-519, BHR Group, Rouen, France, 1994.
Martinec, P. and Skoda, V., “Garnet Minerals – Fibrogenicity of Respirable Dust Particles,”Proceedings of the 14th International Conference on Jetting Technology, pp. 347-353,BHR Group, Brugge, Belgium, 1998.
Mason, F., “Water with Attitude: Waterjet Cutting Basics,” Forming & Fabricating, pp. 43-49,June, 1996.
Olsen, C., “Waterjet Web Reference,” HTTP://WWW.WATERJETS.ORG, June 1999.
Olsen, J. H., “Motion Control with Precomputation,” US Patent No.5,508,596, 1996.
“World Special Machine Tools Markets”, Frost & Sullivan Research Publication, Code: 5447-10, June 24, 1998.
Zeng, J., “Mechanisms of Brittle Material Erosion Associated with High Pressure AbrasiveWaterjet Processing,” Doctoral Dissertation, University of Rhode Island, Kingston,Rhode Island, 1992.
Zeng, J. and Kim, T.J., “Machinability of Engineering Materials in Abrasive Water JetMachining,” International Journal of Water Jet Technology, Vol. 2, No. 2, pp. 103-110,1995.
Zeng, J., Kim, T.J., and Wallace, R.J., “Quantitative Evaluation of Machinability in AbrasiveWaterjet Machining,” Proceedings of the 1992 Winter Annual Meeting of ASME,“Precision Machining: Technology and Machine Development and Improvement,” PED-Vol.58, pp. 169-179, Anaheim, 1992.
Zeng, J. and Munoz, J., “Optimization of Abrasive Waterjet Cutting --- The Abrasive Issues,”Proceedings of the Waterjet Machining Technology Conference, Paper No. MR94-247,SME, Chicago, Illinois, 1994.
Zeng, J. and Munoz, J., “Surface Finish Evaluation for Abrasive Waterjet Cutting,” Proceedingsof the 9th American Waterjet Conference, pp. 1-14, WJTA, Dearborn, Michigan, 1997.
10th American Waterjet ConferenceAugust 14-17, 1999: Houston, Texas
Paper 66
ON THE DEVELOPMENT OF AN INTELLIGENT ABRASIVE
WATERJET CUTTING SYSTEM SOFTWARE
Pawan SinghQuantum Technologies International
Bethlehem, PA
Greg Mort and Ihab KainAAB-IR Waterjet Systems
Wixom, MI
ABSTRACT
The paper will outline the process used in developing a commercial intelligent software for operatingabrasive waterjet cutting systems that has the potential of revolutionizing abrasive waterjet cutting. Thesoftware’s salient feature is its embedded knowledge, manifested through various algorithms and schemaincluded in the software. As a result, a user can go from a CAD drawing to actually cutting the part inless than a minute, irrespective of the complexity of the part. Further, by continuously monitoring theshape of the profile and intelligently adjusting the cutting speed, the software helps produce parts with acut quality that has rarely been achieved before.
The software development began with a market research study that identified key metrics the users valuemost in a cutting system software. From this study, a blueprint for best-in-class software was developed,with a goal to establish a new benchmark in software usability, capabilities and power. The power of thesoftware comes from an embedded knowledge base that automatically defines optimum cuttingparameters, optimum piercing characteristics, and optimum cutting speed that varies along the profile.The software automatically defines cutting path, applies offset and lead-in/lead-outs, and createsrectangular nesting.
Simplicity, versatility and openness add immeasurably to the power of the software. The software,arranged in the form of software Wizard, leads the user from the drawing to cutting with only a fewclicks. Further, the user can modify, adjust, or override the automatic attributes. The software uses acommercial software engine to create CNC code that is displayed in text editor window. The softwareuses a commercial software engine to create CNC code that is displayed in text editor window. Thesoftware includes file management features, cost computations, job report and cutting simulation.
The paper will focus on the methodology used in developing the software from the concept evolution toits commercialization, and compare the software results in cut quality and time savings with the resultsfrom the standard industry practices before the development of the software. Results show that the newsoftware has more than met its promise of overarching goals set before the beginning of the development.
Organized and Sponsored by the WaterJet Technology Association
10th American Waterjet ConferenceAugust 14-17, 1999: Houston, Texas
Paper 67
ABRASIVE WATERJET CUTTING LOWERING YOUR OPERATING
COST WHILE INCREASING YOUR TOTAL PROFIT
Dennis ChisumInternational Waterjet Parts
Ephrata, WA
• Down time leading to higher operating cost.- Changing abrasive- Changing material- Cleaning tank- Maintenance
• How cleanliness and routine maintenance reduces operating cost.
• Multiple heads versus just one.- 13/40 versus dual 10/30 or 11/40 combinations.- Percentage of single head cutting versus two heads.- Utilizing your pump while getting the best bang for the buck.- Percentage of increased production.
• Different abrasives and there specific needs.- Different abrasives for different jobs.- Percentage of what grit for most jobs.- Benefits in buying in truck load qtys.
• Reduce programming time.- Controller which allows the operator to change offsets on the fly.- Controller which is user friendly. Allows minor changes to be done without totally reprogramming the job.- Having a programmer who understands the operation of the machine.
• Inexpensive tooling materials.- Using the waterjet to make your tooling.
• Cutting head wear parts, their condition and how it effects the efficiency.
• Water quality and how it effects the life of components.
• Understanding the tolerance capabilities of the abrasivejet and how best to use them to increase yourprofits.
• Different materials for your cutting table surface.
• Different sources for your spare parts.
Organized and Sponsored by the WaterJet Technology Association
10th American Waterjet ConferenceAugust 14-17, 1999: Houston, Texas
Paper 68
A COMPREHENSIVE WATERBLAST
HEALTH & SAFETY PROCESS
Michael A. Zustra, CIHMPW Industrial Services, Inc.
Hebron, Ohio, U.S.A.
ABSTRACT
MPW Industrial Services, Inc. is establishing a comprehensive waterblast health & safetyprogram that strives for continuous improvement. The program relies on integrated systems thathave been devised to ensure that all waterblast and related hazards are recognized, assessed andcontrolled.
The program is based on five elements:
• management leadership• employee involvement• job site analysis• hazard prevention/control• training Tools, or systems, have been developed to facilitate the recognition, evaluation and control ofhazards. They include:
• safety improvement committees• safety observer program• job safety analysis (JSAs)• health & safety assessments• safety performance recognition• incident investigation
Organized and Sponsored by the WaterJet Technology Association
1. INTRODUCTION MPW Industrial Services has established a comprehensive health & safety process. The processis proactive and based in integrated management systems that have been devised to ensure thatwaterjetting and other workplace hazards are recognized, assessed and controlled. The application of quality management systems to occupational health and safety has increasedin recent years. Health and safety management is experiencing a movement away from strictcompliance with established standards toward management systems. Several governmental andconsensus organizations have drafted guidance documents on the use of occupational health andsafety management systems (OHSMS). The U.S. Occupational Safety and HealthAdministration (OSHA) has promulgated voluntary guidelines for safety and health programmanagement. OSHA has also instituted the Voluntary Protection Program, a formalized programfor organizations that agree to comply with tight requirements for using occupational safety andhealth management systems. Australia, New Zealand, Korea and many European nations aredeveloping formalized OHSMS standards. The American Industrial Hygiene Association hasdrafted an ISO-compatible OHSMS guidance document and the American National Standardsinstitute is investigating OHSMS standards. Adoption of a global OHSMS standard by theInternational Organization for Standardization (ISO) is an eventuality. The systems approach seeks to minimize or eliminate workplace hazards whether or not requiredby regulation. MPW’s health & safety process is proactive, prevention-oriented. The systemsthat have been implemented prevent injuries and illnesses by ensuring that internal policy,procedures, specifications and systems themselves are being followed, and important activitiesare done, standardized and documented. Like other quality processes, the systems arequantifiable and a mechanism for continuous improvement.
2. GUIDELINES All aspects of MPW’s health & safety process fall into a framework that guides the process. Theprocess seeks to recognize and understand all hazards and potential hazards in the work area,control the hazards, and train personnel to ensure that they are aware of and understand thehazards to which they may be exposed and know how to perform tasks safely. The guidelines aremanagement leadership, employee involvement, job site analysis, hazard prevention and controland training. 2.1 Management Leadership Senior managers must be the leaders of the health & safety process. Management must make aclear statement that safety is valued by the organization. A written policy must clearlycommunicate these values to all employees so that they take appropriate actions when conflictsarise. Management should also set organizational safety performance goals, and objectives formeeting the goals, so that employees may clearly understand expectations, and can view theireffort as a contribution toward achievement of the goals and objectives.
Much as production and quality are line functions, so should be safety. Managers must takecontrol of the process and be accountable for the health and safety of workers under theirsupervision. Responsibilities for maintaining a safe work site, as well as the provision ofauthority and adequate resources, should also be assigned to subordinates. It is important that managers be visible in demonstrating their commitment to safety. They must“walk the talk” to confirm that health & safety is important to them. Managers must set theexample by knowing and following all the rules. They should point out unsafe acts or conditionsas they inspect operations, and begin each meeting with a comment or question about pertinentsafety issues. If employees see their managers stressing workplace safety, they will also becomeinterested. 2.2 Employee Involvement Employees with their hands on the waterjet gun everyday are most likely to be injured, andprobably know best how to safely perform a task. It makes sense then that these employees mustbe active in the health & safety process to maximize the effectiveness of the process. A goal of the health & safety process, with regard to employee involvement, is to develop anawareness among employees whereby safety is considered before each job is performed, everytime, no matter how small the job. An evolution of sorts must occur before this positive safetyculture can exist. Employees must go from mere participation in the process, to beingempowered to act within the guidelines of the process, to ultimately taking ownership of theprocess. Employee participation begins with an understanding of management’s commitment tohealth and safety, company safety policy and process objectives, work rules and procedure, andthe discipline/award system. Involvement develops so employees can be independent ofsupervisory control. They have personal knowledge, have made a personal commitment to healthand safety, care about their personal safety and seek individual recognition for their contributionto the health & safety process. In the last phase of employee involvement, workers begin to takea proprietary interest in the process. They help co-workers conform, care about the safety ofothers, rely on one another, and take pride in the overall process. 2.3 Job Site Analysis An effective health & safety process must be able to anticipate harmful occurrences. To do that,systematic actions must be taken to ensure workplace hazards and potential hazards are fullycharacterized. Initially, a comprehensive hazard inventory must be compiled. The inventory should include alisting of tasks performed and hazardous materials encountered. Each task should be brokendown into sub-tasks so that specific hazards encountered in performing the work are identified,and preventive methods or controls are devised. As new tasks are added, or when there is achange of facilities, equipment, processes or materials to existing tasks, the inventory must beupdated. Supervisors must perform routine health and safety inspections to verify compliance
with the job analyses. Workers who perform and are familiar with the task can also be utilized toobserve work being performed to help in finding unsafe acts and conditions. Incident investigation should be viewed as another opportunity to identify hazards, developcontrol methods and detect flaws in the health & safety process. Root and contributing causes ofaccidents should be uncovered and measures should be taken to prevent recurrence.Accordingly, a periodic statistical review of accident types and resulting injuries and illnessesshould be conducted to reveal patterns that may be indicative of common deficiencies. 2.4 Hazard Prevention and Control Once identified, hazards should be removed or controlled. Ideally, engineering controls, such assubstitution of less harmful materials, ventilation, or alteration to a process, are implemented tocompletely eliminate exposure to a hazard. If engineering controls are not possible, as is oftenthe case when working in a customer’s facility, personal protective equipment (PPE) oradministrative controls, or a combination of the two may be applied to prevent unsafe andunhealthful exposure. PPE must be checked frequently to ensure it is in use and continues tofunction effectively. Administrative controls, which should be considered a last resort, includerotation of work crews to minimize the relative duration of exposures and transfer of personnelwho have reached the upper limits of allowable exposure. Other measures that may be taken to prevent accidents are the provision of a preventivemaintenance program, preparation for emergencies and implementation of a medical surveillanceprogram. 2.5 Training The role of an effective health and safety training program is to ensure that all personnelunderstand and can ably fulfill their role in the health & safety process. Managers must be taughtto set the example. Supervisors must be able to recognize, evaluate and control workplacehazards, sometimes with the support of health & safety professionals. Employees mustunderstand the hazards of the tasks they perform, safe work practices that will minimizeexposure, and emergency response procedures. 3. SYSTEMS MPW has implemented several systems, or control programs, to ensure that important health andsafety functions are done in accordance with internal requirements every time. These systemshave been formalized and are woven into the fabric of the organization. Because they havebecome part of MPW’s operating methodologies, they are self-sustaining, requiring minimaloversight. Since all are hard copy programs, verification of use of the systems can be tracked.

3.1 “Commitments” to Health & Safety MPW has developed two formal “commitment to health & safety” documents. The management“Commitment to Health and Safety” details corporate goals and objectives for the health & safetyprocess. The company’s goal is simple: Zero accidents in performing all aspects of our work.The objectives were borne out of the corporate Safety Improvement Committee (discussedbelow) and largely detail basic tenets of the process. Corporate leaders and members of theSafety Improvement Committee signed the document. Framed copies of the “Commitment toHealth and Safety” hang in every MPW office. Laminated versions are required to be posted atevery job site. The “Personal Commitment to Health and Safety” is an extension of the top managementcommitment. It reiterates company goals and communicates five basic personal health and safetyresponsibilities: know job hazards, comply with specifications, wear PPE, report all workplacehazards and immediately report incidents. Administration of the program is tiered throughsupervisors to employees. Every employee from the Chairman to the newest hire signs the“personal commitment.” Completed documents have been posted in office spaces. A hard hatsticker is issued to personnel as they enroll. Many benefits have been derived from the “commitments to health and safety.” Employees nowclearly understand that management has made safety a priority, and have full knowledge of theirrole in the process. Since the “commitments” were done at the start of the process, it was also ahighly visible means of kicking the process off.
3.2 Hazard Inventory The corporate hazard communication standard has been modified to require semi-annualreporting of complete hazard inventories by each MPW location. Included in the inventory aretasks performed and chemicals to which employees are potentially exposed. Location managersare asked to update the inventory as new tasks are added, or facilities, equipment, processes ormaterials change. In addition to acting as the starting point for a thorough job site analysis, maintenance of thehazard inventories has enabled location managers to become more aware of workplace hazardsand potential hazards, and therefore, better able to prevent accidents from occurring. 3.3 Job Safety Analysis (JSA) JSAs are job-specific planning tools that help identify engineering controls, safe work practices,PPE and administrative controls that may be required to perform a job safely. Typically, JSAsare co-written by a member of the operations staff (technicians, foremen or supervisors) and ahealth & safety professional. JSAs are developed by breaking down the job into basic steps,specifying hazards that could arise during each step, and then devising control methods for eachhazard. JSAs have been developed for all major tasks and most smaller, less complex tasks.

In addition to further developing job site characterization, JSAs are also a valuable training tool.The work crew that will perform the task is trained on the content of the JSA prior to beginningwork. Not only does JSA training develop worker safety skills, but overall safety awareness alsoimproves. Additionally, employee ownership of the health & safety process is enhanced byworker participation in the development of JSAs. 3.4 Health & Safety Assessments Job sites must be audited frequently to gauge how well the organization, health & safety systemsand people within the organization are performing toward providing a safe workplace. MPWperforms audits, or assessments, at three levels. Onsite supervisors conduct weekly hazardcontrol inspection using a checklist-type form with yes/no responses. The assessment is broad-based in its coverage of the health and safety aspects of an operation, including a review of jobsetup, PPE use, fire protection, material handling, hazard communication, walking/workingsurfaces, power tools, environmental factors, vehicles/equipment, containers, warning/signalingdevices and electrical equipment. The inspection is a self-assessment, conducted mainly to helpthe supervisor detect potential hazards so they can be corrected before an incident occurs. Arecord of all assessments, however, is maintained by the supervisor and reviewed periodically byoffsite managers and health and safety personnel. Offsite managers conduct assessments of their own once a month. Unlike onsite supervisors,managers assessments are objective, and focus on job site compliance with health & safetyprocess systems. The form used to conduct the assessment, the Health & Safety ManagementSystems Review, contains evaluation criteria that measure progress toward achieving companyobjectives. The evaluation criteria are pointed questions that are weighted according to theirrelative importance in the process. The reviewer’s responses to each evaluation criterion are alsoweighted: 0=does not meet, 1=partially meets, 2=meets the criteria. The result is a quantitativevalue that scores the audited job sites compliance with health & safety process systems. A SafetyImprovement Committee reviews the management assessments, where scores can be comparedwith other job sites, other geographic regions and other work-types to define specific areas of thehealth & safety process most in need of attention. Staff health & safety professionals conduct assessments that are both hazard control inspectionsand health & safety systems reviews. Health & safety auditors log “areas of improvement”identified during the audit on the assessment form. Due dates for abatement of hazards aremutually agreed upon by the auditor and the job site supervisor. Each “area of improvement” iscoded to a particular hazard category (PPE use, material handling, hazard communication) andtracked. 3.5 Safety Observer Program The purpose of the Safety Observer program is to get systematic feedback from employees whoobserve work in progress to determine if the work is being performed according to plan. Sinceworkers with their hands on the tools can be a valuable health and safety resource, it is critical
that a positive line of communication between worker and supervisor be established andmaintained. Safety observers are randomly selected at a job site by the site supervisor. The number ofobservers and frequency of observations will vary depending on the complexity and redundancyof the task being observed. The assigned observer will typically make two 15-minute dedicatedobservations during the workday to watch a task being performed by co-workers. The observershould be familiar with the task being observed, but on occasion, the observer should come fromoutside the job classification or work group performing the task. The observer’s role is todetermine if the task observed is being done according to MPW standards. Unsafe acts andunsafe conditions are identified, with the focus of the observation on the work task being done,not on the individual performing the task. Positive aspects of safety performance are also noted.The observer completes the Safety Observer form documenting his or her findings, and submitsthe form to the job site supervisor at the end of the shift. The observer may also recommendactions to be taken to improve job site safety. At the next day’s toolbox safety meeting, theobserver presents an oral report. The job site supervisor is required to respond, in writing on theSafety Observer form, to deficiencies identified. The Safety Observer program has paid dividends. Not only do supervisors get useful input fromemployees that will improve safety performance, but workers feel empowered by theirparticipation in the program and the resulting improvements. In a larger sense, the safetyobserver program has helped create a more positive safety culture; an active team-orientedclimate where the safety of co-workers is important. 3.6 Accident Investigation Accidents and “near miss” incidents must be investigated so that their causes and means forpreventing their repetitions are identified, rather than being a search for “whom to blame.” Tomake the investigation process most effective, first line investigation is conducted by the injuredemployee and the direct supervisor. Initial investigation and reporting must be timely andthorough. Local managers and health & safety professionals review the accident report forcompleteness and to ensure that initial corrective actions have been taken. The report is thenforwarded to the regional Safety Improvement Committee (SIC) for formal review. The SICanalyzes accidents in depth to uncover direct and contributing causes and to identify anyshortcomings in policies, standard operating procedures, training, safe work practices or systemsthat might allow similar incidents to occur again. If flaws are uncovered, Safety Bulletinscontaining lessons learned are distributed immediately. Disciplinary action may be taken if poorperformance is identified as a cause. 3.7 Toolbox Safety Meetings Safety meetings are held at the start of each shift to set the tone for the day. Job site supervisorstypically lead the meetings. Each supervisor has receiving formal instruction on the conduct oftoolbox meetings, training techniques and meeting content. The meetings usually focus on thework at hand: job safety analyses for upcoming work are reviewed and the safety observer’s oral
report is delivered. Previously identified deficiencies that have been remedied or other job sitesafety improvements might also be discussed. When Safety Bulletins are issued or safety-relatedinternal correspondence is distributed, these are presented to the crew. User-friendly lesson plansthat will be used for “refresher” training on topics such as heat stress, confined space entry,lockout/tagout will soon be developed. 3.8 Health & Safety Plans A site-specific health and safety plan (HASP) or a Safety/Environmental Worksheet is developedfor every job. These documents, which address hazards unique to each job and hazard controlmeasures that are to be implemented, are written by health & safety practitioners and are used on-site as a tool to communicate site-specific health and safety requirements. HASPs, which aremore comprehensive than Safety/Environmental Worksheets, are written for longer, morecomplex projects. HASPs contain a detailed description of the facility and the work processesinvolved, and information on key personnel, job hazard analysis, regulated work areas, protectiveequipment, decontamination, air monitoring, emergency response, training requirements andmedical surveillance. Safety/Environmental Worksheets are developed for short duration orsingle-task work. Worksheets are in a checklist form and address the scope of work, physicaland chemical hazards present, PPE required and emergency information. 3.9 Safety Improvement Committee SICs act as steering groups for the health & safety process. They are multi-level and multi-disciplinary: multi-level in that they are organized at the corporate, zone and local levels withinMPW’s organization chart; multi-disciplinary in that many functions (operations, engineering,maintenance, sales, human resources) are represented on the committee. At the zone and locallevels, field personnel, including crew leaders and laborers, are committee members. SICs meetmonthly and are chaired by the most senior business manager at each level. During meetings, SICs reevaluate all elements of the health & safety process. Meeting agendasinclude a review of safety performance indicators, goals and objectives, health & safetyprocedures and the adequacy of training programs. An in-depth review of recent incidents takesplace where injured employees and their supervisors are interviewed to determine root and basiccauses of the accident. SICs devise corrective actions for systemic problems uncovered and arethe source of disciplinary action for poor safety performance. It is through the corporate SIC thatcriteria for high pressure hose inspection were devised, and development of a network ofphysicians that would treat waterjet injuries was initiated. Periodically, injury/illness statisticsare compiled for SIC analysis of trends in incident causes or injury types.

3.10 Other Systems As the health & safety process progresses, other systems will be implemented. They include:
• Mechanism to formally and quantitatively integrate supervisors’ and managers’ participationin the health & safety process into their overall performance evaluation
• Safety award system whereby teams and individuals that demonstrate outstanding safetyperformance are rewarded
• Written progressive disciplinary system that will assist supervisors in controlling the workenvironment
• System to document the tracking of hazard correction at the local level
4. CONCLUSIONS Adoption of health & safety management systems does not come easily. OHSMS redefinesthinking on how things are done in an organization. It involves a paradigm shift away from thetraditional methods of managing health and safety. The traditional health and safety managementmethod is reactive, where health and safety professionals investigate accidents, identify andcorrect unsafe acts and conditions, monitor the use of PPE, and generally act as safety “cops.”OHSMS requires a culture change where safety is a core value, part of the business fabric, ratherthan just an add-on. In the proactive OHSMS culture, workers and line management takeownership of workplace health and safety. Benefits associated with the use of OHSMS, however, are many. The use of health and safetymanagement systems has proven to be effective in reducing workplace accidents. OSHAestimates that “Star” level VPP participants (“outstanding work sites”) avoid 2097 lost workdayinjuries annually, while “Merit” level participants (“stepping stone to Star”) have a lost workdaycase rate that is 35% below the national average. In the first eleven months of the health & safetyprocess, MPW has seen its total OSHA-recordable accident rate (TOR) drop by 33% and the lostworkday incident rate reduced by 60%. MPW has reduced its costs for worker’s compensationinsurance and other costs of injuries and illnesses, and now uses the health & safety process as aselling tool. For workers, the health & safety process has contributed to the quality of work life,enhanced participatory skills and improved employee morale.
5. REFERENCES
U.S. Department of Labor, Occupational Safety and Health Administration, “Safety and HealthProgram Management Guidelines; Issuance of Voluntary Guidelines,” Federal Register, January 26, 1989.
Pierce, F.D., “Total Quality for Safety and Health Professionals“, Government Institutes, 1995.

“Occupational Health and Safety Management Systems: An AIHA Guidance Document,” American Industrial Hygiene Association, Fairfax, Virginia, 1996.
American Industrial Hygiene Association Board of Directors, “Boldly Going Where No Association Has Gone Before- Release of OHSMS Guidance Document Places AIHA in Leadership Position for International Management Systems,” The Synergist, pp. 31-32, 1996.
10th American Waterjet ConferenceAugust 14-17, 1999: Houston, Texas
Paper 69
FACTORS INFLUENCING THE LEAKAGE CHARACTERISTICS OF
NPT AND NPTF THREADED CONNECTORS
William A LeesMaxbar, Inc.
Houston, Texas
P. Shaun CroftonMechanical Engineering Department
Imperial CollegeLondon, U.K.
ABSTRACT
At inception, the water jet cleaning industry was largely confined to the use of operatingpressures of up to 5,000 psi. Working pressures have steadily increased, and NTP fittings arenow commonly used at pressures of up to 20,000 psi. Concern has frequently been expressedabout the use of NPT fittings at higher and higher pressures, but little factual and objectiveinformation is available on their performance. Industry standards for high pressure fittings havegenerally originated from the high pressure chemical industry, but the needs of the water jetindustry are creating a growing demand for fittings larger and more robust than the traditionalinstrumentation style fitting, but smaller and lighter than the heavy flanged fittings designed forpermanent, in-plant installations.
Since any fitting is prone to leakage and potential failure when over-pressurized, it is of interestfrom a safety and reliability point of view to establish the factors which determine the leakagecharacteristics of NPT and NPTF threaded connectors.
This work describes the results of a preliminary experimental program designed to assess the safeworking pressure of two of the more popular sizes of NPT and NPTF threaded connectors, ¼”and ½”. Since it is not uncommon to find apparently indiscriminate mixtures of NPT and NPTFmale and female parts being used in a single connection, the leakage pressure of variouspermutations of mating thread forms has also been determined. Finally the method of jointpreparation in terms of joint sealant using a conventional PTFE sealing tape or a proprietarysealing compound has also been investigated.
Organized and Sponsored by the WaterJet Technology Association
1. INTRODUCTION
Despite the widespread use of NPT fittings, most research orientated organizations have beenreluctant to conduct any quantitative research into their behavior because the joint is notamenable to finite element or other computer analysis, the fittings are entirely generic, and thereseem to be so many variables that can affect performance. Indeed, many are sweepingly criticalof the use of NTP fittings, and recommend that they should not be used at all. However, thereappears to be no objective justification for this broad condemnation, and the fact remains thatthey are used daily with success. Two major questions are: at what pressure will the connectionleak, and at what pressure will it fail catastrophically and blow out? A preliminary, objective andquantitative study was conducted to begin to examine the major factors governing the behavior ofNPT fittings at high pressure.
Two variations of NPT threads were tested because they can be interchanged, and they also allowthe effect of thread manufacturing tolerances to be investigated. The threads, namely NPT(National Pipe thread, Tapered, and NPTF, also known as “Dryseal” are defined by the AmericanNational Standard Institute. The NPTF thread has been designed specifically for sealing,(originally without sealing compound, hence the name “Dryseal”), whilst the NPT thread hasbeen designed for general purposes, including mechanical (non-pressurized) connections, andpressurized connections using pipe dope. The two threads are identical except that in the NPTFthread no clearance is allowed between the rest and root of the thread, to reduce leakage.
Two of the more popular sizes were covered, ¼”, and ½”. The fittings were made from 316stainless steel.
Tests were conducted dry, with no lubricant, with PTFE tape, and with a proprietary threadsealant/lubricant, at a variety of tightening torques. The variables included in these tests were:
SizeThreadTorqueLubricant/sealant
2. MATERIALS
2.1 Fittings
The male fittings were made from cold drawn 316 stainless steel bar, 25mm (1”) hexagon forboth the ¼” and ½” male fittings (plugs) with a yield strength of 62,400 psi. The female fittingswere made from 40mm (1-9/16”) hexagon for the ¼” female fittings, and 50mm (2”) hexagon forthe ½” female fittings (couplings) with a yield strength of 58,900 psi. Hexagon sizes are acrossflats (A/F). The A/F dimension of the sockets was chosen to give a ratio of inside to outsidediameter of at least 3. With such a heavy wall thickness, the effect of the wall thickness of thefitting is effectively eliminated as a variable in these experiments. Threads were cut using new,
ground, taps and dies (non-adjustable type) and were checked for dimensional accuracy usingplug and ring gauges.
2.2 Thread Sealant
The fittings were tested with no lubricant (dry) as a baseline, and also with the usual PTFE tape,and with “Threadmate”, (a Parker Hannifin, Inc. product) a commercial thread sealant/lubricant.The version of Threadmate used for these tests was a mixture of PTFE particles, an extreme dutyanti-galling lubricant, and heavy oil, the whole forming a yellow grease or paste.
3. TEST METHOD
The fittings were tested using simple pressure test equipment. The plugs were tightened into thecoupling using a standard commercial torque wrench, then the pressure was increased slowlyusing an air operated high-pressure pump. The test fluid was a very low viscosity hydraulic oil.Pressure was monitored using a transducer and computer. During testing, the fittings wereimmersed in water in an open-topped steel tank. Leakage was determined to have occurred whena drop or drops of oil were seen on the surface of the water. In some tests bubbles of air wereseen to come from the connection at pressures lower than the liquid leakage pressure. Pressureswere not increased above 80,000 for any test, even if no leakage had occurred, as it was felt thatthere was very little probability of anyone using NPT fittings above 80,000 psi in the waterblastindustry.
Two methods of tightening were used:
a. Progressively increasing the tightening torque after each leak.
b. Tightening directly to the maximum torque (“reference” test).
The maximum torque was limited to 100 ftlb for the ¼” fittings, and 150 ftlb for the ½” fittings,to avoid torsional yielding of the plugs during tightening.
The combinations tested are summarized in the tables below:
¼” Size Male (plug)NPT Dryseal
Female NPT Dry, Sealant(coupling) Dryseal Dry, Sealant,
PTFE
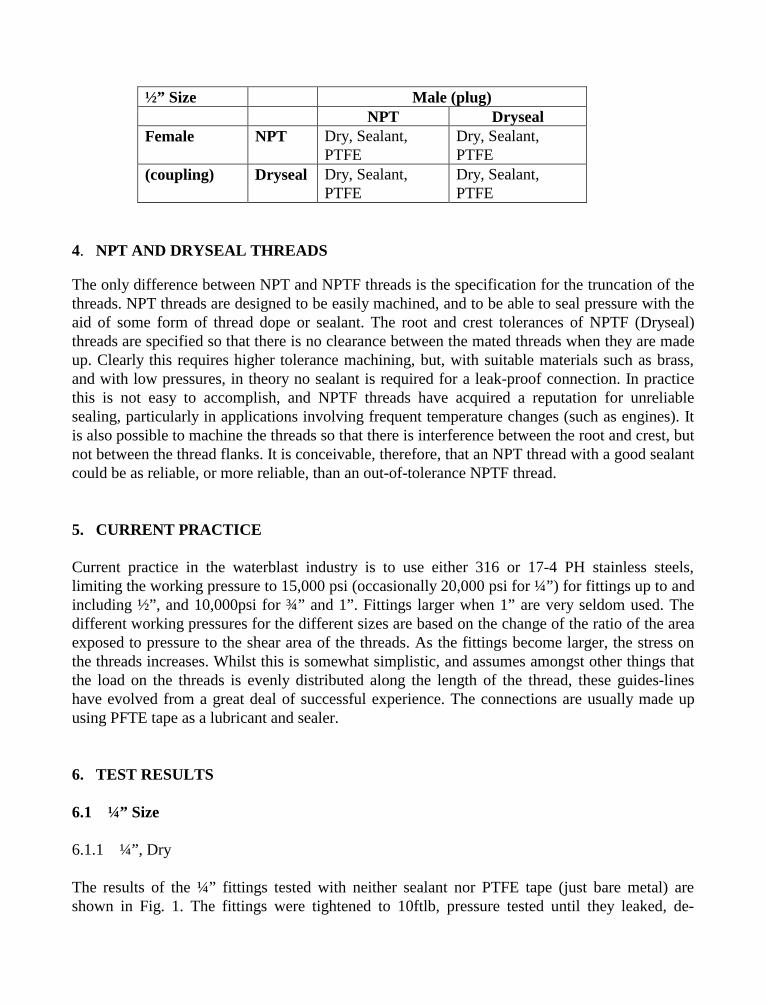
½” Size Male (plug)NPT Dryseal
Female NPT Dry, Sealant,PTFE
Dry, Sealant,PTFE
(coupling) Dryseal Dry, Sealant,PTFE
Dry, Sealant,PTFE
4. NPT AND DRYSEAL THREADS
The only difference between NPT and NPTF threads is the specification for the truncation of thethreads. NPT threads are designed to be easily machined, and to be able to seal pressure with theaid of some form of thread dope or sealant. The root and crest tolerances of NPTF (Dryseal)threads are specified so that there is no clearance between the mated threads when they are madeup. Clearly this requires higher tolerance machining, but, with suitable materials such as brass,and with low pressures, in theory no sealant is required for a leak-proof connection. In practicethis is not easy to accomplish, and NPTF threads have acquired a reputation for unreliablesealing, particularly in applications involving frequent temperature changes (such as engines). Itis also possible to machine the threads so that there is interference between the root and crest, butnot between the thread flanks. It is conceivable, therefore, that an NPT thread with a good sealantcould be as reliable, or more reliable, than an out-of-tolerance NPTF thread.
5. CURRENT PRACTICE
Current practice in the waterblast industry is to use either 316 or 17-4 PH stainless steels,limiting the working pressure to 15,000 psi (occasionally 20,000 psi for ¼”) for fittings up to andincluding ½”, and 10,000psi for ¾” and 1”. Fittings larger when 1” are very seldom used. Thedifferent working pressures for the different sizes are based on the change of the ratio of the areaexposed to pressure to the shear area of the threads. As the fittings become larger, the stress onthe threads increases. Whilst this is somewhat simplistic, and assumes amongst other things thatthe load on the threads is evenly distributed along the length of the thread, these guides-lineshave evolved from a great deal of successful experience. The connections are usually made upusing PFTE tape as a lubricant and sealer.
6. TEST RESULTS
6.1 ¼” Size
6.1.1 ¼”, Dry
The results of the ¼” fittings tested with neither sealant nor PTFE tape (just bare metal) areshown in Fig. 1. The fittings were tightened to 10ftlb, pressure tested until they leaked, de-
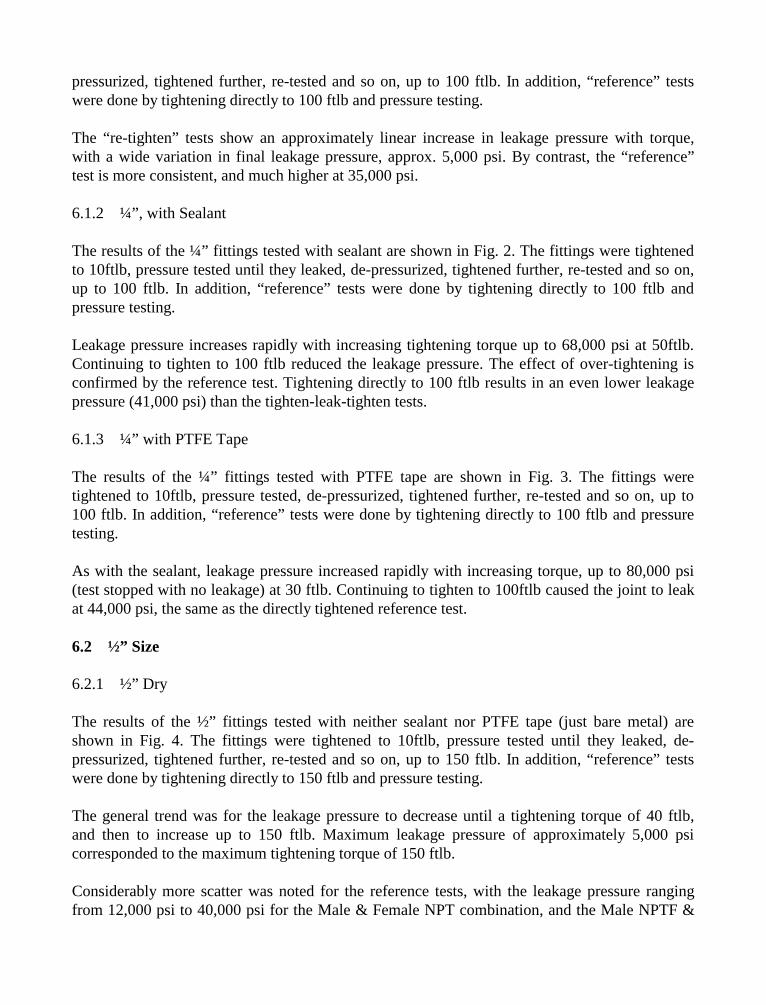
pressurized, tightened further, re-tested and so on, up to 100 ftlb. In addition, “reference” testswere done by tightening directly to 100 ftlb and pressure testing.
The “re-tighten” tests show an approximately linear increase in leakage pressure with torque,with a wide variation in final leakage pressure, approx. 5,000 psi. By contrast, the “reference”test is more consistent, and much higher at 35,000 psi.
6.1.2 ¼”, with Sealant
The results of the ¼” fittings tested with sealant are shown in Fig. 2. The fittings were tightenedto 10ftlb, pressure tested until they leaked, de-pressurized, tightened further, re-tested and so on,up to 100 ftlb. In addition, “reference” tests were done by tightening directly to 100 ftlb andpressure testing.
Leakage pressure increases rapidly with increasing tightening torque up to 68,000 psi at 50ftlb.Continuing to tighten to 100 ftlb reduced the leakage pressure. The effect of over-tightening isconfirmed by the reference test. Tightening directly to 100 ftlb results in an even lower leakagepressure (41,000 psi) than the tighten-leak-tighten tests.
6.1.3 ¼” with PTFE Tape
The results of the ¼” fittings tested with PTFE tape are shown in Fig. 3. The fittings weretightened to 10ftlb, pressure tested, de-pressurized, tightened further, re-tested and so on, up to100 ftlb. In addition, “reference” tests were done by tightening directly to 100 ftlb and pressuretesting.
As with the sealant, leakage pressure increased rapidly with increasing torque, up to 80,000 psi(test stopped with no leakage) at 30 ftlb. Continuing to tighten to 100ftlb caused the joint to leakat 44,000 psi, the same as the directly tightened reference test.
6.2 ½” Size
6.2.1 ½” Dry
The results of the ½” fittings tested with neither sealant nor PTFE tape (just bare metal) areshown in Fig. 4. The fittings were tightened to 10ftlb, pressure tested until they leaked, de-pressurized, tightened further, re-tested and so on, up to 150 ftlb. In addition, “reference” testswere done by tightening directly to 150 ftlb and pressure testing.
The general trend was for the leakage pressure to decrease until a tightening torque of 40 ftlb,and then to increase up to 150 ftlb. Maximum leakage pressure of approximately 5,000 psicorresponded to the maximum tightening torque of 150 ftlb.
Considerably more scatter was noted for the reference tests, with the leakage pressure rangingfrom 12,000 psi to 40,000 psi for the Male & Female NPT combination, and the Male NPTF &
Female NPT combination respectively. The Male and Female NPTF combination, which mightreasonably have been expected to be the best performer, fell in the middle at just under 20,000psi.
6.2.2 ½”, with Sealant
The results of the ½” fittings tested with sealant are shown in Fig. 5. The fittings were tightenedto 10 ftlb, pressure tested until they leaked, de-pressurized, tightened further, re-tested and so on,up to 150 ftlb. In addition, “reference” tests were done by tightening directly to 150 ftlb andpressure testing.
The considerable scatter is immediately apparent, with no clear trend, except that, with oneexception, leakage pressure increased with tightening torque to the maximum tested. Leakagepressure varied from 2,000 psi to 80,000 psi (test stopped, no leakage).
The reference tests are much less scattered, and are grouped in the 40,000 psi area.
6.2.3 ½”, with PTFE Tape
The results of the ½” fittings tested with PTFE tape are shown in Fig. 6. The fittings weretightened to 10 ftlb, pressure tested until they leaked, de-pressurized, tightened further, re-testedand so on, up to 150 ftlb. In addition, “reference” tests were done by tightening directly to 150ftlb and pressure testing.
There is much less scatter in the PTFE tape tests than in the sealant tests, with the final leakagepressure lying between 40,000 and 52,000 psi, in the same area as the sealant reference tests.However, none of the PTFE tests came close to the maximum pressure of 80,000 psi achievedwith the sealant.
7. CONCLUSIONS
7.1 Effect of Threadform
When the tests program was initially considered, it was assumed that the NPTF/NPTFcombination would perform best, followed by an NPTF/NPT combination, and finally theNPT/NPT, based on the fact that the NPTF thread is designed to ensure that there is no clearancebetween the root and crest, eliminating the spiral leakage path.
However, it is clear from the tests that there is no combination that consistently out-performedthe others. This could be attributed to the high tightening torques tending to flow the threadplastically. Given the similarities of the dry tests, the lack of a clear “best combination” cannot beattributed to any effect of sealants. Just how far the threads can be truncated without significantlyaffecting performance is a important issue, especially for female threads, as even a modest
truncation can greatly reduce the torque required to cut the thread, an important considerationwhen machining tough, high strength materials.
7.2 Tightening Torque
From the results of the 1/4” tests with both PTFE tape and Threadmate, it appears as though thereis a definite reduction in leakage pressure when the tightening torque exceeds approximately 50ftlb. This suggests that the plastic deformation of the threads has reached a point where thethreads are deforming, allowing leakage. The tests on the 1/2” threads show that leakage pressurecontinues to rise up to the maximum torque tested, 150 ftlb.
7.3 Blow-out Pressure
An interesting and unexpected result was the ability of both the 1/4” and 1/2” fittings towithstand 80,000 psi not only without blowing out, but without leakage. This indicates thatcorrectly tightened NPT fittings in good condition and made from the materials used for thesetests (typical of materials used in the waterblast industry) do in fact have a good margin of safetyagainst blow-out, even at 20,000 psi.
7.4 Leakage Pressure
Tests were conducted on dry fittings to form a baseline for establishing the effectiveness ofsealants and lubricants.
For the 1/4” fittings tightened directly to 100ftlb the leakage pressure is approximately doubledfrom 35,000 psi (dry) to 68,000 psi (sealant) and 80,000+ psi for the PTFE tape. The effect isvery noticeable in the tests that were re-tightened after each leakage. Re-tightened dry jointsachieved a maximum leakage pressure of less than 10,000 psi, compared to 80,000+ psi withPTFE tape. “Used” fittings can be successfully re-used if they are re-coated with PTFE tape orsealant.
Again, for the 1/2” fittings tightened directly to 150 ftlb the leakage pressure is approximatelydoubled from around 20,000 psi to around 40,000 psi for both PTFE tape and sealant. As for the1/4” fittings, re-tightened dry fittings performed poorly compared to the re-tightened fittings withtape or sealant.
There appears to be no consistent difference between the PTFE tape and the sealant as far asleakage pressures determined by these tests.
The leakage pressure of the 1/4” fittings made from these materials, installed with sealant/tapeand tightened to a maximum of 50 ftlb is approximately 70,000 to 80,000 psi.
The leakage pressure of the 1/2” fittings made from these materials, installed with sealant/tapeand tightened 150 ftlb is approximately 40,000 psi. It is possible that the leakage pressure may behigher with higher tightening torques.

8. FURTHER WORK
Very clearly this is only a preliminary study, and much remains to be done. Obviously animportant variable that was not addressed in this study was the strength of the material. Nodiscussion or rating of fittings can omit this fundamental variable. It is quite meaningless todebate the performance of NPT fittings without a clear reference to the strength of the materialthat the fittings are made from. Future studies will study this in more detail, especially with aview to determining if there is an optimum combination of material properties.
9. DISCLAIMER
These are the results of a brief, preliminary study. These results and comments are not intendedto be recommendations or approvals for the use of any type of fitting at any pressure.
10. ACKNOWLEDGMENTS
The assistance of the staff and technicians of Imperial College are gratefully acknowledged.
Fig. 1 1/4", Dry
0
5000
10000
15000
20000
25000
30000
35000
40000
10 20 30 40 50 60 70 80 90 100
Tightening Torque (ftlb)
Leak
age
Pre
ssur
e (p
si)
Male & Female NPT Male NPT, Female NPTF Male & Female NPT Ref. Male NPT, Female NPTF Ref.
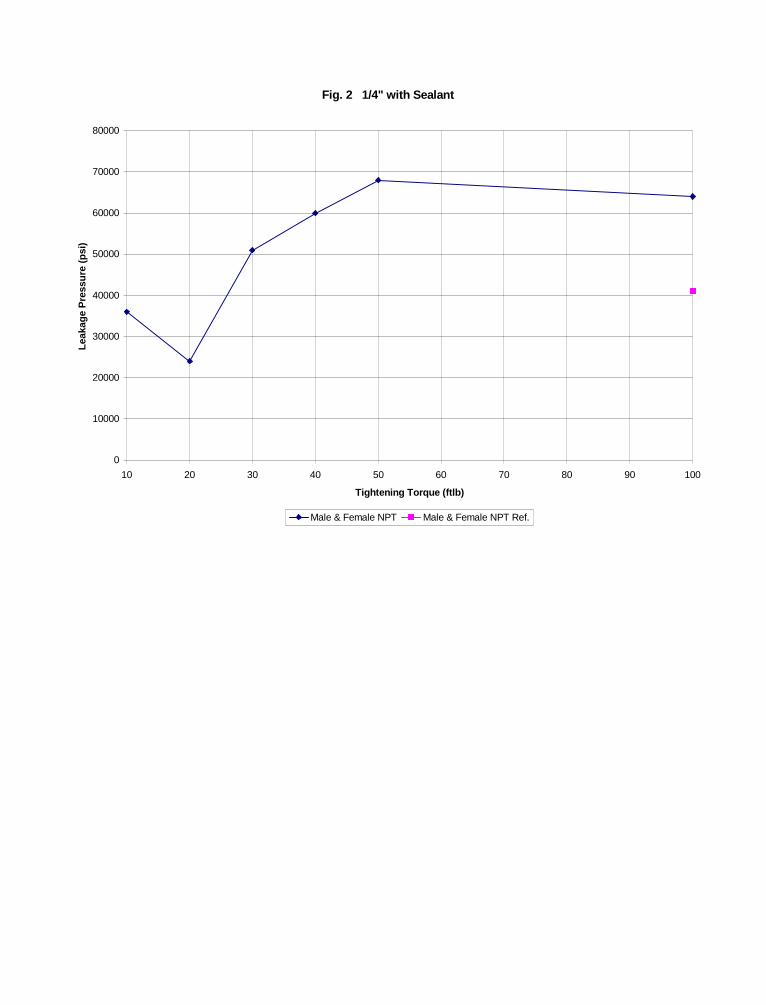
Fig. 2 1/4" with Sealant
0
10000
20000
30000
40000
50000
60000
70000
80000
10 20 30 40 50 60 70 80 90 100
Tightening Torque (ftlb)
Leak
age
Pre
ssur
e (p
si)
Male & Female NPT Male & Female NPT Ref.
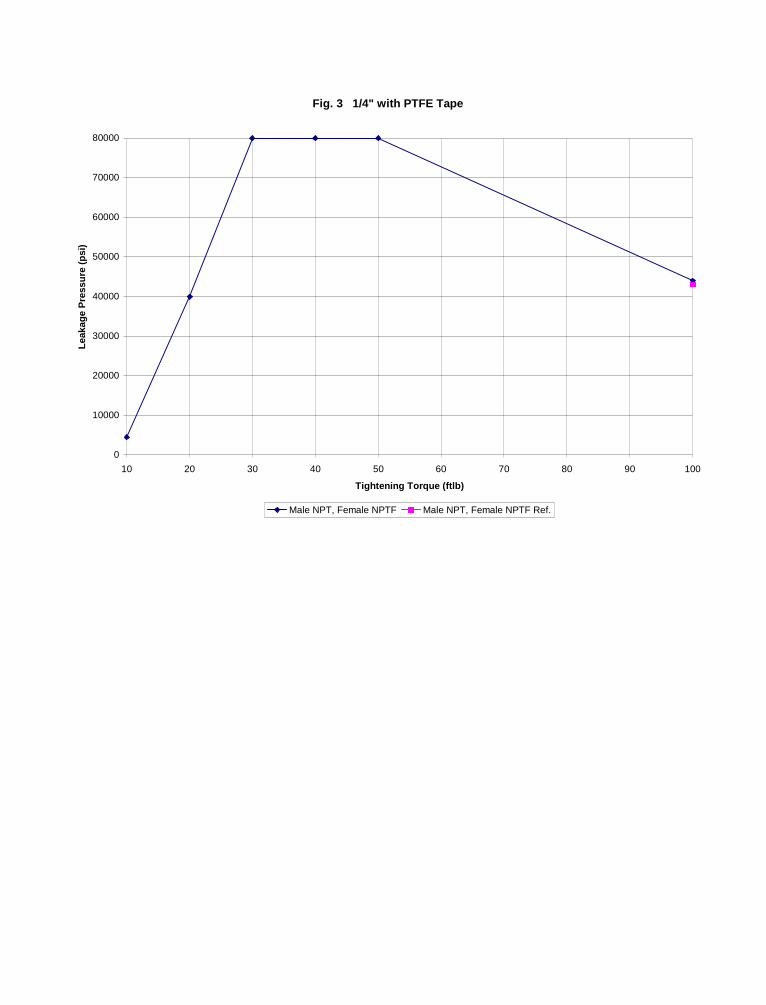
Fig. 3 1/4" with PTFE Tape
0
10000
20000
30000
40000
50000
60000
70000
80000
10 20 30 40 50 60 70 80 90 100
Tightening Torque (ftlb)
Leak
age
Pre
ssur
e (p
si)
Male NPT, Female NPTF Male NPT, Female NPTF Ref.
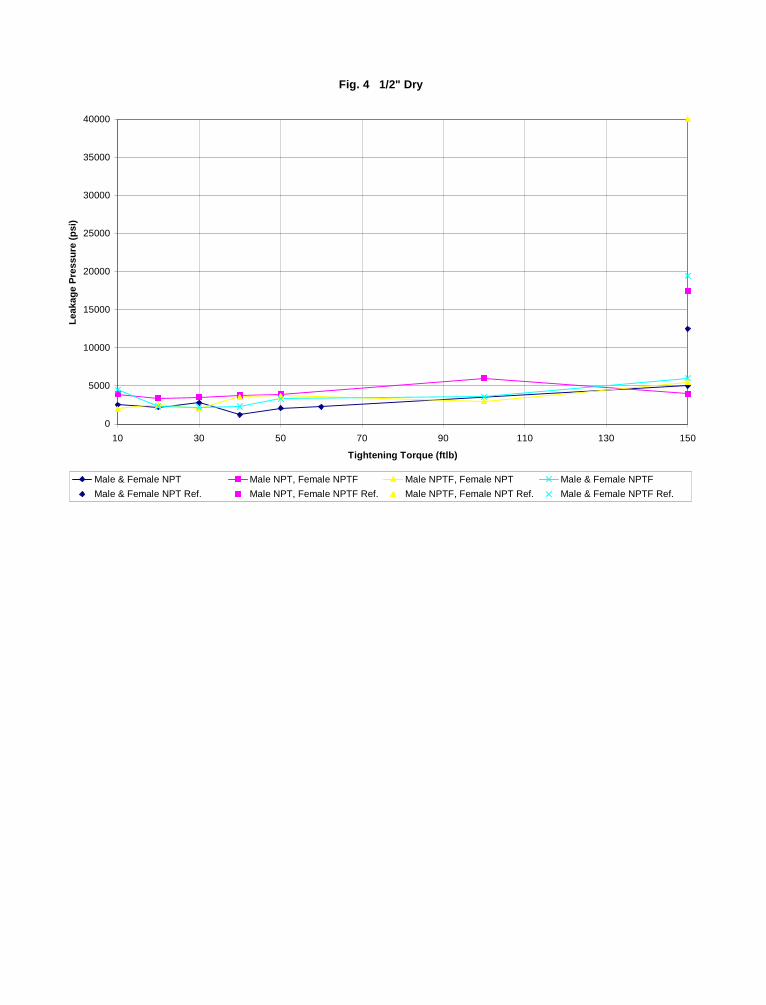
Fig. 4 1/2" Dry
0
5000
10000
15000
20000
25000
30000
35000
40000
10 30 50 70 90 110 130 150
Tightening Torque (ftlb)
Leak
age
Pre
ssur
e (p
si)
Male & Female NPT Male NPT, Female NPTF Male NPTF, Female NPT Male & Female NPTF
Male & Female NPT Ref. Male NPT, Female NPTF Ref. Male NPTF, Female NPT Ref. Male & Female NPTF Ref.
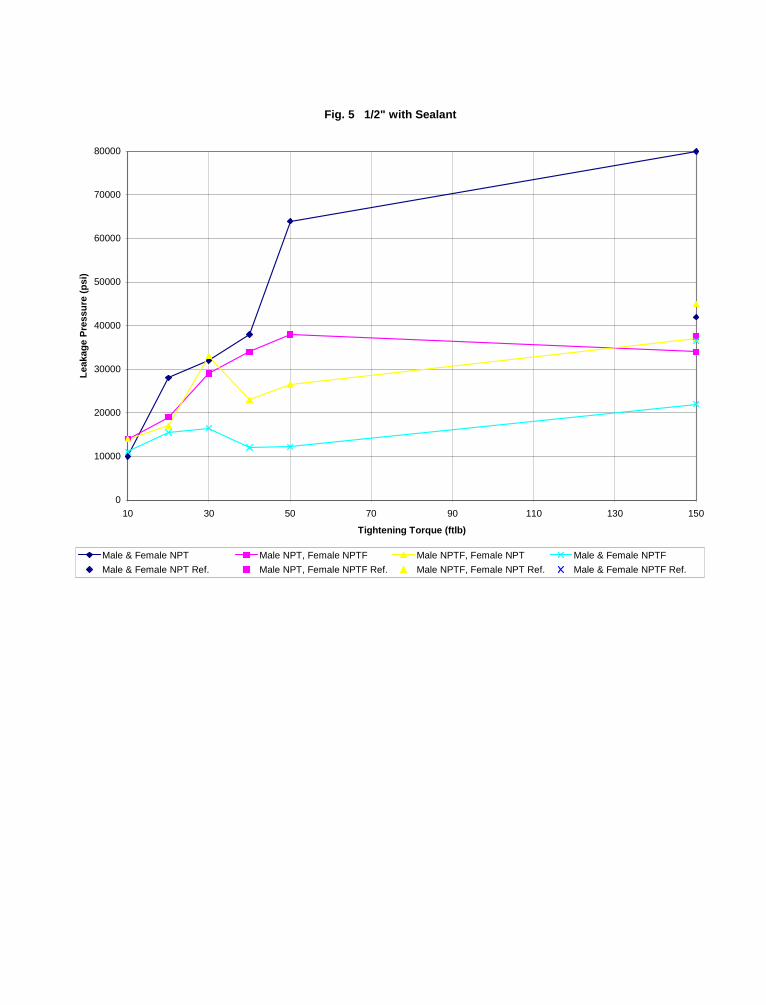
Fig. 5 1/2" with Sealant
0
10000
20000
30000
40000
50000
60000
70000
80000
10 30 50 70 90 110 130 150
Tightening Torque (ftlb)
Leak
age
Pre
ssur
e (p
si)
Male & Female NPT Male NPT, Female NPTF Male NPTF, Female NPT Male & Female NPTF
Male & Female NPT Ref. Male NPT, Female NPTF Ref. Male NPTF, Female NPT Ref. Male & Female NPTF Ref.
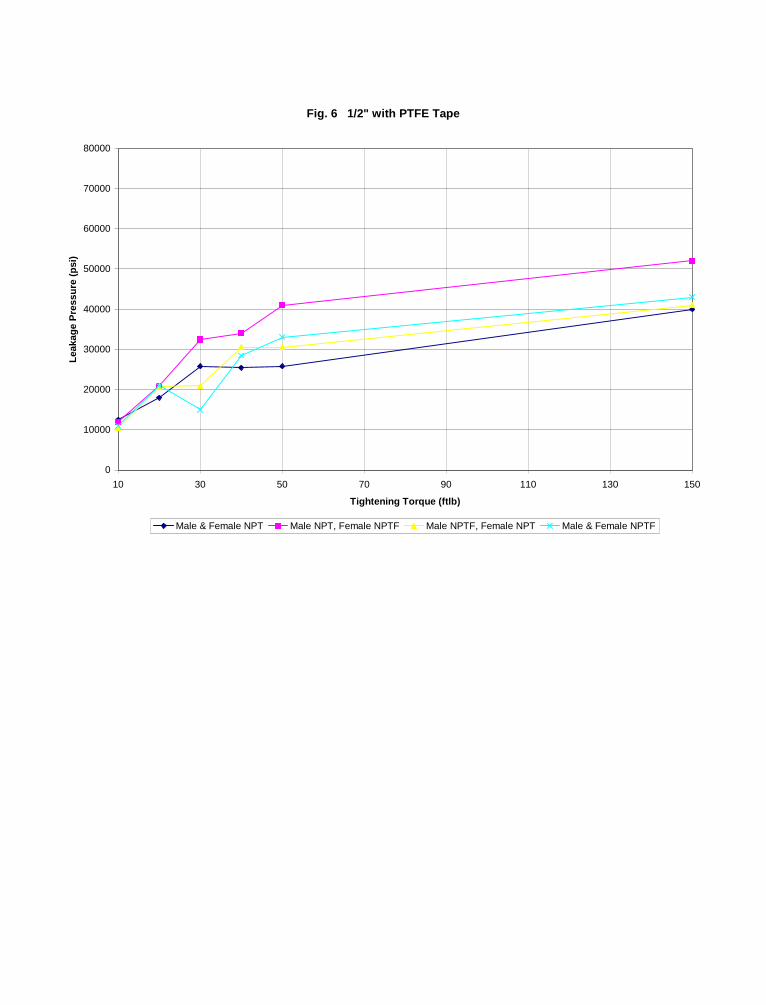
Fig. 6 1/2" with PTFE Tape
0
10000
20000
30000
40000
50000
60000
70000
80000
10 30 50 70 90 110 130 150
Tightening Torque (ftlb)
Leak
age
Pre
ssur
e (p
si)
Male & Female NPT Male NPT, Female NPTF Male NPTF, Female NPT Male & Female NPTF
10th American Waterjet ConferenceAugust 14-17, 1999: Houston, Texas
Paper 70
FLUID JET IGNITION HAZARDS SAFETY ANALYSIS
Paul L. MillerTeledyne Brown Engineering
Huntsville, AL, USA
ABSTRACT
The use of high-pressure abrasive fluid jets has caused concern among safety professionals due tothe presence of sparks during the cutting operations on certain metals. These sparks wereanalyzed as to their size, velocity, and temperature, and compared against unclassified militaryformulas for ignition probabilities. As a further test of the probabilistic model, abrasive waterjettests were conducted against steel, titanium, and zirconium targets in flammable gasenvironments.
Organized and Sponsored by the WaterJet Technology Association
1. INTRODUCTION
The need to cut or process materials can often occur in areas where flammable gases, liquids, andsolids are present. NFPA 70 (1996) classifies these environments as hazardous. Cutting metalsusing a heat-producing torch or saw in these hazardous locations is contraindicated because theflammable materials could ignite from either the process heat or from the incandescent swarfthrown from the process materials.
In recent years, non-traditional technologies for cutting materials have evolved and beenperfected. Radically different from those used only twenty years ago, these non-traditionalprocesses include ultrasonic machining, electrochemical machining, and fluid jet machining. Asin any machining process, each of these processes contains certain advantages and disadvantagesthat must be understood before evaluating the risks and benefits. The purpose of this paper is tospecifically address the hazards of using fluid jets for the abrasive cutting of metals in flammableenvironments.
2. STATEMENT OF PROBLEM
The use of abrasive fluid jet systems in flammable environments presents certain operationalparameters that are of concern to the safety professional. The two major areas of concern are themechanisms associated with abrasive fluid jets and the conditions that are required in order toinitiate a flammable reaction within a hazardous environment. In order to properly evaluate thehazards associated with abrasive fluid jet cutting of materials within a flammable environment,an analysis of the processes and parameters for ignition was first performed which incorporatedthe military pyrophoric ignition model. Once these mechanisms were understood, a series ofverification tests were performed in order to validate the model when used with abrasive fluidjets.
2.1 Mechanisms of Fluid Jet Operation
The abrasive fluid jet system works by pressurizing water (the most common fluid used) to highlevels and converting the pressure to velocity by means of a small diameter orifice. Downstreamof the orifice an abrasive stream is fed either by aspiration or by a compressed gas stream. Themixing of the fluid jet stream accelerates the abrasives to nearly one quarter the speed of the jetstream, which can be as high as 1000 m•s-1 (3300 fps). The high-velocity abrasive particles actas single-point cutting tools to remove small amounts of target material with each particleimpact. The major components of an abrasive fluid jet machine are the hydraulic intensifier, theorifice assembly, and the abrasive mixing assembly. The intensifier increases the pressure of thewater by means of hydraulic pistons from approximately 0.7 MPa inlet pressure to as high as1000 MPa (150,000 psi). The upper limit of 1000 MPa is functionally set by the freezing pointof water at room temperature. Currently, few systems are designed to operate at these pressures.Instead, most of the systems operate in the 200 to 400 MPa (30 to 60 Ksi) range to maximize thereliability of the equipment. The lower pressure is limited by the need for the kinetic energy ofthe cutting medium to exceed the yield strength of the target material.
Once the fluid jet is formed downstream of the orifice, the abrasive is entrained into the fluidstream in a mixing chamber. The three major fluid jet companies differ slightly in theirapproaches to entraining the abrasives with the same net results. The abrasive is fed from ahopper to the mixing chamber either by the suction formed by the passage of the fluid jet througha venturi, or by positive pressure. In either case, the abrasive is then fed into the water stream.In using positive pressure, excess gas is introduced. Since this excess gas is then entrained intothe fluid jet stream, this process effectively lowers the density and performance of the mixture.
The final component of the fluid jet system is the focusing tube, typically fabricated fromtungsten carbide or boron nitride. The function of the tube is to re-collimate the water streamthat has been disrupted by the introduction of the large mass of abrasive that the fluid stream hadto accelerate. The typical diameter of the focusing tube is about three times that of the orifice. Anominal abrasive fluid jet cutting combination would use a 3.6x10⁻⁴ m (0.014 inch) orifice inconjunction with a 1.1x10⁻³ m (0.043 inch) focusing tube.
2.1.1 Abrasive Fluid Jet Cutting Process
Abrasive fluid jet cutting is essentially forming a kerf by numerous individual abrasive grainsThese grains are accelerated by the fluid stream and act by gouging out minute particles (swarf)from the target material. To evaluate using fluid jets in hazardous locations, three considerationsmust be reviewed: the abrasive effects, the fluid stream spray, and spark formation from theswarf.
2.1.2 Abrasive Effects
The type, size, and quantity of abrasive used are all critical parameters for efficient cutting withthe abrasive fluid jet system. A de facto industry standard is a variety of garnet abrasive minedby Barton Abrasives in upstate New York. Other materials that can be used as abrasives in fluidjet systems include copper slag, steel shot, silica sand, and olivine sand. Materials containingfree silica, such as certain quartz sands, should be avoided due to their formation of both toxicsilica fines and the potential generation of electric discharge from the piezoelectric action ofquartz crystal deformation.
For typical fluid jet steel cutting operations, the abrasive size is usually specified as 180 microns(80 mesh). Abrasive materials finer than 100 microns can be used, but the cutting ratediminishes rapidly. Typical mass ratios of abrasive to fluid are 10% to 15%. According toSwanson (1987), the abrasive is accelerated under nominal conditions to well over 50 m⋅•s-1 andmay reach velocities in excess of 200 m•s-1 in the short distance through the focusing tube.
2.1.3 Spray Formation
The liquid fraction of the abrasive fluid jet remains coherent for less than a few thousanddiameters from the orifice. The flow rate from the orifice, at 300 MPa, is about 7.5x10⁻⁵ m3•s-1
or about 4.5 liters per minute. During the cutting action, the temperature of the fluid jet risesfrom ambient to between 338 K and 353 K (65º and 80º C) because of the mechanical workadded to the fluid from mechanical compression. (Although water is commonly thought of asincompressible, at the higher pressures used in fluid jet systems the water has about 11%compressibility.) After the jet stream has broken up due to dissipation or impact, the fluid isatomized and appears as a dense fog that is generally directed by momentum away from thecutting nozzle.
2.1.4 Spark Formation from the Swarf
The eroded pieces from the target material, known as swarf, are ejected under force from thecutting region and are collected along with the residual abrasive components for disposal. Theswarf forms the most likely candidate for igniting hazardous material as the ejecta is potentiallyvery hot from the energy imparted to it from the kinetic energy of the abrasive particles. The sizeof the swarf is governed to a large degree by the initial size of the abrasive particles forming it.The abrasive used in abrasive fluid jet cutting is substantially reduced in the process of fluid jetentrainment and may average only 50% of its original size. The impact of the abrasive grains inthe mixing and focusing tubes of the fluid jet apparatus tends to attrit the grains into muchsmaller sizes. In a hazard analysis performed in 1992, swarf collected from cutting ASI 4130steel with 180 micron (80 mesh) Barton garnet at 320 MPa (45 Ksi) water pressure yielded amixture of garnet and steel distributed as shown in Table 1. The largest swarf particle found byscanning electron microscopy (SEM) was approximately 100 microns. The surfaces of thematerials, both garnet and metal, showed distinctively sharp edges, precluding that neithermaterial was subjected to sufficient heat to cause edge rounding or melting. This useful markerprovided an upper limit for the localized heating effects at the point of swarf formation. Themelting point of steel is about 1700 K (1400° C) and that of garnet-like materials is about 2300 K(2000º C). Since the materials were not melted, nor appeared from the SEM data to be oxidized,the actual temperature the swarf reached was much lower.
2.2 Flammable Material Ignition Parameters
In order for flammable materials to ignite, conditions that take the low-rate chemicaldecomposition kinetics to a rate high enough to propagate into a combustion wave must occur.These parameters are typically compatible concentrations of fuel and oxidizer, along with asuitable ignition source. Other parameters present can either encourage the reaction rate orinhibit the reaction growth.
2.2.1 Flammability Limits
Most materials require a separate oxidizer, such as oxygen from the air, to burn. The reactivecombination of fuel and oxidizer is typically called the flammability range. Not all mixtures offlammable gases and air are reactive enough to generate sufficient heat to propagate or sustain aburning event. The lowest concentration limit for flammable vapor to propagate in a givenatmosphere is the lower flammability limit (LFL) or the lean mixture limit, and the upperconcentration limit is the upper flammability limit (UFL) or the rich mixture limit.
The flammability limits for hydrogen/air mixtures, according to Coward and Jones (1952), arebetween 4% and 74%. These flammability limits change radically with different combinations inthe gas mixtures. Standard air contains about 21% oxygen and 78% nitrogen. The rest of thematerials are gases such as argon and carbon dioxide. If the nitrogen content is replaced with adifferent diluent gas, for instance argon, the flammability limits may be substantially differentand the ignition energies reduced.
The ultimate flammable mixture is the undiluted combination of a fuel and an oxidizer. Suchmixtures are commonly found in liquid-fueled rocket engines which deliver the incredible energyreleases necessary for space travel (Huzel and Huang, 1971). Many other operations may find anoxygen-enriched atmosphere (OEA) containing in excess of 21% oxygen. In OEAs the upperflammability limits are substantially increased while the lower limits are approximately the sameas in air. The ignition energies are thus reduced by several orders of magnitude. According toNFPA 53 (1994), OEAs are so dangerous that even stainless steels will burn in them. The loss ofthree astronauts during a launch rehearsal in Apollo-1 using an OEA may have been the mostpublic loss, but numerous individuals are killed or injured each year in industrial accidents orduring medical procedures in which OEAs are used.
Different chemicals require significantly different ignition energy levels in order to initiate aburning reaction. The energy levels for a wide range of materials are published in NFPA 53(1994). A few representative materials have been selected for Table 2.
2.3 Ignition Sources
A flammable concentration alone is not sufficient for combustion to occur. An ignition sourcemust supply the necessary energy of activation in order for the chemical reaction to proceed at arate faster than the dissipation of energy into the environment. Typical ignition sources can begeneralized as:
• Electric discharge sparks• Thermal sources in excess of the autoignition temperature (AIT)• Adiabatic compression• Catalytic ignition• Kinetic energy sparks• Pyrophoric sparks.
2.3.1 Electric Discharge Sparks
The formation of electric discharge sparks from fluid spray is particularly important as the flowof liquid can easily contain several thousand volts due to triboelectric generation. This problemreceived worldwide attention in the late 1960s when three very large petroleum tankers ignitedduring water washdown operations. Safety hazard analyses by ESCIS (1988) identify that staticelectric charges occur in the following four circumstances: 1) liquids flowing through piping atrates greater than 1 m•s-1; 2) liquids passing through fine filters or orifices; 3) liquids beingsprayed; and 4) liquids impacting fixed parts. These conditions essentially describe the entirefluid jet cutting process. In testing in which low conductivity water was used, a distinct pinkcorona discharge was present at the tip of the ungrounded waterjet focusing tube indicatingionization of the local air, not water vapor, according to Rosebury (1993). Based on ESCIS(1988), a large corona would have a static potential in excess of 3000 kV•m-1.
Vos (1971) further concludes that the charge generation is proportional to the square of the jetvelocity and inversely proportional to the square of the fluid’s conductivity. Additives to thefluid that improve the surface activity and fluid impact increase the charge generation.
The control of static generation can be achieved by proper grounding and bonding of the systemcomponents. Proper grounding and bonding procedures to eliminate spray charge accumulationare available from numerous sources such as NFPA 30, NFPA 77, chemical process handbookssuch as Perry (1984), and military handbook MIL-HDBK-419 (1982). In addition, waterjetmanufacturing companies, according to Reynolds (1998), can suggest proprietary fluid additivesto minimize electrostatic generation.
2.3.2 Thermal Sources in Excess of Autoignition Temperatures
In order for flammable combinations of hydrocarbons in air to ignite from a thermal source, thethermal source must be of sufficient size and surface temperature must be in excess of 813 K(540º C), according to API Pub 2216 (1991). These thermal sources are commonly anexothermic flame source or a large heated piece of material, such as an exhaust manifold. Thismethod of ignition is not likely with an abrasive fluid jet since the presence of massive quantitiesof liquid typically prevents component temperatures from exceeding 373 K (100º C).
2.3.3 Adiabatic Compression Ignition
Adiabatic compression is a process in which a gas is compressed mechanically, thereby raisingthe temperature of the compressed gas through mechanical work. This ignition throughcompression is the basic operating principal behind the diesel engine. Although the impact of thefluid jet stream can create localized pressures far exceeding the compression ratios of a moderndiesel engine, the compressed area under the fluid stream is minuscule. Liquid flooding the areaalso limits any heat generation.
2.3.4 Catalytic Ignition
Certain chemicals substantially lower their energy of activation in the presence of specificcatalytic materials. A classic reaction is the room temperature reaction of hydrogen in air in thepresence of Raney nickel. The use of abrasive fluid jets on these certain materials may releasefinely divided catalytic reactants into the hazardous atmosphere and initiate a reaction. Metalsthat would release reactant catalysts for specific chemical mixtures would contain nickel,palladium, platinum, and, possibly, gold. Although cutting a precious metal with an abrasivefluid jet is unlikely because of the metal’s intrinsic value, the potential for cutting high nickelalloys is possible. The presence of strong catalytic sources, however, would likely cause asurface reaction that would lead to an ignition long before the components were cut by the fluidjet. For this reason, the catalytic reaction process is also unlikely to be a major ignition source,but should be researched prior to any operations with hazardous materials.
2.3.5 Kinetic Energy Sparks
Bernstein and Young (1957) identify that three distinctively different types of sparks may forman ignition source in a flammable gas environment: friction sparks, impact sparks, or electricalsparks. Friction and impact sparks are similar in nature and are the result of two hard materials’respectively abrading or impacting each other. Electrical sparks are the result of a dischargebetween two items having different electrical potential. Although these three types of sparks maylook identical, they perform very differently. Electrical spark ignition has a well-developedmethodology, as detailed by Roux et al. (1993). Repeatable results can be achieved whenelectrode size, shape, and material are described along with the spark duration and gap. For thesereasons most of the sensitivity tests on energetic materials are based on electrical spark initiationtests.
The energy levels required for electrical and impact sparks to ignite materials, however, may besignificantly different and have different initiation mechanisms. The thermal ignition ofmaterials is a physically complex task. In a study performed by Dixon-Lewis (1978), theminimum thermal ignition kernel, defined as the initial spheroid of ignited material, for non-pyrophoric metal in a hydrogen/air mixture, is approximately 2x10⁻³ m. Studies by Cutler(1974), Cutler (1978), Silver (1937), and Paterson (1940) investigate hot particle ignition offlammable gases. These studies show that for a given ignitable material, the temperaturenecessary for a given probability of ignition is inversely proportional to the heated particle’ssurface area. These studies also found that the temperature required for thermally hot particles toignite hydrogen/air goes up significantly for particles less than 4x10⁻³ m in diameter. For2x10-3 m diameter metal particles, the temperature required for Silver (1937) to give the 50%ignition probability in hydrogen/air was 1203 K (930º C), as compared with NFPA 325’s (1994)hot plate ignition temperature of 773 K (500º C).
In Silver’s (1937) work, hot particles fashioned from quartz spheres of various sizes werepropelled through various gas samples, and the temperature of the particle varied. Theseparticles were projected at about 4 m•s-1 (13 ft•s-1) through the gas mixture and the reaction, ifany, was recorded. Paterson (1940) repeated Silver’s work at slower speeds, 1.2 m•s-1 (4 ft•s-1),
and duplicated the pronounced effect that particle size has on the thermal requirements to ignite ahydrogen gas sample. In addition, Paterson commented that the effect of particle speed had aneven greater effect of shifting the ignition curves to hotter particles to achieve ignition, as shownin Figure 1. Since the swarf from an abrasive fluid jet is most likely traveling at some fraction ofthe initial abrasive particle velocity, it is likely that the thermal sparks are traveling at least a fullorder of magnitude faster than either Paterson’s or Silver’s test spheres.
Scull (1952) supports the suggestion that common metal sparks are incapable of ignitinghydrocarbon vapors in air:
“…Explosive mixtures of gasoline vapors and air at atmospheric pressure andtemperatures of 70° to 120° F would not ignite when exposed to sparks producedby the impact breaking of piano wire, contact of two pieces of hardened steel, steelin contact with a rotating emery wheel, or the sparks from red-hot steel. Suchsparks ordinarily lack the thermal energy required to ignite inflammable mixtures.Ordinary white friction sparks produced by grinding steel in air are actually smallmetal particles, which oxidize or burn in air after being initially heated by beingtorn off in the grinding process. These sparks will not ignite petroleum vaporsunless the metal is held to the wheel for a long time to preheat the metal andthereby increase the thermal energy of the spark.…” (emphasis added)
Another form of kinetic energy heating is in the impact cratering of the surface as the energy istransferred from the striking abrasive particle to the target surface. Research performed byTitman and Wynn (1954) showed a 15% ignition probability in a hydrogen/air gas mixture whenmild steel pieces impacted against each other with a force of about 500 joules. In the same seriesof tests, steel and brass spheres were projected at sandstone targets. The steel and brass sphereswere 6.3x10⁻³ m (0.25 inch) in diameter and weighed 1.04x10⁻³ kg and 1.13x10⁻³ kg respectively.The 50% probability of ignition in a hydrogen/air atmosphere was about 17 joules. The kineticenergy transfer mechanism is also an unlikely ignition mechanism as the kinetic energy in a fluidjet abrasive particle is substantially less than one joule. Given that garnet has a density of about3.8 x 102 kg•m-3, the energy released from a 500 m•s-1 cubic particle of garnet of 180 µ on a sidewould be less than 280 mJ.
Finally, in a series of tests by Sanders, Griffiths, and Moodie (1980) with abrasive slurry jets onmild steel and sandstone, the cutting process did not ignite hydrogen/air or methane/air mixturesin their test chambers. Unfortunately, these tests used a cutting process that is different from theabrasive fluid jet systems more commonly used today. According to Sanders (1982) thepressures in these early tests were limited to about 35 MPa to 85 MPa, compared to the 300 MPasystems currently used, and the abrasives used were either copper slag or sand rather than today’sgarnet. None of these tests, however, attempted to cut pyrophoric metals.
2.3.6 Pyrophoric Metals
Certain metals are classified as pyrophoric and require very little energy to cause an extensiverelease of thermal energy. These metals are not just releasing the thermal energy that waskinetically imparted to them by an abrasive particle, but are actually exothermicly reacting(burning) in the atmosphere, either spontaneously, or when the surface is abraded. A studyperformed on incendiary metals for military applications by Hillstrom (1973) identified fourteenpyrophoric metals; an additional five metals have since been suggested as being pyrophoric (seeboxed area in Figure 2). Metals tend to be pyrophoric, according to the military’s formula, if theoxide volume is larger than the parent metal volume and the free energy of oxide formation peroxygen atom exceeds approximately -105 kg-cal/mole, as shown in Figure 2. According to theformula, iron (steel) would not be pyrophoric, whereas titanium would be marginally pyrophoric,and zirconium would be markedly pyrophoric.
2.3.7 Ignition Inhibition
The opposite of an ignition source is an ignition inhibitor. Certain materials can radically modifythe LFL and UFL of flammable vapors by either thermal or thermal chemical effects. The mostpronounced effects are those of halogenated compounds that actively interfere with the ignitionprocess. Less effective than the halogen compounds are the “inert” gases, principally carbondioxide, water vapor, nitrogen, helium, and argon. Segeler (1965) states that the effectiveness ofthe inerting gases is in the order stated, namely CO2, H2O, N2, He, and Ar. These materials actby displacing the oxidizer from the reaction zone of the ignition kernel and by directly removingheat from the reaction zone. As stated earlier, the substitution of certain noble gases, such asargon, for atmospheric nitrogen may actually increase the ignition potential, while theintroduction of large quantities of water vapor may inhibit the chance of ignition through energyabsorption.
This concept of ignition inhibition by removing energy from the reaction is supported by Mitani(1983) in his work on the use of liquid sprays to prevent ignition. In the normal course of theoperation of an abrasive waterjet, over 7.5x10⁻⁵ m3•s-1 (1.1 gpm) of water is directly injected intothe zone of cutting and is atomized into a dense fog. It is highly possible that in some cases theratio of water mist to the existing flammable atmosphere creates its own inert gas blanket aroundthe cutting operation that extends for some distance in all directions. As shown in Table 3, watervapor has been proven to be a significant ignition inhibitor in the case of hydrogen gas andhydrocarbon ignition.
2.3.8 Summary of Ignition Process
The process of abrasive fluid jet cutting of metals in hazardous environments contains many ofthe potential mechanisms for ignition of common flammable materials. For these reasons, theentire process for fluid jet cutting was tested in a series of controlled test cuts using four differentmetals using an abrasive water jet at 300 MPa (45 ksi) in a series of flammable hydrogen gasenvironments of differing minimum ignition energy levels. Hydrogen was chosen as being boththe most sensitive flammable material and a common reference test material. The use of
hydrogen also provides additional statistical margin for operations using abrasive waterjets in thehydrocarbon/air mixtures. The minimum ignition energy for aliphatic or aromatichydrocarbon/air mixtures are a full order of magnitude greater than that required to ignitehydrogen/air. Likewise, hydrocarbon/air MIE are almost two hundred times greater than the MIEfor the hydrogen/oxygen mixture.
3. TEST METHODOLOGY
3.1 Test Overview
In order to test the limits of abrasive fluid jet hazards, a series of tests was arranged to pierce cutvarious metals with an abrasive waterjet inside of a controlled atmosphere of flammable gases.The test materials included ASI 1020 low carbon steel, ASI 4130 chrome-molybdenum steel,titanium, and zirconium metals. Atmospheres ranged from hydrogen/air to hydrogen/oxygen.The metals were cut using a 300 MPa (45 ksi) waterjet using 180 micron (80-mesh) Barton 80HP garnet. A series of forty-five plunge cuts established statistical accuracy. The plunge cut waschosen to maximize the potential for spark formation.
3.2 Test Chamber
Due to the potential hazards of performing a series of tests in OEAs, the cubic test chamber waslimited to about 2.8x10⁻² m3 (1 ft3) and constructed of 9x10⁻³ m (3/8 inch) steel plate inaccordance with TM5-1300 (1992). Construction of the chamber utilized full penetration weldsfollowed by interior surface polishing to minimize surface effects on the testing. The chamberwas proof-tested at 150% maximum expected pressure prior to being placed into service. Thevolume of the box was adjusted with internal void-filling objects to achieve 2.53x10⁻² m3
(0.89 ft3), which equates to one mole of gas at a room temperature of 293 K (20º C).
To achieve visibility for photographic purposes the front closure plate was constructed of tworedundant sheets of 3x10⁻³ m (1/8 inch) Lexan polycarbonate and restrained using 3x10⁻³ m(1/8 inch) cross wires. The pressure relief vent consisted of the rear side’s being left open andcovered with 4x10⁻⁵ m (0.002 inch) aluminum foil. The foil was secured using 1.2x10⁻² m widestrip magnets to form a gas-tight seal. In order to discharge the atmosphere in the event of a“failure to ignite” from the cutting action, a hole was drilled and threaded into one of the sideplates and a sparkplug was inserted. Electrical energy for the sparkplug was provided by a 5 kVignition transformer.
3.3 Test Setup
The testing was performed at Ingersoll-Rand’s McCartney Works facility in Baxter Springs, KS,during the last week of 1998. An Ingersoll-Rand Streamline II waterjet intensifier, using high-purity water from their reverse osmosis water polishing system, was used to deliver7x10-5 m3•sec-1 (1.1 gpm) at 300 MPa (45 ksi) with 0.5 kg•min-1 (1.1 lb•min-1) Barton 80 HPgarnet aspirated into the cutting head assembly. The test chamber cutting head was set up with a
3.6x10⁻⁴ m (0.014 inch) diameter diamond orifice and a 1.02x10⁻³ m (0.040 inch) Borazonfocusing tube. The fixture was arranged so that the nozzle maintained a 3x10⁻³ m (0.13 inch)standoff from the target plates. Specific attention was paid to assure that the equipment wasproperly grounded and bonded per military safety regulations.
The metal plates were positioned in the test chamber and the test chamber sealed using thealuminum foil blowout panel and the magnetic strips. A purge line to the chamber was left openand the chamber was flooded with either compressed shop air or CGA specification Type I,Grade A-E oxygen, depending on the oxidizer fill required for the test sequence. To maximizethe ignition sensitivity of the flammable gas mixture, the chamber was filled with a measuredamount of CGA specification Type I, Grade A-D hydrogen gas. The fuel/oxidizer mixture wasdetermined from Lewis and von Elbe (1961) as 20% H2 in air and 30% H2 in oxygen.
The mixtures provided a range of minimum ignition energies over an order of magnitude, therebyallowing the ignition potential to be bracketed. This procedure allowed for certain metals toignite gas mixtures at different levels of sensitivity. The sensitivity of hydrogen in an OEA is toodangerous for the mixture to be safely handled except in extremely rare and controlledconditions. According to Berkey et al. (1988), the human body can store many times the energynecessary to achieve the minimum ignition energies needed for hydrocarbon ignition. The staticdischarge from touching a metal object in such atmospheres can result in serious injuries. Theoxygen-enriched mixtures used were quite capable of developing a high-order detonation inexcess of 2500 m•sec-2, or approximately that of a primary high explosive, as shown in (Lewisand von Elbe, 1961).
During testing, the operators retreated approximately 5 meters (15 feet) from the test chamberand remotely operated the waterjet equipment. The pneumatic actuating valve for the cuttinghead was attached to an automatic sequencing timer set to cut for approximately 8 seconds,sufficient time to cut through the metal targets. “Successful” ignitions were determined by therupture or blow-off of the safety relief vent covered with aluminum foil. In the event of anignition “failure,” the chamber was intentionally ignited by the sparkplug igniter to purge thehazardous mixture. The test chamber and target were then cleaned prior to the next test.
3.4 Test Samples
Test coupons used in these tests were 6.25x10⁻³ m (0.246 inch) ASI 1020 steel, 6.8x10⁻³ m(0.268 inch) ASI 4130 steel, 6.4x10⁻³ m (0.252 inch) chemically pure (CP) titanium, Gr. 2, and7.53x10-3 (0.296 inch) zirconium 730. These materials contained certifications that indicatedcompliance with either ASI or military specifications.
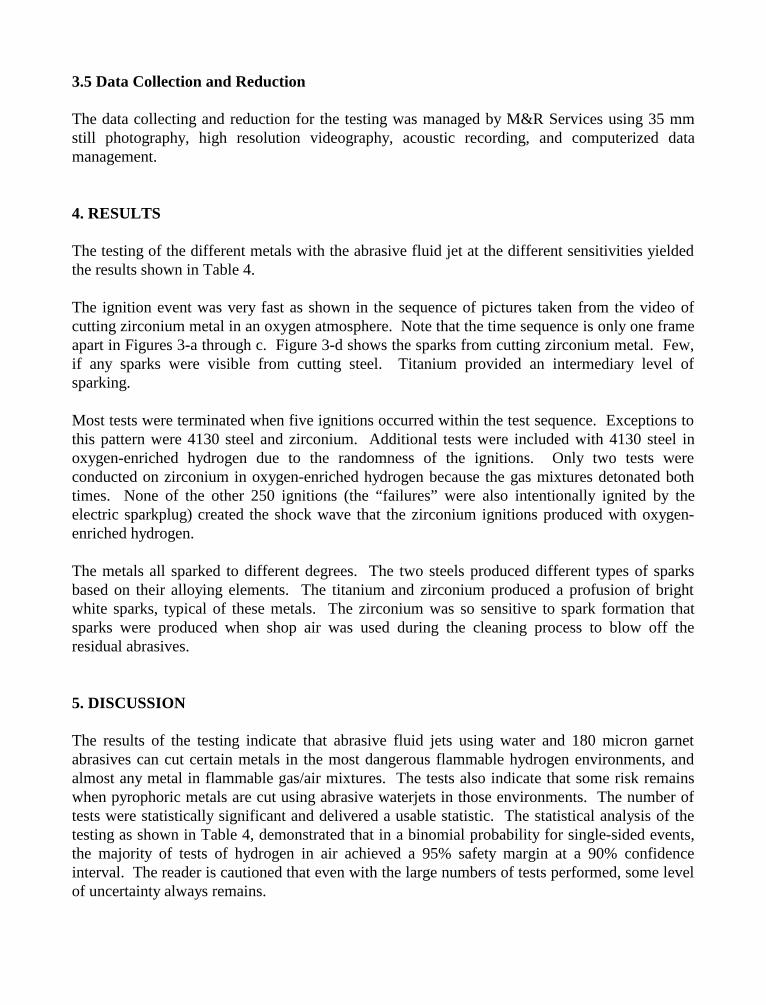
3.5 Data Collection and Reduction
The data collecting and reduction for the testing was managed by M&R Services using 35 mmstill photography, high resolution videography, acoustic recording, and computerized datamanagement.
4. RESULTS
The testing of the different metals with the abrasive fluid jet at the different sensitivities yieldedthe results shown in Table 4.
The ignition event was very fast as shown in the sequence of pictures taken from the video ofcutting zirconium metal in an oxygen atmosphere. Note that the time sequence is only one frameapart in Figures 3-a through c. Figure 3-d shows the sparks from cutting zirconium metal. Few,if any sparks were visible from cutting steel. Titanium provided an intermediary level ofsparking.
Most tests were terminated when five ignitions occurred within the test sequence. Exceptions tothis pattern were 4130 steel and zirconium. Additional tests were included with 4130 steel inoxygen-enriched hydrogen due to the randomness of the ignitions. Only two tests wereconducted on zirconium in oxygen-enriched hydrogen because the gas mixtures detonated bothtimes. None of the other 250 ignitions (the “failures” were also intentionally ignited by theelectric sparkplug) created the shock wave that the zirconium ignitions produced with oxygen-enriched hydrogen.
The metals all sparked to different degrees. The two steels produced different types of sparksbased on their alloying elements. The titanium and zirconium produced a profusion of brightwhite sparks, typical of these metals. The zirconium was so sensitive to spark formation thatsparks were produced when shop air was used during the cleaning process to blow off theresidual abrasives.
5. DISCUSSION
The results of the testing indicate that abrasive fluid jets using water and 180 micron garnetabrasives can cut certain metals in the most dangerous flammable hydrogen environments, andalmost any metal in flammable gas/air mixtures. The tests also indicate that some risk remainswhen pyrophoric metals are cut using abrasive waterjets in those environments. The number oftests were statistically significant and delivered a usable statistic. The statistical analysis of thetesting as shown in Table 4, demonstrated that in a binomial probability for single-sided events,the majority of tests of hydrogen in air achieved a 95% safety margin at a 90% confidenceinterval. The reader is cautioned that even with the large numbers of tests performed, some levelof uncertainty always remains.
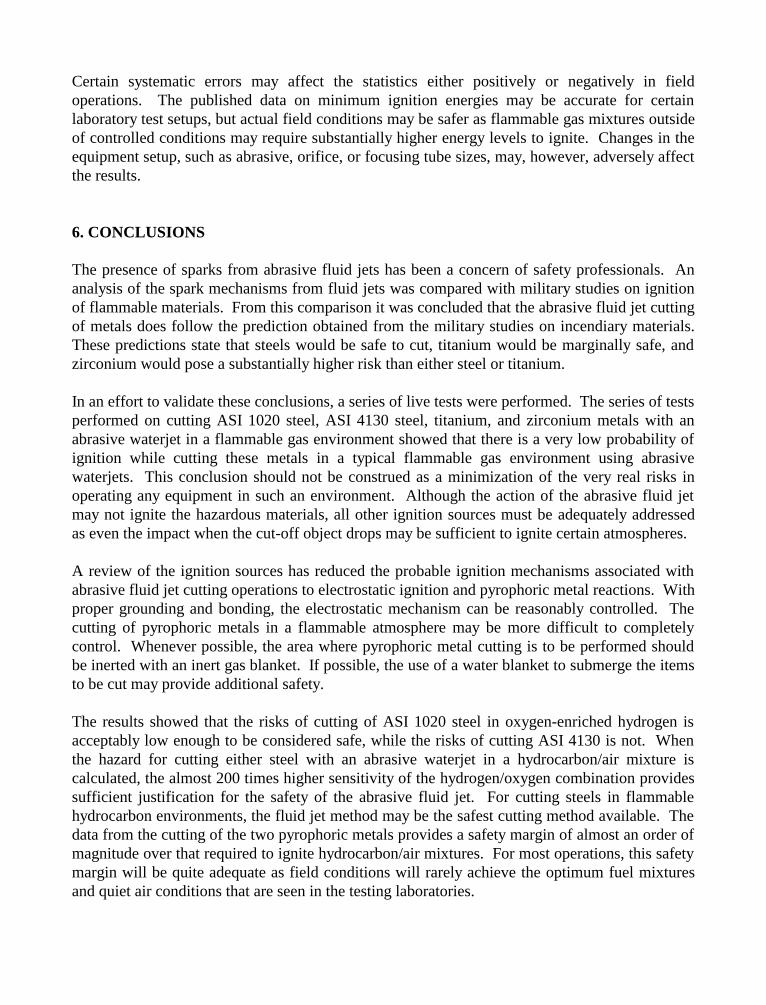
Certain systematic errors may affect the statistics either positively or negatively in fieldoperations. The published data on minimum ignition energies may be accurate for certainlaboratory test setups, but actual field conditions may be safer as flammable gas mixtures outsideof controlled conditions may require substantially higher energy levels to ignite. Changes in theequipment setup, such as abrasive, orifice, or focusing tube sizes, may, however, adversely affectthe results.
6. CONCLUSIONS
The presence of sparks from abrasive fluid jets has been a concern of safety professionals. Ananalysis of the spark mechanisms from fluid jets was compared with military studies on ignitionof flammable materials. From this comparison it was concluded that the abrasive fluid jet cuttingof metals does follow the prediction obtained from the military studies on incendiary materials.These predictions state that steels would be safe to cut, titanium would be marginally safe, andzirconium would pose a substantially higher risk than either steel or titanium.
In an effort to validate these conclusions, a series of live tests were performed. The series of testsperformed on cutting ASI 1020 steel, ASI 4130 steel, titanium, and zirconium metals with anabrasive waterjet in a flammable gas environment showed that there is a very low probability ofignition while cutting these metals in a typical flammable gas environment using abrasivewaterjets. This conclusion should not be construed as a minimization of the very real risks inoperating any equipment in such an environment. Although the action of the abrasive fluid jetmay not ignite the hazardous materials, all other ignition sources must be adequately addressedas even the impact when the cut-off object drops may be sufficient to ignite certain atmospheres.
A review of the ignition sources has reduced the probable ignition mechanisms associated withabrasive fluid jet cutting operations to electrostatic ignition and pyrophoric metal reactions. Withproper grounding and bonding, the electrostatic mechanism can be reasonably controlled. Thecutting of pyrophoric metals in a flammable atmosphere may be more difficult to completelycontrol. Whenever possible, the area where pyrophoric metal cutting is to be performed shouldbe inerted with an inert gas blanket. If possible, the use of a water blanket to submerge the itemsto be cut may provide additional safety.
The results showed that the risks of cutting of ASI 1020 steel in oxygen-enriched hydrogen isacceptably low enough to be considered safe, while the risks of cutting ASI 4130 is not. Whenthe hazard for cutting either steel with an abrasive waterjet in a hydrocarbon/air mixture iscalculated, the almost 200 times higher sensitivity of the hydrogen/oxygen combination providessufficient justification for the safety of the abrasive fluid jet. For cutting steels in flammablehydrocarbon environments, the fluid jet method may be the safest cutting method available. Thedata from the cutting of the two pyrophoric metals provides a safety margin of almost an order ofmagnitude over that required to ignite hydrocarbon/air mixtures. For most operations, this safetymargin will be quite adequate as field conditions will rarely achieve the optimum fuel mixturesand quiet air conditions that are seen in the testing laboratories.
The use of abrasive fluid jet cutting systems for cutting metals in hazardous environmentsappears to be an acceptable risk under most circumstances. In special cases in which thesensitivities of the hazardous mixtures or reactivity of the metal being cut are extreme, additionalverification tests should be performed. The safety professional must always evaluate both theprobabilities and the consequences when passing judgment where personnel or property is at risk.
7. REFERENCES
API Pub. 2216, 2nd ed., Ignition Risk of Hydrocarbon Vapors by Hot Surfaces in the Open Air,American Petroleum Institute, January 1991.
Berkey, B. D., Pratt, T. H., Williams, G. M., “Review of Literature Related to Human SparkScenarios,” Plant / Operations Progress, Vol. 7, No. 1, p. 32, Jan 1988.
Bernstein, H. and Young, G., Sparking Characteristics and Safety Hazards of MetallicMaterials, NAVORD RPT 5205, (AD 127 905) [Unclassified - Distribution Unlimited], p.1, 8 Apr. 1957.
Coordinating Research Council, Handbook of Aviation Fuel Properties (ADA 132 106)[Unclassified - Distribution Unlimited], Table 8, Society of Automotive Engineers, 1983.
Coward, H. F., and Jones, G. W., Limits of Flammability of Gases and Vapors, U.S. BuMinesBull 503, p. 17, 1952.
Cutler, D. P., “The Ignition of Gases by Rapidly Heated Surfaces,” Combustion and Flame, Vol.22, pp. 105-109, 1974.
Cutler, D.P., “Further Studies of the Ignition of Gases by Transiently Heated Surfaces,”Combustion and Flame, Vol. 33, pp. 85-91, 1978.
Dixon-Lewis, G., “Effect of Core Size on Ignition Energy by Localized Sources,” Combustionand Flame, Vol. 33, p. 320, 1978.
Expert Commission for Safety in the Swiss Chemical Industry (ESCIS), “Static Electricity: Rulesfor Plant Safety,” Plant/Operations Progress, Vol. 7, pp. 4 and 17, January 1988.
Hillstrom, W. W., Formation of Pyrophoric Fragments, BRL MR 2306 (AD 765 447)[Unclassified - Distribution Unlimited], p. 11, Ballistic Research Laboratories, AberdeenProving Ground, MD, June 1973.
Huzel, D. K., and Huang, D. H., Design of Liquid Propellant Rocket Engines, NASA SP-125, 2nd
ed. [Unclassified - Distribution Unlimited], p. 27, National Aeronautics and SpaceAdministration, 1971.
Lewis, B., and von Elbe, G., Combustion, Flames and Explosions of Gases, 2nd ed., p. 333,Academic Press, Inc., 1961.
Lyman, Taylor, ed., Metals Handbook, p. 20, American Society for Metals (ASM), 1948.
M&R Services, 113 Wandering Lane, Suite 301, Harvest, AL 35749-8266.
MIL-HDBK-419 Grounding, Bonding, and Shielding [Unclassified - Distribution Unlimited],Department of Defense USGPO.
Mitani, Tohru, “A Flame Inhibition Theory by Inert Dust and Spray,” Combustion and Flame,Vol. 43. p. 243, 1983.
NFPA 30, Flammable and Combustible Liquid Code, National Fire Protection Association,Batterymarch, MA, 1996.
NFPA 325 Fire Protection Guide on Hazardous Materials, 8th ed., Table 325M-59, NationalFire Protection Association, Batterymarch, MA, 1984.
NFPA 53, Fire Hazards in Oxygen Enriched Atmospheres, National Fire Protection Association,Batterymarch, MA, 1994.
NFPA 70, National Electric Code, Article 500 (Defined as Class I or Class II hazardouslocations), National Fire Protection Association, Batterymarch, MA, 1996.
NFPA 77, Static Electricity, National Fire Protection Association, Batterymarch, MA, 1996O’Donoghue, Michael, A Guide to Man-Made Gemstones, p. 23, Van Nostrand Reinhold,1983.
Paterson, Stewart, “The Ignition of Inflammable Gasses by Hot Moving Particles”, Phil. Mag. S.Series 7, Vol. 30, p. 443, December 1940.
Perry, R. H., ed., Perry’s Chemical Engineers’ Handbook, 6th ed., McGraw-Hill Book Company,New York, NY, 1984.
Reynolds, R.E. (Skip), Ingersoll-Rand Waterjet Division, Personal Communication, December1998.
Rosebury, F., Handbook of Electron Tube and Vacuum Techniques, p. 213, American Institute ofPhysics, New York, NY, 1993.
Roux, Michel, Auzanneau, Max, and Brassy, Claude, “Electric Spark and ESD Sensitivity ofReactive Solids (Primary or Secondary Explosive, Propellant, Pyrotechnics), Part One:Experimental Results and Reflection Factors for Sensitivity Test Optimization,”Propellants, Explosives, Pyrotechnics, Vol. 18, p. 317, 1993.
Saunders, D. H., “A Safe Method of Cutting Steel and Rock,” Paper K5, 6th Int. Symposiumon Jet Cutting Technology, p. 505, BHRA Fluid Engineering, 1982.
Saunders, D. H., Griffiths, N., Moodie, K., Water Abrasive Jet Cutting in FlammableAtmospheres, RR1608, British Hydrodynamic Research Association Fluid Engineering,June 1980.
Scull, W. E., Relationship Between Inflammables and Ignition Sources in Aircraft Environments,NACA TR 1019 [Unclassified - Distribution Unlimited], p. 315, National AdvisoryCommittee for Aeronautics, USGPO, 1952.
Segeler, C. George, ed., Gas Engineers Handbook, p. 2-75, American Gas Association, 1965.
Silver, Robert, “The Ignition of Gaseous Mixtures by Hot Particles,” Phil. Mag. S., Vol. 23, No.156. Suppl., p. 647, April 1937.
Swanson, R. K., Kilman, M., Rarver, W., and Wellman, R., “The Study of Particle Velocities inWater Driven Abrasive Jet Cutting,” Proc. 4th U.S. Waterjet Conference, p. 103, ASME,1987.
Titman, H., and Wynn, A. H. A., The Ignition of Explosive Gas Mixtures by Friction, ResearchReport No. 95, p. 12, Ministry of Fuel and Power (UK) Safety in Mines ResearchEstablishment, July 1954.
TM5-1300 Structures to Resist the Effects of Accidental Explosions (AD M000 097)[Unclassified - Distribution Unlimited], Department of Defense Explosive Safety Board,1992.
Vos, B., “Electrostatic Charge Generation during the Washing of Tanks with Water Sprays -IV:Mechanism Studies”, Static Electrification, Institute of Physics, London and Bristol, May1971.
Wynn, A. H. A., The Ignition of Firedamp by Friction Research Report No. 42, p. 14, Ministryof Fuel and Power (UK) Safety in Mines Research Establishment, July 1952.
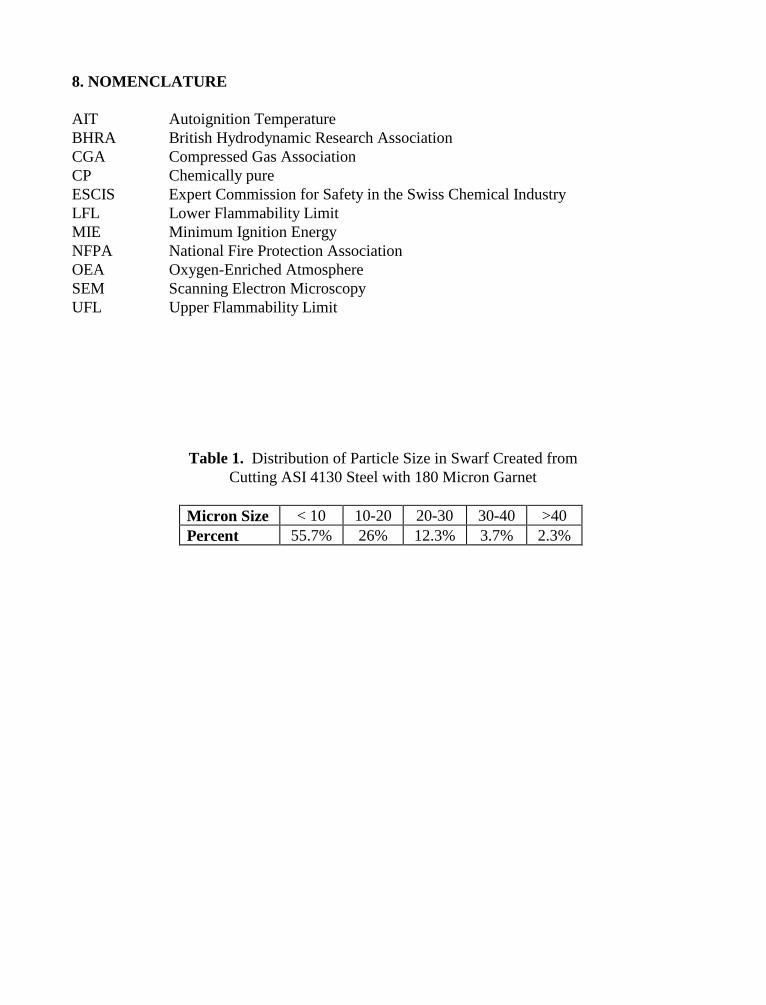
8. NOMENCLATURE
AIT Autoignition TemperatureBHRA British Hydrodynamic Research AssociationCGA Compressed Gas AssociationCP Chemically pureESCIS Expert Commission for Safety in the Swiss Chemical IndustryLFL Lower Flammability LimitMIE Minimum Ignition EnergyNFPA National Fire Protection AssociationOEA Oxygen-Enriched AtmosphereSEM Scanning Electron MicroscopyUFL Upper Flammability Limit
Table 1. Distribution of Particle Size in Swarf Created fromCutting ASI 4130 Steel with 180 Micron Garnet
Micron Size < 10 10-20 20-30 30-40 >40Percent 55.7% 26% 12.3% 3.7% 2.3%
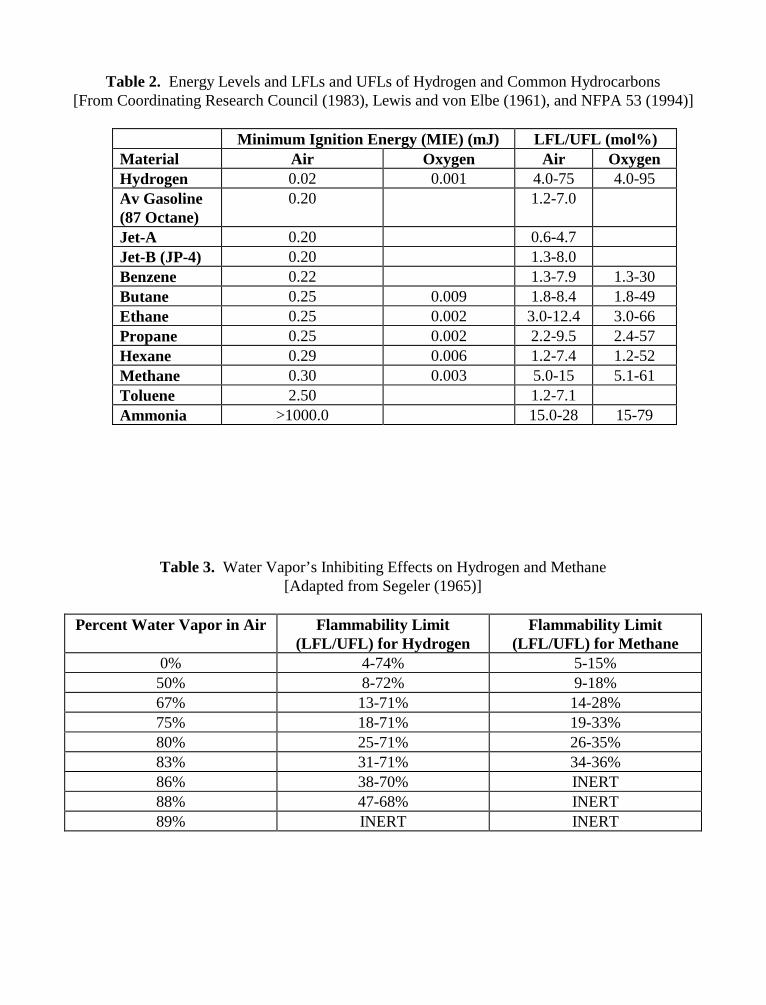
Table 2. Energy Levels and LFLs and UFLs of Hydrogen and Common Hydrocarbons[From Coordinating Research Council (1983), Lewis and von Elbe (1961), and NFPA 53 (1994)]
Minimum Ignition Energy (MIE) (mJ) LFL/UFL (mol%)Material Air Oxygen Air OxygenHydrogen 0.02 0.001 4.0-75 4.0-95Av Gasoline(87 Octane)
0.20 1.2-7.0
Jet-A 0.20 0.6-4.7Jet-B (JP-4) 0.20 1.3-8.0Benzene 0.22 1.3-7.9 1.3-30Butane 0.25 0.009 1.8-8.4 1.8-49Ethane 0.25 0.002 3.0-12.4 3.0-66Propane 0.25 0.002 2.2-9.5 2.4-57Hexane 0.29 0.006 1.2-7.4 1.2-52Methane 0.30 0.003 5.0-15 5.1-61Toluene 2.50 1.2-7.1Ammonia >1000.0 15.0-28 15-79
Table 3. Water Vapor’s Inhibiting Effects on Hydrogen and Methane[Adapted from Segeler (1965)]
Percent Water Vapor in Air Flammability Limit(LFL/UFL) for Hydrogen
Flammability Limit(LFL/UFL) for Methane
0% 4-74% 5-15%50% 8-72% 9-18%67% 13-71% 14-28%75% 18-71% 19-33%80% 25-71% 26-35%83% 31-71% 34-36%86% 38-70% INERT88% 47-68% INERT89% INERT INERT
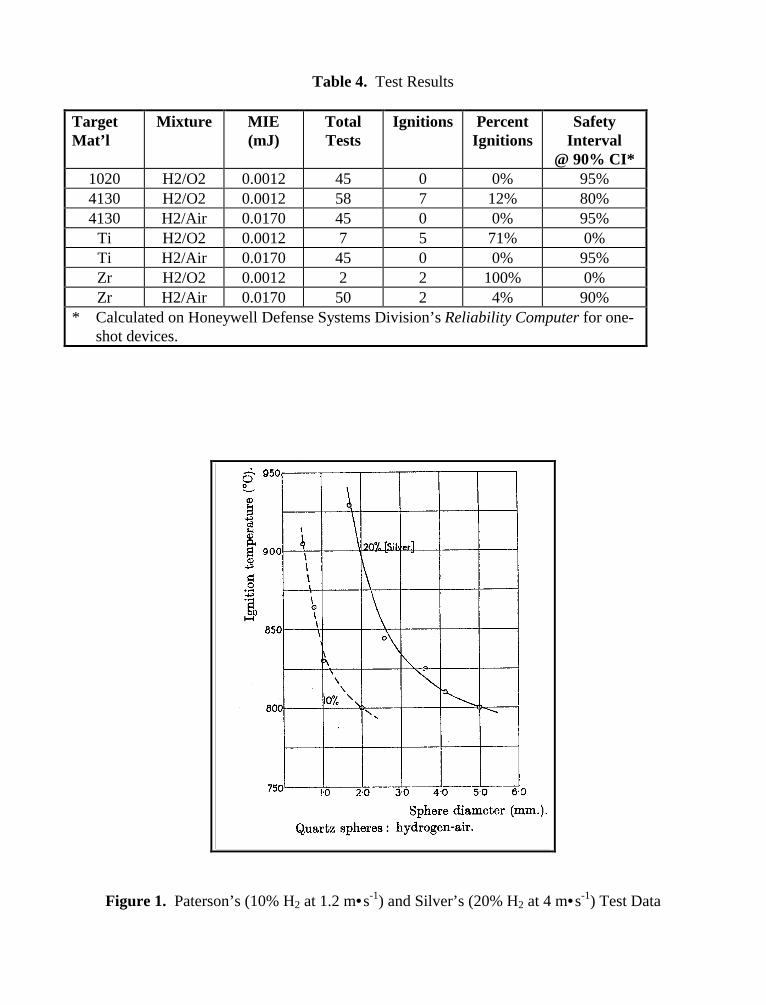
Table 4. Test Results
TargetMat’l
Mixture MIE(mJ)
TotalTests
Ignitions PercentIgnitions
SafetyInterval
@ 90% CI*1020 H2/O2 0.0012 45 0 0% 95%4130 H2/O2 0.0012 58 7 12% 80%4130 H2/Air 0.0170 45 0 0% 95%
Ti H2/O2 0.0012 7 5 71% 0%Ti H2/Air 0.0170 45 0 0% 95%Zr H2/O2 0.0012 2 2 100% 0%Zr H2/Air 0.0170 50 2 4% 90%
* Calculated on Honeywell Defense Systems Division’s Reliability Computer for one-shot devices.
Figure 1. Paterson’s (10% H2 at 1.2 m•s-1) and Silver’s (20% H2 at 4 m•s-1) Test Data
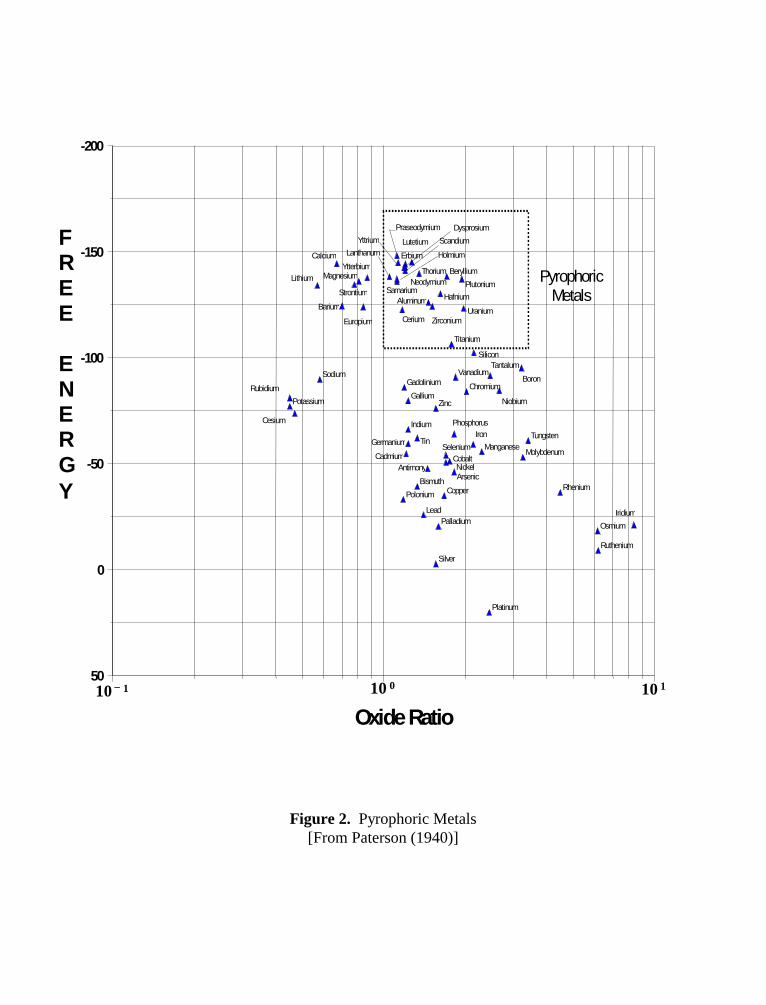
Figure 2. Pyrophoric Metals[From Paterson (1940)]
-200
Aluminum
AntimonyArsenic
Barium
Beryllium
Bismuth
Boron
Cadmium
Calcium
Cerium
Cesium
Chromium
Cobalt
Copper
Dysprosium
Erbium
Europium
Gadolinium
Gallium
Germanium
Hafnium
Holmium
Indium
Iridium
Iron
Lanthanum
Lead
Lithium
Lutetium
Magnesium
ManganeseMolybdenum
Neodymium
Nickel
Niobium
OsmiumPalladium
Phosphorus
Platinum
Plutonium
Polonium
Potassium
Praseodymium
Rhenium
Rubidium
Ruthenium
Samarium
Scandium
Selenium
Silicon
Silver
Sodium
Strontium
Tantalum
Thorium
Tin
Titanium
Tungsten
Uranium
Vanadium
Ytterbium
Yttrium
Zinc
Zirconium
10110010– 1
Oxide Ratio
50
0
-50
-100
-150FREE
ENERGY
PyrophoricMetals
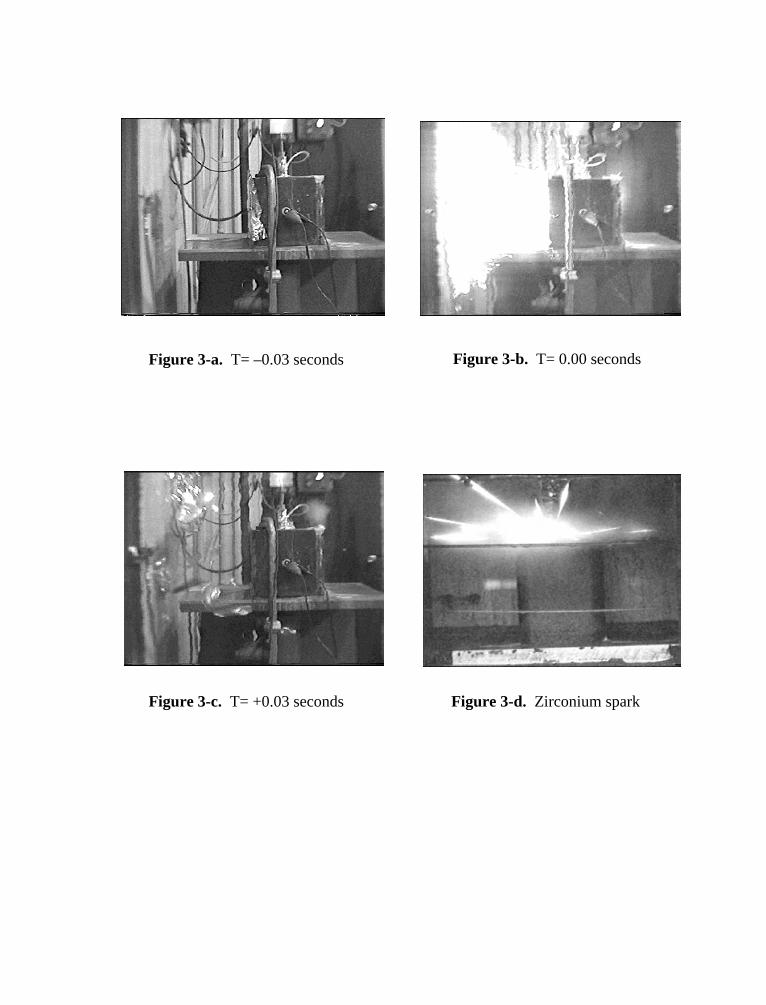
Figure 3-a. T= –0.03 seconds Figure 3-b. T= 0.00 seconds
Figure 3-c. T= +0.03 seconds Figure 3-d. Zirconium spark
10th American Waterjet ConferenceAugust 14-17, 1999: Houston, Texas
Paper 71
ULTRA HIGH PRESSURE WATERJETTING
FOR COATING REMOVAL
Richard F. SchmidFlow International Corporation
Kent, Washington, USA
ABSTRACT
Ultra high pressure (UHP) waterjetting is gaining acceptance as an alternate and many timespreferred method of surface preparation. However, knowledge of its applications and advantagesis somewhat unknown in the industry. This paper will focus on several actual case studies ofprojects where waterjetting has been used.
Organized and Sponsored by the WaterJet Technology Association
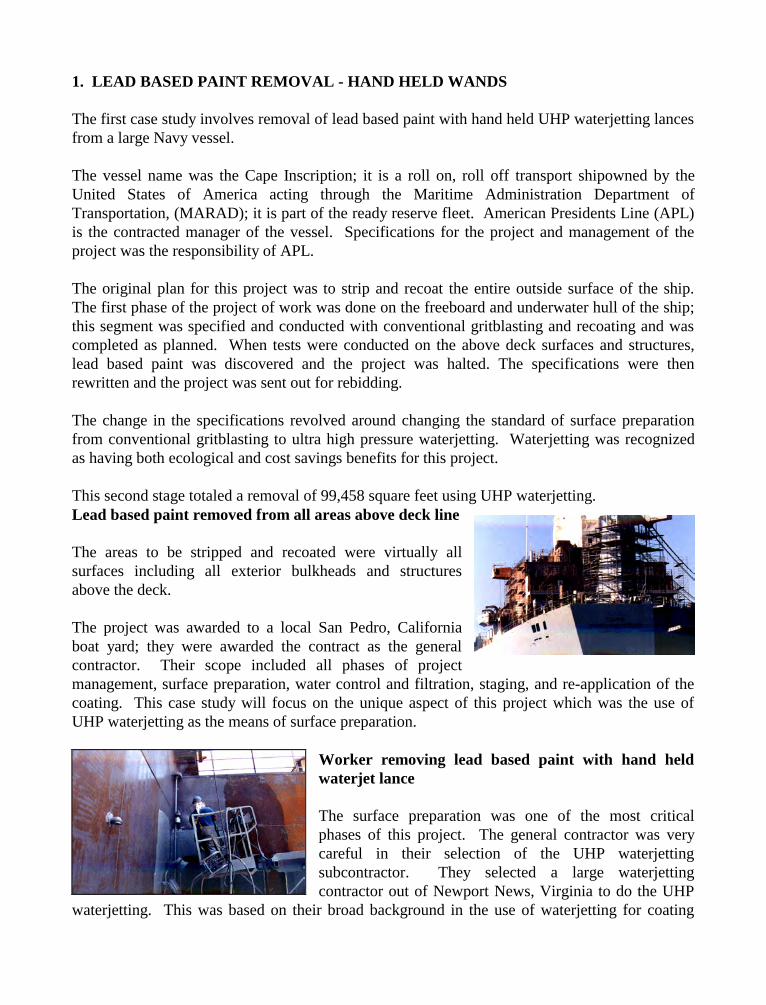
1. LEAD BASED PAINT REMOVAL - HAND HELD WANDS
The first case study involves removal of lead based paint with hand held UHP waterjetting lancesfrom a large Navy vessel.
The vessel name was the Cape Inscription; it is a roll on, roll off transport shipowned by theUnited States of America acting through the Maritime Administration Department ofTransportation, (MARAD); it is part of the ready reserve fleet. American Presidents Line (APL)is the contracted manager of the vessel. Specifications for the project and management of theproject was the responsibility of APL.
The original plan for this project was to strip and recoat the entire outside surface of the ship.The first phase of the project of work was done on the freeboard and underwater hull of the ship;this segment was specified and conducted with conventional gritblasting and recoating and wascompleted as planned. When tests were conducted on the above deck surfaces and structures,lead based paint was discovered and the project was halted. The specifications were thenrewritten and the project was sent out for rebidding.
The change in the specifications revolved around changing the standard of surface preparationfrom conventional gritblasting to ultra high pressure waterjetting. Waterjetting was recognizedas having both ecological and cost savings benefits for this project.
This second stage totaled a removal of 99,458 square feet using UHP waterjetting.Lead based paint removed from all areas above deck line
The areas to be stripped and recoated were virtually allsurfaces including all exterior bulkheads and structuresabove the deck.
The project was awarded to a local San Pedro, Californiaboat yard; they were awarded the contract as the generalcontractor. Their scope included all phases of projectmanagement, surface preparation, water control and filtration, staging, and re-application of thecoating. This case study will focus on the unique aspect of this project which was the use ofUHP waterjetting as the means of surface preparation.
Worker removing lead based paint with hand heldwaterjet lance
The surface preparation was one of the most criticalphases of this project. The general contractor was verycareful in their selection of the UHP waterjettingsubcontractor. They selected a large waterjettingcontractor out of Newport News, Virginia to do the UHP
waterjetting. This was based on their broad background in the use of waterjetting for coating
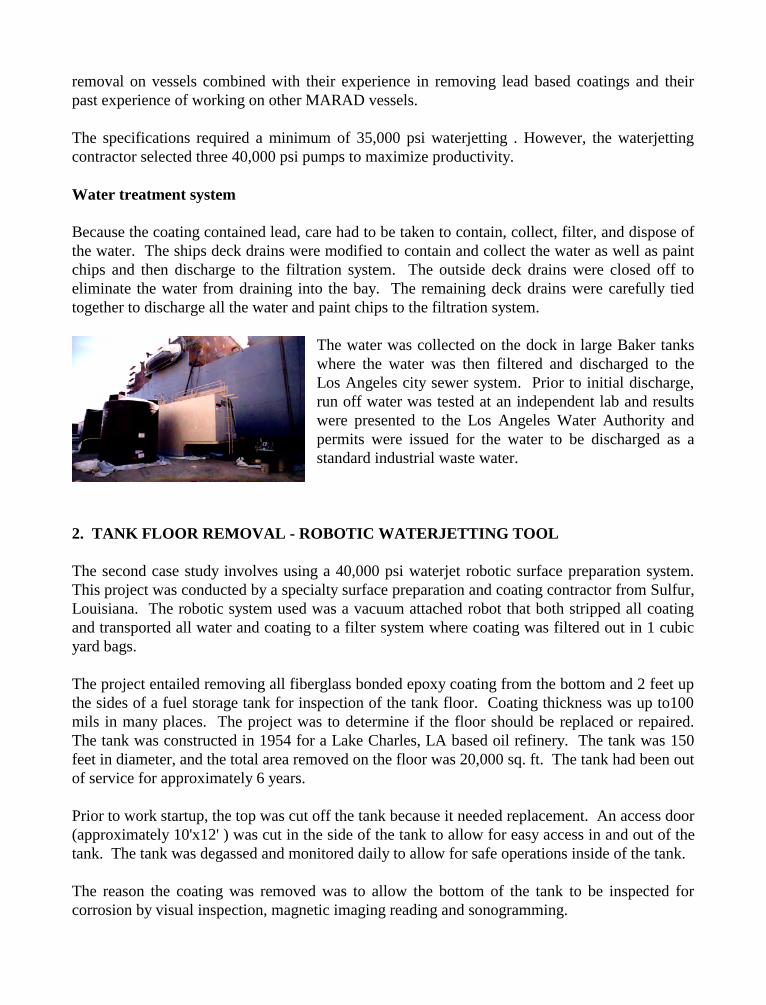
removal on vessels combined with their experience in removing lead based coatings and theirpast experience of working on other MARAD vessels.
The specifications required a minimum of 35,000 psi waterjetting . However, the waterjettingcontractor selected three 40,000 psi pumps to maximize productivity.
Water treatment system
Because the coating contained lead, care had to be taken to contain, collect, filter, and dispose ofthe water. The ships deck drains were modified to contain and collect the water as well as paintchips and then discharge to the filtration system. The outside deck drains were closed off toeliminate the water from draining into the bay. The remaining deck drains were carefully tiedtogether to discharge all the water and paint chips to the filtration system.
The water was collected on the dock in large Baker tankswhere the water was then filtered and discharged to theLos Angeles city sewer system. Prior to initial discharge,run off water was tested at an independent lab and resultswere presented to the Los Angeles Water Authority andpermits were issued for the water to be discharged as astandard industrial waste water.
2. TANK FLOOR REMOVAL - ROBOTIC WATERJETTING TOOL
The second case study involves using a 40,000 psi waterjet robotic surface preparation system.This project was conducted by a specialty surface preparation and coating contractor from Sulfur,Louisiana. The robotic system used was a vacuum attached robot that both stripped all coatingand transported all water and coating to a filter system where coating was filtered out in 1 cubicyard bags.
The project entailed removing all fiberglass bonded epoxy coating from the bottom and 2 feet upthe sides of a fuel storage tank for inspection of the tank floor. Coating thickness was up to100mils in many places. The project was to determine if the floor should be replaced or repaired.The tank was constructed in 1954 for a Lake Charles, LA based oil refinery. The tank was 150feet in diameter, and the total area removed on the floor was 20,000 sq. ft. The tank had been outof service for approximately 6 years.
Prior to work startup, the top was cut off the tank because it needed replacement. An access door(approximately 10'x12' ) was cut in the side of the tank to allow for easy access in and out of thetank. The tank was degassed and monitored daily to allow for safe operations inside of the tank.
The reason the coating was removed was to allow the bottom of the tank to be inspected forcorrosion by visual inspection, magnetic imaging reading and sonogramming.
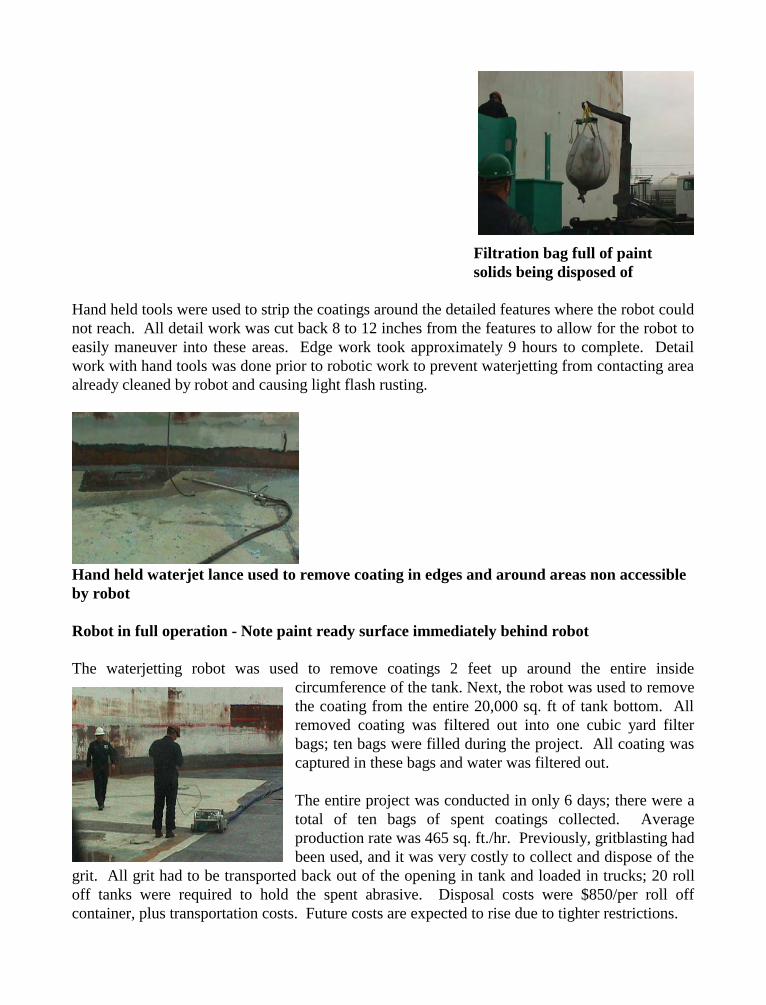
Hand held tools were used to strip the coatings around the detailed features where the robot couldnot reach. All detail work was cut back 8 to 12 inches from the features to allow for the robot toeasily maneuver into these areas. Edge work took approximately 9 hours to complete. Detailwork with hand tools was done prior to robotic work to prevent waterjetting from contacting areaalready cleaned by robot and causing light flash rusting.
Hand held waterjet lance used to remove coating in edges and around areas non accessibleby robot
Robot in full operation - Note paint ready surface immediately behind robot
The waterjetting robot was used to remove coatings 2 feet up around the entire insidecircumference of the tank. Next, the robot was used to removethe coating from the entire 20,000 sq. ft of tank bottom. Allremoved coating was filtered out into one cubic yard filterbags; ten bags were filled during the project. All coating wascaptured in these bags and water was filtered out.
The entire project was conducted in only 6 days; there were atotal of ten bags of spent coatings collected. Averageproduction rate was 465 sq. ft./hr. Previously, gritblasting hadbeen used, and it was very costly to collect and dispose of the
grit. All grit had to be transported back out of the opening in tank and loaded in trucks; 20 rolloff tanks were required to hold the spent abrasive. Disposal costs were $850/per roll offcontainer, plus transportation costs. Future costs are expected to rise due to tighter restrictions.
Filtration bag full of paintsolids being disposed of
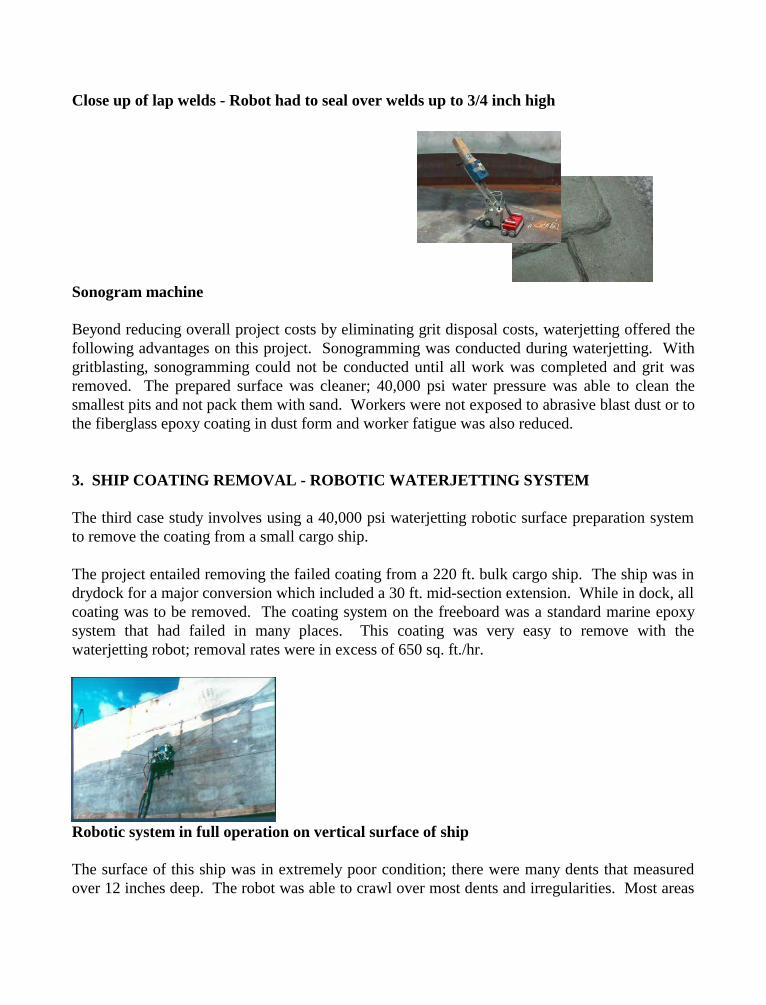
Close up of lap welds - Robot had to seal over welds up to 3/4 inch high
Sonogram machine
Beyond reducing overall project costs by eliminating grit disposal costs, waterjetting offered thefollowing advantages on this project. Sonogramming was conducted during waterjetting. Withgritblasting, sonogramming could not be conducted until all work was completed and grit wasremoved. The prepared surface was cleaner; 40,000 psi water pressure was able to clean thesmallest pits and not pack them with sand. Workers were not exposed to abrasive blast dust or tothe fiberglass epoxy coating in dust form and worker fatigue was also reduced.
3. SHIP COATING REMOVAL - ROBOTIC WATERJETTING SYSTEM
The third case study involves using a 40,000 psi waterjetting robotic surface preparation systemto remove the coating from a small cargo ship.
The project entailed removing the failed coating from a 220 ft. bulk cargo ship. The ship was indrydock for a major conversion which included a 30 ft. mid-section extension. While in dock, allcoating was to be removed. The coating system on the freeboard was a standard marine epoxysystem that had failed in many places. This coating was very easy to remove with thewaterjetting robot; removal rates were in excess of 650 sq. ft./hr.
Robotic system in full operation on vertical surface of ship
The surface of this ship was in extremely poor condition; there were many dents that measuredover 12 inches deep. The robot was able to crawl over most dents and irregularities. Most areas
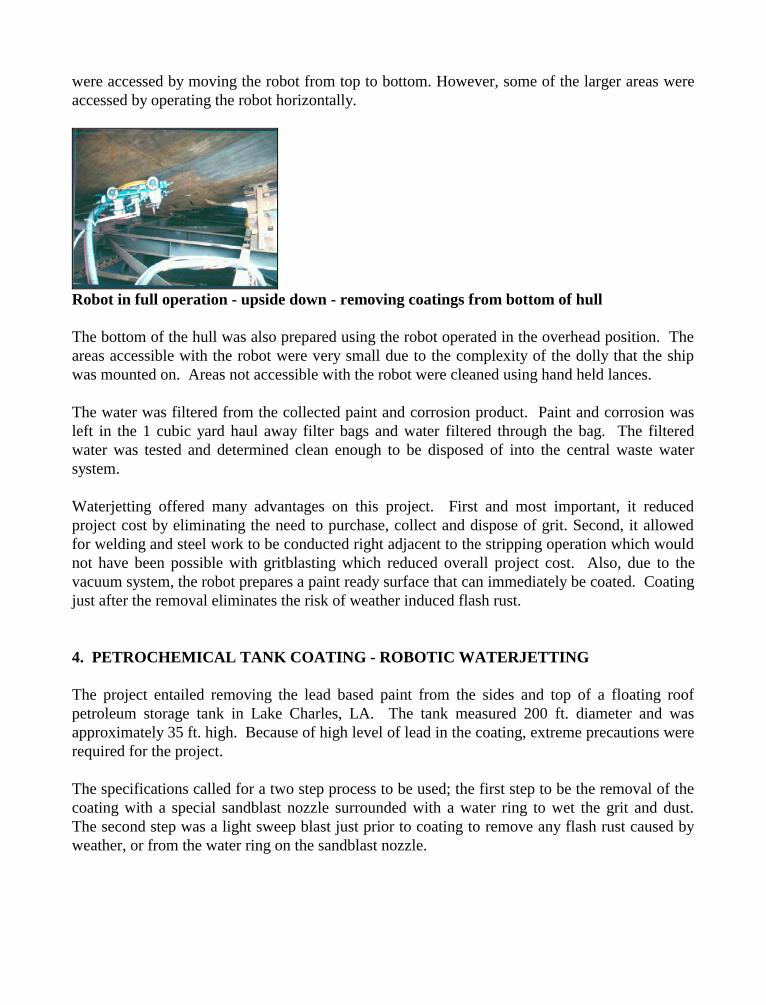
were accessed by moving the robot from top to bottom. However, some of the larger areas wereaccessed by operating the robot horizontally.
Robot in full operation - upside down - removing coatings from bottom of hull
The bottom of the hull was also prepared using the robot operated in the overhead position. Theareas accessible with the robot were very small due to the complexity of the dolly that the shipwas mounted on. Areas not accessible with the robot were cleaned using hand held lances.
The water was filtered from the collected paint and corrosion product. Paint and corrosion wasleft in the 1 cubic yard haul away filter bags and water filtered through the bag. The filteredwater was tested and determined clean enough to be disposed of into the central waste watersystem.
Waterjetting offered many advantages on this project. First and most important, it reducedproject cost by eliminating the need to purchase, collect and dispose of grit. Second, it allowedfor welding and steel work to be conducted right adjacent to the stripping operation which wouldnot have been possible with gritblasting which reduced overall project cost. Also, due to thevacuum system, the robot prepares a paint ready surface that can immediately be coated. Coatingjust after the removal eliminates the risk of weather induced flash rust.
4. PETROCHEMICAL TANK COATING - ROBOTIC WATERJETTING
The project entailed removing the lead based paint from the sides and top of a floating roofpetroleum storage tank in Lake Charles, LA. The tank measured 200 ft. diameter and wasapproximately 35 ft. high. Because of high level of lead in the coating, extreme precautions wererequired for the project.
The specifications called for a two step process to be used; the first step to be the removal of thecoating with a special sandblast nozzle surrounded with a water ring to wet the grit and dust.The second step was a light sweep blast just prior to coating to remove any flash rust caused byweather, or from the water ring on the sandblast nozzle.
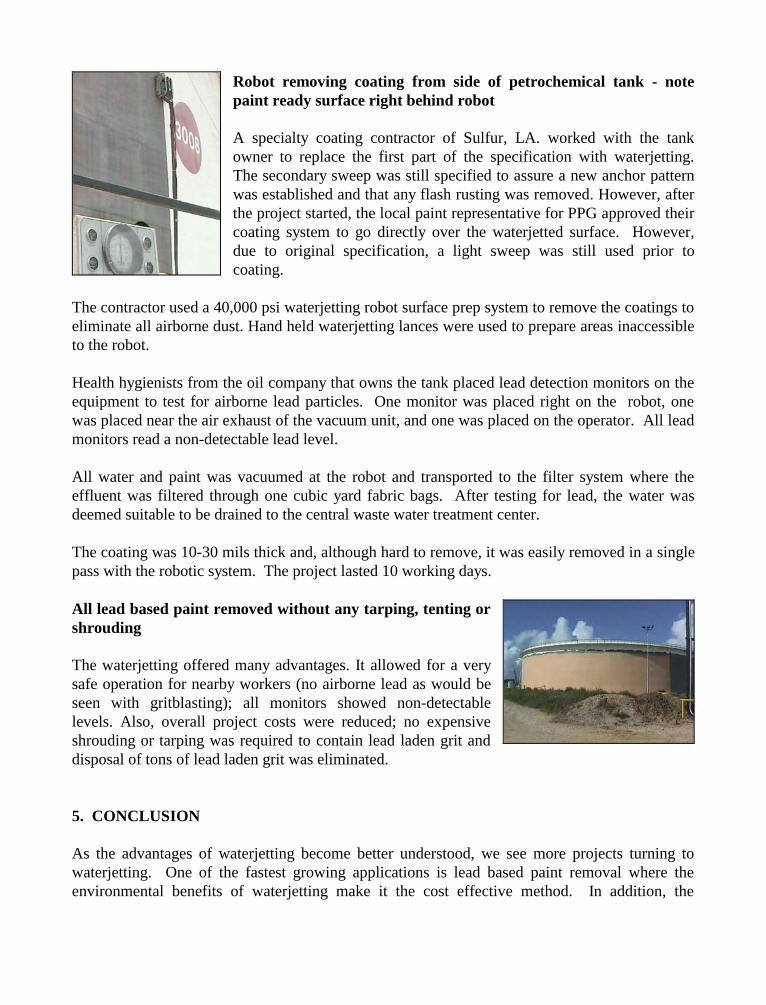
Robot removing coating from side of petrochemical tank - notepaint ready surface right behind robot
A specialty coating contractor of Sulfur, LA. worked with the tankowner to replace the first part of the specification with waterjetting.The secondary sweep was still specified to assure a new anchor patternwas established and that any flash rusting was removed. However, afterthe project started, the local paint representative for PPG approved theircoating system to go directly over the waterjetted surface. However,due to original specification, a light sweep was still used prior tocoating.
The contractor used a 40,000 psi waterjetting robot surface prep system to remove the coatings toeliminate all airborne dust. Hand held waterjetting lances were used to prepare areas inaccessibleto the robot.
Health hygienists from the oil company that owns the tank placed lead detection monitors on theequipment to test for airborne lead particles. One monitor was placed right on the robot, onewas placed near the air exhaust of the vacuum unit, and one was placed on the operator. All leadmonitors read a non-detectable lead level.
All water and paint was vacuumed at the robot and transported to the filter system where theeffluent was filtered through one cubic yard fabric bags. After testing for lead, the water wasdeemed suitable to be drained to the central waste water treatment center.
The coating was 10-30 mils thick and, although hard to remove, it was easily removed in a singlepass with the robotic system. The project lasted 10 working days.
All lead based paint removed without any tarping, tenting orshrouding
The waterjetting offered many advantages. It allowed for a verysafe operation for nearby workers (no airborne lead as would beseen with gritblasting); all monitors showed non-detectablelevels. Also, overall project costs were reduced; no expensiveshrouding or tarping was required to contain lead laden grit anddisposal of tons of lead laden grit was eliminated.
5. CONCLUSION
As the advantages of waterjetting become better understood, we see more projects turning towaterjetting. One of the fastest growing applications is lead based paint removal where theenvironmental benefits of waterjetting make it the cost effective method. In addition, the

introduction of robotic surface preparation systems are making larger size projects cost effectivewith waterjetting.
10th American Waterjet ConferenceAugust 14-17, 1999: Houston, Texas
Paper 72
SURFACE PREPARATION OF CONCRETE AND METAL WITH HIGH
PRESSURE AND ULTRA HIGH PRESSURE WATER
Ted KupscznkNLB Corporation
Wixom, MI
ABSTRACT
Presentation will focus on the proper procedures for cleaning and preparing concrete and metalsurfaces – both horizontal and vertical – so that new coatings can be applied. Removingcontaminants is essential for new coatings to adhere properly, but good adhesion also depends ona suitably rough surface or profile.
The advantage of water jetting will be discussed relative to coating and contaminant removalwithout damage to the original profile. Also new developments and accessories which enablesemi automated and fully automated vacuum recovery and containment of water and removeddebris will also be discussed.
Organized and Sponsored by the WaterJet Technology Association
10 American Waterjet Conference th
August 14-17, 1999: Houston, Texas Paper 73
NOZZLE PERFORMANCE IN ROTARY APPLICATIONS
D. Wright, J. Wolgamott, G. ZinkStoneAge, Inc.
Durango, Colorado, U.S.A.
ABSTRACT
Waterblast cleaning is widely used due to improved productivity, effectiveness and environmentalfriendliness. The development of new waterjet tools and more capable pumping equipment hascontributed to this acceptance. A critical aspect of all these tools is the jet quality produced. Theflow path through these tools is often very disruptive, which results in turbulent upstream conditionsand poor jet quality. The type of nozzle used can mean using an expensive pump to its fullestadvantage, or throwing away up to 50% of its power.
This paper studies the performance of common, commercially available nozzle types under both poorand good upstream conditions. Variations in flow, pressure, standoff distance, traverse velocity andjet angle were compared. Flow conditioning methods such as vanes, screens and feeder tubes wereevaluated for relative performance. The range of study included flow rates of 7.5 to 150 lpm (2 to40 gpm), pressures from 35 to 105 MPa (5000 to 15000 psi) and standoff distances from 3.8 to 185cm (1.5 to 73 in.), corresponding to 50 to 1000 nozzle diameters.
A mixture of cement and sand was used as a target material. The volume removed was measuredto determine jet effectiveness. Resulting jet performance was quantified and compared to real lifecleaning tasks.
Organized and Sponsored by the WaterJet Technology Association
1. INTRODUCTION
The performance of a waterjet cleaning tool is dependent on applying the necessary power to thesurface for proper cleaning. Once the jet exits the nozzle, it begins to lose power as it travels throughthe surrounding air. The better the jet quality (the tighter the jet) the more power it will deliver tothe target surface. Jet quality is influenced primarily by the upstream flow path conditions and theparticular nozzle design. Jet power deteriorates over distance after it leaves the nozzle. When this distance is expressed interms of nozzle diameters, the deterioration is uniform for all sizes of a nozzle style. For this reason,standoff distances are best expressed in terms of nozzle diameters. This method of expressingperformance was first suggested by Leach and Walker (1966). For example, if the standoff distanceto the surface to be cleaned is 750 mm (30 in.), the distance in terms of nozzle diameters for a .75mm (.030 in.) diameter nozzle would be 1000 nozzle diameters; while for a 1.8 mm (.073 in.)diameter nozzle this distance would be 410 nozzle diameters. If both jets had the same pressure atthe nozzle, the jet from the larger nozzle would reach the surface with more remaining power thanthe smaller nozzle jet.
Material to be removed from a surface has a minimum threshold pressure, below which it will notbe affected. Therefore, it must be attacked with a certain minimum amount of power for effectivecleaning. If this pressure is known, along with the standoff distance and the rate of deterioration ofthe jet through the air, minimum operating conditions of pressure and flow can be estimated. Thispaper addresses the rate of deterioration of various nozzle types and the effect on this rate withdifferent upstream conditions. Standoff distance, nozzle size, pressure, surface speed, and jet anglewere tested over a typical range of operating values.
2. TEST PROCEDURE
Test samples measuring 30 cm square by 14 cm thick (12 in. square by 5.5 in thick) of a cement/sandaggregate were prepared from a single mixed batch. An apparatus consisting of an air poweredgearbox, high pressure water swivel, and nozzle head was used to rotate the jet resulting in specificsurface speeds across the sample. The carriage with the nozzle head attached advanced 5 mm (.2in.) with each revolution of the head. This was accomplished with a tooth belt drive from therotating shaft to a threaded shaft. This equipment is shown in Figure 1. The sample was maskedwith a steel plate to expose a fixed surface area of the sample measuring 7.6 by 10 cm (3 by 4 in.)A typical test sample is shown in Figure 2. After the tests had been run, the volume removed wasmeasured using the struck sand method. This entailed pouring sand into the blasted out void,scraping off level with the top, and then collecting and measuring the resultant volume of sand. Atotal of 260 tests were conducted over a period of 3 months.
3. STUDIES
3.1 Nozzle Type Performance
Nine types of nozzles were tested with both poor and good upstream conditions at various flow ratesand pressures. The cross sections and nozzle types are described in Figure 3. These nozzles arecommonly used in waterblasting operations. Each nozzle was tested at standoff distances of 50, 200and 500 times the nozzle diameter. Surface speed across the samples for all tests was .6 m/sec (2ft/sec). Section 3.3 provides a description of the upstream conditions used. The results of nozzle performance with good upstream conditions are shown in Figure 4. With goodupstream conditions, nozzle I and nozzle B had the best performance. Nozzle I uses the carbide
insert as nozzle B, combined with a transition section to blend the nozzle entrance. The internalgeometry of these nozzles, in terms of inlet taper and length, is the closest to the optimum found byShavlovsky (1972) and Savanick and Frank (1976). Their studies showed an optimum inlet anglebetween 10 and 14 degrees, and a straight section of nozzle 3 to 4 times the orifice diameter.
The results of nozzle performance with poor upstream conditions are shown in Figure 5. Under poorupstream conditions, nozzle A had the best performance. This is due to the vane type flowconditioner, described in Section 3.4. The use of this type flow conditioner would improve theperformance of any nozzle type when operating under poor upstream conditions.
The type of nozzle used can mean using an expensive pump to its fullest advantage, or throwingaway up to 50% of its power. This study measured performance in terms of volume of materialremoved; some nozzles are optimized for other purposes, such as fan jets, which are optimized forsurface cleaning. It was observed during these tests that different nozzle types had different impactpatterns, which would result in different cleaning paths. For example, nozzle F cut a very narrowpath, and left ribs of material between passes. Nozzle C cut a wider path than the other nozzles,which would be useful in surface cleaning where complete coverage is required.
3.2 Effect of Flow and Pressure
A single nozzle type was tested at a variety of conditions to measure performance over a range ofstandoff distances. Nozzle type A was tested with both poor and good upstream conditions, atstandoff distances of 50, 200, 500 and 1000 times the nozzle diameter, at pressures of 35, 70 and 105MPa (5000, 10000 and 15000 psi), and at flow rates of 19, 57 and 150 lpm (5, 15 and 40 gpm) ateach of the pressures. Surface speeds across the samples for all tests were .6 m/sec (2 ft/sec).
Figure 6 shows the relationship of performance to standoff distance for the three different flow rates.A nozzle with good upstream conditions will decay by 35 percent between 50 and 500 nozzlediameter standoffs, while a nozzle with poor upstream conditions will decay by 60 percent over thesame range. Figure 7 shows the relationship of performance to standoff in nozzle diameters for thethree different pressures. A similar rate of decay occurs with pressure as did with flow. From thisanalysis, expressing performance versus standoff distance in terms of nozzle diameters appearsreasonable within this range of flows and pressures.
3.3 Effect of Upstream Conditions
Two types of nozzle heads were used; one typical of poor upstream conditions found in commonwaterjet tools, the other to represent good upstream conditions. These two heads are shown in Figure8. A feeder tube was used to produce good upstream conditions. Ideal feeder tubes are straight andaxially symmetric with a smooth bore leading to the nozzle. The good upstream condition used forthese tests was based on findings by Shavlovsky (1972), where the length of the feeder tube shouldnot be less than 40 to 50 times the inside diameter. For this study, the length of feeder tube used was61 cm (24 in.) with an inside diameter of 1.2 cm (.46 in.), resulting in a ratio of length to insidediameter of 52 times.
Figure 9 shows the results obtained with poor upstream conditions using nozzle type B, relative tothe results obtained by Leach and Walker (1966) when testing the Shavlovsky nozzle design. Leachand Walker measured the performance of a nozzle by measuring the stagnation pressure of the jeton a surface relative to the pressure at the nozzle, whereas this study measured nozzle performancein terms of volume of material removed. The results appear very similar.
Figure 10 compares nozzle type B, poor upstream conditions, with the same nozzle, good upstreamconditions tested at a flow rate of 19 lpm (5 gpm). This shows that good upstream conditions can
double the performance found with poor upstream conditions. Overall, all nozzle types showed anaverage improvement of 45% over poor upstream conditions.
The importance of good upstream conditions increases as flow rates increase. This can be seen inFigure 11, comparing poor and good upstream conditions at flow rates of 19, 57 and 151 lpm (5, 15and 40 gpm). At 19 lpm (5 gpm), the ratio of poor upstream performance divided by the goodupstream performance was .76, while at 151 lpm (40 gpm), this ratio dropped to .46. At the highestflow rate, the inside diameter of the feeder tube used for good upstream conditions was only 3.5times the nozzle diameter used for this condition. Shavlovsky (1972) found that increasing theinside diameter of the feeder tube up to ten times the nozzle diameter gave the optimumperformance.
3.4 Effect of Flow Conditioning
Limitations of access to pipes, ducts or vessels often require that nozzle head designs with poorupstream conditions be used. In these cases, more compact methods of flow conditioning becomeimportant. Four different methods of flow conditioning were evaluated at 70 MPa (10000 psi), 57lpm (15 gpm) at standoff distances of 200, 500 and 1000 nozzle diameters. Figure 12 shows the fourtypes evaluated. The cone and screen type flow conditioners showed no performance improvementat the conditions tested. However, other field results at flow rates above 300 lpm (80 gpm) haveshown screens to be beneficial.
The effect of the vane type flow conditioner to improve poor upstream conditions is shown in Figure13, relative to results obtained with no flow conditioning, and results with good upstream conditions.The vane flow conditioner provided an improvement of 40 percent over a nozzle without one, butwas still 25 percent less effective than the nozzle with good upstream conditions.
Further study was conducted on the effect of length feeder tubes when used for flow conditioning.The use of feeder tubes has limitations; the length of feeder tube is often limited by the size of theaccess to the vessel or pipe to be cleaned. Using feeder tubes, or nozzle arms, as they are commonlycalled, serves the purpose of reducing the standoff distance to the surface, as well as conditioningthe flow.
Figure 14 shows the performance of feeder tubes with increasing ratio of length to inside diameter.Lengths of 5, 10, 25 and 60 cm (2, 4, 10 and 24 in.) with an inside diameter of 1.2 cm (.46 in.) werecompared in these tests. Nozzle A, with the vane type flow conditioner, was used in these tests,conducted at 70 MPa (10000 psi), 57 lpm (15 gpm). The ratio of the inside diameter of the feedertube to the nozzle diameter was 6.5. The shortest section improved jet performance by 22 percentoverall. Improvement was seen out to the maximum lengths tested, with increasing effect as standoffdistance was increased.
3.5 Effect of Surface Speed
Tests were conducted to study the effect of jet surface speed. Surface speeds of 1.5, 3, 6 and 12m/sec (5, 10, 20 and 40 ft/sec) at standoff distances of 200, 500 and 750 nozzle diameters were tried.Multiple passes were made at the faster speeds to achieve a constant energy application. A singlepass was made at 1.5 m/sec (5 ft/sec), two passes at 3 m/sec (10 ft/sec), four passes at 6 m/sec (20ft/sec), and eight passes at 12 m/sec (40 ft/sec).
The testing of surface speed effect was done using poor upstream conditions, at 70 MPa (10000 psi),57 lpm (15 gpm) with nozzle A. The results are shown in Figure 15. The maximum performancewas achieved with eight passes at 12 m/sec (40 ft/sec) at a 200 nozzle diameter standoff. At a
standoff of 500 nozzle diameters the optimum effect occurred with four passes at 6 m/sec (20 ft/sec).At a standoff of 750 nozzle diameters, the optimum effect occurred with a single pass at 1.5 m/sec(5 ft/sec).
In a single pass, slower speed results in a deeper cut. There are cases where a single slow pass canresult in penetration to a boundary layer, such as a hard, brittle material in a steel vessel, whichresults in larger pieces being spalled off at the boundary layer. This method of material removalmight be more efficient than slowly eroding the material in shallow fast passes.
3.6 Effect of Nozzle Angle
Tests were conducted to determine jet performance relative to exit angles from the head. The samplesurface remained parallel to the axis of rotation, so the angle of impingement was the same as theexit angle. Figure 16 illustrates the angles tested.
Performance of the angled jets relative to 90( was affected by the direction of progression ofsuccessive passes of the angled jets. Plowing describes the progression in the same direction as thejet; dragging is progression opposite to the jet angle, as shown in Figure 16. When the jet wasplowing, the performance with the 45( and 135( angle was 12 percent better than that achieved withthe 90( jet. However, if the angled jet traveled in the dragging direction, the performance of the 45(
and 135( angle was 27 percent less than that of the 90( jet. Figure 17 shows the effect of jet angleand direction of travel on jet performance. Overall, with nozzle A, the jet exiting at 45( exhibited10 percent better quality than the jet exiting at 135(.
The improved performance resulting from the plowing direction of travel was dependent on thecumulative effect of successive passes; the path spacing used for these tests was close to matchingthe jet path width. Single, independent passes at 45( were not as effective as the 90( angle of attack.
4. CONCLUSIONS
4.1 Nozzle Selection
The results of the tests performed on various nozzles showed a difference in performance of up to50 percent between nozzle types. The optimum performance with good upstream conditions wasobtained by the nozzle type with a geometry that has been proven in tests by others to be the best.When poor upstream conditions exist, nozzles with vane type flow conditioners should be used whenpossible.
4.2 Upstream Conditions
Poor upstream conditions reduce jet performance by 25 to 55 percent compared to performance withgood upstream conditions. The deterioration increases with increasing flow rate. Poor upstreamconditions can be improved through the use of flow conditioning. The vane type flow conditioneris inserted behind a nozzle, and will improve performance by up to 40 percent.
Feeder tubes or nozzle arms are useful for reducing standoff distance; they also act as flowconditioners. A length of 4 times the inside diameter of the feeder tube improved performance by22 percent. Feeder tubes with lengths up to 50 times their inside diameter have greater effect at largestandoff distances.
4.3 Surface Speed
The effect of surface speed was dependent on standoff distance. At a 200 nozzle diameter standoff,the optimum was found to occur at or above 12m/sec (40 ft/sec) when multiple passes were made.At a standoff distance of 750 nozzle diameters, the optimum occurred with a single pass at 1.5 m/sec(5 ft/sec).
4.4 Jet Angle
The jet angle exiting the head between 45( and 135( affected jet quality by up to 10 percent.However, performance differences of between 12 and 25 percent were seen depending on directionof travel over the surface relative to the jet angle.
5. REFERENCES
Leach, S.J., and Walker, G.L., “Some Aspects of Rock Cutting by High Speed Water Jets,” Phil.Trans. Royal Society, Vol. 260A, pp. 295-308, London, UK, 1966.
Savanick, G.A., and Frank, J.N., “Force Exerted by Water Jet Impact at Long StandoffDistances,” Third International Symposium on Jet Cutting Technology, pp. B5-59-B5-68,BHRA Fluid Engineering, Cranfield, UK, 1976.
Shavlovsky, D.S., “Hydrodynamics of High Pressure Fine Continuous Jets,” First InternationalSymposium on Jet Cutting Technology, pp. A6-81-A6-92, BHRA Fluid Engineering,Cranfield, UK, 1972.
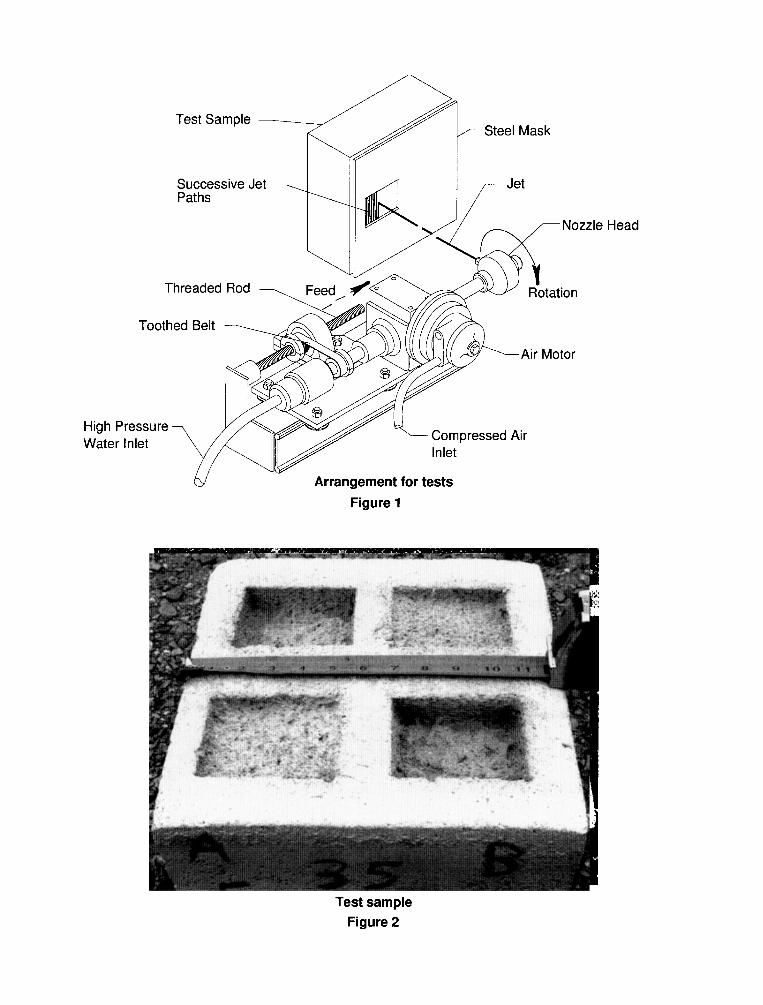
Nozzle
ion
Too
tor
High Pressur
Water Inlet
Figure 1
Head
Test sample
Figure 2
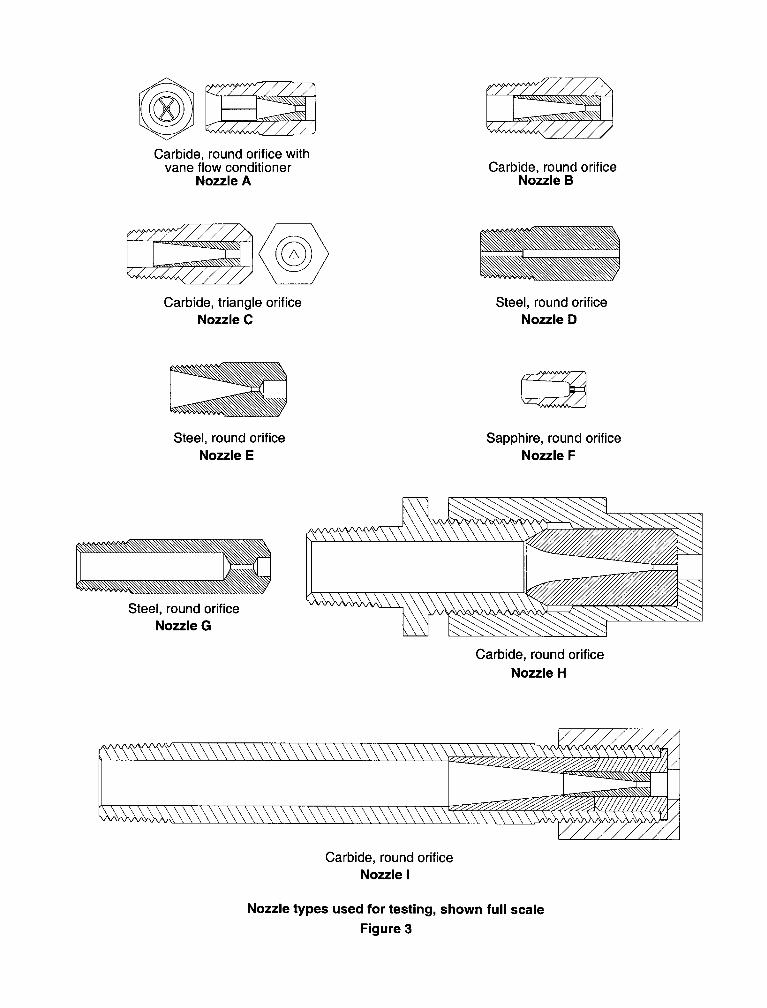
Carbide, round orifice withvane flow conditioner
Nozzle A
Carbide, triangle orifice
Nozzle C
Steel, round orifice
Nozzle E
Steel, round orifice
Nozzle G
Carbide, round orificeNozzle B
Steel, round orifice
Nozzle D
Sapphire, round orifice
Nozzle F
Carbide, round orifice
Nozzle H
Carbide, round orifice
Nozzle 1
Nozzle types used for testing, shown full scale
Figure 3
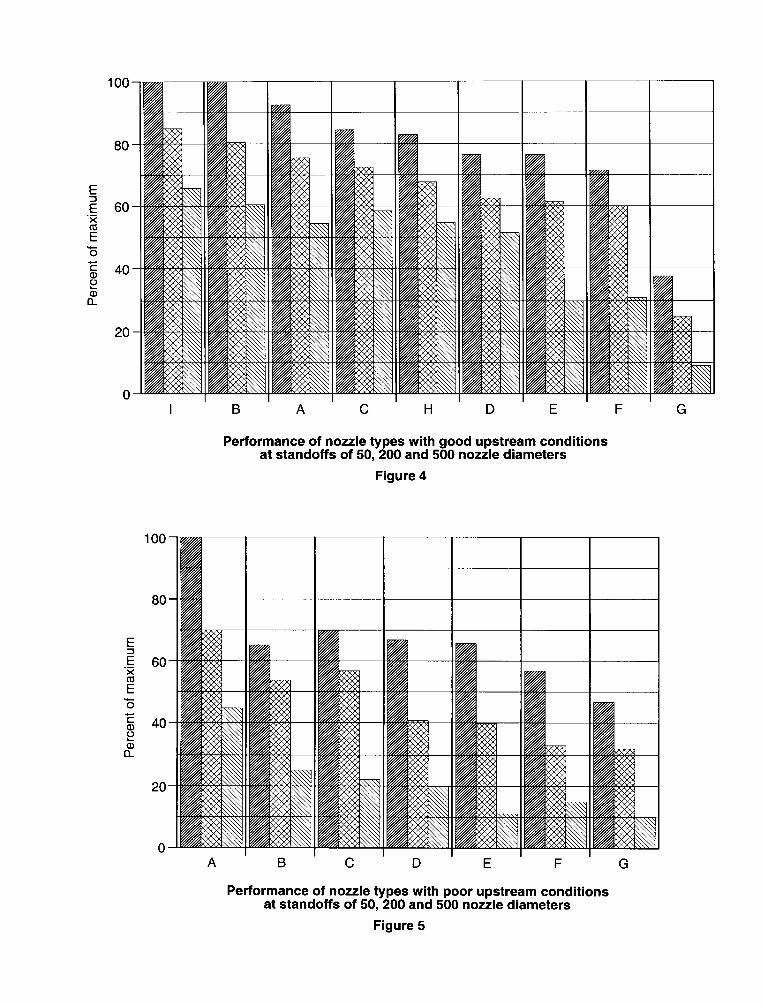
I
1oo-
80-
60-
40-
20-
0-
B’A’C’H’D ‘E’F’
Performance of nozzle types with good upstream conditionsat standoffs of 50, 200 and 500 nozzle diameters
Figure 4
A B c D
I I
E’F’G
G
Performance of nozzle types with poor upstream conditionsat standoffs of 50, 200 and 500 nozzle diameters
Figure 5
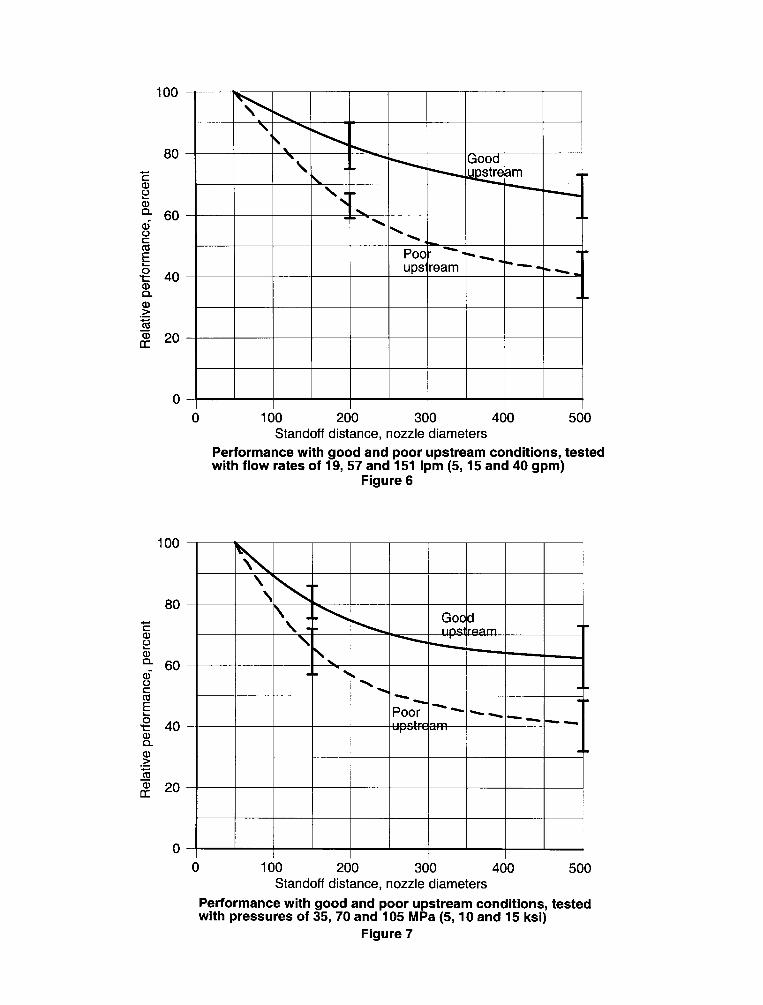
100
80
o
100
0
\
\\
\Good-e am
\- -
\\
\\.
Poo - -“ --ups’ ream “*-- .-
0 100 200 300 400 500Standoff distance, nozzle diameters
Performance with good and poor upstream conditions, testedwith flow rates of 19, 57 and 151 Ipm (5, 15 and 40 gpm)
Figure 6
\’\
\- .’ \ _ Goo dream
\
\ .N
-Poor -- -- _
- -_, am
0 100 200 300 400 500Standoff distance, nozzle diameters
Performance with good and poor upstream conditions, testedwith pressures of 35, 70 and 105 MPa (5, 10 and 15 ksi)
Figure 7
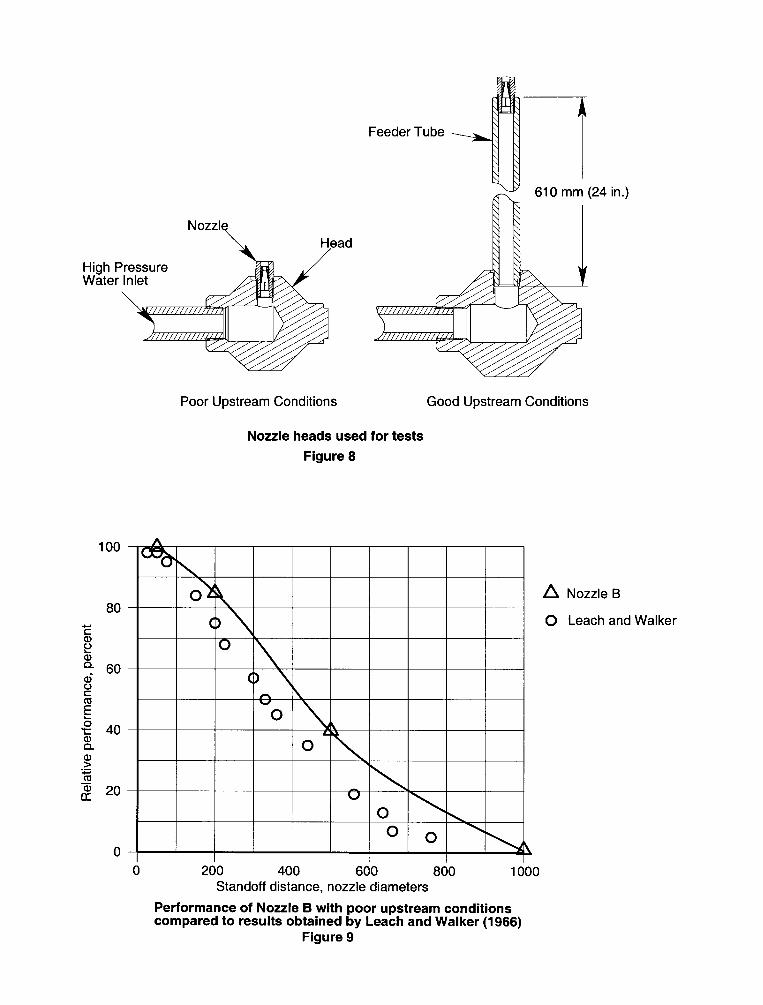
ad
HighWate
100
80
al>.—
76~ 20
0
Poor Upstream Conditions
(24
Nozzle heads used for tests
Figure 8
Good Upstream Conditions
oc)o !
c)n \
oA
x .G
o
c)o \o 0
\
o 200 400 600 800 1000Standoff distance, nozzle diameters
Performance of Nozzle B with poor upstream conditionscompared to results obtained by Leach and Walker (1966)
in.)
Ao
Nozzle B
Leach and Walker
Figure 9
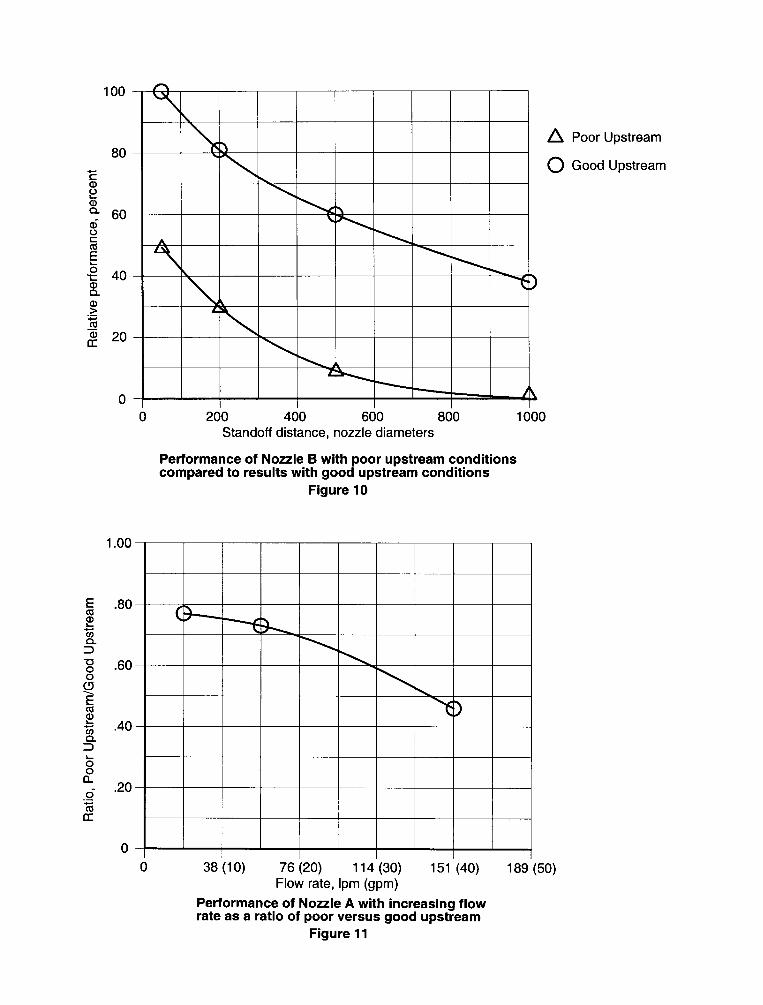
A
0
0 200 400 600 800 1000Standoff distance, nozzle diameters
Performance of Nozzle B with poor upstream conditionscompared to results with good upstream conditions
Figure 10
0 38 (10) 76 (20) 114 (30) 151 (40) 189 (50)Flow rate, Ipm (gpm)
Poor Upstream
Good Upstream
Performance of Nozzle A with increasing flowrate as a ratio of poor versus good upstream
Figure 11
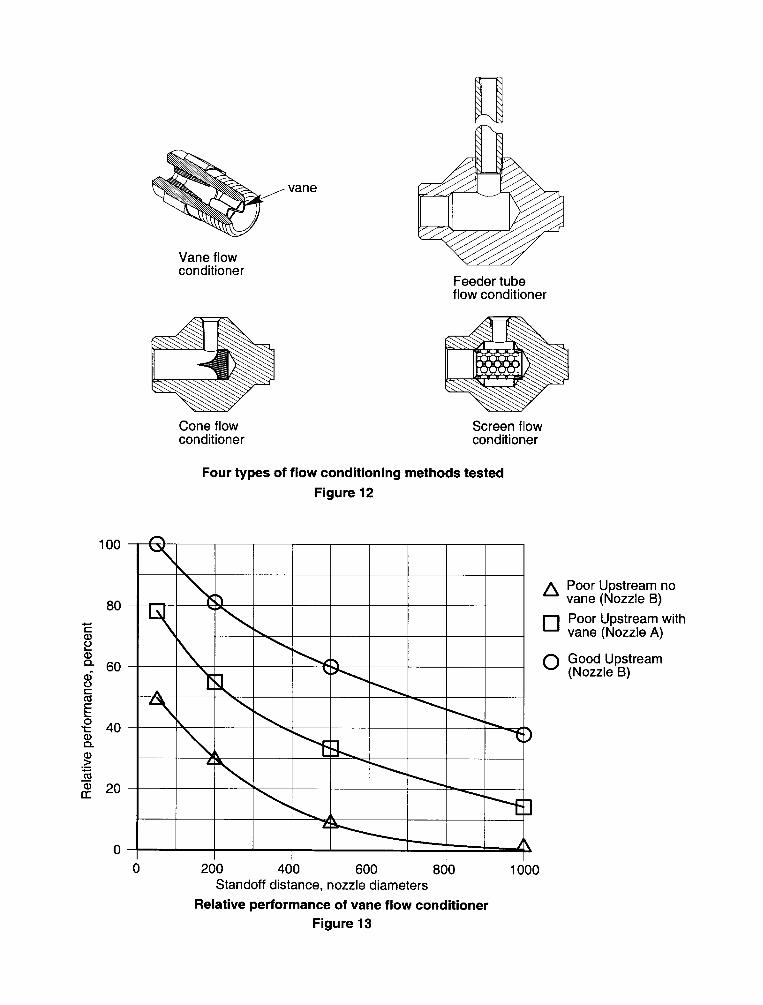
vane
Vane flowconditioner
El!
Feeder tubeflow conditioner
Cone flow Screen flowconditioner conditioner
Four types of flow conditioning methods tested
Figure 12
I200 400 600 800 1000
Standoff distance, nozzle diameters
Relative performance of vane flow conditioner
Figure 13
A
•1
o
Poor Upstream novane (Nozzle B)
Poor Upstream withvane (Nozzle A)
Good Upstream(Nozzle B)
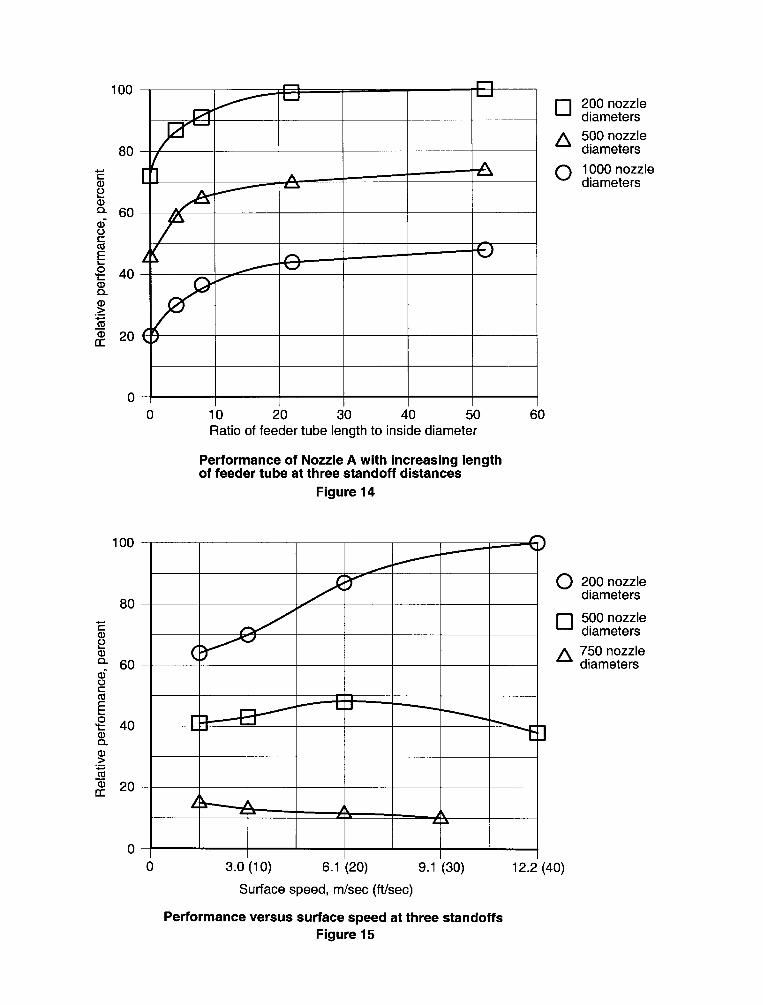
n n
L ( n
o 10 20 30 40 50 c
—
—
—
—
—
—
Ratio of feeder tube length to inside diameter
Performance of Nozzle A with increasing lengthof feeder tube at three standoff distances
Figure 14
3.0 (lo) 6.1 (20) 9.1 (30) 12.2 (40)
Surface speed, m/see (ft/see)
Performance versus surface speed at three standoffs
Figure 15
0200 nozzlediameters
500 nozzlediameters
A ;::;~:
100
80
0
7’350\
Nozzle exit angles tested
Figure 16
n
\P N
)
c$ \) \
!
r
I\
q \/I/E \ \
// ?\/ \ 1
\ \
I 1,
( t\\
/
o 30 60 90 120 150 180
Jet angle exiting head
o plow
drag
Performance versus jet angle and direction of traverse
Figure 17
10th American Waterjet ConferenceAugust 14-17, 1999: Houston, Texas
Paper 74
MATHEMATICAL MODELING OF THICK WALL TUBING
Thomas ThrashCharles Britton
HydroChem Industrial ServicesHouston, Texas, USA
ABSTRACT
Very few manufacturers of thick wall tubing publish ratings of their tubing. The water blastingmarket is unique and demanding. It requires tubing not readily available, which often meansspecial mill runs to user specifications of length, size and material. To help determine themaximum allowable working pressure of the tubing used by HydroChem, we developed acomputer model that would estimate the yield and burst pressure of a thick wall tube. Thismodel was verified by testing samples. Burst tests were performed on commercial pipe as wellas custom tubing to verify the computer model and determine safe operating limits of standardpipe and tubing.
Organized and Sponsored by the WaterJet Technology Association
1. INTRODUCTION
Tubing used for water jet lances must be evaluated for safe operating parameters. When customor other non-rated tubing is used, there should be a method of rating the tubing for allowableoperating pressure. Since industrial water jets operate at relatively high pressures, such as 69to138 MPa (10,000 to 20,000 psi), the burst pressure of the lance tubing can become a limitingfactor.
While it would be easy to use a very high safety factor to avoid any bursting risk, this couldunnecessarily compromise the water jet design for small diameter tube cleaning. By using well-established design criteria for calculating stresses in thick-walled tubing, a reliable and safemethod can be used for rating lance tubing. Widely available spreadsheet software can beprogrammed for calculating the critical yield and burst pressures base on material properties andtubing dimensions. HydroChem Industrial Services has developed an Excel spreadsheet toperform these calculations.
To verify the accuracy of these results, HydroChem tested the actual burst pressures andcompared the results for various tubing samples. The burst pressure is much easier to determinethan the tubing yield pressure without sophisticated laboratory facilities.
2. BURST PRESSURE MODELING
A thick-walled cylinder is defined as one having the ratio of wall thickness to inner radiusgreater than 0.1. In this case, the stresses in the tubing are recognized as varying as a function ofthe radius. This compares to a thin-walled cylinder where the wall stresses are assumed to beconstant.
There are four stresses to consider when modeling a thick-walled cylinder: longitudinal,tangential, radial, and shear. For the purposes of this investigation, only constant internalpressure is taken into account. The following variables are used in the equations for modelingthick-walled cylinders:
a = outer radius (OD/2)b = inner radius (ID/2)r = internal wall radius where b<r<ap = uniform internal pressure
Figure 1 provides a graphic illustration of the variables and stresses present in a thick-walledcylinder.
The longitudinal stress (σ1) is uniform through the wall thickness except for end effects that canbe neglected for this analysis. The equation for this stress is (Boresi et al.):
σ1 = p b2__ (1) (a2-b2)
The tangential or hoop stress (σ2) at any radius is described by the equation (Young):
σ2 = p b2 (a2+r2) (2)r2 (a2-b2)
This stress is greatest at the inner radius where r = b:
σ2,max = p (a2+b2) (a2-b2)
The maximum radial stress (σ3) is also at the inner diameter and is the negative, compressivereaction to the internal pressure (Linghaiah):
σ3,max = -p (3)
The maximum shear stress (τ) is a function of both the tangential and radial stresses as seen inthe following equation (Young):
τmax = σ2,max - σ3 ,max = p (a2+b2) + p = p a2__ (4) 2 2(a2-b2) 2 (a2-b2)
The equivalent stress generated by the longitudinal, tangential, and radial stresses is (Dawson):
σe = « [((σ2 - σ3)
2+(σ1 - σ3)2+(σ2 - σ1
2))/2] (5)
If the pressure term is left out of the component stresses, an equivalent stress factor (σ’ e ) basedsolely on geometry can be determined. The yield pressure can then be calculated by dividing thematerial yield strength by the equivalent stress factor:
py = σy (6)
σ’ e
Another method of determining yield stress is by determining the isotropic (or fully plastic)yield stress (Dawson):
piy = 2 τy ln(b/a) = 2 σy ln(b/a) (7)
« 3
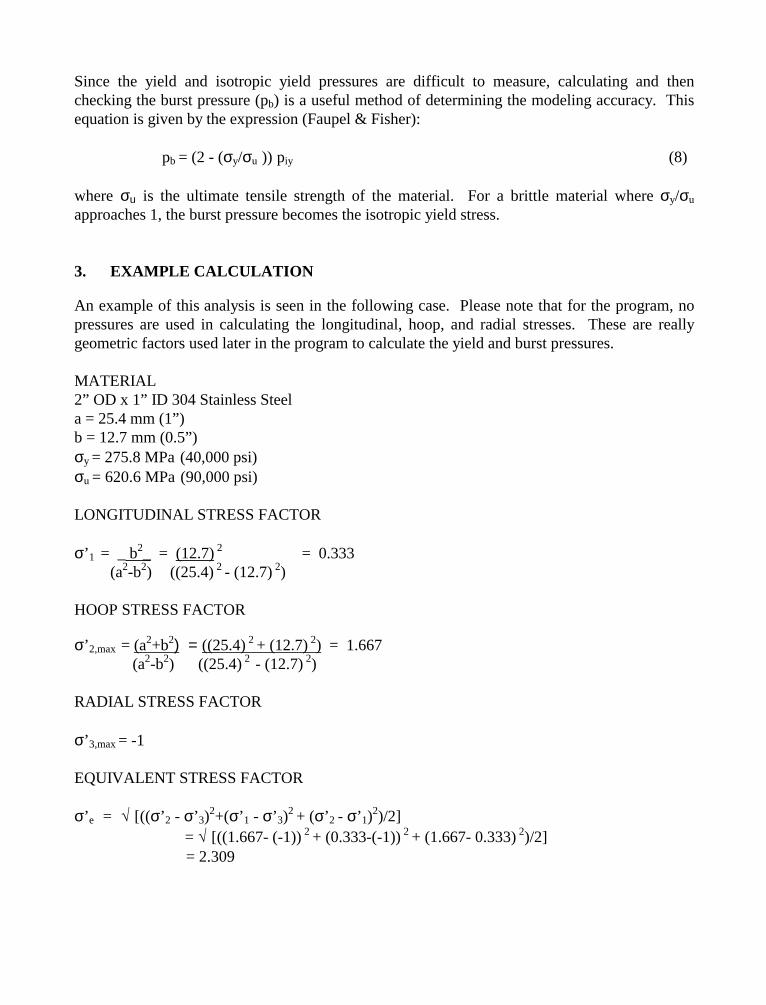
Since the yield and isotropic yield pressures are difficult to measure, calculating and thenchecking the burst pressure (pb) is a useful method of determining the modeling accuracy. Thisequation is given by the expression (Faupel & Fisher):
pb = (2 - (σy/σu )) piy (8)
where σu is the ultimate tensile strength of the material. For a brittle material where σy/σu
approaches 1, the burst pressure becomes the isotropic yield stress.
3. EXAMPLE CALCULATION
An example of this analysis is seen in the following case. Please note that for the program, nopressures are used in calculating the longitudinal, hoop, and radial stresses. These are reallygeometric factors used later in the program to calculate the yield and burst pressures.
MATERIAL2” OD x 1” ID 304 Stainless Steela = 25.4 mm (1”)b = 12.7 mm (0.5”)σy = 275.8 MPa (40,000 psi)σu = 620.6 MPa (90,000 psi)
LONGITUDINAL STRESS FACTOR
σ’ 1 = _ b2_ = (12.7) 2 = 0.333 (a2-b2) ((25.4) 2 - (12.7) 2)
HOOP STRESS FACTOR
σ’ 2,max = (a2+b2) = ((25.4) 2 + (12.7) 2) = 1.667 (a2-b2) ((25.4) 2 - (12.7) 2)
RADIAL STRESS FACTOR
σ’ 3,max = -1
EQUIVALENT STRESS FACTOR
σ’ e = « [((σ’ 2 - σ’ 3)
2+(σ’ 1 - σ’ 3)2 + (σ’ 2 - σ’ 1)
2)/2] = « [((1.667- (-1)) 2 + (0.333-(-1)) 2 + (1.667- 0.333) 2)/2] = 2.309
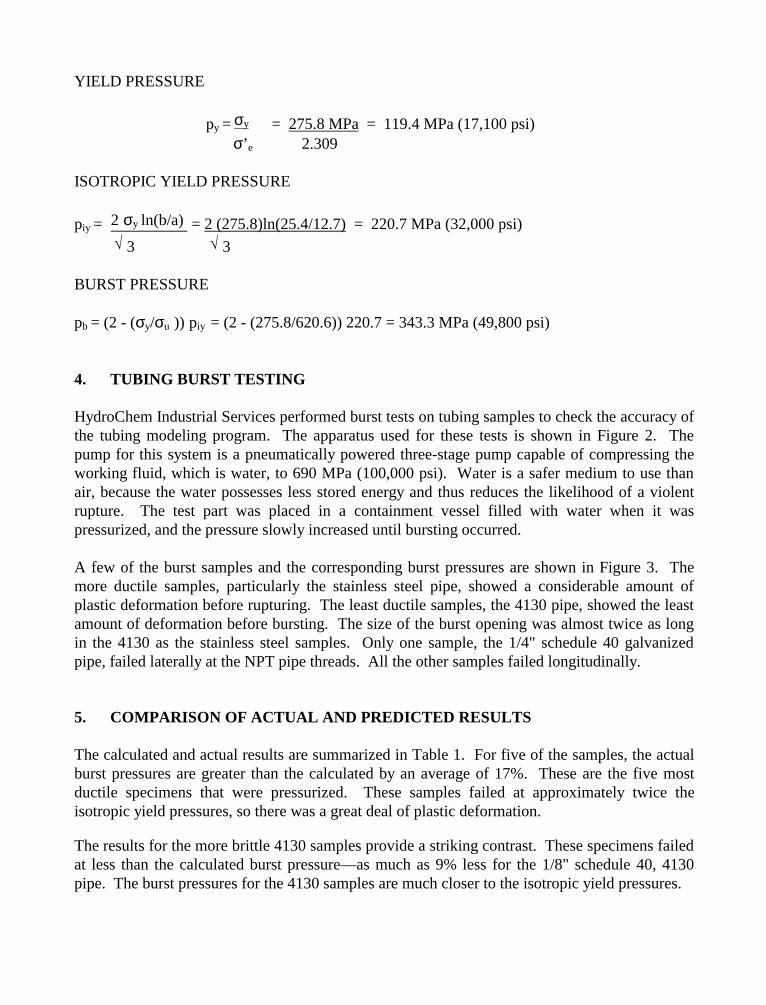
YIELD PRESSURE
py = σy = 275.8 MPa = 119.4 MPa (17,100 psi) σ’ e 2.309
ISOTROPIC YIELD PRESSURE
piy = 2 σy ln(b/a) = 2 (275.8)ln(25.4/12.7) = 220.7 MPa (32,000 psi)
« 3 « 3
BURST PRESSURE
pb = (2 - (σy/σu )) piy = (2 - (275.8/620.6)) 220.7 = 343.3 MPa (49,800 psi)
4. TUBING BURST TESTING
HydroChem Industrial Services performed burst tests on tubing samples to check the accuracy ofthe tubing modeling program. The apparatus used for these tests is shown in Figure 2. Thepump for this system is a pneumatically powered three-stage pump capable of compressing theworking fluid, which is water, to 690 MPa (100,000 psi). Water is a safer medium to use thanair, because the water possesses less stored energy and thus reduces the likelihood of a violentrupture. The test part was placed in a containment vessel filled with water when it waspressurized, and the pressure slowly increased until bursting occurred.
A few of the burst samples and the corresponding burst pressures are shown in Figure 3. Themore ductile samples, particularly the stainless steel pipe, showed a considerable amount ofplastic deformation before rupturing. The least ductile samples, the 4130 pipe, showed the leastamount of deformation before bursting. The size of the burst opening was almost twice as longin the 4130 as the stainless steel samples. Only one sample, the 1/4" schedule 40 galvanizedpipe, failed laterally at the NPT pipe threads. All the other samples failed longitudinally.
5. COMPARISON OF ACTUAL AND PREDICTED RESULTS
The calculated and actual results are summarized in Table 1. For five of the samples, the actualburst pressures are greater than the calculated by an average of 17%. These are the five mostductile specimens that were pressurized. These samples failed at approximately twice theisotropic yield pressures, so there was a great deal of plastic deformation.
The results for the more brittle 4130 samples provide a striking contrast. These specimens failedat less than the calculated burst pressure—as much as 9% less for the 1/8" schedule 40, 4130pipe. The burst pressures for the 4130 samples are much closer to the isotropic yield pressures.
6. CONCLUSIONS
The formulae used in calculating the tubing burst pressures provide a useful guide fordetermining allowable system working pressures. The results were low for less ductile materials,so perhaps the ductility factor in equation 8 needs improvement. A working pressure based on33% of the burst pressure seems a reasonable balance of safety and economics for lance tubing.
Industry standards do not exist for high pressure tubing used for lancing. Special attention isneeded to ensure you acquire quality tubing that safely meets your pressure demands. It iscustomary for pipe to be purchased using nominal specifications. This permits wall thickness tovary +15% and can reduce the maximum allowable working pressure by more than 25%.Acquiring lances from unqualified suppliers could place water blasting personnel at risk.
7. OBSERVATIONS
Some of the pipe-threaded connections leaked before the sample burst. However, none of thepipe-threaded connections experienced catastrophic failure due to thread shear in the axialdirection. Low strength materials such as 304 stainless steel required the threaded connections tobe retightened repeatedly before the pipe burst. High strength materials such as 4130 pipe did notrequire retightening and held pressure up to eight times the normal operating pressure. Standardcone and high pressure connections were more difficult to keep sealed than pipe-threadedconnections.
8. REFERENCES
Boresi, A., Schmidt, R., and Sidebottom, O. “Advanced Mechanics of Materials,” Fifth Edition, John Wiley & Sons, 1993.
Dawson, V.C.D. “High Pressure Containment in Cylindrical Vessels.” High Pressure Technology, Vol. 1, pp. 229-234, 1977.
Faupel, J. and Fisher, F. “Engineering Design.” Second Edition, John Wiley & Sons, 1981.
Lingaiah, L. “Machine Design Data Handbook,” McGraw-Hill, 1994.
Young, W. “Roark’s Formulas for Stress & Strain,” Sixth Edition, McGraw-Hill, 1989.
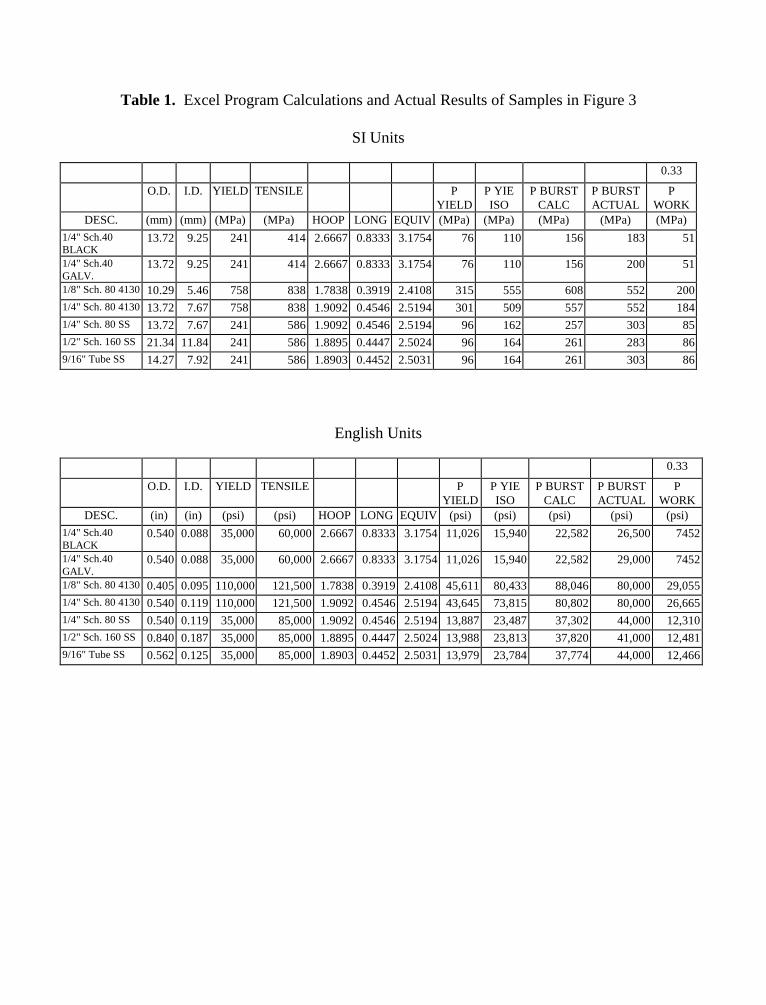
Table 1. Excel Program Calculations and Actual Results of Samples in Figure 3
SI Units
0.33
O.D. I.D. YIELD TENSILE PYIELD
P YIEISO
P BURSTCALC
P BURSTACTUAL
PWORK
DESC. (mm) (mm) (MPa) (MPa) HOOP LONG EQUIV (MPa) (MPa) (MPa) (MPa) (MPa)
1/4" Sch.40BLACK
13.72 9.25 241 414 2.6667 0.8333 3.1754 76 110 156 183 51
1/4" Sch.40GALV.
13.72 9.25 241 414 2.6667 0.8333 3.1754 76 110 156 200 51
1/8" Sch. 80 413010.29 5.46 758 838 1.7838 0.3919 2.4108 315 555 608 552 2001/4" Sch. 80 413013.72 7.67 758 838 1.9092 0.4546 2.5194 301 509 557 552 1841/4" Sch. 80 SS 13.72 7.67 241 586 1.9092 0.4546 2.5194 96 162 257 303 851/2" Sch. 160 SS 21.34 11.84 241 586 1.8895 0.4447 2.5024 96 164 261 283 869/16" Tube SS 14.27 7.92 241 586 1.8903 0.4452 2.5031 96 164 261 303 86
English Units
0.33
O.D. I.D. YIELD TENSILE PYIELD
P YIEISO
P BURSTCALC
P BURSTACTUAL
PWORK
DESC. (in) (in) (psi) (psi) HOOP LONG EQUIV (psi) (psi) (psi) (psi) (psi)
1/4" Sch.40BLACK
0.540 0.088 35,000 60,000 2.6667 0.8333 3.1754 11,026 15,940 22,582 26,500 7452
1/4" Sch.40GALV.
0.540 0.088 35,000 60,000 2.6667 0.8333 3.1754 11,026 15,940 22,582 29,000 7452
1/8" Sch. 80 41300.405 0.095 110,000 121,500 1.7838 0.3919 2.4108 45,611 80,433 88,046 80,000 29,0551/4" Sch. 80 41300.540 0.119 110,000 121,500 1.9092 0.4546 2.5194 43,645 73,815 80,802 80,000 26,6651/4" Sch. 80 SS 0.540 0.119 35,000 85,000 1.9092 0.4546 2.5194 13,887 23,487 37,302 44,000 12,3101/2" Sch. 160 SS 0.840 0.187 35,000 85,000 1.8895 0.4447 2.5024 13,988 23,813 37,820 41,000 12,4819/16" Tube SS 0.562 0.125 35,000 85,000 1.8903 0.4452 2.5031 13,979 23,784 37,774 44,000 12,466
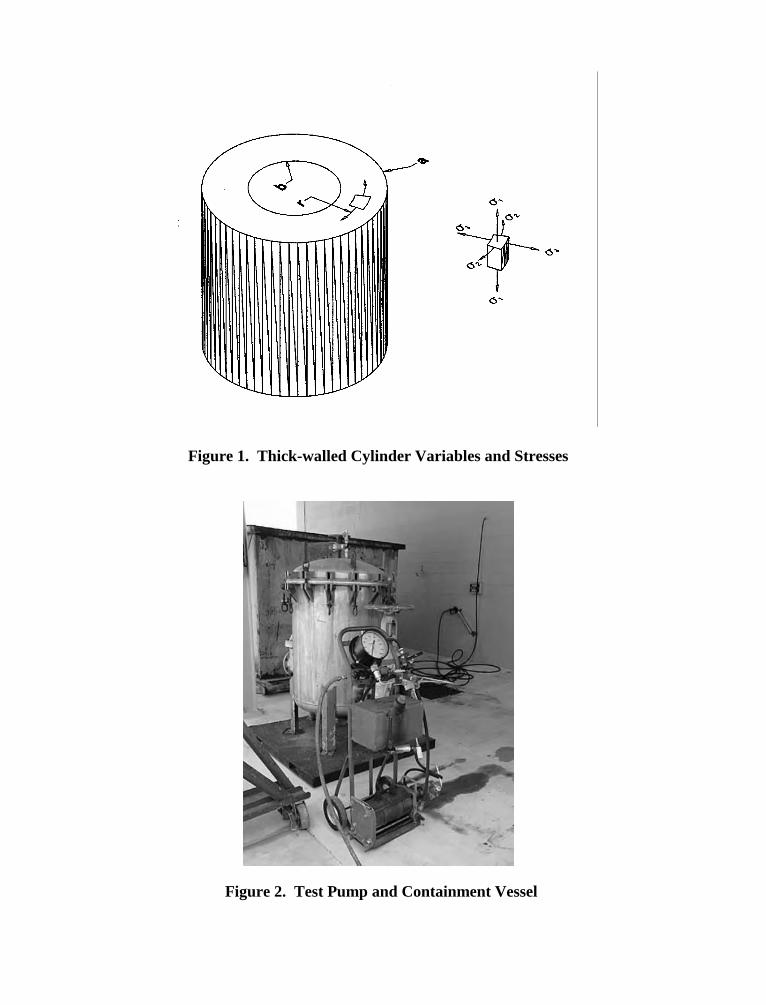
Figure 1. Thick-walled Cylinder Variables and Stresses
Figure 2. Test Pump and Containment Vessel
Figure 3. Burst Tubing Samples
Related Documents


![Appearing in the proceedings of the 10th ... - start [IIS]](https://static.cupdf.com/doc/110x72/6287d9059f45d45bef2a026b/appearing-in-the-proceedings-of-the-10th-start-iis.jpg)