Welcome message from author
This document is posted to help you gain knowledge. Please leave a comment to let me know what you think about it! Share it to your friends and learn new things together.
Transcript

Copyright 2017 Asia-Pacific Society for Computers in Education©
All rights reserved. No part of this book may be reproduced, stored in a retrieval system, transmitted,
in any forms or any means, without the prior permission of the Asia-Pacific Society for Computers in
Education
ISBN: 978-986-94012-2-7
Publisher: Intelligent Computer Tutoring Group, University of Canterbury, Christchurch, New
Zealand

EDITORS
Yusuke HAYASHI
Moffat MATHEWS
Thepchai SUPNITHI
Wenli CHEN
Jie-Chi YANG
Ahmad Fauzi MOHD AYUB
Su Luan WONG
Antonija MITROVIC

i
1 MESSAGE FROM THE CHAIRS
Welcome to the Workshop Proceedings of the 25th International Conference on Computers in
Education (ICCE 2017). ICCE 2017 was held from the 4th of December to the 8th of December 2017
in Christchurch, New Zealand.
Established in 1989, ICCE is now an annual international conference organised by the Asia-
Pacific Society for Computers in Education (APSCE), and it has become a major event for scholars
and researchers in the Asia-Pacific region to share ideas and to discuss their work in the use of
technologies in education.
On this 25th year anniversary of the conference, we accepted twelve workshop proposals with
the goal of exploring focused issues across various themes. Each proposal in these proceedings was
peer-reviewed by international reviewers in their respective areas to ensure high quality work. We
believe that the workshops provide a valuable venue for researchers to share their work, and create
and strengthen links for future collaboration. The workshop papers span a range of topics that will
stimulate further interesting research in their respective areas, not only in the Asia-Pacific region, but
also further afield. We hope that the readers find the ideas and lessons presented in the proceedings
relevant to their research.
We would like to thank the Executive Committee of the Asia-Pacific Society for Computers in
Education and the ICCE 2017 Co-Chairs for entrusting us with the important task of chairing the
workshop programme. It was a privilege and honour to work with many outstanding researchers
during the whole process. We would also like to thank the Local Organising Committee for helping
organise the resources and logistics required to run this workshop programme. Finally, we would like
to thank each person involved in each of the workshops, including the organisers of each workshop,
the authors, and the reviewers, all of whom ensured that the high quality of the ICCE workshops
continued to be maintained.
Workshop, Tutorial, and Interactive Event Coordination Co-Chairs
Yusuke HAYASHI, Hiroshima University, Japan
Moffat MATHEWS, University of Canterbury, New Zealand
Thepchai SUPNITHI, Nectec, Thailand

ii
2 ORGANISERS
Workshop W1: The Applications of Information and Communication Technologies in Adult
and Continuing Education
Kun-Hung Cheng, National Chiao Tung University, Taiwan
Pei-Shan Tsai, National Taipei University of Technology, Taiwan
Jyh-Chong Liang, National Taiwan University of Science and Technology, Taiwan
Min-Hsien Lee, National Sun Yat-sen University, Taiwan
Workshop W2: Digital Game-based Learning and Gamification Instructional Strategies for K-
12 Schools
Huei-Tse Hou, National Taiwan University of Science and Technology, Taiwan
Shu-Ming Wang, Chinese Culture University, Taiwan
Feng-Kuang Chiang, Beijing Normal University, China
Workshop W3: The 6th Workshop on ICT Trends in Emerging Economies
(WICTTEE 2017)
Mas Nida Md Khambari, Universiti Putra Malaysia, Malaysia
Niwat Srisawasdi, Khon Kaen University, Thailand
Workshop W4: Information and Communication Technology for Disaster and Safety Education
(ICTDSE)
Hiroyuki Mitsuhara, Tokushima University, Japan
Workshop W5: Innovative Design of Learning Space
Yueh-Min Huang, National Cheng Kung University, Taiwan
Shu-Chen Cheng, Southern Taiwan University of Science and Technology, Taiwan
Workshop W6: The 8th Workshop on Innovative Designs for Mobile and Ubiquitous Learning:
1:1 and Beyond
Xiaoqing Gu, East China Normal University, China
Workshop W7: The 4th Workshop on Learning Analytics (LA): Improving learning and its
contexts - developing a learning analytics agenda for our community
Weiqin Chen
Tore Hoel
Yong-Sang Cho
Workshop W8: Nurturing Lifelong Interest-Driven Creators (IDC)
Ben Chang, National Central University, Taiwan
Jon Mason, Charles Darwin University, Australia
Yanjie Song, The Education University of Hong Kong, Hong Kong
Lung-Hsiang Wong, Nanyang Technological University, Singapore
Workshop W9: Promoting cognitive access, processes and knowledge building towards deeper
learning and creativity
Chien-Sing Lee, Sunway University, Malaysia
David Drew, Claremont Graduate University, USA
Maggie Minhong Wang, The University of Hong Kong
Wenli Chen, National Institute of Education, Singapore

iii
Workshop W10: The 10th Workshop on Technology Enhanced Learning by Posing/Solving
Problems/Questions
Fu-Yun Yu, National Cheng Kung University, Taiwan
Tomoko Kojiri, Kansai University, Japan
Tanja Mitrovic, University of Canterbury, New Zealand
Tsukasa Hirashima, Hiroshima University, Japan
Kazuaki Kojima, Teikyo University, Japan
Yusuke Hayashi, Hiroshima University, Japan
Workshop W12: The 5th Workshop on Technology-Enhanced STEM Education (TeSTEM)
Ying-Tien Wu, National Central University, Taiwan
Niwat Srisawasdi, Khom Kaen University, Thailand
Patcharin Panjaburee, Mahidol University, Thailand
Chia-Ching Lin, National Kaohsiung Normal University, Taiwan
Workshop W13: ICCE-Smart2017: The New Smarts - But are we Smart Enough?
Jon Mason, Charles Darwin University, Australia
Tore Hoel, Oslo and Akershus University College of Applied Sciences (HiOA), Norway
Khalid Khan, Charles Darwin University, Australia
iv
3 TABLE OF CONTENTS
The Relationships between Teachers’ TPACK-R and Teaching Beliefs of Robots
Yuan-Kai CHU, Meng-Jung TSAI , Jyh-Chong LIANG & Chin-Chung TSAI ................................................. 1
A Study on Illustration Design in Learning Infant Development
Li-En LIE, An-Hsuan WU, Po-Fen HSU & Meng-Jung TSAI ......................................................................... 6
Speaking-related Anxiety in Computer-Assisted Language Testing Settings
Lingyu XU, Xin ZHAO, Chunping ZHENG & Zhihong LU ........................................................................... 12
Analysis of Educational Research Using CiteSpace Applications in CSSCI Journals
(2012-2016)
Zixi WANG, Yang LIU, Mengya GAO, Jia XI & Chunping ZHENG ............................................................. 17
The Relationships of Taiwanese College Students’ Conceptions, Approaches, and
Self-efficacy to Learning Civil Engineering in a Flipped Classroom
Meilun SHIH, Yi-Nan HUANG, Jyh-Chong LIANG, Min-Hsien LEE & Silvia Wen-Yu LEE ....................... 22
Pre-Testing the Chinese Version of the System Usability Scale (C-SUS)
Feng-Ru SHEU, Hui-Jung FU & Meilun SHIH ............................................................................................ 28
Pre-service Teachers’ Conceptions of Teaching using Mobile Devices
Pei-Shan TSAI, Chin-Chung TSAI & Ching Sing CHAI ................................................................................ 35
A Science History Educational Board Game with Augmented Reality Integrating
Collaborative Problem Solving and Scaffolding Strategies
Shu-Ming WANG, Kuan-Ting CHEN, Huei-Tse HOU & Cheng-Tai LI ........................................................ 40
A Preliminary Study of Implementing an Interactive Learning Game Story Book Mobile
App on Science and Technology for Primary School Students
Meng-Yu TSAI, Shelley Shwu-Ching YOUNG & Jun-Ming SU ..................................................................... 48
Using English Learning Toys as the Emotional Analysis Tool to Evaluate Children Behavior
Ru-Shan CHEN, Shian-Chi MENG, Wei-Kuang HO, Chih-Hsuan TSUI, Wei-Fan CHEN &
ShengChih CHEN .......................................................................................................................................... 53
A Case Study of Curriculum-Based Game Design Fork-12
Fan ZOU ........................................................................................................................................................ 61
Workshop W1: The Applications of Information and Communication Technologies
in Adult and Continuing Education
Workshop W2: Digital Game-based Learning and Gamification Instructional
Strategies for K-12 Schools
v
A Preliminary Study Of A Digital Game System To Support Mathematics Learning: Using
Circle and Compound Shapes As An Example
Yi-Tien HSU & Shelley Shwu-Ching YOUNG ............................................................................................... 73
Learning with Minecraft and Kodu: Examining Complex Problem-Solving Strategies
Hyo-Jeong SO, Matthew GAYDOS, Minhwi SEO, Yeonji JUNG & Hyeran LEE ......................................... 79
Study of Game-based Learning upon Flow Experience: An Example of Mobile App System
for Visit Historical Monuments
Chih-Ming CHU ............................................................................................................................................ 87
The Implementation of Instructional Innovations and Assistive Technologies in Emerging
Developing Countries within the Asia-Pacific Region
Mas Nida MD KHAMBARI & Niwat SRISAWASDI ...................................................................................... 92
The Effect of Think-Pair-Share Cooperative Learning Model Assisted With ICT on
Mathematical Problem Solving Ability among Junior High School Students
Khoerul UMAM, SUSWANDARI, Nur ASIAH, Indri Trisno WIBOWO & Syaiful ROHIM .......................... 94
A PBL-based Professional Development Framework to Incorporating Vocational Teachers
in Thailand: Perceptions and Guidelines from Training Workshop
Sasithorn CHOOKAEW, Charoenchai WONGWATKIT & Suppachai HOWIMANPORN ........................... 99
Motivation towards Mathematics Learning in the Technology-enhanced Environment
Shu Ling WONG & Su Luan WONG ........................................................................................................... 109
What Influence Teachers’ Satisfaction Towards E-Learning? A Synthesis of the Literature
Mei Lick CHEOK, Su Luan WONG, Mohd Ayub AHMAD FAUZI & Mahmud ROSNAINI ....................... 116
Teacher Identity: Influence of Emerging Trends
Arit UYOUKO, Sylvester Dominic UDO & Doris Godwin ASUQUO ........................................................ 124
Transfer of Ownership: Designing for Scholarship of Learning and Teaching
Jayakrishnan WARRIEM, Sahana MURTHY & Sridhar IYER .................................................................... 131
An Investigation of Collaborative Ubiquitous Learning in Promoting Socio-Cultural
Knowledge and Skills in 21st Century: Integrating History, Geography, Architecture,
Science and Culture Study
Chitphon YACHULAWETKUNAKORN, Ratthakarn NA PHATTHALUNG, Jintana WONGTA &
Charoenchai WONGWATKIT ..................................................................................................................... 140
Fostering Pre-service Science Teachers’ Technological Pedagogical Content Knowledge of
Mobile Laboratory Learning in Science
Phattaraporn PONDEE, Sasivimol PREMTHAISONG & Niwat SRISAWASDI ......................................... 151
An Emic Perspective on Students’ Learning Experiences Using Augmented Reality
Fariza KHALID & Su Luan WONG ............................................................................................................ 161
Workshop W3: The 6th Workshop on ICT Trends in Emerging Economies
(WICTTEE 2017)
vi
Prototyping of Community-based Hazard Mapping Support System for Traditional Towns
with Local Heritage
Yasuhisa OKAZAKI, Shun KOZAKI, Sho MATSUO, Hiroshi WAKUYA, Nobuo MISHIMA,
Yukuo HAYASHIDA, & Byung-Won MIN .................................................................................................... 171
The Role of Serious Games in Disaster and Safety Education: An Integrative Review
Didin WAHYUDIN & Shinobu HASEGAWA ............................................................................................... 180
Earthquake Disaster Prevention Learning Approach in Japan Combining Fieldwork
Survey Learning and Evacuation Drill Training
Hisashi HATAKEYAMA, Masahiro NAGAI & Masao MUROTA ............................................................... 191
Disaster Prevention Learning by Karutagameto Facilitate Understanding Relations
Between Unsafe and Safe Behaviors
Yuichi KITAGAWA, Kengo KUWAHARA, Koji TANAKA, Mitsuru IKEDA & Masahiro HORI ................. 198
War from the Perspective of Both Offenders and Victims: Lesson Plan Proposal using VR
Learning Materials
Norio SETOZAKI & Toru NAGAHAMA ..................................................................................................... 205
The Impact of Prior Knowledge on the Usability Evaluation of a Competitive Game-Based
Learning System Including Item Bank
Gwo-Haur HWANG, Beyin CHEN, Ru-Shan CHEN, Yu-Ling LAI, You-Hong SU & Ya-Han CAO ........... 210
Effects of concept map based cooperative peer assessment system on students’ learning
outcomes on programming
Ya-Jing YU, Po-Han WU & Yu-Sheng SU ................................................................................................... 219
Exploring the primary school children’s air pollution environmental education learning
effectiveness and air quality protection intention through augmented reality material and
air quality monitor instrument
Yi-Wen LIAO & Min-Chai HSIEH .............................................................................................................. 225
Cultivating Interest in History and Culture using Augmented Reality for Elementary
Students
Sie Wai CHEW, I-Hsiu LIN, Yin-Cheng HUANG & Nian-Shing CHEN ..................................................... 236
The Study on the Application in the Combination of Pervasive Gaming and Augmented
Reality in the Temple Tour for Users with Different Cognitive Styles
Yu-Hsuan LIN, Hao-Chiang Koong LIN & I-Cheng LIO ............................................................................ 248
Workshop W5: Innovative Design of Learning Space
Workshop W4: Information and Communication Technology for Disaster and
Safety Education (ICTDSE)
vii
Using Brainwave to Measure and Explore the Correlation between Attention and Cognitive
Load
Shu-Chen CHENG, Yu-Ping CHENG, Yi-Lin CHEN & Yueh-Min HUANG ............................................... 258
On Technology Awareness and Acceptance among Preschool English Language Teachers
in Ukraine
Olha DALTE, Jing LENG & Xiaoqing GU .................................................................................................. 266
C2FIP: A Design Framework for Streamlining ICT-Enhanced Seamless Science Learning
for Wider Diffusion in Primary Schools
Lung-Hsiang WONG, Chee-Kit LOOI & Su Fen GOH ............................................................................... 275
Investigating the Attitude of Teachers and Parents in the Internet era: A Case Study of
Preschoolers’ Use of Mobile Devices to learn English in a Class of Shanghai Kindergarten
Rifa GUO, Chuxin FU & Jing LENG .......................................................................................................... 281
A Cloud-based Awareness Classroom Learning Activity Portfolio System Based on
iBeacon for Flipped Classroom
Hung-Hsu TSAI, You-Ming YONG, Jie-Yan PENG, Kuo-Ching CHIOU & Pao-Ta YU ............................ 289
Language Learning with Mobiles, Social Media and Gamification in Mongolia: Possibilities
and Challenges
Hyo-Jeong SO, Christine SHIN, Lung Hsiang WONG, Minhwi SEO & Bolor DAVAASUREN ................. 299
A BYOD Hybrid Learning Approach to Incorporating The In-Field Social Study based on
Guided Inquiry Learning Strategy: Design and Evaluation of Enjoy The Field Trip Ever
Project (EFTE)
Ratthakarn NA PHATTHALUNG, Charoenchai WONGWATKIT, Jintana WONGTA, Chitphon
YACHULAWETKUNAKORN & Chayanuch WATTHANA.......................................................................... 308
Teacher-actionable insights in student engagement: A learning analytics taxonomy
Elizabeth KOH & Jennifer Pei-Ling TAN ................................................................................................... 319
Design of a Learning Analytics Dashboard Based on Digital Textbooks and Online
Learning
Yun-Gon PARK, Yong-Sang CHO & Jeong-Eun SON ................................................................................ 326
A Study on Capturing Learning Data from Virtual and Mixed Reality Contents Through
Data Collection API
Jeong-Eun SON & Yong-Sang CHO ........................................................................................................... 335
Virtual and Mixed Reality for students: How to Control Human Factors
Hyojeong LEE & Yong-Sang CHO .............................................................................................................. 343
Workshop W6: The 8th Workshop on Innovative Designs for Mobile and
Ubiquitous Learning: 1:1 and Beyond
Workshop W7: The 4th Workshop on Learning Analytics (LA): Improving
learning and its contexts - developing a learning analytics agenda for our
community
viii
Integration of Learning Analytics Research and Production Systems While Protecting
Privacy
Brendan FLANAGAN & Hiroaki OGATA ................................................................................................... 355
Requirements for Learning Analytics in Flipped Learning
Byung-gi CHOI, Wooin BAE & Jaeho LEE ................................................................................................ 361
Applying Interest Loop to Develop Game-based Model for Chinese Character Learning
Zhi-Hong CHEN, Pei-Yun CHI & Huei-Jhen CIOU ................................................................................... 372
Cultivating Students’ Writing Habit in a Game-based Learning Environment
Calvin C. Y. LIAO, Wan-Chen CHANG, Hercy N. H. CHENG & Tak-Wai CHAN .................................... 376
Creation Loop Example of IDC Theory: CoCoing.info
Ben CHANG, Yen-An SHIH & Tzu-Chen HUANG ..................................................................................... 381
Minecraft as a Sandbox for STEM Interest Development: Preliminary Results
H. Chad LANE, Sherry YI, Brian GUERRERO & Neil COMINS ................................................................ 387
Improving Jakarta Historical Understanding Ability through Inquiry Learning Model
Assisted With ICT Among Junior High School Students
SUSWANDARI, Laely ARMIYATI, Khoerul UMAM, Nur ASIAH & Eka Nana SUSANTI .......................... 398
Using 2D Simulation Applications to Motivate Students to Learn STEAM
Tercia-Marie Tafadzwa TEMBO & Chien-Sing LEE .................................................................................. 403
Creation Process in Design Research Class
Weng Ping CHIN, Ah Choo KOO, Chee Weng KHONG & Chui Yin WONG ............................................. 410
The Missing Link in Engineering Education: The Arts and Humanities
David E. DREW & Louis L. BUCCIARELLI ............................................................................................... 418
Exploring possibilities for synergizing embodied, embedded and extended cognition:
Implications to STEM Education
Chien-Sing LEE ........................................................................................................................................... 425
Design and Development of an Online System in Support of Teaching-by-Questioning in
Classrooms
Yu-Hsin LIU & Fu-Yun YU.......................................................................................................................... 435
Workshop W8: Nurturing Lifelong Interest-Driven Creators (IDC)
Workshop W9: Promoting cognitive access, processes and knowledge building
towards deeper learning and creativity
Workshop W10: The 10th Workshop on Technology Enhanced Learning by
Posing/Solving Problems/Questions
ix
Preliminary Study on Learning by Constructinga Cognitive Model Based on Problem-Solving
Processes
Kazuaki KOJIMA, Kazuhisa MIWA, Ryuichi NAKAIKE, Nana KANZAKI, Hitoshi TERAI,
Jun’ya MORITA, Hitomi SAITO & Miki MATSUMURO ............................................................................ 438
The Effects of Cognitive Styles on Problem Solving in the Context of English Logics
Yu-Fen TSENG & Sherry Y. CHEN ............................................................................................................. 445
An Experimental Investigation on Using Pedagogical Conversational Agents: Effects of Posing
Facilitation Prompts in Oral-Based Peer Learning
Yugo HAYASHI ............................................................................................................................................ 454
A Learning Support System for Mathematics with Visualization of Errors in Symbolic
Expression by mapping to Graphical Expression
Kai KUROKAWA, Takahito TOMOTO, Tomoya HORIGUCHI & Tsukasa HIRASHIMA ......................... 461
Proposal of a Stepwise Support for Structural Understanding in Programming
Kento KOIKE, Takahito TOMOTO & Tsukasa HIRASHIMA ..................................................................... 471
Enhancing Metacognitive Inference Activities Using Eye-movements on One’s Academic
Paper
Ryo OGINO, Yuki HAYASHI & Kazuhisa SETA ......................................................................................... 482
A Case Study of Learning Environment for Building Structures for Learners with Reading
Disabilities Based on Cognitive Load Theory
Sho YAMAMOTO & Tsukasa HIRASHIMA ................................................................................................ 493
Development and Experimental Evaluation of An Interactive Reading Application
Designed For Comprehensibility And Interest
Pedro Gabriel Fonteles FURTADO, Tsukasa HIRASHIMA & Yusuke HAYASHI ...................................... 504
A STEM Robotics Workshop to Promote Computational Thinking Process of Pre-Engineering
Students in Thailand: STEMRobot
Santi HUTAMARN, Sasithorn CHOOKAEW, Charoenchai WONGWATKIT,
Suppachai HOWIMANPORN, Tarinee TONGGEOD & Sarut PANJAN .................................................... 514
Students’ Virtual Experiment Behavior Using an Interactive Simulation
Hsin-Yi CHANG & Yu-Shan HSIAO ........................................................................................................... 523
A Quantitative Analysis on Interactive Method Makes Teaching More Scientific
Bin LI, Lie-Ming LI & Ying LUO ................................................................................................................ 529
Analysis of Students’ Personalities and Gaming Strategies in a Technology-Enhanced
Board Game-The Fragrance Channel
Chang-Hsin LIN & Ju-Ling SHIH ............................................................................................................... 536
The Design and Evaluation of a STEM Interdisciplinary Game-based Learning about
the Great Voyage
Shu-Hsien HUANG, Chia-Chun TSENG & Ju-Ling SHIH .......................................................................... 546
Workshop W12: The 5th Workshop on Technology-Enhanced STEM Education
(TeSTEM)
x
Adoption of Computer Programming Exercises for Automatic Assessment — Issues and
Caution
Yuen Tak YU, Chung Man TANG, Chung Keung POON & Jacky Wai KEUNG ........................................ 555
Learner’s Creative Thinking of Learners Learning with Constructivist Web-Based
Learning Environment Model: Integration between Pedagogy and Neuroscience
Sumalee CHAIJAROEN, Orawan TECHAPORNPONG & Charuni SAMAT ............................................. 565
Developing Interactive Simulation in Physical Science for Eliminating Students’
Misunderstanding of Heat Transfer: A DSLM Approach
Sureerat SATCHUKORN & Niwat SRISAWASDI ....................................................................................... 572
How to link pedagogy, technology and STEM learning?
Margus PEDASTE, Äli LEIJEN, Katrin SAKS, Ton de JONG & Denis GILLET ....................................... 578
A Flipped Inquiry -based Learning with Mobility to Improving Students’ Learning
Performance in Science: A Comparative Study
Pawat CHAIPIDECH & Niwat SRISAWASDI ............................................................................................ 587
Online knowledge-structure-based adaptive science learning: Integrates adaptive dynamic
assessment into adaptive learning
Chia-Ching LIN, Ying-Tien WU & Teng-Yao CHENG ............................................................................... 595
A Contextual Online Game based on Inquiry Learning Approach for Improving Students’
Learning Performance in a Chemistry Course
Niwat SRISAWASDI, Nattida NANTAKAEW & Patcharin PANJABUREE ................................................ 601
Designing Framework of Constructivist Augmented Reality Web-based Learning
Environments to Enhance Creative Thinking for Design and Create Three-Dimensional
for Secondary School.
Phummiphat KLOMWIPHAWAT & Charuni SAMAT ................................................................................. 609
Developing Smartphone-based Hands-on Inquiry Laboratory: Results on Students’ Affective
Channels of Chemistry Learning
Banjong PRASONGSAP & Niwat SRISAWASDI ........................................................................................ 615
Learning to be Data Smart
Khalid KHAN & Jon MASON ...................................................................................................................... 623
Validation of Collaborative Problem Solving Process Framework from Evidence of
Student Observations for Developing Generic Measures
Nafisa AWWAL, Patrick GRIFFIN, Zhonghua ZHANG, Claire SCOULAR, Monjurul ALOM,
Daniel JIMENEZ & Mark WILSON ............................................................................................................ 631
Author Index ................................................................................................................................................ 643
Workshop W13: ICCE-Smart2017: The New Smarts - But are we Smart Enough?
Hayashi, Y., et al. (Eds.) (2017). Workshop Proceedings of the 25th International Conference on Computers in Education. New Zealand: Asia-Pacific Society for Computers in Education
1
The Relationships between Teachers’ TPACK-R and Teaching Beliefs of Robots
Yuan-Kai CHUa*, Meng-Jung TSAIa , Jyh-Chong LIANGb & Chin-Chung TSAIb aGraduate Institute of Digital Learning and Education, National Taiwan University of Science and
Technology, Taiwan bProgram of Learning Sciences, National Taiwan Normal University, Taiwan
*M10411017@ mail.ntust.edu.tw
Abstract: This study developed two questionnaires, named Technological Pedagogical Content Knowledge–Robot (TPACK-R) and Teaching Beliefs about Robotics education (RTBS), to investigate 94 teachers’ TPACK-R as well as to assess their attitudes, belief and motivation toward robotics education. The purpose of this study was to explore the relationships between the TPACK-R and the RTBS. Factors of the TPACK-R Scale and the RTBS Scale were identified by the exploratory factor analyses. There were some positive correlations between the all factors of TPACK-R and all factors of the RTBS. In addition, this study also found that teachers’ attitude is the key factor to predict their Technological Pedagogical Content Knowledge about Robotics education; however, teachers’ RPK can predict the RPCK only.
Keywords: Robotics education, TPACK-R, RTBS
1. Introduction
1.1. Robotics Education
Technological development is increasingly incorporated in our lives. An exponent from this current reality consists of robots, which can be used for multiple purposes, such as entertainment, home, education and industry support (Basoeki, Libera, Menegatti, & Moro, 2013). In twenty-first century, the hands- on education get more attention around the world. Many researchers believe that robotics is the great tool in hands-on education, such as robot assembly and creative robot construction provides more powerful motivation than the learning of abstract knowledge, and the STEM (science, technology, engineering and math) education is expanded with new educational tools based on the robotics curriculum rapidly.
Empirical evidence has suggested the effectiveness of robotics as a learning complementary tool (Spolaor & Benitti, 2017). Using robotics technologies in education is increasingly common and has the potential to impact students' learning. Educational robotics is a valuable tool for developing students' cognitive and social skills and it has greatly attracted teachers’ and reseachers’ interests (Sevda , &Burak , 2017). A number of studies have focused on using educational robotics in different subject areas and school levels. However, few studies focus on the teachers’ views of the robotics education and their acceptances of such curricula. While the robotics education is potentially useful for improving teaching and learning, finding a theoretical framework that helps to probe practitioners’ knowledge of teaching with robotics has become crucial.
1.2. Technological Pedagogical Content Knowledge-Robotics (TPACK-R)
Recently, several studies in the area of educational technology have proposed ‘‘Technological Pedagogical Content Knowledge’’ (TPCK) by building on Shulman’s idea of ‘‘pedagogical content knowledge’’ to elaborate teachers’ technology integration into pedagogy (e.g., Ferdig 2006; Koehler et al. 2007; Koehler & Mishra 2005; Mishra & Koehler 2006; Niess 2005). This study proposes an TPACK-R framework as consisting of robotics knowledge (RK), robotics pedagogical knowledge
2
(RPK), robotics content knowledge (RCK), and robotics pedagogical content knowledge (RPCK). The definition of RK refers to the knowledge about general usage of robots. RPK is knowledge about how to use robots with various pedagogical strategies. RCK is knowledge about how to combine robots with related subjects and teaching content. RPCK is knowledge of using robotics to implement teaching methods for any targeted content. For instance, if one has sufficient RPCK, he/she is capable of choosing appropriate robots to enhance what he/she teaches, how he/she teaches and what students learn in classrooms. In addition, the fact that teachers’ teaching behaviors are influenced by their beliefs, confidence and motivations for teaching. For instance, teachers who believed that technology works best for instruction were found to be able to integrate technology into their teaching practices (Blackwell et al., 2013; Ertmer, Ottenbreit-Leftwich, Sadik, Sendurur, & Sendurur, 2012; Kordaki, 2013). Teachers with higher confidence in technology are likely to effectively and significantly succeed in technology-related tasks (Celik & Yesilyurt, 2013; Teo, 2009). Accordingly, this study aimed to explore the relationship between technology pedagogical content knowledge-robotics (TPACK-R) and teachers’ teaching beliefs about robotics education (RTBS) and the main purposes of this study were to: Develop a new questionnaire to assess a group of teachers’ perceived knowledge on robotics
education. Explore the relationships between TPACK-R and RTBS.
2. Method
2.1. Participants
The participants in this study were 94 inservice and preservice teachers from a selection of schools in Taiwan. These teachers have been trained or have teaching experiences of the robotics-related courses, so they have a certain degree of robotics-related prior knowledge.
2.2. Data Analyses
The data analyses involve an exploratory factor analysis (EFA) and a path analysis. For the EFA, items that had an initial loading below 0.40 and were cross loaded were removed. In addition, path analyses were conducted to further examine the relations among the factors of the TPACK-R and the teachers’ teaching beliefs of robotics education.
3. Results
3.1. Exploratory Factor Analysis of the TPACK-R and RTBS.
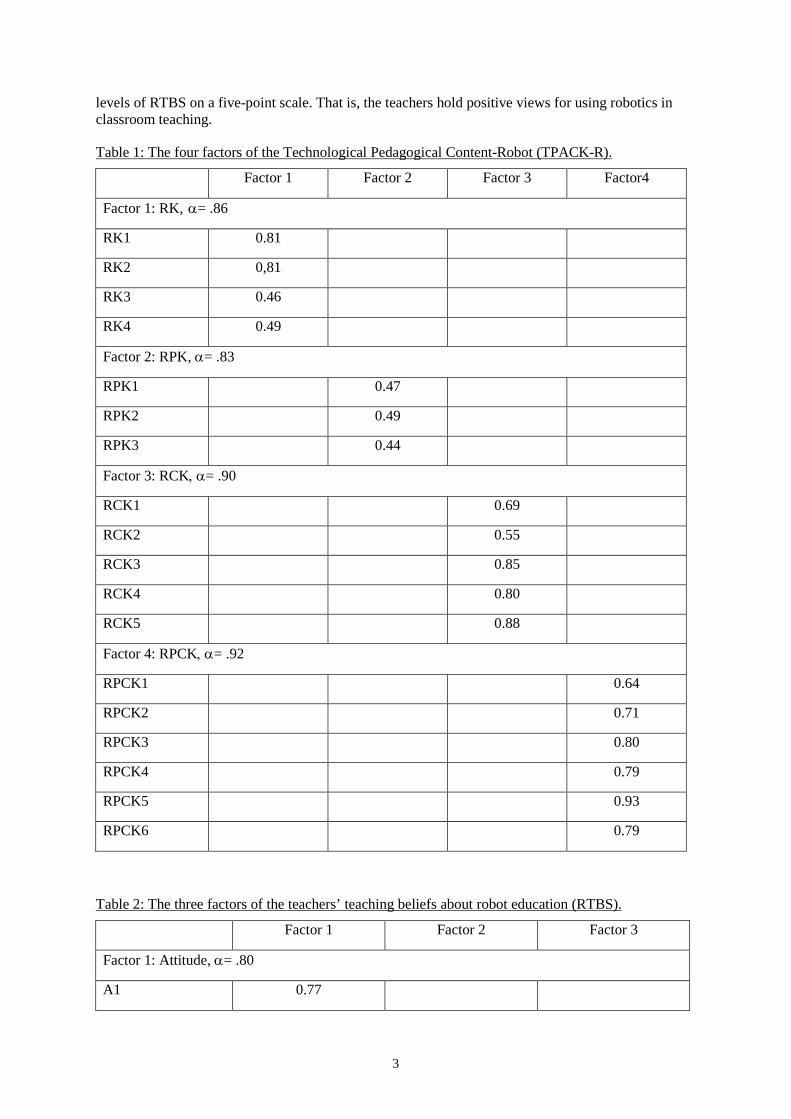
The results of the exploratory factor analysis for the TPACK-R survey are shown in Table1. This study used the principal axis method with a Direct Oblimin to conduct the exploratory factor analyses as a validation to clarify the structures of the TPACK Scale and RTBS Scale. The participants’ responses were grouped into four orthogonal factors: RK, RPK, RCK and RPCK. The items with a factor loading less than 0.4 or with many cross loadings were deleted. The cumulative variances explained by the four factors were 69 %. A total of 22 items were kept in the final version of the TPACK-R survey. There are 4 items for ‘Robotics Knowledge,’ 3 for ‘Robotics Pedagogical Knowledge,’ 5 for ‘Robotics Content Knowledge,’ and ‘Robotics Pedagogical Content Knowledge.’ The reliability coefficients (alpha) of the factors were .86, .83, .90, and 92.
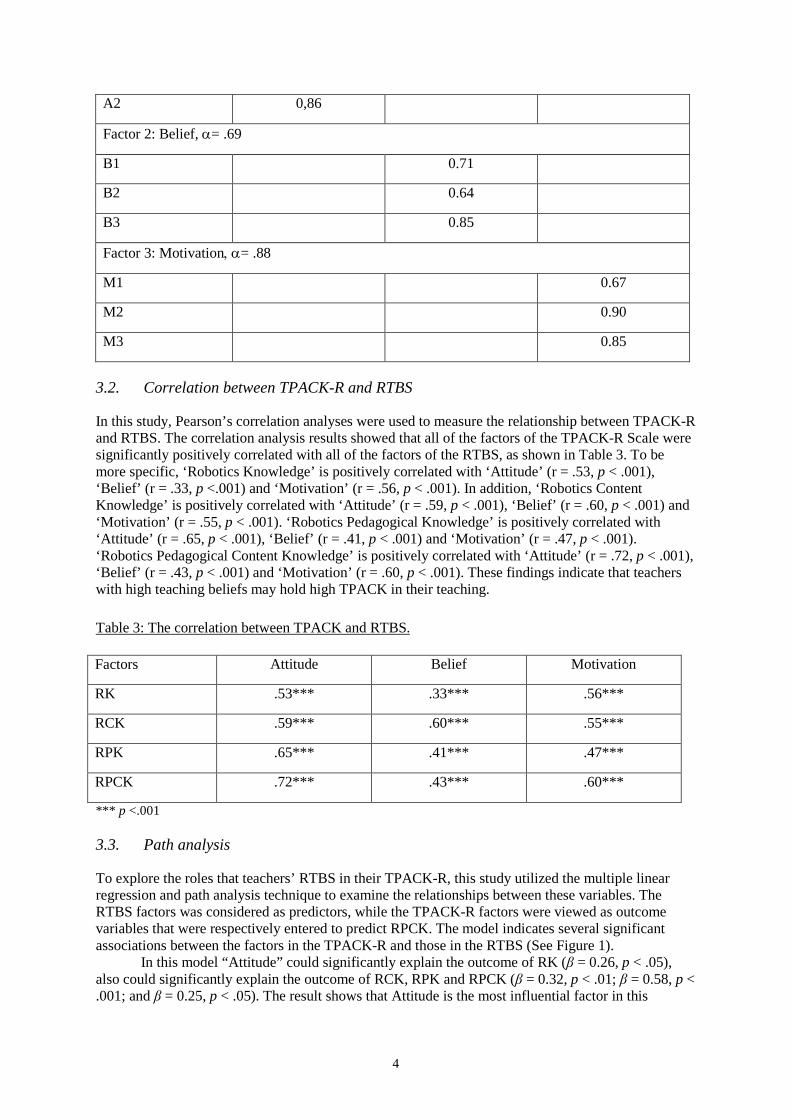
The results of the exploratory factor analysis for the RTBS survey are shown in Table2. Similarly, the RTBS used a factor loading greater than 0.4 for retaining the items. A total of 8 items were kept in the final version of the RTBS survey. There are 2 items for ‘Attitude,’ 3 for ‘Belief,’ and 3 for ‘Motivation.’ The reliability coefficients (alpha) of the factors were .80, .69, and .88. The total variances explained are 77 %. The results indicate that the overall participates had medium-to-high
3
levels of RTBS on a five-point scale. That is, the teachers hold positive views for using robotics in classroom teaching.
Table 1: The four factors of the Technological Pedagogical Content-Robot (TPACK-R).
Factor 1 Factor 2 Factor 3 Factor4
Factor 1: RK, α= .86
RK1 0.81
RK2 0,81
RK3 0.46
RK4 0.49
Factor 2: RPK, α= .83
RPK1 0.47
RPK2 0.49
RPK3 0.44
Factor 3: RCK, α= .90
RCK1 0.69
RCK2 0.55
RCK3 0.85
RCK4 0.80
RCK5 0.88
Factor 4: RPCK, α= .92
RPCK1 0.64
RPCK2 0.71
RPCK3 0.80
RPCK4 0.79
RPCK5 0.93
RPCK6 0.79
Table 2: The three factors of the teachers’ teaching beliefs about robot education (RTBS).
Factor 1 Factor 2 Factor 3
Factor 1: Attitude, α= .80
A1 0.77
4
A2 0,86
Factor 2: Belief, α= .69
B1 0.71
B2 0.64
B3 0.85
Factor 3: Motivation, α= .88
M1 0.67
M2 0.90
M3 0.85
3.2. Correlation between TPACK-R and RTBS
In this study, Pearson’s correlation analyses were used to measure the relationship between TPACK-R and RTBS. The correlation analysis results showed that all of the factors of the TPACK-R Scale were significantly positively correlated with all of the factors of the RTBS, as shown in Table 3. To be more specific, ‘Robotics Knowledge’ is positively correlated with ‘Attitude’ (r = .53, p < .001), ‘Belief’ (r = .33, p <.001) and ‘Motivation’ (r = .56, p < .001). In addition, ‘Robotics Content Knowledge’ is positively correlated with ‘Attitude’ (r = .59, p < .001), ‘Belief’ (r = .60, p < .001) and ‘Motivation’ (r = .55, p < .001). ‘Robotics Pedagogical Knowledge’ is positively correlated with ‘Attitude’ (r = .65, p < .001), ‘Belief’ (r = .41, p < .001) and ‘Motivation’ (r = .47, p < .001). ‘Robotics Pedagogical Content Knowledge’ is positively correlated with ‘Attitude’ (r = .72, p < .001), ‘Belief’ (r = .43, p < .001) and ‘Motivation’ (r = .60, p < .001). These findings indicate that teachers with high teaching beliefs may hold high TPACK in their teaching.
Table 3: The correlation between TPACK and RTBS.
*** p <.001
3.3. Path analysis
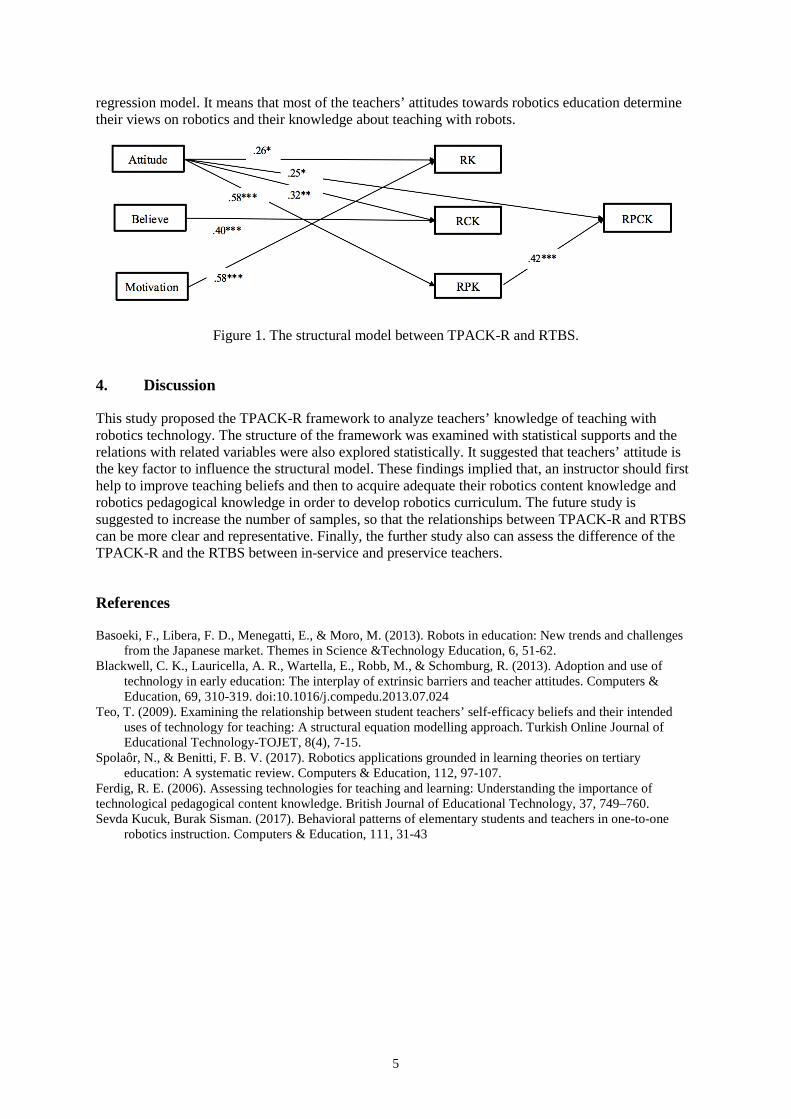
To explore the roles that teachers’ RTBS in their TPACK-R, this study utilized the multiple linear regression and path analysis technique to examine the relationships between these variables. The RTBS factors was considered as predictors, while the TPACK-R factors were viewed as outcome variables that were respectively entered to predict RPCK. The model indicates several significant associations between the factors in the TPACK-R and those in the RTBS (See Figure 1).
In this model “Attitude” could significantly explain the outcome of RK (β = 0.26, p < .05), also could significantly explain the outcome of RCK, RPK and RPCK (β = 0.32, p < .01; β = 0.58, p < .001; and β = 0.25, p < .05). The result shows that Attitude is the most influential factor in this
Factors Attitude Belief Motivation
RK .53*** .33*** .56***
RCK .59*** .60*** .55***
RPK .65*** .41*** .47***
RPCK .72*** .43*** .60***
5
regression model. It means that most of the teachers’ attitudes towards robotics education determine their views on robotics and their knowledge about teaching with robots.
Figure 1. The structural model between TPACK-R and RTBS.
4. Discussion
This study proposed the TPACK-R framework to analyze teachers’ knowledge of teaching with robotics technology. The structure of the framework was examined with statistical supports and the relations with related variables were also explored statistically. It suggested that teachers’ attitude is the key factor to influence the structural model. These findings implied that, an instructor should first help to improve teaching beliefs and then to acquire adequate their robotics content knowledge and robotics pedagogical knowledge in order to develop robotics curriculum. The future study is suggested to increase the number of samples, so that the relationships between TPACK-R and RTBS can be more clear and representative. Finally, the further study also can assess the difference of the TPACK-R and the RTBS between in-service and preservice teachers.
References
Basoeki, F., Libera, F. D., Menegatti, E., & Moro, M. (2013). Robots in education: New trends and challenges from the Japanese market. Themes in Science &Technology Education, 6, 51-62.
Blackwell, C. K., Lauricella, A. R., Wartella, E., Robb, M., & Schomburg, R. (2013). Adoption and use of technology in early education: The interplay of extrinsic barriers and teacher attitudes. Computers & Education, 69, 310-319. doi:10.1016/j.compedu.2013.07.024
Teo, T. (2009). Examining the relationship between student teachers’ self-efficacy beliefs and their intended uses of technology for teaching: A structural equation modelling approach. Turkish Online Journal of Educational Technology-TOJET, 8(4), 7-15.
Spolaôr, N., & Benitti, F. B. V. (2017). Robotics applications grounded in learning theories on tertiary education: A systematic review. Computers & Education, 112, 97-107.
Ferdig, R. E. (2006). Assessing technologies for teaching and learning: Understanding the importance of technological pedagogical content knowledge. British Journal of Educational Technology, 37, 749–760. Sevda Kucuk, Burak Sisman. (2017). Behavioral patterns of elementary students and teachers in one-to-one
robotics instruction. Computers & Education, 111, 31-43
Hayashi, Y., et al. (Eds.) (2017). Workshop Proceedings of the 25th International Conference on Computers in Education. New Zealand: Asia-Pacific Society for Computers in Education
6
A Study on Illustration Design in Learning Infant Development
Li-En LIE*, An-Hsuan WU, Po-Fen HSU & Meng-Jung TSAI Graduate Institute of Digital Learning and Education, National Taiwan University of Science and
Technology, Taiwan * [email protected]
Abstract: This study aims to explore the effect dynamic and static illustrations design of infant multimedia materials in learners’ visual behaviors and learning outcomes. An eye-tracking experiment was conducted with purposive sampling of 20 volunteers in Taiwan. The participants were randomly assigned to either static group or animation group. Mann–Whitney U test and Pearson’s correlation analyses were used to analyze the data. The preliminary results showed that the static group had significant higher scores than the animation group on immediately posttest. Besides, there has high significantly in the area of interest, except the middle title and the illustrations (subtitle & text content) reading time and fixation count of the static group is more than the dynamic group. Although no significant relationships were found between visual behaviors and posttest in dynamic group, some significant correlations were found between visual behaviors and learning effectiveness in static group. More details results are discussed in the paper.
Keywords: eye-tracking, selective attention, multimedia design, visual behavior
1. Introduction
Technological development enables educational systems to create and combine enormous amounts of different learning materials. Besides compressing the complex content, its can combine with different multimedia objects, such as pictures, sounds, text, animation, etc., making teaching material more lively and interesting. However, although these designs satisfy human sensory needs and increase learning contexts, but teachers nowadays often use auxiliary content to supplement their course contents, such as charts and illustrations. Different presentations support textual information and to some degree facilitate learning interest, learning motivation and thus expanding the attention span. Previous study (Mayer, 2005) showed that learners who learned with textual and pictorial representations had better performance than those who learned with textual only information. Whether the learning contents are presented in hard copy or multimedia format, images have some particular functions to assist learners achieving a positive effect on learning (Carney & Levin, 2002). Duchastel (1978) held a similar view saying that illustrations could attract attention, explain, and enhance memory. However, Vernon (1953) suspects that illustrations may distract learners’ attention from the text and affect learning. Atkinson & Mayer (2004) pointed out that pictures have the function and potential to enhance learning, but improper decorative or layout designs were not helpful in learning. The results of the above studies are not consistent, so it is necessary to understanding of the learning effect of illustrations is not easy. Therefore, this study mainly explores the effect of visual-based multimedia teaching materials design with decorative illustrations on learning effect.
In addition, many studies related to multimedia learning were evidenced through the learning outcomes, and seldom concerned about learning strategies in depth. This study produces a detailed account of changes in the learner’s visual perception through eye tracking software, which include their attention distribution characteristic in the specific area and browsing behavior. The expected research results provide suggestions for the design of future multimedia teaching materials.
7
1.1. Selective Attention and Redundancy Effect
In the modern age which information explodes, human beings have to face a lot of information in daily life, so how to choose the information is very important. Selective attention helps us determine the importance of external stimuli and filter unnecessary or less importance information before the brain starts processing. In addition to stimulating their own physical characteristics factors, human beings' interest, motivation and cognitive strategies for receiving stimuli can also influence the process of attention selection (Mesulam, 2000). Because selective attention contains the process of filtering external information, it plays an important role of people’s learning and development. The scholar advocate that people cannot control attention by themselves, they manage attention by visual features. For example, a red ball in a group of green balls always attracts human attention. When the red object is the task target, it can improve the search efficiency. Conversely, when the object is not a task target, it will be an interference information of “attentional capture” (Theeuwes, 1994).
Therefore, the decoration of teaching materials is also a source of cognitive load on learning. When students face multiple sources of information, even if each piece of information is clear and concise, the amount of cognitive load on their working memory will cause a redundancy effect which lowers their learning achievement. The redundancy principle comes from Richard E. Mayer’s seminal Multimedia Learning (Mayer,2001) and states that “people learn better from graphics and narration than from graphics, narration and on-screen text.”
1.2. The effect of illustration on learning
Students likely have been heavily exposed to PowerPoint in their school education. Although PowerPoint presentations can be created in a variety of formats, a majority of faculty members rely solely on traditional PowerPoint, in which slides are filled with bullet points and excessive wordiness that may lead to student boredom and fatigue during lectures, so often with illustrations.
According to Levin’s five functions that pictures serve in text processing—five functions: decoration, representational, organizational, interpretational and transformational. Briefly, decoration pictures simply decorate the page, bearing little or no relationship to the text content. (Levin et al., 1987). Learning benefits occur when pictures and text provide congruent, or supporting, information.
Decorational illustrations may help to make the text more attractive or more marketable, but they are unlikely to enhance desired outcomes related to understanding, remembering, or applying the text content.
Some studies indicate that illustrations have no effect on learning, probably the students did not get into the habit of observing the illustrations. So, most of the school learning is delivered through verbal or text, illustrations are dispensable, and students do not pay attention to the illustrations when they read.
1.3. Eye movement
In the beginning of 1990’s, visual attention application of reading and information processing eye movement research developed gradually. The eye is one of the most important sensory sources when humans receive message, and most of the messages in the message processing process are visually obtained. In recent years, eye-tracking has become one of the useful tool to explore cognitive processing and provide effective eye movement data (Rayner, 1998; Radach & Kennedy, 2004; Rayner, Chace, Slattery, & Ashby, 2006). Rayner (1998) indicated that researchers can understand learners’ reading processing and learning process with the eye movement.
2. Purpose
The purpose of this study was explore the effect of multimedia illustrations designed with PowerPoint learning achievement and attention distribution, a pilot eye tracking examination was used in this study. Particularly, this study explored how two different designs of multimedia illustrations in the PowerPoint (i.e., static illustration and dynamic illustration) effect learning performance (i.e., posttests for infant development) and visual behavior? (i.e., percentage of reading time in zone,
8
percentage of total fixations, and percentage of fixation duration in zone). The research questions are as following:
RQ1: What are the effects of multimedia illustrations design between static and dynamic illustrations in infant development materials on students’ learning achievement?
RQ2: What are the effects of multimedia illustrations design between static and dynamic illustrations in infant development materials on students’ attention distribution?
RQ3: Are there any relationships between learning achievement and distribution of attention when looking at static or dynamic illustrations in multimedia learning material?
3. Methods
3.1. Participants
Twenty participants were selected from a university of Taiwan in this study. Most of them have no prior knowledge about human development. The number of participants in each group is ten. Participants in static group read the learning material static illustrations, while participants in dynamic group read the learning content with dynamic illustrations.
3.2. Instruments
3.2.1. Background Questionnaire
The Background Questionnaire was developed to realize participants’ major, age, gender, the experiences, attitude of multimedia learning and whether the participants have experiences in learning infant development.
3.2.2. Posttest
The asked questions were created from the learning material to determine how the extent participants have. Furthermore, the given answers were also taken as references to understand the effect on short-term memory through learning.
3.2.3. Eye-Tracking system
FaceLab 4.5 with a sampling rate of 60 Hz was used to record participants' eye-movements during the reading process. The system uses infrared lights and two cameras to identify six facial features to determine where on the screen the eyes were focused on. Gazetracker full 10.0 was used to analyze eye movement data.
3.2.4. Learning material
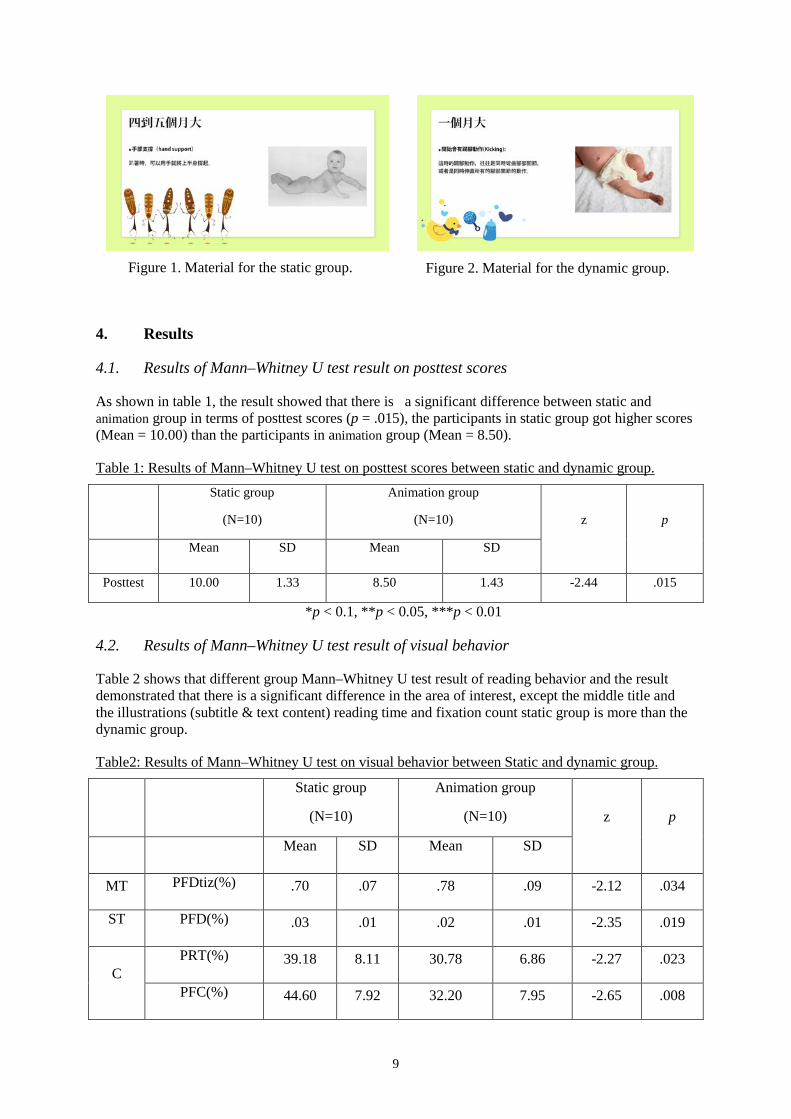
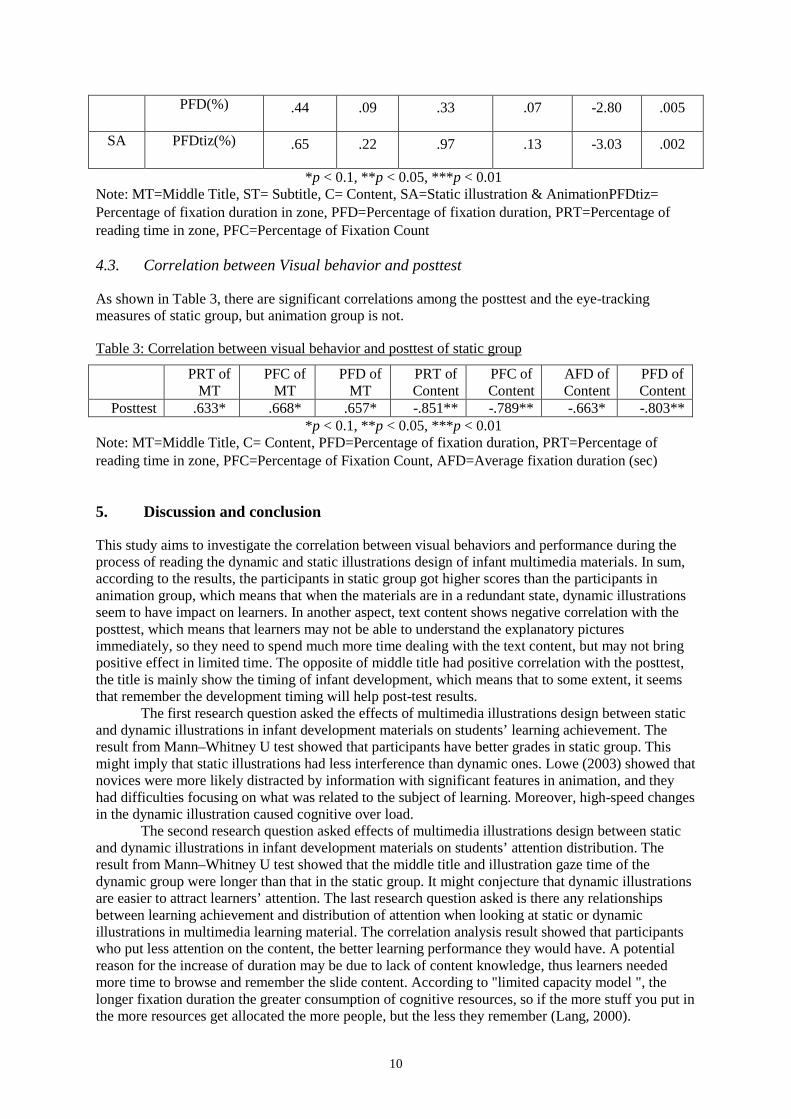
The learning material in this study was about infant development. Illustrations were presented in different modes as two versions of learning materials: dynamic illustration and static illustration. Each participant read the same content, but illustration design has different with dynamic and static. The purpose of this study is to explore the effects of multimedia illustrations on student's distribution of attention and learning
9
Figure 1. Material for the static group.
Figure 2. Material for the dynamic group.
4. Results
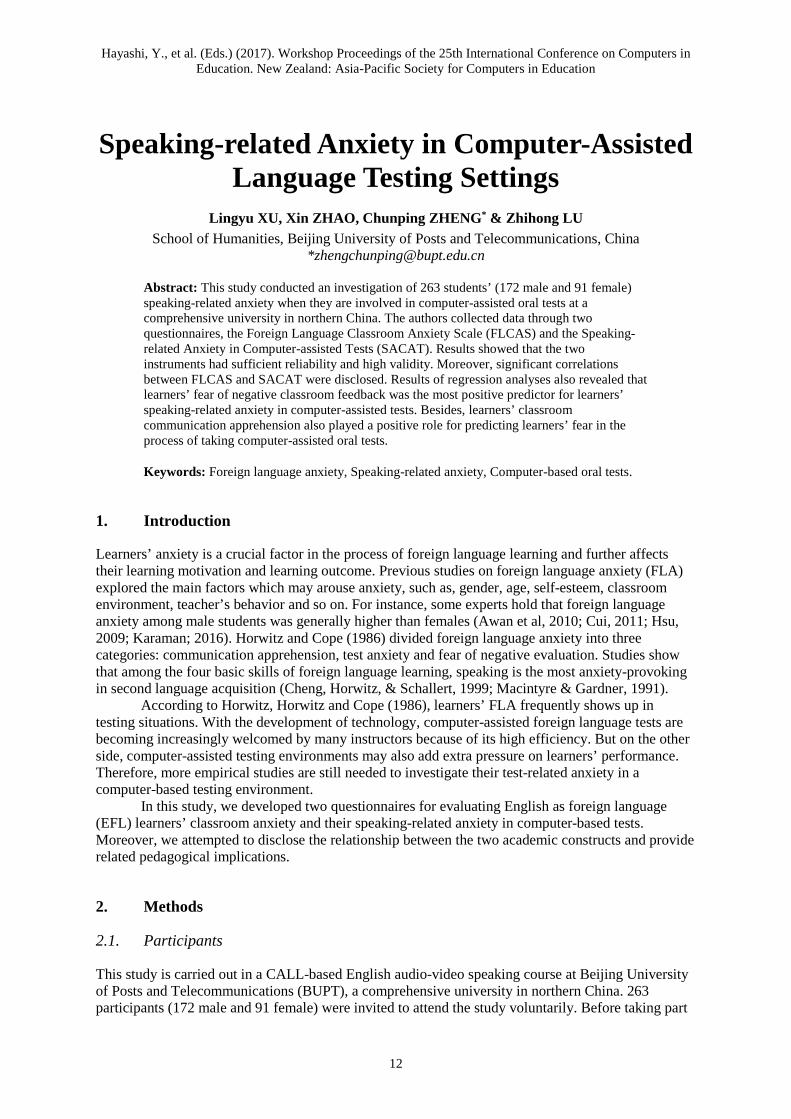
4.1. Results of Mann–Whitney U test result on posttest scores
As shown in table 1, the result showed that there is a significant difference between static and animation group in terms of posttest scores (p = .015), the participants in static group got higher scores (Mean = 10.00) than the participants in animation group (Mean = 8.50).
Table 1: Results of Mann–Whitney U test on posttest scores between static and dynamic group.
Static group
(N=10)
Animation group
(N=10) z p
Mean SD Mean SD
Posttest 10.00 1.33 8.50 1.43 -2.44 .015
*p < 0.1, **p < 0.05, ***p < 0.01
4.2. Results of Mann–Whitney U test result of visual behavior
Table 2 shows that different group Mann–Whitney U test result of reading behavior and the result demonstrated that there is a significant difference in the area of interest, except the middle title and the illustrations (subtitle & text content) reading time and fixation count static group is more than the dynamic group.
Table2: Results of Mann–Whitney U test on visual behavior between Static and dynamic group.
Static group
(N=10)
Animation group
(N=10) z p
Mean SD Mean SD
MT PFDtiz(%) .70 .07 .78 .09 -2.12 .034
ST PFD(%) .03 .01 .02 .01 -2.35 .019
C PRT(%) 39.18 8.11 30.78 6.86 -2.27 .023
PFC(%) 44.60 7.92 32.20 7.95 -2.65 .008
10
PFD(%) .44 .09 .33 .07 -2.80 .005
SA PFDtiz(%) .65 .22 .97 .13 -3.03 .002
*p < 0.1, **p < 0.05, ***p < 0.01 Note: MT=Middle Title, ST= Subtitle, C= Content, SA=Static illustration & AnimationPFDtiz= Percentage of fixation duration in zone, PFD=Percentage of fixation duration, PRT=Percentage of reading time in zone, PFC=Percentage of Fixation Count
4.3. Correlation between Visual behavior and posttest
As shown in Table 3, there are significant correlations among the posttest and the eye-tracking measures of static group, but animation group is not.
Table 3: Correlation between visual behavior and posttest of static group
PRT of MT
PFC of MT
PFD of MT
PRT of Content
PFC of Content
AFD of Content
PFD of Content
Posttest .633* .668* .657* -.851** -.789** -.663* -.803** *p < 0.1, **p < 0.05, ***p < 0.01
Note: MT=Middle Title, C= Content, PFD=Percentage of fixation duration, PRT=Percentage of reading time in zone, PFC=Percentage of Fixation Count, AFD=Average fixation duration (sec)
5. Discussion and conclusion
This study aims to investigate the correlation between visual behaviors and performance during the process of reading the dynamic and static illustrations design of infant multimedia materials. In sum, according to the results, the participants in static group got higher scores than the participants in animation group, which means that when the materials are in a redundant state, dynamic illustrations seem to have impact on learners. In another aspect, text content shows negative correlation with the posttest, which means that learners may not be able to understand the explanatory pictures immediately, so they need to spend much more time dealing with the text content, but may not bring positive effect in limited time. The opposite of middle title had positive correlation with the posttest, the title is mainly show the timing of infant development, which means that to some extent, it seems that remember the development timing will help post-test results.
The first research question asked the effects of multimedia illustrations design between static and dynamic illustrations in infant development materials on students’ learning achievement. The result from Mann–Whitney U test showed that participants have better grades in static group. This might imply that static illustrations had less interference than dynamic ones. Lowe (2003) showed that novices were more likely distracted by information with significant features in animation, and they had difficulties focusing on what was related to the subject of learning. Moreover, high-speed changes in the dynamic illustration caused cognitive over load.
The second research question asked effects of multimedia illustrations design between static and dynamic illustrations in infant development materials on students’ attention distribution. The result from Mann–Whitney U test showed that the middle title and illustration gaze time of the dynamic group were longer than that in the static group. It might conjecture that dynamic illustrations are easier to attract learners’ attention. The last research question asked is there any relationships between learning achievement and distribution of attention when looking at static or dynamic illustrations in multimedia learning material. The correlation analysis result showed that participants who put less attention on the content, the better learning performance they would have. A potential reason for the increase of duration may be due to lack of content knowledge, thus learners needed more time to browse and remember the slide content. According to "limited capacity model ", the longer fixation duration the greater consumption of cognitive resources, so if the more stuff you put in the more resources get allocated the more people, but the less they remember (Lang, 2000).

11
In this study, because the sample size of participants is small, future studies can enroll larger samples to get a deeper understanding of how the learners read. Future studies can examine the relationships between participants’ cognitive load and visual attention by eye-tracking methods.
References
Lai, M. L., Tsai, M.-J., Yang, F. Y., Hsu, C. Y., Liu, T. C., Lee, S. W. Y., Lee, M. H., Chiou, G. L., Liang, J. C., & Tsai, C. C. (2013). A review of using eye-tracking technology in exploring learning from 2000 to 2012. Educational Research Review, 10, 90-115.
Theeuwes, J. (1994). Stimulus-driven capture and attentional set: selective search for color and visual abrupt onsets. Journal of Experimental Psychology: Human perception and performance, 20(4), 799.
Duchastel, P. C. (1978). Illustrating Instructional Texts. Educational Technology, 18(11), 36-39. Mayer, R. E., & Betrancourt, M. (2005). The animation and interactivity principles in multimedia learning. The
Cambridge Handbook of Multimedia Learning, 19. Duchastel, P. C. (1980). Research on illustrations in text: Issues and perspectives. Educational Technology
Research and Development, 28(4), 283-287.
Hayashi, Y., et al. (Eds.) (2017). Workshop Proceedings of the 25th International Conference on Computers in Education. New Zealand: Asia-Pacific Society for Computers in Education
12
Speaking-related Anxiety in Computer-Assisted Language Testing Settings
Lingyu XU, Xin ZHAO, Chunping ZHENG* & Zhihong LU School of Humanities, Beijing University of Posts and Telecommunications, China
Abstract: This study conducted an investigation of 263 students’ (172 male and 91 female) speaking-related anxiety when they are involved in computer-assisted oral tests at a comprehensive university in northern China. The authors collected data through two questionnaires, the Foreign Language Classroom Anxiety Scale (FLCAS) and the Speaking-related Anxiety in Computer-assisted Tests (SACAT). Results showed that the two instruments had sufficient reliability and high validity. Moreover, significant correlations between FLCAS and SACAT were disclosed. Results of regression analyses also revealed that learners’ fear of negative classroom feedback was the most positive predictor for learners’ speaking-related anxiety in computer-assisted tests. Besides, learners’ classroom communication apprehension also played a positive role for predicting learners’ fear in the process of taking computer-assisted oral tests.
Keywords: Foreign language anxiety, Speaking-related anxiety, Computer-based oral tests.
1. Introduction
Learners’ anxiety is a crucial factor in the process of foreign language learning and further affects their learning motivation and learning outcome. Previous studies on foreign language anxiety (FLA) explored the main factors which may arouse anxiety, such as, gender, age, self-esteem, classroom environment, teacher’s behavior and so on. For instance, some experts hold that foreign language anxiety among male students was generally higher than females (Awan et al, 2010; Cui, 2011; Hsu, 2009; Karaman; 2016). Horwitz and Cope (1986) divided foreign language anxiety into three categories: communication apprehension, test anxiety and fear of negative evaluation. Studies show that among the four basic skills of foreign language learning, speaking is the most anxiety-provoking in second language acquisition (Cheng, Horwitz, & Schallert, 1999; Macintyre & Gardner, 1991).
According to Horwitz, Horwitz and Cope (1986), learners’ FLA frequently shows up in testing situations. With the development of technology, computer-assisted foreign language tests are becoming increasingly welcomed by many instructors because of its high efficiency. But on the other side, computer-assisted testing environments may also add extra pressure on learners’ performance. Therefore, more empirical studies are still needed to investigate their test-related anxiety in a computer-based testing environment.
In this study, we developed two questionnaires for evaluating English as foreign language (EFL) learners’ classroom anxiety and their speaking-related anxiety in computer-based tests. Moreover, we attempted to disclose the relationship between the two academic constructs and provide related pedagogical implications.
2. Methods
2.1. Participants
This study is carried out in a CALL-based English audio-video speaking course at Beijing University of Posts and Telecommunications (BUPT), a comprehensive university in northern China. 263 participants (172 male and 91 female) were invited to attend the study voluntarily. Before taking part
13
in this study, almost all participants have passed the College English Test (CET, a national English test for non-English majors) and 70% of the participants also had online CET experience. During the course, all the students were asked to use the self-developed language training and testing system, named the English Language Skill Training System for online speaking tests. On a whole, participants in this study shared similar experience in computer-assisted language tests at similar English proficiency level.
2.2. Data Collection
Two questionnaires were developed and further administered in this research to collect students’ responses about their foreign language anxiety and speaking-related anxiety in computer-assisted testing environments. The first questionnaire is called the Foreign Language Classroom Anxiety Scale (FLCAS). It was developed based on the questionnaire of in-class foreign language anxiety (Horwitz et al., 1986). The second questionnaire is named Speaking-related Anxiety in Computer-assisted Tests (SACAT). It was designed to explore learners’ speaking-related anxiety in computer-assisted language testing settings based on Young’s (1990) study. Five-point Likert scale from 1 point “strongly disagree”, to 5 points “strongly agree”, was used to measure all the questionnaire items.
The first questionnaire consists of three factors, namely, fear of negative classroom feedback (like “I am afraid that my English teacher is ready to correct every mistake I make.”), comfort of using English in classroom (like “I don’t worry about making mistakes in English classes.”) and classroom communication apprehension (like “I tremble when I know that I’m going to be called on in English class.”). The second questionnaire includes fear of taking computer-assisted oral test (like “I am afraid that I will make mistake, and I’m anxious about it”), negative attitudes towards computer-assisted oral test (like “I feel nervous about a bad grade.”) and fear of inadequate performance in computer-assisted oral test (like “I start to panic when I have to speak without preparation.”).
2.3. Data Analysis
Both the FLCAS and SACAT in the study were translated from English into Chinese since the participants were all EFL learners. Since the two questionnaires were all adapted from previous questionnaires, we firstly used exploratory factor analysis (EFA) and reliability analysis to confirm its validity and reliability. Then, we analyzed the correlation between all the factors of the two questionnaires. Finally, a stepwise regression analysis between factors of FLCAS (as predictor variables) and SACAT (as outcome variables) was conducted.
3. Results and Discussion
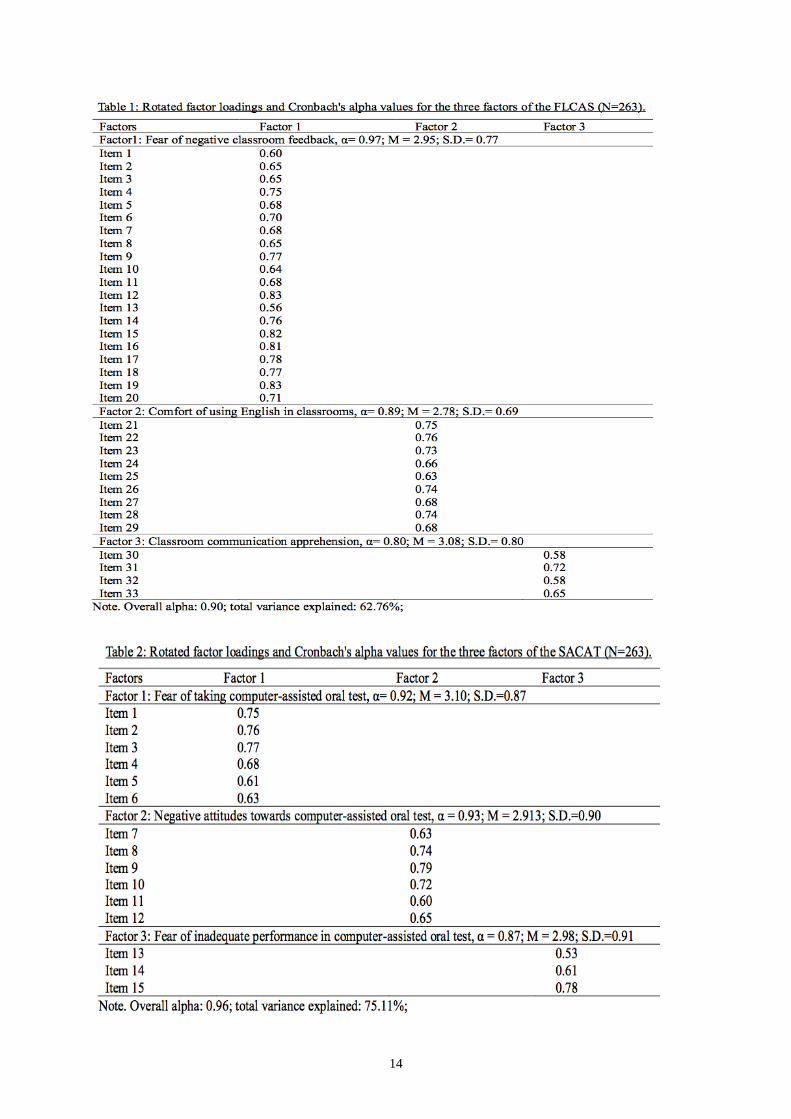
3.1. Exploratory Factor Analysis of the Questionnaires
After the process of EFA, three factors with 33 items were retained in the final version of the FLCAS (see Table 1). The three factors were fear of negative classroom feedback (α= 0.97, M = 2.95, S.D. = 0.77), comfort of using English in classroom (α= 0.89, M = 2.78, S.D. = 0.69) and classroom communication apprehension (α= 0.80, M = 3.08, S.D. = 0.80). All the factor loadings were greater than 0.4 and the total variance explained was 62.76%. The alpha coefficients were around 0.80-0.89 for each factor (overall alpha = 0.90), indicating a high internal consistency reliability of the scale.
The same analytical method was applied to test the validity and reliability of the SACAT. Three factors with 15 items were maintained in the final scale (see Table 2). The three factors were fear of taking computer-assisted oral test (α = 0.92, M = 3.1, S.D. = 0.87), negative attitudes towards computer-assisted oral test (α = 0.93, M = 2.91, S.D. = 0.90) and fear of inadequate performance in computer-assisted oral test (α = 0.87, M = 2.98, S.D. = 0.91). All the factor loadings were greater than 0.40 and the total variance explained for the SACAT was 71.11%. The alpha coefficients were around 0.87-0.93 (overall alpha = 0.96), indicating high reliability of the SACAT.
14
15
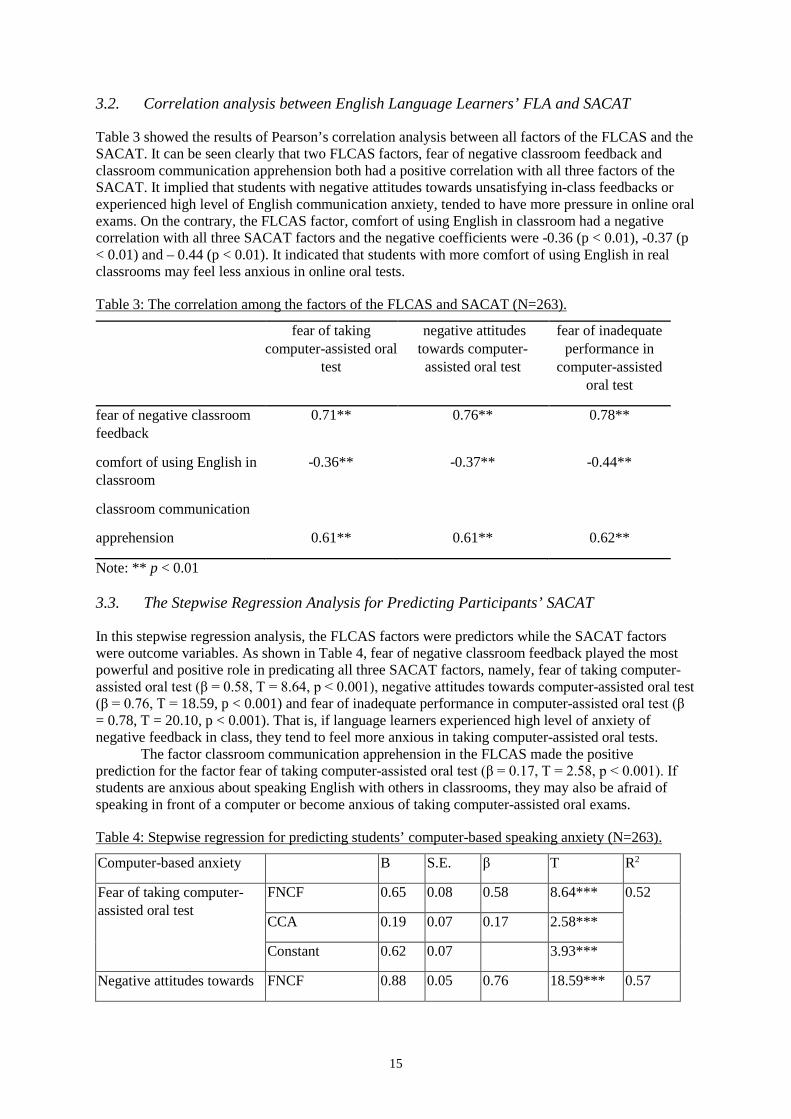
3.2. Correlation analysis between English Language Learners’ FLA and SACAT
Table 3 showed the results of Pearson’s correlation analysis between all factors of the FLCAS and the SACAT. It can be seen clearly that two FLCAS factors, fear of negative classroom feedback and classroom communication apprehension both had a positive correlation with all three factors of the SACAT. It implied that students with negative attitudes towards unsatisfying in-class feedbacks or experienced high level of English communication anxiety, tended to have more pressure in online oral exams. On the contrary, the FLCAS factor, comfort of using English in classroom had a negative correlation with all three SACAT factors and the negative coefficients were -0.36 (p < 0.01), -0.37 (p < 0.01) and – 0.44 (p < 0.01). It indicated that students with more comfort of using English in real classrooms may feel less anxious in online oral tests.
Table 3: The correlation among the factors of the FLCAS and SACAT (N=263).
fear of taking computer-assisted oral
test
negative attitudes towards computer-assisted oral test
fear of inadequate performance in
computer-assisted oral test
fear of negative classroom feedback
0.71** 0.76** 0.78**
comfort of using English in classroom
-0.36** -0.37** -0.44**
classroom communication
apprehension
0.61**
0.61**
0.62**
Note: ** p < 0.01
3.3. The Stepwise Regression Analysis for Predicting Participants’ SACAT
In this stepwise regression analysis, the FLCAS factors were predictors while the SACAT factors were outcome variables. As shown in Table 4, fear of negative classroom feedback played the most powerful and positive role in predicating all three SACAT factors, namely, fear of taking computer-assisted oral test (β = 0.58, T = 8.64, p < 0.001), negative attitudes towards computer-assisted oral test (β = 0.76, T = 18.59, p < 0.001) and fear of inadequate performance in computer-assisted oral test (β = 0.78, T = 20.10, p < 0.001). That is, if language learners experienced high level of anxiety of negative feedback in class, they tend to feel more anxious in taking computer-assisted oral tests.
The factor classroom communication apprehension in the FLCAS made the positive prediction for the factor fear of taking computer-assisted oral test (β = 0.17, T = 2.58, p < 0.001). If students are anxious about speaking English with others in classrooms, they may also be afraid of speaking in front of a computer or become anxious of taking computer-assisted oral exams.
Table 4: Stepwise regression for predicting students’ computer-based speaking anxiety (N=263).
Computer-based anxiety B S.E. β T R2
Fear of taking computer-assisted oral test
FNCF 0.65 0.08 0.58 8.64*** 0.52
CCA 0.19 0.07 0.17 2.58***
Constant 0.62 0.07 3.93***
Negative attitudes towards FNCF 0.88 0.05 0.76 18.59*** 0.57
16
computer-assisted oral test Constant 0.32 0.14 2.25**
Fear of inadequate performance in computer-assisted oral test
FNCF 0.91 0.05 0.78 20.10*** 0.61
Constant 0.29 0.14 2.08**
Notes: FNCF= Fear of negative classroom feedback; CCA = Classroom communication apprehension; *p < 0.05, **p < 0.01, ***p < 0.001.
4. Conclusion
This study explored learners’ in-class foreign language anxiety and speaking-related anxiety in computer-assisted testing settings. Two questionnaires, the FLCAS and the SACAT were developed for achieving our research objectives. The findings revealed the significant correlations between foreign language anxiety and speaking-related anxiety in computer-assisted testing settings. The study also revealed that learners’ fear of negative classroom feedback has the strongest and positive prediction for speaking-related anxiety in computer-assisted testing environments. Future studies through qualitative methods, such as interviews or observations, are still needed to provide more pedagogical implications for understanding and further relieving learners’ foreign language anxiety.
Acknowledgements
The research is funded by the Humanities and Social Sciences Fund of Chinese Ministry of Education (Grant 16YJC740099, awarded to Chunping Zheng).
References
Awan, R. N., Azher, M., Anwar, M. N., & Naz, A. (2010). An investigation of foreign language classroom anxiety and its relationship with students' achievement. Journal of College Teaching & Learning, 7(11), 33-40.
Cheng, Y. S., Horwitz, E. K., & Schallert, D. L. (1999). Language anxiety: differentiating writing and speaking components. Language Learning, 49(3), 417-446.
Cui, J. (2011). Research on high school students’ English learning anxiety. Journal of Language Teaching & Research, 2(4), 875–880.
Horwitz, E. K., Horwitz, M. B., & Cope, J. (1986). Foreign Language Classroom Anxiety. The Modern Language Journal, 70(2), 125-132.
Hsu, S. C. (2009). Foreign language anxiety among technical college students in English class. National Formosa University J. 28(1), 113-126.
Karaman, A.U. (2016). Foreign Language Learning Anxiety Factor and Its Effects on Students’ Oral Production. Retrieved from http://www.academia.edu/download/41397719/aziz_article.pdf.
Macintyre, P. D., & Gardner, R. C. (1991). Investigating language class anxiety using the focused essay technique. Modern Language Journal, 75(3), 296-304.
Young, D. J. (1990). An investigation of students’ perspectives on anxiety and speaking. Foreign Language Annals, 23(6), 539–553.
Hayashi, Y., et al. (Eds.) (2017). Workshop Proceedings of the 25th International Conference on Computers in Education. New Zealand: Asia-Pacific Society for Computers in Education
17
Analysis of Educational Research Using CiteSpace Applications in CSSCI Journals
(2012-2016) Zixi WANG*, Yang LIU, Mengya GAO, Jia XI & Chunping ZHENG
School of Humanities, Beijing University of Posts and Telecommunications, China *[email protected]
Abstract: This paper adopts content analysis to assess the current state and the trends of educational research using CiteSpace applications in China. 89 peer-reviewed articles are retrieved from Chinese Social Science Citation Index (CSSCI) journals that appeared from 2012 to 2016. Our results show that higher education is the main research setting for these educational studies. CiteSpace applications are mainly used to release research hot topics and trends in the field of educational research. Keywords co-occurrence knowledge maps have a dominant position as presentations of knowledge maps of educational research. The authors believe that this review can facilitate fruitful discussions of future educational research using CiteSpace applications.
Keywords: Educational research, CiteSpace, Knowledge mapping
1. Introduction
With increasingly extensive and in-depth applications of information technology in educational research, visualization technology has received considerable attention over the past few years. CiteSpace is a Java-based application (Chen, 2004) that can analyze connections between authors, institutions, countries, keywords, journals, or references in the scientific literature (Cobo et al., 2011). Based on an analysis of Chinese educational research using CiteSpace applications from 2012 to 2016, this paper aims at investigating the trends and hot topics of educational research in China.
1. Research Design
1.1. Research Methods and Questions
This research adopts content analysis to analyze educational research using CiteSpace applications based on 89 peer-reviewed articles retrieved from Chinese Social Science Citation Index (CSSCI) journals from 2012 to 2016. It attempts to address the following research questions: What are the trends of educational research using CiteSpace applications in China from 2012 to
2016? What are the research settings and research topics of educational research using CiteSpace
applications in China from 2012 to 2016? What are the main presentations of knowledge maps in educational research using CiteSpace
applications in China from 2012 to 2016?
1.2. Data Sources
In this research, we have retrieved 98 publications in CSSCI-indexed journals from China National Knowledge Infrastructure (CNKI) from 2012 to 2016 based on four keywords: CiteSpace, education, teaching and learning. After excluding irrelevant publications, we finally selected 89 peer-reviewed
18
articles closely related to this research as data sources. Status of educational research using CiteSpace applications in recent five years has been summarized according to data sources.
1.3. Coding System
Content analysis is a research method which enables researchers to include large amounts of textual information and identify its properties. This research strictly follows the steps of content analysis, regarding each independent paper as an analysis unit in the process of coding and analyzing. This research consulted the coding system proposed by Hsu, Hung, and Tsai (2013), and selected five categories of information for further content analysis, namely the numbers of published articles per year, journals, research settings, research topics and presentations of knowledge maps.
2. Research Results and Discussions
2.1. Numbers of published articles per year
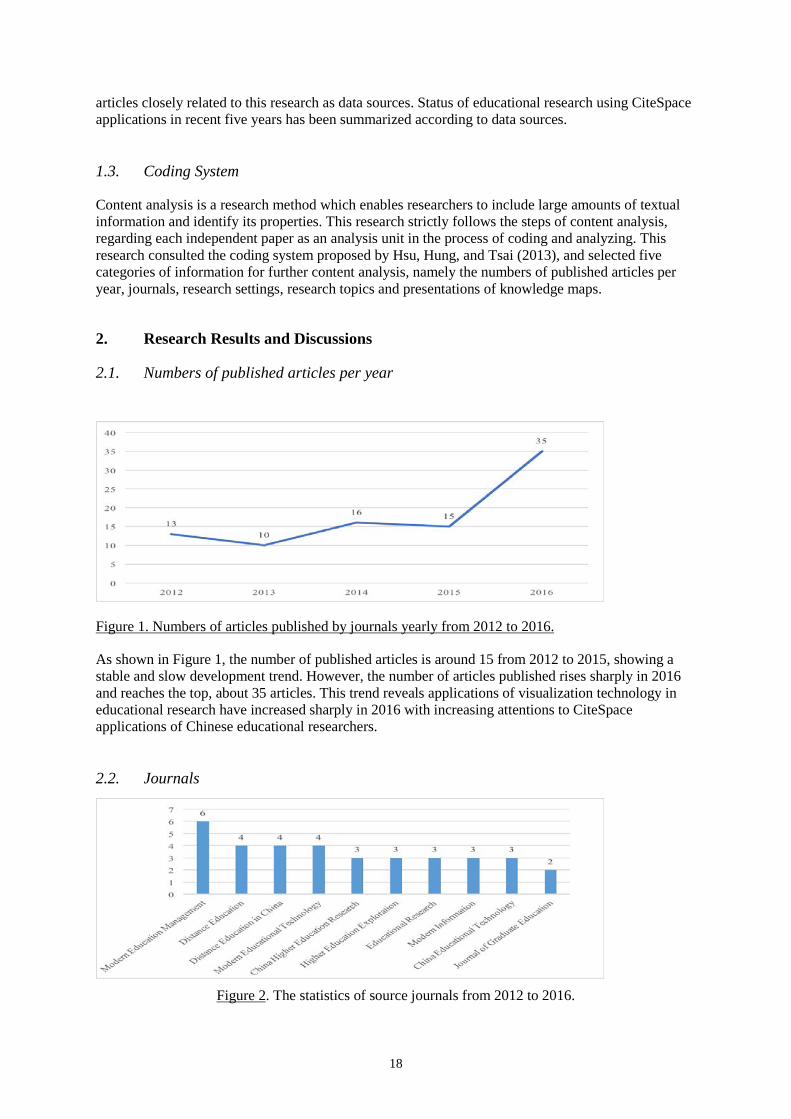
Figure 1. Numbers of articles published by journals yearly from 2012 to 2016.
As shown in Figure 1, the number of published articles is around 15 from 2012 to 2015, showing a stable and slow development trend. However, the number of articles published rises sharply in 2016 and reaches the top, about 35 articles. This trend reveals applications of visualization technology in educational research have increased sharply in 2016 with increasing attentions to CiteSpace applications of Chinese educational researchers.
2.2. Journals
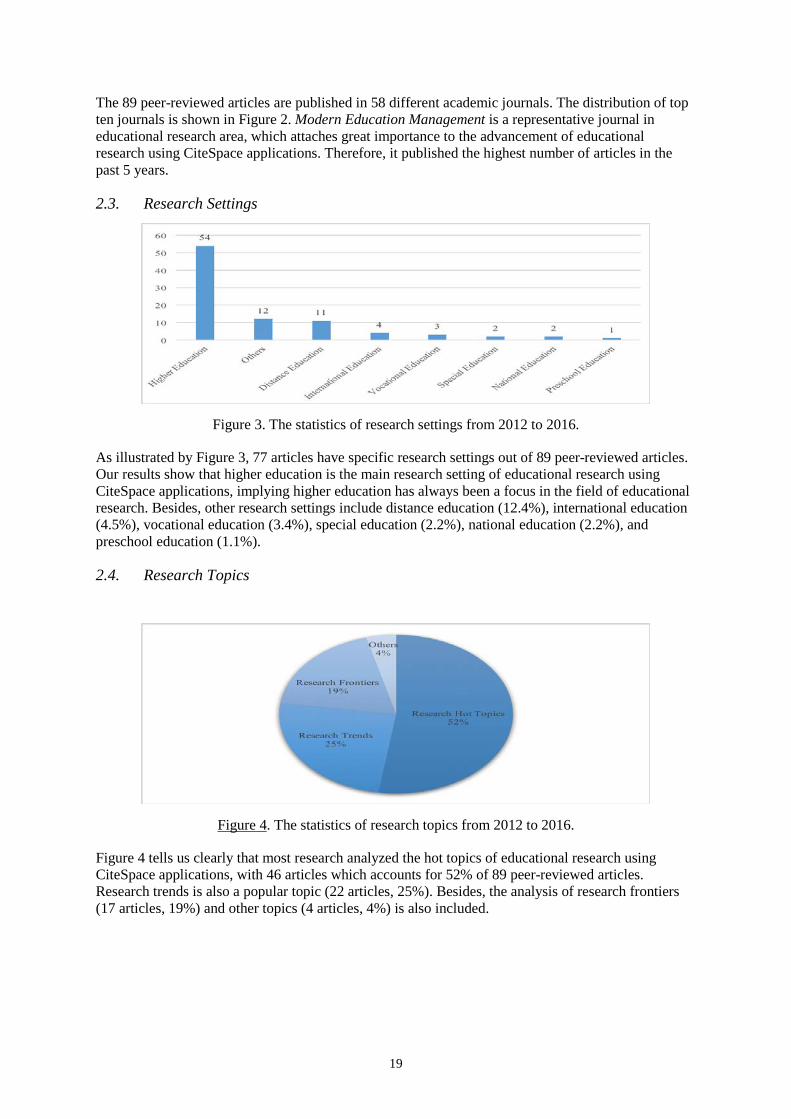
Figure 2. The statistics of source journals from 2012 to 2016.
19
The 89 peer-reviewed articles are published in 58 different academic journals. The distribution of top ten journals is shown in Figure 2. Modern Education Management is a representative journal in educational research area, which attaches great importance to the advancement of educational research using CiteSpace applications. Therefore, it published the highest number of articles in the past 5 years.
2.3. Research Settings
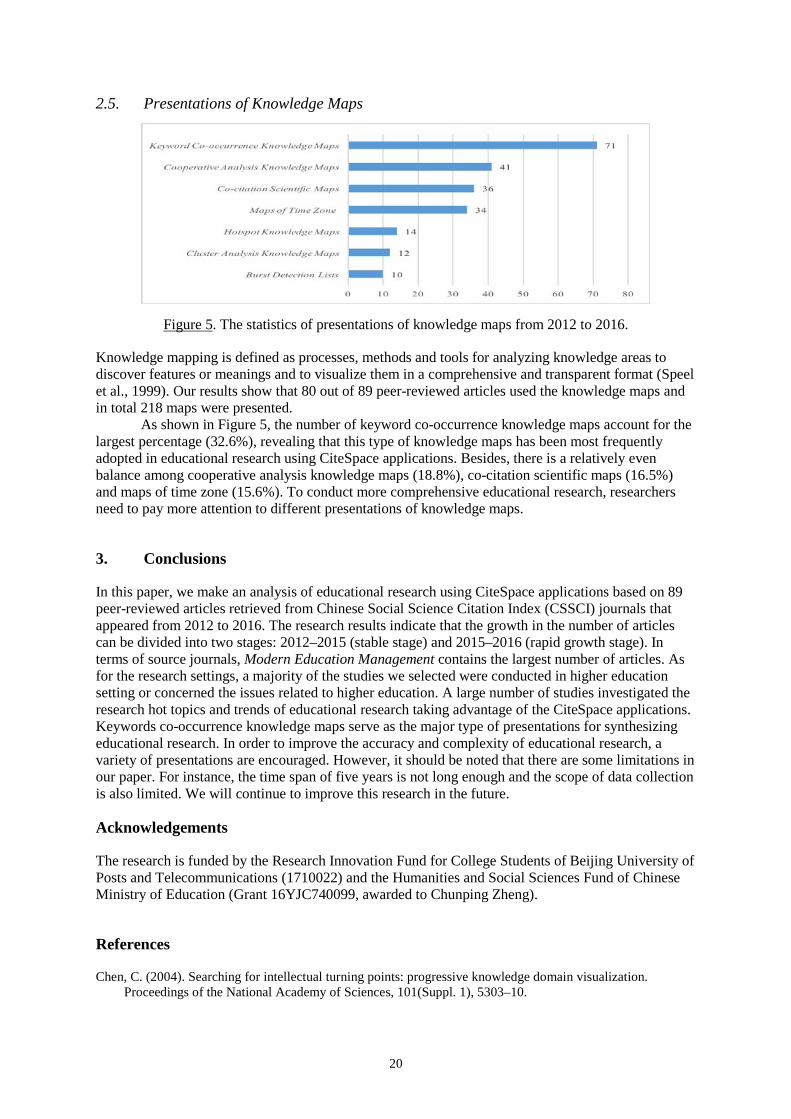
Figure 3. The statistics of research settings from 2012 to 2016.
As illustrated by Figure 3, 77 articles have specific research settings out of 89 peer-reviewed articles. Our results show that higher education is the main research setting of educational research using CiteSpace applications, implying higher education has always been a focus in the field of educational research. Besides, other research settings include distance education (12.4%), international education (4.5%), vocational education (3.4%), special education (2.2%), national education (2.2%), and preschool education (1.1%).
2.4. Research Topics
Figure 4. The statistics of research topics from 2012 to 2016.
Figure 4 tells us clearly that most research analyzed the hot topics of educational research using CiteSpace applications, with 46 articles which accounts for 52% of 89 peer-reviewed articles. Research trends is also a popular topic (22 articles, 25%). Besides, the analysis of research frontiers (17 articles, 19%) and other topics (4 articles, 4%) is also included.
20
2.5. Presentations of Knowledge Maps
Figure 5. The statistics of presentations of knowledge maps from 2012 to 2016.
Knowledge mapping is defined as processes, methods and tools for analyzing knowledge areas to discover features or meanings and to visualize them in a comprehensive and transparent format (Speel et al., 1999). Our results show that 80 out of 89 peer-reviewed articles used the knowledge maps and in total 218 maps were presented.
As shown in Figure 5, the number of keyword co-occurrence knowledge maps account for the largest percentage (32.6%), revealing that this type of knowledge maps has been most frequently adopted in educational research using CiteSpace applications. Besides, there is a relatively even balance among cooperative analysis knowledge maps (18.8%), co-citation scientific maps (16.5%) and maps of time zone (15.6%). To conduct more comprehensive educational research, researchers need to pay more attention to different presentations of knowledge maps.
3. Conclusions
In this paper, we make an analysis of educational research using CiteSpace applications based on 89 peer-reviewed articles retrieved from Chinese Social Science Citation Index (CSSCI) journals that appeared from 2012 to 2016. The research results indicate that the growth in the number of articles can be divided into two stages: 2012–2015 (stable stage) and 2015–2016 (rapid growth stage). In terms of source journals, Modern Education Management contains the largest number of articles. As for the research settings, a majority of the studies we selected were conducted in higher education setting or concerned the issues related to higher education. A large number of studies investigated the research hot topics and trends of educational research taking advantage of the CiteSpace applications. Keywords co-occurrence knowledge maps serve as the major type of presentations for synthesizing educational research. In order to improve the accuracy and complexity of educational research, a variety of presentations are encouraged. However, it should be noted that there are some limitations in our paper. For instance, the time span of five years is not long enough and the scope of data collection is also limited. We will continue to improve this research in the future.
Acknowledgements
The research is funded by the Research Innovation Fund for College Students of Beijing University of Posts and Telecommunications (1710022) and the Humanities and Social Sciences Fund of Chinese Ministry of Education (Grant 16YJC740099, awarded to Chunping Zheng).
References
Chen, C. (2004). Searching for intellectual turning points: progressive knowledge domain visualization. Proceedings of the National Academy of Sciences, 101(Suppl. 1), 5303–10.

21
Chen, C., & Paul, R. J. (2001). Visualizing a knowledge domain’s intellectual structure. Computer, 34(3), 65–71.
Cobo, M. J., Lopez-Herrera, A. G., Herrera-Viedma, E., & Herrera, F. (2011). Science mapping software tools: Review, analysis, and cooperative study among tools. Journal of the American Society for Information Science and Technology, 62(7), 1382–1402.
Chai, C. S., Koh, J. H. L., & Tsai, C. C. (2013). A review of technological pedagogical content knowledge. Educational Technology & Society, 16(2), 31–51.
Lin, Z., Wu, C. Z., & Hong, W. (2015). Visualization analysis of ecological assets/values research by knowledge mapping. Acta Ecologica Sinica, 35(2015), 142–154.
Li, X. J., Emily, Ma., & Qu, H. L. (2017). Knowledge mapping of hospitality research – a visual analysis using CiteSpace. International Journal of Hospitality Management, 60(2017), 77–93.
Small, H. (2003). Paradigms, citations, and maps of science: a personal history. Journal of the American Society for Information Science and Technology, 54(5), 394–399.
Speel, P. H., Shadbolt, N., Vries, W. D., Dam, P. H. V., & O’Hara, K. (1999). Knowledge mapping for industrial purpose. October 99, Banff, Canada. Conference KAW99.
Yu, D. J., & Xu, C. (2017). Mapping research on carbon emissions trading: a co-citation analysis. Ecological Engineering, 99(2017), 400–408.
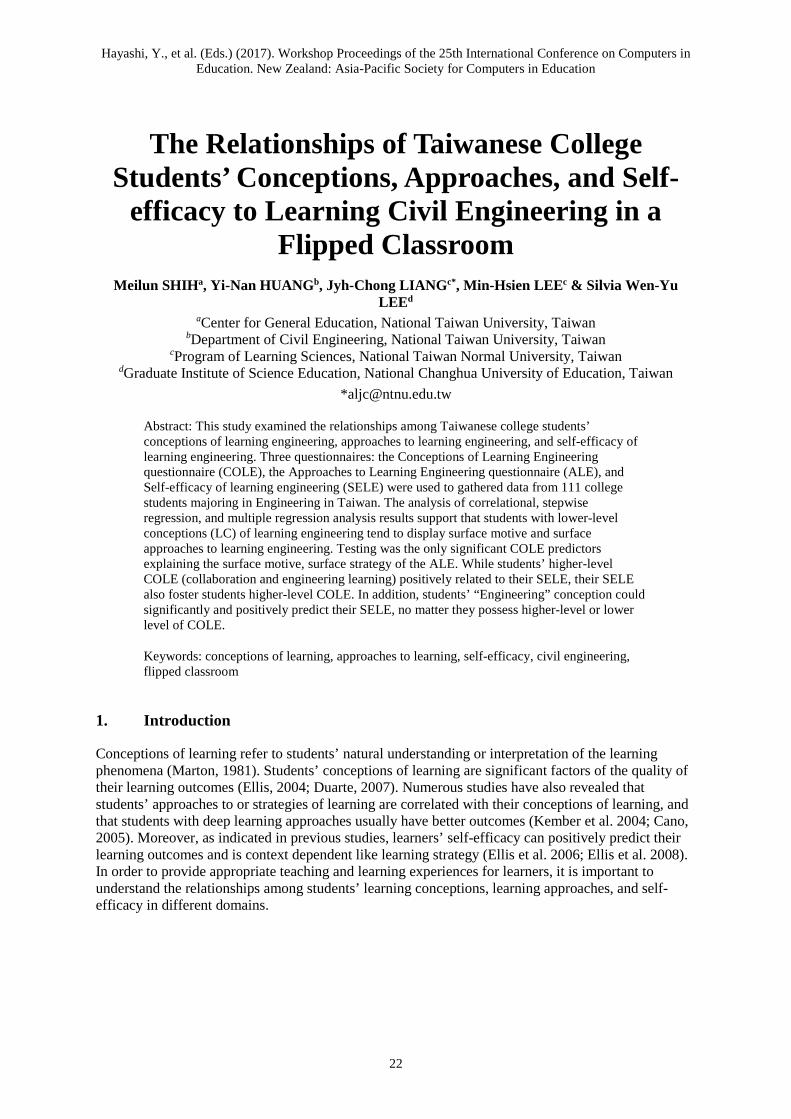
Hayashi, Y., et al. (Eds.) (2017). Workshop Proceedings of the 25th International Conference on Computers in Education. New Zealand: Asia-Pacific Society for Computers in Education
22
The Relationships of Taiwanese College Students’ Conceptions, Approaches, and Self-
efficacy to Learning Civil Engineering in a Flipped Classroom
Meilun SHIHa, Yi-Nan HUANGb, Jyh-Chong LIANGc*, Min-Hsien LEEc & Silvia Wen-Yu LEEd
aCenter for General Education, National Taiwan University, Taiwan bDepartment of Civil Engineering, National Taiwan University, Taiwan
cProgram of Learning Sciences, National Taiwan Normal University, Taiwan dGraduate Institute of Science Education, National Changhua University of Education, Taiwan
Abstract: This study examined the relationships among Taiwanese college students’ conceptions of learning engineering, approaches to learning engineering, and self-efficacy of learning engineering. Three questionnaires: the Conceptions of Learning Engineering questionnaire (COLE), the Approaches to Learning Engineering questionnaire (ALE), and Self-efficacy of learning engineering (SELE) were used to gathered data from 111 college students majoring in Engineering in Taiwan. The analysis of correlational, stepwise regression, and multiple regression analysis results support that students with lower-level conceptions (LC) of learning engineering tend to display surface motive and surface approaches to learning engineering. Testing was the only significant COLE predictors explaining the surface motive, surface strategy of the ALE. While students’ higher-level COLE (collaboration and engineering learning) positively related to their SELE, their SELE also foster students higher-level COLE. In addition, students’ “Engineering” conception could significantly and positively predict their SELE, no matter they possess higher-level or lower level of COLE.
Keywords: conceptions of learning, approaches to learning, self-efficacy, civil engineering, flipped classroom
1. Introduction
Conceptions of learning refer to students’ natural understanding or interpretation of the learning phenomena (Marton, 1981). Students’ conceptions of learning are significant factors of the quality of their learning outcomes (Ellis, 2004; Duarte, 2007). Numerous studies have also revealed that students’ approaches to or strategies of learning are correlated with their conceptions of learning, and that students with deep learning approaches usually have better outcomes (Kember et al. 2004; Cano, 2005). Moreover, as indicated in previous studies, learners’ self-efficacy can positively predict their learning outcomes and is context dependent like learning strategy (Ellis et al. 2006; Ellis et al. 2008). In order to provide appropriate teaching and learning experiences for learners, it is important to understand the relationships among students’ learning conceptions, learning approaches, and self-efficacy in different domains.
23
2. Literature Review
2.1. Conceptions of Learning
Learners conceive learning in different ways. Research on learning has shown that learners’ conceptions or beliefs of learning have profound impacts on their learning process, and thus their quality of learning outcomes (Purdie & Hattie, 2002). Although overall similarities in the conceptions of learning had been found across previous studies, variations within different educational contexts may still occur. Most of researchers agreed that there is a hierarchical distinction from constructivist (actively constructing meanings) to reproductive (passively receiving knowledge) among these categories. Conceptions at the upper levels reflect a constructivist view of learning (e.g., understanding), while those at the lower levels reflect a reproduced view of learning (e.g., memorization) (Purdie & Hattie, 2002; Burnett et al. 2004).
2.2. Approaches to Learning
According to Marton and Booth (1997), learning can be elaborated from three aspects: what conceptions learners refer to the experience, what learners think they learn through the experience, and how they approach the experience. Earlier studies by Marton and Sӓljӧ (1976) and Biggs (1994) classified learning approaches into deep approaches and surface approaches. As described by Biggs and Tang (2007), a deep approach refers to the situation in which learners show an intrinsic motivation to learn, are active in their learning, and are willing to participate in various learning activities. In contrast, a surface approach refers to the situation in which learners are passive in their learning, view learning as externally imposed tasks, and only perform learning activities to fulfill course requirements or to memorize facts. Although similarities in the meanings of deep and surface approaches may exist across different domains, learners’ learning strategies may be context dependent. As such, further investigation of learning approaches in different contexts is quite important.
2.3. Self-Efficacy of Learning
Self-efficacy is defined as one’s belief in one’s capability to organize or execute the actions required to complete a specific task or given goal (Cordova, Sinatra, Jones, Taasoobshiraz, & Lombardi, 2014). It related to how people fee, think, motivate themselves to achieve the desired outcome (Bandura, 1986). When individuals recognize familiar activities, they usually possess high self-efficacy. Conversely, when they identify new activities, their perceived self-efficacy is low. Therefore, students’ learning experiences play an important role in explaining their self-efficacy of learning (Bandura, 1997). A variety of studies have proved that the judgment of self-efficacy on performance prediction is situation- or discipline-specific (Tsai, Ho, Liang, & Lin, 2011; Liu, Hsieh, Cho, & Schallet, 2006). That is, how students judge their own capability to master academic tasks can positively predict their learning outcomes.
3. Methodology
3.1. Participants
The participants in this study included 111 college students from a university in northern in Taiwan. There were 86 male and 25 female students, and they were all majoring in engineering. The age distribution of the participating students was from 19 to 24, with an average of 19.91.
3.2. Instruments
Three questionnaires were employed in this study: conceptions of learning engineering (COLE), approaches to learning engineering (ALE), and self-efficacy of learning engineering (SELE). The
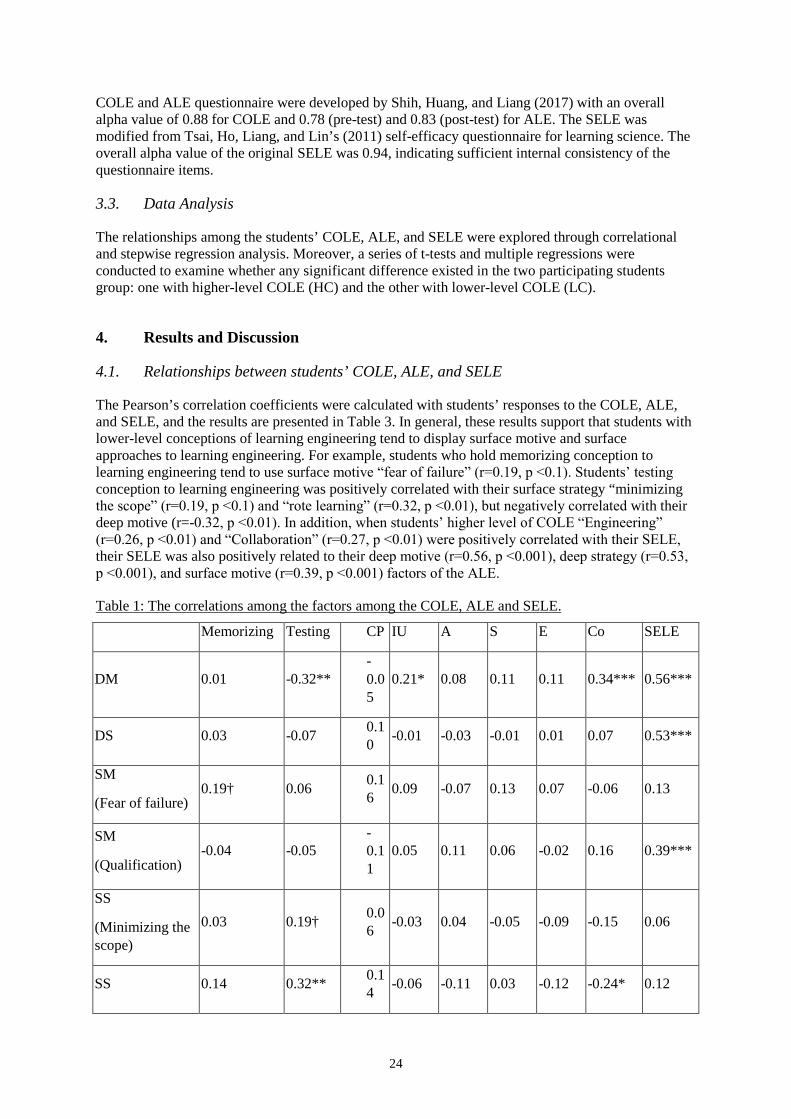
24
COLE and ALE questionnaire were developed by Shih, Huang, and Liang (2017) with an overall alpha value of 0.88 for COLE and 0.78 (pre-test) and 0.83 (post-test) for ALE. The SELE was modified from Tsai, Ho, Liang, and Lin’s (2011) self-efficacy questionnaire for learning science. The overall alpha value of the original SELE was 0.94, indicating sufficient internal consistency of the questionnaire items.
3.3. Data Analysis
The relationships among the students’ COLE, ALE, and SELE were explored through correlational and stepwise regression analysis. Moreover, a series of t-tests and multiple regressions were conducted to examine whether any significant difference existed in the two participating students group: one with higher-level COLE (HC) and the other with lower-level COLE (LC).
4. Results and Discussion
4.1. Relationships between students’ COLE, ALE, and SELE
The Pearson’s correlation coefficients were calculated with students’ responses to the COLE, ALE, and SELE, and the results are presented in Table 3. In general, these results support that students with lower-level conceptions of learning engineering tend to display surface motive and surface approaches to learning engineering. For example, students who hold memorizing conception to learning engineering tend to use surface motive “fear of failure” (r=0.19, р <0.1). Students’ testing conception to learning engineering was positively correlated with their surface strategy “minimizing the scope” (r=0.19, р <0.1) and “rote learning” (r=0.32, р <0.01), but negatively correlated with their deep motive (r=-0.32, р <0.01). In addition, when students’ higher level of COLE “Engineering” (r=0.26, р <0.01) and “Collaboration” (r=0.27, р <0.01) were positively correlated with their SELE, their SELE was also positively related to their deep motive (r=0.56, р <0.001), deep strategy (r=0.53, р <0.001), and surface motive (r=0.39, р <0.001) factors of the ALE.
Table 1: The correlations among the factors among the COLE, ALE and SELE.
Memorizing Testing CP IU A S E Co SELE
DM 0.01 -0.32** -0.05
0.21* 0.08 0.11 0.11 0.34*** 0.56***
DS 0.03 -0.07 0.10 -0.01 -0.03 -0.01 0.01 0.07 0.53***
SM
(Fear of failure) 0.19† 0.06 0.1
6 0.09 -0.07 0.13 0.07 -0.06 0.13
SM
(Qualification) -0.04 -0.05
-0.11
0.05 0.11 0.06 -0.02 0.16 0.39***
SS
(Minimizing the scope)
0.03 0.19† 0.06 -0.03 0.04 -0.05 -0.09 -0.15 0.06
SS 0.14 0.32** 0.14 -0.06 -0.11 0.03 -0.12 -0.24* 0.12
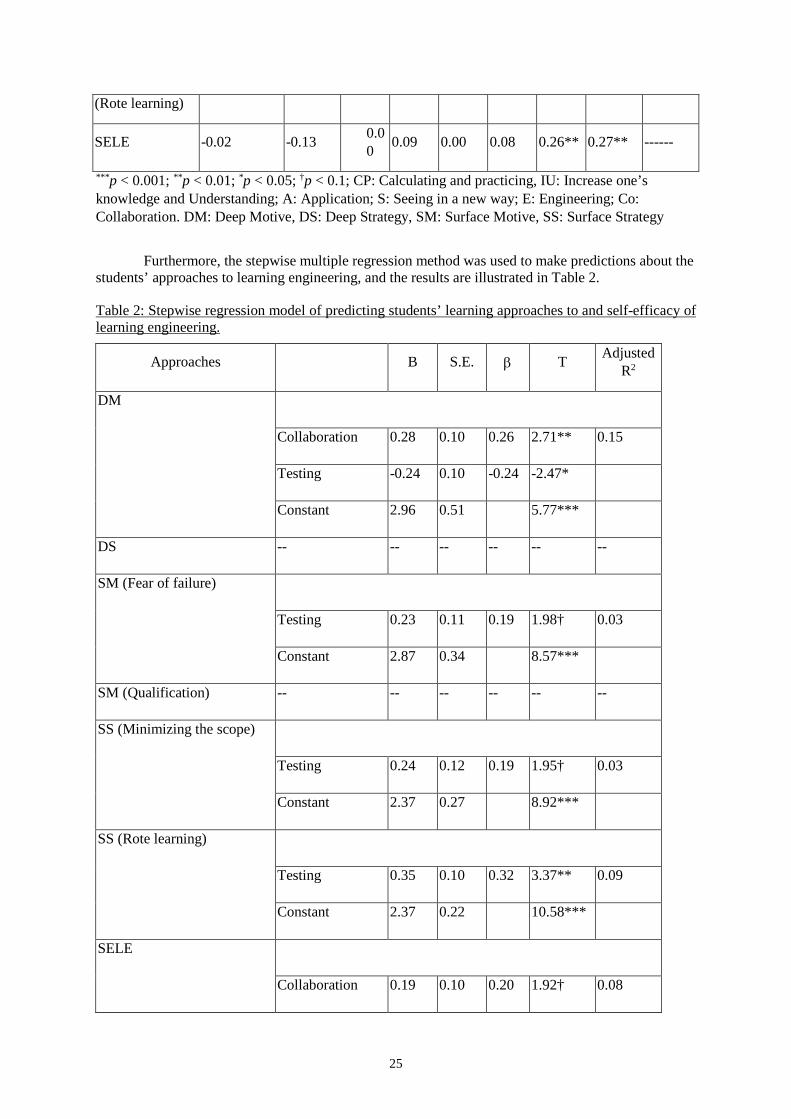
25
(Rote learning)
SELE -0.02 -0.13 0.00 0.09 0.00 0.08 0.26** 0.27** ------
***p < 0.001; **p < 0.01; *p < 0.05; †p < 0.1; CP: Calculating and practicing, IU: Increase one’s knowledge and Understanding; A: Application; S: Seeing in a new way; E: Engineering; Co: Collaboration. DM: Deep Motive, DS: Deep Strategy, SM: Surface Motive, SS: Surface Strategy
Furthermore, the stepwise multiple regression method was used to make predictions about the
students’ approaches to learning engineering, and the results are illustrated in Table 2.
Table 2: Stepwise regression model of predicting students’ learning approaches to and self-efficacy of learning engineering.
Approaches B S.E. β T Adjusted R2
DM
Collaboration 0.28 0.10 0.26 2.71** 0.15
Testing -0.24 0.10 -0.24 -2.47*
Constant 2.96 0.51 5.77***
DS -- -- -- -- -- --
SM (Fear of failure)
Testing 0.23 0.11 0.19 1.98† 0.03
Constant 2.87 0.34 8.57***
SM (Qualification) -- -- -- -- -- --
SS (Minimizing the scope)
Testing 0.24 0.12 0.19 1.95† 0.03
Constant 2.37 0.27 8.92***
SS (Rote learning)
Testing 0.35 0.10 0.32 3.37** 0.09
Constant 2.37 0.22 10.58***
SELE
Collaboration 0.19 0.10 0.20 1.92† 0.08
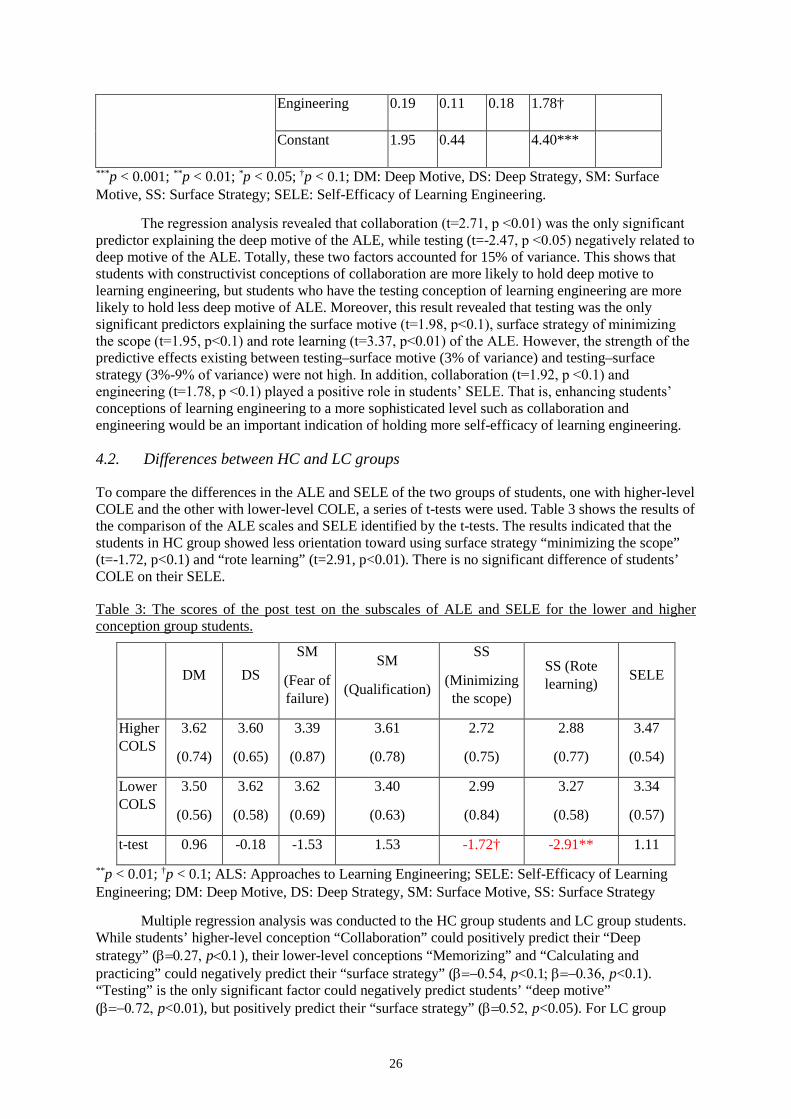
26
Engineering 0.19 0.11 0.18 1.78†
Constant 1.95 0.44 4.40***
***p < 0.001; **p < 0.01; *p < 0.05; †p < 0.1; DM: Deep Motive, DS: Deep Strategy, SM: Surface Motive, SS: Surface Strategy; SELE: Self-Efficacy of Learning Engineering.
The regression analysis revealed that collaboration (t=2.71, р <0.01) was the only significant predictor explaining the deep motive of the ALE, while testing (t=-2.47, р <0.05) negatively related to deep motive of the ALE. Totally, these two factors accounted for 15% of variance. This shows that students with constructivist conceptions of collaboration are more likely to hold deep motive to learning engineering, but students who have the testing conception of learning engineering are more likely to hold less deep motive of ALE. Moreover, this result revealed that testing was the only significant predictors explaining the surface motive (t=1.98, р<0.1), surface strategy of minimizing the scope (t=1.95, р<0.1) and rote learning (t=3.37, p<0.01) of the ALE. However, the strength of the predictive effects existing between testing–surface motive (3% of variance) and testing–surface strategy (3%-9% of variance) were not high. In addition, collaboration (t=1.92, р <0.1) and engineering (t=1.78, р <0.1) played a positive role in students’ SELE. That is, enhancing students’ conceptions of learning engineering to a more sophisticated level such as collaboration and engineering would be an important indication of holding more self-efficacy of learning engineering.
4.2. Differences between HC and LC groups
To compare the differences in the ALE and SELE of the two groups of students, one with higher-level COLE and the other with lower-level COLE, a series of t-tests were used. Table 3 shows the results of the comparison of the ALE scales and SELE identified by the t-tests. The results indicated that the students in HC group showed less orientation toward using surface strategy “minimizing the scope” (t=-1.72, p<0.1) and “rote learning” (t=2.91, p<0.01). There is no significant difference of students’ COLE on their SELE.
Table 3: The scores of the post test on the subscales of ALE and SELE for the lower and higher conception group students.
DM DS
SM
(Fear of failure)
SM
(Qualification)
SS
(Minimizing the scope)
SS (Rote learning) SELE
Higher COLS
3.62
(0.74)
3.60
(0.65)
3.39
(0.87)
3.61
(0.78)
2.72
(0.75)
2.88
(0.77)
3.47
(0.54)
Lower COLS
3.50
(0.56)
3.62
(0.58)
3.62
(0.69)
3.40
(0.63)
2.99
(0.84)
3.27
(0.58)
3.34
(0.57)
t-test 0.96 -0.18 -1.53 1.53 -1.72† -2.91** 1.11 **p < 0.01; †p < 0.1; ALS: Approaches to Learning Engineering; SELE: Self-Efficacy of Learning Engineering; DM: Deep Motive, DS: Deep Strategy, SM: Surface Motive, SS: Surface Strategy
Multiple regression analysis was conducted to the HC group students and LC group students. While students’ higher-level conception “Collaboration” could positively predict their “Deep strategy” (β=0.27, p<0.1), their lower-level conceptions “Memorizing” and “Calculating and practicing” could negatively predict their “surface strategy” (β=−0.54, p<0.1; β=−0.36, p<0.1). “Testing” is the only significant factor could negatively predict students’ “deep motive” (β=−0.72, p<0.01), but positively predict their “surface strategy” (β=0.52, p<0.05). For LC group
27
students, students’ “surface motive-fear of failure” could be positively predict by their “Memorizing” conception (β=0.43, p<0.05), but negatively predict by their “collaboration” conception (β=−0.41, p<0.05). For LC students, “Collaboration” is the only significant predictor for their “deep motive” (β=0.30, p<0.05).
In general, as showed in Table 4 and Table 5, students’ “Engineering” conception could significantly and positively predict their SELE of both HC (β=0.31, p<0.05) and LC (β=0.29, p<0.1) groups. For LC groups, students’ “Collaboration” (β=0.32, p<0.05) was another positive predictor for their SELE. However, “Seeing in a new way” could negatively predict LC students’ SELE (β=−0.58, p<0.05).
References
Bandura, A. (1986). Social foundations of thought and action: A social cognitive theory. Englewood Cliffs, NJ: Prentice-Hall.
Bandura, A. (1997). Self-efficacy: The exercise of control. New York: W. H. Freeman and Company. Biggs, J. (1994). Approaches to learning:Nature and measurement of. In T. Husen, T. N. Postlethwaiter (Eds),
The international encyclopedia of education (pp. 319-322). Pergamon, Oxford, England. Cano, F. (2005). Consonance and dissonance in students’ learning experience. Learning and Instruction, 15,
201-223. Cordova, J. R., Sinatra, G. M., Jones, S. H., Taasoobshirazi, G., & Lombardi, D. (2014). Confidence in prior
knowledge, self-efficacy, interest and prior knowledge: Influences on conceptual change. Contemporary Educational Psychology, 39(2), 164-174.
Duarte, A. M. (2007). Conceptions of learning and approaches to learning in Portuguese students. Higher Education, 54(6), 781-794.
Ellis, R. A., Goodyear, P., Calvo, R. A., & Prosser, M. (2008). Engineering students’ conceptions of and approaches to learning through discussions in face-to-face and online contexts. Learning and Instruction, 189, 267-282.
Ellis, R. A., Goodyear, P., Prosser, M., & Ohara, A. (2006). How and what university students learn through online and face-to-face discussion: Conceptions, intentions and approaches. Journal of Computer Assisted Learning, 22, 244-256.
Hayashi, Y., et al. (Eds.) (2017). Workshop Proceedings of the 25th International Conference on Computers in Education. New Zealand: Asia-Pacific Society for Computers in Education
28
Pre-Testing the Chinese Version of the System Usability Scale (C-SUS)
Feng-Ru SHEUa, Hui-Jung FUb*, & Meilun SHIHc aUniversity Libraries, Kent State University, USA
bPhysical Education Center, Southern Taiwan University of Science and Technology, Taiwan cCenter for Teaching & Learning Development, National Taiwan University, Taiwan
Abstract: Background: Given many advancement in technology, information & communication technology (ICT) in education for enhancing effectiveness of teaching and learning has become a widely applied and discussed area. Usability is central for the success of any instructional design product or learning materials, including any educational websites, learning management system, mobile devices, and wearable technology. The System Usability Scale (SUS) is one of the commonly used questionnaires for usability rating. Objectives: With the increasing interest in usability studies and user experience research, there is a need to officially translate it into Chinese and also to validate the translation. The aim of this paper is to describe the process of translating the original System Usability Scale (SUS) from English into Chinese (C-SUS), and to evaluate its reliability and validity in the college students. Methods: This study consisted of two phases. In phase one, the SUS was translated into Chinese by a group of translators and experts in education using Brislin’s (1970, 1986) translation and back-translation method. Both semantic equivalence and content validity were assessed. In the second phase, the psychometric properties of the C-SUS were tested with two studies and with convenience samples of 125 (study 1) and 104 (study 2) college students recruited from a private university in southern Taiwan. Reliability was assessed by internal consistency and construct validity was tested using exploratory factor analysis. Data analyses was performed using SPSS 23.0 to assess reliability and validity. Results: The sematic equivalence and content validity index of the Chinese version of SUS were satisfactory. Results also indicated that the Chinese version had a high level of equivalence with the original English version and demonstrated a high internal consistency. Exploratory factor analysis revealed the presence of two factors supporting the conceptual dimension of the original instrument. Conclusion: The study provides initial psychometric properties of the Chinese version of the SUS and supports it as a reliable and valid instrument to measure usability for design products and services for Chinese speaking individuals.
Keywords: System Usability Scale (SUS), translation, validation, usability testing
1. Introduction
Information & communication technology (ICT) has been important and used in education for decades to promote effective teaching and learning. It is even more so with recent technology advancements, such as interactive educational websites, mobile applications (APP) in both Android and OS, learning management system (LMS), virtual reality (VR), and wearable technology, to name a few. Among all elements for design and development, usability is the most important element for instructional design products and services to be successful. There are several questionnaires available for professionals to assess the usability of given products or services with target users, such as After Scenario Questionnaire (ASQ), Computer System Usability Questionnaire (CSUQ), Software Usability Measurement Inventory (SUMI), Usefulness, Satisfaction and Ease of Use (USE), Website Analysis and Measurement Inventory (WAMMI), and System Usability Scale (SUS). In that list of tools, the System Usability Scale (SUS), first developed by Brooke in 1986 as a quick and easy-to-use scale, is the most commonly used questionnaire for rating usability (Brooke, 1996; Sauro, 2011). In
29
Tullis and Stetson’s study (2004), SUS, the shortest survey in the study, was among those providing the most reliable results across sample sizes for user satisfaction on web assessment.
As mentioned, the SUS was initially developed by John Brooke for a quick measurement on usability. The standard SUS consists of ten items with 5 Likert scale from 1= strongly disagree to 5= strongly agree and odd-numbered items worded positively and even-numbered items worded negatively:
1. I think that I would like to use this system frequently.
2. I found the system unnecessarily complex.
3. I thought the system was easy to use.
4. I think that I would need the support of a technical person to be able to use this system.
5. I found the various functions in this system were well integrated.
6. I thought there was too much inconsistency in this system.
7. I would imagine that most people would learn to use this system very quickly.
8. I found the system very cumbersome to use.
9. I felt very confident using the system.
10. I needed to learn a lot of things before I could get going with this system.
There are many positive attributes that lead to the wide use of the SUS. The SUS is short, containing only 10 items and is easy to use, allowing professionals in the usability field to quickly and easily assess the usability rating of a given product from users’ perspective. The SUS has been shown to have good reliability and validity (Bangor, Kortum, & Miller, 2008; Sauro, 2011). A key factor is that the scale is technology-agnostic so that it can be used for a wide range of products, such as websites, cell phones, software, applications, and TV programs etc. It also can be understood by a wide range of people. In other words, it can be used for assessing usability of educational materials and devices, including learning management system, educational websites, and any other information communication technology for teaching and learning. In addition, the scale is free of charge and open access, which makes it a good, cost-effective tool (Sauro, 2011).
The SUS has been unofficially translated into several languages, including Spanish, French, and Dutch (Brooke, 2013; Sauro, 2011) and has been used on projects in various development stages. With the increasing interest in usability studies and user experience research, there is a need to officially translate it into Chinese and to validate the translation. This study addresses those needs. This present study reports the process of translating the original SUS from English into Chinese and assessing its reliability and validity among Chinese speaking individuals.
2. Research Design
The purpose of this study is to formally evaluate the Chinese translation of System Usability Scale from English to Chinese. The common procedure of psychological scale/test adaptation usually consists of two phases: translation and validation. In the phase one, the SUS was translated into Chinese using Brislin’s (1970, 1986) translation and back-translation method by a group of 3 translators and 3 experts in education. Both semantic equivalence and content validity were assessed. In the second phase, the psychometric properties of the C-SUS were tested with two studies. In study one, it was tested with a convenience sample of 125 college students on an educational website. In study two, the C-SUS was tested with 87 students with three different type of educational systems.
30
3. Phase One: Translation and Back-Translation
In the first phase, the SUS was translated into Chinese using Brislin’s (1970, 1986) translation and back-translation method. The semantic equivalence and content validity were assessed. The translation process was conducted by applying Brislin’s methods of translation and back- translation (1970) as well as translation guidelines by Guillemin, Bombardier, and Beaton (1993). Translators were fluent in both Chinese and English and were familiar with the cultures. The quality of translation was tested by considering semantic equivalence and cross-culture relevance of the scale. The translations were compared and analyzed by three experts in educational technology and education administration. Both the original English scale and the translations were compared by the researcher and the translators. Where there was a disagreement on translation, discussion took place until consensus was reached. The translated version was pre-tested by five people before being used in the usability studies in phase two. Below shows the Chinese translation of SUS:
1. 我覺得我會常使用這個系統。
2. 我覺得這個系統太過不必要的複雜。
3. 我覺得這個系統是容易操作的。
4. 我覺得我需要透過專人的協助才能操作這個系統。
5. 我覺得這個系統許有多不同功能,整合的很好。
6. 我覺得這個系統很多地方不一致令人困惑。
7. 我覺得大部分的人都能很快知道怎麼使用這個系統。
8. 我覺得這個系統使用起來有點麻煩。
9. 我非常有信心下次能自己順利操作這個系統。
10. 我在能操作這個系統前,要學很多東西。
4. Phase Two: Psychometric Testing
4.1. Study 1
According to Fang and Liu (2002), the sample size should be 5-10 times larger than the number of items in the instrument used and expanded by at least 10% to ensure a sufficient sample size. As a result, a reasonable/legitimate/effective sample size of ranging 60 to 110 was calculated, as the number of items of C-SUS is 10. In study 1, a convenience sample of 125 freshmen who speak Chinese from a private university in southern Taiwan was recruited through an announcement post on the learning management system at the school. The translated Chinese version of SUS was used. The test system was an educational website about volleyball. Students were instructed to complete 3 information-searching tasks using the website. After completion of the tasks, they were asked to fill out Chinese version of SUS.
4.2. Study 2
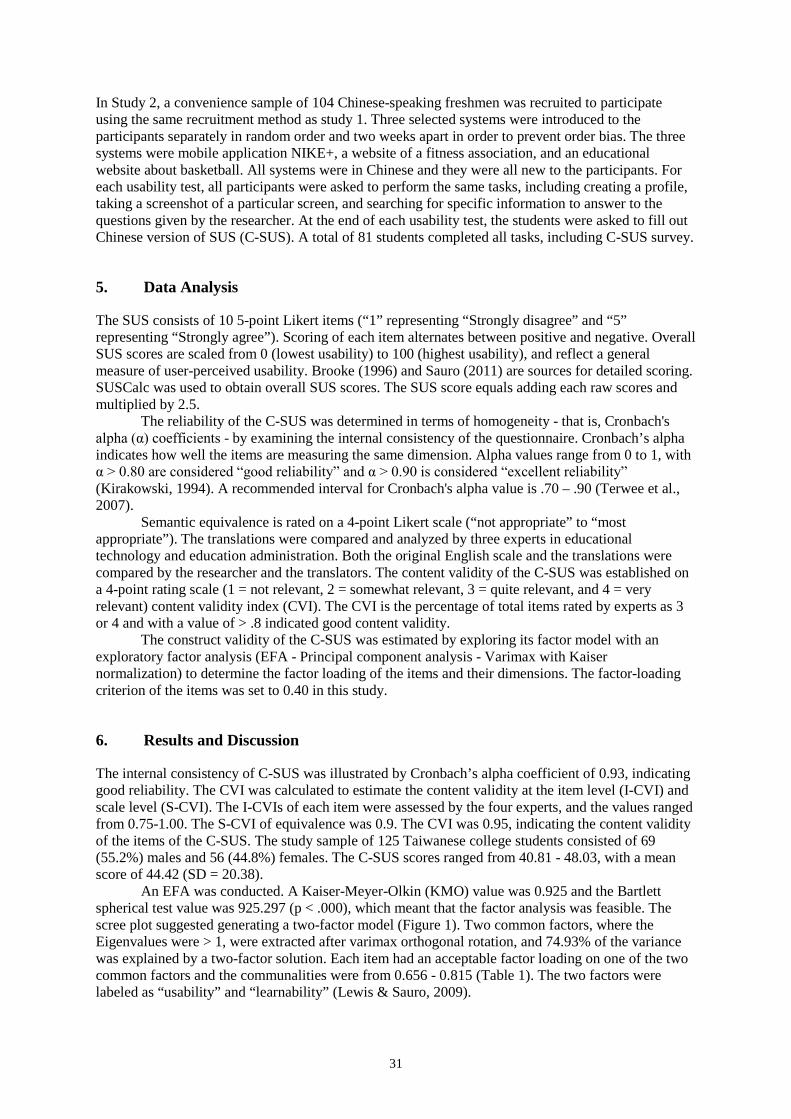
31
In Study 2, a convenience sample of 104 Chinese-speaking freshmen was recruited to participate using the same recruitment method as study 1. Three selected systems were introduced to the participants separately in random order and two weeks apart in order to prevent order bias. The three systems were mobile application NIKE+, a website of a fitness association, and an educational website about basketball. All systems were in Chinese and they were all new to the participants. For each usability test, all participants were asked to perform the same tasks, including creating a profile, taking a screenshot of a particular screen, and searching for specific information to answer to the questions given by the researcher. At the end of each usability test, the students were asked to fill out Chinese version of SUS (C-SUS). A total of 81 students completed all tasks, including C-SUS survey.
5. Data Analysis
The SUS consists of 10 5-point Likert items (“1” representing “Strongly disagree” and “5” representing “Strongly agree”). Scoring of each item alternates between positive and negative. Overall SUS scores are scaled from 0 (lowest usability) to 100 (highest usability), and reflect a general measure of user-perceived usability. Brooke (1996) and Sauro (2011) are sources for detailed scoring. SUSCalc was used to obtain overall SUS scores. The SUS score equals adding each raw scores and multiplied by 2.5.
The reliability of the C-SUS was determined in terms of homogeneity - that is, Cronbach's alpha (α) coefficients - by examining the internal consistency of the questionnaire. Cronbach’s alpha indicates how well the items are measuring the same dimension. Alpha values range from 0 to 1, with α > 0.80 are considered “good reliability” and α > 0.90 is considered “excellent reliability” (Kirakowski, 1994). A recommended interval for Cronbach's alpha value is .70 – .90 (Terwee et al., 2007).
Semantic equivalence is rated on a 4-point Likert scale (“not appropriate” to “most appropriate”). The translations were compared and analyzed by three experts in educational technology and education administration. Both the original English scale and the translations were compared by the researcher and the translators. The content validity of the C-SUS was established on a 4-point rating scale (1 = not relevant, 2 = somewhat relevant, 3 = quite relevant, and 4 = very relevant) content validity index (CVI). The CVI is the percentage of total items rated by experts as 3 or 4 and with a value of > .8 indicated good content validity.
The construct validity of the C-SUS was estimated by exploring its factor model with an exploratory factor analysis (EFA - Principal component analysis - Varimax with Kaiser normalization) to determine the factor loading of the items and their dimensions. The factor-loading criterion of the items was set to 0.40 in this study.
6. Results and Discussion
The internal consistency of C-SUS was illustrated by Cronbach’s alpha coefficient of 0.93, indicating good reliability. The CVI was calculated to estimate the content validity at the item level (I-CVI) and scale level (S-CVI). The I-CVIs of each item were assessed by the four experts, and the values ranged from 0.75-1.00. The S-CVI of equivalence was 0.9. The CVI was 0.95, indicating the content validity of the items of the C-SUS. The study sample of 125 Taiwanese college students consisted of 69 (55.2%) males and 56 (44.8%) females. The C-SUS scores ranged from 40.81 - 48.03, with a mean score of 44.42 (SD = 20.38).
An EFA was conducted. A Kaiser-Meyer-Olkin (KMO) value was 0.925 and the Bartlett spherical test value was 925.297 (p < .000), which meant that the factor analysis was feasible. The scree plot suggested generating a two-factor model (Figure 1). Two common factors, where the Eigenvalues were > 1, were extracted after varimax orthogonal rotation, and 74.93% of the variance was explained by a two-factor solution. Each item had an acceptable factor loading on one of the two common factors and the communalities were from 0.656 - 0.815 (Table 1). The two factors were labeled as “usability” and “learnability” (Lewis & Sauro, 2009).
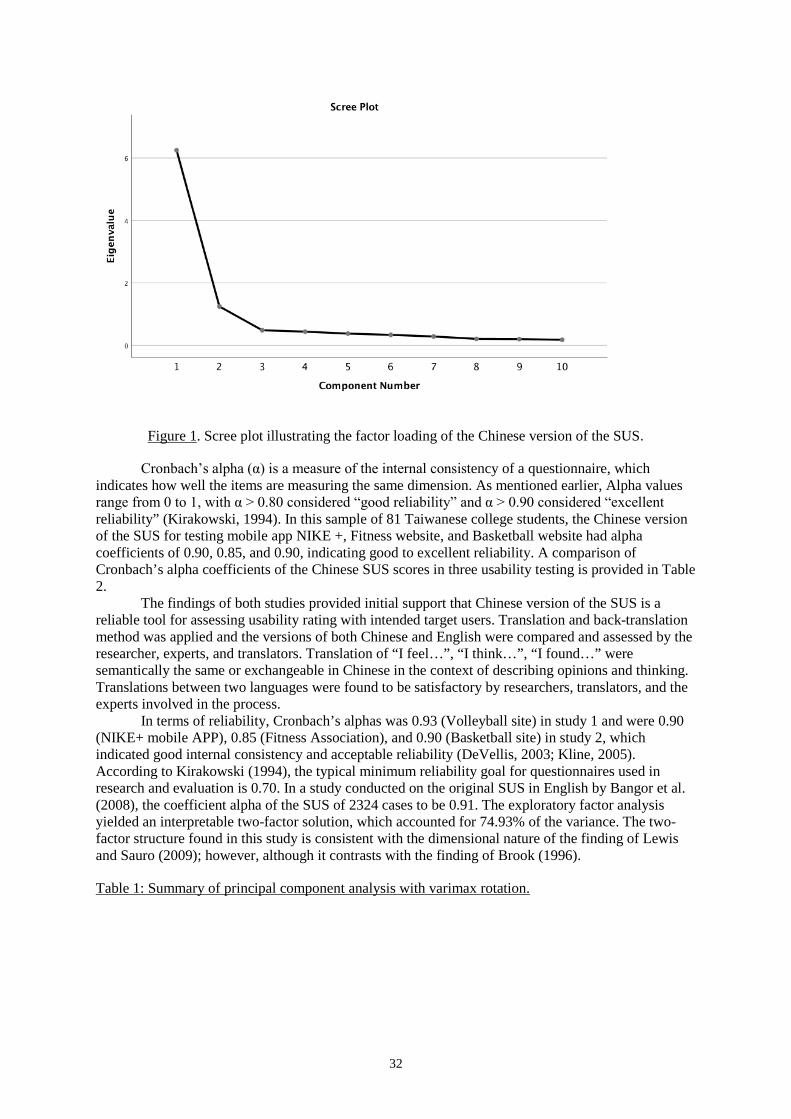
32
Figure 1. Scree plot illustrating the factor loading of the Chinese version of the SUS.
Cronbach’s alpha (α) is a measure of the internal consistency of a questionnaire, which indicates how well the items are measuring the same dimension. As mentioned earlier, Alpha values range from 0 to 1, with α > 0.80 considered “good reliability” and α > 0.90 considered “excellent reliability” (Kirakowski, 1994). In this sample of 81 Taiwanese college students, the Chinese version of the SUS for testing mobile app NIKE +, Fitness website, and Basketball website had alpha coefficients of 0.90, 0.85, and 0.90, indicating good to excellent reliability. A comparison of Cronbach’s alpha coefficients of the Chinese SUS scores in three usability testing is provided in Table 2.
The findings of both studies provided initial support that Chinese version of the SUS is a reliable tool for assessing usability rating with intended target users. Translation and back-translation method was applied and the versions of both Chinese and English were compared and assessed by the researcher, experts, and translators. Translation of “I feel…”, “I think…”, “I found…” were semantically the same or exchangeable in Chinese in the context of describing opinions and thinking. Translations between two languages were found to be satisfactory by researchers, translators, and the experts involved in the process.
In terms of reliability, Cronbach’s alphas was 0.93 (Volleyball site) in study 1 and were 0.90 (NIKE+ mobile APP), 0.85 (Fitness Association), and 0.90 (Basketball site) in study 2, which indicated good internal consistency and acceptable reliability (DeVellis, 2003; Kline, 2005). According to Kirakowski (1994), the typical minimum reliability goal for questionnaires used in research and evaluation is 0.70. In a study conducted on the original SUS in English by Bangor et al. (2008), the coefficient alpha of the SUS of 2324 cases to be 0.91. The exploratory factor analysis yielded an interpretable two-factor solution, which accounted for 74.93% of the variance. The two-factor structure found in this study is consistent with the dimensional nature of the finding of Lewis and Sauro (2009); however, although it contrasts with the finding of Brook (1996).
Table 1: Summary of principal component analysis with varimax rotation.
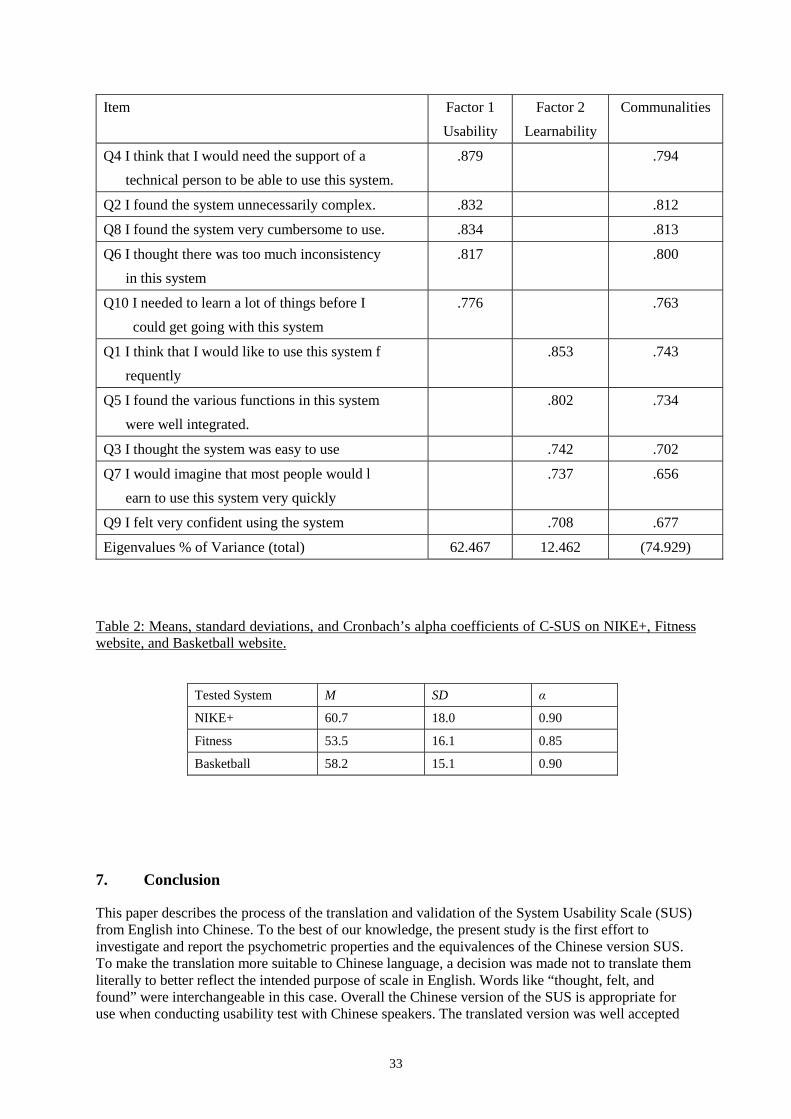
33
Item Factor 1 Usability
Factor 2 Learnability
Communalities
Q4 I think that I would need the support of a technical person to be able to use this system.
.879 .794
Q2 I found the system unnecessarily complex. .832 .812
Q8 I found the system very cumbersome to use. .834 .813
Q6 I thought there was too much inconsistency in this system
.817 .800
Q10 I needed to learn a lot of things before I could get going with this system
.776 .763
Q1 I think that I would like to use this system f requently
.853 .743
Q5 I found the various functions in this system were well integrated.
.802 .734
Q3 I thought the system was easy to use .742 .702
Q7 I would imagine that most people would l earn to use this system very quickly
.737 .656
Q9 I felt very confident using the system .708 .677
Eigenvalues % of Variance (total) 62.467 12.462 (74.929)
Table 2: Means, standard deviations, and Cronbach’s alpha coefficients of C-SUS on NIKE+, Fitness website, and Basketball website.
Tested System M SD α
NIKE+ 60.7 18.0 0.90
Fitness 53.5 16.1 0.85
Basketball 58.2 15.1 0.90
7. Conclusion
This paper describes the process of the translation and validation of the System Usability Scale (SUS) from English into Chinese. To the best of our knowledge, the present study is the first effort to investigate and report the psychometric properties and the equivalences of the Chinese version SUS. To make the translation more suitable to Chinese language, a decision was made not to translate them literally to better reflect the intended purpose of scale in English. Words like “thought, felt, and found” were interchangeable in this case. Overall the Chinese version of the SUS is appropriate for use when conducting usability test with Chinese speakers. The translated version was well accepted
34
and understood by the participants. Therefore, the finding of this study may be valuable for providing usability professionals an easy-to-use tool for assessing usability for products or services in education, especially as these products or services involve information communication technology, such as educational websites, mobile APP, or wearable technology. It would also provide a tool for cross-culture research. Long-term development of this research should include a follow-up study with both English and Chinese speakers on the same system(s) that are free of culture bias.
Acknowledgements
We would like to thank Kristin Yeager for her statistical expertise and assistance, and all the participants, the experts, and the translators involved in this study.
References
Bangor, A., Kortum, P. T., & Miller, J. T. (2008). An empirical evaluation of the system usability scale. Intl. Journal of Human–Computer Interaction, 24(6), 574-594.
Brislin, R. W. (1970). Back-translation for cross-cultural research. Journal of Cross-Culture Psychology, 1, 185-216.
Brislin, R. W. (1986). The wording and translation of research instruments. In W. J. Lonner & J. W. Berry (Eds.), Field methods in cross-cultural research. (pp. 137-164). Thousand Oaks, CA: Sage Publications, Inc.
Brooke, J. (1996). SUS: A “quick and dirty” usability scale. In P.W. Jordan, B. Thmoas, B. A. Weerdmeester, & I. L. McClelland (Eds.), Usability evaluation in industry (pp. 189-194). London: Taylor & Francis.
Brooke, J. (2013). SUS: A retrospective. Journal of Usability Studies, 8(2), pp. 29-40. DeVellis, R. (2003). Scale development: Theory and applications. Thousand Oaks, CA: Sage Publications, Inc. Fang, J. Q., & Lu, Y. (2002). Advanced medical statistics. Beijing, China: People's Medical Publishing House. Finstad, K. (2006). The System Usability Scale and non-native English speakers. Journal of Usability Studies,
4(1), 185-188. Guillemin, F., Bombardier, C., & Beaton, D. (1993). Cross-cultural adaptation of health-related quality of life
measures: literature review and proposed guidelines. Journal of Clinical Epidemiology, 46(12), 1417-1432. Kirakowski, J. (1994). The Use of Questionnaire Methods for Usability Assessment. In T. Bösser (Ed.),
Measures and methods for quality of use. Retrieved from http://sumi.ucc.ie/sumipapp.html Kline, T. (2005). Psychological testing: A Practical approach to design and evaluation. Thousand Oaks, CA:
Sage Publications, Inc. Lewis, J. R., & Sauro, J. (2009). The factor structure of the system usability scale. In Human Centered Design
(pp. 94-103). Springer Berlin Heidelberg. Sauro, J. (2011). A practical guide to the System Usability Scale (SUS): Background, Benchmarks & Best
Practice. Denver, USA: A measuring usability LLC Publication. Terwee, C. B., Bot, S. D., de Boer, M. R., van der Windt, D. A., Knol, D. L., Dekker, J., Bouter, L. M., & de
Vet, H. C. (2007). Quality criteria were proposed for measurement properties of health status questionnaires. Journal of Clinical Epidemiology, 60, 34–42.
Tullis, T. S., & Stetson, J.N. (2004). A Comparison of questionnaires for assessing website usability. Proceedings of Usability of Professionals’ Association (pp. 1-12), Minneapolis, MN, June 7-11. Retrieved from http://home.comcast.net/~tomtullis/publications/UPA2004TullisStetson.pdf
Hayashi, Y., et al. (Eds.) (2017). Workshop Proceedings of the 25th International Conference on Computers in Education. New Zealand: Asia-Pacific Society for Computers in Education
35
Pre-service Teachers’ Conceptions of Teaching using Mobile Devices
Pei-Shan TSAIa*, Chin Chung TSAIb & Ching Sing CHAIc aTeacher Education Center and Graduate Institute of Technological and Vocational Education,
National Taipei University of Technology, Taiwan bProgram of Learning Sciences, National Taiwan Normal University, Taiwan
cNational Institute of Education, Nanyang Technological University, Singapore *[email protected]
Abstract: This study explored the pre-service teachers’ conceptions of teaching using mobile devices. Forty-seven pre-service teachers who had experiences in designing lesson plans and teaching materials (i.e. eBooks and APPs) with the use of mobile devices (i.e. smart phones and tablet PC) participated in the present study. The result showed that four qualitatively different conceptions of teaching using mobile devices, including “technology support,” “knowledge transmission,” “learning facilitation,” and “supporting student learning” were identified.
Keywords: Conceptions of teaching; mobile devices
1. Introduction
Since they may play an important role in students’ learning, conceptions of teaching have been investigated for decades (Gow & Kember, 1993). According to Kember (1997) and Lee and Tsai (2011), conceptions of teaching are related to teachers’ ideas or the understanding they have experienced during the process of instruction. Kember (1997) reviewed thirteen studies in regard of conceptions of teaching, and classified the findings into five major categories, consisting of “imparting information,” “transmitting structured knowledge,” “student-teacher interaction,” “facilitating understanding, and “conceptual change/intellectual development.” Furthermore, Kember (1997) utilized two broad orientations (i.e. “teacher-centered/content-oriented” conceptions and “student-centered/learning-oriented” conceptions) to further classify these five categories of conceptions. In general, it is noted that individuals with teacher-centered/content-oriented conceptions tend to focus on the transfer of knowledge and content, whereas those with student-centered/learning-oriented conceptions are likely to place more emphasis on students’ learning. As a result, Kember(1997) indicated that “imparting information” conceptions are considered to be more teacher-centered or content-oriented, while “conceptual change/intellectual development” conceptions are viewed as more student-centered or learning-oriented.
On the basis of the conclusion revealed by Kember (1997), a number of scholars (e.g. Boulton-Lewis et al., 2001; Cheng, et al., 2009; Koballa, et al., 2000; Lee & Tsai, 2011) have similarly implemented these two broad orientations. For example, Lee and Tsai (2011) applied similar categories, namely “traditional” conceptions and “constructivist” conceptions, to understand teachers’ conceptions of teaching. Likewise, traditional conceptions refer to teacher-centered conceptions focusing on the delivery of knowledge and content, while constructivist conceptions suggest student-centered conceptions emphasizing the importance of helping learners construct knowledge. In sum, the application of such broad orientations may hence be seen as useful analytical tools for exploring instructors’ conceptions of teaching.
Besides, some studies have asserted that conceptions of teaching can be context-dependent (Gao, Watkins, 2002; Lee & Tsai, 2011; Roberts, 2003; Tsai, 2002). That is, perspectives on conceptions of teaching may vary within different learning contexts, such as subjects, curriculums, levels of schooling, and learning environments. Without doubts, the rapid development of technology,
36
like wireless network, tablets, and mobile devices, has provided unique opportunities for both instruction and learning in recent years. In fact, some pioneer studies have probed individuals’ conceptions of technology-based learning and teaching. For instance, Roberts (2003) investigated teachers’ conceptions on using Web for teaching. Khan (2015) conducted a study inquiring instructors’ conceptions regarding information and communication technologies (ICT)-enhanced teaching. In a similar fashion, Hsieh and Tsai (2017) studied learners’ conceptions on mobile learning.
Moreover, it is worth mentioning that a research methodology, called phenomenographic method, is often applied to explore teachers’ conceptions of and approaches to learning and teaching in a variety of contexts (Ellis, Steed, & Applebee, 2006; Hsieh & Tsai, 2017; Khan, 2015; Prosser, Trigwell, & Taylor, 1994; Roberts, 2003). As Åkerlind (2005) stated, the phenomenographic method, through which researchers can identify qualitatively different categories of conceptions, is frequently utilized to understand the perspectives on people’s experiences. For example, Roberts (2003) used the phenomenographic method to examine university teachers’ conceptions of teaching and conceptions of using Web for teaching, identifying different categories between the contexts. On the one hand, it was found that instructors held conceptions of teaching in six qualitatively different and hierarchically related categories, comprising “imparting information,” “transmitting structured information,” “tutor-student interaction,” “learning facilitation,” “intellectual development,” and “conceptual change.” On the other hand, participants revealed conceptions of using Web for teaching in four qualitatively different and hierarchically related categories, involving “inanimate object subject focus,” “tutor-student interaction,” “learning facilitation,” and “intellectual development.”
Recently, the Ministry of Education in Taiwan has promoted mobile learning programs in order to foster blended learning activities. As a matter of fact, research has demonstrated the significance of technology integration in mobile learning (Hwang, & Wu, 2014) and explored in-service teachers’ conceptions of mobile learning (Hsieh & Tsai, 2017). However, pre-service teachers’ conceptions of teaching using mobile devices remain unknown. Since information and communication technology, such as wireless network, has been widely recognized as a useful tool to integrate mobile learning activities into the curriculum, it becomes important to probe individuals’ perceptions on the implementation of instruction with mobile devices during the time that pre-service teachers are trained. Therefore, the current research aimed to examine pre-service teachers’ conceptions of teaching with the use of mobile devices.
2. Method
2.1. Participants
Forty-seven pre-service teachers (15 males and 32 females) with an average age of 22.38 participated in the present research. They were enrolled in a course which aimed to help pre-service teachers construct lesson plans and teaching materials (i.e. eBooks and APPs) with the use of mobile devices (i.e. smart phones and tablet PC). The main purpose of the course was to help not only instructors organize the teaching material, but also students learn within classroom settings and out of classes. At the end of the course, participants need to demonstrate in class so as to receive suggestions from peers in order to enhance their teaching performance. Afterwards, they were interviewed in regard of their teaching experiences with the use of mobile devices.
2.2. Data Collection and Analysis
To explore pre-service teachers’ conceptions of teaching using mobile devices, each participant was individually interviewed by a trained researcher. The interview questions, modified from Lee and Tsai (2011) and Tsai (2002), are presented below: Based on your experience, what is teaching using mobile devices? What makes the most successful teaching using mobile devices? Could you describe what the ideal teaching using mobile devices would look like? Why?
The phenomenographic method was utilized to analyze the participants’ interview responses. At first, the interview verbatim transcripts were reviewed by the researcher. Meaningful sentences and
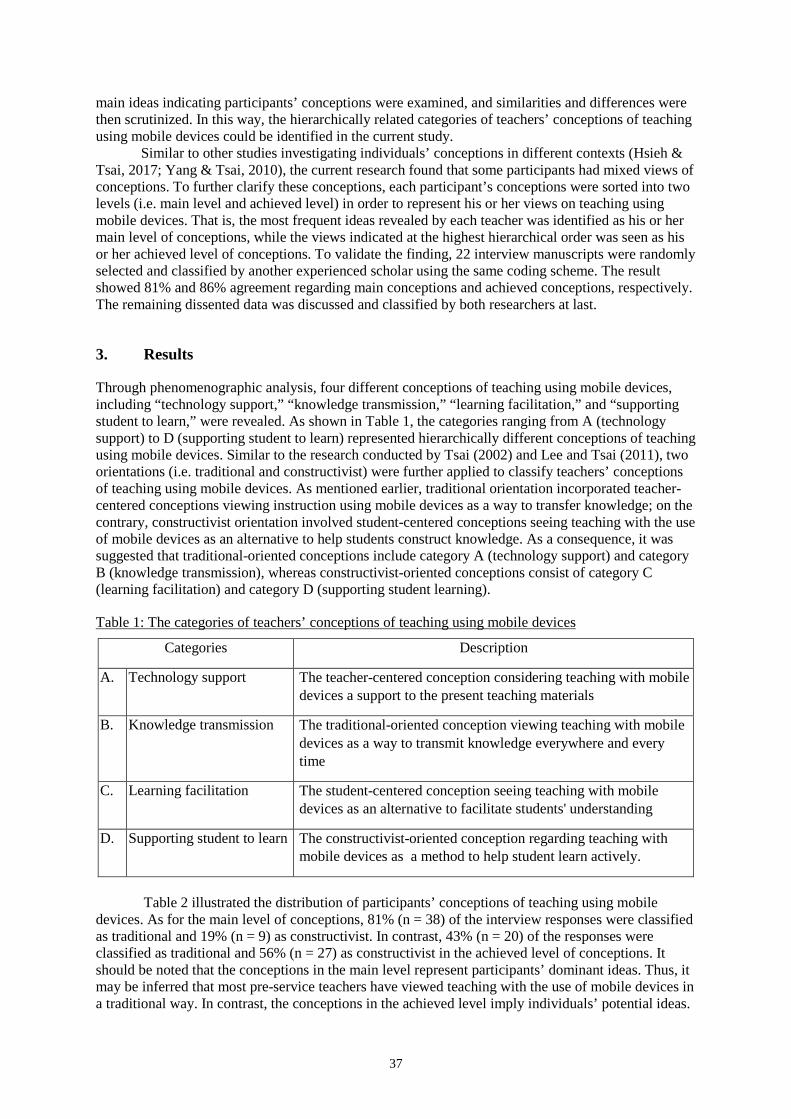
37
main ideas indicating participants’ conceptions were examined, and similarities and differences were then scrutinized. In this way, the hierarchically related categories of teachers’ conceptions of teaching using mobile devices could be identified in the current study.
Similar to other studies investigating individuals’ conceptions in different contexts (Hsieh & Tsai, 2017; Yang & Tsai, 2010), the current research found that some participants had mixed views of conceptions. To further clarify these conceptions, each participant’s conceptions were sorted into two levels (i.e. main level and achieved level) in order to represent his or her views on teaching using mobile devices. That is, the most frequent ideas revealed by each teacher was identified as his or her main level of conceptions, while the views indicated at the highest hierarchical order was seen as his or her achieved level of conceptions. To validate the finding, 22 interview manuscripts were randomly selected and classified by another experienced scholar using the same coding scheme. The result showed 81% and 86% agreement regarding main conceptions and achieved conceptions, respectively. The remaining dissented data was discussed and classified by both researchers at last.
3. Results
Through phenomenographic analysis, four different conceptions of teaching using mobile devices, including “technology support,” “knowledge transmission,” “learning facilitation,” and “supporting student to learn,” were revealed. As shown in Table 1, the categories ranging from A (technology support) to D (supporting student to learn) represented hierarchically different conceptions of teaching using mobile devices. Similar to the research conducted by Tsai (2002) and Lee and Tsai (2011), two orientations (i.e. traditional and constructivist) were further applied to classify teachers’ conceptions of teaching using mobile devices. As mentioned earlier, traditional orientation incorporated teacher-centered conceptions viewing instruction using mobile devices as a way to transfer knowledge; on the contrary, constructivist orientation involved student-centered conceptions seeing teaching with the use of mobile devices as an alternative to help students construct knowledge. As a consequence, it was suggested that traditional-oriented conceptions include category A (technology support) and category B (knowledge transmission), whereas constructivist-oriented conceptions consist of category C (learning facilitation) and category D (supporting student learning).
Table 1: The categories of teachers’ conceptions of teaching using mobile devices
Categories Description
A. Technology support The teacher-centered conception considering teaching with mobile devices a support to the present teaching materials
B. Knowledge transmission The traditional-oriented conception viewing teaching with mobile devices as a way to transmit knowledge everywhere and every time
C. Learning facilitation The student-centered conception seeing teaching with mobile devices as an alternative to facilitate students' understanding
D. Supporting student to learn The constructivist-oriented conception regarding teaching with mobile devices as a method to help student learn actively.
Table 2 illustrated the distribution of participants’ conceptions of teaching using mobile
devices. As for the main level of conceptions, 81% (n = 38) of the interview responses were classified as traditional and 19% (n = 9) as constructivist. In contrast, 43% (n = 20) of the responses were classified as traditional and 56% (n = 27) as constructivist in the achieved level of conceptions. It should be noted that the conceptions in the main level represent participants’ dominant ideas. Thus, it may be inferred that most pre-service teachers have viewed teaching with the use of mobile devices in a traditional way. In contrast, the conceptions in the achieved level imply individuals’ potential ideas.
38
Therefore, it may be encouraging that pre-service teachers still have the potential to improve their instruction in a more constructivist way.
Table 2: The distribution of categories regarding conceptions of teaching using mobile devices
Orientations Category Main Achieved
Traditional A 17 (36%) 8 (17%)
B 21 (45%) 12 (26%)
Constructivist C 5 (11%) 13 (26%)
D 4 (9%) 14 (30%)
Total 47 (100%) 47 (100%)
4. Discussion and Conclusion
This study was intended to explore pre-service teachers’ conceptions of teaching using mobile devices. Four qualitatively different and hierarchically related conceptions, namely “technology support,” “knowledge transmission,” “learning facilitation,” and “supporting student to learn” were revealed with the implementation of phenomenographic analysis. Moreover, the result indicates that more than half of the participants have held traditional conceptions (i.e., technology support or knowledge transmission) in the main level. Meanwhile, it is found that more than half of the teachers have embraced constructivist conceptions (i.e., learning facilitation or supporting student to learn) in the achieved level. As a result, it may be proposed that although most pre-service teachers see mobile devices as technology gadgets to transmit knowledge, they are aware of the fact that teaching using mobile devices can facilitate and support students’ understanding, and thus make them become active learners. The finding is consistent with the claim asserted by constructivist theory, suggesting that educational technology or Web-based learning activities may provide opportunities for learners to construct knowledge by themselves (Tsai, 2001). It is indeed important for teachers to form such conceptions of teaching, so that they can potentially enhance their instruction and assist students to learn in a more active way with the use of educational technology.
Acknowledgements This study is supported in part by the Ministry of Science and Technology, Taiwan, under grant numbers MOST 104-2511-S-027 -002 -MY2 and MOST 106-2511-S-027 -001 -MY2.
References
Åkerlind, G. (2005). Variation and commonality in phenomenographic research methods. Higher Education Research & Development, 24(4), 321–334.
Ellis, R. A., Steed, A. F., & Applebee, A. C. (2006). Teacher conceptions of blended learning, blended teaching and associations with approaches to design. Australian Journal of Educational Technology, 22(3), 312-335.
Gao, L. B., & Watkins, D. (2002). Conceptions of teaching held by school science teachers in P. R. China: Identifying and crosscultural comparisons. International Journal of Science Education, 24(1), 61-79.
Gow, L., & Kember, D. (1993). Conceptions of teaching and their relationship to student learning. British Journal of Educational Psychology, 63(1), 20-23.
Hsieh, W. M., & Tsai, C. C. (2017). Taiwanese high school teachers’ conceptions of mobile learning. Computers & Education, 115, 82-95.
Kember, D. (1997). A reconceptualization of the research into university academics’ conceptions of teaching. Learning and Instruction, 7(3), 255-275.
Khan, S. H. (2015). Emerging conceptions of ICT-enhanced teaching: Australian TAFE context. Instructional Science, 43(6), 683-708.

39
Lee, M. H., & Tsai, C. C. (2011). Teachers’ scientific epistemological views, conceptions of teaching science and their approaches to teaching science: an exploratory study of in-service science teachers in Taiwan. In Brownlee, J., Schraw, G., & Berthelsen, D. (Eds.), Personal Epistemology and Teacher Education, (pp. 246-262). London: Routledge.
Prosser, M., Trigwell, K., & Taylor, P. (1994). A phenomenographic study of academics’ conceptions of science learning and teaching. Learning and Instruction, 4(3), 217-231.
Roberts, G. (2003). Teaching using the Web: Conceptions and approaches from a phenomenographic perspective. Instructional Science, 31(1-2), 127-150.
Tsai, C-C (2001) The interpretation construction design model for teaching science and its applications to Internet-based instruction in Taiwan. International Journal of Educational Development, 21(5), 401–15.
Tsai, C. C. (2002). Nested epistemologies: Science teachers’ beliefs of teaching, learning and science. International Journal of Science Education, 24(8), 771-783.
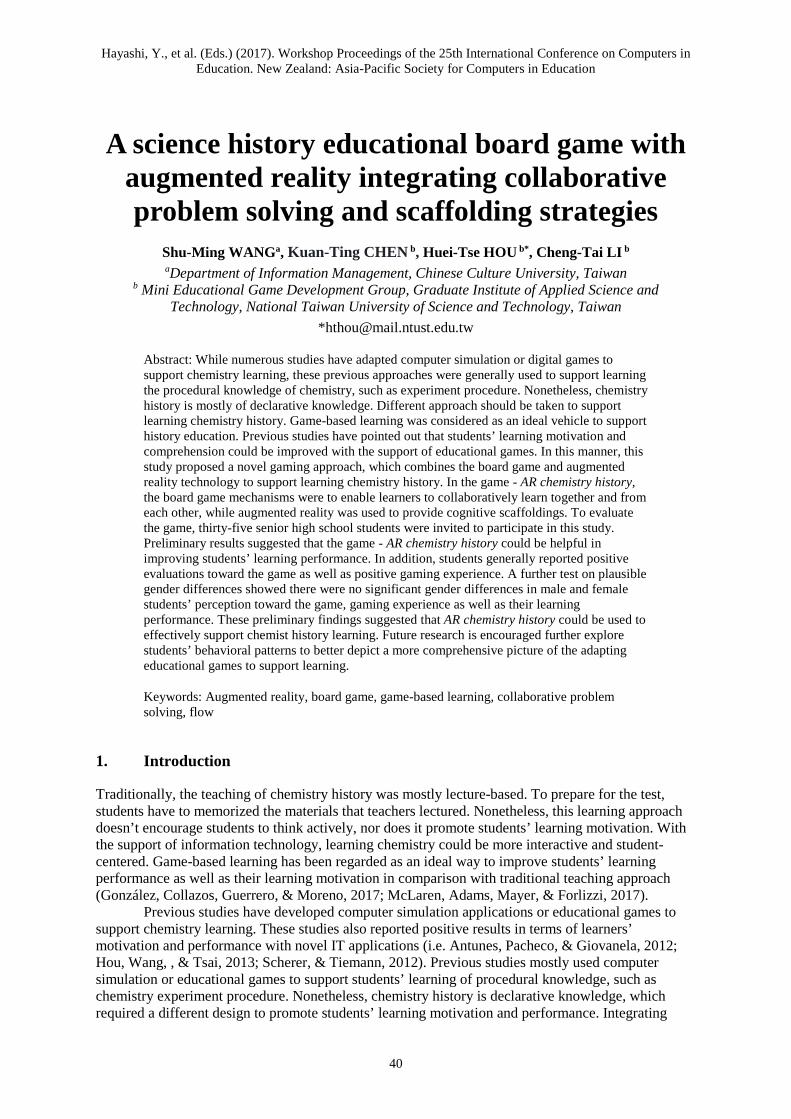
Hayashi, Y., et al. (Eds.) (2017). Workshop Proceedings of the 25th International Conference on Computers in Education. New Zealand: Asia-Pacific Society for Computers in Education
40
A science history educational board game with augmented reality integrating collaborative problem solving and scaffolding strategies
Shu-Ming WANGa, Kuan-Ting CHEN b, Huei-Tse HOU b*, Cheng-Tai LI b aDepartment of Information Management, Chinese Culture University, Taiwan
b Mini Educational Game Development Group, Graduate Institute of Applied Science and Technology, National Taiwan University of Science and Technology, Taiwan
Abstract: While numerous studies have adapted computer simulation or digital games to support chemistry learning, these previous approaches were generally used to support learning the procedural knowledge of chemistry, such as experiment procedure. Nonetheless, chemistry history is mostly of declarative knowledge. Different approach should be taken to support learning chemistry history. Game-based learning was considered as an ideal vehicle to support history education. Previous studies have pointed out that students’ learning motivation and comprehension could be improved with the support of educational games. In this manner, this study proposed a novel gaming approach, which combines the board game and augmented reality technology to support learning chemistry history. In the game - AR chemistry history, the board game mechanisms were to enable learners to collaboratively learn together and from each other, while augmented reality was used to provide cognitive scaffoldings. To evaluate the game, thirty-five senior high school students were invited to participate in this study. Preliminary results suggested that the game - AR chemistry history could be helpful in improving students’ learning performance. In addition, students generally reported positive evaluations toward the game as well as positive gaming experience. A further test on plausible gender differences showed there were no significant gender differences in male and female students’ perception toward the game, gaming experience as well as their learning performance. These preliminary findings suggested that AR chemistry history could be used to effectively support chemist history learning. Future research is encouraged further explore students’ behavioral patterns to better depict a more comprehensive picture of the adapting educational games to support learning.
Keywords: Augmented reality, board game, game-based learning, collaborative problem solving, flow
1. Introduction
Traditionally, the teaching of chemistry history was mostly lecture-based. To prepare for the test, students have to memorized the materials that teachers lectured. Nonetheless, this learning approach doesn’t encourage students to think actively, nor does it promote students’ learning motivation. With the support of information technology, learning chemistry could be more interactive and student-centered. Game-based learning has been regarded as an ideal way to improve students’ learning performance as well as their learning motivation in comparison with traditional teaching approach (González, Collazos, Guerrero, & Moreno, 2017; McLaren, Adams, Mayer, & Forlizzi, 2017).
Previous studies have developed computer simulation applications or educational games to support chemistry learning. These studies also reported positive results in terms of learners’ motivation and performance with novel IT applications (i.e. Antunes, Pacheco, & Giovanela, 2012; Hou, Wang, , & Tsai, 2013; Scherer, & Tiemann, 2012). Previous studies mostly used computer simulation or educational games to support students’ learning of procedural knowledge, such as chemistry experiment procedure. Nonetheless, chemistry history is declarative knowledge, which required a different design to promote students’ learning motivation and performance. Integrating
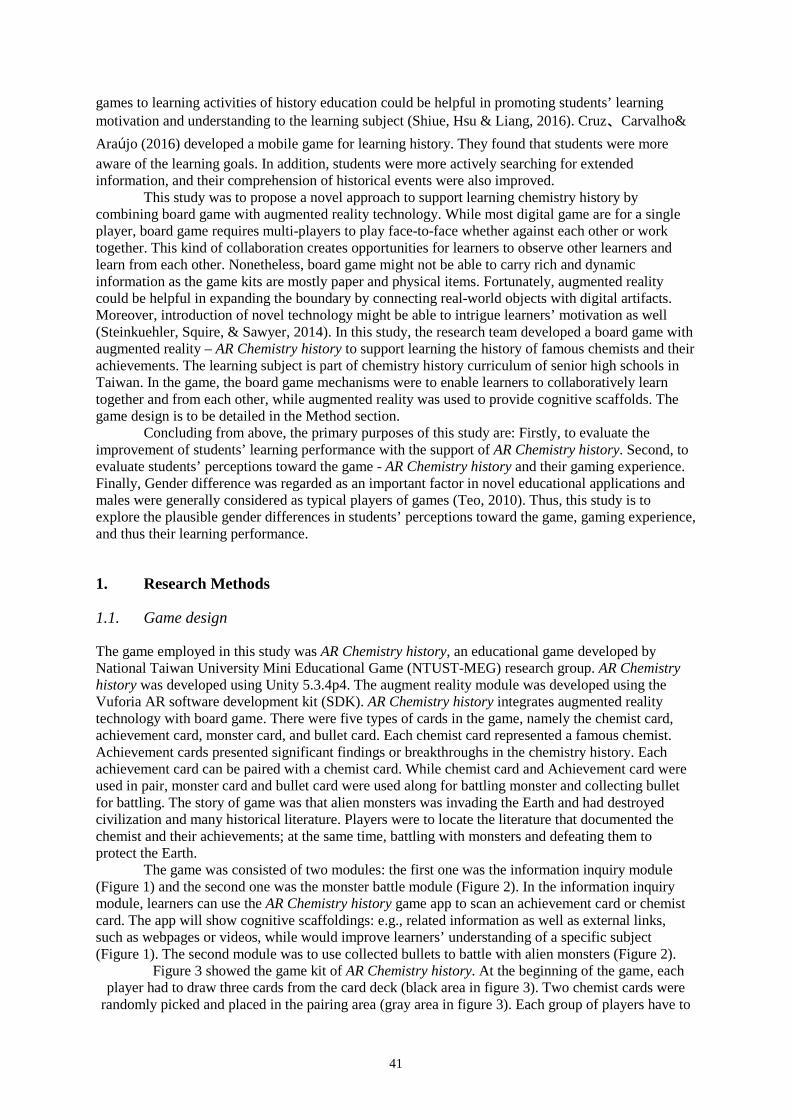
41
games to learning activities of history education could be helpful in promoting students’ learning motivation and understanding to the learning subject (Shiue, Hsu & Liang, 2016). Cruz、Carvalho& Araújo (2016) developed a mobile game for learning history. They found that students were more aware of the learning goals. In addition, students were more actively searching for extended information, and their comprehension of historical events were also improved.
This study was to propose a novel approach to support learning chemistry history by combining board game with augmented reality technology. While most digital game are for a single player, board game requires multi-players to play face-to-face whether against each other or work together. This kind of collaboration creates opportunities for learners to observe other learners and learn from each other. Nonetheless, board game might not be able to carry rich and dynamic information as the game kits are mostly paper and physical items. Fortunately, augmented reality could be helpful in expanding the boundary by connecting real-world objects with digital artifacts. Moreover, introduction of novel technology might be able to intrigue learners’ motivation as well (Steinkuehler, Squire, & Sawyer, 2014). In this study, the research team developed a board game with augmented reality – AR Chemistry history to support learning the history of famous chemists and their achievements. The learning subject is part of chemistry history curriculum of senior high schools in Taiwan. In the game, the board game mechanisms were to enable learners to collaboratively learn together and from each other, while augmented reality was used to provide cognitive scaffolds. The game design is to be detailed in the Method section.
Concluding from above, the primary purposes of this study are: Firstly, to evaluate the improvement of students’ learning performance with the support of AR Chemistry history. Second, to evaluate students’ perceptions toward the game - AR Chemistry history and their gaming experience. Finally, Gender difference was regarded as an important factor in novel educational applications and males were generally considered as typical players of games (Teo, 2010). Thus, this study is to explore the plausible gender differences in students’ perceptions toward the game, gaming experience, and thus their learning performance.
1. Research Methods
1.1. Game design
The game employed in this study was AR Chemistry history, an educational game developed by National Taiwan University Mini Educational Game (NTUST-MEG) research group. AR Chemistry history was developed using Unity 5.3.4p4. The augment reality module was developed using the Vuforia AR software development kit (SDK). AR Chemistry history integrates augmented reality technology with board game. There were five types of cards in the game, namely the chemist card, achievement card, monster card, and bullet card. Each chemist card represented a famous chemist. Achievement cards presented significant findings or breakthroughs in the chemistry history. Each achievement card can be paired with a chemist card. While chemist card and Achievement card were used in pair, monster card and bullet card were used along for battling monster and collecting bullet for battling. The story of game was that alien monsters was invading the Earth and had destroyed civilization and many historical literature. Players were to locate the literature that documented the chemist and their achievements; at the same time, battling with monsters and defeating them to protect the Earth.
The game was consisted of two modules: the first one was the information inquiry module (Figure 1) and the second one was the monster battle module (Figure 2). In the information inquiry module, learners can use the AR Chemistry history game app to scan an achievement card or chemist card. The app will show cognitive scaffoldings: e.g., related information as well as external links, such as webpages or videos, while would improve learners’ understanding of a specific subject (Figure 1). The second module was to use collected bullets to battle with alien monsters (Figure 2).
Figure 3 showed the game kit of AR Chemistry history. At the beginning of the game, each player had to draw three cards from the card deck (black area in figure 3). Two chemist cards were
randomly picked and placed in the pairing area (gray area in figure 3). Each group of players have to
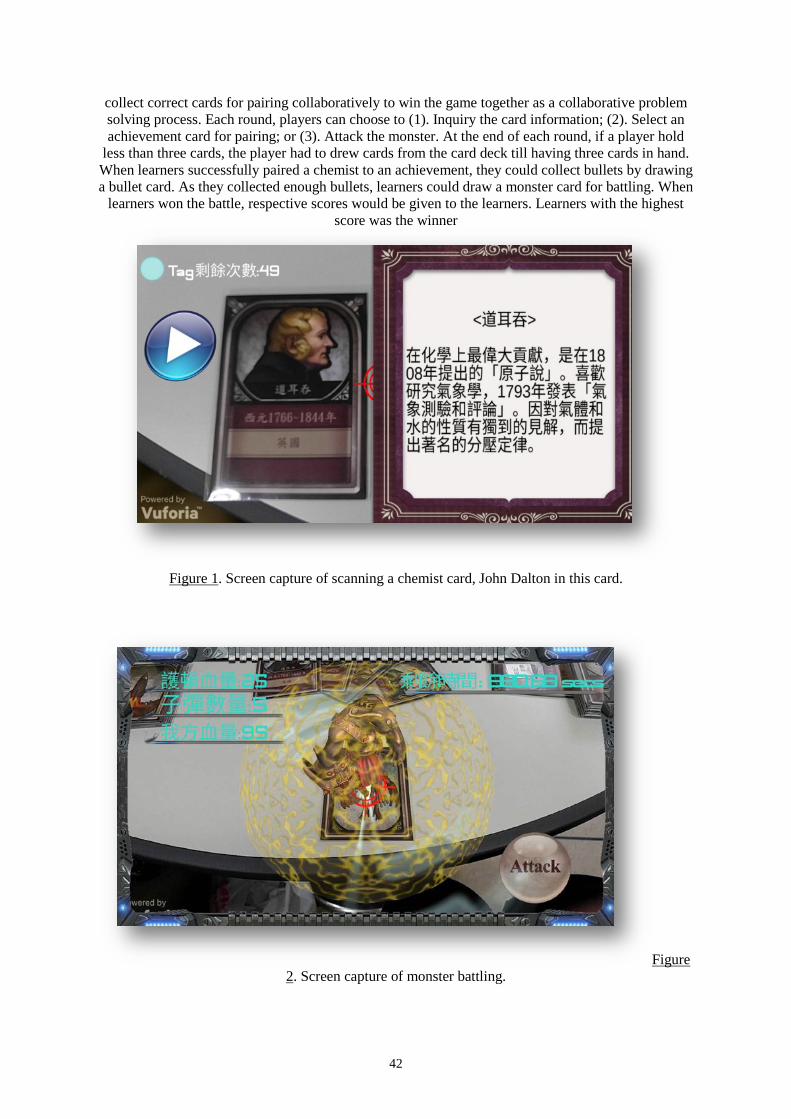
42
collect correct cards for pairing collaboratively to win the game together as a collaborative problem solving process. Each round, players can choose to (1). Inquiry the card information; (2). Select an achievement card for pairing; or (3). Attack the monster. At the end of each round, if a player hold
less than three cards, the player had to drew cards from the card deck till having three cards in hand. When learners successfully paired a chemist to an achievement, they could collect bullets by drawing a bullet card. As they collected enough bullets, learners could draw a monster card for battling. When
learners won the battle, respective scores would be given to the learners. Learners with the highest score was the winner
Figure 1. Screen capture of scanning a chemist card, John Dalton in this card.
Figure 2. Screen capture of monster battling.
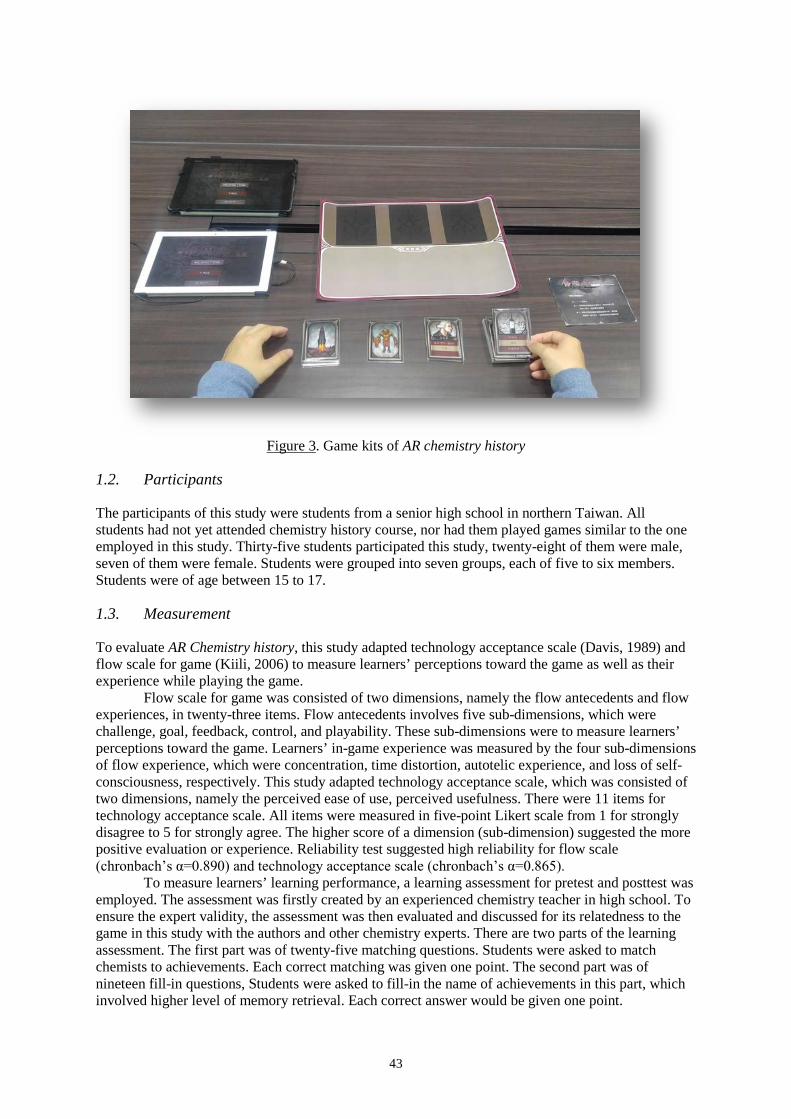
43
Figure 3. Game kits of AR chemistry history
1.2. Participants
The participants of this study were students from a senior high school in northern Taiwan. All students had not yet attended chemistry history course, nor had them played games similar to the one employed in this study. Thirty-five students participated this study, twenty-eight of them were male, seven of them were female. Students were grouped into seven groups, each of five to six members. Students were of age between 15 to 17.
1.3. Measurement
To evaluate AR Chemistry history, this study adapted technology acceptance scale (Davis, 1989) and flow scale for game (Kiili, 2006) to measure learners’ perceptions toward the game as well as their experience while playing the game.
Flow scale for game was consisted of two dimensions, namely the flow antecedents and flow experiences, in twenty-three items. Flow antecedents involves five sub-dimensions, which were challenge, goal, feedback, control, and playability. These sub-dimensions were to measure learners’ perceptions toward the game. Learners’ in-game experience was measured by the four sub-dimensions of flow experience, which were concentration, time distortion, autotelic experience, and loss of self-consciousness, respectively. This study adapted technology acceptance scale, which was consisted of two dimensions, namely the perceived ease of use, perceived usefulness. There were 11 items for technology acceptance scale. All items were measured in five-point Likert scale from 1 for strongly disagree to 5 for strongly agree. The higher score of a dimension (sub-dimension) suggested the more positive evaluation or experience. Reliability test suggested high reliability for flow scale (chronbach’s α=0.890) and technology acceptance scale (chronbach’s α=0.865).
To measure learners’ learning performance, a learning assessment for pretest and posttest was employed. The assessment was firstly created by an experienced chemistry teacher in high school. To ensure the expert validity, the assessment was then evaluated and discussed for its relatedness to the game in this study with the authors and other chemistry experts. There are two parts of the learning assessment. The first part was of twenty-five matching questions. Students were asked to match chemists to achievements. Each correct matching was given one point. The second part was of nineteen fill-in questions, Students were asked to fill-in the name of achievements in this part, which involved higher level of memory retrieval. Each correct answer would be given one point.
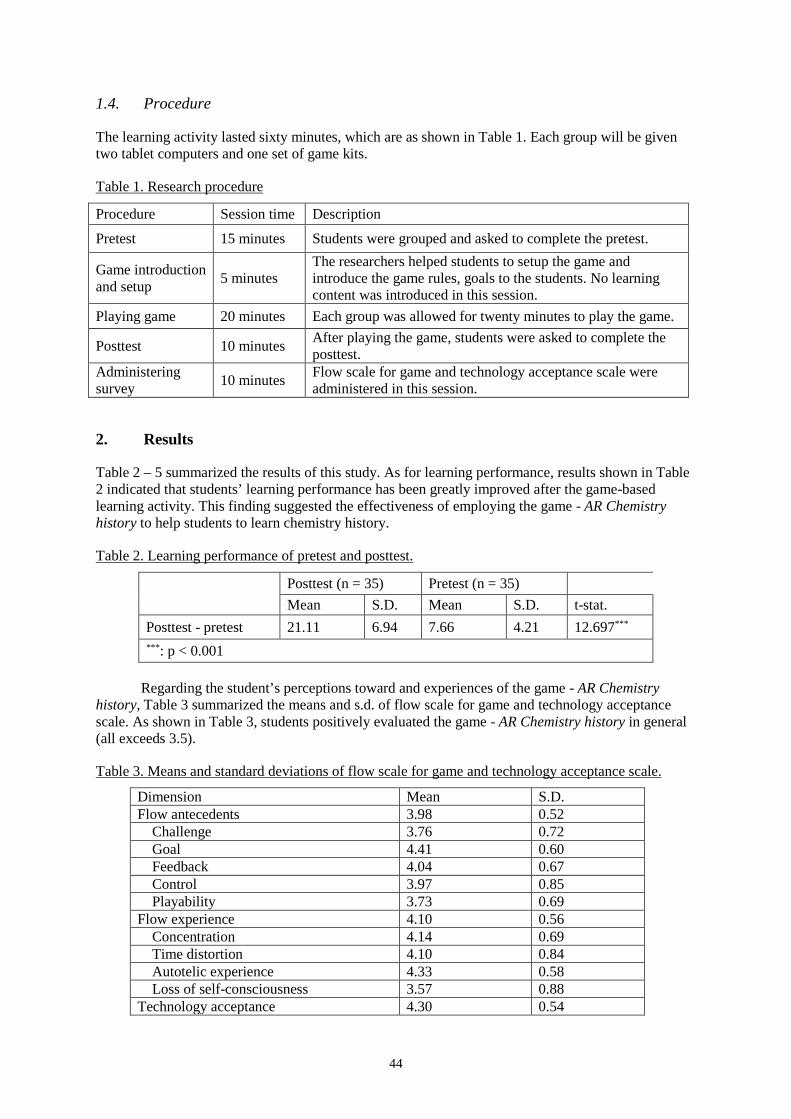
44
1.4. Procedure
The learning activity lasted sixty minutes, which are as shown in Table 1. Each group will be given two tablet computers and one set of game kits.
Table 1. Research procedure
Procedure Session time Description
Pretest 15 minutes Students were grouped and asked to complete the pretest.
Game introduction and setup 5 minutes
The researchers helped students to setup the game and introduce the game rules, goals to the students. No learning content was introduced in this session.
Playing game 20 minutes Each group was allowed for twenty minutes to play the game.
Posttest 10 minutes After playing the game, students were asked to complete the posttest.
Administering survey 10 minutes Flow scale for game and technology acceptance scale were
administered in this session.
2. Results
Table 2 – 5 summarized the results of this study. As for learning performance, results shown in Table 2 indicated that students’ learning performance has been greatly improved after the game-based learning activity. This finding suggested the effectiveness of employing the game - AR Chemistry history to help students to learn chemistry history.
Table 2. Learning performance of pretest and posttest.
Posttest (n = 35) Pretest (n = 35) Mean S.D. Mean S.D. t-stat.
Posttest - pretest 21.11 6.94 7.66 4.21 12.697*** ***: p < 0.001
Regarding the student’s perceptions toward and experiences of the game - AR Chemistry
history, Table 3 summarized the means and s.d. of flow scale for game and technology acceptance scale. As shown in Table 3, students positively evaluated the game - AR Chemistry history in general (all exceeds 3.5).
Table 3. Means and standard deviations of flow scale for game and technology acceptance scale.
Dimension Mean S.D. Flow antecedents 3.98 0.52 Challenge 3.76 0.72 Goal 4.41 0.60 Feedback 4.04 0.67 Control 3.97 0.85 Playability 3.73 0.69 Flow experience 4.10 0.56 Concentration 4.14 0.69 Time distortion 4.10 0.84 Autotelic experience 4.33 0.58 Loss of self-consciousness 3.57 0.88 Technology acceptance 4.30 0.54
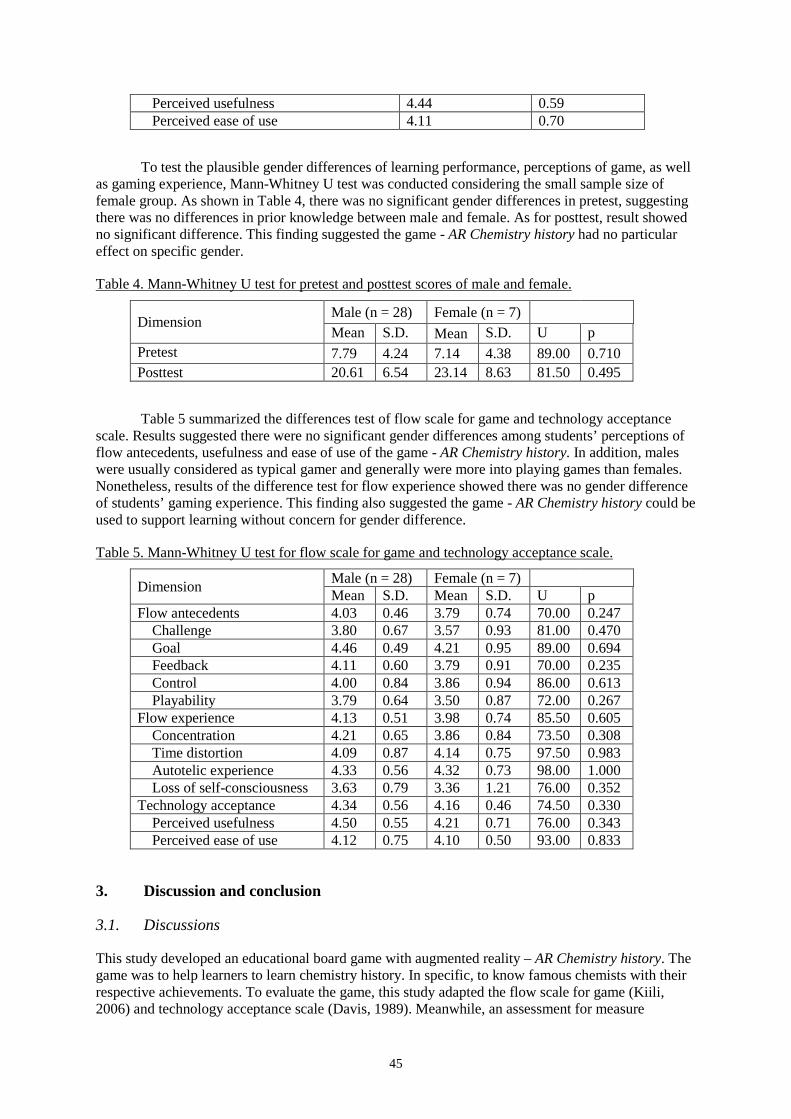
45
Perceived usefulness 4.44 0.59 Perceived ease of use 4.11 0.70
To test the plausible gender differences of learning performance, perceptions of game, as well as gaming experience, Mann-Whitney U test was conducted considering the small sample size of female group. As shown in Table 4, there was no significant gender differences in pretest, suggesting there was no differences in prior knowledge between male and female. As for posttest, result showed no significant difference. This finding suggested the game - AR Chemistry history had no particular effect on specific gender.
Table 4. Mann-Whitney U test for pretest and posttest scores of male and female.
Dimension Male (n = 28) Female (n = 7) Mean S.D. Mean S.D. U p
Pretest 7.79 4.24 7.14 4.38 89.00 0.710 Posttest 20.61 6.54 23.14 8.63 81.50 0.495
Table 5 summarized the differences test of flow scale for game and technology acceptance scale. Results suggested there were no significant gender differences among students’ perceptions of flow antecedents, usefulness and ease of use of the game - AR Chemistry history. In addition, males were usually considered as typical gamer and generally were more into playing games than females. Nonetheless, results of the difference test for flow experience showed there was no gender difference of students’ gaming experience. This finding also suggested the game - AR Chemistry history could be used to support learning without concern for gender difference.
Table 5. Mann-Whitney U test for flow scale for game and technology acceptance scale.
Dimension Male (n = 28) Female (n = 7) Mean S.D. Mean S.D. U p
Flow antecedents 4.03 0.46 3.79 0.74 70.00 0.247 Challenge 3.80 0.67 3.57 0.93 81.00 0.470 Goal 4.46 0.49 4.21 0.95 89.00 0.694 Feedback 4.11 0.60 3.79 0.91 70.00 0.235 Control 4.00 0.84 3.86 0.94 86.00 0.613 Playability 3.79 0.64 3.50 0.87 72.00 0.267 Flow experience 4.13 0.51 3.98 0.74 85.50 0.605 Concentration 4.21 0.65 3.86 0.84 73.50 0.308 Time distortion 4.09 0.87 4.14 0.75 97.50 0.983 Autotelic experience 4.33 0.56 4.32 0.73 98.00 1.000 Loss of self-consciousness 3.63 0.79 3.36 1.21 76.00 0.352 Technology acceptance 4.34 0.56 4.16 0.46 74.50 0.330 Perceived usefulness 4.50 0.55 4.21 0.71 76.00 0.343 Perceived ease of use 4.12 0.75 4.10 0.50 93.00 0.833
3. Discussion and conclusion
3.1. Discussions
This study developed an educational board game with augmented reality – AR Chemistry history. The game was to help learners to learn chemistry history. In specific, to know famous chemists with their respective achievements. To evaluate the game, this study adapted the flow scale for game (Kiili, 2006) and technology acceptance scale (Davis, 1989). Meanwhile, an assessment for measure
46
students’ learning performance was developed by experience senior high school chemistry teacher and the researchers. Discussions on the findings are as follows.
As for flow scale for game, students in general positively evaluated the game – AR Chemistry history as challenging, provided clear goals and feedback, having a sense of control and playable. With these positive perceptions of flow antecedents, students generally reported positive gaming experience. One thing to note is that playability was relatively lower among all flow antecedents. This finding might be attributed to the nature of educational game. Once students were aware of the learning subject, they might perceive educational game as less enjoyable, or less playable. On the other hand, loss of self-consciousness was relatively lower than other sub-dimensions of flow experience. This finding might also be attributed to the learning nature of educational game. Students might experience time distortion, fully concentration, or autotelic experience. Nonetheless, they were still in the classroom with a learning activity. Subsequent research could design an experiment to determine how the context might affect students’ evaluations of an educational game. Lastly, students generally evaluated the game as easy to play (ease of use) and useful to support their learning (usefulness).
As for effectiveness of the game - AR Chemistry history, results showed there was a significant difference between pretest and posttest. In specific, after playing the game, students generally have higher score than they did before playing the game. This finding suggested the effectiveness of the game - AR Chemistry history in supporting students’ to learn chemistry history.
Lastly, gender difference was regarded as an important factor in technology acceptance (Teo, 2010). Therefore, this study conducted difference test in students’ learning performance, perceptions toward the game as well as their gaming experience. Results pointed out that there were no significant differences in learning performance as well as sub-dimensions of flow antecedents and flow experience. As males were generally regarded as typical gamers, our finding suggested that AR Chemistry history didn’t lay stress on particular gender.
In conclusion, AR Chemistry history is a hybrid educational game that combines real-world board game and digital technology – augmented reality. This hybrid game design could take the benefit of the collaborative nature of board game. At the same time, with the support of novel technology, the boundary of physical world could be expanded and students could access rich and dynamic information while playing the game. In this preliminary study, we showed the effectiveness and students’ positive evaluation and gaming experience. Nonetheless, there would be research limitations, which also shed light on the ways for future research.
3.2. Research limitation and future research
The primary research limitation is the small sample size as the preliminary stage of this studs is in. Thus, interpretation of the results of this study should be with cautious. Future research is encouraged to conduct a larger scale research and collect more evaluations from the learners or domain experts. These kinds of feedback could improve our understanding of how to integrate board game with novel information technologies, such as augmented reality in this study. Secondly, this study didn’t analyze the behavioral patterns of students’ interaction as analyzing the interaction of board game can be difficult and labor-intensive. Future research can use videotaping along with observers to log students’ interaction when playing the game. The collected log can be subsequently used for interaction analysis to depict a clearer picture of how gaming might help students learn better (Bakeman & Gottman, 1997; Hou, 2015). Lastly, future research is also encouraged to adapt the game mechanism in this study to a new learning subject, such as introducing other historical or cultural assets. By expanding the learning subject using board game with novel information technology, we would thus able to develop a more comprehensive understanding of how gaming might contribute to better learning outcomes.
47
Acknowledgements
This research was supported by the projects from the Ministry of Science and Technology, Republic of China, under contract number MOST- 104-2511-S-011 -003 -MY3, MOST- 105-2511-S-011 -006 -MY3 and MOST-105-2511-S-034-001.
References
Antunes, M., Pacheco, M. A. R., & Giovanela, M. (2012). Design and Implementation of an Educational Game for Teaching Chemistry in Higher Education. Journal of Chemical Education, 89(4), 517-521.
Bakeman, R., & Gottman, J. M. (1997). Observing Interaction : An Introduction to Sequential Analysis (2nd ed.). New York: Cambridge University Press.
Davis, F. D. (1989). Perceived Usefulness, Perceived Ease of Use, and User Acceptance of Information Technology. MIS Quarterly, 13(3), 319-340.
González, C. S. G., Collazos, C. A., Guerrero, L. A., & Moreno, L. (2017). Game-based learning environments: designing the collaborative learning processes. Acta Scientiae, 18(4).
Hou, H.-T., Wang, S.-M., & Tsai, D.-S. (2013). The Development and Evaluation of a 3D Simulation Game for Chemistry Learning: Exploration of Learners’ Flow, Acceptance, and Sense of Directions. Paper presented at the The 21st International Conference on Computers in Education (ICCE 2013), Bali, Indonesia.
Hou, H. T. (2015). Integrating cluster and sequential analysis to explore learners' flow and behavioral patterns in a simulation game with situated-learning context for science courses: a video-based process exploration, Computers in Human Behavior, 48, 424-435.
Kiili, K. (2006). Evaluations of An Experiential Gaming Model. Human Technology: An Interdisciplinary Journal on Humans in ICT Environment, 2(2), 187-201.
McLaren, B. M., Adams, D. M., Mayer, R. E., & Forlizzi, J. (2017). A Computer-based Game that Promotes Mathematics Learning More than a Conventional Approach. International Journal of Game-Based Learning (IJGBL), 7(1), 36-56.
Scherer, R., & Tiemann, R. (2012). Factors of problem-solving competency in a virtual chemistry environment: The role of metacognitive knowledge about strategies. Computers & Education, 59(4), 1199-1214.
Steinkuehler, C., Squire, K., & Sawyer, K. (2014). Videogames and learning. Cambridge handbook of the learning sciences, 377-396.
Teo, T. (2010). Gender Differences in The Intention to Use Technology: A Measurement Invariance Analysis. British Journal of Educational Technology, 41(6), E120-E123.
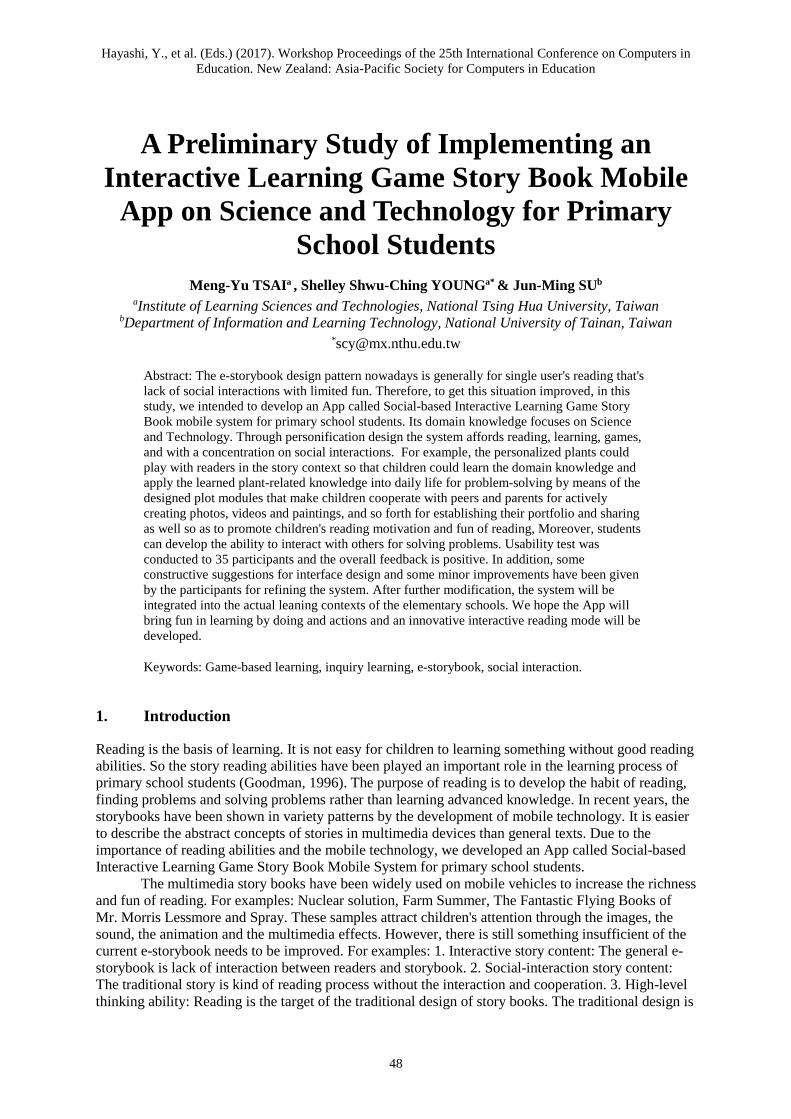
Hayashi, Y., et al. (Eds.) (2017). Workshop Proceedings of the 25th International Conference on Computers in Education. New Zealand: Asia-Pacific Society for Computers in Education
48
A Preliminary Study of Implementing an Interactive Learning Game Story Book Mobile
App on Science and Technology for Primary School Students
Meng-Yu TSAIa , Shelley Shwu-Ching YOUNGa* & Jun-Ming SUb aInstitute of Learning Sciences and Technologies, National Tsing Hua University, Taiwan
bDepartment of Information and Learning Technology, National University of Tainan, Taiwan *[email protected]
Abstract: The e-storybook design pattern nowadays is generally for single user's reading that's lack of social interactions with limited fun. Therefore, to get this situation improved, in this study, we intended to develop an App called Social-based Interactive Learning Game Story Book mobile system for primary school students. Its domain knowledge focuses on Science and Technology. Through personification design the system affords reading, learning, games, and with a concentration on social interactions. For example, the personalized plants could play with readers in the story context so that children could learn the domain knowledge and apply the learned plant-related knowledge into daily life for problem-solving by means of the designed plot modules that make children cooperate with peers and parents for actively creating photos, videos and paintings, and so forth for establishing their portfolio and sharing as well so as to promote children's reading motivation and fun of reading, Moreover, students can develop the ability to interact with others for solving problems. Usability test was conducted to 35 participants and the overall feedback is positive. In addition, some constructive suggestions for interface design and some minor improvements have been given by the participants for refining the system. After further modification, the system will be integrated into the actual leaning contexts of the elementary schools. We hope the App will bring fun in learning by doing and actions and an innovative interactive reading mode will be developed.
Keywords: Game-based learning, inquiry learning, e-storybook, social interaction.
1. Introduction
Reading is the basis of learning. It is not easy for children to learning something without good reading abilities. So the story reading abilities have been played an important role in the learning process of primary school students (Goodman, 1996). The purpose of reading is to develop the habit of reading, finding problems and solving problems rather than learning advanced knowledge. In recent years, the storybooks have been shown in variety patterns by the development of mobile technology. It is easier to describe the abstract concepts of stories in multimedia devices than general texts. Due to the importance of reading abilities and the mobile technology, we developed an App called Social-based Interactive Learning Game Story Book Mobile System for primary school students.
The multimedia story books have been widely used on mobile vehicles to increase the richness and fun of reading. For examples: Nuclear solution, Farm Summer, The Fantastic Flying Books of Mr. Morris Lessmore and Spray. These samples attract children's attention through the images, the sound, the animation and the multimedia effects. However, there is still something insufficient of the current e-storybook needs to be improved. For examples: 1. Interactive story content: The general e-storybook is lack of interaction between readers and storybook. 2. Social-interaction story content: The traditional story is kind of reading process without the interaction and cooperation. 3. High-level thinking ability: Reading is the target of the traditional design of story books. The traditional design is
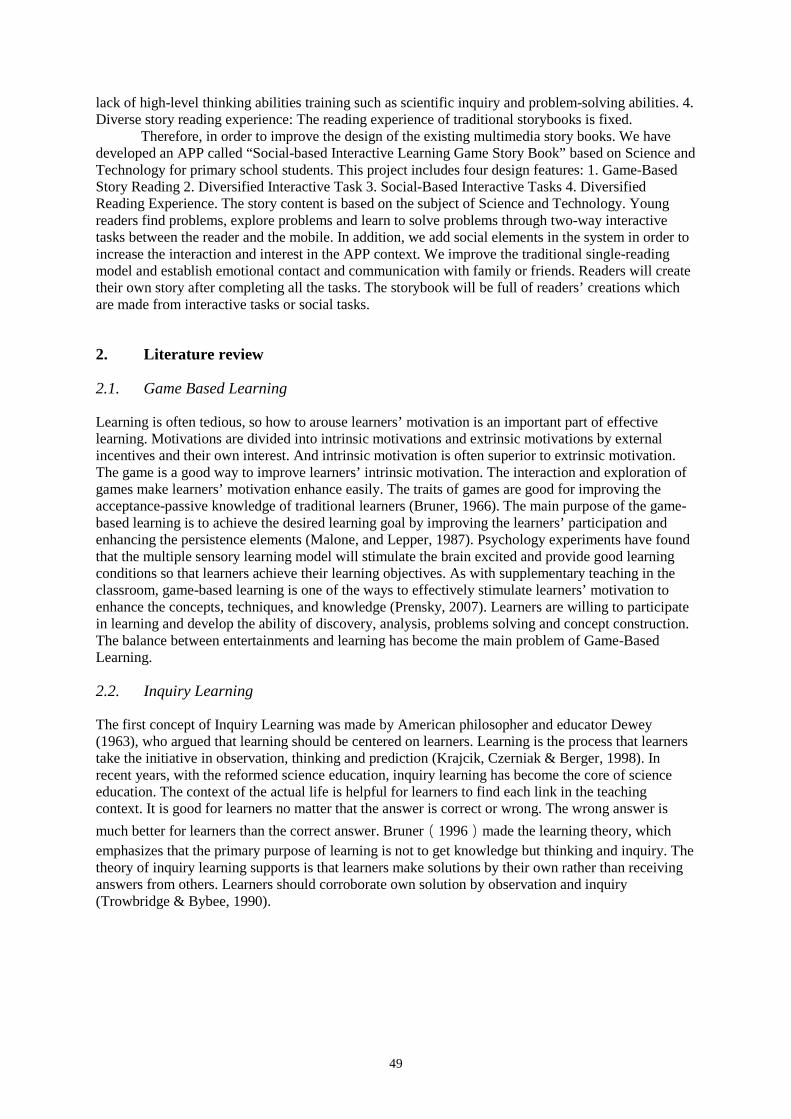
49
lack of high-level thinking abilities training such as scientific inquiry and problem-solving abilities. 4. Diverse story reading experience: The reading experience of traditional storybooks is fixed.
Therefore, in order to improve the design of the existing multimedia story books. We have developed an APP called “Social-based Interactive Learning Game Story Book” based on Science and Technology for primary school students. This project includes four design features: 1. Game-Based Story Reading 2. Diversified Interactive Task 3. Social-Based Interactive Tasks 4. Diversified Reading Experience. The story content is based on the subject of Science and Technology. Young readers find problems, explore problems and learn to solve problems through two-way interactive tasks between the reader and the mobile. In addition, we add social elements in the system in order to increase the interaction and interest in the APP context. We improve the traditional single-reading model and establish emotional contact and communication with family or friends. Readers will create their own story after completing all the tasks. The storybook will be full of readers’ creations which are made from interactive tasks or social tasks.
2. Literature review
2.1. Game Based Learning
Learning is often tedious, so how to arouse learners’ motivation is an important part of effective learning. Motivations are divided into intrinsic motivations and extrinsic motivations by external incentives and their own interest. And intrinsic motivation is often superior to extrinsic motivation. The game is a good way to improve learners’ intrinsic motivation. The interaction and exploration of games make learners’ motivation enhance easily. The traits of games are good for improving the acceptance-passive knowledge of traditional learners (Bruner, 1966). The main purpose of the game-based learning is to achieve the desired learning goal by improving the learners’ participation and enhancing the persistence elements (Malone, and Lepper, 1987). Psychology experiments have found that the multiple sensory learning model will stimulate the brain excited and provide good learning conditions so that learners achieve their learning objectives. As with supplementary teaching in the classroom, game-based learning is one of the ways to effectively stimulate learners’ motivation to enhance the concepts, techniques, and knowledge (Prensky, 2007). Learners are willing to participate in learning and develop the ability of discovery, analysis, problems solving and concept construction. The balance between entertainments and learning has become the main problem of Game-Based Learning.
2.2. Inquiry Learning
The first concept of Inquiry Learning was made by American philosopher and educator Dewey (1963), who argued that learning should be centered on learners. Learning is the process that learners take the initiative in observation, thinking and prediction (Krajcik, Czerniak & Berger, 1998). In recent years, with the reformed science education, inquiry learning has become the core of science education. The context of the actual life is helpful for learners to find each link in the teaching context. It is good for learners no matter that the answer is correct or wrong. The wrong answer is much better for learners than the correct answer. Bruner(1996)made the learning theory, which emphasizes that the primary purpose of learning is not to get knowledge but thinking and inquiry. The theory of inquiry learning supports is that learners make solutions by their own rather than receiving answers from others. Learners should corroborate own solution by observation and inquiry (Trowbridge & Bybee, 1990).
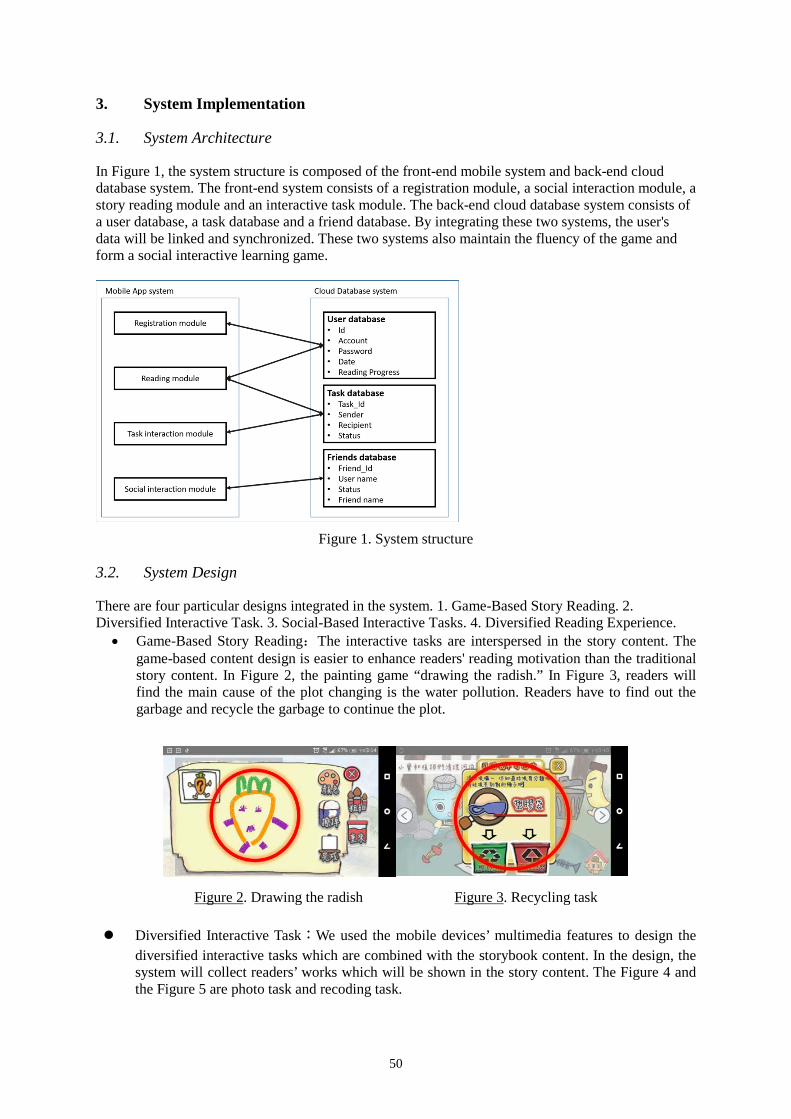
50
3. System Implementation
3.1. System Architecture
In Figure 1, the system structure is composed of the front-end mobile system and back-end cloud database system. The front-end system consists of a registration module, a social interaction module, a story reading module and an interactive task module. The back-end cloud database system consists of a user database, a task database and a friend database. By integrating these two systems, the user's data will be linked and synchronized. These two systems also maintain the fluency of the game and form a social interactive learning game.
Figure 1. System structure
3.2. System Design
There are four particular designs integrated in the system. 1. Game-Based Story Reading. 2. Diversified Interactive Task. 3. Social-Based Interactive Tasks. 4. Diversified Reading Experience.
• Game-Based Story Reading:The interactive tasks are interspersed in the story content. The game-based content design is easier to enhance readers' reading motivation than the traditional story content. In Figure 2, the painting game “drawing the radish.” In Figure 3, readers will find the main cause of the plot changing is the water pollution. Readers have to find out the garbage and recycle the garbage to continue the plot.
Figure 2. Drawing the radish Figure 3. Recycling task
Diversified Interactive Task:We used the mobile devices’ multimedia features to design the diversified interactive tasks which are combined with the storybook content. In the design, the system will collect readers’ works which will be shown in the story content. The Figure 4 and the Figure 5 are photo task and recoding task.
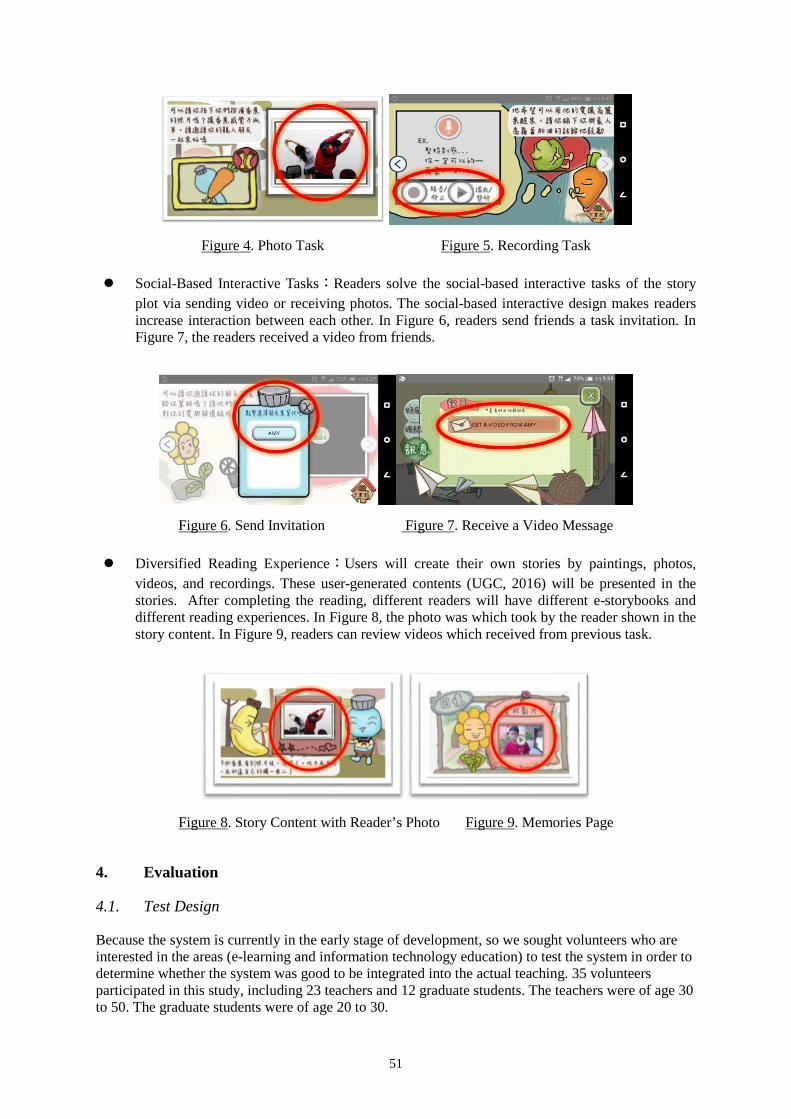
51
Figure 4. Photo Task Figure 5. Recording Task
Social-Based Interactive Tasks:Readers solve the social-based interactive tasks of the story plot via sending video or receiving photos. The social-based interactive design makes readers increase interaction between each other. In Figure 6, readers send friends a task invitation. In Figure 7, the readers received a video from friends.
Figure 6. Send Invitation Figure 7. Receive a Video Message
Diversified Reading Experience:Users will create their own stories by paintings, photos, videos, and recordings. These user-generated contents (UGC, 2016) will be presented in the stories. After completing the reading, different readers will have different e-storybooks and different reading experiences. In Figure 8, the photo was which took by the reader shown in the story content. In Figure 9, readers can review videos which received from previous task.
Figure 8. Story Content with Reader’s Photo Figure 9. Memories Page
4. Evaluation
4.1. Test Design
Because the system is currently in the early stage of development, so we sought volunteers who are interested in the areas (e-learning and information technology education) to test the system in order to determine whether the system was good to be integrated into the actual teaching. 35 volunteers participated in this study, including 23 teachers and 12 graduate students. The teachers were of age 30 to 50. The graduate students were of age 20 to 30.
52
We collected feedback from the 35 users after the test. First, we introduced the research origin and the purpose of the system to the users, and assisted users to create an account and start the test. We played a role of the user's friends or parents to help users complete the social cooperation task in the story, during the process of the test. After the test, we had a meeting with the users. The meeting was mainly for the use of the system on the issue or recommendations. The collected questions and suggestions are divided into three parts: system content, system interface and system function.
4.2. Result and Feedback
The overall feedback is positive and we also acquire some suggestions for improvement. The collected feedback and suggestions are divided into three parts: system content, system interface and system function. In terms of system content, most of participants gave us some suggestions to make the content richer and diverse. We can make the learning content more diverse by combining with different subjects. In the system interface part, the system should increase system feedback and notification. Because the target users of the system are primary students, so the number of words and picture style should be adjusted slightly. System function suggestions are all about additional features such as the talking function and the light detect function.
5. Conclusion and Future Work
In this study, we developed an APP called “Social-based Interactive Learning Game Story Book”, which combines reading, learning, game and social interaction. The app improves the user’s motivation of reading and makes learners learn the plants and pollution knowledge. The system had been tested by 35 participants, who had an interview with us after the user completed the use of the test. The interview results are positive. After the system being tested, the system is still needed to be partially modified and strengthened to meet the students' needs. After further modification, we hope the system will be integrated into the actual leaning contexts of the elementary schools. We hope the App will bring fun into learning by doing and actions and an innovative interactive reading mode will be developed.
Acknowledgements
Thanks for the support from the Ministry of Science and Technology (MOST), R.O.C., under the grant code: MOST 105-2511-S-007 -002 -MY3.
References
Bruner, J. S. (1966). Toward a theory of instruction. New York: Norton. Dewey, J. (1963). Experience and education. New York: Collier Books. Dillenbourg, P. (1999). What do you mean by collaborative learning. Collaborative-learning: Cognitive and
computational approaches, 1, 1-15. Goodman, K. (1996). On reading. USA: Heinemann Krajcik, J., Blumenfeld, P. C., Marx, R. W., Bass, K. M., Fredericks, J., & Soloway, E. (1998). Inquiry in
project-based science classrooms: Initial attempts by middle school students. The Journal of the Learning Sciences, 7(3&4), 313-350.
Malone, T. W. and Lepper, M. R. (1987). Making learning fun: A taxonomy of intrinsic motivation for learning. Aptitude, Learning, and Instruction: Cognitive and Affective Process Analyses, 3, 223-235.
Prensky, M., (2007). Digital Game-Based Learning, New York: McGraw-Hill. Squire, K. (2005). Game-based learning: An X-learn perspective paper. MASIE center: e-Learning Consortium. Trowbridge, L. W. & Bybee, R. W. (1990). Becoming a Secondary School Science Teacher (5th ed.).New York:
Merrill. UGC (2016). User-Generated Content. Retrieved from: https://en.wikipedia.org/wiki/User-generated_content. of
Physics. 66(1), 64-74.
Hayashi, Y., et al. (Eds.) (2017). Workshop Proceedings of the 25th International Conference on Computers in Education. New Zealand: Asia-Pacific Society for Computers in Education
53
Using English Learning Toys as the Emotional Analysis Tool to Evaluate Children Behavior
Ru-Shan CHENa*, Shian-Chi MENGb, Wei-Kuang HOb , Chih-Hsuan TSUIb, Wei-Fan CHENb & Sheng-Chih CHENc
aCollege of International Business and Foreign Language, Department of Applied English, Chihlee University of Technology, Taiwan(R.O.C)
bThe Innovative DigiTech-Enabled Applications & Services Institute (IDEAS), Institute for Information Industry, Taipei, Taiwan (R.O.C)
cMaster’s Program in Digital Content and Technologies, College of Communication, National Chengchi University, Taipei, Taiwan (R.O.C)
Abstract: This study aims to develop a user-center design; UCD English learning toy for children to learn English. The research mainly used qualitative interviews to make a recording and conversation with the children. From observing the users’ interaction with the toy, the researchers can record a unique learning process and emotional fluctuation from the children. By doing a comprehensive evaluation, the analytical items include participants’ emotion, facial expression, speaking, and motion factors. In addition, the research sought whether the children can use the toy’s voice functioning to recognize the English word or a sentence from the word cards. The study results have shown that the English learning toy increased the children’s curiosity, motivation and imagination during the interactive process with the toy.
Keywords: English learning toys, user-center design, emotional analysis, children behavior
1. Introduction
According to the Central Intelligence Agency (2014), Taiwan ranked at 215th for the lowest birth rate in comparison with the total of 223 countries in the world. The birth rate has been on a decline (Sander, 2017). Many parents only need to foster one child per household, thus allowing them in putting more effort on their child’s education development. There’s an idiom that states “To Get off to a Good Start” which sends a message for productive parenting, therefore, in this case most parents would like their child to have access to knowledge at the earliest.
The United Nations Educational, Scientific and Cultural Organization, or UNESCO, had mentioned the importance of literacy by proposing that “literacy is not an end in itself, it is a fundamental human right” (Oxenham, p 24). The organization maintained the importance of building up a persons’ literacy capability. Starting from 2005, Taiwan Ministry of Education had started a new policy for children to learn English from the 3rd grade. This initiative has generated a spark in learning English as a national movement. This study has designed an English learning toy. Resnick (1989) once mentioned that “effective learning depends on the intentions, self-monitoring, elaborations, and representational constructions of the individual learner,” (p. 2). From this philosophical inspiration, the purpose of this study is to see how a designed English learning toy can enhance a child’s interests and motivation to learn English. Furthermore, the study intends to discover on how a child’s emotional fluctuation change when they integrate with the learning toy.
54
2. Literature Review
2.1. Behaviorism
By the 1900s, some psychologists believed that learning happens according to the external environment’s stimulation (S) and learners’ response (R); rewards play an important role that influence a person’s motivation and behavior (Ormrod, 2010). Ivan Pavlov (1849-1936) and B.F. Skinner (1904-1990) are perhaps the two best known behaviorists. Pavlov created the classical conditioning theory by experimenting with dogs, seeing how they salivate when they have been trained that a ringing bell means food. On the other hand, Skinner (1938, 1953) advocated operant conditioning, for he thought that learning occurs when people make a response based on a reinforcing stimulus. In addition children learned through imitation. As for this study, the research use the English toy’s movement, voice, and eyes as reinforcement conditions to stimulate a child’s desire toward learning a second language.
2.2. Social constructivism
Lev Vygotsky (1896-1934) focused on how the environment, especially society and culture, can influence children’s cognitive development. Vygotsky pointed out the intimate relationship between children and play. He suggested that play can not only enhance a child’s imaginative capability but zone of proximal development (ZPD). Vygotsky defined ZPD as “the distance between the actual developmental level as determined by independent problem solving and the level of potential development as determined through problem solving under adult guidance or in collaboration with more capable peers” (as cited in Cole, John-Steiner, Scrbner, & Souberman, 1978, p. 86). The second stage of the qualitative interviews were designed from Vygotsky’s (1978) theory on scaffolding, which interprets on hoping that children can get their imagination while they are integrating with the English learning toy.
2.3. Social constructivism, User-center Design
The original concept of user-center design; UCD was initiated by Norman and Draper (1986) through their laboratory research at the university. Since then, UCD has become a culture vernacular that has been widely used for designing a user-friendly products’ principles (Abrass, Maloney-Krichmar, & Preece, 2004; Mao, Vredenburg, Smith, & Carey, 2005; Sotamaa, 2005). Norman’s (1988) designing principles are based on the idea of knowledge, simplification, visible, mappings, error adjustment, task-orientation, and standardization. Furthermore, Garrett (2011) pointed out the essential element for user experience requires “design for engagement” (p.132). In regards to the application of Norman’s principles and Garrett’s concept, this study designed an English learning toy that is efficient, memorable, error adjustable, and satisfied.
3. Methodology
3.1. Research Question
The aims of the experimental observation and the research questions are as followed: (1) Evaluate children’s interactive relation with the toy: investigating if children can make interaction with the toy naturally, or if they have difficulty in operating with the toy? This designed question aims to seek if there are any other hidden questions. (2) Compare the children’s interactions with the toy into three different situational experiments: seek how children’s emotion are, see how their preference and usage are different while they play with the toy in three different situations.
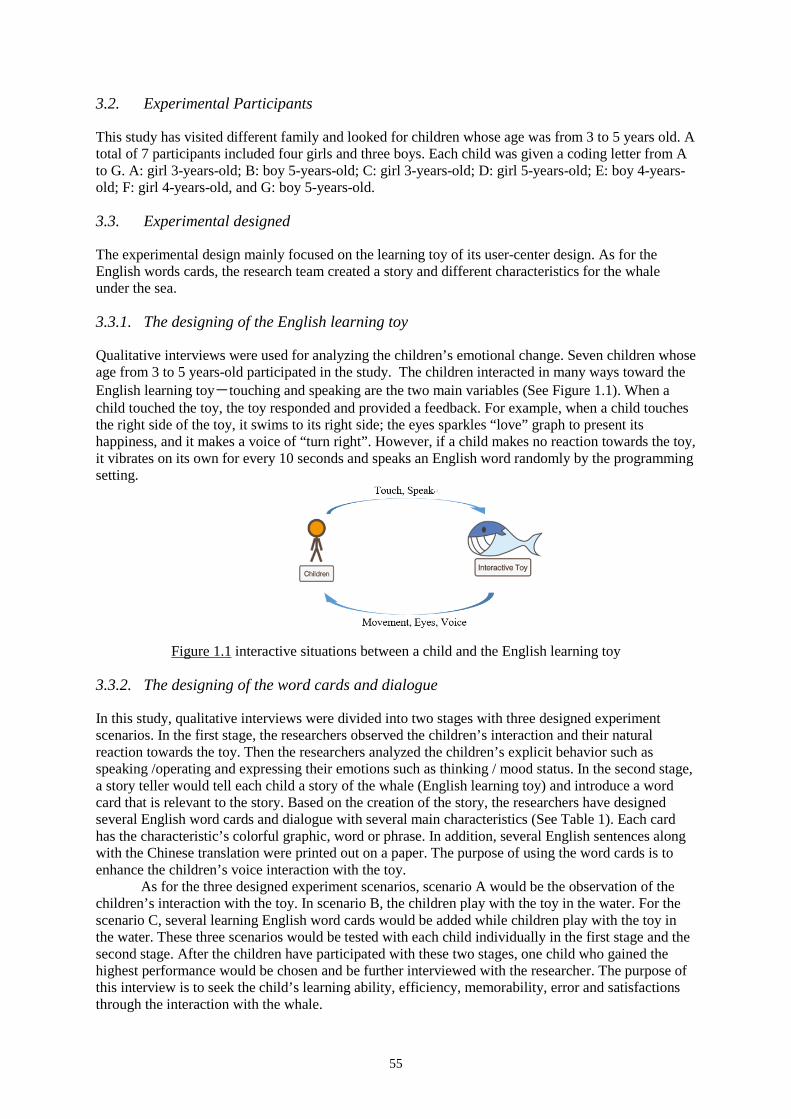
55
3.2. Experimental Participants
This study has visited different family and looked for children whose age was from 3 to 5 years old. A total of 7 participants included four girls and three boys. Each child was given a coding letter from A to G. A: girl 3-years-old; B: boy 5-years-old; C: girl 3-years-old; D: girl 5-years-old; E: boy 4-years-old; F: girl 4-years-old, and G: boy 5-years-old.
3.3. Experimental designed
The experimental design mainly focused on the learning toy of its user-center design. As for the English words cards, the research team created a story and different characteristics for the whale under the sea.
3.3.1. The designing of the English learning toy
Qualitative interviews were used for analyzing the children’s emotional change. Seven children whose age from 3 to 5 years-old participated in the study. The children interacted in many ways toward the English learning toy-touching and speaking are the two main variables (See Figure 1.1). When a child touched the toy, the toy responded and provided a feedback. For example, when a child touches the right side of the toy, it swims to its right side; the eyes sparkles “love” graph to present its happiness, and it makes a voice of “turn right”. However, if a child makes no reaction towards the toy, it vibrates on its own for every 10 seconds and speaks an English word randomly by the programming setting.
Figure 1.1 interactive situations between a child and the English learning toy
3.3.2. The designing of the word cards and dialogue
In this study, qualitative interviews were divided into two stages with three designed experiment scenarios. In the first stage, the researchers observed the children’s interaction and their natural reaction towards the toy. Then the researchers analyzed the children’s explicit behavior such as speaking /operating and expressing their emotions such as thinking / mood status. In the second stage, a story teller would tell each child a story of the whale (English learning toy) and introduce a word card that is relevant to the story. Based on the creation of the story, the researchers have designed several English word cards and dialogue with several main characteristics (See Table 1). Each card has the characteristic’s colorful graphic, word or phrase. In addition, several English sentences along with the Chinese translation were printed out on a paper. The purpose of using the word cards is to enhance the children’s voice interaction with the toy.
As for the three designed experiment scenarios, scenario A would be the observation of the children’s interaction with the toy. In scenario B, the children play with the toy in the water. For the scenario C, several learning English word cards would be added while children play with the toy in the water. These three scenarios would be tested with each child individually in the first stage and the second stage. After the children have participated with these two stages, one child who gained the highest performance would be chosen and be further interviewed with the researcher. The purpose of this interview is to seek the child’s learning ability, efficiency, memorability, error and satisfactions through the interaction with the whale.
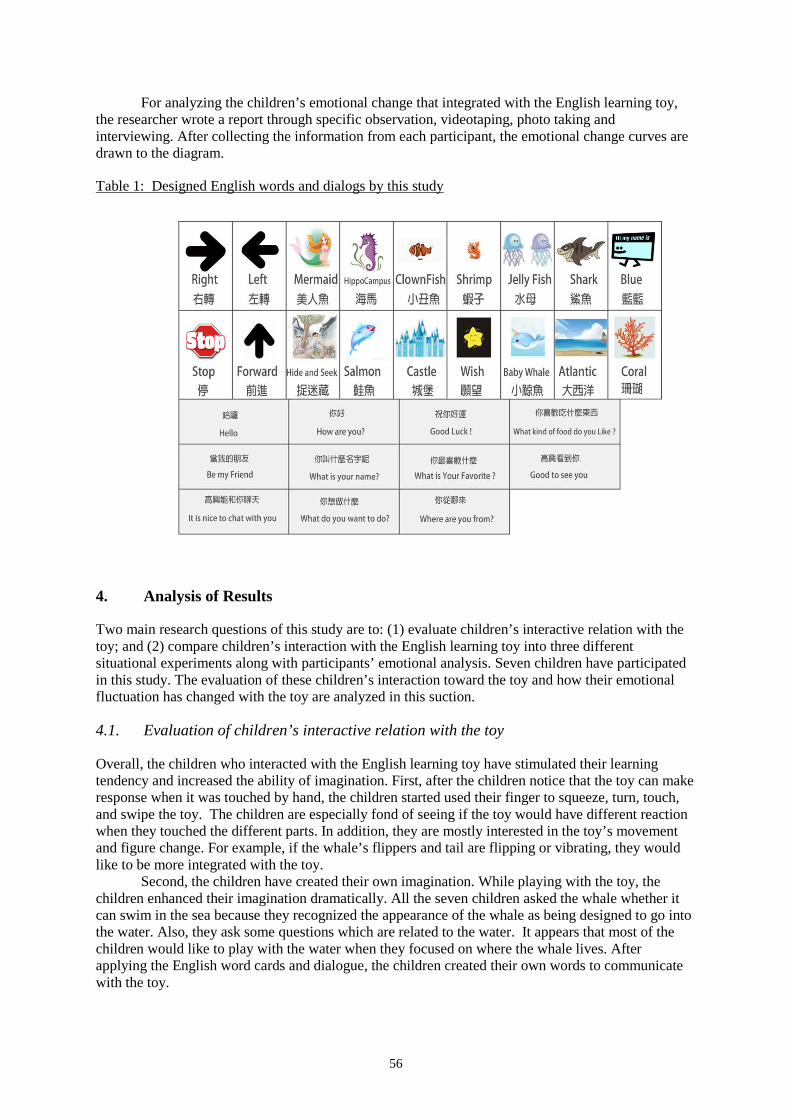
56
For analyzing the children’s emotional change that integrated with the English learning toy, the researcher wrote a report through specific observation, videotaping, photo taking and interviewing. After collecting the information from each participant, the emotional change curves are drawn to the diagram.
Table 1: Designed English words and dialogs by this study
4. Analysis of Results
Two main research questions of this study are to: (1) evaluate children’s interactive relation with the toy; and (2) compare children’s interaction with the English learning toy into three different situational experiments along with participants’ emotional analysis. Seven children have participated in this study. The evaluation of these children’s interaction toward the toy and how their emotional fluctuation has changed with the toy are analyzed in this suction.
4.1. Evaluation of children’s interactive relation with the toy
Overall, the children who interacted with the English learning toy have stimulated their learning tendency and increased the ability of imagination. First, after the children notice that the toy can make response when it was touched by hand, the children started used their finger to squeeze, turn, touch, and swipe the toy. The children are especially fond of seeing if the toy would have different reaction when they touched the different parts. In addition, they are mostly interested in the toy’s movement and figure change. For example, if the whale’s flippers and tail are flipping or vibrating, they would like to be more integrated with the toy.
Second, the children have created their own imagination. While playing with the toy, the children enhanced their imagination dramatically. All the seven children asked the whale whether it can swim in the sea because they recognized the appearance of the whale as being designed to go into the water. Also, they ask some questions which are related to the water. It appears that most of the children would like to play with the water when they focused on where the whale lives. After applying the English word cards and dialogue, the children created their own words to communicate with the toy.
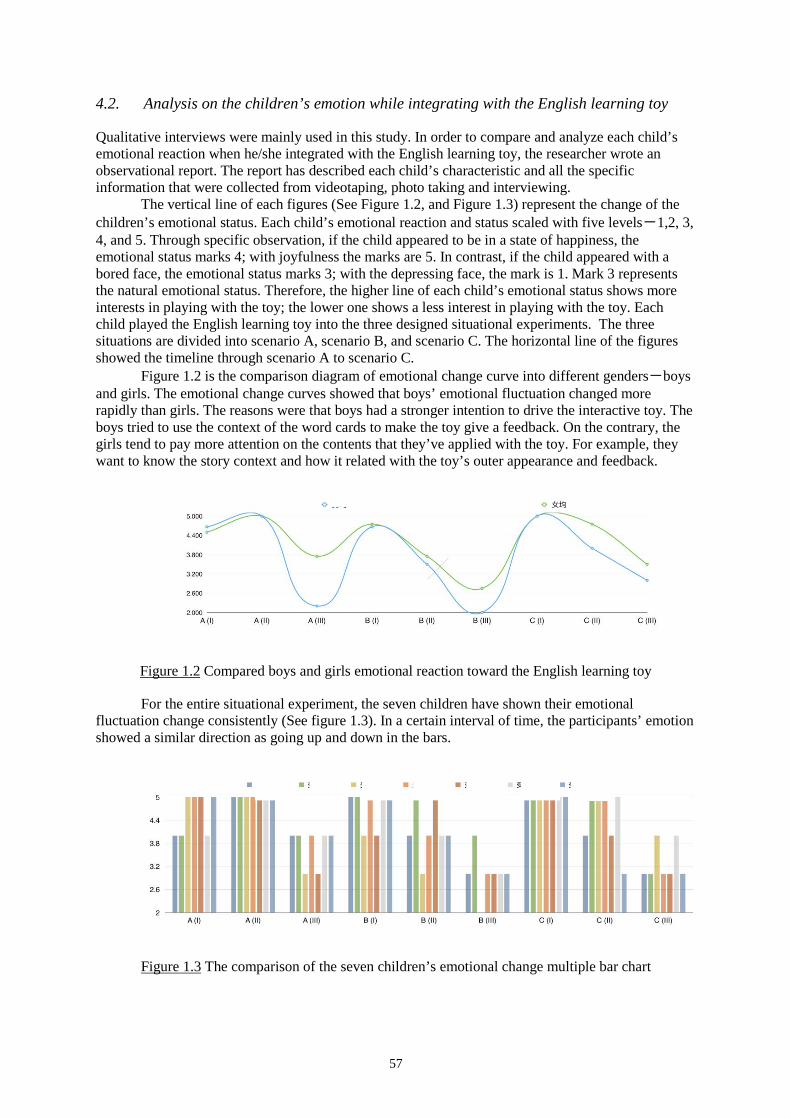
57
4.2. Analysis on the children’s emotion while integrating with the English learning toy
Qualitative interviews were mainly used in this study. In order to compare and analyze each child’s emotional reaction when he/she integrated with the English learning toy, the researcher wrote an observational report. The report has described each child’s characteristic and all the specific information that were collected from videotaping, photo taking and interviewing.
The vertical line of each figures (See Figure 1.2, and Figure 1.3) represent the change of the children’s emotional status. Each child’s emotional reaction and status scaled with five levels-1,2, 3, 4, and 5. Through specific observation, if the child appeared to be in a state of happiness, the emotional status marks 4; with joyfulness the marks are 5. In contrast, if the child appeared with a bored face, the emotional status marks 3; with the depressing face, the mark is 1. Mark 3 represents the natural emotional status. Therefore, the higher line of each child’s emotional status shows more interests in playing with the toy; the lower one shows a less interest in playing with the toy. Each child played the English learning toy into the three designed situational experiments. The three situations are divided into scenario A, scenario B, and scenario C. The horizontal line of the figures showed the timeline through scenario A to scenario C.
Figure 1.2 is the comparison diagram of emotional change curve into different genders-boys and girls. The emotional change curves showed that boys’ emotional fluctuation changed more rapidly than girls. The reasons were that boys had a stronger intention to drive the interactive toy. The boys tried to use the context of the word cards to make the toy give a feedback. On the contrary, the girls tend to pay more attention on the contents that they’ve applied with the toy. For example, they want to know the story context and how it related with the toy’s outer appearance and feedback.
Figure 1.2 Compared boys and girls emotional reaction toward the English learning toy
For the entire situational experiment, the seven children have shown their emotional fluctuation change consistently (See figure 1.3). In a certain interval of time, the participants’ emotion showed a similar direction as going up and down in the bars.
Figure 1.3 The comparison of the seven children’s emotional change multiple bar chart
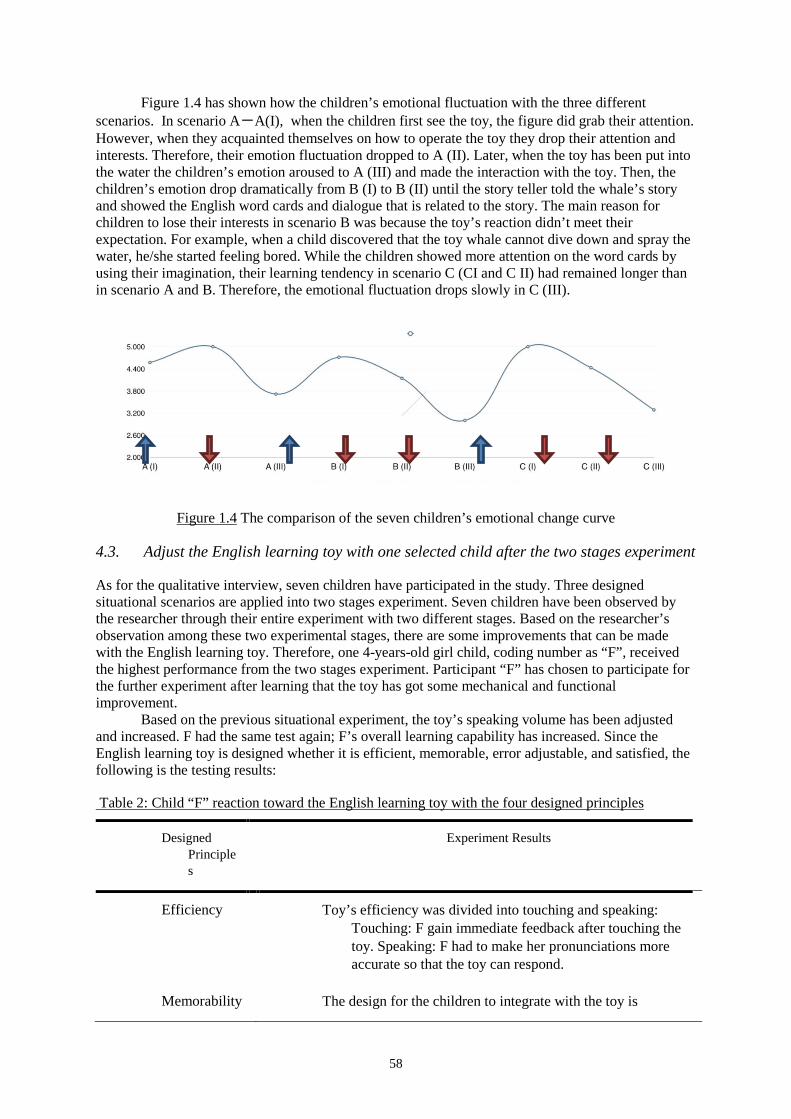
58
Figure 1.4 has shown how the children’s emotional fluctuation with the three different scenarios. In scenario A-A(I), when the children first see the toy, the figure did grab their attention. However, when they acquainted themselves on how to operate the toy they drop their attention and interests. Therefore, their emotion fluctuation dropped to A (II). Later, when the toy has been put into the water the children’s emotion aroused to A (III) and made the interaction with the toy. Then, the children’s emotion drop dramatically from B (I) to B (II) until the story teller told the whale’s story and showed the English word cards and dialogue that is related to the story. The main reason for children to lose their interests in scenario B was because the toy’s reaction didn’t meet their expectation. For example, when a child discovered that the toy whale cannot dive down and spray the water, he/she started feeling bored. While the children showed more attention on the word cards by using their imagination, their learning tendency in scenario C (CI and C II) had remained longer than in scenario A and B. Therefore, the emotional fluctuation drops slowly in C (III).
Figure 1.4 The comparison of the seven children’s emotional change curve
4.3. Adjust the English learning toy with one selected child after the two stages experiment
As for the qualitative interview, seven children have participated in the study. Three designed situational scenarios are applied into two stages experiment. Seven children have been observed by the researcher through their entire experiment with two different stages. Based on the researcher’s observation among these two experimental stages, there are some improvements that can be made with the English learning toy. Therefore, one 4-years-old girl child, coding number as “F”, received the highest performance from the two stages experiment. Participant “F” has chosen to participate for the further experiment after learning that the toy has got some mechanical and functional improvement.
Based on the previous situational experiment, the toy’s speaking volume has been adjusted and increased. F had the same test again; F’s overall learning capability has increased. Since the English learning toy is designed whether it is efficient, memorable, error adjustable, and satisfied, the following is the testing results:
Table 2: Child “F” reaction toward the English learning toy with the four designed principles
Designed Principles
Experiment Results
Efficiency Toy’s efficiency was divided into touching and speaking: Touching: F gain immediate feedback after touching the toy. Speaking: F had to make her pronunciations more accurate so that the toy can respond.
Memorability The design for the children to integrate with the toy is
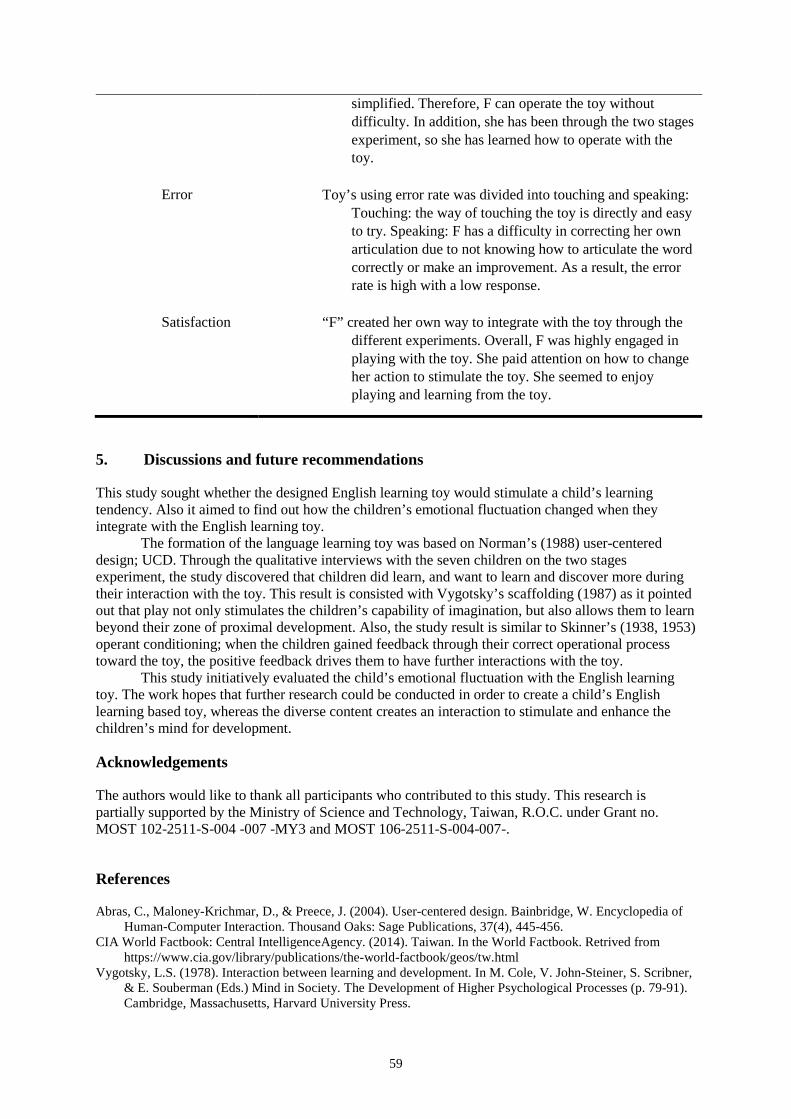
59
simplified. Therefore, F can operate the toy without difficulty. In addition, she has been through the two stages experiment, so she has learned how to operate with the toy.
Error Toy’s using error rate was divided into touching and speaking: Touching: the way of touching the toy is directly and easy to try. Speaking: F has a difficulty in correcting her own articulation due to not knowing how to articulate the word correctly or make an improvement. As a result, the error rate is high with a low response.
Satisfaction “F” created her own way to integrate with the toy through the different experiments. Overall, F was highly engaged in playing with the toy. She paid attention on how to change her action to stimulate the toy. She seemed to enjoy playing and learning from the toy.
5. Discussions and future recommendations
This study sought whether the designed English learning toy would stimulate a child’s learning tendency. Also it aimed to find out how the children’s emotional fluctuation changed when they integrate with the English learning toy.
The formation of the language learning toy was based on Norman’s (1988) user-centered design; UCD. Through the qualitative interviews with the seven children on the two stages experiment, the study discovered that children did learn, and want to learn and discover more during their interaction with the toy. This result is consisted with Vygotsky’s scaffolding (1987) as it pointed out that play not only stimulates the children’s capability of imagination, but also allows them to learn beyond their zone of proximal development. Also, the study result is similar to Skinner’s (1938, 1953) operant conditioning; when the children gained feedback through their correct operational process toward the toy, the positive feedback drives them to have further interactions with the toy.
This study initiatively evaluated the child’s emotional fluctuation with the English learning toy. The work hopes that further research could be conducted in order to create a child’s English learning based toy, whereas the diverse content creates an interaction to stimulate and enhance the children’s mind for development.
Acknowledgements
The authors would like to thank all participants who contributed to this study. This research is partially supported by the Ministry of Science and Technology, Taiwan, R.O.C. under Grant no. MOST 102-2511-S-004 -007 -MY3 and MOST 106-2511-S-004-007-.
References
Abras, C., Maloney-Krichmar, D., & Preece, J. (2004). User-centered design. Bainbridge, W. Encyclopedia of Human-Computer Interaction. Thousand Oaks: Sage Publications, 37(4), 445-456.
CIA World Factbook: Central IntelligenceAgency. (2014). Taiwan. In the World Factbook. Retrived from https://www.cia.gov/library/publications/the-world-factbook/geos/tw.html
Vygotsky, L.S. (1978). Interaction between learning and development. In M. Cole, V. John-Steiner, S. Scribner, & E. Souberman (Eds.) Mind in Society. The Development of Higher Psychological Processes (p. 79-91). Cambridge, Massachusetts, Harvard University Press.

60
Garrett, J. J. (2010). Elements of user experience, the: user-centered design for the web and beyond. Pearson Education. Mao, J. Y., Vredenburg, K., Smith, P. W., & Carey, T. (2005). The state of user-centered design practice. Communications of the ACM, 48(3), 105-109.
Norman, D. A. & Draper, S. W. (Editors) (1986). User-Centered System Design: New Perspectives on Human-Computer Interaction. Hillsdale, NJ: Lawrence Erlbaum Associaties.
Norman, D. (1988). The design of everyday things. New York: Doubleday. Ormrod, J. E. (2010). Educational psychology: Developing learners (7th ed.). Upper Saddle River, NJ: Pearson Oxenham, J. (2008). Effective Literacy Programmes: Options for Policy-Makers. Fundamentals of Educational
Planning. Retrieved from unesdoc.unesco.org/images/0016/001636/163607e.pdf Resnick, L. B. (1989). Introduction. In L. B. Resnick (Ed.), Knowing, learning and instruction: Essays in honor
of Robert Glaser (pp. 1-24). Hillsdale, NJ: Lawrence Erlaum Associates Publishers. Sander, L. (2017, July, 16). Taiwan’s birth rate is declining – again. The China Post. Retrieved
fromhttp://www.chinapost.com.tw Skinner, B. F. (1938). The Behavior of organisms: An experimental analysis. New York: Appleton-Century. Skinner, B. F. (1953). Science and human behavior. SimonandSchuster.com. Sotamaa, O. (2005). Creative user-centered design practices: lessons from game cultures. Everyday innovators:
Researching the role of users in shaping ICTs, 104-116.
Hayashi, Y., et al. (Eds.) (2017). Workshop Proceedings of the 25th International Conference on Computers in Education. New Zealand: Asia-Pacific Society for Computers in Education
61
A case study of curriculum-based game design for k-12
Fan ZOUa* aCollege of Foundation Education, Sichuan Normal University, China
Abstract: While it has already been widely established that games can be assimilated into the education mainstream achieving excellent results, the current researches focusing on classroom-based educational game for k-12 are relatively fewer than that on other areas. In this paper, we analyzed the currently existing related educational games for k-12, then attempted to analyze and design a suitable game matching withk-12 class teaching based on syllabus. Finally, we tested this game on corresponding graders with great success. We sincerely hope that these ideas and our experiences can be worthy of the following relevant works.
Keywords: K-12, Educational game, Classroom learning, Game design, Game evaluation
1. Introduction
Currently, in the field of educational games, great progress is being made in programming new games and applying them to the classroom, most of which is built upon cooperation between the educational game industry and schools to create, produce, and apply certain informal games.
On the other hand, Andrew J. Stapleton (2004) found that while the K-12 sector is recognized and understood as a possible market for games, presently it is not considered a key focus within the serious games community.
Furthermore, many difficulties have arisen in integrating these educational or traditional games into the k-12 classroom. For example, in the study of McFarlane (2002), through surveys of the teachers and parents, it was determined that although they believe that games can support the healthy development of logic reasoning, mathematics, coordination and so on, they think the greatest obstacle in the full integration of games into the curriculum is that their contents do not completely match. Meanwhile, the abilities that students may gain from these games may not be helpful when used in formal, traditional education.
As a result, through analysis of current related articles and existing related educational games, it seems that rarely have educators or researchers paid attention to how to integrate games with “formal” class teaching or produced “formal” school-based games to match the syllabus of class teaching, especially, on the aspect of K-12 primary education.
In this paper, after discussing the current situation of educational game, we introduced the whole progress of analyzing, designing, realizing and evaluating a sample of classroom-based educational game for k-12. We sincerely hope that these ideas and our experiences can be worthy of the following relevant works.
2. Analysis of existed related games
As our study shows, the majority of the existing programs lean towards one of two extremes (Prensky, M, 2003).
On one end, it may follow MMOrpg (Massive Multiplayer Online Role Playing Games) format, incorporating many roles, complex rules and stories as well as making the portion of the game non-relevant to educational material, which would bring an extra bundle of information that the
62
students must learn. This is counterproductive to the goal of making games lighten the cognition load of education.
On the other end, many educators and game-designers are well aware of this flaw, thus leading to the other extreme: monotonous games with no story or point that are loaded with textbook style information, such as quiz games, which seems like normal paper tests except shows on screen and by using music, score, vivid interface and some other forms of game. The whole process is just answer the questions and judge the answers right or wrong. When this is the case, the players quickly lose interest in the game once they play enough to familiarize themselves with the format. Focusing on classroom-based educational game in k-12, we have discovered an interesting phenomenon, which is that the story and point of the game is very often far removed from its educational content and it is a great challenge to the attempt to bring these two ends to meet. Many programs that fail to achieve a unification of the two present the educational portion as question-answer format. For example, in order to strike a monster or advance a step in a dungeon, the player must answer a scholastic question that is entirely non-relevant to the monster or the dungeon. This unnatural forcing together of two completely different worlds of thought is a great downfall for many games and thus, any new program that we design must overcome this flaw by creating a smooth transition or link between the scholastic information and the game-play.
Thus, we conclude that the current classroom-based educational games in K-12 are inadequate and further research is necessary to create programs to overcome these fatal design flaws. Especially, as many educators and researchers have referred to (Squire Kurt, 2006), keeping the balance between “entertainment” and “education” in an educational game is a key point, which we need to specially stress on in the following work.
3. Perry’s game: a sample case of curriculum-based educational game for k-12
3.1. Site and sample selections
Before realizing a suitable educational game, we must choose a specific discipline and target audience on which to test our method. Therefore, we created a formal educational game that aimed to meet three targets: one, to be suitable for the K-12 audience; two, to be compatible with classroom teaching; three, to achieve a balance between entertainment and education. Thus, we decided to choose measurement skills from the K-12 curriculum (Alternative Education/Special Education Division, 2008) on which following test-run is based. Reasons as below:
3.1.1. Match up curriculum
Through analysis, we have found that as a cell of discipline, measurement skills are included in the syllabus of 1st to 5th graders and are good representative skills for the K-12 curriculum.
3.1.2. Match up requirements from school
From the feedback of students and teachers, we can see that although the concept of measurement is straight-forward and simple, many children do not possess a comprehensive command of the subject. Thus, we have concluded that a measurement game would be helpful to the students in their cognitive development.
3.1.3. Fill up the lack of satisfied related educational games
Through our research on programs dedicated to improvement of measurement skills, we have found that there are very few of them, and the ones that do exist are in either question answer format, which does little to differentiate them from a textbook, or simulation-type games, which very boring and lose the point of using software rather than an actual ruler and object. These games fail to achieve the goal of entertainment.
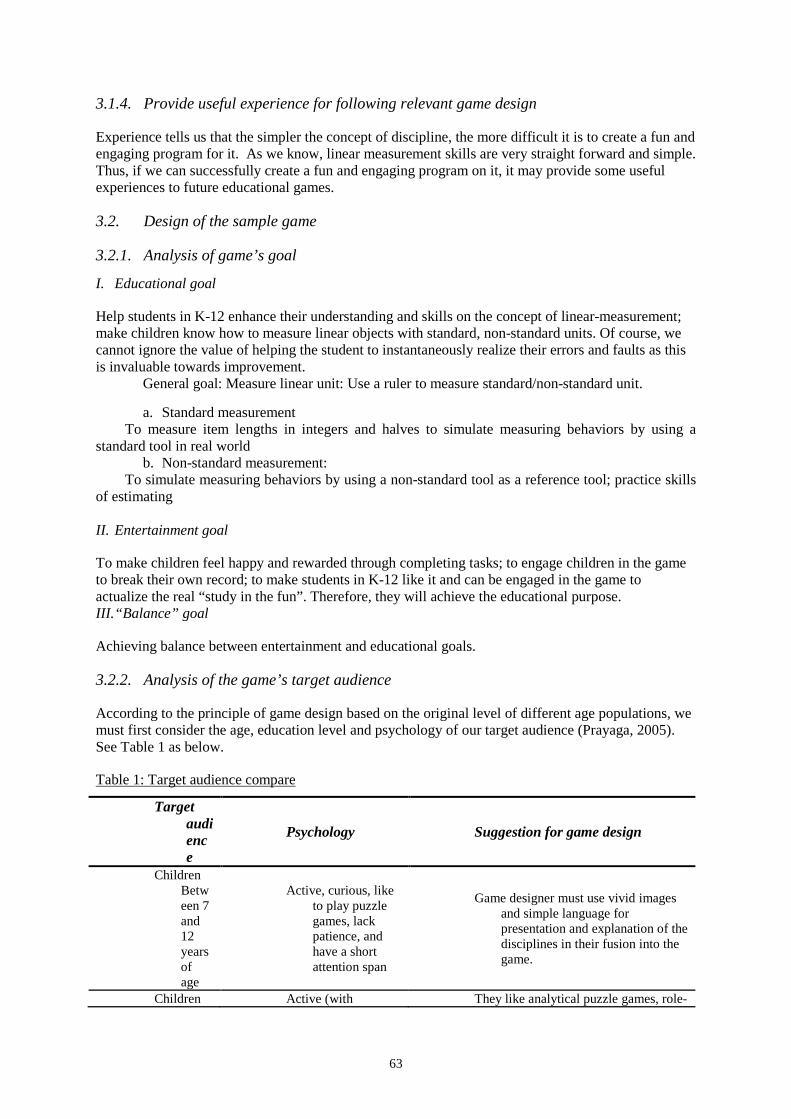
63
3.1.4. Provide useful experience for following relevant game design
Experience tells us that the simpler the concept of discipline, the more difficult it is to create a fun and engaging program for it. As we know, linear measurement skills are very straight forward and simple. Thus, if we can successfully create a fun and engaging program on it, it may provide some useful experiences to future educational games.
3.2. Design of the sample game
3.2.1. Analysis of game’s goal
I. Educational goal
Help students in K-12 enhance their understanding and skills on the concept of linear-measurement; make children know how to measure linear objects with standard, non-standard units. Of course, we cannot ignore the value of helping the student to instantaneously realize their errors and faults as this is invaluable towards improvement.
General goal: Measure linear unit: Use a ruler to measure standard/non-standard unit.
a. Standard measurement To measure item lengths in integers and halves to simulate measuring behaviors by using a
standard tool in real world b. Non-standard measurement:
To simulate measuring behaviors by using a non-standard tool as a reference tool; practice skills of estimating
II. Entertainment goal
To make children feel happy and rewarded through completing tasks; to engage children in the game to break their own record; to make students in K-12 like it and can be engaged in the game to actualize the real “study in the fun”. Therefore, they will achieve the educational purpose. III. “Balance” goal
Achieving balance between entertainment and educational goals.
3.2.2. Analysis of the game’s target audience
According to the principle of game design based on the original level of different age populations, we must first consider the age, education level and psychology of our target audience (Prayaga, 2005). See Table 1 as below.
Table 1: Target audience compare
Target audience
Psychology Suggestion for game design
Children Between 7 and 12 years of age
Active, curious, like to play puzzle games, lack patience, and have a short attention span
Game designer must use vivid images and simple language for presentation and explanation of the disciplines in their fusion into the game.
Children Active (with They like analytical puzzle games, role-
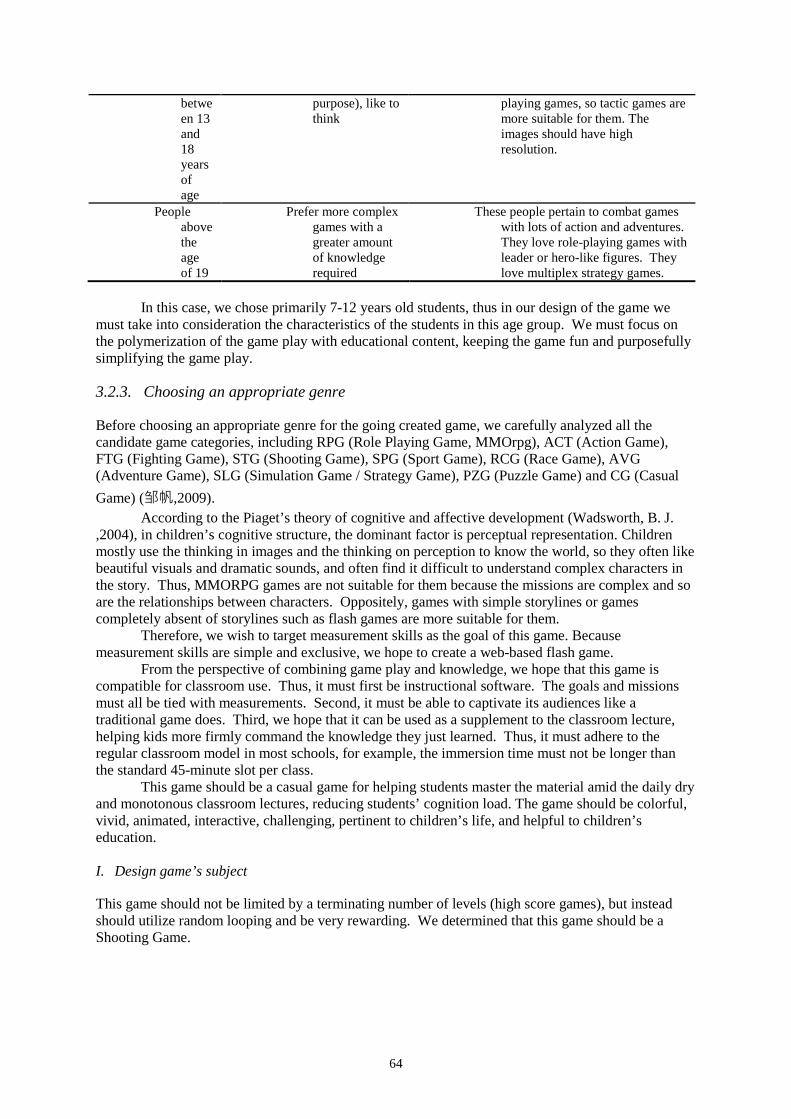
64
between 13 and 18 years of age
purpose), like to think
playing games, so tactic games are more suitable for them. The images should have high resolution.
People above the age of 19
Prefer more complex games with a greater amount of knowledge required
These people pertain to combat games with lots of action and adventures. They love role-playing games with leader or hero-like figures. They love multiplex strategy games.
In this case, we chose primarily 7-12 years old students, thus in our design of the game we
must take into consideration the characteristics of the students in this age group. We must focus on the polymerization of the game play with educational content, keeping the game fun and purposefully simplifying the game play.
3.2.3. Choosing an appropriate genre
Before choosing an appropriate genre for the going created game, we carefully analyzed all the candidate game categories, including RPG (Role Playing Game, MMOrpg), ACT (Action Game), FTG (Fighting Game), STG (Shooting Game), SPG (Sport Game), RCG (Race Game), AVG (Adventure Game), SLG (Simulation Game / Strategy Game), PZG (Puzzle Game) and CG (Casual Game) (邹帆,2009).
According to the Piaget’s theory of cognitive and affective development (Wadsworth, B. J. ,2004), in children’s cognitive structure, the dominant factor is perceptual representation. Children mostly use the thinking in images and the thinking on perception to know the world, so they often like beautiful visuals and dramatic sounds, and often find it difficult to understand complex characters in the story. Thus, MMORPG games are not suitable for them because the missions are complex and so are the relationships between characters. Oppositely, games with simple storylines or games completely absent of storylines such as flash games are more suitable for them.
Therefore, we wish to target measurement skills as the goal of this game. Because measurement skills are simple and exclusive, we hope to create a web-based flash game.
From the perspective of combining game play and knowledge, we hope that this game is compatible for classroom use. Thus, it must first be instructional software. The goals and missions must all be tied with measurements. Second, it must be able to captivate its audiences like a traditional game does. Third, we hope that it can be used as a supplement to the classroom lecture, helping kids more firmly command the knowledge they just learned. Thus, it must adhere to the regular classroom model in most schools, for example, the immersion time must not be longer than the standard 45-minute slot per class.
This game should be a casual game for helping students master the material amid the daily dry and monotonous classroom lectures, reducing students’ cognition load. The game should be colorful, vivid, animated, interactive, challenging, pertinent to children’s life, and helpful to children’s education.
I. Design game’s subject
This game should not be limited by a terminating number of levels (high score games), but instead should utilize random looping and be very rewarding. We determined that this game should be a Shooting Game.
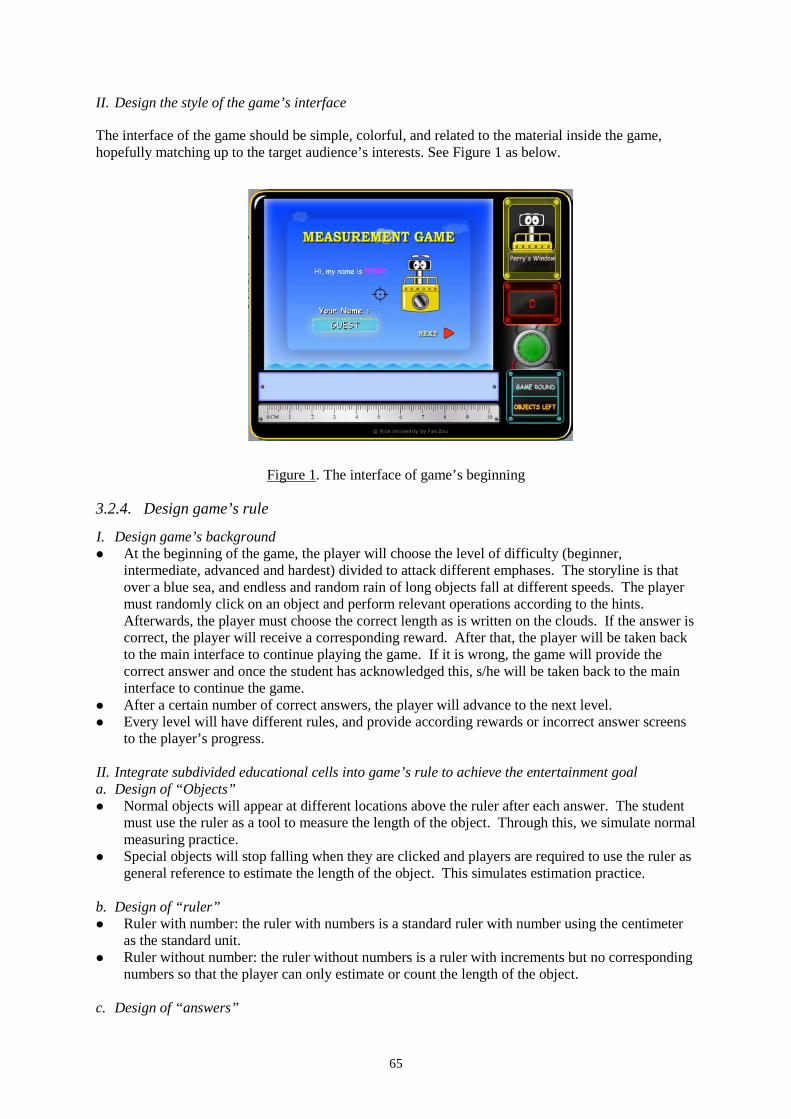
65
II. Design the style of the game’s interface
The interface of the game should be simple, colorful, and related to the material inside the game, hopefully matching up to the target audience’s interests. See Figure 1 as below.
Figure 1. The interface of game’s beginning
3.2.4. Design game’s rule
I. Design game’s background At the beginning of the game, the player will choose the level of difficulty (beginner,
intermediate, advanced and hardest) divided to attack different emphases. The storyline is that over a blue sea, and endless and random rain of long objects fall at different speeds. The player must randomly click on an object and perform relevant operations according to the hints. Afterwards, the player must choose the correct length as is written on the clouds. If the answer is correct, the player will receive a corresponding reward. After that, the player will be taken back to the main interface to continue playing the game. If it is wrong, the game will provide the correct answer and once the student has acknowledged this, s/he will be taken back to the main interface to continue the game.
After a certain number of correct answers, the player will advance to the next level. Every level will have different rules, and provide according rewards or incorrect answer screens
to the player’s progress.
II. Integrate subdivided educational cells into game’s rule to achieve the entertainment goal a. Design of “Objects” Normal objects will appear at different locations above the ruler after each answer. The student
must use the ruler as a tool to measure the length of the object. Through this, we simulate normal measuring practice.
Special objects will stop falling when they are clicked and players are required to use the ruler as general reference to estimate the length of the object. This simulates estimation practice.
b. Design of “ruler” Ruler with number: the ruler with numbers is a standard ruler with number using the centimeter
as the standard unit. Ruler without number: the ruler without numbers is a ruler with increments but no corresponding
numbers so that the player can only estimate or count the length of the object.
c. Design of “answers”
66
When the answer is an integer: it allows the students to practice with full centimeters When the answer is a half of a centimeter: it allows players to see that more precise
measurements than a whole can be made.
d. Design of locations where chosen object shows up When normal objects align themselves with the 0cm mark, it simulates the most common
measurement practice in the classroom. Normal objects that do not align themselves with the 0cm mark
a) When normal objects need to be dragged to the 0cm mark to be measured. b) Students must align the object, simulating practical measurement. c) Objects can only be dragged to an integer other than 0cm mark. d) Helps students get a steadier grasp at the concept of measurement (as opposed to only
looking at the number that the object ends at).
e. Design of Answer feedback
When the player selects an answer, the game will instantly give feedback, helping students to immediately understand one’s own fault and grasp the right answer.
f. integrating “fun” function with “educational” function
Uses multiple interactive properties, vivid animations, enhancing sound effects, and gratifying rewards to engage the player.
4. Evaluation
To test whether our game achieved the original design purpose of allowing students to quickly and easily master the skill of measuring to a proficiency level, we conducted an experiment in which two groups of children were taught measurement concepts by the instructor, to evaluate the effectiveness of the game, to discover the possible flaws of classroom teaching and possibly improve on them.
The experiment: the experiment was pilot-tested in 3th, 4th and 5th grades and results from that pilot were used to improve the experiment.
4.1. Participants
4.1.1. Reasons for choosing 3th, 4th and 5th grades students as sample group
According to previous analysis, we saw that although the k-12 Mathematics Curriculum (Texas Education Agency, 2012) in Texas covers measurement skills in kindergarten through 5th grade, our game targets the sample group that would already have finished the learning of the basics of measurement. In grades kindergarten through 2nd grade, students practice with non-standard units, and in 3rd grade students begin to use a ruler. Therefore, our game targets those students from grades 3 to 5 that have learned the basic concept of measurement and can then deepen their understanding of the topic.
4.1.2. Reason for choosing large number of students from different classes
We selected sixteen different classes from 3th-5th grades (6 third grade classed, 6 fourth grade classes and 4 fifth grade classes) to ensure that the experiment results would truthfully or near-truthfully reflect the actual level of proficiency that the average commands in the area of measurement. This also diminishes the probability that differences in the instructors may sway the results (which is why we divided each classroom into two equal groups for control and experiment with consideration to gender balance).
67
Therefore, participants in this study included approximately 300 students from 16 4th grade classes at Treasure Forest Elementary School in Houston, TX and 16 4th grade teachers from each class; one observer and one research assistant. See Table 2 as bellow.
Table 2: Arrangement of the participants.
Sample Population of The Experimental Group
Sample Population of The Control Group
The Total Number of Participants
The Number of Classes
Number 138 145 283 16
Scale 48.8% 51.2%
4.2. The experiment for evaluation
4.2.1. Purposes of the experiment:
In this phase, we hope to: Compare the results of the pretest and post-test of the experimental group to determine that the
game at least has educational value. Compare post-tests from the control and experimental group (from students with comparable
pretest scores) to compare the effectiveness of our game with traditional classroom teaching.
4.2.2. Design of Paper tests
Before executing the experiment, we carefully designed the paper-tests. To ensure the results from pre-test & post-test can be objectively and effectively compared, we created the post-test similar with the pre-test in the number of questions, the varying degrees of difficulty, and the area of coverage. Only the actual questions were completely different.
We created twenty-five questions on the area of measurement according to the curriculum with varying degrees of difficulty, covering all or nearly all aspects of the discipline. (“SKILL1”=can read the integer scale of a standard ruler; “SKILL2”=can put an object to a standard ruler from 0 cm to do the measure activity as in real world; “SKILL3”=can read the scale number of an standard ruler to measure an object; “SKILL4”= can read decimal scales of a standard ruler; “SKILL5”=can measure an object from anywhere of a standard ruler; “SKILL6”=can measure objects by using an standard ruler without number and can estimate objects with a reference). Each question has 1 score with a total of 25 scores. Each question involves one or a few SKILLs respectively, such as question #1 involving SKILL1~SKILL3. In another word, each of the skills would also have accordingly different questions. Thus, each of the skill would involve different numbers of questions and has a different sum. Therefore, to better analyze the study effects of the students’, later analysis will not adopt the raw sum of each skill but the percent correct. In addition, to avoid the potential clues from the orderly arrangements of the questions, the questions and according skills are arranged randomly.
Furthermore, we divided those questions into some small groups in detail to make them specially represent the different aspects of measurement skills.
4.2.3. Procedure of treatments
The concrete procedure of the 2 treatments is below: I. Pre-test: Based on reviewed the correlative concepts of measurement under the same
teacher’s instruction. All the students had the Pre-test on linear measurement in a limited time (10 min).
II. The control group and the experimental group: to assure comparability, each class was randomly divided into two equivalent groups which have the equal proportion of males and females, one as the control group and the other one as the experimental group.
68
III. Then the experimental group went to the computer lab to play the game (no instructions were given during their entire playing duration, except helping them access the game online) and the control group stayed in the class room to use normal class practice under teacher’s assistance (pencil and paper activity).
IV. Time duration: 40 min. V. Post- test: 40 minutes later, both groups stopped their respective activities to take the post-
test (10 min).
4.3. Gathering data from the experiment
4.3.1. Results of evaluating entertainment goal
This part of data is gathered for validating whether the game achieved the Entertainment purpose.
I. Results From observation
a. A real relaxed gaming time
To get the most effective data and students’ authentic feedback, during the whole duration when the experiment group played the game, the researcher and designer were present that did not interact with them very much. Without any interruption, students in this group enjoyed the game and were relaxed.
While they played the game, no matter whether they were shouting, cheering, exhibited exciting, flourishing or playing silently, we could conclude that they were completely engaged in the game.
When forty minutes had elapsed, most of the students in the experimental group wished to continue playing.
b. no instruction, no management, no assistance
At the beginning of their playing, we told them this is game time and they should just enjoy the game and have fun. We suggested that if they met any problem or had any question about how to continue the game, they should carefully observe all the interactions or animations and try to figure it out on them own.
During the whole experiment, seldom of the students needed our assistance. And these finally figured the problem they had after we told them to carefully observe some hints information in the game.
II. Results from questionnaire
a. Feedback from students
Every time when the experiment group was ready to come back to class, we always asked them these questions:
(i) Do you like the game?
All the students from each experiment group loudly said “yes”, and urgently shared their feelings and experiences about the game to us.
(ii) Do you think the game is very interesting?
Still a loud answer of “yes”. Some said it’s very cool.
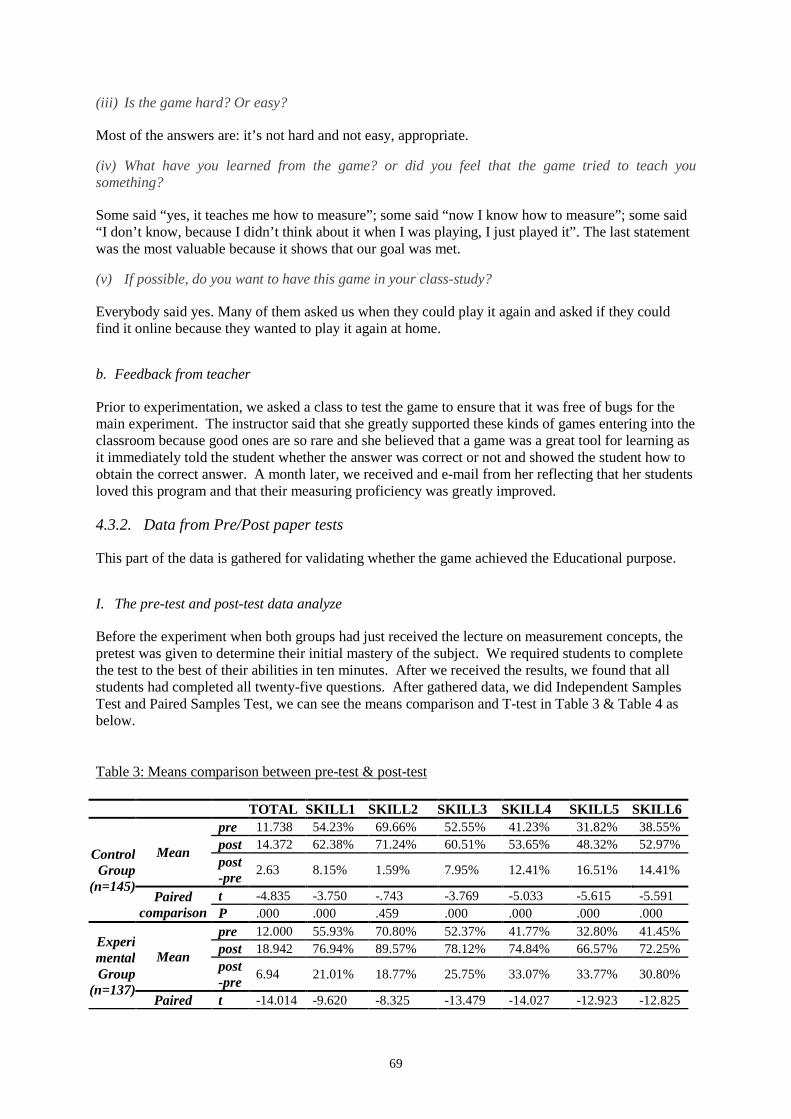
69
(iii) Is the game hard? Or easy?
Most of the answers are: it’s not hard and not easy, appropriate.
(iv) What have you learned from the game? or did you feel that the game tried to teach you something?
Some said “yes, it teaches me how to measure”; some said “now I know how to measure”; some said “I don’t know, because I didn’t think about it when I was playing, I just played it”. The last statement was the most valuable because it shows that our goal was met.
(v) If possible, do you want to have this game in your class-study?
Everybody said yes. Many of them asked us when they could play it again and asked if they could find it online because they wanted to play it again at home.
b. Feedback from teacher
Prior to experimentation, we asked a class to test the game to ensure that it was free of bugs for the main experiment. The instructor said that she greatly supported these kinds of games entering into the classroom because good ones are so rare and she believed that a game was a great tool for learning as it immediately told the student whether the answer was correct or not and showed the student how to obtain the correct answer. A month later, we received and e-mail from her reflecting that her students loved this program and that their measuring proficiency was greatly improved.
4.3.2. Data from Pre/Post paper tests
This part of the data is gathered for validating whether the game achieved the Educational purpose.
I. The pre-test and post-test data analyze
Before the experiment when both groups had just received the lecture on measurement concepts, the pretest was given to determine their initial mastery of the subject. We required students to complete the test to the best of their abilities in ten minutes. After we received the results, we found that all students had completed all twenty-five questions. After gathered data, we did Independent Samples Test and Paired Samples Test, we can see the means comparison and T-test in Table 3 & Table 4 as below.
Table 3: Means comparison between pre-test & post-test
TOTAL SKILL1 SKILL2 SKILL3 SKILL4 SKILL5 SKILL6
Control Group
(n=145)
Mean
pre 11.738 54.23% 69.66% 52.55% 41.23% 31.82% 38.55% post 14.372 62.38% 71.24% 60.51% 53.65% 48.32% 52.97% post-pre 2.63 8.15% 1.59% 7.95% 12.41% 16.51% 14.41%
Paired comparison
t -4.835 -3.750 -.743 -3.769 -5.033 -5.615 -5.591 P .000 .000 .459 .000 .000 .000 .000
Experimental Group
(n=137)
Mean
pre 12.000 55.93% 70.80% 52.37% 41.77% 32.80% 41.45% post 18.942 76.94% 89.57% 78.12% 74.84% 66.57% 72.25% post-pre 6.94 21.01% 18.77% 25.75% 33.07% 33.77% 30.80%
Paired t -14.014 -9.620 -8.325 -13.479 -14.027 -12.923 -12.825
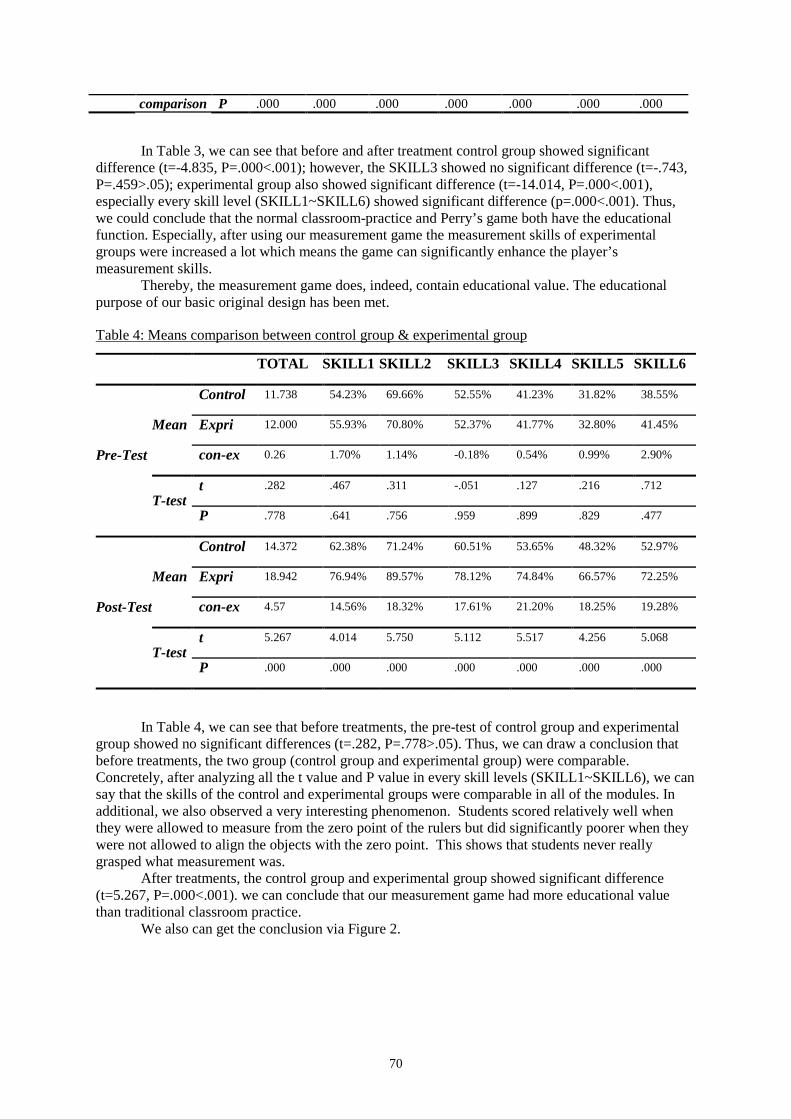
70
In Table 3, we can see that before and after treatment control group showed significant difference (t=-4.835, P=.000<.001); however, the SKILL3 showed no significant difference (t=-.743, P=.459>.05); experimental group also showed significant difference (t=-14.014, P=.000<.001), especially every skill level (SKILL1~SKILL6) showed significant difference (p=.000<.001). Thus, we could conclude that the normal classroom-practice and Perry’s game both have the educational function. Especially, after using our measurement game the measurement skills of experimental groups were increased a lot which means the game can significantly enhance the player’s measurement skills.
Thereby, the measurement game does, indeed, contain educational value. The educational purpose of our basic original design has been met.
Table 4: Means comparison between control group & experimental group
In Table 4, we can see that before treatments, the pre-test of control group and experimental group showed no significant differences (t=.282, P=.778>.05). Thus, we can draw a conclusion that before treatments, the two group (control group and experimental group) were comparable. Concretely, after analyzing all the t value and P value in every skill levels (SKILL1~SKILL6), we can say that the skills of the control and experimental groups were comparable in all of the modules. In additional, we also observed a very interesting phenomenon. Students scored relatively well when they were allowed to measure from the zero point of the rulers but did significantly poorer when they were not allowed to align the objects with the zero point. This shows that students never really grasped what measurement was.
After treatments, the control group and experimental group showed significant difference (t=5.267, P=.000<.001). we can conclude that our measurement game had more educational value than traditional classroom practice.
We also can get the conclusion via Figure 2.
comparison P .000 .000 .000 .000 .000 .000 .000
TOTAL SKILL1 SKILL2 SKILL3 SKILL4 SKILL5 SKILL6
Pre-Test
Mean
Control 11.738 54.23% 69.66% 52.55% 41.23% 31.82% 38.55%
Expri 12.000 55.93% 70.80% 52.37% 41.77% 32.80% 41.45%
con-ex 0.26 1.70% 1.14% -0.18% 0.54% 0.99% 2.90%
T-test t .282 .467 .311 -.051 .127 .216 .712
P .778 .641 .756 .959 .899 .829 .477
Post-Test
Mean
Control 14.372 62.38% 71.24% 60.51% 53.65% 48.32% 52.97%
Expri 18.942 76.94% 89.57% 78.12% 74.84% 66.57% 72.25%
con-ex 4.57 14.56% 18.32% 17.61% 21.20% 18.25% 19.28%
T-test t 5.267 4.014 5.750 5.112 5.517 4.256 5.068
P .000 .000 .000 .000 .000 .000 .000
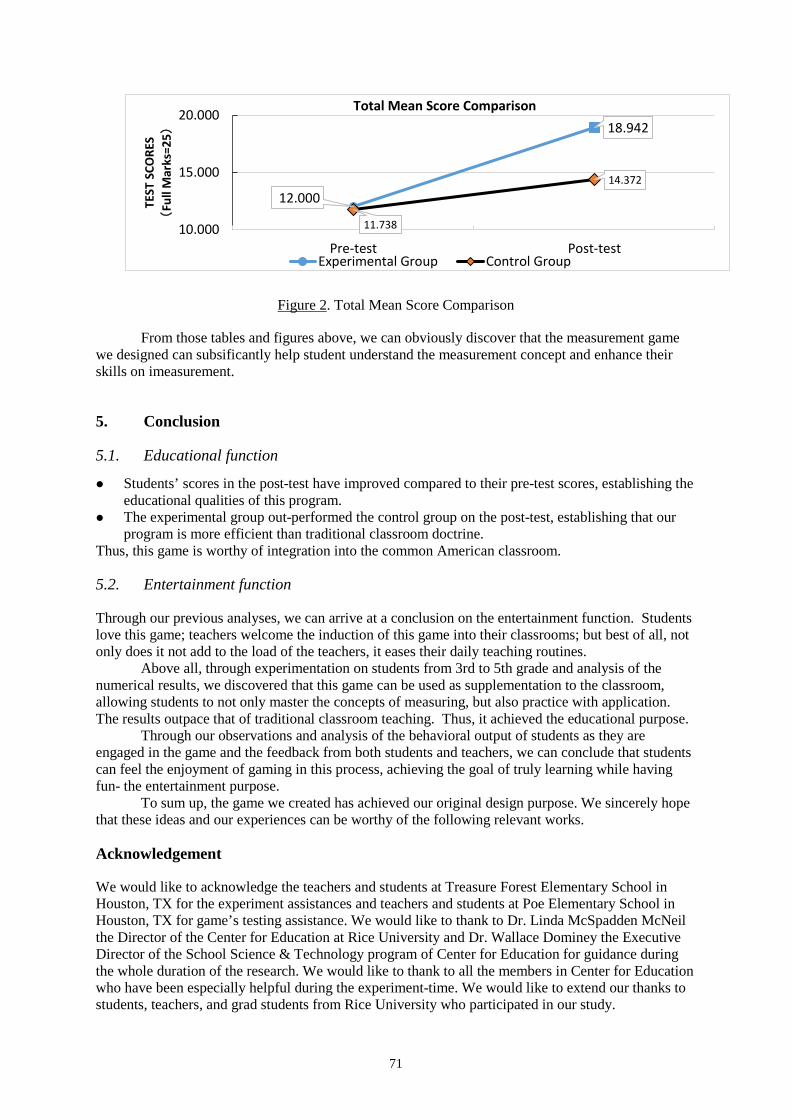
71
Figure 2. Total Mean Score Comparison
From those tables and figures above, we can obviously discover that the measurement game we designed can subsificantly help student understand the measurement concept and enhance their skills on imeasurement.
5. Conclusion
5.1. Educational function
Students’ scores in the post-test have improved compared to their pre-test scores, establishing the educational qualities of this program.
The experimental group out-performed the control group on the post-test, establishing that our program is more efficient than traditional classroom doctrine.
Thus, this game is worthy of integration into the common American classroom.
5.2. Entertainment function
Through our previous analyses, we can arrive at a conclusion on the entertainment function. Students love this game; teachers welcome the induction of this game into their classrooms; but best of all, not only does it not add to the load of the teachers, it eases their daily teaching routines.
Above all, through experimentation on students from 3rd to 5th grade and analysis of the numerical results, we discovered that this game can be used as supplementation to the classroom, allowing students to not only master the concepts of measuring, but also practice with application. The results outpace that of traditional classroom teaching. Thus, it achieved the educational purpose.
Through our observations and analysis of the behavioral output of students as they are engaged in the game and the feedback from both students and teachers, we can conclude that students can feel the enjoyment of gaming in this process, achieving the goal of truly learning while having fun- the entertainment purpose.
To sum up, the game we created has achieved our original design purpose. We sincerely hope that these ideas and our experiences can be worthy of the following relevant works.
Acknowledgement
We would like to acknowledge the teachers and students at Treasure Forest Elementary School in Houston, TX for the experiment assistances and teachers and students at Poe Elementary School in Houston, TX for game’s testing assistance. We would like to thank to Dr. Linda McSpadden McNeil the Director of the Center for Education at Rice University and Dr. Wallace Dominey the Executive Director of the School Science & Technology program of Center for Education for guidance during the whole duration of the research. We would like to thank to all the members in Center for Education who have been especially helpful during the experiment-time. We would like to extend our thanks to students, teachers, and grad students from Rice University who participated in our study.
12.000
18.942
11.738
14.372
10.000
15.000
20.000
Pre-test Post-test
TEST
SCO
RES
(Fu
ll M
arks
=25)
Total Mean Score Comparison
Experimental Group Control Group

72
References
Stapleton, A. J. (2004). Serious games: Serious opportunities. Prensky, M. (2003). Digital game-based learning. ACM. Mcfarlane, A., Sparrowhawk, A., & Heald, Y. (2002). Report on the educational use of games. Teem Teachers
Evaluating Educational Multimedia(Sept). Squire, K. (2006). From content to context: videogames as designed experience. Educational Researcher, 35(8),
19-29. Alternative Education/Special Education Division. (2008). Mathematics CurriculumK-12. Erie2Chautauqua-
Cattaragus BOCES. Prayaga, L. (2005). Game technology as a tool to actively engage K-12 students in the act of learning.
Conference on Information Technology Education, Sigite 2005, Newark, Nj, Usa, October (pp.307-310). DBLP.
邹帆. (2009). 教育网络游戏的设计与实现. (Doctoral dissertation, 四川师范大学). Wadsworth, B. J. (2004). Piaget's theory of cognitive and affective development: foundations of constructivism.
Pearson Schweiz Ag. Texas Education Agency. (2012). Texas Essential Knowledge and Skills for Mathematics.
http://ritter.tea.state.tx.us/rules/tac/chapter111/index.html
Hayashi, Y., et al. (Eds.) (2017). Workshop Proceedings of the 25th International Conference on Computers in Education. New Zealand: Asia-Pacific Society for Computers in Education
73
A preliminary study of a digital game system to support mathematics learning: Using circle and
compound shapes as an example Yi-Tien HSUa& Shelley Shwu-Ching YOUNGb*
aInstitute of Information Systems and Applications, National Tsing Hua University, Taiwan bInstitute of Learning and Sciences and Technologies, National Tsing Hua University, Taiwan
Abstract: This study mainly focuses on building a digital game system to support learners to increase their learning motivations and achievements in mathematic learning. Through interviews with teachers and literature review, we found it difficult for students to learn about compound shapes. When students do not understand the relationship between circle and compound shapes, they may decrease their learning motivations and interests because of failing in advanced questions. For this problem, we selected this mathematical unit of “Circle and Compound Shapes” as an example for our study. Primary 6 class with 24 students who have studied this unit in Taiwan participated in a questionnaire survey as the requirement analysis for system development in this study. Based on the result of questionnaire, the game type of the system is adventure game. The design of scenario is an adaptation of a Taiwanese folk tale “Aunty Tigress” which is familiar to students. The contents are based on the van Hiele’s geometric thinking level theory. Four game processes and bonus stage are designed in the courseware. This study is in stage of system development. We hope we can build a better game-based learning system by the result of questionnaire and game design to enhance students’ knowledge and learning motivation of mathematics.
Keywords: e-Learning, Digital game-based learning, Mathematics learning, Circle, Compound Shapes.
1. Introduction
In the class of plane geometry, calculation of a circular area is the important competence indicator (Ministry of Education, 2008). Compound Shapes is hard to learn for elementary school students. They may use formulas directly without the understanding of compound shapes’ composing. (Chen, & Wu, 2016). In order to realise these, we talked with an elementary school teacher. Students learn circle and compound shapes with difficulty. When they do exercises, they use the formulas of compound shapes to calculate. However, they don't realize how to use partition and combination in compound shapes. Hence, when solving advanced problems, they might fail or not understand and then affect their learning achievements. As well as the general teaching model, it usually by the teacher one-way teaching knowledge. It can’t be adjusted according to the degrees of students. By teaching with paper for geometric abstract concept of graphics, such as the circular area and pi, students may not understand the association between them, and thus affect the follow-up unit or advanced knowledge of the circle.
In this study, the research questions: • Through requirement analysis, what can we attribute to the direction of the system
design? • How to develop a digital game-based learning system with the mathematical unit of
“Circle and Compound Shapes” to support learners learning? In order to solve the above problems and discuss more proper teaching material design and
method application, this research aims to develop a digital game-based learning system with circle and compound shapes. Let students manipulate graphics by digital devices to understand the
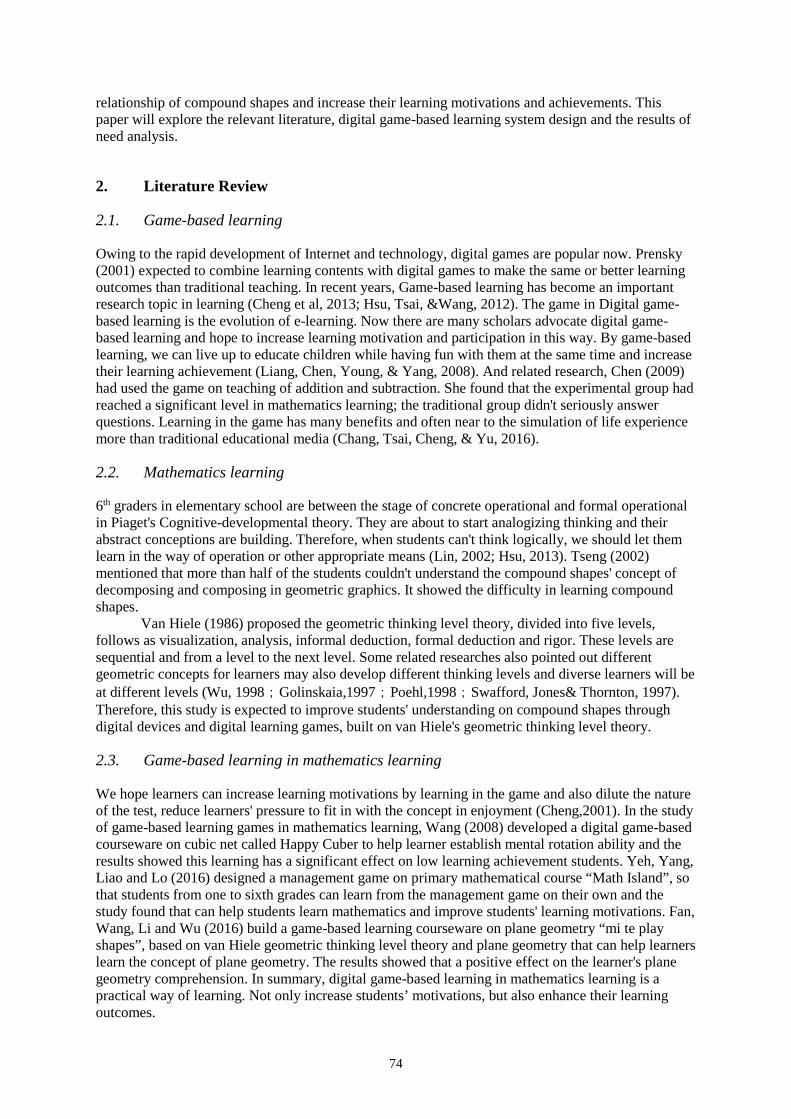
74
relationship of compound shapes and increase their learning motivations and achievements. This paper will explore the relevant literature, digital game-based learning system design and the results of need analysis.
2. Literature Review
2.1. Game-based learning
Owing to the rapid development of Internet and technology, digital games are popular now. Prensky (2001) expected to combine learning contents with digital games to make the same or better learning outcomes than traditional teaching. In recent years, Game-based learning has become an important research topic in learning (Cheng et al, 2013; Hsu, Tsai, &Wang, 2012). The game in Digital game-based learning is the evolution of e-learning. Now there are many scholars advocate digital game-based learning and hope to increase learning motivation and participation in this way. By game-based learning, we can live up to educate children while having fun with them at the same time and increase their learning achievement (Liang, Chen, Young, & Yang, 2008). And related research, Chen (2009) had used the game on teaching of addition and subtraction. She found that the experimental group had reached a significant level in mathematics learning; the traditional group didn't seriously answer questions. Learning in the game has many benefits and often near to the simulation of life experience more than traditional educational media (Chang, Tsai, Cheng, & Yu, 2016).
2.2. Mathematics learning
6th graders in elementary school are between the stage of concrete operational and formal operational in Piaget's Cognitive-developmental theory. They are about to start analogizing thinking and their abstract conceptions are building. Therefore, when students can't think logically, we should let them learn in the way of operation or other appropriate means (Lin, 2002; Hsu, 2013). Tseng (2002) mentioned that more than half of the students couldn't understand the compound shapes' concept of decomposing and composing in geometric graphics. It showed the difficulty in learning compound shapes.
Van Hiele (1986) proposed the geometric thinking level theory, divided into five levels, follows as visualization, analysis, informal deduction, formal deduction and rigor. These levels are sequential and from a level to the next level. Some related researches also pointed out different geometric concepts for learners may also develop different thinking levels and diverse learners will be at different levels (Wu, 1998;Golinskaia,1997;Poehl,1998;Swafford, Jones& Thornton, 1997). Therefore, this study is expected to improve students' understanding on compound shapes through digital devices and digital learning games, built on van Hiele's geometric thinking level theory.
2.3. Game-based learning in mathematics learning
We hope learners can increase learning motivations by learning in the game and also dilute the nature of the test, reduce learners' pressure to fit in with the concept in enjoyment (Cheng,2001). In the study of game-based learning games in mathematics learning, Wang (2008) developed a digital game-based courseware on cubic net called Happy Cuber to help learner establish mental rotation ability and the results showed this learning has a significant effect on low learning achievement students. Yeh, Yang, Liao and Lo (2016) designed a management game on primary mathematical course “Math Island”, so that students from one to sixth grades can learn from the management game on their own and the study found that can help students learn mathematics and improve students' learning motivations. Fan, Wang, Li and Wu (2016) build a game-based learning courseware on plane geometry “mi te play shapes”, based on van Hiele geometric thinking level theory and plane geometry that can help learners learn the concept of plane geometry. The results showed that a positive effect on the learner's plane geometry comprehension. In summary, digital game-based learning in mathematics learning is a practical way of learning. Not only increase students’ motivations, but also enhance their learning outcomes.
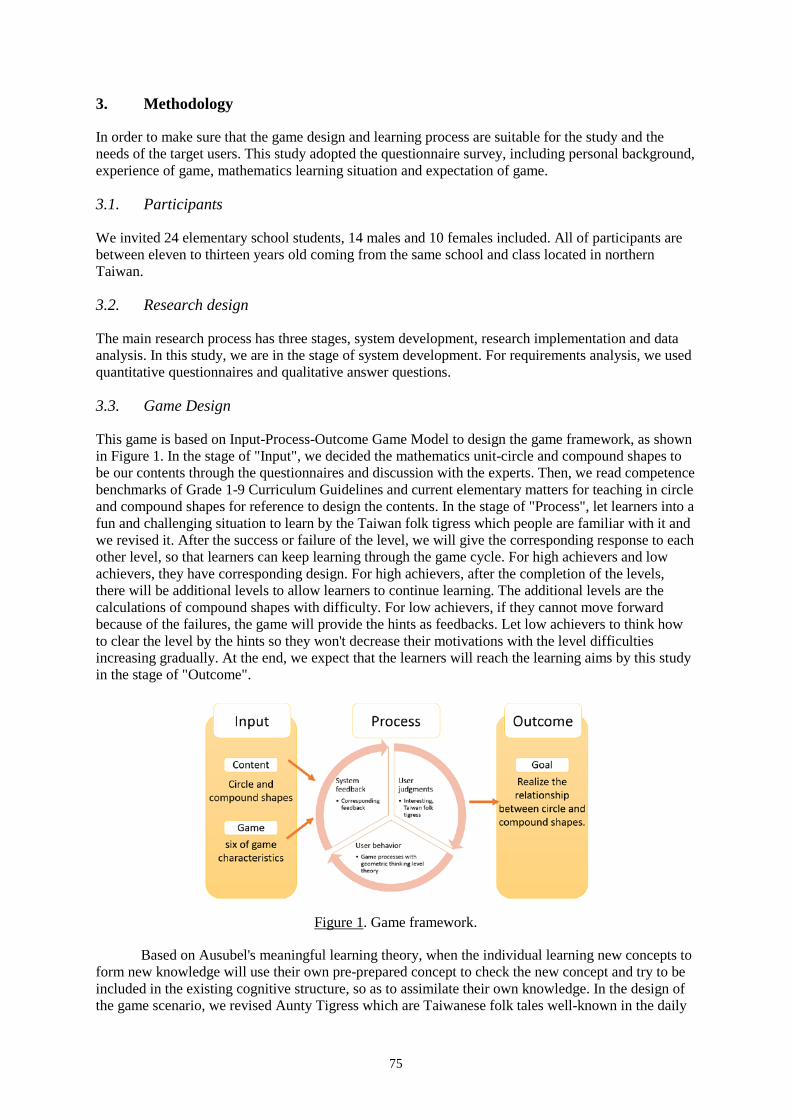
75
3. Methodology
In order to make sure that the game design and learning process are suitable for the study and the needs of the target users. This study adopted the questionnaire survey, including personal background, experience of game, mathematics learning situation and expectation of game.
3.1. Participants
We invited 24 elementary school students, 14 males and 10 females included. All of participants are between eleven to thirteen years old coming from the same school and class located in northern Taiwan.
3.2. Research design
The main research process has three stages, system development, research implementation and data analysis. In this study, we are in the stage of system development. For requirements analysis, we used quantitative questionnaires and qualitative answer questions.
3.3. Game Design
This game is based on Input-Process-Outcome Game Model to design the game framework, as shown in Figure 1. In the stage of "Input", we decided the mathematics unit-circle and compound shapes to be our contents through the questionnaires and discussion with the experts. Then, we read competence benchmarks of Grade 1-9 Curriculum Guidelines and current elementary matters for teaching in circle and compound shapes for reference to design the contents. In the stage of "Process", let learners into a fun and challenging situation to learn by the Taiwan folk tigress which people are familiar with it and we revised it. After the success or failure of the level, we will give the corresponding response to each other level, so that learners can keep learning through the game cycle. For high achievers and low achievers, they have corresponding design. For high achievers, after the completion of the levels, there will be additional levels to allow learners to continue learning. The additional levels are the calculations of compound shapes with difficulty. For low achievers, if they cannot move forward because of the failures, the game will provide the hints as feedbacks. Let low achievers to think how to clear the level by the hints so they won't decrease their motivations with the level difficulties increasing gradually. At the end, we expect that the learners will reach the learning aims by this study in the stage of "Outcome".
Figure 1. Game framework.
Based on Ausubel's meaningful learning theory, when the individual learning new concepts to form new knowledge will use their own pre-prepared concept to check the new concept and try to be included in the existing cognitive structure, so as to assimilate their own knowledge. In the design of the game scenario, we revised Aunty Tigress which are Taiwanese folk tales well-known in the daily
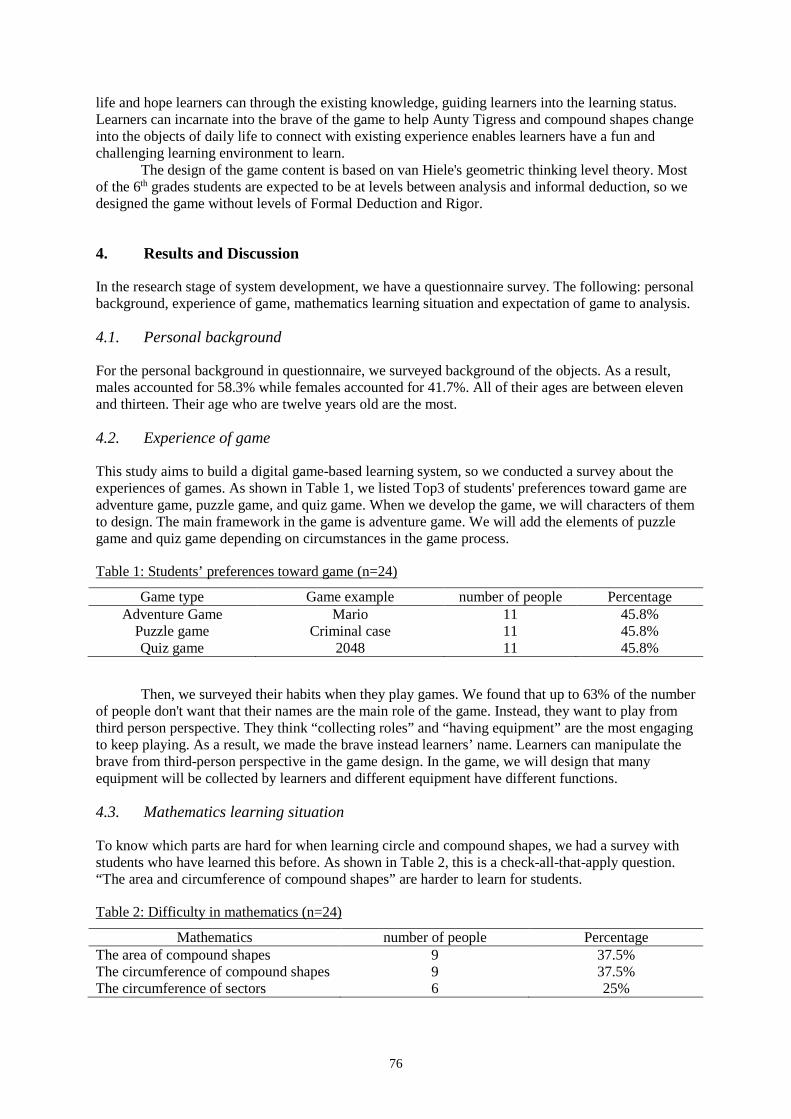
76
life and hope learners can through the existing knowledge, guiding learners into the learning status. Learners can incarnate into the brave of the game to help Aunty Tigress and compound shapes change into the objects of daily life to connect with existing experience enables learners have a fun and challenging learning environment to learn.
The design of the game content is based on van Hiele's geometric thinking level theory. Most of the 6th grades students are expected to be at levels between analysis and informal deduction, so we designed the game without levels of Formal Deduction and Rigor.
4. Results and Discussion
In the research stage of system development, we have a questionnaire survey. The following: personal background, experience of game, mathematics learning situation and expectation of game to analysis.
4.1. Personal background
For the personal background in questionnaire, we surveyed background of the objects. As a result, males accounted for 58.3% while females accounted for 41.7%. All of their ages are between eleven and thirteen. Their age who are twelve years old are the most.
4.2. Experience of game
This study aims to build a digital game-based learning system, so we conducted a survey about the experiences of games. As shown in Table 1, we listed Top3 of students' preferences toward game are adventure game, puzzle game, and quiz game. When we develop the game, we will characters of them to design. The main framework in the game is adventure game. We will add the elements of puzzle game and quiz game depending on circumstances in the game process.
Table 1: Students’ preferences toward game (n=24)
Game type Game example number of people Percentage Adventure Game Mario 11 45.8%
Puzzle game Criminal case 11 45.8% Quiz game 2048 11 45.8%
Then, we surveyed their habits when they play games. We found that up to 63% of the number of people don't want that their names are the main role of the game. Instead, they want to play from third person perspective. They think “collecting roles” and “having equipment” are the most engaging to keep playing. As a result, we made the brave instead learners’ name. Learners can manipulate the brave from third-person perspective in the game design. In the game, we will design that many equipment will be collected by learners and different equipment have different functions.
4.3. Mathematics learning situation
To know which parts are hard for when learning circle and compound shapes, we had a survey with students who have learned this before. As shown in Table 2, this is a check-all-that-apply question. “The area and circumference of compound shapes” are harder to learn for students.
Table 2: Difficulty in mathematics (n=24)
Mathematics number of people Percentage The area of compound shapes 9 37.5% The circumference of compound shapes 9 37.5% The circumference of sectors 6 25%
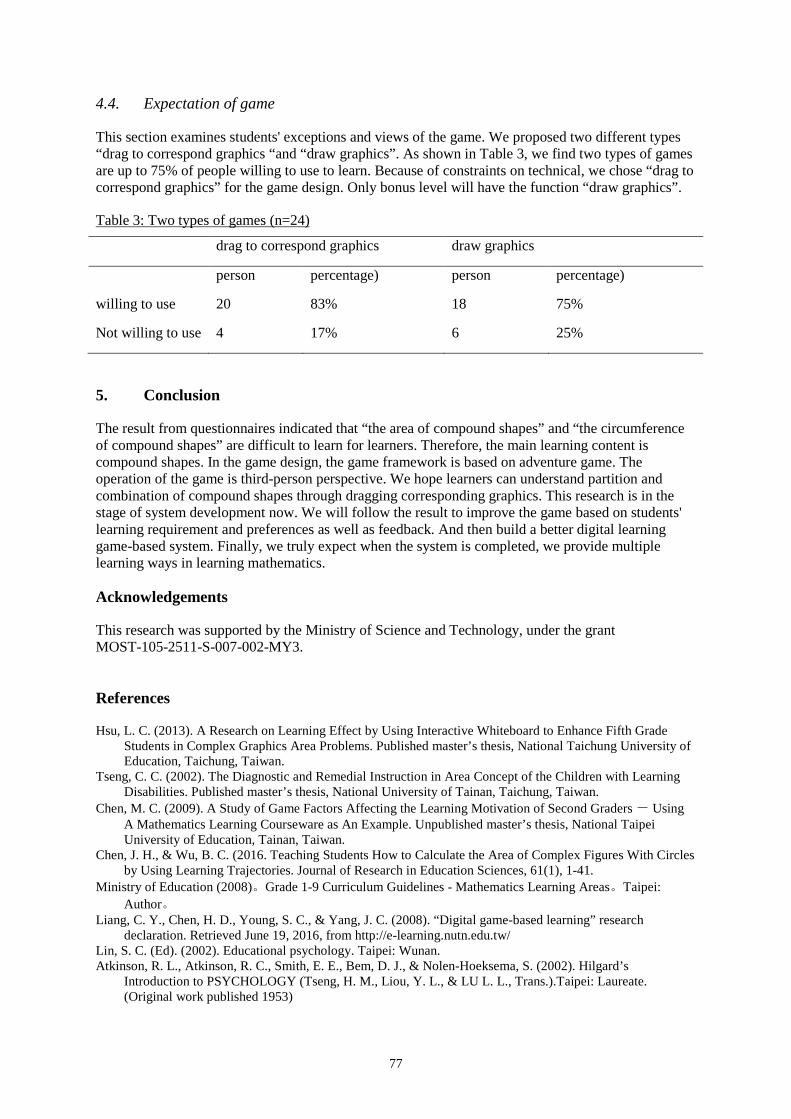
77
4.4. Expectation of game
This section examines students' exceptions and views of the game. We proposed two different types “drag to correspond graphics “and “draw graphics”. As shown in Table 3, we find two types of games are up to 75% of people willing to use to learn. Because of constraints on technical, we chose “drag to correspond graphics” for the game design. Only bonus level will have the function “draw graphics”.
Table 3: Two types of games (n=24)
drag to correspond graphics draw graphics
person percentage) person percentage)
willing to use 20 83% 18 75%
Not willing to use 4 17% 6 25%
5. Conclusion
The result from questionnaires indicated that “the area of compound shapes” and “the circumference of compound shapes” are difficult to learn for learners. Therefore, the main learning content is compound shapes. In the game design, the game framework is based on adventure game. The operation of the game is third-person perspective. We hope learners can understand partition and combination of compound shapes through dragging corresponding graphics. This research is in the stage of system development now. We will follow the result to improve the game based on students' learning requirement and preferences as well as feedback. And then build a better digital learning game-based system. Finally, we truly expect when the system is completed, we provide multiple learning ways in learning mathematics.
Acknowledgements
This research was supported by the Ministry of Science and Technology, under the grant MOST-105-2511-S-007-002-MY3.
References
Hsu, L. C. (2013). A Research on Learning Effect by Using Interactive Whiteboard to Enhance Fifth Grade Students in Complex Graphics Area Problems. Published master’s thesis, National Taichung University of Education, Taichung, Taiwan.
Tseng, C. C. (2002). The Diagnostic and Remedial Instruction in Area Concept of the Children with Learning Disabilities. Published master’s thesis, National University of Tainan, Taichung, Taiwan.
Chen, M. C. (2009). A Study of Game Factors Affecting the Learning Motivation of Second Graders - Using A Mathematics Learning Courseware as An Example. Unpublished master’s thesis, National Taipei University of Education, Tainan, Taiwan.
Chen, J. H., & Wu, B. C. (2016. Teaching Students How to Calculate the Area of Complex Figures With Circles by Using Learning Trajectories. Journal of Research in Education Sciences, 61(1), 1-41.
Ministry of Education (2008)。Grade 1-9 Curriculum Guidelines - Mathematics Learning Areas。Taipei: Author。
Liang, C. Y., Chen, H. D., Young, S. C., & Yang, J. C. (2008). “Digital game-based learning” research declaration. Retrieved June 19, 2016, from http://e-learning.nutn.edu.tw/
Lin, S. C. (Ed). (2002). Educational psychology. Taipei: Wunan. Atkinson, R. L., Atkinson, R. C., Smith, E. E., Bem, D. J., & Nolen-Hoeksema, S. (2002). Hilgard’s
Introduction to PSYCHOLOGY (Tseng, H. M., Liou, Y. L., & LU L. L., Trans.).Taipei: Laureate. (Original work published 1953)

78
Wu, D. B. (1998). A study on the geometric thinking level of van Hiele for junior high school. Department of Science Education, 87th mathematics education research project Conference, 91-96. Taipei: National Science Council.
Chen, Y. M., Lou, S. J., Kuo, S. H., & Shih, R. C. (2013). Investigating elementary school students’ technology acceptance by applying digital game-based learning to environmental education. Australasiam Journal of Educational Technology, 29(1).
Golinskaia, L. (1997). Van Hiele theory in Russian and United States geometry curricula. Unpublished Doctoral disseratation. Columbia University, Columbia.
Hsu, C. Y., Tsai, C. C., & Wang, H. Y. (2012). Facilitating third graders’ acquisition of scientific concepts through digital game-based learning: The effects of self-explanation principles. The Asia Pacific Education Researcher, 21(1), 71-82.
Pohel, T. T, (1998). Using the van Hiele model of thinking: assessing geometry knowledge of high ability and gifted high school students in algebra II, trigonometry, and AP calculus (Doctoral dissertation, The University of New Orleans, 1997). Disertation Abstracts International, 58(8), 3054A.
Swafford, J., Jones, G., & Thornton, C, (1997). Increase knowledge in geometry and instructional practice. Journal for Research in Mathematics Education, 28(4), 467-483.
Van Hiele, P. M. (1986). Structure and Insight: A Theory of Mathematics Education. Orlando, FL: Academic Press.
Presky, M. (2001). True believers: Digital game-based learning in the military. Digital game-based learning. Chang, C. T., Tsai, C. Y., Cheng, P. J., & Yu, P. T. (2016). Toward a Teaching Strategy Design for Game-
Based Learning. Workshop Proceedings of the 24th International Conference on Computers in Education, 26-32. India: Asia-Pacific Society for Computers in Education.
Fang, P. L., Wang, H. Wu, Li, C. Y., & Wu. C. Y. (2016, May). Using a Game-Based Learning Courseware to Study the Learning Effects on Plane Geometry of Elementary Students. Conference Proceedings of the 20th Global Chinese Conference on Computers in Education 2016 (pp. 296-303). Hong Kong: The Hong Kong Institute of Education.
Yeh, Y. C., Yang, F. Y., Liao, C. Y., Lo, Y. F. & Chen, T. H. (2016, May). Math Island: The Design of Management Game on Primary Mathematical Course to Support Low Achieving Student Learning. Conference Proceedings of the 20th Global Chinese Conference on Computers in Education 2016 (pp. 312-319). Hong Kong: The Hong Kong Institute of Education.
Chang, W. P. (2011). Research on the Design and Development of Three-dimensional Digital Game-based Learning Materials. Unpublished master’s thesis, National Taiwan Normal University, Taipei.
Wang, Y. Y. (2008). Effects of Competition inside Computer Assisted Learning Games for Learning Outcomes. Published master’s thesis, National Taipei University of Education, Taipei.
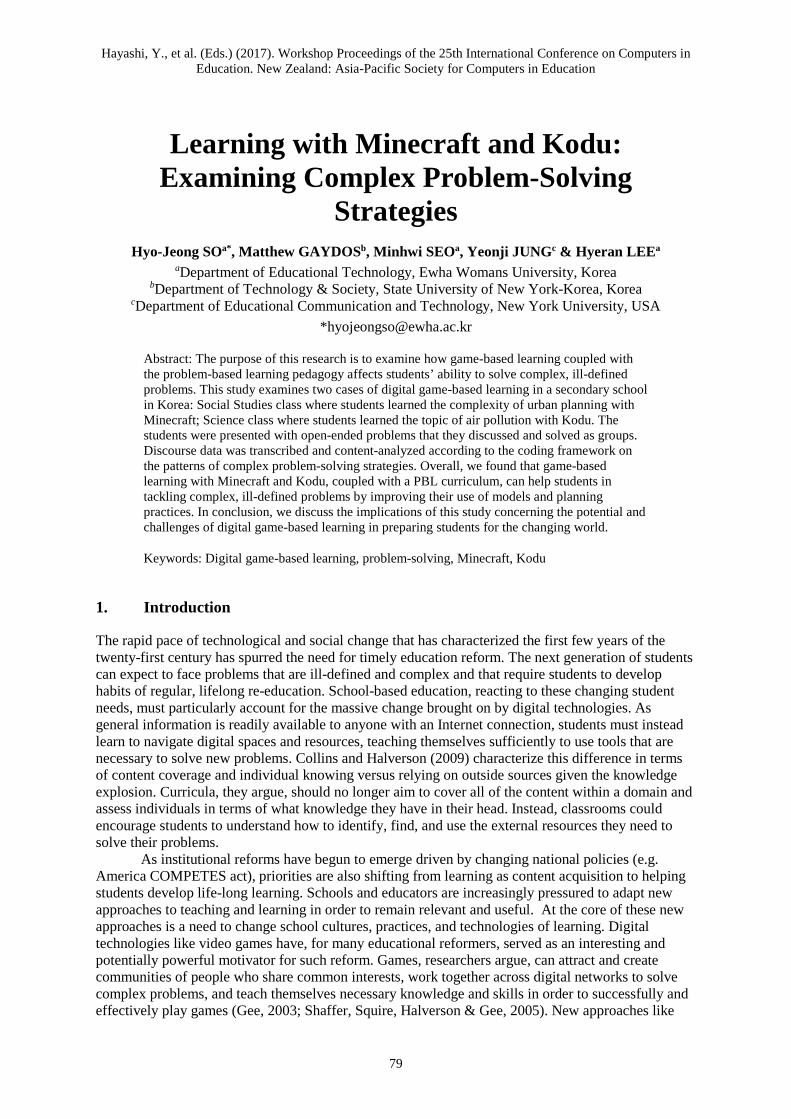
Hayashi, Y., et al. (Eds.) (2017). Workshop Proceedings of the 25th International Conference on Computers in Education. New Zealand: Asia-Pacific Society for Computers in Education
79
Learning with Minecraft and Kodu: Examining Complex Problem-Solving
Strategies Hyo-Jeong SOa*, Matthew GAYDOSb, Minhwi SEOa, Yeonji JUNGc & Hyeran LEEa
aDepartment of Educational Technology, Ewha Womans University, Korea bDepartment of Technology & Society, State University of New York-Korea, Korea
cDepartment of Educational Communication and Technology, New York University, USA *[email protected]
Abstract: The purpose of this research is to examine how game-based learning coupled with the problem-based learning pedagogy affects students’ ability to solve complex, ill-defined problems. This study examines two cases of digital game-based learning in a secondary school in Korea: Social Studies class where students learned the complexity of urban planning with Minecraft; Science class where students learned the topic of air pollution with Kodu. The students were presented with open-ended problems that they discussed and solved as groups. Discourse data was transcribed and content-analyzed according to the coding framework on the patterns of complex problem-solving strategies. Overall, we found that game-based learning with Minecraft and Kodu, coupled with a PBL curriculum, can help students in tackling complex, ill-defined problems by improving their use of models and planning practices. In conclusion, we discuss the implications of this study concerning the potential and challenges of digital game-based learning in preparing students for the changing world.
Keywords: Digital game-based learning, problem-solving, Minecraft, Kodu
1. Introduction
The rapid pace of technological and social change that has characterized the first few years of the twenty-first century has spurred the need for timely education reform. The next generation of students can expect to face problems that are ill-defined and complex and that require students to develop habits of regular, lifelong re-education. School-based education, reacting to these changing student needs, must particularly account for the massive change brought on by digital technologies. As general information is readily available to anyone with an Internet connection, students must instead learn to navigate digital spaces and resources, teaching themselves sufficiently to use tools that are necessary to solve new problems. Collins and Halverson (2009) characterize this difference in terms of content coverage and individual knowing versus relying on outside sources given the knowledge explosion. Curricula, they argue, should no longer aim to cover all of the content within a domain and assess individuals in terms of what knowledge they have in their head. Instead, classrooms could encourage students to understand how to identify, find, and use the external resources they need to solve their problems.
As institutional reforms have begun to emerge driven by changing national policies (e.g. America COMPETES act), priorities are also shifting from learning as content acquisition to helping students develop life-long learning. Schools and educators are increasingly pressured to adapt new approaches to teaching and learning in order to remain relevant and useful. At the core of these new approaches is a need to change school cultures, practices, and technologies of learning. Digital technologies like video games have, for many educational reformers, served as an interesting and potentially powerful motivator for such reform. Games, researchers argue, can attract and create communities of people who share common interests, work together across digital networks to solve complex problems, and teach themselves necessary knowledge and skills in order to successfully and effectively play games (Gee, 2003; Shaffer, Squire, Halverson & Gee, 2005). New approaches like
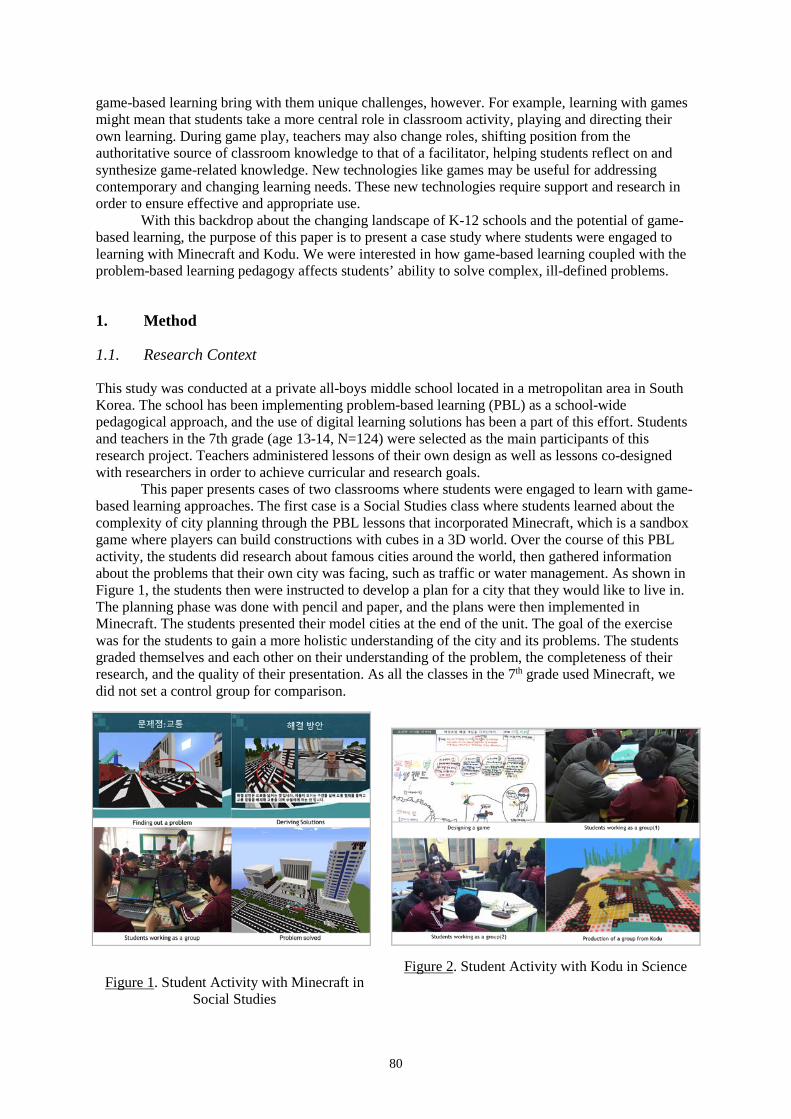
80
game-based learning bring with them unique challenges, however. For example, learning with games might mean that students take a more central role in classroom activity, playing and directing their own learning. During game play, teachers may also change roles, shifting position from the authoritative source of classroom knowledge to that of a facilitator, helping students reflect on and synthesize game-related knowledge. New technologies like games may be useful for addressing contemporary and changing learning needs. These new technologies require support and research in order to ensure effective and appropriate use.
With this backdrop about the changing landscape of K-12 schools and the potential of game-based learning, the purpose of this paper is to present a case study where students were engaged to learning with Minecraft and Kodu. We were interested in how game-based learning coupled with the problem-based learning pedagogy affects students’ ability to solve complex, ill-defined problems.
1. Method
1.1. Research Context
This study was conducted at a private all-boys middle school located in a metropolitan area in South Korea. The school has been implementing problem-based learning (PBL) as a school-wide pedagogical approach, and the use of digital learning solutions has been a part of this effort. Students and teachers in the 7th grade (age 13-14, N=124) were selected as the main participants of this research project. Teachers administered lessons of their own design as well as lessons co-designed with researchers in order to achieve curricular and research goals.
This paper presents cases of two classrooms where students were engaged to learn with game-based learning approaches. The first case is a Social Studies class where students learned about the complexity of city planning through the PBL lessons that incorporated Minecraft, which is a sandbox game where players can build constructions with cubes in a 3D world. Over the course of this PBL activity, the students did research about famous cities around the world, then gathered information about the problems that their own city was facing, such as traffic or water management. As shown in Figure 1, the students then were instructed to develop a plan for a city that they would like to live in. The planning phase was done with pencil and paper, and the plans were then implemented in Minecraft. The students presented their model cities at the end of the unit. The goal of the exercise was for the students to gain a more holistic understanding of the city and its problems. The students graded themselves and each other on their understanding of the problem, the completeness of their research, and the quality of their presentation. As all the classes in the 7th grade used Minecraft, we did not set a control group for comparison.
Figure 1. Student Activity with Minecraft in Social Studies
Figure 2. Student Activity with Kodu in Science
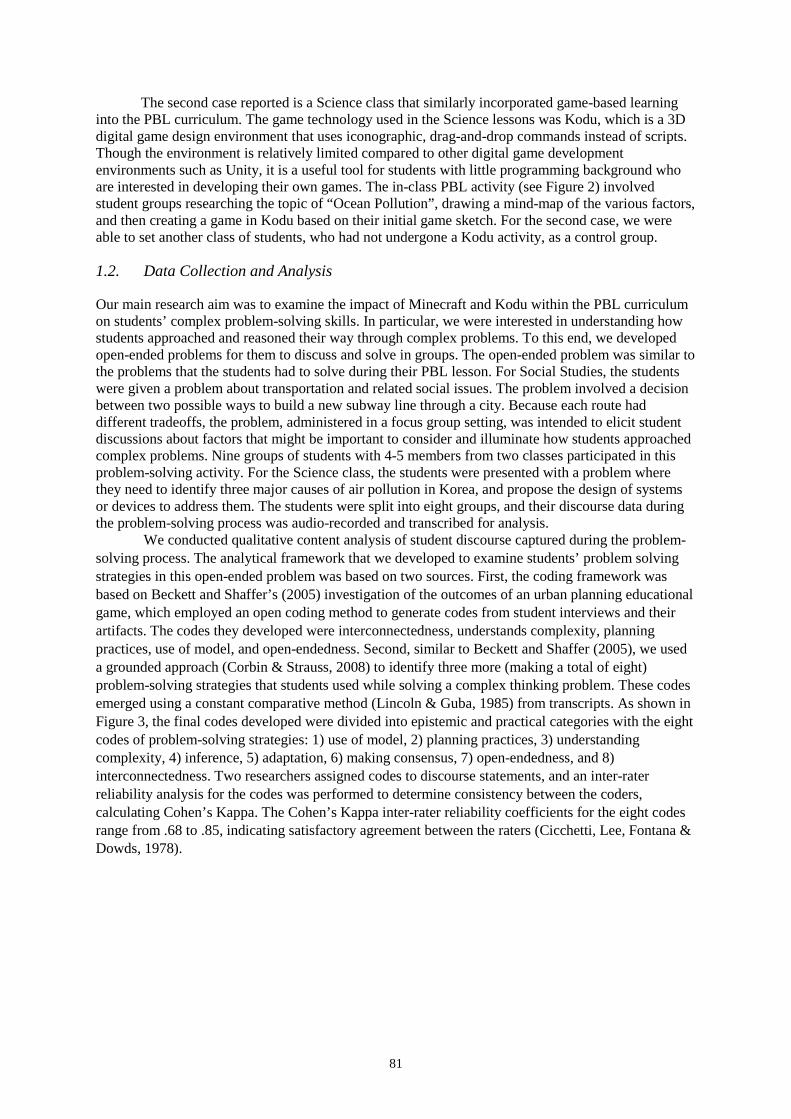
81
The second case reported is a Science class that similarly incorporated game-based learning into the PBL curriculum. The game technology used in the Science lessons was Kodu, which is a 3D digital game design environment that uses iconographic, drag-and-drop commands instead of scripts. Though the environment is relatively limited compared to other digital game development environments such as Unity, it is a useful tool for students with little programming background who are interested in developing their own games. The in-class PBL activity (see Figure 2) involved student groups researching the topic of “Ocean Pollution”, drawing a mind-map of the various factors, and then creating a game in Kodu based on their initial game sketch. For the second case, we were able to set another class of students, who had not undergone a Kodu activity, as a control group.
1.2. Data Collection and Analysis
Our main research aim was to examine the impact of Minecraft and Kodu within the PBL curriculum on students’ complex problem-solving skills. In particular, we were interested in understanding how students approached and reasoned their way through complex problems. To this end, we developed open-ended problems for them to discuss and solve in groups. The open-ended problem was similar to the problems that the students had to solve during their PBL lesson. For Social Studies, the students were given a problem about transportation and related social issues. The problem involved a decision between two possible ways to build a new subway line through a city. Because each route had different tradeoffs, the problem, administered in a focus group setting, was intended to elicit student discussions about factors that might be important to consider and illuminate how students approached complex problems. Nine groups of students with 4-5 members from two classes participated in this problem-solving activity. For the Science class, the students were presented with a problem where they need to identify three major causes of air pollution in Korea, and propose the design of systems or devices to address them. The students were split into eight groups, and their discourse data during the problem-solving process was audio-recorded and transcribed for analysis.
We conducted qualitative content analysis of student discourse captured during the problem-solving process. The analytical framework that we developed to examine students’ problem solving strategies in this open-ended problem was based on two sources. First, the coding framework was based on Beckett and Shaffer’s (2005) investigation of the outcomes of an urban planning educational game, which employed an open coding method to generate codes from student interviews and their artifacts. The codes they developed were interconnectedness, understands complexity, planning practices, use of model, and open-endedness. Second, similar to Beckett and Shaffer (2005), we used a grounded approach (Corbin & Strauss, 2008) to identify three more (making a total of eight) problem-solving strategies that students used while solving a complex thinking problem. These codes emerged using a constant comparative method (Lincoln & Guba, 1985) from transcripts. As shown in Figure 3, the final codes developed were divided into epistemic and practical categories with the eight codes of problem-solving strategies: 1) use of model, 2) planning practices, 3) understanding complexity, 4) inference, 5) adaptation, 6) making consensus, 7) open-endedness, and 8) interconnectedness. Two researchers assigned codes to discourse statements, and an inter-rater reliability analysis for the codes was performed to determine consistency between the coders, calculating Cohen’s Kappa. The Cohen’s Kappa inter-rater reliability coefficients for the eight codes range from .68 to .85, indicating satisfactory agreement between the raters (Cicchetti, Lee, Fontana & Dowds, 1978).
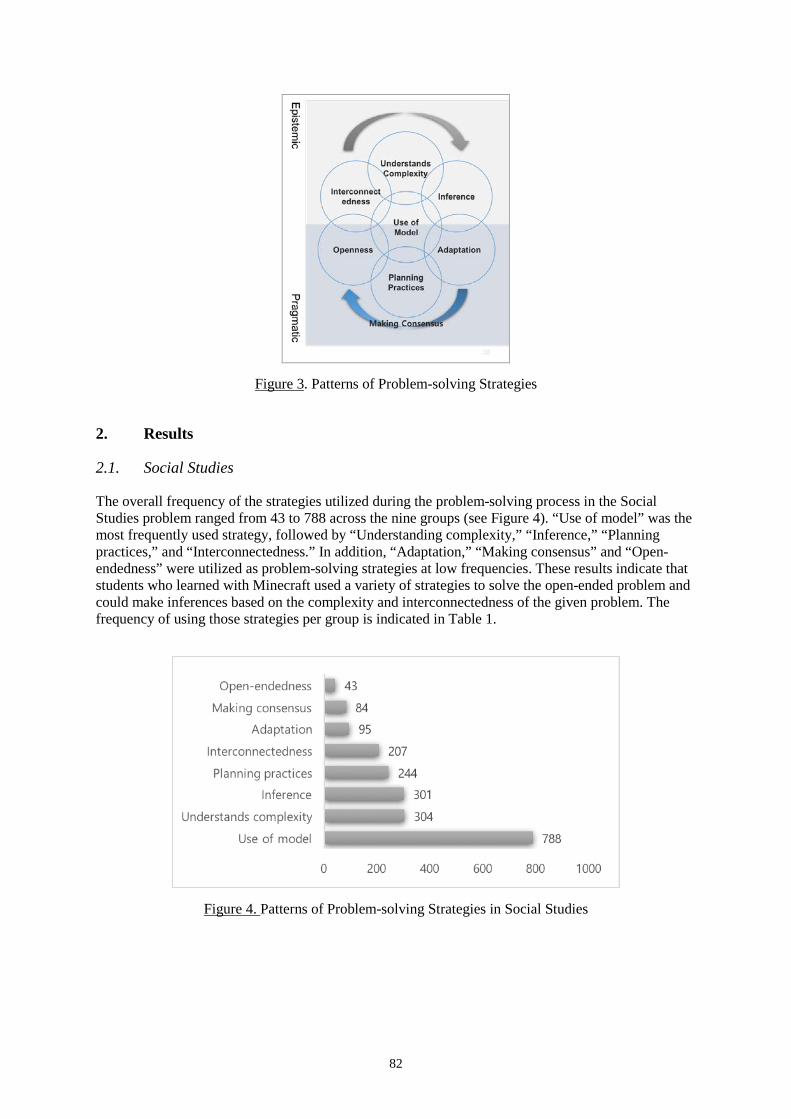
82
Figure 3. Patterns of Problem-solving Strategies
2. Results
2.1. Social Studies
The overall frequency of the strategies utilized during the problem-solving process in the Social Studies problem ranged from 43 to 788 across the nine groups (see Figure 4). “Use of model” was the most frequently used strategy, followed by “Understanding complexity,” “Inference,” “Planning practices,” and “Interconnectedness.” In addition, “Adaptation,” “Making consensus” and “Open-endedness” were utilized as problem-solving strategies at low frequencies. These results indicate that students who learned with Minecraft used a variety of strategies to solve the open-ended problem and could make inferences based on the complexity and interconnectedness of the given problem. The frequency of using those strategies per group is indicated in Table 1.
Figure 4. Patterns of Problem-solving Strategies in Social Studies
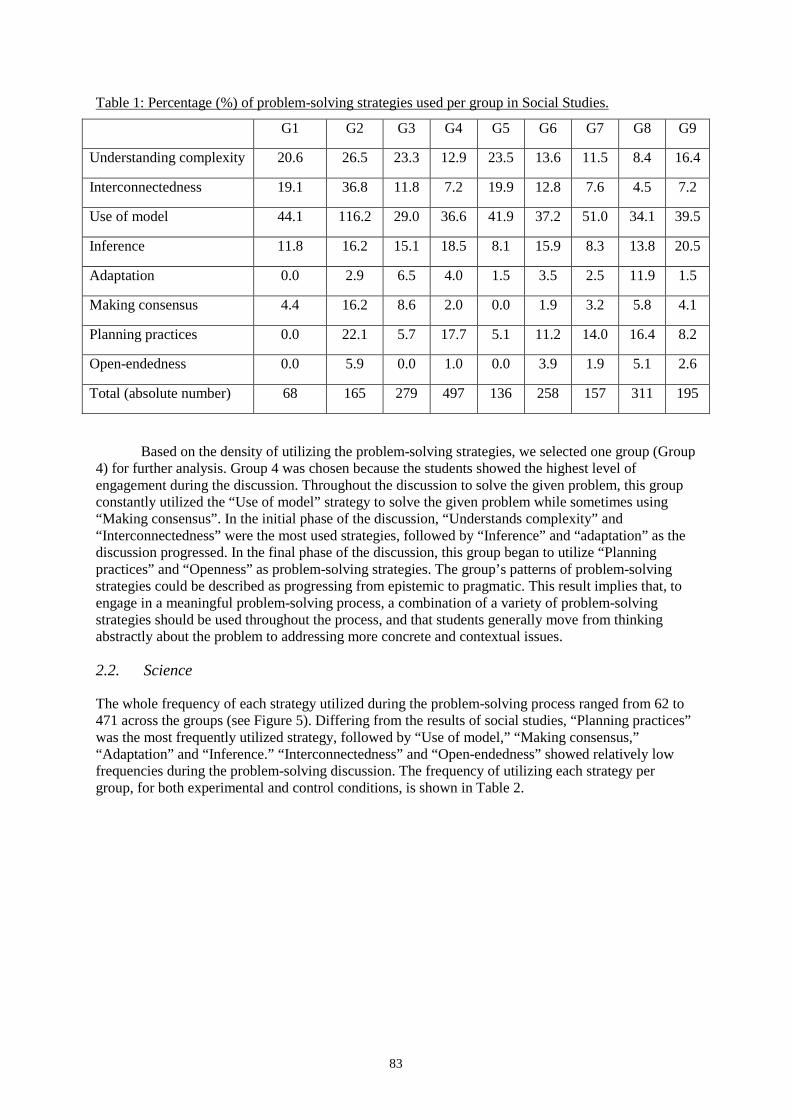
83
Table 1: Percentage (%) of problem-solving strategies used per group in Social Studies.
G1 G2 G3 G4 G5 G6 G7 G8 G9
Understanding complexity 20.6 26.5 23.3 12.9 23.5 13.6 11.5 8.4 16.4
Interconnectedness 19.1 36.8 11.8 7.2 19.9 12.8 7.6 4.5 7.2
Use of model 44.1 116.2 29.0 36.6 41.9 37.2 51.0 34.1 39.5
Inference 11.8 16.2 15.1 18.5 8.1 15.9 8.3 13.8 20.5
Adaptation 0.0 2.9 6.5 4.0 1.5 3.5 2.5 11.9 1.5
Making consensus 4.4 16.2 8.6 2.0 0.0 1.9 3.2 5.8 4.1
Planning practices 0.0 22.1 5.7 17.7 5.1 11.2 14.0 16.4 8.2
Open-endedness 0.0 5.9 0.0 1.0 0.0 3.9 1.9 5.1 2.6
Total (absolute number) 68 165 279 497 136 258 157 311 195
Based on the density of utilizing the problem-solving strategies, we selected one group (Group 4) for further analysis. Group 4 was chosen because the students showed the highest level of engagement during the discussion. Throughout the discussion to solve the given problem, this group constantly utilized the “Use of model” strategy to solve the given problem while sometimes using “Making consensus”. In the initial phase of the discussion, “Understands complexity” and “Interconnectedness” were the most used strategies, followed by “Inference” and “adaptation” as the discussion progressed. In the final phase of the discussion, this group began to utilize “Planning practices” and “Openness” as problem-solving strategies. The group’s patterns of problem-solving strategies could be described as progressing from epistemic to pragmatic. This result implies that, to engage in a meaningful problem-solving process, a combination of a variety of problem-solving strategies should be used throughout the process, and that students generally move from thinking abstractly about the problem to addressing more concrete and contextual issues.
2.2. Science
The whole frequency of each strategy utilized during the problem-solving process ranged from 62 to 471 across the groups (see Figure 5). Differing from the results of social studies, “Planning practices” was the most frequently utilized strategy, followed by “Use of model,” “Making consensus,” “Adaptation” and “Inference.” “Interconnectedness” and “Open-endedness” showed relatively low frequencies during the problem-solving discussion. The frequency of utilizing each strategy per group, for both experimental and control conditions, is shown in Table 2.
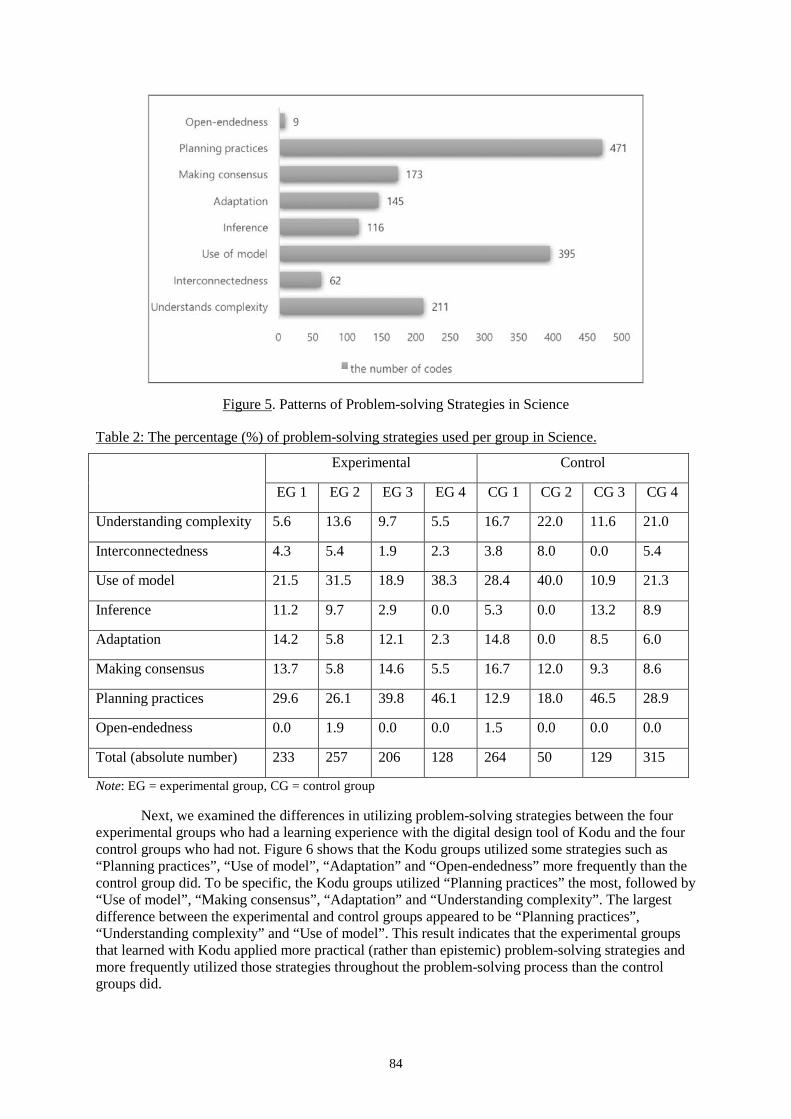
84
Figure 5. Patterns of Problem-solving Strategies in Science
Table 2: The percentage (%) of problem-solving strategies used per group in Science.
Experimental Control
EG 1 EG 2 EG 3 EG 4 CG 1 CG 2 CG 3 CG 4
Understanding complexity 5.6 13.6 9.7 5.5 16.7 22.0 11.6 21.0
Interconnectedness 4.3 5.4 1.9 2.3 3.8 8.0 0.0 5.4
Use of model 21.5 31.5 18.9 38.3 28.4 40.0 10.9 21.3
Inference 11.2 9.7 2.9 0.0 5.3 0.0 13.2 8.9
Adaptation 14.2 5.8 12.1 2.3 14.8 0.0 8.5 6.0
Making consensus 13.7 5.8 14.6 5.5 16.7 12.0 9.3 8.6
Planning practices 29.6 26.1 39.8 46.1 12.9 18.0 46.5 28.9
Open-endedness 0.0 1.9 0.0 0.0 1.5 0.0 0.0 0.0
Total (absolute number) 233 257 206 128 264 50 129 315
Note: EG = experimental group, CG = control group
Next, we examined the differences in utilizing problem-solving strategies between the four experimental groups who had a learning experience with the digital design tool of Kodu and the four control groups who had not. Figure 6 shows that the Kodu groups utilized some strategies such as “Planning practices”, “Use of model”, “Adaptation” and “Open-endedness” more frequently than the control group did. To be specific, the Kodu groups utilized “Planning practices” the most, followed by “Use of model”, “Making consensus”, “Adaptation” and “Understanding complexity”. The largest difference between the experimental and control groups appeared to be “Planning practices”, “Understanding complexity” and “Use of model”. This result indicates that the experimental groups that learned with Kodu applied more practical (rather than epistemic) problem-solving strategies and more frequently utilized those strategies throughout the problem-solving process than the control groups did.
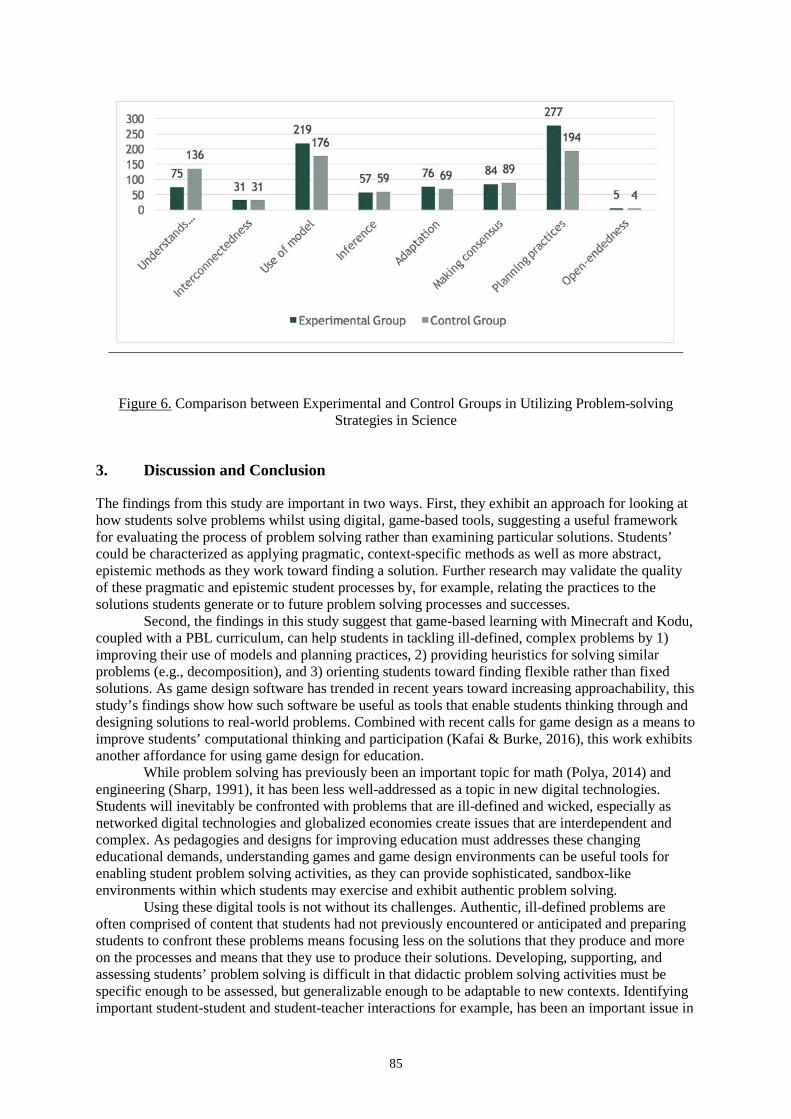
85
Figure 6. Comparison between Experimental and Control Groups in Utilizing Problem-solving Strategies in Science
3. Discussion and Conclusion
The findings from this study are important in two ways. First, they exhibit an approach for looking at how students solve problems whilst using digital, game-based tools, suggesting a useful framework for evaluating the process of problem solving rather than examining particular solutions. Students’ could be characterized as applying pragmatic, context-specific methods as well as more abstract, epistemic methods as they work toward finding a solution. Further research may validate the quality of these pragmatic and epistemic student processes by, for example, relating the practices to the solutions students generate or to future problem solving processes and successes.
Second, the findings in this study suggest that game-based learning with Minecraft and Kodu, coupled with a PBL curriculum, can help students in tackling ill-defined, complex problems by 1) improving their use of models and planning practices, 2) providing heuristics for solving similar problems (e.g., decomposition), and 3) orienting students toward finding flexible rather than fixed solutions. As game design software has trended in recent years toward increasing approachability, this study’s findings show how such software be useful as tools that enable students thinking through and designing solutions to real-world problems. Combined with recent calls for game design as a means to improve students’ computational thinking and participation (Kafai & Burke, 2016), this work exhibits another affordance for using game design for education.
While problem solving has previously been an important topic for math (Polya, 2014) and engineering (Sharp, 1991), it has been less well-addressed as a topic in new digital technologies. Students will inevitably be confronted with problems that are ill-defined and wicked, especially as networked digital technologies and globalized economies create issues that are interdependent and complex. As pedagogies and designs for improving education must addresses these changing educational demands, understanding games and game design environments can be useful tools for enabling student problem solving activities, as they can provide sophisticated, sandbox-like environments within which students may exercise and exhibit authentic problem solving.
Using these digital tools is not without its challenges. Authentic, ill-defined problems are often comprised of content that students had not previously encountered or anticipated and preparing students to confront these problems means focusing less on the solutions that they produce and more on the processes and means that they use to produce their solutions. Developing, supporting, and assessing students’ problem solving is difficult in that didactic problem solving activities must be specific enough to be assessed, but generalizable enough to be adaptable to new contexts. Identifying important student-student and student-teacher interactions for example, has been an important issue in
86
effective mathematics problem solving practices (Lester, 1994) and remains an important issue for digital, game-based tools.
Acknowledgements
This research was supported by Microsoft. We would like to thank all the teachers and students who participated in this research project.
References
Beckett, K. L., & Shaffer, D. W. (2005). Augmented by reality: The pedagogical praxis of urban planning as a pathway to ecological thinking. Journal of Educational Computing Research, 33(1), 31-52.
Cicchetti, D. V., Lee, C., Fontana, A. F., & Dowds, B. N. (1978). A computer program for assessing specific category rater agreement for qualitative data. Educational and Psychological Measurement, 38, 805–813
Collins, A., & Halverson, R. (2009). Rethinking education in the age of technology: The digital revolution and schooling in America. Teachers College Press.
Corbin, J. M., & Strauss, A. L. (2008). Basics of qualitative research. London, England: Sage Publications. Gee, J. P. (2003). What video games have to teach us about learning and literacy. Palgrave Macmillan. Kafai, Y. B., & Burke, Q. (2016). Connected gaming: what making video games can teach us about learning and
literacy. MIT Press. Lester, F. K. (1994). Musings about mathematical problem-solving research: 1970-1994. Journal for Research in
Mathematics Education, 25(6), 660–675. Lincoln, Y. S., & Guba, E. G. (1985). Naturalistic inquiry. Beverly Hills, CA: Sage Publications. Polya, G. (2014). How to solve it: A new aspect of mathematical method. Princeton university press. Shaffer, D. W., Squire, K., Halverson, R., Gee, J. P., & Co-Laboratory, A. A. D. L. (2004). Video games and the
future of learning (2nd ed.). University of Wisconsin-Madison: Academic Advanced Distributed Learning Co-Laboratory.
Sharp, J. J. (1991). Methodologies for problem solving: An engineering approach. The Vocational Aspect of Education, 43(1), 147–157.
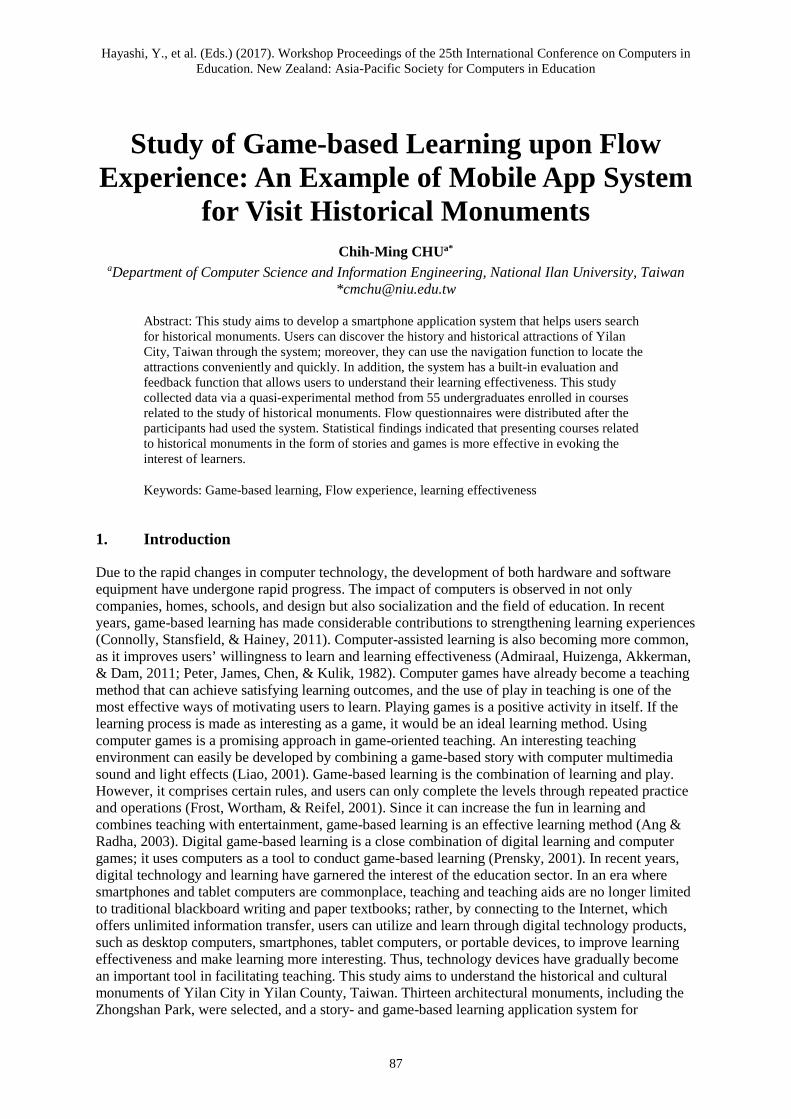
Hayashi, Y., et al. (Eds.) (2017). Workshop Proceedings of the 25th International Conference on Computers in Education. New Zealand: Asia-Pacific Society for Computers in Education
87
Study of Game-based Learning upon Flow Experience: An Example of Mobile App System
for Visit Historical Monuments Chih-Ming CHUa*
aDepartment of Computer Science and Information Engineering, National Ilan University, Taiwan *[email protected]
Abstract: This study aims to develop a smartphone application system that helps users search for historical monuments. Users can discover the history and historical attractions of Yilan City, Taiwan through the system; moreover, they can use the navigation function to locate the attractions conveniently and quickly. In addition, the system has a built-in evaluation and feedback function that allows users to understand their learning effectiveness. This study collected data via a quasi-experimental method from 55 undergraduates enrolled in courses related to the study of historical monuments. Flow questionnaires were distributed after the participants had used the system. Statistical findings indicated that presenting courses related to historical monuments in the form of stories and games is more effective in evoking the interest of learners.
Keywords: Game-based learning, Flow experience, learning effectiveness
1. Introduction
Due to the rapid changes in computer technology, the development of both hardware and software equipment have undergone rapid progress. The impact of computers is observed in not only companies, homes, schools, and design but also socialization and the field of education. In recent years, game-based learning has made considerable contributions to strengthening learning experiences (Connolly, Stansfield, & Hainey, 2011). Computer-assisted learning is also becoming more common, as it improves users’ willingness to learn and learning effectiveness (Admiraal, Huizenga, Akkerman, & Dam, 2011; Peter, James, Chen, & Kulik, 1982). Computer games have already become a teaching method that can achieve satisfying learning outcomes, and the use of play in teaching is one of the most effective ways of motivating users to learn. Playing games is a positive activity in itself. If the learning process is made as interesting as a game, it would be an ideal learning method. Using computer games is a promising approach in game-oriented teaching. An interesting teaching environment can easily be developed by combining a game-based story with computer multimedia sound and light effects (Liao, 2001). Game-based learning is the combination of learning and play. However, it comprises certain rules, and users can only complete the levels through repeated practice and operations (Frost, Wortham, & Reifel, 2001). Since it can increase the fun in learning and combines teaching with entertainment, game-based learning is an effective learning method (Ang & Radha, 2003). Digital game-based learning is a close combination of digital learning and computer games; it uses computers as a tool to conduct game-based learning (Prensky, 2001). In recent years, digital technology and learning have garnered the interest of the education sector. In an era where smartphones and tablet computers are commonplace, teaching and teaching aids are no longer limited to traditional blackboard writing and paper textbooks; rather, by connecting to the Internet, which offers unlimited information transfer, users can utilize and learn through digital technology products, such as desktop computers, smartphones, tablet computers, or portable devices, to improve learning effectiveness and make learning more interesting. Thus, technology devices have gradually become an important tool in facilitating teaching. This study aims to understand the historical and cultural monuments of Yilan City in Yilan County, Taiwan. Thirteen architectural monuments, including the Zhongshan Park, were selected, and a story- and game-based learning application system for
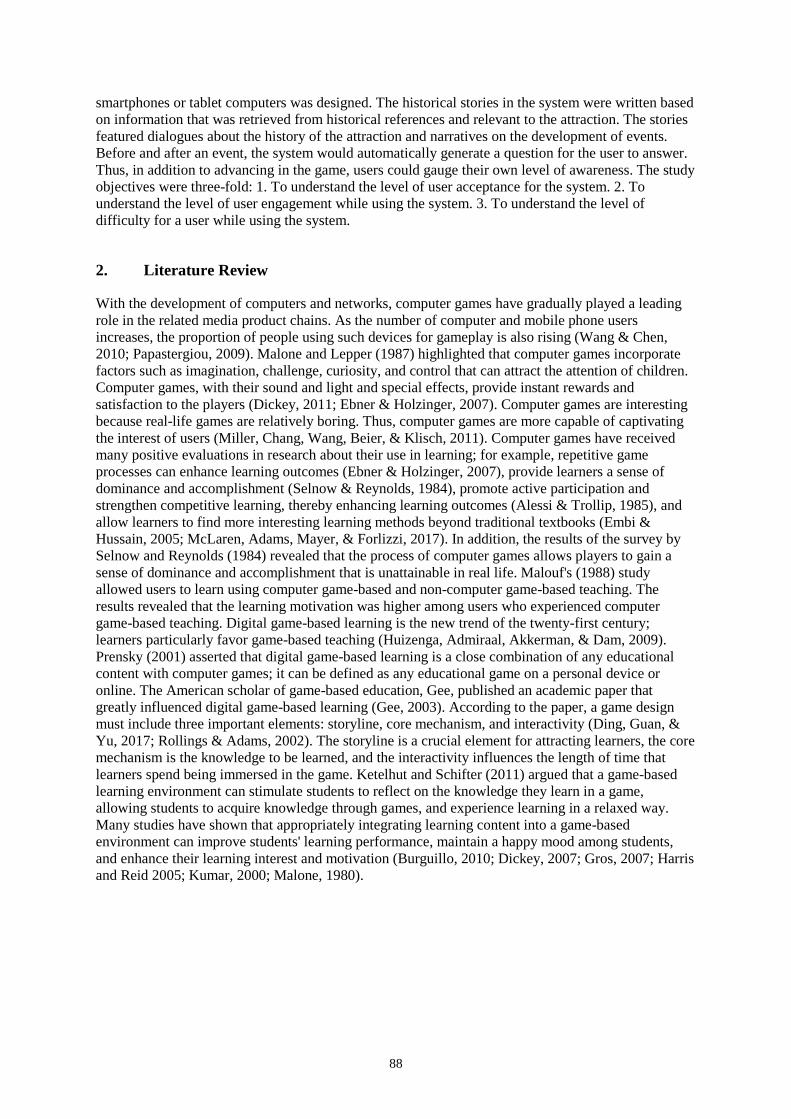
88
smartphones or tablet computers was designed. The historical stories in the system were written based on information that was retrieved from historical references and relevant to the attraction. The stories featured dialogues about the history of the attraction and narratives on the development of events. Before and after an event, the system would automatically generate a question for the user to answer. Thus, in addition to advancing in the game, users could gauge their own level of awareness. The study objectives were three-fold: 1. To understand the level of user acceptance for the system. 2. To understand the level of user engagement while using the system. 3. To understand the level of difficulty for a user while using the system.
2. Literature Review
With the development of computers and networks, computer games have gradually played a leading role in the related media product chains. As the number of computer and mobile phone users increases, the proportion of people using such devices for gameplay is also rising (Wang & Chen, 2010; Papastergiou, 2009). Malone and Lepper (1987) highlighted that computer games incorporate factors such as imagination, challenge, curiosity, and control that can attract the attention of children. Computer games, with their sound and light and special effects, provide instant rewards and satisfaction to the players (Dickey, 2011; Ebner & Holzinger, 2007). Computer games are interesting because real-life games are relatively boring. Thus, computer games are more capable of captivating the interest of users (Miller, Chang, Wang, Beier, & Klisch, 2011). Computer games have received many positive evaluations in research about their use in learning; for example, repetitive game processes can enhance learning outcomes (Ebner & Holzinger, 2007), provide learners a sense of dominance and accomplishment (Selnow & Reynolds, 1984), promote active participation and strengthen competitive learning, thereby enhancing learning outcomes (Alessi & Trollip, 1985), and allow learners to find more interesting learning methods beyond traditional textbooks (Embi & Hussain, 2005; McLaren, Adams, Mayer, & Forlizzi, 2017). In addition, the results of the survey by Selnow and Reynolds (1984) revealed that the process of computer games allows players to gain a sense of dominance and accomplishment that is unattainable in real life. Malouf's (1988) study allowed users to learn using computer game-based and non-computer game-based teaching. The results revealed that the learning motivation was higher among users who experienced computer game-based teaching. Digital game-based learning is the new trend of the twenty-first century; learners particularly favor game-based teaching (Huizenga, Admiraal, Akkerman, & Dam, 2009). Prensky (2001) asserted that digital game-based learning is a close combination of any educational content with computer games; it can be defined as any educational game on a personal device or online. The American scholar of game-based education, Gee, published an academic paper that greatly influenced digital game-based learning (Gee, 2003). According to the paper, a game design must include three important elements: storyline, core mechanism, and interactivity (Ding, Guan, & Yu, 2017; Rollings & Adams, 2002). The storyline is a crucial element for attracting learners, the core mechanism is the knowledge to be learned, and the interactivity influences the length of time that learners spend being immersed in the game. Ketelhut and Schifter (2011) argued that a game-based learning environment can stimulate students to reflect on the knowledge they learn in a game, allowing students to acquire knowledge through games, and experience learning in a relaxed way. Many studies have shown that appropriately integrating learning content into a game-based environment can improve students' learning performance, maintain a happy mood among students, and enhance their learning interest and motivation (Burguillo, 2010; Dickey, 2007; Gros, 2007; Harris and Reid 2005; Kumar, 2000; Malone, 1980).
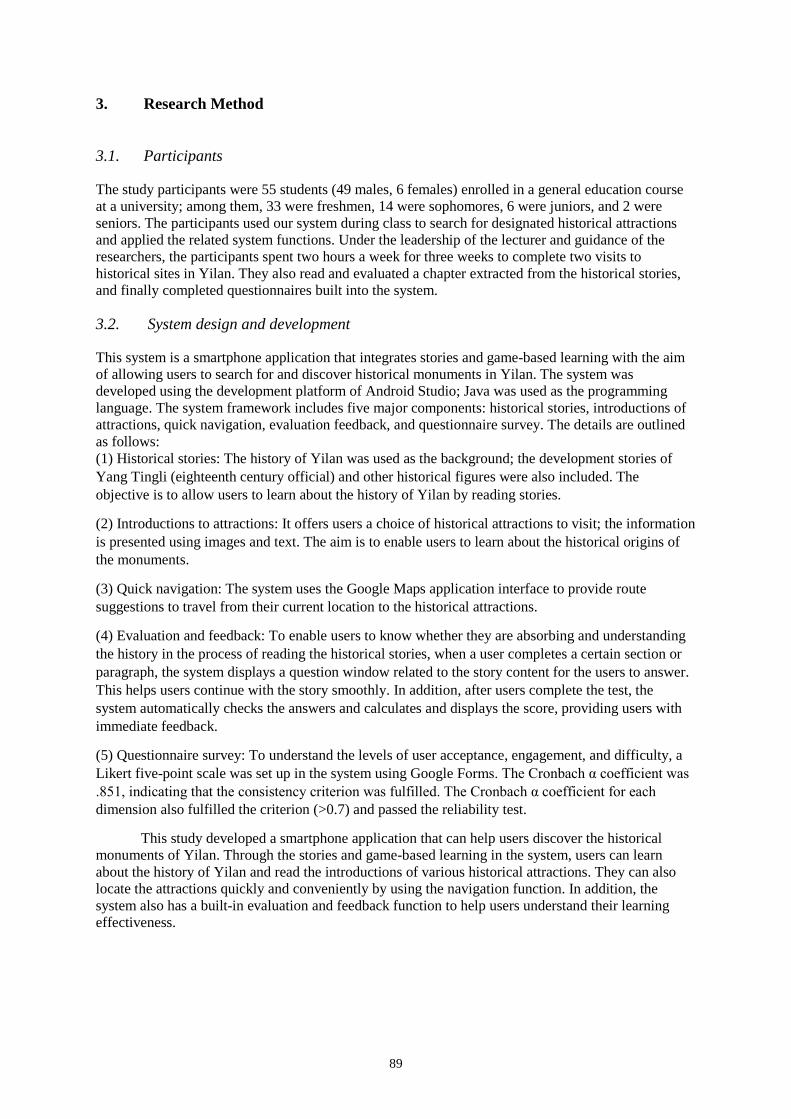
89
3. Research Method
3.1. Participants
The study participants were 55 students (49 males, 6 females) enrolled in a general education course at a university; among them, 33 were freshmen, 14 were sophomores, 6 were juniors, and 2 were seniors. The participants used our system during class to search for designated historical attractions and applied the related system functions. Under the leadership of the lecturer and guidance of the researchers, the participants spent two hours a week for three weeks to complete two visits to historical sites in Yilan. They also read and evaluated a chapter extracted from the historical stories, and finally completed questionnaires built into the system.
3.2. System design and development
This system is a smartphone application that integrates stories and game-based learning with the aim of allowing users to search for and discover historical monuments in Yilan. The system was developed using the development platform of Android Studio; Java was used as the programming language. The system framework includes five major components: historical stories, introductions of attractions, quick navigation, evaluation feedback, and questionnaire survey. The details are outlined as follows: (1) Historical stories: The history of Yilan was used as the background; the development stories of Yang Tingli (eighteenth century official) and other historical figures were also included. The objective is to allow users to learn about the history of Yilan by reading stories.
(2) Introductions to attractions: It offers users a choice of historical attractions to visit; the information is presented using images and text. The aim is to enable users to learn about the historical origins of the monuments.
(3) Quick navigation: The system uses the Google Maps application interface to provide route suggestions to travel from their current location to the historical attractions.
(4) Evaluation and feedback: To enable users to know whether they are absorbing and understanding the history in the process of reading the historical stories, when a user completes a certain section or paragraph, the system displays a question window related to the story content for the users to answer. This helps users continue with the story smoothly. In addition, after users complete the test, the system automatically checks the answers and calculates and displays the score, providing users with immediate feedback.
(5) Questionnaire survey: To understand the levels of user acceptance, engagement, and difficulty, a Likert five-point scale was set up in the system using Google Forms. The Cronbach α coefficient was .851, indicating that the consistency criterion was fulfilled. The Cronbach α coefficient for each dimension also fulfilled the criterion (>0.7) and passed the reliability test.
This study developed a smartphone application that can help users discover the historical monuments of Yilan. Through the stories and game-based learning in the system, users can learn about the history of Yilan and read the introductions of various historical attractions. They can also locate the attractions quickly and conveniently by using the navigation function. In addition, the system also has a built-in evaluation and feedback function to help users understand their learning effectiveness.
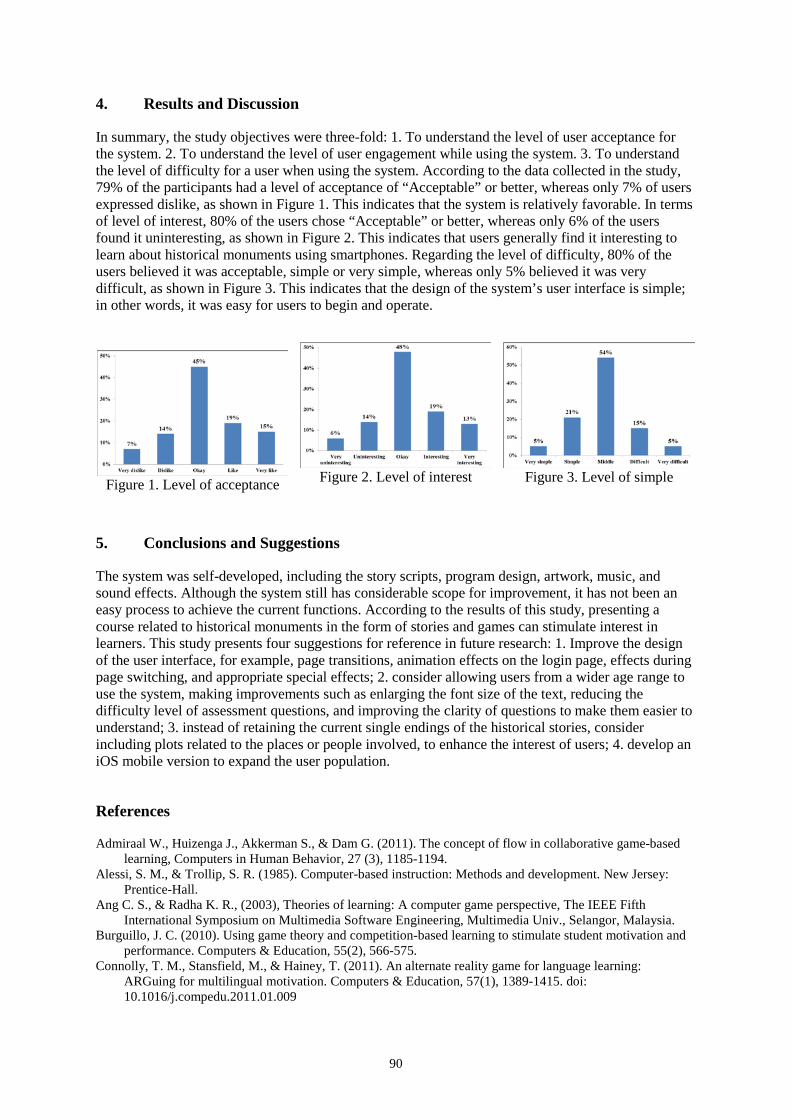
90
4. Results and Discussion
In summary, the study objectives were three-fold: 1. To understand the level of user acceptance for the system. 2. To understand the level of user engagement while using the system. 3. To understand the level of difficulty for a user when using the system. According to the data collected in the study, 79% of the participants had a level of acceptance of “Acceptable” or better, whereas only 7% of users expressed dislike, as shown in Figure 1. This indicates that the system is relatively favorable. In terms of level of interest, 80% of the users chose “Acceptable” or better, whereas only 6% of the users found it uninteresting, as shown in Figure 2. This indicates that users generally find it interesting to learn about historical monuments using smartphones. Regarding the level of difficulty, 80% of the users believed it was acceptable, simple or very simple, whereas only 5% believed it was very difficult, as shown in Figure 3. This indicates that the design of the system’s user interface is simple; in other words, it was easy for users to begin and operate.
Figure 1. Level of acceptance
Figure 2. Level of interest
Figure 3. Level of simple
5. Conclusions and Suggestions
The system was self-developed, including the story scripts, program design, artwork, music, and sound effects. Although the system still has considerable scope for improvement, it has not been an easy process to achieve the current functions. According to the results of this study, presenting a course related to historical monuments in the form of stories and games can stimulate interest in learners. This study presents four suggestions for reference in future research: 1. Improve the design of the user interface, for example, page transitions, animation effects on the login page, effects during page switching, and appropriate special effects; 2. consider allowing users from a wider age range to use the system, making improvements such as enlarging the font size of the text, reducing the difficulty level of assessment questions, and improving the clarity of questions to make them easier to understand; 3. instead of retaining the current single endings of the historical stories, consider including plots related to the places or people involved, to enhance the interest of users; 4. develop an iOS mobile version to expand the user population.
References
Admiraal W., Huizenga J., Akkerman S., & Dam G. (2011). The concept of flow in collaborative game-based learning, Computers in Human Behavior, 27 (3), 1185-1194.
Alessi, S. M., & Trollip, S. R. (1985). Computer-based instruction: Methods and development. New Jersey: Prentice-Hall.
Ang C. S., & Radha K. R., (2003), Theories of learning: A computer game perspective, The IEEE Fifth International Symposium on Multimedia Software Engineering, Multimedia Univ., Selangor, Malaysia.
Burguillo, J. C. (2010). Using game theory and competition-based learning to stimulate student motivation and performance. Computers & Education, 55(2), 566-575.
Connolly, T. M., Stansfield, M., & Hainey, T. (2011). An alternate reality game for language learning: ARGuing for multilingual motivation. Computers & Education, 57(1), 1389-1415. doi: 10.1016/j.compedu.2011.01.009
91
Dickey, M. D. (2007). Game design and learning: a conjectural analysis of how massively multiple online role-playing games (MMORPGs) foster intrinsic motivation. Educational Technology Research and Development, 55(3), 253-273.
Dickey, M. D. (2011). Murder on Grimm Isle: The impact of game narrative design in an educational game-based learning environment. British Journal of Educational Technology, 42(3), 456-469. doi: 10.1111/j.1467-8535.2009.01032.x
Ding, D., Guan, C., & Yu, Y. (2017). Game-Based Learning in Tertiary Education: A New Learning Experience for the Generation Z. International Journal of Information and Education Technology, 7(2), 148.
Ebner, M., & Holzinger, A.(2007). Successful implementation of user-centered game based learning in higher education: An example from civil engineering. Computers & Education, 49(3),873-890.
Embi Z. C. & Hussain H. (2005), Analysis of local and foreign edutainment products - An effort to implement the design framework for an edutainment environment in Malaysia. Journal of Computers in Mathematics and Science Teaching, 24(1), 27-42.
Forst, J. L., Wortham, S. C., & Reifel, S. (2001). play and child development. New Jersey: Prentice Hall. Gee, J. P. (2003). What Video Games Have to Teach Us about Learning and Literacy. New York: Palgrave
Macmillan. 225. Gros, B. (2007). Digital games in education: the design of game-based learning environment. Journal of
Research on Technology in Education, 40(1), 23-38. Hainey, T., Connolly, T. M., Stansfield, M., & Boyle, E.A. (2011). Evaluation of a game to teach requirements
collection and analysis in software engineering at tertiary education level. Computers & Education, 56(1), 21-35. doi: 10.1016/j.compedu.2010.09.008
Harris, K., & Reid, D. (2005). The influence of virtual reality play on children’s motivation. Canadian Journal of Occupational Therapy, 72(1), 21-30.
Huizenga, J., Admiraal, W., Akkerman, S., & Dam, G. ten. (2009). Mobile game-based learning in secondary education: Engagement, motivation and learning in a mobile city game. Journal of Computer Assisted Learning, 25(4), 332-344. doi: 10.1111/j.1365-2729.2009.00316.x
Kumar, D. (2000). Pedagogical dimensions of game playing. ACM Intelligence Magazine, 10(1), 9-10. Malone, T. W., & Lepper, M. R. (1987). Making learning fun: A taxonomy of intrinsic motivations for learning.
In Snow, R. E. & Farr, M. J. (Eds.). Aptitude, learning, and instruction (Vol. 3). Cognitive and affective process analyses(pp. 223-253). Hillsdale, NJ: Erlbaum.
Malouf, D. B. (1988). The effects of instruc-tional computer games on continuing student motivation. Journal of Special Education, 21(4), 27-38.
McLaren, B. M., Adams, D. M., Mayer, R. E., & Forlizzi, J. (2017). A Computer-based Game that Promotes Mathematics Learning More than a Conventional Approach. International Journal of Game-Based Learning, 7(1), 36-56.
Miller, L. M., Chang, C., Wang, S., Beier, M. E., & Klisch, Y. (2011). Learning and motivational impacts of a multimedia science game. Computers & Education, 57(1), 1425–1433.
Papastergiou, M. (2009). Digital game-based learning in high school computer science education: impact on educational effectiveness and student motivation. Computers & Education, 52(1), 1-12.
Peter A. C., James A. K., & Chen-Lin C. K. (1982). Educational outcomes of tutoring: A meta-analysis of findings, American Educational Research Journal 19(2), 237-248.
Prensky, M. (2001). Digital game-based learning. New York: McGraw-Hill. Rollings, A., & Adams, E.(2002). Game Design. New Riders Games. Selnow, G. W., & Reynolds, H. (1984). Some opportunity costs of television viewing. Journal of Broadcasting,
28(3), 315-322 Wang, L. C., & Chen, M. P. (2010). The effects of game strategy and preference-matching on flow experience
and programming performance in game-based learning. Innovations in Education and Teaching International, 47(1), 39-52.
Hayashi, Y., et al. (Eds.) (2017). Workshop Proceedings of the 25th International Conference on Computers in Education. New Zealand: Asia-Pacific Society for Computers in Education
92
The Implementation of Instructional Innovations and Assistive Technologies in
Emerging Developing Countries within the Asia-Pacific Region
Mas Nida MD KHAMBARIa* & Niwat SRISAWASDIb
a bOrganizers of WICTTEE 2017
aFaculty of Educational Studies, Universiti Putra Malaysia, Malaysia
bFaculty of Education, Khon Kaen University, Thailand
Most of the emerging developing countries within the Asia-Pacific region are actively elevating their education system to greater heights. Technologies are considered as instrumental in fostering effective and inclusive learning environment and moving pedagogical stance towards a learner-centered instruction (UNESCO, 2016). Instructional innovations and assistive technologies are high on the agenda in emerging developing countries within the Asia Pacific region. Harnessing ICT in learning institutions are one of the aspirations outlined in Education 2030 as a means to strengthen the education system, knowledge dissemination, and information access, and quality and effective learning (UNESCO, 2017).
In response to the growing research diversity among emerging developing nations within the Asia-Pacific region, the Sixth International Workshop on ICT Trends in Emerging Economies (WICTTEE 2017) is held in conjunction with the 25th International Conference on Computers in Education, Christchurch, New Zealand. WICTTEE 2017 is organized by the SIG on Development of Information and Communication Technology in the Asia Pacific Neighbourhood—DICTAP. The visions of DICTAP are to:
• Share ideas and best implementation practices related to government policies and incentives
aimed at promoting human resource development, technology transfer, effective e-learning strategies and implementation, software and content development suitable for each member of the Asia-Pacific neighborhood;
• Coordinate and promote community-based e-learning activities, global sharing and management of information and knowledge. Examples of such communities are the Asia-Pacific Society on Computers in Education (APSCE) and the Association of South East Asian Nations (ASEAN); and
• Coordinate and promote student and staff exchange among Asia-Pacific neighborhood member nations to promote more effective sharing of knowledge and practices.
The missions of DICTAP are to:
1. Connect researchers from emerging developing countries within the Asia-Pacific region to share scholarly findings and professional insights in ICT development in the field of education;
2. Establish networking opportunities among researchers, reduce the research gap between the researchers from more developed and less developed countries; and
3. Foster, enhance and sustain collaborations among these researchers.

93
WICTTEE 2017 is the sixth workshop that we are organizing in the hope to realize the aforementioned visions and missions. The workshop is a continuation of our relentless effort to provide a dynamic platform for practitioners and researchers alike to come together to share their country experiences.
We are extremely pleased that practitioners and scholars with university affiliations from Malaysia, Thailand, Indonesia, Nigeria and India will be congregating in Christchurch, New Zealand to present their research findings and share their views at WICTTEE 2017. A total of ten papers will be presented in a half day workshop.
We would like to take this opportunity to thank all the authors who submitted their papers to WICTTEE 2017. We would like to record our sincerest appreciation to our Program Committee Members who dedicated their time and expertise to the most challenging and demanding task of reviewing the paper submissions. Last but not least, we would like to thank DICTAP’s Advisory Committee Members for their wisdom and guidance in making WICTTEE 2017 a reality.
References
UNESCO (2016). Education for people and planet: creating sustainable futures for all. United Nations Educational, Scientific and Cultural Organization. Unesco Publishing: France.
UNESCO (2017). Education transform lives. United Nations Educational, Scientific and Cultural Organization. Unesco Publishing: France.
Hayashi, Y., et al. (Eds.) (2017). Workshop Proceedings of the 25th International Conference on Computers in Education. New Zealand: Asia-Pacific Society for Computers in Education
94
The Effect of Think-Pair-Share Cooperative Learning Model Assisted With ICT on
Mathematical Problem Solving Ability among Junior High School Students
Khoerul UMAM*, SUSWANDARI, Nur ASIAH, Indri Trisno WIBOWO & Syaiful ROHIM University of Muhammadiyah Prof DR HAMKA, Indonesia
Abstract: The main purpose of this research examines the effectiveness on how mathematics teachers have begun to Integrate Information and Communication Technology (ICT) with Think Pair Share Cooperative Learning Model to improve students’ mathematical problem solving ability in junior high school classroom practice. This study was experimental research with a quasi-experimental design. The samples of the study are 36 students for classroom experiments and 36 students for classroom control. The instruments employed in this study were pre-test and post-test. The instruments are made in essays forms which design to measure students’ mathematical problem solving ability. The data were analyzed by using descriptive and inferential statistics. Our finding has shown us that (1) Think Pair Share Cooperative Learning model assisted with ICT had a positive impact on student’s mathematical problem solving ability; (2) there is a statistically significant mean difference in students' mathematical problem solving ability between experiment class and control class.
Keyword: Think Pair Share Cooperative Learning, Mathematical Problem Solving Ability.
1. Introduction
Mathematics learning is not only oriented toward students’ mathematics learning outcomes, but it needs to accommodate the various abilities that must be possessed by students in the mathematical learning process. One of the abilities developed in the learning of mathematics is a mathematical problem solving ability. This ability can assist students in solving many complicated or simple mathematical problems. The research findings facts in Jakarta schools show that students' mathematical problem solving skills are still not satisfactory (Septiany,Purwanto & Umam,2015; Slamet & Samsul,2014). To improve student’s mathematical problem solving ability, we need to enrinch our learning process by using various media such as ICT. According to Alim, Umam, & Rohim (2015), teaching and learning process which is used ICT will improve learning quality. Improving learning quality will encourage students to more engaged and enjoyable in learning process (Alim, Umam & Wijirahayu,2016). One of the learning models that can be used to improve learning quality and students' mathematical problem solving ability is Cooperative Learning Model.
In applying cooperative learning model, the researchers chose Think-Pair-Share Cooperative Learning Model because it offers a learning process to more challenging activity which is started by involving students to think about a problem given by a teacher. Lie (2005) believes that pair exchange techniques give students more opportunities to engage themselves and work collaboratively with other students. Furthermore, students are also created in pairs so that students can discuss the information presented from the problems given by the teacher and then share with the whole class they have been talking about. Wena (2009) said that cooperative learning seeks to use peers as a resource for learning. Think-Pair-Share cooperative learning model steps that begin with thinking, pairing and sharing which is integrated with ICT media are designed to improve students' mathematical problem solving skills.
95
2. Literatures
2.1. Think Pair Share Cooperative Learning Model assisted with ICT
According to Wena (2009), Cooperative Learning is a learning system that seeks to use peers (other students) as a source of learning in addition to teachers and other learning resources. Cooperative learning is a learning approach that focuses on the use of small groups of students to work together in maximizing learning conditions to achieve learning objectives (Junaedi, 2008).
Think-Pair-Share Cooperative Learning Model is a cooperative learning model first developed by Frank Lyman of the University of Marykand in 1985 (Rahmatun, 2014). Learning model is oriented to students, students are asked to process the problems presented by the teacher. Lie (2005) believes that pair exchange techniques give students the opportunity to engage themselves and work with others.
Think-Pair-Share cooperative learning model gives students more opportunities to think for themselves, to discuss, to help each other in groups, and to be given opportunities to share with other students.
In Think-Pair-Share Cooperative Learning Model there are 3 steps, namely thinking, pairing and sharing. According to Trianto "Master uses the following steps: (1) thinking; (2) in pairs; (3) share (Trinoto, 2009). The first stage is thinking, at this stage the teacher asks a question or problem associated with the lesson using ICT, and ask students to use a few minutes to think for themselves. The second stage is pairing, at which point the teacher asks the students to pair up and discuss what they have gained. The third stage is sharing, at this stage the teacher asks the pairs of students to share their work using ICT with whole class and other students give feedback from their friend's performance. The stages in Think-Pair-Share Cooperative Learning Model techniques are:
1. Thinking, the teacher asks questions and gives the opportunity to think before the students answer the proposed submission.
2. In pairs, the teacher asks students to answer the problem. 3. Sharing, teachers ask pair of students to present their work in front of class while other
students give feedbacks for their friends’ performances (Trianto, 2009)
2.2. Student’s Mathematical Problem Solving Abilities
Mathematical problems ability is the ability to find a way to solve mathematical problems by using the relationship between mathematical conceptual and logics (Schoenfeld, 2014). The ability to solve mathematical problems is an attempt to translate mathematics that includes the ability to apply mathematical ideas to the context of problems and the ability to work together to develop and solve problems. Thus, the ability to solve mathematical problems is the ability of students in finding solutions to mathematical problems in accordance with the ability to think logically by applying mathematical ideas in solving problems. In solving the problems, each individual needs a different time based on their mathematical knowledge and skills. According to Siswono (2008), there are several factors that affect the problem-solving ability, namely:
1. Initial experience. Experience on tasks to solve the story or application problem. Early experiences
such as fear (phobia) towards mathematics can hinder students' ability to solve problems. 2. Mathematical background.
Students 'ability to varying degrees of mathematical concepts can lead to differences in students' ability to solve problems.
3. Desire and motivation. Strong internal impulses, such as cultivating my "CAN" and external beliefs, such as
being given interesting, challenging, contextual problems can affect the outcome of problem solving.
4. Problem Structure. The structure of the problem given to the students (problem solving), such as verbal or image
formats, complexity (degree of difficulty), context (story or theme background), language problems, or problem patterns.
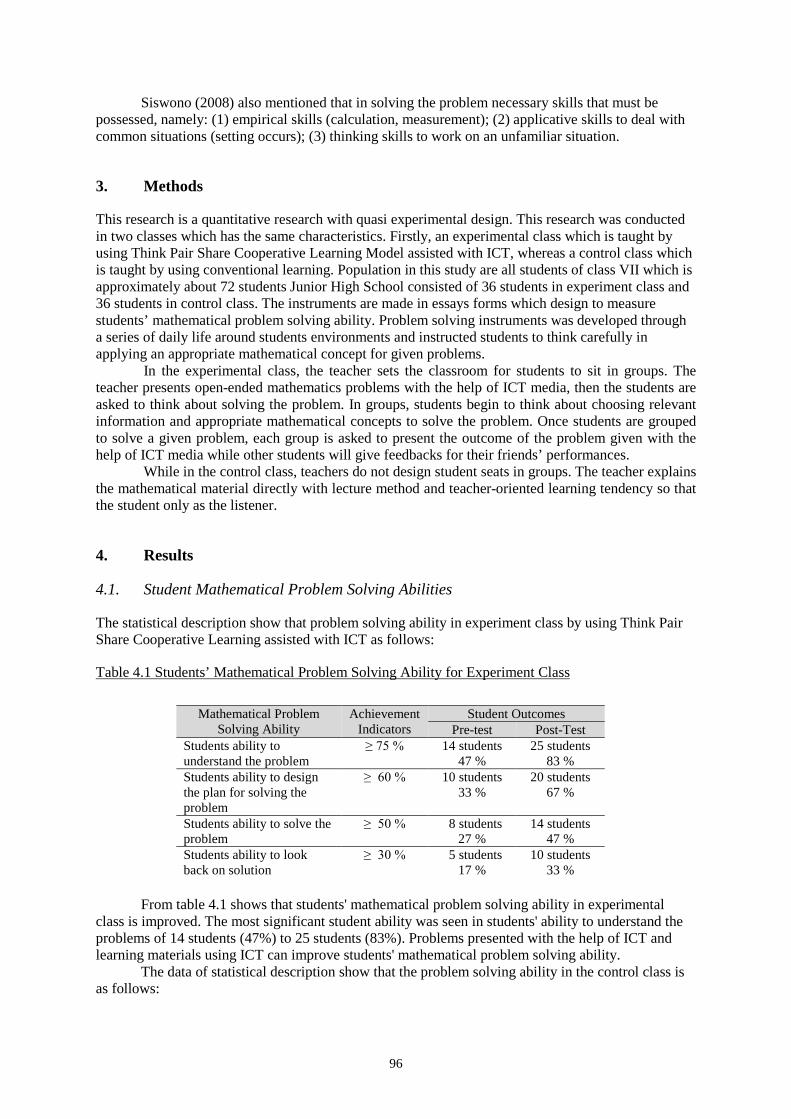
96
Siswono (2008) also mentioned that in solving the problem necessary skills that must be possessed, namely: (1) empirical skills (calculation, measurement); (2) applicative skills to deal with common situations (setting occurs); (3) thinking skills to work on an unfamiliar situation.
3. Methods
This research is a quantitative research with quasi experimental design. This research was conducted in two classes which has the same characteristics. Firstly, an experimental class which is taught by using Think Pair Share Cooperative Learning Model assisted with ICT, whereas a control class which is taught by using conventional learning. Population in this study are all students of class VII which is approximately about 72 students Junior High School consisted of 36 students in experiment class and 36 students in control class. The instruments are made in essays forms which design to measure students’ mathematical problem solving ability. Problem solving instruments was developed through a series of daily life around students environments and instructed students to think carefully in applying an appropriate mathematical concept for given problems.
In the experimental class, the teacher sets the classroom for students to sit in groups. The teacher presents open-ended mathematics problems with the help of ICT media, then the students are asked to think about solving the problem. In groups, students begin to think about choosing relevant information and appropriate mathematical concepts to solve the problem. Once students are grouped to solve a given problem, each group is asked to present the outcome of the problem given with the help of ICT media while other students will give feedbacks for their friends’ performances.
While in the control class, teachers do not design student seats in groups. The teacher explains the mathematical material directly with lecture method and teacher-oriented learning tendency so that the student only as the listener.
4. Results
4.1. Student Mathematical Problem Solving Abilities
The statistical description show that problem solving ability in experiment class by using Think Pair Share Cooperative Learning assisted with ICT as follows:
Table 4.1 Students’ Mathematical Problem Solving Ability for Experiment Class
Mathematical Problem
Solving Ability Achievement
Indicators Student Outcomes
Pre-test Post-Test Students ability to understand the problem
≥ 75 % 14 students 47 %
25 students 83 %
Students ability to design the plan for solving the problem
≥ 60 % 10 students 33 %
20 students 67 %
Students ability to solve the problem
≥ 50 % 8 students 27 %
14 students 47 %
Students ability to look back on solution
≥ 30 % 5 students 17 %
10 students 33 %
From table 4.1 shows that students' mathematical problem solving ability in experimental
class is improved. The most significant student ability was seen in students' ability to understand the problems of 14 students (47%) to 25 students (83%). Problems presented with the help of ICT and learning materials using ICT can improve students' mathematical problem solving ability.
The data of statistical description show that the problem solving ability in the control class is as follows:
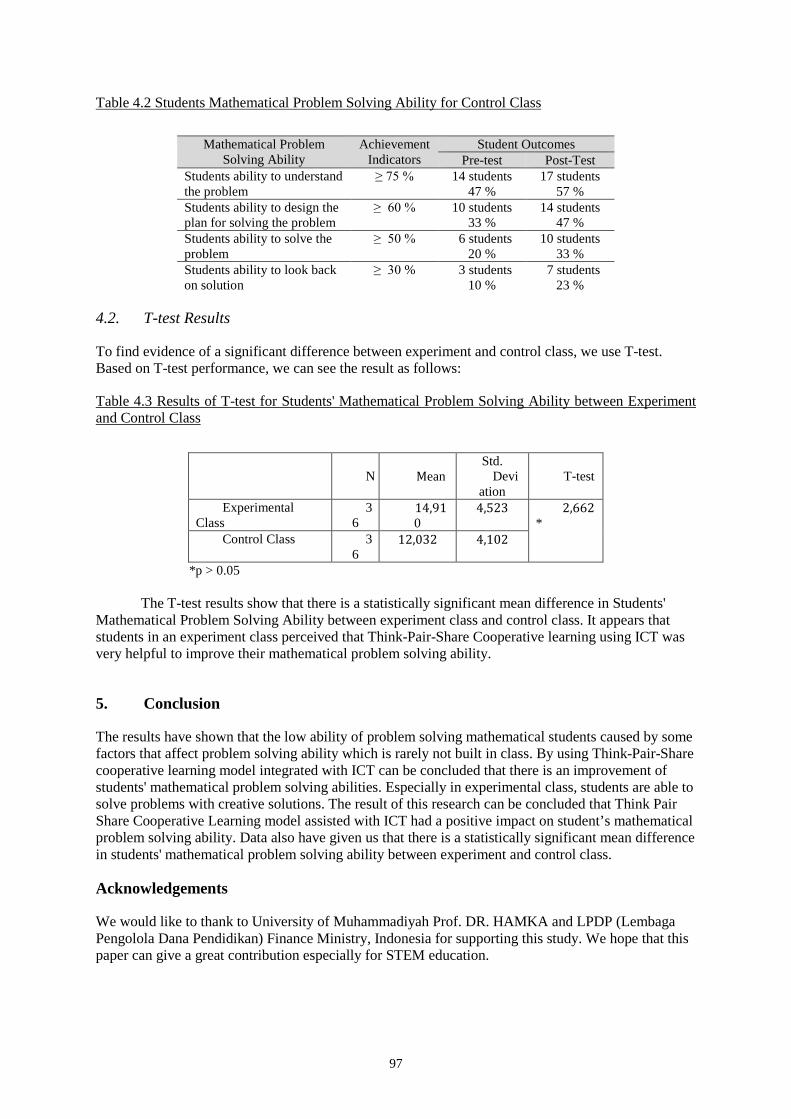
97
Table 4.2 Students Mathematical Problem Solving Ability for Control Class
Mathematical Problem
Solving Ability Achievement
Indicators Student Outcomes
Pre-test Post-Test Students ability to understand the problem
≥ 75 % 14 students 47 %
17 students 57 %
Students ability to design the plan for solving the problem
≥ 60 % 10 students 33 %
14 students 47 %
Students ability to solve the problem
≥ 50 % 6 students 20 %
10 students 33 %
Students ability to look back on solution
≥ 30 % 3 students 10 %
7 students 23 %
4.2. T-test Results
To find evidence of a significant difference between experiment and control class, we use T-test. Based on T-test performance, we can see the result as follows:
Table 4.3 Results of T-test for Students' Mathematical Problem Solving Ability between Experiment and Control Class
N Mean Std.
Deviation
T-test
Experimental Class
36
14,910
4,523 2,662*
Control Class 36
12,032 4,102
*p > 0.05 The T-test results show that there is a statistically significant mean difference in Students'
Mathematical Problem Solving Ability between experiment class and control class. It appears that students in an experiment class perceived that Think-Pair-Share Cooperative learning using ICT was very helpful to improve their mathematical problem solving ability.
5. Conclusion
The results have shown that the low ability of problem solving mathematical students caused by some factors that affect problem solving ability which is rarely not built in class. By using Think-Pair-Share cooperative learning model integrated with ICT can be concluded that there is an improvement of students' mathematical problem solving abilities. Especially in experimental class, students are able to solve problems with creative solutions. The result of this research can be concluded that Think Pair Share Cooperative Learning model assisted with ICT had a positive impact on student’s mathematical problem solving ability. Data also have given us that there is a statistically significant mean difference in students' mathematical problem solving ability between experiment and control class.
Acknowledgements
We would like to thank to University of Muhammadiyah Prof. DR. HAMKA and LPDP (Lembaga Pengolola Dana Pendidikan) Finance Ministry, Indonesia for supporting this study. We hope that this paper can give a great contribution especially for STEM education.

98
References
Alim, E. S., Umam, K., & Rohim, S. (2015). Integration of Reciprocal Teaching-ICT Model To Improve Students’ Mathematics Critical Thinking Ability. Proceedings of the 23rd International Conference on Computers in Education ICCE (pp 483-487).
Alim, E. S., Umam, K., & Wijirahayu, S. (2016). The Implementation of Blended Learning Instruction by Utilizing WeChat Application. Proceedings of the 24th International Conference on Computers in Education ICCE (pp 100-107).
Junaedi, et. al. (2008). Strategi Pembelajaran. Edisi Pertama. Surabaya: LAPIS-PGMI. Lie, A. (2005). Cooperative Learning. Mempraktikan Cooperative Learning di Ruang-Ruang Kelas. Jakarta:
Grasindo. Rahmatun Nisa, et al.(2014). Penerapan Pembelajaran Kooperatif Tipe Think-Pair-Share pada Pembelajaran
Matematika di Kelas IX IPS SMA Negeri 2 Padang Panjang. Jurnal Pendidikan Matematika, 3(1), 25-32. Schoenfeld, A. H. (2014).Mathematical problem solving. Florida: Academic Press Inc. Septiany, S., Purwanto, S. E., & Umam, K. (2015). Influence of Learning on Realistic Mathematics ICT-
Assisted Mathematical Problem Solving Skills Students. Proceedings of the 23rd International Conference on Computers in Education ICCE (pp 29-31).
Siswono. (2008). Model pembelajaran matematika berbasis pengajuan dan pemecahan masalah untuk meningkatkan kemampuan berpikir kreatif. Surabaya: UNESA Press.
Slamet, S. & Maa’rif, S. (2014). Pengaruh bentuk tes formatif assosiasi pilihan ganda dengan reward dan punishment score pada pembelajaran matematika siswa SMA. Infinity Journal. 3(1), 59-80. DOI: http://dx.doi.org/10.22460/infinity.v3i1.39.
Trianto. (2009).Mendesain Model-Model Pembelajaran Inovatif-Progresif Konsep, Landasan, dan Implementasinya pada Kurikulum Tingkat Satuan Pendidikan (KTSP). Jakarta: Kencana.
Wena, M. (2009). Strategi Pembelajaran Inovatif Kontemporer: Suatu Pendekatan Konseptual Operasional. Jakarta: Bumi Aksara.
Hayashi, Y., et al. (Eds.) (2017). Workshop Proceedings of the 25th International Conference on Computers in Education. New Zealand: Asia-Pacific Society for Computers in Education
99
A PBL-based Professional Development Framework to Incorporating Vocational Teachers in Thailand: Perceptions and Guidelines from Training Workshop
Sasithorn CHOOKAEWa*, Charoenchai WONGWATKITb & Supachai HOWIMANPORNc
a,cDepartment of Teacher Training in Mechanical Engineering, Faculty of Technical Education, King Mongkut’s University of Technology North Bangkok, Thailand
bIndependent Researcher, Bangkok 10160, Thailand *[email protected]
Abstract: Vocational education and training have become significant in developing the country in various aspects. Thailand has emphasized on improving the quality of vocational education with the promotion of ICT to support the teaching and learning. However, vocational teachers are limited with the knowledge, skills, and confidence in using technology in their classroom, making their students’ learning unmotivated and unengaged to the learning. Therefore, this study proposes a novel framework to developing the vocational teaching with the use of ICT support. The framework aims to make the vocational teachers skillful with TPACK in serving 21st-century education. Thus, this framework is integrated into the training workshop basing on project-based learning strategy, starting from considering actual teaching context, planning and finding solutions to address the need-to-be-enhanced learning topics in particular situations, applying learning technologies to support and motivate teaching and learning, to creating instructional activities. Furthermore, an experiment to investigate the perceptions and feedbacks towards the proposed framework was conducted with the vocational teachers in a training workshop. The findings show that the framework could help increase the vocational teachers’ perceptions on using ICT for teaching on confidence in using ICT for teaching and ease of use the ICT to assist teaching. Moreover, the teachers provide qualitative perspective in using ICT and suggestions for the institution. In addition, a proposal of practical guidelines and suggestions on vocational teachers’ development in Thailand with ICT has been proposed.
Keywords: Technology-enhanced vocational learning, vocational education and training workshop, TPACK
1. Introduction
Information and communication technology (ICT) skills are essential for effective participation in today’s world. Thailand’s ICT education policies and explores some of the reason why despite significant investment. While OECD/UNESCO (2016) identified one of policy issues that may be holding Thailand that is teachers’ confidence and capacity to use ICT in the classroom. The teachers have limited confidence in using technology to facilitate specific concepts or skills and to support creativity (Kafyulilo & Keengwe, 2014).
Moreover, Thai formal education system has included general education and vocational education to help move the country beyond; especially, Thailand government has focused on enhancing the vocational education. Presently, several countries have seen a significant return of interest in vocational education and training (VET) and an increasing policy focuses on qualification completions in VET education (McGrath, 2012; Van, Ritzen & Pieters, 2014; Fieger, 2015). Vocational education and training (VET) focus on specific practical skills which allow individuals to
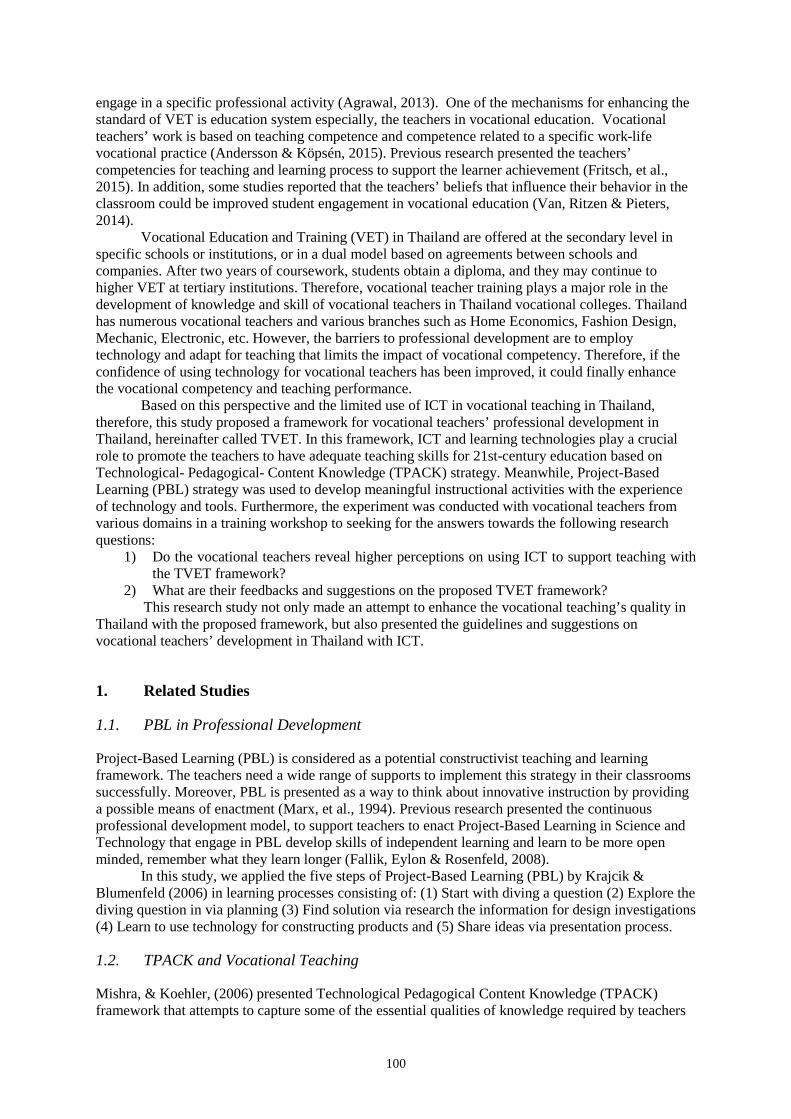
100
engage in a specific professional activity (Agrawal, 2013). One of the mechanisms for enhancing the standard of VET is education system especially, the teachers in vocational education. Vocational teachers’ work is based on teaching competence and competence related to a specific work-life vocational practice (Andersson & Köpsén, 2015). Previous research presented the teachers’ competencies for teaching and learning process to support the learner achievement (Fritsch, et al., 2015). In addition, some studies reported that the teachers’ beliefs that influence their behavior in the classroom could be improved student engagement in vocational education (Van, Ritzen & Pieters, 2014).
Vocational Education and Training (VET) in Thailand are offered at the secondary level in specific schools or institutions, or in a dual model based on agreements between schools and companies. After two years of coursework, students obtain a diploma, and they may continue to higher VET at tertiary institutions. Therefore, vocational teacher training plays a major role in the development of knowledge and skill of vocational teachers in Thailand vocational colleges. Thailand has numerous vocational teachers and various branches such as Home Economics, Fashion Design, Mechanic, Electronic, etc. However, the barriers to professional development are to employ technology and adapt for teaching that limits the impact of vocational competency. Therefore, if the confidence of using technology for vocational teachers has been improved, it could finally enhance the vocational competency and teaching performance.
Based on this perspective and the limited use of ICT in vocational teaching in Thailand, therefore, this study proposed a framework for vocational teachers’ professional development in Thailand, hereinafter called TVET. In this framework, ICT and learning technologies play a crucial role to promote the teachers to have adequate teaching skills for 21st-century education based on Technological- Pedagogical- Content Knowledge (TPACK) strategy. Meanwhile, Project-Based Learning (PBL) strategy was used to develop meaningful instructional activities with the experience of technology and tools. Furthermore, the experiment was conducted with vocational teachers from various domains in a training workshop to seeking for the answers towards the following research questions:
1) Do the vocational teachers reveal higher perceptions on using ICT to support teaching with the TVET framework?
2) What are their feedbacks and suggestions on the proposed TVET framework? This research study not only made an attempt to enhance the vocational teaching’s quality in
Thailand with the proposed framework, but also presented the guidelines and suggestions on vocational teachers’ development in Thailand with ICT.
1. Related Studies
1.1. PBL in Professional Development
Project-Based Learning (PBL) is considered as a potential constructivist teaching and learning framework. The teachers need a wide range of supports to implement this strategy in their classrooms successfully. Moreover, PBL is presented as a way to think about innovative instruction by providing a possible means of enactment (Marx, et al., 1994). Previous research presented the continuous professional development model, to support teachers to enact Project-Based Learning in Science and Technology that engage in PBL develop skills of independent learning and learn to be more open minded, remember what they learn longer (Fallik, Eylon & Rosenfeld, 2008).
In this study, we applied the five steps of Project-Based Learning (PBL) by Krajcik & Blumenfeld (2006) in learning processes consisting of: (1) Start with diving a question (2) Explore the diving question in via planning (3) Find solution via research the information for design investigations (4) Learn to use technology for constructing products and (5) Share ideas via presentation process.
1.2. TPACK and Vocational Teaching
Mishra, & Koehler, (2006) presented Technological Pedagogical Content Knowledge (TPACK) framework that attempts to capture some of the essential qualities of knowledge required by teachers
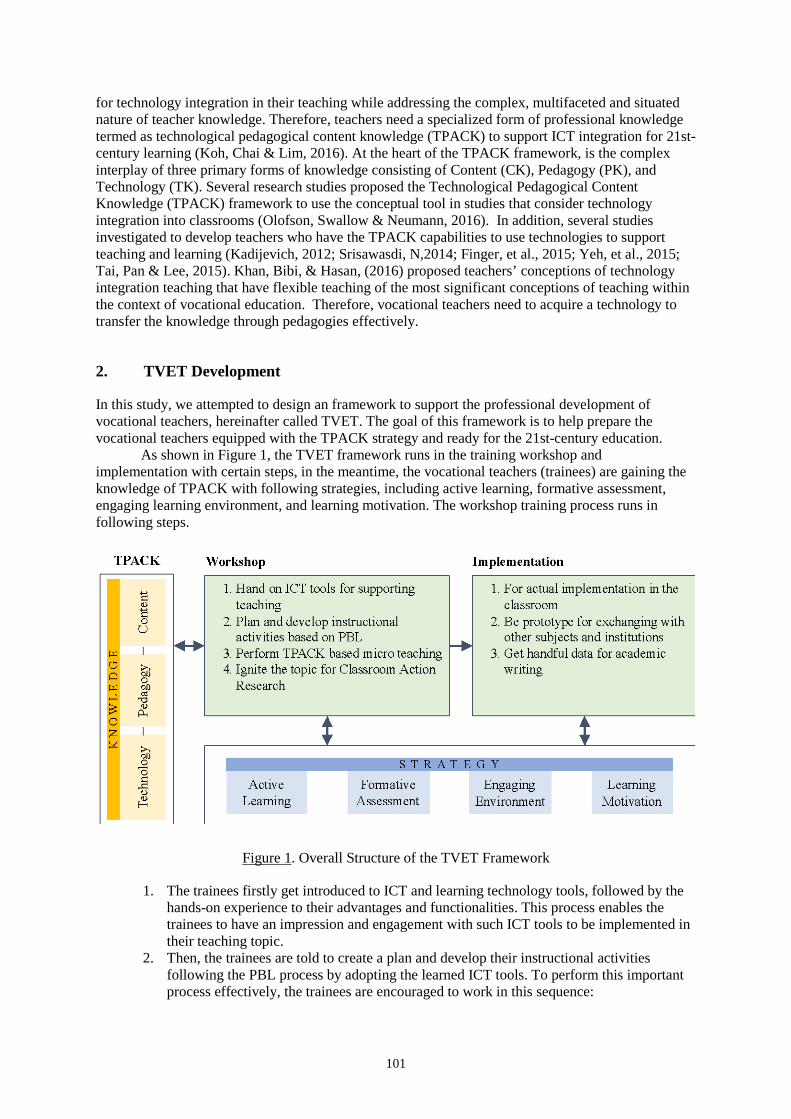
101
for technology integration in their teaching while addressing the complex, multifaceted and situated nature of teacher knowledge. Therefore, teachers need a specialized form of professional knowledge termed as technological pedagogical content knowledge (TPACK) to support ICT integration for 21st-century learning (Koh, Chai & Lim, 2016). At the heart of the TPACK framework, is the complex interplay of three primary forms of knowledge consisting of Content (CK), Pedagogy (PK), and Technology (TK). Several research studies proposed the Technological Pedagogical Content Knowledge (TPACK) framework to use the conceptual tool in studies that consider technology integration into classrooms (Olofson, Swallow & Neumann, 2016). In addition, several studies investigated to develop teachers who have the TPACK capabilities to use technologies to support teaching and learning (Kadijevich, 2012; Srisawasdi, N,2014; Finger, et al., 2015; Yeh, et al., 2015; Tai, Pan & Lee, 2015). Khan, Bibi, & Hasan, (2016) proposed teachers’ conceptions of technology integration teaching that have flexible teaching of the most significant conceptions of teaching within the context of vocational education. Therefore, vocational teachers need to acquire a technology to transfer the knowledge through pedagogies effectively.
2. TVET Development
In this study, we attempted to design an framework to support the professional development of vocational teachers, hereinafter called TVET. The goal of this framework is to help prepare the vocational teachers equipped with the TPACK strategy and ready for the 21st-century education.
As shown in Figure 1, the TVET framework runs in the training workshop and implementation with certain steps, in the meantime, the vocational teachers (trainees) are gaining the knowledge of TPACK with following strategies, including active learning, formative assessment, engaging learning environment, and learning motivation. The workshop training process runs in following steps.
Figure 1. Overall Structure of the TVET Framework
1. The trainees firstly get introduced to ICT and learning technology tools, followed by the hands-on experience to their advantages and functionalities. This process enables the trainees to have an impression and engagement with such ICT tools to be implemented in their teaching topic.
2. Then, the trainees are told to create a plan and develop their instructional activities following the PBL process by adopting the learned ICT tools. To perform this important process effectively, the trainees are encouraged to work in this sequence:
102
• Diving a question: this helps the trainees to establish the topic needed to scaffold or to enhance as it may frequently find difficulties, misconception, low motivation, low participation/involvement by their students. At this point, the project has already been initiated.
• Planning: this step would create an operation plan to achieve the need-to-solve problems by considering their capacity, institutional infrastructure and facilitation, classroom environment, and availability of the computer/mobile devices. At this point, a plan is visualized.
• Find the solution: in considering the plan and actual environment, the trainees search and study for the possible solutions, e.g. using mobile devices in a group activity, using social media for the discussion and reflection, asking students to learn some basic knowledge before the scaffolding sessions in the classroom. The solution might incorporate multiple activities and tools upon the problem and situation.
• Use ICT technology to construct the product: at this point, the handed-on ICT tools can be applied to supplement the solutions. For example, the Internet Response System (IRS) might be used during the instruction to seek for students’ ongoing understanding with their personal mobile devices. The online collaborative presentation making could be used for brainstorming, analyzing and creativity.
• Share ideas: this is inter-operational with the third step in the workshop. 3. Lastly, the trainees perform a TPACK-based micro-teaching with the developed
instructional activities on the selected topic. The other trainees act as their students and give reflections on the received activities, while the trainers provide the feedbacks for further improvements.
However, after the training workshop process, the trainees have some time to make the
improvements for the final instructional activities to address the exact problems in their situations. The implementation phase is expected in the follow-up study.
3. Methods
3.1. Participants
The participants of this study included 43 vocational teachers (male = 14, female = 29) aged between 20 and 60 years old from 11 teaching domains, including General Relations, Fashion, Textiles, Food, Nutrition, Home Economics, Hotel, Design, Arts, Screen Printing, and Communication Technology from a vocational college in Thailand. Each of them has teaching experience at least two years and have attended at least three workshops on training ICT earlier. They attended a vocational teacher training workshop run by our proposed framework for two days (16 hours).
3.2. Instruments and Validation
In this study, a questionnaire was developed to measure the vocational teachers’ perceptions of the effectiveness of ICT competence training. The questionnaire was adapted from (Galanouli Murphy & Gardner, 2004), which consists of nine 5-Likert Scale items to measure the following dimensions: Confidence in using ICT for teaching (CFD), Importance of ICT to teachers (IPT), and Ease of Use the ICT to assist teaching (EOU). The adapted questionnaire was validated for the reliability with the Cronbach’s alpha of 0.866, implying the internal consistency in the measuring items. Example items can be found in the Appendix.
Moreover, an open-ended questionnaire was developed to assess the vocational teacher’s qualitative perspective on using ICT for teaching in the classroom (TCR), and suggestions for the improvement of using ICT in the vocational institution (SIM). The questionnaire was validated, with suggestions, by five experienced ICT technicians, infrastructure engineer and vocational teachers, for the accepted validity.
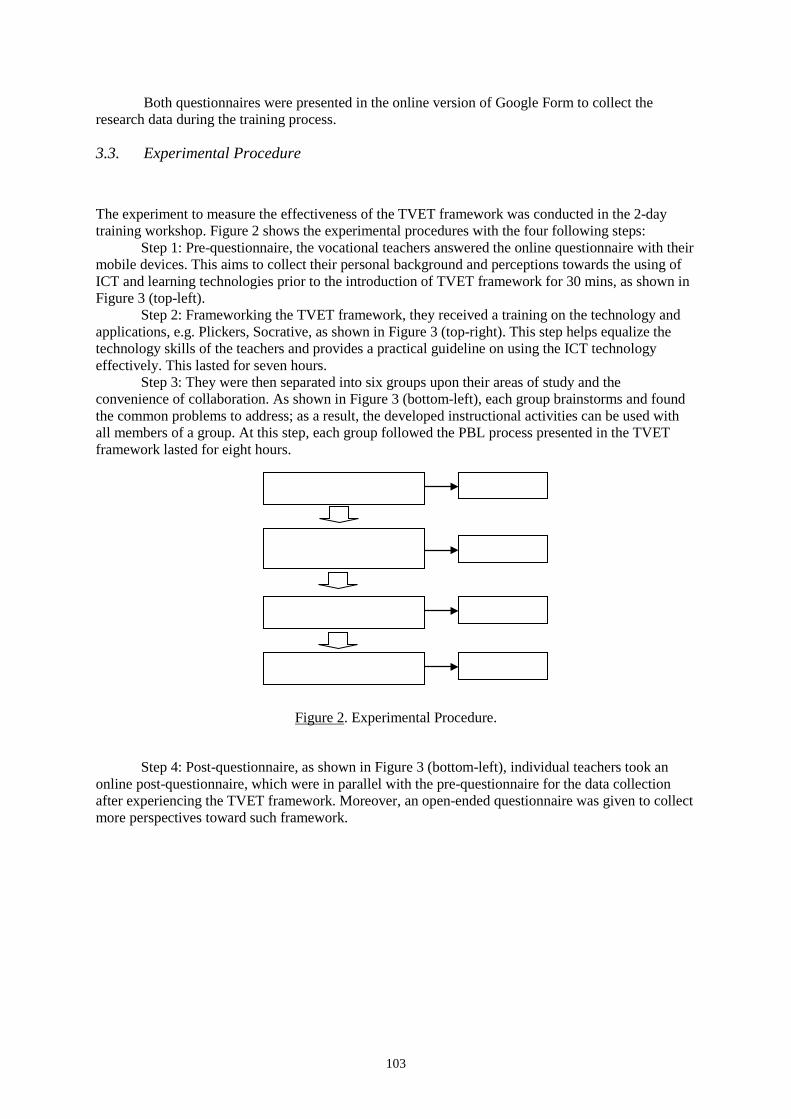
103
Both questionnaires were presented in the online version of Google Form to collect the research data during the training process.
3.3. Experimental Procedure
The experiment to measure the effectiveness of the TVET framework was conducted in the 2-day training workshop. Figure 2 shows the experimental procedures with the four following steps:
Step 1: Pre-questionnaire, the vocational teachers answered the online questionnaire with their mobile devices. This aims to collect their personal background and perceptions towards the using of ICT and learning technologies prior to the introduction of TVET framework for 30 mins, as shown in Figure 3 (top-left).
Step 2: Frameworking the TVET framework, they received a training on the technology and applications, e.g. Plickers, Socrative, as shown in Figure 3 (top-right). This step helps equalize the technology skills of the teachers and provides a practical guideline on using the ICT technology effectively. This lasted for seven hours.
Step 3: They were then separated into six groups upon their areas of study and the convenience of collaboration. As shown in Figure 3 (bottom-left), each group brainstorms and found the common problems to address; as a result, the developed instructional activities can be used with all members of a group. At this step, each group followed the PBL process presented in the TVET framework lasted for eight hours.
Figure 2. Experimental Procedure.
Step 4: Post-questionnaire, as shown in Figure 3 (bottom-left), individual teachers took an
online post-questionnaire, which were in parallel with the pre-questionnaire for the data collection after experiencing the TVET framework. Moreover, an open-ended questionnaire was given to collect more perspectives toward such framework.
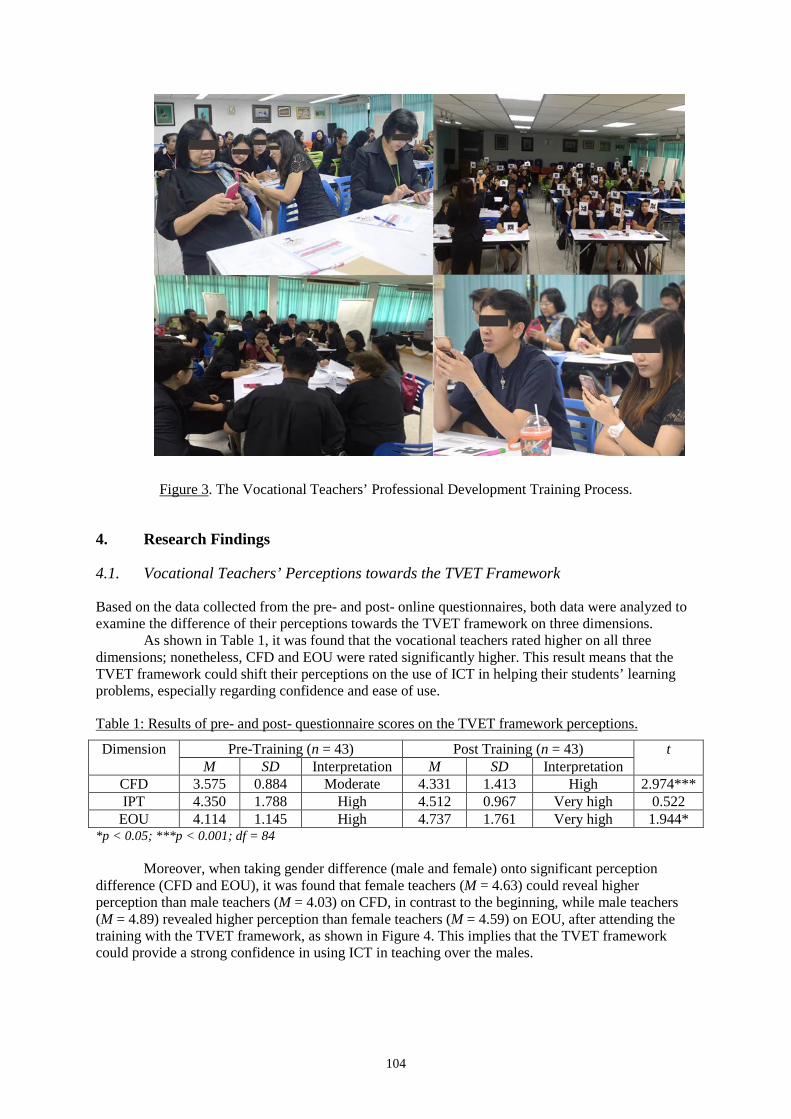
104
Figure 3. The Vocational Teachers’ Professional Development Training Process.
4. Research Findings
4.1. Vocational Teachers’ Perceptions towards the TVET Framework
Based on the data collected from the pre- and post- online questionnaires, both data were analyzed to examine the difference of their perceptions towards the TVET framework on three dimensions.
As shown in Table 1, it was found that the vocational teachers rated higher on all three dimensions; nonetheless, CFD and EOU were rated significantly higher. This result means that the TVET framework could shift their perceptions on the use of ICT in helping their students’ learning problems, especially regarding confidence and ease of use.
Table 1: Results of pre- and post- questionnaire scores on the TVET framework perceptions.
Dimension Pre-Training (n = 43) Post Training (n = 43) t M SD Interpretation M SD Interpretation
CFD 3.575 0.884 Moderate 4.331 1.413 High 2.974*** IPT 4.350 1.788 High 4.512 0.967 Very high 0.522
EOU 4.114 1.145 High 4.737 1.761 Very high 1.944* *p < 0.05; ***p < 0.001; df = 84
Moreover, when taking gender difference (male and female) onto significant perception difference (CFD and EOU), it was found that female teachers (M = 4.63) could reveal higher perception than male teachers (M = 4.03) on CFD, in contrast to the beginning, while male teachers (M = 4.89) revealed higher perception than female teachers (M = 4.59) on EOU, after attending the training with the TVET framework, as shown in Figure 4. This implies that the TVET framework could provide a strong confidence in using ICT in teaching over the males.
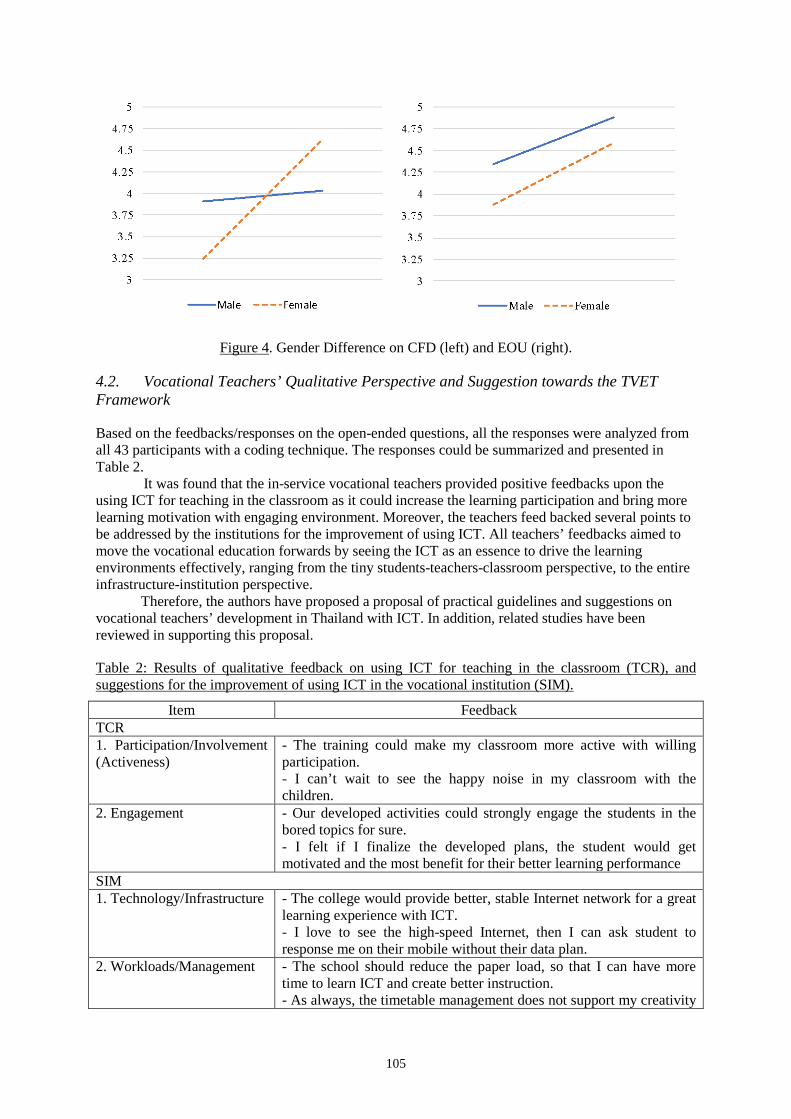
105
Figure 4. Gender Difference on CFD (left) and EOU (right).
4.2. Vocational Teachers’ Qualitative Perspective and Suggestion towards the TVET Framework
Based on the feedbacks/responses on the open-ended questions, all the responses were analyzed from all 43 participants with a coding technique. The responses could be summarized and presented in Table 2.
It was found that the in-service vocational teachers provided positive feedbacks upon the using ICT for teaching in the classroom as it could increase the learning participation and bring more learning motivation with engaging environment. Moreover, the teachers feed backed several points to be addressed by the institutions for the improvement of using ICT. All teachers’ feedbacks aimed to move the vocational education forwards by seeing the ICT as an essence to drive the learning environments effectively, ranging from the tiny students-teachers-classroom perspective, to the entire infrastructure-institution perspective.
Therefore, the authors have proposed a proposal of practical guidelines and suggestions on vocational teachers’ development in Thailand with ICT. In addition, related studies have been reviewed in supporting this proposal.
Table 2: Results of qualitative feedback on using ICT for teaching in the classroom (TCR), and suggestions for the improvement of using ICT in the vocational institution (SIM).
Item Feedback TCR 1. Participation/Involvement (Activeness)
- The training could make my classroom more active with willing participation. - I can’t wait to see the happy noise in my classroom with the children.
2. Engagement - Our developed activities could strongly engage the students in the bored topics for sure. - I felt if I finalize the developed plans, the student would get motivated and the most benefit for their better learning performance
SIM 1. Technology/Infrastructure - The college would provide better, stable Internet network for a great
learning experience with ICT. - I love to see the high-speed Internet, then I can ask student to response me on their mobile without their data plan.
2. Workloads/Management - The school should reduce the paper load, so that I can have more time to learn ICT and create better instruction. - As always, the timetable management does not support my creativity
106
to enhance the teaching. 3. Incentive/Supports - The school should consider our effort on taking ICT to enhance the
students’ learning outcomes, and offer some more incentive, at least as an encouragement. - Learning ICT and implementing in the actual course, this could be measured for the promotion.
5. Guidelines and Suggestions on Vocational Teachers’ Development in Thailand with ICT
In the last decade, several research studies have been described the contribution to utilize of Information and Communication Technology (ICT) in an educational system that many countries agree that teachers should update their knowledge, skills, and competences. Some have even included professional development in their use ICT for teaching (Vanderlinde, Braak, & Tondeur, 2010; Wastiau, et al., 2013; Kabakci & Çoklar, 2014; Vrasidas, 2015). Many research on Information and Communication Technology (ICT) policy in education have revealed multiple methods concerning design and implementation of policies adopted by many researchers of developing countries especially, in vocational education (McGrath, 2012; Khan, Bibi & Hasan, 2016) that attempted to suggest the government each country in order to improve vocational education system.
In this study, we have found that the vocational teachers do not have methods for applying the technology for teaching and learning while they can use routine technology. In addition, they need to be supported with the facilities such as internet, tablet or device in order to use during the learning process. Vocational teachers need to prepare to integrate ICT in teaching. In the case of an ICT training, even more, concerns have to be considered. The results show that professional development for teachers is most effective if directed to the stage of ICT development reached by the college. We found that the attitude of vocational teachers was improved about using ICT. This can be considered as an important step towards the successful integration of ICT in vocational education.
6. Conclusions
This study presented a novel framework to vocational teachers’ professional developments with ICT to address the shortages and flaws of present learning and teaching situations in Thailand vocational context. The TVET framework was proposed by taking ICT and learning technologies as a major tool to be applied in developing the instructional activities for the particular topics upon the teachers’ context. With the TVET framework, the teachers are expected to have TPACK skill of practice through the training workshop process. Besides, PBL was adopted to serve as a concrete structure in developing such needed instructional activities.
Importantly, this research offers a significant contribution to enhancing the quality of vocational teaching and learning with ICT support; moreover, the provided framework could be a leap in advancing the community of technology-enhanced vocational education. As mentioned earlier, this initial version of the proposed TVET framework has just passed the experiment to seek for its effectiveness with only one group of participants. However, continuous improvements can be made upon the follow-up implementations of the ICT-facilitated instructional activities developed during the training workshop, and upon the improvement of the institution’s network, infrastructure and managements. Moreover, the study with multiple groups of participants is required examine the difference among interesting variables and students’ background.
Acknowledgements
The authors would like to express special thanks to the executives and participants from Saowabha Vocational College, Thailand for wonderful supports and amazing perspectives and discussions for improving vocational education in Thailand forward.
107
References
Agrawal, T. (2013). Vocational education and training programs (VET): An Asian perspective. Asia-Pacific Journal of Cooperative Education, 14(1), 15-26.
Andersson, P., & Köpsén, S. (2015). Continuing professional development of vocational teachers: participation in a Swedish national initiative. Empirical Research in Vocational Education and Training, 7(1), 1-20.
Chai, C. S., Koh, E., Lim, C. P., & Tsai, C. C. (2014). Deepening ICT integration through multilevel design of technological pedagogical content knowledge. Journal of Computers in Education, 1(1), 1-17.
Fallik, O., Eylon, B. S., & Rosenfeld, S. (2008). Motivating teachers to enact free-choice project-based learning in science and technology (PBLSAT): Effects of a professional development model. Journal of Science Teacher Education, 19(6), 565-591.
Fieger, P. (2015). Determinants of course completions in vocational education and training: evidence from Australia. Empirical Research in Vocational Education and Training, 7(1), 14.
Finger, G., Romeo, G., Lloyd, M., Heck, D., Sweeney, T., Albion, P., & Jamieson-Proctor, R. (2015). Developing graduate TPACK capabilities in initial teacher education programs: insights from the Teaching Teachers for the Future Project. The Asia-Pacific Education Researcher, 24(3), 505-513.
Fritsch, S., Berger, S., Seifried, J., Bouley, F., Wuttke, E., Schnick-Vollmer, K., & Schmitz, B. (2015). The impact of university teacher training on prospective teachers’ CK and PCK - A comparison between Austria and Germany. Empirical Research in Vocational Education and Training, 7(1), 1–20.
Galanouli, D., Murphy, C., & Gardner, J. (2004). Teachers' perceptions of the effectiveness of ICT-competence training. Computers & Education, 43(1), 63-79.
Kabakci Yurdakul, I., & Çoklar, A. N. (2014). Modeling preservice teachers’ TPACK competencies based on ICT usage. Journal of Computer Assisted Learning, 30(4), 363-376.
Kadijevich, D. M. (2012). TPACK framework: assessing teachers' knowledge and designing courses for their professional development. British Journal of Educational Technology, 43(1), E28-E30.
Kafyulilo, A., & Keengwe, J. (2014). Teachers’ perspectives on their use of ICT in teaching and learning: A case study. Education and Information Technologies, 19(4), 913-923.
Khan, M. S. H., Bibi, S., & Hasan, M. (2016). Australian Technical Teachers’ Experience of Technology Integration in Teaching. SAGE Open, 6(3), 2158244016663609. JOUR.
Krajcik, J. S., & Blumenfeld, P. C. (2006). Project-based learning (pp. 317-34). Koh, J. H. L., Chai, C. S., & Lim, W. Y. (2017). Teacher professional development for TPACK-21CL: Effects
on teacher ICT integration and student outcomes. Journal of Educational Computing Research, 55(2), 172-196.
Marx, R. W., Blumenfeld, P. C., Krajcik, J. S., Blunk, M., Crawford, B., Kelly, B., & Meyer, K. M. (1994). Enacting project-based science: Experiences of four middle grade teachers. The Elementary School Journal, 94(5), 517-538.
McGrath, S. (2012). Vocational education and training for development: A policy in need of a theory?. International Journal of Educational Development, 32(5), 623-631.
Mishra, P., & Koehler, M. J. (2006). Technological pedagogical content knowledge: A framework for teacher knowledge. Teachers college record, 108(6), 1017-1054.
Srisawasdi, N. (2014). Developing technological pedagogical content knowledge in using computerized science laboratory environment: An arrangement for science teacher education program. Research and Practice in Technology Enhanced Learning, 9(1), 123-143.
OECD/UNESCO (2016), Education in Thailand: An OECD-UNESCO Perspective, Reviews of National Policies for Education, OECD Publishing, Paris.
Olofson, M. W., Swallow, M. J., & Neumann, M. D. (2016). TPACKing: A constructivist framing of TPACK to analyze teachers' construction of knowledge. Computers & Education, 95, 188-201.
Tai, H. C., Pan, M. Y., & Lee, B. O. (2015). Applying Technological Pedagogical and Content Knowledge (TPACK) model to develop an online English writing course for nursing students. Nurse education today, 35(6), 782-788.
Vanderlinde, R., Van Braak, J., & Tondeur, J. (2010). Using an online tool to support school‐based ICT policy planning in primary education. Journal of Computer Assisted Learning, 26(5), 434-447.
Van Uden, J. M., Ritzen, H., & Pieters, J. M. (2014). Engaging students: The role of teacher beliefs and interpersonal teacher behavior in fostering student engagement in vocational education. Teaching and Teacher Education, 37, 21-32.
Vrasidas, C. (2015). The rhetoric of reform and teachers' use of ICT. British Journal of Educational Technology, 46(2), 370-380.
Wastiau, P., Blamire, R., Kearney, C., Quittre, V., Van de Gaer, E., & Monseur, C. (2013). The use of ICT in education: a survey of schools in Europe. European Journal of Education, 48(1), 11-27.
108
Yeh, Y. F., Lin, T. C., Hsu, Y. S., Wu, H. K., & Hwang, F. K. (2015). Science teachers’ proficiency levels and patterns of TPACK in a practical context. Journal of Science Education and Technology, 24(1), 78-90.
Appendix Example of questionnaire items for measuring the teachers’ perception towards the use of ICT in
teaching. 1) I feel confident when teaching with ICT. 2) I am generally quite good with ICT. 3) I use ICT in many ways in my teaching. 4) I would generally feel OK trying something new teaching with ICT. 5) I believe I could do advanced ICT for teaching. 6) Figuring out computer problems appeals to me. 7) Learning about ICT is worthwhile. 8) I would like to know more about ICT. 9) All teachers should be able to use ICT in their teaching.
Hayashi, Y., et al. (Eds.) (2017). Workshop Proceedings of the 25th International Conference on Computers in Education. New Zealand: Asia-Pacific Society for Computers in Education
109
Motivation towards Mathematics Learning in the Technology-enhanced Environment
Shu Ling WONG*, Su Luan WONG Faculty of Educational Studies, Universiti Putra Malaysia, Malaysia
Abstract: This paper reviews the motivation construct in mathematics learning, particularly in the technology-enhanced learning (TEL) environment. The discussion here is not limited to a single motivational theory but encompasses multiple facets of the construct. While technology can be effective in motivating students in the learning process, it should not be presumed that motivation can be improved with the mere integration of technology. To enhance motivation in the TEL environment, teachers and instructional designers need to consider students’ current motivational needs as they grapple with understanding mathematical concepts. There is also the challenge of ensuring that initial motivation attributed to the novelty effects of technology be sustained so that students continue to be motivated in the long run. It is important to understand the strengths and limitations of the affordance of technology to complement mathematics learning.
Keywords: Motivation, mathematics, technology-enhanced learning
1. Introduction
Motivation has a pivotal role in mathematics education (Hannula, 2006; Walter & Hart, 2009). Numerous studies have shown that mathematics performance is strongly related to students’ motivation towards mathematics learning (Schiefele & Csikszentmihalyi, 1995; Kim, Park, & Cozart, 2014; OECD, 2014a; Mullis, Martin, Foy, & Arora, 2012). This is evident from the case study of the Programme for International Student Assessment (PISA), a grand-scale international assessment conducted by the Organization of Economic Co-operation and Development (OECD) to measure students’ proficiency in mathematics, science and reading every three years. It was found that highly-motivated students across the OECD countries achieved better scores, equivalent to an additional half year of schooling, than students who were not as motivated (OECD, 2014b). As such, mathematics teachers play a very important role of providing a stimulating environment that will motivate students in the mathematics classroom (Schiefele & Csikszentmihalyi, 1995; Yu & Singh, 2016; Pantziara & Philippou, 2013; Tarmizi & Tarmizi, 2010).
Teachers are urged to revise their teaching strategies to facilitate and improve students’ motivation towards learning mathematics (Thien & Ong, 2015; Ismail & Awang, 2012; Kim et al., 2014). This is where technology comes into the play. Technology has been utilised extensively in education to enhance teaching and learning of mathematics (Star, et al., 2014; Foshee, Elliott, & Atkinson, 2015; Erbas & Yenmez, 2011). Such a learning environment is described as technology-enhanced learning (TEL), where Information and Communication Technology (ICT) is applied (Kirkwood & Prince, 2014). Technological tools or aids can be as general as the Internet connection, computers or laptops, and LCD projectors. They can also be subject specific, examples of which are scientific or graphic calculators, dynamic geometry software, statistical analysis software, and online learning forum or platforms. These technologies can be leveraged to benefit students in mathematics learning. One means by which this is achieved is through promoting students’ motivation towards mathematics. In fact, motivation or affective characteristics have frequently been taken as predictors for mathematics performance (Thien & Ong, 2015; Gilbert et al., 2014; Walter & Hart, 2009; Hannula, 2006; Holmes & Hwang, 2016). This leads then to the role of technology in enhancing these two inter-linked factors, namely mathematics performance and motivation. In other words, when technology is employed intentionally to enhance
110
mathematics learning, should we presume students’ motivation towards mathematics will be improved as well? Here, the authors review the motivation construct in mathematics education and the role of technology in improving mathematics teaching and learning.
2. Motivation in Mathematics Education
The scope of motivation encompasses what people desire, what goals they opt to pursue and how much effort they are willing to put in to execute their action plans, i.e. motivation explains the magnitude and direction of people’s behavior (Keller, 2010). However, the conceptualisation of the motivation construct in mathematics education has been inconsistent since varying dimensions of motivation have been considered by different scholars. It is crucial to recognise various aspects of the motivation construct in mathematics learning before one can revise strategies to increase motivation.
For instance, self-efficacy (Bandura, 1994) is often associated with motivation in mathematical research (Gilbert, 2016; Skaalvik, Federici, & Klassen, 2015; Holmes & Hwang, 2016; Hannula, 2006; Star et al., 2014; Pantziara & Philippou, 2013; OECD, 2014a; Yu & Singh, 2016). Introduced by Bandura (1994), self-efficacy is about how one perceives his or her ability to complete a task. In a learning context, mathematics self-efficacy is conceptualised as students’ perceptions of their competency to solve or perform mathematical tasks (Skaalvik et al., 2015). Gilbert (2016) analyses students’ motivational level in mathematics learning in terms of self-efficacy and interest in mathematics. Start et al. (2014) also included self-efficacy in the motivational domain when exploring the effects of technology-based activities on motivation in mathematics. As such, students who have high mathematics self-efficacy are deemed to be highly motivated to study mathematics (Skaalvik et al., 2015).
Next, utility value, which is a part of the Expectancy-value Theory (Wigfield & Eccles, 2000), has been derived as motivation in mathematics learning as well (Thien & Ong, 2015; Holmes & Hwang, 2016; Gilbert, 2016; OECD, 2014a). The utility value embedded in the theory refers to the usefulness of a task for one’s daily or future life (Wigfield & Eccles, 2000). In learning mathematics, it refers to the real-life usefulness of the material that is learnt in school. In the case of PISA 2012, students’ perception on the utility value of mathematics in their future career was used to conceptualise instrumental motivation (OECD, 2014a). Gilbert (2016) observes that utility and mastery-approach goals are types of motivation related to the more cognitive-engaging mathematical tasks.
Interest is sometimes equated with intrinsic motivation in mathematics studies (OECD, 2014a; Skaalvik et al., 2015). Intrinsic motivation is defined as the inclination to do things for the sake of the activity itself, which is interesting or enjoyable (Ryan & Deci, 2000). In fact, for PISA 2012, students’ responses on whether they enjoyed and had interest in learning mathematics were adopted as an index for intrinsic motivation (OECD, 2014a). Skaalvik et al. (2015) used intrinsic motivation to represent interest when exploring the relationship between motivation and mathematics performance. This conceptualisation of intrinsic motivation is grounded in the Self-determination Theory (Deci, 1972) which argues that interestingness of an activity is dominant in intrinsic motivation, where interest exists between an individual’s intrinsic needs (i.e. competency, autonomy, and social-acceptance) and affordance of the activity. This suggests that one is intrinsically motivated when engaging in the activity that one is interested in.
In contrast, Hannula (2006) conceptualises motivation as a potential that cannot be directly observed. The potential refers to the force that is driven by needs and goals which are also affected by emotions at the same time, and which eventually navigates one’s behaviour (Hannula, 2006). Kim et al. (2014) state that motivation should be viewed as a part of emotion, and vice versa. In other words, students’ emotions, attitudes and beliefs can affect the degree of perseverance in the pursuit of goals, i.e. better grades in mathematics or mastery of mathematics.
Thus far, various aspects of the motivation construct have been discussed in the context of mathematics learning. It has been related to self-efficacy, utility value in the Expectancy-value Theory or instrumental motivation, intrinsic motivation in the Self-determination Theory, as well as interest, beliefs and emotions. Therefore, the discussion of the motivation construct in
111
mathematics learning in this paper is not restricted to a single motivational theory but encompasses multiple facets of the construct.
3. Student Motivation and Mathematics Performance
As mentioned earlier, previous studies have established the correlational relationship between motivation and mathematics performance (Gilbert et al., 2014; Walter & Hart, 2009; Hannula, 2006). According to PISA 2012, the relationship was better established among students who performed at an outstanding level than among lower performing students (OECD, 2014a). By adopting results from PISA 2012, Thien and Ong (2015) reported that mathematics self-efficacy and anxiety had a statistically significant effect on Malaysian students’ mathematics performance. Skaalvik et al. (2015) state that mathematics self-efficacy could make a difference in students’ mathematics performance while Holmes and Hwang (2016) suggested that motivation was one of the factors that contributed to mathematics success when exploring the effects of project-based learning in mathematics. Walter and Hart (2009) reported that students chose to act when motivated by tasks that had a bearing to the social and personal context. This eventually fostered the students’ engagement in mathematics learning. Hannula (2006) carried out a case study to observe students’ motivational behavior in relation to mathematics performance. The study concluded that students’ needs and goals directed their motivational behavior, which eventually affected their mathematics learning. Students who focused on impressing their teacher (i.e. performance goal) were less likely to involve themselves in mathematical exploration (i.e. learning goal), and consequently this affected their decision to learn (Hannula, 2006). Also, Gilbert (2016) revealed that students with greater interest in mathematics and higher mathematics self-efficacy experienced fewer negative emotions, and their performance varied with the cognitive level required.
In short, motivation has a vital role in mathematics learning. The following part of this paper moves on to describe in greater detail motivation towards mathematics in the TEL environment.
4. Motivation towards mathematics in the Technology-enhanced Learning Environment
ICT has been used increasingly in mathematics education to enhance teaching and learning. It is intended that, along with these efforts, students’ motivation towards mathematics would be improved as well. Therefore, it is important to ask what aspects of technology should be considered to enhance students’ motivation, particularly towards mathematics learning in the TEL environment.
Erbas and Yenmez (2011) used a dynamic geometry software (i.e. Geometer’s Sketchpad) to provide a computer-supported and student-centered collaborative inquiry learning environment to help elementary school students improve learning about polygons. The qualitative results revealed that students in the experimental group, unlike those in the control group, showed higher interest and motivation towards learning geometry based on the amount of time spent in the computer laboratory. However, the study also noted that the students’ positive attitudes might be associated with the novelty effects of using technology (Erbas & Yenmez, 2011). Hannafin, Burrus and Little (2001) reported similar results where students’ interest and attitudes towards geometry seemed to be changed positively during student-centered learning activities using dynamic geometry software. Nevertheless, their teacher observed that the novelty effects faded faster among lower mathematics proficiency students in the middle of the second week of the study (Hannafin et al., 2001). Therefore, it is important and necessary to take into account the possibility of novelty effects of technology wearing off by and to design strategies to sustain the motivation to learn mathematics.
Next, Kim et al. (2014) studied affective and motivational factors of learning in an online mathematics course. The results indicated that mathematics self-efficacy is a predictor of mathematics achievement, but that was not the case when achievement emotions (i.e. enjoyment or
112
anxiety) were considered in the virtual learning environment. Thus, it was suggested that since students’ emotions play a part in motivation and achievement of learning, enhanced social presence could regulate their emotions and improve the cognitive process (Kim et al., 2014). The results supported those obtained by Clayton, Blumberg and Auld (2010) who found that most students, when asked to choose among traditional, online or hybrid learning environment, preferred a learning environment that matched their learning style, i.e. one that offered engagement and interaction with the teacher and fellow students. Therefore, it is important to recognise the need for social presence in the learning environment, especially for instance, in a technology-enhanced learning environment. This implies that technology (e.g. relational agent) could be leveraged to facilitate and regulate emotions to enhance motivation in the virtual mathematics learning environment (Kim et al., 2014). The computer artefact should be designed to build a socio-emotional relationship with users, in this case, to regulate emotions of the students in the virtual learning platform (Campbell, Grimshaw, & Green, 2009). The authors of this paper do not intend to review the relational agent in detail but to raise the point that technology might be able to afford opportunities to regulate students’ emotions and motivation.
In another study, Star et al. (2014) examined technology-based strategies to enhance motivation in mathematics. Three technology-based strategies were used, each differing in terms of the type of motivation construct, the level of expenses, and technical sophistication. First, students were provided with an immersive virtual environment to promote self-efficacy by introducing game-like mathematical activities. Second, students were engaged in a web-based activity that did not contain any mathematical content but was aimed at changing their views on learning ability from fixed view of ability to incremental view of ability. Lastly, students watched a 56-minute mathematics-related video which could be considered an affordable and straightforward technological teaching tool, without any intention to improve any particular motivation construct. In terms of mathematics learning, the interventions had modest effects on students’ mathematics scores which saw moderate gains (Star et al., 2014). Rather unexpectedly, students’ self-efficacy did not improve significantly and students’ incremental view of ability was found to be low (Star et al., 2014). The study highlighted the critical need to provide a motivational experience that could be adapted to the students’ current developmental level (Star et al., 2014). Thus, it is suggested that an adaptive or individualized instruction is needed if technology is to be used as a motivational tool.
With regard to adaptive or individualised instruction, Foshee et al. (2015) used TEL to facilitate an individualised, adaptive, and mastery-based instruction for a college mathematics remedial class. TEL, in this case, was a highly developed software programme for mathematics learning. It is important to note that the adaptive instructions in the study referred to the process of determining the most suitable learning path for students by using thousands of data points that were from a constant assessment of students, and hence, individualised instructions were prepared for each student. The results showed that the adaptive TEL significantly improved remedial class students’ mathematics scores as well as the perception of their ability in mathematics, which was conceptualised as mathematics self-efficacy. Foshee et al. (2015) concluded that repeated success experience had increased students’ expectancy for success, thus changing their perception of their own mathematics ability. Surprisingly, students’ motivation was significantly decreased, with motivation in this study being conceptualised as manifested behavior like participation in the class, being responsible for own learning and preparing for exams. Foshee et al. (2015) were of the view that the structure of the adaptive instruction system had lowered students’ self-initiated behavior because the programme offered the learning path for them, i.e. making it easier for them to learn but not adequately motivating them. Thus, their motivation decreased. Nevertheless, Foshee et al. (2015) acknowledged the ability of TEL to improve students’ self-efficacy.
Another technological tool, a 3-dimensional instructional game, was developed and used as a supplementary aid in mathematics lessons to improve students’ achievement and motivation (Bai, Pan, & Kebritchi, 2012). The specially designed instructional game was aimed at enhancing motivation by stimulating students’ curiosity, helping them develop a clear learning objective throughout the game, and encouraging them to be persistent in the process (Bai et al., 2012). The study revealed that while students subsequently increased their knowledge in algebra, there was only a slight increase in motivation for the treatment group, while motivation was decreased in the control group. Bai et al. (2012) argued that the results were in line with literature in that they
113
reflected students’ refusal to learn mathematics when it got more difficult and it became a challenge to motivate students to learn mathematics.
Taken together, these results provide important insights into the motivation construct in the TEL environment. Apparently, the novelty effects of technology could be mistaken for motivation to learn (Erbas & Yenmez, 2011; Hannafin et al., 2001). More importantly, social presence is needed in TEL to motivate students as they need to interact with their peers in order to improve learning (Kim et al., 2014; Clayton et al., 2010). It should be noted that when mathematics achievement is improved with the integration of technology, it does not mean that that students are more motivated to learn (Kim et al., 2014; Star et al., 2014; Foshee et al., 2015; Bai et al., 2012). In other words, in the TEL environment, it is necessary to have strategies to improve and sustain motivation. However, there is no need to choose between scaffolding cognition (i.e. learning mathematics concepts) and motivation (Belland, Kim, & Hannafin, 2013). Specially designed adaptive instructional learning software could help remedial class students by providing motivating learning experiences and reinforcing their self-confidence when they experience repeated success (Foshee et al., 2015). Moreover, technology tools could also complement the teacher’s role (Bai et al., 2012; Star et al., 2014) by providing a virtual learning environment where the instructor plays a supplementary role sometimes (Foshee et al., 2015; Kim et al., 2014). In either role, it is envisaged that technology could be leveraged to facilitate motivation towards mathematics.
5. Conclusion
In general, the literature suggests that technology is an effective tool for mathematics teaching and learning while potentially it can be a motivational tool as well. Nevertheless, whether or not technology can be used to enhance motivation in TEL depends on several considerations. For instance, the novelty effects of technology should be cautiously controlled in future research design to ensure that they do not affect the level of students’ motivation in the long run. It should not be taken for granted that motivation will be enhanced when technology is used in mathematics learning. This implies the need for educators and policy-makers to understand and exploit the affordance of technology as a tool to improve mathematics instruction but not necessarily for motivating students to want to learn mathematics. It is also important to decide whether technology should play a supplementary or primary role in mathematics instruction at various levels of education, taking into account the motivational needs of students as well as the importance of social interaction in the classroom. In other words, the frequency and the extent to which technology would be used in classroom instruction should be complementary to the needs of students. The integration of technology itself cannot take care of motivation and learning in the TEL environment. The teacher or instructional designer should ensure that there is social presence as well so that learning can be meaningful and effective.
It is noteworthy that many studies have emphasized mathematics self-efficacy as one of the most critical motivational factors in mathematics learning. In this regard, TEL can be used to enhance students’ self-efficacy, for instance, it provides repeated success in students’ mathematics learning via adaptive software programmes. In other words, motivational factors in technology-enhanced mathematics learning can be improved by identifying students’ present motivational problems beforehand. Instructional designers then can opt for the most suitable and available materials and tools for the instruction. Nevertheless, TEL should not replace the student’s role in learning; self-initiation to learn and awareness about his or her own responsibility in the learning process are vital to building up motivation to learn. Therefore, TEL should be complementary to the student’s motivational needs in the mathematics classroom. To conclude, while TEL has the potential to enhance motivation to learn, it is important to bear in mind its affordance as well as its efficacy as a supplementary or main instructional tool in the long run.
114
References
Bai, H., Pan, W. H., & Kebritchi, M. (2012). Assessing the effectiveness of a 3-D instructional game on improving mathematics achivement and motivation of middle school students. British Journal of Educational Technology, 43(6), 993-1003.
Bandura, A. (1994). Self-efficacy. In V. S. Ramachaudran, Encyclopedia of human behavior (Vol. 4, pp. 71-81). New York: Academic Press.
Belland, B. R., Kim, C., & Hannafin, M. J. (2013). A framework for designing scaffolds that improve motivation and cognition. Educational Psychologist, 48(4), 243-270.
Campbell, R. H., Grimshaw, M. N., & Green, G. M. (2009). Relational agent: A critical review. The Open Virtual Reality Journal, 1, 1-7.
Clayton, K., Blumberg, F., & Auld, D. P. (2010). The relationship between motivation,learning strategies and choice of environment whether traditional or including an online component. British Journal of Educational Technology, 41(3), 349-364.
Deci, E. L. (1972). Intrinsic motivation, extrinsic reinforcement, and inequity. Journal of Personality and Social Psychology, 22(1), 113-120.
Erbas, A. K., & Yenmez, A. A. (2011). The effects of inquiry-based explorations in a dynamic geometry environment on sixth grade students' achievements in polygons. Computers & Education, 57, 2462-2475. doi:10.1016/j.compedu.2011.07.002
Foshee, C. M., Elliott, S. N., & Atkinson, R. K. (2015). Technology-enhanced learning in college mathematics remediation. British Journal of Eductional Technology, 1-13. doi:10.1111/bjet.12285
Gilbert, M. C. (2016). Relating aspects of motivation to facets of mathematical competence varying in cognitive demand. The Journal of Educational Research, 109(6), 647-657. doi:10.1080/00220671.2015.1020912
Gilbert, M., Musu-Gillette, L., Woolley, M., Karabenick, S., Strutchens, M., & Martin, W. (2014). Student perceptions of the classroom environment: Relations to motivation and achievement in mathematics. Learning Environment Research, 17, 287-304.
Hannafin, R. D., Burrus, J. D., & Little, C. (2001). Learning with dynamic geometry programs: Perspectives of teachers and learners. The Journal of Educational Research, 94(3), 132-144. doi:10.1080/00220670109599911
Hannula, M. S. (2006). Motivation in mathematics: Goals reflected in emotions. Educational Studies in Mathematics, 63(2), 165-178. doi:10.1007/s10649-005-9019-8
Holmes, V. L., & Hwang, Y. (2016). Exploring the effects of project-based learning in secondary mathematics education. The Journal of Educational Research, 109(5), 449-463.
Ismail, N. A., & Awang, H. (2012). Students' factors and mathematics achievement: Evidence from TIMSS 2007. Eurasia Journal of Mathematics, Science and Technology Education, 8(3), 249-255.
Keller, J. M. (2010). Motivational design for learning and performance. New York: Springer. Kim, C., Park, S. W., & Cozart, J. (2014). Affective and motivational factors of learning in online
mathematics course. British Journal of Educational Technology, 45(1), 171-185. doi:10.1111/j.1467-8535.2012.01382.X
Kirkwood, A., & Prince, L. (2014). Technology-enhanced learning and teaching in higher education: what is 'enhanced' and how do we know? A critical literature review. Learning, Media and Technology, 39(1), 6-36.
Mullis, I. V., Martin, M. O., Foy, P., & Arora, A. (2012). TIMSS 2011 International Results in Mathematics. Chestnut Hill, MA: TIMSS & PIRLS International Study Center, Boston College.
OECD. (2014a). In PISA 2012 results: What students know and can do- Student performance in mathematics,reading and science (Revised ed., Vol. 1). OECD Publishing. doi:10.1787/9789264208780
OECD. (2014b). PISA in Focus: Are grouping and selecting students for different school related to students' motivation to learn?. 1-4. doi:10.1787/5jz5hlpb6nxw-en
Pantziara, M., & Philippou, G. N. (2013). Students' motivation in the mathematics classrooms: Revealing causes and consequences. International Journal of Science and Mathematics Education, 13, 385-411. doi:10.1007/s10763-013-9502-0
Ryan, R. M., & Deci, E. L. (2000). Intrinsic and extrinsic motivation: Classic definitions and new directions. Contemporary Educational Psychology, 25, 54-67. doi:10.1006/ceps.1999.1020
Schiefele, U., & Csikszentmihalyi, M. (1995). Motivation and ability as factors in mathematics experience and achievement. Journal for Research in Mathematics Education, 26(2), 163-181.
Skaalvik, E. M., Federici, R. A., & Klassen, R. M. (2015). Mathematics achievement and self-efficacy: Relations with motivation for mathematics. International Journal of Educational Research, 72, 129-136. doi:10.1016/j.ijer.2015.06.008

115
Star, J. R., Chen, J. A., Taylor, M. W., Durkin, K., Dede, C., & Chao, T. (2014). Studying technology-based strategies for enhancing motivation in mathematics. International Journal of STEM Education, 1(7), 1-19.
Tarmizi, R. A., & Tarmizi, M. A. (2010). Analysis of mathematical beliefs of Malaysian secondary school students. Procedia Social and Behavioral Sciences, 2, 4702-4706.
Thien, L. M., & Ong, M. Y. (2015). Malaysian and Singaporean students' affective characteristics and mathematics performance: evidence from 2012. SpringerPlus, 4, 563-577. doi:10.1186/s40064-015-1358-z
Walter, J. G., & Hart, J. (2009). Understanding the complexities of student motivations in mathematics learning. The Journal of Mathematical Behaviour, 162-170. doi:10.1016/j.jmathb.2009.07.001
Wigfield, A., & Eccles, J. S. (2000). Expectancy-value theory of achievement motivation. Contemporary Educational Psychology, 25, 68-81. doi:10.1006/ceps.1999.1015
Yu, R., & Singh, K. (2016). Teacher support, instructional practices, student motivation, and mathematics achievement in high school. The Journal of Educational Research, 1-14. doi:10.1080/00220671.2016.1204260
Hayashi, Y., et al. (Eds.) (2017). Workshop Proceedings of the 25th International Conference on Computers in Education. New Zealand: Asia-Pacific Society for Computers in Education
116
What Influence Teachers’ Satisfaction Towards E-Learning? A Synthesis of the
Literature Mei Lick CHEOKa*, Su Luan WONGb , Mohd Ayub AHMAD FAUZIc
& Mahmud ROSNAINId
aMalay Women Teacher Training Institute, Melaka, Malaysia b c dUniversiti Putra, Malaysia
Abstract: The e-learning system being used in the Malaysian schools is known as the Frog Virtual Learning Environment (VLE). The availability of the system has allowed for blended learning to take place. However, there is an obvious gap between the enthusiasm of the Ministry and results of the some studies carried out that have shown a poor uptake of the Frog VLE in schools. Levels of adoption of the VLE by the teachers have been disappointing. This paper investigates factors that are critical in influencing satisfaction towards the Frog VLE. As satisfaction influences continuation of future usage intention and behaviour, it makes sense for policymakers and relevant stakeholders to know and understand factors that could bring about teachers’ satisfaction.
Keywords: satisfaction, teachers, virtual learning environment
1. Introduction
A comprehensive review of the education system in Malaysia found that despite the massive expenditure on the Smart School; an ICT project which started in 1999 and completed in 2010, 80 percent of the teachers used ICT less than an hour per week (as cited in Ministry of Education, 2012). Even when ICT was used, it was limited to word processing applications. The review process preceded the formation of the Malaysian Education Blueprint (MEB). This Blueprint is a document that provides the vision of the education system which the country needs and deserves. It suggests 11 strategic and operational shifts in order to achieve the vision. One policy shifts stated in the MEB is to leverage on ICT in order to improve the learning quality across Malaysia. As a result 1BestariNet project was created in order to provide access to a single learning platform and a high-speed 4G internet connectivity to all 10,000 schools nationwide. All the schools in Malaysia have internet access and a learning platform via the 1BestariNet project. The learning platform provides a cloud- based virtual learning platform known as the Frog VLE, a United Kingdom’s designed application created to ease lesson plan development, facilitate administrative tasks, and allow students to access learning resources.
Despite the enthusiasm, RM663 million spent on the 1BestariNet project, it is suffering from lack of usage (National Audit Department, 2013). There has not been corresponding increase of usage in technology among the teachers. The report revealed that usage of the FROG VLE by teachers, students and parents was between 0.01 percent and 4.69 percent. Daily utilisation of the VLE by teachers was found to be between 0.01 percent and 0.03 percent. This suggests that the VLE is hardly used by most teachers. Irfan Naufal Umar and Mohd Tarmizi Mohd Yusoff (2014) in their study highlighted Malaysian teachers as being highly competent in using the internet application for searching and sharing information, using the word processor, spreadsheet and slide presentation but they lacked the skills in doing the more advanced applications like producing graphics, animations and multimedia design. The biggest challenge to e-learning seems to be the lack of competent academics, whereby nearly two third of academic
117
members in the public universities have reported low motivation to incorporate e-learning tools in their teaching and learning (Adnan & Zamari, 2012).
Policy makers need to do away with the beliefs that by providing access to the e-learning, it would lead to major changes in the classroom teaching and learning. The presence of a new innovation despite its promises of greater benefits, does not automatically translate into actual usage. This proves that the cause of failure or lack of usage is still poorly understood.
2. End User Satisfaction
End-user satisfaction is a concept which suggests that an information system which meets the needs of its users will reinforce satisfaction towards the system. Satisfaction of users towards their information system is a potentially measurable and generally acceptable, surrogate for utility in decision making. End-user satisfaction does not only measure a system’s success, it also looks at how users view their information system rather than the technical quality of the system. So no matter how good a system is, if users perceived it as poor, then it is considered poor. If the system does not provide the required needs, it will create dissatisfaction and forces the users to walk away from the system. Some findings from recent studies also indicated that users are rarely satisfied with the functionalities of new e- learning systems and are worried with the problems of integrating the system with other organisational systems (Russell, 2005). User dissatisfaction with newly introduced systems, mismatches between a new technology and existing work practices, underestimating technological complexity and inefficient end-users support are just some of the many issues raised concerning the e- learning (Bondarouk, 2006). Users’ satisfaction towards their information system is a measurable and acceptable surrogate for utility in decision making instead of its technical quality (Bai, Law & Wen, 2008).
Users’ satisfaction is not a new concept as many studies have been carried out in an effort to understand its antecedents and consequences. However, current studies are needed as situations and environment are fast changing. Now, we hardly find users who interact with service personnel, instead users are dealing directly with the technology adopted. So new findings are needed to find out what affect users’ perceptions of quality and the values that they placed in their interactions with the technology in place. Factors that lead to satisfaction are often difficult to be isolated and recognized, due to their complex inter-relationships (Mahmood, Burn, Gemoets, & Jacquez, 2000). Despite that we still need to examine teachers and beliefs they hold about teaching, learning and technology. Integration of computers in the educational system will never be possible without reconciliation between teachers and computers. To encourage teachers to use computers, we need to study teachers and what make them use computers. Research into the factors that predicts satisfaction could shed light into what the teacher training division and management need to focus, what aspects matter most to their teachers in order to encourage continuous and increased participation and usage.
3. Research Method
A comprehensive search of satisfaction on eLearning literature from 2000 to the present was conducted by the author. Articles from journals, books and conferences relevant to the topic were identified and selected for this review using the following criteria. Key concepts from the studies were translated into the literature review.
4. Factors that lead to Satisfaction among Teachers
Teachers in general face various glitches and challenges as they learn to use and familiarize themselves with any new technological instructional activities in the classroom. System satisfaction is defined as a cognitive discrepancy between the feelings prior to and after the use of system; when users obtain a better feeling after using the system, they will be satisfied and be willing to continue to use the system (Doll & Torkzadeh,1991). When users’ satisfaction falls short
118
of their expectations, psychologically, they will reject the system and will refrain from using it (Seddon,1997). Factors affecting end user satisfaction are of critical importance to researchers. It is important to recognize and discuss major determinants of satisfaction in order to be able to have a better understanding of the phenomenon. The predictors most widely studied and related to satisfaction among teachers are computer attitude, internet self-efficacy, computer anxiety, perceived usefulness, perceived ease of use, interaction, flexibility, school management support, training and internal ICT support. These ten factors are grouped under three headings. Teachers’ characteristics include computer attitude, computer anxiety and internet self-efficacy, while learning management system characteristics will focus on perceived use, perceived ease of use, interaction and flexibility. Finally, If we expect to see growth in e-learning, in the Malaysian education landscape, then the intangible things like perception of the users; specifically the teachers are equally important as the infrastructure.
4.1. Organisational Characteristics
The responsibility of today’s educational leaders is to identify, design and implement appropriate paradigms that are capable of using this mechanism to bring the vision as established in our Malaysian Blueprint to fruition. The importance of the interplay between the organisation and the adoption and implementation of new technology cannot be underestimated. Organisational support represents the degree to which employees perceive that their employers support their participation in the development activities and value their learning through supportive organisational policies such as skill-based pay systems and visible rewards. In accordance with the technology acceptance model, facilitating conditions like training and financial resources have been found to have a direct effect on perceived usefulness when using a system (Wang, Lin & Luarn, 2006). However, a study by Teo and Wong (2013), showed no direct influence of facilitating conditions (training, technical support, peer and organisational support) on satisfaction. Therefore, an understanding of organisational contributions to the success of technology innovation is important as it can better prepare educational leaders to embrace the responsibilities that are required of them.
4.1.1. School Management
Management in schools must create conditions in which educators can continue to grow and learn as professionals. Management support is the key factor in determining teachers’ satisfaction towards LMS. Their opened approval, and clear identification of how LMS aligned with the school’s vision, are just some of the examples of how management can encourage adoption. A number of past studies have revealed significant relationship between supportive learning environment and satisfaction (Joo, Joung & Son, 2014). The environment as dictated by the management in schools, are crucial, as it facilitates the diffusion process of an innovation. School administrators are seen as key in the implementation of e-learning environments in their schools. It is because through their leadership, provision of training, tools and support can be provided for their teachers. These are essential for a successful implementation. There is a consensus in the literature that management must define a clear strategy for any innovation that would be introduced in order to provide that vision of a common goal. A clear and a well-communicated strategy can help to avoid fragmented and small pockets of adoption (Stiles & Yorke, 2006). Therefore, lack of institutional support may hinder the widespread adoption.
4.1.2. Technical Support
Technical support is deemed essential in the use of a learning management system (Zhao & Bryant, 2006). Without having a quick technical support or knowledge, it may lead to problems and frustrations among the users. Troubleshooting skills are important if ICT is to be used as a reliable tool. Besides relying on technical support alone, teachers are also expected to be self-reliant and to take the initiatives to improve their capabilities. Technology support has been found to have great impact on educators’ use of technology as it can boost technology use and acceptance, thus increase likelihood of ICT integration in the teaching and learning processes
119
(Sanchez & Hueros, 2010). Teachers need a reliable on-site technology support for their day-to-day use of ICT. The paper also found a significant relationship between technical support and professional development which suggests that technical personnel can help teachers to grow and develop their knowledge and skills as the integration process develops.
4.1.3. Training
End-users come replete with ingrained habits of feelings, thoughts and actions (Nelson & Cheney, 1987). To change through training, their normal habits have to be questioned first. Introduce other methods which allow users to experiment with new ways of behaving. Thus, if they find this new way to be more useful, chances are they will continue with this new behaviour. Therefore, trainings designed for end-users must consider their specific job performance’s needs and job satisfaction. This must be taken care of before providing them with the most relevant and efficient system and training programmes that are appropriate in their context (Lee, Kim & Lee, 1995). A large amount of training and support for users are needed to help them to be comfortable with the new system and to train them to effectively use ICT in the classroom (UNESCO, 2014). Faculty members were not eager to integrate technology into their classes due to their technological incompetence. They need to be guided in order to overcome their own fears of technology. Knowledge and skills obtained from training, empower teachers to carry out their work effectively and efficiently and this will result in a positive effect on end-user computing satisfaction (Aggelidis & Chatzoglou, 2012).
4.2. Virtual Learning Environment Characteristics
Many studies on the use of VLE has focused on the relationship between VLE quality and satisfaction with the system as information and system quality have been shown to influence satisfaction (Bailey & Pearson, 1983; DeLone & McLean, 1992). Instructors’ satisfaction towards the VLE may be impacted to a great extent by system quality. The more functionality and interactivity for example, the better will be its acceptance and utilization. As such, designers should continuously look for opportunities to further improve e-learning platform even those that have already been implemented. A number of characteristics of a system have been proposed and examined in prior studies.
4.2.1. Interaction
Interaction is the key to the continued use of an e-learning system (Pituch & Lee, 2006). Although there are a few studies that suggest otherwise, many other studies claimed it to be a key component of an effective online course (Arbaugh & Rau, 2007). In some studies which looked at student-student interaction, they claimed that interaction helped in creating a sense of community which is an important aspect for the teachers especially when having to learn and use a new innovation in their classrooms (Liu, Magjuka, Bonk & Lee, 2007). Collaboration resulted from interaction between students and instructor or between students through the email, bulletin board and the chat room on the VLE have been found to increase students’ satisfaction (Lonn & Teasley, 2009). When students are involved in intellectual exchange with their fellow peers and instructor, they are given the opportunity to articulate their current understanding and refining that understanding after knowing what the others in their online community have in mind. A study which looked at three types of interaction; learner- content, learner-instructor and learner-learner were studied in an attempt to identify predictors of satisfaction in online education courses (Kuo, Walker, Schroder and Belland, 2014). It found learner- content and learner-instructor to be significant predictors of student satisfaction but learner-content was found to be the strongest predictor of the three.
4.2.2. Flexibility
Flexibility is also crucial in promoting satisfaction as it gives students that anytime anywhere access to course content (Selim, 2003). In e-learning context, flexibility in terms of time, location, instructional methods, participation and satisfaction are to be expected. Amongst others, it
120
eliminates physical barriers and awkwardness of the traditional face-to-face communication. Lu and Chiou (2010) conducted a study on the impact of contingent variables between four predictors and students’ satisfaction with e-learning. They found three significant predictors of e-learning satisfaction, perceived flexibility is amongst them. In another study, Sun et. al. (2008) found flexibility is a strong indicator of student satisfaction. This is explained by the fact that many respondents were in continuing education; balancing job, family and work-related activities. Not constrained by time, space and location, students have a high degree of flexibility when enrolled in an e-learning course. Arbaugh (2000) examined factors related to student satisfaction with internet-based courses among students who were doing their graduate management in education. It also found that flexibility had a significant role in predicting satisfaction towards the courses. Flexibility-based advantages like any time and any where are important features for distance-learning mature students in this study.
4.2.3. Perceived Ease of Use
Perceived ease of use refers to the degree to which an individual believes that using a particular system would be free from physical and mental effort (Davis, 1989). It is often considered as a predictor of satisfaction (Aggelidis & Chatzoglou, 2012). The complexity of an information system will definitely hinder acceptance of the system. A study carried out by Teo and Wong (2013) to explore key drivers of e-learning satisfaction among student teachers and found six variables that influence e-learning satisfaction; satisfaction, instructor, perceived usefulness, perceived ease of use, course delivery and facilitating conditions. Analysis of findings confirmed the significant direct influence of perceived ease of use on satisfcation, and it is also has the strongest influence. As such, the researchers suggest e-learning conditions to be managed in such a manner that users need not use much effort to utilise the system. However, they also caution the interdependence of all the variables studied, which means no variable was independent of each other. Therefore, understanding of the key drivers of e-learning satisfaction is important as it will help stakeholders to further maintain or sustain the e-learning satisfaction.
4.3. Perceived Usefulness
Perceived usefulness is defined as the degree of improvement after adoption of a system. When users perceive e-learning to be useful in acquiring the desired skills and knowledge, they are more likely to use the system. Previous studies have shown that perceived usefulness has a positive usefulness on users’ intention to use a particular system (Luan & Teo, 2009). It has also been shown to have a direct impact on satisfaction (Sun, Tsai, Finger, Chen & Yeh, 2008). A study has found teachers’ behavioural beliefs positively predict the usefulness and ease in which the e-learning is used and they found perceived usefulness significantly influenced student teachers’ satisfaction with e-learning (Kao & Tsai, 2009). A study looking at four variables believed to have an impact on website satisfaction and intention to re-use; information quality, system quality, perceived usefulness and social influence. They found perceived usefulness to be a significant predictor of website satisfaction (Schaupp, 2010). They suggest organisation to understand users’ needs in order to design a website that would be considered relevant and useful. As they found satisfaction to be a significant predictor of intention to re-use, aligning website designs to users’ needs is the most appropriate thing to do.
4.4. User Quality
Users form different perceptions of an e-learning system due to individual attributes. Individual characteristics have been found in previous studies to influence instructors’ adoption of the learning system (Teo, 2009). There is a need to examine the opinions of the instructors and their beliefs as their beliefs will influence their technology integration practices (Ottenbreit-Leftwich et al., 2010). In this study, computer attitude, computer anxiety (Harrison & Rainer, 1996) and internet self-efficacy are posited as three factors that are expected to influence satisfaction towards e-learning.
121
4.4.1. Computer Attitude
Technology-push approaches must consider users’ individual differences, personal characteristics, opinions and learning styles (Akkoyunlu & Yilmaz-Soylu, 2008). The attitude that end-users bring in dealing with the e-learning environment is an important factor (Albirini, 2006). Those who have positive attitudes toward technology are more comfortable in using it and thus, are prepared to overcome any challenges. Significance of attitude was derived from the proposition of attitude theorists, Fishbein & Azjen (1975) who claim that users’ attitude towards the system that they are using play an important role in influencing their subsequent behaviour towards it. Attitude represents beliefs and feelings that they have towards something. The more positive they are towards the LMS, and they are not afraid of the challenges and complexity of using the system, the more satisfied they will be with the VLE. However, research also caution that attitude can either be changed through training (Pancer, George & Gebotys, 1992) or it can also be stable and unchanging. Igbaria and Nachman’s (1990) study found significant relatiosnhip between attitude and user satisfaction. According to the Theory of Reasoned Action, an individual’s attitude towards an object plays a important role in influencing his or her subsequent behaviour towards it. As such, we can conclude that teachers’ attitude towards the Frog VLE is an important indicator of satisfaction.
4.4.2. 4.4.2 Internet Self-Efficacy
Self-efficacy reflects one’s beliefs about the ability to perform certain tasks successfully (Bandura, 1977). Unless teachers believe that they are capable of implementing the innovation in the classroom, that innovation will remain intact and unused. Those who believe strongly in their own ability will persevere despite setbacks and will continue in spite of technical difficulties. It is a belief that one has towards one’s own capabilities in performing a particular task (Compeau & Higgins, 1995). Success in using the technology will depend on users’ ability to cope with technical difficulty and it is a testament of their confidence in using technology to engage in learning (Gunawardena, Linder- VanBerschot, LaPointe & Rao, 2010). Kuo and Tseng (2014) in his study of 221graduate and undergraduate students found that Internet Self Efficacy was not a significant predictor for student satisfaction although positive correlation between them was found. On the other hand, Gunawardena et al. (2010) examined factors that predict learner satisfaction and transfer of learning in an online educational programme at a multinational corporation. They found online self-efficacy to be the strongest predictor of learner satisfaction. Some other past studies have also found different roles of self-efficacy in an online learning like being the only statistically significant variable that predict learners’ intent to participate in future web-based courses and to show acceptance of online education in high-tech companies among employees (Ong, Lai & Wang, 2004).
4.4.3. Computer Anxiety
Anxiety or fear of computers is described as a powerful and widespread psychological phenomenon (Igbaria & Parasuraman, 1989). Computer-related anxiety remains an important issue as the number of online courses have increased over the past few years. Fear and panic inflicted whenever one has to deal with the system will naturally hamper one’s satisfaction level. According to Barbeite and Weiss (2004), anxiety is an emotional fear of potential negative outcomes. A study examining key factors that influence 82 instructors’ satisfaction of LMS in blended learning found that amongst others, instructors’ computer anxiety negatively impacts satisfaction of LMS. It also found that this variable was the key factor in influencing instructors’ satisfaction of LMS. The study proposed for organisations to investigate the causes of computer anxiety in order to eliminate it if they want to improve the adoption of LMS in their organisations Al-Busaidi and Al-Shihi (2012).
5. Satisfaction Model
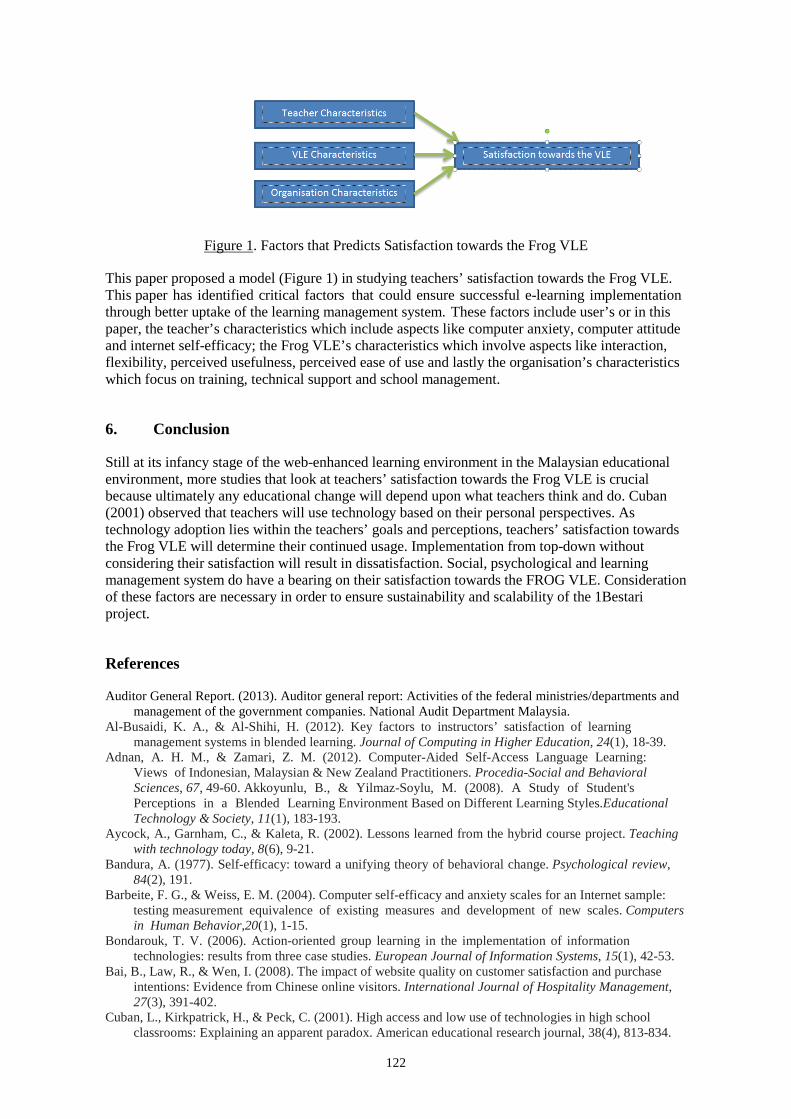
122
Figure 1. Factors that Predicts Satisfaction towards the Frog VLE
This paper proposed a model (Figure 1) in studying teachers’ satisfaction towards the Frog VLE. This paper has identified critical factors that could ensure successful e-learning implementation through better uptake of the learning management system. These factors include user’s or in this paper, the teacher’s characteristics which include aspects like computer anxiety, computer attitude and internet self-efficacy; the Frog VLE’s characteristics which involve aspects like interaction, flexibility, perceived usefulness, perceived ease of use and lastly the organisation’s characteristics which focus on training, technical support and school management.
6. Conclusion
Still at its infancy stage of the web-enhanced learning environment in the Malaysian educational environment, more studies that look at teachers’ satisfaction towards the Frog VLE is crucial because ultimately any educational change will depend upon what teachers think and do. Cuban (2001) observed that teachers will use technology based on their personal perspectives. As technology adoption lies within the teachers’ goals and perceptions, teachers’ satisfaction towards the Frog VLE will determine their continued usage. Implementation from top-down without considering their satisfaction will result in dissatisfaction. Social, psychological and learning management system do have a bearing on their satisfaction towards the FROG VLE. Consideration of these factors are necessary in order to ensure sustainability and scalability of the 1Bestari project.
References
Auditor General Report. (2013). Auditor general report: Activities of the federal ministries/departments and management of the government companies. National Audit Department Malaysia.
Al-Busaidi, K. A., & Al-Shihi, H. (2012). Key factors to instructors’ satisfaction of learning management systems in blended learning. Journal of Computing in Higher Education, 24(1), 18-39.
Adnan, A. H. M., & Zamari, Z. M. (2012). Computer-Aided Self-Access Language Learning: Views of Indonesian, Malaysian & New Zealand Practitioners. Procedia-Social and Behavioral Sciences, 67, 49-60. Akkoyunlu, B., & Yilmaz-Soylu, M. (2008). A Study of Student's Perceptions in a Blended Learning Environment Based on Different Learning Styles.Educational Technology & Society, 11(1), 183-193.
Aycock, A., Garnham, C., & Kaleta, R. (2002). Lessons learned from the hybrid course project. Teaching with technology today, 8(6), 9-21.
Bandura, A. (1977). Self-efficacy: toward a unifying theory of behavioral change. Psychological review, 84(2), 191.
Barbeite, F. G., & Weiss, E. M. (2004). Computer self-efficacy and anxiety scales for an Internet sample: testing measurement equivalence of existing measures and development of new scales. Computers in Human Behavior,20(1), 1-15.
Bondarouk, T. V. (2006). Action-oriented group learning in the implementation of information technologies: results from three case studies. European Journal of Information Systems, 15(1), 42-53.
Bai, B., Law, R., & Wen, I. (2008). The impact of website quality on customer satisfaction and purchase intentions: Evidence from Chinese online visitors. International Journal of Hospitality Management, 27(3), 391-402.
Cuban, L., Kirkpatrick, H., & Peck, C. (2001). High access and low use of technologies in high school classrooms: Explaining an apparent paradox. American educational research journal, 38(4), 813-834.
123
Compeau, D. R., & Higgins, C. A. (1995). Computer self-efficacy: Development of a measure and initial test. MIS quarterly, 189-211.
Doll, W. J., & Torkzadeh, G. (1991). The measurement of end-user computing satisfaction: theoretical and methodological issues. MIS quarterly, 5-10.
Gunawardena, C. N., Linder-VanBerschot, J. A., LaPointe, D. K., & Rao, L. (2010). Predictors of learner satisfaction and transfer of learning in a corporate online education program. The Amer. Jrnl. of Distance Education,24(4), 207-226.
Igbaria, M., & Nachman, S. A. (1990). Correlates of user satisfaction with end user computing: an exploratory study. Information & Management, 19(2), 73-82.
Igbaria, M., & Parasuraman, S. (1989). A path analytic study of individual characteristics, computer anxiety and attitudes toward microcomputers. Journal of Management, 15(3), 373-388.
Joo, Y. J., Joung, S., & Son, H. S. (2014). Structural relationships among effective factors on e-learners’ motivation for skill transfer. Computers in Human Behavior, 32, 335-342.
MOE Malaysia, 2012. Education Blueprint 2013-2025. Mahmood, M. A., Burn, J. M., Gemoets, L. A., & Jacquez, C. (2000). Variables affecting
information technology end-user satisfaction: a meta-analysis of the empirical literature. International Journal of Human-Computer Studies, 52(4), 751-771.
Nelson, R. R., & Cheney, P. H. (1987). Training end users: an exploratory study. MIS quarterly, 547-559. Ong, C. S., Lai, J. Y., & Wang, Y. S. (2004). Factors affecting engineers’ acceptance of
asynchronous e- learning systems in high-tech companies. Information & management, 41(6), 795-804.
Pancer, S. M., George, M., & Gebotys, R. J. (1992). Understanding and predicting attitudes towards computers. Computers in Human Behavior, 8(2-3), 211-222.
Russell, C. (2009). A systemic framework for managing e-learning adoption in campus universities: individual strategies in context. Research in learning technology, 17(1).
Seddon, P. B. (1997). A respecification and extension of the DeLone and McLean model of IS success. Information systems research, 8(3), 240-253.
Sánchez, R. A., & Hueros, A. D. (2010). Motivational factors that influence the acceptance of Moodle using TAM. Computers in human behavior, 26(6), 1632-1640.
Shiller, R. J. (2003). From efficient markets theory to behavioral finance. The Journal of Economic.
Tseng, F. C., & Kuo, F. Y. (2014). A study of social participation and knowledge sharing in the teachers' online professional community of practice. Computers & Education, 72, 37-47.
Teo, T., & Wong, S. L. (2013). Modeling key drivers of e-learning satisfaction among student teachers. Journal of educational computing research, 48(1), 71-95.
Umar, I. N., & Yusoff, M. T. M. (2014). A study on Malaysian Teachers’ Level of ICT Skills and Practices, and its Impact on Teaching and Learning.Procedia-Social and Behavioral Sciences, 116, 979-984.
Wang, Y. S., Lin, H. H., & Luarn, P. (2006). Predicting consumer intention to use mobile service. Information systems journal, 16(2), 157-179.
Zhao, Y., & Bryant, F. L. (2006). Can teacher technology integration training alone lead to high levels of technology integration? A qualitative look at teachers’ technology integration after state mandated technology training. Electronic Journal for the Integration of Technology in Education, 5(1), 53-62.
Hayashi, Y., et al. (Eds.) (2017). Workshop Proceedings of the 25th International Conference on Computers in Education. New Zealand: Asia-Pacific Society for Computers in Education
124
Teacher Identity: Influence of Emerging Trends
Arit UYOUKO*, Sylvester Dominic UDO & Doris Godwin ASUQUO College of Education, Afaha Nsit, Nigeria
Abstract: Using a qualitative research method, the study aims to analyze the teacher identity and how such an identity is being influenced by current technology trends in educational practice. Sample of the study was composed of five teachers, with teaching experiences of 8 to10 years. The interview technique was used as the data collection instrument. The recorded interviews were transcribed and analysis was carried out on this dataset. The result showed that teachers form their professional identity based on the expectations and conditions after they take up appointment as teachers, identities continue to change and develop along practice, societal recognitions, as well as life experiences. Further, findings of the study are discussed as reflection of teachers’ work environment and development.
Keywords: Teachers’ identity; teachers’ professional development; technology, ICT.
1. Introduction
Teachers in the 21st century are different from years gone by. The forceful growth of Information and Communication Technology (ICT) in education redirects the focus of teaching and learning. The emergence of technology in the classroom has opened up a whole new world of investigation into the issue of effective teaching (Rahimi & Yadollahi, 2011). ICT plays a significant role in facilitating educational change reforms, teachers therefore have become the agents of change. As agents of change, if teacher become ICT literate, they would make a lot of positive attitude to computer use and information technologies (Kpai, Joe-Kinanee, & Ekeleme, 2012). Beijaard, Verloop, & Vermunt (2000), maintains that teachers' perceptions of their own professional identity affect their efficacy and professional development as well as their ability and willingness to cope with educational change and to implement innovations in their own practice about teaching. One major rationale behind the ICT’s failure in teaching is teacher resistance to ICT. Carnoy (2014) argues that difficulties are the consequences of the lack of training, as many teachers feel uncomfortable because they do not have both the necessary ICT abilities and the specific training to use the new resources in the classroom environment.
Research studies have repeatedly put forward the question as to what variables determine the integration of ICT in teaching and learning (Jo Tondeur, Keer, Braak,& Valcke 2010). A number of studies have shown that teacher factors play a key role towards ICT integration in schools, research in ICT integration have failed to focus on the teacher identity building and teacher resilience in the face of change. Changing teaching practice is a challenging and laborious process that involves changing teachers’ existing beliefs and individual disciplines, in teaching and learning as well as reshaping their professional identity (Schutz, Cross, Hong & Osbon, 2007). Emerging new ways often involves teachers’ transition from traditional –“talk and chalk”, teacher-centered approach to student-centered and inquiry based instructions. Teachers have a key responsibility for their professional development, for they must realise that self-motivation and interest are the underlying factors for success in professionalism. This is especially important in areas of rapid change such as the educational application of ICT and the use of networks and other ICT innovations to support the flow of knowledge that is crucial in enhancing teaching capabilities (Albion, Tondeur, Forkosh-Baruch & Peeraer, 2015).
Therefore, Leask and Younie (2013) question then, if teacher quality is accepted as a critical factor in educational outcomes, why is there so little attention paid to improving the quality
125
of teachers’ professional knowledge for ICT integration. In view of the rapid changes occurring in ICT and the relative lack of related transformation in education, the need for effective Teacher Professional Development (TPD) in relation to ICT is apparent but it is less clear what TPD would be most beneficial and how it should be most effectively delivered (Albion, Tondeur, Forkosh-Baruch, & Peeraer, 2015). Gaps in usage and outcomes have been identified globally. Some of these gaps may be explained in terms of teachers’ digital competence and ICT acceptance. Learning and developing a craft of teaching is an ongoing process throughout a teachers’ teaching career. With the fast pace of technology changes globally, one area of development employers expect to see in teachers’ practices is an up to date use and knowledge of ICT tools in teaching and learning, an expectation teachers need to address throughout their practicing career. The study aims to explore two key research questions:
i. How does teacher professional identity affect ICT Integration? ii. What influences a teachers’ resilience?
2. Teacher Identity
Teacher identity is conceptualized generally as complex, dynamic, evolving, and emergent (Beijaard, Meijer, & Verloop, 2004). Trent (2014) views that teacher identities are created and recreated over time and influenced by an array of factors. Teachers are confronted with multi-faceted, constantly shifting, and unstable definitions of themselves. Pillen, den Brok, and Beijaard, (2013) further explains that the process of identity creation takes place throughout a working life, it is in pre-service and early-career stages where identities are most volatile, tensions experienced in teacher education commonly continue into early-service practice. The processes of reconciliation of the personal and professional dimensions of what it means to be a teacher are conflicts that can have consequences not only for current learning but also longer term career (Henry, 2016). Teacher “identities refer to the different views that individuals have about themselves as teachers in general, and how this view changes over time and in different contexts” (Dworet, 1996, p.67). Beijaard Verloop and Vermunt (2000) propose an idea where teachers’ professional identity is a framework established and maintained through the interaction in social situations, and negotiation of roles within the particular context. Cross and Hong (2009) explain that, the way teachers perceive themselves influences their choice of action and judgment, thereby making identity a critical factor in understanding teachers’ classroom behaviors.
For teachers, their professional identities embody how teachers view themselves in their instructional role and how they represent themselves to their students and colleagues. These mental representations of themselves are intimately intertwined with emotions. What teachers believe constitute knowledge and the process through which students obtain this knowledge informs the ways they manipulate learning in the classroom and their responsibilities in the teaching learning process. The teacher’s professional identity is an essential element in understanding teachers’ behavior, judgment, and subsequent emotional experiences in the classroom. Implementing reform policies and practices ultimately ask teachers to reshape their professional identities by adopting different roles and perspectives. Several studies have noted this procedure, and emphasized teachers’ professional identity as one of the most important factors for successful implementation of a reform agenda (Cross & Hong, 2009). The importance of teacher identity, the experiences of individual teachers, how they go about their work and how this influences their professional practice will be investigated in this study.
2.1. Teachers’ Resilience
Resilience is understood as dealing with a process (Bobek, 2002; Masten, Best, & Garmezy, 1990), a capacity or ability to resist and overcome challenges (Sammons, Day, Kington, Gu, Stobart, & Smees, 2007). The definition of resilience is multidimensional and complex. There is no universally accepted definition of resilience, but there are some defining and determining features such as bouncing back, overcoming adversity, adapting oneself . It is resilience that represents the capacity of teachers to rebound and understand the necessity for change and adaptation despite being through difficulty. Teacher resilience has three components; first, is the
126
individual teacher’s capacity to harness not only personal or psychological resources but also physical, social, and cultural resources. Second, is the process whereby characteristics of individual teachers and of their personal and professional contexts interact over time. Thirdly, resilience is evident in the outcome of a teacher who, despite facing challenges, experiences professional commitment, growth, wellbeing, and a ”strong sense of vocation, self-efficacy and motivation to teach” (Resilience Research Centre, 2014; Mansfield et al., 2014; Sammons et al., 2007, p. 694). Henderson and Milstein (2003) in their study defines a resilient teacher as one who gives of self in service to others and /or a cause, uses life skills, including good decision making, assertiveness, impulse control, and problem solving, and one who has the ability to be a friend, ability to form positive relationships, sense of humor, self-discipline, independence, positive view of personal future, flexibility, capacity for and connection to learning, personal competence (is good at something), self-motivation, and feelings of self-worth and self-confidence.
Earlier studies revealed that resilience developed through the rebounding qualities of self-esteem, self-efficacy, and support systems (Richardson, 2002). Day and Gu, (2007) view resilience as the ability to withstand difficulty and bounce back. Teachers with characteristics of resiliency are far more likely to persevere in adverse situations, they are far less likely to consider quitting the profession, and find it easier to adapt to change. This study therefore, attempts to add to the literature by providing empirical evidence on teacher resilience and examining beliefs, and perceptions of teachers with the aim of building a supportive professional development settings conducive for technology inclusion to make both teaching and learning more effortless. The study in doing so takes on the views of five teachers at different stages of their careers to explore the interaction between teachers’ professional and personal identities and their management of these interaction which they experiences in each professional life phase. Teachers’ capacity to manage such interplay is a challenging process which contributes strongly to the relative strength of their resilience in ICT emerging trends. Studies have revealed a range of challenges that may constrain teacher resilience in the classrooms (Beltman, Mansfield & Harris, 2016). Teachers may need to cater for students with difficult behaviour or individual learning needs, schools in low socio-economic status (SES) areas can be demanding and difficult to staff due to the presence of students with behavioural problems, low achievement, and multilingual backgrounds (Castro, Kelly, & Shih, 2010). Schools located in disadvantaged areas with limited resources and ICT facilities also add to the challenge. These challenges may force teachers in areas of low SES to stay on as teachers for a short period of time and such schools are likely to employ untrained teachers as staff members (Riddell, 2013). Unsupportive school leaders or lack of resources, problematic relationships with students’ and parents, heavy workloads and externally imposed regulations from school boards can also be a challenge (Eberso¨hn, 2012; Beltman et al., 2016).
3. Methods
To allow for a detailed examination of the relationship and interaction between teachers’ professional, personal identities and relative strength of their resilience in technology emerging trends, the author used a case study approach (Yin, 2009). The research questions required participants who were interested in making changes in their professional development and were willing to share and be open in speaking about both positive and negative experiences related to their teaching experience. Because such experiences might be difficult to talk about with a stranger, the author recruited participating teachers who had previous working relationship with the author in a professional development institute. Three out of five of the teachers, referred to in this paper as Stella, Julie and Sly, agreed to participate and speak freely. All teachers allowed me to inquire extensively into their experiences as they tried to enact changes, sharing their successes and their challenges and continuous struggles as teaching becomes redirected towards ICT integration. As such, these cases provided a suitable context for investigating the aforesaid research questions which also includes whether experiences played any role in these struggles. I see the case selection criteria as similar to that described by Lloyd (2008), whose case study subject was chosen “in light of his willingness to share his experiences, on one hand, and the interesting qualities of his experiences, on the other” (p. 167).
127
Semi-structured interview protocols were designed based on the research questions and participants’ stage in the teaching. Two paired (Evens & Houssart, 2007) and two individual interviews were administered and were also audio-taped. Core questions were pre-developed to explore participants’ perceptions and probes were used based on their answers. Pre-developed interview questions were guided by the main research questions, and sample interview questions included “How do you describe yourself as a teacher?” and “How do you view ICT as a tool in teaching?” The interviews were conducted over the course of a semester. Conducting the paired interview was like conducting a focus group interview, Julie and Sly were paired as they are in the same department. This was also to elicit more open and candid responses (Hatch, 2010). In such situations the participants assume a level of control in the conversation that will allow a good flexibility in the direction of the interview (Byers & Wilcox, 1991). The interview allowed the teachers to evaluate themselves and sort strategies they planned to follow in the integration of ICT in teaching and learning.
3.1. Participants
Stella, Julie and Sly, teach at the same teacher college in a suburban area near a state capital in the south part of Nigeria and also graduated from the same university in the city. Julie has 10 full years of teaching experience, while Stella and Sly have taught for eight years. The school enrolled approximately 2000 students in the first year level and has more females (65%) than male student population (35%). About 5% of students in the school have learning disabilities. All teachers have courses they have taught repeatedly over each school year as this has become a method for improving teaching practice and resilience.
4. Findings and Discussion
In this research two major issues stood out for the teachers. Firstly, teachers responded positively to reforms, because they believed that the very nature of the reform and their professional development places them on the path of success of technology integration. Even as studies suggest teachers interpret reforms to mean that their current performance is unsatisfactory and thus needs to be modified in order to increase achievement levels as they are ineffective in their jobs (Cross & Hong, 2009). Sly considers himself to be a successful teacher and the teaching profession quite rewarding. He responded quite favorably when asked about ICT integration in his class, but has his reservation of “its practicality, it can’t work with my class size,…this talk has been around for a while, too many reforms all in paperwork, it will be best for everybody, me, students, other teachers if they come to terms with how technology will be placed in the class, I sometimes think this people are not serious”. Sly considers himself as having good pedagogical skills and associates his student’s success with his skills. These skills, from his point of view he developed through professional training which included reform-based practices associated with science teaching and ICT devices, he has not used and has to improvise, he perceives the reform clamour from outside of the school community to mean that he was not an competent teacher, an assessment that poses a threat to both his teacher identity and efficacy and so elicited unpleasant feelings for a situation he didn’t cause. He wasn’t taught in his school days with ICT tools but accepted the new learning approach. He concludes “I am very frustrated and just angry with the whole process, I want to give my best but in the present circumstance what do I do?” When teachers experience unpleasant emotions in the process of implementing their classroom goals, the result may be emotion-induced action or inaction, feelings of frustration may lead teachers to be less creative and innovative in seeking solutions and developing alternative teaching strategies to meet the goal (Cross & Hong, 2009). It is believed that education managers and administrators can also enable teacher resilience in a number of ways. By taking up this critical role they can support teacher through developing collaborative and supportive school communities, teachers need recognition and affirmation (Day & Gu, 2014). Hong, (2012) posit that such communities can have a positive impact on teachers’ efficacy and job satisfaction. Administrators can enable teachers to exercise autonomy, teachers’ enthusiasm and persistence improve (Taylor, 2013). To facilitate the development of resilience ‘that is essential if teachers are to thrive in the profession’ (Buchanan, Prescott, Schuck, Aubusson,
128
& Burke, 2013, p. 126). Building positive relationships with teaching colleagues and both formal and informal mentors can also support teachers (Cameron & Lovett, 2015).
Dahiya (2004) views teaching as a social phenomenon, involving a series of actions, actions held together and formed to uplift an individual by enabling him/her to acquire knowledge, skills, and attitudes. Teaching is a profession or service of a community or group of individuals known as teachers. Maphalala, (2014) stresses various professional components like competence, professional motivation, work stress, accessibility, dedication, enthusiasm, professional conduct, as greatly influencing the teaching profession. The second issue in the findings was teacher identity formation, answering the question how do you view yourself as a teacher? For Stella and Julie, both did not set out to be teachers but found themselves in the profession out of “nothing else to do”, and had no prior professional training as teachers. Questioning her choice of career, Julie responded, “I think I am a lot more secured now. She tells how, initially arriving home each day, I felt so tired and dejected. I will ask myself “how did I end up with this job?” and “do I really want to do be a teacher?” she says, “I felt hopeless.” Stella’s challenge is on focusing and embracing the job, “I have had a lot of thoughts about whether the teaching profession suits me eight years on and I am still not sure I want to be here”. In the midst of identity conflicts, Stella is concerned about performing her teacher duties in the way that she wants to. It may appear as though her lack of interest in the profession has little to do with the ICT integration and classroom practice. But Stella says, ‘I tried desperately to focus on my course preparation because I did not want my work performance to decline in any way due to me’. “I am struggling to hold it in”, “Then I have to work with technology and the training is so tasking”
The interview has revealed a lot about Stella’s identity experiences of becoming a teacher. Ms. Stella has still not recognized herself as a teacher in her terms even though this is the identity that she tries to maintain while in and out of the school. In line with Carter and Doyle (1996) who suggest that “the process of learning to teach, the act of teaching and teachers’ experiences and choices are deeply personal matters inexorably linked to their identity and life story” (p. 120). They further suggest that becoming a teacher means (a) transforming an identity, (b) adapting personal understandings and ideals to institutional realities, and (c) deciding how to express one’s self in classroom activity” (p. 139). Individuals who bring themselves into the classroom have to become aware of and understand their professional identities because doing so has implications for their practice (Farrell, 2015).
5. Conclusion
The insights generated by this study have wider implications for teacher professional development. The present study fills an important gap by focusing on identities that are articulated in inter-personal dialogue and which reveal personal transformations of individuals for technology integration. For the participants it is a shift from who they were onto who they have to be, building and developing an identity of self and societal expectations, working under set regulations and conformity, also revealing how experiences of being a teacher and the emotions connected with such experiences can easily change. Findings from Buchanan et al., 2013 have demonstrated the importance of reflection, responsiveness and resourcefulness for teacher retention, in 21st century classroom. The development of skills for ICT integration and handling of identity experiences can have a similarly positive effect.
In Henry’s (2016) view, when individual teachers ask personal questions such that will allow them make connections between who they are and what they do in their classrooms, schools, and beyond, then may be it would not be a destabilizing and emotionally charged experience, but a focus of building a professional identity alongside emerging new technology in teaching and learning.
5.1. Limitation
This study is limited by a small sample size and single point of data collection. A study of five teacher’s identity transformations is not a representation in views of teachers in the whole country,
129
or other individuals in other settings. Therefore, if the insights generated by the study are to be of wider value in teacher identity and ICT integration, further case study research is required.
References
Albion, P. R., Tondeur, J., Forkosh-Baruch, A., & Peeraer, J. (2015). Teachers’ professional development for ICT integration: towards a reciprocal relationship between research and practice. Education and Information Technologies, 20(4), 655-673.
Beijaard D., Verloop N., Vermunt J.D. (2000) Teachers’ perceptions of professional identity: an exploratory study from a personal knowledge perspective. Teach Teach Educ 16(7):749–764.
Beijaard, D., Meijer, P. C., & Verloop, N. (2004). Reconsidering research on teachers’ professional identity. Teaching and Teacher Education, 20, 107-128.
Beltman, S., Mansfield, C. F., & Harris, A. (2016). Quietly sharing the load? The role of school psychologists in enabling teacher resilience. School Psychology International, 37(2), 172-188.
Bobek, B. L. (2002). Teacher resiliency: A key to career longevity. Clearing House, 75(4), 202-205. Buchanan, J., Prescott, A., Schuck, S., Aubusson, P., & Burke, P. (2013). Teacher retention and attrition: Views of early career teachers. Australian Journal of Teacher Education, 38(3), 112–129. Byers, P. Y., & Wilcox, J. R. (1991). Focus groups: a qualitative opportunity for researchers. Journal of
Business Communication, 28(1), 63-78. Carter, K, & Doyle, W. (1996) Personal narrative and life history in learning to teach. In J. Sikula, T.J.
Buttery, & E. Guyton (eds.), Handbook on Research in Teacher Education. New York: Simon & Schuster Macmillan
Castro, A. J., Kelly, J., & Shih, M. (2010). Resilience strategies for new teachers in high-needs areas. Teaching and Teacher Education, 26(3), 622–629.
Cross, D.I., & Hong, J. Y. (2009). Beliefs and Professional Identity: Critical Constructs in Examining the Impact of Reform on the Emotional Experiences of Teachers. In P.A. Schutz and M. Zembylas (eds.), Advances in Teacher Emotion Research: The Impact on Teachers’ Lives, Springer Science+Business Media, DOI 10.1007/978-1-4419-0564-2_14
Carnoy, M. (2004). ICT in education: Possibilities and challenges. Inaugural Lecture of the UOC 2004-2005, Barcelona.
Day, C., & Gu, Q. (2007). Variations in the conditions for teachers' professional learning and development: Sustaining commitment and effectiveness over a career. Oxford Review of Education, 33(4), 423-443.
Dworet, D. (1996). Teachers’ identities: overview. Changing research and practice: Teachers’ professionalism identities and knowledge, 67-68.
Eberso¨hn, L. (2012). Adding ‘flock’ to ‘fight and flight’: A honeycomb of resilience where supply of relationships meets demand for support. Journal of Psychology in Africa, 27(2), 29–42.
Evens, H., & Houssart, J. (2007). Paired interviews in mathematics education. In D. Kuchemann (Ed.), Proceedings of the British Society for Research into Learning Mathematics 27, 19-24.
Farrell TSC (2015) Promoting Teacher Reflection in Second Language Education: A Framework for TESOL Professionals. New York: Routledge
Harris, A. (2014). Teacher resilience in challenging primary schools located in low SES suburbs (Unpublished honours thesis). Curtin University, Perth, Western Australia.
Henderson, N., & Milstein, M. M. (2003).Resiliency in schools: Making it happen for students and educators. Thousand Oaks, CA: Corwin Press.
Henry, A. (2016). Conceptualizing Teacher Identity as a Complex Dynamic System The Inner Dynamics of Transformations During a Practicum. Journal of Teacher Education, 0022487116655382.
Kpai, T., Joe-Kinanee, J. N., & Ekeleme, C. (2012). A study of computer literacy among trainee teachers in a Nigerian university of education. Global Voice of Educators, 1(1), 1-7.
Leask, M., & Pachler, N. (2013). Learning to teach using ICT in the secondary school: A companion to school experience. Routledge.
Lloyd, G. M. (2008). Teaching mathematics with a new curriculum: changes to classroom organization and interactions. Mathematical Thinking and Learning, 10, 163-198.
Mansfield, C. F., Beltman, S., & Price, A. (2014). ‘I’m coming back again!’ The resilience process of early career teachers. Teachers and Teaching, 20(5), 547–567.
Masten, A., Best, K., & Garmezy, N. (1990). Resilience and development: Contributions from the study of children who overcome adversity. Development and Psychopathology, 2, 425-444.
Pillen, M. T., den Brok, P. J., & Beijaard, D. (2013). Profiles and change in beginning teachers’ professional identity tensions. Teaching and Teacher Education, 34, 86-97.
Rahimi, M., & Yadollahi, S. (2011). ICT use in EFL classes: A focus on EFL teachers’ characteristics. World Journal of English Language, 1(2), 17-29.

130
Resilience Research Centre. (2014).What is resilience? Retrieved from http://resilienceresearch.org. Richardson, G. (2002). The metatheory of resilience and resiliency. Journal of Clinical Psychology, 58(3),
307-321. Riddell, S. (2013, June 27). Early career teaching in low SES schools. http:// socialventures.com.au/early-
career-teaching-in-low-ses-schools. Sammons, P., Day, C., Kington, A., Gu, Q., Stobart, G., & Smees, R. (2007). Exploring variations in
teachers’ work, lives and their effects on pupils: Key findings and implications from a longitudinal mixed-method study. British Educational Research Journal, 33(5), 681-701.
Schutz PA, Cross DI, Hong JY, Osbon JN (2007) Teacher understandings, thoughts and beliefs about emotions in the classroom. In: Schutz PA, Pekrun R (eds) Emotions in education. Elsevier, San Diego, CA, pp 215–233.
Taylor, J. L. (2013). The power of resilience: A theoretical model to empower, encourage and retain teachers. The Qualitative Report, 18(35), 1–25.
Yin, R. K. (2009). Case study research: Design and methods (4). Thousand Oaks, CA: SAGE, Inc.
Hayashi, Y., et al. (Eds.) (2017). Workshop Proceedings of the 25th International Conference on Computers in Education. New Zealand: Asia-Pacific Society for Computers in Education
131
Transfer of Ownership: Designing for Scholarship of Learning and Teaching
Jayakrishnan WARRIEM a*, Sahana MURTHY a & Sridhar IYER a aIDP in Educational Technology, IIT Bombay, India
Abstract: Teachers engaged in higher levels of Scholarship of Learning and Teaching (SoLT) is associated with better teaching-learning outcomes. Variety of strategies, like seminars, conferences, trainings etc. is used for elevating teachers to engage in higher levels of SoLT. In this paper, we extend the design principle of “Transfer of Ownership”, available in development research literature, to design teacher professional development (TPD) programmes to target SoLT among in-service teachers. We explain how this design principle was used in implementation of a blended TPD for technology integration among a group of 53 engineering college teachers. At the end of the training, 9 of the teachers who were most engaged in the training had successfully taken ownership of the problem of effective technology integration in their own classroom and had devised action research studies to further investigate it. The results opens up avenues for us in exploring ways of operationalizing “Transfer of Ownership” across multiple modes and scales of TPD implementation.
Keywords: Scholarship of Learning and Teaching, Transfer of Ownership, Teacher Professional Development, Technology Integration
1. Introduction
Scholarship of Learning and Teaching (SoLT) movement encourages teachers to perform inquiry on students’ learning and further disseminate their findings through peer-reviewed academic publications (Boshier & Huang, 2008). Adoptions of SoLT practices have shown evidences of faculty contribution to the knowledge in their individual discipline (Healey, 2000) and generation of sustainable teaching-learning practices within an institution (Richlin & Cox, 2004). With the ubiquitous use of technology in teaching-learning practices now, promotion of SoLT around teacher professional development (TPD) practices gains currency and relevance (Hutchings, Huber & Ciccone, 2011). The existing conceptual models of SoLT (Trigwell & Shale, 2004, Kreber and Cranton, 2000; Trigwell et. al., 2000) provide additional guidance in the aspects to be considered while designing and implementing such TPD activities. However the challenge lies in, i) facilitating the participants to rethink and refine their current practices, and ii) further scaffolding them in the process of inquiry on students’ learning due to the refined practice (Kreber & Kanuka, 2006).
An initial effort of the authors targeting SoLT practices through a TPD programme had shown encouraging results. In addition to statistically significant learning gains in educational research methods, 9 participants had successfully disseminated their action research experiences in a peer reviewed international conference (Warriem, Murthy & Iyer, 2013). However, a major challenge that we faced during this effort was that most of the teachers in our operating context didn’t have any formal pedagogical training (National Knowledge Commission, 2009). This made it hard for them to learn and engage with the SoLT practices. To overcome this challenge, we had designed and implemented two large-scale training programmes that focused on introducing research-based student-centered pedagogy (Murthy, Iyer and Warriem, 2015). These efforts had introduced the design principles of “Immersivity” and “Pertinency” for design and implementation of TPD programmes (Warriem, Murthy & Iyer, 2015). These principles were found to have a visible impact on teachers’ awareness of their teaching-learning practices and its effect on students’ learning, which is a desirable starting point to engage in SoLT practices. In this paper,
132
we present an extended TPD effort to engage teachers in further SoLT practices by adapting the design principle of “Transfer of Ownership”.
We have adapted the idea of transfer of ownership from the works of Honkalaskar et. al. (2014) and Chambers (2007), that identifies peoples’ involvement, their sense of ownership and control to be crucial in sustainability and spread of interventions, while being done by an external agency. We have extended this idea to the context of teacher professional development (TPD) by identifying Transfer of Ownership as the planned action of shifting the focus of TPD from the trainer’s goal of improving teaching-learning practice to the participants’ involvement and control to engage in effective teaching-learning practices. In our TPD program we apply transfer of ownership to design relevant activities and corresponding scaffolds for participants. We first provide teachers with scaffolds to elicit ideas for solving their teaching-learning problems. Then these teachers are provided with training on educational research methods that they can use to conduct systematic inquiry on the implementation of these ideas. This design principle thus helps in design of TPDs that reflect a “narrative of growth”, emphasizing the agency and desire of the participating teacher in their own professional development (O’Meara, Terosky & Neumann, 2008) and resulting in improvement of student learning. The narrative of growth is known to have alignment with the key ideas in SoLT practices (Kong, Lai and Wong, 2017).
In the current work, we explain design and implementation a teacher professional development programme for engineering educators in India in blended mode. The focus of this training was to train teachers in action research and disseminate their action research findings. Results at the end of the training showed that participants had taken up the ownership of the teaching-learning problem within their classrooms and devised study plans to perform an inquiry on their practice.
2. Related Work
2.1. Evolution of Scholarship of Learning and Teaching (SoLT)
Boyer (1990) initially proposed the idea of “Scholarship of Teaching”, where he identified teaching as a “highest form of understanding” that can be further taken up for scholarly research work (Vardi, 2011). This was further refined to differentiate it from excellent teaching, by clarifying the need for teachers engaged in “Scholarship of Teaching and Learning” to systematically investigate questions related to students’ learning (Hutchings & Schulman, 1999). McKinney (2006) further expanded the teaching practice to include three levels: i) good teaching, which looks at performance of the teacher, ii) scholarly teaching, which requires teachers to reflect and refine their practice and iii) scholarship of teaching and learning, that advances the knowledge on teaching-learning issues by making it available for public review. Thus teachers engaged in SoTL typically poses questions about their own practice, tries to collect evidence, analyze and interpret the results, take informed action on the findings and finally document and disseminate both the process and outcomes (Connolly et. al., 2007). Though evidences are collected on student learning, SoTL was criticized for both its focus on the formal classroom practice that stresses teaching more than learning (Boshier and Huang, 2008) and the ambiguities involved in the operationalization of SoTL (Boshier, 2009). Scholarship of Learning and Teaching (SoLT) was thus proposed for the practice to emphasize the paradigm shift to learning from teaching (Boshier and Huang, 2008).
2.2. Models of SoLT
There exist several conceptual models that provide us guidelines on the processes involved in engaging teachers in SoLT practices. Trigwell et. al. (2000) had proposed a model that consisted of four dimensions – Informed dimension, Reflection dimension, Communication dimension and Conception dimension, that tries to explain the engagement of teacher in the process of SoLT. The informed dimension measures the extent to which a teacher engages in scholarly contributions of others (research literature) while the conception dimension measures the extent of the teacher’s focus on the teaching practice as against that on student learning. The reflection dimension
133
measures the extent of reflection and can vary from an unfocused approach to a very focused approach aimed at increasing the teacher’s present understanding of the teaching-learning process. The communication dimension refers to the extent to which the teacher engages in dissemination of their findings and can vary from absence of dissemination to publication in international journals. Kreber and Canton (2000) had developed their model on the basis of types of reflection possible across three domains of knowledge about teaching – Instructional knowledge, Pedagogical Knowledge and Curricular Knowledge. Three types of reflections were found to be possible in each of the dimension viz. Content reflection, Process reflection and Premise reflection. Thus a total of 9 elements were present in this model.
With teaching academies being created to support SoLT, Schulman (2004) had proposed four models that involved different roles played by teaching academies in promoting SoLT practices. These models considered teaching academy as – An interdisciplinary center, an aspect of graduate education, organized around technology and distributed teaching academy. A practice-oriented model also was available that looked into the dimensions of knowledge, practice and outcome to explain achievement of SoLT (Trigwell & Shale, 2004). While the knowledge included the various dimensions of domain, pedagogy and context, outcomes included elements like student learning, documentation, teacher learning and teacher satisfaction. The dimension of practice acts as a bridge between knowledge and outcome and included elements of teaching, evaluation, reflection, communication and learning.
A common feature that can be seen in all models, except Schulman’s institutional model, is the focus on teacher’s internal processes and the ways in which these could be measured.
2.3. Teacher Professional Development and SoLT
The relevance of SoLT for teacher professional development has further increased due to the ubiquitous presence of technology within teaching-learning (Hutchings, Huber and Ciccone, 2011), as the impact of technology on student-learning can be carefully examined and understood by the teacher themself. Numerous TPD activities like seminars, pedagogical courses, campus conferences on learning and teaching and reward programmes are available for engaging faculty in SoLT. Engaging teachers in a community of practice is yet another PD activity that is found to greatly avoid issues related to isolation, stress and marginalization among teachers participating in an SoLT community (Martensson, Roxa & Olsson, 2011).
2.4. Positioning of our work
SoLT based professional development is being criticized due to a lack of clarity involved in the exact activities and outputs expected from the faculty (Brew, 2007). The current models for promoting SoTL inform us of different dimensions across which the change has to occur within the participating teachers. However the TPD designer faces the challenge of i) facilitating the participants to rethink and refine their current practices, and ii) further scaffolding them in the process of inquiry on students’ learning due to the refined practice (Kreber & Kanuka, 2006). The current work tries to address this gap by providing a design principle and an instance of its operationalization that will benefit TPD designers.
3. Background
Before the current study, we had designed and implemented two large-scale blended training programmes focusing on introducing research-based student-centered pedagogy while integrating technology in classroom (Murthy, Iyer and Warriem, 2015). Participants were trained in student-centered pedagogies like Think-Pair-Share and Peer Instruction and also in effective use of technologies like Wiki, Screencast and Visualizations. These trainings were designed and developed using the design principles of “Immersivity” and “Pertinency”.
“Immersivity” is defined as the feature of the learning environment that drives participants to be involved in a set of meaningful activities (Howland et. al., 2012) and to get cognitively engaged in the content (Sherman & Craig, 2003). Immersivity is built upon the need for having
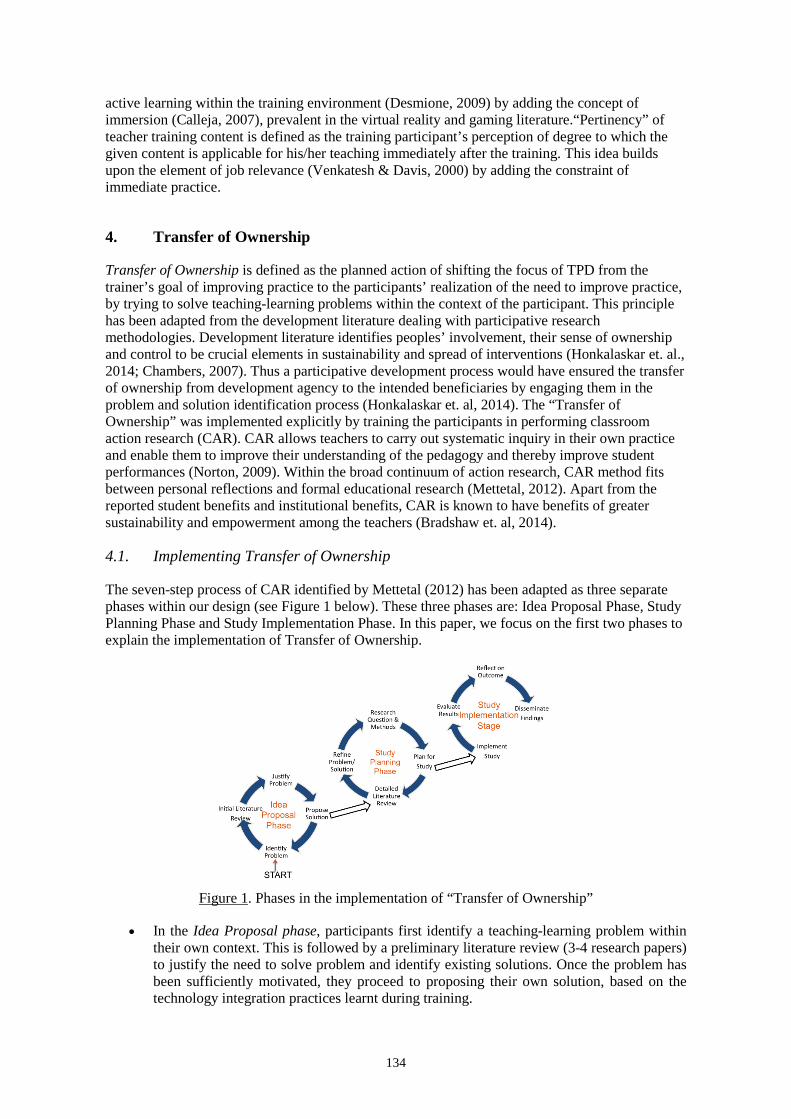
134
active learning within the training environment (Desmione, 2009) by adding the concept of immersion (Calleja, 2007), prevalent in the virtual reality and gaming literature.“Pertinency” of teacher training content is defined as the training participant’s perception of degree to which the given content is applicable for his/her teaching immediately after the training. This idea builds upon the element of job relevance (Venkatesh & Davis, 2000) by adding the constraint of immediate practice.
4. Transfer of Ownership
Transfer of Ownership is defined as the planned action of shifting the focus of TPD from the trainer’s goal of improving practice to the participants’ realization of the need to improve practice, by trying to solve teaching-learning problems within the context of the participant. This principle has been adapted from the development literature dealing with participative research methodologies. Development literature identifies peoples’ involvement, their sense of ownership and control to be crucial elements in sustainability and spread of interventions (Honkalaskar et. al., 2014; Chambers, 2007). Thus a participative development process would have ensured the transfer of ownership from development agency to the intended beneficiaries by engaging them in the problem and solution identification process (Honkalaskar et. al, 2014). The “Transfer of Ownership” was implemented explicitly by training the participants in performing classroom action research (CAR). CAR allows teachers to carry out systematic inquiry in their own practice and enable them to improve their understanding of the pedagogy and thereby improve student performances (Norton, 2009). Within the broad continuum of action research, CAR method fits between personal reflections and formal educational research (Mettetal, 2012). Apart from the reported student benefits and institutional benefits, CAR is known to have benefits of greater sustainability and empowerment among the teachers (Bradshaw et. al, 2014).
4.1. Implementing Transfer of Ownership
The seven-step process of CAR identified by Mettetal (2012) has been adapted as three separate phases within our design (see Figure 1 below). These three phases are: Idea Proposal Phase, Study Planning Phase and Study Implementation Phase. In this paper, we focus on the first two phases to explain the implementation of Transfer of Ownership.
Figure 1. Phases in the implementation of “Transfer of Ownership”
• In the Idea Proposal phase, participants first identify a teaching-learning problem within their own context. This is followed by a preliminary literature review (3-4 research papers) to justify the need to solve problem and identify existing solutions. Once the problem has been sufficiently motivated, they proceed to proposing their own solution, based on the technology integration practices learnt during training.
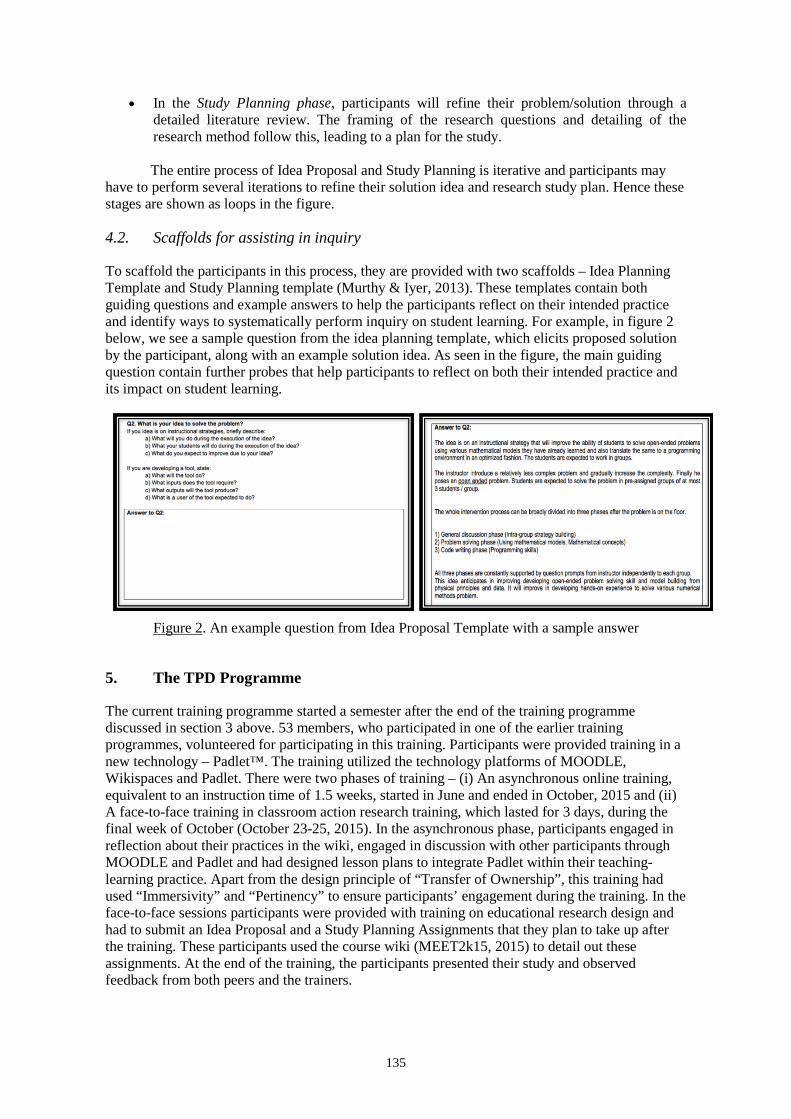
135
• In the Study Planning phase, participants will refine their problem/solution through a detailed literature review. The framing of the research questions and detailing of the research method follow this, leading to a plan for the study. The entire process of Idea Proposal and Study Planning is iterative and participants may
have to perform several iterations to refine their solution idea and research study plan. Hence these stages are shown as loops in the figure.
4.2. Scaffolds for assisting in inquiry
To scaffold the participants in this process, they are provided with two scaffolds – Idea Planning Template and Study Planning template (Murthy & Iyer, 2013). These templates contain both guiding questions and example answers to help the participants reflect on their intended practice and identify ways to systematically perform inquiry on student learning. For example, in figure 2 below, we see a sample question from the idea planning template, which elicits proposed solution by the participant, along with an example solution idea. As seen in the figure, the main guiding question contain further probes that help participants to reflect on both their intended practice and its impact on student learning.
Figure 2. An example question from Idea Proposal Template with a sample answer
5. The TPD Programme
The current training programme started a semester after the end of the training programme discussed in section 3 above. 53 members, who participated in one of the earlier training programmes, volunteered for participating in this training. Participants were provided training in a new technology – Padlet™. The training utilized the technology platforms of MOODLE, Wikispaces and Padlet. There were two phases of training – (i) An asynchronous online training, equivalent to an instruction time of 1.5 weeks, started in June and ended in October, 2015 and (ii) A face-to-face training in classroom action research training, which lasted for 3 days, during the final week of October (October 23-25, 2015). In the asynchronous phase, participants engaged in reflection about their practices in the wiki, engaged in discussion with other participants through MOODLE and Padlet and had designed lesson plans to integrate Padlet within their teaching-learning practice. Apart from the design principle of “Transfer of Ownership”, this training had used “Immersivity” and “Pertinency” to ensure participants’ engagement during the training. In the face-to-face sessions participants were provided with training on educational research design and had to submit an Idea Proposal and a Study Planning Assignments that they plan to take up after the training. These participants used the course wiki (MEET2k15, 2015) to detail out these assignments. At the end of the training, the participants presented their study and observed feedback from both peers and the trainers.
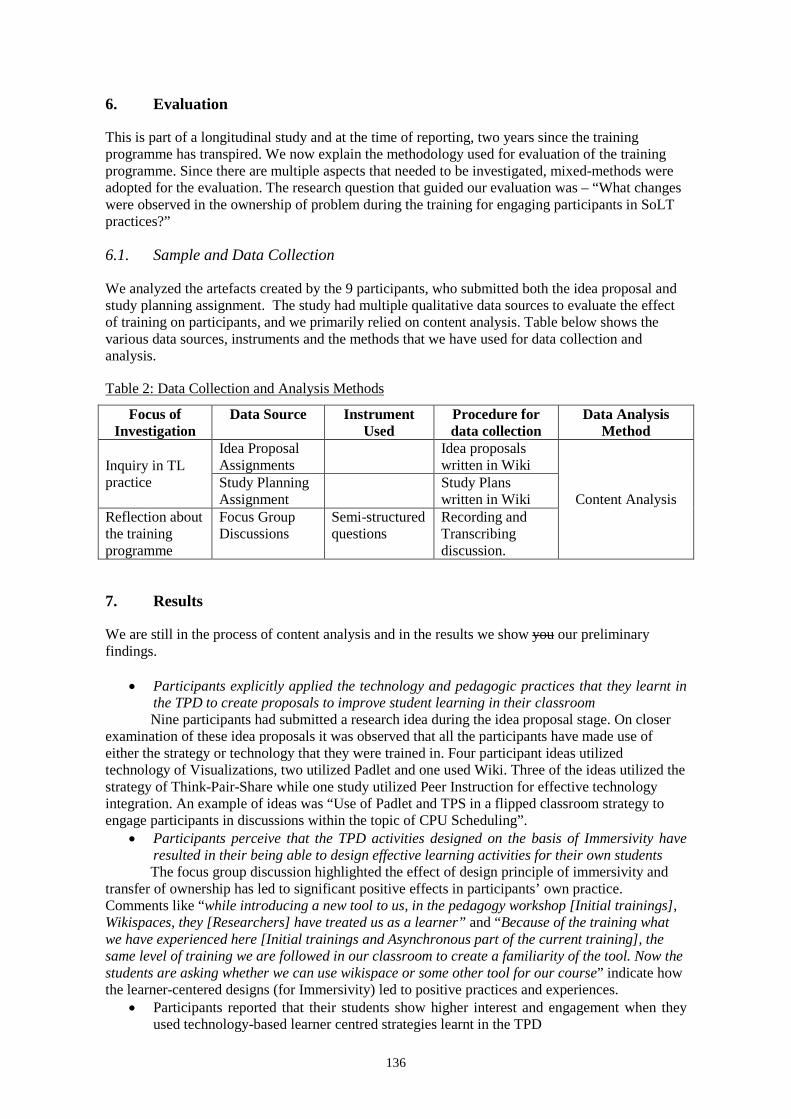
136
6. Evaluation
This is part of a longitudinal study and at the time of reporting, two years since the training programme has transpired. We now explain the methodology used for evaluation of the training programme. Since there are multiple aspects that needed to be investigated, mixed-methods were adopted for the evaluation. The research question that guided our evaluation was – “What changes were observed in the ownership of problem during the training for engaging participants in SoLT practices?”
6.1. Sample and Data Collection
We analyzed the artefacts created by the 9 participants, who submitted both the idea proposal and study planning assignment. The study had multiple qualitative data sources to evaluate the effect of training on participants, and we primarily relied on content analysis. Table below shows the various data sources, instruments and the methods that we have used for data collection and analysis.
Table 2: Data Collection and Analysis Methods
Focus of Investigation
Data Source Instrument Used
Procedure for data collection
Data Analysis Method
Inquiry in TL practice
Idea Proposal Assignments
Idea proposals written in Wiki
Content Analysis Study Planning Assignment
Study Plans written in Wiki
Reflection about the training programme
Focus Group Discussions
Semi-structured questions
Recording and Transcribing discussion.
7. Results
We are still in the process of content analysis and in the results we show you our preliminary findings.
• Participants explicitly applied the technology and pedagogic practices that they learnt in the TPD to create proposals to improve student learning in their classroom Nine participants had submitted a research idea during the idea proposal stage. On closer
examination of these idea proposals it was observed that all the participants have made use of either the strategy or technology that they were trained in. Four participant ideas utilized technology of Visualizations, two utilized Padlet and one used Wiki. Three of the ideas utilized the strategy of Think-Pair-Share while one study utilized Peer Instruction for effective technology integration. An example of ideas was “Use of Padlet and TPS in a flipped classroom strategy to engage participants in discussions within the topic of CPU Scheduling”.
• Participants perceive that the TPD activities designed on the basis of Immersivity have resulted in their being able to design effective learning activities for their own students The focus group discussion highlighted the effect of design principle of immersivity and
transfer of ownership has led to significant positive effects in participants’ own practice. Comments like “while introducing a new tool to us, in the pedagogy workshop [Initial trainings], Wikispaces, they [Researchers] have treated us as a learner” and “Because of the training what we have experienced here [Initial trainings and Asynchronous part of the current training], the same level of training we are followed in our classroom to create a familiarity of the tool. Now the students are asking whether we can use wikispace or some other tool for our course” indicate how the learner-centered designs (for Immersivity) led to positive practices and experiences.
• Participants reported that their students show higher interest and engagement when they used technology-based learner centred strategies learnt in the TPD
137
The focus group discussions shed light on evidence of positive student attitudes and behaviours when particpiants devised more learner-centered strategies using technology. The participants also indicated how the students, taking examples of specific tools that they were trained in, appreciated their technology integration practices. E.g. the comment by a participant “the students are so much interested whenever the staff [the participant] comes to class. [The students say that] we will be using wikispace, so we will be posting materials there, we will be getting materials, we will be doing activities there, mini projects in a team work. So they [students] have too much interest to work with the tool [wikispaces] ” indicates how ownership of technology integration practices are being taken up actively by teachers.
• Participants plan action research to sustain inquiry practices post training Participants created the idea proposal and study planning assignments to solve problems
related to student learning within their own practice. Comments like ‘[the workshop] is promoting us to be an Educational Researcher. We have learnt these things [about planning the research], now we need to practice’ indicated that participants had intention to follow-up and sustain the inquiry practices that they were trained in. The engagement in the workshop has also led the participants to think of more action research studies as is evident from the comment ‘Actually we have taken 3-4 ideas with us [after this training]. So it is 3-4 [study] templates we can independently plan.’
8. Discussion and Conclusion
The above results indicate that the TPD training has helped participants to refine their practice. Taking their role as action researcher further, participants prepared detailed action research study plans to evaluate their students’ learning. Finally, participants have intention to apply technology integration strategies beyond what they learnt the TPD, and have planned further studies. To address our RQ, “What changes were observed in the ownership of problem during the training for engaging participants in SoLT practices?”, we see that the training helped in transfer of ownership of the problem from the trainer to the participant teacher and they have engaged in higher levels of SoLT.
Two months post the training; two of the participants had presented four action research studies in a peer reviewed international conference. These studies were co-authored with 9 other colleagues from their institution, who were among the participants of initial pedagogy training (described in 4.1). Three of these papers dealt with classroom teaching-learning experiences (Mistry, Halkude and Awasekar, 2016; Indi, Yalagi and Nirgude, 2016; Yalagi, Indi, and Nirgude, 2016) and one paper dealt with the working of professional learning community developed in an institution based on the various student-centered practices detailed in the pedagogy training (Halkude et. al., 2016). Together these results can be interpreted as teachers taking both ownership and leadership roles in solving the teaching-learning problems within their own context.
A limitation of this study is that we have not reported the analysis of evaluation of the idea and study plans to provide insights on the quality of the inquiry practices reported. This is planned as a future work, as the current effort primarily looked at the evaluation of the training. Another limitation is that we have not explored the specific reasons for high attrition (only 9 out of 53 attending face-to-face training) within the training itself. Being a voluntary effort, we suspect that contextual factors like timing of the workshop (mid-semester) and academic load would have had a greater bearing on participation rates.
In this paper, we describe the implementation and evaluation of TPD aimed at engaging teachers in SoLT practices. The design principle of “Transfer of Ownership” was utilized in the TPD design to achieve this aim. It is seen that over the course of training, participants shift their focus from effective use of technology to sustain inquiry practices about student learning. Thus transfer of ownership can be regarded as a potential means to progress towards higher levels of scholarship of learning and teaching. Further work can focus on how TPDs can be designed to incorporate transfer of ownership as the basis of the TPD activities right from the start.
138
Acknowledgements
We would like to acknowledge the T10kT project that provided the support for this effort. We also thank all the teachers who participated in this study and the research scholars from IDP in Educational Technology Department who assisted us in this study.
References
Boshier, R., & Huang, Y. (2008). In the House of Scholarship of Teaching and Learning (SoTL), teaching lives upstairs and learning in the basement. Teaching in Higher Education, 13(6), 645-656.
Boshier, R. (2009). Why is the Scholarship of Teaching and Learning such a hard sell?. Higher Education Research & Development, 28(1), 1-15.
Chambers, R. (2007). Ideas For Development. Earthscan publishers, London Felder, R. M., Brent, R., & Prince, M. J. (2011). Engineering instructional development: Programs, best
practices, and recommendations. Journal of Engineering Education, 100(1), 89. Fullan, M. (2006). The future of educational change: System thinkers in action. Journal of Educational
Change, 7, 113-122. Hutchings, P., & Shulman, L.S. (1999). The Scholarship of Teaching: New elaborations, new developments.
Change, 31(5), 11–15. Kreber, C., & Kanuka, H. (2006). The scholarship of teaching and learning and the online classroom.
Canadian Journal of University Continuing Education, 32(2), 109-131. Martensson, K., Roxa, T., & Olsson, T. (2011). Developing a quality culture through the scholarship of
teaching and learning. Higher Education Research & Development, 30(1), Mettetal, G. (2012). The what, why and how of classroom action research. Journal of the Scholarship of
Teaching and Learning, 2(1), 6-13. Halkude, S. A., Nirgude, M. A., Awasekar, D. A., Kashid, S. S., Sathe, V. D., Mahant, M. M., & Agalave,
G. B. (2016, March). Sustaining Faculty Professional Development: Evidences from a Localized Professional Learning Community. In Learning and Teaching in Computing and Engineering (LaTICE), 2016 International Conference on (pp. 89-93). IEEE.
Healey, M. (2000). Developing the scholarship of teaching in higher education: a discipline-based approach. Higher Education Research & Development, 19(2), 169-189.
Honkalaskar, V. H., Sohoni, M., & Bhandarkar, U. V. (2014). A participatory decision making process for community-level water supply. Water Policy, 16(1), 39-61.
Indi, T. S., Yalagi, P. S., & Nirgude, M. A. (2016, March). Use of Java Exception Stack Trace to Improve Bug Fixing Skills of Intermediate Java Learners. In Learning and Teaching in Computing and Engineering (LaTICE), 2016 International Conference on (pp. 194-198). IEEE.
Kong, S. C., Lai, M., & Wong, T. L. (2017). Toward a Framework of Studying Scholarship of Learning and Teaching in Higher Education in a Digital Technology Era. In Emerging Practices in Scholarship of Learning and Teaching in a Digital Era (pp. 1-16). Springer Singapore.
Murthy, S., & Iyer, S. (2013). Guidelines and Templates for Planning, Conducting and Reporting Educational Technology Research. Technical Report, Indian Institute of Technology Bombay, IDP in Educational Technology, Mumbai. accessible at: http://www.et.iitb.ac.in/Resources/files/ET-Research-Templates/pdf006ET-research-guidelines-t4e2013.pdf
MEET2k15 (2015). Accessible at: http://meet2k15.wikispaces.com/ , last accessed on May 29, 2017 Mistry, R. D., Halkude, S. A., & Awasekar, D. D. (2016, March). APIT: Evidences of Aligning Project
Based Learning with Various Instructional Strategies for Enhancing Knowledge in Automobile Engineering. In Learning and Teaching in Computing and Engineering (LaTICE), 2016 International Conference on (pp. 107-114). IEEE.
Indi, T. S., Yalagi, P. S., & Nirgude, M. A. (2016, March). Use of Java Exception Stack Trace to Improve Bug Fixing Skills of Intermediate Java Learners. In Learning and Teaching in Computing and Engineering (LaTICE), 2016 International Conference on (pp. 194-198). IEEE.
Murthy, S., Iyer, S., & Warriem, J. (2015). ET4ET: A Large-Scale Faculty Professional Development Program on Effective Integration of Educational Technology. Journal of Educational Technology & Society, 18(3), 16-28.
Shulman, L. S. (2004). Visions of the possible: Models for campus support of the scholarship of teaching and learning. In W. E. Becker & M. L. Andrews (Eds.), The scholarship of teaching and learning: Contributions of research universities (pp.9-23). Bloomington: University of Indiana Press.
National Knowledge Commission. (2009). Report to the Nation 2006-2009. Government of India. New Delhi: National Knowledge Commission.

139
O’Meara, K., Terosky, A. L., & Neumann, A. (2008). Faculty careers and work lives: A professional growth perspective. ASHE Higher Education Report, 34(3), 1-221.
Richlin, L., & Cox, M. D. (2004). Developing scholarly teaching and the scholarship of teaching and learning through faculty learning communities. New directions for teaching and learning, 2004(97), 127-135.
Trigwell, K., Martin, E., Benjamin, J., & Prosser, M. (2000). Scholarship of teaching: Amodel. Higher Education Research & Development, 19, 155-168.
Trigwell, K., & Shale, S. (2004). Student learning and the scholarship of university teaching. Studies in Higher Education, 29(4), 523–536.
Warriem, J., Murthy, S. & Iyer, S. (2013). Training In-service teachers to do action research in educational technology. In 5th IEEE International Conference on Technology for Education (T4E2013), Kharagpur, India.
Yalagi, P. S., Indi, T. S., & Nirgude, M. A. (2016, March). Enhancing the Cognitive Level of Novice Learners Using Effective Program Writing Skills. In Learning and Teaching in Computing and Engineering (LaTICE), 2016 International Conference on (pp. 167-171). IEEE.
Hayashi, Y., et al. (Eds.) (2017). Workshop Proceedings of the 25th International Conference on Computers in Education. New Zealand: Asia-Pacific Society for Computers in Education
140
An Investigation of Collaborative Ubiquitous Learning in Promoting Socio-Cultural Knowledge and Skills in 21st Century:
Integrating History, Geography, Architecture, Science and Culture Study
Chitphon YACHULAWETKUNAKORNa, Ratthakarn Na PHATTHALUNGb, Jintana WONGTAc & Charoenchai WONGWATKITd*
a,b,cEngineering Science Classroom, King Mongkut’s University of Technology Thonburi, Thailand dDepartment of Computer and Information Technology, Faculty of Industrial Education and
Technology, King Mongkut’s University of Technology Thonburi, Thailand *[email protected]
Abstract: This paper attempts to investigate the effects of the collaborative ubiquitous learning approach in promoting socio-cultural knowledge. The content used in this study was associated with history, geography, architecture, science and culture study of the Rattanakosin period; moreover, these chronological events were represented in a story timeline. Besides, the learning activities were designed to support such learning environment and incorporating 21st-century skills. These processes required students’ efforts to work in groups to experience the actual sites on a field trip in order to inquire the socio-cultural knowledge. The students received and responded to the missions on their mobile devices. After the actual implementation of the proposed learning method, it was found that the students could reach the high level of the learning achievements from the proposed learning activities, implying that they could apply the integrated knowledge of several subjects to form the historical story. Furthermore, the high-achieving students could perform more advanced 21st-century skills than the other groups on their works. Moreover, the finding of this study could bring more applications of ubiquitous learning to promote integrated learning contents with collaborative knowledge construction.
Keywords: Story-based learning, ubiquitous learning, social study, 21st century skills, constructionism, collaborative knowledge construction
1. Introduction
Nowadays, story-based learning is considered as the interesting concept for teaching and learning which many educational institutes popularized to use this concept as the main concept for learning, especially the curriculum that collaborates each science area in order to discuss in the form of knowledge story. For the concept of story-based learning applied, the subject is set as the core’ s inevitably be History. Generally, History is a part of Social studies. Social studies are the integrated study of the social sciences, humanities, and history. Within the school program, social studies provides coordinated, systematic study drawing upon such disciplines as anthropology, archaeology, economics, geography, history, jurisprudence, philosophy, political science, psychology, religion, and sociology, as well as appropriate content from the humanities, mathematics, and natural sciences (Story-Based learning, 2016). In addition to learning memorization, students could discuss their knowledge not only in the form of memorization but also in the form of critical thinking. Hence, history is considered as science that suited to be the core science which collaborates other subjects in the form of story-based learning.
For the social studies situation of existing learning, the form of teaching mostly based on the lecture, especially in the classroom which students quietly attended in class. Due to lecturing in
141
class, teacher normally encouraged students to participate in the classroom. For instance, the teacher encouraged students to analyze the historical incident by persuading them to explain the historical result, while lecturing, students could freely use a mobile phone for searching data that they want. From the classroom’s situation mentioned, teacher attempted to inject the systematic thinking, the cognitive process of studying and understanding systems of every kind. Nevertheless, in this present class, learning is not enough for skills needed in the 21st century era; therefore, the self-learning using the device in the form of the field trip is necessary to consort with the skill of learning and innovation skill, and digital literacy skill too. In addition to regular classroom, a field trip is another form of learning that support that students to participate with place, people, and environment (DeWitt & Storksdieck, 2008).
Even though mobile learning’s not considered as the newest form of learning but it was popularized among students. Owing to it’s convenient to search any data from Website, mobile learning was gradually an important role in education inevitably. In the past decade, teachers gradually change from the lecture-based learning to mobile learning through the mission that allocated to each group instead of lecturing from the lecturing even in the field trip. From the field trip using device, most students reacted feedback positively in many aspects. Nevertheless, mobile learning in field is still be advantage as following; First, it is convenient to search data from many credible website. Second, it is an active learning so students can participate with the real context. Last, it is an opportunity for students to think and analyze data online in order that they could segregate both unbelievable and credible data from Internet and others channel (Laru, Järvelä, & Clariana, 2012).
Skills needed in 21st Century is considered as the renounced latest trend of education and human resource’s performance in nowadays. Its objectives aim to construct students and personnel to be accepted not only in workplace, but also enjoyably live in 21st Century (Pellegrino & Hilton, 2012). Hence, skills needed in 21st Century considered as a significant concept for develop students and personnel in the present and future time. Students could collaborate knowledge in the term of interdisciplinary. For example, Communication skill used in the interview’s mission because students had to interview peoples in the field, such as, guide, monk or even tourist. Collaboration skill normally used in every mission because it’s group work. Creativity skill also used in ordered to make Video clip, and drawing. For the critical thinking skill, all students used this skill in every question inevitably.
According to the phenomenon of learning social studies, therefore, the collaborative ubiquitous learning is adopted as an efficient learning form in this study, called CULS. The concept of CULS encouraged students to be active learners more than the old field trip because all students mostly participated in their own groups. They were assigned any tasks to every member. So peer anticipated them to do their task as good as possible. In addition to the advantage of CULS, the activities that assigned to students were greatly developed for learning efficiency. Moreover, these developed activities help students to promote the socio-cultural knowledge and skills in 21st Century by integrating certain stories from History, Geography, Architecture, Science and Culture Study.
2. Related Study
2.1. Ubiquitous Learning and Social Study
Ubiquitous learning is considered to be both pervasive and persistent, allowing students to access education conveniently, calmly and seamlessly. Ubiquitous learning has the potential to revolutionize education and remove many of the physical constraints of traditional learning (Yahya, Ahmad, 2010). Moreover, the integration of adaptive learning with ubiquitous computing and u-learning may offer great innovation in the delivery of education, allowing for personalization and customization to students needs. According to Ogata and Yano (2004), there are six essential components of ubiquitous learning are the following: First is Permanency: Learners never lose their work unless it is purposefully deleted. In addition, all the learning processes are recorded continuously every day. Second is Accessibility: Learners have access to their documents, data, or videos from anywhere. That information is provided based on their
142
requests. Therefore, the learning involved is self-directed. The third is Immediacy: Wherever learners are, they can get any information immediately. Thus, learners can solve problems quickly. Otherwise, the learner can record the questions and look for the answer later. Fourth is Interactivity: Learners can interact with experts, teachers, or peers in the form of synchronous or asynchronous communication. Hence, the experts are more reachable, and the knowledge becomes more available. Fifth is Situating of instructional activities: The learning could be embedded in our daily life. The problems encountered as well as the knowledge required are all presented in their natural and authentic forms. This helps learners notice the features of problem situations that make particular actions relevant, and the last is Adaptability: Learners can get the right information at the right place with the right way.
There are many research studies on ubiquitous learning in the past decade. Hwang, Hung, Chen, and Liu (2014) developed an advanced ubiquitous learning to develop students' competent in field ubiquitous learning. Shih, Kuo, and Liu (2012) found that the u-learning model is conductive to the improvement of students’ mathematics achievements. For others, u-learning aspect, Hung (2016) have attempted to develop learning environments that combine real-world contexts and digital-world resources to provide students with direct experiences of the real world with sufficient learning support. Wu, Hwang, and Tsai (2013) also supported the idea that context-aware ubiquitous learning is such an approach that enables students to learn from the real world with support from the learning system using technologies. Finally, ubiquitous learning is quietly effective to improve and also enhance learning skill both in the context of the real world and digital world.
Ubiquitous learning rapidly popularized among education’s sector. Social studies are considered as the subject that slightly changes comparing with science because it recognized as the knowledge that students learned from the historical period, politics, social, and economical change. So the social studies theory’ s quietly certain. Applying ubiquitous learning to social studies class is necessary for students to oppose to any opportunity to exchange and construct knowledge (Hover, Berson, Bolick, & Swan, 2004). Moreover, u-learning could also become a means for micro-managing school districts, teachers, students, and curricula too. In addition, ubiquitous learning had an important role to develop social studies curriculum which affects each sector which involves with social studies curriculum construction realize the effect of ubiquitous learning in the future.
2.2. The 21st Century Skills
21st-century skills are the form of higher-order skills, abilities, and learning dispositions that have been identified as being required for success in 21st-century society and workplaces by educators, business leaders, academics, and governmental agencies. According to rapidly change phenomenon, many sectors realized that there are skills required for students to master in preparation for success in the 21st century. Hence, many of these skills are also associated with deeper learning, which is based on mastering skills such as analytic reasoning, complex problem solving, and teamwork (Pellegrino & Hilton, 2012).
Nowadays, many educational institutes widely adapted their curriculum and teacher professional development in ordered to consort with 21st-century skill. According to Bell (2010), the teacher encouraged students to construct knowledge in the form of the project-based learning; as a result, students could increase the critical thinking and collaboration skill as they engage in the project. In addition, problem-based learning (PBL) was another concept learning for a 21st-century skill that students should concern. Gwee (2009) applied PBL as learning system design for the education of healthcare by taking the demonstrative situation in class. In this case, the problem is considered as a stimulus for learning. Thus PBL can contribute to the improvement.
To be a good learner and staff in the 21st Century, technology is considered as a significant tool that enhances skill need in this century inevitably. Mobile-learning is another concept of education that everyone should concern, especially in social studies subject, using mobile technology attracted students participate in learning. Charitonos (2011) studied the potential of social and mobile technologies to support and enhance visitor’s learning experience in museum, the result showed social and mobile technologies have an impact on the social dynamics; it is anchored in sociocultural perspectives of learning as meaning-making, with a focus on mediating
143
artefacts in the development of understanding. Like Shih, Chuang, and Hwang (2010), mobile-learning was the learning’s concept that be effective in the field trip.
Therefore, applying m-learning in social studies’ field is so necessary that educational institute should adapt this concept in their curriculum because it’s not only increase learning performance, but also popularized among learner too.
2.3. Interdisciplinary Learning and Collaborative Knowledge Construction
Interdisciplinary learning is the integrating of multidisciplinary knowledge across a central program theme which helps learners to develop more advanced epistemological beliefs, improved critical thinking and metacognitive skills, and an understanding of the relevant among perspectives derived from various disciplines (Ivanitskaya, Clark, Montgomery, & Primeau, 2002). Moreover, the Interdisciplinary study is a process of answering a question, solving a problem, or addressing a topic that is a single discipline could not be dealt with because of its’ complexity, and the goal of integrating the learner’s insights to construct a more deep understanding of knowledge (Repko, 2008).
Nowadays, many research studies try to implement interdisciplinary learning in different aspects. Kinniburgh and Byrd (2008) integrated mathematics, reading and social studies activities that engages and inspires students while covering the content and standards of three subject areas. Bogan, King-Mckenzie, and Bantwini (2012) used Bogan Differentiated Instruction Model (BDIM) to integrate reading, science, and social studies to enhance inquiry, problem-solving, interest, critical thinking skills, and learning. This model combined major teaching concepts to develop interdisciplinary learning. However, Interdisciplinary curricula are time-consuming and use collaborative team work to invent that seems like a hard and disadvantage, but finally, the interdisciplinary approached inhibits many preferred skills that are needed by future colleges and employers. The use of interdisciplinary techniques helped students and their teachers improving in critical thinking, communication, creativity, pedagogy, and essential (Jones, 2009).
Collaborative Knowledge Construction is the discussions centered on the team on jointly solving a problem or carrying out a mission which helps to construct new knowledge. This method requires the use and adaptation of existing knowledge, so the groups produce and create the contexts of involved in joint problem-solving (Linehan & Mccarthy, 2001; Tscholl & Dowell, 2010). Fischer, Bruhn, Gräsel, and Mandl (2002) investigates that collaborative knowledge construction could be fostered by supporting students with visualization tools. Oehl and Pfister (2010) studied about E-Collaborative Knowledge Construction which can develop the learning discourse and support collaborative knowledge construction. Baloian and Zurita (2012) practiced a system called MCKC to supporting collaborative face-to-face tacit knowledge construction and sharing in ubiquitous scenarios.
Therefore, the interdisciplinary learning including history, geography, architecture, science and cultural study which is supported story-based learning curriculum is considered in this study. This interdisciplinary project aims to help students construct their knowledge by using collaborative knowledge construction.
3. Description of Story-Based Ubiquitous Learning in Promoting Social Study
History is the facts of all event happened in the pastime. Understanding the past makes us understand human thinking even more so that we can use the story in the past as an experience. Both from the mistake side, the successful side. It leads to the historical study process in ordered to obtain the knowledge and answers that reflect the facts of the pastime. It is necessary to use credible evidence to analyze and connect to the form of stories, such as evidence from a geographic location, Art and architecture, and cultures (education, religion, beliefs, customs, etc.)
Story-based learning is based on the concept of collaborating historical events in the form of stories. So it is necessary that a teaching course that learning or understanding content of knowledge originated from the recognition of knowledge in the form of story-based learning, which consorts with timeline’s history. Hence it is necessary for students to understand and memorize any content in the form of a story. (Learning in the form of story memorization could
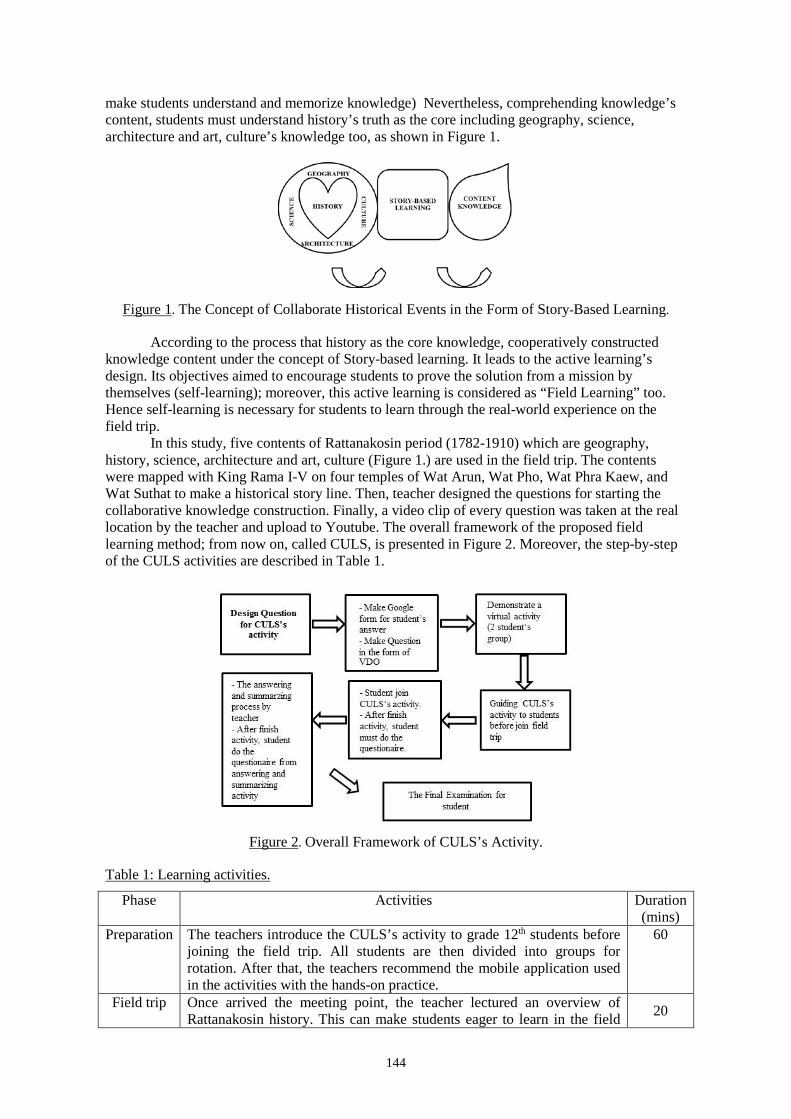
144
make students understand and memorize knowledge) Nevertheless, comprehending knowledge’s content, students must understand history’s truth as the core including geography, science, architecture and art, culture’s knowledge too, as shown in Figure 1.
Figure 1. The Concept of Collaborate Historical Events in the Form of Story-Based Learning.
According to the process that history as the core knowledge, cooperatively constructed knowledge content under the concept of Story-based learning. It leads to the active learning’s design. Its objectives aimed to encourage students to prove the solution from a mission by themselves (self-learning); moreover, this active learning is considered as “Field Learning” too. Hence self-learning is necessary for students to learn through the real-world experience on the field trip.
In this study, five contents of Rattanakosin period (1782-1910) which are geography, history, science, architecture and art, culture (Figure 1.) are used in the field trip. The contents were mapped with King Rama I-V on four temples of Wat Arun, Wat Pho, Wat Phra Kaew, and Wat Suthat to make a historical story line. Then, teacher designed the questions for starting the collaborative knowledge construction. Finally, a video clip of every question was taken at the real location by the teacher and upload to Youtube. The overall framework of the proposed field learning method; from now on, called CULS, is presented in Figure 2. Moreover, the step-by-step of the CULS activities are described in Table 1.
Figure 2. Overall Framework of CULS’s Activity.
Table 1: Learning activities.
Phase Activities Duration (mins)
Preparation The teachers introduce the CULS’s activity to grade 12th students before joining the field trip. All students are then divided into groups for rotation. After that, the teachers recommend the mobile application used in the activities with the hands-on practice.
60
Field trip
Once arrived the meeting point, the teacher lectured an overview of Rattanakosin history. This can make students eager to learn in the field 20
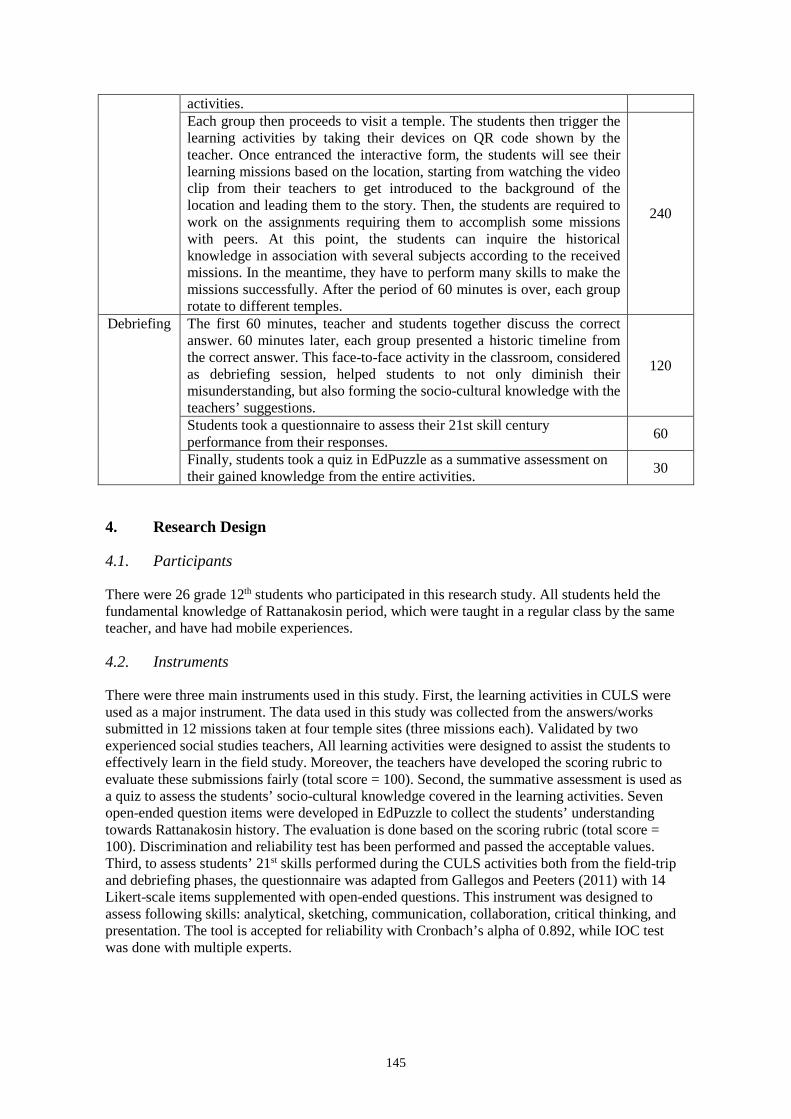
145
activities. Each group then proceeds to visit a temple. The students then trigger the learning activities by taking their devices on QR code shown by the teacher. Once entranced the interactive form, the students will see their learning missions based on the location, starting from watching the video clip from their teachers to get introduced to the background of the location and leading them to the story. Then, the students are required to work on the assignments requiring them to accomplish some missions with peers. At this point, the students can inquire the historical knowledge in association with several subjects according to the received missions. In the meantime, they have to perform many skills to make the missions successfully. After the period of 60 minutes is over, each group rotate to different temples.
240
Debriefing The first 60 minutes, teacher and students together discuss the correct answer. 60 minutes later, each group presented a historic timeline from the correct answer. This face-to-face activity in the classroom, considered as debriefing session, helped students to not only diminish their misunderstanding, but also forming the socio-cultural knowledge with the teachers’ suggestions.
120
Students took a questionnaire to assess their 21st skill century performance from their responses. 60
Finally, students took a quiz in EdPuzzle as a summative assessment on their gained knowledge from the entire activities. 30
4. Research Design
4.1. Participants
There were 26 grade 12th students who participated in this research study. All students held the fundamental knowledge of Rattanakosin period, which were taught in a regular class by the same teacher, and have had mobile experiences.
4.2. Instruments
There were three main instruments used in this study. First, the learning activities in CULS were used as a major instrument. The data used in this study was collected from the answers/works submitted in 12 missions taken at four temple sites (three missions each). Validated by two experienced social studies teachers, All learning activities were designed to assist the students to effectively learn in the field study. Moreover, the teachers have developed the scoring rubric to evaluate these submissions fairly (total score = 100). Second, the summative assessment is used as a quiz to assess the students’ socio-cultural knowledge covered in the learning activities. Seven open-ended question items were developed in EdPuzzle to collect the students’ understanding towards Rattanakosin history. The evaluation is done based on the scoring rubric (total score = 100). Discrimination and reliability test has been performed and passed the acceptable values. Third, to assess students’ 21st skills performed during the CULS activities both from the field-trip and debriefing phases, the questionnaire was adapted from Gallegos and Peeters (2011) with 14 Likert-scale items supplemented with open-ended questions. This instrument was designed to assess following skills: analytical, sketching, communication, collaboration, critical thinking, and presentation. The tool is accepted for reliability with Cronbach’s alpha of 0.892, while IOC test was done with multiple experts.
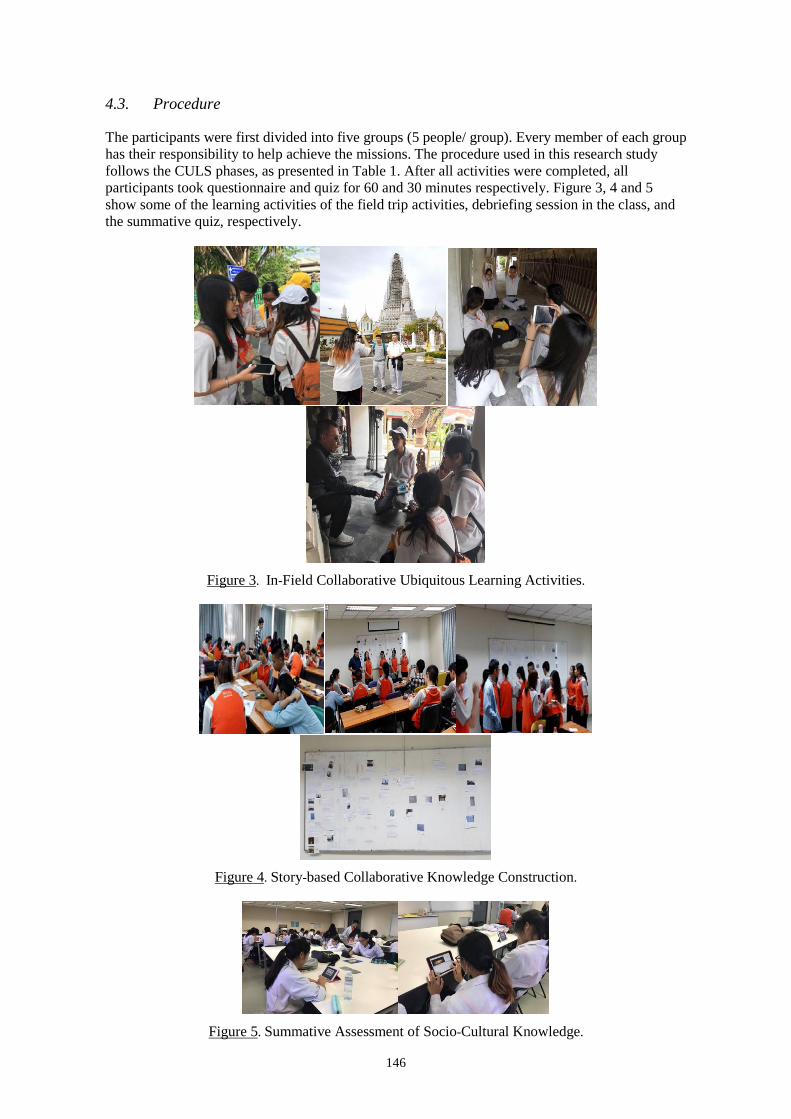
146
4.3. Procedure
The participants were first divided into five groups (5 people/ group). Every member of each group has their responsibility to help achieve the missions. The procedure used in this research study follows the CULS phases, as presented in Table 1. After all activities were completed, all participants took questionnaire and quiz for 60 and 30 minutes respectively. Figure 3, 4 and 5 show some of the learning activities of the field trip activities, debriefing session in the class, and the summative quiz, respectively.
Figure 3. In-Field Collaborative Ubiquitous Learning Activities.
Figure 4. Story-based Collaborative Knowledge Construction.
Figure 5. Summative Assessment of Socio-Cultural Knowledge.
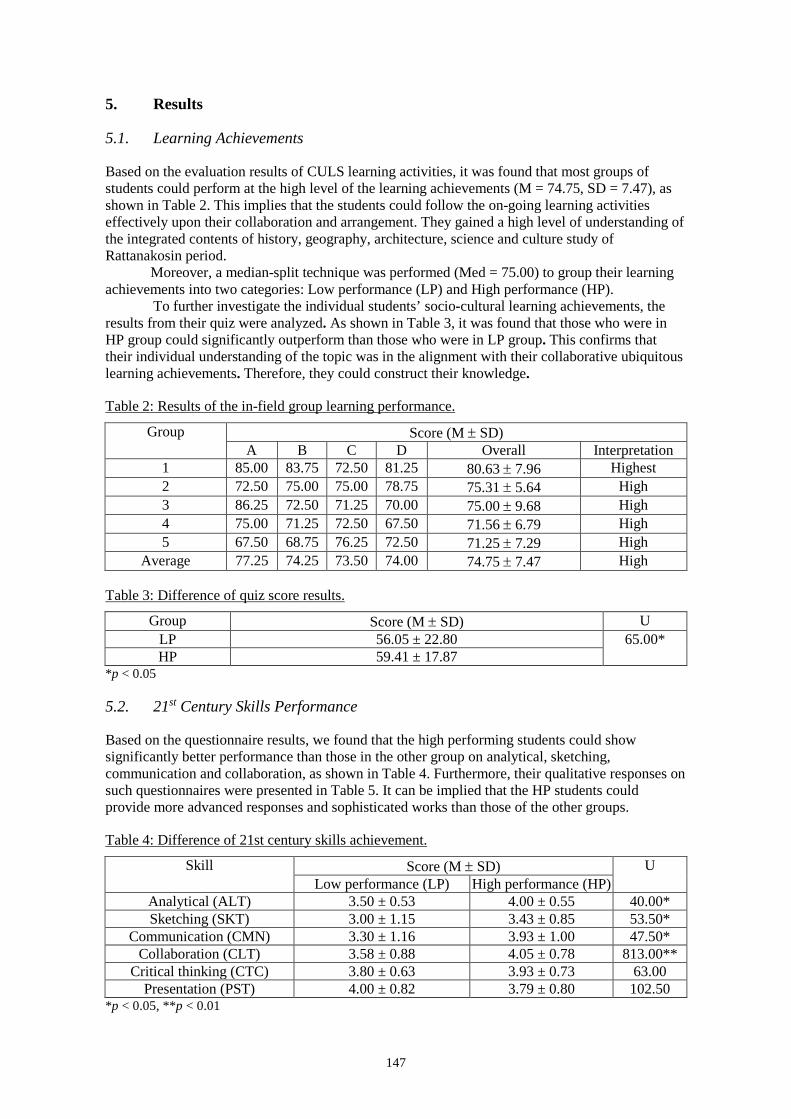
147
5. Results
5.1. Learning Achievements
Based on the evaluation results of CULS learning activities, it was found that most groups of students could perform at the high level of the learning achievements (M = 74.75, SD = 7.47), as shown in Table 2. This implies that the students could follow the on-going learning activities effectively upon their collaboration and arrangement. They gained a high level of understanding of the integrated contents of history, geography, architecture, science and culture study of Rattanakosin period.
Moreover, a median-split technique was performed (Med = 75.00) to group their learning achievements into two categories: Low performance (LP) and High performance (HP).
To further investigate the individual students’ socio-cultural learning achievements, the results from their quiz were analyzed. As shown in Table 3, it was found that those who were in HP group could significantly outperform than those who were in LP group. This confirms that their individual understanding of the topic was in the alignment with their collaborative ubiquitous learning achievements. Therefore, they could construct their knowledge.
Table 2: Results of the in-field group learning performance.
Group Score (M ± SD) A B C D Overall Interpretation
1 85.00 83.75 72.50 81.25 80.63 ± 7.96 Highest 2 72.50 75.00 75.00 78.75 75.31 ± 5.64 High 3 86.25 72.50 71.25 70.00 75.00 ± 9.68 High 4 75.00 71.25 72.50 67.50 71.56 ± 6.79 High 5 67.50 68.75 76.25 72.50 71.25 ± 7.29 High
Average 77.25 74.25 73.50 74.00 74.75 ± 7.47 High
Table 3: Difference of quiz score results.
Group Score (M ± SD) U LP 56.05 ± 22.80 65.00* HP 59.41 ± 17.87
*p < 0.05
5.2. 21st Century Skills Performance
Based on the questionnaire results, we found that the high performing students could show significantly better performance than those in the other group on analytical, sketching, communication and collaboration, as shown in Table 4. Furthermore, their qualitative responses on such questionnaires were presented in Table 5. It can be implied that the HP students could provide more advanced responses and sophisticated works than those of the other groups.
Table 4: Difference of 21st century skills achievement.
Skill Score (M ± SD) U Low performance (LP) High performance (HP)
Analytical (ALT) 3.50 ± 0.53 4.00 ± 0.55 40.00* Sketching (SKT) 3.00 ± 1.15 3.43 ± 0.85 53.50*
Communication (CMN) 3.30 ± 1.16 3.93 ± 1.00 47.50* Collaboration (CLT) 3.58 ± 0.88 4.05 ± 0.78 813.00**
Critical thinking (CTC) 3.80 ± 0.63 3.93 ± 0.73 63.00 Presentation (PST) 4.00 ± 0.82 3.79 ± 0.80 102.50
*p < 0.05, **p < 0.01
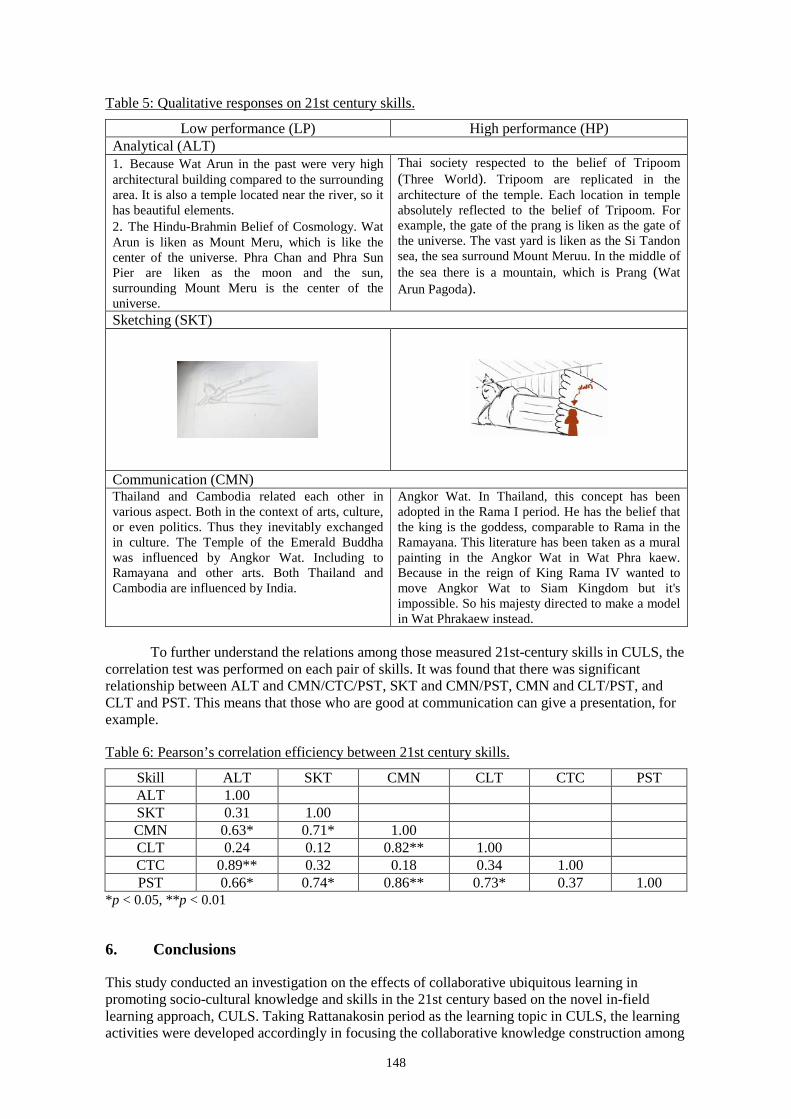
148
Table 5: Qualitative responses on 21st century skills.
Low performance (LP) High performance (HP) Analytical (ALT) 1. Because Wat Arun in the past were very high architectural building compared to the surrounding area. It is also a temple located near the river, so it has beautiful elements. 2. The Hindu-Brahmin Belief of Cosmology. Wat Arun is liken as Mount Meru, which is like the center of the universe. Phra Chan and Phra Sun Pier are liken as the moon and the sun, surrounding Mount Meru is the center of the universe.
Thai society respected to the belief of Tripoom (Three World). Tripoom are replicated in the architecture of the temple. Each location in temple absolutely reflected to the belief of Tripoom. For example, the gate of the prang is liken as the gate of the universe. The vast yard is liken as the Si Tandon sea, the sea surround Mount Meruu. In the middle of the sea there is a mountain, which is Prang (Wat Arun Pagoda).
Sketching (SKT)
Communication (CMN) Thailand and Cambodia related each other in various aspect. Both in the context of arts, culture, or even politics. Thus they inevitably exchanged in culture. The Temple of the Emerald Buddha was influenced by Angkor Wat. Including to Ramayana and other arts. Both Thailand and Cambodia are influenced by India.
Angkor Wat. In Thailand, this concept has been adopted in the Rama I period. He has the belief that the king is the goddess, comparable to Rama in the Ramayana. This literature has been taken as a mural painting in the Angkor Wat in Wat Phra kaew. Because in the reign of King Rama IV wanted to move Angkor Wat to Siam Kingdom but it's impossible. So his majesty directed to make a model in Wat Phrakaew instead.
To further understand the relations among those measured 21st-century skills in CULS, the
correlation test was performed on each pair of skills. It was found that there was significant relationship between ALT and CMN/CTC/PST, SKT and CMN/PST, CMN and CLT/PST, and CLT and PST. This means that those who are good at communication can give a presentation, for example.
Table 6: Pearson’s correlation efficiency between 21st century skills.
Skill ALT SKT CMN CLT CTC PST ALT 1.00 SKT 0.31 1.00 CMN 0.63* 0.71* 1.00 CLT 0.24 0.12 0.82** 1.00 CTC 0.89** 0.32 0.18 0.34 1.00 PST 0.66* 0.74* 0.86** 0.73* 0.37 1.00
*p < 0.05, **p < 0.01
6. Conclusions
This study conducted an investigation on the effects of collaborative ubiquitous learning in promoting socio-cultural knowledge and skills in the 21st century based on the novel in-field learning approach, CULS. Taking Rattanakosin period as the learning topic in CULS, the learning activities were developed accordingly in focusing the collaborative knowledge construction among
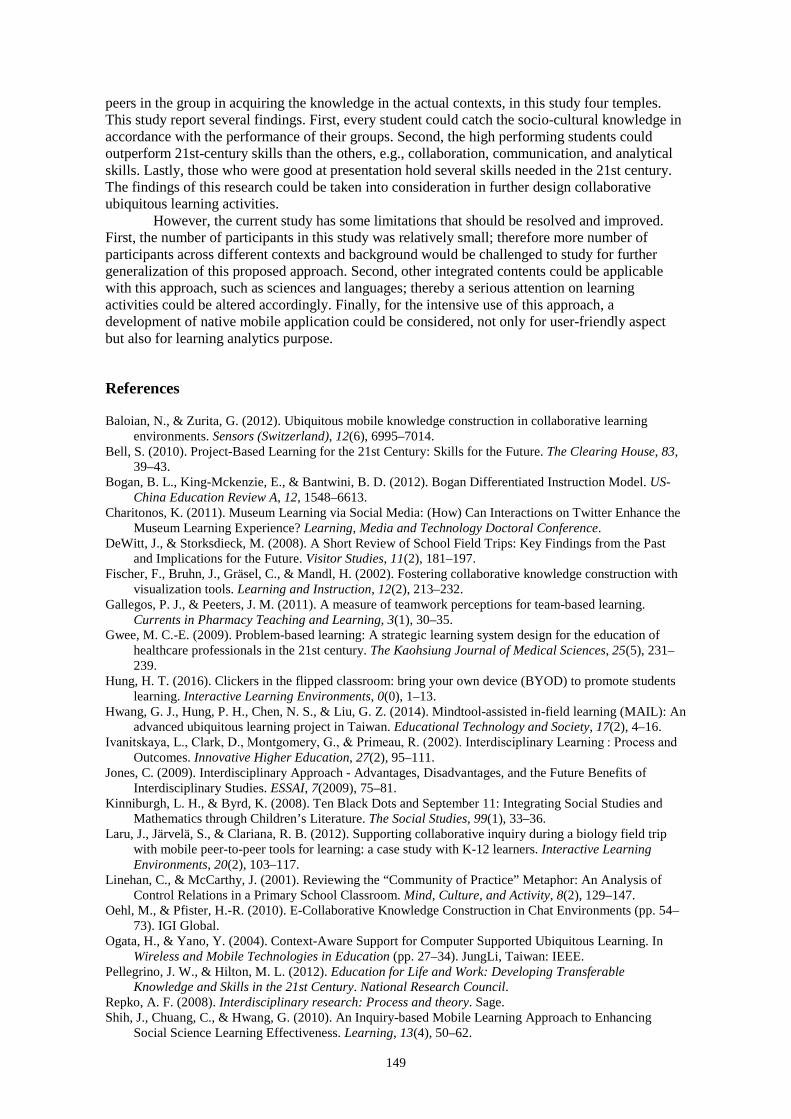
149
peers in the group in acquiring the knowledge in the actual contexts, in this study four temples. This study report several findings. First, every student could catch the socio-cultural knowledge in accordance with the performance of their groups. Second, the high performing students could outperform 21st-century skills than the others, e.g., collaboration, communication, and analytical skills. Lastly, those who were good at presentation hold several skills needed in the 21st century. The findings of this research could be taken into consideration in further design collaborative ubiquitous learning activities.
However, the current study has some limitations that should be resolved and improved. First, the number of participants in this study was relatively small; therefore more number of participants across different contexts and background would be challenged to study for further generalization of this proposed approach. Second, other integrated contents could be applicable with this approach, such as sciences and languages; thereby a serious attention on learning activities could be altered accordingly. Finally, for the intensive use of this approach, a development of native mobile application could be considered, not only for user-friendly aspect but also for learning analytics purpose.
References
Baloian, N., & Zurita, G. (2012). Ubiquitous mobile knowledge construction in collaborative learning environments. Sensors (Switzerland), 12(6), 6995–7014.
Bell, S. (2010). Project-Based Learning for the 21st Century: Skills for the Future. The Clearing House, 83, 39–43.
Bogan, B. L., King-Mckenzie, E., & Bantwini, B. D. (2012). Bogan Differentiated Instruction Model. US-China Education Review A, 12, 1548–6613.
Charitonos, K. (2011). Museum Learning via Social Media: (How) Can Interactions on Twitter Enhance the Museum Learning Experience? Learning, Media and Technology Doctoral Conference.
DeWitt, J., & Storksdieck, M. (2008). A Short Review of School Field Trips: Key Findings from the Past and Implications for the Future. Visitor Studies, 11(2), 181–197.
Fischer, F., Bruhn, J., Gräsel, C., & Mandl, H. (2002). Fostering collaborative knowledge construction with visualization tools. Learning and Instruction, 12(2), 213–232.
Gallegos, P. J., & Peeters, J. M. (2011). A measure of teamwork perceptions for team-based learning. Currents in Pharmacy Teaching and Learning, 3(1), 30–35.
Gwee, M. C.-E. (2009). Problem-based learning: A strategic learning system design for the education of healthcare professionals in the 21st century. The Kaohsiung Journal of Medical Sciences, 25(5), 231–239.
Hung, H. T. (2016). Clickers in the flipped classroom: bring your own device (BYOD) to promote students learning. Interactive Learning Environments, 0(0), 1–13.
Hwang, G. J., Hung, P. H., Chen, N. S., & Liu, G. Z. (2014). Mindtool-assisted in-field learning (MAIL): An advanced ubiquitous learning project in Taiwan. Educational Technology and Society, 17(2), 4–16.
Ivanitskaya, L., Clark, D., Montgomery, G., & Primeau, R. (2002). Interdisciplinary Learning : Process and Outcomes. Innovative Higher Education, 27(2), 95–111.
Jones, C. (2009). Interdisciplinary Approach - Advantages, Disadvantages, and the Future Benefits of Interdisciplinary Studies. ESSAI, 7(2009), 75–81.
Kinniburgh, L. H., & Byrd, K. (2008). Ten Black Dots and September 11: Integrating Social Studies and Mathematics through Children’s Literature. The Social Studies, 99(1), 33–36.
Laru, J., Järvelä, S., & Clariana, R. B. (2012). Supporting collaborative inquiry during a biology field trip with mobile peer-to-peer tools for learning: a case study with K-12 learners. Interactive Learning Environments, 20(2), 103–117.
Linehan, C., & McCarthy, J. (2001). Reviewing the “Community of Practice” Metaphor: An Analysis of Control Relations in a Primary School Classroom. Mind, Culture, and Activity, 8(2), 129–147.
Oehl, M., & Pfister, H.-R. (2010). E-Collaborative Knowledge Construction in Chat Environments (pp. 54–73). IGI Global.
Ogata, H., & Yano, Y. (2004). Context-Aware Support for Computer Supported Ubiquitous Learning. In Wireless and Mobile Technologies in Education (pp. 27–34). JungLi, Taiwan: IEEE.
Pellegrino, J. W., & Hilton, M. L. (2012). Education for Life and Work: Developing Transferable Knowledge and Skills in the 21st Century. National Research Council.
Repko, A. F. (2008). Interdisciplinary research: Process and theory. Sage. Shih, J., Chuang, C., & Hwang, G. (2010). An Inquiry-based Mobile Learning Approach to Enhancing
Social Science Learning Effectiveness. Learning, 13(4), 50–62.

150
Shih, S. C., Kuo, B. C., & Liu, Y. L. (2012). Adaptively ubiquitous learning in campus math path. Educational Technology and Society, 15(2), 298–308.
Story-based learning. (2016). In ESC: Engineering–Science Classroom. Retrieved August 2, 2017, from www.kmutt.ac.th/GiftEd
Tscholl, M., & Dowell, J. (2010). Collaborative knowledge construction: examples of distributed cognitive processing. E-Collaborative Knowledge Construction: Learning from Computer-Supported and Virtual Environments, 74–90.
van Hover, S. D., Berson, M. J., Bolick, C. M., & Swan, K. O. (2004). Implications of Ubiquitous Computing For the Social Studies Curriculum. Journal of Computing in Teacher Education, 20(3), 107–112.
Wu, P. H., Hwang, G. J., & Tsai, W. H. (2013). An expert system-based context-aware ubiquitous learning approach for conducting science learning activities. Educational Technology and Society, 16(4), 217–230.
Yahya, Ahmad, J. (2010). The definition and characteristics of ubiquiteous learning. International Journal of Education and Development Using Information and Communication Technology, 6(1), 117–127.
Hayashi, Y., et al. (Eds.) (2017). Workshop Proceedings of the 25th International Conference on Computers in Education. New Zealand: Asia-Pacific Society for Computers in Education
151
Fostering Pre-service Science Teachers’ Technological Pedagogical Content
Knowledge of Mobile Laboratory Learning in Science
Phattaraporn PONDEEa, Sasivimol PREMTHAISONGa & Niwat SRISAWASDIb,c* a Science Education Program, Faculty of Education, Khon Kaen University, Thailand b Division of Science, Mathematics and Technology Education, Faculty of Education,
Khon Kaen University, Thailand c Institute of Learning and Teaching Innovation, Khon Kaen University, Thailand
Abstract: The framework of technology pedagogical and content knowledge (TPACK) is currently considered as essential qualities of knowledge for highly qualified teachers in the 21st century education. This knowledge framework has been suggested by researchers to be helpful in preparing literate pre-service teachers in the use of digital technology in their classroom teaching practices of specific subject contents. As such, the researchers have implemented the framework for designing a module of the pedagogy of Mobile Laboratory Learning in Science (MLLS) for pre-service science teachers. The purpose of this study was to examine an efficacy of the MLLS for enhancing pre-service science teachers’ TPACK. The study participants were 119 pre-service science teachers in general science teacher education program at a Rajabhat university of Thailand, and they were assigned to participate with the module in four weeks. The preliminary results showed that the pre-service science teachers have improved their conceptions of TPACK of mobile laboratory learning in science to higher level after interacting with the MLLS module.
Keywords: TPACK, mobile learning, science laboratory, mobile experimentation, pre-service teacher
1. Introduction
Mobile devices are recognized as an emerging technology with the potential to facilitate teaching and learning strategies that exploit individual learners’ context (Jeng et al., 2010). Nowadays, the use of mobile devices in education, as mobile learning, is popular educational activity that many researchers have implemented in many subject areas for improving the effectiveness of instruction. Mobile learning makes sense only when the technology in use is fully mobile and when the users of the technology are also mobile while they learn. These observations emphasize the mobility of learning and the significance of the term mobile learning (El-Hussein, M. O. M., & Cronje, J.C., 2010). Mobile technology offers a plethora of features and benefits that enable it to break the educational system wide open, engaging students in new ways and making educational experiences more meaningful. It offers flexibility in when the learning take place, personalized content, teaches relevant skills for the future. Mobile technologies offer a new paradigm in connectivity, communication, and collaboration in our everyday lives. It is anywhere, anytime learning indeed (McQuiggan et al., 2015). In context of science education, this has led to several research initiatives that investigate the potential of the educational paradigm shift from the traditional science teaching approaches to mobile learning in science. Currently, researchers in science education community have concentrated on investigating effective ways to facilitate science learning in authentic context with the support of mobile technology.
Mobile learning in science seems to be a pedagogic way to deliver the authenticity of scientific phenomena into science teaching and learning, both formal and informal contexts. More
152
precisely, mobile learning can (a) engage students in experiential and situated learning without place, time and device restrictions, (b) enable students to continue learning activities, initiated inside the traditional classroom, outside the classroom through their constant and contextual interaction and communication with their classmates and/or their tutors, (c) support on-demand access to educational resources regardless of students’ commitments, (d) allow for new skills or knowledge to be immediately applied and (e) extend traditional teacher-led classroom scenario with informal learning activities performed outside the classroom (Gomez et al., 2014). With the advancement of mobile technology, learning in real-world context, outside the classroom, is no longer a problem and learning combined with authentic contexts becomes easier for science-based education. However, a challenge for mobile learning in science related to teachers’ adoption of mobile technologies in their science class emerged from the fact that they were not prepared effectively in investigating the affordances of mobile technologies for their pedagogy and the content they teach to make informed decisions (Kukulska-Hulme et al., 2008).
The big challenge for mobile learning in science related to teachers’ adoption of mobile technologies in their science class emerged from the fact that they were not prepared effectively in investigating the affordances of mobile technologies for their pedagogy and the content they teach to make informed decisions (Kukulska-Hulme et al., 2008). We believed that a major obstacle of science teachers for using mobile technology in the classroom is the lack of sufficient knowledge and skills of how to utilize it pedagogically into the science class. To overcome this obstacle, Smarkola (2008) has suggested training preservice teachers in educational technology during their initial teacher education. To achieve that, their knowledge of how to use mobile technology in science teaching and learning is very important for gaining high quality teaching competencies in science. Srisawasdi (2014) stated that not only all students need a more robust process of technology-enhanced science learning, but teachers also need to be educated and prepared for gaining high quality teaching competencies by integrating digital technologies, such as mobile devices, into their classroom teaching practice.
Preparing preservice teachers for digital technology integration is a complex job given the fast-changing nature of digital technology, such as mobile devices, and the multiple sources of knowledge which need to be synthesized. Meaningful use of digital technology in the classroom requires the teachers to integrate technological affordances with pedagogical approaches for the specific subject matter to be taught (Jonassen et al., 2008; Mishra & Khoeler, 2006) To be an technology-integrating teacher means going beyond technology skills, and developing an understanding of the complex relationships between pedagogy, content and technology (Hughes, 2005; Keating & Evans, 2001; Lundeberg, Bergland, Klyczek & Hoffman, 2003; Margerum-Leys & Marx, 2002; Niess, 2005; Zhao, 2003). Hence, a teacher preparation program should provide students with the knowledge, skills, and experience needed to integrate technology effectively in their future practice, considering the interactions between pedagogy, content and technology. This integrated form of contextualized knowledge has been recently referred to as technological pedagogical and content knowledge, shortly called TPACK (Mishra & Khoeler, 2006; Thompson & Mishra, 2007). TPACK is currently considered as possessing the essential qualities of knowledge for highly qualified teachers in the 21st century (Srisawasdi, 2014).The TPACK framework stresses the importance of the interactions between these bodies of knowledge.These include pedagogical content knowledge PCK) as addressed by Shulman (1987), technological content knowledge (TCK) referring to how ICT and content influence each other, technological pedagogical knowledge (TPK) addressing how pedagogies change while using technology, and technological pedagogical content knowledge (TPACK), which is the knowledge that emerges from interactions among the three knowledge domains (Koehler & Mishra, 2008). The TPACK framework has been used to re-design teacher preparation programs and teacher development workshops (i.e. Niess, 2005; Niess, 2007; Niess, Suharwoto, Lee, & Sadri, 2006; Shoffner, 2007; Burns, 2007). Special emphasis has been given to incorporating technology design projects as avenues to help teachers develop connections between TK, PK, and CK (i.e. Niess, 2005; Mishra & Koehler, 2006; Srisawasdi, 2014). TPACK may new directions for teacher educators in solving the problems associated with infusing ICT into classroom teaching practice and learning process (Chai et al., 2011 cited in Srisawasdi, 2012). However, mobile learning is especially under-theorized in teacher education (Kearney & Maher, 2013), despite the need to inform teachers of
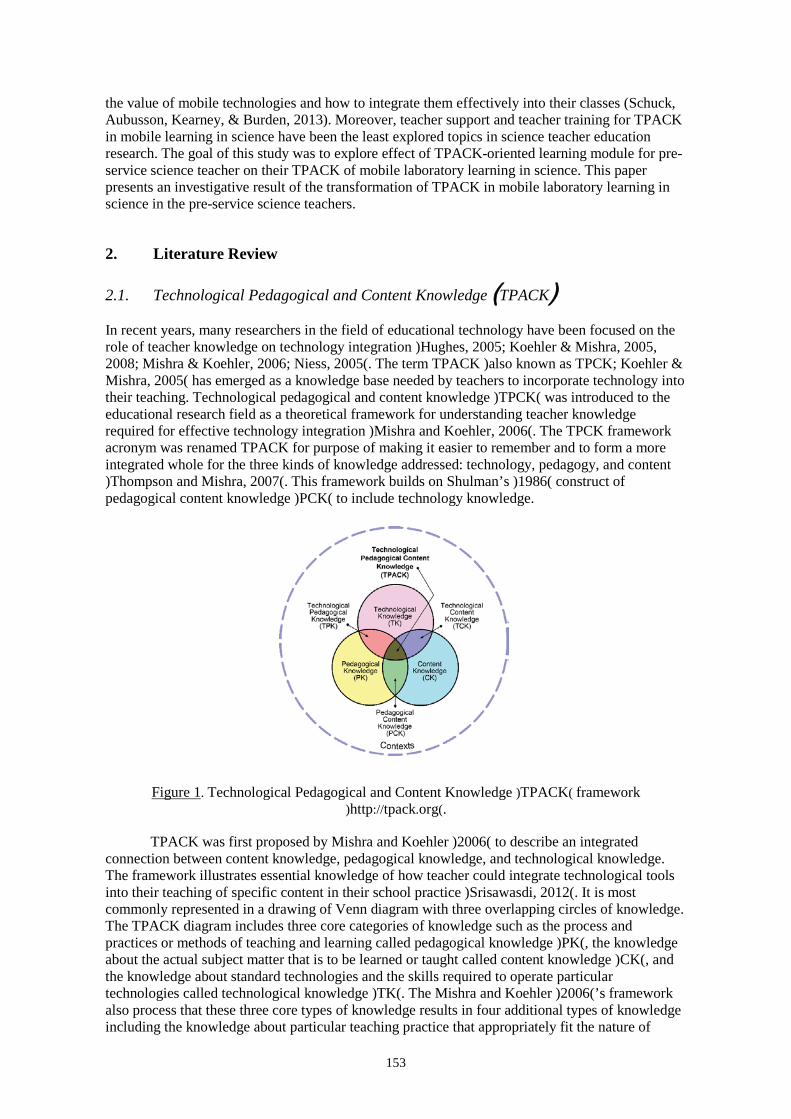
153
the value of mobile technologies and how to integrate them effectively into their classes (Schuck, Aubusson, Kearney, & Burden, 2013). Moreover, teacher support and teacher training for TPACK in mobile learning in science have been the least explored topics in science teacher education research. The goal of this study was to explore effect of TPACK-oriented learning module for pre-service science teacher on their TPACK of mobile laboratory learning in science. This paper presents an investigative result of the transformation of TPACK in mobile laboratory learning in science in the pre-service science teachers.
2. Literature Review
2.1. Technological Pedagogical and Content Knowledge (TPACK)
In recent years, many researchers in the field of educational technology have been focused on the role of teacher knowledge on technology integration )Hughes, 2005; Koehler & Mishra, 2005, 2008; Mishra & Koehler, 2006; Niess, 2005(. The term TPACK )also known as TPCK; Koehler & Mishra, 2005( has emerged as a knowledge base needed by teachers to incorporate technology into their teaching. Technological pedagogical and content knowledge )TPCK( was introduced to the educational research field as a theoretical framework for understanding teacher knowledge required for effective technology integration )Mishra and Koehler, 2006(. The TPCK framework acronym was renamed TPACK for purpose of making it easier to remember and to form a more integrated whole for the three kinds of knowledge addressed: technology, pedagogy, and content )Thompson and Mishra, 2007(. This framework builds on Shulman’s )1986( construct of pedagogical content knowledge )PCK( to include technology knowledge.
Figure 1. Technological Pedagogical and Content Knowledge )TPACK( framework )http://tpack.org(.
TPACK was first proposed by Mishra and Koehler )2006( to describe an integrated connection between content knowledge, pedagogical knowledge, and technological knowledge. The framework illustrates essential knowledge of how teacher could integrate technological tools into their teaching of specific content in their school practice )Srisawasdi, 2012(. It is most commonly represented in a drawing of Venn diagram with three overlapping circles of knowledge. The TPACK diagram includes three core categories of knowledge such as the process and practices or methods of teaching and learning called pedagogical knowledge )PK(, the knowledge about the actual subject matter that is to be learned or taught called content knowledge )CK(, and the knowledge about standard technologies and the skills required to operate particular technologies called technological knowledge )TK(. The Mishra and Koehler )2006(’s framework also process that these three core types of knowledge results in four additional types of knowledge including the knowledge about particular teaching practice that appropriately fit the nature of
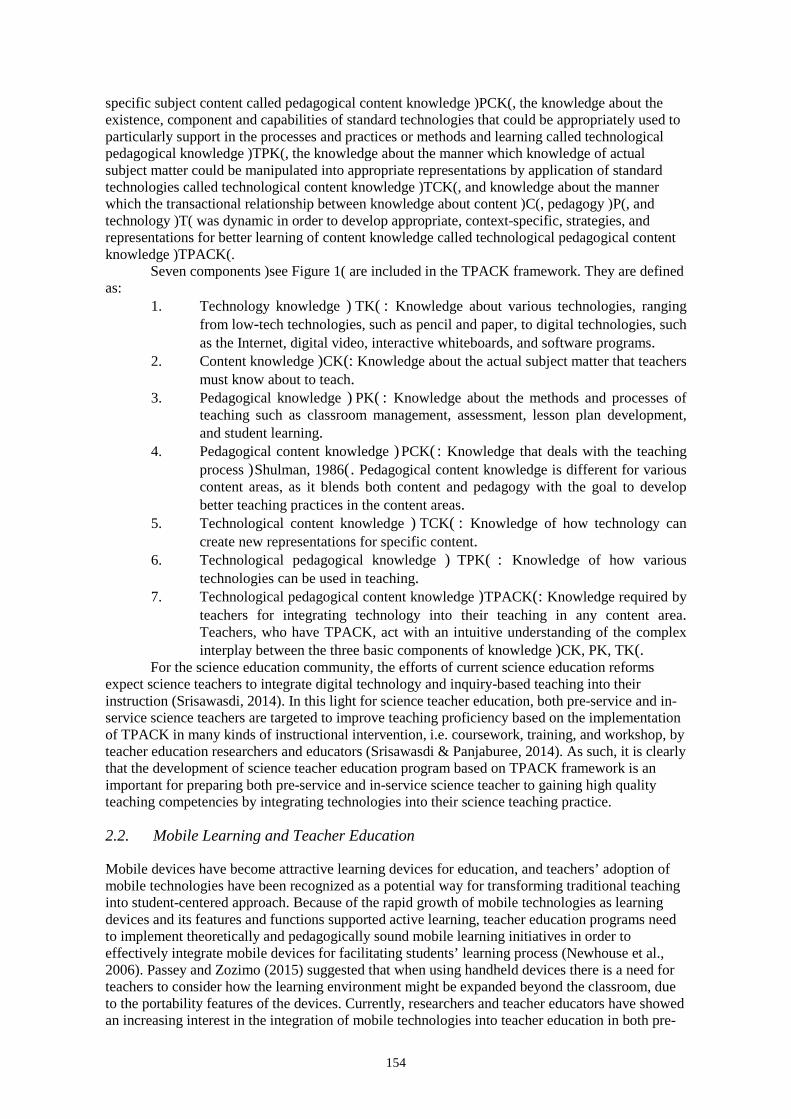
154
specific subject content called pedagogical content knowledge )PCK(, the knowledge about the existence, component and capabilities of standard technologies that could be appropriately used to particularly support in the processes and practices or methods and learning called technological pedagogical knowledge )TPK(, the knowledge about the manner which knowledge of actual subject matter could be manipulated into appropriate representations by application of standard technologies called technological content knowledge )TCK(, and knowledge about the manner which the transactional relationship between knowledge about content )C(, pedagogy )P(, and technology )T( was dynamic in order to develop appropriate, context-specific, strategies, and representations for better learning of content knowledge called technological pedagogical content knowledge )TPACK(.
Seven components )see Figure 1( are included in the TPACK framework. They are defined as:
1. Technology knowledge ) TK( : Knowledge about various technologies, ranging from low-tech technologies, such as pencil and paper, to digital technologies, such as the Internet, digital video, interactive whiteboards, and software programs.
2. Content knowledge )CK(: Knowledge about the actual subject matter that teachers must know about to teach.
3. Pedagogical knowledge ) PK( : Knowledge about the methods and processes of teaching such as classroom management, assessment, lesson plan development, and student learning.
4. Pedagogical content knowledge ) PCK( : Knowledge that deals with the teaching process )Shulman, 1986(. Pedagogical content knowledge is different for various content areas, as it blends both content and pedagogy with the goal to develop better teaching practices in the content areas.
5. Technological content knowledge ) TCK( : Knowledge of how technology can create new representations for specific content.
6. Technological pedagogical knowledge ) TPK( : Knowledge of how various technologies can be used in teaching.
7. Technological pedagogical content knowledge )TPACK(: Knowledge required by teachers for integrating technology into their teaching in any content area. Teachers, who have TPACK, act with an intuitive understanding of the complex interplay between the three basic components of knowledge )CK, PK, TK(.
For the science education community, the efforts of current science education reforms expect science teachers to integrate digital technology and inquiry-based teaching into their instruction (Srisawasdi, 2014). In this light for science teacher education, both pre-service and in-service science teachers are targeted to improve teaching proficiency based on the implementation of TPACK in many kinds of instructional intervention, i.e. coursework, training, and workshop, by teacher education researchers and educators (Srisawasdi & Panjaburee, 2014). As such, it is clearly that the development of science teacher education program based on TPACK framework is an important for preparing both pre-service and in-service science teacher to gaining high quality teaching competencies by integrating technologies into their science teaching practice.
2.2. Mobile Learning and Teacher Education
Mobile devices have become attractive learning devices for education, and teachers’ adoption of mobile technologies have been recognized as a potential way for transforming traditional teaching into student-centered approach. Because of the rapid growth of mobile technologies as learning devices and its features and functions supported active learning, teacher education programs need to implement theoretically and pedagogically sound mobile learning initiatives in order to effectively integrate mobile devices for facilitating students’ learning process (Newhouse et al., 2006). Passey and Zozimo (2015) suggested that when using handheld devices there is a need for teachers to consider how the learning environment might be expanded beyond the classroom, due to the portability features of the devices. Currently, researchers and teacher educators have showed an increasing interest in the integration of mobile technologies into teacher education in both pre-
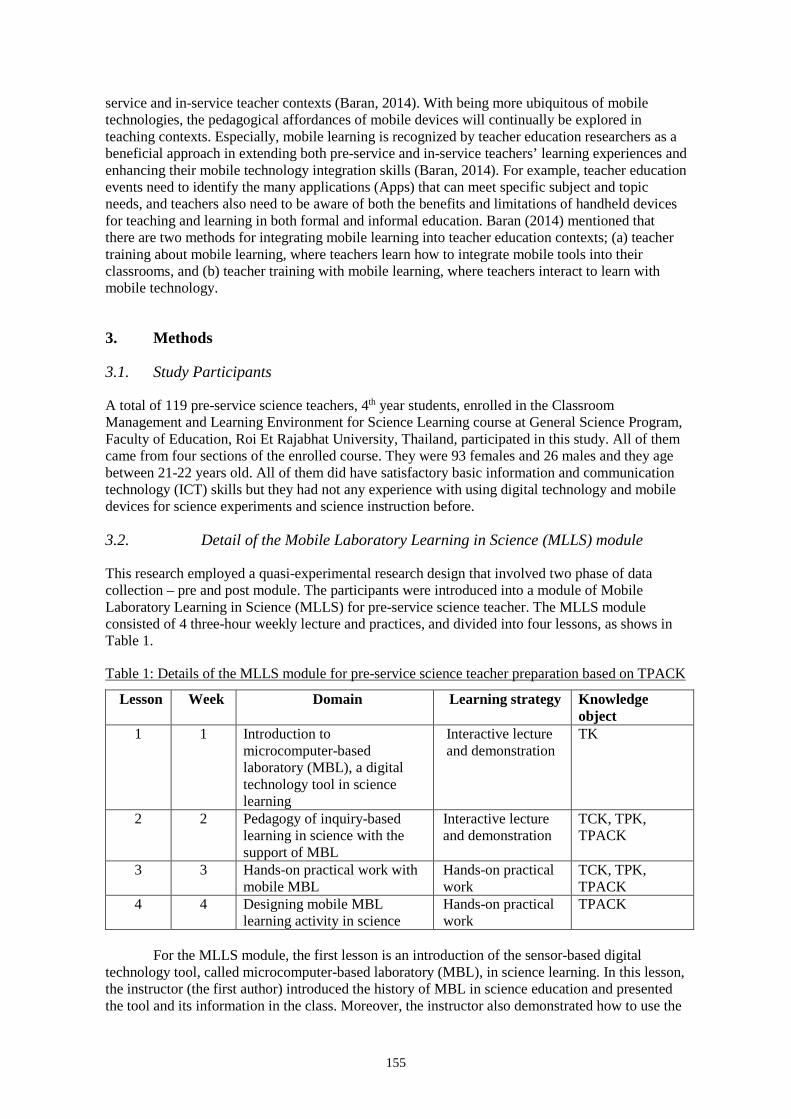
155
service and in-service teacher contexts (Baran, 2014). With being more ubiquitous of mobile technologies, the pedagogical affordances of mobile devices will continually be explored in teaching contexts. Especially, mobile learning is recognized by teacher education researchers as a beneficial approach in extending both pre-service and in-service teachers’ learning experiences and enhancing their mobile technology integration skills (Baran, 2014). For example, teacher education events need to identify the many applications (Apps) that can meet specific subject and topic needs, and teachers also need to be aware of both the benefits and limitations of handheld devices for teaching and learning in both formal and informal education. Baran (2014) mentioned that there are two methods for integrating mobile learning into teacher education contexts; (a) teacher training about mobile learning, where teachers learn how to integrate mobile tools into their classrooms, and (b) teacher training with mobile learning, where teachers interact to learn with mobile technology.
3. Methods
3.1. Study Participants
A total of 119 pre-service science teachers, 4th year students, enrolled in the Classroom Management and Learning Environment for Science Learning course at General Science Program, Faculty of Education, Roi Et Rajabhat University, Thailand, participated in this study. All of them came from four sections of the enrolled course. They were 93 females and 26 males and they age between 21-22 years old. All of them did have satisfactory basic information and communication technology (ICT) skills but they had not any experience with using digital technology and mobile devices for science experiments and science instruction before.
3.2. Detail of the Mobile Laboratory Learning in Science (MLLS) module
This research employed a quasi-experimental research design that involved two phase of data collection – pre and post module. The participants were introduced into a module of Mobile Laboratory Learning in Science (MLLS) for pre-service science teacher. The MLLS module consisted of 4 three-hour weekly lecture and practices, and divided into four lessons, as shows in Table 1.
Table 1: Details of the MLLS module for pre-service science teacher preparation based on TPACK
Lesson Week Domain Learning strategy Knowledge object
1 1 Introduction to microcomputer-based laboratory (MBL), a digital technology tool in science learning
Interactive lecture and demonstration
TK
2 2 Pedagogy of inquiry-based learning in science with the support of MBL
Interactive lecture and demonstration
TCK, TPK, TPACK
3 3 Hands-on practical work with mobile MBL
Hands-on practical work
TCK, TPK, TPACK
4 4 Designing mobile MBL learning activity in science
Hands-on practical work
TPACK
For the MLLS module, the first lesson is an introduction of the sensor-based digital
technology tool, called microcomputer-based laboratory (MBL), in science learning. In this lesson, the instructor (the first author) introduced the history of MBL in science education and presented the tool and its information in the class. Moreover, the instructor also demonstrated how to use the
156
tool in school science laboratory. Figure 2 illustrates the introduction of MBL in science learning class.
Figure 2. An Illustration of the first lesson class, an introduction of MBL for preservice science
teachers
In the second lesson, the instructor introduced them the pedagogy of inquiry-based learning in science in both instructional strategies, i.e. learning cycle-oriented and openness- oriented approach (Srisawasdi, 2016). Then, they were presented to a mini lesson on how to use MBL as an inquiry tool in the learning process of science. In addition, the instructor also showed the pedagogic case for implementing technology-enhanced science learning with the support of sensor-based MBL, as shows in Figure 3.
Figure 3. An Illustration of the pre-service science teachers’ practice in class using sensor-based
MBL in the second lesson
For the hands-on practical work with mobile MBL in the third lesson, the instructor assigned the pre-service teachers to conduct a scientific inquiry with mobile MBL outside the classroom. The mobile MBL-based scientific inquiry was focused on the investigation of water quality of various resources within the university. They were assigned to conduct the investigation in small groups by using smartphone and MBL connected via Bluetooth. Figure 4 illustrates the pre-service science teachers with conducting the water quality experiment with mobile laboratory.
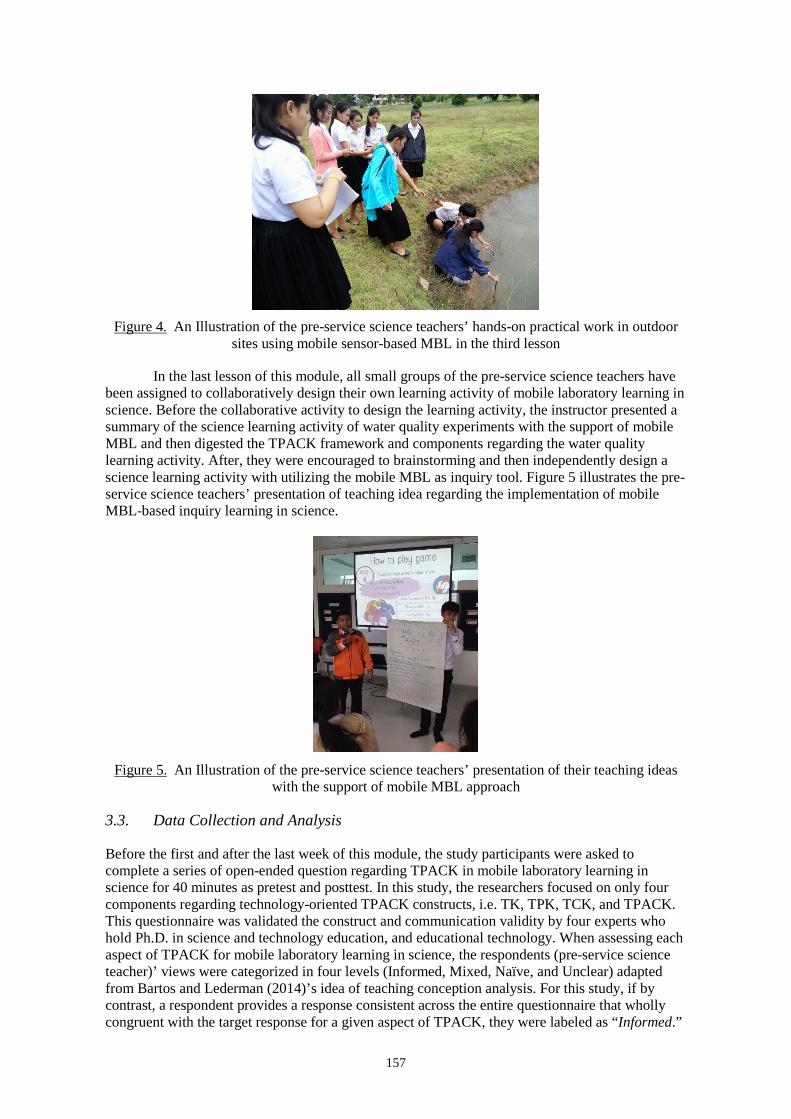
157
Figure 4. An Illustration of the pre-service science teachers’ hands-on practical work in outdoor
sites using mobile sensor-based MBL in the third lesson
In the last lesson of this module, all small groups of the pre-service science teachers have been assigned to collaboratively design their own learning activity of mobile laboratory learning in science. Before the collaborative activity to design the learning activity, the instructor presented a summary of the science learning activity of water quality experiments with the support of mobile MBL and then digested the TPACK framework and components regarding the water quality learning activity. After, they were encouraged to brainstorming and then independently design a science learning activity with utilizing the mobile MBL as inquiry tool. Figure 5 illustrates the pre-service science teachers’ presentation of teaching idea regarding the implementation of mobile MBL-based inquiry learning in science.
Figure 5. An Illustration of the pre-service science teachers’ presentation of their teaching ideas
with the support of mobile MBL approach
3.3. Data Collection and Analysis
Before the first and after the last week of this module, the study participants were asked to complete a series of open-ended question regarding TPACK in mobile laboratory learning in science for 40 minutes as pretest and posttest. In this study, the researchers focused on only four components regarding technology-oriented TPACK constructs, i.e. TK, TPK, TCK, and TPACK. This questionnaire was validated the construct and communication validity by four experts who hold Ph.D. in science and technology education, and educational technology. When assessing each aspect of TPACK for mobile laboratory learning in science, the respondents (pre-service science teacher)’ views were categorized in four levels (Informed, Mixed, Naïve, and Unclear) adapted from Bartos and Lederman (2014)’s idea of teaching conception analysis. For this study, if by contrast, a respondent provides a response consistent across the entire questionnaire that wholly congruent with the target response for a given aspect of TPACK, they were labeled as “Informed.”
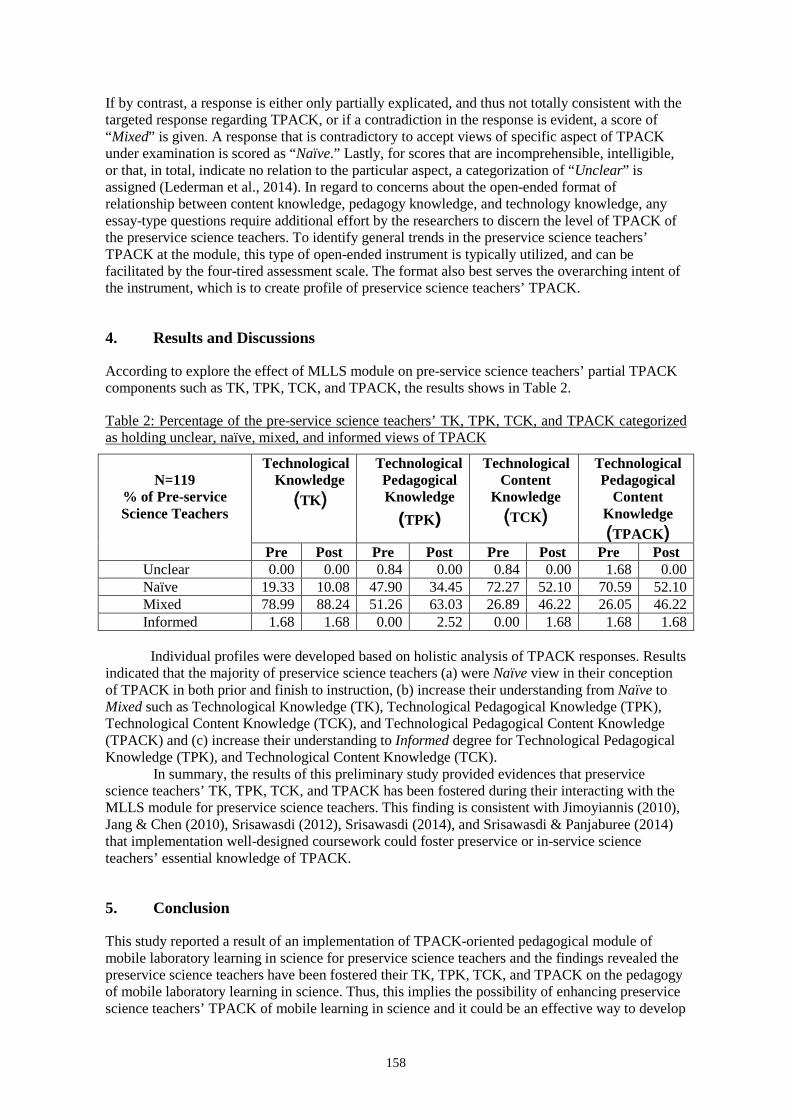
158
If by contrast, a response is either only partially explicated, and thus not totally consistent with the targeted response regarding TPACK, or if a contradiction in the response is evident, a score of “Mixed” is given. A response that is contradictory to accept views of specific aspect of TPACK under examination is scored as “Naïve.” Lastly, for scores that are incomprehensible, intelligible, or that, in total, indicate no relation to the particular aspect, a categorization of “Unclear” is assigned (Lederman et al., 2014). In regard to concerns about the open-ended format of relationship between content knowledge, pedagogy knowledge, and technology knowledge, any essay-type questions require additional effort by the researchers to discern the level of TPACK of the preservice science teachers. To identify general trends in the preservice science teachers’ TPACK at the module, this type of open-ended instrument is typically utilized, and can be facilitated by the four-tired assessment scale. The format also best serves the overarching intent of the instrument, which is to create profile of preservice science teachers’ TPACK.
4. Results and Discussions
According to explore the effect of MLLS module on pre-service science teachers’ partial TPACK components such as TK, TPK, TCK, and TPACK, the results shows in Table 2.
Table 2: Percentage of the pre-service science teachers’ TK, TPK, TCK, and TPACK categorized as holding unclear, naïve, mixed, and informed views of TPACK
N=119
% of Pre-service Science Teachers
Technological Knowledge
(TK)
Technological Pedagogical Knowledge
(TPK)
Technological Content
Knowledge (TCK)
Technological Pedagogical
Content Knowledge (TPACK)
Pre Post Pre Post Pre Post Pre Post Unclear 0.00 0.00 0.84 0.00 0.84 0.00 1.68 0.00 Naïve 19.33 10.08 47.90 34.45 72.27 52.10 70.59 52.10 Mixed 78.99 88.24 51.26 63.03 26.89 46.22 26.05 46.22 Informed 1.68 1.68 0.00 2.52 0.00 1.68 1.68 1.68
Individual profiles were developed based on holistic analysis of TPACK responses. Results
indicated that the majority of preservice science teachers (a) were Naïve view in their conception of TPACK in both prior and finish to instruction, (b) increase their understanding from Naïve to Mixed such as Technological Knowledge (TK), Technological Pedagogical Knowledge (TPK), Technological Content Knowledge (TCK), and Technological Pedagogical Content Knowledge (TPACK) and (c) increase their understanding to Informed degree for Technological Pedagogical Knowledge (TPK), and Technological Content Knowledge (TCK).
In summary, the results of this preliminary study provided evidences that preservice science teachers’ TK, TPK, TCK, and TPACK has been fostered during their interacting with the MLLS module for preservice science teachers. This finding is consistent with Jimoyiannis (2010), Jang & Chen (2010), Srisawasdi (2012), Srisawasdi (2014), and Srisawasdi & Panjaburee (2014) that implementation well-designed coursework could foster preservice or in-service science teachers’ essential knowledge of TPACK.
5. Conclusion
This study reported a result of an implementation of TPACK-oriented pedagogical module of mobile laboratory learning in science for preservice science teachers and the findings revealed the preservice science teachers have been fostered their TK, TPK, TCK, and TPACK on the pedagogy of mobile laboratory learning in science. Thus, this implies the possibility of enhancing preservice science teachers’ TPACK of mobile learning in science and it could be an effective way to develop
159
their essential knowledge of technology-enhanced learning in science to address the 21st century education.
Acknowledgements
This contribution was partially supported by Graduate School, Khon Kaen University, Thailand. The authors would like to express gratefully acknowledge to Science Education Program, Faculty of Education, Khon Kaen University, for supporting the implementation of this study.
References
Angeli, C. & Valanides, N. (2005). Preservice elementary teachers as information and communication technology designers: an instructional systems design model based on an expanded view of pedagogical content knowledge. Journal of Computer Assisted Learning, 21 (4), 292–302.
Angeli, C., & Valanides, N. )2009(. Epistemological and methodological issues for the conceptualization, development, and assessment of ICT-TPCK: Advances in technological pedagogical content knowledge )TPCK(. Computers & Education, 52)1(, 154-168.
Baran, E. (2014). A review of research on mobile learning in teacher education. Educational Technology & Society, 17)4(, 17-32.
Bartos, S. A., & Lederman, N. G. (2014). Teachers’ knowledge structures for nature of science and scientific inquiry: Conceptions and classroom practice. Journal of Research in Science Teaching, 51(9), 1150-1184.
Burns, K. )2007(. Technology, content and pedagogy: United in pre-service teacher instruction. Technology and Teacher Education Annual, 18)4(, 2177.
El-Hussein, M. O. M., & Cronje, J.C. )2010(. Defining mobile learning in the higher education landscape. Educational Technology & Society, 13)3(, 12-21.
Goktas, Y., Yildirim, S. & Yildirim, Z. )2009(. Main barriers and possible enablers of ICT integration into preservice teacher education programs. Educational Technology & Society, 12)1(, 193-204.
Gomez et al. (2014). Context-aware adaptive and personalized mobile learning delivery supported by OoLmP. Computer and Information Sciences, 26, 47-61.
Gunhaart, A., & Srisawasdi, N. )2012( Effect of integrated computer-based laboratory environment on students’ physics conceptual learning of sound wave properties. Procedia-Social and Behavioral Sciences, 46, 5750-5755
Hughes, J. (2005). The role of teacher knowledge and learning experiences in forming technology-integrated pedagogy. Journal of Technology and Teacher Education, 13(2), 277-302.
Jang, S. J., & Chen, K.-C. )2010(. From PCK to TPACK: Developing a transformative model for pre-service science teachers. Journal of Science Education and Technology, 19)6(, 553–564.
Jimoyiannis, A. )2010(. Designing and implementing an integrated technological pedagogical science knowledge framework for science teachers professional development. Computers & Education, 55(3), 1259-1269.
Jonassen, D., Howland, J., Marra, R., & Crismond, D. (2008). Meaningful learning with technology (3rd ed.(. Upper Saddle River, NJ: Pearson.
Judith S. Lederman Norman., et al. )2014(. Meaningful assessment of learners’ understandings about scientific inquiry The views about scientific inquiry )VASI( questionnaire. Journal of Research in Science Teaching, 51(1), 65-83.
Kearney, M., & Maher, D. (2013). Mobile learning in math teacher education: Using iPads to support pre-service teachers’ professional development. Australian Educational Computing, 27)3(, 76-84.
Keating, T. & Evans, E. (2001). Three computers in the back of the classroom: Pre-service teachers’ conceptions of technology integration. In J. Price, D. Willis, N. Davis & J. Willis (Eds.), Proceedings of SITE 2001 Society for Information Technology & Teacher Education International Conference (pp. 1671-1676). Norfolk, VA: Association for the Advancement of Computing in Education (AACE).
Kukulska-Hulme, A, & Shield, L. (2008). An overview of mobile assisted language learning: From content delivery to supported collaboration and interaction. European Association for Computer Assisted Language Learning, 20)3(, 271-289.
Koehler, M. J., & Mishra, P. (2005). What happens when teachers design educational technology? The development of technological pedagogical content knowledge. Education Computing Research, 32)2(, 131-152.
160
Koehler, M. J., & Mishra, P. (2008). Introducing TPCK. The handbook of technological pedagogical content knowledge (TPCK) for educators. Mahwah, NJ: Lawrence Erlbaum Associates, 3-29.
Lederman, N. G., Antink, A., & Bartos, S. (2014). Nature of science, scientific inquiry, and socio-scientific issues arising from genetics: A pathway to developing a scientifically literate citizenry. Science & Education, 23(2), 285-302.
Liao, Y., & She, H. )2009(. Enhancing eight grade students’ scientific conceptual change and scientific reasoning through a web-based learning program. Educational Technology & Society, 12(4), 228-240.
Lundeberg, M., Bergland, M., Klyczek, K. & Hoffman, D. (2003). Using action research to develop preservice teachers’ confidence, knowledge and beliefs about technology. Journal of Interactive Online Learning, 1(4). Retrieved September 14, 2016 from http://www.ncolr.org/jiol/issues/pdf/1.4.5.pdf
Margerum-Leys, J. & Marx, R. W. (2002). Teacher knowledge of educational technology: A case study of student/mentor teacher pairs. Journal of Educational Computing Research, 26(4), 427462. Retrieved September 14, 2016 from http://dx.doi.org/10.2190/JXBR-2G0G-1E4T-7T4M
McQuiggan, S., L., Kosturko, J. McQuiggan, & J. Sabourin. ( 1502 ). Mobile Learning: A Handbook for Developers, Educators and Learners. Hoboken: Wiley & Sons, 56, 7-8.
Mishra, P., & Koehler, M. J. )2006(. Technological pedagogical content knowledge: A framework for teacher
knowledge. Teachers College Record, 108)6(, 1017–1054. Newhouse, C. P., William, P. J., & Pearson. (2006). Supporting mobile education for pre-service teachers.
Australasian Journal of Education Technology, 22(3), 289-311. Niess, M. L. (2005). Preparing teachers to teach science and mathematics with technology: Developing a
technology pedagogical content knowledge. Teaching and Teacher Education, 21, 509-523. Niess, M. L., Suharwoto, G., Lee, K., & Sadri, P. )2006(. Guiding inservice mathematics teachers in
developing TPCK. Paper presentation for the American Education Research Association Annual Conference, San Francisco, CA.
Niess, M. L. (2007). Mathematics teachers developing technological pedagogical content knowledge (TPCK), Paper presentation for IMICT2007, Boston, MA.
Passey and Zozimo. (2015). Mobile learning and teacher education: Researching MLEARN pilot development. Paper presentation for 11th International Conference Mobile Learning.
Reigeluth. C. M., & Joseph, R. )2002(. Beyond technology integration: The case for technology transformation. Education Technology, 17)2(, 9-12.
Schuck, S., Aubusson, P., Kearney, M., & Burden, K. (2013). Mobilising teacher education: A study of a professional learning community. Teacher Development, 17(1), 1-8.
She, H. C. )2004(. Fostering ‘‘radical’’ conceptual change through dual-situated learning model. Journal of Research in Science Teaching, 41)2(, 142-164.
Shoffner, M. (2007). The PT3 crossroads project: Searching for technology-PCK and results. Paper presented at the Society for Information Technology and Teacher Education International Conference, Chesapeake, VA.
Shulman, L. S. )1986(. Those who understand: Knowledge growth in teaching. Educational Researcher, 15(2), 4-14.
Shulman, L. S. (1987). Knowledge and teaching: Foundation of the new reform, Harvard Educational Review, 57(1), 1ข22.
Smarkola, C. (2008). Efficacy of a planned behavior model: Beliefs that contribute to computer usage intentions of student teachers and experienced teachers. Computer in Human Behavior, 24, 1196ข1215.
Srisawasdi, N. )2012(. Student teachers’ perceptions of computerized laboratory practice for science teaching: A comparative analysis. Procedia - Social and Behavioral Sciences, 46, 4031-4038.
Srisawasdi, N. )2014(. Developing technological pedagogical content knowledge in using computerized science laboratory environment: An arrangement for science teacher education program. Research and Practice in Technology Enhanced Learning, 9)1(, 123-143.
Srisawasdi, N. & Panjaburee, P. (2014). Technology-enhanced Learning in science, technology, and mathematics education: Results on supporting student learning. Procedia - Social and Behavior Sciences, 116, 946-950.
Srisawasdi, N. (2016). Motivating inquiry-based learning through a combination of physical and virtual computer-based laboratory experiments in high school science. In M. Urban & D. Falvo (Eds.), improving K-12 STEM Education Outcomes through Technological Integration, 108-134.
Thompson, A., & Mishra, P. (2007). Breaking news: TPCK becomes TPACK. Journal of Computing in Teacher Education, 24(2), 38-64.
Zhao, Y. )Ed.) (2003). What teachers should know about technology: Perspectives and practices. Greenwich, CT: Information Age.
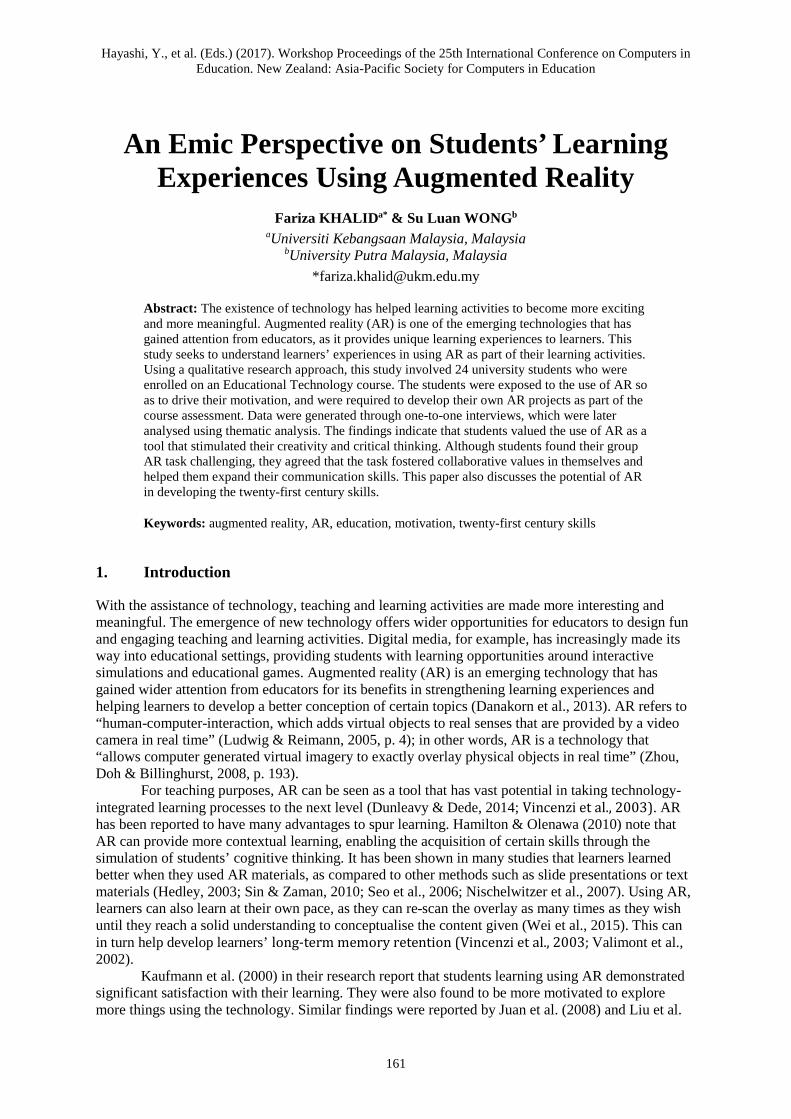
Hayashi, Y., et al. (Eds.) (2017). Workshop Proceedings of the 25th International Conference on Computers in Education. New Zealand: Asia-Pacific Society for Computers in Education
161
An Emic Perspective on Students’ Learning Experiences Using Augmented Reality
Fariza KHALIDa* & Su Luan WONGb aUniversiti Kebangsaan Malaysia, Malaysia
bUniversity Putra Malaysia, Malaysia *[email protected]
Abstract: The existence of technology has helped learning activities to become more exciting and more meaningful. Augmented reality (AR) is one of the emerging technologies that has gained attention from educators, as it provides unique learning experiences to learners. This study seeks to understand learners’ experiences in using AR as part of their learning activities. Using a qualitative research approach, this study involved 24 university students who were enrolled on an Educational Technology course. The students were exposed to the use of AR so as to drive their motivation, and were required to develop their own AR projects as part of the course assessment. Data were generated through one-to-one interviews, which were later analysed using thematic analysis. The findings indicate that students valued the use of AR as a tool that stimulated their creativity and critical thinking. Although students found their group AR task challenging, they agreed that the task fostered collaborative values in themselves and helped them expand their communication skills. This paper also discusses the potential of AR in developing the twenty-first century skills.
Keywords: augmented reality, AR, education, motivation, twenty-first century skills
1. Introduction
With the assistance of technology, teaching and learning activities are made more interesting and meaningful. The emergence of new technology offers wider opportunities for educators to design fun and engaging teaching and learning activities. Digital media, for example, has increasingly made its way into educational settings, providing students with learning opportunities around interactive simulations and educational games. Augmented reality (AR) is an emerging technology that has gained wider attention from educators for its benefits in strengthening learning experiences and helping learners to develop a better conception of certain topics (Danakorn et al., 2013). AR refers to “human-computer-interaction, which adds virtual objects to real senses that are provided by a video camera in real time” (Ludwig & Reimann, 2005, p. 4); in other words, AR is a technology that “allows computer generated virtual imagery to exactly overlay physical objects in real time” (Zhou, Doh & Billinghurst, 2008, p. 193).
For teaching purposes, AR can be seen as a tool that has vast potential in taking technology-integrated learning processes to the next level (Dunleavy & Dede, 2014; Vincenzi et al., 2003). AR has been reported to have many advantages to spur learning. Hamilton & Olenawa (2010) note that AR can provide more contextual learning, enabling the acquisition of certain skills through the simulation of students’ cognitive thinking. It has been shown in many studies that learners learned better when they used AR materials, as compared to other methods such as slide presentations or text materials (Hedley, 2003; Sin & Zaman, 2010; Seo et al., 2006; Nischelwitzer et al., 2007). Using AR, learners can also learn at their own pace, as they can re-scan the overlay as many times as they wish until they reach a solid understanding to conceptualise the content given (Wei et al., 2015). This can in turn help develop learners’ long-term memory retention (Vincenzi et al., 2003; Valimont et al., 2002).
Kaufmann et al. (2000) in their research report that students learning using AR demonstrated significant satisfaction with their learning. They were also found to be more motivated to explore more things using the technology. Similar findings were reported by Juan et al. (2008) and Liu et al.
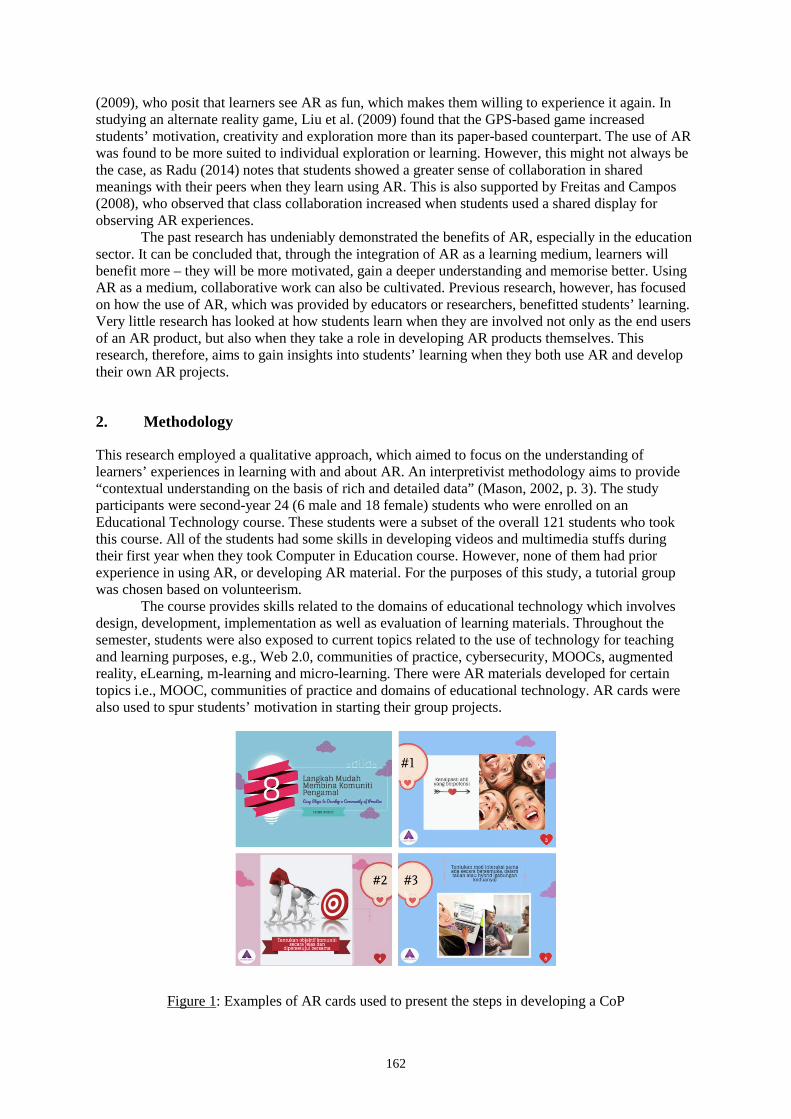
162
(2009), who posit that learners see AR as fun, which makes them willing to experience it again. In studying an alternate reality game, Liu et al. (2009) found that the GPS-based game increased students’ motivation, creativity and exploration more than its paper-based counterpart. The use of AR was found to be more suited to individual exploration or learning. However, this might not always be the case, as Radu (2014) notes that students showed a greater sense of collaboration in shared meanings with their peers when they learn using AR. This is also supported by Freitas and Campos (2008), who observed that class collaboration increased when students used a shared display for observing AR experiences.
The past research has undeniably demonstrated the benefits of AR, especially in the education sector. It can be concluded that, through the integration of AR as a learning medium, learners will benefit more – they will be more motivated, gain a deeper understanding and memorise better. Using AR as a medium, collaborative work can also be cultivated. Previous research, however, has focused on how the use of AR, which was provided by educators or researchers, benefitted students’ learning. Very little research has looked at how students learn when they are involved not only as the end users of an AR product, but also when they take a role in developing AR products themselves. This research, therefore, aims to gain insights into students’ learning when they both use AR and develop their own AR projects.
2. Methodology
This research employed a qualitative approach, which aimed to focus on the understanding of learners’ experiences in learning with and about AR. An interpretivist methodology aims to provide “contextual understanding on the basis of rich and detailed data” (Mason, 2002, p. 3). The study participants were second-year 24 (6 male and 18 female) students who were enrolled on an Educational Technology course. These students were a subset of the overall 121 students who took this course. All of the students had some skills in developing videos and multimedia stuffs during their first year when they took Computer in Education course. However, none of them had prior experience in using AR, or developing AR material. For the purposes of this study, a tutorial group was chosen based on volunteerism.
The course provides skills related to the domains of educational technology which involves design, development, implementation as well as evaluation of learning materials. Throughout the semester, students were also exposed to current topics related to the use of technology for teaching and learning purposes, e.g., Web 2.0, communities of practice, cybersecurity, MOOCs, augmented reality, eLearning, m-learning and micro-learning. There were AR materials developed for certain topics i.e., MOOC, communities of practice and domains of educational technology. AR cards were also used to spur students’ motivation in starting their group projects.
Figure 1: Examples of AR cards used to present the steps in developing a CoP
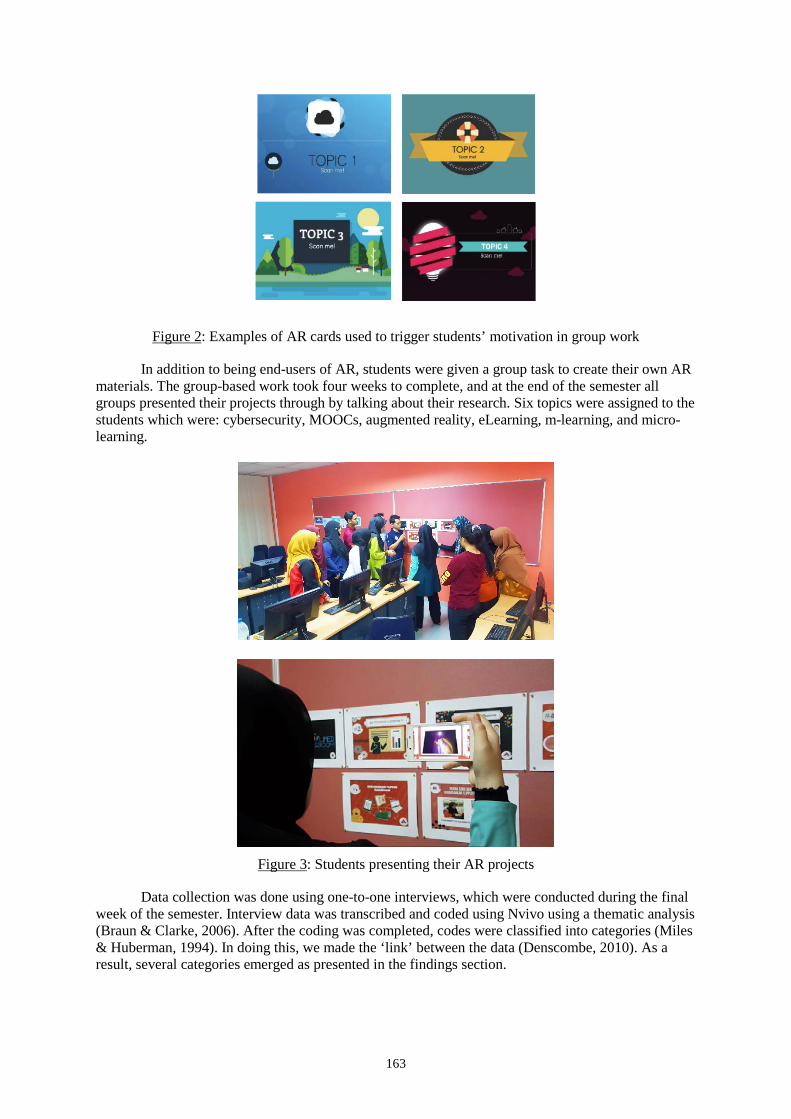
163
Figure 2: Examples of AR cards used to trigger students’ motivation in group work
In addition to being end-users of AR, students were given a group task to create their own AR materials. The group-based work took four weeks to complete, and at the end of the semester all groups presented their projects through by talking about their research. Six topics were assigned to the students which were: cybersecurity, MOOCs, augmented reality, eLearning, m-learning, and micro-learning.
Figure 3: Students presenting their AR projects
Data collection was done using one-to-one interviews, which were conducted during the final week of the semester. Interview data was transcribed and coded using Nvivo using a thematic analysis (Braun & Clarke, 2006). After the coding was completed, codes were classified into categories (Miles & Huberman, 1994). In doing this, we made the ‘link’ between the data (Denscombe, 2010). As a result, several categories emerged as presented in the findings section.
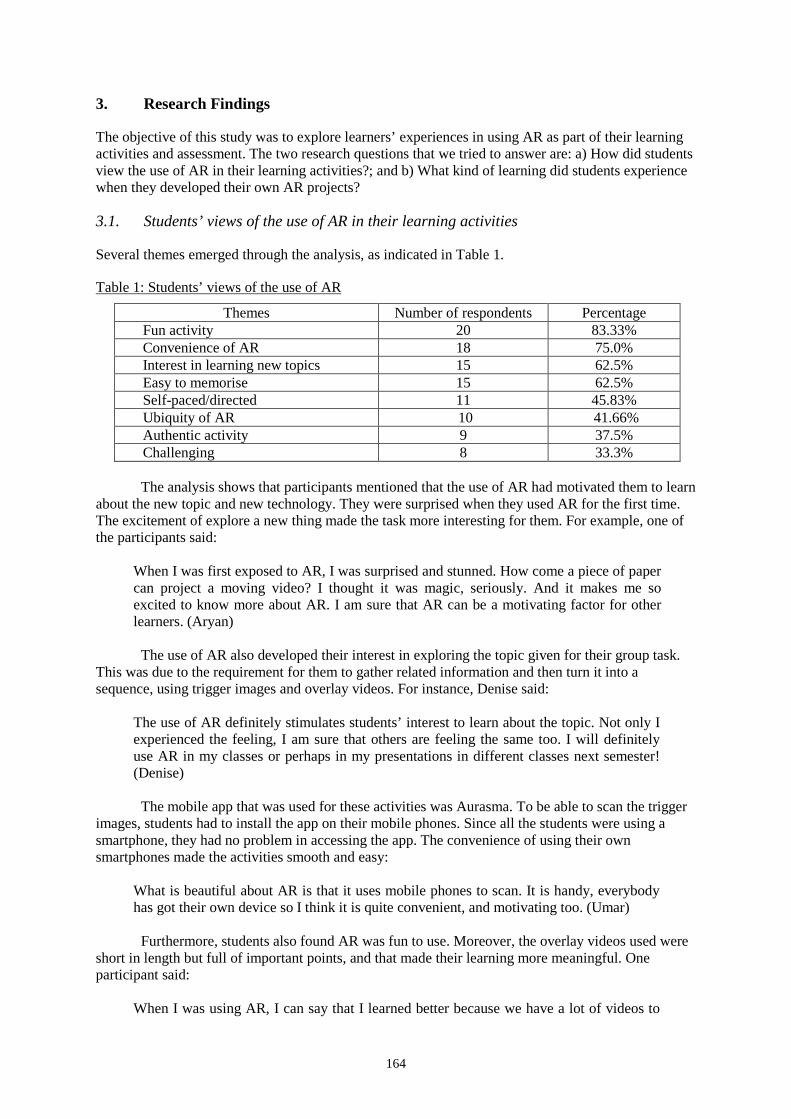
164
3. Research Findings
The objective of this study was to explore learners’ experiences in using AR as part of their learning activities and assessment. The two research questions that we tried to answer are: a) How did students view the use of AR in their learning activities?; and b) What kind of learning did students experience when they developed their own AR projects?
3.1. Students’ views of the use of AR in their learning activities
Several themes emerged through the analysis, as indicated in Table 1.
Table 1: Students’ views of the use of AR
Themes Number of respondents Percentage Fun activity 20 83.33% Convenience of AR 18 75.0% Interest in learning new topics 15 62.5% Easy to memorise 15 62.5% Self-paced/directed 11 45.83% Ubiquity of AR 10 41.66% Authentic activity 9 37.5% Challenging 8 33.3%
The analysis shows that participants mentioned that the use of AR had motivated them to learn
about the new topic and new technology. They were surprised when they used AR for the first time. The excitement of explore a new thing made the task more interesting for them. For example, one of the participants said:
When I was first exposed to AR, I was surprised and stunned. How come a piece of paper can project a moving video? I thought it was magic, seriously. And it makes me so excited to know more about AR. I am sure that AR can be a motivating factor for other learners. (Aryan)
The use of AR also developed their interest in exploring the topic given for their group task.
This was due to the requirement for them to gather related information and then turn it into a sequence, using trigger images and overlay videos. For instance, Denise said:
The use of AR definitely stimulates students’ interest to learn about the topic. Not only I experienced the feeling, I am sure that others are feeling the same too. I will definitely use AR in my classes or perhaps in my presentations in different classes next semester! (Denise)
The mobile app that was used for these activities was Aurasma. To be able to scan the trigger
images, students had to install the app on their mobile phones. Since all the students were using a smartphone, they had no problem in accessing the app. The convenience of using their own smartphones made the activities smooth and easy:
What is beautiful about AR is that it uses mobile phones to scan. It is handy, everybody has got their own device so I think it is quite convenient, and motivating too. (Umar)
Furthermore, students also found AR was fun to use. Moreover, the overlay videos used were
short in length but full of important points, and that made their learning more meaningful. One participant said:
When I was using AR, I can say that I learned better because we have a lot of videos to
165
scan but in smaller chunks. It is easy to digest in a very short period of time. And what’s more, it is fun! It brings the learning process to the next level of motivation. (Fara)
Shorter videos seemed not only to help students to pay more attention to each piece of content,
but also to memorise better. This can be seen from the response below:
The use of multimedia actually helps me to memorise the content better. I do not like to read too many words actually. And what’s more, I can re-scan the trigger image as many times as I wish. (Atia)
Another opinion on AR was that it allows students to spend their own time to digest the
information presented in each AR material provided. The promotion of self-directed learning can be seen from participants’ answers. The use of this approach seemed to be appreciated by the students, as an alternative to open discussions or lectures. Anne, for example, elaborated on how she views AR:
It [AR] is interactive, and gives us the freedom to spend our own time to watch all the multimedia given. I love it because it is something new to me. I mean Aurasma is like magic. It integrates a photo and a video and your mobile phone becomes the medium to make it happen! (Anne)
Using AR can actually fulfill our individual needs. We have different paces or speeds of learning. (Zurani)
Meaningful learning can be achieved through satisfying activities and when learners
experience the process themselves. While learning to use the Aurasma app, students were also given a chance to do a hands-on activity in which they created their own trigger images and videos as overlays prior to developing their actual projects. All the students had to demonstrate their Auras (videos overlayyed on trigger images created using Aurasma software) in one of the tutorial classes. Hands-on activities were mentioned by the students as what made AR interesting and satisfying, for example:
The most important impact on me when I learn to create AR is the fact that we had to experience a hands-on activity. We needed to do everything from scratch, from planning to developing and uploading. The best feeling is when the product runs well. That is the highest satisfaction [laughs]. I think there should be more projects like this using AR. (Aryan)
Another feature of AR is its ubiquity, which was mentioned by 41.66% of the participants.
They appeared to appreciate the fact that they can use AR anytime and anywhere they wished. For example:
Because AR uses mobile apps, it can be used anywhere, anytime. Ubiquitous, that’s the word! (Amirul) AR in a way can replace a one-way teaching and learning process. No boredom. (Iza)
Although students found the use of AR motivating, interesting and beneficial for learning, a
few students mentioned that AR was also challenging. For example:
Developing an AR product means we have to do lots of things. First, we have to decide on a topic. Once we have the topic, we then search for related information. Our group project is on social media. So it is quite a tricky process. We hardly sleep at night. The main challenge for me is to be creative in making our videos, and at the same time we have to design the trigger images. If it is not interesting enough, people might not want to scan it. But after we manage to complete the work, it is really satisfying. (Noni)
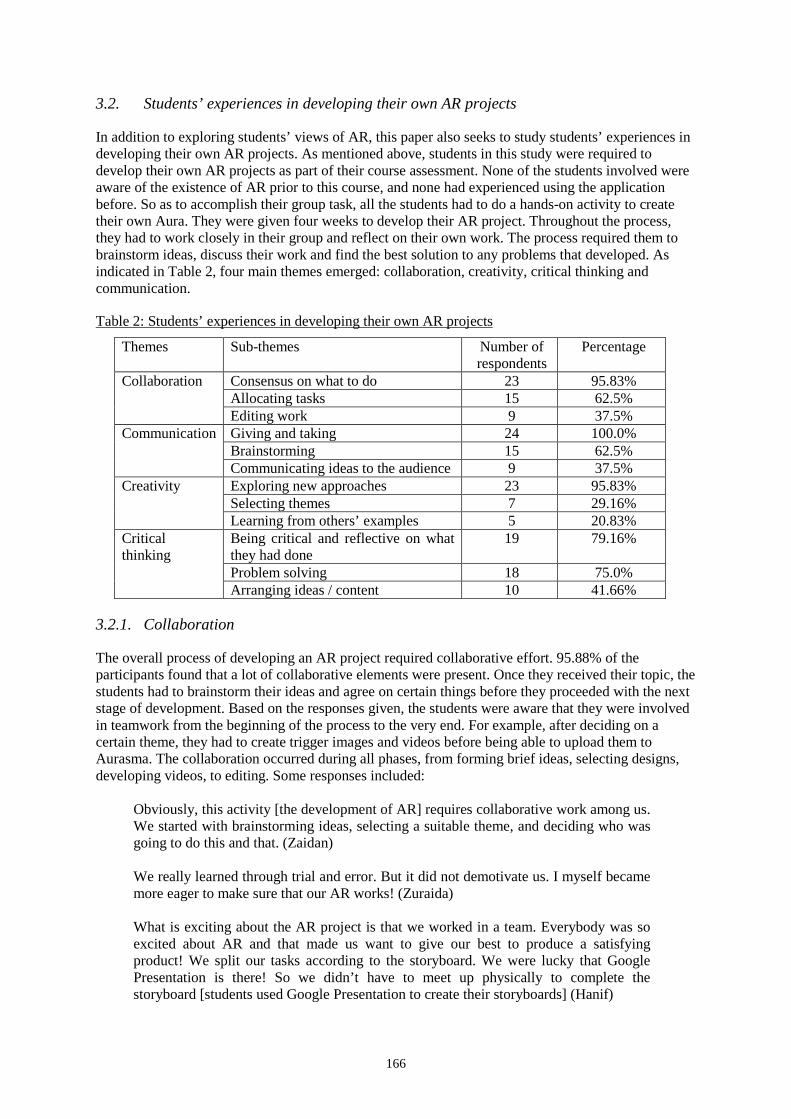
166
3.2. Students’ experiences in developing their own AR projects
In addition to exploring students’ views of AR, this paper also seeks to study students’ experiences in developing their own AR projects. As mentioned above, students in this study were required to develop their own AR projects as part of their course assessment. None of the students involved were aware of the existence of AR prior to this course, and none had experienced using the application before. So as to accomplish their group task, all the students had to do a hands-on activity to create their own Aura. They were given four weeks to develop their AR project. Throughout the process, they had to work closely in their group and reflect on their own work. The process required them to brainstorm ideas, discuss their work and find the best solution to any problems that developed. As indicated in Table 2, four main themes emerged: collaboration, creativity, critical thinking and communication.
Table 2: Students’ experiences in developing their own AR projects
Themes Sub-themes Number of respondents
Percentage
Collaboration Consensus on what to do 23 95.83% Allocating tasks 15 62.5% Editing work 9 37.5%
Communication
Giving and taking 24 100.0% Brainstorming 15 62.5% Communicating ideas to the audience 9 37.5%
Creativity
Exploring new approaches 23 95.83% Selecting themes 7 29.16% Learning from others’ examples 5 20.83%
Critical thinking
Being critical and reflective on what they had done
19 79.16%
Problem solving 18 75.0% Arranging ideas / content 10 41.66%
3.2.1. Collaboration
The overall process of developing an AR project required collaborative effort. 95.88% of the participants found that a lot of collaborative elements were present. Once they received their topic, the students had to brainstorm their ideas and agree on certain things before they proceeded with the next stage of development. Based on the responses given, the students were aware that they were involved in teamwork from the beginning of the process to the very end. For example, after deciding on a certain theme, they had to create trigger images and videos before being able to upload them to Aurasma. The collaboration occurred during all phases, from forming brief ideas, selecting designs, developing videos, to editing. Some responses included:
Obviously, this activity [the development of AR] requires collaborative work among us. We started with brainstorming ideas, selecting a suitable theme, and deciding who was going to do this and that. (Zaidan) We really learned through trial and error. But it did not demotivate us. I myself became more eager to make sure that our AR works! (Zuraida) What is exciting about the AR project is that we worked in a team. Everybody was so excited about AR and that made us want to give our best to produce a satisfying product! We split our tasks according to the storyboard. We were lucky that Google Presentation is there! So we didn’t have to meet up physically to complete the storyboard [students used Google Presentation to create their storyboards] (Hanif)
167
3.2.2. Communication
Another theme that emerged from the analysis was communication. Connected closely with collaboration, students mentioned how they were engaged in communication activities with their peers. When they talked about communication, it did not only involve the skill of expressing ideas effectively to others, but the students also mentioned give and take processes as part of their communication:
We communicate a lot about AR. I would say that this project not only scaffolds our communication skills among the group members, but also how to communicate out ideas to our users. That part is more challenging I think. (Zuraida)
This task is meaningful to me personally. As a pre-service teacher, I have to master communication skills. I mean, how to explain concepts in a very accurate and effective way. I am in love with AR. I will surely use it as part of my teaching materials. (Noni)
Nine students also highlighted communication skills with audiences, in the form of video and
animation. For example:
AR is like a medium of communication. You provide the videos in a sequence and the users will go through them one by one. I wish that we had had more time to create an online quiz, but we had no time for it. (Dahlia)
3.2.3. Creativity
It is undeniable that the development of AR requires creativity, not only in designing the illustration for trigger images, but more importantly in video production. The creativity aspect was mentioned many times by the participants. In the process of completing their group task, students were given the freedom to think of the theme of their product, as well as the depth of the content they would cover. This task was challenging for them as they needed to conceptualise their product and think of its possibilities. These aspects can be seen in the following example responses:
Creating AR really challenges our creativity. We explored many potential approaches actually, and finally we decided to use the one we have presented today. Infographics are the best way to convince users as it takes less time, but the video is something that we think makes the difference. (Mike)
The AR presentation was something that we were looking forward to, although I cannot deny that we were so nervous … we were not that confident whether the overlay videos would play accordingly when others scanned [the images]! But the most important thing that I experienced through this task is … it taught me to think more creatively. (Azura) This is the best project we have ever had since we become students here! I think AR requires not only ICT skills but more on how to be creative and selective, but at the same time we also have to be precise in selecting which points to be highlighted in sequence. (Dahlia)
To overcome a lack of creativity, students cited learning from others’ examples, such as
watching videos via YouTube:
What was the most challenging aspect in developing AR was creativity. As we could not think of many creative ways, we decided to view videos on YouTube and learn from those examples. We chose the best and then we tried to produce a somewhat similar video. (Mimi)
168
3.2.4. Critical thinking
Critical thinking is defined as a cognitive process, a purposeful self-regulatory judgment that includes cognitive skills such as interpretation, analysis, inference, evaluation, explanation, logical thinking and problem solving (Perry, 1981). The analysis shows that the students also talked about how they learned to develop their critical thinking throughout the process of completing their AR projects, and this involved their judgments about their own work, for example:
It is a process in which we need to ‘judge’ our product critically. Is it understandable? Is it interesting enough for users? Does it achieve our objectives? Those are the things that we have to critically think about. (Hanif) It is like ‘what if’ thinking … you know what I mean … we have to wear that kind of ‘hat’. (Zuraida)
Students mentioned that they learned through trial and error, through which they developed
better skills in AR development:
We really learned through trial and error. But it did not demotivate us. I myself became more eager to make sure that our AR works! (Mimi)
In addition, the students mentioned how they had to be problem-solvers and to work with
objectives - a good characteristic of an instructional designer. For example:
This project helps me to be more objective. Our lecturer also reminds us that we have to always go back to our objective. We are taught how to identify problems, and what needs to be done to solve the existing problem. We learned how to fix things on our own. (Mahadi)
41.66% of participants mentioned that they learned to use their cognitive skills more
effectively to arrange the content so that the information related to their topic would help their audience to grasp the concept more meaningfully:
It’s not only about creating a good design for trigger images, but also the skills to arrange the content so that it will ease our users to follow the idea, and at the end of it they will learn something about the topic (Dahlia) There are many things that need to be explained, but you have to do it in chunks. We are used to developing a long video, like 15 minutes or so … but for this project we have to split them into shorter videos. We have to think carefully about the content and the arrangement of the videos themselves. (Suraya)
4. Discussion and Conclusions
The overall findings show that students had positive views of the use of AR as part of their learning. Using AR was valued as a fun activity and one that helped learners to memorise better. These findings are in line with Vincenzi et al. (2003) and Valimont et al. (2002). Students also reported to that they were motivated and interested to learn about new topics using AR. These findings are consistent with Juan et al. (2008) and Liu et al. (2009). With the use of their own smartphones to access to the overlay videos, students saw how convenient it is to learn using AR. In addition, they could use their own time to re-scan the overlay videos as frequently as they wished. This is also mentioned in Wei et al. (2015). Nevertheless, despite the fact that students demonstrated positive views of the use of AR for
169
learning, when they had to develop their own AR projects, many of them saw it as a challenging task. However, the challenges they faced did not demotivate them from their tasks.
When asked about their learning experiences throughout the process of developing their AR projects, students gave varying answers. It was clear that the process of developing an AR project had built their collaborative skills, as working in a team needed such skills to make the project successful. It seemed that the students not only learned collaboratively when they used AR materials together, as found in the research of Freitas and Campos (2008) and Radu (2014), but also that they worked collaboratively when they developed the AR material themselves. It was also revealed that in addition to collaborative skills, the students also experienced an increase in their communication skills and creativity.
The low ability of students, particularly in higher education settings, to demonstrate critical thinking has been identified as an issue (Khalid et al., 2015; 2016). This has been believed to be due to a lack of tasks that stimulate their critical thinking. The findings from this study indicate that the task of developing an AR project can inculcate students with critical thinking abilities, including the cognitive ability to interpret, analyse, evaluate, explain things effectively (Perry, 1981), reflect, criticise (Khalid et al., 2015; 2016) and solve problems (Rimiene, 2016).
The emerging themes of collaboration, communication, creativity and critical thinking are dimensions of twenty-first century skills. From the findings of this study, it can be concluded that the integration of AR elements into learning activities can promote these skills among students, and leverage educational experiences, particularly when they are asked to develop AR materials. The findings also suggest that the use of AR should be encouraged among tertiary students as an effective way to construct learning experiences (Radu, 2014), as they will experience a new way of learning that is dynamic, interactive, and allows them to control their education (Chen, 2006). This study also contributes to suggesting how educators can maximise the potential learning benefits of and generate guidelines for designing effective educational AR experiences.
References
Braun, V., & Clarke, V. (2006). Using thematic analysis in psychology. Qualitative Research in Psychology, 3 (2), 77-101.
Chen, Y. C. (2006). A study of comparing the use of augmented reality and physical models in chemistry education. International Conference on virtual reality continuum and its applications. Hong Kong-China, pp. 369-372.
Danakorn, N. P., Mohamad B. A., & Halim, N. D. A. (2013). Potensi Teknologi Augmented Reality dalam Pembelajaran Sains: Satu Tinjauan terhadap Penyelidikan Lepas. Universiti Teknologi Malaysia, Skudai.
Denscombe, M. (2010). The Good Research Guide for small scale research projects (4th ed.). Buckingham: Open University Press.
Dunleavy, M., & Dede, C. (2014). Augmented reality teaching and learning. In J. M. Spector, M. D. Merrill, J. Elen & M. J. Bishop. (Eds.), Handbook of research on educational communications and technology, pp. 735-745. Springer, New York.
Freitas, R., & Campos, P. (2008). SMART: a SysteM of Augmented Reality for Teaching 2nd grade students. Paper presented at the Proceedings of the 22nd British CHI Group Annual Conference on HCI 2008: People and Computers XXII: Culture, Creativity, Interaction - Volume 2, Liverpool, United Kingdom.
Hamilton, K. & Olenewa, J. (May, 2010). Augmented reality in education [PowerPoint slides]. Retrieved from Lecture Notes Online Web site: http://www.authorstream. com/Presentation/k3hamilton-478823-augmented-reality-in-education/
Hedley, N. R. (2003) Empirical evidence for advanced geographic visualization interface use. In: International cartographic congress, Durban, South Africa
Juan, C., Beatrice, F., Cano, J. (2008). An augmented reality system for learning the interior of the human body. In: International conference on advanced learning technologies, Santander, Cantabria, Spain, pp 186–188H.
Kaufmann, D., Schmalstieg, & Wagner, M.. (2000). Construct 3D: A Virtual Reality Application for Mathematics and Geometry Education. Education and Information Technologies, Vol. 5, No.4, pp. 263-276

170
Khalid, F., Mazalah Ahmad, Aidah Abdul Karim, Md. Yusoff Daud & Din, R. (2015). Reflective Thinking: An Analysis of Students’ Reflections in Their Learning about Computers in Education. Creative Education, 6, 2160-2168.
Khalid, F., Yassin, S. F. M., Daud, M. Y., Karim, A. A. & Rahman, M. J. A. (2016). Exploring Reflective Capacity among First-Year Students on a Computer in Education Course. Creative Education, 7, 77-85.
Liu, T-Y., Tan, T-H., Chu, Y-L. (2009). Outdoor natural science learning with an RFID-supported immersive ubiquitous learning environment. J Educ Technol Soc 12:161–175.
Lowe, M. (2007). Beginning Research: A guide for foundation degree students. Oxford: Routledge. Ludwig, C., & Reimann, C. (2005). Augmented reality: Information at focus. Cooperative Computing
Communication Laboratory (Volume 4. No. 1). Universitat Paderbom. Mason, J. (2002). Qualitative researching. London: Sage Publications. Miles, M.B., & Huberman, A. M. (1994). An expanded source book: Qualitative data analysis (2nd ed.).
Thousand Oaks, CA: Sage. Nischelwitzer, A., Lenz, F-j., Searle, G., Holzinger, A. (2007). Some aspects of the development of low-cost
augmented reality learning environments as examples for future interfaces in technology enhanced learning. In: Proceedings of the 4th international conference on universal access in human-computer interaction: applications and services. Springer, pp 728–737
Perry, W.G. Jr. (1981). Cognitive and ethical growth: The making of meaning. In Arthur Chickering and Associates (eds), The Modern American College: Responding to the New Realities of Diverse Students and a Changing Society. San Francisco: Jossey-Bass: 76-116.
Rimiene, V. (2016). Assessing and developing students’ critical thinking. Psychology Learning and Teaching, 2(1), 17-22
Radu, I. (2014). Augmented reality in education: a meta-review and cross-media analysis. Pers Ubiquit Comput (2014) 18:1533–1543 DOI 10.1007/s00779-013-0747-y
Seo, J., Kim, N., Kim, G. (2006). Designing interactions for augmented reality based educational contents. In: International conference on edutainment, Hangzhou, China, pp 1188–1197
Sin, A. K., & Zaman, H. B. (2010) Live solar system (LSS): evaluation of an augmented reality book-based educational tool. In: International symposium in information technology, Kuala Lumpur, Malaysia, pp 1–6
Valimont, R.B., Vincenzi, D. A., Gangadharan, S. N., Majoros, A. E. (2002). The effectiveness of augmented reality as a facilitator of information acquisition. In: Digital avionics systems conference, vol. 2, Irvine, CA, USA, pp 7C5-1–7C5-9 17.
Vincenzi, D. A., Valimont, B., Macchiarella, N., Opalenik, C., Gangadharan, S. N., Majoros, A. E. (2003). The effectiveness of cognitive elaboration using augmented reality as a training and learning paradigm. In: Annual meeting of the human factors and ergonomics society, Denver, CO, USA, pp 2054–2058
Wei, X. D., Weng, D. D., Liu, Y., & Wang, Y. T. (2015). Teaching based on augmented reality for a technical creative design course. Computer & Education, 81, 221-234. Retrieved from <Go to ISI>://WOS:000347606300021
Zhou, F. Doh, H.-L., & Billinghurst, M. 2008. Trends in Augmented reality tracing, interaction and display: A review of ten years in ISMAR. Mixed and Augmented Reality. ISMAR 7th IEE/ACM International Symposium, pp. 193-202. Cambridge: IEEE.
Hayashi, Y., et al. (Eds.) (2017). Workshop Proceedings of the 25th International Conference on Computers in Education. New Zealand: Asia-Pacific Society for Computers in Education
171
Prototyping of Community-based Hazard Mapping Support System for Traditional Towns
with Local Heritage Yasuhisa OKAZAKI a*, Shun KOZAKI a, Sho MATSUO a, Hiroshi WAKUYA a,
Nobuo MISHIMA a, Yukuo HAYASHIDA a, Byung-Won MIN b a Graduate School of Science and Engineering, Saga University, Japan
b Division of Information and Communication Convergence Engineering, Mokwon University, Korea *[email protected]
Abstract: This paper describes the design and trial development of a system that supports continuous hazard mapping by local residents in their daily life. We performed an interview survey to design our system in a model traditional town in Saga Prefecture, Japan. The results show that despite continued efforts, many practical problems remain and residents feel unsafe. Considering these results, we designed and developed a unique information and communication technology-based support system that contributes to community-based disaster prevention and reduction. The continuous resident participation and posting design are the core concept for our community-based approach. Our system continues to support making a hazard map by integrating the community-based hazard information. Local residents register information (disaster types, risk level, photographs, comments, positional information) about locations that could be dangerous in a disaster. In addition, our system enables information sharing through a Web server. We expect that this information sharing will allow local hazard information for each district to be used.
Keywords: Disaster Prevention, Hazard Map, Traditional Town, Community-Based, ICT-Based.
1. Introduction
Japan is a disaster-prone country because of its geographical, topographical, and meteorological conditions (Disaster Management, Cabinet Office, 2015). The country faces the threat of various natural disasters, such as earthquakes, typhoons, and volcanic eruptions. Disaster prevention and reduction measures have been strengthened following the Great East Japan Earthquake and subsequent disasters, including volcanic eruptions, and landslides and flooding caused by heavy rain.
Disaster imagination games (Komura, T. & Hirano, A., 1997), which are map exercises to improve disaster prevention in communities, and a variety of information and communication technology (ICT)-based approaches, including information collection by cameras and sensors, ICT disaster information notification, and game-based training, have been developed (Geospatial Information Authority of Japan (GSI),2017; Mitsuhara, H. et al., 2015).
Although cities are better prepared to cope with future disasters because of their advanced infrastructure, there are many traditional Japanese towns that suffer from specific risks (Japan Guide.com, 2012). These towns are characterized by the preservation of the traditional landscape and environment, depopulation, and aging. They are vulnerable to disasters because these factors cause spatial and human constraints. Disaster prevention measures adapted for these towns are now being studied (Mishima, N. et al., 2015; Nakai, F. et al., 2014; Nonomura, A. et al., 2016; Park, S. G. et al., 2015; Sakuma, A. et.al., 2015). A prospective ICT-based disaster prevention approach for local heritage is large-scale networks that use sensors and benefit from advanced ICT (Min, B. W. et al., 2015). However, this requires large investment in equipment, including initial installation costs and maintenance costs.
Our approach in this paper is small-start ICT-based disaster prevention, which is rooted in the region and based on the characteristics of these towns (Kozaki, S. et al., 2016; Mori, S. et al., 2015; Okazaki, Y., et al., 2015; Okazaki, Y., et al., 2016). In these traditional local towns, there is a
172
characteristic that there is a strong connection between residents. Our approach is to utilize the power of these local communities in disaster prevention and reduction by ICT. To safeguard livelihoods, our system encourages local residents to be conscious of disaster risks and to participate in disaster prevention and reduction activities. Furthermore, the system allows local residents to collect and record detailed hazard information. This continuous resident participation and posting design can make a major contribution to community-based disaster prevention and reduction.
We selected Hizen-Hamashuku in Kashima City, Saga Prefecture, Japan as a model area of a traditional local town (Saga Trip Genius, 2014). This area has retained its Edo-era architecture and has been designated as a nationally important traditional building preservation district (Wikipedia, 2017.). Figure 1 shows its historic town scenery. We carried out an interview survey on natural disasters with local residents of Hizen-Hamashuku to understand their needs and measures related to disaster prevention and reduction. Based on the results, we designed and implemented a hazard-mapping support system for traditional towns. We expect that this system will provide residents with better knowledge of disasters and deeper awareness of disaster prevention. The organization of this paper is as follows. In Section 2, we describe our interview survey for designing our system. In Section 3, we present our prototype hazard-mapping support system. In Section 4, we give our concluding remarks and outline future work.
2. Interview Survey
1.1 Methods
We performed a survey by face-to-face interview at the Hizen-Hamashuku community center on August 18, 2014 with 18 participants, who are district welfare officers or ward chiefs who play a leadership role in this region. We asked about existing measures for disaster prevention and reduction, problems with the present measures, and information sharing for disaster prevention and reduction.
1.2 Results
We identified the following problems by analyzing the survey results.
1.2.1 Existing Disaster Prevention and Reduction Measures
There is a voluntary disaster prevention organization that implements firefighting training once or twice a year, which has achieved some success in firefighting. We also found that there is a mutual assistance system, in which district welfare officers and chiefs of wards play leading roles during disasters. Although the voluntary disaster prevention organizations and the mutual assistance system are organized, their specific roles and cooperation are unclear. The effectiveness of these organizations should be improved.
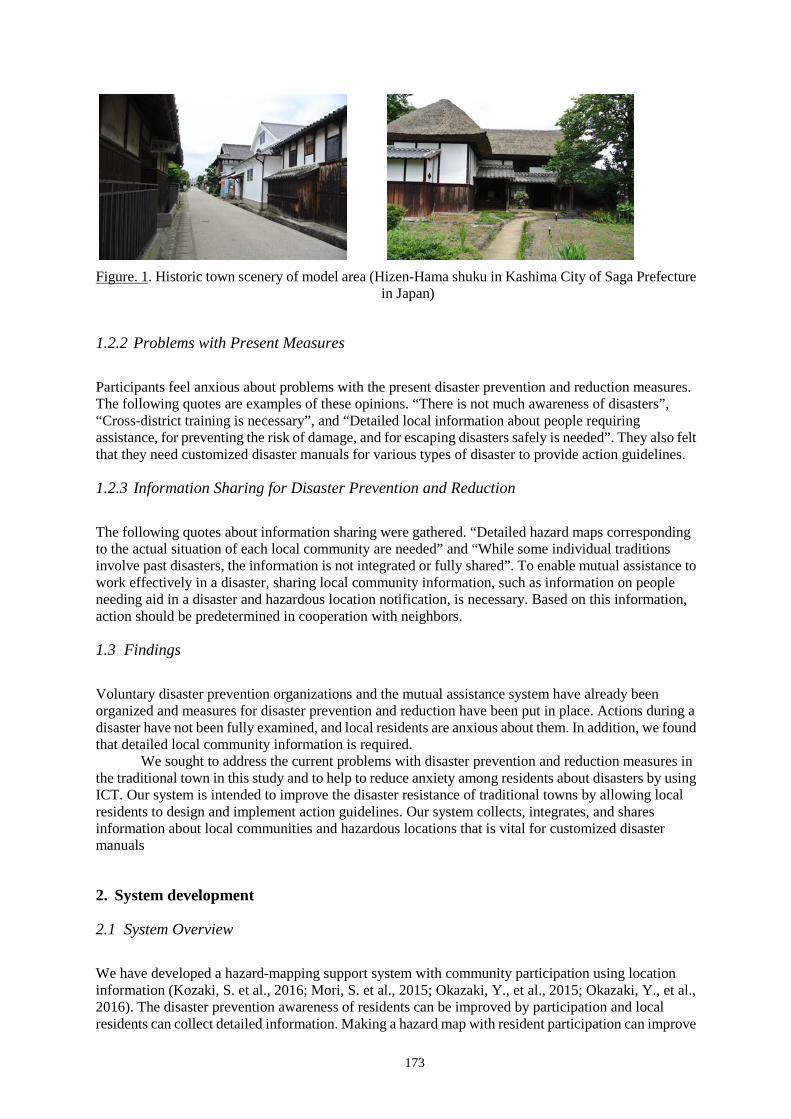
173
Figure. 1. Historic town scenery of model area (Hizen-Hama shuku in Kashima City of Saga Prefecture
in Japan)
1.2.2 Problems with Present Measures
Participants feel anxious about problems with the present disaster prevention and reduction measures. The following quotes are examples of these opinions. “There is not much awareness of disasters”, “Cross-district training is necessary”, and “Detailed local information about people requiring assistance, for preventing the risk of damage, and for escaping disasters safely is needed”. They also felt that they need customized disaster manuals for various types of disaster to provide action guidelines.
1.2.3 Information Sharing for Disaster Prevention and Reduction
The following quotes about information sharing were gathered. “Detailed hazard maps corresponding to the actual situation of each local community are needed” and “While some individual traditions involve past disasters, the information is not integrated or fully shared”. To enable mutual assistance to work effectively in a disaster, sharing local community information, such as information on people needing aid in a disaster and hazardous location notification, is necessary. Based on this information, action should be predetermined in cooperation with neighbors.
1.3 Findings
Voluntary disaster prevention organizations and the mutual assistance system have already been organized and measures for disaster prevention and reduction have been put in place. Actions during a disaster have not been fully examined, and local residents are anxious about them. In addition, we found that detailed local community information is required.
We sought to address the current problems with disaster prevention and reduction measures in the traditional town in this study and to help to reduce anxiety among residents about disasters by using ICT. Our system is intended to improve the disaster resistance of traditional towns by allowing local residents to design and implement action guidelines. Our system collects, integrates, and shares information about local communities and hazardous locations that is vital for customized disaster manuals
2. System development
2.1 System Overview
We have developed a hazard-mapping support system with community participation using location information (Kozaki, S. et al., 2016; Mori, S. et al., 2015; Okazaki, Y., et al., 2015; Okazaki, Y., et al., 2016). The disaster prevention awareness of residents can be improved by participation and local residents can collect detailed information. Making a hazard map with resident participation can improve
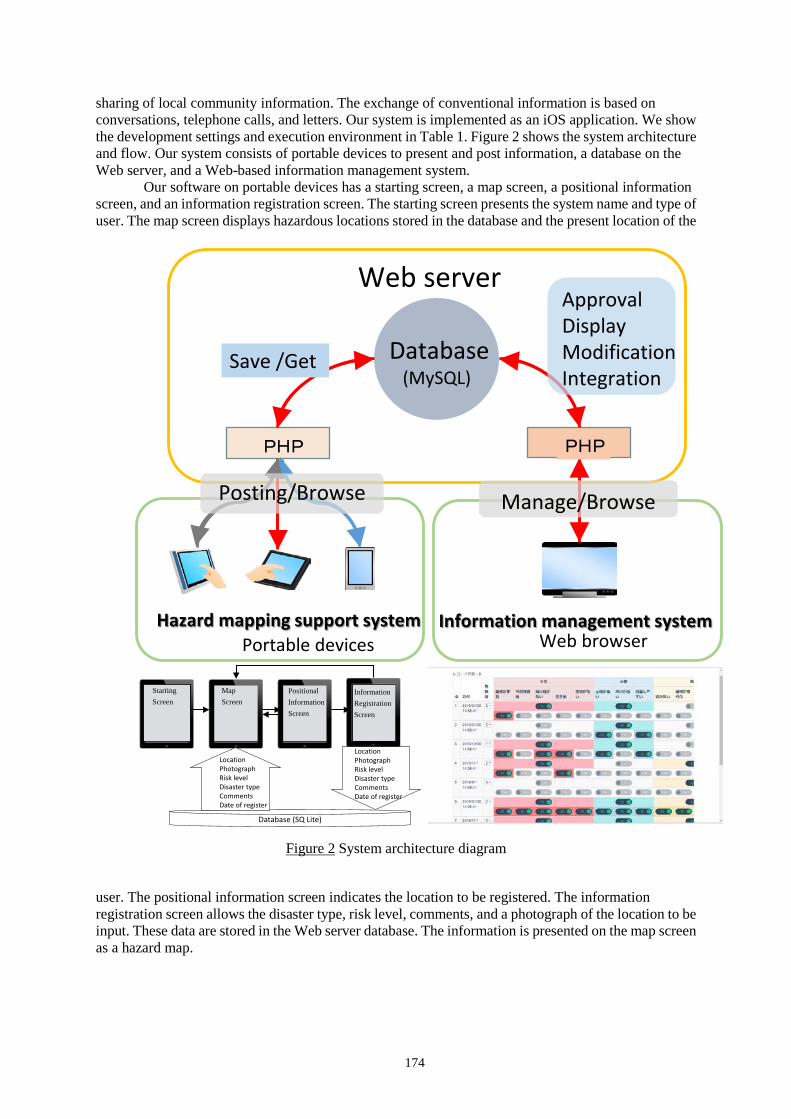
174
sharing of local community information. The exchange of conventional information is based on conversations, telephone calls, and letters. Our system is implemented as an iOS application. We show the development settings and execution environment in Table 1. Figure 2 shows the system architecture and flow. Our system consists of portable devices to present and post information, a database on the Web server, and a Web-based information management system.
Our software on portable devices has a starting screen, a map screen, a positional information screen, and an information registration screen. The starting screen presents the system name and type of user. The map screen displays hazardous locations stored in the database and the present location of the
Figure 2 System architecture diagram
user. The positional information screen indicates the location to be registered. The information registration screen allows the disaster type, risk level, comments, and a photograph of the location to be input. These data are stored in the Web server database. The information is presented on the map screen as a hazard map.
Web server
PHP
Portable devices
Database(MySQL)
Hazard mapping support system Information management systemWeb browser
PHP
Manage/Browse
Save /Get
ApprovalDisplayModificationIntegration
Posting/Browse
StartingScreen
MapScreen
Database (SQ Lite)
LocationPhotographRisk levelDisaster typeCommentsDate of register
PositionalInformationScreen
InformationRegistrationScreen
LocationPhotographRisk levelDisaster typeCommentsDate of register
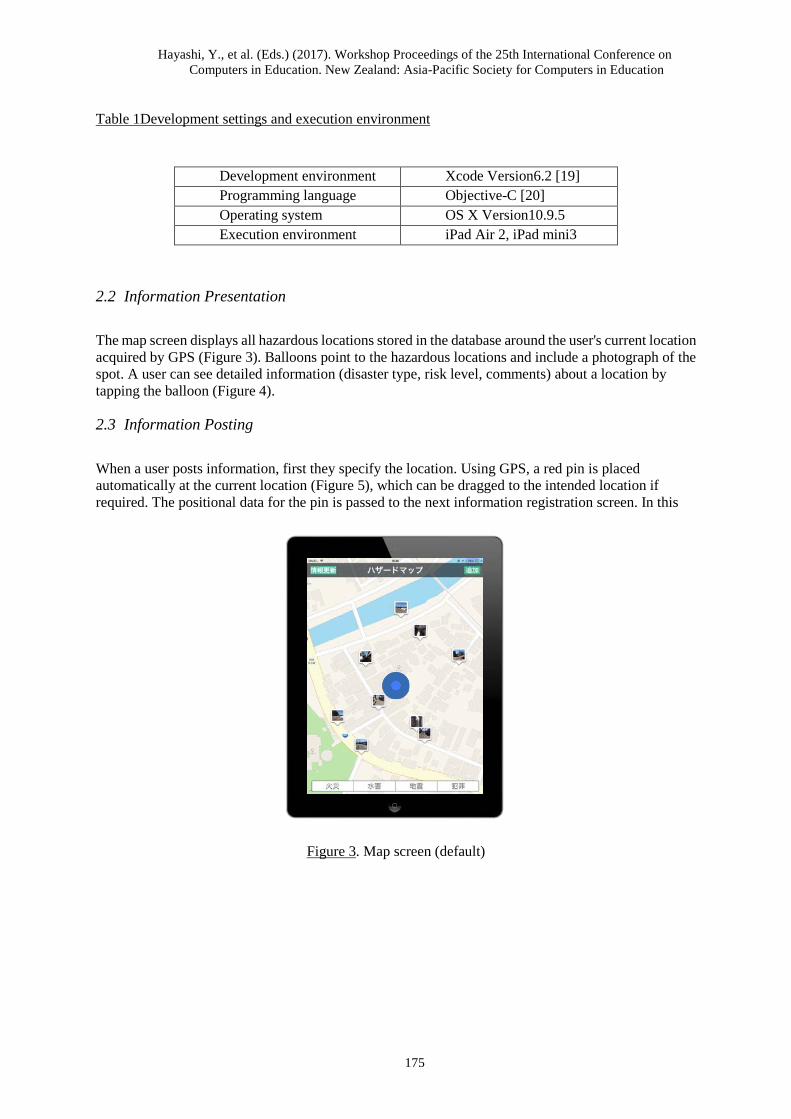
Hayashi, Y., et al. (Eds.) (2017). Workshop Proceedings of the 25th International Conference on Computers in Education. New Zealand: Asia-Pacific Society for Computers in Education
175
Table 1Development settings and execution environment
2.2 Information Presentation
The map screen displays all hazardous locations stored in the database around the user's current location acquired by GPS (Figure 3). Balloons point to the hazardous locations and include a photograph of the spot. A user can see detailed information (disaster type, risk level, comments) about a location by tapping the balloon (Figure 4).
2.3 Information Posting
When a user posts information, first they specify the location. Using GPS, a red pin is placed automatically at the current location (Figure 5), which can be dragged to the intended location if required. The positional data for the pin is passed to the next information registration screen. In this
Figure 3. Map screen (default)
Development environment Xcode Version6.2 [19] Programming language Objective-C [20] Operating system OS X Version10.9.5 Execution environment iPad Air 2, iPad mini3
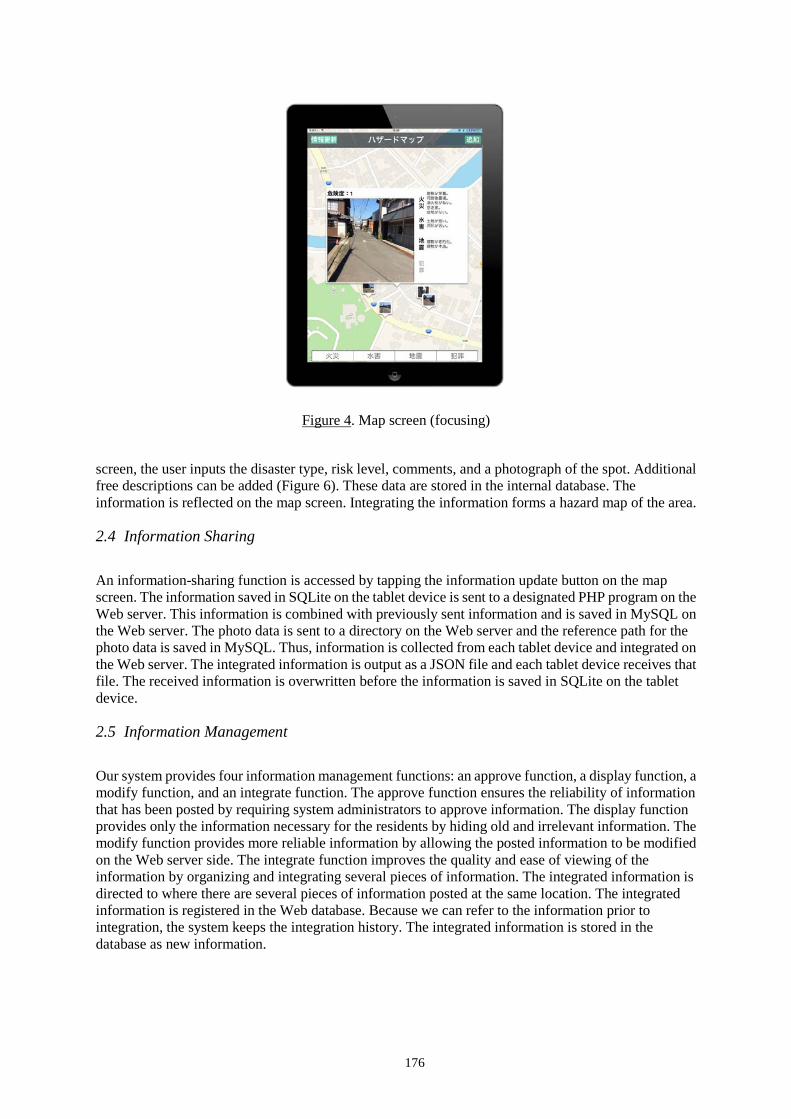
176
Figure 4. Map screen (focusing)
screen, the user inputs the disaster type, risk level, comments, and a photograph of the spot. Additional free descriptions can be added (Figure 6). These data are stored in the internal database. The information is reflected on the map screen. Integrating the information forms a hazard map of the area.
2.4 Information Sharing
An information-sharing function is accessed by tapping the information update button on the map screen. The information saved in SQLite on the tablet device is sent to a designated PHP program on the Web server. This information is combined with previously sent information and is saved in MySQL on the Web server. The photo data is sent to a directory on the Web server and the reference path for the photo data is saved in MySQL. Thus, information is collected from each tablet device and integrated on the Web server. The integrated information is output as a JSON file and each tablet device receives that file. The received information is overwritten before the information is saved in SQLite on the tablet device.
2.5 Information Management
Our system provides four information management functions: an approve function, a display function, a modify function, and an integrate function. The approve function ensures the reliability of information that has been posted by requiring system administrators to approve information. The display function provides only the information necessary for the residents by hiding old and irrelevant information. The modify function provides more reliable information by allowing the posted information to be modified on the Web server side. The integrate function improves the quality and ease of viewing of the information by organizing and integrating several pieces of information. The integrated information is directed to where there are several pieces of information posted at the same location. The integrated information is registered in the Web database. Because we can refer to the information prior to integration, the system keeps the integration history. The integrated information is stored in the database as new information.
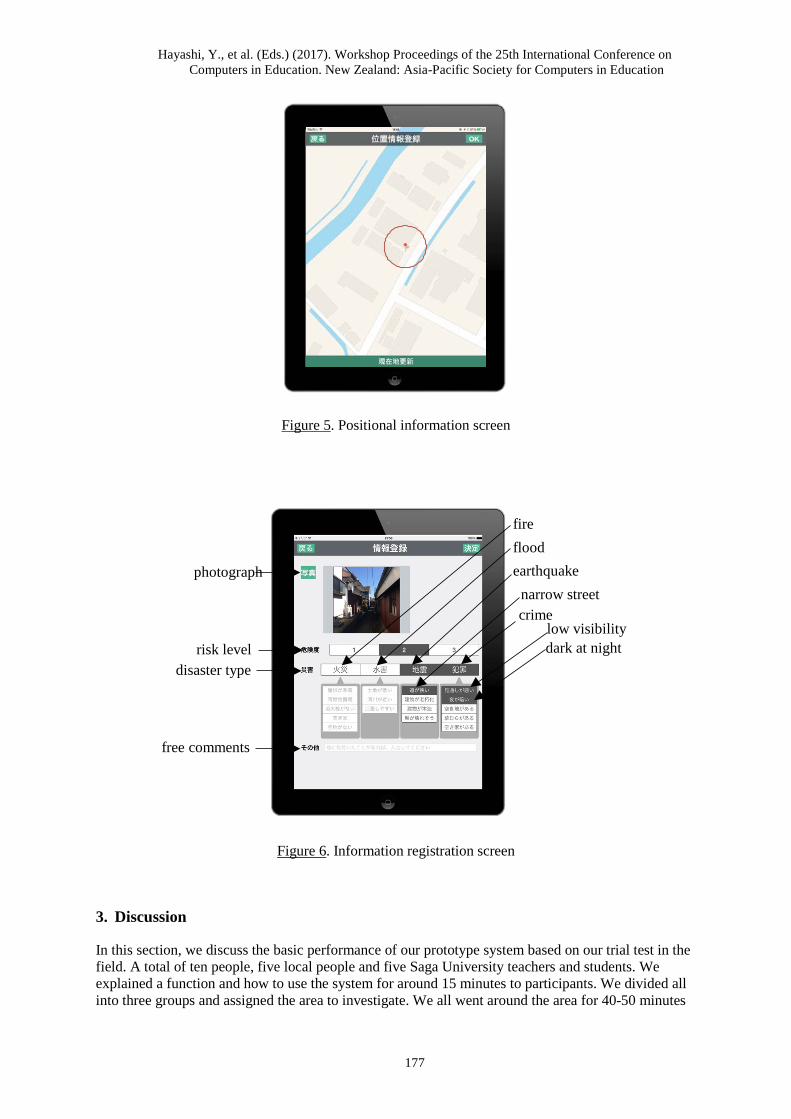
Hayashi, Y., et al. (Eds.) (2017). Workshop Proceedings of the 25th International Conference on Computers in Education. New Zealand: Asia-Pacific Society for Computers in Education
177
Figure 5. Positional information screen
Figure 6. Information registration screen
3. Discussion
In this section, we discuss the basic performance of our prototype system based on our trial test in the field. A total of ten people, five local people and five Saga University teachers and students. We explained a function and how to use the system for around 15 minutes to participants. We divided all into three groups and assigned the area to investigate. We all went around the area for 40-50 minutes
risk leveldisaster type
free comments
earthquake
crime
fireflood
low visibilitydark at night
narrow streetphotograph
178
and input the data of hazardous location. A total of 27 locations, 46 information was registered in just less than one hour.
3.1 Collection of Local Hazard Information
Information associated with flood hazards was registered in low-lying areas, whereas hazard information for fires and earthquakes was registered where houses are clustered. This indicates that it was possible to collect information about hazardous locations from local residents in a short time.
Our trial experiment shows that people in the region are most concerned about earthquake hazards. The next greatest concern is the risk from crime rather than from other natural disasters. This is because fire hydrants and river improvement work have reduced the risk from fire and flooding.
Originally, the targets of the hazard maps were natural disasters, such as earthquakes and floods. In this study, we considered crime from the perspective of the safety of local residents. Our field test revealed potential anxiety about local crime.
3.2 Operational Performance
Our system is designed to allow elderly people who are not used to digital terminals to input information by touching presented choices. The comments for each hazard are also prepared and easily selected by touch. In addition, a user can input original comments by using a keyboard. One user expressed the opinion “It was easy to use”. The user input worked smoothly and input took about one minute per entry. These results demonstrate that our system is a user-friendly iOS application.
3.3 Overlooked Information
We also identified the necessity of multiple viewpoints. Posting information from local residents makes it possible to register unique local information. However, residents may overlook hazards because they become familiar with and complacent about risks.
4. Conclusion and Future Work
We have designed and implemented a hazard-mapping support system for traditional towns with local heritage based on an interview survey with local residents of the model area. Community-based disaster prevention and reduction is the main feature of our approach. Our system encourages the participation of local residents and allows residents to collect detailed hazard information about the area. The continuous resident participation and posting design are core concepts for our approach, which can make a major contribution to lasting community-based disaster prevention and reduction.
Our system creates a hazard map by displaying the posted hazard information on the map. Local residents register information (disaster type, risk level, photographs, comments, positional information) about locations that could be hazardous in a disaster. We have tested the usefulness and possibilities of our prototype system in the model area. The easy-to-use interface contributed to the smooth registration of information. Our prototype system demonstrates ICT-based hazard mapping by local residents and the potential of our system.
In future work, we will organize information management schemes in cooperation with local residents. We will use our system to make a practical hazard map and demonstrate our ICT-based approach to community-based disaster prevention and mitigation.
Acknowledgements
This study is supported by the funds of Japan Society for Promotion of Science (JSPS) and National Research Foundation of Korea (NRFK)’s bilateral Joint Research Projects during 2014 to 2016, and by JSPS KAKENHI Grant Number JP16H04478. We would like to thank persons resident in Hizen

179
Hamashuku and all who understood and cooperated our on-site field work. We also wish to appreciate valuable discussions and comments with project members.
References
Disaster Management, Cabinet Office. (2015). Disaster Management in Japan. Retrieved August 1, 2017, from http://www.bousai.go.jp/1info/pdf/saigaipamphlet_je.pdf
Geospatial Information Authority of Japan (GSI). (2017). Disaster Measures. Retrieved August 1, 2017, from http://www.gsi.go.jp/ENGLISH/page_e30066.html
Japan Guide.com. (2012), Historic Sites. Retrieved August 1, 2017, from http://www.japan-guide.com/e/e2422.html Komura, T. & Hirano, A. (1997). On Disaster Imagination Game, Institute of Social Safety Science (ISSS),7,
136-139. Kozaki, S., Okazaki,Y. Wakuya, H., Mishima, N., Hayashida, Y. & Min, B. W. (2016). Implementation of the
Information Management Function of a Hazard Map Creation Support System in a Traditional Local Town. ICCC2016 International Conference on Convergence Content, 113-114.
Min, B. W., Oh, S. H., Oh, Y. S., Okazaki, Y., Yoo, J. S., Park S. G. & Noh, H. W. (2015). Design of an Integrated Monitoring System for Constructional Structures Based on Mobile Cloud in Traditional Towns with Local Heritage. International Journal of Contents, 11(2), 37-49.
Mishima, N. Taguchi, Y. Okazaki, Y. Wakuya, H., Kitagawa, K., Hayashida, Y., Oh, Y. S. & Park, S. G.(2015). Improvement strategy of open space at the center of a traditional lowland town with narrow paths for securing persons in need of aids viewing from evacuation time. Lowland Technology International 2015, 17(3), 197-206.
Mitsuhara ,H., Inoue, T., Yamaguchi, K. Takechi, Y., Morimoto, M., Iwaka, K.,Kozuki Y. & Shishibori, M. (2015). Web-Based System for Designing Game-Based Evacuation Drills. Procedia Computer Science, 72, 277-284.
Mori, S., Okazaki, Y., Wakuya, H. Mishima,N., Hayashida, Y. & Min, B. W.(2015). Usability of Hazard Map Creation Support System for Traditional Towns with Local Heritage. ICCC2015 International Conference on Convergence Content, 125-126.
Nakai, F., Hatayama, M., & Yamori, K. (2014). A Study on Evaluation for Community Based Planning Process of Tsunami Evacuation using Agent Based Simulation. SIG Technical Reports of IPSJ, IS-127(6), 1-9.
Nonomura, A., Hasewaga, S & Inomo, H. (2016). Use of the community disaster prevention map for community disaster prevention plan. Environmental science, 28(1), 45-49.
Okazaki, Y., Mori, S., Wakuya, H., Mishima, N., Hayashida,Y. & Min, B. W. (2015). Preliminary Inquiry for Design of Local Community Based Disaster Prevention Support System. Proceedings of 1st International Symposium on ICT-based Disaster Prevention Design(ICTDPD2015), 33-34.
Okazaki. Y, Mori. S, Wakuya. H, Mishima. N, Hayashida. Y, Min. B-W. (2016). Development of a Sustainable Community-based Hazard Map Creation Support System for Traditional Towns with Local Heritage. International Journal of Contents, 12(2), 58-65.
Park, S. G., Mishima, H., Noh, H. W., Yoo, J. S., Oh, S. H., Min B. W. & Oh, Y. S. (2015). Countermeasure against Fire Disaster in Regional Heritage Villages on the Concept of ICT-Based Disaster Prevention Design. International Journal of Contents, 11(1), 62-68.
Saga Trip Genius. (2014). Hizenhamashuku Area. Retrieved August 1, 2017, from http://www.saga-tripgenius.com/tourism_search/hizenhamashuku-area.html Sakuma, A., Matsuo, I., Ito, S., Tanaka, S. & Nakaseko, T. (2015). Disaster Prevention Activities of Japanese Fire
Companies. Journal of disaster research, 10(5), 929-938. Wikipedia. (2017). Groups of Traditional Buildings. Retrieved August 1, 2017, from https://en.wikipedia.org/wiki/Groups_of_Traditional_Buildings
Hayashi, Y., et al. (Eds.) (2017). Workshop Proceedings of the 25th International Conference on Computers in Education. New Zealand: Asia-Pacific Society for Computers in Education
180
The Role of Serious Games in Disaster and Safety Education: An Integrative Review
Didin WAHYUDIN1*, Shinobu HASEGAWA2 1 Universitas Pendidikan Indonesia, Bandung, Indonesia
2 Research Center for Advanced Computing Infrastructure (RCACI), JAIST, Japan *[email protected]
Abstract: One of the critical elements of catastrophe preparedness is a training of the disaster responders and society. However, conducting a live disaster training is costly and labor intensive. Hence, serious game (SG) may offer a possible solution as a method of disaster and safety education. Besides, the advancement of games for education and training has been increasingly used for decades. SG provides a challenging and realistic environment that can mimic actual setting of crisis and disaster situation. Furthermore, there are numerous of SG and applications that have been researched for disaster and safety training. Toward sustainable education and training in this field, it is important to clarify the potential of SG that can improve disaster awareness and skill. Therefore, this paper discusses SG’s role for disaster and safety training using an integrative review methodology. A process of the integrative review consisted of five steps to obtain the results, that is, identification of problems and purposes, definition of search strategy, assessment and analysis of the findings. The search criteria were applied to various electronic article databases relevant to information technology, disaster or emergency, and training. This integrative review found the key factor of SG for disaster and safety training. We finally conclude SG has a potential to deliver the disaster awareness through a virtual environment that could motivate learners to have a broader skill and knowledge to prepare the appropriate actions when a disaster occurred.
Keywords: Serious game, disaster, and safety training, integrative review.
1. Introduction
Disasters can be destructive, leading to the emergence of environmental devastation and loss of property, physical and psychological effects, and personal catastrophes. There are numerous human-made and natural disasters which strike both developing and developed country. For example, the disaster of forest and land fire occurred in Indonesia especially in West Sumatra and Central Kalimantan 2002 to 2015, (Miettinen, Shi, & Liew, 2016). The forest and land fire were mostly caused by the carelessness of the palm oil and pulp industry that ignored the nature protection. It had a significant impact on smog pollution, decreased the level of health, and damaged ecosystem (Hayasaka, Noguchi, Putra, Yulianti, & Vadrevu, 2014; Kirana, Sitanggang, & Syaufina, 2016). Other calamities are natural disasters that affected the countries in various ways. A natural disaster is the aftermath or sequences of incidents. It can interrupt and force the lives and livelihoods of people affected by natural events including tornado, landslide, flooding, earthquake, volcano eruption and tsunami (Berz et al., 2001). However, all types of the disasters will have the capacity to consume social and physical assets. Therefore, not only the disaster responders but also the society need adequate preparedness and response approaches. Hence, they can minimize the impacts of disasters such as climate change, increasing urbanization, and poverty that influences factors to expand the frequency, severity, and complexity of disasters. Preparedness for such disasters is serious for families, societies, emergency manager including disaster first responders, but many of them stay unprepared. As contemporary, the disasters perform to underline the necessity for personal responsibility, local management, and continuity plans to ensure the ability to respond to and recover from major events without a doubt. On the other hand, in the recent years, serious game (SG) and simulation have been massively adopted as an important additional apparatus to the training. By the
181
empirical evidence, it has been proven that SG can be used to improve motivation (Annetta, Minogue, Holmes, & Cheng, 2009), learning, and retention (Girard, Ecalle, & Magnan, 2012). According to the need of providing an alternative way for disaster preparedness, SG would be a possible tool to fulfill this demand.
This paper presents an integrative review to evaluate the critical role of SG in disaster and safety education. One of the study goals is to examine the learning outcome by measuring the evidence of game assessment. Also, the review shows that there are plenty of SG intended for disaster responders and staffs. In contrast, SG for societies, in particular for students or children is limited. Hence, it can be concluded that there is the necessity of such SG for developing their awareness to the disaster preparedness. The rest of this paper is ordered as follows. Section 2 will briefly review the terminology of SG and explain the definition of disaster and safety training. Section 3 will describe the five steps of the integrative review method defined by Whittemore and Knafl (Whittemore & Knafl, 2005). Section 4 will show the results of the review and analyze the key factors of SG role for disaster and safety education. Finally, this paper will conclude the integrative review of SG role by presenting findings of SG potency for preparing disaster responders and society to deal with the catastrophe impacts.
2. Serious Games and Disaster Training
2.1. Disaster and Safety Education
Disaster can create various risks for responders and society in the impacted area. Preparing before a disaster occurrence plays an important role to ensure them to have the essential skill, knowledge, and equipment to solve the disaster issues. It also trains the feeling about know-how to keep themselves protected when a disaster happens and how to escape from the impacted area. These concepts of disaster preparedness and response guide the potential survivors about how to prepare and how to be aware when the disaster occurs. Japan is an example of the country leading in the disaster preparedness. The regular exercise and campaign how to deal with the catastrophe situation are well organized regularly. It involves not only disaster responders to maintain the response skill but also persuade society to be aware of the disaster which occurred recurrently (Tomio, Sato, Matsuda, Koga, & Mizumura, 2014). Thus, engaging in a regular simulation would foster the necessary instincts to respond instantaneously in disaster situations. The expert said that through recurrent training and simulation practices, disaster responders and society would be able to increase and maintain their skill until an actual disaster happened. (Wahyudin & Hasegawa, 2015).
2.2. What is the serious games?
Games are artifacts to provide learners a competitive activity with a particular goal and context within a set of rules. SG is one of the game genre but combines practical aspects with an original amusement use. In other words, SG uses the terminology and technology of games, which implement for education (non-entertain) purposes. In recent decades, SG has been popularly used for many educational setting such as in health (Sardi, Idri, & Fernández-Alemán, 2017), and medical (Graafland, Schraagen, & Schijven, 2012). According to the increasing of gaming technology, SG also adopts the new paradigm, not only for learning by playing but also for encouraging learners to have high motivation and engagement in their learning processes. Games would expand their benefits if they can involve the learners in all situations within particular characteristics. Also, SG empowers the learners’ characteristics to assist that the learners acquire appropriate knowledge with the precise learning experience through the seamless integration of entertainment and learning (Gee 2003).
However, the main disparity between games for entertainment and SG for educational goal is the outcome of SG itself. In users’ side, an entertainment game intention is mostly as an amusement toy. Hence, for developers, a successful game development can be examined by how popular the game among users, and how much revenue can be collected. In contrast, a game for educational purposes can reach the success position if the game can raise the magnitude of learners’ learning outcome and revive its function for forthcoming learning uses. Michael and Chen stated that SG as a
182
tool for educational purposes should be able to present the required factors indicating that the learning process has occurred (Michael & Chen 2005). Hence, SG would be reliable for educational apparatus if it could stipulate a scaffold assessment of the learners’ achievement and progress tracking of their learning exerts. It is correlated with the Corti’s postulate that SG could reach the popularity as an industry if the learning experience is measurable, quantifiable, and definable (Corti, 2006). SG is principally attentive on learning rather than entertaining (Miller, Chang, Wang, Beier, & Klisch, 2011). In conclusion, by combining gaming and learning, SG represents an intense interest in the educational research field.
3. Aim and Method
The purpose of this paper is to present an integrative review of the use of SG in the disaster and safety education. It is to examine the empirical evidence of the role of SG in this field. The integrative review is a way to allow various approaches (i.e., investigational and non-investigational research) to have a potential play and a greater role in evidence-based practice. As described in section 2, SG is one of the promise methods for delivering learning contents to invite learners to be aware of the disaster situation and its impact. Whittemore and Knafl proposed five steps of the process to do the integrative review. The first step is to identify issues related to the use of SG for training by answering what the role of SG for such issues is. The second step is to define the purpose of review which is a depth analysis of utilizing SG in this field. The third step is to determine a search approach to find appropriate academic evidence of SG for disaster and safety training. The fourth and last steps are assessment and exploration of data and the presentation of the findings (Whittemore & Knafl, 2005). To realize these steps, some search criteria were defined as follows. Title and abstract of articles should be focused on term serious game or game-based learning, application of various game technology, and as much as possible excluded articles on simulation. The simulation was excluded from the search criteria due to the reason that there is no explicit win/lose state. Simulation is the learner is not trying to win and no scoring. The learners are also not competing against anyone else or cooperating to beat the computer opponent. Another criterion was that article should be published in the indexed journals during 2010 – July 2017. It was to make sure that the effective training of disaster using game claimed in the article proofed by the empirical evidence and judgment by the expert review. The article criteria then applied to various electronic databases relevant to information technology, disaster or emergency, game development, education, and training. They are PubMed, Cambridge, Science Direct, ERIC, Springer, IEEE, ACM, Willey, EBSCO, and SAGE. However, the search keyword was contained the following words or phrases of (computer game OR digital game OR serious game OR video game OR game-based learning) AND (learning OR training OR education OR exercise) AND (disaster OR emergency OR safety OR incident) and also searched for other articles of interest cited in the articles that we selected. Data were mined from all articles, including game name and development technology, learning purpose and target, game mechanic, and the presence of validation studies.
4. Results
The procedure to get the game model which will be reviewed was started by selecting the title and abstract which supposed to satisfy the criteria. From this step, 30 articles relevant to the inclusion criteria, focused on disaster or emergency purpose, were collected. After rigorous reading, six articles were selected to include in the review as shown in table 1.
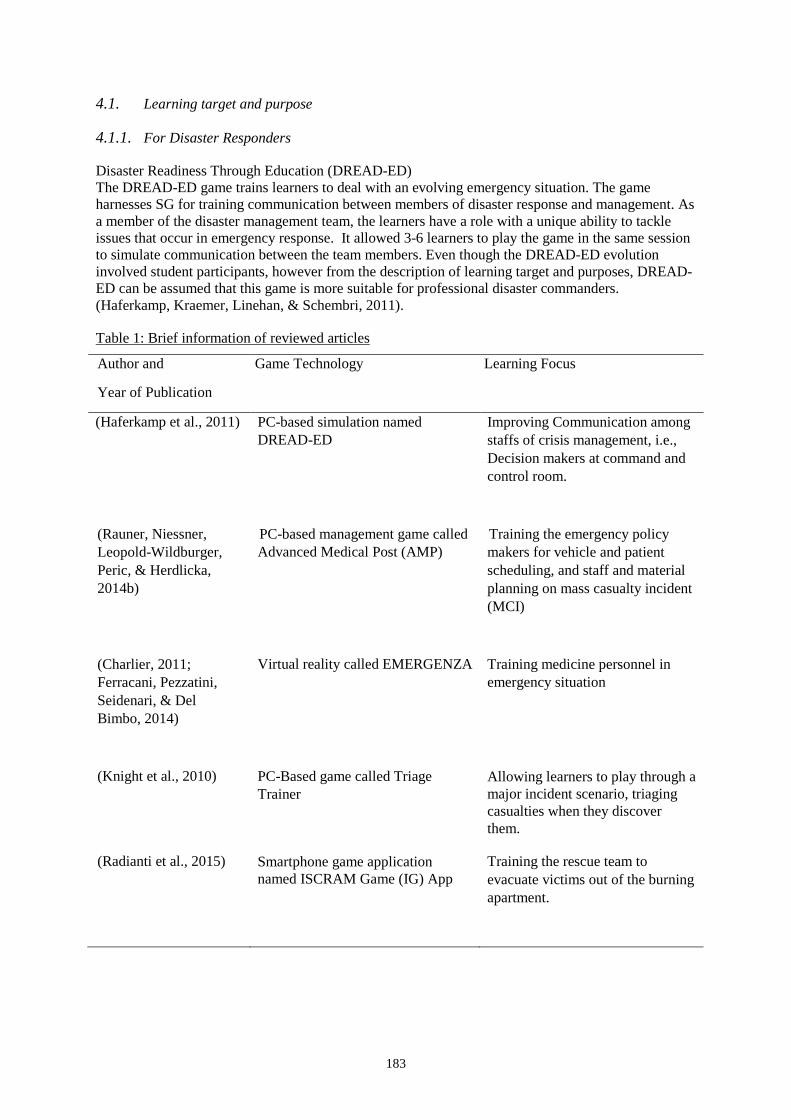
183
4.1. Learning target and purpose
4.1.1. For Disaster Responders
Disaster Readiness Through Education (DREAD-ED) The DREAD-ED game trains learners to deal with an evolving emergency situation. The game harnesses SG for training communication between members of disaster response and management. As a member of the disaster management team, the learners have a role with a unique ability to tackle issues that occur in emergency response. It allowed 3-6 learners to play the game in the same session to simulate communication between the team members. Even though the DREAD-ED evolution involved student participants, however from the description of learning target and purposes, DREAD-ED can be assumed that this game is more suitable for professional disaster commanders. (Haferkamp, Kraemer, Linehan, & Schembri, 2011).
Table 1: Brief information of reviewed articles
Author and
Year of Publication
Game Technology Learning Focus
(Haferkamp et al., 2011) PC-based simulation named DREAD-ED
Improving Communication among staffs of crisis management, i.e., Decision makers at command and control room.
(Rauner, Niessner, Leopold-Wildburger, Peric, & Herdlicka, 2014b)
PC-based management game called Advanced Medical Post (AMP)
Training the emergency policy makers for vehicle and patient scheduling, and staff and material planning on mass casualty incident (MCI)
(Charlier, 2011; Ferracani, Pezzatini, Seidenari, & Del Bimbo, 2014)
Virtual reality called EMERGENZA
Training medicine personnel in emergency situation
(Knight et al., 2010)
PC-Based game called Triage Trainer
Allowing learners to play through a major incident scenario, triaging casualties when they discover them.
(Radianti et al., 2015) Smartphone game application named ISCRAM Game (IG) App
Training the rescue team to evacuate victims out of the burning apartment.
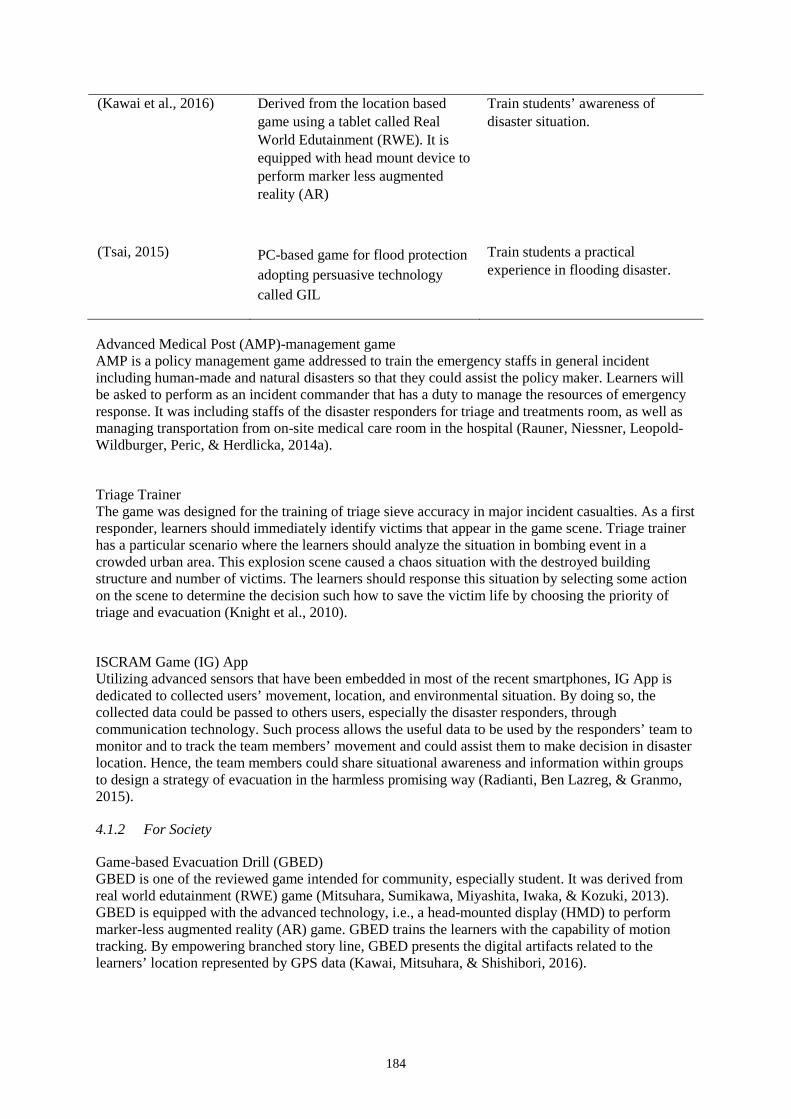
184
(Kawai et al., 2016) Derived from the location based game using a tablet called Real World Edutainment (RWE). It is equipped with head mount device to perform marker less augmented reality (AR)
Train students’ awareness of disaster situation.
(Tsai, 2015) PC-based game for flood protection adopting persuasive technology called GIL
Train students a practical experience in flooding disaster.
Advanced Medical Post (AMP)-management game AMP is a policy management game addressed to train the emergency staffs in general incident including human-made and natural disasters so that they could assist the policy maker. Learners will be asked to perform as an incident commander that has a duty to manage the resources of emergency response. It was including staffs of the disaster responders for triage and treatments room, as well as managing transportation from on-site medical care room in the hospital (Rauner, Niessner, Leopold-Wildburger, Peric, & Herdlicka, 2014a).
Triage Trainer The game was designed for the training of triage sieve accuracy in major incident casualties. As a first responder, learners should immediately identify victims that appear in the game scene. Triage trainer has a particular scenario where the learners should analyze the situation in bombing event in a crowded urban area. This explosion scene caused a chaos situation with the destroyed building structure and number of victims. The learners should response this situation by selecting some action on the scene to determine the decision such how to save the victim life by choosing the priority of triage and evacuation (Knight et al., 2010).
ISCRAM Game (IG) App Utilizing advanced sensors that have been embedded in most of the recent smartphones, IG App is dedicated to collected users’ movement, location, and environmental situation. By doing so, the collected data could be passed to others users, especially the disaster responders, through communication technology. Such process allows the useful data to be used by the responders’ team to monitor and to track the team members’ movement and could assist them to make decision in disaster location. Hence, the team members could share situational awareness and information within groups to design a strategy of evacuation in the harmless promising way (Radianti, Ben Lazreg, & Granmo, 2015).
4.1.2 For Society
Game-based Evacuation Drill (GBED) GBED is one of the reviewed game intended for community, especially student. It was derived from real world edutainment (RWE) game (Mitsuhara, Sumikawa, Miyashita, Iwaka, & Kozuki, 2013). GBED is equipped with the advanced technology, i.e., a head-mounted display (HMD) to perform marker-less augmented reality (AR) game. GBED trains the learners with the capability of motion tracking. By empowering branched story line, GBED presents the digital artifacts related to the learners’ location represented by GPS data (Kawai, Mitsuhara, & Shishibori, 2016).
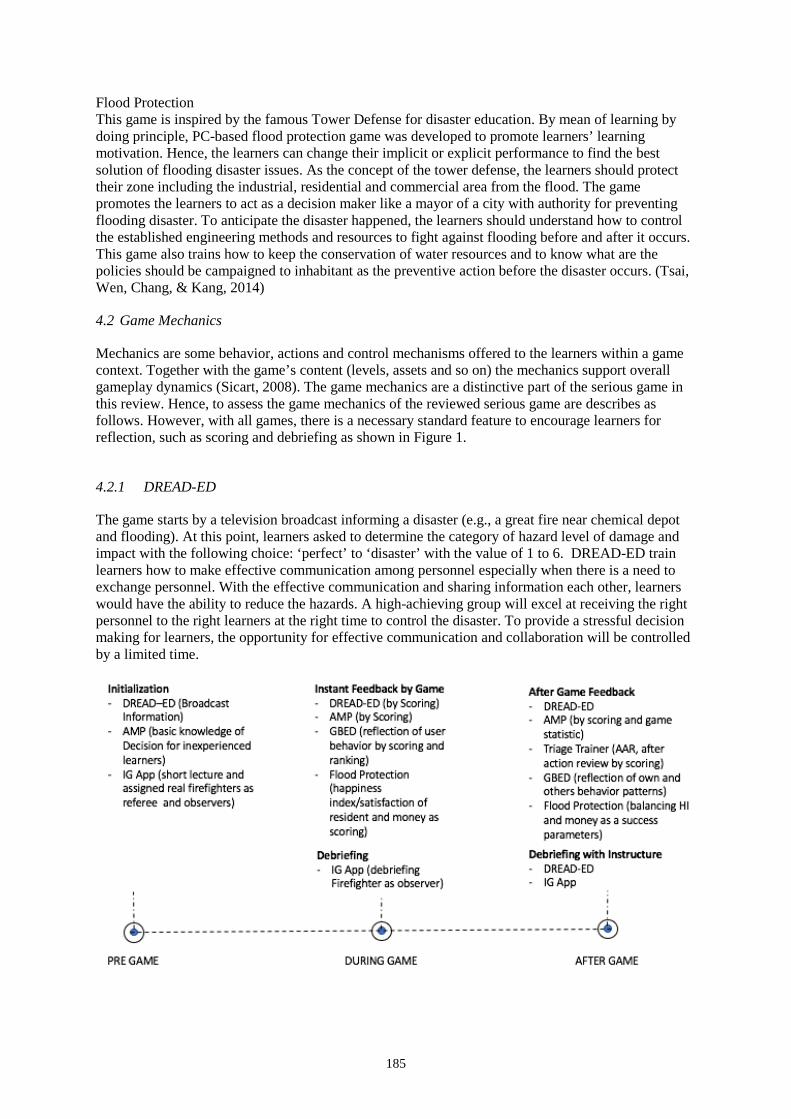
185
Flood Protection This game is inspired by the famous Tower Defense for disaster education. By mean of learning by doing principle, PC-based flood protection game was developed to promote learners’ learning motivation. Hence, the learners can change their implicit or explicit performance to find the best solution of flooding disaster issues. As the concept of the tower defense, the learners should protect their zone including the industrial, residential and commercial area from the flood. The game promotes the learners to act as a decision maker like a mayor of a city with authority for preventing flooding disaster. To anticipate the disaster happened, the learners should understand how to control the established engineering methods and resources to fight against flooding before and after it occurs. This game also trains how to keep the conservation of water resources and to know what are the policies should be campaigned to inhabitant as the preventive action before the disaster occurs. (Tsai, Wen, Chang, & Kang, 2014)
4.2 Game Mechanics
Mechanics are some behavior, actions and control mechanisms offered to the learners within a game context. Together with the game’s content (levels, assets and so on) the mechanics support overall gameplay dynamics (Sicart, 2008). The game mechanics are a distinctive part of the serious game in this review. Hence, to assess the game mechanics of the reviewed serious game are describes as follows. However, with all games, there is a necessary standard feature to encourage learners for reflection, such as scoring and debriefing as shown in Figure 1.
4.2.1 DREAD-ED
The game starts by a television broadcast informing a disaster (e.g., a great fire near chemical depot and flooding). At this point, learners asked to determine the category of hazard level of damage and impact with the following choice: ‘perfect’ to ‘disaster’ with the value of 1 to 6. DREAD-ED train learners how to make effective communication among personnel especially when there is a need to exchange personnel. With the effective communication and sharing information each other, learners would have the ability to reduce the hazards. A high-achieving group will excel at receiving the right personnel to the right learners at the right time to control the disaster. To provide a stressful decision making for learners, the opportunity for effective communication and collaboration will be controlled by a limited time.
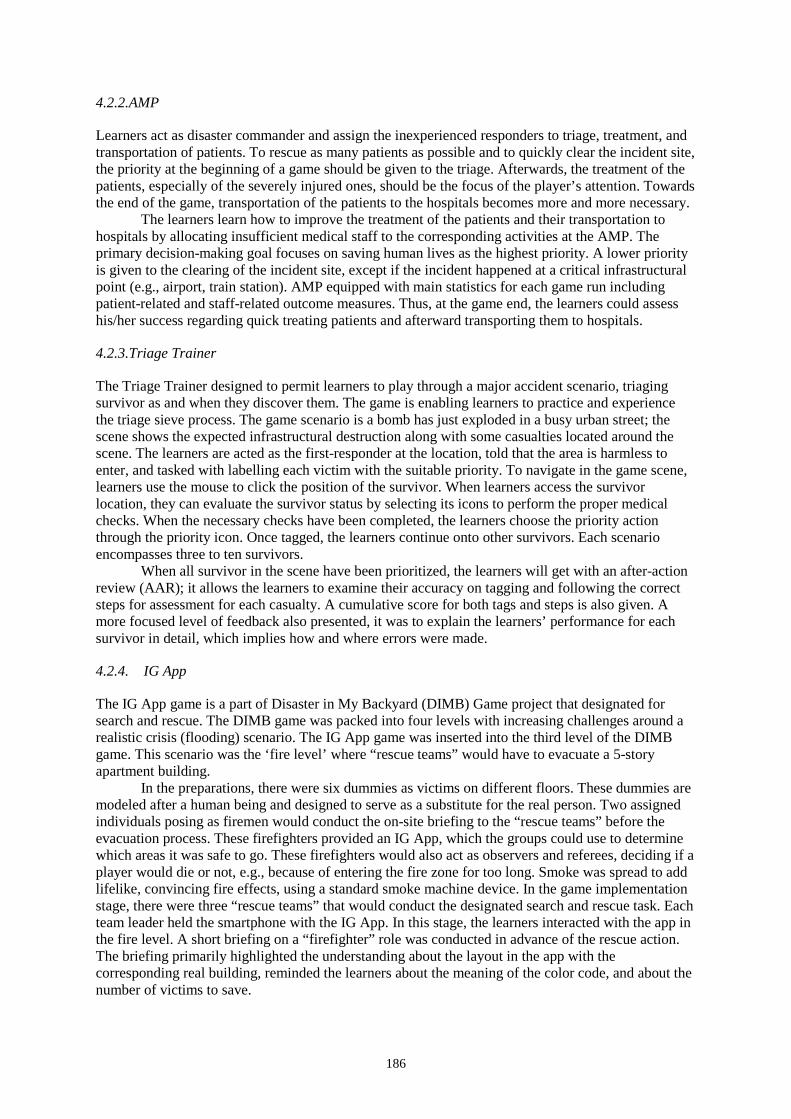
186
4.2.2.AMP
Learners act as disaster commander and assign the inexperienced responders to triage, treatment, and transportation of patients. To rescue as many patients as possible and to quickly clear the incident site, the priority at the beginning of a game should be given to the triage. Afterwards, the treatment of the patients, especially of the severely injured ones, should be the focus of the player’s attention. Towards the end of the game, transportation of the patients to the hospitals becomes more and more necessary.
The learners learn how to improve the treatment of the patients and their transportation to hospitals by allocating insufficient medical staff to the corresponding activities at the AMP. The primary decision-making goal focuses on saving human lives as the highest priority. A lower priority is given to the clearing of the incident site, except if the incident happened at a critical infrastructural point (e.g., airport, train station). AMP equipped with main statistics for each game run including patient-related and staff-related outcome measures. Thus, at the game end, the learners could assess his/her success regarding quick treating patients and afterward transporting them to hospitals.
4.2.3.Triage Trainer
The Triage Trainer designed to permit learners to play through a major accident scenario, triaging survivor as and when they discover them. The game is enabling learners to practice and experience the triage sieve process. The game scenario is a bomb has just exploded in a busy urban street; the scene shows the expected infrastructural destruction along with some casualties located around the scene. The learners are acted as the first-responder at the location, told that the area is harmless to enter, and tasked with labelling each victim with the suitable priority. To navigate in the game scene, learners use the mouse to click the position of the survivor. When learners access the survivor location, they can evaluate the survivor status by selecting its icons to perform the proper medical checks. When the necessary checks have been completed, the learners choose the priority action through the priority icon. Once tagged, the learners continue onto other survivors. Each scenario encompasses three to ten survivors.
When all survivor in the scene have been prioritized, the learners will get with an after-action review (AAR); it allows the learners to examine their accuracy on tagging and following the correct steps for assessment for each casualty. A cumulative score for both tags and steps is also given. A more focused level of feedback also presented, it was to explain the learners’ performance for each survivor in detail, which implies how and where errors were made.
4.2.4. IG App
The IG App game is a part of Disaster in My Backyard (DIMB) Game project that designated for search and rescue. The DIMB game was packed into four levels with increasing challenges around a realistic crisis (flooding) scenario. The IG App game was inserted into the third level of the DIMB game. This scenario was the ‘fire level’ where “rescue teams” would have to evacuate a 5-story apartment building.
In the preparations, there were six dummies as victims on different floors. These dummies are modeled after a human being and designed to serve as a substitute for the real person. Two assigned individuals posing as firemen would conduct the on-site briefing to the “rescue teams” before the evacuation process. These firefighters provided an IG App, which the groups could use to determine which areas it was safe to go. These firefighters would also act as observers and referees, deciding if a player would die or not, e.g., because of entering the fire zone for too long. Smoke was spread to add lifelike, convincing fire effects, using a standard smoke machine device. In the game implementation stage, there were three “rescue teams” that would conduct the designated search and rescue task. Each team leader held the smartphone with the IG App. In this stage, the learners interacted with the app in the fire level. A short briefing on a “firefighter” role was conducted in advance of the rescue action. The briefing primarily highlighted the understanding about the layout in the app with the corresponding real building, reminded the learners about the meaning of the color code, and about the number of victims to save.
187
4.2.5. GBED
GBED equipped with HMD that learners can learn through experiences while simultaneously viewing digital contents according to the storyline. GBED has the game component as follows. AR content: In experiential learning, digital materials should be associated with the real world (e.g., locations). Although the use of RWE can satisfy the association requirement, it can be strengthened via augmented reality (AR), which superimposes virtual objects (digital contents) onto the real world via a digital media interface. Some AR-based edutainment systems have been released previously. The storyline: Game has branches an evacuation scenario according to a learners’ response to single-choice questions. However, due to difficulties of answering the question using HMD, hence learners could response the question by their eye direction. Reflection: After experiential learning, a learner could reflect their experiences and behavior (including the behavior patterns) to strengthen multi-perspective knowledge stabilization.
4.2.6. Flood Protection
The learners asked to be the decision makers, for example, the mayor of a city that suffers from flooding. The primary purpose goal of this game is to understand how to manipulate the existing engineering approaches and resources to fight against flooding before and after it occurs and to instill the knowledge of modern water conservation methods and policies into students. The learners should protect multiple areas, including residential, commercial, or urban industrial zones from flooding. They also need to install appropriate construction items to prevent the city from flooding. The key to victory depends on how well the learners manipulate the available resources.
Multiple protection regions: The game includes three areas: residential, commercial, and industrial. Each region has its properties such as population, tax rates, and flood resistance. These designs simplify the reality while maintaining the balance of the game without involving complicated political issues.
Multiple evaluation indicators: The happiness index (HI) and money are defined as the two most important indicators for the assessment of a single game play; HI represents the satisfaction level of the residents. As a decision maker, citizens’ satisfaction is the primary concern. When the HI drops to zero, the learners fail the game. Learners will need to balance the HI and money while manipulating the arrangement of the different flood protection approaches.
Various disaster mitigation methods: A positive approach, Learners have to save resources for positive approaches and must consider pre-construction activities. Passive approaches, learners use passive approaches as temporary and emergency approaches.
Sequential levels: Game equipped by six levels of difficulty and challenge that have a unique and different map. By providing these various challenges, learners will have more choice in decision-making processes.
4.3 Validation Studies
4.3.1 Assessment of DREAD-ED.
This game measured the decision-making ability of learners within two trials. Each experiment involved 10 participants that divided into two categories, i.e., five students acted as inexperienced disaster responders, and the remaining were expert emergency managers. The selection of the participants with different background was to make sure that they can use the game for building their soft skill by comparing the effectiveness. The general conclusion of both trials of DREAD-ED gave the empirical evidence that this game could improve the social skill of the participants on the aspect of critical thinking how to make reflex the decision. Another useful information obtained the game assessment was that the expert participants used their experience in disaster to solve the game task. Compared to inexperienced students getting stressfully and faced troubles to make the same decision.
188
4.3.2 Assessment of AMP-Management Game
AMP-management game deals with a complicated process of AMP in an emergency location. This complex problem including how to prioritize the triage and treatment of the casualties and how to care and deliver them (to, within, and from AMP). Assessment of the AMP management game conducted in three trial sessions involved 96 participants, including students, practitioners from health care services, and researchers in investigating the potential of the AMP management Game. Each experiment started by an explanation of the theory, how to do AMP and how to use the AMP management game for understanding the AMP process. Then, the participants were invited to play the AMP management game. After playing this game, they were asked to fill the questionnaire set divided into two categories. The first category consisted of the questions for collecting the participants’ opinions about evaluation to measure their improvement of decision-making ability. The second category involved the questions in measuring their rating to the game efficiency and effectiveness of rescue treatment in the AMP. The general results from all conducted trials gave the evidence that game could improve the participants’ performance how to do AMP. However, the participants with the medical practitioner background received benefit from the game and felt comfortable to conduct the AMP procedure.
4.3.3 Assessment of Triage Trainer
The evaluation of the triage Trainer game involved 96 participants with the background of clinicians including nurses, paramedics, and doctors. The participants then received different treatment. Half of them have used the Triage Trainer game, and the remaining used card-sort exercises to understand the triage concept. The finding of this assessment showed that the participants exposed by SG got a more significant improvement to do the accurate triage all the casualties using the triage sieve. The general conclusion from its findings was that gaming could integrate effectively into existing courses. Using SG, the learners would get more benefits of the training compared to the traditional way.
4.3.4 Assessment of IG App
The evaluation involved 19 participants who were asked to play the IG App combined with the debriefing after playing the game. They were also requested to fill up the question about their opinion as to whether they liked and disliked the game. Another question was about the quality of debriefing and the usefulness of the application. The general conclusion of the assessment, notwithstanding with the limitation, there was the constructive impression of the IG App session could enhance the learners to make a decision based on real-time fire information.
4.3.5 Assessment of GBED
The evaluation of GBED involved students from 17 high schools that participated in university campus tour. However, due to safety reason, they used Oculus rift only in indoor trial and accompanied by an instructor. Before and after trying the GBED game, they were asked to response a set of the questionnaire consisted of five degrees Likert statement and some free descriptions to measure the capability of GBED. The findings of this assessment gave the conclusion that GBED could improve the visual reality of disaster and encourage the learners to engage in disaster study.
4.3.6 Assessment of Flood Protection
The assessment involved 33 students of ordinary high school comprised of three different grades. They were divided into 11 groups of 3 participants. Before the participants experienced to play Flood Protection on the desktop PCs, they were asked to fill the set of pre-test question that measured their experiences on disaster drill in their life. To collect post-test, a suitable software was used to record the process of playing the game including mouse tracking and screen capturing, student facial expression and voices. The assessment findings provided three necessity evidence, i.e., the participants’ motivation data showed the degree of their motivation was high. Base on the evidence, it
189
can be concluded SG implemented for disaster training at the ordinary school level could improve their motivation to study the protection of flood incident (flooding). Also, learning disaster using the game encouraged the learners’ curiosity to know the method of flood protection, such as by applying the concept of green environment.
5 Conclusion
The six SGs with different learning focus and development technology show that developers or researchers should define the suitable technology and learning approach to achieve the learning goal of the educational game. All of the SG study conducted for different learning focus and target, from ordinary student to disaster first responders and management staffs, shows that SG can be applied for inexperienced and experienced learners. However, in an emergency training, the necessity of the learners to get instant feedback is undoubted. With the immediate feedback, the learners would have experience how to make a mistake and receive the instant advice to solve the problem from its action. SG can fulfill such necessary feature of live training. Hence, SG is a proven way to train disaster responders and also society about disaster awareness.
On the other hand, the conducted integrative review gives the evidence that SG does not intend for student and children so much. Hence, it is promising to do research and development to provide students and children have an alternative game to train their ability according to the disaster preparedness. Based on this fact, the research will continue to measure the possibility of developing children’s awareness to the disaster impact employing the mobile serious game.
6 Limitation
The conducted review has a weakness that causes the findings bias. The limitation is due to a difficulty to access articles in inclusion because of inadequate article database subscription. However, even though the review is insufficient, it could give a new insight for us to continue the research and development of SG used in disaster and safety education field.
Acknowledgements
We would like to thank Universitas Pendidikan Indonesia for the funding of this research.
References
Annetta, L. A., Minogue, J., Holmes, S. Y., & Cheng, M.-T. (2009). Investigating the impact of video games on high school students’ engagement and learning about genetics. Computers & Education, 53(1), 74–85. http://doi.org/10.1016/j.compedu.2008.12.020
Berz, G., Loster, T., Kron, W., Raunch, E., Schimetschek, J., Schmieder, J., et al. (2001). World Map of Natural Hazards – A Global View of the Distribution and Intensity of Significant Exposures. Natural Hazards, 23, 443–365. http://doi.org/https://doi.org/10.1023/A:1011193724026
Charlier, N. (2011). Game-based assessment of first aid and resuscitation skills. Resuscitation, 82(4), 442–446. http://doi.org/10.1016/j.resuscitation.2010.12.003
Ferracani, A., Pezzatini, D., Seidenari, L., & Del Bimbo, A. (2014). Natural and virtual environments for the training of emergency medicine personnel. Universal Access in the Information Society, 14(3), 351–362. http://doi.org/10.1007/s10209-014-0364-1
Girard, C., Ecalle, J., & Magnan, A. (2012). Serious games as new educational tools: how effective are they? A meta-analysis of recent studies. Journal of Computer Assisted Learning, 29(3), 207–219. http://doi.org/10.1111/j.1365-2729.2012.00489.x
Graafland, M., Schraagen, J. M., & Schijven, M. P. (2012). Systematic review of serious games for medical education and surgical skills training. British Journal of Surgery, 99(10), 1322–1330. http://doi.org/10.1002/bjs.8819

190
Haferkamp, N., Kraemer, N. C., Linehan, C., & Schembri, M. (2011). Training disaster communication by means of serious games in virtual environments. Entertainment Computing, 2(2), 81–88. http://doi.org/10.1016/j.entcom.2010.12.009
Hayasaka, H., Noguchi, I., Putra, E. I., Yulianti, N., & Vadrevu, K. (2014). Peat-fire-related air pollution in Central Kalimantan, Indonesia. Environmental Pollution, 195(C), 257–266. http://doi.org/10.1016/j.envpol.2014.06.031
Kawai, J., Mitsuhara, H., & Shishibori, M. (2016). Game-based evacuation drill using augmented reality and head-mounted display. Interactive Technology and Smart Education, 13(3), 186–201. http://doi.org/10.1108/ITSE-01-2016-0001
Kirana, A. P., Sitanggang, I. S., & Syaufina, L. (2016). Hotspot Pattern Distribution in Peat Land Area in Sumatera Based on Spatio Temporal Clustering, 1–11. http://doi.org/10.1016/j.proenv.2016.03.118
Knight, J. F., Carley, S., Tregunna, B., Jarvis, S., Smithies, R., de Freitas, S., et al. (2010). Serious gaming technology in major incident triage training: A pragmatic controlled trial. Resuscitation, 81(9), 1175–1179. http://doi.org/10.1016/j.resuscitation.2010.03.042
Miettinen, J., Shi, C., & Liew, S. C. (2016). Land cover distribution in the peatlands of Peninsular Malaysia, Sumatra and Borneo in 2015 with changes since 1990. Global Ecology and Conservation, 6, 67–78. http://doi.org/10.1016/j.gecco.2016.02.004
Miller, L. M., Chang, C.-I., Wang, S., Beier, M. E., & Klisch, Y. (2011). Learning and motivational impacts of a multimedia science game. Computers & Education, 57(1), 1425–1433. http://doi.org/10.1016/j.compedu.2011.01.016
Mitsuhara, H., Sumikawa, T., Miyashita, J., Iwaka, K., & Kozuki, Y. (2013). Game-based evacuation drill using real world edutainment. Interactive Technology and Smart Education, 10(3), 194–210. http://doi.org/10.1108/ITSE-05-2013-0012
Radianti, J., Ben Lazreg, M., & Granmo, O.-C. (2015). Fire simulation-based adaptation of SmartRescue App for serious game_ Design, setup and user experience. Engineering Applications of Artificial Intelligence, 46(PB), 312–325. http://doi.org/10.1016/j.engappai.2015.06.012
Rauner, M. S., Niessner, H., Leopold-Wildburger, U., Peric, N., & Herdlicka, T. (2014a). A policy management game for mass casualty incidents: an experimental study. Flexible Services and Manufacturing Journal, 28(1-2), 336–365. http://doi.org/10.1007/s10696-014-9205-z
Rauner, M. S., Niessner, H., Leopold-Wildburger, U., Peric, N., & Herdlicka, T. (2014b). A policy management game for mass casualty incidents: an experimental study. Flexible Services and Manufacturing Journal, 28(1-2), 336–365. http://doi.org/10.1007/s10696-014-9205-z
Sardi, L., Idri, A., & Fernández-Alemán, J. L. (2017). A Systematic Review of Gamification in e-Health. Journal of Biomedical Informatics, 1–37. http://doi.org/10.1016/j.jbi.2017.05.011
Sicart, M. (2008). Defining Game Mechanics. Retrieved August 26, 2017, from Tomio, J., Sato, H., Matsuda, Y., Koga, T., & Mizumura, H. (2014). Household and Community Disaster
Preparedness in Japanese Provincial City: A Population-Based Household Survey. Advances in Anthropology, 04(02), 68–77. http://doi.org/10.4236/aa.2014.42010
Tsai, M.-H. (2015). The effectiveness of a flood protection computer game for disaster education, 1–13. http://doi.org/10.1186/s40327-015-0021-7
Tsai, M.-H., Wen, M.-C., Chang, Y.-L., & Kang, S.-C. (2014). Game-based education for disaster prevention. Ai & Society, 30(4), 463–475. http://doi.org/10.1007/s00146-014-0562-7
Wahyudin, D., & Hasegawa, S. (2015). Mobile Serious Game Design for Training Ethical Decision Making Skills of Inexperienced Disaster Volunteers. The Journal of Information and Systems in Education, 14(1), 28–41. http://doi.org/http://doi.org/10.12937/ejsise.14.28
Whittemore, R., & Knafl, K. (2005). The integrative review: updated methodology. Journal of Advanced Nursing, 52(5), 546–553. http://doi.org/10.1111/j.1365-2648.2005.03621.x
Hayashi, Y., et al. (Eds.) (2017). Workshop Proceedings of the 25th International Conference on Computers in Education. New Zealand: Asia-Pacific Society for Computers in Education
191
Earthquake Disaster Prevention Learning Approach in Japan Combining Fieldwork
Survey Learning and Evacuation Drill Training Hisashi HATAKEYAMAa,b*, Masahiro NAGAIc,a & Masao MUROTAd
aLibrary and Academic Information Center, Tokyo Metropolitan University, Japan bDepartment of Human System Science, Tokyo Institute of Technology, Japan
cUniversity Education Center, Tokyo Metropolitan University, Japan dInstitute for Liberal Arts, Tokyo Institute of Technology, Japan
Abstract: There has been increasing awareness on disaster prevention in Japan. The aim of this research is to ascertain whether learning activities on earthquake disasters consisting of pre-incident fieldwork survey learning and evacuation drill training, can be converted to disaster preparedness awareness. Learners study the situation and danger in a particular region through fieldwork. Subsequently, they review the findings and conduct retrospective learning assuming a disaster has occurred. Based on this assumption, they execute evacuation drills simulating a disaster outdoors. We designed a series of similar learning activities and developed learning support systems for tablet devices. Conducting classes at a high school, we analyzed changes in learners’ consciousness. Learners participated with interest and studied disaster prevention while simulating disasters with the support of the system. Results of the subjective survey revealed that certain effects were recognized during disaster preparedness, developing learners’ self-efficacy in protecting themselves in the event of a disaster.
Keywords: Disaster prevention, mobile learning, scenario-based learning, system development
1. Introduction
After massive earthquake disasters such as the Great East Japan Earthquake and the Kumamoto earthquake in 2016, there has been increasing awareness for the need for disaster prevention in Japan. Following the Great East Japan Earthquake, the Ministry of Education, Culture, Sports, Science and Technology Japan (MEXT) experts’ conference—called the “Council on Disaster Prevention Education and Disaster Management”—was aimed at children and students to 'encourage positive protective behavior' in the future (Ministry of Education, Culture, Sports, Science and Technology, 2012b). It also indicated that guidance on fundamental knowledge as a foundation of disaster prevention education, such as acquiring basic disaster prevention knowledge and understanding past and possible disasters based on an area, improved. The importance of learning subjectively to improve behavior and increase awareness through experiential activities was indicated. MEXT formulated a plan on school safety promotion in the same year. This plan required acquisition of basic knowledge at school and possession of appropriate ability to take decisions and perform actions based on it; this necessitated securing teaching time and establish an educational method (Ministry of Education, Culture, Sports, Science and Technology, 2012a).
In disaster prevention education in Japan, many cases using Information and Communication Technology (ICT) are reported. Most are based on a game-based learning method that is an extension of knowledge learning in classrooms. In recent years, however, some case studies incorporating real world situations in experimental learning are being studied. Activities that study a region through fieldwork and compile the information on disaster prevention maps have been reported. A case on developing a system that performs evacuation drills in the real world also exists.
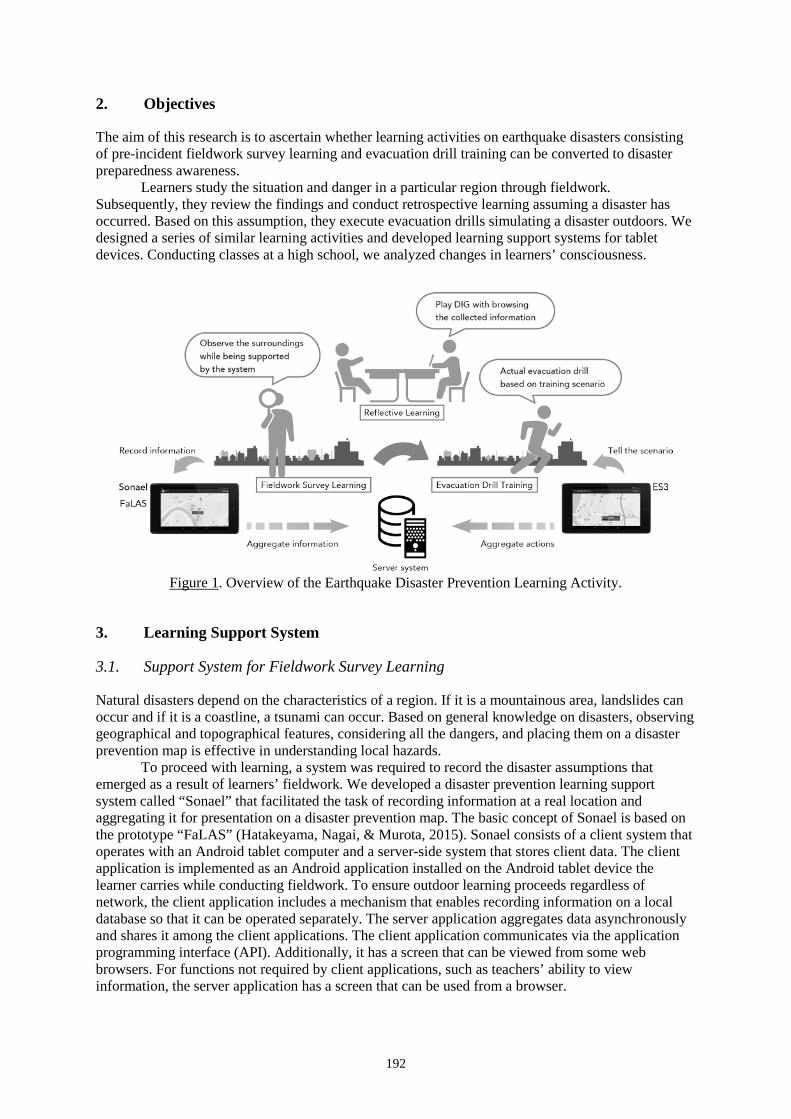
192
2. Objectives
The aim of this research is to ascertain whether learning activities on earthquake disasters consisting of pre-incident fieldwork survey learning and evacuation drill training can be converted to disaster preparedness awareness.
Learners study the situation and danger in a particular region through fieldwork. Subsequently, they review the findings and conduct retrospective learning assuming a disaster has occurred. Based on this assumption, they execute evacuation drills simulating a disaster outdoors. We designed a series of similar learning activities and developed learning support systems for tablet devices. Conducting classes at a high school, we analyzed changes in learners’ consciousness.
Figure 1. Overview of the Earthquake Disaster Prevention Learning Activity.
3. Learning Support System
3.1. Support System for Fieldwork Survey Learning
Natural disasters depend on the characteristics of a region. If it is a mountainous area, landslides can occur and if it is a coastline, a tsunami can occur. Based on general knowledge on disasters, observing geographical and topographical features, considering all the dangers, and placing them on a disaster prevention map is effective in understanding local hazards.
To proceed with learning, a system was required to record the disaster assumptions that emerged as a result of learners’ fieldwork. We developed a disaster prevention learning support system called “Sonael” that facilitated the task of recording information at a real location and aggregating it for presentation on a disaster prevention map. The basic concept of Sonael is based on the prototype “FaLAS” (Hatakeyama, Nagai, & Murota, 2015). Sonael consists of a client system that operates with an Android tablet computer and a server-side system that stores client data. The client application is implemented as an Android application installed on the Android tablet device the learner carries while conducting fieldwork. To ensure outdoor learning proceeds regardless of network, the client application includes a mechanism that enables recording information on a local database so that it can be operated separately. The server application aggregates data asynchronously and shares it among the client applications. The client application communicates via the application programming interface (API). Additionally, it has a screen that can be viewed from some web browsers. For functions not required by client applications, such as teachers’ ability to view information, the server application has a screen that can be used from a browser.
193
As fieldwork activities, learners gather information on local features and hazards separately. They carry the tablet device outdoors and the application provides instructions on how to take pictures, record classifications indicating safety or danger, and input comments explaining the basis for the classifications. This record is stored in a local database together with the GPS coordinates for that area. These records are transmitted to the server in the classroom and aggregated when communication is established. The aggregated data is redistributed to the devices from which learners can share information and view the merged records on maps. If there is aggregated information, even in an area s/he never visited, s/he can obtain information based on the records and make assumptions during disasters. With limited fieldwork time, activities can be conducted to understand an area and consider disaster mitigation measures.
3.2. Support System for Evacuation Drill Training
When encountering a disaster, one has to act immediately to protect oneself based on one’s own judgment. Various scenarios for disaster evacuation education have been developed in similar research. Alexander (2000) reports that scenario methods are useful in developing decision-making skills under stress. However, such scenarios have certain limitations such as divergent narratives based on given choices. Hence, we propose outdoor evacuation drill training with flexible scenarios based on assumptions made during disasters in the area.
We developed a flexible scenario-based learning support system called the “Evacuation Scenario Simulator System” (ES3), based on an improvised situation at a real location (Hatakeyama, Nagai, Shibayama, & Murota, 2016). The scenario consists of location-based elements of the disaster situation and shelters, with certain sections of the area damaged by the disaster. The scenario includes no set route or order of events and actions, having only two types of points namely disaster encounter points and shelters as goal points. The disaster encounter points include the first point encounter, namely the beginning of the training and various secondary disaster points encountered during the evacuation. Since it is not a pre-defined scenario with a prepared narrative, the learner experiences the situation flexibly, diverging in terms of the hypothetical disaster.
The ES3 system consists of a server and a client application operating on an Android tablet connected bidirectionally to the server. The primary features of the application are its presentation of a hypothetical disaster scenario based on a real location, and its recording of learners’ activity logs, such as locations and input values. The scenario is pre-set on any device on which the client application is installed. Learners bring their devices outdoors for the evacuation training. When the disaster encounter point approaches, the system displays the hypothetical disaster situation through an image on the device and a message indicating the commencement of the training. The learner executes actions using his/her own judgment to navigate routes and shelters throughout the disaster evacuation. During the evacuation, dangers are revealed at certain points along the route, directing the learner to select an appropriate action with a reason. The evacuation is complete when the learner reaches a shelter that is the goal point. The server collects the activity logs recorded on each device in which the client application is installed. The collected data are stored and arranged to be displayed on a map of the scenario. Learners can view the data using a web browser to study their actions after the experiential learning.
4. Classroom Practice
4.1. Outline
We conducted experimental hands-on lessons at a high school to help students learn about the types of hazards that can occur in a specific area based on its features. These lessons were conducted on first-year high school students during the Integrated Study period. The school is located near Tokyo Bay in the western region of Chiba Prefecture, inland from the sea. A river flows beside the school. There is extensive topographic relief here, including a small hill near the school. For this learning activity, the study area was set at about 1 km between the school and the coast.
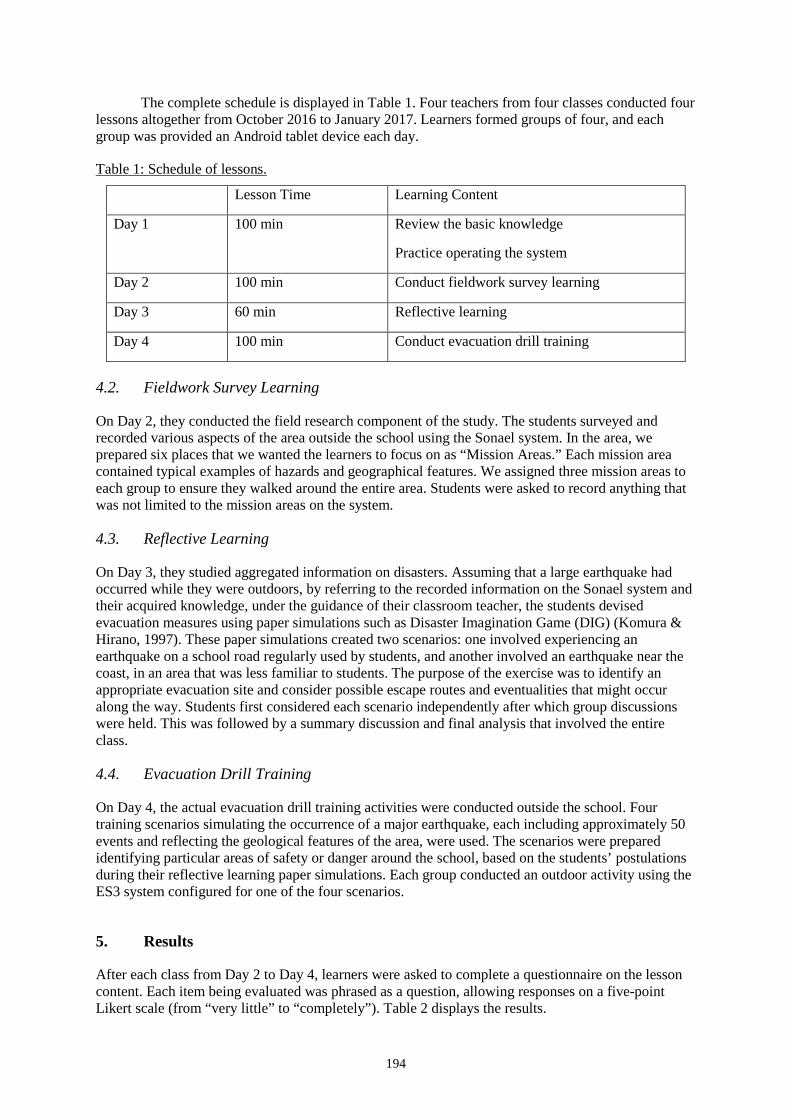
194
The complete schedule is displayed in Table 1. Four teachers from four classes conducted four lessons altogether from October 2016 to January 2017. Learners formed groups of four, and each group was provided an Android tablet device each day.
Table 1: Schedule of lessons.
Lesson Time Learning Content
Day 1 100 min Review the basic knowledge
Practice operating the system
Day 2 100 min Conduct fieldwork survey learning
Day 3 60 min Reflective learning
Day 4 100 min Conduct evacuation drill training
4.2. Fieldwork Survey Learning
On Day 2, they conducted the field research component of the study. The students surveyed and recorded various aspects of the area outside the school using the Sonael system. In the area, we prepared six places that we wanted the learners to focus on as “Mission Areas.” Each mission area contained typical examples of hazards and geographical features. We assigned three mission areas to each group to ensure they walked around the entire area. Students were asked to record anything that was not limited to the mission areas on the system.
4.3. Reflective Learning
On Day 3, they studied aggregated information on disasters. Assuming that a large earthquake had occurred while they were outdoors, by referring to the recorded information on the Sonael system and their acquired knowledge, under the guidance of their classroom teacher, the students devised evacuation measures using paper simulations such as Disaster Imagination Game (DIG) (Komura & Hirano, 1997). These paper simulations created two scenarios: one involved experiencing an earthquake on a school road regularly used by students, and another involved an earthquake near the coast, in an area that was less familiar to students. The purpose of the exercise was to identify an appropriate evacuation site and consider possible escape routes and eventualities that might occur along the way. Students first considered each scenario independently after which group discussions were held. This was followed by a summary discussion and final analysis that involved the entire class.
4.4. Evacuation Drill Training
On Day 4, the actual evacuation drill training activities were conducted outside the school. Four training scenarios simulating the occurrence of a major earthquake, each including approximately 50 events and reflecting the geological features of the area, were used. The scenarios were prepared identifying particular areas of safety or danger around the school, based on the students’ postulations during their reflective learning paper simulations. Each group conducted an outdoor activity using the ES3 system configured for one of the four scenarios.
5. Results
After each class from Day 2 to Day 4, learners were asked to complete a questionnaire on the lesson content. Each item being evaluated was phrased as a question, allowing responses on a five-point Likert scale (from “very little” to “completely”). Table 2 displays the results.
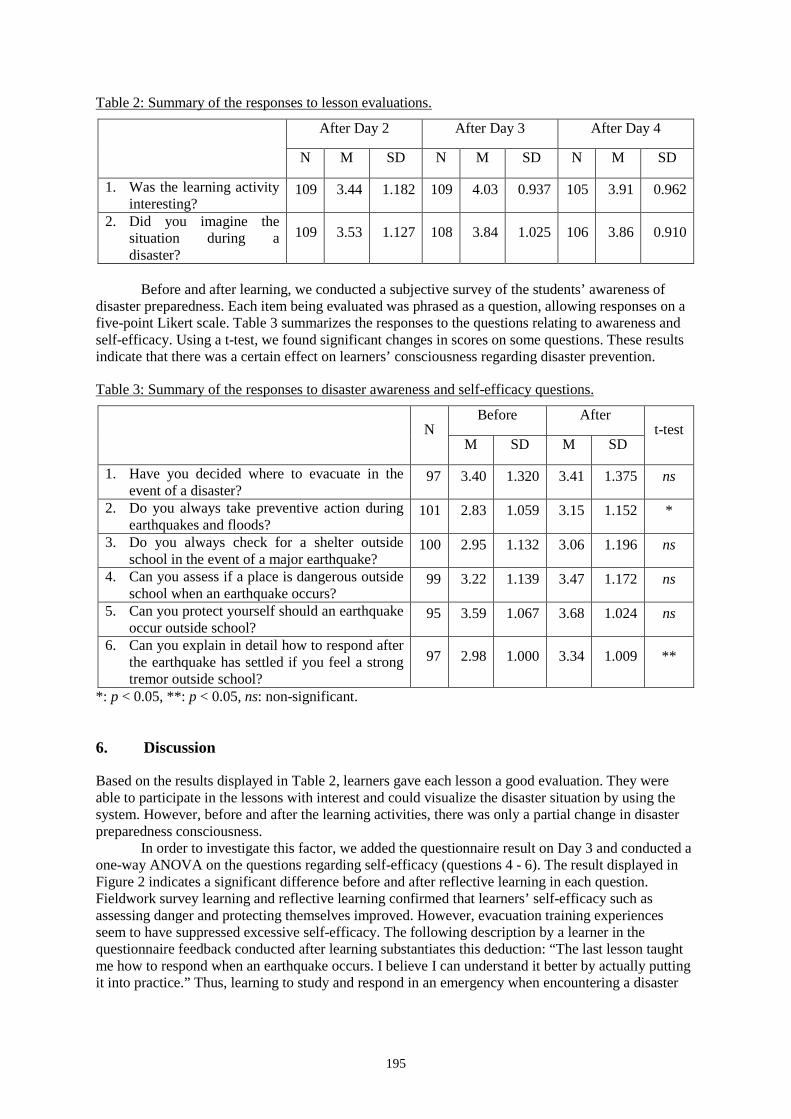
195
Table 2: Summary of the responses to lesson evaluations.
After Day 2 After Day 3 After Day 4
N M SD N M SD N M SD
1. Was the learning activity interesting?
109 3.44 1.182 109 4.03 0.937 105 3.91 0.962
2. Did you imagine the situation during a disaster?
109 3.53 1.127 108 3.84 1.025 106 3.86 0.910
Before and after learning, we conducted a subjective survey of the students’ awareness of
disaster preparedness. Each item being evaluated was phrased as a question, allowing responses on a five-point Likert scale. Table 3 summarizes the responses to the questions relating to awareness and self-efficacy. Using a t-test, we found significant changes in scores on some questions. These results indicate that there was a certain effect on learners’ consciousness regarding disaster prevention.
Table 3: Summary of the responses to disaster awareness and self-efficacy questions.
N
Before After t-test
M SD M SD
1. Have you decided where to evacuate in the event of a disaster?
97 3.40 1.320 3.41 1.375 ns
2. Do you always take preventive action during earthquakes and floods?
101 2.83 1.059 3.15 1.152 *
3. Do you always check for a shelter outside school in the event of a major earthquake?
100 2.95 1.132 3.06 1.196 ns
4. Can you assess if a place is dangerous outside school when an earthquake occurs?
99 3.22 1.139 3.47 1.172 ns
5. Can you protect yourself should an earthquake occur outside school?
95 3.59 1.067 3.68 1.024 ns
6. Can you explain in detail how to respond after the earthquake has settled if you feel a strong tremor outside school?
97 2.98 1.000 3.34 1.009 **
*: p < 0.05, **: p < 0.05, ns: non-significant.
6. Discussion
Based on the results displayed in Table 2, learners gave each lesson a good evaluation. They were able to participate in the lessons with interest and could visualize the disaster situation by using the system. However, before and after the learning activities, there was only a partial change in disaster preparedness consciousness.
In order to investigate this factor, we added the questionnaire result on Day 3 and conducted a one-way ANOVA on the questions regarding self-efficacy (questions 4 - 6). The result displayed in Figure 2 indicates a significant difference before and after reflective learning in each question. Fieldwork survey learning and reflective learning confirmed that learners’ self-efficacy such as assessing danger and protecting themselves improved. However, evacuation training experiences seem to have suppressed excessive self-efficacy. The following description by a learner in the questionnaire feedback conducted after learning substantiates this deduction: “The last lesson taught me how to respond when an earthquake occurs. I believe I can understand it better by actually putting it into practice.” Thus, learning to study and respond in an emergency when encountering a disaster
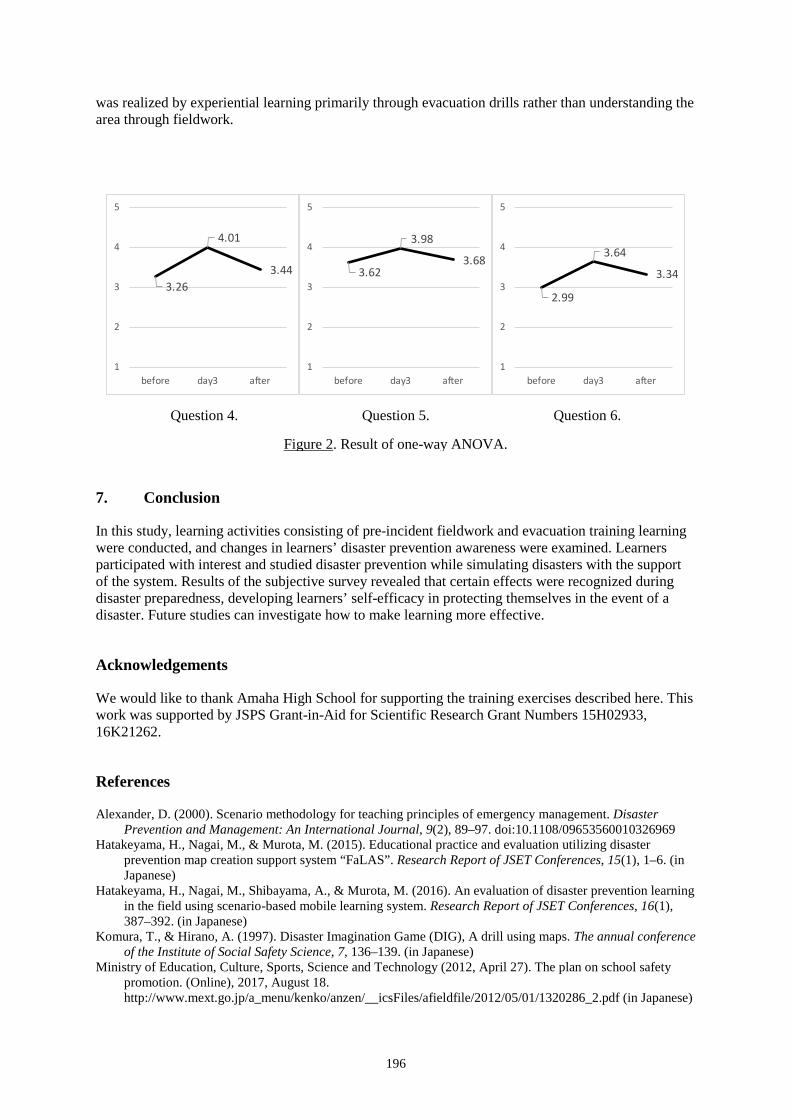
196
was realized by experiential learning primarily through evacuation drills rather than understanding the area through fieldwork.
7. Conclusion
In this study, learning activities consisting of pre-incident fieldwork and evacuation training learning were conducted, and changes in learners’ disaster prevention awareness were examined. Learners participated with interest and studied disaster prevention while simulating disasters with the support of the system. Results of the subjective survey revealed that certain effects were recognized during disaster preparedness, developing learners’ self-efficacy in protecting themselves in the event of a disaster. Future studies can investigate how to make learning more effective.
Acknowledgements
We would like to thank Amaha High School for supporting the training exercises described here. This work was supported by JSPS Grant-in-Aid for Scientific Research Grant Numbers 15H02933, 16K21262.
References
Alexander, D. (2000). Scenario methodology for teaching principles of emergency management. Disaster Prevention and Management: An International Journal, 9(2), 89–97. doi:10.1108/09653560010326969
Hatakeyama, H., Nagai, M., & Murota, M. (2015). Educational practice and evaluation utilizing disaster prevention map creation support system “FaLAS”. Research Report of JSET Conferences, 15(1), 1–6. (in Japanese)
Hatakeyama, H., Nagai, M., Shibayama, A., & Murota, M. (2016). An evaluation of disaster prevention learning in the field using scenario-based mobile learning system. Research Report of JSET Conferences, 16(1), 387–392. (in Japanese)
Komura, T., & Hirano, A. (1997). Disaster Imagination Game (DIG), A drill using maps. The annual conference of the Institute of Social Safety Science, 7, 136–139. (in Japanese)
Ministry of Education, Culture, Sports, Science and Technology (2012, April 27). The plan on school safety promotion. (Online), 2017, August 18. http://www.mext.go.jp/a_menu/kenko/anzen/__icsFiles/afieldfile/2012/05/01/1320286_2.pdf (in Japanese)
Question 4. Question 5. Question 6.
Figure 2. Result of one-way ANOVA.
3.26
4.01
3.44
1
2
3
4
5
before day3 after
3.62
3.98
3.68
1
2
3
4
5
before day3 after
2.99
3.64
3.34
1
2
3
4
5
before day3 after

197
Ministry of Education, Culture, Sports, Science and Technology (2012, July 25). Final report of the council on disaster prevention education and disaster management. (Online), 2017, August 18. http://www.mext.go.jp/b_menu/shingi/chousa/sports/012/toushin/__icsFiles/afieldfile/2012/07/31/1324017_01.pdf (in Japanese)
Hayashi, Y., et al. (Eds.) (2017). Workshop Proceedings of the 25th International Conference on Computers in Education. New Zealand: Asia-Pacific Society for Computers in Education
198
Disaster prevention learning by Karuta game to facilitate understanding relations between
unsafe and safe behaviors Yuichi KITAGAWAa*, Kengo KUWAHARAa , Koji TANAKAb,
Mitsuru IKEDAb & Masahiro HORIa a Graduate School of Informatics, Kansai University, Japan
b School of Knowledge Science, JAIST, Japan *[email protected]
Abstract: There have been various disaster prevention learning methods based on gaming, such as simulation games and card games, to help acquire the knowledge of disaster prevention. Evacuation behaviors include mutually related unsafe and safe behaviors, and such behaviors are needed to be understood as pairs because it is often difficult to guess one type of safe or unsafe behavior from another type. For example, if knowing the danger of wearing rain boots during flooding as unsafe behavior, it is not easy to guess how to behave in such situation to ensure safety. Therefore, it is important to understand the relations between unsafe and safe behaviors so that evacuation behavior can be acquired as practical knowledge. In this study, we propose a disaster prevention learning method that employs a traditional Japanese card game called Karuta game in order to facilitate understanding the relations between unsafe and safe behaviors. Karuta games consist of two types of cards: reading cards and grabbing cards. The reading cards are given with phrases on unsafe and safe behaviors respectively in the upper and lower words, and each grabbing card is depicted with a scene of taking safe behavior. In this way, disaster prevention knowledge is represented in the contents of Karuta game, taking the relations between unsafe and safe behaviors into account. Karuta game is played by two or more players with the help of a reciter, and the reciter randomly takes a reading card from the deck and reads it aloud. The players race to grab or touch a grabbing card that matches the meaning of the reading card. As a preliminary evaluation of the Karuta game, we conducted user observation in an evacuation drill in cooperation with elementary school children. As results, it was observed that children payed attention to the differences between unsafe and safe behaviors, and their accompanied guardians also understood the idea of unsafe behaviors.
Keywords: disaster prevention learning, gaming, card game, evacuation behaviors
1. Introduction
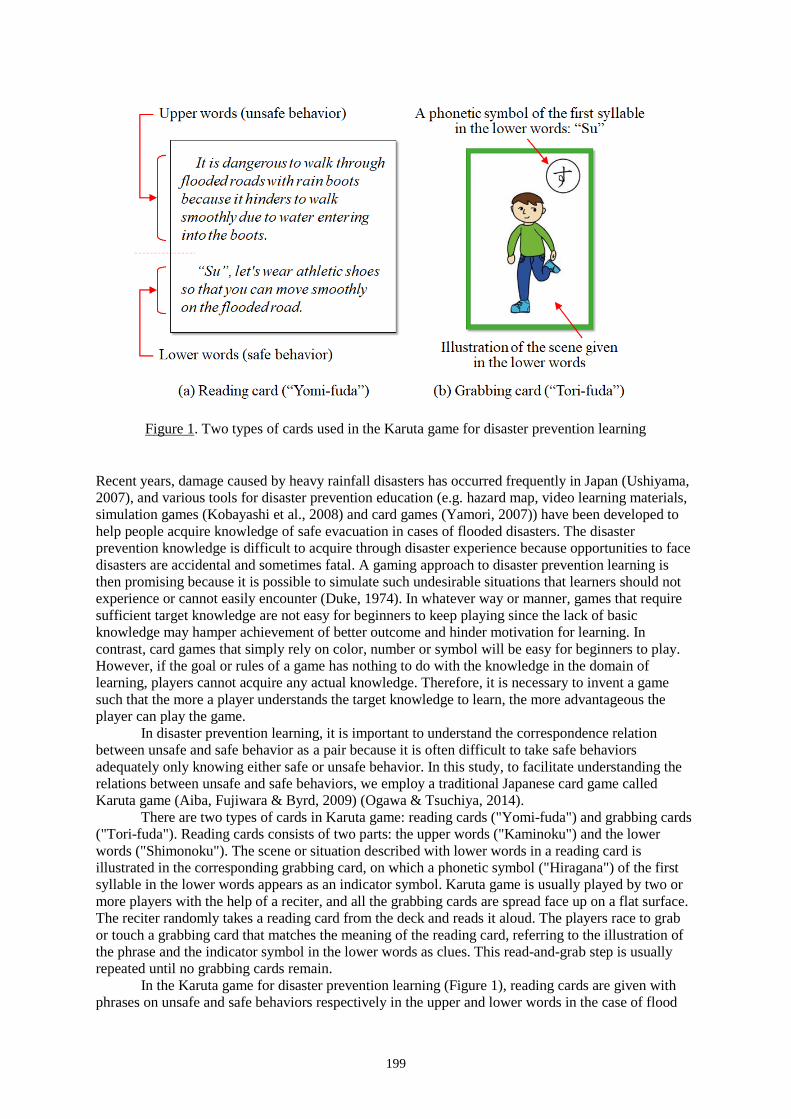
199
Recent years, damage caused by heavy rainfall disasters has occurred frequently in Japan (Ushiyama, 2007), and various tools for disaster prevention education (e.g. hazard map, video learning materials, simulation games (Kobayashi et al., 2008) and card games (Yamori, 2007)) have been developed to help people acquire knowledge of safe evacuation in cases of flooded disasters. The disaster prevention knowledge is difficult to acquire through disaster experience because opportunities to face disasters are accidental and sometimes fatal. A gaming approach to disaster prevention learning is then promising because it is possible to simulate such undesirable situations that learners should not experience or cannot easily encounter (Duke, 1974). In whatever way or manner, games that require sufficient target knowledge are not easy for beginners to keep playing since the lack of basic knowledge may hamper achievement of better outcome and hinder motivation for learning. In contrast, card games that simply rely on color, number or symbol will be easy for beginners to play. However, if the goal or rules of a game has nothing to do with the knowledge in the domain of learning, players cannot acquire any actual knowledge. Therefore, it is necessary to invent a game such that the more a player understands the target knowledge to learn, the more advantageous the player can play the game.
In disaster prevention learning, it is important to understand the correspondence relation between unsafe and safe behavior as a pair because it is often difficult to take safe behaviors adequately only knowing either safe or unsafe behavior. In this study, to facilitate understanding the relations between unsafe and safe behaviors, we employ a traditional Japanese card game called Karuta game (Aiba, Fujiwara & Byrd, 2009) (Ogawa & Tsuchiya, 2014).
There are two types of cards in Karuta game: reading cards ("Yomi-fuda") and grabbing cards ("Tori-fuda"). Reading cards consists of two parts: the upper words ("Kaminoku") and the lower words ("Shimonoku"). The scene or situation described with lower words in a reading card is illustrated in the corresponding grabbing card, on which a phonetic symbol ("Hiragana") of the first syllable in the lower words appears as an indicator symbol. Karuta game is usually played by two or more players with the help of a reciter, and all the grabbing cards are spread face up on a flat surface. The reciter randomly takes a reading card from the deck and reads it aloud. The players race to grab or touch a grabbing card that matches the meaning of the reading card, referring to the illustration of the phrase and the indicator symbol in the lower words as clues. This read-and-grab step is usually repeated until no grabbing cards remain.
In the Karuta game for disaster prevention learning (Figure 1), reading cards are given with phrases on unsafe and safe behaviors respectively in the upper and lower words in the case of flood
Figure 1. Two types of cards used in the Karuta game for disaster prevention learning
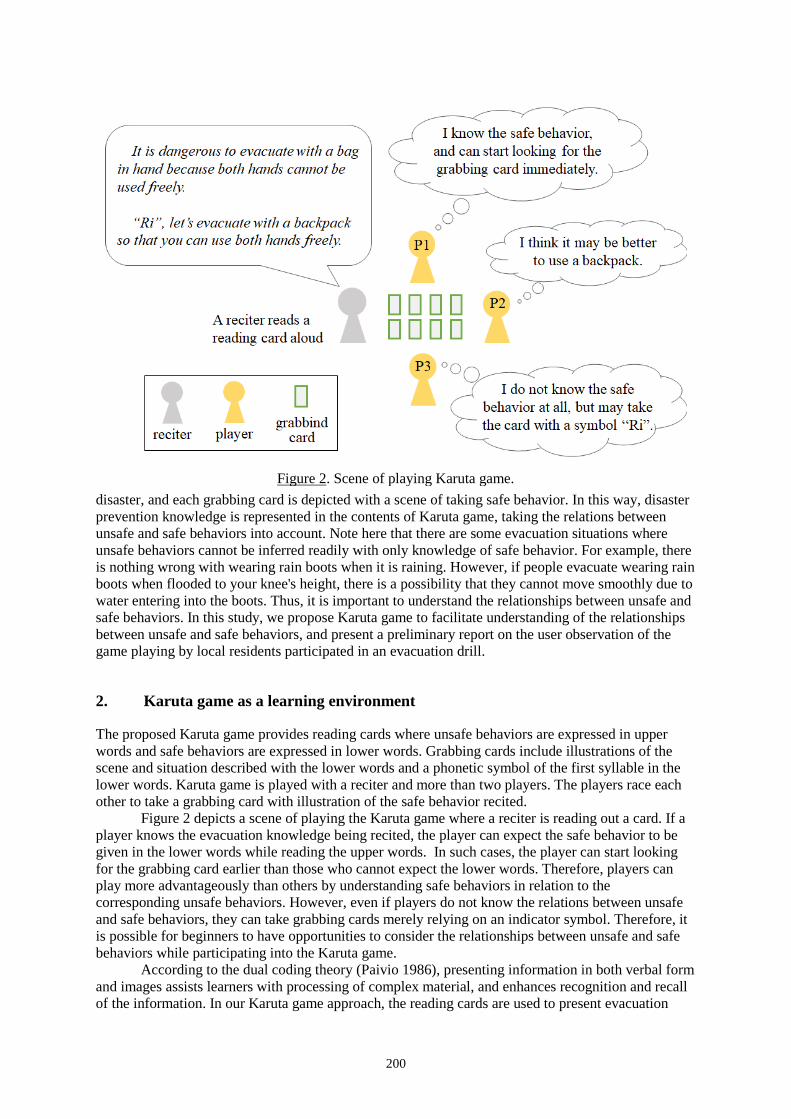
200
disaster, and each grabbing card is depicted with a scene of taking safe behavior. In this way, disaster prevention knowledge is represented in the contents of Karuta game, taking the relations between unsafe and safe behaviors into account. Note here that there are some evacuation situations where unsafe behaviors cannot be inferred readily with only knowledge of safe behavior. For example, there is nothing wrong with wearing rain boots when it is raining. However, if people evacuate wearing rain boots when flooded to your knee's height, there is a possibility that they cannot move smoothly due to water entering into the boots. Thus, it is important to understand the relationships between unsafe and safe behaviors. In this study, we propose Karuta game to facilitate understanding of the relationships between unsafe and safe behaviors, and present a preliminary report on the user observation of the game playing by local residents participated in an evacuation drill.
2. Karuta game as a learning environment
The proposed Karuta game provides reading cards where unsafe behaviors are expressed in upper words and safe behaviors are expressed in lower words. Grabbing cards include illustrations of the scene and situation described with the lower words and a phonetic symbol of the first syllable in the lower words. Karuta game is played with a reciter and more than two players. The players race each other to take a grabbing card with illustration of the safe behavior recited.
Figure 2 depicts a scene of playing the Karuta game where a reciter is reading out a card. If a player knows the evacuation knowledge being recited, the player can expect the safe behavior to be given in the lower words while reading the upper words. In such cases, the player can start looking for the grabbing card earlier than those who cannot expect the lower words. Therefore, players can play more advantageously than others by understanding safe behaviors in relation to the corresponding unsafe behaviors. However, even if players do not know the relations between unsafe and safe behaviors, they can take grabbing cards merely relying on an indicator symbol. Therefore, it is possible for beginners to have opportunities to consider the relationships between unsafe and safe behaviors while participating into the Karuta game.
According to the dual coding theory (Paivio 1986), presenting information in both verbal form and images assists learners with processing of complex material, and enhances recognition and recall of the information. In our Karuta game approach, the reading cards are used to present evacuation
Figure 2. Scene of playing Karuta game.

201
behavior in verbal form, and the grabbing cards provide scenes of safe behavior as images. Following the rules of the game, players pay attention to the correspondence between the illustration on grabbing cards and recited evacuation behavior. In addition, since it is often difficult to distinguish items presented with a similar situation, there may be possibilities of confusing safe behaviors with unsafe behaviors under the same evacuation situation. In this Karuta game, to prevent mistakenly remembering unsafe behaviors as safe behaviors, safe behaviors are expressed as the illustration of grabbing cards and the lower words of reading cards, while unsafe behaviors are expressed only in the upper words of the reading cards without imagery representation.
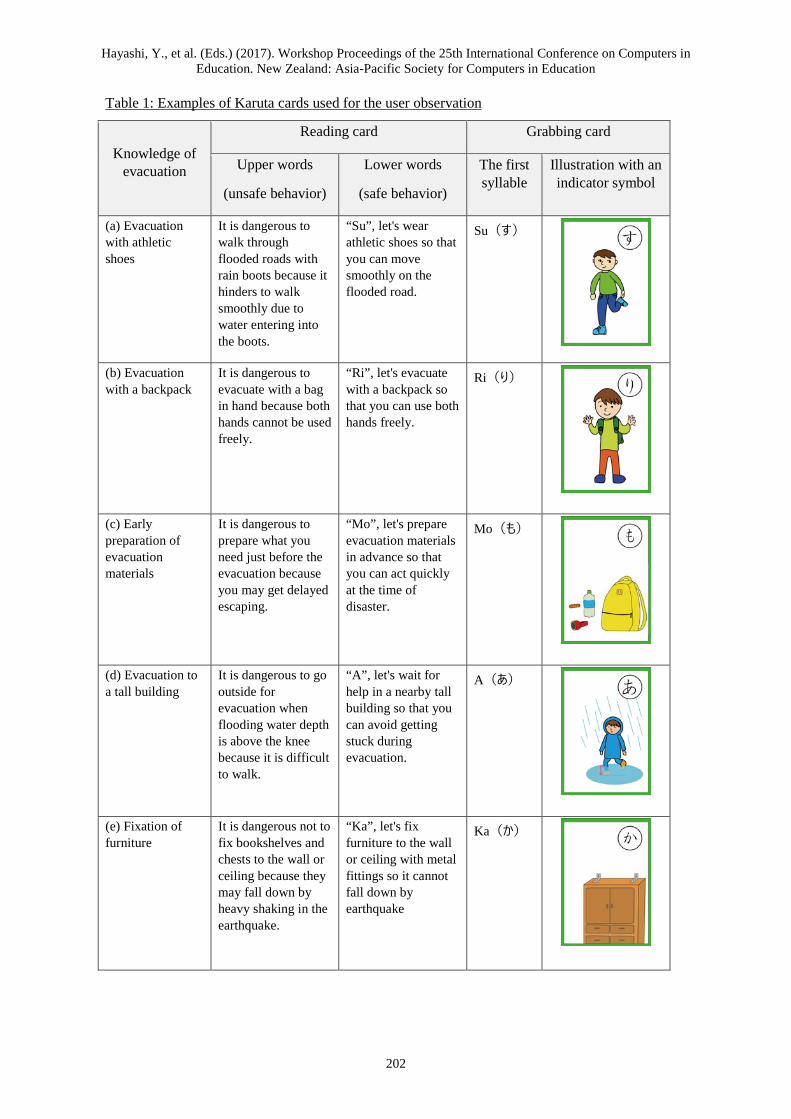
Hayashi, Y., et al. (Eds.) (2017). Workshop Proceedings of the 25th International Conference on Computers in Education. New Zealand: Asia-Pacific Society for Computers in Education
202
Table 1: Examples of Karuta cards used for the user observation
Knowledge of evacuation
Reading card Grabbing card
Upper words
(unsafe behavior)
Lower words
(safe behavior)
The first syllable
Illustration with an indicator symbol
(a) Evacuation with athletic shoes
It is dangerous to walk through flooded roads with rain boots because it hinders to walk smoothly due to water entering into the boots.
“Su”, let's wear athletic shoes so that you can move smoothly on the flooded road.
Su(す)
(b) Evacuation with a backpack
It is dangerous to evacuate with a bag in hand because both hands cannot be used freely.
“Ri”, let's evacuate with a backpack so that you can use both hands freely.
Ri(り)
(c) Early preparation of evacuation materials
It is dangerous to prepare what you need just before the evacuation because you may get delayed escaping.
“Mo”, let's prepare evacuation materials in advance so that you can act quickly at the time of disaster.
Mo(も)
(d) Evacuation to a tall building
It is dangerous to go outside for evacuation when flooding water depth is above the knee because it is difficult to walk.
“A”, let's wait for help in a nearby tall building so that you can avoid getting stuck during evacuation.
A(あ)
(e) Fixation of furniture
It is dangerous not to fix bookshelves and chests to the wall or ceiling because they may fall down by heavy shaking in the earthquake.
“Ka”, let's fix furniture to the wall or ceiling with metal fittings so it cannot fall down by earthquake
Ka(か)
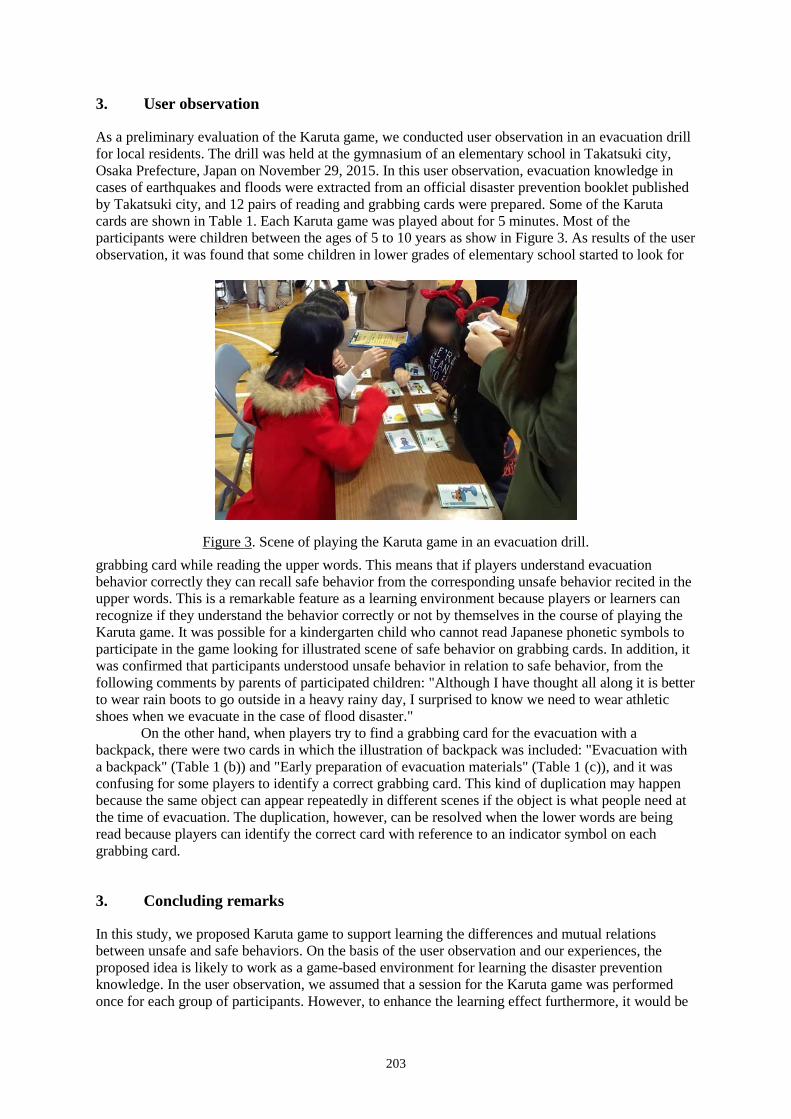
203
3. User observation
As a preliminary evaluation of the Karuta game, we conducted user observation in an evacuation drill for local residents. The drill was held at the gymnasium of an elementary school in Takatsuki city, Osaka Prefecture, Japan on November 29, 2015. In this user observation, evacuation knowledge in cases of earthquakes and floods were extracted from an official disaster prevention booklet published by Takatsuki city, and 12 pairs of reading and grabbing cards were prepared. Some of the Karuta cards are shown in Table 1. Each Karuta game was played about for 5 minutes. Most of the participants were children between the ages of 5 to 10 years as show in Figure 3. As results of the user observation, it was found that some children in lower grades of elementary school started to look for
grabbing card while reading the upper words. This means that if players understand evacuation behavior correctly they can recall safe behavior from the corresponding unsafe behavior recited in the upper words. This is a remarkable feature as a learning environment because players or learners can recognize if they understand the behavior correctly or not by themselves in the course of playing the Karuta game. It was possible for a kindergarten child who cannot read Japanese phonetic symbols to participate in the game looking for illustrated scene of safe behavior on grabbing cards. In addition, it was confirmed that participants understood unsafe behavior in relation to safe behavior, from the following comments by parents of participated children: "Although I have thought all along it is better to wear rain boots to go outside in a heavy rainy day, I surprised to know we need to wear athletic shoes when we evacuate in the case of flood disaster."
On the other hand, when players try to find a grabbing card for the evacuation with a backpack, there were two cards in which the illustration of backpack was included: "Evacuation with a backpack" (Table 1 (b)) and "Early preparation of evacuation materials" (Table 1 (c)), and it was confusing for some players to identify a correct grabbing card. This kind of duplication may happen because the same object can appear repeatedly in different scenes if the object is what people need at the time of evacuation. The duplication, however, can be resolved when the lower words are being read because players can identify the correct card with reference to an indicator symbol on each grabbing card.
3. Concluding remarks
In this study, we proposed Karuta game to support learning the differences and mutual relations between unsafe and safe behaviors. On the basis of the user observation and our experiences, the proposed idea is likely to work as a game-based environment for learning the disaster prevention knowledge. In the user observation, we assumed that a session for the Karuta game was performed once for each group of participants. However, to enhance the learning effect furthermore, it would be
Figure 3. Scene of playing the Karuta game in an evacuation drill.

204
useful to repeat the session for each participant changing the members because learning effect depends on not only the understanding level of the player but that of the other members. It is also our future study to develop a learning support tool or application based on the proposed Karuta game so that many people can be engaged in the disaster prevention learning by themselves.
References
Aiba, C. Fujiwara, M. and Byrd, B. (2009). Teaching the Momotaro story to children using English. JALT2008 Conference Proceedings, 736-743.
Duke, R. D. (1974). Gaming: The future’s language. NewYork: Sage Publications. Kobayashi, K. Narita, A. Hirano, M. Tanaka, K. Katada, T. and Kuwasawa, N. (2008). DIGTable: a tabletop
simulation system for disaster education. Proc. of the Sixth International Conference on Pervasive Computing, band236, 57-60.
Ogawa, A. Tsuchiya, Y. (2014). Designing Digital Storytelling Workshops for Vulnerable People: A Collaborative Story-weaving Model from the “Pre-story Space”. Journal of Socio-Informatics, 7(1), 25-36.
Paivio, A. (1986). Mental Representations: A Dual-Coding Approach. New York: Oxford University Press. Ushiyama, M. (2007). An analysis of human damage caused by recent heavy rainfall disasters in Japan.
Proceedings of the 4th Civil Engineering Conference in the Asian Region. Yamori, K. (2007). Disaster risk sense in Japan and gaming approach to risk communication. International
Journal of Mass Emergencies and Disasters, 25(2), 101–131.
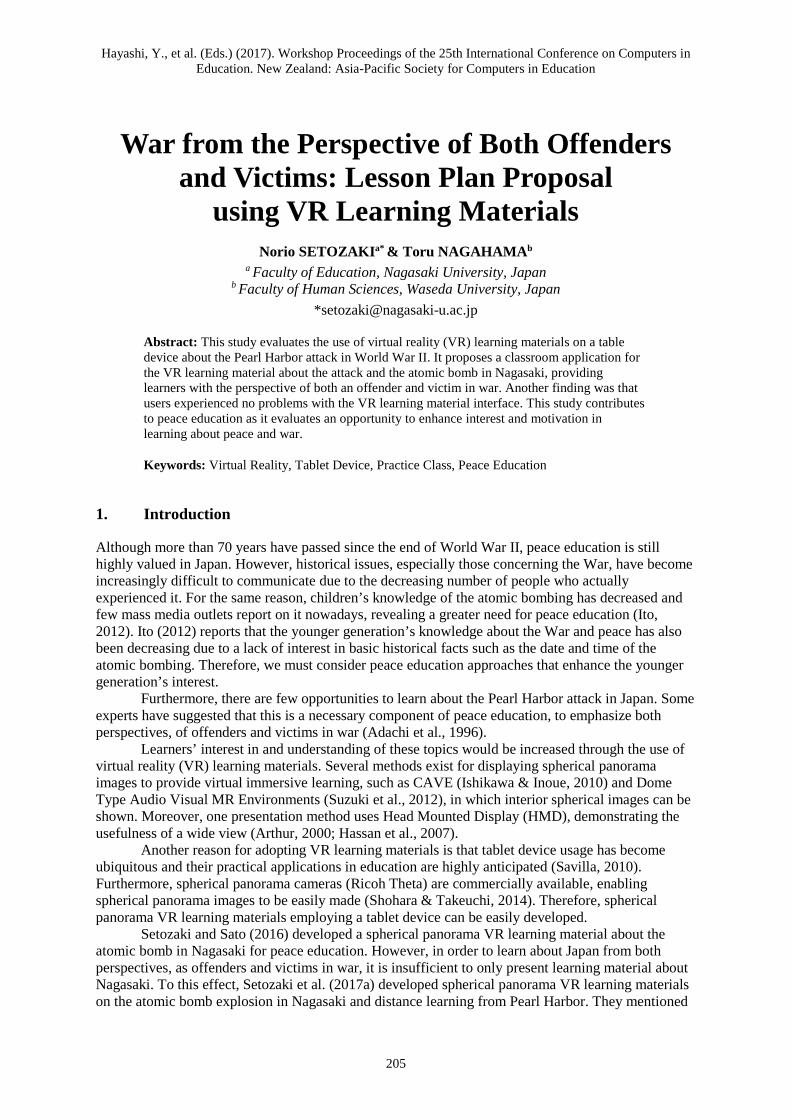
Hayashi, Y., et al. (Eds.) (2017). Workshop Proceedings of the 25th International Conference on Computers in Education. New Zealand: Asia-Pacific Society for Computers in Education
205
War from the Perspective of Both Offenders and Victims: Lesson Plan Proposal
using VR Learning Materials Norio SETOZAKIa* & Toru NAGAHAMAb
a Faculty of Education, Nagasaki University, Japan
b Faculty of Human Sciences, Waseda University, Japan *[email protected]
Abstract: This study evaluates the use of virtual reality (VR) learning materials on a table device about the Pearl Harbor attack in World War II. It proposes a classroom application for the VR learning material about the attack and the atomic bomb in Nagasaki, providing learners with the perspective of both an offender and victim in war. Another finding was that users experienced no problems with the VR learning material interface. This study contributes to peace education as it evaluates an opportunity to enhance interest and motivation in learning about peace and war.
Keywords: Virtual Reality, Tablet Device, Practice Class, Peace Education
1. Introduction
Although more than 70 years have passed since the end of World War II, peace education is still highly valued in Japan. However, historical issues, especially those concerning the War, have become increasingly difficult to communicate due to the decreasing number of people who actually experienced it. For the same reason, children’s knowledge of the atomic bombing has decreased and few mass media outlets report on it nowadays, revealing a greater need for peace education (Ito, 2012). Ito (2012) reports that the younger generation’s knowledge about the War and peace has also been decreasing due to a lack of interest in basic historical facts such as the date and time of the atomic bombing. Therefore, we must consider peace education approaches that enhance the younger generation’s interest.
Furthermore, there are few opportunities to learn about the Pearl Harbor attack in Japan. Some experts have suggested that this is a necessary component of peace education, to emphasize both perspectives, of offenders and victims in war (Adachi et al., 1996).
Learners’ interest in and understanding of these topics would be increased through the use of virtual reality (VR) learning materials. Several methods exist for displaying spherical panorama images to provide virtual immersive learning, such as CAVE (Ishikawa & Inoue, 2010) and Dome Type Audio Visual MR Environments (Suzuki et al., 2012), in which interior spherical images can be shown. Moreover, one presentation method uses Head Mounted Display (HMD), demonstrating the usefulness of a wide view (Arthur, 2000; Hassan et al., 2007).
Another reason for adopting VR learning materials is that tablet device usage has become ubiquitous and their practical applications in education are highly anticipated (Savilla, 2010). Furthermore, spherical panorama cameras (Ricoh Theta) are commercially available, enabling spherical panorama images to be easily made (Shohara & Takeuchi, 2014). Therefore, spherical panorama VR learning materials employing a tablet device can be easily developed.
Setozaki and Sato (2016) developed a spherical panorama VR learning material about the atomic bomb in Nagasaki for peace education. However, in order to learn about Japan from both perspectives, as offenders and victims in war, it is insufficient to only present learning material about Nagasaki. To this effect, Setozaki et al. (2017a) developed spherical panorama VR learning materials on the atomic bomb explosion in Nagasaki and distance learning from Pearl Harbor. They mentioned
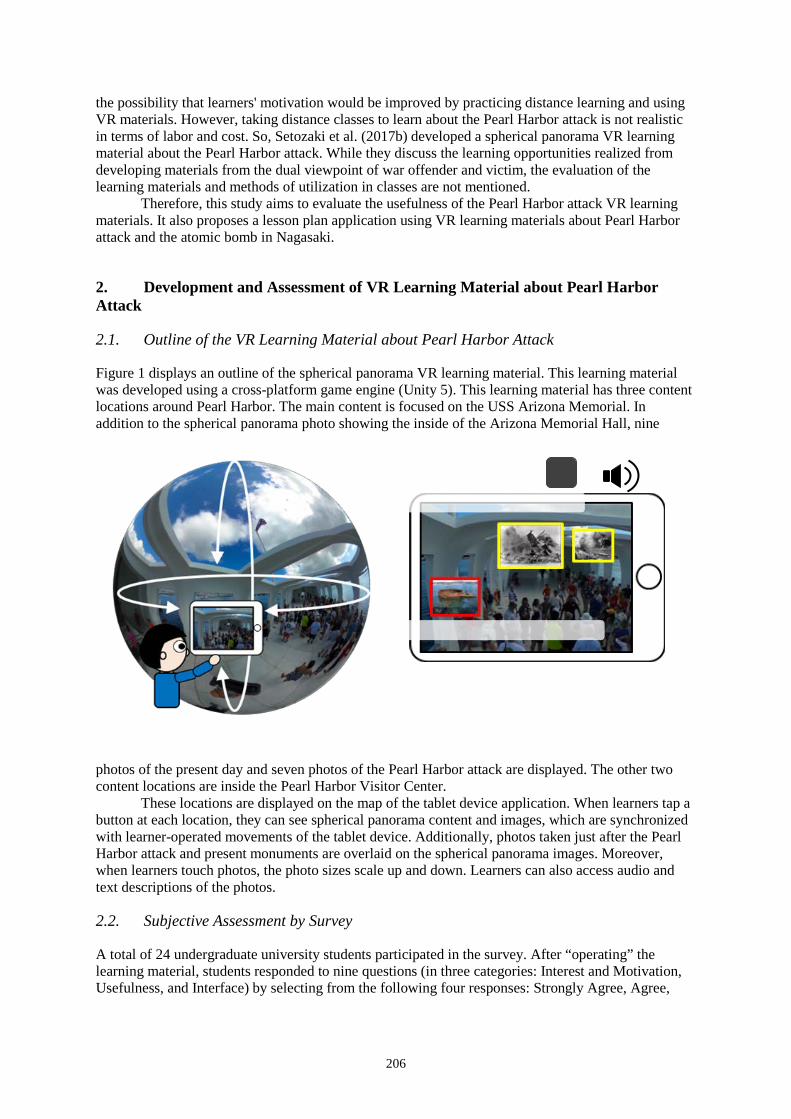
206
the possibility that learners' motivation would be improved by practicing distance learning and using VR materials. However, taking distance classes to learn about the Pearl Harbor attack is not realistic in terms of labor and cost. So, Setozaki et al. (2017b) developed a spherical panorama VR learning material about the Pearl Harbor attack. While they discuss the learning opportunities realized from developing materials from the dual viewpoint of war offender and victim, the evaluation of the learning materials and methods of utilization in classes are not mentioned.
Therefore, this study aims to evaluate the usefulness of the Pearl Harbor attack VR learning materials. It also proposes a lesson plan application using VR learning materials about Pearl Harbor attack and the atomic bomb in Nagasaki.
2. Development and Assessment of VR Learning Material about Pearl Harbor Attack
2.1. Outline of the VR Learning Material about Pearl Harbor Attack
Figure 1 displays an outline of the spherical panorama VR learning material. This learning material was developed using a cross-platform game engine (Unity 5). This learning material has three content locations around Pearl Harbor. The main content is focused on the USS Arizona Memorial. In addition to the spherical panorama photo showing the inside of the Arizona Memorial Hall, nine
photos of the present day and seven photos of the Pearl Harbor attack are displayed. The other two content locations are inside the Pearl Harbor Visitor Center.
These locations are displayed on the map of the tablet device application. When learners tap a button at each location, they can see spherical panorama content and images, which are synchronized with learner-operated movements of the tablet device. Additionally, photos taken just after the Pearl Harbor attack and present monuments are overlaid on the spherical panorama images. Moreover, when learners touch photos, the photo sizes scale up and down. Learners can also access audio and text descriptions of the photos.
2.2. Subjective Assessment by Survey
A total of 24 undergraduate university students participated in the survey. After “operating” the learning material, students responded to nine questions (in three categories: Interest and Motivation, Usefulness, and Interface) by selecting from the following four responses: Strongly Agree, Agree,
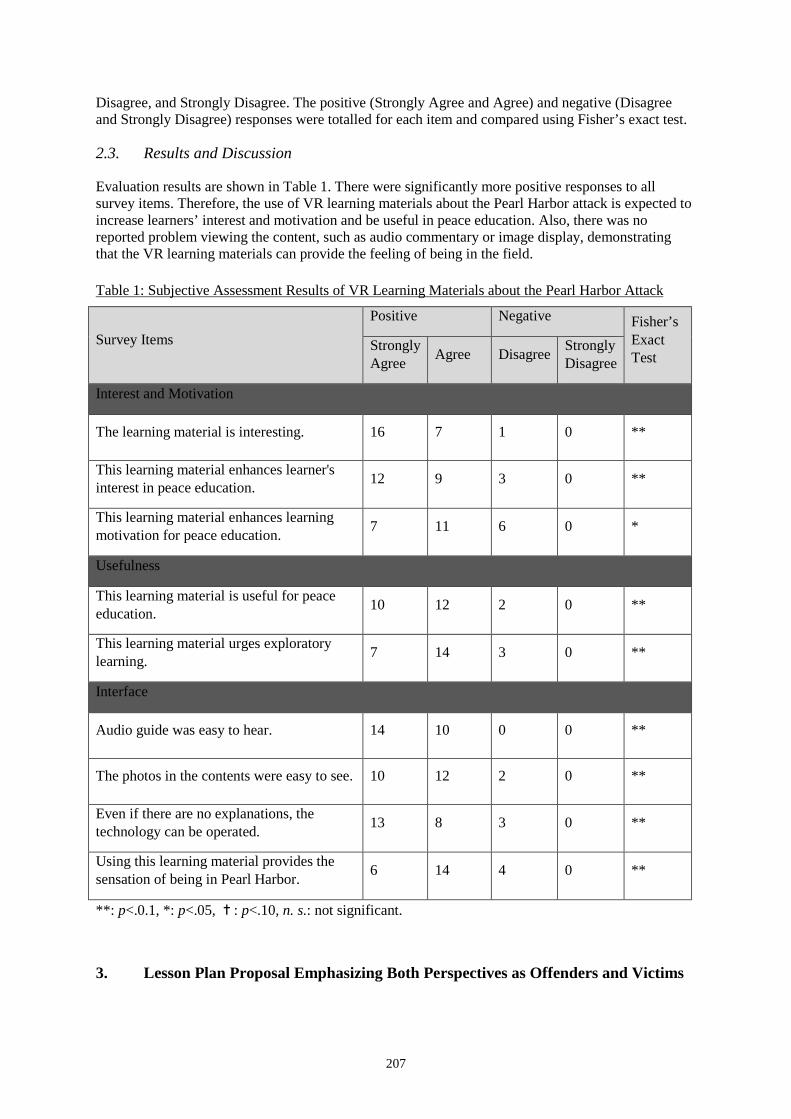
207
Disagree, and Strongly Disagree. The positive (Strongly Agree and Agree) and negative (Disagree and Strongly Disagree) responses were totalled for each item and compared using Fisher’s exact test.
2.3. Results and Discussion
Evaluation results are shown in Table 1. There were significantly more positive responses to all survey items. Therefore, the use of VR learning materials about the Pearl Harbor attack is expected to increase learners’ interest and motivation and be useful in peace education. Also, there was no reported problem viewing the content, such as audio commentary or image display, demonstrating that the VR learning materials can provide the feeling of being in the field.
3. Lesson Plan Proposal Emphasizing Both Perspectives as Offenders and Victims
Table 1: Subjective Assessment Results of VR Learning Materials about the Pearl Harbor Attack
Survey Items Positive Negative Fisher’s
Exact Test
Strongly Agree Agree Disagree Strongly
Disagree
Interest and Motivation
The learning material is interesting. 16 7 1 0 **
This learning material enhances learner's interest in peace education. 12 9 3 0 **
This learning material enhances learning motivation for peace education. 7 11 6 0 *
Usefulness
This learning material is useful for peace education. 10 12 2 0 **
This learning material urges exploratory learning. 7 14 3 0 **
Interface
Audio guide was easy to hear. 14 10 0 0 **
The photos in the contents were easy to see. 10 12 2 0 **
Even if there are no explanations, the technology can be operated. 13 8 3 0 **
Using this learning material provides the sensation of being in Pearl Harbor. 6 14 4 0 **
**: p<.0.1, *: p<.05, ✝: p<.10, n. s.: not significant.
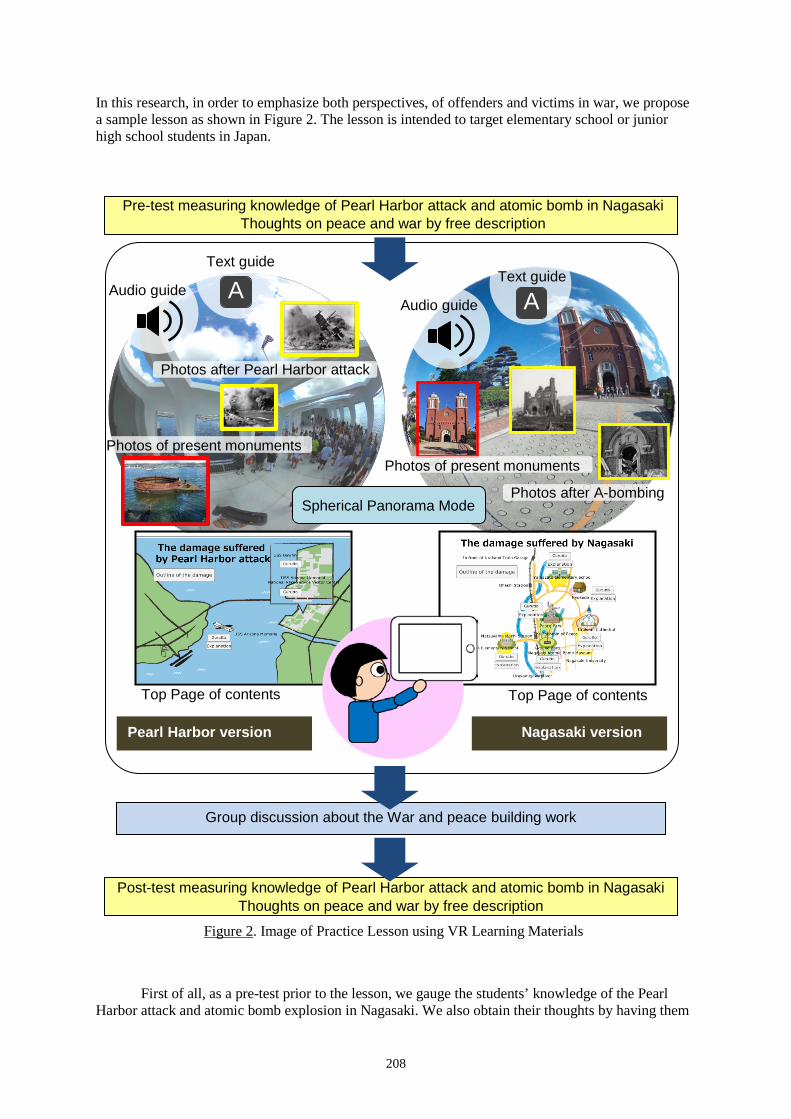
208
In this research, in order to emphasize both perspectives, of offenders and victims in war, we propose a sample lesson as shown in Figure 2. The lesson is intended to target elementary school or junior high school students in Japan.
First of all, as a pre-test prior to the lesson, we gauge the students’ knowledge of the Pearl Harbor attack and atomic bomb explosion in Nagasaki. We also obtain their thoughts by having them
Top Page of contents Top Page of contents
Spherical Panorama Mode
Figure 2. Image of Practice Lesson using VR Learning Materials
Audio guide A
Text guide
Audio guide A
Text guide
Group discussion about the War and peace building work
Post-test measuring knowledge of Pearl Harbor attack and atomic bomb in Nagasaki Thoughts on peace and war by free description
Pre-test measuring knowledge of Pearl Harbor attack and atomic bomb in Nagasaki Thoughts on peace and war by free description
Pearl Harbor version Nagasaki version
Photos of present monuments
Photos after A-bombing
Photos after Pearl Harbor attack
Photos of present monuments
209
freely describe peace and war. We then conduct the exploratory learning with the learners using VR learning materials about the Pearl Harbor attack and atomic bomb explosion in Nagasaki. It is desirable to use one tablet device for one or two learners. Afterwards, learners discuss war and peace building as a group composed of four to five people.
Finally, the same task as the pre-test is set up as a post-test. We will analyze the change in knowledge about the Pearl Harbor attack and Nagasaki's atomic bombing and in thoughts on peace and war. Based on the results of this analysis, we will examine the usefulness of these learning materials and obtain knowledge about the lesson’s effect on learning.
4. Conclusion
This study evaluated the usefulness of the Pearl Harbor attack VR learning materials. Findings suggest that use of VR learning materials about the Pearl Harbor attack will increase learners’ interest and motivation and be useful in peace education. The study also proposed an application of the materials in a lesson plan about the attack and the atomic bomb in Nagasaki, from the perspective of both offenders and victims in war. The users reported no problems with the interface.
The future task is to practice the proposed lesson and clarify the learning effect of these learning materials.
Acknowledgements
This research was supported by JSPS KAKENHI Grant-in-Aid for Young Scientists (B) Number 16K16322.
References
Adachi, Y., Fukuda, H., Tsushima, T., Igasaki, A. & Takashima, N. (1996). Education for peace, human rights and international understanding. The Japanese Journal of Educational Research, 63(1), 43-48.
Arthur, K, W. (2000) Effects of Field of View on Performance with Head-Mounted Displays. The University of North Carolina at Chapel Hill, Doctoral Dissertation.
Hassan, S, E., Hicks, H. Lei, H. & Turano, K, A. (2007) What is the Minimum Field of View Required for Efficient Navigation? . Vision Research, 47(16), 2115-2123.
Ishikawa, T.& Inoue, T. (2010) Head Tracking interface for CAVE−1ike VR Displays using the WiiRemote, IEICE Technical Report, 109(447), 119-124.
Ito, T. (2012) Learner's Experience of : Peace, Knowledge of the Atomic Bomb, World War II, and Peace Consciousness -An Analysis of Data Collected from Elementary & Junior High School Students in Hiroshima. Departmental Bulletin Paper(Hiroshima Kokusai Gakuin University), 13, 23-48.
Savilla, B. (2010) Integrating the iPod Touch in K-12 Education: Visions and Vices. Computers in the Schools, 27(2), 121–131.
Setozaki, N.& Sato, K. (2016) Practice Class Using Spherical Panorama VR Learning Material for Peace Education. Proceedings of 24th International Conference on Computers in Education, 363-367.
Setozaki, N., Uchida, T. & Nagahama, T (2017a) Practicing Peace Education Together with Students in a Different Culture. Japan Journal of Educational Technology, 41(Suppl.) printing.
Setozaki, N., Matsushita, S. & Nagahama, T. (2017b) Development of Spherical Panorama VR Learning Materials about the Pearl Harbor Attack. International Conference for Media in Education.
Shohara, M. & Takeuchi, M. (2014) Development of “RICOH THETA”: Spherical Image Camera. Journal of the Society of Photographic Science and Imaging of Japan, 77(3), 234–237.
Suzuki, S., Sugiyama, T., Miyai, T., Kimura, A., Shibata, F.& Tamura, H. (2012) Dome Type Audio Visual MR Environment and Its Core Software Library, IEICE Technical Report, 111(499), 135-140.
Hayashi, Y., et al. (Eds.) (2017). Workshop Proceedings of the 25th International Conference on Computers in Education. New Zealand: Asia-Pacific Society for Computers in Education
210
The Impact of Prior Knowledge on the Usability Evaluation of a Competitive Game-Based Learning System Including Item Bank
Gwo-Haur HWANGa*, Beyin CHENa, Ru-Shan CHENb, Yu-Ling LAIc, You-Hong SUd & Ya-Han CAOa
aDepartment of Information Networking and System Administration, Ling Tung University, Taiwan bChihlee University of Technology, Taiwan
cDepartment of Information Management, Ling Tung University, Taiwan dGraduate Institute of Digital Learning and Education, National Taiwan University of Science and
Technology * [email protected]
Abstract: By using a competitive game-based learning system including item bank, this study aims to explore the impact of prior knowledge on Nielsen, J’s usability evaluation. The results show that it still needs improvement for “Aesthetic and minimalist design” and “Help and documentation”. Regarding to prior knowledge, the average scores for high prior knowledge learners are significantly higher than those for low prior knowledge learners on “Visibility of system status”, “Match between system and the real world”, “User control and freedom”, “Consistency”, “Error prevention”, “Recognition rather than recall”, “Flexibility and efficiency of use” and “Help users recognize, diagnose, and recover from errors”. It means that high prior knowledge learners are more satisfied than low prior knowledge ones.
Keywords: Prior knowledge, usability evaluation, competitive game, learning system, item bank
1. Introduction
Nowadays, information technologies has changed rapidly. Digital learning becomes a learning trend, because it can record students’ learning situation on the learning system and help teachers to understand and manage students’ learning portfolio (Hwang, Su & Chen, 2015). Prensky (2001) pointed out that game-based learning can improve learners’ learning motivation, because games contains some elements those can attract learners, such as target, mechanism, interactivity and challenge, etc. (Dempsey, Lucassen, Haynes & Casey, 1996; Shi & Shih, 2015). Thus, many scholars found that game-based learning can effectively improve learning motivation to achieve good learning effectiveness (Chang, Hou & Chang, 2015; Chen, Wong & Wang, 2014; Hwang, Hsu, Lai & Hsueh, 2017). If games do not appropriately combine with teaching materials, learners may only focus on the games but ignore the teaching materials (Hsiao, Huang, Hong, Lin, & Tsai, 2010). On the other hand, competition is also a learning strategy that can effectively improve learning motivation and learning effectiveness (Yu & Liu, 2009; Atanasijevic-Kunc, Logar, Karba, Papic, & Kos, 2011). Learners will practice in order to win on the ranking, so appropriate competition is helpful for learning motivation and effectiveness (Davis & Rimm, 1985). However, competition may also have a negative impact on some learners' self-confidence. It may reduce learning motivation and affect learning effectiveness. Besides, human factors (gender, prior knowledge, cognitive style or learning style) are also the factors that affect learners' preference. Some scholars pointed out that different human factors have significant differences in the usability evaluation of learning systems (Hwang, Lee & Kuo, 2016; Hwang, Lee, Lai, Su & Cao, 2017). In these human factors, prior knowledge is the key factor to affect game-based learning (Chen & Huang, 2013). Therefore, this study will explore the impact of prior knowledge on the usability evaluation of a competitive game-based learning system including item bank.
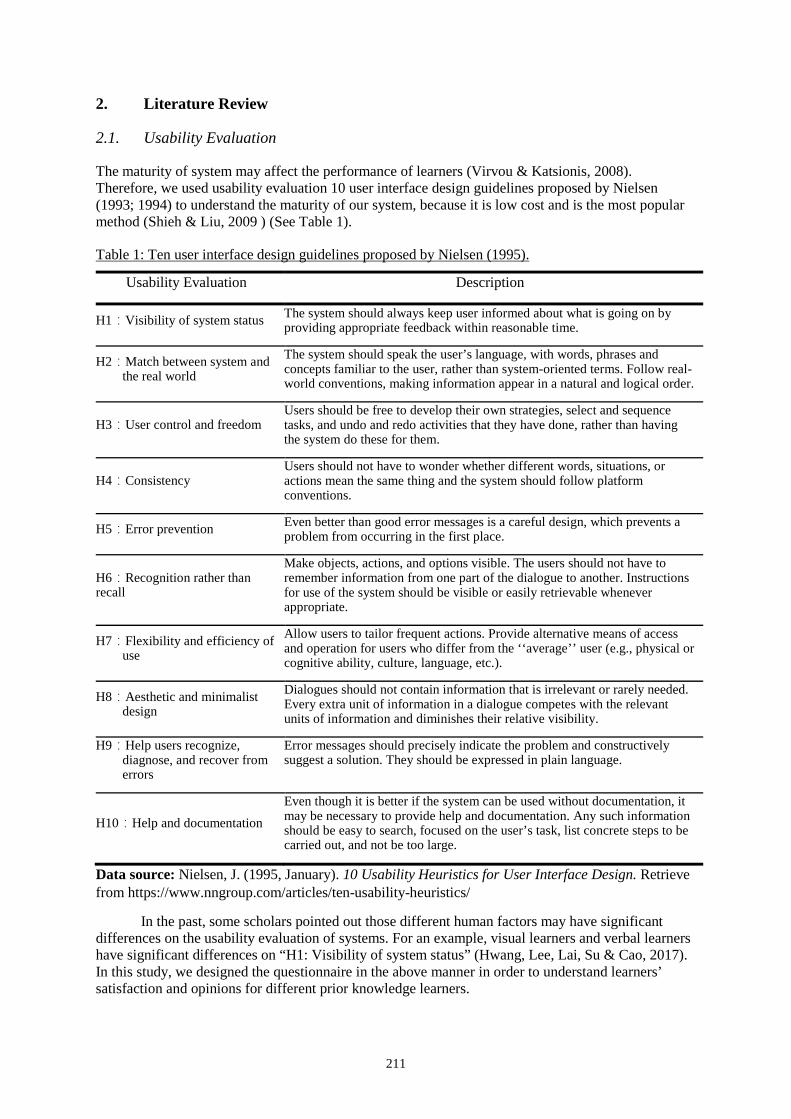
211
2. Literature Review
2.1. Usability Evaluation
The maturity of system may affect the performance of learners (Virvou & Katsionis, 2008). Therefore, we used usability evaluation 10 user interface design guidelines proposed by Nielsen (1993; 1994) to understand the maturity of our system, because it is low cost and is the most popular method (Shieh & Liu, 2009 ) (See Table 1).
Table 1: Ten user interface design guidelines proposed by Nielsen (1995).
Usability Evaluation Description
H1:Visibility of system status The system should always keep user informed about what is going on by providing appropriate feedback within reasonable time.
H2:Match between system and the real world
The system should speak the user’s language, with words, phrases and concepts familiar to the user, rather than system-oriented terms. Follow real-world conventions, making information appear in a natural and logical order.
H3:User control and freedom Users should be free to develop their own strategies, select and sequence tasks, and undo and redo activities that they have done, rather than having the system do these for them.
H4:Consistency Users should not have to wonder whether different words, situations, or actions mean the same thing and the system should follow platform conventions.
H5:Error prevention Even better than good error messages is a careful design, which prevents a problem from occurring in the first place.
H6:Recognition rather than recall
Make objects, actions, and options visible. The users should not have to remember information from one part of the dialogue to another. Instructions for use of the system should be visible or easily retrievable whenever appropriate.
H7:Flexibility and efficiency of use
Allow users to tailor frequent actions. Provide alternative means of access and operation for users who differ from the ‘‘average’’ user (e.g., physical or cognitive ability, culture, language, etc.).
H8:Aesthetic and minimalist design
Dialogues should not contain information that is irrelevant or rarely needed. Every extra unit of information in a dialogue competes with the relevant units of information and diminishes their relative visibility.
H9:Help users recognize, diagnose, and recover from errors
Error messages should precisely indicate the problem and constructively suggest a solution. They should be expressed in plain language.
H10:Help and documentation Even though it is better if the system can be used without documentation, it may be necessary to provide help and documentation. Any such information should be easy to search, focused on the user’s task, list concrete steps to be carried out, and not be too large.
Data source: Nielsen, J. (1995, January). 10 Usability Heuristics for User Interface Design. Retrieve from https://www.nngroup.com/articles/ten-usability-heuristics/
In the past, some scholars pointed out those different human factors may have significant differences on the usability evaluation of systems. For an example, visual learners and verbal learners have significant differences on “H1: Visibility of system status” (Hwang, Lee, Lai, Su & Cao, 2017). In this study, we designed the questionnaire in the above manner in order to understand learners’ satisfaction and opinions for different prior knowledge learners.
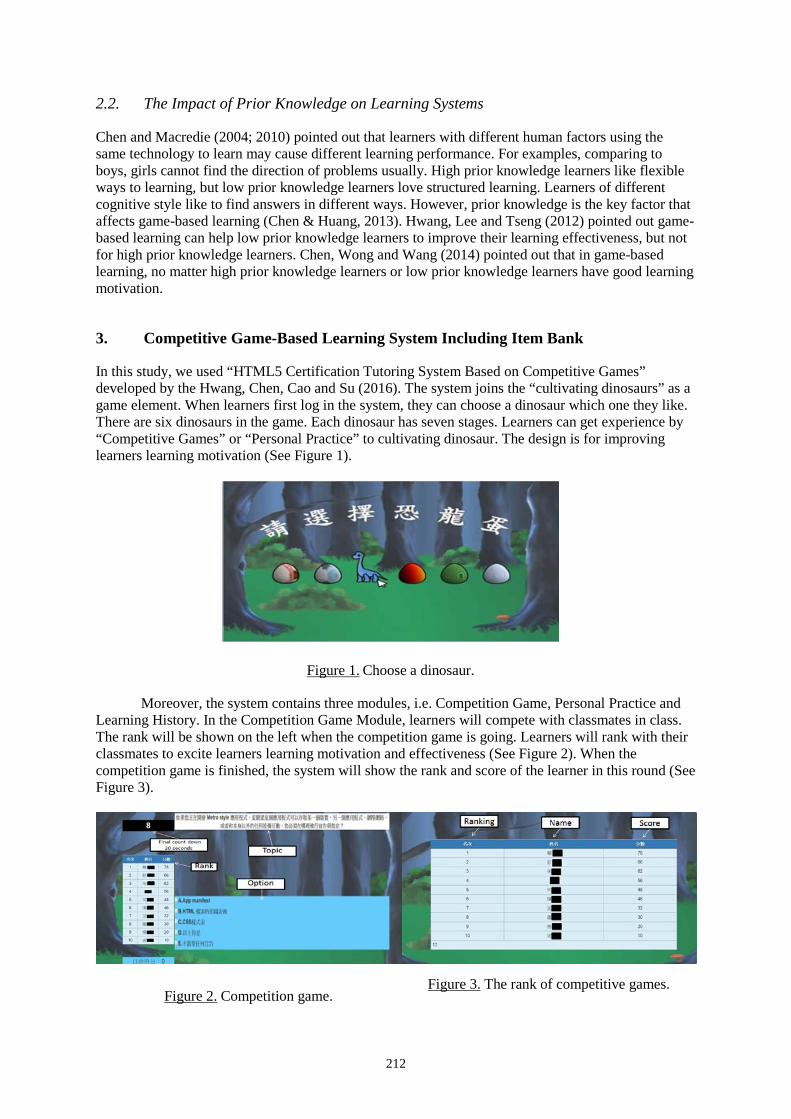
212
2.2. The Impact of Prior Knowledge on Learning Systems
Chen and Macredie (2004; 2010) pointed out that learners with different human factors using the same technology to learn may cause different learning performance. For examples, comparing to boys, girls cannot find the direction of problems usually. High prior knowledge learners like flexible ways to learning, but low prior knowledge learners love structured learning. Learners of different cognitive style like to find answers in different ways. However, prior knowledge is the key factor that affects game-based learning (Chen & Huang, 2013). Hwang, Lee and Tseng (2012) pointed out game-based learning can help low prior knowledge learners to improve their learning effectiveness, but not for high prior knowledge learners. Chen, Wong and Wang (2014) pointed out that in game-based learning, no matter high prior knowledge learners or low prior knowledge learners have good learning motivation.
3. Competitive Game-Based Learning System Including Item Bank
In this study, we used “HTML5 Certification Tutoring System Based on Competitive Games” developed by the Hwang, Chen, Cao and Su (2016). The system joins the “cultivating dinosaurs” as a game element. When learners first log in the system, they can choose a dinosaur which one they like. There are six dinosaurs in the game. Each dinosaur has seven stages. Learners can get experience by “Competitive Games” or “Personal Practice” to cultivating dinosaur. The design is for improving learners learning motivation (See Figure 1).
Figure 1. Choose a dinosaur.
Moreover, the system contains three modules, i.e. Competition Game, Personal Practice and Learning History. In the Competition Game Module, learners will compete with classmates in class. The rank will be shown on the left when the competition game is going. Learners will rank with their classmates to excite learners learning motivation and effectiveness (See Figure 2). When the competition game is finished, the system will show the rank and score of the learner in this round (See Figure 3).
Figure 2. Competition game. Figure 3. The rank of competitive games.
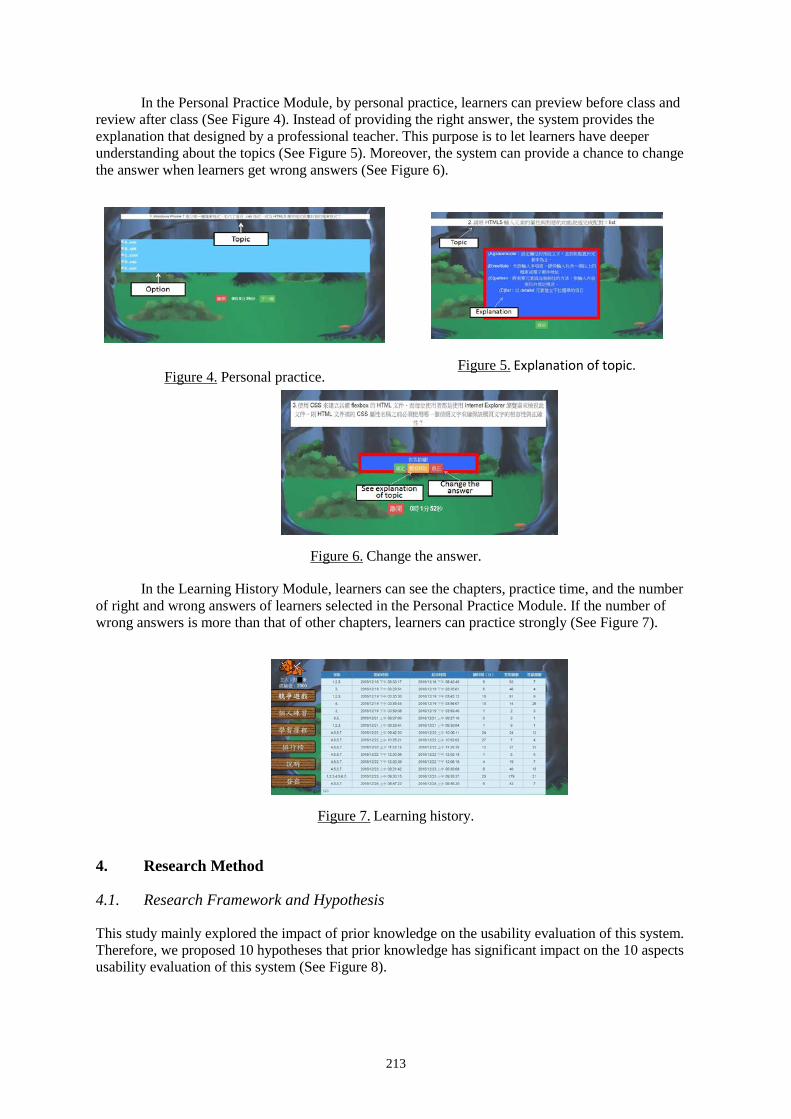
213
In the Personal Practice Module, by personal practice, learners can preview before class and review after class (See Figure 4). Instead of providing the right answer, the system provides the explanation that designed by a professional teacher. This purpose is to let learners have deeper understanding about the topics (See Figure 5). Moreover, the system can provide a chance to change the answer when learners get wrong answers (See Figure 6).
Figure 4. Personal practice. Figure 5. Explanation of topic.
Figure 6. Change the answer.
In the Learning History Module, learners can see the chapters, practice time, and the number of right and wrong answers of learners selected in the Personal Practice Module. If the number of wrong answers is more than that of other chapters, learners can practice strongly (See Figure 7).
Figure 7. Learning history.
4. Research Method
4.1. Research Framework and Hypothesis
This study mainly explored the impact of prior knowledge on the usability evaluation of this system. Therefore, we proposed 10 hypotheses that prior knowledge has significant impact on the 10 aspects usability evaluation of this system (See Figure 8).
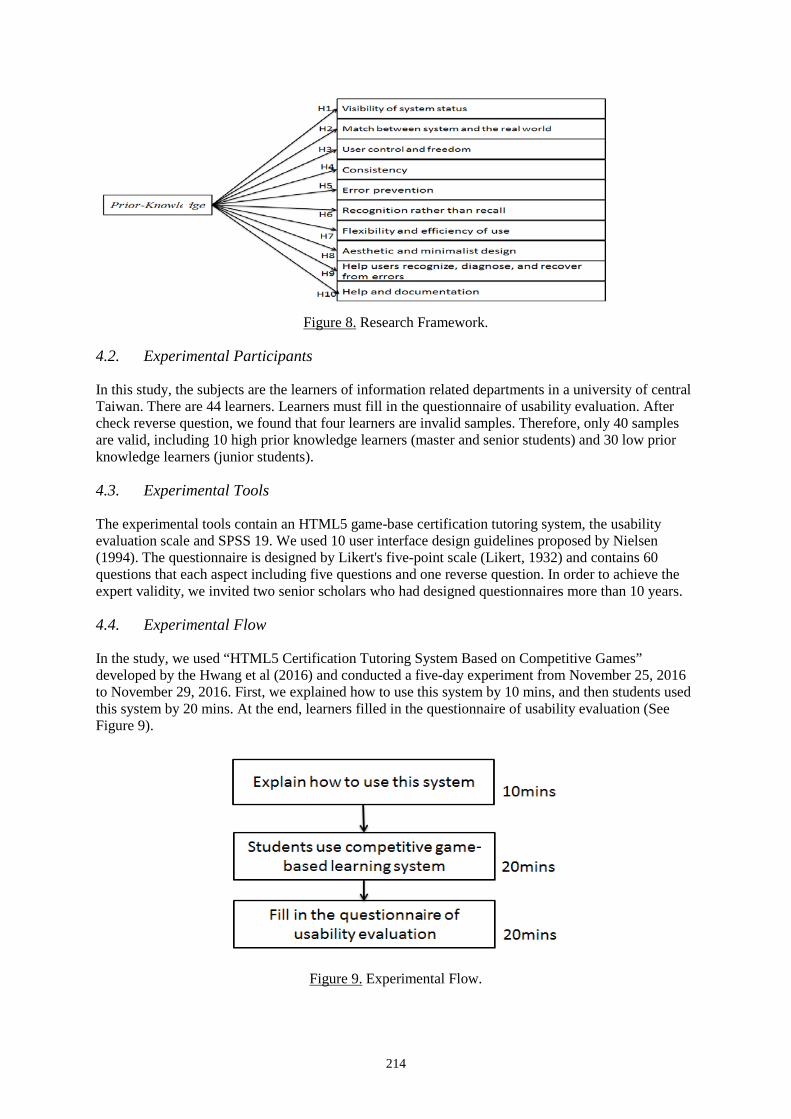
214
Figure 8. Research Framework.
4.2. Experimental Participants
In this study, the subjects are the learners of information related departments in a university of central Taiwan. There are 44 learners. Learners must fill in the questionnaire of usability evaluation. After check reverse question, we found that four learners are invalid samples. Therefore, only 40 samples are valid, including 10 high prior knowledge learners (master and senior students) and 30 low prior knowledge learners (junior students).
4.3. Experimental Tools
The experimental tools contain an HTML5 game-base certification tutoring system, the usability evaluation scale and SPSS 19. We used 10 user interface design guidelines proposed by Nielsen (1994). The questionnaire is designed by Likert's five-point scale (Likert, 1932) and contains 60 questions that each aspect including five questions and one reverse question. In order to achieve the expert validity, we invited two senior scholars who had designed questionnaires more than 10 years.
4.4. Experimental Flow
In the study, we used “HTML5 Certification Tutoring System Based on Competitive Games” developed by the Hwang et al (2016) and conducted a five-day experiment from November 25, 2016 to November 29, 2016. First, we explained how to use this system by 10 mins, and then students used this system by 20 mins. At the end, learners filled in the questionnaire of usability evaluation (See Figure 9).
Figure 9. Experimental Flow.
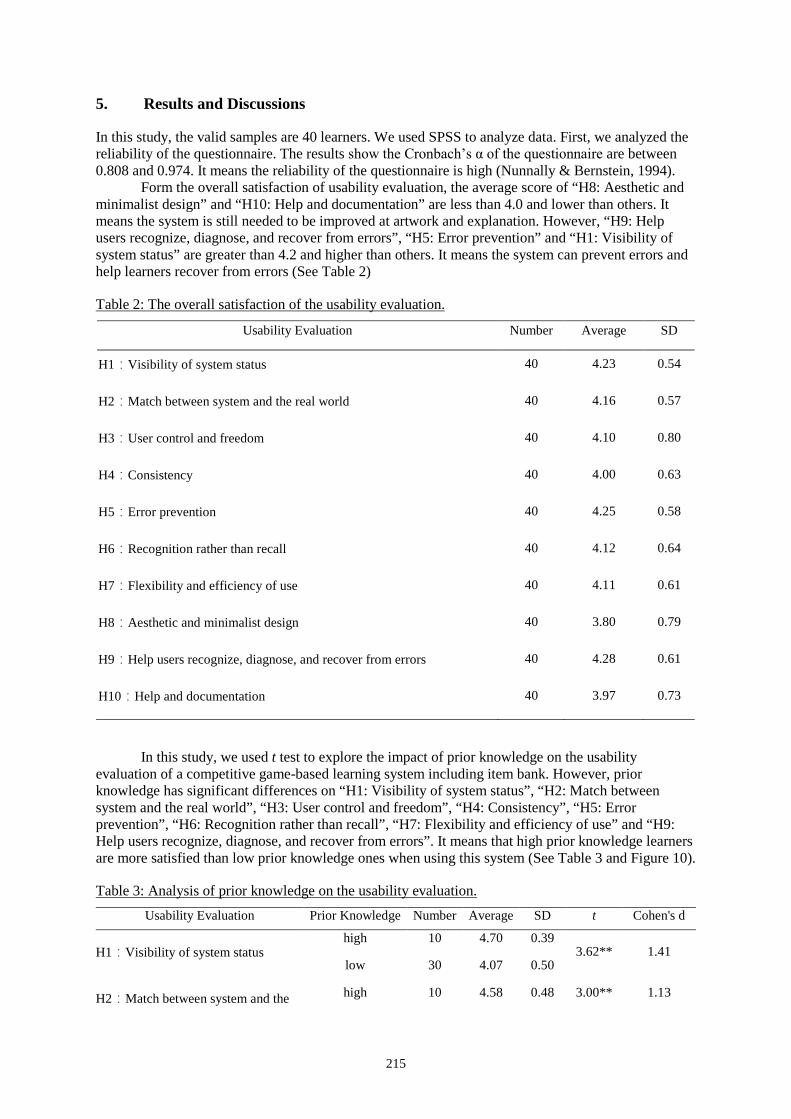
215
5. Results and Discussions
In this study, the valid samples are 40 learners. We used SPSS to analyze data. First, we analyzed the reliability of the questionnaire. The results show the Cronbach’s α of the questionnaire are between 0.808 and 0.974. It means the reliability of the questionnaire is high (Nunnally & Bernstein, 1994).
Form the overall satisfaction of usability evaluation, the average score of “H8: Aesthetic and minimalist design” and “H10: Help and documentation” are less than 4.0 and lower than others. It means the system is still needed to be improved at artwork and explanation. However, “H9: Help users recognize, diagnose, and recover from errors”, “H5: Error prevention” and “H1: Visibility of system status” are greater than 4.2 and higher than others. It means the system can prevent errors and help learners recover from errors (See Table 2)
Table 2: The overall satisfaction of the usability evaluation.
Usability Evaluation Number Average SD
H1:Visibility of system status 40 4.23 0.54
H2:Match between system and the real world 40 4.16 0.57
H3:User control and freedom 40 4.10 0.80
H4:Consistency 40 4.00 0.63
H5:Error prevention 40 4.25 0.58
H6:Recognition rather than recall 40 4.12 0.64
H7:Flexibility and efficiency of use 40 4.11 0.61
H8:Aesthetic and minimalist design 40 3.80 0.79
H9:Help users recognize, diagnose, and recover from errors 40 4.28 0.61
H10:Help and documentation 40 3.97 0.73
In this study, we used t test to explore the impact of prior knowledge on the usability evaluation of a competitive game-based learning system including item bank. However, prior knowledge has significant differences on “H1: Visibility of system status”, “H2: Match between system and the real world”, “H3: User control and freedom”, “H4: Consistency”, “H5: Error prevention”, “H6: Recognition rather than recall”, “H7: Flexibility and efficiency of use” and “H9: Help users recognize, diagnose, and recover from errors”. It means that high prior knowledge learners are more satisfied than low prior knowledge ones when using this system (See Table 3 and Figure 10).
Table 3: Analysis of prior knowledge on the usability evaluation. Usability Evaluation Prior Knowledge Number Average SD t Cohen's d
H1:Visibility of system status high 10 4.70 0.39
3.62** 1.41 low 30 4.07 0.50
H2:Match between system and the high 10 4.58 0.48 3.00** 1.13
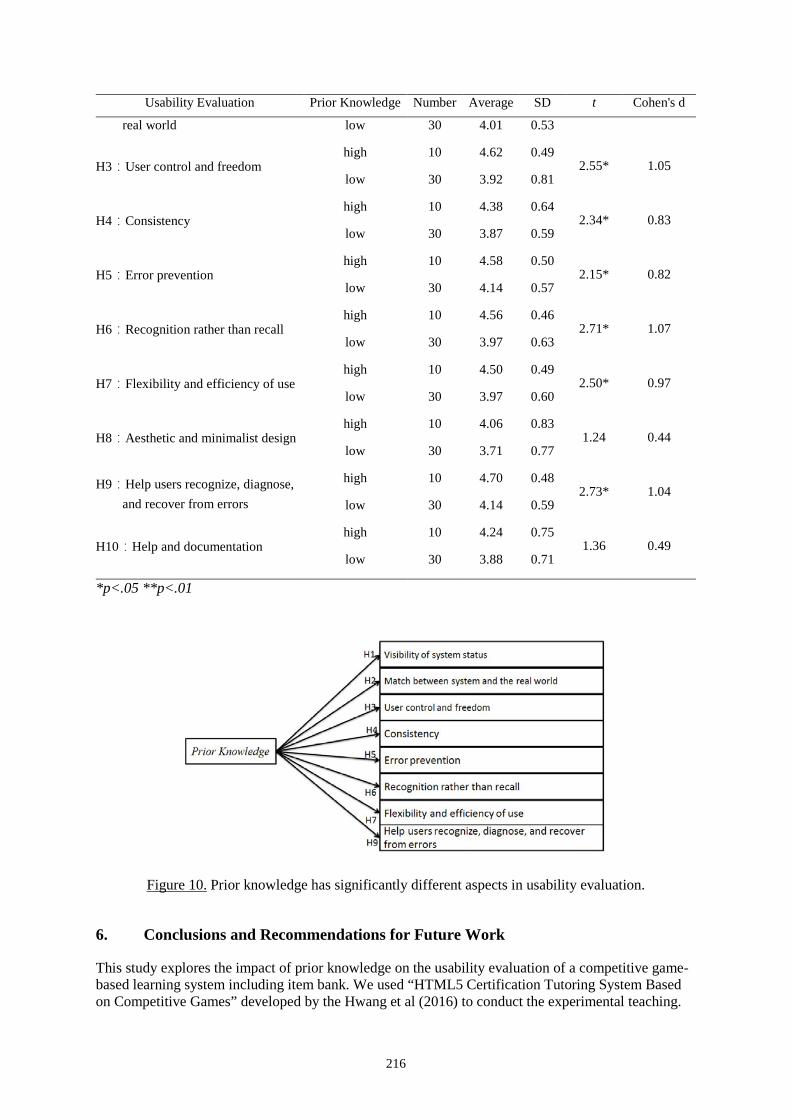
216
Usability Evaluation Prior Knowledge Number Average SD t Cohen's d
real world low 30 4.01 0.53
H3:User control and freedom high 10 4.62 0.49
2.55* 1.05 low 30 3.92 0.81
H4:Consistency high 10 4.38 0.64
2.34* 0.83 low 30 3.87 0.59
H5:Error prevention high 10 4.58 0.50
2.15* 0.82 low 30 4.14 0.57
H6:Recognition rather than recall high 10 4.56 0.46
2.71* 1.07 low 30 3.97 0.63
H7:Flexibility and efficiency of use high 10 4.50 0.49
2.50* 0.97 low 30 3.97 0.60
H8:Aesthetic and minimalist design high 10 4.06 0.83
1.24 0.44 low 30 3.71 0.77
H9:Help users recognize, diagnose, and recover from errors
high 10 4.70 0.48 2.73* 1.04
low 30 4.14 0.59
H10:Help and documentation high 10 4.24 0.75
1.36 0.49 low 30 3.88 0.71
*p<.05 **p<.01
Figure 10. Prior knowledge has significantly different aspects in usability evaluation.
6. Conclusions and Recommendations for Future Work
This study explores the impact of prior knowledge on the usability evaluation of a competitive game-based learning system including item bank. We used “HTML5 Certification Tutoring System Based on Competitive Games” developed by the Hwang et al (2016) to conduct the experimental teaching.
217
Then, we analyzed the questionnaire of usability evaluation. The results showed that the average of the overall satisfaction is high, but the average scores of artwork and explanation are lower than other aspects. It means that the system is still needed to improve in artwork and explanation. We also found that the high prior knowledge learners are more satisfied than the low prior knowledge ones while the high prior knowledge learners and the low prior knowledge learners are no significant differences in artwork and explanation.
In the future, we will improve the system based on the above research results. Moreover, we will carry out experimental teaching to explore the impact of human factors on competitive game-based learning.
Acknowledgements
This study is supported in part by the Ministry of Science and Technology of the Taiwan under Contract NO. MOST 105-2511-S-275-003, MOST 105-2815-C-275- 008-U and MOST 106-2511-S-275-002.
References
Atanasijevic-Kunc, M., Logar, V., Karba, R., Papic, M., & Kos, A. (2011). Remote multivariable control design using a competition game. IEEE Transactions on Education, 54(1), 97-103.
Chang, S. P., Hou, H. T., & Chang, R. C (2015). Development and Application of Game-Based Learning Software Combining Role-Playing with Problem-Solving Strategies. Advances in Social Sciences Research Journal, 2(6).
Chen, M. P., Wong, Y. T., & Wang, L. C. (2014). Effects of type of exploratory strategy and prior knowledge on middle school students' learning of chemical formulas from a 3D role-playing game. Educational Technology Research and Development 62(2), 163.
Chen, S. Y., & Huang, P. R. (2013). The comparisons of the influences of prior knowledge on two game-based learning systems. Computers & Ecducation, 68, 177-186
Chen, S. Y., & Macredie, R. (2010). Web-based interaction: A review of three important human factors. International Journal of Information Management, 31(6), 1-9.
Chen, S. Y., & Macredie, R. D. (2004). Cognitive modeling of student learning in web-based instructional programs. International Journal of Human-Computer Interaction, 17(3), 375-402.
Davis, G., & Rimm, S. (1985). Education of the gifted and talented. Englewood Cliffs, NJ: Prentice-Hall. Dempsey, J. V., Lucassen, B., Haynes, L., & Casey, M. (1996). Instructional applications of computer games.
Retrieved from ERIC database. (ED394500) Hsiao, H. S., Huang, Y. H., Hong, W. T., Lin, C. Y., & Tsai, F. H. (2010). The study of online game-based
learning system with learning companion. International Journal on Digital Learning Technology, 2(2), 1-21. https://www.nngroup.com/articles/ten-usability-heuristics/
Hwang, G. H., Chen, B., Cao, Y.H., & Su, Y.H. (2016, May). Development of a Certification Tutoring System Based on Competitive Games - Taking HTML5 Certification as an Example. The 20th Global Chinese Conference on Computers in Education 2016. Hong Kong: The Hong Kong Institute of Education.
Hwang, G. H., Lee, C.Y., & Kuo, T.H. (2016, May). The Impact of Different Human Factors on the Usability Evaluation of Game-Based Formative Assessment Mathematical Algebra Tutorial APP. The 20th Global Chinese Conference on Computers in Education 2016. Hong Kong: The Hong Kong Institute of Education.
Hwang, G. J., Hsu, T. C., Lai, C. L., & Hsueh, C. J. (2017). Interaction of problem-based gaming and learning anxiety in language students' English listening performance and progressive behavioral patterns. Computers & Education, 106, 26-42.
Hwang, G. J., Su, J. M., & Chen, N. S. (2015). Introduction and Practice of Digital Learning (2nd Edition). Taiwan, New Taipei City: Drmaster.
Likert, R. (1932). A technique for the measurement of attitudes. Archives of Psychology, 22(140), 1-55. Nielsen, J. (1993). Usability engineering. Boston: Academic Press. Nielsen, J. (1994). Heuristic evaluation. Usability inspection methods. New York: John. Nielsen, J. (1995, January). 10 Usability Heuristics for User Interface Design. Retrieve from Nunnally, J. C. & Bernstein, I. H. (1994). Psychometric theory. New York: McGraw-Hill. Prensky, M. (2001). Digital game-based learning. New York: McGraw-Hill.

218
Shi, Yen-Ru, & Shih, Ju-Ling (2015). Game Factors and Game-Based Learning Design Model. International Journal of Computer Games Technology 2015, 11.
Shieh, J. C., & Liu, C. F., (2009). The Usability Evaluation Study of University Library Websites. Journal of Educational Media & Library Sciences, 47(2), 163-198.
Virvou, M., & Katsionis, G. (2008). On the usability and likeability of virtual reality games for education: The case of VR-ENGAGE. Computers & Education, 50(1), 154-178.
Yu, F. Y., & Liu, Y. H. (2009). Creating a psychologically safe online space for a student-generated questions learning activity via different identity revelation modes. British Journal of Educational Technology, 40(6), 1109-1123.
Hayashi, Y., et al. (Eds.) (2017). Workshop Proceedings of the 25th International Conference on Computers in Education. New Zealand: Asia-Pacific Society for Computers in Education
219
Effects of concept map based cooperative peer assessment system on students’ learning
outcomes on programming Ya-Jing YUa, Po-Han WUa* & Yu-Sheng SUb
a Department of Mathematics and Information Education, National Taipei University of Education, Taiwan
b Department of Computer Science and Information Engineering, Research Center for Advanced Science and Technology, National Central University, Taiwan
Abstract: In past programming education, teachers could not offer students with learning assistance and feedback when students appeared misconception on the learning. This study integrates the real-time concept map based cooperative peer assessment system into programming course and applies the jigsaw cooperative learning strategy for the activity. The concept map drawn by students at each stage of the programming course is regarded as the auxiliary tool to diagnose the learning misconception. Students could clarify the misconception with the learning diagnosis feedback provided by the system and modify the concept map with experts’ feedback. The research results reveal that students using the “real-time concept map based cooperative peer assessment system” present significantly better learning outcomes than other groups.
Keywords: concept map, peer assessment, programming
1. Introduction
Programming education aims to cultivate students’ programming skills and capability to process data with computers. The US government regards programming education as an important indicator to enhance the global competitiveness and considers programming as the critical survival skill for the next generation. It is not the simple idea of programming education, but it stresses on cultivating students’ problem-solving capability through the skills learned in classes, under messy situations (Robins, Rountree, & Rountree, 2003).
However, students, in the programming learning process, do not simply encounter difficulties on a single concept, but many problems, that it is necessary to divide difficulties into several questions for the solution (Bonar & Soloway, 1985; Robins et al., 2003). Besides, assessment strategies should be included in students’ learning process so that teachers could understand students’ learning conditions according to the assessment results, offer students with individual feedback according to the learning conditions, and adjust the teaching contents at any time to decide the necessity of review or material adjustment. Nonetheless, past research on programming learning focused on teachers requesting students to complete designated tasks and then evaluating such tasks completed by students. Under such a traditional learning environment, teachers had to precede individual assessment and give individual feedback to so many students that the learning outcomes could not reach the expectation (Wu, Hwang, Milrad, Ke, & Huang, 2012; Conklin, 1987).
Current research on programming courses mainly stresses on students implementing works through subject knowledge that the concept problems in the subject knowledge are likely ignored in students’ learning process (Lahtinen, Ala-Mutka, & Järvinen, 2005). For this reason, it is important to cultivate students to actively construct knowledge before the implementation and assist students in learning meaningful programming concepts. Kinchin, Hay, and Adams (2000) considered that concept mapping could clearly present students’ concept structure, teachers could find out which concepts students had understood or needed reinforcement from the concept mapping, and, more
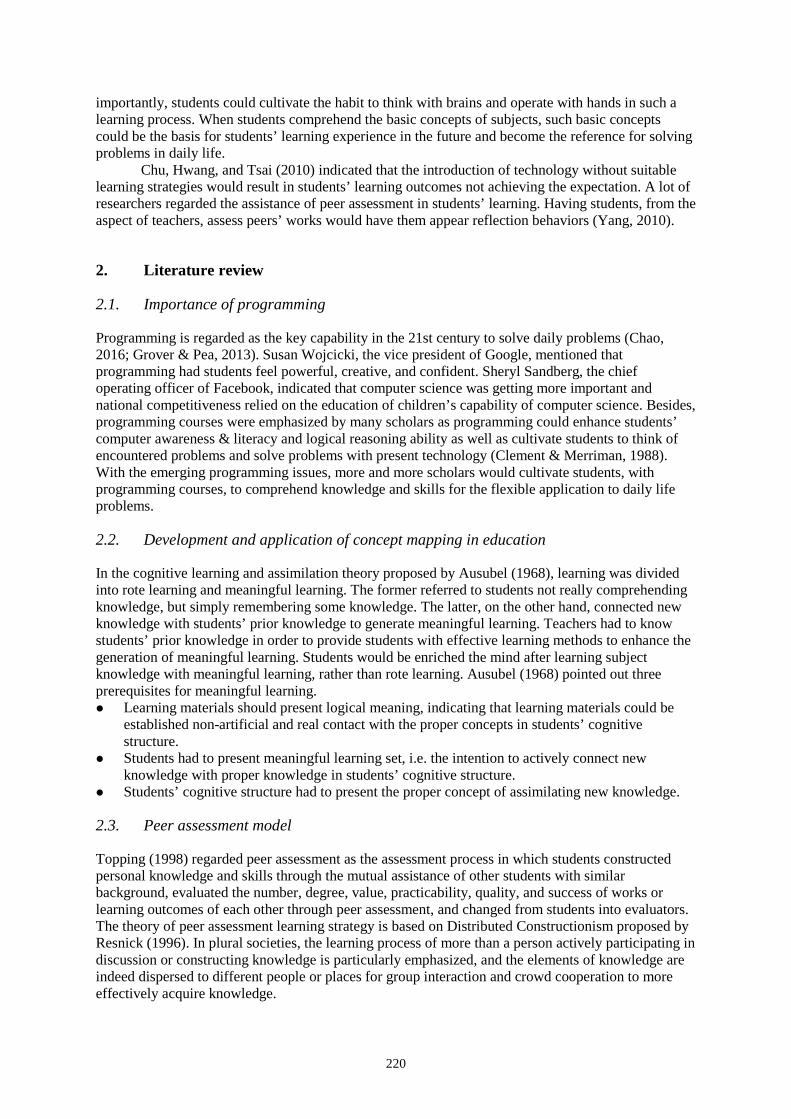
220
importantly, students could cultivate the habit to think with brains and operate with hands in such a learning process. When students comprehend the basic concepts of subjects, such basic concepts could be the basis for students’ learning experience in the future and become the reference for solving problems in daily life.
Chu, Hwang, and Tsai (2010) indicated that the introduction of technology without suitable learning strategies would result in students’ learning outcomes not achieving the expectation. A lot of researchers regarded the assistance of peer assessment in students’ learning. Having students, from the aspect of teachers, assess peers’ works would have them appear reflection behaviors (Yang, 2010).
2. Literature review
2.1. Importance of programming
Programming is regarded as the key capability in the 21st century to solve daily problems (Chao, 2016; Grover & Pea, 2013). Susan Wojcicki, the vice president of Google, mentioned that programming had students feel powerful, creative, and confident. Sheryl Sandberg, the chief operating officer of Facebook, indicated that computer science was getting more important and national competitiveness relied on the education of children’s capability of computer science. Besides, programming courses were emphasized by many scholars as programming could enhance students’ computer awareness & literacy and logical reasoning ability as well as cultivate students to think of encountered problems and solve problems with present technology (Clement & Merriman, 1988). With the emerging programming issues, more and more scholars would cultivate students, with programming courses, to comprehend knowledge and skills for the flexible application to daily life problems.
2.2. Development and application of concept mapping in education
In the cognitive learning and assimilation theory proposed by Ausubel (1968), learning was divided into rote learning and meaningful learning. The former referred to students not really comprehending knowledge, but simply remembering some knowledge. The latter, on the other hand, connected new knowledge with students’ prior knowledge to generate meaningful learning. Teachers had to know students’ prior knowledge in order to provide students with effective learning methods to enhance the generation of meaningful learning. Students would be enriched the mind after learning subject knowledge with meaningful learning, rather than rote learning. Ausubel (1968) pointed out three prerequisites for meaningful learning. Learning materials should present logical meaning, indicating that learning materials could be
established non-artificial and real contact with the proper concepts in students’ cognitive structure.
Students had to present meaningful learning set, i.e. the intention to actively connect new knowledge with proper knowledge in students’ cognitive structure.
Students’ cognitive structure had to present the proper concept of assimilating new knowledge.
2.3. Peer assessment model
Topping (1998) regarded peer assessment as the assessment process in which students constructed personal knowledge and skills through the mutual assistance of other students with similar background, evaluated the number, degree, value, practicability, quality, and success of works or learning outcomes of each other through peer assessment, and changed from students into evaluators. The theory of peer assessment learning strategy is based on Distributed Constructionism proposed by Resnick (1996). In plural societies, the learning process of more than a person actively participating in discussion or constructing knowledge is particularly emphasized, and the elements of knowledge are indeed dispersed to different people or places for group interaction and crowd cooperation to more effectively acquire knowledge.
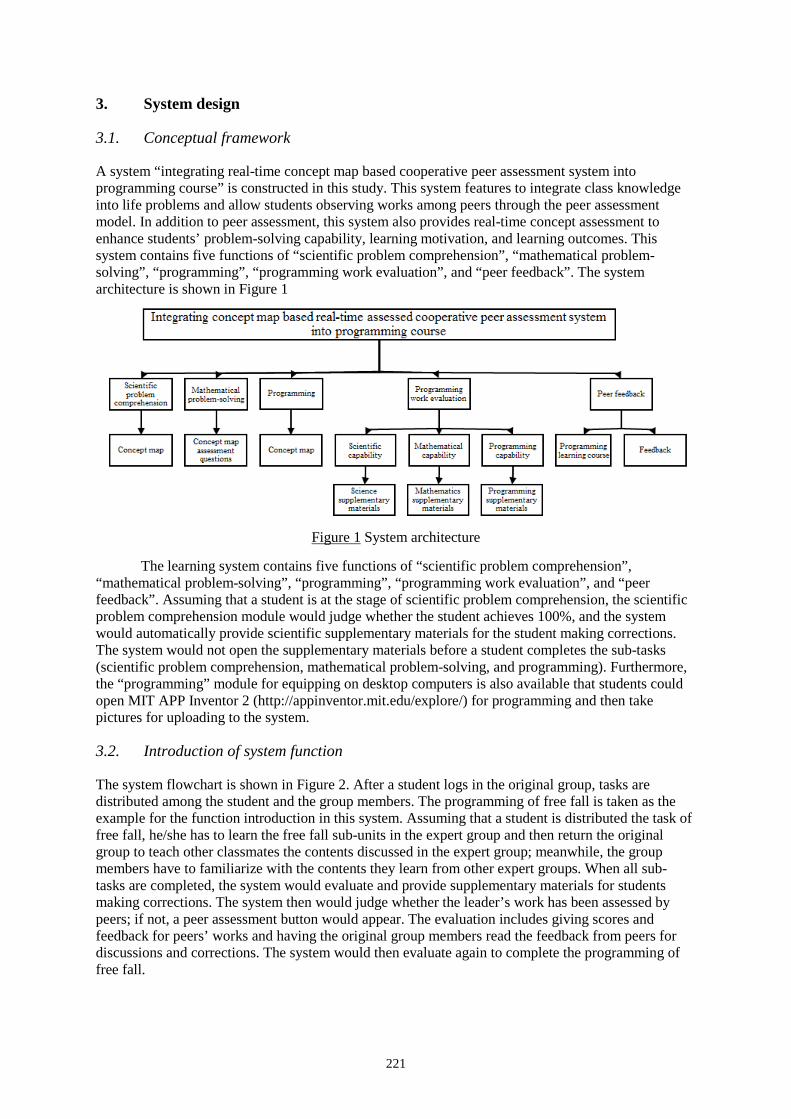
221
3. System design
3.1. Conceptual framework
A system “integrating real-time concept map based cooperative peer assessment system into programming course” is constructed in this study. This system features to integrate class knowledge into life problems and allow students observing works among peers through the peer assessment model. In addition to peer assessment, this system also provides real-time concept assessment to enhance students’ problem-solving capability, learning motivation, and learning outcomes. This system contains five functions of “scientific problem comprehension”, “mathematical problem-solving”, “programming”, “programming work evaluation”, and “peer feedback”. The system architecture is shown in Figure 1
Figure 1 System architecture
The learning system contains five functions of “scientific problem comprehension”, “mathematical problem-solving”, “programming”, “programming work evaluation”, and “peer feedback”. Assuming that a student is at the stage of scientific problem comprehension, the scientific problem comprehension module would judge whether the student achieves 100%, and the system would automatically provide scientific supplementary materials for the student making corrections. The system would not open the supplementary materials before a student completes the sub-tasks (scientific problem comprehension, mathematical problem-solving, and programming). Furthermore, the “programming” module for equipping on desktop computers is also available that students could open MIT APP Inventor 2 (http://appinventor.mit.edu/explore/) for programming and then take pictures for uploading to the system.
3.2. Introduction of system function
The system flowchart is shown in Figure 2. After a student logs in the original group, tasks are distributed among the student and the group members. The programming of free fall is taken as the example for the function introduction in this system. Assuming that a student is distributed the task of free fall, he/she has to learn the free fall sub-units in the expert group and then return the original group to teach other classmates the contents discussed in the expert group; meanwhile, the group members have to familiarize with the contents they learn from other expert groups. When all sub-tasks are completed, the system would evaluate and provide supplementary materials for students making corrections. The system then would judge whether the leader’s work has been assessed by peers; if not, a peer assessment button would appear. The evaluation includes giving scores and feedback for peers’ works and having the original group members read the feedback from peers for discussions and corrections. The system would then evaluate again to complete the programming of free fall.
222
Figure 2 Student operation flowchart
The programming course in this study is referred to the jigsaw cooperative learning grouping model proposed by Jones and Steinbrink (1989). Four people are in a group; the jigsaw cooperative learning contains four stages. First, students, in the original group, would discuss with the group members to distribute tasks. The expert group is then established for learning the distributed tasks. Students would return the original group, after completing the distributed tasks, to share with the other three classmates. All learning sub-tasks are mastered from mutual teaching. Finally, teacher’s feedback is given after the completion at each stage.
The system is demonstrated as following. The system, with a tutor, would inform the current stage, e.g. Please move to the expert group after selecting the task. Students, after see in the reminder of the system tutor, could discuss with the original group members for the task distribution. Students then tick the distributed sub-tasks, which contain free fall, vertical upcast, horizontal toss, and horizontal distance in this system. Finally, students move to the expert group according to the system grouping prompts
4. Experiment design
4.1. Research tool and object
Total 87 students in a college in northern Taiwan are experimented in this study. The experiment is preceded for four months. With Quasi-Experimental Research, the students with the “concept map based real-time assessment programming evaluation system” and different system functions are compared the learning outcomes, learning motivation, problem-solving capability, and cognitive load. The learning content is free fall in physics for senior high schools, and the sub-tasks in the system are provided by experts, including free fall, vertical upcast, horizontal toss, and horizontal distance.
4.2. Experiment process
Quasi-Experimental Research, as the major research design, is utilized in this study. The experimental research is preceded according to the research objective and discusses the relationship between dependent variables and independent variables. The teaching experiment is preceded for four hours, including the courses of system introduction and operation explanation. The experimental group and
223
the control group apply different learning models and fill in three questionnaires (learning motivation, problem-solving capability, and cognitive load) and a learning test paper.
4.3. Experimental result and analysis
Two-way Analysis of Covariance, with “learning outcome pretest” as the covariant and “learning outcome posttest” as the dependent variable, is used in this study. The Levene homogeneity of variance test results do not disobey the assumption of homogeneity of variance (F=.517,p=.672>.05), revealing the homogeneity of the between-group discrete case.
Regarding the between-group effect (Table 1), the interaction between concept map based real-time assessment and peer assessment achieves the significance (F=7.30,p=.008<.05,Partial η2=.082) that the simple main effect test is preceded. In regard to the simple main effect analysis of learning outcomes, Table 2, the concept map based real-time assessment and peer assessment mutually interact with learning outcomes, but the effects appear under different conditions. The simple main effect of the concept map based real-time assessment “with introduction of concept map based real-time assessment” achieves the significance (F=17.62,p=.000<.001), showing that students using the “system integrating concept map based real-time peer assessment model into programming” (mean=52.90) present remarkably better performance on learning outcome posttest than those with the “system integrating concept map based real-time assessment into programming” (mean=32.43). In the concept map based real-time assessment “without introduction of concept map based real-time assessment”, the simple main effect also reaches the significance (F=4.35,p=.045<.05), revealing that students with “traditional teacher feedback model integrated programming” (mean=42.81) notably outperform those with “system integrating concept map based peer assessment model into programming” (mean=42.77) on learning outcome posttest.
Furthermore, researchers pointed out the simple main effect of peer assessment “with peer assessment” not achieving the significance (F=1.26,p=.269>.05), showing that students with the “system integrating concept map based real-time peer assessment model into programming” (mean=52.9) outperform those with the “system integrating concept map based peer assessment model into programming” (mean=42.77) on learning outcome posttest, but not showing significant differences. The simple main effect of students in peer assessment “without peer assessment” also reaches the significance (F=.22,p=.639>.05), presenting that students with “traditional teacher feedback model integrated programming” (mean=42.81) outperform those with the “system integrating concept map based real-time assessment into programming” on learning outcome posttest (mean=32.43), but not showing notable differences.
Regarding the concept map based real-time assessment, both “with introduction of concept map based real-time assessment” and “with peer assessment” receive high learning outcomes, while the learning outcome posttest does not appear large differences on both “without introduction of concept map based real-time assessment” and “with peer assessment”. In regard to peer assessment, “with peer assessment” and “with introduction of concept map based real-time assessment” receive high learning outcomes, while, both “without peer assessment” and “without introduction of concept map based real-time assessment” are better than “with introduction of concept map based real-time assessment”.
5. Conclusion and suggestion
The research results reveal the remarkable interaction between concept map based real-time assessment and peer assessment. The learning outcomes of students with peer assessment “with introduction of concept map based real-time assessment” are higher than those without peer assessment. On the contrary, the learning outcomes of students without peer assessment “without introduction of concept map based real-time assessment” are higher than those with peer assessment. Accordingly, the researcher consider that including concept map based real-time assessment in the group with peer assessment would enhance the learning outcomes on the programming subject, as a lot of researchers would design the programming courses and activities with groups, who would
224
induce more ideas through group discussion among peers. When peer assessment is included in the complicated programming subject, the classmates could simultaneously be the evaluators as well as the evaluated. When evaluating others’ works, the classmates would repeatedly compare with personal works to present reflection. Students could find out the advantages and drawbacks of the works through peer work and modify the work to enhance the quality. The evaluated would modify the work according to peers’ evaluation and feedback. The result conforms to it of Lai and Hwang (2015). Apparently, the peer assessment model could largely enhance students’ learning outcomes. However, it is better in the groups without concept map based real-time assessment, possibly because students’ feedback, in the experiment process, is rather simple or irrelevant to the experiment so that students are distracted from the learning process for viewing peers’ suggestions. Such a result conforms to it of Hsia, Huang, and Hwang (2016). The research result points out the best learning outcome on peer assessment. The researcher also indicates that the ineffective learning outcome might result from the students being lack of expression in traditional classes. In this case, peers’ feedback show better meanings for students, after viewing experts’ feedback.
Acknowledgment
This study is supported in part by the Ministry of Science and Technology under contract No. MOST: 104-2511-S-152 -007 -MY2 and 105-2511-S-152 -004 -MY2
References
Ausubel, D. P. (1968). Educational Psychology: A Cognitive View. New York, NY: Hold, Rinehart and Winston.
Bonar, J., & Soloway, E. (1985). Preprogramming knowledge: A major source of misconceptions in novice programmers. Human–Computer Interaction, 1(2), 133-161.
Chao, P. Y. (2016). Exploring students' computational practice, design and performance of problem-solving through a visual programming environment. Computers & Education, 95, 202-215.
Chu, H. C., Hwang, G. J., Tsai, C. C., & Tseng, J. C. R. (2010). A two-tier test approach to developing location-aware mobile learning systems for natural science courses. Computers & Education, 55(4), 1618-1627.
Conklin, J. (1987). Hypertext: An Introduction and SurvevJ. IEEE computer, 20(9), 17-41. Grover, S., & Pea, R. (2013). Computational thinking in K–12: A review of the state of the field. Educational
Researcher, 42(1), 38-43. Hsia, L. H., Huang, I., & Hwang, G. J. (2016). A web‐based peer‐assessment approach to improving junior high
school students' performance, self‐efficacy and motivation in performing arts courses. British Journal of Educational Technology, 47(4), 618-632.
Jones, R. M., & Steinbrink, J. E. (1989). Using Cooperative Groups in Science Teaching. School Science and Mathematics, 89(7), 541-551.
Kinchin, I. M., Hay, D. B., & Adams, A. (2000). How a qualitative approach to concept map analysis can be used to aid learning by illustrating patterns of conceptual development. Educational research, 42(1), 43-57.
Lahtinen, E., Ala-Mutka, K., & Järvinen, H. M. (2005). A study of the difficulties of novice programmers. Acm Sigcse Bulletin s, 37(3), 14-18.
Lai, C. L., Hwang, G. J. (2015). An interactive peer-assessment criteria development approach to improving students' art design performance using handheld devices. Computers & Education, 85, 149-159.
Resnick, M. (1996). Distributed Constructionism. Proceedings of the International Conference on the Learning Sciences: Northwestern University, IL.
Robins, A., Rountree, J., & Rountree, N. (2003). Learning and teaching programming: A review and discussion. Computer science education, 13(2), 137-172.
Topping, K. (1998). Peer Assessment between Students in Colleges and Universities. Review of Educational Research, 68(3), 249-276.
Wu, P. H., Hwang, G. J., Milrad, M., Ke, H. R. & Huang, Y. M. (2012). An innovative concept map approach for improving students’ learning performance with an instant feedback mechanism. British Journal of Educational Technology, 43(2), 217-232.
Yang, Y. F. (2010). Students’ reflection on online self-correction and peer review to improve writing. Computers & Education, 55(3), 1202-1210
Hayashi, Y., et al. (Eds.) (2017). Workshop Proceedings of the 25th International Conference on Computers in Education. New Zealand: Asia-Pacific Society for Computers in Education
225
Exploring the primary school children’s air pollution environmental education learning
effectiveness and air quality protection intention through augmented reality material
and air quality monitor instrument Yi-Wen LIAO a* *, Min-Chai HSIEHb
aDepartment of Information Management, Cheng Shiu University, Kaohsiung City, Taiwan (R.O.C.) bDepartment of Multimedia and Animation, Tainan University of Technology, Tainan City, Taiwan
(R.O.C.) *[email protected]
Abstract: In this paper, we develop air quality monitoring material based on the concept of Maker and using a simple and low-cost device development board, combined with temperature and humidity, PM 2.5 sensing elements. According to the teaching materials, the integration of the latest air pollution-related knowledge, the development of AR multimedia interactive teaching materials and monitoring instruction into the national air pollution environmental education in the environmental education courses of high degree students in the elementary school. This study compares learning motivation and learning performance of learning air pollution related knowledge and concept using different learning method, including multimedia teaching materials, air quality monitor instruments and augmented reality materials.
Keywords: Air pollution, AR, PM 2.5, teaching material
1. Introduction
Air pollution is becoming more and more serious and a global challenge of environmental protection. Air pollution is a hard-to-see, easy-to-prepare and highly toxic stealth killer, which has a great impact on health. Air pollution is the most important global health threat in the 21st century, the International Cancer Agency in 2013 has PM2.5 as a carcinogen, is considered a "global public enemy", the world moving up with the poor air pollution confrontation, World Health Organization said that air pollution has become the world's largest environmental health risks, Taiwan's air quality is actually "the end of the world class"!
The world is moving against the harsh air pollution, the World Health Organization said that air pollution has become the world's largest environmental health risks. Taiwan's air quality is "the end of the world class!" Air pollution is very serious, most consumers in Taiwan agree that the environment is air pollution, but the people for their own health awareness is very low, in addition to effective control or counseling means to reduce the economic development of pollution. Achieving the goal of protecting air quality is a fairly important issue, it is necessary to improve the environmental education through environmental action. Environmental action has been regarded as the primary goal of environmental education by most of the students, so as to solve the present and future environmental problems.
People's awareness of air pollution is generally inadequate, and the lack of awareness of warning and protective behavior. Although there are many studies to explore the students on air pollution and environmental education awareness and behavior, but on the air pollution-related teaching materials, textbooks are mostly limited to multimedia digital teaching materials. Many of the study mostly use custom textbooks, not with the school textbook air pollution unit. The combination
226
of domestic laws and regulations, teaching materials are also lack of interaction. Many literatures confirm that the growth of reality can improve learning motivation and learning outcomes. For example, the studies of Furió et al., (2015), ElSayed et al., (2016) , Cai et al., (2014) , and Wu et al., (2013) use augmented reality in the learning context to improve learning motivation and learning performance, but the current air pollution-related teaching materials in the country has not yet updated the curriculum. In addition, many studies have explored the importance of children's awareness of air pollution and environmental education awareness and behavior. Air pollution-related environmental education is very important and should be educated on a small scale. However, it is less effective in exploring air pollution related teaching aids and whether AR interactive teaching materials could enhance students' awareness of air pollution education.
The aim of this study is to develop air quality monitoring material based on the concept of Maker and using a simple and low-cost device development board, combined with temperature and humidity, PM 2.5 sensing elements. According to the teaching materials unit, the integration of the latest air pollution-related knowledge, the development of AR multimedia interactive teaching materials and monitoring instruction into the national air pollution environmental education in the environmental education courses of high degree elementary school. This study compares learning motivation and learning outcomes of learning air pollution related knowledge and concept using different learning method, including multimedia teaching materials, air quality monitor aids and augmented reality material.
2. Literature Review
2.1. Air Quality Indicator (AQI) and PM2.5
The Environmental Protection Department (EPA) defines the Air Quality Standards as "Air Pollution Standards in Outdoor Air". When natural environments such as volcanic eruptions, forest fires, or anthropogenic burning of wood, coal , fossil fuels and other events, resulting in clean air composition changes, resulting in air pollution. Particulate matter (PM) is a mixture of solid and liquid particulate air pollutants suspended in the atmosphere. It’s diameter less than or equal to 10 microns (μm) are called PM10 and are less than or equal to 2.5 microns called PM2.5, about one-eighth of hair diameter. PM2.5 are more likely to adsorb toxic substances, such as heavy metals, toxic microbes and so on. PM2.5 is the world's largest environmental health risk. Many epidemiological studies have shown that PM2.5 easily attached to dioxin, polycyclic aromatic hydrocarbons and heavy metals and other harmful substances, long-term inhalation may cause allergies, asthma, emphysema, lung cancer, cardiovascular disease. Whether long or short exposure to high concentrations of PM2.5 environment, will improve the risk of respiratory diseases and death, especially for the sensitivity of the ethnic group is more significant (Executive Yuan Environmental Protection Agency, Understanding Fine Suspension Particle Manual, 2016).
Air pollution is important for children, and children are particularly in need of protection. Some literature refers to the impact of air pollution on children, such as (1) air pollution can affect children's cognitive ability, (2) traffic exhaust pollution may slow down the cognitive development of children, (3) indoor air quality seriously affect children's intelligence, (4) air pollution on school-age children's brain can also cause harm. Harvard University School of Public Health recent study shows that the more serious air pollution, children's IQ test results are worse, children in fresh air environment, their memory, vocabulary, learning ability, IQ and other aspects than in air pollution is better than children in air pollution area.
2.2. Air Pollution Monitor Instruments
Maker use a variety of devices development board, combined with temperature and humidity, PM2.5 sensor components based on the concept of Internet of Things. They combine open hardware and open software to monitor the air pollution situation, through simple, open source hardware and software, and cheap price. We want to drive the public attention to the quality of air and vigilance
227
control, down to the promotion of schools at all levels of environmental education and campus air monitoring, but also through hands-on education concept, driven skill of technical turnover.
2.3. Augmented Reality (AR)
Augmented Reality made in 1990, in a way that is enhanced or supplemented by computer-generated sound, video, graphics or GPS data presented in a direct or indirect manner, in a real-world dynamic background and virtual message overlapping context (Miller & Dousay, 2015). AR can provide video to transfer information through the equipment as a medium to allow users to experience the reality of reality and the virtual world of mutual integration (Klopfer & Sheldon, 2010). The use of visual interaction effects and operation can enhance the experience (Dunleavy et al., 2009). AR can provide information that reality cannot be directly informed to the diversity of information presented in front of the vast majority of technical applications are used to enhance or supplement the real information. Therefore, AR in the field of computer science and educational science and technology has been a lot of research scholars to define the diversity of AR (wiki). Cai et al., (2014) argues that augmented reality can present experiments that cannot be simulated in the real world and overcome the obvious shortcomings (such as dangers) of real experiments, and consider AR has multiple representations of function. AR could present the concepts in different 3D representations to provide more thought and construction of knowledge, and has the function of connecting giant, microscopic and symbolic, so that students can learn more comprehensively understand the relationship between phenomena, scientific symbols or scientific representations.
2.4. The application of augmented reality in the learning field
AR technology can help learners to explore the link between the real world and virtual objects. AR system can supplement the course information through the text, graphics, video and voice combination into the student real learning environment. AR could produce the effect of simulation that allow students to operate the measurement of virtual 3D objects and learn more about the relationship between objects and space. AR applied to learn the concept of mechanical engineering, mathematical or geometric calculation and identification in higher education, and the use of AR technology in education is the focus of future development (Dalgarno & Lee, 2010).
At present, AR has been widely used in different disciplines (such as mathematics, physics, chemistry, biology, earth science, medicine, etc.). For example, Martin-Gutierrez et al., (2015) promote cooperation and self - learning in higher education through AR. Riera & Fonseca, (2015) explore the relationship between student participation and academic performance using AR technology for visual building models. Kamarainen et al., (2013) combined with environmental education experience in the local pond environment based on situational learning theory through the EcoMOBILE platform. Bujak et al., (2013) explores the application of the realities in the development of mathematics classroom, and proposes a framework of AR learning from the perspective of psychology, including physical, cognitive and situational factors. AR is currently considered to have the potential for teaching applications, and assisted learning can provide different learning possibilities for science in science education.
3. Research Model
The main purpose of this study is to explore whether learners use the "multimedia teaching materials" and the use of "air pollution detection box and the AR aids" for teaching activities, whether there have different on learning achievement and learning retention level between the three groups. A total of 84 schoolchildren, aged 12 years old, were chosen in this study. A total of 70 schoolchildren were enrolled in this study excluded who did not agree to participate in the experiment. The learners were divided into 20 control groups, 23 in the experimental group 1 and 27 in the experimental group in the experiment. The three groups of members had basic mental operation ability and had the skills to guide their use before the experiment. Three groups are air pollution multimedia teaching materials
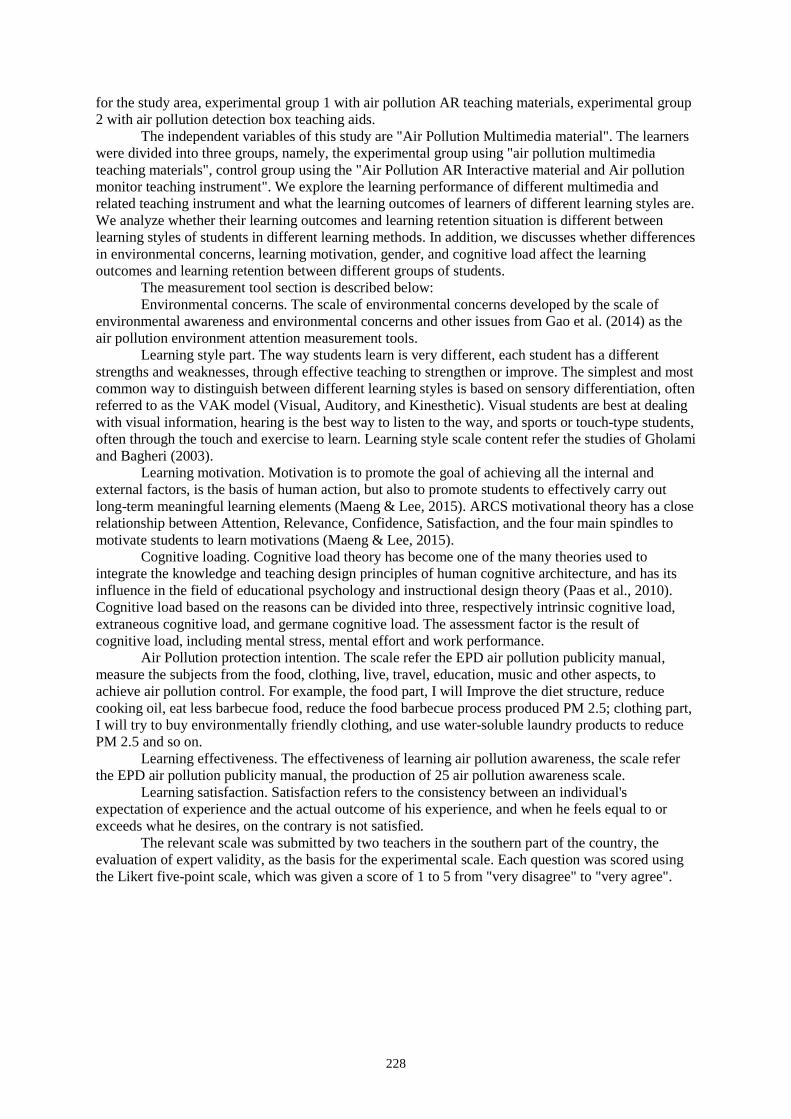
228
for the study area, experimental group 1 with air pollution AR teaching materials, experimental group 2 with air pollution detection box teaching aids.
The independent variables of this study are "Air Pollution Multimedia material". The learners were divided into three groups, namely, the experimental group using "air pollution multimedia teaching materials", control group using the "Air Pollution AR Interactive material and Air pollution monitor teaching instrument". We explore the learning performance of different multimedia and related teaching instrument and what the learning outcomes of learners of different learning styles are. We analyze whether their learning outcomes and learning retention situation is different between learning styles of students in different learning methods. In addition, we discusses whether differences in environmental concerns, learning motivation, gender, and cognitive load affect the learning outcomes and learning retention between different groups of students.
The measurement tool section is described below: Environmental concerns. The scale of environmental concerns developed by the scale of
environmental awareness and environmental concerns and other issues from Gao et al. (2014) as the air pollution environment attention measurement tools.
Learning style part. The way students learn is very different, each student has a different strengths and weaknesses, through effective teaching to strengthen or improve. The simplest and most common way to distinguish between different learning styles is based on sensory differentiation, often referred to as the VAK model (Visual, Auditory, and Kinesthetic). Visual students are best at dealing with visual information, hearing is the best way to listen to the way, and sports or touch-type students, often through the touch and exercise to learn. Learning style scale content refer the studies of Gholami and Bagheri (2003).
Learning motivation. Motivation is to promote the goal of achieving all the internal and external factors, is the basis of human action, but also to promote students to effectively carry out long-term meaningful learning elements (Maeng & Lee, 2015). ARCS motivational theory has a close relationship between Attention, Relevance, Confidence, Satisfaction, and the four main spindles to motivate students to learn motivations (Maeng & Lee, 2015).
Cognitive loading. Cognitive load theory has become one of the many theories used to integrate the knowledge and teaching design principles of human cognitive architecture, and has its influence in the field of educational psychology and instructional design theory (Paas et al., 2010). Cognitive load based on the reasons can be divided into three, respectively intrinsic cognitive load, extraneous cognitive load, and germane cognitive load. The assessment factor is the result of cognitive load, including mental stress, mental effort and work performance.
Air Pollution protection intention. The scale refer the EPD air pollution publicity manual, measure the subjects from the food, clothing, live, travel, education, music and other aspects, to achieve air pollution control. For example, the food part, I will Improve the diet structure, reduce cooking oil, eat less barbecue food, reduce the food barbecue process produced PM 2.5; clothing part, I will try to buy environmentally friendly clothing, and use water-soluble laundry products to reduce PM 2.5 and so on.
Learning effectiveness. The effectiveness of learning air pollution awareness, the scale refer the EPD air pollution publicity manual, the production of 25 air pollution awareness scale.
Learning satisfaction. Satisfaction refers to the consistency between an individual's expectation of experience and the actual outcome of his experience, and when he feels equal to or exceeds what he desires, on the contrary is not satisfied.
The relevant scale was submitted by two teachers in the southern part of the country, the evaluation of expert validity, as the basis for the experimental scale. Each question was scored using the Likert five-point scale, which was given a score of 1 to 5 from "very disagree" to "very agree".
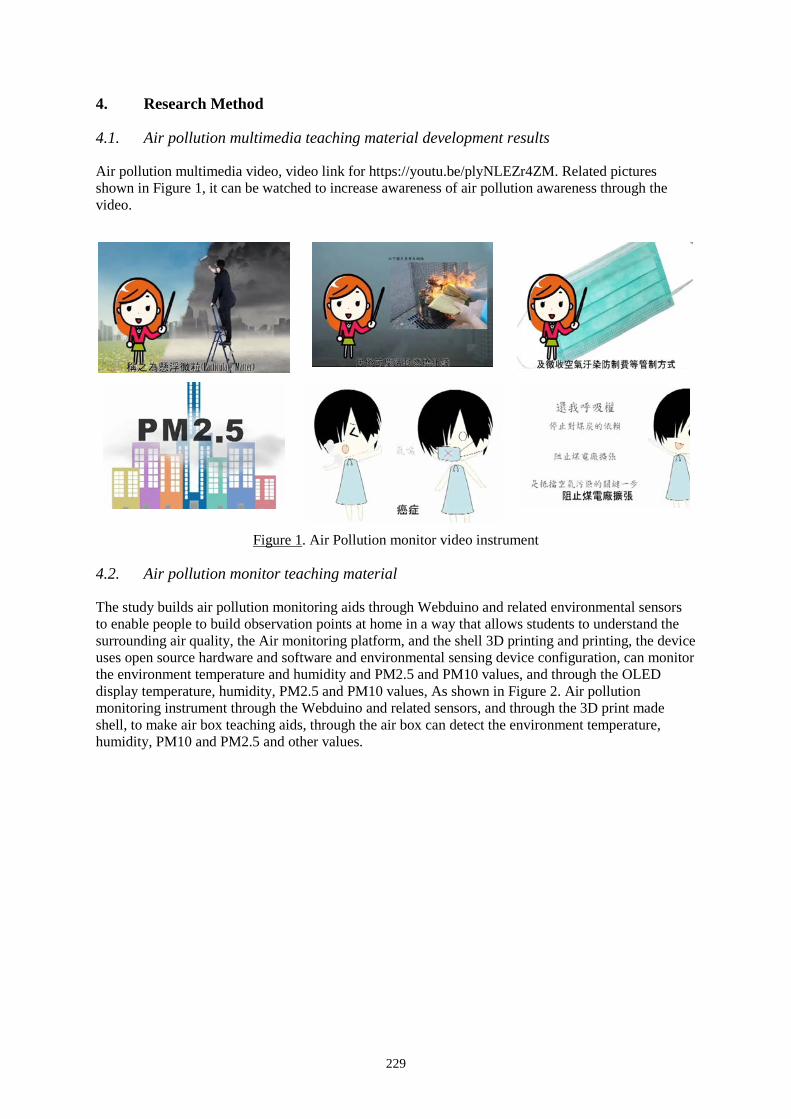
229
4. Research Method
4.1. Air pollution multimedia teaching material development results
Air pollution multimedia video, video link for https://youtu.be/plyNLEZr4ZM. Related pictures shown in Figure 1, it can be watched to increase awareness of air pollution awareness through the video.
Figure 1. Air Pollution monitor video instrument
4.2. Air pollution monitor teaching material
The study builds air pollution monitoring aids through Webduino and related environmental sensors to enable people to build observation points at home in a way that allows students to understand the surrounding air quality, the Air monitoring platform, and the shell 3D printing and printing, the device uses open source hardware and software and environmental sensing device configuration, can monitor the environment temperature and humidity and PM2.5 and PM10 values, and through the OLED display temperature, humidity, PM2.5 and PM10 values, As shown in Figure 2. Air pollution monitoring instrument through the Webduino and related sensors, and through the 3D print made shell, to make air box teaching aids, through the air box can detect the environment temperature, humidity, PM10 and PM2.5 and other values.
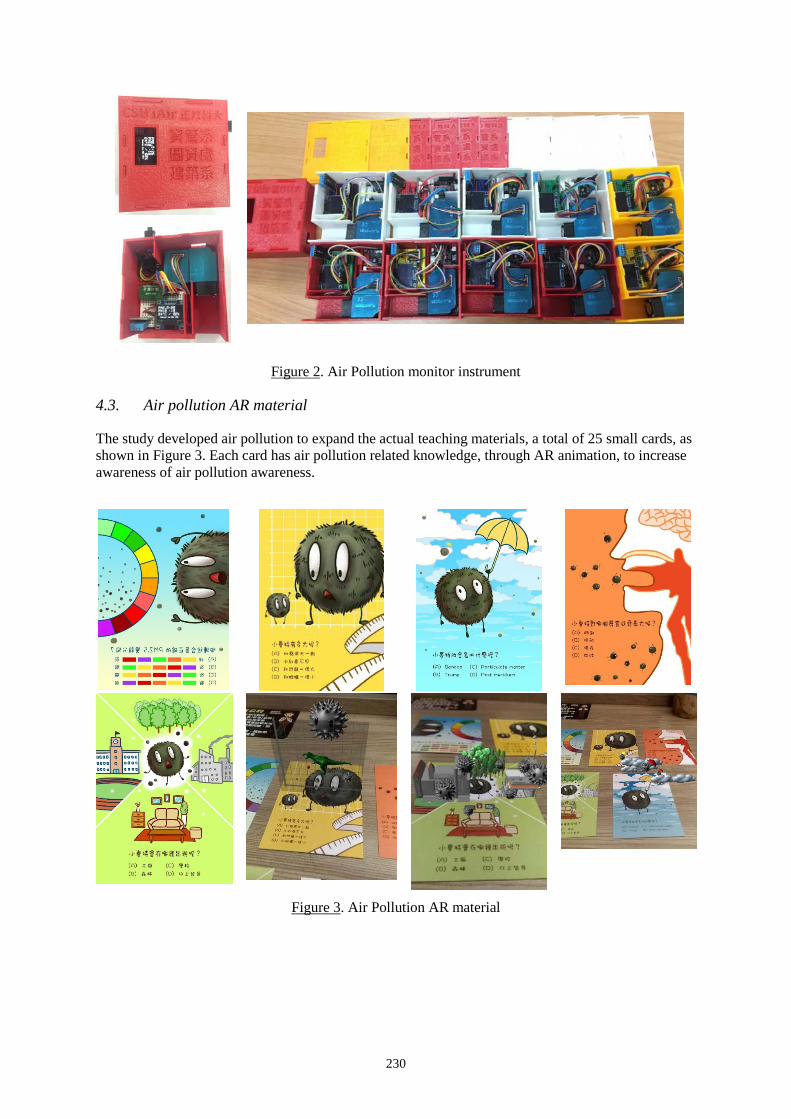
230
Figure 2. Air Pollution monitor instrument
4.3. Air pollution AR material
The study developed air pollution to expand the actual teaching materials, a total of 25 small cards, as shown in Figure 3. Each card has air pollution related knowledge, through AR animation, to increase awareness of air pollution awareness.
Figure 3. Air Pollution AR material
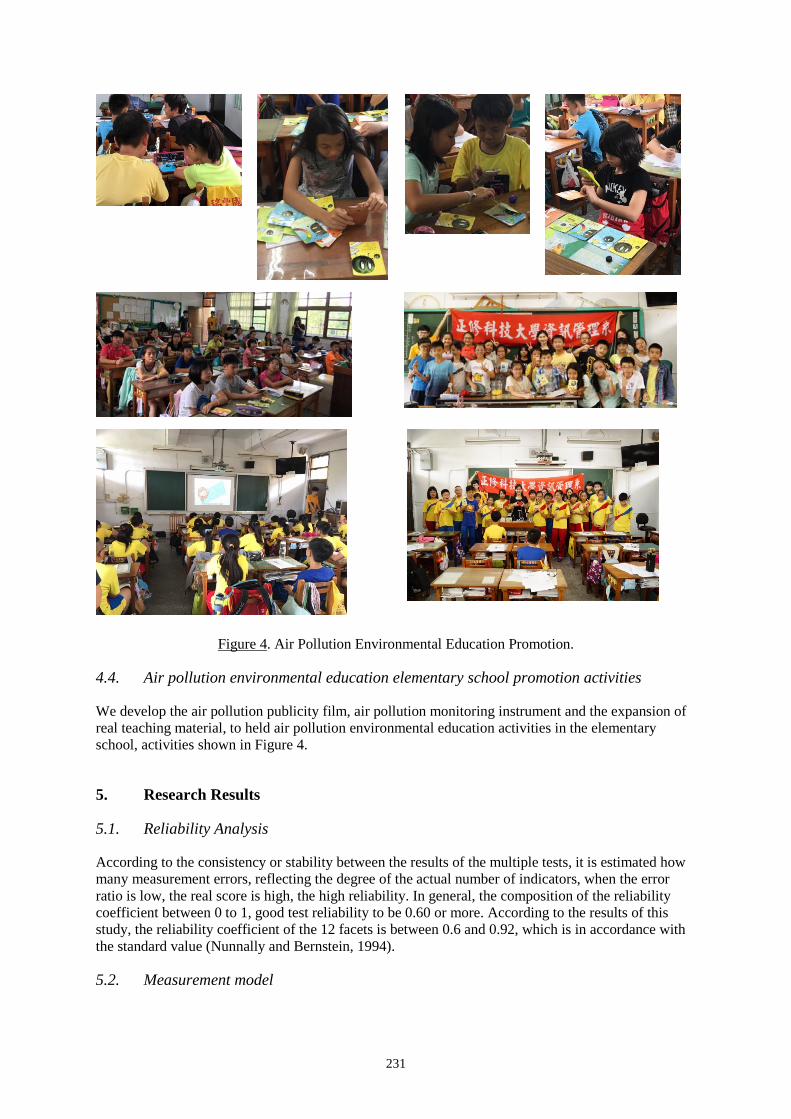
231
Figure 4. Air Pollution Environmental Education Promotion.
4.4. Air pollution environmental education elementary school promotion activities
We develop the air pollution publicity film, air pollution monitoring instrument and the expansion of real teaching material, to held air pollution environmental education activities in the elementary school, activities shown in Figure 4.
5. Research Results
5.1. Reliability Analysis
According to the consistency or stability between the results of the multiple tests, it is estimated how many measurement errors, reflecting the degree of the actual number of indicators, when the error ratio is low, the real score is high, the high reliability. In general, the composition of the reliability coefficient between 0 to 1, good test reliability to be 0.60 or more. According to the results of this study, the reliability coefficient of the 12 facets is between 0.6 and 0.92, which is in accordance with the standard value (Nunnally and Bernstein, 1994).
5.2. Measurement model
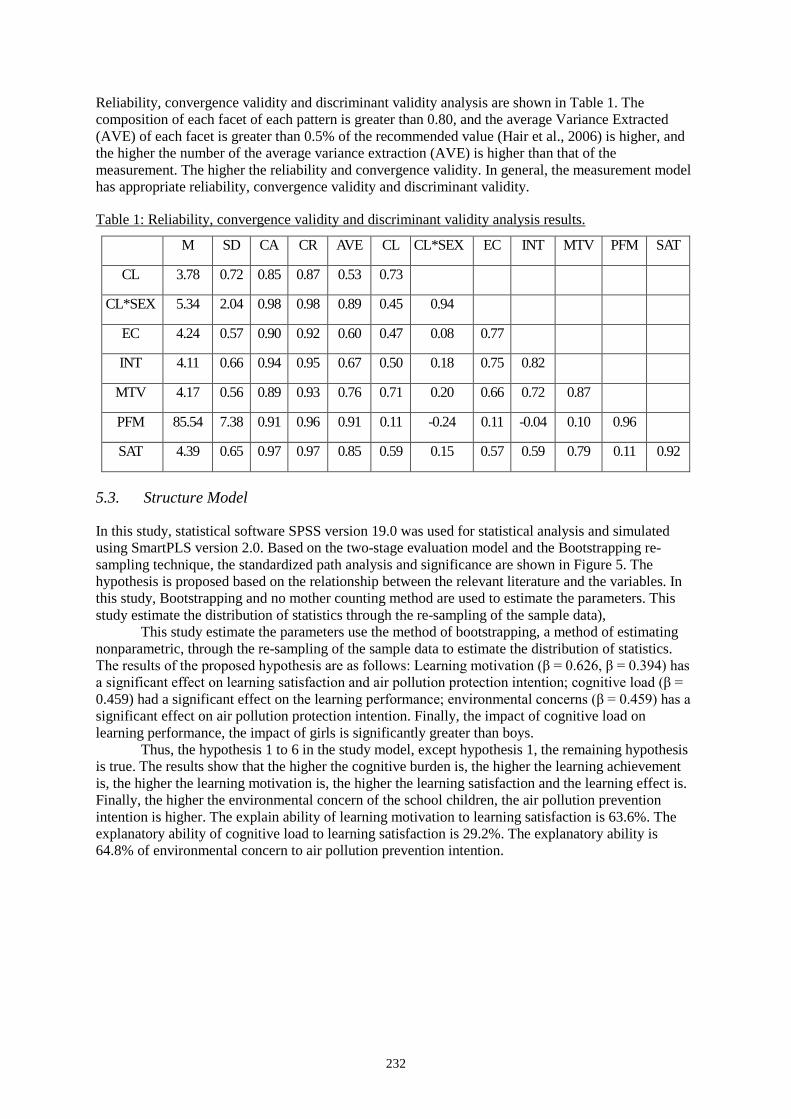
232
Reliability, convergence validity and discriminant validity analysis are shown in Table 1. The composition of each facet of each pattern is greater than 0.80, and the average Variance Extracted (AVE) of each facet is greater than 0.5% of the recommended value (Hair et al., 2006) is higher, and the higher the number of the average variance extraction (AVE) is higher than that of the measurement. The higher the reliability and convergence validity. In general, the measurement model has appropriate reliability, convergence validity and discriminant validity.
Table 1: Reliability, convergence validity and discriminant validity analysis results.
M SD CA CR AVE CL CL*SEX EC INT MTV PFM SAT
CL 3.78 0.72 0.85 0.87 0.53 0.73
CL*SEX 5.34 2.04 0.98 0.98 0.89 0.45 0.94
EC 4.24 0.57 0.90 0.92 0.60 0.47 0.08 0.77
INT 4.11 0.66 0.94 0.95 0.67 0.50 0.18 0.75 0.82
MTV 4.17 0.56 0.89 0.93 0.76 0.71 0.20 0.66 0.72 0.87
PFM 85.54 7.38 0.91 0.96 0.91 0.11 -0.24 0.11 -0.04 0.10 0.96
SAT 4.39 0.65 0.97 0.97 0.85 0.59 0.15 0.57 0.59 0.79 0.11 0.92
5.3. Structure Model
In this study, statistical software SPSS version 19.0 was used for statistical analysis and simulated using SmartPLS version 2.0. Based on the two-stage evaluation model and the Bootstrapping re-sampling technique, the standardized path analysis and significance are shown in Figure 5. The hypothesis is proposed based on the relationship between the relevant literature and the variables. In this study, Bootstrapping and no mother counting method are used to estimate the parameters. This study estimate the distribution of statistics through the re-sampling of the sample data),
This study estimate the parameters use the method of bootstrapping, a method of estimating nonparametric, through the re-sampling of the sample data to estimate the distribution of statistics. The results of the proposed hypothesis are as follows: Learning motivation (β = 0.626, β = 0.394) has a significant effect on learning satisfaction and air pollution protection intention; cognitive load (β = 0.459) had a significant effect on the learning performance; environmental concerns (β = 0.459) has a significant effect on air pollution protection intention. Finally, the impact of cognitive load on learning performance, the impact of girls is significantly greater than boys.
Thus, the hypothesis 1 to 6 in the study model, except hypothesis 1, the remaining hypothesis is true. The results show that the higher the cognitive burden is, the higher the learning achievement is, the higher the learning motivation is, the higher the learning satisfaction and the learning effect is. Finally, the higher the environmental concern of the school children, the air pollution prevention intention is higher. The explain ability of learning motivation to learning satisfaction is 63.6%. The explanatory ability of cognitive load to learning satisfaction is 29.2%. The explanatory ability is 64.8% of environmental concern to air pollution prevention intention.
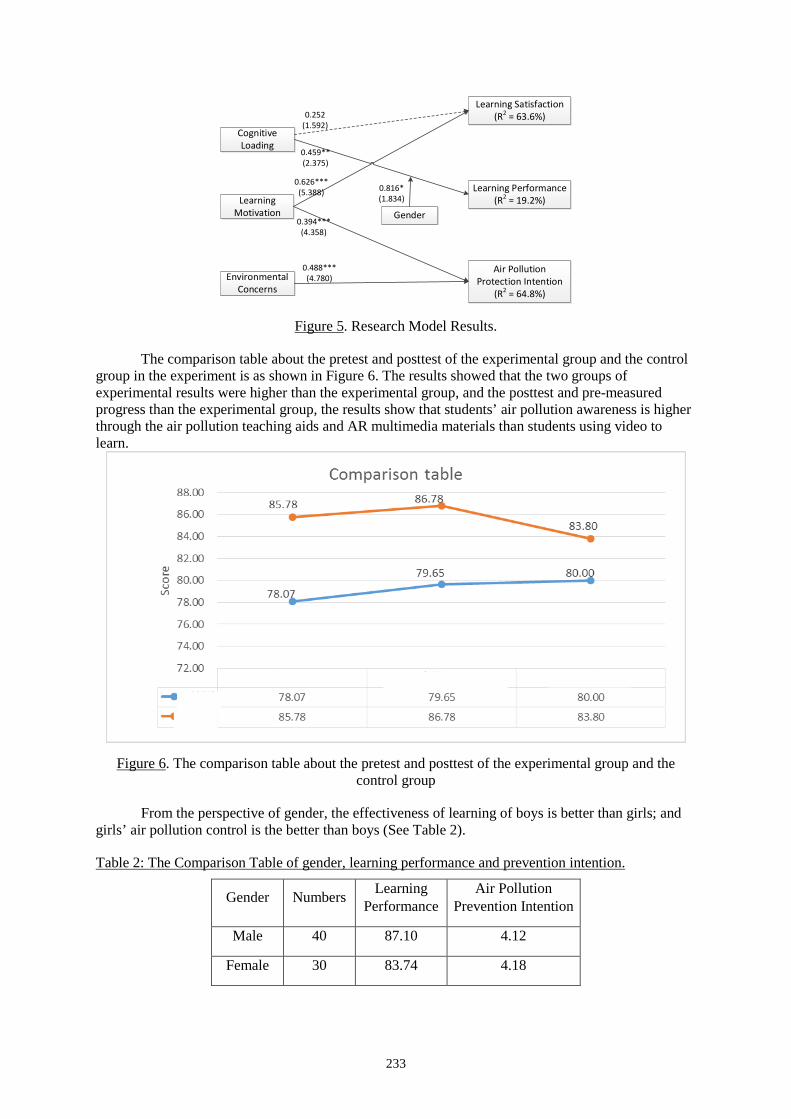
233
Learning Motivation
Environmental Concerns
Cognitive Loading
Learning Satisfaction(R2 = 63.6%)
Gender
Learning Performance(R2 = 19.2%)
Air Pollution Protection Intention
(R2 = 64.8%)
0.252 (1.592)
0.459** (2.375)
0.626*** (5.388)
0.394*** (4.358)
0.488*** (4.780)
0.816* (1.834)
Figure 5. Research Model Results.
The comparison table about the pretest and posttest of the experimental group and the control group in the experiment is as shown in Figure 6. The results showed that the two groups of experimental results were higher than the experimental group, and the posttest and pre-measured progress than the experimental group, the results show that students’ air pollution awareness is higher through the air pollution teaching aids and AR multimedia materials than students using video to learn.
Figure 6. The comparison table about the pretest and posttest of the experimental group and the control group
From the perspective of gender, the effectiveness of learning of boys is better than girls; and girls’ air pollution control is the better than boys (See Table 2).
Table 2: The Comparison Table of gender, learning performance and prevention intention.
Gender Numbers Learning Performance
Air Pollution Prevention Intention
Male 40 87.10 4.12
Female 30 83.74 4.18
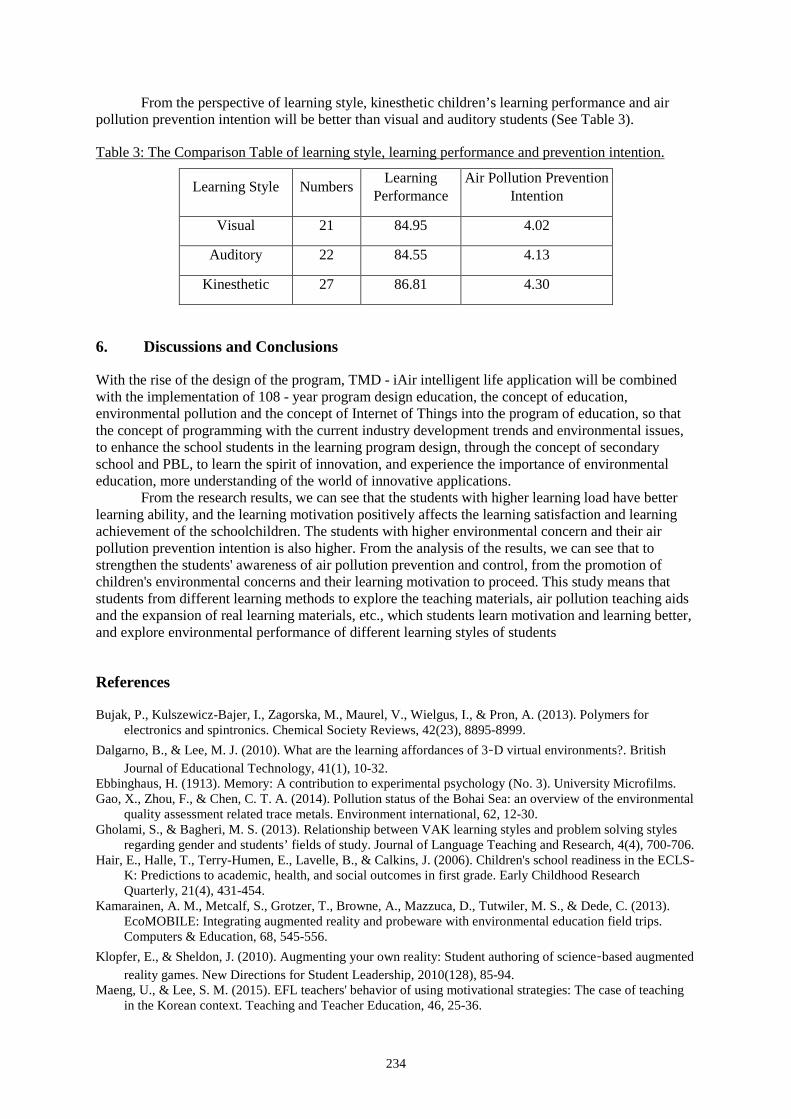
234
From the perspective of learning style, kinesthetic children’s learning performance and air pollution prevention intention will be better than visual and auditory students (See Table 3).
Table 3: The Comparison Table of learning style, learning performance and prevention intention.
Learning Style Numbers Learning Performance
Air Pollution Prevention Intention
Visual 21 84.95 4.02
Auditory 22 84.55 4.13
Kinesthetic 27 86.81 4.30
6. Discussions and Conclusions
With the rise of the design of the program, TMD - iAir intelligent life application will be combined with the implementation of 108 - year program design education, the concept of education, environmental pollution and the concept of Internet of Things into the program of education, so that the concept of programming with the current industry development trends and environmental issues, to enhance the school students in the learning program design, through the concept of secondary school and PBL, to learn the spirit of innovation, and experience the importance of environmental education, more understanding of the world of innovative applications.
From the research results, we can see that the students with higher learning load have better learning ability, and the learning motivation positively affects the learning satisfaction and learning achievement of the schoolchildren. The students with higher environmental concern and their air pollution prevention intention is also higher. From the analysis of the results, we can see that to strengthen the students' awareness of air pollution prevention and control, from the promotion of children's environmental concerns and their learning motivation to proceed. This study means that students from different learning methods to explore the teaching materials, air pollution teaching aids and the expansion of real learning materials, etc., which students learn motivation and learning better, and explore environmental performance of different learning styles of students
References
Bujak, P., Kulszewicz-Bajer, I., Zagorska, M., Maurel, V., Wielgus, I., & Pron, A. (2013). Polymers for electronics and spintronics. Chemical Society Reviews, 42(23), 8895-8999.
Dalgarno, B., & Lee, M. J. (2010). What are the learning affordances of 3‐D virtual environments?. British Journal of Educational Technology, 41(1), 10-32.
Ebbinghaus, H. (1913). Memory: A contribution to experimental psychology (No. 3). University Microfilms. Gao, X., Zhou, F., & Chen, C. T. A. (2014). Pollution status of the Bohai Sea: an overview of the environmental
quality assessment related trace metals. Environment international, 62, 12-30. Gholami, S., & Bagheri, M. S. (2013). Relationship between VAK learning styles and problem solving styles
regarding gender and students’ fields of study. Journal of Language Teaching and Research, 4(4), 700-706. Hair, E., Halle, T., Terry-Humen, E., Lavelle, B., & Calkins, J. (2006). Children's school readiness in the ECLS-
K: Predictions to academic, health, and social outcomes in first grade. Early Childhood Research Quarterly, 21(4), 431-454.
Kamarainen, A. M., Metcalf, S., Grotzer, T., Browne, A., Mazzuca, D., Tutwiler, M. S., & Dede, C. (2013). EcoMOBILE: Integrating augmented reality and probeware with environmental education field trips. Computers & Education, 68, 545-556.
Klopfer, E., & Sheldon, J. (2010). Augmenting your own reality: Student authoring of science‐based augmented reality games. New Directions for Student Leadership, 2010(128), 85-94.
Maeng, U., & Lee, S. M. (2015). EFL teachers' behavior of using motivational strategies: The case of teaching in the Korean context. Teaching and Teacher Education, 46, 25-36.

235
Martín-Gutiérrez, J., Fabiani, P., Benesova, W., Meneses, M. D., & Mora, C. E. (2015). Augmented reality to promote collaborative and autonomous learning in higher education. Computers in Human Behavior, 51, 752-761.
Miller, D. R., & Dousay, T. (2015). Implementing Augmented Reality in the Classroom. Issues and Trends in Educational Technology, 3(2).
Paas, F., Van Gog, T., & Sweller, J. (2010). Cognitive load theory: New conceptualizations, specifications, and integrated research perspectives. Educational Psychology Review, 22(2), 115-121.
Riera, A. S., Redondo, E., & Fonseca, D. (2015). Geo-located teaching using handheld augmented reality: good practices to improve the motivation and qualifications of architecture students. Universal Access in the Information Society, 14(3), 363-374.
Sanchez-Pulido, L., Pidoux, A. L., Ponting, C. P., & Allshire, R. C. (2009). Common ancestry of the CENP-A chaperones Scm3 and HJURP. Cell, 137(7), 1173.
Webdiono,https://webduino.io
Hayashi, Y., et al. (Eds.) (2017). Workshop Proceedings of the 25th International Conference on Computers in Education. New Zealand: Asia-Pacific Society for Computers in Education
236
Cultivating Interest in History and Culture using Augmented Reality for Elementary
Students Sie Wai CHEW, I-Hsiu LIN, Yin-Cheng HUANG & Nian-Shing CHEN*
Department of Information Management, National Sun Yat-sen University, Kaohsiung, Taiwan [email protected]
Abstract: Local history and culture are vital elements shaping the identity of a society and its civilization. Yet, the appreciation of local history and culture among the younger generation are decreasing, where this could be observed in the social or history classes offered in schools. In Taiwan, elementary schools would organize field trips visiting local historic sites to encourage and improve students’ appreciation of the local history and culture. Past research had shown that technology could assist in engaging and motivating students to better appreciate the history and culture. Hence, a design based research was conducted with the objective of cultivating students’ interest and increasing their appreciation towards the local history and folk culture by designing an augmented reality application which used the strategy of situated learning and critical thinking in designing the learning content and assessment. After conducting two iterations, the research found that after using the designed application, students’ interest in local history and culture had increased, and the students were engaged in the learning process as the situated learning strategy and critical thinking questioning were applied.
Keywords: Design based research, History and culture, Situated learning, Critical thinking, Augmented reality
1. Introduction
Understanding the local history and preserving its folk culture are important elements for the inheritance of future generations. The appreciation of the historic value and folk culture are interests that should be cultivated in the younger generation at an early age. However, most of the younger generation are in the opinion that history and culture were “meaningless recitation of names, dates, and facts” (Squire & Barab, 2004, p. 506) and often do not recognize nor appreciate the importance of these folk cultural practices. Most students are in the opinion that social class which covers history and cultural learning are “the most boring” subject in schools (Loewen, 1995; Squire & Barab, 2004), including students in Taiwan. In order to mitigate this problem, most elementary schools in Taiwan would organized field trips and visits to historical landmarks and villages with the aim of cultivating students’ appreciation of local culture and history. Past research had shown that by integrating technology into the learning process of the social class would increase motivation and engagement of students in learning and understanding the historic and cultural elements of the class (Squire & Barab, 2004; Chang, & Hwang, 2014). These research had shown that with the usage of technology in the learning process during the field trip, this could promote students’ appreciation of local culture and history (Chang & Hwang, 2014).
With the current rapid development in the work field and industry, critical thinking was no longer deemed as a preferable skill of the elite group, instead it is considered as an essential competency required in each individual in order for them succeed in their respective fields (Kettler, 2014; Kay, & Greenhill, 2011). Therefore, along with the advancement of technology in augmented reality and its increasing popularity among the younger generation, this research’s objective was to utilize augmented reality in designing a learning system on the topic of history and culture, complimented with critical thinking questions regarding these historic and cultural topics, to promote
237
students’ interest and appreciation towards local history and culture. The research questions of this research were
(1) How does the designed learning system assist in instilling interest in students on the topic of history and culture?
(2) How does situated learning affect the students’ critical thinking thoughts as compared to classroom setting?
2. Literature Review
Design based research is a combination of “empirical education research with theory-driven design of learning environments” which “help create and extend knowledge about developing, enacting and sustaining innovative learning environments” (The Design-Based Research Collective, 2003, p. 5). As proposed by The Design-Based Research Collective (2003), design-based research consist of five characteristics: (1) Learning environment and theory development are closely associated during the designing process; (2) Continuous improvements are made through different cycles of design, analysis and redesigns; (3) Research’s design would share theoretical suggestions that would be useful for practitioners and for future research; (4) Research should clarify reasons the research design conducted in authentic settings are appropriate, sharing its success and failure, identifying its interaction with students and its learning issues; (5) Methods used in the research design are documented along with the processes resulting to the research’s outcome. This research utilized design based research in order to identify elements of the designed learning system which were effective in promoting students’ interest and appreciation towards local history and culture, and examined elements which were less effective as they were expected.
Situated learning involves having students experiencing events and learning regarding a topic in its actual environment, and applying what was learnt to solve problems which occurs in the environment itself (Dawley, & Dede, 2014). Past research had found evidence on the importance of situated learning which enabled students to learn and experience the learning topic in its authentic settings, and providing students with the opportunity to solve problems involved in its real environment (Chu, Hwang, Tsai, & Tseng, 2010). Hence, this research utilized the situated learning strategy in designing the learning content on local history and culture, and to provide students the opportunity to learn about the local history and culture at the actual site, facilitated with the designed application.
Critical thinking is one of the essential 21th century skills (Kay & Greenhill, 2011). Facione (1990) defined critical thinking as “purposeful, self-regulatory judgment which results in interpretations, analysis, evaluation and inference, as well as explanation of the evidential, conceptual, methodological, criteriological, or conceptual consideration upon which that judgment is based (p. 3).” Critical thinking consist of six sub skills (i.e., interpretation, analysis, evaluation, inference, explanation, self-regulation) which involves understanding and analyzing claims and arguments, assessing the credibility of the statement, identifying required items in order to draw reasonable conclusions, and explaining the reasons behind a judgment made (Facione, 1990; Lai, 2011). Based on Facione’s (1990) definition of critical thinking and its sub skills, past research had used different methods in designing critical thinking assessments for elementary students, i.e., written assessment using comic script, vocal assessment using story-telling (Gelerstein et al., 2016; Lin et al., 2017). This research designed critical thinking questions based on local history and culture in order to examine the effect of students’ thoughts during classroom setting and during situated learning setting.
In the recent years, the amount of attention allocated on the application of the augmented reality in education is increasing rapidly along with its popularity (Tăbușcă, 2015; Liou, Yang, Chen, & Tarng 2017). Augmented reality involved having an application embedding and integrating the digital information into the real environment, resulting in a better simulation which would improve and engage students during the learning process (Tăbușcă, 2015). Past research had shown that augmented reality could improve and enhance the students’ learning process and experience (Chiang, Yang, & Hwang, 2014). As mentioned by Chu et al. (2010), “it has become an important and challenging issue to place students in a series of designed lessons that combine both real-world and
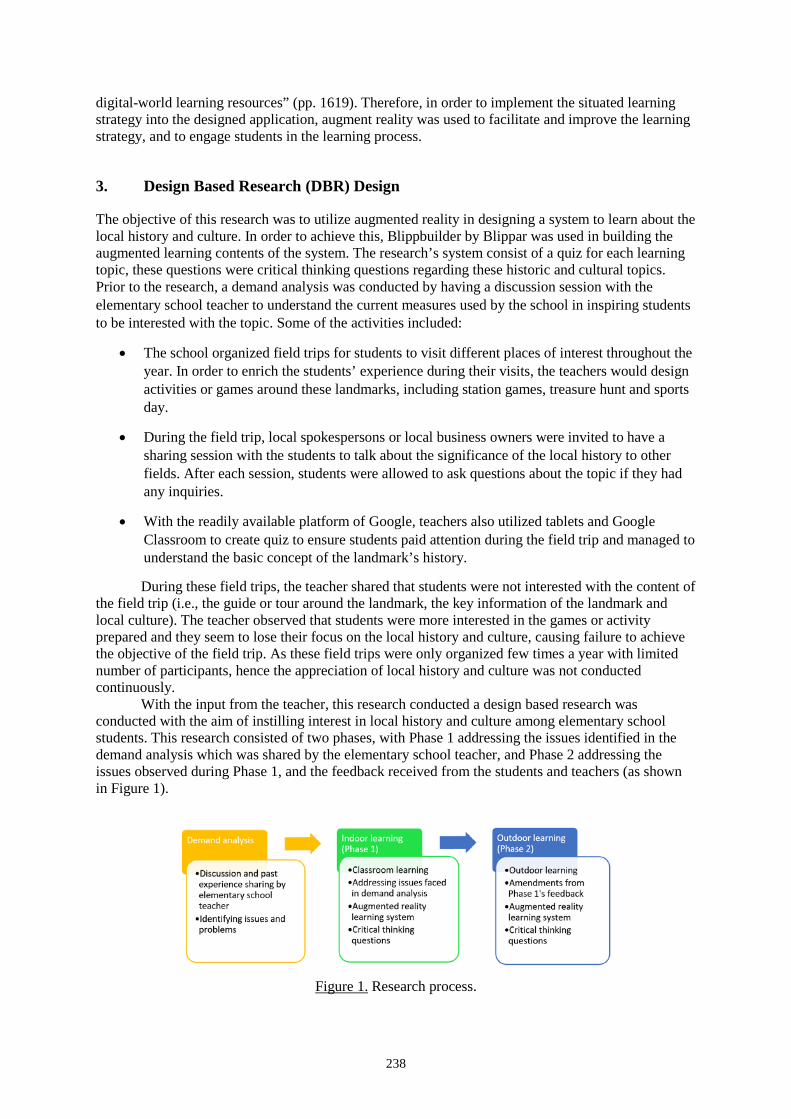
238
digital-world learning resources” (pp. 1619). Therefore, in order to implement the situated learning strategy into the designed application, augment reality was used to facilitate and improve the learning strategy, and to engage students in the learning process.
3. Design Based Research (DBR) Design
The objective of this research was to utilize augmented reality in designing a system to learn about the local history and culture. In order to achieve this, Blippbuilder by Blippar was used in building the augmented learning contents of the system. The research’s system consist of a quiz for each learning topic, these questions were critical thinking questions regarding these historic and cultural topics. Prior to the research, a demand analysis was conducted by having a discussion session with the elementary school teacher to understand the current measures used by the school in inspiring students to be interested with the topic. Some of the activities included:
• The school organized field trips for students to visit different places of interest throughout the year. In order to enrich the students’ experience during their visits, the teachers would design activities or games around these landmarks, including station games, treasure hunt and sports day.
• During the field trip, local spokespersons or local business owners were invited to have a sharing session with the students to talk about the significance of the local history to other fields. After each session, students were allowed to ask questions about the topic if they had any inquiries.
• With the readily available platform of Google, teachers also utilized tablets and Google Classroom to create quiz to ensure students paid attention during the field trip and managed to understand the basic concept of the landmark’s history.
During these field trips, the teacher shared that students were not interested with the content of the field trip (i.e., the guide or tour around the landmark, the key information of the landmark and local culture). The teacher observed that students were more interested in the games or activity prepared and they seem to lose their focus on the local history and culture, causing failure to achieve the objective of the field trip. As these field trips were only organized few times a year with limited number of participants, hence the appreciation of local history and culture was not conducted continuously.
With the input from the teacher, this research conducted a design based research was conducted with the aim of instilling interest in local history and culture among elementary school students. This research consisted of two phases, with Phase 1 addressing the issues identified in the demand analysis which was shared by the elementary school teacher, and Phase 2 addressing the issues observed during Phase 1, and the feedback received from the students and teachers (as shown in Figure 1).
Figure 1. Research process.
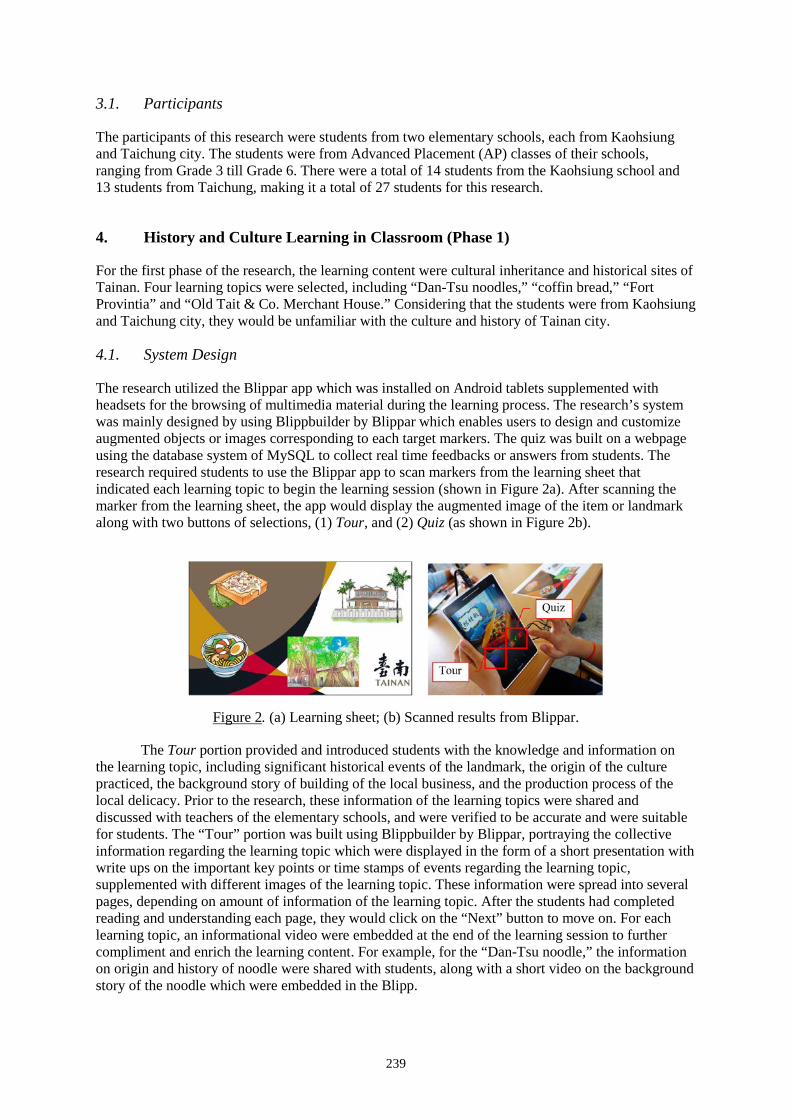
239
3.1. Participants
The participants of this research were students from two elementary schools, each from Kaohsiung and Taichung city. The students were from Advanced Placement (AP) classes of their schools, ranging from Grade 3 till Grade 6. There were a total of 14 students from the Kaohsiung school and 13 students from Taichung, making it a total of 27 students for this research.
4. History and Culture Learning in Classroom (Phase 1)
For the first phase of the research, the learning content were cultural inheritance and historical sites of Tainan. Four learning topics were selected, including “Dan-Tsu noodles,” “coffin bread,” “Fort Provintia” and “Old Tait & Co. Merchant House.” Considering that the students were from Kaohsiung and Taichung city, they would be unfamiliar with the culture and history of Tainan city.
4.1. System Design
The research utilized the Blippar app which was installed on Android tablets supplemented with headsets for the browsing of multimedia material during the learning process. The research’s system was mainly designed by using Blippbuilder by Blippar which enables users to design and customize augmented objects or images corresponding to each target markers. The quiz was built on a webpage using the database system of MySQL to collect real time feedbacks or answers from students. The research required students to use the Blippar app to scan markers from the learning sheet that indicated each learning topic to begin the learning session (shown in Figure 2a). After scanning the marker from the learning sheet, the app would display the augmented image of the item or landmark along with two buttons of selections, (1) Tour, and (2) Quiz (as shown in Figure 2b).
Figure 2. (a) Learning sheet; (b) Scanned results from Blippar.
The Tour portion provided and introduced students with the knowledge and information on the learning topic, including significant historical events of the landmark, the origin of the culture practiced, the background story of building of the local business, and the production process of the local delicacy. Prior to the research, these information of the learning topics were shared and discussed with teachers of the elementary schools, and were verified to be accurate and were suitable for students. The “Tour” portion was built using Blippbuilder by Blippar, portraying the collective information regarding the learning topic which were displayed in the form of a short presentation with write ups on the important key points or time stamps of events regarding the learning topic, supplemented with different images of the learning topic. These information were spread into several pages, depending on amount of information of the learning topic. After the students had completed reading and understanding each page, they would click on the “Next” button to move on. For each learning topic, an informational video were embedded at the end of the learning session to further compliment and enrich the learning content. For example, for the “Dan-Tsu noodle,” the information on origin and history of noodle were shared with students, along with a short video on the background story of the noodle which were embedded in the Blipp.
240
As for the Quiz portion, for each learning topic, five questions were designed in accordance to the five sub skills of critical thinking (i.e., Interpretation, Analysis, Evaluation, Inference, and Explanation). These questions were discussed with the elementary teachers to determine their appropriateness and relevance to the learning topics. With four learning topics, the total number of questions were 20 questions, with four questions for each sub skills. For the questions on the sub skills of critical thinking “Interpretation” and “Analysis,” the relevant information to assist students in answering these questions were provided in the “Tour” portion, either in the short presentation or short video. Questions for “Interpretation” and “Analysis” skill were mostly multiple choice questions or short answer questions. As for the sub skills of critical thinking “Evaluation” and “Inference,” questions designed required students to provide short written answers which would be relevant to the learning topic. For the questions on the critical thinking sub skill “Explanation,” students would be required to provide a short essay in explaining their answers and they were encouraged to be as thorough as possible, providing as much relevant details as possible. Students could utilize the keyboard (using the function of typing in or writing on) or Google’s speech-to-text function to input their answers. These questions were designed on a webpage with the hyperlink inserted in Blippar. The data of the question’s input from students were collected and monitored in real time through the database built on the webpage (i.e., MySQL).
4.2. Research Process
Before starting the experiment, students were provided with an Android tablet installed with Blippar, a learning sheet and a headset. A briefing session was conducted to introduce the usage and function of Blippar, and the research procedures. Students were then led to use Blippar to scan the marker of the learning topic on “coffin bread” and to begin with the “Tour” of the learning topic on “coffin bread.” Students were reminded to watch the short video and were informed that they could replay the presentation and video again if they were unclear. After completing the “Tour,” students would complete the “Quiz” of the learning topic which consist of five questions. With the completion of all five question of the learning topic’s quiz, students would then move on to the next learning topic. In order to activate the next learning topic, students would then use the Blippar app to scan the next target marker on the learning sheet. Once the students had completed all four learning topics, they would be required to complete a feedback questionnaire. The whole session was one hour with the research taking place inside the classroom. Students from two school completed this experiment at separation sessions in their respective schools.
4.3. Results
The total input received from the participants of both schools for Phase 1 was 27. As there were four learning topics with each consisting five questions matching with the critical thinking sub skills (Facione, 1990), the total score for the quiz was 20. For each question, the students would receive the score “1” given that the answers provided were correct (for multiple choice questions) and fulfilled the criteria of the critical thinking skill intended to be capture through each questions (i.e., interpretation, analysis, inference, evaluation and explanation), else they would be scored as “0.” The students’ answers for the quiz were evaluated and scored among two researchers whereby the Cohen’s Kappa coefficient was maintained above 0.9 and the Cronbach’s alpha for the Phase 1 quiz was 0.84. As shown in Table 1, the mean score of the quiz for both school are 12.55 and 12.31 respectively, with t-value of 0.32 (p > .05). This indicated that there were no significant difference in the students’ performance for both schools. However, there was significant difference in the students’ performance in terms of their grade (as shown in Table 2). The students higher grades (i.e., Grade 5 and 6) would perform better compared to the students of lower grade (i.e., Grade 3 and 4). As the students’ grade increases, the mean score of the quiz would increase, indicating that the questions designed for this research was with suitable difficulty that was capable of differentiating the students’ ability in terms of their grades.
After completing the all four learning topics, students were required to complete a feedback questionnaire. The questionnaire consisted of seven questions with five questions that were measured by using a 5-Likert scale (i.e., Strong Agree = 5, Agree = 4, Neutral = 3, Disagree = 2, Strongly
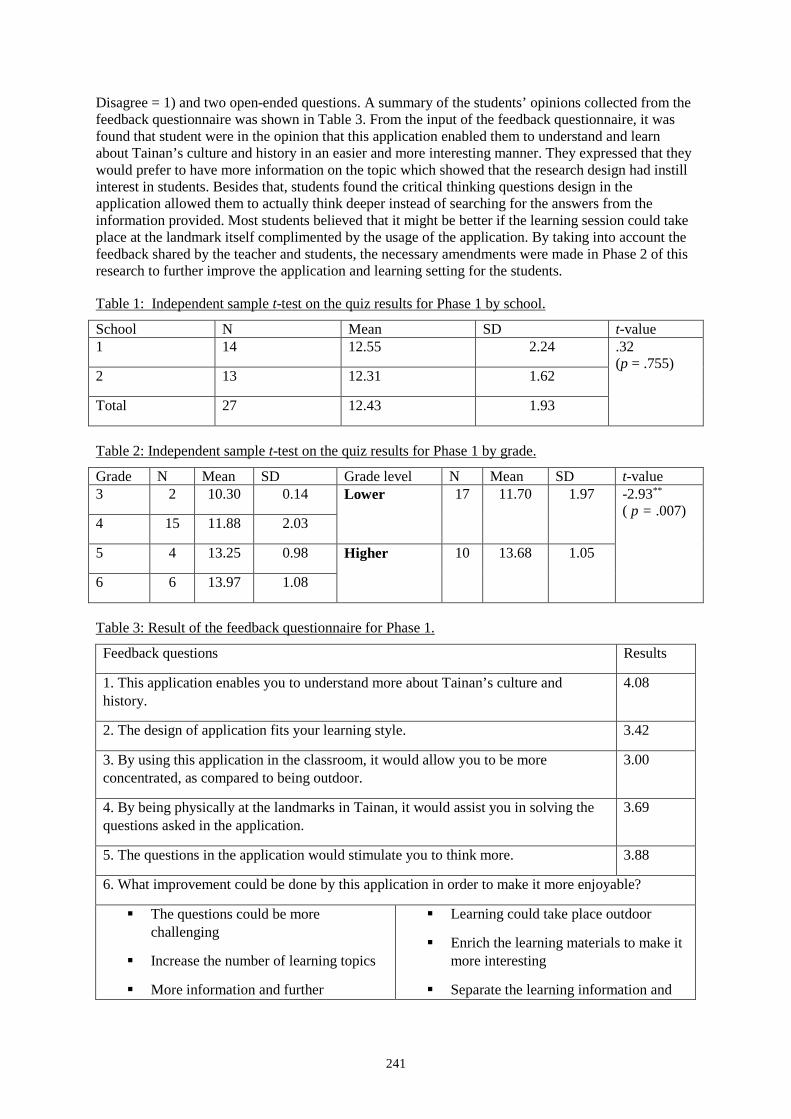
241
Disagree = 1) and two open-ended questions. A summary of the students’ opinions collected from the feedback questionnaire was shown in Table 3. From the input of the feedback questionnaire, it was found that student were in the opinion that this application enabled them to understand and learn about Tainan’s culture and history in an easier and more interesting manner. They expressed that they would prefer to have more information on the topic which showed that the research design had instill interest in students. Besides that, students found the critical thinking questions design in the application allowed them to actually think deeper instead of searching for the answers from the information provided. Most students believed that it might be better if the learning session could take place at the landmark itself complimented by the usage of the application. By taking into account the feedback shared by the teacher and students, the necessary amendments were made in Phase 2 of this research to further improve the application and learning setting for the students.
Table 1: Independent sample t-test on the quiz results for Phase 1 by school.
School N Mean SD t-value 1 14 12.55 2.24 .32
(p = .755) 2 13 12.31 1.62
Total 27 12.43 1.93
Table 2: Independent sample t-test on the quiz results for Phase 1 by grade.
Grade N Mean SD Grade level N Mean SD t-value 3 2 10.30 0.14 Lower 17 11.70 1.97 -2.93**
( p = .007) 4 15 11.88 2.03
5 4 13.25 0.98 Higher 10 13.68 1.05
6 6 13.97 1.08
Table 3: Result of the feedback questionnaire for Phase 1.
Feedback questions Results
1. This application enables you to understand more about Tainan’s culture and history.
4.08
2. The design of application fits your learning style. 3.42
3. By using this application in the classroom, it would allow you to be more concentrated, as compared to being outdoor.
3.00
4. By being physically at the landmarks in Tainan, it would assist you in solving the questions asked in the application.
3.69
5. The questions in the application would stimulate you to think more. 3.88
6. What improvement could be done by this application in order to make it more enjoyable?
The questions could be more challenging
Increase the number of learning topics
More information and further
Learning could take place outdoor
Enrich the learning materials to make it more interesting
Separate the learning information and
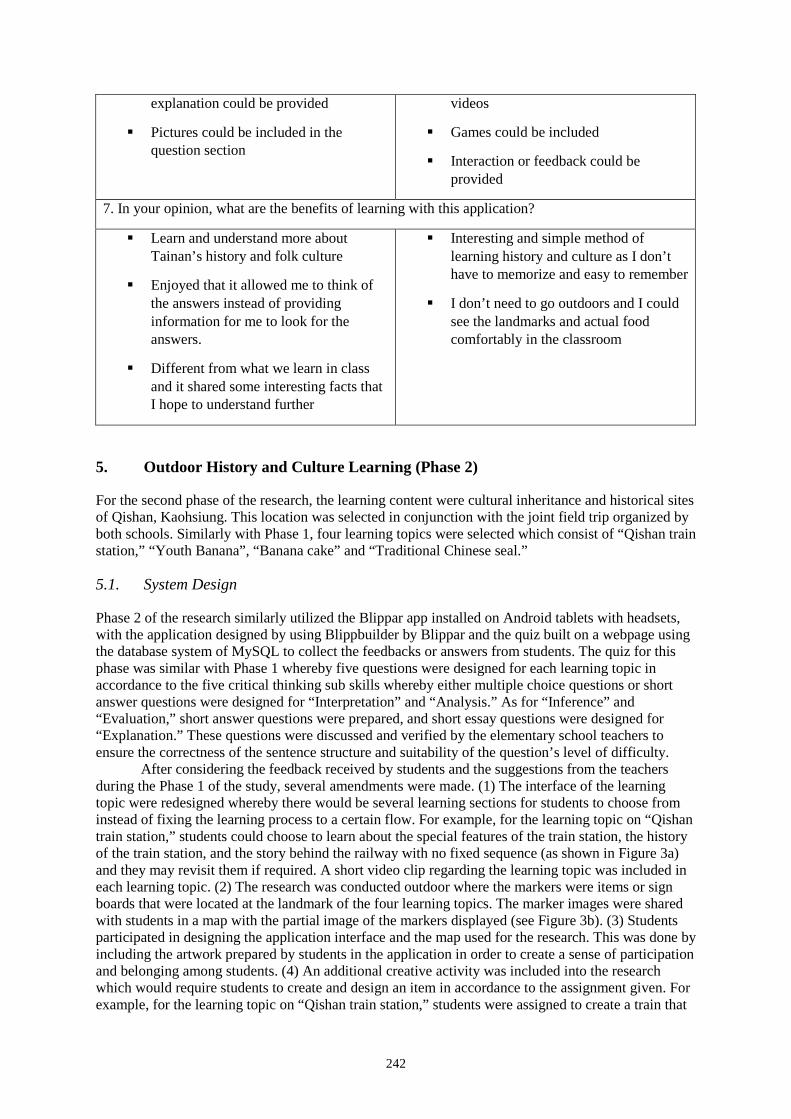
242
explanation could be provided
Pictures could be included in the question section
videos
Games could be included
Interaction or feedback could be provided
7. In your opinion, what are the benefits of learning with this application?
Learn and understand more about Tainan’s history and folk culture
Enjoyed that it allowed me to think of the answers instead of providing information for me to look for the answers.
Different from what we learn in class and it shared some interesting facts that I hope to understand further
Interesting and simple method of learning history and culture as I don’t have to memorize and easy to remember
I don’t need to go outdoors and I could see the landmarks and actual food comfortably in the classroom
5. Outdoor History and Culture Learning (Phase 2)
For the second phase of the research, the learning content were cultural inheritance and historical sites of Qishan, Kaohsiung. This location was selected in conjunction with the joint field trip organized by both schools. Similarly with Phase 1, four learning topics were selected which consist of “Qishan train station,” “Youth Banana”, “Banana cake” and “Traditional Chinese seal.”
5.1. System Design
Phase 2 of the research similarly utilized the Blippar app installed on Android tablets with headsets, with the application designed by using Blippbuilder by Blippar and the quiz built on a webpage using the database system of MySQL to collect the feedbacks or answers from students. The quiz for this phase was similar with Phase 1 whereby five questions were designed for each learning topic in accordance to the five critical thinking sub skills whereby either multiple choice questions or short answer questions were designed for “Interpretation” and “Analysis.” As for “Inference” and “Evaluation,” short answer questions were prepared, and short essay questions were designed for “Explanation.” These questions were discussed and verified by the elementary school teachers to ensure the correctness of the sentence structure and suitability of the question’s level of difficulty.
After considering the feedback received by students and the suggestions from the teachers during the Phase 1 of the study, several amendments were made. (1) The interface of the learning topic were redesigned whereby there would be several learning sections for students to choose from instead of fixing the learning process to a certain flow. For example, for the learning topic on “Qishan train station,” students could choose to learn about the special features of the train station, the history of the train station, and the story behind the railway with no fixed sequence (as shown in Figure 3a) and they may revisit them if required. A short video clip regarding the learning topic was included in each learning topic. (2) The research was conducted outdoor where the markers were items or sign boards that were located at the landmark of the four learning topics. The marker images were shared with students in a map with the partial image of the markers displayed (see Figure 3b). (3) Students participated in designing the application interface and the map used for the research. This was done by including the artwork prepared by students in the application in order to create a sense of participation and belonging among students. (4) An additional creative activity was included into the research which would require students to create and design an item in accordance to the assignment given. For example, for the learning topic on “Qishan train station,” students were assigned to create a train that
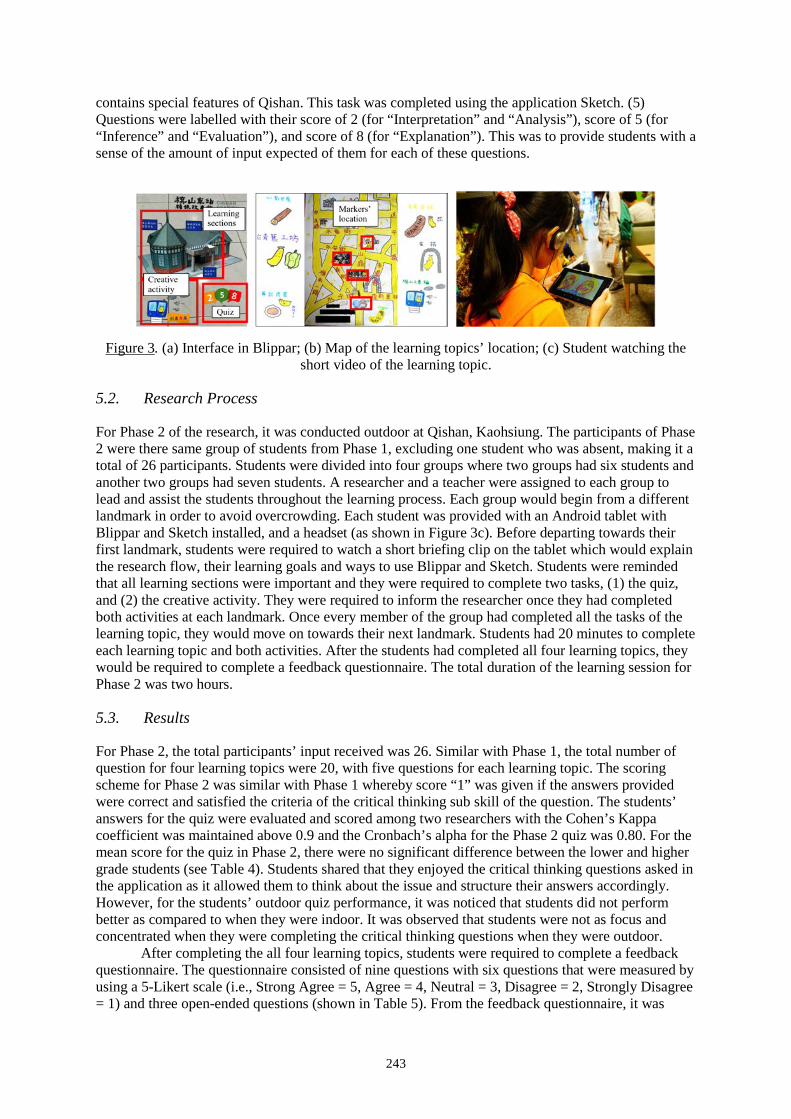
243
contains special features of Qishan. This task was completed using the application Sketch. (5) Questions were labelled with their score of 2 (for “Interpretation” and “Analysis”), score of 5 (for “Inference” and “Evaluation”), and score of 8 (for “Explanation”). This was to provide students with a sense of the amount of input expected of them for each of these questions.
Figure 3. (a) Interface in Blippar; (b) Map of the learning topics’ location; (c) Student watching the short video of the learning topic.
5.2. Research Process
For Phase 2 of the research, it was conducted outdoor at Qishan, Kaohsiung. The participants of Phase 2 were there same group of students from Phase 1, excluding one student who was absent, making it a total of 26 participants. Students were divided into four groups where two groups had six students and another two groups had seven students. A researcher and a teacher were assigned to each group to lead and assist the students throughout the learning process. Each group would begin from a different landmark in order to avoid overcrowding. Each student was provided with an Android tablet with Blippar and Sketch installed, and a headset (as shown in Figure 3c). Before departing towards their first landmark, students were required to watch a short briefing clip on the tablet which would explain the research flow, their learning goals and ways to use Blippar and Sketch. Students were reminded that all learning sections were important and they were required to complete two tasks, (1) the quiz, and (2) the creative activity. They were required to inform the researcher once they had completed both activities at each landmark. Once every member of the group had completed all the tasks of the learning topic, they would move on towards their next landmark. Students had 20 minutes to complete each learning topic and both activities. After the students had completed all four learning topics, they would be required to complete a feedback questionnaire. The total duration of the learning session for Phase 2 was two hours.
5.3. Results
For Phase 2, the total participants’ input received was 26. Similar with Phase 1, the total number of question for four learning topics were 20, with five questions for each learning topic. The scoring scheme for Phase 2 was similar with Phase 1 whereby score “1” was given if the answers provided were correct and satisfied the criteria of the critical thinking sub skill of the question. The students’ answers for the quiz were evaluated and scored among two researchers with the Cohen’s Kappa coefficient was maintained above 0.9 and the Cronbach’s alpha for the Phase 2 quiz was 0.80. For the mean score for the quiz in Phase 2, there were no significant difference between the lower and higher grade students (see Table 4). Students shared that they enjoyed the critical thinking questions asked in the application as it allowed them to think about the issue and structure their answers accordingly. However, for the students’ outdoor quiz performance, it was noticed that students did not perform better as compared to when they were indoor. It was observed that students were not as focus and concentrated when they were completing the critical thinking questions when they were outdoor.
After completing the all four learning topics, students were required to complete a feedback questionnaire. The questionnaire consisted of nine questions with six questions that were measured by using a 5-Likert scale (i.e., Strong Agree = 5, Agree = 4, Neutral = 3, Disagree = 2, Strongly Disagree = 1) and three open-ended questions (shown in Table 5). From the feedback questionnaire, it was
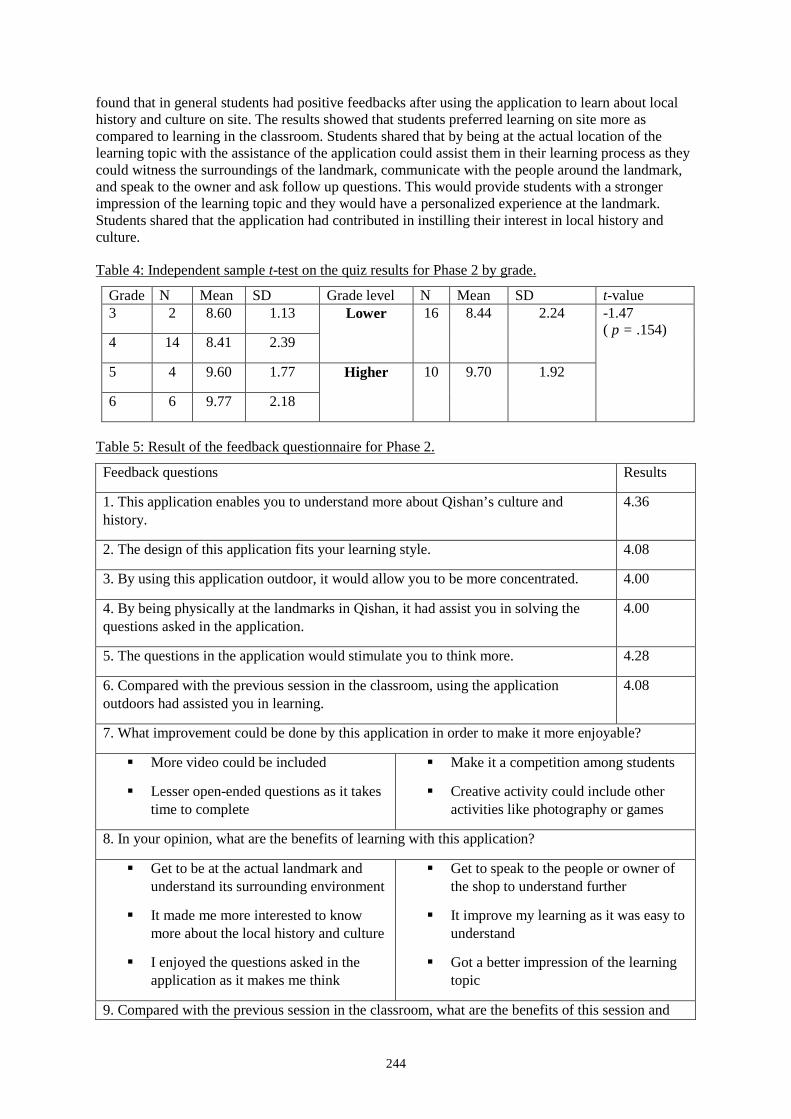
244
found that in general students had positive feedbacks after using the application to learn about local history and culture on site. The results showed that students preferred learning on site more as compared to learning in the classroom. Students shared that by being at the actual location of the learning topic with the assistance of the application could assist them in their learning process as they could witness the surroundings of the landmark, communicate with the people around the landmark, and speak to the owner and ask follow up questions. This would provide students with a stronger impression of the learning topic and they would have a personalized experience at the landmark. Students shared that the application had contributed in instilling their interest in local history and culture.
Table 4: Independent sample t-test on the quiz results for Phase 2 by grade.
Grade N Mean SD Grade level N Mean SD t-value 3 2 8.60 1.13 Lower 16 8.44 2.24 -1.47
( p = .154) 4 14 8.41 2.39
5 4 9.60 1.77 Higher 10 9.70 1.92
6 6 9.77 2.18
Table 5: Result of the feedback questionnaire for Phase 2.
Feedback questions Results
1. This application enables you to understand more about Qishan’s culture and history.
4.36
2. The design of this application fits your learning style. 4.08
3. By using this application outdoor, it would allow you to be more concentrated. 4.00
4. By being physically at the landmarks in Qishan, it had assist you in solving the questions asked in the application.
4.00
5. The questions in the application would stimulate you to think more. 4.28
6. Compared with the previous session in the classroom, using the application outdoors had assisted you in learning.
4.08
7. What improvement could be done by this application in order to make it more enjoyable?
More video could be included
Lesser open-ended questions as it takes time to complete
Make it a competition among students
Creative activity could include other activities like photography or games
8. In your opinion, what are the benefits of learning with this application?
Get to be at the actual landmark and understand its surrounding environment
It made me more interested to know more about the local history and culture
I enjoyed the questions asked in the application as it makes me think
Get to speak to the people or owner of the shop to understand further
It improve my learning as it was easy to understand
Got a better impression of the learning topic
9. Compared with the previous session in the classroom, what are the benefits of this session and
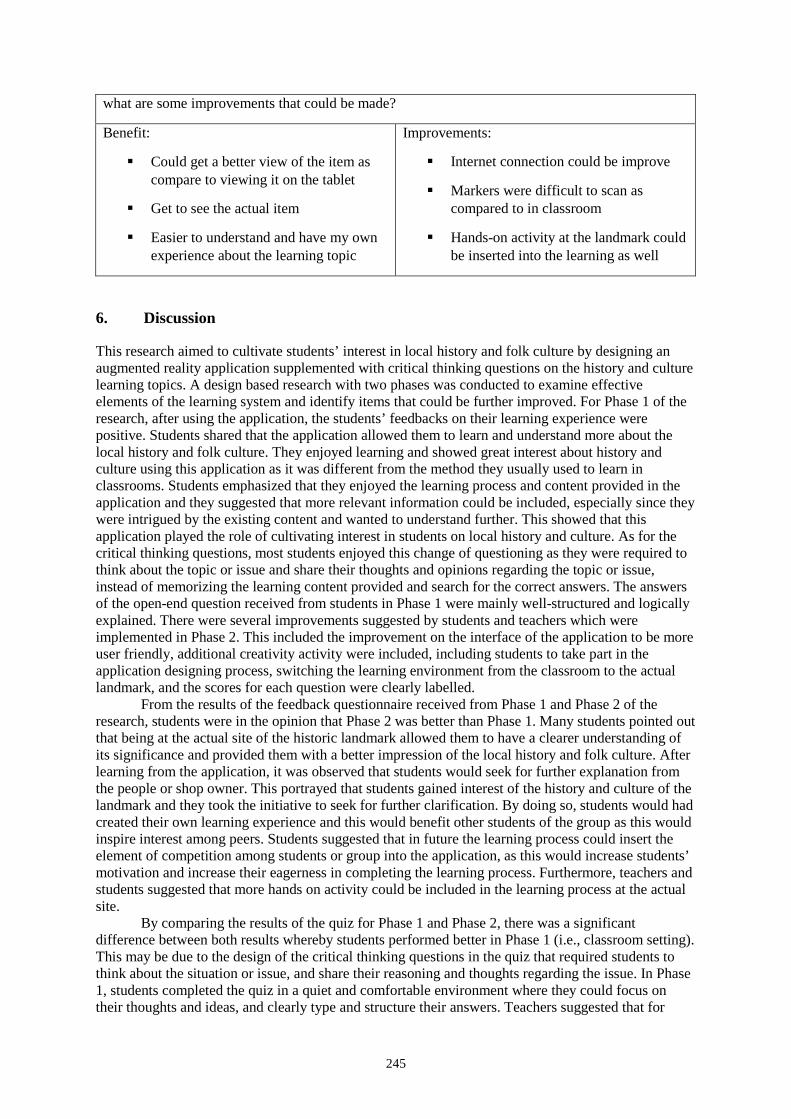
245
what are some improvements that could be made?
Benefit:
Could get a better view of the item as compare to viewing it on the tablet
Get to see the actual item
Easier to understand and have my own experience about the learning topic
Improvements:
Internet connection could be improve
Markers were difficult to scan as compared to in classroom
Hands-on activity at the landmark could be inserted into the learning as well
6. Discussion
This research aimed to cultivate students’ interest in local history and folk culture by designing an augmented reality application supplemented with critical thinking questions on the history and culture learning topics. A design based research with two phases was conducted to examine effective elements of the learning system and identify items that could be further improved. For Phase 1 of the research, after using the application, the students’ feedbacks on their learning experience were positive. Students shared that the application allowed them to learn and understand more about the local history and folk culture. They enjoyed learning and showed great interest about history and culture using this application as it was different from the method they usually used to learn in classrooms. Students emphasized that they enjoyed the learning process and content provided in the application and they suggested that more relevant information could be included, especially since they were intrigued by the existing content and wanted to understand further. This showed that this application played the role of cultivating interest in students on local history and culture. As for the critical thinking questions, most students enjoyed this change of questioning as they were required to think about the topic or issue and share their thoughts and opinions regarding the topic or issue, instead of memorizing the learning content provided and search for the correct answers. The answers of the open-end question received from students in Phase 1 were mainly well-structured and logically explained. There were several improvements suggested by students and teachers which were implemented in Phase 2. This included the improvement on the interface of the application to be more user friendly, additional creativity activity were included, including students to take part in the application designing process, switching the learning environment from the classroom to the actual landmark, and the scores for each question were clearly labelled.
From the results of the feedback questionnaire received from Phase 1 and Phase 2 of the research, students were in the opinion that Phase 2 was better than Phase 1. Many students pointed out that being at the actual site of the historic landmark allowed them to have a clearer understanding of its significance and provided them with a better impression of the local history and folk culture. After learning from the application, it was observed that students would seek for further explanation from the people or shop owner. This portrayed that students gained interest of the history and culture of the landmark and they took the initiative to seek for further clarification. By doing so, students would had created their own learning experience and this would benefit other students of the group as this would inspire interest among peers. Students suggested that in future the learning process could insert the element of competition among students or group into the application, as this would increase students’ motivation and increase their eagerness in completing the learning process. Furthermore, teachers and students suggested that more hands on activity could be included in the learning process at the actual site.
By comparing the results of the quiz for Phase 1 and Phase 2, there was a significant difference between both results whereby students performed better in Phase 1 (i.e., classroom setting). This may be due to the design of the critical thinking questions in the quiz that required students to think about the situation or issue, and share their reasoning and thoughts regarding the issue. In Phase 1, students completed the quiz in a quiet and comfortable environment where they could focus on their thoughts and ideas, and clearly type and structure their answers. Teachers suggested that for
246
outdoor learning, it may be better to have less open-ended questions as students tend to be less concentrated and easily distracted by their surroundings, or a separate session could be included where students could sit down and calmly answer these open-ended questions. For both phases, students were allowed to use different methods to input their answers into the application (i.e., by typing, using Google Speech-to-Text, writing the Chinese characters on the screen). It was found that students were unfamiliar with text input methods on the tablet, hence it takes them a longer time to input their answers. Some students faced difficulty in inputting their answers as they were unfamiliar with the input method of the keyboard. This could had contributed to lowering their performance in the quiz.
7. Conclusion
This research’s objective was to cultivate and instill interest and appreciation in students on the local history and folk culture. In order to accomplish the objective, an augmented reality application was designed which utilized the situated learning strategy and complimented by critical thinking questions as a quiz of the learning topic. The findings of the research showed that this research was successful in inspiring students on the importance of the local history and folk culture as students expressed their interests on the learning topic and urged for more information. The results of the research provided some useful insights that could assist future researchers in designing their learning content and application. The augmented reality application, Blippar, was used in this research. Teachers found that this application was easily customizable and it was user friendly. The application allowed teachers to easily design augmented items for their classes, and the Blippar platform did not require the user to have programming skills. Furthermore, Blippar is operational on both Android and iOS operating system. For future research, further improvement based on the input received from the students and teachers of this research in Phase 2 could be explored. As Gelerstein et al. (2016) and Lin et al.’s (2017) research utilized comic and children’s story to measure student’s level of critical thinking skill, this research had provided another alternative approach in measuring the level of the skill.
Acknowledgements
This study is supported by the Ministry of Science and Technology, Taiwan, under project numbers MOST 106-2511-S-110 -002 -MY3, MOST 104-2511-S-110 -009 -MY3 and MOST 104-2511-S-110 -007 -MY3.
References
Chang, S. C., & Hwang, G. J. (2014, August). Effects of In-Field Mobile Game-Based Learning Activities on Students Local Culture Identity. In Advanced Applied Informatics (IIAIAAI), 2014 IIAI 3rd International Conference on (pp. 297-300). IEEE.
Chiang, T. H. C., Yang, S. J. H., & Hwang, G. J. (2014). Students’ online interactive patterns in augmented reality-based inquiry activities. Computers & Education, 78, 97-108.
Chu, H. C., Hwang, G. J., Tsai, C. C., & Tseng, J. C. R. (2010). A two-tier test approach to developing location-aware mobile learning systems for natural science course. Computers & Education, 55(4), 1618–1627.
Dawley, L., & Dede, C. (2014). Situated learning in virtual worlds and immersive simulations. In Handbook of research on educational communications and technology (pp. 723-734). Springer New York.
The Design-Based Research Collective. (2003). Design-based research: An emerging paradigm for educational inquiry. Educational Researcher, 5-8.
Gelerstein, D., del Río, R., Nussbaum, M., Chiuminatto, P., & López, X. (2016). Designing and implementing a test for measuring critical thinking in primary school. Thinking Skills and Creativity, 20, 40-49.
Kay, K., & Greenhill, V. (2011). Twenty-first century students need 21st century skills. In Bringing schools into the 21st century (pp. 41-65). Springer Netherlands. doi:10.1007/978-94-007-0268-4_3
Kettler, T. (2014). Critical thinking skills among elementary school students: Comparing identified gifted and general education student performance. Gifted Child Quarterly, 58(2), 127-136.
Lai, E. R. (2011). Critical thinking: A Literature review. Pearson’s Research Reports, 6, 40-41.

247
Lin, I.-H., Chew, S. W., & Chen, N.-S. (2017). A Vocal assessment approach to measure elementary school students’ critical thinking skills. In Proceedings of 2017 IEEE 17th International Conference on Advanced Learning Technologies (ICALT2017). Conference Publishing Services.
Liou, H.-H., Yang, S. J. H., Chen, S. Y., & Tarng, W. (2017). The Influences of the 2D Image-Based Augmented Reality and Virtual Reality on Student Learning. Educational Technology & Society, 20(3), 110–121.
Loewen, J. W. (1995). Lies my teacher told me: Everything your American history textbook got wrong. New York, NY: Simon & Schuster.
Squire, K., & Barab, S. (2004, June). Replaying history: Engaging urban underserved students in learning world history through computer simulation games. In Proceedings of the 6th international conference on Learning sciences (pp. 505-512). International Society of the Learning Sciences.
Tăbușcă, A. (2015). Augmented reality – A Possible game-changer in education. National Strategies Observer, 1(2), 245-254.
Hayashi, Y., et al. (Eds.) (2017). Workshop Proceedings of the 25th International Conference on Computers in Education. New Zealand: Asia-Pacific Society for Computers in Education
248
The Study on the Application in the Combination of Pervasive Gaming and
Augmented Reality in the Temple Tour for Users with Different Cognitive Styles
Yu-Hsuan LIN a*, Hao-Chiang KOONG Lin b & I-Cheng LIO c Department of Information and Learning Technology, National University of Tainan
33 Sec 2 Shu-Lin St, Tainan 70005, Taiwan *[email protected]
Abstract: As time goes by, the temple culture is fading away along with the loss of senior and aging temple managers. It’s worth discussing how to prolong the cultural property and to stretch the stories that have been passed down from generation to generation. In Taiwan, using mobile device to assist visitors to know better in the temple tour has been applied for years by many well-known temples, however, other small temples contain the obscure but essential culture that completes the atlas of religious affiliation not only as the centers of religion but also of education, civil culture, fine arts, sightseeing and humanities. The technology of PG and AR on mobile devices with the digital tour guides introduces the name, history and story about the trigger images. Through the guidance for each mission, users can feel secured and achieve “studying by playing”. This study emphasizes on the different learning performances of the students with diverse cognitive styles, and also innovates teaching models by PG. The aim of this study was to obtain qualitative and quantitative data from all 60 participants, with no limit to any age, gender or educational status, by parallel value from both types of data evaluation through the pre- and post-learning performance scale, SOP, SUS and focus group interviews. The result shows (1) PG in the ARTTS was evaluated to be highly satisfying. (2) There was no significant difference between participants with different cognitive styles in use of the system. (3) There was no difference in the learning performance of the participants with different cognitive styles. (4) The learning performance was more effective by the Temple Tour System than printed brochures. (5) The learning performance by the Temple Tour System from all cognitive styles was higher. The study makes 3 suggestions to the future researches, the temple architecture can be added into the introduction, the AR system can be triggered into the pictures rendered in 3D for the more innovative experience, and the customized tour systems for any ages that provide service to the families with children for the better experience and knowledge during the temple tour.
Keywords: Augmented Reality, Pervasive Gaming, temple culture, cognitive style, temple tour
1. Introduction
While the clock ticked, the temple culture was lapsing year-by-year due to the vanishing of temple managers. The aim of this study is to discuss how to perpetuate the cultural value and to conserve the legends made by every generation. Traditionally, visitors explore highlights of the temples through a variety of tours led by temple-trained managers or volunteers with printed brochures, which usually become some flat souvenirs but nothing more. Meanwhile, the management may have difficulties in human resources for guided tours. As a result, the visitors would undergo struggles for inquiring the needed information. For energy conservation and cost reduction, the mobile digital tour systems have been developed and widely installed on tablets and smartphones. There are many famous temples in Taiwan using mobile devices to help visitors navigate and learn about the interesting features, in the meantime, other temples still embrace the noteworthy culture. For the above reasons, this study
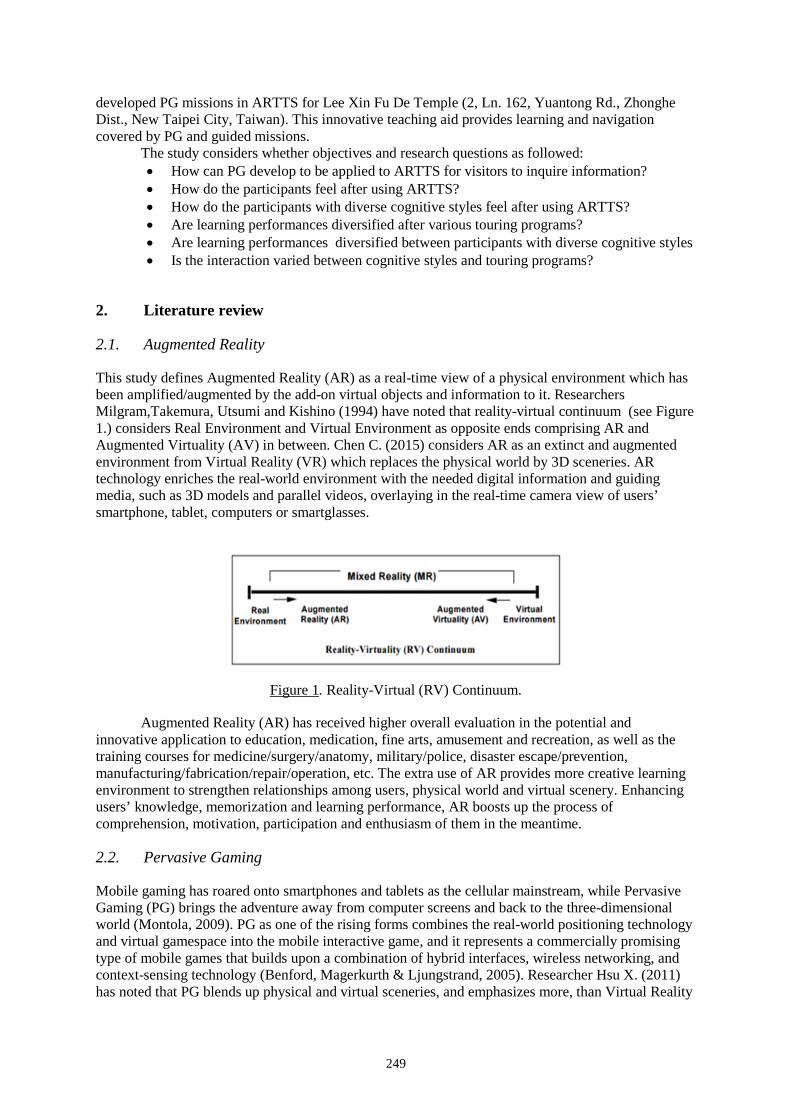
249
developed PG missions in ARTTS for Lee Xin Fu De Temple (2, Ln. 162, Yuantong Rd., Zhonghe Dist., New Taipei City, Taiwan). This innovative teaching aid provides learning and navigation covered by PG and guided missions.
The study considers whether objectives and research questions as followed: • How can PG develop to be applied to ARTTS for visitors to inquire information? • How do the participants feel after using ARTTS? • How do the participants with diverse cognitive styles feel after using ARTTS? • Are learning performances diversified after various touring programs? • Are learning performances diversified between participants with diverse cognitive styles • Is the interaction varied between cognitive styles and touring programs?
2. Literature review
2.1. Augmented Reality
This study defines Augmented Reality (AR) as a real-time view of a physical environment which has been amplified/augmented by the add-on virtual objects and information to it. Researchers Milgram,Takemura, Utsumi and Kishino (1994) have noted that reality-virtual continuum (see Figure 1.) considers Real Environment and Virtual Environment as opposite ends comprising AR and Augmented Virtuality (AV) in between. Chen C. (2015) considers AR as an extinct and augmented environment from Virtual Reality (VR) which replaces the physical world by 3D sceneries. AR technology enriches the real-world environment with the needed digital information and guiding media, such as 3D models and parallel videos, overlaying in the real-time camera view of users’ smartphone, tablet, computers or smartglasses.
Figure 1. Reality-Virtual (RV) Continuum.
Augmented Reality (AR) has received higher overall evaluation in the potential and innovative application to education, medication, fine arts, amusement and recreation, as well as the training courses for medicine/surgery/anatomy, military/police, disaster escape/prevention, manufacturing/fabrication/repair/operation, etc. The extra use of AR provides more creative learning environment to strengthen relationships among users, physical world and virtual scenery. Enhancing users’ knowledge, memorization and learning performance, AR boosts up the process of comprehension, motivation, participation and enthusiasm of them in the meantime.
2.2. Pervasive Gaming
Mobile gaming has roared onto smartphones and tablets as the cellular mainstream, while Pervasive Gaming (PG) brings the adventure away from computer screens and back to the three-dimensional world (Montola, 2009). PG as one of the rising forms combines the real-world positioning technology and virtual gamespace into the mobile interactive game, and it represents a commercially promising type of mobile games that builds upon a combination of hybrid interfaces, wireless networking, and context-sensing technology (Benford, Magerkurth & Ljungstrand, 2005). Researcher Hsu X. (2011) has noted that PG blends up physical and virtual sceneries, and emphasizes more, than Virtual Reality
250
(VR) gaming does, on the gaming process of the interaction between users and real-world environment.
The main theme of this study is Pervasive Gaming (PG) in Temple Tour containing the guided PG missions about the history, stories of the gods, mythological weapons, etc. Began on the mission of history, the visitors as users of Augmented Reality Temple Tour System (ARTTS) are sequentially guided through each missions to the final destination for real-world expedition of learning-by-playing.
2.3. Cognitive Style
Cognitive style is a term used in cognitive psychology to describe the way of individuals’ typical mode to think, perceive, remember and processing information for problem-solving. Cognitive style differs from cognitive ability of the individuals in the development of learning. The hypotheses of cognitive styles has been widely discussed and studied, still, there is controversy over the explicit meaning of the term "cognitive style" and whether it is a single or multiple aspect of human personality. Definitions from scholars and researchers (See Table 1.) improve our understanding and learning.
Table 1. Definitions of Cognitive Style from different scholars
Scholars & Researchers Year Definitions of Cognitive Style
Messick 1976 the individual’s typical mode to either process information, think, memorize or solve problems.
K.Y. Yang 1996 the preference of learner to process the received information
R. J. Riding & Rayner 1998 an individual’s consistent approach to organising and
processing information during thinking
Y. J. Lin 2013 an individual’s different mode and preference to process new external stimulation
J. Cheng 2014 an individual’s personal characteristic to construct and process learning status on external information and environment
3. Research Design
3.1. Pervasive Gaming in Augmented Reality Temple Tour System
Augmented Reality Temple Tour system (ARTTS) was developed on Unity, including Vuforia Software Development Kit (SDK) as the main kit for Augmented Reality (AR). Began on “A new temple host” (see Figure 2.) as the introduction, Pervasive Gaming (PG) in ARTTS contains 4 levels, Visiting Route, Constructing History, Almighty Power of God, and Mythological Weapons. The contents of the missions above as followed, Visiting Route provides directions for the better touring experience, Constructing History brings back what had been contributed in the past, Almighty Power of God shows the mythological strength and legend, and Mythological Weapons demonstrate the fascinating power.
Augmented Reality Temple Tour system (ARTTS) is designed with a linear plot begins at a certain point, moves through 4 missions and then ends up at the other point. Take Almighty Power of God for instance, users begin the mission with Temple Primary School (see Figure 4.) and learn about the facts and basic information about the god of this section. Then, The rules of this mission (see Figure 5.) will come up for visitors to follow and complete it. Finally, the God of Land will
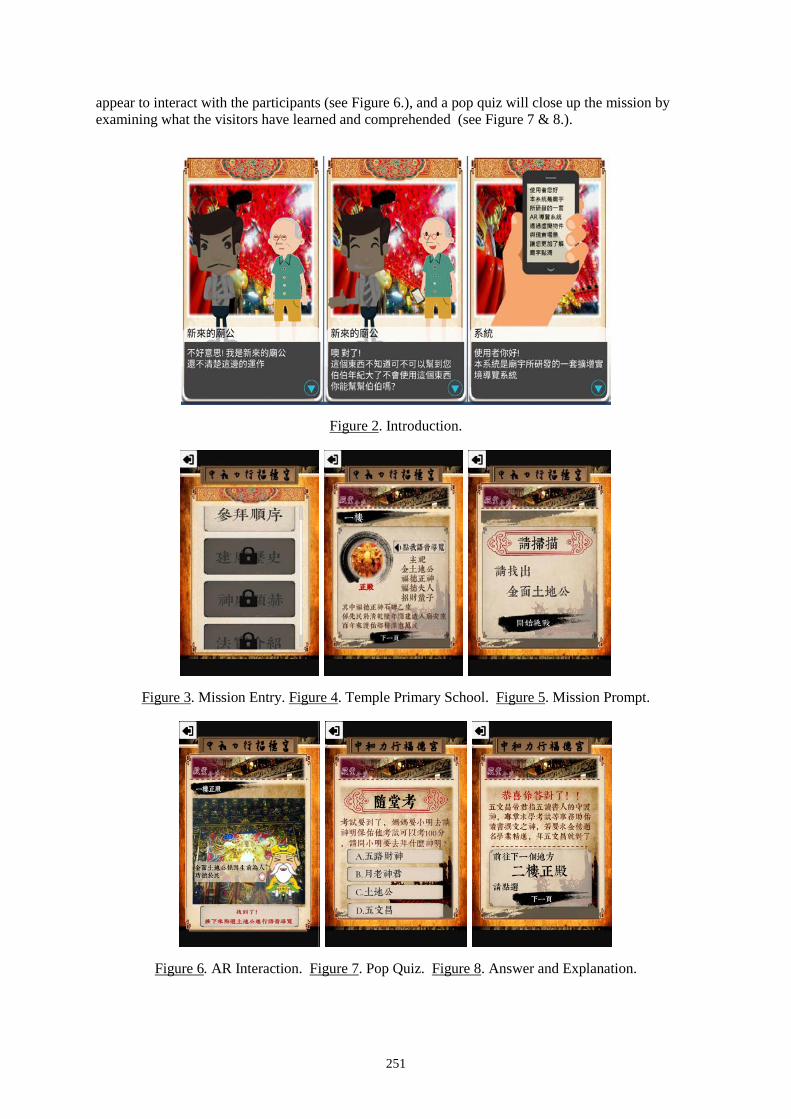
251
appear to interact with the participants (see Figure 6.), and a pop quiz will close up the mission by examining what the visitors have learned and comprehended (see Figure 7 & 8.).
Figure 2. Introduction.
Figure 3. Mission Entry. Figure 4. Temple Primary School. Figure 5. Mission Prompt.
Figure 6. AR Interaction. Figure 7. Pop Quiz. Figure 8. Answer and Explanation.
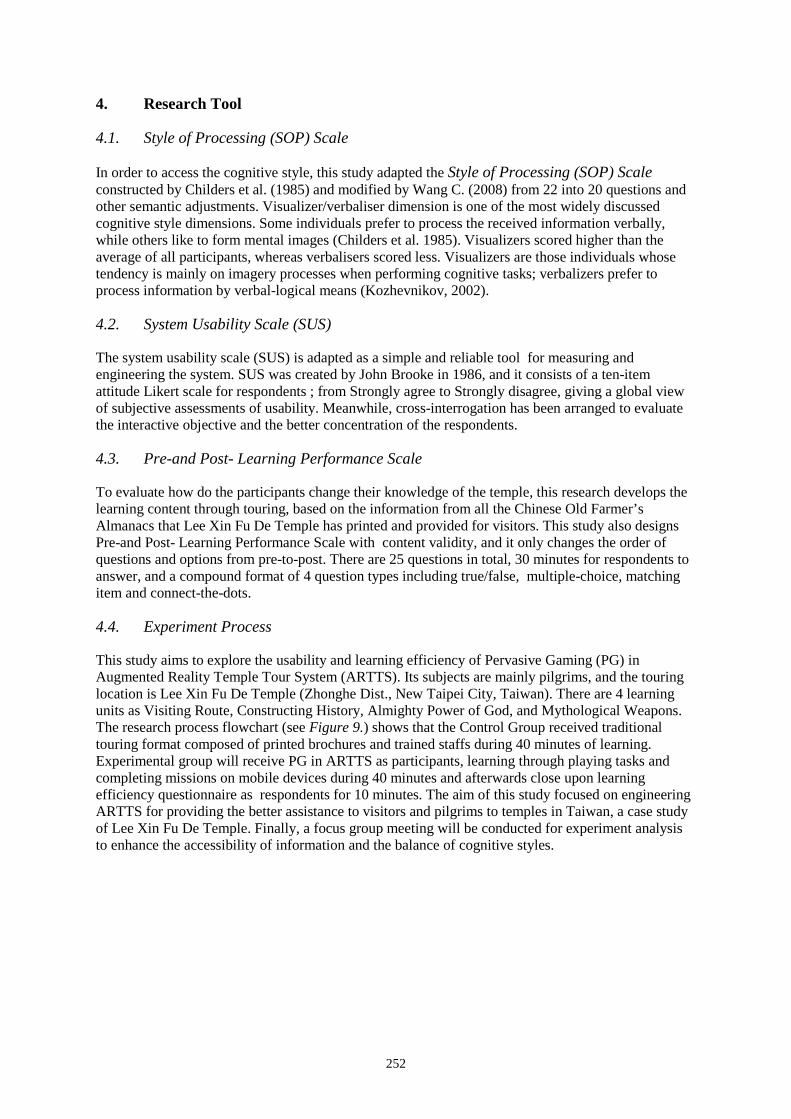
252
4. Research Tool
4.1. Style of Processing (SOP) Scale
In order to access the cognitive style, this study adapted the Style of Processing (SOP) Scale constructed by Childers et al. (1985) and modified by Wang C. (2008) from 22 into 20 questions and other semantic adjustments. Visualizer/verbaliser dimension is one of the most widely discussed cognitive style dimensions. Some individuals prefer to process the received information verbally, while others like to form mental images (Childers et al. 1985). Visualizers scored higher than the average of all participants, whereas verbalisers scored less. Visualizers are those individuals whose tendency is mainly on imagery processes when performing cognitive tasks; verbalizers prefer to process information by verbal-logical means (Kozhevnikov, 2002).
4.2. System Usability Scale (SUS)
The system usability scale (SUS) is adapted as a simple and reliable tool for measuring and engineering the system. SUS was created by John Brooke in 1986, and it consists of a ten-item attitude Likert scale for respondents ; from Strongly agree to Strongly disagree, giving a global view of subjective assessments of usability. Meanwhile, cross-interrogation has been arranged to evaluate the interactive objective and the better concentration of the respondents.
4.3. Pre-and Post- Learning Performance Scale
To evaluate how do the participants change their knowledge of the temple, this research develops the learning content through touring, based on the information from all the Chinese Old Farmer’s Almanacs that Lee Xin Fu De Temple has printed and provided for visitors. This study also designs Pre-and Post- Learning Performance Scale with content validity, and it only changes the order of questions and options from pre-to-post. There are 25 questions in total, 30 minutes for respondents to answer, and a compound format of 4 question types including true/false, multiple-choice, matching item and connect-the-dots.
4.4. Experiment Process
This study aims to explore the usability and learning efficiency of Pervasive Gaming (PG) in Augmented Reality Temple Tour System (ARTTS). Its subjects are mainly pilgrims, and the touring location is Lee Xin Fu De Temple (Zhonghe Dist., New Taipei City, Taiwan). There are 4 learning units as Visiting Route, Constructing History, Almighty Power of God, and Mythological Weapons. The research process flowchart (see Figure 9.) shows that the Control Group received traditional touring format composed of printed brochures and trained staffs during 40 minutes of learning. Experimental group will receive PG in ARTTS as participants, learning through playing tasks and completing missions on mobile devices during 40 minutes and afterwards close upon learning efficiency questionnaire as respondents for 10 minutes. The aim of this study focused on engineering ARTTS for providing the better assistance to visitors and pilgrims to temples in Taiwan, a case study of Lee Xin Fu De Temple. Finally, a focus group meeting will be conducted for experiment analysis to enhance the accessibility of information and the balance of cognitive styles.
253
Figure 9. The Research Process Flowchart.
5. Results
5.1. Cognitive Style
In this study, 60 questionnaires had been issued to each of 60 participants, and we collected 58 valid samples, and 2 removed invalid samples. After analysis, Mean is 74.32, and Standard Deviation is 9.636. Verbalizers are the participants under 71, and visualizers are the participants above 78. In the traditional Control Group, the number of verbalizers is 8 and visualizers 13. In the ARTTS Experimental Group, the number of verbalizers is 12 and visualizers 14. Table 2. shows the cognitive style distribution of the participants.
Table 2. the cognitive style distribution of the participants
Group Visualizer Verbalizer Neutral Counts M+1/3D M-1/3D
Control 13 8 7 29
77.539 71.115 Experimental 14 12 4 29
SUM 27 20 11 58
5.2. System Usability Scale (SUS)
After being transferred, the data (see Table 3.) shows the calculation of SUS, Mean is 85.19, Median is 90, Maximum Number is 97.5, Minimum Number is 42.5, and Standard Deviation is 13.53.
Table 3. the calculation of SUS
Sample Average Median Max. Min. Std Dev
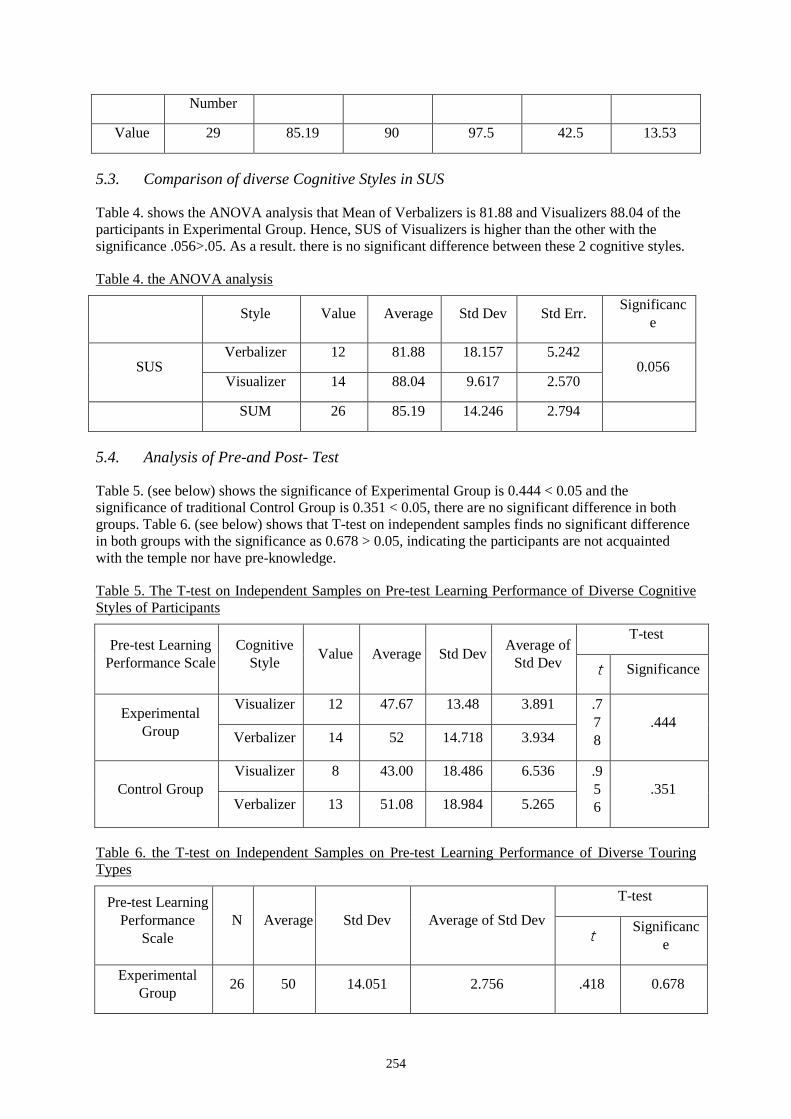
254
Number
Value 29 85.19 90 97.5 42.5 13.53
5.3. Comparison of diverse Cognitive Styles in SUS
Table 4. shows the ANOVA analysis that Mean of Verbalizers is 81.88 and Visualizers 88.04 of the participants in Experimental Group. Hence, SUS of Visualizers is higher than the other with the significance .056>.05. As a result. there is no significant difference between these 2 cognitive styles.
Table 4. the ANOVA analysis
Style Value Average Std Dev Std Err. Significance
SUS Verbalizer 12 81.88 18.157 5.242
0.056 Visualizer 14 88.04 9.617 2.570
SUM 26 85.19 14.246 2.794
5.4. Analysis of Pre-and Post- Test
Table 5. (see below) shows the significance of Experimental Group is 0.444 < 0.05 and the significance of traditional Control Group is 0.351 < 0.05, there are no significant difference in both groups. Table 6. (see below) shows that T-test on independent samples finds no significant difference in both groups with the significance as 0.678 > 0.05, indicating the participants are not acquainted with the temple nor have pre-knowledge.
Table 5. The T-test on Independent Samples on Pre-test Learning Performance of Diverse Cognitive Styles of Participants
Pre-test Learning Performance Scale
Cognitive Style Value Average Std Dev Average of
Std Dev
T-test
t Significance
Experimental Group
Visualizer 12 47.67 13.48 3.891 .778
.444 Verbalizer 14 52 14.718 3.934
Control Group Visualizer 8 43.00 18.486 6.536 .9
56
.351 Verbalizer 13 51.08 18.984 5.265
Table 6. the T-test on Independent Samples on Pre-test Learning Performance of Diverse Touring Types
Pre-test Learning Performance
Scale N Average Std Dev Average of Std Dev
T-test
t Significanc
e
Experimental Group 26 50 14.051 2.756 .418 0.678
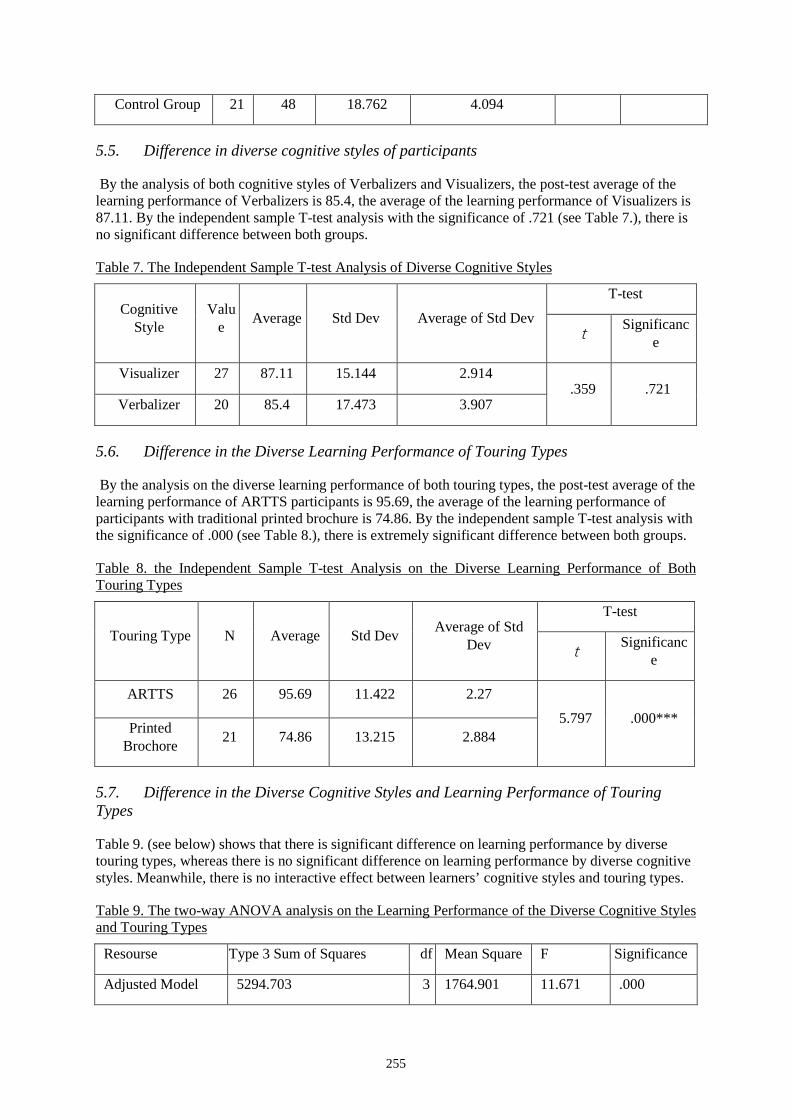
255
Control Group 21 48 18.762 4.094
5.5. Difference in diverse cognitive styles of participants
By the analysis of both cognitive styles of Verbalizers and Visualizers, the post-test average of the learning performance of Verbalizers is 85.4, the average of the learning performance of Visualizers is 87.11. By the independent sample T-test analysis with the significance of .721 (see Table 7.), there is no significant difference between both groups.
Table 7. The Independent Sample T-test Analysis of Diverse Cognitive Styles
Cognitive Style
Value Average Std Dev Average of Std Dev
T-test
t Significanc
e
Visualizer 27 87.11 15.144 2.914 .359 .721
Verbalizer 20 85.4 17.473 3.907
5.6. Difference in the Diverse Learning Performance of Touring Types
By the analysis on the diverse learning performance of both touring types, the post-test average of the learning performance of ARTTS participants is 95.69, the average of the learning performance of participants with traditional printed brochure is 74.86. By the independent sample T-test analysis with the significance of .000 (see Table 8.), there is extremely significant difference between both groups.
Table 8. the Independent Sample T-test Analysis on the Diverse Learning Performance of Both Touring Types
Touring Type N Average Std Dev Average of Std Dev
T-test
t Significanc
e
ARTTS 26 95.69 11.422 2.27 5.797 .000***
Printed Brochore 21 74.86 13.215 2.884
5.7. Difference in the Diverse Cognitive Styles and Learning Performance of Touring Types
Table 9. (see below) shows that there is significant difference on learning performance by diverse touring types, whereas there is no significant difference on learning performance by diverse cognitive styles. Meanwhile, there is no interactive effect between learners’ cognitive styles and touring types.
Table 9. The two-way ANOVA analysis on the Learning Performance of the Diverse Cognitive Styles and Touring Types
Resourse Type 3 Sum of Squares df Mean Square F Significance
Adjusted Model 5294.703 3 1764.901 11.671 .000
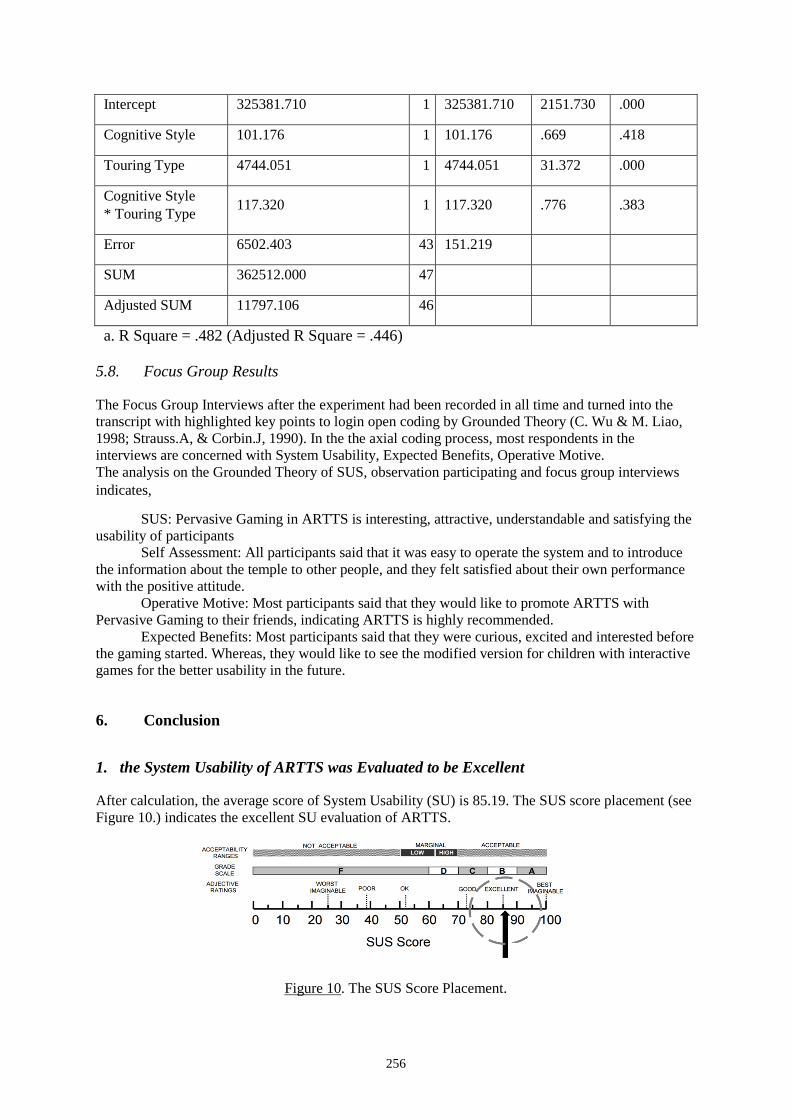
256
Intercept 325381.710 1 325381.710 2151.730 .000
Cognitive Style 101.176 1 101.176 .669 .418
Touring Type 4744.051 1 4744.051 31.372 .000
Cognitive Style * Touring Type 117.320 1 117.320 .776 .383
Error 6502.403 43 151.219
SUM 362512.000 47
Adjusted SUM 11797.106 46
a. R Square = .482 (Adjusted R Square = .446)
5.8. Focus Group Results
The Focus Group Interviews after the experiment had been recorded in all time and turned into the transcript with highlighted key points to login open coding by Grounded Theory (C. Wu & M. Liao, 1998; Strauss.A, & Corbin.J, 1990). In the the axial coding process, most respondents in the interviews are concerned with System Usability, Expected Benefits, Operative Motive. The analysis on the Grounded Theory of SUS, observation participating and focus group interviews indicates,
SUS: Pervasive Gaming in ARTTS is interesting, attractive, understandable and satisfying the usability of participants
Self Assessment: All participants said that it was easy to operate the system and to introduce the information about the temple to other people, and they felt satisfied about their own performance with the positive attitude.
Operative Motive: Most participants said that they would like to promote ARTTS with Pervasive Gaming to their friends, indicating ARTTS is highly recommended.
Expected Benefits: Most participants said that they were curious, excited and interested before the gaming started. Whereas, they would like to see the modified version for children with interactive games for the better usability in the future.
6. Conclusion
1. the System Usability of ARTTS was Evaluated to be Excellent
After calculation, the average score of System Usability (SU) is 85.19. The SUS score placement (see Figure 10.) indicates the excellent SU evaluation of ARTTS.
Figure 10. The SUS Score Placement.
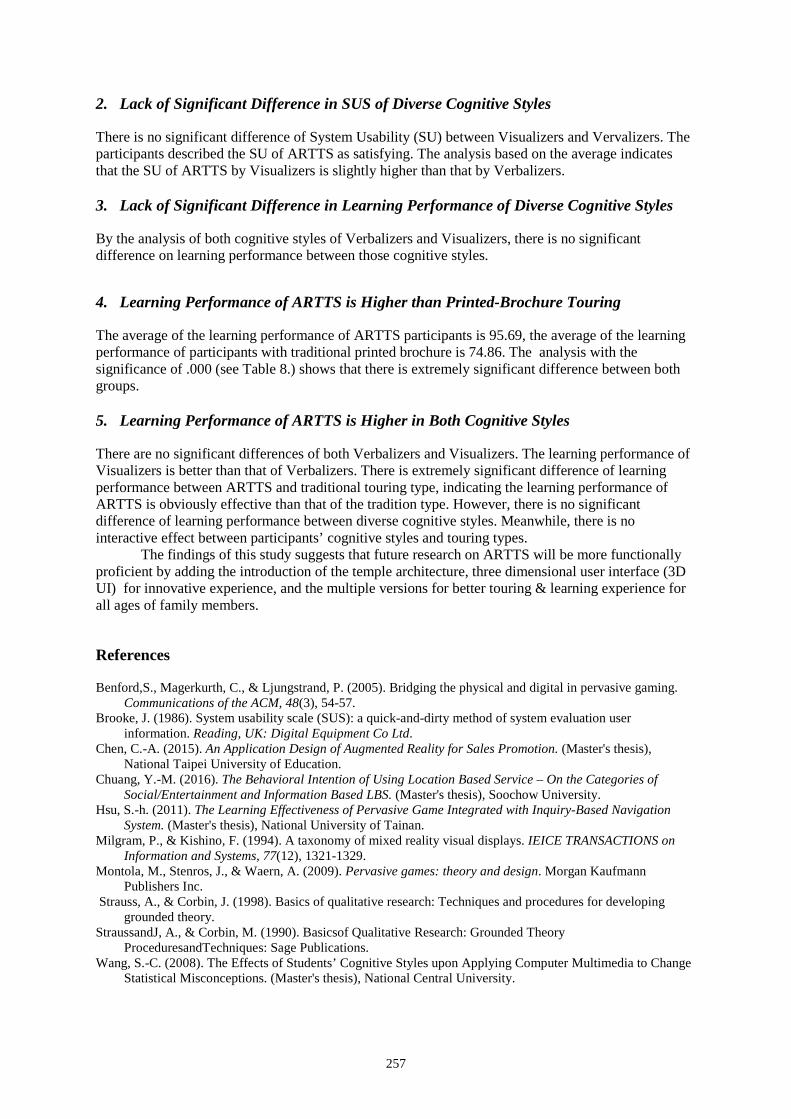
257
2. Lack of Significant Difference in SUS of Diverse Cognitive Styles
There is no significant difference of System Usability (SU) between Visualizers and Vervalizers. The participants described the SU of ARTTS as satisfying. The analysis based on the average indicates that the SU of ARTTS by Visualizers is slightly higher than that by Verbalizers.
3. Lack of Significant Difference in Learning Performance of Diverse Cognitive Styles
By the analysis of both cognitive styles of Verbalizers and Visualizers, there is no significant difference on learning performance between those cognitive styles.
4. Learning Performance of ARTTS is Higher than Printed-Brochure Touring
The average of the learning performance of ARTTS participants is 95.69, the average of the learning performance of participants with traditional printed brochure is 74.86. The analysis with the significance of .000 (see Table 8.) shows that there is extremely significant difference between both groups.
5. Learning Performance of ARTTS is Higher in Both Cognitive Styles
There are no significant differences of both Verbalizers and Visualizers. The learning performance of Visualizers is better than that of Verbalizers. There is extremely significant difference of learning performance between ARTTS and traditional touring type, indicating the learning performance of ARTTS is obviously effective than that of the tradition type. However, there is no significant difference of learning performance between diverse cognitive styles. Meanwhile, there is no interactive effect between participants’ cognitive styles and touring types.
The findings of this study suggests that future research on ARTTS will be more functionally proficient by adding the introduction of the temple architecture, three dimensional user interface (3D UI) for innovative experience, and the multiple versions for better touring & learning experience for all ages of family members.
References
Benford,S., Magerkurth, C., & Ljungstrand, P. (2005). Bridging the physical and digital in pervasive gaming. Communications of the ACM, 48(3), 54-57.
Brooke, J. (1986). System usability scale (SUS): a quick-and-dirty method of system evaluation user information. Reading, UK: Digital Equipment Co Ltd.
Chen, C.-A. (2015). An Application Design of Augmented Reality for Sales Promotion. (Master's thesis), National Taipei University of Education.
Chuang, Y.-M. (2016). The Behavioral Intention of Using Location Based Service – On the Categories of Social/Entertainment and Information Based LBS. (Master's thesis), Soochow University.
Hsu, S.-h. (2011). The Learning Effectiveness of Pervasive Game Integrated with Inquiry-Based Navigation System. (Master's thesis), National University of Tainan.
Milgram, P., & Kishino, F. (1994). A taxonomy of mixed reality visual displays. IEICE TRANSACTIONS on Information and Systems, 77(12), 1321-1329.
Montola, M., Stenros, J., & Waern, A. (2009). Pervasive games: theory and design. Morgan Kaufmann Publishers Inc.
Strauss, A., & Corbin, J. (1998). Basics of qualitative research: Techniques and procedures for developing grounded theory.
StraussandJ, A., & Corbin, M. (1990). Basicsof Qualitative Research: Grounded Theory ProceduresandTechniques: Sage Publications.
Wang, S.-C. (2008). The Effects of Students’ Cognitive Styles upon Applying Computer Multimedia to Change Statistical Misconceptions. (Master's thesis), National Central University.
Hayashi, Y., et al. (Eds.) (2017). Workshop Proceedings of the 25th International Conference on Computers in Education. New Zealand: Asia-Pacific Society for Computers in Education
258
Using Brainwave to Measure and Explore the Correlation between Attention and Cognitive
Load Shu-Chen CHENGa*, Yu-Ping CHENGb, Yi-Lin CHENa & Yueh-Min HUANGb
a Department of Computer Science and Information Engineering, Southern Taiwan University of Science and Technology, Taiwan
b Department of Engineering Science, National Cheng Kung University, Taiwan *[email protected]
Abstract: Currently, as the developments of the measuring techniques of non-invasive brain wave measurement instrument have become increasingly mature, it is widely applied for medical or educational researches. This study combined NueroSky and the cognitive load scale to discuss learning considerations and discover the learning pattern for each student. The experimental data found that most learners are more concentrated in the medium and low loads of learning-oriented tasks or non-learning-oriented tasks during their learning process, and the total task execution time or the attention duration of such kinds of tasks will last longer.
Keywords: Attention, Cognitive Load
1. Introduction
As science and technology become increasingly developed, learners can rely on the convenience brought by science and technology to learn new knowledge in an efficient manner. Based on the research of many scholars, this research understands the importance of attention, as attention is the beginning of all learning activities. When learners’ attention is attracted, they will continue to concentrate on learning, and link such learning with their known knowledge. In this way, knowledge gradually becomes the long-term memories of learners, and is stored in the brain. Therefore, in order to discuss learners’ learning environments at home, this research uses brain wave measurement instrument to record learners’ attention during various activities, which is combined with the cognitive load scale to discuss learners’ attention and cognitive load during various activities, and observe whether there exists significant relevance between attention and cognitive load.
2. Literature review
2.1. Brain wave
The potential signals of brain waves are very weak (about 5~100Hz) (Webster, 1998), thus, the detection and recording of EEG is quite difficult, as they are easily affected by external or other factors during the measurement process, meaning that brain wave data cannot be smoothly collected. As shown in Figure 1, according to the different frequencies, the EEG signal will divide brain waves into 5 main wave bands: α wave, β wave, γ wave, θ wave, and δ wave (Campisi, P., La Rocca, D., & Scarano, G.,2012; Sanei, & Chambers, 2007; Gregory, & Pettus, 2005). The β wave is also associated with attention and cognitive behavior.
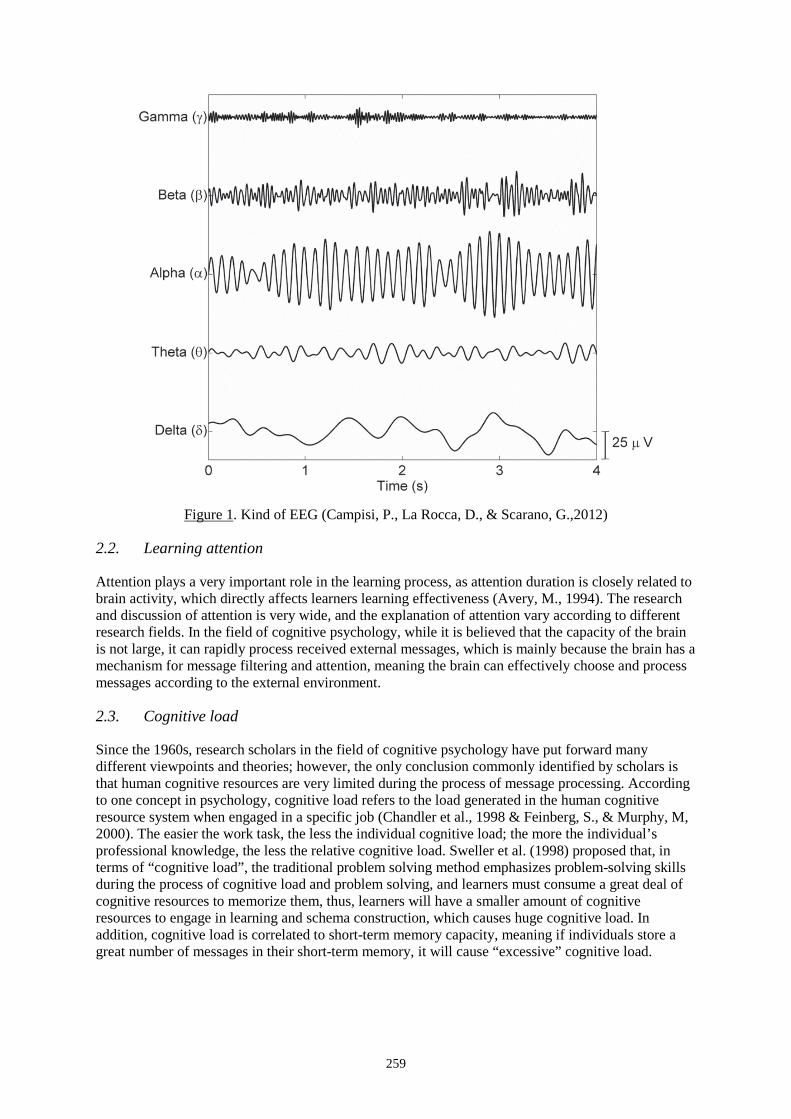
259
Figure 1. Kind of EEG (Campisi, P., La Rocca, D., & Scarano, G.,2012)
2.2. Learning attention
Attention plays a very important role in the learning process, as attention duration is closely related to brain activity, which directly affects learners learning effectiveness (Avery, M., 1994). The research and discussion of attention is very wide, and the explanation of attention vary according to different research fields. In the field of cognitive psychology, while it is believed that the capacity of the brain is not large, it can rapidly process received external messages, which is mainly because the brain has a mechanism for message filtering and attention, meaning the brain can effectively choose and process messages according to the external environment.
2.3. Cognitive load
Since the 1960s, research scholars in the field of cognitive psychology have put forward many different viewpoints and theories; however, the only conclusion commonly identified by scholars is that human cognitive resources are very limited during the process of message processing. According to one concept in psychology, cognitive load refers to the load generated in the human cognitive resource system when engaged in a specific job (Chandler et al., 1998 & Feinberg, S., & Murphy, M, 2000). The easier the work task, the less the individual cognitive load; the more the individual’s professional knowledge, the less the relative cognitive load. Sweller et al. (1998) proposed that, in terms of “cognitive load”, the traditional problem solving method emphasizes problem-solving skills during the process of cognitive load and problem solving, and learners must consume a great deal of cognitive resources to memorize them, thus, learners will have a smaller amount of cognitive resources to engage in learning and schema construction, which causes huge cognitive load. In addition, cognitive load is correlated to short-term memory capacity, meaning if individuals store a great number of messages in their short-term memory, it will cause “excessive” cognitive load.
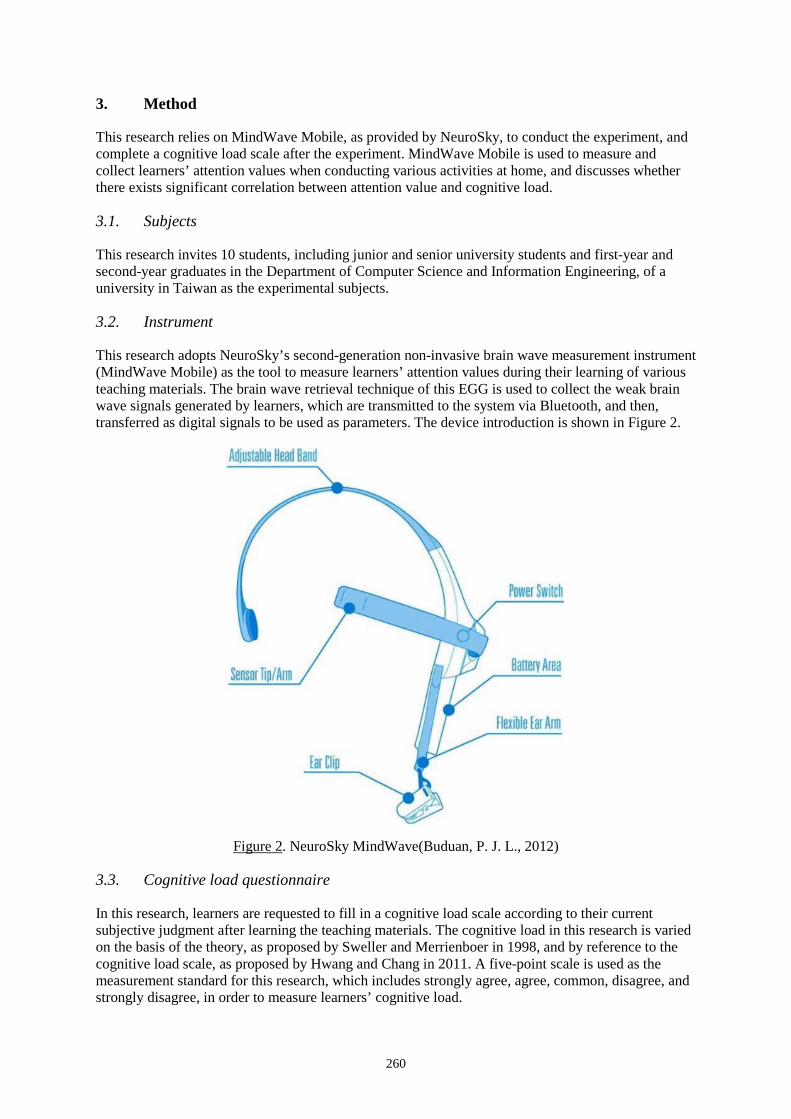
260
3. Method
This research relies on MindWave Mobile, as provided by NeuroSky, to conduct the experiment, and complete a cognitive load scale after the experiment. MindWave Mobile is used to measure and collect learners’ attention values when conducting various activities at home, and discusses whether there exists significant correlation between attention value and cognitive load.
3.1. Subjects
This research invites 10 students, including junior and senior university students and first-year and second-year graduates in the Department of Computer Science and Information Engineering, of a university in Taiwan as the experimental subjects.
3.2. Instrument
This research adopts NeuroSky’s second-generation non-invasive brain wave measurement instrument (MindWave Mobile) as the tool to measure learners’ attention values during their learning of various teaching materials. The brain wave retrieval technique of this EGG is used to collect the weak brain wave signals generated by learners, which are transmitted to the system via Bluetooth, and then, transferred as digital signals to be used as parameters. The device introduction is shown in Figure 2.
Figure 2. NeuroSky MindWave(Buduan, P. J. L., 2012)
3.3. Cognitive load questionnaire
In this research, learners are requested to fill in a cognitive load scale according to their current subjective judgment after learning the teaching materials. The cognitive load in this research is varied on the basis of the theory, as proposed by Sweller and Merrienboer in 1998, and by reference to the cognitive load scale, as proposed by Hwang and Chang in 2011. A five-point scale is used as the measurement standard for this research, which includes strongly agree, agree, common, disagree, and strongly disagree, in order to measure learners’ cognitive load.
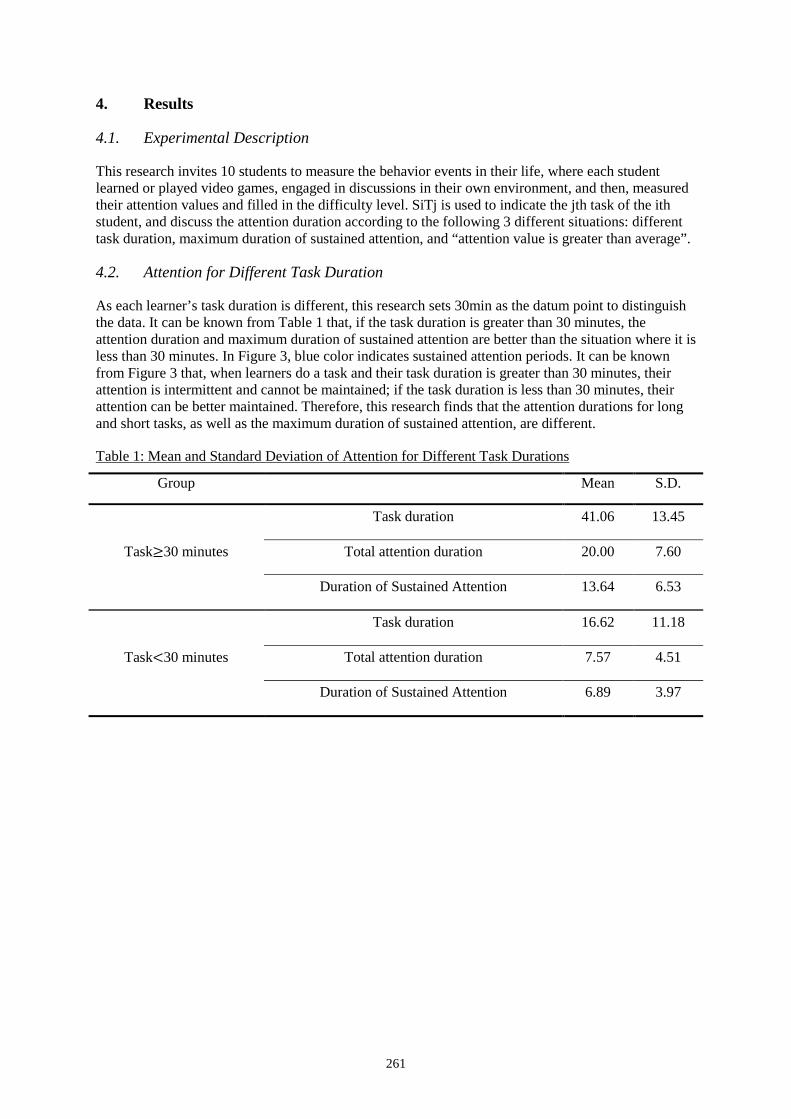
261
4. Results
4.1. Experimental Description
This research invites 10 students to measure the behavior events in their life, where each student learned or played video games, engaged in discussions in their own environment, and then, measured their attention values and filled in the difficulty level. SiTj is used to indicate the jth task of the ith student, and discuss the attention duration according to the following 3 different situations: different task duration, maximum duration of sustained attention, and “attention value is greater than average”.
4.2. Attention for Different Task Duration
As each learner’s task duration is different, this research sets 30min as the datum point to distinguish the data. It can be known from Table 1 that, if the task duration is greater than 30 minutes, the attention duration and maximum duration of sustained attention are better than the situation where it is less than 30 minutes. In Figure 3, blue color indicates sustained attention periods. It can be known from Figure 3 that, when learners do a task and their task duration is greater than 30 minutes, their attention is intermittent and cannot be maintained; if the task duration is less than 30 minutes, their attention can be better maintained. Therefore, this research finds that the attention durations for long and short tasks, as well as the maximum duration of sustained attention, are different.
Table 1: Mean and Standard Deviation of Attention for Different Task Durations
Group Mean S.D.
Task≥30 minutes
Task duration 41.06 13.45
Total attention duration 20.00 7.60
Duration of Sustained Attention 13.64 6.53
Task<30 minutes
Task duration 16.62 11.18
Total attention duration 7.57 4.51
Duration of Sustained Attention 6.89 3.97
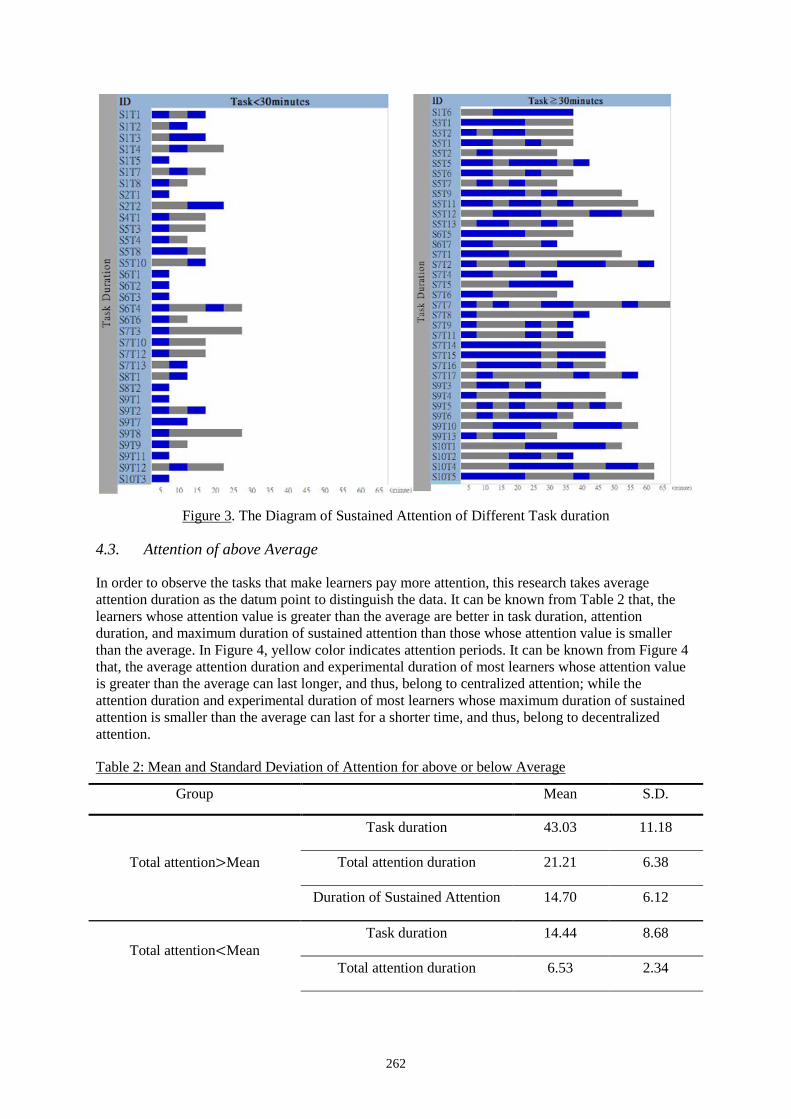
262
Figure 3. The Diagram of Sustained Attention of Different Task duration
4.3. Attention of above Average
In order to observe the tasks that make learners pay more attention, this research takes average attention duration as the datum point to distinguish the data. It can be known from Table 2 that, the learners whose attention value is greater than the average are better in task duration, attention duration, and maximum duration of sustained attention than those whose attention value is smaller than the average. In Figure 4, yellow color indicates attention periods. It can be known from Figure 4 that, the average attention duration and experimental duration of most learners whose attention value is greater than the average can last longer, and thus, belong to centralized attention; while the attention duration and experimental duration of most learners whose maximum duration of sustained attention is smaller than the average can last for a shorter time, and thus, belong to decentralized attention.
Table 2: Mean and Standard Deviation of Attention for above or below Average
Group Mean S.D.
Total attention>Mean
Task duration 43.03 11.18
Total attention duration 21.21 6.38
Duration of Sustained Attention 14.70 6.12
Total attention<Mean Task duration 14.44 8.68
Total attention duration 6.53 2.34
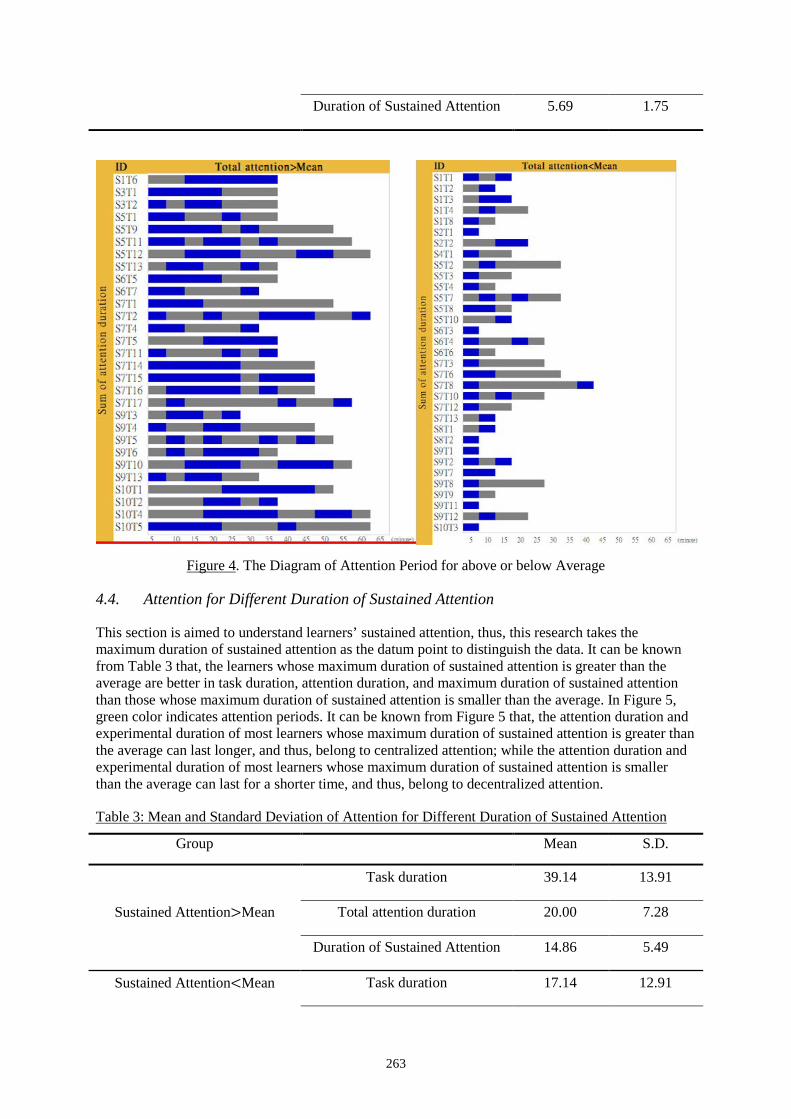
263
Duration of Sustained Attention 5.69 1.75
Figure 4. The Diagram of Attention Period for above or below Average
4.4. Attention for Different Duration of Sustained Attention
This section is aimed to understand learners’ sustained attention, thus, this research takes the maximum duration of sustained attention as the datum point to distinguish the data. It can be known from Table 3 that, the learners whose maximum duration of sustained attention is greater than the average are better in task duration, attention duration, and maximum duration of sustained attention than those whose maximum duration of sustained attention is smaller than the average. In Figure 5, green color indicates attention periods. It can be known from Figure 5 that, the attention duration and experimental duration of most learners whose maximum duration of sustained attention is greater than the average can last longer, and thus, belong to centralized attention; while the attention duration and experimental duration of most learners whose maximum duration of sustained attention is smaller than the average can last for a shorter time, and thus, belong to decentralized attention.
Table 3: Mean and Standard Deviation of Attention for Different Duration of Sustained Attention
Group Mean S.D.
Sustained Attention>Mean
Task duration 39.14 13.91
Total attention duration 20.00 7.28
Duration of Sustained Attention 14.86 5.49
Sustained Attention<Mean Task duration 17.14 12.91
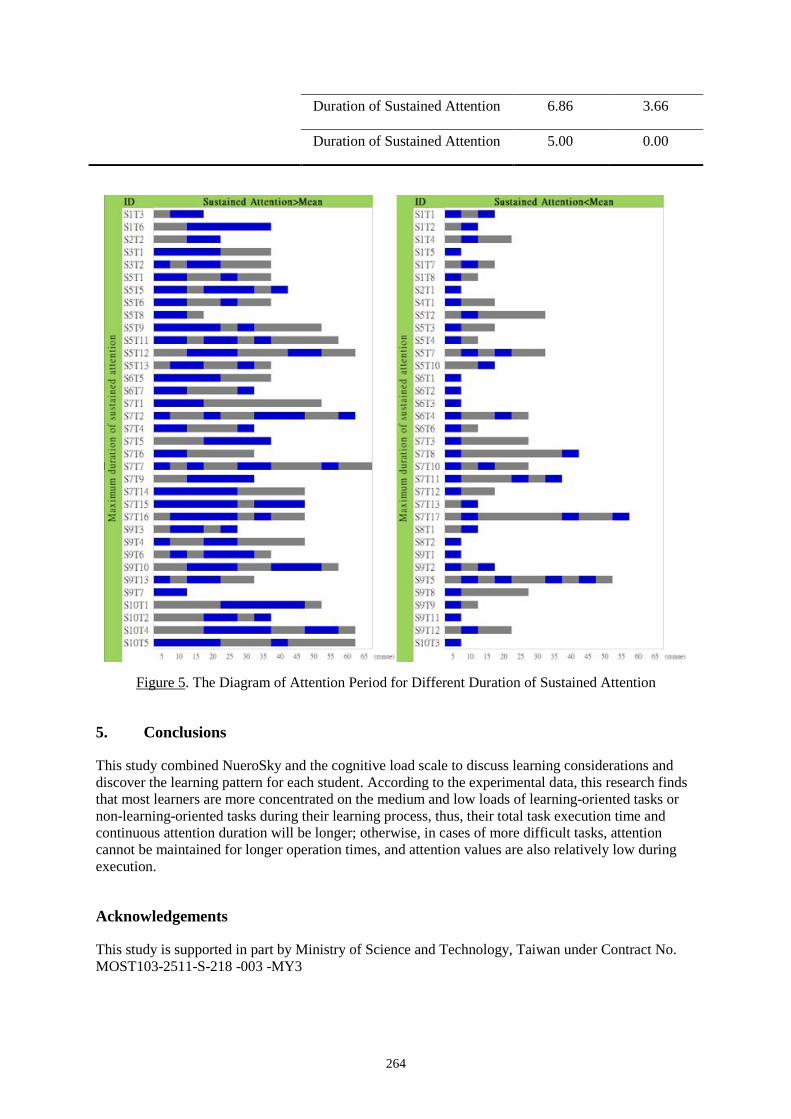
264
Duration of Sustained Attention 6.86 3.66
Duration of Sustained Attention 5.00 0.00
Figure 5. The Diagram of Attention Period for Different Duration of Sustained Attention
5. Conclusions
This study combined NueroSky and the cognitive load scale to discuss learning considerations and discover the learning pattern for each student. According to the experimental data, this research finds that most learners are more concentrated on the medium and low loads of learning-oriented tasks or non-learning-oriented tasks during their learning process, thus, their total task execution time and continuous attention duration will be longer; otherwise, in cases of more difficult tasks, attention cannot be maintained for longer operation times, and attention values are also relatively low during execution.
Acknowledgements
This study is supported in part by Ministry of Science and Technology, Taiwan under Contract No. MOST103-2511-S-218 -003 -MY3

265
References
Avery, M. (1994). Preschool physical education: A practical approach. Journal of Physical Education, Recreation & Dance, 65(6), 37-39.
Buduan, P. J. L. (2012). Brain Controlled LCD Message Display for Disabled (Doctoral dissertation, Holy Angel University).
Chandler, P., Cooper, G., Pollock, E., & Tindall-Ford, S. (1998). Applying cognitive psychology principles to education and training. Australian Association for Research in Education, retrieved April, 17, 2003.
Feinberg, S., & Murphy, M. (2000, September). Applying cognitive load theory to the design of web-based instruction. In Proceedings of IEEE professional communication society international professional communication conference and Proceedings of the 18th annual ACM international conference on Computer documentation: technology & teamwork (pp. 353-360). IEEE Educational Activities Department.
Gregory, T. K., & Pettus, D. C. (1986). An electroencephalographic processing algorithm specifically intended for analysis of cerebral electrical activity. Journal of clinical monitoring, 2(3), 190-197.
Campisi, P., La Rocca, D., & Scarano, G. (2012). EEG for automatic person recognition. Computer, 45(7), 87-89.
Hwang, G. J., & Chang, H. F. (2011). A formative assessment-based mobile learning approach to improving the learning attitudes and achievements of students. Computers & Education, 56(4), 1023-1031.
Sanei, S., & Chambers, J. A. (2007). EEG Signal processing, 2007. Sweller, J., Van Menienboer, J., & Paas, F. (1998). Cognitive architecture and instructional design. Educational
Psychology Review. 10(3). 251-296. Sweller, J., Van Merrienboer, J. J., & Paas, F. G. (1998). Cognitive architecture and instructional design.
Educational psychology review, 10(3), 251-296. Webster, J. (1998). Electroencephalography: Brain electrical activity. Encyclopedia of medical devices and
instrumentation, 2, 1084-1107.
Hayashi, Y., et al. (Eds.) (2017). Workshop Proceedings of the 25th International Conference on Computers in Education. New Zealand: Asia-Pacific Society for Computers in Education
266
On Technology Awareness and Acceptance among Preschool English Language Teachers in
Ukraine Olha DALTE*, Jing LENGb & Xiaoqing GUc
Department of Educational Technology, East China Normal University,
Shanghai, China *[email protected]
Abstract: Previous research has proved that ubiquitous learning environment supports language learning among preschoolers, but the children cannot access the technology if their parents and teachers do not use it in their daily life and learning process. The usage of the Applications for the English teaching in kindergartens still poses lots of questions. The current research aims to evaluate the current level of technology usage among preschool English teachers and analysis whether their attitude towards technologies can change after the technologies are included in the learning curriculum. The participants are five preschool teachers from the private kindergarten in Ukraine. The results showed that before the implementation of the experimental course, two out of five teachers have not been enough qualified for using modern technologies in the preschool classroom. After the implementation of the course, all teachers admit that their level of technology usage improves and they are willing to use modern technologies in their future work. The current research highlights the importance of modern technologies for preschool education and describes it from teachers prospective of view.
Keywords: preschool education, technology-enhanced language teaching, technology acceptance model, technology awareness.
1. Introduction
New technologies produce great influence on different aspects of modern life. The development of digital communication methods, information transfer and storage has had a significant influence on education, and technology development has made it possible for individuals with less computer skills to produce and disseminate information. As a result, learning now can occur almost at any time and in any place that has communication services. Nowadays, even the youngest learners can become the part of learning progress. According to Geng et al (2016), the toddlers start to use iPads even before they can speak. The previous research proves that usage of modern technologies can speed up the efficiency of learning process up to 3.8 times and can keep children attention 2.8 times more effective that the traditional paper-based materials (Dalte, Jing, Gu, 2017).
While the adult learners can get an access to modern technologies on their own, the usage of them among preschoolers depends directly on the technology awareness and acceptance among their teachers and parents.
According to the report of Ukrainian Ministry of Sports and Education (2012), more than 80% of 3-5 year old children are affiliated with different kindergartens and preschool educational centers. The majority of them start to learn there English as their second language. However, the educational system of Ukraine is quite conservative and modern technologies still have not widely penetrated in it, especially on the preschool level. That is why it is extremely important to get a better understanding on the technology awareness, acceptance and usage among preschool teachers. In addition, the current research aims to highlight the change in teachers attitude towards technologies after they have been implemented in the teaching plan and approved by the principle.
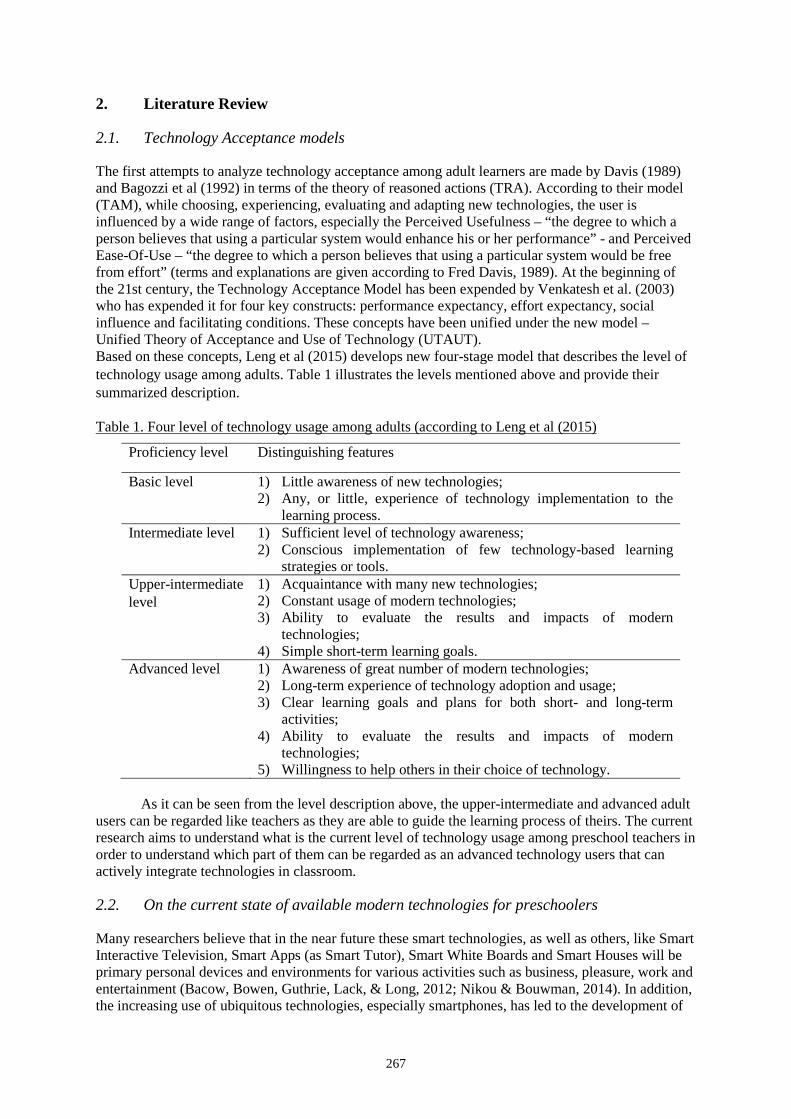
267
2. Literature Review
2.1. Technology Acceptance models
The first attempts to analyze technology acceptance among adult learners are made by Davis (1989) and Bagozzi et al (1992) in terms of the theory of reasoned actions (TRA). According to their model (TAM), while choosing, experiencing, evaluating and adapting new technologies, the user is influenced by a wide range of factors, especially the Perceived Usefulness – “the degree to which a person believes that using a particular system would enhance his or her performance” - and Perceived Ease-Of-Use – “the degree to which a person believes that using a particular system would be free from effort” (terms and explanations are given according to Fred Davis, 1989). At the beginning of the 21st century, the Technology Acceptance Model has been expended by Venkatesh et al. (2003) who has expended it for four key constructs: performance expectancy, effort expectancy, social influence and facilitating conditions. These concepts have been unified under the new model – Unified Theory of Acceptance and Use of Technology (UTAUT). Based on these concepts, Leng et al (2015) develops new four-stage model that describes the level of technology usage among adults. Table 1 illustrates the levels mentioned above and provide their summarized description.
Table 1. Four level of technology usage among adults (according to Leng et al (2015)
Proficiency level Distinguishing features
Basic level 1) Little awareness of new technologies; 2) Any, or little, experience of technology implementation to the
learning process. Intermediate level 1) Sufficient level of technology awareness;
2) Conscious implementation of few technology-based learning strategies or tools.
Upper-intermediate level
1) Acquaintance with many new technologies; 2) Constant usage of modern technologies; 3) Ability to evaluate the results and impacts of modern
technologies; 4) Simple short-term learning goals.
Advanced level 1) Awareness of great number of modern technologies; 2) Long-term experience of technology adoption and usage; 3) Clear learning goals and plans for both short- and long-term
activities; 4) Ability to evaluate the results and impacts of modern
technologies; 5) Willingness to help others in their choice of technology.
As it can be seen from the level description above, the upper-intermediate and advanced adult
users can be regarded like teachers as they are able to guide the learning process of theirs. The current research aims to understand what is the current level of technology usage among preschool teachers in order to understand which part of them can be regarded as an advanced technology users that can actively integrate technologies in classroom.
2.2. On the current state of available modern technologies for preschoolers
Many researchers believe that in the near future these smart technologies, as well as others, like Smart Interactive Television, Smart Apps (as Smart Tutor), Smart White Boards and Smart Houses will be primary personal devices and environments for various activities such as business, pleasure, work and entertainment (Bacow, Bowen, Guthrie, Lack, & Long, 2012; Nikou & Bouwman, 2014). In addition, the increasing use of ubiquitous technologies, especially smartphones, has led to the development of
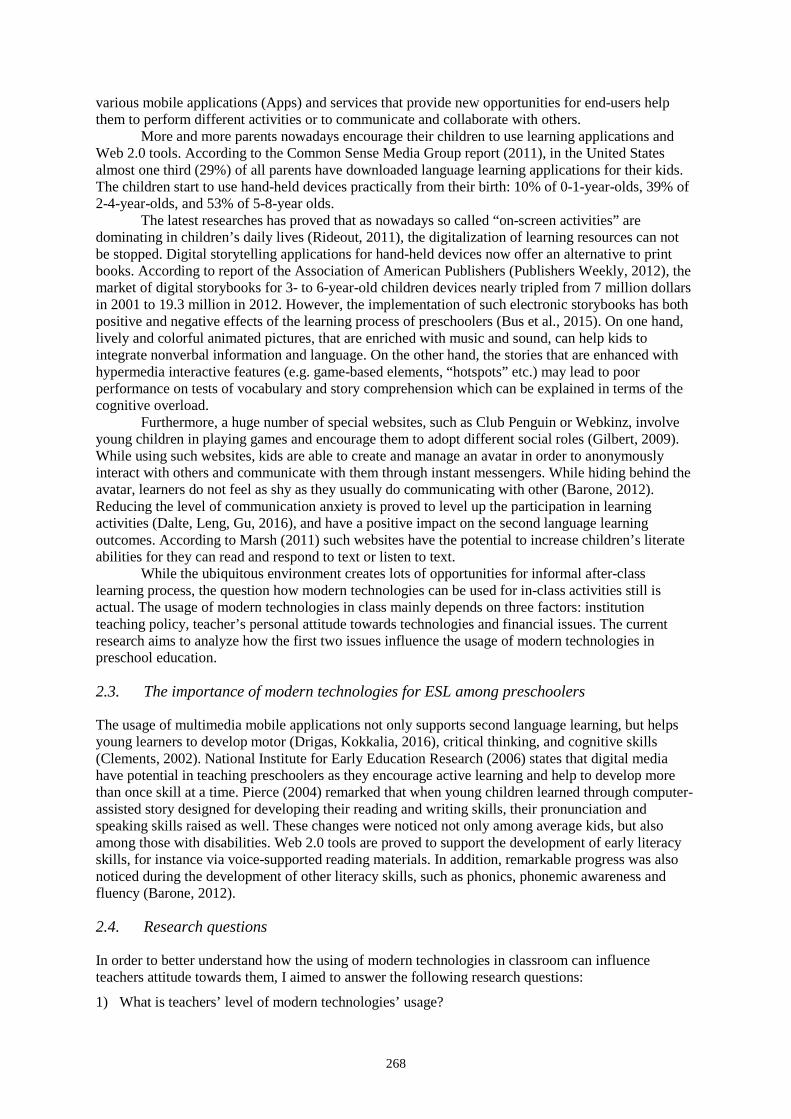
268
various mobile applications (Apps) and services that provide new opportunities for end-users help them to perform different activities or to communicate and collaborate with others.
More and more parents nowadays encourage their children to use learning applications and Web 2.0 tools. According to the Common Sense Media Group report (2011), in the United States almost one third (29%) of all parents have downloaded language learning applications for their kids. The children start to use hand-held devices practically from their birth: 10% of 0-1-year-olds, 39% of 2-4-year-olds, and 53% of 5-8-year olds.
The latest researches has proved that as nowadays so called “on-screen activities” are dominating in children’s daily lives (Rideout, 2011), the digitalization of learning resources can not be stopped. Digital storytelling applications for hand-held devices now offer an alternative to print books. According to report of the Association of American Publishers (Publishers Weekly, 2012), the market of digital storybooks for 3- to 6-year-old children devices nearly tripled from 7 million dollars in 2001 to 19.3 million in 2012. However, the implementation of such electronic storybooks has both positive and negative effects of the learning process of preschoolers (Bus et al., 2015). On one hand, lively and colorful animated pictures, that are enriched with music and sound, can help kids to integrate nonverbal information and language. On the other hand, the stories that are enhanced with hypermedia interactive features (e.g. game-based elements, “hotspots” etc.) may lead to poor performance on tests of vocabulary and story comprehension which can be explained in terms of the cognitive overload.
Furthermore, a huge number of special websites, such as Club Penguin or Webkinz, involve young children in playing games and encourage them to adopt different social roles (Gilbert, 2009). While using such websites, kids are able to create and manage an avatar in order to anonymously interact with others and communicate with them through instant messengers. While hiding behind the avatar, learners do not feel as shy as they usually do communicating with other (Barone, 2012). Reducing the level of communication anxiety is proved to level up the participation in learning activities (Dalte, Leng, Gu, 2016), and have a positive impact on the second language learning outcomes. According to Marsh (2011) such websites have the potential to increase children’s literate abilities for they can read and respond to text or listen to text.
While the ubiquitous environment creates lots of opportunities for informal after-class learning process, the question how modern technologies can be used for in-class activities still is actual. The usage of modern technologies in class mainly depends on three factors: institution teaching policy, teacher’s personal attitude towards technologies and financial issues. The current research aims to analyze how the first two issues influence the usage of modern technologies in preschool education.
2.3. The importance of modern technologies for ESL among preschoolers
The usage of multimedia mobile applications not only supports second language learning, but helps young learners to develop motor (Drigas, Kokkalia, 2016), critical thinking, and cognitive skills (Clements, 2002). National Institute for Early Education Research (2006) states that digital media have potential in teaching preschoolers as they encourage active learning and help to develop more than once skill at a time. Pierce (2004) remarked that when young children learned through computer-assisted story designed for developing their reading and writing skills, their pronunciation and speaking skills raised as well. These changes were noticed not only among average kids, but also among those with disabilities. Web 2.0 tools are proved to support the development of early literacy skills, for instance via voice-supported reading materials. In addition, remarkable progress was also noticed during the development of other literacy skills, such as phonics, phonemic awareness and fluency (Barone, 2012).
2.4. Research questions
In order to better understand how the using of modern technologies in classroom can influence teachers attitude towards them, I aimed to answer the following research questions:
1) What is teachers’ level of modern technologies’ usage?
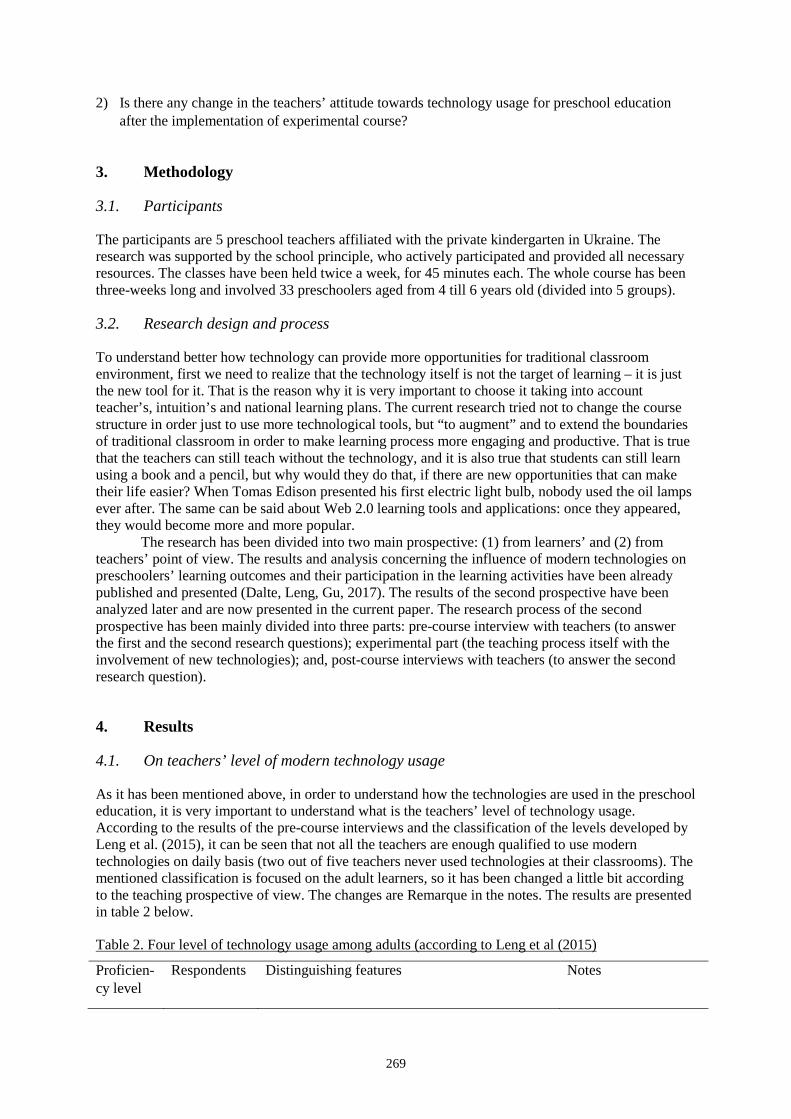
269
2) Is there any change in the teachers’ attitude towards technology usage for preschool education after the implementation of experimental course?
3. Methodology
3.1. Participants
The participants are 5 preschool teachers affiliated with the private kindergarten in Ukraine. The research was supported by the school principle, who actively participated and provided all necessary resources. The classes have been held twice a week, for 45 minutes each. The whole course has been three-weeks long and involved 33 preschoolers aged from 4 till 6 years old (divided into 5 groups).
3.2. Research design and process
To understand better how technology can provide more opportunities for traditional classroom environment, first we need to realize that the technology itself is not the target of learning – it is just the new tool for it. That is the reason why it is very important to choose it taking into account teacher’s, intuition’s and national learning plans. The current research tried not to change the course structure in order just to use more technological tools, but “to augment” and to extend the boundaries of traditional classroom in order to make learning process more engaging and productive. That is true that the teachers can still teach without the technology, and it is also true that students can still learn using a book and a pencil, but why would they do that, if there are new opportunities that can make their life easier? When Tomas Edison presented his first electric light bulb, nobody used the oil lamps ever after. The same can be said about Web 2.0 learning tools and applications: once they appeared, they would become more and more popular.
The research has been divided into two main prospective: (1) from learners’ and (2) from teachers’ point of view. The results and analysis concerning the influence of modern technologies on preschoolers’ learning outcomes and their participation in the learning activities have been already published and presented (Dalte, Leng, Gu, 2017). The results of the second prospective have been analyzed later and are now presented in the current paper. The research process of the second prospective has been mainly divided into three parts: pre-course interview with teachers (to answer the first and the second research questions); experimental part (the teaching process itself with the involvement of new technologies); and, post-course interviews with teachers (to answer the second research question).
4. Results
4.1. On teachers’ level of modern technology usage
As it has been mentioned above, in order to understand how the technologies are used in the preschool education, it is very important to understand what is the teachers’ level of technology usage. According to the results of the pre-course interviews and the classification of the levels developed by Leng et al. (2015), it can be seen that not all the teachers are enough qualified to use modern technologies on daily basis (two out of five teachers never used technologies at their classrooms). The mentioned classification is focused on the adult learners, so it has been changed a little bit according to the teaching prospective of view. The changes are Remarque in the notes. The results are presented in table 2 below.
Table 2. Four level of technology usage among adults (according to Leng et al (2015)
Proficien-cy level
Respondents Distinguishing features Notes
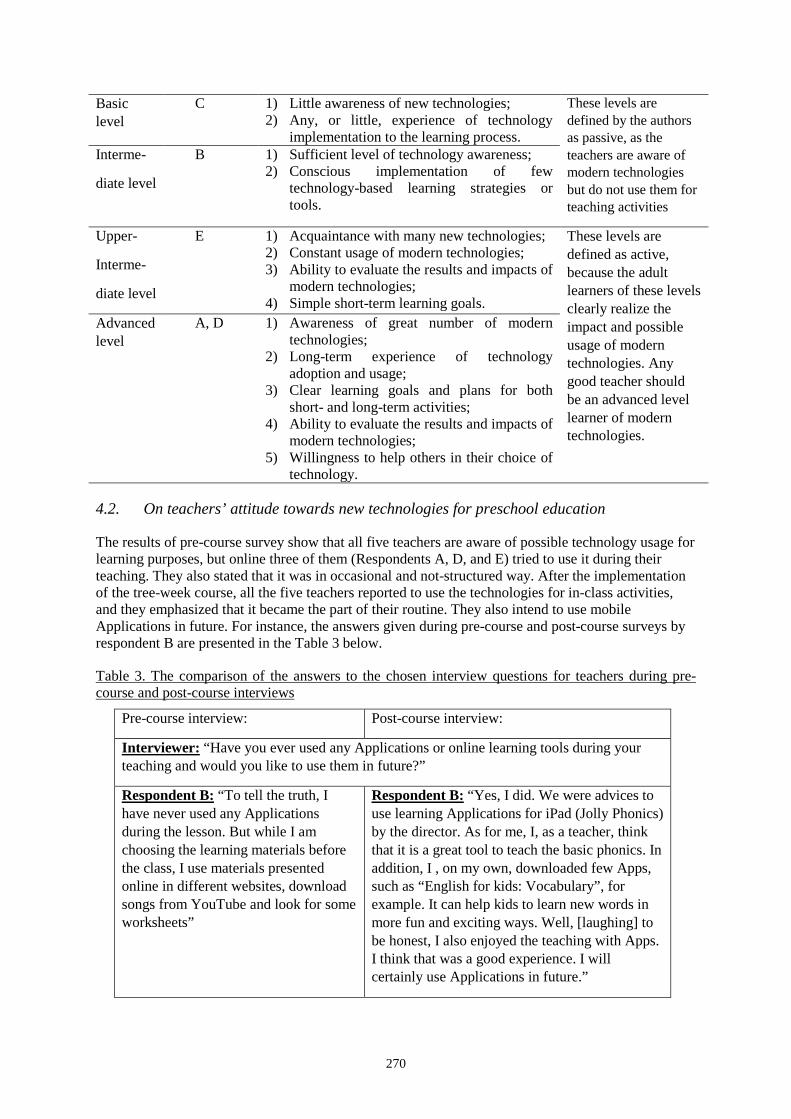
270
Basic level
C 1) Little awareness of new technologies; 2) Any, or little, experience of technology
implementation to the learning process.
These levels are defined by the authors as passive, as the teachers are aware of modern technologies but do not use them for teaching activities
Interme-
diate level
B 1) Sufficient level of technology awareness; 2) Conscious implementation of few
technology-based learning strategies or tools.
Upper-
Interme-
diate level
E 1) Acquaintance with many new technologies; 2) Constant usage of modern technologies; 3) Ability to evaluate the results and impacts of
modern technologies; 4) Simple short-term learning goals.
These levels are defined as active, because the adult learners of these levels clearly realize the impact and possible usage of modern technologies. Any good teacher should be an advanced level learner of modern technologies.
Advanced level
A, D 1) Awareness of great number of modern technologies;
2) Long-term experience of technology adoption and usage;
3) Clear learning goals and plans for both short- and long-term activities;
4) Ability to evaluate the results and impacts of modern technologies;
5) Willingness to help others in their choice of technology.
4.2. On teachers’ attitude towards new technologies for preschool education
The results of pre-course survey show that all five teachers are aware of possible technology usage for learning purposes, but online three of them (Respondents A, D, and E) tried to use it during their teaching. They also stated that it was in occasional and not-structured way. After the implementation of the tree-week course, all the five teachers reported to use the technologies for in-class activities, and they emphasized that it became the part of their routine. They also intend to use mobile Applications in future. For instance, the answers given during pre-course and post-course surveys by respondent B are presented in the Table 3 below.
Table 3. The comparison of the answers to the chosen interview questions for teachers during pre-course and post-course interviews
Pre-course interview: Post-course interview:
Interviewer: “Have you ever used any Applications or online learning tools during your teaching and would you like to use them in future?”
Respondent B: “To tell the truth, I have never used any Applications during the lesson. But while I am choosing the learning materials before the class, I use materials presented online in different websites, download songs from YouTube and look for some worksheets”
Respondent B: “Yes, I did. We were advices to use learning Applications for iPad (Jolly Phonics) by the director. As for me, I, as a teacher, think that it is a great tool to teach the basic phonics. In addition, I , on my own, downloaded few Apps, such as “English for kids: Vocabulary”, for example. It can help kids to learn new words in more fun and exciting ways. Well, [laughing] to be honest, I also enjoyed the teaching with Apps. I think that was a good experience. I will certainly use Applications in future.”
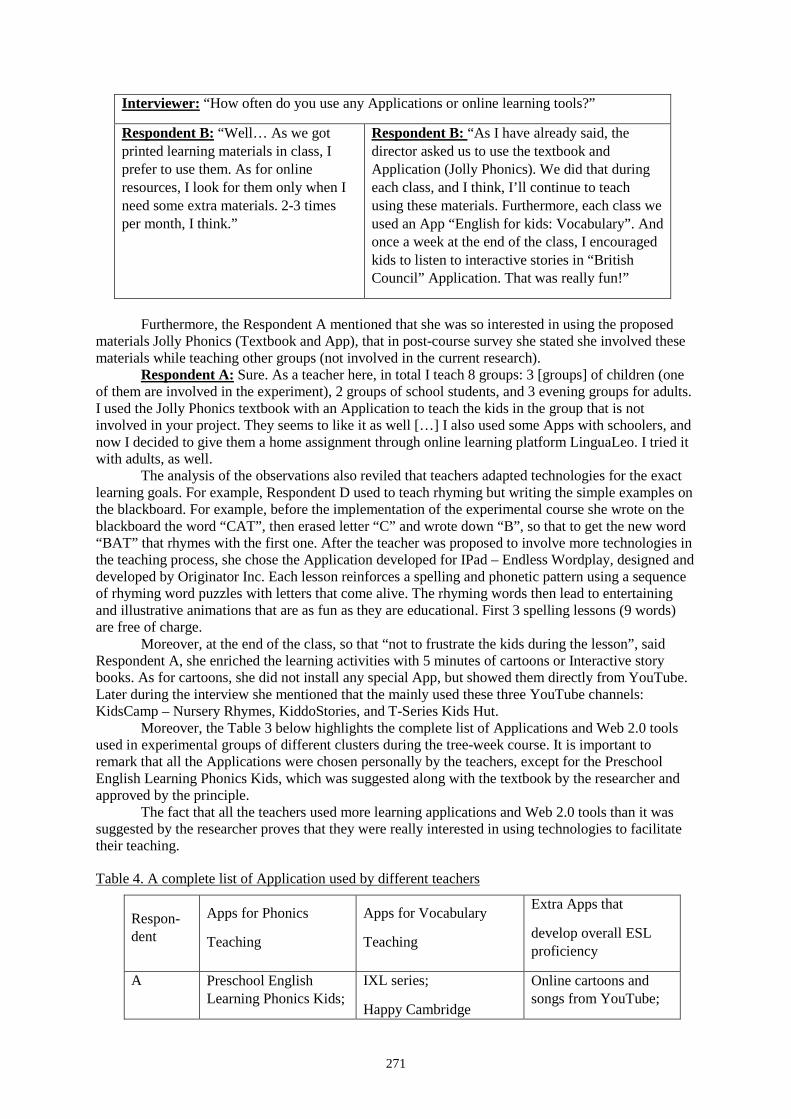
271
Interviewer: “How often do you use any Applications or online learning tools?”
Respondent B: “Well… As we got printed learning materials in class, I prefer to use them. As for online resources, I look for them only when I need some extra materials. 2-3 times per month, I think.”
Respondent B: “As I have already said, the director asked us to use the textbook and Application (Jolly Phonics). We did that during each class, and I think, I’ll continue to teach using these materials. Furthermore, each class we used an App “English for kids: Vocabulary”. And once a week at the end of the class, I encouraged kids to listen to interactive stories in “British Council” Application. That was really fun!”
Furthermore, the Respondent A mentioned that she was so interested in using the proposed
materials Jolly Phonics (Textbook and App), that in post-course survey she stated she involved these materials while teaching other groups (not involved in the current research).
Respondent A: Sure. As a teacher here, in total I teach 8 groups: 3 [groups] of children (one of them are involved in the experiment), 2 groups of school students, and 3 evening groups for adults. I used the Jolly Phonics textbook with an Application to teach the kids in the group that is not involved in your project. They seems to like it as well […] I also used some Apps with schoolers, and now I decided to give them a home assignment through online learning platform LinguaLeo. I tried it with adults, as well.
The analysis of the observations also reviled that teachers adapted technologies for the exact learning goals. For example, Respondent D used to teach rhyming but writing the simple examples on the blackboard. For example, before the implementation of the experimental course she wrote on the blackboard the word “CAT”, then erased letter “C” and wrote down “B”, so that to get the new word “BAT” that rhymes with the first one. After the teacher was proposed to involve more technologies in the teaching process, she chose the Application developed for IPad – Endless Wordplay, designed and developed by Originator Inc. Each lesson reinforces a spelling and phonetic pattern using a sequence of rhyming word puzzles with letters that come alive. The rhyming words then lead to entertaining and illustrative animations that are as fun as they are educational. First 3 spelling lessons (9 words) are free of charge.
Moreover, at the end of the class, so that “not to frustrate the kids during the lesson”, said Respondent A, she enriched the learning activities with 5 minutes of cartoons or Interactive story books. As for cartoons, she did not install any special App, but showed them directly from YouTube. Later during the interview she mentioned that the mainly used these three YouTube channels: KidsCamp – Nursery Rhymes, KiddoStories, and T-Series Kids Hut.
Moreover, the Table 3 below highlights the complete list of Applications and Web 2.0 tools used in experimental groups of different clusters during the tree-week course. It is important to remark that all the Applications were chosen personally by the teachers, except for the Preschool English Learning Phonics Kids, which was suggested along with the textbook by the researcher and approved by the principle.
The fact that all the teachers used more learning applications and Web 2.0 tools than it was suggested by the researcher proves that they were really interested in using technologies to facilitate their teaching.
Table 4. A complete list of Application used by different teachers
Respon-dent
Apps for Phonics
Teaching
Apps for Vocabulary
Teaching
Extra Apps that
develop overall ESL proficiency
A Preschool English Learning Phonics Kids;
IXL series;
Happy Cambridge
Online cartoons and songs from YouTube;
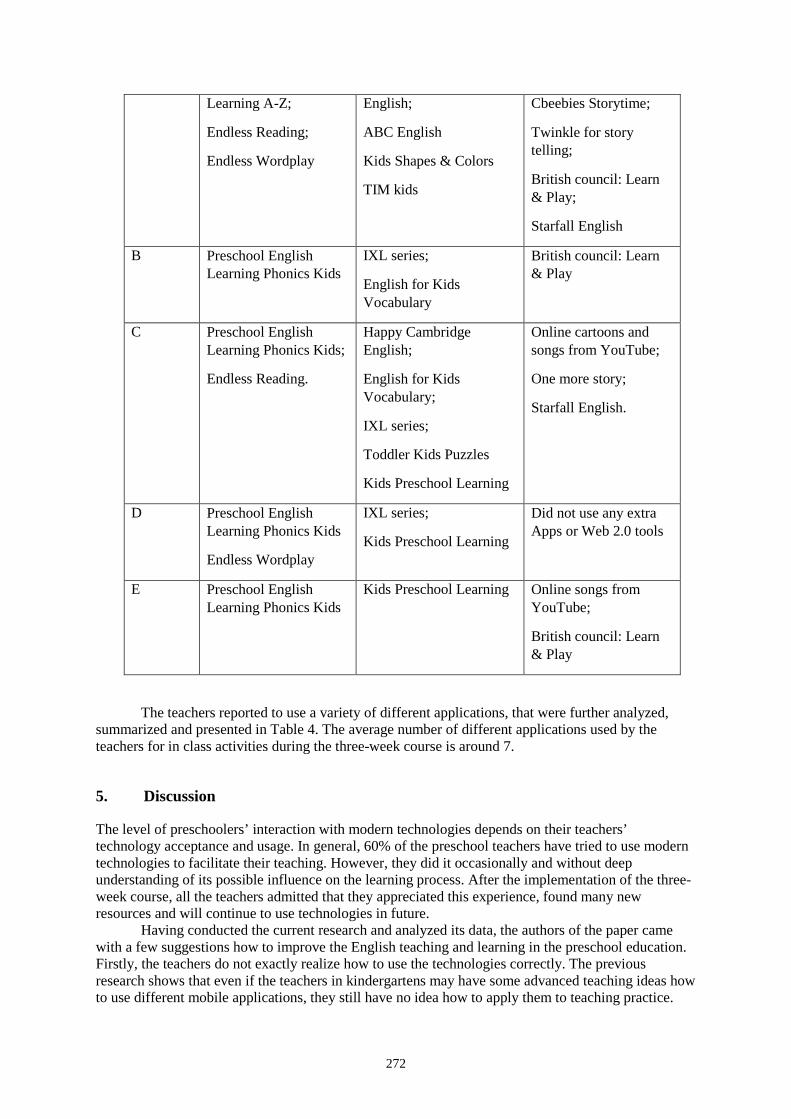
272
Learning A-Z;
Endless Reading;
Endless Wordplay
English;
ABC English
Kids Shapes & Colors
TIM kids
Cbeebies Storytime;
Twinkle for story telling;
British council: Learn & Play;
Starfall English
B Preschool English Learning Phonics Kids
IXL series;
English for Kids Vocabulary
British council: Learn & Play
C Preschool English Learning Phonics Kids;
Endless Reading.
Happy Cambridge English;
English for Kids Vocabulary;
IXL series;
Toddler Kids Puzzles
Kids Preschool Learning
Online cartoons and songs from YouTube;
One more story;
Starfall English.
D Preschool English Learning Phonics Kids
Endless Wordplay
IXL series;
Kids Preschool Learning
Did not use any extra Apps or Web 2.0 tools
E Preschool English Learning Phonics Kids
Kids Preschool Learning Online songs from YouTube;
British council: Learn & Play
The teachers reported to use a variety of different applications, that were further analyzed, summarized and presented in Table 4. The average number of different applications used by the teachers for in class activities during the three-week course is around 7.
5. Discussion
The level of preschoolers’ interaction with modern technologies depends on their teachers’ technology acceptance and usage. In general, 60% of the preschool teachers have tried to use modern technologies to facilitate their teaching. However, they did it occasionally and without deep understanding of its possible influence on the learning process. After the implementation of the three-week course, all the teachers admitted that they appreciated this experience, found many new resources and will continue to use technologies in future.
Having conducted the current research and analyzed its data, the authors of the paper came with a few suggestions how to improve the English teaching and learning in the preschool education. Firstly, the teachers do not exactly realize how to use the technologies correctly. The previous research shows that even if the teachers in kindergartens may have some advanced teaching ideas how to use different mobile applications, they still have no idea how to apply them to teaching practice.
273
After the clear instructions were given to the teachers by the principle and the researchers, the teachers admitted that their understanding improved. Secondly, the researcher noticed that teachers should pay more attention to the choice of teaching methods taking into account children’s psychological and physical development. Thirdly, more attention should be paid to the ways of keeping children active during the lesson. According to the results of the current research, modern technologies can help children to focus better on the materials, however, some of them still are not involved in the learning process. In the kindergarten, preschoolers acquires the firth impression about the foreign language and the emotions which accompanies this process can significantly influence their future success. That is why it is important to cultivate positive attitude towards learning at the very first steps.
References
Attewell, P., & Battle, J. (1999). Home computers and school performance. The Information Society, 15, 1-10. Attewell, P., Suazo-Garcia, B., & Battle, J. (2003). Computers and young children: Social benefit or social
problem? Social Forces, 82, 277-296. Bacow, L. S., Bowen, W. G., Guthrie, K. M., Lack, K. A., & Long, M. P. (2012). Barriers to Adoption of
Online Learning Systems in U.S. Higher Education Ithaka S+R report. Bagozzi, R. P., Davis, F. D., & Warshaw, P. R. (1992). Development and test of a theory of technological
learning and usage. Human Relations, 45(7), 660-686. Barone, D., & Wright, T. (2008). Literacy instruction with digital and media technologies. The Reading
Teacher, 62, 292-301. Bus, A. G., Takacs, Z. K., & Kegel, C. A. T. (2015). Affordances and limitations of electronic storybooks for
young children’s emergent literacy. Developmental Review, 35, 79–97. http://doi.org/10.1016/j.dr.2014.12.004
Clements, H.D. (2002) Computers in early childhood mathematics. Contemporary İssues İn Early Childhood 3(2),160-181
Common Sense Media (2011). Zero to eight: Children’s media use in America. New York, NY: Common Sense Media.
Dalte, Leng, & Gu. (2016). Exploring the Relationship between Language Learning Strategy Usage and Anxiety among Chinese University Students. In Proceedings of the 24th International Conference on Computers in Education (ICCE2016) (pp. 489–491).
Dalte, O., Leng, J., Gu, X. (2017) The Influence of Technology-enhanced Environment on the Progress and Participation in ESL Learning Activities among Ukrainian Preschoolers. Proceedings of the ICALT 2015, Romania, Accepted on March, 2017, 3 p.
Davis, F. D. (1989). Perceived usefulness, perceived ease of use, and user acceptance of information technology. MIS Quarterly, 13(3), 319-340.
Drigas, A. S., Kokkalia, G. K. (2016) Mobile learning for special preschool education. International Journal of Interactive Mobile Technologies (iJIM), 10, 67-74
Geng, G., Disney, L., Mason, J. (2016) Transference of Learning from Play with iPads in Early Childhood. Proceedings of the 24th International Conference on Computers in Education (ICCE2016), p. 431-436.
Gilbert, B. (2009). Virtual worlds market forecast 2009-2015. Strategy Analytics. Retrieved from www.strategyanalytics.com/default.spx?mod=R eportAbstractViewer&a0=4779
Leng, J., Gu, X., & Dalte, O. (2015). Understanding Learners ’ Technology Adoption Behavior for English language learning in Ubiquitous Environments. In Proceedings of the 23rd International Conference on Computers in Education, pp. 459–464.
Marsh, J. (2011). Young children’s literacy practices in a virtual world: Establishing an online interaction order. Reading Research Quarterly, 46, 101-118.
National Center for Education Statistics. (2005). Rates of computer and Internet use by children in nursery school and students in kindergarten through twelfth grade: 2003. Retrieved from http://nces.ed.gob/pubsearch/pubsinfo.asp?pubi d=2005111rev
Nikou, S., & Bouwman, H. (2014). Ubiquitous use of mobile social network services. Telematics and Informatics, 31, 422-433.
Pierce, P. (2004). Technology integration into early childhood curricula: Where we’ve been, where are we are, where we should go. (Chapter 3). Retrieved from Chapel Hill, NC: University of North Carolina.
Publishers Weekly. (June 21, 2012). www.publisher-weekly.com/pw/by-topic/childrens/childrens-industry-news/article/ 52632-the-kids-books-are-alright-says-the-aap-s-monthly-statshot.hml.

274
Rideout, V. (2011). Zero to eight: Children’s media use in America. San Francisco: Common Sense Media. <www.commonsense>, <media.org/sites/default/files/research/zerotoeightfinal2011.pdf
Ukrainian Ministry of Sports and Education (2012) Early childhood education: current state and prospective. Reports #41-42. Citation in Ukrainian: Стан та перспективи розвитку дошкільної освіти / Освіта, 2012. – № 41–42. – С. 2
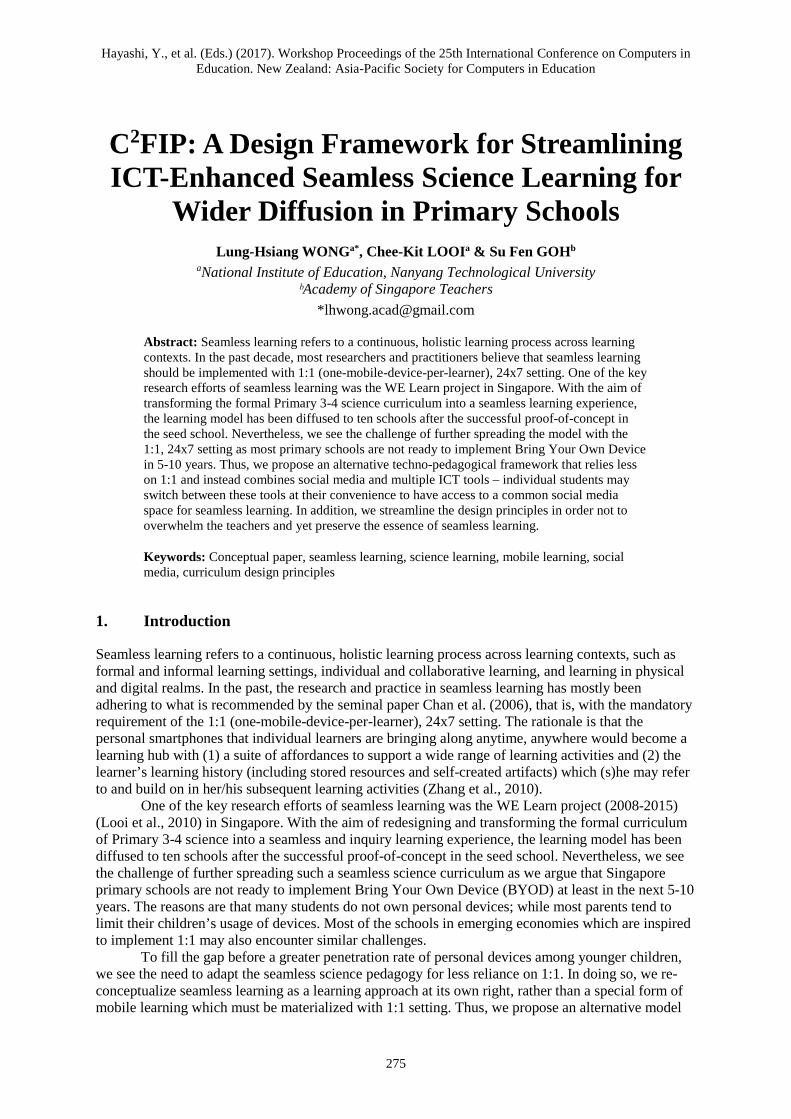
Hayashi, Y., et al. (Eds.) (2017). Workshop Proceedings of the 25th International Conference on Computers in Education. New Zealand: Asia-Pacific Society for Computers in Education
275
C2FIP: A Design Framework for Streamlining ICT-Enhanced Seamless Science Learning for
Wider Diffusion in Primary Schools Lung-Hsiang WONGa*, Chee-Kit LOOIa & Su Fen GOHb
aNational Institute of Education, Nanyang Technological University ᵇAcademy of Singapore Teachers
Abstract: Seamless learning refers to a continuous, holistic learning process across learning contexts. In the past decade, most researchers and practitioners believe that seamless learning should be implemented with 1:1 (one-mobile-device-per-learner), 24x7 setting. One of the key research efforts of seamless learning was the WE Learn project in Singapore. With the aim of transforming the formal Primary 3-4 science curriculum into a seamless learning experience, the learning model has been diffused to ten schools after the successful proof-of-concept in the seed school. Nevertheless, we see the challenge of further spreading the model with the 1:1, 24x7 setting as most primary schools are not ready to implement Bring Your Own Device in 5-10 years. Thus, we propose an alternative techno-pedagogical framework that relies less on 1:1 and instead combines social media and multiple ICT tools – individual students may switch between these tools at their convenience to have access to a common social media space for seamless learning. In addition, we streamline the design principles in order not to overwhelm the teachers and yet preserve the essence of seamless learning.
Keywords: Conceptual paper, seamless learning, science learning, mobile learning, social media, curriculum design principles
1. Introduction
Seamless learning refers to a continuous, holistic learning process across learning contexts, such as formal and informal learning settings, individual and collaborative learning, and learning in physical and digital realms. In the past, the research and practice in seamless learning has mostly been adhering to what is recommended by the seminal paper Chan et al. (2006), that is, with the mandatory requirement of the 1:1 (one-mobile-device-per-learner), 24x7 setting. The rationale is that the personal smartphones that individual learners are bringing along anytime, anywhere would become a learning hub with (1) a suite of affordances to support a wide range of learning activities and (2) the learner’s learning history (including stored resources and self-created artifacts) which (s)he may refer to and build on in her/his subsequent learning activities (Zhang et al., 2010).
One of the key research efforts of seamless learning was the WE Learn project (2008-2015) (Looi et al., 2010) in Singapore. With the aim of redesigning and transforming the formal curriculum of Primary 3-4 science into a seamless and inquiry learning experience, the learning model has been diffused to ten schools after the successful proof-of-concept in the seed school. Nevertheless, we see the challenge of further spreading such a seamless science curriculum as we argue that Singapore primary schools are not ready to implement Bring Your Own Device (BYOD) at least in the next 5-10 years. The reasons are that many students do not own personal devices; while most parents tend to limit their children’s usage of devices. Most of the schools in emerging economies which are inspired to implement 1:1 may also encounter similar challenges.
To fill the gap before a greater penetration rate of personal devices among younger children, we see the need to adapt the seamless science pedagogy for less reliance on 1:1. In doing so, we re-conceptualize seamless learning as a learning approach at its own right, rather than a special form of mobile learning which must be materialized with 1:1 setting. Thus, we propose an alternative model
276
that combines social media and multiple ICT (InfoComm Technology) tools (school and home computers, schools’ or family members’ handheld devices or cameras, etc.) – individual students may switch between these devices at their convenience to have access to a common social media space for seamless learning activities. In addition, we strive for simplifying the design principles in order not to overwhelm the teachers (who will shoulder the seamless learning design tasks when the researchers have completed their studies and left the schools) and yet preserve the essence of seamless learning.
2. Literature Review
Seamless learning has been identified as one of the advanced learning approaches that can address the needs of 21st century learners (Sharples et al., 2012). With the salient characteristic of bridging multifaceted learning efforts across a variety of learning settings, the intention is to nurture a disposition in students to continually carry out the trajectories of learning-application-reflection through recontextualizations of previously constructed knowledge (Wong, Milrad, & Specht, 2015).
Seamless learning was first proposed in the field of higher education (American College Personnel Association, 1994; Kuh, 1996) with an emphasis on policy-level reform to foster a culture of seamless learning (bridging in-class and out-of-class, curricular and co-curricular experiences) within colleges while the potential facilitating role of the technology is not explicitly explicated. The notion was then incepted into the context of mobile learning by Chan et al. (2006) which advocated the use of mobile technology in 1:1, 24x7 setting to facilitate individual students’ ongoing, cross-contextual seamless learning. This seminal paper launched the line of research in mobile-assisted seamless learning which has later been spread to more than 40 countries in the past decade, with science being the most popular domain that seamless learning has been applied to (Wong, 2015). Over the years, there has been a gradual shift of researchers’ perceptions on mobile-assisted seamless learning from a technology-enabling perspective (e.g., Hwang, Tsai, & Yang, 2008) to a curriculum design perspective (e.g., Looi & Wong, 2013) to the fostering of a learning culture (e.g., Milrad et al., 2013). This reflects a swing of the foci of the community of seamless learning from developing innovative technologies for seamless learning to the unpacking of the nature of seamless learning and making pragmatic impacts in the schools. The perception of having 1:1, 24x7 as a mandatory condition for seamless learning has been challenged. Rather than taking it as a special form of mobile learning, more recent literature argues that seamless learning is a learning notion at its own right – as an aspiration (Sharples et al., 2012), a habit-of-mind (Wong & Looi, 2011) or as a set of metacognitive abilities (Sharples, 2015). Thus, alternative technological support models have been proposed, such as the “division of labor” (i.e., using different digital or even non-digital tools available at various locations) model (Wong, 2012; Wong & Looi, 2011) and the use of social media (Charitonos, Blake, Scanlon, & Jones, 2012).
In particular, social media are increasingly used for supporting students’ communicative and creative endeavors (Greenhow, Robelia, & Hughes, 2009). Social media supports process-oriented learning by promoting interactions amongst students and between students and teachers. Posted thoughts and ‘‘information pieces” make it possible for users to participate with others in their thinking (Ebner, Lienhardt, Rohs, & Meyer, 2010). More importantly, social media affords situating of learning in multiple contexts through the same social network. For science learning, teachers may create topical social media items to solicit student responses in and out of classroom, or encourage the students to generate social media on specific curricular themes, or on any real-life encounter that triggers curiosity. Such student-generated social media will then be opened to negotiation and retelling through peer replies, as contending meanings come into play, as different experiences are shared, and as new ideas come to light (Lewis, Pea, & Rosen, 2010). In the perspective of seamless learning, designing seamless learning processes around social media would free the students from relying on 24x7 access to personal devices, as social media spaces are accessible by multiple platforms or devices (i.e., “division of labor”). In short, the age of social media offers unprecedented opportunities for educators to create learning environments for pervasive trajectory of authentic, cross-contextual and socialized learning.
277
3. Our Prior Work – the “WE Learn” Project
Since the inception of seamless learning in Singapore science classrooms in 2009, we have established a proof-of-concept for the learning model. Beginning with a pilot study in a Primary 3 class in the seed school during 2009-2010 (1st cycle of intervention), the model was later refined and scaled up to the entire Primary 3 level in 2012 (2nd cycle of intervention). The model has now become the anchoring pedagogical model in the regular Primary 3-4 science classes in the seed school, with the support of 1:1, 24x7 setting. Furthermore, the school has taken over the agency to diffuse the model to nine other schools since 2014, with further model localization (3rd cycle of intervention). Rich data were collected and analyzed across these cycles, with the evidences of the model’s efficacy in transforming science learning being reported in Zhang et al. (2010) and Looi et al. (2014). In particular, we found the students developed inquiry skills, reflective thinking skills and reasoning skills with participation in more inquiry activities, collaborative activities and completion of mobile learning tasks using different learning tools (Looi et al., 2014; Song, Wong, & Looi, 2012).
4. A New Seamless Science Learning Design Framework – C2FIP
4.1. C2FIP
Despite of the success of the WE Learn project, we see the need to address the issue of relatively limited access to mobile devices for most of the young students at present stage before we can further diffuse our seamless learning model to more schools. Whereas the mainstream educational technology research tends to push the boundary of technology and assume that students can benefit from the most advanced (but typically costly and not necessarily sustainable) technical solutions in an ideal world, it is equally important for practice-driven researchers to explore lower-cost means to accomplish similar learning outcomes – for those educational settings which cannot afford relatively expensive technologies. Another key consideration and motivation for us to translate the design framework is that we would like to streamline various sets of design principles that we developed in different cycles of the WE Learn project in order not to overwhelm the teachers in developing the design capacity for seamless learning.
Throughout the course of the WE Learn project, we had developed three sets of design principles as reported in Zhang et al. (2010), Wong (2013b) and Looi and Wong (2013) respectively, with 6-8 principles being laid out in each set. Now, with the aim of reducing the design complexity, we streamlined these principle sets into five principles, namely, C2FIP (Connectivity of learning spaces, (socio-)Constructivist inquiry learning; Formative assessments with student artifacts; leveraging resources in Informal settings; Personalized and self-directed learning). We hope the streamlining will make the model easier for more teachers to comprehend and adopt for implementation, while retaining the essence of seamless learning. By making each lesson plan (typically for delivering one scientific topic) as a unit of design, a teacher may apply the principles to transform the learning process into a seamless learning experience. The five principles are elaborated below, • Connectivity of learning activities: Make the learning process cross-contextual, not just
encompassing formal and informal settings but also learning in both individual and social settings, and in both physical and digital environments, that is, to “do the right thing with the right tool at the right time/place” (Sha, 2015) (e.g., engagement and preliminary learning in class, application and observation in daily life, and further research and peer discussions on the web, etc.), and to bridge these learning efforts. In addition, facilitate outdoor learning trails (in or out of campus) that require the applications of knowledge of not just one single science topic but across multiple topics (i.e., help students to connect old and new knowledge).
• socio-Constructivist inquiry learning: Facilitate an interplay of individual and collaborative inquiry learning. Encourage diverse ideas from the students during various learning activities, and help the students in connecting ideas or pieces of knowledge (e.g., between concrete and abstract knowledge, between prior and new knowledge) through various means such as concept
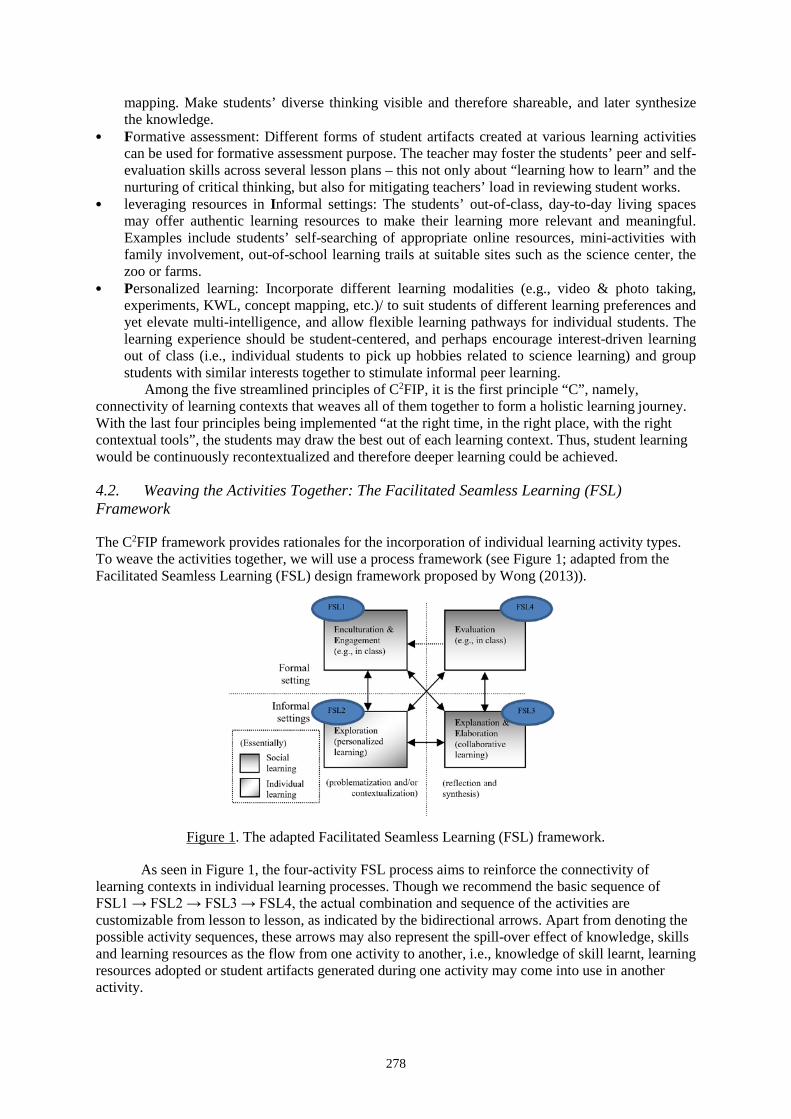
278
mapping. Make students’ diverse thinking visible and therefore shareable, and later synthesize the knowledge.
• Formative assessment: Different forms of student artifacts created at various learning activities can be used for formative assessment purpose. The teacher may foster the students’ peer and self-evaluation skills across several lesson plans – this not only about “learning how to learn” and the nurturing of critical thinking, but also for mitigating teachers’ load in reviewing student works.
• leveraging resources in Informal settings: The students’ out-of-class, day-to-day living spaces may offer authentic learning resources to make their learning more relevant and meaningful. Examples include students’ self-searching of appropriate online resources, mini-activities with family involvement, out-of-school learning trails at suitable sites such as the science center, the zoo or farms.
• Personalized learning: Incorporate different learning modalities (e.g., video & photo taking, experiments, KWL, concept mapping, etc.)/ to suit students of different learning preferences and yet elevate multi-intelligence, and allow flexible learning pathways for individual students. The learning experience should be student-centered, and perhaps encourage interest-driven learning out of class (i.e., individual students to pick up hobbies related to science learning) and group students with similar interests together to stimulate informal peer learning.
Among the five streamlined principles of C2FIP, it is the first principle “C”, namely, connectivity of learning contexts that weaves all of them together to form a holistic learning journey. With the last four principles being implemented “at the right time, in the right place, with the right contextual tools”, the students may draw the best out of each learning context. Thus, student learning would be continuously recontextualized and therefore deeper learning could be achieved.
4.2. Weaving the Activities Together: The Facilitated Seamless Learning (FSL) Framework
The C2FIP framework provides rationales for the incorporation of individual learning activity types. To weave the activities together, we will use a process framework (see Figure 1; adapted from the Facilitated Seamless Learning (FSL) design framework proposed by Wong (2013)).
Figure 1. The adapted Facilitated Seamless Learning (FSL) framework.
As seen in Figure 1, the four-activity FSL process aims to reinforce the connectivity of learning contexts in individual learning processes. Though we recommend the basic sequence of FSL1 → FSL2 → FSL3 → FSL4, the actual combination and sequence of the activities are customizable from lesson to lesson, as indicated by the bidirectional arrows. Apart from denoting the possible activity sequences, these arrows may also represent the spill-over effect of knowledge, skills and learning resources as the flow from one activity to another, i.e., knowledge of skill learnt, learning resources adopted or student artifacts generated during one activity may come into use in another activity.
279
5. Discussion and Conclusion
This paper articulates C2FIP, a design framework for seamless science learning adapted for primary schools where most of their students do not have regular 1:1, 24x7 access to mobile devices. We believe that the lower penetration rate of advanced technological tools (due to cost or other concerns) should not hinder further diffusion of a technology-enhanced learning notion which has proven its effectiveness through research. We are inspired to explore alternative strategies which leverages technologies that are readily available in specific school contexts while striving for preserving the critical success factors of the learning notion through constructing a streamlined set of lesson design principles.
Teachers will play a key role in facilitating and affectively supporting their students’ seamless science learning journeys. To ensure successful translation and diffusion of the C2FIP model, we recommend the enactment of comprehensive teachers’ professional development (PD) activities to develop the teachers’ capacity in accomplishing the pedagogical goals. We envisage that through co-designing (with the researchers) and enacting lesson plans guided by the C2FIP and FSL frameworks, the teachers will experience the facilitation of, and observe their students’ engagement in socio-constructivist, authentic, personalized activities and the generation of a variety of student artifacts which are formatively, critically assessed by their peers; and more importantly, these activities are weaved together to form a cross-temporal, cross-spatial trajectory of learn-apply-reflect. If such seamless learning journeys are indeed properly designed and enacted, the teachers will witness the positive learning outcomes from the students, thus levelling up their understanding and confidence in the model. We foresee that such PD activities will become an agent to transform the teacher learning and student learning cultures into a participatory, constructivist nature.
Acknowledgements
We would like to thank Jennifer Yeo, Peter Seow and Longkai Wu for their intellectual inputs in shaping up the key concepts of this paper.
References
American College Personnel Association. (1994). The student learning imperative: Implications for student affairs. Washington, D.C.: Author.
Chan, T.-W., Roschelle, J., Hsi, S., Kinshuk, Sharples, M., Brown, T., . . . Hoppe, U. (2006). One-to-one technology-enhanced learning: An opportunity for global research collaboration. Research and Practice in Technology-Enhanced Learning, 1(1), 3-29.
Charitonos, K., Blake, C., Scanlon, E., & Jones, A. (2012). Museum learning via social and mobile technologies: (How) can online interactions enhance the visitor experience? British Journal of Educational Technology, 43(5), 802-819.
Ebner, M., Lienhardt, C., Rohs, M., & Meyer, I. (2010). Microblogs in higher education - a chance to facilitate informal and process-oriented learning. Computers & Education, 55, 92-100.
Greenhow, C., Robelia, B., & Hughes, J. E. (2009). Web 2.0 and classroom research: What path should we take now? Educational Researchers, 38(4), 246-259.
Hwang, G.-J., Tsai, C.-C., & Yang, S. J. H. (2008). Criteria, strategies and research issues of context-aware ubiquitous learning. Educational Technology & Society, 11(2), 81-91.
Kuh, G. D. (1996). Guiding principles for creating seamless learning environments for undergraduates. College Student Development, 37(2), 135-148.
Lewis, S., Pea, R., & Rosen, J. (2010). Beyond participation to co-creation of meaning: mobile social media in generative learning communities. Social Science Information, 49(3), 1-19.
Looi, C.-K., Seow, P., Zhang, B. H., So, H.-J., Chen, W., & Wong, L.-H. (2010). Leveraging mobile technology for sustainable seamless learning: A research agenda. British Journal of Educational Technology, 42(1), 154-169.
Looi, C.-K., Sun, D., Wu, L., Seow, P., Chia, G., Wong, L.-H., . . . Norris, C. (2014). Implementing mobile learning curricula in a grade level: Empirical study of learning effectiveness at scale. Computers & Education, 77, 101-115.

280
Looi, C.-K., & Wong, L.-H. (2013). Designing for seamless learning. In R. Luckin, P. Goodyear, B. Grabowski, & N. Winters (Eds.), Handbook of Design in Educational Technology (pp. 146-157): Routledge.
Milrad, M., Wong, L.-H., Sharples, M., Hwang, G.-J., Looi, C.-K., & Ogata, H. (2013). Seamless learning: An international perspective on next generation technology enhanced learning. In Z. L. Berge & L. Y. Muilenburg (Eds.), The Handbook of Mobile Learning (pp. 95-108). New York: Routledge.
Sha, L. (2015). Self-regulation: A critical learner characteristic for seamless learning as habit of mind. In L.-H. Wong, M. Milrad, & M. Specht (Eds.), Seamless Learning in the Age of Mobile Connectivity (pp. 91-108): Springer.
Sharples, M. (2015). Seamless learning despite context. In L.-H. Wong, M. Milrad, & M. Specht (Eds.), Seamless Learning in the Age of Mobile Connectivity (pp. 41-56): Springer.
Sharples, M., McAndrew, P., Weller, M., Ferguson, R., FitzGerald, E., Hirst, T., . . . Whitelock, D. (2012). Innovating Pedagogy 2012. Retrieved from Milton Keynes, UK:
Song, Y., Wong, L.-H., & Looi, C.-K. (2012). Fostering personalized learning in science inquiry supported by mobile technologies. Educational Technology Research and Development, 60(4), 679-701.
Wong, L.-H. (2012). A learner-centric view of mobile seamless learning. British Journal of Educational Technology, 43(1), E19-E23.
Wong, L.-H. (2013). Enculturating self-directed learners through a facilitated seamless learning process framework. Technology, Pedagogy and Education, 22(3), 319-338.
Wong, L.-H. (2015). A brief history of mobile seamless learning. In L.-H. Wong, M. Milrad, & M. Specht (Eds.), Seamless Learning in the Age of Mobile Connectivity (pp. 3-40): Springer.
Wong, L.-H., & Looi, C.-K. (2011). What seams do we remove in mobile assisted seamless learning? A critical review of the literature. Computers & Education, 57(4), 2364-2381.
Wong, L.-H., Milrad, M., & Specht, M. (Eds.). (2015). Seamless Learning in the Age of Mobile Connectivity: Springer.
Zhang, B. H., Looi, C.-K., Seow, P., Chia, G., Wong, L.-H., Chen, W., . . . Norris, C. (2010). Deconstructing and reconstructing: Transforming primary science learning via a mobilized curriculum. Computers & Education, 55(4), 1504-1523.
Hayashi, Y., et al. (Eds.) (2017). Workshop Proceedings of the 25th International Conference on Computers in Education. New Zealand: Asia-Pacific Society for Computers in Education
281
Investigating the Attitude of Teachers and Parents in the Internet era: A Case Study of Preschoolers’ Use of Mobile Devices to learn English in a Class of Shanghai Kindergarten
Rifa GUO a, Chuxin FU b & Jing LENG c* a Department of Educational Information Technology, East China Normal University, China b Department of Educational Information Technology, East China Normal University, China c Department of Educational Information Technology, East China Normal University, China
Abstract: With the rapid development of technology, English learning becomes more and more important. In the mobile Internet era, more and more pre-school children use tablets, smart phones and other mobile electronic devices to learn English. On the one hand, teachers and parents hope that preschoolers could master relevant mobile network technologies for learning. On the other hand, they also express concerns about the excessive or premature use of mobile devices by young children. Therefore, this paper intends to investigate the attitudes of teachers and parents about pre-school children's use of mobile electronic devices based on a case study conducted in a kindergarten in Shanghai. The paper also analyzes the causes of anxiety and other influencing factors for teachers and parents and suggests a series of effective recommendations and measures about the use of the mobile electronic devices in the pre-school English education.
Keywords: preschooler; mobile electronic devices; attitudes
1. Introduction
With the development of mobile information and communication, cloud technology, big data and other modern information technology, there are many things further enriching the pre-school education information resources, such as micro-curriculum, APPs, wearable equipment and so on. In the local government guidance and support, many kindergartens rely on the local pre-school education information platform to provide mobile electronic devices for pre-school children's learning. With the arrival of “Internet + era”, the mobile terminal equipment on the early class of APP in the market get popular, which causes the boom of the majority of preschool children using mobile equipment in English learning.
At present, China's preschool education community is committed to advocating infiltration and integration of education. In particular, more emphasis is placed on the role of language. Children communicate with each other via language. They also develop their interpersonal skills, and the ability to determine the situation, the ability to organize their own minds (Saunders, B.1979). Pre-school children use mobile devices to learn English, which adapts to the current education of mobile Internet era and reduce the burden on parents. What is more, it can improve the diversity of English learning and stimulate the interest of learning English. On the other hand, children are attracted by the new media technology, but the development of children's cognitive ability is greatly influenced by intelligent mobile devices. So many teachers and parents show anxious in response to preschoolers’ use of mobile devices to learn English. Therefore, it is important to investigate the attitude towards teachers and parents for pre-school children using mobile devices to learn English.
This paper mainly explores the attitudes to teachers and parents for the use of mobile devices in preschool children in kindergarten class in Shanghai. Questionnaire and focus group interviews
282
were conducted to investigate teachers’ and parents’ attitudes toward preschooler’s use of mobile devices to learn English in a class of Shanghai kindergarten.
2. Literature review
2.1 The definition of mobile devices and its application in schools
Mobile devices are portable lightweight devices that are sometimes small enough to accommodate in pockets or in the palm of one’s hand. For example, Tablet personal computer is one of the mobile devices which can be used to interact with other people and equipment, draw charts, take notes, process operations and watch video lectures (Fojtik, R.2015). It is very convenient for pre-school children to use mobile devices to read electronic textbooks, e-books for innovative education needs (Zaranis, N., Kalogiannakis, M., & Papadakis, S. 2013). In the “Internet +” era, some language learning abilities are very crucial to preschoolers, including phonological awareness, alphabetical spelling, verbal reading, vocabulary and comprehension (Staa, B. V., & Reis, L. 2009). The researchers provide preschoolers with e-books that meet their reading level and are embedded with electronic dictionaries, when children encounter unknowing words, interpretation would be given after clicking on the words, including the meaning of the word voice, animation and correct spelling methods. Relevant studies have shown that children are able to grasp these words more quickly by using mobile devices (Lei, H. E. 2009).
In recent years, with the rapid development of information technology, it is more convenient to disseminate information through new media, in particular, vivid images with gorgeous colors attract the attention of young people (Wan, M. W. I., Ahmad, F., Amin, M. A. M., Deris, M. S. M., Rozaimee, A., & Wan, M. R. W. I., et al. 2010). Modern brain science research also shows that the brain of "digital indigenous" is changing. Learners are good at dealing with a variety of tasks at the same time. And they are keen to receive all kinds of information quickly and favor game-based learning rather than "serious" organized work. In the information society, students are required to possess learning ability, cooperation ability and information processing ability (Zhong, J., He, J., & Liu, Z. 2015). Therefore, the key to the rejuvenation of preschool children is that parents and teachers can have a rational understanding about new media technology products, and they are able to monitor and guide children to use intelligent electronic products such as iPad (Tan, Y. C., Li, M. A., & Wang, R. N. 2016). Some of the above studies showed that in the field of modern diversified education, more and more learning methods are combined with mobile devices, especially in pre-school children's English learning. In the field of English learning of pre-school children, the rapid development of technology makes the application of mobile devices indispensable.
2.2 The impact of mobile devices on the pre-school children’ learning
The emergence of digital media displayed rich visual and auditory feature that can be used to promote children's learning in recreation (Calvert, S. L. 2008). Some research showed that children can read e-book faster by using e-book readers, compared to the print version, they prefer e-books (Maynard, S. 2010). In addition, studies have found that social interaction between children increased when they used tablet computer applications rather than paper books in storytelling activities. This newer interaction increased the participation of the children because they are experiencing more pleasant activities, gaining more confidence and less anxiety (Hourcade, J. P., Williams, S. R., Miller, E. A., Huebner, K. E., & Liang, L. J. 2013). Most children use mobile devices to watch videos, play games for a long time, teachers and parents expressed varying degrees of concern about children’s media utilization. At the same time, studies have shown that the intangible nature of the digital text gives the reader a shallow and less focused reading experience (Mangen, A. 2008), That is, digital reading is not the same as paper reading, the information technology involved will affect reader's attention and persistence. There were also studies pointed out the fact normal vision of children exposed to electronic products too frequently may lead to their eye discomfort (Li, S., Jin, X., Wu, S., Jiang, F., Yan, C., & Shen, X. 2007). Therefore, this study conducted a questionnaire survey and interviews on teachers 'and parents' attitudes towards pre-school children using mobile devices for English learning.
283
2.3 The attitude to teachers and parents for pre-school children using electronic mobile devices to learn English
Pre-school stage is the fastest development of language, many teachers and parents are particularly concerned about young children's English learning. Today, the quantity of pre-school children's English learning applications is also improved. Compared with adults, preschoolers make significant differences in habits and physical and mental development (Price, S., Jewitt, C., & Crescenzi, L. 2015). While skilled in using mobile devices for English learning, some preschoolers lack of the self-control ability and easily waste too much time playing. Teachers and parents should have the ability to cultivate pre-school children's interest in learning English and habits, and help them choose the appropriate applications. They also need to have some technical knowledge, so as to guide children to learn better. Therefore, it is important to investigate the attitude of teachers and parents for preschoolers to learn English by using mobile devices. Their attitudes would directly affect whether preschoolers could use mobile devices to learn English effectively and efficiently.
2.4 Research questions
This paper puts forward the following two research questions: (1) What is parents’ attitude toward preschoolers’ use of mobile devices to learn English? (2) What are the concerns of teachers toward using mobile devices to teach English and their
attitude towards preschoolers’ use of mobile devices in English learning?
3. Research methods and design
3.1 Participants
In this study, 39 pre-school children’ parents and the corresponding eight teachers in a kindergarten class in Shanghai were studied in order to investigate their attitude towards pre-school children using e-mobile devices for English learning. For eight instructors, an interview was conducted to conduct an in-depth interview with their pre-school children's use of mobile devices for English learning. We conducted a questionnaire survey for parents, and it includes five variables: "importance", "usefulness", "validity", "support degree" and "educational investment intention" in the aspects of cognition, practice, experience and comprehensive attitude.
3.2 The design of questionnaire
A questionnaire is used based on "Parents' attitude towards young children's learning American English" compiled by Cai Zhenghua in Taiwan's Nanhua University. The questionnaire includes five independent variables such as "importance", "usefulness", "validity", "support degree" and "educational investment intention" in the aspects of cognition, practice, experience and comprehensive attitude. A total of 39 parents’ questionnaires were collected, with the effective rate of 100%.
3.3 Teacher interview scale design
Considering the number of teachers (N = 8), this study interviewed teachers on their attitude toward preschoolers use of mobile devices for English learning. The interview protocol covers "awareness", "usage", "accreditation", "the type of mobile device used in the teaching process", "the attitude towards new technology in the education process", "The type of after-class use of education application", "whether to recommend parents to use mobile devices to learn with children" and other seven dimensions.
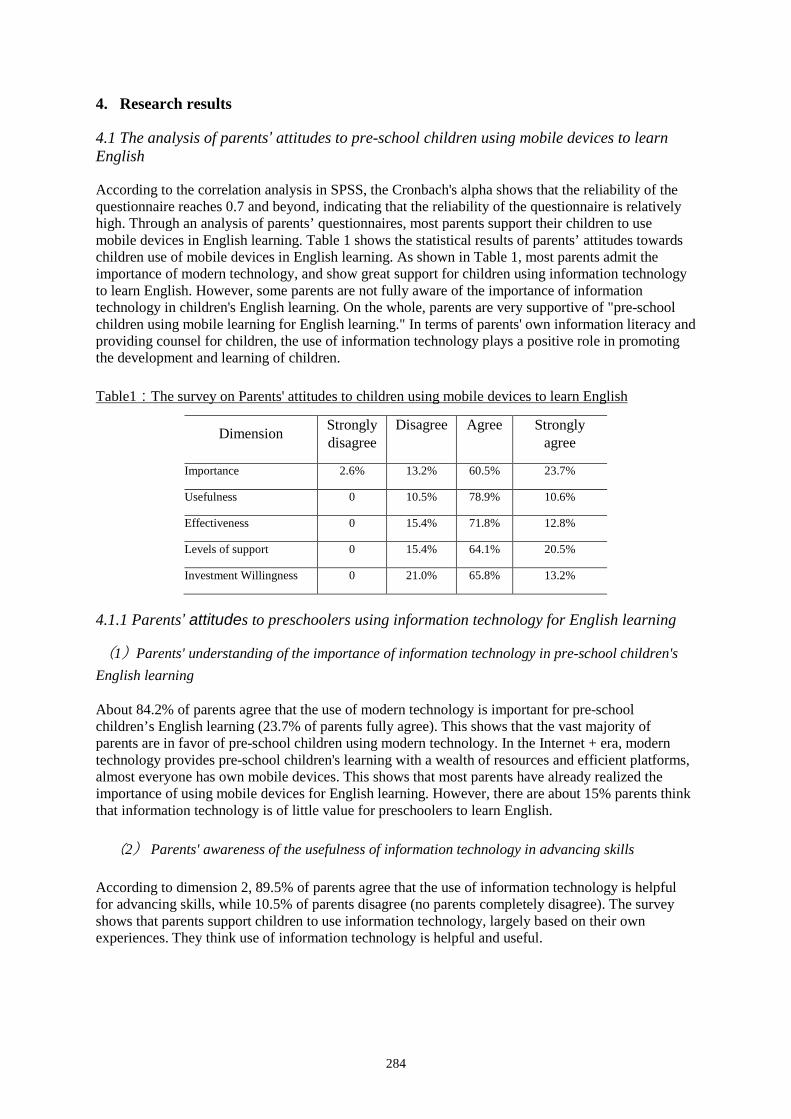
284
4. Research results
4.1 The analysis of parents’ attitudes to pre-school children using mobile devices to learn English
According to the correlation analysis in SPSS, the Cronbach's alpha shows that the reliability of the questionnaire reaches 0.7 and beyond, indicating that the reliability of the questionnaire is relatively high. Through an analysis of parents’ questionnaires, most parents support their children to use mobile devices in English learning. Table 1 shows the statistical results of parents’ attitudes towards children use of mobile devices in English learning. As shown in Table 1, most parents admit the importance of modern technology, and show great support for children using information technology to learn English. However, some parents are not fully aware of the importance of information technology in children's English learning. On the whole, parents are very supportive of "pre-school children using mobile learning for English learning." In terms of parents' own information literacy and providing counsel for children, the use of information technology plays a positive role in promoting the development and learning of children.
Table1:The survey on Parents' attitudes to children using mobile devices to learn English
Dimension Strongly disagree
Disagree Agree Strongly agree
Importance 2.6% 13.2% 60.5% 23.7%
Usefulness 0 10.5% 78.9% 10.6%
Effectiveness 0 15.4% 71.8% 12.8%
Levels of support 0 15.4% 64.1% 20.5%
Investment Willingness 0 21.0% 65.8% 13.2%
4.1.1 Parents’ attitudes to preschoolers using information technology for English learning
(1)Parents' understanding of the importance of information technology in pre-school children's English learning
About 84.2% of parents agree that the use of modern technology is important for pre-school children’s English learning (23.7% of parents fully agree). This shows that the vast majority of parents are in favor of pre-school children using modern technology. In the Internet + era, modern technology provides pre-school children's learning with a wealth of resources and efficient platforms, almost everyone has own mobile devices. This shows that most parents have already realized the importance of using mobile devices for English learning. However, there are about 15% parents think that information technology is of little value for preschoolers to learn English.
(2) Parents' awareness of the usefulness of information technology in advancing skills
According to dimension 2, 89.5% of parents agree that the use of information technology is helpful for advancing skills, while 10.5% of parents disagree (no parents completely disagree). The survey shows that parents support children to use information technology, largely based on their own experiences. They think use of information technology is helpful and useful.
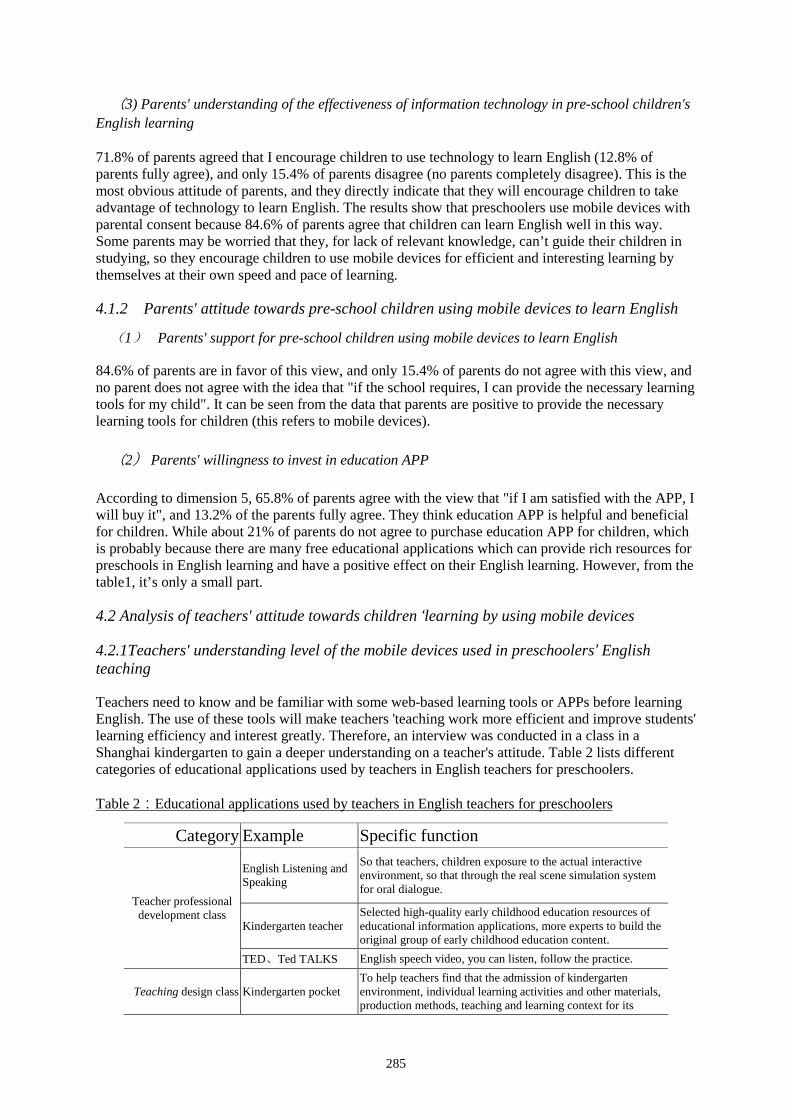
285
(3) Parents' understanding of the effectiveness of information technology in pre-school children's English learning
71.8% of parents agreed that I encourage children to use technology to learn English (12.8% of parents fully agree), and only 15.4% of parents disagree (no parents completely disagree). This is the most obvious attitude of parents, and they directly indicate that they will encourage children to take advantage of technology to learn English. The results show that preschoolers use mobile devices with parental consent because 84.6% of parents agree that children can learn English well in this way. Some parents may be worried that they, for lack of relevant knowledge, can’t guide their children in studying, so they encourage children to use mobile devices for efficient and interesting learning by themselves at their own speed and pace of learning.
4.1.2 Parents' attitude towards pre-school children using mobile devices to learn English
(1) Parents' support for pre-school children using mobile devices to learn English
84.6% of parents are in favor of this view, and only 15.4% of parents do not agree with this view, and no parent does not agree with the idea that "if the school requires, I can provide the necessary learning tools for my child". It can be seen from the data that parents are positive to provide the necessary learning tools for children (this refers to mobile devices).
(2) Parents' willingness to invest in education APP
According to dimension 5, 65.8% of parents agree with the view that "if I am satisfied with the APP, I will buy it", and 13.2% of the parents fully agree. They think education APP is helpful and beneficial for children. While about 21% of parents do not agree to purchase education APP for children, which is probably because there are many free educational applications which can provide rich resources for preschools in English learning and have a positive effect on their English learning. However, from the table1, it’s only a small part.
4.2 Analysis of teachers' attitude towards children ‘learning by using mobile devices
4.2.1Teachers' understanding level of the mobile devices used in preschoolers’ English teaching
Teachers need to know and be familiar with some web-based learning tools or APPs before learning English. The use of these tools will make teachers 'teaching work more efficient and improve students' learning efficiency and interest greatly. Therefore, an interview was conducted in a class in a Shanghai kindergarten to gain a deeper understanding on a teacher's attitude. Table 2 lists different categories of educational applications used by teachers in English teachers for preschoolers.
Table 2:Educational applications used by teachers in English teachers for preschoolers
Category Example Specific function
Teacher professional development class
English Listening and Speaking
So that teachers, children exposure to the actual interactive environment, so that through the real scene simulation system for oral dialogue.
Kindergarten teacher Selected high-quality early childhood education resources of educational information applications, more experts to build the original group of early childhood education content.
TED、Ted TALKS English speech video, you can listen, follow the practice.
Teaching design class Kindergarten pocket To help teachers find that the admission of kindergarten environment, individual learning activities and other materials, production methods, teaching and learning context for its
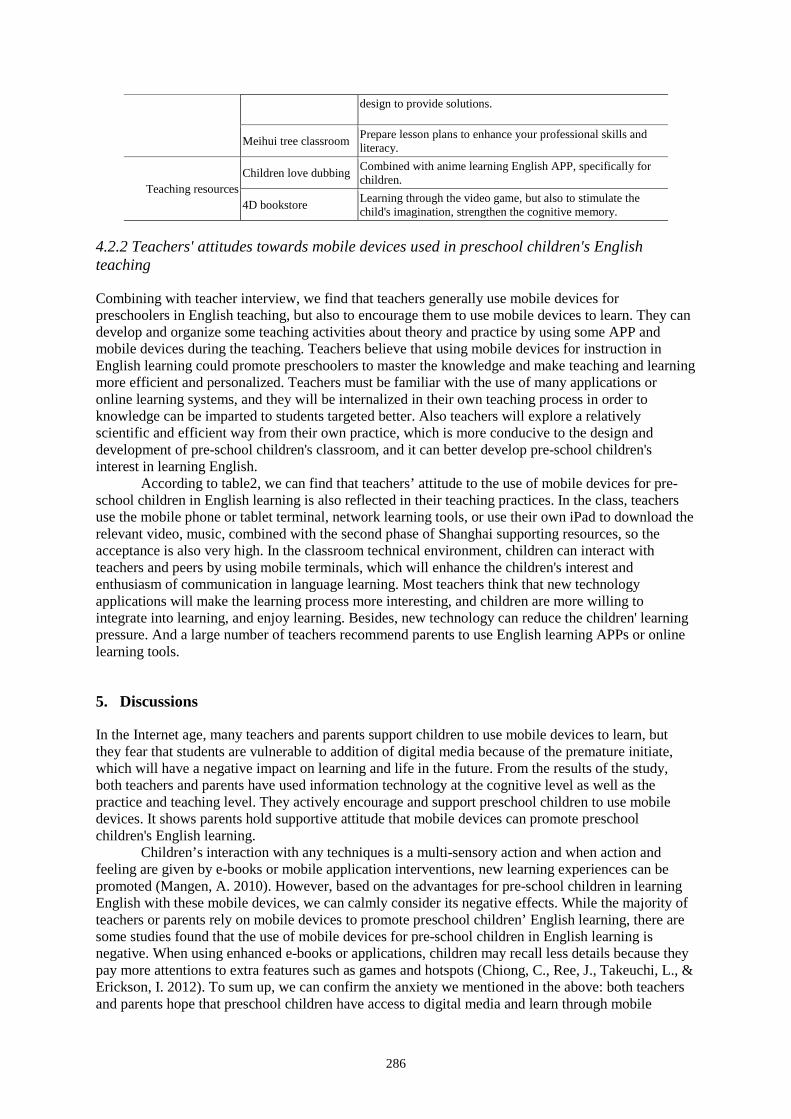
286
design to provide solutions.
Meihui tree classroom Prepare lesson plans to enhance your professional skills and literacy.
Teaching resources Children love dubbing Combined with anime learning English APP, specifically for
children.
4D bookstore Learning through the video game, but also to stimulate the child's imagination, strengthen the cognitive memory.
4.2.2 Teachers' attitudes towards mobile devices used in preschool children's English teaching
Combining with teacher interview, we find that teachers generally use mobile devices for preschoolers in English teaching, but also to encourage them to use mobile devices to learn. They can develop and organize some teaching activities about theory and practice by using some APP and mobile devices during the teaching. Teachers believe that using mobile devices for instruction in English learning could promote preschoolers to master the knowledge and make teaching and learning more efficient and personalized. Teachers must be familiar with the use of many applications or online learning systems, and they will be internalized in their own teaching process in order to knowledge can be imparted to students targeted better. Also teachers will explore a relatively scientific and efficient way from their own practice, which is more conducive to the design and development of pre-school children's classroom, and it can better develop pre-school children's interest in learning English.
According to table2, we can find that teachers’ attitude to the use of mobile devices for pre-school children in English learning is also reflected in their teaching practices. In the class, teachers use the mobile phone or tablet terminal, network learning tools, or use their own iPad to download the relevant video, music, combined with the second phase of Shanghai supporting resources, so the acceptance is also very high. In the classroom technical environment, children can interact with teachers and peers by using mobile terminals, which will enhance the children's interest and enthusiasm of communication in language learning. Most teachers think that new technology applications will make the learning process more interesting, and children are more willing to integrate into learning, and enjoy learning. Besides, new technology can reduce the children' learning pressure. And a large number of teachers recommend parents to use English learning APPs or online learning tools.
5. Discussions
In the Internet age, many teachers and parents support children to use mobile devices to learn, but they fear that students are vulnerable to addition of digital media because of the premature initiate, which will have a negative impact on learning and life in the future. From the results of the study, both teachers and parents have used information technology at the cognitive level as well as the practice and teaching level. They actively encourage and support preschool children to use mobile devices. It shows parents hold supportive attitude that mobile devices can promote preschool children's English learning.
Children’s interaction with any techniques is a multi-sensory action and when action and feeling are given by e-books or mobile application interventions, new learning experiences can be promoted (Mangen, A. 2010). However, based on the advantages for pre-school children in learning English with these mobile devices, we can calmly consider its negative effects. While the majority of teachers or parents rely on mobile devices to promote preschool children’ English learning, there are some studies found that the use of mobile devices for pre-school children in English learning is negative. When using enhanced e-books or applications, children may recall less details because they pay more attentions to extra features such as games and hotspots (Chiong, C., Ree, J., Takeuchi, L., & Erickson, I. 2012). To sum up, we can confirm the anxiety we mentioned in the above: both teachers and parents hope that preschool children have access to digital media and learn through mobile
287
devices, especially in English learning. However, they worry about that their early exposure to digital media may make children indulge in other functional areas of mobile devices, and that their future learning and life are adversely affected. Based on the above anxiety, we should:
5.1 Consider it versatilely according to the actual situation
We should analyze and think of it calmly with the specific circumstances. As for whether preschool children could use mobile electronic devices for English learning, our attitude should be eclectic. Neither too much anxiety, nor over-reliance is a wise option. These two extreme attitudes are not conducive to preschool children's English learning and development of learning interest. First of all, we must know that electronic mobile devices for preschool children to learn English is largely helpful in the mobile Internet era, because mobile electronic devices with attractive pictures, vivid and rich stories, targeted voice and visual and auditory combinatively effects offer preschool children motivation and curiosity of learning English. As we all know, the use of touch-screen equipment will enhance children's ability and speed up their speed of mastering knowledge. Some children do not match the way of mobile electronic devices using to stimulate their interest in learning and curiosity. And some children do not want to take advantage of APP referring to study and they go straight to other functional areas like the game area. Once in that case, these children will be stuck in the entertainment function on the mobile electronic devices, following much anxiety of parents and teachers. If children who are not keen on mobile electronic device are forced to use it, they may lose interest in learning English and negatively impact their future learning. Therefore, teachers and parents should constantly communicate. They should make decisions according to the actual situations and children's actual conditions and try their best to give them the greatest learning "booster”.
5.2 Enhance the information literacy of teachers and parents
As for children’s English language learning, it is important for parents and teachers to strengthen their own information literacy and develop the information technology skills in case of a lack of the ability to develop preschool children's interest and curiosity in learning English by using mobile electronic devices as well as the correct and scientific guidance. Only parents, teachers and preschool children collaborate together, can it create an information touch-screen learning environment and make a difference in preschool children’s learning ability, learning interest and their own development. By investigating parents' and teachers' attitudes towards English learning through mobile electronic devices for pre-school children, researchers can help parents and teachers to correctly guide preschool children to use mobile electronic devices and offer children the English learning APP or e-learning tools that accord with their ages.
References:
Calvert, S. L. (2008). Maximizing informal learning from digital technologies. In Educating the other America: Top experts tackle poverty, literacy, and achievement in our schools (1st ed., pp. 319-332). Brookes Publishing.
Chiong, C., Ree, J., Takeuchi, L., & Erickson, I. (2012). Comparing parent-child co-reading on print, basic, and enhanced e-book platforms. New York: The Joan Ganz Cooney Center.
Fojtik, R. (2015). Ebooks and mobile devices in education. Procedia-Social and Behavioral Sciences ,182,742-745.
Hourcade, J. P., Williams, S. R., Miller, E. A., Huebner, K. E., & Liang, L. J. (2013). Evaluation of tablet APPs to encourage social interaction in children with autism spectrum disorders. In Proceedings of the SIGCHI Conference on human factors in computing systems (pp. 31-97). New York, USA: ACM Press.
Lei, H. E. (2009). Research on the effect for the application of multimedia in the preschool language teaching. Modern Educational Technology.
Li, S., Jin, X., Wu, S., Jiang, F., Yan, C., & Shen, X. (2007). The impact of media use on sleep patterns and sleep disorders among school-aged children in china. Sleep, 30(3), 361-367.

288
Mangen, A. (2010). Point and click: Theoretical and phenomenological reflections on the digitization of early childhood education. Contemporary Issues in Early Childhood, 11(4), 415-431.
Maynard, S. (2010). The impact of e-books on young children’s reading habits. Publishing Research Quarterly, 26(4), 236-248.
Price, S., Jewitt, C., & Crescenzi, L. (2015). The role of ipads in pre-school children's mark making development. Computers & Education,87(C), 131-141.
Saunders, B. (1979). Interpersonal skills -- the key to a new role.Management Services. Staa, B. V., & Reis, L. (2009). The Impact of the Multi-sensory Program Alfabeto on the Development of
Literacy Skills of Third Stage Pre-school Children. Education and Technology for A Better World, Ifip Tc 3 World Conference on Computers in Education, Wcce 2009, Bento Gonçalves, Brazil, July 27-31, 2009. Proceedings (Vol.302, pp.39-47). DBLP.
Tan, Y. C., Li, M. A., & Wang, R. N. (2016). Investigation on the use of intelligent electronic products for preschool children in bengbu city. Journal of Bengbu University.
Wan, M. W. I., Ahmad, F., Amin, M. A. M., Deris, M. S. M., Rozaimee, A., & Wan, M. R. W. I., et al. (2010). Development and innovation of multimedia courseware for teaching and learning of KAFA subjects.International Conference on Computer Technology and Development(pp.100-104). IEEE Xplore.
Zaranis, N., Kalogiannakis, M., & Papadakis, S. (2013). Using mobile devices for teaching realistic mathematics in kindergarten education.Creative Education, 04(12), 1328-1335.
Zhong, J., He, J., & Liu, Z. (2015). On Self-learning Ability of College Students and Its Cultivation. International Conference on Management, Education, Information and Control.
Hayashi, Y., et al. (Eds.) (2017). Workshop Proceedings of the 25th International Conference on Computers in Education. New Zealand: Asia-Pacific Society for Computers in Education
289
A Cloud-based Awareness Classroom Learning Activity Portfolio System Based on iBeacon for
Flipped Classroom Hung-Hsu TSAI a*, You-Ming YONG b, Jie-Yan PENG c, Kuo-Ching CHIOU d& Pao-Ta YUe
a b c Department of Information Management, National Formosa University, Yunlin, Taiwan. d Department of Finance, Chaoyang University of Technology, Taichung, Taiwan.
e Department of Computer Science and Information Engineering, National Chung Cheng University , Chiayi, Taiwan.
Abstract: The paper presents a cloud service system that builds students’ awareness classroom activity portfolio. Here the system is call a classroom learning activity portfolio (CLAP) system. It utilizes iBeacon devices, a kind of wireless devices to connect without human intervention, as awareness functions in the learning environment construction. Also, it develops APPs for mobile devices to get students’ classroom activity portfolio, and then to keep them in the cloud server of the system. Additionally, Apps offers web links for learning. There are several types of students’ classroom activity portfolio including log data of recording students enter/leave classroom, responses to pushing information once students entered classroom, and distances from students’ position (seat) in classroom to teacher’ presentation location (for example, the front desk of the classroom). The CLAP system can offer analysis results of the classroom activity portfolio. Hence, it can help students who can readily send their records or responses on class in classroom. Moreover, they do not require in typing many data (for example, long URLs) for interacting with the portfolio collection system. Furthermore, the system can assist teachers in collecting students’ classroom activity portfolio, and then to have analysis results of the portfolio. For instance, teachers can get the result that students entered classroom but they send less or no feedback in classroom to the cloud server. Experimental results demonstrate the CLAP system has high learning interests while applying it in flipped-classroom learning.
Keywords: iBeacon, Flipped Classroom, Bluetooth4.0, Classroom Learning, Classroom Activity Portfolio.
1. Introduction
Recently, e-Learning is becoming popular in our life. More and more courses are teaching over Internet via asynchronous and synchronous learning manners so as to enhance learning performance. However, how to increase high interaction among teachers and students during e-Learning is still a critical research topic. Therefore, it is an emerging popular issue to develop appropriate information technology for classroom learning (c-Learning) and then to blend c-Learning with e-Learning such that learning performance can be further promoted (Domingo & Gargante, 2016; Volk et al., 2017; López, 2010).
Nowadays, mobile devices (like smart phones and tablets) are widely used in our life (Moreira et al., 2016). Especially, how to increase high interactions for c-Learning via integrating wireless sensor technology with mobile devices in constructing awareness learning environments is an important research issue. Here the paper first presents the design of a learning awareness environment (LAE) based on wireless sensor technology, and then proposes the CLAP system based on the LAE, which provides functions to collect students’ learning activity portfolio in traditional classroom via Apps, and also offers analysis results for these portfolios. According to the results, teachers can
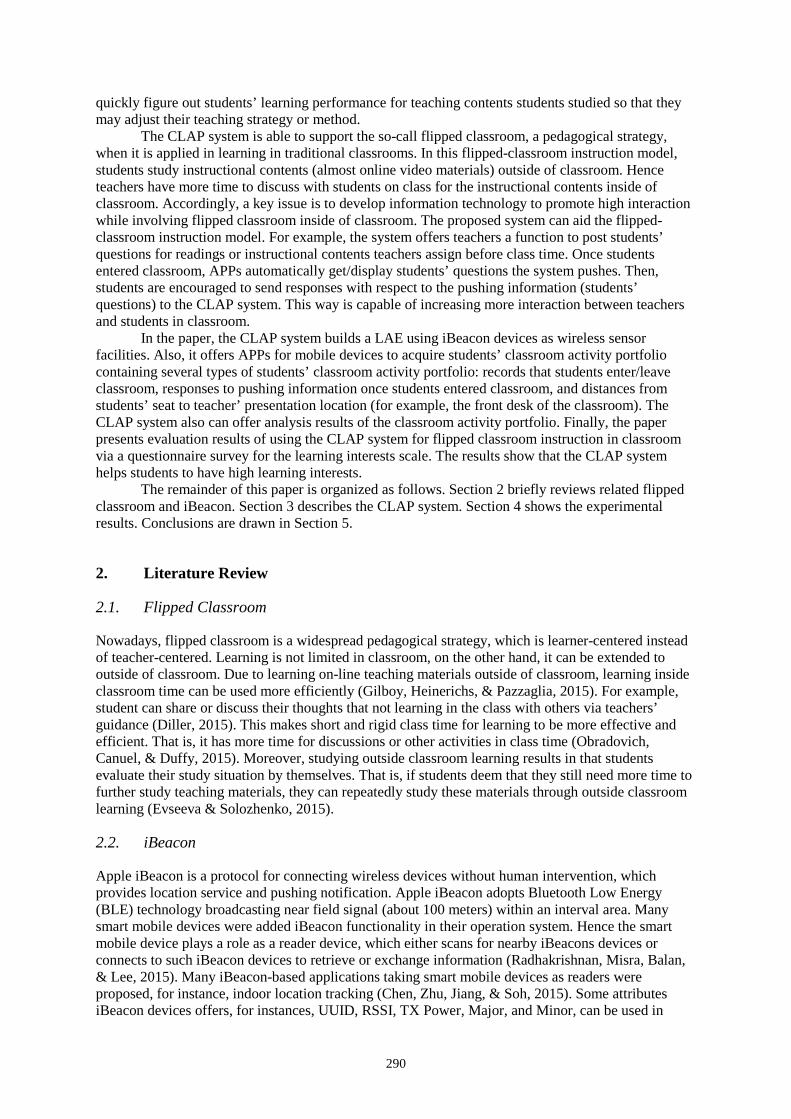
290
quickly figure out students’ learning performance for teaching contents students studied so that they may adjust their teaching strategy or method.
The CLAP system is able to support the so-call flipped classroom, a pedagogical strategy, when it is applied in learning in traditional classrooms. In this flipped-classroom instruction model, students study instructional contents (almost online video materials) outside of classroom. Hence teachers have more time to discuss with students on class for the instructional contents inside of classroom. Accordingly, a key issue is to develop information technology to promote high interaction while involving flipped classroom inside of classroom. The proposed system can aid the flipped-classroom instruction model. For example, the system offers teachers a function to post students’ questions for readings or instructional contents teachers assign before class time. Once students entered classroom, APPs automatically get/display students’ questions the system pushes. Then, students are encouraged to send responses with respect to the pushing information (students’ questions) to the CLAP system. This way is capable of increasing more interaction between teachers and students in classroom.
In the paper, the CLAP system builds a LAE using iBeacon devices as wireless sensor facilities. Also, it offers APPs for mobile devices to acquire students’ classroom activity portfolio containing several types of students’ classroom activity portfolio: records that students enter/leave classroom, responses to pushing information once students entered classroom, and distances from students’ seat to teacher’ presentation location (for example, the front desk of the classroom). The CLAP system also can offer analysis results of the classroom activity portfolio. Finally, the paper presents evaluation results of using the CLAP system for flipped classroom instruction in classroom via a questionnaire survey for the learning interests scale. The results show that the CLAP system helps students to have high learning interests.
The remainder of this paper is organized as follows. Section 2 briefly reviews related flipped classroom and iBeacon. Section 3 describes the CLAP system. Section 4 shows the experimental results. Conclusions are drawn in Section 5.
2. Literature Review
2.1. Flipped Classroom
Nowadays, flipped classroom is a widespread pedagogical strategy, which is learner-centered instead of teacher-centered. Learning is not limited in classroom, on the other hand, it can be extended to outside of classroom. Due to learning on-line teaching materials outside of classroom, learning inside classroom time can be used more efficiently (Gilboy, Heinerichs, & Pazzaglia, 2015). For example, student can share or discuss their thoughts that not learning in the class with others via teachers’ guidance (Diller, 2015). This makes short and rigid class time for learning to be more effective and efficient. That is, it has more time for discussions or other activities in class time (Obradovich, Canuel, & Duffy, 2015). Moreover, studying outside classroom learning results in that students evaluate their study situation by themselves. That is, if students deem that they still need more time to further study teaching materials, they can repeatedly study these materials through outside classroom learning (Evseeva & Solozhenko, 2015).
2.2. iBeacon
Apple iBeacon is a protocol for connecting wireless devices without human intervention, which provides location service and pushing notification. Apple iBeacon adopts Bluetooth Low Energy (BLE) technology broadcasting near field signal (about 100 meters) within an interval area. Many smart mobile devices were added iBeacon functionality in their operation system. Hence the smart mobile device plays a role as a reader device, which either scans for nearby iBeacons devices or connects to such iBeacon devices to retrieve or exchange information (Radhakrishnan, Misra, Balan, & Lee, 2015). Many iBeacon-based applications taking smart mobile devices as readers were proposed, for instance, indoor location tracking (Chen, Zhu, Jiang, & Soh, 2015). Some attributes iBeacon devices offers, for instances, UUID, RSSI, TX Power, Major, and Minor, can be used in
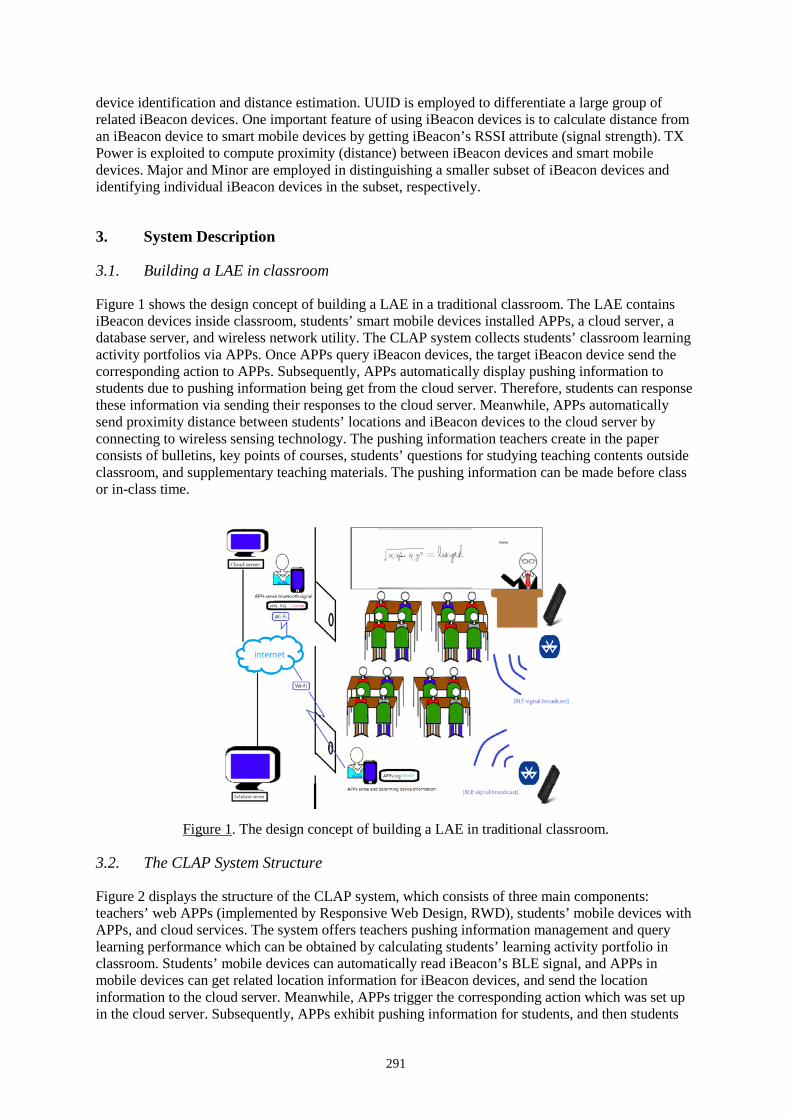
291
device identification and distance estimation. UUID is employed to differentiate a large group of related iBeacon devices. One important feature of using iBeacon devices is to calculate distance from an iBeacon device to smart mobile devices by getting iBeacon’s RSSI attribute (signal strength). TX Power is exploited to compute proximity (distance) between iBeacon devices and smart mobile devices. Major and Minor are employed in distinguishing a smaller subset of iBeacon devices and identifying individual iBeacon devices in the subset, respectively.
3. System Description
3.1. Building a LAE in classroom
Figure 1 shows the design concept of building a LAE in a traditional classroom. The LAE contains iBeacon devices inside classroom, students’ smart mobile devices installed APPs, a cloud server, a database server, and wireless network utility. The CLAP system collects students’ classroom learning activity portfolios via APPs. Once APPs query iBeacon devices, the target iBeacon device send the corresponding action to APPs. Subsequently, APPs automatically display pushing information to students due to pushing information being get from the cloud server. Therefore, students can response these information via sending their responses to the cloud server. Meanwhile, APPs automatically send proximity distance between students’ locations and iBeacon devices to the cloud server by connecting to wireless sensing technology. The pushing information teachers create in the paper consists of bulletins, key points of courses, students’ questions for studying teaching contents outside classroom, and supplementary teaching materials. The pushing information can be made before class or in-class time.
Figure 1. The design concept of building a LAE in traditional classroom.
3.2. The CLAP System Structure
Figure 2 displays the structure of the CLAP system, which consists of three main components: teachers’ web APPs (implemented by Responsive Web Design, RWD), students’ mobile devices with APPs, and cloud services. The system offers teachers pushing information management and query learning performance which can be obtained by calculating students’ learning activity portfolio in classroom. Students’ mobile devices can automatically read iBeacon’s BLE signal, and APPs in mobile devices can get related location information for iBeacon devices, and send the location information to the cloud server. Meanwhile, APPs trigger the corresponding action which was set up in the cloud server. Subsequently, APPs exhibit pushing information for students, and then students
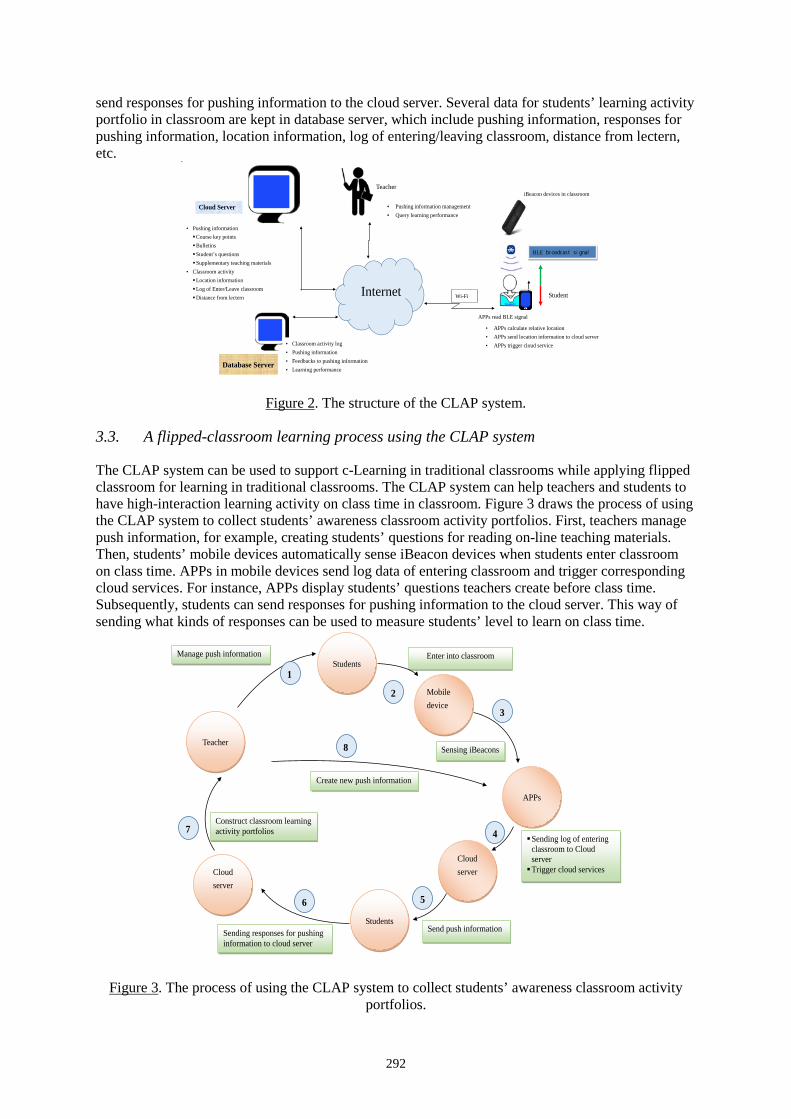
292
send responses for pushing information to the cloud server. Several data for students’ learning activity portfolio in classroom are kept in database server, which include pushing information, responses for pushing information, location information, log of entering/leaving classroom, distance from lectern, etc.
Internet
iBeacon devices in classroom
Database Server
Cloud Server
APPs read BLE signal
• APPs calculate relative location • APPs send location information to cloud server • APPs trigger cloud service
Wi-Fi
• Pushing information Course key points Bulletins Student’s questions Supplementary teaching materials
• Classroom activity Location information Log of Enter/Leave classroom Distance from lectern
• Classroom activity log • Pushing information • Feedbacks to pushing information • Learning performance
BLE br oadcast si gnal
Teacher
• Pushing information management • Query learning performance
Student
Figure 2. The structure of the CLAP system.
3.3. A flipped-classroom learning process using the CLAP system
The CLAP system can be used to support c-Learning in traditional classrooms while applying flipped classroom for learning in traditional classrooms. The CLAP system can help teachers and students to have high-interaction learning activity on class time in classroom. Figure 3 draws the process of using the CLAP system to collect students’ awareness classroom activity portfolios. First, teachers manage push information, for example, creating students’ questions for reading on-line teaching materials. Then, students’ mobile devices automatically sense iBeacon devices when students enter classroom on class time. APPs in mobile devices send log data of entering classroom and trigger corresponding cloud services. For instance, APPs display students’ questions teachers create before class time. Subsequently, students can send responses for pushing information to the cloud server. This way of sending what kinds of responses can be used to measure students’ level to learn on class time.
Enter into classroom
7
2
3
Students
Mobile device
Cloud server
Send push information
Sensing iBeacons
Students
Cloud server
4
Sending responses for pushing information to cloud server
Teacher
5
Construct classroom learning activity portfolios
6
Manage push information
Sending log of entering classroom to Cloud server Trigger cloud services
APPs
1
8
Create new push information
Figure 3. The process of using the CLAP system to collect students’ awareness classroom activity portfolios.
293
In Figure 3, the process of using the CLAP system to collect students’ awareness classroom activity portfolios is briefly described as follows. Suppose students had finished to study on-line teaching materials and teachers also got their questions from learning management systems or other learning platforms.
Step 1. Teacher creates pushing information before class time. Step 2. Students’ smart mobile devices get ready before entering classroom. Step 3. Students’ smart mobile devices automatically query iBeacon devices in classroom
while entering classroom. Step 4. Once iBeacon device is read, APPs get position information for target iBeacon
devices. Apps send students’ position information to the cloud server, and also trigger corresponding cloud services which are specified in advance associated with iBeacon devices.
Step 5. The corresponding cloud services is to push information to Apps. Step 6. Students utilize APPs to send responses for these pushing information to the cloud
server. Some students may do nothing for the pushing information. Step 7. The cloud server collect records sent by APPs, which including students enter/leave
classroom, responses to pushing information once students entered classroom, and distances from students’ seat to teacher’ presentation location (for example, the front desk of the classroom. It construct these types of records to form students’ classroom activity portfolios. Subsequently, it also can offer analysis results of the classroom activity portfolios when teachers query the results.
Step 8. Teachers may create or update pushing information on class time for interacting with students. The system can perform high interaction on class time due to having time limits for sending responses for pushing information. The process is repeated starting Step 3 until students leave classroom or class closed.
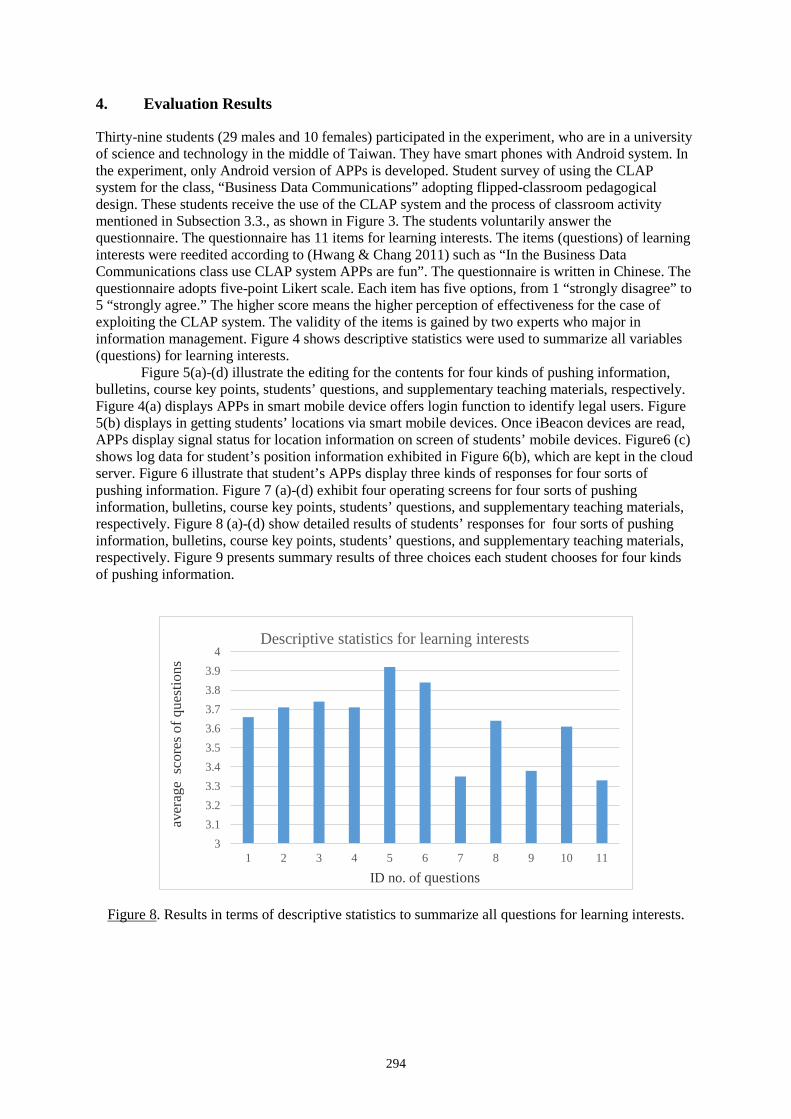
294
4. Evaluation Results
Thirty-nine students (29 males and 10 females) participated in the experiment, who are in a university of science and technology in the middle of Taiwan. They have smart phones with Android system. In the experiment, only Android version of APPs is developed. Student survey of using the CLAP system for the class, “Business Data Communications” adopting flipped-classroom pedagogical design. These students receive the use of the CLAP system and the process of classroom activity mentioned in Subsection 3.3., as shown in Figure 3. The students voluntarily answer the questionnaire. The questionnaire has 11 items for learning interests. The items (questions) of learning interests were reedited according to (Hwang & Chang 2011) such as “In the Business Data Communications class use CLAP system APPs are fun”. The questionnaire is written in Chinese. The questionnaire adopts five-point Likert scale. Each item has five options, from 1 “strongly disagree” to 5 “strongly agree.” The higher score means the higher perception of effectiveness for the case of exploiting the CLAP system. The validity of the items is gained by two experts who major in information management. Figure 4 shows descriptive statistics were used to summarize all variables (questions) for learning interests.
Figure 5(a)-(d) illustrate the editing for the contents for four kinds of pushing information, bulletins, course key points, students’ questions, and supplementary teaching materials, respectively. Figure 4(a) displays APPs in smart mobile device offers login function to identify legal users. Figure 5(b) displays in getting students’ locations via smart mobile devices. Once iBeacon devices are read, APPs display signal status for location information on screen of students’ mobile devices. Figure6 (c) shows log data for student’s position information exhibited in Figure 6(b), which are kept in the cloud server. Figure 6 illustrate that student’s APPs display three kinds of responses for four sorts of pushing information. Figure 7 (a)-(d) exhibit four operating screens for four sorts of pushing information, bulletins, course key points, students’ questions, and supplementary teaching materials, respectively. Figure 8 (a)-(d) show detailed results of students’ responses for four sorts of pushing information, bulletins, course key points, students’ questions, and supplementary teaching materials, respectively. Figure 9 presents summary results of three choices each student chooses for four kinds of pushing information.
33.13.23.33.43.53.63.73.83.9
4
1 2 3 4 5 6 7 8 9 10 11
aver
age
scor
es o
f que
stio
ns
ID no. of questions
Descriptive statistics for learning interests
Figure 8. Results in terms of descriptive statistics to summarize all questions for learning interests.
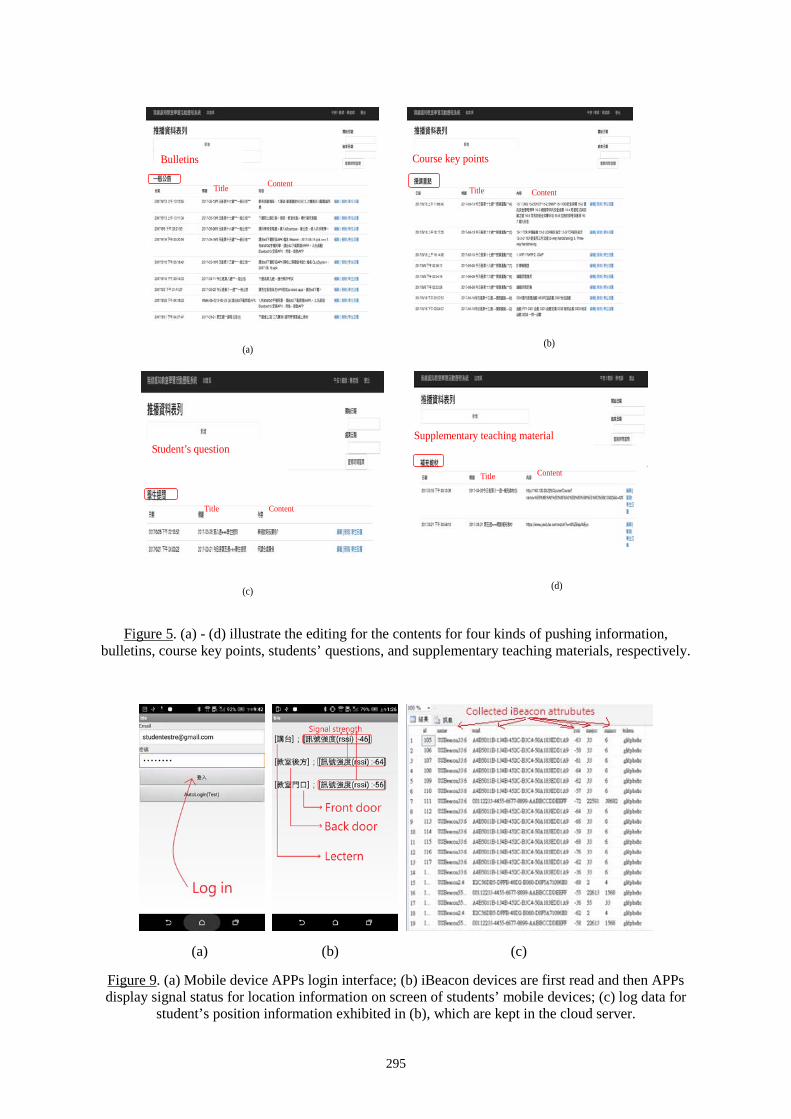
295
(b) (a)
(d) (c)
Student’s question
Title Content
Supplementary teaching material
Title Content
Bulletins
Title Content Title Content
Course key points
Figure 5. (a) - (d) illustrate the editing for the contents for four kinds of pushing information, bulletins, course key points, students’ questions, and supplementary teaching materials, respectively.
(a) (b) (c)
Figure 9. (a) Mobile device APPs login interface; (b) iBeacon devices are first read and then APPs display signal status for location information on screen of students’ mobile devices; (c) log data for
student’s position information exhibited in (b), which are kept in the cloud server.
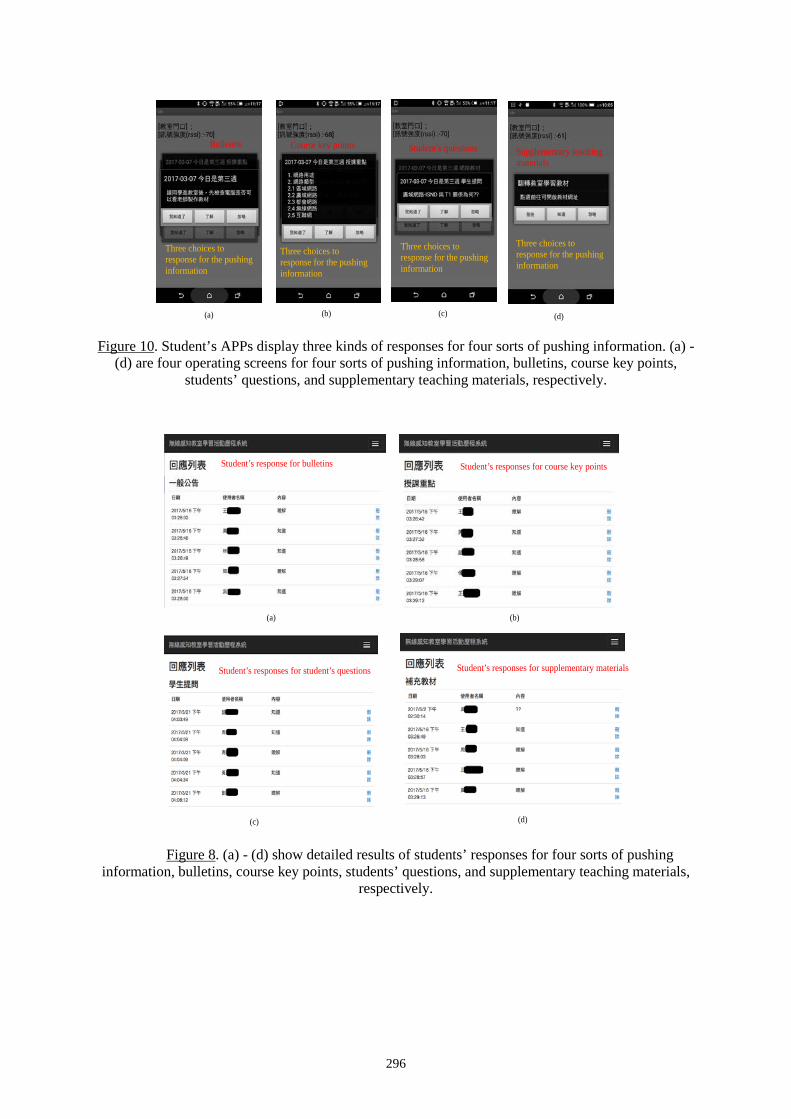
296
Bulletins
(b) (a) (d) (c)
Student’s questions Course key points Supplementary teaching materials
Three choices to response for the pushing information
Three choices to response for the pushing information
Three choices to response for the pushing information
Three choices to response for the pushing information
Figure 10. Student’s APPs display three kinds of responses for four sorts of pushing information. (a) - (d) are four operating screens for four sorts of pushing information, bulletins, course key points,
students’ questions, and supplementary teaching materials, respectively.
Student’s responses for course key points
(b) (a)
Student’s response for bulletins
Student’s responses for student’s questions Student’s responses for supplementary materials
(d) (c)
Figure 8. (a) - (d) show detailed results of students’ responses for four sorts of pushing information, bulletins, course key points, students’ questions, and supplementary teaching materials,
respectively.
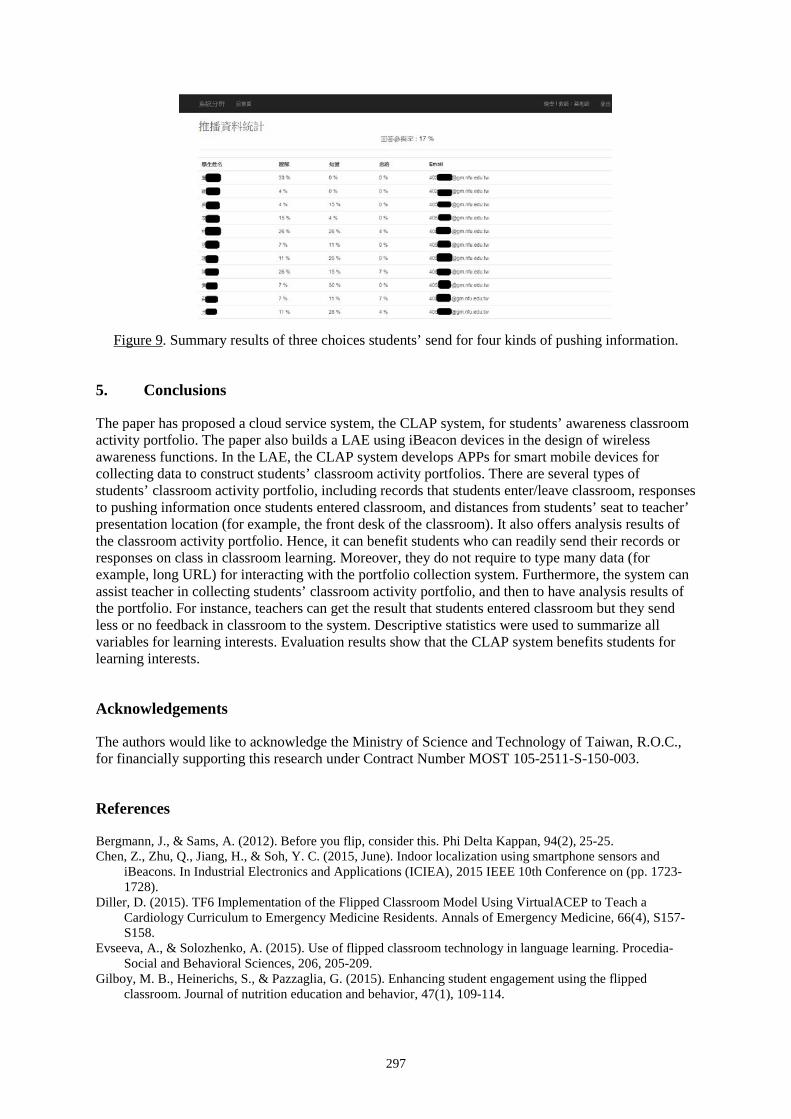
297
Figure 9. Summary results of three choices students’ send for four kinds of pushing information.
5. Conclusions
The paper has proposed a cloud service system, the CLAP system, for students’ awareness classroom activity portfolio. The paper also builds a LAE using iBeacon devices in the design of wireless awareness functions. In the LAE, the CLAP system develops APPs for smart mobile devices for collecting data to construct students’ classroom activity portfolios. There are several types of students’ classroom activity portfolio, including records that students enter/leave classroom, responses to pushing information once students entered classroom, and distances from students’ seat to teacher’ presentation location (for example, the front desk of the classroom). It also offers analysis results of the classroom activity portfolio. Hence, it can benefit students who can readily send their records or responses on class in classroom learning. Moreover, they do not require to type many data (for example, long URL) for interacting with the portfolio collection system. Furthermore, the system can assist teacher in collecting students’ classroom activity portfolio, and then to have analysis results of the portfolio. For instance, teachers can get the result that students entered classroom but they send less or no feedback in classroom to the system. Descriptive statistics were used to summarize all variables for learning interests. Evaluation results show that the CLAP system benefits students for learning interests.
Acknowledgements
The authors would like to acknowledge the Ministry of Science and Technology of Taiwan, R.O.C., for financially supporting this research under Contract Number MOST 105-2511-S-150-003.
References
Bergmann, J., & Sams, A. (2012). Before you flip, consider this. Phi Delta Kappan, 94(2), 25-25. Chen, Z., Zhu, Q., Jiang, H., & Soh, Y. C. (2015, June). Indoor localization using smartphone sensors and
iBeacons. In Industrial Electronics and Applications (ICIEA), 2015 IEEE 10th Conference on (pp. 1723-1728).
Diller, D. (2015). TF6 Implementation of the Flipped Classroom Model Using VirtualACEP to Teach a Cardiology Curriculum to Emergency Medicine Residents. Annals of Emergency Medicine, 66(4), S157-S158.
Evseeva, A., & Solozhenko, A. (2015). Use of flipped classroom technology in language learning. Procedia-Social and Behavioral Sciences, 206, 205-209.
Gilboy, M. B., Heinerichs, S., & Pazzaglia, G. (2015). Enhancing student engagement using the flipped classroom. Journal of nutrition education and behavior, 47(1), 109-114.

298
Hwang, G. J., & Chang, H. F. (2011). A formative assessment-based mobile learning approach to improving the learning attitudes and achievements of students. Computers & Education, 56(4), 1023-1031.
Obradovich, A., Canuel, R., & Duffy, E. P. (2015). A survey of online library tutorials: guiding instructional video creation to use in flipped classrooms. The Journal of Academic Librarianship, 41(6), 751-757.
Radhakrishnan, M., Misra, A., Balan, R. K., & Lee, Y. (2015, October). Smartphones and ble services: Empirical insights. In Mobile Ad Hoc and Sensor Systems (MASS), 2015 IEEE 12th International Conference on (pp. 226-234).
Domingo, M. G., & Gargante, A. B. (2016). Exploring the use of educational technology in primary education: Teachers' perception of mobile technology learning impacts and applications' use in the classroom. Computers in Human Behavior, 56, 21-28.
Volk, M., Cotič, M., Zajc, M., & Starčič, A. I. (2017). Tablet-based cross-curricular maths vs. traditional maths classroom practice for higher-order learning outcomes. Computers & Education, 114, 1-23.
López, O. S. (2010). The digital learning classroom: Improving English language learners’ academic success in mathematics and reading using interactive whiteboard technology. Computers & Education, 54(4), 901-915.
Moreira, F., Ferreira, M. J., Santos, C. P., & Durão, N. (2016). Evolution and use of mobile devices in higher education: A case study in Portuguese Higher Education Institutions between 2009/2010 and 2014/2015. Telematics and Informatics, 34(6), 838-852.
Hayashi, Y., et al. (Eds.) (2017). Workshop Proceedings of the 25th International Conference on Computers in Education. New Zealand: Asia-Pacific Society for Computers in Education
299
Language Learning with Mobiles, Social Media and Gamification in Mongolia: Possibilities and
Challenges Hyo-Jeong SOa*, Christine SHINb, Lung Hsiang WONGc, Minhwi SEOa & Bolor
DAVAASURENa aDepartment of Educational Technology, Ewha Womans University, Korea
bDepartment of English Education, Mongolia International University, Mongolia cNational Institute of Education, Nanyang Technological University, Singapore
Abstract: In this paper, we present the design and evaluation of the mobile-assisted language learning (MALL) program that was implemented in three schools in Mongolia, and how students perceived the efficacy of such a digital learning solution for improving their English competency. The digital learning solution employed in this research includes mobiles, social media, and gamification to help students learn English through contextualized social learning processes. The students (N=67) completed the perception survey that measured their perceived efficacy of the digital learning solution. In addition, interviews with selected students and teachers were conducted to further investigate their experiences and challenged faced during the intervention. Overall, the findings indicate high levels of student participation throughout the intervention period and their increased interest towards English learning. In conclusion, we discuss both possibilities and challenges of integrating digital learning solutions in the developing world.
Keywords: Gamification, Facebook, mobile-assisted language learning (MALL), digital learning, international development
1. Introduction
Mongolia, a rapidly developing country in Asia has been facing new challenges brought by rapid modernization and urbanization since its political democracy has emerged in the 1990s. The fall of Soviet Union, the extreme climate, and the recent economic crisis have created a unique emergency situation in which people in the rural area have been abandoning the nomadic lifestyle and moving to the capital city. This recent phenomenon has also been heavily influencing Mongolia’s public education system. Many nomads head to the capital in search of better schooling for their children (Kingsley, 2017). Due to the insufficient number of public schools which cannot accommodate the rapidly increasing student population in Ulaanbaatar, most students have to share school buildings and can only receive on average 4 hours of education a day.
Concerning the emerging challenges that Mongolian public education has been facing, the main goal of this research program was to investigate how gamification and social media can be incorporated into the design of an effective mobile-assisted language learning (MALL) program in Mongolian public schools, in order to promote effective contextualized learning experiences. This study was implemented in Mongolia to deliver a new model of mobile-assisted language learning to teachers and students. We believed that a packaged model with pre-defined content would not be a sustainable solution in developing countries in the long-term since such solutions often rely on the expertise of external researchers. Beyond the content-delivery model of language learning, this project explored how to motivate and empower learners in the developing world to participate in social learning environments where they can exchange ideas and generate learning content that are meaningful and relevant to them. Our digital learning solution includes the integration of social media and mobiles that are readily available in Mongolia. Further, we explored the use of gamification in the
300
learning activity design to make learning experiences more learner-centered and participatory. This paper presents the design and evaluation of the MALL program that was implemented in three schools in Mongolia, and how students perceived the efficacy of such the MALL solution for improving their English competency. In conclusion, we discuss both possibilities and challenges of integrating such digital learning solutions in the developing world.
2. Theoretical Background
2.1. Social Media for Learning
Social media, which plays an important role in the life of the youth for both communicative and creative activities, has the potential to situate and support language learning in authentic social contexts (Kukulska-Hulme, Traxler, & Pettit, 2007; Yunus, Salehi, & Chen, 2012). Social media can also support user-generated activities in which students share everyday life situations with meaning-making processes across time and context. Leveraging its communicative nature, social media has been widely used for educational purposes (Gikas & Grant, 2013). Some of the most popular social media platforms include Facebook, Linkedin, and Edmodo. Facebook has especially been widely used to enhance student interactions in and out of classroom settings (Ghani, 2015), promote students’ involvement (Buga, Căpeneaţă, Chirasnel, & Popa, 2014), and utilize the platform as an institutional tool (Hunter-Brown, 2012).
In Asia, two Singapore-based MALL projects “Move, Idioms!” (Wong, Chin, Tan, & Liu, 2010;) and MyCLOUD (Wong, King, Chai, & Liu, 2016) have genuinely transformed and connected classroom-based participatory learning of language knowledge and skills with learners’ day-to-day authentic social media creation. Subsequently, such learner-generated content fostered further peer learning and social interactions through the reply feature. The low-stakes (not graded) social media spaces became a ‘brave new world’ for the young learners to tinker with their ideas and learn language without the fear of overt academic consequences. According to Wong et al. (2016), 37 students who participated in such a MALL-based Chinese as L2 learning trajectory over a year gradually developed their propensity to proactively and spontaneously create meaning through interacting with their living spaces. This resulted in the retrieval of a greater diversity of the learned vocabulary and the application of the language in 1,043 social media items which they created, particularly the use of significantly more “less frequent words” (which are typically more difficult words) in the informal physical context, as compared to those from the formal or online contexts.
2.2. Games and Gamification for Learning
Another line of studies seeks to infuse game or gamification elements into MALL designs. For game-based learning, beyond behaviorist mobile games that drill learners in (e.g., recognizing words), there were mobile games rooted in the notion of mobile Computer-Supported Collaborative Learning (mCSCL) in which either individual Spanish syllables (Zurita & Nussbaum, 2004) or Chinese character components (Wong, Boticki, Sun, & Looi, 2011) were assigned to individual gamers’ mobile applications; and the gamers need to negotiate with their peers that get hold of the other syllables or components to form teams that will constitute legitimate Spanish words or Chinese characters. Meanwhile, Holden and Sykes (2012) developed “Mentira”, an augmented reality game that requires learners to converse with fictional characters in Spanish concerning a murder case. The conversations are a portion of partly-fictional, geographically situated narrative. Each choice of where to go, what to say, or what to do can trigger an event or gives the player an item to carry on with the game. A similar location-based English learning game, HELLO, was reported in Liu and Chu (2010), which requires college students to carry out learning tasks that utilize the target language in the campus.
Regarding gamification, Nicholson (2012) suggests that, so far, the use of game elements focuses mainly on external motivation with reward-based systems. The BLAP gamification refers to the acronym of the four commonly used reward-based elements: Badges, Levels and Leaderboards, Achievements, and Points. Nicholson cautions against the excessive use of BLAP gamification
301
elements, especially when the essential goal is to change human behaviors and attitudes in the long term. Our review of the existing literature indicates that gamification-based learning research in Asian context is still at the early stage and that only a few research studies have been conducted (e.g., Boticki, Baksa, Seow, & Looi, 2015; Liu & Chu, 2010; Su & Cheng, 2015;). For instance, Boticki et al. (2015) examined how gamified learning experiences unfolded across multiple locations over a one-year period and unpacked how primary school students in Singapore participated in the gamified mobile learning platform across formal and informal settings.
3. Methods
3.1. Research Context and Participants
The main goal of this research program was to deliver a participatory model of mobile-assisted language learning (MALL) to improve English teaching methods and learning experience in public schools in Mongolia. Our intention was to go beyond didactic and decontextualized language learning experience through the mobile gamification-based learning solution. The main research intervention took place from October 2016 to January 2017 with three teachers (two 10th grade and one 6th grade) and their students (N=67). The three selected schools cover both the Ulaanbaatar city-center area and the Ger district, and both the lower secondary and upper secondary grades. Two teachers were teaching 10th-grade students (Schools 67 and 87), and one was teaching 6th-grade students (School 2). Each teacher selected one class on a random basis to be the experiment group and another class of the same grade as the control group. Students in School 65 (n=28) studied English for 4-5 hours per week whereas those in School 87 (n=17) and School 2 (n=22) studied English for 3 hours per week.
We used a BYOD (Bring Your Own Device) approach where students used their own cell phones to complete the learning activities. This decision was made based on the baseline survey results, where we found that most high school students own smartphones or a feature phone, and have access to mobile devices at home. For a small number of students who did not own a smartphone, the teachers provided a smartphone or encouraged sharing of the device among the students. To support the Internet connection in and out of school, we provided the students and teachers in each class with cellular data cards that allowed Internet access for 24 hours.
3.2. Intervention Design & Implementation
Figure 1 visualizes the interweaved relationships among the three main components in the digital learning solution proposed in this research project. The idea central to this design framework is to create a participatory language-learning environment where students with mobile phones can learn English through contextualized social learning processes. Mobiles and social media (i.e., Facebook), hence, play critical roles to make this design work in and out of class. The baseline study conducted revealed that 97% of the students used Facebook, which confirmed that Facebook is the most commonly used social media channel in Mongolia. Leveraging the existing media practices among the Mongolian youth, the research team decided to create Facebook groups as the main online learning platform. This social media became a central learning place supporting a diverse range of teaching and learning activities.
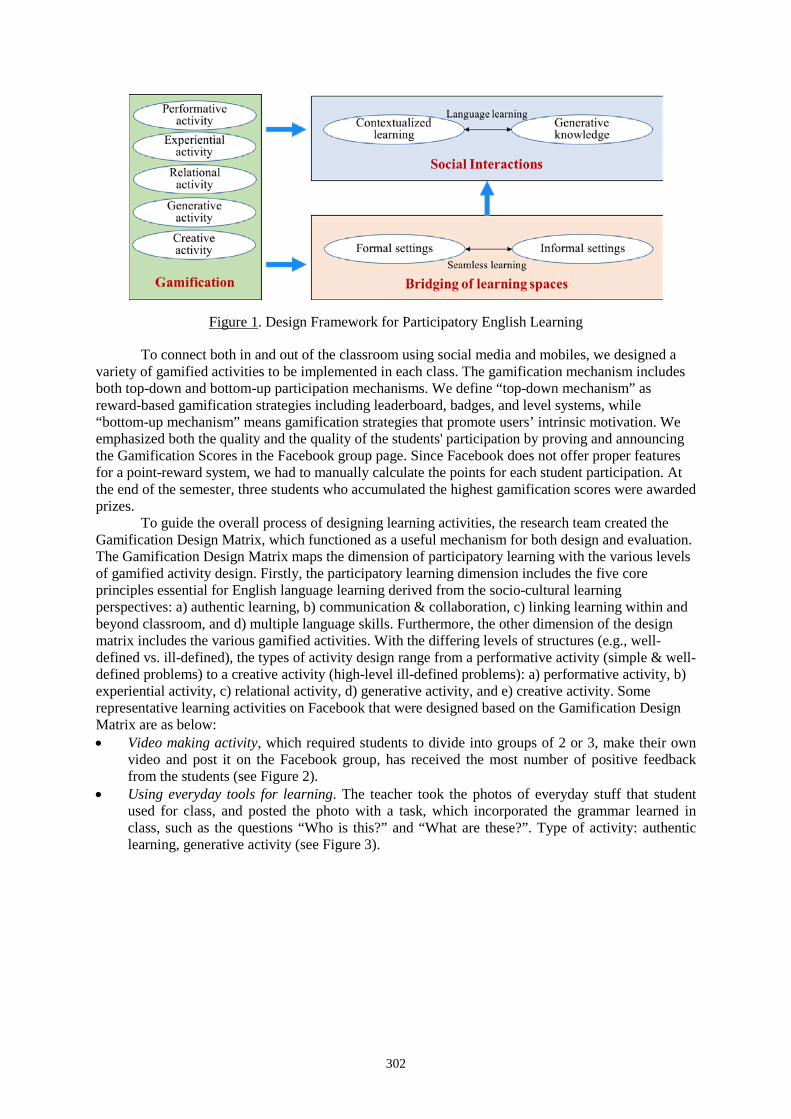
302
Figure 1. Design Framework for Participatory English Learning
To connect both in and out of the classroom using social media and mobiles, we designed a variety of gamified activities to be implemented in each class. The gamification mechanism includes both top-down and bottom-up participation mechanisms. We define “top-down mechanism” as reward-based gamification strategies including leaderboard, badges, and level systems, while “bottom-up mechanism” means gamification strategies that promote users’ intrinsic motivation. We emphasized both the quality and the quality of the students' participation by proving and announcing the Gamification Scores in the Facebook group page. Since Facebook does not offer proper features for a point-reward system, we had to manually calculate the points for each student participation. At the end of the semester, three students who accumulated the highest gamification scores were awarded prizes.
To guide the overall process of designing learning activities, the research team created the Gamification Design Matrix, which functioned as a useful mechanism for both design and evaluation. The Gamification Design Matrix maps the dimension of participatory learning with the various levels of gamified activity design. Firstly, the participatory learning dimension includes the five core principles essential for English language learning derived from the socio-cultural learning perspectives: a) authentic learning, b) communication & collaboration, c) linking learning within and beyond classroom, and d) multiple language skills. Furthermore, the other dimension of the design matrix includes the various gamified activities. With the differing levels of structures (e.g., well-defined vs. ill-defined), the types of activity design range from a performative activity (simple & well-defined problems) to a creative activity (high-level ill-defined problems): a) performative activity, b) experiential activity, c) relational activity, d) generative activity, and e) creative activity. Some representative learning activities on Facebook that were designed based on the Gamification Design Matrix are as below: • Video making activity, which required students to divide into groups of 2 or 3, make their own
video and post it on the Facebook group, has received the most number of positive feedback from the students (see Figure 2).
• Using everyday tools for learning. The teacher took the photos of everyday stuff that student used for class, and posted the photo with a task, which incorporated the grammar learned in class, such as the questions “Who is this?” and “What are these?”. Type of activity: authentic learning, generative activity (see Figure 3).
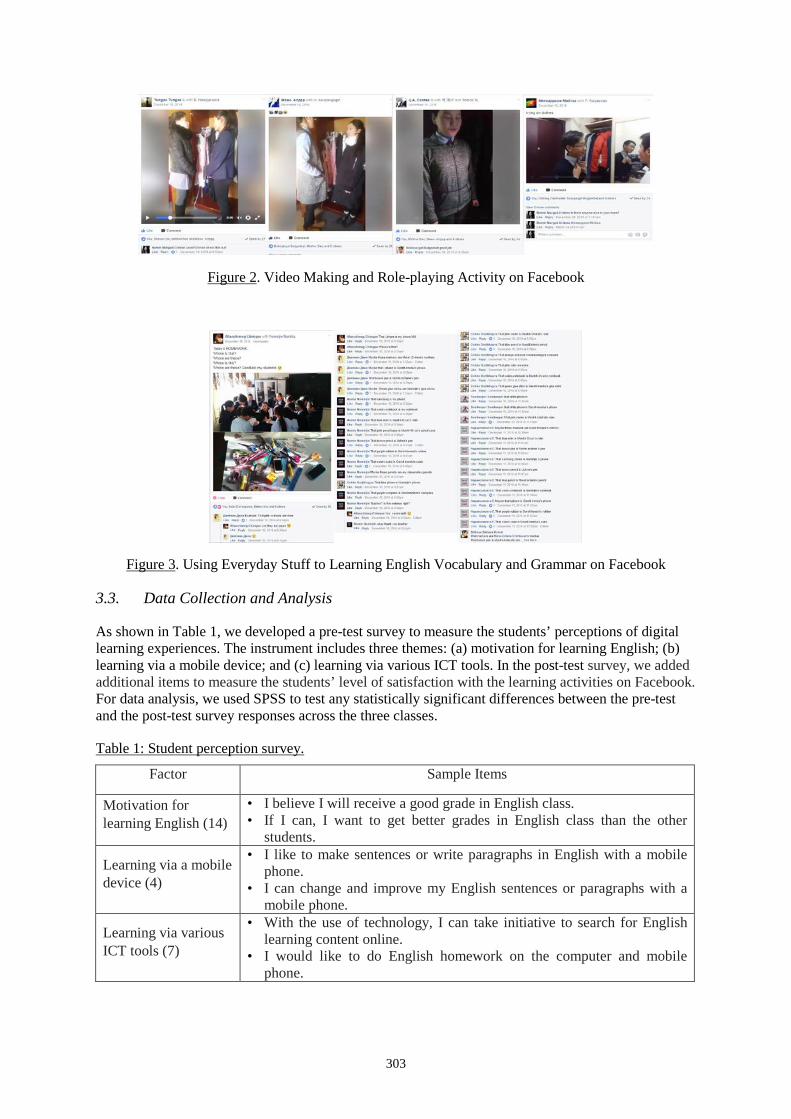
303
Figure 2. Video Making and Role-playing Activity on Facebook
Figure 3. Using Everyday Stuff to Learning English Vocabulary and Grammar on Facebook
3.3. Data Collection and Analysis
As shown in Table 1, we developed a pre-test survey to measure the students’ perceptions of digital learning experiences. The instrument includes three themes: (a) motivation for learning English; (b) learning via a mobile device; and (c) learning via various ICT tools. In the post-test survey, we added additional items to measure the students’ level of satisfaction with the learning activities on Facebook. For data analysis, we used SPSS to test any statistically significant differences between the pre-test and the post-test survey responses across the three classes.
Table 1: Student perception survey.
Factor Sample Items
Motivation for learning English (14)
• I believe I will receive a good grade in English class. • If I can, I want to get better grades in English class than the other
students.
Learning via a mobile device (4)
• I like to make sentences or write paragraphs in English with a mobile phone.
• I can change and improve my English sentences or paragraphs with a mobile phone.
Learning via various ICT tools (7)
• With the use of technology, I can take initiative to search for English learning content online.
• I would like to do English homework on the computer and mobile phone.
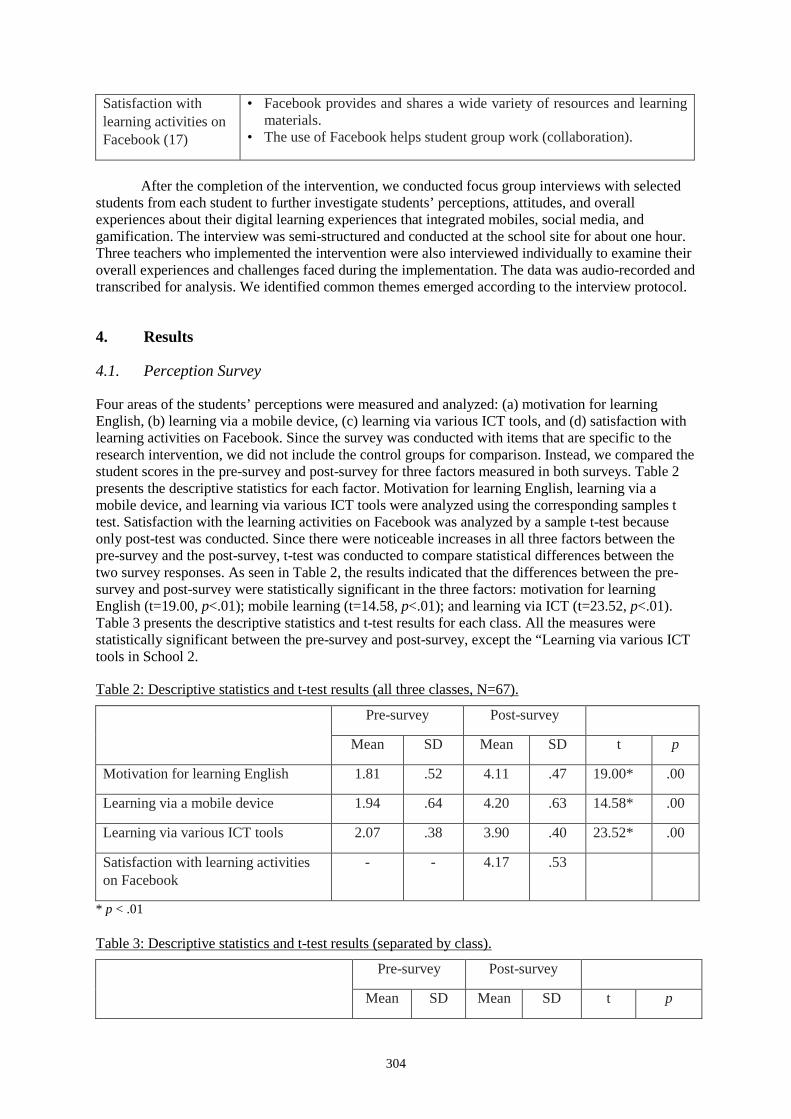
304
Satisfaction with learning activities on Facebook (17)
• Facebook provides and shares a wide variety of resources and learning materials.
• The use of Facebook helps student group work (collaboration).
After the completion of the intervention, we conducted focus group interviews with selected
students from each student to further investigate students’ perceptions, attitudes, and overall experiences about their digital learning experiences that integrated mobiles, social media, and gamification. The interview was semi-structured and conducted at the school site for about one hour. Three teachers who implemented the intervention were also interviewed individually to examine their overall experiences and challenges faced during the implementation. The data was audio-recorded and transcribed for analysis. We identified common themes emerged according to the interview protocol.
4. Results
4.1. Perception Survey
Four areas of the students’ perceptions were measured and analyzed: (a) motivation for learning English, (b) learning via a mobile device, (c) learning via various ICT tools, and (d) satisfaction with learning activities on Facebook. Since the survey was conducted with items that are specific to the research intervention, we did not include the control groups for comparison. Instead, we compared the student scores in the pre-survey and post-survey for three factors measured in both surveys. Table 2 presents the descriptive statistics for each factor. Motivation for learning English, learning via a mobile device, and learning via various ICT tools were analyzed using the corresponding samples t test. Satisfaction with the learning activities on Facebook was analyzed by a sample t-test because only post-test was conducted. Since there were noticeable increases in all three factors between the pre-survey and the post-survey, t-test was conducted to compare statistical differences between the two survey responses. As seen in Table 2, the results indicated that the differences between the pre-survey and post-survey were statistically significant in the three factors: motivation for learning English (t=19.00, p<.01); mobile learning (t=14.58, p<.01); and learning via ICT (t=23.52, p<.01). Table 3 presents the descriptive statistics and t-test results for each class. All the measures were statistically significant between the pre-survey and post-survey, except the “Learning via various ICT tools in School 2.
Table 2: Descriptive statistics and t-test results (all three classes, N=67).
Pre-survey Post-survey
Mean SD Mean SD t p
Motivation for learning English 1.81 .52 4.11 .47 19.00* .00
Learning via a mobile device 1.94 .64 4.20 .63 14.58* .00
Learning via various ICT tools 2.07 .38 3.90 .40 23.52* .00
Satisfaction with learning activities on Facebook
- - 4.17 .53
* p < .01
Table 3: Descriptive statistics and t-test results (separated by class).
Pre-survey Post-survey
Mean SD Mean SD t p
305
Motivation for learning English
School 2 1.53 .44 4.31 .38 14.96* .00
School 65 1.83 .52 4.04 .53 11.68* .00
School 87 2.08 .47 4.01 .40 9.16* .00
Learning via a mobile device
School 2 1.95 .60 4.23 .64 8.62* .00
School 65 2.02 .68 4.07 .66 8.33* .00
School 87 1.82 .63 4.35 .57 8.30* .00
Learning via various ICT tools
School 2 2.03 .31 3.87 .35 16.30 .00
School 65 2.05 .38 3.85 .37 18.37* .00
School 87 2.18 .47 4.02 .50 8.27* .00
Satisfaction with the learning activities on Facebook
School 2 - - 4.19 .54
School 65 - - 4.09 .53
School 87 - - 4.27 .53
*p <.05
4.2. Interview Findings
Through the constant comparison method, we identified three main themes (localization, teaching and learning outcomes, and sustainable adoption) and several sub-themes for each respective factor, as summarized in Table 4. It should be noted that we synthesized the key findings from analyzing both the teacher interviews and the student interviews for a more holistic understanding, by corroborating the interpretations from the two different interview sources. The most frequently mentioned factor for localizing digital learning innovations in Mongolia was the limited Internet infrastructure in public schools. The limited Internet infrastructure affected both the teachers’ and students’ level of motivation for adopting mobile-devices and social media for teaching and learning activities. This issue became even more prominent after the intervention. Even though the students were given with the mobile data card to help complete the learning activities on Facebook, the limited Internet connection often prevented them from active participation. During the post-intervention interview, the teachers reported some changes in their own teaching styles and expressed enthusiasm for self-improvement. Activities and homework on Facebook mostly involved group work that required collaboration among the students. It appears that such social learning experience influenced the students’ perceptions towards learning and impacted their interests and engagement in the learning process:
• “I liked making videos with friend. It was difficult but we really enjoyed it. We spend hours to make 30 second video.” (Student from School 65)
It was also interesting that the use of social media affected students’ attitudes of doing their homework and made them more aware of the contents learned. Since most students were active Facebook users, their routine of checking instant notifications naturally increased the level of participation in the gamified learning activities:
• “In the past, we used to procrastinate our homework until the last moment. From this semester, we waited for homework to be posted on Facebook.” (Student from School 87)
Most students reported that they improved their English skills, especially in the areas of vocabulary, grammar, and writing. Some students indicated that the activities on Facebook helped them better understand the lessons given in the classrooms because interactive communication extends the classroom’s learning environments:
• “Facebook activities increased my vocabulary. Because when I do my homework on Facebook and there are words I don’t know, I can ask for help.” (Student from School 2)
306
• “Facebook helps us to understand English topics better and to express better ideas because [Facebook] is like a continuing class.” (Student from School 87)
Some students also mentioned that the authentic photos of real-life context uploaded on Facebook helped them make better linkages to the English lesson, instead of learning only through the textbook materials:
• “When we see the photos for vocabulary learning on Facebook, it is much easier to memorize because they are authentic. From textbooks, you cannot get such good visualization.” (Student from School 65)
Table 4: Main themes and sub-themes of interviews findings.
Main themes Sub-themes
Critical factors for localization • Internet infrastructure • Curriculum and teaching materials • Teacher professional development
Teaching and learning outcomes • Changes in teaching styles • Changes in student’s perception on learning • Improvement in English proficiency
Sustainable adoption • Technical infrastructure • Teacher facilitation • Government and school support
5. Implications & Conclusion
This research emphasizes the criticality of culturally relevant and learner-centered approaches when addressing digital learning innovations in Mongolia. In this project, we re-designed various kinds of materials and contents for teaching and learning activities to make them relevant to the local context and to the students’ needs. The situation analysis conducted during the baseline study (e.g., learner survey, expert interviews, and examination of the school curricula) greatly enhanced the research team’s understanding of the challenges that the Mongolian public school system had been facing, especially in the area of English education. In addition, our decision to utilize mobiles and social media (i.e., Facebook) was intentionally made to maximize the potential of localizing our digital learning solution. Our belief was that the adoption rate by the teachers and the students would increase when the solution leverages the existing technology and media practices, since user acceptance would likely to be low and slow if we introduce new solutions. Concerning the quality and equity, our digital learning solution aimed to go beyond didactic and decontextualized language learning by utilizing the mobile gamification-based learning solution.
Regarding the sustainability issue, this study demonstrates that the potential of adopting and sustaining digital learning innovations in Mongolian public schools can be enhanced (a) when the solution leverages the existing resources and cultural practices; and (b) when continuous efforts are made for building local teachers’ pedagogical knowledge and skills. As mentioned earlier, the digital learning solution in this research program was designed to utilize the material and cultural resources that are already readily available in Mongolian school contexts. With the use of mobile devices, employing the BYOD approach, and using Facebook where our participants were already active users, we were able to minimize technical set-up issues that digital learning initiatives in developing countries might often face. We were able to confirm that social media like Facebook hold great possibilities to be participatory learning spaces in developing countries when appropriate pedagogical design is accompanied.
To address the equity issue in education, we intentionally selected two schools located in the Ger district. We were able to achieve high levels of student participation throughout the intervention period, and to increase their overall interest towards English learning, as confirmed by the survey results. The interview with students and teachers further revealed several issues at multiple layers that need to be considered for localizing and sustaining such digital learning solutions in the developing
307
world like Mongolia. As Ertmer (1999) argues, we believe that the first-order barriers such as technical infrastructure and devices issues may be resolved gradually over time. Second-order barriers such as beliefs and culture are more challenging and complex issues that future research and policy actions need to address. This research demonstrated that the new model of MALL with meaningful gamification strategies could be beneficial to both teachers and students who want to improve their English knowledge and skills.
Acknowledgements
This research was conducted under the Digital Learning for Development (DL4D) project of the Foundation for Information Technology Education and Development (FIT-ED) of the Philippines, jointly funded by the International Development Research Centre (IDRC) of Canada and the Department for International Development (DFID) of the United Kingdom. We would like to thank all the teachers and students who participated in this research project.
References
Boticki, I., Baksa, J., Seow, P., & Looi, C. K. (2015). Usage of a mobile social learning platform with virtual badges in a primary school. Computers & Education, 86, 120-136.
Buga, R., Căpeneaţă, I., Chirasnel, C., & Popa, A. (2014). Facebook in foreign language teaching–A tool to improve communication competences. Procedia-Social and Behavioral Sciences, 128, 93-98.
Ertmer, P. A. (1999). Addressing first-and second-order barriers to change: Strategies for technology integration. Educational Technology Research and Development, 47(4), 47-61.
Ghani, M. B. A. (2015). The use of Facebook in the teaching and learning of research report writing in a Malaysian college (Doctoral dissertation, Universiti Pendidikan Sultan Idris).
Gikas, J., & Grant, M. M. (2013). Mobile computing devices in higher education: Student perspectives on learning with cellphones, smartphones & social media. The Internet and Higher Education, 19, 18-26.
Holden, C., & Sykes, J. (2012, January). Mentira: Prototyping language-based locative gameplay. In Mobile Media Learning (pp. 111-130). Springer-Verlag.
Hunter-Brown, S. (2012). Facebook as an instructional tool in the secondary classroom: A case study. (Doctoral dissertation). Retrieved from ProQuest Dissertations & Theses Full Text. (1115317512)
Kingsley, P. (2017). Nomads no more: why Mongolian headers are moving to the city. Retrieved on March 3rd 2017 from https://www.theguardian.com/world/2017/jan/05/mongolian-herders-moving-to-city-climate-change
Kukulska-Hulme, A., Traxler, J., & Pettit, J. (2007). Designed and user-generated activity in the mobile age. Journal of Learning Design, 2(1), 52-65.
Liu, T. Y., & Chu, Y. L. (2010). Using ubiquitous games in an English listening and speaking course: Impact on learning outcomes and motivation. Computers & Education, 55(2), 630-643.
Nicholson, S. (2012). A user-centered theoretical framework for meaningful gamification. Games+ Learning+ Society, 8(1), 223-230.
Su, C. H., & Cheng, C. H. (2015). A mobile gamification learning system for improving the learning motivation and achievements. Journal of Computer Assisted Learning, 31(3), 268-286.
Wong, L.-H., Chin, C.-K., Tan, C.-L., & Liu, M. (2010). Students' personal and social meaning making in a Chinese idiom mobile learning environment. Educational Technology & Society, 13(4), 15-26.
Wong, L.-H., King, R. B., Chai, C. S., & Liu, M. (2016). Seamlessly learning Chinese: contextual meaning making and vocabulary growth in a seamless Chinese as a second language learning environment. Instructional Science, 44(5), 399-422.
Wong, L.-H., Boticki, I., Sun, J., & Looi, C.-K. (2011). Improving the scaffolds of a mobile-assisted Chinese character forming game via a design-based research cycle. Computers in Human Behavior, 27(5), 1783-1793.
Yunus, M. M., Salehi, H. A. D. I., Sun, C. H., Yen, J. Y. P., & Li, L. K. S. (2011). Using Facebook groups in teaching ESL writing. Recent Researches in Chemistry, Biology, Environment and Culture, 75(1), 75-80.
Zurita, G., & Nussbaum, M. (2004). Computer supported collaborative learning using wirelessly interconnected handheld computers. Computers & Education, 42(3), 289-314.
Hayashi, Y., et al. (Eds.) (2017). Workshop Proceedings of the 25th International Conference on Computers in Education. New Zealand: Asia-Pacific Society for Computers in Education
308
A BYOD Hybrid Learning Approach to Incorporating The In-Field Social Study based on Guided Inquiry Learning Strategy: Design and Evaluation of Enjoy The Field Trip Ever
Project (EFTE) Ratthakarn NA PHATTHALUNGa, Charoenchai WONGWATKITb*, Jintana WONGTAc,
Chitphon YACHULAWETKUNAKORNd & Chayanuch WATTHANAe a,c,d,eEngineering Science Classroom, King Mongkut’s University of Technology Thonburi, Thailand
bDepartment of Computer and Information Technology, Faculty of Industrial Education and Technology, King Mongkut’s University of Technology Thonburi, Thailand
Abstract: Social study plays a critical role in understanding different phenomena in the society from the past to the present. This involves several subjects ranging from geography, history, science to arts. Many schools promote this learning by taking students to study in the actual fields to experience their contexts; however, the students could not fully inquire the knowledge due to the limitations of learning activities. With the advancements in mobile technology, the students are encouraged to use their own devices to obtain more knowledge. Based on this perspective, the researchers aimed to tackle this challenge by redesigning such learning activities. Therefore, this study introduced the design of hybrid learning approach to incorporate the in-field social study. A careful analysis of learning activities has been designed to support the mobile learning; moreover, the missions to accomplish at the sites are developed to reflect the content of the certain subjects behind. After one-day field trip with the proposed approach, the debriefing session is given in the classroom to ensure that all students can reach and understand the historical story from their actions. To retrieve the initial feedback of this approach, a simple evaluation was done, and the results were collected for further improvement.
Keywords: BYOD, mobile learning, guided inquiry, field study, social study, hybrid learning, technology-enhanced learning, ubiquitous learning
1. Introduction
Social studies are considered as the integrated study which combined the social sciences, humanities, and history to promote civic competence. Within the school program, social studies provides coordinated, systematic study drawing upon such disciplines as anthropology, archaeology, economics, geography, history, law, philosophy, political science, psychology, religion, and sociology, as well as appropriate content from the humanities, mathematics, and natural sciences (Jorgensen, 2012). Also, the primary purpose of social studies is to help young people develop the ability to make informed and reasoned decisions for the public good as citizens of a culturally diverse, democratic society in an interdependent world (Vinson, 1999). Hence, it is necessary for the students to study social studies at all level since the kindergarten.
Social studies also are the branch of learning the emergence, present, and history of the societies in different contexts around the globe. This can deepen the learners to understand how the existence has become and how the future tends to be based on the history by studying various aspect of social studies. Normally, learning social study can be relevant to social sciences, history, and humanities. In the past, learning this subject happened in the traditional lecture-based instruction, in
309
which the students passively receive the knowledge. This caused the students just only learning by memorization, namely rote learning, regardless of the real context understanding. Nevertheless, lecturing in class is also considered as the limitation for learning because authentic social studies learning composed of various discipline; Geography, Architecture, Culture, and Science.
Although different modes of teaching methods have been adopted to help increase the learning achievement of social studies, educational researchers widely agreed that learning in the context (in-field study) is considered as one of the effective methods that could significantly help the learners to experience these phenomena, leading to better learning performance and learning motivation (Stoddard, 2009). The most significant thing for studying social studies inevitably be the teacher because they must understand the whole content of the subject in order to convey to the students. The best method to convey must be relayed through the instructor’s experience. For example, teacher’s experience discussed. Moreover, another significant thing is that the teacher should encourage the students to create the question that they suspect and encourage students to criticize, comment, and debate. It is a result of the effective learning experience (Adler, 2008). According to Susan Adler, the teacher is like to be the knowledge’s storage, which is categorized as a limitation of knowledge. Hence applying technology device for learning is important to learning and developing (Meghan, 2017).
Therefore, learning in real field trip could increase student’s comprehension and memorization too (Stoddard, 2009). Moreover, Field trip learning will effective when the students have been intellectually prepared for the trip. For example, students can best apply the field trip experience to construct knowledge in sites when teachers have intensively introduced students to the topic or are actualizing a sectional unit on a related topic (Noel, 2006, 2007). During a field trip, the learning may take place while the optimization will occur only when the contents of field trip are well integrating with the curriculum (Noel, 2007). Moreover, learners can also memorize the knowledge content better. Because knowledge comes from self-learning through his various senses, such as seeing, hearing and touching (Risinger, 2010).
In the past years, mobile technology has been rapidly improved regarding both quantity and quality. This enables many learning opportunities for the students. Many educational institutes encourage students to bring their own mobile devices to the classrooms, widely known as BYOD, to obtain their learning participations and engagements. (Adhkari, Mathrani, & Scogings, 2016) With their devices, the teachers can employ different teaching methods to enhance their learning achievements. Moreover, this possibility could make the learning environments more challenging, while the learning activities are not only limited to the classroom but can be extended to many realities (Cristol & Gimbert, 2014). Furthermore, these activities can be designed to be a hybrid between online and offline worlds to suit with such environments and to be bridged among subject contents for better understand the situations in place.
Based on the limitations of learning social studies and possibilities of employing BYOD strategy to bring more learning success, this study aims to tackle such challenges for the benefits of students. Therefore, the researchers have considered the actual situation of learning social study subject at a school in Thailand as a case and designed a hybrid learning approach to incorporating the in-field social study based on guided inquiry learning strategy. In this paper, a study of related topics for developing such approach has been reviewed, and a detailed structure of the approach has been given. To extend the understandability, the analysis of content, the design of learning missions, and the development of BYOD hybrid learning activities have been presented. Finally, the evaluation of this approach has been conducted with a trial group of students, and the results could be used and considered for further improvement.
2. Related Study
2.1. Bring Your Own Device and Mobile Learning
In the recent decade, technology gradually plays an important role in promoting education. It is considered as a part of teaching and learning process. In addition, many research confirmed that the mobile device could offer advantages in education through the support of mobile technology, students
310
are allowed to explore and organize their knowledge in real scenarios (G.-J. Hwang, Chu, & Lai, 2017). A significant thing to study mobile device used to promote learning, the researcher must comprehend the concept of Bring Your Own Device (BYOD). It is used to describe the students using personally owned devices in education settings (Burns-sardone, 2014). Nowadays, BYOD rapidly popularized among educators because it could encourage the students to search and analyze the data from the website, and others channel. Moreover, it increased student participation which encouraged the student to drive learning and also increase their collaboration and communication skill through devices.
In the past decade, many research studies have applied BYOD strategy to promote learning in various aspects. For example, In 2012, Kingston et al., encouraged students to bring their mobile devices to investigate the landscape in the field study, while Handfield (2014) created Google Art Project allowing the students to see the art works from famous museums around the world. The museum is considered as an appropriate place for using a mobile device. According to Jang and Lien (2014) found that graphic-user-interface and mobile computing technology can improve exhibition form in the museum that enhances learning experience. In addition, studying in class and laboratory need to adopt BYOD to apply in education all levels (Hamza & Noordin, 2013).
In addition to that, mobile learning is widely considered by many educational researchers as the intersection of mobile computing and e-learning comprising of accessible resources. Wherever you are, students can search for the data that can support effective learning, and performance-based assessment (Robson, 2003; Hwang, Chu, & Lai, 2017). Mobile learning can be used to diversify the types of learning activities students partake in (or a blended learning approach). In the present, learning and studying are not only limited to lecture-based learning, but mobile learning could assist the students in constructing knowledge by exploring the real world and the virtual world (Shih, Chuang, & Hwang, 2010; Vishwakarma, 2015). Chatterjea (2012) created NIEmGeo, the app allows students to geo-tag data like text, photos, and videos onto a shared map for Geography field. In addition to their advantage and applications, the m-learning concept is a significant component for expanding education in the remote area and equal education access to citizens in the unreachable area (Kurzweil, Age, & Machines, 2007).
Based on these advantages, the concept of BYOD and mobile learning are used in this study to design the social learning activities by allowing the students to bring their own mobile devices to learn in the real context.
2.2 Hybrid Learning and Guided Inquiry Learning in Social Study
Hybrid learning was created to design the courses that combine traditional, face-to-face (FTF) instruction with online instruction (Kurthen & Smith, 2005). The goal of combined online and traditional education is to take full advantage of each (Osguthorpe & Graham, 2003). Many pieces of research showed that the use of hybrid learning is more effective than FTF or online models alone in higher education (Boyle, Bradley, Chalk, Jones, & Pickard, 2003; Poon, 2013). The hybrid format for the lab-based class showed positive experience in student’s learning which was using the large part of 50/ 50 hybrid delivery format (50% online + 50% FTF) (Park, 2011). Hybrid learning or blended learning enables the student to become more interacted in the learning process, and they were more behaviorally, intellectually and emotionally elaborate in their learning tasks (Wang, Shen, Novak, & Pan, 2009). The advantage of using blended learning was course flexibility, and this flexibility helped students with varied learning styles (Poon, 2013). Due to the potential benefits, an increasing number of institutions are interested in developing hybrid courses, programs, and degrees (Meydanlioglu & Arikan, 2014).
Inquiry-based learning is a pedagogy for teaching and learning that applies questions, ideas, and observations of students at the focus of the learning experience. Underlying this methodology is the concept that both instructors and students share responsibility for their learning (Scardamalia, 2002). Guided inquiry is a way of teaching and learning that build the school’s culture to a collaborative inquiry community and respond to the critical requirement for transforming the school into nowadays world (Kuhlthau, Maniotes, & Caspari, 2015).
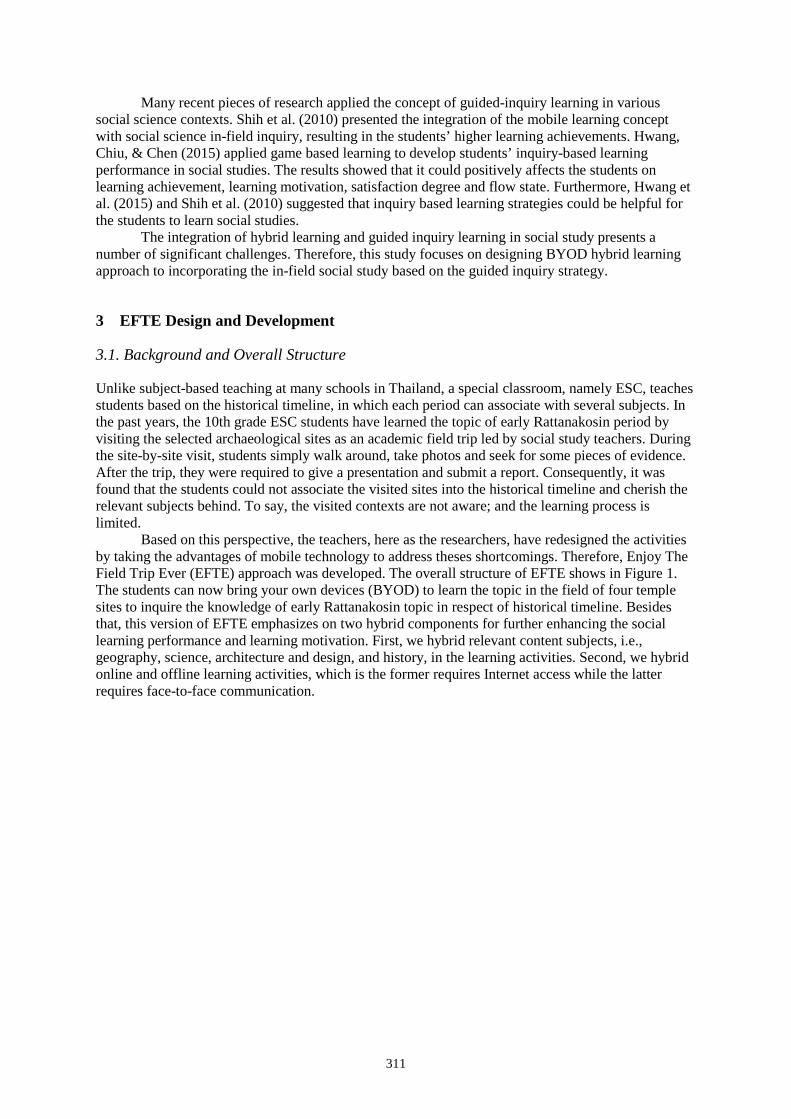
311
Many recent pieces of research applied the concept of guided-inquiry learning in various social science contexts. Shih et al. (2010) presented the integration of the mobile learning concept with social science in-field inquiry, resulting in the students’ higher learning achievements. Hwang, Chiu, & Chen (2015) applied game based learning to develop students’ inquiry-based learning performance in social studies. The results showed that it could positively affects the students on learning achievement, learning motivation, satisfaction degree and flow state. Furthermore, Hwang et al. (2015) and Shih et al. (2010) suggested that inquiry based learning strategies could be helpful for the students to learn social studies.
The integration of hybrid learning and guided inquiry learning in social study presents a number of significant challenges. Therefore, this study focuses on designing BYOD hybrid learning approach to incorporating the in-field social study based on the guided inquiry strategy.
3 EFTE Design and Development
3.1. Background and Overall Structure
Unlike subject-based teaching at many schools in Thailand, a special classroom, namely ESC, teaches students based on the historical timeline, in which each period can associate with several subjects. In the past years, the 10th grade ESC students have learned the topic of early Rattanakosin period by visiting the selected archaeological sites as an academic field trip led by social study teachers. During the site-by-site visit, students simply walk around, take photos and seek for some pieces of evidence. After the trip, they were required to give a presentation and submit a report. Consequently, it was found that the students could not associate the visited sites into the historical timeline and cherish the relevant subjects behind. To say, the visited contexts are not aware; and the learning process is limited.
Based on this perspective, the teachers, here as the researchers, have redesigned the activities by taking the advantages of mobile technology to address theses shortcomings. Therefore, Enjoy The Field Trip Ever (EFTE) approach was developed. The overall structure of EFTE shows in Figure 1. The students can now bring your own devices (BYOD) to learn the topic in the field of four temple sites to inquire the knowledge of early Rattanakosin topic in respect of historical timeline. Besides that, this version of EFTE emphasizes on two hybrid components for further enhancing the social learning performance and learning motivation. First, we hybrid relevant content subjects, i.e., geography, science, architecture and design, and history, in the learning activities. Second, we hybrid online and offline learning activities, which is the former requires Internet access while the latter requires face-to-face communication.
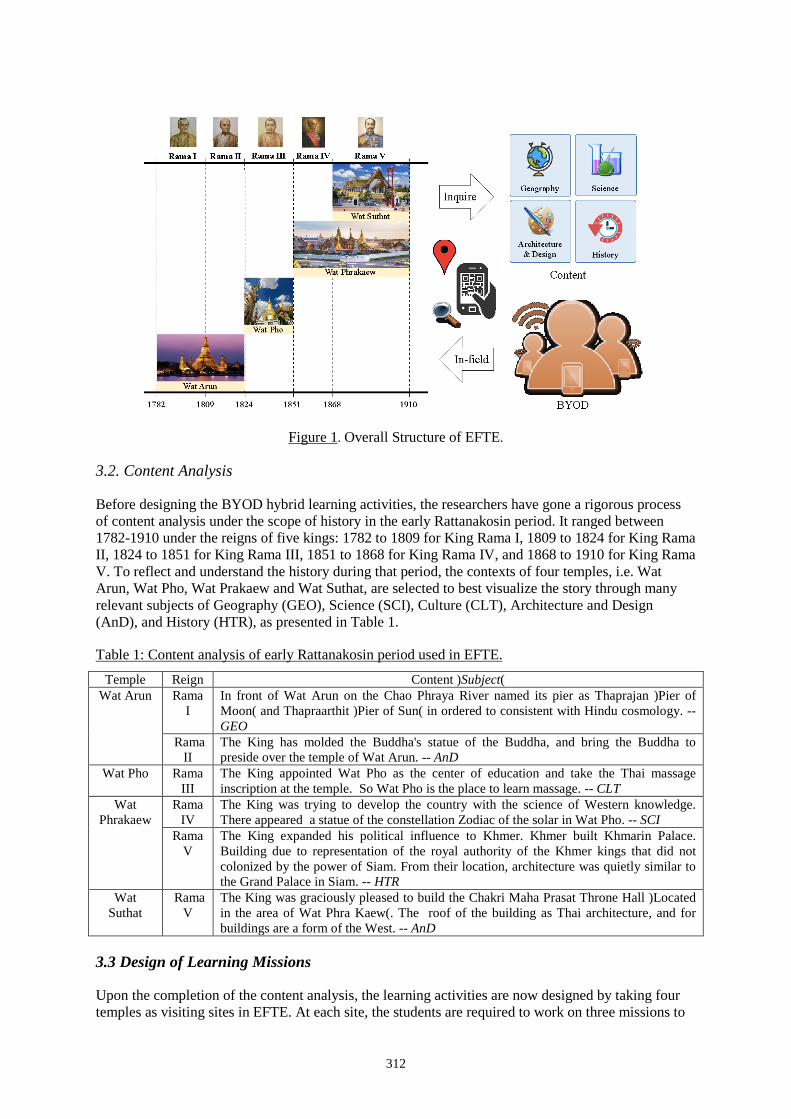
312
Figure 1. Overall Structure of EFTE.
3.2. Content Analysis
Before designing the BYOD hybrid learning activities, the researchers have gone a rigorous process of content analysis under the scope of history in the early Rattanakosin period. It ranged between 1782-1910 under the reigns of five kings: 1782 to 1809 for King Rama I, 1809 to 1824 for King Rama II, 1824 to 1851 for King Rama III, 1851 to 1868 for King Rama IV, and 1868 to 1910 for King Rama V. To reflect and understand the history during that period, the contexts of four temples, i.e. Wat Arun, Wat Pho, Wat Prakaew and Wat Suthat, are selected to best visualize the story through many relevant subjects of Geography (GEO), Science (SCI), Culture (CLT), Architecture and Design (AnD), and History (HTR), as presented in Table 1.
Table 1: Content analysis of early Rattanakosin period used in EFTE.
Temple Reign Content )Subject( Wat Arun
Rama I
In front of Wat Arun on the Chao Phraya River named its pier as Thaprajan )Pier of Moon( and Thapraarthit )Pier of Sun( in ordered to consistent with Hindu cosmology. -- GEO
Rama II
The King has molded the Buddha's statue of the Buddha, and bring the Buddha to preside over the temple of Wat Arun. -- AnD
Wat Pho Rama III
The King appointed Wat Pho as the center of education and take the Thai massage inscription at the temple. So Wat Pho is the place to learn massage. -- CLT
Wat Phrakaew
Rama IV
The King was trying to develop the country with the science of Western knowledge. There appeared a statue of the constellation Zodiac of the solar in Wat Pho. -- SCI
Rama V
The King expanded his political influence to Khmer. Khmer built Khmarin Palace. Building due to representation of the royal authority of the Khmer kings that did not colonized by the power of Siam. From their location, architecture was quietly similar to the Grand Palace in Siam. -- HTR
Wat Suthat
Rama V
The King was graciously pleased to build the Chakri Maha Prasat Throne Hall )Located in the area of Wat Phra Kaew(. The roof of the building as Thai architecture, and for buildings are a form of the West. -- AnD
3.3 Design of Learning Missions
Upon the completion of the content analysis, the learning activities are now designed by taking four temples as visiting sites in EFTE. At each site, the students are required to work on three missions to
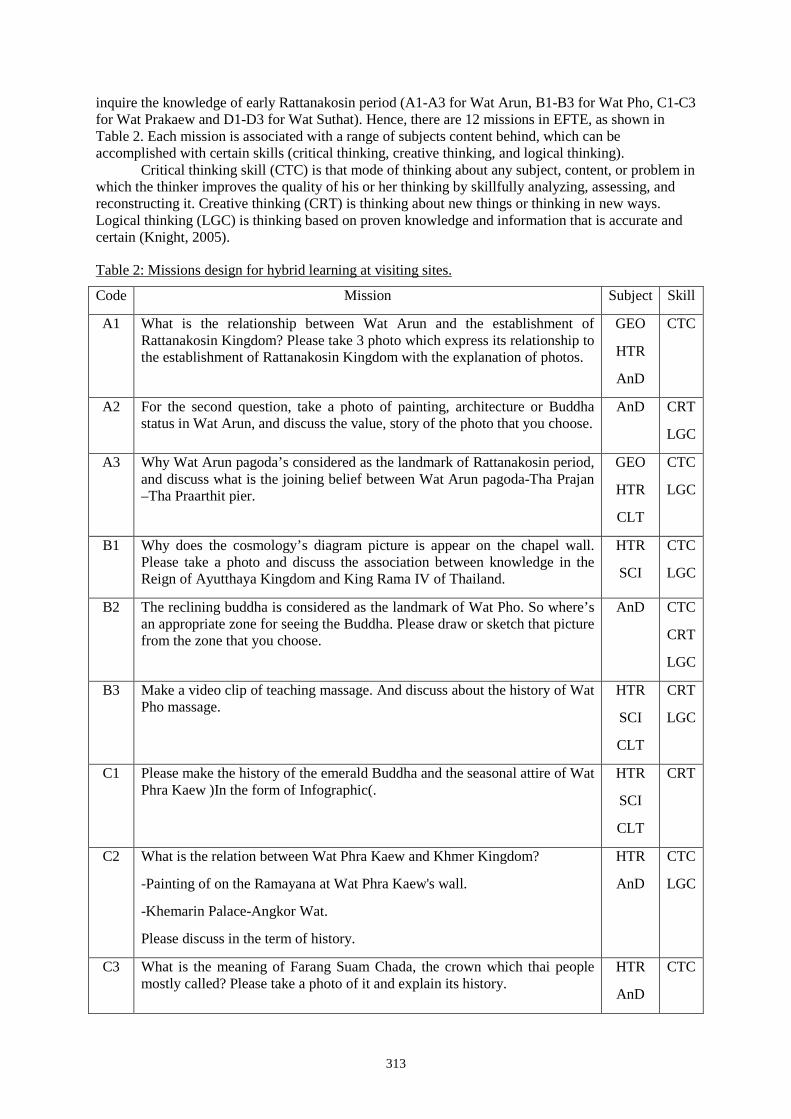
313
inquire the knowledge of early Rattanakosin period (A1-A3 for Wat Arun, B1-B3 for Wat Pho, C1-C3 for Wat Prakaew and D1-D3 for Wat Suthat). Hence, there are 12 missions in EFTE, as shown in Table 2. Each mission is associated with a range of subjects content behind, which can be accomplished with certain skills (critical thinking, creative thinking, and logical thinking).
Critical thinking skill (CTC) is that mode of thinking about any subject, content, or problem in which the thinker improves the quality of his or her thinking by skillfully analyzing, assessing, and reconstructing it. Creative thinking (CRT) is thinking about new things or thinking in new ways. Logical thinking (LGC) is thinking based on proven knowledge and information that is accurate and certain (Knight, 2005).
Table 2: Missions design for hybrid learning at visiting sites.
Code Mission Subject Skill
A1 What is the relationship between Wat Arun and the establishment of Rattanakosin Kingdom? Please take 3 photo which express its relationship to the establishment of Rattanakosin Kingdom with the explanation of photos.
GEO
HTR
AnD
CTC
A2 For the second question, take a photo of painting, architecture or Buddha status in Wat Arun, and discuss the value, story of the photo that you choose.
AnD
CRT
LGC
A3 Why Wat Arun pagoda’s considered as the landmark of Rattanakosin period, and discuss what is the joining belief between Wat Arun pagoda-Tha Prajan –Tha Praarthit pier.
GEO
HTR
CLT
CTC
LGC
B1 Why does the cosmology’s diagram picture is appear on the chapel wall. Please take a photo and discuss the association between knowledge in the Reign of Ayutthaya Kingdom and King Rama IV of Thailand.
HTR
SCI
CTC
LGC
B2 The reclining buddha is considered as the landmark of Wat Pho. So where’s an appropriate zone for seeing the Buddha. Please draw or sketch that picture from the zone that you choose.
AnD CTC
CRT
LGC
B3 Make a video clip of teaching massage. And discuss about the history of Wat Pho massage.
HTR
SCI
CLT
CRT
LGC
C1 Please make the history of the emerald Buddha and the seasonal attire of Wat Phra Kaew )In the form of Infographic(.
HTR
SCI
CLT
CRT
C2 What is the relation between Wat Phra Kaew and Khmer Kingdom?
-Painting of on the Ramayana at Wat Phra Kaew's wall.
-Khemarin Palace-Angkor Wat.
Please discuss in the term of history.
HTR
AnD
CTC
LGC
C3 What is the meaning of Farang Suam Chada, the crown which thai people mostly called? Please take a photo of it and explain its history.
HTR
AnD
CTC
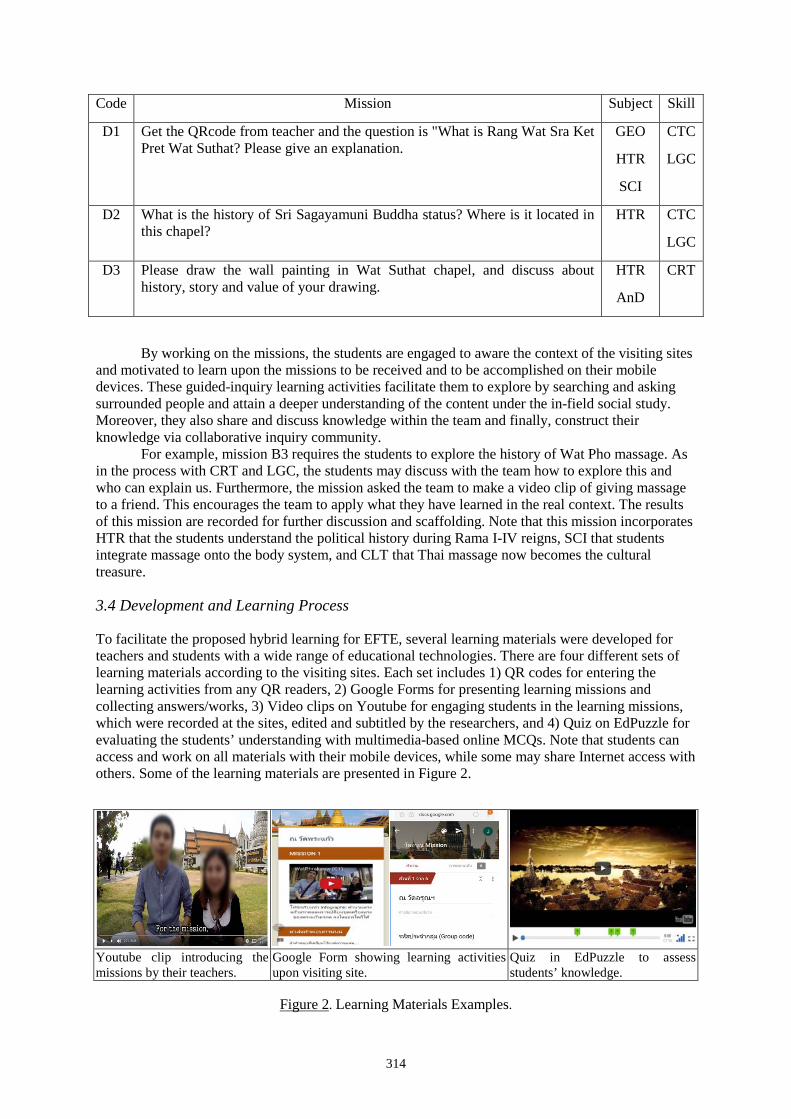
314
Code Mission Subject Skill
D1 Get the QRcode from teacher and the question is "What is Rang Wat Sra Ket Pret Wat Suthat? Please give an explanation.
GEO
HTR
SCI
CTC
LGC
D2 What is the history of Sri Sagayamuni Buddha status? Where is it located in this chapel?
HTR CTC
LGC
D3 Please draw the wall painting in Wat Suthat chapel, and discuss about history, story and value of your drawing.
HTR
AnD
CRT
By working on the missions, the students are engaged to aware the context of the visiting sites and motivated to learn upon the missions to be received and to be accomplished on their mobile devices. These guided-inquiry learning activities facilitate them to explore by searching and asking surrounded people and attain a deeper understanding of the content under the in-field social study. Moreover, they also share and discuss knowledge within the team and finally, construct their knowledge via collaborative inquiry community.
For example, mission B3 requires the students to explore the history of Wat Pho massage. As in the process with CRT and LGC, the students may discuss with the team how to explore this and who can explain us. Furthermore, the mission asked the team to make a video clip of giving massage to a friend. This encourages the team to apply what they have learned in the real context. The results of this mission are recorded for further discussion and scaffolding. Note that this mission incorporates HTR that the students understand the political history during Rama I-IV reigns, SCI that students integrate massage onto the body system, and CLT that Thai massage now becomes the cultural treasure.
3.4 Development and Learning Process
To facilitate the proposed hybrid learning for EFTE, several learning materials were developed for teachers and students with a wide range of educational technologies. There are four different sets of learning materials according to the visiting sites. Each set includes 1) QR codes for entering the learning activities from any QR readers, 2) Google Forms for presenting learning missions and collecting answers/works, 3) Video clips on Youtube for engaging students in the learning missions, which were recorded at the sites, edited and subtitled by the researchers, and 4) Quiz on EdPuzzle for evaluating the students’ understanding with multimedia-based online MCQs. Note that students can access and work on all materials with their mobile devices, while some may share Internet access with others. Some of the learning materials are presented in Figure 2.
Youtube clip introducing the missions by their teachers.
Google Form showing learning activities upon visiting site.
Quiz in EdPuzzle to assess students’ knowledge.
Figure 2. Learning Materials Examples.
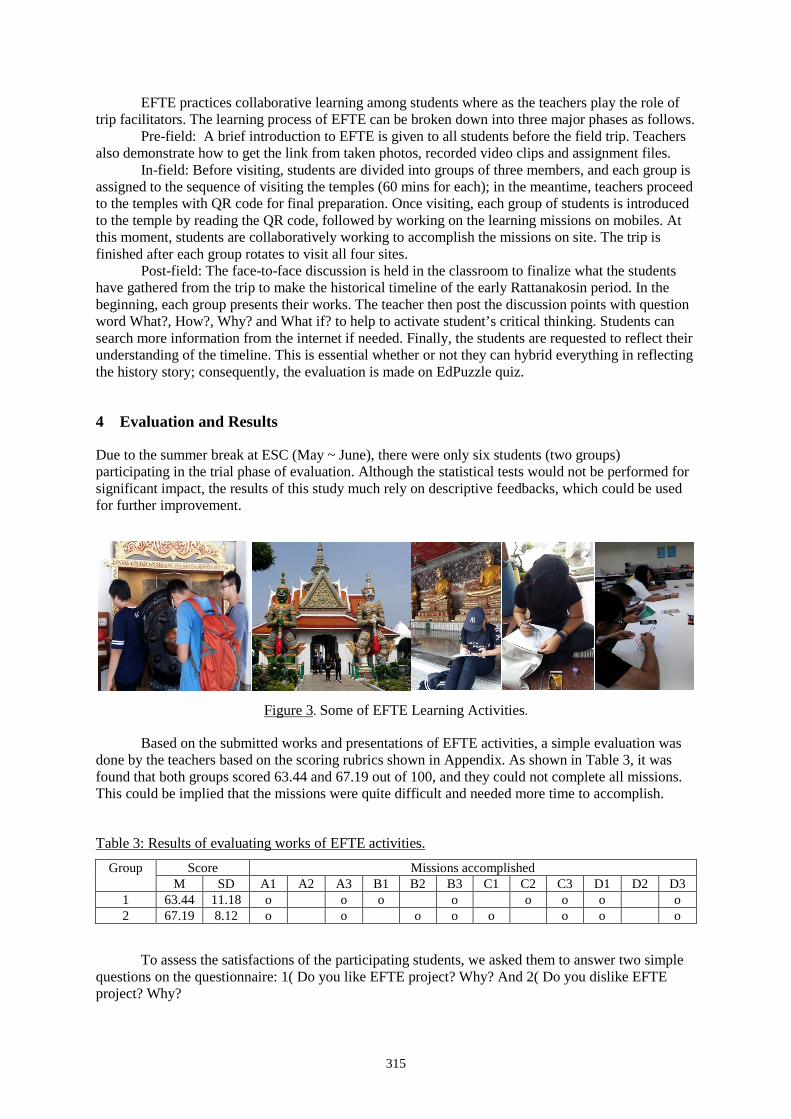
315
EFTE practices collaborative learning among students where as the teachers play the role of trip facilitators. The learning process of EFTE can be broken down into three major phases as follows.
Pre-field: A brief introduction to EFTE is given to all students before the field trip. Teachers also demonstrate how to get the link from taken photos, recorded video clips and assignment files.
In-field: Before visiting, students are divided into groups of three members, and each group is assigned to the sequence of visiting the temples (60 mins for each); in the meantime, teachers proceed to the temples with QR code for final preparation. Once visiting, each group of students is introduced to the temple by reading the QR code, followed by working on the learning missions on mobiles. At this moment, students are collaboratively working to accomplish the missions on site. The trip is finished after each group rotates to visit all four sites.
Post-field: The face-to-face discussion is held in the classroom to finalize what the students have gathered from the trip to make the historical timeline of the early Rattanakosin period. In the beginning, each group presents their works. The teacher then post the discussion points with question word What?, How?, Why? and What if? to help to activate student’s critical thinking. Students can search more information from the internet if needed. Finally, the students are requested to reflect their understanding of the timeline. This is essential whether or not they can hybrid everything in reflecting the history story; consequently, the evaluation is made on EdPuzzle quiz.
4 Evaluation and Results
Due to the summer break at ESC (May ~ June), there were only six students (two groups) participating in the trial phase of evaluation. Although the statistical tests would not be performed for significant impact, the results of this study much rely on descriptive feedbacks, which could be used for further improvement.
Figure 3. Some of EFTE Learning Activities.
Based on the submitted works and presentations of EFTE activities, a simple evaluation was done by the teachers based on the scoring rubrics shown in Appendix. As shown in Table 3, it was found that both groups scored 63.44 and 67.19 out of 100, and they could not complete all missions. This could be implied that the missions were quite difficult and needed more time to accomplish.
Table 3: Results of evaluating works of EFTE activities. Group Score Missions accomplished
M SD A1 A2 A3 B1 B2 B3 C1 C2 C3 D1 D2 D3 1 63.44 11.18 o o o o o o o o 2 67.19 8.12 o o o o o o o o
To assess the satisfactions of the participating students, we asked them to answer two simple questions on the questionnaire: 1( Do you like EFTE project? Why? And 2( Do you dislike EFTE project? Why?
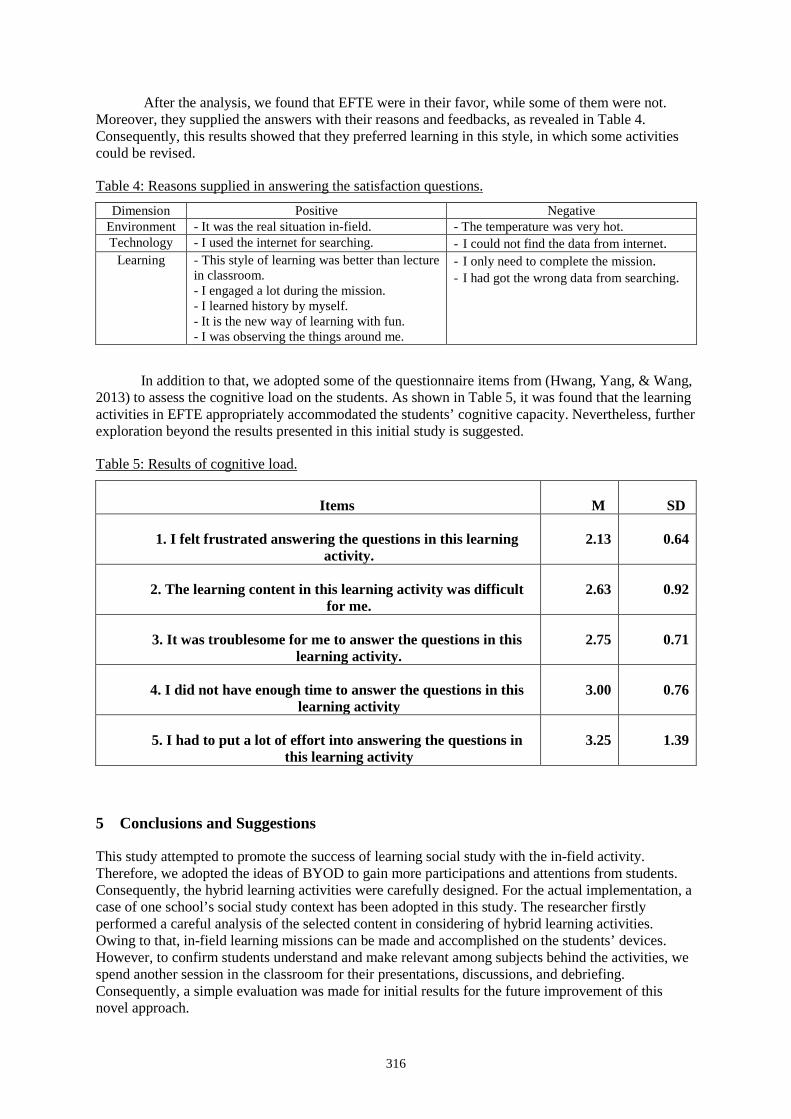
316
After the analysis, we found that EFTE were in their favor, while some of them were not. Moreover, they supplied the answers with their reasons and feedbacks, as revealed in Table 4. Consequently, this results showed that they preferred learning in this style, in which some activities could be revised.
Table 4: Reasons supplied in answering the satisfaction questions. Dimension Positive Negative
Environment - It was the real situation in-field. - The temperature was very hot. Technology - I used the internet for searching. - I could not find the data from internet.
Learning - This style of learning was better than lecture in classroom. - I engaged a lot during the mission. - I learned history by myself. - It is the new way of learning with fun. - I was observing the things around me.
- I only need to complete the mission. - I had got the wrong data from searching.
In addition to that, we adopted some of the questionnaire items from (Hwang, Yang, & Wang, 2013) to assess the cognitive load on the students. As shown in Table 5, it was found that the learning activities in EFTE appropriately accommodated the students’ cognitive capacity. Nevertheless, further exploration beyond the results presented in this initial study is suggested.
Table 5: Results of cognitive load.
Items M SD
1. I felt frustrated answering the questions in this learning activity.
2.13 0.64
2. The learning content in this learning activity was difficult for me.
2.63 0.92
3. It was troublesome for me to answer the questions in this learning activity.
2.75 0.71
4. I did not have enough time to answer the questions in this learning activity
3.00 0.76
5. I had to put a lot of effort into answering the questions in this learning activity
3.25 1.39
5 Conclusions and Suggestions
This study attempted to promote the success of learning social study with the in-field activity. Therefore, we adopted the ideas of BYOD to gain more participations and attentions from students. Consequently, the hybrid learning activities were carefully designed. For the actual implementation, a case of one school’s social study context has been adopted in this study. The researcher firstly performed a careful analysis of the selected content in considering of hybrid learning activities. Owing to that, in-field learning missions can be made and accomplished on the students’ devices. However, to confirm students understand and make relevant among subjects behind the activities, we spend another session in the classroom for their presentations, discussions, and debriefing. Consequently, a simple evaluation was made for initial results for the future improvement of this novel approach.
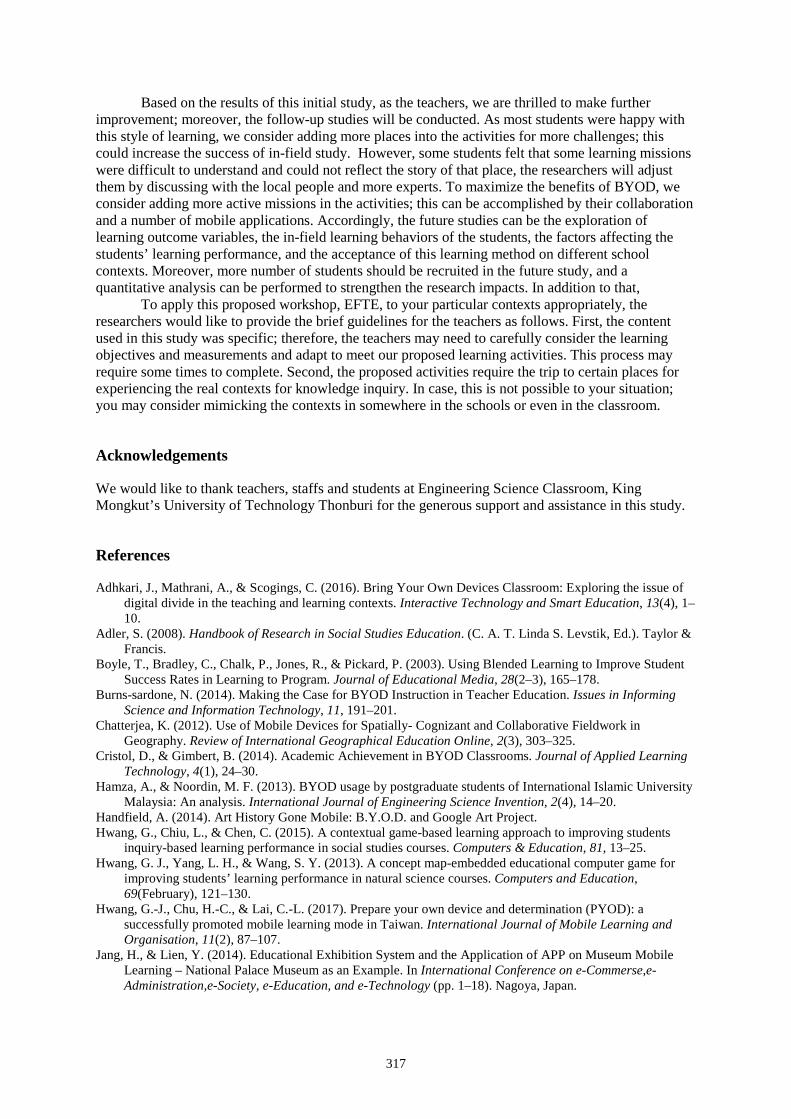
317
Based on the results of this initial study, as the teachers, we are thrilled to make further improvement; moreover, the follow-up studies will be conducted. As most students were happy with this style of learning, we consider adding more places into the activities for more challenges; this could increase the success of in-field study. However, some students felt that some learning missions were difficult to understand and could not reflect the story of that place, the researchers will adjust them by discussing with the local people and more experts. To maximize the benefits of BYOD, we consider adding more active missions in the activities; this can be accomplished by their collaboration and a number of mobile applications. Accordingly, the future studies can be the exploration of learning outcome variables, the in-field learning behaviors of the students, the factors affecting the students’ learning performance, and the acceptance of this learning method on different school contexts. Moreover, more number of students should be recruited in the future study, and a quantitative analysis can be performed to strengthen the research impacts. In addition to that,
To apply this proposed workshop, EFTE, to your particular contexts appropriately, the researchers would like to provide the brief guidelines for the teachers as follows. First, the content used in this study was specific; therefore, the teachers may need to carefully consider the learning objectives and measurements and adapt to meet our proposed learning activities. This process may require some times to complete. Second, the proposed activities require the trip to certain places for experiencing the real contexts for knowledge inquiry. In case, this is not possible to your situation; you may consider mimicking the contexts in somewhere in the schools or even in the classroom.
Acknowledgements
We would like to thank teachers, staffs and students at Engineering Science Classroom, King Mongkut’s University of Technology Thonburi for the generous support and assistance in this study.
References
Adhkari, J., Mathrani, A., & Scogings, C. (2016). Bring Your Own Devices Classroom: Exploring the issue of digital divide in the teaching and learning contexts. Interactive Technology and Smart Education, 13(4), 1–10.
Adler, S. (2008). Handbook of Research in Social Studies Education. (C. A. T. Linda S. Levstik, Ed.). Taylor & Francis.
Boyle, T., Bradley, C., Chalk, P., Jones, R., & Pickard, P. (2003). Using Blended Learning to Improve Student Success Rates in Learning to Program. Journal of Educational Media, 28(2–3), 165–178.
Burns-sardone, N. (2014). Making the Case for BYOD Instruction in Teacher Education. Issues in Informing Science and Information Technology, 11, 191–201.
Chatterjea, K. (2012). Use of Mobile Devices for Spatially- Cognizant and Collaborative Fieldwork in Geography. Review of International Geographical Education Online, 2(3), 303–325.
Cristol, D., & Gimbert, B. (2014). Academic Achievement in BYOD Classrooms. Journal of Applied Learning Technology, 4(1), 24–30.
Hamza, A., & Noordin, M. F. (2013). BYOD usage by postgraduate students of International Islamic University Malaysia: An analysis. International Journal of Engineering Science Invention, 2(4), 14–20.
Handfield, A. (2014). Art History Gone Mobile: B.Y.O.D. and Google Art Project. Hwang, G., Chiu, L., & Chen, C. (2015). A contextual game-based learning approach to improving students
inquiry-based learning performance in social studies courses. Computers & Education, 81, 13–25. Hwang, G. J., Yang, L. H., & Wang, S. Y. (2013). A concept map-embedded educational computer game for
improving students’ learning performance in natural science courses. Computers and Education, 69(February), 121–130.
Hwang, G.-J., Chu, H.-C., & Lai, C.-L. (2017). Prepare your own device and determination (PYOD): a successfully promoted mobile learning mode in Taiwan. International Journal of Mobile Learning and Organisation, 11(2), 87–107.
Jang, H., & Lien, Y. (2014). Educational Exhibition System and the Application of APP on Museum Mobile Learning – National Palace Museum as an Example. In International Conference on e-Commerse,e-Administration,e-Society, e-Education, and e-Technology (pp. 1–18). Nagoya, Japan.
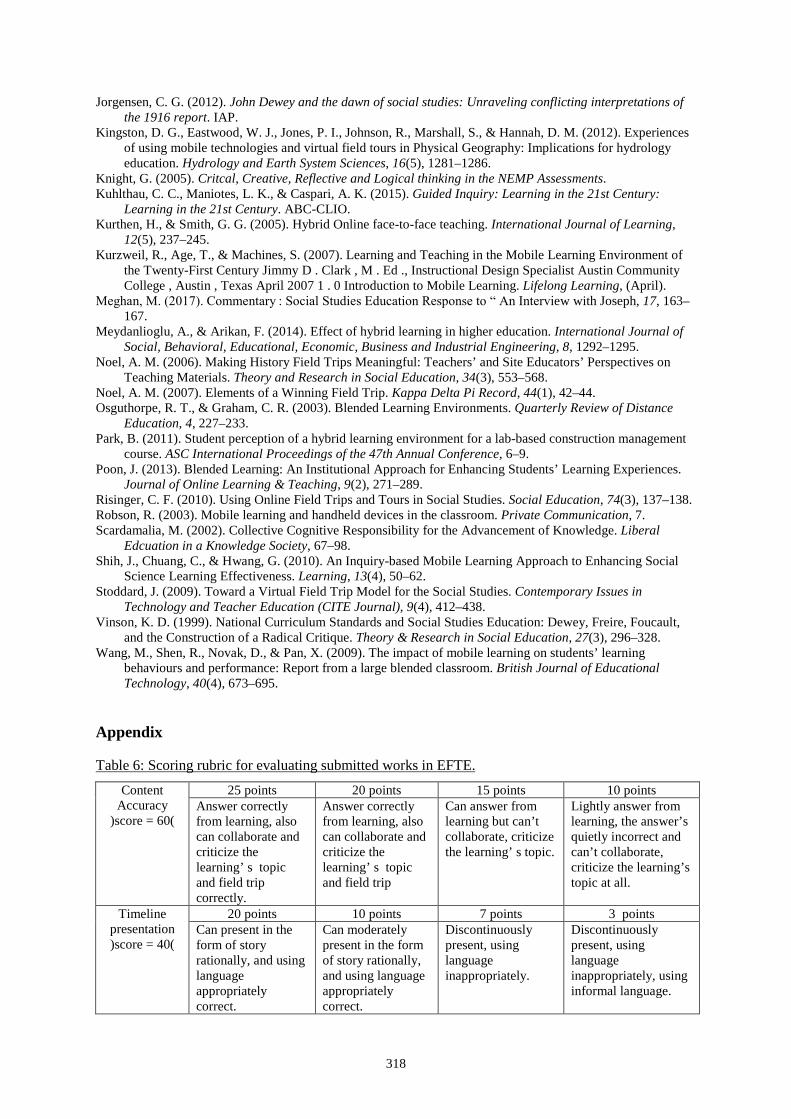
318
Jorgensen, C. G. (2012). John Dewey and the dawn of social studies: Unraveling conflicting interpretations of the 1916 report. IAP.
Kingston, D. G., Eastwood, W. J., Jones, P. I., Johnson, R., Marshall, S., & Hannah, D. M. (2012). Experiences of using mobile technologies and virtual field tours in Physical Geography: Implications for hydrology education. Hydrology and Earth System Sciences, 16(5), 1281–1286.
Knight, G. (2005). Critcal, Creative, Reflective and Logical thinking in the NEMP Assessments. Kuhlthau, C. C., Maniotes, L. K., & Caspari, A. K. (2015). Guided Inquiry: Learning in the 21st Century:
Learning in the 21st Century. ABC-CLIO. Kurthen, H., & Smith, G. G. (2005). Hybrid Online face-to-face teaching. International Journal of Learning,
12(5), 237–245. Kurzweil, R., Age, T., & Machines, S. (2007). Learning and Teaching in the Mobile Learning Environment of
the Twenty-First Century Jimmy D . Clark , M . Ed ., Instructional Design Specialist Austin Community College , Austin , Texas April 2007 1 . 0 Introduction to Mobile Learning. Lifelong Learning, (April).
Meghan, M. (2017). Commentary : Social Studies Education Response to “ An Interview with Joseph, 17, 163–167.
Meydanlioglu, A., & Arikan, F. (2014). Effect of hybrid learning in higher education. International Journal of Social, Behavioral, Educational, Economic, Business and Industrial Engineering, 8, 1292–1295.
Noel, A. M. (2006). Making History Field Trips Meaningful: Teachers’ and Site Educators’ Perspectives on Teaching Materials. Theory and Research in Social Education, 34(3), 553–568.
Noel, A. M. (2007). Elements of a Winning Field Trip. Kappa Delta Pi Record, 44(1), 42–44. Osguthorpe, R. T., & Graham, C. R. (2003). Blended Learning Environments. Quarterly Review of Distance
Education, 4, 227–233. Park, B. (2011). Student perception of a hybrid learning environment for a lab-based construction management
course. ASC International Proceedings of the 47th Annual Conference, 6–9. Poon, J. (2013). Blended Learning: An Institutional Approach for Enhancing Students’ Learning Experiences.
Journal of Online Learning & Teaching, 9(2), 271–289. Risinger, C. F. (2010). Using Online Field Trips and Tours in Social Studies. Social Education, 74(3), 137–138. Robson, R. (2003). Mobile learning and handheld devices in the classroom. Private Communication, 7. Scardamalia, M. (2002). Collective Cognitive Responsibility for the Advancement of Knowledge. Liberal
Edcuation in a Knowledge Society, 67–98. Shih, J., Chuang, C., & Hwang, G. (2010). An Inquiry-based Mobile Learning Approach to Enhancing Social
Science Learning Effectiveness. Learning, 13(4), 50–62. Stoddard, J. (2009). Toward a Virtual Field Trip Model for the Social Studies. Contemporary Issues in
Technology and Teacher Education (CITE Journal), 9(4), 412–438. Vinson, K. D. (1999). National Curriculum Standards and Social Studies Education: Dewey, Freire, Foucault,
and the Construction of a Radical Critique. Theory & Research in Social Education, 27(3), 296–328. Wang, M., Shen, R., Novak, D., & Pan, X. (2009). The impact of mobile learning on students’ learning
behaviours and performance: Report from a large blended classroom. British Journal of Educational Technology, 40(4), 673–695.
Appendix
Table 6: Scoring rubric for evaluating submitted works in EFTE.
Content Accuracy
)score = 60(
25 points 20 points 15 points 10 points Answer correctly from learning, also can collaborate and criticize the learning’ s topic and field trip correctly.
Answer correctly from learning, also can collaborate and criticize the learning’ s topic and field trip
Can answer from learning but can’t collaborate, criticize the learning’ s topic.
Lightly answer from learning, the answer’s quietly incorrect and can’t collaborate, criticize the learning’s topic at all.
Timeline presentation )score = 40(
20 points 10 points 7 points 3 points Can present in the form of story rationally, and using language appropriately correct.
Can moderately present in the form of story rationally, and using language appropriately correct.
Discontinuously present, using language inappropriately.
Discontinuously present, using language inappropriately, using informal language.
Hayashi, Y., et al. (Eds.) (2017). Workshop Proceedings of the 25th International Conference on Computers in Education. New Zealand: Asia-Pacific Society for Computers in Education
319
Teacher-actionable insights in student engagement: A learning analytics taxonomy
Elizabeth KOH* & Jennifer Pei-Ling TAN National Institute of Education, Nanyang Technological University, Singapore
Abstract: In the emerging field of learning analytics (LA), actionable insight from LA designs tends to be a buzzword without clear understandings. Student engagement is commonly measured in LA designs and used to inform actionable insight. Moreover, in K-12 education, where the teacher is a key stakeholder, what teacher-actionable insights can be derived from LA designs? Towards providing greater clarity on this issue, we concretize a taxonomy of LA decision support for teacher-actionable insights in student engagement. Four types of decision support are conceived in this taxonomy with relevant teacher implications. Through this taxonomy, we hope to offer possible pathways for actionable insight in LA designs and make clearer the role of the teacher.
Keywords: Learning analytics, teacher, design, taxonomy, actionable insight
1. Introduction
In the field of data analytics, the term “actionable insight” often represents buzzwords without clear definitions. Recognizing this, Tan and Chan (2015) provide a three-tiered definition for actionable insights in general data analytics systems – analytic insight (understanding and inferring individual information), synergistic insight (contextualizing, combining and linking information), and prognostic insight (deriving information of future results). Similarly, in the field of education, there have been several conceptions and understandings of actionable insight. For instance, Cooper (2012, p. 4) defines actionable insight as analytics that are “concerned with the potential for practical action rather than either theoretical description or mere reporting”. The report highlights that insight from learning analytics (LA) needs to provide a “level of clarity” such that a “rational person” can choose a path of action (Cooper, 2012, p. 4).
Additionally, Clow (2012, 2013) elaborated that in any LA design, there is a cyclical process of learners generating data, which is processed into metrics. This then informs interventions, and these actions affect learners. In particular, these actions can be performed by the learner, teacher, manager or policy maker (Clow, 2012).
Evident from extant literature is that the specificity of “actionable insight” in LA can be understood in several ways and from different stakeholders. Many LA designs have focused on providing interventions such as tasks and recommendations for the learner. However, comparably less attention is paid to a closely intertwined stakeholder, the teacher (Sergis & Sampson, 2017). While learner-actionable insights are important, in this paper, we examine teacher-actionable insights, especially within the K-12 education context, where the teacher more often than not plays a crucial ‘make-or-break’ role in the learning and teaching process (Hattie, Masters, & Birch, 2015).
In K-12 education, the role of the teacher is paramount in the learning equation. With younger learners, teachers are the learners’ coach, lifeguard, instructor, technology decider, and more. This context is markedly different from Higher Education, where learners are relatively more independent of their teachers throughout the learning process, and where teachers play a more academic role. Higher education students tend to decide on their own technology and systems, as well as have access to a wide range of technologies and/or engage in online learning. On the other hand, in K-12, technology access is still an issue (Monroy, Rangel, & Whitaker, 2013; Rodríguez-Triana, Martínez-
320
Monés, & Villagrá-Sobrino, 2016), and blended learning is the dominant mode of learning with technology .
In a recent systematic literature review on teaching and LA (Sergis & Sampson, 2017), the research identified only 50 papers that examined the role of the teacher in the field of LA. Of these papers, only four papers (7.4% of the papers) provided concrete actionable insights for teachers. The bulk of LA designs (92.6% of the papers), provided unstructured and/or ad-hoc actionable insights for teachers. Also, many papers are exploring what types of LA are useful for teachers, and ways to provide better feedback for them. For instance, Van Leeuwen et al. (2017) details a high school teacher making sense of and responding to LA tools to offer the possibility of how LA can be used pedagogically for student learning.
What teacher-actionable insights can be derived from LA systems? Towards scoping this question, we premise the design of many LA systems in the area of engagement in learning. In the pedagogical core of learning there is an interaction between learners and the content, as well as between peer learners (Tan & Koh, 2017). Hence, student engagement is commonly measured in LA designs and used to inform actionable insight (Lu, Huang, Huang, & Yang, 2017). We posit that LA can provide teacher-actionable insights for understanding this engagement in learning. As such, we conceptualize a taxonomy of LA decision support for teacher-actionable insights in student engagement.
This taxonomy will be illustrated with examples from two prototype LA systems, My Groupwork Buddy (MGB) and the Collaborative Video Annotation and LA (CoVAA) Learning Environment. Briefly, MGB is a formative assessment tool for teamwork while CoVAA is a time-point based video annotation system.
2. Related work
2.1. Student engagement and LA
Student engagement is associated with learning performance as well as student motivation and the reduction in school dropouts (Fredricks, Blumenfeld, & Paris, 2004; Wang & Eccles, 2012). While there are many definitions, student engagement is generally defined as a multi-dimensional construct consisting of behavior, emotion and cognition (Fredricks et al., 2004). Student engagement is commonly measured in LA through the engagement of students with the content, and with other peers in the system (Lu et al., 2017; Monroy et al., 2013; Tan & Koh, 2017; Tan, Yang, Koh, & Jonathan, 2016). Moreover, many of these sub-types of engagement are currently in LA designs. A typical learning analytic design focuses on behavioral engagement which relies on the concept of participation (e.g., Monroy et al., 2013; Tan et al., 2016). Metrics for behavioral engagement include logins, page views, mouse clicks, time on page, task submissions, and other forms of trace data. There are also different levels of granularity for behavioral engagement metrics. A related behavioral engagement technique is social network analysis; it shows a description of connections between learners, i.e., who is talking to who.
Another level of engagement is the affective or emotional engagement. Although less common, this is also another emerging area that can be collected and detected by LA designs (e.g., Grawemeyer et al., 2016). These include emotions such as boredom and off-task behaviors, as well as positive emotions like happiness and curiosity. Past research has derived algorithms to measure off-task behavior. Sentiment analysis is also another technique that uses text and online discourse.
The third category of engagement is cognitive engagement. This deals with what the students’ have learned, mastered, and understood. Many LA measure and assess students’ knowledge, skills, and other learning. This can be in terms of the right answers to a quiz, the correct moves in a game, the number of attempts, a coded set of words and/or keywords in a dialogue etc. This is common in intelligent tutoring systems.
With engagement as a common backdrop in LA designs, we next describe the types of teacher-actionable insights in LA.
321
2.2. Teacher-actionable insights in LA
In the general field of analytics, drawing from many best practices of data science and system development, extant literature has conceived a continuum of analytics ranging from descriptive, diagnostic analytics, to predictive and prescriptive analytics (Gartner.com). Actionable insight can be derived from these various types of analytics. Many business solution providers advise developing predictive and prescriptive analytics, which emphasize system recommendations, in order to derive greater business value, although this is the most technologically challenging. Predictive analytics, similarly, is advocated in LA in order to provide likely future states of learners, and to design appropriate interventions to enhance learning outcomes (Clow, 2013). For instance, Lonn et al. (2012) developed a predictive model to classify students into three categories based on students’ assessment grades and login activity on the Learning Management System. This provided an early warning system to allow teachers (academic advisors) to encourage students who were doing well, explore with students who could need more help, or engage with those who were possibly at-risk.
Nevertheless, descriptive analytics are still an important area for LA. To understand learning engagement, we first have to measure such descriptions of engagement. Descriptive analytics generally provide aggregations of metrics of engagement indicators, as described earlier.
As for diagnostic analytics, these are learning analytic designs that pinpoint relationships between two variables e.g., visualizations that plot effort and academic achievement (Nagy, 2016). Diagnostic analytics can also be derived from statistics and machine learning.
The primary challenge is turning data into actionable insights for teachers (Melero, Hernández-Leo, Sun, Santos, & Blat, 2015; Monroy et al., 2013; Rodríguez-Triana et al., 2016). Sergis & Sampson (Sergis & Sampson, 2017) identify and review 50 papers on teacher inquiry in LA and found that a majority of teacher actions do not provide an additional layer of decision support. For instance, they found that some designs identify different clusters of students, or a visualization of interactions of learners with teachers, without providing scripts or further structured support for teacher action. Teachers are left to their own resources and capabilities to take action.
On the other hand, the review also identified two types of teacher-actionable insights. First, Yen et al. (2015) provided explicit suggested instructions to the teacher using rule-based, pre-defined feedback templates that were informed based on data analyses. A second type of study used a script-aware monitoring process to provide actionable insight for teachers (Rodríguez-Triana, Martínez-Monés, Asensio-Pérez, & Dimitriadis, 2015). Teachers would first define key learning outcomes for students, and the LA design monitored students’ progress, and provided feedback on students’ progress to teachers. This feedback of the process allowed the teachers to better manage the learning process of students. These examples of actionable insights for teachers are specific recommendations to help teachers improve their teaching and learning practice.
As can be seen, there are different ways of implementing LA designs for teacher-actionable insights. The next section illustrates our proposed taxonomy.
3. Conceptualizing a LA taxonomy for teacher-actionable insights
Informed by extant literature, we conceptualize four types of LA decision support for teacher-actionable insights in student engagement: descriptive, diagnostic, predictive and prescriptive. The proposed taxonomy is depicted in Table 1. The second column in Table 1 describes the areas of teacher-actionable insight which is a more macro view of system feedback to the teacher. The third column highlights certain data science methodologies and techniques required while the last column provides implications of this decision support for teachers.
3.1. Descriptive
Descriptive analytics describes what students’ activities on the system are, depicting indicators of student engagement for the teacher. It represents the foundational data structures in LA and asks, what are my students’ engaged in? It describes what students’ activities on the system are. For instance, in MGB, submission data (whether students have completed their teamwork reflection or not), is
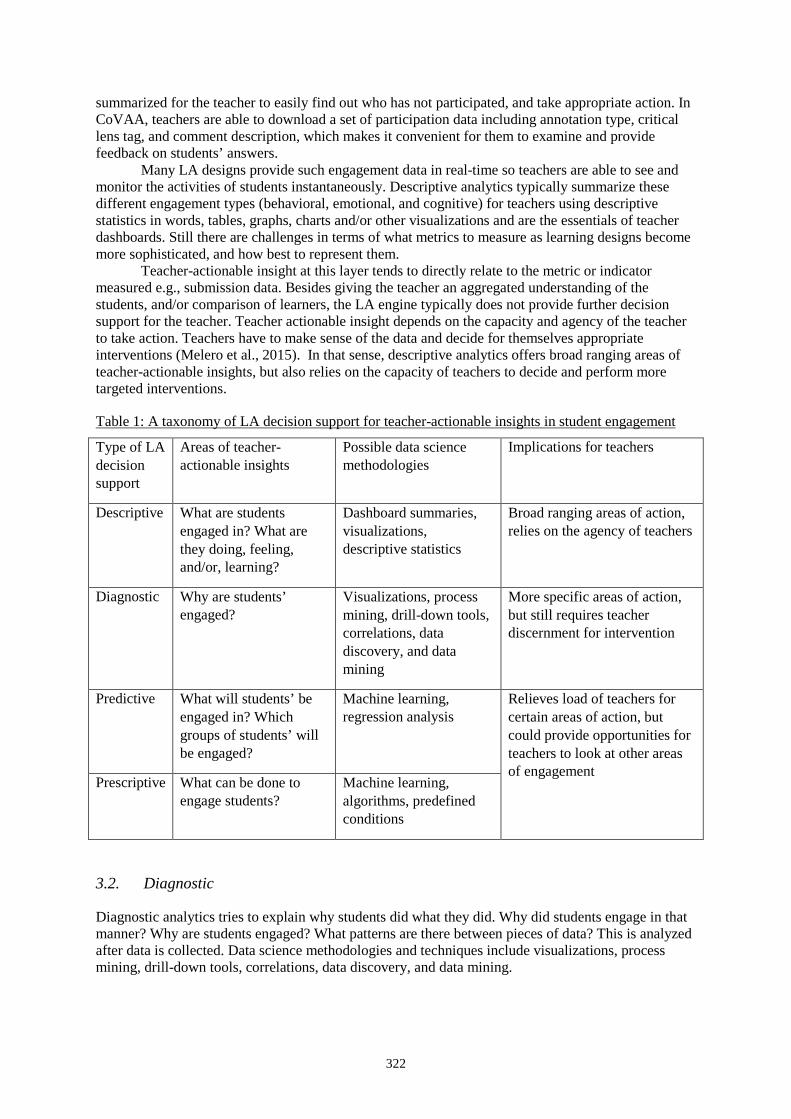
322
summarized for the teacher to easily find out who has not participated, and take appropriate action. In CoVAA, teachers are able to download a set of participation data including annotation type, critical lens tag, and comment description, which makes it convenient for them to examine and provide feedback on students’ answers.
Many LA designs provide such engagement data in real-time so teachers are able to see and monitor the activities of students instantaneously. Descriptive analytics typically summarize these different engagement types (behavioral, emotional, and cognitive) for teachers using descriptive statistics in words, tables, graphs, charts and/or other visualizations and are the essentials of teacher dashboards. Still there are challenges in terms of what metrics to measure as learning designs become more sophisticated, and how best to represent them.
Teacher-actionable insight at this layer tends to directly relate to the metric or indicator measured e.g., submission data. Besides giving the teacher an aggregated understanding of the students, and/or comparison of learners, the LA engine typically does not provide further decision support for the teacher. Teacher actionable insight depends on the capacity and agency of the teacher to take action. Teachers have to make sense of the data and decide for themselves appropriate interventions (Melero et al., 2015). In that sense, descriptive analytics offers broad ranging areas of teacher-actionable insights, but also relies on the capacity of teachers to decide and perform more targeted interventions.
Table 1: A taxonomy of LA decision support for teacher-actionable insights in student engagement
Type of LA decision support
Areas of teacher-actionable insights
Possible data science methodologies
Implications for teachers
Descriptive What are students engaged in? What are they doing, feeling, and/or, learning?
Dashboard summaries, visualizations, descriptive statistics
Broad ranging areas of action, relies on the agency of teachers
Diagnostic Why are students’ engaged?
Visualizations, process mining, drill-down tools, correlations, data discovery, and data mining
More specific areas of action, but still requires teacher discernment for intervention
Predictive What will students’ be engaged in? Which groups of students’ will be engaged?
Machine learning, regression analysis
Relieves load of teachers for certain areas of action, but could provide opportunities for teachers to look at other areas of engagement
Prescriptive What can be done to engage students?
Machine learning, algorithms, predefined conditions
3.2. Diagnostic
Diagnostic analytics tries to explain why students did what they did. Why did students engage in that manner? Why are students engaged? What patterns are there between pieces of data? This is analyzed after data is collected. Data science methodologies and techniques include visualizations, process mining, drill-down tools, correlations, data discovery, and data mining.
323
This LA design attempts to link relationships to explain student engagement (and all the different forms of engagement). This LA support helps teachers to pinpoint specific areas for possible interventions. Still, teachers should be discerning and decide pedagogically if they should intervene.
For both MGB and CoVAA, this layer of diagnosis is currently done in the back-end using existing statistical techniques by researchers, and shared with the teachers, as data-driven evidence for teachers to take action. In MGB, in attempting to explain why students were more cognitively engaged in teamwork, we performed a correlation and found a significant and higher association between peer-rated teamwork scores and students’ goal-setting status check completion. In other words, there was a relationship between students who claimed they completed their target goals related to their teamwork behaviors, and their peer-rated teamwork dimensions. With this, one possible implication is that the teachers should ensure that students fulfil their targeted goals.
3.3. Predictive and prescriptive
Predictive and prescriptive analytics are closely related. While predictive analytics provide empirical evidence of what students will be engaged in, prescriptive analytics provide recommendations to the student, reducing the immediate intervention required by the teacher. Predictive analytics provide empirical evidence of what students will be engaged in, or the groups of students who will become engaged. This layer provides teachers with foresight, what will happen based on probability estimates. Techniques include machine learning, regression analysis etc.
On the other hand, prescriptive analytics asks the question of “what can be done to engage students” and prescribes actions that the system takes on behalf of the teacher. It computes activities and responses that the system can do now based on predefined conditions, that were determined by diagnostic and predictive analyses.
Predictive analytics provides very clear and specific teacher-actionable insight. Decision support for the teacher is precise and could include filtering and identifying different clusters of students such as those potentially at risk from academic failure and dropout. It can also identify students who are potentially on an accelerated trajectory. Teachers’ usage of system tools can also predict student achievement.
Prescriptive analytics then seeks to identify specific sets of activities that students can take, without the immediate intervention from the teacher.
While on one hand these two types of support may seem to reduce the need for the teacher, we posit that at the same time, this provides opportunities for teachers to go beyond the common set of responses to probe deeper into student engagement or examine new trends among their students.
Seemingly, this could help to relieve the load of teachers’ direct instruction to the student, and could help the teacher to focus on other areas of student engagement that is not provided for by the system.
As such solutions require more time and testing, these analytics are part of the future work planned in MGB and CoVAA.
4. Discussion and Conclusion
This paper conceptualizes a taxonomy of teacher-actionable insights based on student engagement in LA designs. As can be seen in these four types of decision support, teacher-actionable insights range from broad to specific. While these types may seem to have some sort hierarchical relationship, e.g., each type being a more complex type of the other, we realize that each type could uncover engagement ranging from the superficial, simple to complex and deep. We do not offer any type as better than the other, but highlight that these are possible pathways of providing feedback to teachers, and that each pathway is important to examine student engagement. There are important teacher-actionable insights that can be highlighted for each category in the taxonomy.
In fact, the broader socio-cultural issues of teacher ownership and agency are a concern for each type. Many of these teacher-actionable insights require the teacher’s capability and impetus to take action. This is echoed in many of the K-12 LA designs reported (Sergis & Sampson, 2017).
324
Helping teachers to discern and decide on actions to take is a process that requires the partnership of research, design and pedagogical teams.
It is hoped that this taxonomy will help learning designers, developers and teachers to consider the engagement of their learners from behavioral, affective and cognitive outcomes and the multiple pathways of LA. Moreover, this taxonomy could provide greater clarity of where their respective LA designs are at and where it could be heading towards. For instance, an LA design which is of type descriptive might want to consider building capacity and development towards predictive analytics, to provide opportunities for teachers to help students in other behavioral, affective or cognitive aspects.
An underlying assumption in this typology, is that all these types of LA need to show some measure of validity or reliability (such as its confidence level, statistical significance), and/or an acknowledgement of limitations or bias (Cooper, 2012). Especially for the descriptive level, this helps to scope decision areas for teachers, rather than overwhelm teachers with a large pool of possible indicators. It also highlights the importance of intentional LA design that makes explicit its pedagogical value (Knight, Shum, & Littleton, 2014; Koh, Shibani, Tan, & Hong, 2016; Lockyer, Heathcote, & Dawson, 2013). While the typology provides a heuristic in understanding the complexity and potential of teacher-actionable insight, these insights are in recognition of the learning design of the LA. In other words, the actionable insight should be in line with the overall learning goal and LA design.
This taxonomy is a first step towards providing a clearer framework of teacher-actionable insights in LA designs. It is based on current and international literature and trends. It also recognizes the importance of the role of the teacher, especially with regard to the K-12 context, and provides a conceptualization to map different kinds of LA designs in student engagement. Teacher-actionable insights in student engagement is a crucial area for the emerging field of LA, and in clarifying possible pathways, LA designs can be made more useful for teaching and learning.
Acknowledgements
This paper refers to data and analysis from the project NRF2015-EDU001-IHL08 and NRF2015-EDU001-IHL09 funded by the Singapore National Research Foundation, eduLab Research Program. The views expressed in this paper are the authors’ and do not necessarily represent the views of the National Institute of Education.
References
Clow, D. (2012). The learning analytics cycle: closing the loop effectively. Paper presented at the Proceedings of the 2nd international conference on learning analytics and knowledge.
Clow, D. (2013). An overview of learning analytics. Teaching in Higher Education, 18(6), 683-695. Cooper, A. (2012). What is analytics? Definition and essential characteristics. Retrieved from
http://publications.cetis.ac.uk/2012/521 Fredricks, J. A., Blumenfeld, P. C., & Paris, A. H. (2004). School Engagement: Potential of the Concept, State
of the Evidence. Review of Educational Research, 74(1), 59-109. doi:10.3102/00346543074001059 Grawemeyer, B., Mavrikis, M., Holmes, W., Gutierrez-Santos, S., Wiedmann, M., & Rummel, N. (2016).
Affecting off-task behaviour: how affect-aware feedback can improve student learning. Paper presented at the Proceedings of the Sixth International Conference on Learning Analytics & Knowledge.
Hattie, J., Masters, D., & Birch, K. (2015). Visible learning into action: International case studies of impact. Oxon: Routledge.
Knight, S., Shum, S. B., & Littleton, K. (2014). Epistemology, assessment, pedagogy: where learning meets analytics in the middle space. Journal of Learning Analytics, 1(2), 23-47.
Koh, E., Shibani, A., Tan, J. P.-L., & Hong, H. (2016). A pedagogical framework for learning analytics in collaborative inquiry tasks: an example from a teamwork competency awareness program. Paper presented at the Proceedings of the Sixth International Conference on Learning Analytics & Knowledge, Edinburgh, United Kingdom.
Lockyer, L., Heathcote, E., & Dawson, S. (2013). Informing pedagogical action: Aligning learning analytics with learning design. American Behavioral Scientist, 57(10), 1439-1459.

325
Lonn, S., Krumm, A. E., Waddington, R. J., & Teasley, S. D. (2012). Bridging the gap from knowledge to action: Putting analytics in the hands of academic advisors. Paper presented at the Proceedings of the 2nd International Conference on Learning Analytics and Knowledge.
Lu, O. H. T., Huang, J. C. H., Huang, A. Y. Q., & Yang, S. J. H. (2017). Applying learning analytics for improving students engagement and learning outcomes in an MOOCs enabled collaborative programming course. Interactive Learning Environments, 25(2), 220-234. doi:10.1080/10494820.2016.1278391
Melero, J., Hernández-Leo, D., Sun, J., Santos, P., & Blat, J. (2015). How was the activity? A visualization support for a case of location-based learning design. British Journal of Educational Technology, 46(2), 317-329.
Monroy, C., Rangel, V. S., & Whitaker, R. (2013). STEMscopes: contextualizing learning analytics in a K-12 science curriculum. Paper presented at the Proceedings of the Third International Conference on Learning Analytics and Knowledge.
Nagy, R. P. (2016). Tracking and Visualising Student Effort: Evolution of a Practical Analytics Tool for Staff and Student Engagement. Journal of Learning Analytics, 3(2), 164-192.
Rodríguez-Triana, M. J., Martínez-Monés, A., Asensio-Pérez, J. I., & Dimitriadis, Y. (2015). Scripting and monitoring meet each other: Aligning learning analytics and learning design to support teachers in orchestrating CSCL situations. British Journal of Educational Technology, 46(2), 330-343.
Rodríguez-Triana, M. J., Martínez-Monés, A., & Villagrá-Sobrino, S. (2016). Learning analytics in small-scale teacher-led innovations: Ethical and data privacy issues. Journal of Learning Analytics, 3(1), 43–65. doi:http://dx.doi.org/10.18608/jla.2016.31.4
Sergis, S., & Sampson, D. (2017). Teaching and Learning Analytics: a Systematic Literature Review. In A. Peña-Ayala (Ed.), Learning analytics: Fundaments, applications, and trends (pp. 25-63). Switzerland: Springer.
Tan, J. P.-L., & Koh, E. (2017). Situating learning analytics pedagogically: towards an ecological lens. Learning: Research and Practice, 3(1), 1-11. doi:10.1080/23735082.2017.1305661
Tan, J. P.-L., Yang, S., Koh, E., & Jonathan, C. (2016). Fostering 21st century literacies through a collaborative critical reading and learning analytics environment: user-perceived benefits and problematics. Paper presented at the Proceedings of the Sixth International Conference on Learning Analytics & Knowledge, Edinburgh, United Kingdom.
Tan, S.-Y., & Chan, T. (2015). Defining and Conceptualizing Actionable Insight: A Conceptual Framework for Decision-centric Analytics. Paper presented at the Australasian Conference on Information Systems, Adelaide.
van Leeuwen, A., van Wermeskerken, M., Erkens, G., & Rummel, N. (2017). Measuring teacher sense making strategies of learning analytics: a case study. Learning: Research and Practice, 3(1), 42-58. doi:10.1080/23735082.2017.1284252
Wang, M.-T., & Eccles, J. S. (2012). Adolescent Behavioral, Emotional, and Cognitive Engagement Trajectories in School and Their Differential Relations to Educational Success. Journal of Research on Adolescence, 22(1), 31-39. doi:10.1111/j.1532-7795.2011.00753.x
Yen, C.-H., Chen, I.-C., Lai, S.-C., & Chuang, Y.-R. (2015). An analytics-based approach to managing cognitive load by using log data of learning management systems and footprints of social media. Educational Technology & Society, 18(4), 141-159.
Hayashi, Y., et al. (Eds.) (2017). Workshop Proceedings of the 25th International Conference on Computers in Education. New Zealand: Asia-Pacific Society for Computers in Education
326
Design of a Learning Analytics Dashboard Based on Digital Textbooks and Online
Learning Yun-Gon PARK, Yong-Sang CHO, Jeong-Eun SON *
Korea Education and Research Information Service, Korea *[email protected]
Abstract: In general, online learning provides functions such as access to video and learning materials, assessments what learners have learned, and participation in community activities. However, it is difficult to provide a learning environment that meets the achievement level or needs for each learner by providing such a function, and it is especially limited to prescribe in a proper situation. Learning analytics, which has received much attention in recent years, provides a tool to collect and analyze learning activity data. Since the process of collecting and analyzing data is generally performed in the system, the information presented by the analysis results is very important as an interface that users meet. Therefore, research on how teachers and students design intuitively to understand results and messages from data analysis bas a great implication on the place of learning analytics. This study introduces the process of designing a dashboard on users’ requirements to intuitively express the collected data based on digital textbooks and online learning.
Keywords: Learning Analytics, Dashboard, Digital Textbook, Online Learning, Visualization
1. Introduction
Online learning is widely available today, catering to students of all age groups and interests in all subjects. Examples include the virtual classes and the Educational Broadcasting System (EBS)’ college entrance preparation lectures for primary and secondary school students, the college lecture courses provided via the Cyber University and Korea Open Course-Ware (KOCW), and the remote training programs for teachers and other adult workers.
Online learning today typically involves providing video-recorded lectures, hardcopy textbooks in the forms of books or document files, evaluations by students on what they have learned, and online interactions among students.
The typical and current format of online learning, however, is incapable of providing effective help for students of different learning achievement levels or with different needs. Learning analytics has emerged recently as a potential solution to this problem. Learning analytics is a technology for collecting and analyzing data on the learning behavior of students and providing proper learning prescriptions and feedback at timely moments toward maximizing students’ motivation and performance.
The emergences of data analysis technologies have inspired many to seek and develop their applications to learning. Examples include the learning management system (LMS) and virtual learning environments (VLE) analytics dashboards, predictive analytics, adaptive learning analytics, social network analytics, and discourse analytics (Cho, 2013). In this study, our focus is on learning analytics dashboards that can analyze and visualize data collected from digital textbooks and online learning activities. More specifically, our goal is to design a dashboard that can deliver such information in a more intuitive manner.
To this end, we first review the progresses that have been made so far with respect to learning analytics dashboards, identify the necessary elements of design, and develop a method for designing such a dashboard.
327
Second, we design a dashboard that provides visualized data on digital textbooks and online learning activities. For this, we analyze the patterns of users’ use of online learning services and identify the dashboard functions they require. We also analyze users’ preferred visualization methods.
Third, we analyze the visualization tools that can be used to create our dashboard.
2. Literature Review
A dashboard is the panel-type device installed in the cockpit of a car or an airplane facing the driver or a pilot and featuring diverse switches for operation. A dashboard used in learning analytics and other such systems can be defined as a device for visually displaying the most important information required for achieving one or more given goals. Such a device displays key information on one surface or panel so that users can easily check and monitor such information.
Learning activity data gathered via learning platforms are often in formats that are machine-readable. However, these data are not so comprehensible to users, whether students or teachers. Presenting these data in the form of an intuitive dashboard is crucial to enable users to understand the meaning provided by data.
Most of existing studies on the designs of these dashboards focus on providing learning support for online learning environments and teaching activities. Commonly visualized types of data include those on the learning output and hours, interactions between teachers and students, results on tests and assignments, and the use of learning content. Bar, pie, and line graphs are frequently used to display these data. There are also a number of studies analyzing how convenient dashboard designs are to users, reflecting the predominance of interests in computer science and software engineering in the discipline. There are also numerous studies analyzing the effectiveness of existing dashboards (Jin & Yu, 2015).
One important Korean study analyzing the educational effects of dashboards concern a university located in Seoul (Park & Cho, 2014). The authors of this study surveyed users’ perceptions of online learning activities. Based on the findings of this opinion poll, the authors designed and developed their own dashboard, and investigated whether it was useful. The authors applied their dashboard to a virtual campus environment and analyzed students’ virtual learning activities. The authors then surveyed participants in the virtual learning activities on how closely the dashboard catered to their expectations of needed information, how useful they perceived the dashboard to be, and how easy it was for them to understand and use the dashboard. The survey also asked open-answer questions regarding the improvements to be made to the dashboard. The conclusion of this study can be summarized as follows. • Learning analytics dashboards should display only information that students themselves think is
useful. • While students in general understood the dashboard and its operation quite well, they indicated
confusion and difficulty over interpreting the mixture of diverse types of information displayed in each single graph.
• The most important question students asked was whether the information provided by the dashboard was really useful to their learning.
• The preliminary opinion poll revealed that the degrees of students’ active participation in virtual campus environments were dependent on the natures of the given subjects and the characteristics of professors.
• It is important to inform students that the data displayed by the dashboard on students’ online learning activities do not decisively affect their final performance.
The Society for Learning Analytics Research (SoLAR) also provides a standard process for designing a learning analytics dashboard in the Handbook of Learning Analytics (Klerkx, Verbert & Duval, 2017). Below is a summary.
(1) Understand the given objective(s) by answering the following questions:
- What is the purpose of visualizing the given data?
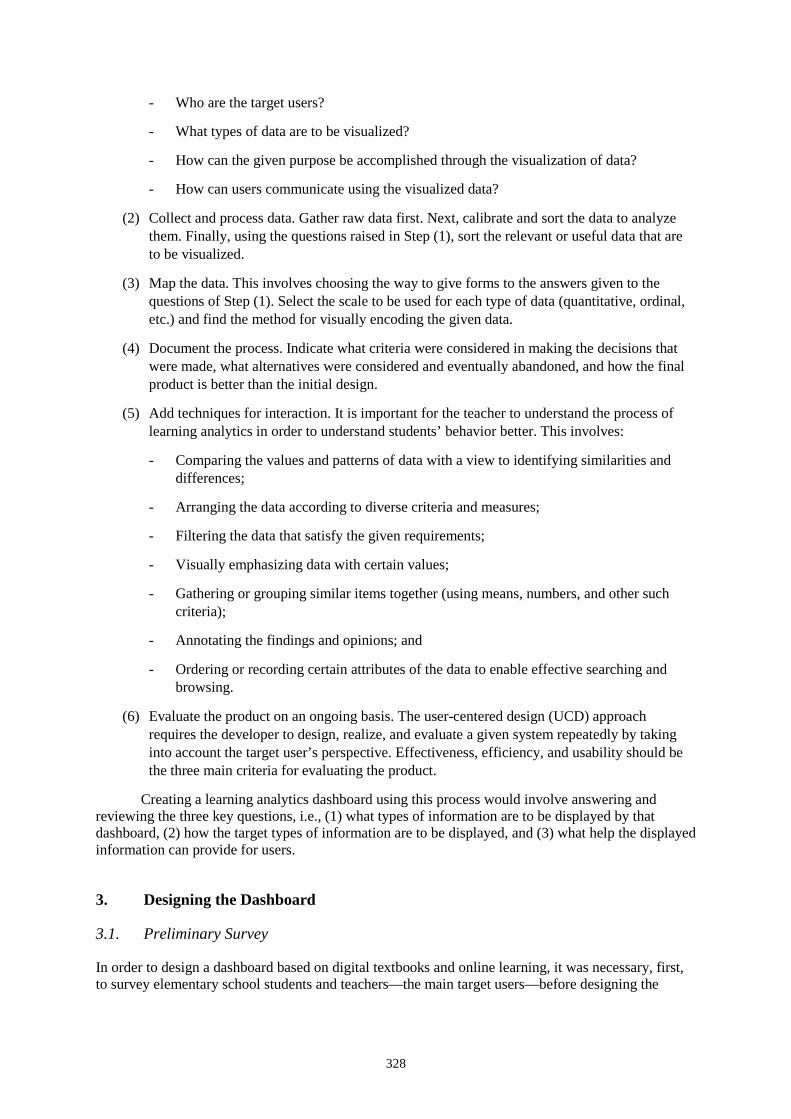
328
- Who are the target users?
- What types of data are to be visualized?
- How can the given purpose be accomplished through the visualization of data?
- How can users communicate using the visualized data?
(2) Collect and process data. Gather raw data first. Next, calibrate and sort the data to analyze them. Finally, using the questions raised in Step (1), sort the relevant or useful data that are to be visualized.
(3) Map the data. This involves choosing the way to give forms to the answers given to the questions of Step (1). Select the scale to be used for each type of data (quantitative, ordinal, etc.) and find the method for visually encoding the given data.
(4) Document the process. Indicate what criteria were considered in making the decisions that were made, what alternatives were considered and eventually abandoned, and how the final product is better than the initial design.
(5) Add techniques for interaction. It is important for the teacher to understand the process of learning analytics in order to understand students’ behavior better. This involves:
- Comparing the values and patterns of data with a view to identifying similarities and differences;
- Arranging the data according to diverse criteria and measures;
- Filtering the data that satisfy the given requirements;
- Visually emphasizing data with certain values;
- Gathering or grouping similar items together (using means, numbers, and other such criteria);
- Annotating the findings and opinions; and
- Ordering or recording certain attributes of the data to enable effective searching and browsing.
(6) Evaluate the product on an ongoing basis. The user-centered design (UCD) approach requires the developer to design, realize, and evaluate a given system repeatedly by taking into account the target user’s perspective. Effectiveness, efficiency, and usability should be the three main criteria for evaluating the product.
Creating a learning analytics dashboard using this process would involve answering and reviewing the three key questions, i.e., (1) what types of information are to be displayed by that dashboard, (2) how the target types of information are to be displayed, and (3) what help the displayed information can provide for users.
3. Designing the Dashboard
3.1. Preliminary Survey
In order to design a dashboard based on digital textbooks and online learning, it was necessary, first, to survey elementary school students and teachers—the main target users—before designing the
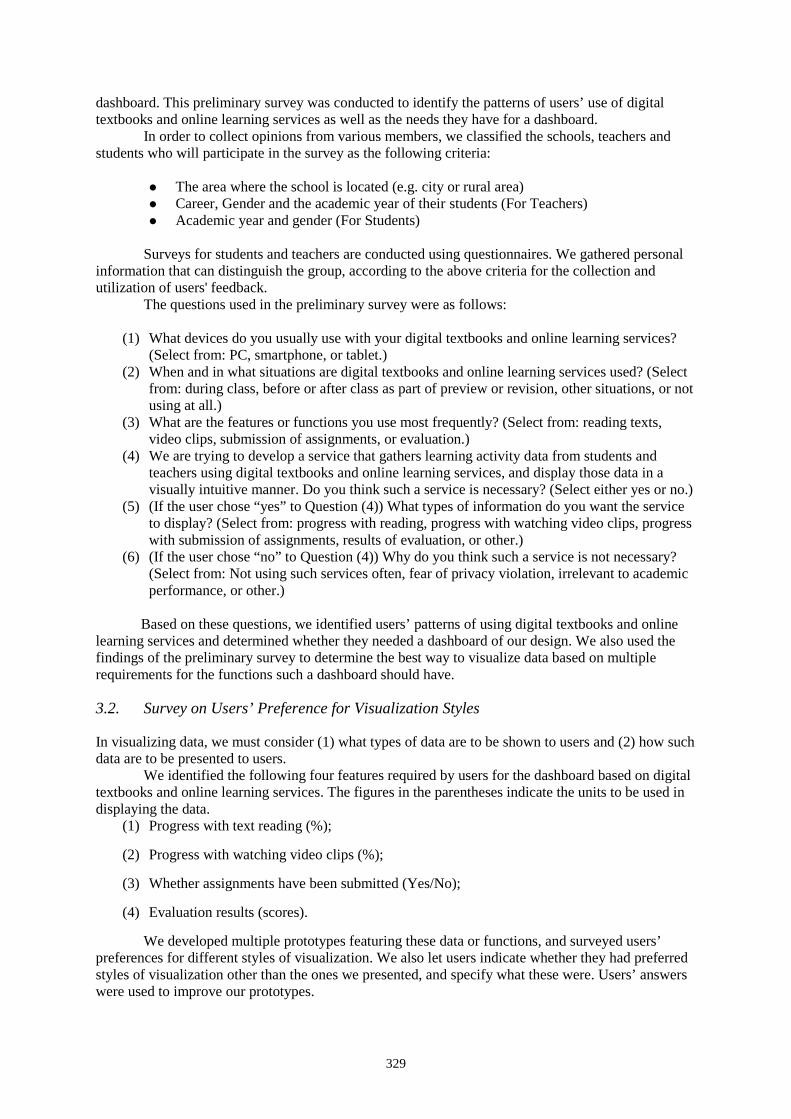
329
dashboard. This preliminary survey was conducted to identify the patterns of users’ use of digital textbooks and online learning services as well as the needs they have for a dashboard.
In order to collect opinions from various members, we classified the schools, teachers and students who will participate in the survey as the following criteria:
The area where the school is located (e.g. city or rural area) Career, Gender and the academic year of their students (For Teachers) Academic year and gender (For Students)
Surveys for students and teachers are conducted using questionnaires. We gathered personal
information that can distinguish the group, according to the above criteria for the collection and utilization of users' feedback.
The questions used in the preliminary survey were as follows:
(1) What devices do you usually use with your digital textbooks and online learning services? (Select from: PC, smartphone, or tablet.)
(2) When and in what situations are digital textbooks and online learning services used? (Select from: during class, before or after class as part of preview or revision, other situations, or not using at all.)
(3) What are the features or functions you use most frequently? (Select from: reading texts, video clips, submission of assignments, or evaluation.)
(4) We are trying to develop a service that gathers learning activity data from students and teachers using digital textbooks and online learning services, and display those data in a visually intuitive manner. Do you think such a service is necessary? (Select either yes or no.)
(5) (If the user chose “yes” to Question (4)) What types of information do you want the service to display? (Select from: progress with reading, progress with watching video clips, progress with submission of assignments, results of evaluation, or other.)
(6) (If the user chose “no” to Question (4)) Why do you think such a service is not necessary? (Select from: Not using such services often, fear of privacy violation, irrelevant to academic performance, or other.)
Based on these questions, we identified users’ patterns of using digital textbooks and online
learning services and determined whether they needed a dashboard of our design. We also used the findings of the preliminary survey to determine the best way to visualize data based on multiple requirements for the functions such a dashboard should have.
3.2. Survey on Users’ Preference for Visualization Styles
In visualizing data, we must consider (1) what types of data are to be shown to users and (2) how such data are to be presented to users.
We identified the following four features required by users for the dashboard based on digital textbooks and online learning services. The figures in the parentheses indicate the units to be used in displaying the data.
(1) Progress with text reading (%);
(2) Progress with watching video clips (%);
(3) Whether assignments have been submitted (Yes/No);
(4) Evaluation results (scores).
We developed multiple prototypes featuring these data or functions, and surveyed users’ preferences for different styles of visualization. We also let users indicate whether they had preferred styles of visualization other than the ones we presented, and specify what these were. Users’ answers were used to improve our prototypes.
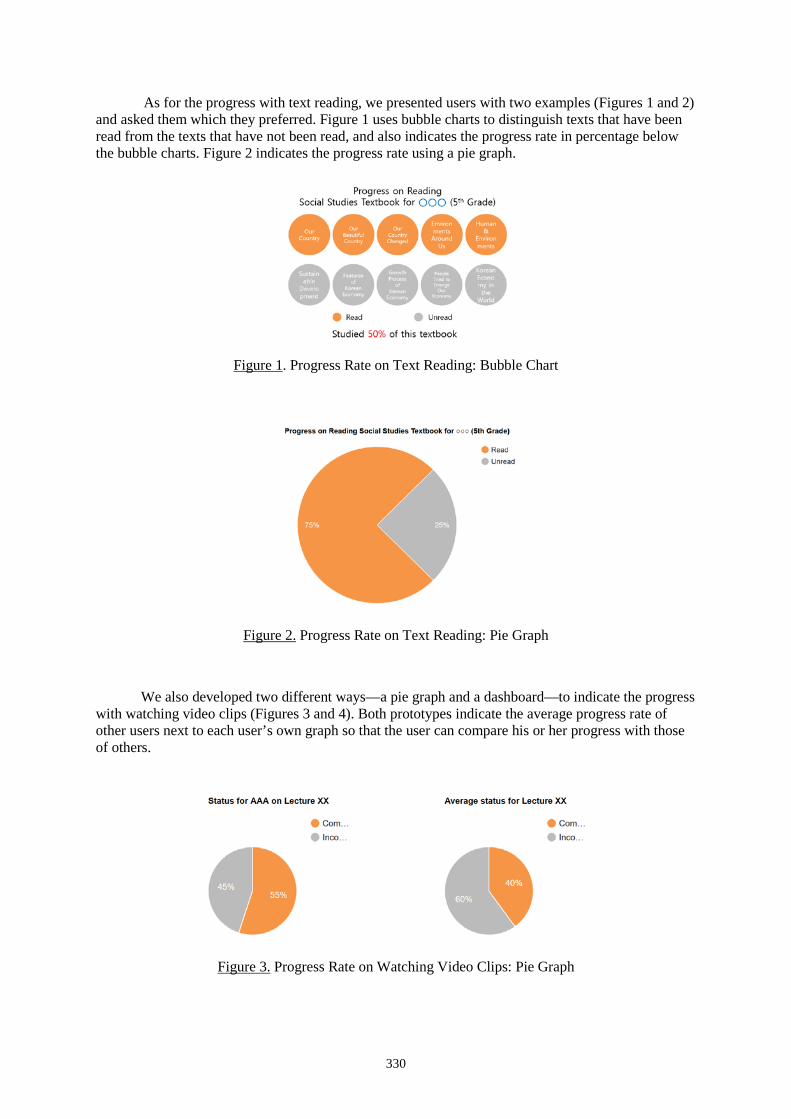
330
As for the progress with text reading, we presented users with two examples (Figures 1 and 2) and asked them which they preferred. Figure 1 uses bubble charts to distinguish texts that have been read from the texts that have not been read, and also indicates the progress rate in percentage below the bubble charts. Figure 2 indicates the progress rate using a pie graph.
Figure 1. Progress Rate on Text Reading: Bubble Chart
Figure 2. Progress Rate on Text Reading: Pie Graph
We also developed two different ways—a pie graph and a dashboard—to indicate the progress with watching video clips (Figures 3 and 4). Both prototypes indicate the average progress rate of other users next to each user’s own graph so that the user can compare his or her progress with those of others.
Figure 3. Progress Rate on Watching Video Clips: Pie Graph
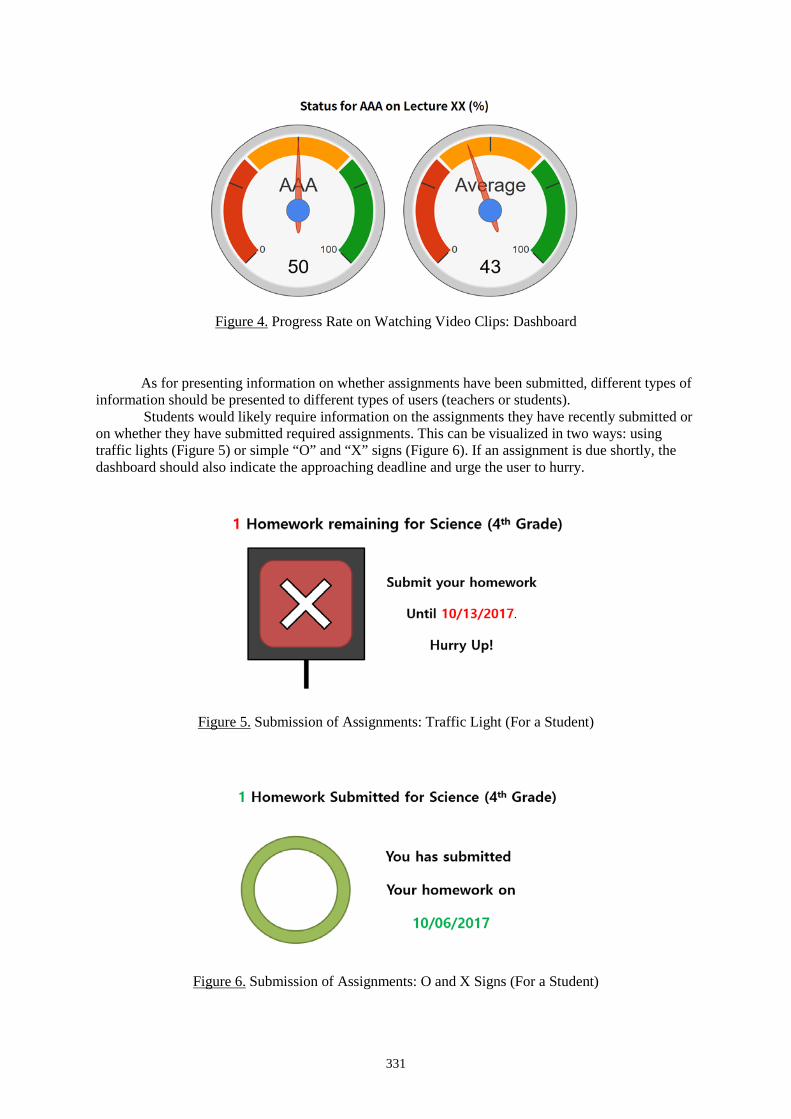
331
Figure 4. Progress Rate on Watching Video Clips: Dashboard
As for presenting information on whether assignments have been submitted, different types of information should be presented to different types of users (teachers or students).
Students would likely require information on the assignments they have recently submitted or on whether they have submitted required assignments. This can be visualized in two ways: using traffic lights (Figure 5) or simple “O” and “X” signs (Figure 6). If an assignment is due shortly, the dashboard should also indicate the approaching deadline and urge the user to hurry.
Figure 5. Submission of Assignments: Traffic Light (For a Student)
Figure 6. Submission of Assignments: O and X Signs (For a Student)
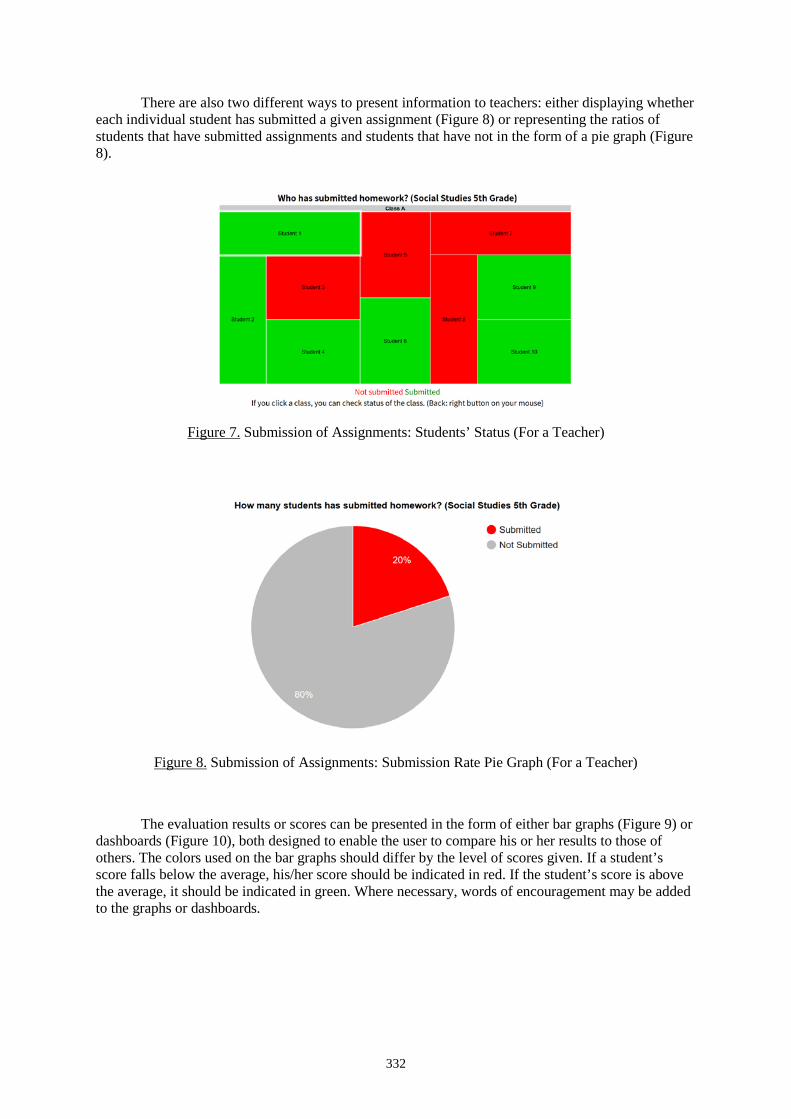
332
There are also two different ways to present information to teachers: either displaying whether each individual student has submitted a given assignment (Figure 8) or representing the ratios of students that have submitted assignments and students that have not in the form of a pie graph (Figure 8).
Figure 7. Submission of Assignments: Students’ Status (For a Teacher)
Figure 8. Submission of Assignments: Submission Rate Pie Graph (For a Teacher)
The evaluation results or scores can be presented in the form of either bar graphs (Figure 9) or dashboards (Figure 10), both designed to enable the user to compare his or her results to those of others. The colors used on the bar graphs should differ by the level of scores given. If a student’s score falls below the average, his/her score should be indicated in red. If the student’s score is above the average, it should be indicated in green. Where necessary, words of encouragement may be added to the graphs or dashboards.
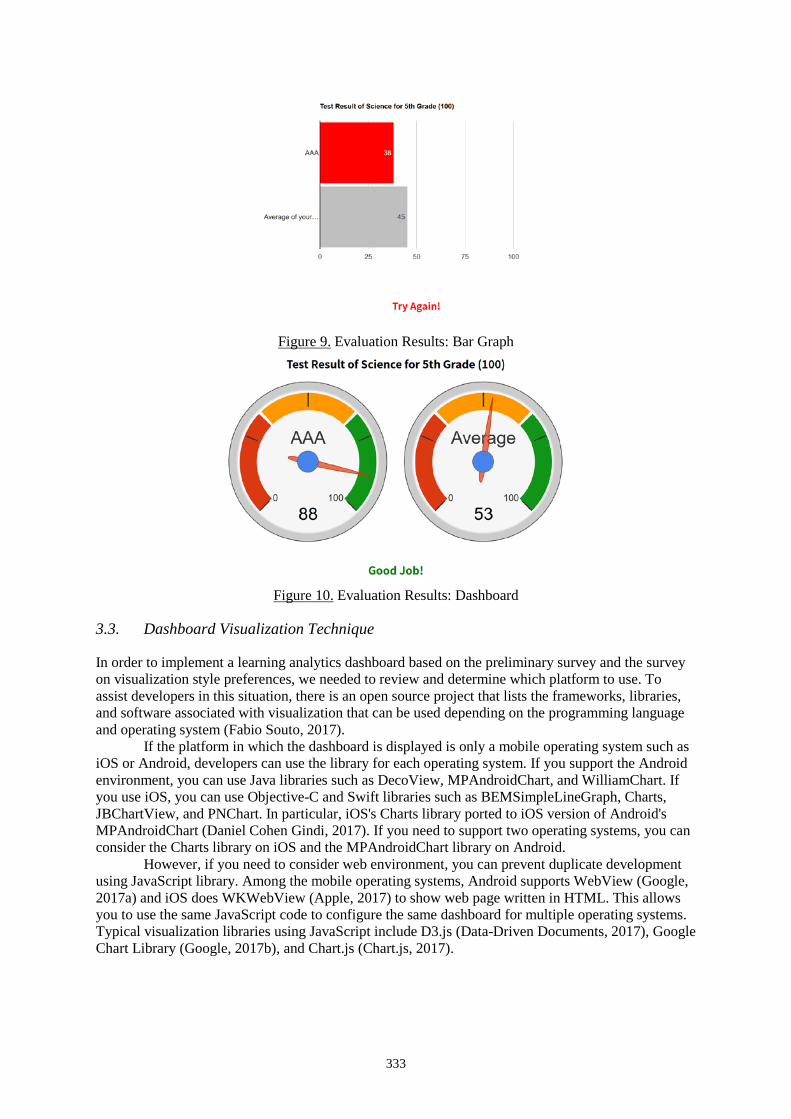
333
Figure 9. Evaluation Results: Bar Graph
Figure 10. Evaluation Results: Dashboard
3.3. Dashboard Visualization Technique
In order to implement a learning analytics dashboard based on the preliminary survey and the survey on visualization style preferences, we needed to review and determine which platform to use. To assist developers in this situation, there is an open source project that lists the frameworks, libraries, and software associated with visualization that can be used depending on the programming language and operating system (Fabio Souto, 2017).
If the platform in which the dashboard is displayed is only a mobile operating system such as iOS or Android, developers can use the library for each operating system. If you support the Android environment, you can use Java libraries such as DecoView, MPAndroidChart, and WilliamChart. If you use iOS, you can use Objective-C and Swift libraries such as BEMSimpleLineGraph, Charts, JBChartView, and PNChart. In particular, iOS's Charts library ported to iOS version of Android's MPAndroidChart (Daniel Cohen Gindi, 2017). If you need to support two operating systems, you can consider the Charts library on iOS and the MPAndroidChart library on Android.
However, if you need to consider web environment, you can prevent duplicate development using JavaScript library. Among the mobile operating systems, Android supports WebView (Google, 2017a) and iOS does WKWebView (Apple, 2017) to show web page written in HTML. This allows you to use the same JavaScript code to configure the same dashboard for multiple operating systems. Typical visualization libraries using JavaScript include D3.js (Data-Driven Documents, 2017), Google Chart Library (Google, 2017b), and Chart.js (Chart.js, 2017).
334
4. Conclusion and Suggestions
In this study, we review the process by which we designed a learning analytics dashboard based on digital textbooks and online learning activities. We first sought to identify users’ patterns of using online learning materials and determine their needs for a dashboard. In order to find ways to visualize our dashboard in the most intuitive and convenient manner for users possible, we also developed a number of visualization prototypes. Finally, we surveyed and reviewed the possible platforms that could be used to support our dashboard.
This report provides only an overview of how the prototypes for the dashboard we propose could be designed and produced. Once these prototypes are developed, we will need to test them in terms of efficiency, effectiveness, and usability by applying them to actual services with learning analytics systems. Then we will need to identify what improvements and changes are to be made. We also need to look for dashboard designs and applications that users actually require.
Acknowledgements
This work was supported by Institute for Information & communications Technology Promotion(IITP) grant funded by the Korea government(MSIT) (No.2016-0-00327, Technical development for distribution system of educational contents and services platform based on Multi-format Clipped Learning Assets as well as the global commercialization for accompanied growth)
References
Cho, Y. (2013). Possibility and prospects of using learning analytics. KERIS. Jin, S. & Yu, M. (2015). Analysis of trends in learning analytics-based dashboard research in e-learning
environments. Journal of Educational Information Media 21(2). 185-213. Park, Y. & Cho, I. (2014). Design and application of learning analytics-based dashboards. Journal of
Educational Information Media 20(2). 191-216. Klerkx, J., Verbert, K., & Duval, E. (2017). Learning analytics dashboards. Society for Learning Analytics
Research. Handbook of Learning Analytics. First Edition. 143-149. Fabio Souto (2017), Awesome dataviz, Retrieved September 15, 2017, from
https://github.com/fasouto/awesome-dataviz Google (2017a). WebView, Android Developers Reference, Retrieved September 15, 2017, from
https://developer.android.com/reference/android/webkit/WebView.html Apple (2017). WKWebView - WebKit, Apple Developer Documentation, Retrieved September 15, 2017, from
https://developer.apple.com/documentation/webkit/wkwebview Daniel Cohen Gindi (2017). Charts, Retrieved September 15, 2017, from https://github.com/danielgindi/Charts Data-Driven Documents (2017). Data-Driven Documents(D3.js) Wiki, Retrieved August 15, 2017, from
https://github.com/d3/d3/wiki Google (2017b). Using Google Charts – Google Developers, Retrieved August 15, 2017, from https://google-
developers.appspot.com/chart/interactive/docs Chart.js (2017). Chart.js - Open Source HTML5 Charts for Your Website, Retrieved September 15, 2017, from
http://www.chartjs.org
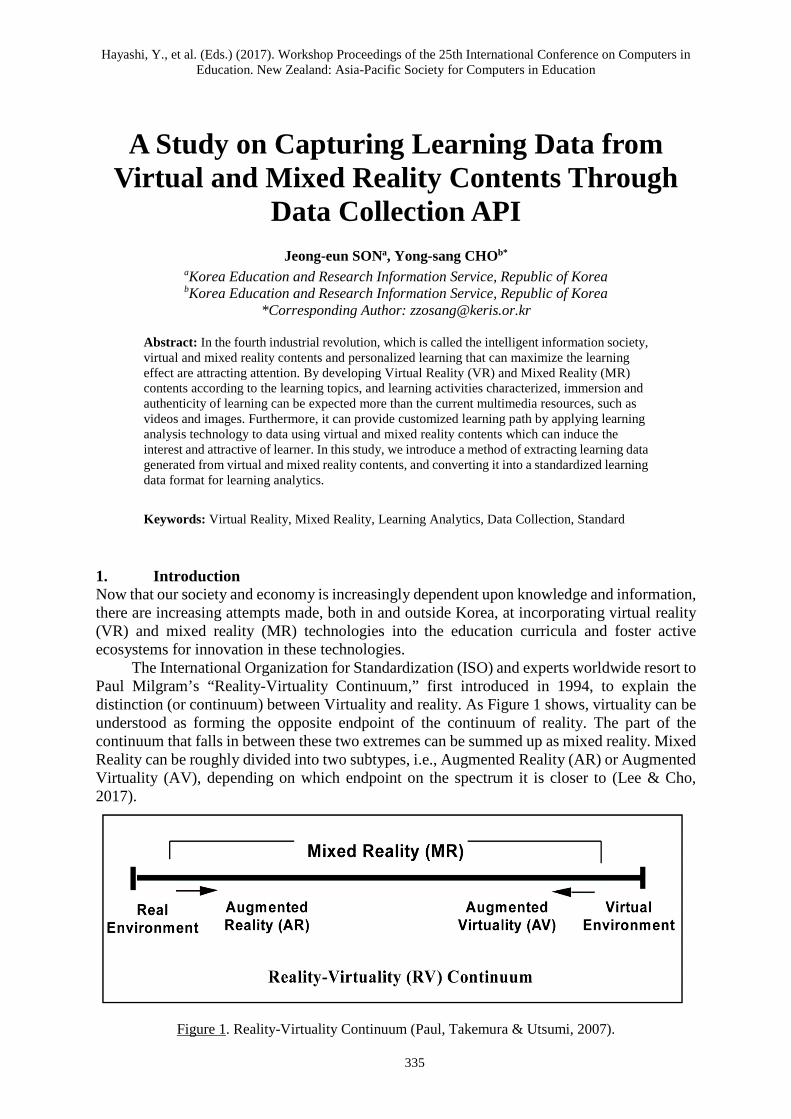
Hayashi, Y., et al. (Eds.) (2017). Workshop Proceedings of the 25th International Conference on Computers in Education. New Zealand: Asia-Pacific Society for Computers in Education
335
A Study on Capturing Learning Data from Virtual and Mixed Reality Contents Through
Data Collection API Jeong-eun SONa, Yong-sang CHOb*
aKorea Education and Research Information Service, Republic of Korea bKorea Education and Research Information Service, Republic of Korea
*Corresponding Author: [email protected]
Abstract: In the fourth industrial revolution, which is called the intelligent information society, virtual and mixed reality contents and personalized learning that can maximize the learning effect are attracting attention. By developing Virtual Reality (VR) and Mixed Reality (MR) contents according to the learning topics, and learning activities characterized, immersion and authenticity of learning can be expected more than the current multimedia resources, such as videos and images. Furthermore, it can provide customized learning path by applying learning analysis technology to data using virtual and mixed reality contents which can induce the interest and attractive of learner. In this study, we introduce a method of extracting learning data generated from virtual and mixed reality contents, and converting it into a standardized learning data format for learning analytics.
Keywords: Virtual Reality, Mixed Reality, Learning Analytics, Data Collection, Standard
1. Introduction Now that our society and economy is increasingly dependent upon knowledge and information, there are increasing attempts made, both in and outside Korea, at incorporating virtual reality (VR) and mixed reality (MR) technologies into the education curricula and foster active ecosystems for innovation in these technologies.
The International Organization for Standardization (ISO) and experts worldwide resort to Paul Milgram’s “Reality-Virtuality Continuum,” first introduced in 1994, to explain the distinction (or continuum) between Virtuality and reality. As Figure 1 shows, virtuality can be understood as forming the opposite endpoint of the continuum of reality. The part of the continuum that falls in between these two extremes can be summed up as mixed reality. Mixed Reality can be roughly divided into two subtypes, i.e., Augmented Reality (AR) or Augmented Virtuality (AV), depending on which endpoint on the spectrum it is closer to (Lee & Cho, 2017).
Figure 1. Reality-Virtuality Continuum (Paul, Takemura & Utsumi, 2007).
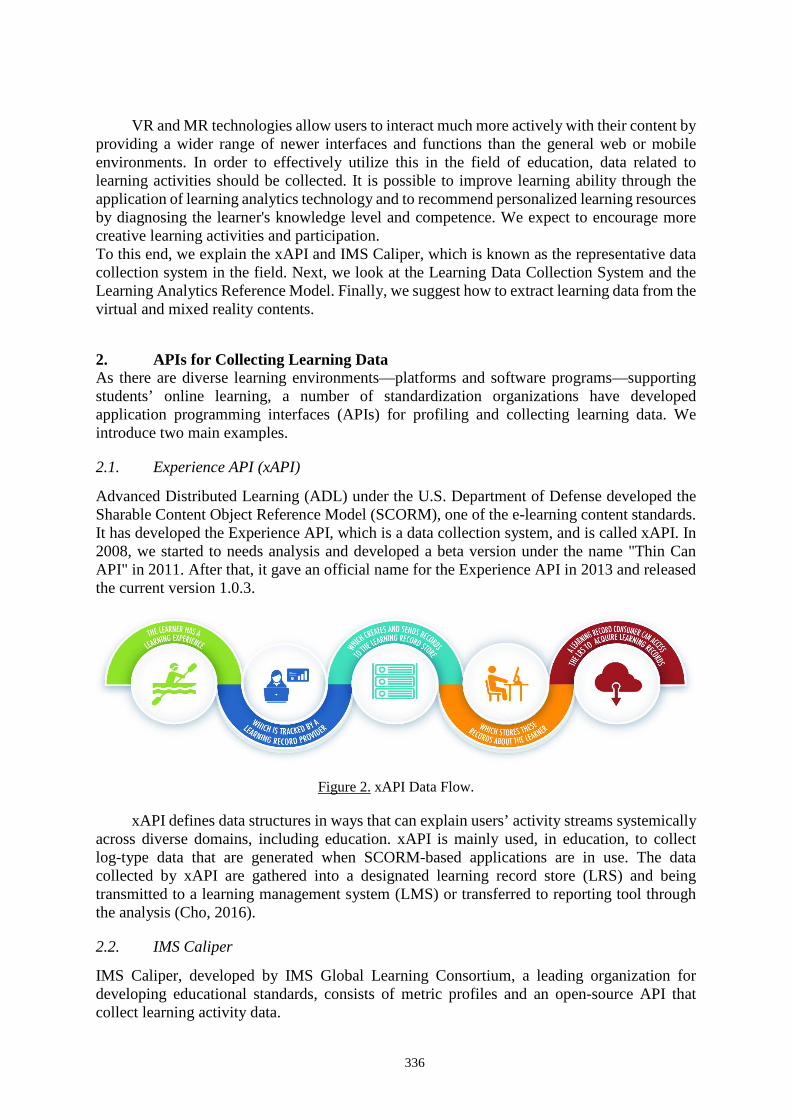
336
VR and MR technologies allow users to interact much more actively with their content by providing a wider range of newer interfaces and functions than the general web or mobile environments. In order to effectively utilize this in the field of education, data related to learning activities should be collected. It is possible to improve learning ability through the application of learning analytics technology and to recommend personalized learning resources by diagnosing the learner's knowledge level and competence. We expect to encourage more creative learning activities and participation. To this end, we explain the xAPI and IMS Caliper, which is known as the representative data collection system in the field. Next, we look at the Learning Data Collection System and the Learning Analytics Reference Model. Finally, we suggest how to extract learning data from the virtual and mixed reality contents.
2. APIs for Collecting Learning Data As there are diverse learning environments—platforms and software programs—supporting students’ online learning, a number of standardization organizations have developed application programming interfaces (APIs) for profiling and collecting learning data. We introduce two main examples.
2.1. Experience API (xAPI)
Advanced Distributed Learning (ADL) under the U.S. Department of Defense developed the Sharable Content Object Reference Model (SCORM), one of the e-learning content standards. It has developed the Experience API, which is a data collection system, and is called xAPI. In 2008, we started to needs analysis and developed a beta version under the name "Thin Can API" in 2011. After that, it gave an official name for the Experience API in 2013 and released the current version 1.0.3.
Figure 2. xAPI Data Flow.
xAPI defines data structures in ways that can explain users’ activity streams systemically across diverse domains, including education. xAPI is mainly used, in education, to collect log-type data that are generated when SCORM-based applications are in use. The data collected by xAPI are gathered into a designated learning record store (LRS) and being transmitted to a learning management system (LMS) or transferred to reporting tool through the analysis (Cho, 2016).
2.2. IMS Caliper
IMS Caliper, developed by IMS Global Learning Consortium, a leading organization for developing educational standards, consists of metric profiles and an open-source API that collect learning activity data.
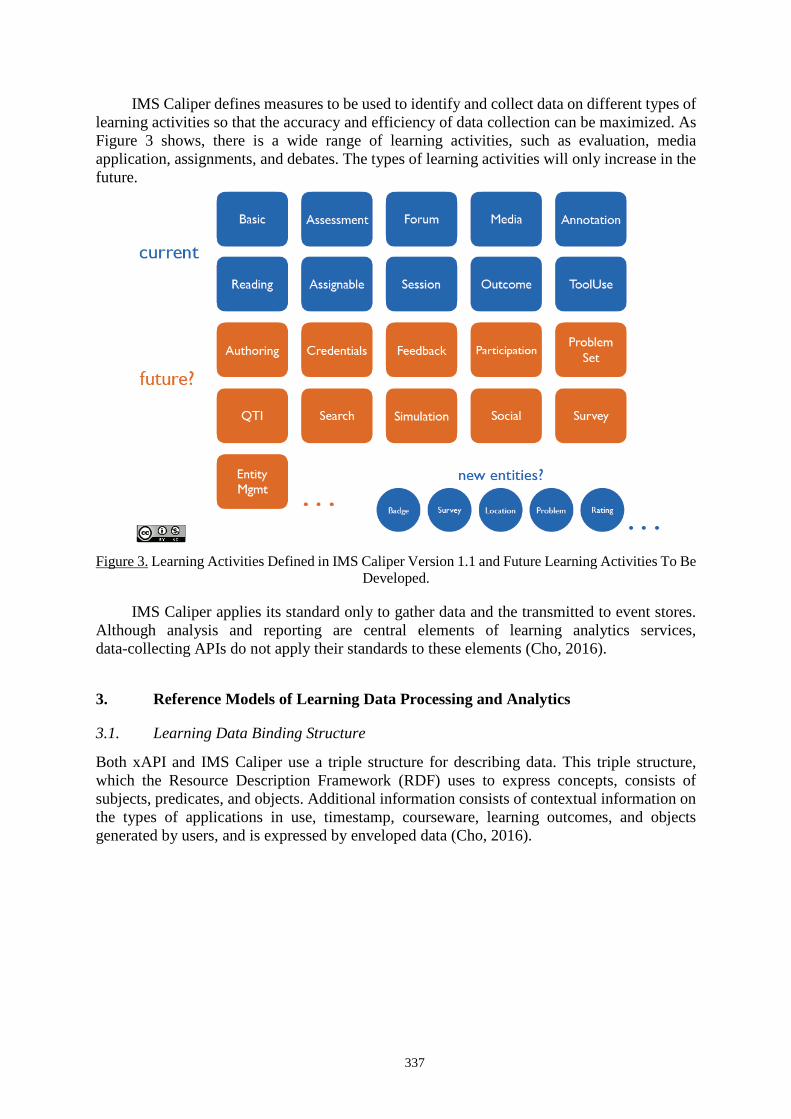
337
IMS Caliper defines measures to be used to identify and collect data on different types of learning activities so that the accuracy and efficiency of data collection can be maximized. As Figure 3 shows, there is a wide range of learning activities, such as evaluation, media application, assignments, and debates. The types of learning activities will only increase in the future.
Figure 3. Learning Activities Defined in IMS Caliper Version 1.1 and Future Learning Activities To Be
Developed.
IMS Caliper applies its standard only to gather data and the transmitted to event stores. Although analysis and reporting are central elements of learning analytics services, data-collecting APIs do not apply their standards to these elements (Cho, 2016).
3. Reference Models of Learning Data Processing and Analytics
3.1. Learning Data Binding Structure
Both xAPI and IMS Caliper use a triple structure for describing data. This triple structure, which the Resource Description Framework (RDF) uses to express concepts, consists of subjects, predicates, and objects. Additional information consists of contextual information on the types of applications in use, timestamp, courseware, learning outcomes, and objects generated by users, and is expressed by enveloped data (Cho, 2016).
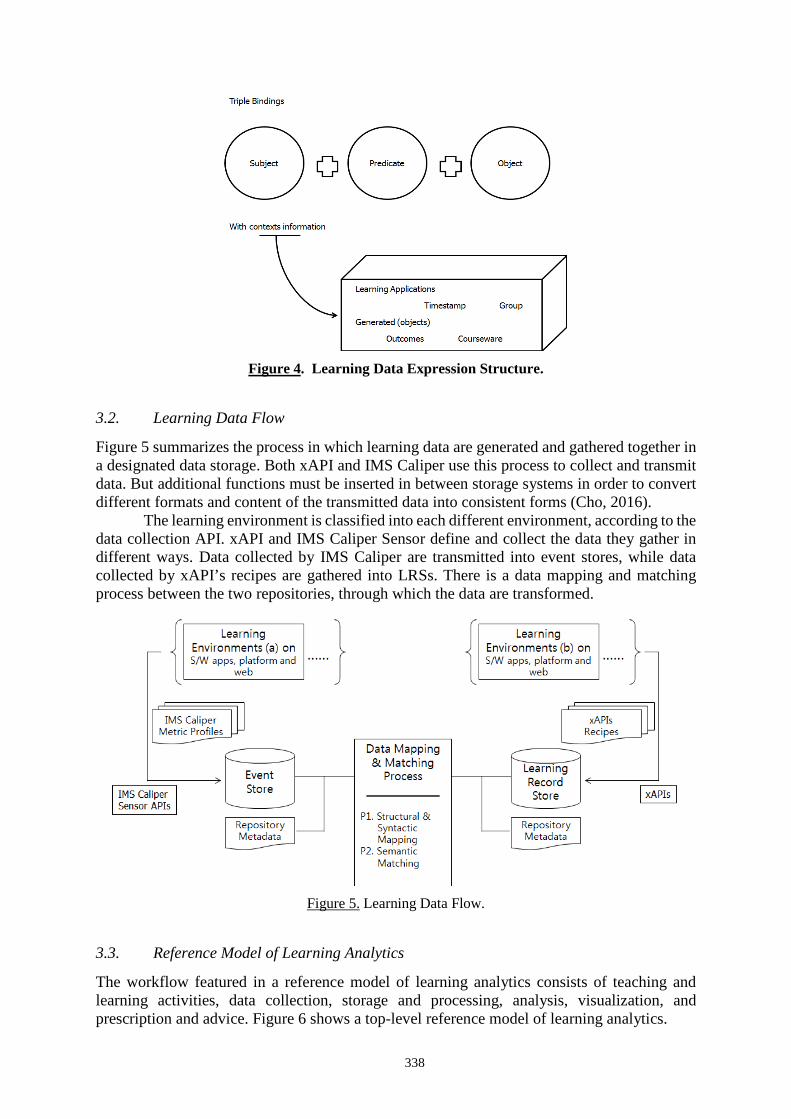
338
Figure 4. Learning Data Expression Structure.
3.2. Learning Data Flow
Figure 5 summarizes the process in which learning data are generated and gathered together in a designated data storage. Both xAPI and IMS Caliper use this process to collect and transmit data. But additional functions must be inserted in between storage systems in order to convert different formats and content of the transmitted data into consistent forms (Cho, 2016).
The learning environment is classified into each different environment, according to the data collection API. xAPI and IMS Caliper Sensor define and collect the data they gather in different ways. Data collected by IMS Caliper are transmitted into event stores, while data collected by xAPI’s recipes are gathered into LRSs. There is a data mapping and matching process between the two repositories, through which the data are transformed.
Figure 5. Learning Data Flow.
3.3. Reference Model of Learning Analytics
The workflow featured in a reference model of learning analytics consists of teaching and learning activities, data collection, storage and processing, analysis, visualization, and prescription and advice. Figure 6 shows a top-level reference model of learning analytics.
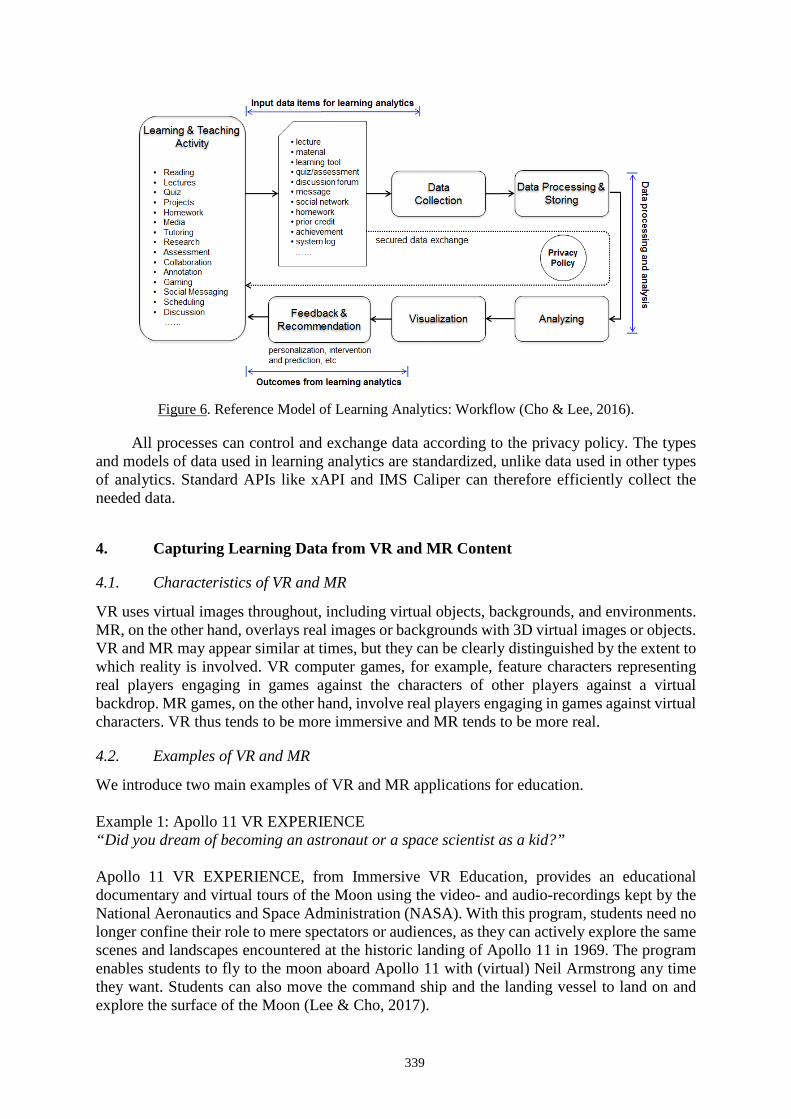
339
Figure 6. Reference Model of Learning Analytics: Workflow (Cho & Lee, 2016).
All processes can control and exchange data according to the privacy policy. The types and models of data used in learning analytics are standardized, unlike data used in other types of analytics. Standard APIs like xAPI and IMS Caliper can therefore efficiently collect the needed data.
4. Capturing Learning Data from VR and MR Content
4.1. Characteristics of VR and MR
VR uses virtual images throughout, including virtual objects, backgrounds, and environments. MR, on the other hand, overlays real images or backgrounds with 3D virtual images or objects. VR and MR may appear similar at times, but they can be clearly distinguished by the extent to which reality is involved. VR computer games, for example, feature characters representing real players engaging in games against the characters of other players against a virtual backdrop. MR games, on the other hand, involve real players engaging in games against virtual characters. VR thus tends to be more immersive and MR tends to be more real.
4.2. Examples of VR and MR
We introduce two main examples of VR and MR applications for education. Example 1: Apollo 11 VR EXPERIENCE “Did you dream of becoming an astronaut or a space scientist as a kid?” Apollo 11 VR EXPERIENCE, from Immersive VR Education, provides an educational documentary and virtual tours of the Moon using the video- and audio-recordings kept by the National Aeronautics and Space Administration (NASA). With this program, students need no longer confine their role to mere spectators or audiences, as they can actively explore the same scenes and landscapes encountered at the historic landing of Apollo 11 in 1969. The program enables students to fly to the moon aboard Apollo 11 with (virtual) Neil Armstrong any time they want. Students can also move the command ship and the landing vessel to land on and explore the surface of the Moon (Lee & Cho, 2017).
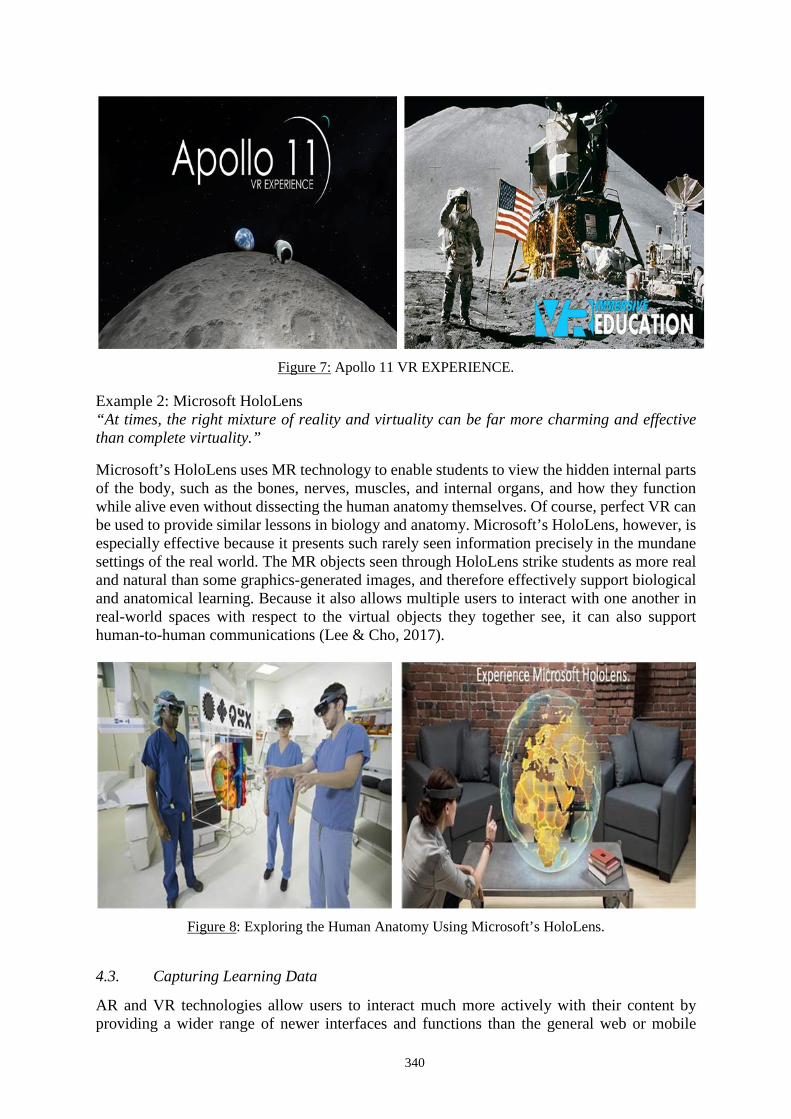
340
Figure 7: Apollo 11 VR EXPERIENCE.
Example 2: Microsoft HoloLens “At times, the right mixture of reality and virtuality can be far more charming and effective than complete virtuality.” Microsoft’s HoloLens uses MR technology to enable students to view the hidden internal parts of the body, such as the bones, nerves, muscles, and internal organs, and how they function while alive even without dissecting the human anatomy themselves. Of course, perfect VR can be used to provide similar lessons in biology and anatomy. Microsoft’s HoloLens, however, is especially effective because it presents such rarely seen information precisely in the mundane settings of the real world. The MR objects seen through HoloLens strike students as more real and natural than some graphics-generated images, and therefore effectively support biological and anatomical learning. Because it also allows multiple users to interact with one another in real-world spaces with respect to the virtual objects they together see, it can also support human-to-human communications (Lee & Cho, 2017).
Figure 8: Exploring the Human Anatomy Using Microsoft’s HoloLens.
4.3. Capturing Learning Data
AR and VR technologies allow users to interact much more actively with their content by providing a wider range of newer interfaces and functions than the general web or mobile
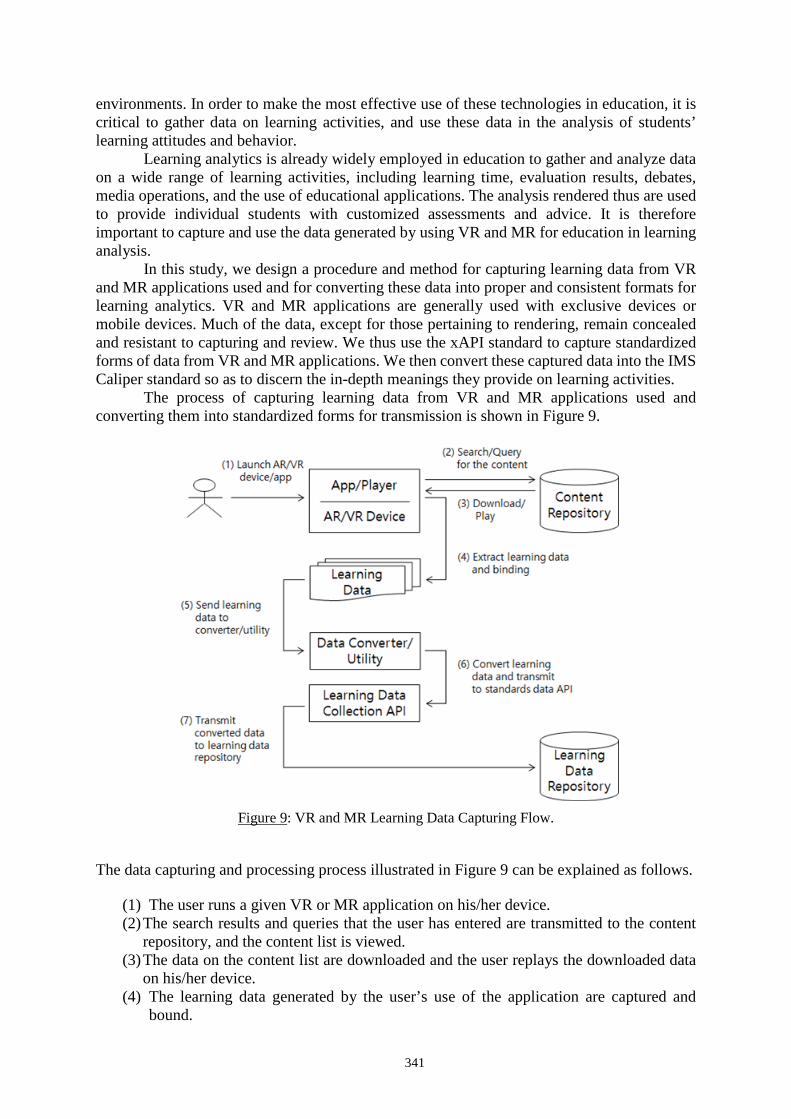
341
environments. In order to make the most effective use of these technologies in education, it is critical to gather data on learning activities, and use these data in the analysis of students’ learning attitudes and behavior.
Learning analytics is already widely employed in education to gather and analyze data on a wide range of learning activities, including learning time, evaluation results, debates, media operations, and the use of educational applications. The analysis rendered thus are used to provide individual students with customized assessments and advice. It is therefore important to capture and use the data generated by using VR and MR for education in learning analysis.
In this study, we design a procedure and method for capturing learning data from VR and MR applications used and for converting these data into proper and consistent formats for learning analytics. VR and MR applications are generally used with exclusive devices or mobile devices. Much of the data, except for those pertaining to rendering, remain concealed and resistant to capturing and review. We thus use the xAPI standard to capture standardized forms of data from VR and MR applications. We then convert these captured data into the IMS Caliper standard so as to discern the in-depth meanings they provide on learning activities.
The process of capturing learning data from VR and MR applications used and converting them into standardized forms for transmission is shown in Figure 9.
Figure 9: VR and MR Learning Data Capturing Flow.
The data capturing and processing process illustrated in Figure 9 can be explained as follows.
(1) The user runs a given VR or MR application on his/her device. (2) The search results and queries that the user has entered are transmitted to the content
repository, and the content list is viewed. (3) The data on the content list are downloaded and the user replays the downloaded data
on his/her device. (4) The learning data generated by the user’s use of the application are captured and
bound.
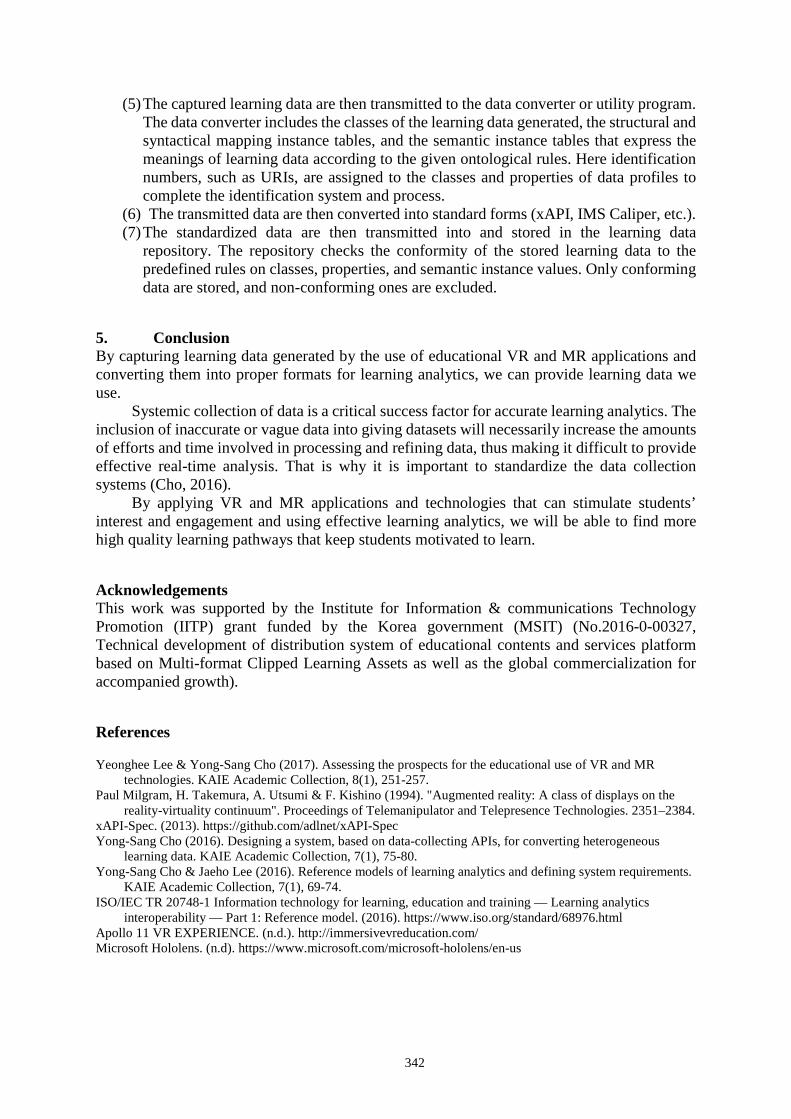
342
(5) The captured learning data are then transmitted to the data converter or utility program. The data converter includes the classes of the learning data generated, the structural and syntactical mapping instance tables, and the semantic instance tables that express the meanings of learning data according to the given ontological rules. Here identification numbers, such as URIs, are assigned to the classes and properties of data profiles to complete the identification system and process.
(6) The transmitted data are then converted into standard forms (xAPI, IMS Caliper, etc.). (7) The standardized data are then transmitted into and stored in the learning data
repository. The repository checks the conformity of the stored learning data to the predefined rules on classes, properties, and semantic instance values. Only conforming data are stored, and non-conforming ones are excluded.
5. Conclusion By capturing learning data generated by the use of educational VR and MR applications and converting them into proper formats for learning analytics, we can provide learning data we use.
Systemic collection of data is a critical success factor for accurate learning analytics. The inclusion of inaccurate or vague data into giving datasets will necessarily increase the amounts of efforts and time involved in processing and refining data, thus making it difficult to provide effective real-time analysis. That is why it is important to standardize the data collection systems (Cho, 2016).
By applying VR and MR applications and technologies that can stimulate students’ interest and engagement and using effective learning analytics, we will be able to find more high quality learning pathways that keep students motivated to learn.
Acknowledgements This work was supported by the Institute for Information & communications Technology Promotion (IITP) grant funded by the Korea government (MSIT) (No.2016-0-00327, Technical development of distribution system of educational contents and services platform based on Multi-format Clipped Learning Assets as well as the global commercialization for accompanied growth).
References
Yeonghee Lee & Yong-Sang Cho (2017). Assessing the prospects for the educational use of VR and MR technologies. KAIE Academic Collection, 8(1), 251-257.
Paul Milgram, H. Takemura, A. Utsumi & F. Kishino (1994). "Augmented reality: A class of displays on the reality-virtuality continuum". Proceedings of Telemanipulator and Telepresence Technologies. 2351–2384.
xAPI-Spec. (2013). https://github.com/adlnet/xAPI-Spec Yong-Sang Cho (2016). Designing a system, based on data-collecting APIs, for converting heterogeneous
learning data. KAIE Academic Collection, 7(1), 75-80. Yong-Sang Cho & Jaeho Lee (2016). Reference models of learning analytics and defining system requirements.
KAIE Academic Collection, 7(1), 69-74. ISO/IEC TR 20748-1 Information technology for learning, education and training — Learning analytics
interoperability — Part 1: Reference model. (2016). https://www.iso.org/standard/68976.html Apollo 11 VR EXPERIENCE. (n.d.). http://immersivevreducation.com/ Microsoft Hololens. (n.d). https://www.microsoft.com/microsoft-hololens/en-us
Hayashi, Y., et al. (Eds.) (2017). Workshop Proceedings of the 25th International Conference on Computers in Education. New Zealand: Asia-Pacific Society for Computers in Education
343
Virtual and Mixed Reality for students: How to Control Human Factors
Hyojeong LEE, Yong-Sang CHO* Korea Education and Research Information Service, Korea
Abstract: Emerging technologies, such as virtual reality and mixed reality, help teachers as well as students understand educational contents more easily. But we need to consider more deeply. Because most of the devices and contents that released recently are targeted at the game and entertainment market, it may well be doubted whether they are proper for education. Some people have difficulty in health and social aspects after experience virtual or mixed reality. In this paper, we introduce the human factors issues in the virtual and mixed reality area. If we know how to control human factors, virtual and mixed reality could be used more safely in education. We gathered the usage guides, best practices and guidelines about those. We analyze and put the parts commonly mentioned together. But the consideration of hardware itself is excluded. As a result, we propose human factor guideline for users and contents creators using virtual and mixed reality in education.
Keywords: Guidelines, Human Factors, Virtual Reality, Augmented Reality, Education
1. Introduction
Virtual reality (VR) and augmented reality (AR) are emerging around the world. Facebook has announced their plan to pioneer AR and Microsoft has shown an interest in applying VR, AR, and mixed reality (MR) to expand their Windows from monitors onto walls and table surfaces. Google, too, has been lead the popularization of VR and AR technologies with its affordable and efficient things such as Cardboard and platforms like YouTube.
With the Fourth Industrial Revolution (Industry 4.0) underway around the world, attempts are increasingly made to develop and adopt new technologies, such as robotics, VR, and artificial intelligence (AI). K-12 schools are expected to incorporate AR and VR into the classroom in the 2-3 years (The New Media Consortium, 2016). Also, aggregate market size of the educational AR and VR content are expected to $0.7bn by 2025 (The Goldman Sachs Group, Inc. , 2016)..
According to the survey on K-12 teachers in the United States, 85 percent of the participants expect that VR has positive effect to the students (Samsung, 2016). Another survey is conducted on in Germany (Samsung, 2015). It is similarly showed that 74 percent of the participants expect that VR would help keep students motivated better. The experiences such as operability, presence, and immersive learning that AR provides would likely affect the learning effect on students (Bogyeong Gye & Yeongsu Kim, 2008). There were researches that education using VR increase the efficiency of learning more than conventional teaching (Mads T Bonde, etc., 2014).
In using these technologies for more immersive experiences, however, some people experience physical symptoms, such as fatigue in the eyes, and also psychological symptoms including the inability to distinguish between the virtual world and the real world (Changmin Lee, 1999). Particularly, as K-12 students are undergoing critical periods in physical and mental development, it is crucial to consider various issues of human factors before introducing VR and AR into schools.
This study compares and analyzes the existing literature on the involved issues. We propose the human factor guidelines regarding the educational applications of VR and MR technologies. In chapter 2, we introduce some of the recent trends in the educational VR and MR content. In chapter 3, we introduce the human factors of VR and MR. In chapter 4, we analysis of the guides and best practices provided by major head mounted displays (HMDs) manufacturers. Finally, in chapter 5, we present the human factor guideline for using in education fields.
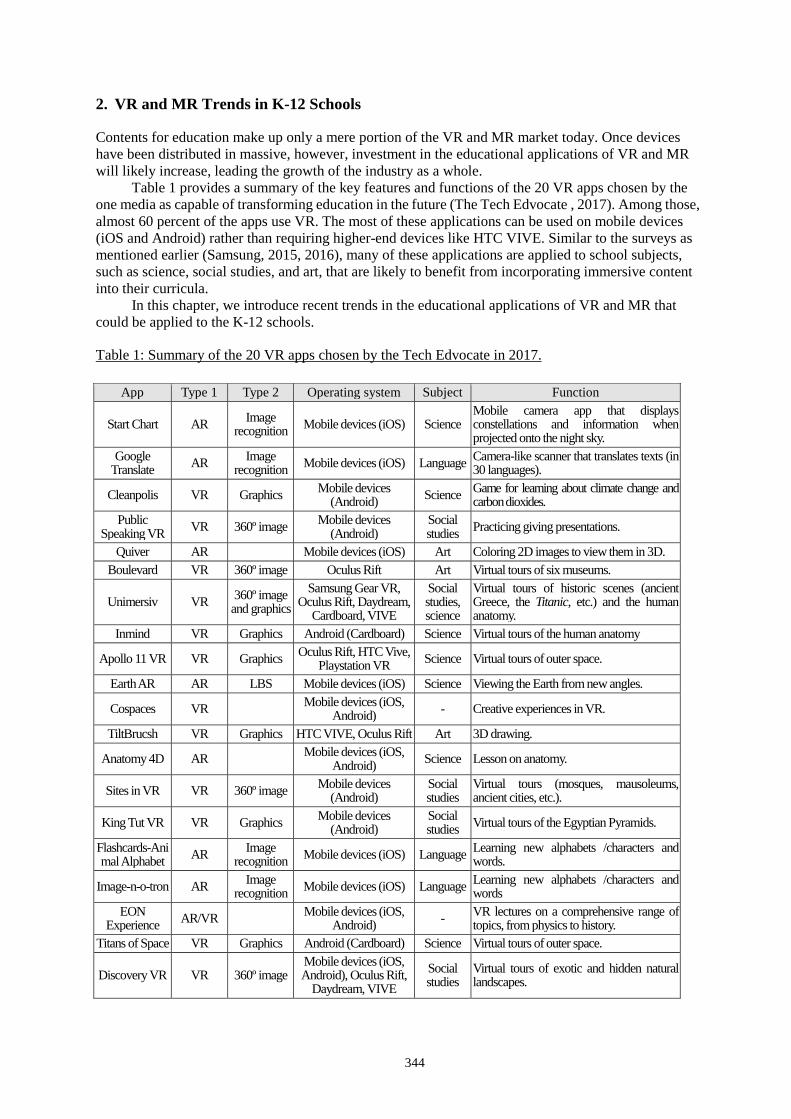
344
2. VR and MR Trends in K-12 Schools
Contents for education make up only a mere portion of the VR and MR market today. Once devices have been distributed in massive, however, investment in the educational applications of VR and MR will likely increase, leading the growth of the industry as a whole.
Table 1 provides a summary of the key features and functions of the 20 VR apps chosen by the one media as capable of transforming education in the future (The Tech Edvocate , 2017). Among those, almost 60 percent of the apps use VR. The most of these applications can be used on mobile devices (iOS and Android) rather than requiring higher-end devices like HTC VIVE. Similar to the surveys as mentioned earlier (Samsung, 2015, 2016), many of these applications are applied to school subjects, such as science, social studies, and art, that are likely to benefit from incorporating immersive content into their curricula.
In this chapter, we introduce recent trends in the educational applications of VR and MR that could be applied to the K-12 schools.
Table 1: Summary of the 20 VR apps chosen by the Tech Edvocate in 2017.
App Type 1 Type 2 Operating system Subject Function
Start Chart AR Image recognition Mobile devices (iOS) Science
Mobile camera app that displays constellations and information when projected onto the night sky.
Google Translate AR Image
recognition Mobile devices (iOS) Language Camera-like scanner that translates texts (in 30 languages).
Cleanpolis VR Graphics Mobile devices (Android) Science Game for learning about climate change and
carbon dioxides. Public
Speaking VR VR 360º image Mobile devices (Android)
Social studies Practicing giving presentations.
Quiver AR Mobile devices (iOS) Art Coloring 2D images to view them in 3D. Boulevard VR 360º image Oculus Rift Art Virtual tours of six museums.
Unimersiv VR 360º image and graphics
Samsung Gear VR, Oculus Rift, Daydream,
Cardboard, VIVE
Social studies, science
Virtual tours of historic scenes (ancient Greece, the Titanic, etc.) and the human anatomy.
Inmind VR Graphics Android (Cardboard) Science Virtual tours of the human anatomy
Apollo 11 VR VR Graphics Oculus Rift, HTC Vive, Playstation VR Science Virtual tours of outer space.
Earth AR AR LBS Mobile devices (iOS) Science Viewing the Earth from new angles.
Cospaces VR Mobile devices (iOS, Android) - Creative experiences in VR.
TiltBrucsh VR Graphics HTC VIVE, Oculus Rift Art 3D drawing.
Anatomy 4D AR Mobile devices (iOS, Android) Science Lesson on anatomy.
Sites in VR VR 360º image Mobile devices (Android)
Social studies
Virtual tours (mosques, mausoleums, ancient cities, etc.).
King Tut VR VR Graphics Mobile devices (Android)
Social studies Virtual tours of the Egyptian Pyramids.
Flashcards-Animal Alphabet AR Image
recognition Mobile devices (iOS) Language Learning new alphabets /characters and words.
Image-n-o-tron AR Image recognition Mobile devices (iOS) Language Learning new alphabets /characters and
words EON
Experience AR/VR Mobile devices (iOS, Android) - VR lectures on a comprehensive range of
topics, from physics to history. Titans of Space VR Graphics Android (Cardboard) Science Virtual tours of outer space.
Discovery VR VR 360º image Mobile devices (iOS, Android), Oculus Rift,
Daydream, VIVE Social studies
Virtual tours of exotic and hidden natural landscapes.
345
2.1 VR-Based Contents
Contents using virtual reality can be divided into contents created by 360 images and contents made by 3D simulations. Most of this type is played through HMDs of See-Closed method.
• Contents created by 360º images: Panoramic pictures or moving images that capture objects in all the 360 degrees are used. This type is used mainly for the virtual tours of places that are not easily accessed due to locations and time limitation. These can most fruitfully be applied to social studies or science. 360º images contained of actual landscapes can make students feel as if they had been transported into those places. Creators also show only the intended images and thereby maximize the presence of the experiences by fix the target user’s vision to the camera. This type has a merit of cost relatively. Also, it is possible to play on common mobile devices.
• Contents by 3D simulations: With authoring or graphics tools in computer, we can place 3D objects on virtual simulated spaces. Landscapes that do not exist in reality (ancient cities, future worlds, etc.) could be shown. Creators enable greater freedom in users’ eye and body movements. As this tend to be costlier than 360-degree image- contents, there are mostly founded in game and entertainment fields that can generate profits. To play this, computer-based devices with high computational powers are required such as HTC VIVE.
2.2 AR-Based Contents
AR-based contents include marker- or image-recognition, location-based service (LBS), and projection-type. Because these contents overlay the real world with virtual objects, they require the use of mobile device or see-through devices.
• LBS contents: By gathering and identifying users’ locations using global positioning systems (GPS) and/or gyroscope sensors, image are shown. These are mostly found in advertisements, marketing, and entertainment. A leading example is Pokémon GO. This type requires active movements of users. This technology could be applied to support field trips.
• Marker or image-recognition contents: The cameras mounted on the display devices recognized given markers or images to display additional information by overlapping those. Most of these are in the forms of AR cards or AR books. This is used to project onto images not only to show information in textbooks or relics at museums but also help little children learn alphabets and vocabularies.
• Projection-type contents: Small projectors are mounted on display devices, it project images directly onto users’ retinas or eyeglasses to display the intended images. Since it needs to the high costs for implement the devices required for use, there are few contents have been developed so far. Recently, various companies are investing in the development of these types. It can be used for sharing same contents in classroom or auditorium for many students.
3. Human Factor Issues in VR and MR
Human factors and ergonomics refer to the areas of scientific research required to find theories, mechanisms, and data that are needed to optimize machinery and systems for human use (IEA, 2000). In this chapter, we introduce a number of VR- and MR-related human factor issues across four areas (Yeonghee Lee & Yong-Sang Cho, 2016).
3.1 Health Related Issues
The causes and symptoms of health-related human factor issues can be summarized as follows
346
• Discomfort: In experiencing VR or MR, users can feel unpleasant physical symptoms such as lightheadedness, dizziness, headaches, and nausea. These symptoms are commonly referred to as VR sickness, simulator sickness, motion sickness, and cyber sickness. It is occurred due to the inability of users to react physically to the visual stimuli they experience in virtual environments (Gyeonghun Han & Hyeontaek Kim, 2011).
• Bad impact on vision: Since the most of VR or MR devices are close to the users’ eyes, excessive use of these can lead to a variety of symptoms affecting the eyes and vision, such as visual fatigue, blurs, double vision (Jeongmin Hwang, Jinhak Lee & Taesu Park, 1999 ).
• Irlen syndrome: Also known as the Pokémon shock or the Nintendo syndrome, the Irlen syndrome causes sudden seizures in users in response to rapidly flickering visual stimuli involving bright lights.
• Musculoskeletal fatigue: When using VR and MR devices in the same position for an extended period of time, which, if repeated, can exert duress on the user’s musculoskeletal system, leading to fatigue and pain.
• Hygiene: Letting multiple users use the same device together or one user using his/her own device repeatedly without taking care to disinfect or clean the device regularly could turn these devices into sources of infectious or communicable diseases.
3.2 Safety Related Issues
Safety issues related to VR and MR is the risks of injuries. Users using see-closed devices that blocked vision to display could fall, trip, or bump into surrounding objects, which increases the risks of their injuries. Even see-through devices that overlay the reality with virtual objects could increase risks of accidents, such as falls and car accidents, by overwhelming users’ attention. Also, due to confusion between reality and the virtual world, users may try to sit on chairs or lean against walls those do not exist in reality, thus injuring themselves.
3.3 Social Related Issues
In the social related issues, there are infringe of privacy and over-immersion. Users may (be tempted to) abuse the recording functions of their VR or MR display devices. Users may be too engrossed in the virtual world that they may become unable to distinguish between reality and the virtual world. Further, they could be engaged in violent or self-destructive behavior in reality. Excessive immersive user could think that the outcomes of such behavior could be “undone” or “reset” as in the virtual world.
3.4 Others
There are Accessibility issue that related to whether VR and MR applications and devices can deliver the same beneficial experiences to people with physical disabilities, the infirm and the elderly, and the poor.
4. Analysis of User Manuals, Best Practices and Guidelines
We analyze the user manuals and best practice provided by the major HMD devices makers on the market such as Samsung, Sony, Oculus, Google and HTC. Some organizations, also, has making guidelines.
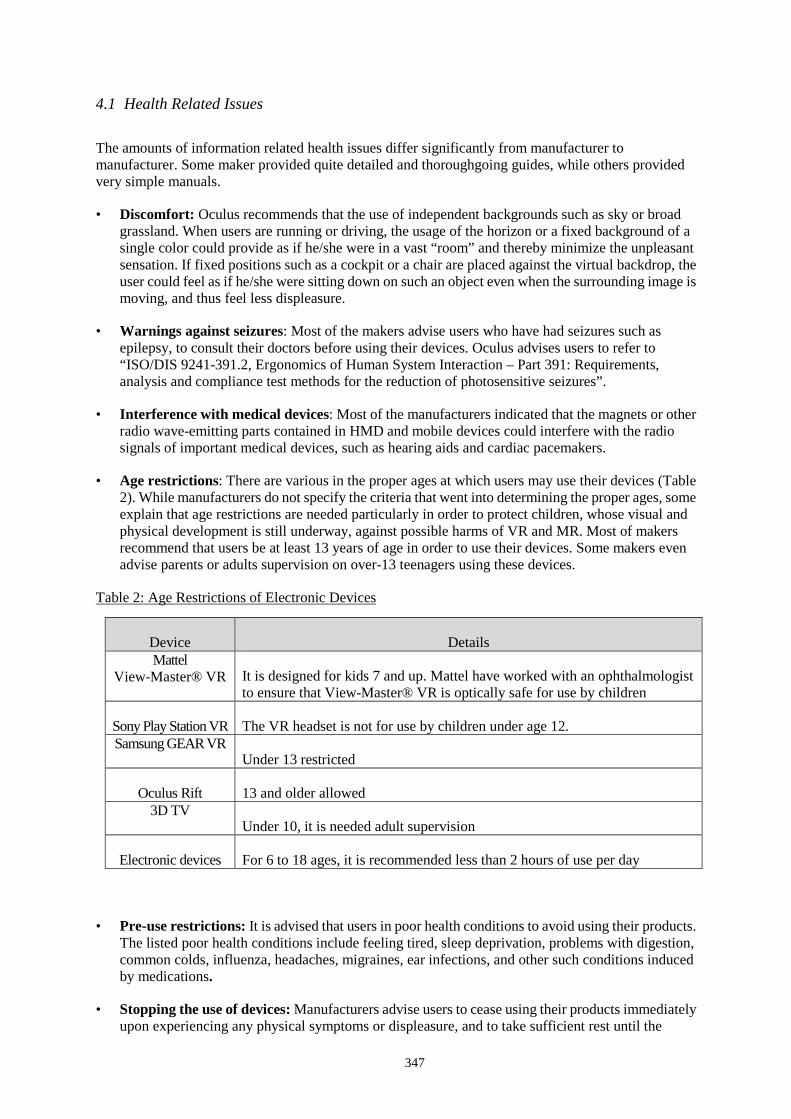
347
4.1 Health Related Issues
The amounts of information related health issues differ significantly from manufacturer to manufacturer. Some maker provided quite detailed and thoroughgoing guides, while others provided very simple manuals.
• Discomfort: Oculus recommends that the use of independent backgrounds such as sky or broad grassland. When users are running or driving, the usage of the horizon or a fixed background of a single color could provide as if he/she were in a vast “room” and thereby minimize the unpleasant sensation. If fixed positions such as a cockpit or a chair are placed against the virtual backdrop, the user could feel as if he/she were sitting down on such an object even when the surrounding image is moving, and thus feel less displeasure.
• Warnings against seizures: Most of the makers advise users who have had seizures such as epilepsy, to consult their doctors before using their devices. Oculus advises users to refer to “ISO/DIS 9241-391.2, Ergonomics of Human System Interaction – Part 391: Requirements, analysis and compliance test methods for the reduction of photosensitive seizures”.
• Interference with medical devices: Most of the manufacturers indicated that the magnets or other radio wave-emitting parts contained in HMD and mobile devices could interfere with the radio signals of important medical devices, such as hearing aids and cardiac pacemakers.
• Age restrictions: There are various in the proper ages at which users may use their devices (Table 2). While manufacturers do not specify the criteria that went into determining the proper ages, some explain that age restrictions are needed particularly in order to protect children, whose visual and physical development is still underway, against possible harms of VR and MR. Most of makers recommend that users be at least 13 years of age in order to use their devices. Some makers even advise parents or adults supervision on over-13 teenagers using these devices.
Table 2: Age Restrictions of Electronic Devices
• Pre-use restrictions: It is advised that users in poor health conditions to avoid using their products. The listed poor health conditions include feeling tired, sleep deprivation, problems with digestion, common colds, influenza, headaches, migraines, ear infections, and other such conditions induced by medications.
• Stopping the use of devices: Manufacturers advise users to cease using their products immediately upon experiencing any physical symptoms or displeasure, and to take sufficient rest until the
Device Details Mattel
View-Master® VR It is designed for kids 7 and up. Mattel have worked with an ophthalmologist to ensure that View-Master® VR is optically safe for use by children
Sony Play Station VR The VR headset is not for use by children under age 12. Samsung GEAR VR
Under 13 restricted
Oculus Rift 13 and older allowed 3D TV
Under 10, it is needed adult supervision
Electronic devices For 6 to 18 ages, it is recommended less than 2 hours of use per day
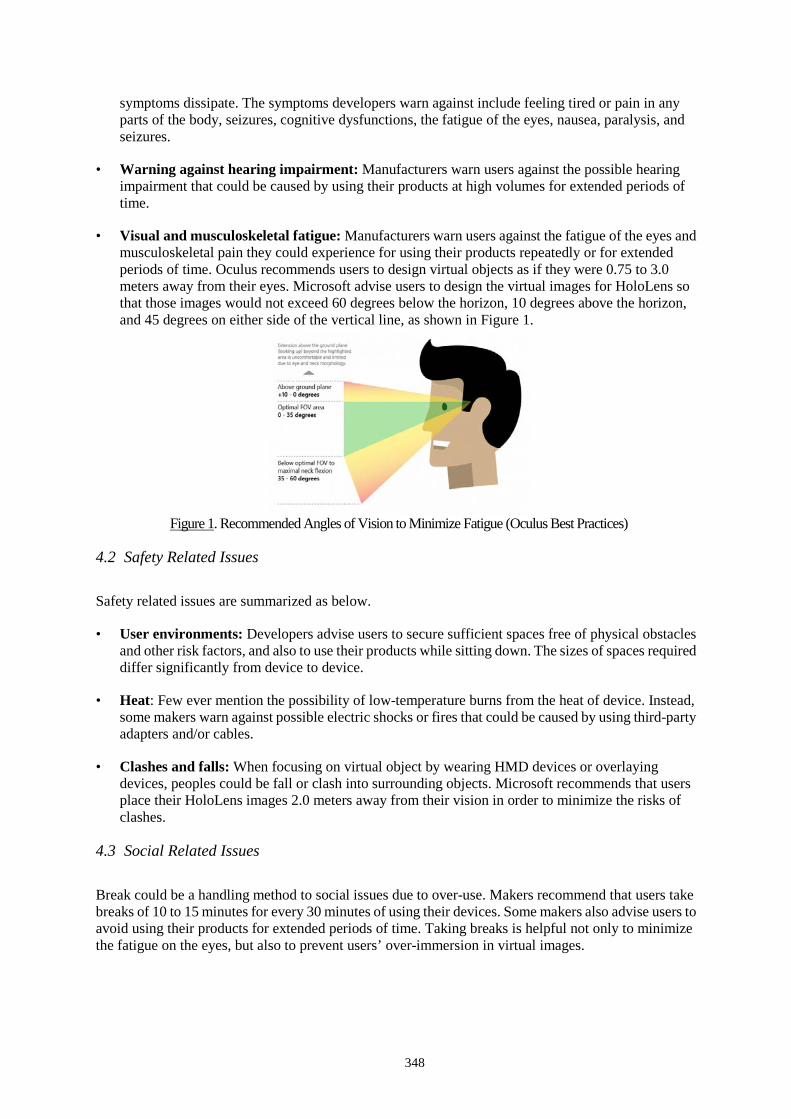
348
symptoms dissipate. The symptoms developers warn against include feeling tired or pain in any parts of the body, seizures, cognitive dysfunctions, the fatigue of the eyes, nausea, paralysis, and seizures.
• Warning against hearing impairment: Manufacturers warn users against the possible hearing impairment that could be caused by using their products at high volumes for extended periods of time.
• Visual and musculoskeletal fatigue: Manufacturers warn users against the fatigue of the eyes and musculoskeletal pain they could experience for using their products repeatedly or for extended periods of time. Oculus recommends users to design virtual objects as if they were 0.75 to 3.0 meters away from their eyes. Microsoft advise users to design the virtual images for HoloLens so that those images would not exceed 60 degrees below the horizon, 10 degrees above the horizon, and 45 degrees on either side of the vertical line, as shown in Figure 1.
Figure 1. Recommended Angles of Vision to Minimize Fatigue (Oculus Best Practices)
4.2 Safety Related Issues
Safety related issues are summarized as below.
• User environments: Developers advise users to secure sufficient spaces free of physical obstacles and other risk factors, and also to use their products while sitting down. The sizes of spaces required differ significantly from device to device.
• Heat: Few ever mention the possibility of low-temperature burns from the heat of device. Instead, some makers warn against possible electric shocks or fires that could be caused by using third-party adapters and/or cables.
• Clashes and falls: When focusing on virtual object by wearing HMD devices or overlaying devices, peoples could be fall or clash into surrounding objects. Microsoft recommends that users place their HoloLens images 2.0 meters away from their vision in order to minimize the risks of clashes.
4.3 Social Related Issues
Break could be a handling method to social issues due to over-use. Makers recommend that users take breaks of 10 to 15 minutes for every 30 minutes of using their devices. Some makers also advise users to avoid using their products for extended periods of time. Taking breaks is helpful not only to minimize the fatigue on the eyes, but also to prevent users’ over-immersion in virtual images.
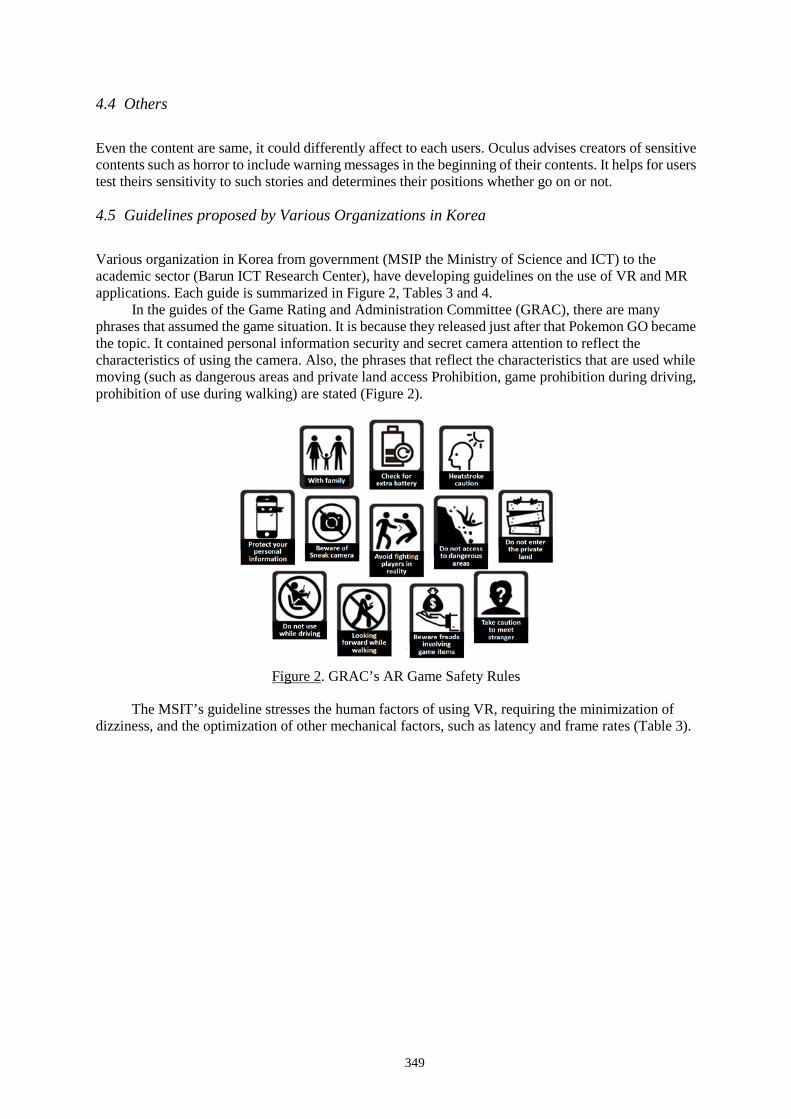
349
4.4 Others
Even the content are same, it could differently affect to each users. Oculus advises creators of sensitive contents such as horror to include warning messages in the beginning of their contents. It helps for users test theirs sensitivity to such stories and determines their positions whether go on or not.
4.5 Guidelines proposed by Various Organizations in Korea
Various organization in Korea from government (MSIP the Ministry of Science and ICT) to the academic sector (Barun ICT Research Center), have developing guidelines on the use of VR and MR applications. Each guide is summarized in Figure 2, Tables 3 and 4.
In the guides of the Game Rating and Administration Committee (GRAC), there are many phrases that assumed the game situation. It is because they released just after that Pokemon GO became the topic. It contained personal information security and secret camera attention to reflect the characteristics of using the camera. Also, the phrases that reflect the characteristics that are used while moving (such as dangerous areas and private land access Prohibition, game prohibition during driving, prohibition of use during walking) are stated (Figure 2).
Figure 2. GRAC’s AR Game Safety Rules
The MSIT’s guideline stresses the human factors of using VR, requiring the minimization of dizziness, and the optimization of other mechanical factors, such as latency and frame rates (Table 3).
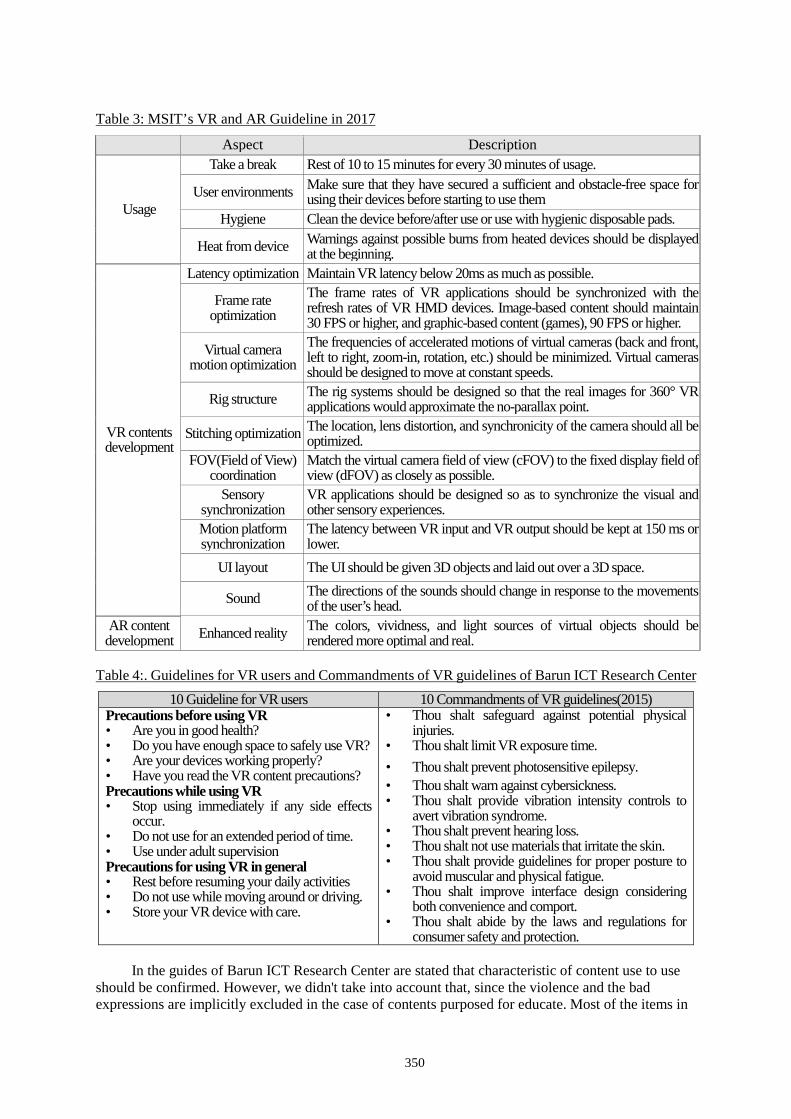
350
Table 3: MSIT’s VR and AR Guideline in 2017
Aspect Description
Usage
Take a break Rest of 10 to 15 minutes for every 30 minutes of usage.
User environments Make sure that they have secured a sufficient and obstacle-free space for using their devices before starting to use them
Hygiene Clean the device before/after use or use with hygienic disposable pads.
Heat from device Warnings against possible burns from heated devices should be displayed at the beginning.
VR contents development
Latency optimization Maintain VR latency below 20ms as much as possible.
Frame rate optimization
The frame rates of VR applications should be synchronized with the refresh rates of VR HMD devices. Image-based content should maintain 30 FPS or higher, and graphic-based content (games), 90 FPS or higher.
Virtual camera motion optimization
The frequencies of accelerated motions of virtual cameras (back and front, left to right, zoom-in, rotation, etc.) should be minimized. Virtual cameras should be designed to move at constant speeds.
Rig structure The rig systems should be designed so that the real images for 360° VR applications would approximate the no-parallax point.
Stitching optimization The location, lens distortion, and synchronicity of the camera should all be optimized.
FOV(Field of View) coordination
Match the virtual camera field of view (cFOV) to the fixed display field of view (dFOV) as closely as possible.
Sensory synchronization
VR applications should be designed so as to synchronize the visual and other sensory experiences.
Motion platform synchronization
The latency between VR input and VR output should be kept at 150 ms or lower.
UI layout The UI should be given 3D objects and laid out over a 3D space.
Sound The directions of the sounds should change in response to the movements of the user’s head.
AR content development Enhanced reality The colors, vividness, and light sources of virtual objects should be
rendered more optimal and real.
Table 4:. Guidelines for VR users and Commandments of VR guidelines of Barun ICT Research Center 10 Guideline for VR users 10 Commandments of VR guidelines(2015)
Precautions before using VR • Are you in good health? • Do you have enough space to safely use VR? • Are your devices working properly? • Have you read the VR content precautions? Precautions while using VR • Stop using immediately if any side effects
occur. • Do not use for an extended period of time. • Use under adult supervision Precautions for using VR in general • Rest before resuming your daily activities • Do not use while moving around or driving. • Store your VR device with care.
• Thou shalt safeguard against potential physical injuries.
• Thou shalt limit VR exposure time. • Thou shalt prevent photosensitive epilepsy. • Thou shalt warn against cybersickness. • Thou shalt provide vibration intensity controls to
avert vibration syndrome. • Thou shalt prevent hearing loss. • Thou shalt not use materials that irritate the skin. • Thou shalt provide guidelines for proper posture to
avoid muscular and physical fatigue. • Thou shalt improve interface design considering
both convenience and comport. • Thou shalt abide by the laws and regulations for
consumer safety and protection.
In the guides of Barun ICT Research Center are stated that characteristic of content use to use should be confirmed. However, we didn't take into account that, since the violence and the bad expressions are implicitly excluded in the case of contents purposed for educate. Most of the items in
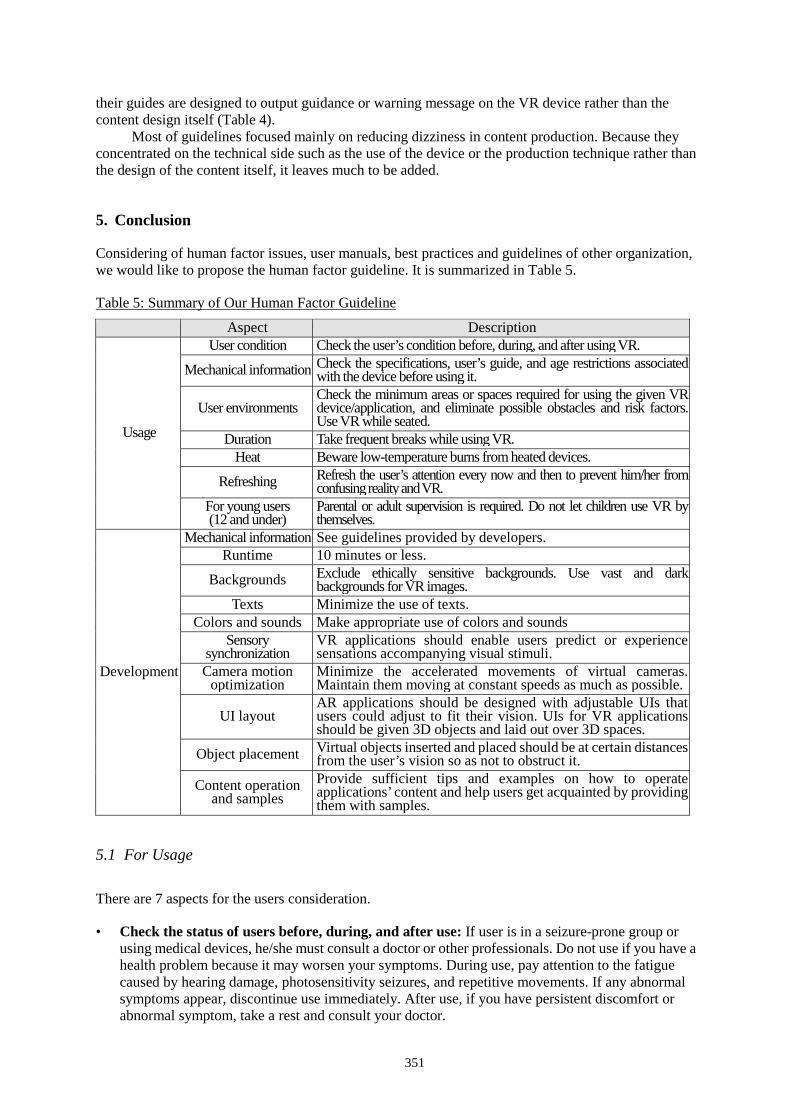
351
their guides are designed to output guidance or warning message on the VR device rather than the content design itself (Table 4).
Most of guidelines focused mainly on reducing dizziness in content production. Because they concentrated on the technical side such as the use of the device or the production technique rather than the design of the content itself, it leaves much to be added.
5. Conclusion
Considering of human factor issues, user manuals, best practices and guidelines of other organization, we would like to propose the human factor guideline. It is summarized in Table 5.
Table 5: Summary of Our Human Factor Guideline
Aspect Description
Usage
User condition Check the user’s condition before, during, and after using VR.
Mechanical information Check the specifications, user’s guide, and age restrictions associated with the device before using it.
User environments Check the minimum areas or spaces required for using the given VR device/application, and eliminate possible obstacles and risk factors. Use VR while seated.
Duration Take frequent breaks while using VR. Heat Beware low-temperature burns from heated devices.
Refreshing Refresh the user’s attention every now and then to prevent him/her from confusing reality and VR.
For young users (12 and under)
Parental or adult supervision is required. Do not let children use VR by themselves.
Development
Mechanical information See guidelines provided by developers. Runtime 10 minutes or less.
Backgrounds Exclude ethically sensitive backgrounds. Use vast and dark backgrounds for VR images.
Texts Minimize the use of texts. Colors and sounds Make appropriate use of colors and sounds
Sensory synchronization
VR applications should enable users predict or experience sensations accompanying visual stimuli.
Camera motion optimization
Minimize the accelerated movements of virtual cameras. Maintain them moving at constant speeds as much as possible.
UI layout AR applications should be designed with adjustable UIs that users could adjust to fit their vision. UIs for VR applications should be given 3D objects and laid out over 3D spaces.
Object placement Virtual objects inserted and placed should be at certain distances from the user’s vision so as not to obstruct it.
Content operation and samples
Provide sufficient tips and examples on how to operate applications’ content and help users get acquainted by providing them with samples.
5.1 For Usage
There are 7 aspects for the users consideration.
• Check the status of users before, during, and after use: If user is in a seizure-prone group or using medical devices, he/she must consult a doctor or other professionals. Do not use if you have a health problem because it may worsen your symptoms. During use, pay attention to the fatigue caused by hearing damage, photosensitivity seizures, and repetitive movements. If any abnormal symptoms appear, discontinue use immediately. After use, if you have persistent discomfort or abnormal symptom, take a rest and consult your doctor.
352
• Check the status, user's guide and the age restrictions of the device: Make sure the device is not damaged, clean (disinfected), and sufficiently charged before using it. Different devices have different age restrictions and operational requirements. Check these restrictions and requirements in advance in order to ensure safe handling. Since K-12 students are at the stage of physical and mental development, it is recommended that students take an actions as conservatively as possible.
• Identify the range that can be safely used before use and remove obstacles around it: As see-Closed devices completely block the user's gaze and see-through devices can confuse the user's eyes, it is possible to cause safety accidents during use. It is necessary to check the surrounding environment in advance and remove obstacles. Also, it is recommended to use in seated position. In particular, when many students are in the same space, be careful about clashes and falls between students.
• Take breaks often: When using virtual / mixed reality contents for a long time, somatic side effects such as dizziness, headache, nausea, and eyeball may appear, and mental side effects such as immersion may be experienced. Most manufacturers recommend a 10 to 15 minute break per 30 minutes of use, but it is expected that the continuous use of content on actual training sites will be shorter than 30 minutes.
• Pay attention to the burn caused by device heat: Most VR or AR devices are worn on users’ bodies or used in close proximity to users’ body. If excessive heat is generated in the equipment, it may cause bodily harm such as low temperature burns. The skin of the K-12 students is especially fragile, and in the case of low fever, students are also slow to recognize signs of burns while they are immersed in VR or AR applications.
• Refresh users’ attention after use: People experienced VR or MR could confuse reality with the virtual world. Especially kids those lack of cognitive ability could confuse more than adults.
• Do not let young students (age 12 or under) use VR or MR devices alone: Be sure to observe and supervise by the guardian or guidance teacher. Almost of VR and MR devices have been developed for adult usage, and makers advise children aged 12 and under not to use these devices. Because young children are in critical phases of development, adult supervision and instruction is mandatory in letting them use VR.
5.2 For Contents Create
There are 10 aspects for the contents creators to consider.
• Check the guidelines provided by the manufacturer of the device you intend to play the content on: Virtual and mixed reality devices have not yet been standardized, and the driving method and usage method are different for each manufacturer. In particular, referring to the manufacturing guidelines provided by some makers of devices, it may be useful for producing content optimized for the device. In some sensors, the body does not recognize a small child, or a teacher or adult around a child is recognized as a user. If sensors are used, it is needed to design for minimizing these errors.
• The runtime of each application not be more than 10 minutes: None of the guidelines surveyed for this study mentioned the proper runtimes of VR or AR applications. Given the experiences of contents creates and young students’ age, contents that involve rapid movements of images is suitable for about five minutes, and contents that involve slow-moving images or plots is possible to run for 10 minutes or less.
• Avoid using ethically sensitive or controversial backgrounds: Some VR and AR applications have generated controversies by featuring ethically sensitive places as backgrounds. Ethics is considered to be an important factor in education, so caution is needed in selecting the background of learning content. Using vast and dark backgrounds can also help minimize dizziness.
353
• Minimize the use of texts: Many texts are less readable and can cause dizziness. Reduce text, and consider UI design in the form of images or 3D objects.
• Make appropriate use of colors and sounds: Bright colors, colors of low chromaticity, and colors that contrast the surrounding backgrounds can catch attention. Further research is needed, however, on the appropriate use of colors. Sound can also capture attention like colors. If eyesight and sounds do not match, the sense of reality may be degraded.
• Synchronize sensory experiences: Contents should especially provide situations or expressions that cater to users’ expectations or predictions of synchronicity. Using same contents over and over, it reduces dizziness over time. Because it enables the user to predict subsequent situations better.
• Optimize the movements of cameras: Abrupt movements of virtual cameras in VR applications can be a major source of dizziness for users. As the vestibular system is sensitive to state changes, camera movement such as forward, backward, left and right movement, rotation, and zooming should be as constant as possible.
• Adjust of virtual object to the user's eye level: For VR content, it is recommended for the UI should be 3D objective in virtual space. Deployment of inappropriate UI can cause dizziness. It is better to make it appear only when it is not normally visible, or overlay it on a three-dimensional object.
• Maintain proper distance when placing virtual objects: Arranging the objects at a proper distance from the user in the virtual space can prevent the excessive movement of the body as well as securing the view of the user, thereby ensuring the comfort of use. Objects placed at sufficient intervals also appear more natural when they are overlaid on reality.
• Provide examples and content samples of manipulations: Even if you experience the same content, your user experience may be different. For safer use, it is advisable to present some of the contents as a sample screen in advance, so that you can get guidance on how to operate and understand the sensitivity of the user.
The contents discussed here are the result of analysis of various papers and data. Although we assumed that the main HMD manufacturer made their manual based on sufficient self-research results, it is needed additional medical research considered the usage environment in the education field.
This guideline should be updated regularly to reflect new trends in the standardization and development of VR and AR technologies. It will also need to gather expert's opinions including education site and developers of traditional educational contents.
Acknowledgements
This work was supported by Institute for Information & communications Technology Promotion(IITP) grant funded by the Korea government(MSIT) (No.2016-0-00327, Technical development for distribution system of educational contents and services platform based on Multi-format Clipped Learning Assets as well as the global commercialization for accompanied growth)
References
Barun ICT Research Center (2016). 10 Guideline for VR users, from http://barunict.kr/?p=6214 Barun ICT Research Center (2015). 10 Commandments of VR guidelines, from
http://barunict.kr/wp-content/uploads/2016/05/VR%EA%B0%9C%EB%B0%9C%EA%B0%80%EC%9D%B4%EB%93%9C%EB%9D%BC%EC%9D%B810%EA%B3%84%EB%AA%85.pdf
Bogyeong Gye & Yeongsu Kim (2008). Analysis on correlations among the medium characteristics, presence, learning immersion, and learning effects of AR-based learning. Journal of Educational Engineering 24(4). 193-224.
Changmin Lee (1999). Study on side effects of VR. Korean Journal of Multimedia Studies 3(1).

354
Designing for Google Cardboard, from https://www.google.com/design/spec-vr/designing-for-google-cardboard/a-new-dimension.html
GRAC (2017). Safety rules for AR games. Google Cardboard, Product safety information, from https://vr.google.com/cardboard/product-safety/. Gyeonghun Han & Hyeontaek Kim (2011). Causes of cyber sickness and treatment. Korean Journal of
Psychology: Cognition and Biology 23(2). 287-299. HTC VIVE. Safety and regulatory guide, from
http://dl4.htc.com/vive/safty_guide/91H02887-08M%20Rev.A.PDF?ga=2.174671845.632038444.1500280194-1279580701.1499660953.
Hyejeong Lee, Manho Jang & Gijung Ma (2010). Effects of VR images on the eyes. Korean Journal of Optical Science 12(3). 153-162.
Hyeyeong Jeon (2017). VIP report for the renaissance of the Korean Peninsula: Trends and implications of AR and VR industries in and outside Korea 17-14. HERI.
Jeongmin Hwang, Jinhak Lee & Taesu Park (1999). Effects of using HMD devices on the human eyes. Korean Journal of Ophthalmology 40(8). 2267-2275.
LEAP MOTION VR Best Practices Guidelines, from https://developer-archive.leapmotion.com/assets/Leap%20Motion%20VR%20Best%20Practices%20Guidelines.pdf.
Mads T Bonde, Guido Makransky, Jakob Wandall, Mette V Larsen, Mikkel Morsing, Hanne Jarmer & Morten O A Sommer (2014). Improving biotech education through gamified laboratory simulations. Nature Biotechnology 32, 694–697.
Matthew Lynch (2017). 20 top virtual reality apps that are changing education. The Tech Edvocate, from http://www.thetechedvocate.org/20-top-virtual-reality-apps-that-are-changing-education/.
Microsoft., Interaction design, from https://developer.microsoft.com/en-us/windows/mixed-reality/category/interaction_design.
MSIT (2017).VR/AR use and development safety guidelines. Oculus Best Practices, from https://developer.oculus.com/design/latest/concepts/book-bp/. Oculus Rift. Health and Safety, from
https://static.oculus.com/documents/310-30023-01_Rift_HealthSafety_English.pdf. Samsung (2016). Is virtual reality ready for the classroom? , from
http://www.samsung.com/us/system/b2b/resource/2016/06/29/INFOGRAPHIC_VR_in_EDU_Survey_JUN16AP_1.pdf?redir=VIRTUAL%20REALITY.
Samsung Gear VR. User safety guide, from https://scontent-icn1-1.xx.fbcdn.net/v/t39.2365-6/17640394_1904229119717177_578257461677391872_n.pdf•oh=79802bb236bdd5dfe9cf199fbd611467&oe=5A0FCB7F.
Samsung Newsroom (2017). What do German teachers think of VR in school education? , from https://news.samsung.com/kr/%EA%B0%80%EC%83%81%ED%98%84%EC%8B%A4-%ED%99%9C%EC%9A%A9%ED%95%9C-%ED%95%99%EA%B5%90-%EC%88%98%EC%97%85-%EA%B5%90%EC%82%AC%EB%93%A4%EC%9D%98-%EC%83%9D%EA%B0%81%EC%9D%80.
SONY PlayStation VR (2016). Instruction Manual., from https://www.playstation.com/en-au/content/dam/support/manuals/scee/web-manuals/ps-vr/PSVR_Instruction_Manual_ANZ_Web.pdf/.
The Goldman Sachs Group, Inc. (2016). Equity Research. Virtual & Augmented Reality, from http://www.goldmansachs.com/our-thinking/pages/technology-driving-innovation-folder/virtual-and-augmented-reality/report.pdf.
The Guardian (2016).Pokémon Go: US holocaust museum asks players to stay away, from https://www.theguardian.com/technology/2016/jul/13/pokemon-go-us-holocaust-museum-asks-players-to-stay-away.
The New Media Consortium. NMC/CoSN Horizon Report > 2016 K-12 Edition (2016), from https://www.nmc.org/publication/nmc-cosn-horizon-report-2016-k-12-edition/
Yeonghee Lee & Yong-Sang Cho (2016). Standardization issue report: Educational application and prospects of VR and MR technologies. KERIS.
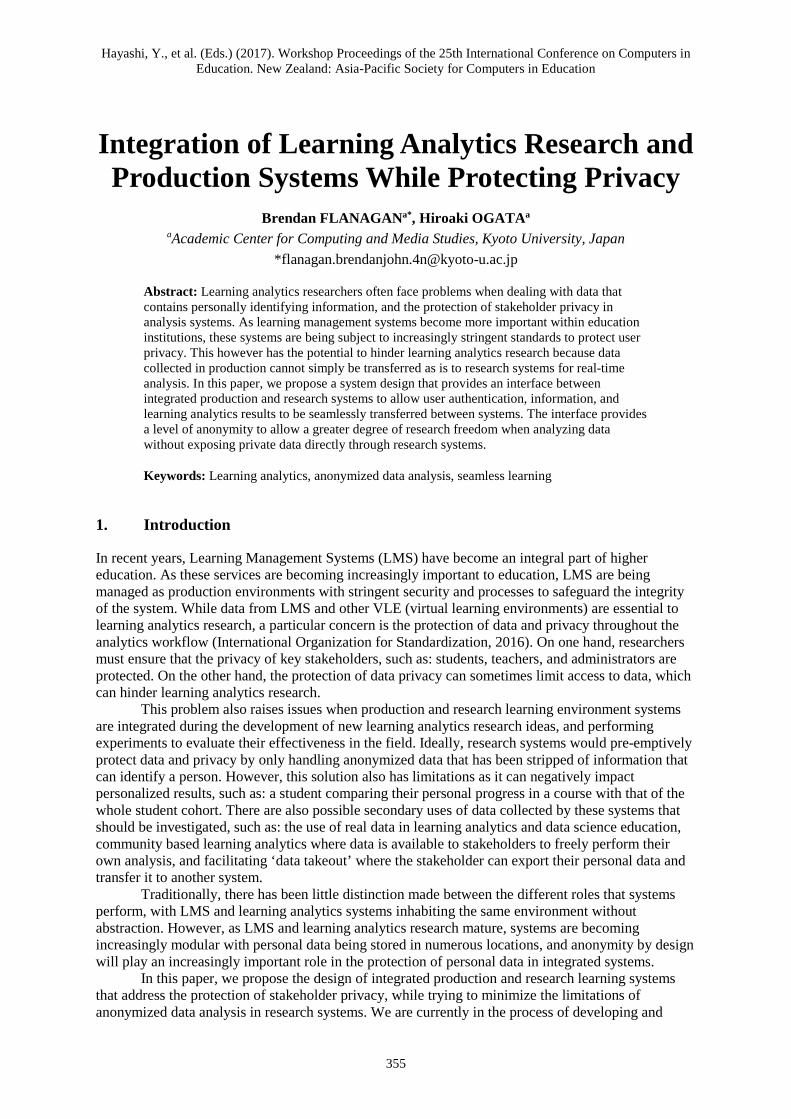
Hayashi, Y., et al. (Eds.) (2017). Workshop Proceedings of the 25th International Conference on Computers in Education. New Zealand: Asia-Pacific Society for Computers in Education
355
Integration of Learning Analytics Research and Production Systems While Protecting Privacy
Brendan FLANAGANa*, Hiroaki OGATAa aAcademic Center for Computing and Media Studies, Kyoto University, Japan
Abstract: Learning analytics researchers often face problems when dealing with data that contains personally identifying information, and the protection of stakeholder privacy in analysis systems. As learning management systems become more important within education institutions, these systems are being subject to increasingly stringent standards to protect user privacy. This however has the potential to hinder learning analytics research because data collected in production cannot simply be transferred as is to research systems for real-time analysis. In this paper, we propose a system design that provides an interface between integrated production and research systems to allow user authentication, information, and learning analytics results to be seamlessly transferred between systems. The interface provides a level of anonymity to allow a greater degree of research freedom when analyzing data without exposing private data directly through research systems.
Keywords: Learning analytics, anonymized data analysis, seamless learning
1. Introduction
In recent years, Learning Management Systems (LMS) have become an integral part of higher education. As these services are becoming increasingly important to education, LMS are being managed as production environments with stringent security and processes to safeguard the integrity of the system. While data from LMS and other VLE (virtual learning environments) are essential to learning analytics research, a particular concern is the protection of data and privacy throughout the analytics workflow (International Organization for Standardization, 2016). On one hand, researchers must ensure that the privacy of key stakeholders, such as: students, teachers, and administrators are protected. On the other hand, the protection of data privacy can sometimes limit access to data, which can hinder learning analytics research.
This problem also raises issues when production and research learning environment systems are integrated during the development of new learning analytics research ideas, and performing experiments to evaluate their effectiveness in the field. Ideally, research systems would pre-emptively protect data and privacy by only handling anonymized data that has been stripped of information that can identify a person. However, this solution also has limitations as it can negatively impact personalized results, such as: a student comparing their personal progress in a course with that of the whole student cohort. There are also possible secondary uses of data collected by these systems that should be investigated, such as: the use of real data in learning analytics and data science education, community based learning analytics where data is available to stakeholders to freely perform their own analysis, and facilitating ‘data takeout’ where the stakeholder can export their personal data and transfer it to another system.
Traditionally, there has been little distinction made between the different roles that systems perform, with LMS and learning analytics systems inhabiting the same environment without abstraction. However, as LMS and learning analytics research mature, systems are becoming increasingly modular with personal data being stored in numerous locations, and anonymity by design will play an increasingly important role in the protection of personal data in integrated systems.
In this paper, we propose the design of integrated production and research learning systems that address the protection of stakeholder privacy, while trying to minimize the limitations of anonymized data analysis in research systems. We are currently in the process of developing and
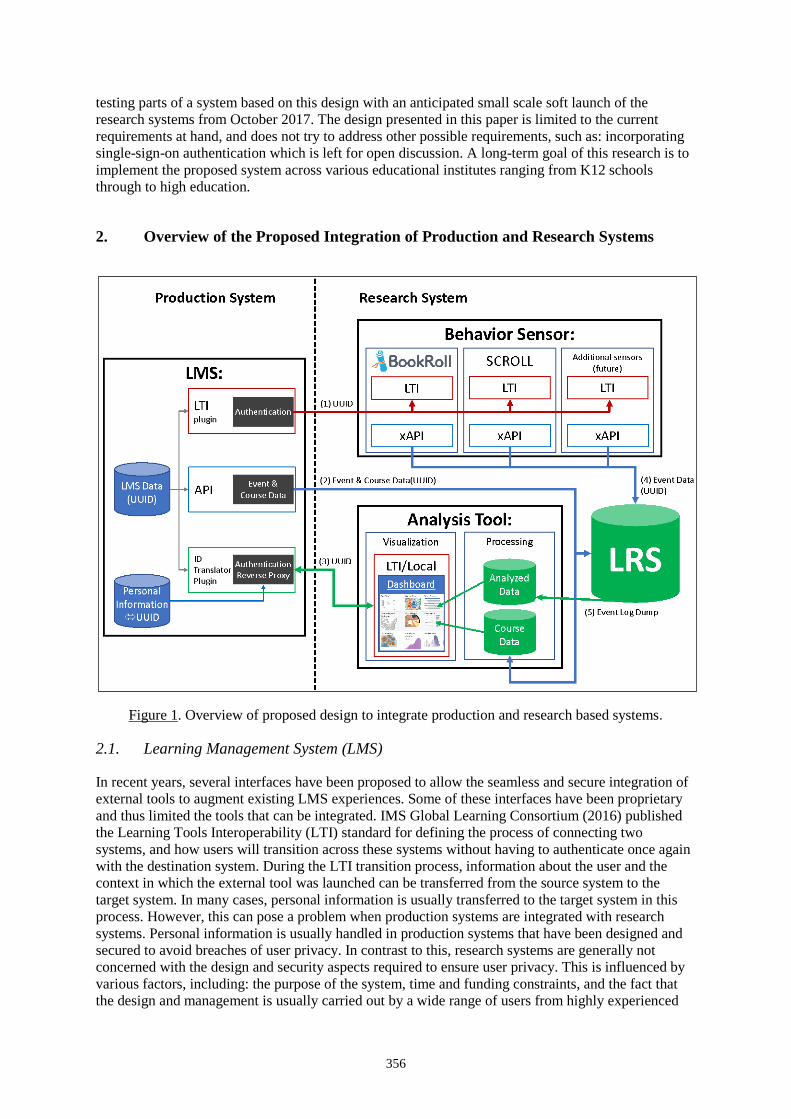
356
testing parts of a system based on this design with an anticipated small scale soft launch of the research systems from October 2017. The design presented in this paper is limited to the current requirements at hand, and does not try to address other possible requirements, such as: incorporating single-sign-on authentication which is left for open discussion. A long-term goal of this research is to implement the proposed system across various educational institutes ranging from K12 schools through to high education.
2. Overview of the Proposed Integration of Production and Research Systems
Figure 1. Overview of proposed design to integrate production and research based systems.
2.1. Learning Management System (LMS)
In recent years, several interfaces have been proposed to allow the seamless and secure integration of external tools to augment existing LMS experiences. Some of these interfaces have been proprietary and thus limited the tools that can be integrated. IMS Global Learning Consortium (2016) published the Learning Tools Interoperability (LTI) standard for defining the process of connecting two systems, and how users will transition across these systems without having to authenticate once again with the destination system. During the LTI transition process, information about the user and the context in which the external tool was launched can be transferred from the source system to the target system. In many cases, personal information is usually transferred to the target system in this process. However, this can pose a problem when production systems are integrated with research systems. Personal information is usually handled in production systems that have been designed and secured to avoid breaches of user privacy. In contrast to this, research systems are generally not concerned with the design and security aspects required to ensure user privacy. This is influenced by various factors, including: the purpose of the system, time and funding constraints, and the fact that the design and management is usually carried out by a wide range of users from highly experienced
357
professors to students who are just starting their first research. Because of these reasons, it is important to consider how user privacy can be protected when integrating production and research systems.
2.1.1. Anonymized Id Management
We propose that the information that is transferred when connecting external tools should be limited to attributes that cannot directly be used to identify a user as a particular person. Most modern LMS utilize an internal universal unique identifier (UUID) to which personal information, such as: real name, student/teacher id, and email address are attributed. As shown in Figure 1, we propose that (1) UUID should be the only user identification information that is transferred to research systems. The relation between the LMS’s internal UUID and personal information is only available within the production system and therefore reduces the risk of a user privacy breach. External tools will then attribute learner events with the LMS’s internal UUID that is sent during the LTI launch process, therefore anonymizing (4) Event data collected in the research system side LRS (Learning Record Store).
Anonymized (2) Course and event data using the LMS internal UUIDs in place of personal information will also be exported from the LMS to an analysis tool and LRS. A simple plugin within the LMS is being developed to translate the UUIDs displayed in research system analysis results into the real name, id, or email address of students and teachers. The plugin will act as a LTI Tool consumer reverse proxy, which involves both authentication using (3) UUID with the LTI Tool provider, and translating UUIDs by retrieving the contents from the provider instead of the user directly transitioning to the external tool. This ensures that the students and teachers will be able to meaningfully interpret research system analysis. This is particularly important for research into predicting at risk students as anonymized results would be difficult to use for intervention support.
2.2. Behavior Sensors
The actions in tasks that learners take during the course of their studies that occur outside the LMS need to be captured by behavior sensors. These tasks can take place in both formal and informal learning situations in seamless learning environments (Uosaki et al. 2013), and therefore it is important to collect data on the events that occur in both of these environments. We currently plan to implement the addition of two behavior sensor systems: a digital learning material reader called BookRoll, and an informal language learning tool called SCROLL (Ogata et al. 2011). The design of the system allows additional behavior sensors to be integrated into the proposed system. Currently the planned behavior sensors are proprietary independent systems and do not support open interoperability with other systems. We are currently developing standardized interfaces based on: LTI for seamless authentication transition from existing production LMS by anonymized (1) UUID, and xAPI (Advanced Distributed Learning, 2016) which is an open source statement API for outputting anonymized (4) Event data to a centralized independent Learning Record Store (LRS). As the main purpose of the data collected by behavior sensors is for research analysis, all users of the systems will be giving the option to opt-out on initial authentication if they do not consent to participation and will not have their actions logged.
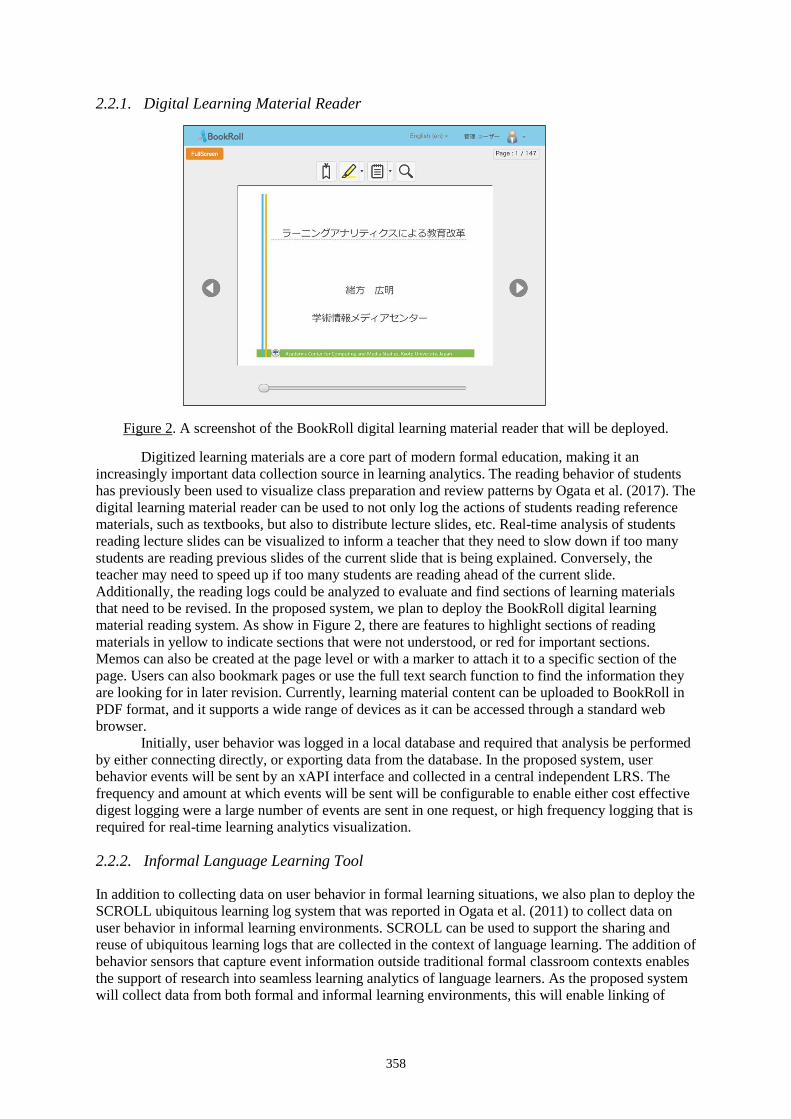
358
2.2.1. Digital Learning Material Reader
Figure 2. A screenshot of the BookRoll digital learning material reader that will be deployed.
Digitized learning materials are a core part of modern formal education, making it an increasingly important data collection source in learning analytics. The reading behavior of students has previously been used to visualize class preparation and review patterns by Ogata et al. (2017). The digital learning material reader can be used to not only log the actions of students reading reference materials, such as textbooks, but also to distribute lecture slides, etc. Real-time analysis of students reading lecture slides can be visualized to inform a teacher that they need to slow down if too many students are reading previous slides of the current slide that is being explained. Conversely, the teacher may need to speed up if too many students are reading ahead of the current slide. Additionally, the reading logs could be analyzed to evaluate and find sections of learning materials that need to be revised. In the proposed system, we plan to deploy the BookRoll digital learning material reading system. As show in Figure 2, there are features to highlight sections of reading materials in yellow to indicate sections that were not understood, or red for important sections. Memos can also be created at the page level or with a marker to attach it to a specific section of the page. Users can also bookmark pages or use the full text search function to find the information they are looking for in later revision. Currently, learning material content can be uploaded to BookRoll in PDF format, and it supports a wide range of devices as it can be accessed through a standard web browser.
Initially, user behavior was logged in a local database and required that analysis be performed by either connecting directly, or exporting data from the database. In the proposed system, user behavior events will be sent by an xAPI interface and collected in a central independent LRS. The frequency and amount at which events will be sent will be configurable to enable either cost effective digest logging were a large number of events are sent in one request, or high frequency logging that is required for real-time learning analytics visualization.
2.2.2. Informal Language Learning Tool
In addition to collecting data on user behavior in formal learning situations, we also plan to deploy the SCROLL ubiquitous learning log system that was reported in Ogata et al. (2011) to collect data on user behavior in informal learning environments. SCROLL can be used to support the sharing and reuse of ubiquitous learning logs that are collected in the context of language learning. The addition of behavior sensors that capture event information outside traditional formal classroom contexts enables the support of research into seamless learning analytics of language learners. As the proposed system will collect data from both formal and informal learning environments, this will enable linking of
359
knowledge learnt in either context in addition to information from the LMS, and could be analyzed to predict and extract behaviors of overachieving and underachieving language learners.
Additional integration of specialized language learning tools, such as: testing and exercise systems for the four major skills: listening, speaking, reading, and writing, into the proposed system would provide further opportunities to analyze in detail the behavior of language learners, however at the time of writing this is beyond the scope of this paper and will be addressed in future work.
2.3. Learning Record Store (LRS)
The LRS is an integral part of the proposed system as it will be a central independent point to collect all event data from both the production LMS system and behavior sensors which are still in the research phase of the development cycle. While we have chosen to adopt xAPI as the mode of transporting events data from other systems to the LRS, this is not a strict limitation. We have decided to deploy the latest version of Apereo Foundation’s OpenLRS (Apereo Foundation, 2017), which has the ability to support the storing and querying of event data from both xAPI and Global Learning Consortium’s Caliper Analytics API (2015). Data from both interfaces are stored in a unified format within the LRS, which will aid data analysis as researchers will not have to spend as much time extracting, transforming, and loading data (ETL). The collection of data in an LRS also reduces information silos were data is only stored locally in a number of different modular systems, and has the potential to increase the availability of data for analysis. In the proposed system, we plan to automate the ETL process by taking incremental (5) Event log dumps from the LRS database as seen in Figure 1, and sending it to the Learning Analytics Tool for automated processing.
2.4. Learning Analytics Tool
The Learning Analytic Tool will act as a dashboard portal system to display actionable results and outcomes of learning analytics in the form of visualizations. The portal is intended to serve a number of different stakeholders, from students comparing their individual progress against that of their anonymous peers, teachers checking the overall progress of the classes under their care, to administrators surveying the effectiveness of education they are offering in their institution. It is proposed that students and teachers will access the portal via a plugin within an LMS that will provide both authentication of the user and also translate the UUIDs that are displayed in the portal into their corresponding real identities depending on their role in the LMS. Teachers who are in charge of class will be able to view all the student identities of students within that specific class. However, students will only be able to view their own identity, and the identities of their peers will remain anonymous in the results of the analysis. Administrators will login into the portal through a local authentication system, and the visualizations will only contain anonymized results that protect the identities of individuals. This tool will be split into two main parts. The first part is a processing system that will analyze raw (5) Event log dumps from the LRS along with (2) Event and course data from the LMS. This process will extract and calculate relevant metrics for actionable results and outcomes and store these in a local database for analyzed data. The second part is a visualization system platform which will host customizable visualizations of the analyzed data. The UUIDs that are displayed in the portal will be marked up with tags to enable quick and effective parsing and translation to the real identities by a plugin within the production LMS system.
3. Conclusion
In this paper, we propose the design of integrated production and research learning analytics systems where personal information is only stored in the production system. We address issues on user privacy by proposing the use of an LMS’s internal UUIDs to anonymously collect and analyze learner behavior while using research systems. The visualizations of outcomes and actionable results from the research systems can then be viewed via a reverse proxy plugin that resides within the production
360
LMS system, and translates the anonymous UUIDs into the real identities based on the users’ role within the LMS system.
An advantage of the proposed system is that as the data collected by the system does not contain information that can directly identify students, it allows the data to be openly analyzed within the connected research systems. In the future, we plan to allow students of courses, such as: learning analytics and data mining, to analyze the real data collected by the proposed system. We expect this will help in the development of education of these fields, and encourage students to pursue further research and analysis of their own learning behavior.
In future work, we will complete the implementation of the system and evaluate its effectiveness in meeting the needs of students, faculty staff, and researchers.
Acknowledgements
This work was supported by JSPS KAKENHI Grant Number 16H06304.
References
Advanced Distributed Learning. (2016). Experience API (xAPI) Specification. Retrieved from http://github.com/adlnet/xAPI-Spec/
Apereo Foundation. (2017). Apereo Learning Analytics Initiative: Open LRS. Retrieved from the website of Apereo Foundation http://www.apereo.org/projects/openlrs
IMS Global Learning Consortium. (2015). Caliper analytics. Retrieved from the website of IMS Global Learning Consortium http://www.imsglobal.org/activity/caliper
IMS Global Learning Consortium. (2016). Learning Tools Interoperability (LTI). Retrieved from the website of IMS Global Learning Consortium http://www.imsglobal.org/activity/learning-tools-interoperability
International Organization for Standardization. (2016). Information technology for learning, education and training -- Learning analytics interoperability — Part 1: Reference model (ISO/IEC TR 20748-1:2016). Retrieved from http://www.iso.org/standard/68976.html
Ogata, H., Li, M., Hou, B., Uosaki, N., El-Bishouty, M. M., & Yano, Y. (2011). SCROLL: Supporting to share and reuse ubiquitous learning log in the context of language learning. Research & Practice in Technology Enhanced Learning, 6(2), 69-82.
Ogata, H., Oi, M., Mohri, K., Okubo, F., Shimada, A., Yamada, M., ... & Hirokawa, S. (2017). Learning Analytics for E-Book-Based Educational Big Data in Higher Education. In Smart Sensors at the IoT Frontier (pp. 327-350). Springer International Publishing.
Uosaki, N., Ogata, H., Li, M., Hou, B., & Mouri, K. (2013). Guidelines on Implementing Successful Seamless Learning Environments. International Journal of Interactive Mobile Technologies, 7(2).
Hayashi, Y., et al. (Eds.) (2017). Workshop Proceedings of the 25th International Conference on Computers in Education. New Zealand: Asia-Pacific Society for Computers in Education
361
Requirements for Learning Analytics in Flipped Learning
Byung-gi CHOI a, Wooin BAEb, Jaeho LEEc* aSchool of Electronical and Computer Engineering, University of Seoul, Republic of Korea
bDirector, T-IME Education Co., Ltd., Republic of Korea cSchool of Electrical and Computer Engineering, University of Seoul, Republic of Korea
Abstract: Learning analytics needs to collect and use data originated from various learning environments and analyze them to help learners, instructors, and institutions achieve the goal to improve learning and teaching. The selection of data to be collected and analyzed depends on the requirements of the learning analytics. The requirements in turn are typically derived from use cases of learning activities in the learning model. Most use cases for learning analytics, however, are based on traditional learning methods and thus do not reflect new types of learning methods such as flipped learning. In this paper, we present new use cases and requirements derived from the new pedagogical models and propose a standardization area to encompass new pedagogical models.
Keywords: Learning Analytics, Flipped Learning, Pedagogical Model
1. Introduction
Flipped Learning is a pedagogical approach in which direct instruction moves from the group learning space to the individual learning space, and the resulting group space is transformed into a dynamic, interactive learning environment where the educator guides students as they apply concepts and engage creatively in the subject matter (Flipped Learning Network, 2014). Flipped learning has the advantage of being able to concentrate more on leading the students' learning and reducing the dropout rate of the students (EDUCAUSE, 2012). Furthermore, flipped learning utilizes a variety of multimedia equipment and systems to effectively communicate learning materials and support learning in the classroom, and has environmental characteristics suitable for producing and analyzing learning activity information.
Based on our previous design and implementation of a reference model for learning analytics (Choi, Cho & Lee, 2014; Bae, Cho & Lee, 2015; Choi, You & Lee, 2016; ISO/IEC TR 20748-1:2016), recently we carried out a project to conducts a pilot application of learning analytics in the flipped learning classroom. In this project, we designed two pedagogical models on the basis of the flipped learning model and found intrinsic limitations of existing data models for learning analytics. In this paper, we present new use cases and requirements derived from the new pedagogical models and propose a standardization area to encompass new pedagogical models.
2. Pedagogical Model For Flipped Learning
The flipped learning model is a pedagogical model for improving the learning effect by expanding the participation and autonomy of the learners. Flipped learning as a type of blended learning reverses the traditional learning environment by delivering instructional content before class and moves learning activities, including homework in the traditional learning, into the classroom. In this paper we present a participatory learning process performed as a group activity. The learning process consists of,
1. Pre-Learning step where the scope of the content are defined and contents are delivered to students so that students are familiarized with new material before class;
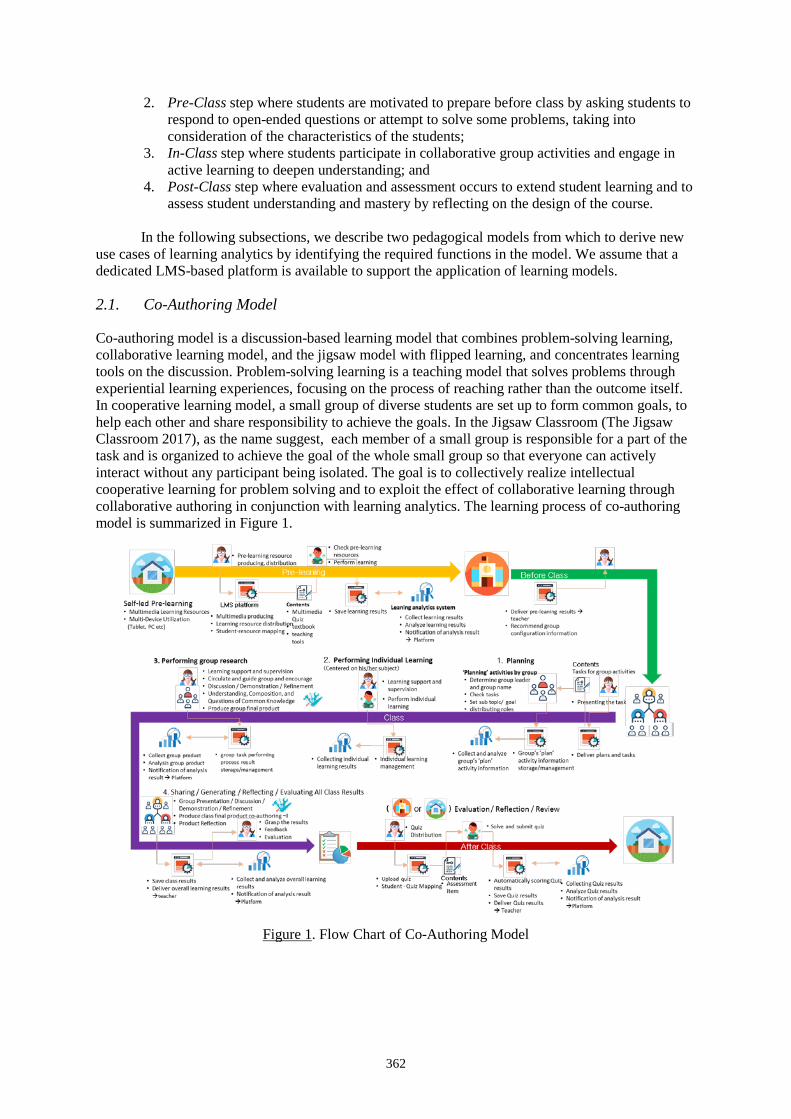
362
2. Pre-Class step where students are motivated to prepare before class by asking students to respond to open-ended questions or attempt to solve some problems, taking into consideration of the characteristics of the students;
3. In-Class step where students participate in collaborative group activities and engage in active learning to deepen understanding; and
4. Post-Class step where evaluation and assessment occurs to extend student learning and to assess student understanding and mastery by reflecting on the design of the course.
In the following subsections, we describe two pedagogical models from which to derive new
use cases of learning analytics by identifying the required functions in the model. We assume that a dedicated LMS-based platform is available to support the application of learning models.
2.1. Co-Authoring Model
Co-authoring model is a discussion-based learning model that combines problem-solving learning, collaborative learning model, and the jigsaw model with flipped learning, and concentrates learning tools on the discussion. Problem-solving learning is a teaching model that solves problems through experiential learning experiences, focusing on the process of reaching rather than the outcome itself. In cooperative learning model, a small group of diverse students are set up to form common goals, to help each other and share responsibility to achieve the goals. In the Jigsaw Classroom (The Jigsaw Classroom 2017), as the name suggest, each member of a small group is responsible for a part of the task and is organized to achieve the goal of the whole small group so that everyone can actively interact without any participant being isolated. The goal is to collectively realize intellectual cooperative learning for problem solving and to exploit the effect of collaborative learning through collaborative authoring in conjunction with learning analytics. The learning process of co-authoring model is summarized in Figure 1.
Figure 1. Flow Chart of Co-Authoring Model
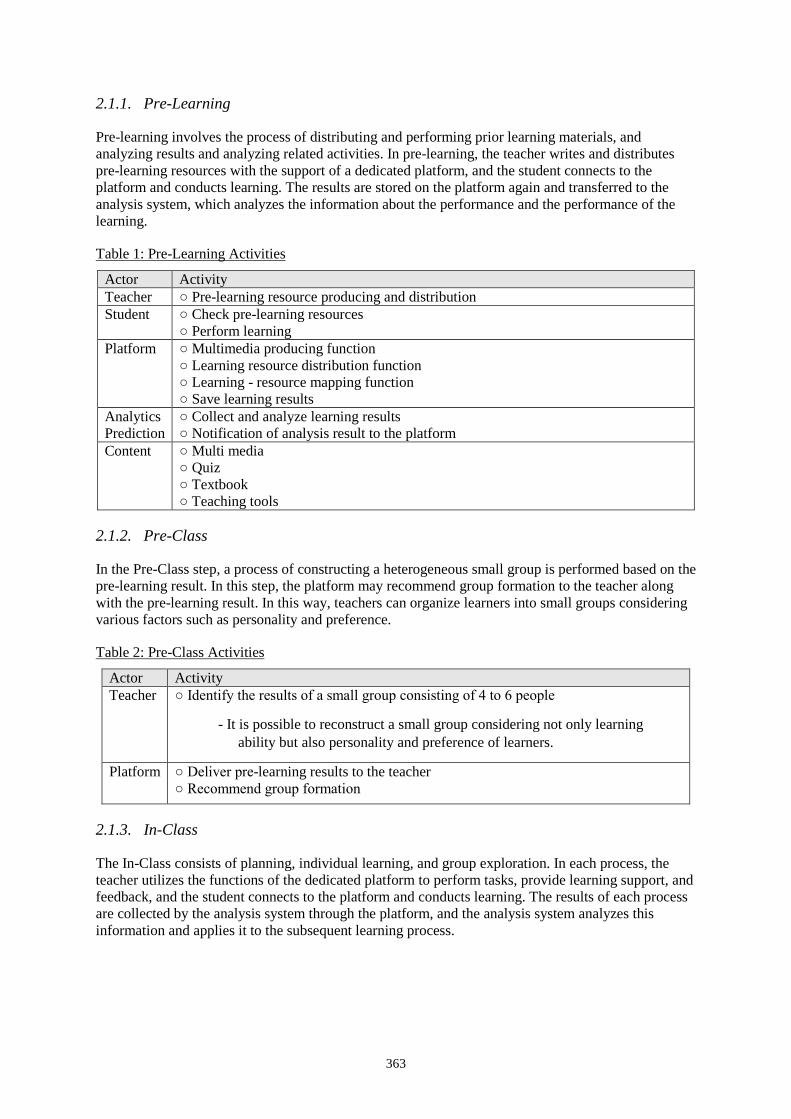
363
2.1.1. Pre-Learning
Pre-learning involves the process of distributing and performing prior learning materials, and analyzing results and analyzing related activities. In pre-learning, the teacher writes and distributes pre-learning resources with the support of a dedicated platform, and the student connects to the platform and conducts learning. The results are stored on the platform again and transferred to the analysis system, which analyzes the information about the performance and the performance of the learning.
Table 1: Pre-Learning Activities
Actor Activity Teacher ○ Pre-learning resource producing and distribution Student ○ Check pre-learning resources
○ Perform learning Platform ○ Multimedia producing function
○ Learning resource distribution function ○ Learning - resource mapping function ○ Save learning results
Analytics Prediction
○ Collect and analyze learning results ○ Notification of analysis result to the platform
Content ○ Multi media ○ Quiz ○ Textbook ○ Teaching tools
2.1.2. Pre-Class
In the Pre-Class step, a process of constructing a heterogeneous small group is performed based on the pre-learning result. In this step, the platform may recommend group formation to the teacher along with the pre-learning result. In this way, teachers can organize learners into small groups considering various factors such as personality and preference.
Table 2: Pre-Class Activities
Actor Activity Teacher ○ Identify the results of a small group consisting of 4 to 6 people
- It is possible to reconstruct a small group considering not only learning ability but also personality and preference of learners.
Platform ○ Deliver pre-learning results to the teacher ○ Recommend group formation
2.1.3. In-Class
The In-Class consists of planning, individual learning, and group exploration. In each process, the teacher utilizes the functions of the dedicated platform to perform tasks, provide learning support, and feedback, and the student connects to the platform and conducts learning. The results of each process are collected by the analysis system through the platform, and the analysis system analyzes this information and applies it to the subsequent learning process.
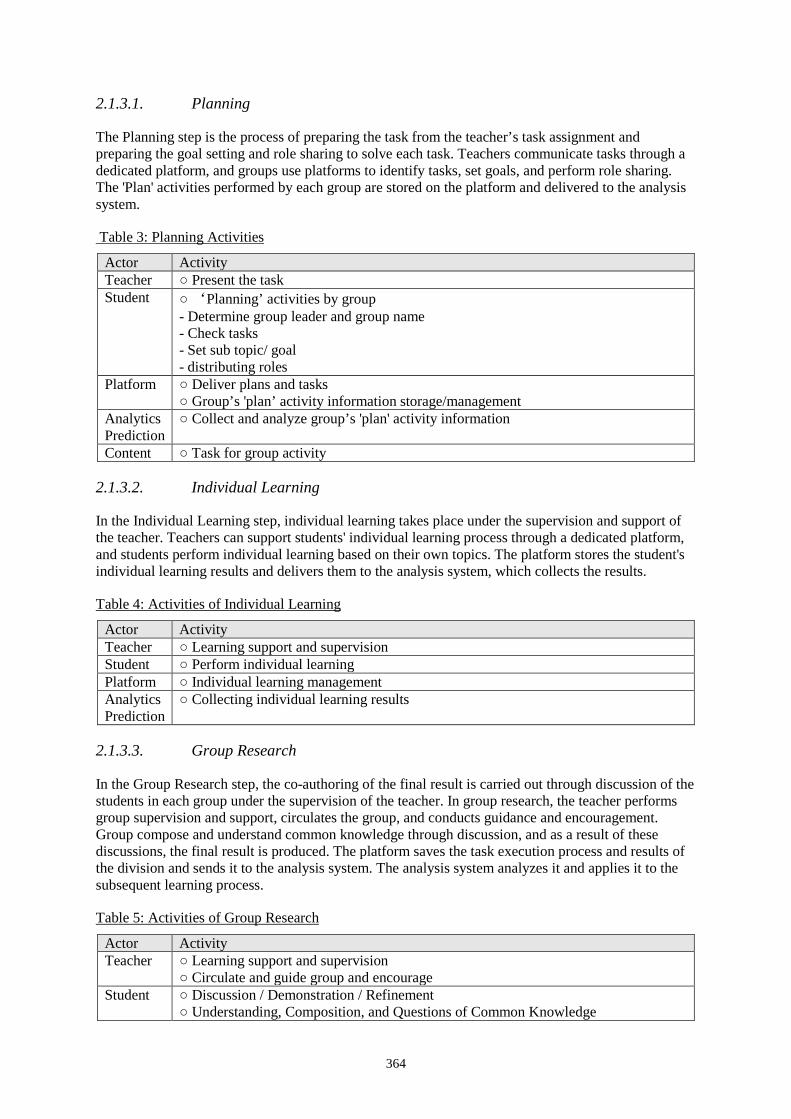
364
2.1.3.1. Planning
The Planning step is the process of preparing the task from the teacher’s task assignment and preparing the goal setting and role sharing to solve each task. Teachers communicate tasks through a dedicated platform, and groups use platforms to identify tasks, set goals, and perform role sharing. The 'Plan' activities performed by each group are stored on the platform and delivered to the analysis system.
Table 3: Planning Activities
Actor Activity Teacher ○ Present the task Student ○ ‘Planning’ activities by group
- Determine group leader and group name - Check tasks - Set sub topic/ goal - distributing roles
Platform ○ Deliver plans and tasks ○ Group’s 'plan’ activity information storage/management
Analytics Prediction
○ Collect and analyze group’s 'plan' activity information
Content ○ Task for group activity
2.1.3.2. Individual Learning
In the Individual Learning step, individual learning takes place under the supervision and support of the teacher. Teachers can support students' individual learning process through a dedicated platform, and students perform individual learning based on their own topics. The platform stores the student's individual learning results and delivers them to the analysis system, which collects the results.
Table 4: Activities of Individual Learning
Actor Activity Teacher ○ Learning support and supervision Student ○ Perform individual learning Platform ○ Individual learning management Analytics Prediction
○ Collecting individual learning results
2.1.3.3. Group Research
In the Group Research step, the co-authoring of the final result is carried out through discussion of the students in each group under the supervision of the teacher. In group research, the teacher performs group supervision and support, circulates the group, and conducts guidance and encouragement. Group compose and understand common knowledge through discussion, and as a result of these discussions, the final result is produced. The platform saves the task execution process and results of the division and sends it to the analysis system. The analysis system analyzes it and applies it to the subsequent learning process.
Table 5: Activities of Group Research
Actor Activity Teacher ○ Learning support and supervision
○ Circulate and guide group and encourage Student ○ Discussion / Demonstration / Refinement
○ Understanding, Composition, and Questions of Common Knowledge
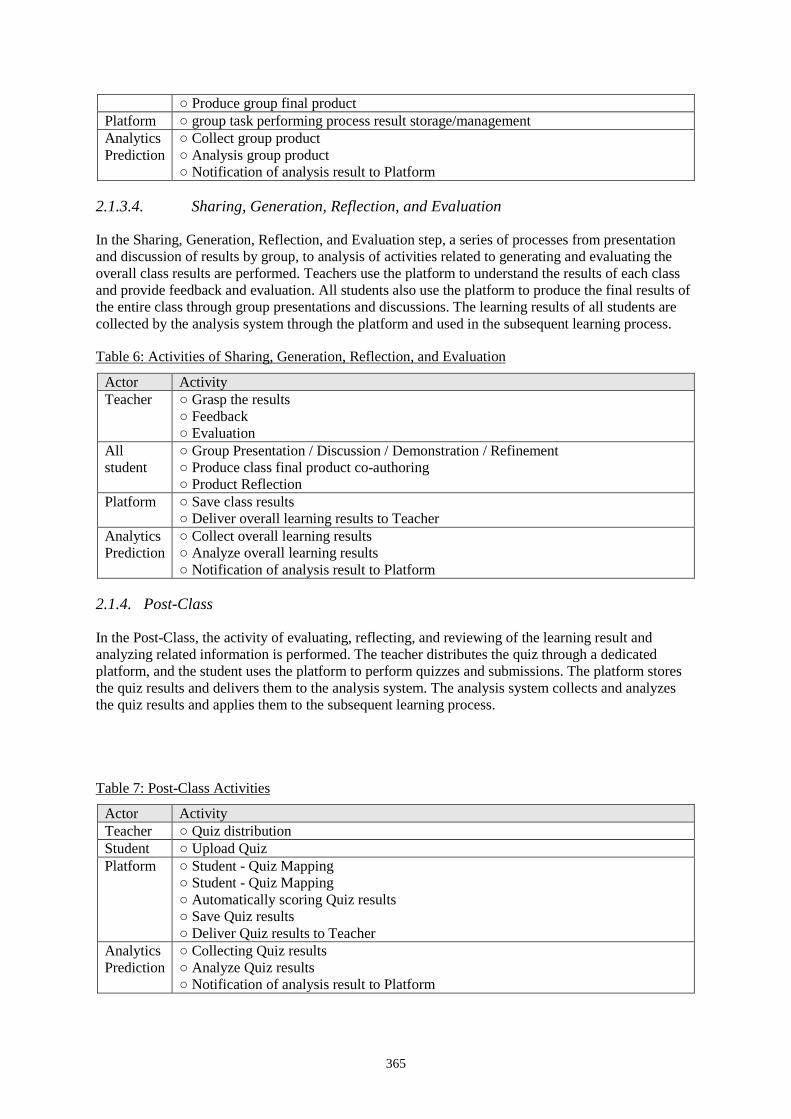
365
○ Produce group final product Platform ○ group task performing process result storage/management Analytics Prediction
○ Collect group product ○ Analysis group product ○ Notification of analysis result to Platform
2.1.3.4. Sharing, Generation, Reflection, and Evaluation
In the Sharing, Generation, Reflection, and Evaluation step, a series of processes from presentation and discussion of results by group, to analysis of activities related to generating and evaluating the overall class results are performed. Teachers use the platform to understand the results of each class and provide feedback and evaluation. All students also use the platform to produce the final results of the entire class through group presentations and discussions. The learning results of all students are collected by the analysis system through the platform and used in the subsequent learning process.
Table 6: Activities of Sharing, Generation, Reflection, and Evaluation
Actor Activity Teacher ○ Grasp the results
○ Feedback ○ Evaluation
All student
○ Group Presentation / Discussion / Demonstration / Refinement ○ Produce class final product co-authoring ○ Product Reflection
Platform ○ Save class results ○ Deliver overall learning results to Teacher
Analytics Prediction
○ Collect overall learning results ○ Analyze overall learning results ○ Notification of analysis result to Platform
2.1.4. Post-Class
In the Post-Class, the activity of evaluating, reflecting, and reviewing of the learning result and analyzing related information is performed. The teacher distributes the quiz through a dedicated platform, and the student uses the platform to perform quizzes and submissions. The platform stores the quiz results and delivers them to the analysis system. The analysis system collects and analyzes the quiz results and applies them to the subsequent learning process.
Table 7: Post-Class Activities
Actor Activity Teacher ○ Quiz distribution Student ○ Upload Quiz Platform ○ Student - Quiz Mapping
○ Student - Quiz Mapping ○ Automatically scoring Quiz results ○ Save Quiz results ○ Deliver Quiz results to Teacher
Analytics Prediction
○ Collecting Quiz results ○ Analyze Quiz results ○ Notification of analysis result to Platform
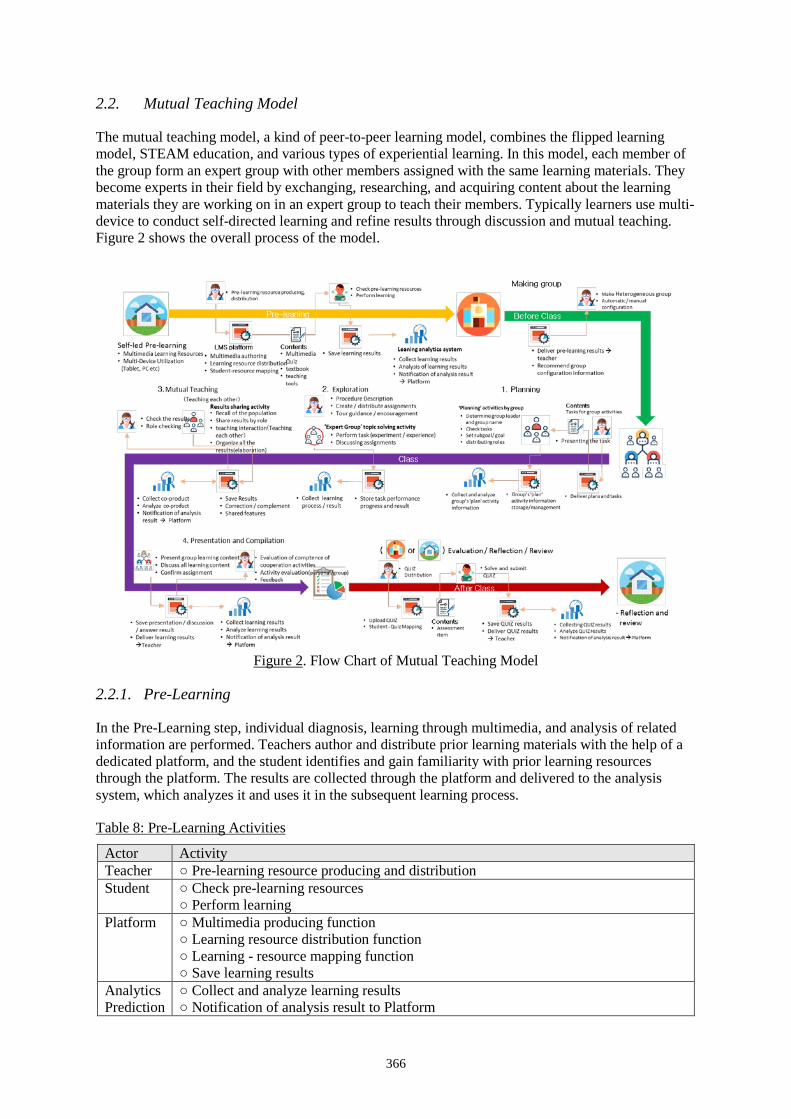
366
2.2. Mutual Teaching Model
The mutual teaching model, a kind of peer-to-peer learning model, combines the flipped learning model, STEAM education, and various types of experiential learning. In this model, each member of the group form an expert group with other members assigned with the same learning materials. They become experts in their field by exchanging, researching, and acquiring content about the learning materials they are working on in an expert group to teach their members. Typically learners use multi-device to conduct self-directed learning and refine results through discussion and mutual teaching. Figure 2 shows the overall process of the model.
Figure 2. Flow Chart of Mutual Teaching Model
2.2.1. Pre-Learning
In the Pre-Learning step, individual diagnosis, learning through multimedia, and analysis of related information are performed. Teachers author and distribute prior learning materials with the help of a dedicated platform, and the student identifies and gain familiarity with prior learning resources through the platform. The results are collected through the platform and delivered to the analysis system, which analyzes it and uses it in the subsequent learning process.
Table 8: Pre-Learning Activities
Actor Activity Teacher ○ Pre-learning resource producing and distribution Student ○ Check pre-learning resources
○ Perform learning Platform ○ Multimedia producing function
○ Learning resource distribution function ○ Learning - resource mapping function ○ Save learning results
Analytics Prediction
○ Collect and analyze learning results ○ Notification of analysis result to Platform
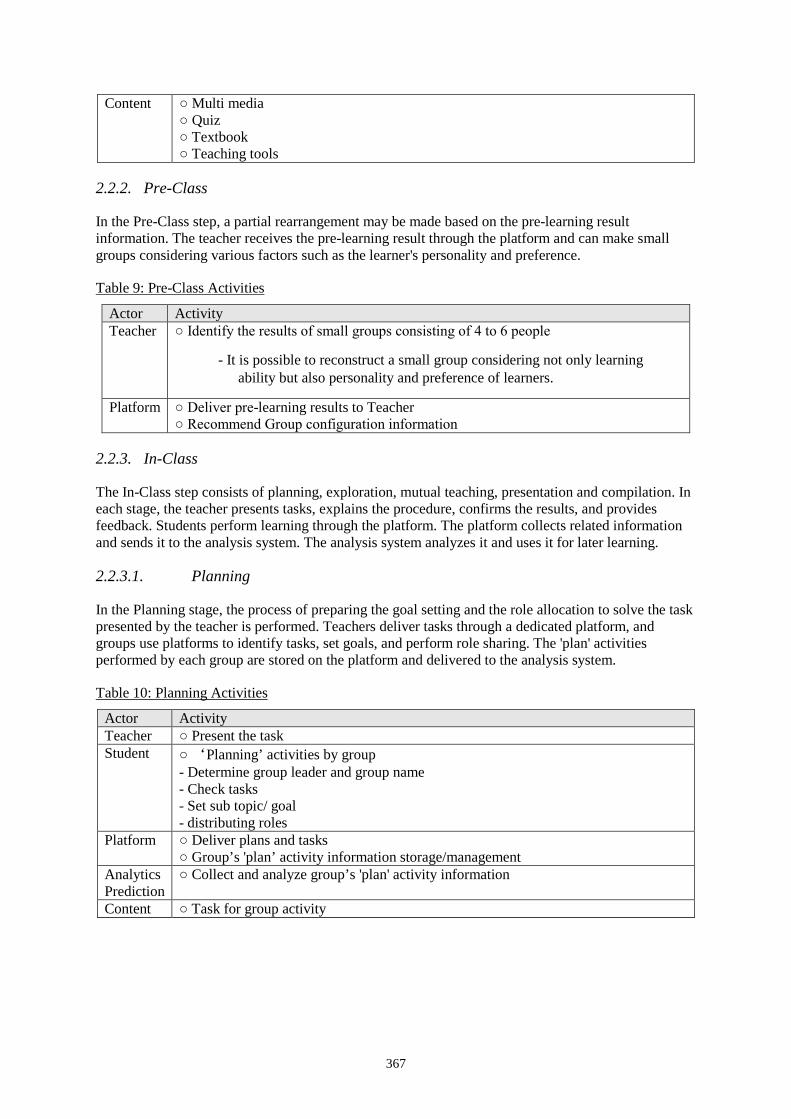
367
Content ○ Multi media ○ Quiz ○ Textbook ○ Teaching tools
2.2.2. Pre-Class
In the Pre-Class step, a partial rearrangement may be made based on the pre-learning result information. The teacher receives the pre-learning result through the platform and can make small groups considering various factors such as the learner's personality and preference.
Table 9: Pre-Class Activities
Actor Activity Teacher ○ Identify the results of small groups consisting of 4 to 6 people
- It is possible to reconstruct a small group considering not only learning ability but also personality and preference of learners.
Platform ○ Deliver pre-learning results to Teacher ○ Recommend Group configuration information
2.2.3. In-Class
The In-Class step consists of planning, exploration, mutual teaching, presentation and compilation. In each stage, the teacher presents tasks, explains the procedure, confirms the results, and provides feedback. Students perform learning through the platform. The platform collects related information and sends it to the analysis system. The analysis system analyzes it and uses it for later learning.
2.2.3.1. Planning
In the Planning stage, the process of preparing the goal setting and the role allocation to solve the task presented by the teacher is performed. Teachers deliver tasks through a dedicated platform, and groups use platforms to identify tasks, set goals, and perform role sharing. The 'plan' activities performed by each group are stored on the platform and delivered to the analysis system.
Table 10: Planning Activities
Actor Activity Teacher ○ Present the task Student ○ ‘Planning’ activities by group
- Determine group leader and group name - Check tasks - Set sub topic/ goal - distributing roles
Platform ○ Deliver plans and tasks ○ Group’s 'plan’ activity information storage/management
Analytics Prediction
○ Collect and analyze group’s 'plan' activity information
Content ○ Task for group activity
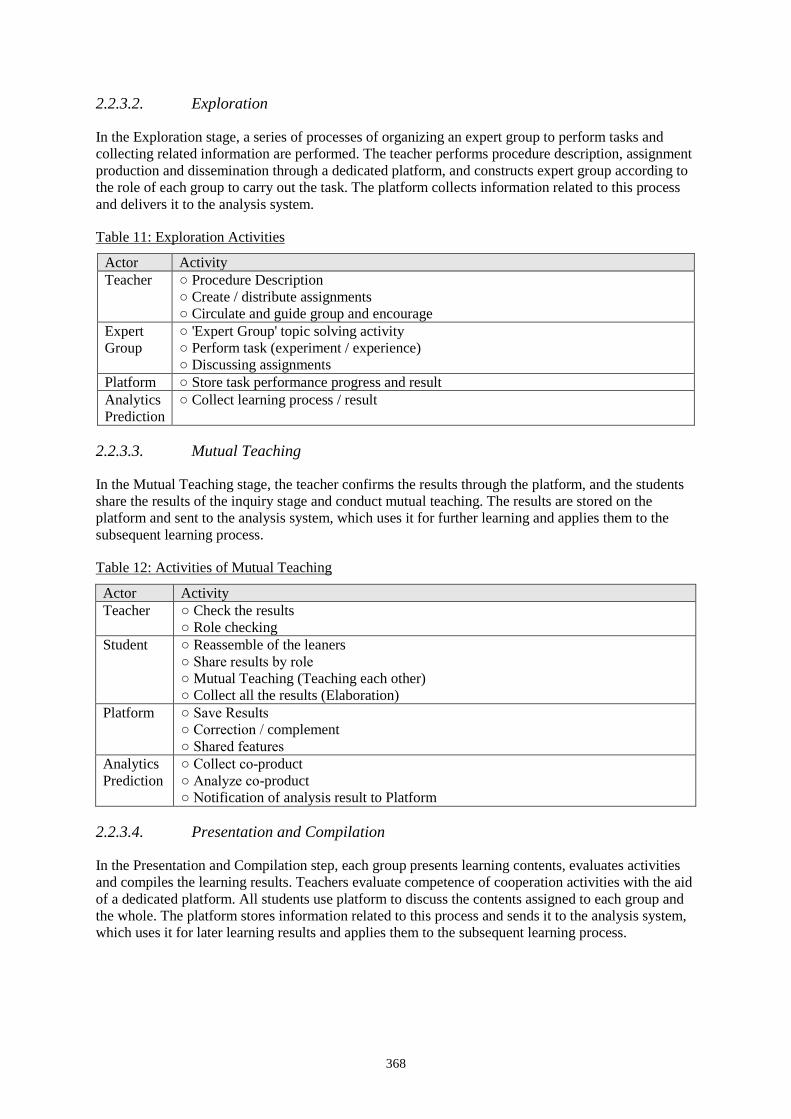
368
2.2.3.2. Exploration
In the Exploration stage, a series of processes of organizing an expert group to perform tasks and collecting related information are performed. The teacher performs procedure description, assignment production and dissemination through a dedicated platform, and constructs expert group according to the role of each group to carry out the task. The platform collects information related to this process and delivers it to the analysis system.
Table 11: Exploration Activities
Actor Activity Teacher ○ Procedure Description
○ Create / distribute assignments ○ Circulate and guide group and encourage
Expert Group
○ 'Expert Group' topic solving activity ○ Perform task (experiment / experience) ○ Discussing assignments
Platform ○ Store task performance progress and result Analytics Prediction
○ Collect learning process / result
2.2.3.3. Mutual Teaching
In the Mutual Teaching stage, the teacher confirms the results through the platform, and the students share the results of the inquiry stage and conduct mutual teaching. The results are stored on the platform and sent to the analysis system, which uses it for further learning and applies them to the subsequent learning process.
Table 12: Activities of Mutual Teaching
Actor Activity Teacher ○ Check the results
○ Role checking Student ○ Reassemble of the leaners
○ Share results by role ○ Mutual Teaching (Teaching each other) ○ Collect all the results (Elaboration)
Platform ○ Save Results ○ Correction / complement ○ Shared features
Analytics Prediction
○ Collect co-product ○ Analyze co-product ○ Notification of analysis result to Platform
2.2.3.4. Presentation and Compilation
In the Presentation and Compilation step, each group presents learning contents, evaluates activities and compiles the learning results. Teachers evaluate competence of cooperation activities with the aid of a dedicated platform. All students use platform to discuss the contents assigned to each group and the whole. The platform stores information related to this process and sends it to the analysis system, which uses it for later learning results and applies them to the subsequent learning process.
369
Table 13: Activities of Presentation and Compilation
Actor Activity Teacher ○ Evaluation of capability of cooperation activities
○ Activity evaluation(personal/group) ○ Feedback
Student ○ Present group learning content ○ Discuss all learning content ○ Confirm assignment
Platform ○ Save presentation / discussion / answer result ○ Deliver learning results to Teacher
Analytics Prediction
○ Collect overall learning results ○ Analyze overall learning results ○ Notification of analysis result to Platform
2.3. Post-Class
In the Post-Class, the activities of evaluating, reflecting, and reviewing of the learning result and analyzing related information are performed. The teacher distributes the quiz through a dedicated platform, and the student uses the platform to perform quizzes and submissions. The platform stores the quiz results and delivers them to the analysis system. The analysis system collects and analyzes the quiz results and applies them to the subsequent learning process.
Table 14: Post-Class Activities
Actor Activity Teacher ○ Quiz distribution Student ○ Upload Quiz Platform ○ Student - Quiz Mapping
○ Student - Quiz Mapping ○ Automatically scoring Quiz results ○ Save Quiz results ○ Deliver Quiz results to Teacher
Analytics Prediction
○ Collecting Quiz results ○ Analyze Quiz results ○ Notification of analysis result to Platform
3. Requirements for Learning Analytics
In Section 2, we presented pedagogical models to improve pedagogical effectiveness through group learning within the flipped learning educational environment. In these pedagogical models, various requirements for collecting and analyzing information through learning and analytics system are presented. In the course of designing the data model for actual implementation, however, we found some aspects of model that cannot be described by existing standards such as IMS Caliper Analytics (IMS GLOBAL Learning Consortium) or xAPI (Advanced Distributed Learning 2016). In this section, we identify the limitations of current standards and suggest directions for future standards.
3.1. Group Dynamics
In the traditional learning models, the groups for collaborative learning are static in that members of a group are fixed and the groups persist throughout the learning process. However, in the aforementioned pedagogical model, a student can join more than one group at the same time and a new group can be created dynamically during the learning process. Explicit specification of groups
370
and memberships is thus necessary in order to represent learning events associated with groups as well as members of the group.
3.2. Roles in a Group
One of the notable features of flipped learning is that the role and membership of an individual in a group can change over time. The change itself is an event to be monitored and recorded for effective learning analytics. The history of changes also play a part of the learning analytics. Upfront specification of the changes of the role and the membership in one or more groups is thus desired for analysis of the tendency of students and the dynamics of the group.
3.3. Collaborative Work
Student evaluation and feedback are fundamental and intrinsic aspects of learning analytics. In the collaborative pedagogical model as mentioned in Section 2, each group member may move to the expert group and work on group tasks as well as individual assignments. Current standards such as IMS Caliper Analytics focus only on individual or group activities, while the new models require individual evaluation over multiple groups or evaluation of multiple authors of a collaborative work in a group. Such evaluation is possible with clear specification of the relations among a group, members, and collaborative work. Consequently the events generated from the collaborative work need to specify these contextual information.
3.4. Group as an Actor
For several learning activities in flipped learning model, the actor of the activities are best described by a group instead of a specific person. In the case of a group assignment, it may be described as a single submission by all the members of the group, but this would involve unnecessary repeated submission and transmission of events, which in turn can cause burden to the analysis process. If a group can be treated as an actor like a juridical person, the overhead caused by the repetition can be reduced and analysis can take advantage of agreed semantics about the group instead of inferencing from the raw data.
4. Conclusion
In this paper, we described two pedagogical models from which to derive new use cases of learning analytics in flipped learning by identifying the learning activities in the model. The derived uses cases are then examined to identify new requirements for learning analytics in flipped learning along with limitations of the existing standards such IMS Caliper Analytics. The key requirements come from the existence of a dynamic group that should be treated as a virtual actor. Future work includes the extended specification of existing standards to fulfill the identified requirements to encompass the proposed pedagogical models in flipped learning.
Acknowledgements
This paper is based upon work supported by the Ministry of Trade, Industry & Energy (MOTIE, Korea) under Industrial Technology Innovation Program. No.10060301, 'Development of a service platform and contents for flipped learning’.
371
References
IMS GLOBAL Learning Consortium (October 2015). IMS Caliper Analytics™ Implementation Guide. Retrieved from http://www.imsglobal.org/caliper/caliperv1p0/ims-caliper-analytics-implementation-guide
Advanced Distributed Learning (2016). xAPI-Spec. Retrieved from https://github.com/adlnet/xAPI-Spec Flipped Learning Network (2014). Definition of Flipped Learning. Retrieved from
https://flippedlearning.org/definition-of-flipped-learning/ EDUCAUSE (2012). 7 Things You Should Know About Flipped Classrooms. Retrieved from
https://library.educause.edu/resources/2012/2/7-things-you-should-know-about-flipped-classrooms THE JIGSAW CLASSROOM (2017). Retrieved from https://www.jigsaw.org/ Chatti, M. A., Dyckhoff, A. L., Schroeder, U., & Thüs, H. (2012). A reference model for learning analytics.
International Journal of Technology Enhanced Learning, 4(5), 318-331. ISO/IEC TR 20748-1:2016 (2016). Information technology for learning, education, and training — Learning
analytics interoperability — Part 1: Reference model, Choi, B.-G., You, S., & Lee, J. (2016). Towards an Open and Extensible Learning Analytics Systems.
Proceeding of the 24th International Conference on Computer in Education, The ICCE Workshop on Learning Analytics (LA2016)
Bae, J.-H., Cho, Y.-S., & Lee, J. (2015). Designing a Reference Model for Learning Analytics Interoperability. Proceeding of the 23rd International Conference on Computer in Education, The ICCE Workshop on Learning Analytics (LA2015)
Choi, B.-G., Cho, Y.-S., & Lee, J. (2014). Preliminary Requirements Analysis towards an Integrated Learning Analytics System. Proceeding of the 22nd International Conference on Computer in Education, The ICCE Workshop on Learning Analytics (LA2014)
Hayashi, Y., et al. (Eds.) (2017). Workshop Proceedings of the 25th International Conference on Computers in Education. New Zealand: Asia-Pacific Society for Computers in Education
372
Applying Interest Loop to Develop Game-based Model for Chinese Character Learning
Zhi-Hong CHENa*, Pei-Yun CHIb, Huei-Jhen CIOUb aGraduate Institute of Information and Computer Education, National Taiwan Normal University,
Taiwan bDepartment of Information Communication, Yuan-Ze University, Taiwan
Abstract: Interest is a critical element for student learning and should be cultivated. To this end, different interest development models have been investigated. This study focuses on interest loop, which comprises three components, including triggering, immersing, and extending interest. Based on the interest loop, this study proposes a game-based model for Chinese character learning. In addition, a learning system, named CharacterMonster, is also implemented to realize this conceptual model for examining its feasibility. The detailed functions of the system are described in this paper.
Keywords: Game-based learning, Interest loop, Chinese character learning
1. Significance of interest
Interest, which involves how students pay their attention and make their efforts, has been regarded as a significant and foundational element of learning (Wong, et. al., 2015). Previous studies have demonstrated that interest would influence student learning in terms of various aspects, such as performance (Schraw, Flowerday, & Lehman, 2001), self-efficacy (Hidi, Berndorff, & Ainley, 2002), and self-regulation (Sansone, Thoman, & Smith, 2000). In addition, some studies further assert that interest could be cultivated through some models, such as four-phase model (Hidi & Renninger, 2006) and interest loop model (Wong, et. al., 2015).
For four-phase model, interest is viewed as malleable forms of interests, including triggered situational interest, maintained situational interest, emerging individual interest, and well-developed individual interest (Hidi & Renninger, 2006). The former two (i.e., triggered and maintained situational interest) could be triggered by environmental stimuli, whereas the latter two (i.e., emerging and well-developed interest) could emerge after triggering and maintaining situational interest.
For interest loop model, interest comprises three components, including triggering interest, immersing interest, and extending interest. The three components link to each other and form as a loop. In addition, the three components are respectively characterized by three general design strategies: curiosity, flow, and meaningfulness. For triggering interest, curiosity could invoke students to seek out personal interests (Deci, 1975) through information gap (Loewenstein, 1994). When interest is triggered, students might involve themselves fully in a learning activity, leading to flow experience (Csíkszentmihályi, 1991). Besides, knowledge and interest could reinforce each other (Silvia, 2006) to enrich prior knowledge and meaningful learning, which in turn extends interest.
2. Game-based model and system for Chinese characters
Figure 1 illustrates the conceptual model of the game-based model for Chinese character learning. The game-based model is underpinned by the interest loop. Specifically, the game-based model consists of three game components, and each game component is developed based on the three components of interest loop, respectively (i.e., triggering, immersing, and extending interest). According to the conceptual model, a game-based system for Chinese character learning is implemented. The learning
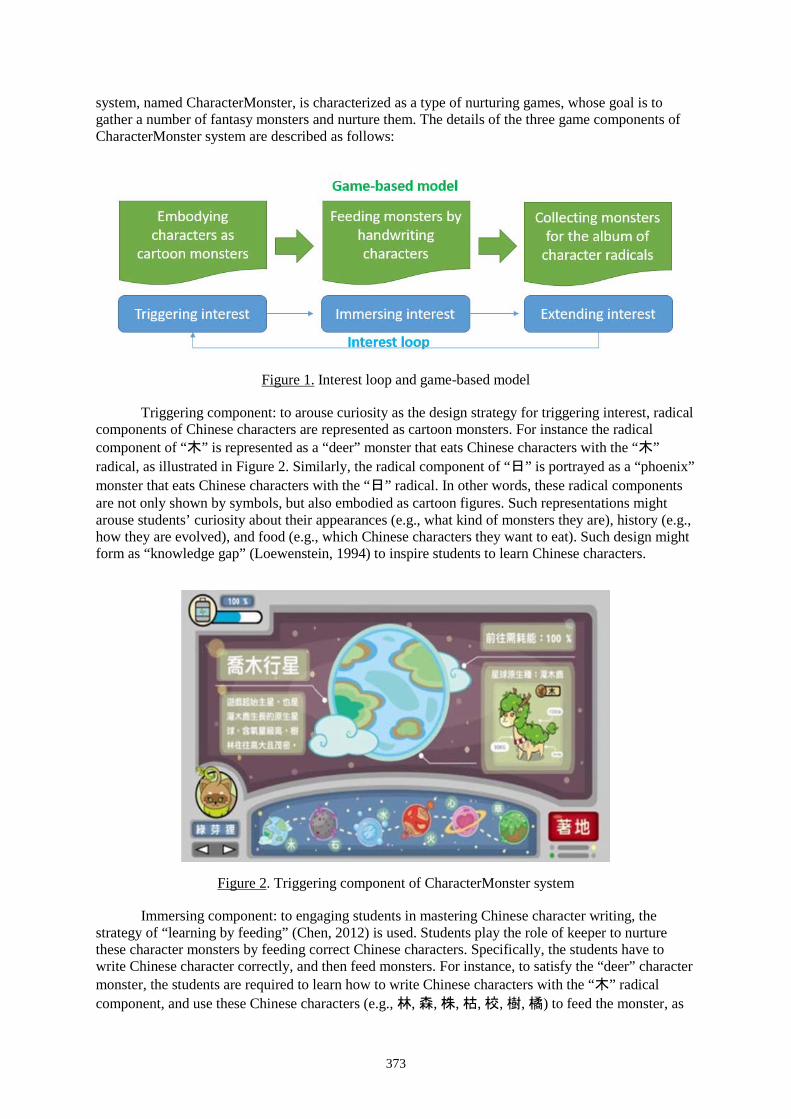
373
system, named CharacterMonster, is characterized as a type of nurturing games, whose goal is to gather a number of fantasy monsters and nurture them. The details of the three game components of CharacterMonster system are described as follows:
Figure 1. Interest loop and game-based model
Triggering component: to arouse curiosity as the design strategy for triggering interest, radical components of Chinese characters are represented as cartoon monsters. For instance the radical component of “木” is represented as a “deer” monster that eats Chinese characters with the “木” radical, as illustrated in Figure 2. Similarly, the radical component of “日” is portrayed as a “phoenix” monster that eats Chinese characters with the “日” radical. In other words, these radical components are not only shown by symbols, but also embodied as cartoon figures. Such representations might arouse students’ curiosity about their appearances (e.g., what kind of monsters they are), history (e.g., how they are evolved), and food (e.g., which Chinese characters they want to eat). Such design might form as “knowledge gap” (Loewenstein, 1994) to inspire students to learn Chinese characters.
Figure 2. Triggering component of CharacterMonster system
Immersing component: to engaging students in mastering Chinese character writing, the strategy of “learning by feeding” (Chen, 2012) is used. Students play the role of keeper to nurture these character monsters by feeding correct Chinese characters. Specifically, the students have to write Chinese character correctly, and then feed monsters. For instance, to satisfy the “deer” character monster, the students are required to learn how to write Chinese characters with the “木” radical component, and use these Chinese characters (e.g., 林, 森, 株, 枯, 校, 樹, 橘) to feed the monster, as
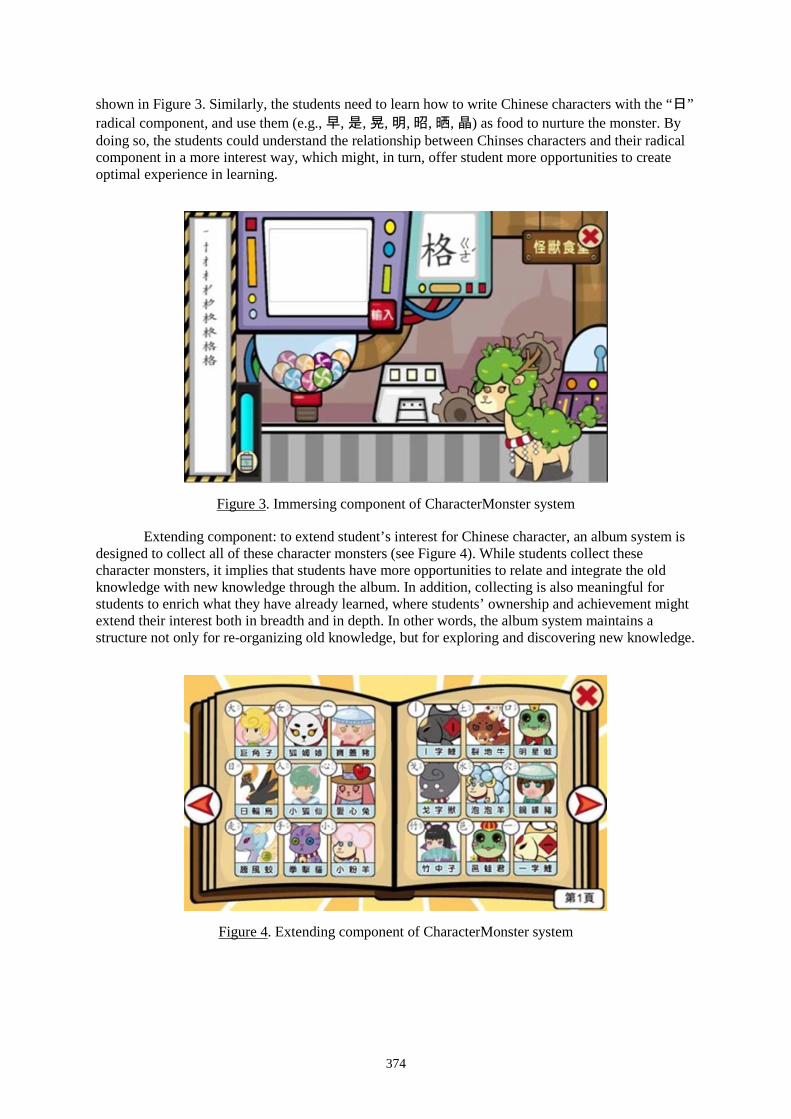
374
shown in Figure 3. Similarly, the students need to learn how to write Chinese characters with the “日” radical component, and use them (e.g., 早, 是, 晃, 明, 昭, 晒, 晶) as food to nurture the monster. By doing so, the students could understand the relationship between Chinses characters and their radical component in a more interest way, which might, in turn, offer student more opportunities to create optimal experience in learning.
Figure 3. Immersing component of CharacterMonster system
Extending component: to extend student’s interest for Chinese character, an album system is designed to collect all of these character monsters (see Figure 4). While students collect these character monsters, it implies that students have more opportunities to relate and integrate the old knowledge with new knowledge through the album. In addition, collecting is also meaningful for students to enrich what they have already learned, where students’ ownership and achievement might extend their interest both in breadth and in depth. In other words, the album system maintains a structure not only for re-organizing old knowledge, but for exploring and discovering new knowledge.
Figure 4. Extending component of CharacterMonster system

375
Acknowledgements
The authors would like to thank the Ministry of Science and Technology of the Republic of China, Taiwan, for financial support (MOST-105-2511-S-003-051).
References
Chen, Z. H. (2012). We care about you: Incorporating pet characteristics with educational agents through reciprocal caring approach. Computers and Education, 59(4), 1081-1088.
Csíkszentmihályi, M. (1991). Flow: The psychology of optimal experience. New York: Harper Perennial. Deci, E. L. (1975). Intrinsic motivation. New York: Plenum. Hidi, S., Berndorff, D., & Ainley, M. (2002). Children's argument writing, interest and self-efficacy: an
intervention study. Learning and Instruction, 12(4), 429-446. Hidi, S. & Renninger, K. A. (2006). The four-phase model of interest development. Educational psychologist,
41(2), 111-127. Loewenstein, G. (1994). The psychology of curiosity: A review and reinterpretation. Psychological Bulletin,
116(1), 75-98. Sansone, C., Thoman, D. B., & Smith, J. L. (2000). Interest and self-regulation. Intrinsic and extrinsic
motivation: The search for optimal motivation and performance. In R. H. Hoyle (Ed.), Handbook of Personality and Self-Regulation (pp. 343-374): Wiley-Blackwell.
Schraw, G., Flowerday, T., & Lehman, S. (2001). Increasing situational interest in the classroom. Educational Psychology Review, 13(3), 211-224.
Silvia, P. J. (2006). Exploring the psychology of interest, Oxford University Press. Wong, L. H., Chan, T. W., Chen, Z. H., King, R. B., & Wong, S. L. (2015). The IDC theory: Interest and the
Interest Loop. In T. Kojiri, T. Supnithi, Y. Wang, Y.-T. Wu, H. Ogata, W. Chen, S. C. Kong, & F. Qiu (Eds.), Workshop Proceedings of the 23rd International Conference on Computers in Education. Hangzhou, China: Asia-Pacific Society for Computers in Education.

Hayashi, Y., et al. (Eds.) (2017). Workshop Proceedings of the 25th International Conference on Computers in Education. New Zealand: Asia-Pacific Society for Computers in Education
376
Cultivating Students’ Writing Habit in a Game-based Learning Environment
Calvin C. Y. LIAOa*, Wan-Chen CHANGb, Hercy N. H. CHENGa, & Tak-Wai CHANc a National Engineering Research Center for E-Learning, Central China Normal University, China
b Department of Human Development and Family Studies, National Taiwan Normal University, Taiwan
c Graduate Institute of Network Learning Technology, National Central University, Taiwan *[email protected]
Abstract: This study focused on delineating and utilizing “habit loop” framework: cueing environment, routine, and satisfaction. This study further integrated the habit loop framework into portfolio management game for helping elementary school students to write and rewrite to cultivate good writing habit. According to the habit loop framework, we also proposed two design principles: portfolio visualization and management. The former supports cueing environment; the latter increases satisfaction. Students performed their routines (i.e., writing and rewriting) in a portfolio management game. Briefly, this study creates an environment more conducive to students’ writing to cultivate their consistent habit.
Keywords: portfolio management game, writing habit, habit loop
1. Habit and Habit Loop
Practitioner, educators, and parents have long acknowledged the importance of cultivating students’ good habit for writing (Duhigg, 2012) because writing involves a persistent and stable change in what students know or does (Zimmerman, & Risemberg, 1997). Forming useful and productive writing habits is important for students. Specifically, habit formation is often related to interest and persistence. Briefly, habit is a routine of behavior that is regularly repeated and tends to occur unconsciously (Durhigg, 2012). “Habits are the result of automatic cognitive processes, developed by extensive repetition, so well-learned that they do not require conscious effort” (Ronis, Yates, & Kirscht, 1989, p. 219).
While considerable attention has been paid in the past to research issues of Health Psychology (e.g., drinking a lot of water or doing exercise regularly), the literature on issues of Educational Psychology has emerged only very slowly and in a more separate way. A previous study (Chen, Chan, Liao, Cheng, So, & Gu, 2015) proposed a framework of “James’ Habit Loop” to promote habit formation. In particular, Chen et al. (2015) adapted from the framework of Durhigg (2012) (i. e. a cue, a routine, and a reward) and, proposed a habit formation framework in the context of education and learning which consisted of three components: cueing environment (e. g. arrangement of place, time, people, or incidents), routine (e. g. repetitive pattern of activities), and satisfaction, forming the habit loop, see figure 1. In other words, habits are automatic behavioral which responses to environmental cues, develops through repetition of behavior in consistent contexts, and reinforces a students’ satisfaction. In short, to create a habit, students need to repeat the behavior in the same situation.
Moreover, it is known that the game-based learning approach has great potential for facilitating the engagement of students in learning activities. For example, Proske, Roscoe, & McNamara (2014) explored the motivational aspect, like in game-based practice for writing. Many researchers also believe that sustaining motivation is critical for transforming learning from the use of digital games to educational goals (Barab, Thomas, Dodge, Carteaux, & Tuzun, 2005). Essentially this framework is a phenomenal hypothesis and lacks empirical investigation; hence this study integrated this idea of habit loop into portfolio management game, entitled Creation-Island (Liao, Chang, & Chan, 2016) for helping elementary school students to write and rewrite to cultivate
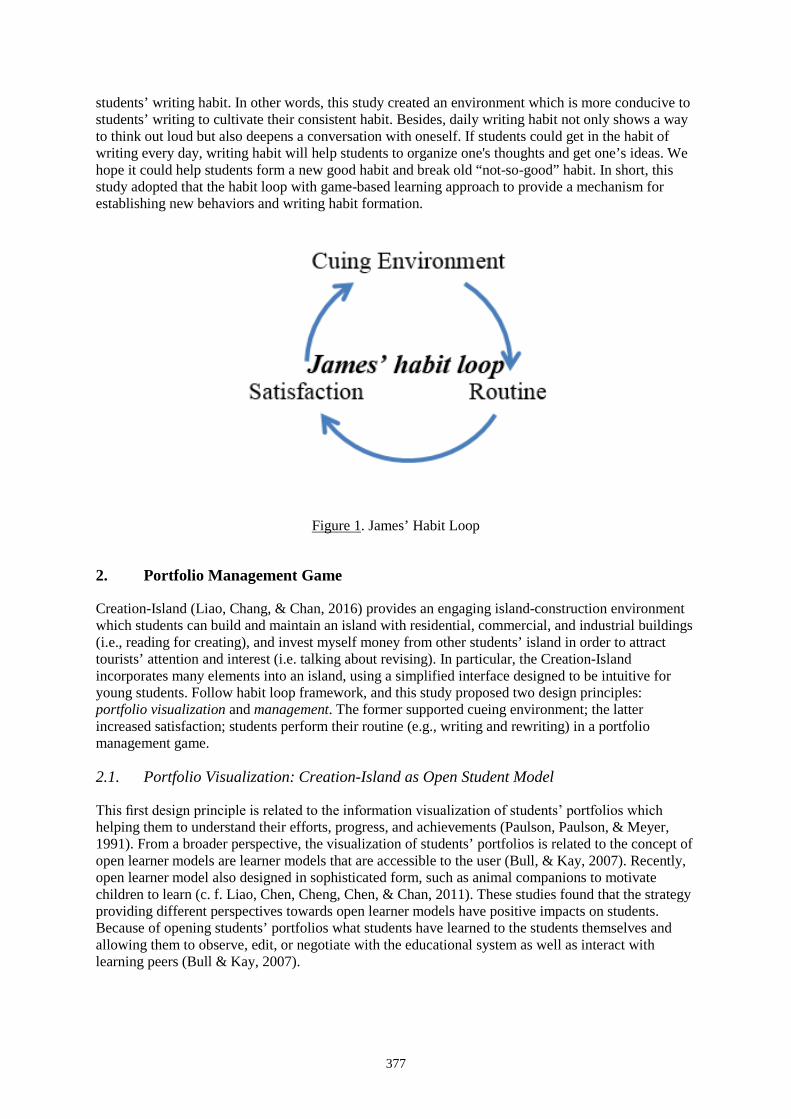
377
students’ writing habit. In other words, this study created an environment which is more conducive to students’ writing to cultivate their consistent habit. Besides, daily writing habit not only shows a way to think out loud but also deepens a conversation with oneself. If students could get in the habit of writing every day, writing habit will help students to organize one's thoughts and get one’s ideas. We hope it could help students form a new good habit and break old “not-so-good” habit. In short, this study adopted that the habit loop with game-based learning approach to provide a mechanism for establishing new behaviors and writing habit formation.
Figure 1. James’ Habit Loop
2. Portfolio Management Game
Creation-Island (Liao, Chang, & Chan, 2016) provides an engaging island-construction environment which students can build and maintain an island with residential, commercial, and industrial buildings (i.e., reading for creating), and invest myself money from other students’ island in order to attract tourists’ attention and interest (i.e. talking about revising). In particular, the Creation-Island incorporates many elements into an island, using a simplified interface designed to be intuitive for young students. Follow habit loop framework, and this study proposed two design principles: portfolio visualization and management. The former supported cueing environment; the latter increased satisfaction; students perform their routine (e.g., writing and rewriting) in a portfolio management game.
2.1. Portfolio Visualization: Creation-Island as Open Student Model
This first design principle is related to the information visualization of students’ portfolios which helping them to understand their efforts, progress, and achievements (Paulson, Paulson, & Meyer, 1991). From a broader perspective, the visualization of students’ portfolios is related to the concept of open learner models are learner models that are accessible to the user (Bull, & Kay, 2007). Recently, open learner model also designed in sophisticated form, such as animal companions to motivate children to learn (c. f. Liao, Chen, Cheng, Chen, & Chan, 2011). These studies found that the strategy providing different perspectives towards open learner models have positive impacts on students. Because of opening students’ portfolios what students have learned to the students themselves and allowing them to observe, edit, or negotiate with the educational system as well as interact with learning peers (Bull & Kay, 2007).
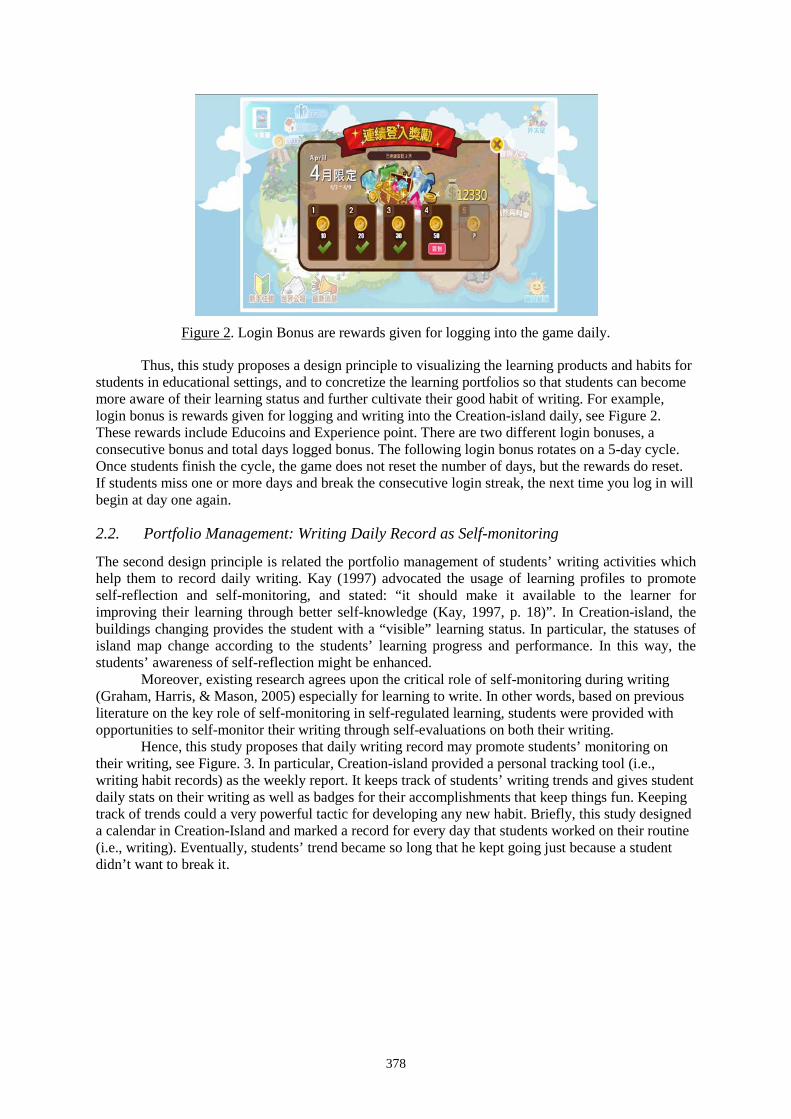
378
Figure 2. Login Bonus are rewards given for logging into the game daily.
Thus, this study proposes a design principle to visualizing the learning products and habits for students in educational settings, and to concretize the learning portfolios so that students can become more aware of their learning status and further cultivate their good habit of writing. For example, login bonus is rewards given for logging and writing into the Creation-island daily, see Figure 2. These rewards include Educoins and Experience point. There are two different login bonuses, a consecutive bonus and total days logged bonus. The following login bonus rotates on a 5-day cycle. Once students finish the cycle, the game does not reset the number of days, but the rewards do reset. If students miss one or more days and break the consecutive login streak, the next time you log in will begin at day one again.
2.2. Portfolio Management: Writing Daily Record as Self-monitoring
The second design principle is related the portfolio management of students’ writing activities which help them to record daily writing. Kay (1997) advocated the usage of learning profiles to promote self-reflection and self-monitoring, and stated: “it should make it available to the learner for improving their learning through better self-knowledge (Kay, 1997, p. 18)”. In Creation-island, the buildings changing provides the student with a “visible” learning status. In particular, the statuses of island map change according to the students’ learning progress and performance. In this way, the students’ awareness of self-reflection might be enhanced.
Moreover, existing research agrees upon the critical role of self-monitoring during writing (Graham, Harris, & Mason, 2005) especially for learning to write. In other words, based on previous literature on the key role of self-monitoring in self-regulated learning, students were provided with opportunities to self-monitor their writing through self-evaluations on both their writing.
Hence, this study proposes that daily writing record may promote students’ monitoring on their writing, see Figure. 3. In particular, Creation-island provided a personal tracking tool (i.e., writing habit records) as the weekly report. It keeps track of students’ writing trends and gives student daily stats on their writing as well as badges for their accomplishments that keep things fun. Keeping track of trends could a very powerful tactic for developing any new habit. Briefly, this study designed a calendar in Creation-Island and marked a record for every day that students worked on their routine (i.e., writing). Eventually, students’ trend became so long that he kept going just because a student didn’t want to break it.
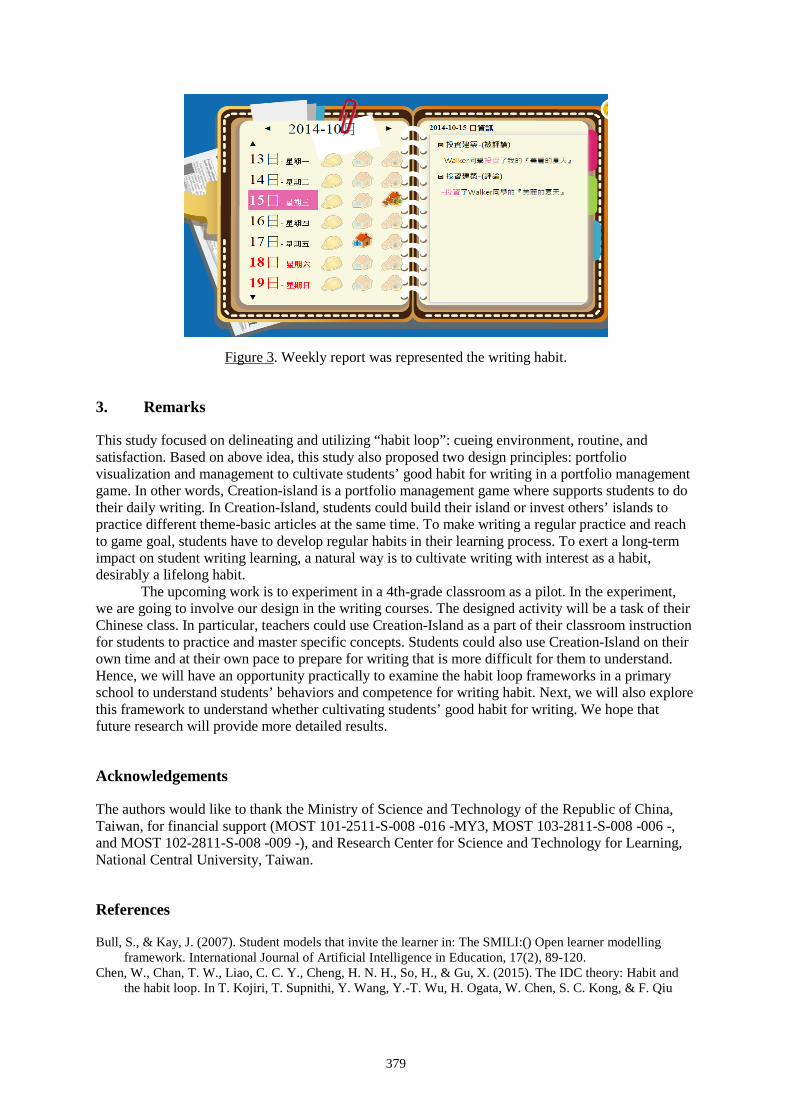
379
Figure 3. Weekly report was represented the writing habit.
3. Remarks
This study focused on delineating and utilizing “habit loop”: cueing environment, routine, and satisfaction. Based on above idea, this study also proposed two design principles: portfolio visualization and management to cultivate students’ good habit for writing in a portfolio management game. In other words, Creation-island is a portfolio management game where supports students to do their daily writing. In Creation-Island, students could build their island or invest others’ islands to practice different theme-basic articles at the same time. To make writing a regular practice and reach to game goal, students have to develop regular habits in their learning process. To exert a long-term impact on student writing learning, a natural way is to cultivate writing with interest as a habit, desirably a lifelong habit.
The upcoming work is to experiment in a 4th-grade classroom as a pilot. In the experiment, we are going to involve our design in the writing courses. The designed activity will be a task of their Chinese class. In particular, teachers could use Creation-Island as a part of their classroom instruction for students to practice and master specific concepts. Students could also use Creation-Island on their own time and at their own pace to prepare for writing that is more difficult for them to understand. Hence, we will have an opportunity practically to examine the habit loop frameworks in a primary school to understand students’ behaviors and competence for writing habit. Next, we will also explore this framework to understand whether cultivating students’ good habit for writing. We hope that future research will provide more detailed results.
Acknowledgements
The authors would like to thank the Ministry of Science and Technology of the Republic of China, Taiwan, for financial support (MOST 101-2511-S-008 -016 -MY3, MOST 103-2811-S-008 -006 -, and MOST 102-2811-S-008 -009 -), and Research Center for Science and Technology for Learning, National Central University, Taiwan.
References
Bull, S., & Kay, J. (2007). Student models that invite the learner in: The SMILI:() Open learner modelling framework. International Journal of Artificial Intelligence in Education, 17(2), 89-120.
Chen, W., Chan, T. W., Liao, C. C. Y., Cheng, H. N. H., So, H., & Gu, X. (2015). The IDC theory: Habit and the habit loop. In T. Kojiri, T. Supnithi, Y. Wang, Y.-T. Wu, H. Ogata, W. Chen, S. C. Kong, & F. Qiu

380
(Eds.), Workshop proceedings of the 23rd international conference on computers in education (pp. 821–828). Hangzhou: Asia-Pacific Society for Computers in Education.
Duhigg, C. (2012). The Power of Habit: Why We Do What We Do in Life and Business. Random House. Graham, S., Harris, K. R., & Mason, L. (2005). Improving the writing performance, knowledge, and self-
efficacy of struggling young writers: The effects of self-regulated strategy development. Contemporary Educational Psychology, 30(2), 207-241.
Kay J. (1997) Learner know thyself: student models to give learner control and responsibility. In International Conference on Computers in Education (eds Z. Halim, T. Ottomann & Z. Razak), pp. 17-24. AACE, Charlottesville, VA.
Liao, C. C. Y., Chang, W. C., & Chan, T. W. (2016). Investigating the effect of game-based writing environment on students’ writing participation, performance, and interest, Proceedings of the 24th International Conference on Computers in Education. Bombay, India: Asia-Pacific Society for Computers in Education.
Liao, C. C. Y., Chen, Z. H., Cheng, H. N. H., Chen, F. C., & Chan, T. W. (2011). My-Mini-Pet: a handheld pet-nurturing game to engage students in arithmetic practices. Journal of Computer Assisted Learning, 27(1), 76-89. doi:10.1111/j.1365-2729.2010.00367.x
Paulson, F. L., Paulson, P. R., & Meyer, C. A. (1991). What makes a portfolio a portfolio? Educational Leadership, 48(5):60–63 EJ421352.
Proske, A., Roscoe, R. D., & McNamara, D. S. (2014). Game-based practice versus traditional practice in computer-based writing strategy training: effects on motivation and achievement. Educational Technology Research and Development, 62(5), 481-505.
Ronis, D. L., Yates, J. E, & Kirscht, J. P. (1989). Attitudes, decisions, and habits as determinants of repeated behavior. In A. R. Pratkanis, S. J. Breckler, & A. G. Greenwald (Eds.), Attitude Structure and Function (pp. 213-239). Hillsdale, NJ: Erlbaum.
Zimmerman, B., & Risemberg, R. (1997). Becoming a self-regulated writer: A social cognitive perspective. Contemporary Educational Psychology, 22, 73-101.
Hayashi, Y., et al. (Eds.) (2017). Workshop Proceedings of the 25th International Conference on Computers in Education. New Zealand: Asia-Pacific Society for Computers in Education
381
Creation Loop Example of IDC Theory: CoCoing.info
Ben CHANG, Yen-An SHIH & Tzu-Chen HUANG Graduate Institute of Learning and Instruction, National Central University, Taiwan
Abstract: Advocated by a group of Asia researchers, a design theory named IDC (Interest-Driven Creator) is proposed to support system designers to design learning system. The IDC theory as a learning-activity design theory has three major anchored concepts that are Interest Loop, Creation Loop, and James’ Habit Loop. Furthermore, each of the anchored concepts has three well-defined components. For instance, the Creation Loop of the IDC theory is consisted of acquiring, combining, and staging components. From a learning system design perspective, the IDC theory provides a useful reference framework to guide the system designers on how to design a learning system. In this article, guided by the Creation Loop anchored concept of the IDC theory and the Creation Loop components, a social networking platform named CoCoing.info is implemented and illustrated. Learners on the platform can acquire their knowledge collaboratively, combine their knowledge in a shared workspace, and stage to present their work in the classroom. The developing experiences of the CoCoing.info indicate that a well-designed developing guideline such as the IDC theory provides system designers an effective and accurate developing process.
Keywords: IDC Theory, creation loop, CoCoing.info, social networking platform
1. Introduction
With technology evolution, learners utilizing information and communication technology (ICT) like mobile phone, tablet, and laptop computer can easily practice their learning activities anytime and anywhere (Wong, Milrad, & Specht, 2015). This movement has undoubtedly affected how people learn (Sawyer, 2005). However, adopting ICT to enhance learning requires a deliberate design (Chan et al., 2006) since designing ICT in learning is an interdisciplinary study covers various domains, such as social interaction, learning behavior analysis, educational goal, learning activity design and, no doubt, ICT. From an ICT enhanced learning designer perspective, too many design variables make ICT enhanced learning system design very challenging and difficult. Therefore, a well-elaborated reference framework might provide the designers a clear direction on how to design a learning system effectively and accurately.
To let the designers a clear design guideline, a group of Asian researchers has been developing an Interest-Driven Creator (IDC) theory which is a design theory based on three anchored concepts. The three anchored concepts are Interest Concept, Creation Concept, and Habit Concept. Each of these concepts is represented by a loop that comprises three components. For example, Interest Loop is consisted of Triggering, Immersing, and Extending components; Creation Loop is consisted of Acquiring, Combining, and Staging components; and James’ Habit Loop is consisted of Cuing Environment, Routine, and Satisfaction. With technological support, the IDC theory developers advocated that the design of learning activities based on the IDC theory will enable students to develop their interest in learning.
When adopting technology in learning, a well-designed framework will improve the design quality (Chan et al., 2006). With technological support, the learning activities design based on the IDC theory will enable students to develop their interest in learning. In this study, by adopting the Creation loop of IDC theory, a social networking learning system named CoCoing.info is illustrated. On the CoCoing.info system, the learners can acquire knowledge, combine knowledge, and stage to present their combined outcomes. The experience of adopting IDC theory on designing the
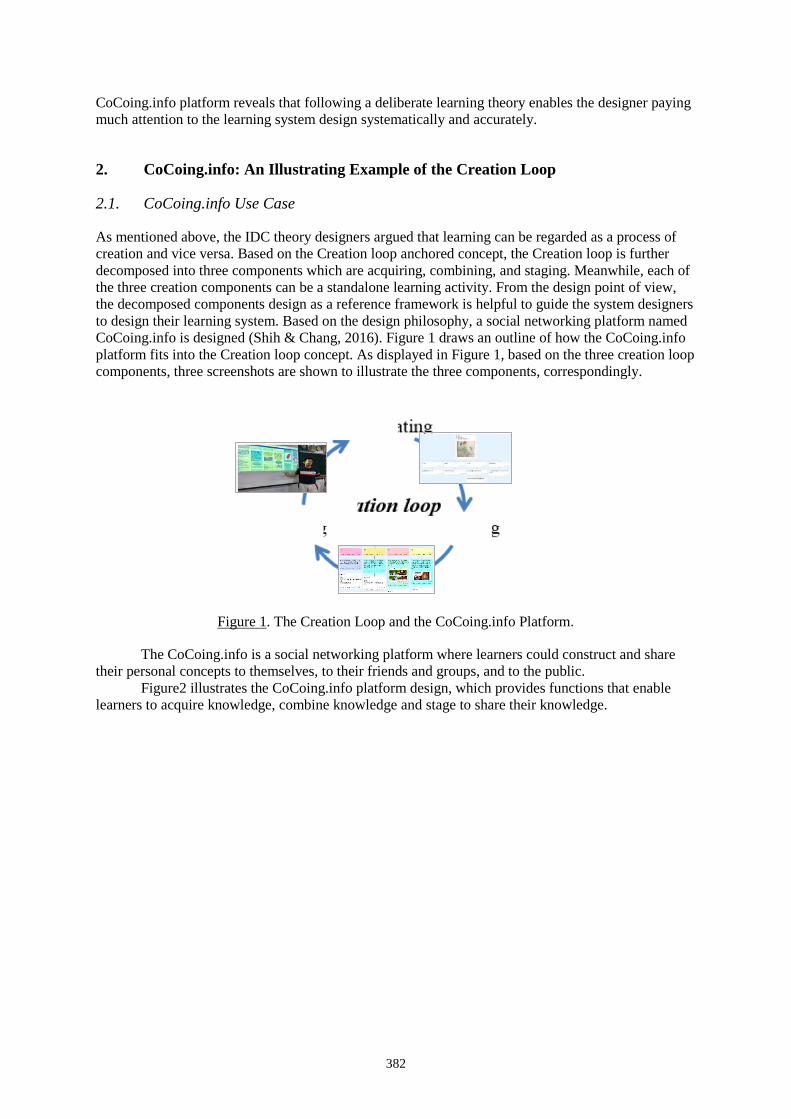
382
CoCoing.info platform reveals that following a deliberate learning theory enables the designer paying much attention to the learning system design systematically and accurately.
2. CoCoing.info: An Illustrating Example of the Creation Loop
2.1. CoCoing.info Use Case
As mentioned above, the IDC theory designers argued that learning can be regarded as a process of creation and vice versa. Based on the Creation loop anchored concept, the Creation loop is further decomposed into three components which are acquiring, combining, and staging. Meanwhile, each of the three creation components can be a standalone learning activity. From the design point of view, the decomposed components design as a reference framework is helpful to guide the system designers to design their learning system. Based on the design philosophy, a social networking platform named CoCoing.info is designed (Shih & Chang, 2016). Figure 1 draws an outline of how the CoCoing.info platform fits into the Creation loop concept. As displayed in Figure 1, based on the three creation loop components, three screenshots are shown to illustrate the three components, correspondingly.
Figure 1. The Creation Loop and the CoCoing.info Platform.
The CoCoing.info is a social networking platform where learners could construct and share their personal concepts to themselves, to their friends and groups, and to the public.
Figure2 illustrates the CoCoing.info platform design, which provides functions that enable learners to acquire knowledge, combine knowledge and stage to share their knowledge.
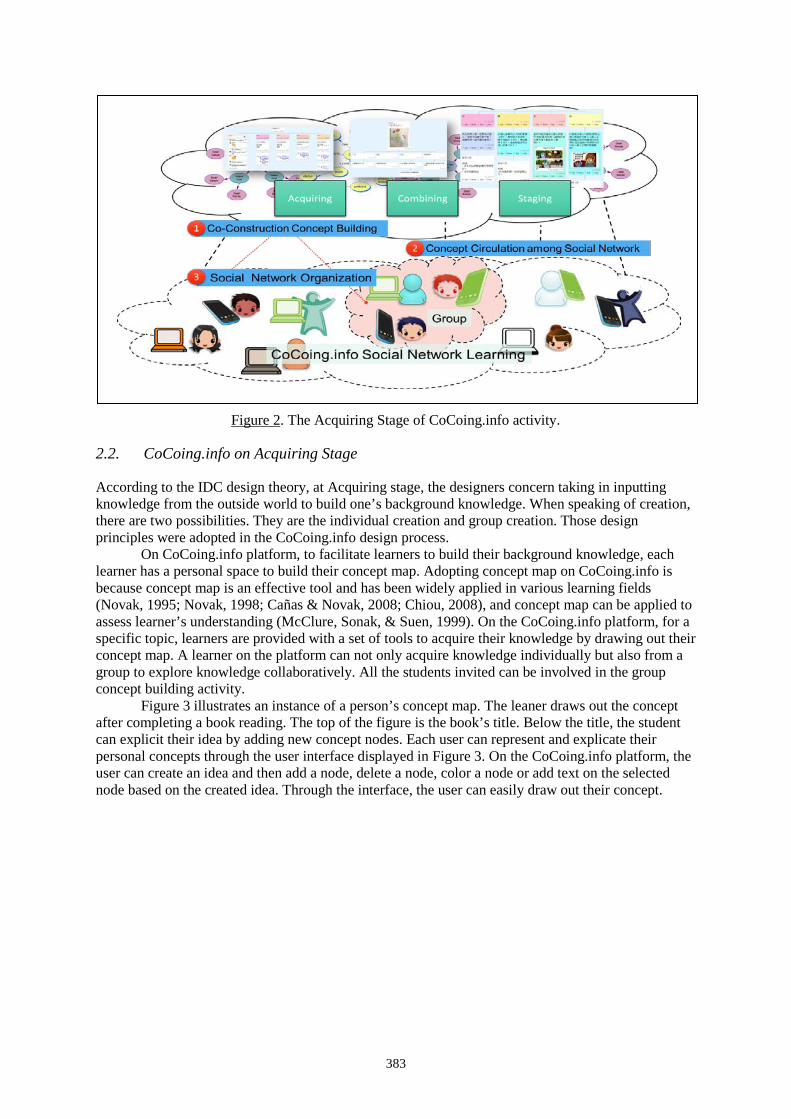
383
Figure 2. The Acquiring Stage of CoCoing.info activity.
2.2. CoCoing.info on Acquiring Stage
According to the IDC design theory, at Acquiring stage, the designers concern taking in inputting knowledge from the outside world to build one’s background knowledge. When speaking of creation, there are two possibilities. They are the individual creation and group creation. Those design principles were adopted in the CoCoing.info design process.
On CoCoing.info platform, to facilitate learners to build their background knowledge, each learner has a personal space to build their concept map. Adopting concept map on CoCoing.info is because concept map is an effective tool and has been widely applied in various learning fields (Novak, 1995; Novak, 1998; Cañas & Novak, 2008; Chiou, 2008), and concept map can be applied to assess learner’s understanding (McClure, Sonak, & Suen, 1999). On the CoCoing.info platform, for a specific topic, learners are provided with a set of tools to acquire their knowledge by drawing out their concept map. A learner on the platform can not only acquire knowledge individually but also from a group to explore knowledge collaboratively. All the students invited can be involved in the group concept building activity.
Figure 3 illustrates an instance of a person’s concept map. The leaner draws out the concept after completing a book reading. The top of the figure is the book’s title. Below the title, the student can explicit their idea by adding new concept nodes. Each user can represent and explicate their personal concepts through the user interface displayed in Figure 3. On the CoCoing.info platform, the user can create an idea and then add a node, delete a node, color a node or add text on the selected node based on the created idea. Through the interface, the user can easily draw out their concept.
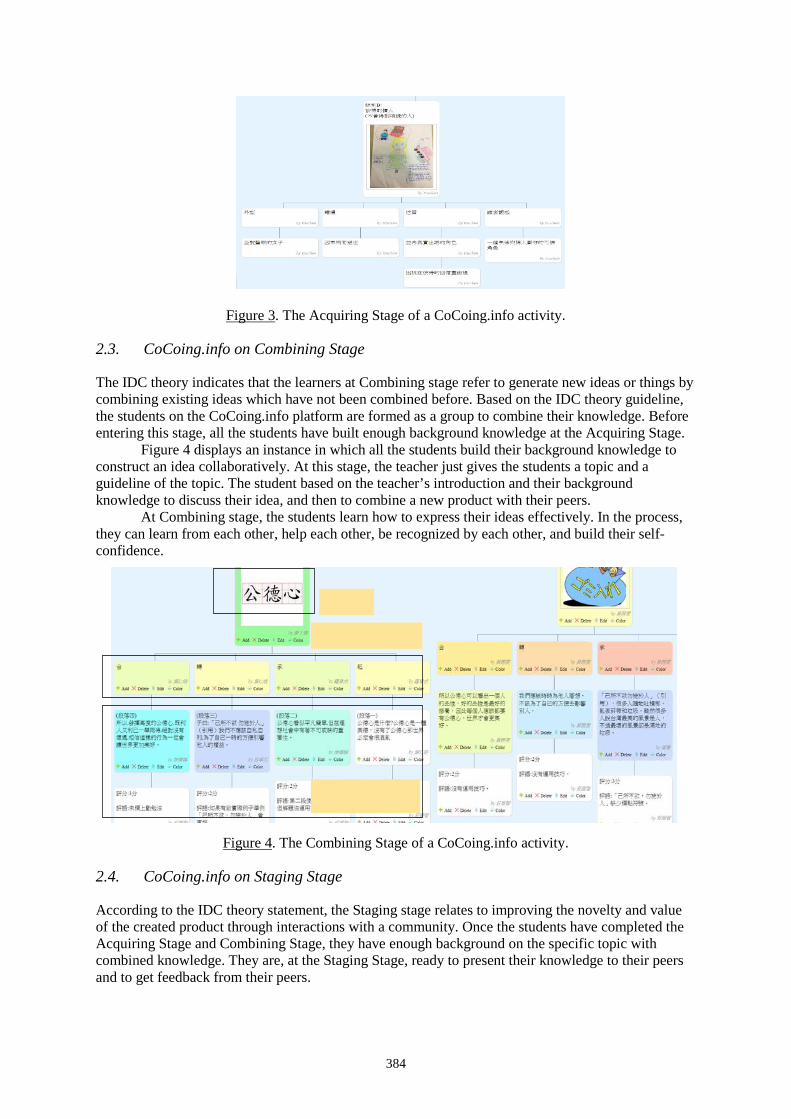
384
Figure 3. The Acquiring Stage of a CoCoing.info activity.
2.3. CoCoing.info on Combining Stage
The IDC theory indicates that the learners at Combining stage refer to generate new ideas or things by combining existing ideas which have not been combined before. Based on the IDC theory guideline, the students on the CoCoing.info platform are formed as a group to combine their knowledge. Before entering this stage, all the students have built enough background knowledge at the Acquiring Stage.
Figure 4 displays an instance in which all the students build their background knowledge to construct an idea collaboratively. At this stage, the teacher just gives the students a topic and a guideline of the topic. The student based on the teacher’s introduction and their background knowledge to discuss their idea, and then to combine a new product with their peers.
At Combining stage, the students learn how to express their ideas effectively. In the process, they can learn from each other, help each other, be recognized by each other, and build their self-confidence.
Figure 4. The Combining Stage of a CoCoing.info activity.
2.4. CoCoing.info on Staging Stage
According to the IDC theory statement, the Staging stage relates to improving the novelty and value of the created product through interactions with a community. Once the students have completed the Acquiring Stage and Combining Stage, they have enough background on the specific topic with combined knowledge. They are, at the Staging Stage, ready to present their knowledge to their peers and to get feedback from their peers.
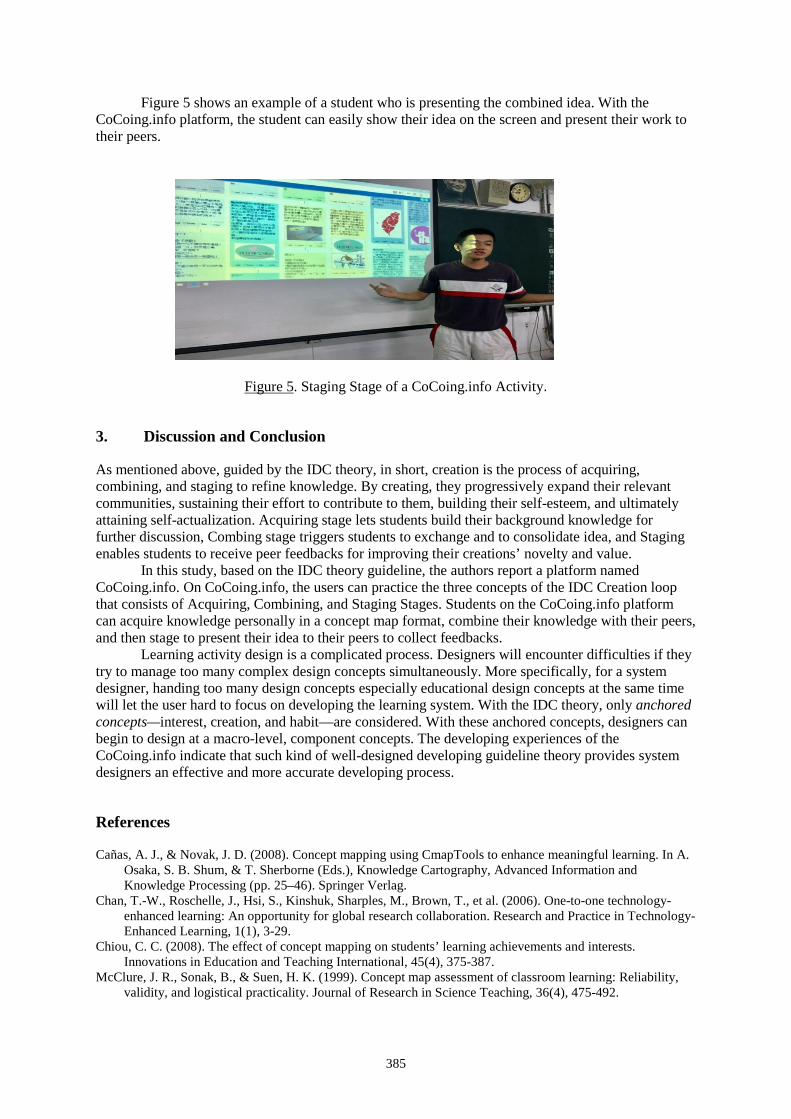
385
Figure 5 shows an example of a student who is presenting the combined idea. With the CoCoing.info platform, the student can easily show their idea on the screen and present their work to their peers.
Figure 5. Staging Stage of a CoCoing.info Activity.
3. Discussion and Conclusion
As mentioned above, guided by the IDC theory, in short, creation is the process of acquiring, combining, and staging to refine knowledge. By creating, they progressively expand their relevant communities, sustaining their effort to contribute to them, building their self-esteem, and ultimately attaining self-actualization. Acquiring stage lets students build their background knowledge for further discussion, Combing stage triggers students to exchange and to consolidate idea, and Staging enables students to receive peer feedbacks for improving their creations’ novelty and value.
In this study, based on the IDC theory guideline, the authors report a platform named CoCoing.info. On CoCoing.info, the users can practice the three concepts of the IDC Creation loop that consists of Acquiring, Combining, and Staging Stages. Students on the CoCoing.info platform can acquire knowledge personally in a concept map format, combine their knowledge with their peers, and then stage to present their idea to their peers to collect feedbacks.
Learning activity design is a complicated process. Designers will encounter difficulties if they try to manage too many complex design concepts simultaneously. More specifically, for a system designer, handing too many design concepts especially educational design concepts at the same time will let the user hard to focus on developing the learning system. With the IDC theory, only anchored concepts—interest, creation, and habit—are considered. With these anchored concepts, designers can begin to design at a macro-level, component concepts. The developing experiences of the CoCoing.info indicate that such kind of well-designed developing guideline theory provides system designers an effective and more accurate developing process.
References
Cañas, A. J., & Novak, J. D. (2008). Concept mapping using CmapTools to enhance meaningful learning. In A. Osaka, S. B. Shum, & T. Sherborne (Eds.), Knowledge Cartography, Advanced Information and Knowledge Processing (pp. 25–46). Springer Verlag.
Chan, T.-W., Roschelle, J., Hsi, S., Kinshuk, Sharples, M., Brown, T., et al. (2006). One-to-one technology-enhanced learning: An opportunity for global research collaboration. Research and Practice in Technology-Enhanced Learning, 1(1), 3-29.
Chiou, C. C. (2008). The effect of concept mapping on students’ learning achievements and interests. Innovations in Education and Teaching International, 45(4), 375-387.
McClure, J. R., Sonak, B., & Suen, H. K. (1999). Concept map assessment of classroom learning: Reliability, validity, and logistical practicality. Journal of Research in Science Teaching, 36(4), 475-492.

386
Novak, J. D. (1995) Concept mapping: A strategy for organizing knowledge. In S.M. Glynn & R. Duit (eds), Learning science in the schools: Research reforming practice (pp. 229-245). New York: Lawrence Erlbaum Associates, Inc.
Novak, J. D. (1998). Learning, creating, and using knowledge: Concept maps as facilitative tools in schools and corporations. Mahwah, NJ: Lawrence Erlbaum Associates.
Sawyer, R. K. (Ed.). (2005). The Cambridge handbook of the learning sciences. Cambridge University Press. Shih, Y. A., & Chang, B. (2016). A relational design oriented seamless framework to support idea sharing and
social network. Proceedings of the 24th International Conference on Computers in Education. pp. 297-299. India: Asia-Pacific Society for Computers in Education.
Wong, L. H., Milrad, M., & Specht, M. (2015). Seamless learning in the age of mobile connectivity. Singapore: Springer.
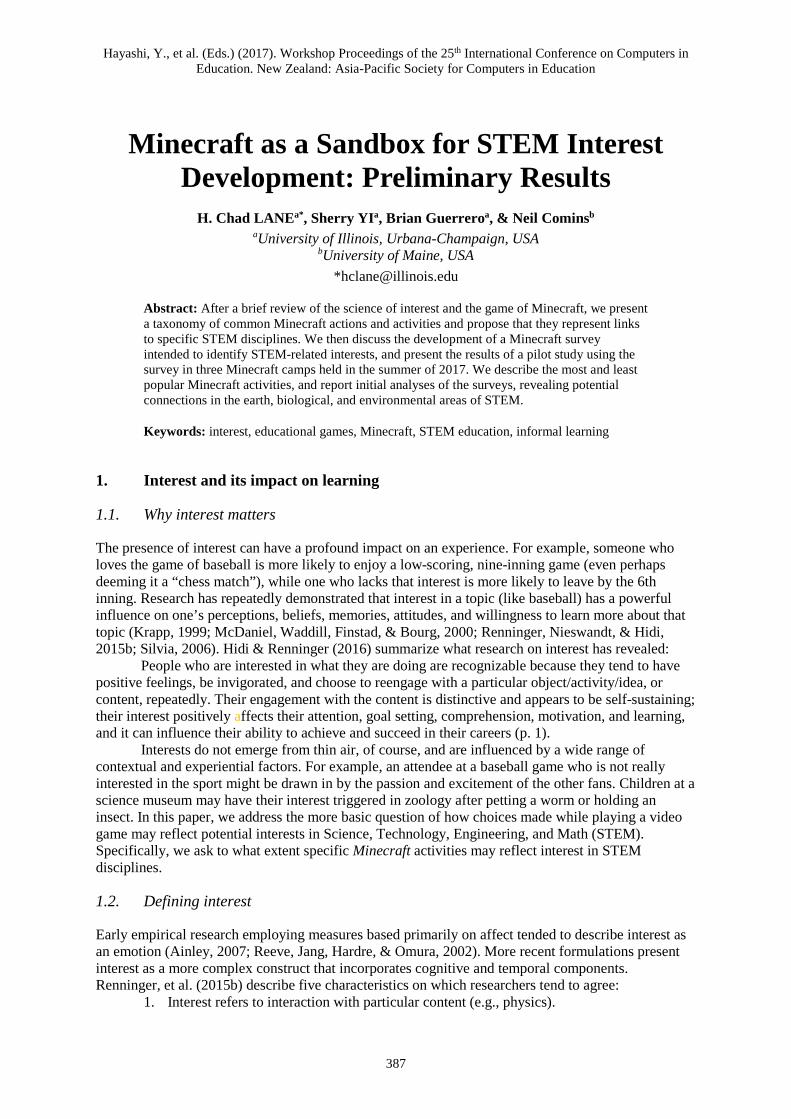
Hayashi, Y., et al. (Eds.) (2017). Workshop Proceedings of the 25th International Conference on Computers in Education. New Zealand: Asia-Pacific Society for Computers in Education
387
Minecraft as a Sandbox for STEM Interest Development: Preliminary Results
H. Chad LANEa*, Sherry YIa, Brian Guerreroa, & Neil Cominsb aUniversity of Illinois, Urbana-Champaign, USA
bUniversity of Maine, USA *[email protected]
Abstract: After a brief review of the science of interest and the game of Minecraft, we present a taxonomy of common Minecraft actions and activities and propose that they represent links to specific STEM disciplines. We then discuss the development of a Minecraft survey intended to identify STEM-related interests, and present the results of a pilot study using the survey in three Minecraft camps held in the summer of 2017. We describe the most and least popular Minecraft activities, and report initial analyses of the surveys, revealing potential connections in the earth, biological, and environmental areas of STEM.
Keywords: interest, educational games, Minecraft, STEM education, informal learning
1. Interest and its impact on learning
1.1. Why interest matters
The presence of interest can have a profound impact on an experience. For example, someone who loves the game of baseball is more likely to enjoy a low-scoring, nine-inning game (even perhaps deeming it a “chess match”), while one who lacks that interest is more likely to leave by the 6th inning. Research has repeatedly demonstrated that interest in a topic (like baseball) has a powerful influence on one’s perceptions, beliefs, memories, attitudes, and willingness to learn more about that topic (Krapp, 1999; McDaniel, Waddill, Finstad, & Bourg, 2000; Renninger, Nieswandt, & Hidi, 2015b; Silvia, 2006). Hidi & Renninger (2016) summarize what research on interest has revealed:
People who are interested in what they are doing are recognizable because they tend to have positive feelings, be invigorated, and choose to reengage with a particular object/activity/idea, or content, repeatedly. Their engagement with the content is distinctive and appears to be self-sustaining; their interest positively affects their attention, goal setting, comprehension, motivation, and learning, and it can influence their ability to achieve and succeed in their careers (p. 1).
Interests do not emerge from thin air, of course, and are influenced by a wide range of contextual and experiential factors. For example, an attendee at a baseball game who is not really interested in the sport might be drawn in by the passion and excitement of the other fans. Children at a science museum may have their interest triggered in zoology after petting a worm or holding an insect. In this paper, we address the more basic question of how choices made while playing a video game may reflect potential interests in Science, Technology, Engineering, and Math (STEM). Specifically, we ask to what extent specific Minecraft activities may reflect interest in STEM disciplines.
1.2. Defining interest
Early empirical research employing measures based primarily on affect tended to describe interest as an emotion (Ainley, 2007; Reeve, Jang, Hardre, & Omura, 2002). More recent formulations present interest as a more complex construct that incorporates cognitive and temporal components. Renninger, et al. (2015b) describe five characteristics on which researchers tend to agree:
1. Interest refers to interaction with particular content (e.g., physics).
388
2. Interest exists as a relation between the learner and the environment. 3. Interest has both affective and cognitive components, which can vary over time. 4. Learners may or may not be consciously aware that interest has been triggered. 5. Interest has a neurological/physiological basis – it is rewarding and linked to approach
behaviors. At this stage of our work, we adopt the simplistic view that interests can be inferred via likert
ratings to judge interest in Minecraft play and STEM fields, but will adopt a longer-term orientation for our upcoming studies.
1.3. Consequences of interest
The many positive consequences of establishing interest and its facilitating effect on learning are well-documented (Hidi & Harackiewicz, 2000; Renninger, Nieswandt, & Hidi, 2015a). When a learner is interested, that interest can actually feed on itself and grow (i.e., it is self-sustaining) (Barron, 2006). As a result, motivation to learn and attitudes about content improve (Potvin & Hasni, 2014), achievement and performance in school improves (Harackiewicz & Hulleman, 2010), and learners are more prone to establish deep conceptual understanding than are those lacking interest in the subject (Andre & Windschitl, 2003).
One of the most important findings is that interest is malleable and can change over time. A four-phase model (Hidi & Renninger, 2006) captures this malleability as two primary forms of interest: situational interest, a product of environmental features, followed by individual interest, a relatively self-motivating and enduring state that is marked by reengagement over time. Two sub-phases of each lead a four-phase model: 1) triggered situational interest can become 2) maintained situational interest, then under ideal conditions 3) emerging individual interest can grow into 4) well-developed interest, an enduring and resilient state. In learning contexts, a trigger is simply some experience (e.g., touching a worm) that establishes engagement and involves contextual features (Renninger & Bachrach, 2015).
Importantly, a well-developed interest has been linked to higher levels of self-efficacy and decreased negative self-perceptions (Lipstein & Renninger, 2006) and is predictive of future academic choices (Harackiewicz, Barron, Tauer, & Elliot, 2002). Conversely, an absence of interest can hinder a learner’s willingness to engage or persist (Nieswandt, 2007; Sansone, Fraughton, Zachary, Butner, & Heiner, 2011). Interest both emerges from experience and is heavily influenced by context. Our on-going research integrates both of these aspects, and seeks to inform the design and deployment of educational technologies in informal learning contexts. How to foster interest development is a critical question with widespread implications for parents, educators, researchers, and policymakers. Appropriate triggers and continuing opportunities to pursue those interests are needed if interest is to flourish, both independently and with encouragement.
1.4. Research aims
We are engaged in a research project investigating the impact of video game play on STEM interest. Specifically, we are interested in two key research questions: 1) In what ways does use of modern entertainment technologies influence learners’ interest in STEM? And 2) How can game-based learning experiences be deployed to trigger interest in specific areas of STEM? In this paper, we focus on the first question and in the context of Minecraft, a game rich in STEM connections. We are also designing customized versions of Minecraft (i.e., via “mods”) that focus on Astronomy. The work reported in this paper focuses on the first research question, and lays the groundwork for linking interests to game play.
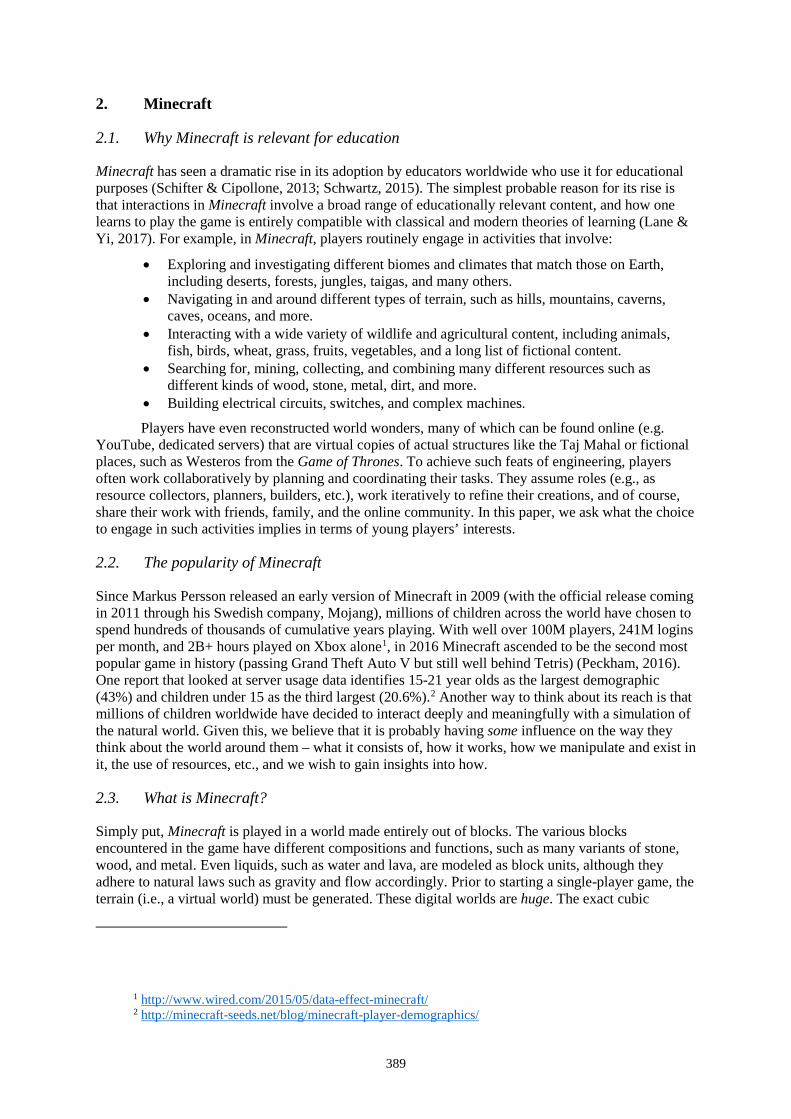
389
2. Minecraft
2.1. Why Minecraft is relevant for education
Minecraft has seen a dramatic rise in its adoption by educators worldwide who use it for educational purposes (Schifter & Cipollone, 2013; Schwartz, 2015). The simplest probable reason for its rise is that interactions in Minecraft involve a broad range of educationally relevant content, and how one learns to play the game is entirely compatible with classical and modern theories of learning (Lane & Yi, 2017). For example, in Minecraft, players routinely engage in activities that involve:
• Exploring and investigating different biomes and climates that match those on Earth, including deserts, forests, jungles, taigas, and many others.
• Navigating in and around different types of terrain, such as hills, mountains, caverns, caves, oceans, and more.
• Interacting with a wide variety of wildlife and agricultural content, including animals, fish, birds, wheat, grass, fruits, vegetables, and a long list of fictional content.
• Searching for, mining, collecting, and combining many different resources such as different kinds of wood, stone, metal, dirt, and more.
• Building electrical circuits, switches, and complex machines.
Players have even reconstructed world wonders, many of which can be found online (e.g. YouTube, dedicated servers) that are virtual copies of actual structures like the Taj Mahal or fictional places, such as Westeros from the Game of Thrones. To achieve such feats of engineering, players often work collaboratively by planning and coordinating their tasks. They assume roles (e.g., as resource collectors, planners, builders, etc.), work iteratively to refine their creations, and of course, share their work with friends, family, and the online community. In this paper, we ask what the choice to engage in such activities implies in terms of young players’ interests.
2.2. The popularity of Minecraft
Since Markus Persson released an early version of Minecraft in 2009 (with the official release coming in 2011 through his Swedish company, Mojang), millions of children across the world have chosen to spend hundreds of thousands of cumulative years playing. With well over 100M players, 241M logins per month, and 2B+ hours played on Xbox alone1, in 2016 Minecraft ascended to be the second most popular game in history (passing Grand Theft Auto V but still well behind Tetris) (Peckham, 2016). One report that looked at server usage data identifies 15-21 year olds as the largest demographic (43%) and children under 15 as the third largest (20.6%).2 Another way to think about its reach is that millions of children worldwide have decided to interact deeply and meaningfully with a simulation of the natural world. Given this, we believe that it is probably having some influence on the way they think about the world around them – what it consists of, how it works, how we manipulate and exist in it, the use of resources, etc., and we wish to gain insights into how.
2.3. What is Minecraft?
Simply put, Minecraft is played in a world made entirely out of blocks. The various blocks encountered in the game have different compositions and functions, such as many variants of stone, wood, and metal. Even liquids, such as water and lava, are modeled as block units, although they adhere to natural laws such as gravity and flow accordingly. Prior to starting a single-player game, the terrain (i.e., a virtual world) must be generated. These digital worlds are huge. The exact cubic
1 http://www.wired.com/2015/05/data-effect-minecraft/ 2 http://minecraft-seeds.net/blog/minecraft-player-demographics/
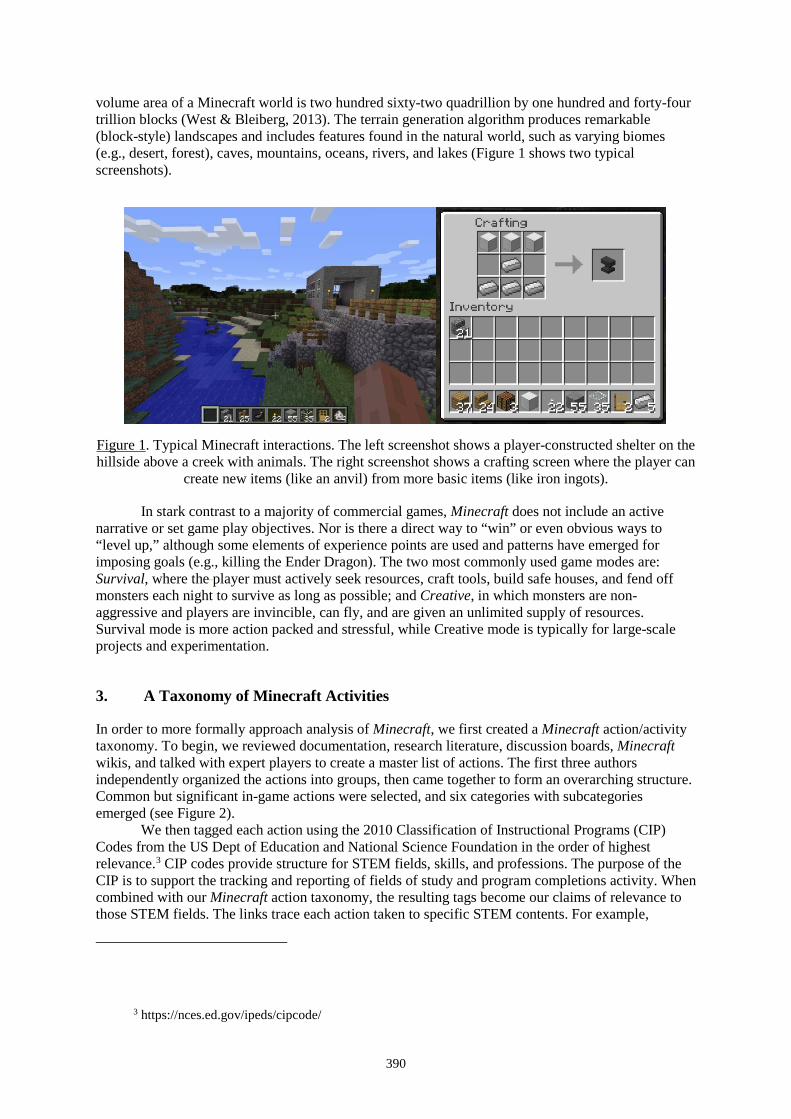
390
volume area of a Minecraft world is two hundred sixty-two quadrillion by one hundred and forty-four trillion blocks (West & Bleiberg, 2013). The terrain generation algorithm produces remarkable (block-style) landscapes and includes features found in the natural world, such as varying biomes (e.g., desert, forest), caves, mountains, oceans, rivers, and lakes (Figure 1 shows two typical screenshots).
Figure 1. Typical Minecraft interactions. The left screenshot shows a player-constructed shelter on the hillside above a creek with animals. The right screenshot shows a crafting screen where the player can
create new items (like an anvil) from more basic items (like iron ingots).
In stark contrast to a majority of commercial games, Minecraft does not include an active narrative or set game play objectives. Nor is there a direct way to “win” or even obvious ways to “level up,” although some elements of experience points are used and patterns have emerged for imposing goals (e.g., killing the Ender Dragon). The two most commonly used game modes are: Survival, where the player must actively seek resources, craft tools, build safe houses, and fend off monsters each night to survive as long as possible; and Creative, in which monsters are non-aggressive and players are invincible, can fly, and are given an unlimited supply of resources. Survival mode is more action packed and stressful, while Creative mode is typically for large-scale projects and experimentation.
3. A Taxonomy of Minecraft Activities
In order to more formally approach analysis of Minecraft, we first created a Minecraft action/activity taxonomy. To begin, we reviewed documentation, research literature, discussion boards, Minecraft wikis, and talked with expert players to create a master list of actions. The first three authors independently organized the actions into groups, then came together to form an overarching structure. Common but significant in-game actions were selected, and six categories with subcategories emerged (see Figure 2).
We then tagged each action using the 2010 Classification of Instructional Programs (CIP) Codes from the US Dept of Education and National Science Foundation in the order of highest relevance.3 CIP codes provide structure for STEM fields, skills, and professions. The purpose of the CIP is to support the tracking and reporting of fields of study and program completions activity. When combined with our Minecraft action taxonomy, the resulting tags become our claims of relevance to those STEM fields. The links trace each action taken to specific STEM contents. For example,
3 https://nces.ed.gov/ipeds/cipcode/
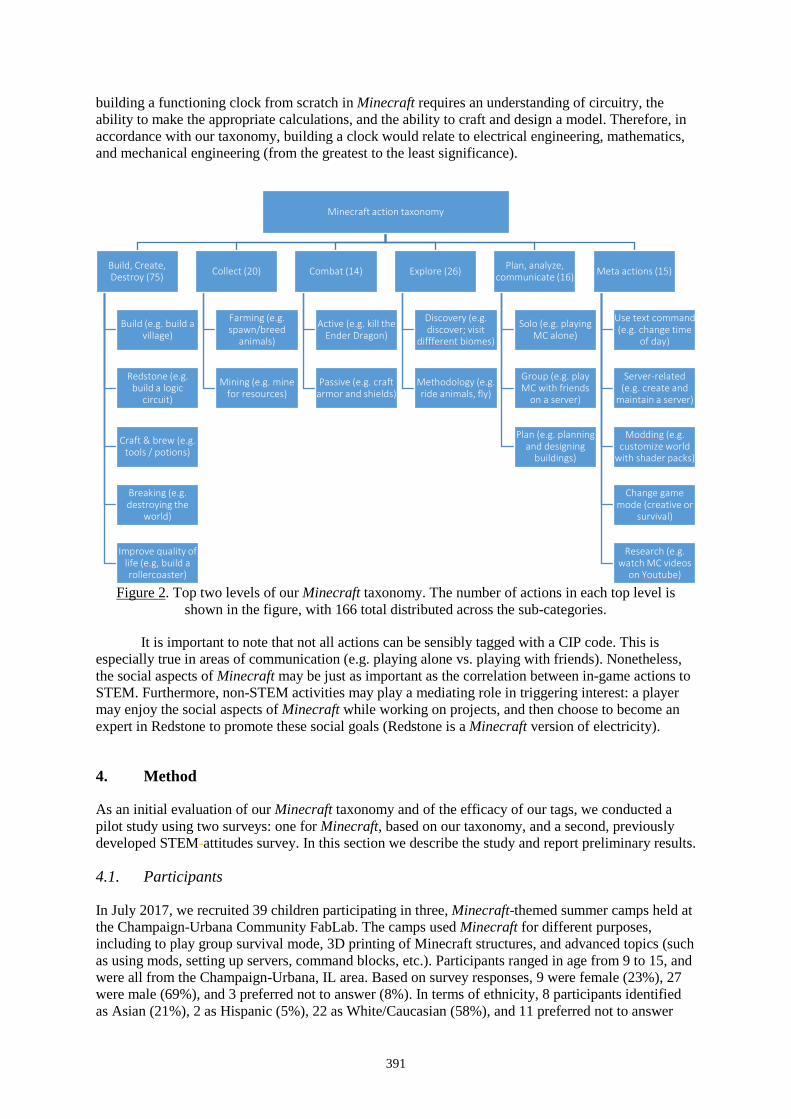
391
building a functioning clock from scratch in Minecraft requires an understanding of circuitry, the ability to make the appropriate calculations, and the ability to craft and design a model. Therefore, in accordance with our taxonomy, building a clock would relate to electrical engineering, mathematics, and mechanical engineering (from the greatest to the least significance).
Figure 2. Top two levels of our Minecraft taxonomy. The number of actions in each top level is shown in the figure, with 166 total distributed across the sub-categories.
It is important to note that not all actions can be sensibly tagged with a CIP code. This is especially true in areas of communication (e.g. playing alone vs. playing with friends). Nonetheless, the social aspects of Minecraft may be just as important as the correlation between in-game actions to STEM. Furthermore, non-STEM activities may play a mediating role in triggering interest: a player may enjoy the social aspects of Minecraft while working on projects, and then choose to become an expert in Redstone to promote these social goals (Redstone is a Minecraft version of electricity).
4. Method
As an initial evaluation of our Minecraft taxonomy and of the efficacy of our tags, we conducted a pilot study using two surveys: one for Minecraft, based on our taxonomy, and a second, previously developed STEM-attitudes survey. In this section we describe the study and report preliminary results.
4.1. Participants
In July 2017, we recruited 39 children participating in three, Minecraft-themed summer camps held at the Champaign-Urbana Community FabLab. The camps used Minecraft for different purposes, including to play group survival mode, 3D printing of Minecraft structures, and advanced topics (such as using mods, setting up servers, command blocks, etc.). Participants ranged in age from 9 to 15, and were all from the Champaign-Urbana, IL area. Based on survey responses, 9 were female (23%), 27 were male (69%), and 3 preferred not to answer (8%). In terms of ethnicity, 8 participants identified as Asian (21%), 2 as Hispanic (5%), 22 as White/Caucasian (58%), and 11 preferred not to answer
Minecraft action taxonomy
Build, Create, Destroy (75)
Build (e.g. build a village)
Redstone (e.g. build a logic
circuit)
Craft & brew (e.g. tools / potions)
Breaking (e.g. destroying the
world)
Improve quality of life (e.g, build a rollercoaster)
Collect (20)
Farming (e.g. spawn/breed
animals)
Mining (e.g. mine for resources)
Combat (14)
Active (e.g. kill the Ender Dragon)
Passive (e.g. craft armor and shields)
Explore (26)
Discovery (e.g. discover; visit
diffferent biomes)
Methodology (e.g. ride animals, fly)
Plan, analyze, communicate (16)
Solo (e.g. playing MC alone)
Group (e.g. play MC with friends
on a server)
Plan (e.g. planning and designing
buildings)
Meta actions (15)
Use text command (e.g. change time
of day)
Server-related (e.g. create and
maintain a server)
Modding (e.g. customize world
with shader packs)
Change game mode (creative or
survival)
Research (e.g. watch MC videos
on Youtube)
392
(29%). In terms of experience with Minecraft, 2 said they were “new” (5%), 4 had played before and knew the basics (10%), 10 played “often” and for “hours at a time” (26%), 19 considered themselves experts (49%), and 4 said they play “way too much” and explore advanced topics often (10%).
4.2. Procedure
Upon arrival on the first day of each camp, parents were approached by researchers who introduced themselves and described the goals of the research. Children were then invited to participate in the research project if they chose to and their parents approved. Consent forms were given to the parents to read and sign. Researchers spent the first day of each camp getting to know the participants, observing their work, asking general questions, and helping whenever possible. At a designated time during each camp, two surveys were given to participants who had consented: the first survey focused on Minecraft play and the second on attitudes and interests in STEM topics. At later times, we the interviewed selected campers to gain a better understanding of their interest in Minecraft and STEM.
4.2.1. Minecraft interest survey
We designed a 60-item survey by pulling a representative sample of items from the Minecraft action taxonomy (section 3), which currently has 166 leaf nodes (recall: leaf nodes represent game actions or activities). We chose items based on several criteria. First, we sought balance across the STEM disciplines, but also included other critical aspects of playing that were not directly STEM-related, such as playing with friends, decorating buildings, and combat-related activities. This opens the possibility to infer a more nuanced understanding of why children choose to play. Second, we attempted to include critical game activities that were somewhat core to game play (such as crafting, building, exploring, mining). Finally, for advanced activities (such as Redstone), we sought activities that were more common and likely to be recognized by a wider range of players. Some sample items and a screenshot of the survey is shown in Figure 3. Given our focus on middle school learners, we chose to use emoji rather than verbal descriptions for eliciting judgments. The selected set is based on research that these specific representations have been shown to have high reliability and appeal for children (Rounds, Phan, Amrhein, & Lewis, 2016). A big smiley represents “strongly like” and progressively less positive faces through to the tongue out emoticon represent “strongly dislike”. Participants were instructed to mark the middle item, “neither like or dislike”, for actions that they did not recognize.
Figure 3. Example survey items and interface (from SurveyMonkey).
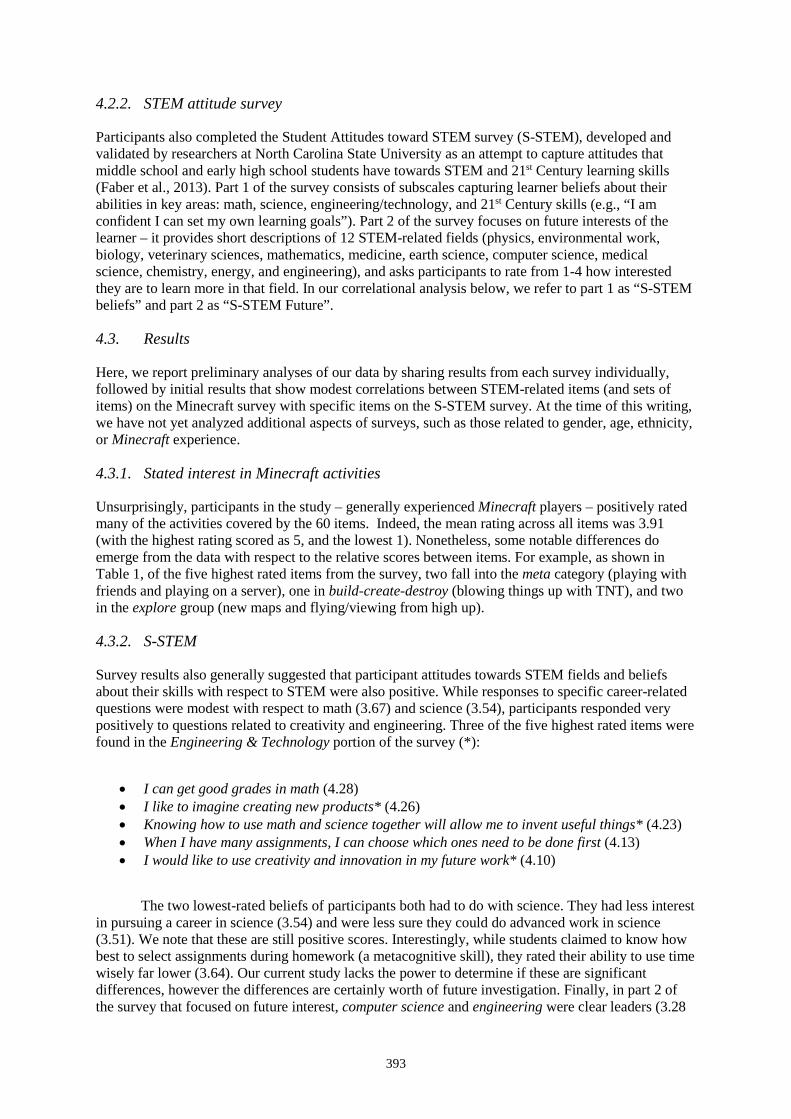
393
4.2.2. STEM attitude survey
Participants also completed the Student Attitudes toward STEM survey (S-STEM), developed and validated by researchers at North Carolina State University as an attempt to capture attitudes that middle school and early high school students have towards STEM and 21st Century learning skills (Faber et al., 2013). Part 1 of the survey consists of subscales capturing learner beliefs about their abilities in key areas: math, science, engineering/technology, and 21st Century skills (e.g., “I am confident I can set my own learning goals”). Part 2 of the survey focuses on future interests of the learner – it provides short descriptions of 12 STEM-related fields (physics, environmental work, biology, veterinary sciences, mathematics, medicine, earth science, computer science, medical science, chemistry, energy, and engineering), and asks participants to rate from 1-4 how interested they are to learn more in that field. In our correlational analysis below, we refer to part 1 as “S-STEM beliefs” and part 2 as “S-STEM Future”.
4.3. Results
Here, we report preliminary analyses of our data by sharing results from each survey individually, followed by initial results that show modest correlations between STEM-related items (and sets of items) on the Minecraft survey with specific items on the S-STEM survey. At the time of this writing, we have not yet analyzed additional aspects of surveys, such as those related to gender, age, ethnicity, or Minecraft experience.
4.3.1. Stated interest in Minecraft activities
Unsurprisingly, participants in the study – generally experienced Minecraft players – positively rated many of the activities covered by the 60 items. Indeed, the mean rating across all items was 3.91 (with the highest rating scored as 5, and the lowest 1). Nonetheless, some notable differences do emerge from the data with respect to the relative scores between items. For example, as shown in Table 1, of the five highest rated items from the survey, two fall into the meta category (playing with friends and playing on a server), one in build-create-destroy (blowing things up with TNT), and two in the explore group (new maps and flying/viewing from high up).
4.3.2. S-STEM
Survey results also generally suggested that participant attitudes towards STEM fields and beliefs about their skills with respect to STEM were also positive. While responses to specific career-related questions were modest with respect to math (3.67) and science (3.54), participants responded very positively to questions related to creativity and engineering. Three of the five highest rated items were found in the Engineering & Technology portion of the survey (*):
• I can get good grades in math (4.28) • I like to imagine creating new products* (4.26) • Knowing how to use math and science together will allow me to invent useful things* (4.23) • When I have many assignments, I can choose which ones need to be done first (4.13) • I would like to use creativity and innovation in my future work* (4.10)
The two lowest-rated beliefs of participants both had to do with science. They had less interest in pursuing a career in science (3.54) and were less sure they could do advanced work in science (3.51). We note that these are still positive scores. Interestingly, while students claimed to know how best to select assignments during homework (a metacognitive skill), they rated their ability to use time wisely far lower (3.64). Our current study lacks the power to determine if these are significant differences, however the differences are certainly worth of future investigation. Finally, in part 2 of the survey that focused on future interest, computer science and engineering were clear leaders (3.28
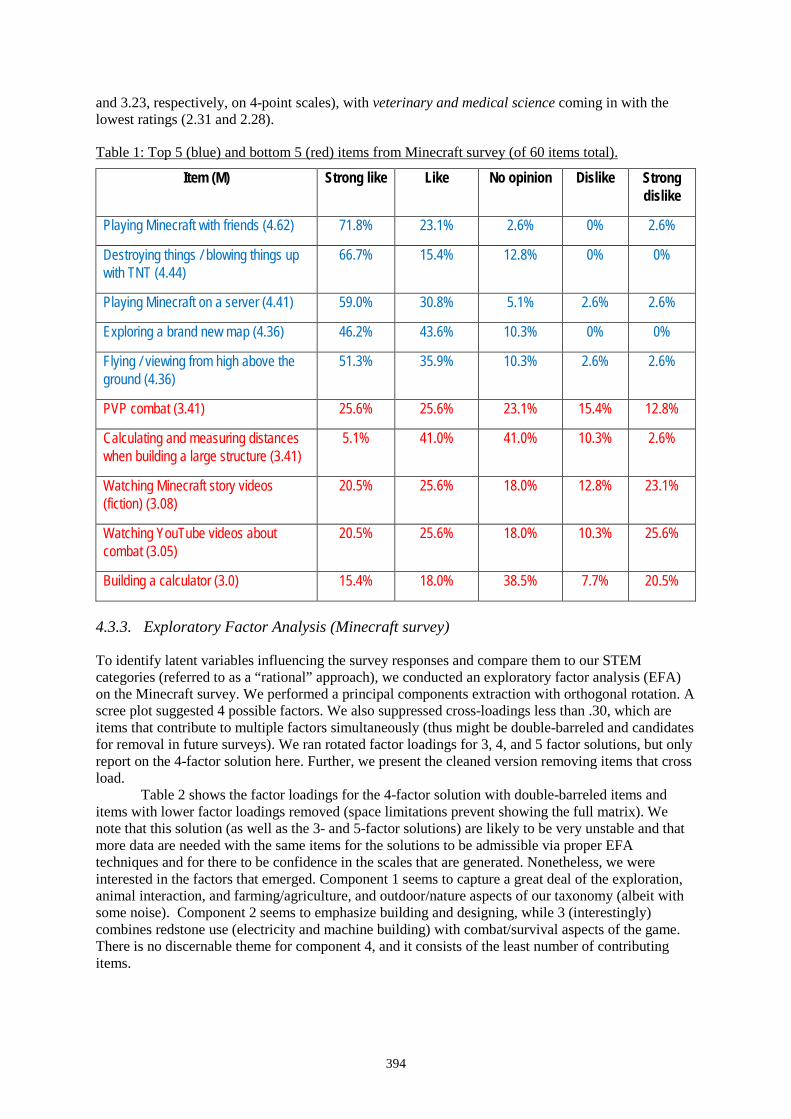
394
and 3.23, respectively, on 4-point scales), with veterinary and medical science coming in with the lowest ratings (2.31 and 2.28).
Table 1: Top 5 (blue) and bottom 5 (red) items from Minecraft survey (of 60 items total).
Item (M) Strong like Like No opinion Dislike Strong dislike
Playing Minecraft with friends (4.62) 71.8% 23.1% 2.6% 0% 2.6%
Destroying things / blowing things up with TNT (4.44)
66.7% 15.4% 12.8% 0% 0%
Playing Minecraft on a server (4.41) 59.0% 30.8% 5.1% 2.6% 2.6%
Exploring a brand new map (4.36) 46.2% 43.6% 10.3% 0% 0%
Flying / viewing from high above the ground (4.36)
51.3% 35.9% 10.3% 2.6% 2.6%
PVP combat (3.41) 25.6% 25.6% 23.1% 15.4% 12.8%
Calculating and measuring distances when building a large structure (3.41)
5.1% 41.0% 41.0% 10.3% 2.6%
Watching Minecraft story videos (fiction) (3.08)
20.5% 25.6% 18.0% 12.8% 23.1%
Watching YouTube videos about combat (3.05)
20.5% 25.6% 18.0% 10.3% 25.6%
Building a calculator (3.0) 15.4% 18.0% 38.5% 7.7% 20.5%
4.3.3. Exploratory Factor Analysis (Minecraft survey)
To identify latent variables influencing the survey responses and compare them to our STEM categories (referred to as a “rational” approach), we conducted an exploratory factor analysis (EFA) on the Minecraft survey. We performed a principal components extraction with orthogonal rotation. A scree plot suggested 4 possible factors. We also suppressed cross-loadings less than .30, which are items that contribute to multiple factors simultaneously (thus might be double-barreled and candidates for removal in future surveys). We ran rotated factor loadings for 3, 4, and 5 factor solutions, but only report on the 4-factor solution here. Further, we present the cleaned version removing items that cross load.
Table 2 shows the factor loadings for the 4-factor solution with double-barreled items and items with lower factor loadings removed (space limitations prevent showing the full matrix). We note that this solution (as well as the 3- and 5-factor solutions) are likely to be very unstable and that more data are needed with the same items for the solutions to be admissible via proper EFA techniques and for there to be confidence in the scales that are generated. Nonetheless, we were interested in the factors that emerged. Component 1 seems to capture a great deal of the exploration, animal interaction, and farming/agriculture, and outdoor/nature aspects of our taxonomy (albeit with some noise). Component 2 seems to emphasize building and designing, while 3 (interestingly) combines redstone use (electricity and machine building) with combat/survival aspects of the game. There is no discernable theme for component 4, and it consists of the least number of contributing items.
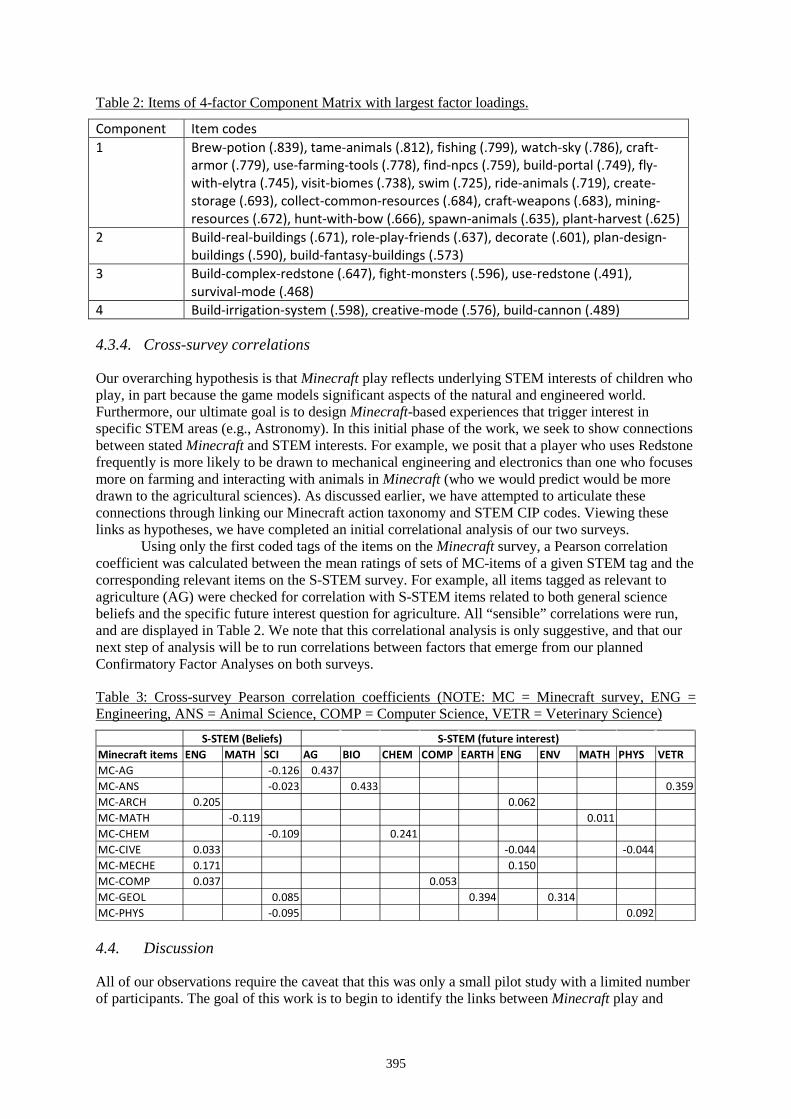
395
Table 2: Items of 4-factor Component Matrix with largest factor loadings.
Component Item codes 1 Brew-potion (.839), tame-animals (.812), fishing (.799), watch-sky (.786), craft-
armor (.779), use-farming-tools (.778), find-npcs (.759), build-portal (.749), fly-with-elytra (.745), visit-biomes (.738), swim (.725), ride-animals (.719), create-storage (.693), collect-common-resources (.684), craft-weapons (.683), mining-resources (.672), hunt-with-bow (.666), spawn-animals (.635), plant-harvest (.625)
2 Build-real-buildings (.671), role-play-friends (.637), decorate (.601), plan-design-buildings (.590), build-fantasy-buildings (.573)
3 Build-complex-redstone (.647), fight-monsters (.596), use-redstone (.491), survival-mode (.468)
4 Build-irrigation-system (.598), creative-mode (.576), build-cannon (.489)
4.3.4. Cross-survey correlations
Our overarching hypothesis is that Minecraft play reflects underlying STEM interests of children who play, in part because the game models significant aspects of the natural and engineered world. Furthermore, our ultimate goal is to design Minecraft-based experiences that trigger interest in specific STEM areas (e.g., Astronomy). In this initial phase of the work, we seek to show connections between stated Minecraft and STEM interests. For example, we posit that a player who uses Redstone frequently is more likely to be drawn to mechanical engineering and electronics than one who focuses more on farming and interacting with animals in Minecraft (who we would predict would be more drawn to the agricultural sciences). As discussed earlier, we have attempted to articulate these connections through linking our Minecraft action taxonomy and STEM CIP codes. Viewing these links as hypotheses, we have completed an initial correlational analysis of our two surveys.
Using only the first coded tags of the items on the Minecraft survey, a Pearson correlation coefficient was calculated between the mean ratings of sets of MC-items of a given STEM tag and the corresponding relevant items on the S-STEM survey. For example, all items tagged as relevant to agriculture (AG) were checked for correlation with S-STEM items related to both general science beliefs and the specific future interest question for agriculture. All “sensible” correlations were run, and are displayed in Table 2. We note that this correlational analysis is only suggestive, and that our next step of analysis will be to run correlations between factors that emerge from our planned Confirmatory Factor Analyses on both surveys.
Table 3: Cross-survey Pearson correlation coefficients (NOTE: MC = Minecraft survey, ENG = Engineering, ANS = Animal Science, COMP = Computer Science, VETR = Veterinary Science)
4.4. Discussion
All of our observations require the caveat that this was only a small pilot study with a limited number of participants. The goal of this work is to begin to identify the links between Minecraft play and
Minecraft items ENG MATH SCI AG BIO CHEM COMP EARTH ENG ENV MATH PHYS VETRMC-AG -0.126 0.437MC-ANS -0.023 0.433 0.359MC-ARCH 0.205 0.062MC-MATH -0.119 0.011MC-CHEM -0.109 0.241MC-CIVE 0.033 -0.044 -0.044MC-MECHE 0.171 0.150MC-COMP 0.037 0.053MC-GEOL 0.085 0.394 0.314MC-PHYS -0.095 0.092
S-STEM (Beliefs) S-STEM (future interest)
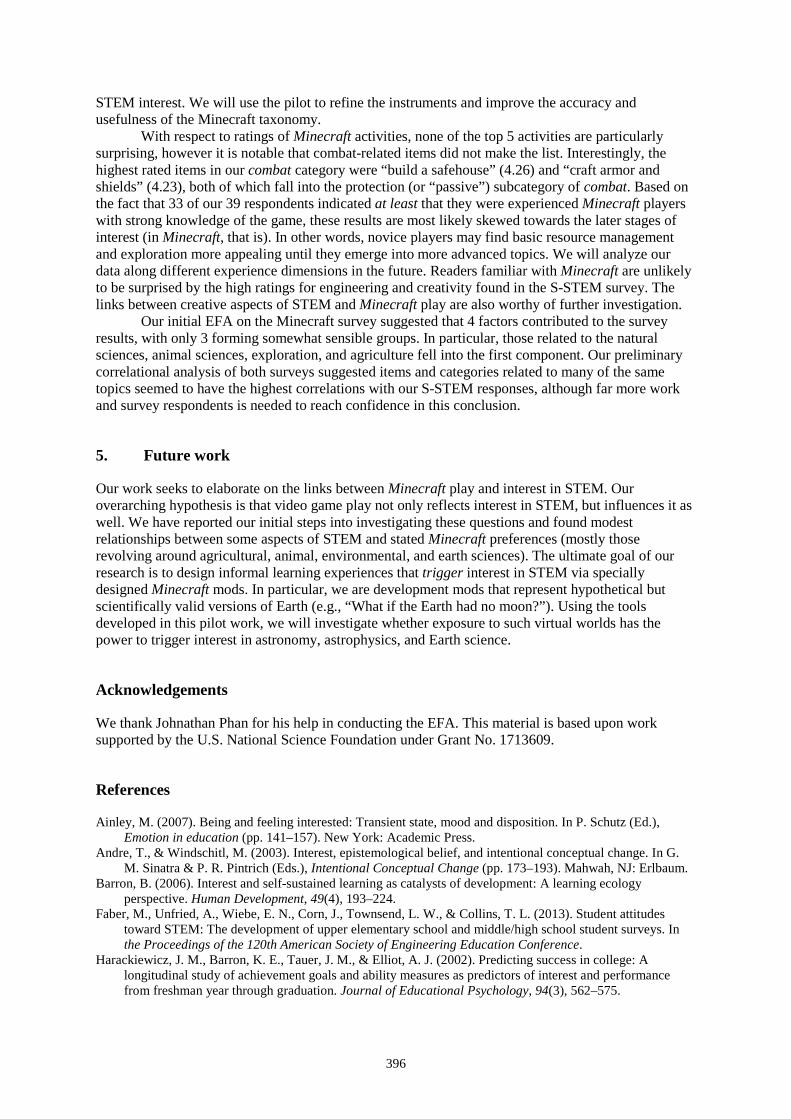
396
STEM interest. We will use the pilot to refine the instruments and improve the accuracy and usefulness of the Minecraft taxonomy.
With respect to ratings of Minecraft activities, none of the top 5 activities are particularly surprising, however it is notable that combat-related items did not make the list. Interestingly, the highest rated items in our combat category were “build a safehouse” (4.26) and “craft armor and shields” (4.23), both of which fall into the protection (or “passive”) subcategory of combat. Based on the fact that 33 of our 39 respondents indicated at least that they were experienced Minecraft players with strong knowledge of the game, these results are most likely skewed towards the later stages of interest (in Minecraft, that is). In other words, novice players may find basic resource management and exploration more appealing until they emerge into more advanced topics. We will analyze our data along different experience dimensions in the future. Readers familiar with Minecraft are unlikely to be surprised by the high ratings for engineering and creativity found in the S-STEM survey. The links between creative aspects of STEM and Minecraft play are also worthy of further investigation.
Our initial EFA on the Minecraft survey suggested that 4 factors contributed to the survey results, with only 3 forming somewhat sensible groups. In particular, those related to the natural sciences, animal sciences, exploration, and agriculture fell into the first component. Our preliminary correlational analysis of both surveys suggested items and categories related to many of the same topics seemed to have the highest correlations with our S-STEM responses, although far more work and survey respondents is needed to reach confidence in this conclusion.
5. Future work
Our work seeks to elaborate on the links between Minecraft play and interest in STEM. Our overarching hypothesis is that video game play not only reflects interest in STEM, but influences it as well. We have reported our initial steps into investigating these questions and found modest relationships between some aspects of STEM and stated Minecraft preferences (mostly those revolving around agricultural, animal, environmental, and earth sciences). The ultimate goal of our research is to design informal learning experiences that trigger interest in STEM via specially designed Minecraft mods. In particular, we are development mods that represent hypothetical but scientifically valid versions of Earth (e.g., “What if the Earth had no moon?”). Using the tools developed in this pilot work, we will investigate whether exposure to such virtual worlds has the power to trigger interest in astronomy, astrophysics, and Earth science.
Acknowledgements
We thank Johnathan Phan for his help in conducting the EFA. This material is based upon work supported by the U.S. National Science Foundation under Grant No. 1713609.
References
Ainley, M. (2007). Being and feeling interested: Transient state, mood and disposition. In P. Schutz (Ed.), Emotion in education (pp. 141–157). New York: Academic Press.
Andre, T., & Windschitl, M. (2003). Interest, epistemological belief, and intentional conceptual change. In G. M. Sinatra & P. R. Pintrich (Eds.), Intentional Conceptual Change (pp. 173–193). Mahwah, NJ: Erlbaum.
Barron, B. (2006). Interest and self-sustained learning as catalysts of development: A learning ecology perspective. Human Development, 49(4), 193–224.
Faber, M., Unfried, A., Wiebe, E. N., Corn, J., Townsend, L. W., & Collins, T. L. (2013). Student attitudes toward STEM: The development of upper elementary school and middle/high school student surveys. In the Proceedings of the 120th American Society of Engineering Education Conference.
Harackiewicz, J. M., Barron, K. E., Tauer, J. M., & Elliot, A. J. (2002). Predicting success in college: A longitudinal study of achievement goals and ability measures as predictors of interest and performance from freshman year through graduation. Journal of Educational Psychology, 94(3), 562–575.
397
Harackiewicz, J. M., & Hulleman, C. S. (2010). The importance of interest: The role of achievement goals and task values in promoting the development of interest. Social and Personality Psychology Compass, 4(1), 42–52.
Hidi, S., & Harackiewicz, J. M. (2000). Motivating the academically unmotivated: A critical issue for the 21st century. Review of Educational Research, 70(2), 151–179.
Hidi, S., & Renninger, K. A. (2006). The Four-Phase Model of Interest Development. Educational Psychologist, 41(2), 111–127. https://doi.org/10.1207/s15326985ep4102_4
Krapp, A. (1999). Interest, motivation and learning: An educational-psychological perspective. European Journal of Psychology of Education, 14(1), 23–40. https://doi.org/10.1007/BF03173109
Lane, H. C., & Yi, S. (2017). Playing with virtual blocks: Minecraft as a learning environment for practice and research. In F. C. Blumberg & P. J. Brooks (Eds.), Cognitive Development in Digital Contexts (pp. 145–166). Amsterdam, Netherlands: Elsevier.
Lipstein, R., & Renninger, K. A. (2006). Putting things into words: The development of 12-15-year-old students’ interest for writing. Motivation and Writing: Research and School Practice, 113–140.
McDaniel, M. A., Waddill, P. J., Finstad, K., & Bourg, T. (2000). The effects of text-based interest on attention and recall. Journal of Educational Psychology, 92(3), 492.
Nieswandt, M. (2007). Student affect and conceptual understanding in learning chemistry. Journal of Research in Science Teaching, 44(7), 908–937.
Peckham, M. (2016). “Minecraft” Is Now the Second Best-Selling Game of All Time. Time. Retrieved from http://time.com/4354135/minecraft-bestelling/
Potvin, P., & Hasni, A. (2014). Interest, motivation and attitude towards science and technology at K-12 levels: a systematic review of 12 years of educational research. Studies in Science Education, 50(1), 85–129.
Reeve, J., Jang, H., Hardre, P., & Omura, M. (2002). Providing a rationale in an autonomy-supportive way as a strategy to motivate others during an uninteresting activity. Motivation and Emotion, 26(3), 183–207.
Renninger, K. A., & Bachrach, J. E. (2015). Studying triggers for interest and engagement using observational methods. Educational Psychologist, 50(1), 58–69.
Renninger, K. A., & Hidi, S. (2016). The power of interest for motivation and engagement. New York, NY: Routledge.
Renninger, K. A., Nieswandt, M., & Hidi, S. (2015a). Interest in Mathematics and Science Learning. American Educational Research Association. Retrieved from https://books.google.com/books?id=F5KRrgEACAAJ
Renninger, K. A., Nieswandt, M., & Hidi, S. (2015b). On the Power of Interest. In K. A. Renninger, M. Nieswandt, & S. Hidi (Eds.), Interest in Mathematics and Science Learning (pp. 1–14). Washington, DC: American Educational Research Association.
Rounds, J., Phan, W. M. J., Amrhein, R., & Lewis, P. (2016). Examining the Efficacy of Emoji Anchors for the O* NET Interest Profiler Short Form.
Sansone, C., Fraughton, T., Zachary, J. L., Butner, J., & Heiner, C. (2011). Self-regulation of motivation when learning online: the importance of who, why and how. Educational Technology Research and Development, 59(2), 199–212.
Schifter, C., & Cipollone, M. (2013). Minecraft as a teaching tool: One case study. In Society for Information Technology & Teacher Education International Conference (Vol. 2013, pp. 2951–2955).
Schwartz, K. (2015). For the hesitant teacher: Leveraging the power of Minecraft. Mind/Shift: How We Will Learn. Retrieved from http://ww2.kqed.org/mindshift/2015/09/28/for-the-hesitant-teacher-leveraging-the-power-of-minecraft/
Silvia, P. J. (2006). Exploring the psychology of interest. Oxford; New York: Oxford University Press.
Hayashi, Y., et al. (Eds.) (2017). Workshop Proceedings of the 25th International Conference on Computers in Education. New Zealand: Asia-Pacific Society for Computers in Education
398
Improving Jakarta Historical Understanding Ability Through Inquiry Learning Model
Assisted With ICT Among Junior High School Students
SUSWANDARI*a, Laely ARMIYATIb, Khoerul UMAMc,Nur ASIAH,Eka Nana SUSANTId, a,b,dSocial Studies, University of Muhammadiyah Prof DR HAMKA, Jakarta
dMathematics Education, University of Muhammadiyah Prof DR HAMKA, Jakarta *[email protected]
Abstract: The main purpose of this study is to improve students’ understanding about Jakarta History and their wisdom local values by integrating Information and Communication Technology (ICT) with Inquiry Learning Model. This study was a quasi-experimental design. The samples of the study are 40 students for classroom experiments and 40 students for classroom control. The instruments employed in this study were pre-test and post-test. The instruments are made in essays forms which design to measure students understanding about Jakarta History and in questionnaire form which is design to measure students’ preferences about their learning experiences. The data were analyzed by using descriptive and inferential statistics. Our finding has shown us that (1) Inquiry Learning model assisted with ICT had a positive impact on student’s understanding about Jakarta History; (2) An experimental group has been chosen history about as students preference lesson because the learning process offers integrating ICT with Inquiry learning model; (3) there is a statistically significant mean difference in students' understanding ability about Jakarta History between experiment group and control group.
Keywords: Integrated Inquiry with ICT, Jakarta History, Betawi values.
1. Introduction
Historical learning in a school commonly focus on students learning outcome but rarely many students skills ability have been forgotten in learning process such as students’ understanding skill, students communication skill, and students’ problem solving skills. This is mainly because many teachers only used a book as single learning recourses and using conventional teaching method for learning process. Learning innovation are compulsory to be initiated and implemented in learning process especially to accommodate other students’ learning ability. Inquiry learning model offers some activity which is encouraged students to investigate some historical event around the world especially Jakarta History by using their own observation in a learning process (National Research Council 1996, p.123). Furthermore, using ICT media will give more advantages for improving many students’ skills (Alim, Umam & Wijirahayu, 2016). This mainly because ICT offers more visualization about learning materials and interactive learning media which will make students to be involved in learning activity (Umam, 2016).
This study will choose Jakarta History for subject because Jakarta Local culture is growing slowly around local community and student’s achievements for history is still not satisfactory (Suswandari & Astuti, 2016; Suswandari, 2017). Jakarta Local culture should be improved simultaneously both in a school and a local community. Real actions should be taken to conserve this valuable heritages by providing some exciting cultural events and accelerating both collaborative and integrative learning process about Jakarta History especially in a school. Teachers and researchers should collaboratively redesign an exciting learning activity which is provided more engaging activities and used more attractive learning media. To accommodate all of this, Integrating ICT and
399
inquiry learning model have become a new trend which has been shown when learning activities were brought via information technology (Ainley and Ainley, 2011). The study offers a collaborative and integrative learning design of ICT-assisted Integrated Inquiry Model which can assist students not only in shaping the character of local wisdom of Betawi culture but also in improving their understanding about Jakarta History, as well.
2. Inquiry Learning Model Assisted with ICT
Inquiry Learning Model is chosen because this learning model not only provide more engaging activities but also encourage students to be more active in learning process. Inquiry Learning Model that is used in this research has five main steps, namely stimulation, exploration, scanning value, presentation, and reflection (Suswandari & Astuti, 2016). An overview of the implementation will be presented as follows;
2.1. Stimulation
This step begins to focus on increasing students’ interest for learning materials and exploring their previous knowledge. At this stage the teacher encourage students to some attractive situation by using movies, videos, stories, or pictures relating to Jakarta History and Betawi local wisdom values videos.
2.2. Exploration
The main purposes of this stages is to hone students’ ability in concluding and analyzing the values contained in Jakarta local wisdom values and Jakarta History. The exploration phase is linked to the learner's previous knowledge so that students can be more engaging to their new knowledge. An exploration process need to improve simultaneously during the entire learning process.
2.3. Scanning Value
Scanning value is the main activity in Inquiry Learning model which is developed by (Suswandari, 2016). This is because this stage learners will be asked to investigate what values are contained in the material being studied by observing some ICT media that has been prepared to complement the learning materials. ICT media offers a beneficial tools for students to investigate main values in Jakarta’s culture and History which is sharpening students’ sensitivity and students’ analysis from what they see, hear, and do. At this stage, the teachers have provides a worksheet that has been formed to sharpen students’ understanding about Jakarta History and their local culture values.
2.4. Presentation
At this stage, the teacher asks each group to submit the results of their analysis, then ask a representative students from each different groups to perform their investigation and analysis about Jakarta History and local culture values by using ICT media as well. After presenting their analysis, others students need to ask and give a feedback from their own perspectives.
2.5. Reflection
The reflection stage is the last process in Inquir learning Model. At this stage, the teacher reflects on students’ performance and give some appreciation for their collaborative work during learning process. Some students will be chosen to represent their group to conclude learning material for this meeting.
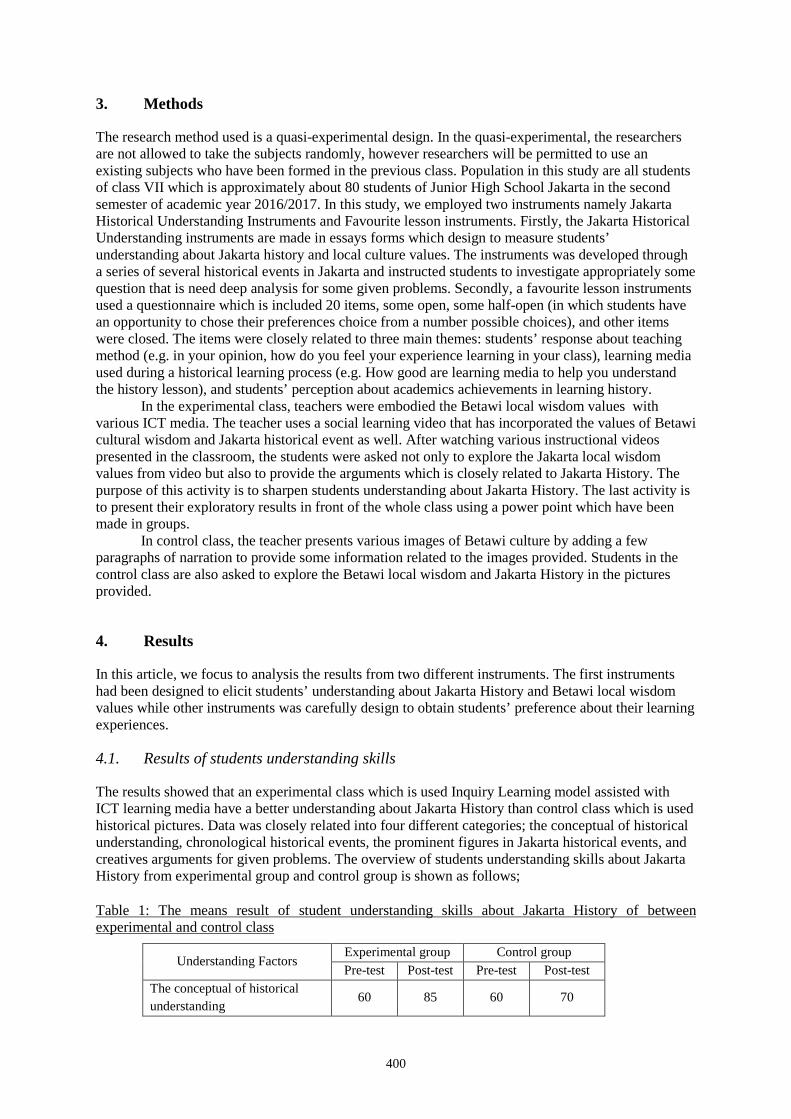
400
3. Methods
The research method used is a quasi-experimental design. In the quasi-experimental, the researchers are not allowed to take the subjects randomly, however researchers will be permitted to use an existing subjects who have been formed in the previous class. Population in this study are all students of class VII which is approximately about 80 students of Junior High School Jakarta in the second semester of academic year 2016/2017. In this study, we employed two instruments namely Jakarta Historical Understanding Instruments and Favourite lesson instruments. Firstly, the Jakarta Historical Understanding instruments are made in essays forms which design to measure students’ understanding about Jakarta history and local culture values. The instruments was developed through a series of several historical events in Jakarta and instructed students to investigate appropriately some question that is need deep analysis for some given problems. Secondly, a favourite lesson instruments used a questionnaire which is included 20 items, some open, some half-open (in which students have an opportunity to chose their preferences choice from a number possible choices), and other items were closed. The items were closely related to three main themes: students’ response about teaching method (e.g. in your opinion, how do you feel your experience learning in your class), learning media used during a historical learning process (e.g. How good are learning media to help you understand the history lesson), and students’ perception about academics achievements in learning history.
In the experimental class, teachers were embodied the Betawi local wisdom values with various ICT media. The teacher uses a social learning video that has incorporated the values of Betawi cultural wisdom and Jakarta historical event as well. After watching various instructional videos presented in the classroom, the students were asked not only to explore the Jakarta local wisdom values from video but also to provide the arguments which is closely related to Jakarta History. The purpose of this activity is to sharpen students understanding about Jakarta History. The last activity is to present their exploratory results in front of the whole class using a power point which have been made in groups.
In control class, the teacher presents various images of Betawi culture by adding a few paragraphs of narration to provide some information related to the images provided. Students in the control class are also asked to explore the Betawi local wisdom and Jakarta History in the pictures provided.
4. Results
In this article, we focus to analysis the results from two different instruments. The first instruments had been designed to elicit students’ understanding about Jakarta History and Betawi local wisdom values while other instruments was carefully design to obtain students’ preference about their learning experiences.
4.1. Results of students understanding skills
The results showed that an experimental class which is used Inquiry Learning model assisted with ICT learning media have a better understanding about Jakarta History than control class which is used historical pictures. Data was closely related into four different categories; the conceptual of historical understanding, chronological historical events, the prominent figures in Jakarta historical events, and creatives arguments for given problems. The overview of students understanding skills about Jakarta History from experimental group and control group is shown as follows;
Table 1: The means result of student understanding skills about Jakarta History of between experimental and control class
Understanding Factors Experimental group Control group Pre-test Post-test Pre-test Post-test
The conceptual of historical understanding
60 85 60 70
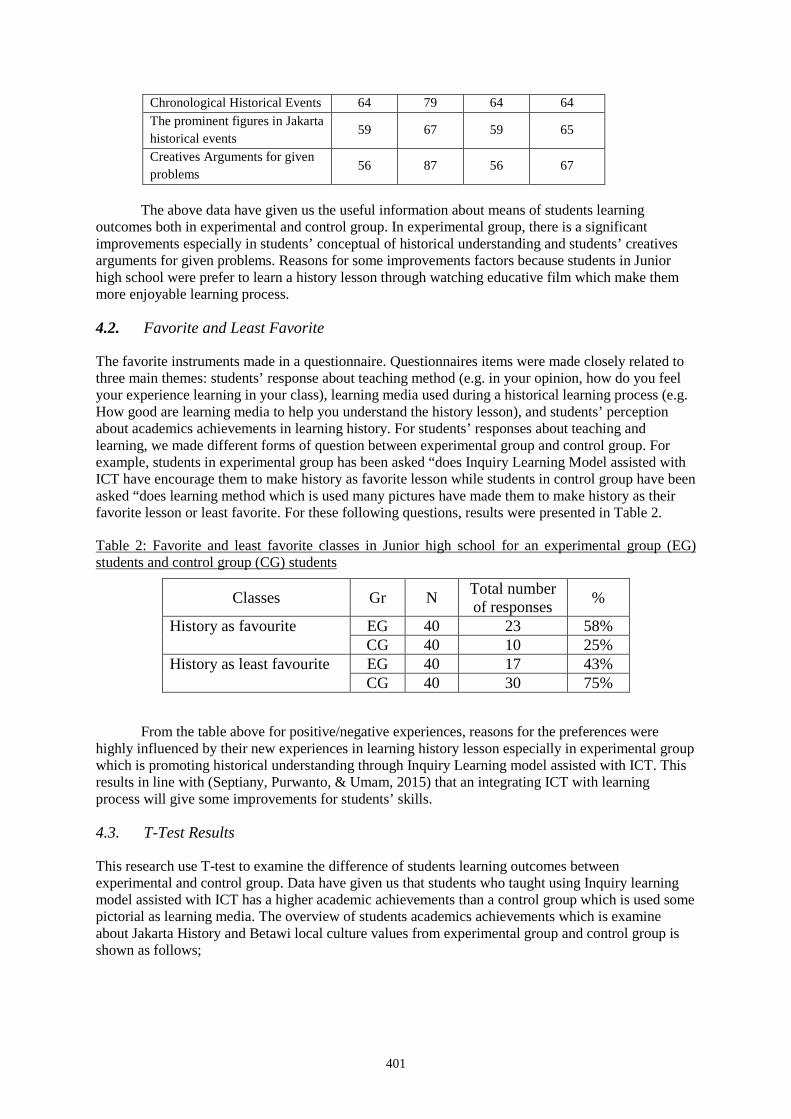
401
Chronological Historical Events 64 79 64 64 The prominent figures in Jakarta historical events
59 67 59 65
Creatives Arguments for given problems
56 87 56 67
The above data have given us the useful information about means of students learning
outcomes both in experimental and control group. In experimental group, there is a significant improvements especially in students’ conceptual of historical understanding and students’ creatives arguments for given problems. Reasons for some improvements factors because students in Junior high school were prefer to learn a history lesson through watching educative film which make them more enjoyable learning process.
4.2. Favorite and Least Favorite
The favorite instruments made in a questionnaire. Questionnaires items were made closely related to three main themes: students’ response about teaching method (e.g. in your opinion, how do you feel your experience learning in your class), learning media used during a historical learning process (e.g. How good are learning media to help you understand the history lesson), and students’ perception about academics achievements in learning history. For students’ responses about teaching and learning, we made different forms of question between experimental group and control group. For example, students in experimental group has been asked “does Inquiry Learning Model assisted with ICT have encourage them to make history as favorite lesson while students in control group have been asked “does learning method which is used many pictures have made them to make history as their favorite lesson or least favorite. For these following questions, results were presented in Table 2.
Table 2: Favorite and least favorite classes in Junior high school for an experimental group (EG) students and control group (CG) students
Classes Gr N Total number of responses %
History as favourite EG 40 23 58% CG 40 10 25%
History as least favourite EG 40 17 43% CG 40 30 75%
From the table above for positive/negative experiences, reasons for the preferences were highly influenced by their new experiences in learning history lesson especially in experimental group which is promoting historical understanding through Inquiry Learning model assisted with ICT. This results in line with (Septiany, Purwanto, & Umam, 2015) that an integrating ICT with learning process will give some improvements for students’ skills.
4.3. T-Test Results
This research use T-test to examine the difference of students learning outcomes between experimental and control group. Data have given us that students who taught using Inquiry learning model assisted with ICT has a higher academic achievements than a control group which is used some pictorial as learning media. The overview of students academics achievements which is examine about Jakarta History and Betawi local culture values from experimental group and control group is shown as follows;
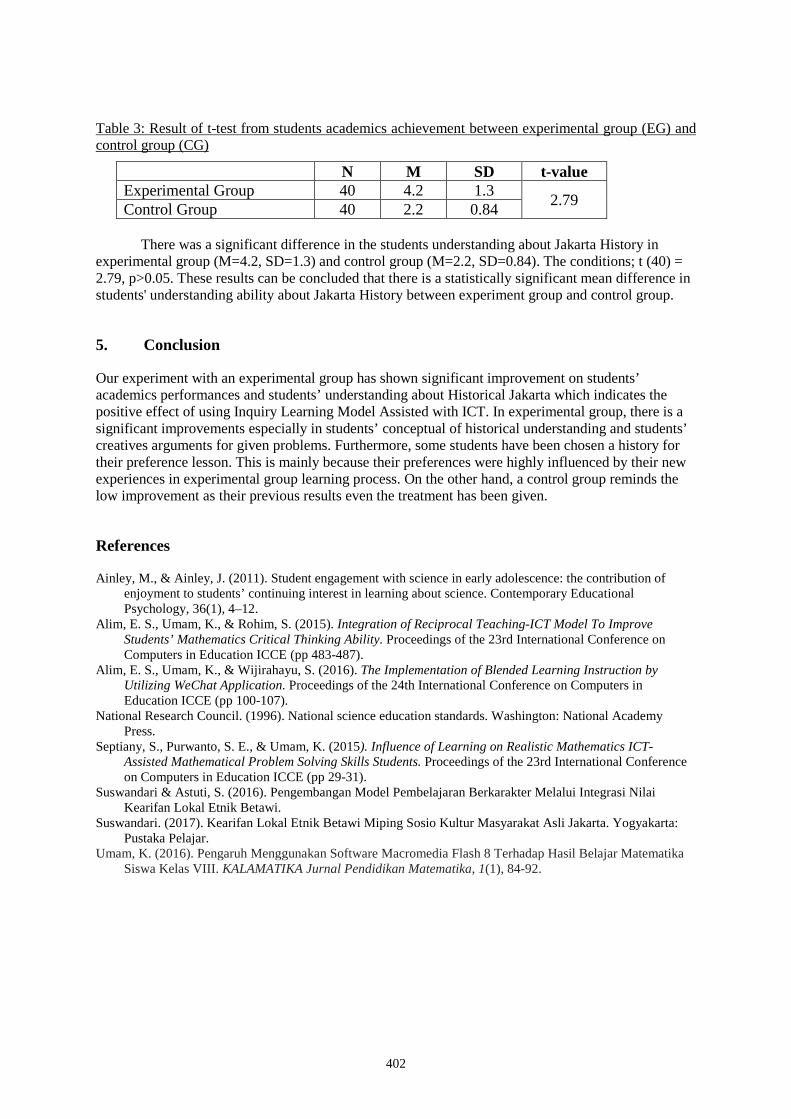
402
Table 3: Result of t-test from students academics achievement between experimental group (EG) and control group (CG)
N M SD t-value Experimental Group 40 4.2 1.3 2.79 Control Group 40 2.2 0.84
There was a significant difference in the students understanding about Jakarta History in
experimental group (M=4.2, SD=1.3) and control group (M=2.2, SD=0.84). The conditions; t (40) = 2.79, p>0.05. These results can be concluded that there is a statistically significant mean difference in students' understanding ability about Jakarta History between experiment group and control group.
5. Conclusion
Our experiment with an experimental group has shown significant improvement on students’ academics performances and students’ understanding about Historical Jakarta which indicates the positive effect of using Inquiry Learning Model Assisted with ICT. In experimental group, there is a significant improvements especially in students’ conceptual of historical understanding and students’ creatives arguments for given problems. Furthermore, some students have been chosen a history for their preference lesson. This is mainly because their preferences were highly influenced by their new experiences in experimental group learning process. On the other hand, a control group reminds the low improvement as their previous results even the treatment has been given.
References
Ainley, M., & Ainley, J. (2011). Student engagement with science in early adolescence: the contribution of enjoyment to students’ continuing interest in learning about science. Contemporary Educational Psychology, 36(1), 4–12.
Alim, E. S., Umam, K., & Rohim, S. (2015). Integration of Reciprocal Teaching-ICT Model To Improve Students’ Mathematics Critical Thinking Ability. Proceedings of the 23rd International Conference on Computers in Education ICCE (pp 483-487).
Alim, E. S., Umam, K., & Wijirahayu, S. (2016). The Implementation of Blended Learning Instruction by Utilizing WeChat Application. Proceedings of the 24th International Conference on Computers in Education ICCE (pp 100-107).
National Research Council. (1996). National science education standards. Washington: National Academy Press.
Septiany, S., Purwanto, S. E., & Umam, K. (2015). Influence of Learning on Realistic Mathematics ICT-Assisted Mathematical Problem Solving Skills Students. Proceedings of the 23rd International Conference on Computers in Education ICCE (pp 29-31).
Suswandari & Astuti, S. (2016). Pengembangan Model Pembelajaran Berkarakter Melalui Integrasi Nilai Kearifan Lokal Etnik Betawi.
Suswandari. (2017). Kearifan Lokal Etnik Betawi Miping Sosio Kultur Masyarakat Asli Jakarta. Yogyakarta: Pustaka Pelajar.
Umam, K. (2016). Pengaruh Menggunakan Software Macromedia Flash 8 Terhadap Hasil Belajar Matematika Siswa Kelas VIII. KALAMATIKA Jurnal Pendidikan Matematika, 1(1), 84-92.
Hayashi, Y., et al. (Eds.) (2017). Workshop Proceedings of the 25th International Conference on Computers in Education. New Zealand: Asia-Pacific Society for Computers in Education
403
Using 2D Simulation Applications to Motivate Students to Learn STEAM
Tercia-Marie Tafadzwa TEMBO* & Chien-Sing LEE Department of Computing & Information Systems, Sunway University, Malaysia
Abstract: In this paper, we discuss the declining interest in STEM subjects of high school students in Malaysia and delve into our ongoing research towards developing a learning activity that will motivate them to pursue learning STEAM. The activity is developed using a combination of Learning by Design pedagogy along with PhET and Algodoo Simulation applications to teach students Physics topics facilitated by a website with gamification features.
Keywords: 2D Simulations, Physics, Learning by Design, STEAM Learning
1. Introduction
The term “STEAM” refers to the fields of science, technology, engineering, and mathematics together with the arts. The integration of STEM subjects and art and design in education teaches students to think critically and have an interdisciplinary approach towards real-world problems while building on their mathematics and science knowledge. Individually the subjects are important in their own regard but once integrated, STEM is ubiquitous and shapes our everyday lives - one can’t fully function without the other. For instance, engineering uses the findings of science research, the application of mathematics for calculations and uses technological tools to design solutions for real world problems, vital to a thriving economy. STEAM Education gives students meaningful experiences and allows them to explore real-world issues for themselves from another perspective. It encourages them to make connections they otherwise wouldn’t have made from reading a single discipline textbook.
An adequate implementation of STEAM Education can create generations of critical thinkers and innovators, resulting in a more creative workforce, which will help in the economy’s development.
However, Nasa and Anwar (2016) from New Straits Times reported that Malaysia is experiencing a drastic decline in STEM student enrolment, which may result in the country losing the developed nation status in comparison with other advanced countries. Arfudi (2016) reported that only 18% of 500,000 students sit for the SPM annually which is significantly less than the targeted 54%. He attributed the decline to students shying away from the field due to their perception of how difficult it is. In secondary school, the students are divided into science and non-science streams, with the high achievers automatically being placed into the science classes. This segregation instilled the notion that STEM can only be pursued by top students as they are difficult subjects. Similarly, Jayarajah, Saat, and Rauf (2014) and Bunyamin and Finley’s (2016) studies on STEM education in Malaysia found that STEM integration was lacking in schools. Furthermore, there is more emphasis on science and technology but the least attention is given to engineering education. However, it is the latter which helps to educate students about the design process.
The ability to motivate students to learn with just direct instruction classes is also a major challenge. If teaching methods focus on reiterating textbook content alone and doesn’t implement a more engaging and interactive form of delivery, the students may drift away from the subject with the belief that it is too difficult to understand. O.C (2016) reported that “The main reason students shy away from STEM subjects was because many experienced difficulty and complexity in grasping the basic conceptual knowledge.” This shows that educators need to explore diverse teaching methods
404
that can help students apply critical and scientific thinking to better comprehend the learning materials and gain more confidence in pursuing STE(A)M careers.
2. Theoretical Framework
Considering the aforementioned issues, the following literature review will explore methods of delivering STEAM content to students in a more intriguing and less intimidating way that gives the learner more confidence to pursue STEAM subjects while also making clear connections between the subjects and how to utilise them to solve real world issues.
2.1. Literature Review
While reviewing the physics curriculum in Malaysia, Bunyamin and Finley (2016) used a suggestion by Roehrig, Moore, Wang and Park (2012) who stated that there is a natural fit between physics and engineering at high school level. Furthermore, in a survey conducted by Wilkinson and Lancaster (2013) on 209 students, 97 were studying STEM subjects. Findings showed that technology can motivate STEM students. Using these studies as a base, we decided to motivate our students to take interest in STEM using technology to teach them Physics. We referred to Mellema’s (2001) physics education pedagogy to determine what type of technology to use and how to integrate it. Mellema’s (2001) pedagogy focused on students learning physics with the assistance of Web technology. The Web technology consisted of the WebAssign website that he used to assign tasks such as notes, problems and quizzes. He also used Physlets, interactive simulations of a physical phenomenon that students could interact with to help visualise the concepts and solve problems. His method incorporated testing students at multiple stages of their learning for just-in-time teaching and collaborative context-rich problem solving with ill-structured real-world problems to encourage learning in context. The pedagogy thus aided students to develop Bloom’s Taxonomy progressively such as from recalling to understanding and applying conceptual information, while also building a flexible knowledge base, group collaboration and communication skills.
The latter stages of Bloom’s taxonomy foster Higher Order Thinking Skills (HOTS). HOTS are important in STEM Education (Bunyamin and Finley, 2016 and O.C, 2016). Using the revised Bloom’s taxonomy (Anderson and Krathwohl, 2001) as reference, the topmost level of cognitive ability is the creation skill, where the learner acquires the ability to produce their own original work based on information they analysed and evaluated, showing that they truly comprehended the concept. To work our way up Bloom’s Taxonomy’s educational objectives, we apply Case-Based Reasoning (CBR) with Problem Based Learning (PBL) in Learning-by-Design (LBD), a pedagogy developed by Kolodner, Crismond, Gray, Holbrook and Puntambekar (1998) and Kolodner, Camp, Crismond, Fasse, Gray, Holbrook, Puntambekar and Ryan (2003). In CBR, students use solutions of past related problems to formulate a solution for a newly presented case. The CBR cycle of retrieving, reusing, revising and retaining cases, teaches students to decompose data, recognise patterns, abstract the essential information and analyse it to draw probable conclusions. This approach picks up where we left off with Mellema’s (2001) pedagogy and further builds on the acquisition of Bloom’s learning skills by sharpening the apply, analyse and evaluation skill bands. An example of learning outcome, is the ability to design mechanically-powered toy vehicles. Similarly, we will go back to our base theory of using technology and ask our students to first experiment, draw conclusions and subsequently, create a 2D Simulation to be shared with other students. Simulations are important as they can display abstract scientific concepts that may be difficult to recreate in the real world.
2.2. Research Gap and Rationale
Our research extends from Mellema’s (2001) in terms of asking the students to design/create. While Mellema’s participants only interacted with pre-created Physlets, our students will collaboratively design their own simulations from scratch with the facilitation of a website with gamification features such as points, badges and leaderboards. We believe that these factors have not been tackled in this combination and could contribute to STEAM education in Malaysia. Table 1 shows how our
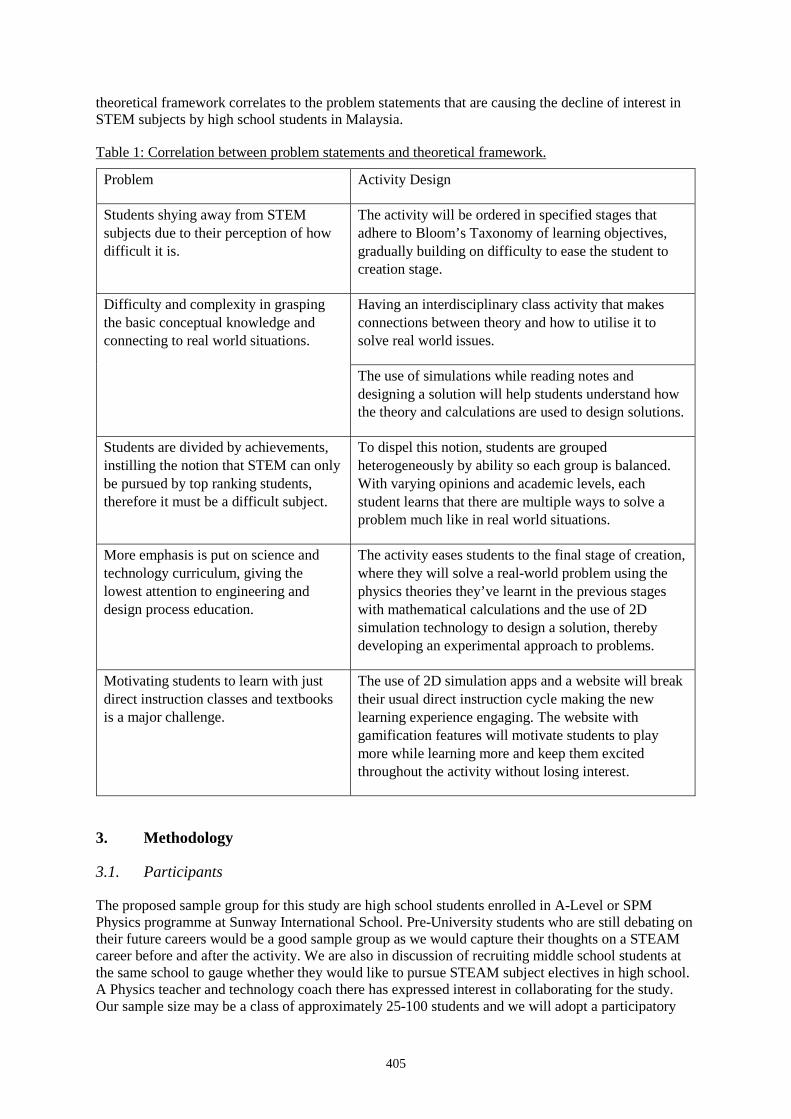
405
theoretical framework correlates to the problem statements that are causing the decline of interest in STEM subjects by high school students in Malaysia.
Table 1: Correlation between problem statements and theoretical framework.
Problem Activity Design
Students shying away from STEM subjects due to their perception of how difficult it is.
The activity will be ordered in specified stages that adhere to Bloom’s Taxonomy of learning objectives, gradually building on difficulty to ease the student to creation stage.
Difficulty and complexity in grasping the basic conceptual knowledge and connecting to real world situations.
Having an interdisciplinary class activity that makes connections between theory and how to utilise it to solve real world issues.
The use of simulations while reading notes and designing a solution will help students understand how the theory and calculations are used to design solutions.
Students are divided by achievements, instilling the notion that STEM can only be pursued by top ranking students, therefore it must be a difficult subject.
To dispel this notion, students are grouped heterogeneously by ability so each group is balanced. With varying opinions and academic levels, each student learns that there are multiple ways to solve a problem much like in real world situations.
More emphasis is put on science and technology curriculum, giving the lowest attention to engineering and design process education.
The activity eases students to the final stage of creation, where they will solve a real-world problem using the physics theories they’ve learnt in the previous stages with mathematical calculations and the use of 2D simulation technology to design a solution, thereby developing an experimental approach to problems.
Motivating students to learn with just direct instruction classes and textbooks is a major challenge.
The use of 2D simulation apps and a website will break their usual direct instruction cycle making the new learning experience engaging. The website with gamification features will motivate students to play more while learning more and keep them excited throughout the activity without losing interest.
3. Methodology
3.1. Participants
The proposed sample group for this study are high school students enrolled in A-Level or SPM Physics programme at Sunway International School. Pre-University students who are still debating on their future careers would be a good sample group as we would capture their thoughts on a STEAM career before and after the activity. We are also in discussion of recruiting middle school students at the same school to gauge whether they would like to pursue STEAM subject electives in high school. A Physics teacher and technology coach there has expressed interest in collaborating for the study. Our sample size may be a class of approximately 25-100 students and we will adopt a participatory
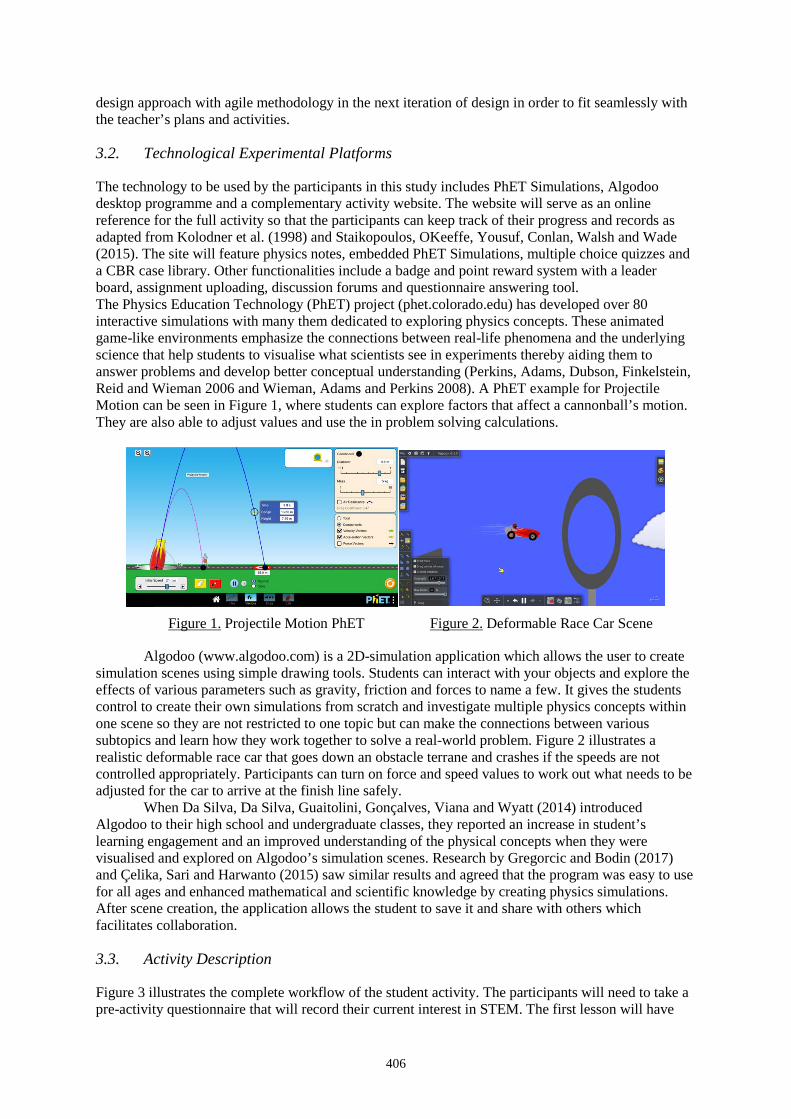
406
design approach with agile methodology in the next iteration of design in order to fit seamlessly with the teacher’s plans and activities.
3.2. Technological Experimental Platforms
The technology to be used by the participants in this study includes PhET Simulations, Algodoo desktop programme and a complementary activity website. The website will serve as an online reference for the full activity so that the participants can keep track of their progress and records as adapted from Kolodner et al. (1998) and Staikopoulos, OKeeffe, Yousuf, Conlan, Walsh and Wade (2015). The site will feature physics notes, embedded PhET Simulations, multiple choice quizzes and a CBR case library. Other functionalities include a badge and point reward system with a leader board, assignment uploading, discussion forums and questionnaire answering tool. The Physics Education Technology (PhET) project (phet.colorado.edu) has developed over 80 interactive simulations with many them dedicated to exploring physics concepts. These animated game-like environments emphasize the connections between real-life phenomena and the underlying science that help students to visualise what scientists see in experiments thereby aiding them to answer problems and develop better conceptual understanding (Perkins, Adams, Dubson, Finkelstein, Reid and Wieman 2006 and Wieman, Adams and Perkins 2008). A PhET example for Projectile Motion can be seen in Figure 1, where students can explore factors that affect a cannonball’s motion. They are also able to adjust values and use the in problem solving calculations.
Figure 1. Projectile Motion PhET Figure 2. Deformable Race Car Scene
Algodoo (www.algodoo.com) is a 2D-simulation application which allows the user to create simulation scenes using simple drawing tools. Students can interact with your objects and explore the effects of various parameters such as gravity, friction and forces to name a few. It gives the students control to create their own simulations from scratch and investigate multiple physics concepts within one scene so they are not restricted to one topic but can make the connections between various subtopics and learn how they work together to solve a real-world problem. Figure 2 illustrates a realistic deformable race car that goes down an obstacle terrane and crashes if the speeds are not controlled appropriately. Participants can turn on force and speed values to work out what needs to be adjusted for the car to arrive at the finish line safely.
When Da Silva, Da Silva, Guaitolini, Gonçalves, Viana and Wyatt (2014) introduced Algodoo to their high school and undergraduate classes, they reported an increase in student’s learning engagement and an improved understanding of the physical concepts when they were visualised and explored on Algodoo’s simulation scenes. Research by Gregorcic and Bodin (2017) and Çelika, Sari and Harwanto (2015) saw similar results and agreed that the program was easy to use for all ages and enhanced mathematical and scientific knowledge by creating physics simulations. After scene creation, the application allows the student to save it and share with others which facilitates collaboration.
3.3. Activity Description
Figure 3 illustrates the complete workflow of the student activity. The participants will need to take a pre-activity questionnaire that will record their current interest in STEM. The first lesson will have
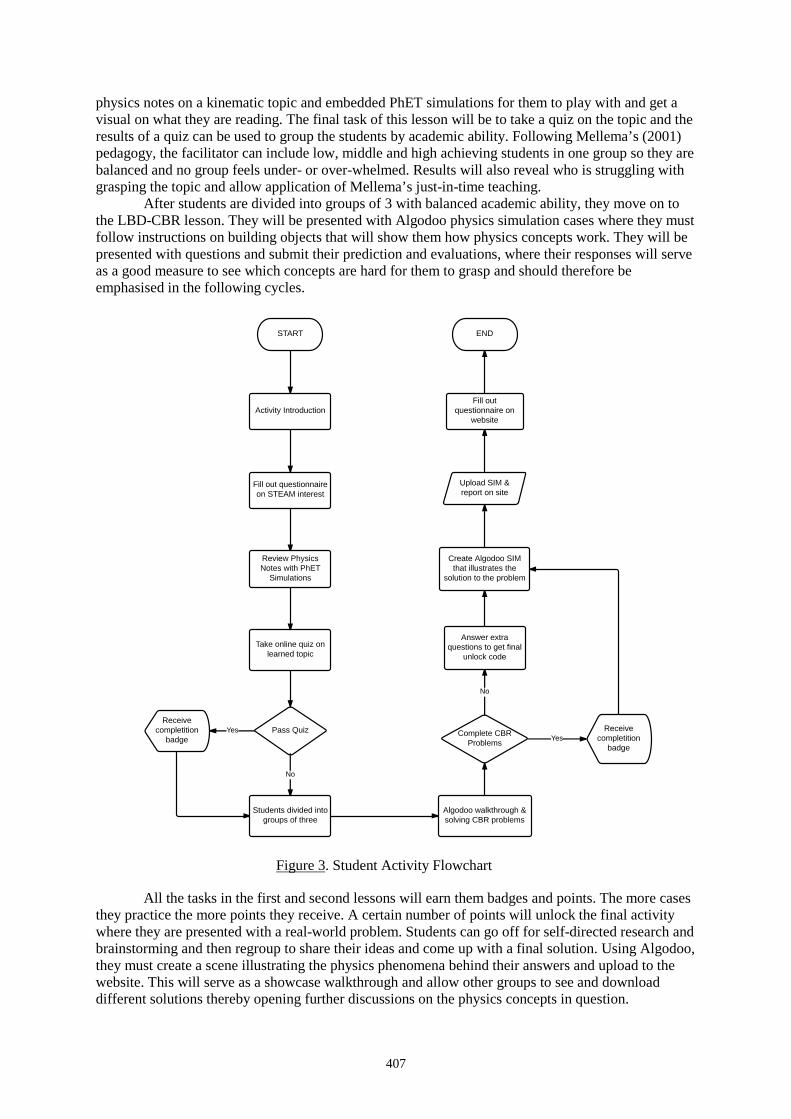
407
physics notes on a kinematic topic and embedded PhET simulations for them to play with and get a visual on what they are reading. The final task of this lesson will be to take a quiz on the topic and the results of a quiz can be used to group the students by academic ability. Following Mellema’s (2001) pedagogy, the facilitator can include low, middle and high achieving students in one group so they are balanced and no group feels under- or over-whelmed. Results will also reveal who is struggling with grasping the topic and allow application of Mellema’s just-in-time teaching.
After students are divided into groups of 3 with balanced academic ability, they move on to the LBD-CBR lesson. They will be presented with Algodoo physics simulation cases where they must follow instructions on building objects that will show them how physics concepts work. They will be presented with questions and submit their prediction and evaluations, where their responses will serve as a good measure to see which concepts are hard for them to grasp and should therefore be emphasised in the following cycles.
Figure 3. Student Activity Flowchart
All the tasks in the first and second lessons will earn them badges and points. The more cases they practice the more points they receive. A certain number of points will unlock the final activity where they are presented with a real-world problem. Students can go off for self-directed research and brainstorming and then regroup to share their ideas and come up with a final solution. Using Algodoo, they must create a scene illustrating the physics phenomena behind their answers and upload to the website. This will serve as a showcase walkthrough and allow other groups to see and download different solutions thereby opening further discussions on the physics concepts in question.
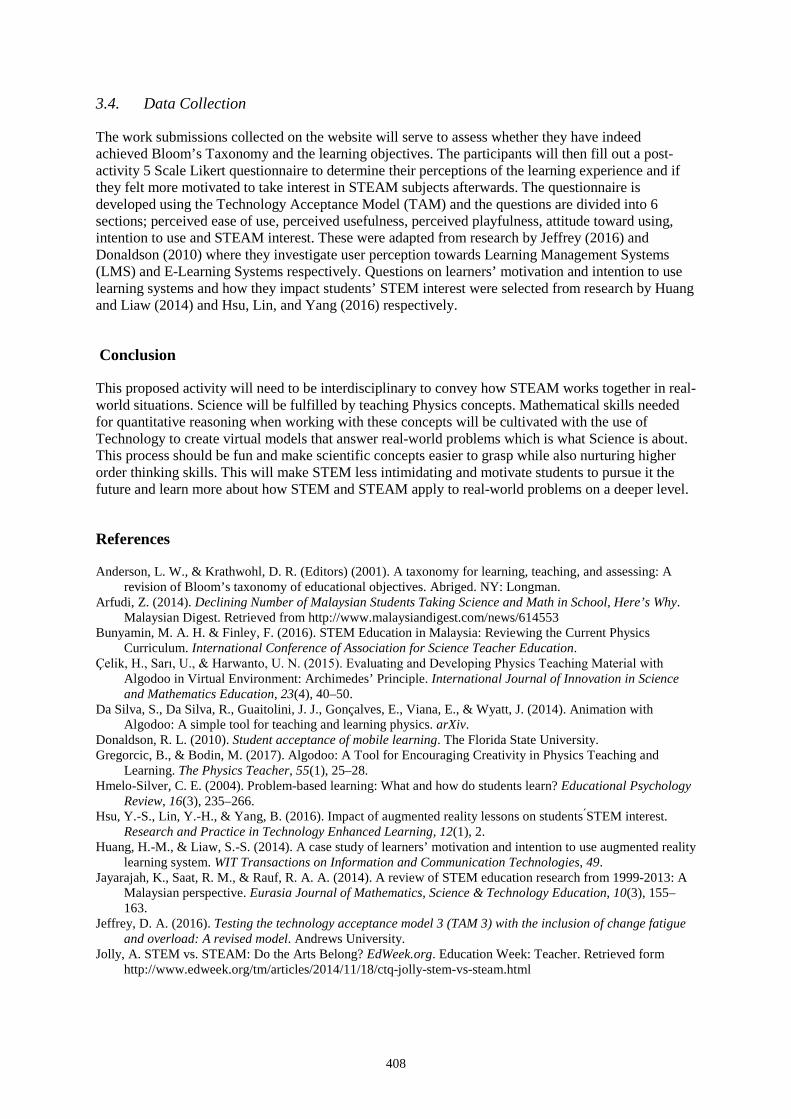
408
3.4. Data Collection
The work submissions collected on the website will serve to assess whether they have indeed achieved Bloom’s Taxonomy and the learning objectives. The participants will then fill out a post-activity 5 Scale Likert questionnaire to determine their perceptions of the learning experience and if they felt more motivated to take interest in STEAM subjects afterwards. The questionnaire is developed using the Technology Acceptance Model (TAM) and the questions are divided into 6 sections; perceived ease of use, perceived usefulness, perceived playfulness, attitude toward using, intention to use and STEAM interest. These were adapted from research by Jeffrey (2016) and Donaldson (2010) where they investigate user perception towards Learning Management Systems (LMS) and E-Learning Systems respectively. Questions on learners’ motivation and intention to use learning systems and how they impact students’ STEM interest were selected from research by Huang and Liaw (2014) and Hsu, Lin, and Yang (2016) respectively.
Conclusion
This proposed activity will need to be interdisciplinary to convey how STEAM works together in real-world situations. Science will be fulfilled by teaching Physics concepts. Mathematical skills needed for quantitative reasoning when working with these concepts will be cultivated with the use of Technology to create virtual models that answer real-world problems which is what Science is about. This process should be fun and make scientific concepts easier to grasp while also nurturing higher order thinking skills. This will make STEM less intimidating and motivate students to pursue it the future and learn more about how STEM and STEAM apply to real-world problems on a deeper level.
References
Anderson, L. W., & Krathwohl, D. R. (Editors) (2001). A taxonomy for learning, teaching, and assessing: A revision of Bloom’s taxonomy of educational objectives. Abriged. NY: Longman.
Arfudi, Z. (2014). Declining Number of Malaysian Students Taking Science and Math in School, Here’s Why. Malaysian Digest. Retrieved from http://www.malaysiandigest.com/news/614553
Bunyamin, M. A. H. & Finley, F. (2016). STEM Education in Malaysia: Reviewing the Current Physics Curriculum. International Conference of Association for Science Teacher Education.
Çelik, H., Sarı, U., & Harwanto, U. N. (2015). Evaluating and Developing Physics Teaching Material with Algodoo in Virtual Environment: Archimedes’ Principle. International Journal of Innovation in Science and Mathematics Education, 23(4), 40–50.
Da Silva, S., Da Silva, R., Guaitolini, J. J., Gonçalves, E., Viana, E., & Wyatt, J. (2014). Animation with Algodoo: A simple tool for teaching and learning physics. arXiv.
Donaldson, R. L. (2010). Student acceptance of mobile learning. The Florida State University. Gregorcic, B., & Bodin, M. (2017). Algodoo: A Tool for Encouraging Creativity in Physics Teaching and
Learning. The Physics Teacher, 55(1), 25–28. Hmelo-Silver, C. E. (2004). Problem-based learning: What and how do students learn? Educational Psychology
Review, 16(3), 235–266. Hsu, Y.-S., Lin, Y.-H., & Yang, B. (2016). Impact of augmented reality lessons on students STEM interest.
Research and Practice in Technology Enhanced Learning, 12(1), 2. Huang, H.-M., & Liaw, S.-S. (2014). A case study of learners’ motivation and intention to use augmented reality
learning system. WIT Transactions on Information and Communication Technologies, 49. Jayarajah, K., Saat, R. M., & Rauf, R. A. A. (2014). A review of STEM education research from 1999-2013: A
Malaysian perspective. Eurasia Journal of Mathematics, Science & Technology Education, 10(3), 155–163.
Jeffrey, D. A. (2016). Testing the technology acceptance model 3 (TAM 3) with the inclusion of change fatigue and overload: A revised model. Andrews University.
Jolly, A. STEM vs. STEAM: Do the Arts Belong? EdWeek.org. Education Week: Teacher. Retrieved form http://www.edweek.org/tm/articles/2014/11/18/ctq-jolly-stem-vs-steam.html

409
Kolodner, J. L., Camp, P. J., Crismond, D., Fasse, B., Gray, J., Holbrook, J., Puntambekar, S., & Ryan, M. (2003). Problem-Based Learning Meets Case-Based Reasoning in the Middle-School Science Classroom: Putting Learning by Design into Practice. Journal of the Learning Sciences, 12(4), 495–547.
Kolodner, J. L., Crismond, D., Gray, J., Holbrook, J., & Puntambekar, S. (1998). Learning by design from theory to practice. In Proceedings of the international conference of the learning sciences (Vol. 98, pp. 16–22).
Mellema, S. (2001). A physics lecture for the 21st century. Physics Education, 36(4), 306. Nasa, A. & Anwar, Z. (2016). Too few STEM Students. New Straits Times. Retrieved from
http://www.nst.com.my/news/2016/05/147260/too-few-stem-students O.C. (2016). Is Science too daunting for too many students? New Straits Times. Retrieved from
https://www.nst.com.my/news/2017/03/151648/science-too-daunting-too-many-students Perkins, K., Adams, W., Dubson, M., Finkelstein, N., Reid, S., & Wieman, C. (2006). PhET: interactive
simulations for teaching and learning physics. The Physics Teacher, 44, 18-23. Roehrig, G., Moore J., Wang, H.-H., & Park, M. (2012). Is adding the E enough? Investigating the impact of K-
12 engineering standards on the implementation of STEM integration. School Science & Mathematics, 112(1), 31– 44.
Staikopoulos, A., OKeeffe, I., Yousuf, B., Conlan, O., Walsh, E., & Wade, V. (2015). Enhancing Student Engagement through Personalized Motivations. In 2015 IEEE 15th International Conference on Advanced Learning Technologies (pp. 340–344).
Wieman, C. E., Adams, W. K., & Perkins, K. K. (2008) PhET: Simulations that enhance learning. Science, 322: 682–683. doi:10.1126/science
Wilkinson, R., & Lancaster, T. (2014). Improving student motivation using technology within the STEM disciplines. In A paper from the STEM Annual Conference (Vol. 2014, pp. 1–6).
Hayashi, Y., et al. (Eds.) (2017). Workshop Proceedings of the 25th International Conference on Computers in Education. New Zealand: Asia-Pacific Society for Computers in Education
410
Creation Process in Design Research Class Weng Ping, CHINa*, Ah Choo, KOOb & Chee Weng, KHONGc & Chui Yin, WONGd
abcdFaculty of Creative Multimedia, Multimedia University, Malaysia *[email protected]
Abstract: In this paper, we describe the problems in the creation process for a Design Research (DR) class at Faculty of Creative Multimedia, Multimedia University in Malaysia. There were 117 students from their final year studies taking this subject, which served as the research component for their Final Year Projects (FYPs). These students are from the major of Virtual Reality, Animation & Visual Effects, Interface Design, Media Arts and Advertising Design. The aim of this paper is to discuss the creation process using Creative Cognition framework in writing dissertation. This paper illustrates a qualitative approach for studying the creation process. Students approached their FYP projects by conducting critical literature review using secondary research through reading and analyzing research articles in their chosen research topics. There are four (4) steps to guide the students: 1. Ask Questions, 2. The Problem, 3. The Method, 4. The Practice. These 4 steps through reading research articles encourage for critical thinking process. A deeper and broader perspective on learning to create Abstract, Proposal, and Chapter 1 to Chapter 5 using 4-steps research methodology as the dissertation creation process for the first trimester of 2017/2018 academic year. To facilitate collaborative learning process, a Facebook group was created for students to engage in this creation process. Five themes have emerged: creativity, problem-solving skills, communication skills, self-regulated learning and engagement. This study reveals that the creation process learning style can enrich the learning experience of students and can help them develop the design mind mapping skills. Information literacy was crucial in establishing a framework for research experience using secondary research through reading and gathering information. Most students needed the lecturers to guide in problem solving and to facilitate in their learning processes. The connection to theories and concepts gathered from secondary research was an exploratory creation process for students. When a “Design” approach is applied correctly, it becomes a valuable method for students to answer their own research question. The key elements for designing and implementing a secondary research dissertation required active learning and critical thinking skills. This study concluded the challenges in writing dissertation using Creative Cognitive framework in the creation process.
Keywords: Creativity, Creation process, Critical thinking, Creative Cognition, Design Research
1. Introduction
At university level, most undergraduate students are compulsory to produce dissertation as part of their bachelor degree requirements. Writing a decent dissertation required skills such as critical thinking, creative process, analyzing and writing skills. In DR class, reading and thinking skills are reflections on their ability to write and interpreting secondary data to produce a dissertation. As such, MMW3013 Design Research (DR) class at Faculty of Creative Multimedia (FCM), Multimedia University, Malaysia is a class for the final year design students to prepare them for their dissertation writing. Writing dissertations was a subject of analysis in DR class. There were 117 students from their final year studies taking this subject, which served as the research component for their Final Year Projects (FYPs). These students are from the major of Virtual Reality, Animation & Visual Effects, Interface Design, Media Arts and Advertising Design.
To investigate critical reading and critical thinking skills, the creation process behind the act of the research creation is acquired by students after being exposed to the way this course was presented and taught. Besides using a lecture-based model for most of the lectures, the lecturers
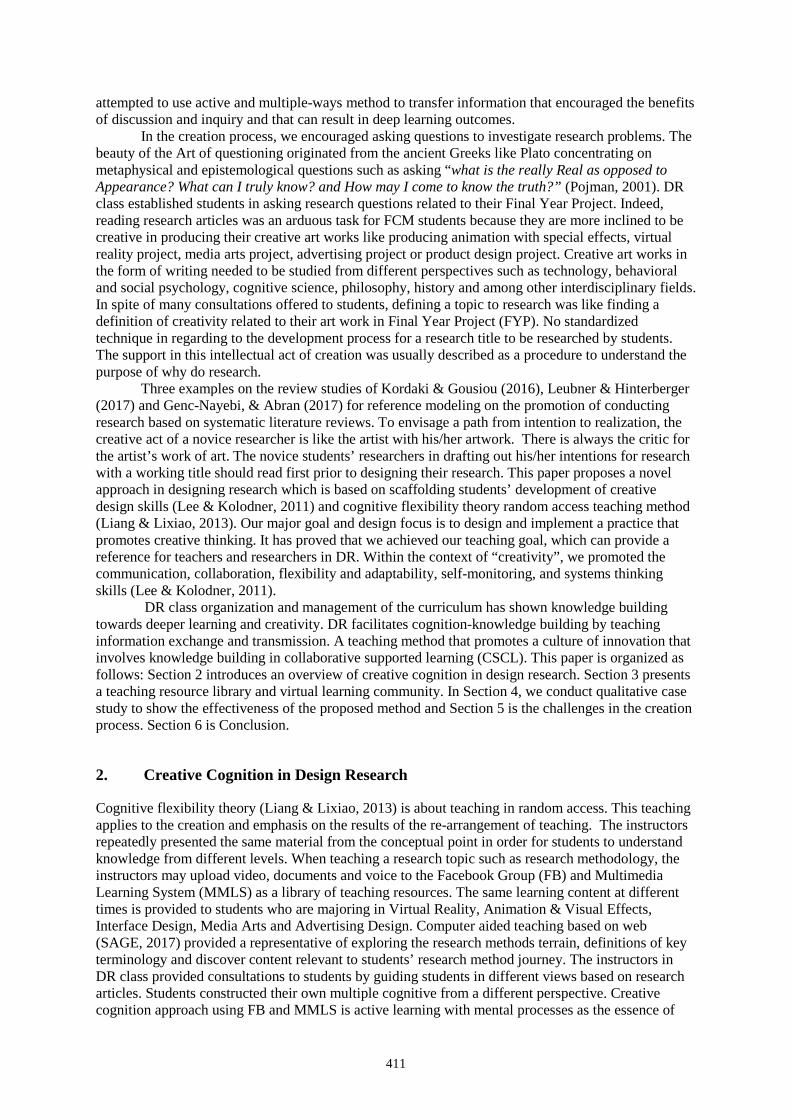
411
attempted to use active and multiple-ways method to transfer information that encouraged the benefits of discussion and inquiry and that can result in deep learning outcomes.
In the creation process, we encouraged asking questions to investigate research problems. The beauty of the Art of questioning originated from the ancient Greeks like Plato concentrating on metaphysical and epistemological questions such as asking “what is the really Real as opposed to Appearance? What can I truly know? and How may I come to know the truth?” (Pojman, 2001). DR class established students in asking research questions related to their Final Year Project. Indeed, reading research articles was an arduous task for FCM students because they are more inclined to be creative in producing their creative art works like producing animation with special effects, virtual reality project, media arts project, advertising project or product design project. Creative art works in the form of writing needed to be studied from different perspectives such as technology, behavioral and social psychology, cognitive science, philosophy, history and among other interdisciplinary fields. In spite of many consultations offered to students, defining a topic to research was like finding a definition of creativity related to their art work in Final Year Project (FYP). No standardized technique in regarding to the development process for a research title to be researched by students. The support in this intellectual act of creation was usually described as a procedure to understand the purpose of why do research.
Three examples on the review studies of Kordaki & Gousiou (2016), Leubner & Hinterberger (2017) and Genc-Nayebi, & Abran (2017) for reference modeling on the promotion of conducting research based on systematic literature reviews. To envisage a path from intention to realization, the creative act of a novice researcher is like the artist with his/her artwork. There is always the critic for the artist’s work of art. The novice students’ researchers in drafting out his/her intentions for research with a working title should read first prior to designing their research. This paper proposes a novel approach in designing research which is based on scaffolding students’ development of creative design skills (Lee & Kolodner, 2011) and cognitive flexibility theory random access teaching method (Liang & Lixiao, 2013). Our major goal and design focus is to design and implement a practice that promotes creative thinking. It has proved that we achieved our teaching goal, which can provide a reference for teachers and researchers in DR. Within the context of “creativity”, we promoted the communication, collaboration, flexibility and adaptability, self-monitoring, and systems thinking skills (Lee & Kolodner, 2011).
DR class organization and management of the curriculum has shown knowledge building towards deeper learning and creativity. DR facilitates cognition-knowledge building by teaching information exchange and transmission. A teaching method that promotes a culture of innovation that involves knowledge building in collaborative supported learning (CSCL). This paper is organized as follows: Section 2 introduces an overview of creative cognition in design research. Section 3 presents a teaching resource library and virtual learning community. In Section 4, we conduct qualitative case study to show the effectiveness of the proposed method and Section 5 is the challenges in the creation process. Section 6 is Conclusion.
2. Creative Cognition in Design Research
Cognitive flexibility theory (Liang & Lixiao, 2013) is about teaching in random access. This teaching applies to the creation and emphasis on the results of the re-arrangement of teaching. The instructors repeatedly presented the same material from the conceptual point in order for students to understand knowledge from different levels. When teaching a research topic such as research methodology, the instructors may upload video, documents and voice to the Facebook Group (FB) and Multimedia Learning System (MMLS) as a library of teaching resources. The same learning content at different times is provided to students who are majoring in Virtual Reality, Animation & Visual Effects, Interface Design, Media Arts and Advertising Design. Computer aided teaching based on web (SAGE, 2017) provided a representative of exploring the research methods terrain, definitions of key terminology and discover content relevant to students’ research method journey. The instructors in DR class provided consultations to students by guiding students in different views based on research articles. Students constructed their own multiple cognitive from a different perspective. Creative cognition approach using FB and MMLS is active learning with mental processes as the essence of
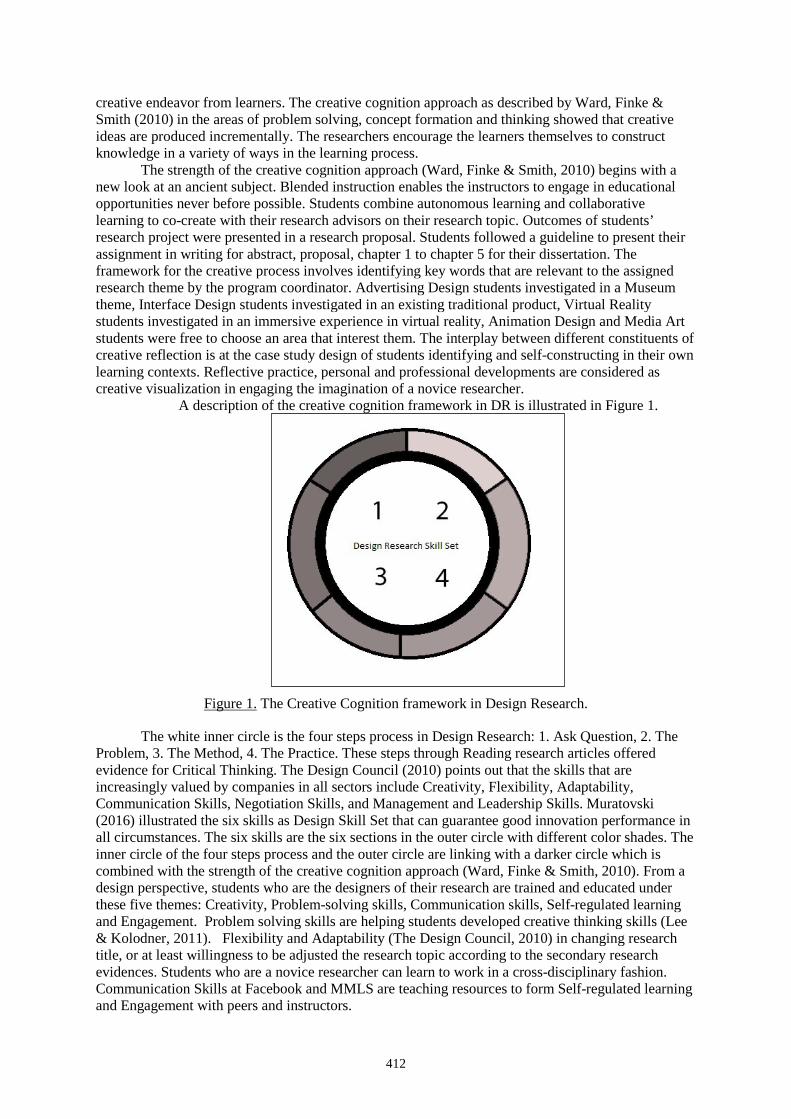
412
creative endeavor from learners. The creative cognition approach as described by Ward, Finke & Smith (2010) in the areas of problem solving, concept formation and thinking showed that creative ideas are produced incrementally. The researchers encourage the learners themselves to construct knowledge in a variety of ways in the learning process.
The strength of the creative cognition approach (Ward, Finke & Smith, 2010) begins with a new look at an ancient subject. Blended instruction enables the instructors to engage in educational opportunities never before possible. Students combine autonomous learning and collaborative learning to co-create with their research advisors on their research topic. Outcomes of students’ research project were presented in a research proposal. Students followed a guideline to present their assignment in writing for abstract, proposal, chapter 1 to chapter 5 for their dissertation. The framework for the creative process involves identifying key words that are relevant to the assigned research theme by the program coordinator. Advertising Design students investigated in a Museum theme, Interface Design students investigated in an existing traditional product, Virtual Reality students investigated in an immersive experience in virtual reality, Animation Design and Media Art students were free to choose an area that interest them. The interplay between different constituents of creative reflection is at the case study design of students identifying and self-constructing in their own learning contexts. Reflective practice, personal and professional developments are considered as creative visualization in engaging the imagination of a novice researcher.
A description of the creative cognition framework in DR is illustrated in Figure 1.
Figure 1. The Creative Cognition framework in Design Research.
The white inner circle is the four steps process in Design Research: 1. Ask Question, 2. The Problem, 3. The Method, 4. The Practice. These steps through Reading research articles offered evidence for Critical Thinking. The Design Council (2010) points out that the skills that are increasingly valued by companies in all sectors include Creativity, Flexibility, Adaptability, Communication Skills, Negotiation Skills, and Management and Leadership Skills. Muratovski (2016) illustrated the six skills as Design Skill Set that can guarantee good innovation performance in all circumstances. The six skills are the six sections in the outer circle with different color shades. The inner circle of the four steps process and the outer circle are linking with a darker circle which is combined with the strength of the creative cognition approach (Ward, Finke & Smith, 2010). From a design perspective, students who are the designers of their research are trained and educated under these five themes: Creativity, Problem-solving skills, Communication skills, Self-regulated learning and Engagement. Problem solving skills are helping students developed creative thinking skills (Lee & Kolodner, 2011). Flexibility and Adaptability (The Design Council, 2010) in changing research title, or at least willingness to be adjusted the research topic according to the secondary research evidences. Students who are a novice researcher can learn to work in a cross-disciplinary fashion. Communication Skills at Facebook and MMLS are teaching resources to form Self-regulated learning and Engagement with peers and instructors.
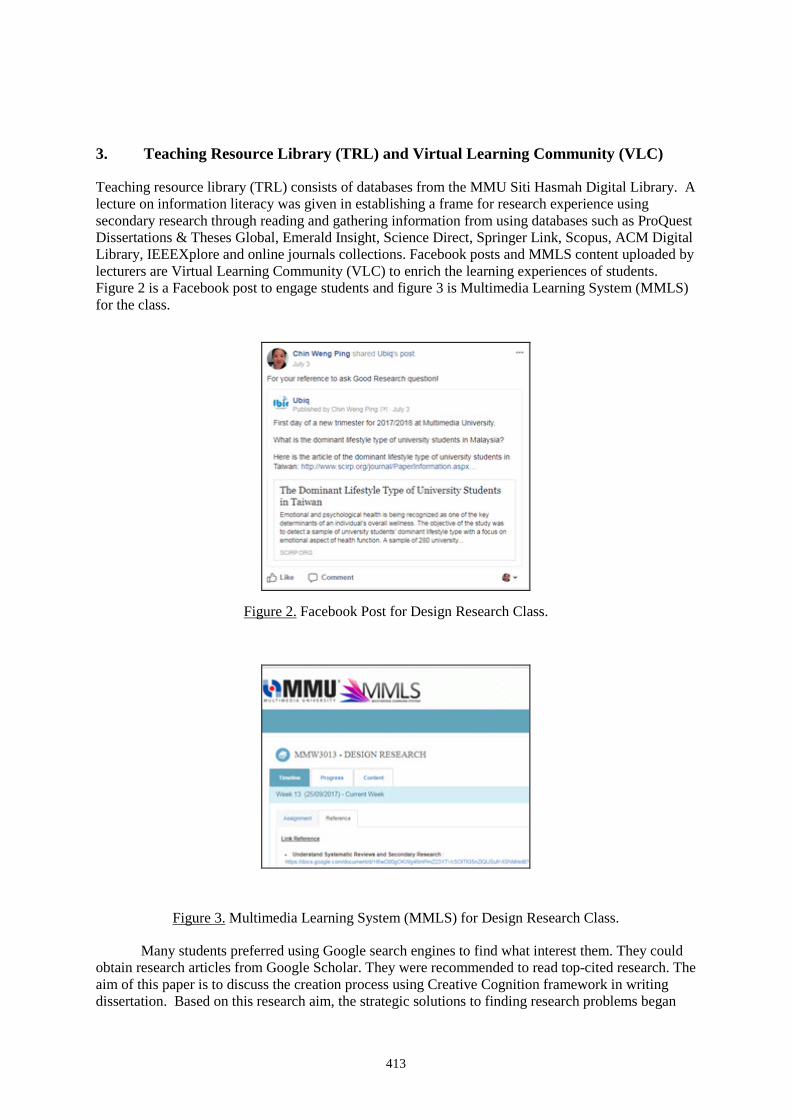
413
3. Teaching Resource Library (TRL) and Virtual Learning Community (VLC)
Teaching resource library (TRL) consists of databases from the MMU Siti Hasmah Digital Library. A lecture on information literacy was given in establishing a frame for research experience using secondary research through reading and gathering information from using databases such as ProQuest Dissertations & Theses Global, Emerald Insight, Science Direct, Springer Link, Scopus, ACM Digital Library, IEEEXplore and online journals collections. Facebook posts and MMLS content uploaded by lecturers are Virtual Learning Community (VLC) to enrich the learning experiences of students. Figure 2 is a Facebook post to engage students and figure 3 is Multimedia Learning System (MMLS) for the class.
Figure 2. Facebook Post for Design Research Class.
Figure 3. Multimedia Learning System (MMLS) for Design Research Class.
Many students preferred using Google search engines to find what interest them. They could obtain research articles from Google Scholar. They were recommended to read top-cited research. The aim of this paper is to discuss the creation process using Creative Cognition framework in writing dissertation. Based on this research aim, the strategic solutions to finding research problems began
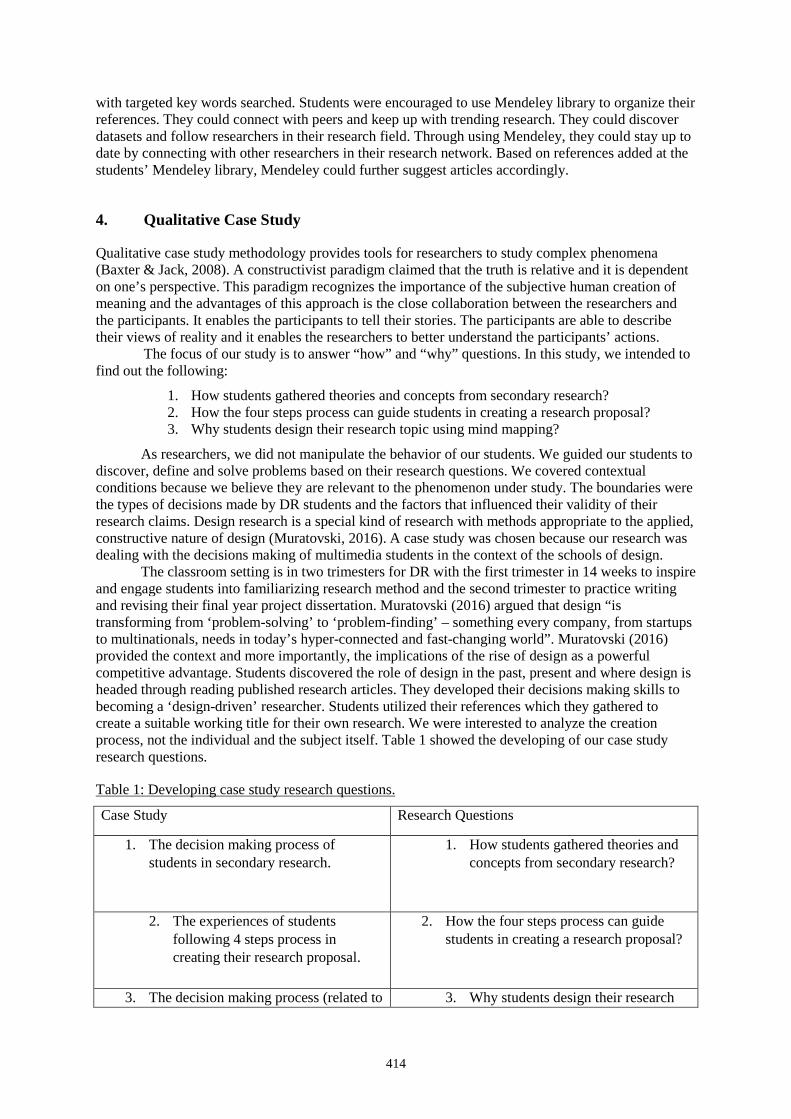
414
with targeted key words searched. Students were encouraged to use Mendeley library to organize their references. They could connect with peers and keep up with trending research. They could discover datasets and follow researchers in their research field. Through using Mendeley, they could stay up to date by connecting with other researchers in their research network. Based on references added at the students’ Mendeley library, Mendeley could further suggest articles accordingly.
4. Qualitative Case Study
Qualitative case study methodology provides tools for researchers to study complex phenomena (Baxter & Jack, 2008). A constructivist paradigm claimed that the truth is relative and it is dependent on one’s perspective. This paradigm recognizes the importance of the subjective human creation of meaning and the advantages of this approach is the close collaboration between the researchers and the participants. It enables the participants to tell their stories. The participants are able to describe their views of reality and it enables the researchers to better understand the participants’ actions.
The focus of our study is to answer “how” and “why” questions. In this study, we intended to find out the following:
1. How students gathered theories and concepts from secondary research? 2. How the four steps process can guide students in creating a research proposal? 3. Why students design their research topic using mind mapping?
As researchers, we did not manipulate the behavior of our students. We guided our students to discover, define and solve problems based on their research questions. We covered contextual conditions because we believe they are relevant to the phenomenon under study. The boundaries were the types of decisions made by DR students and the factors that influenced their validity of their research claims. Design research is a special kind of research with methods appropriate to the applied, constructive nature of design (Muratovski, 2016). A case study was chosen because our research was dealing with the decisions making of multimedia students in the context of the schools of design.
The classroom setting is in two trimesters for DR with the first trimester in 14 weeks to inspire and engage students into familiarizing research method and the second trimester to practice writing and revising their final year project dissertation. Muratovski (2016) argued that design “is transforming from ‘problem-solving’ to ‘problem-finding’ – something every company, from startups to multinationals, needs in today’s hyper-connected and fast-changing world”. Muratovski (2016) provided the context and more importantly, the implications of the rise of design as a powerful competitive advantage. Students discovered the role of design in the past, present and where design is headed through reading published research articles. They developed their decisions making skills to becoming a ‘design-driven’ researcher. Students utilized their references which they gathered to create a suitable working title for their own research. We were interested to analyze the creation process, not the individual and the subject itself. Table 1 showed the developing of our case study research questions.
Table 1: Developing case study research questions.
Case Study Research Questions
1. The decision making process of students in secondary research.
1. How students gathered theories and concepts from secondary research?
2. The experiences of students following 4 steps process in creating their research proposal.
2. How the four steps process can guide students in creating a research proposal?
3. The decision making process (related to 3. Why students design their research
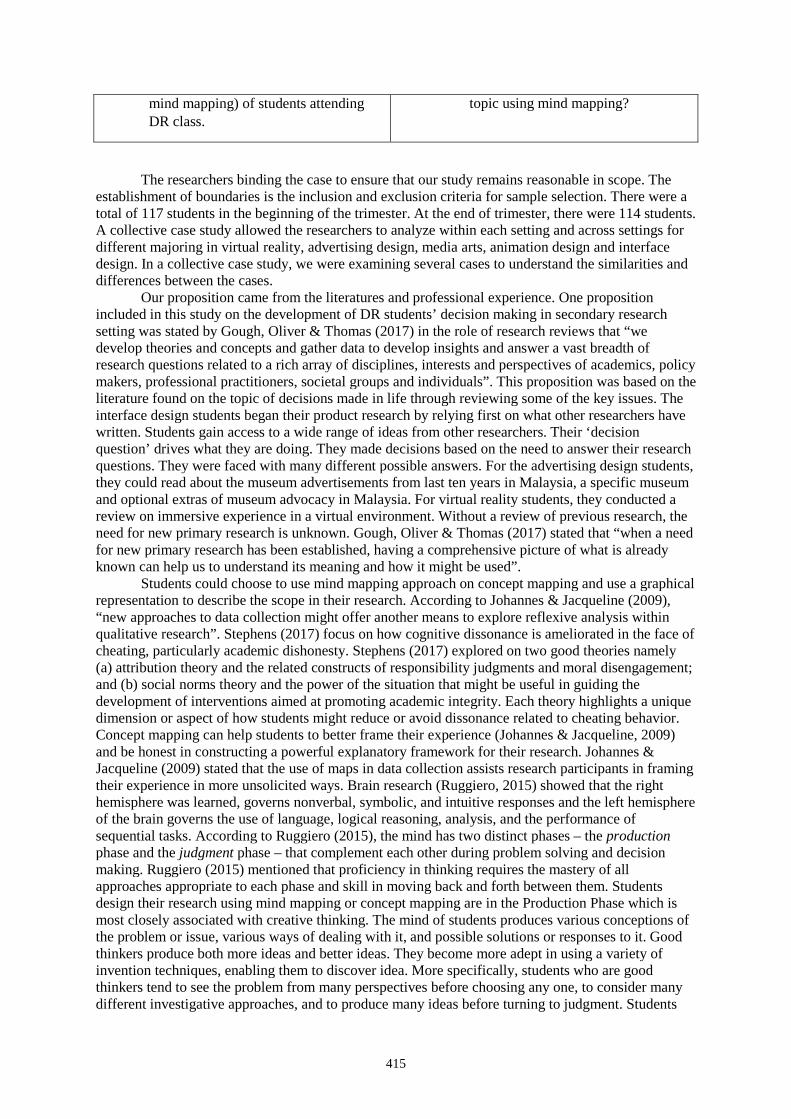
415
mind mapping) of students attending DR class.
topic using mind mapping?
The researchers binding the case to ensure that our study remains reasonable in scope. The establishment of boundaries is the inclusion and exclusion criteria for sample selection. There were a total of 117 students in the beginning of the trimester. At the end of trimester, there were 114 students. A collective case study allowed the researchers to analyze within each setting and across settings for different majoring in virtual reality, advertising design, media arts, animation design and interface design. In a collective case study, we were examining several cases to understand the similarities and differences between the cases.
Our proposition came from the literatures and professional experience. One proposition included in this study on the development of DR students’ decision making in secondary research setting was stated by Gough, Oliver & Thomas (2017) in the role of research reviews that “we develop theories and concepts and gather data to develop insights and answer a vast breadth of research questions related to a rich array of disciplines, interests and perspectives of academics, policy makers, professional practitioners, societal groups and individuals”. This proposition was based on the literature found on the topic of decisions made in life through reviewing some of the key issues. The interface design students began their product research by relying first on what other researchers have written. Students gain access to a wide range of ideas from other researchers. Their ‘decision question’ drives what they are doing. They made decisions based on the need to answer their research questions. They were faced with many different possible answers. For the advertising design students, they could read about the museum advertisements from last ten years in Malaysia, a specific museum and optional extras of museum advocacy in Malaysia. For virtual reality students, they conducted a review on immersive experience in a virtual environment. Without a review of previous research, the need for new primary research is unknown. Gough, Oliver & Thomas (2017) stated that “when a need for new primary research has been established, having a comprehensive picture of what is already known can help us to understand its meaning and how it might be used”.
Students could choose to use mind mapping approach on concept mapping and use a graphical representation to describe the scope in their research. According to Johannes & Jacqueline (2009), “new approaches to data collection might offer another means to explore reflexive analysis within qualitative research”. Stephens (2017) focus on how cognitive dissonance is ameliorated in the face of cheating, particularly academic dishonesty. Stephens (2017) explored on two good theories namely (a) attribution theory and the related constructs of responsibility judgments and moral disengagement; and (b) social norms theory and the power of the situation that might be useful in guiding the development of interventions aimed at promoting academic integrity. Each theory highlights a unique dimension or aspect of how students might reduce or avoid dissonance related to cheating behavior. Concept mapping can help students to better frame their experience (Johannes & Jacqueline, 2009) and be honest in constructing a powerful explanatory framework for their research. Johannes & Jacqueline (2009) stated that the use of maps in data collection assists research participants in framing their experience in more unsolicited ways. Brain research (Ruggiero, 2015) showed that the right hemisphere was learned, governs nonverbal, symbolic, and intuitive responses and the left hemisphere of the brain governs the use of language, logical reasoning, analysis, and the performance of sequential tasks. According to Ruggiero (2015), the mind has two distinct phases – the production phase and the judgment phase – that complement each other during problem solving and decision making. Ruggiero (2015) mentioned that proficiency in thinking requires the mastery of all approaches appropriate to each phase and skill in moving back and forth between them. Students design their research using mind mapping or concept mapping are in the Production Phase which is most closely associated with creative thinking. The mind of students produces various conceptions of the problem or issue, various ways of dealing with it, and possible solutions or responses to it. Good thinkers produce both more ideas and better ideas. They become more adept in using a variety of invention techniques, enabling them to discover idea. More specifically, students who are good thinkers tend to see the problem from many perspectives before choosing any one, to consider many different investigative approaches, and to produce many ideas before turning to judgment. Students
416
are more willing to take intellectual risks, to be adventurous and consider unusual ideas, and to use their imaginations.
5. Challenges in Design Research Creation Process
This study reveals that the creation process learning style can enrich the learning experience of students. However, there are challenges in strengths and weaknesses due to students’ reading, thinking and writing ability. Students who were poor readers and thinkers tend to see the problem from a limited or single narrow perspective. Taking into consideration from Muratovski’s (2016) to move research students from studying research skills and methods to practicing effective research for advanced design practice. The four steps creation process framework offers a framework in the design field. It helps research student in generating the methods of inquiry to solve research problems by first learning to ask question. Asking research questions are closely associated with critical thinking. Students are required to examine and evaluate their research questions.
Muratovski (2016) explained that a great deal of design research involves useful individual learning to solve situated problems for specific clients. Designers often make a distinction between ‘knowing that’ and ‘knowing how’, as though design research involves knowing how to do something practical rather than describing something in the world as scientists do. In design, the researchers need to examine or explain issues and show others how the researchers showed the results whether that result is a process, a product, or a system. Muratovski (2016) described design research means offering an explanation that makes sense so that others can use the concepts and ideas, the methods, or the results to further their work. Faculty of Creative Multimedia students are required to conduct their final year project. Hence, DR class helped to examine or explain issue that related to their final year project. They had to evaluate what they produced, made its judgments, and where appropriate, refine their ideas. Good thinker students handle judgment phase of their research with care where the poor thinker students had the tendency to take the first approach that occurs to them, to judge each idea immediately, and to settle for only a few ideas. Good thinker students made decisions by basing their conclusions on evidence from literature reviews. They double-check the logic of their thinking and refining their ideas with their advisers. Poor thinker students ignoring the gathering of evidences from literature reviews and they trust their judgment implicitly. They ignore the possibility of flaws in their thinking. Unconsciously, poor thinker students tend to conform to the common, familiar and expected ideas. The difficulty of improving students’ thinking skill depends on the habits and attitudes they have. Students must have the desire to improve their research skill and the willingness to apply what they learn. We believe the realities of the interaction at the Facebook group can help students to reflect on what they have learned during lectures and to keep students engaged in reflective thinking.
Based on James & Brookfield (2014, p.15) and the solutions provided by (Lee & Kolodner, 2011) in helping students to become a creative and reflective thinker, reflective thinking happens when students do one or more of these things:
1. Check the assumptions that inform their actions and judgments. 2. Seek to open themselves to new and unfamiliar perspectives. 3. Attempt to understand how another researcher develops the design mind mapping skills. 4. General communication and collaboration skills in the context of answering research
questions. 5. Evaluate and refine their own reasoning by looking for blind spots and omissions in their
thinking. 6. Become progressively more expert in reasoning across different contexts. 7. Identify what is justified and well grounded in their thinking. 8. Accept and experiment with multiple learning modalities. 9. Become more aware of their habitual epistemic cognition – the typical ways they judge
something to be true. 10. Apply reflective protocols in contextually appropriate ways.
417
6. Conclusion
In summary, we concluded that information literacy skill was crucial in establishing research experience using secondary research through reading and gathering information. To enhance research writing for dissertation to undergraduate students, Creative Cognitive framework can be utilized by using the four steps framework. In order to designing and implementing a secondary research dissertation, the thought process behind design research is in the connection to theories and concepts gathered from secondary research. The key elements for designing and implementing a secondary research dissertation required active learning and critical thinking skills, creativity, problem-solving skills, communication skills, self-regulated learning and engagement in becoming a reflective thinker.
Our next steps are to look at approaches and particular activities that facilitate collaborative learning process. We want to explore alternative approaches to engaging student reflection. We hope that the decision making process of students in secondary research, the experiences of students following 4 steps process in creating their research proposal and the decision making process (related to mind mapping) of students writing their dissertation can promote a deeper learning. We hope that DR students can broaden and deepen their understanding of knowledge and open their minds to becoming a lifelong learner in the creation process in design research.
References
Baxter, P., & Jack, S. (December 01, 2008). Qualitative Case Study Methodology: Study Design and Implementation for Novice Researchers. Qualitative Report, 13, 4, 544-559.
Design Council (2010). Multi-Disciplinary Design Education in the UK: Report and Recommendations from the Multi-Disciplinary Design Network. London: Design Council.
Genc-Nayebi, N., & Abran, A. (March 01, 2017). A systematic literature review: Opinion mining studies from mobile app store user reviews. Journal of Systems and Software, 125, 2, 207-219.
Gough, D., Oliver, S., & Thomas, J. (2017). An introduction to systematic reviews. Los Angeles: SAGE. James, A., & Brookfield, S. D. (2014). Engaging imagination https: Helping students become creative and
reflective thinkers. San Francisco, CA: Jossey-Bass. Johannes, W., & Jacqueline, F. (September 01, 2009). Framing Experience: Concept Maps, Mind Maps, and
Data Collection in Qualitative Research. International Journal of Qualitative Methods, 8, 3, 68-83. Kordaki, M., & Gousiou, A. (January 01, 2016). Computer card games in computer science education: A 10-
year review. Educational Technology and Society, 19, 4, 11-21. Lee, C.-S., & Kolodner, J. L. (January 01, 2011). Scaffolding Students' Development of Creative Design Skills:
A Curriculum Reference Model. Educational Technology & Society, 14, 1, 3-15. Leubner, D., & Hinterberger, T. (January 01, 2017). Reviewing the Effectiveness of Music Interventions in
Treating Depression. Frontiers in Psychology, 8. Liang, L., & Lixiao, H. (November 01, 2013). Multimedia Bilingual Teaching Design and Practice Research for
Information Discipline. 398-402. Paper presented at 2013 Fourth International Conference on Intelligent Systems Design and Engineering Applications (ISDEA).
Muratovski, G. (2016). Research for designers: A guide to methods and practice. Los Angeles: SAGE. Pojman, L. P. (2001). Philosophy: The pursuit of wisdom. Australia: Thomson/Wadsworth. Ruggiero, V. R. (2015). The art of thinking: A guide to critical and creative thought. New Jersey: Pearson
Education, Inc. SAGE. (2017). Methods Map. Retrieved from https://methods.sagepub.com/methods-map/literature-search. Stephens, J. M. (April 03, 2017). How to Cheat and Not Feel Guilty: Cognitive Dissonance and its Amelioration
in the Domain of Academic Dishonesty. Theory into Practice, 56, 2, 111-120. Ward, T. B., Finke, R. A., & Smith, S. M. (2010). The creative cognition approach. Cambridge, Mass: MIT
Press.
Hayashi, Y., et al. (Eds.) (2017). Workshop Proceedings of the 25th International Conference on Computers in Education. New Zealand: Asia-Pacific Society for Computers in Education
418
The Missing Link in Engineering Education: The Arts and Humanities David E. DREWa and Louis L. BUCCIARELLIb
aSchool of Educational Studies, Claremont Graduate University, USA bProgram in Science, Technology and Society, Massachusetts Institute of Technology, USA
Abstract: We suggest that engineering education would benefit from a closer integration with the arts and humanities: to improve the design process, to attract a more diverse student body, and to sensitize students to the social impact of technology. Conversely, in today’s high-tech environment, the liberal arts would be strengthened by introducing students to engineering concepts. We propose a program, Liberal Studies in Engineering, and outline its key components. Creating this interdisciplinary program in higher education requires confronting and transcending academic silos.
Keywords: Reforming engineering education, interdisciplinary majors and concentrations, technology and society
1. Introduction
For centuries, universities have been organized on a discipline by discipline basis. Often, those with advanced degrees in one discipline have seen no need to communicate with those outside their field. However, increasingly in the 21st Century, creative research is interdisciplinary. This kind of innovative scholarship requires both new cognitive skills and organizational flexibility in confronting academic silos. These challenges can be seen most directly in the field of engineering.
In past reports calling for the renovation of engineering education we find some claiming that the traditional engineering curriculum is too narrowly defined and inadequate to serve as preparation for professional practice. James Duderstadt, former chair of the National Science Board has said,
“In view of...changes occurring in engineering practice and research, it is easy to understand why some raise concerns that we are attempting to educate 21st-century engineers with a 20th-century curriculum taught in 19th-century institutions.” (Duderstadt, 2009, p. 4)
All other professions require completion of an undergraduate degree - some form of major in the liberal arts - before seeking professional training and certification. Engineering differs in that the first professional degree is the Bachelor of Science degree. (This means that students must decide to major in engineering before they graduate from high school.) Because of this, the undergraduate program is filled with science/engineering core requirements and restricted electives thought necessary to prepare students for practice. This severely constrains educational innovation. Furthermore, a curriculum so focused on solving well posed problems via instrumental means detracts from student understanding of the social, economic, and environmental constraints and impacts of engineering innovation - factors increasingly important in today's world of rapid technological change. This is one reason for looking to the other end of campus to establish a smoother, broader pathway into engineering.
Another reason springs from the data that shows that enrollments in engineering are declining. There is a need to broaden participation in the discipline. The American population has been changing dramatically, but the demographic profile of engineers has not - women, students of color, and students from poverty are under-represented.
419
We believe that one curricular innovation could address each and all of the issues: a tighter integration of engineering education with the liberal arts. We propose a new kind of degree program - a Bachelor of Arts in Liberal Studies in Engineering (LSE) - to both better prepare students for engineering practice and to increase participation in the discipline.
We acknowledge that curriculum design is a zero-sum game, and we allow for flexibility in planning an LSE program. Some institutions may find room for the liberal arts courses by replacing engineering electives. Others may introduce a master’s degree in engineering as the program that provides a professional credential.
2. Women and Students of Color
National concern repeatedly has been expressed about achievement gaps in science and engineering - especially between male and female students and between White students and students of color. These gaps not only raise issues about equity in our educational systems, but also raise alarm about the future competitiveness of the United States in a high-tech information economy. These gaps are as striking in the field of engineering as they are in other fields.
Wang, Eccles, and Kenny (2013) studied a large sample of young people twice: as 18 year olds and 15 years later. They compared the SAT scores of these youths with their occupational choices at 33. They were particularly interested in those who chose a STEM career. Forty nine percent of those with high math scores and moderate verbal scores chose a STEM career. However, only 34% of those with high math scores and high verbal scores chose a STEM career. The majority of the missing 15% were women.
Some have suggested that fewer women choose STEM careers because women lack an aptitude for math, science, and technology. Maybe it really is the opposite: some women don’t find science and engineering subjects, as currently presented, to be interesting and challenging enough. In the words of Jud King, “That’s not an achievement gap; it’s an interest gap.” (personal communication)
Computer science programs have been particularly resistant to broadening the demographic. The AAUW, in a report on women in STEM, recommended a fix: (Jane Margolis and Alan Fisher, quoted in Hill, et al, 2010, p. 63): “Broaden the scope of early course work.”
The challenge facing women in technical careers was articulated well by Jean Bartik, the first programmer of the historic ENIAC computer, who said that women in computing should “look like a girl, act like a lady, think like a man, and work like a dog.” (Beach, 2013, p. 173)
Other observers of this phenomenon claim that “A critical part of attracting more girls and women in computer science is providing multiple ways to ‘be in’ computer science” noting (Hill, et al, 2010, p. 60)
Computer science programs often focus on technical aspects of programming early in the curriculum and leave the broader applications for later. This can be a deterrent to students, both female and male, who may be interested in broader, multidisciplinary applications, and especially to women, who are more likely to report interest in these broader applications.
This finding parallels the conclusion of a classic study by Helen Astin about the research experiences of frequently-cited authors:
“women appear to be more interested in how their work can be useful to others….They see their research as integrating knowledge and providing direction for further work.” (Astin p. 68)
Based on this principle, that women seek programs that help humanity, the New Jersey Institute of Technology has offered programs to attract women to engineering for more than 30 years. (Koppel et al, 2002).
Lina Nilsson, who holds a Ph.D. in biomedical engineering, reports,
420
“An experience here at the University of California, Berkeley, where I teach, suggests that if the content of the work itself is made more societally meaningful, women will enroll in droves. That applies not only to computer engineering, but also to traditional, equally male-dominated fields like mechanical and chemical engineering.” (Nilsson, 2015, p. A19)
She reports similar findings from other universities. For example, 74% of the 230 MIT students enrolled in the interdisciplinary D-lab at MIT, which focuses on developing “technologies that improve the lives of people living in poverty”, were women.
Research cited in an international conference, Gender and Interdisciplinary Education for Engineers, 2011, concluded:
“that 34.6% of the male and 37.9% of the female engineering students want more interdisciplinarity (like subjects from the humanities) in their engineering degree courses and second that 26.9% of the non-engineering students say that they would have changed their minds about studying engineering if there had been more subjects from the humanities and social sciences included (Thaler, 2011)”
A study of physics departments that revealed that historically Black colleges and universities have had unique success in attracting students of color and women to physics majors by offering alternative paths to the major (Hill, et al, 2010, p. 64).
Jeffrey Froyd, in a White Paper on Promising Practices in Undergraduate Education, observes that (Froyd, 2008)
While many national reports have repeatedly called for a set of attributes for STEM graduates that these reports state are required by recent global, societal, and economic conditions, these reports have not taken steps to clarify these attributes in terms of learning outcomes. Frequently mentioned desirable attributes include critical thinking, lifelong learning, representation competence, interdisciplinary thinking, entrepreneurship, and systems thinking. [our emphasis]
These are some of the attributes contributed by study of the liberal arts; verbal skills in particular are necessary for successful interdisciplinary work. Each year, the Keck Science Department at the Claremont Colleges offers a unique double course for freshmen which combines physics, chemistry, and biology. Students consistently reflect about how significant this course was in their development, “AISS encouraged me to ask deep, meaningful scientific questions in a way other science courses did not. I loved the interdisciplinary approach.” Evaluators each year employ a variety of independent variables, e.g., high school grades, SAT scores, self-concepts and expectations about college, to predict the final AISS course grade (Drew and Dor, 2013). Virtually every year, the top predictor, surprisingly, has been the student’s verbal SAT score.
We expect that interdisciplinary courses, including those that combine the humanities and technical subjects - the kind we see as constituting the core of a Bachelor of Arts in Liberal Studies in Engineering - will attract students who possess both quantitative and verbal skills.
3. Empathy & Engineering
In a thoughtful examination of liberal education, Michael Roth notes that “Critical thinking is sterile without the capacity for empathy and comprehension that stretches the self…..Creating a culture that values the desire to learn from unexpected and uncomfortable sources as much as it values the critical faculties would be an important contribution to our academic and civic life.” (Roth, 2014, p. 184).
And a recent article about the Stanford School of Design (Miller, 2015) discussed
421
“…the core of what is significant about the D School’s work for the rest of academe and for the humanities in particular: Human-centered design re-describes the classical aim of education as the care and teaching of the soul; its focus on empathy follows directly from Rousseau’s stress on compassion as a social virtue.”
The explicit linking of empathy and technology is evident in the engineering of products and systems for the media e.g., music, games, film. Corporations in this line of business seek creative technical workers who have both skill sets. If we in higher education do not educate and train such workers, industry may develop new in-house educational programs. Cal Poly’s David Gillette (personal communication) notes,
“We had just come from the meeting with NBC Universal and were talking with them a great deal about the LAES program and they were quite impressed and receptive--especially where it concerned their internship program. They can get media-studies type students by the bucket at NBC and so they aren’t that interested in seeing more media-trained students. They have a hard time getting hard-core engineers interested in them as a technology company. But the LAES students seemed to offer to them the benefits of both: engineering-trained/interested students, along with media-trained/interested with a specific hybrid crossover between the skills that their best people at NBC all had as well. The top people in TV production are all cross-trained, hybrid-trained people with crosses between technology competency and artistic training/appreciation.”
Cal Poly’s Michael Huang (personal communication) adds,
I met with hiring representatives from Rosetta (http://www.rosetta.com), Disney, and Dreamworks. Rosetta stated they were looking to hire what they call “Creative Engineers”. Disney, of course, has their Imagineers. And, at CalPoly, we created a new interdisciplinary minor that combines Art and Computer Science to address the needs of companies like Dreamworks and Pixar.
And in a commencement address at Stanford, Steven Jobs famously reflected about how his study of calligraphy after dropping out of college contributed to his later technological innovations.
"Reed College at that time offered perhaps the best calligraphy instruction in the country. Throughout the campus every poster, every label on every drawer, was beautifully hand calligraphed. Because I had dropped out and didn't have to take the normal classes, I decided to take a calligraphy class to learn how to do this. I learned about serif and sans serif typefaces, about varying the amount of space between different letter combinations, about what makes great typography great. It was beautiful, historical, artistically subtle in a way that science can't capture, and I found it fascinating. ….None of this had even a hope of any practical application in my life. But 10 years later, when we were designing the first Macintosh computer, it all came back to me. And we designed it all into the Mac. It was the first computer with beautiful typography. If I had never dropped in on that single course in college, the Mac would have never had multiple typefaces or proportionally spaced fonts. And since Windows just copied the Mac, it's likely that no personal computer would have them. “(Jobs, 2005)
4. Integrating the Liberal Arts and Engineering Education - A Way Forward.
How to do this?
422
We believe it is time to make the humanities, arts and social sciences more of a core ingredient of an engineering major. This seems to be the sort of innovation encouraged by the engineering deans who signed a letter to President Obama in support of the National Academy of Engineering's Grand Challenges Initiative, an effort focused on “ambitious but achievable goals that harness science, technology and innovation to solve important national or global problems”:
“We further note that achieving these Grand Challenges requires technology and engineering, but that none can be solved by engineering alone. Hence, there is a crucial need for a new educational model that builds upon essential engineering fundamentals to develop students’ broader understanding of behavior, policy, entrepreneurship, and global perspective; one that kindles the passion necessary to take on challenges at humanity’s grandest scale.”
We take this a step further: any new educational model meant to develop students’ broader understanding of the vagaries of stakeholders' behavior and interests, of the rough and tumble of policy decision making, of the risk-laden history of the business of entrepreneurship, and of the challenges of dealing with a foreign culture that lives, survives, maybe thrives according to different values and norms than us in the US, is going to have to build upon more than “essential engineering fundamentals”. Instrumental rationality falls short, will not suffice, when these Grand Challenges are fixed as much by social, political and cultural forces and currents as by engineering constraints and opportunities.
Our proposed program would give the liberal arts as prominent a place in the education of the engineer as the engineering sciences, laboratory exercises, and design studios and to do so in a way which explores the tensions which may emerge between the two cultures when brought into close contact. The aim is to provide a firm basis for the students' understanding of the cultural contexts of production and widespread use of technology, improve the creativity of engineers in the design and making of products and systems, and prepare them for a life of change and learning. (Studies show that twenty years after college, 40% of engineers are not doing engineering.) Pulling this off will not be easy – for either faculty or students. It raises the bar, rather than lowering it.
We envision three different venues for Liberal Studies in Engineering programs - the university, the liberal arts college, the community college - with different forms adapted to the different needs and opportunities of each. At the university, the program might find a home in either a liberal arts college or a school or college of engineering. The four year college seeking to revitalize its so-called, “3-2” pre-engineering program presents a second opportunity. The community college with an established record of successful student transfer into an accredited engineering program after a two year Associate in Science degree is a third possible site.
The program would be grounded in the liberal arts, to achieve the goals of broadening engineering education, encouraging critical thinking and preparing students for leadership. This best comes from the liberal arts - even if the program is housed in a school of engineering. (Note that Liberal Studies in Engineering also provides a growth opportunity for the liberal arts, where enrollments have been dropping.)
Given this wide variety of possible venues, we dare not venture to prescribe a curriculum, a set of requirements (nor to say anything about ABET accreditation). We do lay down two functional design requirements.
• The core of the program would consist of courses in the liberal arts infused with exemplary, substantive engineering content and taught from the perspectives of the humanities and the social sciences.
• The core sequence should be of such intensity, robustness to ensure a sense of community among students (and faculty). While we avoid listing specific courses, we aim to flesh out possible course content by
recruiting interested parties to develop “module”, learning units that meet the first of these requirements. Science and the Courts is an example. (Bucciarelli, 2015)
The big challenge is moving faculty from engineering to collaborate with faculty of the humanities and social sciences in the development and teaching of core courses. It may be that it is
423
too much to ask that the two cultures, like oil and water, be mixed. But we believe otherwise: It's time for engineering education to open up to the ways of engineering in the world and for the liberal arts to acknowledge and embrace engineering as a subject worthy of study as part of its canon.
Collaboration is a critical 21st Century skill. Universities have tended to be organizations that resist change. It has been suggested that if the Edsel Division of Ford had been a university department, it would still be in existence. However, there is ample evidence that faculty from different departments and disciplines can work together to effect change. Consider the EPSCoR program of NSF, a Federal funding program to increase the competitiveness of scientific research at universities in states that traditionally had received little research support from the government. Successful state programs developed strong collaboration within and among universities and between academia, the business world, and state government (Drew, 1985). Or consider the LSAMP program of NSF, through which, for example, a consortium of colleges and universities in Houston doubled the number of minority students receiving bachelor’s degrees in STEM in only five years. Collaboration between institutions--for example, careful articulation between community colleges and four year universities—was essential, as was collaboration among professors from different departments within each institution (Drew, 2011).
Two years ago, we co-chaired a workshop of educators - faculty from the liberal arts as well as engineering - at the National Academy of Engineering in Washington, DC to discuss the possibilities for establishing an undergraduate, pre-professional Bachelor of Arts in Liberal Studies in Engineering (Bucciarelli, Drew, and Tobias, 2015).Argument ranged over the challenge of promoting and sustaining collaboration to the need to provide a convincing argument to students that an engineering program rooted in the liberal arts made sense.
Subsequently, a special double issue of the journal, Engineering Studies, was devoted to presentation of our proposal (Bucciarelli and Drew, 2015) followed by the responses and reactions of thirty scholars who attended the NAE conference. Currently we are conducting a national feasibility study of this programmatic concept under funding from the National Science Foundation.
To conclude, we return to Steve Jobs. In 2010, when he was struggling with serious illness, he became reflective and philosophical during a product presentation of the iPAD. He said, “It’s in Apple’s DNA that technology alone is not enough. It’s technology married with liberal arts, married with the humanities, that yields the results that make our hearts sing.”
Acknowledgements
Jessica Perez assisted in the preparation of this paper. Jud King and John Heywood provided valuable comments and suggestions about an earlier draft of this paper.
References
Astin, H. (1991). Citation Classics: Women’s and Men’s Perceptions of Their Contributions to Science, in The Outer Circle: Women in the Scientific Community, ed. H. Zuckerman, J.R. Cole, and J.T. Bruer (New York: Norton)
Beach, G. (2013). The U.S. Technology Skills Gap, Hoboken, New Jersey: Wiley. Bucciarelli, L. (2015). Science and the Courts, Available: https://edge.edx.org/courses/MIT/0.123x/Sandbox/courseware Bucciarelli, L. and Drew, D. (2015). Liberal Studies in Engineering: A Design Plan. Engineering Studies, 7(2-
3). Bucciarelli, L., Drew, D., and Tobias, S. (2015). Liberal Studies in Engineering: Workshop Report, March, 12,
2015. Available: https://dspace.mit.edu/handle/1721.1/96672 Drew, D. (1985). Strengthening Academic Science. New York: Praeger/Greenwood. Drew, D. (2011). STEM the Tide: Reforming Science, Technology, Engineering, and Math Education in
America. Baltimore, MD: The Johns Hopkins University Press. Drew, D. and Dor, A. (2013). Evaluation of the Advanced Accelerated Interdisciplinary Science (AISS) Course,
Technical Report, Claremont, CA.

424
Duderstadt, J. (2009). Engineering for a Changing World: A Roadmap to the Future of Engineering Practice, Research, and Education in Holistic Engineering Education: Beyond Technology, ed Grasso, D. and Burkins, M. New York: Springer.
Froyd, J. (2008). White Paper on Promising Practices in Undergraduate STEM Education. Texas A&M University, commissioned paper for NAS Board on Science Education STEM Education Workshop, June 30, 2008.
Hill, C., Corbett, C. and St. Rose, A (2010). Why So Few? Women in Science, Technology, Engineering, and Mathematics, AAUW.
Jobs, S. (2005). Stanford Commencement Address, June 12, 2005. Johnson, S. (2011). Marrying Tech and Art. The Wall Street Journal, August 27, 2011. Koppel, N., Cano, R., and Hyman, S. (2002). An Attractive Engineering Option for Girls. Conference
Proceedings, Frontiers in Education. Miller, P. (2015). Is Design Thinking the New Liberal Arts? The Chronicle of Higher Education, March 26,
2105. Nilsson, L. (2015). How to Attract Female Engineers. New York Times, April 27, 2015. Roth, M. (2013). Beyond the University: Why Liberal Education Matters, New Haven: Yale University Press. Thaler, A. (2011). Interdisciplinarities--Students’ Perceptions of Interdisciplinary Engineering Education in
Europe. Gender and Interdisciplinary Education for Engineers (GIEE) Conference, Paris, 209-221. U.S. Engineering Schools Deans. (2015). Educating Engineers to Meet the Grand Challenges, March, 2015. Wang, M.T., Eccles, J.S., & Kenny, S. (2013). Not Lack of Ability but More Choice: Individual and Gender:
Differences in Choice of Careers in Science, Technology, Engineering, and Mathematics. Psychological Science, 24(5), 770-775.
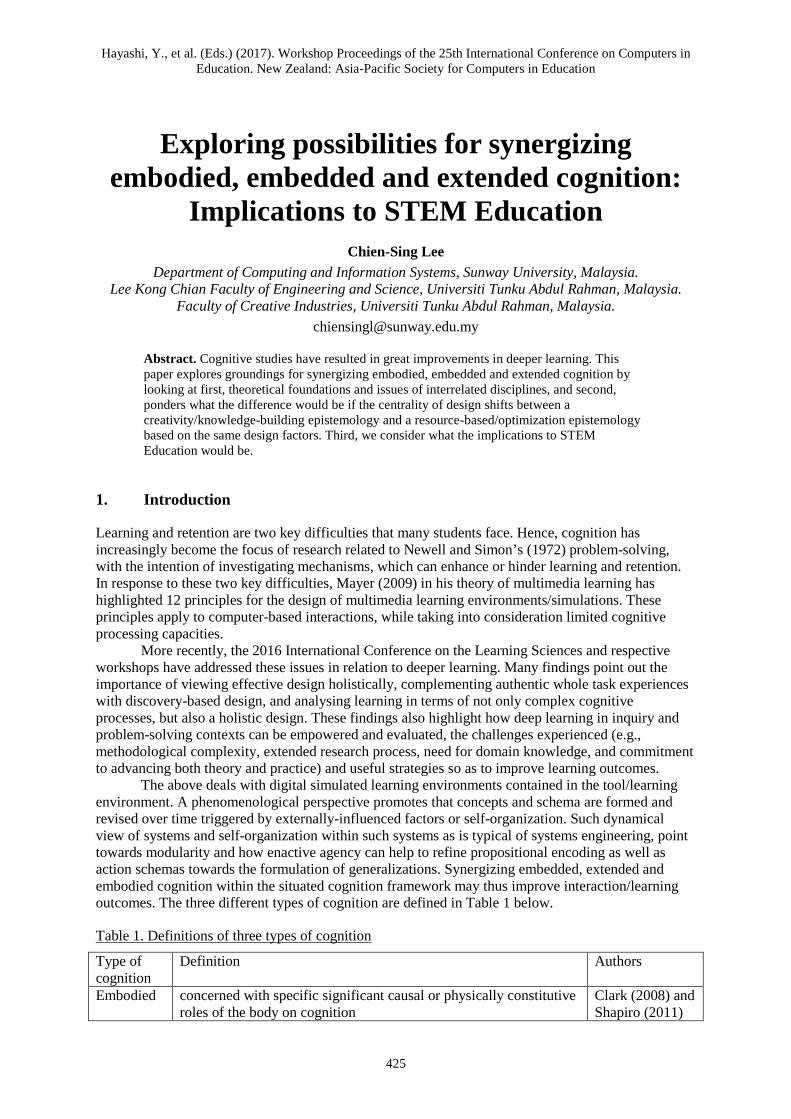
Hayashi, Y., et al. (Eds.) (2017). Workshop Proceedings of the 25th International Conference on Computers in Education. New Zealand: Asia-Pacific Society for Computers in Education
425
Exploring possibilities for synergizing embodied, embedded and extended cognition:
Implications to STEM Education Chien-Sing Lee
Department of Computing and Information Systems, Sunway University, Malaysia. Lee Kong Chian Faculty of Engineering and Science, Universiti Tunku Abdul Rahman, Malaysia.
Faculty of Creative Industries, Universiti Tunku Abdul Rahman, Malaysia. [email protected]
Abstract. Cognitive studies have resulted in great improvements in deeper learning. This paper explores groundings for synergizing embodied, embedded and extended cognition by looking at first, theoretical foundations and issues of interrelated disciplines, and second, ponders what the difference would be if the centrality of design shifts between a creativity/knowledge-building epistemology and a resource-based/optimization epistemology based on the same design factors. Third, we consider what the implications to STEM Education would be.
1. Introduction
Learning and retention are two key difficulties that many students face. Hence, cognition has increasingly become the focus of research related to Newell and Simon’s (1972) problem-solving, with the intention of investigating mechanisms, which can enhance or hinder learning and retention. In response to these two key difficulties, Mayer (2009) in his theory of multimedia learning has highlighted 12 principles for the design of multimedia learning environments/simulations. These principles apply to computer-based interactions, while taking into consideration limited cognitive processing capacities.
More recently, the 2016 International Conference on the Learning Sciences and respective workshops have addressed these issues in relation to deeper learning. Many findings point out the importance of viewing effective design holistically, complementing authentic whole task experiences with discovery-based design, and analysing learning in terms of not only complex cognitive processes, but also a holistic design. These findings also highlight how deep learning in inquiry and problem-solving contexts can be empowered and evaluated, the challenges experienced (e.g., methodological complexity, extended research process, need for domain knowledge, and commitment to advancing both theory and practice) and useful strategies so as to improve learning outcomes.
The above deals with digital simulated learning environments contained in the tool/learning environment. A phenomenological perspective promotes that concepts and schema are formed and revised over time triggered by externally-influenced factors or self-organization. Such dynamical view of systems and self-organization within such systems as is typical of systems engineering, point towards modularity and how enactive agency can help to refine propositional encoding as well as action schemas towards the formulation of generalizations. Synergizing embedded, extended and embodied cognition within the situated cognition framework may thus improve interaction/learning outcomes. The three different types of cognition are defined in Table 1 below.
Table 1. Definitions of three types of cognition
Type of cognition
Definition Authors
Embodied concerned with specific significant causal or physically constitutive roles of the body on cognition
Clark (2008) and Shapiro (2011)
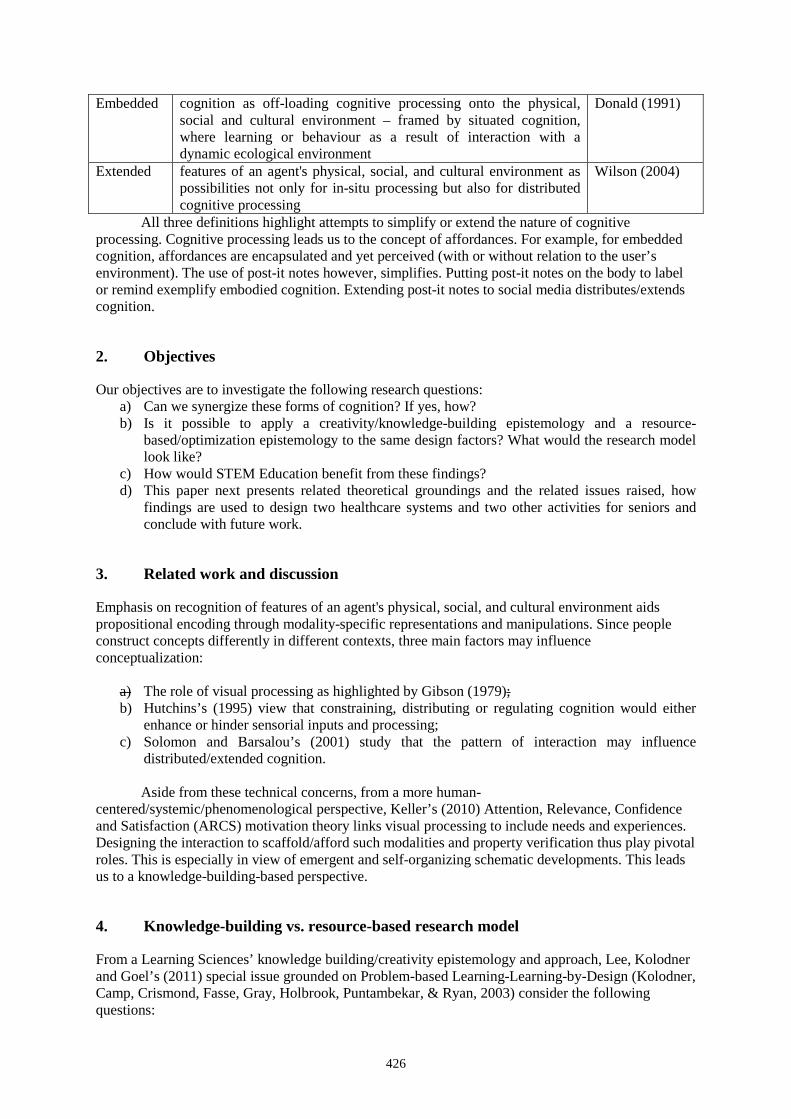
426
Embedded cognition as off-loading cognitive processing onto the physical, social and cultural environment – framed by situated cognition, where learning or behaviour as a result of interaction with a dynamic ecological environment
Donald (1991)
Extended features of an agent's physical, social, and cultural environment as possibilities not only for in-situ processing but also for distributed cognitive processing
Wilson (2004)
All three definitions highlight attempts to simplify or extend the nature of cognitive processing. Cognitive processing leads us to the concept of affordances. For example, for embedded cognition, affordances are encapsulated and yet perceived (with or without relation to the user’s environment). The use of post-it notes however, simplifies. Putting post-it notes on the body to label or remind exemplify embodied cognition. Extending post-it notes to social media distributes/extends cognition.
2. Objectives
Our objectives are to investigate the following research questions: a) Can we synergize these forms of cognition? If yes, how? b) Is it possible to apply a creativity/knowledge-building epistemology and a resource-
based/optimization epistemology to the same design factors? What would the research model look like?
c) How would STEM Education benefit from these findings? d) This paper next presents related theoretical groundings and the related issues raised, how
findings are used to design two healthcare systems and two other activities for seniors and conclude with future work.
3. Related work and discussion
Emphasis on recognition of features of an agent's physical, social, and cultural environment aids propositional encoding through modality-specific representations and manipulations. Since people construct concepts differently in different contexts, three main factors may influence conceptualization:
a) The role of visual processing as highlighted by Gibson (1979); b) Hutchins’s (1995) view that constraining, distributing or regulating cognition would either
enhance or hinder sensorial inputs and processing; c) Solomon and Barsalou’s (2001) study that the pattern of interaction may influence
distributed/extended cognition.
Aside from these technical concerns, from a more human-centered/systemic/phenomenological perspective, Keller’s (2010) Attention, Relevance, Confidence and Satisfaction (ARCS) motivation theory links visual processing to include needs and experiences. Designing the interaction to scaffold/afford such modalities and property verification thus play pivotal roles. This is especially in view of emergent and self-organizing schematic developments. This leads us to a knowledge-building-based perspective.
4. Knowledge-building vs. resource-based research model
From a Learning Sciences’ knowledge building/creativity epistemology and approach, Lee, Kolodner and Goel’s (2011) special issue grounded on Problem-based Learning-Learning-by-Design (Kolodner, Camp, Crismond, Fasse, Gray, Holbrook, Puntambekar, & Ryan, 2003) consider the following questions:
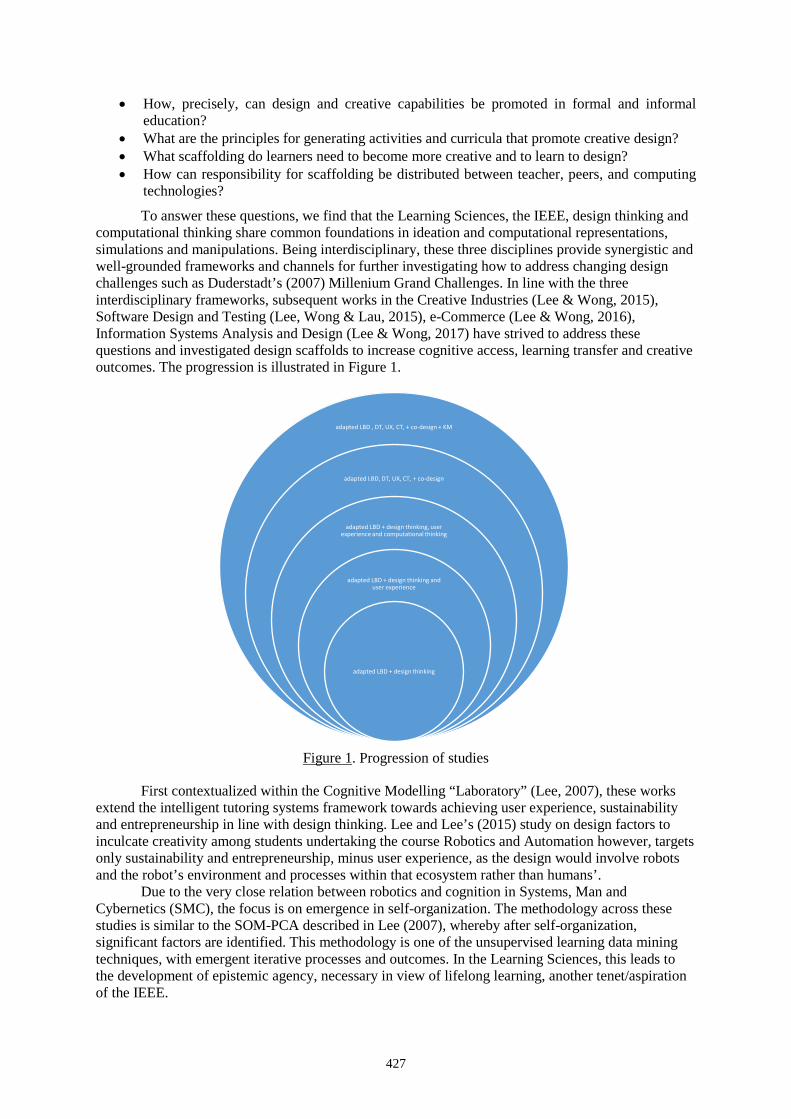
427
• How, precisely, can design and creative capabilities be promoted in formal and informal education?
• What are the principles for generating activities and curricula that promote creative design? • What scaffolding do learners need to become more creative and to learn to design? • How can responsibility for scaffolding be distributed between teacher, peers, and computing
technologies?
To answer these questions, we find that the Learning Sciences, the IEEE, design thinking and computational thinking share common foundations in ideation and computational representations, simulations and manipulations. Being interdisciplinary, these three disciplines provide synergistic and well-grounded frameworks and channels for further investigating how to address changing design challenges such as Duderstadt’s (2007) Millenium Grand Challenges. In line with the three interdisciplinary frameworks, subsequent works in the Creative Industries (Lee & Wong, 2015), Software Design and Testing (Lee, Wong & Lau, 2015), e-Commerce (Lee & Wong, 2016), Information Systems Analysis and Design (Lee & Wong, 2017) have strived to address these questions and investigated design scaffolds to increase cognitive access, learning transfer and creative outcomes. The progression is illustrated in Figure 1.
Figure 1. Progression of studies
First contextualized within the Cognitive Modelling “Laboratory” (Lee, 2007), these works extend the intelligent tutoring systems framework towards achieving user experience, sustainability and entrepreneurship in line with design thinking. Lee and Lee’s (2015) study on design factors to inculcate creativity among students undertaking the course Robotics and Automation however, targets only sustainability and entrepreneurship, minus user experience, as the design would involve robots and the robot’s environment and processes within that ecosystem rather than humans’.
Due to the very close relation between robotics and cognition in Systems, Man and Cybernetics (SMC), the focus is on emergence in self-organization. The methodology across these studies is similar to the SOM-PCA described in Lee (2007), whereby after self-organization, significant factors are identified. This methodology is one of the unsupervised learning data mining techniques, with emergent iterative processes and outcomes. In the Learning Sciences, this leads to the development of epistemic agency, necessary in view of lifelong learning, another tenet/aspiration of the IEEE.
adapted LBD , DT, UX, CT, + co-design + KM
adapted LBD, DT, UX, CT, + co-design
adapted LBD + design thinking, user experience and computational thinking
adapted LBD + design thinking and user experience
adapted LBD + design thinking
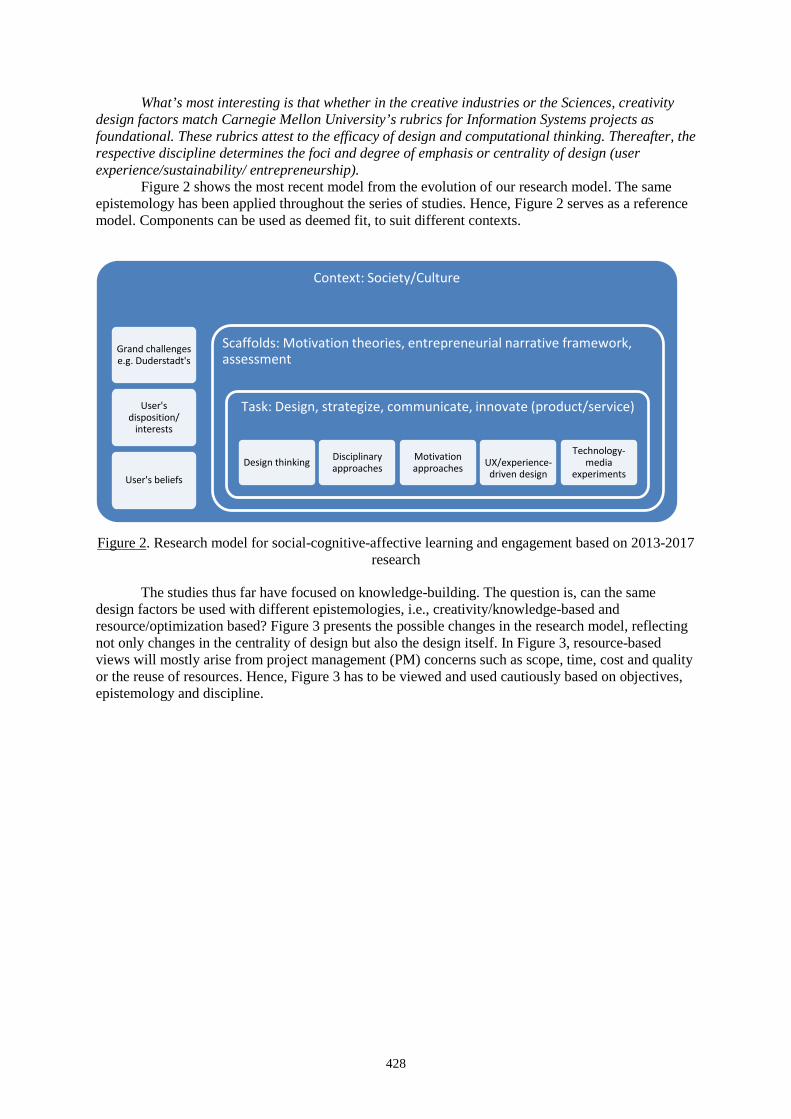
428
What’s most interesting is that whether in the creative industries or the Sciences, creativity design factors match Carnegie Mellon University’s rubrics for Information Systems projects as foundational. These rubrics attest to the efficacy of design and computational thinking. Thereafter, the respective discipline determines the foci and degree of emphasis or centrality of design (user experience/sustainability/ entrepreneurship).
Figure 2 shows the most recent model from the evolution of our research model. The same epistemology has been applied throughout the series of studies. Hence, Figure 2 serves as a reference model. Components can be used as deemed fit, to suit different contexts.
Figure 2. Research model for social-cognitive-affective learning and engagement based on 2013-2017 research
The studies thus far have focused on knowledge-building. The question is, can the same design factors be used with different epistemologies, i.e., creativity/knowledge-based and resource/optimization based? Figure 3 presents the possible changes in the research model, reflecting not only changes in the centrality of design but also the design itself. In Figure 3, resource-based views will mostly arise from project management (PM) concerns such as scope, time, cost and quality or the reuse of resources. Hence, Figure 3 has to be viewed and used cautiously based on objectives, epistemology and discipline.
Context: Society/Culture
Grand challenges e.g. Duderstadt's
User's disposition/
interests
User's beliefs
Scaffolds: Motivation theories, entrepreneurial narrative framework, assessment
Task: Design, strategize, communicate, innovate (product/service)
Design thinking Disciplinary approaches
Motivation approaches UX/experience-
driven design
Technology-media
experiments
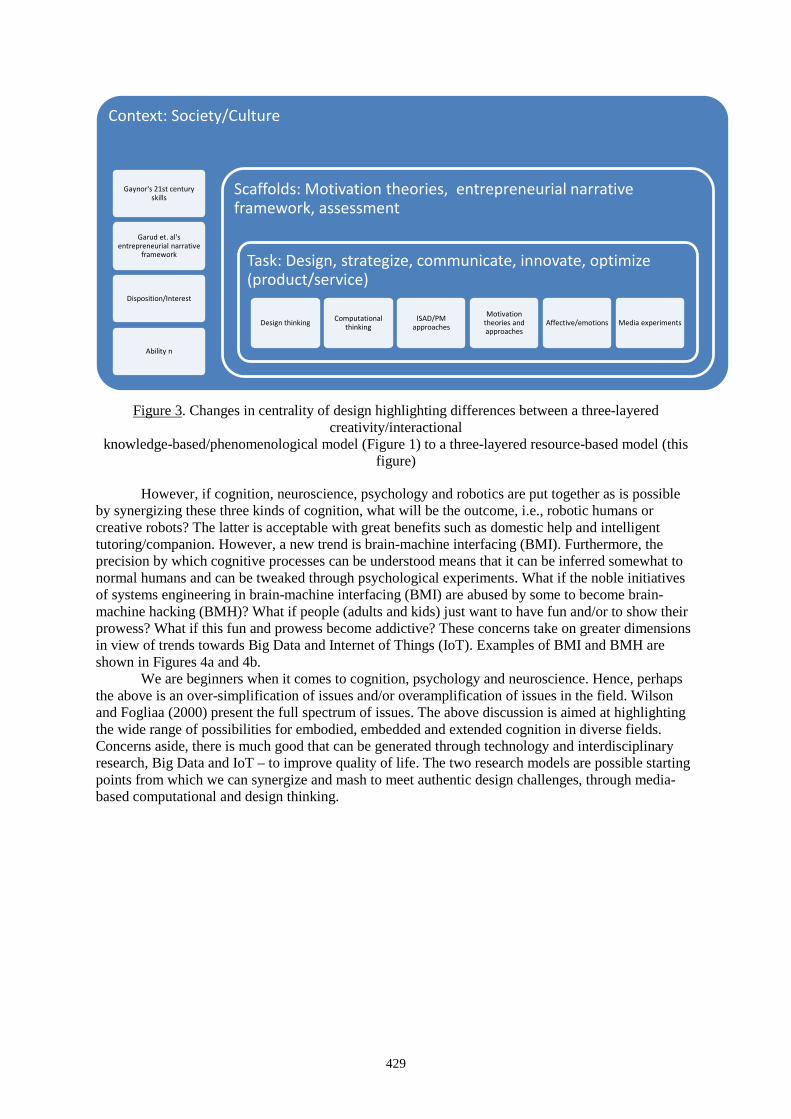
429
Figure 3. Changes in centrality of design highlighting differences between a three-layered creativity/interactional
knowledge-based/phenomenological model (Figure 1) to a three-layered resource-based model (this figure)
However, if cognition, neuroscience, psychology and robotics are put together as is possible by synergizing these three kinds of cognition, what will be the outcome, i.e., robotic humans or creative robots? The latter is acceptable with great benefits such as domestic help and intelligent tutoring/companion. However, a new trend is brain-machine interfacing (BMI). Furthermore, the precision by which cognitive processes can be understood means that it can be inferred somewhat to normal humans and can be tweaked through psychological experiments. What if the noble initiatives of systems engineering in brain-machine interfacing (BMI) are abused by some to become brain-machine hacking (BMH)? What if people (adults and kids) just want to have fun and/or to show their prowess? What if this fun and prowess become addictive? These concerns take on greater dimensions in view of trends towards Big Data and Internet of Things (IoT). Examples of BMI and BMH are shown in Figures 4a and 4b.
We are beginners when it comes to cognition, psychology and neuroscience. Hence, perhaps the above is an over-simplification of issues and/or overamplification of issues in the field. Wilson and Fogliaa (2000) present the full spectrum of issues. The above discussion is aimed at highlighting the wide range of possibilities for embodied, embedded and extended cognition in diverse fields. Concerns aside, there is much good that can be generated through technology and interdisciplinary research, Big Data and IoT – to improve quality of life. The two research models are possible starting points from which we can synergize and mash to meet authentic design challenges, through media-based computational and design thinking.
Context: Society/Culture
Gaynor's 21st century skills
Garud et. al's entrepreneurial narrative
framework
Disposition/Interest
Ability n
Scaffolds: Motivation theories, entrepreneurial narrative framework, assessment
Task: Design, strategize, communicate, innovate, optimize (product/service)
Design thinking Computational thinking
ISAD/PM approaches
Motivation theories and approaches
Affective/emotions Media experiments
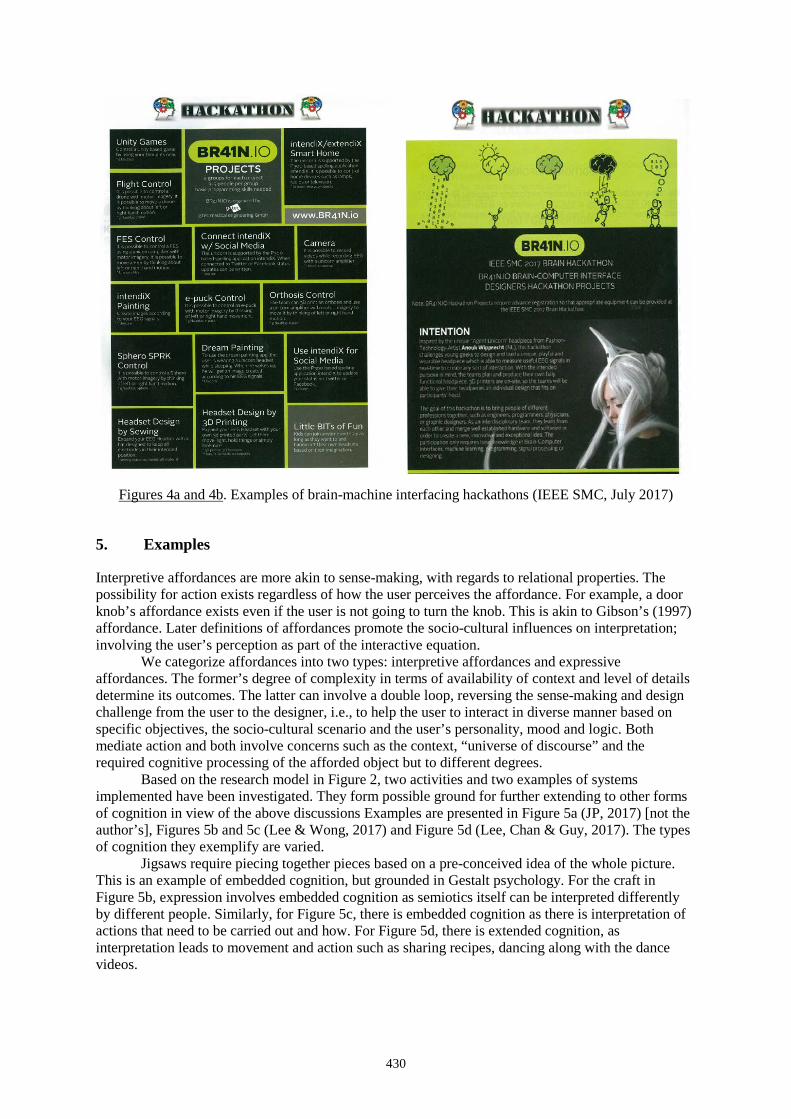
430
Figures 4a and 4b. Examples of brain-machine interfacing hackathons (IEEE SMC, July 2017)
5. Examples
Interpretive affordances are more akin to sense-making, with regards to relational properties. The possibility for action exists regardless of how the user perceives the affordance. For example, a door knob’s affordance exists even if the user is not going to turn the knob. This is akin to Gibson’s (1997) affordance. Later definitions of affordances promote the socio-cultural influences on interpretation; involving the user’s perception as part of the interactive equation.
We categorize affordances into two types: interpretive affordances and expressive affordances. The former’s degree of complexity in terms of availability of context and level of details determine its outcomes. The latter can involve a double loop, reversing the sense-making and design challenge from the user to the designer, i.e., to help the user to interact in diverse manner based on specific objectives, the socio-cultural scenario and the user’s personality, mood and logic. Both mediate action and both involve concerns such as the context, “universe of discourse” and the required cognitive processing of the afforded object but to different degrees.
Based on the research model in Figure 2, two activities and two examples of systems implemented have been investigated. They form possible ground for further extending to other forms of cognition in view of the above discussions Examples are presented in Figure 5a (JP, 2017) [not the author’s], Figures 5b and 5c (Lee & Wong, 2017) and Figure 5d (Lee, Chan & Guy, 2017). The types of cognition they exemplify are varied.
Jigsaws require piecing together pieces based on a pre-conceived idea of the whole picture. This is an example of embedded cognition, but grounded in Gestalt psychology. For the craft in Figure 5b, expression involves embedded cognition as semiotics itself can be interpreted differently by different people. Similarly, for Figure 5c, there is embedded cognition as there is interpretation of actions that need to be carried out and how. For Figure 5d, there is extended cognition, as interpretation leads to movement and action such as sharing recipes, dancing along with the dance videos.
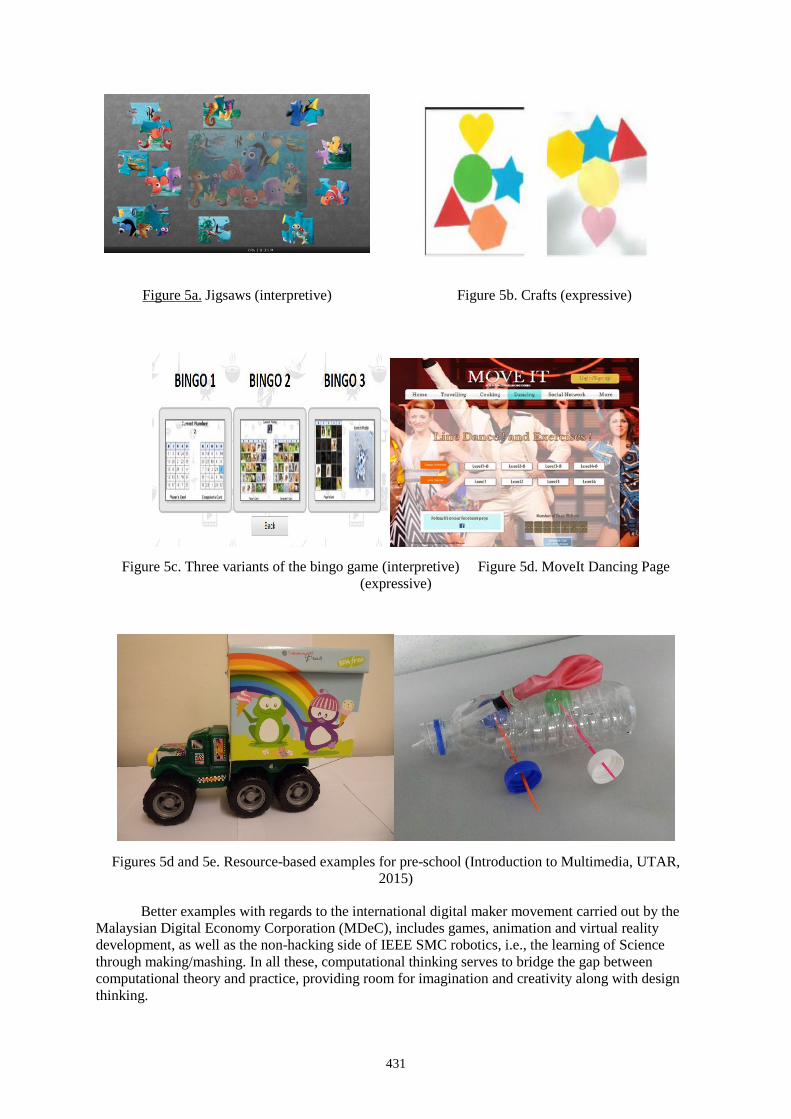
431
Figure 5a. Jigsaws (interpretive)
Figure 5b. Crafts (expressive)
Figure 5c. Three variants of the bingo game (interpretive) Figure 5d. MoveIt Dancing Page
(expressive)
Figures 5d and 5e. Resource-based examples for pre-school (Introduction to Multimedia, UTAR, 2015)
Better examples with regards to the international digital maker movement carried out by the Malaysian Digital Economy Corporation (MDeC), includes games, animation and virtual reality development, as well as the non-hacking side of IEEE SMC robotics, i.e., the learning of Science through making/mashing. In all these, computational thinking serves to bridge the gap between computational theory and practice, providing room for imagination and creativity along with design thinking.
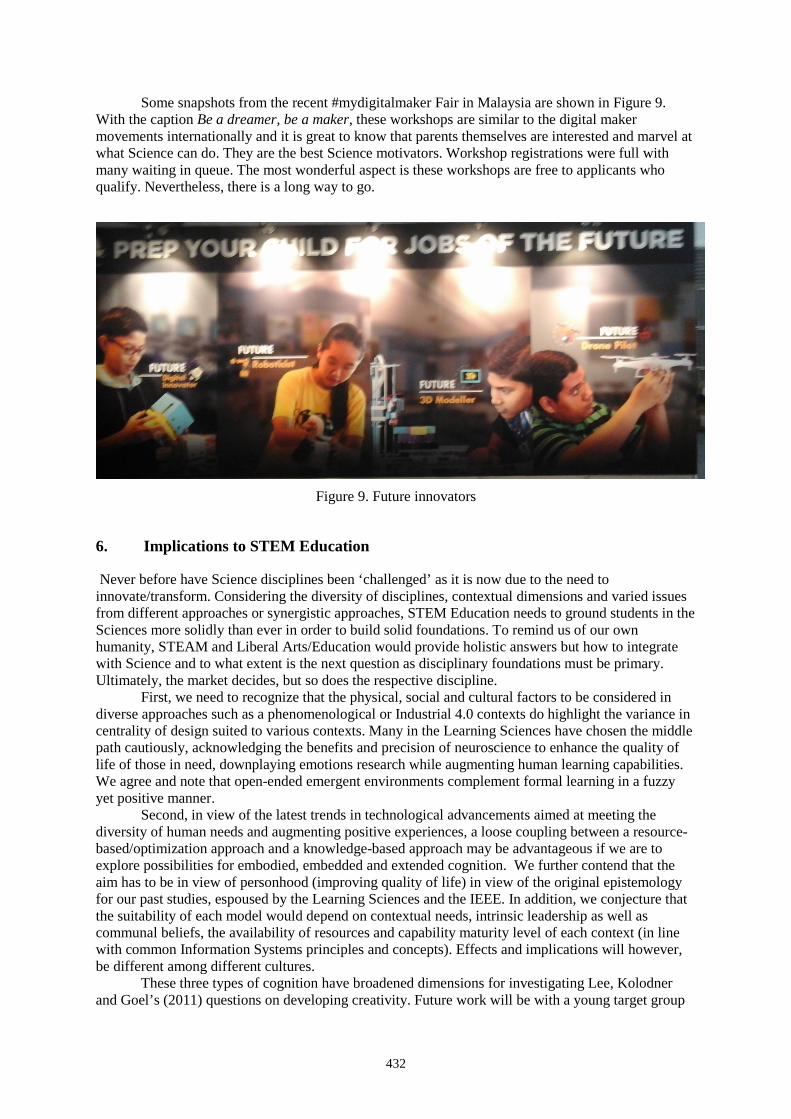
432
Some snapshots from the recent #mydigitalmaker Fair in Malaysia are shown in Figure 9. With the caption Be a dreamer, be a maker, these workshops are similar to the digital maker movements internationally and it is great to know that parents themselves are interested and marvel at what Science can do. They are the best Science motivators. Workshop registrations were full with many waiting in queue. The most wonderful aspect is these workshops are free to applicants who qualify. Nevertheless, there is a long way to go.
Figure 9. Future innovators
6. Implications to STEM Education
Never before have Science disciplines been ‘challenged’ as it is now due to the need to innovate/transform. Considering the diversity of disciplines, contextual dimensions and varied issues from different approaches or synergistic approaches, STEM Education needs to ground students in the Sciences more solidly than ever in order to build solid foundations. To remind us of our own humanity, STEAM and Liberal Arts/Education would provide holistic answers but how to integrate with Science and to what extent is the next question as disciplinary foundations must be primary. Ultimately, the market decides, but so does the respective discipline.
First, we need to recognize that the physical, social and cultural factors to be considered in diverse approaches such as a phenomenological or Industrial 4.0 contexts do highlight the variance in centrality of design suited to various contexts. Many in the Learning Sciences have chosen the middle path cautiously, acknowledging the benefits and precision of neuroscience to enhance the quality of life of those in need, downplaying emotions research while augmenting human learning capabilities. We agree and note that open-ended emergent environments complement formal learning in a fuzzy yet positive manner.
Second, in view of the latest trends in technological advancements aimed at meeting the diversity of human needs and augmenting positive experiences, a loose coupling between a resource-based/optimization approach and a knowledge-based approach may be advantageous if we are to explore possibilities for embodied, embedded and extended cognition. We further contend that the aim has to be in view of personhood (improving quality of life) in view of the original epistemology for our past studies, espoused by the Learning Sciences and the IEEE. In addition, we conjecture that the suitability of each model would depend on contextual needs, intrinsic leadership as well as communal beliefs, the availability of resources and capability maturity level of each context (in line with common Information Systems principles and concepts). Effects and implications will however, be different among different cultures.
These three types of cognition have broadened dimensions for investigating Lee, Kolodner and Goel’s (2011) questions on developing creativity. Future work will be with a young target group
433
who characteristically keep repeating certain actions. If we continue with this research, we will present our hypothesis why and how we propose to transfer these findings.
Acknowledgement
An average pure Science student before embarking on a vocation in Education, Artificial Intelligence, and the Learning Sciences and the incidental foray into the creative industries, the author wishes to thank Multimedia University (MMU) and Universiti Tunku Abdul Rahman (UTAR) where she learnt deeper about Engineering/Computer Science and the creative industries respectively; the Fulbright Commission, Prof. Janet Kolodner, Prof. Glenn David Blank and Prof. Ashok K. Goel for exposure to the Learning Sciences in the EE/CS Computing School in 2008/2009 and Adjunct Assoc. Prof. Dr. K. Daniel Wong for collaboration on Brown and Wyatt’s (2007) design thinking. Thanks also to Universiti Tunku Abdul Rahman for the internal grant on Scaffolds and design factors to increase creative outcomes in Engineering Education based on the first research model, which led to research on Software Design and Testing and Robotics and Automation where she was PI; Sunway University, the Malaysian Ministry of Higher Education’s Fundamental Research Grant Scheme for funding research on the two prototypes (bingo and Moveit). Thanks also to Dr. John H. Hughes, Senior Fulbright Scholar, Arizona for introducing embodied cognition, and the Malaysian Invention and Design Society for encouraging interdisciplinary research. The views in this paper on BMI, BMH are that of the author’s and do not reflect that of her institution.
References
Clark, A. (2008). Supersizing the Mind: Embodiment, Action, and Cognitive Extension, New York: Oxford University Press.
Duderstadt, J. J. (2008). Engineering for a Changing World: A Roadmap to the Future of Engineering Practice, Research, and Education, The Millennium Project, The University of Michigan.
Gibson, J.J. (1979). The Ecological Approach to Visual Perception, Boston: Houghton Mifflin. Hutchins, E. (1995). Cognition in the Wild, Cambridge, MA: MIT Press. Jigsaw Planet. Available: https://www.jigsawplanet.com/ [Accessed: March 2015]. Keller, J. M. (2010). ARCS Motivation Model. Kolodner, J. L., Camp, P. J., Crismond, D., Fasse, B., Gray, J., Holbrook, J., Puntambekar, S. and Ryan. M.
(2003). Problem-Based Learning Meets Case-Based Reasoning in the Middle-School Science Classroom: Putting Learning by Design™ Into Practice. The Journal of the Learning Sciences, 12(4), 495–547, 2003, Lawrence Erlbaum Associates, Inc.
Lee, C. S. (2007). Diagnostic, predictive and compositional modeling with data mining in integrated learning environments. Computers & Education, 49(3), 562-580.
Lee, C. S. and Wong, K. D. (2015). Discovering an Ontological Affective-Socio-Cognitive Co-Design Model: Towards a Symbiotic Context-Aware Recommender, International Conference on Cognition and Exploratory Learning in the Digital Age, October 24-26, 2015, Ireland.
Lee, C. S., Wong, K. D. and Lau, S. B. Y. (2015). Scaffolds and design factors to increase creative outcomes in teaching Software Design and Testing, IEEE International Conference on Industrial Engineering and Engineering Management, December 9-12, 2015, Singapore.
Lee, C. S. and Lee, J. V. (2015). Investigating design factors/scaffolds to improve knowledge building and creative outcomes in Robotics and Automation. Technical report. Universiti Tunku Abdul Rahman Research Grant.
Lee, C. S. and Wong, K. D. (2016). E-commerce Web design engineering: Towards discovery of innovational opportunities, IEEE International Conference on Advanced Learning Technologies, July 25-28, 2016, Austin, Texas.
Lee, C. S. and Wong, K. D. (2017). An entrepreneurial narrative media-model framework for knowledge building and open co-design, IEEE SAI Computing, July 18-20, 2017, London, UK.
Lee, C. S. and Wong, K. D. (2017). Developing Community-based Engagement in Smart Cities: A Design-computational Thinking Approach, IEEE International Conference on Industrial Engineering and Engineering Management, December 10-13, 2017, Singapore.

434
Lee, C. S., Chan, W. L. and Guy, S. Y. (2017). Socially-enhanced Variants of Mobile Bingo Game: Towards Personalized Cognitive and Social Engagement among Seniors. International Conference on Soft Computing, Intelligent System and Information Technology. Bali, Indonesia, September 26-29, 2017.
Mayer, R. E. 2009. Multimedia Learning. Cambridge University Press. Newell, A., and Simon, H.A. (1972). Human problem solving, Englewood Cliffs, NJ: Prentice-Hall. Shapiro, L., 2011, Embodied Cognition. New York: Routledge. Solomon, K.O., and Barsalou, L.W. (2001). Representing properties locally. Cognitive Psychology, 43: 129–
169. Wilson, M. (2002). Six views of embodied cognition. Psychonomic Bulletin and Review, 9: 625–636. Wilson, R. A. and Fogliaa, L. (2015). Embodied cognition. Stanford Encyclopaedia of Philosophy.
Hayashi, Y., et al. (Eds.) (2017). Workshop Proceedings of the 25th International Conference on Computers in Education. New Zealand: Asia-Pacific Society for Computers in Education
435
Design and Development of an Online System in Support of Teaching-by-Questioning in
Classrooms Yu-Hsin LIUa & Fu-Yun YU*b
aDepartment of Civil Engineering, National Chi Nan University, Taiwan *bInstitute of Education, National Cheng Kung University, Taiwan
Abstract: An online system supporting a teaching-by-questioning strategy in classrooms was developed. The most distinctive designs of the system (i.e., the delay of participants’ response display at the instructor’s control, and the re-open of the response space when the accuracy rate falls between certain ranges) were explicated. Data on the perceived usefulness and ease of use found that more than 90% of the participants agreed that the use of the developed system to support the teacher’s in-class questioning helps their learning of the course material, and that the system is easy to use.
Keywords: Active learning, classroom activities, online learning system, teaching-by-questioning
1. Introduction
1.1. Background of this work
Contemporary educational paradigms stress active information processing and meaningful knowledge-building on the part of the learner (Slavin, 2014). Current perspectives on educational assessment highlight the beneficial effects of continuous, formative evaluation during the learning process (Brookhart & Nitko, 2014). Despite this, students at all educational levels tend to have passive learning habits. Thus, it is important to design activities to change the status quote.
One such powerful teaching strategy is teaching-by-questioning. While this strategy has been practiced by many educators with effects attested (Chin, 2007; Gall, 1984), its implementation in today’s classrooms encounters some difficulties. Particularly, due to the lack of appropriately designed support tools, it has been found that students’ attentiveness to the teacher’s in-class questioning and equal participation among students are rarely observed (Yu & Liu, 2015).
In an attempt to promote wider and more equal participation among students, and tap on the current generation of students as digital natives, researchers have explored the use of Moodle and Facebook (Deng & Tavares, 2013; Hogg, 2014; Liu & Yu, 2016; Yu & Liu, 2015). Even though encouraging findings support these tools for teaching-by-questioning in classrooms, the simultaneous and instant display of all participants’ responses does not allow the strategy to reach its full potential. Many times students appeared to agree to already display answers. As a consequence, answering to the teacher’s in-class questioning on these digital platforms tends to encourage group and convergent thinking from all participants.
1.2. Purposes of this work
To allow students’ knowledge-building and sharing in classrooms not to be restrained by the pre-mature display of peers’ responses to the teacher’s in-class questioning, which may inadvertently induce group think, as implied by the conformity theory (Smith & Bond, 1993), an online system to address this problem is proposed. Specifically, the design and development of an online system in
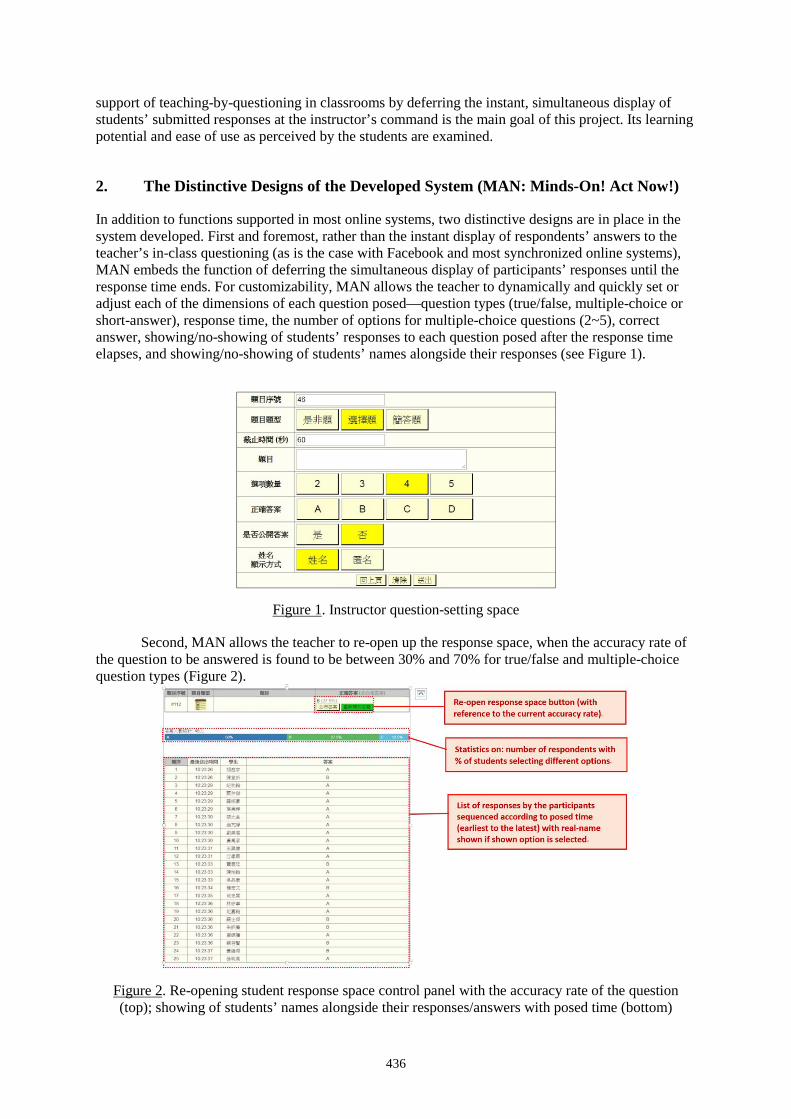
436
support of teaching-by-questioning in classrooms by deferring the instant, simultaneous display of students’ submitted responses at the instructor’s command is the main goal of this project. Its learning potential and ease of use as perceived by the students are examined.
2. The Distinctive Designs of the Developed System (MAN: Minds-On! Act Now!)
In addition to functions supported in most online systems, two distinctive designs are in place in the system developed. First and foremost, rather than the instant display of respondents’ answers to the teacher’s in-class questioning (as is the case with Facebook and most synchronized online systems), MAN embeds the function of deferring the simultaneous display of participants’ responses until the response time ends. For customizability, MAN allows the teacher to dynamically and quickly set or adjust each of the dimensions of each question posed—question types (true/false, multiple-choice or short-answer), response time, the number of options for multiple-choice questions (2~5), correct answer, showing/no-showing of students’ responses to each question posed after the response time elapses, and showing/no-showing of students’ names alongside their responses (see Figure 1).
Figure 1. Instructor question-setting space
Second, MAN allows the teacher to re-open up the response space, when the accuracy rate of the question to be answered is found to be between 30% and 70% for true/false and multiple-choice question types (Figure 2).
Figure 2. Re-opening student response space control panel with the accuracy rate of the question (top); showing of students’ names alongside their responses/answers with posed time (bottom)
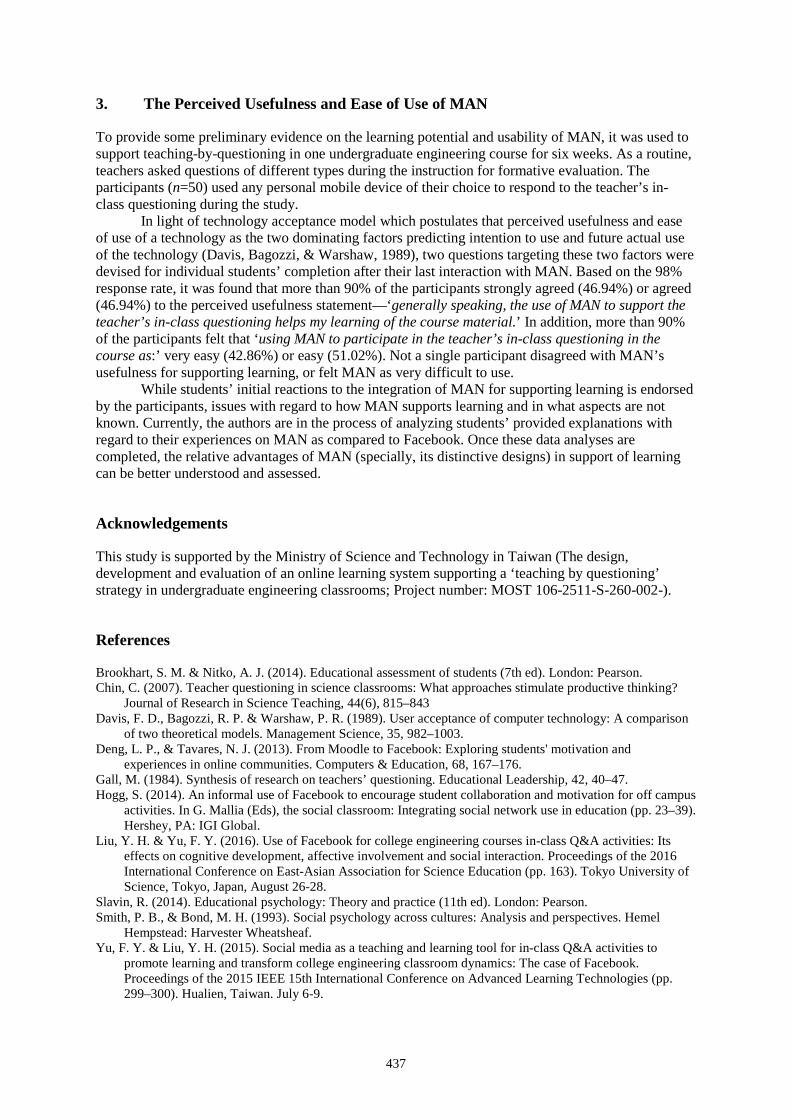
437
3. The Perceived Usefulness and Ease of Use of MAN
To provide some preliminary evidence on the learning potential and usability of MAN, it was used to support teaching-by-questioning in one undergraduate engineering course for six weeks. As a routine, teachers asked questions of different types during the instruction for formative evaluation. The participants (n=50) used any personal mobile device of their choice to respond to the teacher’s in-class questioning during the study.
In light of technology acceptance model which postulates that perceived usefulness and ease of use of a technology as the two dominating factors predicting intention to use and future actual use of the technology (Davis, Bagozzi, & Warshaw, 1989), two questions targeting these two factors were devised for individual students’ completion after their last interaction with MAN. Based on the 98% response rate, it was found that more than 90% of the participants strongly agreed (46.94%) or agreed (46.94%) to the perceived usefulness statement—‘generally speaking, the use of MAN to support the teacher’s in-class questioning helps my learning of the course material.’ In addition, more than 90% of the participants felt that ‘using MAN to participate in the teacher’s in-class questioning in the course as:’ very easy (42.86%) or easy (51.02%). Not a single participant disagreed with MAN’s usefulness for supporting learning, or felt MAN as very difficult to use.
While students’ initial reactions to the integration of MAN for supporting learning is endorsed by the participants, issues with regard to how MAN supports learning and in what aspects are not known. Currently, the authors are in the process of analyzing students’ provided explanations with regard to their experiences on MAN as compared to Facebook. Once these data analyses are completed, the relative advantages of MAN (specially, its distinctive designs) in support of learning can be better understood and assessed.
Acknowledgements
This study is supported by the Ministry of Science and Technology in Taiwan (The design, development and evaluation of an online learning system supporting a ‘teaching by questioning’ strategy in undergraduate engineering classrooms; Project number: MOST 106-2511-S-260-002-).
References
Brookhart, S. M. & Nitko, A. J. (2014). Educational assessment of students (7th ed). London: Pearson. Chin, C. (2007). Teacher questioning in science classrooms: What approaches stimulate productive thinking?
Journal of Research in Science Teaching, 44(6), 815–843 Davis, F. D., Bagozzi, R. P. & Warshaw, P. R. (1989). User acceptance of computer technology: A comparison
of two theoretical models. Management Science, 35, 982–1003. Deng, L. P., & Tavares, N. J. (2013). From Moodle to Facebook: Exploring students' motivation and
experiences in online communities. Computers & Education, 68, 167–176. Gall, M. (1984). Synthesis of research on teachers’ questioning. Educational Leadership, 42, 40–47. Hogg, S. (2014). An informal use of Facebook to encourage student collaboration and motivation for off campus
activities. In G. Mallia (Eds), the social classroom: Integrating social network use in education (pp. 23–39). Hershey, PA: IGI Global.
Liu, Y. H. & Yu, F. Y. (2016). Use of Facebook for college engineering courses in-class Q&A activities: Its effects on cognitive development, affective involvement and social interaction. Proceedings of the 2016 International Conference on East-Asian Association for Science Education (pp. 163). Tokyo University of Science, Tokyo, Japan, August 26-28.
Slavin, R. (2014). Educational psychology: Theory and practice (11th ed). London: Pearson. Smith, P. B., & Bond, M. H. (1993). Social psychology across cultures: Analysis and perspectives. Hemel
Hempstead: Harvester Wheatsheaf. Yu, F. Y. & Liu, Y. H. (2015). Social media as a teaching and learning tool for in-class Q&A activities to
promote learning and transform college engineering classroom dynamics: The case of Facebook. Proceedings of the 2015 IEEE 15th International Conference on Advanced Learning Technologies (pp. 299–300). Hualien, Taiwan. July 6-9.
Hayashi, Y., et al. (Eds.) (2017). Workshop Proceedings of the 25th International Conference on Computers in Education. New Zealand: Asia-Pacific Society for Computers in Education
438
Preliminary Study on Learning by Constructing a Cognitive Model Based on
Problem-Solving Processes Kazuaki KOJIMAa*, Kazuhisa MIWAb, Ryuichi NAKAIKEc, Nana KANZAKId,
Hitoshi TERAIe, Jun’ya MORITAf, Hitomi SAITOg, & Miki MATSUMUROb aLearning Technology Laboratory, Teikyo University, Japan
bGraduate School of Information Science, Nagoya University, Japan cDepartment of International Tourism, Heian Jogakuin Universiry, Japan
dCollege of Nagoya Women's University, Japan eFaculty of Humanity-Oriented Science and Engineering, Kindai University, Japan
fFaculty of Informatics, Shizuoka University, Japan gFaculty of Education, Aichi University of Education, Japan
Abstract: Construction of models is promising as a learning activity, and computational environments are useful for that. However, it can be a heavy task for novice learners to construct computational models because it requires considerable instruction and practice of programming languages. We designed a basic framework for learning by experiencing construction of models on a production system in the domain of cognitive science. In this framework, a model abstractly describing human problem-solving processes and its computer model implemented on the production system is prepared by an instructor in advance. A learner is given the abstract model and processes of problem solving produced by executing the implementation model, and then engaged in instantiating the abstract model into an implementation model. This activity is expected to deepen learner understanding of mental processes embedded in the abstract model. We preliminary studied the effect of learning a model which simulates subtraction requiring regrouping in the framework. The results confirm the possibility that such experience can improve learner understanding of mental processes behind the model, and necessity to expand learning activities in the framework.
Keywords: Learning by construction, cognitive model, production system, problem solving
1. Introduction
Science in recent decades has used two approaches to understand the natures of targets: an analytical approach through observation of targets, and a constructive approach through construction and simulation of target models. For example, cognitive science research adopted empirical studies of human behaviors and running computational models in understanding human mind (Schunn, Crowley and Okada, 1998).
Models are essential to the production, dissemination, and acceptance of scientific knowledge (Gilbert, 2004). As well as science research, science education uses models to have learners interpret scientific knowledge. Besides the model use, construction and simulation of models by learners has also been argued (Clement, 2000; Gilbert, 2004; Harrison, and Treagust, 1998). Model construction is promising as a learning activity in understanding complex or invisible targets, and computational environments are useful both for researchers and learners because they enable to instantly construct, test, and evaluate models. However, it can be a heavy task for novice learners to construct computational models because it requires considerable instruction and practice of programming languages (Penner, 2000). Therefore, several studies addressed support for model construction by learners (e.g., Basu, Dukeman, Kinnebrew, Biswas and Sengupta, 2014; Brady, Holbert, Soylu, Novak, and Wilensky, 2015; Hirashima, Imai, Horiguchi and Toumoto, 2009). Support by the studies
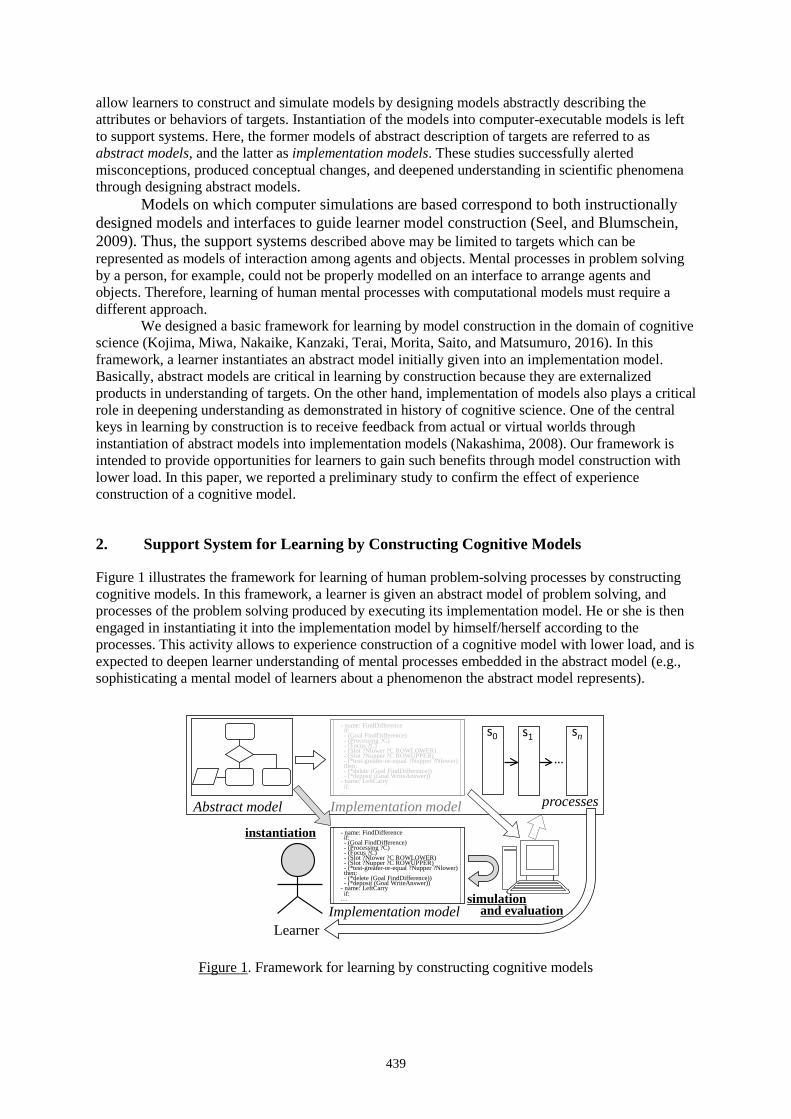
439
allow learners to construct and simulate models by designing models abstractly describing the attributes or behaviors of targets. Instantiation of the models into computer-executable models is left to support systems. Here, the former models of abstract description of targets are referred to as abstract models, and the latter as implementation models. These studies successfully alerted misconceptions, produced conceptual changes, and deepened understanding in scientific phenomena through designing abstract models.
Models on which computer simulations are based correspond to both instructionally designed models and interfaces to guide learner model construction (Seel, and Blumschein, 2009). Thus, the support systems described above may be limited to targets which can be represented as models of interaction among agents and objects. Mental processes in problem solving by a person, for example, could not be properly modelled on an interface to arrange agents and objects. Therefore, learning of human mental processes with computational models must require a different approach.
We designed a basic framework for learning by model construction in the domain of cognitive science (Kojima, Miwa, Nakaike, Kanzaki, Terai, Morita, Saito, and Matsumuro, 2016). In this framework, a learner instantiates an abstract model initially given into an implementation model. Basically, abstract models are critical in learning by construction because they are externalized products in understanding of targets. On the other hand, implementation of models also plays a critical role in deepening understanding as demonstrated in history of cognitive science. One of the central keys in learning by construction is to receive feedback from actual or virtual worlds through instantiation of abstract models into implementation models (Nakashima, 2008). Our framework is intended to provide opportunities for learners to gain such benefits through model construction with lower load. In this paper, we reported a preliminary study to confirm the effect of experience construction of a cognitive model.
2. Support System for Learning by Constructing Cognitive Models
Figure 1 illustrates the framework for learning of human problem-solving processes by constructing cognitive models. In this framework, a learner is given an abstract model of problem solving, and processes of the problem solving produced by executing its implementation model. He or she is then engaged in instantiating it into the implementation model by himself/herself according to the processes. This activity allows to experience construction of a cognitive model with lower load, and is expected to deepen learner understanding of mental processes embedded in the abstract model (e.g., sophisticating a mental model of learners about a phenomenon the abstract model represents).
Learner
Abstract model Implementation model processes
…
s0 s1 sn- name: FindDifferenceif:- (Goal FindDifference)- (Processing ?C)- (Focus ?C)- (Slot ?Nlower ?C ROWLOWER)- (Slot ?Nupper ?C ROWUPPER)- (*test-greater-or-equal ?Nupper ?Nlower)then:- (*delete (Goal FindDifference))- (*deposit (Goal WriteAnswer))
- name: LeftCarryif:
…
- name: FindDifferenceif:- (Goal FindDifference)- (Processing ?C)- (Focus ?C)- (Slot ?Nlower ?C ROWLOWER)- (Slot ?Nupper ?C ROWUPPER)- (*test-greater-or-equal ?Nupper ?Nlower)then:- (*delete (Goal FindDifference))- (*deposit (Goal WriteAnswer))
- name: LeftCarryif:
…
Implementation model
instantiation
simulationand evaluation
Figure 1. Framework for learning by constructing cognitive models
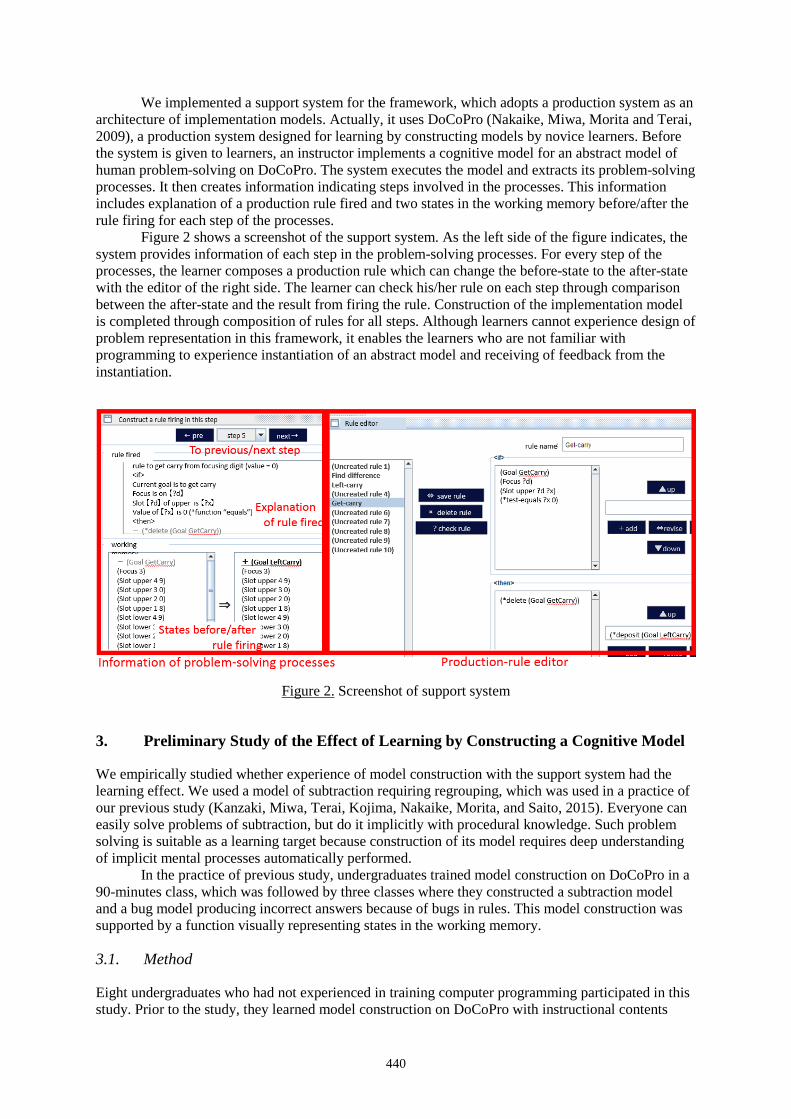
440
We implemented a support system for the framework, which adopts a production system as an architecture of implementation models. Actually, it uses DoCoPro (Nakaike, Miwa, Morita and Terai, 2009), a production system designed for learning by constructing models by novice learners. Before the system is given to learners, an instructor implements a cognitive model for an abstract model of human problem-solving on DoCoPro. The system executes the model and extracts its problem-solving processes. It then creates information indicating steps involved in the processes. This information includes explanation of a production rule fired and two states in the working memory before/after the rule firing for each step of the processes.
Figure 2 shows a screenshot of the support system. As the left side of the figure indicates, the system provides information of each step in the problem-solving processes. For every step of the processes, the learner composes a production rule which can change the before-state to the after-state with the editor of the right side. The learner can check his/her rule on each step through comparison between the after-state and the result from firing the rule. Construction of the implementation model is completed through composition of rules for all steps. Although learners cannot experience design of problem representation in this framework, it enables the learners who are not familiar with programming to experience instantiation of an abstract model and receiving of feedback from the instantiation.
Figure 2. Screenshot of support system
3. Preliminary Study of the Effect of Learning by Constructing a Cognitive Model
We empirically studied whether experience of model construction with the support system had the learning effect. We used a model of subtraction requiring regrouping, which was used in a practice of our previous study (Kanzaki, Miwa, Terai, Kojima, Nakaike, Morita, and Saito, 2015). Everyone can easily solve problems of subtraction, but do it implicitly with procedural knowledge. Such problem solving is suitable as a learning target because construction of its model requires deep understanding of implicit mental processes automatically performed.
In the practice of previous study, undergraduates trained model construction on DoCoPro in a 90-minutes class, which was followed by three classes where they constructed a subtraction model and a bug model producing incorrect answers because of bugs in rules. This model construction was supported by a function visually representing states in the working memory.
3.1. Method
Eight undergraduates who had not experienced in training computer programming participated in this study. Prior to the study, they learned model construction on DoCoPro with instructional contents
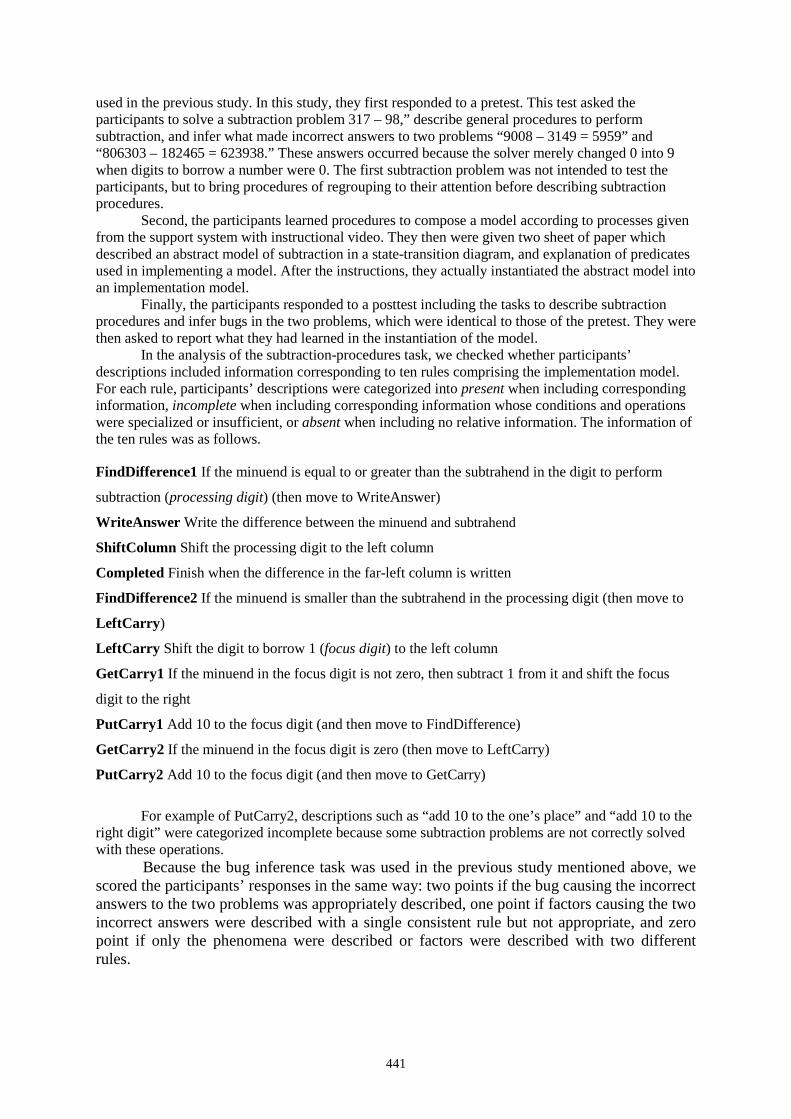
441
used in the previous study. In this study, they first responded to a pretest. This test asked the participants to solve a subtraction problem 317 – 98,” describe general procedures to perform subtraction, and infer what made incorrect answers to two problems “9008 – 3149 = 5959” and “806303 – 182465 = 623938.” These answers occurred because the solver merely changed 0 into 9 when digits to borrow a number were 0. The first subtraction problem was not intended to test the participants, but to bring procedures of regrouping to their attention before describing subtraction procedures.
Second, the participants learned procedures to compose a model according to processes given from the support system with instructional video. They then were given two sheet of paper which described an abstract model of subtraction in a state-transition diagram, and explanation of predicates used in implementing a model. After the instructions, they actually instantiated the abstract model into an implementation model.
Finally, the participants responded to a posttest including the tasks to describe subtraction procedures and infer bugs in the two problems, which were identical to those of the pretest. They were then asked to report what they had learned in the instantiation of the model.
In the analysis of the subtraction-procedures task, we checked whether participants’ descriptions included information corresponding to ten rules comprising the implementation model. For each rule, participants’ descriptions were categorized into present when including corresponding information, incomplete when including corresponding information whose conditions and operations were specialized or insufficient, or absent when including no relative information. The information of the ten rules was as follows.
FindDifference1 If the minuend is equal to or greater than the subtrahend in the digit to perform
subtraction (processing digit) (then move to WriteAnswer)
WriteAnswer Write the difference between the minuend and subtrahend
ShiftColumn Shift the processing digit to the left column
Completed Finish when the difference in the far-left column is written
FindDifference2 If the minuend is smaller than the subtrahend in the processing digit (then move to
LeftCarry)
LeftCarry Shift the digit to borrow 1 (focus digit) to the left column
GetCarry1 If the minuend in the focus digit is not zero, then subtract 1 from it and shift the focus
digit to the right
PutCarry1 Add 10 to the focus digit (and then move to FindDifference)
GetCarry2 If the minuend in the focus digit is zero (then move to LeftCarry)
PutCarry2 Add 10 to the focus digit (and then move to GetCarry)
For example of PutCarry2, descriptions such as “add 10 to the one’s place” and “add 10 to the right digit” were categorized incomplete because some subtraction problems are not correctly solved with these operations.
Because the bug inference task was used in the previous study mentioned above, we scored the participants’ responses in the same way: two points if the bug causing the incorrect answers to the two problems was appropriately described, one point if factors causing the two incorrect answers were described with a single consistent rule but not appropriate, and zero point if only the phenomena were described or factors were described with two different rules.
442
3.2. Results
All of the participants successfully instantiated the implementation model on the support system. The average time it took them to finish the tests and model construction was about 60 minutes.
The participants successfully solved the subtraction problem in the pre-test. Figure 3 indicates the categories for each rule in the subtraction procedures task in the pre- and posttests. The participants’ descriptions in the pretest included much incomplete information or no information about the lower five rules. These rules are corresponding to procedures to borrow a number in regrouping. Descriptions including such information increased, on the other hand, in the posttest.
The average score of the bug inference task was 0.88 in the pre-test, and 1.13 in the post-test. Actually, only two of the eight participants scored higher in the post-test than in the pre-test.
0 20 40 60 80 100
FindDifference1
WriteAnswer
ShiftColumn
Completed
FindDifference2
LeftCarry
GetCarry1
PutCarry1
GetCarry2
PutCarry2
0 20 40 60 80 100
FindDifference1
WriteAnswer
ShiftColumn
Completed
FindDifference2
LeftCarry
GetCarry1
PutCarry1
GetCarry2
PutCarry2
Proportions of participants (%)
pre-test post-test
present
incomplete
absent
Figure 3. Categories for each rule in the subtraction procedures task
3.3. Discussion
Figure 3 revealed that the participants’ descriptions about subtraction procedures were improved through experience of instantiation into the implementation model on the support system. In the pretest, their descriptions omitted much information about regrouping procedures. Although they could easily perform subtraction procedures, they could not exactly explain them. The information was expanded in the posttest. In the posttest, five out of the eight participants reported findings about their implicit, automatized mental processes, such as “the process was complex than I had expected, although I perform subtraction in everyday life” and “I found I usually omit some steps when I explain procedures of subtraction to someone.” Those facts confirm the possibility that support system improved their understanding of mental processes behind the model they learned. On the other hand, information about some procedures did not change such as FindDifference 1 and Completed. They are conditions to perform subtraction in a column and finish entire subtraction. Perhaps that was because of the difficulty in externalizing automatized mental processes. And this difficulty had not been overcome thoroughly.
The scores in the bug inference task did not changed in the pre- and posttests. Because the participants did not experience construction of any bug model, performance in this task to infer thinking processes by other persons was not improved.
443
The support system recorded 63 errors in log files when the eight participants operated it. Twenty of the errors were due to an uninformed specification1 of DoCoPro. Nineteen out of the remaining 43 were semantic errors because of positions of variables in predicates, such as inputting “(Leftof R L)” in a line which must have “(Leftof L R)2” in the implementation model. The learning activity on the support system does not include design of problem representation. The participants were only given texts explaining problem representation in the sheets provided. Actually in the posttest, some of the participants reported difficulty in comprehending the problem representation, such as “Task of programming was heavy, so I did not afford to learn things about the model construction” and “I wanted graphical information to understand the processes.” This indicates necessity to expand the learning activity in the framework of the support system in terms of comprehending problem representation.
The participants’ descriptions about subtraction procedures were incomplete, even though, they might be sufficient as explanation for people. People would unconsciously complete the missing condition “the minuend must be equals to or greater than the subtrahend when performing subtraction (FindDifference1)” if the operation “borrow one from the left digit when the minuend is smaller than the subtrahend (FindDifference2)” is presented. For computers, however, such incomplete descriptions are not acceptable. Therefore, having learners examine their own mental processes with construction of cognitive models may help in facilitating certain thinking, such as computational thinking. Recent research on science education has paid much attention to computational thinking, the thought processes involved in formulating problems and their solutions so that the solutions are represented in a form that can be effectively carried out by an information-processing agent (Brennan, and Resnick, 2012; Yadav, Mayfield, Zhou, Hambrusch, and Korb, 2014). Our framework to provide opportunities to construct cognitive models for non-information engineering students might contribute development of computational thinking.
Acknowledgements
This research was partially supported by Grant-in-Aid for Challenging Exploratory Research 15H02927 of the Ministry of Education, Culture, Sports, Science and Technology, Japan.
References
Basu, S., Dukeman, A., Kinnebrew, J., Biswas, G., & Sengupta, P. (2014). Investigating student generated computational models of science. Proceedings of ICLS2014 (pp. 1097-1101). Boulder, CO: International Society of the Learning Sciences.
Brady, C. Holbert, H., Soylu, F., Novak, M., & Wilensky, U. (2015). Sandboxes for model-based inquiry. Journal of Science Education and Technology, 24(2-3), 265-286.
Brennan, K., & Resnick, M. (2012). New frameworks for studying and assessing the development of computational thinking. Proceedings of 2012 Annual Meeting of the American Educational Research Association.
Clement, J. (2000). Model based learning as a key research area for science education. International Journal of Science Education, 22(9), 1041-1053.
Gilbert, J. K. (2004). Models and modelling: routes to more authentic science education. International Journal of Science and Mathematics Education, 2(2), 115-130.
Harrison, A. G., & Treagust, D. F. (1998). Modelling in science lessons: are there better ways to learn with models. School Science and Mathematics, 98(8), 420-479.
1 A syntax error occurs in DoCoPro when a rule name includes some specific multi-byte characters. 2 It is a predicate representing a fact “Column L is located at the left of column R (L and R are
variables).”

444
Hirashima, H., Imai, I., Horiguchi, T., & Toumoto, T. (2009). Error-based simulation to promote awareness of errors in elementary mechanics and its evaluation. Proceedings of AIED2009 (pp. 409-416). Amsterdam, Netherlands: IOS Press.
Kanzaki, N., Miwa, K., Terai, H., Kojima, K., Nakaike, R., Morita, J., & Saito, H. (2015). A Class Practice and Its Evaluation for Understanding Cognitive Information Processing by Constructing Computational Cognitive Models. Transactions of the Japanese Society for Artificial Intelligence, 30(3), 536-546
Kojima, K., Miwa, K., Nakaike, R., Kanzaki, N., Terai, H., Morita, J., Saito, H., & Matsumuro, M. (2016). Basic framework for learning by constructing cognitive models based on problem-solving processes. Workshop Proceedings of ICCE2016 (pp. 451-453). Taoyuan, Taiwan: APSCE.
Nakaike, R., Miwa, K., Morita J., & Terai, H. (2009). Development and evaluation of a web-based production system for learning anywhere. Proceedings of ICCE2009 (pp. 127-131). Jhongli, Taiwan: Asia-Pacific Society for Computers in Education.
Nakashima, H. (2008). Methodology and a discipline for synthetic research. Synthesiology, 1(4), 305-313. Penner, D. E. (2000). Cognition, computers, and synthetic science: building knowledge and meaning through
modeling. Review of Research in Education, 25, 1-35. Schunn, C. D., Crowley, K., & Okada, T. (1998). The growth of multidisciplinarity in the Cognitive Science
Society. Cognitive Science, 22(1), 107-130. Seel, N. M., & Blumschein, P. (2009). Modeling and simulation in learning and instruction: a theoretical
perspective. In P. Blumschein, W. Hung, & D. Jonassen (Eds) Model-Based Approaches to Learning (pp. 3-16). Rotterdam, Netherlands: Sense Publishers.
Yadav, A., Mayfield, C., Zhou, N., Hambrusch, S., & Korb, J. T. (2014). Computational thinking in elementary and secondary teacher education. ACM Transactions on Computing Education, 14(1).
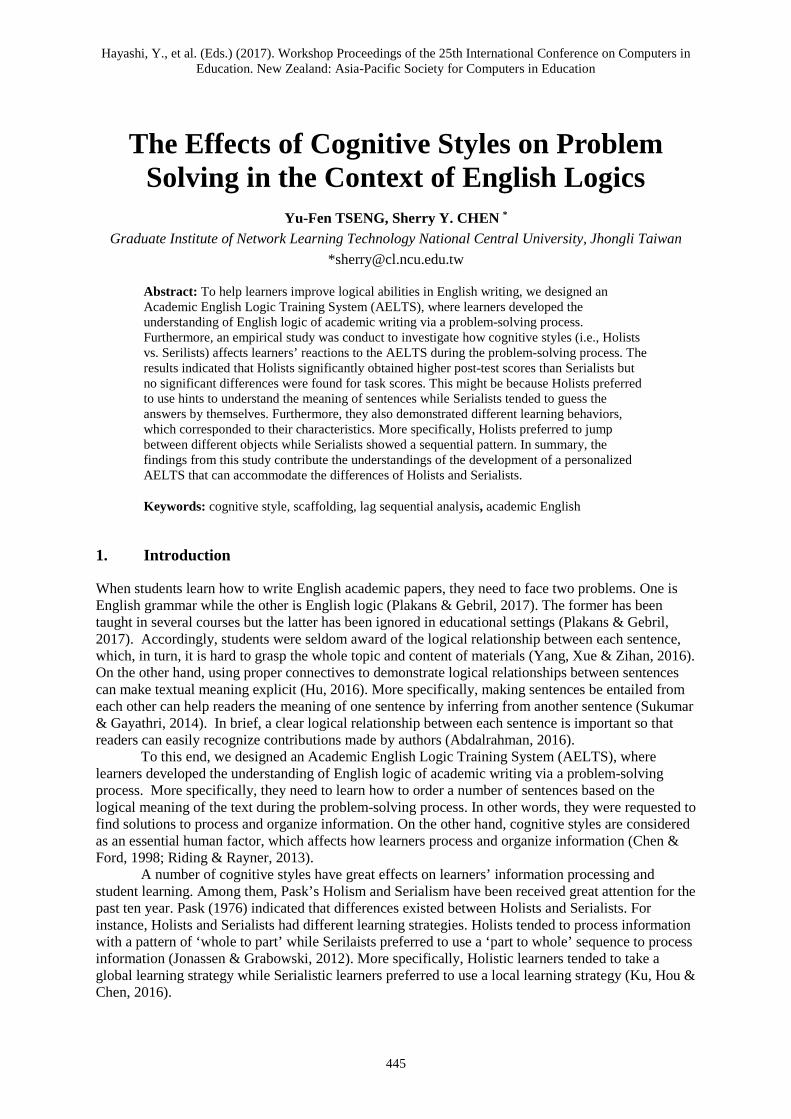
Hayashi, Y., et al. (Eds.) (2017). Workshop Proceedings of the 25th International Conference on Computers in Education. New Zealand: Asia-Pacific Society for Computers in Education
445
The Effects of Cognitive Styles on Problem Solving in the Context of English Logics
Yu-Fen TSENG, Sherry Y. CHEN * Graduate Institute of Network Learning Technology National Central University, Jhongli Taiwan
Abstract: To help learners improve logical abilities in English writing, we designed an Academic English Logic Training System (AELTS), where learners developed the understanding of English logic of academic writing via a problem-solving process. Furthermore, an empirical study was conduct to investigate how cognitive styles (i.e., Holists vs. Serilists) affects learners’ reactions to the AELTS during the problem-solving process. The results indicated that Holists significantly obtained higher post-test scores than Serialists but no significant differences were found for task scores. This might be because Holists preferred to use hints to understand the meaning of sentences while Serialists tended to guess the answers by themselves. Furthermore, they also demonstrated different learning behaviors, which corresponded to their characteristics. More specifically, Holists preferred to jump between different objects while Serialists showed a sequential pattern. In summary, the findings from this study contribute the understandings of the development of a personalized AELTS that can accommodate the differences of Holists and Serialists.
Keywords: cognitive style, scaffolding, lag sequential analysis, academic English
1. Introduction
When students learn how to write English academic papers, they need to face two problems. One is English grammar while the other is English logic (Plakans & Gebril, 2017). The former has been taught in several courses but the latter has been ignored in educational settings (Plakans & Gebril, 2017). Accordingly, students were seldom award of the logical relationship between each sentence, which, in turn, it is hard to grasp the whole topic and content of materials (Yang, Xue & Zihan, 2016). On the other hand, using proper connectives to demonstrate logical relationships between sentences can make textual meaning explicit (Hu, 2016). More specifically, making sentences be entailed from each other can help readers the meaning of one sentence by inferring from another sentence (Sukumar & Gayathri, 2014). In brief, a clear logical relationship between each sentence is important so that readers can easily recognize contributions made by authors (Abdalrahman, 2016).
To this end, we designed an Academic English Logic Training System (AELTS), where learners developed the understanding of English logic of academic writing via a problem-solving process. More specifically, they need to learn how to order a number of sentences based on the logical meaning of the text during the problem-solving process. In other words, they were requested to find solutions to process and organize information. On the other hand, cognitive styles are considered as an essential human factor, which affects how learners process and organize information (Chen & Ford, 1998; Riding & Rayner, 2013).
A number of cognitive styles have great effects on learners’ information processing and student learning. Among them, Pask’s Holism and Serialism have been received great attention for the past ten year. Pask (1976) indicated that differences existed between Holists and Serialists. For instance, Holists and Serialists had different learning strategies. Holists tended to process information with a pattern of ‘whole to part’ while Serilaists preferred to use a ‘part to whole’ sequence to process information (Jonassen & Grabowski, 2012). More specifically, Holistic learners tended to take a global learning strategy while Serialistic learners preferred to use a local learning strategy (Ku, Hou & Chen, 2016).
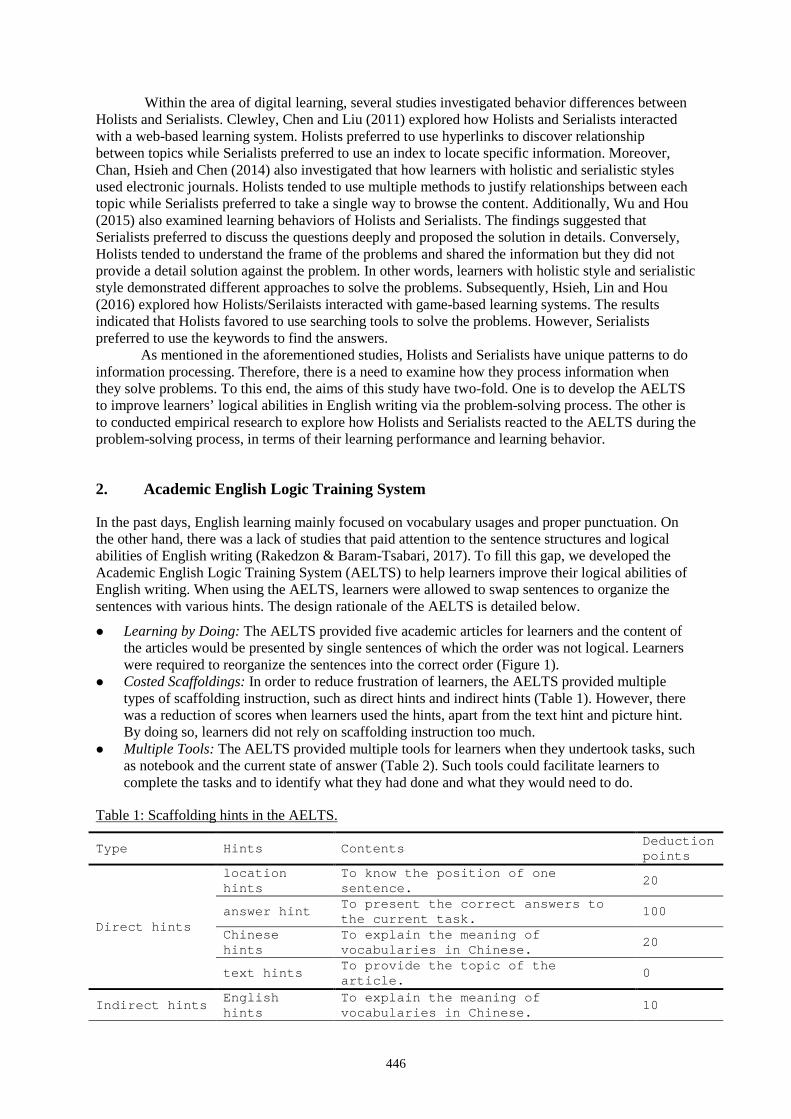
446
Within the area of digital learning, several studies investigated behavior differences between Holists and Serialists. Clewley, Chen and Liu (2011) explored how Holists and Serialists interacted with a web-based learning system. Holists preferred to use hyperlinks to discover relationship between topics while Serialists preferred to use an index to locate specific information. Moreover, Chan, Hsieh and Chen (2014) also investigated that how learners with holistic and serialistic styles used electronic journals. Holists tended to use multiple methods to justify relationships between each topic while Serialists preferred to take a single way to browse the content. Additionally, Wu and Hou (2015) also examined learning behaviors of Holists and Serialists. The findings suggested that Serialists preferred to discuss the questions deeply and proposed the solution in details. Conversely, Holists tended to understand the frame of the problems and shared the information but they did not provide a detail solution against the problem. In other words, learners with holistic style and serialistic style demonstrated different approaches to solve the problems. Subsequently, Hsieh, Lin and Hou (2016) explored how Holists/Serilaists interacted with game-based learning systems. The results indicated that Holists favored to use searching tools to solve the problems. However, Serialists preferred to use the keywords to find the answers.
As mentioned in the aforementioned studies, Holists and Serialists have unique patterns to do information processing. Therefore, there is a need to examine how they process information when they solve problems. To this end, the aims of this study have two-fold. One is to develop the AELTS to improve learners’ logical abilities in English writing via the problem-solving process. The other is to conducted empirical research to explore how Holists and Serialists reacted to the AELTS during the problem-solving process, in terms of their learning performance and learning behavior.
2. Academic English Logic Training System
In the past days, English learning mainly focused on vocabulary usages and proper punctuation. On the other hand, there was a lack of studies that paid attention to the sentence structures and logical abilities of English writing (Rakedzon & Baram-Tsabari, 2017). To fill this gap, we developed the Academic English Logic Training System (AELTS) to help learners improve their logical abilities of English writing. When using the AELTS, learners were allowed to swap sentences to organize the sentences with various hints. The design rationale of the AELTS is detailed below.
Learning by Doing: The AELTS provided five academic articles for learners and the content of the articles would be presented by single sentences of which the order was not logical. Learners were required to reorganize the sentences into the correct order (Figure 1).
Costed Scaffoldings: In order to reduce frustration of learners, the AELTS provided multiple types of scaffolding instruction, such as direct hints and indirect hints (Table 1). However, there was a reduction of scores when learners used the hints, apart from the text hint and picture hint. By doing so, learners did not rely on scaffolding instruction too much.
Multiple Tools: The AELTS provided multiple tools for learners when they undertook tasks, such as notebook and the current state of answer (Table 2). Such tools could facilitate learners to complete the tasks and to identify what they had done and what they would need to do.
Table 1: Scaffolding hints in the AELTS.
Type Hints Contents Deduction points
Direct hints
location hints
To know the position of one sentence.
20
answer hint To present the correct answers to the current task.
100
Chinese hints
To explain the meaning of vocabularies in Chinese.
20
text hints To provide the topic of the article.
0
Indirect hints English hints
To explain the meaning of vocabularies in Chinese. 10
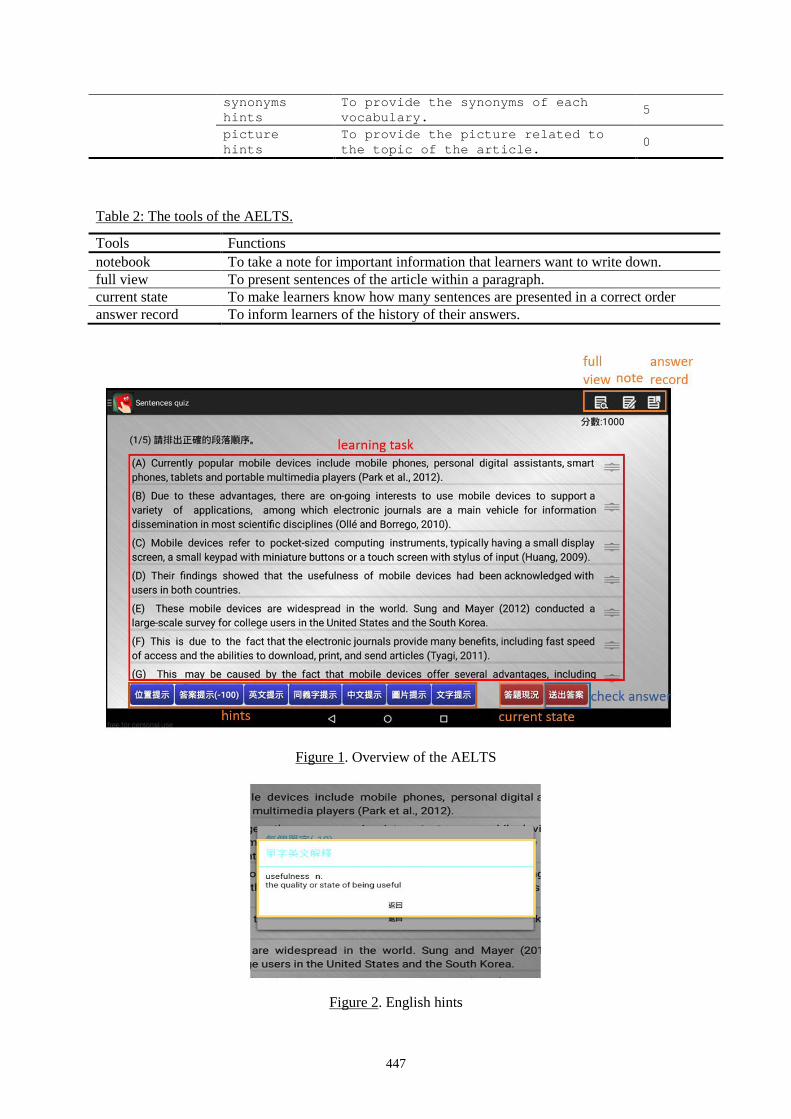
447
synonyms hints
To provide the synonyms of each vocabulary.
5
picture hints
To provide the picture related to the topic of the article. 0
Table 2: The tools of the AELTS.
Tools Functions notebook To take a note for important information that learners want to write down. full view To present sentences of the article within a paragraph. current state To make learners know how many sentences are presented in a correct order answer record To inform learners of the history of their answers.
Figure 1. Overview of the AELTS
Figure 2. English hints
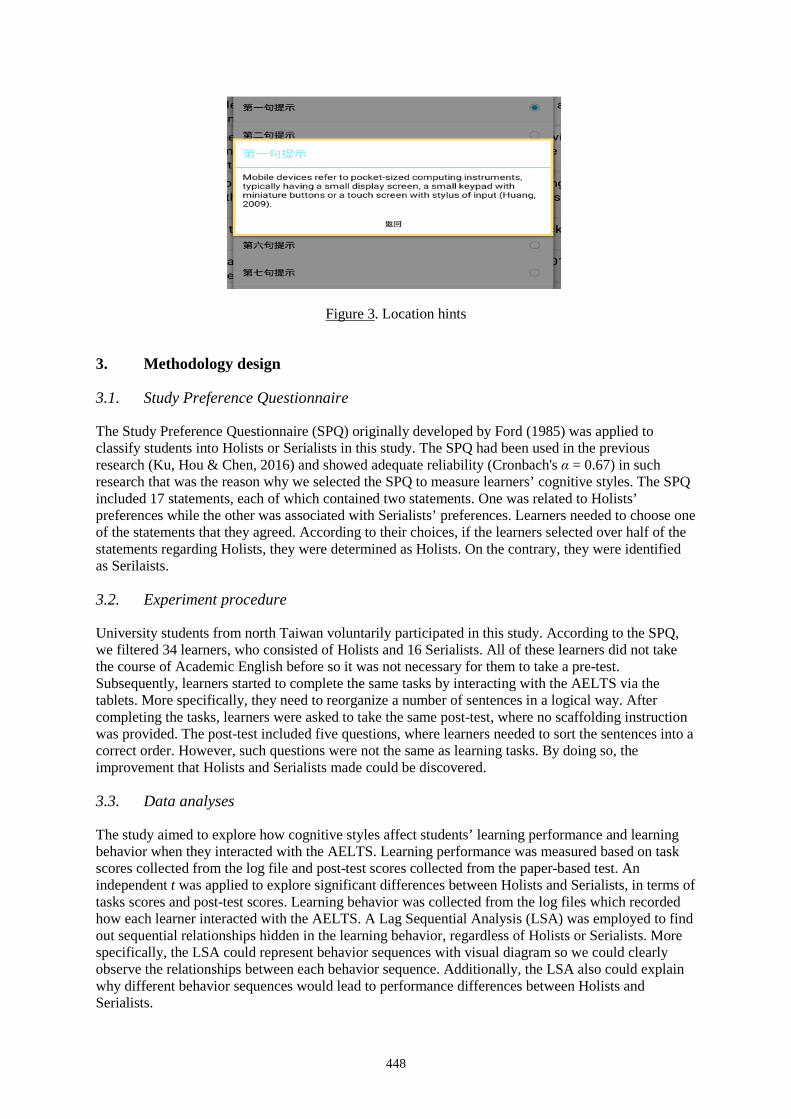
448
Figure 3. Location hints
3. Methodology design
3.1. Study Preference Questionnaire
The Study Preference Questionnaire (SPQ) originally developed by Ford (1985) was applied to classify students into Holists or Serialists in this study. The SPQ had been used in the previous research (Ku, Hou & Chen, 2016) and showed adequate reliability (Cronbach's α = 0.67) in such research that was the reason why we selected the SPQ to measure learners’ cognitive styles. The SPQ included 17 statements, each of which contained two statements. One was related to Holists’ preferences while the other was associated with Serialists’ preferences. Learners needed to choose one of the statements that they agreed. According to their choices, if the learners selected over half of the statements regarding Holists, they were determined as Holists. On the contrary, they were identified as Serilaists.
3.2. Experiment procedure
University students from north Taiwan voluntarily participated in this study. According to the SPQ, we filtered 34 learners, who consisted of Holists and 16 Serialists. All of these learners did not take the course of Academic English before so it was not necessary for them to take a pre-test. Subsequently, learners started to complete the same tasks by interacting with the AELTS via the tablets. More specifically, they need to reorganize a number of sentences in a logical way. After completing the tasks, learners were asked to take the same post-test, where no scaffolding instruction was provided. The post-test included five questions, where learners needed to sort the sentences into a correct order. However, such questions were not the same as learning tasks. By doing so, the improvement that Holists and Serialists made could be discovered.
3.3. Data analyses
The study aimed to explore how cognitive styles affect students’ learning performance and learning behavior when they interacted with the AELTS. Learning performance was measured based on task scores collected from the log file and post-test scores collected from the paper-based test. An independent t was applied to explore significant differences between Holists and Serialists, in terms of tasks scores and post-test scores. Learning behavior was collected from the log files which recorded how each learner interacted with the AELTS. A Lag Sequential Analysis (LSA) was employed to find out sequential relationships hidden in the learning behavior, regardless of Holists or Serialists. More specifically, the LSA could represent behavior sequences with visual diagram so we could clearly observe the relationships between each behavior sequence. Additionally, the LSA also could explain why different behavior sequences would lead to performance differences between Holists and Serialists.
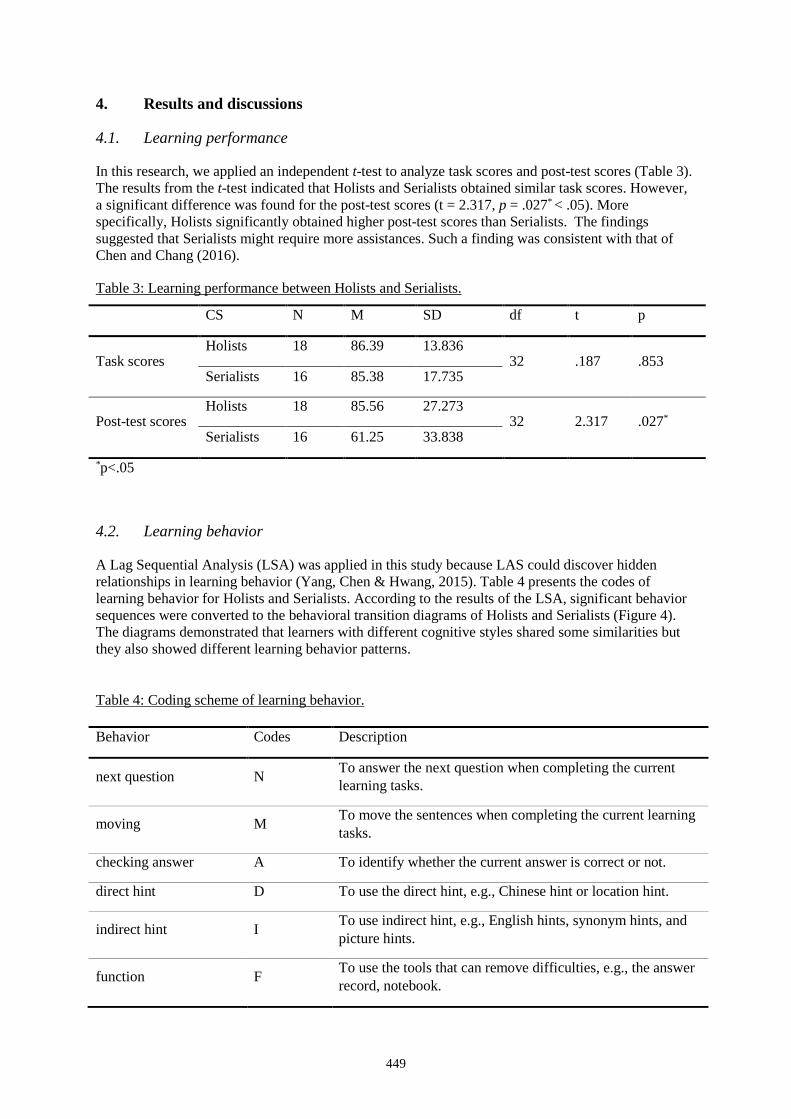
449
4. Results and discussions
4.1. Learning performance
In this research, we applied an independent t-test to analyze task scores and post-test scores (Table 3). The results from the t-test indicated that Holists and Serialists obtained similar task scores. However, a significant difference was found for the post-test scores (t = 2.317, p = .027* < .05). More specifically, Holists significantly obtained higher post-test scores than Serialists. The findings suggested that Serialists might require more assistances. Such a finding was consistent with that of Chen and Chang (2016).
Table 3: Learning performance between Holists and Serialists.
CS N M SD df t p
Task scores Holists 18 86.39 13.836
32 .187 .853 Serialists 16 85.38 17.735
Post-test scores Holists 18 85.56 27.273
32 2.317 .027* Serialists 16 61.25 33.838
*p<.05
4.2. Learning behavior
A Lag Sequential Analysis (LSA) was applied in this study because LAS could discover hidden relationships in learning behavior (Yang, Chen & Hwang, 2015). Table 4 presents the codes of learning behavior for Holists and Serialists. According to the results of the LSA, significant behavior sequences were converted to the behavioral transition diagrams of Holists and Serialists (Figure 4). The diagrams demonstrated that learners with different cognitive styles shared some similarities but they also showed different learning behavior patterns.
Table 4: Coding scheme of learning behavior.
Behavior Codes Description
next question N To answer the next question when completing the current learning tasks.
moving M To move the sentences when completing the current learning tasks.
checking answer A To identify whether the current answer is correct or not.
direct hint D To use the direct hint, e.g., Chinese hint or location hint.
indirect hint I To use indirect hint, e.g., English hints, synonym hints, and picture hints.
function F To use the tools that can remove difficulties, e.g., the answer record, notebook.
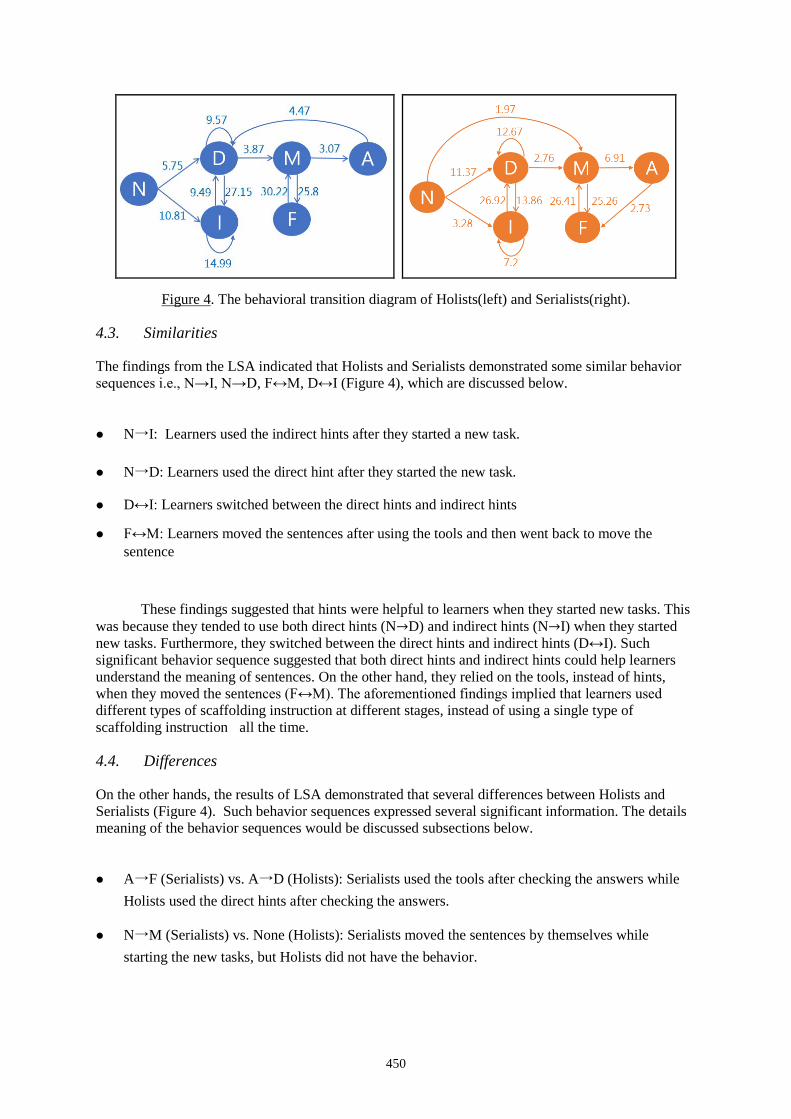
450
Figure 4. The behavioral transition diagram of Holists(left) and Serialists(right).
4.3. Similarities
The findings from the LSA indicated that Holists and Serialists demonstrated some similar behavior sequences i.e., N→I, N→D, F↔M, D↔I (Figure 4), which are discussed below.
N→I: Learners used the indirect hints after they started a new task.
N→D: Learners used the direct hint after they started the new task.
D↔I: Learners switched between the direct hints and indirect hints
F↔M: Learners moved the sentences after using the tools and then went back to move the sentence
These findings suggested that hints were helpful to learners when they started new tasks. This was because they tended to use both direct hints (N→D) and indirect hints (N→I) when they started new tasks. Furthermore, they switched between the direct hints and indirect hints (D↔I). Such significant behavior sequence suggested that both direct hints and indirect hints could help learners understand the meaning of sentences. On the other hand, they relied on the tools, instead of hints, when they moved the sentences (F↔M). The aforementioned findings implied that learners used different types of scaffolding instruction at different stages, instead of using a single type of scaffolding instruction all the time.
4.4. Differences
On the other hands, the results of LSA demonstrated that several differences between Holists and Serialists (Figure 4). Such behavior sequences expressed several significant information. The details meaning of the behavior sequences would be discussed subsections below.
A→F (Serialists) vs. A→D (Holists): Serialists used the tools after checking the answers while Holists used the direct hints after checking the answers.
N→M (Serialists) vs. None (Holists): Serialists moved the sentences by themselves while starting the new tasks, but Holists did not have the behavior.
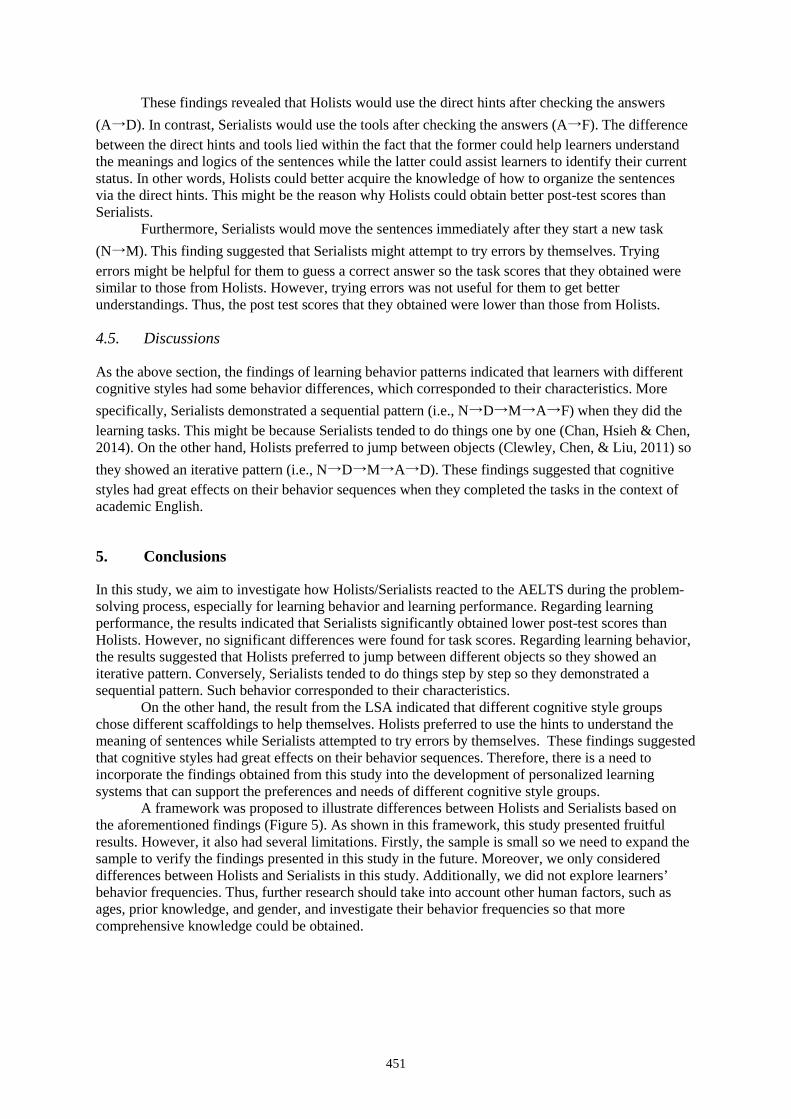
451
These findings revealed that Holists would use the direct hints after checking the answers (A→D). In contrast, Serialists would use the tools after checking the answers (A→F). The difference between the direct hints and tools lied within the fact that the former could help learners understand the meanings and logics of the sentences while the latter could assist learners to identify their current status. In other words, Holists could better acquire the knowledge of how to organize the sentences via the direct hints. This might be the reason why Holists could obtain better post-test scores than Serialists.
Furthermore, Serialists would move the sentences immediately after they start a new task (N→M). This finding suggested that Serialists might attempt to try errors by themselves. Trying errors might be helpful for them to guess a correct answer so the task scores that they obtained were similar to those from Holists. However, trying errors was not useful for them to get better understandings. Thus, the post test scores that they obtained were lower than those from Holists.
4.5. Discussions
As the above section, the findings of learning behavior patterns indicated that learners with different cognitive styles had some behavior differences, which corresponded to their characteristics. More specifically, Serialists demonstrated a sequential pattern (i.e., N→D→M→A→F) when they did the learning tasks. This might be because Serialists tended to do things one by one (Chan, Hsieh & Chen, 2014). On the other hand, Holists preferred to jump between objects (Clewley, Chen, & Liu, 2011) so they showed an iterative pattern (i.e., N→D→M→A→D). These findings suggested that cognitive styles had great effects on their behavior sequences when they completed the tasks in the context of academic English.
5. Conclusions
In this study, we aim to investigate how Holists/Serialists reacted to the AELTS during the problem-solving process, especially for learning behavior and learning performance. Regarding learning performance, the results indicated that Serialists significantly obtained lower post-test scores than Holists. However, no significant differences were found for task scores. Regarding learning behavior, the results suggested that Holists preferred to jump between different objects so they showed an iterative pattern. Conversely, Serialists tended to do things step by step so they demonstrated a sequential pattern. Such behavior corresponded to their characteristics.
On the other hand, the result from the LSA indicated that different cognitive style groups chose different scaffoldings to help themselves. Holists preferred to use the hints to understand the meaning of sentences while Serialists attempted to try errors by themselves. These findings suggested that cognitive styles had great effects on their behavior sequences. Therefore, there is a need to incorporate the findings obtained from this study into the development of personalized learning systems that can support the preferences and needs of different cognitive style groups.
A framework was proposed to illustrate differences between Holists and Serialists based on the aforementioned findings (Figure 5). As shown in this framework, this study presented fruitful results. However, it also had several limitations. Firstly, the sample is small so we need to expand the sample to verify the findings presented in this study in the future. Moreover, we only considered differences between Holists and Serialists in this study. Additionally, we did not explore learners’ behavior frequencies. Thus, further research should take into account other human factors, such as ages, prior knowledge, and gender, and investigate their behavior frequencies so that more comprehensive knowledge could be obtained.
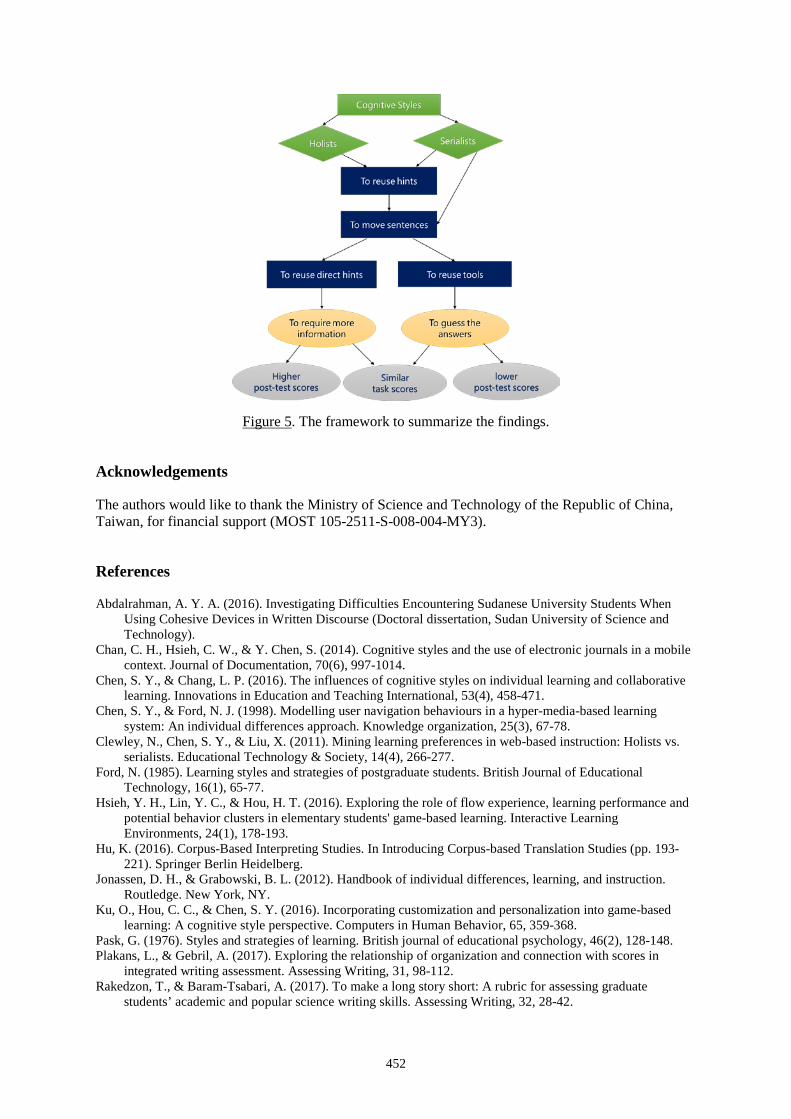
452
Figure 5. The framework to summarize the findings.
Acknowledgements
The authors would like to thank the Ministry of Science and Technology of the Republic of China, Taiwan, for financial support (MOST 105-2511-S-008-004-MY3).
References
Abdalrahman, A. Y. A. (2016). Investigating Difficulties Encountering Sudanese University Students When Using Cohesive Devices in Written Discourse (Doctoral dissertation, Sudan University of Science and Technology).
Chan, C. H., Hsieh, C. W., & Y. Chen, S. (2014). Cognitive styles and the use of electronic journals in a mobile context. Journal of Documentation, 70(6), 997-1014.
Chen, S. Y., & Chang, L. P. (2016). The influences of cognitive styles on individual learning and collaborative learning. Innovations in Education and Teaching International, 53(4), 458-471.
Chen, S. Y., & Ford, N. J. (1998). Modelling user navigation behaviours in a hyper-media-based learning system: An individual differences approach. Knowledge organization, 25(3), 67-78.
Clewley, N., Chen, S. Y., & Liu, X. (2011). Mining learning preferences in web-based instruction: Holists vs. serialists. Educational Technology & Society, 14(4), 266-277.
Ford, N. (1985). Learning styles and strategies of postgraduate students. British Journal of Educational Technology, 16(1), 65-77.
Hsieh, Y. H., Lin, Y. C., & Hou, H. T. (2016). Exploring the role of flow experience, learning performance and potential behavior clusters in elementary students' game-based learning. Interactive Learning Environments, 24(1), 178-193.
Hu, K. (2016). Corpus-Based Interpreting Studies. In Introducing Corpus-based Translation Studies (pp. 193-221). Springer Berlin Heidelberg.
Jonassen, D. H., & Grabowski, B. L. (2012). Handbook of individual differences, learning, and instruction. Routledge. New York, NY.
Ku, O., Hou, C. C., & Chen, S. Y. (2016). Incorporating customization and personalization into game-based learning: A cognitive style perspective. Computers in Human Behavior, 65, 359-368.
Pask, G. (1976). Styles and strategies of learning. British journal of educational psychology, 46(2), 128-148. Plakans, L., & Gebril, A. (2017). Exploring the relationship of organization and connection with scores in
integrated writing assessment. Assessing Writing, 31, 98-112. Rakedzon, T., & Baram-Tsabari, A. (2017). To make a long story short: A rubric for assessing graduate
students’ academic and popular science writing skills. Assessing Writing, 32, 28-42.

453
Riding, R., & Rayner, S. (2013). Cognitive styles and learning strategies: Understanding style differences in learning and behavior. Routledge.
Sukumar, P., & Gayathri, K. S. (2014). Semantic based Sentence Ordering Approach for Multi-Document Summarization. International Journal of Recent Technology and Engineering (IJRTE), 3(2), 71-76
Wu, S.-Y., & Hou, H.-T. (2015). How cognitive styles affect the learning behaviors of online problem-solving based discussion activity a lag sequential analysis. Journal of Educational Computing Research, 52(2), 277-298.
Yang, L. I. U., Xue, B. A. I., Lei, H. A. N., & Zihan, G. A. O. (2016). A Study of English Listening Barrier and Effective Solutions. DEStech Transactions on Social Science, Education and Human Science, (emass).
Yang, T. C., Chen, S. Y., & Hwang, G. J. (2015). The influences of a two-tier test strategy on student learning: A lag sequential analysis approach. Computers & Education, 82, 366-377.
Hayashi, Y., et al. (Eds.) (2017). Workshop Proceedings of the 25th International Conference on Computers in Education. New Zealand: Asia-Pacific Society for Computers in Education
454
An Experimental Investigation on Using Pedagogical Conversational Agents: Effects of
Posing Facilitation Prompts in Oral-Based Peer Learning Yugo HAYASHI
Ritsumeikan University, 2-150 Iwakura-cho, Ibaraki, Osaka, 567-8570, Japan [email protected]
Abstract: This study investigates the use of pedagogical conversational agents (PCAs) that intervene in learner-learner collaborative learning activities. In addition, this study investigates how the quality of learning performance in a simple concept explanation task may change due to the use of multiple PCAs that pose different types of facilitation prompts to the learners. A controlled experiment was performed by comparing a condition using multiple PCAs wherein each PCA provided different types of facilitations with a condition using multiple PCAs wherein each PCA provided a mixture of the two types of facilitations. Using the WOZ method, this study reports the preliminary results of an analysis of oral-based peer learning. Lexical network analysis was used to understand the complexity of learner’s semantic knowledge over two-time series. The results of the analysis show that when multiple PCAs were used with different facilitation prompts, the lexical network became more complex, showing that the learners developed a more sophisticated knowledge about the concept throughout their explanations. The significance of using multiple PCA is that it allows different types of contents to be considered during interaction.
Keywords: Pedagogical Conversational Agent, Explanation Activity, Collaborative Learning
1. Introduction
Learning through social interaction is known as one of the most effective strategies to develop deeper understanding (Vygotsky, 1980). Research shows that learning through sharing knowledge with others can lead to conceptual changes that can generate new knowledge (Chi, Leeuw, Chiu, & Lavancher, 1994). In addition, discussions based on different perspectives can bring an understanding of the content at higher levels of cognition (Schwartz, 1995). Studies on learning sciences have shown that explanation activity in peer learning can improve the quality of interaction and facilitate better learning performance (Miyake, 1986). However, such activities cannot be easily performed by novice learners and there is a need to investigate the type of interventions that can enhance their learning. This study focuses on the design of tutoring systems with conversational agents to facilitate peer to peer explanation activities. Additionally, it investigates the extent to which pedagogical conversational agents (PCAs) used in an explanation task are effective and examines how such techniques can improve learning performance. Further, this research particularly focuses on the use of multiple PCAs and investigates the most effective design of each PCA.
1.1. Using multiple pedagogical agents
Recently, studies on pedagogical technology have investigated the use of computer-based tutoring systems and PCAs in various types of tutoring settings (Moreno, 2005; Mayer, Johnsonb, Shaw, & Sandhu, 2006; Holmes, 2007; Graesser & McNamara, 2010; Louwerse, Graesser, Mcnamara, & Lu, 2008). Research on the development of such systems based on artificial intelligence has led to the development of systems using which learners can learn through teaching teachable agents (Biswas,
455
Leelawong, Schwartz, & Vye, 2005; Matsuda et al., 2013). Previous research has also investigated the role of helping learners to compose explanations through the use of interactive tutoring systems (Graesser, Chipman, & Olney, 2005). However, most studies have focused on the nature of learner-PCA interaction, while very few studies focused on aiding learner-learner interaction. One of the advantages of human-human interactions is the high degree of success achieved in developing common knowledge through communication (Csibra & Gergely, 2011). Thus, considering this point, this study focuses on the use of PCAs in facilitating learner-learner interaction.
In this research, a series of studies has been conducted to investigate the effects of using a PCA in order to facilitate learner-learner collaborative learning. In Hayashi (2012), the author investigated the role of affective feedback from a PCA that provided prompts to facilitate the two learner interactions in an explanation task. Participants formed an explanation of a key concept, and the PCA intervened in the learner’s activity and provided metacognitive suggestions, which were aimed at facilitating their explanation activities. In a further study(Hayashi, 2014), the effects of social influences, such as pressures from multiple PCAs, may produce more learner awareness toward PCAs and motivate learners to work harder on the task. It was also shown that compared to using only one PCA, the use of multiple PCAs can facilitate better explanation activities. However, although the effects of using multiple PCAs may raise learner’s social awareness and facilitate their conversations, it was not clearly understood what type of facilitations/prompts from these PCAs are adequate for producing better quality of explanations. Furthermore, it is problematic to simply add the number of PCAs in such activities because the learner may not be able to consume all the information that is presented by the PCAs as they present several types of facilitations. Such situations may cause information overload (Jonston & Uhl, 1976), and it is predicted that learners may find it easier to absorb information when it is separately presented by different PCAs.
Studies on multimedia learning (Mayer et al., 2006) have examined the effect of cognitive load and suggested that learners understand the subject matter better when it is presented in the form of less multiple information sources by distributing such material via different communication channels. Therefore, considering this, this research investigated the use of facilitation prompts by distributing the contents of the facilitations between multiple PCAs, with each one playing different roles. Similar to Hayashi (2014), this study will set up a situation in which dyads will give explanations about a concept taught in class while receiving help from a PCA. Each PCA will present different types of learning material related facilitation prompts, which will enable them to clearly distinguish the types of facilitations and thus enable them to digest all the information that is posed to them and produce better explanations. The study focused on the use of two types of PCAs, which pose suggestions from different perspectives, such as the explanation adviser and the communication adviser. The study investigated whether the use of these PCAs would enable learners to produce better oral explanations and thus gain a more thorough understanding of the study materials.
1.2. Goal and Hypothesis
This study provides the preliminary results of an investigation into the use of multiple PCAs, which intervene in learner-learner explanation activities and provide facilitations related to the learning material. This study aims to investigate whether the use of multiple PCAs were each have different roles and provides different types of content-related suggestions. It was hypothesized that when the PCA intervenes in the learner’s activities with multiple suggestions, learners may be unable to cognitively process all the comments from all the PCAs effectively. On the other hand, if multiple PCAs provide facilitations by individually taking on roles and splitting the learning content, learners may be able to process all the information and thus may generate explanations based on these different perspectives. From this viewpoint, this study conducts a controlled experiment by comparing two types of conditions: (1) a double condition wherein the two PCAs intervene by posing two mixed types of facilitation prompts (communication advice and explanation advice) and (2) a split double condition wherein two PCAs intervene by providing information to learners separately. One PCA will play the role of an explanation adviser and will pose suggestions related to topics on communication efficiency (i.e., how to ask effective questions to their partners). The other PCA will provide more cognitively related suggestions, such as asking them to try to think about the concept from various viewpoints and try to explain concepts from broader viewpoints. Thus, if learners consider these
456
posed suggestions carefully, they should be able to develop their understanding of the subject by linking their existing knowledge with these more diverse approaches. Therefore, considering this point, one of the challenges of this study was to analyze learner performance using lexical network analysis in order to assess the quality of learner’s explanations (Hayashi, 2016).
2. Method
2.1. Procedure
The participants used two desktop computers and were asked to sit in designated places. A description of the key term was presented on the screen. Learners explained the key terms orally to each other while two PCAs appeared on the screen and provided suggestions. Learners in this experiment were required to formulate explanations of psychological terms such as ”short- and long- term memory” and ”figure-ground reversal.” The concepts were equally distributed among both conditions for internal validity. In the double condition, 12 worked on short- and long-term memory, and 14 worked on figure-ground reversal. In the split double condition, 12 worked on short- and long- term memory, and 12 worked on figure-ground reversal.
2.2. Experimental System
The experimental system was redeveloped based on the Java based platform created by (Hayashi & Inoue, 2015; Hayashi, 2014). It comprises two PCAs and enables feedback to be generated based on the learner’s utterances, which provided tips on how to form a sufficient explanation, applause, and back-channel feedback. The experimental settings were manipulated so as to match those used by (Hayashi, 2014) with one exception. In this experiment, the learners did not use text chat or wear headphones during the activity. Instead, they interacted orally. The experimenter manually inputted the keywords into the system using the WOZ method. Following the same rules as used by Hayashi (2014), when learners used words such as ”technical,” ”general,” ”trouble,” ”question pose,” and ”example,” they were inputted into the system. In addition, in the current experiment, the frequency at which PCAs provided messages were strictly controlled to ensure that all groups received the same number of facilitations from both PCAs. The experimenter inputted the detected keywords within a minute of utterance, and the learners in both conditions received a total of 10 messages each from the PCAs.
2.3. Participants and Conditions
The learners participated in this study as part of their coursework. One participant’s data were lost due to a technical issue. Each participant was randomly assigned to one of the two conditions, which varied according to the roles of the PCA suggestions (i.e., for double condition, n = 26, whereas for split-double condition, n = 24). In this experiment, the double condition was manipulated to ensure that both PCAs would provide suggestions; however, but their roles were not fixed as in (Hayashi, 2014), Either communicator advice or explanations were randomly generated. In the double condition, the PCAs responded randomly as either a communication adviser or an explanation adviser. No labels were visible to identify each PCA’s role nor were the instructions provided regarding the types of facilitations to be given.
In contrast, in the split-double condition, the types of facilitations used by PCAs were fixed and each was given a label describing their role affixed to the computer screen. In addition, to ensure that the learners could understand the PCA’s intentions clearly during the activity and to enable them to understand that they were working in a diverse group with divisions, they received explanations regarding each PCA’s role. In addition, participants in the split-double condition were provided with more specific information about their group. It was emphasized that their group was organized in a division of labor style. The merits of such group forms were also explained to the learners to ensure that they completely understood the nature of each agent’s role.
457
2.4. Dependent Variables
The main data were collected on two occasions as a free- recall test to explain about the key terms in a pre-test and post-test. The pre-test was conducted before the task, and the post-test was conducted after the task. These results are subject to lexical network analysis, as detailed in the following section.
3. Results
3.1. Lexical Network Analysis
3.1.1. Pre-processing
The first stage of analysis involves developing a dictionary database to collect a series of keywords that are used as the training dataset. While developing such a dataset, an expert (i.e., a teacher) was asked to create lists of words that could possibly relate to the instances of the key terms. As two intrinsically different types of concepts are used, a dictionary database is independently constructed and a network comprising 30 words is developed. For the pre-defined key terms for "long- and short-term memory," we used words such as "memory," "long," "short," "information," "temporary," "time," "necessary," "forever," "head," "save," "enormous," "amount," "embedded," "work," "storage," "brain," "always," "knowledge," "capacity," "process," "things," "behavior," "routine," "preserve," "moment," "period," "word," "constant," "playback," and "conscious." For the pre-defined key terms for "figure-ground reversal," we used words such as "ground," "meaning," "area," "picture," "background," "reverse," "link," "side," "person," "middle," "relation," "eye shot," "Rubin," "jar," "angle," "double," "apparition," "one way," "perspective," "attention," "conscious," "recognition," "aspect," "face," "human," "handle," "opposite," "things," and "diagram."
3.1.2. Network Analysis
Using the semantic dictionary database as the training dataset, the textual inputs from the learners were further analyzed. For each trial input, the number of appearances of the semantic keywords in the dictionary was counted and the data related to these semantic keywords were then analyzed using the aforementioned social-network analysis method. For each condition and phase, a network was developed based on a bipartite graph of keywords (i.e., 30 keywords X 18 participants). Each node represents the lexical category of the keyword that was frequently used in each participant's explanation. Fig. 1 and Fig. 2 show an example of the lexical network for participants in the split-double condition. The following equation represents the network density, where n denotes the number of nodes and l denotes the number of links:
(1)
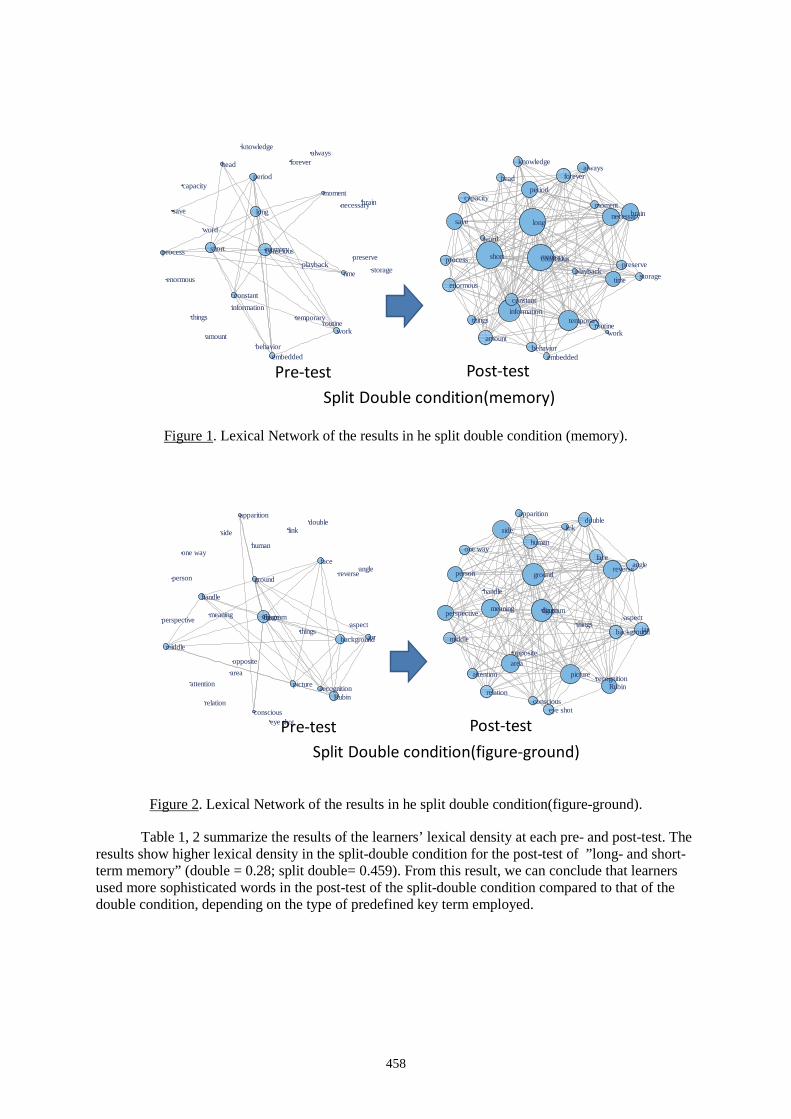
458
Split Double condition(memory)Pre-test Post-test
memory
long
short
informationtemporary
time
necessary
foreverhead
save
enormous
amount
embedded
work
storage
brain
alwaysknowledge
capacity
process
things
behavior
routine
preserve
moment
period
word
constant
playbackconscious
memory
long
short
informationtemporary
time
necessary
foreverhead
save
enormous
amount
embedded
work
storage
brain
alwaysknowledge
capacity
process
things
behavior
routine
preserve
moment
period
word
constant
playback
conscious
Figure 1. Lexical Network of the results in he split double condition (memory).
Split Double condition(figure-ground)Pre-test Post-test
figure
ground
meaning
areapicture
background
reverse
linkside
person
middle
relation
eye shot
Rubin
jar
angle
doubleapparition
one way
perspective
attention
conscious
recognition
aspect
face
human
handle
opposite
things
diagramfigure
ground
meaning
areapicture
background
reverse
linkside
person
middle
relation
eye shot
Rubin
jar
angle
doubleapparition
one way
perspective
attention
conscious
recognition
aspect
face
human
handle
opposite
things
diagram
Figure 2. Lexical Network of the results in he split double condition(figure-ground).
Table 1, 2 summarize the results of the learners’ lexical density at each pre- and post-test. The results show higher lexical density in the split-double condition for the post-test of ”long- and short-term memory” (double = 0.28; split double= 0.459). From this result, we can conclude that learners used more sophisticated words in the post-test of the split-double condition compared to that of the double condition, depending on the type of predefined key term employed.
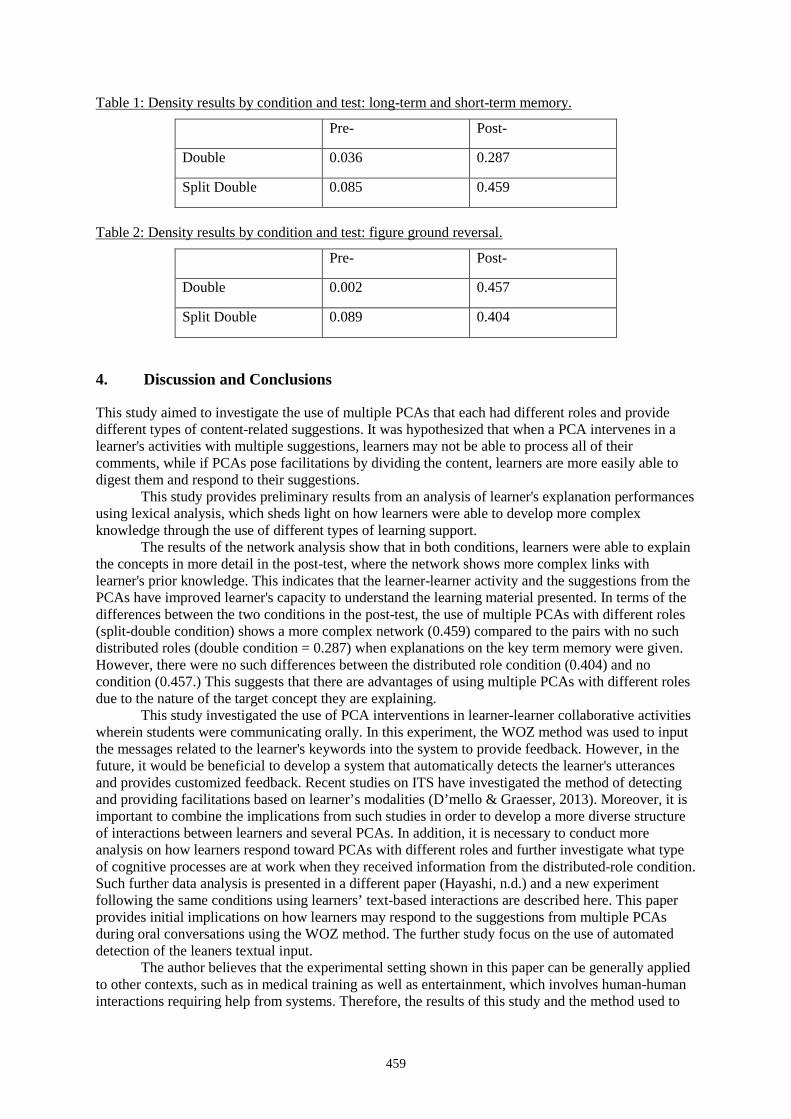
459
Table 1: Density results by condition and test: long-term and short-term memory.
Pre- Post-
Double 0.036 0.287
Split Double 0.085 0.459
Table 2: Density results by condition and test: figure ground reversal.
Pre- Post-
Double 0.002 0.457
Split Double 0.089 0.404
4. Discussion and Conclusions
This study aimed to investigate the use of multiple PCAs that each had different roles and provide different types of content-related suggestions. It was hypothesized that when a PCA intervenes in a learner's activities with multiple suggestions, learners may not be able to process all of their comments, while if PCAs pose facilitations by dividing the content, learners are more easily able to digest them and respond to their suggestions.
This study provides preliminary results from an analysis of learner's explanation performances using lexical analysis, which sheds light on how learners were able to develop more complex knowledge through the use of different types of learning support.
The results of the network analysis show that in both conditions, learners were able to explain the concepts in more detail in the post-test, where the network shows more complex links with learner's prior knowledge. This indicates that the learner-learner activity and the suggestions from the PCAs have improved learner's capacity to understand the learning material presented. In terms of the differences between the two conditions in the post-test, the use of multiple PCAs with different roles (split-double condition) shows a more complex network (0.459) compared to the pairs with no such distributed roles (double condition = 0.287) when explanations on the key term memory were given. However, there were no such differences between the distributed role condition (0.404) and no condition (0.457.) This suggests that there are advantages of using multiple PCAs with different roles due to the nature of the target concept they are explaining.
This study investigated the use of PCA interventions in learner-learner collaborative activities wherein students were communicating orally. In this experiment, the WOZ method was used to input the messages related to the learner's keywords into the system to provide feedback. However, in the future, it would be beneficial to develop a system that automatically detects the learner's utterances and provides customized feedback. Recent studies on ITS have investigated the method of detecting and providing facilitations based on learner’s modalities (D’mello & Graesser, 2013). Moreover, it is important to combine the implications from such studies in order to develop a more diverse structure of interactions between learners and several PCAs. In addition, it is necessary to conduct more analysis on how learners respond toward PCAs with different roles and further investigate what type of cognitive processes are at work when they received information from the distributed-role condition. Such further data analysis is presented in a different paper (Hayashi, n.d.) and a new experiment following the same conditions using learners’ text-based interactions are described here. This paper provides initial implications on how learners may respond to the suggestions from multiple PCAs during oral conversations using the WOZ method. The further study focus on the use of automated detection of the leaners textual input.
The author believes that the experimental setting shown in this paper can be generally applied to other contexts, such as in medical training as well as entertainment, which involves human-human interactions requiring help from systems. Therefore, the results of this study and the method used to
460
analyze learner’s knowledge may contribute to the design of future human-machine communication systems.
Acknowledgements
This work was supported by Grant-in-Aid for Scientific Research (KAKENHI), The Ministry of Education, Culture, Sports, Science, and Technology, Japan (MEXTGrant), Grant No. 16K00219.
References
Biswas, G., Leelawong, K., Schwartz, D., & Vye, N. (2005). Learning by teaching: A new agent paradigm for educa- tional software. Applied Artificial Intelligence, 19(3), 363- 392.
Chi, M., Leeuw, N., Chiu, M., & Lavancher, C. (1994). Eliciting self-explanations improves understanding. Cognitive Science, 18(3), 439-477.
Csibra, G., & Gergely, G. (2011). Natural pedagogy as evolutionary adaptation. Philosophical Transactions of the Royal Society B: Biological Sciences, 366(1567), 1149-1157.
D’mello, S., & Graesser, A. (2013, January). Autotutor and affective autotutor: Learning by talking with cognitively and emotionally intelligent computers that talk back. ACM Trans. Interact. Intell. Syst., 2(4), 23:1?23:39.
Graesser, A., Chipman, B., P. and Haynes, & Olney, A. (2005). Autotutor: An intelligent tutoring system with mixed-initiative dialogue. IEEE Transactions on Education, 48(4), 612-618.
Graesser, A., & McNamara, D. (2010). Self-regulated learning in learning environments with pedagogical agents that interact in natural language. Educational Psychologist, 45(4), 234-244.
Hayashi, Y. (n.d.). Facilitating collaborative explanation activities: Effects of splitting suggestion types using multiple pedagogical conversational agents. (submitted)
Hayashi, Y. (2012). On pedagogical effects of learner-support agents in collaborative interaction. In Proceeding of the 11th international conference on intelligent tutoring systems(its2012) (p. 22-32).
Hayashi, Y. (2014). Togetherness: Multiple pedagogical conversational agents as companions in collaborative learning. In Proceeding of the 11th international conference on intelligent tutoring systems(its2014) (p. 114-123).
Hayashi, Y. (2016). Lexical network analysis on an online explanation task: Effects of affect and embodiment of a pedagogical agent. IEICE Transactions on Information and Systems, E99.D(6), 1455-1461. doi: 10.1587/transinf.2015CBP0005
Hayashi, Y., & Inoue, T. (2015). Designing collaborative learning by multiple pedagogical conversational agents. IEICE transactions on Fundamentals A (Japanese Edition), J98-A(1), 76-84.
Holmes, J. (2007). Designing agents to support learning by explaining. Computers & Education, 48(4), 523-547. Jonston, W. A., & Uhl, C. N. (1976). The contributions of encoding effort and variability to the spacing effect
on free recall. Journal of Experimental Psychology: Human Learning and Memory, 2(2), 153-160. Louwerse, M., Graesser, A., Mcnamara, D., & Lu, S. (2008). Embodied conversational agents as conversational
partners. Applied Cognitive Psychology, 23, 1244-1255. Matsuda, N., Yarzebinski, E., Keiser, V., Raizada, R., Stylianides, G. J., & Koedinger, K. R. (2013). Studying
the effect of a competitive game show in a learning by teaching environment. International Journal of Artificial Intelligence in Education, 23(1), 1-21.
Mayer, R., E, Johnsonb, W., L, Shaw, E., & Sandhu, S. (2006). Constructing computer-based tutors that are so- cially sensitive: Politeness in educational software. Inter- national Journal of Human-Computer Studies, 1(1), 36-42. Miyake, N. (1986). Constructive interaction and the inter- active process of understanding. Cognitive Science, 10(2), 151-177.
Moreno, R. (2005). Multimedia learning with animated pedagogical agents. In R. Mayer (Ed.), The cambridge hand- book of multimedia learning (p. 507-524). Cambridge University Press.
Schwartz, L. D. (1995). The emergence of abstract representation in dyad problem solving. Journal of the Learning Science, 4, 321-354.
Vygotsky, L. S. (1980). The development of higher psychological processes. Harverd University Press.
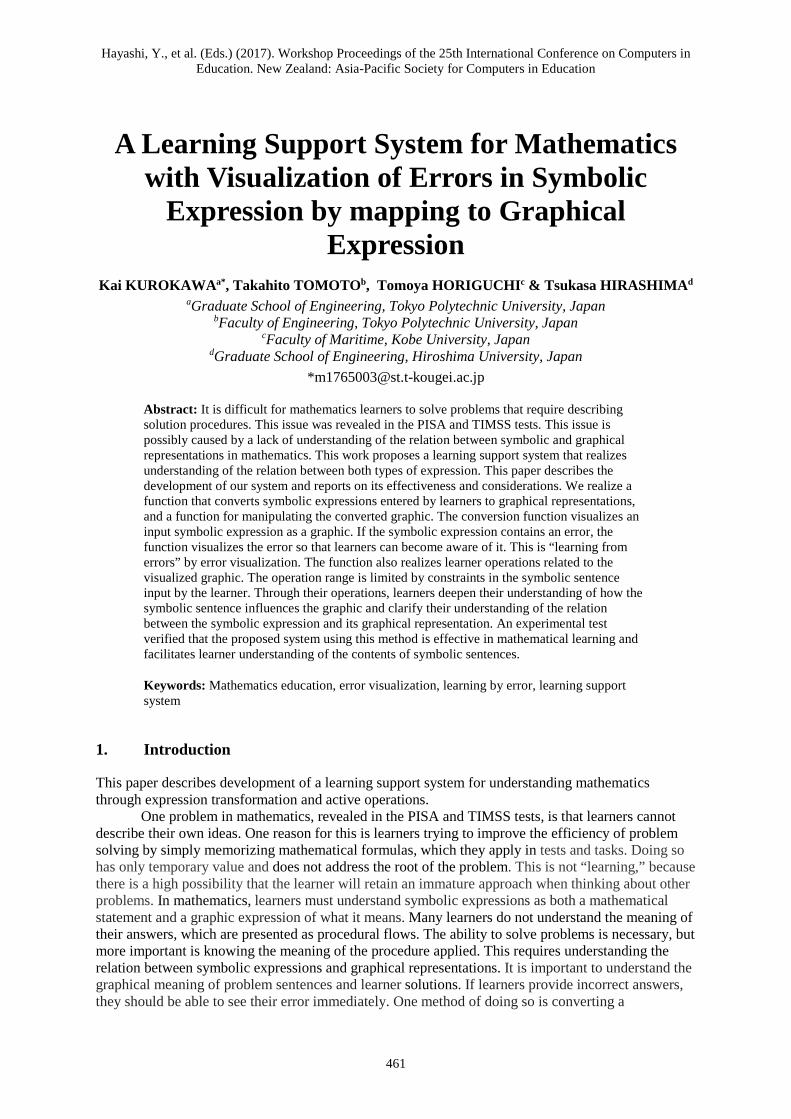
Hayashi, Y., et al. (Eds.) (2017). Workshop Proceedings of the 25th International Conference on Computers in Education. New Zealand: Asia-Pacific Society for Computers in Education
461
A Learning Support System for Mathematics with Visualization of Errors in Symbolic
Expression by mapping to Graphical Expression
Kai KUROKAWAa*, Takahito TOMOTOb, Tomoya HORIGUCHIc & Tsukasa HIRASHIMAd aGraduate School of Engineering, Tokyo Polytechnic University, Japan
bFaculty of Engineering, Tokyo Polytechnic University, Japan cFaculty of Maritime, Kobe University, Japan
dGraduate School of Engineering, Hiroshima University, Japan *[email protected]
Abstract: It is difficult for mathematics learners to solve problems that require describing solution procedures. This issue was revealed in the PISA and TIMSS tests. This issue is possibly caused by a lack of understanding of the relation between symbolic and graphical representations in mathematics. This work proposes a learning support system that realizes understanding of the relation between both types of expression. This paper describes the development of our system and reports on its effectiveness and considerations. We realize a function that converts symbolic expressions entered by learners to graphical representations, and a function for manipulating the converted graphic. The conversion function visualizes an input symbolic expression as a graphic. If the symbolic expression contains an error, the function visualizes the error so that learners can become aware of it. This is “learning from errors” by error visualization. The function also realizes learner operations related to the visualized graphic. The operation range is limited by constraints in the symbolic sentence input by the learner. Through their operations, learners deepen their understanding of how the symbolic sentence influences the graphic and clarify their understanding of the relation between the symbolic expression and its graphical representation. An experimental test verified that the proposed system using this method is effective in mathematical learning and facilitates learner understanding of the contents of symbolic sentences.
Keywords: Mathematics education, error visualization, learning by error, learning support system
1. Introduction
This paper describes development of a learning support system for understanding mathematics through expression transformation and active operations.
One problem in mathematics, revealed in the PISA and TIMSS tests, is that learners cannot describe their own ideas. One reason for this is learners trying to improve the efficiency of problem solving by simply memorizing mathematical formulas, which they apply in tests and tasks. Doing so has only temporary value and does not address the root of the problem. This is not “learning,” because there is a high possibility that the learner will retain an immature approach when thinking about other problems. In mathematics, learners must understand symbolic expressions as both a mathematical statement and a graphic expression of what it means. Many learners do not understand the meaning of their answers, which are presented as procedural flows. The ability to solve problems is necessary, but more important is knowing the meaning of the procedure applied. This requires understanding the relation between symbolic expressions and graphical representations. It is important to understand the graphical meaning of problem sentences and learner solutions. If learners provide incorrect answers, they should be able to see their error immediately. One method of doing so is converting a
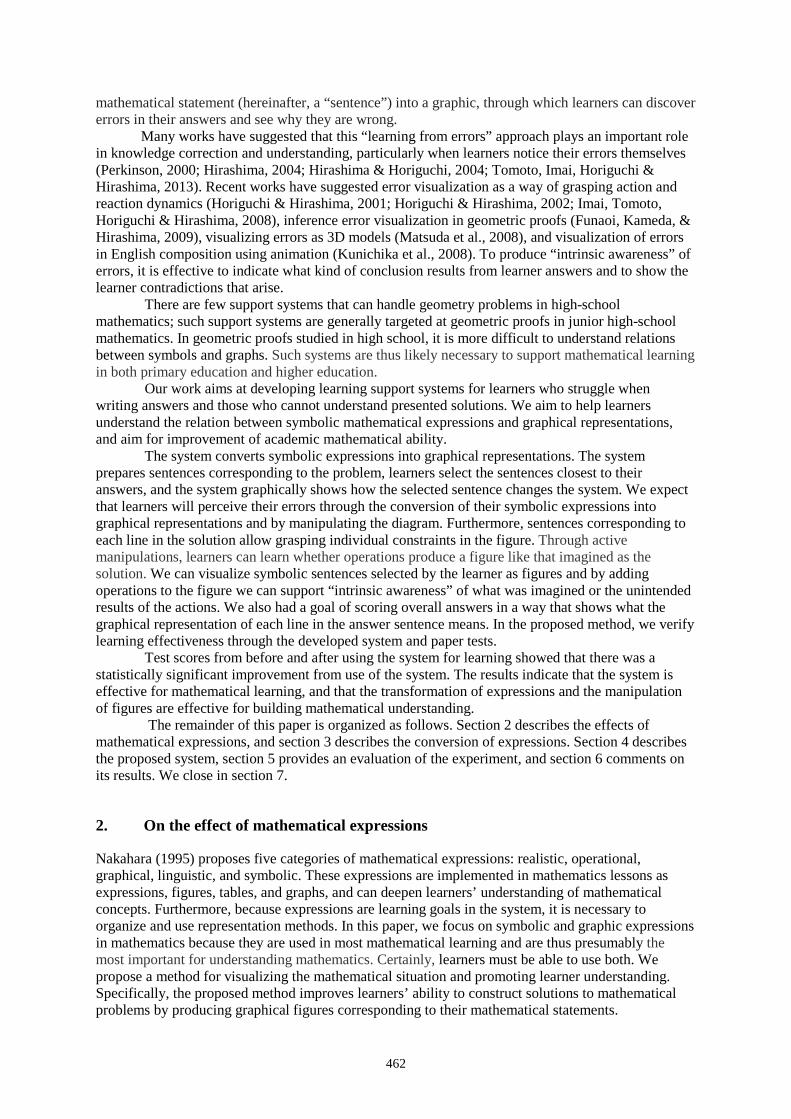
462
mathematical statement (hereinafter, a “sentence”) into a graphic, through which learners can discover errors in their answers and see why they are wrong.
Many works have suggested that this “learning from errors” approach plays an important role in knowledge correction and understanding, particularly when learners notice their errors themselves (Perkinson, 2000; Hirashima, 2004; Hirashima & Horiguchi, 2004; Tomoto, Imai, Horiguchi & Hirashima, 2013). Recent works have suggested error visualization as a way of grasping action and reaction dynamics (Horiguchi & Hirashima, 2001; Horiguchi & Hirashima, 2002; Imai, Tomoto, Horiguchi & Hirashima, 2008), inference error visualization in geometric proofs (Funaoi, Kameda, & Hirashima, 2009), visualizing errors as 3D models (Matsuda et al., 2008), and visualization of errors in English composition using animation (Kunichika et al., 2008). To produce “intrinsic awareness” of errors, it is effective to indicate what kind of conclusion results from learner answers and to show the learner contradictions that arise.
There are few support systems that can handle geometry problems in high-school mathematics; such support systems are generally targeted at geometric proofs in junior high-school mathematics. In geometric proofs studied in high school, it is more difficult to understand relations between symbols and graphs. Such systems are thus likely necessary to support mathematical learning in both primary education and higher education.
Our work aims at developing learning support systems for learners who struggle when writing answers and those who cannot understand presented solutions. We aim to help learners understand the relation between symbolic mathematical expressions and graphical representations, and aim for improvement of academic mathematical ability.
The system converts symbolic expressions into graphical representations. The system prepares sentences corresponding to the problem, learners select the sentences closest to their answers, and the system graphically shows how the selected sentence changes the system. We expect that learners will perceive their errors through the conversion of their symbolic expressions into graphical representations and by manipulating the diagram. Furthermore, sentences corresponding to each line in the solution allow grasping individual constraints in the figure. Through active manipulations, learners can learn whether operations produce a figure like that imagined as the solution. We can visualize symbolic sentences selected by the learner as figures and by adding operations to the figure we can support “intrinsic awareness” of what was imagined or the unintended results of the actions. We also had a goal of scoring overall answers in a way that shows what the graphical representation of each line in the answer sentence means. In the proposed method, we verify learning effectiveness through the developed system and paper tests.
Test scores from before and after using the system for learning showed that there was a statistically significant improvement from use of the system. The results indicate that the system is effective for mathematical learning, and that the transformation of expressions and the manipulation of figures are effective for building mathematical understanding.
The remainder of this paper is organized as follows. Section 2 describes the effects of mathematical expressions, and section 3 describes the conversion of expressions. Section 4 describes the proposed system, section 5 provides an evaluation of the experiment, and section 6 comments on its results. We close in section 7.
2. On the effect of mathematical expressions
Nakahara (1995) proposes five categories of mathematical expressions: realistic, operational, graphical, linguistic, and symbolic. These expressions are implemented in mathematics lessons as expressions, figures, tables, and graphs, and can deepen learners’ understanding of mathematical concepts. Furthermore, because expressions are learning goals in the system, it is necessary to organize and use representation methods. In this paper, we focus on symbolic and graphic expressions in mathematics because they are used in most mathematical learning and are thus presumably the most important for understanding mathematics. Certainly, learners must be able to use both. We propose a method for visualizing the mathematical situation and promoting learner understanding. Specifically, the proposed method improves learners’ ability to construct solutions to mathematical problems by producing graphical figures corresponding to their mathematical statements.
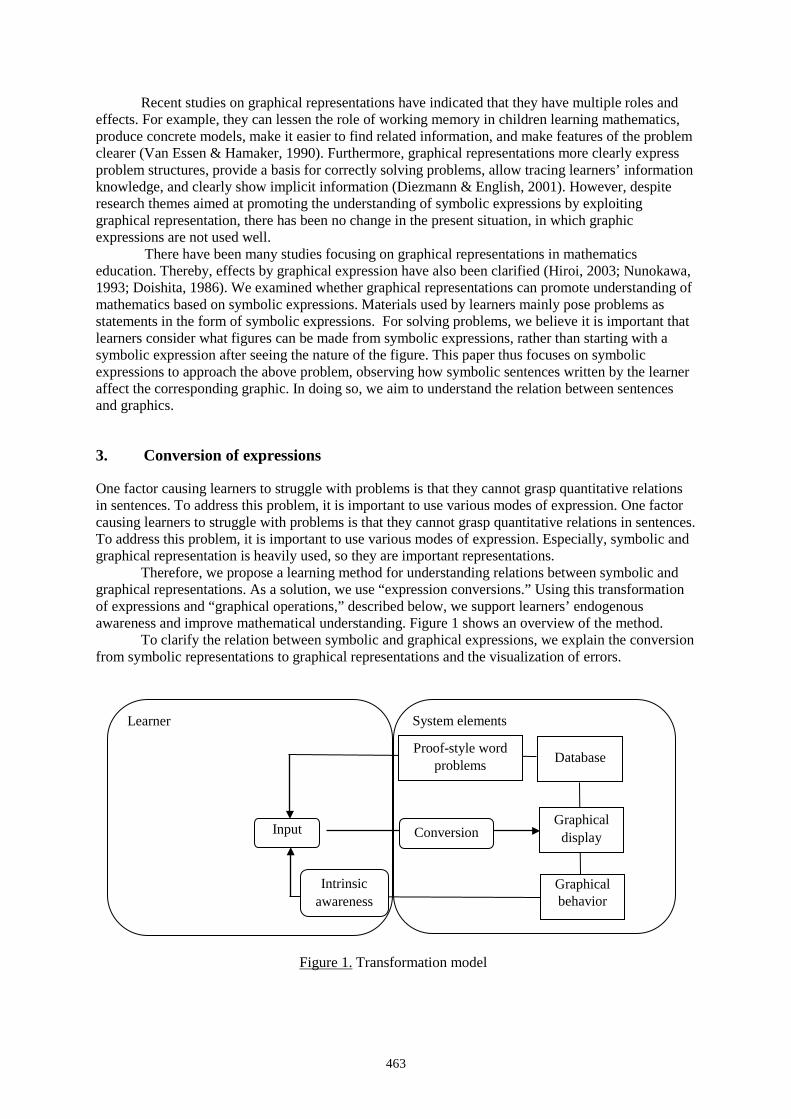
463
Recent studies on graphical representations have indicated that they have multiple roles and effects. For example, they can lessen the role of working memory in children learning mathematics, produce concrete models, make it easier to find related information, and make features of the problem clearer (Van Essen & Hamaker, 1990). Furthermore, graphical representations more clearly express problem structures, provide a basis for correctly solving problems, allow tracing learners’ information knowledge, and clearly show implicit information (Diezmann & English, 2001). However, despite research themes aimed at promoting the understanding of symbolic expressions by exploiting graphical representation, there has been no change in the present situation, in which graphic expressions are not used well.
There have been many studies focusing on graphical representations in mathematics education. Thereby, effects by graphical expression have also been clarified (Hiroi, 2003; Nunokawa, 1993; Doishita, 1986). We examined whether graphical representations can promote understanding of mathematics based on symbolic expressions. Materials used by learners mainly pose problems as statements in the form of symbolic expressions. For solving problems, we believe it is important that learners consider what figures can be made from symbolic expressions, rather than starting with a symbolic expression after seeing the nature of the figure. This paper thus focuses on symbolic expressions to approach the above problem, observing how symbolic sentences written by the learner affect the corresponding graphic. In doing so, we aim to understand the relation between sentences and graphics.
3. Conversion of expressions
One factor causing learners to struggle with problems is that they cannot grasp quantitative relations in sentences. To address this problem, it is important to use various modes of expression. One factor causing learners to struggle with problems is that they cannot grasp quantitative relations in sentences. To address this problem, it is important to use various modes of expression. Especially, symbolic and graphical representation is heavily used, so they are important representations.
Therefore, we propose a learning method for understanding relations between symbolic and graphical representations. As a solution, we use “expression conversions.” Using this transformation of expressions and “graphical operations,” described below, we support learners’ endogenous awareness and improve mathematical understanding. Figure 1 shows an overview of the method.
To clarify the relation between symbolic and graphical expressions, we explain the conversion from symbolic representations to graphical representations and the visualization of errors.
Learner System elements
Input Conversion
Database
Graphical behavior
Intrinsic awareness
Proof-style word problems
Graphical
display
Figure 1. Transformation model
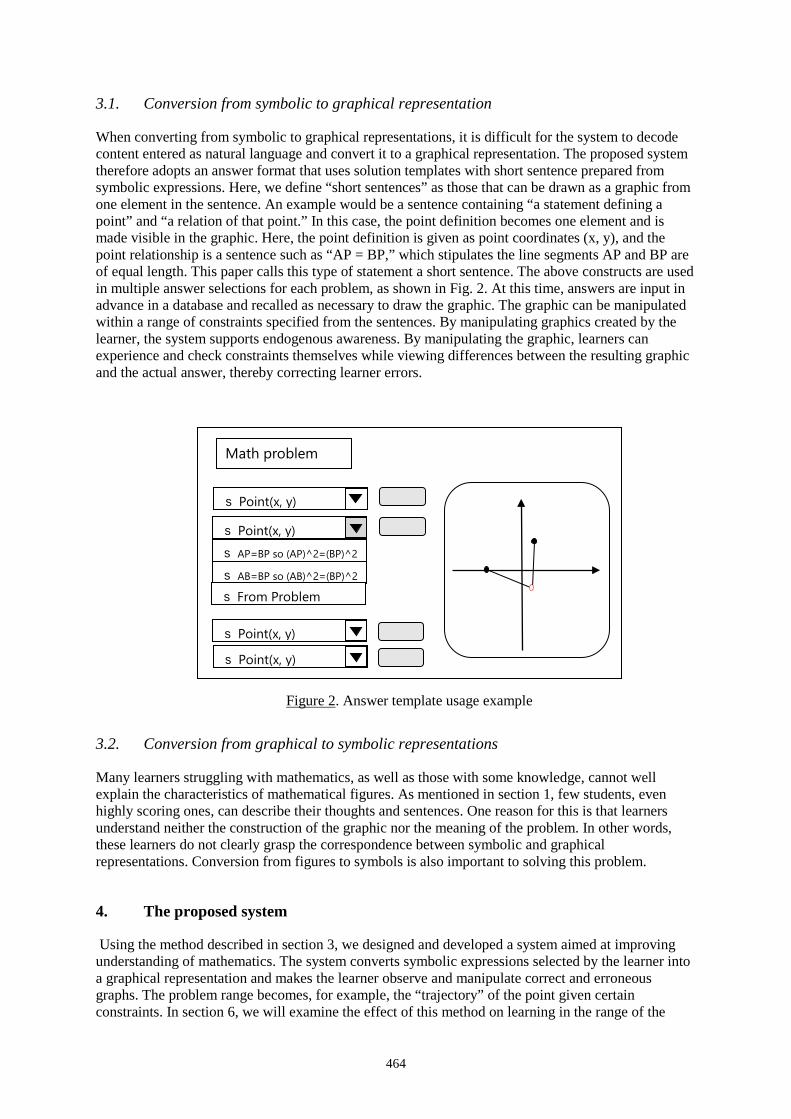
464
3.1. Conversion from symbolic to graphical representation
When converting from symbolic to graphical representations, it is difficult for the system to decode content entered as natural language and convert it to a graphical representation. The proposed system therefore adopts an answer format that uses solution templates with short sentence prepared from symbolic expressions. Here, we define “short sentences” as those that can be drawn as a graphic from one element in the sentence. An example would be a sentence containing “a statement defining a point” and “a relation of that point.” In this case, the point definition becomes one element and is made visible in the graphic. Here, the point definition is given as point coordinates (x, y), and the point relationship is a sentence such as “AP = BP,” which stipulates the line segments AP and BP are of equal length. This paper calls this type of statement a short sentence. The above constructs are used in multiple answer selections for each problem, as shown in Fig. 2. At this time, answers are input in advance in a database and recalled as necessary to draw the graphic. The graphic can be manipulated within a range of constraints specified from the sentences. By manipulating graphics created by the learner, the system supports endogenous awareness. By manipulating the graphic, learners can experience and check constraints themselves while viewing differences between the resulting graphic and the actual answer, thereby correcting learner errors.
3.2. Conversion from graphical to symbolic representations
Many learners struggling with mathematics, as well as those with some knowledge, cannot well explain the characteristics of mathematical figures. As mentioned in section 1, few students, even highly scoring ones, can describe their thoughts and sentences. One reason for this is that learners understand neither the construction of the graphic nor the meaning of the problem. In other words, these learners do not clearly grasp the correspondence between symbolic and graphical representations. Conversion from figures to symbols is also important to solving this problem.
4. The proposed system
Using the method described in section 3, we designed and developed a system aimed at improving understanding of mathematics. The system converts symbolic expressions selected by the learner into a graphical representation and makes the learner observe and manipulate correct and erroneous graphs. The problem range becomes, for example, the “trajectory” of the point given certain constraints. In section 6, we will examine the effect of this method on learning in the range of the
Math problem
s Point(x, y)
s Point(x, y) s AP=BP so (AP)^2=(BP)^2 s AB=BP so (AB)^2=(BP)^2
s From Problem
s Point(x, y)
s Point(x, y)
Figure 2. Answer template usage example
465
trajectory for that type of problem. When constructing an answer, the system provides learners with short sentences, namely those composed of few elements. Learners then use the elements of these short sentences as answer templates used to solve the problem. Developed functions and system operations are limited to graphical functions using short sentence symbols, functions for manipulating the figure, and a true/false judgment function. Functions are flexibly applied to all problems in the system. Especially since questions in this system start from assumptions of the positions of points, functioning is highly versatile. For example, when a learner uses a template to generate points while solving a problem, the points can be moved (manipulated) over the entire plane if their location is determined by an unknown quantity. If one axis is determined by a constant, the point can be moved along that axis. Questions with this kind of function have been created in the system. As described above, the system can produce graphics matching the problem contents, based on answer templates selected by the learner. Furthermore, learners can manipulate the generated points and lines. However, if there are drawing conditions (such as placing a point on the x-axis) specific in the selected answer template, the drawing can be manipulated only in ways that continue to satisfy that constraint.
In mathematics solutions, we use point (x, y), (x, 0) answer templates for manipulating points. The system allows confirming what kind of expression and movement learner-provided sentences will produce. As the answer construction progresses, the drawing area is gradually limited. For example, after setting a point P to (x, y) and adding the condition AP = BP, the point is constrained by that equation. In another pattern, setting point P to (x, 0) fixes the point, so it cannot be moved at all. Learners can observe and experience the situation when partial answers are mistaken. They can also experience such things through the operation of points, and can approach the relation between symbolic expressions and their graphical representation.
The goal of this system is to understand the contents of the diagram as expressed by the meaning and restrictions of learner-provided sentences.
The system was developed using the Visual Basic 2010 programming language.
4.1. Activities in the system
The operational flow of the system is as follows. The system presents three problems, and learners select the problem they wish to solve. They
are then taken to a “Practice” screen that presents a tutorial for system operation. Other problems are for calculating coordinates of a fixed point and a point P satisfying a certain condition, and a “trajectory” problem for calculating the point on which a straight line exists, where the point is not fixed. Our goal is for the learner to be able to solve the “trajectory” problem after using the system.
Learner activities within the system are as follows:
1. Check the mathematical problem provided by the system and select the answer that the learner intends as optimal from the given multiple symbolic mathematical expressions.
2. The system visualizes the selected sentence. The learner observes the graphic, understands the numerical content of the symbolic sentence and the relation with the sentences before and after it, clearly showing the relation between the mathematical sentence and the graphic.
3. In the visualized figure, it is possible for the subject to manipulate the graphic (move the generated point with the mouse). Users can thus experience constraints included in sentences, based on visualization from manipulation of the resulting graphic or the sentence while viewing how the completed answer sentence influences the graphic.
4.2. Interface
In the mathematical solution method, learners need to construct sentences according to the problem. An inherent problem is that even if the student represents the contents of the sentence as a diagram and attempts to understand it, the amount of work increases. As a result, the meaning of the sentence cannot be grasped, and answers may be erroneous. There may also be learners who do not understand
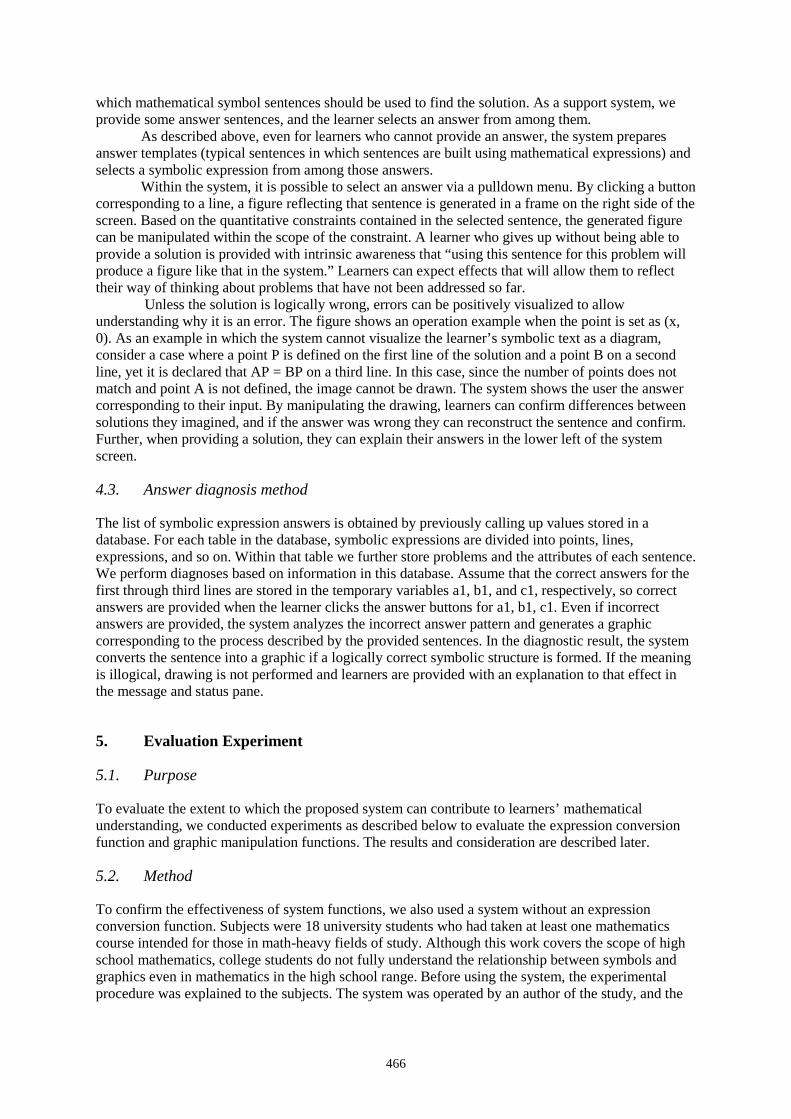
466
which mathematical symbol sentences should be used to find the solution. As a support system, we provide some answer sentences, and the learner selects an answer from among them.
As described above, even for learners who cannot provide an answer, the system prepares answer templates (typical sentences in which sentences are built using mathematical expressions) and selects a symbolic expression from among those answers.
Within the system, it is possible to select an answer via a pulldown menu. By clicking a button corresponding to a line, a figure reflecting that sentence is generated in a frame on the right side of the screen. Based on the quantitative constraints contained in the selected sentence, the generated figure can be manipulated within the scope of the constraint. A learner who gives up without being able to provide a solution is provided with intrinsic awareness that “using this sentence for this problem will produce a figure like that in the system.” Learners can expect effects that will allow them to reflect their way of thinking about problems that have not been addressed so far.
Unless the solution is logically wrong, errors can be positively visualized to allow understanding why it is an error. The figure shows an operation example when the point is set as (x, 0). As an example in which the system cannot visualize the learner’s symbolic text as a diagram, consider a case where a point P is defined on the first line of the solution and a point B on a second line, yet it is declared that AP = BP on a third line. In this case, since the number of points does not match and point A is not defined, the image cannot be drawn. The system shows the user the answer corresponding to their input. By manipulating the drawing, learners can confirm differences between solutions they imagined, and if the answer was wrong they can reconstruct the sentence and confirm. Further, when providing a solution, they can explain their answers in the lower left of the system screen.
4.3. Answer diagnosis method
The list of symbolic expression answers is obtained by previously calling up values stored in a database. For each table in the database, symbolic expressions are divided into points, lines, expressions, and so on. Within that table we further store problems and the attributes of each sentence. We perform diagnoses based on information in this database. Assume that the correct answers for the first through third lines are stored in the temporary variables a1, b1, and c1, respectively, so correct answers are provided when the learner clicks the answer buttons for a1, b1, c1. Even if incorrect answers are provided, the system analyzes the incorrect answer pattern and generates a graphic corresponding to the process described by the provided sentences. In the diagnostic result, the system converts the sentence into a graphic if a logically correct symbolic structure is formed. If the meaning is illogical, drawing is not performed and learners are provided with an explanation to that effect in the message and status pane.
5. Evaluation Experiment
5.1. Purpose
To evaluate the extent to which the proposed system can contribute to learners’ mathematical understanding, we conducted experiments as described below to evaluate the expression conversion function and graphic manipulation functions. The results and consideration are described later.
5.2. Method
To confirm the effectiveness of system functions, we also used a system without an expression conversion function. Subjects were 18 university students who had taken at least one mathematics course intended for those in math-heavy fields of study. Although this work covers the scope of high school mathematics, college students do not fully understand the relationship between symbols and graphics even in mathematics in the high school range. Before using the system, the experimental procedure was explained to the subjects. The system was operated by an author of the study, and the
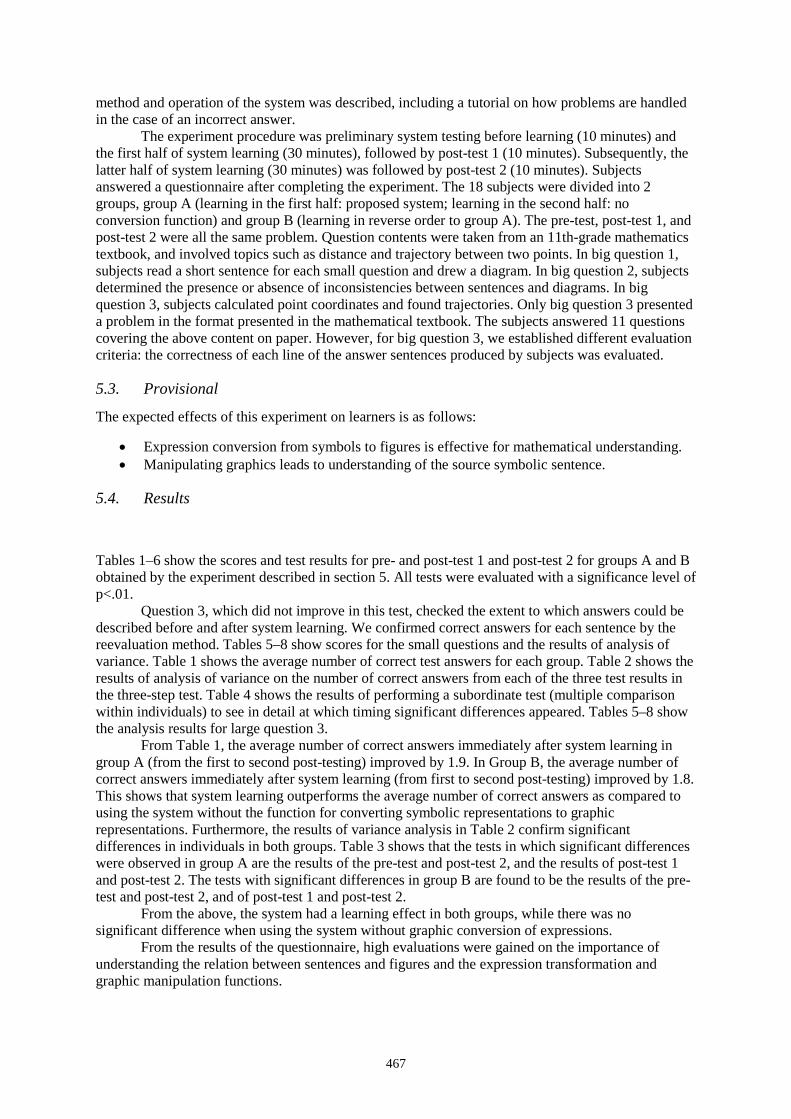
467
method and operation of the system was described, including a tutorial on how problems are handled in the case of an incorrect answer.
The experiment procedure was preliminary system testing before learning (10 minutes) and the first half of system learning (30 minutes), followed by post-test 1 (10 minutes). Subsequently, the latter half of system learning (30 minutes) was followed by post-test 2 (10 minutes). Subjects answered a questionnaire after completing the experiment. The 18 subjects were divided into 2 groups, group A (learning in the first half: proposed system; learning in the second half: no conversion function) and group B (learning in reverse order to group A). The pre-test, post-test 1, and post-test 2 were all the same problem. Question contents were taken from an 11th-grade mathematics textbook, and involved topics such as distance and trajectory between two points. In big question 1, subjects read a short sentence for each small question and drew a diagram. In big question 2, subjects determined the presence or absence of inconsistencies between sentences and diagrams. In big question 3, subjects calculated point coordinates and found trajectories. Only big question 3 presented a problem in the format presented in the mathematical textbook. The subjects answered 11 questions covering the above content on paper. However, for big question 3, we established different evaluation criteria: the correctness of each line of the answer sentences produced by subjects was evaluated.
5.3. Provisional
The expected effects of this experiment on learners is as follows:
• Expression conversion from symbols to figures is effective for mathematical understanding. • Manipulating graphics leads to understanding of the source symbolic sentence.
5.4. Results
Tables 1–6 show the scores and test results for pre- and post-test 1 and post-test 2 for groups A and B obtained by the experiment described in section 5. All tests were evaluated with a significance level of p<.01.
Question 3, which did not improve in this test, checked the extent to which answers could be described before and after system learning. We confirmed correct answers for each sentence by the reevaluation method. Tables 5–8 show scores for the small questions and the results of analysis of variance. Table 1 shows the average number of correct test answers for each group. Table 2 shows the results of analysis of variance on the number of correct answers from each of the three test results in the three-step test. Table 4 shows the results of performing a subordinate test (multiple comparison within individuals) to see in detail at which timing significant differences appeared. Tables 5–8 show the analysis results for large question 3.
From Table 1, the average number of correct answers immediately after system learning in group A (from the first to second post-testing) improved by 1.9. In Group B, the average number of correct answers immediately after system learning (from first to second post-testing) improved by 1.8. This shows that system learning outperforms the average number of correct answers as compared to using the system without the function for converting symbolic representations to graphic representations. Furthermore, the results of variance analysis in Table 2 confirm significant differences in individuals in both groups. Table 3 shows that the tests in which significant differences were observed in group A are the results of the pre-test and post-test 2, and the results of post-test 1 and post-test 2. The tests with significant differences in group B are found to be the results of the pre-test and post-test 2, and of post-test 1 and post-test 2.
From the above, the system had a learning effect in both groups, while there was no significant difference when using the system without graphic conversion of expressions.
From the results of the questionnaire, high evaluations were gained on the importance of understanding the relation between sentences and figures and the expression transformation and graphic manipulation functions.
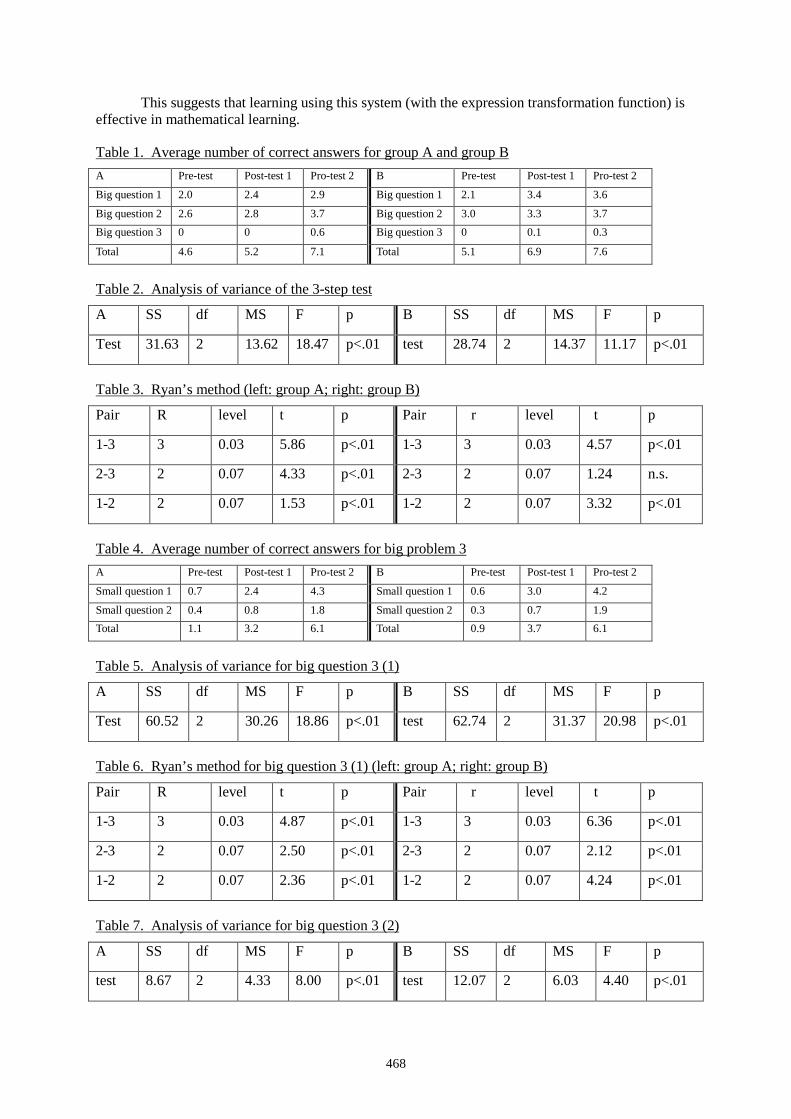
468
This suggests that learning using this system (with the expression transformation function) is effective in mathematical learning.
Table 1. Average number of correct answers for group A and group B A Pre-test Post-test 1 Pro-test 2 B Pre-test Post-test 1 Pro-test 2
Big question 1 2.0 2.4 2.9 Big question 1 2.1 3.4 3.6
Big question 2 2.6 2.8 3.7 Big question 2 3.0 3.3 3.7 Big question 3 0 0 0.6 Big question 3 0 0.1 0.3
Total 4.6 5.2 7.1 Total 5.1 6.9 7.6
Table 2. Analysis of variance of the 3-step test
A SS df MS F p B SS df MS F p
Test 31.63 2 13.62 18.47 p<.01 test 28.74 2 14.37 11.17 p<.01
Table 3. Ryan’s method (left: group A; right: group B)
Pair R level t p Pair r level t p
1-3 3 0.03 5.86 p<.01 1-3 3 0.03 4.57 p<.01
2-3 2 0.07 4.33 p<.01 2-3 2 0.07 1.24 n.s.
1-2 2 0.07 1.53 p<.01 1-2 2 0.07 3.32 p<.01
Table 4. Average number of correct answers for big problem 3
A Pre-test Post-test 1 Pro-test 2 B Pre-test Post-test 1 Pro-test 2
Small question 1 0.7 2.4 4.3 Small question 1 0.6 3.0 4.2
Small question 2 0.4 0.8 1.8 Small question 2 0.3 0.7 1.9 Total 1.1 3.2 6.1 Total 0.9 3.7 6.1
Table 5. Analysis of variance for big question 3 (1)
A SS df MS F p B SS df MS F p
Test 60.52 2 30.26 18.86 p<.01 test 62.74 2 31.37 20.98 p<.01
Table 6. Ryan’s method for big question 3 (1) (left: group A; right: group B)
Pair R level t p Pair r level t p
1-3 3 0.03 4.87 p<.01 1-3 3 0.03 6.36 p<.01
2-3 2 0.07 2.50 p<.01 2-3 2 0.07 2.12 p<.01
1-2 2 0.07 2.36 p<.01 1-2 2 0.07 4.24 p<.01
Table 7. Analysis of variance for big question 3 (2)
A SS df MS F p B SS df MS F p
test 8.67 2 4.33 8.00 p<.01 test 12.07 2 6.03 4.40 p<.01
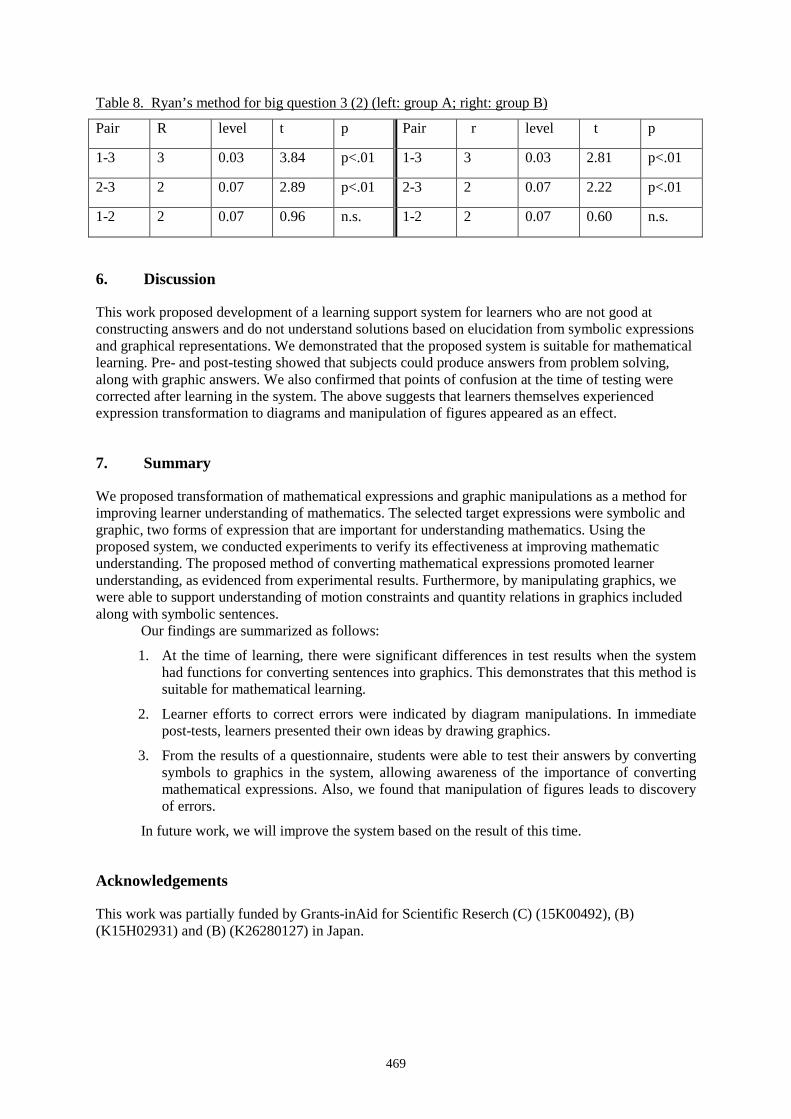
469
Table 8. Ryan’s method for big question 3 (2) (left: group A; right: group B)
Pair R level t p Pair r level t p
1-3 3 0.03 3.84 p<.01 1-3 3 0.03 2.81 p<.01
2-3 2 0.07 2.89 p<.01 2-3 2 0.07 2.22 p<.01
1-2 2 0.07 0.96 n.s. 1-2 2 0.07 0.60 n.s.
6. Discussion
This work proposed development of a learning support system for learners who are not good at constructing answers and do not understand solutions based on elucidation from symbolic expressions and graphical representations. We demonstrated that the proposed system is suitable for mathematical learning. Pre- and post-testing showed that subjects could produce answers from problem solving, along with graphic answers. We also confirmed that points of confusion at the time of testing were corrected after learning in the system. The above suggests that learners themselves experienced expression transformation to diagrams and manipulation of figures appeared as an effect.
7. Summary
We proposed transformation of mathematical expressions and graphic manipulations as a method for improving learner understanding of mathematics. The selected target expressions were symbolic and graphic, two forms of expression that are important for understanding mathematics. Using the proposed system, we conducted experiments to verify its effectiveness at improving mathematic understanding. The proposed method of converting mathematical expressions promoted learner understanding, as evidenced from experimental results. Furthermore, by manipulating graphics, we were able to support understanding of motion constraints and quantity relations in graphics included along with symbolic sentences.
Our findings are summarized as follows:
1. At the time of learning, there were significant differences in test results when the system had functions for converting sentences into graphics. This demonstrates that this method is suitable for mathematical learning.
2. Learner efforts to correct errors were indicated by diagram manipulations. In immediate post-tests, learners presented their own ideas by drawing graphics.
3. From the results of a questionnaire, students were able to test their answers by converting symbols to graphics in the system, allowing awareness of the importance of converting mathematical expressions. Also, we found that manipulation of figures leads to discovery of errors.
In future work, we will improve the system based on the result of this time.
Acknowledgements
This work was partially funded by Grants-inAid for Scientific Reserch (C) (15K00492), (B) (K15H02931) and (B) (K26280127) in Japan.

470
References
Carmel M.Diezmann & Lyn D.English. (2001). The Roles of Representation in School Mathematics, (NCTM2001YEARBOOK), NCTM, Promoting the Use of Diagrams as Tools for Thinking, 77-89.
Doishita, A., Shimizu, H., Ueoka, T. & Ichisaki, M. Teaching Strategy in the Problem Solving : -Conducting a Survey of the Pupils on Pictures and Figures and Putting it into Practice-. Japan Society of Mathematical Education-Math education-, 68(4), 18-22. (in Japanense)
Funaoi, H., Kameda, T., & Hirashima, T.(2009). Visualization of an Error in Solution of Geometry Proof Problems. Japan Journal of Education Technologys,32(4), 425-433. (in Japanese)
Hirashima, T. (2004). Aiming at Interaction Giving Awareness of error. Human Interface: The Transaction of Human Interface Society, 6(2), 99-102. (in Japanese)
Hirashima, T., & Horiguchi, T. (2004). Attempt to Visualize Errors from Orienting Learning from Error. Transactions of Japanese Society for Information and Systems in Education, 21(3), 178-186. (in Japanese)
Hiroi, H.(2003). Understanding problems by graphic in elementary school fifth grade. Japan Society of Mathematical Education-Arithmetic/ Mathematics-, 85(6), 10-19. (in Japanese)
Horiguchi, T., & Hirashima, T. (2001). Simulation-Based Learning Environment for Assisting Error-Awareness - Management of Error-Based Simulation Considering the Expressiveness and Effectiveness-. Transactions of Japanese Society for Information and Systems in Education,18(3),364-376. (in Japanese)
Horiguchi, T., & Hirashima, T.(2002). Simulation-Based Learning Enviroment for Assisting Error-Correction. The Japanese Society for Artificial Intelligence, 17(4), 462-472. (in Japanese)
Imai, I., Tomoto. T, Horiguchi, T., & Hirashima, T.(2008). A classroom practice of error-based simulation to improve pulils' understanding of mechanics: the “challenge to Newton!” project. Transactions of Japanese Society for Information and Systems in Education, 25(2),194-203. (in Japanese)
Kunichika, H., Koga, T., Deyama, T., Murakami, T., Hirashima, T., & Takeuchi, A.(2008). Learning Support for English Composition with Error Visualization. The IEICE transactions on information and systems, 91(2), 210-219. (in Japanese)
Matsuda, N., Takagi, S., Soga, M., Horiguchi, T., Hirashima, T., Taki, H., & Yoshimoto, H.(2008). Error Visualization for Pencil Drawing with Three-Dimensional Model. The IEICE Transactions on Information and Systems, 91(2), 324-332. (in Japanese)
Nakahara, T. (1995). Study of constitutive approach in mathematics and mathematics. seibunsha, 389. Nunokawa, K.(1993). Role of graphic in mathematical problem solution and meaning by solver. Tatsuro Miwa's
Retirement Commemorative Papers Collection Committee-Advancement in mathematical education-, Toyo-kan's publisher, (4), 303-320. (in Japanese)
Perkinson, H. J, (2000). Learning from Our Mistakes: A Reinterpretation of Twentieth- Century Educational Theory. keiso shobo, 305. (in Japanese)
Tomoto, T., Imai, I., Horiguchi, T., & Hirashima, T. (2013). A support Environment for Learning of Class Structure by Concept Mapping Using Error-Visualization. Transactions of Japanese Society for Information and Systems in Education, 30(1), 42-53.
Van Essen, G, & Hamaker. (1990). The Journal of Educationai Research. Using Self-Generated Drawings to Solve Arithmetic Word Problems, 83(6), 301-312.
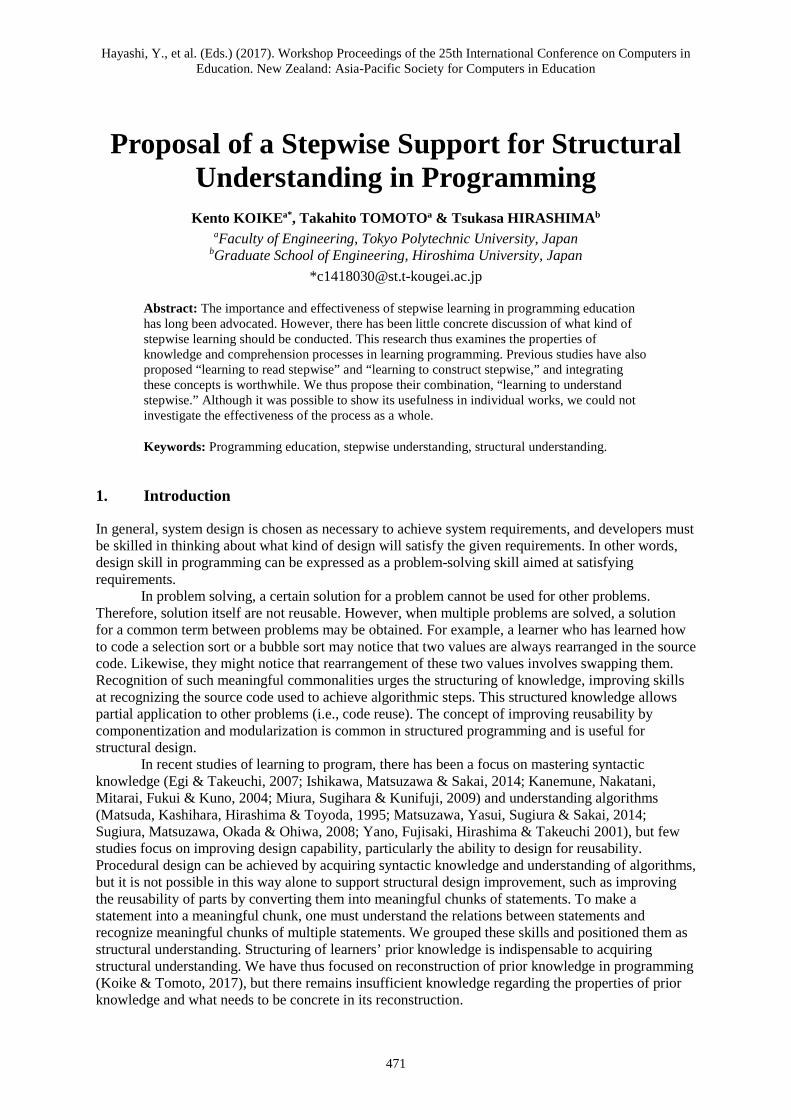
Hayashi, Y., et al. (Eds.) (2017). Workshop Proceedings of the 25th International Conference on Computers in Education. New Zealand: Asia-Pacific Society for Computers in Education
471
Proposal of a Stepwise Support for Structural Understanding in Programming
Kento KOIKEa*, Takahito TOMOTOa & Tsukasa HIRASHIMAb aFaculty of Engineering, Tokyo Polytechnic University, Japan
bGraduate School of Engineering, Hiroshima University, Japan *[email protected]
Abstract: The importance and effectiveness of stepwise learning in programming education has long been advocated. However, there has been little concrete discussion of what kind of stepwise learning should be conducted. This research thus examines the properties of knowledge and comprehension processes in learning programming. Previous studies have also proposed “learning to read stepwise” and “learning to construct stepwise,” and integrating these concepts is worthwhile. We thus propose their combination, “learning to understand stepwise.” Although it was possible to show its usefulness in individual works, we could not investigate the effectiveness of the process as a whole.
Keywords: Programming education, stepwise understanding, structural understanding.
1. Introduction
In general, system design is chosen as necessary to achieve system requirements, and developers must be skilled in thinking about what kind of design will satisfy the given requirements. In other words, design skill in programming can be expressed as a problem-solving skill aimed at satisfying requirements.
In problem solving, a certain solution for a problem cannot be used for other problems. Therefore, solution itself are not reusable. However, when multiple problems are solved, a solution for a common term between problems may be obtained. For example, a learner who has learned how to code a selection sort or a bubble sort may notice that two values are always rearranged in the source code. Likewise, they might notice that rearrangement of these two values involves swapping them. Recognition of such meaningful commonalities urges the structuring of knowledge, improving skills at recognizing the source code used to achieve algorithmic steps. This structured knowledge allows partial application to other problems (i.e., code reuse). The concept of improving reusability by componentization and modularization is common in structured programming and is useful for structural design.
In recent studies of learning to program, there has been a focus on mastering syntactic knowledge (Egi & Takeuchi, 2007; Ishikawa, Matsuzawa & Sakai, 2014; Kanemune, Nakatani, Mitarai, Fukui & Kuno, 2004; Miura, Sugihara & Kunifuji, 2009) and understanding algorithms (Matsuda, Kashihara, Hirashima & Toyoda, 1995; Matsuzawa, Yasui, Sugiura & Sakai, 2014; Sugiura, Matsuzawa, Okada & Ohiwa, 2008; Yano, Fujisaki, Hirashima & Takeuchi 2001), but few studies focus on improving design capability, particularly the ability to design for reusability. Procedural design can be achieved by acquiring syntactic knowledge and understanding of algorithms, but it is not possible in this way alone to support structural design improvement, such as improving the reusability of parts by converting them into meaningful chunks of statements. To make a statement into a meaningful chunk, one must understand the relations between statements and recognize meaningful chunks of multiple statements. We grouped these skills and positioned them as structural understanding. Structuring of learners’ prior knowledge is indispensable to acquiring structural understanding. We have thus focused on reconstruction of prior knowledge in programming (Koike & Tomoto, 2017), but there remains insufficient knowledge regarding the properties of prior knowledge and what needs to be concrete in its reconstruction.
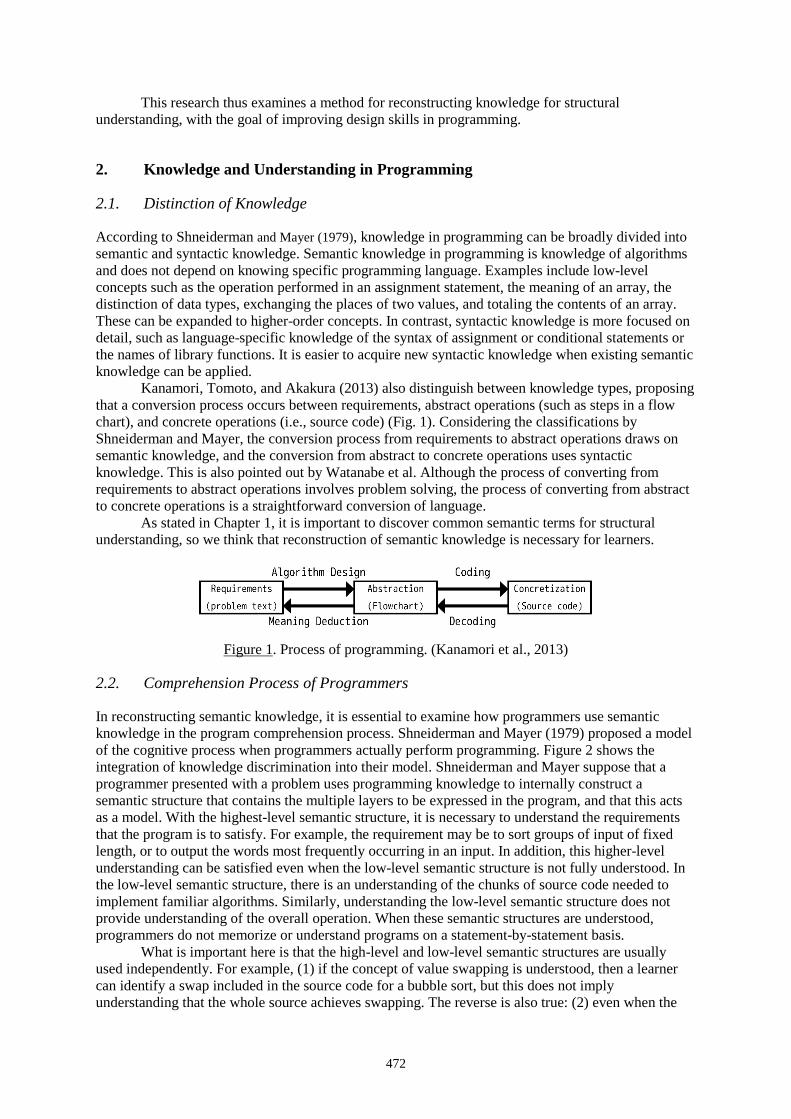
472
This research thus examines a method for reconstructing knowledge for structural understanding, with the goal of improving design skills in programming.
2. Knowledge and Understanding in Programming
2.1. Distinction of Knowledge
According to Shneiderman and Mayer (1979), knowledge in programming can be broadly divided into semantic and syntactic knowledge. Semantic knowledge in programming is knowledge of algorithms and does not depend on knowing specific programming language. Examples include low-level concepts such as the operation performed in an assignment statement, the meaning of an array, the distinction of data types, exchanging the places of two values, and totaling the contents of an array. These can be expanded to higher-order concepts. In contrast, syntactic knowledge is more focused on detail, such as language-specific knowledge of the syntax of assignment or conditional statements or the names of library functions. It is easier to acquire new syntactic knowledge when existing semantic knowledge can be applied.
Kanamori, Tomoto, and Akakura (2013) also distinguish between knowledge types, proposing that a conversion process occurs between requirements, abstract operations (such as steps in a flow chart), and concrete operations (i.e., source code) (Fig. 1). Considering the classifications by Shneiderman and Mayer, the conversion process from requirements to abstract operations draws on semantic knowledge, and the conversion from abstract to concrete operations uses syntactic knowledge. This is also pointed out by Watanabe et al. Although the process of converting from requirements to abstract operations involves problem solving, the process of converting from abstract to concrete operations is a straightforward conversion of language.
As stated in Chapter 1, it is important to discover common semantic terms for structural understanding, so we think that reconstruction of semantic knowledge is necessary for learners.
Figure 1. Process of programming. (Kanamori et al., 2013)
2.2. Comprehension Process of Programmers
In reconstructing semantic knowledge, it is essential to examine how programmers use semantic knowledge in the program comprehension process. Shneiderman and Mayer (1979) proposed a model of the cognitive process when programmers actually perform programming. Figure 2 shows the integration of knowledge discrimination into their model. Shneiderman and Mayer suppose that a programmer presented with a problem uses programming knowledge to internally construct a semantic structure that contains the multiple layers to be expressed in the program, and that this acts as a model. With the highest-level semantic structure, it is necessary to understand the requirements that the program is to satisfy. For example, the requirement may be to sort groups of input of fixed length, or to output the words most frequently occurring in an input. In addition, this higher-level understanding can be satisfied even when the low-level semantic structure is not fully understood. In the low-level semantic structure, there is an understanding of the chunks of source code needed to implement familiar algorithms. Similarly, understanding the low-level semantic structure does not provide understanding of the overall operation. When these semantic structures are understood, programmers do not memorize or understand programs on a statement-by-statement basis.
What is important here is that the high-level and low-level semantic structures are usually used independently. For example, (1) if the concept of value swapping is understood, then a learner can identify a swap included in the source code for a bubble sort, but this does not imply understanding that the whole source achieves swapping. The reverse is also true: (2) even when the
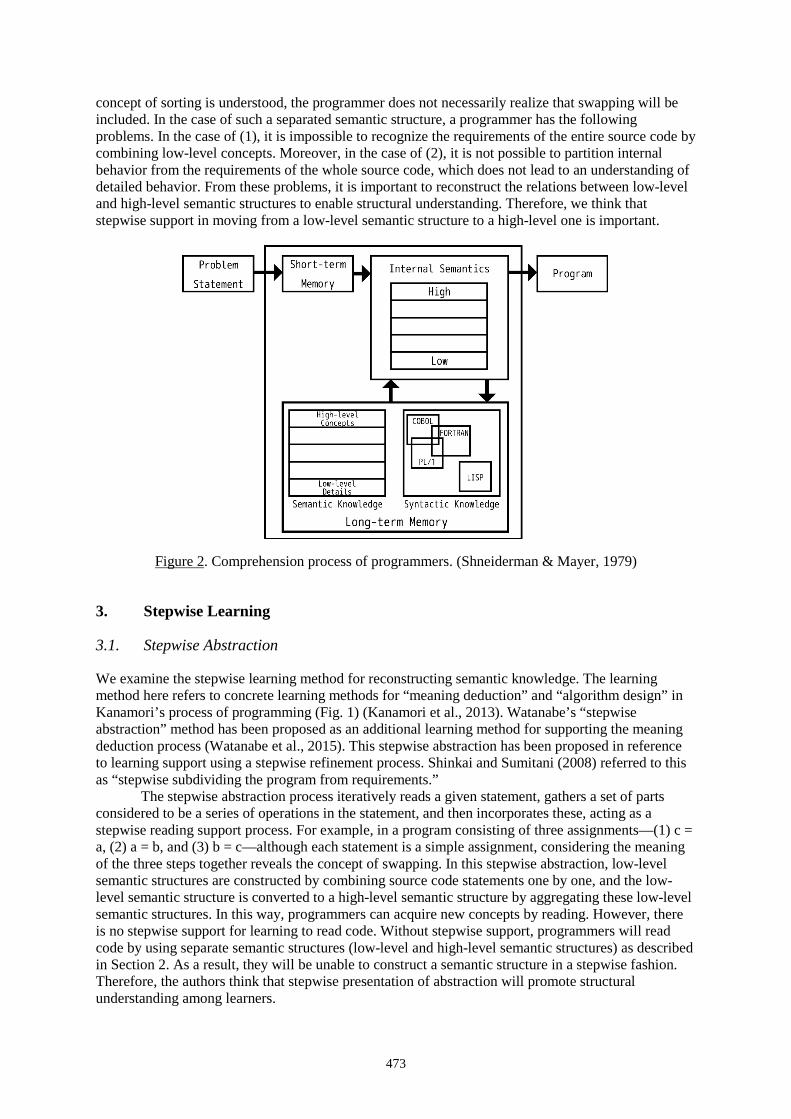
473
concept of sorting is understood, the programmer does not necessarily realize that swapping will be included. In the case of such a separated semantic structure, a programmer has the following problems. In the case of (1), it is impossible to recognize the requirements of the entire source code by combining low-level concepts. Moreover, in the case of (2), it is not possible to partition internal behavior from the requirements of the whole source code, which does not lead to an understanding of detailed behavior. From these problems, it is important to reconstruct the relations between low-level and high-level semantic structures to enable structural understanding. Therefore, we think that stepwise support in moving from a low-level semantic structure to a high-level one is important.
Figure 2. Comprehension process of programmers. (Shneiderman & Mayer, 1979)
3. Stepwise Learning
3.1. Stepwise Abstraction
We examine the stepwise learning method for reconstructing semantic knowledge. The learning method here refers to concrete learning methods for “meaning deduction” and “algorithm design” in Kanamori’s process of programming (Fig. 1) (Kanamori et al., 2013). Watanabe’s “stepwise abstraction” method has been proposed as an additional learning method for supporting the meaning deduction process (Watanabe et al., 2015). This stepwise abstraction has been proposed in reference to learning support using a stepwise refinement process. Shinkai and Sumitani (2008) referred to this as “stepwise subdividing the program from requirements.”
The stepwise abstraction process iteratively reads a given statement, gathers a set of parts considered to be a series of operations in the statement, and then incorporates these, acting as a stepwise reading support process. For example, in a program consisting of three assignments—(1) c = a, (2) a = b, and (3) b = c—although each statement is a simple assignment, considering the meaning of the three steps together reveals the concept of swapping. In this stepwise abstraction, low-level semantic structures are constructed by combining source code statements one by one, and the low-level semantic structure is converted to a high-level semantic structure by aggregating these low-level semantic structures. In this way, programmers can acquire new concepts by reading. However, there is no stepwise support for learning to read code. Without stepwise support, programmers will read code by using separate semantic structures (low-level and high-level semantic structures) as described in Section 2. As a result, they will be unable to construct a semantic structure in a stepwise fashion. Therefore, the authors think that stepwise presentation of abstraction will promote structural understanding among learners.
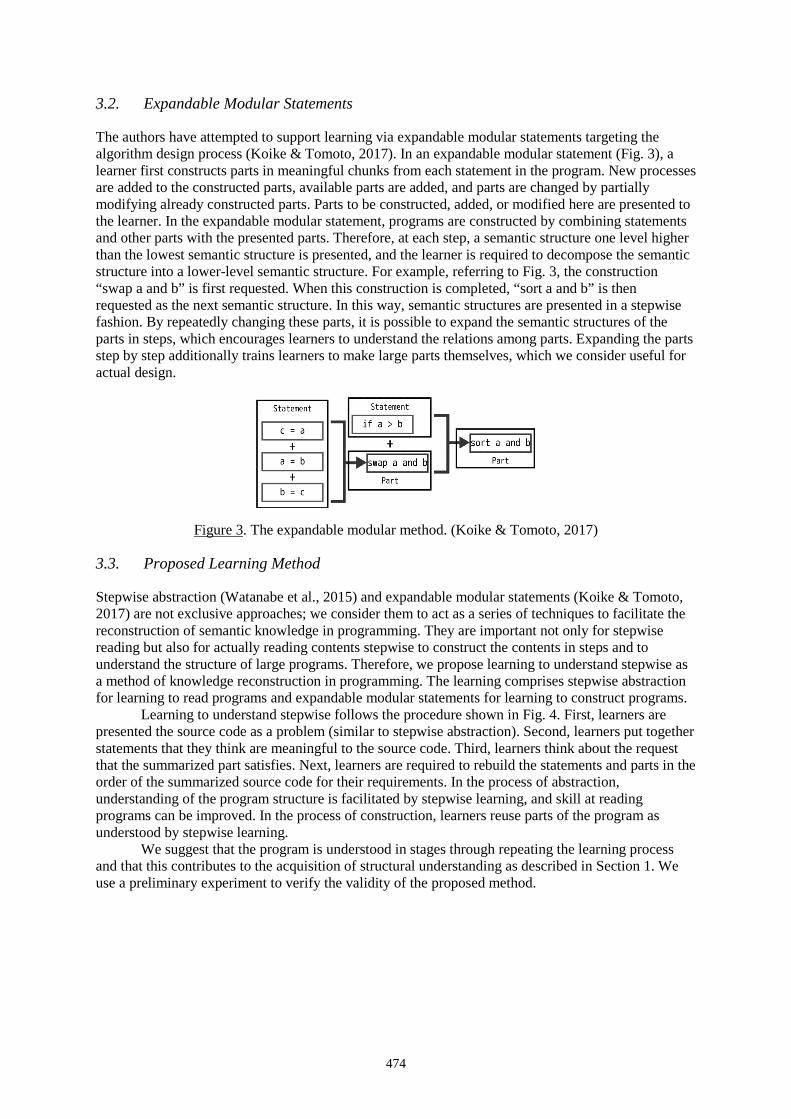
474
3.2. Expandable Modular Statements
The authors have attempted to support learning via expandable modular statements targeting the algorithm design process (Koike & Tomoto, 2017). In an expandable modular statement (Fig. 3), a learner first constructs parts in meaningful chunks from each statement in the program. New processes are added to the constructed parts, available parts are added, and parts are changed by partially modifying already constructed parts. Parts to be constructed, added, or modified here are presented to the learner. In the expandable modular statement, programs are constructed by combining statements and other parts with the presented parts. Therefore, at each step, a semantic structure one level higher than the lowest semantic structure is presented, and the learner is required to decompose the semantic structure into a lower-level semantic structure. For example, referring to Fig. 3, the construction “swap a and b” is first requested. When this construction is completed, “sort a and b” is then requested as the next semantic structure. In this way, semantic structures are presented in a stepwise fashion. By repeatedly changing these parts, it is possible to expand the semantic structures of the parts in steps, which encourages learners to understand the relations among parts. Expanding the parts step by step additionally trains learners to make large parts themselves, which we consider useful for actual design.
Figure 3. The expandable modular method. (Koike & Tomoto, 2017)
3.3. Proposed Learning Method
Stepwise abstraction (Watanabe et al., 2015) and expandable modular statements (Koike & Tomoto, 2017) are not exclusive approaches; we consider them to act as a series of techniques to facilitate the reconstruction of semantic knowledge in programming. They are important not only for stepwise reading but also for actually reading contents stepwise to construct the contents in steps and to understand the structure of large programs. Therefore, we propose learning to understand stepwise as a method of knowledge reconstruction in programming. The learning comprises stepwise abstraction for learning to read programs and expandable modular statements for learning to construct programs.
Learning to understand stepwise follows the procedure shown in Fig. 4. First, learners are presented the source code as a problem (similar to stepwise abstraction). Second, learners put together statements that they think are meaningful to the source code. Third, learners think about the request that the summarized part satisfies. Next, learners are required to rebuild the statements and parts in the order of the summarized source code for their requirements. In the process of abstraction, understanding of the program structure is facilitated by stepwise learning, and skill at reading programs can be improved. In the process of construction, learners reuse parts of the program as understood by stepwise learning.
We suggest that the program is understood in stages through repeating the learning process and that this contributes to the acquisition of structural understanding as described in Section 1. We use a preliminary experiment to verify the validity of the proposed method.
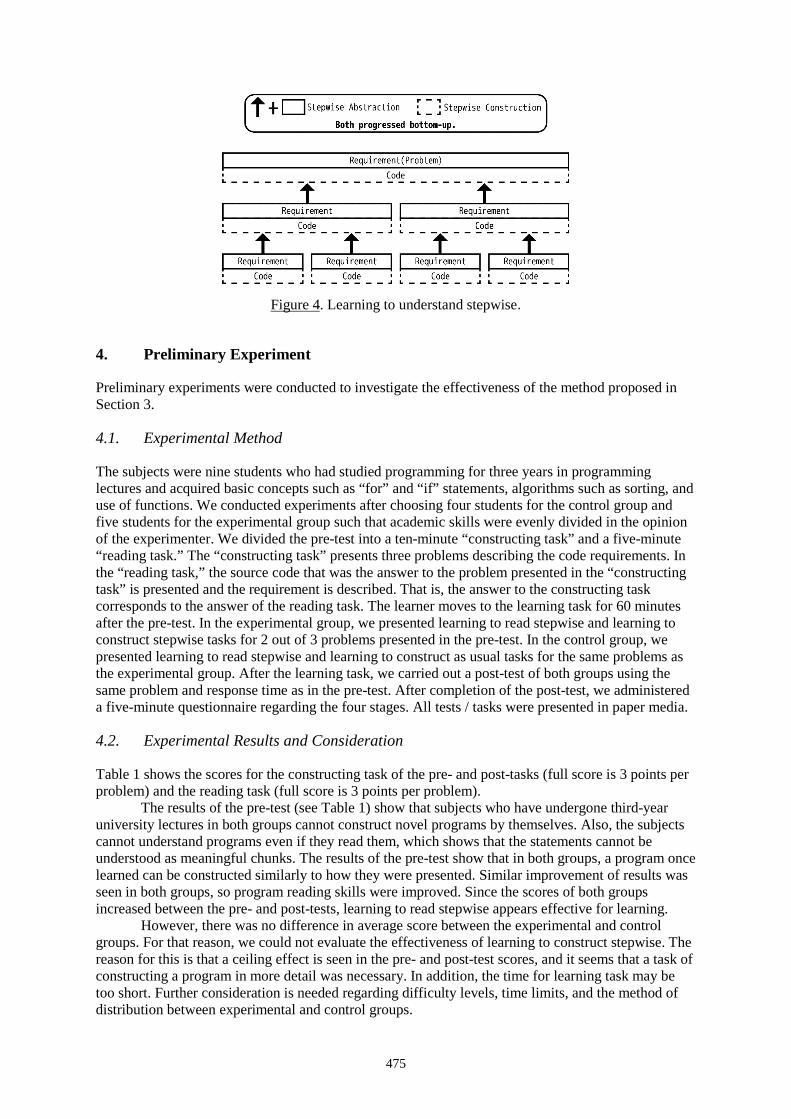
475
Figure 4. Learning to understand stepwise.
4. Preliminary Experiment
Preliminary experiments were conducted to investigate the effectiveness of the method proposed in Section 3.
4.1. Experimental Method
The subjects were nine students who had studied programming for three years in programming lectures and acquired basic concepts such as “for” and “if” statements, algorithms such as sorting, and use of functions. We conducted experiments after choosing four students for the control group and five students for the experimental group such that academic skills were evenly divided in the opinion of the experimenter. We divided the pre-test into a ten-minute “constructing task” and a five-minute “reading task.” The “constructing task” presents three problems describing the code requirements. In the “reading task,” the source code that was the answer to the problem presented in the “constructing task” is presented and the requirement is described. That is, the answer to the constructing task corresponds to the answer of the reading task. The learner moves to the learning task for 60 minutes after the pre-test. In the experimental group, we presented learning to read stepwise and learning to construct stepwise tasks for 2 out of 3 problems presented in the pre-test. In the control group, we presented learning to read stepwise and learning to construct as usual tasks for the same problems as the experimental group. After the learning task, we carried out a post-test of both groups using the same problem and response time as in the pre-test. After completion of the post-test, we administered a five-minute questionnaire regarding the four stages. All tests / tasks were presented in paper media.
4.2. Experimental Results and Consideration
Table 1 shows the scores for the constructing task of the pre- and post-tasks (full score is 3 points per problem) and the reading task (full score is 3 points per problem).
The results of the pre-test (see Table 1) show that subjects who have undergone third-year university lectures in both groups cannot construct novel programs by themselves. Also, the subjects cannot understand programs even if they read them, which shows that the statements cannot be understood as meaningful chunks. The results of the pre-test show that in both groups, a program once learned can be constructed similarly to how they were presented. Similar improvement of results was seen in both groups, so program reading skills were improved. Since the scores of both groups increased between the pre- and post-tests, learning to read stepwise appears effective for learning.
However, there was no difference in average score between the experimental and control groups. For that reason, we could not evaluate the effectiveness of learning to construct stepwise. The reason for this is that a ceiling effect is seen in the pre- and post-test scores, and it seems that a task of constructing a program in more detail was necessary. In addition, the time for learning task may be too short. Further consideration is needed regarding difficulty levels, time limits, and the method of distribution between experimental and control groups.
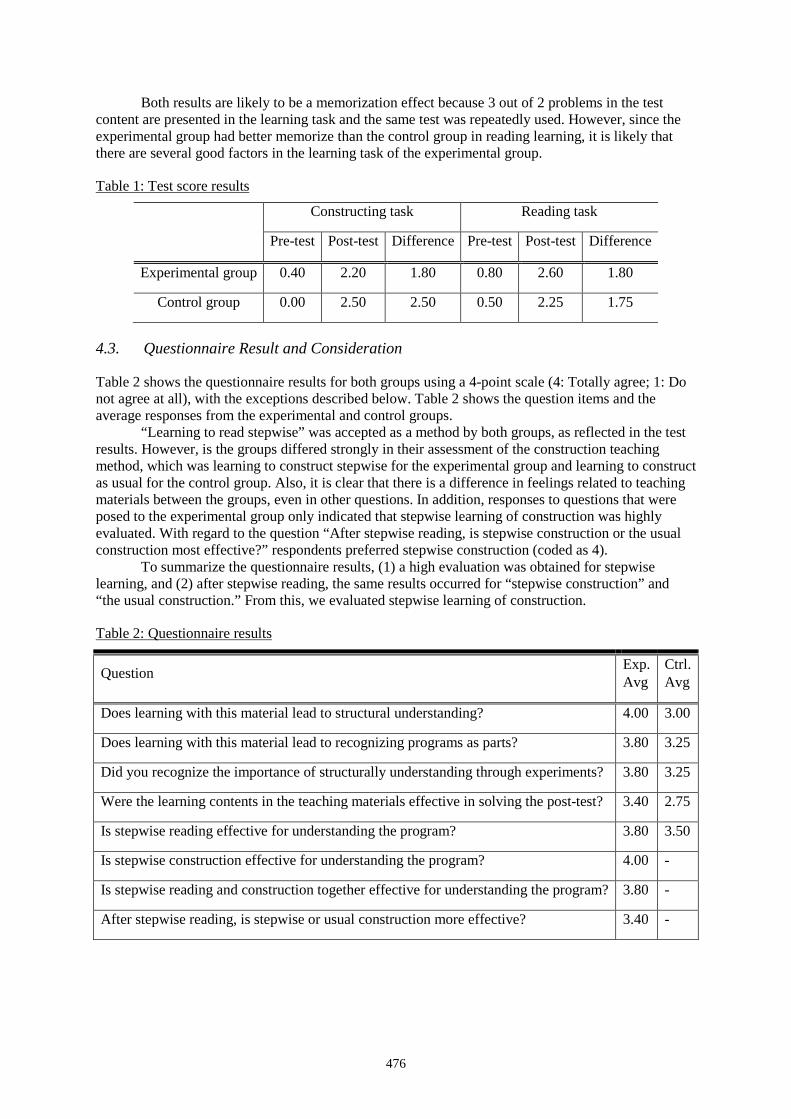
476
Both results are likely to be a memorization effect because 3 out of 2 problems in the test content are presented in the learning task and the same test was repeatedly used. However, since the experimental group had better memorize than the control group in reading learning, it is likely that there are several good factors in the learning task of the experimental group.
Table 1: Test score results
Constructing task Reading task
Pre-test Post-test Difference Pre-test Post-test Difference
Experimental group 0.40 2.20 1.80 0.80 2.60 1.80
Control group 0.00 2.50 2.50 0.50 2.25 1.75
4.3. Questionnaire Result and Consideration
Table 2 shows the questionnaire results for both groups using a 4-point scale (4: Totally agree; 1: Do not agree at all), with the exceptions described below. Table 2 shows the question items and the average responses from the experimental and control groups.
“Learning to read stepwise” was accepted as a method by both groups, as reflected in the test results. However, is the groups differed strongly in their assessment of the construction teaching method, which was learning to construct stepwise for the experimental group and learning to construct as usual for the control group. Also, it is clear that there is a difference in feelings related to teaching materials between the groups, even in other questions. In addition, responses to questions that were posed to the experimental group only indicated that stepwise learning of construction was highly evaluated. With regard to the question “After stepwise reading, is stepwise construction or the usual construction most effective?” respondents preferred stepwise construction (coded as 4).
To summarize the questionnaire results, (1) a high evaluation was obtained for stepwise learning, and (2) after stepwise reading, the same results occurred for “stepwise construction” and “the usual construction.” From this, we evaluated stepwise learning of construction.
Table 2: Questionnaire results
Question Exp. Avg
Ctrl. Avg
Does learning with this material lead to structural understanding? 4.00 3.00
Does learning with this material lead to recognizing programs as parts? 3.80 3.25
Did you recognize the importance of structurally understanding through experiments? 3.80 3.25
Were the learning contents in the teaching materials effective in solving the post-test? 3.40 2.75
Is stepwise reading effective for understanding the program? 3.80 3.50
Is stepwise construction effective for understanding the program? 4.00 -
Is stepwise reading and construction together effective for understanding the program? 3.80 -
After stepwise reading, is stepwise or usual construction more effective? 3.40 -
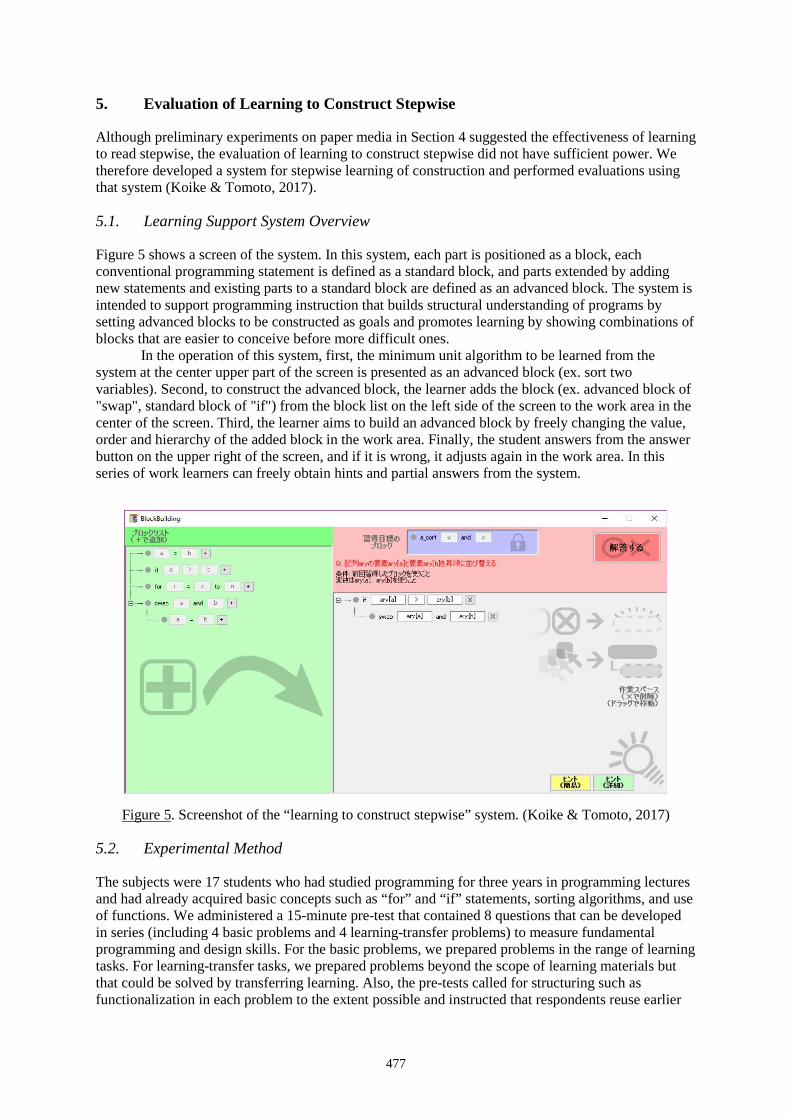
477
5. Evaluation of Learning to Construct Stepwise
Although preliminary experiments on paper media in Section 4 suggested the effectiveness of learning to read stepwise, the evaluation of learning to construct stepwise did not have sufficient power. We therefore developed a system for stepwise learning of construction and performed evaluations using that system (Koike & Tomoto, 2017).
5.1. Learning Support System Overview
Figure 5 shows a screen of the system. In this system, each part is positioned as a block, each conventional programming statement is defined as a standard block, and parts extended by adding new statements and existing parts to a standard block are defined as an advanced block. The system is intended to support programming instruction that builds structural understanding of programs by setting advanced blocks to be constructed as goals and promotes learning by showing combinations of blocks that are easier to conceive before more difficult ones.
In the operation of this system, first, the minimum unit algorithm to be learned from the system at the center upper part of the screen is presented as an advanced block (ex. sort two variables). Second, to construct the advanced block, the learner adds the block (ex. advanced block of "swap", standard block of "if") from the block list on the left side of the screen to the work area in the center of the screen. Third, the learner aims to build an advanced block by freely changing the value, order and hierarchy of the added block in the work area. Finally, the student answers from the answer button on the upper right of the screen, and if it is wrong, it adjusts again in the work area. In this series of work learners can freely obtain hints and partial answers from the system.
Figure 5. Screenshot of the “learning to construct stepwise” system. (Koike & Tomoto, 2017)
5.2. Experimental Method
The subjects were 17 students who had studied programming for three years in programming lectures and had already acquired basic concepts such as “for” and “if” statements, sorting algorithms, and use of functions. We administered a 15-minute pre-test that contained 8 questions that can be developed in series (including 4 basic problems and 4 learning-transfer problems) to measure fundamental programming and design skills. For the basic problems, we prepared problems in the range of learning tasks. For learning-transfer tasks, we prepared problems beyond the scope of learning materials but that could be solved by transferring learning. Also, the pre-tests called for structuring such as functionalization in each problem to the extent possible and instructed that respondents reuse earlier
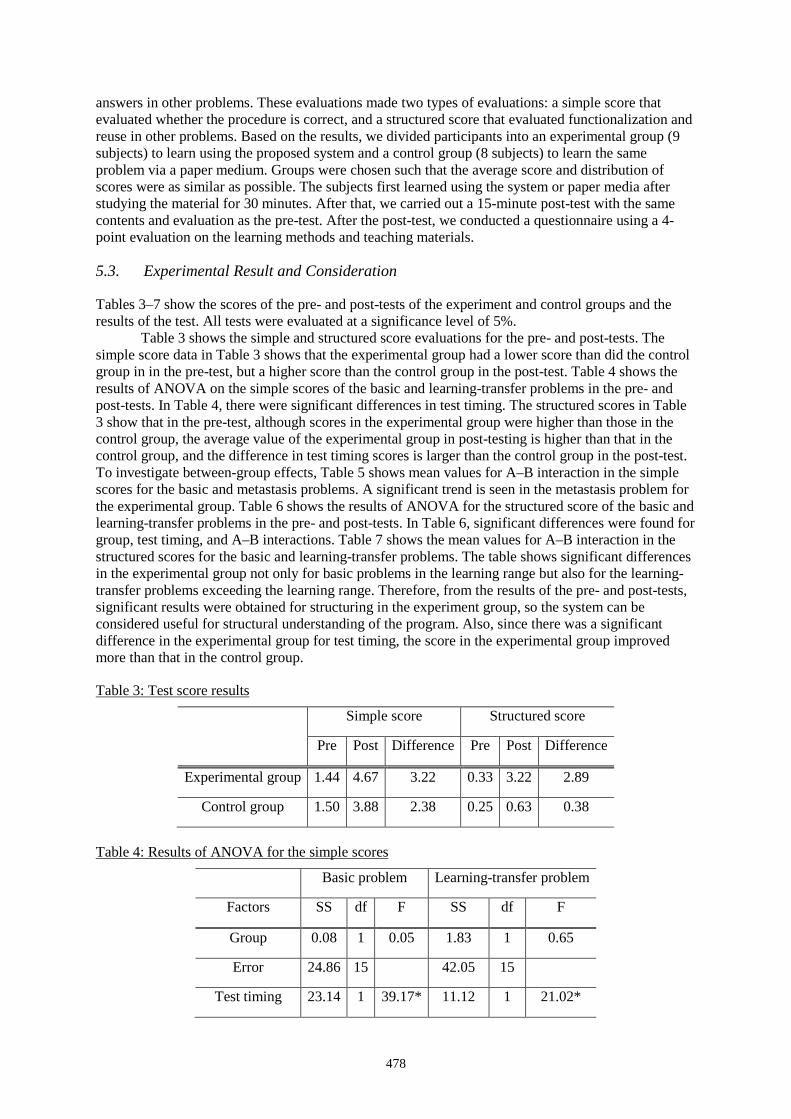
478
answers in other problems. These evaluations made two types of evaluations: a simple score that evaluated whether the procedure is correct, and a structured score that evaluated functionalization and reuse in other problems. Based on the results, we divided participants into an experimental group (9 subjects) to learn using the proposed system and a control group (8 subjects) to learn the same problem via a paper medium. Groups were chosen such that the average score and distribution of scores were as similar as possible. The subjects first learned using the system or paper media after studying the material for 30 minutes. After that, we carried out a 15-minute post-test with the same contents and evaluation as the pre-test. After the post-test, we conducted a questionnaire using a 4-point evaluation on the learning methods and teaching materials.
5.3. Experimental Result and Consideration
Tables 3–7 show the scores of the pre- and post-tests of the experiment and control groups and the results of the test. All tests were evaluated at a significance level of 5%.
Table 3 shows the simple and structured score evaluations for the pre- and post-tests. The simple score data in Table 3 shows that the experimental group had a lower score than did the control group in in the pre-test, but a higher score than the control group in the post-test. Table 4 shows the results of ANOVA on the simple scores of the basic and learning-transfer problems in the pre- and post-tests. In Table 4, there were significant differences in test timing. The structured scores in Table 3 show that in the pre-test, although scores in the experimental group were higher than those in the control group, the average value of the experimental group in post-testing is higher than that in the control group, and the difference in test timing scores is larger than the control group in the post-test. To investigate between-group effects, Table 5 shows mean values for A–B interaction in the simple scores for the basic and metastasis problems. A significant trend is seen in the metastasis problem for the experimental group. Table 6 shows the results of ANOVA for the structured score of the basic and learning-transfer problems in the pre- and post-tests. In Table 6, significant differences were found for group, test timing, and A–B interactions. Table 7 shows the mean values for A–B interaction in the structured scores for the basic and learning-transfer problems. The table shows significant differences in the experimental group not only for basic problems in the learning range but also for the learning-transfer problems exceeding the learning range. Therefore, from the results of the pre- and post-tests, significant results were obtained for structuring in the experiment group, so the system can be considered useful for structural understanding of the program. Also, since there was a significant difference in the experimental group for test timing, the score in the experimental group improved more than that in the control group.
Table 3: Test score results
Simple score Structured score
Pre Post Difference Pre Post Difference
Experimental group 1.44 4.67 3.22 0.33 3.22 2.89
Control group 1.50 3.88 2.38 0.25 0.63 0.38
Table 4: Results of ANOVA for the simple scores
Basic problem Learning-transfer problem
Factors SS df F SS df F
Group 0.08 1 0.05 1.83 1 0.65
Error 24.86 15
42.05 15
Test timing 23.14 1 39.17* 11.12 1 21.02*
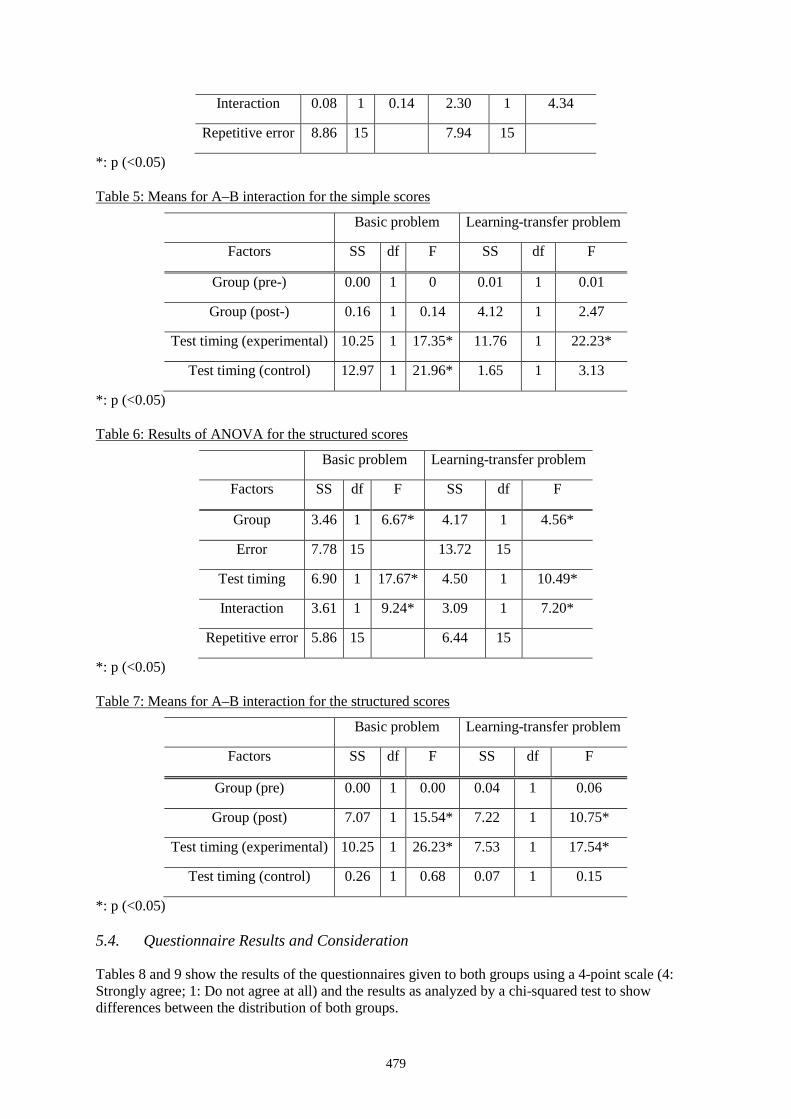
479
Interaction 0.08 1 0.14 2.30 1 4.34
Repetitive error 8.86 15
7.94 15
*: p (<0.05)
Table 5: Means for A–B interaction for the simple scores
Basic problem Learning-transfer problem
Factors SS df F SS df F
Group (pre-) 0.00 1 0 0.01 1 0.01
Group (post-) 0.16 1 0.14 4.12 1 2.47
Test timing (experimental) 10.25 1 17.35* 11.76 1 22.23*
Test timing (control) 12.97 1 21.96* 1.65 1 3.13
*: p (<0.05)
Table 6: Results of ANOVA for the structured scores
Basic problem Learning-transfer problem
Factors SS df F SS df F
Group 3.46 1 6.67* 4.17 1 4.56*
Error 7.78 15
13.72 15
Test timing 6.90 1 17.67* 4.50 1 10.49*
Interaction 3.61 1 9.24* 3.09 1 7.20*
Repetitive error 5.86 15
6.44 15
*: p (<0.05)
Table 7: Means for A–B interaction for the structured scores
Basic problem Learning-transfer problem
Factors SS df F SS df F
Group (pre) 0.00 1 0.00 0.04 1 0.06
Group (post) 7.07 1 15.54* 7.22 1 10.75*
Test timing (experimental) 10.25 1 26.23* 7.53 1 17.54*
Test timing (control) 0.26 1 0.68 0.07 1 0.15
*: p (<0.05)
5.4. Questionnaire Results and Consideration
Tables 8 and 9 show the results of the questionnaires given to both groups using a 4-point scale (4: Strongly agree; 1: Do not agree at all) and the results as analyzed by a chi-squared test to show differences between the distribution of both groups.
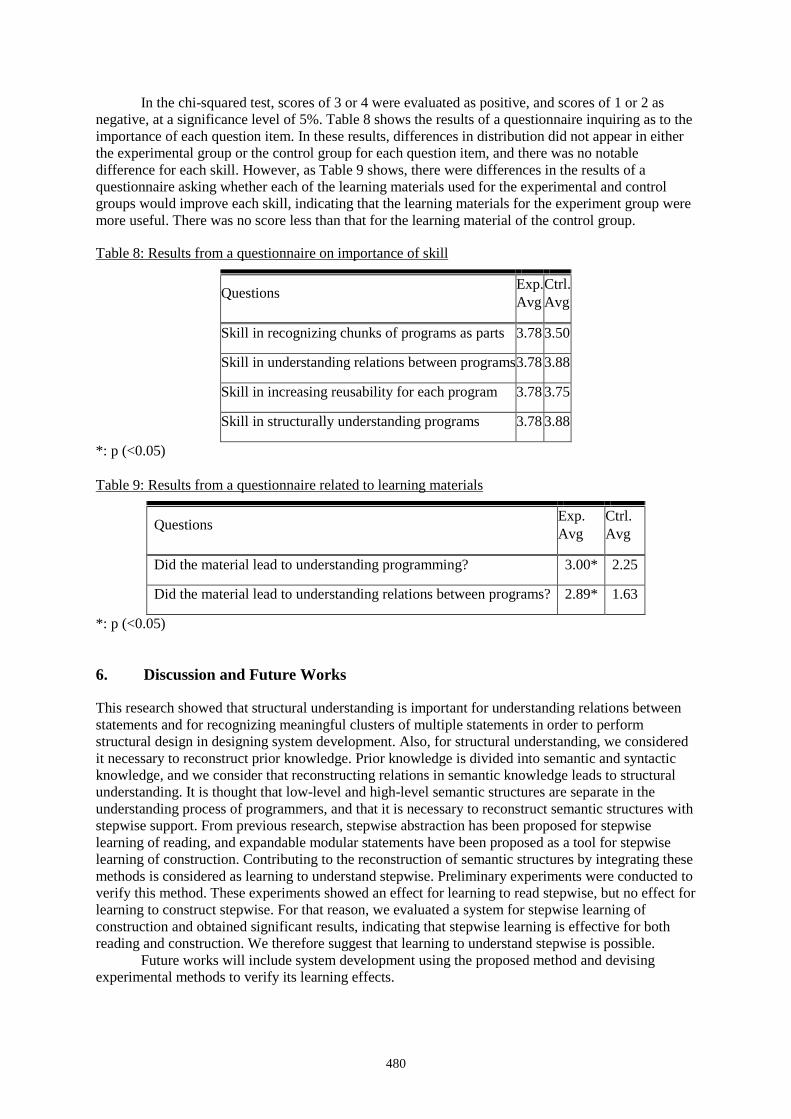
480
In the chi-squared test, scores of 3 or 4 were evaluated as positive, and scores of 1 or 2 as negative, at a significance level of 5%. Table 8 shows the results of a questionnaire inquiring as to the importance of each question item. In these results, differences in distribution did not appear in either the experimental group or the control group for each question item, and there was no notable difference for each skill. However, as Table 9 shows, there were differences in the results of a questionnaire asking whether each of the learning materials used for the experimental and control groups would improve each skill, indicating that the learning materials for the experiment group were more useful. There was no score less than that for the learning material of the control group.
Table 8: Results from a questionnaire on importance of skill
Questions Exp. Avg
Ctrl. Avg
Skill in recognizing chunks of programs as parts 3.78 3.50
Skill in understanding relations between programs 3.78 3.88
Skill in increasing reusability for each program 3.78 3.75
Skill in structurally understanding programs 3.78 3.88
*: p (<0.05)
Table 9: Results from a questionnaire related to learning materials
Questions Exp. Avg
Ctrl. Avg
Did the material lead to understanding programming? 3.00* 2.25
Did the material lead to understanding relations between programs? 2.89* 1.63
*: p (<0.05)
6. Discussion and Future Works
This research showed that structural understanding is important for understanding relations between statements and for recognizing meaningful clusters of multiple statements in order to perform structural design in designing system development. Also, for structural understanding, we considered it necessary to reconstruct prior knowledge. Prior knowledge is divided into semantic and syntactic knowledge, and we consider that reconstructing relations in semantic knowledge leads to structural understanding. It is thought that low-level and high-level semantic structures are separate in the understanding process of programmers, and that it is necessary to reconstruct semantic structures with stepwise support. From previous research, stepwise abstraction has been proposed for stepwise learning of reading, and expandable modular statements have been proposed as a tool for stepwise learning of construction. Contributing to the reconstruction of semantic structures by integrating these methods is considered as learning to understand stepwise. Preliminary experiments were conducted to verify this method. These experiments showed an effect for learning to read stepwise, but no effect for learning to construct stepwise. For that reason, we evaluated a system for stepwise learning of construction and obtained significant results, indicating that stepwise learning is effective for both reading and construction. We therefore suggest that learning to understand stepwise is possible.
Future works will include system development using the proposed method and devising experimental methods to verify its learning effects.

481
Acknowledgements
This study was partially funded by Grants-in-Aid for Scientific Research (C) (15K00492) and (B) (K26280127) in Japan.
References
Egi, T., & Takeuchi, A. (2007). An Analysis on a Learning Support System for Tracing in Beginner’s Debugging. In Proceedings of the 2007 Conference on Supporting Learning Flow Through Integrative Technologies (pp. 509–516). Amsterdam, The Netherlands, The Netherlands: IOS Press. Retrieved from http://dl.acm.org/citation.cfm?id=1565478.1565573
Ishikawa, Y., Matsuzawa, Y. & Sakai, S. (2014). A Prototype of Workbench for Understanding the Concept of Polymorphism in Object-Oriented Language. Transactions of Japanese Society for Information and Systems in Education, 31(2), 208–213. http://doi.org/10.14926/jsise.31.208 (in Japanese)
Kanamori, H., Tomoto, T. & Akakura, T. (2013). Development of a Computer Programming Learning Support System Based on Reading Computer Program. (S. Yamamoto, Ed.) Human Interface and the Management of Information. Information and Interaction for Learning, Culture, Collaboration and Business. Springer Berlin Heidelberg. http://doi.org/10.1007/978-3-642-39226-9_8
Kanemune, S., Nakatani, T., Mitarai, R., Fukui, S. & Kuno, Y. (2004). Design and Implementation of Object Sharing for Dolittle Language. Journal of Information Processing, 45(5), 81. Retrieved from http://ci.nii.ac.jp/naid/110002712352/en/ (in Japanese)
Koike, K. & Tomoto, T. (2017). Proposal of Granularity Expand Method in Parts for Structural Understanding on Programming and Development Leaning Support System. Japanese Society for Information and Systems in Education - Research Report, (8), 211–221. (in Japanese)
Matsuda, N., Kashihara, A., Hirashima, T., & Toyoda, J. (1995). An Instructional System for Constructing Algorithms in Recursive Programming. Advances in Human Factors/Ergonomics, 20, 889–894. http://doi.org/http://dx.doi.org/10.1016/S0921-2647(06)80140-1
Matsuzawa, Y., Yasui, H., Sugiura, M. & Sakai, S. (2014). Seamless Language Migration in Introductory Programming Education through Mutual Language Translation between Visual and Java. Journal of Information Processing, 55(1), 57–71. Retrieved from http://ci.nii.ac.jp/naid/110009660234/en/ (in Japanese)
Miura, M., Sugihara, T. & Kunifuji, S. (2009). A Workbench for Understanding Relationship between Variable and Data in Object Oriented Programming Language. Journal of Information Processing, 50(10), 2396–2408. Retrieved from http://ci.nii.ac.jp/naid/110007970523/en/ (in Japanese)
Shinkai, J. & Sumitani, S. (2008). Development of Programming Learning Support System Emphasizing Process. Japan Journal of Educational Technology, 31, 45–48. http://doi.org/10.15077/jjet.KJ00004964344 (in Japanese)
Shneiderman, B. & Mayer, R. (1979). Syntactic/semantic interactions in programmer behavior: A model and experimental results. International Journal of Parallel Programming, 8(3), 219–238.
Sugiura, M., Matsuzawa, Y., Okada, T. & Ohiwa, H. (2008). Introductory Education for Algorithm Construction: Understanding Concepts of Algorithm through Unplugged Work and Its Effects. Journal of Information Processing, 49(10), 3409–3427. Retrieved from http://ci.nii.ac.jp/naid/110007970228/en/ (in Japanese)
Watanabe, K., Tomoto, T. & Akakura, T. (2015). Development of a Learning Support System for Reading Source Code by Stepwise Abstraction. In International Conference on Human Interface and the Management of Information (pp. 387–394). Springer.
Yano, M., Fujisaki, K., Hirashima, T., & Takeuchi, A. (2001). Prolog Learnig Assistant System with Structured Diagram. Transactions of Japanese Society for Information and Systems in Education, 18(3), 319–327. Retrieved from http://ci.nii.ac.jp/naid/10007406289/en/
Hayashi, Y., et al. (Eds.) (2017). Workshop Proceedings of the 25th International Conference on Computers in Education. New Zealand: Asia-Pacific Society for Computers in Education
482
Enhancing Metacognitive Inference Activities Using Eye-movements on One’s Academic
Paper Ryo OGINO*, Yuki HAYASHI & Kazuhisa SETA
Graduate School of Humanities and Sustainable System Sciences, Osaka Prefecture University, Japan *[email protected]
Abstract: Metacognitive thinking skills are essential for learning. Performing writing activities with experts is a great opportunity for learners to construct metacognitive knowledge by inferring experts’ critical reading processes. In this study, we refer to “metacognitive inference activities” as learners’ inferring activities of experts’ metacognitive knowledge in their critical readings. In order to promote such learners’ metacognitive inference activities, we first discuss about learning processes using learners’ own academic paper and eye-movements during their critical reading to find metacognitive knowledge without instructions. Then, we propose a system featuring three types of visualization based on learners’ and experts’ eye-movements information. Experimental results showed that the visualized information of comparative heat map (C-view) and experts’ eye-movement processes (EM-view) promote learners’ metacognitive inference activities. More specifically, EM-view increasingly promotes their reflections toward being aware of metacognitive knowledge without instructions.
Keywords: Metacognitive inference activity, metacognitive knowledge, eye-movements, critical reading processes
1. Introduction
Metacognitive thinking skills for performing monitoring and control of one’s own thought are an essential and important competency/ability in various fields/domains such as business activities, problem-solving, reading and learning (Flavell, 1979; Schraw and Dennison, 1994). Since thinking itself is unobservable even by the subjects themselves and chaotically behaves, we are often faced with situations in which we cannot exert our metacognitive skills appropriately. It is therefore a good chance for learners to perform writing activities so that they develop such metacognitive skills (Hacker, Keener and Kircher, 2009). By monitoring one’s own sentences seen as visible expressions of own thought (Baker, 1989), one can realize the inconsistency or logical contradictions, so as to reconstruct one’s own thought.
However, in writing academic reports, it is difficult for ordinary learners to be aware of logical inconsistencies or lacks of some viewpoints even by monitoring their own documents. On the other hand, experts can do well by demonstrating their metacognitive monitoring activities in their critical reading processes according to the cognitive dissonance. Consequently, marks, comments and error-corrections attached to the documents by the experts are results of their metacognitive activities. It is essentially a good chance for learners to become aware of their immature metacognitive thinking processes by carefully reading experts’ intentions from their corrections or comments. However, in most situations, learners tend to dedicate themselves to just adopting experts’ corrections without any careful reading of intentions underlying such corrections; They do not tend to adopt a learning-oriented behavior but rather a problem-solving oriented one, i.e., they set their goals to finish writing, and even when they tried to infer, it is difficult since the metacognitive processes of experts are implicit and only their corrections are described in the documents in many cases (Schraw and Moshman, 1995).
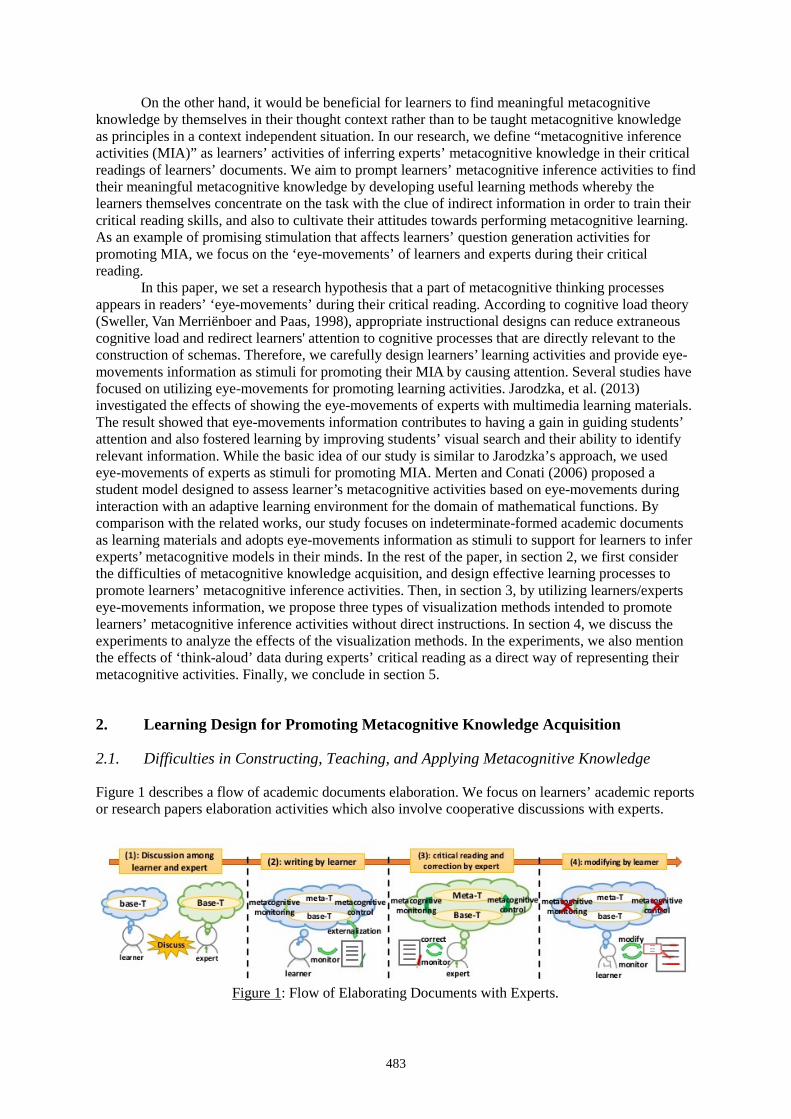
483
On the other hand, it would be beneficial for learners to find meaningful metacognitive knowledge by themselves in their thought context rather than to be taught metacognitive knowledge as principles in a context independent situation. In our research, we define “metacognitive inference activities (MIA)” as learners’ activities of inferring experts’ metacognitive knowledge in their critical readings of learners’ documents. We aim to prompt learners’ metacognitive inference activities to find their meaningful metacognitive knowledge by developing useful learning methods whereby the learners themselves concentrate on the task with the clue of indirect information in order to train their critical reading skills, and also to cultivate their attitudes towards performing metacognitive learning. As an example of promising stimulation that affects learners’ question generation activities for promoting MIA, we focus on the ‘eye-movements’ of learners and experts during their critical reading.
In this paper, we set a research hypothesis that a part of metacognitive thinking processes appears in readers’ ‘eye-movements’ during their critical reading. According to cognitive load theory (Sweller, Van Merriënboer and Paas, 1998), appropriate instructional designs can reduce extraneous cognitive load and redirect learners' attention to cognitive processes that are directly relevant to the construction of schemas. Therefore, we carefully design learners’ learning activities and provide eye-movements information as stimuli for promoting their MIA by causing attention. Several studies have focused on utilizing eye-movements for promoting learning activities. Jarodzka, et al. (2013) investigated the effects of showing the eye-movements of experts with multimedia learning materials. The result showed that eye-movements information contributes to having a gain in guiding students’ attention and also fostered learning by improving students’ visual search and their ability to identify relevant information. While the basic idea of our study is similar to Jarodzka’s approach, we used eye-movements of experts as stimuli for promoting MIA. Merten and Conati (2006) proposed a student model designed to assess learner’s metacognitive activities based on eye-movements during interaction with an adaptive learning environment for the domain of mathematical functions. By comparison with the related works, our study focuses on indeterminate-formed academic documents as learning materials and adopts eye-movements information as stimuli to support for learners to infer experts’ metacognitive models in their minds. In the rest of the paper, in section 2, we first consider the difficulties of metacognitive knowledge acquisition, and design effective learning processes to promote learners’ metacognitive inference activities. Then, in section 3, by utilizing learners/experts eye-movements information, we propose three types of visualization methods intended to promote learners’ metacognitive inference activities without direct instructions. In section 4, we discuss the experiments to analyze the effects of the visualization methods. In the experiments, we also mention the effects of ‘think-aloud’ data during experts’ critical reading as a direct way of representing their metacognitive activities. Finally, we conclude in section 5.
2. Learning Design for Promoting Metacognitive Knowledge Acquisition
2.1. Difficulties in Constructing, Teaching, and Applying Metacognitive Knowledge
Figure 1 describes a flow of academic documents elaboration. We focus on learners’ academic reports or research papers elaboration activities which also involve cooperative discussions with experts.
Figure 1: Flow of Elaborating Documents with Experts.
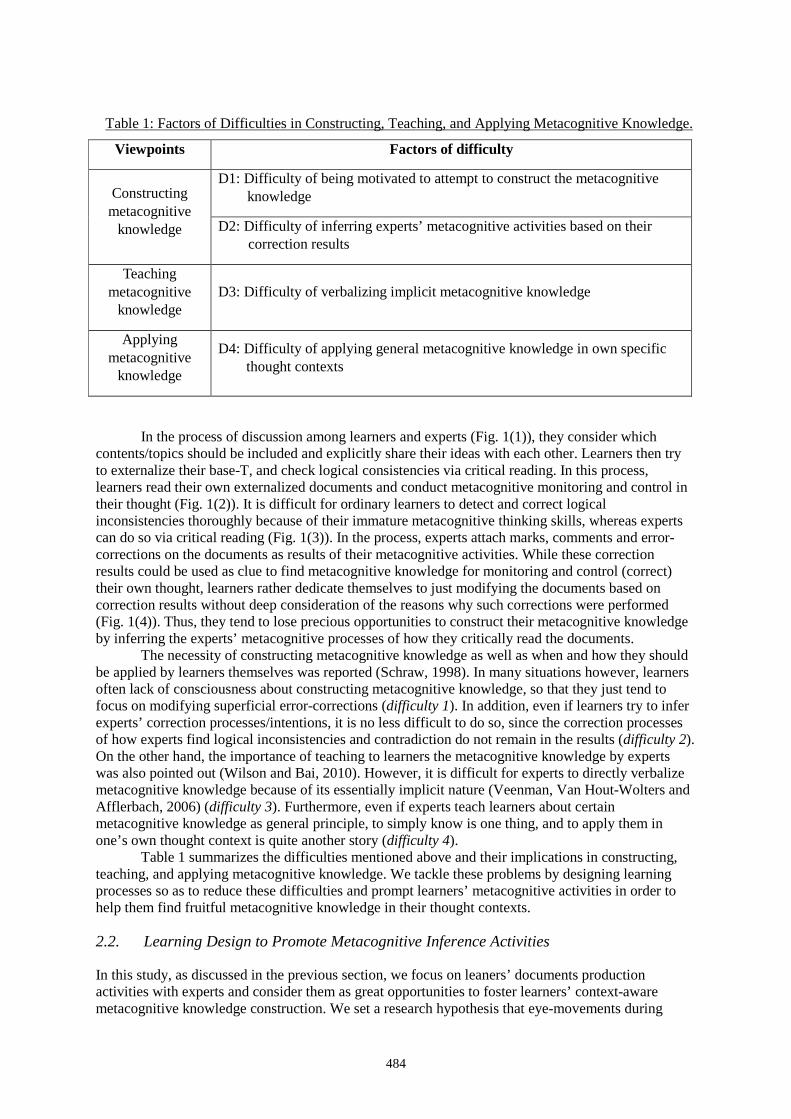
484
In the process of discussion among learners and experts (Fig. 1(1)), they consider which
contents/topics should be included and explicitly share their ideas with each other. Learners then try to externalize their base-T, and check logical consistencies via critical reading. In this process, learners read their own externalized documents and conduct metacognitive monitoring and control in their thought (Fig. 1(2)). It is difficult for ordinary learners to detect and correct logical inconsistencies thoroughly because of their immature metacognitive thinking skills, whereas experts can do so via critical reading (Fig. 1(3)). In the process, experts attach marks, comments and error-corrections on the documents as results of their metacognitive activities. While these correction results could be used as clue to find metacognitive knowledge for monitoring and control (correct) their own thought, learners rather dedicate themselves to just modifying the documents based on correction results without deep consideration of the reasons why such corrections were performed (Fig. 1(4)). Thus, they tend to lose precious opportunities to construct their metacognitive knowledge by inferring the experts’ metacognitive processes of how they critically read the documents.
The necessity of constructing metacognitive knowledge as well as when and how they should be applied by learners themselves was reported (Schraw, 1998). In many situations however, learners often lack of consciousness about constructing metacognitive knowledge, so that they just tend to focus on modifying superficial error-corrections (difficulty 1). In addition, even if learners try to infer experts’ correction processes/intentions, it is no less difficult to do so, since the correction processes of how experts find logical inconsistencies and contradiction do not remain in the results (difficulty 2). On the other hand, the importance of teaching to learners the metacognitive knowledge by experts was also pointed out (Wilson and Bai, 2010). However, it is difficult for experts to directly verbalize metacognitive knowledge because of its essentially implicit nature (Veenman, Van Hout-Wolters and Afflerbach, 2006) (difficulty 3). Furthermore, even if experts teach learners about certain metacognitive knowledge as general principle, to simply know is one thing, and to apply them in one’s own thought context is quite another story (difficulty 4).
Table 1 summarizes the difficulties mentioned above and their implications in constructing, teaching, and applying metacognitive knowledge. We tackle these problems by designing learning processes so as to reduce these difficulties and prompt learners’ metacognitive activities in order to help them find fruitful metacognitive knowledge in their thought contexts.
2.2. Learning Design to Promote Metacognitive Inference Activities
In this study, as discussed in the previous section, we focus on leaners’ documents production activities with experts and consider them as great opportunities to foster learners’ context-aware metacognitive knowledge construction. We set a research hypothesis that eye-movements during
Table 1: Factors of Difficulties in Constructing, Teaching, and Applying Metacognitive Knowledge.
Viewpoints Factors of difficulty
Constructing metacognitive
knowledge
D1: Difficulty of being motivated to attempt to construct the metacognitive knowledge
D2: Difficulty of inferring experts’ metacognitive activities based on their correction results
Teaching metacognitive
knowledge D3: Difficulty of verbalizing implicit metacognitive knowledge
Applying metacognitive
knowledge
D4: Difficulty of applying general metacognitive knowledge in own specific thought contexts
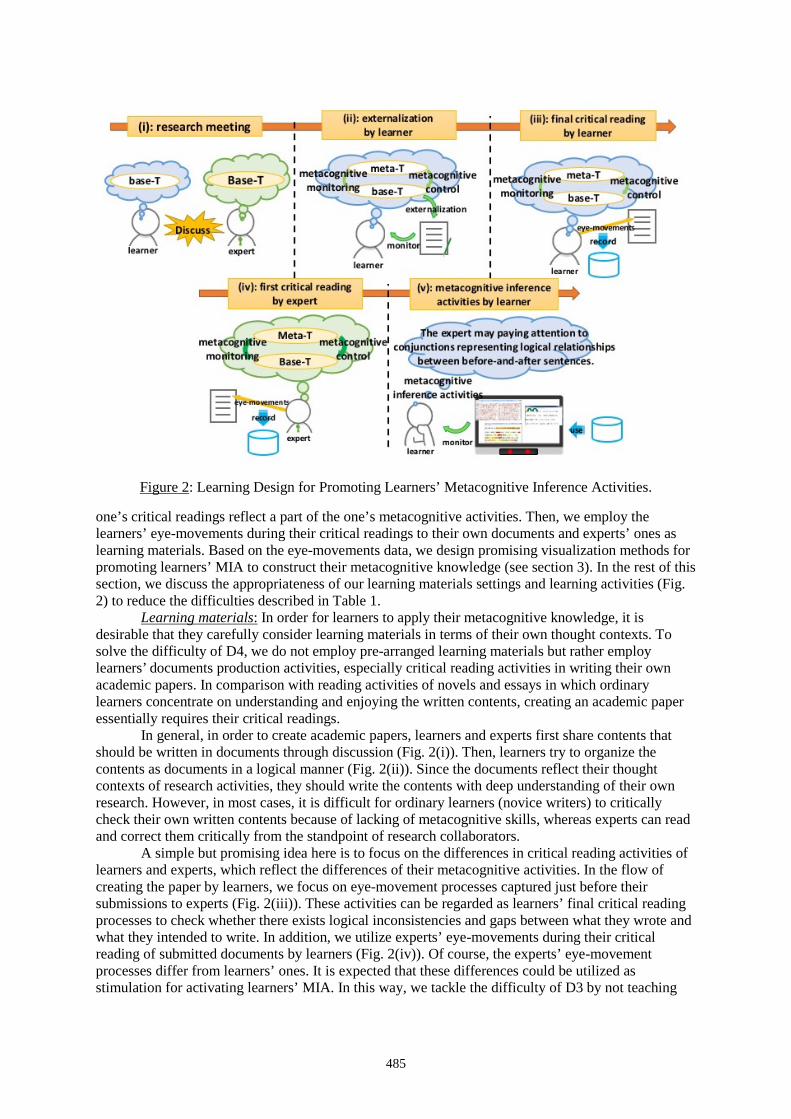
485
one’s critical readings reflect a part of the one’s metacognitive activities. Then, we employ the learners’ eye-movements during their critical readings to their own documents and experts’ ones as learning materials. Based on the eye-movements data, we design promising visualization methods for promoting learners’ MIA to construct their metacognitive knowledge (see section 3). In the rest of this section, we discuss the appropriateness of our learning materials settings and learning activities (Fig. 2) to reduce the difficulties described in Table 1.
Learning materials: In order for learners to apply their metacognitive knowledge, it is desirable that they carefully consider learning materials in terms of their own thought contexts. To solve the difficulty of D4, we do not employ pre-arranged learning materials but rather employ learners’ documents production activities, especially critical reading activities in writing their own academic papers. In comparison with reading activities of novels and essays in which ordinary learners concentrate on understanding and enjoying the written contents, creating an academic paper essentially requires their critical readings.
In general, in order to create academic papers, learners and experts first share contents that should be written in documents through discussion (Fig. 2(i)). Then, learners try to organize the contents as documents in a logical manner (Fig. 2(ii)). Since the documents reflect their thought contexts of research activities, they should write the contents with deep understanding of their own research. However, in most cases, it is difficult for ordinary learners (novice writers) to critically check their own written contents because of lacking of metacognitive skills, whereas experts can read and correct them critically from the standpoint of research collaborators.
A simple but promising idea here is to focus on the differences in critical reading activities of learners and experts, which reflect the differences of their metacognitive activities. In the flow of creating the paper by learners, we focus on eye-movement processes captured just before their submissions to experts (Fig. 2(iii)). These activities can be regarded as learners’ final critical reading processes to check whether there exists logical inconsistencies and gaps between what they wrote and what they intended to write. In addition, we utilize experts’ eye-movements during their critical reading of submitted documents by learners (Fig. 2(iv)). Of course, the experts’ eye-movement processes differ from learners’ ones. It is expected that these differences could be utilized as stimulation for activating learners’ MIA. In this way, we tackle the difficulty of D3 by not teaching
Figure 2: Learning Design for Promoting Learners’ Metacognitive Inference Activities.

486
the metacognitive knowledge explicitly but utilizing the eye-movement processes during critical readings as learning materials in an indirect fashion.
Learning activities: In order to reduce the difficulty of D1, we develop a visualization system of captured eye-movement information that allows leaners to concentrate on MIA to construct their metacognitive knowledge in their thought context (Fig. 2(v)), e.g., “the expert might be paying attention to conjunctions representing logical relationships between previous-and-next sentences.” To not provide correction results (answers) but rather the processes of eye-movement information contributes to eliminate the difficulty of D2. By devising visualization methods as promising stimuli, we expect that learners can be aware of their immature metacognitive activities, so that they try to construct their new metacognitive knowledge by themselves without instructions.
3. Developing System
The methodology of using the eye-movement information as stimuli to promote a learner’s metacognition have not yet been proposed. We propose a promising idea that promotes learners’ metacognitive activities to find metacognitive knowledge by themselves without instructions. More concretely, we proposed three types of visualization methods, i.e., comparative heat map, overlaid degree heat map, and eye-movements visualization, each of which is designed to trigger learners’ awareness based on the differences between the learner’s own eye-movements and those of an expert during check/correction of the learner’s document.
Figure 3: Interface of the System
Figure 4: Three Types of Visualization.
487
In order to utilize a learner’s and an expert’s eye-movements, we developed a system that captures and records their gaze data when reading a document. Figure 3 shows the interface of the system that embeds a screen-based eye-tracking device (Tobii Technology). The system starts when a learner inputs a target document as text format in Japanese, then it divides the texts into a set of minimal word units each of which has a syntactic function using a Japanese dependency parser (Kudo and Matsumoto, 2002). After processing, the system automatically sets area-of-interest (AOI) regions to respective word units and displays them. Based on the AOI regions, the system detects if the eye-movements fall within such an AOI at each frame; it records the timing of the user’s eye-movements on the objects on a millisecond time scale and their respective IDs, whereas AOIs are transparent so as to be invisible for learners.
Based on the recorded information, the system can provide the following three types of visualization:
Comparative heat map (C-view): This visualization method is designed to make the learner be aware of the differences between gazing-time of respective sentence-objects of him/her and those of the expert so that he/she can find metacognitive knowledge. The interface includes two heat maps each of which statically represents the aggregations of gazing times of the learner (left side) and expert (right side) at each sentence-object (Fig. 4). In the heat maps, the background color of each sentence-object becomes darker red proportionally to their gazing time at the object. The proportional density of each sentence-object is set up by two steps: First, we calculate the total gazing times at the object. Then, we calculate the normalized total time of each object by dividing the total gazing time by the number of characters that compose the object.
Overlaid degree heat map (OD-view): This visualization method is designed to emphasize the difference between total gazing time of a learner and an expert on each sentence-object by overlaid degree information based on the above C-view. Figure 4 shows the interface of OD-view. Here, we use four types of combinations of learner and expert’s gazing degrees (‘frequently’ / ‘scarcely’) to each sentence-object as shown in Table 2. We heuristically define the combinations that could contribute to making the learner be aware of metacognitive knowledge based on the information such as only the expert focused on certain sentence-object (i.e., learner = ‘scarcely’ and expert = ‘frequently’) and both of them focused on (i.e., learner = ‘frequently’ and expert = ‘frequently’).
Respective degrees for each object are calculated by following three steps: First, we calculate normalized density of each statement-object by the same way of C-view. Then, we calculate both theµ (mean) and σ (standard deviation) of the normalized densities of all the statement-objects for the learner and the expert, respectively. Finally, we judge whether ‘frequently’ or ‘scarcely’ by calculating if the normalized density of certain statement-object is greater than σµ + (‘frequently’) or smaller than σµ − (‘scarcely’).
Eye-movements visualization (EM-view): This represents the untouched ‘processes’ of eye-movement of reading/correction activity according to the timing data of the expert’s eye-movements to statement-objects. Through the EM- view, the learner can follow the expert’s reading processes which reflects his/her metacognitive knowledge activities. In the interface, the gazed statement-object at the time is highlighted in turn. While this visualization method might be quite straightforward, we expect that it could help the learner touch the expert’s metacognitive monitoring processes, i.e., how the expert reads the document by monitoring his/her gazing processes, e.g., he/she is repetitively gazing at the same part.
4. Experimental study
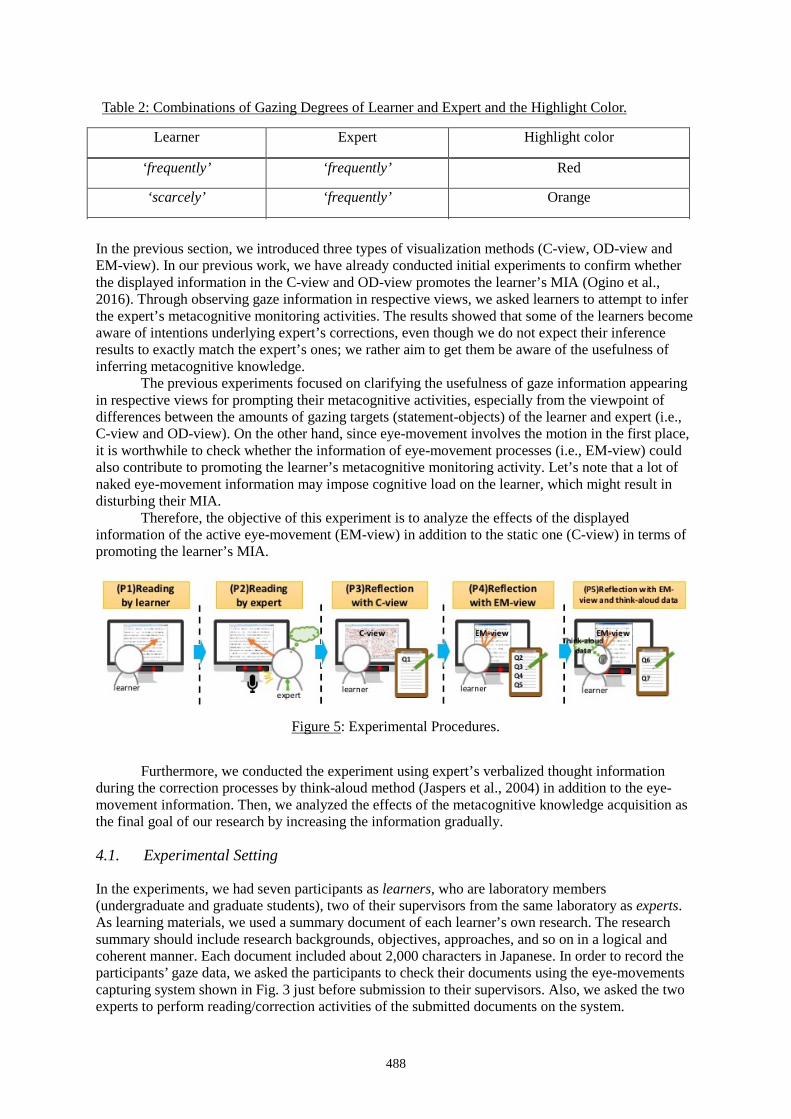
488
In the previous section, we introduced three types of visualization methods (C-view, OD-view and EM-view). In our previous work, we have already conducted initial experiments to confirm whether the displayed information in the C-view and OD-view promotes the learner’s MIA (Ogino et al., 2016). Through observing gaze information in respective views, we asked learners to attempt to infer the expert’s metacognitive monitoring activities. The results showed that some of the learners become aware of intentions underlying expert’s corrections, even though we do not expect their inference results to exactly match the expert’s ones; we rather aim to get them be aware of the usefulness of inferring metacognitive knowledge.
The previous experiments focused on clarifying the usefulness of gaze information appearing in respective views for prompting their metacognitive activities, especially from the viewpoint of differences between the amounts of gazing targets (statement-objects) of the learner and expert (i.e., C-view and OD-view). On the other hand, since eye-movement involves the motion in the first place, it is worthwhile to check whether the information of eye-movement processes (i.e., EM-view) could also contribute to promoting the learner’s metacognitive monitoring activity. Let’s note that a lot of naked eye-movement information may impose cognitive load on the learner, which might result in disturbing their MIA.
Therefore, the objective of this experiment is to analyze the effects of the displayed information of the active eye-movement (EM-view) in addition to the static one (C-view) in terms of promoting the learner’s MIA.
Furthermore, we conducted the experiment using expert’s verbalized thought information during the correction processes by think-aloud method (Jaspers et al., 2004) in addition to the eye-movement information. Then, we analyzed the effects of the metacognitive knowledge acquisition as the final goal of our research by increasing the information gradually.
4.1. Experimental Setting
In the experiments, we had seven participants as learners, who are laboratory members (undergraduate and graduate students), two of their supervisors from the same laboratory as experts. As learning materials, we used a summary document of each learner’s own research. The research summary should include research backgrounds, objectives, approaches, and so on in a logical and coherent manner. Each document included about 2,000 characters in Japanese. In order to record the participants’ gaze data, we asked the participants to check their documents using the eye-movements capturing system shown in Fig. 3 just before submission to their supervisors. Also, we asked the two experts to perform reading/correction activities of the submitted documents on the system.
Table 2: Combinations of Gazing Degrees of Learner and Expert and the Highlight Color.
Learner Expert Highlight color
‘frequently’ ‘frequently’ Red
‘scarcely’ ‘frequently’ Orange
Figure 5: Experimental Procedures.
489
4.2. Experimental Procedure
Figure 5 represents the experimental procedures and Table 3 shows questionnaires used in the experiments. The experimental procedure is composed of two phases: data collection phase (P1 and P2) and learning phase (P3, P4 and P5). The learners undertake the task of P1, P3, P4 and P5 and the experts only do P2.
Data collection phase:
P1. Critical reading by learners: After learners proofread their documents, they calibrate the eye-tracking devices and critically read their respective documents using our eye-movements capturing system.
P2. Critical reading by experts: After experts calibrate the eye-tracking devices, they read each learner’s document using the eye-movements capturing system as well as conducting think-aloud, i.e., say whatever comes into their mind until they finished reading.
Learning phase:
P3. Reviewing with C-view: The learners were asked to review their documents using C-view, and answer Q1 to confirm if the visualized information in C-view promotes their metacognitive activities.
P4. Reviewing with EM-view: The learners were asked to review their documents using EM-view in which an expert’s eye-movement is displayed. Then, they were asked to answer Q2 to Q5: Q2 is set to confirm if inferring an experts’ thought processes with visualized eye-movement promotes learners’ metacognitive monitoring. Q3 is to clarify whether the EM-view further activates their metacognitive activities in comparison with the results of Q1. Q4 and Q5 are to clarify the possibilities that the learners themselves could find their metacognitive knowledge.
P5. Reviewing with EM-view and think-aloud data: The learners are asked to review their documents using EM-view with synchronized think-aloud data of an expert. Then, they are asked to answer Q6 and Q7 that are set to clarify the possibilities if the learners can acquire metacognitive knowledge from the thought information. This was conducted by four learners out of the initial seven.
Experimental Result and Discussion
Table 3: Questionnaire Items.
Q1 List up the points that should be modified in your document by referring to the expert’s gaze behavior.
Q2 Think-aloud what the expert was thinking about during his reading your document by referring to his gaze behavior.
Q3 List up the points that should be modified in your document.
Q4 Do you think you thought about what you answered in Q2 during your writing/reviewing? (yes or no)
Q5 Do you think you thought about what you answered in Q2 when you wrote other documents? (yes or no)
Q6 List up what the instructor was thinking about during his reading by listening to his think-aloud.
Q7 List up what you didn’t conduct in reviewing your own paper but noticed by listening to experts’ think-aloud.
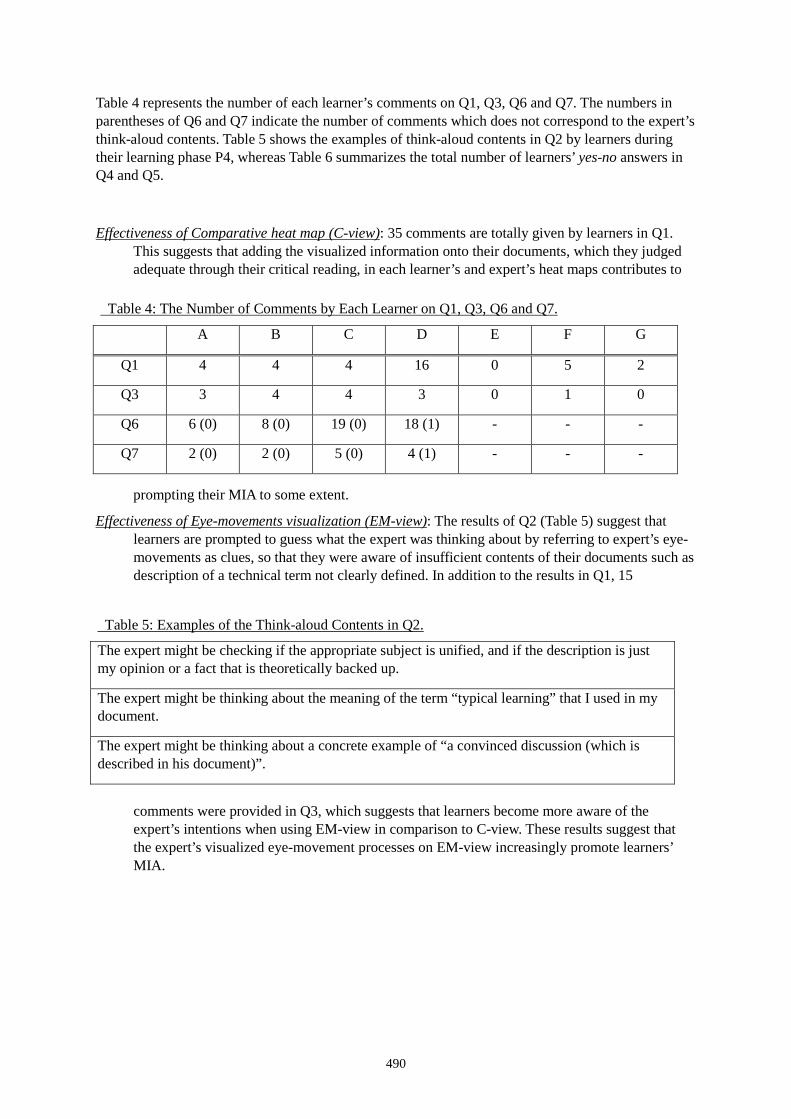
490
Table 4 represents the number of each learner’s comments on Q1, Q3, Q6 and Q7. The numbers in parentheses of Q6 and Q7 indicate the number of comments which does not correspond to the expert’s think-aloud contents. Table 5 shows the examples of think-aloud contents in Q2 by learners during their learning phase P4, whereas Table 6 summarizes the total number of learners’ yes-no answers in Q4 and Q5.
Effectiveness of Comparative heat map (C-view): 35 comments are totally given by learners in Q1. This suggests that adding the visualized information onto their documents, which they judged adequate through their critical reading, in each learner’s and expert’s heat maps contributes to
prompting their MIA to some extent.
Effectiveness of Eye-movements visualization (EM-view): The results of Q2 (Table 5) suggest that learners are prompted to guess what the expert was thinking about by referring to expert’s eye-movements as clues, so that they were aware of insufficient contents of their documents such as description of a technical term not clearly defined. In addition to the results in Q1, 15
comments were provided in Q3, which suggests that learners become more aware of the expert’s intentions when using EM-view in comparison to C-view. These results suggest that the expert’s visualized eye-movement processes on EM-view increasingly promote learners’ MIA.
Table 4: The Number of Comments by Each Learner on Q1, Q3, Q6 and Q7.
A B C D E F G
Q1 4 4 4 16 0 5 2
Q3 3 4 4 3 0 1 0
Q6 6 (0) 8 (0) 19 (0) 18 (1) - - -
Q7 2 (0) 2 (0) 5 (0) 4 (1) - - -
Table 5: Examples of the Think-aloud Contents in Q2.
The expert might be checking if the appropriate subject is unified, and if the description is just my opinion or a fact that is theoretically backed up.
The expert might be thinking about the meaning of the term “typical learning” that I used in my document.
The expert might be thinking about a concrete example of “a convinced discussion (which is described in his document)”.
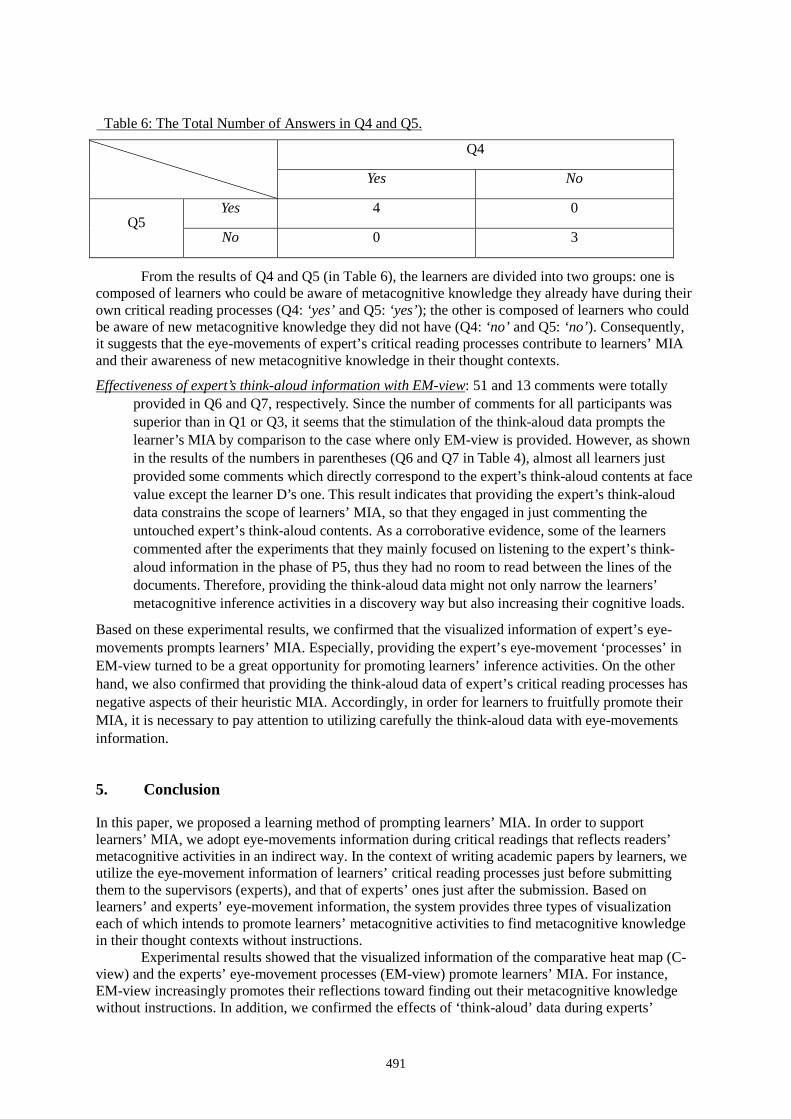
491
From the results of Q4 and Q5 (in Table 6), the learners are divided into two groups: one is composed of learners who could be aware of metacognitive knowledge they already have during their own critical reading processes (Q4: ‘yes’ and Q5: ‘yes’); the other is composed of learners who could be aware of new metacognitive knowledge they did not have (Q4: ‘no’ and Q5: ‘no’). Consequently, it suggests that the eye-movements of expert’s critical reading processes contribute to learners’ MIA and their awareness of new metacognitive knowledge in their thought contexts.
Effectiveness of expert’s think-aloud information with EM-view: 51 and 13 comments were totally provided in Q6 and Q7, respectively. Since the number of comments for all participants was superior than in Q1 or Q3, it seems that the stimulation of the think-aloud data prompts the learner’s MIA by comparison to the case where only EM-view is provided. However, as shown in the results of the numbers in parentheses (Q6 and Q7 in Table 4), almost all learners just provided some comments which directly correspond to the expert’s think-aloud contents at face value except the learner D’s one. This result indicates that providing the expert’s think-aloud data constrains the scope of learners’ MIA, so that they engaged in just commenting the untouched expert’s think-aloud contents. As a corroborative evidence, some of the learners commented after the experiments that they mainly focused on listening to the expert’s think-aloud information in the phase of P5, thus they had no room to read between the lines of the documents. Therefore, providing the think-aloud data might not only narrow the learners’ metacognitive inference activities in a discovery way but also increasing their cognitive loads.
Based on these experimental results, we confirmed that the visualized information of expert’s eye-movements prompts learners’ MIA. Especially, providing the expert’s eye-movement ‘processes’ in EM-view turned to be a great opportunity for promoting learners’ inference activities. On the other hand, we also confirmed that providing the think-aloud data of expert’s critical reading processes has negative aspects of their heuristic MIA. Accordingly, in order for learners to fruitfully promote their MIA, it is necessary to pay attention to utilizing carefully the think-aloud data with eye-movements information.
5. Conclusion
In this paper, we proposed a learning method of prompting learners’ MIA. In order to support learners’ MIA, we adopt eye-movements information during critical readings that reflects readers’ metacognitive activities in an indirect way. In the context of writing academic papers by learners, we utilize the eye-movement information of learners’ critical reading processes just before submitting them to the supervisors (experts), and that of experts’ ones just after the submission. Based on learners’ and experts’ eye-movement information, the system provides three types of visualization each of which intends to promote learners’ metacognitive activities to find metacognitive knowledge in their thought contexts without instructions.
Experimental results showed that the visualized information of the comparative heat map (C-view) and the experts’ eye-movement processes (EM-view) promote learners’ MIA. For instance, EM-view increasingly promotes their reflections toward finding out their metacognitive knowledge without instructions. In addition, we confirmed the effects of ‘think-aloud’ data during experts’
Table 6: The Total Number of Answers in Q4 and Q5.
Q4
Yes No
Q5 Yes 4 0
No 0 3

492
critical readings which directly reflect the thinkers’ metacognitive processes. The result indicated that think-aloud information constrains learners’ own MIA, so that almost all learners did not focus on reading between the lines but rather on listening to the surface of the expert’s think-aloud contents.
For future works, we plan to conduct further evaluations to establish the validity of our proposed visualization methods. In addition, we need to refine the learning design in order to promote learners’ MIA under the learners’ self-motivation by eliminating their cognitive loads.
References
Baker, L. (1989). Metacognition, comprehension monitoring, and the adult reader. Educ. Psychol. Rev. 1: 3–38. Flavell, J. H. (1979). Metacognition and cognitive monitoring: A new area of cognitive-developmental
inquiry. American Psychologist, 34, 906–911. Hacker, D. J., Keener, M. C., & Kircher, J. C. (2009). Writing is applied metacognition. In D. J. Hacker, J.
Dunlosky, & A. C. Graesser (Eds.), Handbook of metacognition in education, 154–172. Jarodzka, H., van Gog, T., Dorr, M., Scheiter, K., & Gerjets, P. (2013). Learning to see: Guiding students’
attention via a Model’s eye movements fosters learning. Learning and Instruction, 25, 62–70. Jaspers, M. W., Steen, T., van den Bos, C., & Geenen, M. (2004). The think aloud method: a guide to user
interface design. International Journal of Medical Informatics, 73(11), 781–795. Kudo, T., & Matsumoto, Y. (2002). Japanese dependency analysis using cascaded chunking. In Proc. of the 6th
Conference on Natural Language Learning, 20, 1–7. Merten C., & Conati, C. (2006). Eye-tracking to model and adapt to user meta-cognition in intelligent learning
environments. In Proc. of the 11th international conference on Intelligent user interfaces, ACM, 39–46. Ogino, R., Hayashi, Y., & Seta., K. (2016). Towards Reflective Thinking Support Based on Eye-movements in
Reviewing Own Paper. In Proc. of the 41st annual Conference of JSiSE, H4-3. [in Japanese] Schraw, G., & Dennison, R. S. (1994). Assessing metacognitive awareness. Contemporary Educational
Psychology, 19, 460–475. Schraw, G. & Moshman, D. (1995). Metacognitive theories. Educational Psychological Review, 7: 351–371. Schraw, G. (1998). Promoting general metacognitive awareness. Instructional Science, 26, 113–125. Sweller, J., Van Merriënboer, J. J. G., & Paas, F. (1998). Cognitive architecture and instructional design.
Educational Psychology Review, 10, 251–295. Tobii Technology, Tobii Pro X2-30: https://www.tobiipro.com/ja/product-listing/tobii-pro-x2-30/. Veenman, M. V. J., Van Hout-Wolters, B. H. A. M., & Afflerbach, P. (2006). Metacognition and learning:
conceptual and methodological considerations. Metacognition and Learning, 1, 3–14. Wilson, N. S., & Bai, H. (2010). The relationships and impact of teachers’ metacognitive knowledge and
pedagogical understandings of metacognition. Metacognition and Learning, 5, 269–288.
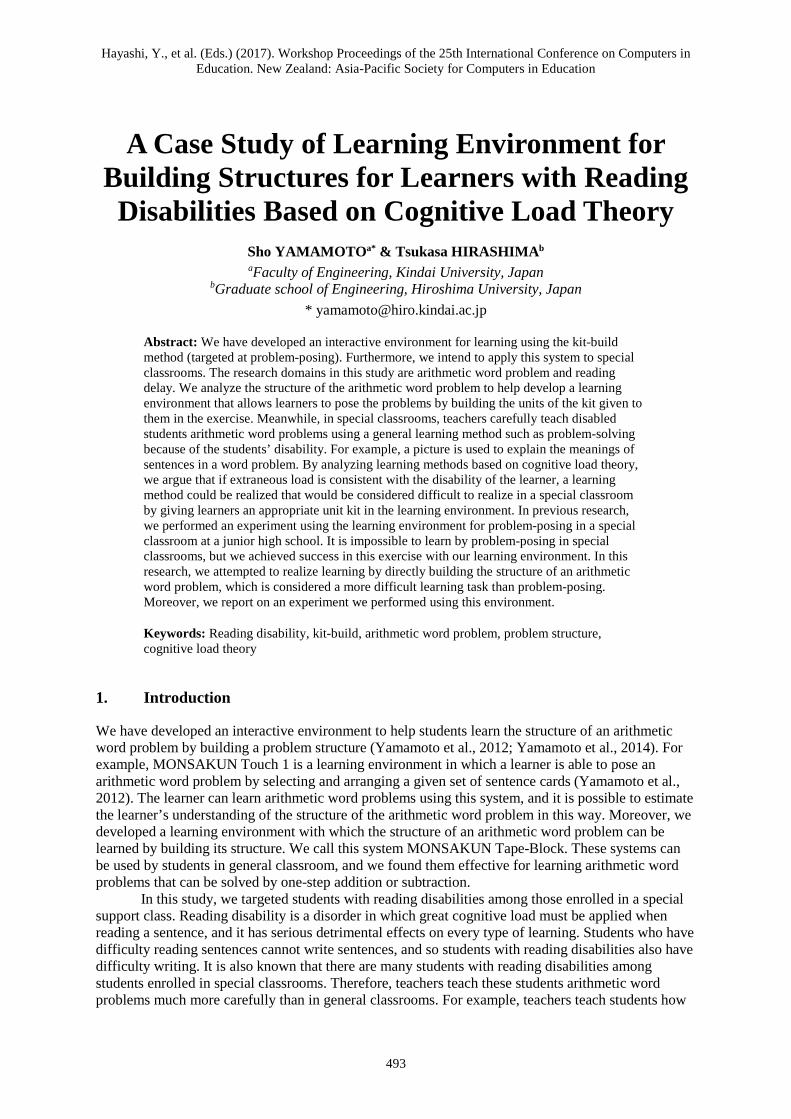
Hayashi, Y., et al. (Eds.) (2017). Workshop Proceedings of the 25th International Conference on Computers in Education. New Zealand: Asia-Pacific Society for Computers in Education
493
A Case Study of Learning Environment for Building Structures for Learners with Reading Disabilities Based on Cognitive Load Theory
Sho YAMAMOTOa* & Tsukasa HIRASHIMAb aFaculty of Engineering, Kindai University, Japan
bGraduate school of Engineering, Hiroshima University, Japan * [email protected]
Abstract: We have developed an interactive environment for learning using the kit-build method (targeted at problem-posing). Furthermore, we intend to apply this system to special classrooms. The research domains in this study are arithmetic word problem and reading delay. We analyze the structure of the arithmetic word problem to help develop a learning environment that allows learners to pose the problems by building the units of the kit given to them in the exercise. Meanwhile, in special classrooms, teachers carefully teach disabled students arithmetic word problems using a general learning method such as problem-solving because of the students’ disability. For example, a picture is used to explain the meanings of sentences in a word problem. By analyzing learning methods based on cognitive load theory, we argue that if extraneous load is consistent with the disability of the learner, a learning method could be realized that would be considered difficult to realize in a special classroom by giving learners an appropriate unit kit in the learning environment. In previous research, we performed an experiment using the learning environment for problem-posing in a special classroom at a junior high school. It is impossible to learn by problem-posing in special classrooms, but we achieved success in this exercise with our learning environment. In this research, we attempted to realize learning by directly building the structure of an arithmetic word problem, which is considered a more difficult learning task than problem-posing. Moreover, we report on an experiment we performed using this environment.
Keywords: Reading disability, kit-build, arithmetic word problem, problem structure, cognitive load theory
1. Introduction
We have developed an interactive environment to help students learn the structure of an arithmetic word problem by building a problem structure (Yamamoto et al., 2012; Yamamoto et al., 2014). For example, MONSAKUN Touch 1 is a learning environment in which a learner is able to pose an arithmetic word problem by selecting and arranging a given set of sentence cards (Yamamoto et al., 2012). The learner can learn arithmetic word problems using this system, and it is possible to estimate the learner’s understanding of the structure of the arithmetic word problem in this way. Moreover, we developed a learning environment with which the structure of an arithmetic word problem can be learned by building its structure. We call this system MONSAKUN Tape-Block. These systems can be used by students in general classroom, and we found them effective for learning arithmetic word problems that can be solved by one-step addition or subtraction.
In this study, we targeted students with reading disabilities among those enrolled in a special support class. Reading disability is a disorder in which great cognitive load must be applied when reading a sentence, and it has serious detrimental effects on every type of learning. Students who have difficulty reading sentences cannot write sentences, and so students with reading disabilities also have difficulty writing. It is also known that there are many students with reading disabilities among students enrolled in special classrooms. Therefore, teachers teach these students arithmetic word problems much more carefully than in general classrooms. For example, teachers teach students how
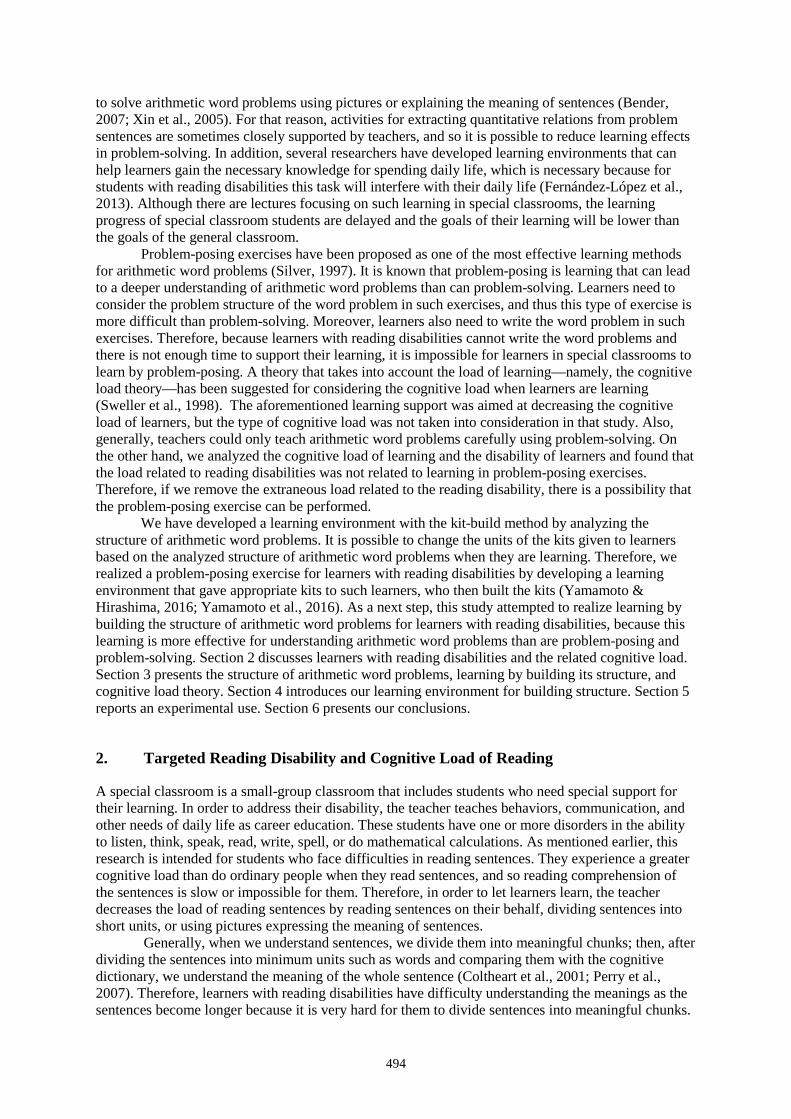
494
to solve arithmetic word problems using pictures or explaining the meaning of sentences (Bender, 2007; Xin et al., 2005). For that reason, activities for extracting quantitative relations from problem sentences are sometimes closely supported by teachers, and so it is possible to reduce learning effects in problem-solving. In addition, several researchers have developed learning environments that can help learners gain the necessary knowledge for spending daily life, which is necessary because for students with reading disabilities this task will interfere with their daily life (Fernández-López et al., 2013). Although there are lectures focusing on such learning in special classrooms, the learning progress of special classroom students are delayed and the goals of their learning will be lower than the goals of the general classroom.
Problem-posing exercises have been proposed as one of the most effective learning methods for arithmetic word problems (Silver, 1997). It is known that problem-posing is learning that can lead to a deeper understanding of arithmetic word problems than can problem-solving. Learners need to consider the problem structure of the word problem in such exercises, and thus this type of exercise is more difficult than problem-solving. Moreover, learners also need to write the word problem in such exercises. Therefore, because learners with reading disabilities cannot write the word problems and there is not enough time to support their learning, it is impossible for learners in special classrooms to learn by problem-posing. A theory that takes into account the load of learning—namely, the cognitive load theory—has been suggested for considering the cognitive load when learners are learning (Sweller et al., 1998). The aforementioned learning support was aimed at decreasing the cognitive load of learners, but the type of cognitive load was not taken into consideration in that study. Also, generally, teachers could only teach arithmetic word problems carefully using problem-solving. On the other hand, we analyzed the cognitive load of learning and the disability of learners and found that the load related to reading disabilities was not related to learning in problem-posing exercises. Therefore, if we remove the extraneous load related to the reading disability, there is a possibility that the problem-posing exercise can be performed.
We have developed a learning environment with the kit-build method by analyzing the structure of arithmetic word problems. It is possible to change the units of the kits given to learners based on the analyzed structure of arithmetic word problems when they are learning. Therefore, we realized a problem-posing exercise for learners with reading disabilities by developing a learning environment that gave appropriate kits to such learners, who then built the kits (Yamamoto & Hirashima, 2016; Yamamoto et al., 2016). As a next step, this study attempted to realize learning by building the structure of arithmetic word problems for learners with reading disabilities, because this learning is more effective for understanding arithmetic word problems than are problem-posing and problem-solving. Section 2 discusses learners with reading disabilities and the related cognitive load. Section 3 presents the structure of arithmetic word problems, learning by building its structure, and cognitive load theory. Section 4 introduces our learning environment for building structure. Section 5 reports an experimental use. Section 6 presents our conclusions.
2. Targeted Reading Disability and Cognitive Load of Reading
A special classroom is a small-group classroom that includes students who need special support for their learning. In order to address their disability, the teacher teaches behaviors, communication, and other needs of daily life as career education. These students have one or more disorders in the ability to listen, think, speak, read, write, spell, or do mathematical calculations. As mentioned earlier, this research is intended for students who face difficulties in reading sentences. They experience a greater cognitive load than do ordinary people when they read sentences, and so reading comprehension of the sentences is slow or impossible for them. Therefore, in order to let learners learn, the teacher decreases the load of reading sentences by reading sentences on their behalf, dividing sentences into short units, or using pictures expressing the meaning of sentences.
Generally, when we understand sentences, we divide them into meaningful chunks; then, after dividing the sentences into minimum units such as words and comparing them with the cognitive dictionary, we understand the meaning of the whole sentence (Coltheart et al., 2001; Perry et al., 2007). Therefore, learners with reading disabilities have difficulty understanding the meanings as the sentences become longer because it is very hard for them to divide sentences into meaningful chunks.
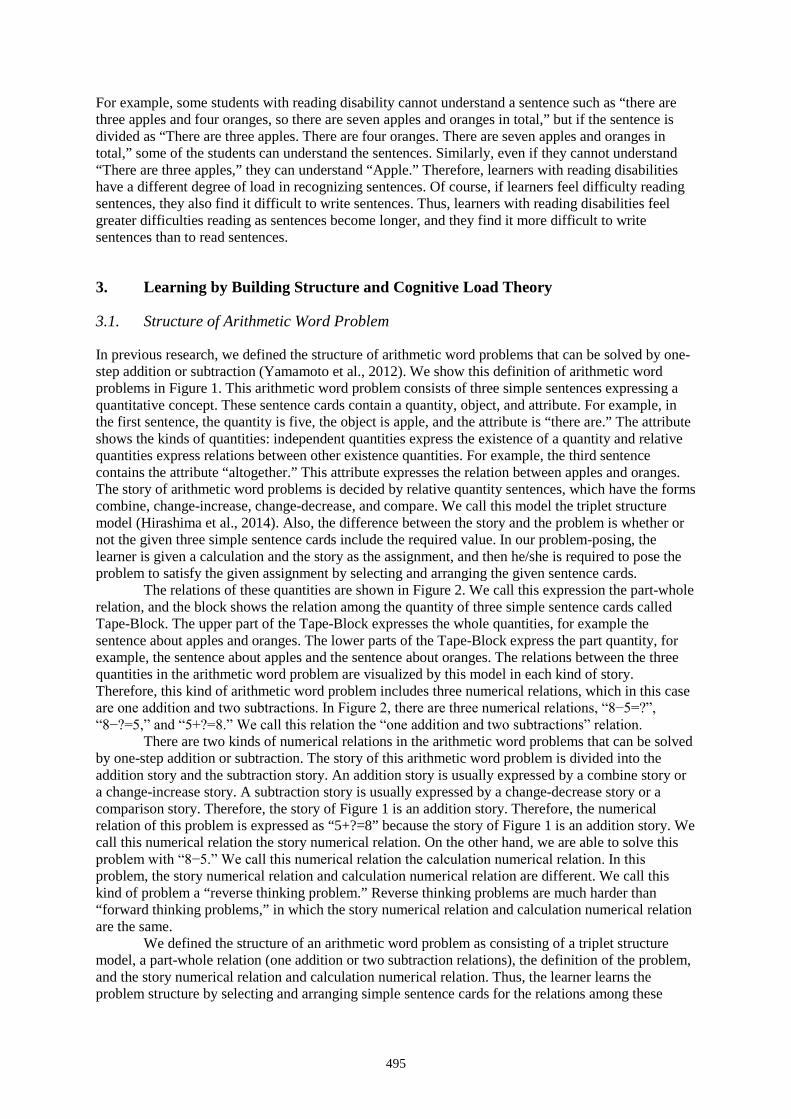
495
For example, some students with reading disability cannot understand a sentence such as “there are three apples and four oranges, so there are seven apples and oranges in total,” but if the sentence is divided as “There are three apples. There are four oranges. There are seven apples and oranges in total,” some of the students can understand the sentences. Similarly, even if they cannot understand “There are three apples,” they can understand “Apple.” Therefore, learners with reading disabilities have a different degree of load in recognizing sentences. Of course, if learners feel difficulty reading sentences, they also find it difficult to write sentences. Thus, learners with reading disabilities feel greater difficulties reading as sentences become longer, and they find it more difficult to write sentences than to read sentences.
3. Learning by Building Structure and Cognitive Load Theory
3.1. Structure of Arithmetic Word Problem
In previous research, we defined the structure of arithmetic word problems that can be solved by one-step addition or subtraction (Yamamoto et al., 2012). We show this definition of arithmetic word problems in Figure 1. This arithmetic word problem consists of three simple sentences expressing a quantitative concept. These sentence cards contain a quantity, object, and attribute. For example, in the first sentence, the quantity is five, the object is apple, and the attribute is “there are.” The attribute shows the kinds of quantities: independent quantities express the existence of a quantity and relative quantities express relations between other existence quantities. For example, the third sentence contains the attribute “altogether.” This attribute expresses the relation between apples and oranges. The story of arithmetic word problems is decided by relative quantity sentences, which have the forms combine, change-increase, change-decrease, and compare. We call this model the triplet structure model (Hirashima et al., 2014). Also, the difference between the story and the problem is whether or not the given three simple sentence cards include the required value. In our problem-posing, the learner is given a calculation and the story as the assignment, and then he/she is required to pose the problem to satisfy the given assignment by selecting and arranging the given sentence cards.
The relations of these quantities are shown in Figure 2. We call this expression the part-whole relation, and the block shows the relation among the quantity of three simple sentence cards called Tape-Block. The upper part of the Tape-Block expresses the whole quantities, for example the sentence about apples and oranges. The lower parts of the Tape-Block express the part quantity, for example, the sentence about apples and the sentence about oranges. The relations between the three quantities in the arithmetic word problem are visualized by this model in each kind of story. Therefore, this kind of arithmetic word problem includes three numerical relations, which in this case are one addition and two subtractions. In Figure 2, there are three numerical relations, “8−5=?”, “8−?=5,” and “5+?=8.” We call this relation the “one addition and two subtractions” relation.
There are two kinds of numerical relations in the arithmetic word problems that can be solved by one-step addition or subtraction. The story of this arithmetic word problem is divided into the addition story and the subtraction story. An addition story is usually expressed by a combine story or a change-increase story. A subtraction story is usually expressed by a change-decrease story or a comparison story. Therefore, the story of Figure 1 is an addition story. Therefore, the numerical relation of this problem is expressed as “5+?=8” because the story of Figure 1 is an addition story. We call this numerical relation the story numerical relation. On the other hand, we are able to solve this problem with “8−5.” We call this numerical relation the calculation numerical relation. In this problem, the story numerical relation and calculation numerical relation are different. We call this kind of problem a “reverse thinking problem.” Reverse thinking problems are much harder than “forward thinking problems,” in which the story numerical relation and calculation numerical relation are the same.
We defined the structure of an arithmetic word problem as consisting of a triplet structure model, a part-whole relation (one addition or two subtraction relations), the definition of the problem, and the story numerical relation and calculation numerical relation. Thus, the learner learns the problem structure by selecting and arranging simple sentence cards for the relations among these
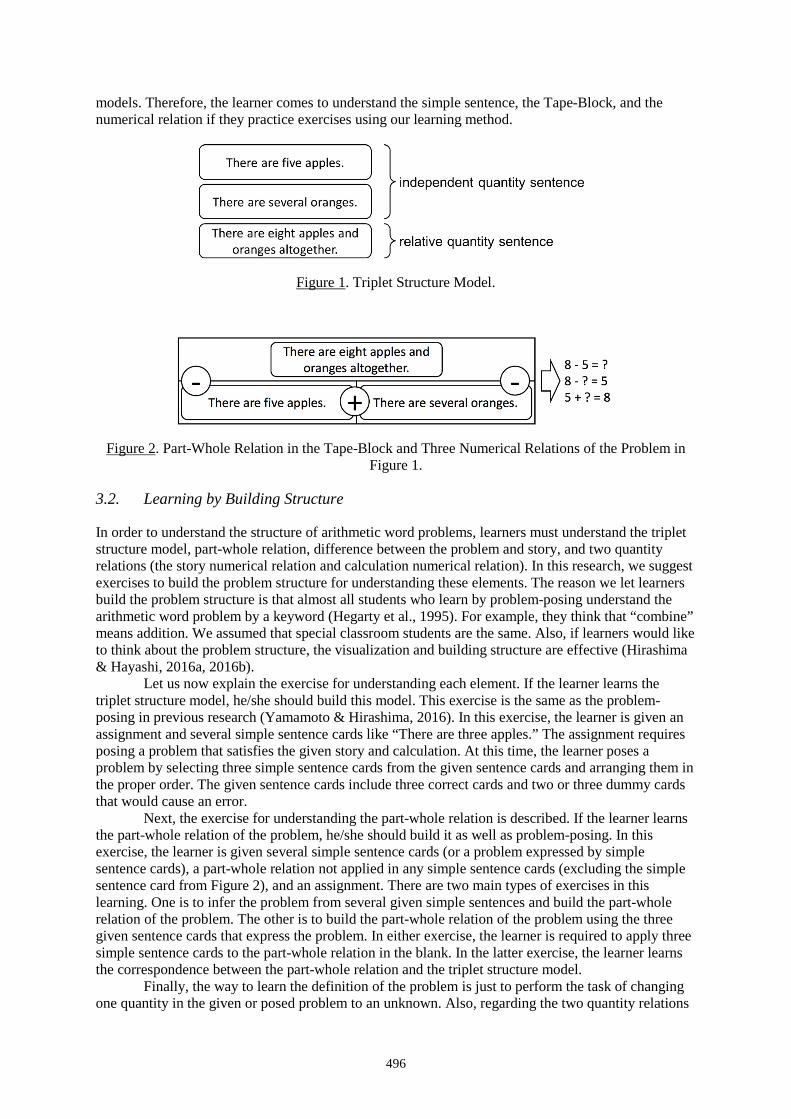
496
models. Therefore, the learner comes to understand the simple sentence, the Tape-Block, and the numerical relation if they practice exercises using our learning method.
Figure 1. Triplet Structure Model.
Figure 2. Part-Whole Relation in the Tape-Block and Three Numerical Relations of the Problem in Figure 1.
3.2. Learning by Building Structure
In order to understand the structure of arithmetic word problems, learners must understand the triplet structure model, part-whole relation, difference between the problem and story, and two quantity relations (the story numerical relation and calculation numerical relation). In this research, we suggest exercises to build the problem structure for understanding these elements. The reason we let learners build the problem structure is that almost all students who learn by problem-posing understand the arithmetic word problem by a keyword (Hegarty et al., 1995). For example, they think that “combine” means addition. We assumed that special classroom students are the same. Also, if learners would like to think about the problem structure, the visualization and building structure are effective (Hirashima & Hayashi, 2016a, 2016b).
Let us now explain the exercise for understanding each element. If the learner learns the triplet structure model, he/she should build this model. This exercise is the same as the problem-posing in previous research (Yamamoto & Hirashima, 2016). In this exercise, the learner is given an assignment and several simple sentence cards like “There are three apples.” The assignment requires posing a problem that satisfies the given story and calculation. At this time, the learner poses a problem by selecting three simple sentence cards from the given sentence cards and arranging them in the proper order. The given sentence cards include three correct cards and two or three dummy cards that would cause an error.
Next, the exercise for understanding the part-whole relation is described. If the learner learns the part-whole relation of the problem, he/she should build it as well as problem-posing. In this exercise, the learner is given several simple sentence cards (or a problem expressed by simple sentence cards), a part-whole relation not applied in any simple sentence cards (excluding the simple sentence card from Figure 2), and an assignment. There are two main types of exercises in this learning. One is to infer the problem from several given simple sentences and build the part-whole relation of the problem. The other is to build the part-whole relation of the problem using the three given sentence cards that express the problem. In either exercise, the learner is required to apply three simple sentence cards to the part-whole relation in the blank. In the latter exercise, the learner learns the correspondence between the part-whole relation and the triplet structure model.
Finally, the way to learn the definition of the problem is just to perform the task of changing one quantity in the given or posed problem to an unknown. Also, regarding the two quantity relations
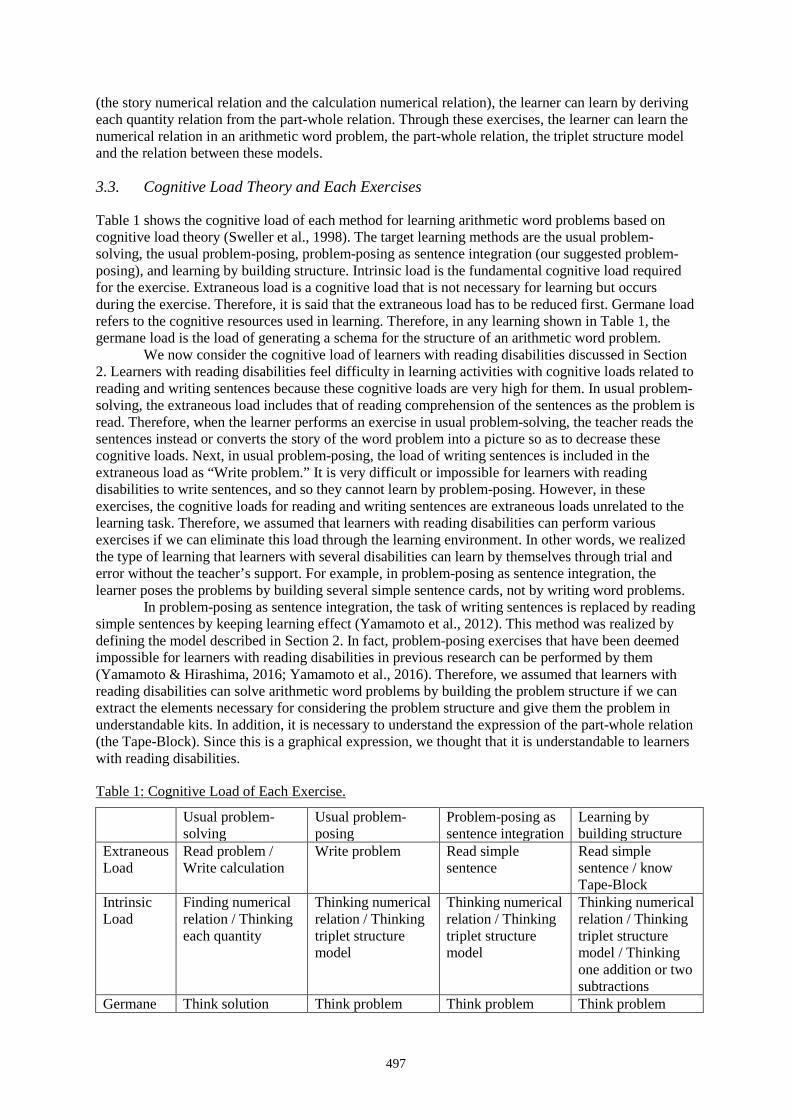
497
(the story numerical relation and the calculation numerical relation), the learner can learn by deriving each quantity relation from the part-whole relation. Through these exercises, the learner can learn the numerical relation in an arithmetic word problem, the part-whole relation, the triplet structure model and the relation between these models.
3.3. Cognitive Load Theory and Each Exercises
Table 1 shows the cognitive load of each method for learning arithmetic word problems based on cognitive load theory (Sweller et al., 1998). The target learning methods are the usual problem-solving, the usual problem-posing, problem-posing as sentence integration (our suggested problem-posing), and learning by building structure. Intrinsic load is the fundamental cognitive load required for the exercise. Extraneous load is a cognitive load that is not necessary for learning but occurs during the exercise. Therefore, it is said that the extraneous load has to be reduced first. Germane load refers to the cognitive resources used in learning. Therefore, in any learning shown in Table 1, the germane load is the load of generating a schema for the structure of an arithmetic word problem.
We now consider the cognitive load of learners with reading disabilities discussed in Section 2. Learners with reading disabilities feel difficulty in learning activities with cognitive loads related to reading and writing sentences because these cognitive loads are very high for them. In usual problem-solving, the extraneous load includes that of reading comprehension of the sentences as the problem is read. Therefore, when the learner performs an exercise in usual problem-solving, the teacher reads the sentences instead or converts the story of the word problem into a picture so as to decrease these cognitive loads. Next, in usual problem-posing, the load of writing sentences is included in the extraneous load as “Write problem.” It is very difficult or impossible for learners with reading disabilities to write sentences, and so they cannot learn by problem-posing. However, in these exercises, the cognitive loads for reading and writing sentences are extraneous loads unrelated to the learning task. Therefore, we assumed that learners with reading disabilities can perform various exercises if we can eliminate this load through the learning environment. In other words, we realized the type of learning that learners with several disabilities can learn by themselves through trial and error without the teacher’s support. For example, in problem-posing as sentence integration, the learner poses the problems by building several simple sentence cards, not by writing word problems.
In problem-posing as sentence integration, the task of writing sentences is replaced by reading simple sentences by keeping learning effect (Yamamoto et al., 2012). This method was realized by defining the model described in Section 2. In fact, problem-posing exercises that have been deemed impossible for learners with reading disabilities in previous research can be performed by them (Yamamoto & Hirashima, 2016; Yamamoto et al., 2016). Therefore, we assumed that learners with reading disabilities can solve arithmetic word problems by building the problem structure if we can extract the elements necessary for considering the problem structure and give them the problem in understandable kits. In addition, it is necessary to understand the expression of the part-whole relation (the Tape-Block). Since this is a graphical expression, we thought that it is understandable to learners with reading disabilities.
Table 1: Cognitive Load of Each Exercise.
Usual problem-solving
Usual problem-posing
Problem-posing as sentence integration
Learning by building structure
Extraneous Load
Read problem / Write calculation
Write problem Read simple sentence
Read simple sentence / know Tape-Block
Intrinsic Load
Finding numerical relation / Thinking each quantity
Thinking numerical relation / Thinking triplet structure model
Thinking numerical relation / Thinking triplet structure model
Thinking numerical relation / Thinking triplet structure model / Thinking one addition or two subtractions
Germane Think solution Think problem Think problem Think problem
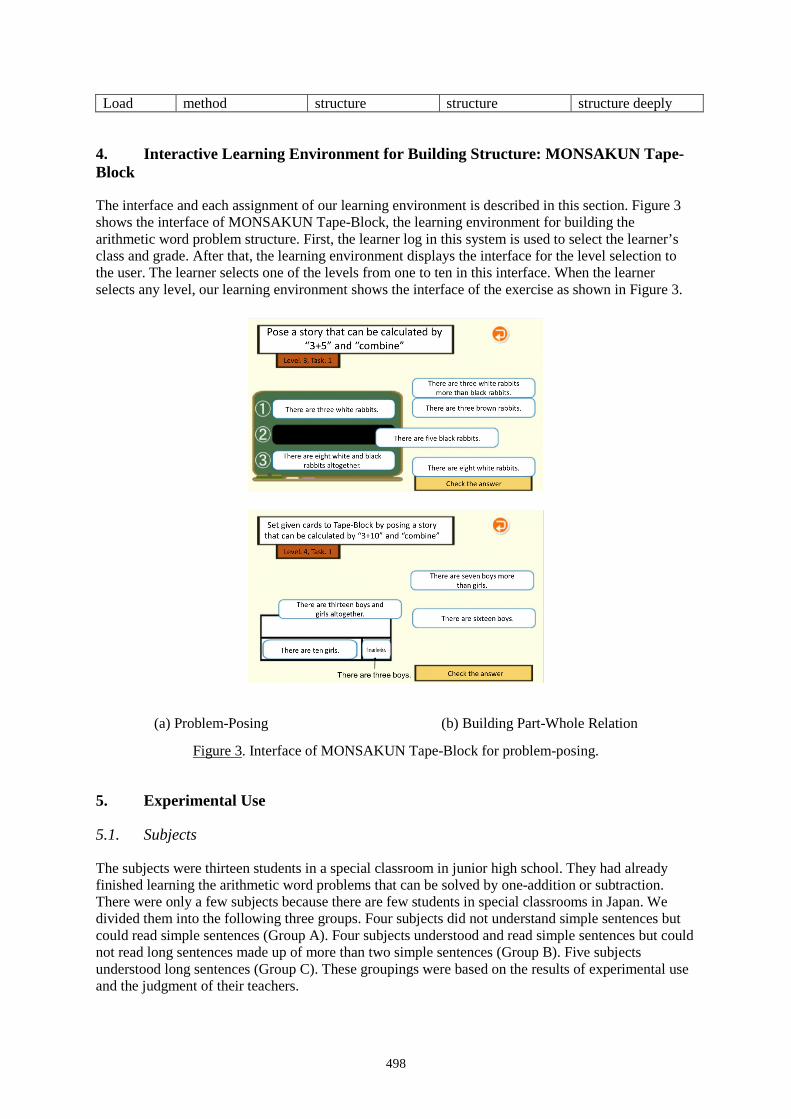
498
Load method structure structure structure deeply
4. Interactive Learning Environment for Building Structure: MONSAKUN Tape-Block
The interface and each assignment of our learning environment is described in this section. Figure 3 shows the interface of MONSAKUN Tape-Block, the learning environment for building the arithmetic word problem structure. First, the learner log in this system is used to select the learner’s class and grade. After that, the learning environment displays the interface for the level selection to the user. The learner selects one of the levels from one to ten in this interface. When the learner selects any level, our learning environment shows the interface of the exercise as shown in Figure 3.
(a) Problem-Posing (b) Building Part-Whole Relation
Figure 3. Interface of MONSAKUN Tape-Block for problem-posing.
5. Experimental Use
5.1. Subjects
The subjects were thirteen students in a special classroom in junior high school. They had already finished learning the arithmetic word problems that can be solved by one-addition or subtraction. There were only a few subjects because there are few students in special classrooms in Japan. We divided them into the following three groups. Four subjects did not understand simple sentences but could read simple sentences (Group A). Four subjects understood and read simple sentences but could not read long sentences made up of more than two simple sentences (Group B). Five subjects understood long sentences (Group C). These groupings were based on the results of experimental use and the judgment of their teachers.
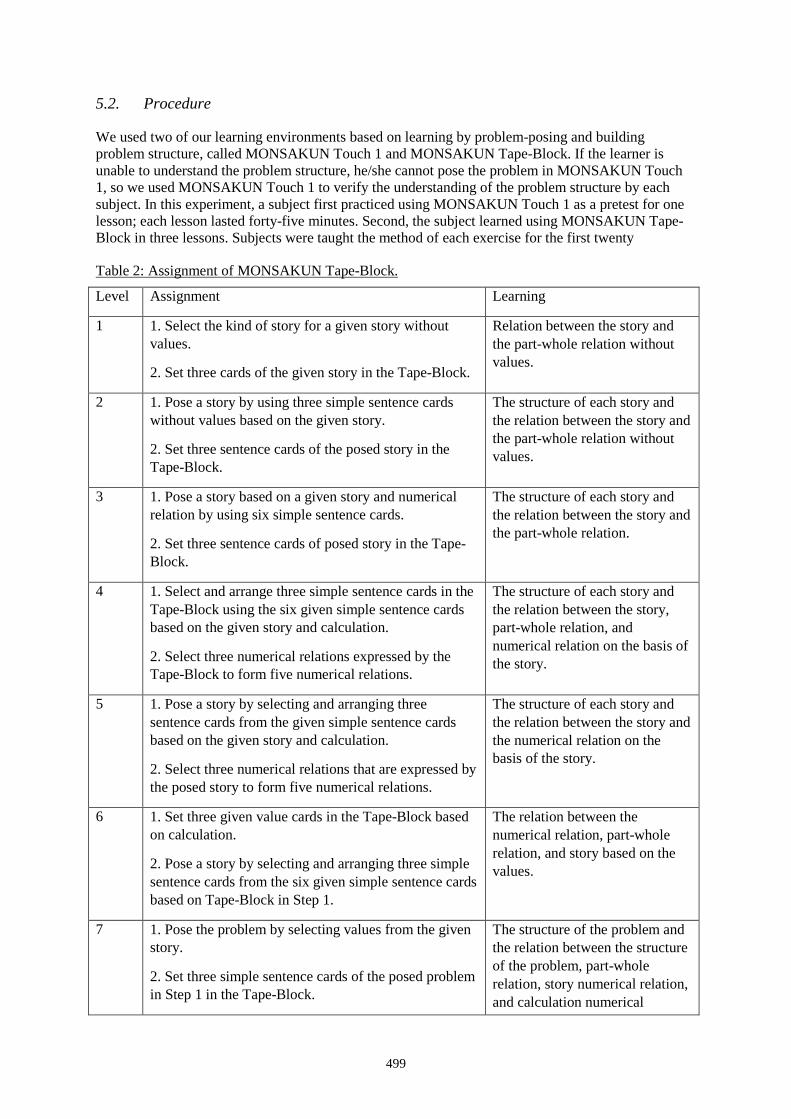
499
5.2. Procedure
We used two of our learning environments based on learning by problem-posing and building problem structure, called MONSAKUN Touch 1 and MONSAKUN Tape-Block. If the learner is unable to understand the problem structure, he/she cannot pose the problem in MONSAKUN Touch 1, so we used MONSAKUN Touch 1 to verify the understanding of the problem structure by each subject. In this experiment, a subject first practiced using MONSAKUN Touch 1 as a pretest for one lesson; each lesson lasted forty-five minutes. Second, the subject learned using MONSAKUN Tape-Block in three lessons. Subjects were taught the method of each exercise for the first twenty
Table 2: Assignment of MONSAKUN Tape-Block.
Level Assignment Learning
1 1. Select the kind of story for a given story without values.
2. Set three cards of the given story in the Tape-Block.
Relation between the story and the part-whole relation without values.
2 1. Pose a story by using three simple sentence cards without values based on the given story.
2. Set three sentence cards of the posed story in the Tape-Block.
The structure of each story and the relation between the story and the part-whole relation without values.
3 1. Pose a story based on a given story and numerical relation by using six simple sentence cards.
2. Set three sentence cards of posed story in the Tape-Block.
The structure of each story and the relation between the story and the part-whole relation.
4 1. Select and arrange three simple sentence cards in the Tape-Block using the six given simple sentence cards based on the given story and calculation.
2. Select three numerical relations expressed by the Tape-Block to form five numerical relations.
The structure of each story and the relation between the story, part-whole relation, and numerical relation on the basis of the story.
5 1. Pose a story by selecting and arranging three sentence cards from the given simple sentence cards based on the given story and calculation.
2. Select three numerical relations that are expressed by the posed story to form five numerical relations.
The structure of each story and the relation between the story and the numerical relation on the basis of the story.
6 1. Set three given value cards in the Tape-Block based on calculation.
2. Pose a story by selecting and arranging three simple sentence cards from the six given simple sentence cards based on Tape-Block in Step 1.
The relation between the numerical relation, part-whole relation, and story based on the values.
7 1. Pose the problem by selecting values from the given story.
2. Set three simple sentence cards of the posed problem in Step 1 in the Tape-Block.
The structure of the problem and the relation between the structure of the problem, part-whole relation, story numerical relation, and calculation numerical
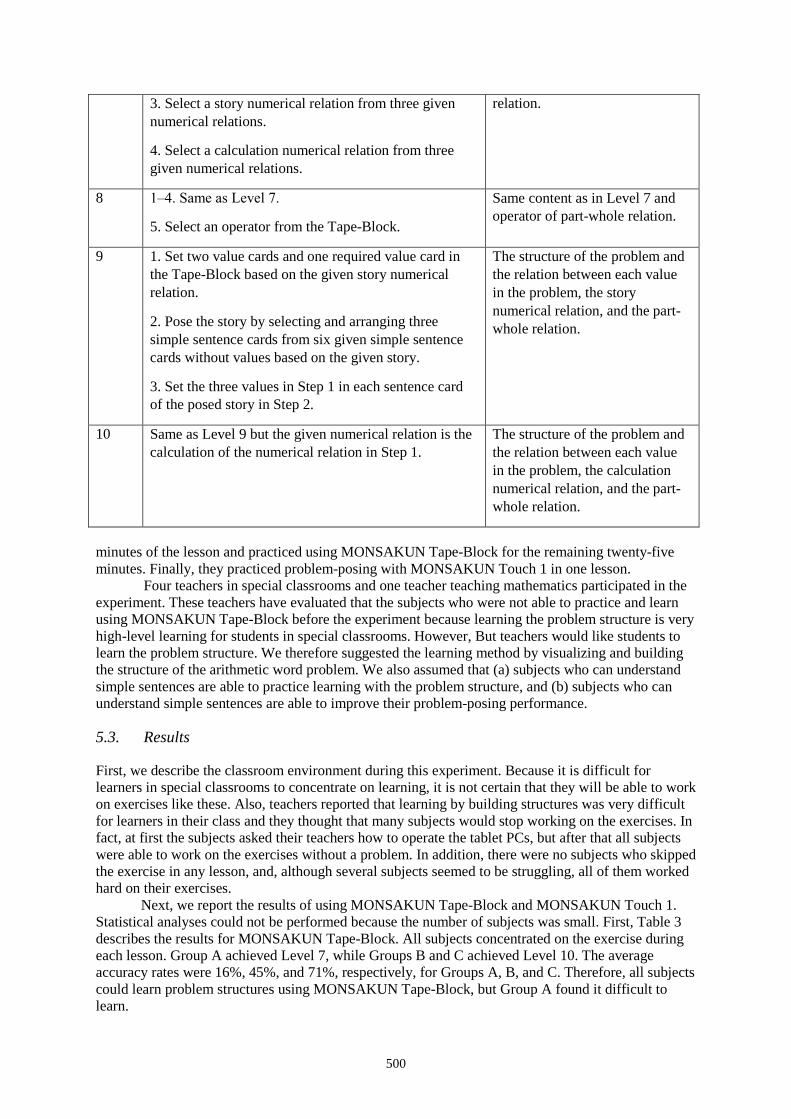
500
3. Select a story numerical relation from three given numerical relations.
4. Select a calculation numerical relation from three given numerical relations.
relation.
8 1‒4. Same as Level 7.
5. Select an operator from the Tape-Block.
Same content as in Level 7 and operator of part-whole relation.
9 1. Set two value cards and one required value card in the Tape-Block based on the given story numerical relation.
2. Pose the story by selecting and arranging three simple sentence cards from six given simple sentence cards without values based on the given story.
3. Set the three values in Step 1 in each sentence card of the posed story in Step 2.
The structure of the problem and the relation between each value in the problem, the story numerical relation, and the part-whole relation.
10 Same as Level 9 but the given numerical relation is the calculation of the numerical relation in Step 1.
The structure of the problem and the relation between each value in the problem, the calculation numerical relation, and the part-whole relation.
minutes of the lesson and practiced using MONSAKUN Tape-Block for the remaining twenty-five minutes. Finally, they practiced problem-posing with MONSAKUN Touch 1 in one lesson.
Four teachers in special classrooms and one teacher teaching mathematics participated in the experiment. These teachers have evaluated that the subjects who were not able to practice and learn using MONSAKUN Tape-Block before the experiment because learning the problem structure is very high-level learning for students in special classrooms. However, But teachers would like students to learn the problem structure. We therefore suggested the learning method by visualizing and building the structure of the arithmetic word problem. We also assumed that (a) subjects who can understand simple sentences are able to practice learning with the problem structure, and (b) subjects who can understand simple sentences are able to improve their problem-posing performance.
5.3. Results
First, we describe the classroom environment during this experiment. Because it is difficult for learners in special classrooms to concentrate on learning, it is not certain that they will be able to work on exercises like these. Also, teachers reported that learning by building structures was very difficult for learners in their class and they thought that many subjects would stop working on the exercises. In fact, at first the subjects asked their teachers how to operate the tablet PCs, but after that all subjects were able to work on the exercises without a problem. In addition, there were no subjects who skipped the exercise in any lesson, and, although several subjects seemed to be struggling, all of them worked hard on their exercises.
Next, we report the results of using MONSAKUN Tape-Block and MONSAKUN Touch 1. Statistical analyses could not be performed because the number of subjects was small. First, Table 3 describes the results for MONSAKUN Tape-Block. All subjects concentrated on the exercise during each lesson. Group A achieved Level 7, while Groups B and C achieved Level 10. The average accuracy rates were 16%, 45%, and 71%, respectively, for Groups A, B, and C. Therefore, all subjects could learn problem structures using MONSAKUN Tape-Block, but Group A found it difficult to learn.
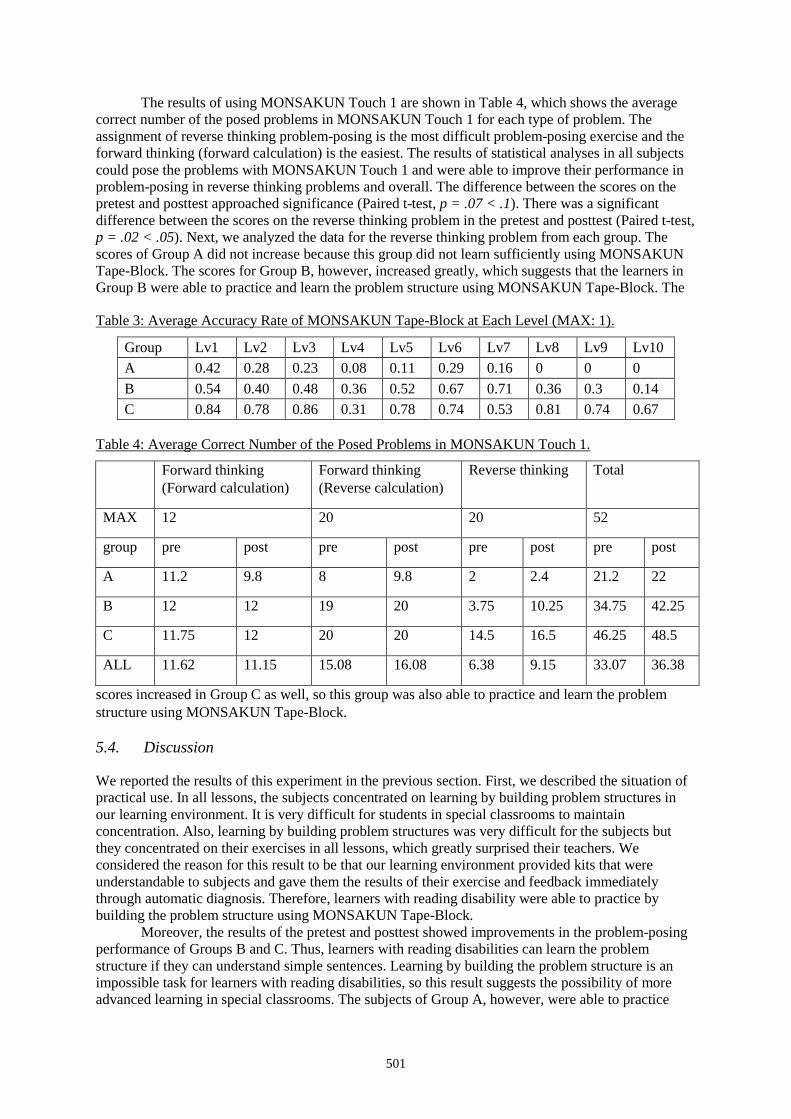
501
The results of using MONSAKUN Touch 1 are shown in Table 4, which shows the average correct number of the posed problems in MONSAKUN Touch 1 for each type of problem. The assignment of reverse thinking problem-posing is the most difficult problem-posing exercise and the forward thinking (forward calculation) is the easiest. The results of statistical analyses in all subjects could pose the problems with MONSAKUN Touch 1 and were able to improve their performance in problem-posing in reverse thinking problems and overall. The difference between the scores on the pretest and posttest approached significance (Paired t-test, p = .07 < .1). There was a significant difference between the scores on the reverse thinking problem in the pretest and posttest (Paired t-test, p = .02 < .05). Next, we analyzed the data for the reverse thinking problem from each group. The scores of Group A did not increase because this group did not learn sufficiently using MONSAKUN Tape-Block. The scores for Group B, however, increased greatly, which suggests that the learners in Group B were able to practice and learn the problem structure using MONSAKUN Tape-Block. The
Table 3: Average Accuracy Rate of MONSAKUN Tape-Block at Each Level (MAX: 1).
Group Lv1 Lv2 Lv3 Lv4 Lv5 Lv6 Lv7 Lv8 Lv9 Lv10 A 0.42 0.28 0.23 0.08 0.11 0.29 0.16 0 0 0 B 0.54 0.40 0.48 0.36 0.52 0.67 0.71 0.36 0.3 0.14 C 0.84 0.78 0.86 0.31 0.78 0.74 0.53 0.81 0.74 0.67
Table 4: Average Correct Number of the Posed Problems in MONSAKUN Touch 1.
Forward thinking (Forward calculation)
Forward thinking (Reverse calculation)
Reverse thinking Total
MAX 12 20 20 52
group pre post pre post pre post pre post
A 11.2 9.8 8 9.8 2 2.4 21.2 22
B 12 12 19 20 3.75 10.25 34.75 42.25
C 11.75 12 20 20 14.5 16.5 46.25 48.5
ALL 11.62 11.15 15.08 16.08 6.38 9.15 33.07 36.38
scores increased in Group C as well, so this group was also able to practice and learn the problem structure using MONSAKUN Tape-Block.
5.4. Discussion
We reported the results of this experiment in the previous section. First, we described the situation of practical use. In all lessons, the subjects concentrated on learning by building problem structures in our learning environment. It is very difficult for students in special classrooms to maintain concentration. Also, learning by building problem structures was very difficult for the subjects but they concentrated on their exercises in all lessons, which greatly surprised their teachers. We considered the reason for this result to be that our learning environment provided kits that were understandable to subjects and gave them the results of their exercise and feedback immediately through automatic diagnosis. Therefore, learners with reading disability were able to practice by building the problem structure using MONSAKUN Tape-Block.
Moreover, the results of the pretest and posttest showed improvements in the problem-posing performance of Groups B and C. Thus, learners with reading disabilities can learn the problem structure if they can understand simple sentences. Learning by building the problem structure is an impossible task for learners with reading disabilities, so this result suggests the possibility of more advanced learning in special classrooms. The subjects of Group A, however, were able to practice
502
using the MONSAKUN Tape-Block and MONSAKUN Touch 1 but could not learn the problem structure. This means that practicing by visualizing and building the problem structure was effective for them but the kit was not suitable for them. We thus had to realize a learning environment for building simple sentences. For example, it was considered effective for subjects in Group A to learn by building simple sentences before learning with MONSAKUN Tape-Block. This experiment verified the stages of reading disabilities. If learners are to understand arithmetic word problems that can be solved by one-step addition or subtraction, they must understand simple sentences. Therefore, if learners understand simple sentences, they can learn the structure of arithmetic word problem even though they have reading disabilities. However, learners who do not understand simple sentences need to understand them by building the elements that constitute simple sentences.
Finally, the subjects made many mistakes in MONSAKUN Tape-Block and MONSAKUN Touch 1 because the feedback of these system presented several sentences, which is not easy for students with reading disabilities to understand. Thus, most subjects only used the critical feedback that showed whether the answer was correct or not. The feedback for each system must be improved.
Using the cognitive load theory, the results of the experiment suggest that more advanced learning can be realized in special classrooms by decreasing the cognitive load subject to the learner’s disability if the learner’s disability affects the extraneous load. The aforementioned learning does not mean an activity where teachers carefully support learners during exercises, but one where the learner learns by himself/herself through trial and error. In this research, if learners with reading disabilities are given a suitable kit, like simple sentences for learning, they can practice more effectively and learn difficult learning tasks like structure building. We also consider that subjects who failed to learn using MONSAKUN Tape-Block could learn if they learn simple sentences by building understandable kits.
6. Conclusions
In this research, we constructed an interactive environment for learning problem structures. It is impossible for learners with reading disabilities to learn the structure of arithmetic word problems because the learner must read or write a long sentence in usual problem-solving and problem-posing, which they find difficult. We analyzed the cognitive load of these types of learning and assumed that a learner with a reading disability can learn the structure of a problem if the extraneous load in reading and writing a sentence is reduced. We suggested problem-posing exercises and structure building exercises by selecting and arranging given simple sentence cards that many learners with reading disabilities can understand.
We developed this interactive learning environment and performed an experiment using it in special classrooms in junior high school. The results show that learners with reading disabilities can practice structure building and learn the structure of arithmetic word problems if he/she understands simple sentence cards. Learners who cannot understand simple sentences are not able to learn the problem structure, but there is a possibility of their learning the problem structure if they learn by building simple sentences from a given kit.
In future research, we will improve the interface for reading disabilities and verify its effects. We will also develop the environment for learning the structures of simple sentences and its practical use. Also, the confirmation of our assumptions in other domains, such as in arithmetic word problems that can be solved by one-multiplication and division, is important.
503
Acknowledgements
I am deeply grateful to the teacher and the students in the elementary school for participating in the experiment and giving insightful comments. This work was supported by JSPS KAKENHI Grant Number 17K12954.
References
Bender, W. N. (2007). Learning disabilities: Characteristics, identification, and teaching strategies (6th ed.). Boston: Pearson, Allyn and Bacon.
Coltheart, M., Rastle, K., Perry, C., Langdon, R., & Ziegler, J. (2001). DRC: A dual route cascaded model of visual word recognition and reading aloud. Psychological Review, 108(1), 204.
Fernández-López, Á., Rodríguez-Fórtiz, M. J., Rodríguez-Almendros, M. L., & Martínez-Segura, M. J. (2013). Mobile learning technology based on iOS devices to support students with special education needs. Computers & Education, 61, 77‒90.
Hegarty, M., Mayer, R. E., & Monk, C. A. (1995). Comprehension of arithmetic word problems: A comparison of successful and unsuccessful problem solvers. Journal of Educational Psychology, 87(1), 18.
Hirashima, T., Yamamoto, S., & Hayashi, Y. (2014). Triplet structure model of arithmetical word problems for learning by problem-posing. In International Conference on Human Interface and the Management of Information, Springer International Publishing, 42‒50.
Hirashima, T., & Hayashi, Y. (2016a). Scaffolding of thinking about structure with kit-building task. Workshop Proceedings of ICCE2016, 379‒382.
Hirashima, T., & Hayashi, Y. (2016b). Educational externalization of thinking task by kit-build method. International Conference on Human Interface and the Management of Information,126‒137.
Perry, C., Ziegler, J. C., & Zorzi, M. (2007). Nested incremental modeling in the development of computational theories: The CDP+ model of reading aloud. Psychological Review, 114(2), 273.
Plaut, D. C., McClelland, J. L., Seidenberg, M. S., & Patterson, K. (1996). Understanding normal and impaired word reading: Computational principles in quasi-regular domains. Psychological Review, 103(1), 56.
Silver, E. A. (1997). Fostering creativity through instruction rich in mathematical problem solving and problem posing. ZDM Mathematics Education, 29(3), 75‒80.
Sweller, J., Van Merrienboer, J. J., & Paas, F. G. (1998). Cognitive architecture and instructional design. Educational Psychology Review, 10(3), 251‒296.
VanLehn, K., Lynch, C., Schulze, K., Shapiro, J. A., Shelby, R., Taylor, L., & Wintersgill, M. (2005). The Andes physics tutoring system: Lessons learned. International Journal of Artificial Intelligence in Education, 15(3), 147‒204.
Xin, Y. P., Jitendra, A. K., & Deatline-Buchman, A. (2005). Effects of mathematical word problem-solving instruction on middle school students with learning problems. The Journal of Special Education, 39(3), 181‒192.
Yamamoto, S., & Hirashima, T. (2016). A case study of interactive environment for learning by problem-posing in special classroom at junior high school. Proceedings of ICCE2016, 282‒287.
Yamamoto, S., Hirashima, T., & Ogihara, A. (2016). Experimental use of learning environment by posing problem for learning disability. In Applied Computing & Information Technology, Springer International Publishing, 101‒112.
Yamamoto, S., Kanbe, T., Yoshida, Y., Maeda, K., & Hirashima, T. (2012). A case study of learning by problem-posing in introductory phase of arithmetic word problems. Proceedings of ICCE2012, 25‒32.
Yamamoto, S., Akao, Y., Murotsu, M., Kanbe, T., Yoshida, Y., Maeda, K., & Hirashima, T. (2014). Interactive environment for learning by problem-posing of arithmetic word problems solved by one-step multiplication and division. Proceedings of ICCE2014, 89‒94.
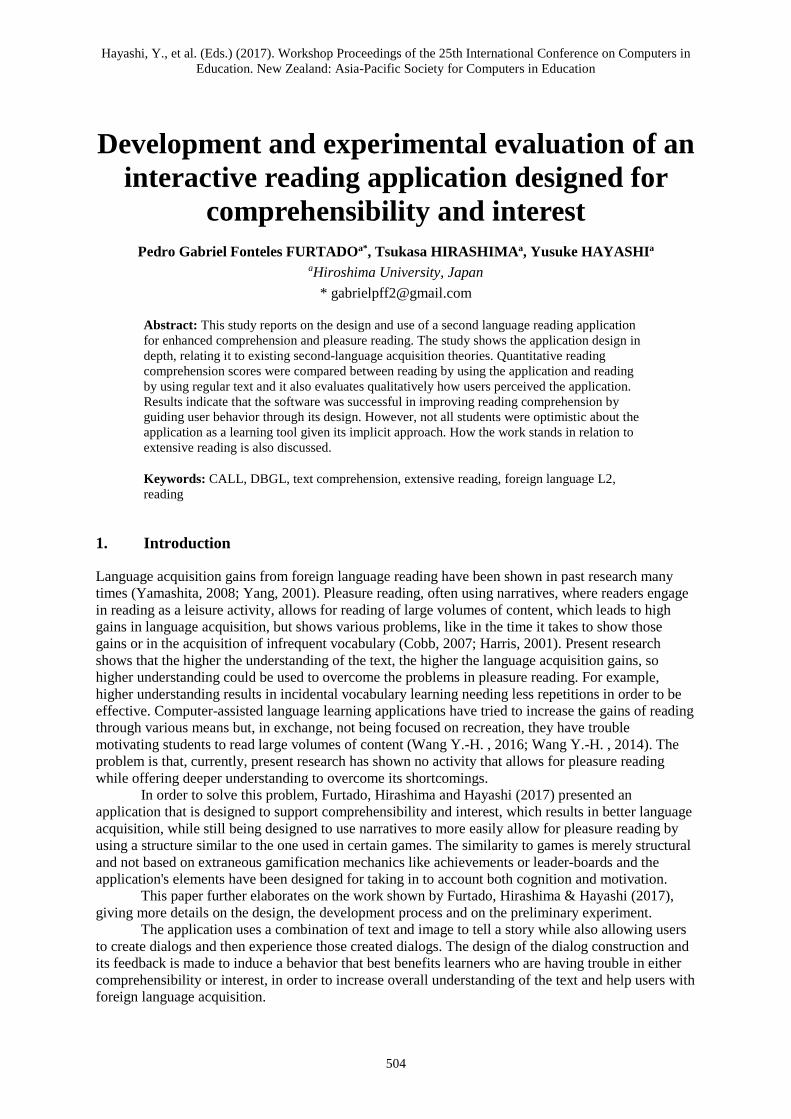
Hayashi, Y., et al. (Eds.) (2017). Workshop Proceedings of the 25th International Conference on Computers in Education. New Zealand: Asia-Pacific Society for Computers in Education
504
Development and experimental evaluation of an interactive reading application designed for
comprehensibility and interest Pedro Gabriel Fonteles FURTADOa*, Tsukasa HIRASHIMAa, Yusuke HAYASHIa
aHiroshima University, Japan * [email protected]
Abstract: This study reports on the design and use of a second language reading application for enhanced comprehension and pleasure reading. The study shows the application design in depth, relating it to existing second-language acquisition theories. Quantitative reading comprehension scores were compared between reading by using the application and reading by using regular text and it also evaluates qualitatively how users perceived the application. Results indicate that the software was successful in improving reading comprehension by guiding user behavior through its design. However, not all students were optimistic about the application as a learning tool given its implicit approach. How the work stands in relation to extensive reading is also discussed.
Keywords: CALL, DBGL, text comprehension, extensive reading, foreign language L2, reading
1. Introduction
Language acquisition gains from foreign language reading have been shown in past research many times (Yamashita, 2008; Yang, 2001). Pleasure reading, often using narratives, where readers engage in reading as a leisure activity, allows for reading of large volumes of content, which leads to high gains in language acquisition, but shows various problems, like in the time it takes to show those gains or in the acquisition of infrequent vocabulary (Cobb, 2007; Harris, 2001). Present research shows that the higher the understanding of the text, the higher the language acquisition gains, so higher understanding could be used to overcome the problems in pleasure reading. For example, higher understanding results in incidental vocabulary learning needing less repetitions in order to be effective. Computer-assisted language learning applications have tried to increase the gains of reading through various means but, in exchange, not being focused on recreation, they have trouble motivating students to read large volumes of content (Wang Y.-H. , 2016; Wang Y.-H. , 2014). The problem is that, currently, present research has shown no activity that allows for pleasure reading while offering deeper understanding to overcome its shortcomings.
In order to solve this problem, Furtado, Hirashima and Hayashi (2017) presented an application that is designed to support comprehensibility and interest, which results in better language acquisition, while still being designed to use narratives to more easily allow for pleasure reading by using a structure similar to the one used in certain games. The similarity to games is merely structural and not based on extraneous gamification mechanics like achievements or leader-boards and the application's elements have been designed for taking in to account both cognition and motivation.
This paper further elaborates on the work shown by Furtado, Hirashima & Hayashi (2017), giving more details on the design, the development process and on the preliminary experiment.
The application uses a combination of text and image to tell a story while also allowing users to create dialogs and then experience those created dialogs. The design of the dialog construction and its feedback is made to induce a behavior that best benefits learners who are having trouble in either comprehensibility or interest, in order to increase overall understanding of the text and help users with foreign language acquisition.
505
2. Related Works and Theories
2.1. The reading process and reading comprehension
When explaining reading, the purpose of reading plays a big role. Two examples are reading for learning and reading for general comprehension (Khalifa & Weir, 2009). Reading for learning is usually done at schools, with the goal of attaining new information and relating it to previous knowledge. Reading for general comprehension is the usual reading done by native readers. This is the reading done when reading a story for entertainment, or just to get a general idea of what the text is about. According to Grabe and Stoller (2013), reading for general comprehension is more demanding than reading for learning. That is because reading for general comprehension by a native reader is done at a faster pace, uses automatic word processing and has high demands on forming a general idea on a small amount of time. Hours of reading would be necessary to achieve this (Grabe & Stoller, 2013).
2.2. Language Acquisition Through Reading
Acquisition through reading, specially extensive reading (reading large volumes of content for enjoyment), has been amply researched, with gains being shown in multiple areas, such as reading comprehension (Hafiz & Tudor, 1989; Hitosugi & Day, 2004), reading strategy (Nishino, 2007), reading rate / speed (Hunt & Beglar, 2005), vocabulary acquisition (Horst, 2005; Pigada & Schmitt, 2006), grammar (Yang, 2001), writing (Elley & Mangubhai, 1983) and attitude/motivation (Yamashita, 2013).
2.2.1. Relation to Comprehensibility and Interest
The input theory states that, for acquisition to take place, content must be both interesting and comprehensible to the reader (Krashen S. , 2005; Krashen S. , 1982). Those 2 elements are taken into account in almost, if not all the programs cited in extensive reading research and can be seen in the fact that extensive reading classes often allow users to decide what they want to read (thus allowing them to pick the content that interests them the most) and are based on graded-readers (which allows users to gauge the comprehensibility of a book and try to read content appropriated to their levels).
2.2.2. Limitations of Extensive Reading
The gains of extensive reading take time to show up and show up at different rates (Yamashita, 2008), which stands in the way of extensive reading adoption.
The work of Harris (2001) goes over many other limitations of extensive reading, of interest to this research is content selection. The problem is not the lack of content but the abundance of content, which may make users demotivated if they choose an unsuitable text, a problem also cited by Brown (2000).
Cobb (2007) argues that it is extreme unlikely that learners can acquire an adequate L2 reading lexicon through reading alone, because many of the words are not frequent enough.
2.2.3. The Role of the Computer in Supporting Reading.
After pointing out limitations in extensive reading, Cobb (2007) points out to how computer assisted technologies could support extensive reading to alleviate these problems, such as by linking texts with a corpus to provide more context in to which words appear. He also suggests using computer generated problems for assisting users in acquiring vocabulary encountered during reading. Examples of computer-assisted reading with a similar line of thought to that of Cobb's have been done and they showed good results (Wang Y.-H. , 2016; Wang Y.-H. , 2014). However, those approaches, while succeeding at increasing vocabulary, are far from the voluntary reading described by Krashen (2005), which empowers students to read in great volume. Other works have shown good results in increasing reading comprehension but are not focused on reading in volume, instead being focused on
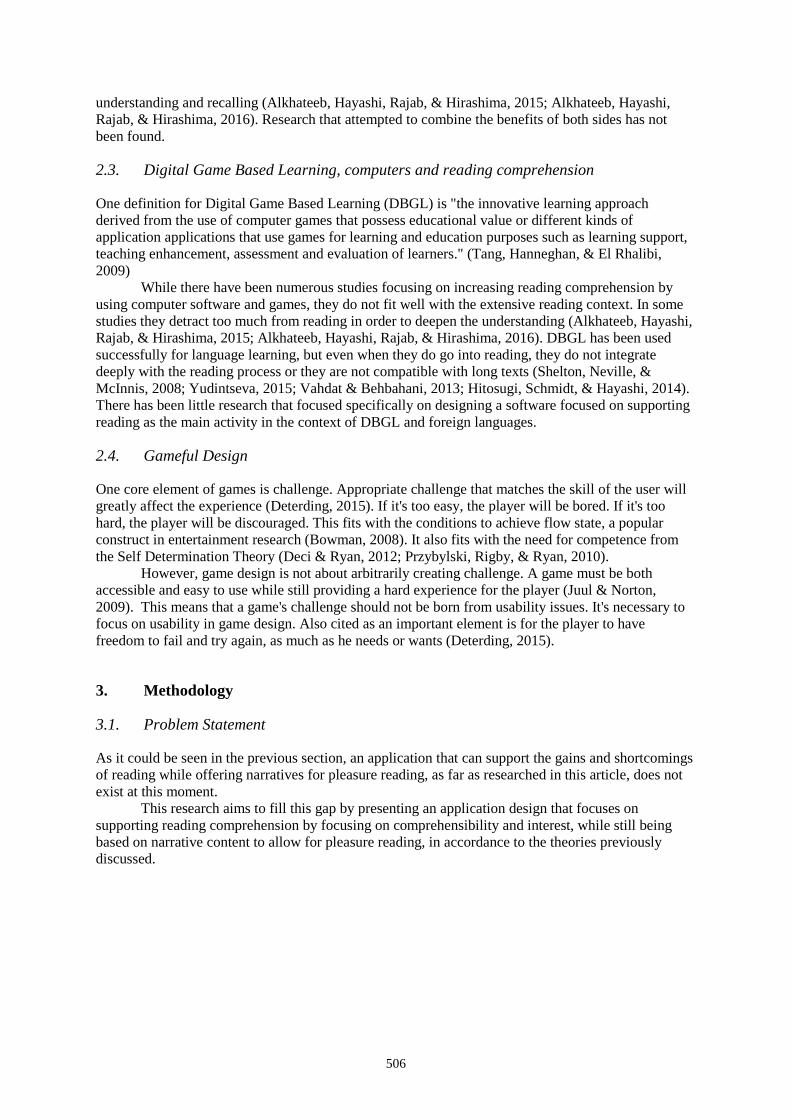
506
understanding and recalling (Alkhateeb, Hayashi, Rajab, & Hirashima, 2015; Alkhateeb, Hayashi, Rajab, & Hirashima, 2016). Research that attempted to combine the benefits of both sides has not been found.
2.3. Digital Game Based Learning, computers and reading comprehension
One definition for Digital Game Based Learning (DBGL) is "the innovative learning approach derived from the use of computer games that possess educational value or different kinds of application applications that use games for learning and education purposes such as learning support, teaching enhancement, assessment and evaluation of learners." (Tang, Hanneghan, & El Rhalibi, 2009)
While there have been numerous studies focusing on increasing reading comprehension by using computer software and games, they do not fit well with the extensive reading context. In some studies they detract too much from reading in order to deepen the understanding (Alkhateeb, Hayashi, Rajab, & Hirashima, 2015; Alkhateeb, Hayashi, Rajab, & Hirashima, 2016). DBGL has been used successfully for language learning, but even when they do go into reading, they do not integrate deeply with the reading process or they are not compatible with long texts (Shelton, Neville, & McInnis, 2008; Yudintseva, 2015; Vahdat & Behbahani, 2013; Hitosugi, Schmidt, & Hayashi, 2014). There has been little research that focused specifically on designing a software focused on supporting reading as the main activity in the context of DBGL and foreign languages.
2.4. Gameful Design
One core element of games is challenge. Appropriate challenge that matches the skill of the user will greatly affect the experience (Deterding, 2015). If it's too easy, the player will be bored. If it's too hard, the player will be discouraged. This fits with the conditions to achieve flow state, a popular construct in entertainment research (Bowman, 2008). It also fits with the need for competence from the Self Determination Theory (Deci & Ryan, 2012; Przybylski, Rigby, & Ryan, 2010).
However, game design is not about arbitrarily creating challenge. A game must be both accessible and easy to use while still providing a hard experience for the player (Juul & Norton, 2009). This means that a game's challenge should not be born from usability issues. It's necessary to focus on usability in game design. Also cited as an important element is for the player to have freedom to fail and try again, as much as he needs or wants (Deterding, 2015).
3. Methodology
3.1. Problem Statement
As it could be seen in the previous section, an application that can support the gains and shortcomings of reading while offering narratives for pleasure reading, as far as researched in this article, does not exist at this moment.
This research aims to fill this gap by presenting an application design that focuses on supporting reading comprehension by focusing on comprehensibility and interest, while still being based on narrative content to allow for pleasure reading, in accordance to the theories previously discussed.
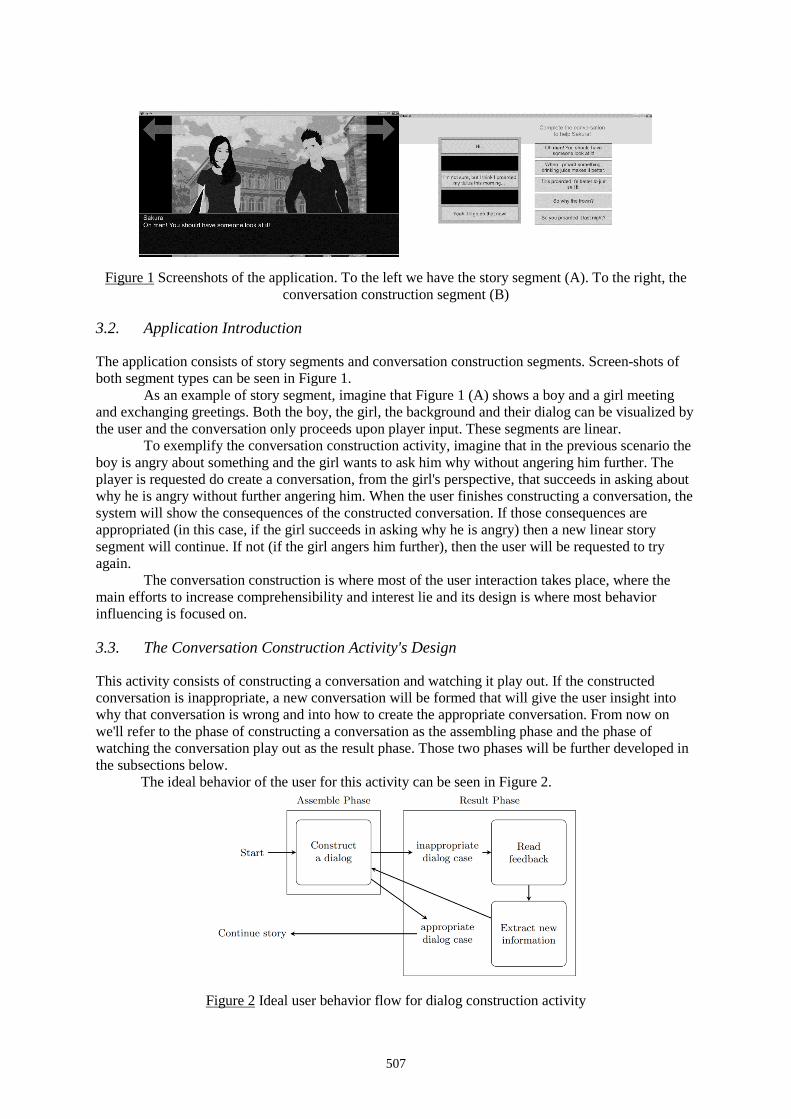
507
Figure 1 Screenshots of the application. To the left we have the story segment (A). To the right, the conversation construction segment (B)
3.2. Application Introduction
The application consists of story segments and conversation construction segments. Screen-shots of both segment types can be seen in Figure 1.
As an example of story segment, imagine that Figure 1 (A) shows a boy and a girl meeting and exchanging greetings. Both the boy, the girl, the background and their dialog can be visualized by the user and the conversation only proceeds upon player input. These segments are linear.
To exemplify the conversation construction activity, imagine that in the previous scenario the boy is angry about something and the girl wants to ask him why without angering him further. The player is requested do create a conversation, from the girl's perspective, that succeeds in asking about why he is angry without further angering him. When the user finishes constructing a conversation, the system will show the consequences of the constructed conversation. If those consequences are appropriated (in this case, if the girl succeeds in asking why he is angry) then a new linear story segment will continue. If not (if the girl angers him further), then the user will be requested to try again.
The conversation construction is where most of the user interaction takes place, where the main efforts to increase comprehensibility and interest lie and its design is where most behavior influencing is focused on.
3.3. The Conversation Construction Activity's Design
This activity consists of constructing a conversation and watching it play out. If the constructed conversation is inappropriate, a new conversation will be formed that will give the user insight into why that conversation is wrong and into how to create the appropriate conversation. From now on we'll refer to the phase of constructing a conversation as the assembling phase and the phase of watching the conversation play out as the result phase. Those two phases will be further developed in the subsections below.
The ideal behavior of the user for this activity can be seen in Figure 2.
Figure 2 Ideal user behavior flow for dialog construction activity
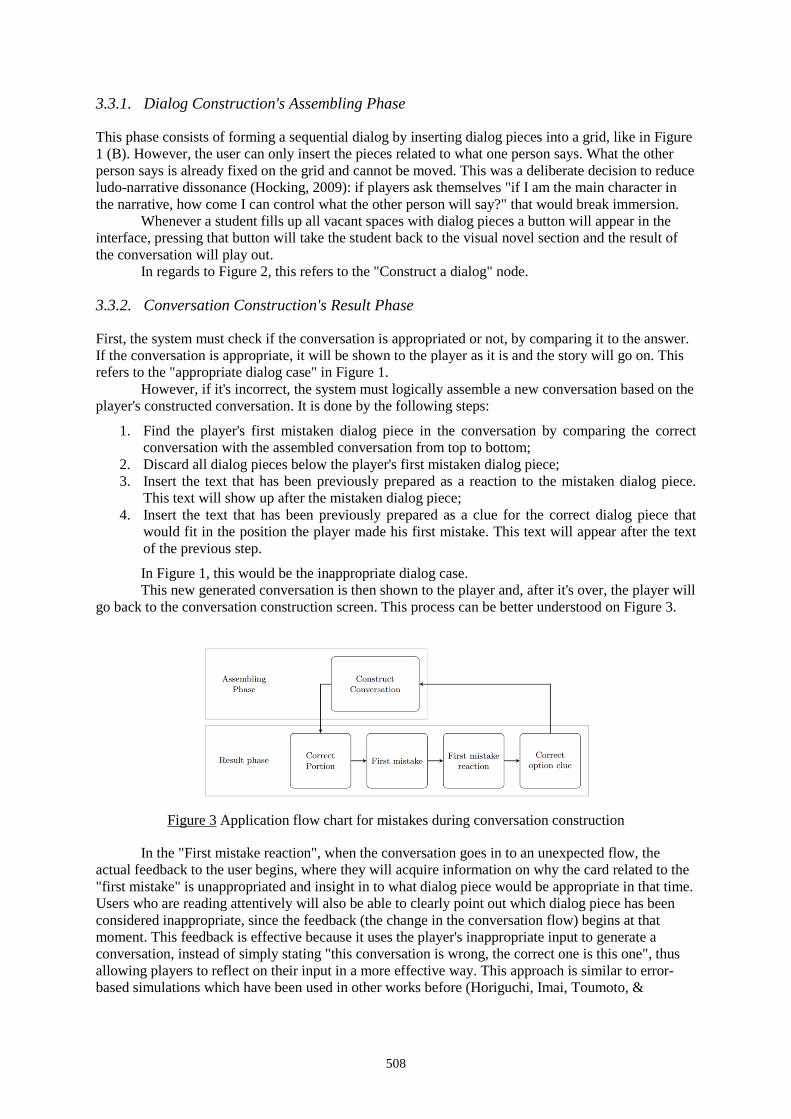
508
3.3.1. Dialog Construction's Assembling Phase
This phase consists of forming a sequential dialog by inserting dialog pieces into a grid, like in Figure 1 (B). However, the user can only insert the pieces related to what one person says. What the other person says is already fixed on the grid and cannot be moved. This was a deliberate decision to reduce ludo-narrative dissonance (Hocking, 2009): if players ask themselves "if I am the main character in the narrative, how come I can control what the other person will say?" that would break immersion.
Whenever a student fills up all vacant spaces with dialog pieces a button will appear in the interface, pressing that button will take the student back to the visual novel section and the result of the conversation will play out.
In regards to Figure 2, this refers to the "Construct a dialog" node.
3.3.2. Conversation Construction's Result Phase
First, the system must check if the conversation is appropriated or not, by comparing it to the answer. If the conversation is appropriate, it will be shown to the player as it is and the story will go on. This refers to the "appropriate dialog case" in Figure 1.
However, if it's incorrect, the system must logically assemble a new conversation based on the player's constructed conversation. It is done by the following steps:
1. Find the player's first mistaken dialog piece in the conversation by comparing the correct conversation with the assembled conversation from top to bottom;
2. Discard all dialog pieces below the player's first mistaken dialog piece; 3. Insert the text that has been previously prepared as a reaction to the mistaken dialog piece.
This text will show up after the mistaken dialog piece; 4. Insert the text that has been previously prepared as a clue for the correct dialog piece that
would fit in the position the player made his first mistake. This text will appear after the text of the previous step.
In Figure 1, this would be the inappropriate dialog case. This new generated conversation is then shown to the player and, after it's over, the player will
go back to the conversation construction screen. This process can be better understood on Figure 3.
Figure 3 Application flow chart for mistakes during conversation construction
In the "First mistake reaction", when the conversation goes in to an unexpected flow, the actual feedback to the user begins, where they will acquire information on why the card related to the "first mistake" is unappropriated and insight in to what dialog piece would be appropriate in that time. Users who are reading attentively will also be able to clearly point out which dialog piece has been considered inappropriate, since the feedback (the change in the conversation flow) begins at that moment. This feedback is effective because it uses the player's inappropriate input to generate a conversation, instead of simply stating "this conversation is wrong, the correct one is this one", thus allowing players to reflect on their input in a more effective way. This approach is similar to error-based simulations which have been used in other works before (Horiguchi, Imai, Toumoto, &
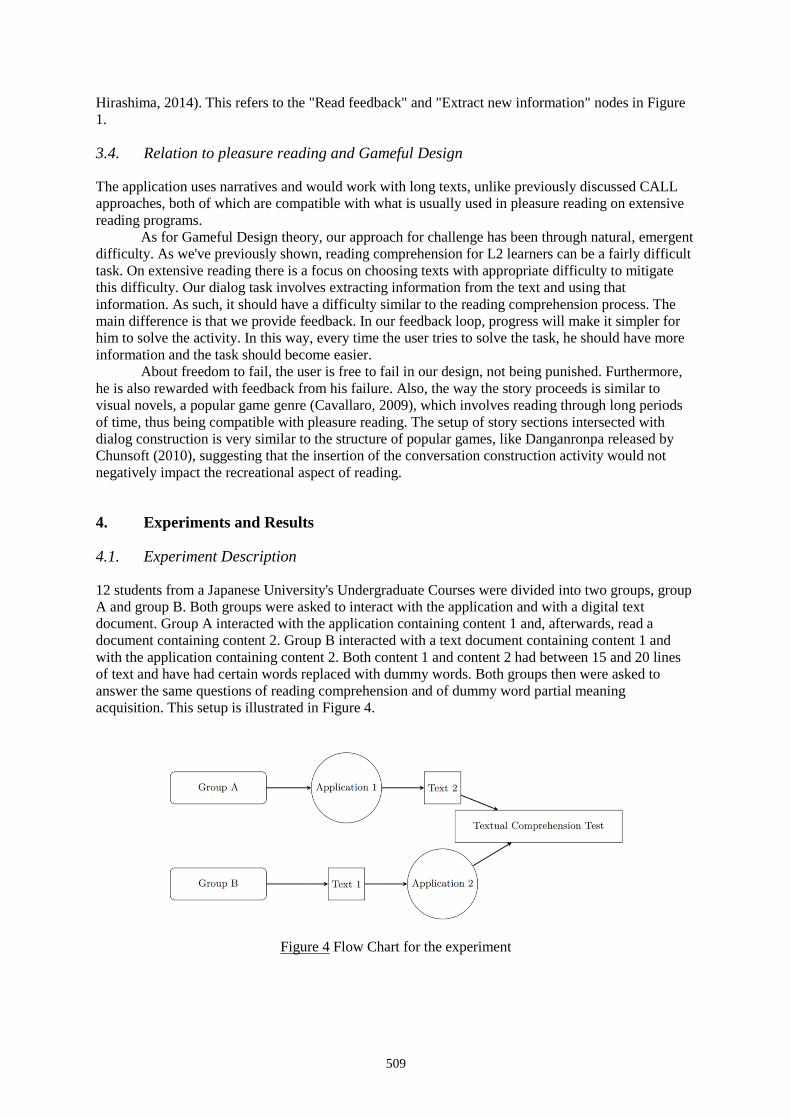
509
Hirashima, 2014). This refers to the "Read feedback" and "Extract new information" nodes in Figure 1.
3.4. Relation to pleasure reading and Gameful Design
The application uses narratives and would work with long texts, unlike previously discussed CALL approaches, both of which are compatible with what is usually used in pleasure reading on extensive reading programs.
As for Gameful Design theory, our approach for challenge has been through natural, emergent difficulty. As we've previously shown, reading comprehension for L2 learners can be a fairly difficult task. On extensive reading there is a focus on choosing texts with appropriate difficulty to mitigate this difficulty. Our dialog task involves extracting information from the text and using that information. As such, it should have a difficulty similar to the reading comprehension process. The main difference is that we provide feedback. In our feedback loop, progress will make it simpler for him to solve the activity. In this way, every time the user tries to solve the task, he should have more information and the task should become easier.
About freedom to fail, the user is free to fail in our design, not being punished. Furthermore, he is also rewarded with feedback from his failure. Also, the way the story proceeds is similar to visual novels, a popular game genre (Cavallaro, 2009), which involves reading through long periods of time, thus being compatible with pleasure reading. The setup of story sections intersected with dialog construction is very similar to the structure of popular games, like Danganronpa released by Chunsoft (2010), suggesting that the insertion of the conversation construction activity would not negatively impact the recreational aspect of reading.
4. Experiments and Results
4.1. Experiment Description
12 students from a Japanese University's Undergraduate Courses were divided into two groups, group A and group B. Both groups were asked to interact with the application and with a digital text document. Group A interacted with the application containing content 1 and, afterwards, read a document containing content 2. Group B interacted with a text document containing content 1 and with the application containing content 2. Both content 1 and content 2 had between 15 and 20 lines of text and have had certain words replaced with dummy words. Both groups then were asked to answer the same questions of reading comprehension and of dummy word partial meaning acquisition. This setup is illustrated in Figure 4.
Figure 4 Flow Chart for the experiment
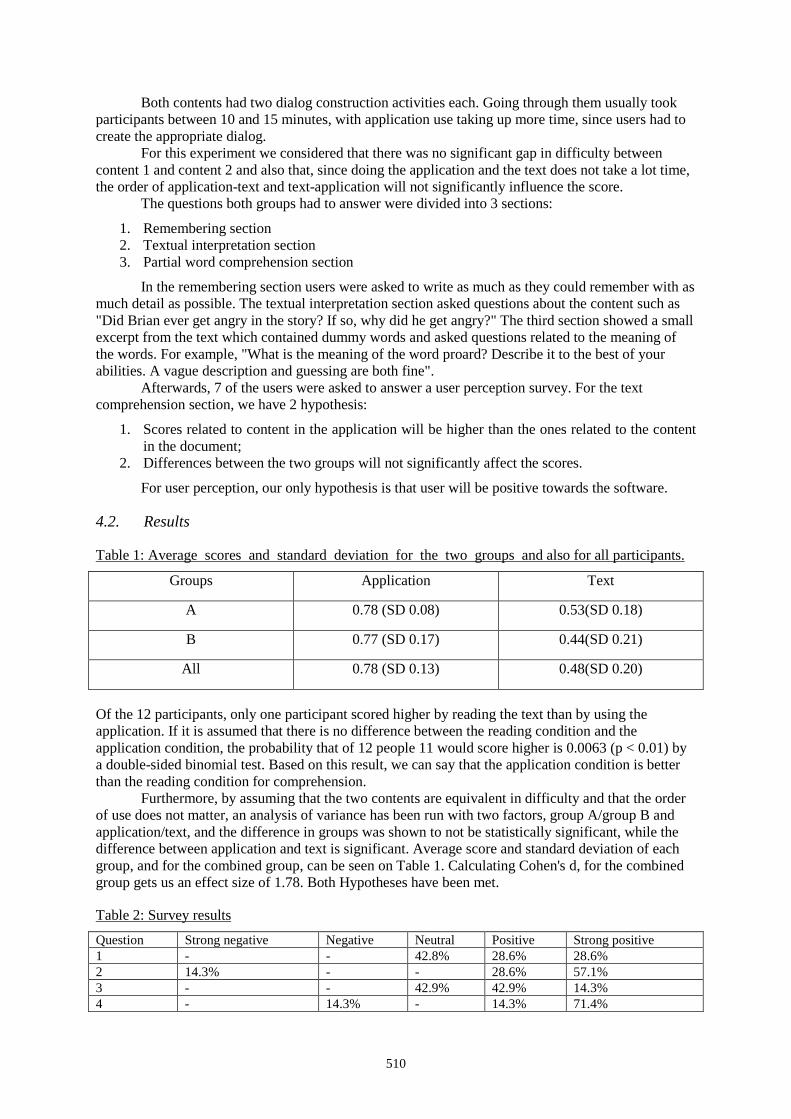
510
Both contents had two dialog construction activities each. Going through them usually took participants between 10 and 15 minutes, with application use taking up more time, since users had to create the appropriate dialog.
For this experiment we considered that there was no significant gap in difficulty between content 1 and content 2 and also that, since doing the application and the text does not take a lot time, the order of application-text and text-application will not significantly influence the score.
The questions both groups had to answer were divided into 3 sections:
1. Remembering section 2. Textual interpretation section 3. Partial word comprehension section
In the remembering section users were asked to write as much as they could remember with as much detail as possible. The textual interpretation section asked questions about the content such as "Did Brian ever get angry in the story? If so, why did he get angry?" The third section showed a small excerpt from the text which contained dummy words and asked questions related to the meaning of the words. For example, "What is the meaning of the word proard? Describe it to the best of your abilities. A vague description and guessing are both fine".
Afterwards, 7 of the users were asked to answer a user perception survey. For the text comprehension section, we have 2 hypothesis:
1. Scores related to content in the application will be higher than the ones related to the content in the document;
2. Differences between the two groups will not significantly affect the scores.
For user perception, our only hypothesis is that user will be positive towards the software.
4.2. Results
Table 1: Average scores and standard deviation for the two groups and also for all participants.
Groups Application Text
A 0.78 (SD 0.08) 0.53(SD 0.18)
B 0.77 (SD 0.17) 0.44(SD 0.21)
All 0.78 (SD 0.13) 0.48(SD 0.20)
Of the 12 participants, only one participant scored higher by reading the text than by using the application. If it is assumed that there is no difference between the reading condition and the application condition, the probability that of 12 people 11 would score higher is 0.0063 (p < 0.01) by a double-sided binomial test. Based on this result, we can say that the application condition is better than the reading condition for comprehension.
Furthermore, by assuming that the two contents are equivalent in difficulty and that the order of use does not matter, an analysis of variance has been run with two factors, group A/group B and application/text, and the difference in groups was shown to not be statistically significant, while the difference between application and text is significant. Average score and standard deviation of each group, and for the combined group, can be seen on Table 1. Calculating Cohen's d, for the combined group gets us an effect size of 1.78. Both Hypotheses have been met.
Table 2: Survey results
Question Strong negative Negative Neutral Positive Strong positive 1 - - 42.8% 28.6% 28.6% 2 14.3% - - 28.6% 57.1% 3 - - 42.9% 42.9% 14.3% 4 - 14.3% - 14.3% 71.4%
511
As for the user perception survey results, results can be found in Table 2. The questions are similar to a Likert scale. Favoring the application would be interpreted as positive and favoring text documents as negative. The questions are:
1. Which one is easier to understand, the application or the text document? 2. Which one makes you want to read it more, the application or the text document? 3. Which one do you think is better for studying English, the application or the text document? 4. Was the application easy to use?
The following trends were found:
1. In the area of interest, all users except for one had a positive opinion towards the application, with over half of the users completely favoring the application;
2. On perceived comprehensibility and perceived learning, half of the users had a positive opinion while the other half had a neutral opinion;
3. On usability, one user found the application a little bit hard to use, while the vast majority thought the application was easy to use;
4. The user who felt the application is a little bit hard to use is the only one user that was unfavorable towards the application in any of the areas. He also favored printed text in the area of interest.
Those trends show that the hypothesis was true. About the one user that was unfavorable towards the application, his scores were checked in order to see if his opinion affected his scores. Surprisingly, he was the only user to get a perfect grade related to the content in the application version he used, suggesting that the comprehensibility scores are not affected by dislike of the application for short passages.
5. Conclusion(s)
This application has shown promising results in offering a gain in reading comprehension while still offering narrative content for pleasure reading. Further research with a bigger sample size would create the base for further research to investigate if this leads to further gains in foreign language acquisition.
User’s higher comprehensibility when using the application can be attributed to being able to read the feedback information to solve the dialog assembling problems. This suggests that users were performing according to the ideal behavior previously defined, indicating that our efforts to create an activity that can only be practically solved by displaying the needed behavior have been successful. While this sort of approach is not the best for every type of application, when we talk about reading, which follows a linear path, this approach is promising.
As for the qualitative results, they have been overall positive, which fits well with past results suggesting good affective reception from learners in relation to DBGL (Hainey, Connolly, Boyle, Wilson, & Razak, 2016).
As for the perception of the application as an English studying tool in comparison to the paper version, around half of the users pointed to them being equally effective. And yet the comprehension scores for the application version have been much higher. This contradiction between user's perceived learning effectiveness and the actual effectiveness has also been reported before (Shelton, Neville, & McInnis, 2008). Low perceived learning is also one of the challenges of extensive reading, so making DBGL tools have a higher perceived learning by students should positively impact their performance and studies in that direction are necessary, such as measuring differences in flow and motivation between implicit and explicit learning.
Remaining issues would be the low perceived learning, the small sample size and the fact that the design relies on the presence of conversations. Expansions to this research could focus on making learning more explicit by mixing the narratives with explicit vocabulary teaching, thus making the learning process more obvious to the student. Another problem is that, currently, producing content for the application is a complex task. Creating a tool to assist this process would allow content to be created by teachers and other content creators.
512
Another direction would be creating a new application design in the same vein but with a content agnostic approach, allowing it to be used in texts that do not contain conversations. And finally producing enough content to test the application in an extensive reading context in order to measure second language acquisition gains.
Acknowledgements
This work was partially supported by JSPS KAKENHI Grant Number 26280127 and 15H02931.
References
Alkhateeb, M., Hayashi, Y., Rajab, T., & Hirashima, T. (2015). Comparison between kit-build and scratch-build concept mapping methods in supporting EFL reading comprehension. The Journal of Information and Systems in Education, 14, 13-27.
Alkhateeb, M., Hayashi, Y., Rajab, T., & Hirashima, T. (2016). Experimental Evaluation of the KB-mapping Method to Avoid Sentence-by-Sentence Map-building Style in EFL Reading with Concept Mapping. The Journal of Information and Systems in Education, 15, 1-14.
Bowman, N. D. (2008). A PAT on the Back: Media Flow Theory Revis (it) ed. Rocky Mountain Communication Review, 4.
Brown, R. V. (2000). Extensive reading in action. Seinan Gakuin University, Department of Literature, Division of Foreign Languages, dissertation thesis, 41, 79-123.
Cavallaro, D. (2009). Anime and the visual novel: narrative structure, design and play at the crossroads of animation and computer games. McFarland.
Chunsoft, S. (2010). Danganronpa: Trigger Happy Havoc. Cobb, T. (2007). Computing the vocabulary demands of L2 reading. Language Learning \& Technology, 11, 38-
63. Deci, E. L., & Ryan, R. M. (2012). Motivation, personality, and development within embedded social contexts:
An overview of self-determination theory. The Oxford handbook of human motivation, 85-107. Deterding, S. (2015). The lens of intrinsic skill atoms: A method for gameful design. Human--Computer
Interaction, 30, 294-335. Elley, W. B., & Mangubhai, F. (1983). The impact of reading on second language learning. Reading research
quarterly, 53-67. Furtado, P., Hirashima, T., & Hayashi, Y. (2017). Transforming Foreign Language Narratives into Interactive
Reading Applications Designed for Comprehensibility and Interest. International Conference on Artificial Intelligence in Education, (pp. 510-513).
Grabe, W. P., & Stoller, F. L. (2013). Teaching and researching: Reading. Routledge. Hafiz, F. M., & Tudor, I. (1989). Extensive reading and the development of language skills. ELT journal, 43, 4-
13. Hainey, T., Connolly, T. M., Boyle, E. A., Wilson, A., & Razak, A. (2016). A systematic literature review of
games-based learning empirical evidence in primary education. Computers \& Education, 102, 202-223. Harris, S. (2001). The Role of Extensive Reading in the Development of Second Language Proficiency in
Secondary Level Education. Hitosugi, C. I., & Day, R. R. (2004). Extensive reading in Japanese. Reading in a foreign language, 16, 20. Hitosugi, C. I., Schmidt, M., & Hayashi, K. (2014). Digital game-based learning (DGBL) in the L2 classroom:
The impact of the UNś off-the-shelf videogame, Food Force, on learner affect and vocabulary retention. CALICO Journal, 31, 19.
Hocking, C. (2009). Ludonarrative dissonance in Bioshock: The problem of what the game is about. Well Played 1.0, (pp. 114-117).
Horiguchi, T., Imai, I., Toumoto, T., & Hirashima, T. (2014). Error-Based Simulation for Error-Awareness in Learning Mechanics: An Evaluation. Educational Technology \& Society, 17, 1-13.
Horst, M. (2005). Learning L2 vocabulary through extensive reading: A measurement study. Canadian Modern Language Review, 61, 355-382.
Hunt, A., & Beglar, D. (2005). A framework for developing EFL reading vocabulary. Reading in a Foreign language, 17, 23.
Juul, J., & Norton, M. (2009). Easy to use and incredibly difficult: on the mythical border between interface and gameplay. Proceedings of the 4th international conference on foundations of digital Games, (pp. 107-112).
Khalifa, H., & Weir, C. J. (2009). Examining reading (Vol. 29). Ernst Klett Sprachen.

513
Krashen, S. (1982). Principles and practice in second language acquisition. Krashen, S. (2005). Free voluntary reading: New research, applications, and controversies. Anthology series-
Seameo regional language centre, 46. Nishino, T. (2007). Beginning to read extensively: A case study with Mako and Fumi. Reading in a Foreign
Language, 19, 76. Pigada, M., & Schmitt, N. (2006). Vocabulary acquisition from extensive reading: A case study. Reading in a
foreign language, 18, 1. Przybylski, A. K., Rigby, C. S., & Ryan, R. M. (2010). A motivational model of video game engagement.
Review of general psychology, 14, 154. Shelton, B. E., Neville, D., & McInnis, B. (2008). Cybertext redux: using interactive fiction to teach german
vocabulary, reading, and culture. Proceedings of the 8th international conference on International conference for the learning sciences-Volume 3, (pp. 128-129).
Tang, S., Hanneghan, M., & El Rhalibi, A. (2009). Introduction to games-based learning. Games Based Learning Advancements for Multi-Sensory Human Computer Interfaces. New York: IGI Global.
Vahdat, S., & Behbahani, A. R. (2013). The effect of video games on Iranian EFL learners’ vocabulary learning. Reading, 13.
Wang, Y.-H. (2014). Developing and evaluating an adaptive Business English self-learning system for EFL vocabulary learning. Mathematical Problems in Engineering, 2014.
Wang, Y.-H. (2016). Promoting contextual vocabulary learning through an adaptive computer-assisted EFL reading system. Journal of Computer Assisted Learning.
Yamashita, J. (2008). Extensive reading and development of different aspects of L2 proficiency. System, 36, 661-672.
Yamashita, J. (2013). Effects of extensive reading on reading attitudes in a foreign language. Reading in a Foreign Language, 25, 248.
Yang, A. (2001). Reading and the non-academic learner: A mystery solved. System, 29, 451-466. Yudintseva, A. (2015). Synthesis of Research on Video Games for the Four Second Language Skills and
Vocabulary Practice.
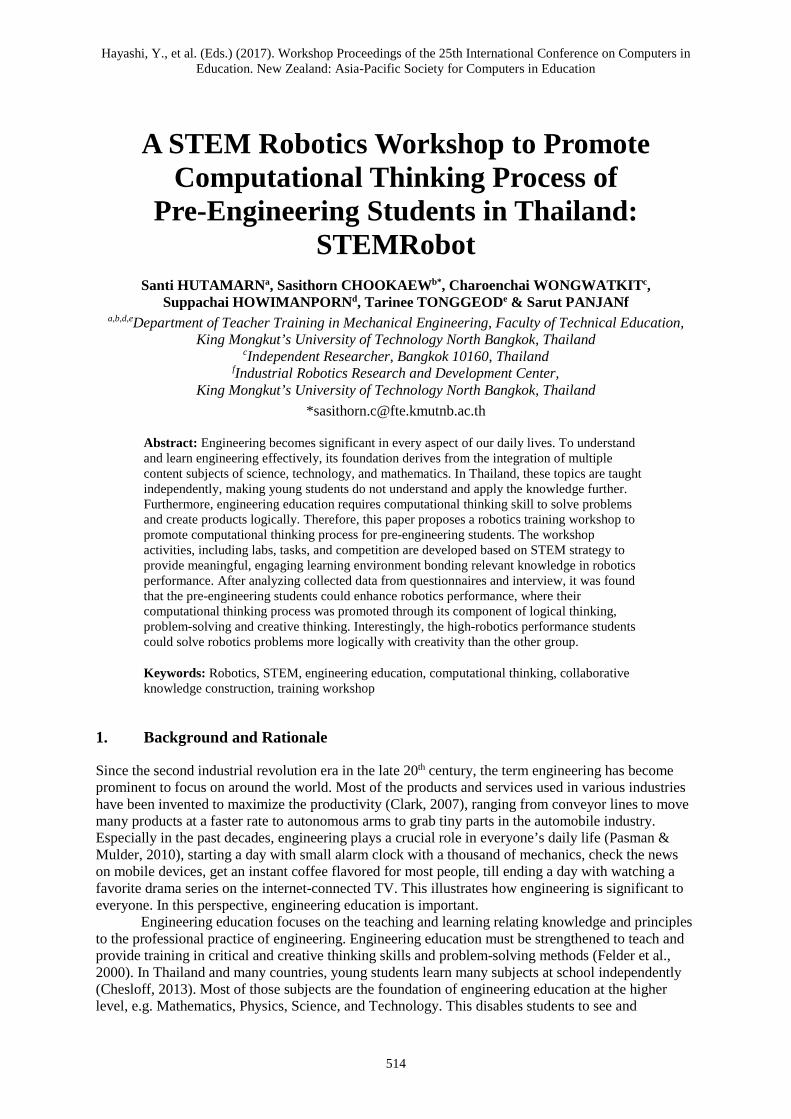
Hayashi, Y., et al. (Eds.) (2017). Workshop Proceedings of the 25th International Conference on Computers in Education. New Zealand: Asia-Pacific Society for Computers in Education
514
A STEM Robotics Workshop to Promote Computational Thinking Process of
Pre-Engineering Students in Thailand: STEMRobot
Santi HUTAMARNa, Sasithorn CHOOKAEWb*, Charoenchai WONGWATKITc, Suppachai HOWIMANPORNd, Tarinee TONGGEODe & Sarut PANJANf
a,b,d,eDepartment of Teacher Training in Mechanical Engineering, Faculty of Technical Education, King Mongkut’s University of Technology North Bangkok, Thailand
cIndependent Researcher, Bangkok 10160, Thailand fIndustrial Robotics Research and Development Center,
King Mongkut’s University of Technology North Bangkok, Thailand *[email protected]
Abstract: Engineering becomes significant in every aspect of our daily lives. To understand and learn engineering effectively, its foundation derives from the integration of multiple content subjects of science, technology, and mathematics. In Thailand, these topics are taught independently, making young students do not understand and apply the knowledge further. Furthermore, engineering education requires computational thinking skill to solve problems and create products logically. Therefore, this paper proposes a robotics training workshop to promote computational thinking process for pre-engineering students. The workshop activities, including labs, tasks, and competition are developed based on STEM strategy to provide meaningful, engaging learning environment bonding relevant knowledge in robotics performance. After analyzing collected data from questionnaires and interview, it was found that the pre-engineering students could enhance robotics performance, where their computational thinking process was promoted through its component of logical thinking, problem-solving and creative thinking. Interestingly, the high-robotics performance students could solve robotics problems more logically with creativity than the other group.
Keywords: Robotics, STEM, engineering education, computational thinking, collaborative knowledge construction, training workshop
1. Background and Rationale
Since the second industrial revolution era in the late 20th century, the term engineering has become prominent to focus on around the world. Most of the products and services used in various industries have been invented to maximize the productivity (Clark, 2007), ranging from conveyor lines to move many products at a faster rate to autonomous arms to grab tiny parts in the automobile industry. Especially in the past decades, engineering plays a crucial role in everyone’s daily life (Pasman & Mulder, 2010), starting a day with small alarm clock with a thousand of mechanics, check the news on mobile devices, get an instant coffee flavored for most people, till ending a day with watching a favorite drama series on the internet-connected TV. This illustrates how engineering is significant to everyone. In this perspective, engineering education is important.
Engineering education focuses on the teaching and learning relating knowledge and principles to the professional practice of engineering. Engineering education must be strengthened to teach and provide training in critical and creative thinking skills and problem-solving methods (Felder et al., 2000). In Thailand and many countries, young students learn many subjects at school independently (Chesloff, 2013). Most of those subjects are the foundation of engineering education at the higher level, e.g. Mathematics, Physics, Science, and Technology. This disables students to see and
515
understand how the knowledge of multi disciplines integrate together to perform or operate certain tasks/functions of the engineering process. Furthermore, the students lack essential skills which are significantly required for an engineer; that is computational thinking process (National Academy of Engineering, 2009; Swaid, 2015).
Computational thinking was firstly introduced by Papert in 1996 as the value of applying human cognitive primitives to object oriented problems by noticing the relationships between the components of a complex system based on students’ thinking. After that, Wing (2006) proposed the computational thinking that is a kind of analytical thinking. It shares with engineering thinking in the general ways in which we might approach designing and evaluating a large, complex system that operates within the constraints of the real world that approach to solving problems, designing systems and understanding human behavior that draws on concepts fundamental to computing (Wing, 2006; Wing, 2008). To enhance the computational thinking process, three major components are required, i.e. logical thinking, problem-solving skill and creative thinking (Bocconi, Chioccariello, Dettori, Ferrari, & Engelhardt, 2016). Especially for engineering education, young students should get ready and trained with carefully designed learning activities. Many research attempts to study the element of preparing high school students into engineering education such as engaging in design thinking with a little understanding of the problem of high school students (Mentzer, Becker & Sutton, 2015). In addition, the integration of science, mathematics, and engineering is a benefit of students in high school engineering they can design work without teacher prompting when the concepts were familiar (Valtorta, and Berland, 2015).
The current research interest in science, technology, engineering, and mathematics (STEM) has been emphasized in high schools and higher education (Eguchi, 2015; Thomas & Watters, 2015; Mosley, Ardito & Scollins, 2016; Master et al., 2017). In the past decade marked the beginning of a transformative time for engineering education, many research has interested the challenge in engineering education is the ability to promote students’ learning by thinking and working in pursuing careers in STEM. Moreover, several researchers’ interesting design and implement STEM using robotics (Kim et al., 2015; Master et al., 2017). Educational robots enable the students to integrate different fields of knowledge, from basic mechanical devices, electrical peripherals, sensors, computer programming, to operate the robots. Meanwhile, the students have to perform systematical, logical, critical, and computational thinking to analyze the robotics environments, assemble the parts, configure to meet the surrounding conditions. These processes require hands-on exercises with trial-error basis to achieve the goals (Leonard et al., 2016).
Presently, many research used the advantage of robotics that offers opportunities for students to engage computational thinking skills (Atmatzidou & Demetriadis, 2015). Computational thinking tries to strengthen the development of students’ learning achievement. Computer programming has become an important skill to express ideas, inspiring student’s originality while helping develop logical thinking. Many studies attempt to use robotics technologies in education is increasingly common and has the potential to impact students' learning (Kucuk & Sisman, 2017).
Using robotic programming software has become an increasingly popular, and the use of tools is regulated in education. The graphic programming environments play an essential role to enhance computational thinking in the learning process (Basogain et al., 2017). Thus, finding ways to foster computational thinking and to incorporate computer programming in many research, such as Chen, et al. (2017) proposed framework of computational thinking for elementary school where a new humanoid robotics curriculum has good psychometric properties and has the potential to reveal student learning challenges and growth in terms of computational thinking.
Based on this significant perspectives, therefore, this study aims to propose a STEM-based robotics workshop to enhance pre-engineering students in Thailand. mBot educational robot kit was used in a series of workshop tasks and activities, which were developed accordingly to promote students’ computational thinking process. To direct this study, several research questions were formulated: 1) how is the computational thinking process of the students who participate in the proposed workshop, and 2) what are their engagements towards the STEM-based activities in the proposed workshop?
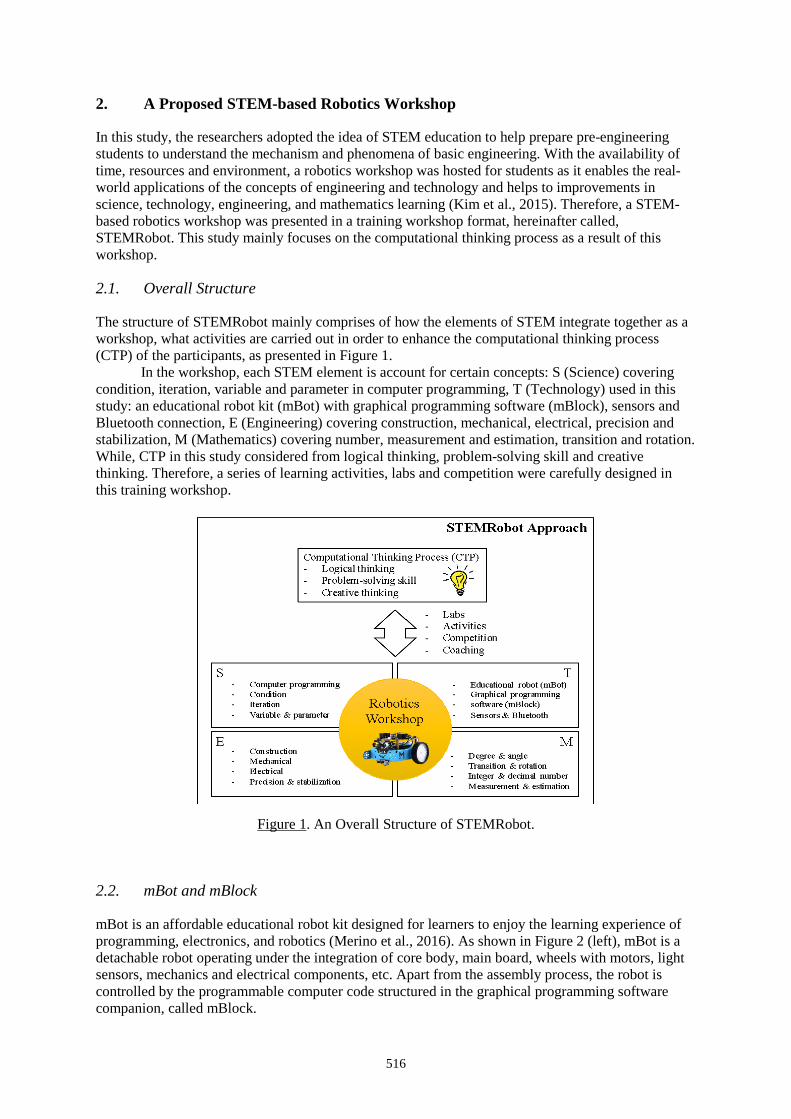
516
2. A Proposed STEM-based Robotics Workshop
In this study, the researchers adopted the idea of STEM education to help prepare pre-engineering students to understand the mechanism and phenomena of basic engineering. With the availability of time, resources and environment, a robotics workshop was hosted for students as it enables the real-world applications of the concepts of engineering and technology and helps to improvements in science, technology, engineering, and mathematics learning (Kim et al., 2015). Therefore, a STEM-based robotics workshop was presented in a training workshop format, hereinafter called, STEMRobot. This study mainly focuses on the computational thinking process as a result of this workshop.
2.1. Overall Structure
The structure of STEMRobot mainly comprises of how the elements of STEM integrate together as a workshop, what activities are carried out in order to enhance the computational thinking process (CTP) of the participants, as presented in Figure 1.
In the workshop, each STEM element is account for certain concepts: S (Science) covering condition, iteration, variable and parameter in computer programming, T (Technology) used in this study: an educational robot kit (mBot) with graphical programming software (mBlock), sensors and Bluetooth connection, E (Engineering) covering construction, mechanical, electrical, precision and stabilization, M (Mathematics) covering number, measurement and estimation, transition and rotation. While, CTP in this study considered from logical thinking, problem-solving skill and creative thinking. Therefore, a series of learning activities, labs and competition were carefully designed in this training workshop.
Figure 1. An Overall Structure of STEMRobot.
2.2. mBot and mBlock
mBot is an affordable educational robot kit designed for learners to enjoy the learning experience of programming, electronics, and robotics (Merino et al., 2016). As shown in Figure 2 (left), mBot is a detachable robot operating under the integration of core body, main board, wheels with motors, light sensors, mechanics and electrical components, etc. Apart from the assembly process, the robot is controlled by the programmable computer code structured in the graphical programming software companion, called mBlock.
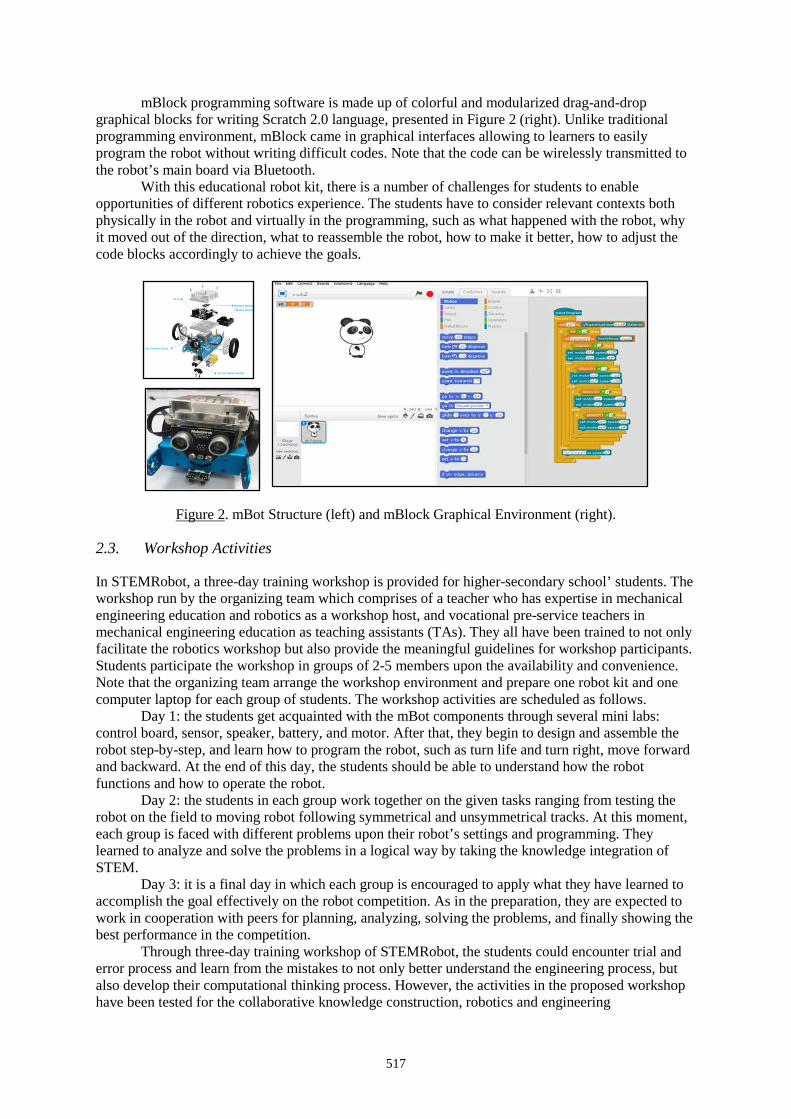
517
mBlock programming software is made up of colorful and modularized drag-and-drop graphical blocks for writing Scratch 2.0 language, presented in Figure 2 (right). Unlike traditional programming environment, mBlock came in graphical interfaces allowing to learners to easily program the robot without writing difficult codes. Note that the code can be wirelessly transmitted to the robot’s main board via Bluetooth.
With this educational robot kit, there is a number of challenges for students to enable opportunities of different robotics experience. The students have to consider relevant contexts both physically in the robot and virtually in the programming, such as what happened with the robot, why it moved out of the direction, what to reassemble the robot, how to make it better, how to adjust the code blocks accordingly to achieve the goals.
Figure 2. mBot Structure (left) and mBlock Graphical Environment (right).
2.3. Workshop Activities
In STEMRobot, a three-day training workshop is provided for higher-secondary school’ students. The workshop run by the organizing team which comprises of a teacher who has expertise in mechanical engineering education and robotics as a workshop host, and vocational pre-service teachers in mechanical engineering education as teaching assistants (TAs). They all have been trained to not only facilitate the robotics workshop but also provide the meaningful guidelines for workshop participants. Students participate the workshop in groups of 2-5 members upon the availability and convenience. Note that the organizing team arrange the workshop environment and prepare one robot kit and one computer laptop for each group of students. The workshop activities are scheduled as follows.
Day 1: the students get acquainted with the mBot components through several mini labs: control board, sensor, speaker, battery, and motor. After that, they begin to design and assemble the robot step-by-step, and learn how to program the robot, such as turn life and turn right, move forward and backward. At the end of this day, the students should be able to understand how the robot functions and how to operate the robot.
Day 2: the students in each group work together on the given tasks ranging from testing the robot on the field to moving robot following symmetrical and unsymmetrical tracks. At this moment, each group is faced with different problems upon their robot’s settings and programming. They learned to analyze and solve the problems in a logical way by taking the knowledge integration of STEM.
Day 3: it is a final day in which each group is encouraged to apply what they have learned to accomplish the goal effectively on the robot competition. As in the preparation, they are expected to work in cooperation with peers for planning, analyzing, solving the problems, and finally showing the best performance in the competition.
Through three-day training workshop of STEMRobot, the students could encounter trial and error process and learn from the mistakes to not only better understand the engineering process, but also develop their computational thinking process. However, the activities in the proposed workshop have been tested for the collaborative knowledge construction, robotics and engineering
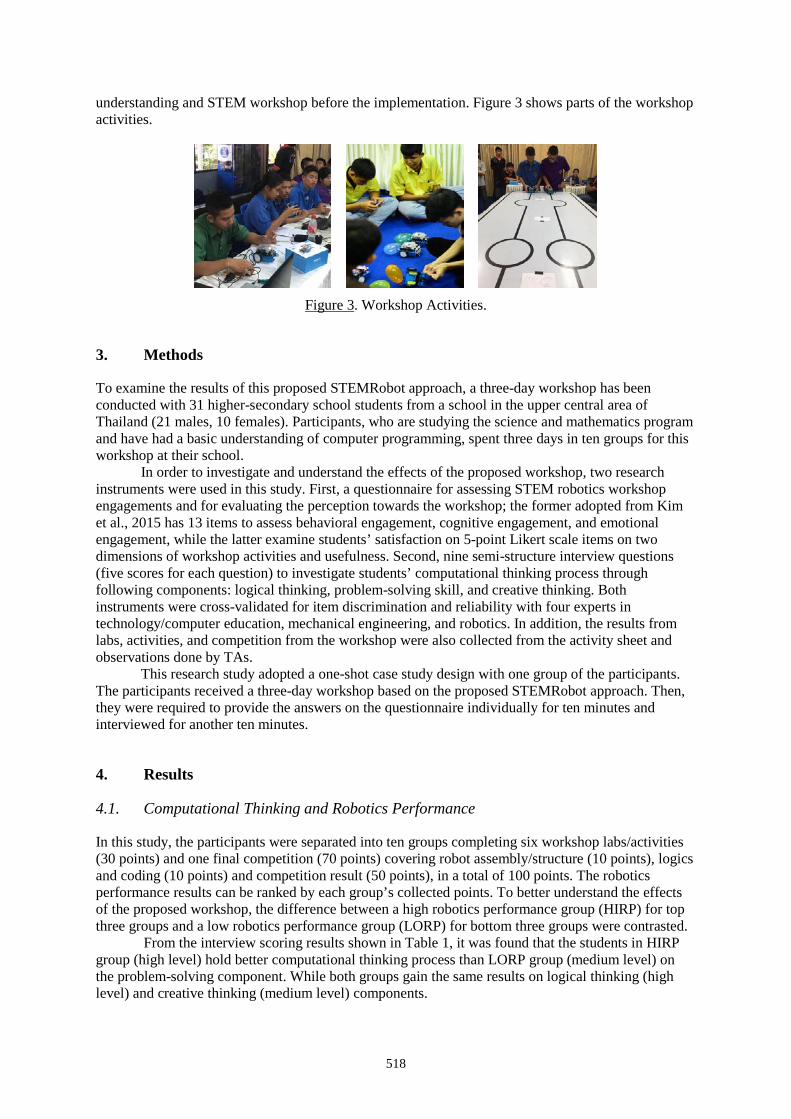
518
understanding and STEM workshop before the implementation. Figure 3 shows parts of the workshop activities.
Figure 3. Workshop Activities.
3. Methods
To examine the results of this proposed STEMRobot approach, a three-day workshop has been conducted with 31 higher-secondary school students from a school in the upper central area of Thailand (21 males, 10 females). Participants, who are studying the science and mathematics program and have had a basic understanding of computer programming, spent three days in ten groups for this workshop at their school.
In order to investigate and understand the effects of the proposed workshop, two research instruments were used in this study. First, a questionnaire for assessing STEM robotics workshop engagements and for evaluating the perception towards the workshop; the former adopted from Kim et al., 2015 has 13 items to assess behavioral engagement, cognitive engagement, and emotional engagement, while the latter examine students’ satisfaction on 5-point Likert scale items on two dimensions of workshop activities and usefulness. Second, nine semi-structure interview questions (five scores for each question) to investigate students’ computational thinking process through following components: logical thinking, problem-solving skill, and creative thinking. Both instruments were cross-validated for item discrimination and reliability with four experts in technology/computer education, mechanical engineering, and robotics. In addition, the results from labs, activities, and competition from the workshop were also collected from the activity sheet and observations done by TAs.
This research study adopted a one-shot case study design with one group of the participants. The participants received a three-day workshop based on the proposed STEMRobot approach. Then, they were required to provide the answers on the questionnaire individually for ten minutes and interviewed for another ten minutes.
4. Results
4.1. Computational Thinking and Robotics Performance
In this study, the participants were separated into ten groups completing six workshop labs/activities (30 points) and one final competition (70 points) covering robot assembly/structure (10 points), logics and coding (10 points) and competition result (50 points), in a total of 100 points. The robotics performance results can be ranked by each group’s collected points. To better understand the effects of the proposed workshop, the difference between a high robotics performance group (HIRP) for top three groups and a low robotics performance group (LORP) for bottom three groups were contrasted.
From the interview scoring results shown in Table 1, it was found that the students in HIRP group (high level) hold better computational thinking process than LORP group (medium level) on the problem-solving component. While both groups gain the same results on logical thinking (high level) and creative thinking (medium level) components.
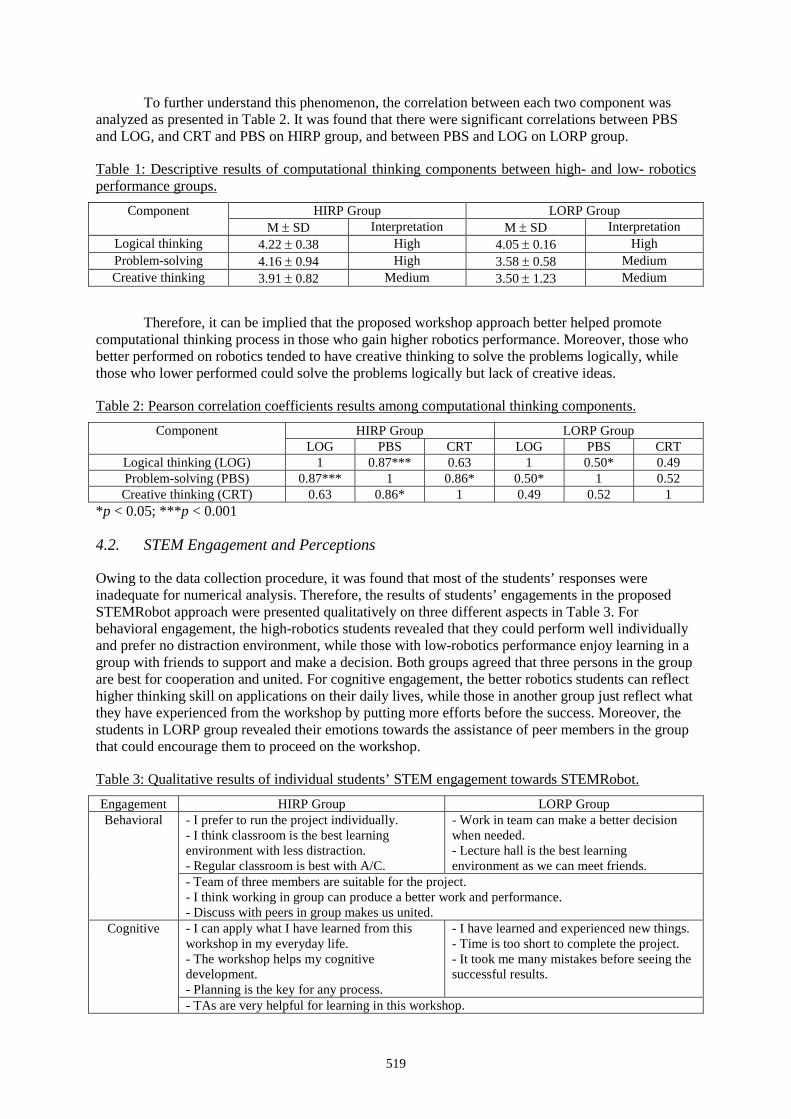
519
To further understand this phenomenon, the correlation between each two component was analyzed as presented in Table 2. It was found that there were significant correlations between PBS and LOG, and CRT and PBS on HIRP group, and between PBS and LOG on LORP group.
Table 1: Descriptive results of computational thinking components between high- and low- robotics performance groups.
Component HIRP Group LORP Group M ± SD Interpretation M ± SD Interpretation
Logical thinking 4.22 ± 0.38 High 4.05 ± 0.16 High Problem-solving 4.16 ± 0.94 High 3.58 ± 0.58 Medium Creative thinking 3.91 ± 0.82 Medium 3.50 ± 1.23 Medium
Therefore, it can be implied that the proposed workshop approach better helped promote computational thinking process in those who gain higher robotics performance. Moreover, those who better performed on robotics tended to have creative thinking to solve the problems logically, while those who lower performed could solve the problems logically but lack of creative ideas.
Table 2: Pearson correlation coefficients results among computational thinking components. Component HIRP Group LORP Group
LOG PBS CRT LOG PBS CRT Logical thinking (LOG) 1 0.87*** 0.63 1 0.50* 0.49 Problem-solving (PBS) 0.87*** 1 0.86* 0.50* 1 0.52 Creative thinking (CRT) 0.63 0.86* 1 0.49 0.52 1
*p < 0.05; ***p < 0.001
4.2. STEM Engagement and Perceptions
Owing to the data collection procedure, it was found that most of the students’ responses were inadequate for numerical analysis. Therefore, the results of students’ engagements in the proposed STEMRobot approach were presented qualitatively on three different aspects in Table 3. For behavioral engagement, the high-robotics students revealed that they could perform well individually and prefer no distraction environment, while those with low-robotics performance enjoy learning in a group with friends to support and make a decision. Both groups agreed that three persons in the group are best for cooperation and united. For cognitive engagement, the better robotics students can reflect higher thinking skill on applications on their daily lives, while those in another group just reflect what they have experienced from the workshop by putting more efforts before the success. Moreover, the students in LORP group revealed their emotions towards the assistance of peer members in the group that could encourage them to proceed on the workshop.
Table 3: Qualitative results of individual students’ STEM engagement towards STEMRobot.
Engagement HIRP Group LORP Group Behavioral - I prefer to run the project individually.
- I think classroom is the best learning environment with less distraction. - Regular classroom is best with A/C.
- Work in team can make a better decision when needed. - Lecture hall is the best learning environment as we can meet friends.
- Team of three members are suitable for the project. - I think working in group can produce a better work and performance. - Discuss with peers in group makes us united.
Cognitive - I can apply what I have learned from this workshop in my everyday life. - The workshop helps my cognitive development. - Planning is the key for any process.
- I have learned and experienced new things. - Time is too short to complete the project. - It took me many mistakes before seeing the successful results.
- TAs are very helpful for learning in this workshop.
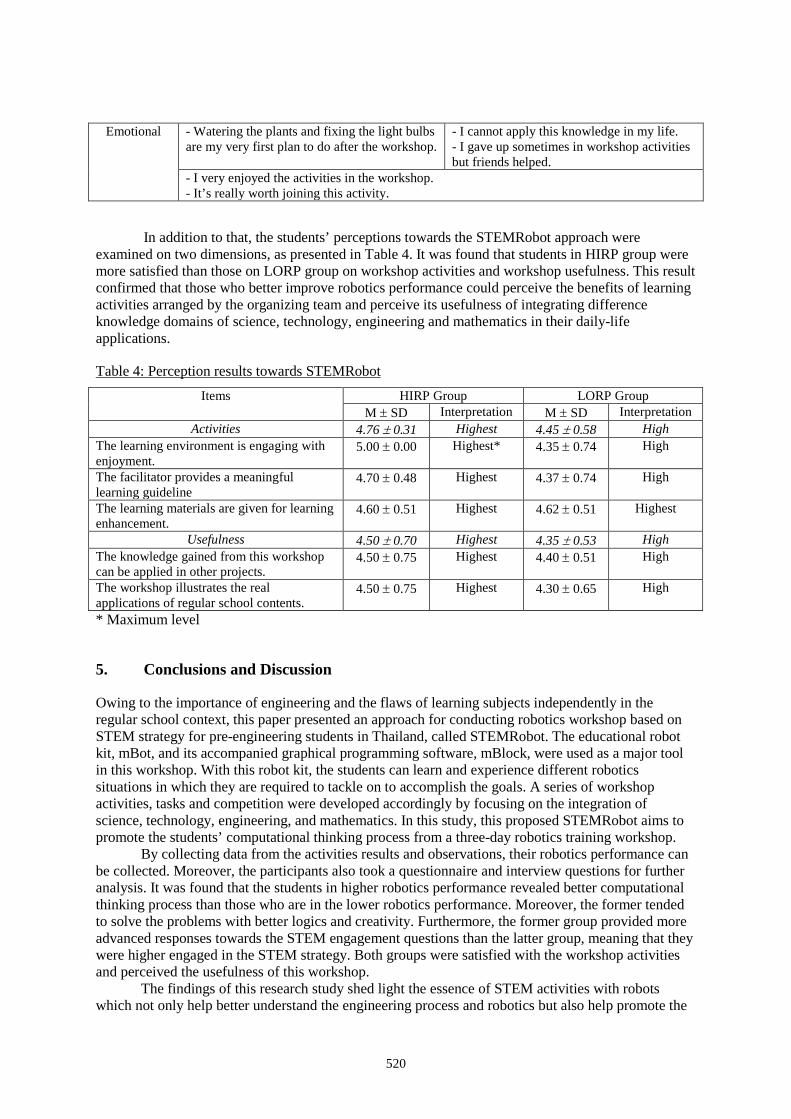
520
Emotional - Watering the plants and fixing the light bulbs are my very first plan to do after the workshop.
- I cannot apply this knowledge in my life. - I gave up sometimes in workshop activities but friends helped.
- I very enjoyed the activities in the workshop. - It’s really worth joining this activity.
In addition to that, the students’ perceptions towards the STEMRobot approach were examined on two dimensions, as presented in Table 4. It was found that students in HIRP group were more satisfied than those on LORP group on workshop activities and workshop usefulness. This result confirmed that those who better improve robotics performance could perceive the benefits of learning activities arranged by the organizing team and perceive its usefulness of integrating difference knowledge domains of science, technology, engineering and mathematics in their daily-life applications.
Table 4: Perception results towards STEMRobot Items HIRP Group LORP Group
M ± SD Interpretation M ± SD Interpretation Activities 4.76 ± 0.31 Highest 4.45 ± 0.58 High
The learning environment is engaging with enjoyment.
5.00 ± 0.00 Highest* 4.35 ± 0.74 High
The facilitator provides a meaningful learning guideline
4.70 ± 0.48 Highest 4.37 ± 0.74 High
The learning materials are given for learning enhancement.
4.60 ± 0.51 Highest 4.62 ± 0.51 Highest
Usefulness 4.50 ± 0.70 Highest 4.35 ± 0.53 High The knowledge gained from this workshop can be applied in other projects.
4.50 ± 0.75 Highest 4.40 ± 0.51 High
The workshop illustrates the real applications of regular school contents.
4.50 ± 0.75 Highest 4.30 ± 0.65 High
* Maximum level
5. Conclusions and Discussion
Owing to the importance of engineering and the flaws of learning subjects independently in the regular school context, this paper presented an approach for conducting robotics workshop based on STEM strategy for pre-engineering students in Thailand, called STEMRobot. The educational robot kit, mBot, and its accompanied graphical programming software, mBlock, were used as a major tool in this workshop. With this robot kit, the students can learn and experience different robotics situations in which they are required to tackle on to accomplish the goals. A series of workshop activities, tasks and competition were developed accordingly by focusing on the integration of science, technology, engineering, and mathematics. In this study, this proposed STEMRobot aims to promote the students’ computational thinking process from a three-day robotics training workshop.
By collecting data from the activities results and observations, their robotics performance can be collected. Moreover, the participants also took a questionnaire and interview questions for further analysis. It was found that the students in higher robotics performance revealed better computational thinking process than those who are in the lower robotics performance. Moreover, the former tended to solve the problems with better logics and creativity. Furthermore, the former group provided more advanced responses towards the STEM engagement questions than the latter group, meaning that they were higher engaged in the STEM strategy. Both groups were satisfied with the workshop activities and perceived the usefulness of this workshop.
The findings of this research study shed light the essence of STEM activities with robots which not only help better understand the engineering process and robotics but also help promote the
521
significance of computational thinking process from different aspects. However, the results of this study could not generalize to bigger population due to the limited number of participants (Polit & Beck, 2010). The finding was aligned with Eguchi (2016) and Leonard et al. (2016) that the high robotics achievers can better handle different robotics tasks logically.
Based on the existing results, we would suggest the educators on STEM, robotics, engineering to be aware of applying the proposed approach to your actual contexts with following recommendations. First, the grouping process of workshop participants is important to the success of their learning. Second, the materials and robots setup should be carefully tested at the workshop location in advance. Additionally, a series of follow-up studies can be performed upon the future implementation of the proposed approach, such as the behavioral pattern of participants, the effects of peer collaboration, and the use of digital tools to track the participants’ ongoing robotics performance.
Acknowledgement
The authors would like to acknowledge Department of Teacher Training in Mechanical Engineering, Faculty of Technical Education, and Industrial Robotics Research and Development Center, King Mongkut’s University of Technology North Bangkok for their wonderful supports. In addition, the cooperation of teachers and students at Nongchang Wittaya School are truly appreciated.
References
Atmatzidou, S., & Demetriadis, S. (2015). Advancing students’ computational thinking skills through educational robotics: A study on age and gender relevant differences. Robotics and Autonomous Systems.
Basogain, X., Olabe, M. Á., Olabe, J. C., & Rico, M. J. (2017). Computational Thinking in pre-university Blended Learning classrooms. Computers in Human Behavior.
Bocconi, S., Chioccariello, A., Dettori, G., Ferrari, A., & Engelhardt, K. (2016). Developing Computational Thinking in Compulsory Education-Implications for policy and practice. JRC Science for Policy Report.
Chen, G., Shen, J., Barth-Cohen, L., Jiang, S., Huang, X., & Eltoukhy, M. (2017). Assessing elementary students’ computational thinking in everyday reasoning and robotics programming. Computers and Education, 109, 162–175.
Chesloff, J. D. (2013). Why STEM Education Must Start in Early Childhood. Education Week, pp. 32–27. Clark, G. (2007). The Industrial Revolution. Am. Econ. Rev., 90, 802–828. Eguchi, A. (2015). RoboCupJunior for promoting STEM education, 21st century skills, and technological
advancement through robotics competition. Robotics and Autonomous Systems. Eguchi, A. (2016). Computational Thinking with Educational Robotics. Society for Information Technology &
Teacher, 79–84. Felder, R. M., Woods, D. R., Stice, J. E., & Rugarcia, A. (2000). The future of engineering education: Part 2.
Teaching methods that work. Chemical Engineering Education. Kucuk, S., & Sisman, B. (2017). Behavioral patterns of elementary students and teachers in one-to-one robotics
instruction. Computers and Education, 111, 31–43. Kim, C., Kim, D., Yuan, J., Hill, R. B., Doshi, P., & Thai, C. N. (2015). Robotics to promote elementary
education pre-service teachers’ STEM engagement, learning, and teaching. Computers and Education, 91, 14–31.
Leonard, J., Buss, A., Gamboa, R., Mitchell, M., Fashola, O. S., Hubert, T., & Almughyirah, S. (2016). Using Robotics and Game Design to Enhance Children’s Self-Efficacy, STEM Attitudes, and Computational Thinking Skills. Journal of Science Education and Technology, 25(6), 860–876.
Master, A., Cheryan, S., Moscatelli, A., & Meltzoff, A. N. (2017). Programming experience promotes higher STEM motivation among first-grade girls. Journal of Experimental Child Psychology, 160, 92–106.
Merino, P. P., Ruiz, E. S., Fernandez, G. C., & Gil, M. C. (2016). A Wireless robotic educational platform approach. In Proceedings of 2016 13th International Conference on Remote Engineering and Virtual Instrumentation (pp. 145–152).
Mentzer, N., Becker, K., & Sutton, M. (2015). Engineering Design Thinking: High School Students’ Performance and Knowledge. Journal of Engineering Education, 104(4), 417–432.
Mosley, P., Ardito, G., & Scollins, L. (2016). Robotic Cooperative Learning Promotes Student STEM Interest. American Journal of Engineering Education, 7(2), 117–128.

522
National Academy of Engineering. (2009). Engineering in K-12 Education : Understanding the Status and Improving the Prospects. Engineering Education.
Papert, S. (1996). An exploration in the space of mathematics educations. International Journal of Computers for Mathematical Learning, 1(1), 1–20.
Pasman, G., & Mulder, I. (2010). Bringing the everyday life into engineering education. In 2010 IEEE Education Engineering Conference (pp. 1433–1440).
Polit, D. F., & Beck, C. T. (2010). Generalization in quantitative and qualitative research: Myths and strategies. International Journal of Nursing Studies, 47(11), 1451–1458.
Swaid, S. I. (2015). Bringing Computational Thinking to STEM Education. Procedia Manufacturing, 3, 3657–3662.
Thomas, B., & Watters, J. J. (2015). Perspectives on Australian, Indian and Malaysian approaches to STEM education. International Journal of Educational Development, 45, 42–53.
Valtorta, C. G., & Berland, L. K. (2015). Math, Science, and Engineering Integration in a High School Engineering Course: A Qualitative Study. Journal of Pre-College Engineering Education Research, 5(5), 1–15.
Wing, J. M. (2006). Computational thinking. Communications of the ACM. Wing, J. M. (2008). Computational thinking and thinking about computing. Philosophical Transactions of the
Royal Society A: Mathematical, Physical and Engineering Sciences, 366(1881), 3717–3725.
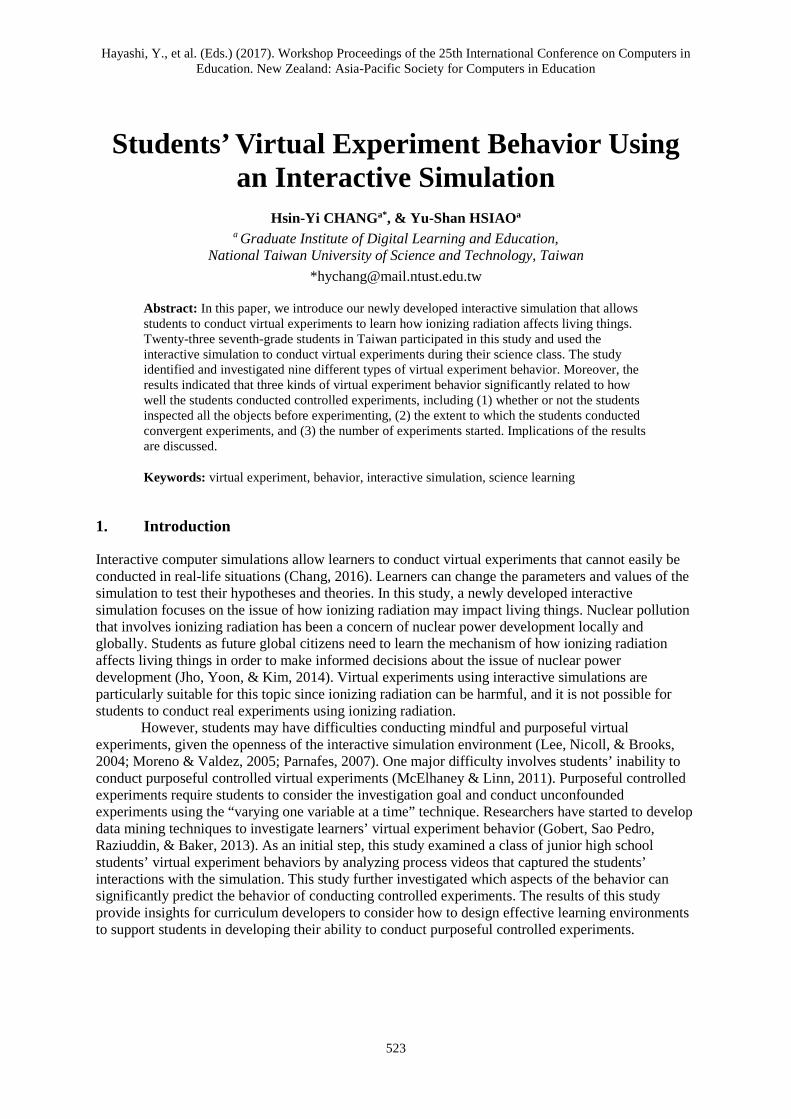
Hayashi, Y., et al. (Eds.) (2017). Workshop Proceedings of the 25th International Conference on Computers in Education. New Zealand: Asia-Pacific Society for Computers in Education
523
Students’ Virtual Experiment Behavior Using an Interactive Simulation
Hsin-Yi CHANGa*, & Yu-Shan HSIAOa a Graduate Institute of Digital Learning and Education,
National Taiwan University of Science and Technology, Taiwan *[email protected]
Abstract: In this paper, we introduce our newly developed interactive simulation that allows students to conduct virtual experiments to learn how ionizing radiation affects living things. Twenty-three seventh-grade students in Taiwan participated in this study and used the interactive simulation to conduct virtual experiments during their science class. The study identified and investigated nine different types of virtual experiment behavior. Moreover, the results indicated that three kinds of virtual experiment behavior significantly related to how well the students conducted controlled experiments, including (1) whether or not the students inspected all the objects before experimenting, (2) the extent to which the students conducted convergent experiments, and (3) the number of experiments started. Implications of the results are discussed.
Keywords: virtual experiment, behavior, interactive simulation, science learning
1. Introduction
Interactive computer simulations allow learners to conduct virtual experiments that cannot easily be conducted in real-life situations (Chang, 2016). Learners can change the parameters and values of the simulation to test their hypotheses and theories. In this study, a newly developed interactive simulation focuses on the issue of how ionizing radiation may impact living things. Nuclear pollution that involves ionizing radiation has been a concern of nuclear power development locally and globally. Students as future global citizens need to learn the mechanism of how ionizing radiation affects living things in order to make informed decisions about the issue of nuclear power development (Jho, Yoon, & Kim, 2014). Virtual experiments using interactive simulations are particularly suitable for this topic since ionizing radiation can be harmful, and it is not possible for students to conduct real experiments using ionizing radiation.
However, students may have difficulties conducting mindful and purposeful virtual experiments, given the openness of the interactive simulation environment (Lee, Nicoll, & Brooks, 2004; Moreno & Valdez, 2005; Parnafes, 2007). One major difficulty involves students’ inability to conduct purposeful controlled virtual experiments (McElhaney & Linn, 2011). Purposeful controlled experiments require students to consider the investigation goal and conduct unconfounded experiments using the “varying one variable at a time” technique. Researchers have started to develop data mining techniques to investigate learners’ virtual experiment behavior (Gobert, Sao Pedro, Raziuddin, & Baker, 2013). As an initial step, this study examined a class of junior high school students’ virtual experiment behaviors by analyzing process videos that captured the students’ interactions with the simulation. This study further investigated which aspects of the behavior can significantly predict the behavior of conducting controlled experiments. The results of this study provide insights for curriculum developers to consider how to design effective learning environments to support students in developing their ability to conduct purposeful controlled experiments.
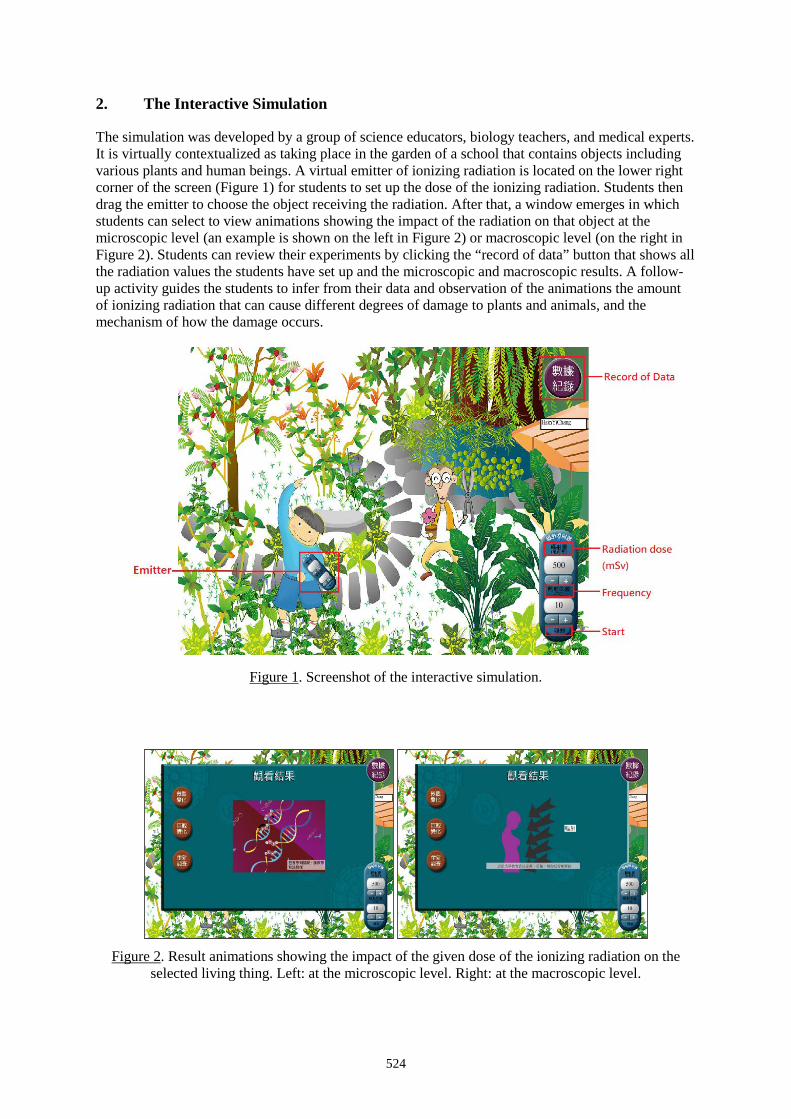
524
2. The Interactive Simulation
The simulation was developed by a group of science educators, biology teachers, and medical experts. It is virtually contextualized as taking place in the garden of a school that contains objects including various plants and human beings. A virtual emitter of ionizing radiation is located on the lower right corner of the screen (Figure 1) for students to set up the dose of the ionizing radiation. Students then drag the emitter to choose the object receiving the radiation. After that, a window emerges in which students can select to view animations showing the impact of the radiation on that object at the microscopic level (an example is shown on the left in Figure 2) or macroscopic level (on the right in Figure 2). Students can review their experiments by clicking the “record of data” button that shows all the radiation values the students have set up and the microscopic and macroscopic results. A follow-up activity guides the students to infer from their data and observation of the animations the amount of ionizing radiation that can cause different degrees of damage to plants and animals, and the mechanism of how the damage occurs.
Figure 1. Screenshot of the interactive simulation.
Figure 2. Result animations showing the impact of the given dose of the ionizing radiation on the
selected living thing. Left: at the microscopic level. Right: at the macroscopic level.
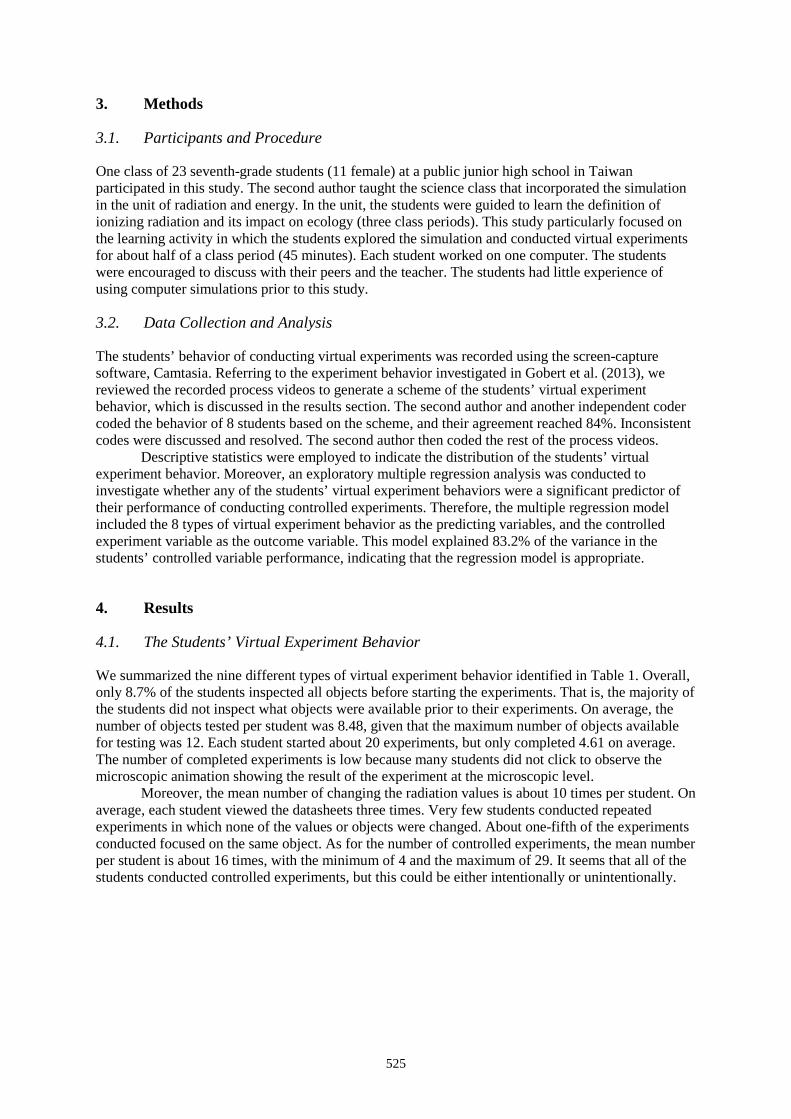
525
3. Methods
3.1. Participants and Procedure
One class of 23 seventh-grade students (11 female) at a public junior high school in Taiwan participated in this study. The second author taught the science class that incorporated the simulation in the unit of radiation and energy. In the unit, the students were guided to learn the definition of ionizing radiation and its impact on ecology (three class periods). This study particularly focused on the learning activity in which the students explored the simulation and conducted virtual experiments for about half of a class period (45 minutes). Each student worked on one computer. The students were encouraged to discuss with their peers and the teacher. The students had little experience of using computer simulations prior to this study.
3.2. Data Collection and Analysis
The students’ behavior of conducting virtual experiments was recorded using the screen-capture software, Camtasia. Referring to the experiment behavior investigated in Gobert et al. (2013), we reviewed the recorded process videos to generate a scheme of the students’ virtual experiment behavior, which is discussed in the results section. The second author and another independent coder coded the behavior of 8 students based on the scheme, and their agreement reached 84%. Inconsistent codes were discussed and resolved. The second author then coded the rest of the process videos.
Descriptive statistics were employed to indicate the distribution of the students’ virtual experiment behavior. Moreover, an exploratory multiple regression analysis was conducted to investigate whether any of the students’ virtual experiment behaviors were a significant predictor of their performance of conducting controlled experiments. Therefore, the multiple regression model included the 8 types of virtual experiment behavior as the predicting variables, and the controlled experiment variable as the outcome variable. This model explained 83.2% of the variance in the students’ controlled variable performance, indicating that the regression model is appropriate.
4. Results
4.1. The Students’ Virtual Experiment Behavior
We summarized the nine different types of virtual experiment behavior identified in Table 1. Overall, only 8.7% of the students inspected all objects before starting the experiments. That is, the majority of the students did not inspect what objects were available prior to their experiments. On average, the number of objects tested per student was 8.48, given that the maximum number of objects available for testing was 12. Each student started about 20 experiments, but only completed 4.61 on average. The number of completed experiments is low because many students did not click to observe the microscopic animation showing the result of the experiment at the microscopic level.
Moreover, the mean number of changing the radiation values is about 10 times per student. On average, each student viewed the datasheets three times. Very few students conducted repeated experiments in which none of the values or objects were changed. About one-fifth of the experiments conducted focused on the same object. As for the number of controlled experiments, the mean number per student is about 16 times, with the minimum of 4 and the maximum of 29. It seems that all of the students conducted controlled experiments, but this could be either intentionally or unintentionally.
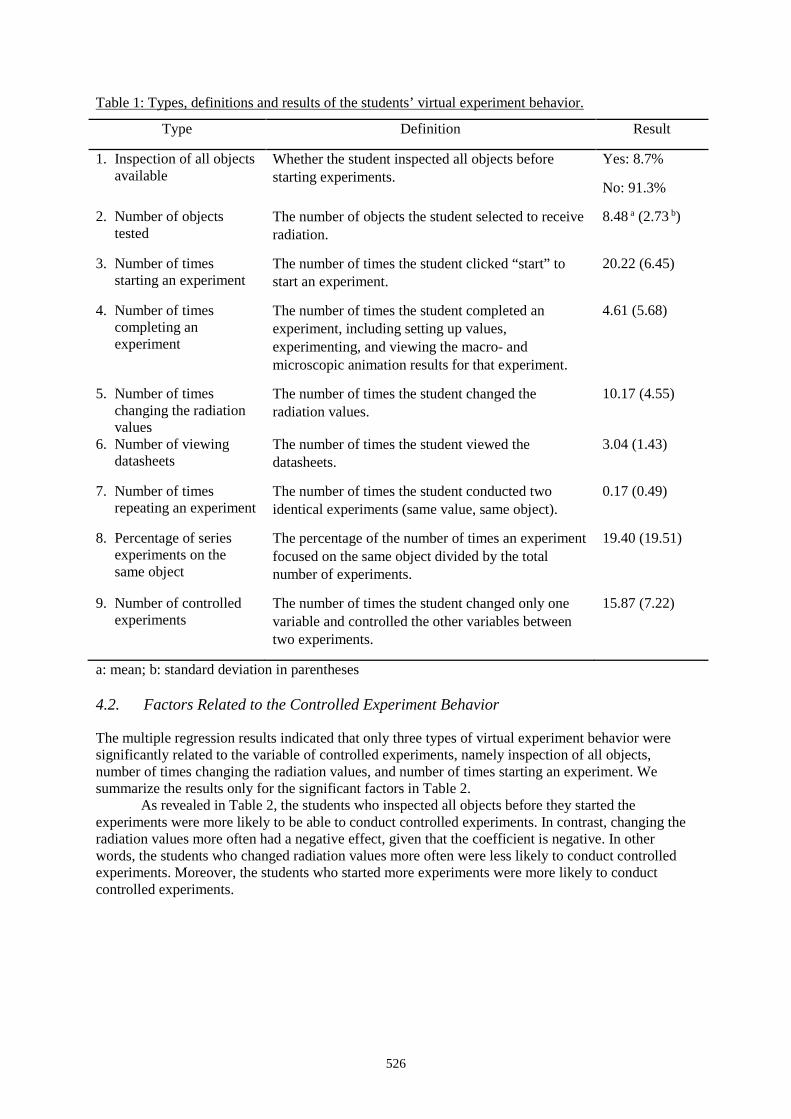
526
Table 1: Types, definitions and results of the students’ virtual experiment behavior.
Type Definition Result
1. Inspection of all objects available
Whether the student inspected all objects before starting experiments.
Yes: 8.7%
No: 91.3%
2. Number of objects tested
The number of objects the student selected to receive radiation.
8.48 a (2.73 b)
3. Number of times starting an experiment
The number of times the student clicked “start” to start an experiment.
20.22 (6.45)
4. Number of times completing an experiment
The number of times the student completed an experiment, including setting up values, experimenting, and viewing the macro- and microscopic animation results for that experiment.
4.61 (5.68)
5. Number of times changing the radiation values
The number of times the student changed the radiation values.
10.17 (4.55)
6. Number of viewing datasheets
The number of times the student viewed the datasheets.
3.04 (1.43)
7. Number of times repeating an experiment
The number of times the student conducted two identical experiments (same value, same object).
0.17 (0.49)
8. Percentage of series experiments on the same object
The percentage of the number of times an experiment focused on the same object divided by the total number of experiments.
19.40 (19.51)
9. Number of controlled experiments
The number of times the student changed only one variable and controlled the other variables between two experiments.
15.87 (7.22)
a: mean; b: standard deviation in parentheses
4.2. Factors Related to the Controlled Experiment Behavior
The multiple regression results indicated that only three types of virtual experiment behavior were significantly related to the variable of controlled experiments, namely inspection of all objects, number of times changing the radiation values, and number of times starting an experiment. We summarize the results only for the significant factors in Table 2.
As revealed in Table 2, the students who inspected all objects before they started the experiments were more likely to be able to conduct controlled experiments. In contrast, changing the radiation values more often had a negative effect, given that the coefficient is negative. In other words, the students who changed radiation values more often were less likely to conduct controlled experiments. Moreover, the students who started more experiments were more likely to conduct controlled experiments.
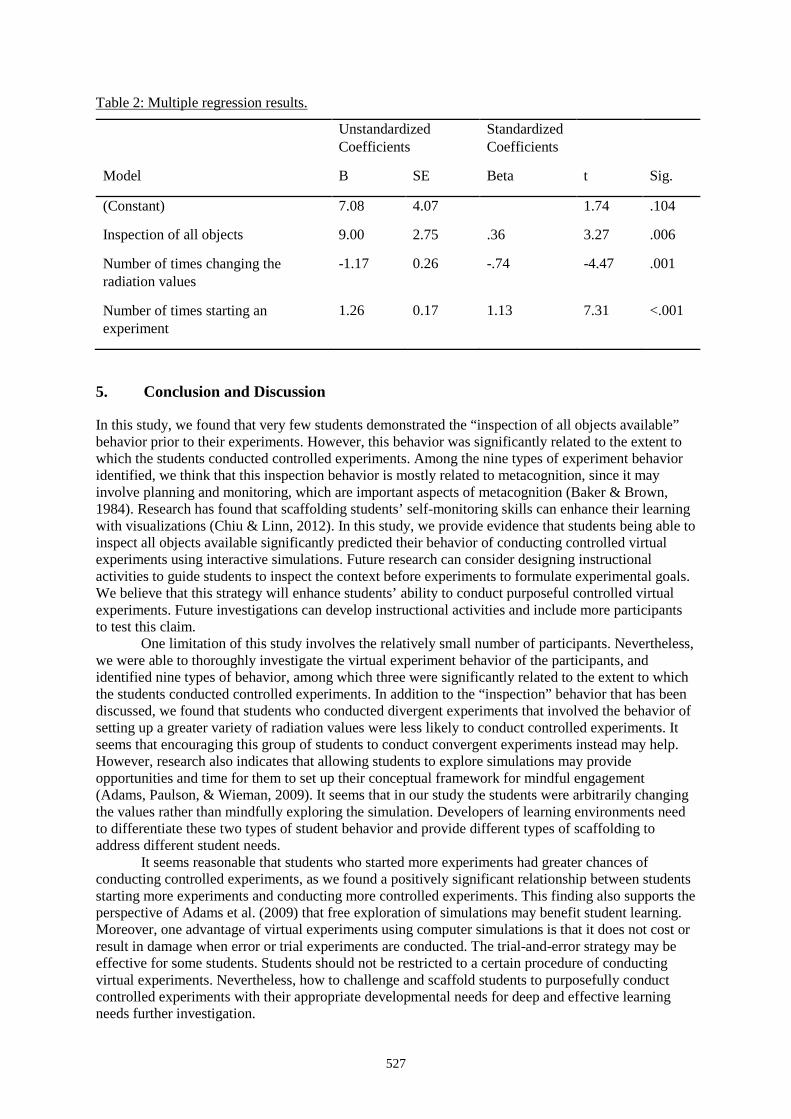
527
Table 2: Multiple regression results.
Unstandardized Coefficients
Standardized Coefficients
Model B SE Beta t Sig.
(Constant) 7.08 4.07 1.74 .104
Inspection of all objects 9.00 2.75 .36 3.27 .006
Number of times changing the radiation values
-1.17 0.26 -.74 -4.47 .001
Number of times starting an experiment
1.26 0.17 1.13 7.31 <.001
5. Conclusion and Discussion
In this study, we found that very few students demonstrated the “inspection of all objects available” behavior prior to their experiments. However, this behavior was significantly related to the extent to which the students conducted controlled experiments. Among the nine types of experiment behavior identified, we think that this inspection behavior is mostly related to metacognition, since it may involve planning and monitoring, which are important aspects of metacognition (Baker & Brown, 1984). Research has found that scaffolding students’ self-monitoring skills can enhance their learning with visualizations (Chiu & Linn, 2012). In this study, we provide evidence that students being able to inspect all objects available significantly predicted their behavior of conducting controlled virtual experiments using interactive simulations. Future research can consider designing instructional activities to guide students to inspect the context before experiments to formulate experimental goals. We believe that this strategy will enhance students’ ability to conduct purposeful controlled virtual experiments. Future investigations can develop instructional activities and include more participants to test this claim.
One limitation of this study involves the relatively small number of participants. Nevertheless, we were able to thoroughly investigate the virtual experiment behavior of the participants, and identified nine types of behavior, among which three were significantly related to the extent to which the students conducted controlled experiments. In addition to the “inspection” behavior that has been discussed, we found that students who conducted divergent experiments that involved the behavior of setting up a greater variety of radiation values were less likely to conduct controlled experiments. It seems that encouraging this group of students to conduct convergent experiments instead may help. However, research also indicates that allowing students to explore simulations may provide opportunities and time for them to set up their conceptual framework for mindful engagement (Adams, Paulson, & Wieman, 2009). It seems that in our study the students were arbitrarily changing the values rather than mindfully exploring the simulation. Developers of learning environments need to differentiate these two types of student behavior and provide different types of scaffolding to address different student needs.
It seems reasonable that students who started more experiments had greater chances of conducting controlled experiments, as we found a positively significant relationship between students starting more experiments and conducting more controlled experiments. This finding also supports the perspective of Adams et al. (2009) that free exploration of simulations may benefit student learning. Moreover, one advantage of virtual experiments using computer simulations is that it does not cost or result in damage when error or trial experiments are conducted. The trial-and-error strategy may be effective for some students. Students should not be restricted to a certain procedure of conducting virtual experiments. Nevertheless, how to challenge and scaffold students to purposefully conduct controlled experiments with their appropriate developmental needs for deep and effective learning needs further investigation.

528
Acknowledgements
This material is based upon work supported by the Ministry of Science and Technology, Taiwan, under grant MOST103-2511-S-011-010-MY5.
References
Adams, W. K., Paulson, A., & Wieman, C. E. (2009). What levels of guidance promote engaged exploration with interactive simulations? In H. Charles, S. Mel, & H. Leon (Eds.), 2008 Physics Education Research Conference. AIP Conference Proceedings (Vol. 1064, pp. 59-62). Edmonton, Alberta (Canada): AIP Press.
Baker, L. & Brown, A.L. (1984). Metacognitive skills in reading. In D. Pearson, M. Kamil, R. Barr, & P. Mosenthal (Eds.) Handbook of Reading Research (pp. 353-394). New York: Longman.
Chang, H.-Y. (2016). How to augment the learning impact of computer simulations? The designs and effects of interactivity and scaffolding. Interactive Learning Environments. doi:10.1080/10494820.2016.1250222
Chiu, J., & Linn, M. C. (2012). The role of self-monitoring in learning chemistry with dynamic visualizations. In A. Zohar & Y. J. Dori (Eds.), Metacognition in science education (pp. 133-163). Dordrecht: Springer.
Gobert, J. D., Sao Pedro, M., Raziuddin, J., & Baker, R. S. (2013). From log files to assessment metrics: Measuring students' science inquiry skills using educational data mining. Journal of the Learning Sciences, 22(4), 521-563.
Jho, H., Yoon, H.-G., & Kim, M. (2014). The relationship of science knowledge, attitude and decision making on socio-scientific issues: The case study of students’ debates on a nuclear power plant in Korea. Science & Education, 23(5), 1131-1151.
Lee , K. M., Nicoll, G., & Brooks, D. W. (2004). A comparison of inquiry and worked example web-based instruction using Physlets. Journal of Science Education and Technology, 13(1), 81-88.
McElhaney, K. W., & Linn, M. C. (2011). Investigations of a complex, realistic task: Intentional, unsystematic, and exhaustive experimenters. Journal of Research in Science Teaching, 48(7), 745-770.
Moreno, R., & Valdez, A. (2005). Cognitive load and learning effects of having students organize pictures and words in multimedia environments: The role of student interactivity and feedback. Educational Technology Research and Development, 53(3), 35-45.
Parnafes, O. (2007). What does “fast” mean? Understanding the physical world through computational representations. The Journal of the Learning Sciences, 16(3), 415-450.
Hayashi, Y., et al. (Eds.) (2017). Workshop Proceedings of the 25th International Conference on Computers in Education. New Zealand: Asia-Pacific Society for Computers in Education
529
A Quantitative Analysis on Interactive Method Makes Teaching More Scientific
Bin LIa*, Lie-Ming LIb & Ying LUOc
aInformation Technology Center, Tsinghua University, People’s Republic of China bDepartment of Physics, Tsinghua University, People’s Republic of China
cDepartment of Physics, Beijing Normal University, People’s Republic of China *[email protected]
Abstract: Some researches showed that, comparing the teaching experience and style of teacher, interactive teaching method, which could help teachers to collect and analyze feedback data regarding students’ misconceptions or difficulties, was the key factor of improving the student learning outcomes. Interactive-engagement method makes teaching activities more scientific. In the study, we developed an interactive teaching approach with quantitative analysis for an introductory physics course. The system consists of four instructional components that improve student learning by including warm-up assignments and online homework. Student and instructor activities involve activities both in the classroom and on a designated web site. An experimental study with control groups evaluated the effectiveness of this teaching method. The results indicated that the method is an effective way to improve students’ understanding of physics concepts, develop students’ problem-solving abilities, and identify students’ misconceptions.
Keywords: quantitative analysis, web-based teaching, interactive teaching, science, art
1. Teaching Scientifically
Is teaching an art or a science (Makedon, Alexander, 1990)? There has been a lot of debate about this issue. It is not a good solution to argue simply whether teaching is an art or science, or both, since it tells us nothing about how much of each teaching is, and exactly how the two are combined in teaching practice. Whether teaching is an art or science depends on which definition of teaching we adopt, or what we think the goals of teaching should be.
What are the goals of teaching? Most teachers would like to improve students’ learning outcomes, especially the examination performance. In 1998, Hake reported the results of a study of test results for 6000 students of mechanics, which found that the average normalized gain for the interactive-engagement methods (g=0.48) were higher than the gain for traditional methods (g=0.23), indicating that interactive engagement improved student learning. In this study, comparing the teaching experience and style of teacher, interactive teaching method has become the key factor of affecting the learning outcomes in the following two aspects:
• Through interactive activities, the teacher is able to collect and analyze feedback data regarding students’ misconceptions or difficulties, and discover the gap between their current knowledge and the desired level of knowledge, so as to adjust the lecture.
• The interaction of teacher and student motivates the initiative and enthusiasm of students in the teaching process.
In this case, teaching is more like a science than an art, and the interactive-engagement methods make teaching more scientific.
Hayashi, Y., et al. (Eds.) (2017). Workshop Proceedings of the 25th International Conference on Computers in Education. New Zealand: Asia-Pacific Society for Computers in Education
530
2. The Quantitative Analysis of Feedback Data from Teaching Activities
In fact, interactive approaches are not necessarily able to improve student outcomes. A case study using a clicker-like APP showed that the students' final average scores were not significantly different from previous ones.
In addition, we encountered difficulties when we introduced the Just-in-Time Teaching (JiTT) pedagogical approach to universities in China. In the JiTT approach, warm-ups are used as the basis for each classroom session to enhance learning (A. Gavrin and J. X. Watt et al, 2004). Many researchers and instructors in the U.S. have reported the effectiveness of JiTT, not only in physics but also in other subjects such as math, chemistry, and psychology (A. Marrs Kathleen and N. Gregor, 2004). However, an international research project investigating over 5000 students in the U.S. and China found that Chinese students exhibited a high level of performance on tests of physical concepts due to “numerous and rigorous courses in middle school and high school” (L. Bao et al, 2009). Middle school and high school students in China who choose science or engineering majors and plan to go to a university enroll in approximately 5 years of physics courses. All students receive identical curricula in physics and must perform well on the same national college admission examination. Because of Chinese students’ strong background in physics, it was difficult to identify misconceptions in physics classes, and the common conceptual warm-up questions often failed to evaluate their prior knowledge in introductory physics courses.
Obviously, whether to seek out students’ misconceptions and difficulties and then modify the lecture accordingly is the key point to enhance the efficiency and effectiveness of teaching. In order to availably identify the problems in teaching, it is a good choice to quantify and analyze the feedback data. Then, with the help of Internet to collect and process learning data, the statistical results will provide scientific reference for the adjustment of teaching.
3. The Case Study in an Introductory Physics Class
In order to achieve effective teaching, we developed a dual feedback loop approach by combining warm-up assignments with online homework in an introductory physics course. We used the warm-up assignments to obtain information about students’ prior knowledge, misconceptions, and confusion based on relevant exercises. Students’ responses to the warm-up assignments were used to provide the instructor with information to modify the upcoming lecture to provide a more instructive and engaging course. Similarly, the goal of the online homework was to assess teaching effectiveness by comparing students’ homework responses to students’ responses to the warm-up questions. Furthermore, the postclass homework was used to identify course content that continued to confuse students and required more explanation in discussion sessions.
3.1. Building up Question Bank
The question bank is fundamental to designing and assigning the exercises, which is used to collect feedback data about students’ learning. In order to be adapted to the online format, the bank is consisted of multiple-choice and fill-in-the-blank questions, all of which cover almost the entire lecture content, so as to sufficiently revealed students’ prior knowledge, misconceptions, and difficulties. Meanwhile, according to the results of previous exercises, the questions will be modified to reflect the problems in the learning process. Now the question bank is the Third Edition.
In addition to the collection of objective learning data, we also gather some subjective attitude to learning content. For example, besides four options (A, B, C and D), each question included two additional response options (E and F). Response option E, which stated “this question is too easy for me,” was designed for students who felt that the problem was too easy and could easily be responded to at first glance, and option F, which stated “this question is too difficult for me,” was designed for students who felt that they could not correctly respond to the question even after in-depth reflection. These two response options were provided to reduce student responses based on guess work. Moreover, for each question, students were asked to identify whether the question should be explained during the upcoming lecture.
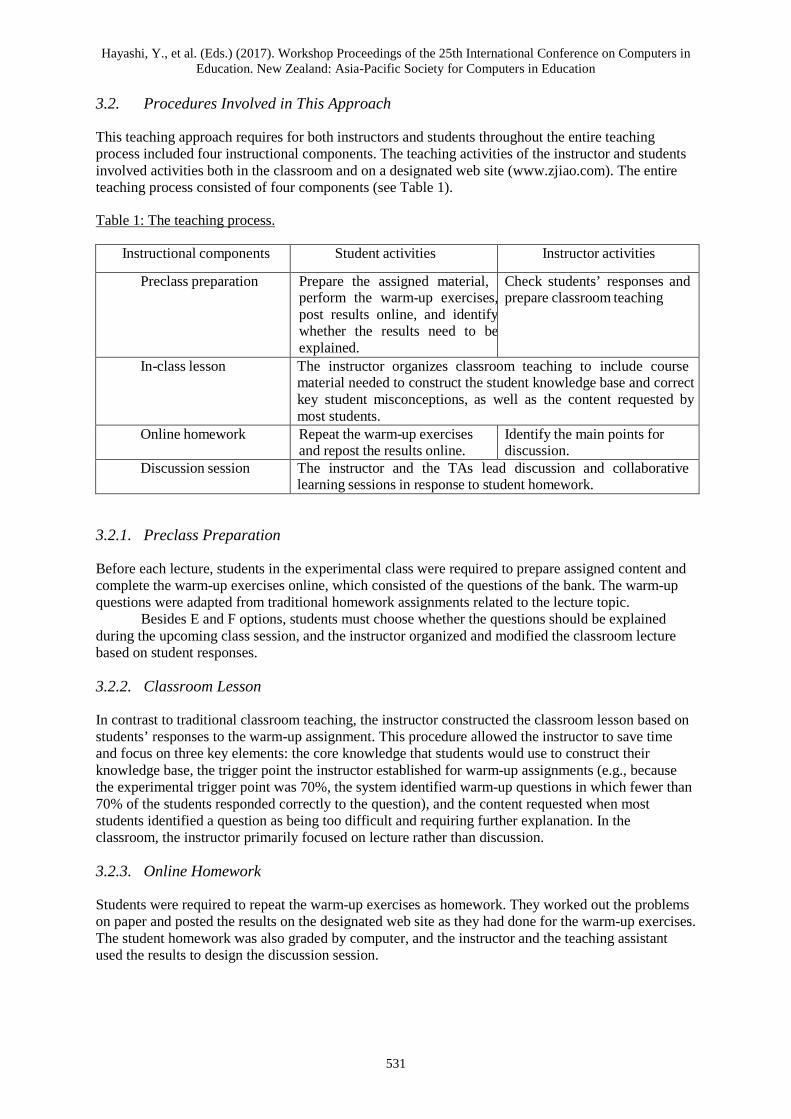
Hayashi, Y., et al. (Eds.) (2017). Workshop Proceedings of the 25th International Conference on Computers in Education. New Zealand: Asia-Pacific Society for Computers in Education
531
3.2. Procedures Involved in This Approach
This teaching approach requires for both instructors and students throughout the entire teaching process included four instructional components. The teaching activities of the instructor and students involved activities both in the classroom and on a designated web site (www.zjiao.com). The entire teaching process consisted of four components (see Table 1).
Table 1: The teaching process.
Instructional components Student activities Instructor activities
Preclass preparation Prepare the assigned material, perform the warm-up exercises, post results online, and identify whether the results need to be explained.
Check students’ responses and prepare classroom teaching
In-class lesson The instructor organizes classroom teaching to include course material needed to construct the student knowledge base and correct key student misconceptions, as well as the content requested by most students.
Online homework Repeat the warm-up exercises and repost the results online.
Identify the main points for discussion.
Discussion session The instructor and the TAs lead discussion and collaborative learning sessions in response to student homework.
3.2.1. Preclass Preparation
Before each lecture, students in the experimental class were required to prepare assigned content and complete the warm-up exercises online, which consisted of the questions of the bank. The warm-up questions were adapted from traditional homework assignments related to the lecture topic.
Besides E and F options, students must choose whether the questions should be explained during the upcoming class session, and the instructor organized and modified the classroom lecture based on student responses.
3.2.2. Classroom Lesson
In contrast to traditional classroom teaching, the instructor constructed the classroom lesson based on students’ responses to the warm-up assignment. This procedure allowed the instructor to save time and focus on three key elements: the core knowledge that students would use to construct their knowledge base, the trigger point the instructor established for warm-up assignments (e.g., because the experimental trigger point was 70%, the system identified warm-up questions in which fewer than 70% of the students responded correctly to the question), and the content requested when most students identified a question as being too difficult and requiring further explanation. In the classroom, the instructor primarily focused on lecture rather than discussion.
3.2.3. Online Homework
Students were required to repeat the warm-up exercises as homework. They worked out the problems on paper and posted the results on the designated web site as they had done for the warm-up exercises. The student homework was also graded by computer, and the instructor and the teaching assistant used the results to design the discussion session.
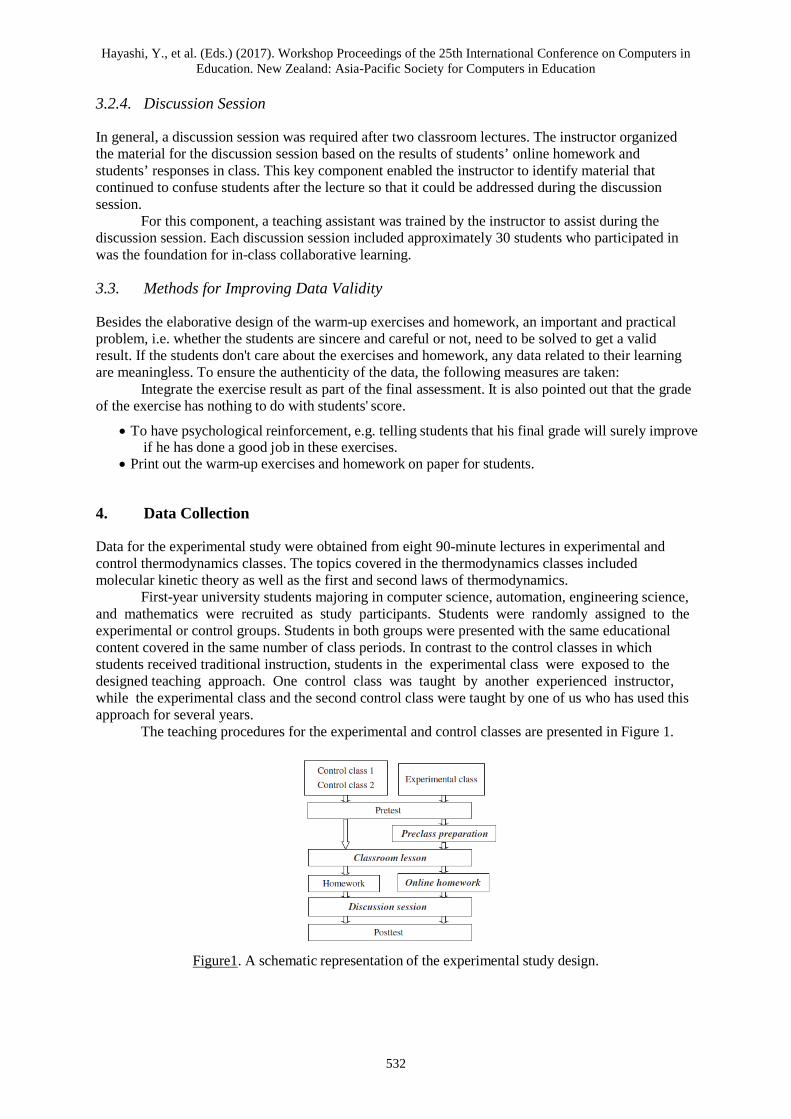
Hayashi, Y., et al. (Eds.) (2017). Workshop Proceedings of the 25th International Conference on Computers in Education. New Zealand: Asia-Pacific Society for Computers in Education
532
3.2.4. Discussion Session
In general, a discussion session was required after two classroom lectures. The instructor organized the material for the discussion session based on the results of students’ online homework and students’ responses in class. This key component enabled the instructor to identify material that continued to confuse students after the lecture so that it could be addressed during the discussion session.
For this component, a teaching assistant was trained by the instructor to assist during the discussion session. Each discussion session included approximately 30 students who participated in was the foundation for in-class collaborative learning.
3.3. Methods for Improving Data Validity
Besides the elaborative design of the warm-up exercises and homework, an important and practical problem, i.e. whether the students are sincere and careful or not, need to be solved to get a valid result. If the students don't care about the exercises and homework, any data related to their learning are meaningless. To ensure the authenticity of the data, the following measures are taken:
Integrate the exercise result as part of the final assessment. It is also pointed out that the grade of the exercise has nothing to do with students' score.
• To have psychological reinforcement, e.g. telling students that his final grade will surely improve if he has done a good job in these exercises.
• Print out the warm-up exercises and homework on paper for students.
4. Data Collection
Data for the experimental study were obtained from eight 90-minute lectures in experimental and control thermodynamics classes. The topics covered in the thermodynamics classes included molecular kinetic theory as well as the first and second laws of thermodynamics.
First-year university students majoring in computer science, automation, engineering science, and mathematics were recruited as study participants. Students were randomly assigned to the experimental or control groups. Students in both groups were presented with the same educational content covered in the same number of class periods. In contrast to the control classes in which students received traditional instruction, students in the experimental class were exposed to the designed teaching approach. One control class was taught by another experienced instructor, while the experimental class and the second control class were taught by one of us who has used this approach for several years.
The teaching procedures for the experimental and control classes are presented in Figure 1.
Figure 1. A schematic representation of the experimental study design.
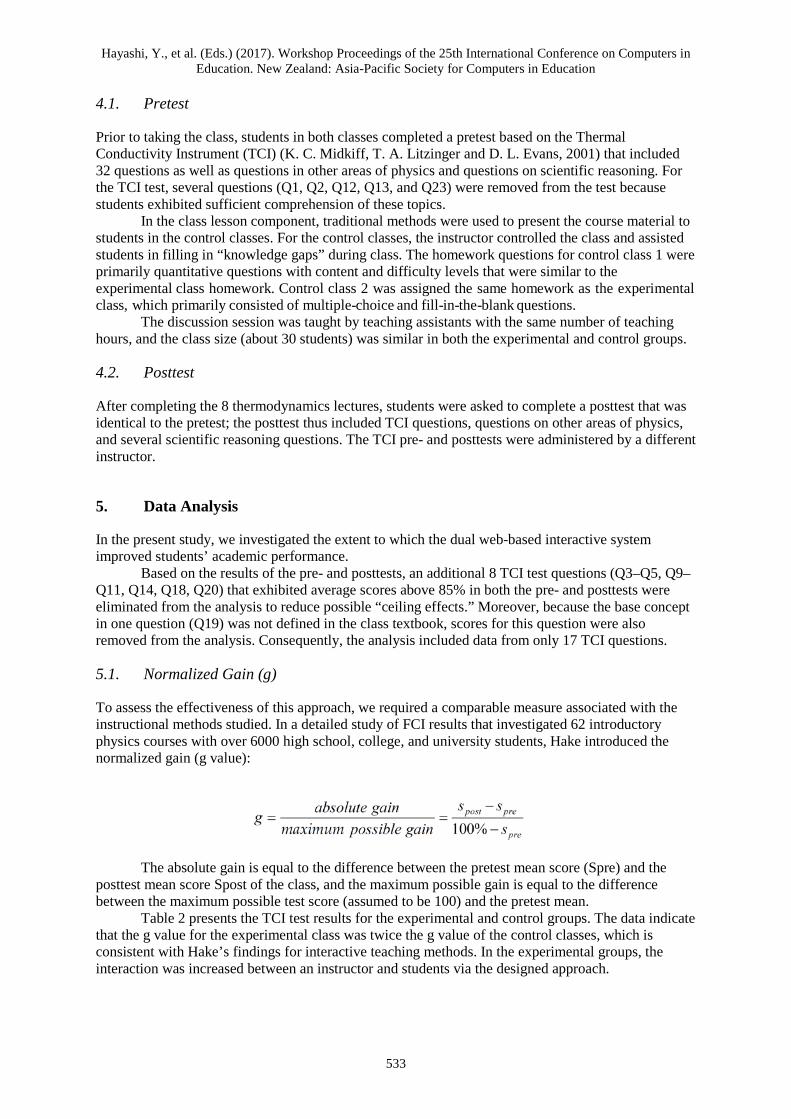
Hayashi, Y., et al. (Eds.) (2017). Workshop Proceedings of the 25th International Conference on Computers in Education. New Zealand: Asia-Pacific Society for Computers in Education
533
4.1. Pretest
Prior to taking the class, students in both classes completed a pretest based on the Thermal Conductivity Instrument (TCI) (K. C. Midkiff, T. A. Litzinger and D. L. Evans, 2001) that included 32 questions as well as questions in other areas of physics and questions on scientific reasoning. For the TCI test, several questions (Q1, Q2, Q12, Q13, and Q23) were removed from the test because students exhibited sufficient comprehension of these topics.
In the class lesson component, traditional methods were used to present the course material to students in the control classes. For the control classes, the instructor controlled the class and assisted students in filling in “knowledge gaps” during class. The homework questions for control class 1 were primarily quantitative questions with content and difficulty levels that were similar to the experimental class homework. Control class 2 was assigned the same homework as the experimental class, which primarily consisted of multiple-choice and fill-in-the-blank questions.
The discussion session was taught by teaching assistants with the same number of teaching hours, and the class size (about 30 students) was similar in both the experimental and control groups.
4.2. Posttest
After completing the 8 thermodynamics lectures, students were asked to complete a posttest that was identical to the pretest; the posttest thus included TCI questions, questions on other areas of physics, and several scientific reasoning questions. The TCI pre- and posttests were administered by a different instructor.
5. Data Analysis
In the present study, we investigated the extent to which the dual web-based interactive system improved students’ academic performance.
Based on the results of the pre- and posttests, an additional 8 TCI test questions (Q3–Q5, Q9–Q11, Q14, Q18, Q20) that exhibited average scores above 85% in both the pre- and posttests were eliminated from the analysis to reduce possible “ceiling effects.” Moreover, because the base concept in one question (Q19) was not defined in the class textbook, scores for this question were also removed from the analysis. Consequently, the analysis included data from only 17 TCI questions.
5.1. Normalized Gain (g)
To assess the effectiveness of this approach, we required a comparable measure associated with the instructional methods studied. In a detailed study of FCI results that investigated 62 introductory physics courses with over 6000 high school, college, and university students, Hake introduced the normalized gain (g value):
The absolute gain is equal to the difference between the pretest mean score (Spre) and the posttest mean score Spost of the class, and the maximum possible gain is equal to the difference between the maximum possible test score (assumed to be 100) and the pretest mean.
Table 2 presents the TCI test results for the experimental and control groups. The data indicate that the g value for the experimental class was twice the g value of the control classes, which is consistent with Hake’s findings for interactive teaching methods. In the experimental groups, the interaction was increased between an instructor and students via the designed approach.
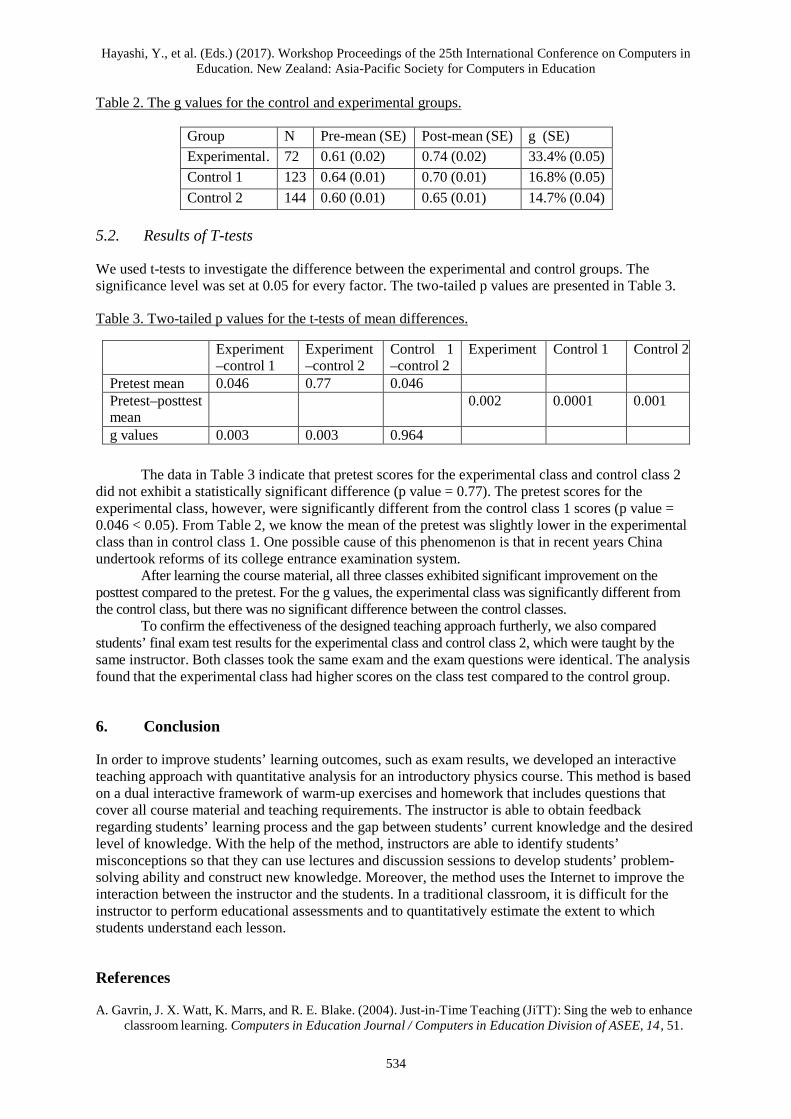
Hayashi, Y., et al. (Eds.) (2017). Workshop Proceedings of the 25th International Conference on Computers in Education. New Zealand: Asia-Pacific Society for Computers in Education
534
Table 2. The g values for the control and experimental groups.
Group N Pre-mean (SE) Post-mean (SE) g (SE) Experimental. 72 0.61 (0.02) 0.74 (0.02) 33.4% (0.05) Control 1 123 0.64 (0.01) 0.70 (0.01) 16.8% (0.05) Control 2 144 0.60 (0.01) 0.65 (0.01) 14.7% (0.04)
5.2. Results of T-tests
We used t-tests to investigate the difference between the experimental and control groups. The significance level was set at 0.05 for every factor. The two-tailed p values are presented in Table 3.
Table 3. Two-tailed p values for the t-tests of mean differences.
Experiment –control 1
Experiment –control 2
Control 1 –control 2
Experiment Control 1 Control 2
Pretest mean 0.046 0.77 0.046 Pretest–posttest mean
0.002 0.0001 0.001
g values 0.003 0.003 0.964
The data in Table 3 indicate that pretest scores for the experimental class and control class 2 did not exhibit a statistically significant difference (p value = 0.77). The pretest scores for the experimental class, however, were significantly different from the control class 1 scores (p value = 0.046 < 0.05). From Table 2, we know the mean of the pretest was slightly lower in the experimental class than in control class 1. One possible cause of this phenomenon is that in recent years China undertook reforms of its college entrance examination system.
After learning the course material, all three classes exhibited significant improvement on the posttest compared to the pretest. For the g values, the experimental class was significantly different from the control class, but there was no significant difference between the control classes.
To confirm the effectiveness of the designed teaching approach furtherly, we also compared students’ final exam test results for the experimental class and control class 2, which were taught by the same instructor. Both classes took the same exam and the exam questions were identical. The analysis found that the experimental class had higher scores on the class test compared to the control group.
6. Conclusion
In order to improve students’ learning outcomes, such as exam results, we developed an interactive teaching approach with quantitative analysis for an introductory physics course. This method is based on a dual interactive framework of warm-up exercises and homework that includes questions that cover all course material and teaching requirements. The instructor is able to obtain feedback regarding students’ learning process and the gap between students’ current knowledge and the desired level of knowledge. With the help of the method, instructors are able to identify students’ misconceptions so that they can use lectures and discussion sessions to develop students’ problem-solving ability and construct new knowledge. Moreover, the method uses the Internet to improve the interaction between the instructor and the students. In a traditional classroom, it is difficult for the instructor to perform educational assessments and to quantitatively estimate the extent to which students understand each lesson.
References
A. Gavrin, J. X. Watt, K. Marrs, and R. E. Blake. (2004). Just-in-Time Teaching (JiTT): Sing the web to enhance classroom learning. Computers in Education Journal / Computers in Education Division of ASEE, 14, 51.

Hayashi, Y., et al. (Eds.) (2017). Workshop Proceedings of the 25th International Conference on Computers in Education. New Zealand: Asia-Pacific Society for Computers in Education
535
A. Marrs Kathleen and N. Gregor. (2004). Just-in-Time Teaching in biology: creating an active learner classroom using the Internet. Cell Biology Education, 3(1), 49-61.
C. M. Sorensen, A. D. Churukian, S. Maleki, and D. A. Zollman. (2006). The new studio format for instruction of introductory physics. American Journal of Physics. 74(12), 1077-1082.
K. C. Midkiff, T. A. Litzinger, and D. L. Evans. (2001). Development of engineering thermodynamics concept inventory instruments. Impact on Engineering and Science Education. 2, F2A.
L. Bao et al. (2009). Learning and scientific reasoning. Science, 323, 586. Liang-Fang Shi and Jian-Jun Wang. (1996). The Debate of Teaching about Science or Art. Curriculum, Teaching
Material and Method. 9, 57-59. Makedon, Alexander. (1990). Is teaching a science or an art. The Annual Conference of the Midwest Philosophy of
Education Society (Chicago, IL, November 10, 1990). Richard R. Hake. (1998). Interactive-engagement vs. traditional methods: A six-thousand student survey of
mechanics test data for introductory physics courses. American Journal of Physics. 66(1), 64-74.
Hayashi, Y., et al. (Eds.) (2017). Workshop Proceedings of the 25th International Conference on Computers in Education. New Zealand: Asia-Pacific Society for Computers in Education
536
Analysis of Students’ Personalities and Gaming Strategies in a Technology-Enhanced Board
Game-The Fragrance Channel Chang-Hsin LIN*, Ju-Ling SHIH
Department of Information and Learning Technology, National University of Tainan, Taiwan *[email protected]
Abstract: Board game has been popular these years, and increasing technology-enhanced board games were developed to extend its playability and content. This study presents an interdisciplinary instructional game, Fragrance Channel, in the context of the Age of Discovery as the game which encourages students to use their history and geography knowledge as well as logistics to win the strategic game. This study uses game records, observation, and focus group interviews to investigate how players’ personality traits and other factors such as game stages, gender, personal conditions, emotional tendencies, and learning styles can influence their gaming behaviors and strategies.
Keywords: technology-enhanced board game, game-based learning, personality, gaming strategies, the Age of Discovery.
1. Introduction
Board game has long history in human civilization. It is played in groups in which players interact with others, either communicates, cooperate, compete, or use strategies to win. It can be played on any surface, with or without cards and objects, and with all kinds of content.
With the wave of Web 2.0 and technological development, many game designers have transformed board games into digital board game (DBG) which uses digital technology and multimedia to simplified game rules and create scenarios that increased the sense of immersion.
In the gaming process, individuals would have different types of thinking, reactions, behaviors, and strategies, which are deeply influenced by their personality traits and many other factors. Personality is one’s feeling, thinking, and performance pattern that is general in certain typical patterns but still unique in each individual. In the game, the mental playing space is large and open where players can choose and manipulate in their own way. They interact with others, cope with others, and learn from others.
This study attempts to design an interdisciplinary technology-enhanced board game which would require players to apply their knowledge in history, geography, and math, named Fragrance Channel; and then focus on observing what factors would influence the players behaviors and strategies to win the game, including their personalities.
Two research questions are aimed in this study:
1. How players in different personality traits would use different gaming strategies in Fragrance Channel?
2. Other than personality traits, what other factors would influence the players’ gaming strategies?
537
2. Related work
2.1. Technology-enhanced Board Games
Board games generally refers to games that can be played on the table, do not depend on electronic products and do not need large movements, such as card games, board games, and dice games, etc. People play different types of board games can have different benefits. Research results show that board games have positive influence to players’ cognitive, organizing strategies, and thinking abilities (Wilson, Barnes, Aggarwal, Boyle, Hebert, de Leon, & Evans, 2010). When board games were properly integrated in the classroom learning, students’ learning achievements have significant improvements through game-based learning (Lin, Huang, Shih, Covaci, & Ghinea, 2017; van der Stege, van Staa, Hilberink, & Visser, 2010).
Board games are normally designed with boards, cards, and objects. With digital technologies, simulated scenarios and extensive game mechanism were much enhanced. Chen, Wu, and Chen (2011) used large touched screen and projections to present digital board game, and used it in formal curriculum in the university. Their results showed significant improvement on students’ class participation and learning achievements.
Wallace et al. (2012) also used large touched table to present the card game so the players can interact with the virtual world map and cards. Han, Kim, Jung, and Lee (2012) created a RFID based digital board game platform to play either puzzled board game or chess board game for kindergarten kids. Andrukaniec, Franken, Kirchhof, Kraus, Schöndorff, and Geiger (2013) integrated augmented reality (AR) into traditional board game The Settlers of Catan and developed OUTLIVE. This game is a multiplayer game in which players act as the settlers of Catan, but other actions can only be imagined through AR, such as fighting, hunting, and gathering resources.
With digital technology integrations to board games to increase game effects was defined as complex board by Lin et al. (Lin, Huang, Shih, Covaci, & Ghinea, 2017). With extended gaming experiences, players can have face-to-face interactions with others, but also have virtual content to increase the content and fun. Players can obtain, manage, and digest more knowledge content (Andrukaniec, Franken, Kirchhof, Kraus, Schöndorff & Geiger, 2013; Broll, Vodicka & Boring, 2013).
2.2. Professional Dynametric Programs (PDP)
Game-based learning provides players simulated situations to think and make internal connections to their external behaviors. Many studies have evident that the behavioral differences between individuals may be caused by their dissimilar personalities (Hampson & Goldberg, 2006). Personality has been an important indicator to individual differences and all theories have posed different views to it. There are four assessments that are commonly used by science researchers and human resources in industries including Five-factor model of personality (Big Five), Myers Briggs Type Indicator (MBTI), DISC, and Professional Dynametric Programs (PDP).
Among all, Big Five are the most used which identified five personality traits (OCEAN) of individuals that are openness, conscientiousness, extraversion, agreeableness, and neuroticism. However, these five personality traits only describe general traits with measurements. In order to be able to explain why personality would influence players’ gaming behaviors and strategies, this study landed the eyes on PDP which would be able to explain how the personality traits would affect individuals’ behaviors, reactions to the environment, and predictable behavioral model
PDP started out from DISC personality test which was developed by Dr. Marston in 1920 which is generated from the ancient Greek personality theories. It is a test about human behavioral languages saying that the individuals’ personalities were composed by four basic elements namely dominance, influence, steadiness, and compliance (DISC). It explains how individual can adapt to certain work type, and what their possible performance and achievement would be. It can diagnose the individual’s management ability and chance to succeed (Cashion & Lynch, 1979).
In order to be more well-rounded and objective, after several decades, Houston, Solomon, and Hubby developed it into Professional Dynametric Programs (PDP) and registered for shared patent between University of South California and University of Colorado (Eastburg, Williamson, Gorsuch,
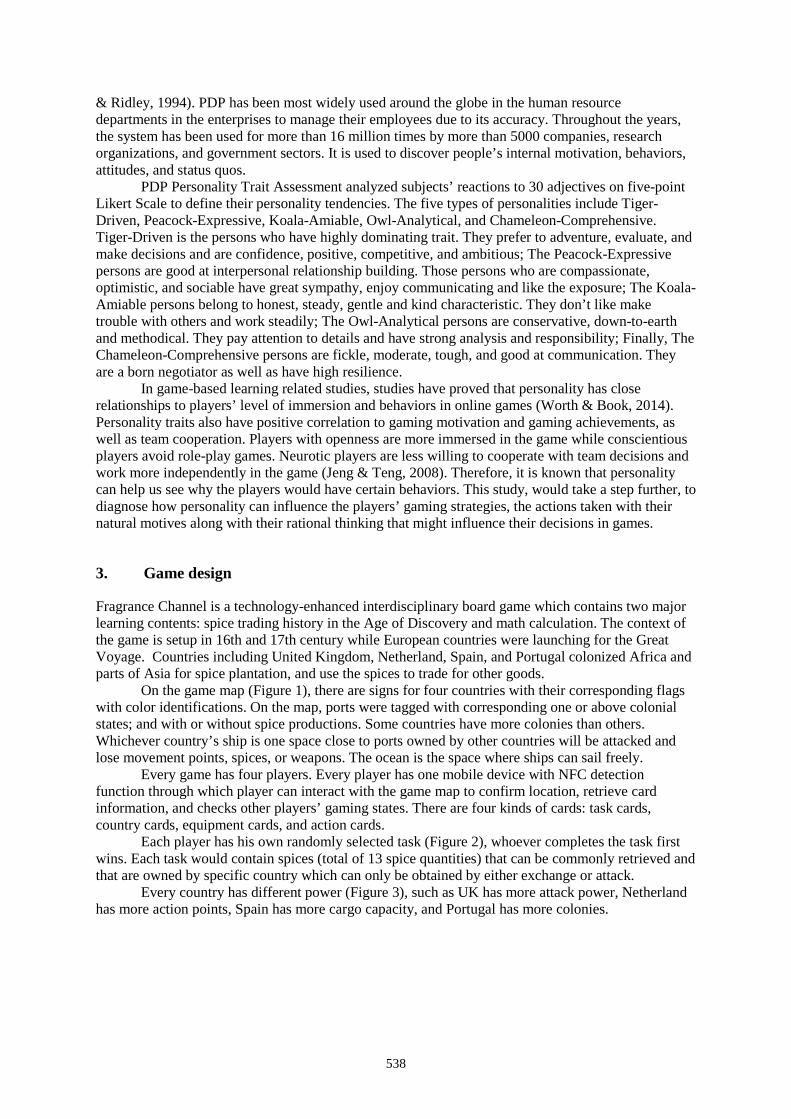
538
& Ridley, 1994). PDP has been most widely used around the globe in the human resource departments in the enterprises to manage their employees due to its accuracy. Throughout the years, the system has been used for more than 16 million times by more than 5000 companies, research organizations, and government sectors. It is used to discover people’s internal motivation, behaviors, attitudes, and status quos.
PDP Personality Trait Assessment analyzed subjects’ reactions to 30 adjectives on five-point Likert Scale to define their personality tendencies. The five types of personalities include Tiger-Driven, Peacock-Expressive, Koala-Amiable, Owl-Analytical, and Chameleon-Comprehensive. Tiger-Driven is the persons who have highly dominating trait. They prefer to adventure, evaluate, and make decisions and are confidence, positive, competitive, and ambitious; The Peacock-Expressive persons are good at interpersonal relationship building. Those persons who are compassionate, optimistic, and sociable have great sympathy, enjoy communicating and like the exposure; The Koala-Amiable persons belong to honest, steady, gentle and kind characteristic. They don’t like make trouble with others and work steadily; The Owl-Analytical persons are conservative, down-to-earth and methodical. They pay attention to details and have strong analysis and responsibility; Finally, The Chameleon-Comprehensive persons are fickle, moderate, tough, and good at communication. They are a born negotiator as well as have high resilience.
In game-based learning related studies, studies have proved that personality has close relationships to players’ level of immersion and behaviors in online games (Worth & Book, 2014). Personality traits also have positive correlation to gaming motivation and gaming achievements, as well as team cooperation. Players with openness are more immersed in the game while conscientious players avoid role-play games. Neurotic players are less willing to cooperate with team decisions and work more independently in the game (Jeng & Teng, 2008). Therefore, it is known that personality can help us see why the players would have certain behaviors. This study, would take a step further, to diagnose how personality can influence the players’ gaming strategies, the actions taken with their natural motives along with their rational thinking that might influence their decisions in games.
3. Game design
Fragrance Channel is a technology-enhanced interdisciplinary board game which contains two major learning contents: spice trading history in the Age of Discovery and math calculation. The context of the game is setup in 16th and 17th century while European countries were launching for the Great Voyage. Countries including United Kingdom, Netherland, Spain, and Portugal colonized Africa and parts of Asia for spice plantation, and use the spices to trade for other goods.
On the game map (Figure 1), there are signs for four countries with their corresponding flags with color identifications. On the map, ports were tagged with corresponding one or above colonial states; and with or without spice productions. Some countries have more colonies than others. Whichever country’s ship is one space close to ports owned by other countries will be attacked and lose movement points, spices, or weapons. The ocean is the space where ships can sail freely.
Every game has four players. Every player has one mobile device with NFC detection function through which player can interact with the game map to confirm location, retrieve card information, and checks other players’ gaming states. There are four kinds of cards: task cards, country cards, equipment cards, and action cards.
Each player has his own randomly selected task (Figure 2), whoever completes the task first wins. Each task would contain spices (total of 13 spice quantities) that can be commonly retrieved and that are owned by specific country which can only be obtained by either exchange or attack.
Every country has different power (Figure 3), such as UK has more attack power, Netherland has more action points, Spain has more cargo capacity, and Portugal has more colonies.
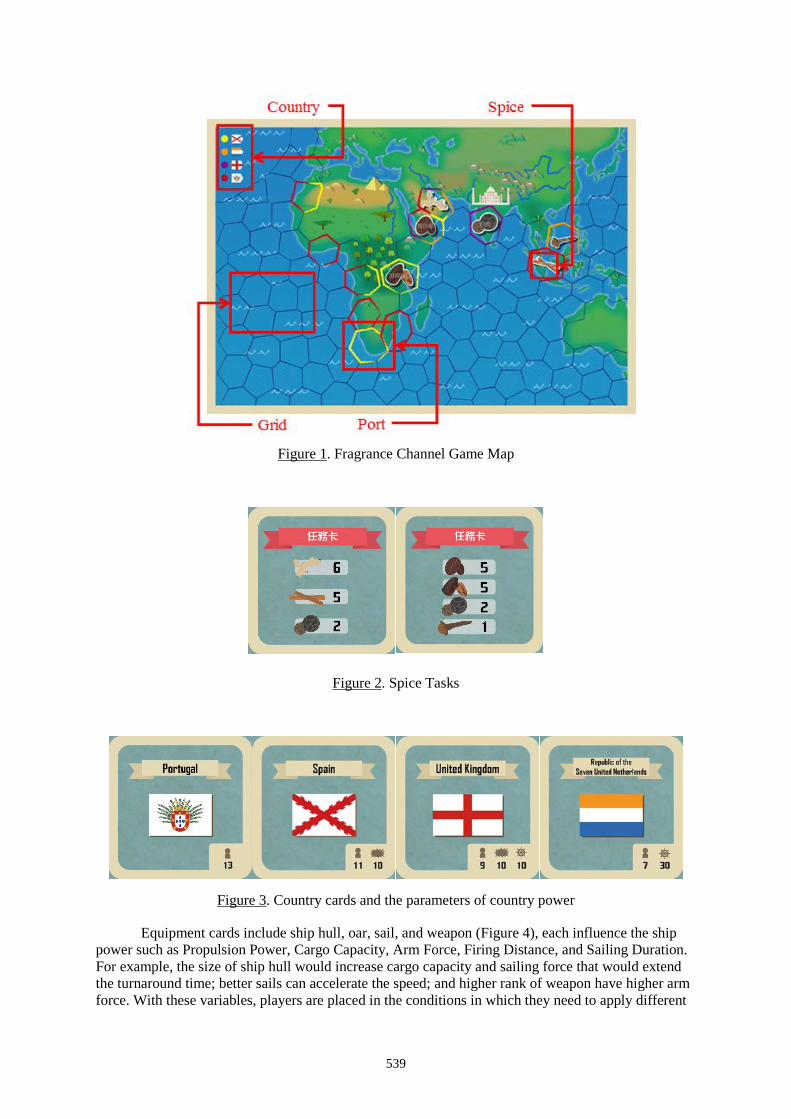
539
Figure 1. Fragrance Channel Game Map
Figure 2. Spice Tasks
Figure 3. Country cards and the parameters of country power
Equipment cards include ship hull, oar, sail, and weapon (Figure 4), each influence the ship power such as Propulsion Power, Cargo Capacity, Arm Force, Firing Distance, and Sailing Duration. For example, the size of ship hull would increase cargo capacity and sailing force that would extend the turnaround time; better sails can accelerate the speed; and higher rank of weapon have higher arm force. With these variables, players are placed in the conditions in which they need to apply different
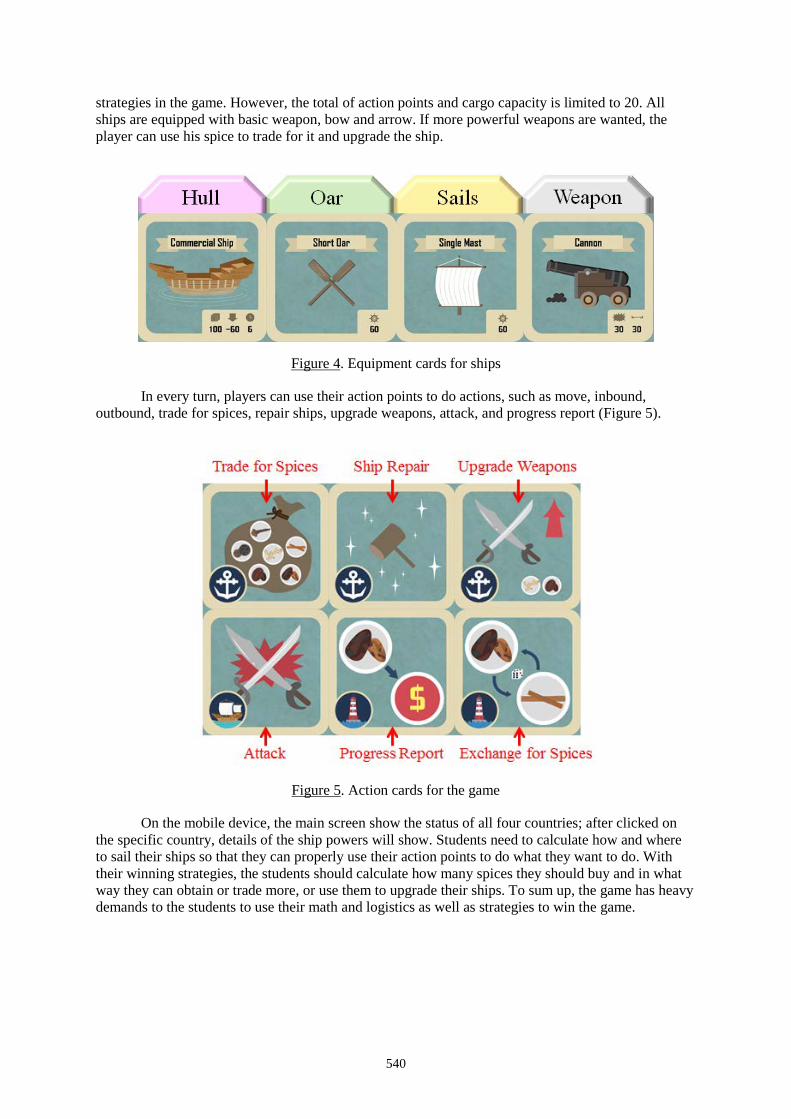
540
strategies in the game. However, the total of action points and cargo capacity is limited to 20. All ships are equipped with basic weapon, bow and arrow. If more powerful weapons are wanted, the player can use his spice to trade for it and upgrade the ship.
Figure 4. Equipment cards for ships
In every turn, players can use their action points to do actions, such as move, inbound, outbound, trade for spices, repair ships, upgrade weapons, attack, and progress report (Figure 5).
Figure 5. Action cards for the game
On the mobile device, the main screen show the status of all four countries; after clicked on the specific country, details of the ship powers will show. Students need to calculate how and where to sail their ships so that they can properly use their action points to do what they want to do. With their winning strategies, the students should calculate how many spices they should buy and in what way they can obtain or trade more, or use them to upgrade their ships. To sum up, the game has heavy demands to the students to use their math and logistics as well as strategies to win the game.
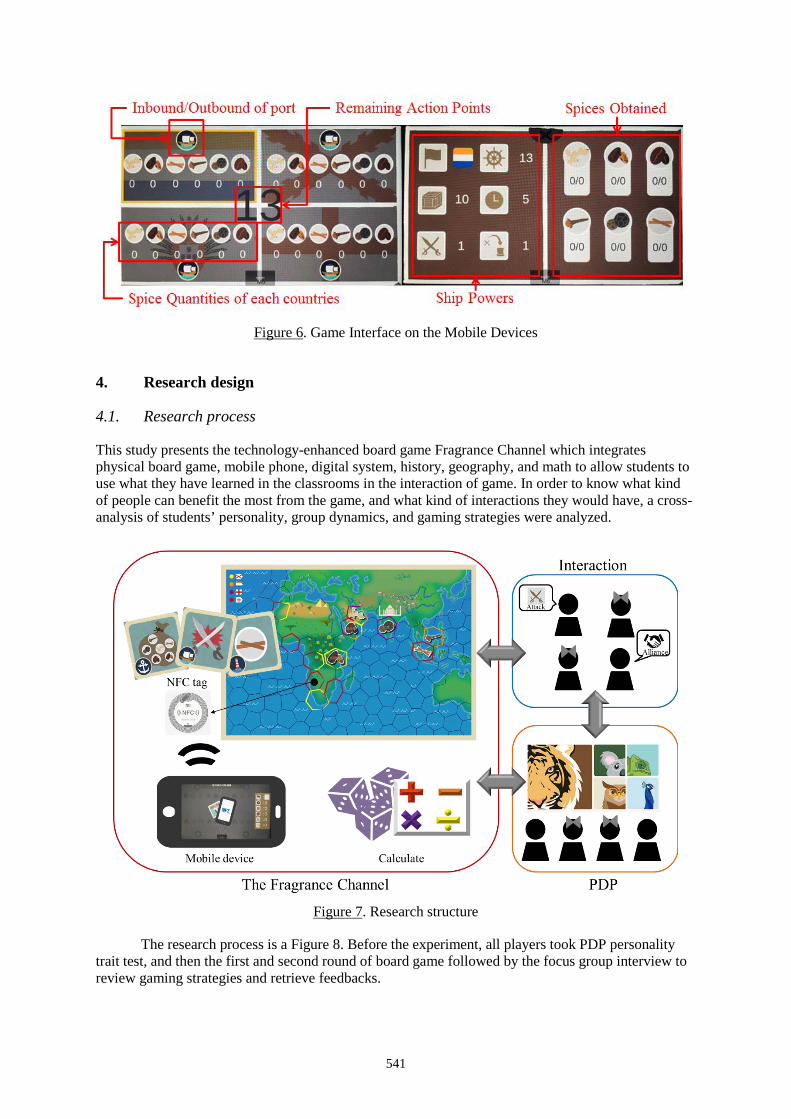
541
Figure 6. Game Interface on the Mobile Devices
4. Research design
4.1. Research process
This study presents the technology-enhanced board game Fragrance Channel which integrates physical board game, mobile phone, digital system, history, geography, and math to allow students to use what they have learned in the classrooms in the interaction of game. In order to know what kind of people can benefit the most from the game, and what kind of interactions they would have, a cross-analysis of students’ personality, group dynamics, and gaming strategies were analyzed.
Figure 7. Research structure
The research process is a Figure 8. Before the experiment, all players took PDP personality trait test, and then the first and second round of board game followed by the focus group interview to review gaming strategies and retrieve feedbacks.
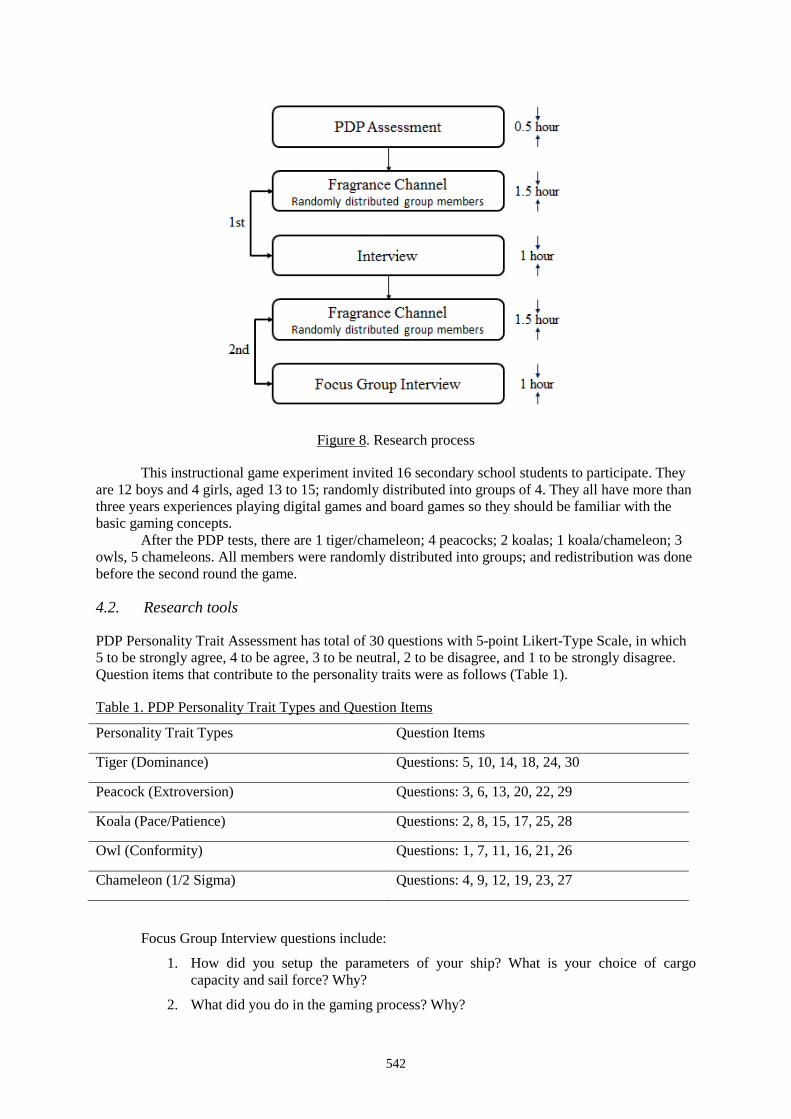
542
Figure 8. Research process
This instructional game experiment invited 16 secondary school students to participate. They are 12 boys and 4 girls, aged 13 to 15; randomly distributed into groups of 4. They all have more than three years experiences playing digital games and board games so they should be familiar with the basic gaming concepts.
After the PDP tests, there are 1 tiger/chameleon; 4 peacocks; 2 koalas; 1 koala/chameleon; 3 owls, 5 chameleons. All members were randomly distributed into groups; and redistribution was done before the second round the game.
4.2. Research tools
PDP Personality Trait Assessment has total of 30 questions with 5-point Likert-Type Scale, in which 5 to be strongly agree, 4 to be agree, 3 to be neutral, 2 to be disagree, and 1 to be strongly disagree. Question items that contribute to the personality traits were as follows (Table 1).
Table 1. PDP Personality Trait Types and Question Items
Personality Trait Types Question Items
Tiger (Dominance) Questions: 5, 10, 14, 18, 24, 30
Peacock (Extroversion) Questions: 3, 6, 13, 20, 22, 29
Koala (Pace/Patience) Questions: 2, 8, 15, 17, 25, 28
Owl (Conformity) Questions: 1, 7, 11, 16, 21, 26
Chameleon (1/2 Sigma) Questions: 4, 9, 12, 19, 23, 27
Focus Group Interview questions include:
1. How did you setup the parameters of your ship? What is your choice of cargo capacity and sail force? Why?
2. What did you do in the gaming process? Why?
543
3. How did you interact with the other three players? Why?
4. What did you do to complete the task before others do?
5. If there is next time, what would you do for change?
5. Result analysis
5.1. PDP Influence Gaming Strategies
Players with specific PDP personality traits would show certain gaming strategies and behavior patterns.
Tigers: They are leaders and should be more dominant in group interactions. In this instructional experiment, there is no student who is with this trait.
Peacocks: They are active, outgoing, talkative, and would brighten up the group atmosphere. Peacocks with prosocial tendencies would use more peaceful gaming strategies. They tend to give suggestions others to complete their tasks step by steps. On the other hand, peacocks with aggressive tendencies would lead the groups to use more conflict strategies. They would encourage others to make alliance, weaken targeted players, and compete to win.
Koalas: They are conservative and rigid. Once they had decided a strategy, they would not easily change their minds. They do not like to attack others, and be attacked. They are passive players in terms of initiating battles. They tend to be prosocial and keep game atmosphere to be more peaceful.
Owls: They are with delicate minds, and would follow the game rules and calculate in detail about movement distance and predict locations. They would think about their next step when it is other’s turn, and would protect them by getting inbound to ports or quickly sailed back to the starting points to complete the task. They tend to play safe, would maximize the effects of action points.
Chameleons: They tend to go with the flow, and would change their strategies as the game progresses. They are goal-oriented, and want to complete game tasks as their priority. They like to like to take aggressive actions such as attack, or persuade others to attack the same target to strengthen his advantages. He may or may not betray his alliance to achieve his goal.
5.2. Other Factors Influence Gaming Behaviors
Game stages: It is found that when unfamiliar players were placed in one group, they were more self-contained, and less interaction would happen. In the middle of the game, when one player fired attack, the group interactions start, and more actions and strategies such as making alliance, persuasion, making commands, and seducing.
Gender issues: In the game, boys tend to attack more than girls, and girls tend to use more prosocial strategies and obtain spices by trading instead of initiating battles. From the interviews, girls in this age would tend to remain in one strategy without being influenced or intervened by others’ opinions or game progress.
Personal conditions: In this experiment, two students were with special conditions and needs and had very special gaming strategies that are different from others. The first one is physical challenged. He chose Spain which has more colonies and ports. He made inbound to a port in every turn from the beginning to the end of the game so that he wouldn’t be attacked by others. He is subconsciously protecting himself all the time which may due to his personal life experience. The second student is with ADHD. He chose Netherland which has higher sailing force in nature. He also setup the ship movements to the highest parameter so that he can sail in very high speed and to the farthest location. He didn’t want to have any contact with others so they would not have any chance to fire attack. With this experience, when he couldn’t choose Netherland in his second round of game, he couldn’t move faster than others, he gave up the game and did not want to play. In the middle of the game, he realized that his country, Portugal, has many colonies and can get away from other by getting inbound to ports, he kept his ship away from the other players. Throughout the game, he kept begging for pities and use emotional strategies to protect himself. However, since he had a fame of
544
poor social interactions and tended to say bad things or used bad body languages to provoke others, other players would make alliance to attack him. Therefore, he felt upset and gave up the game.
Emotional tendencies: Emotional directed players liked to play games in peaceful way, so they were easily influenced by aggressive players. When the atmosphere of the game is filled with attacks, they tend to change their goals or give up. It is better to place them with prosocial players to play games.
Learning styles: Players were generally either goal-oriented or attack-oriented. Although 90% of the players aimed to complete their tasks, others would fire attacks just to increase the fun of the game. Players with more gaming experiences would ask for making alliances or persuading others to change their original strategies regardless whether they would keep their promises in or after they achieve their own goals. Once they betrayed their alliances, the other players would attack him reversely as punishments.
6. Conclusion
It is interesting to see from the game experiment how players with different PDP personality traits would do things in generally categorized patterns, but with different strategies due to other factors. Internal personality traits that an individual born with would not only affect how they think, but also what they do. When players were into different game stages, they would use higher level gaming strategies in the game, such as making alliance, persuasion, making commands to others, and seducing others to do certain actions.
Comparing to the first round of the game, players were more immersed in the second round, have more emotional reactions, and have more interactions. Players with special personal conditions would show behaviors that are corresponding to their real life behaviors. If they are regarded as the vulnerable groups in the real life, they are more protective and defensive in the game. Also, players who are prone to emotional changes are better to play with prosocial players so that their gaming experience would be better.
Quercia, Kosinski, Stillwell and Crowcroft (2011) had stated that the individuals’ personality traits would influence their reactions to their environment, behaviors they do, preferences they have, and strategies they take. Other than external behaviors, the traits also influence their internal interests, value, emotions, and attitudes (Hampson & Goldberg, 2006).
From the experiment, it is found that the interrelationships between personality traits and gaming strategies would also influence group dynamic, and vice versa. A framework for analyzing the gaming process, diagnosing how individuals with various personality traits would be influenced by each other would be an important and valuable contribution so that game designers as well as instructors would know how to place students in groups to enhance group dynamics, increase learning effectiveness, and encourage thinking that require more logical, critical, as well as creative thinking.
Acknowledgements
This study is supported in part by the Ministry of Science and Technology (previously known as National Science Council) of the Republic of China, under MOST 104-2628-S-024 -002 -MY4.
References
Andrukaniec, E., Franken, C., Kirchhof, D., Kraus, T., Schöndorff, F., & Geiger, C. (2013). OUTLIVE–An Augmented Reality Multi-user Board Game Played with a Mobile Device. In Proceedings of 10th International Conference, ACE 2013, pp. 501-504. doi: 10.1007/978-3-319-03161-3_38.
Broll, G., Vodicka, E., & Boring, S. (2013). Exploring multi-user interactions with dynamic NFC-displays. Pervasive and Mobile Computing, 9(2), 242-257.
Cashion, E. L., & Lynch, W. J. (1979). Personality factors and results of lumbar disc surgery. Neurosurgery, 4(2), 141-145.

545
Chen, K. C., Wu, C. J., & Chen, G. D. (2011, July). A digital board game based learning system for authentic learning. In Proceedings of Advanced Learning Technologies (ICALT), 2011 11th IEEE International Conference on, pp. 25-29. doi: 10.1109/ICALT.2011.16
Eastburg, M. C., Williamson, M., Gorsuch, R., & Ridley, C. (1994). Social support, personality, and burnout in nurses. Journal of Applied Social Psychology, 24(14), 1233-1250.
Hampson, S. E., & Goldberg, L. R. (2006). A first large cohort study of personality trait stability over the 40 years between elementary school and midlife. Journal of personality and social psychology, 91(4), 763.
Han, J., Kim, K., Jung, K., & Lee, K. O. (2012). RFID-Based Digital Board Game Platforms. Computing and Informatics, 29(6+), 1141-1158.
Jeng, S. P., & Teng, C. I. (2008). Personality and motivations for playing online games. Social Behavior and Personality: an international journal, 36(8), 1053-1060.
Lin, C. H., Huang, S. H., Shih, J. L., Covaci, A., & Ghinea, G. (2017, July). Game-Based Learning Effectiveness and Motivation Study between Competitive and Cooperative Modes. In Advanced Learning Technologies (ICALT), 2017 IEEE 17th International Conference on pp. 123-127. doi: 10.1109/ICALT.2017.34.
Quercia, D., Kosinski, M., Stillwell, D., & Crowcroft, J. (2011, October). Our twitter profiles, our selves: Predicting personality with twitter. In Privacy, Security, Risk and Trust (PASSAT) and 2011 IEEE Third Inernational Conference on Social Computing (SocialCom), 2011 IEEE Third International Conference on (pp. 180-185).
van der Stege, H. A., van Staa, A., Hilberink, S. R., & Visser, A. P. (2010). Using the new board game SeCZ TaLK to stimulate the communication on sexual health for adolescents with chronic conditions. Patient Education and Counseling, 81(3), 324-331.
Wallace, J. R., Pape, J., Chang, Y. L. B., McClelland, P. J., Graham, T. C., Scott, S. D., & Hancock, M. (2012, February). Exploring automation in digital tabletop board game. In Proceedings of the ACM 2012 conference on Computer Supported Cooperative Work Companion, pp. 231-234. doi: 10.1145/2141512.2141585.
Wilson, R. S., Barnes, L. L., Aggarwal, N. T., Boyle, P. A., Hebert, L. E., de Leon, C. M., & Evans, D. A. (2010). Cognitive activity and the cognitive morbidity of Alzheimer disease. Neurology, 75(11), 990-996.
Worth, N. C., & Book, A. S. (2014). Personality and behavior in a massively multiplayer online role-playing game. Computers in Human Behavior, 38, 322-330.
Hayashi, Y., Mathews, M., Supnithi, T. (Eds.) (2017). Workshop Proceedings of the 25th International Conference on Computers in Education. New Zealand: Asia-Pacific Society for Computers in Education
546
The Design and Evaluation of a STEM Interdisciplinary Game-based Learning about
the Great Voyage Shu-Hsien HUANG*, Chia-Chun TSENG, Ju-Ling SHIH
Department of Information and Learning Technology, National University of Tainan, Taiwan *[email protected]
Abstract: In recent year, STEM education has been widely practiced with computational thinking since it encourages students to be immersed in the problem-solving process which also requires interdisciplinary knowledge. This study presented a 21-hour game-based learning course in the context of Great Voyage with the integration of STEM and robots, called <STEM Port>. Students programmed the robots to play the classroom-size spice-trading game. The results show that students can effectively learn to use programming block editor to control mBot in this course. From the course evaluation and learning motivation survey, it is shown that students are highly motivated to learn knowledge and skills in different fields including science, technology, engineering, and math, and can show significant improvements in all these subject areas.
Keywords: STEM, computational thinking, mBot, game-based learning, Great Voyage
1. Introduction
The 21st Century Skills has been the focus of educational reform in the last decade in several countries including the U.S., Australia, Finland and Singapore. The 21st Century Skills reinforces 5C skills including critical thinking, creative thinking, complex problem solving, communication, and collaboration. Students would not only have to learn the knowledge content in the textbooks but also use multiple abilities to adapt to future society. Therefore, interdisciplinary education is essential, such as STEM education has integrated science, technology, engineering and mathematics into one thematic curriculum. Current STEM practices are educational applications done with 3D printings, robots, tele-controlled aircraft, just to name a few. MIT also has created code.org which use block editor and mini-games to let primary school students to learn basic coding concept.
However, game-based learning can intrigue students to learn in the interesting way which can enhance their learning motivation. The gamification mechanism, such as levels, collective points, badge system, and ranking board, can turn the classroom lectures into a more competitive and activity-based learning so that students can be more autonomous in their own learning, acquire and apply what they learn in the process. Games have enriched students’ learning environment, and gaming tasks have given them clear learning goals. Through either cooperative or competitive ways, students learn from their peers in the positive interactions. They would also enhance their social abilities, train communication skills, and nurture negotiation habits. Student groups would not just be work-sharing groups, but a collaborative team with common goals in which group members know when and how to support each other.
This research describes the design and evaluation of the game <STEM Port> about the spice trades in the Age of Discovery and the complete game-based learning course with the integration of STEM interdisciplinary concepts. In the 21-hour summer camp, twenty primary students aged from 8 to 11 participated the STEM course. They learned coding with block editor to control the robot, mBot; they learned astronomy to be able to define directions without compass; they learned the history of the Age of Discovery to understand how and why the European countries do trading with the Asian countries.
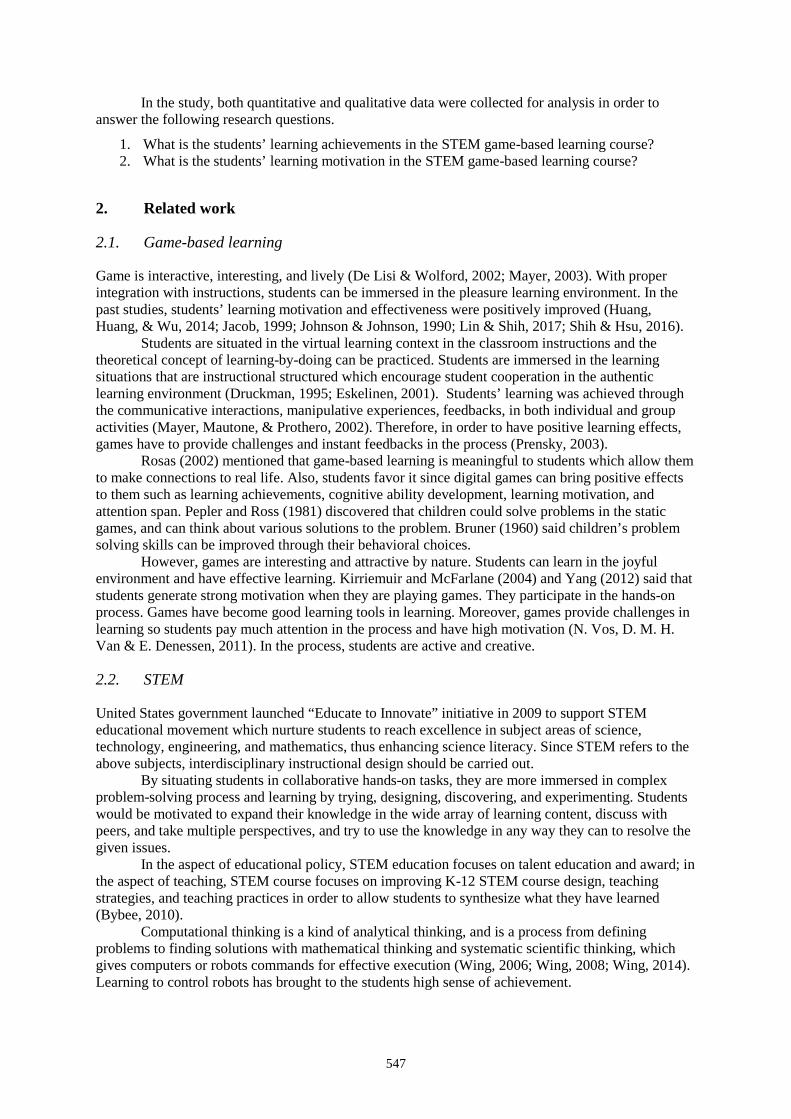
547
In the study, both quantitative and qualitative data were collected for analysis in order to answer the following research questions.
1. What is the students’ learning achievements in the STEM game-based learning course? 2. What is the students’ learning motivation in the STEM game-based learning course?
2. Related work
2.1. Game-based learning
Game is interactive, interesting, and lively (De Lisi & Wolford, 2002; Mayer, 2003). With proper integration with instructions, students can be immersed in the pleasure learning environment. In the past studies, students’ learning motivation and effectiveness were positively improved (Huang, Huang, & Wu, 2014; Jacob, 1999; Johnson & Johnson, 1990; Lin & Shih, 2017; Shih & Hsu, 2016).
Students are situated in the virtual learning context in the classroom instructions and the theoretical concept of learning-by-doing can be practiced. Students are immersed in the learning situations that are instructional structured which encourage student cooperation in the authentic learning environment (Druckman, 1995; Eskelinen, 2001). Students’ learning was achieved through the communicative interactions, manipulative experiences, feedbacks, in both individual and group activities (Mayer, Mautone, & Prothero, 2002). Therefore, in order to have positive learning effects, games have to provide challenges and instant feedbacks in the process (Prensky, 2003).
Rosas (2002) mentioned that game-based learning is meaningful to students which allow them to make connections to real life. Also, students favor it since digital games can bring positive effects to them such as learning achievements, cognitive ability development, learning motivation, and attention span. Pepler and Ross (1981) discovered that children could solve problems in the static games, and can think about various solutions to the problem. Bruner (1960) said children’s problem solving skills can be improved through their behavioral choices.
However, games are interesting and attractive by nature. Students can learn in the joyful environment and have effective learning. Kirriemuir and McFarlane (2004) and Yang (2012) said that students generate strong motivation when they are playing games. They participate in the hands-on process. Games have become good learning tools in learning. Moreover, games provide challenges in learning so students pay much attention in the process and have high motivation (N. Vos, D. M. H. Van & E. Denessen, 2011). In the process, students are active and creative.
2.2. STEM
United States government launched “Educate to Innovate” initiative in 2009 to support STEM educational movement which nurture students to reach excellence in subject areas of science, technology, engineering, and mathematics, thus enhancing science literacy. Since STEM refers to the above subjects, interdisciplinary instructional design should be carried out.
By situating students in collaborative hands-on tasks, they are more immersed in complex problem-solving process and learning by trying, designing, discovering, and experimenting. Students would be motivated to expand their knowledge in the wide array of learning content, discuss with peers, and take multiple perspectives, and try to use the knowledge in any way they can to resolve the given issues.
In the aspect of educational policy, STEM education focuses on talent education and award; in the aspect of teaching, STEM course focuses on improving K-12 STEM course design, teaching strategies, and teaching practices in order to allow students to synthesize what they have learned (Bybee, 2010).
Computational thinking is a kind of analytical thinking, and is a process from defining problems to finding solutions with mathematical thinking and systematic scientific thinking, which gives computers or robots commands for effective execution (Wing, 2006; Wing, 2008; Wing, 2014). Learning to control robots has brought to the students high sense of achievement.
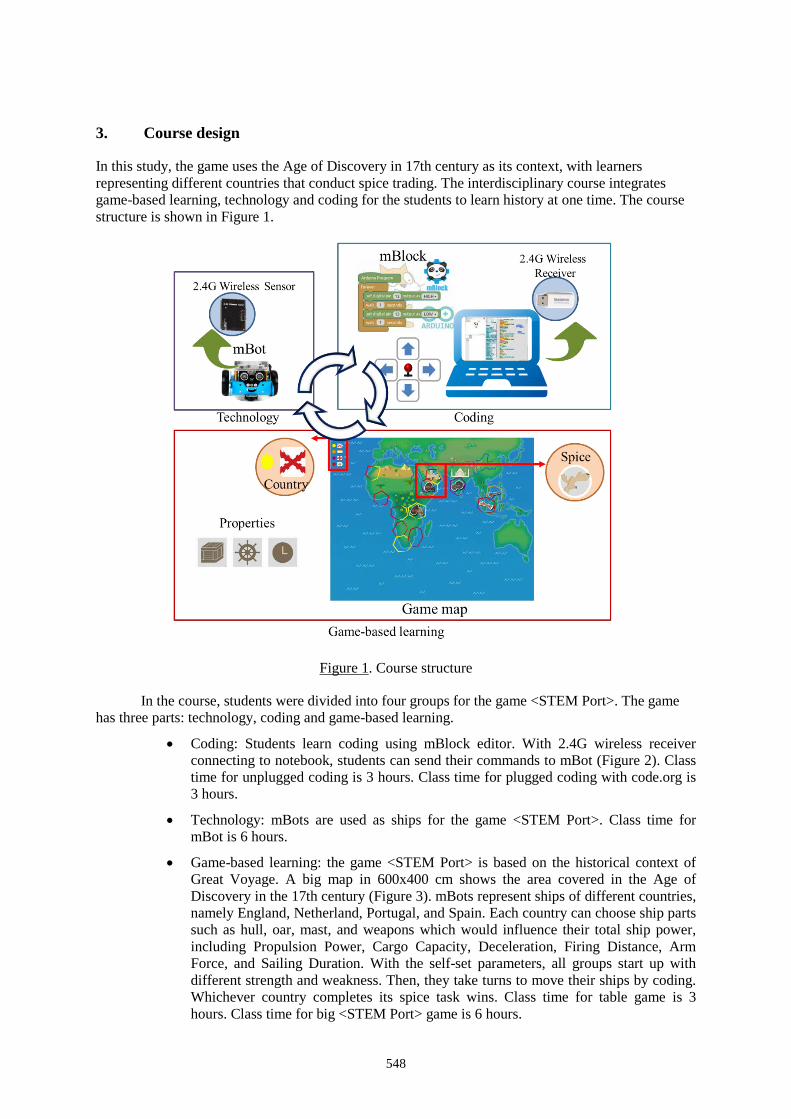
548
3. Course design
In this study, the game uses the Age of Discovery in 17th century as its context, with learners representing different countries that conduct spice trading. The interdisciplinary course integrates game-based learning, technology and coding for the students to learn history at one time. The course structure is shown in Figure 1.
Figure 1. Course structure
In the course, students were divided into four groups for the game <STEM Port>. The game has three parts: technology, coding and game-based learning.
• Coding: Students learn coding using mBlock editor. With 2.4G wireless receiver connecting to notebook, students can send their commands to mBot (Figure 2). Class time for unplugged coding is 3 hours. Class time for plugged coding with code.org is 3 hours.
• Technology: mBots are used as ships for the game <STEM Port>. Class time for mBot is 6 hours.
• Game-based learning: the game <STEM Port> is based on the historical context of Great Voyage. A big map in 600x400 cm shows the area covered in the Age of Discovery in the 17th century (Figure 3). mBots represent ships of different countries, namely England, Netherland, Portugal, and Spain. Each country can choose ship parts such as hull, oar, mast, and weapons which would influence their total ship power, including Propulsion Power, Cargo Capacity, Deceleration, Firing Distance, Arm Force, and Sailing Duration. With the self-set parameters, all groups start up with different strength and weakness. Then, they take turns to move their ships by coding. Whichever country completes its spice task wins. Class time for table game is 3 hours. Class time for big <STEM Port> game is 6 hours.
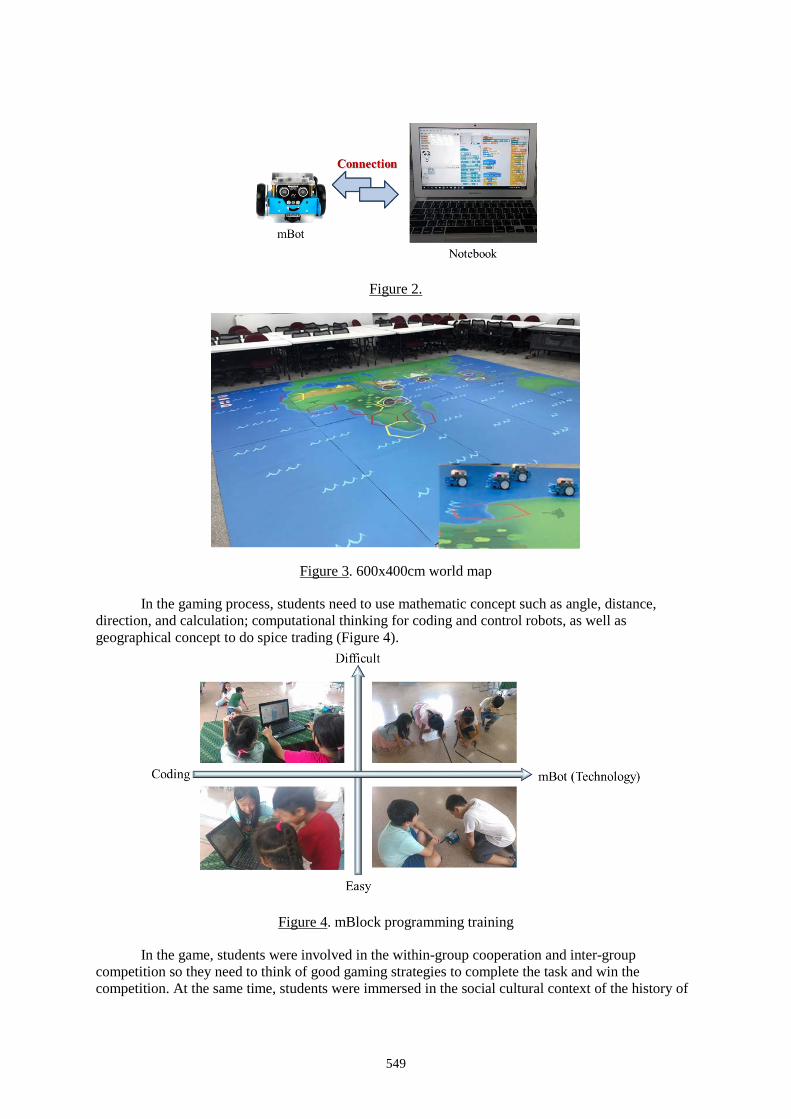
549
Figure 2.
Figure 3. 600x400cm world map
In the gaming process, students need to use mathematic concept such as angle, distance, direction, and calculation; computational thinking for coding and control robots, as well as geographical concept to do spice trading (Figure 4).
Figure 4. mBlock programming training
In the game, students were involved in the within-group cooperation and inter-group competition so they need to think of good gaming strategies to complete the task and win the competition. At the same time, students were immersed in the social cultural context of the history of
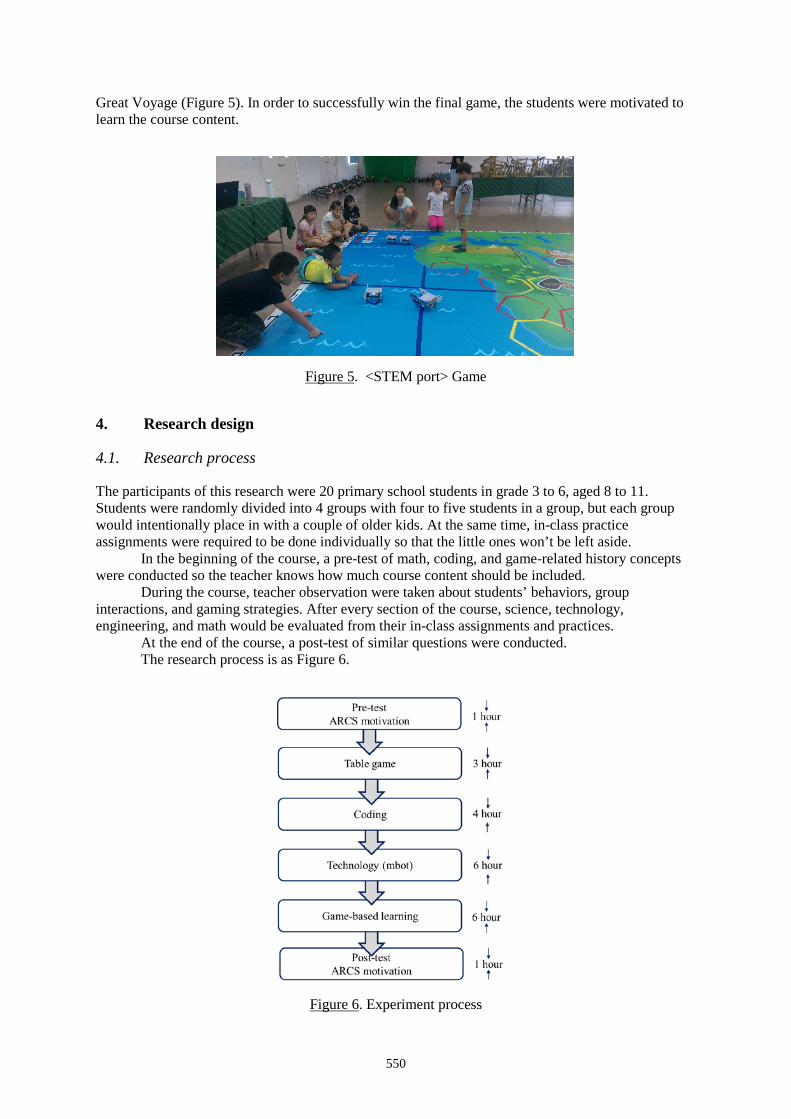
550
Great Voyage (Figure 5). In order to successfully win the final game, the students were motivated to learn the course content.
Figure 5. <STEM port> Game
4. Research design
4.1. Research process
The participants of this research were 20 primary school students in grade 3 to 6, aged 8 to 11. Students were randomly divided into 4 groups with four to five students in a group, but each group would intentionally place in with a couple of older kids. At the same time, in-class practice assignments were required to be done individually so that the little ones won’t be left aside.
In the beginning of the course, a pre-test of math, coding, and game-related history concepts were conducted so the teacher knows how much course content should be included.
During the course, teacher observation were taken about students’ behaviors, group interactions, and gaming strategies. After every section of the course, science, technology, engineering, and math would be evaluated from their in-class assignments and practices.
At the end of the course, a post-test of similar questions were conducted. The research process is as Figure 6.
Figure 6. Experiment process
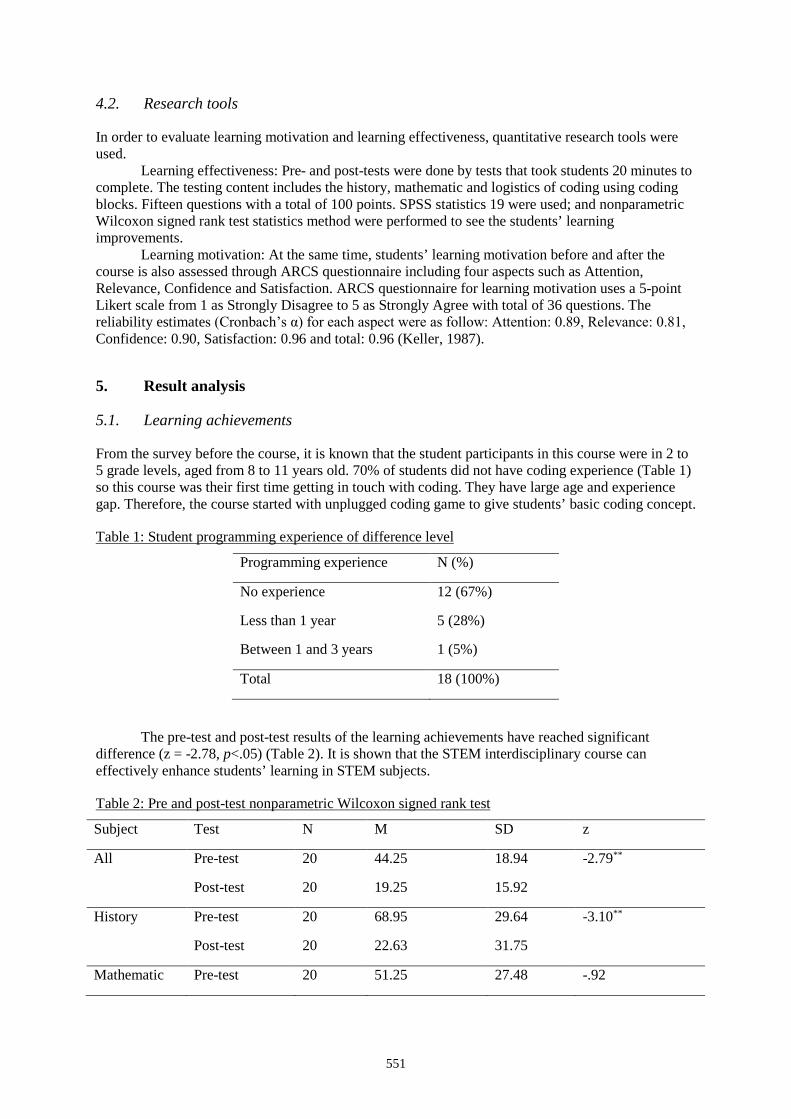
551
4.2. Research tools
In order to evaluate learning motivation and learning effectiveness, quantitative research tools were used.
Learning effectiveness: Pre- and post-tests were done by tests that took students 20 minutes to complete. The testing content includes the history, mathematic and logistics of coding using coding blocks. Fifteen questions with a total of 100 points. SPSS statistics 19 were used; and nonparametric Wilcoxon signed rank test statistics method were performed to see the students’ learning improvements.
Learning motivation: At the same time, students’ learning motivation before and after the course is also assessed through ARCS questionnaire including four aspects such as Attention, Relevance, Confidence and Satisfaction. ARCS questionnaire for learning motivation uses a 5-point Likert scale from 1 as Strongly Disagree to 5 as Strongly Agree with total of 36 questions. The reliability estimates (Cronbach’s α) for each aspect were as follow: Attention: 0.89, Relevance: 0.81, Confidence: 0.90, Satisfaction: 0.96 and total: 0.96 (Keller, 1987).
5. Result analysis
5.1. Learning achievements
From the survey before the course, it is known that the student participants in this course were in 2 to 5 grade levels, aged from 8 to 11 years old. 70% of students did not have coding experience (Table 1) so this course was their first time getting in touch with coding. They have large age and experience gap. Therefore, the course started with unplugged coding game to give students’ basic coding concept.
Table 1: Student programming experience of difference level
Programming experience N (%)
No experience 12 (67%)
Less than 1 year 5 (28%)
Between 1 and 3 years 1 (5%)
Total 18 (100%)
The pre-test and post-test results of the learning achievements have reached significant difference (z = -2.78, p<.05) (Table 2). It is shown that the STEM interdisciplinary course can effectively enhance students’ learning in STEM subjects.
Table 2: Pre and post-test nonparametric Wilcoxon signed rank test
Subject Test N M SD z
All Pre-test 20 44.25 18.94 -2.79**
Post-test 20 19.25 15.92
History Pre-test 20 68.95 29.64 -3.10**
Post-test 20 22.63 31.75
Mathematic Pre-test 20 51.25 27.48 -.92
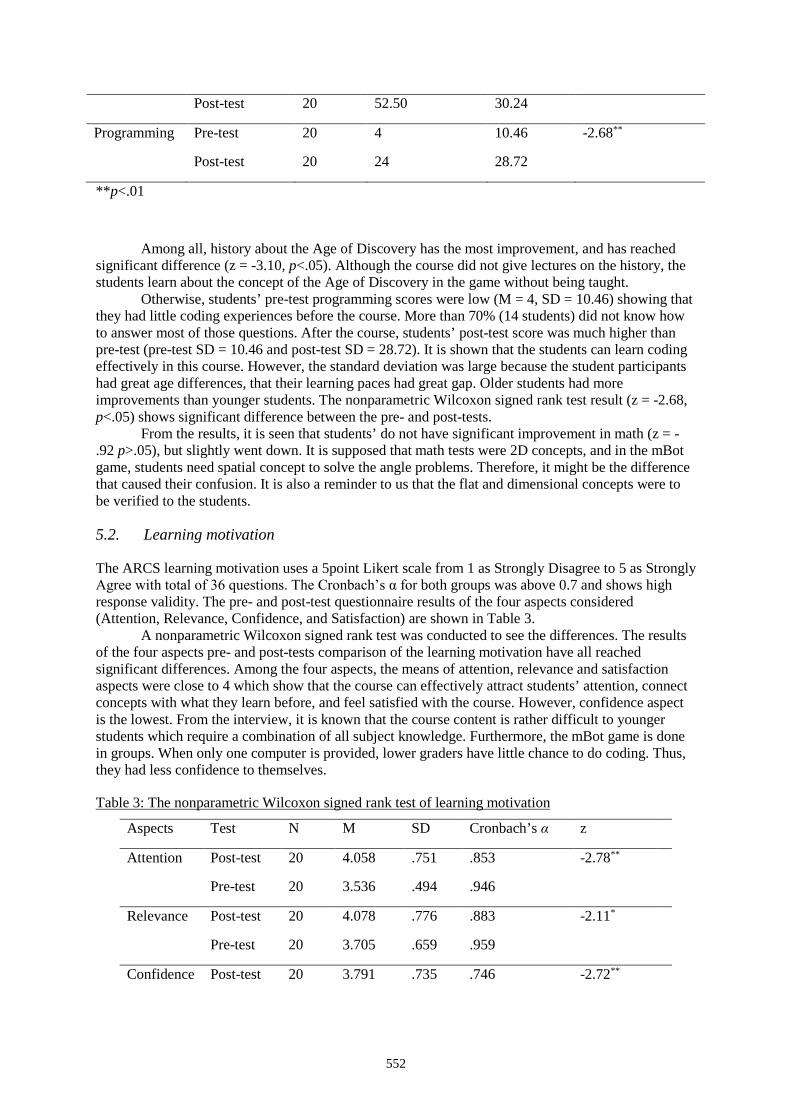
552
Post-test 20 52.50 30.24
Programming Pre-test 20 4 10.46 -2.68**
Post-test 20 24 28.72
**p<.01
Among all, history about the Age of Discovery has the most improvement, and has reached significant difference (z = -3.10, p<.05). Although the course did not give lectures on the history, the students learn about the concept of the Age of Discovery in the game without being taught.
Otherwise, students’ pre-test programming scores were low (M = 4, SD = 10.46) showing that they had little coding experiences before the course. More than 70% (14 students) did not know how to answer most of those questions. After the course, students’ post-test score was much higher than pre-test (pre-test SD = 10.46 and post-test SD = 28.72). It is shown that the students can learn coding effectively in this course. However, the standard deviation was large because the student participants had great age differences, that their learning paces had great gap. Older students had more improvements than younger students. The nonparametric Wilcoxon signed rank test result (z = -2.68, p<.05) shows significant difference between the pre- and post-tests.
From the results, it is seen that students’ do not have significant improvement in math (z = -.92 p>.05), but slightly went down. It is supposed that math tests were 2D concepts, and in the mBot game, students need spatial concept to solve the angle problems. Therefore, it might be the difference that caused their confusion. It is also a reminder to us that the flat and dimensional concepts were to be verified to the students.
5.2. Learning motivation
The ARCS learning motivation uses a 5point Likert scale from 1 as Strongly Disagree to 5 as Strongly Agree with total of 36 questions. The Cronbach’s α for both groups was above 0.7 and shows high response validity. The pre- and post-test questionnaire results of the four aspects considered (Attention, Relevance, Confidence, and Satisfaction) are shown in Table 3.
A nonparametric Wilcoxon signed rank test was conducted to see the differences. The results of the four aspects pre- and post-tests comparison of the learning motivation have all reached significant differences. Among the four aspects, the means of attention, relevance and satisfaction aspects were close to 4 which show that the course can effectively attract students’ attention, connect concepts with what they learn before, and feel satisfied with the course. However, confidence aspect is the lowest. From the interview, it is known that the course content is rather difficult to younger students which require a combination of all subject knowledge. Furthermore, the mBot game is done in groups. When only one computer is provided, lower graders have little chance to do coding. Thus, they had less confidence to themselves.
Table 3: The nonparametric Wilcoxon signed rank test of learning motivation
Aspects Test N M SD Cronbach’s α z
Attention Post-test 20 4.058 .751 .853 -2.78**
Pre-test 20 3.536 .494 .946
Relevance Post-test 20 4.078 .776 .883 -2.11*
Pre-test 20 3.705 .659 .959
Confidence Post-test 20 3.791 .735 .746 -2.72**
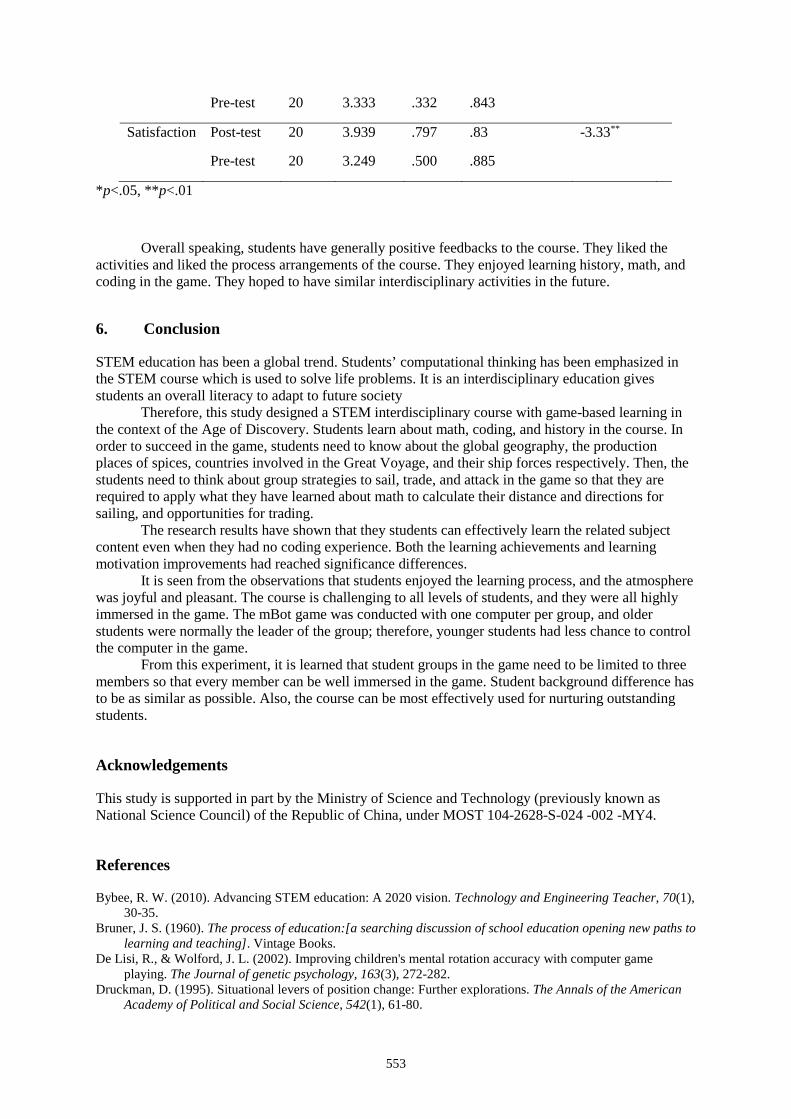
553
Pre-test 20 3.333 .332 .843
Satisfaction Post-test 20 3.939 .797 .83 -3.33**
Pre-test 20 3.249 .500 .885
*p<.05, **p<.01
Overall speaking, students have generally positive feedbacks to the course. They liked the activities and liked the process arrangements of the course. They enjoyed learning history, math, and coding in the game. They hoped to have similar interdisciplinary activities in the future.
6. Conclusion
STEM education has been a global trend. Students’ computational thinking has been emphasized in the STEM course which is used to solve life problems. It is an interdisciplinary education gives students an overall literacy to adapt to future society
Therefore, this study designed a STEM interdisciplinary course with game-based learning in the context of the Age of Discovery. Students learn about math, coding, and history in the course. In order to succeed in the game, students need to know about the global geography, the production places of spices, countries involved in the Great Voyage, and their ship forces respectively. Then, the students need to think about group strategies to sail, trade, and attack in the game so that they are required to apply what they have learned about math to calculate their distance and directions for sailing, and opportunities for trading.
The research results have shown that they students can effectively learn the related subject content even when they had no coding experience. Both the learning achievements and learning motivation improvements had reached significance differences.
It is seen from the observations that students enjoyed the learning process, and the atmosphere was joyful and pleasant. The course is challenging to all levels of students, and they were all highly immersed in the game. The mBot game was conducted with one computer per group, and older students were normally the leader of the group; therefore, younger students had less chance to control the computer in the game.
From this experiment, it is learned that student groups in the game need to be limited to three members so that every member can be well immersed in the game. Student background difference has to be as similar as possible. Also, the course can be most effectively used for nurturing outstanding students.
Acknowledgements
This study is supported in part by the Ministry of Science and Technology (previously known as National Science Council) of the Republic of China, under MOST 104-2628-S-024 -002 -MY4.
References
Bybee, R. W. (2010). Advancing STEM education: A 2020 vision. Technology and Engineering Teacher, 70(1), 30-35.
Bruner, J. S. (1960). The process of education:[a searching discussion of school education opening new paths to learning and teaching]. Vintage Books.
De Lisi, R., & Wolford, J. L. (2002). Improving children's mental rotation accuracy with computer game playing. The Journal of genetic psychology, 163(3), 272-282.
Druckman, D. (1995). Situational levers of position change: Further explorations. The Annals of the American Academy of Political and Social Science, 542(1), 61-80.
554
Eskelinen, M. (2001). The gaming situation. Game studies, 1(1), 68. Huang, Y. M., Huang, S. H., & Wu, T. T. (2014). Embedding diagnostic mechanisms in a digital game for
learning mathematics. Educational Technology Research and Development, 62(2), 187-207. Jacob, E. (1999). Cooperative learning in context: An educational innovation in everyday classrooms. Suny
Press. Johnson, D. W., & Johnson, R. T. (1990). Social skills for successful group work. Educational
leadership, 47(4), 29-33. Keller, J. M. (1987). Development and use of the ARCS model of instructional design. Journal of instructional
development, 10(3), 2-10. Kirriemuir, J., & McFarlane, A. (2004). Literature review in games and learning. Lin, C.H.*, & Shih, J.-L. (2017). Analysing Group Dynamics of a Digital Game-based Adventure Education
Course. Educational Technology & Society.(In press). Mayer, R. E. (2003). The promise of multimedia learning: using the same instructional design methods across
different media. Learning and instruction, 13(2), 125-139. Mayer, R. E., Mautone, P., & Prothero, W. (2002). Pictorial aids for learning by doing in a multimedia geology
simulation game. Journal of Educational Psychology, 94(1), 171. Prensky, M. (2003). Digital game-based learning. Computers in Entertainment (CIE), 1(1), 21-21. Pepler, D. J., & Ross, H. S. (1981). The effects of play on convergent and divergent problem solving. Child
Development, 1202-1210. Shih, J-L., & Hsu, Y.-J. (2016). Advancing Adventure Education Using Digital Motion-Sensing Games. Journal
of Educational Technology & Society, 19(4). 178-189. Vos, N., Van Der Meijden, H., & Denessen, E. (2011). Effects of constructing versus playing an educational
game on student motivation and deep learning strategy use. Computers & Education, 56(1), 127-137. Wing, J. M. (2006). Computational thinking. Communications of the ACM, 49(3), 33-35. Wing, J. M. (2008). Computational thinking and thinking about computing. Philosophical transactions of the
royal society of London A: mathematical, physical and engineering sciences, 366(1881), 3717-3725. Wing, J. (2014). Computational thinking benefits society. 40th Anniversary Blog of Social Issues in Computing,
2014. Yang, Y. T. C. (2012). Building virtual cities, inspiring intelligent citizens: Digital games for developing
students’ problem solving and learning motivation. Computers & Education, 59(2), 365-377.
Hayashi, Y., et al. (Eds.) (2017). Workshop Proceedings of the 25th International Conference on Computers in Education. New Zealand: Asia-Pacific Society for Computers in Education
555
Adoption of Computer Programming Exercises for Automatic Assessment — Issues and
Caution Yuen Tak YUa*, Chung Man TANGb, Chung Keung POONb & Jacky Wai KEUNGa
aDepartment of Computer Science, City University of Hong Kong, Hong Kong bSchool of Computing and Information Sciences, Caritas Institute of Higher Education, Hong Kong
Abstract: Computational thinking is an interdisciplinary core skill to be acquired in STEM education, while computer program coding is a concrete manifestation of such a skill. In response to the increasing size of computer programming classes and rapidly growing number of learners, particularly in massive open online courses (MOOCs), many instructors nowadays heavily rely on the use of automated systems to assess the programming work of students. However, these automated assessment systems typically perform black box testing to determine the correctness of student programs, which limits the type of programming exercises that can be automatically assessed. This paper reports a case study on the adoption of programming exercises from textbook and online resources, and categorises some difficulties and issues of caution due to the technical limitation of typical automated assessment systems. The identified issues are mainly related to the input/output and non-deterministic nature of the programs or the intended learning outcomes of some of the exercises. The paper concludes with a brief outline of recent research directions to alleviate these problems for improvement of learning.
Keywords: Assessment of learning, automated assessment, black box testing, computational thinking, computer programming exercises, technology-enhanced learning and assessment
1. Introduction
Computational thinking is an interdisciplinary core skill to be acquired in STEM education with relevance across all four disciplines of science, technology, engineering and mathematics, while computer programming (or program coding) is a concrete manifestation of such a skill. Computer programming is now taught not only at tertiary and senior secondary levels of education, but increasingly at junior high schools or even primary schools. It is also a core subject of almost all STEM-related majors spanning across different faculties and schools in most universities, and is now a popular subject in general education for students from non-STEM majors. It is not unusual to have hundreds of students attending a computer programming course at the same time (Wang & Wong, 2007), particularly in massive open online courses (MOOCs) (Staubitz et al., 2015; Thiébaut, 2015).
Although there are many other ways to assess students’ knowledge of computer programming such as the use of multiple choice or conventional questions (Siddiqi, Harrison, & Siddiqi, 2010), exercises that require students to write programs are much more common and relevant. Hence, to assess students’ learning, it is necessary for instructors to perform the following tasks (Chong & Choy, 2004):
(T1) design and select many programming exercises as practice and for assessment,
(T2) administer the dissemination of exercises and collection of students’ program submissions, and
(T3) assess the submitted programs and provide feedback to students.
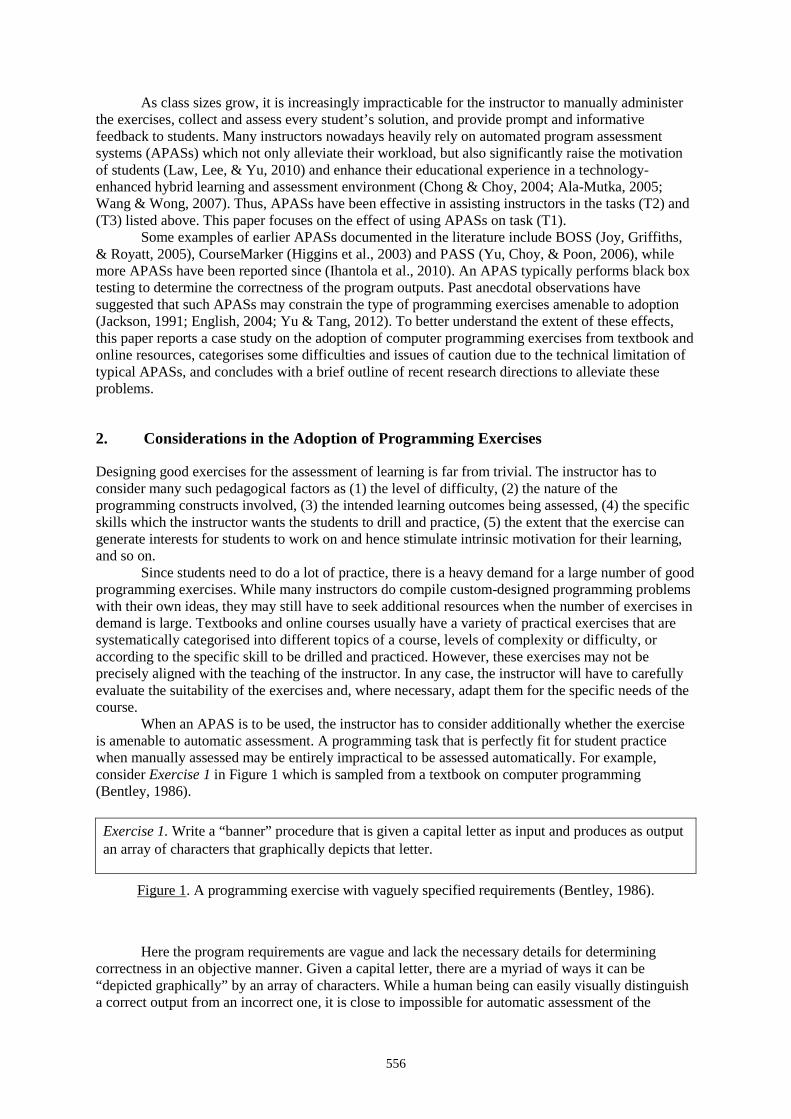
556
As class sizes grow, it is increasingly impracticable for the instructor to manually administer the exercises, collect and assess every student’s solution, and provide prompt and informative feedback to students. Many instructors nowadays heavily rely on automated program assessment systems (APASs) which not only alleviate their workload, but also significantly raise the motivation of students (Law, Lee, & Yu, 2010) and enhance their educational experience in a technology-enhanced hybrid learning and assessment environment (Chong & Choy, 2004; Ala-Mutka, 2005; Wang & Wong, 2007). Thus, APASs have been effective in assisting instructors in the tasks (T2) and (T3) listed above. This paper focuses on the effect of using APASs on task (T1).
Some examples of earlier APASs documented in the literature include BOSS (Joy, Griffiths, & Royatt, 2005), CourseMarker (Higgins et al., 2003) and PASS (Yu, Choy, & Poon, 2006), while more APASs have been reported since (Ihantola et al., 2010). An APAS typically performs black box testing to determine the correctness of the program outputs. Past anecdotal observations have suggested that such APASs may constrain the type of programming exercises amenable to adoption (Jackson, 1991; English, 2004; Yu & Tang, 2012). To better understand the extent of these effects, this paper reports a case study on the adoption of computer programming exercises from textbook and online resources, categorises some difficulties and issues of caution due to the technical limitation of typical APASs, and concludes with a brief outline of recent research directions to alleviate these problems.
2. Considerations in the Adoption of Programming Exercises
Designing good exercises for the assessment of learning is far from trivial. The instructor has to consider many such pedagogical factors as (1) the level of difficulty, (2) the nature of the programming constructs involved, (3) the intended learning outcomes being assessed, (4) the specific skills which the instructor wants the students to drill and practice, (5) the extent that the exercise can generate interests for students to work on and hence stimulate intrinsic motivation for their learning, and so on.
Since students need to do a lot of practice, there is a heavy demand for a large number of good programming exercises. While many instructors do compile custom-designed programming problems with their own ideas, they may still have to seek additional resources when the number of exercises in demand is large. Textbooks and online courses usually have a variety of practical exercises that are systematically categorised into different topics of a course, levels of complexity or difficulty, or according to the specific skill to be drilled and practiced. However, these exercises may not be precisely aligned with the teaching of the instructor. In any case, the instructor will have to carefully evaluate the suitability of the exercises and, where necessary, adapt them for the specific needs of the course.
When an APAS is to be used, the instructor has to consider additionally whether the exercise is amenable to automatic assessment. A programming task that is perfectly fit for student practice when manually assessed may be entirely impractical to be assessed automatically. For example, consider Exercise 1 in Figure 1 which is sampled from a textbook on computer programming (Bentley, 1986).
Here the program requirements are vague and lack the necessary details for determining correctness in an objective manner. Given a capital letter, there are a myriad of ways it can be “depicted graphically” by an array of characters. While a human being can easily visually distinguish a correct output from an incorrect one, it is close to impossible for automatic assessment of the
Exercise 1. Write a “banner” procedure that is given a capital letter as input and produces as output an array of characters that graphically depicts that letter.
Figure 1. A programming exercise with vaguely specified requirements (Bentley, 1986).
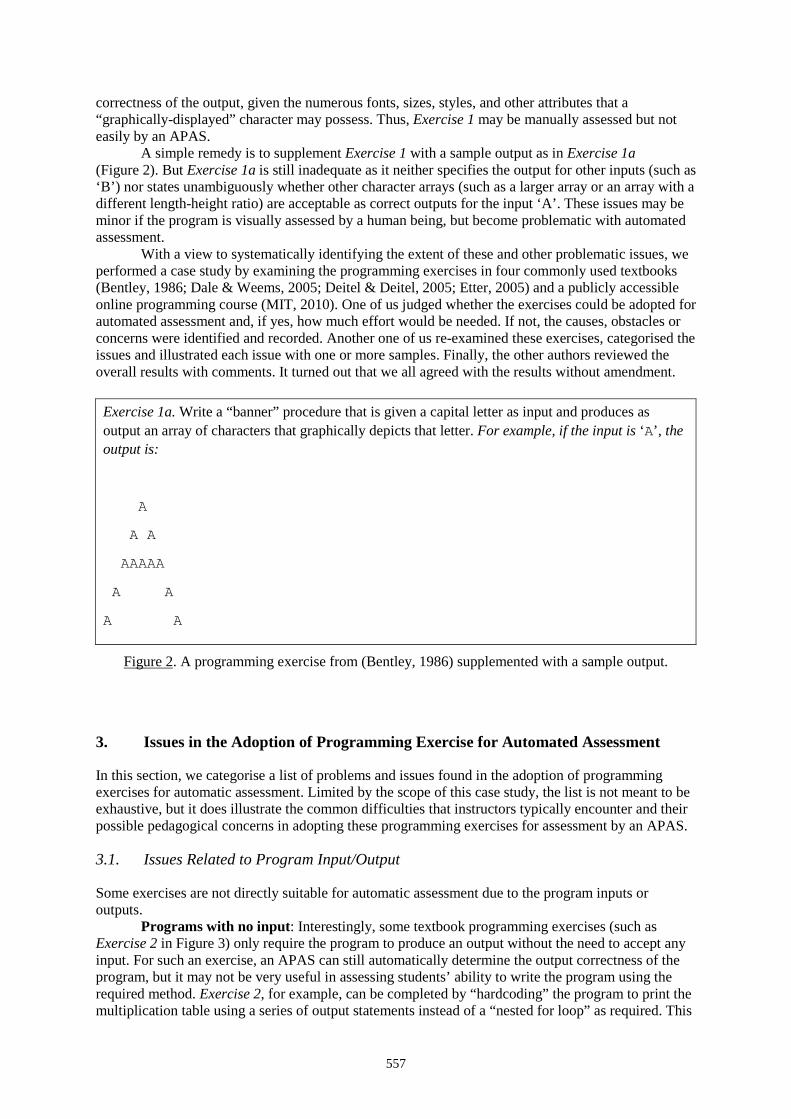
557
correctness of the output, given the numerous fonts, sizes, styles, and other attributes that a “graphically-displayed” character may possess. Thus, Exercise 1 may be manually assessed but not easily by an APAS.
A simple remedy is to supplement Exercise 1 with a sample output as in Exercise 1a (Figure 2). But Exercise 1a is still inadequate as it neither specifies the output for other inputs (such as ‘B’) nor states unambiguously whether other character arrays (such as a larger array or an array with a different length-height ratio) are acceptable as correct outputs for the input ‘A’. These issues may be minor if the program is visually assessed by a human being, but become problematic with automated assessment.
With a view to systematically identifying the extent of these and other problematic issues, we performed a case study by examining the programming exercises in four commonly used textbooks (Bentley, 1986; Dale & Weems, 2005; Deitel & Deitel, 2005; Etter, 2005) and a publicly accessible online programming course (MIT, 2010). One of us judged whether the exercises could be adopted for automated assessment and, if yes, how much effort would be needed. If not, the causes, obstacles or concerns were identified and recorded. Another one of us re-examined these exercises, categorised the issues and illustrated each issue with one or more samples. Finally, the other authors reviewed the overall results with comments. It turned out that we all agreed with the results without amendment.
3. Issues in the Adoption of Programming Exercise for Automated Assessment
In this section, we categorise a list of problems and issues found in the adoption of programming exercises for automatic assessment. Limited by the scope of this case study, the list is not meant to be exhaustive, but it does illustrate the common difficulties that instructors typically encounter and their possible pedagogical concerns in adopting these programming exercises for assessment by an APAS.
3.1. Issues Related to Program Input/Output
Some exercises are not directly suitable for automatic assessment due to the program inputs or outputs.
Programs with no input: Interestingly, some textbook programming exercises (such as Exercise 2 in Figure 3) only require the program to produce an output without the need to accept any input. For such an exercise, an APAS can still automatically determine the output correctness of the program, but it may not be very useful in assessing students’ ability to write the program using the required method. Exercise 2, for example, can be completed by “hardcoding” the program to print the multiplication table using a series of output statements instead of a “nested for loop” as required. This
Exercise 1a. Write a “banner” procedure that is given a capital letter as input and produces as output an array of characters that graphically depicts that letter. For example, if the input is ‘A’, the output is:
A
A A
AAAAA
A A
A A
Figure 2. A programming exercise from (Bentley, 1986) supplemented with a sample output.
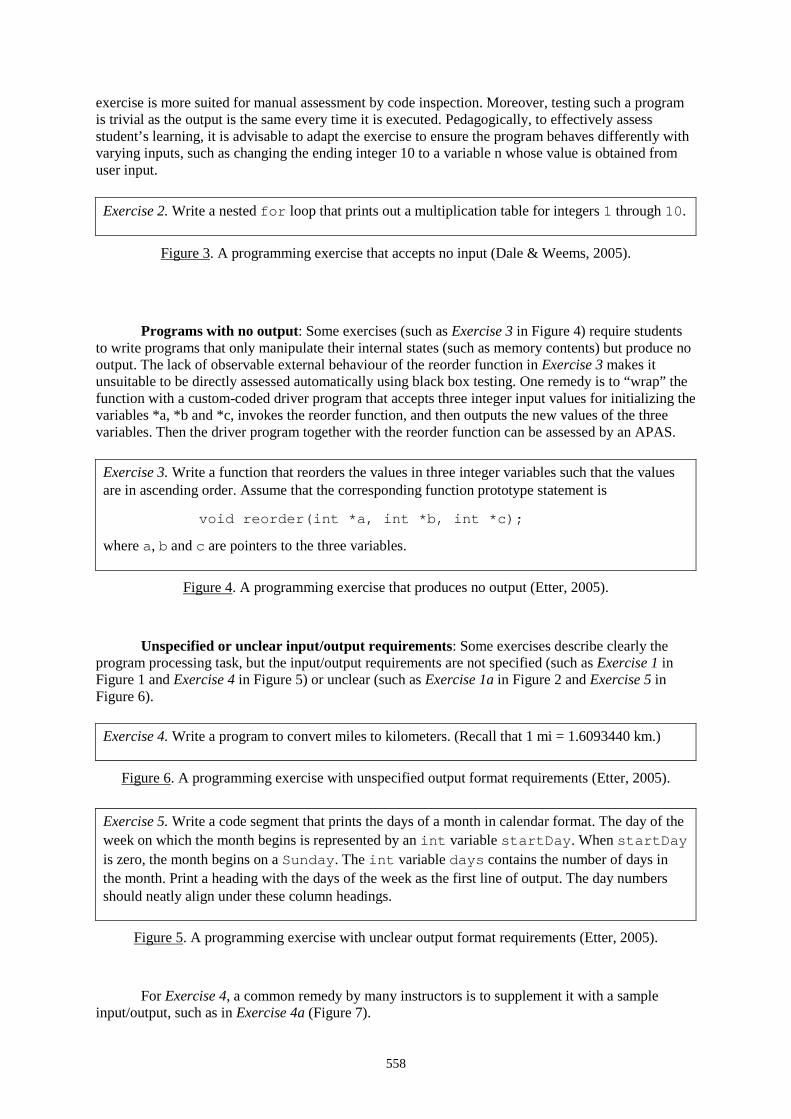
558
exercise is more suited for manual assessment by code inspection. Moreover, testing such a program is trivial as the output is the same every time it is executed. Pedagogically, to effectively assess student’s learning, it is advisable to adapt the exercise to ensure the program behaves differently with varying inputs, such as changing the ending integer 10 to a variable n whose value is obtained from user input.
Programs with no output: Some exercises (such as Exercise 3 in Figure 4) require students to write programs that only manipulate their internal states (such as memory contents) but produce no output. The lack of observable external behaviour of the reorder function in Exercise 3 makes it unsuitable to be directly assessed automatically using black box testing. One remedy is to “wrap” the function with a custom-coded driver program that accepts three integer input values for initializing the variables *a, *b and *c, invokes the reorder function, and then outputs the new values of the three variables. Then the driver program together with the reorder function can be assessed by an APAS.
Unspecified or unclear input/output requirements: Some exercises describe clearly the program processing task, but the input/output requirements are not specified (such as Exercise 1 in Figure 1 and Exercise 4 in Figure 5) or unclear (such as Exercise 1a in Figure 2 and Exercise 5 in Figure 6).
For Exercise 4, a common remedy by many instructors is to supplement it with a sample input/output, such as in Exercise 4a (Figure 7).
Exercise 2. Write a nested for loop that prints out a multiplication table for integers 1 through 10.
Figure 3. A programming exercise that accepts no input (Dale & Weems, 2005).
Exercise 3. Write a function that reorders the values in three integer variables such that the values are in ascending order. Assume that the corresponding function prototype statement is
void reorder(int *a, int *b, int *c);
where a, b and c are pointers to the three variables.
Figure 4. A programming exercise that produces no output (Etter, 2005).
Exercise 4. Write a program to convert miles to kilometers. (Recall that 1 mi = 1.6093440 km.)
Figure 6. A programming exercise with unspecified output format requirements (Etter, 2005).
Exercise 5. Write a code segment that prints the days of a month in calendar format. The day of the week on which the month begins is represented by an int variable startDay. When startDay is zero, the month begins on a Sunday. The int variable days contains the number of days in the month. Print a heading with the days of the week as the first line of output. The day numbers should neatly align under these column headings.
Figure 5. A programming exercise with unclear output format requirements (Etter, 2005).
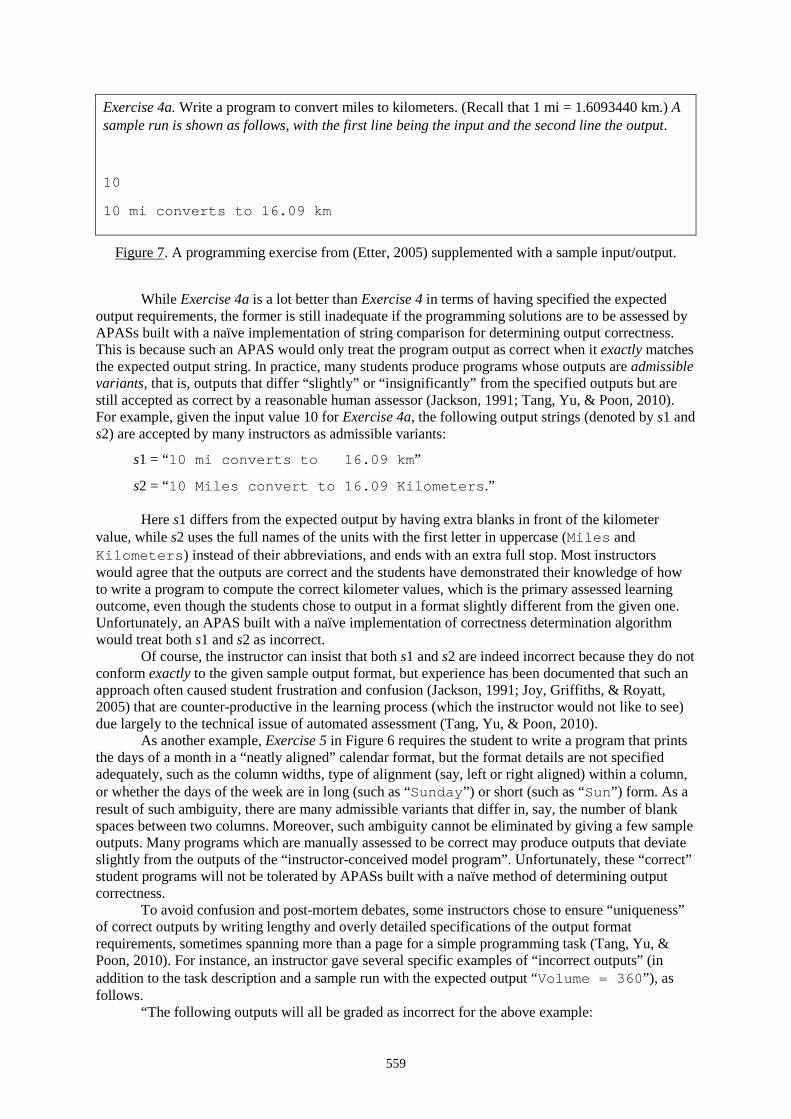
559
While Exercise 4a is a lot better than Exercise 4 in terms of having specified the expected output requirements, the former is still inadequate if the programming solutions are to be assessed by APASs built with a naïve implementation of string comparison for determining output correctness. This is because such an APAS would only treat the program output as correct when it exactly matches the expected output string. In practice, many students produce programs whose outputs are admissible variants, that is, outputs that differ “slightly” or “insignificantly” from the specified outputs but are still accepted as correct by a reasonable human assessor (Jackson, 1991; Tang, Yu, & Poon, 2010). For example, given the input value 10 for Exercise 4a, the following output strings (denoted by s1 and s2) are accepted by many instructors as admissible variants:
s1 = “10 mi converts to 16.09 km”
s2 = “10 Miles convert to 16.09 Kilometers.”
Here s1 differs from the expected output by having extra blanks in front of the kilometer value, while s2 uses the full names of the units with the first letter in uppercase (Miles and Kilometers) instead of their abbreviations, and ends with an extra full stop. Most instructors would agree that the outputs are correct and the students have demonstrated their knowledge of how to write a program to compute the correct kilometer values, which is the primary assessed learning outcome, even though the students chose to output in a format slightly different from the given one. Unfortunately, an APAS built with a naïve implementation of correctness determination algorithm would treat both s1 and s2 as incorrect.
Of course, the instructor can insist that both s1 and s2 are indeed incorrect because they do not conform exactly to the given sample output format, but experience has been documented that such an approach often caused student frustration and confusion (Jackson, 1991; Joy, Griffiths, & Royatt, 2005) that are counter-productive in the learning process (which the instructor would not like to see) due largely to the technical issue of automated assessment (Tang, Yu, & Poon, 2010).
As another example, Exercise 5 in Figure 6 requires the student to write a program that prints the days of a month in a “neatly aligned” calendar format, but the format details are not specified adequately, such as the column widths, type of alignment (say, left or right aligned) within a column, or whether the days of the week are in long (such as “Sunday”) or short (such as “Sun”) form. As a result of such ambiguity, there are many admissible variants that differ in, say, the number of blank spaces between two columns. Moreover, such ambiguity cannot be eliminated by giving a few sample outputs. Many programs which are manually assessed to be correct may produce outputs that deviate slightly from the outputs of the “instructor-conceived model program”. Unfortunately, these “correct” student programs will not be tolerated by APASs built with a naïve method of determining output correctness.
To avoid confusion and post-mortem debates, some instructors chose to ensure “uniqueness” of correct outputs by writing lengthy and overly detailed specifications of the output format requirements, sometimes spanning more than a page for a simple programming task (Tang, Yu, & Poon, 2010). For instance, an instructor gave several specific examples of “incorrect outputs” (in addition to the task description and a sample run with the expected output “Volume = 360”), as follows.
“The following outputs will all be graded as incorrect for the above example:
Exercise 4a. Write a program to convert miles to kilometers. (Recall that 1 mi = 1.6093440 km.) A sample run is shown as follows, with the first line being the input and the second line the output.
10
10 mi converts to 16.09 km
Figure 7. A programming exercise from (Etter, 2005) supplemented with a sample input/output.
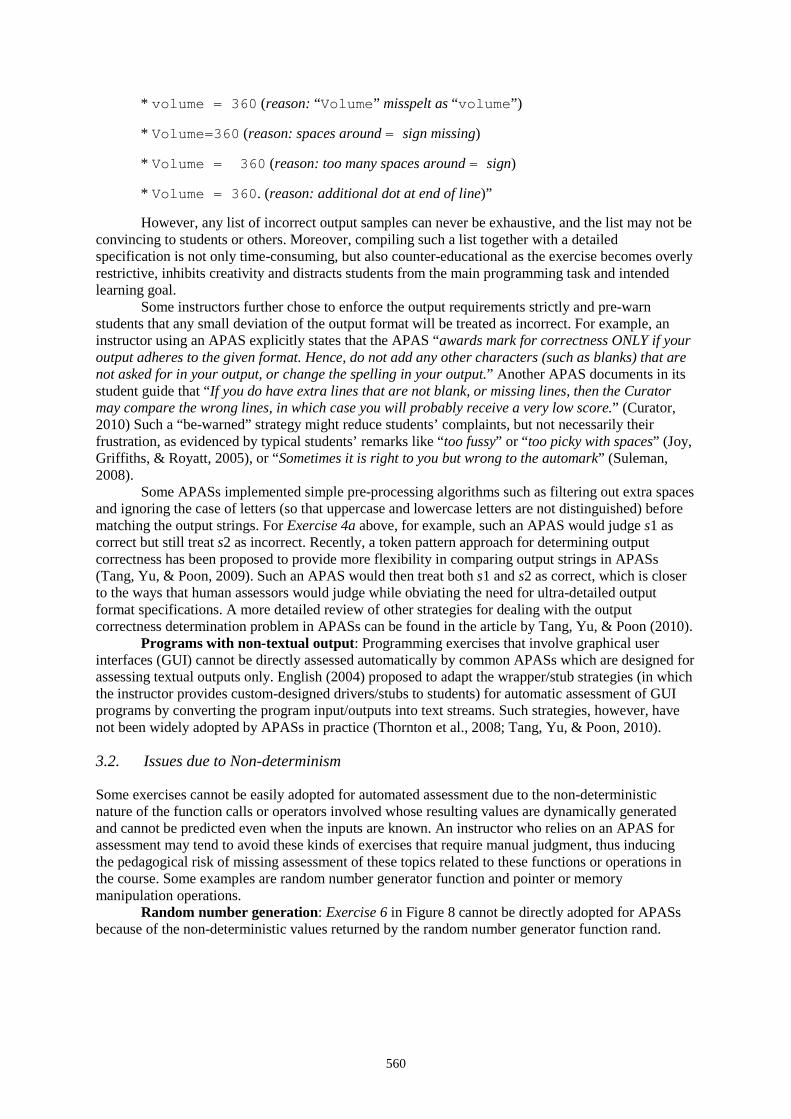
560
* volume = 360 (reason: “Volume” misspelt as “volume”)
* Volume=360 (reason: spaces around = sign missing)
* Volume = 360 (reason: too many spaces around = sign)
* Volume = 360. (reason: additional dot at end of line)”
However, any list of incorrect output samples can never be exhaustive, and the list may not be convincing to students or others. Moreover, compiling such a list together with a detailed specification is not only time-consuming, but also counter-educational as the exercise becomes overly restrictive, inhibits creativity and distracts students from the main programming task and intended learning goal.
Some instructors further chose to enforce the output requirements strictly and pre-warn students that any small deviation of the output format will be treated as incorrect. For example, an instructor using an APAS explicitly states that the APAS “awards mark for correctness ONLY if your output adheres to the given format. Hence, do not add any other characters (such as blanks) that are not asked for in your output, or change the spelling in your output.” Another APAS documents in its student guide that “If you do have extra lines that are not blank, or missing lines, then the Curator may compare the wrong lines, in which case you will probably receive a very low score.” (Curator, 2010) Such a “be-warned” strategy might reduce students’ complaints, but not necessarily their frustration, as evidenced by typical students’ remarks like “too fussy” or “too picky with spaces” (Joy, Griffiths, & Royatt, 2005), or “Sometimes it is right to you but wrong to the automark” (Suleman, 2008).
Some APASs implemented simple pre-processing algorithms such as filtering out extra spaces and ignoring the case of letters (so that uppercase and lowercase letters are not distinguished) before matching the output strings. For Exercise 4a above, for example, such an APAS would judge s1 as correct but still treat s2 as incorrect. Recently, a token pattern approach for determining output correctness has been proposed to provide more flexibility in comparing output strings in APASs (Tang, Yu, & Poon, 2009). Such an APAS would then treat both s1 and s2 as correct, which is closer to the ways that human assessors would judge while obviating the need for ultra-detailed output format specifications. A more detailed review of other strategies for dealing with the output correctness determination problem in APASs can be found in the article by Tang, Yu, & Poon (2010).
Programs with non-textual output: Programming exercises that involve graphical user interfaces (GUI) cannot be directly assessed automatically by common APASs which are designed for assessing textual outputs only. English (2004) proposed to adapt the wrapper/stub strategies (in which the instructor provides custom-designed drivers/stubs to students) for automatic assessment of GUI programs by converting the program input/outputs into text streams. Such strategies, however, have not been widely adopted by APASs in practice (Thornton et al., 2008; Tang, Yu, & Poon, 2010).
3.2. Issues due to Non-determinism
Some exercises cannot be easily adopted for automated assessment due to the non-deterministic nature of the function calls or operators involved whose resulting values are dynamically generated and cannot be predicted even when the inputs are known. An instructor who relies on an APAS for assessment may tend to avoid these kinds of exercises that require manual judgment, thus inducing the pedagogical risk of missing assessment of these topics related to these functions or operations in the course. Some examples are random number generator function and pointer or memory manipulation operations.
Random number generation: Exercise 6 in Figure 8 cannot be directly adopted for APASs because of the non-deterministic values returned by the random number generator function rand.
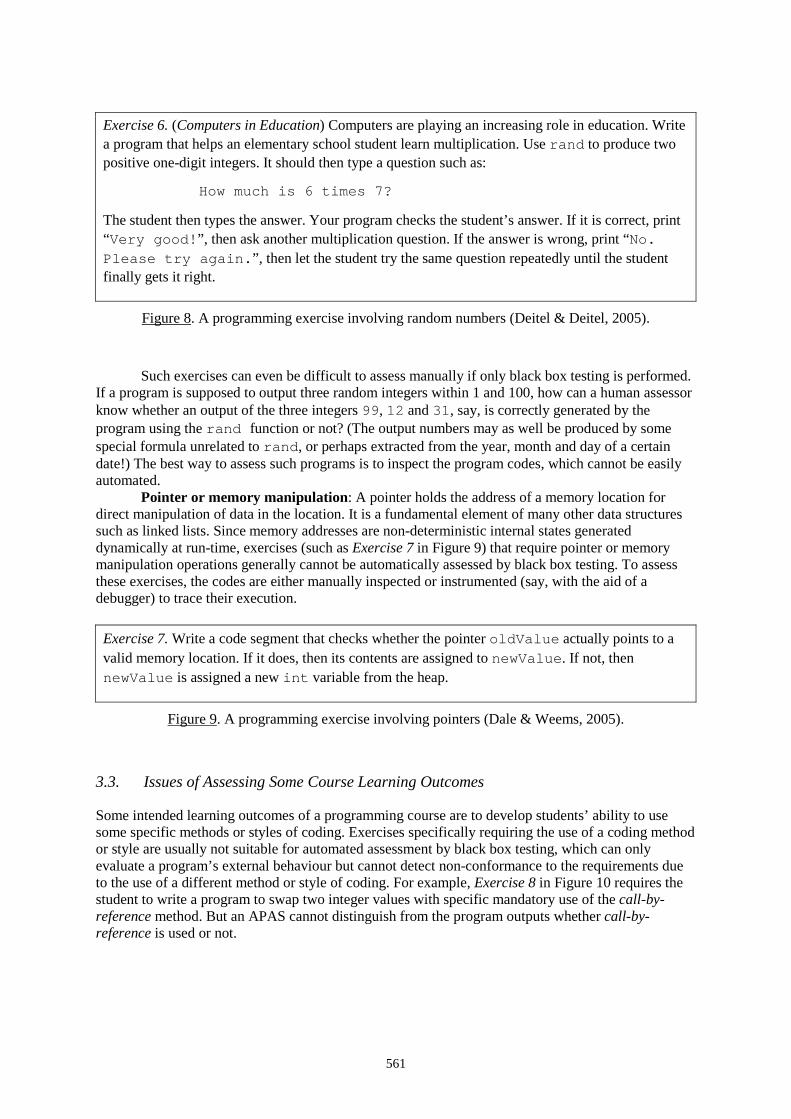
561
Such exercises can even be difficult to assess manually if only black box testing is performed. If a program is supposed to output three random integers within 1 and 100, how can a human assessor know whether an output of the three integers 99, 12 and 31, say, is correctly generated by the program using the rand function or not? (The output numbers may as well be produced by some special formula unrelated to rand, or perhaps extracted from the year, month and day of a certain date!) The best way to assess such programs is to inspect the program codes, which cannot be easily automated.
Pointer or memory manipulation: A pointer holds the address of a memory location for direct manipulation of data in the location. It is a fundamental element of many other data structures such as linked lists. Since memory addresses are non-deterministic internal states generated dynamically at run-time, exercises (such as Exercise 7 in Figure 9) that require pointer or memory manipulation operations generally cannot be automatically assessed by black box testing. To assess these exercises, the codes are either manually inspected or instrumented (say, with the aid of a debugger) to trace their execution.
3.3. Issues of Assessing Some Course Learning Outcomes
Some intended learning outcomes of a programming course are to develop students’ ability to use some specific methods or styles of coding. Exercises specifically requiring the use of a coding method or style are usually not suitable for automated assessment by black box testing, which can only evaluate a program’s external behaviour but cannot detect non-conformance to the requirements due to the use of a different method or style of coding. For example, Exercise 8 in Figure 10 requires the student to write a program to swap two integer values with specific mandatory use of the call-by-reference method. But an APAS cannot distinguish from the program outputs whether call-by-reference is used or not.
Exercise 7. Write a code segment that checks whether the pointer oldValue actually points to a valid memory location. If it does, then its contents are assigned to newValue. If not, then newValue is assigned a new int variable from the heap.
Figure 9. A programming exercise involving pointers (Dale & Weems, 2005).
Exercise 6. (Computers in Education) Computers are playing an increasing role in education. Write a program that helps an elementary school student learn multiplication. Use rand to produce two positive one-digit integers. It should then type a question such as:
How much is 6 times 7?
The student then types the answer. Your program checks the student’s answer. If it is correct, print “Very good!”, then ask another multiplication question. If the answer is wrong, print “No. Please try again.”, then let the student try the same question repeatedly until the student finally gets it right.
Figure 8. A programming exercise involving random numbers (Deitel & Deitel, 2005).
562
Learning outcomes involving the following are generally hard to be assessed by APASs. As such, instructors relying heavily on APASs may also tend to avoid assessing these learning outcomes.
Coding style: Coding style (Ala-Mutka, Uimonen, & Jarvinen, 2004) refers to a set of rules (related to variable naming, use of indentation and comments, etc.) that guide the writing of the source code to ease the effort required to understand and maintain the code. Again these rules only affect human reading of source code but not its execution, and so they are better assessed manually or by static analysis.
Specified control structure: Some exercises are designed for students’ practice of certain control structures, such as recursion. Many students may find recursive function calls difficult to code and use iterations instead. Since automated assessment by black box testing normally cannot distinguish the use of recursion or iteration, such exercises are usually manually assessed by inspecting the source code.
Behaviourally-equivalent algorithms: A programming task can typically be coded by using different algorithms that exhibit the same functional behaviour. If an exercise requires students to practice a specific algorithm (say, binary search), whether the student’s submitted program really implements the required algorithm cannot be easily assessed automatically by means of black box testing.
Specified data structure: Data structures, such as arrays and linked lists, are ways for storing and organizing groups of data so that they can be managed neatly and manipulated efficiently. Some students may find the handling of one type of data structure (say, array) easier than another (say, linked list) and keep using the “easier” one despite the explicit requirement that specifies the use of another. The resulting program that uses an “easier” data structure may perform the same function despite not using the required data structure, which cannot be distinguished by means of black box testing.
4. Recent and Future Work
Our case study has identified and categorised a list of issues when adopting programming exercises for assessment by APASs. A common category of issues is related to program input/output, such as non-existent or underspecified input/output or the use of GUIs. The recently developed token pattern approach for output correctness determination has partly resolved the difficulties of correctly assessing admissible variants without the need of writing overly detailed and rigid specifications (Tang, Yu, & Poon, 2009), while the wrapper strategies proposed by English (2004) have partly addressed the assessment of GUI outputs, but further research to advance these technologies and broaden their applicability is still needed in these directions (Thornton et al., 2008; Tang, Yu, & Poon, 2010).
Another category of issues is due to the non-deterministic functions or operators being practised. Some kinds of non-determinism can be eliminated, such as by fixing the seed of the random number generator. For other types of non-determinism, further research may study the applicability of instructor-defined stubs or drivers (Jackson, 1991; Tremblay et al., 2008; Tang, Yu, & Poon, 2010) to convert these programs into deterministic ones for assessment by APASs.
Finally, there are issues of assessing learning outcomes that require the use of a specific method or style of coding. If not addressed, instructors who rely on APASs may tend to avoid these kinds of exercises, causing some learning outcomes to be not assessed in the programming course. By
Exercise 8. Write a function that swaps two integer values using call-by-reference.
Figure 10. A programming exercise specifically requiring the use of call-by-reference (MIT, 2010).
563
nature, whether a program uses a specific coding style or method is hard to assess by testing and more feasibly by static code analysis. Some recent research has attempted to incorporate static analysis in APASs to perform such tasks as program style assessment (Ala-Mutka, Uimonen, & Jarvinen, 2004) and algorithm recognition (Taherkhani, Malmi, & Korhonen, 2008). Further work in this direction appears promising, but the applicability of most of the existing research results to real APASs is still limited (Striewe & Goedicke, 2014). Our case study has contributed to a categorisation of the main technical issues that hinder the adoption of some programming exercises for automated assessment, providing a basis for further and more focused concerted efforts in systematically addressing these issues.
Acknowledgements
The work described in this paper is supported by the grants from Research Grants Council of the HKSAR (project numbers UGC/FDS11/E02/15 and 11208017).
References
Ala-Mutka, K. (2005). A survey of automated assessment approaches for programming assignments. Computer Science Education, 15(2), 83–102.
Ala-Mutka, K., Uimonen T., & Jarvinen, H.-M. (2004). Supporting students in C++ programming courses with automatic program style assessment. Journal of Information Technology Education, 3, 245–262.
Bentley, J. (1986). Programming Pearls. Addison-Wesley Publishing Company. Chong, S. L., & Choy, M. (2004). Towards a progressive learning environment for programming courses.
Proceedings of the 3rd International Conference on Web-based Learning (ICWL 2004), 200–205. Curator (2010). Curator System Student Guide (September 2010). http://courses.cs.vt.edu/curator/StudentInfo/
CuratorStudentGuide.doc. Dale, N., & Weems, C. (2005). Programming and Problem Solving with C++. Jones and Bartlett Publishers. Deitel, H. M., & Deitel, P. J. (2005). C++ How to Program. Pearson Education International. English, J. (2004). Automatic assessment of GUI programs using JEWL. Proceedings of Annual Conference on
Innovation and Technology in Computer Science Education (ITiCSE 2004), 137–141. Etter, D. M. (2005). Engineering Problem Solving with C. Pearson Education, Inc. Higgins, C., Hergazy, T., Symeonidis, P., & Tsinsifas, A. (2003). The CourseMarker CBA system:
Improvements over Ceilidh. Education and Information Technologies, 8(3), 287–304. Ihantola, P., Ahoniemi, T., Karavirta V., & Seppälä, O. (2010). Review of recent systems for automatic
assessment of programming assignments. Proceedings of Koli Calling International Conference on Computing Education Research, 86–93.
Jackson, D. (1991). Using software tools to automate the assessment of student programs. Computers and Education, 17(2), 133–143.
Joy, M., Griffiths, N., & Royatt, R. (2005). The BOSS online submission and assessment system. ACM Journal on Educational Resources in Computing, 5(3), Article 2.
Law, K. M. Y., Lee, V. C. S., & Yu, Y. T. (2010). Learning motivation in e-learning facilitated computer programming courses. Computers and Education, 55(1), 218–228.
MIT (2009). Course 6.096: Introduction to C++. MIT OpenCourseWare. http://hdl.handle.net/1721.1/74125. Siddiqi, R., Harrison, C. J., & Siddiqi, R. (2010). Improving teaching and learning through automated short-
answer marking. IEEE Transactions on Learning Technologies, 3(3), 237–249. Staubitz, T., Klement, H., Renz, J., Teusner, R., & Meinel, C. (2015). Towards practical programming exercises
and automated assessment in massive open online courses. Proceedings of IEEE International Conference on Teaching, Assessment, and Learning for Engineering (TALE 2015), 23–30.
Striewe, M., & Goedicke, M. (2014). A review of static analysis approaches for programming exercises. Proceedings of International Conference on Computer Assisted Assessment (CAA 2014), 100–113.
Suleman, H. (2008). Automatic marking with Sakai. Proceedings of Annual Conference of the South African Institue of Computer Scientists and Information Technologists 2008 (SAICSIT 2008), 229–236.
Taherkhani, A., Malmi, L., & Korhonen, A. (2008). Algorithm recognition by static analysis and its application in students’ submission assessment. Proceedings of Koli Calling International Conference on Computing Education Research, 88–91.

564
Tang, C. M., Yu, Y. T., & Poon, C. K. (2009). An approach towards automatic testing of student programs using token patterns. Proceedings of International Conference on Computers in Education (ICCE 2009), 188–190.
Tang, C. M., Yu, Y. T., & Poon, C. K. (2010). A review of the strategies for output correctness determination in automated assessment of student programs. Proceedings of Global Chinese Conference on Computers in Education (GCCCE 2010), 551–558.
Thiébaut, D. (2015). Automatic evaluation of computer programs using Moodle’s Virtual Programming Lab (VPL) plug-in. Journal of Computing Sciences in Colleges, 30(6), 145–151.
Thornton, M., Edwards, S. H., Tan, R. P., & Pérez-Quiñones, M. A. (2008). Supporting student-written tests of GUI programs. ACM SIGCSE Bulletin, 40 (1), 537–541.
Tremblay, G., Guérin, F., Pons, A., & Salah, A. (2008). Oto, a generic and extensible tool for marking programming assignments. Software — Practice & Experience, 38(3), 307–333.
Wang, F. L., & Wong, T. L. (2007). Effective teaching and learning of computer programming with large class size. Proceedings of Symposium on Hybrid Learning (SHL 2007), 55–65.
Yu, Y. T., Choy, M. Y., & Poon, C. K. (2006). Experiences with PASS: Developing and using a programming assignment assessment system. Proceedings of International Conference on Quality Software (QSIC 2006), 360–365.
Yu, Y. T., & Tang, C. M. (2012). On the characteristics of programming exercises that affect their suitability for automated assessment. Proceedings of Global Chinese Conference on Computers in Education (GCCCE 2012), 661–662.
Hayashi, Y., et al. (Eds.) (2017). Workshop Proceedings of the 25th International Conference on Computers in Education. New Zealand: Asia-Pacific Society for Computers in Education
565
Learner’s Creative Thinking of Learners Learning with Constructivist Web-Based
Learning Environment Model: Integration between Pedagogy and Neuroscience
Sumalee CHAIJAROEN a* Orawan TECHAPORNPONG b & Charuni SAMAT c
a Associate Professor of Educational Technology, Faculty of Education, Khon Kaen University, Thailand
bDoctoral Degree student in Educational Technology, Faculty of Education, Khon Kaen University, Thailand
cAssistant Professor of Computer Education, Faculty of Education, Khon Kaen University, Thailand * [email protected]
Abstract: The Purposes of this research were: 1) to examine learners’ creative thinking 2) to compare pretest and posttest of the learners’ creative thinking for measuring and evaluation of executive function by using Torrance Tests of Creative Thinking (TTCT). The Model research Phase III Model Use was employed in this study. Both quantitative and qualitative data were collected and analyzed. Mean, standard deviation, percentage and Z test, Wilcoxon Matched-pairs Signed rank test and protocol analysis were used to analyzed the data. The target group was 24 learners of the 2015 academic year at Srisemawittayaserm School. The results showed that: 1) The students’ creative thinking 4 aspects including: (1) fluency (2) flexibility (3) originality and (4) elaboration and 2) The comparison of the pretest and posttest of the learners’ creative thinking, from measuring and evaluation of executive function by using Torrance Tests of Creative Thinking showed that standard scores total activity of posttest all students were significantly higher than standard scores total activity of pretest at the level 0.05.
Keywords: Constructivist, Web-based learning environment, Neuroscience, Creative thinking
Introduction
Regards the society development which driven by knowledge, human resource development in terms of creativity and innovation is very challenge to the education revolution due to make a preparation for the working environment under the new trend of economy. It is very urgent to develop and foster the efficiency of the Thai among the fast moving of economic world which requires the human to be skillful in science, math, and creative thinking to be able to confront and solve a problem effectively, which consistent with the learning in 21st century about the Creativity and Innovation development. Including the Eleventh National Economic and Social Development Plan 2012-2016 (Office of the National Economics and Social Development Board, 2011) which focuses on creative thinking (Drucker,1993; Sawyer,2006; Charoenwongsak, 2004). The creative thinking is higher-order thinking, the ability to think or find a solution in multiple ways by connecting the prior knowledge with the new knowledge into a new work or production or to solve a new problem (Samat, 2015). Therefore the creative thinking is not only the ability to use in learning, but it can be used to solve a problem in different situation (Hardiman, 2010; Rotherham & Willingham, 2009).
The current learning paradigm has been shifting from “teaching” to “learning” which most importantly focuses on the learners. In addition, the development then could be enhanced by using information technology for life-long learning. Furthermore, the unreachable of achievement in basic education school management according to the national standard. This might cause from the lack of learner-centered and thinking enhancement especially in analytical, critical, and creative thinking.
566
One of the learner development for such mentioned enhancement according the national education plan is to design the instruction based on pedagogy as Cognitivism which foster the learners to create and have their own cognitive process, Constructivist which mainly on knowledge construction along with creative thinking in area of information and technology consistent with learning 21st century. Especially in task presentation by using information and technology which requires the originality and presentation in more multiple ways fluently and quickly. This corresponds to the creative thinking (Guildford, 1967): fluency, flexibility, originality, and elaboration.
Moreover, the study of recent studies was found that the results mainly showed creative thinking in cognitive process based on learning theory, but insufficient for the study of what happen in cognitive process of the learners. Therefore, the integration of Pedagogy and Neuroscience in terms of methods and equipment was focused in this study. Qualitative and quantitative data collection with biomarker can show the empirical evidence of its cognitive process. The study of creative thinking by evaluating of executive function along with protocol analysis based on Guildford (1967) is one of the study that integration Pedagogy and Neuroscience. Designing the constructivist web- based learning environment and creative thinking according to Cognitive theories and Cognitive neuroscience. This kind of study is not the study of behavior observation but it is the enhancement of learner’s cognitive process to help them to be able to construct knowledge and confront the authentic problem in real life situation. The knowledge construction is enhanced by the connecting of prior and new knowledge through schema along with media attributes and media symbol system by each learner’s processing ability affected to their learning ability (Kozma, 1991; Chaijaroen, 2008). The web-based learning with hyperlink, hypertext, and hypermedia can help the learners to construct knowledge as each node of knowledge connection can link more and more. This can help the learners elaborate knowledge by their own selves.
As mentioned above, the researchers hence realize the importance of the design and development of the constructivist web-based learning environment to enhance Creative thinking, and intend to study the Creative thinking of the learners. The finding finally may beneficial to enhance the learners to have more creative thinking and learning efficiency. Furthermore, the integration of neuroscience of methods and equipment could showed the empirical evidence of cognitive process. Such results so could be used to develop the human resource and 21st learning century for the stability of knowledge and economic society.
Research purposes
2.1. To study the creative thinking of the learners who learned with the Constructivist.
2.2. To compare the pretest and posttest of the creative thinking between before and after learning with the environment by evaluating the executive function through Torrance Tests of Creative Thinking (TTCT).
Research methodology
3.1. The target group was 24 learners of the 2015 academic year at Srisemawittayaserm School
3.2. The Model research Phase III Model Use (Richey & Klein, 2007) was employed.
3.3. The research instruments used in the experiment and collecting data comprised of 1) the Constructivist web-based learning environment model to enhance creative thinking on the topic of Presentation 2) of the learners’ interview on creative thinking and Torrance tests of Creative Thinking; TTCT).
567
Data collection
The data were collected as following these steps: • Administration Torrance Tests of Creative Thinking (TTCT) to the learners before they
learned with the learning environment. • Divide the students into eight groups, each group consisted of three learners and allowed them
learning with the learning environment by starting to provide a introducing them about how to learn with the learning environment in order to provoke them to get preparation and concentration to learn.
• They learned with the learning environment and completed the tasks to enhance creative thinking by using 8 components as 1) Problem base, 2) Knowledge bank, 3) Cognitive tools, 4) Creative thinking enhancement room, 5) Collaborative room, 6) Coaching, 7) Related cases, and 8) Scaffolding. Then, the researcher summarized the lesson together with them in the end of the class.
• The learners took the TTCT after learned with the learning environment. • The students were interviewed their creative thinking by the researcher.
Data analysis
The quantitative and qualitative data were analyzed as the following: • The creative thinking of the students was analyzed by protocol analysis based on the
framework of Guilford (1967), summarization, interpretation and analytical description. • The creative thinking of the students from the evaluation of executive function by using
TTCT was analyzed by using descriptive statistics which were mean, standard deviation (S.D.), percentage and Z test, Wilcoxon Matched-pairs Signed rank test.
Research result
The results of the learners’ creative thinking who learned with Constructivist web-based learning environment were as follows:
6.1. Creative thinking of the learners
The results of interview and protocol analysis were found that the learners’ creative thinking who learned with Constructivist web-based learning environment on the topic of Presentation consisted of 4 aspects: (1) Fluency which were Word fluency and Associational fluency, it showed the students’ ability to find the answer quickly by naming of 24 presentation patterns in limited time of 1 minute and comparing the advantages of publications media as convenient to use and distribute, the disadvantages of such media as no sound and unable to present animation and picture like video, to suddenly edit work, and waste of papers, advantages of electronic files as able to present animation picture as video, sound effect, make more interesting, and fast edit, and disadvantages of such files as cots a lot of investment if have no background or expertise in technology also difficult to present if have no computer or specific program to open the files or resolve virus problems; (2) Flexibility was the ability to create multiple concepts by be flexible to adapt or adjust presentation styles such as in project or exhibition or presented through a software as Word, Photoshop, e-book, video or web site (3) Originality was the ability to use the knowledge to create a concept that new, originate, and different from the previous concepts which they designed and created the presentation from the provided pictures, and it was found that they presented in exhibition pattern by stimulating places or objects and (4) Elaboration was the ability to elaborate the main concepts until completion which they added an idea to their presentation of The 12 value by summarizing the each main idea, adding cartoons, effects, videos, or music to make more understating to its details which such result consistent with Creative thinking framework of Guilford (1967).
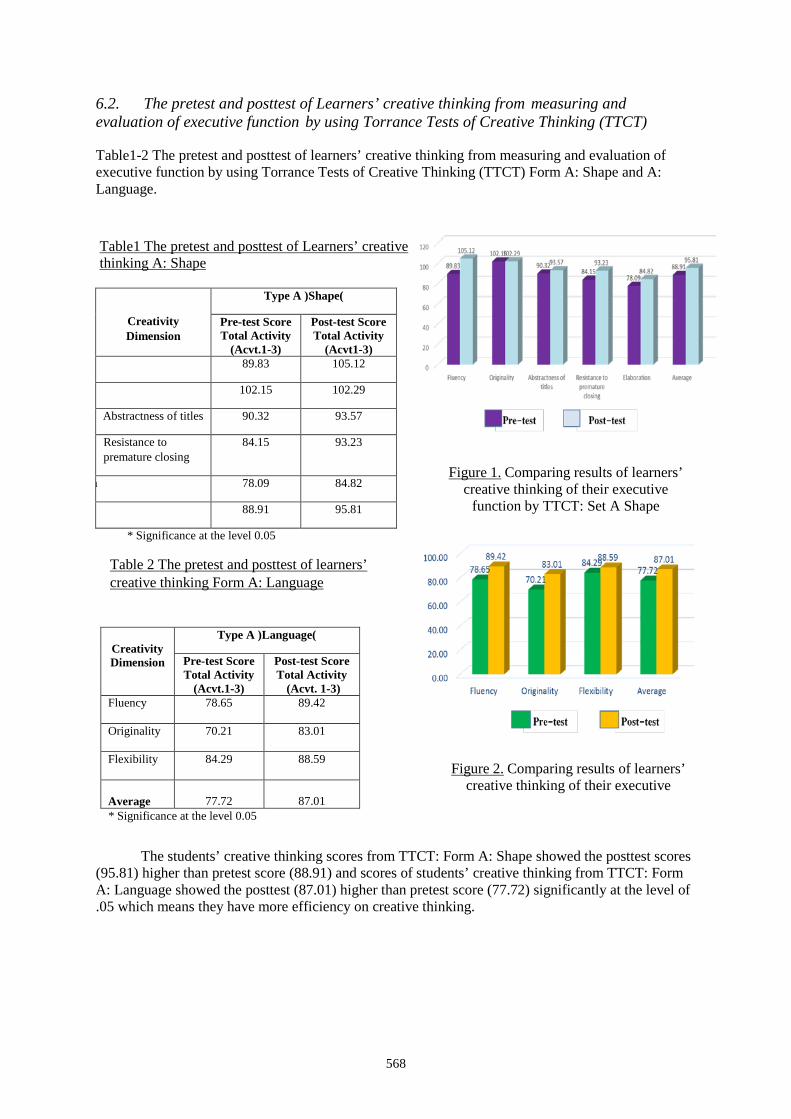
568
6.2. The pretest and posttest of Learners’ creative thinking from measuring and evaluation of executive function by using Torrance Tests of Creative Thinking (TTCT)
Table1-2 The pretest and posttest of learners’ creative thinking from measuring and evaluation of executive function by using Torrance Tests of Creative Thinking (TTCT) Form A: Shape and A: Language.
The students’ creative thinking scores from TTCT: Form A: Shape showed the posttest scores (95.81) higher than pretest score (88.91) and scores of students’ creative thinking from TTCT: Form A: Language showed the posttest (87.01) higher than pretest score (77.72) significantly at the level of .05 which means they have more efficiency on creative thinking.
Figure 1. Comparing results of learners’ creative thinking of their executive
function by TTCT: Set A Shape
Figure 2. Comparing results of learners’ creative thinking of their executive
Creativity Dimension
Type A )Shape(
Pre-test Score Total Activity
(Acvt.1-3)
Post-test Score Total Activity
(Acvt1-3) 89.83 105.12
102.15 102.29
Abstractness of titles 90.32 93.57
Resistance to premature closing
84.15 93.23
n 78.09 84.82
88.91 95.81
* Significance at the level 0.05
Creativity Dimension
Type A )Language(
Pre-test Score Total Activity
(Acvt.1-3)
Post-test Score Total Activity
(Acvt. 1-3) Fluency
78.65 89.42
Originality
70.21 83.01
Flexibility
84.29 88.59
Average
77.72
87.01
* Significance at the level 0.05
Table1 The pretest and posttest of Learners’ creative thinking A: Shape
Table 2 The pretest and posttest of learners’ creative thinking Form A: Language
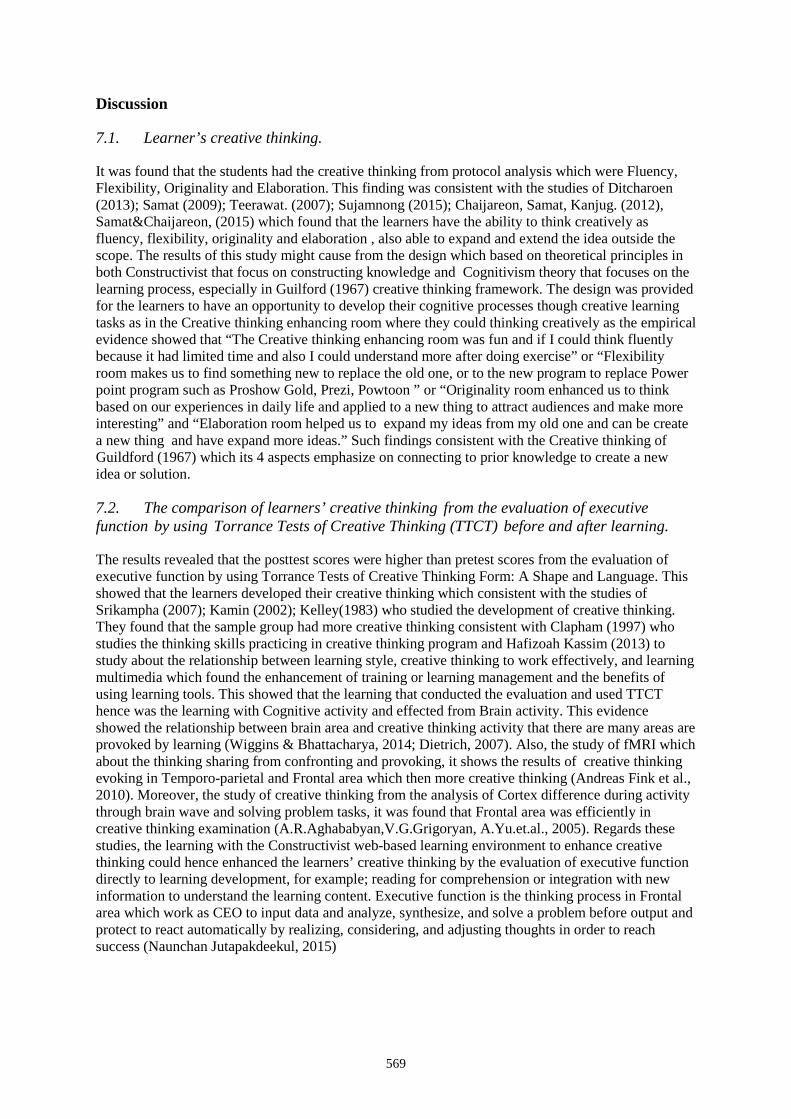
569
Discussion
7.1. Learner’s creative thinking.
It was found that the students had the creative thinking from protocol analysis which were Fluency, Flexibility, Originality and Elaboration. This finding was consistent with the studies of Ditcharoen (2013); Samat (2009); Teerawat. (2007); Sujamnong (2015); Chaijareon, Samat, Kanjug. (2012), Samat&Chaijareon, (2015) which found that the learners have the ability to think creatively as fluency, flexibility, originality and elaboration , also able to expand and extend the idea outside the scope. The results of this study might cause from the design which based on theoretical principles in both Constructivist that focus on constructing knowledge and Cognitivism theory that focuses on the learning process, especially in Guilford (1967) creative thinking framework. The design was provided for the learners to have an opportunity to develop their cognitive processes though creative learning tasks as in the Creative thinking enhancing room where they could thinking creatively as the empirical evidence showed that “The Creative thinking enhancing room was fun and if I could think fluently because it had limited time and also I could understand more after doing exercise” or “Flexibility room makes us to find something new to replace the old one, or to the new program to replace Power point program such as Proshow Gold, Prezi, Powtoon ” or “Originality room enhanced us to think based on our experiences in daily life and applied to a new thing to attract audiences and make more interesting” and “Elaboration room helped us to expand my ideas from my old one and can be create a new thing and have expand more ideas.” Such findings consistent with the Creative thinking of Guildford (1967) which its 4 aspects emphasize on connecting to prior knowledge to create a new idea or solution.
7.2. The comparison of learners’ creative thinking from the evaluation of executive function by using Torrance Tests of Creative Thinking (TTCT) before and after learning. The results revealed that the posttest scores were higher than pretest scores from the evaluation of executive function by using Torrance Tests of Creative Thinking Form: A Shape and Language. This showed that the learners developed their creative thinking which consistent with the studies of Srikampha (2007); Kamin (2002); Kelley(1983) who studied the development of creative thinking. They found that the sample group had more creative thinking consistent with Clapham (1997) who studies the thinking skills practicing in creative thinking program and Hafizoah Kassim (2013) to study about the relationship between learning style, creative thinking to work effectively, and learning multimedia which found the enhancement of training or learning management and the benefits of using learning tools. This showed that the learning that conducted the evaluation and used TTCT hence was the learning with Cognitive activity and effected from Brain activity. This evidence showed the relationship between brain area and creative thinking activity that there are many areas are provoked by learning (Wiggins & Bhattacharya, 2014; Dietrich, 2007). Also, the study of fMRI which about the thinking sharing from confronting and provoking, it shows the results of creative thinking evoking in Temporo-parietal and Frontal area which then more creative thinking (Andreas Fink et al., 2010). Moreover, the study of creative thinking from the analysis of Cortex difference during activity through brain wave and solving problem tasks, it was found that Frontal area was efficiently in creative thinking examination (A.R.Aghababyan,V.G.Grigoryan, A.Yu.et.al., 2005). Regards these studies, the learning with the Constructivist web-based learning environment to enhance creative thinking could hence enhanced the learners’ creative thinking by the evaluation of executive function directly to learning development, for example; reading for comprehension or integration with new information to understand the learning content. Executive function is the thinking process in Frontal area which work as CEO to input data and analyze, synthesize, and solve a problem before output and protect to react automatically by realizing, considering, and adjusting thoughts in order to reach success (Naunchan Jutapakdeekul, 2015)
570
Recommendations
The further study should be studied about other factors such as gender, age, emotions affected creative thinking in order to develop a Constructivist web-based learning environment, media attribute affected creative thinking for using such attributes to design and develop the web-based learning environment more efficiently and brain wave or specific brain area affected learners’ creative thinking for more useful in development and enhancement of learners.
Acknowledgements This research was granted from the National Research Council and supported by Research Group for Innovation and Cognitive Technology, Khon Kaen University.
References
A. R. Aghababyan, V. G. Grigoryan, A. Yu. Stepanyan, et al. (2005). EEG Reactions during Creative Activity. Human Physiology, Vol. 33, No. 2, pp. 252–253.
Andreas Fink, Roland H. Grabner, et al. (2010). Enhancing creativity by means of cognitive stimulation: Evidence from an fMRI study. Neuro Image. 52 1687-1695.
Chaijaroen, Sumalee,. Kanjak, Isara and Samat Charuni. (2012). The Learner’s Creative Thinking Learning with Learning Innovation to Encourage Human Thinking. European Journal of Social Sciences, 28(2), 213 – 218.
Chaijaroen, Sumalee,. Kanjak, Isara and Samat Charuni. (2012). The Study of Learners’ Critical Thinking Potential, Learning with innovation Enhancing Thinking Potential. Procedia - Social and Behavioral Sciences, 46, 3415 – 3420.
Chaijaroen, Sumalee. (2016). Instructional Design: Theory to Practicing. Khon Kaen: Penprinting Publisher. Dietrich, A. 2007. The wavicle of creativity. Methods, 42. Dithjaroen, Chamas. (2013). The Development of Creative Thinking and Achievement for Grade 12 Students,
Using Project Learning Base on Constructionism Theory of an Apply Robot Subject. Master of Education Thesis in Curriculum and Instruction, Graduate School, Khon Kaen University.
Fan-Ray Kuo, Nian-Shing Chen, Gwo-Jen Hwang. (2014). A creative thinking approach to enhance the web-based problem solving performance of university students. Computers & Education 72 (2014) 220–230.
Guilford, J.P. (1967). The Nature of Human Intelligence. New York: McGraw-Hill. Jaroenwongsak, Kriengsak. 2004. Creative thinking. Bangkok: Success Media Co., Ltd. Jessica Adams Dillon. (2009). Play, Creativity, Emotion Regulation and Executive functioning.
Submitted in partial fulfillment of the requirements for the degree of Master of Arts Department of Psychology. Case Western Reserve University.
Jutapakdeekoon, Nualchan. 2015. Executive Functions Administrative thinking for self-management … children success. Raklook magazine. Year 33 Issue No. 387 (April 2015) page 140-142.
Pronrungroj, Channarong. (2013). The pass of primary assessment results of the Office for National Education Standards and Quality Assessment (ONESQA). Retrieved 10 September 2014, from www.thairath.co.th/ content/358599
Richey, R. C. and Klein, J. (2007). Design and development research. New Jersey: Lawrence. Samat, Charuni. 2009. The Development of Constructivist Web-Based Learning Environment Model to Enhance
Creative Thinking for Higher Education Students. Doctor of Philosophy in Educational Technology, Graduate School, Khon Kaen University.
Samat, C., Chaijaroen, S. (2015). Design and Development of Learning Environment to Enhance Creative Thinking and Innovation Skills for Teacher Training in the 21st Century. Proceedings of the 23rd International Conference on Computers in Education, ICCE 2015, 667-672.
Saramano, Teerawat. (2007). The Effects of Constructivist Web-Based Learning Environments Developed to Enhance Students’ Divergent Thinking on the Topic of “Social Problems” for Undergraduate Students. Master of Education Thesis in Educational Technology, Graduate School, Khon Kaen University.
Srikhumpa, Ponwattana. (2007). Creative Thinking Development of Grade IV Students, Mahasarakham University Demonstration School. Master of Education Thesis in Educational Psychology, Graduate School, Khon Kaen University.

571
Sujamnong, Panjarat. (2015). Learner’s Creative Thinking Learned with the Web-Based Learning Environment to Enhance Creative Thinking for Grade X Students. Master of Education Thesis in Educational Technology, Graduate School, Khon Kaen University.
Wiggins, G. A. & Bhattacharya, J. (2014). Mind the gap: An attempt to bridge computational and neuroscientific approaches to study creativity. Frontiers in Human Neuroscience, 8(540), 1-15.
Hayashi, Y., et al. (Eds.) (2017). Workshop Proceedings of the 25th International Conference on Computers in Education. New Zealand: Asia-Pacific Society for Computers in Education
572
Developing Interactive Simulation in Physical Science for Eliminating Students’
Misunderstanding of Heat Transfer: A DSLM Approach
Sureerat SATCHUKORNa , Niwat SRISAWASDIb,c* aScience Education Program, Faculty of Education, Khon Kaen University, Thailand bDivision of Science, Mathematics, and Technology Education, Faculty of Education,
Khon Kaen University, Thailand cInstitute of Learning and Teaching Innovation, Khon Kean University, Thailand
Abstract: Currently, interactive science simulation has been recognized as pedagogical tool in science education in several countries, and the strategic use of science simulation has changed the way of active learning in science. Researchers and educators have reported benefits of science simulation in promoting motivation to learn science and enhancing scientific conceptions for students, especially in compulsory education. This paper illustrates a development of interactive computer-simulated laboratory lessons in physical science for middle school students. For this development, the researchers utilize Dual-Situated Learning Model (DSLM) for producing the interactive science simulation and a series of dual-situated learning activity about heat transfer in physical science subject. In this preliminary study, a total of 129 middle school students in seventh grade in a public secondary school located northeastern region of Thailand participated in the development. All of them were administered a series of two-tier question items in order to discover their misunderstanding of heat transfer concepts. The exploratory result shows that the middle school students hold many types of misconceptions and incomplete conceptions in the physical science concepts related to heat transfer. Moreover, some of them had no conceptions about heat transfer even they have learned the concepts already. As such, the researchers illustrate a conceptual idea of designing an interactive science simulation addressing the physical science concepts of heat transfer for improving the students’ conceptual learning performance, and it might enhance the change of student's misconceptions and their mental model development in science.
Keywords: Computer simulation, inquiry-based learning, DSLM, science concept, heat transfer
1. Introduction
Over the past decades, digital technologies have become commonplace in education reform because of their potential of bringing about change in ways of teaching and learning (Srisawasdi, 2012; 2016). Many researchers, educators, and developers have reported a problematic issue that students at all level came to science class with common misunderstanding in science concepts and students’ misconceptions are highly resistant to change through un-design or traditional teaching in science (She, 2004). To solve these problems, the researchers reported the successful on the use of dual-situated learning model (DSLM) for enhancing students' conceptual understanding in science (e.g. Lee and She 2010; Liao and She 2009; She and Liao 2010; Srisawasdi and Kroothkeaw, 2014; Srisawasdi and Sornkhatha, 2014). Currently, with the support of technological features, interactive computer-simulated learning materials for science teaching and learning provide opportunities to better facilitate students’ understanding of science concepts by visualizing the abstraction of science concepts into more concrete experience. Moreover, the interactive simulation could bring to change
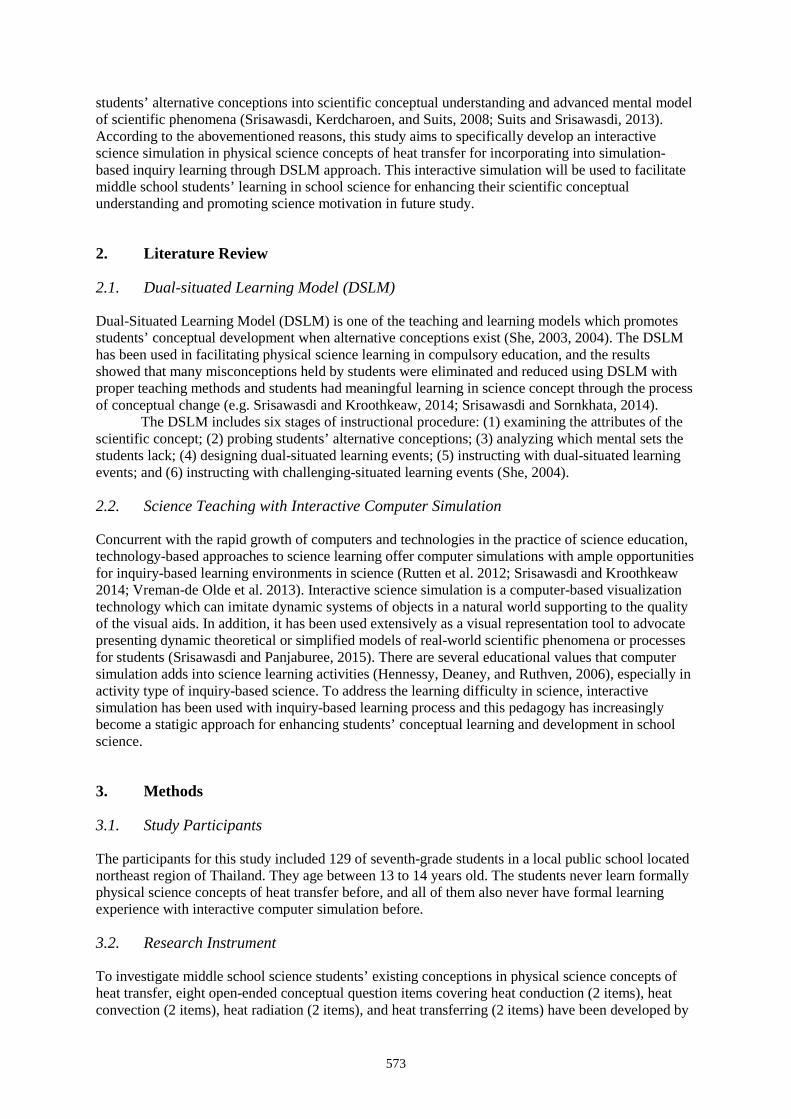
573
students’ alternative conceptions into scientific conceptual understanding and advanced mental model of scientific phenomena (Srisawasdi, Kerdcharoen, and Suits, 2008; Suits and Srisawasdi, 2013). According to the abovementioned reasons, this study aims to specifically develop an interactive science simulation in physical science concepts of heat transfer for incorporating into simulation-based inquiry learning through DSLM approach. This interactive simulation will be used to facilitate middle school students’ learning in school science for enhancing their scientific conceptual understanding and promoting science motivation in future study.
2. Literature Review
2.1. Dual-situated Learning Model (DSLM)
Dual-Situated Learning Model (DSLM) is one of the teaching and learning models which promotes students’ conceptual development when alternative conceptions exist (She, 2003, 2004). The DSLM has been used in facilitating physical science learning in compulsory education, and the results showed that many misconceptions held by students were eliminated and reduced using DSLM with proper teaching methods and students had meaningful learning in science concept through the process of conceptual change (e.g. Srisawasdi and Kroothkeaw, 2014; Srisawasdi and Sornkhata, 2014).
The DSLM includes six stages of instructional procedure: (1) examining the attributes of the scientific concept; (2) probing students’ alternative conceptions; (3) analyzing which mental sets the students lack; (4) designing dual-situated learning events; (5) instructing with dual-situated learning events; and (6) instructing with challenging-situated learning events (She, 2004).
2.2. Science Teaching with Interactive Computer Simulation
Concurrent with the rapid growth of computers and technologies in the practice of science education, technology-based approaches to science learning offer computer simulations with ample opportunities for inquiry-based learning environments in science (Rutten et al. 2012; Srisawasdi and Kroothkeaw 2014; Vreman-de Olde et al. 2013). Interactive science simulation is a computer-based visualization technology which can imitate dynamic systems of objects in a natural world supporting to the quality of the visual aids. In addition, it has been used extensively as a visual representation tool to advocate presenting dynamic theoretical or simplified models of real-world scientific phenomena or processes for students (Srisawasdi and Panjaburee, 2015). There are several educational values that computer simulation adds into science learning activities (Hennessy, Deaney, and Ruthven, 2006), especially in activity type of inquiry-based science. To address the learning difficulty in science, interactive simulation has been used with inquiry-based learning process and this pedagogy has increasingly become a statigic approach for enhancing students’ conceptual learning and development in school science.
3. Methods
3.1. Study Participants
The participants for this study included 129 of seventh-grade students in a local public school located northeast region of Thailand. They age between 13 to 14 years old. The students never learn formally physical science concepts of heat transfer before, and all of them also never have formal learning experience with interactive computer simulation before.
3.2. Research Instrument
To investigate middle school science students’ existing conceptions in physical science concepts of heat transfer, eight open-ended conceptual question items covering heat conduction (2 items), heat convection (2 items), heat radiation (2 items), and heat transferring (2 items) have been developed by
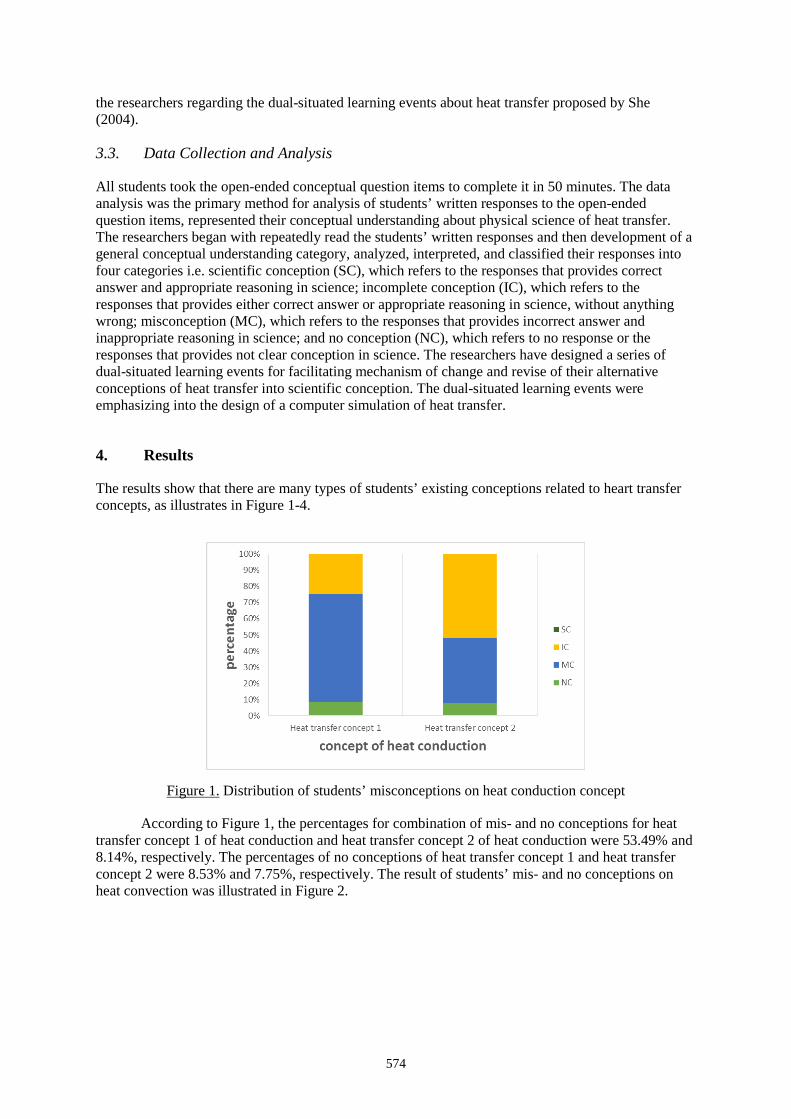
574
the researchers regarding the dual-situated learning events about heat transfer proposed by She (2004).
3.3. Data Collection and Analysis
All students took the open-ended conceptual question items to complete it in 50 minutes. The data analysis was the primary method for analysis of students’ written responses to the open-ended question items, represented their conceptual understanding about physical science of heat transfer. The researchers began with repeatedly read the students’ written responses and then development of a general conceptual understanding category, analyzed, interpreted, and classified their responses into four categories i.e. scientific conception (SC), which refers to the responses that provides correct answer and appropriate reasoning in science; incomplete conception (IC), which refers to the responses that provides either correct answer or appropriate reasoning in science, without anything wrong; misconception (MC), which refers to the responses that provides incorrect answer and inappropriate reasoning in science; and no conception (NC), which refers to no response or the responses that provides not clear conception in science. The researchers have designed a series of dual-situated learning events for facilitating mechanism of change and revise of their alternative conceptions of heat transfer into scientific conception. The dual-situated learning events were emphasizing into the design of a computer simulation of heat transfer.
4. Results
The results show that there are many types of students’ existing conceptions related to heart transfer concepts, as illustrates in Figure 1-4.
Figure 1. Distribution of students’ misconceptions on heat conduction concept
According to Figure 1, the percentages for combination of mis- and no conceptions for heat transfer concept 1 of heat conduction and heat transfer concept 2 of heat conduction were 53.49% and 8.14%, respectively. The percentages of no conceptions of heat transfer concept 1 and heat transfer concept 2 were 8.53% and 7.75%, respectively. The result of students’ mis- and no conceptions on heat convection was illustrated in Figure 2.
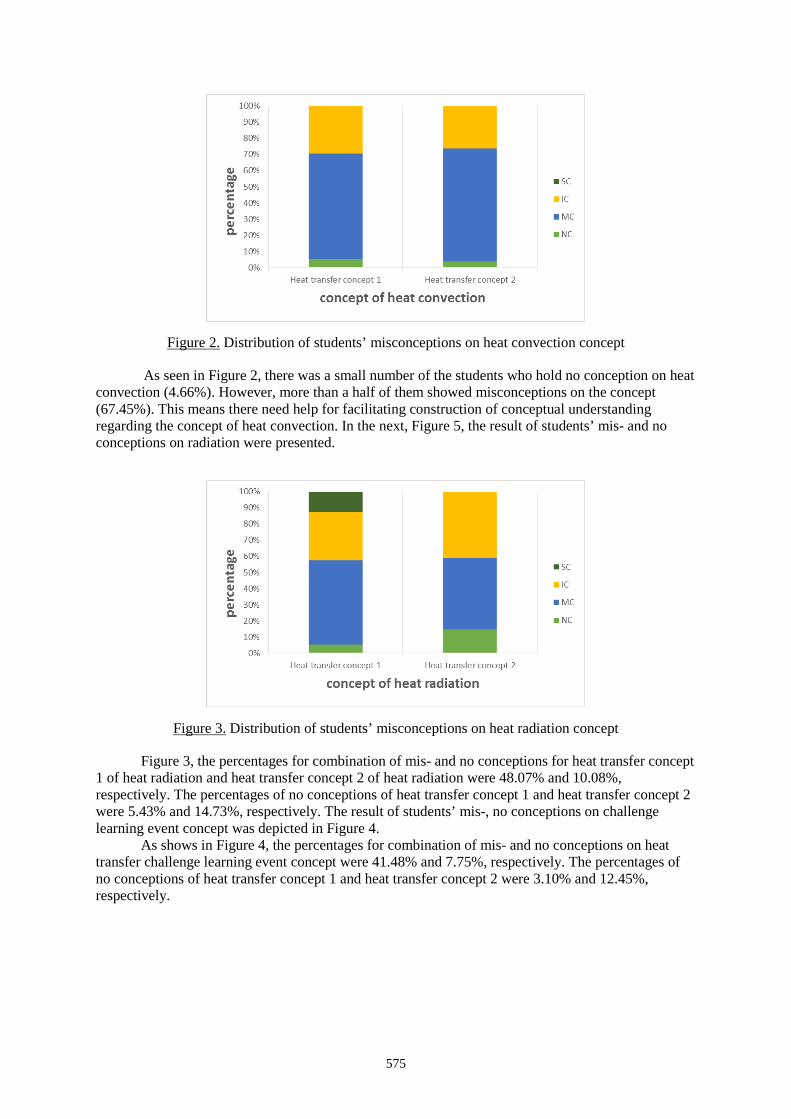
575
Figure 2. Distribution of students’ misconceptions on heat convection concept
As seen in Figure 2, there was a small number of the students who hold no conception on heat convection (4.66%). However, more than a half of them showed misconceptions on the concept (67.45%). This means there need help for facilitating construction of conceptual understanding regarding the concept of heat convection. In the next, Figure 5, the result of students’ mis- and no conceptions on radiation were presented.
Figure 3. Distribution of students’ misconceptions on heat radiation concept
Figure 3, the percentages for combination of mis- and no conceptions for heat transfer concept 1 of heat radiation and heat transfer concept 2 of heat radiation were 48.07% and 10.08%, respectively. The percentages of no conceptions of heat transfer concept 1 and heat transfer concept 2 were 5.43% and 14.73%, respectively. The result of students’ mis-, no conceptions on challenge learning event concept was depicted in Figure 4.
As shows in Figure 4, the percentages for combination of mis- and no conceptions on heat transfer challenge learning event concept were 41.48% and 7.75%, respectively. The percentages of no conceptions of heat transfer concept 1 and heat transfer concept 2 were 3.10% and 12.45%, respectively.
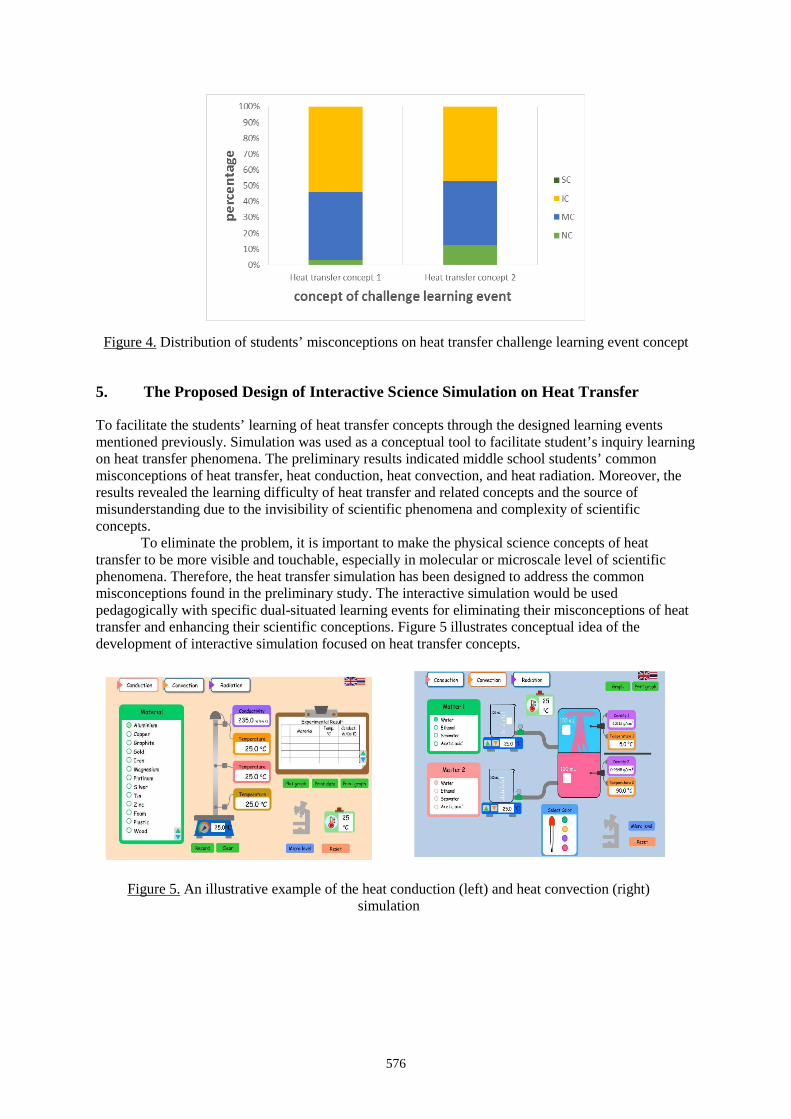
576
Figure 4. Distribution of students’ misconceptions on heat transfer challenge learning event concept
5. The Proposed Design of Interactive Science Simulation on Heat Transfer
To facilitate the students’ learning of heat transfer concepts through the designed learning events mentioned previously. Simulation was used as a conceptual tool to facilitate student’s inquiry learning on heat transfer phenomena. The preliminary results indicated middle school students’ common misconceptions of heat transfer, heat conduction, heat convection, and heat radiation. Moreover, the results revealed the learning difficulty of heat transfer and related concepts and the source of misunderstanding due to the invisibility of scientific phenomena and complexity of scientific concepts.
To eliminate the problem, it is important to make the physical science concepts of heat transfer to be more visible and touchable, especially in molecular or microscale level of scientific phenomena. Therefore, the heat transfer simulation has been designed to address the common misconceptions found in the preliminary study. The interactive simulation would be used pedagogically with specific dual-situated learning events for eliminating their misconceptions of heat transfer and enhancing their scientific conceptions. Figure 5 illustrates conceptual idea of the development of interactive simulation focused on heat transfer concepts.
Figure 5. An illustrative example of the heat conduction (left) and heat convection (right) simulation

577
Acknowledgements
This work was financially supported by Graduate School, Khon Kaen University, Thailand. The author would like to express gratefully acknowledge to Science Education Program, Faculty of Education, Khon Kean University, for supporting this contribution.
References
Buck, L.B., Bretz, S.L. & Towns, M.H. Characterizing the level of inquiry in the undergraduate laboratory. Journal of College Science Teaching, 38(1) (2008): 52-58.
Cengel Y. A., (2003). In G. M. (Ed.), Heat transfer:A practical approach. New York: McGraw-Hill. 17-34. Dykstra, D. I., Boyle, F. C., & Monarch, I. A. (1992). Studying conceptual change in learning physics. Science
Education, 76(6), 615-652. Hennessy, S., Deaney, R. & Ruthven, K. (2006). Situated expertise in integrating use of multimedia simulation
into secondary science teaching. International Journal of Science Education, 28 (7), 701-732. She, H.C. (2003). DSLM instructional approach to conceptual change involving thermal expansion. Research in
Science and Technological Education, 21(1), 43–54. She, H.C. (2004). Fostering ‘‘radical’’ conceptual change through dual situated learning model. Journal of
Research in Science Teaching, 41(2), 142–164. She, H.C., Liao, Y.W. (2010). Bridging Scientific Reasoning and Conceptual Change through Adaptive Web-
based Learning. Journal of Research in Science Teaching, 47(1), 91–119. Srisawasdi, N. (2014). The effect of simulation-based inquiry on students’ conceptual learning and its potential
applications in mobile learning. International Journal Mobile Learning and Organization, 8(1), 28-49. Srisawasdi, N. (2012). Introducing Students to Authentic Inquiry Investigation Using an Artificial Olfactory
System. In K.C.D. Tan & M. Kim (Ed.), Issues and Challenges in Science 93 Education Research: Moving Forward (pp. 93-106). Issues and Challenges in Science 93 Education Research: Moving Forward.
Srisawasdi, N., & Kamtoom, K. (2014). Technology-enhanced Chemistry Learning and Students' Perceptions: Comparison of Microcomputer-based Laboratory and Web based Inquiry Science Environment. Journal of Computers in Education. 1(1), 105-113.
Srisawasdi, N., Kerdcharoen, T. & Suits, J. P. (2008). Turning scientific laboratory research into innovative instructional material for science education: Case studies from practical experience. The International Journal of Learning, 15(5), 201-210.
Srisawasdi, N., & Kroothkeaw, S. (2014). Supporting Students’ Conceptual Learning and Retention of LightRefraction Concepts by Simulation-based Inquiry with Dual-situated Learning Model. Journal of Computers in Education. 1(1), 49-79.
Srisawasdi, N., & Panjaburee, P. (2015). Exploring effectiveness of simulation-based inquiry learning in science with integration of formative assessment. Journal of Computers in Education. 2(3), 232-352.
Zhao, J. C., Zheng, X., & Cahill, D. G. (2012). Thermal conductivity mapping of the Ni-Al system and the beta-NiAl phase in the Ni-Al-Cr system. Journal of Scripta Materialia . 935-938.
Hayashi, Y., et al. (Eds.) (2017). Workshop Proceedings of the 25th International Conference on Computers in Education. New Zealand: Asia-Pacific Society for Computers in Education
578
How to link pedagogy, technology and STEM learning?
Margus PEDASTEa*, Äli LEIJENa, Katrin SAKSa, Ton de JONGb & Denis GILLETc aInstitute of Education, University of Tartu, Estonia
bUniversity of Twente cÉcole Polytechnique Fédérale de Lausanne
Abstract: Several studies show that technology has been actively used in everyday life, but much less in the learning context. When technology has been used by teachers, its main purpose has often been to engage students and motivate them to learn. In the Estonian context there are only 5% of students who use tablets and smartphones not only for searching for and sharing information but also for communication and content creation in the learning context. Linking technology use with different pedagogical approaches and measuring its effect on learning outcomes is much rarer. In several European research and development projects we have tested different pedagogic scenarios to use technology in STEM (Science Technology Engineering and Math) education. In these scenarios the inquiry-based learning approach has been supported with technology. In this paper we describe these cases and provide recommendations to improve learning process by linking pedagogy, technology and STEM learning more successfully. We propose that the main characteristics of new technology-enhanced learning environments have to enable self-directed computer-supported collaborative inquiry-based learning and the teachers have to support students’ self-regulated learning, digital competence and autonomy in learning.
Keywords: STEM learning, technology-enhanced learning, digital competence, inquiry-based learning, self-regulated learning, computer-supported collaborative learning
1. Introduction
Publication of the ‘Science Education Now: A renewed Pedagogy for the Future of Europe’ report (Rocard et al., 2007) brought science and mathematics education to the forefront of educational goals for EU member states (following similar actions in the US in National Science Education Standards, 1996). The authors argued that school science teaching needs to be more engaging, apply inquiry and problem solving methods and designed to meet the interests of young people. It means science education (and also related studies in technology, engineering and math) need to be linked with pedagogical principles (pedagogy) and opportunities available thanks to developments in technology-enhanced learning (technology). According to the report, the origins of the alarming decline in young people’s interest in key science studies and mathematics can be found, among other causes, in the old fashioned way science is often taught at schools. The crucial role that positive contacts with science at a younger age have in the subsequent formation of attitudes toward science has been emphasised in many studies (e.g. PISA, 2006). However, traditional formal science education too often fails to foster these, affecting negatively the development of adolescents’ attitudes towards learning science. Also, as Kinchin (2004) has pointed out, the tension created between objectivism (the objective teacher-centred pedagogy) and constructivism (the constructive and student-centred pedagogy) represents a crucial classroom issue influencing teaching and learning. The TIMSS (Third International Mathematics and Science Study) 2003 International Science Report (Martin et al., 2004) specifically documented that the three activities accounting for 57% of class time in European science classes were: teacher lecture (24%), teacher-guided student practice (19%), and students working on problems on their own (14%).
579
Later, OECD TALIS survey showed in 2013 that not much has changed. The teachers accept a student-centred social-constructivism belief but their pedagogical beliefs are not necessarily related to their instructional practices. About 94% of teachers found that their role is to facilitate students’ own inquiry and a bit more than 93% of teachers believe that students should be allowed to think of solutions to practical problems themselves before the teacher shows them how they are solved but the two most often used practices in classroom are presenting a summary of recently learned content and checking students’ exercise books or homework (TALIS survey, 2013). In contrast, there were only 38% of teachers who reported that their students use frequently ICT for projects or class work.
The use of technology in learning is often seen as a solution to give to students more autonomy over their learning and to engage them more but also to have a positive effect on learning outcomes (see Pedaste et al., 2016). Prensky (2001) have introduced the idea that new generation of learners are digital natives who capture the benefits of technology organically and start using technologies in different context without specific support. Unfortunately, the study of van den Beemt, Akkerman and Simons (2010, 2011) showed that this assumption is not true. They focused on differences in the students’ use of ICT in everyday life for interchanging, browsing, performing, and authoring and found in cluster analysis four profiles of applying ICT: traditionalists, networkers, producers, and gamers. Most of the people were networkers (39%) or traditionalists (28%) and only 6% of them belonged to the group of producers. Similarly, we found in 2016 in our study that smart phones and tablets are actively used in learning context for searching and sharing information, collaboration and content creation only by 5% of students (Pedaste et al., 2017) even if the devices are owned by 97% of the students (Adov et al., 2017). Surprisingly, this study was done in Estonian context and Estonia is well-known as an e-country where people usually have a very positive attitude towards use of technologies and a lot of innovation is also done in schools (see Leijen et al., 2014, Pedaste et al., 2014) and where the Science Technology Engineering and Math (STEM) learning outcomes according to OECD PISA studies are also among the best ones in the world (see http://pisa.oecd.org/).
One of the reasons why the potential of technology hasn’t opened enough is lack of autonomy. During the Soviet times until 1991 the autonomy of the schools and teachers was very low and since that Estonia’s educational system has been reformed many times but some of these activities did not have positive effect on autonomy (see Leijen & Pedaste, in press). For example, the schools were often ranked in national newspapers based on their students’ scores in national exams and these high-stake standardized tests decreased teachers’ autonomy in deciding what and how to teach their students. Considering the average age of teachers in Estonia (48 years) the fear related to autonomy and self-directed learning and teaching still lasts in practice. If the teachers do not feel that they have autonomy, then it’s difficult to give more autonomy to the learners as well. Only during the last decade, both the national curriculum and state exams have been changed. In addition to subject-oriented goals the general competencies have gained much more importance and teachers have more freedom to decide what and how to teach. The number of compulsory national state exams is reduced and in this way more autonomy in several subjects has been given to the teachers. In addition, inquiry-based learning approach is adopted in updating all STEM curricula and new national performance tests are focusing on inquiry skills rather than content knowledge. These changes provide a good basis for implementing several other changes to link the newest pedagogical approaches with technology-enhanced learning to improve STEM learning.
In conclusion it’s evident that there is a need to improve both science education and digital competence and teachers are as pedagogical agents who need guidelines for successful integration of technology-enhanced learning and STEM learning to change their instructional practices. Therefore, we analyse several cases where technology-enhanced STEM education has been in focus of international projects and provide guidelines for improving teachers’ professional development to link pedagogy, technology and STEM learning more successfully.
2. Pedagogical approaches
The main underlying pedagogical approaches used recently in developing technology-enhanced learning in STEM education are self-regulated learning and inquiry-based learning. Often these are
580
linked socio-constructivism indicating that individuals should learn how to regulate their learning in a group of learners and how to benefit from discussions on an inquiry task. As a result, we support the idea of developing learning environments that enable self-directed computer-supported collaborative inquiry-based learning. Next, the pedagogical approaches of self-directed learning, inquiry-based learning and computer-supported collaborative learning are introduced.
2.1. Self-regulated learning
The concept of self-regulated learning has been described through different definitions and models. What most of the theories agree about is that self-regulated learning is a constructive process whereby learners regulate different cognitive, metacognitive, motivational, volitional and behavioural processes during their learning (Winters et al., 2008). Pintrich (2000) drawing on Zimmerman’s cyclical three-phase model, formulated his definition of academic self-regulation as an active, constructive process whereby learners set goals for their learning and attempt to monitor, regulate and control their cognition, motivation, and behaviour, guided and constrained by their goals and contextual features on the environment.
Learners with good self-regulated learning skills are able to use efficient learning strategies independently and control their learning process. It is especially important when a big part of learning takes place outside the traditional classroom, in web-based learning environments, at the workplace or in real-life situations. There is a variety of perspectives on self-regulated learning which incorporate individual self-regulated learning, co-regulation and socially shared regulation of learning (SSRL) (Hadwin et al., 2000) in different educational contexts. The three components of self-regulated learning – motivation, cognitive and metacognitive learning strategies are not static traits but dynamic and contextually bound (Duncan & McKeachie, 2005). They are gradually growing as learners become more aware and confident about their learning and responsibility. This makes observing and measuring the improvement of self-regulated learning interesting and challenging.
Self-regulated learning skills with their components of cognition, metacognition and motivation are a necessary prerequisite for the development of self-directed life-long learner (Saks & Leijen, 2014). To become a successful life-long learner, a primary presumption of developing self-directedness is acquiring self-regulated learning strategies. The use of appropriate learning strategies improves proficiency and achievement, and enables learners to take ownership of their own learning by enhancing learner autonomy, independence and self-direction (Wong, 2011).
2.2. Inquiry-based learning
Inquiry-based learning is defined as a process of discovering new causal relations, with the learner formulating hypotheses and testing them by conducting experiments and/or making observations (Pedaste, Mäeots, Leijen, & Sarapuu, 2012). It is important that the learner is active and takes responsibility in discovering knowledge that is new to him or her (de Jong & van Joolingen, 1998). Thus, by the nature inquiry-based learning is an approach where the main principles of self-regulated learning are applied. In order to guide this self-regulated process inquiry has been often divided into different phases which could be applied in many cycles. Pedaste et al. (2015) made a systematic literature review to describe the diversity of these phases and cycles. Based on analysis there was synthesized an inquiry cycle that combines the strengths of existing inquiry-based learning frameworks. This has been later used as a pedagogical framework in some of the projects described as cases in the current paper. They found in 32 articles 109 different terms for inquiry phases. Based on the analysis these were combined five general phases and some sub-phases in three of them.
According to Pedaste et al. (2015) inquiry learning starts with Orientation phase. In this phase learners get to know something about the problem situation and identify the problem. The second phase is Conceptualization. In this phase learners define the problem by collecting more information in order to formulate research questions and/or hypotheses. Depending on the outcome of the conceptualization phase there are two different pathways available in Investigation phase which is the third general phase. If the students formulated a research question, then they proceed with Exploration sub-phase where they systematically collect data to answer that question. If the learner formulated a hypothesis, then an experiment should be designed for data collection. In both cases the data should
581
be analysed and interpreted in order to proceed to the fourth general phase which is Conclusion. According to this framework the fifth phase – Discussion – is not after the other four but in parallel with them. In Discussion all activities and outcomes of the other phases or these of whole inquiry process are communicated to peer students or others and reflected systematically in order to learn from the learning process. While discussion is one of the general phases of inquiry-based learning, we should they and collaboration a mandatory activity in inquiry-based learning. This leads us to the approach of computer-supported collaborative learning.
2.3. Computer-supported collaborative learning
What is CSCL, link to digital competence (again, self-directedness is needed) . There is no doubt that inquiry-based learning is at least in the context of STEM education more effective than other more traditional approaches. This has been revealed in several meta-analyses (see Alfieri, Brooks, Aldrich, & Tenenbaum, 2011; Furtak, Seidel, Iverson, & Briggs, 2012). The benefits of inquiry learning have been discussed for long time even though it was argued already more than 50 years ago that not all topics should be learned in this way (Taba, 1963). However, recent studies also show that technological advancements can increase the success of inquiry-based learning even more (de Jong, Sotiriou, & Gillet, 2014), especially if specific guidance is available (see Lazonder & Harmsen, 2016).
In order to apply inquiry-based learning in technology-enhanced environments digital competence is needed and might give some structure for guiding learners. According to a European framework of digital competence (Vuorikari, Punie, Carretero, & van den Brande, 2016) there are five competence areas that could be differentiated in digital competence: (i) information and data literacy, (ii) communication and collaboration, (iii) digital content creation, (iv) safety, and (v) problem solving. In each of these competence areas more specific competences (21 in total) are described. Most of these competences are needed in all general inquiry phases; however, the competence area Communication and collaboration provides some basis for computer-supported collaborative learning. The specific competences in this area are (i) interacting through digital technologies, (ii) sharing through digital technologies, (iii) engaging in citizenship through digital technologies, (iv) collaborating through digital technologies, (v) netiquette, and (vi) managing digital identity. This list shows clearly that there is no need to develop digital competence in separation from many other learning activities but digital competence is just a model that could be easily integrated in computer-supported collaborative learning process and also in the self-regulated inquiry-based learning context.
3. Cases
3.1. SCY project
The SCY (Science Created by You, http://scycom.collide.info) was a project financed by European Commission’s 7th Framework Programme to develop a flexible, open-ended learning environment that engages and empowers adolescent learners. The project lasted from 2008 to 2012. The SCY project started from a social constructivist approach by letting the learners to complete different missions in a web-based learning environment SCY-Lab while interacting with other students (de Jong et al., 2010). The central idea of SCY was that students learn by creating artefacts that could be developed by the ones developed by other learners and found in a repository. These were called Emerging Learning Objects (ELOs). The artefacts (products) produced in the learning process where for example pieces of texts (e.g. research questions), datasets (from real or virtual environments), or even physical products like a model of a house. SCY-Lab provided adaptive support for learning activities through providing students with pedagogical scaffolds, collaboration facilities, peer assessment, and social tagging tools. It also enabled to combine physical and online activities in a blended learning process so that different offline activities could be guided by pedagogical scenarios presented online.
A good example of a SCY blended learning mission is SCY Eco Mission (Pedaste, de Jong, Sarapuu, Piksööt, van Joolingen, & Giemza, 2013). This primarily for learning ecology by combining hands-on data collection and working in the SCY-Lab learning environment. On this mission students
582
have to improve water quality of a freshwater lake. In order to do this, students follow four predefined inquiry cycles on related topics: (i) the role of light in the level of photosynthesis, (ii) the concept of pH and pH changes in a water body, (iii) the influence of nutrient concentration on primary production, and (iv) relations between trophic levels in an ecosystem. What we see already in this project, is the integration of pedagogical framework and technology-enhanced learning environment. However, the sequence of activities on the missions was quite pre-defined and there was not much autonomy for students to adapt the experiments according to their own ideas. Indeed, there were available several tools and even pedagogical agents to support collaboration between students (collaborative content creation and chat related to different ELOs) but in practice there were often technical issues that did not allow to use SCY-Lab by wider audiences. This project developed a prototype for learning STEM in a technology-enhanced learning environment but it got evident that collaboration might be still too demanding at this time. Therefore, this learning environment was tested only in small scale.
3.2. Go-Lab and Next-Lab projects
The Go-Lab (Global Online Science Labs for Inquiry Learning at School) project (http://www.go-lab-project.eu), is a European Commission financed project that lasted from 2012 to 2016. The aim of this project was to increase the use on online science laboratories (remote and virtual labs) in school education at ages from 10 to 18. This environment has been now used by thousands of schools with many classes. In this project we also developed the inquiry-based learning cycle that was introduced previously and later used in the Next-Lab and Ark of Inquiry project.
In the project was created a technology-enhanced portal (http://gloabz.eu) that allows searching for hundreds of online labs that could be combined with more than 40 inquiry learning applications in order to build Inquiry Learning Spaces (ILSs). ILSs support particular lesson scenarios that are developed using the inquiry cycle as a guide. In this way Go-Lab is a good example case for combining inquiry-based learning and technological tools. The inquiry cycle is provided for instructional designers (who might be teachers) as a template of the ILS where all general phases are presented as separate spaces. For students these are presented as tabs where pages with phase-specific guidance, assignments and tools are provided. For example, in the conceptualisation phase apps like Hypothesis Scratchpad Concept Map could be used. In all phases could be used some general apps like Shared wiki, Teacher feedback, Quiz tool, Quest. These tools already give some possibilities for interaction between the learners or between learners and teachers; however, collaboration was not the main focus on Go-Lab project. Indeed, the project provided good possibilities for collaboration between teachers – the teachers were supported in building a community that could develop new ILSs, share these with each other, and give some advice to others if one has an issue. The community of teachers developed hundreds of ILSs that cover wide variety of topics to learn STEM subjects.
The Go-Lab project found its continuation in European Commission financed Next-Lab project (Next Generation Stakeholders and Next Level Ecosystem for Collaborative Science Education with Online Labs, http://project.golabz.eu). This project started in January 2017 and lasts until the end of 2019. The main improvement the project is aimed for is focusing clearly on collaboration. It means that the existing Go-Lab portal is updated that special focus is set on 21st century collaboration and reflection skills and new tools for self- and peer-assessment are provided. In addition, there will be created collaborative spaces where students could work in teams on research projects. To date there are eight apps supporting learners’ collaboration, e.g. Padlet or SpeakUp app. The first one allows to create a wall within an inquiry space where text, picture, videos, audio, and hyperlinks could be easily organised in a cloud-based environment. SpeakUp is asocial discussion tool that allows to create a chat room where messages could be anonymous if necessary. In addition, there is also possible to rate the messages or to create simple polls. For teachers there is created the possibility to create ILSs collaboratively. However, they could also use several learning analytics apps to learn more about students’ learning and to support their learning process appropriately. The important message from the Next-Lab case is that technology-enhanced learning is moving towards computer-supported collaborative learning.
583
3.3. Ark of Inquiry project
The Ark of Inquiry project (http://arkofinquiry.eu) is again one more European Commission financed project to support STEM learning. This started in 2014 and will finish in 2018. In this project the pedagogical framework developed in Go-Lab project is implemented and applied for teacher training but first linked with Responsible Research and Innovation (RRI) concept. RRI is a concept that is getting more and more attention in guiding the research and development aims in Europe. One of the best definitions of this have been given by Schomberg (2011, p. 9): “Responsible Research and Innovation is a transparent, interactive process by which societal actors and innovators become mutually responsive to each other with a view on the (ethical) acceptability, sustainability and societal desirability of the innovation process and its marketable products (in order to allow a proper embedding of scientific and technological advances in our society).” In order to specify this concept more for the project, a literature review was done. According to this we could differentiate six dimensions of RRI: (i) inclusion, (ii) anticipation, (iii) responsiveness, (iv) reflexivity, (v) sustainability, and (vi) care (Burget, Bardone, & Pedaste, 2016). Emergence of these dimensions shows very clearly that in collaboration we have to keep in mind and support several aspects and not only between students but according to RRI approach learning should happen in collaboration with the whole society. Thus, the Ark of Inquiry project aims to create a “new science classroom”, one which would provide more challenging, authentic and higher-order learning experiences and more opportunities for pupils to participate in scientific practices and tasks, using the discourse of science and working with scientific representations and tools in collaboration with peer students but also in collaboration with science centres and researchers. Therefore, there has been developed a platform (http://arkportal.eu) through which carefully selected inquiry-based activities will be made widely available across Europe and beyond. This platform will link together inquiry-based activities, learners and supporters (teachers, university students, researchers, staff of museums and universities). To support teachers, the Ark of Inquiry project provides face-to-face training for teachers so that they will be able to support and motivate the pupils in their inquiry-based learning activities.
4. Discussion and recommendations
The cases introduced in this paper give an idea about the changes in approaches to link pedagogical principles with technology-enhanced learning environments for STEM learning during the last 10 years. All these projects are European-wide projects where in each have participated institutions from more than 10 countries. Most of the projects have targeted thousands of students in hundreds of schools. Therefore, these cases represent major movements in Europe and are a good basis for generalisations.
First, we see that in all these projects there have been used a pedagogical scenario (usually inquiry-based learning) that is then enhanced by technological tools. The scenario-based approach has been increasingly used in linking pedagogy and technology-enhanced learning during the last decade (see de Jong et al., 2012; Lejeune et al., 2009). Therefore, our first recommendation for instructional designers is not to focus too much on the technological tools available on the market but on the pedagogical needs.
Second, we saw that autonomy is more and more given to the students and also teachers get in recent projects more possibilities for designing new learning scenarios according to their specific goals. This movement supports both learners’ and teachers’ proficiency while they take ownership of their own learning by enhancing autonomy, independence and self-direction (Wong, 2011). Therefore, our second recommendation is to support students’ skills for self-directed learning more systematically. This is not something new while already more than 40 years ago Malcolm Knowles (1975) envisioned “a process in which individuals take the initiative, with or without the help of others, in diagnosing their learning needs, formulating their learning goals, identifying human and material resources for learning, choosing and implementing appropriate learning strategies, and evaluating learning outcomes” (Knowles, 1975, p. 18). However, it’s interesting that decades later we
584
are still discussing similar ideas. The reason for that might be the new affordances that have been opened by technology, which should be used according the pedagogical goals.
What is similar in all projects reviewed in the current study, is reuse of existing learning objects (for a definition see Cisco Systems, 1999) as it is expected in case of a constructivist approach. Therefore, the third recommendation would be to give some focus on digital competence to use technology-enhanced tools not only for searching and sharing information but also for communication and collaboration in content-creation (for a framework of digital competence see Carretero, Vuorikari, & Punie, 2017). This recommendation is valid for both learners and teachers while both of them could create artefacts that could be re-used by themselves or others. RRI approach introduced in the Ark of Inquiry project (see Burget et al., 2017) takes this responsibility in sharing materials and knowledge beyond the classroom by integrating different stakeholders in the learning process.
Fourth, an interesting change has been seen in supporting collaboration between learners. Although there was a willingness to use a collaborative learning approach already ten years ago it seems that only in the last years the available technological tools provide a stable solution to support collaboration in many different ways. Several apps in the Next-Lab learning environment offer many possibilities for collaborative content creation that is supported by online discussion and sharing information in a problem-solving process. Indeed, it seems that the best solution is to combine different learning objects (e.g., online labs, learning apps) rather than designing very complex learning environments that cannot be customized and adapted by the teachers and learners. This might be one of the reasons why the prototype of the SCY-Lab was not ready for scaling up its use in many schools.
On the basis of these findings and recommendations we can also draw some guidelines for teachers to prepare their students for a self-regulated collaborative STEM learning process in computer-supported learning environments. First, the students need systematic support in developing their competence for self-regulated learning. Second, the students also have to get systematic support for developing their digital competence, especially in the competence areas communication and collaboration and digital content creation. Third, the teachers should keep in mind that a pedagogical framework, e.g. inquiry-based learning framework should be applied so that it allows self-directed and collaborative learning and leaves to the learners’ autonomy in selecting different technological tools according to their learning goals and preferences. However, these developments have to be supported by relevant studies on teachers’ readiness to use technology and both learners’ and teachers’ acceptance of technology (see the TRAM model by Lin, Shih, & Sher, 2007). In the Estonian context our studies show that the learners and teachers are willing to use technology and they have equipment but the missing validated pedagogical learning scenarios seem to be missing too often and it results in quite rare use of modern technologies like smart phones and tablets in learning context (Pedaste et al., 2017). Therefore, the future studies have to focus more on teachers’ and learners’ practices on using learning scenarios where pedagogy and technology are linked to support learning for example in STEM context.
Acknowledgements
We would like to thank all colleagues who have been collaborated with us in the projects that were used as cases in this paper. The reported work was partially funded by the European Union in the context of the SCY project (Grant agreement 212814) and Go-Lab project (Grant Agreement no. 317601) under the Information and Communication Technologies (ICT) theme of the 7th Framework Programme for R&D (FP7), by the Ark of Inquiry project (Grant agreement 612252) under the FP7-SCIENCE-IN-SOCIETY-2013-1, ACTIVITY 5.2.2 Young people and science: Topic SiS.2013.2.2.1-1 Raising youth awareness to Responsible Research and Innovation through Inquiry Based Science Education and by the Next-Lab project (Grant agreement 731685) under the European Union's Horizon 2020 research and innovation programme. This document does not represent the opinion of the European Union, and the European Union is not responsible for any use that might be made of its content.
585
References
Adov, L., Must, O., & Pedaste, M. (2017). Attitudes Towards Mobile Devices in Estonian Basic Education: Using the Framework of the UTAUT Model. In: Zaphiris, P.; Ioannou, A. (Ed.). Learning and Collaboration Technologies (319−329). Springer.
Alfieri, L., Brooks, P. J., Aldrich, N. J., & Tenenbaum, H. R. (2011). Does discovery-based instruction enhance learning? Journal of Educational Psychology, 103, 1–18. doi:10.1037/a0021017.
Burget, M., Bardone, E. & Pedaste, M. (2017). Definitions and conceptual dimensions of responsible research and innovation: A literature review. Science and Engineering Ethics, 23(1) https://doi.org/10.1007/s11948-016-9782-1
Carretero, G. S., Vuorikari, R., & Punie, Y. (2017). DigComp 2.1: The digital competence framework for citizens with eight proficiency levels and examples of use. EUR – Scientific and Technical Research Report. Information Society. Publications Office of the European Union.
Cisco Systems. (1999). Reusable information object strategy. Retrieved from https://www.google.ee/url?sa=t&rct=j&q=&esrc=s&source=web&cd=1&ved=0ahUKEwjri9ucm6XWAhXoQZoKHSrpAegQFggkMAA&url=https%3A%2F%2Fwww.mindmeister.com%2Fgeneric_files%2Fget_file%2F519411%3Ffiletype%3Dattachment_file&usg=AFQjCNGCCGoqPh1wfDdAVth4VZuXZNw8HQ
de Jong, T., Sotiriou, S., & Gillet, D. (2014). Innovations in STEM education: The Go-Lab federation of online labs. Smart Learning Environments, 1, 1–16.
de Jong, T., & van Joolingen,W. R. (1998). Scientific discovery learning with computer simulations of conceptual domains. Review of Educational Research, 68, 179–202. doi:10.2307/1170753.
de Jong, T., van Joolingen, W., Giemza, A., Girault, I., Hoppe, U., Kindermann, J., Kluge, A., Lazonder, A., Vold, V., Weinberger, A., Weinbrenner, S., Wichmann, A., Anjewierden, A., Bodin, M., Bollen, L., d’Ham, C., Dolonen, J., Engler, J., Geraedts, C., Grosskreutz, H. ... van der Zanden, M. (2010). Learning by creating and exchanging objects: The SCY experience. British Journal of Educational Technology, 41(6), 909−921.
de Jong, T., Weinberger, A., Girault, I.; Kluge, A., Lazonder, A. W., Pedaste, M., Ludvigsen, S., Ney, M., Wasson, B., Wichmann, A., Geraedts, C., Giemza, A., Hovardas, A., Julien, R., van Joolingen, W. R., Lejeune, A., Manoli, C., Matteman, Y., Sarapuu, T., Verkade, A. ... Zacharia, Z. C. (2012). Using scenarios to design complex technology-enhanced learning environments. Educational Technology Research & Development, 60(5), 883−901.
Duncan, T. G. & McKeachie, W. J. (2005). The making of the Motivated Strategies for Learning Questionnaire. Educational Psychologist, 40(2), 117–128.
Furtak, E. M., Seidel, T., Iverson, H., & Briggs, D. C. (2012). Experimental and quasi-experimental studies of inquiry-based science teaching. Review of Educational Research, 82, 300–329. doi:10.3102/0034654312457206.
Hadwin, A. F., Järvelä, S. & Miller, M. (2000). Self-regulated, co-regulated, and socially shared regulation of learning. In M. Boekaerts, P. Pintrich & M. Zeidner (Eds), Handbook of self–regulation (pp 65–84). San Diego: Academic Press.
Kinchin, I. M. (2004). Investigating students' beliefs about their preferred role as learners. Educational Research, 46(3), 301–312.
Knowles, M. S. (1975). Self-Directed Learning: a guide for learners and teachers. New York: Associated Press. Lazonder, A. W., & Harmsen, R. (2016). Meta-analysis of inquiry-based learning: Effects of guidance. Review
of Educational Research, 86(3), 681–718. Leijen, Ä., Allas, R., Toom, A., Husu, J., Marcos, J. J. M., Meijer, P., Knezic, D., Pedaste, M. & Krull, E.
(2014). Guided Reflection for Supporting the Development of Student Teachers’ Practical Knowledge. The European Procedia Social and Behavioral Sciences, 112, 314–322.
Leijen, Ä., & Pedaste, M. (in press). Pedagogical beliefs, instructional practices and opportunities for professional development of teachers in Estonia. In H. Niemi, A. Toom, A. Kallioniemi, & J. Lavonen (Eds.) Teachers role in a global changing world. Sense Publishers, Rotterdam, the Netherlands.
Lejeune, A., Ney, M., Weinberger, A., Pedaste, M., Bollen, L., Hovardas, T., Hoppe, U., & de Jong, T. (2009). A graphical modeling language for computer-based learning scenarios. Proceedings of the IEEE International Conference on Advanced Learning Technologies: The 9th IEEE International Conference on Advanced Learning Technologies; Riga, Latvia; 15–17 July 2009. Ed. Aedo, I.; Chen, N.-S., Kinshuk, Sampson, D., & Zaitseva, L. IEEE, 734−735.
Lin, C.-H., Shih, H.-Y., & Sher, P. J. (2007). Integrating technology readiness into technology acceptance: The TRAM model. Psychology & Marketing, 24(7), 641–657.
Martin, M. O., Mullis, I. V. S., Gonzalez, E. J., & Chrostowski, S. J. (2004). TIMSS 2003 International science report. Boston, MA: TIMSS & PIRLS International Study Center, Lynch School of Education, Boston College.

586
National Science Education Standards (1996). Board on Science Education (BOSE). Pedaste, M., de Jong, T., Sarapuu, T., Piksööt, J., van Joolingen, W. R., & Giemza, A. (2013). Investigating
ecosystems as a blended learning experience. Science, 340(6140), 1537−1538. Pedaste, M., Lazonder, A., Raes, A., Wajeman, C., Moore, E., & Girault, I. (2016). Empowering Science
Teachers Using Technology-Enchanced Scaffolding to Improve Inquiry Learning. In: Eberle, J.; Lund, K.; Tchounikine, P.; Fischer, F. (Ed.). Grand Challenge Problems in Technology-Enhanced Learning II: MOOCs and Beyond (pp. 17−20). Springer.
Pedaste, M., Must, O., Leijen, Ä., Mäeots, M., Siiman, L., Kori, K., & Adov, L. (2017). Nutiseadmete kasutamise profiilid loodusainete ja matemaatika õppimise kontekstis. Eesti Haridusteaduste Ajakiri, 5 (1), 99−129.
Pedaste, M., Mäeots, M., Leijen, Ä., & Sarapuu, S. (2012). Improving students’ inquiry skills through reflection and self-regulation scaffolds. Technology, Instruction, Cognition and Learning, 9, 81–95.
Pedaste, M., Mäeots, M., Siiman L. A., de Jong, T., van Riesen, S. A. N., Kamp, E. T., Manoli, C. C., Zacharia, Z. C., & Tsourlidaki, E. (2015). Phases of Inquiry-based Learning: Definitions and the Inquiry Cycle. Educational Research Review, 14, 47–61.
Pedaste, M., Pedaste, K., Lukk, K., Villems, P., & Allas, R. (2014). A Model of Innovation Schools: Estonian Case-study. The European Procedia Social and Behavioral Sciences, 112, 418–427.
Pintrich, P. (2000). The role of goal orientation in self-regulated learning. In M. Boekaerts, P. Pintrich, & M. Zeidner (Eds), Handbook of self–regulation (pp 451–502). San Diego: Academic Press.
PISA 2006 Science Competencies for Tomorrow's World. Retrieved August 18, 2017 from: http://www.pisa.oecd.org
Prensky, M. (2001). Digital natives, digital immigrants. On the Horizon, 9 (5). https://www.marcprensky.com/writing/Prensky%20-%20Digital%20Natives,%20Digital%20Immigrants%20-%20Part1.pdf. https://doi.org/10.1108/10748120110424816
Rocard, M., Csermely, P., Jorde, D., Lenzen, D., Walberg-Henrikson, H., & Hemmo, V. (2007). Science education now: A renewed pedagogy for the future of Europe. Brussels: European Commission: Directorate-General for Research.
Saks, K., & Leijen, Ä. (2014). Distinguishing Self-Directed and Self-Regulated Learning and Measuring them in the E-learning Context. Procedia – Social and Behavioral Sciences, 112, 190–198.
Taba, H. (1963). Learning by discovery: Psychological and educational rationale. Elementary School Journal, 63, 308–316. doi:10.1086/460059
The OECD Teaching and Learning International Survey (2013). http://www.oecd.org/edu/school/talis.htm van den Beemt, A. A. J., Akkerman, S., & Simons, P. R. J. (2010). The use of interactive media among today’s
youth: Results of a survey. Computers in Human Behavior, 26(5), 1158–1165. https://doi.org/10.1016/j.chb.2010.03.022
van den Beemt, A. A. J., Akkerman, S., & Simons, P. R. J. (2011a). Considering young people’s motives for interactive media use. Educational Research Review, 6(1), 55–66. ttps://doi.org/10.1016/j.edurev.2010.06.002
von Schomberg, R. (Ed.). (2011). Towards Responsible Research and Innovation in the Information and Communication Technologies and Security Technologies Fields. Luxembourg: Publications Office of the European Union. http://ec.europa.eu/research/science-society/document_library/pdf_06/mep- rapport-2011_ en.pdf.
Vuorikari, R., Punie, Y., Carretero, S., & van den Brande, L. (2016). DigComp 2.0: The digital competence framework for citizens. Update Phase 1: The Conceptual Reference Model. Luxembourg Publication Office of the European Union. EUR 27948 EN. doi:10.2791/11517 http://publications.jrc.ec.europa.eu/repository/bitstream/JRC101254/lfna27948ene.epub
Winters, F. I., Greene, J. A. & Costich, C. M. (2008). Self-Regulation of Learning within Computer-based Learning Environments: A Critical Analysis. Educational Psychology Review, 20, 429–444.
Wong, M. S-L. (2011). Language learning strategy use: a study of pre-service teachers in Malaysia. http://www.eric.ed.gov/PDFS/ED521415.pdf.
Hayashi, Y., et al. (Eds.) (2017). Workshop Proceedings of the 25th International Conference on Computers in Education. New Zealand: Asia-Pacific Society for Computers in Education
587
A Flipped Inquiry-based Learning with Mobility to Improving Students’ Learning
Performance in Science: A Comparative Study Pawat CHAIPIDECHa & Niwat SRISAWASDIb,c*
aScience Education Program, Faculty of Education, Khon Kaen University, Thailand bDivision of Science, Mathematics, and Technology Education, Faculty of Education,
Khon Kaen University, Thailand cInstitute of Learning and Teaching Innovation, Khon Kaen University, Thailand
Abstract: The present study examines the differential impact of studying in an innovative learning approach, flipped inquiry-based learning with mobility (FILM) setting, as compared to a hands-on inquiry-based learning (HIL), and traditional learning (TL) setting on science learning performance regarding scientific conceptual understanding. Participants were eleventh-grade students (N = 79), enrolled in physics course in a public secondary school in northeastern region of Thailand. They were divided into the three groups and randomly assigned according to one of the three experimental conditions (TL n = 25, HIL n = 23, FILM n = 31). The results showed that conceptual learning performance on liquid pressure was superior in the FILM group as compared to other learning settings (Cohens' d = 3.35), HIL (Cohens' d = 0.64) and TL (Cohens' d = 0.99). Students in the HIL setting had a higher conceptual learning performance as compared to the TL setting. This finding suggest that the FILM setting could be a promising way of enhancing high school students’ learning performance in science.
Keywords: Flipped classroom, inquiry, mobile learning, science education
1. Introduction
The Flipped classroom model was introduced by the high school chemistry teachers Jonathan Bergmann and Aron Sams in 2007 (Tucker, 2012). The principle of this instructional methodology is based on “directs instruction and lecture is not an effective teaching tool in the group learning space, but is effective when delivered to individual” (Sams and Bergmann, 2013). This approach allows students to learn at their own, having more flexibility to distribute their studying time and putting on them more responsibility in the learning process (O'Flaherty and Phillips, 2015). Thus, in the flipped classroom model, students are asked to view a recorded video prior to attending class and the class time is used to engage in student-centered learning activities like inquiry and problem solving, fostering the students to be more interactive during class time (Moraros et al., 2015). Another feature of the flipped classroom is that the video and interactive lesson are always available to students, they could reinforce their learning by re-watching the materials provided by the teacher the number of time they need. Moreover, flipped classroom could be integrating into many subject areas, i.e. general science (Gonzalez-Gomez et al.,2016); mathematics (Lai and Hwang, 2016); ICT teaching (Kostaris et al., 2017). Especially in science classroom with flipped learning, students have positive perceptions and engagement toward this methodology (Chaipidech and Srisawasdi, 2016).
In science learning environment, inquiry teaching approach has been widely used for support students to develop scientific concepts and knowledge. Moreover, the students were asked to observe and purpose explanations or answers from evidences gained by the experiment (National Research Council, 1996). Inquiry learning is procedure that focused on upcoming cognitive domain of students (Hofstein and Lunetta, 2004; Srisawasdi and Kroothkeaw, 2014). Thus, inquiry learning invests more
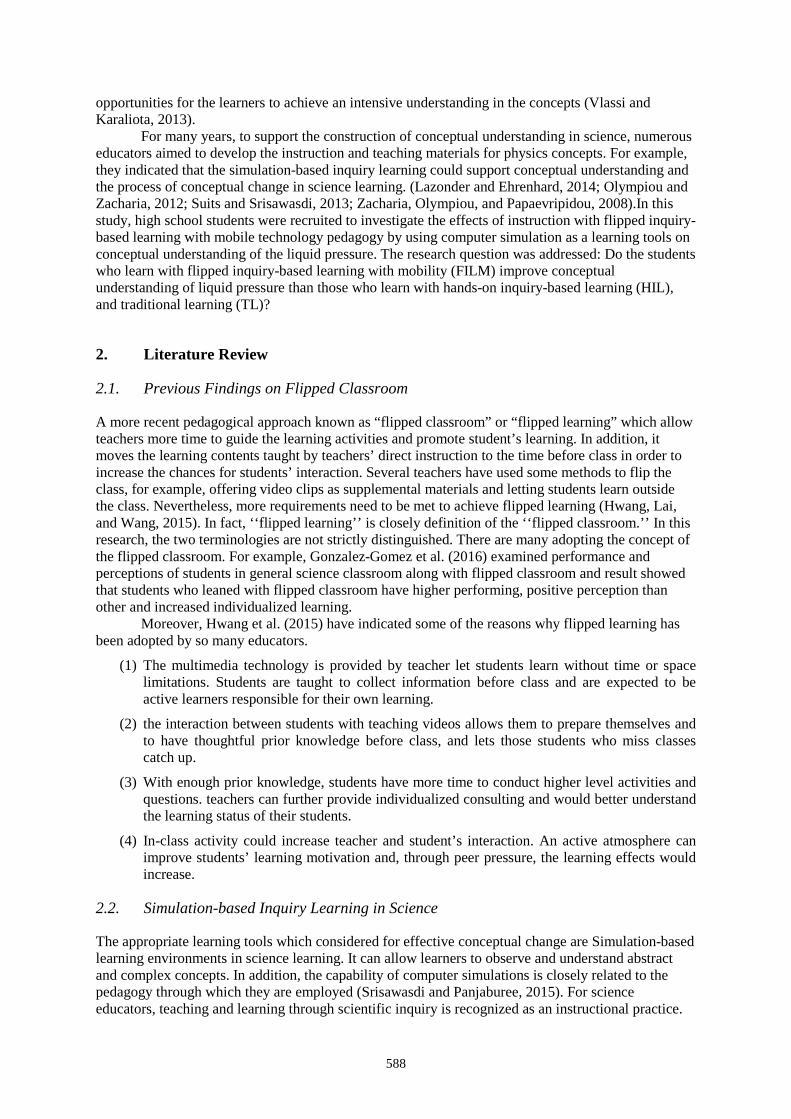
588
opportunities for the learners to achieve an intensive understanding in the concepts (Vlassi and Karaliota, 2013).
For many years, to support the construction of conceptual understanding in science, numerous educators aimed to develop the instruction and teaching materials for physics concepts. For example, they indicated that the simulation-based inquiry learning could support conceptual understanding and the process of conceptual change in science learning. (Lazonder and Ehrenhard, 2014; Olympiou and Zacharia, 2012; Suits and Srisawasdi, 2013; Zacharia, Olympiou, and Papaevripidou, 2008).In this study, high school students were recruited to investigate the effects of instruction with flipped inquiry-based learning with mobile technology pedagogy by using computer simulation as a learning tools on conceptual understanding of the liquid pressure. The research question was addressed: Do the students who learn with flipped inquiry-based learning with mobility (FILM) improve conceptual understanding of liquid pressure than those who learn with hands-on inquiry-based learning (HIL), and traditional learning (TL)?
2. Literature Review
2.1. Previous Findings on Flipped Classroom
A more recent pedagogical approach known as “flipped classroom” or “flipped learning” which allow teachers more time to guide the learning activities and promote student’s learning. In addition, it moves the learning contents taught by teachers’ direct instruction to the time before class in order to increase the chances for students’ interaction. Several teachers have used some methods to flip the class, for example, offering video clips as supplemental materials and letting students learn outside the class. Nevertheless, more requirements need to be met to achieve flipped learning (Hwang, Lai, and Wang, 2015). In fact, ‘‘flipped learning’’ is closely definition of the ‘‘flipped classroom.’’ In this research, the two terminologies are not strictly distinguished. There are many adopting the concept of the flipped classroom. For example, Gonzalez-Gomez et al. (2016) examined performance and perceptions of students in general science classroom along with flipped classroom and result showed that students who leaned with flipped classroom have higher performing, positive perception than other and increased individualized learning.
Moreover, Hwang et al. (2015) have indicated some of the reasons why flipped learning has been adopted by so many educators.
(1) The multimedia technology is provided by teacher let students learn without time or space limitations. Students are taught to collect information before class and are expected to be active learners responsible for their own learning.
(2) the interaction between students with teaching videos allows them to prepare themselves and to have thoughtful prior knowledge before class, and lets those students who miss classes catch up.
(3) With enough prior knowledge, students have more time to conduct higher level activities and questions. teachers can further provide individualized consulting and would better understand the learning status of their students.
(4) In-class activity could increase teacher and student’s interaction. An active atmosphere can improve students’ learning motivation and, through peer pressure, the learning effects would increase.
2.2. Simulation-based Inquiry Learning in Science
The appropriate learning tools which considered for effective conceptual change are Simulation-based learning environments in science learning. It can allow learners to observe and understand abstract and complex concepts. In addition, the capability of computer simulations is closely related to the pedagogy through which they are employed (Srisawasdi and Panjaburee, 2015). For science educators, teaching and learning through scientific inquiry is recognized as an instructional practice.
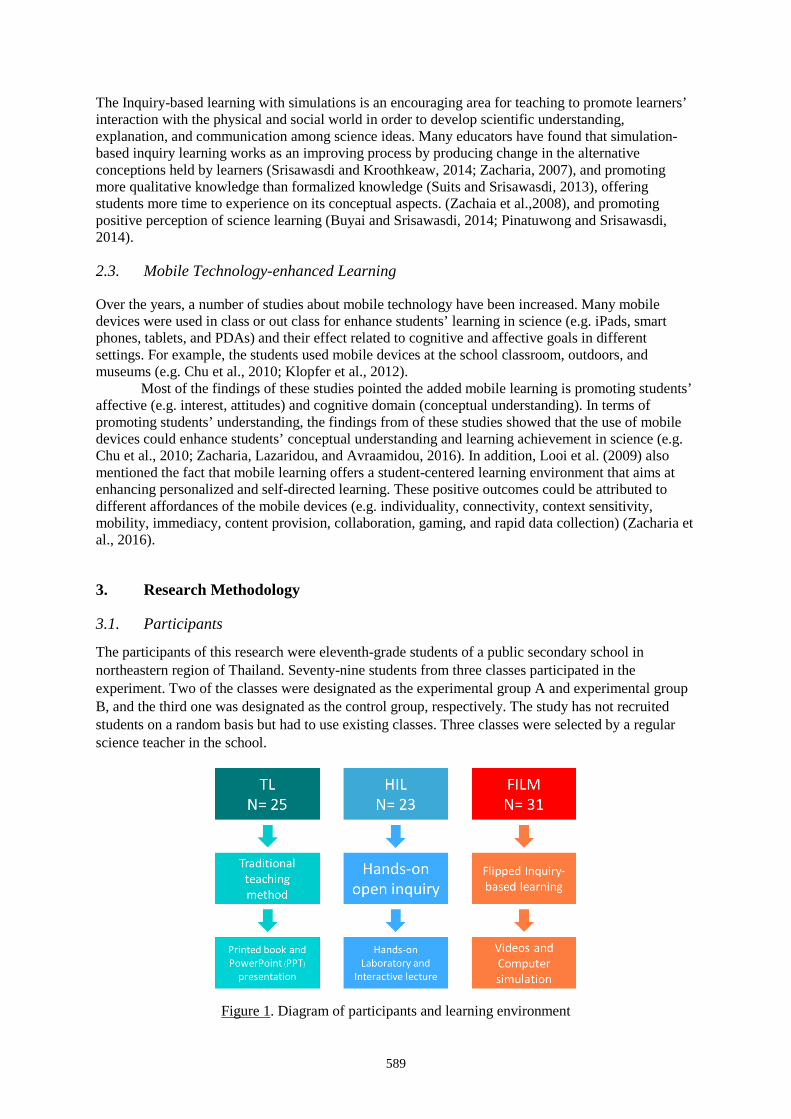
589
The Inquiry-based learning with simulations is an encouraging area for teaching to promote learners’ interaction with the physical and social world in order to develop scientific understanding, explanation, and communication among science ideas. Many educators have found that simulation-based inquiry learning works as an improving process by producing change in the alternative conceptions held by learners (Srisawasdi and Kroothkeaw, 2014; Zacharia, 2007), and promoting more qualitative knowledge than formalized knowledge (Suits and Srisawasdi, 2013), offering students more time to experience on its conceptual aspects. (Zachaia et al.,2008), and promoting positive perception of science learning (Buyai and Srisawasdi, 2014; Pinatuwong and Srisawasdi, 2014).
2.3. Mobile Technology-enhanced Learning
Over the years, a number of studies about mobile technology have been increased. Many mobile devices were used in class or out class for enhance students’ learning in science (e.g. iPads, smart phones, tablets, and PDAs) and their effect related to cognitive and affective goals in different settings. For example, the students used mobile devices at the school classroom, outdoors, and museums (e.g. Chu et al., 2010; Klopfer et al., 2012).
Most of the findings of these studies pointed the added mobile learning is promoting students’ affective (e.g. interest, attitudes) and cognitive domain (conceptual understanding). In terms of promoting students’ understanding, the findings from of these studies showed that the use of mobile devices could enhance students’ conceptual understanding and learning achievement in science (e.g. Chu et al., 2010; Zacharia, Lazaridou, and Avraamidou, 2016). In addition, Looi et al. (2009) also mentioned the fact that mobile learning offers a student-centered learning environment that aims at enhancing personalized and self-directed learning. These positive outcomes could be attributed to different affordances of the mobile devices (e.g. individuality, connectivity, context sensitivity, mobility, immediacy, content provision, collaboration, gaming, and rapid data collection) (Zacharia et al., 2016).
3. Research Methodology
3.1. Participants
The participants of this research were eleventh-grade students of a public secondary school in northeastern region of Thailand. Seventy-nine students from three classes participated in the experiment. Two of the classes were designated as the experimental group A and experimental group B, and the third one was designated as the control group, respectively. The study has not recruited students on a random basis but had to use existing classes. Three classes were selected by a regular science teacher in the school.
Figure 1. Diagram of participants and learning environment
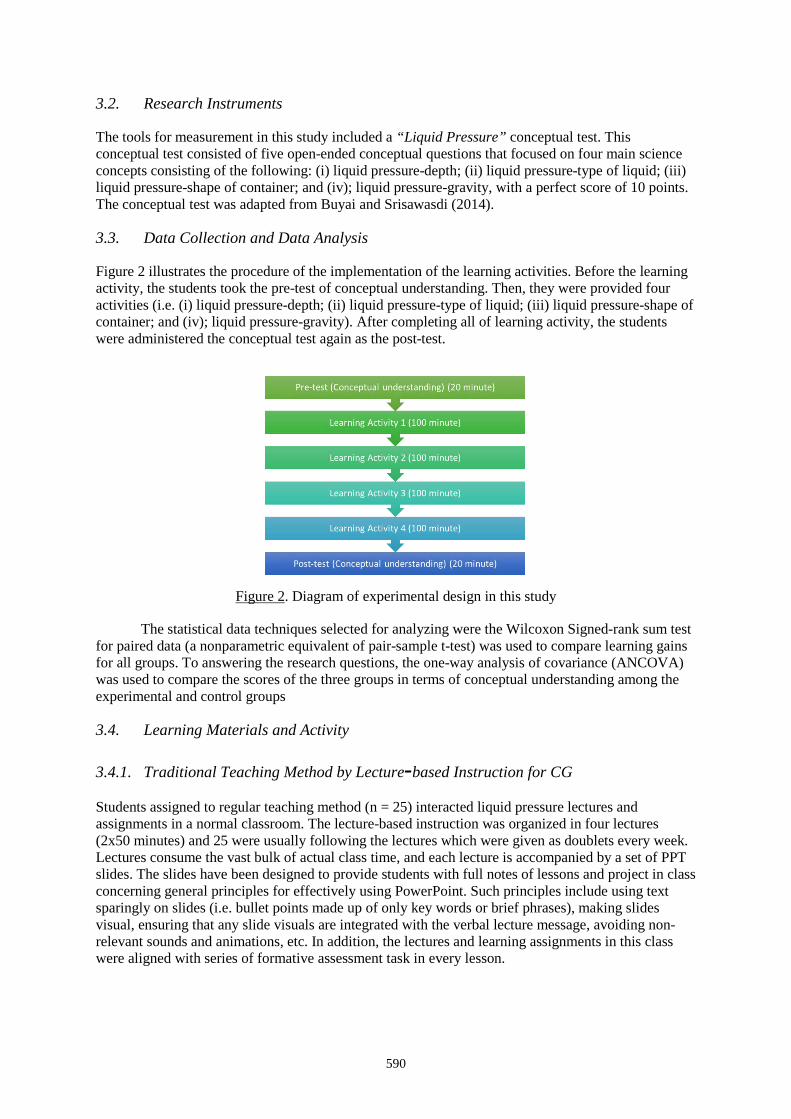
590
3.2. Research Instruments
The tools for measurement in this study included a “Liquid Pressure” conceptual test. This conceptual test consisted of five open-ended conceptual questions that focused on four main science concepts consisting of the following: (i) liquid pressure-depth; (ii) liquid pressure-type of liquid; (iii) liquid pressure-shape of container; and (iv); liquid pressure-gravity, with a perfect score of 10 points. The conceptual test was adapted from Buyai and Srisawasdi (2014).
3.3. Data Collection and Data Analysis
Figure 2 illustrates the procedure of the implementation of the learning activities. Before the learning activity, the students took the pre-test of conceptual understanding. Then, they were provided four activities (i.e. (i) liquid pressure-depth; (ii) liquid pressure-type of liquid; (iii) liquid pressure-shape of container; and (iv); liquid pressure-gravity). After completing all of learning activity, the students were administered the conceptual test again as the post-test.
Figure 2. Diagram of experimental design in this study
The statistical data techniques selected for analyzing were the Wilcoxon Signed-rank sum test for paired data (a nonparametric equivalent of pair-sample t-test) was used to compare learning gains for all groups. To answering the research questions, the one-way analysis of covariance (ANCOVA) was used to compare the scores of the three groups in terms of conceptual understanding among the experimental and control groups
3.4. Learning Materials and Activity
3.4.1. Traditional Teaching Method by Lecture-based Instruction for CG
Students assigned to regular teaching method (n = 25) interacted liquid pressure lectures and assignments in a normal classroom. The lecture-based instruction was organized in four lectures (2x50 minutes) and 25 were usually following the lectures which were given as doublets every week. Lectures consume the vast bulk of actual class time, and each lecture is accompanied by a set of PPT slides. The slides have been designed to provide students with full notes of lessons and project in class concerning general principles for effectively using PowerPoint. Such principles include using text sparingly on slides (i.e. bullet points made up of only key words or brief phrases), making slides visual, ensuring that any slide visuals are integrated with the verbal lecture message, avoiding non-relevant sounds and animations, etc. In addition, the lectures and learning assignments in this class were aligned with series of formative assessment task in every lesson.
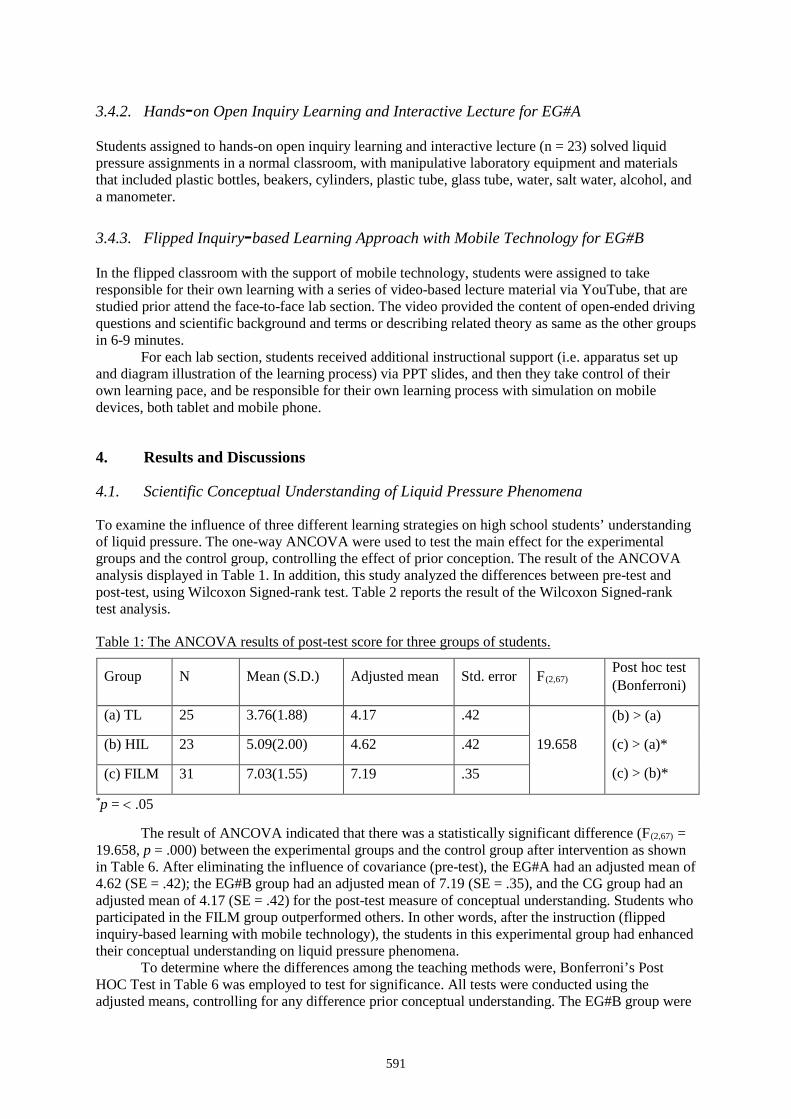
591
3.4.2. Hands-on Open Inquiry Learning and Interactive Lecture for EG#A
Students assigned to hands-on open inquiry learning and interactive lecture (n = 23) solved liquid pressure assignments in a normal classroom, with manipulative laboratory equipment and materials that included plastic bottles, beakers, cylinders, plastic tube, glass tube, water, salt water, alcohol, and a manometer.
3.4.3. Flipped Inquiry-based Learning Approach with Mobile Technology for EG#B
In the flipped classroom with the support of mobile technology, students were assigned to take responsible for their own learning with a series of video-based lecture material via YouTube, that are studied prior attend the face-to-face lab section. The video provided the content of open-ended driving questions and scientific background and terms or describing related theory as same as the other groups in 6-9 minutes.
For each lab section, students received additional instructional support (i.e. apparatus set up and diagram illustration of the learning process) via PPT slides, and then they take control of their own learning pace, and be responsible for their own learning process with simulation on mobile devices, both tablet and mobile phone.
4. Results and Discussions
4.1. Scientific Conceptual Understanding of Liquid Pressure Phenomena
To examine the influence of three different learning strategies on high school students’ understanding of liquid pressure. The one-way ANCOVA were used to test the main effect for the experimental groups and the control group, controlling the effect of prior conception. The result of the ANCOVA analysis displayed in Table 1. In addition, this study analyzed the differences between pre-test and post-test, using Wilcoxon Signed-rank test. Table 2 reports the result of the Wilcoxon Signed-rank test analysis.
Table 1: The ANCOVA results of post-test score for three groups of students.
Group N Mean (S.D.) Adjusted mean Std. error F(2,67) Post hoc test (Bonferroni)
(a) TL 25 3.76(1.88) 4.17 .42
19.658
(b) > (a)
(c) > (a)*
(c) > (b)*
(b) HIL 23 5.09(2.00) 4.62 .42
(c) FILM 31 7.03(1.55) 7.19 .35
*p = < .05
The result of ANCOVA indicated that there was a statistically significant difference (F(2,67) = 19.658, p = .000) between the experimental groups and the control group after intervention as shown in Table 6. After eliminating the influence of covariance (pre-test), the EG#A had an adjusted mean of 4.62 (SE = .42); the EG#B group had an adjusted mean of 7.19 (SE = .35), and the CG group had an adjusted mean of 4.17 (SE = .42) for the post-test measure of conceptual understanding. Students who participated in the FILM group outperformed others. In other words, after the instruction (flipped inquiry-based learning with mobile technology), the students in this experimental group had enhanced their conceptual understanding on liquid pressure phenomena.
To determine where the differences among the teaching methods were, Bonferroni’s Post HOC Test in Table 6 was employed to test for significance. All tests were conducted using the adjusted means, controlling for any difference prior conceptual understanding. The EG#B group were
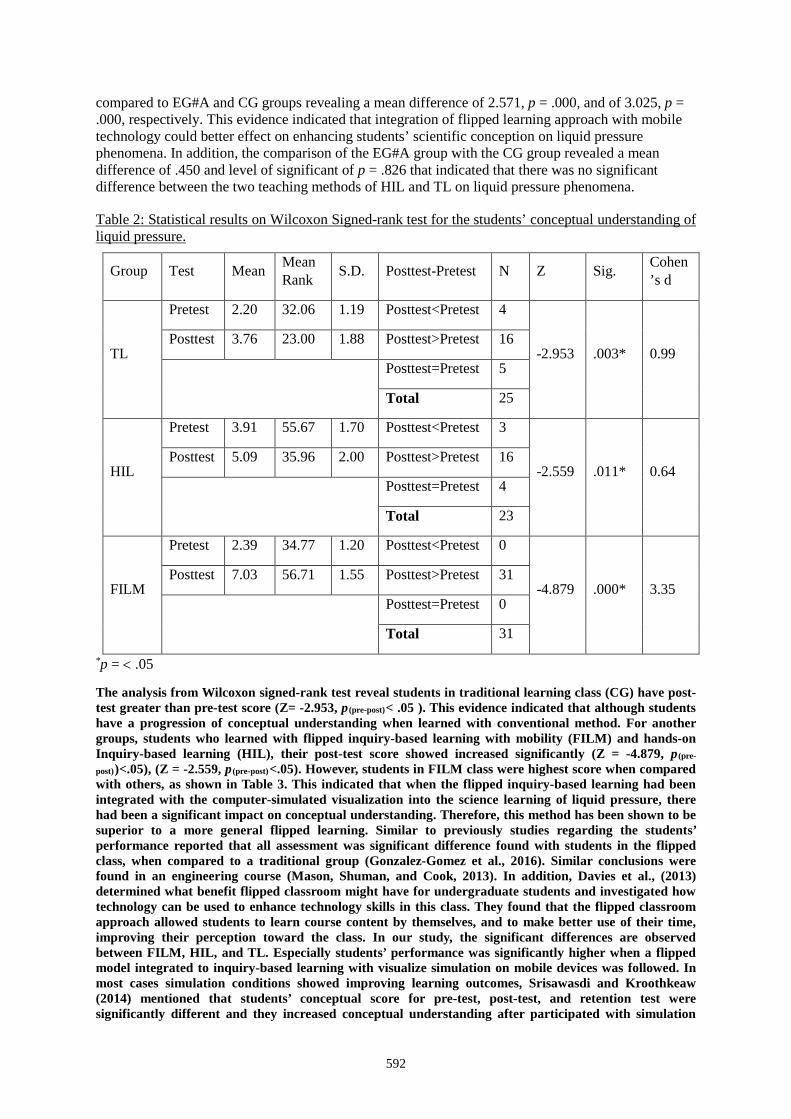
592
compared to EG#A and CG groups revealing a mean difference of 2.571, p = .000, and of 3.025, p = .000, respectively. This evidence indicated that integration of flipped learning approach with mobile technology could better effect on enhancing students’ scientific conception on liquid pressure phenomena. In addition, the comparison of the EG#A group with the CG group revealed a mean difference of .450 and level of significant of p = .826 that indicated that there was no significant difference between the two teaching methods of HIL and TL on liquid pressure phenomena.
Table 2: Statistical results on Wilcoxon Signed-rank test for the students’ conceptual understanding of liquid pressure.
Group Test Mean Mean Rank S.D. Posttest-Pretest N Z Sig. Cohen
’s d
TL
Pretest 2.20 32.06 1.19 Posttest<Pretest 4
-2.953 .003* 0.99 Posttest 3.76 23.00 1.88 Posttest>Pretest 16
Posttest=Pretest 5
Total 25
HIL
Pretest 3.91 55.67 1.70 Posttest<Pretest 3
-2.559 .011* 0.64 Posttest 5.09 35.96 2.00 Posttest>Pretest 16
Posttest=Pretest 4
Total 23
FILM
Pretest 2.39 34.77 1.20 Posttest<Pretest 0
-4.879 .000* 3.35 Posttest 7.03 56.71 1.55 Posttest>Pretest 31
Posttest=Pretest 0
Total 31
*p = < .05
The analysis from Wilcoxon signed-rank test reveal students in traditional learning class (CG) have post-test greater than pre-test score (Z= -2.953, p (pre-post)< .05 ). This evidence indicated that although students have a progression of conceptual understanding when learned with conventional method. For another groups, students who learned with flipped inquiry-based learning with mobility (FILM) and hands-on Inquiry-based learning (HIL), their post-test score showed increased significantly (Z = -4.879, p (pre-
post))<.05), (Z = -2.559, p (pre-post)<.05). However, students in FILM class were highest score when compared with others, as shown in Table 3. This indicated that when the flipped inquiry-based learning had been integrated with the computer-simulated visualization into the science learning of liquid pressure, there had been a significant impact on conceptual understanding. Therefore, this method has been shown to be superior to a more general flipped learning. Similar to previously studies regarding the students’ performance reported that all assessment was significant difference found with students in the flipped class, when compared to a traditional group (Gonzalez-Gomez et al., 2016). Similar conclusions were found in an engineering course (Mason, Shuman, and Cook, 2013). In addition, Davies et al., (2013) determined what benefit flipped classroom might have for undergraduate students and investigated how technology can be used to enhance technology skills in this class. They found that the flipped classroom approach allowed students to learn course content by themselves, and to make better use of their time, improving their perception toward the class. In our study, the significant differences are observed between FILM, HIL, and TL. Especially students’ performance was significantly higher when a flipped model integrated to inquiry-based learning with visualize simulation on mobile devices was followed. In most cases simulation conditions showed improving learning outcomes, Srisawasdi and Kroothkeaw (2014) mentioned that students’ conceptual score for pre-test, post-test, and retention test were significantly different and they increased conceptual understanding after participated with simulation
593
class. However, the flipped approach integrated into simulation-based inquiry was also better than the regular approach for delivering this course.
5. Conclusion
This research aimed to explore students’ learning performance in the flipped inquiry-based learning with mobility (FILM), comparing the results with hands-on inquiry-based learning (HIL) and traditional learning (TL). The study was conducted in a physics course, eleventh grade high school students in the northeastern region of Thailand. The students’ performance was measured in terms of overall students’ testing score. The result showed that better outcomes were achieved when the FILM was followed. In addition, an integration of flipped learning into inquiry-based learning with mobile technology and using simulation as learning tools can help students to comprehend conceptual understanding about liquid pressure both observable and unobservable level of phenomena.
Acknowledgements
This research was financially supported in partial by Graduate School, Khon Kaen University, Thailand. This contribution was partially supported by Science Education Program, Faculty of Education, Khon Kaen University. The authors would like to express sincere thanks to science teachers and middle school students in the school for their kind participations in this study.
References
Buyai, J., & Srisawasdi, N. (2014). An evaluation of macro-micro representation-based computer simulation for physics learning in liquid pressure: results on students' perceptions and attitude. In C.-C. e. Liu (Ed.), the 22nd International Conference on Computers in Education (pp. 330-338). Japan: Asia-Pacific Society for Computers in Education.
Chaipidech, P., & Srisawasdi, N. (2016). Mobile technology-enhanced flipped learning for scientific inquiry laboratory: a comparison of students’ perceptions and engagement. In Proceeding of the 24th International Conference on Computers in Education (pp. 268-275). India: Asia-Pacific Society for Computers in Education.
Chu, H.-C., Hwang, G.J., Tsai, C.-C. (2010). A two-tier test approach to developing location-aware mobile learning systems for natural science courses. Computers & Education, (55), 1618-1627.
Davies, R. S., Dean, D. L., & Ball, N. (2013). Flipped the classroom and instructional technology integration in a college-level information systems spreadsheet course. Educational Technology Research and Development, 61(4), 563-580.
Gonzalez-Gomez, D., Jeong, J. S., Rodriguez, D. A., & Canada-Canada, F. (2016). Performance and perception in the flipped learning model: An initial approach to evaluate effectiveness of anew teaching methodology in a general science classroom. Journal of Science Education and Technology, (26), 450-459.
Hofstein, A., & Lunetta, V. N. (2004). The laboratory in science education: foundations for the twenty-first century. Science Education, 88(1), 28-54.
Hwang, G.-J., & Chang, H.-F. (2011). A formative assessment-based mobile learning approach to improving the learning attitudes and achievements of students. Computers & Education, (56), 1023-1031.
Hwang, G.-J., Lai, C.-L., & Wang, S.-Y. (2015). Seamless flipped learning: a mobile technology-enhanced flipped classroom with effective learning strategies. Journal of Computers in Education, 2(4), 449-473.
Klopfer, E., Sheldon, J., Perry, J. and Chen, V. H.-H. (2012). Ubiquitous games for learning (UbiqGames): weatherlings, a worked example. Journal of Computer Assisted Learning, 28, 465-476.
Kostaris, C., Sergis, S., Sampson, D. G., Giannkos, M. N., & Pelliccione, L. (2017). Investigating the potential of the flipped classroom model in K-12 ICT teaching and learning: an action research study. Journal of Educational Technology & Society, 20(1), 261-273.
Lai, C.-L., & Hwang, G.-J. (2016). A self-regulated flipped classroom approach to improving students' learning performance in a mathematics course. Computers & Education, 100, 126-140.
Lazonder, A., & Ehrenhard, S. (2014). Relative effectiveness of physical and virtual manipulatives for conceptual change in science: how falling objects fall. Journal of Computer Assisted Learning, 30(2), 110-120.
594
Looi, C.-K., Seow, P., Zhang, B., So, H.-J., Chen, W. and Wong, L.-H. (2010), Leveraging mobile technology for sustainable seamless learning: a research agenda. British Journal of Educational Technology, 41, 154-169.
Mason, G., Shuman, T and Cook, K. (2013), Comparing the effectiveness of an inverted classroom to a traditional classroom in and upper divison engineering course. IEEE Transactions on Education, 56(4), 430-435.
Moraros, J., Islam, A., Yu, S., Banow, R., & Schindelka, B. (2015). Flipping for success: evaluating the effectiveness of a novel teaching approach in a graduate level setting. BMC Medical Education, 15(27).
National Research Council. (1996). The National Science Education Standards. Washington DC: National Academy Press.
O'Flaherty, J., & Phillips, C. (2015). The use of flipped classrooms in higher education: a scoping review. The Internet and Higher Education, 27, 85-90.
Olympiou, G., & Zacharia, Z. C. (2012). Blending physical and virtual manipulatives: an effort to improve students' conceptual understanding through science laboratory experimentation. Science Education, 96(1), 21-47.
Pinatuwong, S., & Srisawasdi, N. (2014). An investigation of relationships between biology attitudes and perceptions toward instructional technology in analogy-based simulation on light reaction. In C.-C. e. Liu (Ed.), Proceeding of the 22nd International Conference on Computers in Education (pp. 149-152). Japan: Asia-Pacific Society for Computers in Education.
Sams, A., & Bergmann, J. (2013). Flip your students’ learning. Educational Leadership, 16-20. Srisawasdi, N. (2014). Developing technological pedagogical and content knowledge in using computerized
science laboratory environment: an arrangement for science teacher education. Research and Practice in Technology Enhanced Learning, 9(1). 123-143.
Srisawasdi, N., & Kroothkeaw, S. (2014). Supporting students’ conceptual development of light refraction by simulation-based open inquiry with dual-situated learning model. Journal of Computers in Education, 1(1), 49-79.
Srisawasdi, N., & Panjaburee, P. (2015). Exploring effectiveness of simulation-based inquiry learning in science with integration of formative assessment. Journal of Computers in Education, 2(3), 323-352.
Suits, J. P., & Srisawasdi, N. (2013). Use of an interactive computer-simulated experiment to enhance students’ mental models of hydrogen bonding phenomena. In J. P. Suits, & M. J. Sanger, Pedagogic Roles of Animations and Simulations in Chemistry Courses (Vol. 1142, pp. 241-271). American Chemical Society.
Tucker, B. (2012). Online instruction at home frees class time for learning. Retrieved from Education Next: http://educationnext.org/the-flipped-classroom/
Vlassi, M., & Karaliota, A. (2013). The comparison between guided inquiry and traditional teaching method: a case study for the teaching of the structure of matter to 8th grade Greek students. Procedia - Social and Behavioral Sciences, 93, 494-497.
Zacharia, Z. C. (2007). Comparing and combining real and virtual experimentation: an effort to enhance students' conceptual understanding of electric circuits. Journal of Computer Assisted Learning, 23(2), 120-132.
Zacharia, Z. C., Lazaridou, C., & Avraamidou, L. (2016). The use of mobile devices as means of data collection in supporting elementary school students’ conceptual understanding about plants. International Journal of Science Education, 38(4), 596-620.
Zacharia, Z. C., Olympiou, G., & Papaevripidou, M. (2008). Effects of experimenting with physical and virtual manipulatives on students' conceptual understanding in heat and temperature. Journal of Research in Science Teaching, 45(9), 1021-1035.
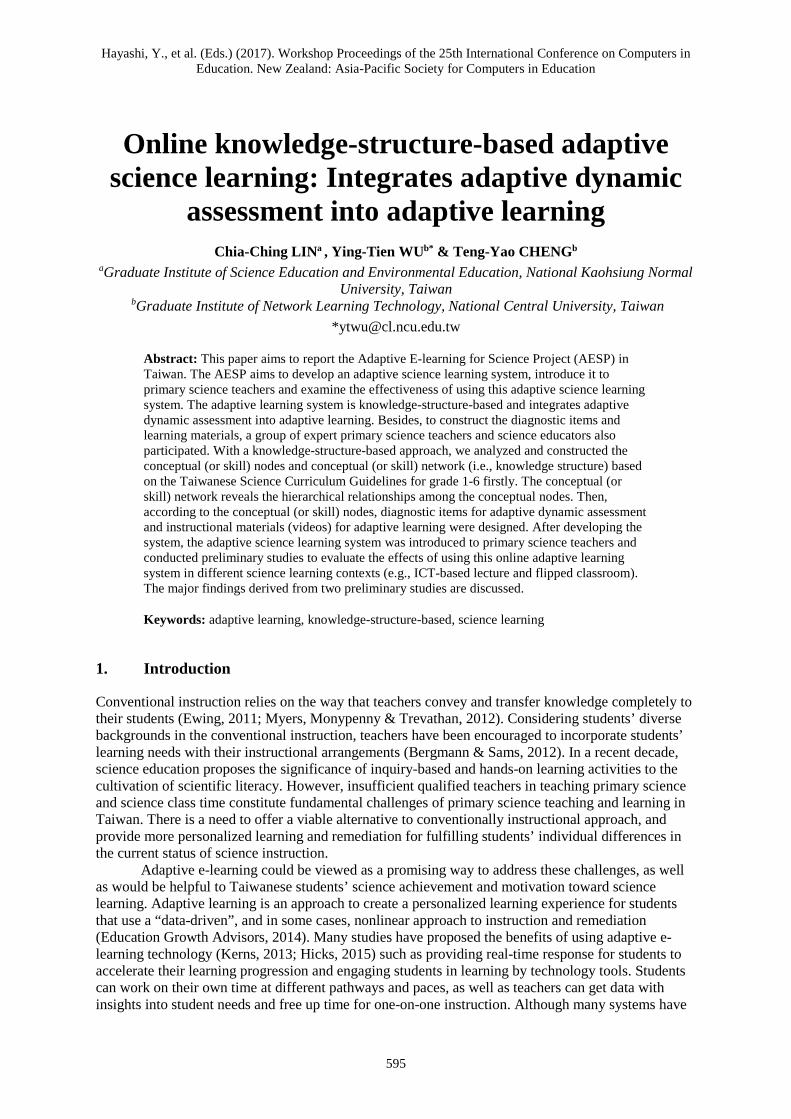
Hayashi, Y., et al. (Eds.) (2017). Workshop Proceedings of the 25th International Conference on Computers in Education. New Zealand: Asia-Pacific Society for Computers in Education
595
Online knowledge-structure-based adaptive science learning: Integrates adaptive dynamic
assessment into adaptive learning Chia-Ching LINa , Ying-Tien WUb* & Teng-Yao CHENGb
aGraduate Institute of Science Education and Environmental Education, National Kaohsiung Normal University, Taiwan
bGraduate Institute of Network Learning Technology, National Central University, Taiwan *[email protected]
Abstract: This paper aims to report the Adaptive E-learning for Science Project (AESP) in Taiwan. The AESP aims to develop an adaptive science learning system, introduce it to primary science teachers and examine the effectiveness of using this adaptive science learning system. The adaptive learning system is knowledge-structure-based and integrates adaptive dynamic assessment into adaptive learning. Besides, to construct the diagnostic items and learning materials, a group of expert primary science teachers and science educators also participated. With a knowledge-structure-based approach, we analyzed and constructed the conceptual (or skill) nodes and conceptual (or skill) network (i.e., knowledge structure) based on the Taiwanese Science Curriculum Guidelines for grade 1-6 firstly. The conceptual (or skill) network reveals the hierarchical relationships among the conceptual nodes. Then, according to the conceptual (or skill) nodes, diagnostic items for adaptive dynamic assessment and instructional materials (videos) for adaptive learning were designed. After developing the system, the adaptive science learning system was introduced to primary science teachers and conducted preliminary studies to evaluate the effects of using this online adaptive learning system in different science learning contexts (e.g., ICT-based lecture and flipped classroom). The major findings derived from two preliminary studies are discussed.
Keywords: adaptive learning, knowledge-structure-based, science learning
1. Introduction
Conventional instruction relies on the way that teachers convey and transfer knowledge completely to their students (Ewing, 2011; Myers, Monypenny & Trevathan, 2012). Considering students’ diverse backgrounds in the conventional instruction, teachers have been encouraged to incorporate students’ learning needs with their instructional arrangements (Bergmann & Sams, 2012). In a recent decade, science education proposes the significance of inquiry-based and hands-on learning activities to the cultivation of scientific literacy. However, insufficient qualified teachers in teaching primary science and science class time constitute fundamental challenges of primary science teaching and learning in Taiwan. There is a need to offer a viable alternative to conventionally instructional approach, and provide more personalized learning and remediation for fulfilling students’ individual differences in the current status of science instruction.
Adaptive e-learning could be viewed as a promising way to address these challenges, as well as would be helpful to Taiwanese students’ science achievement and motivation toward science learning. Adaptive learning is an approach to create a personalized learning experience for students that use a “data-driven”, and in some cases, nonlinear approach to instruction and remediation (Education Growth Advisors, 2014). Many studies have proposed the benefits of using adaptive e-learning technology (Kerns, 2013; Hicks, 2015) such as providing real-time response for students to accelerate their learning progression and engaging students in learning by technology tools. Students can work on their own time at different pathways and paces, as well as teachers can get data with insights into student needs and free up time for one-on-one instruction. Although many systems have
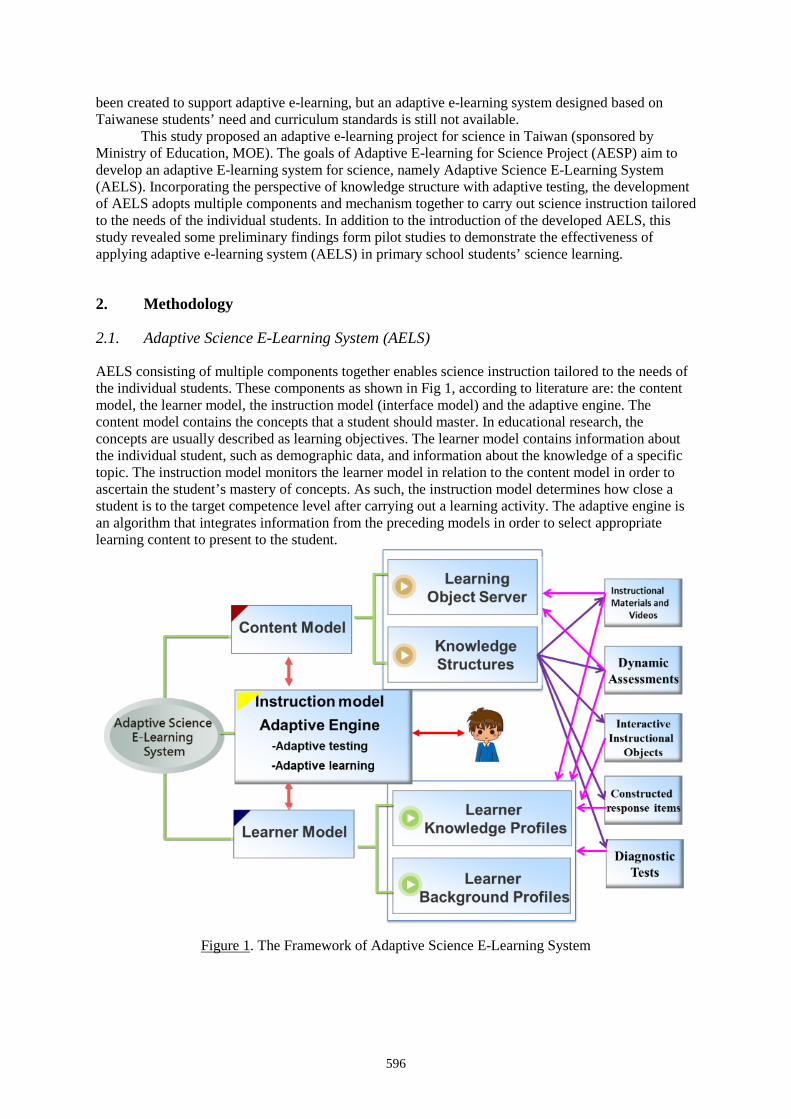
596
been created to support adaptive e-learning, but an adaptive e-learning system designed based on Taiwanese students’ need and curriculum standards is still not available.
This study proposed an adaptive e-learning project for science in Taiwan (sponsored by Ministry of Education, MOE). The goals of Adaptive E-learning for Science Project (AESP) aim to develop an adaptive E-learning system for science, namely Adaptive Science E-Learning System (AELS). Incorporating the perspective of knowledge structure with adaptive testing, the development of AELS adopts multiple components and mechanism together to carry out science instruction tailored to the needs of the individual students. In addition to the introduction of the developed AELS, this study revealed some preliminary findings form pilot studies to demonstrate the effectiveness of applying adaptive e-learning system (AELS) in primary school students’ science learning.
2. Methodology
2.1. Adaptive Science E-Learning System (AELS)
AELS consisting of multiple components together enables science instruction tailored to the needs of the individual students. These components as shown in Fig 1, according to literature are: the content model, the learner model, the instruction model (interface model) and the adaptive engine. The content model contains the concepts that a student should master. In educational research, the concepts are usually described as learning objectives. The learner model contains information about the individual student, such as demographic data, and information about the knowledge of a specific topic. The instruction model monitors the learner model in relation to the content model in order to ascertain the student’s mastery of concepts. As such, the instruction model determines how close a student is to the target competence level after carrying out a learning activity. The adaptive engine is an algorithm that integrates information from the preceding models in order to select appropriate learning content to present to the student.
Figure 1. The Framework of Adaptive Science E-Learning System
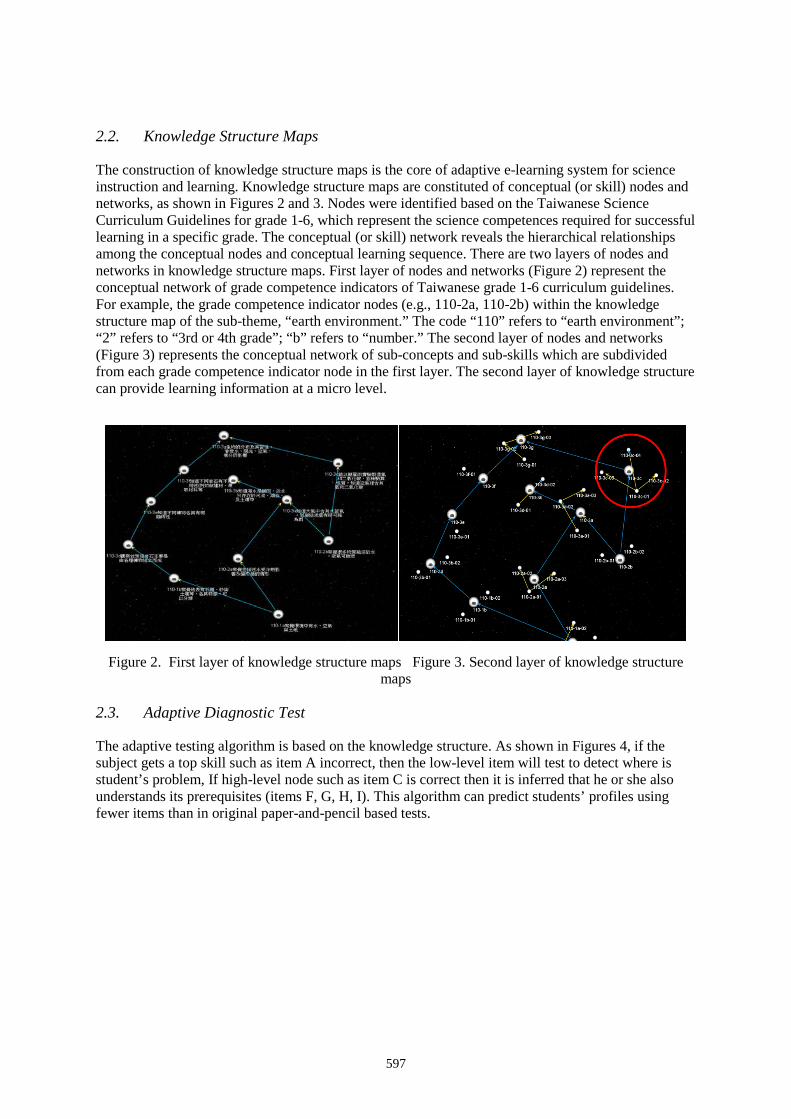
597
2.2. Knowledge Structure Maps
The construction of knowledge structure maps is the core of adaptive e-learning system for science instruction and learning. Knowledge structure maps are constituted of conceptual (or skill) nodes and networks, as shown in Figures 2 and 3. Nodes were identified based on the Taiwanese Science Curriculum Guidelines for grade 1-6, which represent the science competences required for successful learning in a specific grade. The conceptual (or skill) network reveals the hierarchical relationships among the conceptual nodes and conceptual learning sequence. There are two layers of nodes and networks in knowledge structure maps. First layer of nodes and networks (Figure 2) represent the conceptual network of grade competence indicators of Taiwanese grade 1-6 curriculum guidelines. For example, the grade competence indicator nodes (e.g., 110-2a, 110-2b) within the knowledge structure map of the sub-theme, “earth environment.” The code “110” refers to “earth environment”; “2” refers to “3rd or 4th grade”; “b” refers to “number.” The second layer of nodes and networks (Figure 3) represents the conceptual network of sub-concepts and sub-skills which are subdivided from each grade competence indicator node in the first layer. The second layer of knowledge structure can provide learning information at a micro level.
Figure 2. First layer of knowledge structure maps Figure 3. Second layer of knowledge structure maps
2.3. Adaptive Diagnostic Test
The adaptive testing algorithm is based on the knowledge structure. As shown in Figures 4, if the subject gets a top skill such as item A incorrect, then the low-level item will test to detect where is student’s problem, If high-level node such as item C is correct then it is inferred that he or she also understands its prerequisites (items F, G, H, I). This algorithm can predict students’ profiles using fewer items than in original paper-and-pencil based tests.
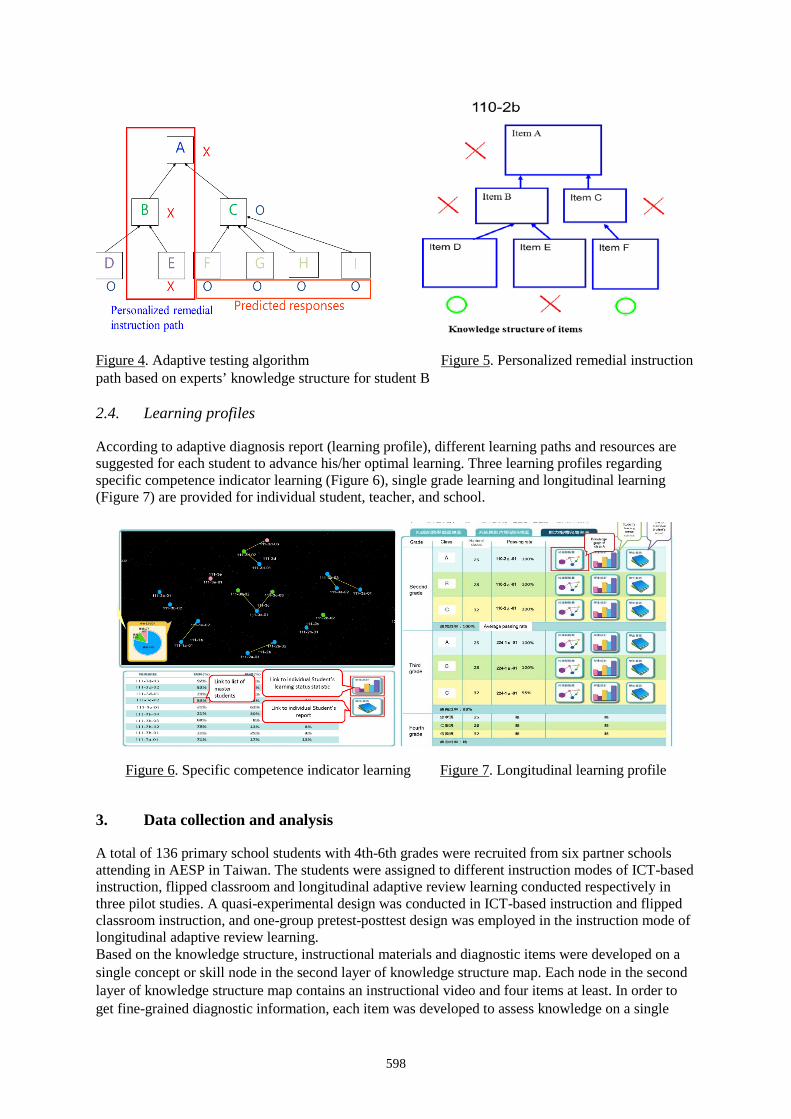
598
Figure 4. Adaptive testing algorithm Figure 5. Personalized remedial instruction path based on experts’ knowledge structure for student B
2.4. Learning profiles
According to adaptive diagnosis report (learning profile), different learning paths and resources are suggested for each student to advance his/her optimal learning. Three learning profiles regarding specific competence indicator learning (Figure 6), single grade learning and longitudinal learning (Figure 7) are provided for individual student, teacher, and school.
Figure 6. Specific competence indicator learning Figure 7. Longitudinal learning profile
3. Data collection and analysis
A total of 136 primary school students with 4th-6th grades were recruited from six partner schools attending in AESP in Taiwan. The students were assigned to different instruction modes of ICT-based instruction, flipped classroom and longitudinal adaptive review learning conducted respectively in three pilot studies. A quasi-experimental design was conducted in ICT-based instruction and flipped classroom instruction, and one-group pretest-posttest design was employed in the instruction mode of longitudinal adaptive review learning. Based on the knowledge structure, instructional materials and diagnostic items were developed on a single concept or skill node in the second layer of knowledge structure map. Each node in the second layer of knowledge structure map contains an instructional video and four items at least. In order to get fine-grained diagnostic information, each item was developed to assess knowledge on a single
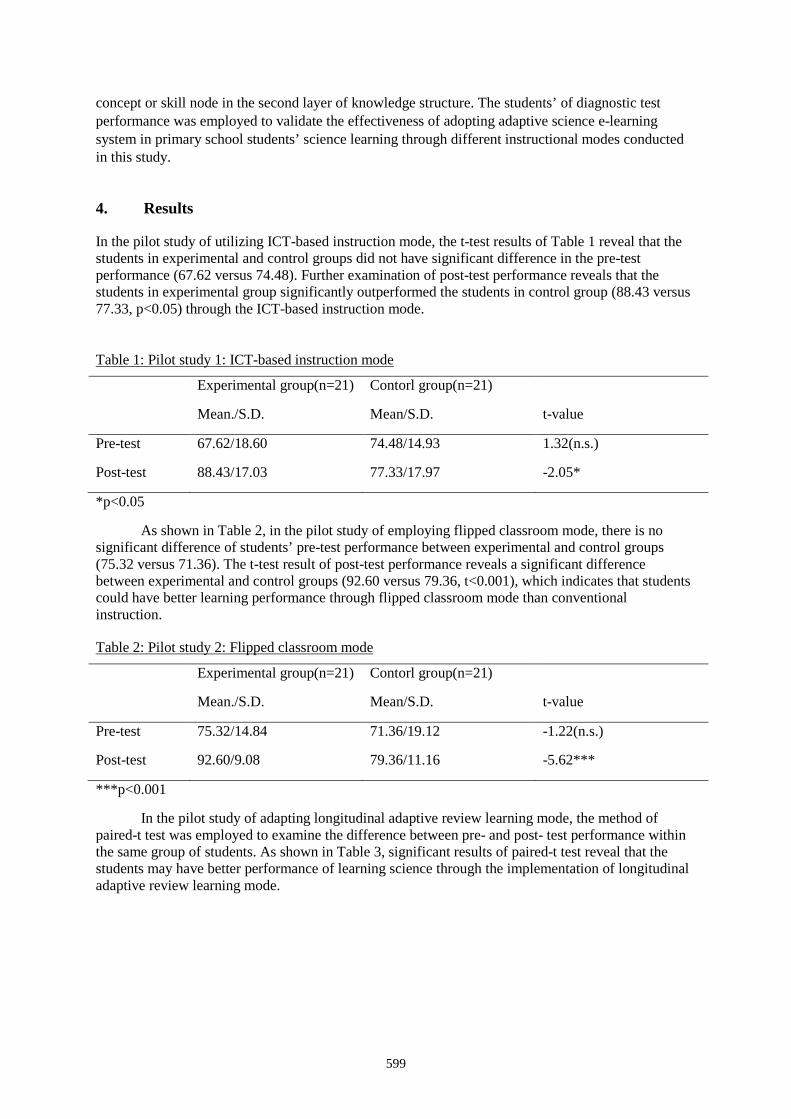
599
concept or skill node in the second layer of knowledge structure. The students’ of diagnostic test performance was employed to validate the effectiveness of adopting adaptive science e-learning system in primary school students’ science learning through different instructional modes conducted in this study.
4. Results
In the pilot study of utilizing ICT-based instruction mode, the t-test results of Table 1 reveal that the students in experimental and control groups did not have significant difference in the pre-test performance (67.62 versus 74.48). Further examination of post-test performance reveals that the students in experimental group significantly outperformed the students in control group (88.43 versus 77.33, p<0.05) through the ICT-based instruction mode.
Table 1: Pilot study 1: ICT-based instruction mode
Experimental group(n=21)
Mean./S.D.
Contorl group(n=21)
Mean/S.D.
t-value
Pre-test 67.62/18.60 74.48/14.93 1.32(n.s.)
Post-test 88.43/17.03 77.33/17.97 -2.05*
*p<0.05
As shown in Table 2, in the pilot study of employing flipped classroom mode, there is no significant difference of students’ pre-test performance between experimental and control groups (75.32 versus 71.36). The t-test result of post-test performance reveals a significant difference between experimental and control groups (92.60 versus 79.36, t<0.001), which indicates that students could have better learning performance through flipped classroom mode than conventional instruction.
Table 2: Pilot study 2: Flipped classroom mode
Experimental group(n=21)
Mean./S.D.
Contorl group(n=21)
Mean/S.D.
t-value
Pre-test 75.32/14.84 71.36/19.12 -1.22(n.s.)
Post-test 92.60/9.08 79.36/11.16 -5.62***
***p<0.001
In the pilot study of adapting longitudinal adaptive review learning mode, the method of paired-t test was employed to examine the difference between pre- and post- test performance within the same group of students. As shown in Table 3, significant results of paired-t test reveal that the students may have better performance of learning science through the implementation of longitudinal adaptive review learning mode.
600
Table 3: Pilot study 3: Longitudinal adaptive review learning mode
Pre-test
Mean./S.D.
Post-test
Mean/S.D.
t-value
6th graders
(N=52)
65.94/14.60 75.83/11.23 --8.73***
***p<0.001
5. Conclusion and Discussion
This study introduced the development and properties of Adaptive Science E-Learning System (AELS). Some initial positive results provide some evidence that the adaptive e-learning system could be incorporated with various instructional modes to promote students’ performance of learning science. AESP’s future work will focus on revising and expanding knowledge structure maps and instructional materials and videos to 9th grade science learning, improving system interface and functions and co-working with more partner schools to find out better practices.
Acknowledgements
Funding of this paper is supported by Ministry of Science and Technology Council, Taiwan, under grant MOST 103-2511-S-008 -007 -MY3, 104-2511-S-008 -015 -MY3 and 105-2511-S-017-002 -
References
Bergmann, J., & Sams, A. (2012). Flip your classroom: Reach every student in every class every day. Washington DC: International Society for Technology in Education.
Ewing, R. (2011). Action research and professional learning: Some reflections on inquiries that advance professional knowledge and practice. In Markauskaite L, Freebody P, Irwin J (Eds.), Methodological choice and design: Scholarship, policy and practice in social and educational research, (pp. 71-77). New York: Springer.
Hicks, K. (2015). 5 Benefits of Using Adaptive Tech in Online Learning. Edudemic: Connecting Education and Technology. Retrieved from: http://www.edudemic.com/how-adaptive-learning-technology-is-being-used-in-online-courses/
Kerns, D. (2013, July). Six Key Benefits of Adaptive Learning. Dreambox Learning, 17. Retrieved from http://www.dreambox.com/blog/six-benefits-of-adaptive-learning
Myers, T., Monypenny, R. & Trevathan, J. (2012). Overcoming the glassy-eyed nod: An application of process-oriented guided inquiry learning techniques in information technology. Journal of Learning Design, 5(1), 12-22.McElhaney, K. W., & Linn, M. C. (2011). Investigations of a complex, realistic task: Intentional, unsystematic, and exhaustive experimenters. Journal of Research in Science Teaching, 48(7), 745-770.
Moreno, R., & Valdez, A. (2005). Cognitive load and learning effects of having students organize pictures and words in multimedia environments: The role of student interactivity and feedback. Educational Technology Research and Development, 53(3), 35-45.
Parnafes, O. (2007). What does “fast” mean? Understanding the physical world through computational representations. The Journal of the Learning Sciences, 16(3), 415-450.
Hayashi, Y., et al. (Eds.) (2017). Workshop Proceedings of the 25th International Conference on Computers in Education. New Zealand: Asia-Pacific Society for Computers in Education
601
A Contextual Online Game based on Inquiry Learning Approach for Improving Students’
Learning Performance in a Chemistry Course Niwat SRISAWASDIa,b, Nattida NANTAKAEWc & Patcharin PANJABUREEd*
aDivision of Science, Mathematics, and Technology Education, Faculty of Education, Khon Kaen University, Khon Kaen, Thailand
bInstitute of Learning and Teaching Innovation, Khon Kaen University, Thailand cChak Kham Khanathon School, Thailand
dInstitute for Innovative Learning, Mahidol University, Thailand *[email protected]
Abstract: Digital game, a technological tool, can be in the form of a scenario or simulation with specific rules and principles for assisting students’ construction of knowledge and promoting their motivation. However, how to trigger students for acquiring educational goals in playing game remains to be settled, especially for chemistry course. In this study, a contextual educational digital game based on an inquiry-based learning strategy is developed to improving students’ learning performance. An experiment has been conducted on a high school chemistry course to evaluate the effects of the proposed approach on the learning performance of students. The experimental results indicate that the proposed approach effectively enhanced the students’ learning performances in terms of their conceptual understanding and learning motivation.
Keywords: Science education, instructional design, learning strategies, active learning
1. Background and Motivation
With the significance of connecting chemical content to real life, researchers are aware of teaching and learning process for chemistry concept in classroom. Chemistry, which is the one of most important discipline, explains daily life phenomena. Its concept related to other concepts in science such as the biology, physics and materials science. The nature of chemistry is abstract content, which need to use imagination for connecting to real life situation. Chemistry requires three different levels of representation, which are macroscopic, submicroscopic, and symbolic level. The topic of adhesive force in chemistry uses three levels of representation for explaining the phenomena. This topic related to understanding the basic phenomena in the science curriculum that student is incomprehensible (Eilam, 2004; Leite et al., 2007). There are many factors related to difficulty in learning chemistry. Sirhan (2007) indicated the main factors of the learning difficulty in chemistry are curriculum content, overload of students’ working memory space, motivation, language, and communication. Several researchers revealed that motivation, which is one of physiological processes, influences human behaviors when being doing something (Moos and Marroquin, 2010), especially, learning in an educational environment (Murphy and Alexander, 2000). Moreover, positive attitudes to learning influence motivation to learn led to success in learning (Osborne et al., 2003).
With the rapid growth of technology-enhanced learning approach, teaching and learning by using the digital game-based learning has been recognized as a model that combines computer technology into the instruction, such that the students who learned with the digital game-based learning can gain both enjoyment and knowledge (McNamara et al., 2010). In recent years, researchers have developed the educational digital game-based learning to support learning performance in several areas. For example, Yien et al. (2011) showed that a game-based learning approach could help students to improve their learning achievements in a nutrition course. Yang et al. (2012) proposed a digital game-based learning system for energy education for the children in the
602
school. Chee and Tan (2012) designed and developed an educational game named Legends of Alkhimia. They found that the developed game effectively fosters learning and supports conceptual understanding of chemistry. Moreover, researchers showed that the digital game-based learning could promote students’ learning motivation. For example, Huang (2011) found that the Trade Ruler game could improve students’ learning motivation in introduce economic. Papastergiou (2009) found that students who learned with the computer game have more motivational than the non-gaming approach.
Moreover, to trigger trigger students for acquiring educational goals in playing game, the use of inquiry-based learning strategy could encourage students to conceptualize a problem and then conduct experiment to find out possible explanations related to that problem (Olson and Loucks-Horsley, 2000). Hwang, et al. (2015) revealed that a contextual game basing on inquiry-based learning approach to enhance students’ learning achievement, learning motivation, satisfaction degree, and flow state on deposits and investments topic in social studies course. Accordingly, the development of digital game with the support of inquiry-based learning activities has become an important and challenging topic, especially in chemistry course. This study extended the digital game developed by Nantakaew and Srisawasdi (2014) for engaging students in meaningful learning activities and examined students’ learning performance in terms of conceptual understanding in chemistry course and learning motivation.
2. The development of Contextual Online Game based on Inquiry Learning Approach
In this study, the inquiry-based learning contexts were incorporated into contextual gaming scenarios for promoting students’ learning performance in chemistry courses. The main gaming interface enables students to learn in various gaming contexts based on the contextual dramas related to chemistry. There are two games named Pipe-game and Factory-game for encouraging chemistry learning.
The main objective of the Pipe-game is to improve students’ conceptual understanding of adhesive force in chemistry course. The main elements (water and pipe) are executed by the players (students). Thus, the students are encouraged to use knowledge of macroscopic, sub-microscopic and symbolic levels in chemistry to select pipe. The students then get a visual idea of water flow timing when using different material of pipe. Such that the game is not complicated game technology. That is the Pipe-game was simple and based-on the traditional simulation game mechanics like reward, encourage, and rethink. Moreover, the game provides the story and mission to students. That is why the Pipe-game was interested and motivated the students to learn the adhesive force content. In the first stage of our game, the learning objectives are introduced to the students. Before participating in the game, they are asked to investigate their prior knowledge on adhesive force. Moreover, the rules, basic functions, and missions of the game are demonstrated. For example, the students receive the problem situation in the factory. The problem states that the water flow through pipes is slowly; if you were a chemist, how do you handle/select the proper pipe to increase rate of water flow. Once the students understand the situation, the game also provides scaffolding for making decisions. The students can see molecular structure of each pipe. In this part, the students can observe experimental demonstration of the water flow. However, the students need to pay coins for seeing that demonstration. During this stage, the students encounter various challenges that they must overcome in order to progress. In this stage, the students have to buy the various shapes of each pipe for connecting two fixed pipes to each other. The teachers have to encourage them to concern about the coins that they have. Thus, they have to play and win the game in order to save coins for playing in the next stage. The ultimate goal of the students is to fix the water flow through pipes in the factory by saving coins. To achieve the ultimate goal, they have to complete that the four bottles are filled. By completing each bottle, the students can gain the knowledge of adhesive force for different pipes that they select by seeing information of macroscopic, sub-microscopic and symbolic level (See details in Nantakaew and Srisawasdi, 2014).
The main objective of the Factory-game is to improve students’ conceptual understanding of properties of liquid topic including the main concepts of cohesive force, evaporation, and boiling in chemistry course. The Factory-game was based-on the mechanics as story and mission, reward,
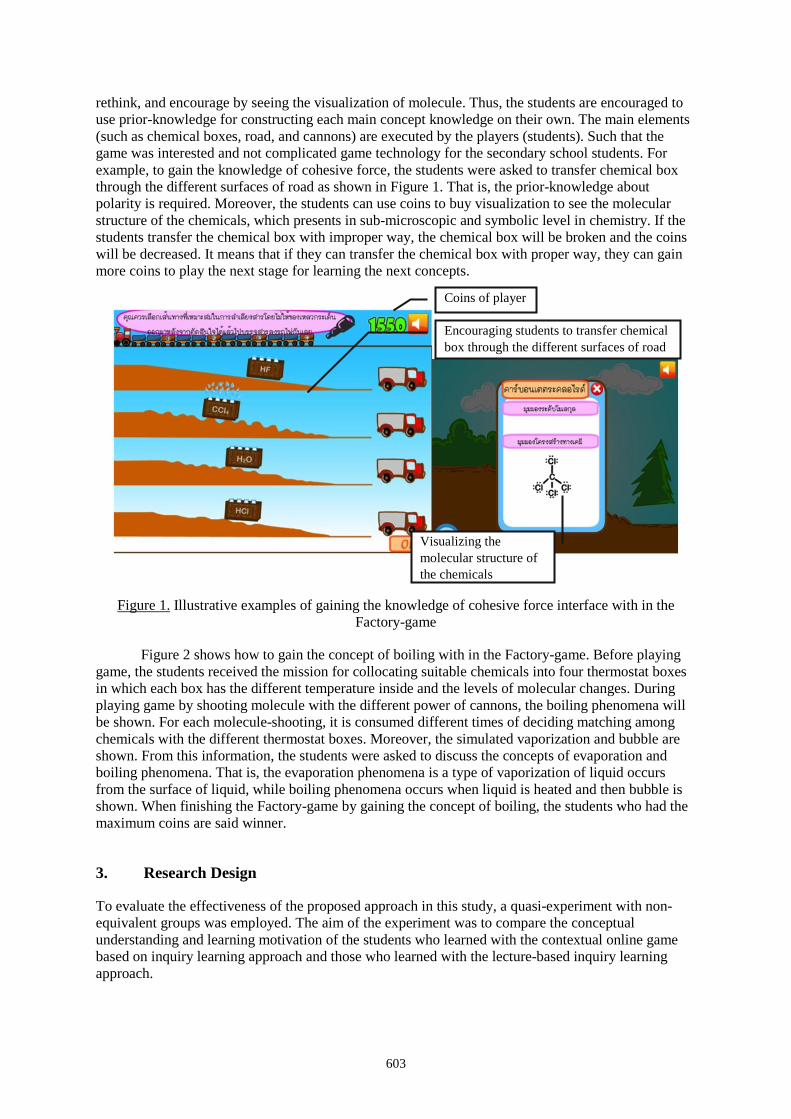
603
rethink, and encourage by seeing the visualization of molecule. Thus, the students are encouraged to use prior-knowledge for constructing each main concept knowledge on their own. The main elements (such as chemical boxes, road, and cannons) are executed by the players (students). Such that the game was interested and not complicated game technology for the secondary school students. For example, to gain the knowledge of cohesive force, the students were asked to transfer chemical box through the different surfaces of road as shown in Figure 1. That is, the prior-knowledge about polarity is required. Moreover, the students can use coins to buy visualization to see the molecular structure of the chemicals, which presents in sub-microscopic and symbolic level in chemistry. If the students transfer the chemical box with improper way, the chemical box will be broken and the coins will be decreased. It means that if they can transfer the chemical box with proper way, they can gain more coins to play the next stage for learning the next concepts.
Figure 1. Illustrative examples of gaining the knowledge of cohesive force interface with in the Factory-game
Figure 2 shows how to gain the concept of boiling with in the Factory-game. Before playing game, the students received the mission for collocating suitable chemicals into four thermostat boxes in which each box has the different temperature inside and the levels of molecular changes. During playing game by shooting molecule with the different power of cannons, the boiling phenomena will be shown. For each molecule-shooting, it is consumed different times of deciding matching among chemicals with the different thermostat boxes. Moreover, the simulated vaporization and bubble are shown. From this information, the students were asked to discuss the concepts of evaporation and boiling phenomena. That is, the evaporation phenomena is a type of vaporization of liquid occurs from the surface of liquid, while boiling phenomena occurs when liquid is heated and then bubble is shown. When finishing the Factory-game by gaining the concept of boiling, the students who had the maximum coins are said winner.
3. Research Design
To evaluate the effectiveness of the proposed approach in this study, a quasi-experiment with non-equivalent groups was employed. The aim of the experiment was to compare the conceptual understanding and learning motivation of the students who learned with the contextual online game based on inquiry learning approach and those who learned with the lecture-based inquiry learning approach.
Encouraging students to transfer chemical box through the different surfaces of road
Visualizing the molecular structure of the chemicals
Coins of player
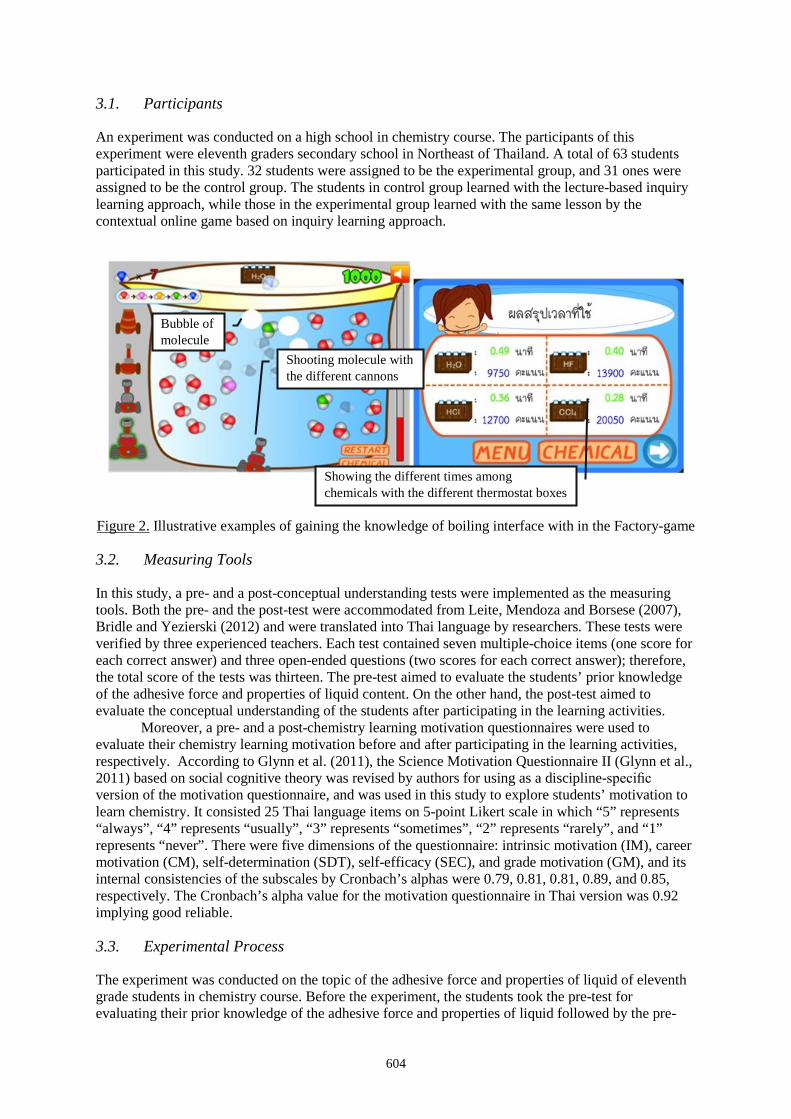
604
3.1. Participants
An experiment was conducted on a high school in chemistry course. The participants of this experiment were eleventh graders secondary school in Northeast of Thailand. A total of 63 students participated in this study. 32 students were assigned to be the experimental group, and 31 ones were assigned to be the control group. The students in control group learned with the lecture-based inquiry learning approach, while those in the experimental group learned with the same lesson by the contextual online game based on inquiry learning approach.
Figure 2. Illustrative examples of gaining the knowledge of boiling interface with in the Factory-game
3.2. Measuring Tools
In this study, a pre- and a post-conceptual understanding tests were implemented as the measuring tools. Both the pre- and the post-test were accommodated from Leite, Mendoza and Borsese (2007), Bridle and Yezierski (2012) and were translated into Thai language by researchers. These tests were verified by three experienced teachers. Each test contained seven multiple-choice items (one score for each correct answer) and three open-ended questions (two scores for each correct answer); therefore, the total score of the tests was thirteen. The pre-test aimed to evaluate the students’ prior knowledge of the adhesive force and properties of liquid content. On the other hand, the post-test aimed to evaluate the conceptual understanding of the students after participating in the learning activities.
Moreover, a pre- and a post-chemistry learning motivation questionnaires were used to evaluate their chemistry learning motivation before and after participating in the learning activities, respectively. According to Glynn et al. (2011), the Science Motivation Questionnaire II (Glynn et al., 2011) based on social cognitive theory was revised by authors for using as a discipline-specific version of the motivation questionnaire, and was used in this study to explore students’ motivation to learn chemistry. It consisted 25 Thai language items on 5-point Likert scale in which “5” represents “always”, “4” represents “usually”, “3” represents “sometimes”, “2” represents “rarely”, and “1” represents “never”. There were five dimensions of the questionnaire: intrinsic motivation (IM), career motivation (CM), self-determination (SDT), self-efficacy (SEC), and grade motivation (GM), and its internal consistencies of the subscales by Cronbach’s alphas were 0.79, 0.81, 0.81, 0.89, and 0.85, respectively. The Cronbach’s alpha value for the motivation questionnaire in Thai version was 0.92 implying good reliable.
3.3. Experimental Process
The experiment was conducted on the topic of the adhesive force and properties of liquid of eleventh grade students in chemistry course. Before the experiment, the students took the pre-test for evaluating their prior knowledge of the adhesive force and properties of liquid followed by the pre-
Shooting molecule with the different cannons
Showing the different times among chemicals with the different thermostat boxes
Bubble of molecule
605
learning motivation questionnaire. The learning activities lasted 50 minutes in each class. The learning content for both the experimental and control group was the same. The students in experimental group learned with the proposed game, whereas those in the control group were taught with traditional teaching method. After learning activities, a post-test was conducted; moreover, the students were asked to response the post-learning motivation questionnaire.
4. Experimental Results
4.1. Students’ Conceptual Understanding
Before conducting the inferential statistic tests, we found that pre-test scores from the control group were normally distributed by Shapiro-Wilk test (p = 0.071), while those from the experimental group were not normally distributed as indicated by Shapiro-Wilk test (p = 0.001). Therefore, we deal with non-parametric hypothesis test, Mann-Whitney U test is used to analyze pre-test scores from both the control group and the experimental group. It was found that the mean ± standard deviation of pre-test of the experimental group was 2.71 ± 1.553, and of control group was 2.82 ± 1.268. There was no significant difference between the mean score of pre-test of the control and the experimental groups (z = 0.468, p = 0.320), indicating that the students in both the groups had similar prior knowledge regarding the topic of the adhesive force and properties of liquid content. Furthermore, to examine how the conceptual understanding was affected by the teaching and learning method after the implementation of the proposed game, the post-test scores of both control and experimental groups were analyzed with non-parametric hypothesis test, Mann-Whitney U test, as shown in Table 1.
Table 1. Mann-Whitney U result of the post-test
Groups N Mean ± SD Z p-value
Control Group 31 3.85 ± 1.916 2.664 0.004*
Experimental Group 32 5.48 ± 2.401 * p <0.05
The results in Table 1 shows the mean score of post-test for the experimental group were significantly higher than that for the control group, implying that the proposed game could enhance better promoting conceptual understanding in the adhesive force and properties of liquid content in chemistry course.
4.2. Students’ Learning Motivation
Non-parametric hypothesis test, Mann-Whitney U test, was employed to analyze the students’ pre-learning motivation by adopting teaching and learning methods (i.e., the proposed game and traditional teaching). Six students and five students in control and experimental group non-responded to the questionnaire, respectively. As shown in Table 2, the Mann-Whitney U result shows that the students in both the groups had similar learning motivation before participating in learning activity.
Table 2. Mann-Whitney U result of the pre-learning motivation questionnaire
Learning motivation Control Group (N=25)
Mean ± SD
Experimental Group (N=27)
Mean ± SD Z p-value
Intrinsic motivation 16.72± 2.132 16.83 ± 2.221 0.264 0.346
Career motivation 16.97± 3.987 15.87 ± 3.394 0.898 0.184
606
Self-determination 16.30± 2.016 15.58 ± 1.586 1.627 0.052
Self-efficacy 13.50 ± 1.978 13.43 ± 2.441 0.718 0.236
Grade motivation 18.04± 2.126 17.14 ± 2.587 1.421 0.077
Furthermore, to evaluate how the learning motivation was affected by the teaching and
learning methods after the implementation of the proposed-game learning method, the post-learning motivation of both control and experimental groups were analyzed with non-parametric hypothesis test, Mann-Whitney U test, as shown in Table 3.
Table 3. Mann-Whitney U result of the post-learning motivation questionnaire
Learning motivation Control Group (N=25)
Mean ± SD
Experimental Group (N=27)
Mean ± SD Z p-value
Intrinsic motivation 16.54 ± 1.351 17.54 ± 1.351 2.299 0.010*
Career motivation 17.10 ± 3.259 17.45 ± 3.434 0.524 0.300
Self-determination 15.19 ± 2.079 17.09 ± 2.308 2.530 0.005*
Self-efficacy 13.43 ± 1.869 15.64 ± 2.405 2.153 0.017*
Grade motivation 18.62 ± 2.908 17.86 ± 2.875 1.260 0.104 * p <0.05
The results in Table 3 shown that there are significant differences of the post-learning motivation: intrinsic motivation, self-determination, and self-efficacy scores between the experimental group and the control group. In the other words, the mean scores of post-learning motivations on intrinsic motivation, self-determination, and self-efficacy for the experimental group were significantly higher than those for the control group, suggesting that the proposed game learning method could improve intrinsic motivation, self-determination, and self-efficacy in topic of properties of liquid more than the traditional teaching and learning method.
5. Discussions and Conclusions
The main objective of this study is to compare the conceptual understanding and learning motivation on the topic of the adhesive force and properties of liquid content between students who learn with the contextual online game based on inquiry learning approach and those who learned with the lecture-based inquiry learning approach. The experimental results were presented, which help in understanding whether the contextual online game based on inquiry learning approach contribute to conceptual understanding and learning motivation. It was found that the game significantly improved the students’ conceptual understanding. As such, our study results verify that the game could play an important tool in enhancing the conceptual understanding for students in the adhesive force and properties of liquid content. In the meantime, the results revealed that students who learned with the game showed higher learning motivations: intrinsic motivation, self-determination, and self-efficacy than those who learned with the conventional teaching approach.
From the developed games, it was found that students were asked to action, reaction, apply knowledge, see experiment demonstration, and see molecular changes in phenomena by being involved in contextual scenarios. For the first game, the students were asked to explore adhesive force in pipes and the rate of water flow from visualizing the macroscopic, sub-microscopic and symbolic level in different material of pipes and simulating water flow through each pipe encouraged them to
607
acquire adhesive force knowledge. Students’ explorations involved reward, encourage, and rethink from errors for saving coins as much as they can. For the second game, there are feedback after finishing each stage. Students could connect liquid splashing when moving through the different surfaces of road with the cohesive force of liquid content. Moreover, when shooting molecule using the different power of cannons, the students were asked to show their understanding about evaporation and boiling phenomena. These are non-observable in everyday life. They also faced challenge with limited time, coins, and feedback data. These were interested and motivated the students to learn the properties of liquid content. In other words, during playing game, learning properties of liquid was interesting and relevant to their life led to promote students’ intrinsic motivation. They could put enough effort and spent a lot of time learning adhesive force by rethinking from errors and receiving teachers’ hints for saving coins led to promote their self-determination. Moreover, they were confident in understanding content and on labs from visualizing macroscopic, sub-microscopic and symbolic level of different pipes led to promote their self-efficacy. Meanwhile, the students in the conventional teaching approach mainly focused on concepts related to content with text-based layout, practice, and drill that required less conceptual constructing and learning motivation. This could be the reason why the developed digital educational chemistry games significant improved the students’ conceptual understanding and promoted their learning motivations (i.e., intrinsic motivation, self-determination, and self-efficacy). The results comply with the view expressed by Erhel and Jamet (2013), Huang, Hung and Tschopp (2010), Daubenfeld and Zenker (2015) that the game could promote students’ learning motivation and engage them in learning with enjoyment; furthermore, on Dorji, Panjaburee, and Srisawasdi (2015) and Antunes et al. (2012) indicated that simulating game could support students’ conceptual construction in an exploration manner. Moreover, these experimental results are in line with previous studies, which stated that the game with authentic scenarios could improve learning achievement and learning motivation (Chee and Tan, 2012; Hwang et al., 2015; Sung et al., 2017).
Although, the experimental results show that the game effectively enhanced the students in terms of conceptual understanding and leaning motivations (i.e., intrinsic motivation, self-determination, and self-efficacy). In particular, students’ conceptual understanding mean score is less than a half of total score, implying that the mean score is quite low. This suggests the need to provide additional supports to students with particular method in the future. For example, teachers can take role to provide hints/feedback for macroscopic, sub-microscopic and symbolic level for assisting students during exploring in the gaming contexts. In addition, to make worth further study, it is to improve the game by concerning conceptual difficulty level of students in the gaming context manner.
Acknowledgements
A part of this research project is supported by Mahidol University.
References
Antunes, M., Pacheco, M., & Giovanela, M. (2012). Design and implementation of an educational game for teaching chemistry in higher education. Journal of Chemical Education, 89(4), 517-521.
Bridle, C., & Yezierski, E. (2012). Evidence for the effectiveness of inquiry-based, particulate-level instruction on conceptions of the particulate nature of matter. Journal of Chemical Education, 89(2), 192-198.
Chee, Y. S. & Tan, K. C. D. (2012). Becoming chemists through game-based inquiry learning: The case of Legends of Alkhimia. Electronic Journal of e-Learning, 10(2), 185–198.
Daubenfeld, T., & Zenker, D. (2015). A game-based approach to an entire physical chemistry course. Journal of Chemical Education, 92(2), 269-277.
Dorji, U., Panjaburee, P., & Srisawasdi, N. (2015). A learning cycle approach to developing educational computer game for improving students’ learning and awareness in electric energy consumption and conservation. Educational Technology & Society, 18(1), 91–105.
Eilam, B. (2004). Drops of water and of soap solution: Students' constraining mental models of the nature of matter. Journal of Research in Science Teaching, 41(10), 970-993.

608
Erhel, S., & Jamet, E. (2013). Digital game-based learning: Impact of instructions and feedback on motivation and learning effectiveness. Computers & Education, 67, 156-167.
Glynn, S., Brickman, P., Armstrong, N., & Taasoobshirazi, G. (2011). Science motivation questionnaire II: Validation with science majors and nonscience majors. Journal of Research in Science Teaching, 48(10), 1159-1176.
Huang, W. (2011) Evaluating learners’ motivational and cognitive processing in an online game-based learning environment. Computers in Human Behavior, 27, 694-704.
Huang, W. H., Huang, W. Y., & Tschopp, J. (2010). Sustaining iterative game playing processes in DGBL: the relationship between motivational processing and outcome processing. Computers & Education, 55(2), 789-797.
Hwang, G., Chiu, L., & Chen, C. (2015). A contextual game-based learning approach to improving students' inquiry-based learning performance in social studies courses. Computers & Education, 81, 13-25.
Leite, L., Mendoza, J., & Borsese, A. (2007). Teachers' and prospective teachers' explanations of liquid-state phenomena: A comparative study involving three European countries. Journal of Research in Science Teaching, 44(2), 349-374.
McNamara, D. S., Jackson, G. T., & Graesser. (2010). Intelligent Tutoring and Games (ItaG). Gaming for Classroom-Based Learning: Digital Role Playing as a Motivator of Study, 44-57.
Nantakaew, N., & Srisawasdi, N. (2014). Investigating Correlation between Attitude toward Chemistry and Motivation within Educational Digital Game-based learning. In Liu, C. C. et al. (Eds.), Workshop Proceedings of the 22nd International Conference on Computers in Education, ICCE 2014 (pp. 316-323). Nara, Japan: Asia-Pacific Society for Computers in Education.
Olson, S., & Loucks-Horsley, S. (Eds.). (2000). Inquiry and the National Science Education Standards: A guide for teaching and learning. Washington, DC: National Academy Press.
Osborne, J., Simon, S., & Collins, S. (2003). Attitudes towards science: A review of the literature and its implications. International Journal of Science Education, 25(9), 1049-1079.
Murphy, P., & Alexander, P. (2000). A motivated exploration of motivation terminology. Contemporary Educational Psychology, 25(1), 3-53.
Papastergiou, M. (2009). Digital game-based learning in high school computer science education: Impact on educational effectiveness and student motivation. Computers & Education, 52(1), 1-12.
Sirhan, G. (2007). Learning Difficulties in Chemistry: An Overview. Journal of Turkish Science Education, 4(2), 2-20.
Sung, H. Y., Hwang, G. J., Hong, Lin, C. J., & Hong, T. W. (2017). Experiencing the Analects of Confucius: An experiential game-based learning approach to promoting students’ motivation and conception of learning. Computers & Education, 110, 143-153.
Yang, J. C., Chien, K. H., & Liu, T. C. (2012). A digital game-based learning system for energy education: an energy conservation pet. The Turkish Online Journal of Educational Technology, 11(2), 29-37.
Yien J.M., Hung C.M., Hwang G.J, Lin Y.C. (2011). A game-based learning approach to improving students’ learning achievements in a nutrition course. The Turkish online journal of educational technology, 10(2), 1–10.
Hayashi, Y., et al. (Eds.) (2017). Workshop Proceedings of the 25th International Conference on Computers in Education. New Zealand: Asia-Pacific Society for Computers in Education
609
Designing Framework of Constructivist Augmented Reality Web-based Learning
Environments to Enhance Creative Thinking for Design and Create Three-Dimensional for
Secondary School Phummiphat KLOMWIPHAWATa & Charuni SAMATb*
aMaster degree student of Educational Technology Faculty of Education, Khon Kaen University Khon Kaen, Thailand
bAssistant Professor of Computer Education, Faculty of Education, Khon Kaen University, Khon Kaen, Thailand
Abstract: This research study aimed to synthesize theoretical framework and designing of constructivist augmented reality web-based learning environments to enhance creative thinking on topic design and create three-dimensional for secondary school. The target group consisted of 3 expert reviewers for content, web-based learning and learning environment designing. Research methodology is developmental research; developmental research consisted of 3 processes: (1) designing process, (2) developing process research methods are document analysis, (3) Evaluate the efficiency of the design framework. And survey. The procedures were as following: (1) to examine and analyze the principles and theories, (2) to synthesize theoretical framework, (3) to synthesize designing framework. The result revealed that: 1) to synthesize theoretical framework comprise of 6 components as following that. Contextual base, Psychological base, Technologies base, Creative Thinking base and Pedagogies base Model learning environments. 2) To synthesize theoretical design framework of constructivist augmented reality web-based learning environments to enhance creative of 6 components i.e., (1) Problem base, (2) Resource, (3) Creative Thinking Center, (4) Collaboration, (5) Coaching, (6) Scaffolding. The efficiency of this learning environment was evaluated by expert review. It was found that the learning environment is appropriate on 3 aspects: content, web-based learning design and learning environment design.
Keywords: Creative Thinking, Augmented Reality, Web-based Learning Environment, Constructivist
1. 1. Introduction
Thailand society stepped into the digital world. Economic social activities are carried out quickly, Competition was increasing. Data access of information through the online world more. Human Development to prepare to face the change is important. Education is an important tool in improving the quality of human resources in the country. The important mechanism for economic development, in the economic arena national and international through education. Creativity is a required skill in the global society in 2020. Enhancement of creative thinking on learner based on the web-based learning environment was achieved using the principles and theories for synthesizing the theoretical framework and the environmental design which promote creative thinking (Samat Charuni and Chaijaroen Sumalee, 2009). The theories and web-based characteristics were brought into the design of instruction that utilized the learning environment media and methods with important components of the Constructivist Theory. Augmented reality technology can be used for promoting learner's creative thinking in order to have meaning verbal learning. This accordingly happen from interaction with learning environment. That can create virtual images that appear in a 3D animation, sound, and
610
hypertext hypermedia. In this paper, are presenting the principles related to the basis of creative thinking and innovation skills for producing students in Thailand 4.0 and the basic context of students training in Thailand that would lead to development of innovation the enhance creative thinking for students in the world economic 2020.
Thus, this research was aimed at designing framework of constructivist augment reality web-based learning environment to enhance creative thinking, from synthesize of theoretical framework and learning environment. In order to obtain the basis for constructing the appropriate and efficient learning environment models for the learners.
2. 2. Methodology
This study was aimed to synthesize theoretical framework and design of Constructivist augment reality web-based learning environment to enhance creative thinking. Research methodology is developmental research consisted of 2 process; (1) Designing process and (2) Developing process research methods are document analysis, (3) Evaluate the efficiency of the design framework The procedures were as following: (1) To examine and analyze the principles and theories. (2) To synthesize theoretical framework. (3) To synthesize designing framework. (4) To evaluate the efficiency of the learning environments.
2.1. Target Groups
Target Group in the design and development process consisted of 3 expert reviewers. (1) Experts in content validity. (2) Experts in web-based learning design. (3) Experts in learning environment design.
2.2. Research Instruments
The instruments in this study as following details: (1) The document examination and analysis recoding form to synthesize a theoretical framework, (2) The recoding form for synthesis of the design framework to learning environment to enhance creative thinking, and (3) The evaluation form for synthesize theoretical framework and designing of constructivist augmented reality web-based learning environments to enhance creative thinking.
2.3. Data collecting and analysis
The researchers collected the data as follows: (1) Synthesis of theoretical framework and Components of the learning environment. The data were collected by analyzing principles, theories, related research of the constructivism theory, cognitive theory, media and technology theory, pedagogy and contextual study, (2) Synthesis of Designing framework of the learning environment: The above synthesized theoretical framework was taken into this process. The underlined theories base such, Contextual base, Psychological base, Technologies and media base (AR: technology and media symbol system), Creative thinking base, and Pedagogies base. (3) Designing and develop of the learning environment based on foundation of creating designing framework was adopted. (4) Evaluate of the learning environment by experts. The analytical description, summarization and interpretation were used to analyze data.
3. 3. Research results
The designing and development of the learning environment that promote student’s creative thinking are follows:
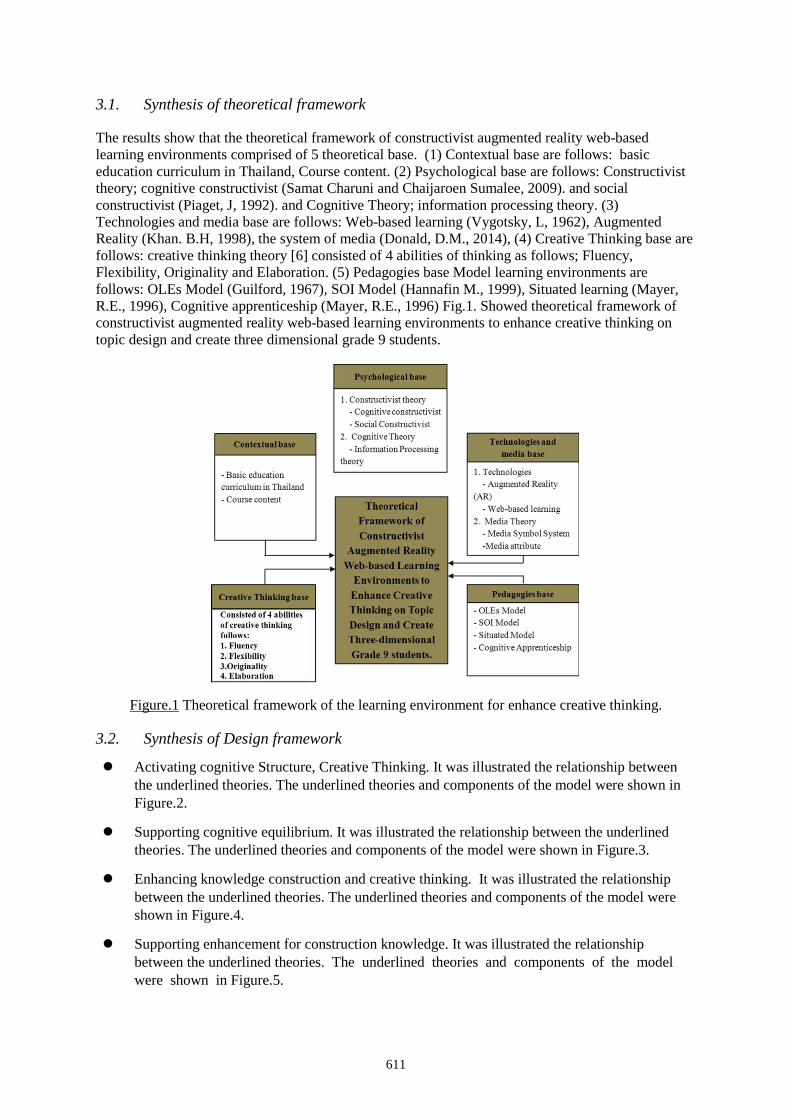
611
3.1. Synthesis of theoretical framework
The results show that the theoretical framework of constructivist augmented reality web-based learning environments comprised of 5 theoretical base. (1) Contextual base are follows: basic education curriculum in Thailand, Course content. (2) Psychological base are follows: Constructivist theory; cognitive constructivist (Samat Charuni and Chaijaroen Sumalee, 2009). and social constructivist (Piaget, J, 1992). and Cognitive Theory; information processing theory. (3) Technologies and media base are follows: Web-based learning (Vygotsky, L, 1962), Augmented Reality (Khan. B.H, 1998), the system of media (Donald, D.M., 2014), (4) Creative Thinking base are follows: creative thinking theory [6] consisted of 4 abilities of thinking as follows; Fluency, Flexibility, Originality and Elaboration. (5) Pedagogies base Model learning environments are follows: OLEs Model (Guilford, 1967), SOI Model (Hannafin M., 1999), Situated learning (Mayer, R.E., 1996), Cognitive apprenticeship (Mayer, R.E., 1996) Fig.1. Showed theoretical framework of constructivist augmented reality web-based learning environments to enhance creative thinking on topic design and create three dimensional grade 9 students.
Figure.1 Theoretical framework of the learning environment for enhance creative thinking.
3.2. Synthesis of Design framework
Activating cognitive Structure, Creative Thinking. It was illustrated the relationship between the underlined theories. The underlined theories and components of the model were shown in Figure.2.
Supporting cognitive equilibrium. It was illustrated the relationship between the underlined theories. The underlined theories and components of the model were shown in Figure.3.
Enhancing knowledge construction and creative thinking. It was illustrated the relationship between the underlined theories. The underlined theories and components of the model were shown in Figure.4.
Supporting enhancement for construction knowledge. It was illustrated the relationship between the underlined theories. The underlined theories and components of the model were shown in Figure.5.
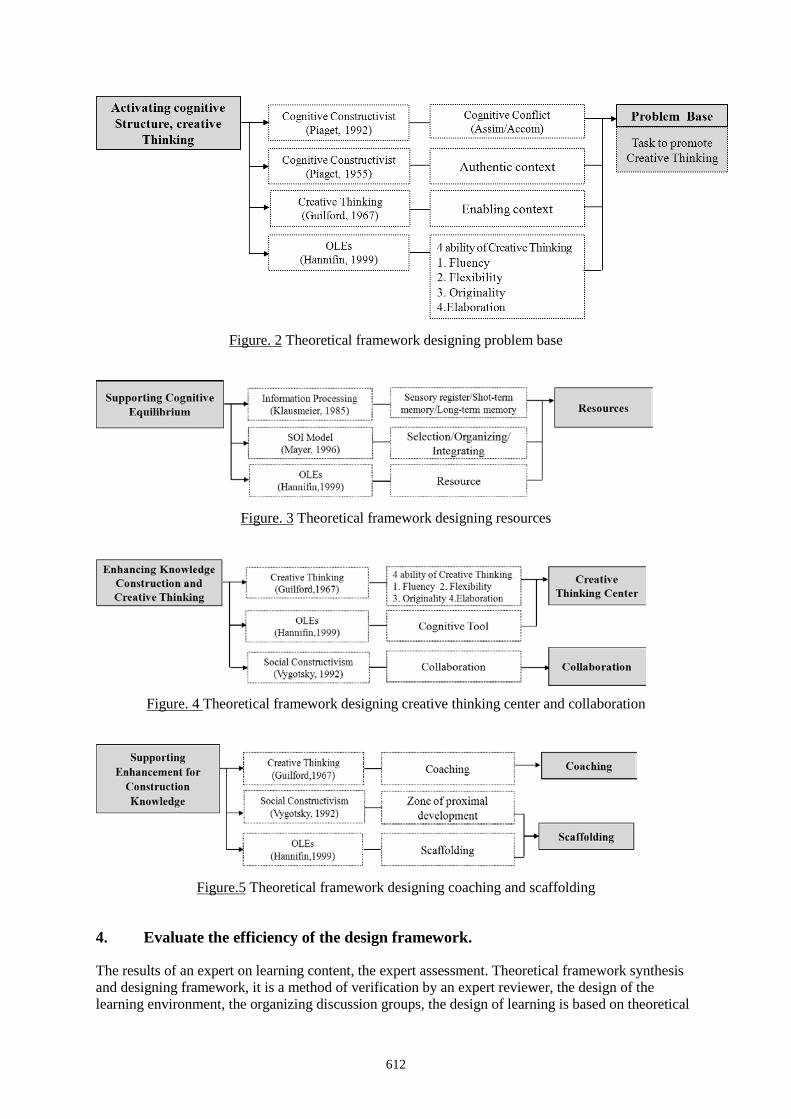
612
Figure. 2 Theoretical framework designing problem base
Figure. 3 Theoretical framework designing resources
Figure. 4 Theoretical framework designing creative thinking center and collaboration
Figure.5 Theoretical framework designing coaching and scaffolding
4. Evaluate the efficiency of the design framework.
The results of an expert on learning content, the expert assessment. Theoretical framework synthesis and designing framework, it is a method of verification by an expert reviewer, the design of the learning environment, the organizing discussion groups, the design of learning is based on theoretical
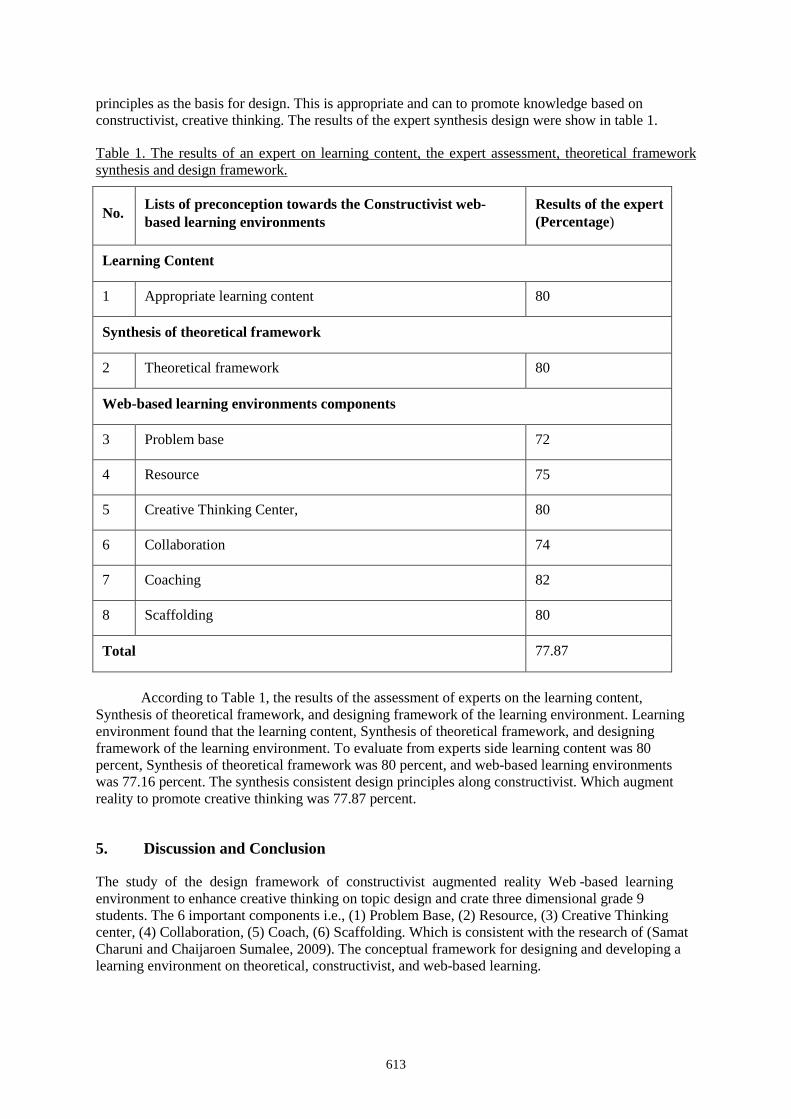
613
principles as the basis for design. This is appropriate and can to promote knowledge based on constructivist, creative thinking. The results of the expert synthesis design were show in table 1.
Table 1. The results of an expert on learning content, the expert assessment, theoretical framework synthesis and design framework.
No. Lists of preconception towards the Constructivist web-based learning environments
Results of the expert (Percentage)
Learning Content
1 Appropriate learning content 80
Synthesis of theoretical framework
2 Theoretical framework 80
Web-based learning environments components
3 Problem base 72
4 Resource 75
5 Creative Thinking Center, 80
6 Collaboration 74
7 Coaching 82
8 Scaffolding 80
Total 77.87
According to Table 1, the results of the assessment of experts on the learning content,
Synthesis of theoretical framework, and designing framework of the learning environment. Learning environment found that the learning content, Synthesis of theoretical framework, and designing framework of the learning environment. To evaluate from experts side learning content was 80 percent, Synthesis of theoretical framework was 80 percent, and web-based learning environments was 77.16 percent. The synthesis consistent design principles along constructivist. Which augment reality to promote creative thinking was 77.87 percent.
5. Discussion and Conclusion
The study of the design framework of constructivist augmented reality Web -based learning environment to enhance creative thinking on topic design and crate three dimensional grade 9 students. The 6 important components i.e., (1) Problem Base, (2) Resource, (3) Creative Thinking center, (4) Collaboration, (5) Coach, (6) Scaffolding. Which is consistent with the research of (Samat Charuni and Chaijaroen Sumalee, 2009). The conceptual framework for designing and developing a learning environment on theoretical, constructivist, and web-based learning.

614
References
Samat, C. and Chaijaroen, S. (2015). Design and development of learning environment to enhance creative thinking and innovation skills for teacher training in the 21st century. Proceedings of the 23rd International Conference on Computers in Education, ICCE 2015, pp. 667-672.
Piaget, J, (1992). Judgment and reasoning in the child. Translated by Marjorie Warden. London: Roultedge & Kegan Paul.
Vygotsky, L. (1962). Thinking and SApeaking. Cambridge, MA; Mit Press. Khan. B.H. (1998). Web-based instructiion. Presentad at the Shlolars Show Case, Marvin Center, The George Washington University, Washingtod D.C. Donald, D.M. (2014). Augmented Reality on Mobile Devices to Improve the Academic Achievement and Independence of Students with Disabilities. Doctoral Dissertations, University of Tennessee, Knoxville. Chijaroen, s. (2009). Education Technology: Priciples, Teories, and Implementation. Khon Kaen: Khlung Nanawittaya. Guilford. (1967). The Nature foHuman Intelligence. New York: McGraw-Hill BookCompany. Hannafin M. (1999). Open Learning Enviroment: Foundation, Method, and Models, New Jersey: In Charles.
Mayer, R.E. (1996). Designing Instruction for Constructivist Learinig. Instructional Design Teories and Model: A
New Paradigm of Instructional Teory. Volme II. Newjersy: Lawrence Erlbaum Associaes. Brown, J. S., Collins, A., & Duguid, P. (1989). Situated cognition and the culture of learning. Educational Reaearch, 18(1),32 43.
Hayashi, Y., et al. (Eds.) (2017). Workshop Proceedings of the 25th International Conference on Computers in Education. New Zealand: Asia-Pacific Society for Computers in Education
615
Developing Smartphone-based Hands-on Inquiry Laboratory: Results on Students’ Affective Channels of Chemistry Learning
Banjong PRASONGSAP a, Niwat SRISAWASDI b,c* aScience Education Program, Faculty of Education, Khon Kaen University, Thailand bDivision of Science, Mathematics, and Technology Education, Faculty of Education,
Khon Kaen University, Thailand cInstitute of Learning and Teaching Innovation, Khon Kean University, Thailand
Abstract: Currently, mobile devices such as smartphones plays an important role in the field of science education. The advancement of mobile technology has changed the way of learning in and about science using mobile application on smartphones. This paper illustrates a development of hands-on inquiry laboratory lessons in chemistry with the support of smartphone, and presents also the results on middle school students’ perceptions and attitudes in chemistry learning with smartphone-based laboratory. 43 middle school students in a public secondary school located northeastern region of Thailand voluntarily participate in this study, and they were assigned to interact with a series of smartphone-based hands-on inquiry laboratory in chemistry of solution lesson for two weeks. After the participation, they were administered 21-items and 20-items perception and engagement questionnaire, respectively. The preliminary results showed that they expressed positive perceptions towards the learning experience of smartphone-based laboratory, and impressed with the laboratory lessons. In addition, they expressed positive attitudes to the technology-enhanced chemistry learning with smartphone-based laboratory. This revealed that it is a challenge to use smartphone-based hands-on inquiry laboratory learning in chemistry as a pedagogy for new generation learners who have digital skills to perform science learning in 21st century education era. The main implication of this study is the rethinking of pedagogy used for modern and up-to-date teaching of solution for promoting favorable motivation to learn chemistry.
Keywords: Mobile learning, hands-on laboratory, inquiry-based learning, perception, attitude
1. Background
Chemistry is a fundamental science which is abstract and complex by its nature. Due with its nature, students lack of transfer what they learned, e.g. concepts, to real-world problems and everyday life, and they give no meaning to what they have learned (Gilbert et al., 2002; Gilbert, 2006). For the past decades, science educators and researchers have attempted to develop chemistry laboratory learning for promoting students’ understanding in the connection of the subject matter with how the world works. However, many researchers found that students still have numerous learning difficulties and they hold various misconceptions about chemistry (Nantakaew and Srisawasdi, 2014; Niroj and Srisawasdi, 2014). To eliminate this problematic issue, mobile digital technology has been recognized as effective teaching tools in inquiry-based learning in science (Srisawasdi, 2014). In context of Thailand, implementation of the mobile digital technology as a pedagogical tool to support inquiry-based learning in science was still limited (Srisawasdi, 2015). With the advancement of mobile technology, one of an effective mobile digital technology, however, that researchers, developers, and educators in worldwide are paying attention to utilize it into traditional chemistry class for reforming the chemistry education is smartphone technology.
Recently, mobile devices, such as smartphone and tablet PC, are recognized as modern, powerful, and convenient laboratory tool which potentially encourages chemistry laboratory learning for students in school science level (Premthaisong and Srisawasdi, 2016). The use of smartphones in
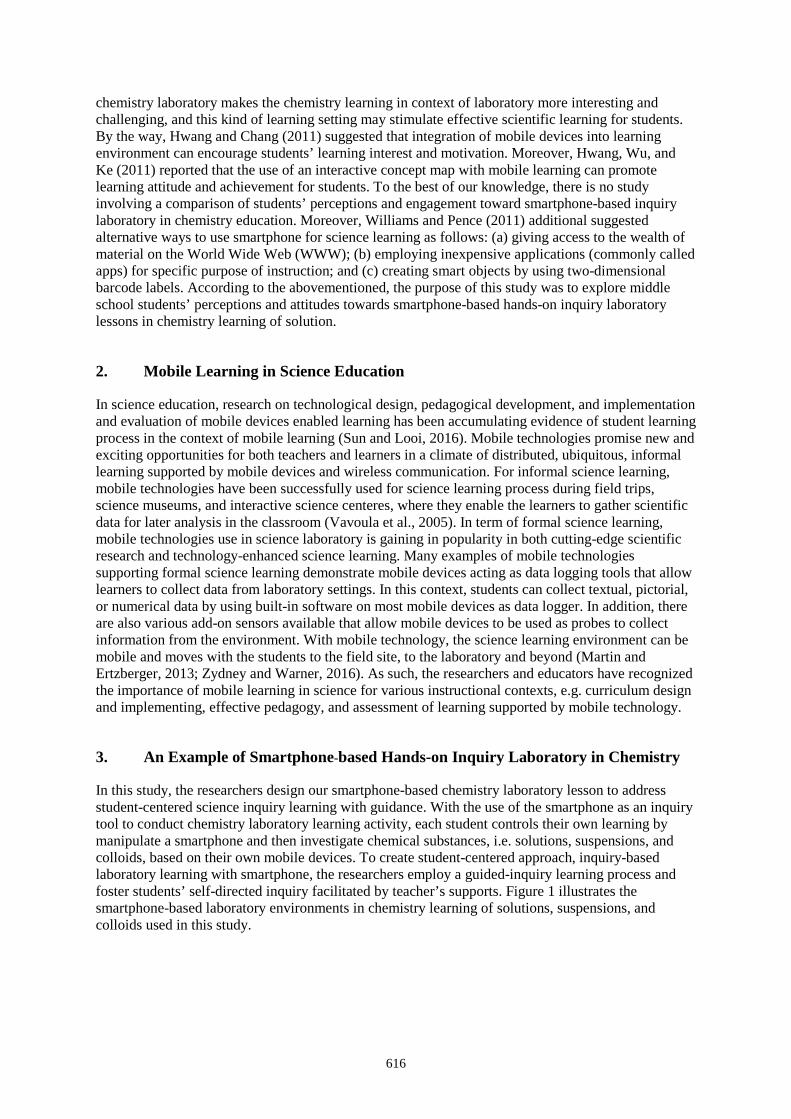
616
chemistry laboratory makes the chemistry learning in context of laboratory more interesting and challenging, and this kind of learning setting may stimulate effective scientific learning for students. By the way, Hwang and Chang (2011) suggested that integration of mobile devices into learning environment can encourage students’ learning interest and motivation. Moreover, Hwang, Wu, and Ke (2011) reported that the use of an interactive concept map with mobile learning can promote learning attitude and achievement for students. To the best of our knowledge, there is no study involving a comparison of students’ perceptions and engagement toward smartphone-based inquiry laboratory in chemistry education. Moreover, Williams and Pence (2011) additional suggested alternative ways to use smartphone for science learning as follows: (a) giving access to the wealth of material on the World Wide Web (WWW); (b) employing inexpensive applications (commonly called apps) for specific purpose of instruction; and (c) creating smart objects by using two-dimensional barcode labels. According to the abovementioned, the purpose of this study was to explore middle school students’ perceptions and attitudes towards smartphone-based hands-on inquiry laboratory lessons in chemistry learning of solution.
2. Mobile Learning in Science Education
In science education, research on technological design, pedagogical development, and implementation and evaluation of mobile devices enabled learning has been accumulating evidence of student learning process in the context of mobile learning (Sun and Looi, 2016). Mobile technologies promise new and exciting opportunities for both teachers and learners in a climate of distributed, ubiquitous, informal learning supported by mobile devices and wireless communication. For informal science learning, mobile technologies have been successfully used for science learning process during field trips, science museums, and interactive science centeres, where they enable the learners to gather scientific data for later analysis in the classroom (Vavoula et al., 2005). In term of formal science learning, mobile technologies use in science laboratory is gaining in popularity in both cutting-edge scientific research and technology-enhanced science learning. Many examples of mobile technologies supporting formal science learning demonstrate mobile devices acting as data logging tools that allow learners to collect data from laboratory settings. In this context, students can collect textual, pictorial, or numerical data by using built-in software on most mobile devices as data logger. In addition, there are also various add-on sensors available that allow mobile devices to be used as probes to collect information from the environment. With mobile technology, the science learning environment can be mobile and moves with the students to the field site, to the laboratory and beyond (Martin and Ertzberger, 2013; Zydney and Warner, 2016). As such, the researchers and educators have recognized the importance of mobile learning in science for various instructional contexts, e.g. curriculum design and implementing, effective pedagogy, and assessment of learning supported by mobile technology.
3. An Example of Smartphone-based Hands-on Inquiry Laboratory in Chemistry
In this study, the researchers design our smartphone-based chemistry laboratory lesson to address student-centered science inquiry learning with guidance. With the use of the smartphone as an inquiry tool to conduct chemistry laboratory learning activity, each student controls their own learning by manipulate a smartphone and then investigate chemical substances, i.e. solutions, suspensions, and colloids, based on their own mobile devices. To create student-centered approach, inquiry-based laboratory learning with smartphone, the researchers employ a guided-inquiry learning process and foster students’ self-directed inquiry facilitated by teacher’s supports. Figure 1 illustrates the smartphone-based laboratory environments in chemistry learning of solutions, suspensions, and colloids used in this study.
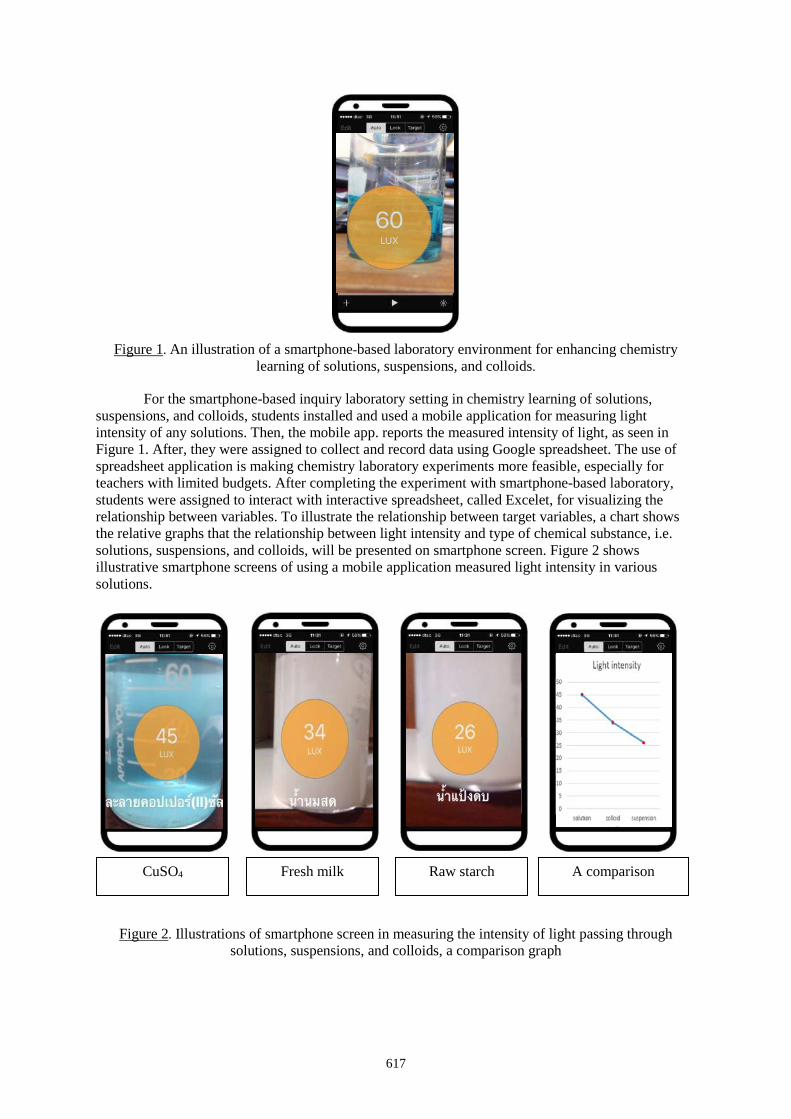
617
Figure 1. An illustration of a smartphone-based laboratory environment for enhancing chemistry learning of solutions, suspensions, and colloids.
For the smartphone-based inquiry laboratory setting in chemistry learning of solutions, suspensions, and colloids, students installed and used a mobile application for measuring light intensity of any solutions. Then, the mobile app. reports the measured intensity of light, as seen in Figure 1. After, they were assigned to collect and record data using Google spreadsheet. The use of spreadsheet application is making chemistry laboratory experiments more feasible, especially for teachers with limited budgets. After completing the experiment with smartphone-based laboratory, students were assigned to interact with interactive spreadsheet, called Excelet, for visualizing the relationship between variables. To illustrate the relationship between target variables, a chart shows the relative graphs that the relationship between light intensity and type of chemical substance, i.e. solutions, suspensions, and colloids, will be presented on smartphone screen. Figure 2 shows illustrative smartphone screens of using a mobile application measured light intensity in various solutions.
Figure 2. Illustrations of smartphone screen in measuring the intensity of light passing through solutions, suspensions, and colloids, a comparison graph
CuSO4 Fresh milk Raw starch A comparison
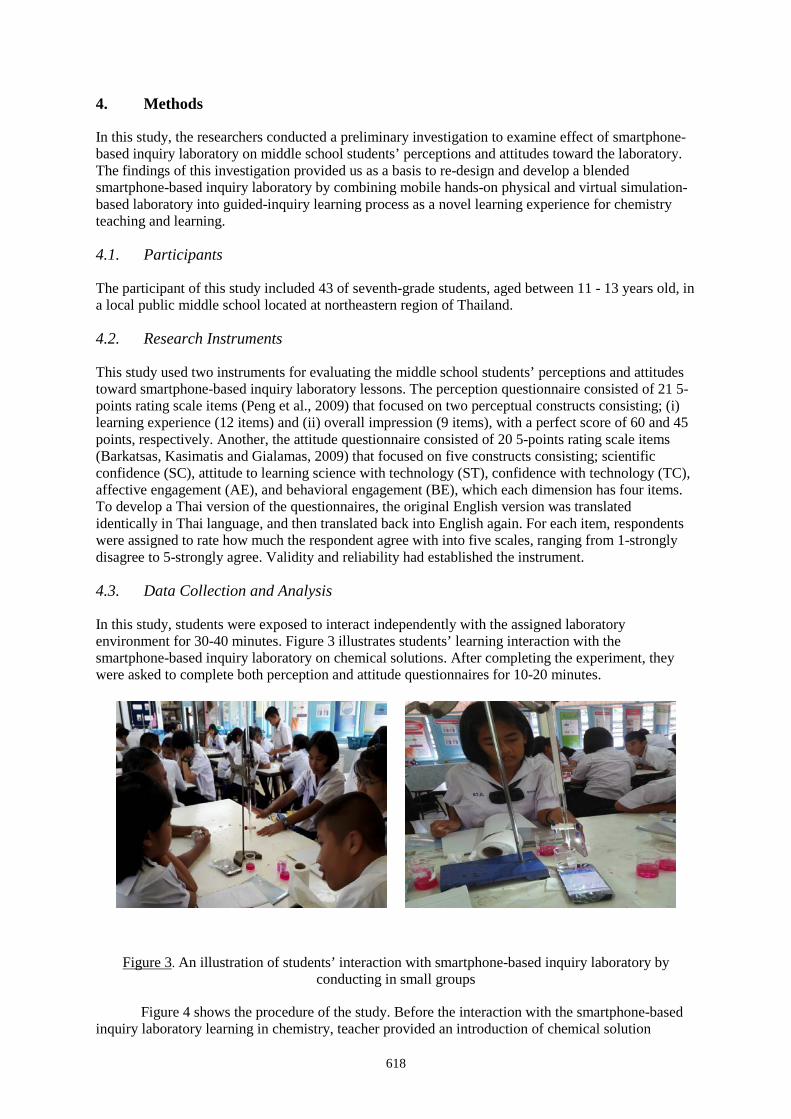
618
4. Methods
In this study, the researchers conducted a preliminary investigation to examine effect of smartphone-based inquiry laboratory on middle school students’ perceptions and attitudes toward the laboratory. The findings of this investigation provided us as a basis to re-design and develop a blended smartphone-based inquiry laboratory by combining mobile hands-on physical and virtual simulation-based laboratory into guided-inquiry learning process as a novel learning experience for chemistry teaching and learning.
4.1. Participants
The participant of this study included 43 of seventh-grade students, aged between 11 - 13 years old, in a local public middle school located at northeastern region of Thailand.
4.2. Research Instruments
This study used two instruments for evaluating the middle school students’ perceptions and attitudes toward smartphone-based inquiry laboratory lessons. The perception questionnaire consisted of 21 5-points rating scale items (Peng et al., 2009) that focused on two perceptual constructs consisting; (i) learning experience (12 items) and (ii) overall impression (9 items), with a perfect score of 60 and 45 points, respectively. Another, the attitude questionnaire consisted of 20 5-points rating scale items (Barkatsas, Kasimatis and Gialamas, 2009) that focused on five constructs consisting; scientific confidence (SC), attitude to learning science with technology (ST), confidence with technology (TC), affective engagement (AE), and behavioral engagement (BE), which each dimension has four items. To develop a Thai version of the questionnaires, the original English version was translated identically in Thai language, and then translated back into English again. For each item, respondents were assigned to rate how much the respondent agree with into five scales, ranging from 1-strongly disagree to 5-strongly agree. Validity and reliability had established the instrument.
4.3. Data Collection and Analysis
In this study, students were exposed to interact independently with the assigned laboratory environment for 30-40 minutes. Figure 3 illustrates students’ learning interaction with the smartphone-based inquiry laboratory on chemical solutions. After completing the experiment, they were asked to complete both perception and attitude questionnaires for 10-20 minutes.
Figure 3. An illustration of students’ interaction with smartphone-based inquiry laboratory by
conducting in small groups
Figure 4 shows the procedure of the study. Before the interaction with the smartphone-based inquiry laboratory learning in chemistry, teacher provided an introduction of chemical solution
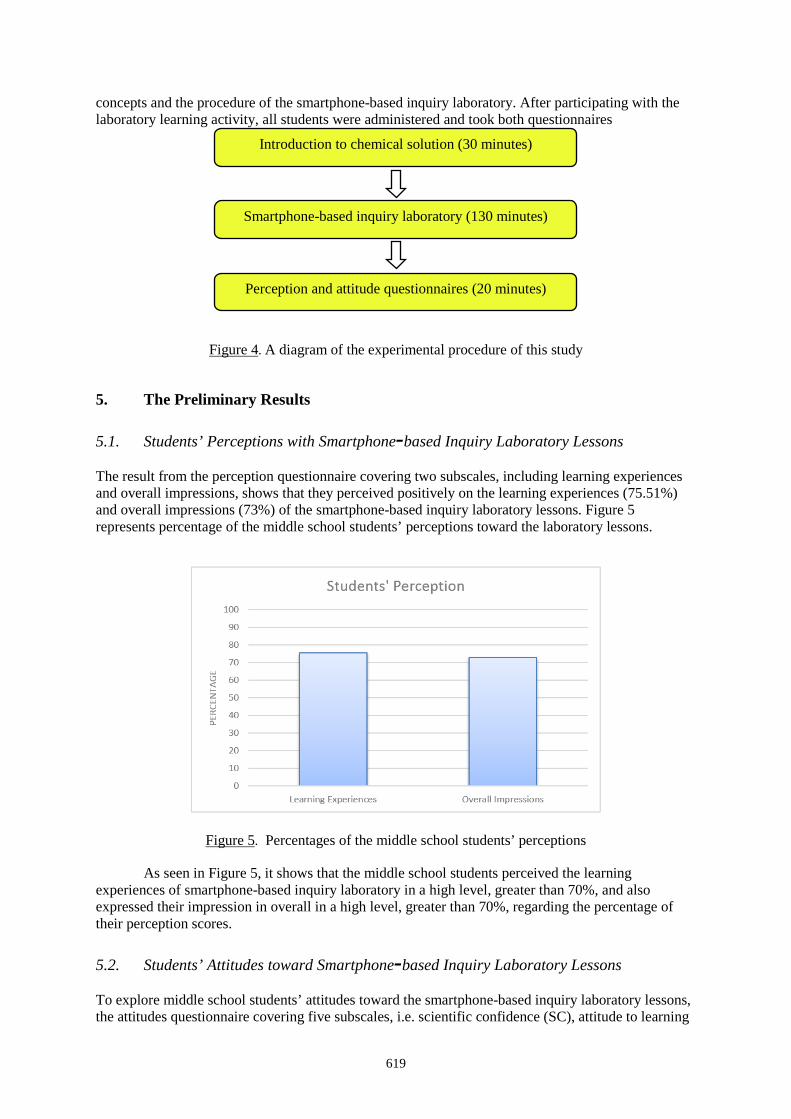
619
concepts and the procedure of the smartphone-based inquiry laboratory. After participating with the laboratory learning activity, all students were administered and took both questionnaires
Figure 4. A diagram of the experimental procedure of this study
5. The Preliminary Results
5.1. Students’ Perceptions with Smartphone-based Inquiry Laboratory Lessons The result from the perception questionnaire covering two subscales, including learning experiences and overall impressions, shows that they perceived positively on the learning experiences (75.51%) and overall impressions (73%) of the smartphone-based inquiry laboratory lessons. Figure 5 represents percentage of the middle school students’ perceptions toward the laboratory lessons.
Figure 5. Percentages of the middle school students’ perceptions
As seen in Figure 5, it shows that the middle school students perceived the learning experiences of smartphone-based inquiry laboratory in a high level, greater than 70%, and also expressed their impression in overall in a high level, greater than 70%, regarding the percentage of their perception scores.
5.2. Students’ Attitudes toward Smartphone-based Inquiry Laboratory Lessons
To explore middle school students’ attitudes toward the smartphone-based inquiry laboratory lessons, the attitudes questionnaire covering five subscales, i.e. scientific confidence (SC), attitude to learning
Introduction to chemical solution (30 minutes)
Smartphone-based inquiry laboratory (130 minutes)
Perception and attitude questionnaires (20 minutes)
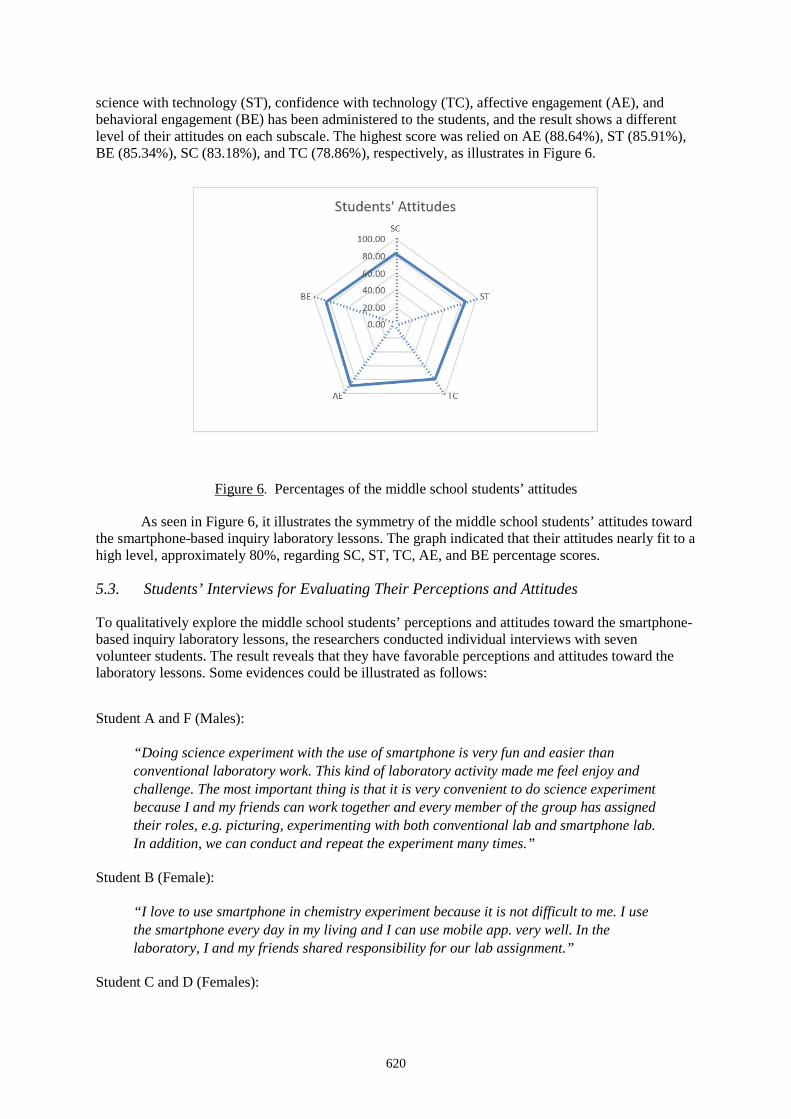
620
science with technology (ST), confidence with technology (TC), affective engagement (AE), and behavioral engagement (BE) has been administered to the students, and the result shows a different level of their attitudes on each subscale. The highest score was relied on AE (88.64%), ST (85.91%), BE (85.34%), SC (83.18%), and TC (78.86%), respectively, as illustrates in Figure 6.
Figure 6. Percentages of the middle school students’ attitudes
As seen in Figure 6, it illustrates the symmetry of the middle school students’ attitudes toward the smartphone-based inquiry laboratory lessons. The graph indicated that their attitudes nearly fit to a high level, approximately 80%, regarding SC, ST, TC, AE, and BE percentage scores.
5.3. Students’ Interviews for Evaluating Their Perceptions and Attitudes
To qualitatively explore the middle school students’ perceptions and attitudes toward the smartphone-based inquiry laboratory lessons, the researchers conducted individual interviews with seven volunteer students. The result reveals that they have favorable perceptions and attitudes toward the laboratory lessons. Some evidences could be illustrated as follows:
Student A and F (Males):
“Doing science experiment with the use of smartphone is very fun and easier than conventional laboratory work. This kind of laboratory activity made me feel enjoy and challenge. The most important thing is that it is very convenient to do science experiment because I and my friends can work together and every member of the group has assigned their roles, e.g. picturing, experimenting with both conventional lab and smartphone lab. In addition, we can conduct and repeat the experiment many times.”
Student B (Female):
“I love to use smartphone in chemistry experiment because it is not difficult to me. I use the smartphone every day in my living and I can use mobile app. very well. In the laboratory, I and my friends shared responsibility for our lab assignment.”
Student C and D (Females):
621
“With the use of smartphone in science laboratory, we can precisely measure quantity of things in the laboratory. It is very interesting experiment in science. We can see and obtain the number of light intensity without any estimation or guess when we use the mobile app. scanning solutions, fresh milk, and raw starch.”
Student E (Male):
“Basically, I love to play digital game on smartphone for every day. When teacher assigned us to use smartphone in the science class, it is very cool, especially for doing science laboratory. It is very easy for me to do the laboratory with smartphone, and it made me more interesting on science lesson.”
Student G (Female):
“When we employed smartphone as a tool for doing science laboratory, it is very challenge that what we will get from the mobile application, and I really want to know how would my smartphone help me in science learning. Finally, I found that it is a quick way to do science, e.g. measuring light intensity and acid-based solutions. In this laboratory, we can clearly see the experimental results and can make sense what happen. I also tell this learning experience to my friends in other class and they said to me they would like to learn science by this way.”
According to the interview transcription above, both female and male middle school students trend to have positive perceptions and attitudes to the smartphone-based inquiry laboratory lessons.
6. Discussion and Conclusion
This study reported a preliminary investigation of smartphone-based inquiry laboratory lessons on middle school students’ perceptions and attitudes toward the laboratory learning. The findings show that they expressed positive perceptions towards the learning experience of smartphone-based laboratory, and impressed with the laboratory lessons. In addition, they expressed positive attitudes to the technology-enhanced chemistry learning with smartphone-based laboratory. This finding is consistent with Permthaisong and Srisawasdi (2016) and Chaipidech and Srisawasdi (2016) that students expressed favorable perceptions and engagements on science laboratory learning experiences with the support of mobile devices such as smartphones. This revealed that it is a challenge to use smartphone-based hands-on inquiry laboratory learning in chemistry as a pedagogy for new generation learners who have digital skills to perform science learning in 21st century education era.
Acknowledgements
This research was financially supported in partial by Graduate School, Khon Kaen University, Thailand, and KKU Smart Learning Academy project. This contribution was partially supported by Science Education Program, Faculty of Education, Khon Kaen University. The authors would like to express sincere thanks to school principal, science teachers, and middle school students in the school for their kind cooperation and participation in this study.
References
Barkatsas, A. T., Kasimatis, K. & Gialamas, V. )2009( Learning secondary mathematics with technology: Exploring the complex interrelationship between students’ attitudes, engagement, gender and achievement. Computers & Education, 52, 562-570.
622
Chaipidech, P., & Srisawasdi, N. (2016). Mobile technology-enhanced flipped learning for scientific inquiry laboratory: a comparison of students’ perceptions and engagement. In Proceedings of the 24th International Conference on Computers in Education (ICCE2016), Asia-Pacific Society for Computers in Education, November 28 – December 2, 2016, Mumbai, India.
Childs, P. E., & Sheehan, M., )2009(. What’s difficult about chemistry? An Irish perspective. Chemistry Education Research and Practice, 10, 204-218.
Cooper M. M. and Kerns T. S., )2006(, Changing the laboratory: effects of a laboratory course on students’attitudes and perceptions. Journal of Chemical Education, 83)9(, 1356.
de Jong, T., Linn, M. C., & Zacharia, Z. C. )2013(. Physical and virtual laboratories in science and engineering education. Science, 340)6130(, 305-308.
de Morais, C. L. M., Silva, S. R. B., Vieira, D. S., & Lima, K. M. G. )2016(. Integrating a smartphone and molecular modeling for determining the binding constant and stoichiometry ratio of the Iron)II( - Phenanthroline complex: an activity for analytical and physical chemistry laboratories. Journal of Chemical Education. DOI: 10.1021/acs.jchemed.6b00112
Hwang, G.-J., & Chang, H.-F. )2011(. A formative assessment-based mobile learning approach to improving the learning attitudes and achievements of students. Computers & Education, 56, 1023-1031.
Hwang, G.-J., Wu, P.-H., & Ke, H. R., )2011(. An interactive concept map approach to supporting mobile learning activities for natural science courses. Computers & Education, 57, 2272-2280.
Karata§, F. O. )2015(. Pre-service chemistry teachers' competencies in the laboratory: a cross-grade study in solution preparation. Chemistry Education Research and Practice, 17, 100-110.
Karata§, F. O. Co§tu B. and Cengiz C., )2015(, Laboratory applications in chemistry teaching, in Ayas and Sozbilir M. )ed.(, Chemistry Education, Ankara: Pegem Akademi, pp. 57-92.
Laredo T., )2013(, Changing the first-year chemistry laboratory manual to implement a problem-based approach that improves student engagement, Journal of Chemical Education, 90, 1151-1154.
National Research Council. )2006(. America’s lab report: Investigations in high school science. Washington, DC: National Academy Press.
Olympiou, G., & Zacharia, Z. C. )2012(. Blending physical and virtual manipulatives: an effort to improve students’ conceptual understanding through science laboratory experimentation. Science Education, 96)1(, 21-47.
Peng, H., Chuang, P.-Y., Hwang, G.-J., Chu, H.-C., Wu, T.-T., & Huang, S.-X. )2009(. Ubiquitous performance-support system as Mindtool: a case study of instructional decision making and learning assistant. Educational Technology & Society, 72)1(,107-120.
Srisawasdi, N. )2014(. Developing technological pedagogical content knowledge in using computerized science laboratory environment: An arrangement for science teacher education program. Research and Practice in Technology Enhanced Learning, 9)1(, 123-143.
Srisawasdi, N. )2015(. Motivating inquiry-based learning through combination of physical and virtual computer-based laboratory experiments in high school science. In M. J. Urban & D. A. Falvo )Eds.( Improving K-l2 STEM Education Outcomes through Technological Integration )pp. 108-134(. Hershey, PA: Information Science Reference.
Permthaisong, S., & Srisawasdi, N. (2016). A Comparative Study of Students’ Perceptions and Engagements toward Smartphone-based Inquiry Laboratory on Solution Concentration. In Proceedings of the 24th International Conference on Computers in Education (ICCE2016), Asia-Pacific Society for Computers in Education, November 28 – December 2, 2016, Mumbai, India.
Suits, J. P., & Srisawasdi, N. )2013(. Use of an interactive computer-simulated experiment to enhance students’ mental models of hydrogen bonding phenomena. In J.P. Suits & M.J. Sanger )Eds.( Pedagogic roles of animations and simulations in chemistry courses ACS Symposium Series 1142, American Chemical Society: Washington, DC.
Williams, A. J., & Pence, H. E. )2011(. Smart phones, a powerful tool in the chemistry classroom. Journal of Chemical Education, 88, 683-686.
Hayashi, Y., et al. (Eds.) (2017). Workshop Proceedings of the 25th International Conference on Computers in Education. New Zealand: Asia-Pacific Society for Computers in Education
623
Learning to be Data Smart Khalid KHAN * & Jon MASON
Charles Darwin University, Australia *[email protected]
Abstract: Recent advances in the computing power have brought the processing of Big Data at the door step of an individual at a personal level. Pattern recognition, decision making, and modelling are some of the few skills that can be employed to make sense of personal data. In this short paper, we summarize some of our findings that highlight data literacy as a critical competency for ‘smart learning’.
Keywords: data literacy, digital literacy, discriminate, correlations, smart learning.
1. Introduction
By 2030 it is predicted that automation, globalization and flexibility will change what we do in every job. With changes in the demands due to changes in job processes and advanced digital capabilities it is also predictable that society on average will spend considerable amount of time on learning skills on and at the job. This is not only a concern for the future; even current employers are looking for creativity and enterprise skills among their potential employees and they are ready to pay a premium to provide these skills. Job market research shows that the demand for critical thinking has increased by 158 percent in the last three years (FYA, 2017, p. 23). With algorithms and intelligent machines automating decision making processes, what key ‘human’ skills we need to carry to our jobs that can’t be automated is the key question that is puzzling many minds.
We locate our current thinking on smart learning within the broader context of smart skills and the big data environment around us. Our positioning on data literacy goes beyond statistical learning and the construction of meaning from data through computational algorithms that try to make sense through mean, median, mode, deviation and related pattern finding mechanical procedures. We see the data, storyteller, and the context within which data is collected (or missed) as inseparable entities. Each of these entities is critical in the pursuit of sense making and discovery of knowledge hidden within data. Within this setting we consider data literacy as a form of mathematical literacy and critical thinking that is not confined and limited to the parameters of spreadsheets.
When words combine in a particular way, they make sentences that in turn combine in different ways to tell different stories, as do numbers and data. Stories, words and data combine, make sense. The woven stories engage and appeal to our imagination at a personal level. Combine these stories with visuals, graphs and colorful displays and we get engagement, emotions and a sense of meaning. Data literacy in this paradigm can be triangulated within the space of data, emotional literacy and mathematics/statistics. While emotional literacy can be understood as the ability to reflect on and exercise our own emotions, mathematics enables us to exercise our mind to draw conclusions objectively on the basis of pure logic and reasoning. It is therefore vital in the development of data literacy skills to make the link between data visualization and various mathematical representations and our emotional intelligence. Emotions distinguish humans from robots. Decision making for humans happens at both levels – emotional and reasoning. How many of our likes or dislikes are based purely on quantification?
The following discussion provides an overview of the issues drawn from our research over a period of last two years that focused on the topic of data literacy. For us, becoming data literate is about being data smart.
624
2. Data Literacy as a critical skill
The cognitive abilities required, in different jobs as listed by O*NET (a database that stores and updates information on skills required in different occupations sponsored by US Department of Labor), are:
• Deductive Reasoning • Flexibility of Closure (ability to identify or detect a known pattern e.g., a figure, object,
word, or sound, that is hidden in other distracting data) • Speed of Closure (the ability to quickly make sense of…) • Information Ordering • Mathematical Reasoning • Number Facility (ability to do basic operation on numbers quickly) • Problem Sensitivity (involving seeing a hidden problem with in the problem) • Selective Attention • Visualization (the ability to imagine changes when parts are moved)
The New Work Smarts report (FYA, 2017, p. 22) provides data that show a critical low in some of the key skills required for work in the future. The report points out that lower level percentages that exists in Problem Solving, Digital Literacy and Mathematics proficiencies being around 35%, 27% and 45 % respectively. The figures are much higher for low socio-economic and Indigenous students. It is important to teach these skills within the curriculum or across curriculum during a student’s school and educational life before the job instead of inculcating them at the job. We propose these skills and capabilities be considered as aspects of data literacy and taught cross-curriculum as a multi-disciplinary skill.
3. Black Box Artificial Intelligence, Algorithms and Mathematical Modelling
In order to avoid bias human decision-making more objective machine intelligence and algorithms have been employed. Machine intelligence is based on mathematical modeling. In a recent issue of MIT Technology Review Knight (2017) states that “Opaque and potentially biased mathematical models are remaking our lives”. Likewise, a group of researchers researching social impacts of artificial intelligence has announced the AI Now Initiative in which one of the main research questions under study is Bias and Inclusion (Artificialintelligencenow.com, 2017):
Data reflects the social and political conditions in which it is collected. AI is only able to "see" what is in the data it's given. This, along with many other factors, can lead to biased and unfair outcomes.
The bias in intelligent machines and algorithms has potentially negative consequences for disadvantaged communities and minorities. Even if the data is not influenced intentionally, the algorithms designed to predict patterns and correlation needs be carefully analyzed and not just believed to be correct.
The underlying assumptions based on which the systems are making their choices are not clear even to the systems’ designers. It’s not necessarily possible to determine which algorithms are biased and which ones are not (Spielkamp, 2017).
Algorithms are becoming ubiquitous on the web. The mathematical models and automated risk assessment that drive them are deciding who to call for job interviews and who to sanction in loan applications. Even judges are using these systems to decide on whether to grant bail applications (Center, 2017).
If the important decisions the algorithms make go unchecked, the financial and legal implications might be serious for equitable society and its social and cultural fabric. For a just society, it is vital that decision making is transparent and clear and not opaque.
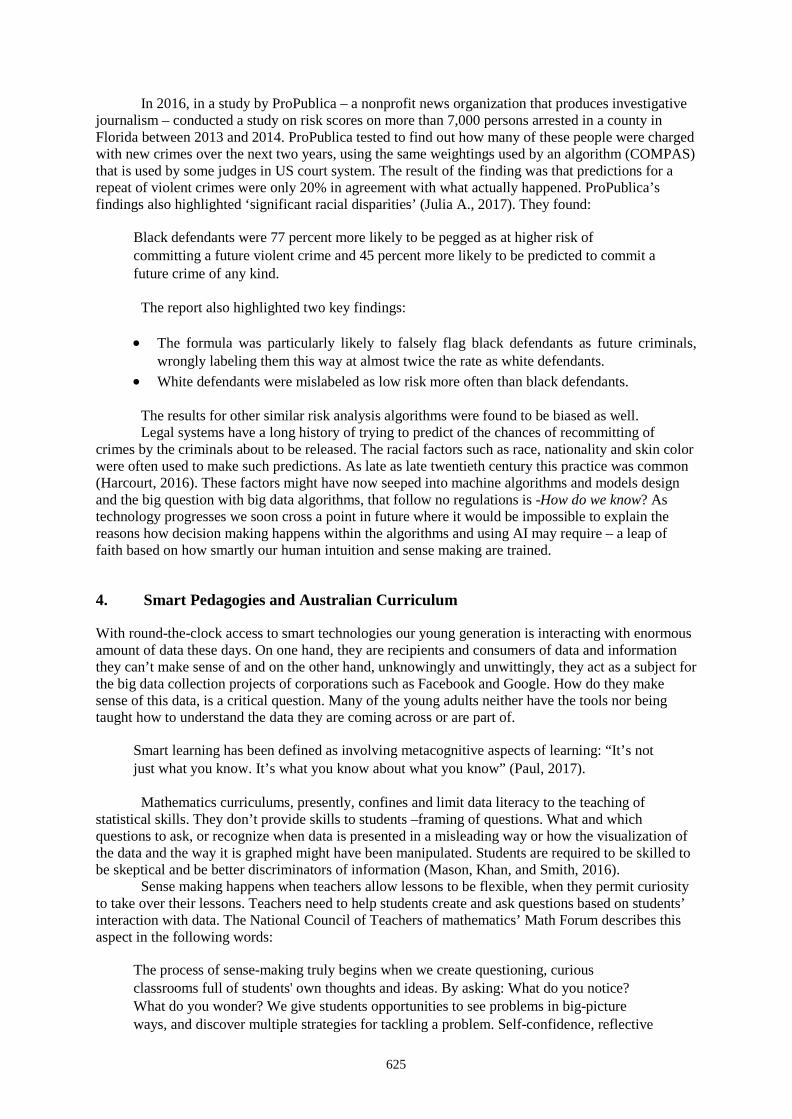
625
In 2016, in a study by ProPublica – a nonprofit news organization that produces investigative journalism – conducted a study on risk scores on more than 7,000 persons arrested in a county in Florida between 2013 and 2014. ProPublica tested to find out how many of these people were charged with new crimes over the next two years, using the same weightings used by an algorithm (COMPAS) that is used by some judges in US court system. The result of the finding was that predictions for a repeat of violent crimes were only 20% in agreement with what actually happened. ProPublica’s findings also highlighted ‘significant racial disparities’ (Julia A., 2017). They found:
Black defendants were 77 percent more likely to be pegged as at higher risk of committing a future violent crime and 45 percent more likely to be predicted to commit a future crime of any kind.
The report also highlighted two key findings:
• The formula was particularly likely to falsely flag black defendants as future criminals, wrongly labeling them this way at almost twice the rate as white defendants.
• White defendants were mislabeled as low risk more often than black defendants.
The results for other similar risk analysis algorithms were found to be biased as well. Legal systems have a long history of trying to predict of the chances of recommitting of
crimes by the criminals about to be released. The racial factors such as race, nationality and skin color were often used to make such predictions. As late as late twentieth century this practice was common (Harcourt, 2016). These factors might have now seeped into machine algorithms and models design and the big question with big data algorithms, that follow no regulations is -How do we know? As technology progresses we soon cross a point in future where it would be impossible to explain the reasons how decision making happens within the algorithms and using AI may require – a leap of faith based on how smartly our human intuition and sense making are trained.
4. Smart Pedagogies and Australian Curriculum
With round-the-clock access to smart technologies our young generation is interacting with enormous amount of data these days. On one hand, they are recipients and consumers of data and information they can’t make sense of and on the other hand, unknowingly and unwittingly, they act as a subject for the big data collection projects of corporations such as Facebook and Google. How do they make sense of this data, is a critical question. Many of the young adults neither have the tools nor being taught how to understand the data they are coming across or are part of.
Smart learning has been defined as involving metacognitive aspects of learning: “It’s not just what you know. It’s what you know about what you know” (Paul, 2017).
Mathematics curriculums, presently, confines and limit data literacy to the teaching of statistical skills. They don’t provide skills to students –framing of questions. What and which questions to ask, or recognize when data is presented in a misleading way or how the visualization of the data and the way it is graphed might have been manipulated. Students are required to be skilled to be skeptical and be better discriminators of information (Mason, Khan, and Smith, 2016).
Sense making happens when teachers allow lessons to be flexible, when they permit curiosity to take over their lessons. Teachers need to help students create and ask questions based on students’ interaction with data. The National Council of Teachers of mathematics’ Math Forum describes this aspect in the following words:
The process of sense-making truly begins when we create questioning, curious classrooms full of students' own thoughts and ideas. By asking: What do you notice? What do you wonder? We give students opportunities to see problems in big-picture ways, and discover multiple strategies for tackling a problem. Self-confidence, reflective
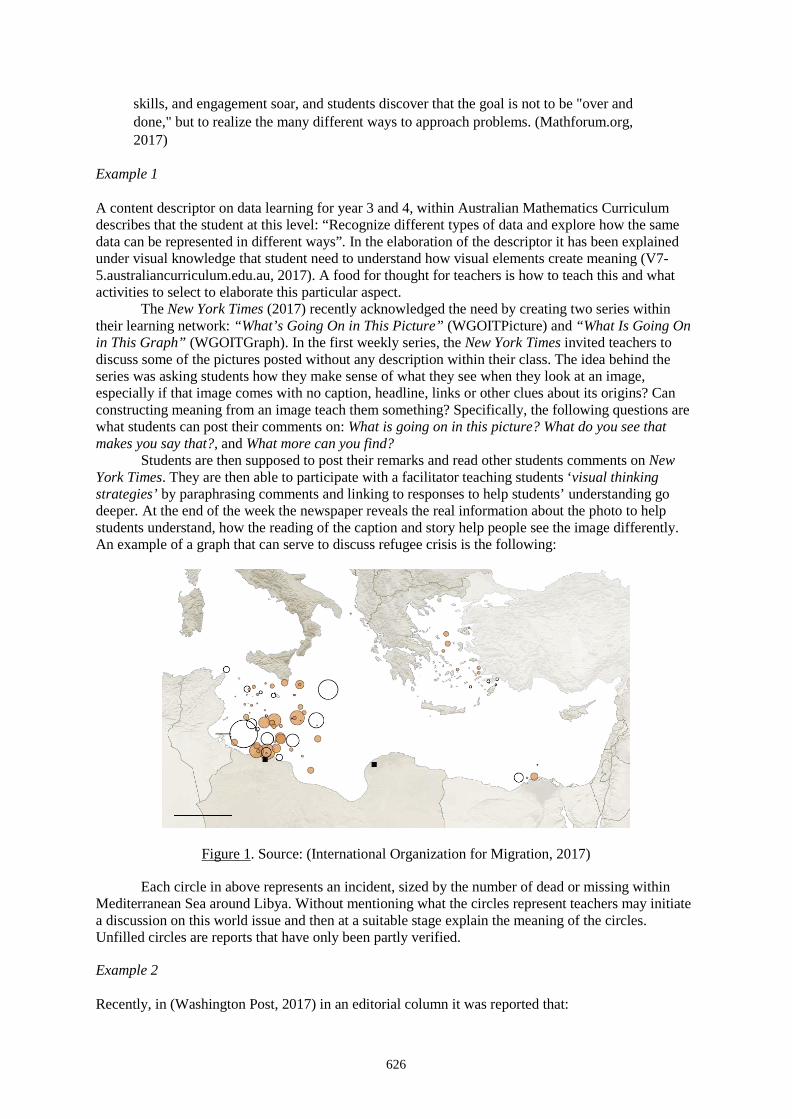
626
skills, and engagement soar, and students discover that the goal is not to be "over and done," but to realize the many different ways to approach problems. (Mathforum.org, 2017)
Example 1
A content descriptor on data learning for year 3 and 4, within Australian Mathematics Curriculum describes that the student at this level: “Recognize different types of data and explore how the same data can be represented in different ways”. In the elaboration of the descriptor it has been explained under visual knowledge that student need to understand how visual elements create meaning (V7-5.australiancurriculum.edu.au, 2017). A food for thought for teachers is how to teach this and what activities to select to elaborate this particular aspect.
The New York Times (2017) recently acknowledged the need by creating two series within their learning network: “What’s Going On in This Picture” (WGOITPicture) and “What Is Going On in This Graph” (WGOITGraph). In the first weekly series, the New York Times invited teachers to discuss some of the pictures posted without any description within their class. The idea behind the series was asking students how they make sense of what they see when they look at an image, especially if that image comes with no caption, headline, links or other clues about its origins? Can constructing meaning from an image teach them something? Specifically, the following questions are what students can post their comments on: What is going on in this picture? What do you see that makes you say that?, and What more can you find?
Students are then supposed to post their remarks and read other students comments on New York Times. They are then able to participate with a facilitator teaching students ‘visual thinking strategies’ by paraphrasing comments and linking to responses to help students’ understanding go deeper. At the end of the week the newspaper reveals the real information about the photo to help students understand, how the reading of the caption and story help people see the image differently. An example of a graph that can serve to discuss refugee crisis is the following:
Figure 1. Source: (International Organization for Migration, 2017)
Each circle in above represents an incident, sized by the number of dead or missing within Mediterranean Sea around Libya. Without mentioning what the circles represent teachers may initiate a discussion on this world issue and then at a suitable stage explain the meaning of the circles. Unfilled circles are reports that have only been partly verified.
Example 2
Recently, in (Washington Post, 2017) in an editorial column it was reported that:

627
North Korean dictator Kim Jong-un] has shown no interest in talks — he won’t even set foot in China, his biggest patron. Even if negotiations took place, the current regime has made clear that “it will never place its self-defensive nuclear deterrence on the negotiating table, as one envoy recently put it. [Emphasis added]
Jon Schwarz (2017), in a news article for The Intercept, reported what North Korea’s Deputy UN Ambassador Kim In Ryong, actually had said:
As long as the U.S. hostile policy and nuclear threat continue [emphasis added], the DPRK, no matter who may say what, will never place its self-defensive nuclear deterrence on the negotiation table or flinch an inch from the road chosen by itself, the road of bolstering up the state nuclear force.
This is a case of (intentionally) missing data to create a different story for the unprepared minds of readers. Due to the lack of skills in understanding the importance of missing data public can be manipulated to design and influence policies. Such examples can be taught in sociology or history classes to teach data literacy capabilities within the curriculum. An example that describes this in a mathematics class it may be explained is following –
Example 3
A teacher in year 11 or year 10 mathematics class asks students to simplify the following:
She asks one student to check the answer on WolframAlpha where the student finds the answer as follows:
Figure 2. Problem solution by algorithms -WolframAlpha
However, she gave a completely different answer to the class via (all mathematically correct and verifiable) steps as follows:
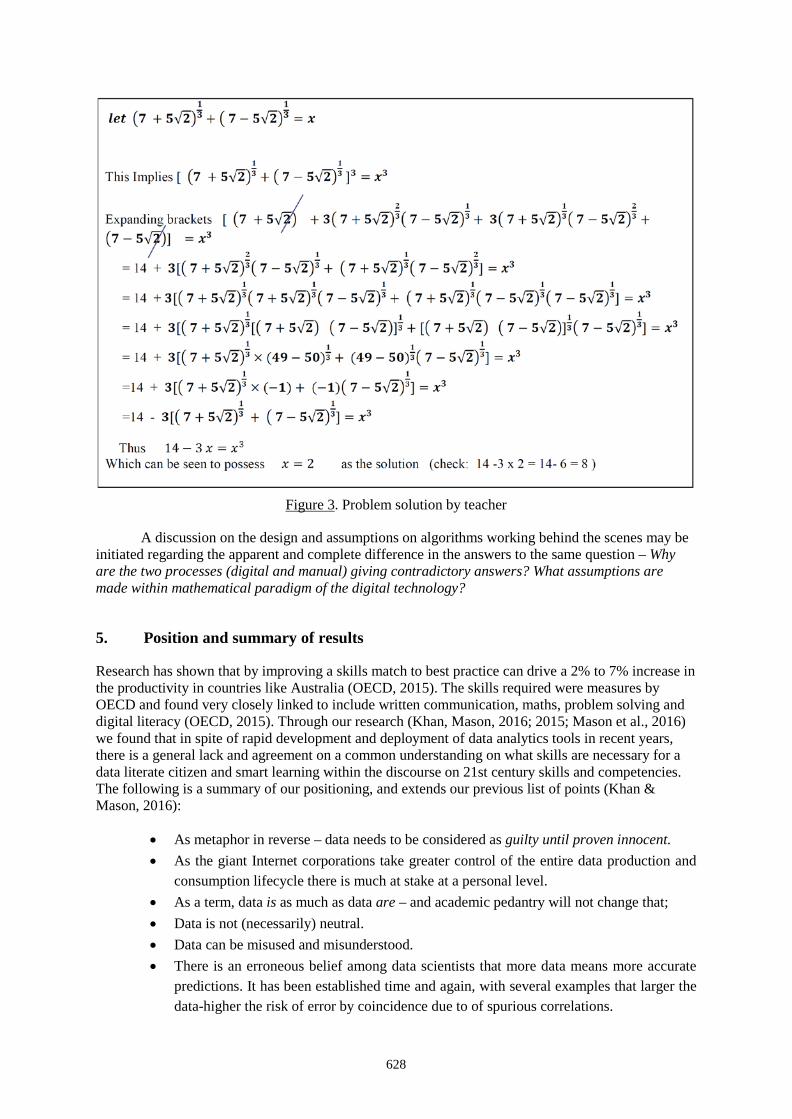
628
Figure 3. Problem solution by teacher
A discussion on the design and assumptions on algorithms working behind the scenes may be initiated regarding the apparent and complete difference in the answers to the same question – Why are the two processes (digital and manual) giving contradictory answers? What assumptions are made within mathematical paradigm of the digital technology?
5. Position and summary of results
Research has shown that by improving a skills match to best practice can drive a 2% to 7% increase in the productivity in countries like Australia (OECD, 2015). The skills required were measures by OECD and found very closely linked to include written communication, maths, problem solving and digital literacy (OECD, 2015). Through our research (Khan, Mason, 2016; 2015; Mason et al., 2016) we found that in spite of rapid development and deployment of data analytics tools in recent years, there is a general lack and agreement on a common understanding on what skills are necessary for a data literate citizen and smart learning within the discourse on 21st century skills and competencies. The following is a summary of our positioning, and extends our previous list of points (Khan & Mason, 2016):
• As metaphor in reverse – data needs to be considered as guilty until proven innocent. • As the giant Internet corporations take greater control of the entire data production and
consumption lifecycle there is much at stake at a personal level. • As a term, data is as much as data are – and academic pedantry will not change that; • Data is not (necessarily) neutral. • Data can be misused and misunderstood. • There is an erroneous belief among data scientists that more data means more accurate
predictions. It has been established time and again, with several examples that larger the data-higher the risk of error by coincidence due to of spurious correlations.
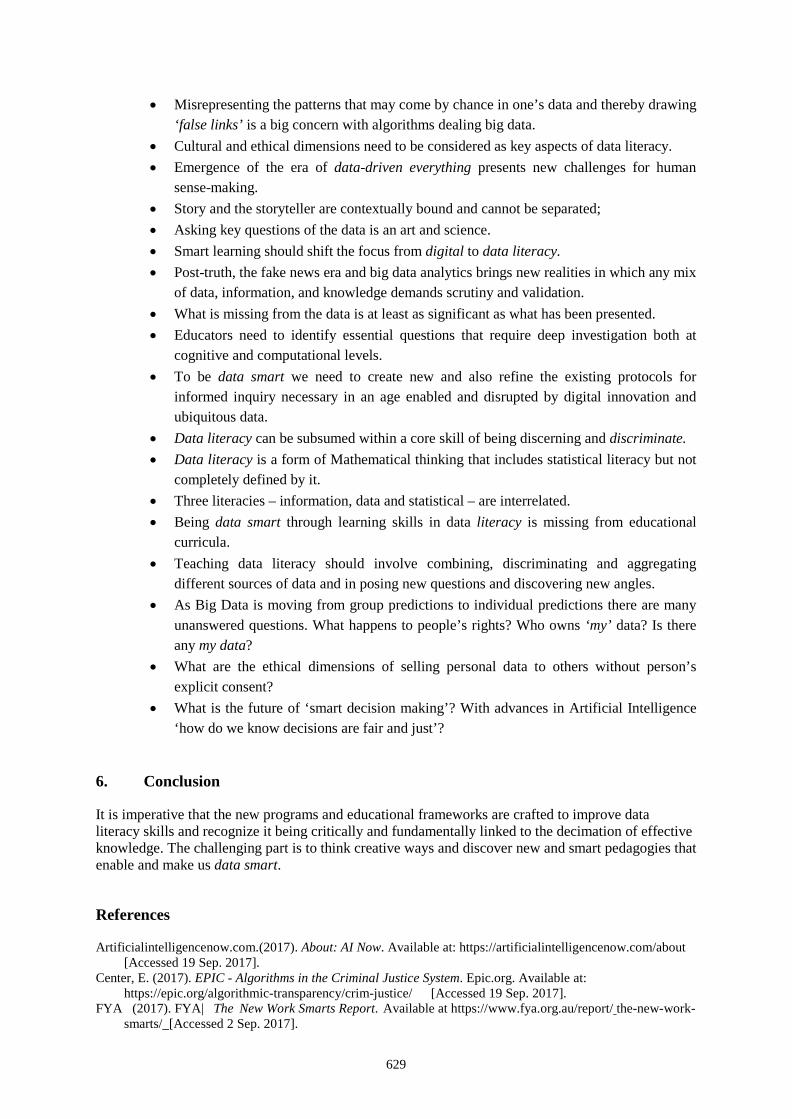
629
• Misrepresenting the patterns that may come by chance in one’s data and thereby drawing ‘false links’ is a big concern with algorithms dealing big data.
• Cultural and ethical dimensions need to be considered as key aspects of data literacy. • Emergence of the era of data-driven everything presents new challenges for human
sense-making. • Story and the storyteller are contextually bound and cannot be separated; • Asking key questions of the data is an art and science. • Smart learning should shift the focus from digital to data literacy. • Post-truth, the fake news era and big data analytics brings new realities in which any mix
of data, information, and knowledge demands scrutiny and validation. • What is missing from the data is at least as significant as what has been presented. • Educators need to identify essential questions that require deep investigation both at
cognitive and computational levels. • To be data smart we need to create new and also refine the existing protocols for
informed inquiry necessary in an age enabled and disrupted by digital innovation and ubiquitous data.
• Data literacy can be subsumed within a core skill of being discerning and discriminate. • Data literacy is a form of Mathematical thinking that includes statistical literacy but not
completely defined by it. • Three literacies – information, data and statistical – are interrelated. • Being data smart through learning skills in data literacy is missing from educational
curricula. • Teaching data literacy should involve combining, discriminating and aggregating
different sources of data and in posing new questions and discovering new angles. • As Big Data is moving from group predictions to individual predictions there are many
unanswered questions. What happens to people’s rights? Who owns ‘my’ data? Is there any my data?
• What are the ethical dimensions of selling personal data to others without person’s explicit consent?
• What is the future of ‘smart decision making’? With advances in Artificial Intelligence ‘how do we know decisions are fair and just’?
6. Conclusion
It is imperative that the new programs and educational frameworks are crafted to improve data literacy skills and recognize it being critically and fundamentally linked to the decimation of effective knowledge. The challenging part is to think creative ways and discover new and smart pedagogies that enable and make us data smart.
References
Artificialintelligencenow.com.(2017). About: AI Now. Available at: https://artificialintelligencenow.com/about [Accessed 19 Sep. 2017].
Center, E. (2017). EPIC - Algorithms in the Criminal Justice System. Epic.org. Available at: https://epic.org/algorithmic-transparency/crim-justice/ [Accessed 19 Sep. 2017].
FYA (2017). FYA| The New Work Smarts Report. Available at https://www.fya.org.au/report/ the-new-work-smarts/ [Accessed 2 Sep. 2017].

630
Harcourt, Bernard E. (2016). Risk as a Proxy for Race. (September 16, 2010). Criminology and Public Policy, Forthcoming; University of Chicago Law & Economics Olin Working Paper No. 535; University of Chicago Public Law Working Paper No. 323. Available at https://ssrn.com/abstract=1677654 [Accessed 19 Sep. 2017].
International Organization for Migration. (2017). International Organization for Migration. [online] Available at: https://www.iom.int/ [Accessed 12 Sep. 2017].
Julia, A.S. (2017). Machine Bias —. ProPublica. Available at: https:// www.propublica.org/article/machine-bias-risk-assessments-in-criminal-sentencing [Accessed 19 Sep.
2017]. Khan, K., & Mason, J. (2016). Data, the Story, the Storyteller, in Chen, W. et al. (Eds.) Workshop Proceedings
of the 24th International Conference on Computers, India: Asia-Pacific Society for Computers in Education. (2016). pp. 142-144.
Khan, K. & Mason, J. (2015). Non-Numerical Aspects of School Mathematics. Ogata, H. et al. (Eds.) Proceedings of the 23rd International Conference on Computers in Education. China: Asia-Pacific Society for Computers in Education. Dec15.
Knight, W. (2017). Biased algorithms are everywhere, and no one seems to care. MIT Technology Review. Available at: https://www.technologyreview.com/s/608248/biased-algorithms-are-everywhere-and-no-one-seems-to-care/ [Accessed 19 Sep. 2017].
Mathforum.org. (2017). The Math Forum. Available at: http://mathforum.org/pow/noticewonder [Accessed 12 Sep. 2017].
Mason, J., Khan, K., &. Smith, S. (2016). Literate, Numerate, Discriminate – Realigning 21st Century Skills, in Chen, W. et al. (Eds.) Proceedings of the 24th International Conference on Computers in Education. India: Asia-Pacific Society for Computers in Education. pp. (2016) 609-614.
Nytimes.com. (2017). What’s Going On in This Picture?. Available at: https://www.nytimes.com/column/learning-whats-going-on-in-this-picture [Accessed 12 Sep. 2017].
OECD (2015). Labour Market Mismatch and Labour Productivity Evidence from PIAAC Data. Available at: https://www.oecd.org/eco/growth/Labour-Market-Mismatch-and-Labour-Productivity-Evidence-from-PIA AC-Data.pdf [Accessed 2 Sep. 2017].
Paul, A. (2017). Smart Learning Strategies. The Creativity Post. Available at: http://www.creativitypost.com/education/smart_learning_strategies [Accessed 19 Sep. 2017].
Schwarz, J. (2017). North Korea Keeps Saying it Might Give Up its Nuclear Weapons — But Most News Outlets Won’t Tell You That. [online] The Intercept. Available at:
https://theintercept.com/2017/08/25/north-korea-keeps-saying-it-might-give-up-its-nuclear-weapons-but-most-news-outlets-wont-tell-you-that/ [Accessed 12 Sep. 2017].
Spielkamp, M. (2017). Inspecting Algorithms for Bias. [online] MIT Technology Review. Available at: https://www.technologyreview.com/s/607955/inspecting-algorithms-for-bias/ [Accessed 19 Sep. 2017].
V7-5.australiancurriculum.edu.au. (2017). Digital Technologies Foundation to Year 10 Curriculum by rows - The Australian Curriculum v7.5. Available at: http://v7-5.australiancurriculum.edu.au/technologies/digital-technologies/curriculum/f-10?layout=1#cdcod e=ACTDIK008&level=3-4 [Accessed 13 Sep. 2017].
Washington Post. (2017). Opinion | Why aren’t we talking about regime change in North Korea? Available at: https://www.washingtonpost.com/opinions/global-opinions/why-arent-we-talking-about-regime-change-in-north-korea/2017/08/31/d36b0b00-8d9e-11e7-91d5-ab4e4bb76a3a_story.html [Accessed 12 Sep. 2017].
Hayashi, Y., et al. (Eds.) (2017). Workshop Proceedings of the 25th International Conference on Computers in Education. New Zealand: Asia-Pacific Society for Computers in Education
631
Validation of Collaborative Problem Solving Process Framework from Evidence of Student
Observations for Developing Generic Measures Nafisa AWWALa*, Patrick GRIFFINa, Zhonghua ZHANGa, Claire SCOULARa, Monjurul
ALOMa, Daniel JIMENEZa & Mark WILSONa aAssessment Research Centre, Melbourne Graduate School of Education,
University of Melbourne, Australia *[email protected]
Abstract: This study recognises the role of collaborative problem solving (CPS) as an important 21st century skill for a higher quality workforce. This study aims to develop performance measures of individuals CPS ability while being engaged in collaborative problem solving tasks online with another human (H2H). With this aim in mind, the authors propose a new CPS Process Framework. The proposed framework portrays CPS as a consolidation of collaboration and problem solving frames. Indicators of observable behaviours are designed for coding and later scoring those behavioural indicators mapped to this framework. Empirical data including student observation will be used as evidence to explore the validity of this new framework. It is expected that the use of multiple data and phases of analysis will enable and provide insight how CPS processes among H2H dyads evolve during CPS assessments in an online collaborative environment.
Keywords: collaborative problem solving, CPS, collaboration, computer-supported, collaborative, problem solving, process, peer interaction, CPS framework, student observation, log file, process data
1. Background of the Study
Collaborative problem solving (CPS) is now well recognised in industry as a core competency of today’s knowledge economy and has taken a central role in recent theoretical and technological developments in education research. It is a relatively new research area and its concepts, methods, and research ideas link collaborative learning, problem solving, data mining, and psychometrics (Kozma, 2009). The OECD decision to assess CPS in the Programme for International Student Assessment (PISA, www.oecd.org/pisa) in 2015 and the pioneering work in Assessment and Teaching of 21st Century Skills study (ATC21S™, www.atc21s.org) has stimulated interest in CPS research as a 21st century skill suitable for formative assessment. The construct has been situated in the zones of education, psychology and employment, often in the context of discussion of 21st century skills. According to ATC21S study, 21st century skills did not all need to be new (Griffin, 2012; Griffin, McGaw & Care, 2012), rather it was argued to be those that must be brought to bear in today’s worlds of education, living and work for individuals to function effectively as students, workers and citizens. Collaborative problem solving (CPS) combines critical thinking, problem solving, communication and collaboration (Griffin & Care, 2015). CPS is a joint activity where groups execute several steps to transform a current state into a desired goal state, in which a group may require varied knowledge, expertise and skills, both in terms of interpersonal dynamics as well as in cognitive processes, which is unlikely to be possessed by any one individual. Where a concept has this level of complexity, tasks designed to measure the construct may present challenges both in terms of how a group of individuals might approach that task as well as in terms of what processes the individuals might use to contribute to the resolution of the task, and in terms of finding ways to observe the characteristics in an unconfounded way. CPS thus can be truly be recognised as the “new smarts” in both the assessment and learning domain.
632
From the outcome of these two pioneering studies, it became evident among researchers that a change to coding and scoring of such complex assessment is required. During the ATC21S experience, repeated attempts to scale score performances using the Hesse et al. (2015) framework have been frustrating and expensive because each time a new CS task was developed the whole process of coding, calibration and scoring was required to be done separately. There is a desperate need for generic indicators that would cover multiple tasks and more than that, enable new tasks to be developed to automatically generate the new indicators. This has not been true for either PISA or ATC21S CPS tasks. The research (Griffin, Care & Wilson, 2015) under the Australian Research Council Grant is focused on identifying efficiency of scoring as a response to the two crucial deficiencies identified in the previous model. The first is a lack of generic scoring encoding procedures and the second is a matter of group size and the differences are of ability between individuals within a group. This paper addresses the first of those issues – issue of a generic scoring encoding system. The answer to this issue was not perceived in the PISA structure, since PISA tasks examined individual persons within a group collaborating to resolve the problem space. As a consequence, task design is implicated in that with four people in a group resolving the problem, tasks need to be designed with unique contribution for four people. This primary focus of this paper is to identify generic coding system which remained overlooked in both ATC21S and PISA.
2. CPS Process Framework
The theoretical understanding of this new framework (Griffin et al., 2015) is derived from observation of people resolving collaborative problem solving. Both PISA and ATC21S lead on from previous theoretical concepts (O'Neil, 1999; OECD, 2012; Polya, 1957) in defining collaborative problem solving within an educational setting. But the result was not efficient. In PISA conceptual framework the dimensions of collaborative problem solving move away from Polya’s mathematical problem solving model into a more exploratory and undeclared complexity of problems. Although sharing some similarities with the PISA model, the new framework developed here is different. It's based on direct observation of people solving problems and explanation of the process why and how they were solving the problems and the way they did, including how they collaborated with their partners. Collaboration itself became more clearly defined as a result of this process to indicate it is a combination of a single shared goal, participants being able to make a unique contribution to the problem resolution, a capacity of people to depend upon each other, and a realisation that each member benefited from the work and contribution of other members. This clearly separated from teamwork and from such things as the PISA human to agent model (H2A) and even from the ATC21S human to human model (H2H). The decision to test the direct observation using the steps of exploring defining, planning, implementing, evaluating and reflecting on the process and structure of common goal, dependence, benefit, and contribution meant that a new matrix similar to that of the PISA was derived. There were essential differences which are explored in this paper.
Table 1 presents the new theoretical CPS Process Framework proposed. Each of the boxes in the framework represents the criteria for identifying the demonstration of the indicator within each capability. It will be clear from description in the following sections that PISA’s dependence upon Polya and its necessity for linking it to their 2012 individual problem solving meant that it was compromised in terms of its scoring and capabilities. Alternatively, ATC21S framework was based upon collaborative learning and computer-assisted collaborative learning but not on collaborative problem solving. It was a worthwhile addition to the initial configuration of collaborative problem solving that the researchers of this study believe the need for a new model.
2.1. Capabilities
The proposed framework describes the CPS process as consisting of six capabilities Exploring, Defining, Planning, Implementing, Evaluating, and Reflecting.
Exploring refers to participants searching and probing both the social and problem space in a task for building an understanding and perception of the problem. During this process, individuals must deal with queries like “What do we have?”. It is assumed that individuals’ initial reaction to a problem is
633
likely be to engage and explore the task space to familiarise themselves and to build an understanding of the problem. Both their actions and role within a task could guide their understanding on the importance how their own contributions could achieve success in the given task. In addition, the ability to interact with their partners and realising the need for such interaction is expected to support in their success. There is less coverage seen for this capability from other available frameworks.
Defining focuses on students jointly outlining the problem. In this process, individuals will find answers for “What is the problem?”. In real-life scenarios, problems are often vague. For good collaboration in like conditions, it is vital to establish a shared vision of the problem (Barron, 2000). To achieve such a common ground, individuals need to identify any gaps in their understanding through managing own resources; sharing, requesting and interpreting information received, and integrating resources to build their mutual understanding of the problem and what is required to solve it (Dillenbourg, 1999; Hesse, Care, Buder, Sassenberg, & Griffin, 2015). This capability extends familiarising beyond self by including others to build and maintain a joint understanding. The idea of this capability is well informed by existing literature of both PS and CPS.
Planning is the process of deliberating a prearranged course of actions or set of steps required to accomplish a certain goal or target (Hayes-Roth & Hayes-Roth, 1979) while at the same time revealing students’ ability to develop strategies based on the steps required to solve the problem (Miller, Galanter, & Pribram, 1986). At this stage, individuals will likely ascertain “What is the plan?”. For planning, individuals need to address a shared problem representation by organising information, analysing the problem and setting a goal to provide the basis for a coordinated solution and to formulate hypotheses for stages of steps required in achieving the desired joint goal (Hesse et al., 2015; Weldon & Weingart, 1993). Researchers consider this capability crucial in solving problems whether independently or collaboratively (Hayes-Roth & Hayes-Roth, 1979), and has been reflected throughout many research studies.
Implementing refers to the way in which individuals approach collaborative tasks and their execution of plans for solving the problem. In this process, individuals join force to utilise their knowledge and expertise to test their hypotheses and execute plans from their previous planning process. Here the focus of individuals is to find “How do we implement our plan?”. The focus of this capability is mainly selecting appropriate actions for setting their join plan transferred into action. For a better collaborative work during this phase, individual participation and contributions are perceived as pre-requisite characteristics. This process has similarities with PISA’s collaborative component “taking appropriate action to solve the problem” which refers to the joint effort of individual to act and follow appropriate steps to solve the problem (OECD, 2013); and with Polya’s and PISA’s problem solving step “carry out the plan” and “executing” respectively.
Evaluating focuses on the shared progress of the problem throughout the task. In this context, individuals are required to periodically evaluate their progress throughout their CPS journey to identify what is working and what is not, recognise any deviances from agreed plan, and rectify misunderstandings before they impede their joint work (Dillenbourg and Traum, 2006; Roschelle & Teasley, 1994). During this process, individuals may review “How did we do?”. Checking progress at different stages of CPS can provide collaborators helpful feedback for forcing necessary adjustments and shaping their future activities. Researchers believe that this process is critical to collaboration (Roschelle & Teasley, 1994), as understanding evolves. In evaluating progress individual are thought to be able to identify connections between information and use this to inform future steps for both current and other tasks. This process overlaps with some of the existing frameworks.
Reflecting refers to individuals need for manifesting both their own and others understand to ensure they are aligned. Here individuals would contemplate on “What do we learn?”. While reflecting individuals may consider if alternative approaches to a problem are more suitable, whether attempted solutions are appropriate, and revisiting initial hypotheses and assumptions (OECD, 2013). If adaptions or modifications is required, individuals may return to the joint planning stage to reorganise information, alter hypotheses, amend plans or set alternative goals. This process has received almost no coverage in existing PS frameworks, but has similarities with PISA’s collaborative component “monitoring and reflecting” which refers to the joint effort of individual to act and follow appropriate steps to solve the problem (OECD, 2013).
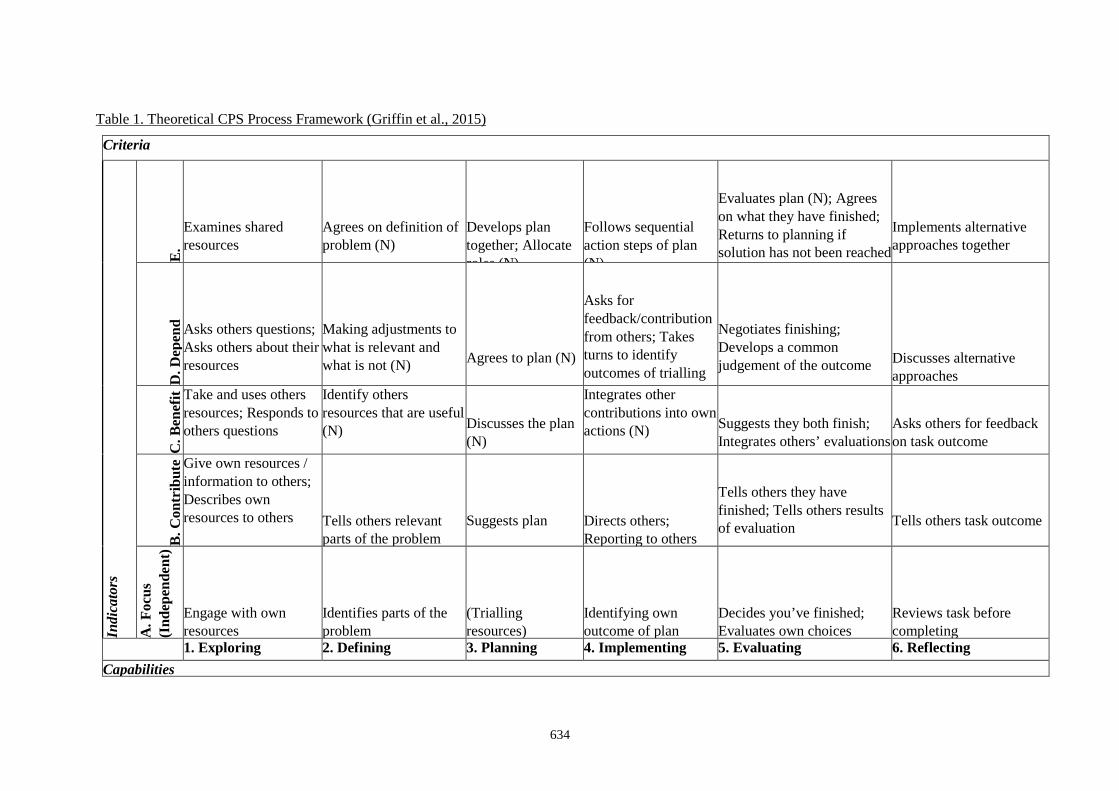
634
Table 1. Theoretical CPS Process Framework (Griffin et al., 2015)
Criteria
Indi
cato
rs
E.
Examines shared resources
Agrees on definition of problem (N)
Develops plan together; Allocate roles (N)
Follows sequential action steps of plan (N)
Evaluates plan (N); Agrees on what they have finished; Returns to planning if solution has not been reached
Implements alternative approaches together
D. D
epen
d
Asks others questions; Asks others about their resources
Making adjustments to what is relevant and what is not (N)
Agrees to plan (N)
Asks for feedback/contribution from others; Takes turns to identify outcomes of trialling
Negotiates finishing; Develops a common judgement of the outcome
Discusses alternative approaches
C. B
enef
it Take and uses others resources; Responds to others questions
Identify others resources that are useful (N)
Discusses the plan (N)
Integrates other contributions into own actions (N)
Suggests they both finish; Integrates others’ evaluations
Asks others for feedback on task outcome
B. C
ontr
ibut
e Give own resources / information to others; Describes own resources to others
Tells others relevant parts of the problem
Suggests plan
Directs others; Reporting to others
Tells others they have finished; Tells others results of evaluation
Tells others task outcome
A. F
ocus
(I
ndep
ende
nt)
Engage with own resources
Identifies parts of the problem
(Trialling resources)
Identifying own outcome of plan
Decides you’ve finished; Evaluates own choices
Reviews task before completing
1. Exploring 2. Defining 3. Planning 4. Implementing 5. Evaluating 6. Reflecting Capabilities
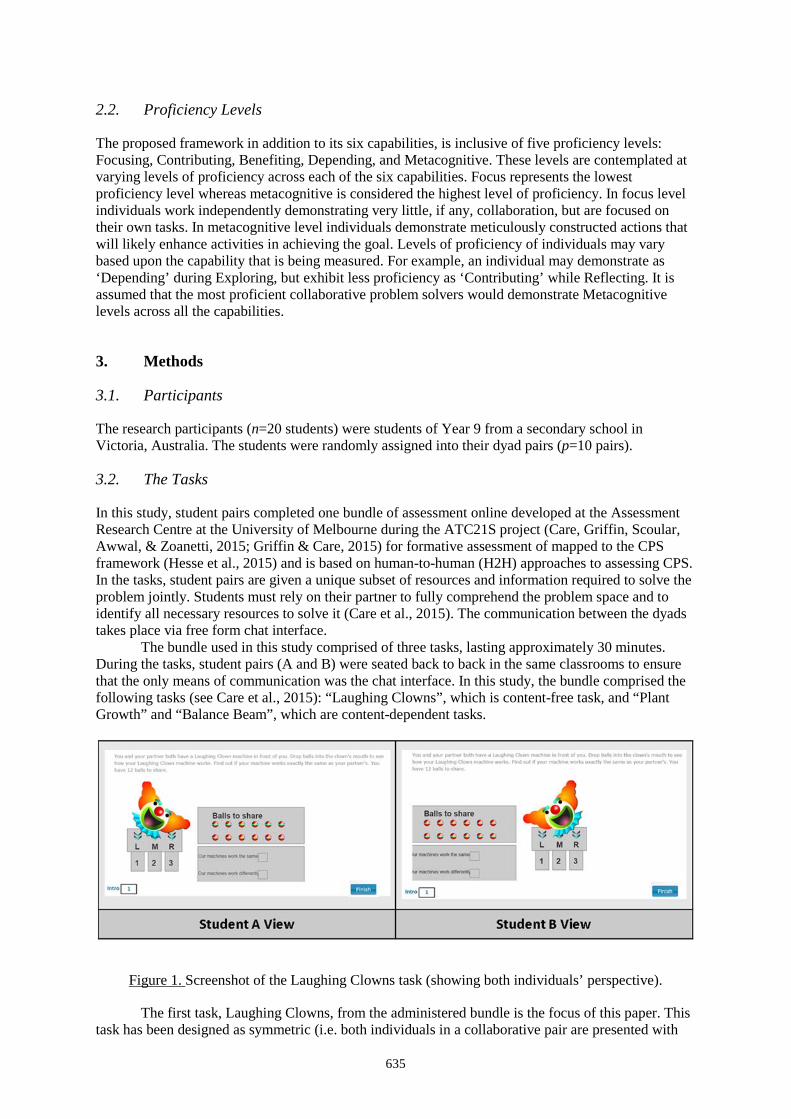
635
2.2. Proficiency Levels
The proposed framework in addition to its six capabilities, is inclusive of five proficiency levels: Focusing, Contributing, Benefiting, Depending, and Metacognitive. These levels are contemplated at varying levels of proficiency across each of the six capabilities. Focus represents the lowest proficiency level whereas metacognitive is considered the highest level of proficiency. In focus level individuals work independently demonstrating very little, if any, collaboration, but are focused on their own tasks. In metacognitive level individuals demonstrate meticulously constructed actions that will likely enhance activities in achieving the goal. Levels of proficiency of individuals may vary based upon the capability that is being measured. For example, an individual may demonstrate as ‘Depending’ during Exploring, but exhibit less proficiency as ‘Contributing’ while Reflecting. It is assumed that the most proficient collaborative problem solvers would demonstrate Metacognitive levels across all the capabilities.
3. Methods
3.1. Participants
The research participants (n=20 students) were students of Year 9 from a secondary school in Victoria, Australia. The students were randomly assigned into their dyad pairs (p=10 pairs).
3.2. The Tasks
In this study, student pairs completed one bundle of assessment online developed at the Assessment Research Centre at the University of Melbourne during the ATC21S project (Care, Griffin, Scoular, Awwal, & Zoanetti, 2015; Griffin & Care, 2015) for formative assessment of mapped to the CPS framework (Hesse et al., 2015) and is based on human-to-human (H2H) approaches to assessing CPS. In the tasks, student pairs are given a unique subset of resources and information required to solve the problem jointly. Students must rely on their partner to fully comprehend the problem space and to identify all necessary resources to solve it (Care et al., 2015). The communication between the dyads takes place via free form chat interface.
The bundle used in this study comprised of three tasks, lasting approximately 30 minutes. During the tasks, student pairs (A and B) were seated back to back in the same classrooms to ensure that the only means of communication was the chat interface. In this study, the bundle comprised the following tasks (see Care et al., 2015): “Laughing Clowns”, which is content-free task, and “Plant Growth” and “Balance Beam”, which are content-dependent tasks.
Figure 1. Screenshot of the Laughing Clowns task (showing both individuals’ perspective).
The first task, Laughing Clowns, from the administered bundle is the focus of this paper. This task has been designed as symmetric (i.e. both individuals in a collaborative pair are presented with
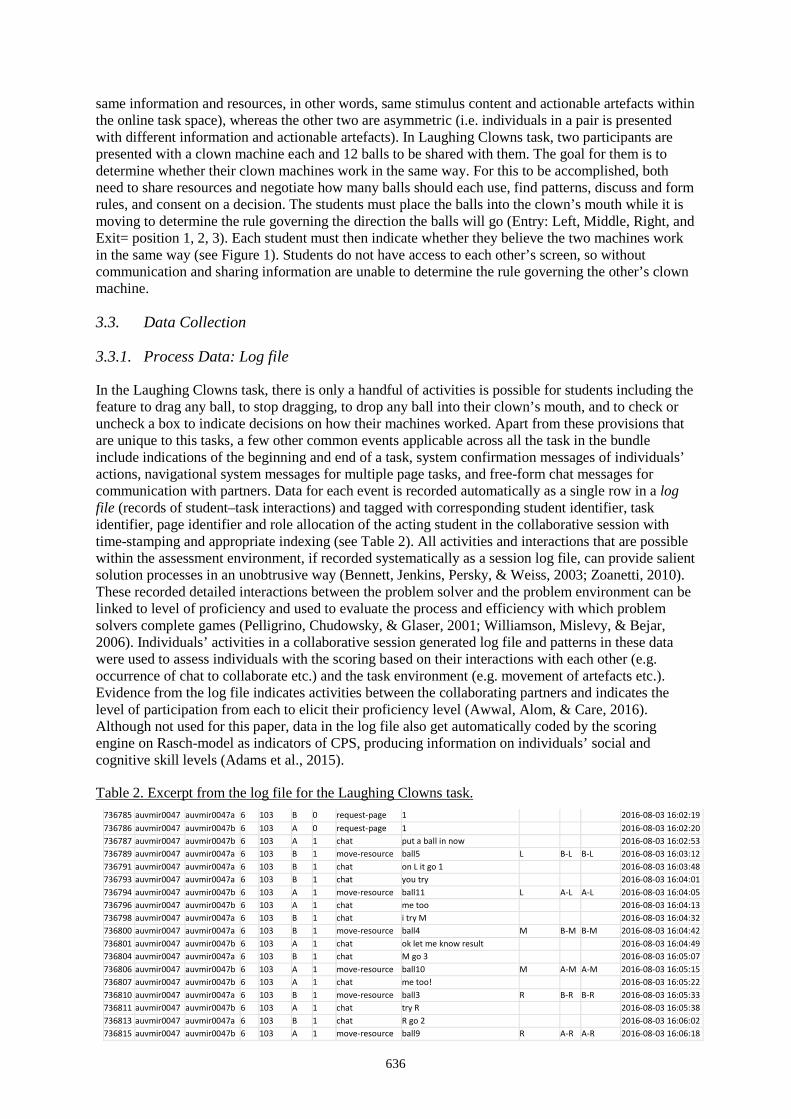
636
same information and resources, in other words, same stimulus content and actionable artefacts within the online task space), whereas the other two are asymmetric (i.e. individuals in a pair is presented with different information and actionable artefacts). In Laughing Clowns task, two participants are presented with a clown machine each and 12 balls to be shared with them. The goal for them is to determine whether their clown machines work in the same way. For this to be accomplished, both need to share resources and negotiate how many balls should each use, find patterns, discuss and form rules, and consent on a decision. The students must place the balls into the clown’s mouth while it is moving to determine the rule governing the direction the balls will go (Entry: Left, Middle, Right, and Exit= position 1, 2, 3). Each student must then indicate whether they believe the two machines work in the same way (see Figure 1). Students do not have access to each other’s screen, so without communication and sharing information are unable to determine the rule governing the other’s clown machine.
3.3. Data Collection
3.3.1. Process Data: Log file
In the Laughing Clowns task, there is only a handful of activities is possible for students including the feature to drag any ball, to stop dragging, to drop any ball into their clown’s mouth, and to check or uncheck a box to indicate decisions on how their machines worked. Apart from these provisions that are unique to this tasks, a few other common events applicable across all the task in the bundle include indications of the beginning and end of a task, system confirmation messages of individuals’ actions, navigational system messages for multiple page tasks, and free-form chat messages for communication with partners. Data for each event is recorded automatically as a single row in a log file (records of student–task interactions) and tagged with corresponding student identifier, task identifier, page identifier and role allocation of the acting student in the collaborative session with time-stamping and appropriate indexing (see Table 2). All activities and interactions that are possible within the assessment environment, if recorded systematically as a session log file, can provide salient solution processes in an unobtrusive way (Bennett, Jenkins, Persky, & Weiss, 2003; Zoanetti, 2010). These recorded detailed interactions between the problem solver and the problem environment can be linked to level of proficiency and used to evaluate the process and efficiency with which problem solvers complete games (Pelligrino, Chudowsky, & Glaser, 2001; Williamson, Mislevy, & Bejar, 2006). Individuals’ activities in a collaborative session generated log file and patterns in these data were used to assess individuals with the scoring based on their interactions with each other (e.g. occurrence of chat to collaborate etc.) and the task environment (e.g. movement of artefacts etc.). Evidence from the log file indicates activities between the collaborating partners and indicates the level of participation from each to elicit their proficiency level (Awwal, Alom, & Care, 2016). Although not used for this paper, data in the log file also get automatically coded by the scoring engine on Rasch-model as indicators of CPS, producing information on individuals’ social and cognitive skill levels (Adams et al., 2015).
Table 2. Excerpt from the log file for the Laughing Clowns task. 736785 auvmir0047 auvmir0047a 6 103 B 0 request-page 1 2016-08-03 16:02:19 736786 auvmir0047 auvmir0047b 6 103 A 0 request-page 1 2016-08-03 16:02:20 736787 auvmir0047 auvmir0047b 6 103 A 1 chat put a ball in now 2016-08-03 16:02:53 736789 auvmir0047 auvmir0047a 6 103 B 1 move-resource ball5 L B-L B-L 2016-08-03 16:03:12 736791 auvmir0047 auvmir0047a 6 103 B 1 chat on L it go 1 2016-08-03 16:03:48 736793 auvmir0047 auvmir0047a 6 103 B 1 chat you try 2016-08-03 16:04:01 736794 auvmir0047 auvmir0047b 6 103 A 1 move-resource ball11 L A-L A-L 2016-08-03 16:04:05 736796 auvmir0047 auvmir0047b 6 103 A 1 chat me too 2016-08-03 16:04:13 736798 auvmir0047 auvmir0047a 6 103 B 1 chat i try M 2016-08-03 16:04:32 736800 auvmir0047 auvmir0047a 6 103 B 1 move-resource ball4 M B-M B-M 2016-08-03 16:04:42 736801 auvmir0047 auvmir0047b 6 103 A 1 chat ok let me know result 2016-08-03 16:04:49 736804 auvmir0047 auvmir0047a 6 103 B 1 chat M go 3 2016-08-03 16:05:07 736806 auvmir0047 auvmir0047b 6 103 A 1 move-resource ball10 M A-M A-M 2016-08-03 16:05:15 736807 auvmir0047 auvmir0047b 6 103 A 1 chat me too! 2016-08-03 16:05:22 736810 auvmir0047 auvmir0047a 6 103 B 1 move-resource ball3 R B-R B-R 2016-08-03 16:05:33 736811 auvmir0047 auvmir0047b 6 103 A 1 chat try R 2016-08-03 16:05:38 736813 auvmir0047 auvmir0047a 6 103 B 1 chat R go 2 2016-08-03 16:06:02 736815 auvmir0047 auvmir0047b 6 103 A 1 move-resource ball9 R A-R A-R 2016-08-03 16:06:18
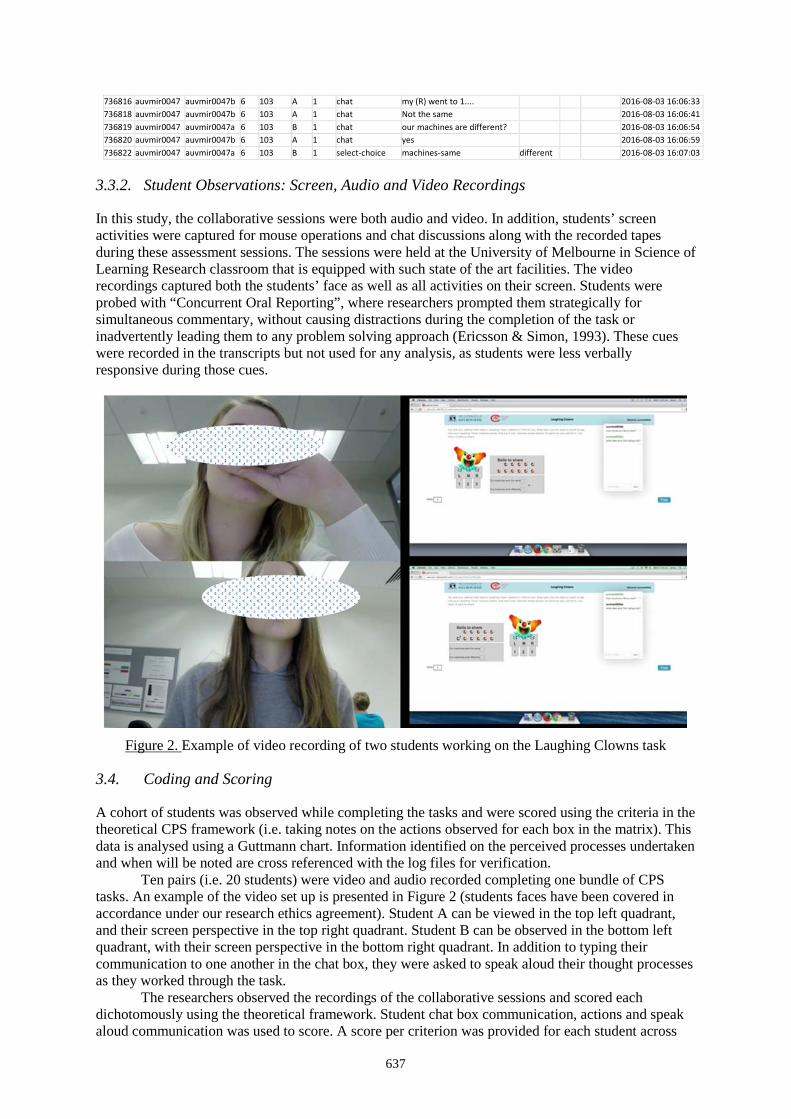
637
736816 auvmir0047 auvmir0047b 6 103 A 1 chat my (R) went to 1.... 2016-08-03 16:06:33 736818 auvmir0047 auvmir0047b 6 103 A 1 chat Not the same 2016-08-03 16:06:41 736819 auvmir0047 auvmir0047a 6 103 B 1 chat our machines are different? 2016-08-03 16:06:54 736820 auvmir0047 auvmir0047b 6 103 A 1 chat yes 2016-08-03 16:06:59 736822 auvmir0047 auvmir0047a 6 103 B 1 select-choice machines-same different 2016-08-03 16:07:03
3.3.2. Student Observations: Screen, Audio and Video Recordings
In this study, the collaborative sessions were both audio and video. In addition, students’ screen activities were captured for mouse operations and chat discussions along with the recorded tapes during these assessment sessions. The sessions were held at the University of Melbourne in Science of Learning Research classroom that is equipped with such state of the art facilities. The video recordings captured both the students’ face as well as all activities on their screen. Students were probed with “Concurrent Oral Reporting”, where researchers prompted them strategically for simultaneous commentary, without causing distractions during the completion of the task or inadvertently leading them to any problem solving approach (Ericsson & Simon, 1993). These cues were recorded in the transcripts but not used for any analysis, as students were less verbally responsive during those cues.
Figure 2. Example of video recording of two students working on the Laughing Clowns task
3.4. Coding and Scoring
A cohort of students was observed while completing the tasks and were scored using the criteria in the theoretical CPS framework (i.e. taking notes on the actions observed for each box in the matrix). This data is analysed using a Guttmann chart. Information identified on the perceived processes undertaken and when will be noted are cross referenced with the log files for verification.
Ten pairs (i.e. 20 students) were video and audio recorded completing one bundle of CPS tasks. An example of the video set up is presented in Figure 2 (students faces have been covered in accordance under our research ethics agreement). Student A can be viewed in the top left quadrant, and their screen perspective in the top right quadrant. Student B can be observed in the bottom left quadrant, with their screen perspective in the bottom right quadrant. In addition to typing their communication to one another in the chat box, they were asked to speak aloud their thought processes as they worked through the task.
The researchers observed the recordings of the collaborative sessions and scored each dichotomously using the theoretical framework. Student chat box communication, actions and speak aloud communication was used to score. A score per criterion was provided for each student across
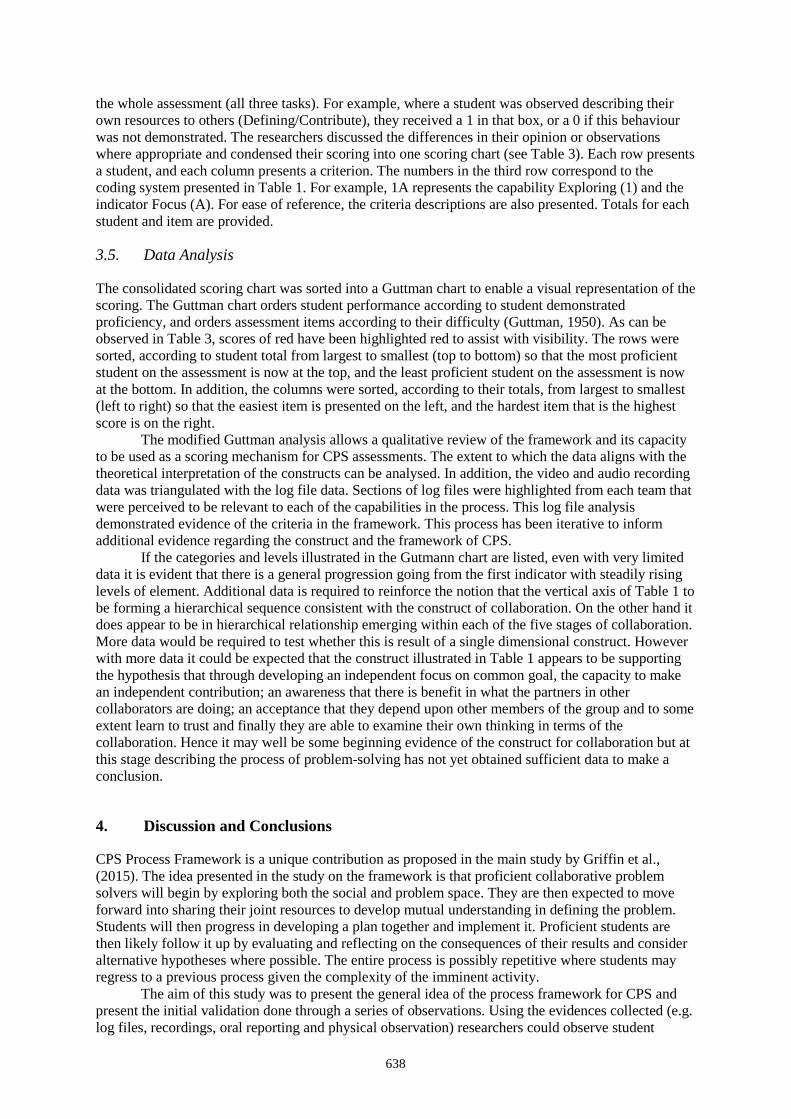
638
the whole assessment (all three tasks). For example, where a student was observed describing their own resources to others (Defining/Contribute), they received a 1 in that box, or a 0 if this behaviour was not demonstrated. The researchers discussed the differences in their opinion or observations where appropriate and condensed their scoring into one scoring chart (see Table 3). Each row presents a student, and each column presents a criterion. The numbers in the third row correspond to the coding system presented in Table 1. For example, 1A represents the capability Exploring (1) and the indicator Focus (A). For ease of reference, the criteria descriptions are also presented. Totals for each student and item are provided.
3.5. Data Analysis
The consolidated scoring chart was sorted into a Guttman chart to enable a visual representation of the scoring. The Guttman chart orders student performance according to student demonstrated proficiency, and orders assessment items according to their difficulty (Guttman, 1950). As can be observed in Table 3, scores of red have been highlighted red to assist with visibility. The rows were sorted, according to student total from largest to smallest (top to bottom) so that the most proficient student on the assessment is now at the top, and the least proficient student on the assessment is now at the bottom. In addition, the columns were sorted, according to their totals, from largest to smallest (left to right) so that the easiest item is presented on the left, and the hardest item that is the highest score is on the right.
The modified Guttman analysis allows a qualitative review of the framework and its capacity to be used as a scoring mechanism for CPS assessments. The extent to which the data aligns with the theoretical interpretation of the constructs can be analysed. In addition, the video and audio recording data was triangulated with the log file data. Sections of log files were highlighted from each team that were perceived to be relevant to each of the capabilities in the process. This log file analysis demonstrated evidence of the criteria in the framework. This process has been iterative to inform additional evidence regarding the construct and the framework of CPS.
If the categories and levels illustrated in the Gutmann chart are listed, even with very limited data it is evident that there is a general progression going from the first indicator with steadily rising levels of element. Additional data is required to reinforce the notion that the vertical axis of Table 1 to be forming a hierarchical sequence consistent with the construct of collaboration. On the other hand it does appear to be in hierarchical relationship emerging within each of the five stages of collaboration. More data would be required to test whether this is result of a single dimensional construct. However with more data it could be expected that the construct illustrated in Table 1 appears to be supporting the hypothesis that through developing an independent focus on common goal, the capacity to make an independent contribution; an awareness that there is benefit in what the partners in other collaborators are doing; an acceptance that they depend upon other members of the group and to some extent learn to trust and finally they are able to examine their own thinking in terms of the collaboration. Hence it may well be some beginning evidence of the construct for collaboration but at this stage describing the process of problem-solving has not yet obtained sufficient data to make a conclusion.
4. Discussion and Conclusions
CPS Process Framework is a unique contribution as proposed in the main study by Griffin et al., (2015). The idea presented in the study on the framework is that proficient collaborative problem solvers will begin by exploring both the social and problem space. They are then expected to move forward into sharing their joint resources to develop mutual understanding in defining the problem. Students will then progress in developing a plan together and implement it. Proficient students are then likely follow it up by evaluating and reflecting on the consequences of their results and consider alternative hypotheses where possible. The entire process is possibly repetitive where students may regress to a previous process given the complexity of the imminent activity.
The aim of this study was to present the general idea of the process framework for CPS and present the initial validation done through a series of observations. Using the evidences collected (e.g. log files, recordings, oral reporting and physical observation) researchers could observe student

639
playing the tasks, identify where they move from one process to the next, then map their judgements to the log files. As an ongoing study, further research is in progress to investigate the validity evidence for this new theoretical CPS Process framework with empirical data.
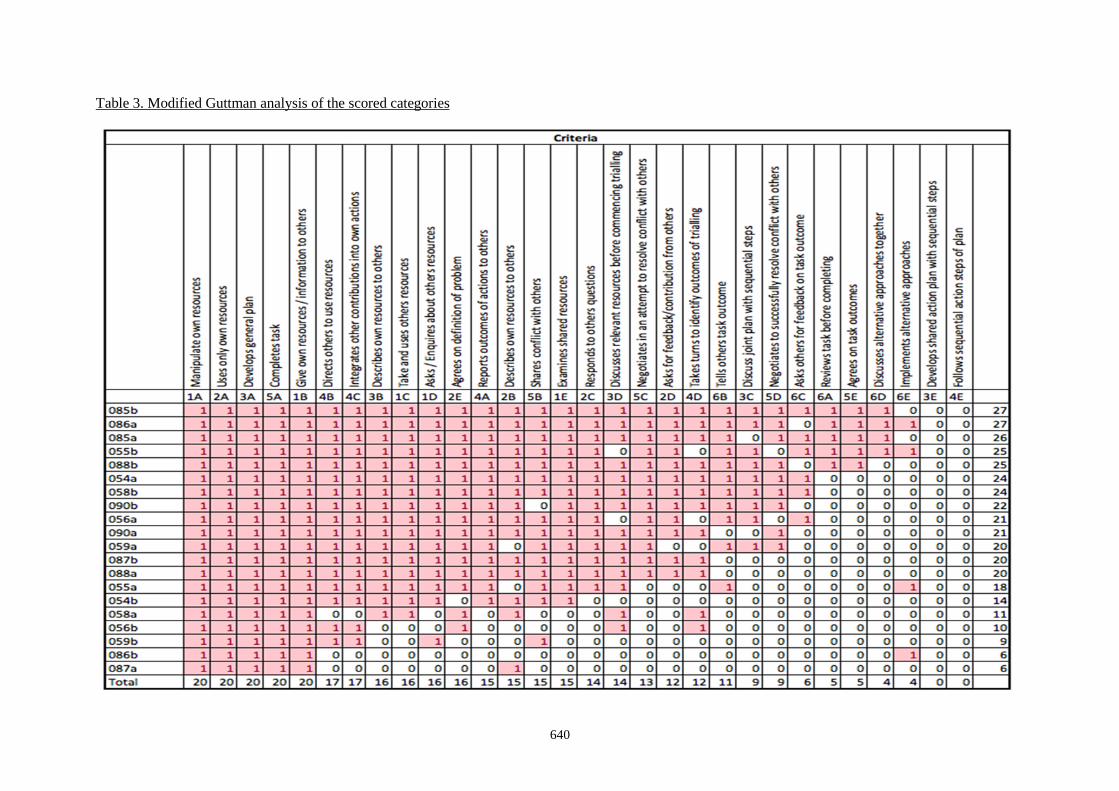
640
Table 3. Modified Guttman analysis of the scored categories

Hayashi, Y., Mathews, M., Supnithi, T. (Eds.) (2017). Workshop Proceedings of the 25th International Conference on Computers in Education. New Zealand: Asia-Pacific Society for Computers in Education
641
Acknowledgments
The work presented here is from the research grant “Measuring individual and group performance in collaborative problem solving” (Griffin et al., 2015) supported under the Australian Research Council's Discovery Projects funding scheme (DP160101678). Acknowledgment for the work presented here is contributed to all the researchers of this project: Patrick Griffin, Mark Wilson, Sandra Milligan, Zhonghua Zhang, Nafisa Awwal, Claire Scoular, BM Monjurul Alom, and Daniel Barrios Jimenez.
References
Adams, R., Vista, A., Scoular, C., Awwal, N., Griffin, P., & Care, E. (2015). Automatic coding procedures for collaborative problem solving. In P. Griffin & E. Care (Eds.), Assessment and teaching of 21st Century skills: Methods and approach (pp. 115-132). Dordecht: Springer.
Awwal, N., Alom, M., & Care, E. (2016). Game Design for Learning to Solve Problems in a Collaborative Environment. Proceedings of the European Conference on Information Management & Evaluation, 25-33.
Barron, B. (2000). Achieving Coordination in Collaborative Problem-Solving Groups. The Journal of the Learning Sciences, 9, 403-436.
Bennett, R. E., Jenkins, F., Persky, H., & Weiss, A. (2003). Assessing complex problem solving performances. Assessment in Education, 10(3), 347-359.
Care, E., Griffin, P., Scoular, C., Awwal, N., & Zoanetti, N. (2015). Collaborative problem solving tasks. In P. Griffin & E. Care (Eds.), Assessment and teaching of 21st century skills: Methods and approach (pp. 85-104). Dordrecht: Springer.
Dillenbourg, P., & Traum, D. (2006). Sharing solutions: Persistence and grounding in multi-modal collaborative problem solving. The Journal of the Learning Sciences, 15, 121-151.
Dillenbourg, P. (1999). Collaborative learning : cognitive and computational approaches: Amsterdam ; New York : Pergamon, 1999. 1st ed.
Ericsson, K. A., & Simon, H. A. (1993). Protocol Analysis: Verbal Reports as Data. In. London: The MIT Press. Griffin, P. (2012). Symposium: The assessment and teaching of 21st century skills. In The 8th Conference of the
International Test Commission Conference. Amsterdam, The Netherlands. Griffin, P., Care, E. & Wilson, M. (2015). Measuring individual and group performance in collaborative
problem solving. Australian Research Council Grant: DP160101678, Australia. Griffin, P., & Care, E. (Eds.). (2015). Assessment and teaching of 21st century skills: Methods and approach.
Dordrecht: Springer. Griffin, P., McGaw, B., & Care, E. (Ed.) (2012). Assessment and Teaching of 21st Century Skills. Dordrecht: Springer. Guttman, L. (1950). The Bases for Scalogram Analysis, Chap. 3. Hayes‐Roth, B., & Hayes‐Roth, F. (1979). A cognitive model of planning. Cognitive science, 3, 275- 310. Hesse, F., Care, E., Buder, J., Sassenberg, K., & Griffin, P. (2015). A Framework for Teachable Collaborative
Problem Solving Skills. In P. Griffin & E. Care (Eds.), Assessment and Teaching of 21st Century Skills Volume 2 - Methods & Approach. Dordrecht: Springer.
Kozma, R. (2009). Assessing and teaching 21st century skills: A call to action. In F. Schueremann & J. Bjornsson (Eds.), The transition to computer-based assessment: New approaches to skills assessment and implications for large scale assessment (pp. 13-23). Brussels: European Communities.
Miller, G. A., Galanter, E., & Pribram, K. H. (1986). Plans and the structure of behavior. Adams Bannister Cox.
O'Neil, H. F. (1999). Perspectives on computer-based performance assessment of problem solving. Computers in Human Behavior(3-4), 255. OECD. (2012). PISA 2012 Field Trial Problem Solving Framework. In. OECD. (2013). PISA 2015: Draft Collaborative Problem Solving Framework. Retrieved from
http://www.oecd.org/callsfortenders/Annex%20ID_PISA%202015%20Collaborative%20Pro blem%20Solving%20Framework%20.pdf:
Pelligrino, J., Chudowsky, N., & Glaser, R. (2001). Knowing what students know: The science and design of educational assessment. Washington, DC: National Academy Press.
Polya, G. (1957). How to solve it (2nd ed.). Princeton University Press: Princeton. Roschelle, J., & Teasley, S. D. (1994). The construction of shared knowledge in collaborative problem solving.
Nato ASI Series of Computer and System Sciences, 128, 69.

642
Weldon, E., & Weingart, L. R. (1993). Group goals and group performance. British Journal of Social Psychology, 32(4), 307-334.
Williamson, D. M., Mislevy, R. J., & Bejar, I. I. (2006). Automated scoring of complex tasks in computer-based testing. New Jersey: Lauwrence Erlbaum Associates, Inc.
Zoanetti, N. P. (2010). Interactive computer based assessment tasks: How problem-solving process data can inform instruction. Australasian Journal of Educational Technology, 26(5), 585-606.
643
AUTHOR INDEX
Author Page
AHMAD FAUZI, Mohd Ayub ...................................................................................................................... 116
ALOM, Monjurul ........................................................................................................................................... 631
ARMIYATI, Laely ......................................................................................................................................... 398
ASIAH, Nur .............................................................................................................................................. 94, 398
ASUQUO, Doris Godwin .............................................................................................................................. 124
AWWAL, Nafisa ............................................................................................................................................ 631
BAE, Wooin ................................................................................................................................................... 361
BUCCIARELLI, Louis L. ............................................................................................................................. 418
CAO, Ya-Han ................................................................................................................................................. 210
CHAI, Ching Sing ........................................................................................................................................... 35
CHAIJAROEN, Sumalee ............................................................................................................................... 565
CHAIPIDECH, Pawat .................................................................................................................................... 587
CHAN, Tak-Wai ............................................................................................................................................. 376
CHANG, Ben.................................................................................................................................................. 381
CHANG, Hsin-Yi ........................................................................................................................................... 523
CHANG, Wan-Chen ....................................................................................................................................... 376
CHEN, Beyin .................................................................................................................................................. 210
CHEN, Kuan-Ting ............................................................................................................................................ 40
CHEN, Nian-Shing ......................................................................................................................................... 236
CHEN, Ru-Shan ....................................................................................................................................... 53, 210
CHEN, ShengChih ............................................................................................................................................ 53
CHEN, Sherry Y. ........................................................................................................................................... 445
CHEN, Wei-Fan ............................................................................................................................................... 53
CHEN, Yi-Lin ................................................................................................................................................ 258
CHEN, Zhi-Hong ............................................................................................................................................ 372
CHENG, Hercy N. H. ..................................................................................................................................... 376
CHENG, Shu-Chen ........................................................................................................................................ 258
CHENG, Teng-Yao ........................................................................................................................................ 595
CHENG, Yu-Ping ........................................................................................................................................... 258
CHEOK, Mei Lick ......................................................................................................................................... 116
CHEW, Sie Wai ............................................................................................................................................. 236
CHI, Pei-Yun .................................................................................................................................................. 372
CHIN, Weng Ping .......................................................................................................................................... 410
CHIOU, Kuo-Ching ........................................................................................................................................ 289
CHO, Yong-Sang ............................................................................................................................ 326, 335, 343
CHOI, Byung-gi ............................................................................................................................................. 361
CHOOKAEW, Sasithorn .......................................................................................................................... 99, 514
CHU, Chih-Ming .............................................................................................................................................. 87
CHU, Yuan-Kai .................................................................................................................................................. 1
CIOU, Huei-Jhen ............................................................................................................................................ 372
COMINS, Neil ................................................................................................................................................ 387
DALTE, Olha ................................................................................................................................................. 266
DAVAASUREN, Bolor .................................................................................................................................. 299
DREW, David E. ........................................................................................................................................... 418
FLANAGAN, Brendan ................................................................................................................................... 355
FU, Chuxin ..................................................................................................................................................... 281
FU, Hui-Jung .................................................................................................................................................... 28
FURTADO, Pedro Gabriel Fonteles ............................................................................................................... 504
GAO, Mengya .................................................................................................................................................. 17
GAYDOS, Matthew ......................................................................................................................................... 79
GILLET, Denis ............................................................................................................................................... 578
644
GOH, Su Fen ................................................................................................................................................. 275
GRIFFIN, Patrick ........................................................................................................................................... 631
GU, Xiaoqing.................................................................................................................................................. 266
GUERRERO, Brian ........................................................................................................................................ 387
GUO, Rifa ....................................................................................................................................................... 281
HASEGAWA, Shinobu .................................................................................................................................. 180
HATAKEYAMA, Hisashi .............................................................................................................................. 191
HAYASHI, Yugo ........................................................................................................................................... 454
HAYASHI, Yuki ............................................................................................................................................ 482
HAYASHI, Yusuke ........................................................................................................................................ 504
HAYASHIDA, Yukuo .................................................................................................................................... 171
HIRASHIMA, Tsukasa............................................................................................................461, 471, 493, 504
HO, Wei-Kuang ................................................................................................................................................ 53
HORI, Masahiro ............................................................................................................................................. 198
HORIGUCHI, Tomoya................................................................................................................................... 461
HOU, Huei-Tse ................................................................................................................................................. 40
HOWIMANPORN, Suppachai ................................................................................................................. 99, 514
HSIAO, Yu-Shan ............................................................................................................................................ 523
HSIEH, Min-Chai ........................................................................................................................................... 225
HSU, Po-Fen ....................................................................................................................................................... 6
HSU, Yi-Tien.................................................................................................................................................... 73
HUANG, Shu-Hsien ....................................................................................................................................... 546
HUANG, Tzu-Chen ........................................................................................................................................ 381
HUANG, Yi-Nan .............................................................................................................................................. 22
HUANG, Yin-Cheng ...................................................................................................................................... 236
HUANG, Yueh-Min ....................................................................................................................................... 258
HUTAMARN, Santi ....................................................................................................................................... 514
HWANG, Gwo-Haur ...................................................................................................................................... 210
IKEDA, Mitsuru ............................................................................................................................................. 198
IYER, Sridhar ................................................................................................................................................. 131
JIMENEZ, Daniel ........................................................................................................................................... 631
JONG, Ton de ................................................................................................................................................ 578
JUNG, Yeonji ................................................................................................................................................... 79
KANZAKI, Nana ............................................................................................................................................ 438
KEUNG, Jacky Wai ...................................................................................................................................... 555
KHALID, Fariza ............................................................................................................................................. 161
KHAMBARI, Mas Nida MD ........................................................................................................................... 92
KHAN, Khalid ................................................................................................................................................ 623
KHONG, Chee Weng .................................................................................................................................... 410
KITAGAWA, Yuichi ..................................................................................................................................... 198
KLOMWIPHAWAT, Phummiphat ................................................................................................................ 609
KOH, Elizabeth .............................................................................................................................................. 319
KOIKE, Kento ................................................................................................................................................ 471
KOJIMA, Kazuaki .......................................................................................................................................... 438
KOO, Ah Choo ............................................................................................................................................... 410
KOZAKI, Shun ............................................................................................................................................... 171
KUROKAWA, Kai ......................................................................................................................................... 461
KUWAHARA, Kengo .................................................................................................................................... 198
LAI, Yu-Ling .................................................................................................................................................. 210
LANE, H. Chad ............................................................................................................................................. 387
LEE, Chien-Sing ..................................................................................................................................... 403, 425
LEE, Hyeran ..................................................................................................................................................... 79
LEE, Hyojeong ............................................................................................................................................... 343
LEE, Jaeho ...................................................................................................................................................... 361
LEE, Min-Hsien................................................................................................................................................ 22
LEE, Silvia Wen-Yu ........................................................................................................................................ 22
645
LEIJEN, Äli .................................................................................................................................................... 578
LENG, Jing ............................................................................................................................................. 266, 281
LI, Bin............................................................................................................................................................. 529
LI, Cheng-Tai ................................................................................................................................................... 40
LI, Lie-Ming ................................................................................................................................................... 529
LIANG, Jyh-Chong ...................................................................................................................................... 1, 22
LIAO, Calvin C. Y. ........................................................................................................................................ 376
LIAO, Yi-Wen ................................................................................................................................................ 225
LIE, Li-En ........................................................................................................................................................... 6
LIN, Chang-Hsin ............................................................................................................................................ 536
LIN, Chia-Ching ............................................................................................................................................. 595
LIN, Hao-Chiang Koong ............................................................................................................................... 248
LIN, I-Hsiu ..................................................................................................................................................... 236
LIN, Yu-Hsuan ............................................................................................................................................... 248
LIO, I-Cheng .................................................................................................................................................. 248
LIU, Yang ......................................................................................................................................................... 17
LIU, Yu-Hsin .................................................................................................................................................. 435
LOOI, Chee-Kit .............................................................................................................................................. 275
LU, Zhihong ..................................................................................................................................................... 12
LUO, Ying ...................................................................................................................................................... 529
MASON, Jon .................................................................................................................................................. 623
MATSUMURO, Miki .................................................................................................................................... 438
MATSUO, Sho ............................................................................................................................................... 171
MENG, Shian-Chi ............................................................................................................................................ 53
MIN, Byung-Won ........................................................................................................................................... 171
MISHIMA, Nobuo .......................................................................................................................................... 171
MIWA, Kazuhisa ............................................................................................................................................ 438
MORITA, Jun’ya ............................................................................................................................................ 438
MUROTA, Masao .......................................................................................................................................... 191
MURTHY, Sahana ......................................................................................................................................... 131
NA PHATTHALUNG, Ratthakarn ........................................................................................................ 140, 308
NAGAHAMA, Toru ....................................................................................................................................... 205
NAGAI, Masahiro .......................................................................................................................................... 191
NAKAIKE, Ryuichi ....................................................................................................................................... 438
NANTAKAEW, Nattida................................................................................................................................. 601
OGATA, Hiroaki ............................................................................................................................................ 355
OGINO, Ryo ................................................................................................................................................... 482
OKAZAKI, Yasuhisa ..................................................................................................................................... 171
PANJABUREE, Patcharin .............................................................................................................................. 601
PANJAN, Sarut .............................................................................................................................................. 514
PARK, Yun-Gon ............................................................................................................................................ 326
PEDASTE, Margus ........................................................................................................................................ 578
PENG, Jie-Yan ............................................................................................................................................... 289
PONDEE, Phattaraporn .................................................................................................................................. 151
POON, Chung Keung .................................................................................................................................... 555
PRASONGSAP, Banjong ............................................................................................................................... 615
PREMTHAISONG, Sasivimol ....................................................................................................................... 151
ROHIM, Syaiful ............................................................................................................................................... 94
ROSNAINI, Mahmud ..................................................................................................................................... 116
SAITO, Hitomi ............................................................................................................................................... 438
SAKS, Katrin .................................................................................................................................................. 578
SAMAT, Charuni ................................................................................................................................... 565, 609
SATCHUKORN, Sureerat .............................................................................................................................. 572
SCOULAR, Claire .......................................................................................................................................... 631
SEO, Minhwi ............................................................................................................................................ 79, 299
SETA, Kazuhisa ............................................................................................................................................. 482
646
SETOZAKI, Norio ......................................................................................................................................... 205
SHEU, Feng-Ru ................................................................................................................................................ 28
SHIH, Ju-Ling ........................................................................................................................................ 536, 546
SHIH, Meilun ............................................................................................................................................. 22, 28
SHIH, Yen-An ................................................................................................................................................ 381
SHIN, Christine .............................................................................................................................................. 299
SO, Hyo-Jeong.......................................................................................................................................... 79, 299
SON, Jeong-Eun ..................................................................................................................................... 326, 335
SRISAWASDI, Niwat ............................................................................................... 92, 151, 572, 587, 601, 615
SU, Jun-Ming.................................................................................................................................................... 48
SU, You-Hong ................................................................................................................................................ 210
SU, Yu-Sheng ................................................................................................................................................. 219
SUSANTI, Eka Nana ..................................................................................................................................... 398
SUSWANDARI........................................................................................................................................ 94, 398
TAN, Jennifer Pei-Ling ................................................................................................................................. 319
TANAKA, Koji .............................................................................................................................................. 198
TANG, Chung Man ....................................................................................................................................... 555
TECHAPORNPONG, Orawan ....................................................................................................................... 565
TEMBO, Tercia-Marie Tafadzwa .................................................................................................................. 403
TERAI, Hitoshi ............................................................................................................................................... 438
TOMOTO, Takahito ............................................................................................................................... 461, 471
TONGGEOD, Tarinee .................................................................................................................................... 514
TSAI, Chin-Chung ........................................................................................................................................ 1, 35
TSAI, Hung-Hsu ............................................................................................................................................. 289
TSAI, Meng-Jung ........................................................................................................................................... 1, 6
TSAI, Meng-Yu ................................................................................................................................................ 48
TSAI, Pei-Shan ................................................................................................................................................. 35
TSENG, Chia-Chun ........................................................................................................................................ 546
TSENG, Yu-Fen ............................................................................................................................................. 445
TSUI, Chih-Hsuan ............................................................................................................................................ 53
UDO, Sylvester Dominic ............................................................................................................................... 124
UMAM, Khoerul ...................................................................................................................................... 94, 398
UYOUKO, Arit .............................................................................................................................................. 124
WAHYUDIN, Didin ....................................................................................................................................... 180
WAKUYA, Hiroshi ........................................................................................................................................ 171
WANG, Shu-Ming ............................................................................................................................................ 40
WANG, Zixi ..................................................................................................................................................... 17
WARRIEM, Jayakrishnan .............................................................................................................................. 131
WATTHANA, Chayanuch ............................................................................................................................. 308
WIBOWO, Indri Trisno ................................................................................................................................... 94
WILSON, Mark .............................................................................................................................................. 631
WONG, Chui Yin .......................................................................................................................................... 410
WONG, Lung Hsiang ............................................................................................................................. 299, 275
WONG, Shu Ling .......................................................................................................................................... 109
WONG, Su Luan ........................................................................................................................... 109, 116, 161
WONGTA, Jintana ................................................................................................................................. 140, 308
WONGWATKIT, Charoenchai .................................................................................................99, 140, 308, 514
WU, An-Hsuan ................................................................................................................................................... 6
WU, Po-Han ................................................................................................................................................... 219
WU, Ying-Tien ............................................................................................................................................... 595
XI, Jia ............................................................................................................................................................... 17
XU, Lingyu ....................................................................................................................................................... 12
YACHULAWETKUNAKORN, Chitphon............................................................................................. 140, 308
YAMAMOTO, Sho ........................................................................................................................................ 493
YI, Sherry ....................................................................................................................................................... 387
YONG, You-Ming .......................................................................................................................................... 289

647
YOUNG, Shelley Shwu-Ching .................................................................................................................. 48, 73
YU, Fu-Yun .................................................................................................................................................... 435
YU, Pao-Ta ..................................................................................................................................................... 289
YU, Ya-Jing .................................................................................................................................................... 219
YU, Yuen Tak ................................................................................................................................................ 555
ZHANG, Zhonghua ........................................................................................................................................ 631
ZHAO, Xin ....................................................................................................................................................... 12
ZHENG, Chunping ..................................................................................................................................... 12, 17
ZOU, Fan .......................................................................................................................................................... 61
Related Documents