Regional Chamber of Commerce Nish ICT Association Serbian Academy of Sciences and Arts Mathematical Institute Center for Women Entrepreneurship RCC Nish Serbian Society for Informatics Center of Excellence and Innovation 6 th International ICT Conference Proceedings Editors: Trajanović, M., Stanković, M. Publisher: Regional Chamber of Commerce - Niš, Serbia ISBN: 978-86-80593-52-4 Serbia, Niš, 14-16 October, 2014

Welcome message from author
This document is posted to help you gain knowledge. Please leave a comment to let me know what you think about it! Share it to your friends and learn new things together.
Transcript

Regional Chamber of Commerce Nish
ICT Association
Serbian Academy of
Sciences and Arts Mathematical Institute
Center for Women Entrepreneurship
RCC Nish
Serbian Society for Informatics
Center of
Excellence and Innovation
6th International ICT
Conference Proceedings
Editors: Trajanović, M., Stanković, M.
Publisher: Regional Chamber of Commerce - Niš, Serbia
ISBN: 978-86-80593-52-4
Serbia, Niš, 14-16 October, 2014

Proceedings of 6th ICT International Conference
Serbia, Niš, 14-16 October, 2014
Editor: Prof. Dr. Miroslav Trajanović and Prof. Dr. Miomir Stanković
Technical Editor: Dr. Lazar Z. Velimirović
Technical Co-Editors: Edin Mulalić
Published by: Regional Chamber of Commerce - Niš, Serbia
Printed by: Regional Chamber of Commerce - Niš, Serbia
Number of copies printed: 200
Printing of this edition has been financially supported by
Serbian Ministry of Education, Science and Technological Development
ISBN 978-86-80593-52-4

6th ICT Conference - Synergy of Science and
Innovation Miroslav Trajanović(1), Miomir Stanković(2),
(1)University of Nis, Faculty of Mechanical Engineering, Nis, Serbia (2)University of Nis, Faculty of ocupational safety, Nis, Serbia
The International ICT Forum is an umbrella event, organized with the aim to bring together
scientists, experts and professionals from ICT fields. Since it is biannual event, participants have the
opportunity to show what they have done in the last two years in the conferences, projects’
presentations, workshops and ICT business fair. Thus, ICT Forum provides an opportunity for
dissemination and exchange of research results, ideas, innovations and new solutions.
The 6th ICT Conference was organized under the umbrella of 6th International ICT Forum. It is
very important to underline that the Conference was organized by industry and thus supported by
Regional Chamber of Commerce in Niš, Center of Excellence and Innovation, Mathematical
Institute of the Serbian Academy of Sciences and Arts, Teodora - Center for Women
Entrepreneurship, and Serbian Society of Informatics. The Conference has established itself as an
open forum where participants from industry and academia can share knowledge, best practices and
experiences from all ICT fields.
Among many submitted papers, 54 were accepted for presentation after the review process, but
after review process only 30 of them are selected for publishing in the Conference proceedings.
Authors came from 11 countries: Croatia, Germany, Portugal, France, the USA, Bulgaria, Sweden,
Slovenia, Bosnia & Herzegovina, Montenegro, and Serbia.
Although the Conference scope was wide, it was possible to identify groups of papers
concentrated in and around the specific topics. The first topic included papers in the field of new
generation of information systems.
Milan Zdravkovic discussed the vision of next-generation enterprise information systems for the
future Internet, by IFAC TC 5.3 Technical Committee for Enterprise Integration and Networking of
the International Federation for Automatic Control. The vision has foreseen that next generation IS
will be federated, omnipresent, model-driven, open, reconfigurable and aware, and thus natively
interoperable in the Future Internet. In the paper titled “Energy-efficient Distributed RSS-based
Localization in Wireless Sensor Networks Using Convex Relaxation”, Slavisa Tomic et al. in the
paper Energy-efficient Distributed RSS-based Localization in Wireless Sensor Networks Using
Convex Relaxation addressed the target localization problem in large-scale cooperative wireless
sensor networks. Dragan Manojlov elaborated the characteristics of old procurement models and
defined steps and guidelines as approach in implementation of new procurement model. Sinisa
Radulovic et al. presented ontological representation of Diploma Supplement and a Semantic Web
based application providing storage and manipulation of Diploma Supplement records. Valentina
Nejkovic and Milan Gocic introduced their view of today’s public private innovation network
conceptual framework based on Web services. Goran Simic et al. presented a hybrid clustering

method of unstructured e-Gov textual content as one of the necessary parts of advanced searching
and information retrieval systems.
Recent trends in technology increasingly demand acquiring, processing and visualizing large
amount of data. As collected data became significantly more complex in size, structure and
semantic, the issue of converting raw data into useful information has become more and more
challenging. As a consequence, traditional techniques for dealing with these problems have become
insufficient and new approaches are required. Aleksandar Janjic et al. presented selection of the
optimal smart grid strategy by using the degree of the approach to the ideal smart grid. The
comparison of alternatives is made by using fuzzy AHP methodology, taking into account the
presence of multiple criteria of both qualitative and quantitative nature, different performance
indicators and the uncertain environment of the smart grid. In the paper titled “Complexity and
throughput analysis of memory efficient APP decoders for LDPC codes”, Velimir Ilic et al.
proposed two memory efficient a posteriori probability decoders for the decoding of low-density
parity-check codes. Milan Cvetkovic presented a hedge fund data analysis using three popular
models: The CAPM, the Fama-French 3 Factor Model, and the Fung and Hsieh 7 Factor Model.
The paper titled “Use of Data Mining Techniques in Higher Education Institutions” dealt with the
presentation of the methods and techniques of data mining, as well as the strengths that made the
concept and practical application of business intelligence tools in some high education tasks.
Two papers at the Conference addressed the problems of software selection and evaluation.
Milos Madic et al. presented application of the recently developed MCDM method, namely a
weighted aggregated sum product assessment method for software selection. Dragan Misic et al.
used Analytic Hierarchy Process to compare open-source BPM Systems. The comparison was done
based on 20 criteria which are evaluated and ranked by using AHP method.
One Conference session dealt with the topic of decision making in emergency situations, ICT
and disaster management, and ICT and safety. Current ICT advancements, related to Internet, GIS,
Remote Sensing and satellite-based communication links, can facilitate the planning and
implementation of disaster risk reduction measures. These technologies have been playing a major
role in designing early warning systems, catalyzing the process of preparedness, response and
mitigation. ICT tools are also being widely used to build knowledge warehouses using internet and
data warehousing techniques. The knowledge warehouses can then facilitate planning & policy
decisions for preparedness, response, recovery and mitigation at all levels. Similarly, GIS-based
systems improve the quality of analysis of hazard vulnerability and capacity assessments, guide
development planning and assist planners in the selection of mitigation measures. Communication
systems have also become indispensable for providing emergency communication and timely relief
and response measures.
The paper titled “Crisis Management in the Defense System”, written by Samed Karovic,
focused on the crisis management leadership and the management and decision making during
crises and especially during emergencies. Ljiljana Mihajlovic et al. presented prevention of
environmental migration by using GIS as a research method. In the paper titled “Aspects of
Decision-making in Emergency Situations”, Nenad Komazec et al. proposed an approach to
modeling a system for decision support in emergency situations, based on risk assessment. Ivan
Mance et al. presented modeling method of internal control of occupational safety in corporate
systems by using multiple criteria decision making methods.
Several scientific papers considering the application of fuzzy logic and fuzzy logic systems in
risk assessment were presented at the conference. The papers (Dragan Pamucar et al.) presented a
fuzzy logic modeling system that supports the process of decision making in risk management. The
model has been tested and the results of the fuzzy model have been compared with the results given
by the present methodology applied in risk management. Also, the possibility of application of
fuzzy logic system in the estimation of how serious the flood risk may be is done.
The important issue of role of women in ICT was discussed during the conference. In the paper
titled “The status of women in Information Systems and Technologies in Serbia”, Ana Pajic and
Dragana Becejski Vujaklija highlighted the necessity of declining gender gap in information
systems and technology in Serbia, in order to use the whole potential of fast growing market.
Miroslava Raspopovic et al. focused on the position of women in the ICT sector in Serbia, and
compared their findings to the position of women in the ICT sector in Europe. In the paper titled
“Challenges and Benefits of Incorporating ICT in NGO Initiatives and Activities”, the authors
published analysis of a project conducted within NGO with the goal to increase safety among
women in order to decrease violence and provide necessary information through mobile platforms.
Several papers of the Conference dealt with the application of ICT in biomedical engineering.
Nikola Vitkovic et al. proposed a reverse engineering modeling technique which is using digitized
human femur model, parametric curves (splines), and anatomically defined geometrical entities to
develop the cloud of points model with strictly defined geometry. Such models of the human bones
can be applied for: preoperative planning in orthopaedics, creation of parametric human bone
models, rapid prototyping, creation of bone implants, etc. Stojanka Arsic et al. presented
morphological properties of the hand. The aim of this study was to show an anatomical review of
the hand bones morphology with specific anatomical landmarks which represent referent
geometrical entities (REF) required for creation of their 3D geometrical models. Nemanja
Majstorovic et al. proposed new technique, based on 3D models of upper and lower jaw, for
assessment of teeth nivelation. The models were obtained by 3D measuring of impressions during
therapy.
Manufacturing of bio form using additive technologies was topic of the paper presented by
Miodrag Manic et al. Another interesting paper was titled “Application of Computed Tomography
in Diagnostics and Management of Osteoporosis”, written by Nikola Korunovic et al. The paper
described the most important CT imaging techniques related to osteoporosis, compared them to
standard ones and outlined their main advantages. Samo Simoncic et al. presented a newly
developed fine search algorithm used in the application of digital image correlation.
Surgical procedures, in modern orthopedics, involve the use of conventional as well as the new
solutions, methods, materials and supplies that contribute to efficient operative and postoperative
procedures. Each of these interventions entails risks and uncertainties that may have effects to the
patients’ state in a shorter or longer period of time. Sasa Randjelovic et al. addressed this problem
by using Failure Mode and Effects Analysis in Orthopedic Surgery. Ivan Golubovic et al. presented
application of telemedicine in treatment of coxarthrosis using cementless endoprosthesis of the hip
joint with Fitmore® hip stem.

At the same time, some important parallel events, such as USAID REG project Workshop,
Project partnership brokerage event, ICT in Education System round table initiative group, meeting
of the Serbian Chamber's Information System, also took place. In addition, ICT Forum joined the
EU Code Week initiative by organizing promotional and educational events for the youngest
generation on the last day of the ICT Forum.


6th ICT International Conference
organized by
Regional Chamber of Commerce Niš, ICT Association
Serbian Academy of Sciences and Arts, Mathematical Institute
Center for Women Entrepreneurship, RCC Niš
Serbian Society for Informatics
Center of Excellence and Innovation
cooperators
supporters:


Program Committee
Chair:
Prof. Dr. Miroslav Trajanović, Faculty of Mechanical Engineering, Niš, Serbia
Members:
Prof. Dr. Bratislav Milovanović, Faculty of Electronic Engineering, Niš, Serbia
Prof. Dr. Vančo Litovski, Faculty of Electronic Engineering, Niš, Serbia
Prof. Dr. Hervé Panetto, Université de Lorraine, Nancy, France
Prof. Dr. Ricardo Jardim Gonçalves, New University of Lisbon UNINOVA, Lisbon, Portugal
Prof. Dr. Ljupčo Kocarev, MANU, Skopje, FYR Macedonia
Prof. Dr. Ivan Milentijević, Faculty of Electronic Engineering, Niš, Serbia
Prof. Dr. Leonid Stoimenov, Faculty of Electronic Engineering, Niš, Serbia
Prof. Dr. Vera Marković, Faculty of Electronic Engineering, Niš, Serbia
Prof. Dr. Milena Stanković, Faculty of Electronic Engineering, Niš, Serbia
Prof. Dr. Dragoljub Pokrajac, Dalaware State University, Dalaware, USA
Prof. Dr. Dragana Bečejski Vujaklija, Serbian Society for Informatics, Belgrade, Serbia
Prof. Dr. Miomir Stanković, Mathematical Institute SASA, Belgrade, Serbia
Prof. Dr. Zorica Pantić, Wentworth Institute of Technology, Boston, USA
Prof. Dr. Zora Konjović, Faculty of Technical Sciences, Novi Sad, Serbia
Prof. Dr. Elissaveta Gourova, Sofia University St. Kliment Ohridski, Sofia, Bulgaria
Prof. Dr. Alexis Aubry, Université de Lorraine, Nancy, France
Prof. Dr. Mario Lezoche, Université de Lorraine, Nancy, France
Prof. Dr. Zoran Marković, Mathematical Institute SASA, Belgrade, Serbia
Prof. Dr. Denis Trcek, Faculty for Computer and Information Science, Ljubljana, Slovenia
Prof. Dr. Peter A. Bruck, WSA, London, England
Prof. Dr. Radovan Stojanović, University of Montenegro, Podgorica, Montenegro
Prof. Dr. Vladimir Trajkovik, Faculty of Computer Science and Engineering, Skopje, FYR
Macedonia
Prof. Dr. Danijela Milošević, Faculty of Technical Sciences, Čačak, Serbia
Prof. Dr. Branko Latinović, Paneuropean University APEIRON, Banja Luka, Republic of
Srpska
Prof. Dr. Danijel Mijić, Faculty of Electrical Engineering, East Sarajevo, Republic of Srpska

Prof. Dr. Branimir Todorović, Faculty of Science and Mathematics, Niš, Serbia
Prof. Dr. Michele Dassisti, Politecnico di Bari, Bari, Italy
Prof. Dr. Branko Vučjak, Faculty of Electrical Engineering, East Sarajevo, Republic of Srpska
Prof. Dr. Miodrag Ivković, Tehnical faculty Mihajlo Pupin, Zrenjanin, Serbia
Prof. Dr. Jelica Protić, School of Electrical Engineering, Belgrade, Serbia
Prof. Dr. Vesna Nikolić, Faculty of Occupational Safety, Niš, Serbia
Prof. Dr. Proda Šećerov, IRC ALFATEC, Niš, Serbia
Prof. Dr. Đorđe Ćosić, Faculty of Technical Sciences, Novi Sad, Serbia
Prof. Dr. Petar Petrović, Faculty of Mechanical Engineering, Belgrade, Serbia
Dr. Lazar Velimirović, Mathematical Institute SASA, Belgrade, Serbia
Dr. George Sharkov, European Software Institute Center East Europe, Sofia, Bulgaria
Dr. Ivailo Georgijev, ESI CEE, Sofia, Bulgaria
Dr. Dragan Mišić, Faculty of Mechanical Engineering, Niš, Serbia
Dr. Milan Zdravković, Faculty of Mechanical Engineering, Niš, Serbia
Dr. Branko Babić, National association for security, crisis and extraordinary situations,
Belgrade, Serbia
Dr. Svetlana Cvetanović, University Metropolitan, Belgrade, Serbia
Dr. Miroslava Raspopović, University Metropolitan, Belgrade, Serbia
M.Sc. Svetislav Pantić, Center of Excellence and Innovation, Niš, Serbia
Igor Silajev, Goverment Services, State of Ontario, Canada
Nikola Iliev, Atos, Barcelona, Spain
Vladan Todorović, Atos, Munich, Germany

Organizing Committee
Chair:
M.Sc. Svetislav Pantić, Center of Excellence and Innovation, Niš, Serbia
Members:
Prof. Dr. Miomir Stanković, Mathematical Institute SASA, Belgrade, Serbia
Prof. Dr. Miroslav Trajanović, Faculty of Mechanical Engineering, Niš, Serbia
Prof. Dr. Bratislav Milovanović, Faculty of Electronic Engineering, Niš, Serbia
Prof. Dr. Branimir Todorović, Faculty of Mathematics and Science, Niš, Serbia
Prof. Dr. Danijel Mijić, Faculty of Electrical Engineering, East Sarajevo, Republic of Srpska
Dr. Lazar Velimirović, Mathematical Institute SASA, Belgrade, Serbia
Dr. Samed Karović, University of Defense, Belgrade, Serbia
Dr. Dragan Mišić, Faculty of Mechanical Engineering, Niš, Serbia
Dr. Milan Zdravković, Faculty of Mechanical Engineering, Niš, Serbia
Dr. Miloš Madić, Faculty of Mechanical Engineering, Niš, Serbia
Saša Matejić, Regional Chamber of Commerce, Niš, Serbia
Zoran Marković, Regional Chamber of Commerce, Niš, Serbia
Dragana Radenković, Regional Chamber of Commerce, Niš, Serbia
Maja Đorđević, Regional Chamber of Commerce, Niš, Serbia
Vule Vuković, Telekom Srbija, Niš, Serbia
Milica Jovanović, Telekom Srbija, Niš, Serbia
Milan Jovanović, Telegroup, Belgrade, Serbia
Dejan Blagojević, High Technical School of Professional Studies, Niš, Serbia
Nikola Marković, Serbian Society for Informatics, Belgrade, Serbia
Dušan Rakić, Belgrade Chamber of Commerce, Belgrade, Serbia
Edin Mulalić, Mathematical Institute SASA, Belgrade, Serbia
Nikola Vitković, Faculty of Mechanical Engineering, Niš, Serbia
Milan Trifunović, Faculty of Mechanical Engineering, Niš, Serbia
Dejan Ivković, JP PTT, Niš, Serbia
Goran Mladenović, Ni-CAT, Niš, Serbia
Marina Blagojević, ICT-NET, Belgrade, Serbia
Milan Solaja, Vojvodina ICT Cluster, Novi Sad, Serbia

Aleksandar Popović, EI Holding Korporacija, Niš, Serbia
Anita Nikova, MASIT, Skopje, FYR Macedonia
George Brashnarov, Nemetschek, Sofia, Bulgaria
Peter Statev, ICT Cluster, Sofia, Bulgaria
Toni Petreski, I-NET, Skopje, FYR Macedonia
Valentina Ivanova, New Bulgarian University, Sofia, Bulgaria
Tanja Radusinović, Montenegro Chamber of Commerce and Industry, Podgorica, Montenegro
Dalibor Drljača, Faculty of Electrical Engineering, East Sarajevo, Republic of Srpska
Igor Pandžić, Regional Chamber of Commerce, Banja Luka, Republic of Srpska
Slobodan Dragićević, Regional Chamber of Commerce, Banja Luka, Republic of Srpska

I
Conference Program
Tuesday, October 14th, 2014
11:00 – 11:30 Opening session of the 6th International ICT Forum 2014
Rasim Ljajić, Minister for Trade, Tourism and Telecommunications, Serbia
Zoran Perišić, Mayor of the City of Niš, Niš, Serbia
Zoran Marković, Mathematical Institute SASA, Belgrade, Serbia
Nikola Marković, Serbian Society for Informatics, Belgrade, Serbia
Snežana Marković, Secretary of State for Ministry of Education, Belgrade,
Serbia
Mihajlo Vesović, Serbian Chamber of Commerce and Industry, Belgrade,
Serbia
Zorica Pantić, Rector of the Wentworth Institute of Technology, Boston,
Massachusetts, USA
Vule Vuković, Telekom Srbija, Niš, Serbia
Dragan Kostić, Regional Chamber of Commerce Niš, Niš, Serbia
11:30 – 11:45 Ceremony of Awarding the Prize for Lifetime Achievements in the Field of
ICT
Host: Miroslav Trajanović, President of the Program Committee
11:45 – 12:15 Cyber Security Challenges From Business Perspective - What is Difference
in Threats and Prevention for Small, Medium and Enterprise Companies
Vladan Todorović, Munich, Germany
12:15 – 12:30 Model of Cooperation Between Metropolitan University and ICT Industry
Dragan Domazet, Belgrade Metropolitan University, Belgrade, Serbia
12:30 – 13:00 Introductory speech
Vili Hadžić, Coordinator of the Niš Region, Telekom Srbija, Niš
Zvonko Milošević, Coordinator of the Executive Unit Niš, Telekom Srbija, Niš
Telekom Srbija Cloud Solution, Ivan Luković, Telekom Srbija, Belgrade,
Serbia
13:00 – 14:30 Cocktail
Hall A Tuesday, October 14th, 2014, Afternoon session
Session 1, Moderator: Zora Konjović
14:30 – 15:00 Invited lecture
Next-generation Enterprise Information Systems for the Future Internet -
Vision of IFAC TC 5.3
Milan Zdravković, Faculty of Mechanical Engineering, University of Niš, Niš,
Serbia

II
15:00 – 15:15 Energy-efficient Distributed RSS-based Localization in Wireless Sensor
Networks Using Convex Relaxation
Slaviša Tomić, Milica Marić, Marko Beko, Rui Dinis, Miroslava Raspopović,
Ramo Sendelj, Institute for Systems and Robotics/IST, Lisbon, Portugal;
Universidade Lusófona de Humanidades e Tecnologias, Lisbon, Portugal;
UNINOVA – Campus FCT/UNL, Caparica, Portugal; Instituto de
Telecomunicações, Lisbon, Portugal; DEE/FCT/UNL, Caparica, Portugal;
Faculty of Information Technology, Metropolitan University, Belgrade, Serbia;
Faculty of Information Technology, University Mediterranean, Montenegro
15:15 – 15:30 SMARTIE – Project Overview
Vladan Rankov, DunavNET, Novi Sad, Serbia
15:30 – 15:45 IoT Lab - Crowdsourced Experimental Environment
Aleksandra Rankov, DunavNET, Novi Sad, Serbia
15:45 – 16:00 SocIoTal – Creating Citizen Centric Internet of Things
Nenad Gligorić, Srđan Krco, DunavNET, Novi Sad, Serbia
16:00 – 16:30 Coffee break
Session 2, Moderator: Dragan Mišić
16:30 – 17:00 Invited lecture
Smart Grid Strategy Assessment using the Fuzzy AHP
Aleksandar Janjić, Miomir Stanković, Lazar Velimirović, Faculty of Electronic
Engineering, University of Niš, Niš, Serbia; Faculty of Occupational Safety,
University of Niš, Niš, Serbia; Mathematical Institute of the Serbian Academy
of Sciences and Arts, Belgrade, Serbia
17:00 – 17:15 Toward Cyber-physical Manufacturing Systems
Nemanja Majstorović, Jelena Mačužić, Tatjana V. Sibalija, Mechanical
Engineering Faculty, University of Belgrade, Belgrade, Serbia; Metropolitan
University, Belgrade, Serbia
17:15 – 17:30 Invited lecture
On the Memory Complexity of APP Decoders for LDPC Codes
Velimir Ilić, Elsa Dupraz, David Declercq, Bane Vasić, Mathematical Institute
SANU, Belgrade, Serbia; ETIS laboratory, Cergy-Pontoise, France; ETIS
laboratory, Cergy-Pontoise, France; Department of ECE, University of Arizona,
Tucson, Arizona, USA
17:30 – 17:45 Invited lecture
Hedge Fund Data Analysis
Milan Cvetković, Central Bank of Serbia, Belgrade, Serbia
17:45 – 18:00 Procurement Optimization in Electric Power
Dragan Manojlov, Deloitte Central Europe/ERS, Belgrade, Serbia
18:00 – 18:15 Software Requirements for Modern Procurement
Dragan Manojlov, Deloitte Central Europe/ERS, Belgrade, Serbia

III
18:15 – 18:30 Semantic Web Based Modeling and Implementation of Diploma
Supplement
Siniša Radulović, Milan Segedinac, Zora Konjović, Danulabs, Novi Sad,
Serbia; Faculty of Technical Sciences, University of Novi Sad, Novi Sad, Serbia
18:30 – 18:45 Web Services for Public-private Innovation Networks
Valentina Nejković, Milan Gocić, Faculty of Electronic Engineering, University
of Niš, Niš, Serbia; Faculty of Civil Engineering and Architecture, University of
Niš, Niš, Serbia
Hall B Tuesday, October 14th, 2014, Afternoon session
Session 3, Moderator: Saša Matejić
14:30 – 16:00 Meeting of the Serbian Chamber’s Information System
Planning and Programming Future Steps in Unified Information System of
the Serbian Chamber System
Chairman: Nebojša Garić, Serbian Chamber of Commerce and Industry,
Belgrade, Serbia
16:00 – 16:30 Coffee break
Session 4, Moderator: Saša Matejić
16:30 – 17:00 ICT in Education System
Meeting of the Workgroup for Round Table Initiation
Moderator: Saša Matejić, Regional Chamber of Commerce Niš, Niš, Serbia
20:00 – Conference dinner
Hall A Wednesday, October 15th, 2014, Morning session
Session 5, Moderator: Miomir Stanković
09:30 – 10:00 Invited lecture
Crisis Management in the Defense System
Samed Karović, Military Academy, University of Defense, Belgrade; Serbia
10:00 – 10:15 eIDAS – qualified Digital Signature – Next Generation
Dušan Berdić, Serbian Chamber of Commerce and Industry, Belgrade, Serbia
10:15 – 10:30 Prevention of Environmental Migration Using GIS as a Research Method
Ljilјana Mihajlović, Nenad Komazec, Mirolјub Milinčić, Bojana Mihajlović,
Tijana Đorđević, Faculty of Geography, University of Belgrade, Belgrade,
Serbia; Military Academy, University of Defense, Belgrade, Serbia

IV
10:30 – 10:45 Aspects of Decision-making in Emergency Situations
Nenad Komazec, Darko Božanić, Liljana Mihajlović, Military Academy,
University of Defense, Belgrade, Serbia; Faculty of Geography, University of
Belgrade, Belgrade, Serbia
10:45 – 11:00 Hybrid Clustering Method of Unstructured e-Gov Textual Content
Goran Simić, Ejub Kajan, Dragan Ranđelović, Military Academy, University of
Defense, Belgrade, Serbia; State University of Novi Pazar, Novi Pazar, Serbia,
The Academy of Criminal and Police Studies, Belgrade, Serbia
11:00 – 11:30 Coffee break
Session 6, Moderator: Aleksandar Janjić
11:30 – 12:00 Invited lecture
Application of Fuzzy Logic for Quantification of Uncertainty in Risk
Management
Dragan Pamučar, Military academy, University of Defense, Belgrade, Serbia
12:00 – 12:15 Invited lecture
Importance of Prevention in Protection and Rescue Systems
Branko Babić, Higher Educational School of Professional Studies, Novi Sad,
Serbia
12:15 – 12:30 Flood Hazard Assessment by Application of Fuzzy Logic
Dragan Pamučar, Darko Božanić, Nenad Komazec, Military Academy,
University of Defense, Belgrade, Serbia
12:30 – 12:45 Modeling Of Internal Control Of Occupational Safety In Corporate
Systems By Using Multiple Criteria Decision Making Methods
Ivan Mance, Vesna Nikolić, Vladimir Hužak, HP - Croatian Post; Faculty of
Occupational Safety, University of Niš, Niš, Serbia; Department of
Occupational Safety, Fire Protection and Ecology, Zagreb, Croatia,
Hall A Wednesday, October 15th, 2014, Afternoon session
Session 7, Moderator: Miroslava Raspopović
14:30 – 14:45 Invited lecture
The Status of Women in Information Systems and Technologies in Serbia,
Ana Pajić, Dragana Bečejski Vujaklija, Faculty of Organizational Sciences,
University of Belgrade, Belgrade, Serbia
14:45 – 15:00 Research of Women Position in ICT Industry – Statistics or Maybe
Something Else
Zora Konjović, Faculty of Technical Sciences, University of Novi Sad, Novi
Sad, Serbia

V
15:00 – 15:15 Women Active in ICT Sector in Serbia
Miroslava Raspopović, Svetlana Cvetanović, Milica Vasiljević Blagojević,
Belgrade Metropolitan University, Faculty of Information Technology,
Metropolitan University, Belgrade, Serbia; Faculty of Management, University
of Belgrade, Belgrade, Serbia
15:15 – 15:30 Challenges and Benefits of Incorporating ICT in NGO Initiatives and
Activities
Miroslava Raspopović, Vuk Vasić, Faculty of Information Technology,
Metropolitan University, Belgrade, Serbia
15:30 – 15:45 Women Enrolled in Bachelor and Master Degree Programs in Informatics
Valentina Ivanova, New Bulgarian University, Sofia, Bulgaria
15:45 – 16:00 Women in IT
Zora Konjović, Faculty of Technical Sciences, University of Novi Sad, Novi
Sad, Serbia
16:00 – 16:30 Coffee break
Session 8, Moderator: Svetlana Cvetanović
16:30 – 17:00 Invited lecture
Agile Organizational Development: what Organizations Can Learn from
Software Development
Jasmina Nikolić, Higher Education Reform Experts (HERE) Team, Ministry of
Education, Science and Technological Development, Belgrade, Serbia
17:00 – 17:15 Invited lecture
E-leadership
Valentina Ivanova, New Bulgarian University, Sofia, Bulgaria
17:15 – 17:30 Woman in High School Education and Research in ICT Industry
Gordana Milosavljević, Faculty of Technical Sciences, University of Novi Sad,
Novi Sad, Serbia
17:30 – 17:45 Use of Data Mining Techniques in Higher Education Institutions
Nataša Aleksić, Higher Technical School, Kragujevac, Serbia
17:45 – 18:00 Women in ICT Industry
Dragana Čalija, Faculty of Technical Sciences, University of Novi Sad, Novi
Sad, Serbia
18:00 – 18:15 Application of the WASPAS Method for Software Selection
Miloš Madić, Nikola Vitković, Milan Trifunović, Faculty of Mechanical
Engineering, University of Niš, Niš, Serbia
18:15 – 18:30 AHP Based Comparison of Open-source BPM Systems
Dragan Mišić, Milena Mišić, Milan Trifunović, Faculty of Mechanical
Engineering, University of Niš, Niš, Serbia; Jožef Stefan Institute, Ljubljana,
Slovenia

VI
USAID REG project Workshop No. 2
Hall B Wednesday, October 15th, 2014, Morning session
Session 9, Moderator: Filip Stojanović
09:45 – 10:00 Opening
10:00 – 11:30 Project Proposal Preparation: Enhancing ICT Cluster Excellence in BSEC
Region / BSEC Excellence
Project idea development;
Working Packages;
Consortia partners
Definition of responsibilities per partner
11:30 – 12:00 Coffee break
12:00 – 13:25 Finalizing the Project Proposal
Budget development
Project management
13:25 – 13:30 Signing of Memorandum of Understanding Between Clusters from the
Region
13:30 – 14:30 Lunch break
Hall B Wednesday, October 15th, 2014, Afternoon session
Session 10, Moderator: Zoran Marković
14:30 – 16:00 Future Activities
discussing/planning future bids for 2015
seeking bidding opportunities for cross-border projects
16:00 – 16:30 Coffee break
Hall B Wednesday, October 15th, 2014, Business 2 Business & Brokerage event
16:30 – 19:00 Brokerage Event - Project Proposal:
Calendar for Social Networking
Open Access Repository of Health Images
Software and hardware development for additional insurance, ATMs OF
PAYMENT AND PAYMENT OF MONEY
FRACTALS
Business 2 Business – Company Contacts
TiCo – Internet shop
Alfatek – R&D Center

VII
Hall A Thursday, October 16th, 2014, Morning session
Session 11, Moderator: Miloš Stojković
09:30 – 10:00 Invited lecture
VandAlert – Your Cyber Eyes and Ears
Marko Živanović, Vand Alert, Niš, Serbia
10:00 – 10:15 Geometrically Defined Cloud of Anatomical Points of Human Femur
Trochanteric and Neck Region
Nikola Vitković, Miodrag Manić, Miroslav Trajanović, Miloš Stojković,
Dragan Mišić, Miloš Madić, Stojanka Arsić, Faculty of Mechanical
Engineering, University of Niš, Niš, Serbia; Faculty of Medicine, University of
Niš, Niš, Serbia
10:15 – 10:30 Morphological Properties of the Hand Bones Important for their 3D
Geometrical Modeling
Stojanka Arsić, Nikola Vitković, Miodrag Manić, Miloš Stojanović, Faculty of
Medicine, University of Niš, Niš, Serbia; Faculty of Mechanical Engineering,
University of Niš, Niš, Serbia
10:30 – 10:45 Bio-Form and Complex Configuration Elements Designing and Their
Production with Additive Technologies
Miodrag Manić, Jelena Milovanović, Nikola Vitković, Miroslav Trajanović
Zoran Stamenković, Faculty of Mechanical Engineering, University of Niš, Niš,
Serbia
10:45 – 11:00 Application of Computed Tomography in Diagnostics and Management of
Osteoporosis
Nikola Korunović, Jelena Rajković, Slađana Petrović, Stevo Najman, Dragan
Mihailović, Faculty of Mechanical Engineering, University of Niš, Niš, Serbia;
Faculty of Science and Mathematics, University of Niš, Niš, Serbia; Clinical
Centre Niš, Niš, Serbia
11:00 – 11:30 Coffee break
Session 12, Moderator: Nikola Korunović
11:30 – 12:00 Failure Mode and Effects Analysis as Support Orthopedic Surgery
Saša Randjelović, Igor Kostić, Dejan Tanikić, Dalibor Đenadić, Faculty of
Mechanical Engineering, University of Niš, Niš, Serbia; Orthopedic and
Traumatology Clinic, Faculty of Medicine, University of Niš, Niš, Serbia;
Technical Faculty Bor, University of Belgrade, Bor, Serbia
12:00 – 12:15 Enhanced Coarse-Fine Search Scheme for Digital Image Correlation
Samo Simončić, Melita Kompolsek, Primož Podržaj, Faculty of Mechanical
Engineering, University of Ljubljana, Ljubljana, Slovenia, Higher Vocational
College, Novo Mesto, Slovenia
12:15 – 12:30 Using 3D Modeling in Assessment of Teeth Nivelation
Nemanja Majstorović, Jelena Macuzić, Branislav Glišić, Faculty of Mechanical
Engineering, University of Belgrade, Belgrade, Serbia; Faculty of Dentistry,
University of Belgrade, Belgrade, Serbia

VIII
12:30 – 12:45 Application of Telemedicine in Treatment of Coxarthrosis Using
Cementless Endoprosthesis of the Hip Joint With Fitmore® Hip Stem
Ivan Golubović, Zoran Baščarević, Zoran Golubović, Predrag Stoiljković, Stevo
Najman, Marija Trenkić Božinović, Slađana Petrović, Zoran Radovanović,
Sanja Stojanović, Milica Stanisavljević, Mila Janjić, Saša Stojanović, Sonja
Stamenić, Milan Ćirić, Faculty of Medicine, University of Niš, Niš, Serbia
12:45 – 13:00 Implementation of IT Data Collection and Processing Methodologies for
Improvement of Electric Energy Corporation Performances
Aleksandar Popović, Electronic Industry Holding Corporation, Niš, Serbia
Hall A Thursday, October 16th, 2014, Afternoon session
Session 13, Moderator: Bratislav Milovanović
14:30 – 15:00 Invited lecture
Research and Development of Software Defined Radio Systems and
Related Technologies in Serbia
Predrag Petrović, IRITEL, Belgrade, Serbia
15:00 – 15:15 Atomia Cloud Hosting Platform
Mladen Stojanović, Atomia, Vasteras, Sweden
15:15 – 15:30 Problems for Development of E-government in Republic of Srpska
Dalibor Drljača, Branko Latinović, Lukavica, University of East Sarajevo,
Bosnia and Herzegovina; Pan European University APEIRON, Banja Luka,
Bosnia and Herzegovina
15:30 – 15:45 A New Approach to Integral Information System of a Company
Mitko Minić, Micro Computer Software, Pirot, Serbia
Hall B Thursday, October 16th, 2014, Morning session
Session 14, Moderator: Dejan Blagojević
10:00 – 14:00
Bring Your Ideas to Life with #coding
13:00 – 15:00 Meeting of the Executive Board of the High Electrotechnical Schools
Association
Moderator: Milan Vukobrat, President of the Association
Instead of Closing – New Hopes and Farewell Coffee
Hall A Thursday, October 16th, 2014, Afternoon session
15:45 – Instead of Closing—New Hopes and Best Presentation Award

IX
Table of Contents
Next-generation Enterprise Information Systems for the Future Internet - Vision of IFAC
TC 5.3 .................................................................................................................................................. 3
Milan Zdravković
Energy-efficient Distributed RSS-based Localization in Wireless Sensor Networks Using
Convex Relaxation ............................................................................................................................. 7
Slaviša Tomić, Milica Marić, Marko Beko, Rui Dinis, Miroslava Raspopović, Ramo Sendelj
Smart Grid Strategy Assessment Using the Fuzzy AHP .............................................................. 13
Aleksandar Janjić, Miomir Stanković, Lazar Velimirović
Toward Cyber-Physical Manufacturing Systems ......................................................................... 19
Nemanja Majstorović, Jelena Mačužić, Tatjana Sibalija
On the Memory Complexity of APP Decoders for LDPC Codes ............................................... 22
Velimir Ilić, Elsa Dupraz, David Declercq, Bane Vasić
Hedge Fund Data Analysis .............................................................................................................. 28
Milan Cvetković
Software Requirements for Modern Procurement ....................................................................... 34
Dragan Manojlov
Semantic Web Based Modeling and Implementation of Diploma Supplement ......................... 40
Siniša Radulović, Milan Segedinac, Zora Konjović, Goran Savić
Web Services for Public-private Innovation Networks ................................................................ 47
Valentina Nejković, Milan Gocić
Crisis Management in the Defense System .................................................................................... 53
Samed Karović
Prevention of Environmental Migration Using GIS as a Research Method .............................. 60
Ljilјana Mihajlović, Nenad Komazec, Mirolјub Milinčić, Bojana Mihajlović, Tijana Đorđević
Aspects of Decision-making in Emergency Situations .................................................................. 64
Nenad Komazec, Darko Božanić, Liljana Mihajlović
Hybrid Clustering Method of Unstructured e-Gov Textual Content ......................................... 68
Goran Simić, Ejub Kajan, Dragan Ranđelović
Application of Fuzzy Logic for Quantification of Uncertainty in Risk Management ............... 72
Dragan Pamučar
Flood Hazard Assessment by Application of Fuzzy Logic ........................................................... 80
Dragan Pamučar, Darko Božanić, Nenad Komazec
Modeling Of Internal Control Of Occupational Safety In Corporate Systems By Using
Multiple Criteria Decision Making Methods ................................................................................. 86
Ivan Mance, Vesna Nikolić, Vladimir Hužak
The Status of Women in Information Systems and Technologies in Serbia............................... 94
Ana Pajić , Dragana Bečejski Vujaklija
Women Active in ICT Sector in Serbia .......................................................................................... 99
Miroslava Raspopović, Svetlana Cvetanović, Milica Vasiljević Blagojević

X
Challenges and Benefits of Incorporating ICT in NGO Initiatives and Activities .................. 103
Miroslava Raspopović, Vuk Vasić
Use of Data Mining Techniques in Higher Education Institutions ........................................... 108
Nataša Aleksić
Application of the WASPAS Method for Software Selection .................................................... 115
Miloš Madić, Nikola Vitković, Milan Trifunović
AHP Based Comparison of Open-source BPM Systems ............................................................ 119
Dragan Mišić, Milena Mišić, Milan Trifunović
Geometrically Defined Cloud of Anatomical Points of Human Femur Trochanteric and
Neck Region .................................................................................................................................... 126
Nikola Vitković, Miodrag Manić, Miroslav Trajanović, Miloš Stojković, Dragan Mišić,
Miloš Madić, Stojanka Arsić
Morphological Properties of the Hand Bones Important for Their 3D Geometrical
Modeling ......................................................................................................................................... 130
Stojanka Arsić, Nikola Vitković, Miodrag Manić, Miloš Stojanović
Bio-Form and Complex Configuration Elements Designing and Their Production with
Additive Technologies .................................................................................................................... 136
Miodrag Manić, Jelena Milovanović, Nikola Vitković, Zoran Stamenković
Application of Computed Tomography in Diagnostics and Management of Osteoporosis .... 141
Nikola Korunović, Jelena Rajković, Slađana Petrović, Stevo Najman, Dragan Mihailović
Failure Mode and Effects Analysis as Support Orthopedic Surgery ........................................ 147
Saša Ranđelović, Igor Kostić, Dejan Tanikić, Dalibor Đenadić
Enhanced Coarse-fine Search Scheme for Digital Image Correlation...................................... 151
Samo Simončić, Melita Kompolšek, Primož Podržaj
Application of Telemedicine in Treatment of Coxarthrosis Using Cementless
Endoprosthesis of the Hip Joint With Fitmore® Hip Stem ....................................................... 155
Ivan Golubović, Zoran Baščarević, Ivica Lalić, Marko Kadija, Zoran Golubović, Predrag
Stoiljković, Stevo Najman, Marija Trenkić-Božinović, Slađana Petrović, Zoran Radovanović,
Sanja Stojanović, Milica Stanisavljević, Mila Janjić, Saša Stojanović, Sonja Stamenić, Milan Ćirić
Problems for development of E-Government in Republic of Srpska ........................................ 158
Dalibor Drljača, Branko Latinović

Tuesday, October 14th, 2014


ISBN 978-86-80593-52-4
3
Next-generation Enterprise Information Systems
for the Future Internet - Vision of IFAC TC 5.3
Milan Zdravković1 1Faculty of Mechanical Engineering, University of Niš, Niš, Serbia
Abstract— The rapid changes of socio-economic and
technological environment in which the enterprises operate
today continuously generate new requirements for the
evolution of both theoretical and practical aspects of the
Enterprise Information Systems (EIS). This evolution
creates the complexity which cannot be handled by the
traditional architectures. The constant pressure of
requirements for more data, more collaboration and more
flexibility launched the discussions on the Next Generation
EIS (NG EIS) which is federated, omnipresent, model-
driven, open, reconfigurable and aware. All these properties
imply that the future enterprise system is inherently,
natively interoperable in the Future Internet. This keynote
presents the discussion that spans several research
challenges of the future interoperable enterprise systems,
specialized from the existing general research priorities and
directions of IFAC TC 5.3 Technical Committee for
Enterprise Integration and Networking of the International
Federation for Automatic Control.
I. INTRODUCTION
Despite the rapid advance of ICT technologies and their different applications for conceptualizing, modeling, development and implementation of the Enterprise Information Systems (EIS), the rate of EISs adoption and effectiveness of their use is not yet at the satisfactory level. The gap between the promised and realized value for enterprises is threatening to become even wider when the rise of ubiquitous computing and its application is considered. The succesful implementations of different ubiquitous technologies, such as Wireless Sensor Networks (WSN), Cyber-physical Systems (CPS) [1], Internet-of-Things (IoT) [2] and Future Internet Enterprise Systems (FinES) [3] are pushing us to reconsider traditional body-of-knowledge on the design and development of EIS. The increasing diversity and multiplicity of platforms where EISs are operating and lack of common, unifying standards and theories bring the distributed, federated architectures into the focus of EIS developers and users.
The above-mentioned paradigms will facilitate the pervasiveness of the enterprise, blurring its traditional boundaries to the point where internal and external stimuli
cannot be distinguished. As pervasiveness implies a federation of processing capabilities and knowledge resources, the new paradigms will also make collective intelligence more accessible and coordinated.
In an attempt to reconsider the notion of the enterprise, the FInES cluster has developed the concept of Sensing Enterprise (SE). The SE is also described as “an enterprise anticipating future decisions by using multi-dimensional information captured through physical and virtual objects and providing added value information to enhance its global context awareness” [1]. In fact, it is not characterized only by awareness (as the term implies), but also by decentralized or even collective intelligence. This does not only concern collaboration in decision making, but also purposefulness evaluated in its environment. Thus, an SE is in fact a social enterprise, sometimes also described as ‘liquid’ to suggest its pervasiveness. The ‘liquid’ character of the SE is supported by the anticipation that sensors will become a commodity in the future [4]. Thus, the ownership of an enterprise on the sensors will not necessarily restrict other organizations to provide value-added services, based on observations of these sensors. Santucci et al. [4] point out that “the Sensing Enterprise will be a sort of radar in perfect osmosis with an ecosystem of ‘objects’ supported by several private area networks and delivering in real time a wealth of unstructured data, not only more data but also new data”.
In order for the above mentioned architectures to work for the benefit of the sensing enterprises, as their enablers and facilitators, interoperability will need to become the key requirement for their design and development.
Semantic interoperability (often referred to as semantic integration) is foreseen as an approach to establish the universal and unconditional interoperability, in the sense that it is expected to reduce the volume of pre-conditions/pre-agreements needed to be fulfilled/established before two systems can effectively interoperate. Unfortunately, it seems that the expectations from the semantic interoperability are failing beyond the limits of the academic exercises. For example, the research community failed to achieve effective automatic reconciliation of semantic heterogeneities of two
ISBN 978-86-80593-52-4
4
models/schemas/ontologies/information artifacts. In practice, this reconciliation is done manually. Hence, it is error-prone, labor intensive and thus, inefficient. It is common that 60-80% of the resources in data sharing projects are spent on addressing the issues of semantic heterogeneities [5]. These efforts are considered as important pre-condition for the interoperability and they involve many pre-agreements, needed to be established, mainly related to the meaning of the heterogeneous models and data structures. Exactly the reduction of these pre-conditions and pre-agreements is considered as a key challenge for semantic interoperability research today.
In this paper, the properties of NG EIS are identified. Based on this process, it is argued that interoperability will become, in fact, the inherent property of NG EIS. Finally, the approach to achieve the semantic interoperability as a property of NG EIS is proposed.
II. PROPERTIES OF NG EIS
The properties of NG EIS have been identified based on the synthesis of the different works, mainly done within Future Internet Enterprise Systems (FInES) cluster of projects, supported by the European Commission [6]. In its recently published research roadmap [3], FInES cluster identified the ICT solutions and socio-technical systems aimed at supporting the emerging future enterprises that will largely operate over the Future Internet, including also enabling technologies. The following properties of NG EIS are identified:
- Omnipresence. NG EIS is not anymore bound to the traditional deployment platforms. Now, these platforms also include the devices, sensors, etc., all of which could host NG EIS or its components, implying that one EIS
will now become in fact, Enterprise Information Ecosystem (EIE). As new platforms are being embedded in the physical enterprise resources (e.g. transport), the NG EIS will become pervasive, ubiquitous, omnipresent.
- Model-driven architecture. NG EIS will solely be based on the different models of the business realities, with associated methods and paradigms not only for transformation of these models to executable code, but to their real-time use [7]. Hence, the complexity of the contexts in which NG EIS operates (business logic, in terms of traditional systems architecture), will be moved out of its core native environment to the independent, reusable, partially open models’ infrastructure, addressing also the problem of business-IT alignment.
- Openness. Not only that the above mentioned models infrastructure will assumingly be distributed and collaboratively maintained, NG EIS will use the different, functionally, logically and geographically distributed knowledge resources, sometimes even public, e.g. Open Linked Data.
- Dynamic configurability. The models will be used also to dynamically configure and reconfigure the system in specific circumstances. NG EIS will be capable to search for and automatically use the required distributed computing elements (e.g. services) and models from cloud repositories [8]. Besides functional issues, this will address the growing computation requirements.
- Multiplicity of the identities. NG EIS will operate in the different circumstances that are posing the different needs to maintain the different identities, e.g. on social networks, negotiation platforms, etc. These identities will be exhibited by the different profiles of one NG EIS, e.g. its smart objects, agents, avatars.
Next Generation Enterprise Information System (NG EIS)
Distributed identities
Services infrastructure Models infrastructure
Deployment platform
Interoperability Infrastructure
Core Execution
Environment
Security
Trust
Scalability
Integrity
Performance
Omnipresence Model driven
architecture Openness
Multiplicity of
identities
Awareness/Inclusive
sensing
Computational
flexibility
Dynamic
configurability
Fig. 1. Abstract architecture of NG EIS
- Awareness/Inclusive sensing. In a long term, NG EIS will exhibit awareness as the property evolved from the system integration paradigm. The awareness assumes also the capability to sense, perceive and understand the messages exchanged with other systems, as well as various multi-modal stimuli from its environment [9]. Aware NG EISs will respond to the recognized need to develop sensing capabilities in an enterprise. Through a
new generation of sensorial networked systems, the NG EIS will establish the Enterprise concept into a scientific framework that tackles novel physical and virtual sensorial capabilities to empower the holistic enterprise capacities.
- Computational flexibility. Increased complexity will often pose the need to consider the progressive abandonment of the deterministic approach in business
ISBN 978-86-80593-52-4
5
applications. The models infrastructure of NG EIS will also provide associated computational assets that will allow the system to seamlessly combine deterministic and non-deterministic reasoning in specific circumstances.
One NG EIS needs to exhibit the above listed properties while maintaining the core horizontal features, such as security, trust, scalability, integrity and performance.
The list of properties implies that interoperability is foreseen as an inherent property of the NG EIS. It facilitates forming ad-hoc EIE, spanning the boundaries of the multiple enterprises; it uses the correspondences between the different models and enables their use by the core execution environments; it integrates data, information and knowledge resources and services; it enables a federation of NG EIS functions to its smart objects, agents and avatars; it facilitates ad-hoc communication of the different systems.
The listed properties are used to propose the generic abstract architecture of the NG EIS, as illustrated on Fig.1.
III. SEMANTIC INTEROPERABILITY AS A PROPERTY OF
NG EIS
The semantic interoperability goes beyond mere data exchange and deals with its interpretation, in order to facilitate interoperability based on the interpreted meaning. The notion of interpretation implies that some
kind of intelligence is needed by the systems so to understand the information that is being transmitted. In the contemporary research of semantic interoperability, the process of understanding is reduced to the process of reasoning about the transmitted concepts, in which the meaning is assigned to transmitted messages. However, there exist a number of theories proposing that the more complex, actually anthropomorphic perspective to semantic interoperability could provide better results. In such a perspective, the semantic interoperability, so far considered as unidirectional property of a pair of the systems [10] that interoperate, is now replaced with an assumption that it is in fact an inherent property of a single system, realizing its capabilities to sense, perceive its environment, make an intelligent decision on the response to a perceived meaning of the stimuli and articulate this response [11] (see Fig.2). The assumption is based on analogies with the human communication process, which is today considered as interplay of 4 physiological and psychological groups of processes: sensation (physiological), perception, cognition and articulation [12]. Hence, the interoperability property of one NG EIS is constituted by the corresponding attributes of awareness, perceptivity, intelligence and extroversion. These attributes can be further decomposed [13], as it is further elaborated.
Cognition Articulation
Sensation Perception
Sensation Perception
Cognition Articulation
sensed-by(p,R)
perceived-by(q’,R)
∧ p⇒q’ ∧ q’⇔q
articulated-by(p,S)
statement-of(q,S)
∧ p⇒q
…. Articulation Articulation
Fig. 2. Abstract architecture of NG EIS
For example, there exist a need to separately consider the self-awareness and environmental awareness of NG EIS. While the latter is crucial for exploiting its omnipresence, the former is relevant for maintaining NG EIS’s multiple identities (e.g. towards suppliers’ and customers’ systems, but also on web or a social network). The omnipresence of a NG EIS extends the conventional domains of interest of an enterprise (e.g. typical channels for detecting new business opportunities). Hence, now, one has to consider not only the functional environmental awareness of NG EIS, but also a universal awareness concerning observations of any stimuli, even from unknown and unanticipated sources. When arbitrary stimuli are taken into account, it becomes important for the system to achieve the capability to perceive any stimulus - be it multi-modal, multi-dimensional, discrete or continuous.
Perceptivity is a capability of a NG EIS to assign a meaning to the observation from its environment or from
within itself. When considering the awareness capabilities, mentioned above, we can distinguish between the perceptivity related to perceiving the sensor data and the perceptivity related to assigning a meaning to an incoming message. Both are based on the access to a wide range of perceptual theories or sets, consisting of different ontologies representing the domain knowledge, but also motivational aspects of communication, e.g. different problem or application ontologies.
Then, based on the perception, the NG EIS should be able to decide on the consequent action. This decision is a result of a cognitive process, which consists of identification, analysis and synthesis of the possible actions to perform in response to the “understood” observation. Consequently, we discuss about the observational and communicative perceptivity. The intelligence also encompasses assertion, storing and acquisition of the behavior patterns, based on the post-

ISBN 978-86-80593-52-4
6
agreements on the purposefulness of the performed actions.
The last desired attribute of a NG EIS, extroversion, is related to its willingness and capability to articulate the above action/s and it demonstrates the enterprise’s business motivation and/or a concern about its physical and social environment.
IV. CONCLUSION
This paper presents a vision statement of IFAC TC5.3 related to the development of the semantic interoperability property of the NG EIS.
Enterprises should be addressed as complex adaptive systems, stimulated by extensive and resilient sensorial capabilities that are able to detect physical and virtual stimulus, recognizing the context of specific situations and responding and/or reacting accordingly. To achieve such capabilities, a novel framework is required with normalized reference models, formal methods, standardized architecture and open platform and tools, model and process adaptation and morphisms for data and model transformation able to realize the universal sensing capabilities of the enterprise. Actually, it is the context-aware NG EIS that will enable the enterprises with the capability for global context awareness of the business systems and with the faculty to perceive their holistic actual status in a real-time and anticipate future decisions by using multi-dimensional and multi-modal information.
The universal awareness and self-awareness of one NG EIS and its corresponding capacity to perceive the stimulus of an unknown background, character, source, underlying motivation, etc., will draw directly from a semantic interoperability as a property of this NG EIS. The Next Generation internet will be a key technological enabler of complex, loosely connected or disconnected functional networks of devices. Each of these networks will sore and maintain knowledge that can be of benefit for a sensing enterprise. When this knowledge become available externally, the NG EIS will become capable to form on-demand virtual ecosystems of data, models, services, and computational resources. Capabilities to sense these resources, perceive their meaning by combining different perceptual theories even computational methods and act upon these perceptions are crucial components of the semantic interoperability property of NG EIS.
NG EIS will enable enterprises to become regulated open, but controlled-border cyber-physical systems of intra- and inter- systems/networks of people, process, data, things, and services cooperating towards common or
compatible goals as well as competing within a Global Networked Economy. Enabling interoperability as a property of any entity in the IoE will become a technical reality in the near future, handling the dynamic categorization, membership, integration, accreditation, rewarding and disintegration of different entities within multiple networks.
REFERENCES
[1] E. Lee, Cyber Physical Systems: Design Challenges. Technical Report No. UCB/EECS-2008-8, 2008, University of California, Berkeley.
[2] K. Ashton, That 'Internet of Things' Thing, in the real world things matter more than ideas. RFID, http://www.rfidjournal.com/articles/view?4986, 2009.
[3] FInES Future INternet Enterprise Systems - Research Roadmap 2025. 2012.
[4] G. Santucci, C. Martinez, and D. Vlad-Câlcic, The Sensing Enterprise. 2012.
[5] A. Doan, N. F. Noy, A. Y. Halevy, Introduction to the special issue on semantic integration, ACM SIGMOD Record. 33(4):11-13, 2004.
[6] FInES, a. FInES Cluster, Position Paper on Orientations for FP8, http://cordis.europa.eu/fp7/ict/enet/documents/fines-position-paper-fp8-orientations-final.pdf
[7] C. Agostinho, J. Černý, and R. Jardim-goncalves, MDA-Based Interoperability Establishment Using Language Independent Information Models, In: M. van Sinderen et al., eds. 4th International IFIP Working Conference on Enterprise Interoperability (IWEI 2012). Harbin, China: Springer, pp. 146–160, 2012.
[8] Y. Ducq, D. Chen, T. Alix, Principles of Servitization and Definition of an Architecture for Model Driven Service System Engineering, In proceedings of the 4th International IFIP Working Conference on Enterprise Interoperability (IWEI 2012). Harbin, China: Springer, 2012.
[9] R. Jardim-Goncalves, A. Grilo, K. Popplewell, Sustainable interoperability: The future of Internet based industrial enterprises, Computers in Industry, 63(8):731-738, 2012.
[10] J. Sowa, Knowledge Representation : Logical, Philosophical, and Computational Foundations, CA:Brooks/Cole Publishing Co. 2000.
[11] M. Zdravković, M. Trajanović, H. Panetto, Enabling Interoperability as a Property of Ubiquitous Systems: Towards the Theory of Interoperability-of-Everything, 4th International Conference on Information Society and Technology (ICIST 2014). 9-12 March, 2014. Kopaonik, Serbia. In: Zdravkovic, M., Trajanovic, M., Konjovic, Z. (Eds.): ICIST 2014 Proceedings, ISBN 978-86-85525-14-8 pp.240-247, 2014.
[12] S. W. Littlejohn, K. A. Foss, Theories of Human Communication, Waveland Press, Inc. 2010.
[13] M. Zdravković, O. Noran, M. Trajanović, Towards Sensing Information Systems, In proceedings of the 23rd International Conference on Information Systems Development, Varaždin, Croatia, September 2-4, 2014.

ISBN 978-86-80593-52-4
7
Energy-efficient Distributed RSS-based
Localization in Wireless Sensor Networks Using
Convex Relaxation
SlavišaTomić1, Milica Marić3, Marko Beko2,3, Rui Dinis4,5, Miroslava Raspopović6, Ramo Sendelj7 1Institute for Systems and Robotics/IST, Lisbon, Portugal
2Universidade Lusófona de Humanidades e Tecnologias, Lisbon, Portugal 3UNINOVA – Campus FCT/UNL, Caparica, Portugal
4Instituto de Telecomunicações, Lisbon, Portugal 5DEE/FCT/UNL, Caparica, Portugal
6Faculty of Information Technology, Belgrade Metropolitan University, Serbia 7Faculty of Information Technology, University Mediterranean, Montenegro
[email protected]; [email protected]; [email protected]; [email protected];
[email protected]; [email protected]
Abstract—We address the target localization problem in
large-scale cooperative wireless sensor networks (WSNs).
Using the noisy range measurements, extracted from the
received signal strength (RSS) information, we formulate the
localization problem by using the maximum likelihood (ML)
criterion. ML-based solutions are particularly important due
to their asymptotically optimal performance, but the
localization problem is highly non-convex. To overcome this
difficulty, we propose a convex relaxation leading to second-
order cone programming (SOCP), which can be efficiently
solved by interior-point algorithms. Since the energy is a very
valuable resource of the WSNs, we investigate the case where
target nodes limit the number of cooperating nodes by
selecting only those neighbors with the highest RSS. This
simple procedure can reduce the energy consumption of an
algorithm in both communication and computation phase.
Our simulation results show that the proposed approach
outperforms the existing ones in terms of the estimation
accuracy. Moreover, they show that the new approach does
not suffer significant performance degradation when the
number of cooperating nodes is reduced.
I. INTRODUCTION
Ad hoc wireless sensor networks (WSNs) composed of large number of scattered sensor nodes form a very useful tool for monitoring environmental characteristics, such as temperature, sound levels, pressure, etc. Low device cost and savings in the infrastructure permit deployment of tens, hundreds, or even thousands of sensor nodes [1]. Besides sensing, sensor nodes have the ability of limited processing and communication.
In many practical applications, data acquired inside a WSN are irrelevant if the referred location is not known. Hence, nodes’ position information becomes imperative.
Installing a global positioning system (GPS) device in each sensors node would be a very expensive solution, which would also restrict the network applicability [2]. An alternative and more cost-efficient solution is to equip only a small fraction of sensor nodes with GPS, called anchor (or reference) nodes, and to determine the position of the remaining nodes, called target nodes, by employing the (noisy) ranging information between target and anchor nodes.
Ranging (distance) measurements are obtained between two sensor nodes which are in the communication range of each other, and are typically extracted from time-of-arrival (TOA), time-difference-of-arrival (TDOA), round-trip time (RTT), angle-of-arrival (AOA), received signal strength (RSS) information or a combination of them, depending on the available hardware [3]. Among all techniques, ranging based on RSS has the lowest implementation costs, since it does not require any special hardware [3], rendering it an attractive low-cost solution for the localization problem.
Algorithmically, localization algorithms can be executed in centralized and distributed fashion. The former approach assumes the existence of a fusion center which coordinates the network and performs all computational processing. Moreover, this approach is characterized by stability and fundamental optimality, but its computational complexity grows with the number of nodes in the network [2]. On the other hand, the main advantages of the latter approach are scalability and low-complexity. However, this approach is executed iteratively; thus, it is sensitive to error propagation and might require a long convergence time. Hence, the trade-off between the computational complexity and estimation accuracy is the main feature that determines the choice between centralized or distributed approach. In this

ISBN 978-86-80593-52-4
8
work, we will focus exclusively on the distributed algorithms, since we deal with large-scale WSNs, and this approach is more likely to preserve energy.
Recently, RSS-based localization techniques have attracted much attention in the research society [4]-[11]. The approaches described in [4]-[8] consider exclusively centralized algorithms. In [9], a distributed algorithm based on an augmented Lagrangian approach using primal-dual decomposition was presented. However, the authors deal only with a non-cooperative localization problem, where a single target node emits beacon frames to all anchor nodes in the network. A distributed cooperative algorithm characterized by a spatial constraint that limits the solution space to a region around the current position estimate was presented in [10]. Using discretization of the solution space, the authors in [10] found the position update of each node by minimizing a local objective function over the candidate set using direct substitution. Another distributed cooperative localization algorithm that dynamically estimates the path loss exponent (PLE) by using RSS measurements was introduced in [11]. This algorithm is based on gradient descent search which employs a circular Gauss-Seidel algorithm. Although the approaches [10], [11] have excellent computational characteristics, their performance highly depends on good initialization, since the objective function is non-convex and the algorithm may get trapped into local minima or a saddle point, resulting in a large estimation error.
In this paper, we consider a large-scale RSS-based cooperative localization problem, and we provide a solution which is founded entirely on a distributed approach. We propose a novel second-order cone programming (SOCP) estimator, which, in huge contrast to the existing methods, does not depend on initialization and requires much less iterations to converge. Furthermore, we investigate the case where the target nodes limit the number of cooperating nodes (neighbors), discarding potentially bad links and reducing the energy consumption in the network.
The remainder of this paper is structured as follows. In Section II, the RSS measurement model is introduced and target localization problem is formulated. Section III provides details about the development of the proposed SOCP estimator and the node selection mechanism for reducing the number of cooperating nodes. The analysis of the computational complexity is summarized in Section IV. In Section V we provide the simulation results in order to compare the performance of the new approach and the existing ones. Finally, Section VI summarizes the main conclusions.
II. PROBLEM FORMULATION
We consider a WSN with |𝒯| + |𝒜| nodes, where 𝒯 and 𝒜 are the sets of all target and anchor nodes, respectively, and | ∙ | represents the cardinality of a set (|𝒯| = 𝑀, |𝒜| =𝑁). The locations of the nodes are denoted as x1, …,xM, xM+1, …, xM+N, where 𝒙𝑖 ∊ ℝ𝑝(𝑝 ≥ 2). The considered network can also be seen as a connected graph, 𝒢(𝒱, ℰ), where 𝒱 and are the set of vertices and edges, respectively. In order to preserve the energy and prolong
the lifetime of the network, each node has a limited communication range, R. Hence, two nodes, i and j, can exchange information if and only if they are within the
communication range of each other, i.e. ℰ = {(𝑖, 𝑗) ∶
‖𝒙𝑖 − 𝒙𝑗‖ ≤ 𝑅, 𝑖 ≠ 𝑗}. Target node i considers any
neighboring node j (target or anchor) as an anchor node in the localization process. Set of neighbors of a target node i is defined as𝛺𝑖 = {𝑗 ∶ (𝑖, 𝑗) ∈ ℰ}.
For ease of expression, we use 𝑿 = [𝒙1, 𝒙2, … , 𝒙M] as the 2 × M matrix of all target positions in the WSN. We assume that the anchor positions are known a priori, while each target node i is given an initial estimation of its
position 𝒙𝑖(0)
, 𝑖 = 1, … , 𝑀; hence, ��(0) contains all initial
estimations of the target positions.
From the relationship 𝐿𝑖𝑗 = 10 log10𝑃𝑇
𝑃𝑖𝑗, where 𝑃𝑇 is the
transmit power of a node, and 𝑃𝑖𝑗 is the received power at
the i-th target node from the j-th neighboring node, the RSS localization problem can be formulated according to the path loss model (in dB) [12],[13]
𝐿𝑖𝑗 = 𝐿0 + 10𝛾 log10
‖𝒙𝑖 − 𝒙𝑗‖
𝑑0
+ 𝑣𝑖𝑗 , ∀(𝑖, 𝑗) ∈ ℰ, (1)
where 𝐿0is the path loss value at a short reference distance
𝑑0 (‖𝒙𝑖 − 𝒙𝑗‖ ≤ 𝑑0), γ is the path loss exponent, and 𝑣𝑖𝑗 is
the log-normal shadowing term between the i-th target node and its j-th neighbor, modeled as a zero-mean Gaussian
random variable with variance 𝜎𝑖𝑗2 , i.e. 𝑣𝑖𝑗 ~ 𝒩(0, 𝜎𝑖𝑗
2 ). We
assume that all path loss measurements are symmetric, i.e. 𝐿𝑖𝑗 = 𝐿𝑗𝑖 , for 𝑖 ≠ 𝑗.
Based on the measurements from (1), we derive the maximum likelihood (ML) estimator as
�� = argmin𝑿
∑1
𝜎𝑖𝑗2
(𝑖,𝑗)∈ℰ
[𝐿𝑖𝑗 − 𝐿0 − 10𝛾 log10
‖𝒙𝑖 − 𝒙𝑗‖
𝑑0]
2
. (2)
The least squares (LS) problem defined in (2) is non-linear and non-convex; hence, finding its globally optimal solution is difficult, since there may exist multiple local optima. In the following text we will show that the ML estimator in (2) can be approximated into a convex estimator, using SOCP relaxation, which can be solved efficiently by interior-point algorithms [14].
For the sake of simplicity (and without loss of generality), in the remainder of this work we assume that 𝜎𝑖𝑗
2 = 𝜎2, ∀(𝑖, 𝑗) ∈ ℰ. Moreover, we assume that 𝑃𝑇 of all
nodes are identical, i.e. 𝐿0 and 𝑅 are equivalent for all nodes.
III. DISTRIBUTED LOCALIZATION USING SOCP
RELAXATION
Observe that the objective function in (2) depends only on the positions and pairwise measurements between adjacent nodes. Given that the initial guess of the targets’ positions and the true anchors’ positions are known, problem in (2) can be solved in dependently by each target node, using only local information from its neighbors. Breaking down the localization problem in (2) into
ISBN 978-86-80593-52-4
9
a)
b)
c)
Fig. 1. A possible network layout of a WSN with N=25, M=50 nodes. Target nodes communicate with a) all nodes in their communication range, b) all anchor neighbors and at most 3 nearest target neighbors, and c) at most 4 nearest neighbors.
smaller sub-problems is particularly suitable for large-scale and highly-dense networks, because this approach can significantly reduce the computational complexity of an algorithm.
Solving the localization problem in a distributed fashion implies using an iterative scheme, which consists of two phases:
1) Communication phase –each target node in the
network transmits its position estimate to its neighbors.
2) Computation phase – each target node updates its
position estimate. To update its position, target node i
solves the following optimization problem:
��𝑖(𝑘+1)
= argmin𝒙i
∑1
𝜎2[𝐿𝑖𝑗 − 𝐿0 − 10𝛾 log10
‖𝒙𝑖 − ��𝑗‖
𝑑0
]
(𝑖,𝑗)∈ℰ
2
, (3)
where𝒙𝑗 denotes the last position estimate of the j-th
neighboring target node (or the true node position, if j-th
node is an anchor) received by i-th target node. In the
following text, we will show that (3) can be converted into
a convex problem.
A. SOCP Relaxation
Given the measurements in (1), the ML estimate of the actual distance between nodes i and j is derived as:
��𝑖𝑗 = 𝑑010𝐿𝑖𝑗−𝐿0
10𝛾 . (4)
We can reformulate (4) as:
𝜆𝑖𝑗��𝑖𝑗2 = 𝜌𝑑0
2, (5)
where 𝜆𝑖𝑗 = 10−
𝐿𝑖𝑗
5𝛾 , and 𝜌 = 10−
𝐿05𝛾. Assuming that the
initial target positions estimates are available, from (5), target node i updates its position estimate by minimizing the following LS problem:
𝒙𝑖(𝑘+1)
= argmin𝒙𝑖
∑ (𝜆𝑖𝑗‖𝒙𝑖 − 𝒙𝑗‖2
− 𝜌𝑑02)
2
.
(𝑖,𝑗)∈ℰ
(6)
Define auxiliary variables 𝑦𝑖 = ‖𝒙𝑖‖2 and 𝒛 = [𝑧𝑖𝑗],
where 𝑧𝑖𝑗 = 𝜆𝑖𝑗(𝑦𝑖 − 2𝒙𝑗𝑇𝒙𝑖 + ‖𝒙𝑗‖
2) − 𝜌𝑑0
2, ∀(𝑖, 𝑗) ∈ ℰ.
Introduce an epigraph variable 𝑡, and apply second-order cone constraint (SOCC) relaxation to obtain the following convex optimization problem:
minimize𝒙𝑖,𝑦𝑖,𝒛,𝑡
𝑡
subject to
𝑧𝑖𝑗 = 𝜆𝑖𝑗 (𝑦𝑖 − 2𝒙𝑗𝑇𝒙𝑖 + ‖𝒙𝑗‖
2) − 𝜌𝑑0
2, ∀(𝑖, 𝑗) ∈ ℰ,
‖2𝒛; 𝑡 − 1‖ ≤ 𝑡 + 1, ‖2𝒙𝑖; 𝑦𝑖 − 1‖ ≤ 𝑦𝑖 + 1. (7)
Problem defined in (7) is a SOCP problem, which can be efficiently solved by the CVX package [15] for
ISBN 978-86-80593-52-4
10
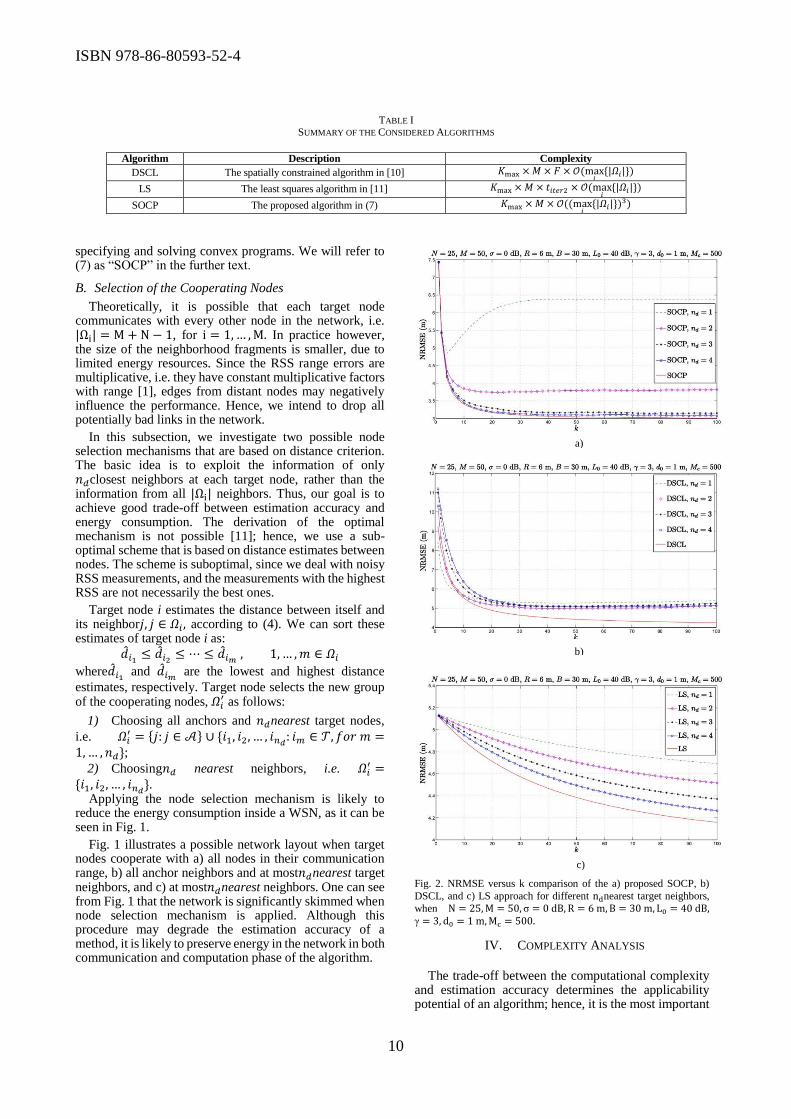
TABLE I SUMMARY OF THE CONSIDERED ALGORITHMS
Algorithm Description Complexity
DSCL The spatially constrained algorithm in [10] 𝐾max × 𝑀 × 𝐹 × 𝒪(max𝑖
{|𝛺𝑖|})
LS The least squares algorithm in [11] 𝐾max × 𝑀 × 𝑡𝑖𝑡𝑒𝑟2 × 𝒪(max𝑖
{|𝛺𝑖|})
SOCP The proposed algorithm in (7) 𝐾max × 𝑀 × 𝒪((max𝑖
{|𝛺𝑖|})3)
specifying and solving convex programs. We will refer to (7) as “SOCP” in the further text.
B. Selection of the Cooperating Nodes
Theoretically, it is possible that each target node communicates with every other node in the network, i.e. |Ωi| = M + N − 1, for i = 1, … , M. In practice however, the size of the neighborhood fragments is smaller, due to limited energy resources. Since the RSS range errors are multiplicative, i.e. they have constant multiplicative factors with range [1], edges from distant nodes may negatively influence the performance. Hence, we intend to drop all potentially bad links in the network.
In this subsection, we investigate two possible node selection mechanisms that are based on distance criterion. The basic idea is to exploit the information of only 𝑛𝑑closest neighbors at each target node, rather than the information from all |Ωi| neighbors. Thus, our goal is to achieve good trade-off between estimation accuracy and energy consumption. The derivation of the optimal mechanism is not possible [11]; hence, we use a sub-optimal scheme that is based on distance estimates between nodes. The scheme is suboptimal, since we deal with noisy RSS measurements, and the measurements with the highest RSS are not necessarily the best ones.
Target node i estimates the distance between itself and its neighbor𝑗, 𝑗 ∈ 𝛺𝑖 , according to (4). We can sort these estimates of target node i as:
��𝑖1≤ ��𝑖2
≤ ⋯ ≤ ��𝑖𝑚 , 1, … , 𝑚 ∈ 𝛺𝑖
where��𝑖1 and ��𝑖𝑚
are the lowest and highest distance
estimates, respectively. Target node selects the new group of the cooperating nodes, 𝛺𝑖
′ as follows:
1) Choosing all anchors and 𝑛𝑑nearest target nodes,
i.e. 𝛺𝑖′ = {𝑗: 𝑗 ∈ 𝒜} ∪ {𝑖1, 𝑖2, … , 𝑖𝑛𝑑
: 𝑖𝑚 ∈ 𝒯, 𝑓𝑜𝑟 𝑚 =1, … , 𝑛𝑑};
2) Choosing𝑛𝑑 nearest neighbors, i.e. 𝛺𝑖′ =
{𝑖1, 𝑖2, … , 𝑖𝑛𝑑}.
Applying the node selection mechanism is likely to reduce the energy consumption inside a WSN, as it can be seen in Fig. 1.
Fig. 1 illustrates a possible network layout when target nodes cooperate with a) all nodes in their communication range, b) all anchor neighbors and at most𝑛𝑑nearest target neighbors, and c) at most𝑛𝑑nearest neighbors. One can see from Fig. 1 that the network is significantly skimmed when node selection mechanism is applied. Although this procedure may degrade the estimation accuracy of a method, it is likely to preserve energy in the network in both communication and computation phase of the algorithm.
Fig. 2. NRMSE versus k comparison of the a) proposed SOCP, b)
DSCL, and c) LS approach for different ndnearest target neighbors,
when N = 25, M = 50, σ = 0 dB, R = 6 m, B = 30 m, L0 = 40 dB,γ = 3, d0 = 1 m, Mc = 500.
IV. COMPLEXITY ANALYSIS
The trade-off between the computational complexity and estimation accuracy determines the applicability potential of an algorithm; hence, it is the most important
a)
b)
c)
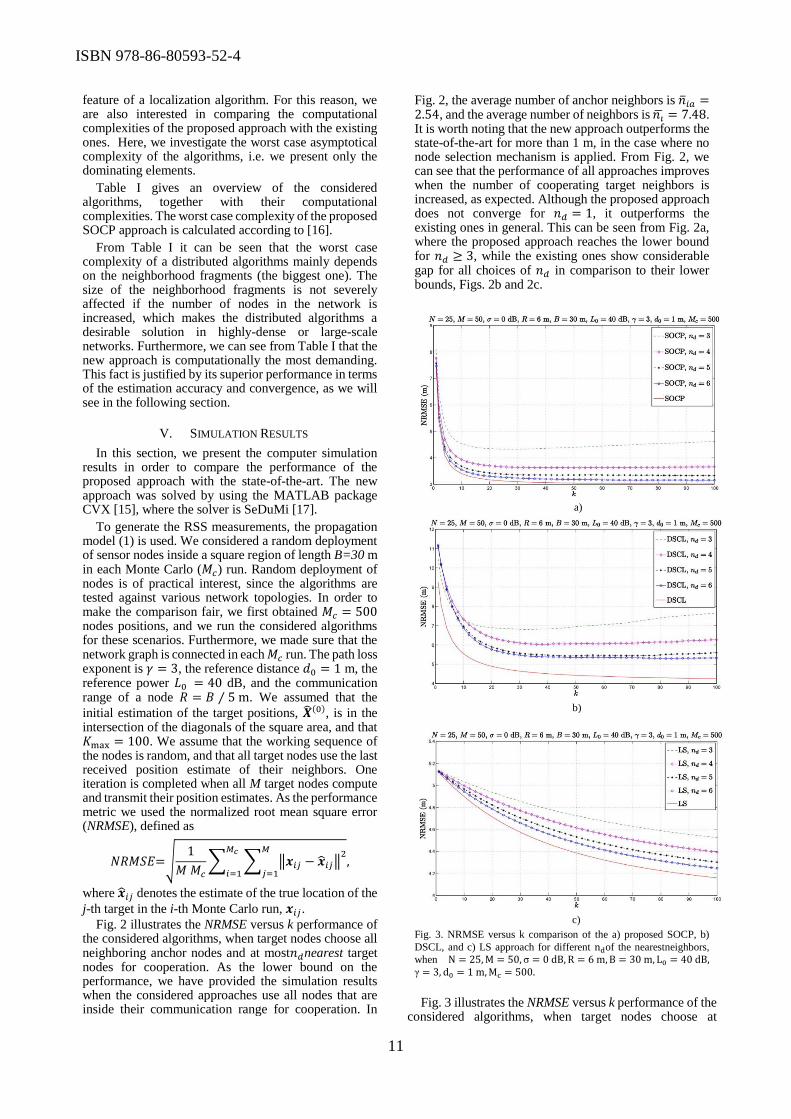
ISBN 978-86-80593-52-4
11
feature of a localization algorithm. For this reason, we are also interested in comparing the computational complexities of the proposed approach with the existing ones. Here, we investigate the worst case asymptotical complexity of the algorithms, i.e. we present only the dominating elements.
Table I gives an overview of the considered algorithms, together with their computational complexities. The worst case complexity of the proposed SOCP approach is calculated according to [16].
From Table I it can be seen that the worst case complexity of a distributed algorithms mainly depends on the neighborhood fragments (the biggest one). The size of the neighborhood fragments is not severely affected if the number of nodes in the network is increased, which makes the distributed algorithms a desirable solution in highly-dense or large-scale networks. Furthermore, we can see from Table I that the new approach is computationally the most demanding. This fact is justified by its superior performance in terms of the estimation accuracy and convergence, as we will see in the following section.
V. SIMULATION RESULTS
In this section, we present the computer simulation results in order to compare the performance of the proposed approach with the state-of-the-art. The new approach was solved by using the MATLAB package CVX [15], where the solver is SeDuMi [17].
To generate the RSS measurements, the propagation model (1) is used. We considered a random deployment of sensor nodes inside a square region of length B=30 m in each Monte Carlo (𝑀𝑐) run. Random deployment of nodes is of practical interest, since the algorithms are tested against various network topologies. In order to make the comparison fair, we first obtained 𝑀𝑐 = 500 nodes positions, and we run the considered algorithms for these scenarios. Furthermore, we made sure that the network graph is connected in each 𝑀𝑐 run. The path loss exponent is 𝛾 = 3, the reference distance 𝑑0 = 1 m, the reference power 𝐿0 = 40 dB, and the communication range of a node 𝑅 = 𝐵 ⁄ 5 m. We assumed that the
initial estimation of the target positions, ��(0), is in the intersection of the diagonals of the square area, and that 𝐾max = 100. We assume that the working sequence of the nodes is random, and that all target nodes use the last received position estimate of their neighbors. One iteration is completed when all M target nodes compute and transmit their position estimates. As the performance metric we used the normalized root mean square error (NRMSE), defined as
𝑁𝑅𝑀𝑆𝐸=√1
𝑀 𝑀𝑐
∑ ∑ ‖𝒙𝑖𝑗 − 𝒙𝑖𝑗‖2𝑀
𝑗=1
𝑀𝑐
𝑖=1,
where 𝒙𝑖𝑗 denotes the estimate of the true location of the
j-th target in the i-th Monte Carlo run, 𝒙𝑖𝑗.
Fig. 2 illustrates the NRMSE versus k performance of the considered algorithms, when target nodes choose all neighboring anchor nodes and at most𝑛𝑑nearest target nodes for cooperation. As the lower bound on the performance, we have provided the simulation results when the considered approaches use all nodes that are inside their communication range for cooperation. In
Fig. 2, the average number of anchor neighbors is ��𝑖𝑎 =2.54, and the average number of neighbors is 𝑛�� = 7.48. It is worth noting that the new approach outperforms the state-of-the-art for more than 1 m, in the case where no node selection mechanism is applied. From Fig. 2, we can see that the performance of all approaches improves when the number of cooperating target neighbors is increased, as expected. Although the proposed approach does not converge for 𝑛𝑑 = 1, it outperforms the existing ones in general. This can be seen from Fig. 2a, where the proposed approach reaches the lower bound for 𝑛𝑑 ≥ 3, while the existing ones show considerable gap for all choices of 𝑛𝑑 in comparison to their lower bounds, Figs. 2b and 2c.
Fig. 3. NRMSE versus k comparison of the a) proposed SOCP, b)
DSCL, and c) LS approach for different ndof the nearestneighbors,
when N = 25, M = 50, σ = 0 dB, R = 6 m, B = 30 m, L0 = 40 dB,γ = 3, d0 = 1 m, Mc = 500.
Fig. 3 illustrates the NRMSE versus k performance of the considered algorithms, when target nodes choose at
c)
b)
a)

ISBN 978-86-80593-52-4
12
most𝑛𝑑nearest neighboring nodes for cooperation. In Fig. 3, the average number of neighbors is 𝑛�� = 7.48. From Fig. 3, it can be seen that the performance of all algorithms betters as the number of cooperating nodes is increased. This result is anticipated, because when 𝑛𝑑 is increased the collected information of each target node also increases, as well as the probability of having more anchor neighbors. Moreover, we can see that the new approach outperforms the existing ones for 𝑛𝑑 > 3, requiring only 𝑘 = 30 iterations to converge in general.
VI. CONCLUSION
In this work, we investigated the RSS-based target localization problem in large-scale cooperative WSN. As the solution, we provided a completely distributed algorithm based on SOCP relaxation technique. The simulation results confirm the superiority of the proposed approach in terms of the estimation accuracy and convergence. Furthermore, we have considered the case where the target nodes limit the number of cooperating nodes, by selecting only a number of the neighbors with high RSS measurements. This simple procedure does not increase the computational complexity of an algorithm, and can reduce the energy consumption inside the network. Unlike the existing approaches, the simulation results show that the proposed method does not deteriorate significantly in the performance when the number of cooperating nodes is reduced.
ACKNOWLEDGMENT
This work was partially supported by Fundaçãopara a Ciência e a Tecnologia under Projects PEst-OE/EEI/UI0066/2014, EXPL/EEI-TEL/0969/2013–MANY2COMWIN and EXPL/EEI-TEL/1582/2013 GLANC,PEst-OE/EEI/LA0008/2013 (IT pluriannual foundingand HETNET), PEst-OE/EEI/UI0066/2011 (UNINOVApluriannual founding), EnAcoMIMOCo EXPL/EEITEL/2408/2013 and ADIN PTDC/EEI-TEL/2990/2012,as well as the grant SFRH/BD/91126/2012 and Ciência 2008 Post-Doctoral Research grant. M. Beko is a collaborative member of INESC-INOV, Instituto Superior Técnico, Universidade de Lisboa, Lisbon, Portugal.
REFERENCES
[1] N. Patwari, “Location Estimation in Sensor Networks,” Thesis of Neal Patwari at University of Michigan, 2005.
[2] G. Destino, “Positioning in Wireless Networks: Non cooperative and Cooperative Algorithms,” Thesis of Giuseppe Destino at University of Oulu, 2012.
[3] N. Patwari, J. N. Ash, S. Kyperountas, A. O. Hero III, R. L. Moses, and N. S. Correal, “Locating the Nodes: Cooperative Localization in Wireless Sensor Networks,” IEEE Signal Process. Mag., vol. 22, no. 4, pp. 54-69, Jul. 2005
[4] R. W. Ouyang, A. K. S. Wong, and C. T. Lea, “Received Signal Strength-based Wireless Localization via Semide finite Programming: Non cooperative and Cooperative Schemes,” IEEE Trans. Veh. Technol., vol. 59, no. 3, pp. 1307-1318, Mar. 2010.
[5] G. Wang and K. Yang, “A New Approach to Sensor Node Localization Using RSS Measurements in Wireless Sensor Networks,” IEEE Trans. Wireless Commun., vol. 10, no. 5, pp. 1389-1395, May 2011.
[6] G. Wang, H. Chen, Y. Li, and M. Jin, “On Received-Signal-Strength Based Localization with Unknown Transmit Power and Path Loss Exponent,” IEEE Wireless Commun. Letters, vol. 1, no. 5, pp. 536-539, Oct. 2012
[7] R. M. Vaghefi, M. R. Gholami, R. M. Buehrer, and E. G. Strom, “Cooperative Received Signal Strength-Based Sensor Localization With Unknown Transmit Powers,” IEEE Trans. Signal. Process., vol. 61, no. 6, pp. 1389-1403, Mar. 2013.
[8] S. Tomic, M. Beko, and R. Dinis, “RSS-based Localization in Wireless Sensor Networks Using Convex Relaxation: Non cooperative and Cooperative Schemes,” accepted for publication in IEEE Trans. Veh. Technol., Jun. 2014
[9] B. Béjar and S. Zazo, “A Practical Approach for Outdoors Distributed Target Localization in Wireless Sensor Networks,” EURASIP Journal on Advances in Signal Processing, pp. 1-11, May 2012.
[10] J. Cota-Ruiz, J. G. Rosiles, P. Rivas-Perea, and E. Sifuentes, “A Distributed Localization Algorithm for Wireless Sensor Networks Based on the Solution of Spatially-Constrained Local Problems,” IEEE Sensors Journal, vol. 13, no. 6, pp. 2181- 2191, Jun. 2013.
[11] A. Bel, J. L. Vicario, and G. Seco-Granados, “Localization Algorithm with On-line Path Loss Estimation and Node Selection,” Sensors, vol. 11, no. 7, pp. 6905-6925, Jul. 2011.
[12] T. S. Rappaport, Wireless Communications: Principles and Practice. Prentice-Hall, 1996.
[13] M. L. Sichitiu and V. Ramadurai, “Localization of wireless sensor networks with a mobile beacon,” in Proc. IEEE International Conference on Mobile Ad-hoc and Sensor Systems, pp. 174-183, Oct. 2004.
[14] S. Boyd, and L. Vandenberghe, Convex Optimization. Cambridge University Press, 2004.
[15] M. Grant and S. Boyd, “CVX: Matlab software for disciplined convex programming,” version 1.21. http://cvxr.com/cvx, Apr. 2010.
[16] I. Pólik and T. Terlaky, “Interior Point Methods for Nonlinear Optimization,” in Nonlin. Optim., G. Di Pillo, F. Schoen,Eds. Springer, 1st Edition, 2010.
[17] J. F. Sturm, “Using SeDuMi 1.02, a MATLAB Toolbox for Optimization Over Symmetric Cones,” Optim. Meth. Softw.,1998.

ISBN 978-86-80593-52-4
13
Smart Grid Strategy Assessment Using the Fuzzy
AHP
Aleksandar Janjić1, Miomir Stanković2, Lazar Velimirović3
1University of Niš, Faculty of Electronic Engineering, Niš, Serbia 2University of Niš, Faculty of Occupational Safety, Niš, Serbia
3Mathematical Institute of the Serbian Academy of Sciences and Arts, Belgrade, Serbia
[email protected]; [email protected]; [email protected]
Abstract—The smart grid concept is introducing new goals and objectives, regarding increased use of renewable electricity sources, grid security, energy conservation, energy efficiency and deregulated energy market. In this paper, the choice of the optimal smart grid strategy is made using the degree of the approach to the ideal smart grid. The comparison of alternatives is made using fuzzy AHP methodology, taking into account the presence of multiple criteria of both qualitative and quantitative nature, different performance indicators and the uncertain environment of the smart grid.
I. INTRODUCTION
The characteristics of the ideal smart grids and defined
metrics to measure progresses and outcomes resulting
from the implementation of these projects have been
defined in [1, 2, 3]. The ideal smart grid has been defined
in terms of “characteristics” in the US and in terms of
“services” in the European Union, including:
Enabling the network to integrate users with new
requirements;
Enabling and encouraging stronger and more direct
involvement of consumers in their energy usage and
management;
Improving market functioning and customer service;
Enhancing efficiency in day-to-day grid operation;
Enabling better planning of future network
investment;
Ensuring network security, system control and
quality of supply.
For each service, a number of corresponding smart
grid functionalities has been defined. To measure
progresses toward the ideal grid, Built/Value metrics in
the USA and Benefits/KPIs in Europe are used.
List of benefits deriving from the implementation of a
smart grid is defined in [1]. Each benefit is expressed via a
set of key performance indicators including both
quantitative and qualitative indicators. Both indicators -
smart grid services and benefits are strongly linked to the
policy goals that are driving the smart grid deployment
(sustainability, competitiveness and security of supply),
and consequently, they can be considered as useful
indicators to evaluate the contribution of projects toward
the achievement of these policy goals. A clearly defined
framework can concretize where exactly the project
contributed to a smart electricity grid.
Decision-making about the smart grid strategy and
renewable energy implementation can be viewed as a
multiple criteria decision-making (MCDM) problem with
correlating criteria and alternatives. This task should take
into consideration several conflicting aspects because of
the increasing complexity of the social, technological,
environmental, and economic factors [4, 5], because the
traditional single criteria decision-making approaches
cannot handle the complexity of current systems and this
problem [6, 7, 8]. An overview of the state of the art
models and methods applied to the problem, analyzing
and classifying current and future research trends in this
field is given in [9, 10, 11].
The application area of MCDM in renewable energy
has been generally divided into five categories
[12, 13, 14]:
a) renewable energy planning and policy, referring to the
assessment of a feasible energy plan and the diffusion of
different renewable energy option,
b) evaluation and assessment, referring to the assessment
of different alternative energies or energy technologies,
c) technology and project selection, including the site
selection, technology selection, and decision support in
renewable energy harnessing projects,
d) environmental, concerned with the alternative
technologies from an environmental perspective and
climate issues, and
e) operational, referring to the optimal distributed
generation outputs to satisfy all the criteria and constraints
imposed by the distribution network.
However, with the development of the Smart grid
architecture, the perspective of the renewable sources

ISBN 978-86-80593-52-4
14
assessment has changed, introducing new goals and
objectives. Smart Grid generally refers to an electricity
network that can intelligently integrate the actions of all
users connected to it – in order to efficiently deliver
sustainable, economic and secure electricity supplies.
These systems are made possible by two-way
communication technology and computer processing that
has been used for decades in other industries. According
to [11] main objectives of smart grids are: increased use of
renewable electricity sources, grid security, energy
conservation and energy efficiency, and deregulated
energy market. Therefore, the strategy for sustainable,
competitive, and safe energy primarily implies:
competitiveness, use of different energy sources,
sustainability, innovation, and technological improvement
[15], while possible benefits brought by renewable
sources integration have to be evaluated by the degree of
the approach to the ideal smart grid.
The mixture of quantitative and qualitative indicators
is one of the major reasons for introducing the multi-
criteria decision analysis techniques. This paper proposes
a new algorithm for the selection of the best energy
management strategy through the smart grid concept,
which uses the fuzzy AHP method for multi-criteria
decision making. The contribution of this paper is the new
assessment framework for the evaluation of the smart grid
efficiency using the reduced set of performance indicators.
II. MULTI-CRITERIA ASSESSMENT MODEL
A. Smart grid indicators
The implementation of the Smart Grid should be
market-driven. Another necessary approach in Smart Grid
assessment is therefore to assess the costs, the benefits and
the beneficiaries of different Smart Grid solutions. A
comprehensive methodology for cost benefit analysis of
Smart Grid projects have been defined [16], while the
European Commission has adapted and expanded the
DOE/EPRI methodology to fit the European context
[17, 18].
The characteristics of the ideal smart grids and defined
metrics to measure progresses and outcomes resulting
from the implementation of these projects have been
defined in terms of “characteristics” in the US and in
terms of “services” in the European Union, including:
Enabling the network to integrate users with new
requirements;
Enabling and encouraging stronger and more
direct involvement of consumers in their energy
usage and management;
Improving market functioning and customer
service;
Enhancing efficiency in day-to-day grid
operation;
Enabling better planning of future network
investment;
Ensuring network security, system control and
quality of supply.
For each service, a number of corresponding smart
grid functionalities has been defined. To measure
progresses toward the ideal grid, Built/Value metrics in
the USA and Benefits/KPIs in Europe are used.
The EC Smart Grid Task Force has identified a list of
benefits deriving from the implementation of a smart grid:
Increased sustainability;
Adequate capacity of transmission and
distribution grids for ‘collecting’ and bringing electricity
to the consumers;
Adequate grid connection and access for all
kinds of grid users;
Satisfactory levels of security and quality of
supply;
Enhanced efficiency and better service in
electricity supply and grid operation;
Effective support of transnational electricity
markets by load flow control to alleviate loop flows and
increased interconnection capacities;
Coordinated grid development through common
European, regional and local grid planning to optimise
transmission grid infrastructure;
Enhanced consumer awareness and participation
in the market by new players;
Enable consumers to make informed decisions
related to their energy to meet the EU Energy Efficiency
targets;
Create a market mechanism for new energy
services such as energy efficiency or energy consulting for
customers;
Consumer bills are either reduced or upward
pressure on them is mitigated.
Each benefit is expressed via a set of key performance
indicators including both quantitative and qualitative
indicators. For illustration, the first benefit – increased
sustainability is valued by the quantified reduction of
carbon emissions, environmental impact of electricity grid
infrastructure and quantified reduction of accidents and
risk associated with generation technologies. The
complete list of indicators can be found in [17]. Smart grid
services and benefits are strongly linked to the policy
goals that are driving the smart grid deployment
(sustainability, competitiveness and security of supply),
and consequently, they can be considered as useful
indicators to evaluate the contribution of projects toward
the achievement of these policy goals. A clearly defined
framework can concretize where exactly the project
contributed to a smart electricity grid.
As explained in the previous section, a multi-criteria
model is developed based on the list of both quantitative
and qualitative indicators. The list of these indicators
includes following indicators.
B. Quantitative indicators:
Quantified reduction of carbon emissions
For every alternative, this indicator is measured by the
kg of CO2 emission per produced kWh of electrical
energy. The impact of renewable sources is taken as the
reduction of the emission produced by the conventional
energy source.
Total voltage deviation
The active power losses
ISBN 978-86-80593-52-4
15
TABLE I DESCRIPTION OF QUALITATIVE INDICATORS
Grade Environmental impact Societal benefits
Minor
Negligible land and material requirements for
producing necessary
power. No substantial environmental impact
Unreasonable to expect any changes in local
economy or enhancement
in market services
Low
No visual and noise
problems caused by the operation of plant. Small
land and material
requirements.
New jobs created, with the
great risk to be retained as a result of new renewable
energy source.
Moderate
Limited visual or noise
problems, with some
disruption to habitat. No impact to the wildlife.
New market mechanism
for new energy services
such as energy efficiency or energy consulting for
customers
High
Increased emission
pollutants, with impact to the wildlife and
landscape.
Improving market
functioning and customer service, new jobs created
and retained as a result of
new renewable energy source
Very high
Large emission
pollutants, land and material requirements,
other life-cycle steps
contributing significantly to the total environmental
impact
More direct involvement
of consumers in their energy usage and
management, new jobs
created and retained as a result of new renewable
energy source
Net Present Value (NPV) is used to determine
the present value of an investment by the discounted
sum of all cash flows received from the project.
C. Qualitative indicators
Both indicators that cannot be exactly measured:
environmental impact of electricity grid infrastructure and
societal benefit of a proposed infrastructure investment
can be evaluated through the ordinal comparison. In this
approach, we adopted the five grade verbal scale for the
assessment of these indicators, which can be composed
from opinion polls results, expert judgments or other
integrated approach. The description of the scale is given
in Table I.
All indicators (quantitative and qualitative) are
influencing all of four main criteria, in different extent
determined by the decision maker. For instance, reduced
voltage deviation and stable voltage profile in the network
will enable the usage of advanced technologies and
services, they will reduced the costs of low power quality,
increasing the customer satisfaction.
For smart grid projects ranking and selection, many
uncertain and non-tangible benefits and criteria are
involved in the smart grid projects assessment. In order to
get a thorough understanding of the status of smart grid
development, the main SMART criteria (they have to be
Specific, Measurable, Attainable, Relevant and Time-
bound) can be defined. Starting from eleven main
benefits, presented in previous section, an adapted list of
main criteria can be defined, including:
Technology, covering all aspects of advanced
services and new requirements;
Costs;
Customer satisfaction;
Environmental impact.
After the first set of benefits defined on the base level
of efficiency assessment, the higher level of assessment
with four criteria explained above can be established.
Different levels between relations can be set up in terms of
the volume of their interconnectedness.
Because of the main characteristic of the adopted
smart grid evaluation framework and its complex
hierarchical structure, we proposed the fuzzy AHP
methodology for the project evaluation, structuring a
decision into a hierarchy of criteria, sub criteria and
alternatives. By means of pairwise comparisons of two
(sub) criteria or alternatives, it generates inconsistency
ratios and weighting factors to prioritise the criteria and
alternatives. Sensitivity analysis can be applied to test the
robustness of the priorities.
D. Fuzzy AHP methodology
The fuzzy AHP method involves the following steps:
Step 1. The overall goal (objective) is identified and clearly defined;
Step 2. The criteria, sub-criteria, and alternatives are identified. Criteria for smart grid projects selection used in our approach are: Technology, Costs, Customer satisfaction, encompassing different options of customer choice and Environmental impact. Sub-criteria are the key performance indicators (KPIs). Finally, the different smart grid development strategies are identified as alternatives.
Step 3. Hierarchical structure formation. The Fuzzy AHP method presents a problem in the form of hierarchy: the first level represents the goal; the second level considers relevant criteria (four identified criteria); the third level considers relevant sub-criteria (identified KPIs); and the fourth level defines development alternatives.
Step 4. Pair-wise comparison. Pairs of elements at each level are compared according to their relative contribution to the elements at the hierarchical level above, using fuzzified Saaty’s scale, as shown in Table II.
In this paper fuzzification is implemented by triangular fuzzy numbers, and the value of fuzzy distance of 2 is used for pairs (1,3,5,7,9), and a fuzzy distance of 1 for pairs (2, 4, 6, 8), as recommended in [19] because the most consistent results can be expected. Pair-wise comparisons at each level, starting from the top of the hierarchy, are presented in the square matrix form, where elements of the matrix are the fuzzy value about the relative importance of criteria/cub-criteria/alternative i over criteria/cub-criteria/ alternative j.
Step 5. Priority weights vectors evaluation. The priority
weighting vectors on each level are evaluated using the
Row Geometric Mean Method (RGMM). The ranking
procedure starts with the determination of criteria
weighting vector, with n alternatives:

ISBN 978-86-80593-52-4
16
Tccc nwwW ,,
1 (1)
where:
____
1
1
1
1
1,1, mi
a
a
w
m
i
mm
j
ij
mm
j
ij
ci
(2)
Sub-criteria weighting vectors are defined by pairwise
comparison of performance according to corresponding
criterion and the final weights are obtained by
multiplying the weights of the performance and the
weight of corresponding criterion. Appropriate elements
of this vector are calculated as follows:
________
1
1
1
1
1,1,5,1, ici
n
i
nn
j
ij
nn
j
ij
p
i npiw
a
a
w
i ii
ii
(3)
where p
iw represents the aggregated fuzzy weights of the
p-th performance with respect to the i-th criterion, and ni
represents the namber of performance for the i-th
criterion. Sub-criteria vector weights is:
Tscsc
Tp
isc kwwwwW ,,,,
1
1
1 (4)
Finally, the smart grid projects are compared
according to the each performance. Proper weights of
projects, i.e. alternatives for individual performance are
determined as follows:
________
1
1
1
1
1,1,,1, kpli
a
a
w
l
i
ll
j
ij
ll
j
ij
p
ai
(5)
where p
aiw represents the fuzzy weights of the i-th project
with respect to the p-th performance. Final smart grid
projects weights are obtained by multiplying the matrix
of the projects weights according to all alternatives and
the matrix of performance weights:
Taasca mwwWWW ,,
1 (6)
Step 6. Consistency control. Consistency in this case
means that the decision procedure is producing coherent
judgments in specifying the pairwise comparison of the
criteria, sub-criteria or alternatives. When the RGMM is
employed as the priorization procedure, the geometric
consistency index (GCI) is used for consistency control
[20–23]. Geometric consistency index is computed as
follow:
ji
ijenn
GCI 2log21
2 (7)
Where iijijij wwae / is the error obtained when the
ratio ji / is approximated by jiijij wwaa ,, are
defuzzification values, i.e. crisp values). For this
measure, GCI = 0.37 has been suggested as the threshold
value associated with a consistency ratio of 10%
(GCI = 0.31 for n = 3, GCI = 0.35 for n = 4, GCI = 0.37
for n > 4).
Step 7. Defuzzification and the final ranking of
alternatives. In this paper triangular fuzzy numbers are
ranked by applying the mean value method. For the given
triangular fuzzy number M = (a,b,c), the mean value
method for defuzzification is defined crisp number value
as follows:
n
cbam
(8)
The highest rank has the alternative with the highest
value m.
The proposed methodology is illustrated on the choice
of the technology, size and location of one distributed
renewable generator [24]. Four possible alternatives are
evaluated on IEEE radial 33 bus test feeder, with
parameters, including the nominal active power (Pnom),
the node the generator is connected to (Bus No), type of
renewable source (RS) and expected annual energy
production of generator (W), represented in Table III.
TABLE II CRISP AND FUZZIFIED SAATY’S SCALE FOR PAIRWISE COMPARISONS
Crisp values (x) Judgment description Fuzzy values
1 Equal importance (1, 1, 1+δ)
3 Week dominance (3-δ, 3, 3+δ)
5 Strong dominance (5-δ, 5, 5+δ)
7 Demonstrated dominance (7-δ, 7, 7+δ)
9 Absolute dominance (9-δ, 9, 9)
2, 4, 6, 8 Intermediate values (x-1, x, x+1)
ISBN 978-86-80593-52-4
17
TABLE III
PROJECT SCENARIOS
Project Pnom Bus No RS W
(GWh)
Project 1 1,8MW 6 Wind 5, 2
Project 2 1 MW 10 Biomass 7,0
Project 3 2 MW 17 Hydro 4,0
Project 4 1 MW 17 Biomass 5,00
In this paper, methodology will be extended to the smart
grid strategy assessment.
III. CASE STUDY
The proposed methodology is illustrated on the choice
of the right smart grid deployment strategy in the medium
size power distribution company. The list of alternatives
with the description of proposed actions and appropriate
indicators is given in Table IV.
Experts first performed pairwise comparison of the
following criteria: technology (C1), costs (C2), customer
satisfaction (C3) and environmental (C4). Results are
presented in Table V.
The experts then compared the following seven
performance indicators chosen from the list of benefits in
relation to every criteria: sustainability (SC1), capacity of
distribution grids for ‘collecting’ and bringing electricity
to the consumers (SC2), possibility of grid connection and
access for all kinds of grid users (SC3), security and
quality of supply (SC4), efficiency and good service in
electricity supply and grid operation (SC5), effective
support of electricity markets (SC6), transparent
information to consumers (SC7). This step is necessary
because of different economical, social and political
conditions for different distribution companies. As stated
above, the pairwise compairison made by experts is
performed both by qualitative and quantitative indicators.
For instance, security criteria (SC4) can be supported by
the reduction of injuries (Table 3), while the market
development criteria (SC6) is much more susceptible to
subjective experts judgments.
At the end, three smart grid projects (Project 1 [A1],
Project 2 [A2], and Project 3 [A3]) are compared in
relation to performances and presented in Table VI.
The most important criterion for the selection of smart
grid (for this particular distribution company) is the
selected technology, followed by the costs, the customer
satisfaction and the environmental protection. Advanced
technology increases the efficiency and security of energy
supply of high performance, thus increases user
satisfaction and protects the environment.
IV. CONCLUSION
In this paper, starting from a general set of smart grid
performance indicators, a new assessment framework for
the evaluation of the smart grid efficiency has been
established, as one of the main conditions for the
successful implementation of any energy management
program. Using the fuzzy AHP methodology with four
main criteria and eleven sub criteria derived from the
adopted set of smart grid benefits, we proved that the
method is highly successful in the evaluation of
alternatives in the presence of heterogeneous criteria.
This method allows the decision makers to incorporate
unquantifiable information, incomplete information, non-
obtainable information and partially ignorant facts into
decision model.
The proposed methodology is illustrated on the choice
of the right smart grid deployment strategy in the medium
size power distribution company. The analysis shows that
the dominant performances of the optimal smart grid
project are the selected technology, followed by the costs,
the customer satisfaction and the environmental
protection. This methodology is applied to the general
assessment of smart grid efficiency, while the further
research will be focused on particular aspects of the
project implementation.
TABLE V PAIRWISE COMPARISON AND ALTERNATIVES RANK
C1 C2 C3 C4 Fuzzy weights wci Rank
C1 1~
3~
5~
5~
(0.1967,0.5303, 1.3141) 1
C2 13
~ 1
~ 3
~ 3
~ (0.0787,0.2778, 0.7885) 2
C3 15
~
13~
1~
1~
(0.0576,0.0960, 0.3504) 3
C4 15
~
13~
1~
1~
(0.0412,0.0960,0.2190) 4
TABLE IV DEVELOPOMENT ALTERNATIVES
Description
of the
proposed
action
Comparative
values A1 A2 A3
Advanced meter
installation
Number of advanced meter
installed (x 103)
20 10 5
Substation automation
Percentage of
substations applying
automation
20% 30% 40%
Introduction
of dynamic
line rating
Number of lines 2 3 4
Solar power plant
connection
Total installed
power (MW) 3 5 7
TABLE VI RANKING OF SMART GRID PROJECTS
λ=0.5 λ=1
Smart grid projects FWs Rank FWs Rank
Project 1 (A1) 0,2669 2 0,2781 2
Project 2 (A2) 0,2580 3 0,2780 3
Project 3 (A3) 0,4661 1 0,4647 1

ISBN 978-86-80593-52-4
18
ACKNOWLEDGMENT
This work was supported by the Ministry of Education,
Science and Technological Development of the Republic
of Serbia under Grant III 42006 and Grant III 44006.
REFERENCES
[1] European Commission Task Force for Smart Grids. Expert Group 3: Roles and responsibilities, 2010
[2] European Electricity Grid Initiative. Roadmap 2010-18 and Detailed Implementation Plan 2010-12, 2010.
[3] U.S. Department of Energy (DOE). Guidebook for ARRA SGDP/RDSI Metrics and Benefits. DOE Report, 2010.
[4] N. H. Afgan, M. G. Carvalho. Multi-criteria assessment of new and renewable energy power plants. Energy 2002; 27:739–755.
[5] S. A. Hosseini et al., Optimal sizing and siting distributed generation resources using a multi objective algorithm. Turkish Journal of Electrical Engineering & Computer Sciences 2013; 21:825-850.
[6] H Aras et al., Multi-criteria selection for a wind observation station location using analytic hierarchy process. Renew Energy 2004; 29:1383–1392.
[7] S. K. Lee et al., Decision support for prioritizing energy technologies against high oil prices: a fuzzy analytic hierarchy process approach. J Loss Prev Process Ind 2009; 22:915–920.
[8] A. Janjic, Z. Stajic, I. Radovic, Power Quality Requirements for the Smart Grid Design, International journal of circuits, systems and signal processing, Issue 6, Volume 5, 2011, pp 643-651
[9] Z. Stajic, A. Janjic, Z. Simendic, Power quality and electrical energy losses as a key drivers for smart grid platform development Recent Researches in System Science, ISBN: 978-1-61804-023-7, pp 417-422
[10] R. A. Taha, T. Daim, Multi-Criteria applications in renewable energy analysis, a literature review. Research and Technology Management in the Electricity Industry 2013; 8:17-30.
[11] P. S. Georgilakis, N. D. Hatziargyriou, Optimal distributed generation placement in power distribution networks: models, methods, and future research. IEEE Transactions on Power Systems 2013, 28: 3420-3428.
[12] A. Janjic, S. Savic, G. Janackovic, Multi-criteria decision support for optimal distributed generation dispatch. 2nd International Symposium on Environment Friendly Energies and Applications, June 2012; 134-139.
[13] A. Barin et al., Multicriteria analysis of the operation of renewable energy sources taking as basis the AHP method and fuzzy logic concerning distributed generation systems, The Online Journal on Electronics and Electrical Engineering (OJEEE), 2009; 1:52-57.
[14] European Commission. Strategic Deployment Document for Europe Electricity Networks of the Future European Technology Platform 2010.
[15] European Network for the Security of Control and Real time systems, R&D and standardization Road Map, final deliverable 3.2, 2011.
[16] EPRI (Electric Power Research Institute). Methodological Approach for Estimating the Benefits and Costs of Smart Grid Demonstration Projects. PaloAlto, CA: EPRI. 1020342. 2010.
[17] European Commission. Guidelines for conducting cost-benefit analysis of Smart Grid projects. Reference Report - Joint Research Centre, Institute for Energy and Transport, 2012.
[18] European Commission. Guidelinesfor cost-benefit analysis of smart metering deployment. Scientific and Policy report - Joint Research Centre, Institute for Energy and Transport, 2012.
[19] B. Srdjevic, Y. Medeiros, Fuzzy AHP assessment of water management plans. Water Resources Management 2008; 22: 877-894.
[20] G. Grawford, C. Williams, A note on the analysis of subjective judgment matrices. Journal of Mathematical Psychology 1985; 29:387-405
[21] J. Aquaron, M. T. Escobar, Moreno-Jimenez JM. Consistency stability intervals for a judgment in AHP decision support systems. European Journal of Operational research 2003; 145:382-393.
[22] J. Aquaron, J. M. Moreno-Jimenez, The geometric consistency index: Approximated thresholds. European Journal of Operational research 2003; 147:137-145
[23] M. T. Escobar, J. Aquaron, J. M. Moreno-Jimenez, A note on AHP Group consistency for the row geometric mean priorization procedure, European Journal of Operational research 2004; 153:318-322.
[24] A. Janjic, L. Velimirovic, S. Savic, M. Stankovic, Multicriteria Analysis of the Smart Grid Project Efficiency, ICEST 2014, Serbia, Niš, June 25 - 27, 2014

ISBN 978-86-80593-52-4
19
Using 3D Modeling in Assessment of Teeth
Nivelation
Nemanja Majstorović1, Jelena Mačužić2, Branislav Glišić1 1Faculty of Dentistry, University of Belgrade
2Faculty of Mechanical Engineering, University of Belgrade
[email protected]; [email protected]; [email protected]
Abstract—3D modeling is often used in orthodontic therapy planning and monitoring. Our researches follow new trends and rely on using 3D models in everyday practice. Patient had incorrect relationship of upper and lower jaw of the third class, so the fix appliance was used as a therapy. This paper shows the modeling results, as well as the values of change of positions of each tooth (translation, rotation), between master model and 6. control model.
I. INTRODUCTION
Therapy with fix appliance is becoming more and more popular among patients. Therapy time is significantly shorter, and the results are visible already after one year. By applying the fix appliance it is possible to close the spaces between the teeth, and also to fix relationships between the upper and lower teeth. However, lately, 3D models are more frequently used for this purpose. They can be used to determine movement of each tooth in jaw with big precision. The purpose of this article is the application of 3D model in establishing translation and rotation parameters of each tooth in the jaw [1-6].
II. 3D DIGITAL MODELS IN ORTHODONTICS – STATE
OF THE ARTS
To determine the accuracy of orthodontic diagnosis and treatment progress, orthodontists use various types of measurement and analysis. Typical measurements made on plaster models include teeth width and length of arc, and for different distances. All measurements are typically performed in the space [7, 10], lower the plane, at least along one axis. These measurements provide insight into the available space between the teeth, which is often necessary to determine the appropriate treatment plan. Today, this procedure include: time (laboratory - taking / spills impressions), space (warehouse - storage impressions) and search for clinical use. Traditionally, these measurements are performed manually on plaster models, using vernier calipers. Digital vernier caliper proved to be accurate, reliable, and reproducibility of the results that are satisfactory for this study [8, 11-12].
Today's 3D sensor technology offers new opportunities to replace manual measurements, which include 3D digital models (images) scanned objects, computer-
supported software for measurement. The usefulness of this technology in orthodontics is reflected in benefits including: measurement accuracy, reducing the time and storage space as well as on-line consultation and presentation capabilities therapy [12].
Today, several companies have developed clinical operative software [9, 12,13], which allows user's negligence to perform a variety of measurements and calculate the required data from the digital model of the orthodontic coordinate system. One of these approaches [24], provides a detailed analysis of the tuber space plane (y-z), which is performed after scanning orthodontic plaster models of holographic sensor.
This tool allows the user to set a pair of transverse plane (the plane tuber – y-z) in any desired position and orientation, in order to measure the widest mesiodistal tooth spacing. The aim of this study was to verify the accuracy of the new technique in comparison to the gold standard, defined digital caliper criterion [1,5, 1], and its accuracy is the range from several to several tens of micrometers.
III. MATERIALS AND METHODS
With the patient’s consent, impressions of upper and lower jaw were taken. The impressions were poured and we got the plaster models. These models were scanned on 3D scanner of the latest generation, with the accuracy of 10 microns. 3D models were downloaded into the GOM Inspect program. The global coordinate system was defined in order to determine the movement of the teeth. X, Y and Z-axis were defined so that each of them coincides with one of the model planes-orthodontic plane. Improvement of the therapy was determined by reciprocal comparison of the models, with the help from the referential geometrical entities (RGE) [8,9]. The impressions were taken on each control (every month), for six months.
IV. RESULTS
Defining patient’s initial state starts by establishing 3D model, which in our researches is called-master model. In
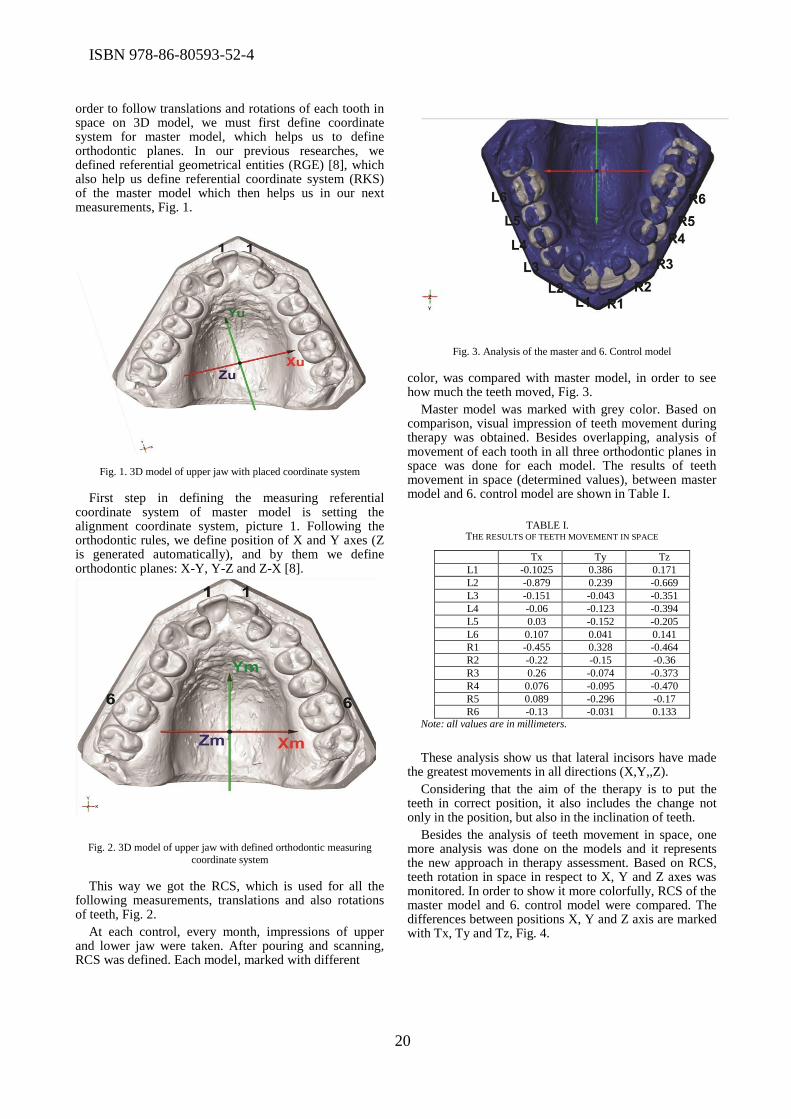
ISBN 978-86-80593-52-4
20
order to follow translations and rotations of each tooth in space on 3D model, we must first define coordinate system for master model, which helps us to define orthodontic planes. In our previous researches, we defined referential geometrical entities (RGE) [8], which also help us define referential coordinate system (RKS) of the master model which then helps us in our next measurements, Fig. 1.
Fig. 1. 3D model of upper jaw with placed coordinate system
First step in defining the measuring referential coordinate system of master model is setting the alignment coordinate system, picture 1. Following the orthodontic rules, we define position of X and Y axes (Z is generated automatically), and by them we define orthodontic planes: X-Y, Y-Z and Z-X [8].
Fig. 2. 3D model of upper jaw with defined orthodontic measuring
coordinate system
This way we got the RCS, which is used for all the following measurements, translations and also rotations of teeth, Fig. 2.
At each control, every month, impressions of upper and lower jaw were taken. After pouring and scanning, RCS was defined. Each model, marked with different
Fig. 3. Analysis of the master and 6. Control model
color, was compared with master model, in order to see how much the teeth moved, Fig. 3.
Master model was marked with grey color. Based on comparison, visual impression of teeth movement during therapy was obtained. Besides overlapping, analysis of movement of each tooth in all three orthodontic planes in space was done for each model. The results of teeth movement in space (determined values), between master model and 6. control model are shown in Table I.
TABLE I. THE RESULTS OF TEETH MOVEMENT IN SPACE
Tx Ty Tz
L1 -0.1025 0.386 0.171
L2 -0.879 0.239 -0.669
L3 -0.151 -0.043 -0.351
L4 -0.06 -0.123 -0.394
L5 0.03 -0.152 -0.205
L6 0.107 0.041 0.141
R1 -0.455 0.328 -0.464
R2 -0.22 -0.15 -0.36
R3 0.26 -0.074 -0.373
R4 0.076 -0.095 -0.470
R5 0.089 -0.296 -0.17
R6 -0.13 -0.031 0.133 Note: all values are in millimeters.
These analysis show us that lateral incisors have made the greatest movements in all directions (X,Y,,Z).
Considering that the aim of the therapy is to put the teeth in correct position, it also includes the change not only in the position, but also in the inclination of teeth.
Besides the analysis of teeth movement in space, one more analysis was done on the models and it represents the new approach in therapy assessment. Based on RCS, teeth rotation in space in respect to X, Y and Z axes was monitored. In order to show it more colorfully, RCS of the master model and 6. control model were compared. The differences between positions X, Y and Z axis are marked with Tx, Ty and Tz, Fig. 4.
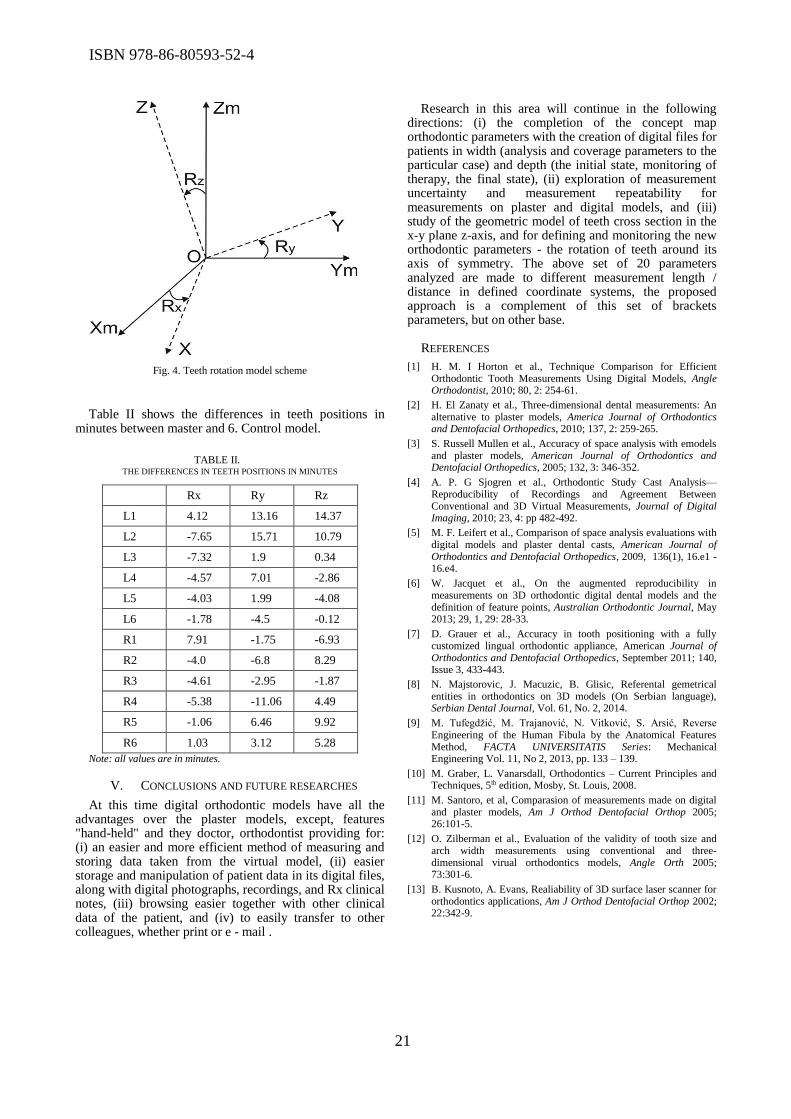
ISBN 978-86-80593-52-4
21
Fig. 4. Teeth rotation model scheme
Table II shows the differences in teeth positions in minutes between master and 6. Control model.
TABLE II. THE DIFFERENCES IN TEETH POSITIONS IN MINUTES
Rx Ry Rz
L1 4.12 13.16 14.37
L2 -7.65 15.71 10.79
L3 -7.32 1.9 0.34
L4 -4.57 7.01 -2.86
L5 -4.03 1.99 -4.08
L6 -1.78 -4.5 -0.12
R1 7.91 -1.75 -6.93
R2 -4.0 -6.8 8.29
R3 -4.61 -2.95 -1.87
R4 -5.38 -11.06 4.49
R5 -1.06 6.46 9.92
R6 1.03 3.12 5.28
Note: all values are in minutes.
V. CONCLUSIONS AND FUTURE RESEARCHES
At this time digital orthodontic models have all the advantages over the plaster models, except, features "hand-held" and they doctor, orthodontist providing for: (i) an easier and more efficient method of measuring and storing data taken from the virtual model, (ii) easier storage and manipulation of patient data in its digital files, along with digital photographs, recordings, and Rx clinical notes, (iii) browsing easier together with other clinical data of the patient, and (iv) to easily transfer to other colleagues, whether print or e - mail .
Research in this area will continue in the following directions: (i) the completion of the concept map orthodontic parameters with the creation of digital files for patients in width (analysis and coverage parameters to the particular case) and depth (the initial state, monitoring of therapy, the final state), (ii) exploration of measurement uncertainty and measurement repeatability for measurements on plaster and digital models, and (iii) study of the geometric model of teeth cross section in the x-y plane z-axis, and for defining and monitoring the new orthodontic parameters - the rotation of teeth around its axis of symmetry. The above set of 20 parameters analyzed are made to different measurement length / distance in defined coordinate systems, the proposed approach is a complement of this set of brackets parameters, but on other base.
REFERENCES
[1] H. M. I Horton et al., Technique Comparison for Efficient Orthodontic Tooth Measurements Using Digital Models, Angle Orthodontist, 2010; 80, 2: 254-61.
[2] H. El Zanaty et al., Three-dimensional dental measurements: An alternative to plaster models, America Journal of Orthodontics and Dentofacial Orthopedics, 2010; 137, 2: 259-265.
[3] S. Russell Mullen et al., Accuracy of space analysis with emodels and plaster models, American Journal of Orthodontics and Dentofacial Orthopedics, 2005; 132, 3: 346-352.
[4] A. P. G Sjogren et al., Orthodontic Study Cast Analysis—Reproducibility of Recordings and Agreement Between Conventional and 3D Virtual Measurements, Journal of Digital Imaging, 2010; 23, 4: pp 482-492.
[5] M. F. Leifert et al., Comparison of space analysis evaluations with digital models and plaster dental casts, American Journal of Orthodontics and Dentofacial Orthopedics, 2009, 136(1), 16.e1 - 16.e4.
[6] W. Jacquet et al., On the augmented reproducibility in measurements on 3D orthodontic digital dental models and the definition of feature points, Australian Orthodontic Journal, May 2013; 29, 1, 29: 28-33.
[7] D. Grauer et al., Accuracy in tooth positioning with a fully customized lingual orthodontic appliance, American Journal of Orthodontics and Dentofacial Orthopedics, September 2011; 140, Issue 3, 433-443.
[8] N. Majstorovic, J. Macuzic, B. Glisic, Referental gemetrical entities in orthodontics on 3D models (On Serbian language), Serbian Dental Journal, Vol. 61, No. 2, 2014.
[9] M. Tufegdžić, M. Trajanović, N. Vitković, S. Arsić, Reverse Engineering of the Human Fibula by the Anatomical Features Method, FACTA UNIVERSITATIS Series: Mechanical Engineering Vol. 11, No 2, 2013, pp. 133 – 139.
[10] M. Graber, L. Vanarsdall, Orthodontics – Current Principles and Techniques, 5th edition, Mosby, St. Louis, 2008.
[11] M. Santoro, et al, Comparasion of measurements made on digital and plaster models, Am J Orthod Dentofacial Orthop 2005; 26:101-5.
[12] O. Zilberman et al., Evaluation of the validity of tooth size and arch width measurements using conventional and three-dimensional virual orthodontics models, Angle Orth 2005; 73:301-6.
[13] B. Kusnoto, A. Evans, Realiability of 3D surface laser scanner for orthodontics applications, Am J Orthod Dentofacial Orthop 2002; 22:342-9.
ISBN 978-86-80593-52-4
Complexity and throughput analysis ofmemory efficient APP decoders for LDPC codes
Velimir Ilic1, Elsa Dupraz2, David Declercq3, Bane Vasic41Mathematical Institute SANU, Belgrade, Serbia
2,3ETIS ENSEA/Univ. of Cergy-Pontoise/CNRS, Cergy-Pontoise, France4Department of ECE, University of Arizona, Tucson
[email protected], [email protected],[email protected], [email protected]
Abstract—In this paper we propose two memory efficienta posteriori probability (APP) decoders for the decoding oflow-density parity-check (LDPC) codes. We characterize thecomplexity of the decoder by providing the exact expressionsof the number of processors, memory requirements, andcomputational complexity of the proposed implementations.We also provides new expression for the decoder throughputwith respect to the number of processors and the com-putational complexity. Finally, we show that the proposeddecoders require memory that is linear in the number ofnodes in the Tanner graph of the code. This is a significantsaving compared to the existing APP decoder, which requiresmemory that is proportional to the number of edges.
I. INTRODUCTION
Belief propagation (BP) is an iterative message-passingalgorithm widely used for decoding Low Density ParityCheck (LDPC) codes [1]. Despite its good error correctionperformance and capability of approaching the Shannonlimit, BP suffers from large memory requirements for mes-sage processing and storage, proportional to the numberof edges in the Tanner graph of the code [2]. Such largememory requirements, coupled with additional hardwareresources needed for the message updating, make the BPless attractive in practical applications.
A posteriori probability (APP) decoder [3], [4] is asuboptimal alternative to BP, in which the variable nodeprocessing is simplified so that a message from a variable
*This work is supported by Ministry of Science and TechnologicalDevelopment, Republic of Serbia, Grant III044006, by the NSF undergrants CCF-1314147 and CCF-0963726 and the Seventh FrameworkProgramme of the European Union, under Grant Agreement number309129 (i-RISC project).
node corresponds to a posteriori value used to estimatethat variable. In the APP decoder, the messages are thussent in an intrinsic manner, which results in significantmemory savings.
In this paper we propose two memory-efficient APPdecoders that require memory proportional to the numberof nodes in the Tanner graph of the LDPC code, ratherthan to the number of edges, as in the original parallelAPP decoder proposed in [3]. The proposed decodersuse the advantages of different types of message passingscheduling previously developed for the BP algorithm. Thefirst algorithm uses the flooding schedule over check nodesproposed in [5] for BP decoding. It operates in a semi-parallel way by processing all the check nodes in a parallelmanner and the variable nodes in a serial one. The secondalgorithm is based on the shuffled schedule proposed in[6] and operates in a fully serial manner.
We also present a rigorous analysis of the decoderscomplexity. The following criteria are considered: 1) Mem-ory requirements for the storage of intermediate resultsused in the decoding process, 2) Number of processorsused for the decoder implementation, 3) Computationalcomplexity defined as the total number of operationsneeded to perform the decoding.
The memory complexity has was analyzed in [7] butonly for the parallel decoder. Moreover, the exact ex-pression of the memory complexity was not derived, butonly an estimation was provided. Here, we derive theexact expressions of the memory requirements, numberof processors, and computational complexity required byparallel, semi-parallel, and serial APP decoders. Moreover,we pay special attention to the connection between the
22

ISBN 978-86-80593-52-4
decoder complexity and its throughput (the number ofinformation bits per time used for the decoding). Weprovide new formula which relates the throughput to thenumber of processors. The results presented in [5] are aspecial case of our expressions.
As the end, we show that the parallel decoder usesthe highest number of processors and has highest thememory requirements. As a consequence it has the highestthroughput. On the other side, the serial decoder usesthe lowest number of processors, has the lowest memoryrequirements and the lowest throughput.
The paper is structured as follows. In Section II wepresent the basic notions on LDPC codes and review theAPP decoder. General expressions for the decoder com-plexity and its relation to throughput are derived in SectionIII. In Section IV, the memory efficient APP decodersare presented and their complexity and throughput areanalyzed.
II. APP DECODING OF LDPC CODES
In this section we introduce basic definitions of LDPCcodes theory and present the original parallel APP decoderproposed in [3] .
A. LDPC codes
A regular LDPC code is a linear block code defined by agenerator matrix G of size pK,Nq and by a sparse parity-check matrix H of size pM,Nq, with N “ K `M . Thecodeword x “ px1, x2, . . . , xN q P t0, 1u
N is constructedfrom the information sequence u “ pu1, u2, . . . , uKq Pt0, 1uK as x “ Gu. The codeword x satisfies HxT “ 0,where xT denotes the transposed (column) vector. Therate of the code is denoted R “ K{N . The Tannergraph [2] of an LDPC code is a bipartite graph whoseadjacency matrix is the parity-check matrix of the codeH . It contains two types of nodes: a set of variable-nodesN “ tv1, v2, . . . , vNu, corresponding to the N columnsof H , and a set of check-nodes M “ tc1, c2, . . . , cMu,corresponding to the M rows of H . A variable-node vnand a check-node cm are connected by an edge if and onlyif the corresponding entry of H is non-zero. The set ofindices of check-nodes connected to the variable-node vnis denoted with Hpvnq and the set of indices of variable-nodes connected to the check-node cm is denoted withHpcmq. In the case of regular LDPC codes cardinalitiesof Hpvnq and Hpcmq are the same for all vn and cm,and denoted with dv and dc, respectively. In the case ofregular codes, the rate of the code can be calculated asR “ 1´ dv
dc.
Let y “ py1, y2, . . . , yN q be the received sequence asdefined in [8]. The channel is defined by the probabilisticmodel ppx,yq9
śNn“1 Prpyn|xnq
śMm“1 1p
ř
nPN pmq xnq,where Prpy|xq is the channel likelihood, 1 is the indicatorfunction and
ř
nPN pmq xn are modulo 2 sums determinedby the parity check matrix H .
B. APP decoderThe goal of the decoding is to compute the a posteri-
ori probability Prpxn|yq, which is used for the decisionmaking on bit values. APP decoder originally proposedin [3] computes the a posteriori probability in an iterativemessage passing manner, by processing all the check andvariable nodes in parallel. In one half-iteration, messagesfrom check nodes are computed according to previouslycomputed (or initialized) values in variable nodes. Afterthat, all the variable nodes take incoming message at sametime and update its values, which completes one iteration.Parallel APP decoder operates as follows.
Initialization: Variable-nodes are initialized to a pri-ori values pγ1, γ2, . . . , γN q from the received sequencepy1, y2, . . . , yN q as
γp0qn “ γn “ppyn | xn “ 0q
ppyn | xn “ 1q. (1)
Iterative processing:1) Check-node processing: consists in computing the
check-to-variable messages µpkqmÑn, for all check-
nodes m and their neighbor variable-nodes vn;
µpkqmÑn “ð
kPN pmqznγpk´1qk , (2)
whereÐ
iPN pmqznstands for the summation over the
set N pmqzn induced by the box-sum operationdefined as
x‘ y “ log1` exey
ex ` ey(3)
2) A posteriori information update: consists in comput-ing the a posteriori messages γpkqn , for all variable-nodes vn,
γpkqn “ γn `ÿ
mPMpnq
µpkqmÑn. (4)
3) Hard decision: Estimated values of sent bits, x “px1, x2, . . . , xN q, according to the rule: γpkqn ą 0
then xpkqn “ 0, otherwise x
pkqn “ 1. The decoder
stops when either x is a codeword or a maximumnumber of decoding iterations is reached.
Check to variable messages requires the computation ofall partial sums
Ð
kPN pmqzn γpk´1qk , which can efficiently
be computed using the inverse operation for ‘ calledminus-box operator:
xa y “ log1´ exey
ex ´ ey(5)
It is easy to check that x‘yay “ x. Using the a operator,the sum
Ψpkqm “ð
kPN pmqγpk´1qk (6)
can be computed once per iteration and node, and all themessages can be computed for all n P N pmq as
µpkqmÑn “ Ψpkqm a γpk´1qn . (7)
23
ISBN 978-86-80593-52-4
III. THROUGHPUT OF APP DECODER
APP decoders are implemented using three differenttypes of processors, which are associated nodes and eachedges of Tanner graph corresponding to the code:
1) Variable node processor (v-processors), which per-forms real addition, in order to compute the aposteriori value according to the equation (4);
2) Check node processors (c-processors), which per-forms ‘ operation, in order to compute check-sumsaccording to the equation (6);
3) Edge processors (e-processors), which performs a
operation, in order to compute messages accordingto the equation (7).
Let the number of x-processors (x may stand for v,c and e) be denoted with Px. During one iteration, allx-processors of the same type, run at same time, forCx times. The processors of different types never run atthe same time, i.e. the processors of one type run afterthe previous type has finished the running (in the orderc, e, v). The total number of computations performed byx-processors per one iteration is denoted with Ex and isequal to Ex “ Px Cx.
The total number of running the processors denoted withC, C “ Cv`Cc`Ce, and the total number of performedcomputations is denoted with E, with E “ Ev`Ec`Ee.
In each iteration in each of N variable nodes, ` oper-ation is performed for dv times, which is Ev “ N dv intotal. In similar manner we get Ec “ Ee “M dc “ N dvi.e.
Ev “ Ec “ Ee “E
3; E “ 3 N dv (8)
An effective number of processors P is introduced sothat E “ P C, and we have
P “E
C“
EEv
Pv` Ec
Pc` Ee
Pe
“3
1Pv` 1
Pc` 1
Pe
(9)
The time needed for finishing one iteration, T , can becomputed as T “ Cv t``Cc t‘`Ce ta, where td standsfor time needed for performing d operations. Although,‘ and a requires higher time, an efficient and accurateapproximation have previously been proposed [9], and inour considerations we consider that all operations are per-formed for same time t for all the operations, in one timeclock f “ 1{t so that T “ pCv`Cc`Ceq t “
Cf “
EP f .
Throughput of a decoder, which runs for I iterations,is defined as a number of information bits per time unitwhich can proceeded, and can be represented as:
D “K
T I“K f P
E I“R N f P
E I(10)
or, by using formulas (8) and (9), as:
D “R f P
3 dv I“R f
dv I¨
11Pv` 1
Pc` 1
Pe
. (11)
Note that if Pc, Pv " Pe then P “ 3Pe and the formula(11) reduces to the formula D “ RfPe{dvI . This special
Algorithm 1: PARALLEL APP DECODER
Input: y “ py1, . . . , yN q P YNŹ received word
Output: x “ px1, . . . , xN q P t0, 1uN
Ź estimated codeword
Initialization:1: for each tvnun“1,...,N do γn “ log
Prpyn|xn “ 0q
Prpyn|xn “ 1q;
2: for each tvnun“1,...,N do γn “ γn;
Iterative processing loop3: for each tcmum“1,...,M do Ψm “ 04: for each vn P Hpcmq do Ψm “ Ψm ‘ γn5: for each tcmum“1,...,M do6: for each vn P Hpcmq do µmÑn “ Ψm a γn
7: for each tvnun“1,...,N do γn “ γn8: for each cm P Hpvnq do γn “ γn ` µ
pnqkÑm
9: for each tvnun“1,...,N do xn “ p1´ signpγnqq{210: if x is codeword then exit the iteration loop
End iterative processing loop
case has previously been derived in [5], where the numberof edge processors Pe is called an edge processing power.
IV. MEMORY EFFICIENT APP DECODING
In this section we consider implementation aspects ofthe APP decoder. First, we present parallel APP decoderproposed in [3]. After that we propose two alternativememory efficient variants, semi-parallel and serial APPdecoders. Each decoder is described using a pseudo-code. The throughput of the decoder, and its complexityare computed. The following types of complexity areconsidered:
1) Memory requirements for storage of the messages,a posteriori values, cahnnel values and check-sums;
2) Number of processors used for the decoder imple-mentation, given by formula P “ Pv ` Pc ` Pe;
3) Computational complexity, defined as the total num-ber of `, ‘ and a operations needed to performdecoding
At the end of the section, we compare the complexitiesof the decoders and derive the throughput analysis for thecase of Eucldian geometry (EGp2, sq) LDPC codes [10].
A. Parallel APP decoder
In the parallel APP decoder proposed in [3], each edgeand each node of the Tanner graph uses its own processorto perform computations. The pseudo-code for the paralleldecoder is given in Algorithm 1.
The computation of check sums Ψm is done in lines 3and 4, with Pc “M c-processor and each of them performa operation for Cv “ dv times. The check-to-variablemessages are computed in the lines 5 and 6, using Pe “
dvN e-processors and each of them perform ‘ operation
24
ISBN 978-86-80593-52-4
for Ce “ 1 time. The computation of the a posteriorivalues γn is done in the lines 7 and 8, using Pc “ N v-processors, and each of them performs real additions forCc “ dc times. The discussion is summarized in the firstrow of Table I.
In accordance, parallel decoder uses P “ Pv ` Pc `
Pe “ Npdv ` 1q ` M processors. The number ofoperations performed by x-processors (x may stand forv, c and e) is given by the expression Ex “ Px Cx.In accordance, Ev “ Ec “ Ee “ dvN and the totalnumber of operations performed during the decoding isE “ pEv`Ec`Eeq Ipar “ 3dvNIpar, where Ipar standsfor the number of iterations needed to achieve desired bit-error rate.
Since Pv “ N , Pc “ M and Pe “ dcM “ dvN , thethroughput of the parallel decoder can be expressed as:
Dpar “R f
dv Ipar¨
11N `
1M ` 1
dcM
(12)
During the computations, parallel decoder uses Mregisters for storing the check-sums Ψm, dvN registersfor storing check-to variable messages µmÑn and Nregisters for the estimated a posteriori values γn. Thisresults in the total number of pdv ` 1qN `M registers.In accordance, parallel APP decoder requires a memorywhich is proportional to the number of edges in the Tannergraph. In the following sections we propose two decoderswhich require memory that is proportional to the numberof the nodes.
The first row of Table II shows the total number of pro-cessors, memory requirements, total number of operationsand the throughput of the parallel decoder.
B. Semi-parallel APP algorithm
A semi-parallel APP decoder uses the flooding scheduleover the check nodes, proposed in [5] for BP decoding. Inthe semi-parallel version, all checks are first computed inparallel. After that check-nodes are proceeded in a serialmanner, and all neighbors of currently proceeded checknode are partially updated. The semi-parallel APP decoderis presented in Algorithm 2.
In the same manner as in parallel decoder, computationsof check-sums Ψm are performed in the lines 3 and 4using Pc “ M c-processors which runs in parallel andeach processor runs for Cc “ dv times. The messagesµmÑn are computed check-node-by-check-node, and alloutgoing messages are computed in line 7 using Pe “ dcprocessors, and each of them runs for Ce “ M times.The estimated a posteirori values γnew
n are initialized tothe channel values in the line 5 and partially updated inline 8, using Pv “ dc v-processors and each of them runsfor Cv “ M times, during the serial processing of checknodes. The computed a posteriori values are saved in theline 9, and used in the next iteration. As a result, at the endof the iteration, the a posteriori values are the same as the
Algorithm 2: SEMI-PARALLEL APP DECODER
Input: y “ py1, . . . , yN q P YNŹ received word
Output: x “ px1, . . . , xN q P t0, 1uN
Ź estimated codeword
Initialization:1: for each tvnun“1,...,N do γn “ log
Prpyn|xn “ 0q
Prpyn|xn “ 1q;
2: for each tvnun“1,...,N do γoldn “ γn;
Iterative processing loop3: for each tcmum“1,...,M do Ψm “ 04: for each vn P Hpcmq do Ψm “ Ψm ‘ γold
n
5: for each tvnun“1,...,N do γnewn “ γn;
6: for each tcmum“1,...,M do7: for each vn P Hpcmq do µmÑn “ Ψm a γold
n
8: for each vn P Hpcmq do γnewn “ γnew
n ` µmÑn
9: for each tvnun“1,...,N do γoldn “ γnew
n
10: for each tvnun“1,...,N do xn “ p1´ signpγnqq{211: if x is codeword then exit the iteration loop
End iterative processing loop
values computed in the parallel decoder. The discussion issummarized in the second row of Table I
Semi-parallel decoder uses P “ Pv ` Pc ` Pe “
2dc ` M processors and performs the total number ofE “ 3dvNIsemi operations, where Isemi stands for thenumber of iterations needed to achieve desired bit-errorrate. Since, the semi-parallel decoder provides exactly thesame output as the parallel decoder, Isemi “ Ipar and thetotal number of operations is the same as in the paralleldecoder.
Since Pv “ N , Pc “ dc and Pe “ dc, the throughputof the semi-parallel decoder can be expressed as:
D “R f
dv I¨
11M ` 2
dc
Note that in semi-parallel APP decoder we do not needto store the messages from all check nodes, but only themessages from the processed one, which results in lowermemory complexity than in the parallel decoder. We needM registers for storing the check-sums Ψm, N registersfor the estimated a posteriori values γnew
n , dc registers forstoring check-to variable messages µmÑn and N registersfor saved values γold
n . This results in the total number ofM ` 2N ` dc registers.
The second row of Table II shows the total numberof processors, memory requirements, total number ofoperations and the throughput of the semi-parallel decoder.
-
C. Serial APP algorithm
A serial APP decoder is based on the shuffled scheduleproposed in [6] and [11] for BP decoding. The decoder is
25

ISBN 978-86-80593-52-4
` ‘ a
Pv Cv Ev Pc Cc Ec Pe Ce Ee
Parallel APP N dv dvN M dc dvN dvN 1 dvN
Semi-parallel APP dc M dvN M dc dvN dc M dvN
Serial APP 1 dvN dvN dv N dvN dv N dvN
TABLE I: Computational complexity of APP decoders. P˚ is number of processors, C˚ time for the performing ofall operations * if P˚ works in parallel, and E˚ “ P˚ ¨ C˚ the total number of * operations performed during one
iteration
Processors Memory Energy Throughput
Parallel APP N `M ` dvN pdv ` 1qN `M 3 dv N Ipar Rf{ dvIpar p1{N ` 1{M ` 1{dcMq
Semi-parallel APP 2dc `M 2N `M ` dc 3 dv N Ipar Rf{ dvIpar p1{M ` 2{dcq
Serial APP 2dv ` 1 N `M 3 dv N α Ipar Rf{ αdvIpar p1` 2{dvq
TABLE II: Number of processors, memory, total number of computations and throughput for different APP decoders
Algorithm 3: SERIAL APP DECODER
Input: y “ py1, . . . , yN q P YNŹ received word
Output: x “ px1, . . . , xN q P t0, 1uN
Ź estimated codeword
Initialization:1: for each tvnun“1,...,N do γn “ log
Prpyn|xn “ 0q
Prpyn|xn “ 1q;
2: for each tvnun“1,...,N do γn “ γn;3: for each tcmum“1,...,M do Ψm “
Ð
nPN pmqγn
Iterative processing loop
4: for each tvnun“1,...,N do5: for each cm P Hpvnq do Ψm “ Ψm a γn6: γn “ γn7: for each cm P Hpvnq do γn “ γn `Ψm
8: for each cm P Hpvnq do Ψm “ Ψm ‘ γn
9: for each tvnun“1,...,N do xn “ p1´ signpγnqq{210: if x is codeword then exit the iteration loop
End iterative processing loop
presented in Algorithm 3.In the serial APP decoder variable nodes are processed
one by one. The check sums are initialized in the line 3,and after that updated during the whole iterative process.The update of the check sums Ψm in the line 5 correspondsto the computation of check-to-variable message and isdone with Pe “ dc e-processors which run for Ce “ Ntimes. After the update, the proceeded variable node isupdated using Pv “ 1 v-processors, which runs Cv “
N ˆ dv times during one iteration. Finally, check sumsare updated again in the line 8, by the newly computed aposteriori values using by Pc “ dv c-processors, and eachof them runs for Cc “ N times. After that, check-sumsare used in the proceeding of the next iteration. This issummarized in the third row of Table I.
Serial decoder uses P “ Pv ` Pc ` Pe “ 2dv ` 1 pro-cessors and performs the total number of E “ 3dvNIseroperations, where Iser stands for the number of iterationsneeded to achieve desired bit-error rate.
Note that, unlike for the semi-parallel decoder, newlycomputed a posteriori values are used immediately aftercomputation for the computations of all subsequent aposteriori values in the same iteration. In the case ofBP decoder, it has already been known that this updat-ing improves the convergence [6], [11]. In other words,Iser “ αIpar where 0 ă α ă 1 and the parameter αdepends on the type of code considered. As a result, theserial decoder uses the smaller number of computationsthan the parallel and the semi-parallel decoders.
Since Pv “ N , Pc “ Pe “ dc and Iser “ αIpar(0 ă α ă 1), the throughput of the serial decoder canbe expressed as:
D “R f
dv Iser¨
1
1` 2dv
.
Unlike the semi-parallel decoder, in the serial decoderthe messages are stored in the check-sum registers and thecopies of a posteriori values are not made, which resultsin total number of M `N registers for storing the valuesΨm and γn.
The third row of Table II shows the total number of pro-cessors, memory requirements, total number of operations
26
ISBN 978-86-80593-52-4
and the throughput of the serial decoder.
D. Case study: EG LDPC codes
In this section we illustrate the previous study of thedecoders complexity by an example of EGp2, sq LDPCcodes [10]. For these codes the number of check and vari-able nodes, as well as the check and variable degrees, aredetermined by the parameter s with: N “ M “ 22s ´ 1,K “ 22s ´ 3s and d “ dc “ dv “ 2s, for s P N.
According to the Table I and Table II, we have thefollowing estimates for parallel APP decoder:
Ppar “ pd` 2qN, Spar “ pd` 2qN,
Dpar “R f
dv Ipar¨Ndv
2dv ` 1“
f
Ipar¨
K
2d` 1. (13)
Since dDpar
ds ą 0, Dpar is increasing with s.For semi-parallel APP decoder we have:
Ssemi “ 4N ` d, Psemi “ 2dc `M,
Dsemi “R f
dv Ipar¨
11N `
2dc
“f
I¨
K
2N ` d. (14)
Dsemi is also increasing with s (since dDsemi
ds ą 0).For the serial APP decoder we have:
Sser “ 3N, Pser “ 2dv ` 1,
Dser “R f
dv Ipar¨
1
1` 2dv
“f
I¨
K
αNpd` 2q. (15)
Unlike the parallel and semi-parallel case, dDsemi
ds ă 0,which means that Dsemi is decreasing with s. In the casesof parallel and semi-parallel decoders number of proces-sors rapidly increases with the value of the parameter s. Asa result, the throughput is also increasing with s. On theother hand, in the case of the serial decoder, the increaseof the number of processors is small, and the throughputdecreases with s.
As we noted parallel and semi-parallel provide sameoutput and run for the same number of iterations “ Ipar “Isemi to achieve desired bit-error rate. The serial decodershould achieve the same bit-error-rate performances in asmaller number of iterations Iser “ αI where 0 ă α ă 1.Note that the throughput of the serial decoder depends onthe parameter α. Note that the throughput Dsemi ă Dser
if α ă 2N`d2N`Nd ă 0.4. However, in practice α is usually
larger. For example, an estimated value α “ 1{2 is given in[12] for EG codes. In accordance, Dpar ą Dsemi ą Dser
expressions for the memory complexity and the numberof processors we have Spar ą Ssemi ą Sser and Ppar ą
Psemi ą Pser. In other words, higher throughput comesat the cost of larger chip area and larger internal memoryrequirements.
V. CONCLUSION
Two memory efficient a posteriori probability (APP)decoders for the decoding of low-density parity-check(LDPC) codes were presented. One of the decoders isbased on semi-parallel processing while the other is basedon serial node processing. The proposed decoders requirememory that is linear in the number of nodes in the Tannergraph of the code, which is a significant saving comparedto the existing parallel APP decoder [3], which requiresmemory that is proportional to the number of edges.
The complexity of the decoder was characterized interms of memory requirements, number of processorsneeded for its implementation, and computational com-plexity. We derived new formulas which relate decoderthroughput with the number of processors and the compu-tational complexity.
The results presented here can easily be adapted formore accurate versions of the APP decoders, such asnormalized APP decoder [7] and uniformly reweightedAPP decoder which we proposed recently [4].
REFERENCES
[1] D. J. C. Mackay, “Good error-correcting codes based on very sparsematrices,” IEEE Trans. Inf. Theory, vol. 45, no. 2, pp. 399–431,Mar. 1999.
[2] R. M. Tanner, “A recursive approach to low complexity codes,”IEEE Trans. Inf. Theory, vol. 27, no. 5, pp. 533–547, May 1981.
[3] M. Fossorier, M. Mihaljevic, and H. Imai, “Reduced complexityiterative decoding of low-density parity check codes based on beliefpropagation,” Communications, IEEE Transactions on, vol. 47,no. 5, pp. 673–680, May 1999.
[4] V. Ilic, E. Dupraz, D. Declercq, and B. Vasic, “Uniformlyreweighted app decoder for memory efficient decoding of ldpccodes,” in Proc. of Allerton Conference, 2014., October, 3 2014.
[5] F. Guilloud, E. Boutillon, J. Tousch, and J.-L. Danger, “Genericdescription and synthesis of ldpc decoders,” Communications, IEEETransactions on, vol. 55, no. 11, pp. 2084–2091, Nov 2007.
[6] J. Zhang and M. Fossorier, “Shuffled belief propagation decoding,”in Signals, Systems and Computers, 2002. Conference Record ofthe Thirty-Sixth Asilomar Conference on, vol. 1, Nov 2002, pp.8–15 vol.1.
[7] J. Chen and M. Fossorier, “Decoding low-density parity checkcodes with normalized APP-based algorithm,” in Proc. of GlobalTelecommunications Conference, 2001. GLOBECOM ’01. IEEE,vol. 2, 2001, pp. 1026–1030 vol.2.
[8] V. Savin, “Chapter 4 - {LDPC} decoders,” in Academic PressLibrary in Mobile and Wireless Communications, D. Declerq,M. Fossorier, and E. Biglieri, Eds. Oxford: Academic Press,2014, pp. 211 – 259. [Online]. Available: http://www.sciencedirect.com/science/article/pii/B9780123964991000042
[9] X.-Y. Hu, E. Eleftheriou, D.-M. Arnold, and A. Dholakia, “Efficientimplementations of the sum-product algorithm for decoding LDPCcodes,” in Proc. of Global Telecommunications Conference, 2001.GLOBECOM ’01. IEEE, vol. 2, 2001, pp. 1036–1036E.
[10] Y. Kou, S. Lin, and M. Fossorier, “Low-density parity-checkcodes based on finite geometries: a rediscovery and new results,”Information Theory, IEEE Transactions on, vol. 47, no. 7, pp. 2711–2736, Nov 2001.
[11] H. Kfir and I. Kanter, “Parallel versus sequential updating for beliefpropagation decoding,” Physica A: Statistical Mechanics and itsApplications, vol. 330, no. 1–2, pp. 259–270, 2003.
[12] J. Kim and W. Sung, “Rate-0.96 ldpc decoding vlsi for soft-decision error correction of nand flash memory,” Very Large ScaleIntegration (VLSI) Systems, IEEE Transactions on, vol. 22, no. 5,pp. 1004–1015, May 2014.
27
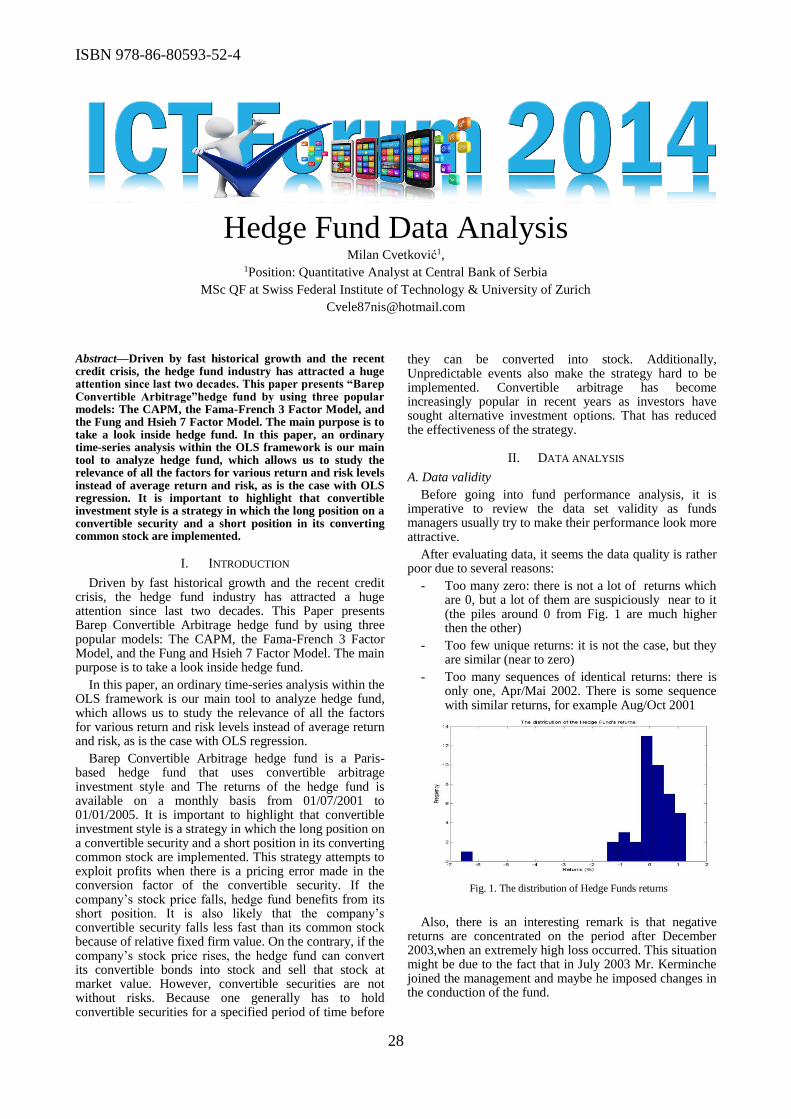
ISBN 978-86-80593-52-4
28
Hedge Fund Data Analysis
Milan Cvetković1, 1Position: Quantitative Analyst at Central Bank of Serbia
MSc QF at Swiss Federal Institute of Technology & University of Zurich
Abstract—Driven by fast historical growth and the recent credit crisis, the hedge fund industry has attracted a huge attention since last two decades. This paper presents “Barep Convertible Arbitrage”hedge fund by using three popular models: The CAPM, the Fama-French 3 Factor Model, and the Fung and Hsieh 7 Factor Model. The main purpose is to take a look inside hedge fund. In this paper, an ordinary time-series analysis within the OLS framework is our main tool to analyze hedge fund, which allows us to study the relevance of all the factors for various return and risk levels instead of average return and risk, as is the case with OLS regression. It is important to highlight that convertible investment style is a strategy in which the long position on a convertible security and a short position in its converting common stock are implemented.
I. INTRODUCTION
Driven by fast historical growth and the recent credit crisis, the hedge fund industry has attracted a huge attention since last two decades. This Paper presents Barep Convertible Arbitrage hedge fund by using three popular models: The CAPM, the Fama-French 3 Factor Model, and the Fung and Hsieh 7 Factor Model. The main purpose is to take a look inside hedge fund.
In this paper, an ordinary time-series analysis within the OLS framework is our main tool to analyze hedge fund, which allows us to study the relevance of all the factors for various return and risk levels instead of average return and risk, as is the case with OLS regression.
Barep Convertible Arbitrage hedge fund is a Paris-based hedge fund that uses convertible arbitrage investment style and The returns of the hedge fund is available on a monthly basis from 01/07/2001 to 01/01/2005. It is important to highlight that convertible investment style is a strategy in which the long position on a convertible security and a short position in its converting common stock are implemented. This strategy attempts to exploit profits when there is a pricing error made in the conversion factor of the convertible security. If the company’s stock price falls, hedge fund benefits from its short position. It is also likely that the company’s convertible security falls less fast than its common stock because of relative fixed firm value. On the contrary, if the company’s stock price rises, the hedge fund can convert its convertible bonds into stock and sell that stock at market value. However, convertible securities are not without risks. Because one generally has to hold convertible securities for a specified period of time before
they can be converted into stock. Additionally, Unpredictable events also make the strategy hard to be implemented. Convertible arbitrage has become increasingly popular in recent years as investors have sought alternative investment options. That has reduced the effectiveness of the strategy.
II. DATA ANALYSIS
A. Data validity
Before going into fund performance analysis, it is imperative to review the data set validity as funds managers usually try to make their performance look more attractive.
After evaluating data, it seems the data quality is rather poor due to several reasons:
- Too many zero: there is not a lot of returns which are 0, but a lot of them are suspiciously near to it (the piles around 0 from Fig. 1 are much higher then the other)
- Too few unique returns: it is not the case, but they are similar (near to zero)
- Too many sequences of identical returns: there is only one, Apr/Mai 2002. There is some sequence with similar returns, for example Aug/Oct 2001
Fig. 1. The distribution of Hedge Funds returns
Also, there is an interesting remark is that negative returns are concentrated on the period after December 2003,when an extremely high loss occurred. This situation might be due to the fact that in July 2003 Mr. Kerminche joined the management and maybe he imposed changes in the conduction of the fund.
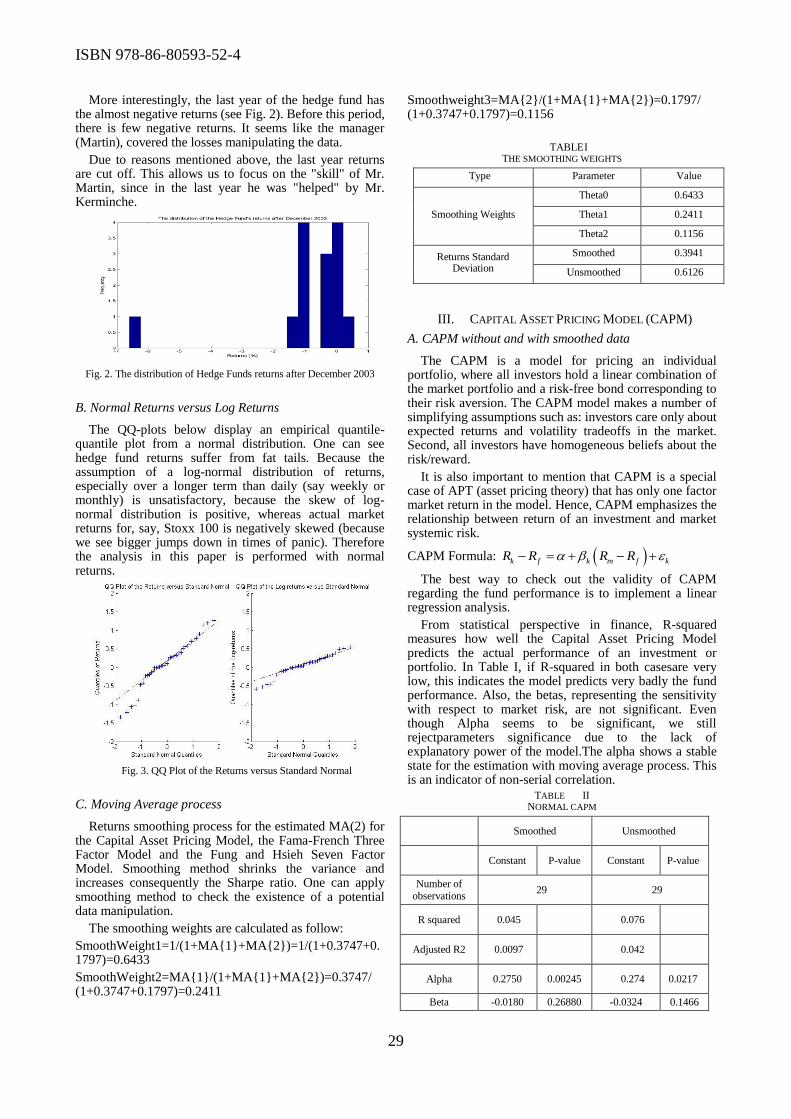
ISBN 978-86-80593-52-4
29
More interestingly, the last year of the hedge fund has the almost negative returns (see Fig. 2). Before this period, there is few negative returns. It seems like the manager (Martin), covered the losses manipulating the data.
Due to reasons mentioned above, the last year returns are cut off. This allows us to focus on the "skill" of Mr. Martin, since in the last year he was "helped" by Mr. Kerminche.
Fig. 2. The distribution of Hedge Funds returns after December 2003
B. Normal Returns versus Log Returns
The QQ-plots below display an empirical quantile-quantile plot from a normal distribution. One can see hedge fund returns suffer from fat tails. Because the assumption of a log-normal distribution of returns, especially over a longer term than daily (say weekly or monthly) is unsatisfactory, because the skew of log-normal distribution is positive, whereas actual market returns for, say, Stoxx 100 is negatively skewed (because we see bigger jumps down in times of panic). Therefore the analysis in this paper is performed with normal returns.
Fig. 3. QQ Plot of the Returns versus Standard Normal
C. Moving Average process
Returns smoothing process for the estimated MA(2) for the Capital Asset Pricing Model, the Fama-French Three Factor Model and the Fung and Hsieh Seven Factor Model. Smoothing method shrinks the variance and increases consequently the Sharpe ratio. One can apply smoothing method to check the existence of a potential data manipulation.
The smoothing weights are calculated as follow:
SmoothWeight1=1/(1+MA{1}+MA{2})=1/(1+0.3747+0.1797)=0.6433
SmoothWeight2=MA{1}/(1+MA{1}+MA{2})=0.3747/ (1+0.3747+0.1797)=0.2411
Smoothweight3=MA{2}/(1+MA{1}+MA{2})=0.1797/ (1+0.3747+0.1797)=0.1156
TABLE I
THE SMOOTHING WEIGHTS
Type Parameter Value
Smoothing Weights
Theta0 0.6433
Theta1 0.2411
Theta2 0.1156
Returns Standard Deviation
Smoothed 0.3941
Unsmoothed 0.6126
III. CAPITAL ASSET PRICING MODEL (CAPM)
A. CAPM without and with smoothed data
The CAPM is a model for pricing an individual portfolio, where all investors hold a linear combination of the market portfolio and a risk-free bond corresponding to their risk aversion. The CAPM model makes a number of simplifying assumptions such as: investors care only about expected returns and volatility tradeoffs in the market. Second, all investors have homogeneous beliefs about the risk/reward.
It is also important to mention that CAPM is a special case of APT (asset pricing theory) that has only one factor market return in the model. Hence, CAPM emphasizes the relationship between return of an investment and market systemic risk.
CAPM Formula: k f k m f kR R R R
The best way to check out the validity of CAPM regarding the fund performance is to implement a linear regression analysis.
From statistical perspective in finance, R-squared measures how well the Capital Asset Pricing Model predicts the actual performance of an investment or portfolio. In Table I, if R-squared in both casesare very low, this indicates the model predicts very badly the fund performance. Also, the betas, representing the sensitivity with respect to market risk, are not significant. Even though Alpha seems to be significant, we still rejectparameters significance due to the lack of explanatory power of the model.The alpha shows a stable state for the estimation with moving average process. This is an indicator of non-serial correlation.
TABLE II NORMAL CAPM
Smoothed Unsmoothed
Constant P-value Constant P-value
Number of observations
29 29
R squared 0.045 0.076
Adjusted R2 0.0097 0.042
Alpha 0.2750 0.00245 0.274 0.0217
Beta -0.0180 0.26880 -0.0324 0.1466

ISBN 978-86-80593-52-4
30
B. Asymmetric CAPM
In order to explain non-linearity that is not captured by linear methods, the asymmetric CAPM is worth to be mentioned:
k f k k k k kR R X X (1)
m fX R R (2)
, 0
0,
k k
k
X if XX
otherwise
(3)
, 0
0,
k k
k
X if XX
otherwise
(4)
TABLE III
ASYMMETRIC CAPM
Unsmoothed Smoothed
Constant P-value Constant P-value
Number of observations
29 29
R squared 0.10155 0.16483
Adjusted R2 0.03244 0.10058
Alpha 0.11992 0.42098 0.00382 0.98462
Mkt-Rf-minus
-0.05101 0.10372 -0.08976 0.03537
Mkt-Rf-Plus 0.02199 0.5356 0.03689 0.43796
As in the previous CAPM normal case, it still shows a ratherbad explanatory power of the model.The alphas are not significant at least the 5% significance level, and the same case for both Mkt-Rf factors except Mkt-Rf-minus in smoothed case. The alpha shows a notable decrease for the estimation with moving average process. This is an indicator of possible serial correlation.
C. CAPM regime model with stressed condition and market recovery
The so called Dot-com bubble or, more widely recognized, Internet bubble is the one of the examples of how investors believes can drive prices far above their fundamental value. Even though investors know they are in the bubble, nobody wants to admit it, hoping to find another trader whom they can sell for higher price and realize gains.During this particular bubble, covering the period between 1997-2000, many industrialized countries saw exponential growth of their stock market primary because of the development of the Internet sector.
Since times series data for our Arbitrage fund don’t cover the period before and during the bubble, we have decided to test the fund’s return during the market distressed conditions and recovery conditions.
The results we obtained from the CAPM in the table above indicate R2 value of 0.1560during the market stress conditions, which means that approximately 15,6 % of variation in our returns can be explained by the excess return on our market index, and slightly higher value of 0.2161 for the period of market recovery. Unfortunately, it seems that we cannot rely only on this factor because it
TABLE IV REGRESSION OUTPUT FOR MARKET STRESS AND MARKET RECOVERY
PERIOD
Smoothed Unsmoothed
Market stress
P-value Market
recovery P-value
Number of observations
11 18
R2 0.1560 0.2161
Adjusted R2 0.0622 0.1671
Alpha 0.1273 0.1523 0.4018 0.0018
Beta with respect toMkt-
Rf 0.0219 0.2291 -0.0420 0.0519
explains only the part of variation in our hedge fund returns. Far more interesting than R2 is the alpha we obtained. The model gives moderately high alpha of around 0.13 even during market stress conditions, which translates to approximately 1.56% annually, however, the alpha is insignificant at 95% confidence level.
IV. FAMA-FRENCH
A. Fama-French: Three Factor Model (FF3)
In order to strengthen the explanatory power of the regression model, Fama-French(FF3) is introduced in this chapter. The biggest difference between FF3 and CAMP is two more factors are introduced in the model. Those two factors are SMB which stands for ‘small minus big’ and the HML which stands for high minus low.
From empirical study, it shows small-cap stocks have a higher overall returns by comparison to big-cap stocks. In practice, the SMB factor is monthly computed as the average return for the smallest 30% of stocks minus the average return of the largest 30% of stocks in that month. A positive SMB indicates small-cap stocks’ return beats the one of big-cap stocks.
The HML factors show historically a higher value premium is provided within stocks with high book-to-market values. The HML is computed as the average return for the 50% of the stocks with the highest book-to-market ratio minus the average return of the 50% of the stocks with the lowest book-to-market ratio each month. A positive HML in a month indicates that the value stocks outperformed the growth stocks. The formula of FF3:
1, 2, 3,k f k m f i i kR R R R SMB HML (5)
The 1 is the sensitivity to market risk, rather similar to
the one from CAPM. However, Beta1 plays less powerful role in this model because of the existence of the other
two factors. 2 shows the return sensitivity to market
capitalization. 3 measures the level of exposure to value
risk. As a result, we can computer the expected return of a given asset thanks to the linear relationship of these three factors.
B. Normal FF3 Analysis
FF3 Analysis with and without smoothed returns

ISBN 978-86-80593-52-4
31
It seems R squared is about 33% in unsmoothed case and 35% in smoothed case. This leads to a higher explanatory power by comparing to CAPM.The F-Test is highly significant (p < 0.05) with p-value 1.2% for smoothed and 1.5% for unsmoothed. By comparison, alpha does not change significantly, which might indicate there is no big impact of serial correlation. In both unsmoothed and smoothed cases, only one factor SMB is not significant. However, in general view, smoothed data give us slightly better results than unsmoothed.
TABLE V SMOOTHED DATA
B. Asymmetric FF3
In order to explain non-linearity in different circumstances. The Asymmetric FF3 has to be considered.
1, , 1, , 2, y,
2, y, 3, z, 3, z,
k f k x k k x k k k
k k k k k k k
R R F F F
F F F
(6)
, y, z,; ;x k m f k kF R R F SMB F (7)
, 0
0,
F if FF
otherwise
(8)
, 0
0,
F if FF
otherwise
(9)
TABLE V ASYMMETRIC FF3
Unsmoothed Smoothed
Factor Constant P-value Constant P-value
Alpha 0.43204 0.11181 0.52089 0.00987
Market Risk -
-0.10758 0.00906 -0.06578 0.0215
Market Risk +
-0.01912 0.66906 -0.01924 0.54386
SMB- 0.05895 0.42344 0.06644 0.20701
SMB+ -0.00977 0.86357 -0.05941 0.14895
HML- -0.03459 0.594 -0.06073 0.19286
HML+ -0.20872 0.01313 -0.14852 0.01263
R2 0.46482 0.48577 AdjustedR2 0.31886 0.34553
F-Test 3.18458 0.02102 3.4638 0.01457
In summary, asymmetric FF3 features generally a better explanatory power than asymmetric CAPM and it is also reasonable to assume that a model with more factors reflect better the financial market that is very complicated. The factors in normal FF3 are generally significant. On the contrary, the factors in the asymmetric FF3 are rarely significant.
C. FF3 time-varying
The time varying has three additional factors which are weighted by the sum of the factors of the Fama French model. These additional factors are assumed to increase the model's explanatory value. We choose the Unemployment rate, the Inflation rate and the Spread between the 10year old Treasury Bonds and 6month old Treasury Bills of the USA.
The implementation of the time varying model is based on the simplification that the transition matrix for the time
dependent parameters β� has dropped. This is necessary in order to avoid the crucial identification of the transition matrix. In addition, the number of estimators is easier to handle. The Formula of FF3 time-varying is:
, , 1, , , 2,
3, , ,
1, , ,
2, , ,
2,
t i t f k t M t f k t
k t t M t f t t
t k t M t f t t
t k t M t f t t
t k k
R R r r SMB
HML R R SMB HML
UNEMP R R SMB HML
USINF R R SMB HML
SPREAD
(10)
We used the FF model and not the Fung and Hsieh model, because the latter has already 7 factors and adding the additional three we would result with a 10 factor model for 29 observations. This doesn’t seem that would give as any meaningful results. In addition, the FS model with the 7 factors it includes we can say that takes into account some macro economic variables.
TABLE VI
FF3 TIME-VARYING
Unsmoothed Smoothed
Factor Constant P-value Constant P-value
Aplha 0.22187 0.07634 0.29307 0.00204
Mkt-RF 0.46125 0.10185 0.42129 0.0371
SMB 0.55675 0.05285 0.45944 0.02512
HML 0.42968 0.13873 0.38048 0.06582
With unemployment
-0.12067 0.02811 -0.09926 0.01164
With inflation
-0.16402 0.04136 -0.10491 0.06127
With spread
0.06256 0.09756 0.04099 0.12092
Adjusted R2 0.3648 0,3972
F-Test 3.6801 0.01104 4.07511 0.00675
From the regression table, it indicates a slightly better explanatory power of smoothed case. The smoothed model is significant in a 5% level as it has ap-value = 0.00675 and with an alpha of α = 0.293.
Unsmoothed Smoothed
Factor Constant P-value Constant P-value
Alpha 0.3088 0.0082 0.32964 0.0002
Market risk -0.0590 0.0102 -0.03544 0.0278
SMB 0.0256 0.4154 -0.00159 0.9427
HML -0.1097 0.0064 -0.09006 0.0021
R2 0.336 0.35
Adjusted R2 0.256 0.272
F-test 4.2076 0.015367 4.4795 0.011953

ISBN 978-86-80593-52-4
32
Each parameter also seems looks significant apart from HML and two of the state variables Inflation and Spread. But without those state variables, the result from previous models is much worse. These results are valid for both non-smoothed and smoothed time-varying model. Since the H0-hypothesis can be rejected and the adjusted �2s are improved, the time varying models succeeded to increase the explanatory value by adding the new factors.
D. FF3 regime model with stressed condition and market recovery
TABLE VII
FF THREE FACTORS RESULTS – REGRESSION OUTPUT FOR MARKET STRESS AND MARKET RECOVERY WITH SMOOTHED RETURNS
Market stressed
Market
recovery
Number of observations
11 18
R2 0.2230 0.5658
Adjusted R2 -0.1099 0.4727
Alpha 0.1188 0.3194 0.3863 0.0013
Beta with respect toMkt-
Rf 0.0142 0.5256 -0.0571 0.0057
Beta with respect to
SMB 0.0145 0.5615 0.0043 0.9084
Beta with respect to
HML -0.0070 0.8356 -0.1277 0.0080
It shows that R2 improves overall during the market recovery in comparison with CAPM normal. Because, it is natural that R2 improves immediately after we include more factors in the regression and try to explain our hedge fund returns. However, R2 that we obtained for the market stress period is significantly lower. It seems that this model doesn’t explain hedge fund returns very well and it is seriously flawed. Far more interesting is the value of alpha that we obtained from recovery condition is significant. While it is highly insignificant in the stressed conditions and therefore we cannot totally rely on it when making conclusions.
V. FUNG AND HSIEH: SEVEN FACTOR MODEL (FH7)
In order to capture the dynamic nature of hedge fund strategies, Fung and Hsieh (1997) put forward a model where a portfolio of hedge funds can be represented as a linear combination of a set of basic, synthetic hedge fund strategies.Fung and Hsieh (2002) later referred to these as asset-based style factors.
The essential keys for a convertible arbitrage strategy to have a good performance are to capture factors is the underlying CB. The three main sources of risks in a CB are equity, credit, and interest rate. This is why size spread, bond spread and credit spread are chosen.
The seven hedge fund risk factors can explain a significant part of the systematic risk of a typical hedge fund portfolio measurable using conventional securities prices. This provides a vital link between hedge fund risks to familiar conventional asset-class risks. The 7 factors are the following:
PTFSBD: Return of PTFS Bond lookback straddle
PTFSFX: Return of PTFS Currency Lookback Straddle
PTFSCOM:Return of PTFS Commodity Lookback Straddle
PTFSSTK:Return of PTFS Stock Index Lookback Straddle
Sizespread: Difference in the returns on the Wilshire Small Cap 1750 index and Wilshire Large Cap 750 index
Bondspread: The monthly change in the 10-year treasury constant maturity yield
Creditspread:Month-end to month-end change in the difference between Moody's Baa yield and the US Federal Reserve 10y constant maturity yield.
1, 2,
3, 4, 5,
6, 7,
k f k k
k k k
k k
R R PTFSBD PTFSFX
PTFSCOM SPCOMP Sizespread
Bondspread Creditspread
(11)
TABLE VIII
SMOOTHED DATA
Unsmoothed Smoothed
Factor Constant P-value Constant P-value
ALPHA 0.2903 0.0219 0.2959 0.0022
B PTFSBD 0.0146 0.0562 0.0089 0.1040
B PTFSFX -0.0020 0.7669 -0.0055 0.2890
B PTFSCOM -0.0033 0.7398 -0.0036 0.6118
B SPCOMP -0.0643 0.0608 -0.0449 0.0702
Size spread -0.0356 0.3529 -0.0106 0.1939
Bond Market 0.3135 0.5161 -0.0002 0.97573
Credit Market -0.7978 0.4273 -0.8317 0.2578
R2 0.298 0.289
adjusted R2 0.0635 0.0523
F-test 1.27 0.311 1.23 0.372
Interestingly, the results from Fung and Hsieh (2001) model in normal FH7 model display very bad significance. Because adjusted R2 is only 0.0635 for unsmoothed and 0.0523 for smoothed case. At the same time, all factors display very high p-value except alpha. We also tested FH7 for time-varying case and the regression displays worse results. FH7 can not evaluate correctly the specific fund in the study performance.
VI. CONCLUSION
After we applied regression to CAPM, FF and FH7, to the whole sample of 29 data, for the smoothed and unsmoothed data. What we have got is that for both smoothed and unsmoothed data, the R squared as well as p values are rather bad for the CAPM and FH7.
For CAPM, R squared for smoothed and unsmoothed data is very low and p values are much bigger than 5%, so this is bad model in general for the specific hedge fund in the study. The main reason why CAPM does not measure fund performance very well might be its theoretical assumptions. The assumptions of CAPM are: linearity must be held in the model; mean-variance preferences are for all investors; investors can borrow and lend at the risk-free rate of return; every investor holds a market portfolio. The CAPM is often criticized as being unrealistic because of the assumptions on which it is based, so it is important to be aware of these assumptions and the reasons why they are criticized.

ISBN 978-86-80593-52-4
33
In case of FH7 model, the model extends to 7 factors, the explanatory power of the model with respect to the squaredis also extremely low and all the factors are not statistically significant. The reason why FH7 does not work in this case could be attributed to factors we use might not be appropriate for the specific fund. More factors in the FH7 do not offer a better explanatory power regarding this specific hedge fund in the paper.
The best case turns out to be FF3 model. We found smoothed data R squared is around 35% for unsmoothed FF3 and around 33% for smoothed normal FF3. R squared is even around 50% for two asymmetric cases. In FF3, we extend the empirical analysis further by applying time varying factors, this leads to a higher expletory power of the model by adding 3 macro-factors. In the end regime model reflects business cycle theory.
From above mentioned facts, it concludes FF3 model seems to be the most appropriate to evaluateBarep Convertible Arbitrage hedge fund, where we can see that it has relativelybetter parameters significance if data we have are correct without manipulation.
References
[1] M. Getmansky, A. W. Lo, and I. Makarov, An econometric model of serial correlation and illiquidity in hedge fund returns. Cambridge, Mass.: NBER. 2003.
[2] Alternative Investments: An introduction to convertible arbitrage investing. Credit Suisse Investment Research 2011.
[3] J. Jackwerth, Hedge Funds Lecture Slides, University of Zurich
[4] M. K. Brunnermeier, and S. Nagel, Hedge funds and the technology bubble. Journal of Finance, 65(1):217–255, 2002.
[5] E. F. Fama, and K. R. French, The cross-section of expected stock returns. Journal ofFinance, 48(1):93–130, 1992.
[6] E. Fama, and F. French, Common risk factors in the returns on stocks and bonds. Journal of Financial Economics, 33(1):3–56, 1993.
[7] F. Fung and G. Hsieh, in working papers and published papers that use any of these data. With link http://faculty.fuqua.duke.edu/~dah7/DataLibrary/TF-FAC.xls, RFS, 2001.
[8] E. F. Fama, and K. R. French, The capital asset pricing model theory and evidence. Tuck School of Business working paper 2003-26, 2004.
[9] W. Fung, and D. A. Hsieh, Hedge fund benchmarks: A risk-based approach. Financial Analysts Journal, 60(5), 2004.
[10] W. Fung and D. A. Hsieh, The risk in hedge fund strategies theory and evidence from long/short equity hedge funds. Faculty research papers / The Fuqua School of Business, Duke University 06-222, 2006.
[11] Milan Cvetkovic, Hedge Funds Seminar, Spring Semester, Unviersity of Zurich, 2014.
ISBN 978-86-80593-52-4
34
Software Requirements for Modern Procurement
Dragan Manojlov, PhD1 1Deloitte Central Europe/ERS, Belgrade, Serbia
Abstract — Basically, the new procurement model would serve for improvements of current procurement process in many companies which use an old purchasing model which covered only procure to pay process. The procure-to-pay cycle, including all activities from the procurement of fixed assets, goods and services to receiving invoices and paying vendors, is the basic business process. The companies, especially in public sector, do not have optimal control of risks in procurement process and face with late fees, wasted time, break in business process and with non-compliance issues such as fraud or overlooked incidents. In order to mitigate these risks and increase market competitiveness, the company must to develop and implement the modern procurement model. Having after developing of new purchasing model which including the whole cycle from sourcing to paying of obligation in procurement, it would be crucial for company to implement an adequate software solution in order to automatize all purchasing processes as much as possible. SAP and Oracle EBS as ERP systems earned more than 38% of total ERP software revenues in 2012 on world-wide basis [1], offer up-to-date solutions for procurement processes. The choice of the right solution for companies is the last, but the most important stage in order to close procurement model [2]. This paper is taken into consideration all the facts and standing conclusions from previous procurement models in an old software version as the source for developing new solution. In this paper, I elaborate the characteristics of old procurement models and define steps & guidelines as approach in implementation of new procurement model. The benefits of creating the right procurement model for the company are substantial, not only in terms of cost reduction, but also in the ability to better focus resources, enhance value from supplier collaboration and innovation, and more fully captured contractual promises. Additionally, the basis for software implementation is requirements for procurement function.
I. INTRODUCTION
The role of the procurement can be formulated on many ways depending of the specifics in the company. The connection between the company`s operation and procurement is very closed. The significance of procurement processes has strong relation with definition of final product of the company. If company is repetitive manufacturer with classic finished products included various raw materials plus external services in their BOM`s, the procurement department plays the critical role. In discrete manufacturing and service companies, the procurement model has the less influence on the
whole business process. However, the procurement is basic process for trading companies. Many trading (distribution & retail) companies structure their business model on discount model with vendor who deliver strategic goods to them. The typical examples of these companies are Agroglobe d.o.o. (structure their Profitability Analysis model based on earning per vendor) and Phoenix (has the methodology of discounts related to rebates and early payments).
The cost of raw materials occupies the first position of all the other costs, so any deviations emerged during the links of purchasing have an effect on the realization of the company’s anticipated goal, and further will have an influence on the enterprise profit target. While abundant of potential risks and uncertainty exist in the whole process of purchasing in such a changeable environment of market economy.
The role of procurement in Serbia is still defined very differently than the rest of the developed world. The public companies in Serbia have the limitation of law who prescribed strict rules in Public procurement act [3]. On the other hand, there is no clear approach related to procurement strategy in private sector. The main decision about procurements in private sectors for strategic materials, services or fixed assets are mainly based on friendly relationships between vendor and customer.
Till the middle of the 90`s due to the generally accepted view, the procurement department belonged to the production in production company and belonged to the sales in distribution company. According to this traditional approach, the objective of the procurement model has to follow settings in production process: Right Quality, the Right Quantity, at the Right Price, at the Right Place, at the Right Time [4]. It is not so far till the true from today`s practice in procurement. Instead of this, purchasing must become supply management. New approach of procurement must to be much wider, primarily the procurement serves to the sales and adversely the sales must to dictate procurement. Anyhow, new procurement model must to operate with many variables in order to obtain competitive advantage.
II. OLD PROCUREMENT MODELS
What procurement exactly means? According to Oxford English Dictionary, “procure” means to obtain

ISBN 978-86-80593-52-4
35
some item, while “purchase” means also to obtain some item in exchange for payment. So, although sometimes these two words are used interchangeably, they have varied interpretations. Tony Colwell referred to “procurement” in the public sector as “care and effort” in upstream activities – strategy, sourcing and negotiating – up to execution of a contract [5]. The exact responsibility of the procurement division may vary across organizations, but often post-execution activities, like contract management, placement of orders for deliveries, the management of day-to-day supplies, and processing payments, are also included in its scope.
Considering level of centralization, there are 3 basic models for procurement, any others are hybrid models, a combination of these three [5]:
Local, where all activity, decision making and control is managed locally and is autonomous.
Central, where decision making and procurement activity is coordinated centrally. (There may be local activity and controls outside the scope of procurement, for example, calling off supply under a centrally negotiated contract.)
Networked, where decision making is not independent, but is controlled in some way across local units, like node, or nodes, on the network.
The combinations of vertical and horizontal centralization in purchasing process divided procurement model on federal procurement and centrally led procurement model.
At federal procurement, managed by the central governance, some items are controlled at local level, while others are controlled centrally. Usually the centre defines the autonomy degree of local level by mutual agreement or by mandate.
At centrally-led network procurement, activity is managed across local unit, the control is performed by the nodes on the network where the centre acts as the primary node.
Generally, centralized procurement in mid and big companies often fails to live up to its promises. Apart from historically falling short on delivering to the bottom line, we are facing new issues such as sustainability. The size of the company is the most important variable for level of centralization of procurement in the companies.
For purpose of this work, we performed research with CEO and/or Procurement Managers in several companies during first quarter of 2014. The main point of this research was impact of level of centralization and planning on the size of the company. Some of the companies who participated in research are TENT d.o.o., Sintelon, Relja Junior, Computer Shop etc.). The results are in Table I.
This research shows that level of centralization in procurement decreases in large companies and the planning is most complicated organized in large companies. Anyhow, this paper will count of all facts in old procurement model and generate the new one which focused on supply management.
This research shows that level of centralization in procurement decreases in large companies and the planning is most complicated organized in large companies. Anyhow, this paper will count of all facts in
TABLE I.
LEVEL ON CENTRALIZATION ON SIZE OF THE COMPANY
Annual level of
sales Planning Centralization
Small company
Under 20k EUR Annual High
Mid company
From 20k-100k EUR Monthly Mid
Big company
Under 100k EUR Daily based
on MRP Low
old procurement model and generate the new one which focused on supply management.
This research shows that level of centralization in procurement decreases in large companies and the planning is most complicated organized in large companies. Anyhow, this paper will count of all facts in old procurement model and generate the new one which focused on supply management.
Generally, the base for old procurement models lies in their centralization. Our research shows that centralization is valid in small and low organized companies. The crucial point of modern procurement model is considering many variables.
The top priority in putting together a powerful operating model is not the issue of overall centralization or decentralization; it is determining how best to structure procurement’s various roles in corporate, business unit, and functional-level purchasing. Should the procurement function own, control, and manage the entire process for every corporate stakeholder? Should it participate actively in the purchasing decisions and processes of the individual business units, functions, and geographic regions in which the company operates? Or should it merely carry out those purchasing decisions?
Additionally, some authors used linear programming of demands in order to have optimal procurement [6]. They proved that an efficient linear programming formulation for the demand response of a price taker, industrial or commercial user of electricity has some ability to self-generate. According to them, new procurement initiated new procurement. They established a monotonicity result that indicates fuel supply of S may be spent in successive steps adding to S in total.
There are many reasons that the operating models constructed to procure and pay for goods and services prove inadequate. They may not include the processes, tools, or resources needed to fully execute the sourcing strategy.
They may not be properly connected to organizational decision making or sufficiently integrated into key corporate planning processes. Decision making authority and accountability may not be clearly defined. Or the IT systems that enable them may be fragmented, impeding efficiency and clouding the visibility necessary to ensure compliance with overall purchasing policies and objectives.
III. SPEND ANALYSIS
One of the most powerful tools in procurement process is spend analysis. Any procurement analyst must to operate with some kind of spend analyze. It is the basic
ISBN 978-86-80593-52-4
36
report in procurement cycle. Generally, spend analysis is the process of collecting, cleansing, classifying and analyzing expenditure data from all sources within the organization (i.e. purchasing card, eProcurement systems, etc.). The process analyzes the current, past and forecasted expenditures to allow visibility of data by vendor, by commodity or service, and by department within the organization. Spend analysis can be used to make future management decisions by providing answers to such questions as: what was bought; when was it bought; where was it purchased; how many vendors were used and how much was spent with each; how much was paid for the item.
Procurement should work to identify all spend data, internal and external, for the organization. Once spend data sources are identified, the data should be collected and automated. The second steps in spend analyze is cleansing. This process is necessary to insure accurate organization and correlation of spend data and to enable actionable analyses. The cleansing must to include the following activities:
Grouping and categorizing spend data should be done by adopting an internal taxonomy or by adopting an industry-standard classification scheme.
Higher-level classification of spend at the category or vendor level is the first step in grouping and categorizing spend data. Examples include: categorizing goods and services that are being acquired; determining how many vendors are being used for specific categories; and how much the organization is spending on specific categories, in total and with each vendor.
Item-level detail of spend data enables a precise view of spending with each vendor and for each commodity on an organizational, departmental, project, and buyer basis.
Additional enhancements should also be applied to the collected spend data. These include but are not limited to: contract terms, minority or women owned business status, alternative parts data, industry pricing indexes, average selling prices, vendor financial risk scores, performance information, lead times and inflation.
The third phase is automation of data extraction, classification, enhancement, and analysis and services that can streamline existing procedures and make spending analysis a repeatable process.
Last phase is analyzing of spend data. In this phase, the procurement analyst make must to assess whether the current procurement structure, processes, and roles are adequate to support a more strategic approach to acquiring goods and services (e.g. whether cross-functional commodity teams would provide more effective, coordinated management of high-dollar, high-volume categories of goods, services, and vendors on an on-going basis).
Ernst & Young, leading auditing & consulting company in USA, presented several benefits from spend analyze in procurement process on US markets in research from 2012.
Normally, the significance of certain benefit depends of various factors in the company. These results arisen from procurement models on US companies must be
TABLE II.
LIST OF BENEFITS FOR COMPANIES FROM SPEND ANALYSE [7]
Eliminate duplicate vendors (Reduction depends on previous efforts.)
Reduce material and service costs through informed strategic sourcing strategies based on the data
Improve contract compliance
Use contract pricing to create savings
Meet regulatory reporting rules
Improve inventory management by cutting excess stocks
Lower inventory costs
Reduce expediting costs
Improve product management by cutting unnecessary part introductions
Increase part reuse
Align design and supply strategies
Facilitate early vendor integration
Reduce spend analysis project cycles
Refocus procurement professionals on strategic tasks
projected on other world-wide market.
As an example, we examined two companies with different size (one is more and other is large) and their management view of these benefits in Serbia. For small company such as Relja Junior d.o.o., the most important thing in the business is to have lower inventory costs and reduce expediting costs. On the other hand, expectations from spend analysis for energy Serbian giant EPS are much different. They expect elimination of duplicate vendors and reducing of material and service costs through informed strategic sourcing strategies based on the data.
Spend analysis begins with identifying internal and external sources for collecting spend related data for the organization. Once data is collected, it should be cleansed, grouped, categorized and analyzed.
Finally, the data should be updated regularly and the spend analysis process should be performed on a continual basis to support decisions on strategic sourcing and procurement management for the organization.
IV. PROCUREMENT MODELS IN EPR SYSTEMS – SAP
EPR AND ORACLE EBS
As previously mentioned, they are two main players on ERP market related to procurement, SAP and Oracle. Additionally, four major technology segments considering procurement model are recognized during 2012 for SAP and Oracle EBS: 1) Spend Visibility, 2) eSourcing/Decision Support, 3) eProcurement/EIPP, and 4) Information, Performance, and Risk Management. The marketplace is characterized by a dominance of ‘top tier’ vendors such as Ariba, SAP, and Oracle with an array of niche vendors providing technology and services. According to the last news published by SAP in 2013 [8],
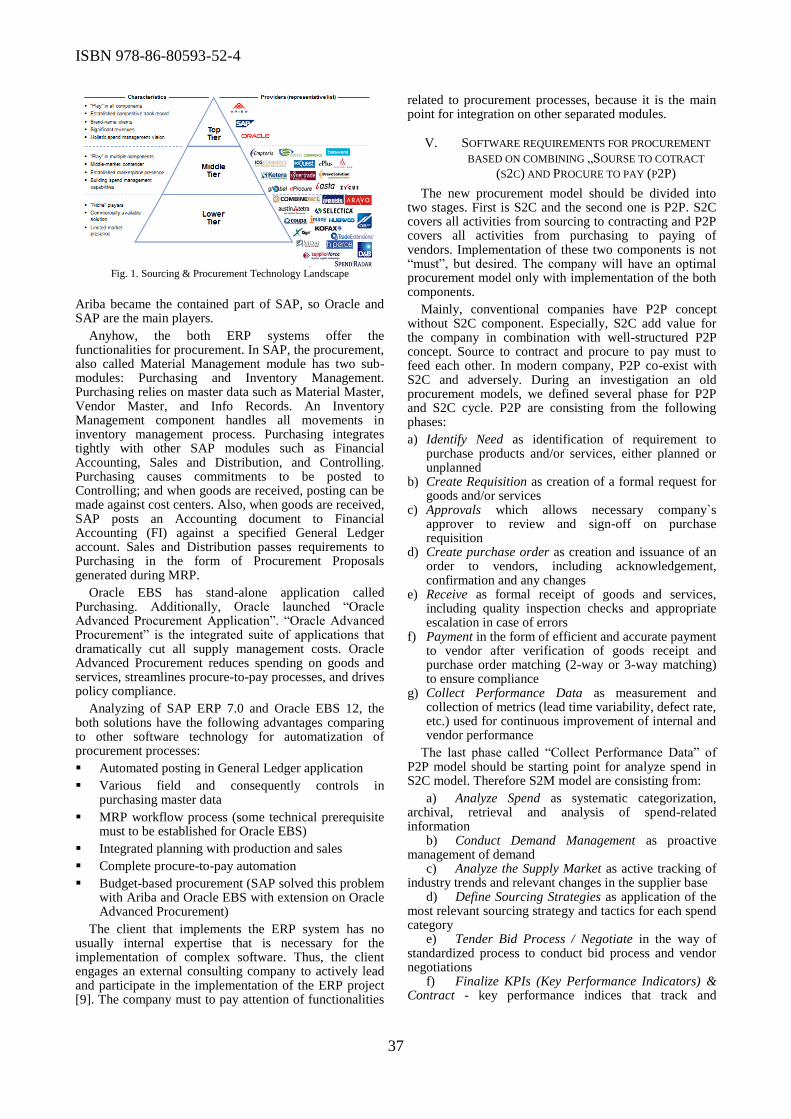
ISBN 978-86-80593-52-4
37
Fig. 1. Sourcing & Procurement Technology Landscape
Ariba became the contained part of SAP, so Oracle and SAP are the main players.
Anyhow, the both ERP systems offer the functionalities for procurement. In SAP, the procurement, also called Material Management module has two sub-modules: Purchasing and Inventory Management. Purchasing relies on master data such as Material Master, Vendor Master, and Info Records. An Inventory Management component handles all movements in inventory management process. Purchasing integrates tightly with other SAP modules such as Financial Accounting, Sales and Distribution, and Controlling. Purchasing causes commitments to be posted to Controlling; and when goods are received, posting can be made against cost centers. Also, when goods are received, SAP posts an Accounting document to Financial Accounting (FI) against a specified General Ledger account. Sales and Distribution passes requirements to Purchasing in the form of Procurement Proposals generated during MRP.
Oracle EBS has stand-alone application called Purchasing. Additionally, Oracle launched “Oracle Advanced Procurement Application”. “Oracle Advanced Procurement” is the integrated suite of applications that dramatically cut all supply management costs. Oracle Advanced Procurement reduces spending on goods and services, streamlines procure-to-pay processes, and drives policy compliance.
Analyzing of SAP ERP 7.0 and Oracle EBS 12, the both solutions have the following advantages comparing to other software technology for automatization of procurement processes:
Automated posting in General Ledger application
Various field and consequently controls in purchasing master data
MRP workflow process (some technical prerequisite must to be established for Oracle EBS)
Integrated planning with production and sales
Complete procure-to-pay automation
Budget-based procurement (SAP solved this problem with Ariba and Oracle EBS with extension on Oracle Advanced Procurement)
The client that implements the ERP system has no usually internal expertise that is necessary for the implementation of complex software. Thus, the client engages an external consulting company to actively lead and participate in the implementation of the ERP project [9]. The company must to pay attention of functionalities
related to procurement processes, because it is the main point for integration on other separated modules.
V. SOFTWARE REQUIREMENTS FOR PROCUREMENT
BASED ON COMBINING „SOURSE TO COTRACT
(S2C) AND PROCURE TO PAY (P2P)
The new procurement model should be divided into two stages. First is S2C and the second one is P2P. S2C covers all activities from sourcing to contracting and P2P covers all activities from purchasing to paying of vendors. Implementation of these two components is not “must”, but desired. The company will have an optimal procurement model only with implementation of the both components.
Mainly, conventional companies have P2P concept without S2C component. Especially, S2C add value for the company in combination with well-structured P2P concept. Source to contract and procure to pay must to feed each other. In modern company, P2P co-exist with S2C and adversely. During an investigation an old procurement models, we defined several phase for P2P and S2C cycle. P2P are consisting from the following phases:
a) Identify Need as identification of requirement to purchase products and/or services, either planned or unplanned
b) Create Requisition as creation of a formal request for goods and/or services
c) Approvals which allows necessary company`s approver to review and sign-off on purchase requisition
d) Create purchase order as creation and issuance of an order to vendors, including acknowledgement, confirmation and any changes
e) Receive as formal receipt of goods and services, including quality inspection checks and appropriate escalation in case of errors
f) Payment in the form of efficient and accurate payment to vendor after verification of goods receipt and purchase order matching (2-way or 3-way matching) to ensure compliance
g) Collect Performance Data as measurement and collection of metrics (lead time variability, defect rate, etc.) used for continuous improvement of internal and vendor performance
The last phase called “Collect Performance Data” of P2P model should be starting point for analyze spend in S2C model. Therefore S2M model are consisting from:
a) Analyze Spend as systematic categorization, archival, retrieval and analysis of spend-related information
b) Conduct Demand Management as proactive management of demand
c) Analyze the Supply Market as active tracking of industry trends and relevant changes in the supplier base
d) Define Sourcing Strategies as application of the most relevant sourcing strategy and tactics for each spend category
e) Tender Bid Process / Negotiate in the way of standardized process to conduct bid process and vendor negotiations
f) Finalize KPIs (Key Performance Indicators) & Contract - key performance indices that track and

ISBN 978-86-80593-52-4
38
measure the supplier performance and internal compliance to preferred vendor lists and contracts
Last phase “Defining of KPI & Contract” (f) initiate identification of needs as lighter for starting point in P2P model (a). Also, the company must to define the relevant persons in order to manage in each step of these two models. The most important thing is defining of leaders i.e. there should be two persons: Leader of P2P and Leader of S2C models.
Additionally, P2P and S2C should be treated as horizontal approach of procurement. S2C is upstream application and P2P is downstream application. However, the most important thing is to define a set of core principles guide “The Source-To-Contract” and “Procure-To-Pay” processes. These set of core principles must to be developed as a basic for implementation of procurement model in the company. Normally, adaption of this model has to follow and consider the company`s specifics.
TABLE III.
DESCRIPTION OF EACH COMPONENT FOR NEW PROCUREMENT
MODEL
SOURCE TO CONTRACT
(UPSTREAM)
PROCURE TO PAY
(DOWNSTREAM)
Spend Intelligence Automation & Intelligence
Create automated “company-wide” spend analysis that
generates periodic “canned”
and ad-hoc reporting aligned with strategic sourcing goals
and category requirements
Create a “lights out” automated transaction
factory where cost effective to do so and capture data in a
clean way that allows
analysis that creates procurement intelligence
Organizational Planning Governance & Compliance
Create a 2 to 3 year
“calendar” prioritizing
sourcing opportunities / events company-wide, which
is updated annually and for
market/contract events to manage ad-hoc needs
Create a common standard of
company-wide policies, procedures, and approvals
that are integrated into the
P2P workflow and tie to other functional systems to
drive compliance and
individual adherence
Formalized Strategies &
Management Strategic Management
Create uniform category
playbooks defining the
driving forces behind price, market complexity, and
business impact. The
primary category value levers & tactics are defined
with total cost of ownership
(TCO) in mind and tied to
operating guidelines
Create procurement and
category strategies that
minimize the need for ad-hoc /exception management and
incorporates supplier
scorecards, supplier management tools, and
preferred supplier
compliance
reporting/monitoring
Governance & Compliance Self-Service & Connectivity
Create defined policies, procedures, and roles &
responsibilities that manage
strategic sourcing and category management (e.g.
mission, guiding principles,
category span of control, category segmentation, etc.)
Create the system
connectivity necessary to support user and supplier
self-service; online catalogs,
product/service master, supplier portal, electronic
document exchange, etc.
Table III: S2C (Upstream) and P2P (Downstream) instructions for implementation of model.
Therefore, the source-to-contract capability is built on a dynamic, closed-loop process that has the ability to address and focus on both indirect and direct spend. On the other hand “procure-to-pay” capability is built on the
above principles in a way that reduces transactional work to enable increased focus on value-added strategic activities.
The benefits of adopting the right procurement model for the company are substantial, not only in terms of cost reduction but also in the ability to better focus resources, enhance value from supplier collaboration and innovation, and more fully capture contractual promises.
Theoretical validation of the new procurement model will initiate the following facts:
Globalization trend is the lighter for the company to drive of best pricing model / reduce of costs and have the process called “spend under management” during the S2C phase of the model.
Improving of management of supplies, qualities, and cost risks in the step of spend analyze.
Enabling of operational excellence and aligning to the needs of the business. Supply chain risks in term of increased regulatory, supply security, quality, and recall risks are forcing some companies to evaluate their risk mitigation strategies during the S2C phase of the model.
Operate “As One”. S2C and P2P phase must to be operated as one in order establish an optimal procurement organization and mitigation the risk of failures in whole business process.
Proactively manage strategic supplier relationship in the step of analyzing of supply market in order to increase focus sustainability. Key trend for proactive procurement management is the fact that customers and governments become demanding companies which have plans to make their operations more sustainable.
VI. CONCLUSION
Generally, the main strength of new procurement model is strong cooperation between P2P and S2C phases in procurement. In the past, an implementation of software considered only the facts contained in an old procurement models - P2P part of procurement. Software requirement for modern procurement function has holistic approach - P2P and S2C are strongly cooperated. It covers the processes from initiation of need to realization of procurement in P2P component which serving as input data in analysing of spend to finalization of key performance indicators in S2P component.
Anyhow, the new procurement model must to provide the basic assumption for providing of robust supply-side information, metrics, and alerts that integrate with implementation of technology applications such as Oracle BI Applications or SAP Ariba. It delivers specific insight across the organization in order to increase the company’s performances in managing its customers, suppliers, and financial decisions.
Many authors tried to develop procurement model such as Tony Colwell (2014) [5], G. Zakeri, D. Craigiey, A. Philpottz, M. Todd (2013) [6], but nobody from them is not taking into considering all relevant facts in procurement process. In other words, it means that we do not have all the facts for implementation of procurement in software.
This model will be the starting point for many companies to define their procurement strategy and

ISBN 978-86-80593-52-4
39
consequently redefine their position on the market. The next step will be practical validation of new procurement model through implementation of relevant software for procurement.
REFERENCES
[1] C. Pang, et al., Market Share Analysis: ERP Software Worldwide, 2014.
[2] M. Lutovac and D. Manojlov The Successful Methodology for Enterprise Resource Planning (ERP) Implementation, Journal of Modern Accounting and Auditing, ISSN 1548-6583, December 2012, Vol. 8, No. 12, ISSN: 1838-1847, 2012.
[3] Ministry of Finance, Retrieved from http://www.ujn.gov.rs/sr/news/story/180/Novi+Zakon+o+javnim+nabavkama.html, 2014.
[4] P. N. Mukherjee, Total quality management, Paper presented in Prentice, Hall of India, New Delhi, 2006.
[5] T. Colwell, Tony Colwell’s Blog post, Retrieved from http://acuityconsultants.com/wp/, 2014.
[6] G. Zakeri, et al., Optimization of Demand Response Through Peak Shaving, Published in Operations Research Letters, Volume 42, Issue 1, 2014.
[7] Ernst&Young publication, Retrived from http://www.ey.com/Publication/, 2012.
[8] SAP publication, Retrieved from http://sap.service.com, 2013.
[9] D. Manojlov, Impact of ERP consulting companies in surveillance of personal and business data in e-commerce. 19th International Conference on Technology, Culture, and Development, Tivat, Montenegro, August 28-30, 2012
[10] C. Han, I. Espada, Procurement of ITS (international practice), Paper presented ARRB Group Limited; ISBN: 9781925037432, 2014.
[11] A. Venkatesh, D. Rameshwar, A. Padmanabha, Analysis of sourcing process through SAP–LAP framework - a case study on apparel manufacturing company use to make the change from one business model to another. Published in International Journal of Procurement Management, ISSN 1753-8440, 2014.
[12] M. Wang, Integrating SAP to Information Systems Curriculum: Design and Delivery, Information Systems Education Journal, 9(5), 97-104, 2011.
ISBN 978-86-80593-52-4
40
Semantic Web Based Modeling and
Implementation of Diploma Supplement
Siniša Radulović1, Milan Segedinac2, Zora Konjović2, Goran Savić2 1Danulabs d.o.o, Novi Sad, Serbia
2University of Novi Sad Faculty of Technical Sciences, Novi Sad, Serbia
[email protected]; [email protected]; [email protected]; [email protected]
Abstract—The paper presents ontological representation of Diploma Supplement and a Semantic Web based application providing storage and manipulation of Diploma Supplement records. The ontology relies on Dublin Core, MLO-AD, MLO-ECTS and LMAI standards, while the application is based on the standard hypothetic Semantic Web architecture. The implementation of the ontology driven application’s user interface is also briefly presented.
I. INTRODUCTION
European Higher Education Area (EHEA) that, in
accordance with modern curriculum theory, should not be
seen as an unification of education systems [1], but as
agora, an open area enabling transnational dialogue on
education [2], is the most important result of curriculum
internationalization. One of the basic goals of EHEA development is to
increase students’ mobility [3] as emphasized in Sorbonne declaration [4]. Leuven Communiqué [5] declares that mobility should be a trademark of the European Higher Education Area. There are numerous mechanisms in the European Higher Education Area aimed at mobility facilitation like joint bachelor-master-PhD cycles, European Qualifications Framework (EQF), European legislation for employment purposes diploma recognition and issuance of diploma supplement [6]. This paper goes about formal and machine readable representation of Diploma Supplement.
Diploma Supplement issued to all students after successful completion of an education cycle is a document describing in standard format all qualifications that student has gained [7]. Document contains information on the character, level, context, content and status of the education cycle mastered by a student and, in addition, provides information on education system in which education cycle has been completed.
Diploma Supplement is, primarily, used as a mechanism for recognition of achieved qualifications [7], even though it can contribute to more detailed informing on study programmes. Diploma Supplement is developed by joint efforts of European Commission, Europe Council and UNESCO through the joint pilot project (1996-1998)
and now it is one of the fundamental documents of the European Higher Education Area. The states that ratified Bologna Process [8] have committed to Diploma Supplement implementation.
The group CEN WS/LT have developed the application profile intended to representation of this document [9] which enables formal, machine readable representation if the Diploma Supplement hence simplifying establishment of ICT infrastructural support to students mobility within the EHEA. This application profile is an extension to the metadata model intended for learning opportunities advertising (MLO-AD) and MLO ECTS IP/CC application profile for credits and courses representation.
CEN application profile for Diploma Supplement representation is a starting point of this paper and, therefore, presented in some more details in section II. Based on this standard the paper proposes the Diploma Supplement (DS) ontology presented in the section III. DS ontology relies on learning opportunities ontology proposed in [10]. In line with the architecture proposed in [11], the application for managing Diploma Supplement is developed utilizing Semantic Web technologies. The application is presented in section IV. Finally, section V brings the concluding considerations and further work directions.
II. METADATA FOR DIPLOMA SUPPLEMENT
REPRESENTATION
A. European Learner Mobility Achievement
Information (EuroLMAI) model
European Learner Mobility Achievement Information (EuroLMAI) model [12] rose from the need to standardize data aimed at reading and exchange of the data about students’ mobility in the European Higher Education Area. The standard that is developed on the basis of the Europass framework enables transparent description of the qualifications and competences. By this standard, learning opportunities in the entire (formal and/or informal) process of lifelong learning are covered. The standard defines a model intended for exchanging information between student services of educational institutions as
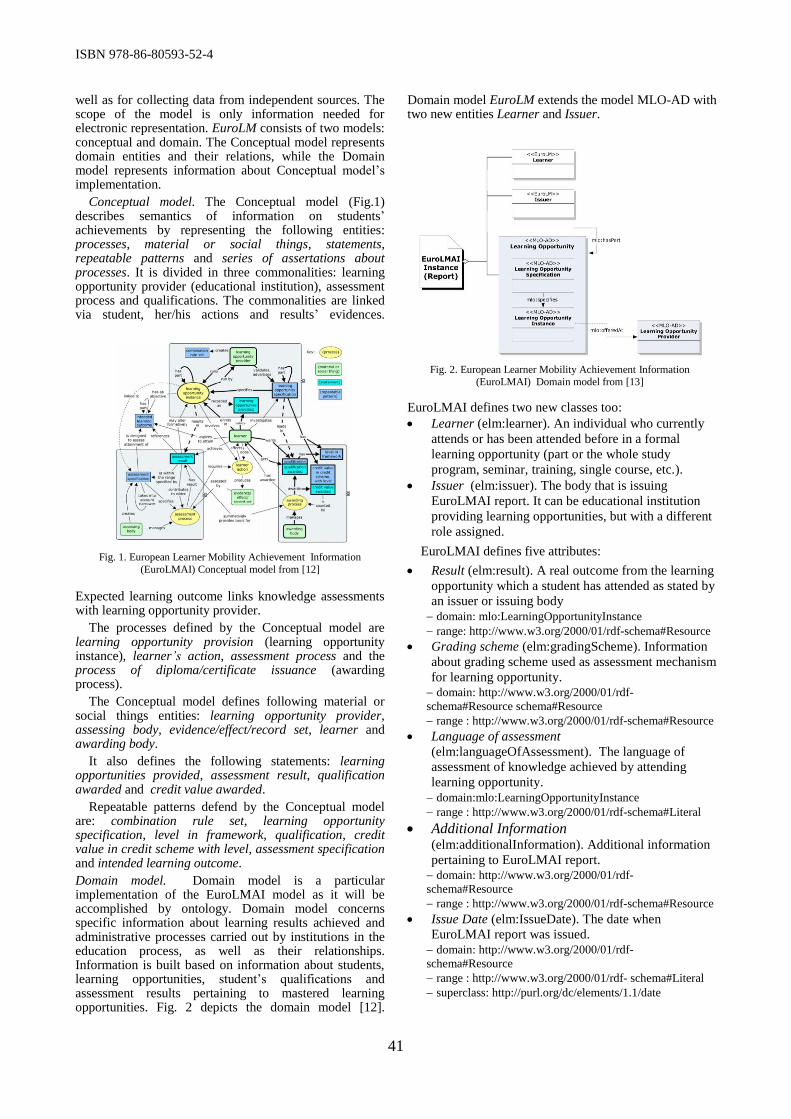
ISBN 978-86-80593-52-4
41
Fig. 1. European Learner Mobility Achievement Information
(EuroLMAI) Conceptual model from [12]
Fig. 2. European Learner Mobility Achievement Information
(EuroLMAI) Domain model from [13]
well as for collecting data from independent sources. The scope of the model is only information needed for electronic representation. EuroLM consists of two models: conceptual and domain. The Conceptual model represents domain entities and their relations, while the Domain model represents information about Conceptual model’s implementation.
Conceptual model. The Conceptual model (Fig.1) describes semantics of information on students’ achievements by representing the following entities: processes, material or social things, statements, repeatable patterns and series of assertations about processes. It is divided in three commonalities: learning opportunity provider (educational institution), assessment process and qualifications. The commonalities are linked via student, her/his actions and results’ evidences.
Expected learning outcome links knowledge assessments with learning opportunity provider.
The processes defined by the Conceptual model are learning opportunity provision (learning opportunity instance), learner’s action, assessment process and the process of diploma/certificate issuance (awarding process).
The Conceptual model defines following material or social things entities: learning opportunity provider, assessing body, evidence/effect/record set, learner and awarding body.
It also defines the following statements: learning opportunities provided, assessment result, qualification awarded and credit value awarded.
Repeatable patterns defend by the Conceptual model are: combination rule set, learning opportunity specification, level in framework, qualification, credit value in credit scheme with level, assessment specification and intended learning outcome.
Domain model. Domain model is a particular implementation of the EuroLMAI model as it will be accomplished by ontology. Domain model concerns specific information about learning results achieved and administrative processes carried out by institutions in the education process, as well as their relationships. Information is built based on information about students, learning opportunities, student’s qualifications and assessment results pertaining to mastered learning opportunities. Fig. 2 depicts the domain model [12].
Domain model EuroLM extends the model MLO-AD with two new entities Learner and Issuer.
EuroLMAI defines two new classes too:
Learner (elm:learner). An individual who currently
attends or has been attended before in a formal
learning opportunity (part or the whole study
program, seminar, training, single course, etc.).
Issuer (elm:issuer). The body that is issuing
EuroLMAI report. It can be educational institution
providing learning opportunities, but with a different
role assigned.
EuroLMAI defines five attributes:
Result (elm:result). A real outcome from the learning
opportunity which a student has attended as stated by
an issuer or issuing body domain: mlo:LearningOpportunityInstance
range: http://www.w3.org/2000/01/rdf-schema#Resource
Grading scheme (elm:gradingScheme). Information
about grading scheme used as assessment mechanism
for learning opportunity. domain: http://www.w3.org/2000/01/rdf-
schema#Resource schema#Resource
range : http://www.w3.org/2000/01/rdf-schema#Resource
Language of assessment
(elm:languageOfAssessment). The language of
assessment of knowledge achieved by attending
learning opportunity. domain:mlo:LearningOpportunityInstance
range : http://www.w3.org/2000/01/rdf-schema#Literal
Additional Information (elm:additionalInformation). Additional information
pertaining to EuroLMAI report. domain: http://www.w3.org/2000/01/rdf-
schema#Resource
range : http://www.w3.org/2000/01/rdf-schema#Resource
Issue Date (elm:IssueDate). The date when
EuroLMAI report was issued. domain: http://www.w3.org/2000/01/rdf-
schema#Resource
range : http://www.w3.org/2000/01/rdf- schema#Literal
superclass: http://purl.org/dc/elements/1.1/date

ISBN 978-86-80593-52-4
42
From such model information will be taken for a EuroLMAI report consisting of [12]:
Learner – an individual attending formal
learning opportunity (whole or a part of
educational program, course , etc.).
Issuer – An authority that awards
certificate/diploma (qualification) and/or proves
students attendance to described learning
opportunities.
Learning opportunity – description of a learning
opportunity and a period of attendance. In the
case of successful completion, defines achieved
qualifications, learner’s results and information
about learning opportunities used for
qualification gaining.
EuroLMAI report consists of several components [13]:
Report on achievements;
Information about currently and formerly enrolled
formal learning opportunities;
Information about report issuer;
Information about learning opportunity attended by a
student, results that student achieved and about the
qualifications obtained;
Information about component programme units and
results achieved for these units;
Other information about credits.
EuroLMAI report defines cardinalities for classes and attributes in the following way.
Report contains one instance of the classes Learner (elm:Learner), Issuer (elm:Issuer), Date of Issuing (elm:issueDate) and can contain at least one learning opportunity specification class corresponding with information about credits in report (mlo:LearningOpportunitySpecification).
Learner must have at least one identifier (http://purl.org/dc/elements/1.1/identifier), can have one or more names (http://www.w3.org/2001/vcard-rdf/3.0#Given), must have one surname (http://www.w3.org/2001/vcard-rdf/3.0#Family), and can have one birth date at most (http://www.w3.org/2001/vcard-rdf/3.0#BDay).
Issuer must have at least one identifier (http://purl.org/dc/elements/1.1/identifier), can have at least one title (http://purl.org/dc/elements/1.1/title), can also have at least one description (http://purl.org/dc/elements/1.1/description), and arbitrary other attribute defined in accordance with MLO standard.
Learning opportunity specification can have link with other Learning opportunity specification established through association mlo:hasPart representing whole/part relation. It can be linked with learning opportunity instance (mlo:LearningOpportunityInstance) via association mlo:specifies. The specification can contain qualification (mlo:qualification) and arbitrary number of credits (mlo:credit). It should have at least one identifier (http://purl.org/dc/elements/1.1/identifier), title (http://purl.org/dc/elements/1.1/title), description (http://purl.org/dc/elements/1.1/description), type (http://purl.org/dc/elements/1.1/type) and any other attribute defined in accordance with MLO standard.
Learning opportunity instance can be linked with at most one learning opportunity provider via association mlo:offeredAt. It can have at most one result (elm:result), grading scheme (elm:gradingScheme), assessment language (elm:languageOfAssessment) and any other attribute defined in MLO standard.
Qualification can have at least one identifier (http://purl.org/dc/elements/1.1/identifier), education level (http://purl.org/dc/terms/educationLevel), and title (http://purl.org/dc/elements/1.1/title). It can have at least one description (http://purl.org/dc/terms/1.1/description).
Credit can contain at least one level of education (http://purl.org/net/cm/level), exactly one scheme (http://purl.org/net/cm/scheme) and at least one value (http://purl.org/net/cm/value) [12].
B. The Europass Diploma Supplement Application
Profile of the EuroLMAI model
The Europass DS Application Profile (AP) of the EuroLMAI model has been developed following the principles of the Singapore Framework for application profiles defined by the Dublin Core Metadata Initiative [13]. It fully conforms to the EuroLMAI Conceptual Model and its associated semantics, and refines the EuroLMAI Domain Model. This standard represents the assemblage pattern of information defined in the Europass Diploma Supplement document [18], consisting of:
Information about the learner/holder of the qualification
Information about the authority that issues the Diploma Supplement
Information about the programme of study leading to the described qualification, as well as the actual result for the specific learner
Information about the component programme units studied, as well as the result and credits in those components (transcript information), and optionally, provider information for modules delivered by an institution different from the awarding one
Additional information The profile does not introduce new classes or properties. The following are attribute properties defined for the Europass DS Application Profile of the EuroLMAI as described in [9].
URI: eds:placeOfBirth
Label: Place of Birth
Domain: elm:Learner
Range: http://www.w3.org/2000/01/rdf-schema#Literal
Definition: The place of birth of the Learner the Diploma
Supplement is issued for.
Comments: As defined in [18].
URI: eds:countryOfBirth
Label: Country of Birth
Domain: elm:Learner
Range: http://www.w3.org/2000/01/rdf-schema#Literal
Definition: The country of birth of the Learner the
Diploma Supplement is issued for.
Comments: As defined in [18]. The content of this
property should be a country code as defined in [19].
URI: eds:qualificationInfoSource
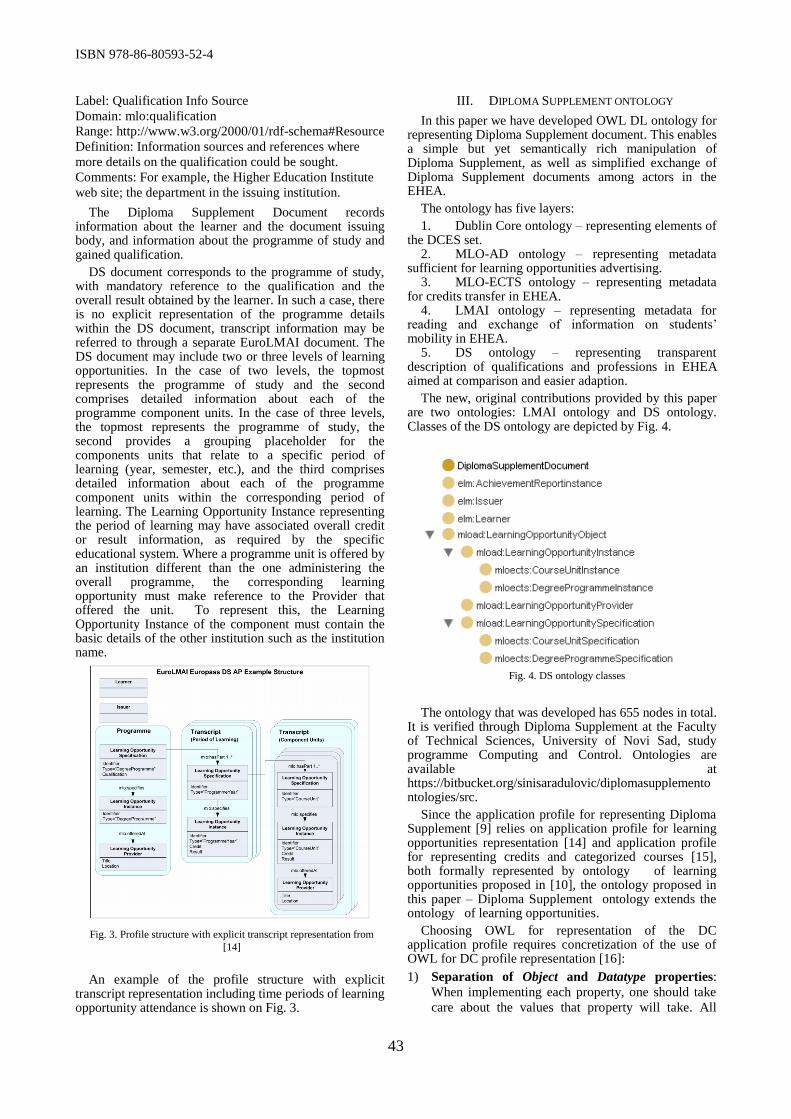
ISBN 978-86-80593-52-4
43
Fig. 3. Profile structure with explicit transcript representation from
[14]
Fig. 4. DS ontology classes
Label: Qualification Info Source
Domain: mlo:qualification
Range: http://www.w3.org/2000/01/rdf-schema#Resource
Definition: Information sources and references where
more details on the qualification could be sought.
Comments: For example, the Higher Education Institute
web site; the department in the issuing institution.
The Diploma Supplement Document records information about the learner and the document issuing body, and information about the programme of study and gained qualification.
DS document corresponds to the programme of study, with mandatory reference to the qualification and the overall result obtained by the learner. In such a case, there is no explicit representation of the programme details within the DS document, transcript information may be referred to through a separate EuroLMAI document. The DS document may include two or three levels of learning opportunities. In the case of two levels, the topmost represents the programme of study and the second comprises detailed information about each of the programme component units. In the case of three levels, the topmost represents the programme of study, the second provides a grouping placeholder for the components units that relate to a specific period of learning (year, semester, etc.), and the third comprises detailed information about each of the programme component units within the corresponding period of learning. The Learning Opportunity Instance representing the period of learning may have associated overall credit or result information, as required by the specific educational system. Where a programme unit is offered by an institution different than the one administering the overall programme, the corresponding learning opportunity must make reference to the Provider that offered the unit. To represent this, the Learning Opportunity Instance of the component must contain the basic details of the other institution such as the institution name.
An example of the profile structure with explicit transcript representation including time periods of learning opportunity attendance is shown on Fig. 3.
III. DIPLOMA SUPPLEMENT ONTOLOGY
In this paper we have developed OWL DL ontology for representing Diploma Supplement document. This enables a simple but yet semantically rich manipulation of Diploma Supplement, as well as simplified exchange of Diploma Supplement documents among actors in the EHEA.
The ontology has five layers:
1. Dublin Core ontology – representing elements of the DCES set.
2. MLO-AD ontology – representing metadata sufficient for learning opportunities advertising.
3. MLO-ECTS ontology – representing metadata for credits transfer in EHEA.
4. LMAI ontology – representing metadata for reading and exchange of information on students’ mobility in EHEA.
5. DS ontology – representing transparent description of qualifications and professions in EHEA aimed at comparison and easier adaption.
The new, original contributions provided by this paper are two ontologies: LMAI ontology and DS ontology. Classes of the DS ontology are depicted by Fig. 4.
The ontology that was developed has 655 nodes in total. It is verified through Diploma Supplement at the Faculty of Technical Sciences, University of Novi Sad, study programme Computing and Control. Ontologies are available at https://bitbucket.org/sinisaradulovic/diplomasupplementontologies/src.
Since the application profile for representing Diploma Supplement [9] relies on application profile for learning opportunities representation [14] and application profile for representing credits and categorized courses [15], both formally represented by ontology of learning opportunities proposed in [10], the ontology proposed in this paper – Diploma Supplement ontology extends the ontology of learning opportunities.
Choosing OWL for representation of the DC application profile requires concretization of the use of OWL for DC profile representation [16]:
1) Separation of Object and Datatype properties:
When implementing each property, one should take
care about the values that property will take. All
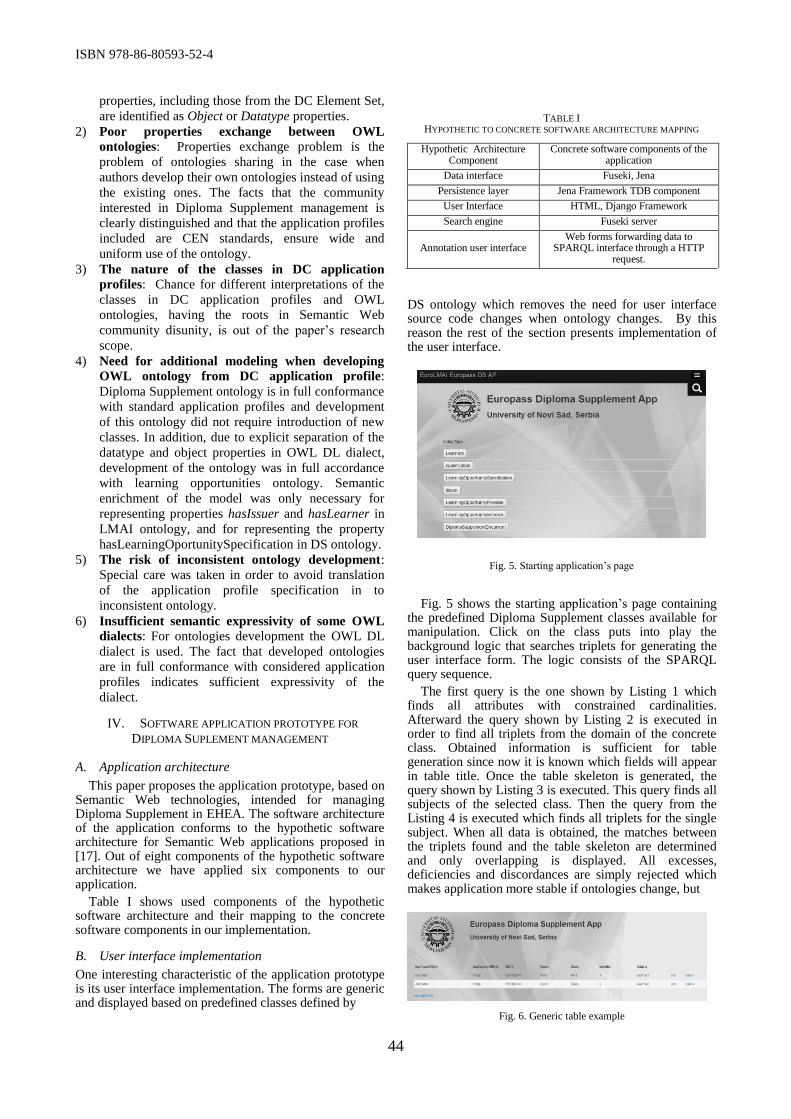
ISBN 978-86-80593-52-4
44
Fig. 5. Starting application’s page
properties, including those from the DC Element Set,
are identified as Object or Datatype properties.
2) Poor properties exchange between OWL
ontologies: Properties exchange problem is the
problem of ontologies sharing in the case when
authors develop their own ontologies instead of using
the existing ones. The facts that the community
interested in Diploma Supplement management is
clearly distinguished and that the application profiles
included are CEN standards, ensure wide and
uniform use of the ontology.
3) The nature of the classes in DC application
profiles: Chance for different interpretations of the
classes in DC application profiles and OWL
ontologies, having the roots in Semantic Web
community disunity, is out of the paper’s research
scope.
4) Need for additional modeling when developing
OWL ontology from DC application profile:
Diploma Supplement ontology is in full conformance
with standard application profiles and development
of this ontology did not require introduction of new
classes. In addition, due to explicit separation of the
datatype and object properties in OWL DL dialect,
development of the ontology was in full accordance
with learning opportunities ontology. Semantic
enrichment of the model was only necessary for
representing properties hasIssuer and hasLearner in
LMAI ontology, and for representing the property
hasLearningOportunitySpecification in DS ontology.
5) The risk of inconsistent ontology development:
Special care was taken in order to avoid translation
of the application profile specification in to
inconsistent ontology.
6) Insufficient semantic expressivity of some OWL
dialects: For ontologies development the OWL DL
dialect is used. The fact that developed ontologies
are in full conformance with considered application
profiles indicates sufficient expressivity of the
dialect.
IV. SOFTWARE APPLICATION PROTOTYPE FOR
DIPLOMA SUPLEMENT MANAGEMENT
A. Application architecture
This paper proposes the application prototype, based on Semantic Web technologies, intended for managing Diploma Supplement in EHEA. The software architecture of the application conforms to the hypothetic software architecture for Semantic Web applications proposed in [17]. Out of eight components of the hypothetic software architecture we have applied six components to our application.
Table I shows used components of the hypothetic software architecture and their mapping to the concrete software components in our implementation.
B. User interface implementation
One interesting characteristic of the application prototype is its user interface implementation. The forms are generic and displayed based on predefined classes defined by
DS ontology which removes the need for user interface source code changes when ontology changes. By this reason the rest of the section presents implementation of the user interface.
Fig. 5 shows the starting application’s page containing the predefined Diploma Supplement classes available for manipulation. Click on the class puts into play the background logic that searches triplets for generating the user interface form. The logic consists of the SPARQL query sequence.
The first query is the one shown by Listing 1 which finds all attributes with constrained cardinalities. Afterward the query shown by Listing 2 is executed in order to find all triplets from the domain of the concrete class. Obtained information is sufficient for table generation since now it is known which fields will appear in table title. Once the table skeleton is generated, the query shown by Listing 3 is executed. This query finds all subjects of the selected class. Then the query from the Listing 4 is executed which finds all triplets for the single subject. When all data is obtained, the matches between the triplets found and the table skeleton are determined and only overlapping is displayed. All excesses, deficiencies and discordances are simply rejected which makes application more stable if ontologies change, but
Fig. 6. Generic table example
TABLE I HYPOTHETIC TO CONCRETE SOFTWARE ARCHITECTURE MAPPING
Hypothetic Architecture Component
Concrete software components of the application
Data interface Fuseki, Jena
Persistence layer Jena Framework TDB component
User Interface HTML, Django Framework
Search engine Fuseki server
Annotation user interface Web forms forwarding data to
SPARQL interface through a HTTP request.
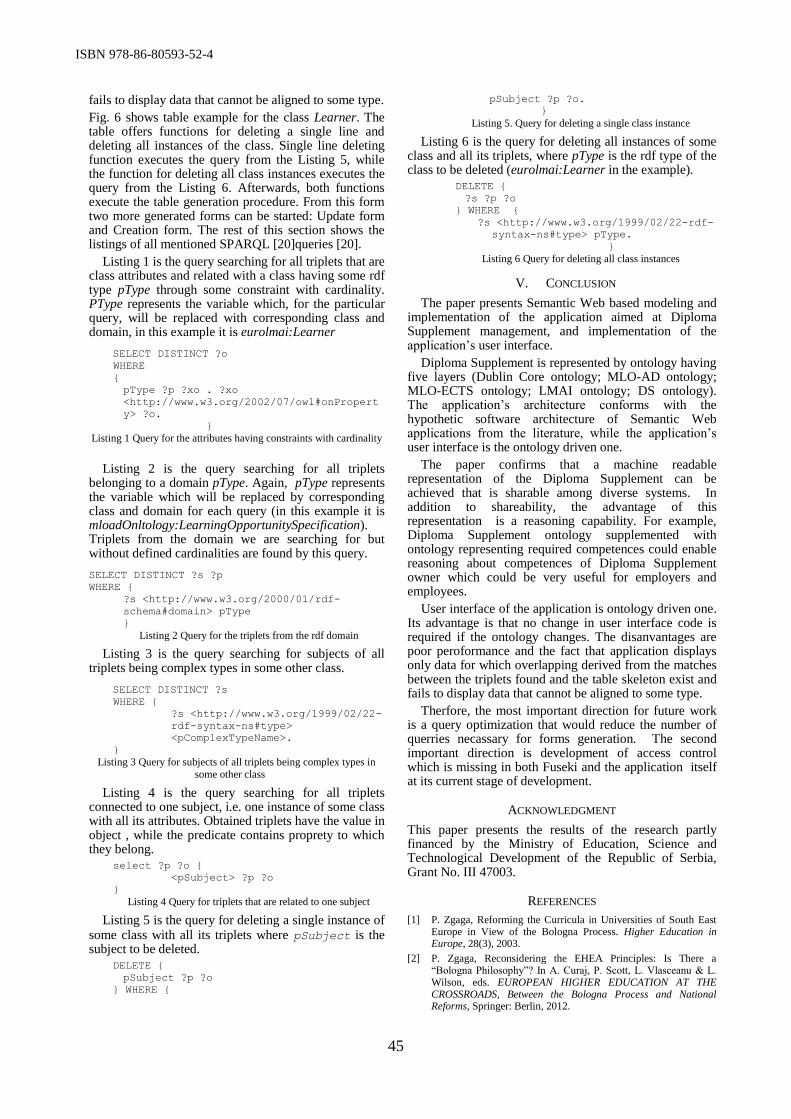
ISBN 978-86-80593-52-4
45
fails to display data that cannot be aligned to some type.
Fig. 6 shows table example for the class Learner. The table offers functions for deleting a single line and deleting all instances of the class. Single line deleting function executes the query from the Listing 5, while the function for deleting all class instances executes the query from the Listing 6. Afterwards, both functions execute the table generation procedure. From this form two more generated forms can be started: Update form and Creation form. The rest of this section shows the listings of all mentioned SPARQL [20]queries [20].
Listing 1 is the query searching for all triplets that are class attributes and related with a class having some rdf type pType through some constraint with cardinality. PType represents the variable which, for the particular query, will be replaced with corresponding class and domain, in this example it is eurolmai:Learner
SELECT DISTINCT ?o
WHERE
{
pType ?p ?xo . ?xo
<http://www.w3.org/2002/07/owl#onPropert
y> ?o.
}
Listing 1 Query for the attributes having constraints with cardinality
Listing 2 is the query searching for all triplets belonging to a domain pType. Again, pType represents the variable which will be replaced by corresponding class and domain for each query (in this example it is mloadOnltology:LearningOpportunitySpecification). Triplets from the domain we are searching for but without defined cardinalities are found by this query.
SELECT DISTINCT ?s ?p
WHERE {
?s <http://www.w3.org/2000/01/rdf-
schema#domain> pType
}
Listing 2 Query for the triplets from the rdf domain
Listing 3 is the query searching for subjects of all triplets being complex types in some other class.
SELECT DISTINCT ?s
WHERE {
?s <http://www.w3.org/1999/02/22-
rdf-syntax-ns#type>
<pComplexTypeName>.
}
Listing 3 Query for subjects of all triplets being complex types in
some other class
Listing 4 is the query searching for all triplets connected to one subject, i.e. one instance of some class with all its attributes. Obtained triplets have the value in object , while the predicate contains proprety to which they belong.
select ?p ?o {
<pSubject> ?p ?o
}
Listing 4 Query for triplets that are related to one subject
Listing 5 is the query for deleting a single instance of some class with all its triplets where pSubject is the subject to be deleted.
DELETE {
pSubject ?p ?o
} WHERE {
pSubject ?p ?o.
}
Listing 5. Query for deleting a single class instance
Listing 6 is the query for deleting all instances of some class and all its triplets, where pType is the rdf type of the class to be deleted (eurolmai:Learner in the example).
DELETE {
?s ?p ?o
} WHERE {
?s <http://www.w3.org/1999/02/22-rdf-
syntax-ns#type> pType.
}
Listing 6 Query for deleting all class instances
V. CONCLUSION
The paper presents Semantic Web based modeling and implementation of the application aimed at Diploma Supplement management, and implementation of the application’s user interface.
Diploma Supplement is represented by ontology having five layers (Dublin Core ontology; MLO-AD ontology; MLO-ECTS ontology; LMAI ontology; DS ontology). The application’s architecture conforms with the hypothetic software architecture of Semantic Web applications from the literature, while the application’s user interface is the ontology driven one.
The paper confirms that a machine readable representation of the Diploma Supplement can be achieved that is sharable among diverse systems. In addition to shareability, the advantage of this representation is a reasoning capability. For example, Diploma Supplement ontology supplemented with ontology representing required competences could enable reasoning about competences of Diploma Supplement owner which could be very useful for employers and employees.
User interface of the application is ontology driven one. Its advantage is that no change in user interface code is required if the ontology changes. The disanvantages are poor peroformance and the fact that application displays only data for which overlapping derived from the matches between the triplets found and the table skeleton exist and fails to display data that cannot be aligned to some type.
Therfore, the most important direction for future work is a query optimization that would reduce the number of querries necassary for forms generation. The second important direction is development of access control which is missing in both Fuseki and the application itself at its current stage of development.
ACKNOWLEDGMENT
This paper presents the results of the research partly financed by the Ministry of Education, Science and Technological Development of the Republic of Serbia, Grant No. III 47003.
REFERENCES
[1] P. Zgaga, Reforming the Curricula in Universities of South East Europe in View of the Bologna Process. Higher Education in Europe, 28(3), 2003.
[2] P. Zgaga, Reconsidering the EHEA Principles: Is There a “Bologna Philosophy”? In A. Curaj, P. Scott, L. Vlasceanu & L. Wilson, eds. EUROPEAN HIGHER EDUCATION AT THE CROSSROADS, Between the Bologna Process and National Reforms, Springer: Berlin, 2012.

ISBN 978-86-80593-52-4
46
[3] P. van der Hijden, Mobility Key to the EHEA and ERA, In A. Curaj, P. Scott, L. Vlasceanu & L. Wilson, eds. EUROPEAN HIGHER EDUCATION AT THE CROSSROADS, Between the Bologna Process and National Reforms, Springer: Berlin, 2012.
[4] THE EUROPEAN HIGHER EDUCATION AREA, Sorbonne Joint Declaration on Harmonisation of the Architecture of the European Higher Education System, 1998, [Online] Available at: http://www.ond.vlaanderen.be/hogeronderwijs/bologna/documents/MDC/SORBONNE_DECLARATION1.pdf
[5] THE EUROPEAN HIGHER EDUCATION AREA, Communiqué of the Conference of European Ministers Responsible for Higher Education, Leuven and Louvain-la-Neuve, 28-29 April 2009. 2009, [Online] Available at: http://www.ond.vlaanderen.be/ hogeronderwijs/bologna/conference/documents/Leuven_Louvain-la-Neuve_Communiqu%C3%A9_ April_2009.pdf
[6] S. Garben, Student Mobility in the EU – Recent Case Law, Reflections and Recommendations, In A. Curaj, P. Scott, L. Vlasceanu & L. Wilson, eds. EUROPEAN HIGHER EDUCATION AT THE CROSSROADS, Between the Bologna Process and National Reforms, Springer: Berlin, 2012.
[7] T. Bourke, Guide to the diploma supplement, Europe Unit: London, 2006.
[8] THE EUROPEAN HIGHER EDUCATION AREA, Communiqué of the Conference of Ministers responsible for Higher Education in Berlin on 19 September 2003, 2003. [Online] Available at: http://www.ond.vlaanderen.be/hogeronderwijs/bologna/documents/MDC/Berlin_Communique1.pdf [Accessed 17 September 2012].
[9] CEN WS-LT, Europass Diploma Supplement Application Profile of the EuroLMAI (EuroLMAI Europass DS AP), CEN, 2010.
[10] M. Segedinac, Z. Konjović, D. Surla, G. Savić, An OWL representation of the MLO model. In IEEE International Symposium on Intelligent Systems and Informatics (SISY 2012). Subotica, 2012.
[11] Segedinac, M., Z. Konjović, D. Surla, I. Kovačević, G. Savić, Software platform for international curriculum communication in Bologna process. In TRENDOVI RAZVOJA: “UNIVERZITET NA TRŽIŠTU”. Maribor, Slovenija, 2013.
[12] CEN WS-LT, European Learner Mobility (EuroLM) Achievement Information, CEN, 2011.
[13] M. Nilsson, T. Baker, P. Johnston, The Singapore Framework for Dublin Core Application Profiles, DCMI, 2008
[14] CEN WS-LT, Metadata for Learning Opportunities (MLO) – Advertising, CEN, 2008.
[15] CEN WS-LT, ECTS Information Package/Course Catalogue MLO Application Profile, CEN, 2010.
[16] CEN, Guidelines for machine-processable representation of Dublin Core Application Profiles, CEN Workshop Agreement CWA 15248, CEN, 2005.
[17] B. Heitmann, C. Hayes, E. Oren, Towards a reference architecture for Semantic Web applications, In Proceedings of the 1st International Web Science Conference, 2009.
[18] DECISION No 2241/2004/EC OF THE EUROPEAN PARLIAMENT AND OF THE COUNCIL of 15 December 2004 on a single Community framework for the transparency of qualifications and competences (Europass), 2004.
[19] Codes for the representation of names of countries and their subdivisions, [Online] Available at: https://www.iso.org/obp/ui/#search [Accessed 7 August 2014]
[20] SPARQL Query Language for RDF - W3C Recommendation 15 January 2008, (eds. Prud'hommeaux, E., Seaborne, A.), The SPARQL Working Group, 2013, [Online] Available at: http://www.w3.org/TR/rdf-sparql-query/ [Accessed 12 August 2014]
ISBN 978-86-80593-52-4
47
Web Services for Public-private Innovation
Networks
Valentina Nejković1, Milan Gocić2 1University of Niš, Faculty of Electronic Engineering, Niš, Serbia
2University of Niš, Faculty of Civil Engineering and Architecture, Niš, Serbia
[email protected]; [email protected]
Abstract—Intensive socio-economic changes and development of new complex information and communication technologies have led to organizational and structural changes. Without having global connections for knowledge and information sharing current sustainability of innovation processes is reduced. Thus, these changes in movements of enterprises’ boundaries to access different expertise and technological fields are required. In this paper, we present our view of today public private innovation network conceptual framework based on Web services.
I. INTRODUCTION
In order to stay competitive, commercial enterprises involve new information and communication technologies into their operations. Integration of new technologies is seen as a way to boost efficiency and productivity of enterprises. The fact about new technology integration is evident since successful innovators spend a significant amount of their budget on implementation processes of modern information technologies [1]. Appliances of Web services are in expansion primarily in the field of financial sector. Today we can find electronic services for e-banking, bill pay and brokerage.
Further, since costs and demands for public services have been increased and public budgets in many developed countries are not sufficient for such demands, new solutions have to be found. Establishment of public- private partnership (PPP) is seen as a possible solution where public and private organizations collaborate. In such organization, private organization access to resources of public organizations and make new profits, while from the other side public organizations have opportunity to exploit experience and flexibility of private organizations and to transfer their risks. Today, a major number of governments use PPP to deliver infrastructure and essential basic services. It can improve availability, quality, innovation and prices of the public services [2]. The success of the PPP is seen when the value of money is achieved [3, 4].
Within public-private cooperation the both sides have common interest and can benefit from such cooperation [5]. This cooperation is a well-known form of cooperation
mobilizing in order to produce technological innovations in industry sector. Thus, public-private innovation networks (PPIN) raised up to achieve more efficient and effective management in public services provision. PPIN goes forward with nowadays trend known as “bring your own cloud” [6], which allows employees to use cloud services or Web services of their choice in the workplace. For this purposes, it is necessary to develop Web services/applications through generating a very large number of small and innovative services that support web-based and service-oriented approaches of the software.
PPIN should be supported by corresponding web-based systems. Key feature of such systems are information retrieving based on users needs followed further with features such as interactivity and personalization [1]. Such interactivity and personalization send back top-down and centralized models of networked policy-making, and bring forward new trends addressed to bottom-up models. The new policy network approaches view network as non-hierarchical and inter-dependent relationships of actors who share common interests and whose cooperation leads to the best ways of achieving common goals [7, 8].
In this paper, it will be presented a conceptual framework with the structural elements of the PPINs. In addition, the description of framework elements considered as required for efficient innovation process design is provided.
II. PUBLIC-PRIVATE INNOVATION NETWORKS
The network can be defined as a group of individuals or organizations (actors) that are interrelated and connected [9, 10]. It is composed of actors, resources that can be shared among actors, mechanisms that provide coherence to the network and activities among actors in network that include the outcome of network [11].
Networks can be applied very successful for producing innovations in nowadays environments. By using network we have an open model for producing innovation on sustainable way. In such environments accessing external knowledge and technological resources are key activities. In this way, innovation networks raised up.
ISBN 978-86-80593-52-4
48
Innovation networks represent social and dynamic environments where different actors collaborate in order to produce innovations. Different actors include small and medium enterprises, universities, innovation centers, industry associations as well as government agencies [12]. The networks provide resources that present the basis for the production of technological solutions. Further, inter-organizational learning is enabled. Actors in innovation networks become crucial in today’s knowledge-based economy. They exchange knowledge, technologies, skills and competences in order to produce different forms of innovations. Most of innovation networks involve complex knowledge, innovation practices and produce a technological innovation. The part of complex knowledge and research and development resources could be acquired through the cooperation of universities, research and development institutions and centers which are the public in nature.
Goals of different networks are different. Some networks exist in order to develop technical solutions to specific problems and to create new business models and new products, while the other to empower marginalized groups by fostering innovations appropriate to their resources and needs [13]. Every network should follow certain policy. Key policy issues related to the emergence and continued success of innovation networks including their sustainability, social considerations and the changing roles of public and private actors in the network [13].
Public-private innovation networks present collaboration among public and private actors where innovation outputs are embodied into technological artifacts [5]. They are effective for developing technical and commercial innovations, which include complex issues, where the problems and the potential solutions that innovation processes will explore are defined at the beginning of processes.
III. WEB SERVICES
Web services present services that are stored on different web servers of services’ providers accessible to users or software via standard protocol [14]. Web services connect computers and devices using the Internet to exchange data. Some web services can communicate with other web services. For that communication it is necessary software known as middleware which implement procedures for data exchange and communications. Technologies based on Web services should extend the functionality of the Web.
Architecture where are services intensively used is service-oriented architecture, which represents paradigm where software components are created with certain interfaces and composed as a set of functions. Each component in such architecture provides a service to other software components. One of the advantages is that there are no technology requirements with such architecture. A service can be developed in any programming language using standards such as remote procedure calls (RPC), CORBA or XML and it is platform independent. For example, Java can communicate with Perl, as well as Unix applications can communicate with Windows applications.
A web service is an example of an service-oriented architecture with a well-defined set of implementation choices. The Web services framework has the following main parts: communication protocols (SOAP or REST), service descriptions (WSDL) and service discovery or retrieving what services are available (UDDI) [15].
SOAP (Simple Object Access Protocol) and REST (Representational State Transfer) are two different protocols of Web services access. SOAP is a standard that defines the XML formatted messages between two applications over IP [16]. It can be used with multiple transport protocols such as FTP, HTTP or SMTP. While SOAP provides a framework for the exchange of information, it lacks the semantics of data transmitted. SOAP has been used intensively in last decade, while REST is newer protocol. REST is a simpler alternative to SOAP, which seeks to fix problems that SOAP had and provide simple method of accessing Web services. However, both protocols had to consider when deciding which protocol to use. SOAP will be more useful in situation when someone is publishing an API to the outside world that is either complex or likely to change. On the contrary, REST is usually the better option and is used by all Yahoo's web services, Flickr and del.icio.us, bloglines, technorati, eBay and Amazon, while SOAP is used by Google.
WSDL (Web Services Description Language) [17] describes functionalities of Web services using XML language. It includes a binding mechanism. WSDL provides an import mechanism of XML Schema, which can be used for integration of Web services.
UDDI (Universal Description, Discovery and Integration) [18] provides a mechanism for customers to locate Web services by defining a standard way to publish and discover information about them. Web services are meaningful only if potential users can find information sufficient to permit their execution. UDDI can be used to find Web services of providers which offer different data.
Fig. 1. Infrastructure for the usage of Web services (adapted from
[19, 20])
Web services consist of three components: service broker, service provider and service requester. Fig. 1 illustrates the infrastructure for the usage of Web services and relationships between the Web service components.
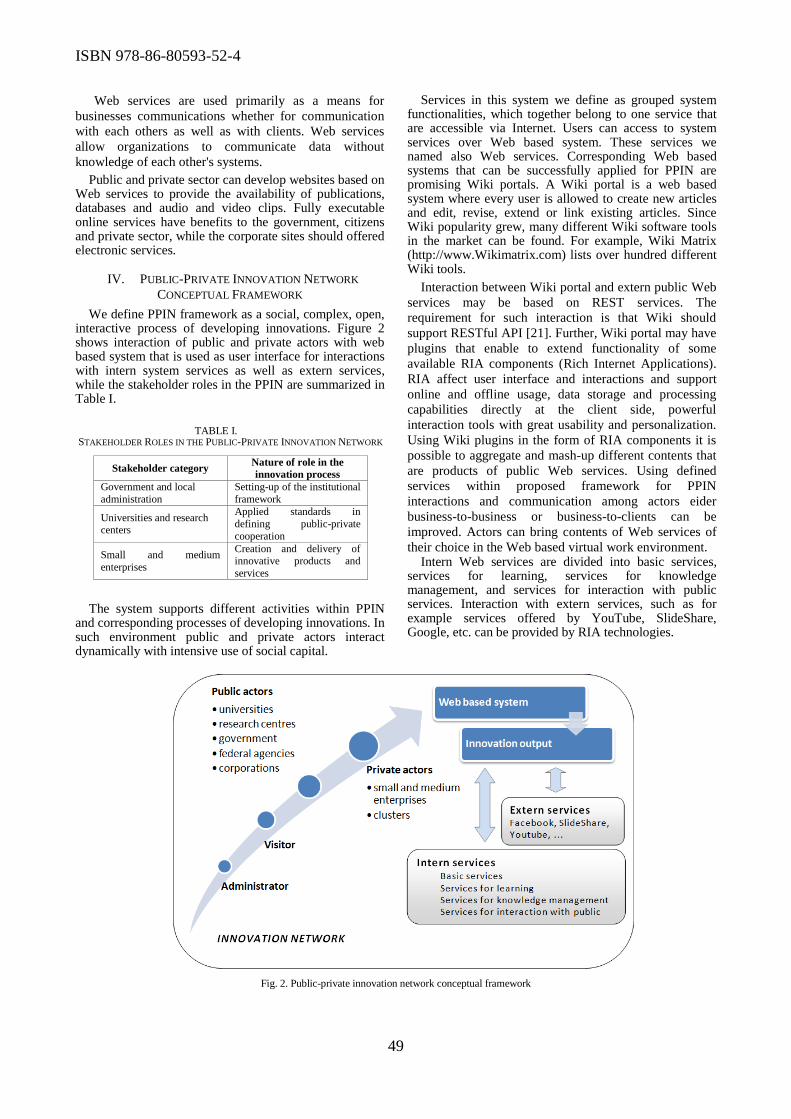
ISBN 978-86-80593-52-4
49
Web services are used primarily as a means for
businesses communications whether for communication
with each others as well as with clients. Web services
allow organizations to communicate data without
knowledge of each other's systems.
Public and private sector can develop websites based on Web services to provide the availability of publications, databases and audio and video clips. Fully executable online services have benefits to the government, citizens and private sector, while the corporate sites should offered electronic services.
IV. PUBLIC-PRIVATE INNOVATION NETWORK
CONCEPTUAL FRAMEWORK
We define PPIN framework as a social, complex, open, interactive process of developing innovations. Figure 2 shows interaction of public and private actors with web based system that is used as user interface for interactions with intern system services as well as extern services, while the stakeholder roles in the PPIN are summarized in Table I.
The system supports different activities within PPIN
and corresponding processes of developing innovations. In such environment public and private actors interact dynamically with intensive use of social capital.
Services in this system we define as grouped system functionalities, which together belong to one service that are accessible via Internet. Users can access to system services over Web based system. These services we named also Web services. Corresponding Web based systems that can be successfully applied for PPIN are promising Wiki portals. A Wiki portal is a web based system where every user is allowed to create new articles and edit, revise, extend or link existing articles. Since Wiki popularity grew, many different Wiki software tools in the market can be found. For example, Wiki Matrix (http://www.Wikimatrix.com) lists over hundred different Wiki tools.
Interaction between Wiki portal and extern public Web
services may be based on REST services. The
requirement for such interaction is that Wiki should
support RESTful API [21]. Further, Wiki portal may have
plugins that enable to extend functionality of some
available RIA components (Rich Internet Applications).
RIA affect user interface and interactions and support
online and offline usage, data storage and processing
capabilities directly at the client side, powerful
interaction tools with great usability and personalization.
Using Wiki plugins in the form of RIA components it is
possible to aggregate and mash-up different contents that
are products of public Web services. Using defined
services within proposed framework for PPIN
interactions and communication among actors eider
business-to-business or business-to-clients can be
improved. Actors can bring contents of Web services of
their choice in the Web based virtual work environment. Intern Web services are divided into basic services,
services for learning, services for knowledge management, and services for interaction with public services. Interaction with extern services, such as for example services offered by YouTube, SlideShare, Google, etc. can be provided by RIA technologies.
Fig. 2. Public-private innovation network conceptual framework
TABLE I. STAKEHOLDER ROLES IN THE PUBLIC-PRIVATE INNOVATION NETWORK
Stakeholder category Nature of role in the
innovation process
Government and local
administration
Setting-up of the institutional
framework
Universities and research centers
Applied standards in
defining public-private
cooperation
Small and medium
enterprises
Creation and delivery of
innovative products and
services

ISBN 978-86-80593-52-4
50
Basic services are responsible for the asynchronous actor’s communication in PPIN, which include forums and commenting over contents. Also, the notification should not be omitted, which ensure actors to be informed of any changes made over the appropriate contents. We count users and groups management as basic service, which performs the function of authentication and authorization system. Different contents blending by using web mash-up technology can extend basic services.
Services for learning should provide basic functionality for creating and using learning resources and corresponding literature materials. Wiki portal can provide collaborative development of materials, contents and documents different extensions. This service should provide functionality that has social networks web sites such as interconnection of users, publishing of blogs, development of personal portfolios and mash-ups of applications in order to manage multimedia contents.
Services for knowledge management should provide data storage, data retrieving and knowledge acquisition. They are a part of the knowledge exchange platform that enables exchange experiences and ideas. In order to retrieve data mechanisms for advanced search documents should be provided. Further, features such as easy navigation, automatic generation of adjacent links, dynamic drop-down menus. The concept of collaborative tagging should provide a collaborative content self-organization, where it is easier to retrieve necessary information and knowledge.
Services for interaction with public services should provide external content aggregation and integration of heterogeneous information. Promising approach that can be used for content aggregation is web mash-ups of different internet applications. Generated content represents a various Web resources involved in different locations. Applications that can be used are widgets that are offered for free on the Internet. It is possible to integrate Youtube videos, SlideShare presentations, and Flickr images under various system content.
Presented PPIN framework offers interactivity and personalization of actors, usage of bottom-up model based on actors needs. That model is agile, adaptable and brings inter-dependent relationships of actors who share common interests. Further, this model publishes government data as an open data in a reusable format. Such open data can provide a development of new services and different analyses [22]. In addition, ICT companies will be able to create new innovative businesses in developing digital services.
V. CONCLUSION
Efficient public-private interaction processes should obtain innovation process that leads to outputs composed of new technological innovations. In this paper, the PPIN conceptual framework is presented. The proposed PPIN framework highlights existence of online services that can lower the cost of service delivery.
Public sector could become more innovative and more collaborative in decision-making processes, while the private sector should be more customers oriented and provide more electronic services.
REFERENCES
[1] D. M. West and J. Lu, Comparing Technology Innovation in the Private and Public Sectors, Brookings Institution, 2009, pp. 1-23.
[2] B. Rakic and T. Radjenovic, “Public-private partnerships as an instrument of new public management”, Facta Universitaties, Series: Ecnomics and Organization, vol. 8, no. 2, 2011, pp. 207-220.
[3] D. Grimsey and M. K. Lewis, “Are Public Private Partnerships value for money? Evaluating alternative approaches and comparing academic and practitioner views”, Accounting Forum, vol. 29, 2005, pp. 345–378.
[4] J. Yuan, A. Y. Zeng, M. J. Skibniewski and Q. Li., “Selection of performance objectives and key performance indicators in public–private partnership projects to achieve value for money”, Construction Management and Economics, vol. 27, no. 3, pp. 253-270, 2009.
[5] R. Morrar, Public-private innovation networks in services, PhD thessis, 2011.
[6] D. Buchholz, E. Goldman, D. Morgan and C. Peters,“Delivering Cloud-based Services in a Bring-Your-Own Environment”, IT Best Practices, pp. 1-7, June 2012.
[7] D. Hazlehurst, “Networks and policy making: from theory to practice in Australian Social Policy”, Discussion Paper No.83, 2001, pp. 1-26.
[8] E. Besussi, “Policy Networks: Conceptual Developments and their European Applications”, UCL Working Papers Series, 2006, pp. 1-17.
[9] A. Inzelt , “Private sector involvement in science and innovation policy-making in Hungary”, Science and Public Policy, vol. 35, no. 2, 2008, pp. 81-94.
[10] F. Gallouj, L. Rubalcaba and P. Windrum, Public–Private Innovation Networks, Edward Elgar, Cheltenham, UK and Northampton, MA, 2013.
[11] D.Iacobucci, Networks in Marketing, Thousand Oaks, Sage, 1996.
[12] F. Gipouloux, “Networks and Guanxi: Towards an Informal Integration through Common Business Practices in Greater China”. In: C. K. Bun (ed.). Chinese Business Networks: State, Economy and Culture. Singapore, Prentice Hall and Nordic Institute of Asian Studies, pp. 57-70.
[13] F. Toedtling, P. Lehner and A. Kaufmann, “Do Different Types of Innovation rely on Specific Kinds of Knowledge Interactions?”, Tehnovation, vol. 29, 2009, pp. 59-71.
[14] D. Booth, H. Haas, F. McCabe, E. Newcomer, M. Champion, C. Ferris and D., Orchard, (eds.) Web services architecture. W3C working group note, 2004.
[15] F. Curbera, D. Matthew, R. Khalaf, W. Nagy, N. Mukhi and S. Weerawarana, “Unraveling the Web Services Web: An Introduction to SOAP, WSDL, and UDDI”. IEEE Internet Computing, vol. 6, no. 2, 2002, pp. 86–93.
[16] N. Mitra and Y. Lafon, (eds.) SOAP Version 1.2 Part 0: Primer, (2nd ed.). W3C Recommendation 27 April 2007.
[17] R. Chinnici, J. J. Moreau, A. Ryman and S. Weerawarana, (eds.). Web services description language (WSDL) Version 2.0. Part 1: Core Language. W3C Working Draft 26 March 2007.
[18] L. Clement, A. Hately, C. von Riegen and T. Rogers, (eds.). UDDI Version 3.0.2. UDDI Spec Technical Committee Draft. 2004.
[19] D. K. Gottschalk, S. Graham, H. Kreger and J. Snell, “Introduction to Web services architecture”, IBM Systems Journal, vol. 41, no. 2, 2002, pp. 170–177.
[20] M. P. Papazoglou and W. J. van den Heuvel, “Service-oriented architectures: approaches, technologies and research issues”, VLDB Journal, vol. 16, 2007, pp. 389–415.
[21] Tosic, M., Manic, M. A RESTful Technique for Collaborative Learning Content Transclusion by Wiki-style Mashups, in Proc. IEEE ICELIE'11, 5th IEEE International Conference on ELearning in Industrial Electronics, Melbourne, Australia, November 7-10., 2011., pp. 27-32.
[22] N. Huijboom and T. V. D. Broek, “Open data: an international comparison of strategies”, European Journal of ePractice, vol. 12, pp. 1-13, April 2012.

Wednesday, October 15th, 2014


ISBN 978-86-80593-52-4
53
Crisis Management in the Defence System
Samed Karović1
1Military Academy, University of Defence, Belgrade, Serbia
Abstract — This paper explains crisis management from the defence system perspective, particularly as it pertains to its functioning during a crisis. The focus is on the crisis management leadership and the management and decision making during crises and especially during emergencies. The paper also considers emergencies as a legal category adopted by the legislative authority in the Republic of Serbia.
I. INTRODUCTION
Crisis management gains its full prominence in situations that are not categorized as being “normal” everyday life or functioning of specific organizations, states, etc. In essence, there is no human activity that is immune to a crisis. All aspects of human activity and the operational success of organizations are measurable in terms of how soon they can identify and deal with crises, even before they actually occur.
A crisis is often neglected, which negatively affects organizations as the unresolved problems keep accumulating. It is of paramount importance to realistically view any crisis, because that is essentially the first requirement for its successful resolution. If organizations make timely preparations and plans, they will create conditions for successful crisis resolution. These actions involve acceptance of reality and practical adaptation to the methods of crisis prevention and other preventive action.
The functioning of crisis management in the defence system during an emergency is the key to successfully overcoming and surpassing such a situation, because the defence system is at the same time the most organized part of a society, designed so as to be able to function even in times of hardship.
Doctrinal documents dealing with important domains for Armed Forces deployment in specific situations are an important aspect for understanding crisis management in the defence system. The specific situations are provisionally listed as crises and defined by a specific mission of the Serbian Armed Forces. In order to analyze this issue, it is necessary to examine the significance of all aspects of crisis management and the specific conditions of crises, under which crisis management could become the main element of crisis resolution in Serbia.
Nowadays, crises are inevitable. Most company executives are aware that the duration and aftermath of crises can be considerably reduced if the defence system is prepared for the crisis. Therefore, the task of crisis management is the assurance of a certain degree of preparedness of the defence system for a potential crisis.
II. CRISIS MANAGEMENT
The results in the field of crisis management so far, suggest that despite the positive results in strengthening the security position of the Republic of Serbia, there are still significant challenges, risks and threats to its security, such as the consequences of natural disasters and technical-technological accidents, as well as caused damages to the environment and citizens’ health due to radiological, chemical and biological contamination. These are ongoing security challenges for the Republic of Serbia, its people and property. Significant risk comes from technological accidents in which the effects of hazardous substances can affect not only the territory of the Republic of Serbia, but also neighboring countries. All this requires a special organization, capabilities and participation of all actors in the protection and rescue of people, material and cultural resources and the environment from natural disasters, technical-technological accidents – disasters, and thus the Serbian Armed Forces as the subject of protection and rescue system.
Based on the characteristics (physiognomy) of contemporary armed conflict and the setting in which the Serbian Armed Forces can perform tasks, the missions and objectives of the Serbian Armed Forces are currently defined and will be elaborated in the future. These elements define the organization, preparation content, the engagement and security of the Serbian Armed Forces.
The Serbian Armed Forces missions are defined as follows: (1) the defense of the Serbian Armed Forces from external armed threats; (2) participation in building and maintaining peace in the region and in the world; (3) support to civil authorities in countering security threats.
Practically, the Serbian Armed Forces accomplish assigned missions by performing tasks. In this case, when it comes to the third mission, tasks are directed principally to support civil authorities in emergencies. It is directly related to the consequences caused by natural

ISBN 978-86-80593-52-4
54
disasters, technical-technological accidents that present an increasing threat to the development of society [4].
Support to civil authorities in countering security threats is achieved through assistance to civil authorities in combating internal security threats, terrorism, separatism, organized crime and the assistance to civil authorities during natural disasters, technical-technological accidents and the other disasters.
The Serbian Armed Forces can be used in peacetime, a state of emergency and a state of war in accordance with the law and decisions of competent state authorities. The engagement of the Serbian Armed Forces covers activities and planning in peacetime and preparation for combat and non-combat activities and execution of the same.
Support to civil authorities in emergencies (countering security threats) includes a variety of activities that are usually carried out in cooperation and coordination with other forces of the defense system of the Republic of Serbia, as well as the forces of partnership and friendly countries. The Serbian Armed Forces, in the third mission that covers support to civil authorities in countering security threats, perform the tasks through the activities in non-combat operations [4].
As opposed to safety and risk management disciplines, which primarily deal with natural disasters, crisis management handles crises directly or indirectly caused by humans, such as computer hacking, environmental pollution, kidnapping of executives, frauds, forgery, and workplace sexual harassment and mobbing. Unlike natural disasters, man-made crises can be avoided. They do not have to happen. Hence, the public is extremely critical of organizations responsible for crises.
Nevertheless, even with the best of frameworks, plans, and preparations, unfortunately not all crises can be avoided. This is true even for those crises which are known to be very likely to happen. Yet, the impact of all crises can be diminished if whoever deals with them possesses basic knowledge of crisis management. Even though not all crises can be predicted or pre-empted, they can all be managed more effectively if they are understood and dealt with to the best of one’s ability.
Crisis management is a part of management that involves theory and practice (science and skill), an authorized group of people, and the process of preparation, organization, and implementation of activities for the effective solution of problems that are causing, or have already caused, the crisis [8].
Crisis management is not a unique and strictly defined activity but a theoretical concept encompassing a specific group of events (crises), which share certain rules but are also very different.
As a rule, crisis management is conducted under circumstances of organizational confusion, with added pressure from the media and a lack of precise information. It has two dimensions. Technical dimension pertains to the capacity of organizations and their established strategy against potential threats. There is also the political dimension – crisis management is a profoundly controversial and politicized activity.
Although crisis management is classified within safety sciences, it is simultaneously an inseparable part of military activity that integrates all elements relevant for
military organizations in terms of defined missions and tasks. Consequently, crisis management becomes an activity with significant implications for military organization systems during crises.
Finally, crisis management should be understood as a crucial and integral part of responsible organization management, which includes numerous decisions involving risk and opportunity assessment and which necessarily includes crises, especially in times of reduced safety and rapid changes. Identification of the existing potential, in addition to error and deficiency analysis, is essential for crisis resolution.
A. Subjects and parts of crisis management in the defence system
Subjects of crisis management are the responsible persons for the process and they handle all the relevant relationships in crisis resolution. They are both the actors in a given crisis and subjective factors within the scope of the crisis. Their key role is to act in a crisis within a certain scope. Nevertheless, it should be noted that the subjects of crisis management during a crisis resolution constitute a part of a wider surrounding, which affects the resolution of that crisis. It is necessary to emphasize that they represent special subjects in crisis resolution and that they are responsible for specific activities in the events during specific crises that affect a specific organization.
In order to fully understand this issue, one must first notice a fact that forms the basis of full analysis of the factors that caused the issue, i.e. crisis, which means that all aspects of the organization need to be analyzed. These are important elements, which affect the entire management handling the problems directly related to the crisis.
In order to consider the role and importance of the subjects and parts of crisis management, it is also necessary to assess the proper future prospect of the defence system. This implies that the defence system needs its planning to look far ahead into the future in order to have sufficient time to prepare. This is especially true of a military organization, which is primarily dependent upon the surrounding, which, in turn, is most often unstable. Accordingly, it is necessary to think about and plan for the long-term effects of what will happen. This is essentially due to the need to adapt to changes in the surrounding and thus requires proper adaptation.
The importance of subjects and parts of crisis management and the difficulties they encounter during crisis resolution can qualitatively resemble other elements that the organizational system encounters during its activity. This is primarily a resemblance to resolution or management of specific projects, so the crisis management leadership has several common features, usually manifesting through unusual activities that seldom recur, skill and experience requirements from people at various functions, and limited time, followed by the return of immediate actors to their regular tasks after the crisis has ended.
The abovementioned elements suggest that the crisis management leadership or crisis teams should be organized and problems should be approached in the same manner as by project teams. Accordingly, they need to gather people with experience, with skills, and from professional or expert fields required for a specific

ISBN 978-86-80593-52-4
55
situation. Yet, there are certain differences, primarily pertaining to insufficient time to plan own activities. Teams gathered for specific hazards (e.g. fires, floods, etc.)1 possess emergency plans but even they lack specific knowledge on what to do because a crisis occurs in an unpredictable manner.
Since project management has four stages: definition and organization, planning, execution management, and project closure, the crisis management leadership can adjust these steps according to their needs [3].
B. Definition and organization
This phase serves to clearly define project aims and organize the right people and resources. The following questions are answered: “What is the exact problem?”, “What do we have to do to solve it?”, “Who should we involve to help us?”, and “What resources will we need to solve the problem and restore the situation back to normal?”
The first assumption of successful activity by the subjects of crisis management is crisis definition and provision of the right people and resources, which is also the basis for project initiation.
C. Planning
The primary task of the manager is to ensure successful performance of activities for which he is responsible. This requires considerable consideration of future events and looking ahead in order to ensure normal operation. All these activities are simply called planning.
Planning begins with the clear setting of a goal and proceeds backward through four successive steps [3]:
Determining specific tasks to be completed;
Determining the most capable individuals or groups for the completion of every task;
Determining the time required for completion of a specific task;
Specifying the head person for every task.
If task realization is approached in this manner, these tasks will inevitably be split into subtasks. What is also characteristic in terms of the role of crisis management leadership is the selection of specific task leaders because it ensures quality task completion.
D. Execution management
The execution management stage involves all the usual jobs of efficient management as well as careful monitoring and control. The two ensure adherence to the plan, standards, and calculations. Special emphasis should be placed on the coordination of activities of designated leadership or teams in the execution process.
E. Project closure
The common aspect of the project and the crisis is their closure. The project is closed the moment its objectives are met. Crisis management has a final stage and one of the main tasks of this stage is the review of the events and the experience and determination of what went well, what
1 The floods that struck Serbia this May exceed every previous
experience in situations when the emergency sector is usually called upon. It should be noted that the Serbian Armed Forces play the key
role in such situations though the way it functions and plans in these
and similar situations.
the mistakes were, will the approach change and how it will change if and when a similar situation affects the organizational system. Drawing on experience is considered in detail and implemented into crisis plans.
The most important aspect is to declare the crisis over, to record the most significant events, and to ensure that the direct leadership in crisis resolution is involved in the follow-up analysis so that the experiences could be implemented into crisis plans.
III. CRISIS MANAGEMENT LEADERSHIP IN
THE DEFENCE SYSTEM
According to the Law on Defence [4], the defence system is a part of the natural security system and a single authority for the organization of preparations for the performance of defence tasks, implementation of measures and actions to enlist the help of citizens, government bodies, companies, and other legal entities to be at the disposal of the Serbian Armed Forces and other forces during peacetime, wartime, and emergencies. Crisis management leadership in the defence system could be defined from two perspectives: (1) within the defence system and (2) outside of the defence system.
In the first case, the Serbian Armed Forces would bear most of the burden and the crisis management leadership would include the following elements: the general staff, commands of all levels, units, and institutions.
In the second case, the leadership would include the President, the National Assembly, the Government and other government bodies, companies, and enterprises.
The obligations of the abovementioned bodies, units, and institutions are prescribed by the Law and other specialized acts in this field. Specifically, many issues are defined by the Law on Defence and the Law on Emergency Situations. Special emphasis should be placed on the definition of operational scope in Article 1 of the Law on Emergency Situations [9], which stipulates the following: “This Law defines emergency action, declaration, and management; safety and rescue system for persons, property, cultural goods, and the environment from natural disasters, technical and technological hazards – accidents and catastrophes, consequences of terrorism, wars, and other large scale disasters (hereinafter: natural disasters and other accidents); competences of state agencies, autonomous provinces, and local governments, and participation of the Serbian Armed Forces and the police in safety and rescue activities; rights and obligations of citizens, organizations, and other legal entities and entrepreneurs pertaining to emergencies; organization and activities of civil defence for safety, rescue, and relief after natural disasters and other accidents; funding; inspection and supervision; international cooperation and other issues relevant to organization and functioning of the safety and rescue system”.
It needs to be pointed out that the above article of the Law on Emergency Situations defines the role of the Armed Forces, which primarily handle the safety and rescue activities against various threats to the population and to the country.
It is particularly noticeable that crisis management is not recognized or mentioned as a category in the defence system. Nevertheless, the manner of operation of the defence system during emergencies contains all the

ISBN 978-86-80593-52-4
56
elements of crisis management and resolution. This especially applies to the decision making on using the Serbian Armed Forces units.
IV. CRISIS AND HAZARD RESPONSE
The operational units of crisis management can include the Army, the Air Force, special units, diplomacy and diplomats, or high-level experts. Capabilities for response to terrorist incidents and natural disasters typically include transport of the injured, food, water, medical supplies, etc. In addition, there is also the need for a warning system designed to warn people to timely evacuate or leave a potentially hazardous location. This refers to elements of natural disasters and the necessity of developing a system that can respond timely according to a unique crisis plan. Therefore, the ability to cope with a natural disaster can suggest preparedness for and capability of efficient response to crises caused by humans, weapons of mass destruction, or other occurrences, especially the so-called technological crises.
It should be stressed that crises are unordered and unstructured events for which no response can be completely adequate and conducted on the highest level. Predicting where, when, or how a crisis will occur is more an art than a science. Thus, the best possible solution is planning, as the basis of any further activity when predicting the worst case scenarios and the corresponding response.
When a crisis reaches its peak, the focus should be on understanding, explaining, and redirecting events. Accordingly, the qualities of good leadership should include the following: perceptiveness, intuitiveness, extensive knowledge of one or more fields, ability to assume additional responsibilities, ability to think clearly, decisiveness, and composure under pressure. Naturally, this raises the issue whether all managers possess these abilities and whether they can perform the activities required for crisis resolution. All managers must know the work they are doing (knowing one’s business), for which they need the proper skills.
V. DEFENCE ACTIVITY
If the defence activity comprises all military-related activities and globally refers to the missions of the Armed Forces, it is fairly easy to conclude that crisis management in this sphere attains its full affirmation in every mission it complements during its implementation. The main mission of defending the country against various challenges, risks, and threat is the most important, and thus crisis management perfectly fits into the domain of risk, uncertainty, and threat. As regards the significance of crisis management, special emphasis should be placed on the third mission, implemented through helping the civil authorities overcome certain types of crises, specifically non-military threats to safety.
A. Defence activity in terms of crises
According to its Operational Doctrine, the Armed Forces conduct different types of operations, according to the criteria under consideration. All types of operations are relevant for crisis management because the contents of crisis management that can be operationalized by stages and by tasks are practically implemented in the operations. Crises come and go, especially if one considers the number of activities involved in the defence
activity. This is by all means an ever-present process in a system directed towards specific decisions. Involvement of the Armed Forces in conflicts is an objective crisis in which the opposed sides (adversaries) see their own role as subjectively defensive and the other side as the aggressor. In this sense, a crisis should essentially be understood in terms of taking measures to defend any kind of system against an accident or to contain the accident as much as possible.
Defence activity includes a variety of activities directed towards building the defence system, in which various factors take part. All elements of the defence system have their role in a given domain and can be considered as integral parts of a unifying system, which functions in a specific environment. The environment significantly influences the defence system segments and acts as a factor of guidance and adaptation of system factors, which gives it a property of changeability and adaptability. However, it should be noted that the main issue in the defence domain is the problem of managing human resources. Thus, crises that accompany the defence activity are also associated with a series of factors from this domain, so some types of crises remain hidden, i.e. there are no morphological manifestations of their occurrence that would otherwise be visible through behavioural and physiological changes. A crisis is always in a developing, transitory, state and it is ambivalent – it will either be resorbed, causing effects of variable significance, or be surpassed [2].
It can be concluded that a crisis, in terms of defence activity, encompasses every subject with a state of their own, which is manifested as an apparent weakening of its regulatory mechanisms and is interpreted as a threat to its own existence [8]. It is important to stress that a crisis always contains a subjective element and that it can be found only in beings that possess awareness. Therefore, a crisis usually leaves the subject some time and space to act – it commands action for survival.
B. Providing assistance to civil authorities
An important segment, the defined mission of the Armed Forces, pertains to provision of assistance to civil authorities to tackle non-military safety threats, which is directly manifest in the crisis management activities, in which the Armed Forces are directly involved. The forms of crises threatening civil structures or civil society may come from various natural sources and possibilities of occurrence of specific crises that could affect certain parts of Serbia. The most pronounced crises are the ones caused by floods, earthquakes, and fires. Accordingly the Serbian Armed Forces are entitled and obliged to train their members for handling exactly these types of crises.
It should be noted that such crises (floods and fires) occur within specific intervals and in specific periods of a season, which improves the predictability of crises and the corresponding preventive measures. Naturally, this raises the question whether today crises are a constant phenomenon caused by natural processes, or whether there are mechanisms capable of eliminating the harmful effects of natural crises that are temporary and predictable. Thus, crises are characterized by their periodical nature, which paradoxically imitates hope – crises are always transitory; there is always a way out of a crisis.

ISBN 978-86-80593-52-4
57
These two paradoxical attitudes are the foundation and the elements based on which the Armed Forces are called upon during naturally-occurring crises. In this sense, crisis management is defined as an activity directed towards controlling a situation that threatens the survival of an organization and planning and implementing measures to secure the main goals of an organization. Crisis management involves increased use of resources and methods required for crisis control and the introduction of radical measures in the functioning of an organization. In terms of crisis prevention, we may speak of the so-called preventive or anticipatory crisis management, whereas in terms of ensuring basic existential variables after the crisis has occurred, we may speak of reactive crisis management, which is characterized by clearly set goals, such as achieving certain success.
There is extensive literature on crisis and thus numerous partially overlapping and partially divergent definitions of a crisis. A crisis is too complex a phenomenon to be easily defined. It engages many theoreticians and practitioners from different fields of study, which results in different definitions and properties of a crisis.
Finally, crisis management is to be understood as an important and integral part of responsible management of organizations, which involves numerous decisions that include risk and opportunity assessment and which cannot disregard crises, in addition to error and deficiency analysis, especially not in times of high uncertainty and rapid changes. Together with error and deficiency analysis, identification of existing potential is decisive for crisis control, which is the end goal of enlisting the Armed Forces within the abovementioned mission.
VI. EMERGENCIES
Article 8 of the Law on Emergency Situations [9] defines an emergency as “a situation when risks and threats or consequences of catastrophes, emergencies, and other threats to population, environment, and property are of such scale and intensity that their occurrence or consequences cannot be prevented or eliminated through regular activity of competent agencies and services, and for whose mitigation or elimination requires special measures, forces, and resources at an increased operating regime”. The very definition in the Law on Emergency Situations affirms the third mission of the Serbian Armed Forces, i.e. support to civil authorities in their fight against safety threats.
The issue that requires special attention, and it pertains to the competence of government bodies regarding emergencies, is the issue of the Ministry of Defence and the Serbian Armed Forces. Article 12 of the Law on Emergency Situations [9], stipulates that “In events when all other forces and resources of the safety and rescue system are not sufficient for efficient protection and rescue of people, property, cultural goods, and the environment from catastrophes caused by natural disasters and other accidents, at the request of the Ministry – organizational unit in charge of emergency situations (hereinafter: the competent department), the Ministry of Defence shall ensure participation of organizational parts of the Ministry of Defence, commands, units, and institutions of the Serbian Armed
Forces to assist in safety and rescue, pursuant to the Law”.
When safety and rescue includes units of the Serbian Armed Forces, they are under the command of their designated commanding officers, pursuant to the decisions by the emergency management headquarters, which leads and coordinates safety and rescue.
A special place in the safety and rescue system is reserved for the safety and rescue forces, comprising the following: emergency management headquarters, civil defence units, fire and rescue units, police, Serbian Armed Forces, subjects whose regular duties include safety and rescue, organizations and other legal entities, Serbian Red Cross, Mountain Rescue Service of Serbia, and associations trained and equipped for safety and rescue. Considering the competences and obligations of civil defence, we will overview and explain this activity as defined in the Law on Defence [9].
Civil defence is defined in Chapter VII, Articles 77-80 of the Law on Defence.Error! Reference source not found. Article 77 states that “Civil defence is organized, prepared, conducted and implemented as a system of protection and rescue of citizens, material and cultural goods from natural disasters, technical and technological disasters and catastrophes, consequences of terrorism, war, and other great accidents in accordance with the valid regulations, principles and demands of the Additional Protocol to the Geneva Convention and other regulations of the international humanitarian law and ratified international agreements”, but also with international multilateral and bilateral agreements [6].
The competence of civil defence is derived from its tasks, which pertain to the following: planning of the implementation of civil defence; development of the assessment of vulnerability to natural disasters, technical and technological and other accidents, wartime threats, and own forces and potentials; organization, formation, and implementation of units and headquarters of civil defence in municipalities, cities, and districts; designation of enterprises, companies, and other services trained and equipped for safety and rescue; detection and disposal of unexploded ordnance (UXO); planning and organization of telecommunication tasks; operational organization of the Monitoring and Reporting Service; preparatory activities for the training of civil defence staff and civil conscripts and for international safety and rescue cooperation.
VII. CRISIS RESOLUTION
To understand crisis resolution from the defence system perspective, it is important to note that the most developed world countries have already adopted and generally accepted principles regarding this issue, as well as defined them in their military doctrines.
According to the Doctrine of the Serbian Armed Forces, “Serbian Armed Forces plan, prepare, and execute operations during peacetime, emergencies, and wartime. Depending on the forces deployed, the operations can be divided into Army operations, Air Force and Air Defence operations, Territorial Forces operations, Special Forces operations, and Joint Forces operations; depending on the type of combat activities, operations can be offensive and defensive. The basic division of military operations according to the manner of
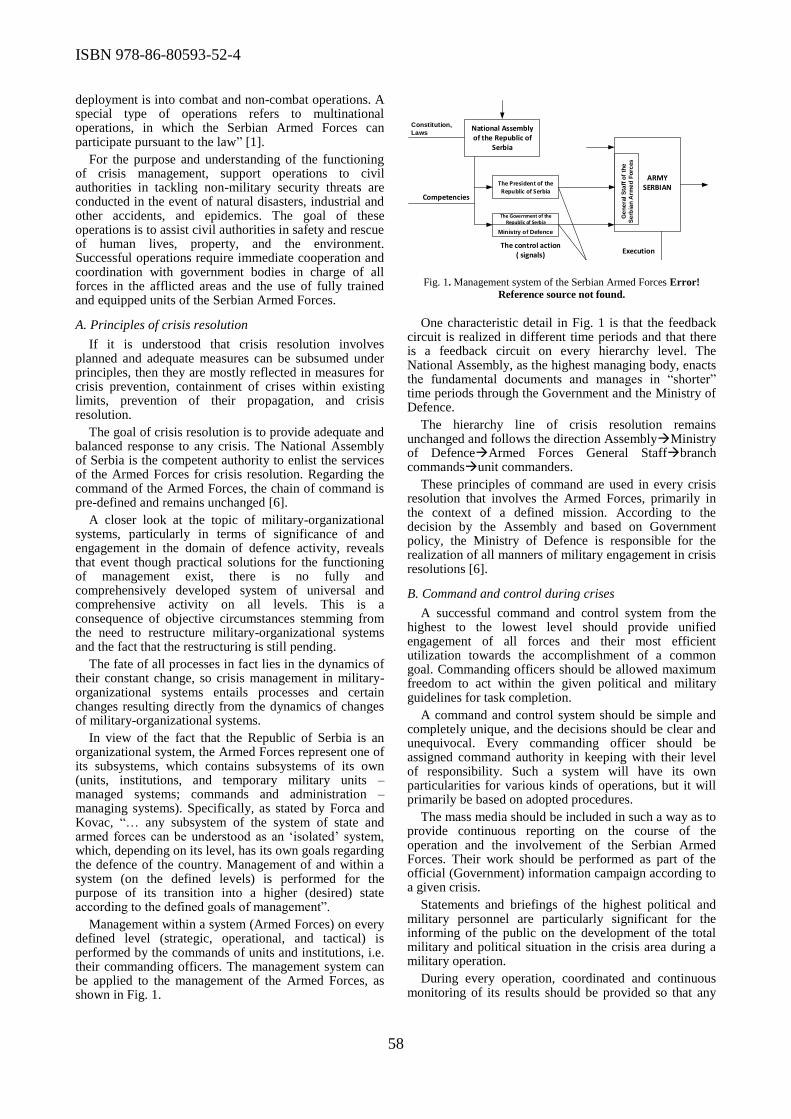
ISBN 978-86-80593-52-4
58
deployment is into combat and non-combat operations. A special type of operations refers to multinational operations, in which the Serbian Armed Forces can participate pursuant to the law” [1].
For the purpose and understanding of the functioning of crisis management, support operations to civil authorities in tackling non-military security threats are conducted in the event of natural disasters, industrial and other accidents, and epidemics. The goal of these operations is to assist civil authorities in safety and rescue of human lives, property, and the environment. Successful operations require immediate cooperation and coordination with government bodies in charge of all forces in the afflicted areas and the use of fully trained and equipped units of the Serbian Armed Forces.
A. Principles of crisis resolution
If it is understood that crisis resolution involves planned and adequate measures can be subsumed under principles, then they are mostly reflected in measures for crisis prevention, containment of crises within existing limits, prevention of their propagation, and crisis resolution.
The goal of crisis resolution is to provide adequate and balanced response to any crisis. The National Assembly of Serbia is the competent authority to enlist the services of the Armed Forces for crisis resolution. Regarding the command of the Armed Forces, the chain of command is pre-defined and remains unchanged [6].
A closer look at the topic of military-organizational systems, particularly in terms of significance of and engagement in the domain of defence activity, reveals that event though practical solutions for the functioning of management exist, there is no fully and comprehensively developed system of universal and comprehensive activity on all levels. This is a consequence of objective circumstances stemming from the need to restructure military-organizational systems and the fact that the restructuring is still pending.
The fate of all processes in fact lies in the dynamics of their constant change, so crisis management in military-organizational systems entails processes and certain changes resulting directly from the dynamics of changes of military-organizational systems.
In view of the fact that the Republic of Serbia is an organizational system, the Armed Forces represent one of its subsystems, which contains subsystems of its own (units, institutions, and temporary military units –managed systems; commands and administration – managing systems). Specifically, as stated by Forca and Kovac, “… any subsystem of the system of state and armed forces can be understood as an ‘isolated’ system, which, depending on its level, has its own goals regarding the defence of the country. Management of and within a system (on the defined levels) is performed for the purpose of its transition into a higher (desired) state according to the defined goals of management”.
Management within a system (Armed Forces) on every defined level (strategic, operational, and tactical) is performed by the commands of units and institutions, i.e. their commanding officers. The management system can be applied to the management of the Armed Forces, as shown in Fig. 1.
National Assembly of the Republic of
Serbia
The President of the Republic of Serbia
Constitution,
Laws
Competencies
The Government of the Republic of Serbia
Ministry of Defence
The control action( signals)
ARMYSERBIAN
Execution
Ge
ne
ral
Sta
ff o
f th
e
Se
rbia
n A
rme
d F
orc
es
Fig. 1. Management system of the Serbian Armed Forces Error!
Reference source not found.
One characteristic detail in Fig. 1 is that the feedback
circuit is realized in different time periods and that there is a feedback circuit on every hierarchy level. The National Assembly, as the highest managing body, enacts the fundamental documents and manages in “shorter” time periods through the Government and the Ministry of Defence.
The hierarchy line of crisis resolution remains unchanged and follows the direction AssemblyMinistry of DefenceArmed Forces General Staffbranch commandsunit commanders.
These principles of command are used in every crisis resolution that involves the Armed Forces, primarily in the context of a defined mission. According to the decision by the Assembly and based on Government policy, the Ministry of Defence is responsible for the realization of all manners of military engagement in crisis resolutions [6].
B. Command and control during crises
A successful command and control system from the highest to the lowest level should provide unified engagement of all forces and their most efficient utilization towards the accomplishment of a common goal. Commanding officers should be allowed maximum freedom to act within the given political and military guidelines for task completion.
A command and control system should be simple and completely unique, and the decisions should be clear and unequivocal. Every commanding officer should be assigned command authority in keeping with their level of responsibility. Such a system will have its own particularities for various kinds of operations, but it will primarily be based on adopted procedures.
The mass media should be included in such a way as to provide continuous reporting on the course of the operation and the involvement of the Serbian Armed Forces. Their work should be performed as part of the official (Government) information campaign according to a given crisis.
Statements and briefings of the highest political and military personnel are particularly significant for the informing of the public on the development of the total military and political situation in the crisis area during a military operation.
During every operation, coordinated and continuous monitoring of its results should be provided so that any

ISBN 978-86-80593-52-4
59
potential oversights and faults could be promptly identified and eliminated.
After the operation, it is imperative that a comprehensive analysis of operation success (or failure) be performed in order to use the new experience to potentially change certain solutions in the Doctrine, the size and structure of the Armed Forces and its operational capabilities. This would ensure the best and the most efficient possible response to future crisis resolution challenges.
VIII. CONCLUSION
Crisis management as a science receives its full affirmation in modern society, which is exposed to different types of hazards and challenges, the most prominent of which are situations due to natural forces and various industrial accidents. Such situations are usually called emergencies, and the practical role of crisis management is to resolve them.
There are many contributing factors that determine its successful functioning. These factors depend on the relationship between the state system and the way the entire defence system functions and how it is regulated. Regarding Serbia, crisis management is taking its rightful place and role as it has recently become the dominant area of interest for theoreticians and practitioners of all profiles and from all fields. Every day, the media are filled with stories about crises, their impact, their potential occurrence, risk factors, and the like.
Successful crisis resolution requires efficient crisis management, which includes an organized defence system and efficient command and management on all levels. What is particularly important is adequate prevention, which is directly associated with the basic
principles of crisis resolution and which is practically responsible for the occurrence of any emergency in a specific part of the country or across the whole country.
There is no efficient crisis resolution without efficient crisis management, in which the Serbian Armed Forces play the key role. This is an issue that must be integrated into the crisis management system in Serbia, which needs to function successfully during emergencies.
REFERENCES
[1] B. Forca, M, Kovac, Management, commandigness and direction in the military organisation, (article), Vojno delo, 5-6, Belgrade, 1999. (ISSN 0042-8426).
[2] Doctrine of Serbian Armed Forces. Ministry of Defence, Belgrade 2010.
[3] K, Mihalski, About crisis, Književna zajednica Novog Sada, Novi Sad, 1987.
[4] R, Luecke, Crisis Management, Zgombic&Partners, Zagreb, 2005, str.129. (ISBN 953-6348-36-5).
[5] R, Slavkovic, S, Karovic, M, Jelic, Engagement of the Serbian Armed Forces in Support of Civil Authorities in Emergencies, Conference proceedings of the international scientific Conference, 24 - 26. septembra 2014, LIPTOVSKÝ MIKULÁŠ. ISBN 978-80-8040-496-3.
[6] S, Karovic, Commandigness and Direction, textbook, Media Centre ''Odbrana'', Belgrade, 2014. (ISBN 978-86-335-0439-3).
[7] S, Karovic, R, Slavkovic, N, Komazec, Crisis Management in Defence and Emergencies, Conference proceedings of the international scientific Conference, 24 - 26. septembra 2014, LIPTOVSKÝ MIKULÁŠ. ISBN 978-80-8040-496-3.
[8] S, Mucibabic, et al.: Some Aspects of State, Problems and Possible Solutions in Defence Sciences, Vojno delo 1/2013. (ISSN 0042-8426).
[9] Law on Defence, Belgrade, 2007.
[10] Law on State of Emergency, Beograd, 2009.

ISBN 978-86-80593-52-4
60
Prevention of Environmental Migration Using
GIS as a Research Method
Ljilјana Mihajlović1, Nenad Komazec2, Mirolјub Milinčić1, Bojana Mihajlović1, Tijana Đorđević1 1Faculty of Geography, University of Belgrade, Serbia
2Military Academy, University of Defence, Belgrade, Serbia
[email protected]; [email protected]; [email protected]; [email protected]; [email protected]
Abstract—The range of the use of GIS in the world is very wide, as its application in a practical way show and solve specific problems, and it is certain that the future of many scientific disciplines will be based on it. Intensification of cause-effect relationship between nature and human activity, creating a growing need for geographic information systems in the field of environmental protection. GIS databases, collected from reference institutions engaged in the study of phenomena and processes that occur in the environment, are characterized by a high degree of precision and globality, than, the prevention of environmental migration, as a necessity caused by changes in the environment, can not imagine without the use of GIS.
I. INTRODUCTION
Diametric relation between nature and society (disruption of the ecological balance) leads to study the overall natural processes and their impact on population migration, which became one of the primary contemporary geospatial research, with a growing existential significance. Taking into account the reality that should be environmental migration socially recognized as one of the most pressing problems of mankind, there is a need for modern research techniques and methods, which would affect the safety improvement, both social and comprehensive.
GIS has a great importance in the management of data related to geographic space (changes in the environment), as one of the most promising research methods and information technologies. The research method is not only collecting and organizing data, as can be found in the literature, but also includes methods of collecting and analyzing data, and conclusions are derived from these processes. GIS in one place collect information from multiple sources , than, their utilitarianism is of great importance. In order to achieve data collection, they must be tied to a particular location on the Earth's surface, which is based on geographic or mathematical coordinates associated with a location on a geographical network. While traditional maps represent an imaginary view of the real world with a selected part of a group of map elements of the images to the cartographic base, GIS maps allow the integration of a large number of data and the ability to update them. This feature GIS gives great applicability, and one of the application is presented in the paper.
II. DEFINITION OF TERMS - ENVIRONMENTAL
MIGRATION
Investigation of the Earth's tolerance to disruption of indigenous values, leads to the conclusion that the human species is at a crossroads with regard to their future - society, and kind - and that on herself has a possibility to choose a way and means for which will be decided to _. Human, given the technical capabilities can destroy nature, but also can decide that "creates" nature, ie. to its technical achievements used for its improvement. There are efforts to forestall a natural disaster, but as long as possessed by technical means, some problems are difficult to resolve. One response to such humanocentric interest are disasters that man returning nomadic way of life and create a new social system, "environmental refugees", and "environmental migrants". Given the terms referring to the victims 'inhuman' behavior towards the environment. It is estimated that the number of displaced people due to the problems arising in the environment is equal or even exceed the number of legitimate migrants [1]. International organizations for migration and a group which deals with migration policy (Refugee Policy Group - RPG) from 1992, estimated that one billion people can be described as removed from their original place of residence due to problems arising in the environment [2].
Many equate terms of environmental migrants and environmental refugees. D. Dimitrijevic, said that the migrant who voluntarily leave the residence to be settled elsewhere, while environmental refugees are represented by people who are forced to leave their place of residence due to changes in the environment that threaten their lives [2]. Ecological migrants are not victims of forced and rapid natural changes or accidents caused by human activity, but they are the victims of gradual and permanent deterioration of quality of environmental. The migration of people from certain areas and parts of the country due to the negative geoecological factors (changes in the precipitation regime, exhausting resources, landslides and other), leads precisely to the appearance of environmental migrants.
There are three categories of environmental migrants. The first group consists of temporarily displaced because pressure on environment. When it is completed and the

ISBN 978-86-80593-52-4
61
area rehabilitated, they are returned to their habitat. These are usually situations resulting from natural disasters such as earthquakes, cyclones, accidents (eg. Earthquake in Kraljevo 2010, flood in Obrenovac 2014.). The second group are those who must be permanently displaced and who have to settle some other area, mainly due to changes of anthropogenic origin (for example, due to the construction of large reservoirs - Selova, resource exploitation, nuclear accidents - Chernobyl). The third group of environmental migrants are people who are permanently or temporarily move, looking for better quality of life (usually when they have exhausted the resources of their place of residence)..
III. CONCEPT AND SIGNIFICANCE OF GIS AS A
RESEARCH METHOD
Geographic Information System (GIS) as a research method is a system for managing spatial data and associated attributes to them. He systematically integrate them, gathers, stores, analyzes and displays graphically. It is based on computer processing of geographic data that includes five components:
• input data (input),
• data management (management)
• reactivation or retrieval and storage of data in the right place (retrieval)
• handling (manipulation) and analysis, and
• displaying output data (output) [3].
Qualified staff for manage geographic information systems must have knowledge for the use of graphics software applications (GeoMedia, AutoCAD, ArcView, Mapinfo, Photoshop, etc..). It is necessary to monitoring continuously for technological innovation within specific programs related to GIS.
While working data are processed and displayed in layers, so that surfaced topological and attribute data of the area showing the order in the new common layer information. In this process, it is usually about the analysis of a large number of geographic data that can be presented on a map or in a GIS. Spatial objects, which appear in the form of points, lines, nodes and polygons are enclosed geographical areas characterized by different attributes or meaning, i.e. cadastral parcels, the forest complex geological formations, houses, roads, etc..
The basic functions of GIS are the transformation of geospatial reference data from various sources into an appropriate set of data, selective integration regarding the given specifications, processing of integrated databases and obtain desired information in a suitable form. Using the GIS can be processing maps and images, vector and raster terrain data, satellite and other digital recordings, and also geospatial statistical attribute data in an integrated environment..
IV. APPLICATION OF GIS IN ENVIRONMENTAL
SCIENCE
With the help of GIS methods, the results of geographical research may be applicable in solving everyday problems. Basically, GIS is a georeferenced database, in which each character given location on the Earth's surface, usually in the form of coordinates expressed latitude and longitude.
Based on a detailed qualitative and quantitative analysis of the natural features and their evaluation, thematic mapping and the method of successive elimination where they applied certain criteria, they can be separated localities in the level of benefits for agriculture, construction, tourism, but can also be accompanied by changes in environmental , progradation and degradation. The advantages and benefits of GIS in monitoring these changes are reflected in:
• strong object-oriented multi-user database
• easier access to information,
• improving remote sensing recordings using classification, filtering, and combination of spectral channels,
• high-quality mapping and simple presentation and preparation of data,
• easier to create, update and modify charts,
• recognition of the global nature problems of environmental,
• realistic modeling of real complex using an object-oriented GIS,
• the ability of modeling of important scientific research and operational management of natural resources.
Geographic information systems allow to researchers from the field of geography and the environment to effectively and efficiently obtain the relevant data and manipulate them for scientific, commercial, managerial and the designer purpose. Using many different types of data on a single map, it is easier to understand and compare the relationships in the environment.
V. APPLICATION OF GIS IN THE PREVENTION
OF ENVIRONMENTAL MIGRATION
In the world is a great use of GIS in various areas of everyday activities - planning, forecasting natural disasters, population censuses and many others. Geographic information system simplified many human activities and reduce the time needed for their implementation, so, for that reason, in the modern world has become a necessity. Scientists use GIS to find adequate solutions of current problems, such as prevention of environmental migration, the forecasting of hurricanes, bumpy areas, potential floodplains, landslides and so on.
Migration are not a new phenomenon. For centuries, people leave their life looking for a better life. Most important actors of migrations are security , demographic, economic, political, Geoecological, but all of them in interaction [4]. The term "environmental migrant" was introduced by Lester Brown in 1976 in "Twenty-two dimensions population problem" (Twenty two dimensions of the population problem), but along with him are used the following terms too: forced migrants of environmental, environmentally motivated migrants , climate refugees, environmentally displaced persons, refugees, disaster, eco-refugees, and many others. The differences between these terms are less important than what they have in common. They suggest that there is a connection between processes in the environment and human migration. This assumes that the nature and the natural environment are "Chasers" that leads people to mass leave their habitat. Results inadequate management of resources have led to the fact that the ecosystem is at risk in all regions of the world. When these issues are
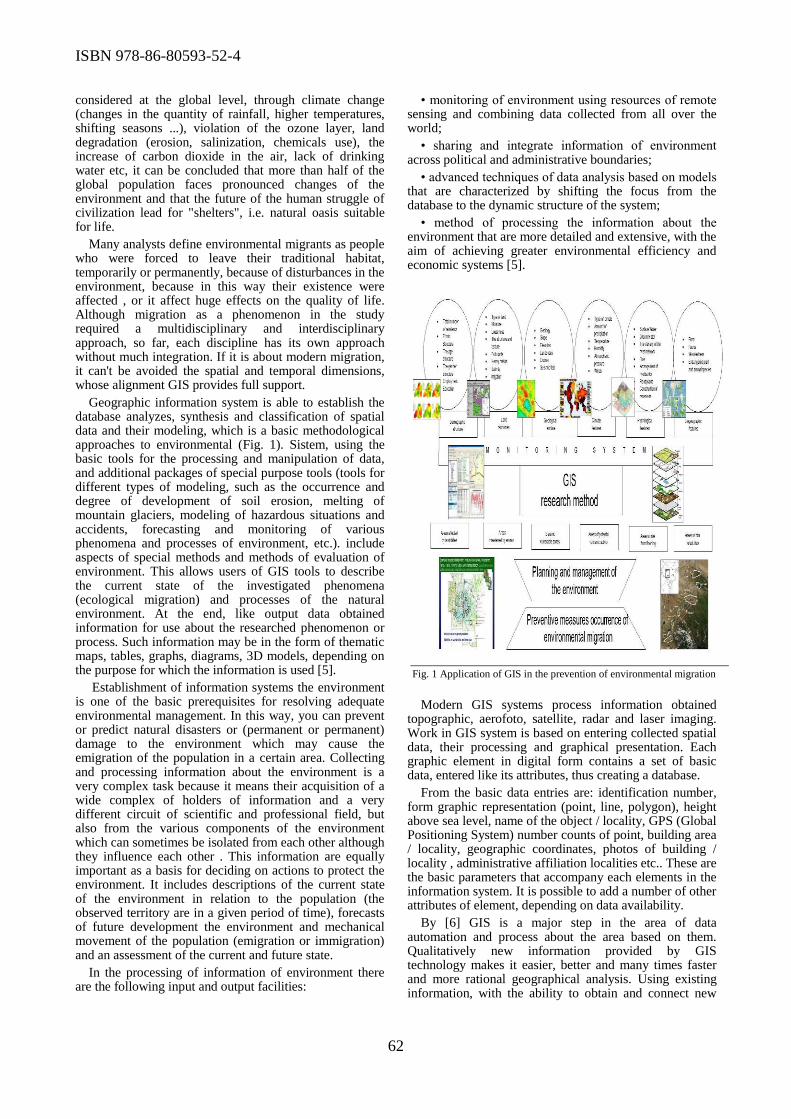
ISBN 978-86-80593-52-4
62
Fig. 1 Application of GIS in the prevention of environmental migration
considered at the global level, through climate change (changes in the quantity of rainfall, higher temperatures, shifting seasons ...), violation of the ozone layer, land degradation (erosion, salinization, chemicals use), the increase of carbon dioxide in the air, lack of drinking water etc, it can be concluded that more than half of the global population faces pronounced changes of the environment and that the future of the human struggle of civilization lead for "shelters", i.e. natural oasis suitable for life.
Many analysts define environmental migrants as people who were forced to leave their traditional habitat, temporarily or permanently, because of disturbances in the environment, because in this way their existence were affected , or it affect huge effects on the quality of life. Although migration as a phenomenon in the study required a multidisciplinary and interdisciplinary approach, so far, each discipline has its own approach without much integration. If it is about modern migration, it can't be avoided the spatial and temporal dimensions, whose alignment GIS provides full support.
Geographic information system is able to establish the database analyzes, synthesis and classification of spatial data and their modeling, which is a basic methodological approaches to environmental (Fig. 1). Sistem, using the basic tools for the processing and manipulation of data, and additional packages of special purpose tools (tools for different types of modeling, such as the occurrence and degree of development of soil erosion, melting of mountain glaciers, modeling of hazardous situations and accidents, forecasting and monitoring of various phenomena and processes of environment, etc.). include aspects of special methods and methods of evaluation of environment. This allows users of GIS tools to describe the current state of the investigated phenomena (ecological migration) and processes of the natural environment. At the end, like output data obtained information for use about the researched phenomenon or process. Such information may be in the form of thematic maps, tables, graphs, diagrams, 3D models, depending on the purpose for which the information is used [5].
Establishment of information systems the environment is one of the basic prerequisites for resolving adequate environmental management. In this way, you can prevent or predict natural disasters or (permanent or permanent) damage to the environment which may cause the emigration of the population in a certain area. Collecting and processing information about the environment is a very complex task because it means their acquisition of a wide complex of holders of information and a very different circuit of scientific and professional field, but also from the various components of the environment which can sometimes be isolated from each other although they influence each other . This information are equally important as a basis for deciding on actions to protect the environment. It includes descriptions of the current state of the environment in relation to the population (the observed territory are in a given period of time), forecasts of future development the environment and mechanical movement of the population (emigration or immigration) and an assessment of the current and future state.
In the processing of information of environment there are the following input and output facilities:
• monitoring of environment using resources of remote sensing and combining data collected from all over the world;
• sharing and integrate information of environment across political and administrative boundaries;
• advanced techniques of data analysis based on models that are characterized by shifting the focus from the database to the dynamic structure of the system;
• method of processing the information about the environment that are more detailed and extensive, with the aim of achieving greater environmental efficiency and economic systems [5].
Modern GIS systems process information obtained topographic, aerofoto, satellite, radar and laser imaging. Work in GIS system is based on entering collected spatial data, their processing and graphical presentation. Each graphic element in digital form contains a set of basic data, entered like its attributes, thus creating a database.
From the basic data entries are: identification number, form graphic representation (point, line, polygon), height above sea level, name of the object / locality, GPS (Global Positioning System) number counts of point, building area / locality, geographic coordinates, photos of building / locality , administrative affiliation localities etc.. These are the basic parameters that accompany each elements in the information system. It is possible to add a number of other attributes of element, depending on data availability.
By [6] GIS is a major step in the area of data automation and process about the area based on them. Qualitatively new information provided by GIS technology makes it easier, better and many times faster and more rational geographical analysis. Using existing information, with the ability to obtain and connect new

ISBN 978-86-80593-52-4
63
one, provides a good basis for geographical analysis and solve specific problems [6].
VI. CONCLUSION
Sustainable way of life in some areas depends on human's relationship to nature. Every anthropogenic activity leads to specific changes in the environment,, but the intensity of these changes can be reduced or prevented, by the use of GIS possess timely information on the state in the environment,. This gives the possibility of timely responses to changes in space. For this reason, it is necessary to establish a system that would integrate all relevant data to achieve the objective - the prevention of environmental migrations. It is necessary to make the conversion and modification of existing data, perform digitization and integrate them into a single database. In order to achieve these demands, imposes a simple answer - the application of geographic information systems.
In order to prevent of environmental migrations , it is not enough that the GIS user only acquire the appropriate hardware, software and the people who will be working on the system, but the system needs to be adequate organizational set up, and the people who work in the system to have the basic geographic and cartographic knowledge . Today, after several decades of development, GIS has demonstrated its benefits in all areas which require visualization of spatial data and manipulate large amounts of data, which are described very complex concepts and a large number of users of various professions. GIS technology provides great progress in all areas and processes of management, monitoring, organization and decision making in relation to conventional methods.
Further development of the GIS system will switch focus to the unification of all the GIS server stations and consolidation of spatial data in one place. Database on condition of the environment created in this way will ensure that all information are easily available, verifiable, integrated, complete and high quality. Application of GIS
methods is manifold: offers the overview possibility of large regional areas, detailed information on tough terrain, potentially flood-prone areas, the occurrence of cyclones, the possibility of systematic monitoring of phenomena and processes important to soil erosion, landslides, locating the most vulnerable zones contaminated with heavy metals, and identifying potential zones of vulnerability of environment.
GIS now has a lot of applications in different fields: geography, security, demography, spatial planning, the environment, the impact assessment and management of natural resources and more. Whichever method is used, GIS has a great importance and will continue to be used in the future, because it allows people to effectively answer questions and resolve problems by watching, easy to understand and share data in the form of tables, graphs, and most important - the maps.
ACKNOWLEDGMENT
The paper is the result of the research within the projectс 173038 & 176008 funded by the Ministry of Education and Science of the Republic of Serbia.
REFERENCES
[1] J. L. Jacobson, Environmental Refugees: a Yardstick of Habitability, Worldwatch paper 86, Worldwatch Institute, Washington DC, 1988.
[2] D. Dimitrijevic, Trends of environmental security in the 21st century. Faculty of Security. Belgrade, 2010.
[3] M. Milanovic, M., Ljesevic, Methods of remote sensing in environmental research, Faculty of Geography, Belgrade, 2009.
[4] M. Milincic, Economic - geographical and environmental space polarization, as a factor of new functional relations between areas, Bulletin of SGD, no. 2, Belgrade, 2004.
[5] M. Ninkovic, Research Environment using the GIS technology and its internet service. Synthesis. Futura, Singidunum University, Belgrade, 2014.
[6] Lj. Gigovic, D. Sekulovic, GIS analysis of Serbian territory under DPTK. 300. Globus, Belgrade, 2008..

ISBN 978-86-80593-52-4
64
Aspects of Decision-making in Emergency
Situations Nenad Komazec1, Darko Božanić1, Ljiljana Mihajlović1
1Military Academy, University of Defence
Abstract - The main problem of preparation and functioning of organizations in times of emergency is how to make efficient and effective decisions. The complexity and unpredictability of emergencies involve the processing of large amounts of information of varying quality in short time units. There are various factors that determine the quality of the information. The quality of the decisions made in conditions of uncertainty, vagueness, incompleteness, and low verification of information can be accomplished with the use of software tools for decision support, designed to help decision makers with problem solving. This paper presents an approach to modelling a system for decision support in emergency situations based on risk assessment.
I. INTRODUCTION
Emergencies are inevitable in the modern age. Rapid increase of the number of events with catastrophic effects serves as a warning sign and requires appropriate response from entities involved in safety and rescue. Response of a safety and rescue system implies planned and organized action to implement personnel and equipment according to the existing safety and rescue plans. Safety and rescue planning is a preventive activity, aimed at predicting event scenarios and offering response solutions with sufficient personnel and equipment. The main characteristic of decision making for emergencies is decision making in the face of risk uncertainty. The uncertainty is due to people’s insufficient knowledge about certain phenomena and their origin. Hence the impossibility of precisely predicting events and planning safety measures against such hazards. The majority of required information is obtained through assessment of the risk of occurrence of specific hazards and through determination of possible consequences. Risk assessment is conducted by persons working at the national and local emergency management headquarters. A large amount of information generated by the emergence and development of an emergency requires special information systems to aid in decision making. Such systems, called decision support systems, are particularly important during emergencies because their quality determines how fast a good decision will be made. The input data for decision support systems are data collected on site by operatives from professional services.
II. DEFINITION OF EMERGENCIES
The common property of emergencies, regardless of their cause, is their negative impact on people, property, and the environment.
A. Origin and classification of emergencies
Emergencies represent a legal form of legitimizing an event with a negative impact, regardless of whether the event has occurred or is possible to occur. Proclamation of Emergency shall be performed by staff in emergency situations. Using the power and resources allocated for emergency response, based on the activation of plans for protection and rescue, directly depends on the time of the declaration of emergency. Fully activate and use of forces and means of protection and rescue is possible only after the declaration of emergency. In the most general sense, an emergency (situation) is the totality of special circumstances and factors occurring in a specified area as a result of an emergency event [1]. An emergency event is a set of circumstances or occurrences of natural, technogenic, or anthropogenic origin in a specified territory, which indicates a deviation from the norms and principles of regular functioning of current processes and phenomena and which highly negatively affects people, property, and the environment. Emergencies can be classified into the following categories: natural; technological; environmental; war; and complex [1].
Emergency classification in terms of the cause and source of emergency events is very important for the design of an emergency response and decision model. According to the nature of emergency sources, the factors responsible for its emergence and the nature of emergency development emergencies can be classified based on the following criteria [1] [8]:
1. Emergency development stages;
2. Emergency spreading/propagation rate;
3. Emergency scope;
4. Nature of the source (origin);
5. Frequency.
Emergency response model has several stages: mitigation, preparation, response, and recovery. These stages are general, but most authors agree that they are sufficient to analyze emergency development and response.
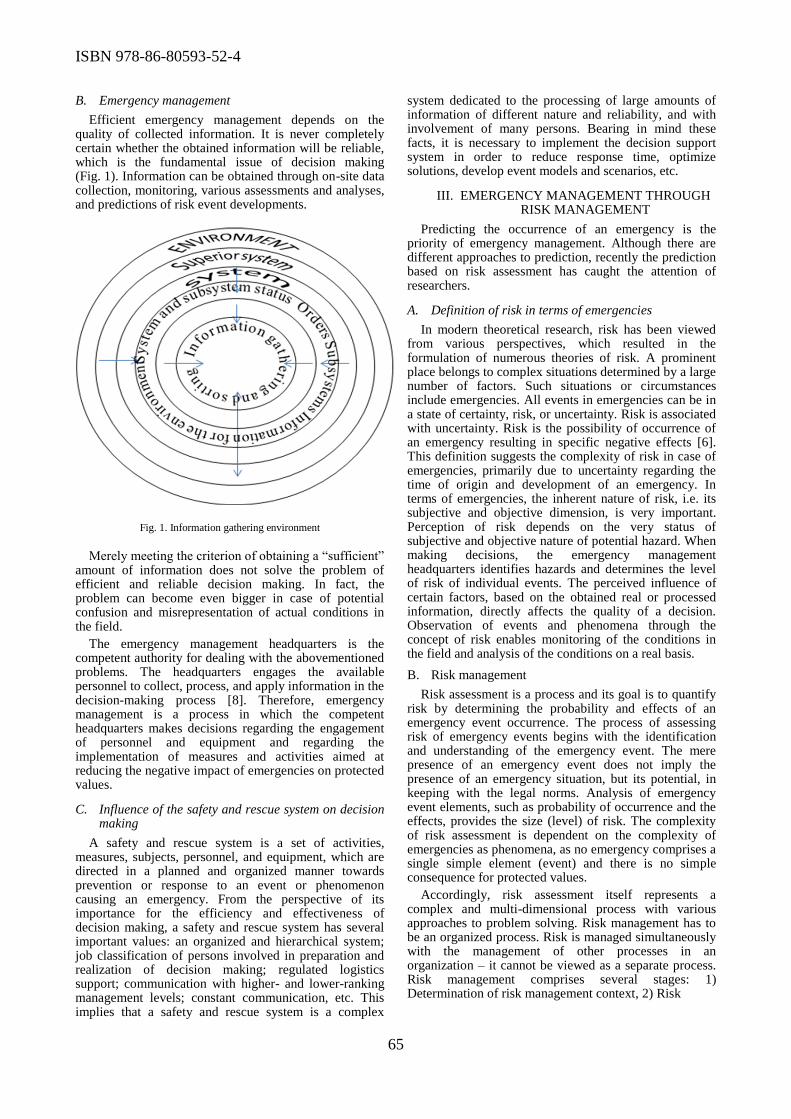
ISBN 978-86-80593-52-4
65
B. Emergency management
Efficient emergency management depends on the quality of collected information. It is never completely certain whether the obtained information will be reliable, which is the fundamental issue of decision making (Fig. 1). Information can be obtained through on-site data collection, monitoring, various assessments and analyses, and predictions of risk event developments.
Fig. 1. Information gathering environment
Merely meeting the criterion of obtaining a “sufficient”
amount of information does not solve the problem of efficient and reliable decision making. In fact, the problem can become even bigger in case of potential confusion and misrepresentation of actual conditions in the field.
The emergency management headquarters is the competent authority for dealing with the abovementioned problems. The headquarters engages the available personnel to collect, process, and apply information in the decision-making process [8]. Therefore, emergency management is a process in which the competent headquarters makes decisions regarding the engagement of personnel and equipment and regarding the implementation of measures and activities aimed at reducing the negative impact of emergencies on protected values.
C. Influence of the safety and rescue system on decision making
A safety and rescue system is a set of activities, measures, subjects, personnel, and equipment, which are directed in a planned and organized manner towards prevention or response to an event or phenomenon causing an emergency. From the perspective of its importance for the efficiency and effectiveness of decision making, a safety and rescue system has several important values: an organized and hierarchical system; job classification of persons involved in preparation and realization of decision making; regulated logistics support; communication with higher- and lower-ranking management levels; constant communication, etc. This implies that a safety and rescue system is a complex
system dedicated to the processing of large amounts of information of different nature and reliability, and with involvement of many persons. Bearing in mind these facts, it is necessary to implement the decision support system in order to reduce response time, optimize solutions, develop event models and scenarios, etc.
III. EMERGENCY MANAGEMENT THROUGH RISK MANAGEMENT
Predicting the occurrence of an emergency is the priority of emergency management. Although there are different approaches to prediction, recently the prediction based on risk assessment has caught the attention of researchers.
A. Definition of risk in terms of emergencies
In modern theoretical research, risk has been viewed from various perspectives, which resulted in the formulation of numerous theories of risk. A prominent place belongs to complex situations determined by a large number of factors. Such situations or circumstances include emergencies. All events in emergencies can be in a state of certainty, risk, or uncertainty. Risk is associated with uncertainty. Risk is the possibility of occurrence of an emergency resulting in specific negative effects [6]. This definition suggests the complexity of risk in case of emergencies, primarily due to uncertainty regarding the time of origin and development of an emergency. In terms of emergencies, the inherent nature of risk, i.e. its subjective and objective dimension, is very important. Perception of risk depends on the very status of subjective and objective nature of potential hazard. When making decisions, the emergency management headquarters identifies hazards and determines the level of risk of individual events. The perceived influence of certain factors, based on the obtained real or processed information, directly affects the quality of a decision. Observation of events and phenomena through the concept of risk enables monitoring of the conditions in the field and analysis of the conditions on a real basis.
B. Risk management
Risk assessment is a process and its goal is to quantify risk by determining the probability and effects of an emergency event occurrence. The process of assessing risk of emergency events begins with the identification and understanding of the emergency event. The mere presence of an emergency event does not imply the presence of an emergency situation, but its potential, in keeping with the legal norms. Analysis of emergency event elements, such as probability of occurrence and the effects, provides the size (level) of risk. The complexity of risk assessment is dependent on the complexity of emergencies as phenomena, as no emergency comprises a single simple element (event) and there is no simple consequence for protected values.
Accordingly, risk assessment itself represents a complex and multi-dimensional process with various approaches to problem solving. Risk management has to be an organized process. Risk is managed simultaneously with the management of other processes in an organization – it cannot be viewed as a separate process. Risk management comprises several stages: 1) Determination of risk management context, 2) Risk
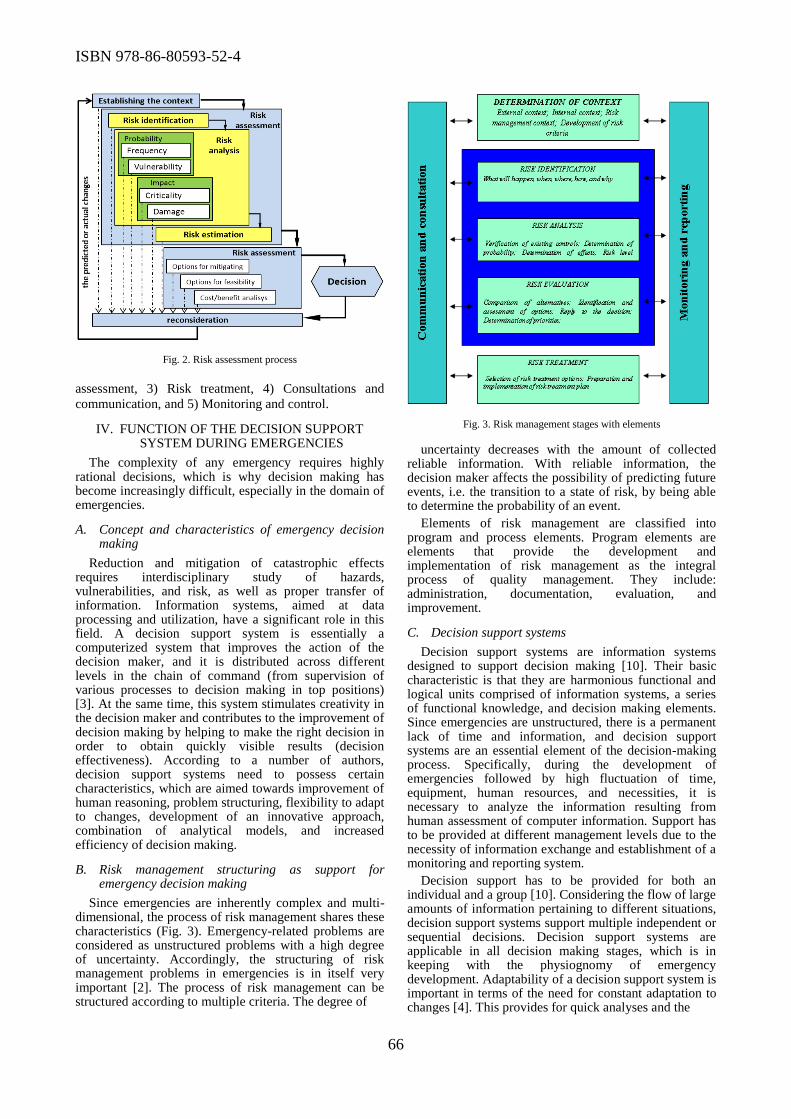
ISBN 978-86-80593-52-4
66
Fig. 2. Risk assessment process
assessment, 3) Risk treatment, 4) Consultations and
communication, and 5) Monitoring and control.
IV. FUNCTION OF THE DECISION SUPPORT SYSTEM DURING EMERGENCIES
The complexity of any emergency requires highly rational decisions, which is why decision making has become increasingly difficult, especially in the domain of emergencies.
A. Concept and characteristics of emergency decision making
Reduction and mitigation of catastrophic effects requires interdisciplinary study of hazards, vulnerabilities, and risk, as well as proper transfer of information. Information systems, aimed at data processing and utilization, have a significant role in this field. A decision support system is essentially a computerized system that improves the action of the decision maker, and it is distributed across different levels in the chain of command (from supervision of various processes to decision making in top positions) [3]. At the same time, this system stimulates creativity in the decision maker and contributes to the improvement of decision making by helping to make the right decision in order to obtain quickly visible results (decision effectiveness). According to a number of authors, decision support systems need to possess certain characteristics, which are aimed towards improvement of human reasoning, problem structuring, flexibility to adapt to changes, development of an innovative approach, combination of analytical models, and increased efficiency of decision making.
B. Risk management structuring as support for emergency decision making
Since emergencies are inherently complex and multi-dimensional, the process of risk management shares these characteristics (Fig. 3). Emergency-related problems are considered as unstructured problems with a high degree of uncertainty. Accordingly, the structuring of risk management problems in emergencies is in itself very important [2]. The process of risk management can be structured according to multiple criteria. The degree of
Fig. 3. Risk management stages with elements
uncertainty decreases with the amount of collected reliable information. With reliable information, the decision maker affects the possibility of predicting future events, i.e. the transition to a state of risk, by being able to determine the probability of an event.
Elements of risk management are classified into program and process elements. Program elements are elements that provide the development and implementation of risk management as the integral process of quality management. They include: administration, documentation, evaluation, and improvement.
C. Decision support systems
Decision support systems are information systems designed to support decision making [10]. Their basic characteristic is that they are harmonious functional and logical units comprised of information systems, a series of functional knowledge, and decision making elements. Since emergencies are unstructured, there is a permanent lack of time and information, and decision support systems are an essential element of the decision-making process. Specifically, during the development of emergencies followed by high fluctuation of time, equipment, human resources, and necessities, it is necessary to analyze the information resulting from human assessment of computer information. Support has to be provided at different management levels due to the necessity of information exchange and establishment of a monitoring and reporting system.
Decision support has to be provided for both an individual and a group [10]. Considering the flow of large amounts of information pertaining to different situations, decision support systems support multiple independent or sequential decisions. Decision support systems are applicable in all decision making stages, which is in keeping with the physiognomy of emergency development. Adaptability of a decision support system is important in terms of the need for constant adaptation to changes [4]. This provides for quick analyses and the
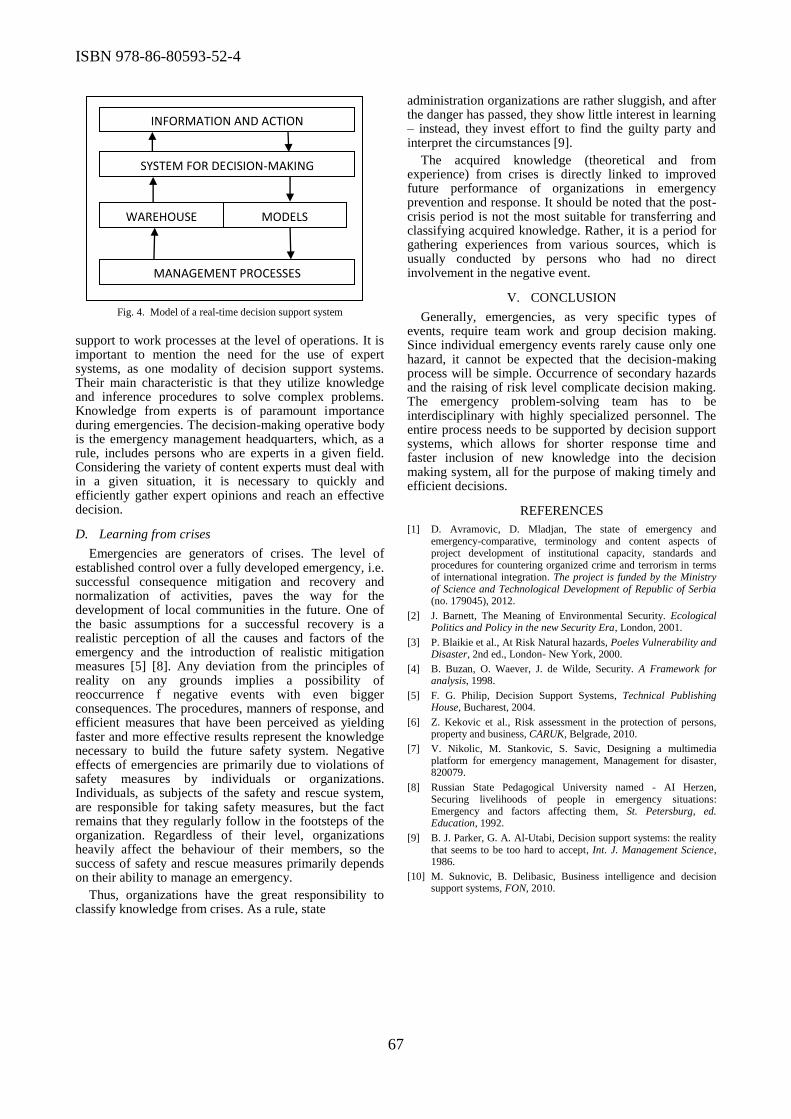
ISBN 978-86-80593-52-4
67
Fig. 4. Model of a real-time decision support system
support to work processes at the level of operations. It is important to mention the need for the use of expert systems, as one modality of decision support systems. Their main characteristic is that they utilize knowledge and inference procedures to solve complex problems. Knowledge from experts is of paramount importance during emergencies. The decision-making operative body is the emergency management headquarters, which, as a rule, includes persons who are experts in a given field. Considering the variety of content experts must deal with in a given situation, it is necessary to quickly and efficiently gather expert opinions and reach an effective decision.
D. Learning from crises
Emergencies are generators of crises. The level of established control over a fully developed emergency, i.e. successful consequence mitigation and recovery and normalization of activities, paves the way for the development of local communities in the future. One of the basic assumptions for a successful recovery is a realistic perception of all the causes and factors of the emergency and the introduction of realistic mitigation measures [5] [8]. Any deviation from the principles of reality on any grounds implies a possibility of reoccurrence f negative events with even bigger consequences. The procedures, manners of response, and efficient measures that have been perceived as yielding faster and more effective results represent the knowledge necessary to build the future safety system. Negative effects of emergencies are primarily due to violations of safety measures by individuals or organizations. Individuals, as subjects of the safety and rescue system, are responsible for taking safety measures, but the fact remains that they regularly follow in the footsteps of the organization. Regardless of their level, organizations heavily affect the behaviour of their members, so the success of safety and rescue measures primarily depends on their ability to manage an emergency.
Thus, organizations have the great responsibility to classify knowledge from crises. As a rule, state
administration organizations are rather sluggish, and after the danger has passed, they show little interest in learning – instead, they invest effort to find the guilty party and interpret the circumstances [9].
The acquired knowledge (theoretical and from experience) from crises is directly linked to improved future performance of organizations in emergency prevention and response. It should be noted that the post-crisis period is not the most suitable for transferring and classifying acquired knowledge. Rather, it is a period for gathering experiences from various sources, which is usually conducted by persons who had no direct involvement in the negative event.
V. CONCLUSION
Generally, emergencies, as very specific types of events, require team work and group decision making. Since individual emergency events rarely cause only one hazard, it cannot be expected that the decision-making process will be simple. Occurrence of secondary hazards and the raising of risk level complicate decision making. The emergency problem-solving team has to be interdisciplinary with highly specialized personnel. The entire process needs to be supported by decision support systems, which allows for shorter response time and faster inclusion of new knowledge into the decision making system, all for the purpose of making timely and efficient decisions.
REFERENCES
[1] D. Avramovic, D. Mladjan, The state of emergency and emergency-comparative, terminology and content aspects of project development of institutional capacity, standards and procedures for countering organized crime and terrorism in terms of international integration. The project is funded by the Ministry of Science and Technological Development of Republic of Serbia (no. 179045), 2012.
[2] J. Barnett, The Meaning of Environmental Security. Ecological Politics and Policy in the new Security Era, London, 2001.
[3] P. Blaikie et al., At Risk Natural hazards, Poeles Vulnerability and Disaster, 2nd ed., London- New York, 2000.
[4] B. Buzan, O. Waever, J. de Wilde, Security. A Framework for analysis, 1998.
[5] F. G. Philip, Decision Support Systems, Technical Publishing House, Bucharest, 2004.
[6] Z. Kekovic et al., Risk assessment in the protection of persons, property and business, CARUK, Belgrade, 2010.
[7] V. Nikolic, M. Stankovic, S. Savic, Designing a multimedia platform for emergency management, Management for disaster, 820079.
[8] Russian State Pedagogical University named - AI Herzen, Securing livelihoods of people in emergency situations: Emergency and factors affecting them, St. Petersburg, ed. Education, 1992.
[9] B. J. Parker, G. A. Al-Utabi, Decision support systems: the reality that seems to be too hard to accept, Int. J. Management Science, 1986.
[10] M. Suknovic, B. Delibasic, Business intelligence and decision support systems, FON, 2010.
INFORMATION AND ACTION
SYSTEM FOR DECISION-MAKING
WAREHOUSE MODELS
MANAGEMENT PROCESSES
ISBN 978-86-80593-52-4
68
Hybrid Clustering Method of Unstructured e-Gov
Textual Content
Goran Šimić1, Ejub Kajan2, Dragan Randjelović3 1University of Defense/Military Academy, Belgrade, Serbia
2State University of Novi Pazar, Novi Pazar, Serbia 3The Academy of Criminalistic and Police Studies, Belgrade, Serbia
[email protected]; [email protected]; [email protected]
Abstract—Clustering as a process of grouping unsupervised
data based on pattern recognition among them represents
one of the necessary parts of advanced searching and
information retrieval systems. It is applicable on
unstructured textual data. There are various approaches
and implementation in it. One of them is presented in this
paper.
I. INTRODUCTION
Clustering as a process of grouping unsupervised data based on pattern recognition represents one of the necessary parts of advanced searching and information retrieval systems. It is applicable on any kind of digital content – searching of pure text documents as well as image processing. Various clustering algorithms and techniques have been developed since its first practical implementation in anthropology [1]. From this time, the researchers have been trying to improve the existing and invent the new ones due to permanent growth of data stored in the information systems.
One of such efforts is described in this paper. Finding a better way for organizing the unstructured text content stored as values of table fields in the databases or as documents in the file system represents the main motive for it. It is the background founding for advanced searching and information retrieval support for contemporary e-government services offered to the citizens in order to obtain more transparency of institutions.
There are huge amount of data and documents accumulated during the last decades in e-government systems. They are structured, formatted and stored in different ways. It produces the high complexity for implementation of common services that can deliver the results of information retrieval (IR) from different sources. There are several approaches developed for dealing with such a purpose. Data warehousing, online analytical processing and other systems based on business intelligence are the representative examples. In all of them one of the preparation stages in data processing is
clustering. The IR can be significantly improved by using appropriate clustering method. Moreover, different part of content can be clustered separately. For instance, the metadata that describe the document in more digestive and precise way can be clustered instead of whole document clustering, while the short messages that consist of one or few sentences can be clustered as a whole. Actual clustering techniques and algorithms provide great flexibility and variety of implementations which enabled the research presented in the paper. The clustering foundations are described in the next sections. The problem description and proposed solution is presented in the third one. The important implementation concepts are explained in the fourth part followed by conclusions.
II. RELATED WORKS
A. Clustering Taxonomies
As mentioned, there are various clustering algorithms and techniques. Moreover, there are different taxonomies for clustering categorization [2]. There are two basic approaches - hierarchical and partitioned. The first one considers the clusters as binary tree structures called dendograms. Hierarchical clustering can be performed in two ways - agglomerative and divisive. Agglomerative clustering represents the ‘bottom up’ approach that starts with iterative joining particular items into pairs based on similarity. This process continues until the targeted aggregation level. Divisive clustering is the opposite one – the ‘top down’ repetitive process in which the items are divided based on mutual difference until the fragmentation level is not satisfied.
Partitioned clustering is based on set theory. Items are initially grouped into predefined number of partitions and the purpose of clustering is to regrouping the particular items as better as possible. Through the iterations the items can belong to different partitions. The process continues until the maximum number of iterations or until there is no more regroupings – other words when the system is stabilized.

ISBN 978-86-80593-52-4
69
There are other taxonomies of clustering. One of them depends on complexity level in text clustering [3]: word based – the simplest one that firstly segments text in to particular words and statistically analyzes them after; knowledge based that uses predefined domain ontology represented as a set of key terms and groups the text based on the presence of these terms in text; finally, the information based clustering represents the highest level one in which the text is semantically analyzed and grouping is based on contained information that are extracted during the clustering process. In accordance with information clustering approach and depending on way in which the information for this purpose are derived, some authors proposed sub-taxonomy [4] into two categories - clustering based on set theory and clustering based on similarity measurement. The first one [5] considers the clusters as sets and differentiates ‘hard’ and ‘soft’ clustering. Hard clustering means that particular item belongs to only one cluster at the moment, while soft clustering enables the item can belong to more than one cluster. Fuzzy set theory is used for this purpose [6] and belonging is expressed by value of membership function.
B. Similarity Measures
Clustering of unsupervised set of data means that there is no information about the content to be clustered. Further, it means that the clustering criteria are not predefined and therefore the clustering can be considered as a machine learning process. Next considerations are focused on clustering of the text content.
There are different taxonomies of similarity/distance measures [7]. They can be grouped in three basic categories: algebraic, probabilistic and measures based on set theory, as shown in Table I.
TABLE I THE TAXONOMIES OF SIMILARITY/DISTANCE MEASURES
Algorithm/ Mathematical
model
Set
theoretic
Algebra
ic
Probabi
listic
Jaccard
Correlation Coefficient X
Euclidian distance X
Kullback-Leibler (KL) divergence
X
Cosine similarity X
Jacquard correlation is the ratio between intersection and union of sets consist of terms that belong to compared documents. The higher ratio means the greater similarity between documents. Euclidian distance represents the oldest similarity measure based on space model. The documents are represented as dots in the N-dimensional space, and their mutual similarity is calculated by measuring the distance between them. There are other similarity measures such as Manhattan and Minkowski distances [8] derived form Euclidian. Kullback-Leibler (KL) divergence is similarity measure based on probability distributions of terms the compared documents consist of. If it divergence is lower, compared documents are more similar and vice versa. Jensen Shannon (JS) divergence is derived from KL and it is based on averaging of distributions which produces the symmetric results (independent of order in which the documents are compared). Cosine similarity [9] represents the one of the most mentioned algebraic measures that depends on vector space model. The documents are represented as vectors and if the angle between these vectors is smaller
the cosine similarity is greater. Orthogonal vectors are not similar at all (0) while parallel ones have maximum similarity (1). There is no influence of the vector intensity (document size) on similarity value. This way, the content can be effectively compared (e.g. searching criteria and content on the Web) regardless of their size.
C. Basic Principles of Text Processing used in
Clustering
The original document representation is neither appropriate for clustering nor for similarity measurement. Therefore, the documents have to be transformed in the other formats. Vector space model is representative example of such transformation. The content is fragmented, cleared from non-useful words, further the words are normalized (e.g. singular infinitive form) and finally they are statistical processed. The term frequency (TF) and inverse document frequency (IDF) are commonly used statistical values used for this purpose. The first one represents the number of occurrences of particular word in the document. The main disadvantage of TF is that it is not normalized due to strong proportional relation between this value and content size. Therefore it’s normalized value is used instead (1).
max
1 tt
TFNTF a a
TF (1)
As usual, the ratio of considered term and one with the maximum number of occurrences is used for normalization. The corrective value a (smoothing term) is introduced for controlling the influence of TFmax on the result value. IDF represents another corrective factor by which the term relevance is evaluated. This factor is calculated by (2).
logt
t
NIDF
df
(2)
It represents the logarithm value of ratio of full number of documents N and dft – number of documents that contains at least one occurrence of term t. TF and IDF (TFIDF) are commonly used together due to their complementary effects. For instance, the term has more relevance if it occurs in fewer documents and if its TF is more than of others in these documents.
III. PROBLEM AND PROPOSED SOLUTION
The published documents and official announcements accessible through the e-government portals are not the only resources used in IR responding on citizens’ demands. There are lots of useful information contained as messages and blogs in the topic forums and other kind of portals designed for social interaction. Instead of intensive engagement of subject matter experts (SME) for making response answer on each citizen request or question, more effective approach is to use answers already given as well as other existing resources for responding to the citizens. For instance, considered the help for citizens in domain of law and regulations the published documents are not the only one IR resource. The citizens’ questions are often redundant and existing SME answers represent the important resource that hold precise information that can satisfy citizens’ expectations. The problem is to prepare such content for fast response by using appropriate dynamically created answers.
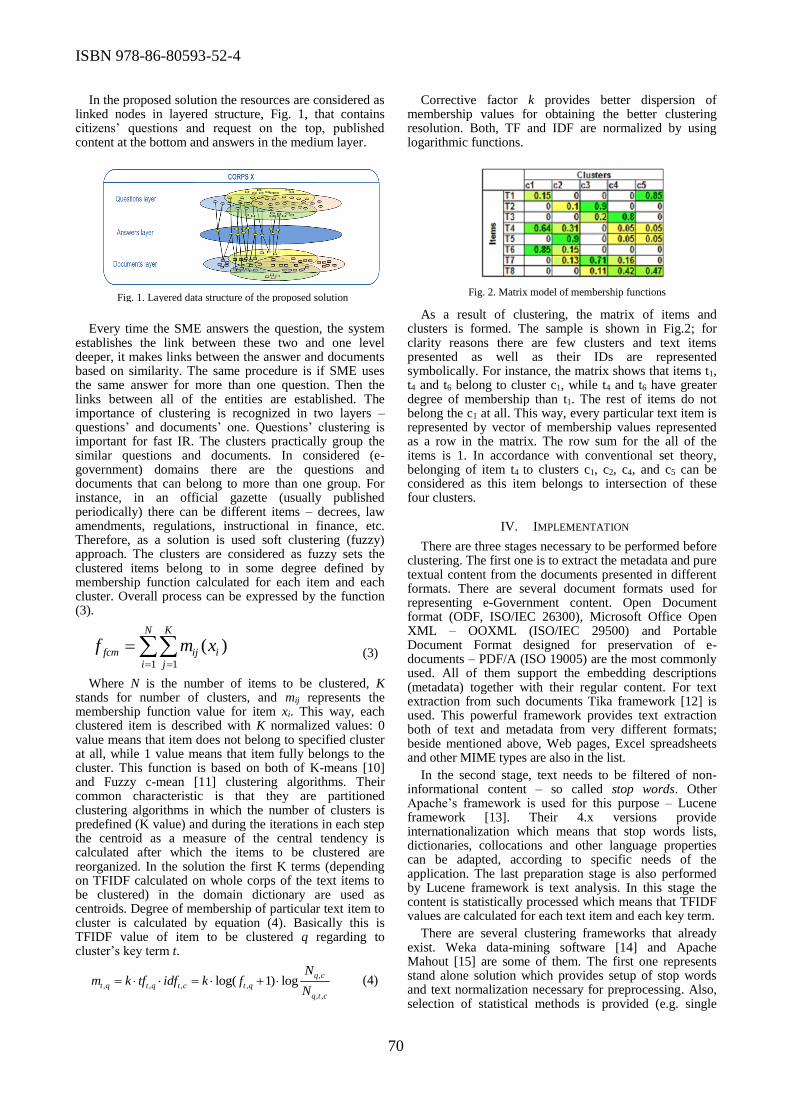
ISBN 978-86-80593-52-4
70
Fig. 1. Layered data structure of the proposed solution
Fig. 2. Matrix model of membership functions
In the proposed solution the resources are considered as linked nodes in layered structure, Fig. 1, that contains citizens’ questions and request on the top, published content at the bottom and answers in the medium layer.
Every time the SME answers the question, the system establishes the link between these two and one level deeper, it makes links between the answer and documents based on similarity. The same procedure is if SME uses the same answer for more than one question. Then the links between all of the entities are established. The importance of clustering is recognized in two layers – questions’ and documents’ one. Questions’ clustering is important for fast IR. The clusters practically group the similar questions and documents. In considered (e-government) domains there are the questions and documents that can belong to more than one group. For instance, in an official gazette (usually published periodically) there can be different items – decrees, law amendments, regulations, instructional in finance, etc. Therefore, as a solution is used soft clustering (fuzzy) approach. The clusters are considered as fuzzy sets the clustered items belong to in some degree defined by membership function calculated for each item and each cluster. Overall process can be expressed by the function (3).
1 1
( )N K
fcm ij ii j
f m x
(3)
Where N is the number of items to be clustered, K stands for number of clusters, and mij represents the membership function value for item xi. This way, each clustered item is described with K normalized values: 0 value means that item does not belong to specified cluster at all, while 1 value means that item fully belongs to the cluster. This function is based on both of K-means [10] and Fuzzy c-mean [11] clustering algorithms. Their common characteristic is that they are partitioned clustering algorithms in which the number of clusters is predefined (K value) and during the iterations in each step the centroid as a measure of the central tendency is calculated after which the items to be clustered are reorganized. In the solution the first K terms (depending on TFIDF calculated on whole corps of the text items to be clustered) in the domain dictionary are used as centroids. Degree of membership of particular text item to cluster is calculated by equation (4). Basically this is TFIDF value of item to be clustered q regarding to cluster’s key term t.
,
, , , ,
, ,
log( 1) logq c
t q t q t c t q
q t c
Nm k tf idf k f
N (4)
Corrective factor k provides better dispersion of membership values for obtaining the better clustering resolution. Both, TF and IDF are normalized by using logarithmic functions.
As a result of clustering, the matrix of items and clusters is formed. The sample is shown in Fig.2; for clarity reasons there are few clusters and text items presented as well as their IDs are represented symbolically. For instance, the matrix shows that items t1, t4 and t6 belong to cluster c1, while t4 and t6 have greater degree of membership than t1. The rest of items do not belong the c1 at all. This way, every particular text item is represented by vector of membership values represented as a row in the matrix. The row sum for the all of the items is 1. In accordance with conventional set theory, belonging of item t4 to clusters c1, c2, c4, and c5 can be considered as this item belongs to intersection of these four clusters.
IV. IMPLEMENTATION
There are three stages necessary to be performed before clustering. The first one is to extract the metadata and pure textual content from the documents presented in different formats. There are several document formats used for representing e-Government content. Open Document format (ODF, ISO/IEC 26300), Microsoft Office Open XML – OOXML (ISO/IEC 29500) and Portable Document Format designed for preservation of e-documents – PDF/A (ISO 19005) are the most commonly used. All of them support the embedding descriptions (metadata) together with their regular content. For text extraction from such documents Tika framework [12] is used. This powerful framework provides text extraction both of text and metadata from very different formats; beside mentioned above, Web pages, Excel spreadsheets and other MIME types are also in the list.
In the second stage, text needs to be filtered of non-informational content – so called stop words. Other Apache’s framework is used for this purpose – Lucene framework [13]. Their 4.x versions provide internationalization which means that stop words lists, dictionaries, collocations and other language properties can be adapted, according to specific needs of the application. The last preparation stage is also performed by Lucene framework is text analysis. In this stage the content is statistically processed which means that TFIDF values are calculated for each text item and each key term.
There are several clustering frameworks that already exist. Weka data-mining software [14] and Apache Mahout [15] are some of them. The first one represents stand alone solution which provides setup of stop words and text normalization necessary for preprocessing. Also, selection of statistical methods is provided (e.g. single

ISBN 978-86-80593-52-4
71
presence, or frequency of term). For clustering purposes in Weka is used K-means algorithm and both of naïve Bayesian classifier and Bayesian network. On the other side Mahout is a framework - set of class libraries designed for providing clustering functionalities in the applications. It implements both of K-means and Fuzzy K-means algorithms and TFIDF represent the basic classification measurement.
The proposed solution is similar to Apache Mahout according to Fuzzy concepts used in both approaches. The main difference is in a way of calculating degree of membership. In Apache Mahout – Euclidian distance is included in calculation due to centroid concept used. The similarity is expressed by ‘distance’ measured between text items and centroids. As explained in (3) and (4) TFIDF measure figurate in proposed solution and using of centroids is not necessary because K most important key terms are used as similarity criteria for calculating both of TFIDF and degree of membership. Other words, in our approach the set of K terms represents the predefined knowledge about the content to be clustered. This way, the complexity of algorithm is reduced due to finite number of iterations necessary for calculating the membership values. As a result of clustering the matrix as example one (Fig.2) is fulfilled. After that, every new citizen’s request is processed in the same way: its vector of membership values are calculated firstly and after, the system responds with the similar ones from the matrix.
V. CONCLUSION
In presented solution, using of centroides and measuring of distances is avoided due to growing complexity of clustering processes related to number of items to be clustered. This way, the complexity of algorithm is reduced due to finite number of iterations necessary for calculating the membership values. Number of clusters is predefined by number of key terms used. The key terms set is always predefined and it is further unchangeable (during a clustering and IR processes). There are two ways for providing this set – by using already existing domain dictionary or by calculating the frequencies and filtering the stop words from the corps of text items to be clustered. The first way is the better and the second one represents just alternative solution without possibility to provide the dictionary.
The system should be re-set if its performances falling down or the results of IR becoming unacceptable. During the system development the prepared sets of text items had been used and the obtained results had been compared with expected ones. The minimizing of average square error was used as correction mechanism together with varying of corrective factor k (4). This way the system behavior was fine tuned. For making corrections during exploitation, using of citizens’ feedback about their satisfaction on responding results should be appropriate self-correction mechanism.
In the presented solution the human language complexity is overwhelmed by using already existing statistical measures, modified functions and various techniques of content preparation in developed clustering algorithm. In the future work the content should be analyzed more semantically. It includes analyzing of collocations of words, finding synonyms and implementation of self correcting mechanism through introducing more modifiers in calculation. Also, introducing of rule based reasoning on input and intermediate data can make system more adaptive.
ACKNOWLEDGMENT
The presented research is performed through the project MTR 44007 III supported by Ministry of Education, Science and Technology Development Republic of Serbia.
REFERENCES
[1] E. Driver, L. Kroeber, Quantitative expression of cultural relationships. University of California Publications in American Archeology and Ethnology, 31, 1932, pp.211-256
[2] A. Jain, M. Murty, P. Flynn, Data Clustering: A Review. ACM Computing Surveys, Vol. 31, No 3, 1999, pp. 264-323
[3] Y. Zheng, X. Cheng, R. Huang, Y. Man, A Comparative Study on Text Clustering Methods in X. Li, O.R. Zaiane, and Z. Li (Eds.): ADMA 2006, LNAI 4093, 2006, pp.644 – 651), Springer-Verlag
[4] P. Cimiano, A. Hotho, S. Staab, Comparing Conceptual, Divisive and Agglomerative Clustering for Learning Taxonomies from Text, Publications at Bielfeld Unversity, Retrieved October 14, 2013, from http://pub.uni-bielefeld.de/luur
[5] J. Conrad, K. Al-Kofahi, Y. Zhao, G. Karypis, Effective Document Clustering for Large Heterogeneous Law Firm Collections, In The Tenth International Conference on Artificial Intelligence and Law, Bologna, Italy, ACM, 2005, pp.177 – 187
[6] J. Bezdek, Pattern Recognition with Fuzzy Objective Function Algoritms, New York, USA, Plenum Press, 1981
[7] D. Kuropka, D. Modelle zur Repräsentation natürlichsprachlicher Dokumente - Information-Filtering und -Retrieval mit relationalen Datenbanken. In series: Advances in Information Systems and Management Science, 10th issue. Logos Verlag, Berlin, 2004
[8] Q. Guo, Minkowski Measure of Asimetric and Minkowski Distance for Convex Bodies, Uppsala dissertations in Mathematics 35, 2004, pp.66
[9] G. Salton, A. Wang, Generation and Search of Clustered Files. ACM Transactions on Database Systems, Vol. 3, No 4, 1978, pp. 321-346
[10] J. Hartigan, M. Wong, A K-Means Clustering Algorithm, Journal of Royal Statistical Society, Vol.28/1, 1979, pp.100
[11] K. Zou, Z. Wang, M. Hu, An new initialization method for fuzzy c-means algorithm, Journal of Fuzzy Optimization and Decision Making, Vol. 7/4, 2008, pp.409 – 416
[12] C. Mattmann, J. Zitting, Tika in Action, book, Greenwich, USA, Manning Publications, 2012
[13] E. Hatcher, O. Gospodnetic, M. McCandless, Lucene in Action, Greenwich, USA, Manning Publications, 2009
[14] M. Hall, E. Frank, G. Holmes, B. Pfahringer, P. Reutemann, I. H. Witten, The WEKA Data Mining Software: An Update, SIGKDD Explorations, Volume 11, Issue 1, 2009
[15] S. Owen, R. Anil, T. Dunning, E. Friedman, Mahout in Action, Greenwich, USA, Manning Publications, 2012
ISBN 978-86-80593-52-4
72
Application of fuzzy logic for quantification of
uncertainty in risk management
Dragan Pamučar1
1Military Academy, University of Defense, Belgrade
Abstract— The paper presents the possibility of applying fuzzy logic and fuzzy logic systems in risk assessment. As the risk assessment is followed by a larger or lesser degree of undetermined criteria which are necessary for making the relevant decisions to exploit the uncertainty and indeterminacy the fuzzy logic is being used. The paper presents a fuzzy logic modeling system that supports the process of decision-making in risk management. In the final part of the paper the model has been tested and the results of the fuzzy model have been compared with the results given by the present methodology applied in risk management.
I. INTRODUCTION
In the modern environment, risk management is increasingly recognized as an indispensable activity in business systems. Central concepts of risk management are: risk and risk assessment. Although these terms have become concerns of a large number of experts, the definition of risk and the way it’s being assessed still has a different point of view. Many different definitions of risk can be found in literature, as well as the different approaches to risk assessment.
Risk can be considered:
The possibility of loss, probability of loss, uncertainty, deviation of the real results from those that are expected or the probability of any outcome which isn’t expected [1],
The uncertainty of loss [2],
A combination of features (probability) of some event and its consequences [2]
Every possibility in a specific system, which can cause, with a certain probability, an unexpected change in the quality of or change or loss of the system [3],
deviation from the expected [4] etc..
The definition may suggest that the risk is associated with probability, uncertainty, opportunity or what is not certain. Keković etc. 3 also explain the concept of risk through the state of the environment in which the observed event is implemented:
the state of the certainty and specificity when there is a possibility to choose concrete alternatives, which implies known result;
the state in which the risk when choosing the specific alternatives can have any outcome from
a set of possible outcomes and where the probability of each outcomes is known;
the state of uncertainty which ,when selecting the specific alternatives, can have any outcome from
the set of possible outcomes, and with probability outcomes that are unknown.
Through the certainties and uncertainties, the risk can be presented mathematically, Table I:
TABLE I OVERVIEW OF THE DIFFERENCE BETWEEN THE RISK,
CERTAINTY AND UNCERTAINTY 5
Future event Probability
of events (p) Explanation
Certain p = 1 event will certainly happen in
the future
Risky 0 ≤ p ≤ 1 the probability of the event in the case of risk is in the interval
from 0-1
Impossible p = 0 event will definitely not happen
Uncertain p = unknown It is unknown whether the event will happen
Risk can be presented through the level of uncertainty. One approach is presented in Table II.
TABLE II
OVERVIEW OF RISK THROUGH LEVEL OF UNCERTAINTY 6
The level of uncertainty Characteristics
There’s no uncertainty result can be predicted very accurately
Level 1 (objective
uncertainty)
outcomes are identified, and
probability is known
Level 2 (subjective uncertainty)
outcomes have been identified, but the probability is unknown
Level 3 outcomes are not fully identified, and
the probability is unknown
All this indicates that the uncertainty, subjectivity and indeterminacy are indispensable risk characteristics. Very convenient mechanism for the exploitation of the indeterminacy and unclearness in decision-making is fuzzy logic. Fuzzy logic can be included in knowledge based systems, that is soft-computing. The most important characteristic of these systems is the exploitation of tolerance that exists in imprecision, vagueness and partial truth in order to make quality and

ISBN 978-86-80593-52-4
73
reliable decisions. The theory of fuzzy sets provides a scientifically based approach that uses the experience and intuition. A large contribution to the theory of fuzzy sets and fuzzy logic consists in the possibility of modeling, ie. Translation into the algorithm of the completely unstructured set of heuristics propositions expressed in words. Fuzzy logic provides a mathematical formalism for achieving this target.
II. FUZZY SETS
Fuzzy sets are introduced with the main goal of ensuring mathematically formalized ways of representation and modelling of indefiniteness in linguistics. Thus defined sets can be understood as generalization of the classical set theory. The main idea of fuzzy sets is very simple.
In classical (non-fuzzy) sets the defined element (a member to the universal set) either is included or is not included in the defined set. A fuzzy set, in this sense, is generalization of a classical set, because the membership of an element to a set can be characterized by a number from interval [0,1]. In other words, membership function of a fuzzy set maps each element of the universal set into this interval of real numbers. One of the biggest differences between classical and fuzzy sets is that classical sets always have a unique membership function, while, in the case of fuzzy sets, there are an infinite number of different membership functions by which it can be described.
This fact enables fuzzy systems to adapt in an appropriate way to situations in which they are applied. In his definition of fuzzy sets, Lotfi Zadeh [7] stressed this fact pointing out that each area can be fuzzified, thus allowing for conventional classical approach to the set theory applied until then to be generalized. In this way neural networks, fuzzy generic algorithms, fuzzy shape recognition, fuzzy stability theory and fuzzy mathematic programming can be created out of neural networks, genetic algorithm, stability theory, shape recognition and mathematical programming. The advantage of this fuzzification is manifested in a higher level of generalization and expression, with a higher possibility of modelling of realistic problems by use of specific methodology for analysis of imprecision tolerance.
III. FUZZY LOGIC SYSTEM TYPE-1
Fuzzy logic is most commonly used for modeling of complex systems in which it is difficult to determine interdependences that exist between certain variables with the use of other methods. The models based on fuzzy logic consist of “If - Then” rules. “If – Then” rules are interconnected by the expression “Or/Else” and make up the algorithm of approximate reasoning. Approximate reasoning is a form of fuzzy logic containing a set of reasoning rules whose premises are fuzzy propositions. It offers much more natural framework for human reasoning than traditional two-value logic [16]. An example of the algorithm of approximate reasoning is the following set of rules:
If Value X High
Then Value Y Low
Or/Else
If Value X Medium
Then Value Y Medium
Or/Else
If Value X Low
Then Value Y High
As we can see from these simple rules, the value of output variable Y is conditioned by the value of input variable X. Input variable X is called fuzzy variable. The value of fuzzy variable is obtained by measuring, observing and frequently by subjective assessment based on experience and intuition.
If part is condition, antecedent part or premise. Here, fuzzy proposition is a premise.
Then part is conclusion or consequent part. In this part, fuzzy proposition is a conclusion. It can be in a complex form and then the system has several output variables.
A number of rules in which the solution to a certain problem is described in words is rules’ base or expert rules. For easier understanding, the rules are written in suitable order, although it is not important. The rules are connected with a conjunction Or/Else, which is frequently omitted. Apart from the conjunction Or/Else the rules can also be connected with a conjunction And.
In reality, input values are most commonly given in numbers, where the output value is also obtained in numerical form. On the other hand, in fuzzy system, the given system is described verbally (qualitatively) through production rules. That is why the numerical values are converted (fuzzificated) first by the use of fuzzy logic operations. Then, the mechanism of approximate reasoning processes them in the fuzzy system through the phases of aggregation, activation and accumulation [18, 19, 20, 21]. Numerical output value is obtained by defuzzification process. In Fig. 1, the process of approximate reasoning is shown.
A. Aggregation
Aggregation is a phase in which certain values of membership function join the measured numerical value; it is the process determining the degree of confidence (level of truthfulness) of a certain numerical value within a given fuzzy set. Aggregation is equivalent to fuzzification in case there is only one premise/antecedent part [17]. In Fig. 1, this phase is shown as a vertical line cutting antecedent fuzzy sets. Each set shows the level of truthfulness for each rule (shadowed part of a triangle).
IF OR THEN
IF OR THEn
X
1x
2x
2x
1x
X
-100 10030.8
Fig. 1. Graphical display of the process of approximate conclusion

ISBN 978-86-80593-52-4
74
Ife n parallel rules are interpreted by means of a conjunction “else/or”, Fig. 1, they can be shown in fuzzy relation:
1
n
k
k
R R
(1)
Membership function of this relation is shown as:
, , max ,
max(min , )
R R Rk k
R Rk
x y x y x y
x y
(2)
Each rule gives as a result a fuzzy set, with a membership function cut in the higher zone. By all the rules is given a set of fuzzy sets with differently cut membership functions, whose deterministic values all have a share in the inferential result. A single value is needed in order to have an useful result.
B. Activation
Activation is a conclusion deduction or the conclusion drawn in Then part of the rule. In Fig. 2, a shadowed part of the triangle shows activated part of a fuzzy set in conclusion. In Fig. 2, two methods of activation in the method of direct conclusion - Mamdani’s methods are graphically shown.
As can be seen in Fig. 2, MIN method performs cutting, while PROD (product) method performs scaling – proportional reduction. It is clearly visible that only two rules are activated, as thickened line is used to mark only activated parts of triangular fuzzy sets. In this kind of conclusion, only true premises are considered [22]. It is important to emphasize that in this method fuzzy sets are in both antecedent and consequent parts.
It is important because another method, Takagi-Sugeno-Kang method, is also frequently used. It is not much different from other methods of direct conclusion, but there is a significant difference in the structure of fuzzy rules. The difference is that, instead of the fuzzy set, there is a linear function between antecedent and consequent parts in conclusion [23].
a) MIN – cutting
b) PROD – scaling
a) MAKS – union
b) SUM – sum
Fig. 2. Activation phase
The most frequently used case is when linear coefficients equal zero and then the type of membership function known as singleton is obtained.
C. Acumulation
In the process of accumulation all activated conclusions are accumulated. Accumulation is most often achieved through two methods: MAKS and SUM. All
activated conclusions are accumulated in different ways, and a graphic interpretation of two methods MAKS and SUM is shown. Fig. 2a presents the MAKS method, according to which the final form appears as a union of the two fuzzy sets from Fig. 2 [18]. Fig. 2b presents a graphic interpretation of accumulation as per the SUM method. The contours of the final form are the algebraic sum of the contours in Fig. 2b. If the sum is bigger than one, then the value of one becomes the norm.
D. Defuzzification
The resulting fuzzy set has to be converted to a real number. This operation is called defuzzification. In Fig. 3, in the bottom right corner, we can see a thick line representing number 30.8 on the scale from -100 to 100. The resulting fuzzy set is defuzzified into real number 30.8. Defuzzification is made in accordance with the Centre of Gravity method – COG, which will be explained hereafter, by which we got the point with coordinate 30.8 on the abscise axis, which is taken to be the final result of defuzzification (Fig. 3).
In general, fuzzy systems as well as methods of defuzzification can be divided into two big groups: Mamdani and Sugeno and Takagi and Sugeno.
30.8 - COG Fig. 3. Phase of defuzzification
It should be noted that mathematical defuzzification is mapping of vectors (values of a linguistic variable) onto a real number. Thus, information is reduced, since mapping is not unique given that different values of the linguistic variable can be mapped onto the same defuzzified real number. Therefore, the method of defuzzification should be carefully chosen taking into consideration that there is no method that is optimal for all cases.
IV. FUZZY LOGIC SYSTEM TYPE-2
There are two different approaches for fuzzy logic system (FLS) design: type-1 FLS (T1FLS) and type-2 FLS (T2FLS). The latter is proposed as an extension of the former. While designing a T1FLS, expertise and knowledge are needed to decide both the membership functions (MF) and fuzzy rules. The linguistic terms that are used in antecedents and consequents have different meanings for different experts. Specialists often provide different conclusions for the same rule base. The T1FLS, who’s MF are type1 fuzzy sets (Fig. 4a), is unable to directly handle rule uncertainties. To deal with this problem, the concept of type-2 fuzzy sets was introduced by Zadeh as an extension of T1FLSs with the intention of being able to model the uncertainties that invariably exist in the rule base of the system [24].
Compared with T1FLS, T2FLS can better handle the vagueness inherent in linguistic words. The uncertainties are modelled by the use of a fuzzy MF (Fig. 4b). Therefore, T2FLS are more suitable under circumstances where it is difficult to determine the exact MF for a fuzzy
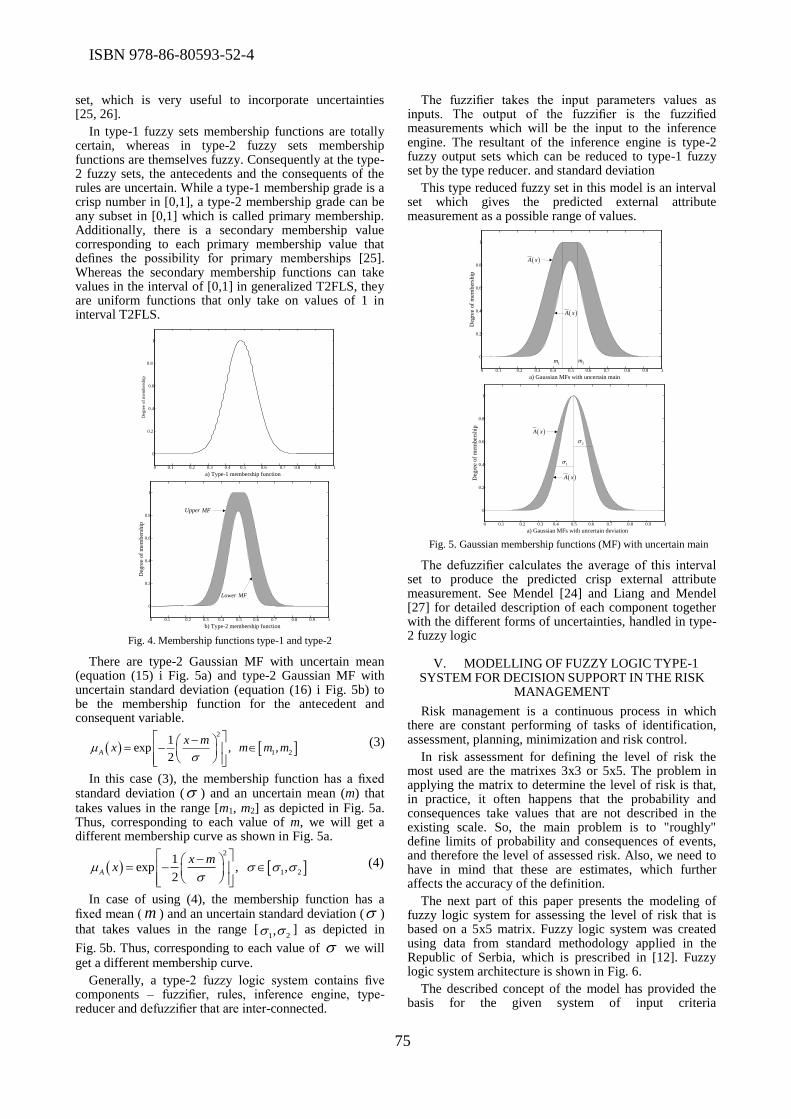
ISBN 978-86-80593-52-4
75
set, which is very useful to incorporate uncertainties [25, 26].
In type-1 fuzzy sets membership functions are totally certain, whereas in type-2 fuzzy sets membership functions are themselves fuzzy. Consequently at the type-2 fuzzy sets, the antecedents and the consequents of the rules are uncertain. While a type-1 membership grade is a crisp number in [0,1], a type-2 membership grade can be any subset in [0,1] which is called primary membership. Additionally, there is a secondary membership value corresponding to each primary membership value that defines the possibility for primary memberships [25]. Whereas the secondary membership functions can take values in the interval of [0,1] in generalized T2FLS, they are uniform functions that only take on values of 1 in interval T2FLS.
0 0.1 0.2 0.3 0.4 0.5 0.6 0.7 0.8 0.9 1
0
0.2
0.4
0.6
0.8
1
Deg
ree
of
mem
ber
ship
b) Type-2 membership function
Upper MF
Lower MF
0 0.1 0.2 0.3 0.4 0.5 0.6 0.7 0.8 0.9 1
0
0.2
0.4
0.6
0.8
1
Deg
ree
of
mem
ber
ship
a) Type-1 membership function
Fig. 4. Membership functions type-1 and type-2
There are type-2 Gaussian MF with uncertain mean (equation (15) i Fig. 5a) and type-2 Gaussian MF with uncertain standard deviation (equation (16) i Fig. 5b) to be the membership function for the antecedent and
consequent variable.
2
1 2
1exp , ,
2A
x mx m m m
(3)
In this case (3), the membership function has a fixed standard deviation ( ) and an uncertain mean (m) that takes values in the range [m1, m2] as depicted in Fig. 5a. Thus, corresponding to each value of m, we will get a different membership curve as shown in Fig. 5a.
2
1 2
1exp , ,
2A
x mx
(4)
In case of using (4), the membership function has a fixed mean ( m ) and an uncertain standard deviation ( )
that takes values in the range [1 2, ] as depicted in
Fig. 5b. Thus, corresponding to each value of we will get a different membership curve.
Generally, a type-2 fuzzy logic system contains five components – fuzzifier, rules, inference engine, type-reducer and defuzzifier that are inter-connected.
The fuzzifier takes the input parameters values as inputs. The output of the fuzzifier is the fuzzified measurements which will be the input to the inference engine. The resultant of the inference engine is type-2 fuzzy output sets which can be reduced to type-1 fuzzy set by the type reducer. and standard deviation
This type reduced fuzzy set in this model is an interval set which gives the predicted external attribute measurement as a possible range of values.
0 0.1 0.2 0.3 0.4 0.5 0.6 0.7 0.8 0.9 1
0
0.2
0.4
0.6
0.8
1
Deg
ree
of
mem
ber
ship
a) Gaussian MFs with uncertain main
A x
A x
1m 2m
0 0.1 0.2 0.3 0.4 0.5 0.6 0.7 0.8 0.9 1
0
0.2
0.4
0.6
0.8
1
Deg
ree
of
mem
ber
ship
a) Gaussian MFs with uncertain deviation
2
1
A x
A x
Fig. 5. Gaussian membership functions (MF) with uncertain main
The defuzzifier calculates the average of this interval set to produce the predicted crisp external attribute measurement. See Mendel [24] and Liang and Mendel [27] for detailed description of each component together with the different forms of uncertainties, handled in type-2 fuzzy logic
V. MODELLING OF FUZZY LOGIC TYPE-1
SYSTEM FOR DECISION SUPPORT IN THE RISK
MANAGEMENT
Risk management is a continuous process in which there are constant performing of tasks of identification, assessment, planning, minimization and risk control.
In risk assessment for defining the level of risk the most used are the matrixes 3x3 or 5x5. The problem in applying the matrix to determine the level of risk is that, in practice, it often happens that the probability and consequences take values that are not described in the existing scale. So, the main problem is to "roughly" define limits of probability and consequences of events, and therefore the level of assessed risk. Also, we need to have in mind that these are estimates, which further affects the accuracy of the definition.
The next part of this paper presents the modeling of fuzzy logic system for assessing the level of risk that is based on a 5x5 matrix. Fuzzy logic system was created using data from standard methodology applied in the Republic of Serbia, which is prescribed in [12]. Fuzzy logic system architecture is shown in Fig. 6.
The described concept of the model has provided the basis for the given system of input criteria
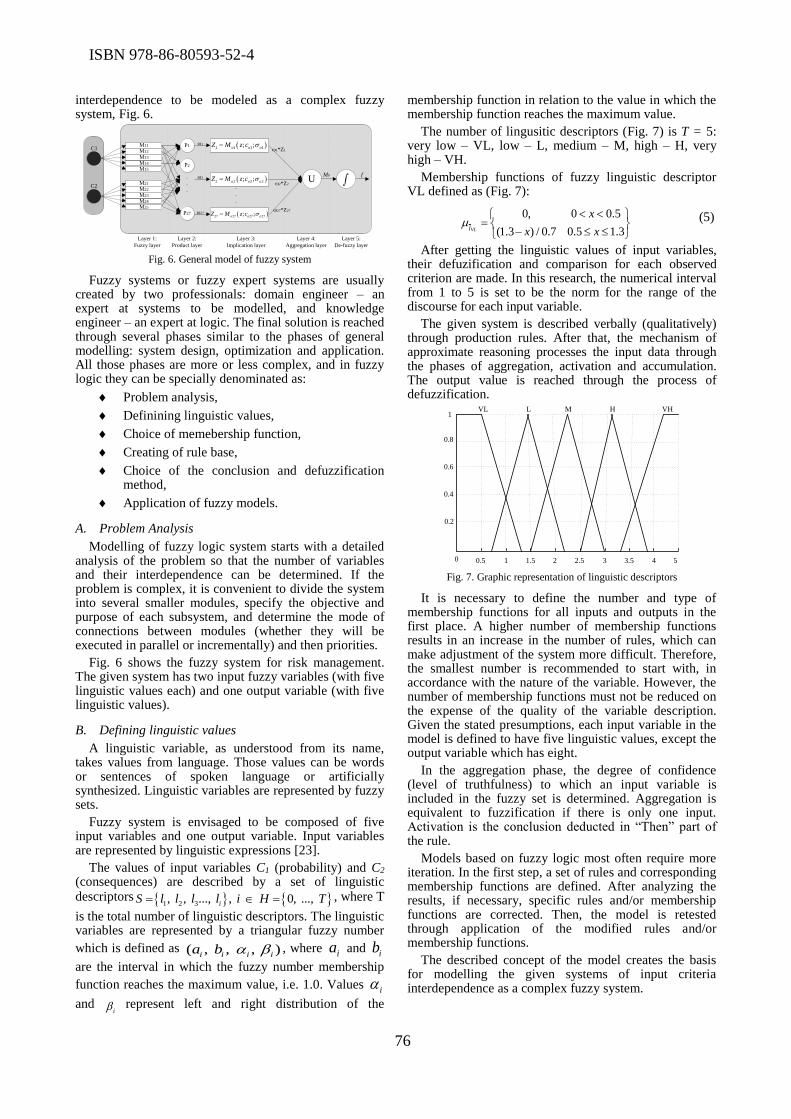
ISBN 978-86-80593-52-4
76
interdependence to be modeled as a complex fuzzy system, Fig. 6.
Layer 1:
Fuzzy layer
Layer 2:
Product layer
Layer 3:
Implication layer
Layer 4:
Aggregation layer
Layer 5:
De-fuzzy layer
M21
M22
M24
P1
P2
P27
1 1 1 1; ;o o oZ M z c
2 2 2 2; ;o o oZ M z c
27 27 27 27; ;o o oZ M z c
C1
C2U
ω1
ω2
ω27
ω1*Z1
ω2*Z2
ω27*Z27
M0 f.
.
..
.
.M23
M25
M11
M12
M14
M13
M15
Fig. 6. General model of fuzzy system
Fuzzy systems or fuzzy expert systems are usually created by two professionals: domain engineer – an expert at systems to be modelled, and knowledge engineer – an expert at logic. The final solution is reached through several phases similar to the phases of general modelling: system design, optimization and application. All those phases are more or less complex, and in fuzzy logic they can be specially denominated as:
Problem analysis,
Definining linguistic values,
Choice of memebership function,
Creating of rule base,
Choice of the conclusion and defuzzification method,
Application of fuzzy models.
A. Problem Analysis
Modelling of fuzzy logic system starts with a detailed analysis of the problem so that the number of variables and their interdependence can be determined. If the problem is complex, it is convenient to divide the system into several smaller modules, specify the objective and purpose of each subsystem, and determine the mode of connections between modules (whether they will be executed in parallel or incrementally) and then priorities.
Fig. 6 shows the fuzzy system for risk management. The given system has two input fuzzy variables (with five linguistic values each) and one output variable (with five linguistic values).
B. Defining linguistic values
A linguistic variable, as understood from its name, takes values from language. Those values can be words or sentences of spoken language or artificially synthesized. Linguistic variables are represented by fuzzy sets.
Fuzzy system is envisaged to be composed of five input variables and one output variable. Input variables are represented by linguistic expressions [23].
The values of input variables C1 (probability) and C2
(consequences)
are described by a set of linguistic descriptors 1 2 3, , ..., , 0, ..., iS l l l l i H T , where T
is the total number of linguistic descriptors. The linguistic variables are represented by a triangular fuzzy number
which is defined as ( , , , )i i i ia b , where ia and
ib
are the interval in which the fuzzy number membership
function reaches the maximum value, i.e. 1.0. Values i
and i represent left and right distribution of the
membership function in relation to the value in which the membership function reaches the maximum value.
The number of lingusitic descriptors (Fig. 7) is T = 5: very low – VL, low – L, medium – M, high – H, very high – VH.
Membership functions of fuzzy linguistic descriptor VL defined as (Fig. 7):
0, 0 0.5
(1.3 ) / 0.7 0.5 1.3VLl
x
x x
(5)
After getting the linguistic values of input variables, their defuzification and comparison for each observed criterion are made. In this research, the numerical interval from 1 to 5 is set to be the norm for the range of the discourse for each input variable.
The given system is described verbally (qualitatively) through production rules. After that, the mechanism of approximate reasoning processes the input data through the phases of aggregation, activation and accumulation. The output value is reached through the process of defuzzification.
1
0.8
0.6
0.4
0.2
0 1 2 3 4
VL L M H VH
0.5 1.5 2.5 3.5 5 Fig. 7. Graphic representation of linguistic descriptors
It is necessary to define the number and type of membership functions for all inputs and outputs in the first place. A higher number of membership functions results in an increase in the number of rules, which can make adjustment of the system more difficult. Therefore, the smallest number is recommended to start with, in accordance with the nature of the variable. However, the number of membership functions must not be reduced on the expense of the quality of the variable description. Given the stated presumptions, each input variable in the model is defined to have five linguistic values, except the output variable which has eight.
In the aggregation phase, the degree of confidence (level of truthfulness) to which an input variable is included in the fuzzy set is determined. Aggregation is equivalent to fuzzification if there is only one input. Activation is the conclusion deducted in “Then” part of the rule.
Models based on fuzzy logic most often require more iteration. In the first step, a set of rules and corresponding membership functions are defined. After analyzing the results, if necessary, specific rules and/or membership functions are corrected. Then, the model is retested through application of the modified rules and/or membership functions.
The described concept of the model creates the basis for modelling the given systems of input criteria interdependence as a complex fuzzy system.
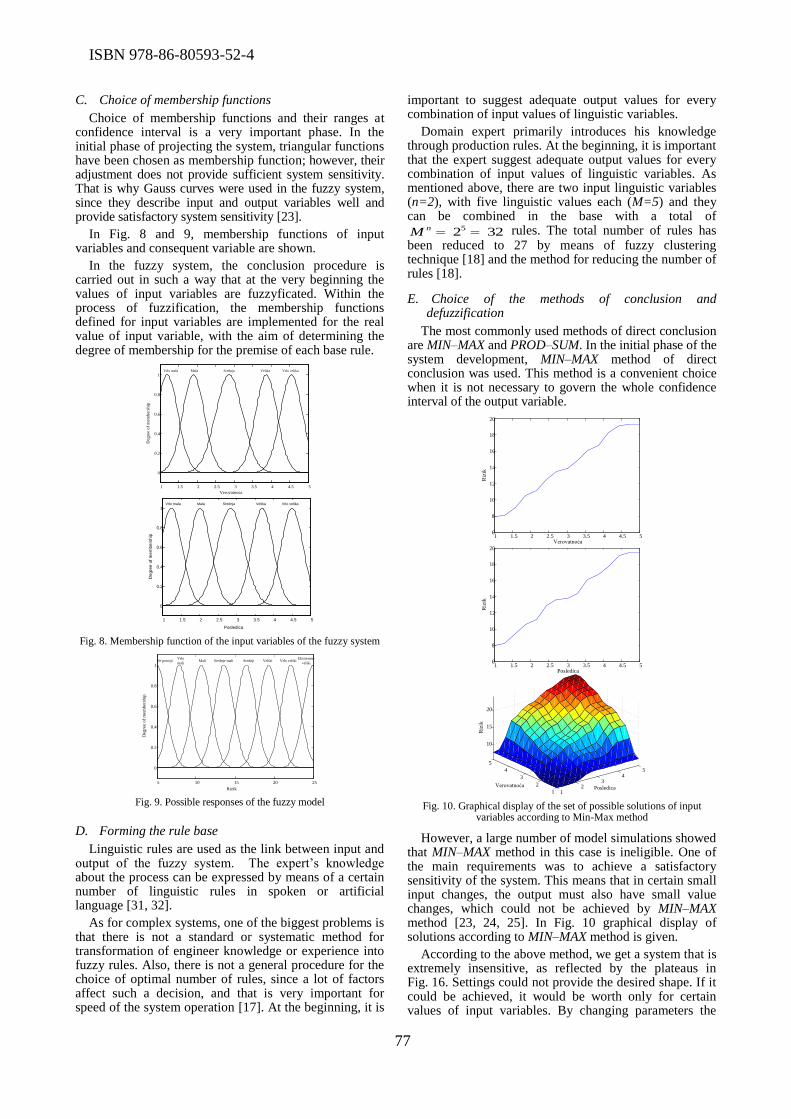
ISBN 978-86-80593-52-4
77
C. Choice of membership functions
Choice of membership functions and their ranges at confidence interval is a very important phase. In the initial phase of projecting the system, triangular functions have been chosen as membership function; however, their adjustment does not provide sufficient system sensitivity. That is why Gauss curves were used in the fuzzy system, since they describe input and output variables well and provide satisfactory system sensitivity [23].
In Fig. 8 and 9, membership functions of input variables and consequent variable are shown.
In the fuzzy system, the conclusion procedure is carried out in such a way that at the very beginning the values of input variables are fuzzyficated. Within the process of fuzzification, the membership functions defined for input variables are implemented for the real value of input variable, with the aim of determining the degree of membership for the premise of each base rule.
1 1.5 2 2.5 3 3.5 4 4.5 5
0
0.2
0.4
0.6
0.8
1
Verovatnoća
Deg
ree
of
mem
ber
ship
Vrlo mala Mala Srednja Velika Vrlo velika
1 1.5 2 2.5 3 3.5 4 4.5 5
0
0.2
0.4
0.6
0.8
1
Posledica
De
gre
e o
f m
em
be
rsh
ip
Vrlo mala Mala Srednja Velika Vrlo velika
Fig. 8. Membership function of the input variables of the fuzzy system
5 10 15 20 25
0
0.2
0.4
0.6
0.8
1
Rizik
Deg
ree
of
mem
ber
ship
Ne postojiVrlo
maliMali Srednje mali Srednji Veliki Vrlo veliki
Ekstremno
veliki
Fig. 9. Possible responses of the fuzzy model
D. Forming the rule base
Linguistic rules are used as the link between input and output of the fuzzy system. The expert’s knowledge about the process can be expressed by means of a certain number of linguistic rules in spoken or artificial language [31, 32].
As for complex systems, one of the biggest problems is that there is not a standard or systematic method for transformation of engineer knowledge or experience into fuzzy rules. Also, there is not a general procedure for the choice of optimal number of rules, since a lot of factors affect such a decision, and that is very important for speed of the system operation [17]. At the beginning, it is
important to suggest adequate output values for every combination of input values of linguistic variables.
Domain expert primarily introduces his knowledge through production rules. At the beginning, it is important that the expert suggest adequate output values for every combination of input values of linguistic variables. As mentioned above, there are two input linguistic variables (n=2), with five linguistic values each (M=5) and they can be combined in the base with a total of
5 2 32nM rules. The total number of rules has been reduced to 27 by means of fuzzy clustering technique [18] and the method for reducing the number of rules [18].
E. Choice of the methods of conclusion and defuzzification
The most commonly used methods of direct conclusion are MIN–MAX and PROD–SUM. In the initial phase of the system development, MIN–MAX method of direct conclusion was used. This method is a convenient choice when it is not necessary to govern the whole confidence interval of the output variable.
12
34
5
1
2
3
4
5
10
15
20
PosledicaVerovatnoća
Riz
ik
1 1.5 2 2.5 3 3.5 4 4.5 56
8
10
12
14
16
18
20
Verovatnoća
Riz
ik
1 1.5 2 2.5 3 3.5 4 4.5 56
8
10
12
14
16
18
20
Posledica
Riz
ik
Fig. 10. Graphical display of the set of possible solutions of input
variables according to Min-Max method
However, a large number of model simulations showed that MIN–MAX method in this case is ineligible. One of the main requirements was to achieve a satisfactory sensitivity of the system. This means that in certain small input changes, the output must also have small value changes, which could not be achieved by MIN–MAX method [23, 24, 25]. In Fig. 10 graphical display of solutions according to MIN–MAX method is given.
According to the above method, we get a system that is extremely insensitive, as reflected by the plateaus in Fig. 16. Settings could not provide the desired shape. If it could be achieved, it would be worth only for certain values of input variables. By changing parameters the
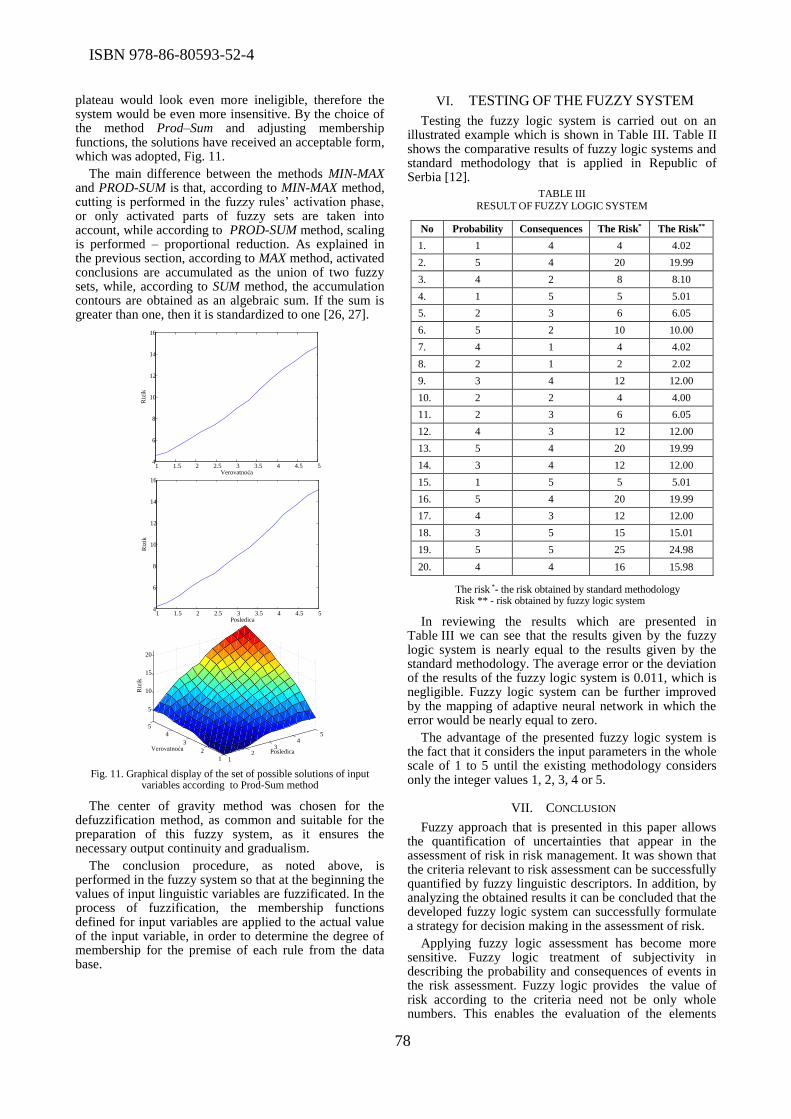
ISBN 978-86-80593-52-4
78
plateau would look even more ineligible, therefore the system would be even more insensitive. By the choice of the method Prod–Sum and adjusting membership functions, the solutions have received an acceptable form, which was adopted, Fig. 11.
The main difference between the methods MIN-MAX and PROD-SUM is that, according to MIN-MAX method, cutting is performed in the fuzzy rules’ activation phase, or only activated parts of fuzzy sets are taken into account, while according to PROD-SUM method, scaling is performed – proportional reduction. As explained in the previous section, according to MAX method, activated conclusions are accumulated as the union of two fuzzy sets, while, according to SUM method, the accumulation contours are obtained as an algebraic sum. If the sum is greater than one, then it is standardized to one [26, 27].
1 1.5 2 2.5 3 3.5 4 4.5 54
6
8
10
12
14
16
Verovatnoća
Riz
ik
1 1.5 2 2.5 3 3.5 4 4.5 54
6
8
10
12
14
16
Posledica
Riz
ik
12
34
5
1
2
3
4
5
5
10
15
20
PosledicaVerovatnoća
Riz
ik
Fig. 11. Graphical display of the set of possible solutions of input
variables according to Prod-Sum method
The center of gravity method was chosen for the defuzzification method, as common and suitable for the preparation of this fuzzy system, as it ensures the necessary output continuity and gradualism.
The conclusion procedure, as noted above, is performed in the fuzzy system so that at the beginning the values of input linguistic variables are fuzzificated. In the process of fuzzification, the membership functions defined for input variables are applied to the actual value of the input variable, in order to determine the degree of membership for the premise of each rule from the data base.
VI. TESTING OF THE FUZZY SYSTEM
Testing the fuzzy logic system is carried out on an illustrated example which is shown in Table III. Table II shows the comparative results of fuzzy logic systems and standard methodology that is applied in Republic of Serbia [12].
TABLE III
RESULT OF FUZZY LOGIC SYSTEM
No Probability Consequences The Risk* The Risk**
1. 1 4 4 4.02
2. 5 4 20 19.99
3. 4 2 8 8.10
4. 1 5 5 5.01
5. 2 3 6 6.05
6. 5 2 10 10.00
7. 4 1 4 4.02
8. 2 1 2 2.02
9. 3 4 12 12.00
10. 2 2 4 4.00
11. 2 3 6 6.05
12. 4 3 12 12.00
13. 5 4 20 19.99
14. 3 4 12 12.00
15. 1 5 5 5.01
16. 5 4 20 19.99
17. 4 3 12 12.00
18. 3 5 15 15.01
19. 5 5 25 24.98
20. 4 4 16 15.98
The risk *- the risk obtained by standard methodology Risk ** - risk obtained by fuzzy logic system
In reviewing the results which are presented in Table III we can see that the results given by the fuzzy logic system is nearly equal to the results given by the standard methodology. The average error or the deviation of the results of the fuzzy logic system is 0.011, which is negligible. Fuzzy logic system can be further improved by the mapping of adaptive neural network in which the error would be nearly equal to zero.
The advantage of the presented fuzzy logic system is the fact that it considers the input parameters in the whole scale of 1 to 5 until the existing methodology considers only the integer values 1, 2, 3, 4 or 5.
VII. CONCLUSION
Fuzzy approach that is presented in this paper allows the quantification of uncertainties that appear in the assessment of risk in risk management. It was shown that the criteria relevant to risk assessment can be successfully quantified by fuzzy linguistic descriptors. In addition, by analyzing the obtained results it can be concluded that the developed fuzzy logic system can successfully formulate a strategy for decision making in the assessment of risk.
Applying fuzzy logic assessment has become more sensitive. Fuzzy logic treatment of subjectivity in describing the probability and consequences of events in the risk assessment. Fuzzy logic provides the value of risk according to the criteria need not be only whole numbers. This enables the evaluation of the elements

ISBN 978-86-80593-52-4
79
whose values are not reliably known. This is particularly important at the stage of data collection in the field, because a problem often occurs related to defining the probability and consequences of events, since it depends on several parameters.
The presented model contributes to saving time necessary for making a decision. The performance of the developed fuzzy system can successfully improve the mapping of fuzzy systems in adaptive neural network, which has the capability of learning and imitating making expert decisions. The development of this adaptive neural network will be the subject of some future research in this field.
REFERENCES
[1] E. Vaughan, T. Vaughan "Basics of Insurance and Risk Management" , MATE, Zagreb, 2011, u: Č. Avakumović, S. Milinković, and N. Vujačić, “Risk management”, Proceedings of the International Scientific Conference Management, Krusevac, p. 387-390, 2010.
[2] Č. Avakumović, S. Milinković, N. Vujačić, “Risk management”, Proceedings of the International Scientific Conference Management, Kruševac, pp. 387-390, 2010.
[3] Z. Keković, S. Savić, N. Komazec, M. Milošević, D. Jovanović, “Risk assessment in the protection of persons, property and business, "Center for Risk Analysis and Crisis Management, Belgrade 2011
[4] S. Karović, N. Komazec, "Risk management is a a precondition in an integrated management system in the organization," Military Technical Bulletin, Vol 3, p. 146-161, 2010
[5] R. Vujović, Risk Management and Insurance, Univerzitet Singidunum, Beograd, 2009
[6] C.A. Williams, L.S. Michel, S. Young, P.S. Young, "Risk Management and Insurence", Irwin/McGraw-Hill, International editions, 1998.
[7] L. A. Zadeh "Fuzzy sets". Information and control, issue 8, pp 338-353, 1965
[8] L. A. Zadeh (1973), "Outline of a new approach to the analysis of complex systems and decision processes", IEEE Trans. on systems, Man and Cybernetics, Vol. 1, pp 28-44, 1973.
[9] L. A. Zadeh, "A Rationale for Fuzzy Control", Journal of Dynamic Systems, Measurement and Control. Vol. 3, pp 3-4, 1974.
[10] E.H. Mamdani, S. Assilian, "An Experiment in Linguistic Synthesis With a Fuzzy Logic Controller", International Journal of Man-Machine Studies. Vol. 1, pp 1-13, 1975.
[11] L.P. Holmblad, J.J. Ostergaard, "Control of cement kiln by fuzzy logic". Fuzzy Information and Decision Processes, Vol 2, pp 389-399, 1982.
[12] B. Kosko, "Fuzzy Systems as Universal Approximators". IEEE Transactions on computers. Vol. 11, pp 1329–1333, 1994.
[13] J. Jantzen, "Design of Fuzzy Controllers". Tech report No98-864. Technical University of Denmark, Department of Automation, 1998.
[14] D. Teodorović, S. Kikuchi, Fuzzy sets and applications in traffic and transport. Serbia: Faculty of Transport and Traffic Engineering, University of Belgrade, 1994.
[15] D. Božanić, D. Pamučar, "Evaluating locations for river crossing using fuzzy logic". Military Technical Courier. No 1. pp. 129-145, 2010.
[16] D. Pamučar, "Design of the organisational structure using fuzzy logic approach". Master paper. Serbia: Faculty of Transport and Traffic Engineering, University of Belgrade, 2009a.
[17] D. Pamučar, "Using ANFIS model during decision making process in Army of Serbia". Belgrade: 12th International Conference Depentability and quality management ICDQM-2009. pp 946 - 953, 2009b.
[18] D. Pamučar, "Using fuzzy logic and neural networks during decision making proces in transport". Military Technical Courier. No 3. pp 125-143, 2010.
[19] A. Kandel, G. Chew, M. Schneider, "Designing Fuzzy Inference Procedures". Lisbon: The second World Congres on Expert Systems, 1994.
[20] P. Subašić, "Fuzzy logic and neural networks". Belgrade: Technical Books, 1997.
[21] Pamučar, D., Božanić, D., Đorović, B., Milić, A. "Modelling of the fuzzy logical system for offering support in making decisions within the engineering units of the Serbian army". International journal of the physical sciences. No 3. pp 592 - 609, 2011.
[22] J.M. Mendel, "Uncertain Rule-Based Fuzzy Logic System: Introduction and New Directions", Upper Saddle River, Prentice Hall, 2001.
[23] O. Castillo, P. Melin, "A review on the design and optimization of interval type-2 fuzzycontrollers", Appl. Soft Comput. Vol. 12(4) pp. 1267–1278, 2012.
[24] R. Sepúlveda, O. Montiel, O. Castillo, P. Melin, "Embedding a high speed interval type-2 fuzzy controller for a real plant into an FPGA", Appl. Soft Comput. Vol. 12 (3), pp. 988–998, 2012.
[25] Q. Liang, J.M. Mendel, "Interval type-2 fuzzy logic systems: Theory and design". IEEE Transactions Fuzzy Systems, 8, pp. 535–550, 2002.
[26] D. Pamučar, V. Lukovac, S. Pejčić Tarle "Application of Adaptive Neuro Fuzzy Inference System in the process of transportation support", Asia-Pacific Journal of Operational Research, 30(2), pp 1250053/1- 1250053/32, 2013.
[27] B. Đorović, D. Pamučar "Fuzzy mathematical model for design and evaluation of the logistic organisational structure", Economic computation and economic cybernetics studies and research, 36 (3), pp. 139-156, 2012.
[28] G. Ćirović, D. Pamučar "Decision support model for prioritizing railway level crossings for safety improvements: Application of the adaptive neuro-fuzzy system", Expert Systems with Applications, 40(6), pp. 2208-2223, 2013.
[29] A. Jovanović, D. Pamučar, S. Pejčić-Tarle "Green vehicle routing in urban zones – A neuro-fuzzy approach", Expert systems with applications, 41, pp. 3189–3203, 2014.
[30] G. Ćirović, D. Pamučar, D. Božanić "Green logistic vehicle routing problem: Routing light delivery vehicles in urban areas using a neuro-fuzzy model", Expert Systems with Applications, 41(9), pp 4245-4258, 2014.
[31] D. Pamučar, D. Božanić., B. Đorović, A. Milić "Modelling of the fuzzy logical system for offering support in making decisions within the engineering units of the Serbian army", International Journal of the Physical Sciences, 6(3), pp. 592 - 609, 2011.
[32] D. Pamučar, G. Ćirović, D. Sekulović, A. Ilić "A new fuzzy mathematical model for multi criteria decision making: An application of fuzzy mathematical model in an SWOT analysis", Scientific Research and Essays, 6(25), pp. 5374- 5386, 201

ISBN 978-86-80593-52-4
80
Flood Hazard Assessment by Application of
Fuzzy Logic
Dragan Pamučar1, Darko Božanić1, Nenad Komazec1 1Military Academy, University of Defence in Belgrade, Serbia
[email protected]; [email protected]; [email protected]
Abstract—Flood risk assessment in a specific territory is
followed by ambiguity and uncertainty. The paper presents
the possibility of application of fuzzy logic system in the
estimation of how serious the flood risk may be. The fuzzy
logic system is developed on the basis of the current
methodology used for solving these issues.
I. INTRODUCTION
Risk management is an integral function of the security management [1]. An integral part of the risk management is the risk assessment. Growing number of experts have been dealing with this issue, trying to devise the solution that would allow more precise prediction of future events. Many terms are related to the issue of risk management, such as: risk, threat, danger, hazard, vulnerability, risk exposure etc. In this paper it is emphasized the term hazard, and its place in the risk assessment.
Hazard is a threat which has the possibility to exploit system weakness, i.e. an event that may cause adverse effects to the system in the the form of its destruction, damage, alteration, disclosure [1]. Hazard analysis occupies an important place in the methodology of risk assessment. For example, references [2], [3], [4] as the first step in risk assessment, stress the identification of potential hazards or threats that could lead to operational risks.
The main objective of the hazard assessment is to establish the existence of a hazard in particular territory, to define its context and its way of impact, and to determine the degree of impact, in terms of endangering protected values, in relation to other hazards [5]. Upon completion, these hazard analysis are ranked according to calculated values from largest to smallest. Based on the obtained ranking of potential hazards, a decision is made about the urgency of taking measures to reduce potential hazards. Results of the preliminary analysis of the potential hazards present incoming results of the risk analysis [6].
Flood is defined as the appearance of unusually large amount of water at a certain place due to natural forces reaction (high precipitation), or other causes, such as loosening or dam removal - artificial or natural, created by pollution (damming) of rivers, landslides, war damages etc. [6].
Floods are a real threat to the sustainable development of nations [7]. The scale ranks flood consequences differently, from very small to large, in both human lives and material damage [8]. Floods with millions of victims were recorded in China on Yellow River in 1887 when it killed two million people, in 1931, nearly four million and in 1938 nearly one million people [9]. In some floods fatalities were measured in tens of thousands, such as floods in China in 1949 which claimed the lives of 57,000 people or in 1954, where 40,000 people lost their lives [10], or in Venezuela in 1999 where there were over 30,000 victims [11]. It is believed that only in the United States approximately nine million people and 390 million dollars in assets are under constant risk of flooding [12]. Available analyzes indicate that the number of floods in the world is increasing, which is more and more associated with climate change planet Earth is exposed to [13], [14], which further suggests that "it is very likely that mankind will in the future be exposed to greater risk of these effects "[15].
Serbia, as located in South East Europe region , is significantly exposed to flooding. Floods make up about 55% of all natural disasters in Serbia [15]. In the late 20th and early 21st century, the incidence of catastrophic floods has increased, and the floods in 1980, 1981, 1988, 1999, 2002, 2005 and 2006 [16], the same as latest events from 2014 corroborate the fact. During the floods of 2005 historical maximum water level is measured on the River Tamis, in 2006, on the River Danube [16], and in 2014 on the Sava River. Consequences of these floods for Serbia and its citizens are enormous. For instance, the damage caused by the flood in 2006, was estimated at 35.7 million EUR [16], while the final estimation of damage from the flood in 2014 has not yet been determined. Today in Serbia about 12.4% of its territory constitutes flood risk area [16]. Even largest cities, such as Belgrade, Sabac, Smederevo, Cuprija, Leskovac et al. are endangered [17]. Flooding in Obrenovac in 2014 indicated the seriousness of these claims.
Foregoing indicates that the problem of flood hazard in the modern world is crucial. Also, a preliminary hazard assessment of such events plays significant role in risk assessment and taking preventive measures. Flood hazard assessment in the Republic of Serbia is defined by
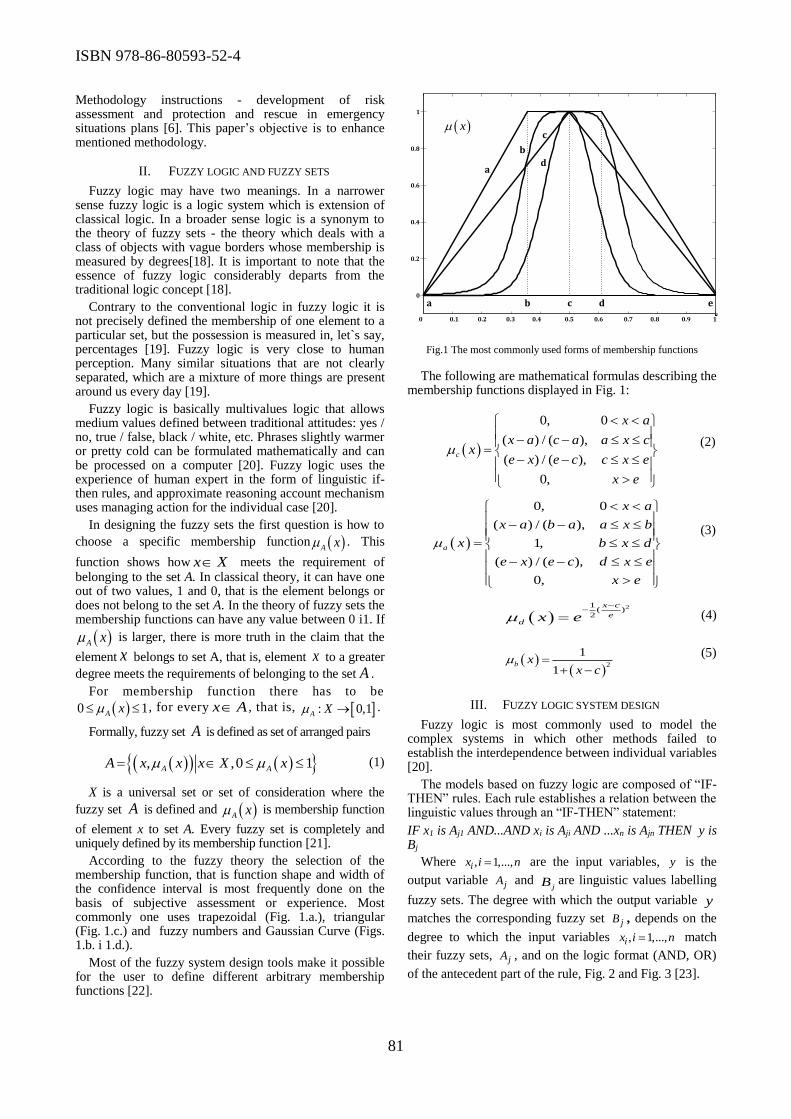
ISBN 978-86-80593-52-4
81
Methodology instructions - development of risk assessment and protection and rescue in emergency situations plans [6]. This paper’s objective is to enhance mentioned methodology.
II. FUZZY LOGIC AND FUZZY SETS
Fuzzy logic may have two meanings. In a narrower sense fuzzy logic is a logic system which is extension of classical logic. In a broader sense logic is a synonym to the theory of fuzzy sets - the theory which deals with a class of objects with vague borders whose membership is measured by degrees[18]. It is important to note that the essence of fuzzy logic considerably departs from the traditional logic concept [18].
Contrary to the conventional logic in fuzzy logic it is not precisely defined the membership of one element to a particular set, but the possession is measured in, let`s say, percentages [19]. Fuzzy logic is very close to human perception. Many similar situations that are not clearly separated, which are a mixture of more things are present around us every day [19].
Fuzzy logic is basically multivalues logic that allows medium values defined between traditional attitudes: yes / no, true / false, black / white, etc. Phrases slightly warmer or pretty cold can be formulated mathematically and can be processed on a computer [20]. Fuzzy logic uses the experience of human expert in the form of linguistic if-then rules, and approximate reasoning account mechanism uses managing action for the individual case [20].
In designing the fuzzy sets the first question is how to
choose a specific membership function A x . This
function shows how x X meets the requirement of belonging to the set A. In classical theory, it can have one out of two values, 1 and 0, that is the element belongs or does not belong to the set A. In the theory of fuzzy sets the membership functions can have any value between 0 i1. If
A x is larger, there is more truth in the claim that the
element x belongs to set A, that is, element x to a greater
degree meets the requirements of belonging to the set A .
For membership function there has to be
0 1A x , for every x A , that is, : 0,1A X .
Formally, fuzzy set A is defined as set of arranged pairs
, ,0 1 A AA x x x X x (1)
X is a universal set or set of consideration where the
fuzzy set A is defined and A x is membership function
of element x to set A. Every fuzzy set is completely and uniquely defined by its membership function [21].
According to the fuzzy theory the selection of the membership function, that is function shape and width of the confidence interval is most frequently done on the basis of subjective assessment or experience. Most commonly one uses trapezoidal (Fig. 1.a.), triangular (Fig. 1.c.) and fuzzy numbers and Gaussian Curve (Figs. 1.b. i 1.d.).
Most of the fuzzy system design tools make it possible for the user to define different arbitrary membership functions [22].
0 0.1 0.2 0.3 0.4 0.5 0.6 0.7 0.8 0.9 1
0
0.2
0.4
0.6
0.8
1
x
a b c d e
a
b
d
c
Fig.1 The most commonly used forms of membership functions
The following are mathematical formulas describing the membership functions displayed in Fig. 1:
0, 0
( ) / ( ),
( ) / ( ),
0,
c
x a
x a c a a x cx
e x e c c x e
x e
(2)
0, 0
( ) / ( ),
1,
( ) / ( ),
0,
a
x a
x a b a a x b
x b x d
e x e c d x e
x e
(3)
21
( )2
d
x c
ex e (4)
2
1
1
b x
x c
(5)
III. FUZZY LOGIC SYSTEM DESIGN
Fuzzy logic is most commonly used to model the complex systems in which other methods failed to establish the interdependence between individual variables [20].
The models based on fuzzy logic are composed of “IF-THEN” rules. Each rule establishes a relation between the linguistic values through an “IF-THEN” statement:
IF x1 is Aj1 AND...AND xi is Aji AND ...xn is Ajn THEN y is Bj
Where , 1,...,ix i n are the input variables, y is the
output variable jA and jB are linguistic values labelling
fuzzy sets. The degree with which the output variable y
matches the corresponding fuzzy set jB , depends on the
degree to which the input variables , 1,...,ix i n match
their fuzzy sets, jA , and on the logic format (AND, OR)
of the antecedent part of the rule, Fig. 2 and Fig. 3 [23].
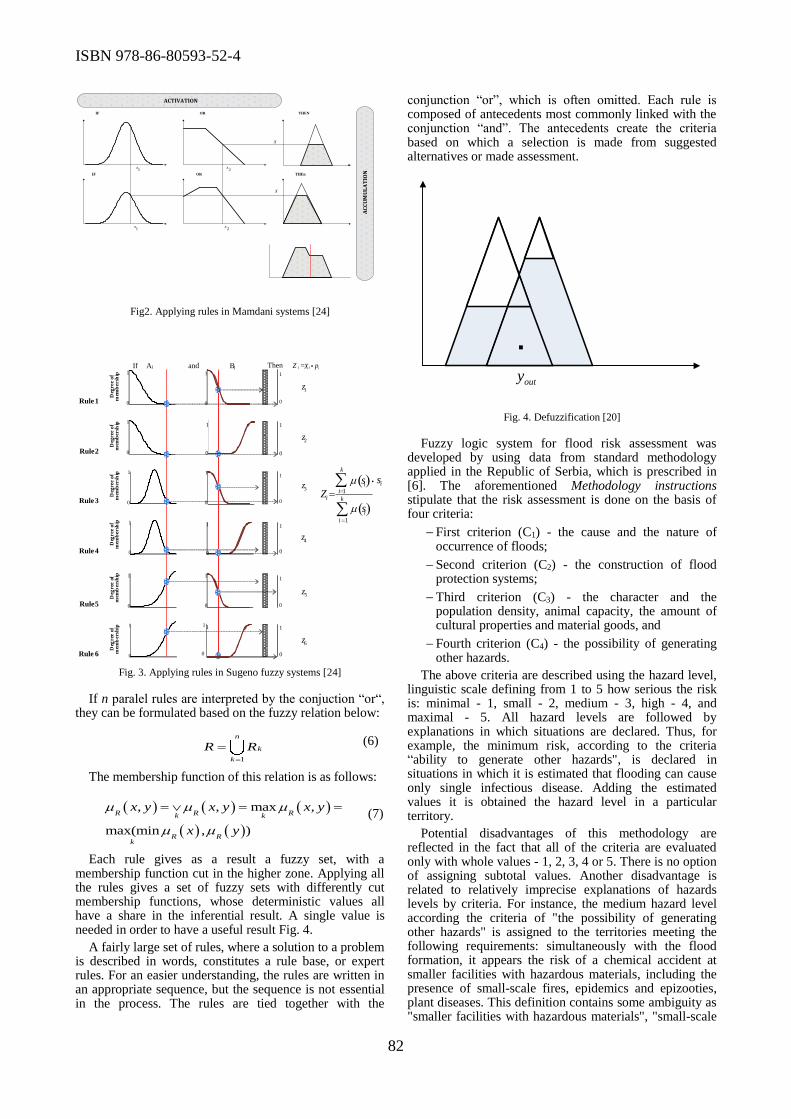
ISBN 978-86-80593-52-4
82
ACTIVATION
IF OR THEN
IF OR THEn
X
1x
2x
2x
1x
AC
CU
MU
LA
TIO
N
X
Fig2. Applying rules in Mamdani systems [24]
Rule1 0
1
Deg
ree
of
m
emb
ersh
ip
0
1
0
1
Deg
ree
of
m
emb
ersh
ip
0
1
0
1
0
1
0
1
1
0
1
Deg
ree
of
mem
bersh
ip
0
1
Deg
ree
of
mem
bersh
ip
0
1
Deg
ree
of
m
emb
ers
hip
0
1
Deg
ree
of
m
emb
ers
hip
0
1
0
1
0
1
0
1
0
1
0
1
Rule2
Rule3
Rule4
Rule5
Rule 6
Ai and BjIf Then
2z
4z
5z
6z
1z
3z
p
1
0
1
1
k
ii k
i
Z
is
is i s
Z iii X
Fig. 3. Applying rules in Sugeno fuzzy systems [24]
If n paralel rules are interpreted by the conjuction “or“, they can be formulated based on the fuzzy relation below:
1
n
k
k
R R (6)
The membership function of this relation is as follows:
, , max ,
max(min , )
R R Rk k
R Rk
x y x y x y
x y
(7)
Each rule gives as a result a fuzzy set, with a membership function cut in the higher zone. Applying all the rules gives a set of fuzzy sets with differently cut membership functions, whose deterministic values all have a share in the inferential result. A single value is needed in order to have a useful result Fig. 4.
A fairly large set of rules, where a solution to a problem is described in words, constitutes a rule base, or expert rules. For an easier understanding, the rules are written in an appropriate sequence, but the sequence is not essential in the process. The rules are tied together with the
conjunction “or”, which is often omitted. Each rule is composed of antecedents most commonly linked with the conjunction “and”. The antecedents create the criteria based on which a selection is made from suggested alternatives or made assessment.
outy
Fig. 4. Defuzzification [20]
Fuzzy logic system for flood risk assessment was developed by using data from standard methodology applied in the Republic of Serbia, which is prescribed in [6]. The aforementioned Methodology instructions stipulate that the risk assessment is done on the basis of four criteria:
First criterion (C1) - the cause and the nature of occurrence of floods;
Second criterion (C2) - the construction of flood protection systems;
Third criterion (C3) - the character and the population density, animal capacity, the amount of cultural properties and material goods, and
Fourth criterion (C4) - the possibility of generating other hazards.
The above criteria are described using the hazard level, linguistic scale defining from 1 to 5 how serious the risk is: minimal - 1, small - 2, medium - 3, high - 4, and maximal - 5. All hazard levels are followed by explanations in which situations are declared. Thus, for example, the minimum risk, according to the criteria “ability to generate other hazards", is declared in situations in which it is estimated that flooding can cause only single infectious disease. Adding the estimated values it is obtained the hazard level in a particular territory.
Potential disadvantages of this methodology are reflected in the fact that all of the criteria are evaluated only with whole values - 1, 2, 3, 4 or 5. There is no option of assigning subtotal values. Another disadvantage is related to relatively imprecise explanations of hazards levels by criteria. For instance, the medium hazard level according the criteria of "the possibility of generating other hazards" is assigned to the territories meeting the following requirements: simultaneously with the flood formation, it appears the risk of a chemical accident at smaller facilities with hazardous materials, including the presence of small-scale fires, epidemics and epizooties, plant diseases. This definition contains some ambiguity as "smaller facilities with hazardous materials", "small-scale
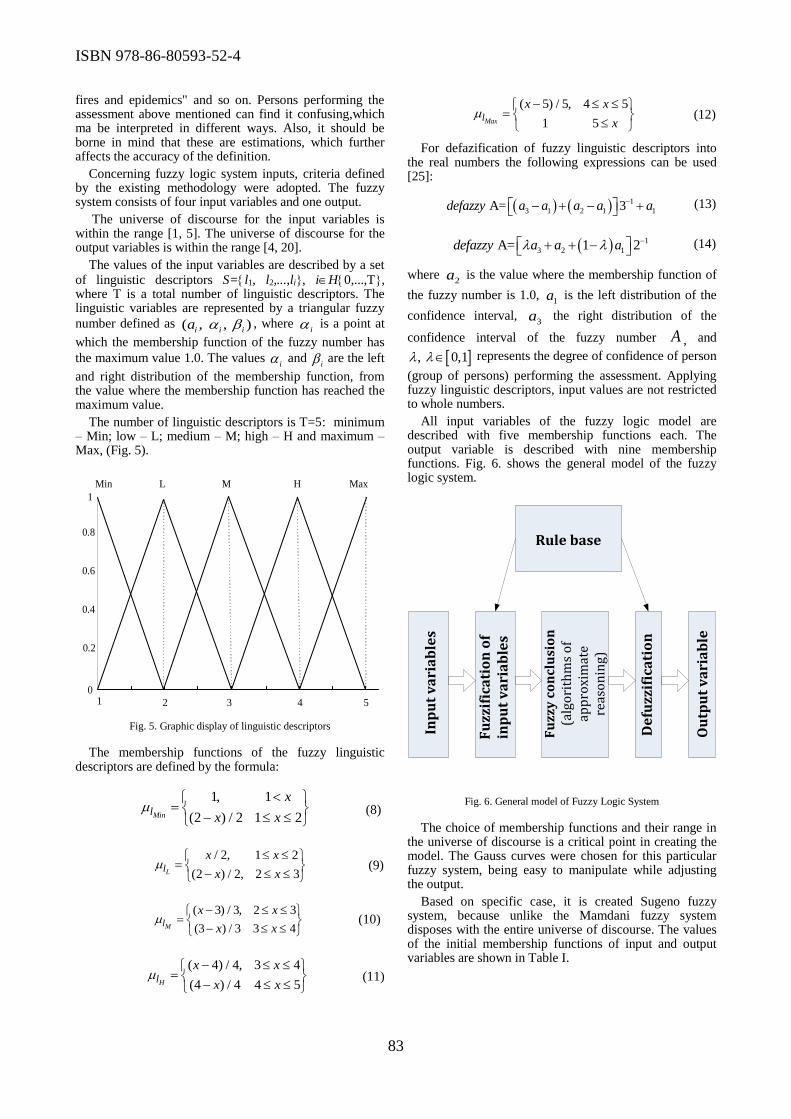
ISBN 978-86-80593-52-4
83
fires and epidemics" and so on. Persons performing the assessment above mentioned can find it confusing,which ma be interpreted in different ways. Also, it should be borne in mind that these are estimations, which further affects the accuracy of the definition.
Concerning fuzzy logic system inputs, criteria defined by the existing methodology were adopted. The fuzzy system consists of four input variables and one output.
The universe of discourse for the input variables is within the range [1, 5]. The universe of discourse for the output variables is within the range [4, 20].
The values of the input variables are described by a set of linguistic descriptors S=l1, l2,...,li, iH0,...,T, where T is a total number of linguistic descriptors. The linguistic variables are represented by a triangular fuzzy
number defined as ( , , )i i ia , where i is a point at
which the membership function of the fuzzy number has
the maximum value 1.0. The values i and
i are the left
and right distribution of the membership function, from the value where the membership function has reached the maximum value.
The number of linguistic descriptors is T=5: minimum – Min; low – L; medium – M; high – H and maximum – Max, (Fig. 5).
1
0.8
0.6
0.4
0.2
1 . 3 5
0
2 4
Min L M H Max
Fig. 5. Graphic display of linguistic descriptors
The membership functions of the fuzzy linguistic descriptors are defined by the formula:
1, 1
(2 ) / 2 1 2
Minl
x
x x (8)
/ 2, 1 2
(2 ) / 2, 2 3
Ll
x x
x x (9)
( 3) / 3, 2 3
(3 ) / 3 3 4
Ml
x x
x x (10)
( 4) / 4, 3 4
(4 ) / 4 4 5
Hl
x x
x x (11)
( 5) / 5, 4 5
1 5
Maxl
x x
x (12)
For defazification of fuzzy linguistic descriptors into the real numbers the following expressions can be used [25]:
1
3 1 2 1 1 A= 3 defazzy a a a a a (13)
1
3 2 1 A= 1 2 defazzy a a a (14)
where 2a is the value where the membership function of
the fuzzy number is 1.0, 1a is the left distribution of the
confidence interval, 3a the right distribution of the
confidence interval of the fuzzy number A , and
, 0,1 represents the degree of confidence of person
(group of persons) performing the assessment. Applying fuzzy linguistic descriptors, input values are not restricted to whole numbers.
All input variables of the fuzzy logic model are described with five membership functions each. The output variable is described with nine membership functions. Fig. 6. shows the general model of the fuzzy logic system.
Rule base
Inp
ut
va
ria
ble
s
Fu
zzif
ica
tio
n o
f in
pu
t v
ari
ab
les
Fu
zzy
co
ncl
usi
on
(a
lgo
rith
ms
of
app
roxi
mat
e re
aso
nin
g)
De
fuzz
ific
ati
on
Ou
tpu
t v
ari
ab
le
Fig. 6. General model of Fuzzy Logic System
The choice of membership functions and their range in the universe of discourse is a critical point in creating the model. The Gauss curves were chosen for this particular fuzzy system, being easy to manipulate while adjusting the output.
Based on specific case, it is created Sugeno fuzzy system, because unlike the Mamdani fuzzy system disposes with the entire universe of discourse. The values of the initial membership functions of input and output variables are shown in Table I.
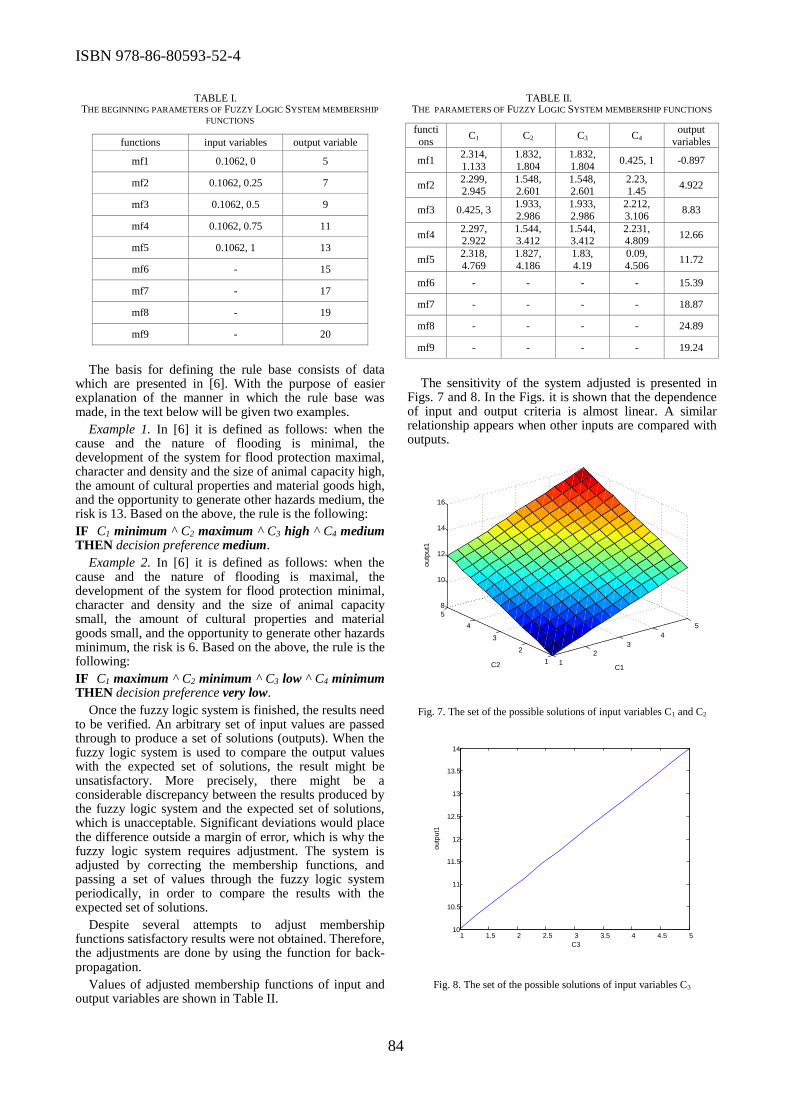
ISBN 978-86-80593-52-4
84
TABLE I. THE BEGINNING PARAMETERS OF FUZZY LOGIC SYSTEM MEMBERSHIP
FUNCTIONS
functions input variables output variable
mf1 0.1062, 0 5
mf2 0.1062, 0.25 7
mf3 0.1062, 0.5 9
mf4 0.1062, 0.75 11
mf5 0.1062, 1 13
mf6 - 15
mf7 - 17
mf8 - 19
mf9 - 20
The basis for defining the rule base consists of data which are presented in [6]. With the purpose of easier explanation of the manner in which the rule base was made, in the text below will be given two examples.
Example 1. In [6] it is defined as follows: when the cause and the nature of flooding is minimal, the development of the system for flood protection maximal, character and density and the size of animal capacity high, the amount of cultural properties and material goods high, and the opportunity to generate other hazards medium, the risk is 13. Based on the above, the rule is the following:
IF C1 minimum ^ C2 maximum ^ C3 high ^ C4 medium THEN decision preference medium.
Example 2. In [6] it is defined as follows: when the cause and the nature of flooding is maximal, the development of the system for flood protection minimal, character and density and the size of animal capacity small, the amount of cultural properties and material goods small, and the opportunity to generate other hazards minimum, the risk is 6. Based on the above, the rule is the following:
IF C1 maximum ^ C2 minimum ^ C3 low ^ C4 minimum THEN decision preference very low.
Once the fuzzy logic system is finished, the results need to be verified. An arbitrary set of input values are passed through to produce a set of solutions (outputs). When the fuzzy logic system is used to compare the output values with the expected set of solutions, the result might be unsatisfactory. More precisely, there might be a considerable discrepancy between the results produced by the fuzzy logic system and the expected set of solutions, which is unacceptable. Significant deviations would place the difference outside a margin of error, which is why the fuzzy logic system requires adjustment. The system is adjusted by correcting the membership functions, and passing a set of values through the fuzzy logic system periodically, in order to compare the results with the expected set of solutions.
Despite several attempts to adjust membership functions satisfactory results were not obtained. Therefore, the adjustments are done by using the function for back-propagation.
Values of adjusted membership functions of input and output variables are shown in Table II.
TABLE II. THE PARAMETERS OF FUZZY LOGIC SYSTEM MEMBERSHIP FUNCTIONS
functi
ons C1 C2 C3 C4
output
variables
mf1 2.314,
1.133
1.832,
1.804
1.832,
1.804 0.425, 1 -0.897
mf2 2.299, 2.945
1.548, 2.601
1.548, 2.601
2.23, 1.45
4.922
mf3 0.425, 3 1.933,
2.986
1.933,
2.986
2.212,
3.106 8.83
mf4 2.297, 2.922
1.544, 3.412
1.544, 3.412
2.231, 4.809
12.66
mf5 2.318,
4.769
1.827,
4.186
1.83,
4.19
0.09,
4.506 11.72
mf6 - - - - 15.39
mf7 - - - - 18.87
mf8 - - - - 24.89
mf9 - - - - 19.24
The sensitivity of the system adjusted is presented in Figs. 7 and 8. In the Figs. it is shown that the dependence of input and output criteria is almost linear. A similar relationship appears when other inputs are compared with outputs.
1
2
3
4
5
1
2
3
4
5
8
10
12
14
16
C1C2
ou
tpu
t1
Fig. 7. The set of the possible solutions of input variables C1 and C2
1 1.5 2 2.5 3 3.5 4 4.5 510
10.5
11
11.5
12
12.5
13
13.5
14
C3
ou
tpu
t1
Fig. 8. The set of the possible solutions of input variables C3
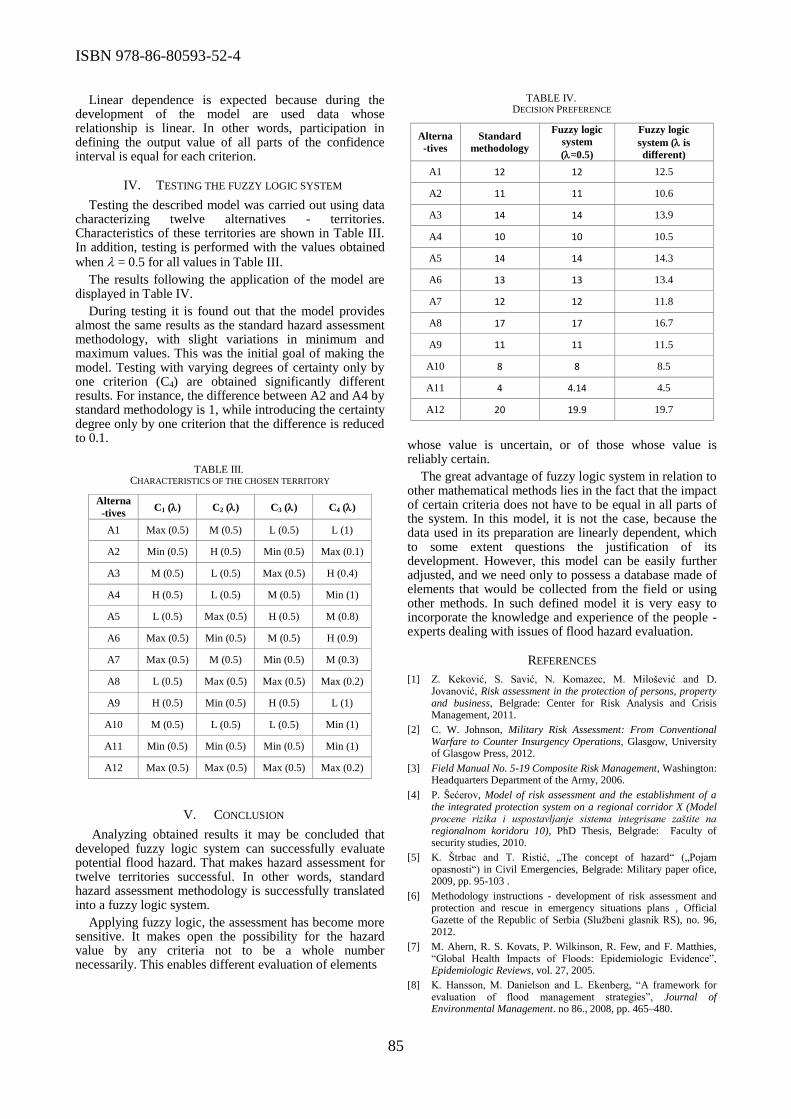
ISBN 978-86-80593-52-4
85
Linear dependence is expected because during the development of the model are used data whose relationship is linear. In other words, participation in defining the output value of all parts of the confidence interval is equal for each criterion.
IV. TESTING THE FUZZY LOGIC SYSTEM
Testing the described model was carried out using data characterizing twelve alternatives - territories. Characteristics of these territories are shown in Table III. In addition, testing is performed with the values obtained when = 0.5 for all values in Table III.
The results following the application of the model are displayed in Table IV.
During testing it is found out that the model provides almost the same results as the standard hazard assessment methodology, with slight variations in minimum and maximum values. This was the initial goal of making the model. Testing with varying degrees of certainty only by one criterion (C4) are obtained significantly different results. For instance, the difference between A2 and A4 by standard methodology is 1, while introducing the certainty degree only by one criterion that the difference is reduced to 0.1.
TABLE III. CHARACTERISTICS OF THE CHOSEN TERRITORY
Alterna
-tives C1 () C2 () C3 () C4 ()
A1 Max (0.5) M (0.5) L (0.5) L (1)
A2 Min (0.5) H (0.5) Min (0.5) Max (0.1)
A3 M (0.5) L (0.5) Max (0.5) H (0.4)
A4 H (0.5) L (0.5) M (0.5) Min (1)
A5 L (0.5) Max (0.5) H (0.5) M (0.8)
A6 Max (0.5) Min (0.5) M (0.5) H (0.9)
A7 Max (0.5) M (0.5) Min (0.5) M (0.3)
A8 L (0.5) Max (0.5) Max (0.5) Max (0.2)
A9 H (0.5) Min (0.5) H (0.5) L (1)
A10 M (0.5) L (0.5) L (0.5) Min (1)
A11 Min (0.5) Min (0.5) Min (0.5) Min (1)
A12 Max (0.5) Max (0.5) Max (0.5) Max (0.2)
V. CONCLUSION
Analyzing obtained results it may be concluded that developed fuzzy logic system can successfully evaluate potential flood hazard. That makes hazard assessment for twelve territories successful. In other words, standard hazard assessment methodology is successfully translated into a fuzzy logic system.
Applying fuzzy logic, the assessment has become more sensitive. It makes open the possibility for the hazard value by any criteria not to be a whole number necessarily. This enables different evaluation of elements
TABLE IV. DECISION PREFERENCE
Alterna
-tives
Standard
methodology
Fuzzy logic
system
(=0.5)
Fuzzy logic
system ( is
different)
A1 12 12 12.5
A2 11 11 10.6
A3 14 14 13.9
A4 10 10 10.5
A5 14 14 14.3
A6 13 13 13.4
A7 12 12 11.8
A8 17 17 16.7
A9 11 11 11.5
A10 8 8 8.5
A11 4 4.14 4.5
A12 20 19.9 19.7
whose value is uncertain, or of those whose value is reliably certain.
The great advantage of fuzzy logic system in relation to other mathematical methods lies in the fact that the impact of certain criteria does not have to be equal in all parts of the system. In this model, it is not the case, because the data used in its preparation are linearly dependent, which to some extent questions the justification of its development. However, this model can be easily further adjusted, and we need only to possess a database made of elements that would be collected from the field or using other methods. In such defined model it is very easy to incorporate the knowledge and experience of the people - experts dealing with issues of flood hazard evaluation.
REFERENCES
[1] Z. Keković, S. Savić, N. Komazec, M. Milošević and D. Jovanović, Risk assessment in the protection of persons, property and business, Belgrade: Center for Risk Analysis and Crisis Management, 2011.
[2] C. W. Johnson, Military Risk Assessment: From Conventional Warfare to Counter Insurgency Operations, Glasgow, University of Glasgow Press, 2012.
[3] Field Manual No. 5-19 Composite Risk Management, Washington: Headquarters Department of the Army, 2006.
[4] P. Šećerov, Model of risk assessment and the establishment of a the integrated protection system on a regional corridor X (Model procene rizika i uspostavljanje sistema integrisane zaštite na regionalnom koridoru 10), PhD Thesis, Belgrade: Faculty of security studies, 2010.
[5] K. Štrbac and T. Ristić, „The concept of hazard“ („Pojam opasnosti“) in Civil Emergencies, Belgrade: Military paper ofice, 2009, pp. 95-103 .
[6] Methodology instructions - development of risk assessment and protection and rescue in emergency situations plans , Official Gazette of the Republic of Serbia (Službeni glasnik RS), no. 96, 2012.
[7] M. Ahern, R. S. Kovats, P. Wilkinson, R. Few, and F. Matthies, “Global Health Impacts of Floods: Epidemiologic Evidence”, Epidemiologic Reviews, vol. 27, 2005.
[8] K. Hansson, M. Danielson and L. Ekenberg, “A framework for evaluation of flood management strategies”, Journal of Environmental Management. no 86., 2008, pp. 465–480.

ISBN 978-86-80593-52-4
86
[9] S. Vukadinović, “Flooding as water management problem”, Globus, vol. 34. no. 28, 2003, pp 159-170.
[10] E. K. Noji, The Public Health Consequences of Disasters, New York: Oxford University Press, 1998.
[11] Floods in Venezuela situation report 27 Dec 1999. Report from Pan American Health Organization. Available at: http://reliefweb.int/report/venezuela-bolivarian-republic/floods-venezuela-situation-report-27-dec-1999 (25. 07. 2013).
[12] G. D. Haddow and J. A. Bullock, Introduction to Emergency Management. 2nd ed., Oxford: Elsevier Butterworth–Heinemann, 2006.
[13] IPCC, Managing the Risks of Extreme Events and Disasters to Advance Climate Change Adaptation: A Special Report of Working Groups I and II of the Intergovernmental Panel on Climate Change, C. B. Field et al, Eds., Cambrige and New York: Cambridge University Press, 2012.
[14] “Directive 2007/60/EC of the European Parliament and of the Council of 23 October 2007 on the assessment and management of flood risks”, Official Journal of the European Union L288, 6.11.2007, pp. 27-34.
[15] G. Sekulić, D. Dimović, Z. Kalmar, K. Jović and N. Todorović, Assessment of vulnerability to climate change - Serbia Belgrade: WWF and Environment Improvement Centre, 2012.
[16] A. Milanović, M. Urošev and D. Milijašević, “Floods in Serbia in the 1999 – 2009 period – Hydrological Analysis and Flood Protection Measures”, Bulletin of the Serbian Geographical Society, no. 1, 2010, pp. 93-121.
[17] “Report on the state of the flood protection system with the proposal of works for 2007 -Water area "Danube River", "Sava River" and "Morava River” JVP “Srbijavode”, Belgrade, 2006.
[18] M. Mareš, Computation over Fuzzy Quantities, USA:CRC Press, 1994.
[19] D. Božanić and D. Pamučar, "Evaluating locations for river crossing using fuzzy logic”, Military Technical Courier, vol. 58, no. 1, 2010, 129-145.
[20] D. Pamučar, D. Božanić, B. Đorović. and A. Milić, "Modelling of the fuzzy logical system for offering support in making decisions within the engineering units of the Serbian army", International journal of the physical sciences, vol. 6, no. 3, 2011, 592 - 609.
[21] L. A. Zadeh, “Fuzzy sets”, Inf control, vol. 8, 1965, 338-353.
[22] D. Pamučar, "Using fuzzy logic and neural networks during a decision making proces in transport", Military Technical Courier, vol. 58, no. 3, 2010, 125-143.
[23] D. Pamučar, D. Božanić and A. Milić, “Selection of a course of action by Obstacle Employment Group base on a Fuzzy logic system”, Yugoslav Journal of Operations Research, in press.
[24] D. Pamučar, D. Božanić B. Đorović, Fuzzy logic in decision making process in the Armed forces of Serbia, Saarbrücken: Lambert Academic Publishing GmbH & Co. KG, 2011.
[25] L. M. Seiford, “The evolution of the state-of-art (1978-1995)”, Journal of Productivity Analysis, vol. 7, 1996, 99-137.

ISBN 978-86-80593-52-4
86
Modeling of Internal Control of Occupational
Safety in Corporate Systems by Using Multiple
Criteria Decision Making Methods
Ivan Mance1, Vesna Nikolić2, Vladimir Hužak1
1HP - Croatian Post, Department of Occupational Safety, Fire Protection and Ecology, Zagreb, Republic of Croatia 2University of Niš, Faculty of Occupational Safety, Niš, Serbia
[email protected]; [email protected]; [email protected]
Abstract- It is possible to use methods of information science to research and resolve many problems in the occupational safety system. Starting from the known theoretical facts and principles, the paper discusses the problems of internal supervision of occupational safety in major corporate systems by using the multiple criteria decision making (MDCM). As the research sample, it was taken a major corporate system HP - Croatian Post. Firstly, the elements (procedures) of internal supervision that are used by occupational safety professionals in everyday practice, are determined and they constitute the criteria of the methodology of MDCM. By taking in consideration that the most biased part of the methodology of MDCM is assigning weights to the criteria, in this paper that step has been accomplished by using AHP methods through the Expert Choice 11® tool. The team of sevenoccupatonal safety professionals, individually compares criteria each "with each other" in sens of how much is one of the criteria more or less significant compared to the other. In that way each criterion receives seven different weights, which are further brought down to a geometric middle, which then represents the actual weight assigned to each criterion. Furthermore, the paper defines several approaches to internal control, which represent alternatives of the methodology of MDCM. Defining the initial decision matrix and applying appropriate Electre I method (Elimination and Choice Expressing the Reality), the paper ultimately defines those alternatives that are the most important, and in the end they make the basis of a proposed model of internal control in big corporate systems.
I. INTRODUCTION
Internal control of occupational safety represents the legal commitment related to occupational safety [18], but it is also an indispensable factor for correct implementation of occupational safety systems in business organizations, and operational performance of occupational safety. The purpose of internal control is reflected in regular and professional monitoring of occupational safety processes in the organization. It is conducted by experts of occupational safety and the other factors of integral safety in the organization (trustees of
the employer, the workers' trustees etc.) and they suggest correction of the organizational, technical and other perceived shortcomings in the field of occupational safety. Certainly the most important work of internal control is carried out and must be carried out precisely by occupational safety professionals [5], because its conduction by other factors is highly questionable given their expertise, motivation and business workload. Some authors [2] observe internal control as an essential part of the security process which is involved in work and work-related activities, but it also affects the forms of behavior of the organization.
Especially interesting are researches of the attitudes of
occupational safety experts on problems of internal
control in this area. Results of the researches that took
place in Croatia show that the most respondents-experts of
occupational safety (41.12%) rate internal supervision
over the implementation of safety rules as very good,
while a negative score is present in 0.59% of respondents
[3]. Experts of occuaptional safety evaluate similarly their
own work in the area of internal control [4]. If we take in
consideration Kacian's cyber security model according to
which the implementation of internal control reflects the
"patterns of behavior" in the field of occupational safety in
the organization, it is to be expected that the efficiency of
the internal control of occupational safety affects the
consciousness of workers and employers as well as of
operating by the rules of secure working. A challenge
would be to conduct a study that would prove or disprove
the thesis. Trupčević also recognizes the importance of internal
control by the employers. [6] The author gives a proposed model by forming checklist / forms for some smaller organizational units, he proposes the internal control elements (elements are very widely proposed and they are related to the specific areas which occupational safety covers such as examination of work resources, protection of non-smokers, hazard assessment, etc. .) and proposes

ISBN 978-86-80593-52-4
87
rating of each area by analyzing the lower organizational units. Total occupational safety condition according to internal control would be administered by summing and giving the average score of all organizational units of the employer. However, the proposed model is not based on a specific research and it belongs to a professional proposal of the author, nor it has been applied in practice, which would have given us an insight into the advantages and disadvantages of that kind of approach.
Norwegian authors [7] display internal control as a concept of proven and systematic strategy for improving health and occupational safety. The results of research in Norway show that the internal occupational safety control in this country is at the level of deviations from prescribed and that it needs to be undertaken multi-disciplinary investigation. The results of this and similar studies encouraged the authors of this paper to the application of methods from the field of information sciences in the research and the projection of the internal occupational safety models in corporate systems.
II. METHODOLOGY
The topic of the research is modeling of internal supervision of occupational safety in a large corporate system. The research was conducted in the corporate system of Croatian Post Inc. which belongs to a public limited company formed by separation of public company Croatian Post and Telecommunications into two companies (HP Inc. and HT). Croatian Post Inc. has a registered capital of HRK 952,636,100.00 divided into 9,526,361 shares with a nominal value of HRK 100 and 9650 employees which makes it a national giant corporation. The objectives of the survey are based on:
- Defining the most important elements in implementation of internal supervision of occupational safety in the corporation Croatian Post
- Selection of 7 experts of occupational safety which will independently and individually compare the importance of the defined elements "with each other"
- Defining multiple access of internal supervision of occupational safety by applying the already set of elements
- Selection of the most important internal control accesses by using MCDM methodology of Electre I
- Proposition of modeling of internal supervision of occupational safety in the corporate system of Croatian Post
From the objectives derive hypotheses:
H1 - It is possible to set different approaches of internal control of occupational safety by taking in consideration the total activity which it contains, and to define through them the most important one.
H2 - By defining significance (importance) of individual accesses of the internal supervision it is possible to propose a model of internal supervision of occuptional safety in the corporate system.
The study used the following apparatus in scientific research:
- Descriptive method to describe the elements and accesses of the internal supervision of occupational safety in the corporation Croatian Post
- Statistical methods (descriptive statistics, arithmetic mean, geometric mean) which will be used to describe
expert analysis of individual elements and to define the value of each of them in the initial decision-making table of multicriterial analysis
- Methods of MCDM (AHP and ELECTRE I) that will prove or disprove H1.
- Method of MCDM Electre III, which will be used to rank by the importance individual approaches of the internal control and modeling method that will prove or disprove the H2.
III. RESULTS
Internal supervision of occupational safety in corporations that make the largest business systems stems from the fact of a large number of employees, a big dislocation and the number of locations and series of business processes that occure on a daily basis in such systems. To monitor physically any process in such circumstances, and having in mind the limited resources of the maximum number of people in the supervision departement, limitation of working hours, the vast territorial coverage and the other represents a huge challenge in the organizational, priority and professional sense. Internal supervision of occupational safety can and must be exclusively conducted on the field, analyzing the safe conduct of work and work-related activities, the excesses of the set system of security as well as possible sources of danger, hazard and effort. The most effective internal supervision of occupational safety, as already mentioned, implement occupational safety specialists according to references [8], [5], [6] and based on this knowledge the professionals are selected among occupational safety experts1,who will analyze the main elements of the internal control in the corporate system of Croatian Post.
There are selected 21 elements of internal supervision of occupational safety (see Table 1), which got abbreviations for easier analysis and modeling. In the first phase of the research the weight values are assigned to the defined elements in a way that the expert team enters the individual estimate values of the elements comparing elements "each with each other," applying "Analytic Hierarchy Process (AHP)" method [10] and Expert Choice11® tool. "The basic steps in constructing and examining an AHP model are: (1) decompose the problem into a hierarhical structure, (2) perform judgments to establish priorities for the elements of the hierarchy, (3) synthesis of the model (4) perform a sensitivity analysis."[11].
Given that the weight assignment criteria is the most subjective part of the methodology of multiple criteria decision making [9], it went on trough seven passes of AHP method (seven experts), which minimized subjectivity in assigning weight criteria.
1Theexpertteamconsistedofseven (7)
occupationalsafetyspecialistintheCroatian Post Inc. (alphabetically):
- Joško Cikojević, BSc, Split areamanager
- Vladimir Huzak, Msc, CoordinatoroftheOccupationalsafetydepartment
- Zdravko Jelenić, bacc., Gospić areamanager
- Ivan Mance, MSc., HeadoftheOccupationalsafetydepartment - Jadran Matić, bacc, Rijeka areamanager
- Ratko Peček, BSc, Zagreb areamanager
- Damir Vidović, BSc, Čakovec areamanager
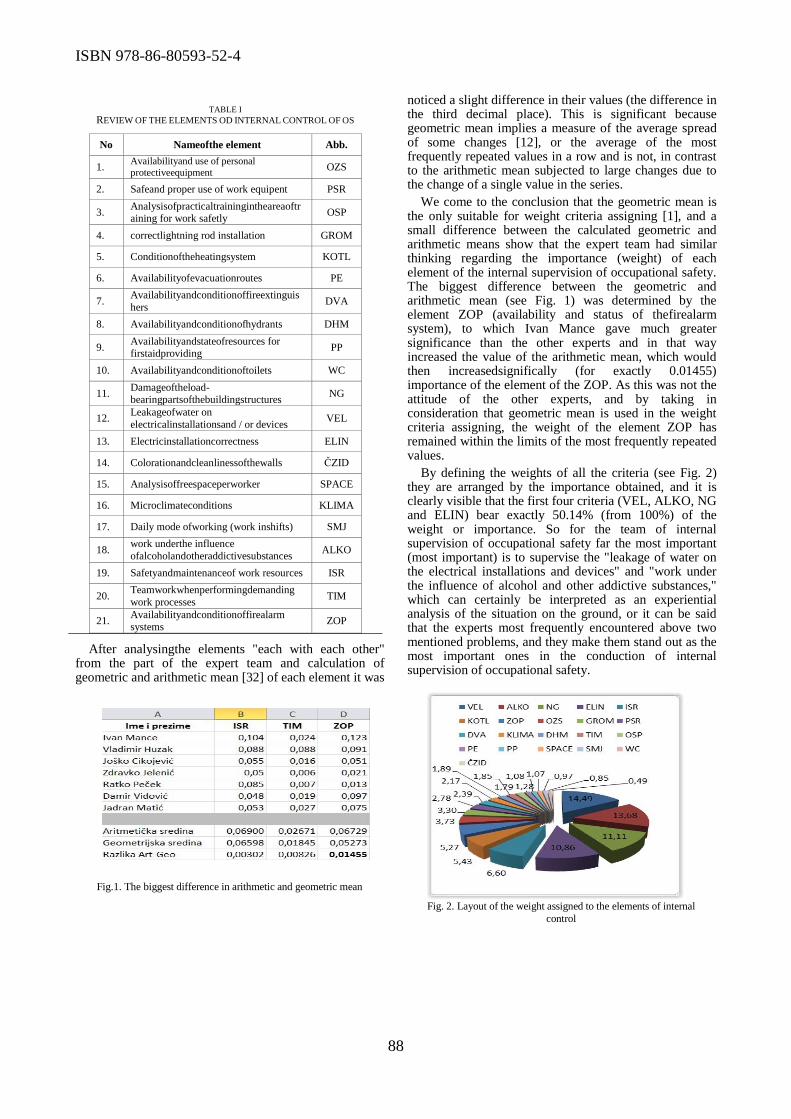
ISBN 978-86-80593-52-4
88
Fig. 2. Layout of the weight assigned to the elements of internal
control
Fig.1. The biggest difference in arithmetic and geometric mean
After analysingthe elements "each with each other" from the part of the expert team and calculation of geometric and arithmetic mean [32] of each element it was
noticed a slight difference in their values (the difference in the third decimal place). This is significant because geometric mean implies a measure of the average spread of some changes [12], or the average of the most frequently repeated values in a row and is not, in contrast to the arithmetic mean subjected to large changes due to the change of a single value in the series.
We come to the conclusion that the geometric mean is the only suitable for weight criteria assigning [1], and a small difference between the calculated geometric and arithmetic means show that the expert team had similar thinking regarding the importance (weight) of each element of the internal supervision of occupational safety. The biggest difference between the geometric and arithmetic mean (see Fig. 1) was determined by the element ZOP (availability and status of thefirealarm system), to which Ivan Mance gave much greater significance than the other experts and in that way increased the value of the arithmetic mean, which would then increasedsignifically (for exactly 0.01455) importance of the element of the ZOP. As this was not the attitude of the other experts, and by taking in consideration that geometric mean is used in the weight criteria assigning, the weight of the element ZOP has remained within the limits of the most frequently repeated values.
By defining the weights of all the criteria (see Fig. 2) they are arranged by the importance obtained, and it is clearly visible that the first four criteria (VEL, ALKO, NG and ELIN) bear exactly 50.14% (from 100%) of the weight or importance. So for the team of internal supervision of occupational safety far the most important (most important) is to supervise the "leakage of water on the electrical installations and devices" and "work under the influence of alcohol and other addictive substances," which can certainly be interpreted as an experiential analysis of the situation on the ground, or it can be said that the experts most frequently encountered above two mentioned problems, and they make them stand out as the most important ones in the conduction of internal supervision of occupational safety.
TABLE I REVIEW OF THE ELEMENTS OD INTERNAL CONTROL OF OS
No Nameofthe element Abb.
1. Availabilityand use of personal
protectiveequipment OZS
2. Safeand proper use of work equipent PSR
3. Analysisofpracticaltrainingintheareaoftraining for work safetly
OSP
4. correctlightning rod installation GROM
5. Conditionoftheheatingsystem KOTL
6. Availabilityofevacuationroutes PE
7. Availabilityandconditionoffireextinguis
hers DVA
8. Availabilityandconditionofhydrants DHM
9. Availabilityandstateofresources for firstaidproviding
PP
10. Availabilityandconditionoftoilets WC
11. Damageoftheload-bearingpartsofthebuildingstructures
NG
12. Leakageofwater on
electricalinstallationsand / or devices VEL
13. Electricinstallationcorrectness ELIN
14. Colorationandcleanlinessofthewalls ČZID
15. Analysisoffreespaceperworker SPACE
16. Microclimateconditions KLIMA
17. Daily mode ofworking (work inshifts) SMJ
18. work underthe influence
ofalcoholandotheraddictivesubstances ALKO
19. Safetyandmaintenanceof work resources ISR
20. Teamworkwhenperformingdemanding
work processes TIM
21. Availabilityandconditionoffirealarm systems
ZOP
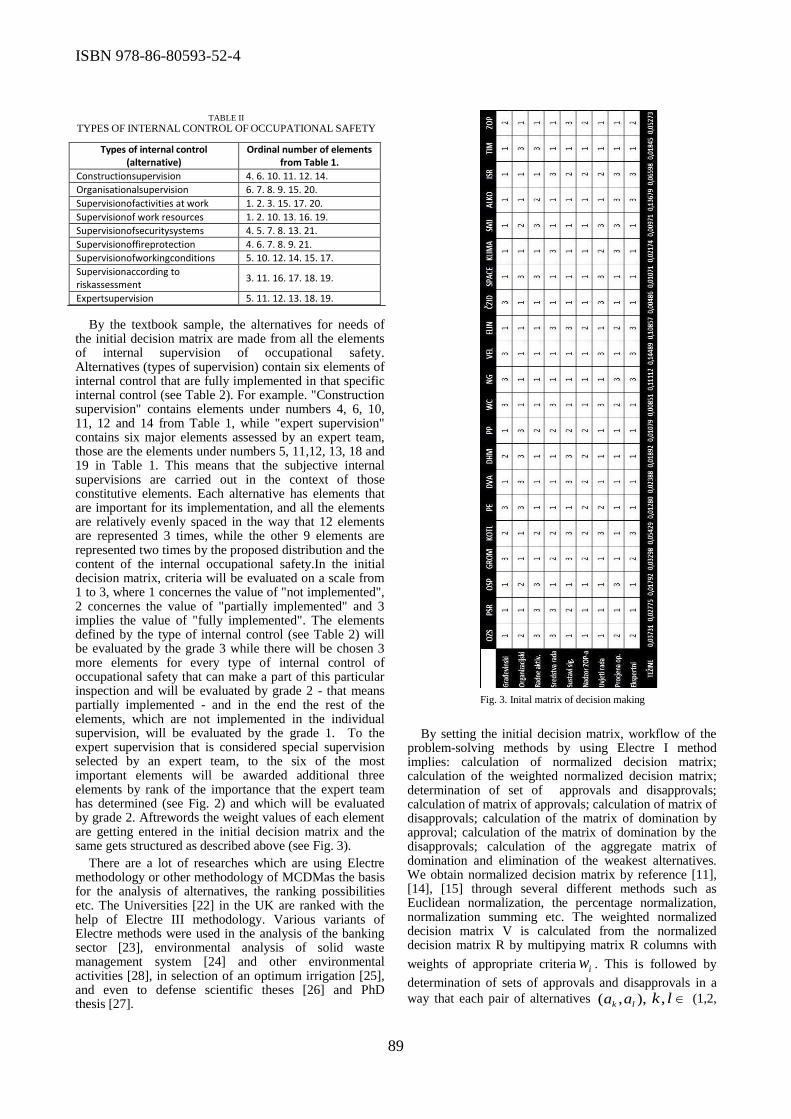
ISBN 978-86-80593-52-4
89
Fig. 3. Inital matrix of decision making
By the textbook sample, the alternatives for needs of the initial decision matrix are made from all the elements of internal supervision of occupational safety. Alternatives (types of supervision) contain six elements of internal control that are fully implemented in that specific internal control (see Table 2). For example. "Construction supervision" contains elements under numbers 4, 6, 10, 11, 12 and 14 from Table 1, while "expert supervision" contains six major elements assessed by an expert team, those are the elements under numbers 5, 11,12, 13, 18 and 19 in Table 1. This means that the subjective internal supervisions are carried out in the context of those constitutive elements. Each alternative has elements that are important for its implementation, and all the elements are relatively evenly spaced in the way that 12 elements are represented 3 times, while the other 9 elements are represented two times by the proposed distribution and the content of the internal occupational safety.In the initial decision matrix, criteria will be evaluated on a scale from 1 to 3, where 1 concernes the value of "not implemented", 2 concernes the value of "partially implemented" and 3 implies the value of "fully implemented". The elements defined by the type of internal control (see Table 2) will be evaluated by the grade 3 while there will be chosen 3 more elements for every type of internal control of occupational safety that can make a part of this particular inspection and will be evaluated by grade 2 - that means partially implemented - and in the end the rest of the elements, which are not implemented in the individual supervision, will be evaluated by the grade 1. To the expert supervision that is considered special supervision selected by an expert team, to the six of the most important elements will be awarded additional three elements by rank of the importance that the expert team has determined (see Fig. 2) and which will be evaluated by grade 2. Aftrewords the weight values of each element are getting entered in the initial decision matrix and the same gets structured as described above (see Fig. 3).
There are a lot of researches which are using Electre methodology or other methodology of MCDMas the basis for the analysis of alternatives, the ranking possibilities etc. The Universities [22] in the UK are ranked with the help of Electre III methodology. Various variants of Electre methods were used in the analysis of the banking sector [23], environmental analysis of solid waste management system [24] and other environmental activities [28], in selection of an optimum irrigation [25], and even to defense scientific theses [26] and PhD thesis [27].
By setting the initial decision matrix, workflow of the problem-solving methods by using Electre I method implies: calculation of normalized decision matrix; calculation of the weighted normalized decision matrix; determination of set of approvals and disapprovals; calculation of matrix of approvals; calculation of matrix of disapprovals; calculation of the matrix of domination by approval; calculation of the matrix of domination by the disapprovals; calculation of the aggregate matrix of domination and elimination of the weakest alternatives. We obtain normalized decision matrix by reference [11], [14], [15] through several different methods such as Euclidean normalization, the percentage normalization, normalization summing etc. The weighted normalized decision matrix V is calculated from the normalized decision matrix R by multipying matrix R columns with
weights of appropriate criteria iw . This is followed by
determination of sets of approvals and disapprovals in a
way that each pair of alternatives ),,( lk aa lk, (1,2,
TABLE II TYPES OF INTERNAL CONTROL OF OCCUPATIONAL SAFETY
Types of internal control (alternative)
Ordinal number of elements from Table 1.
Constructionsupervision 4. 6. 10. 11. 12. 14.
Organisationalsupervision 6. 7. 8. 9. 15. 20.
Supervisionofactivities at work 1. 2. 3. 15. 17. 20.
Supervisionof work resources 1. 2. 10. 13. 16. 19.
Supervisionofsecuritysystems 4. 5. 7. 8. 13. 21.
Supervisionoffireprotection 4. 6. 7. 8. 9. 21.
Supervisionofworkingconditions 5. 10. 12. 14. 15. 17.
Supervisionaccording to riskassessment
3. 11. 16. 17. 18. 19.
Expertsupervision 5. 11. 12. 13. 18. 19.
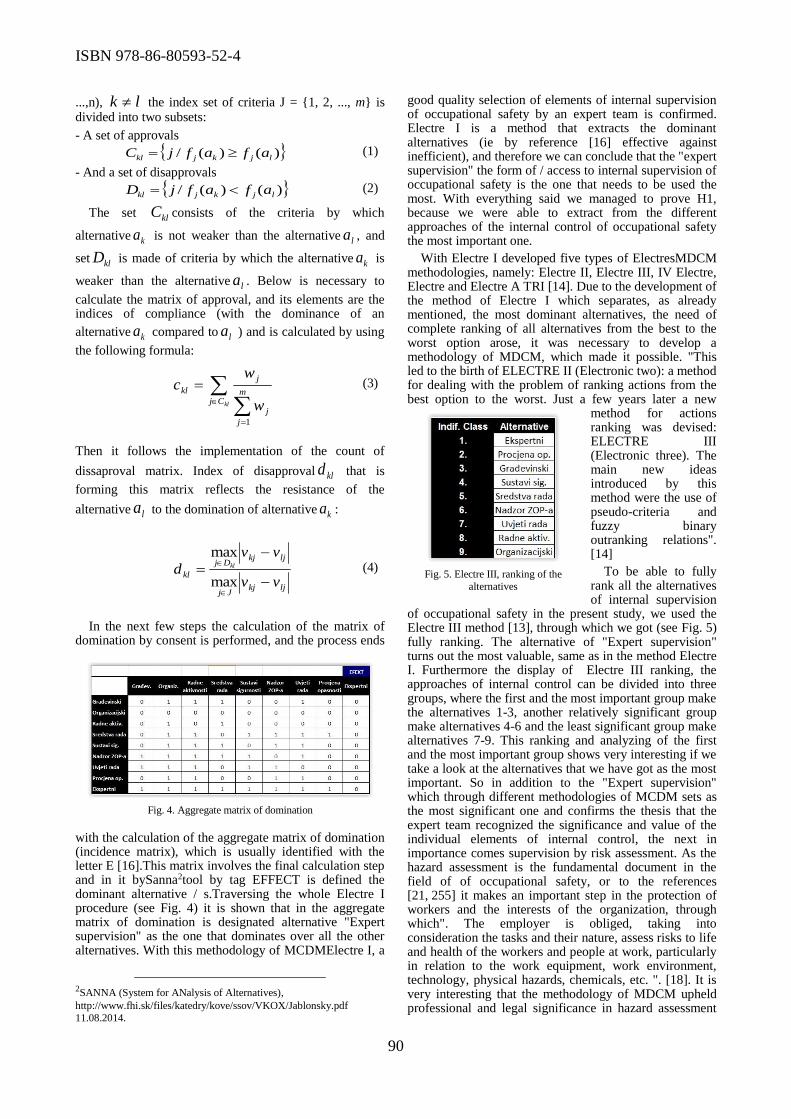
ISBN 978-86-80593-52-4
90
Fig. 4. Aggregate matrix of domination
Figure 2.
Figure 3.
Fig. 5. Electre III, ranking of the
alternatives
...,n), lk the index set of criteria J = {1, 2, ..., m} is divided into two subsets:
- A set of approvals
)()(/ ljkjkl afafjC (1)
- And a set of disapprovals
)()(/ ljkjkl afafjD (2)
The set klC consists of the criteria by which
alternative ka is not weaker than the alternative la , and
set klD is made of criteria by which the alternative ka is
weaker than the alternative la . Below is necessary to
calculate the matrix of approval, and its elements are the indices of compliance (with the dominance of an
alternative ka compared to la ) and is calculated by using
the following formula:
klCj
m
j
j
j
kl
w
wc
1
(3)
Then it follows the implementation of the count of
dissaproval matrix. Index of disapproval kld that is
forming this matrix reflects the resistance of the
alternative la to the domination of alternative ka :
ljkjJj
ljkjDj
klvv
vv
d kl
max
max (4)
In the next few steps the calculation of the matrix of domination by consent is performed, and the process ends
with the calculation of the aggregate matrix of domination (incidence matrix), which is usually identified with the letter E [16].This matrix involves the final calculation step and in it bySanna2tool by tag EFFECT is defined the dominant alternative / s.Traversing the whole Electre I procedure (see Fig. 4) it is shown that in the aggregate matrix of domination is designated alternative "Expert supervision" as the one that dominates over all the other alternatives. With this methodology of MCDMElectre I, a
2SANNA (System for ANalysis of Alternatives),
http://www.fhi.sk/files/katedry/kove/ssov/VKOX/Jablonsky.pdf
11.08.2014.
good quality selection of elements of internal supervision of occupational safety by an expert team is confirmed. Electre I is a method that extracts the dominant alternatives (ie by reference [16] effective against inefficient), and therefore we can conclude that the "expert supervision" the form of / access to internal supervision of occupational safety is the one that needs to be used the most. With everything said we managed to prove H1, because we were able to extract from the different approaches of the internal control of occupational safety the most important one.
With Electre I developed five types of ElectresMDCM methodologies, namely: Electre II, Electre III, IV Electre, Electre and Electre A TRI [14]. Due to the development of the method of Electre I which separates, as already mentioned, the most dominant alternatives, the need of complete ranking of all alternatives from the best to the worst option arose, it was necessary to develop a methodology of MDCM, which made it possible. "This led to the birth of ELECTRE II (Electronic two): a method for dealing with the problem of ranking actions from the best option to the worst. Just a few years later a new
method for actions ranking was devised: ELECTRE III (Electronic three). The main new ideas introduced by this method were the use of pseudo-criteria and fuzzy binary outranking relations". [14]
To be able to fully rank all the alternatives of internal supervision
of occupational safety in the present study, we used the Electre III method [13], through which we got (see Fig. 5) fully ranking. The alternative of "Expert supervision" turns out the most valuable, same as in the method Electre I. Furthermore the display of Electre III ranking, the approaches of internal control can be divided into three groups, where the first and the most important group make the alternatives 1-3, another relatively significant group make alternatives 4-6 and the least significant group make alternatives 7-9. This ranking and analyzing of the first and the most important group shows very interesting if we take a look at the alternatives that we have got as the most important. So in addition to the "Expert supervision" which through different methodologies of MCDM sets as the most significant one and confirms the thesis that the expert team recognized the significance and value of the individual elements of internal control, the next in importance comes supervision by risk assessment. As the hazard assessment is the fundamental document in the field of of occupational safety, or to the references [21, 255] it makes an important step in the protection of workers and the interests of the organization, through which". The employer is obliged, taking into consideration the tasks and their nature, assess risks to life and health of the workers and people at work, particularly in relation to the work equipment, work environment, technology, physical hazards, chemicals, etc. ". [18]. It is very interesting that the methodology of MDCM upheld professional and legal significance in hazard assessment
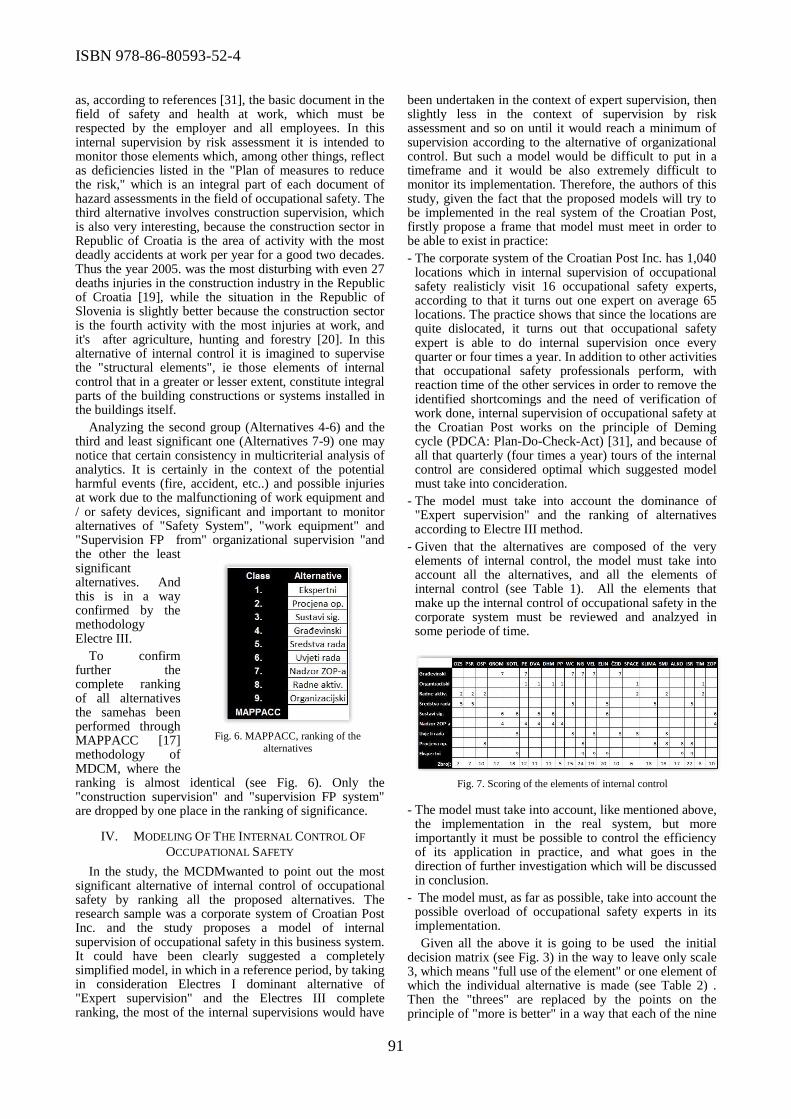
ISBN 978-86-80593-52-4
91
Fig. 6. MAPPACC, ranking of the
alternatives
Fig. 7. Scoring of the elements of internal control
Figure 4.
as, according to references [31], the basic document in the field of safety and health at work, which must be respected by the employer and all employees. In this internal supervision by risk assessment it is intended to monitor those elements which, among other things, reflect as deficiencies listed in the "Plan of measures to reduce the risk," which is an integral part of each document of hazard assessments in the field of occupational safety. The third alternative involves construction supervision, which is also very interesting, because the construction sector in Republic of Croatia is the area of activity with the most deadly accidents at work per year for a good two decades. Thus the year 2005. was the most disturbing with even 27 deaths injuries in the construction industry in the Republic of Croatia [19], while the situation in the Republic of Slovenia is slightly better because the construction sector is the fourth activity with the most injuries at work, and it's after agriculture, hunting and forestry [20]. In this alternative of internal control it is imagined to supervise the "structural elements", ie those elements of internal control that in a greater or lesser extent, constitute integral parts of the building constructions or systems installed in the buildings itself.
Analyzing the second group (Alternatives 4-6) and the third and least significant one (Alternatives 7-9) one may notice that certain consistency in multicriterial analysis of analytics. It is certainly in the context of the potential harmful events (fire, accident, etc..) and possible injuries at work due to the malfunctioning of work equipment and / or safety devices, significant and important to monitor alternatives of "Safety System", "work equipment" and "Supervision FP from" organizational supervision "and the other the least significant alternatives. And this is in a way confirmed by the methodology Electre III.
To confirm further the complete ranking of all alternatives the samehas been performed through MAPPACC [17] methodology of MDCM, where the ranking is almost identical (see Fig. 6). Only the "construction supervision" and "supervision FP system" are dropped by one place in the ranking of significance.
IV. MODELING OF THE INTERNAL CONTROL OF
OCCUPATIONAL SAFETY
In the study, the MCDMwanted to point out the most significant alternative of internal control of occupational safety by ranking all the proposed alternatives. The research sample was a corporate system of Croatian Post Inc. and the study proposes a model of internal supervision of occupational safety in this business system. It could have been clearly suggested a completely simplified model, in which in a reference period, by taking in consideration Electres I dominant alternative of "Expert supervision" and the Electres III complete ranking, the most of the internal supervisions would have
been undertaken in the context of expert supervision, then slightly less in the context of supervision by risk assessment and so on until it would reach a minimum of supervision according to the alternative of organizational control. But such a model would be difficult to put in a timeframe and it would be also extremely difficult to monitor its implementation. Therefore, the authors of this study, given the fact that the proposed models will try to be implemented in the real system of the Croatian Post, firstly propose a frame that model must meet in order to be able to exist in practice:
- The corporate system of the Croatian Post Inc. has 1,040 locations which in internal supervision of occupational safety realisticly visit 16 occupational safety experts, according to that it turns out one expert on average 65 locations. The practice shows that since the locations are quite dislocated, it turns out that occupational safety expert is able to do internal supervision once every quarter or four times a year. In addition to other activities that occupational safety professionals perform, with reaction time of the other services in order to remove the identified shortcomings and the need of verification of work done, internal supervision of occupational safety at the Croatian Post works on the principle of Deming cycle (PDCA: Plan-Do-Check-Act) [31], and because of all that quarterly (four times a year) tours of the internal control are considered optimal which suggested model must take into concideration.
- The model must take into account the dominance of "Expert supervision" and the ranking of alternatives according to Electre III method.
- Given that the alternatives are composed of the very elements of internal control, the model must take into account all the alternatives, and all the elements of internal control (see Table 1). All the elements that make up the internal control of occupational safety in the corporate system must be reviewed and analzyed in some periode of time.
- The model must take into account, like mentioned above, the implementation in the real system, but more importantly it must be possible to control the efficiency of its application in practice, and what goes in the direction of further investigation which will be discussed in conclusion.
- The model must, as far as possible, take into account the possible overload of occupational safety experts in its implementation.
Given all the above it is going to be used the initial decision matrix (see Fig. 3) in the way to leave only scale 3, which means "full use of the element" or one element of which the individual alternative is made (see Table 2) . Then the "threes" are replaced by the points on the principle of "more is better" in a way that each of the nine

ISBN 978-86-80593-52-4
92
alternatives ranks through maximum of nine and a minimum of 1 point. Thus elements (triplets), predominant alternatives of "expert supervision" receive each 9 points, followed by elements of "hazard assessment" each 8 points and so on until the elements of "organizational control" each 1 point, and all of according
to the ranking of alternatives of the Electre I and the Electre III (see Fig. 4).
The resulting points are calculated for each element separately (see Fig. 7), and ultimately we get the power matrix of each element. Thus, for example element NG - damage bearing parts of building structures (see Table 1) gets the highest score, while the element of TIM - teamwork when performing demanding workflows gets the lowest score.
According to the obtained rank of the elements, matrix model of internal control is arranged (see Table 3). The matrix shows a model for use in a five-year cycle, and is defined as followed:
- The abbreviation means the acronym of the element of internal control (see Table 1), which are arranged from the point most important to the least important element (column points).
- The periodicity of internal control involves a proposed model after which, by considering the number of points, we define in which period individualy elements of
internal supervision of occupational safety will be carried out. Since there is the maximum of 24 points, and periodicals are divided into eight steps, so each period will be in the range of three points. Ex.: from 1 to 3 points - elements are used in internal supervision every eighth time; 13 to 15 points - elements are used in internal supervision every fourth time or 22 to 24 points - elements are used in internal supervision every time.
- Ranking simply replaces periodical scoring with ranks from A (elements used in internal control every time) to H (elements used in internal control every eighth time)
- Ordinal control number means to meet the demand by which an internal control is performed once every quarter or four times a year.
- Type of control defines which rank of the internal supervision of the occupational safety we use in the inspection tour by taking in consideration the periodicity of internal supervision and
- Number of yearly elements tells us how overloaded are the occupational safety professionals with the amount of the elements that must be accepted in the whole year activities of internal supervision of occupational safety. Clearly, in the first year that the workload is a bit smaller, but in the following years, that burden gets almost equal.
All the requirements mentioned above are accepted by the suggested model of the internal occupational safety, and especially the ranking obtained by Electre methods. The biggest number of points is related to the elements of the most dominant alternatives, it is easy to conclude that they are the most appearing ones in the periodical of the internal control. This proves also the H2 because it suggests a model of the internal supervision of occupational safety in corporate system through the most important single approaches of the internal control of occupational safety.
V. CONCLUSION
The authors of this study managed to find only two studies that apply the methodology of MCDMin the field of occupational safety. These were the studies [16], in which Electre method was used for ranking versions of system of customer relationship management in the occupational safety companies, or, the AHP method was used for the evaluation of security measures in laboratories of dental restoration production [30]. Similar or same situation exists in the other branches of the security: „Maritime safety is a critical issue and attracts the interest of academics, professionals and policy-makers. There are many approaches and many references available in the literature; however, most of them do not use the MCDM methodological and decision-making tools used and tested in other fields“[29].According to reference [14] theElectre methods of MCDM, can be used in all of the situations when:
- The decision-maker wants to include in the model at least three criteria; - Actions are evaluated (for at least one criterion) on an ordinal scale or on a weakly interval scale; - A strong heterogeneity related with the nature of evaluations exists among criteria (e.g., duration, noise, distance, security, cultural sites, monuments, ...); - Compensation of the loss on a given criterion by a gain on another one may not be acceptable for the decision-maker and; - For at least one criterion the following
TABLE III MATRIX OF THE INTERNAL MODEL OF SUPERVISION
Abbrevi
ation Poin
ts
Per
iod
icso
fint
ernal
super
vis
i
on
Ran
kin
g
Num
ber
ofe
le
men
ats
Ord
inal
num
be
rofs
uper
vis
ion
Typeo
fcontr
ol
Annual
nubero
fele
men
ts
NG 24 EVERY
TIME
(22-24)
A 2 1. A
18 ISR 22
2. AB
ELIN 20 EVERY
2nd (19-
21)
B 2 3. AC
VEL 19 4. ABD
KOTL 18 EVERY
3rd (16-
18)
C 3
1. AE
29 GROM 17 2. ABCF
ALKO 17 3. AG
WC 15 EVERY
4th (13-
15)
D 3
4. ABDH
KLIMA 13 1. AC
29 SMJ 13 2. ABE
PE 12
EVERY
5th (10-
12)
E 6
3. A
DVA 11 4. ABCDF
DHM 11 1. A
27 OSP 10
2. ABG
ČZID 10 3. ACE
ZOP 10 4. ABDH
OZS 7 EVERY
6th(7-9) F 2
1. A
26 PSR 7 2. ABCF
SPACE 6 EVERY
7th(4-6) G 2
3. A
PP 5 4. ABDE
TIM 3 EVERY
8th(1-3) H 1
Annualaverageoft
heelements:
25,
80

ISBN 978-86-80593-52-4
93
holds true: small differences of evaluations are not significant in terms of preferences, while the accumulation of several small differences may become significant.
In accordance with things mentioned above, it is evident that there are a number of problems in the field of occupational safety, and that could or even have to use MCDMmethodology, but unfortunately that is not the practice in the world of scientific research. Therefore, multidisciplinary researches are more than necessary in the field of occupational safety, especially in the aspects of the information science research and methodology.In this study, the model of internal supervision of occupational safety is proposed, and it accepts the ranking obtained through the methodology of MCDMand the reality of implementation into big business systems. The authors plan to implement the proposed model and start with its realisationand monitoring the latest in early, 2015. According to this it is proposed to continue the research in the way to document all measurable activities of the proposed model in practice at work, so a new study that will analyze the adequacy of the proposed model could be done in detirmeneted timeframe. In this analysis, it is suggested to pay attention to the good and bad features of the model and the possible correlation between the proposed model and improval of some elements of occupational safety in the corporate system, for eg.: injuries, raising awareness among workers about the importance of occupational safety, safer working of employees, technicaly correct work equipment, etc.
Acknowledgment
This work was supported by the Ministry of Education,
Science and Technological Development of the Republic
of Serbia under Grant III 42006 and Grant III 44006.
VI. REFERENCES
[1] J. Aczel and T. L. Saaty, Procedures for synthesizing ratio
judgment, Journal of Mathematical Psychology, vol. 27, 1983., pp. 93 – 102.
[2] N. Kacian, Security basics. IPROZ, Zagreb, 2000.
[3] I. Božaićet al., Occupational safety expert. Croatian society of occupational safety engineers, Zagreb, 2010.
[4] D. Cmrečnjak et al., Occupational safety service. Croatian society of occupational safety engineers, Zagreb, 2009.
[5] I. Mance and E. Žiger, Design of the model and management of occupational safety, 2nd Scientific conference with international participation Management and safety, Croatian society of occupational safety engineers, 2007., pp. 125 – 139.
[6] Z. Trupčević, Occupational safety evaluation at the employers, Safety, vol. 48, 2006., pp. 57 – 62.
[7] J. Hovdenand R. K. Tinmannsvik, Internal control - a strategy for occupational-safety and health. Experiences from Norway, Journal of occupational accidents, vol. 12, 1990., pp. 21 – 30.
[8] J. Taradi and N. Grošanić, Process model of occupational safety in business system4th Scientific conference with international participation Management and Safety, Croatian society of occupational safety engineers, 2011., pp. 330 – 341.
[9] M. Nikolić, A possibility of assigning weight citeria in multiple criteria decision making method, IMK 14 – Reasearch and development, vol 8, 2002., pp. 43. – 48.
[10] T. L. Saaty, The Analytic Hierarchy Process, McGraw-Hill, 1980.
[11] T. Hunjak, Mathematical foundations of the methods for multicriterial decision making, Mathematical Communications, vol. 2, 1997., pp. 161 – 169.
[12] B. Petz, Basic statistical methods for non-mathematicians. Publisher Slap, Jastrebarsko, 2007.
[13] J. Jablonský, Software support for multiple criteria decision making problems, Management Information Systems, vol. 4., 2009., pp. 29 – 34.
[14] J. Figueira, V. Mousseau and B. Roy, Electre methods, International Series in Operations Research & Management Science, vol. 78., 2005., pp. 133 – 153.
[15] J. Figueira, V. Mousseau and B. Roy, Multiple Criteria Decision Analysis: State of the Art Surveys, ELECTRE methods, Springer Verlag, Boston, Dordrecht, London, 2005., pp. 133. – 162.
[16] I. Mance and R. Fabac, Application of the ELECTRE method for determination of dominant version of CRM system in the field of occupational safety, Safety, vol. 55, 2014., pp. 319 – 332.
[17] B. Matarazzo, Multicriterion analysis of preferences by means of pairwise actions and criterion comparisons (MAPPACC), Applied mathematics and computation, vol. 18, 1986, pp. 119 – 141.
[18] … Law on Occupational safety, National newspapers, number 71./2014., Zagreb
[19] Đ. Pap, Occupational safety in 2010, Safety, vol. 53, 2011., pp. 203 – 216.
[20] M. Pavlič and M. Markič, Injuries at work in the Republic of Slovenia from 1906. to 2008., Safety, vol. 52, 2010., pp. 1 – 17.
[21] Z. Ćosić, M. Boban and M. Ivković, Integrated approach to risk assessment – Inseparable part of business organization, Safety, vol. 53, 2011., pp. 255 – 260.
[22] C. Giannoulis and A. Ishizaka, A Web-based decision support system with ELECTRE III for a personalized ranking of British universities, Decision Support Systems, vol. 48, 2010., pp. 488 – 497.
[23] X. Damaskos and G. Kalfakakou, Application of ELECTRE III and DEA methods in the BPR of a bank branch network, Yugoslav Journal of Operations Research, vol. 15, 2005., pp. 259 – 276.
[24] A. Özkan et al., Application of the ELECTRE III method for a solid waste management system,Anadolu University Journal Of Science And Technology, vol. 12, 2011., pp. 11 – 23.
[25] B. Karleuša, B. Beraković and N. Ožanić, Application of ELECTRE III method on the selection of optimum irrigation, Builder, vol. 57, 2005., pp. 21 – 28.
[26] B. Kovačić, Multicriteria decision making in traffic–master’s thesis,University inZagrebu, Zagreb, 2004.
[27] Z. Dragašević, Model of multiciteria analysisto rank the banks – PH. D. thesis, University of Montenegro, Podgorica, 2010.
[28] A. Hatami-Marbini et al., A fuzzy group ELECTRE method for safety and health assessment in hazardous waste recycling facilities, Safety Science, vol. 51, 2013., pp. 414 – 426.
[29] O. Schinas, Examining the use and application of Multi-Criteria Decision Making Techniques in Safety Assessment, International Symposium On Maritime Safety, Security And Environmental Protection, Athens, Greece, 2007.
[30] B. Agarski et al., Multi-criteria assessment of environmental and occupational safety measures in dental prosthetics laboratories, Journal of Production Engineering, vol. 15, 2012., pp. 53 –56.
[31] D. Gavanski, M. Sokola and S. Krnjetin, Adoption of the Act on the Risk Assessment-expiriences in the Republic of Serbia, 5th Scientific conference with international participation Management and Safety, Croatian society of occupational safety engineers, 2010., pp. 247 – 260.
[32] M. Biljan-August, S. Pivac and A. Štambuk, Sttistical analysi in economics. Faculty of Economics of University in Rijeka, Rijeka, 2009.

ISBN 978-86-80593-52-4
94
The Status of Women in Information Systems
and Technologies in Serbia Ana Pajić1, Dragana Bečejski-Vujaklija1
1Faculty of Organizational Sciences, University of Belgrade, Serbia
[email protected]; [email protected]
Abstract - The rapid development of information systems and technologies calls for establishment of gender equality at all levels. The issue of women’s underrepresentation in information technology is recognized, but the numbers of women are still disappointing. The study is implemented through online survey, where the link was distributed via email to women who work at jobs related to IT, in the IT sector or other organizations. The first results indicate that women are outnumbered in Serbia and they face certain challenges and obstacles that men do not. The aim of the paper is to point out the necessity of declining gender gap in information systems and technology in Serbia, in order to use the whole potential of fast growing market.
I. INTRODUCTION
For more than a few decades information systems and technologies have changed the world and interpersonal relationships, improving quality of business processes, facilitating access to information and creating new forms of communication. They have led to changes in various spheres of social life, becoming one of the most dominate technology in today’s world. The modern, competitive and profitable business cannot be imagined without the use of information technology.
Fast development of information systems and technologies had a huge impact on employment, as well as women’s employment. On the other side, a disparity between women and men has persisted in the requirement and retention of women at all levels of information technology [IT], particularly in the highest corporate and academic positions. There is still established perception that it is a traditionally male dominating profession and employers prefer more male ICT professionals. Women face different challenges and barriers in this so-called “male” field.
Facing continuously with different stereotypes, through childhood and schooling time, girls don’t recognize technology as perspective career. IT sector, which is growing continuously, are seen as boring activity which is not worth getting involved with. Is it female lack of interest or lack of support and long-term stereotypes that keeping women away?
Despite a number of obstacles, some women succeed at the top of IT. As Famed Y. Rashid (2011) pointed out “the bulk of female power seems to be concentrated in the vice presidents, COOs and CTOs. Women tend to be second-in-command and leaders of major divisions. That’s not a bad place to be, considering where women were only a few short years ago.” (p.1). Unfortunately these women are rare examples, but only with the real role models and good work learning environment the situation can be improved.
Therefore, this study will be addressing this issue. Paper goal will be to assess the general status of women in IT profession in Serbian market.
The basic question to be answered is where the women are in information technology in Serbia, as well as does the market referring differently male computer engineers than female. We want to investigate gender gap in IT field, in order to awake community and government how serious the problem is and to get involved them in solving it.
The starting point is the survey we conducted among female population working in the field. The main results will be presented in this paper, which could be a good starting point for further research and case studies.
II. LITERATURE OVERVIEW
The issue of women’s underrepresentation in information technology, whether in school, higher education, or industry, has been studied in many ways over several decades. It is receiving growing attention not just from scientists, but also in industry. A number of firms and institutions have recognized the problem, women are facing with, trying to discover its very complicated nature.
Gender Gap in IT has been known since as far back as 50s, with appearing of first dedicated electronic business computer [1]. In early computing, women had been mostly involved in advertising to sell data processing equipment and as data processing labour force. The image of woman as low-cost, unskilled worker was then created and seems to left significant mark on further female professional position in the field.
ISBN 978-86-80593-52-4
95
From the 1950s through the mid-1960s, the primary roll of female worker was to demonstrate power of early office machine quite easy to use. The photographs of female workers on adverts, standing by and working on machine, shared the message „although the electronic computers they use ‘‘are so complex,’’ nonetheless, ‘‘a girl can be taught how to work in only ten minutes““(Hicks Marie, 2010, p.7-8). Machine was tending to complete complex tasks, where low skill and inexpensive replaceable labour can use it. Therefore, routine jobs were dedicated to female worker. In 1960s, women raised their voice and tried to improve their position on the market, convincing community to see them not as „cheap labour but as qualified technicians“(Hicks Marie, 2010, p.8). Despite this effort, employers continued to perceive women as unreliable, not committed to a career worker, meant to be on lower-level positions. They were more demonstrators instead of real computer workers. Unfortunately, in 1970s culture norms were more changed and women started to be use as a sexual object in commercials, focusing on their bodies, which more marginalized them.
Fig.1. The advertisements appeared in early computing [1]
Today’s situation is quite better. The number of women in science and engineering was growing, yet men continue to outnumber women, especially at the upper levels of these professions. But recent studies in USA showed that the number is dropped in last few years [2]. The percentage of women in IT is declining despite the programs that specifically addressed young women. The research from June 2002 [3] presented the same results for countries around the world. India was the only exception, where programming is seen as better option in comparison to working in a factory or a farm.
Different theories and empirical studies concentrate on the question why there is a lack of women within the IT profession. Ellen Spertus (1991) have come to the conclusion that not just the problems resulting from working in primary male environment, but also the different ways in which children are raised can influence a girl not to pursue an interest in technology. She highlighted the existence of different expectations for men and women based on culture [4]. Bearing in mind the words of eminent computer scientists, Professor Dame Wendy Hall, “girls still perceive computing to be “for geeks” and that this has proved to be “cultural” obstacle, so far impossible to overcome” (Shepherd Jessica, 2012 ,p.1), we can conclude that cultural
stereotypes of gender skills, abilities and competences are well-established in academic and corporate world.
On the other hand, there is an opinion that women are not quite aware of variety of options IT career has to offer. Mostly women think that IT is mainly about programming and not explore creative parts of the field, which can be more interesting and inspiring for them [6].
Furthermore, it is not enough just to encourage girls to pursue IT career but also to stay within for long-term. Women face difficulties with keeping up with new coming technologies in everyday changing environment, when they make a decision to have a family or to take maternity leave. However, technology itself provides more flexibility with opportunity for working from home via Internet.
III. RESEARCH RESULTS
The main focus of this research is to look at the state of job and working environment satisfaction among women participating in IT sector in Serbia [9]. Data was collecting through online survey, where the link was distributed via email to women who work at jobs related to IT, in organizations where IT is core work or others. The survey is posted on the website https://docs.google.com.
The research was conducted in March 2012 and initial results are presented in this paper. The results should be used for information purposes and be considered as good base for further in-depth comprehensive study of women in information systems and technologies. We used statistical software SPSS version 11.5 to process survey results.
The number of participants involved in the survey is 182, with different educational background and working experience. They are connecting through the interest in technology and science. For the purpose of presenting them, we start with the main variables which can have significant impact on final results.
In Fig. 1 we can see participation rates by age, with the age groups as defined in survey. Most female participants are young. The vast majority (72 percent) of women are below the age of 35 years old. Only 14.8 percent are over the age of 46, and about one-half of those individuals are over 55 years old.
TABLE I
AGE RANGE OF PARTICIPANTS
Frequency Percent
Below 25 24 13.2
26-35 107 58.8
36-45 24 13.2
46-55 18 9.9
Over 55 9 4.9
Total 182 100.0
ISBN 978-86-80593-52-4
96
Fig. 1. Age range
Furthermore, the examination of company profile variable is quite interesting. As we expected, mostly participants (53.3 percent) are coming from companies where IT is core business work. 17 percent of them are working in service industries and substantial number of women is in the companies related to education.
Fig. 2 provides a view on outcomes for this independent variable, which impact on results would be discussed in next section.
Leading companies are failing to capitalize on the talents of women in the workforce, according to the report [8]. Lack of women's participation in the workforce can costs the billions of dollars every year developed and growing fast economies. For purpose of monitoring gender gap in IT sector in Serbia, we observed the percentage of women in companies working at IT related jobs. The rate of IT female professionals in the labour force can be seen in the graph (Fig. 3). Not surprisingly, only 33 participants responded that in their companies, women present over 50 percent of workforce.
TABLE II COMPANY PROFILE
Frequency Percent
Education / Training
IT core business
The public sector
Service industries
Total
20 11.0
97 53.3
12 6.6
31 17.0
22 12.1
182 100.0
TABLE III
FREQUENCY OF WOMEN'S PERCENTAGE
Other
Serv ice industries
The public sector
IT core business
Education / Training
Fig. 2. Company profile distribution
Fig. 3. Frequency of women’s percentage in companies
The leading discussion in this field is regarding different career challenges female IT workers face than their male counterparts. Moreover, there is existing assumption of fewer women at high level positions with responsibilities of leading complex projects. Is this mean that being the women represent disadvantage in getting a job? 85.7 percent of women responded on this question with negative answer. They don’t consider men have an advantage on women in getting a job in IT industry. The distribution of responses is more or less even in all age groups and it is presented in Fig. 4.
On the other side, the statement that women don’t so often lead complex projects is not completely confirmed. Around 27 percent of participants say that no women in their companies get to lead a complex projects. It is more emphasized among younger population, where one-half of respondents below 25 years old say the same (Fig. 5). Performing Chi-square test, we made comparation among these two and company profile variable. Outcome show statistical significant relationship between profile of participants' companies and their responses regarding gender descimination in getting a job. The corresponding probability is 0.001, which is lower than the conventionally accepted significance level of 0.05 or 5 percent.
Frequency Percent
Below 1% 14 7.7
1-5% 16 8.8
6-10% 13 7.1
11-20% 33 18.1
21-50% 73 40.1
over 50% 33 18.1
Total 182 100.0
ISBN 978-86-80593-52-4
97
Fig. 4. Gender difference in getting job
Age range
Over 5546-5536-4526-35Below 25
Coun
t
100
80
60
40
20
0
Y es
No6
28
12
7
1618
79
12
Fig. 5. Women lead complex projects
The brief statistical analysis of gender pay gap shows that women are equally compensated for their work compered to men. There is not substantial difference in wage among IT workers in Serbia in the opinion of research participants. Slightly disagreement can be observed in younger age groups, particularly in group between 35-45 years old. The differences become non-significant as we move up a group.
The similar results are obtained regarding appreciation of women in IT. Around 24 percent of responders are not satisfied with the treatment from the employers and co-workers. Mostly it is visible in the group between 36-55 years old. The response overview is showed using Fig. 7. Undertaken Chi-square test shows an important influence of company profile variable on equality in appreciation of both genders. The corresponding probability is 0.02. We can say that there is a tendency of it to affect also payment equality, which should be confirmed with extended empirical data.
I. CONCLUSION
The study analysis indicates that more proactive guidelines need to be implemented in order to bring a balance in the participation of women in ICT. Women and men are still divided by their perceptions of growth opportunities and compensation levels. Reducing gender gap for technology worker is a slow process and a big
Fig. 6. Gender pay gap
Age range
Over 5546-5536-4526-35Below 25
Coun
t
100
80
60
40
20
0
Y es
No69
24
7
1215
83
21
Fig. 7. Appreciation of women in IT
challenge.
Pursuing the objective of obtaining relevant data regarding status of women in IT profession in Serbia, we have presenting following:
undertake a descriptive study to characterize the independent variables, such as number of women working at IT related jobs in responders companies expressing as a percentage (values presented in Figs. 1, 2 and 3).
in order to understand behaviour and obstacles women facing in IT career, we assess attitudes and opinions of responders regarding gender stereotypes and commonly used statements over women discrimination in IT world.
Results show that the majority of involved women believe in equality between women and men in getting job, leading complex project and payment. As already mentioned, we observed the statistical significant correlation between company profile variable and distribution of responses regarding gender payment gap, women appreciations and differences in getting a job. Therefore, we can’t ignore the other part of the population which disagrees with them.
There is not substantial difference in wage among IT female employees at the same job level within the firm’s hierarchy in research participants' opinions. On the other side, elderly women consider they don’t have equal

ISBN 978-86-80593-52-4
98
promotion opportunities at work and don’t get to lead more complex projects. In conclusion, there are no differences between female and male IT workers in Serbia at lower job levels, but still gender discrimination is the biggest barrier to work promotions for women.
In spite of the encouraging findings of the current study, we identified a number of weaknesses. A limited number of data values were collected during the execution of the survey, due to the limited amount of time and the number of subjects. We may consider the quality of data collection to be not enough for deep comprehensive analysis. Furthermore, we asked subjects firstly for their personal opinion, came from their experience, which should be reviewed with more data in the future. The results of this research should therefore be interpreted only as findings and good basis for further projects.
In view of the brief analysis of the gender gap statistics in IT Serbia, it is important to continue research on this population as studies provide essential information about experience women facing. We intend to conduct more of field studies in cooperation with other institutions and to analyse the representation of females enrolled on studies at Belgrade University.
REFERENCES
[1] M. Hicks, Only the Clothes Changed: Women Operators in British Computing and Advertising, 1950–1970. IEEE Annals of the History of Computing, 2010.
[2] M. Swift, Blacks, Latinos and women lose ground at Silicon Valley tech companies. Retrieved from http://www.mercurynews.com/top-stories/ci_14383730, 2011.
[3] J. James, IT gender gap: Where are the female programmers?. Retrieved from http://www.techrepublic.com/blog/programming-and-development/it-gender-gap-where-are-the-female programmers/2386, 2010.
[4] E. Spertus, Why are there so few female computer scientists?, MIT Artificial Intelligence Laboratory Technical Report 1315, 1991.
[5] J. Shepherd, 'Geek' perception of computer science putting off girls, expert warns. Retrieved from http://www.guardian.co.uk/education/2012/jan/10/fewer-girls-taking-computer-science, 2012.
[6] E. Morton, Beyond the barriers: What women want in IT. Retrieved from http://www.techrepublic.com/article/ beyond-the-barriers-what-women-want-in-t/6310425?tag=content; siu-container, 2005.
[7] Y. F. Rashid, IT Management: 10 Powerful Women Cracking the Glass Ceiling in Technology. Retrieved from http://www.eweek.com/c/a/IT-Management/10-Powerful-Women-Cracking-the-Glass-Ceiling-in-Technology-136451/, 2011.
[8] S. Zahidi and H. Ibarra, The Corporate Gender Gap Report 2010. Geneva, Switzerland: World Economic Forum, 2010.
[9] A. Pajić, D. Bečejski-Vujaklija, Where are the women in IT Serbia, SymOrg 2012 (Symposium of Organizational Sciences), ISBN-10: 86-7680-255-6, Proceedings pp. 1000-1006, Zlatibor, Serbia, 2012.
ISBN 978-86-80593-52-4
99
Women Active in ICT Sector in Serbia
Miroslava Raspopović1, Svetlana Cvetanović1, Milica Vasiljević Blagojević1 1Metropolitan University, Belgrade, Serbia
[email protected]; [email protected];
Abstract— This paper focuses on the position of women in the ICT sector in Serbia, and compares its findings to the position of women in the ICT sector in Europe. This study presents not only the position of women in ICT, but it also gives a perspective on the decreasing number of ICT professionals, while the demand for ICT experts increases. This analysis compares the number of young people who graduate from ICT related study areas in Serbia, and the current employment in Serbia in ICT sectors. Of particular interest is to analyze the presence of women in ICT in both education and working fields.
I. INTRODUCTION
Development of technology and era of Internet has provided many opportunities for men, women, and youth when accessing wide spectrum of learning resources in order to gain knowledge more effectively. Empowering youth to become more familiar with technological advances of information-communication technologies (ICT) allows new ideas and innovations to be developed, which in return can provide sustainability for the technological growth [1]. However, in order to achieve such sustainability it is important to equally involve women and men in the digital sector.
Recent research suggests that ICT development boosts economic growth. On one hand, developing countries who are investing in ICT development can benefit from the economic growth, and on the other, if the country does not seize the opportunity to do so, it may be in jeopardy of losing the technological competitive edge and a chance to increase its economical competitiveness, while increasing inequalities and digital divide [2]. Furthermore, the research shows that including women in ICT can significantly increase Gross Domestic Product (GDP) not only in developing countries. In Europe it was suggested that bringing women into digital sector can bring the boost up to €9 billion annual in GDP [3]. This study also points out that there are barriers that are preventing women from actively participating in this sector such as cultural barriers (traditions and stereotypes), lack of self-confidence, lack of bargaining skills, risk-aversion, lack of role models, etc.
A problem, which affects both men and women, is that
in the growing ICT industry, number of ICT-related jobs is increasing, while the number of youth interested in pursuing ICT-related study areas is decreasing [3]. Even though this fact may harm the pace of further ICT developments, it is evident that due to the particularly low number of females in the ICT sector there is room for improvement when including more females.
This study analyzes number of students enrolling into the universities to study computer-related study areas. In particular, we consider the following ICT-related majors: math and informatics teacher, information technology, electrical and computer engineering, business information system and computer science. Furthermore, we analyze the structure of the workforce in Serbia, including the unemployment. The paper is organized as follows. Section 2 describes the methodology used for the results analysis, Section 3 analyzes the presence of women studying in ICT-related fields, Section 4 presents unemployment rates in Serbia and future perspectives, and Section 5 concludes the paper.
II. METHODOLOGY
This study uses statistical analysis in order to analyze interest of students in ICT in Serbia, and compares these findings to the similar analysis conducted in Europe. Moreover, it is of interest to determine the interest of females in ICT through their involvement in academics in ICT fields. This study provides incites to the presence of women in ICT sector. In order to show the interest of youth in ICT-related study fields, the statistical analysis was conducted on data provided by Statistical Office of the Republic of Serbia. Results are compared on all three levels of academic studies - bachelor, masters and doctoral.
Despite the results, which show that presence of women in ICT sector can contribute to the overall economy growth, women in ICT sector are still underrepresented [3]. Furthermore, the following research will show that both men and women are less interested in ICT in Serbia, than in other fields such as economy, law, medicine, etc.
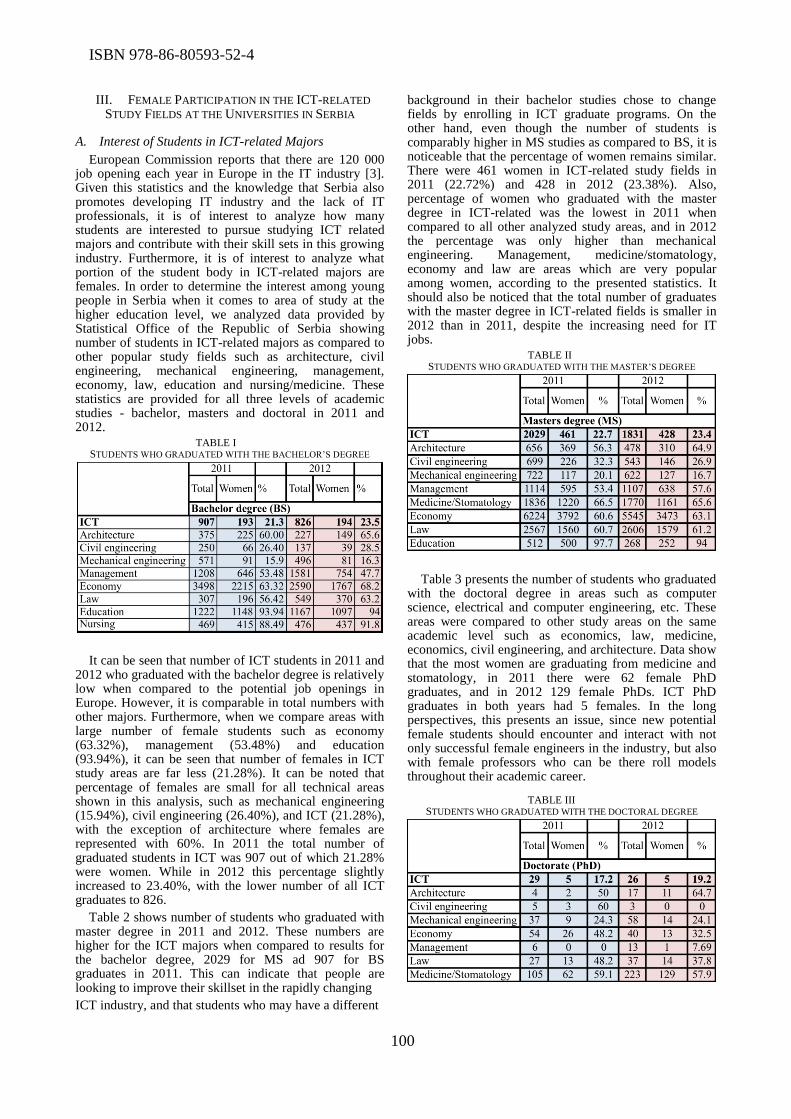
ISBN 978-86-80593-52-4
100
III. FEMALE PARTICIPATION IN THE ICT-RELATED
STUDY FIELDS AT THE UNIVERSITIES IN SERBIA
A. Interest of Students in ICT-related Majors
European Commission reports that there are 120 000 job opening each year in Europe in the IT industry [3]. Given this statistics and the knowledge that Serbia also promotes developing IT industry and the lack of IT professionals, it is of interest to analyze how many students are interested to pursue studying ICT related majors and contribute with their skill sets in this growing industry. Furthermore, it is of interest to analyze what portion of the student body in ICT-related majors are females. In order to determine the interest among young people in Serbia when it comes to area of study at the higher education level, we analyzed data provided by Statistical Office of the Republic of Serbia showing number of students in ICT-related majors as compared to other popular study fields such as architecture, civil engineering, mechanical engineering, management, economy, law, education and nursing/medicine. These statistics are provided for all three levels of academic studies - bachelor, masters and doctoral in 2011 and 2012.
TABLE I STUDENTS WHO GRADUATED WITH THE BACHELOR’S DEGREE
It can be seen that number of ICT students in 2011 and 2012 who graduated with the bachelor degree is relatively low when compared to the potential job openings in Europe. However, it is comparable in total numbers with other majors. Furthermore, when we compare areas with large number of female students such as economy (63.32%), management (53.48%) and education (93.94%), it can be seen that number of females in ICT study areas are far less (21.28%). It can be noted that percentage of females are small for all technical areas shown in this analysis, such as mechanical engineering (15.94%), civil engineering (26.40%), and ICT (21.28%), with the exception of architecture where females are represented with 60%. In 2011 the total number of graduated students in ICT was 907 out of which 21.28% were women. While in 2012 this percentage slightly increased to 23.40%, with the lower number of all ICT graduates to 826.
Table 2 shows number of students who graduated with master degree in 2011 and 2012. These numbers are higher for the ICT majors when compared to results for the bachelor degree, 2029 for MS ad 907 for BS graduates in 2011. This can indicate that people are looking to improve their skillset in the rapidly changing
ICT industry, and that students who may have a different
background in their bachelor studies chose to change fields by enrolling in ICT graduate programs. On the other hand, even though the number of students is comparably higher in MS studies as compared to BS, it is noticeable that the percentage of women remains similar. There were 461 women in ICT-related study fields in 2011 (22.72%) and 428 in 2012 (23.38%). Also, percentage of women who graduated with the master degree in ICT-related was the lowest in 2011 when compared to all other analyzed study areas, and in 2012 the percentage was only higher than mechanical engineering. Management, medicine/stomatology, economy and law are areas which are very popular among women, according to the presented statistics. It should also be noticed that the total number of graduates with the master degree in ICT-related fields is smaller in 2012 than in 2011, despite the increasing need for IT jobs.
TABLE II STUDENTS WHO GRADUATED WITH THE MASTER’S DEGREE
Table 3 presents the number of students who graduated with the doctoral degree in areas such as computer science, electrical and computer engineering, etc. These areas were compared to other study areas on the same academic level such as economics, law, medicine, economics, civil engineering, and architecture. Data show that the most women are graduating from medicine and stomatology, in 2011 there were 62 female PhD graduates, and in 2012 129 female PhDs. ICT PhD graduates in both years had 5 females. In the long perspectives, this presents an issue, since new potential female students should encounter and interact with not only successful female engineers in the industry, but also with female professors who can be there roll models throughout their academic career.
TABLE III STUDENTS WHO GRADUATED WITH THE DOCTORAL DEGREE
ISBN 978-86-80593-52-4
101
B. Female Enrollment in ICT-related Majors
Based on the previously presented data, it is of interest to analyze how many students are graduating from ICT-related majors as compared to all other majors. These numbers can bring the perspectives of how competitive Serbian ICT industry can be as compared to other countries. In 2011 out of 47523 graduates on all three academic levels (19635 men, and 27888 women), 2965 graduated from ICT-related majors, which is 6.23% out of the graduating student body (Table 4). Even though more women are graduating in general than men, it can be seen that 2.36% women are graduating with ICT degrees, and 11.74% men. Statistics are similar for 2012, 2.36% women and 10.35% with ICT degrees. One can conclude that the majority of graduates are women (58.68% in 2011 and 58.43% in 2012), (58.68% in 2011 and 58.43% in 2012). However, although the percentage of graduates of the female population is higher than men, only 2.36% and 2.24% are in the ICT sector. Furthermore, considering that IT industry is growing and that potential for new job positions in this industry have high perspective, both in Serbia and abroad, it should be noted that the total male population of students who graduated in 2011 or 2012 is only 11.74% and 10.35% in ICT, respectively. The number of young people who are pursuing a career in ICT experiences a slight decrease in 2012 as compared to 2011.
TABLE IV PERCENTAGE OF GRADUATING MEN AND WOMEN IN ICT AS
COMPARED TO OTHER FIELDS
When compared to the similar statistics in Europe [3], one can see that there is a deficit of ICT experts, and that Serbia has similar issues as other countries. For every 1000 graduates there are 95 male and 29 female graduates in ICT in Europe, and 117 male and 23 female graduates in Serbia (Fig. 1).
Fig. 1. Female and male participation in ICT sector in Europe and
Serbia
IV. WOMEN’S ROLES IN THE WORKFORCE OF SERBIA
The employment perspective and the current situation in Serbia can be illustrated through the unemployment rate. In March 2014, uneployment rate was 21.6%, and employment rate was 48% for the age of 15 to 64, when compared to the entire population in Serbia of age 15 and older. Out of the population who can work, almost half of the unemployed is youth, while average salary, without taxes and benefits is 43452 Serbian dinars, which was about 370 euros [4]. It is important to note that earning in March of 2014 was nominally lower by 1.4% and realistically lower by 1.1% than in February of the same year. According to the National Employment Service, 106045 people with higher education were unemployed in 2014, including 63063 people with master and 87 with doctoral degrees [4].
It is of interest to analyze the unemployment for people in ICT industry in Serbia (Table 5). It can be seen that according to data, number of unemployed people in ICT is still relatively high. It is important to note that provided data by National Employment Service does not specify detailed information about provided data such as age, gender, school attended, etc. These additional data can provide more information and insight, and why this number is high in the ICT industry, which is in deficit with experts. The reasons could be many such as inadequate occupation classifications, outdated and/or inadequate IT skills, and many others. These should be parameters for the future research and analysis.
These data show that there are 11134 unemployed people, which are classified under ICT occupations, out of which 3884 are women (34%). Even though the further classification of provided data was not available to authors at time of writing this paper, it is clear that even though the number of unemployed people in ICT sector appears to be high, it should be also analyzed as compared to other occupation. Given this angle of analysis one can see that out of all unemployed people in Serbia, 1.5% is male with ICT occupation and less than 1% is women. This, yet again, points out that the structure of unemployed people in ICT occupation should be further analyzed and researched.
TABLE V NUMBER OF UNEMPLOYED PEOPLE CLASSIFIED UNDER THE ICT
OCCUPATION [4]
What is clear from the data of National Employment Service is that even in other fields there similar or higher number of unemployed women (numbers are higher in areas such as education and health). Even when looking at ICT one can notice smaller percentage of women than men. Globally looking, there are still stereotypes, which classify certain occupation, and male or female occupations [5]. In Serbia, in the last three decades, gender structure has drastically changed, in certain sectors. For instance, education has moved from

ISBN 978-86-80593-52-4
102
dominantly male to dominantly female sector [6]. On other hand, women do have their presence in the male dominant sectors; however, number of women in these sectors is not rapidly increasing, especially in countries that are growing through challenging economical transitions.
A. Brain Drain to Other Countries
Unemployment and lower salaries can lead to high skilled workers leaving the country (referred to as “brain drain”). In the ICT industry where most of the countries are in deficit with experts, it is relatively easy for ICT professionals to find job opportunities with highly competitive salaries in other countries. Based on the World Economic Forum report, Serbia is 2nd in the world for the percentage of people with higher education leaving the country, right after Guinea-Bissau [7]. Ristić et.al. have analyzed brain drain for different countries [8]. This analysis showed that in 2012/2013 out of 144 countries only 3 more countries have higher brain drain than Serbia, and those were Burundi, Haiti and Algeria. They also reported that in 2013/2014 out of 148 countries, Serbia was 2nd.
Mineco conducted a survey research among 200 IT companies, primarily within the software industry. This analysis concluded that software companies are actively advocating for IT curriculums to be improved and innovated so that less time can be spend in developing additional IT skills for the incoming new graduated students. In addition, this study highlights ongoing problem of brain drain of IT experts [9]. They emphasize to main reason for this – better salaries and better opportunities for professional and academic development. Another research, conducted among IT students, showed that high number of students is thinking about leaving Serbia even during their studies (Table 6), which indicates that with the current number of IT students, number of future IT experts that will stay in the country is in jeopardy [11].
TABLE VI
NUMBER OF IT STUDENTS THINKING ABOUT LEAVING SERBIA (SURVEY RESULTS [11])
V. CONCLUSION
In this paper we have analyzed the interest of student in studying in ICT-related study areas, and compared the ration of men and women graduating form these programs. The study showed that number of youth interested in pursuing ICT-related study areas in Europe is relatively low compared to the increasing number of ICT jobs. The focus of this paper was students’ participation (especially female) in the ICT-related study
fields in Serbia, and their perspectives of employment after the graduation.
Presented analysis showed that the total male population of students who graduated in ICT-related study on all three academic levels - bachelor, masters and doctoral in 2011 or 2012, when compared to the entire graduating student body, were only 11.74% and 10.35%, respectively. The female population was even smaller 2.36% in 2011 and 2.24% in 2012. Considering that IT industry is growing, comparative analysis showed that Serbia has similar issues about deficit of ICT experts as other countries in Europe.
Statistics also present that in Serbia, number of unemployed people in ICT is relatively high, contrary to fact than there is deficit of ICT professionals. The reasons could be many such as inadequate occupation classifications, outdated and/or inadequate IT skills, and many others. These should be parameters for the future research and analysis. One of the particular questions to be looked in the future research is the fact that high skilled workers in ICT related fields are leaving the country because of better opportunities. Furthermore, this problem starts early, as research showed that high number of students is contemplating about leaving Serbia even during their studies.
REFERENCES
[1] Doubling Digital Opportunities, Enhancing the Inclusion of Women and Girls in the Information Society, A report by Broadband Commission Working Group on Broadband and Gender, 2013.
[2] Information Economy Report, The Software Industry and Developing Countries, United Nations Conference on Trade and Development, United Nations Publication, ISSN 2075-4396, 2012.
[3] Digital Agenda for Europe, Women Active in the ICT Sector, ISBN 978-92-79-32373-7, 2013.
[4] National Employment Service, No139, Monthly Statistic Bulletin, March 2014, RS National Employment Service, March, 2014
[5] Europian Commission (2012) Database on women and men in decision making Data extracted in March 2012; Corporate Gander Gap Report 2010, World Economic Forum, Geneva Switzerland, 2010.
[6] M. Vasiljević Blagojević, D. Kekuš, Efekti komunikacije i odnosa s javnošću u funkciji unapređenja rukovođenja školom, SymOrg, Zlatibor, ISBN 978-86-7680-216-6, 2010
[7] M. Neag, H. Dakic, Serbia’s Brain Drain, Brain Gain and Brain Circulation. Preuzeto sa http://www.balkanalysis.com, 2011.
[8] B. Ristić, S. Tanasković, Konkurentska pozicija RS 2013. prema izveštaju Svetskog ekonomskog foruma, Fondacija za razvoj ekonomske nauke, Beograd, 2013.
[9] Srpski IT osmatrač (SITO), Program državne podrške IT sektoru, http://www.sito.rs/rs/news/detail/65/Program-dravne-podrke-IT-sektoru#sthash.OsGtTmtl.dpuf, 2014.
[10] M. Matijević, M. Šolaja, ICT in Serbia – At a Glance, Treće izdanja studije o IKT sektoru u Srbiji, Vojvođanski IKT klaster i GIZ, ISBN 978-86-6103-066-6, 2013.
[11] V. Lučić, K. Perčić, M. Vasiljević-Blagojević, “BRAIN DRAIN” from the Perspective of Students of the private universities in Serbia, FPN, Novi Sad, 2012.

ISBN 978-86-80593-52-4
103
Challenges and Benefits of Incorporating ICT in
NGO Initiatives and Activities
Miroslava Raspopović1, Vuk Vasić1 1Faculty of Information Technology, Belgrade Metropolitan University, Belgrade, Serbia
[email protected]; [email protected]
Abstract—This paper examines challenges, barriers, and benefits of implementing information and communication technologies (ICT) in the initiatives and activities of non-governmental organizations (NGOs). This study examines challenges in starting and carrying out the ICT project for increasing efficiency and efficacy of the NGO activities. Of particular interest is to present successful collaboration between NGO and ICT experts conducted in Serbia. This paper gives analysis of a project conducted within NGO with the goal to increase safety among women in order to decrease violence and provide necessary information through mobile platforms. Part of this study is to analyze specific roles of NGOs and ICT experts in their collaboration, and to demonstrate a good practice on the case study.
I. INTRODUCTION
Nowadays, Information and Communications Technology (ICT) is allowing people to conduct their work more effective and easier. ICT extends its benefits not only to its contribution in the industry, but it has spread into the every day life. Furthermore, current technologies allow communication to be conducted effectively, which is important when decision-making and response time in emergency situation plays a critical role. The effectiveness and speed in such situations are not the only factors that are important, but it is also important how this information is transferred and communicated. Humanitarian relief efforts have a great challenge to coordinate communications aspects and communications protocols among all of the organization in order to overcome many of the challenges when coordinating across institutions. Non-governmental organizations (NGOs) are organizations that are mostly engaging in emergencies in order to help people that are faced with natural disasters such as fires, floods, storms, or violence, people conflicts, genocide, etc. [1].
It is common for NGOs to have partners and collaborate with others who are not always local to where NGO activities are conducted and/or coordinated from. These partners and collaborators are often located all around the world, which in return requires effective and prompt communication for the best results [2]. It is intuitive, that technology can improve effectiveness in the communication when long distance collaboration is required. However, currently the presence of ICT in NGO
activities is very low. Furthermore, research is showing that most NGOs are not using ICT in their activities and initiatives [3].
When used properly, technology can provide NGOs with tools that can help people in real life situations. Moreover, ICT can provide not only the fast access to information, but it can also provide the necessary knowledge by bridging the distance and time differences.
In this paper we present how ICT can contribute to enhance initiatives and activities of NGOs. It is of particular interest to present challenges and barriers that can often occur during the collaboration between NGOs and ICT experts. Moreover, in this paper we present a case study that demonstrates how successful project can be implemented in collaboration with NGO and ICT experts, along with a proper technology used during this process.
This paper is organized as follows. Section 2 describes common collaboration challenges and barriers when introducing ICT in NGO activities. Section 3 describes a case study depicting successful collaboration between ICT and NGOs, while implementing mobile technologies in their initiatives in fighting against violence. Section 4 concludes the paper.
II. COLLABORATION CHALLENGES AND BARRIERS
Implementing and incorporating ICT into NGO activities and initiatives can be challenging, which can be similar to introducing new technology into the existing system of any corporation. Some of the challenges are:
ICT implementations can sometimes be very expensive. Even though some technologies can be very useful to increase the effectiveness of NGO activities, their implementation is not always easy to conduct, often due to the budget constraints.
The communication gap between NGO professionals and ICT experts can create challenges in order for both parties to be able to come to the same conclusions and realize what can be implemented and where technological challenges may occur in order to achieve the set goals.

ISBN 978-86-80593-52-4
104
ICT experts have a different understanding and approach developing and implementing certain features and functionalities within the project than NGOs experts.
Collaboration between all of the stakeholders: NGO, ICT and sponsors may not be always on the highest level. It is often required from ICT experts to have close collaboration when developing, implementing and testing certain technologies with all of the stakeholders. However, the frequency of this collaboration may not always be as effective as needed in order for the project to be completed in timely manner.
NGOs are not always willing to share all information about certain initiatives with ICT experts.
When initiating a project with NGO there are some things that should be considered. In order to implement any kind of technological idea it should be checked whether there are some legal constraints for the countries in which this initiative is planned for. Moreover, since technology implementation is usually financially and time consuming, it should be considered how likely is that this idea will help people, and to which extend it will be used. Once it is established that this idea will have high impact on the number of people, it should also be considered whether the target group, for whom this project is focused for, would be afraid to use planned technology. No matter how good an idea may be, if people show resistance towards change, and are afraid of this technology, this may be a potential cause for the failure of the initiative, which includes this technology. Furthermore, it should be considered if it is realistic that this idea can be put into the real world with resources that one may have.
It is important to have a grasp on the capacity of NGO prior to starting a project. Some things that should be considered are how open to collaboration NGO is, are they willing to share all of the information they have about the problems, if they have experts that can conduct big project, and other issues related to the capacity of NGO that are related to managing implementation of ICT into their initiatives.
Even though these challenges and barriers should be taken into consideration when working on such projects, they should not be considered as a determining factor for the unsuccessful initiative. Overcoming these challenges can lead into potentially great results and solved problems that can come out of using technology for good, helping people in the disasters, helping people with medical problems, increase the safety of the kids, increase communication and knowledge sharing, etc.
III. CASE STUDY: ICT COORDINATION AND
COLLABORATION IN FIGHTING AGAINST VIOLANCE
TOWARD WOMEN
In this section we present the findings of a project that was conducted with the NGO in Serbia. The goal of this project was to introduce mobile technology that will allow women who are in danger to contact their emergency contacts, nearest help, or to send SOS SMS. This SOS SMS contains current GPS location of the user, which can be send using mobile application or Bluetooth bracelet, in cases when the phone is locked or put away.
A. Motivation
According to the study that analyzed usage of information and communications technology in Serbia, in 2013 about 4.9 milion people were using mobile phones [5]. This study reports that 96% of women of age between 16 and 24 use mobile phones. When it comes to women from age of 25 to 54, 94.1% use mobile phones, and 70.3% women between 55 and 74. As it can be seen from this research, usage of mobile tehnologies is growing among all age groups. From this study it can be seen that the most of young people use mobile phones and that any initiative that focuses on them as a target group may consider incorporating mobile technologies. Due to this, mobile technologies represent a good candidate to be incorporated in different real-life situations in order to help people. One of the possible usage of mobile phones and mobile applications is to help women when in danger, as mobile phones usually have good connections and are so frequenty used by all age groups.
Violence against women is a term often used for gender-based physical, sexual or mental acts of violence targeted towards women. Violence against women can be categorized in three groups: Interpersonal, Self-directed and Collective [4]. Self-directed violence can include suicidal behavior and self-abuse. When it comes to Interpersonal violence this can be family/partner violence and community violence. Collective violence can be categorized as social, political and economic violence.
Global and regional estimates in 2013 state that 35% of women worldwide experienced physical or sexual violence in their lifetime from an intimate partner [7]. According to in-depth study on all forms of violence against women from 2006, between 40% and 50% of women in European Union countries experienced unwanted sexual advances or unwanted physical contact at work [8]. In Australia, Canada, Israel, South Africa and the United States, intimate partner violence ends with between 40 and 70 percent of female murders [9]. When that happens it is hard to react and it is hard to call for help.
Even though fight against the violence acts is a problem throughout the world, motivation for developing mobile application for women in Serbia was motivated by initiatives of Serbian NGO in fighting against violence against women in Serbia. According to a three-month study of Young men gender based violence in 2004, in Belgrade 4% of young men slapped their girlfriend or another women, 2% hit or punched them, 4% pressured his girlfriend or other young women to have intercorse and 13% of young man said that they insulted or humiliated their girlfriends or other young women [6].
Combining ICT technologies with real life problems that are mostly dealt by NGOs can provide tools to contribute to the solution for helping in such situations in a timely manner. Technologies like Bluetooth can be used to increase range of reach and speed up number of actions required in order to call for help. If a women who is in danger is wearing a Bluetooth bracelet, which can be used to activate sending a message while her phone is locked or put away in a purse, the reaction time of receiving help can be faster and woman can have someone coming to her rescue faster when in a questionable or risky situation.
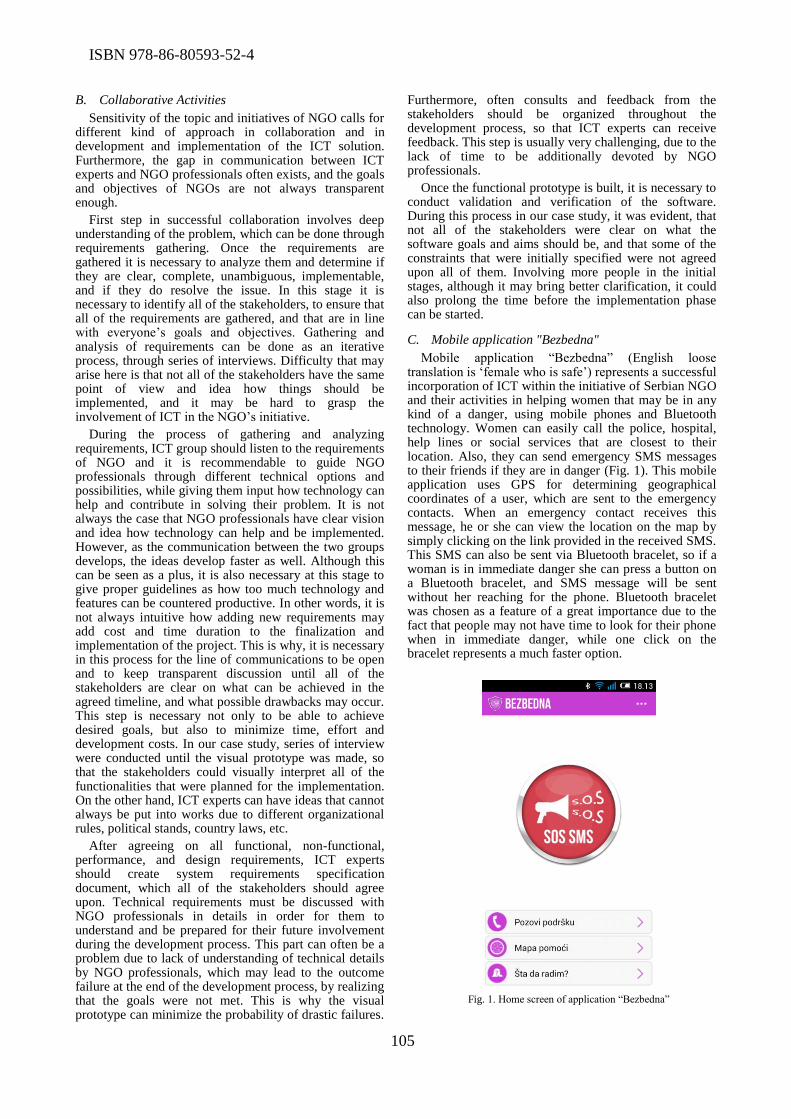
ISBN 978-86-80593-52-4
105
B. Collaborative Activities
Sensitivity of the topic and initiatives of NGO calls for different kind of approach in collaboration and in development and implementation of the ICT solution. Furthermore, the gap in communication between ICT experts and NGO professionals often exists, and the goals and objectives of NGOs are not always transparent enough.
First step in successful collaboration involves deep understanding of the problem, which can be done through requirements gathering. Once the requirements are gathered it is necessary to analyze them and determine if they are clear, complete, unambiguous, implementable, and if they do resolve the issue. In this stage it is necessary to identify all of the stakeholders, to ensure that all of the requirements are gathered, and that are in line with everyone’s goals and objectives. Gathering and analysis of requirements can be done as an iterative process, through series of interviews. Difficulty that may arise here is that not all of the stakeholders have the same point of view and idea how things should be implemented, and it may be hard to grasp the involvement of ICT in the NGO’s initiative.
During the process of gathering and analyzing requirements, ICT group should listen to the requirements of NGO and it is recommendable to guide NGO professionals through different technical options and possibilities, while giving them input how technology can help and contribute in solving their problem. It is not always the case that NGO professionals have clear vision and idea how technology can help and be implemented. However, as the communication between the two groups develops, the ideas develop faster as well. Although this can be seen as a plus, it is also necessary at this stage to give proper guidelines as how too much technology and features can be countered productive. In other words, it is not always intuitive how adding new requirements may add cost and time duration to the finalization and implementation of the project. This is why, it is necessary in this process for the line of communications to be open and to keep transparent discussion until all of the stakeholders are clear on what can be achieved in the agreed timeline, and what possible drawbacks may occur. This step is necessary not only to be able to achieve desired goals, but also to minimize time, effort and development costs. In our case study, series of interview were conducted until the visual prototype was made, so that the stakeholders could visually interpret all of the functionalities that were planned for the implementation. On the other hand, ICT experts can have ideas that cannot always be put into works due to different organizational rules, political stands, country laws, etc.
After agreeing on all functional, non-functional, performance, and design requirements, ICT experts should create system requirements specification document, which all of the stakeholders should agree upon. Technical requirements must be discussed with NGO professionals in details in order for them to understand and be prepared for their future involvement during the development process. This part can often be a problem due to lack of understanding of technical details by NGO professionals, which may lead to the outcome failure at the end of the development process, by realizing that the goals were not met. This is why the visual prototype can minimize the probability of drastic failures.
Furthermore, often consults and feedback from the stakeholders should be organized throughout the development process, so that ICT experts can receive feedback. This step is usually very challenging, due to the lack of time to be additionally devoted by NGO professionals.
Once the functional prototype is built, it is necessary to conduct validation and verification of the software. During this process in our case study, it was evident, that not all of the stakeholders were clear on what the software goals and aims should be, and that some of the constraints that were initially specified were not agreed upon all of them. Involving more people in the initial stages, although it may bring better clarification, it could also prolong the time before the implementation phase can be started.
C. Mobile application "Bezbedna"
Mobile application “Bezbedna” (English loose translation is ‘female who is safe’) represents a successful incorporation of ICT within the initiative of Serbian NGO and their activities in helping women that may be in any kind of a danger, using mobile phones and Bluetooth technology. Women can easily call the police, hospital, help lines or social services that are closest to their location. Also, they can send emergency SMS messages to their friends if they are in danger (Fig. 1). This mobile application uses GPS for determining geographical coordinates of a user, which are sent to the emergency contacts. When an emergency contact receives this message, he or she can view the location on the map by simply clicking on the link provided in the received SMS. This SMS can also be sent via Bluetooth bracelet, so if a woman is in immediate danger she can press a button on a Bluetooth bracelet, and SMS message will be sent without her reaching for the phone. Bluetooth bracelet was chosen as a feature of a great importance due to the fact that people may not have time to look for their phone when in immediate danger, while one click on the bracelet represents a much faster option.
Fig. 1. Home screen of application “Bezbedna”
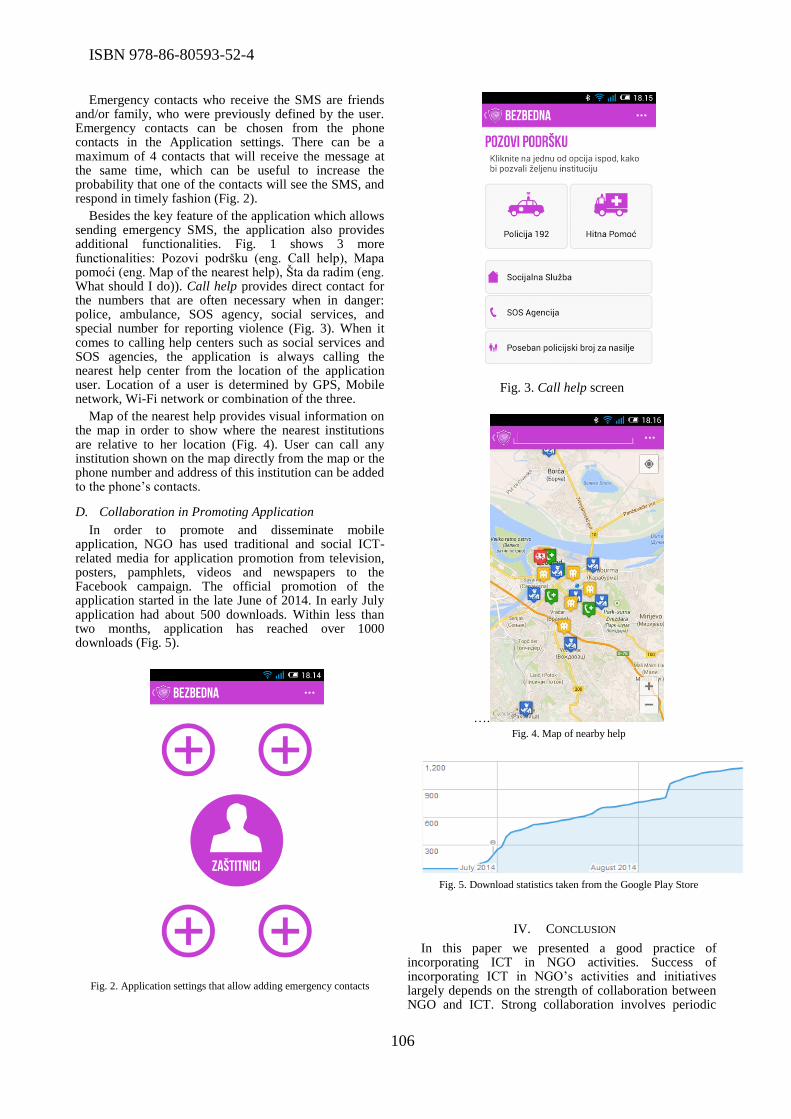
ISBN 978-86-80593-52-4
106
Emergency contacts who receive the SMS are friends and/or family, who were previously defined by the user. Emergency contacts can be chosen from the phone contacts in the Application settings. There can be a maximum of 4 contacts that will receive the message at the same time, which can be useful to increase the probability that one of the contacts will see the SMS, and respond in timely fashion (Fig. 2).
Besides the key feature of the application which allows sending emergency SMS, the application also provides additional functionalities. Fig. 1 shows 3 more functionalities: Pozovi podršku (eng. Call help), Mapa pomoći (eng. Map of the nearest help), Šta da radim (eng. What should I do)). Call help provides direct contact for the numbers that are often necessary when in danger: police, ambulance, SOS agency, social services, and special number for reporting violence (Fig. 3). When it comes to calling help centers such as social services and SOS agencies, the application is always calling the nearest help center from the location of the application user. Location of a user is determined by GPS, Mobile network, Wi-Fi network or combination of the three.
Map of the nearest help provides visual information on the map in order to show where the nearest institutions are relative to her location (Fig. 4). User can call any institution shown on the map directly from the map or the phone number and address of this institution can be added to the phone’s contacts.
D. Collaboration in Promoting Application
In order to promote and disseminate mobile application, NGO has used traditional and social ICT-related media for application promotion from television, posters, pamphlets, videos and newspapers to the Facebook campaign. The official promotion of the application started in the late June of 2014. In early July application had about 500 downloads. Within less than two months, application has reached over 1000 downloads (Fig. 5).
Fig. 2. Application settings that allow adding emergency contacts
Fig. 3. Call help screen
…. Fig. 4. Map of nearby help
Fig. 5. Download statistics taken from the Google Play Store
IV. CONCLUSION
In this paper we presented a good practice of incorporating ICT in NGO activities. Success of incorporating ICT in NGO’s activities and initiatives largely depends on the strength of collaboration between NGO and ICT. Strong collaboration involves periodic

ISBN 978-86-80593-52-4
107
and productive meetings with stakeholders, which lead to good understanding of the existing problems and difficulties that all included in the project may have. Some of the key lessons that were learned during the presented project, and have shown to lead to a successful collaboration between ICT and NGO are:
Active involvement of NGO during the process of developing the idea and the requirement specifications for the application. Specifying all of the project details and characteristics at the beginning may minimize the communication challenges between two groups when talking about technology specifics, and minimizing possibility of misunderstanding of what the outputs should be.
Active collaboration of the stakeholders during the development and testing phases of the project is necessary
Good informational and promotional material understandable to a target group in a local community can lead to successful dissemination of the project
Keeping the lines of communication open and transparent will allow NGO to be fully familiar with difficulties and challenges during the project development
Conducting training and workshops for staff will help proper usage of the technology.
ACKNOWLEDGMENTS
This project was funded by Automoni Ženski Centar as a part of their Potpisujem campaign.
REFERENCES
[1] S. J. David et al., Inter-organizational Coordination in the Wild: Trust Building and Collaboration Among Field-Level ICT Workers in Humanitarian Relief Organizations, International Journal of Voluntary and Nonprofit Organizations, 2012.
[2] S. Saqib, M. Rohde, and V. Wulf Designing IT Systems for NGOs: Issues and Directions Department of Information Systems and New Media, 2008.
[3] M. Surman, K. Reilly, Appropriating the Internet for Social Change: Towards the Strategic use of Networked Technologies by Transnational Civil Society Organizations, Social Science Research Council, 2003.
[4] K. Gunilla, C. Garcia-Moreno, Violence against women, J Epidemiol Community Health, 2005.
[5] Statistical Office of the Republic of Serbia, Usage of ICT technologies in Republic of Serbia, 2013.
[6] International Center for Research on Women, Young Men Initiative for Prevention of Gender‐Based Violence in Western Balkans, 2004.
[7] World Health Organization, Global and regional
estimates of violence against women: prevalence and
health effects of intimate partner violence and non-
partner sexual violence, 2013. [8] Brussels, European Commission, Industrial Relations
and Social Affairs: Sexual harassment at the workplace in the European Union, 1998.
[9] World Health Organization, World Report on Violence and Health, Geneva, 2002.

ISBN 978-86-80593-52-4
108
Use of Data Mining Techniques in Higher
Education Institutions
Nataša Aleksić1 *1Higher Technical School of Professional Studies, Kragujevac, Serbia
Abstract - The main aim of this paper is to define the concept and show the main features of Data Mining. The paper deals with the presentation of the methods and techniques of data mining, as well as the strengths that made the concept and practical application of business intelligence tools in some high education tasks.
I. INTRODUCTION
Business intelligence is a term used for a set of methods and tools intended for decision support.. In the field of higher education, as in many other areas of business, there is a need for the implementation of business intelligence systems as a system for data analysis and support decision making.
Business intelligence systems are also applied to solve problems in education, such as adapting teaching materials to student needs, implementation of quality reporting system based on data collected in Learning Management Systems. In this way can be achieved: better use of financial resources, reduce costs, better decision making, increase enrollment and graduates, etc.
The aim of this paper is to describe the process of data mining, defines its basic steps and phases, and demonstrates techniques of this process that can be used in any business with the aim to increase the quality of decision-making and planning. Data mining is significantly different from similar processes such as OLAP and application of statistical models, since the possibility of interactive learning and prediction. The basic material used in this process uses large databases. Analysis of the possibilities of data mining in the business sector has been established that it can be used in the search for valuable information in large databases in order to improve operations of each company.
Key factors for successful implementation of this process are detailed planning and analysis.
II. CONCEPT AND CHARACTERISTICS OF DATA MINING
Data mining and data mining is often defined as a finding previously unknown potentially useful information from large volumes of (unstructured) data.. A simple definition of data mining is [1]: The extraction of previously unknown, comprehensible and adequate information from large data warehouses and their use in key business decisions so as to support their
implementation and for the formulation of tactical and strategic marketing initiatives and measuring their success.
Data mining is also known as Knowledge Discovery in Databases (KDD) - knowledge discovery in databases. It is a process of analysis that allows users to understand the system and the connections between their data. It helps identifying information in ways not previously possible.
The basic goal of data mining is to discover previously unknown relationships among the data.
The main objective of this paper is to present a way to implement a new business system of intelligence in education, which can enhance the educational process, raise the quality of business processes in education and justify the high costs of introduction.
III. RESEARCH METHODS AND FLOW
RESEARCH PROCESS
For the study, an analysis of the methods of data mining, in order to clarify their meaning and application of certain types of data to be analyzed.
During the work described the current state of the higher education institution. Most of the adopted criteria contain elements that require continuous collection and analysis of data on different elements of the teaching process. The necessary data include indicators of the quality of student enrollment, transition and success of the students in their studies, efficacy studies and the percentage of graduation, the structure and quality of the teaching staff, the results of scientific - teaching staff, the availability and quality of natural resources, and other information that enhance business activity higher education institutions, both educational and scientific - research, and business - administration.
Stated data represent data that change frequently, and whose analysis to obtain information that serve as support in making business decisions. Efficient analysis of large amounts of data involves the use of adequate software support to the abundance of data has been a timely and accurate information needed to make informed business decisions.
First, the analysis of data mining methods used today. In doing so, they explained their characteristics and reasons for what types of data are used and in which
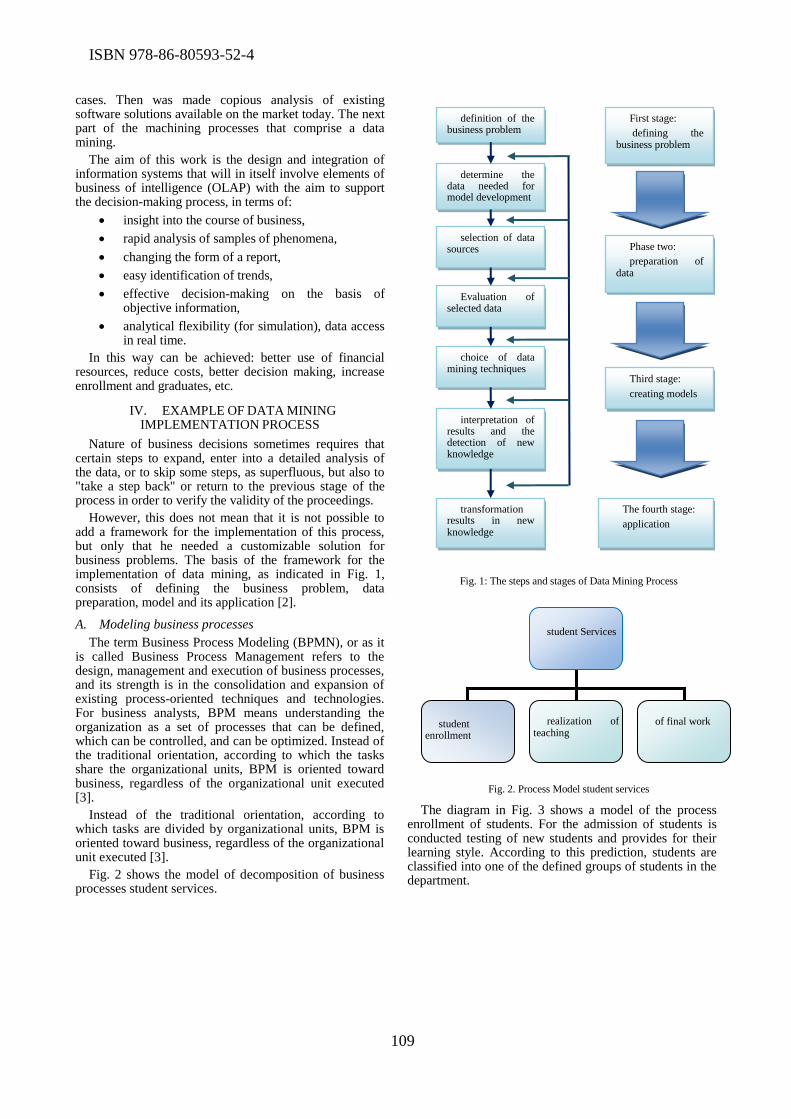
ISBN 978-86-80593-52-4
109
cases. Then was made copious analysis of existing software solutions available on the market today. The next part of the machining processes that comprise a data mining.
The aim of this work is the design and integration of information systems that will in itself involve elements of business of intelligence (OLAP) with the aim to support the decision-making process, in terms of:
insight into the course of business,
rapid analysis of samples of phenomena,
changing the form of a report,
easy identification of trends,
effective decision-making on the basis of objective information,
analytical flexibility (for simulation), data access in real time.
In this way can be achieved: better use of financial resources, reduce costs, better decision making, increase enrollment and graduates, etc.
IV. EXAMPLE OF DATA MINING
IMPLEMENTATION PROCESS
Nature of business decisions sometimes requires that certain steps to expand, enter into a detailed analysis of the data, or to skip some steps, as superfluous, but also to "take a step back" or return to the previous stage of the process in order to verify the validity of the proceedings.
However, this does not mean that it is not possible to add a framework for the implementation of this process, but only that he needed a customizable solution for business problems. The basis of the framework for the implementation of data mining, as indicated in Fig. 1, consists of defining the business problem, data preparation, model and its application [2].
A. Modeling business processes
The term Business Process Modeling (BPMN), or as it is called Business Process Management refers to the design, management and execution of business processes, and its strength is in the consolidation and expansion of existing process-oriented techniques and technologies. For business analysts, BPM means understanding the organization as a set of processes that can be defined, which can be controlled, and can be optimized. Instead of the traditional orientation, according to which the tasks share the organizational units, BPM is oriented toward business, regardless of the organizational unit executed [3].
Instead of the traditional orientation, according to which tasks are divided by organizational units, BPM is oriented toward business, regardless of the organizational unit executed [3].
Fig. 2 shows the model of decomposition of business processes student services.
Fig. 1: The steps and stages of Data Mining Process
Fig. 2. Process Model student services
The diagram in Fig. 3 shows a model of the process enrollment of students. For the admission of students is conducted testing of new students and provides for their learning style. According to this prediction, students are classified into one of the defined groups of students in the department.
definition of the business problem
determine the data needed for model development
transformation results in new knowledge
interpretation of results and the detection of new knowledge
choice of data mining techniques
Evaluation of selected data
selection of data sources
First stage:
defining the business problem
Phase two:
preparation of data
Third stage:
creating models
The fourth stage:
application
student Services
student enrollment
realization of teaching
of final work
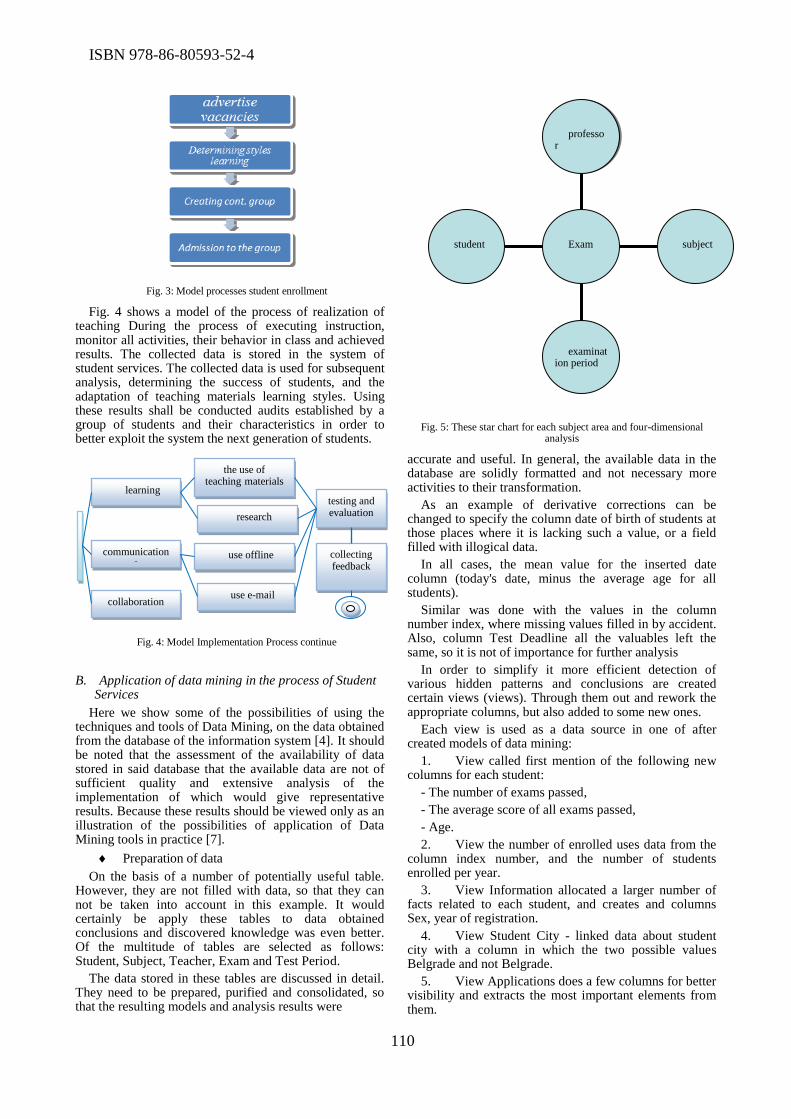
ISBN 978-86-80593-52-4
110
Fig. 3: Model processes student enrollment
Fig. 4 shows a model of the process of realization of teaching During the process of executing instruction, monitor all activities, their behavior in class and achieved results. The collected data is stored in the system of student services. The collected data is used for subsequent analysis, determining the success of students, and the adaptation of teaching materials learning styles. Using these results shall be conducted audits established by a group of students and their characteristics in order to better exploit the system the next generation of students.
Fig. 4: Model Implementation Process continue
B. Application of data mining in the process of Student Services
Here we show some of the possibilities of using the techniques and tools of Data Mining, on the data obtained from the database of the information system [4]. It should be noted that the assessment of the availability of data stored in said database that the available data are not of sufficient quality and extensive analysis of the implementation of which would give representative results. Because these results should be viewed only as an illustration of the possibilities of application of Data Mining tools in practice [7].
Preparation of data
On the basis of a number of potentially useful table. However, they are not filled with data, so that they can not be taken into account in this example. It would certainly be apply these tables to data obtained conclusions and discovered knowledge was even better. Of the multitude of tables are selected as follows: Student, Subject, Teacher, Exam and Test Period.
The data stored in these tables are discussed in detail. They need to be prepared, purified and consolidated, so that the resulting models and analysis results were
Fig. 5: These star chart for each subject area and four-dimensional
analysis
accurate and useful. In general, the available data in the database are solidly formatted and not necessary more activities to their transformation.
As an example of derivative corrections can be changed to specify the column date of birth of students at those places where it is lacking such a value, or a field filled with illogical data.
In all cases, the mean value for the inserted date column (today's date, minus the average age for all students).
Similar was done with the values in the column number index, where missing values filled in by accident. Also, column Test Deadline all the valuables left the same, so it is not of importance for further analysis
In order to simplify it more efficient detection of various hidden patterns and conclusions are created certain views (views). Through them out and rework the appropriate columns, but also added to some new ones.
Each view is used as a data source in one of after created models of data mining:
1. View called first mention of the following new columns for each student:
- The number of exams passed,
- The average score of all exams passed,
- Age.
2. View the number of enrolled uses data from the column index number, and the number of students enrolled per year.
3. View Information allocated a larger number of facts related to each student, and creates and columns Sex, year of registration.
4. View Student City - linked data about student city with a column in which the two possible values Belgrade and not Belgrade.
5. View Applications does a few columns for better visibility and extracts the most important elements from them.
learning
communications
collaboration use e-mail
use offline
research
the use of teaching materials
testing and evaluation
collecting feedback
student
examination period
subject
professo
r
Exam
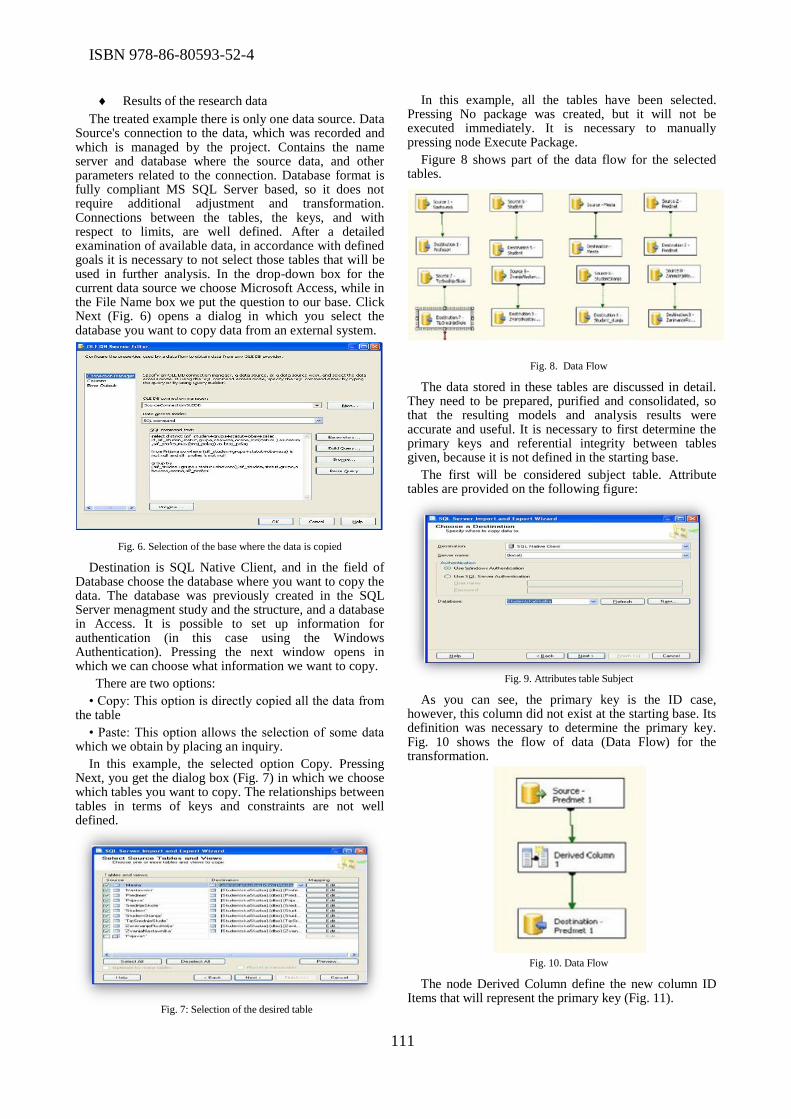
ISBN 978-86-80593-52-4
111
Results of the research data
The treated example there is only one data source. Data Source's connection to the data, which was recorded and which is managed by the project. Contains the name server and database where the source data, and other parameters related to the connection. Database format is fully compliant MS SQL Server based, so it does not require additional adjustment and transformation. Connections between the tables, the keys, and with respect to limits, are well defined. After a detailed examination of available data, in accordance with defined goals it is necessary to not select those tables that will be used in further analysis. In the drop-down box for the current data source we choose Microsoft Access, while in the File Name box we put the question to our base. Click Next (Fig. 6) opens a dialog in which you select the database you want to copy data from an external system.
Fig. 6. Selection of the base where the data is copied
Destination is SQL Native Client, and in the field of Database choose the database where you want to copy the data. The database was previously created in the SQL Server menagment study and the structure, and a database in Access. It is possible to set up information for authentication (in this case using the Windows Authentication). Pressing the next window opens in which we can choose what information we want to copy.
There are two options:
• Copy: This option is directly copied all the data from the table
• Paste: This option allows the selection of some data which we obtain by placing an inquiry.
In this example, the selected option Copy. Pressing Next, you get the dialog box (Fig. 7) in which we choose which tables you want to copy. The relationships between tables in terms of keys and constraints are not well defined.
Fig. 7: Selection of the desired table
In this example, all the tables have been selected. Pressing No package was created, but it will not be executed immediately. It is necessary to manually pressing node Execute Package.
Figure 8 shows part of the data flow for the selected tables.
Fig. 8. Data Flow
The data stored in these tables are discussed in detail. They need to be prepared, purified and consolidated, so that the resulting models and analysis results were accurate and useful. It is necessary to first determine the primary keys and referential integrity between tables given, because it is not defined in the starting base.
The first will be considered subject table. Attribute tables are provided on the following figure:
Fig. 9. Attributes table Subject
As you can see, the primary key is the ID case, however, this column did not exist at the starting base. Its definition was necessary to determine the primary key. Fig. 10 shows the flow of data (Data Flow) for the transformation.
Fig. 10. Data Flow
The node Derived Column define the new column ID Items that will represent the primary key (Fig. 11).
ISBN 978-86-80593-52-4
112
Fig. 11. Defining a new column by node Derived Column
Item ID is a combination of attributes GROUP, statutes and SIF obligations. Only now ID Predmet attribute can be set in a primary key.
The same problem exists in the table Student. Attribute tables are given Fig. 12.
Fig. 12 Attributes table Student
Student Code attribute, which is the primary key in this case is a combination of attributes St_ group, Year of entry and number index. As we see, the composition has a key code which direction the student enrolled. Since the names are changed directions, so that there is more than one label for the same direction, there is an inefficiency in searching the database. In order to improve the performance have been carried out a certain transformation of. For example, the Department of Information Systems appear as IT and IS. To facilitate the search of a label IT has transformed the label IS. This is done by using the Derived Column.
The data stream (Data Flow) shown in Fig. 13. For other table columns that should be the primary key already exists, so no additional transformations. Another problem that arises as constraints between tables. The next problem that arises limits are between tables. Limitations provide that data meets certain rules relating to the integrity of the data. To provide data integrity are not responsible programs that use the database, but the
Fig. 13. Data Flow
database itself. Many of the problems relating to what programs are allowed within the database, it is now perceived much earlier in the development process because the database means to reject the data, although the user program allowing its access.
First, we observe the relationship between the entities subject Student Login. As previously mentioned entity Log is an aggregation two other entities. The relationship between these entities is shown by diagram (Fig. 14). Diagrams are an important tool for efficient design of the database.
Fig. 14. Diagrams the data warehouse
After a defined relationship between the above entities appear to be some problems. In the Report, there are students whose code does not exist in the table Student. It is necessary to find these students by the next query:
select distinct ID_Student
from sign in p
left join Student s on p.ID_Student=s. code of Student
where s. code of Student is null
Once this query gives the student code that does not exist in the table Student. Student with a given code is executing the following query loads in the table Student.
INSERT INTO Student (Code_Student,number_index, enrollment_
year, older_group, statute, name, surname, name_parents, occupation_parents, personal_number, date _ Birth, ZIP Code, nationals, half, high_school, Identification_school, years_ completing_high_school, points_the_entrance_ examination, birthplace.
VALUES ('100000','III-6-07', '07', 'PR', '94', 'Branislav','Ničić', 'Miodrag', '1', '2008984910000', '1984-20-08', '11000','SRB', 'M', '36', 'ETSRK', '03',34.9,' BELGRADE ');
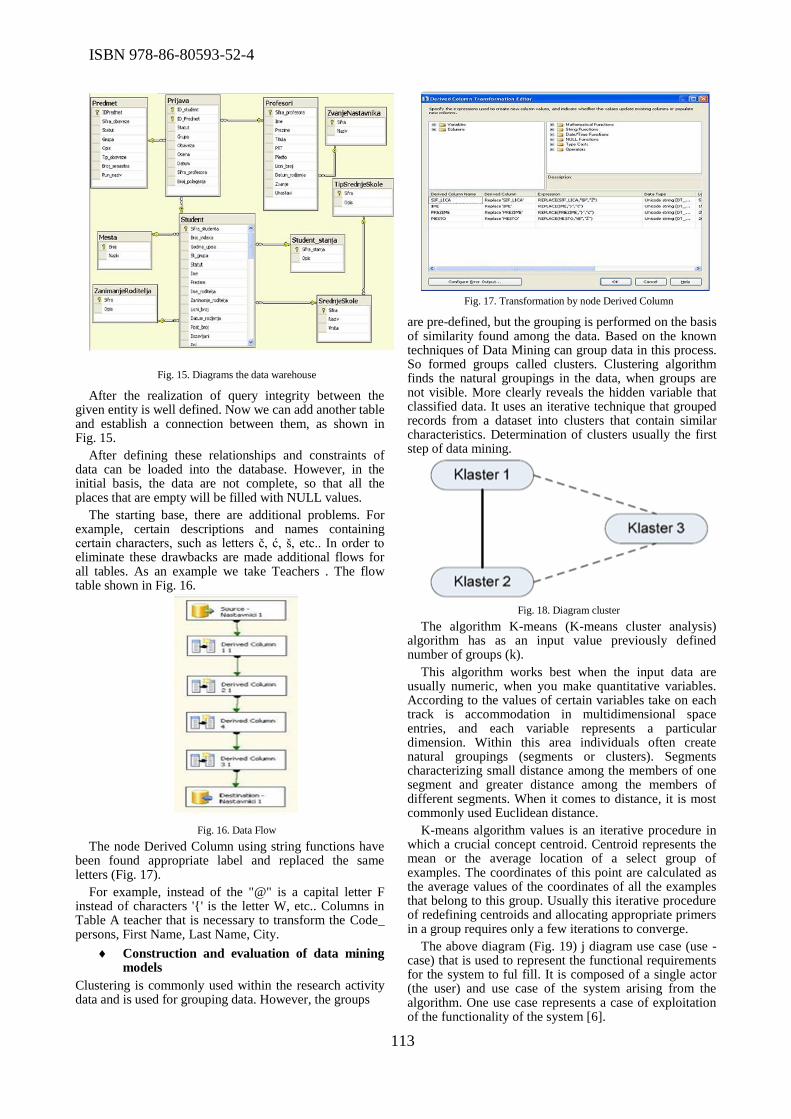
ISBN 978-86-80593-52-4
113
Fig. 15. Diagrams the data warehouse
After the realization of query integrity between the given entity is well defined. Now we can add another table and establish a connection between them, as shown in Fig. 15.
After defining these relationships and constraints of data can be loaded into the database. However, in the initial basis, the data are not complete, so that all the places that are empty will be filled with NULL values.
The starting base, there are additional problems. For example, certain descriptions and names containing certain characters, such as letters č, ć, š, etc.. In order to eliminate these drawbacks are made additional flows for all tables. As an example we take Teachers . The flow table shown in Fig. 16.
Fig. 16. Data Flow
The node Derived Column using string functions have been found appropriate label and replaced the same letters (Fig. 17).
For example, instead of the "@" is a capital letter F instead of characters '{' is the letter W, etc.. Columns in Table A teacher that is necessary to transform the Code_ persons, First Name, Last Name, City.
Construction and evaluation of data mining models
Clustering is commonly used within the research activity data and is used for grouping data. However, the groups
Fig. 17. Transformation by node Derived Column
are pre-defined, but the grouping is performed on the basis of similarity found among the data. Based on the known techniques of Data Mining can group data in this process. So formed groups called clusters. Clustering algorithm finds the natural groupings in the data, when groups are not visible. More clearly reveals the hidden variable that classified data. It uses an iterative technique that grouped records from a dataset into clusters that contain similar characteristics. Determination of clusters usually the first step of data mining.
Fig. 18. Diagram cluster
The algorithm K-means (K-means cluster analysis) algorithm has as an input value previously defined number of groups (k).
This algorithm works best when the input data are usually numeric, when you make quantitative variables. According to the values of certain variables take on each track is accommodation in multidimensional space entries, and each variable represents a particular dimension. Within this area individuals often create natural groupings (segments or clusters). Segments characterizing small distance among the members of one segment and greater distance among the members of different segments. When it comes to distance, it is most commonly used Euclidean distance.
K-means algorithm values is an iterative procedure in which a crucial concept centroid. Centroid represents the mean or the average location of a select group of examples. The coordinates of this point are calculated as the average values of the coordinates of all the examples that belong to this group. Usually this iterative procedure of redefining centroids and allocating appropriate primers in a group requires only a few iterations to converge.
The above diagram (Fig. 19) j diagram use case (use - case) that is used to represent the functional requirements for the system to ful fill. It is composed of a single actor (the user) and use case of the system arising from the algorithm. One use case represents a case of exploitation of the functionality of the system [6].
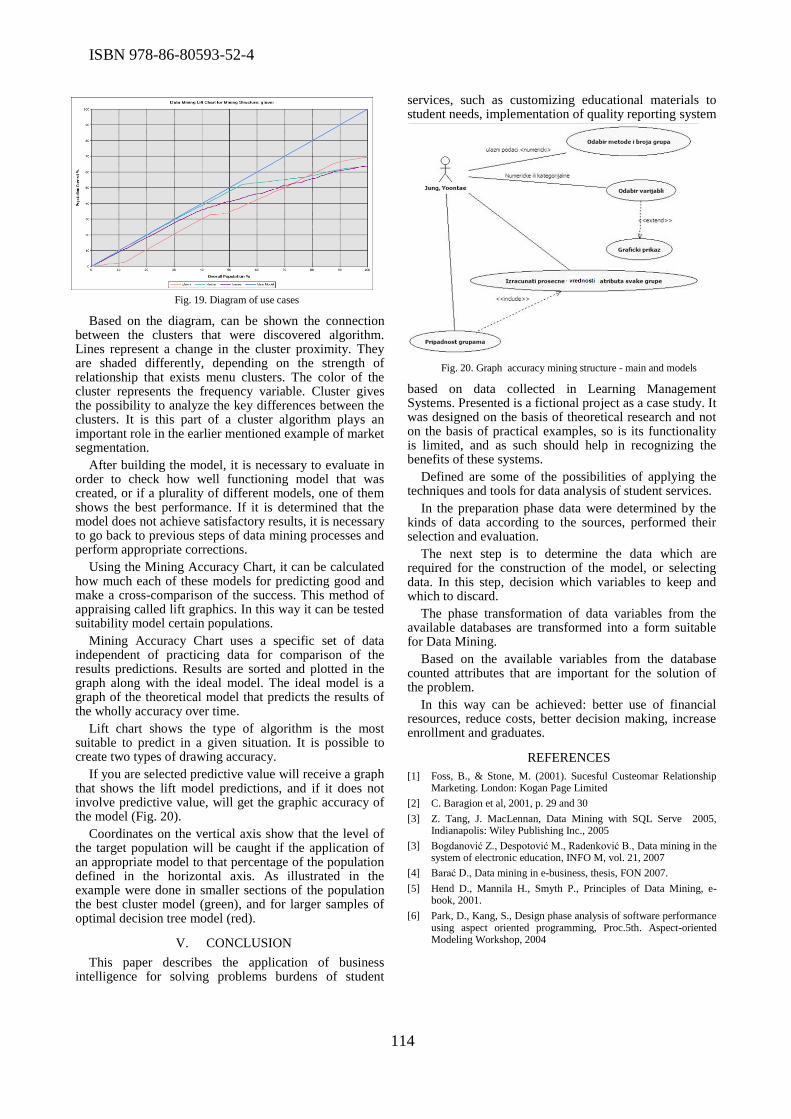
ISBN 978-86-80593-52-4
114
Fig. 19. Diagram of use cases
Based on the diagram, can be shown the connection between the clusters that were discovered algorithm. Lines represent a change in the cluster proximity. They are shaded differently, depending on the strength of relationship that exists menu clusters. The color of the cluster represents the frequency variable. Cluster gives the possibility to analyze the key differences between the clusters. It is this part of a cluster algorithm plays an important role in the earlier mentioned example of market segmentation.
After building the model, it is necessary to evaluate in order to check how well functioning model that was created, or if a plurality of different models, one of them shows the best performance. If it is determined that the model does not achieve satisfactory results, it is necessary to go back to previous steps of data mining processes and perform appropriate corrections.
Using the Mining Accuracy Chart, it can be calculated how much each of these models for predicting good and make a cross-comparison of the success. This method of appraising called lift graphics. In this way it can be tested suitability model certain populations.
Mining Accuracy Chart uses a specific set of data independent of practicing data for comparison of the results predictions. Results are sorted and plotted in the graph along with the ideal model. The ideal model is a graph of the theoretical model that predicts the results of the wholly accuracy over time.
Lift chart shows the type of algorithm is the most suitable to predict in a given situation. It is possible to create two types of drawing accuracy.
If you are selected predictive value will receive a graph that shows the lift model predictions, and if it does not involve predictive value, will get the graphic accuracy of the model (Fig. 20).
Coordinates on the vertical axis show that the level of the target population will be caught if the application of an appropriate model to that percentage of the population defined in the horizontal axis. As illustrated in the example were done in smaller sections of the population the best cluster model (green), and for larger samples of optimal decision tree model (red).
V. CONCLUSION
This paper describes the application of business intelligence for solving problems burdens of student
services, such as customizing educational materials to student needs, implementation of quality reporting system
Fig. 20. Graph accuracy mining structure - main and models
based on data collected in Learning Management Systems. Presented is a fictional project as a case study. It was designed on the basis of theoretical research and not on the basis of practical examples, so is its functionality is limited, and as such should help in recognizing the benefits of these systems.
Defined are some of the possibilities of applying the techniques and tools for data analysis of student services.
In the preparation phase data were determined by the kinds of data according to the sources, performed their selection and evaluation.
The next step is to determine the data which are required for the construction of the model, or selecting data. In this step, decision which variables to keep and which to discard.
The phase transformation of data variables from the available databases are transformed into a form suitable for Data Mining.
Based on the available variables from the database counted attributes that are important for the solution of the problem.
In this way can be achieved: better use of financial resources, reduce costs, better decision making, increase enrollment and graduates.
REFERENCES
[1] Foss, B., & Stone, M. (2001). Sucesful Custeomar Relationship Marketing. London: Kogan Page Limited
[2] C. Baragion et al, 2001, p. 29 and 30
[3] Z. Tang, J. MacLennan, Data Mining with SQL Serve 2005, Indianapolis: Wiley Publishing Inc., 2005
[3] Bogdanović Z., Despotović M., Radenković B., Data mining in the system of electronic education, INFO M, vol. 21, 2007
[4] Barać D., Data mining in e-business, thesis, FON 2007.
[5] Hend D., Mannila H., Smyth P., Principles of Data Mining, e-book, 2001.
[6] Park, D., Kang, S., Design phase analysis of software performance using aspect oriented programming, Proc.5th. Aspect-oriented Modeling Workshop, 2004
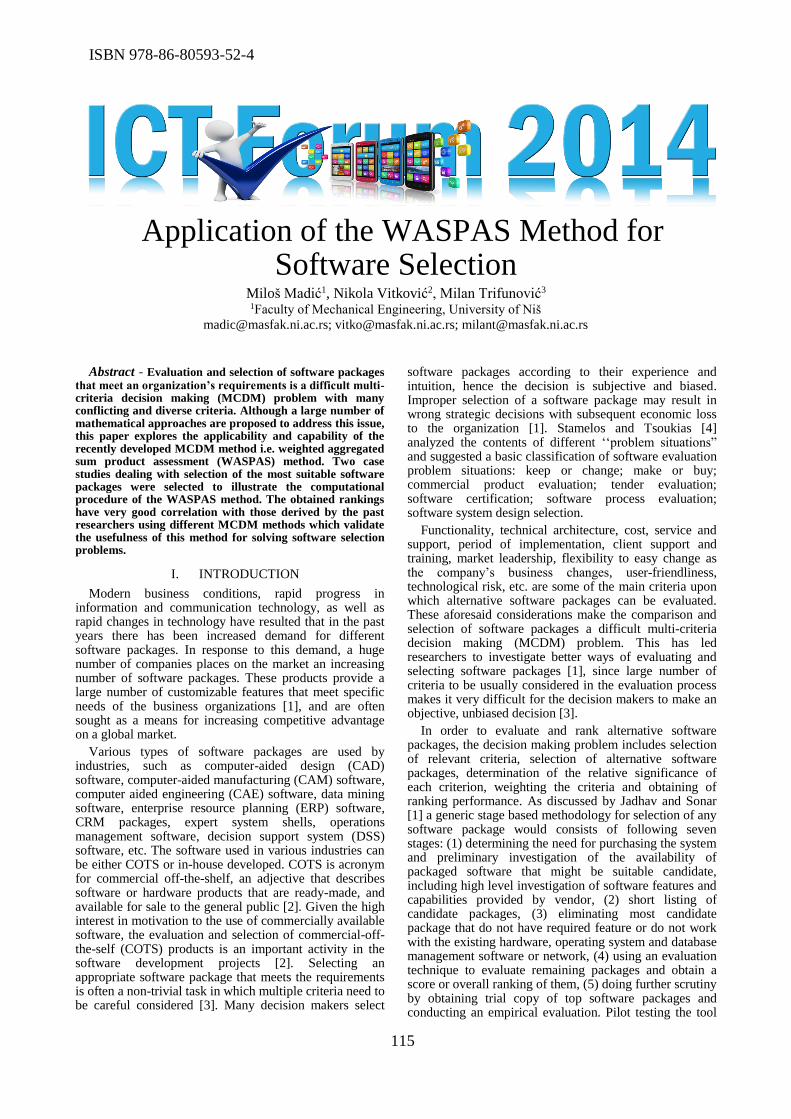
ISBN 978-86-80593-52-4
115
Application of the WASPAS Method for
Software Selection
Miloš Madić1, Nikola Vitković2, Milan Trifunović3 1Faculty of Mechanical Engineering, University of Niš
[email protected]; [email protected]; [email protected]
Abstract - Evaluation and selection of software packages that meet an organization’s requirements is a difficult multi-criteria decision making (MCDM) problem with many conflicting and diverse criteria. Although a large number of mathematical approaches are proposed to address this issue, this paper explores the applicability and capability of the recently developed MCDM method i.e. weighted aggregated sum product assessment (WASPAS) method. Two case studies dealing with selection of the most suitable software packages were selected to illustrate the computational procedure of the WASPAS method. The obtained rankings have very good correlation with those derived by the past researchers using different MCDM methods which validate the usefulness of this method for solving software selection problems.
I. INTRODUCTION
Modern business conditions, rapid progress in information and communication technology, as well as rapid changes in technology have resulted that in the past years there has been increased demand for different software packages. In response to this demand, a huge number of companies places on the market an increasing number of software packages. These products provide a large number of customizable features that meet specific needs of the business organizations [1], and are often sought as a means for increasing competitive advantage on a global market.
Various types of software packages are used by industries, such as computer-aided design (CAD) software, computer-aided manufacturing (CAM) software, computer aided engineering (CAE) software, data mining software, enterprise resource planning (ERP) software, CRM packages, expert system shells, operations management software, decision support system (DSS) software, etc. The software used in various industries can be either COTS or in-house developed. COTS is acronym for commercial off-the-shelf, an adjective that describes software or hardware products that are ready-made, and available for sale to the general public [2]. Given the high interest in motivation to the use of commercially available software, the evaluation and selection of commercial-off-the-self (COTS) products is an important activity in the software development projects [2]. Selecting an appropriate software package that meets the requirements is often a non-trivial task in which multiple criteria need to be careful considered [3]. Many decision makers select
software packages according to their experience and intuition, hence the decision is subjective and biased. Improper selection of a software package may result in wrong strategic decisions with subsequent economic loss to the organization [1]. Stamelos and Tsoukias [4] analyzed the contents of different ‘‘problem situations” and suggested a basic classification of software evaluation problem situations: keep or change; make or buy; commercial product evaluation; tender evaluation; software certification; software process evaluation; software system design selection.
Functionality, technical architecture, cost, service and support, period of implementation, client support and training, market leadership, flexibility to easy change as the company’s business changes, user-friendliness, technological risk, etc. are some of the main criteria upon which alternative software packages can be evaluated. These aforesaid considerations make the comparison and selection of software packages a difficult multi-criteria decision making (MCDM) problem. This has led researchers to investigate better ways of evaluating and selecting software packages [1], since large number of criteria to be usually considered in the evaluation process makes it very difficult for the decision makers to make an objective, unbiased decision [3].
In order to evaluate and rank alternative software packages, the decision making problem includes selection of relevant criteria, selection of alternative software packages, determination of the relative significance of each criterion, weighting the criteria and obtaining of ranking performance. As discussed by Jadhav and Sonar [1] a generic stage based methodology for selection of any software package would consists of following seven stages: (1) determining the need for purchasing the system and preliminary investigation of the availability of packaged software that might be suitable candidate, including high level investigation of software features and capabilities provided by vendor, (2) short listing of candidate packages, (3) eliminating most candidate package that do not have required feature or do not work with the existing hardware, operating system and database management software or network, (4) using an evaluation technique to evaluate remaining packages and obtain a score or overall ranking of them, (5) doing further scrutiny by obtaining trial copy of top software packages and conducting an empirical evaluation. Pilot testing the tool

ISBN 978-86-80593-52-4
116
in an appropriate environment, (6) negotiating a contract specifying software price, number of licenses, payment schedule, functional specification, repair and maintenance responsibilities, time table for delivery, and options to terminate any agreement, (7) purchasing and implementing most appropriate software package.
In the literature application of MCDM methods is well recognized as effective framework for software packages evaluation and comparison [2, 3, 5]. Various MCDM methods and techniques have been proposed to aid the software packages selection process. Analytic hierarchy process (AHP) [5], technique of analytic network process (ANP) and technique for order preference by similarity to ideal solution (TOPSIS) methods [3], graph theory and matrix approach (GTMA) [2], fuzzy logic and AHP [6], weighted sum method (WSM) and multi-objective optimization on the basis of ratio analysis (MOORA) method [7], have been previously applied by past researchers for solving software packages selection problems.
As seen from literature, many MCDM methods have been proposed for software package selection. However, there is need for a systematic and simple mathematical approach for efficient and effective evaluation of competitive software packages. In this paper, an attempt is made to explore the applicability and capability of recently developed MCDM method, i.e. weighted aggregated sum product assessment (WASPAS) method for solving software selection problems. Till date, the WASPAS method has very limited application in the IT domain. Two real time case studies were solved using this method and obtained results prove the applicability, usefulness, and accuracy of the method.
II. WASPAS METHOD
The WASPAS method for solving MCDM problems was proposed by Zavadskas et al. [8] in 2012. In essence the WASPAS method represents a unique combination of two well known MCDM methods, i.e. weighted sum method (WSM) and weighted product method (WPM). The main procedure of the WASPAS method solving MCDM problems includes several steps.
Step 1: Set the initial decision matrix, X:
mnmm
n
n
nmij
xxx
xxx
xxx
xX
. . .
... ... ... ...
. . .
. . .
21
22221
11211
. (1)
where xij is the assessment value of the i-th alternative with respect to the j-th criterion, m is the number of alternatives and n is the number of criteria.
Step 2: Normalization of the decision matrix by using following equations:
for beneficial criteria, where iji xmax is the most
preferable value:
iji
ij
ijx
xx
max . (2a)
for non-beneficial criteria, where iji xmin is the most
preferable value:
ij
iji
ijx
xx
min . (2b)
Step 3: Based on WSM, the total relative importance of
i-th alternative, denoted as )1(
iQ , is calculated as follows
[9]:
n
j
jiji wxQ1
)1( . (3)
where wj is criteria weight which represents relative importance or significance of the j-th criterion.
Step 4: According to the WPM, the total relative
importance of i-th alternative, denoted as )2(
iQ , is
calculated as follows [10]:
n
j
w
ijijxQ
1
)2( . (4)
Step 5: In order to have increased ranking accuracy and effectiveness of the decision making process, in WASPAS method, a more generalized equation for determining the total relative importance of alternatives is developed as below [8, 11]:
,1 ... ,1.0 ,0
)1(
)1(
11
)2()1(
n
j
w
ij
n
jjij
iii
jxwx
QQQ
. (5)
Now, the candidate alternatives are ranked based on the Q values, i.e. the best alternative would be that one having the highest Q value. When the value of λ is 0, WASPAS method is transformed to WPM, and when λ is 1, it becomes WSM [9].
III. SOFTWARE SELECTION CASE STUDIES
In order to demonstrate applicability of the WASPAS method two case studies dealing with solving software selection problems are considered. In each case study the results obtained using the WASPAS method were compared with the results obtained by previous researchers using different MCDM methods.
A. Case Study 1
Shyur [3] modeled a COTS evaluation problem as an MCDM problem and proposes a five-phase COTS selection model, combining the technique of ANP (analytic network process) and modified TOPSIS (technique for order performance by similarity to ideal solution). The ANP was used to determine the relative weights of multiple evaluation criteria and the modified TOPSIS approach is used to rank competing products in terms of their overall performance.
In the MCDM problem, four alternative software packages and seven criteria were considered. The criteria considered were cost (CO), supplier’s support (SS), ease of implementation (EI), closeness of fit to the company’s business (FB), flexibility to easy change as the company’s business changes (FC), technological risk (TR) and system integration (SI). The criteria weights were obtained as: wCO=0.301, wSS=0.332, wEI=0.026, wFB=0.112, wFC=0.041, wTR=0.097 and wSI=0.091. All seven criteria were considered as beneficial, and the

ISBN 978-86-80593-52-4
117
normalized values were calculated, and are given in Table I [2, 3].
The detailed computational procedure of the WASPAS method for solving the aforestated software selection problem is as follows. Since the decision matrix with normalized assessment values of alternatives is already given, the application of the WASPAS method starts with step 3. Thus, firstly by using (3) total relative importance of alternatives by WSM are calculated. Subsequently, by using (4) total relative importance of alternatives by WPM are calculated. Finally, joint criterion of optimality of WASPAS method is calculated by using (5). Table II provides the values of total relative importance (performance scores) for all the considered alternatives for a λ value of 0.5.
It is observed that software A1 is the best choice and the complete ranking order of the alternatives is 1-4-2-3. Using the modified TOPSIS procedure, Shyur [3] obtained the following ranking for the software packages considered: 4-1-2-3.
Using the modified TOPSIS procedure, Shyur [3] obtained the following ranking for the software considered: 4-1-2-3. By using three different MCDM methods that is AHP, simple TOPSIS method and graph theory and matrix approach, Rao [2] consistently obtained the following ranking 1-4-2-3. It should be noted that for this case study, the effect of varying values of λ on the performance scores and rankings is negligible.
TABLE I DECISION MATRIX FOR CASE STUDY 1
Software CO SS EI FB FC TR SI
A1 0.55 0.7 0.39 0.64 0.61 0.3 0.55
A2 0.46 0.35 0.55 0.4 0.41 0.69 0.39
A3 0.28 0.35 0.63 0.32 0.3 0.59 0.39
A4 0.64 0.52 0.39 0.56 0.61 0.3 0.63
TABLE II
COMPUTATIONAL DETAILS OF THE WASPAS METHOD FOR A Λ VALUE OF 0.5 OF CASE STUDY 1
Software )1(
iQ )2(
iQ iQ Rank
A1 0.58393 0.568766 0.576348 1
A2 0.43299 0.423721 0.428356 3
A3 0.35772 0.347301 0.352511 4
A4 0.54958 0.537969 0.543775 2
B. Case Study 2
Uremović [12] addressed the problem of selection of software solutions for implementation of "knowledge management system" in a reputable local IT company. The goal was to select one of the available ready-made software solutions that exist in the market (Microsoft SharePoint, IBM Lotus Notes, kManager) or independent development of modules according to our specific needs. Cost (CO), period of implementation (PI), system capabilities (SC), client support (CS), ease of upgradeability (EU) and experience on the platform (EP) were selected as the most significant criteria. Among the considered criteria, CO and PI are only non-beneficial
criteria. Uremović [12] solved this selection problem using MCDM methods by using the Excel add-in Sanna.xla. All alternatives assessment values were given on a five point scale. The decision matrix is given in Table III.
The criteria weights as determined by Uremović [12] were: wCO=0.3, wPI=0.2, wSC=0.2, wCS=0.1, wEU=0.1 and wEP=0.1. These criteria weights are also considered here for the subsequent analyzes. Firstly, by using (2a) and (2b), normalized assessment values of alternatives for beneficial and non-beneficial criteria were determined. Subsequently, following the same application procedure of the WASPAS method, as discussed in the previous case study, total relative importance (performance scores) for all the considered alternatives (for a λ value of 0.5) are calculated (Table IV).
Based on the descending values of performance scores, the four alternative software solutions are ranked as Microsoft Share Point- kManager- Independent solution- IBM Lotus Notes. Considering the results of the application of different MCDM methods, Uremović [12] identified Microsoft SharePoint as the best alternative. As concluded, an affordable solution with a large well organized network support with great possibilities of upgradeability makes it really as the most appropriate solution for the company.
TABLE III DECISION MATRIX FOR CASE STUDY 2
Software CO PI SC CS EU EP
Microsoft SharePoint 3 1 1 5 5 4
IBM Lotus Notes 5 1 2 4 4 1
kManager 1 2 3 1 2 1
Independent solution 2 5 4 5 3 3
TABLE IV COMPUTATIONAL DETAILS OF THE WASPAS METHOD FOR A
Λ VALUE OF 0.5 OF CASE STUDY 2
Software )1(
iQ )2(
iQ iQ Rank
Microsoft Share Point 0.65 0.545069 0.545069 1
IBM Lotus Notes 0.545 0.447214 0.447214 4
kManager 0.635 0.555788 0.555788 2
Independent solution 0.625 0.543523 0.543523 3
Figs. 1 and 2 show the effect of varying values of λ on total relative importance values and rankings of the considered software solutions.
It is clearly visible that a higher total relative importance values are achieved for the higher value of λ, i.e. when WASPAS method behaves like WSM. The rankings of the least preferred alternatives i.e. independent solution and IBM Lotus Notes remain unaffected for different values of λ. However in the case of Microsoft Share Point and kManager, different values of λ produced different rankings i.e. for λ ≥ 0.5, Microsoft Share Point is the best software solution, while for λ < 0.5, kManager can be regarded as the best software solution.
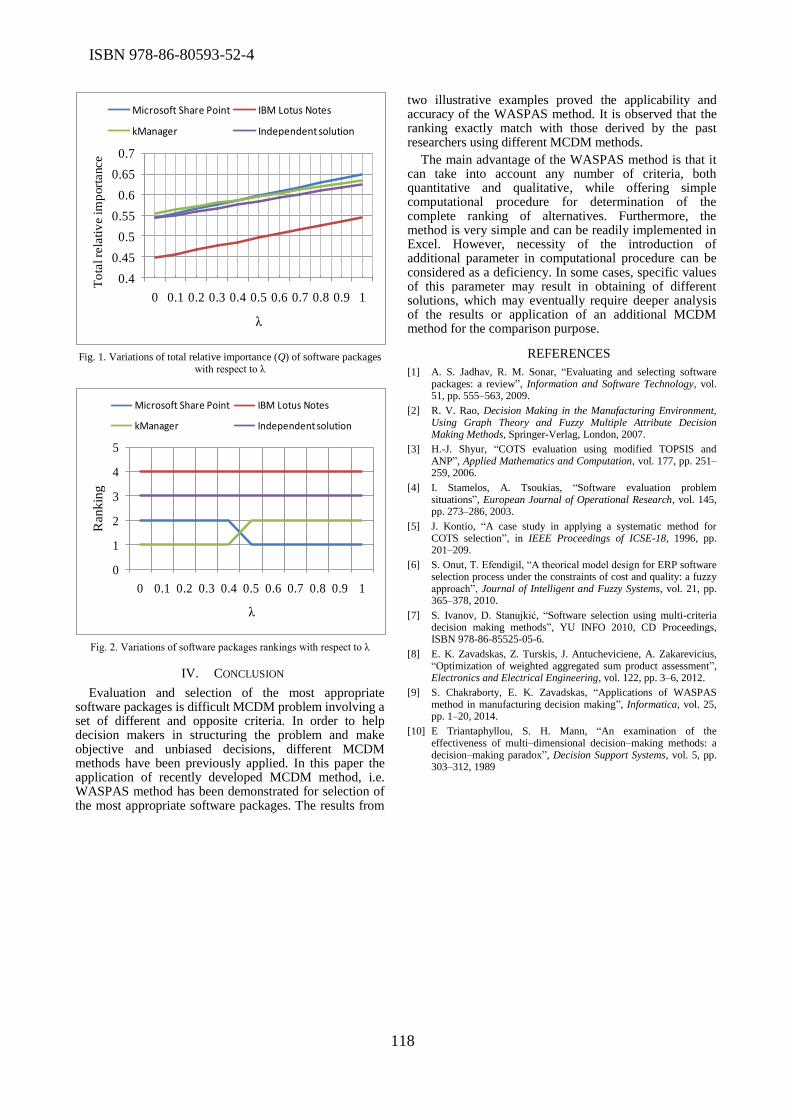
ISBN 978-86-80593-52-4
118
0.4
0.45
0.5
0.55
0.6
0.65
0.7
0 0.1 0.2 0.3 0.4 0.5 0.6 0.7 0.8 0.9 1
To
tal re
lati
ve im
port
ance
λ
Microsoft Share Point IBM Lotus Notes
kManager Independent solution
Fig. 1. Variations of total relative importance (Q) of software packages
with respect to λ
0
1
2
3
4
5
0 0.1 0.2 0.3 0.4 0.5 0.6 0.7 0.8 0.9 1
Ran
kin
g
λ
Microsoft Share Point IBM Lotus Notes
kManager Independent solution
Fig. 2. Variations of software packages rankings with respect to λ
IV. CONCLUSION
Evaluation and selection of the most appropriate software packages is difficult MCDM problem involving a set of different and opposite criteria. In order to help decision makers in structuring the problem and make objective and unbiased decisions, different MCDM methods have been previously applied. In this paper the application of recently developed MCDM method, i.e. WASPAS method has been demonstrated for selection of the most appropriate software packages. The results from
two illustrative examples proved the applicability and accuracy of the WASPAS method. It is observed that the ranking exactly match with those derived by the past researchers using different MCDM methods.
The main advantage of the WASPAS method is that it can take into account any number of criteria, both quantitative and qualitative, while offering simple computational procedure for determination of the complete ranking of alternatives. Furthermore, the method is very simple and can be readily implemented in Excel. However, necessity of the introduction of additional parameter in computational procedure can be considered as a deficiency. In some cases, specific values of this parameter may result in obtaining of different solutions, which may eventually require deeper analysis of the results or application of an additional MCDM method for the comparison purpose.
REFERENCES
[1] A. S. Jadhav, R. M. Sonar, “Evaluating and selecting software packages: a review”, Information and Software Technology, vol. 51, pp. 555–563, 2009.
[2] R. V. Rao, Decision Making in the Manufacturing Environment, Using Graph Theory and Fuzzy Multiple Attribute Decision Making Methods, Springer-Verlag, London, 2007.
[3] H.-J. Shyur, “COTS evaluation using modified TOPSIS and ANP”, Applied Mathematics and Computation, vol. 177, pp. 251–259, 2006.
[4] I. Stamelos, A. Tsoukias, “Software evaluation problem situations”, European Journal of Operational Research, vol. 145, pp. 273–286, 2003.
[5] J. Kontio, “A case study in applying a systematic method for COTS selection”, in IEEE Proceedings of ICSE-18, 1996, pp. 201–209.
[6] S. Onut, T. Efendigil, “A theorical model design for ERP software selection process under the constraints of cost and quality: a fuzzy approach”, Journal of Intelligent and Fuzzy Systems, vol. 21, pp. 365–378, 2010.
[7] S. Ivanov, D. Stanujkić, “Software selection using multi-criteria decision making methods”, YU INFO 2010, CD Proceedings, ISBN 978-86-85525-05-6.
[8] E. K. Zavadskas, Z. Turskis, J. Antucheviciene, A. Zakarevicius, “Optimization of weighted aggregated sum product assessment”, Electronics and Electrical Engineering, vol. 122, pp. 3–6, 2012.
[9] S. Chakraborty, E. K. Zavadskas, “Applications of WASPAS method in manufacturing decision making”, Informatica, vol. 25, pp. 1–20, 2014.
[10] E Triantaphyllou, S. H. Mann, “An examination of the effectiveness of multi–dimensional decision–making methods: a decision–making paradox”, Decision Support Systems, vol. 5, pp. 303–312, 1989
ISBN 978-86-80593-52-4
119
AHP Based Comparison of open-source BPM
Systems
Dragan Mišić1, Milena Mišić2, MilanTrifunović1, Tanja Arh3, Pipan Matić3
1Faculty of Mechanical Engineering, University of Niš, Serbia 2Faculty of Electronic Engineering, University of Niš, Serbia
3Jozef Stefan Institute, Ljubljana, Slovenia
[email protected]; [email protected]; [email protected]; [email protected]; [email protected]
Abstract—Although Business Process Management in companies can be done without using software tools, it is much more efficient to use corresponding software systems as help. Those systems are called Business Process Management systems (BPMS). Today there are many various tools available in the market, which differ in technologies that are used to develop them and which are based on different business models. In order to facilitate the process of choosing the most appropriate tool, in this paper we compared a few solutions, which are based on open-source business model. The comparison was done based on about 20 criteria which are evaluated and ranked by using the AHP method.
I. INTRODUCTION
The world economy has been experiencing crisis for quite a while. Therefore, there is not enough money and many companies have collapsed. This particularly applies to Serbian economy which was not in a good condition even before the crisis. How is it possible to find money for software that could improve the functioning of the company under those circumstances?
One of the possible solutions is using software which comes from the vendor with open source philosophy. When someone mentions open-source software, the first thing that comes to mind is that such software is free. That can be, but it is not always true. The most important characteristic of this software is that people get it along with the program code. That code can be adjusted to suit specific needs, and it can further be distributed under the same conditions.
The number of both profit and non-profit organizations that use the advantages of the open-source industry is rising rapidly [1]. Open-source software has become a serious competitor to commercial programs [2].
Even though we are not talking about free software, the amounts which are paid for this kind of program are much smaller than those that are needed to purchase commercial software of the same category. That is one of the reasons for which we focused our analysis on systems that are from the category of open-source software.
Today, the process orientation of a company is something that is hardly ever questioned [3] [4]. There are some empirical researches that indicate the undoubtful connection between BPM (Business Process Management) and customers' satisfaction [5].
When we are talking about BPMS it is clear that the first thing to do is to define what the term 'process' implies, and then to define what is these systems' task in regard to that process.
According to [6], a business process is "a set of one or more linked procedures or activities which collectively realize a business objective or policy goal, normally within the context of an organizational structure defining functional roles and relationships".
Processes that are defined in this manner must be managed. That management is the task of BPM. BPMS are systems which represent the evolution of Workflow Management Systems (WfMS), which first appeared in the nineties. According to Workflow Management Coalition [6], WfMS is "A system that defines, creates and manages the execution of workflows through the use of software, running on one or more workflow engines, which is able to interpret the process definition, interact with workflow participants and, where required, invoke the use of IT tools and applications". BPMS originate from the evolution of WfMS. For example, van der Aalst, one of the world's leading researchers in this area, defines BPMS as "Supporting business processes using methods, techniques, and software to design, enact, control, and analyse operational processes involving humans, organizations, applications, documents and other sources of information" [7].
According to the two definitions above, it can be seen that the main difference between WfMS and BPM system is the possibility of analysing that exists in BPM systems.
In addition to the use of BPMS in process management in organizations, these systems can also be used to integrate software components and build more complex software.

ISBN 978-86-80593-52-4
120
Further in this paper, alternatives and the way they are evaluated are explained in more detail. The structure of the paper is the following: In the second chapter we briefly describe systems which were evaluated. The third part explains the AHP method which was used to evaluate the alternatives, and gives the explanation of the criteria used to evaluate systems. Results are shown in the fourth chapter, and the conclusion is presented in the fifth part.
II. ALTERNATIVE SYSTEMS FOR BUSINESS PROCESS
MANAGEMENT
Today, there is a large number of various products which are related to computer management of business processes. That number is approximately a few hundred. Some of those products are independent, and some are embedded in some other software products.
It is clear that it is very difficult for the organization to pick one product out of many that are available, and be sure that the one they picked will suit their needs in the best way possible. That task requires a detail analysis, but also the knowledge in the area of BPM by ones that perform the analysis. The goal of this paper is to provide users with some recommendations and help with choosing the right alternative.
Due to limited space and time, we decided to restrict the analysis to a few tools. We chose those tools based on our experience and the analysis of users' experiences which are posted online. One of the conditions was that the products exist for a certain number of years, in other words that they have matured. It was also required that there is a community which uses those products and monitors their development.
We have already mentioned that the comparison is focused on open-source products, because we estimated that the price of these products is something that our organizations and companies are able to pay.
In accordance with all aforementioned we made the comparison of five BPM tools. Those are: Intalio, jBPM, ProcessMaker, Bonita i Yawl.
Some of the chosen tools are fully available under open-source licenses, and some of them have versions which are distributed as open-source, and also as commercial versions.
Intalio (www.intalio.com) is one of the first BPM projects. This tool is available under open-source license, with limited capabilities, and under commercial license which offers a full set of characteristics. Intalio consists of a visual process designer, machine for execution, and also a number of additional tools that you would expect to find within a modern BPM system. Some of those tools are Business Activity Monitoring (BAM), support tool for business rules, document management system, various integration tools etc. It is written in Java programming language.
jBPM (www.jbpm.org) is also a very mature product which has been being developed for a number of years. It is probably one of the first references in the area of open-source BPM tools. jBPM is a tool which is fully available in open-source version. According to its authors, one of its advantages is that it is designed for both non-technical users and developers that intend to adjust the tool to their own needs. It also has a visual designer (two types of it – Eclipse based for developers and web based for business users), support tool for monitoring of business activities, a
possibility of defining rules, support tool for managing documents etc. It is also written in programming language Java.
ProcessMaker (www.processmaker.com) is another BPM tool that is often mentioned as one of the best in the category of open-source software. Unlike other products that we mentioned, this one is written in PHP. Visual tool for creating this process is completely web-based, which is one of the advantages of this product.It is fairly easy to integrate it and connect it to the other systems, such as SugarCRM etc. It is also not completely open-source; there is a community version, and also an enterprise version which costs a certain amount of money, and has additional options.
Bonita (www.bonitasoft.com), which comes from company called BonitaSoft, offers both community and commercial version. It is also developed in Java. It is a product which has existed for years, and it comes with a lot of features that are usual for quality and mature BPM systems. Process Designer is a high quality product. It complies with the standards (BPMN2), and also offers the possibilities of process simulation, integration with other tools, monitoring the activities etc.
Yawl (www.yawlfoundation.org) is the last one of the tools that we compared in this paper. It is also a completely open-source product, and some of the leading experts in the area of BPM systems, such as van der Aalst, Holfstede and others, participate in its development. It is based on modeling language Yawl, which is probably one of the best tools in the aspect of support for workflow patterns. Yawl was also developed in Java programming language.
III. ANALYTIC HIERARCHY PROCESS AND CHOSEN
CRITERIA
In our everyday lives, we make various decisions on daily basis. Sometimes we do that intuitively, and sometimes our decisions are based on detail researches. We use the similar algorithm when we choose BPMS that will suit our needs in the best way possible. There are lots of factors that should be taken into account when making the decision. In order for that to be done in a consistent manner, we decided to use systematic, mathematically proven process of choosing between alternatives – AHP (Analytic Hierarchy Process) [8,9].
The AHP is a decision support tool which can be used to solve complex decision problems. It uses a multi-level hierarchical structure of objectives, criteria, subcriteria, and alternatives. The pertinent data are derived by using a set of pairwise comparisons. These comparisons are used to obtain the weights of importance of the decision criteria, and the relative performance measures of the alternatives in terms of each individual decision criterion. If the comparisons are not perfectly consistent, then it provides a mechanism for improving consistency.
Various authors have various ideas about criteria that a good BPMS must meet. As far back as 2006, Gartner listed some of criteria in his report [10]. Nonacademic press and research institutions such as Gartner and Forrester regularly release reviews on BPM tools, but their analysis are mainly focused on commercial products, which are not appropriate for the conditions prevailing in Serbia, mostly because of their price.

ISBN 978-86-80593-52-4
121
Some other authors also tried to evaluate the quality of BPM system based on their criteria. For example, in [11] the comparison was done based on workflow patterns that a certain system can support. In [12] the case of a BPM tool selection in an Australian government agency is reported, where 10 products from major vendors were evaluated using a weighted scoring model with 47 criteria grouped into six main categories.
Based on the review of the literature and our experience in working with BPMS, we came up with about 20 criteria, which we divided in several categories.
Criteria based on which we did the software evaluation are divided in 8 categories (clusters). Some of these categories are further divided into sub-categories, while others are not.
The first category refers to some external aspects of the system, instead of basic tool characteristics. This includes:
Documentation – Quality of the documentation, both for end users and developers
Installation – Simplicity of installation, and the duration of it
Database management systems that are used for data storage – Whether the system can function and be connected to various database management systems
Licenses and price – Although they are open-source, some of the tools have a commercial version, and this criteria helps to take that into account
Vendor support – What kind of support a user gets from the vendor, and how great that support is. Whether there are forums, blogs, e-mail support etc.
Business templates and models – Whether there are business process templates that users can use to improve their processes, and what their quality is.
In the second category, we presented criteria related to compliance with standards and possibility to connect to other systems. This includes:
Compliance with standards – This refers to compliance with modeling standards (BPMN2), support for XPDL, BPEL and other standards in the area of BPM systems.
Communications with other systems – BPMS are not used in isolation. It is often needed for the model, which was made in a certain tool, to be transferred to some other system, and vice versa.
Integration capabilities – These systems are often connected to other elements of information systems in organizations. This criterion refers to capability of interoperating, and the simplicity of it.
Third category of criteria refers to abilities of the tool in the aspect of simulation and process and activity monitoring, and it also refers to system's ability to respond to exceptions. These criteria are:
Simulation – Capability of process simulation, based on given parameters
BAM (Business Activity Monitoring) – Capability of the tool to monitor the progress of the process, analytical capability, historical event analysis etc.
Exceptions handling support – This criteria evaluates possibilities of the system to react to exceptions which occur during the process execution
The fourth group of criteria is related to users. This includes:
User interface – This refers to potential portals, document management system, search, capability of creating portlets etc.
Quality of modeling tool – This criterion compares visual designers that are used for process modeling.
Team collaboration support – Whether the process can be shared, whether there is a support tool for discussions, an access to shared work lists, potential support for group decisions making systems etc.
Along with the aforementioned criteria, which represent categories with sub-criteria, we used criteria which we did not further divide. This includes the following criteria:
Support for user management – This criterion is used to make comparisons between the tools based on the routing method (work assignment), their capability of describing roles, capability of importing organizational structures from other systems etc.
Support for automatic task and integration – This criteria evaluates capabilities of the tool which are related to sending messages, access to data and its transformation, interoperability with various platforms, creating of web service, creating of complex services, finding services etc.
Support for defining and managing the rules – Various capabilities to present the rules (decision tables, pseudo-linguistic rules etc.), capability of dynamic rule defining (separately from the machine), testing the rule order, the rule version etc.
Human task support – This criterion compares the tools based on their support for manual activities (activities that are executed by human). This refers to whether it is possible to define manual tasks, whether they can be divided into levels, the capability of changing the workflow on the fly, adaptive representation of the workflow etc.
IV. COMPARISON RESULTS
After having defined the criteria, the next thing to do was to put a procedure that AHP method implies into practice. In order to do that, we needed a sample process. We have been working on a project 'Virtual human osteoarticular system and its application in preclinical and clinical practice at the Faculty of Mechanical Engineering. One of the goals of that project is defining the process of designing and manufacturing customized osteofixation material. Since we needed a sample process for comparison of the BPM tools, we decided to choose exactly that one. This process is very complex, so we simplified it for the purposes of this paper. That was done in such a manner that the majority of the elements that could be used to evaluate the tools remain in the process. Process mainly consists of manual activities, but there are some system activities, too. This process contains various data, such as textual, numerical, and it also contains files (patients' images). We will not further explain this process in this paper, it is only important to note that the same process was used as a sample process.
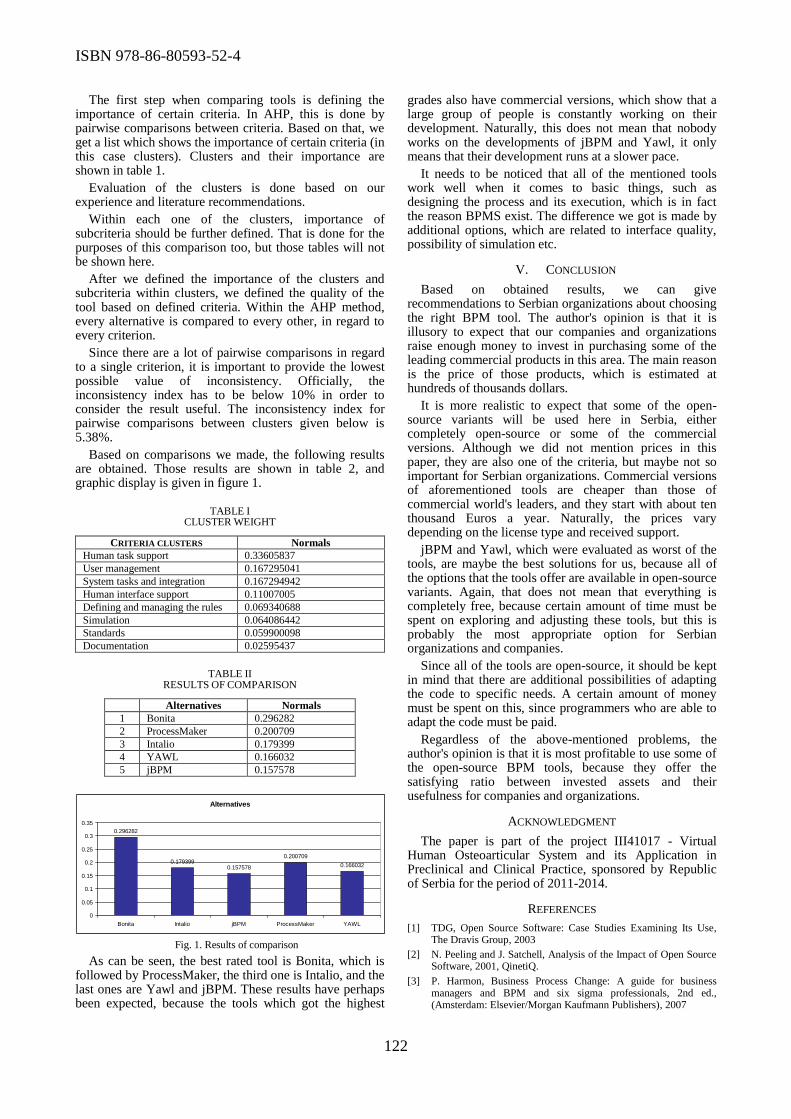
ISBN 978-86-80593-52-4
122
The first step when comparing tools is defining the importance of certain criteria. In AHP, this is done by pairwise comparisons between criteria. Based on that, we get a list which shows the importance of certain criteria (in this case clusters). Clusters and their importance are shown in table 1.
Evaluation of the clusters is done based on our experience and literature recommendations.
Within each one of the clusters, importance of subcriteria should be further defined. That is done for the purposes of this comparison too, but those tables will not be shown here.
After we defined the importance of the clusters and subcriteria within clusters, we defined the quality of the tool based on defined criteria. Within the AHP method, every alternative is compared to every other, in regard to every criterion.
Since there are a lot of pairwise comparisons in regard to a single criterion, it is important to provide the lowest possible value of inconsistency. Officially, the inconsistency index has to be below 10% in order to consider the result useful. The inconsistency index for pairwise comparisons between clusters given below is 5.38%.
Based on comparisons we made, the following results are obtained. Those results are shown in table 2, and graphic display is given in figure 1.
TABLE I CLUSTER WEIGHT
CRITERIA CLUSTERS Normals
Human task support 0.33605837
User management 0.167295041
System tasks and integration 0.167294942
Human interface support 0.11007005
Defining and managing the rules 0.069340688
Simulation 0.064086442
Standards 0.059900098
Documentation 0.02595437
TABLE II RESULTS OF COMPARISON
Alternatives Normals
1 Bonita 0.296282
2 ProcessMaker 0.200709
3 Intalio 0.179399
4 YAWL 0.166032
5 jBPM 0.157578
Alternatives
0.296282
0.1793990.157578
0.200709
0.166032
0
0.05
0.1
0.15
0.2
0.25
0.3
0.35
Bonita Intalio jBPM ProcessMaker YAWL
Fig. 1. Results of comparison
As can be seen, the best rated tool is Bonita, which is followed by ProcessMaker, the third one is Intalio, and the last ones are Yawl and jBPM. These results have perhaps been expected, because the tools which got the highest
grades also have commercial versions, which show that a large group of people is constantly working on their development. Naturally, this does not mean that nobody works on the developments of jBPM and Yawl, it only means that their development runs at a slower pace.
It needs to be noticed that all of the mentioned tools work well when it comes to basic things, such as designing the process and its execution, which is in fact the reason BPMS exist. The difference we got is made by additional options, which are related to interface quality, possibility of simulation etc.
V. CONCLUSION
Based on obtained results, we can give recommendations to Serbian organizations about choosing the right BPM tool. The author's opinion is that it is illusory to expect that our companies and organizations raise enough money to invest in purchasing some of the leading commercial products in this area. The main reason is the price of those products, which is estimated at hundreds of thousands dollars.
It is more realistic to expect that some of the open-source variants will be used here in Serbia, either completely open-source or some of the commercial versions. Although we did not mention prices in this paper, they are also one of the criteria, but maybe not so important for Serbian organizations. Commercial versions of aforementioned tools are cheaper than those of commercial world's leaders, and they start with about ten thousand Euros a year. Naturally, the prices vary depending on the license type and received support.
jBPM and Yawl, which were evaluated as worst of the tools, are maybe the best solutions for us, because all of the options that the tools offer are available in open-source variants. Again, that does not mean that everything is completely free, because certain amount of time must be spent on exploring and adjusting these tools, but this is probably the most appropriate option for Serbian organizations and companies.
Since all of the tools are open-source, it should be kept in mind that there are additional possibilities of adapting the code to specific needs. A certain amount of money must be spent on this, since programmers who are able to adapt the code must be paid.
Regardless of the above-mentioned problems, the author's opinion is that it is most profitable to use some of the open-source BPM tools, because they offer the satisfying ratio between invested assets and their usefulness for companies and organizations.
ACKNOWLEDGMENT
The paper is part of the project III41017 - Virtual Human Osteoarticular System and its Application in Preclinical and Clinical Practice, sponsored by Republic of Serbia for the period of 2011-2014.
REFERENCES
[1] TDG, Open Source Software: Case Studies Examining Its Use, The Dravis Group, 2003
[2] N. Peeling and J. Satchell, Analysis of the Impact of Open Source Software, 2001, QinetiQ.
[3] P. Harmon, Business Process Change: A guide for business managers and BPM and six sigma professionals, 2nd ed., (Amsterdam: Elsevier/Morgan Kaufmann Publishers), 2007

ISBN 978-86-80593-52-4
123
[4] M. Hammer, “Deep Change”, Harvard Business Review, 2004
[5] Kumar et al., Alternative perspectives on service quality and customer satisfaction: the role of BPM, International Journal of Service Industry Management, 19 (2): 176-187, 2008
[6] W. Coalition, Workflow Management Coalition Terminology and Glossary. Technical report, Workflow Management Coalition, 1999
[7] W. Van der Aalst, Business Process Management: A personal view. Business Process Management Journal, 2004
[8] T. L. Saaty, The Analytic Hierarchy Process. New York: McGraw Hill, 1980.
[9] T. L. Saaty, Decision Making for Leaders – The Analytic Hierarchy Process for Decisions in a Complex World, 3 ed. Pittsburgh: RWS Publications, 2001.
[10] Selection Criteria Details for Business Process Management Suites, Gartner BPM report, 2006
[11] P. Wohed et al., “Patterns-based evaluation of open source BPM systems : The cases of jBPM, OpenWFE, and Enhydra Shark,”Information & Software Technology, vol. 51, no. 8, pp. 1187– 1216, 2009.
[12] I. Davies and M. Reeves, BPM Tool Selection: The Case of the Queensland Court of Justice, Handbook on Business Process Management 1, pages 339–360, 2010

Thursday, October 16th, 2014

ISBN 978-86-80593-52-4
126
Geometrically Defined Cloud of Anatomical
Points of Human Femur Trochanteric and Neck
Region
Nikola Vitković1, Miodrag Manić1, Miroslav Trajanović1, Miloš Stojković1, Dragan Mišić1, Miloš Madić1,
Stojanka Arsić2 1Faculty of Mechanical Engineering, University of Niš, Niš, Serbia
2Faculty of Medicine, University of Niš, Niš, Serbia
[email protected]; [email protected]; [email protected]; [email protected];
[email protected]; [email protected]; [email protected]
Abstract— The creation of geometrically accurate 3D models of human long bones implies use of number of different techniques and presents an unique challenge, because their geometry, form and topology are very complex and with high-level surface details. Conventionally, these kind of shapes can be modelled by using surface patches represented by Bezier or B-spline surfaces, or by using NURBS patches, which are commonly applied in traditional CAD applications. There are many problems which can arise when modelling these complex shapes with parametric surfaces. Connecting parts of bones with completely different form and topology can be very complicated, and in most cases it is impossible to maintain smoothness of the whole surface. Here we propose some modelling technique which uses digitized human femur model, parametric curves (splines), and anatomically defined geometrical entities to develop the cloud of points model with strictly defined geometry. By applying this approach we tried to overcome the problems which can appear at the junction of anatomical regions of the bone. Models of the human bones created in this way can be applied for: preoperative planning in orthopaedics, creation of parametric human bone models, rapid prototyping, creation of bone implants, etc.
I. INTRODUCTION
In medicine, especially in orthopedic surgery, there is a requirement to create accurate geometrical models of the human bones. With such models, it is possible to build customized bone implants and fixators using rapid prototyping technologies or performing preoperative planning procedures. Creating geometrical models of human bones is not an easy task, because the outer surface of the human long bones (i.e. femur) can be considered as a free form surface. It is generally known what kind of problems can arise in the process of modeling this kind of surfaces [1]. The use of parametric surface patches can create some numerical and topological errors, especially in the area of bones with greatly changes in curvature
(G2) or tangency (G1), like crests, dents, at a junction of two anatomical regions.
There are two main approaches for the creation of geometrical models of human bones. They can be created by the use of reverse engineering techniques, or the models can be created directly in a CAD software.
Reverse engineering implies use of some kind of medical imaging device for the acquisition of medical data, then processing that data in medical or CAD software, and at the end, creating valid geometrical model [2,3].
Direct modeling presumes that model is created by direct use of various CAD techniques for the creation of geometrical model, e.g. the curves are created by defining anatomical points and basic geometry (lines, planes, axes, etc.). Next, the surface patches are created by performing sweeping, blending, lofting, filling, etc. over curves. At the end of the process merging and trimming of surface patches are performed in order to create valid geometrical model of human bone [2].
It can be said that initial difference between this two approaches is in the way how geometrical entities are created. In the first approach they are created by the use of acquired data (imported cloud of points) from medical scanning devices (CT - Computer Tomography, X-ray), and in the second approach they are created from the designed geometry, not imported.
The main idea of this research is to use first approach but with a little modification. Parametric curves are not used (but they can be used) for the creation of parametric surfaces but for creation of control interpolation points (anatomical points) which are based on Referential Geometrical Entities (RGEs) [3,5]. These points as well as RGEs are defined with respect to the anatomy of a human bone [3]. Anatomical points form cloud of points model which can be used in various CAD software packages for later modification and manipulation.
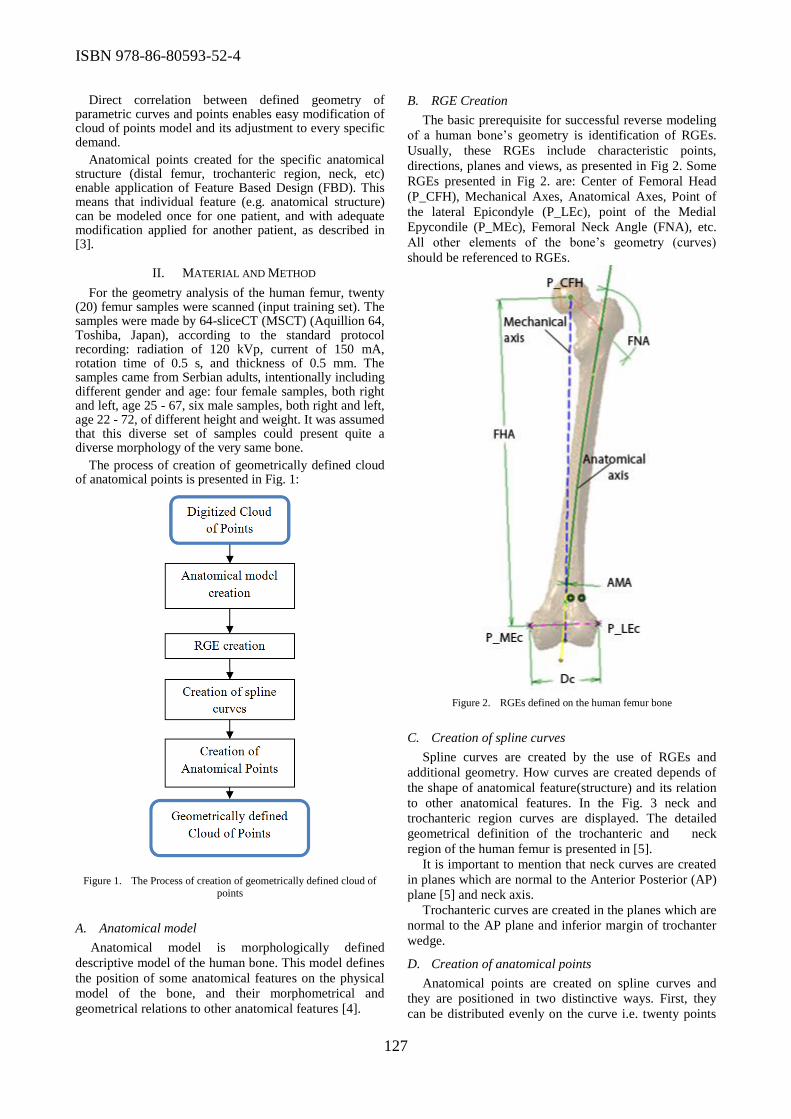
ISBN 978-86-80593-52-4
127
Direct correlation between defined geometry of parametric curves and points enables easy modification of cloud of points model and its adjustment to every specific demand.
Anatomical points created for the specific anatomical structure (distal femur, trochanteric region, neck, etc) enable application of Feature Based Design (FBD). This means that individual feature (e.g. anatomical structure) can be modeled once for one patient, and with adequate modification applied for another patient, as described in [3].
II. MATERIAL AND METHOD
For the geometry analysis of the human femur, twenty (20) femur samples were scanned (input training set). The samples were made by 64-sliceCT (MSCT) (Aquillion 64, Toshiba, Japan), according to the standard protocol recording: radiation of 120 kVp, current of 150 mA, rotation time of 0.5 s, and thickness of 0.5 mm. The samples came from Serbian adults, intentionally including different gender and age: four female samples, both right and left, age 25 - 67, six male samples, both right and left, age 22 - 72, of different height and weight. It was assumed that this diverse set of samples could present quite a diverse morphology of the very same bone.
The process of creation of geometrically defined cloud of anatomical points is presented in Fig. 1:
Figure 1. The Process of creation of geometrically defined cloud of
points
A. Anatomical model
Anatomical model is morphologically defined
descriptive model of the human bone. This model defines
the position of some anatomical features on the physical
model of the bone, and their morphometrical and
geometrical relations to other anatomical features [4].
B. RGE Creation
The basic prerequisite for successful reverse modeling
of a human bone’s geometry is identification of RGEs.
Usually, these RGEs include characteristic points,
directions, planes and views, as presented in Fig 2. Some
RGEs presented in Fig 2. are: Center of Femoral Head
(P_CFH), Mechanical Axes, Anatomical Axes, Point of
the lateral Epicondyle (P_LEc), point of the Medial
Epycondile (P_MEc), Femoral Neck Angle (FNA), etc.
All other elements of the bone’s geometry (curves)
should be referenced to RGEs.
Figure 2. RGEs defined on the human femur bone
C. Creation of spline curves
Spline curves are created by the use of RGEs and
additional geometry. How curves are created depends of
the shape of anatomical feature(structure) and its relation
to other anatomical features. In the Fig. 3 neck and
trochanteric region curves are displayed. The detailed
geometrical definition of the trochanteric and neck
region of the human femur is presented in [5].
It is important to mention that neck curves are created
in planes which are normal to the Anterior Posterior (AP)
plane [5] and neck axis.
Trochanteric curves are created in the planes which are
normal to the AP plane and inferior margin of trochanter
wedge.
D. Creation of anatomical points
Anatomical points are created on spline curves and
they are positioned in two distinctive ways. First, they
can be distributed evenly on the curve i.e. twenty points
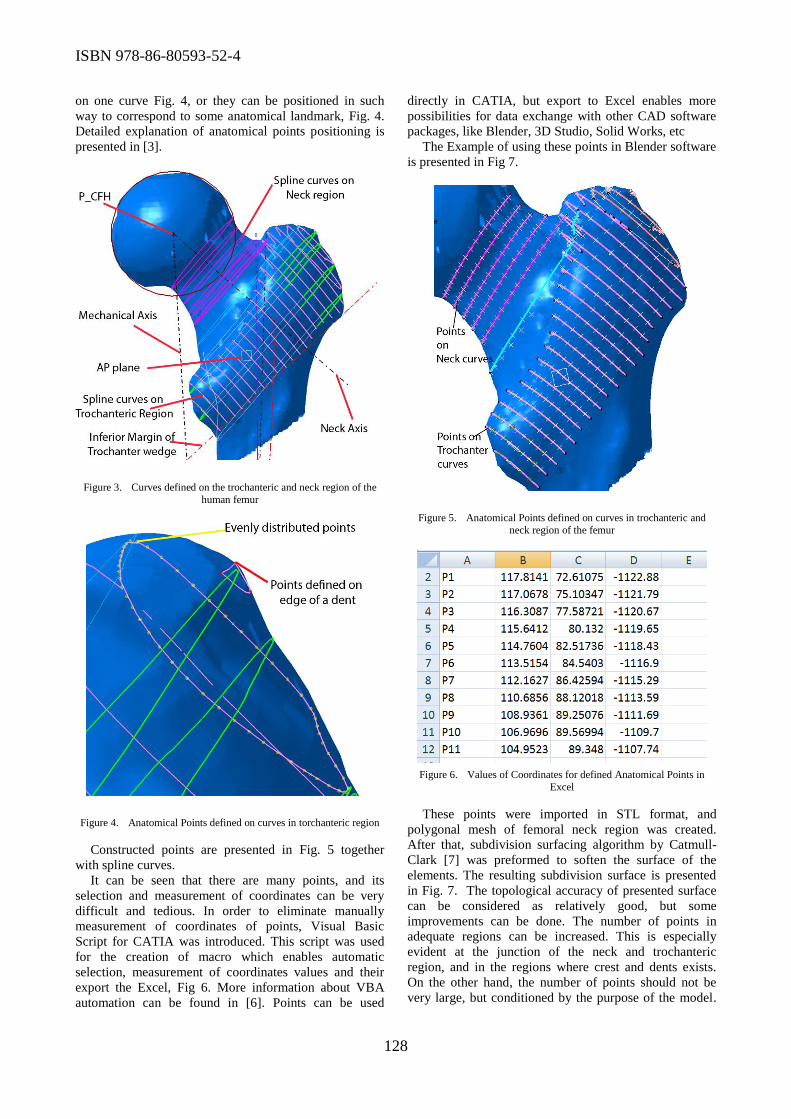
ISBN 978-86-80593-52-4
128
on one curve Fig. 4, or they can be positioned in such
way to correspond to some anatomical landmark, Fig. 4.
Detailed explanation of anatomical points positioning is
presented in [3].
Figure 3. Curves defined on the trochanteric and neck region of the
human femur
Figure 4. Anatomical Points defined on curves in torchanteric region
Constructed points are presented in Fig. 5 together
with spline curves.
It can be seen that there are many points, and its
selection and measurement of coordinates can be very
difficult and tedious. In order to eliminate manually
measurement of coordinates of points, Visual Basic
Script for CATIA was introduced. This script was used
for the creation of macro which enables automatic
selection, measurement of coordinates values and their
export the Excel, Fig 6. More information about VBA
automation can be found in [6]. Points can be used
directly in CATIA, but export to Excel enables more
possibilities for data exchange with other CAD software
packages, like Blender, 3D Studio, Solid Works, etc
The Example of using these points in Blender software
is presented in Fig 7.
Figure 5. Anatomical Points defined on curves in trochanteric and
neck region of the femur
Figure 6. Values of Coordinates for defined Anatomical Points in
Excel
These points were imported in STL format, and
polygonal mesh of femoral neck region was created.
After that, subdivision surfacing algorithm by Catmull-
Clark [7] was preformed to soften the surface of the
elements. The resulting subdivision surface is presented
in Fig. 7. The topological accuracy of presented surface
can be considered as relatively good, but some
improvements can be done. The number of points in
adequate regions can be increased. This is especially
evident at the junction of the neck and trochanteric
region, and in the regions where crest and dents exists.
On the other hand, the number of points should not be
very large, but conditioned by the purpose of the model.

ISBN 978-86-80593-52-4
129
If the final model is created for the presentation purposes,
then there is no need for the large number of points.
Figure 7. Subdivision surface on the neck region of the femur
III. CONCLUSION
The presented method enables creation of
geometrically defined cloud of points model for different
regions (parts) of the human bones. In order to create the
model of a whole bone, merging cloud of points of the
regions is needed. The application of this kind of model
is various. First of all, cloud of points model can be
imported in many CAD software packages, and
manipulated, transformed, converted to polygonal,
surface, or volume model. This model can serve as the
basis for the creation of the human bone implants and
fixators, which can be manufactured by the use of Rapid
Prototyping or conventional technologies.
The future work implies improving the quality of the
model in a sense of geometrical accuracy and anatomical
correctness.
This can be achieved by creating more geometrical
elements (curves, points, etc.) which can define the bone
morphology on anatomically more precise way.
ACKNOWLEDGMENT
The paper presents the case that resulted from application of multidisciplinary research in the domain of bioengineering in real medical practice. The research project (Virtual Human Osteoarticular System and its Application in Preclinical and Clinical Practice) is sponsored by the Ministry of Science and Technology of the Republic of Serbia - project id III 41017 for the period of 2011-2014
REFERENCES
[1] J-P. Pernot, B. Falcidieno, F.Giannini, S. Guilet, J-C. Leon, “Modelling Free-Form Surfaces using a Feature-Based Approach” in Proceedings, SM '03 Proceedings of the eighth ACM symposium on Solid modeling and applications, ACM New York, NY, USA, 2003, pp. 270-273.
[2] S. Filippi, B. Motyl, C. Bandera, “Analysis of existing methods for 3D modelling of femurs starting from two orthogonal images and development of a script for a commercial software package” in Computer methods and programs in biomedicine Vol. 89, No. 1, 2008, pp. 76-82.
[3] N. Vitković, J. Milovanović, N. Korunović, M. Trajanović, M. Stojković, D. Mišić, S. Arsić, “Software System for Creation of Human Femur Customized Polygonal Models” in Computer Science and Information Systems, Vol. 10, No. 3, 2013, pp. 1473-1497.
[4] P.A. Toogood, A. Skalak, D. R. Cooperman, “Proximal Femoral Anatomy in the Normal Human Population” in Clin Orthop Relat Res, Vol. 464, No. 4, 2009, pp. 876-885.
[5] M. Stojković, M. Trajanović, N. Vitković, J. Milovanović, S. Arsić, M. Manić, “Referential Geometrical Entities for Reverse Modeling of Geometry of Femur” in Proceedings, In: João Manuel R.S. Tavares and R.M. Natal Jorge, editor. VIP IMAGE 2009. Porto: Taylor & Francis Group., 2009, pp. 189–194.
[6] CATIA V5 official Help documentation, V5automation.chm
[7] E. Catmull, J. Clark, “Recursively generated B-spline surfaces on arbitrary topological meshes”, Computer Aided Design, vol. 10, No. 6, 1978, pp. 350-355.
ISBN 978-86-80593-52-4
130
Morphological Properties of the Hand Bones
Important for Their 3D Geometrical Modeling Stojanka Arsić1, Nikola Vitković2, Miodrag Manić2, Miloš Stojanović2
1Faculty of Medicine, University of Niš, Serbia 2Faculty of Mechanical Engineering, University of Niš, Serbia
[email protected]; [email protected]; [email protected]; [email protected]; [email protected]
Abstract — The bones of the hand are divided into
three main groups: carpal bones, metacarpal bones and the phalanges of the fingers. Each group of these bones has specific morphological properties: carpal bones are short and irregular bones; metacarpal bones and phalanges have the properties of the long bones.According to their complex morphology, 3D geometrical modeling of the hand bones requires a good knowledge of their anatomical characteristics. The aim of this study is to show an anatomical review of the hand bones morphology with specific anatomical landmarks which represent referent geometrical entities (REF) required for creation of their 3D geometrical models. Knowledge of the precise anatomy and geometry of the hand bones is particularly important for biomedical engineers who want to create their 3D models by rapid prototypig methods.
I. INTRODUCTION
Computer Assisted Orthopedics is increasingly part of everyday orthopedic practice. In the modern hand bone orthopaedic surgery there is a need for preoperative planning and creation of customized implants and fixators. This includes knowledge of the exact geometrical models of all hand bones which can be damaged by trauma fracture or bony tumor. Therefore, it is very important to create geometric models of that bones by rapid prototyping according to anatomical geometry of each separate bone. In addition, development of personalized (customized) implants or scaffold also requires presence of good geometrical models of the bones. Geometric models of bones can be created using data obtained by computed tomography or other scanning technology. Polygonal 3D models obtained bythe processing of these data, relatively well approximate the shape and dimensions of the bones.
A. RELATED WORK
In the available literature there 3D anthropometry of the scaphoid bone was described by Pichler et all (1). Letta et all (2) are described scaphoid bone geometry in three dimensions. Kalazci (3) describe 3D reconstruction of the phalangeal and metacarpal bones of a male judo player. Some studies deal with the shape analyses of all carpal bones (4) or some separate carpal bone like scaphoid and lunate (5) or
triquetral bone (6). Morphometric properties of the metacarpal bones and the phalanges were also investigated (7, 8, 9, and 10). .Antropometric studies of the hand bones also have forensic significance in postmortem identification of the human remains (11, 12).
II. ANATOMY OF THE HAND BONES
The skeleton of the hand is composed of three main groups of bones: carpal bones, metacarpal bones and the phalanges of the fingers Fig. (1, 13).
A. CARPUS
Carpus is formed by eight carpal bones arranged
in proximal and distal rows. In lateral to medial order
the bones of the proximal row are named scaphoid,
lunate, triquetral, and pisiform; those of the distal
row are the trapezium, trapezoid capitate and
hamate (Figs.1, 2). Concave palmar side of the
carpus forms a groove called carpal sulcus covered
by the flexor retinaculum, a sheath of
tough connective tissue, thus forming the carpal
tunnel. The individual carpal bones have several points of
resemblance. Each bone (except the pisiform) has six surfaces, of which the anterior or palmar and posterior or dorsal are rough affording attachment for ligaments. The proximal and distal surfaces are articular, the former being generally convex and the latter concave. The lateral and medial surfaces, when in contact with adjacent bones, are mainly articular, but otherwise rough, giving attachment to ligaments.
The Scaphoid Bone (Figs.1, 2, 3) is the largest bone of the proximal row, and so disposed that its long axis extends obliquely downward and lateralward. The proximal surface is convex and somewhat triangular in shape, articulating with the lateral facet on the distal end of the radius. The distal surface, smooth and convex, is divided into two parts by a ridge; the lateral part articulates with the trapezium bone, the medial, with the trapezoid bone. The palmar surface, rough and concave proximally, is elevated distally into a prominent tubercle for the attachment of the transverse carpal ligament and the

ISBN 978-86-80593-52-4
131
Fig. 1. Bones of the right hand (palmar surface)
Fig. 2. Carpal bones of the right hand (Distal ends of the forearm
bones, and the proximal ends of the metacarpal bones are visible)
abductor pollicis brevis muscle. The dorsal surface
is narrow, being reduced to a groove running the
whole length of the bone; it is rough and receives the
attachment of the dorsal radiocarpal ligament. The
medial surface is occupied by two articular facets, of
which the proximal is crescentic in shape for the
lunate bone, whereas the distal is deeply concave for
the reception of the head of the capitate. The lateral
surface is narrow and rough for the attachment of the
radial collateral ligament of the wrist joint (Fig.
3).The navicular bone articulates with the radius
proximally, greater and lesser multangular distally,
and lunate and capitate medially (Fig.1).
The lunate bone (Figs.1, 2, 4), placed in the
middle of the proximal row of the carpus, and is
Fig. 3. Right scaphoid bone
markedly crescentic in outline. The proximal
surface, smooth and convex, articulates with the
medial of the two facets on the distal end of the
radius. The distal surface presents a deep concavity
divided into two parts by a line running
dorsovolarward. Of these, the lateral and larger
articulates with the capitate; the medial, with the
hamate. The palmar surface is large and convex, the
dorsal surface narrow and fiat; both are rough,
giving attachment to ligaments. The medial surface
is marked by a smooth quadrilateral facet articulating
with the base of the triquetral. The lateral surface
forms a narrow crescentic articular surface meeting
the navicular.The lunate bone articulates with the
radius proximally, capitate and hamate distally,
navicular laterally, and triquetral medially (Fig.1).
Fig. 4. Right lunate bone
The triquetral bone (Figs.1, 5) is pyramidal in shape and placed obliquely, so that its base looks proximally and laterally and the apex distally and medially. The proximal surface presents laterally near the base a small, convex, articular facet that moves upon the articular disk interposed between it and the distal end of the ulna, and medially a rough nonarticular portion giving attachment to ligaments. The distal surface forms a large, triangular undulating facet for articulation with the hamate. The volar surface can be readily recognized by the conspicuous oval facet near the apex articulating with the pisiform bone. The dorsal surface is rough affording attachment to ligaments. The lateral and medial surfaces are represented by the base and the apex of the pyramid. The base is marked by a flat quadrilateral facet for the lunate. The apex forms the most distal part of the bone and is roughened and serves for the attachment of the ulnar collateral ligament of the wrist. The triquetral articulates with the pisiform anteriorly, lunate laterally, hamate distally, and articular disk proximally.
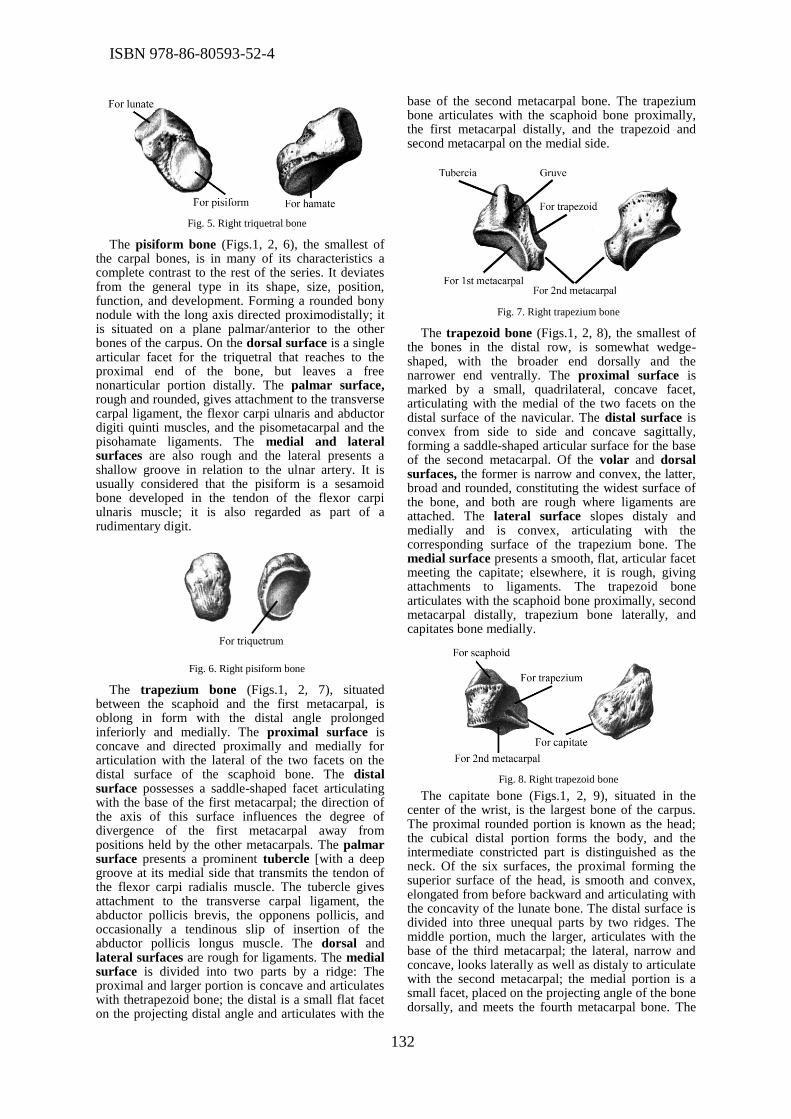
ISBN 978-86-80593-52-4
132
Fig. 5. Right triquetral bone
The pisiform bone (Figs.1, 2, 6), the smallest of the carpal bones, is in many of its characteristics a complete contrast to the rest of the series. It deviates from the general type in its shape, size, position, function, and development. Forming a rounded bony nodule with the long axis directed proximodistally; it is situated on a plane palmar/anterior to the other bones of the carpus. On the dorsal surface is a single articular facet for the triquetral that reaches to the proximal end of the bone, but leaves a free nonarticular portion distally. The palmar surface, rough and rounded, gives attachment to the transverse carpal ligament, the flexor carpi ulnaris and abductor digiti quinti muscles, and the pisometacarpal and the pisohamate ligaments. The medial and lateral surfaces are also rough and the lateral presents a shallow groove in relation to the ulnar artery. It is usually considered that the pisiform is a sesamoid bone developed in the tendon of the flexor carpi ulnaris muscle; it is also regarded as part of a rudimentary digit.
Fig. 6. Right pisiform bone
The trapezium bone (Figs.1, 2, 7), situated between the scaphoid and the first metacarpal, is oblong in form with the distal angle prolonged inferiorly and medially. The proximal surface is concave and directed proximally and medially for articulation with the lateral of the two facets on the distal surface of the scaphoid bone. The distal surface possesses a saddle-shaped facet articulating with the base of the first metacarpal; the direction of the axis of this surface influences the degree of divergence of the first metacarpal away from positions held by the other metacarpals. The palmar surface presents a prominent tubercle [with a deep groove at its medial side that transmits the tendon of the flexor carpi radialis muscle. The tubercle gives attachment to the transverse carpal ligament, the abductor pollicis brevis, the opponens pollicis, and occasionally a tendinous slip of insertion of the abductor pollicis longus muscle. The dorsal and lateral surfaces are rough for ligaments. The medial surface is divided into two parts by a ridge: The proximal and larger portion is concave and articulates with thetrapezoid bone; the distal is a small flat facet on the projecting distal angle and articulates with the
base of the second metacarpal bone. The trapezium bone articulates with the scaphoid bone proximally, the first metacarpal distally, and the trapezoid and second metacarpal on the medial side.
Fig. 7. Right trapezium bone
The trapezoid bone (Figs.1, 2, 8), the smallest of the bones in the distal row, is somewhat wedge-shaped, with the broader end dorsally and the narrower end ventrally. The proximal surface is marked by a small, quadrilateral, concave facet, articulating with the medial of the two facets on the distal surface of the navicular. The distal surface is convex from side to side and concave sagittally, forming a saddle-shaped articular surface for the base of the second metacarpal. Of the volar and dorsal surfaces, the former is narrow and convex, the latter, broad and rounded, constituting the widest surface of the bone, and both are rough where ligaments are attached. The lateral surface slopes distaly and medially and is convex, articulating with the corresponding surface of the trapezium bone. The medial surface presents a smooth, flat, articular facet meeting the capitate; elsewhere, it is rough, giving attachments to ligaments. The trapezoid bone articulates with the scaphoid bone proximally, second metacarpal distally, trapezium bone laterally, and capitates bone medially.
Fig. 8. Right trapezoid bone
The capitate bone (Figs.1, 2, 9), situated in the center of the wrist, is the largest bone of the carpus. The proximal rounded portion is known as the head; the cubical distal portion forms the body, and the intermediate constricted part is distinguished as the neck. Of the six surfaces, the proximal forming the superior surface of the head, is smooth and convex, elongated from before backward and articulating with the concavity of the lunate bone. The distal surface is divided into three unequal parts by two ridges. The middle portion, much the larger, articulates with the base of the third metacarpal; the lateral, narrow and concave, looks laterally as well as distaly to articulate with the second metacarpal; the medial portion is a small facet, placed on the projecting angle of the bone dorsally, and meets the fourth metacarpal bone. The

ISBN 978-86-80593-52-4
133
palmar surface is convex and rough, giving origin to fascicles of the oblique head of the adductor pollicis muscle; the dorsal surface is broad and deeply concave. The lateral surface presents: (1) a smooth convex surface, forming the lateral aspect of the head articulating with the navicular; (2) a groove representing the neck, indented where ligaments are attached; and (3) a small facet, flat and smooth, articulating with the trapezoid bone. Dorsal to this facet is a rough area providing attachment for an interosseous ligament. The medial surface has extending along its whole dorsal margin an oblong surface articulating with the hamate; the distal part of this smooth area sometimes forms a detached facet. The palmar part of the surface is rough and gives attachment to an interosseous ligament. The capitates bone articulates with the lunate and navicular proximally, second, third, and fourth metacarpals distally, trapezoid bone laterally, and hamate bone medially.
Fig. 9. Right capitate bone
The hamate bone (Figs.1, 2, 10) is a large wedge-shaped bone, bearing a hooklike process, situated between the capitate and triquetral, with the base directed distally. The apex of the wedge forms the narrow proximal surface, directed proximally and laterally to articulate with the lunate. The distal surface or base is divided by a ridge into two quadrilateral articular facets meeting the fourth and fifth metacarpal bones. The palmar surface is triangular in outline and presents at its distal part the prominent hook [hamulus oss. hamati], projecting anteriorly and curved toward the carpal canal. It is flattened from side to side so as to present two surfaces, two borders, and a free extremity. To the latter, the transverse carpal ligament and the flexor carpi ulnaris muscle (by means of the pisohamate ligament) are attached. The medial surface affords origin to the flexor brevis and the opponens digiti quinti muscles; the lateral surface is concave and in relation to the flexor tendons. The dorsal surface of the hamate is triangular and gives attachment to ligaments. The lateral surface presents proximally a quadrilateral facet that articulates with the capitate. Palmar and distal to this articular facet the surface is rough, providing attachment for an interosseous ligament. The medial surface is oblong and undulating, that is, concavoconvex from base to apex, and articulates with the triquetral bone.The hamate bone articulates with the triquetral, lunate, capitate, and the fourth and fifth metacarpal bones.
Fig. 10. Righ hamate bone
B. METACARPUS
The skeleton of the metacarpus (Figs.1,11) consists of five cylindric bones ( I to V), described as "long bones in miniature." Articulated with the carpus proximally, they extend, slightly diverging from each other, to articulate with the series of first phalanges; they are numbered from the lateral to the medial side. With the exception of the first that in some respects resembles a phalanx, they conform to a general type.
A typical metacarpal bone (Fig.11) presents a shaft and two extremities. The body or shaft is prismatic and curved so as to be slightly convex toward the dorsum of the hand. Of the three surfaces, two are on the sides, separated in the middle part of the shaft by a prominent palmar ridge, and concave, giving attachment to interosseous muscles. The third or dorsal surface presents a large, smooth, triangular area with the base distally, and two sloping areas, near the carpal extremity, also affording attachment for interosseous muscles. The triangular area is bounded by two lines that commence distally in two dorsal tubercles, and, passing proximally, converge to form a median ridge situated between the sloping areas on each side. About the middle of the shaft, and near the volar border, is the nutrient foramen, entering the bone obliquely proximad.
C. PHALANGES OF THE FINGERS
The base or proximal (carpal) extremity, broader dorsally, gives attachment on both palmar and dorsal surfaces to ligaments; it articulates proximally with the carpus and on each side with the adjacent metacarpal bones. The head or distal (phalangeal)
Fig. 11. 3rd metacarpal bone of the right hand

ISBN 978-86-80593-52-4
134
extremity presents a large rounded articular surface, extending farther on the volar than on the dorsal aspect, articulating with the base of the first phalanx. On each side of the head is a prominent tubercle, and immediately volar to this a well-marked fossa, to both of which the collateral ligament of the metacarpophalangeal joint is attached (Fig. 1, 11). The second is the longest of all the metacarpal bones, and the third, fourth, and fifth successively decrease in length. The several metacarpals possess distinctive characters by which they are readily identified.
The phalanges of the fingers (Figs.1, 12), or the bones of the fingers, number 14 in all. In each finger, except the first, there are three phalanges distinguished as first or proximal, second or middle, and third or distal. In the thumb, the second phalanx is considered to be wanting.
Fig. 12. Phalanges of the fingers
First (proximal) phalanx has the body or shaft of the phalanx which is flat on the palmar surface, smooth and rounded on the dorsal surface, that is, semicylindric in shape. The borders of the volar surface are rough where the sheaths of the flexor tendons are attached. The base or the proximal end presents a single concave, oval articular surface, receiving the convex head of the metacarpal bone. The distal extremity forms a pulleylike surface, the trochlea, grooved in the center and elevated at each side to form two miniature condyles, articulating with the base of a second phalanx.
Second (middle) phalanx is shorter than those of the first row, which they closely resemble in form. It is distinguished by the articular surface on the base or proximal extremity that presents two shallow depressions, separated by a ridge, adapted to the two condyles of the first phalanx. The trochlea or distal end articulates with the base of the third phalanx, is pulleylike, but smaller than that of the first phalanx. The palmar surface of the shaft presents on each side an impression receiving the insertion of the flexor
digitorum superfitialis, and the dorsal aspect of the base is marked by a projection where the extensor digitorum muscle is inserted.
Third (distal) phalanx is recognized by its small size. The base is identical in shape with that of a second phalanx, and bears a depression on its palmar aspect that receives the insertion of the flexor digitorum profundus muscle. The free, flattened and expanded distal extremity presents on its volar surface a rough semilunar elevation that supports the pulp of the finger. The somewhat horseshoe-shaped free extremity is known as the ungual tuberosity.
III. CONCLUSION
Knowledge of the precise anatomy and geometry of the hand bones is particularly important for biomedical engineers who want to create their 3D models by rapid prototypig methods. Our future investigation will be arranged as application of so called Method of Anatomical Features (MAF)(14)for creation the geometrical models of individual hand bones with precisely defining RGEs (planes,lines, axes, points) on the each hand bone in accordance with its anatomical and morphological properties.
ACKNOWLEDGMENT
The paper presents the case that resulted from application of multidisciplinary research in the domain of bioengineering in real medical practice. The research project (Virtual Human Osteoarticular System and its Application in Preclinical and Clinical Practice) is sponsored by the Ministry of Science and Technology of the Republic of Serbia - project id III 41017 for the period of 2011-2014.
REFERENCES
[1] W. Pichler et al., Computer-assisted 3-dimensional Antropometry of the Scaphoid, Orthopedics February 2010 - Volume 33- Issue 2
[2] C. Letta, A. Schweizer, and P. Furnstahl, Quantification of Contralateral Differences of the Scaphoid: A Comparation of Bone Geometry in Three Dimensions, Hindawi Publishing Corporation Anatomy Research International Volume 2014, Article ID 904275, 5pages
[3] I. Kalazci, 3D reconstruction of phalangeal and metacarpal bones of male judo plazers and sedentary men by MDCT images, Journal of Sports Science and Medicine 7, 544-548, 2008.
[4] A. J. Chaudhari et al., Global point signature for shape analysis of carpal bones, Phys Med Biol., 59(4):961-973. doi:10.1088/0031-9155/59/4/961, 2014.
[5] M. van de Giessen et al., Statistical descriptions of scaphoid and lunate bone shapes, Journal of Biomechanics 43,1463-1469, 2010.
[6] T. L. Kivell, A comparative analysis of the hominin triquetrum (SKX 3498) from Swartkrans, South Africa, S Afr J Sci.2011;107(5/6), Art.#515, 10 pages. doi:10.4102/sajs.v107i5/6.515
[7] M. Mišigoj-Duraković, Morphometric dimensions of the left second metacarpal bone in the analysis of the population structue of the island of Hvar, International Journal of Anthropology, Volume 7, Issue 3, pp 75-70, 1992.
[8] I. Lovasić et al., Morphometric Dimensions of Metacarpal Bones in the Population Structure Analysis (Island of Krk, Croatia), Coll. Antropol. 1: 307-313 UDC 572.781:575.17, 1998.

ISBN 978-86-80593-52-4
135
[9] Moller M et al., Metacarpal motphometry in monozygotic and dizygotic elderly twins, Calcified Tissue Research, Volume 25, Issue 1, pp 197-201, 1978.
[10] C.O. John, Flora Ukoli, M.B. B.S., D.P.H. Normal values for metacarpal and phalangeal lengths in Nigerian children, Skeletal Radiology, Volume 20, Issue 6, pp 441-445, 1991.
[11] T. Kanchan and K. Krishan, Anthropometry of hand in sex determination of dismembered remains - A review of literature. Journal of Forensic and Legal Medicine, 18(1): 14-17.DOI:10.1016/j.jflm. 2010. 11. 013, 2011.
[12] A. Ghada, Gender determination from hand bones length and volume using multidetector computed tomography: A study in Egyptian people, Journal of Forensic Medicine, Vol: 18, Number: 6 Pages: 246-252, ISSN: 1752-928X, 2011.
[13] S. Standring (ed.), Gray’s Anatomy, The anatomical basis of clinical practise, 39th ed. Elsevier Churchil Livingstone: London, pp. 1421, 1440-1444, 2005.
[14] V. Majstorović et al., Reverse engineering of human bones by using method of anatomical features, CIRP Annals - Manufacturing Technology . 01/2013; 62:167–170. DOI: 10.1016/j.cirp.2013.03.081
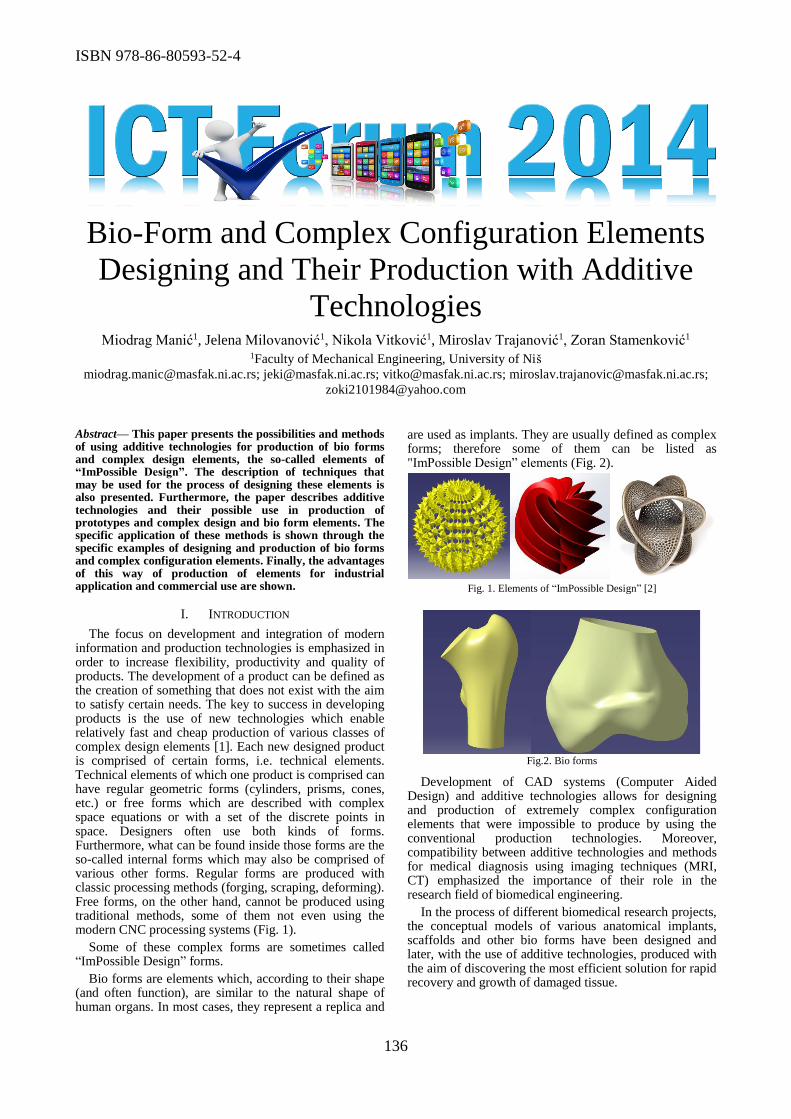
ISBN 978-86-80593-52-4
136
Bio-Form and Complex Configuration Elements
Designing and Their Production with Additive
Technologies Miodrag Manić1, Jelena Milovanović1, Nikola Vitković1, Miroslav Trajanović1, Zoran Stamenković1
1Faculty of Mechanical Engineering, University of Niš
[email protected]; [email protected]; [email protected]; [email protected];
Abstract— This paper presents the possibilities and methods of using additive technologies for production of bio forms and complex design elements, the so-called elements of “ImPossible Design”. The description of techniques that may be used for the process of designing these elements is also presented. Furthermore, the paper describes additive technologies and their possible use in production of prototypes and complex design and bio form elements. The specific application of these methods is shown through the specific examples of designing and production of bio forms and complex configuration elements. Finally, the advantages of this way of production of elements for industrial application and commercial use are shown.
I. INTRODUCTION
The focus on development and integration of modern information and production technologies is emphasized in order to increase flexibility, productivity and quality of products. The development of a product can be defined as the creation of something that does not exist with the aim to satisfy certain needs. The key to success in developing products is the use of new technologies which enable relatively fast and cheap production of various classes of complex design elements [1]. Each new designed product is comprised of certain forms, i.e. technical elements. Technical elements of which one product is comprised can have regular geometric forms (cylinders, prisms, cones, etc.) or free forms which are described with complex space equations or with a set of the discrete points in space. Designers often use both kinds of forms. Furthermore, what can be found inside those forms are the so-called internal forms which may also be comprised of various other forms. Regular forms are produced with classic processing methods (forging, scraping, deforming). Free forms, on the other hand, cannot be produced using traditional methods, some of them not even using the modern CNC processing systems (Fig. 1).
Some of these complex forms are sometimes called “ImPossible Design” forms.
Bio forms are elements which, according to their shape (and often function), are similar to the natural shape of human organs. In most cases, they represent a replica and
are used as implants. They are usually defined as complex forms; therefore some of them can be listed as "ImPossible Design” elements (Fig. 2).
Fig. 1. Elements of “ImPossible Design” [2]
Fig.2. Bio forms
Development of CAD systems (Computer Aided Design) and additive technologies allows for designing and production of extremely complex configuration elements that were impossible to produce by using the conventional production technologies. Moreover, compatibility between additive technologies and methods for medical diagnosis using imaging techniques (MRI, CT) emphasized the importance of their role in the research field of biomedical engineering.
In the process of different biomedical research projects, the conceptual models of various anatomical implants, scaffolds and other bio forms have been designed and later, with the use of additive technologies, produced with the aim of discovering the most efficient solution for rapid recovery and growth of damaged tissue.
ISBN 978-86-80593-52-4
137
II. TECHNIQUES FOR BIO FORM AND COMPLEX
CONFIGURATION ELEMENTS MODELLING
For 3D modelling of bio forms and complex configuration elements it is possible to use two different procedures: direct designing using advanced 3D modelling techniques and reverse designing using the scanned physical models.
In the case of direct designing, modern CAD systems offer a set of advanced modelling tools, for example, Advanced Surfacing, Freeform Surfacing etc.
Advanced Surface is a set of tools for modelling complex surfaces and geometrical shapes with the use of space curves: splines, Bezier curve, NURBS etc.
Freeform Surfacing is a set of tools for modelling free form elements. They provide the possibility for free geometrical manipulation of 3D models by employing generated curve dots on the model’s surface.
CAD systems also provide the possibility to render designed elements, thus creating their photorealistic images and animations which can be further used for catalogues and marketing.
Reverse engineering (RE) is a process which includes 3D scanning of the existing physical object in order to generate the data related to the position of points on the boundary surfaces (point cloud) or inner volume. Scanned data is then used as a basis for the creation of 3D geometrical model, after which the appropriate RP technology is used to create a replica. Physical objects scanning may be performed on contact scanners with high resolution scanning (e.g. CMM with mechanical probe), or on non-contact scanners (e.g. laser scanning) [3]. Contact scanning is performed with the use of probe which moves over the surface of scanned object and touches it in specific points, as shown in Fig. 3. Non-contact scanning doesn't establish direct contact with a scanning object. For example, laser scanning and structured light scanning, are performed by projecting light (laser light, white light, etc.) on the surface of scanned object and recording the reflected light (e.g. with camera). Which method of scanning should be used depends on numerous factors. In either way, the result of the scanning process is the digitized object which defines outer and/or inner area of the scanned object. The example of resulting wraparound area of object scanned in Fig. 3 is shown in Fig. 4.
Fig. 3. The example of
contact scanning method Fig. 4. The surface model of the
scanning object in CAD
application
Scanning of the objects of biological origin can be performed with medical imaging devices.
Most often used scanning devices are CT (Computer Tomography), MRI (Magnetic Resonance Imaging) and ultrasound scanning methods [3]. The result of scanning process (with the use of CT and MRI, or volumetric
ultrasound) are volumetric models made of voxels (3D pixel). With the additional processing in appropriate software solutions (Materialise Mimics, 3D Doctor, etc.) models can be transformed to geometrical models (point, polygonal, etc.) which are suitable for further processing in CAD Software [4].
The process of creating geometrical models of physical objects with the reverse engineering method is comprised of several procedures, as shown in Fig. 5. The scheme shows a generalized and simplified procedure of creating a model from point cloud scanned data, which means that the shown procedures are performed more or less in almost all scanning methods (contact, non-contact, medical imaging).
Fig. 5. The process of creating geometrical models of physical objects with the reverse engineering method
III. ADDITIVE TECHNOLOGIES
Additive technologies (AT) or Rapid Prototyping technologies (RP) are a set of relatively new technological procedures which provide the possibility for production of complex configuration elements by using 3D digital geometrical model as the input. Production of physical model is followed by the process of stacking the materials in layers according to height. Depending on the type of technological procedure used for sequential setting, application, solidification, melting or cutting the layer which is added on top of the other layer, the connection of layers to form a whole is performed. When this process is finished, the final physical model is generated.
For rapid production of elements and tools various types of additive technologies are being used, depending on product’s geometrical complexity, type of material used for their production etc. Additive technologies can be used for [5]:
Scanning
(generalized)
Editing cloud of points
(filtering, adjusting,
adding)
cloud of points
Creation of polygonal
model (tessallation)
Optimization of
polygonal model (e.g.
number and orientation
of triangles)
Creation of adequate
geometrical entitites
Creation of other
types of models
Adjusted cloud of
points
Polygonal model Optimized
Polygonal model
Geometrical Entities
(planes, lines, curves)
Various geometrical
models (surface,
volume)
ISBN 978-86-80593-52-4
138
• Rapid prototyping (RP) - rapid prototype production
• Rapid tooling (RT) - rapid tool production
• Rapid manufacturing (RM) - rapid manufacturing
• Reverse engineering (RE) - rapid replica production.
Additive technologies’ characteristic is that they are related to Reverse Engineering and together they provide the possibility for direct production of replica using the CAx systems. Basic process of RP system for rapid production is comprised of several steps: 3D modelling, data conversion and transfer, checking and preparation, production and post-processing [1], as shown in Fig. 6. Depending on the quality of model and prototype in the preparation and post-processing step, the process can be repeated until the needed quality is achieved [1].
Fig. 6. Chain of RP process [6]
IV. EXAMPLES OF DESIGNING AND PRODUCTION OF BIO
FORMS AND COMPLEX CONFIGURATION ELEMENTS WITH
ADDITIVE TECHNOLOGIES
This paper shows a specific example of modelling a lantern of “ImPossible Design”, scaffold design and their production with the use of additive technologies.
Procedure of lantern modelling by using CATIA V5 software package is initially performed in the module Wireframe and Surface Design, in whose work environment the creation of set of points is being performed based on their coordinates in space. Using the Spline tool the creation of spline is performed, in the form of exponential helix based on the set of defined points in space, as shown in Fig. 7a. What follows is the drawing of a circular profile at the point of lower end of the spline. Using the spline and the circle, modelling of a helical body, i.e. of a wire, is being performed, as shown in Fig. 7b. Conversion of helical tubular surface to the full body is performed by the Close Surface tool, which finally creates the model of a helical body or a wire, as shown in Fig. 8.
a) b) Fig. 7. a) Creation of space spline and
b) Helical tubular surface
Fig. 8. Model of a helical body
After that, the modelling of the sphere on the top of helical body is performed with the rotation of a semi circle around axis, as shown in Fig. 9.
Fig. 9. Sphere modelling
After that, the multiplying of the helical body around the Z axis is being performed with the Circular Pattern tool with the use of referential XY plane, as shown in Fig. 10. The obtained pattern of helical body with sphere is also multiplied with the referential ZX plane and around the Y axis, as shown in Fig. 11.
Fig. 10. Multiplying the helical body around XY axis
Fig. 11. Multiplying of helical body with sphere around ZX plane
In the very end, modelling of annular crotchet at the top
of the upper sphere is performed using the circular rotation around the axis, as shown in Fig. 12.
ISBN 978-86-80593-52-4
139
Fig. 12. Crotchet modelling
Finally, after all the modelling processes in software package CATIA the final model of the lantern is created, as shown in Fig. 13.
Fig. 13. Final lantern model
The production of physical model of the lantern is performed with EOS FORMIGA P100 machine for selective laser sintering of plastic elements. The material used for lantern production is white Polyamide PA 2200. Physical model of a lantern, produced using the SLS technology, is shown in Fig. 14.
Fig. 14. Physical model of the lantern
As previously mentioned, CAD systems and rapid development of additive technologies and their compatibility with methods for medical diagnosis using medical imaging techniques provided the opportunity for production of complex anatomical 3D structures of bio forms with the aim of efficient recovery of damaged tissue due to an injury or illness.
The production of scaffolds, i.e. 3D constructions used as a temporary support for the isolated cells and the process of their development into new tissue, now allowed control of the internal architecture and, as a consequence, size and arrangement of pores, porosity and other important characteristics. Different methods for internal architecture designing of these structures emerged, as well as the new possibilities for their production.
The process of production for these anatomical structures begins with the reverse engineering procedure based on CT scan of damaged area.
The example of designing one type of geometry of anatomically shaped complex configuration scaffolds is shown in Fig. 15. [7] This example was developed for defect in proximal part of diaphysis of experimental animal – rabbit.
Fig. 15. One type of geometry of anatomically shaped scaffolds

ISBN 978-86-80593-52-4
140
Scaffold designed in this way was produced with the direct laser metal sintering technology (DMLS), on EOSINT M280 machine from titanium alloy EOS Titanium Ti64, layer thickness 30µm, as shown in Fig. 16.
Fig. 16. Scaffold sample produced with DMLS procedure on EOSINT
M280 machine [6]
V. CONCLUSION
Advanced designing techniques with contemporary CAD systems development enable the engineers to design very complex shapes and free forms. With the combination of these technologies and object scanning there are basically no objects whose 3D model is impossible to build. This is the main point illustrated in this paper.
Although relatively new in the field of contemporary industrial manufacturing, additive technologies proved to be a very good, and often the only possible, production choice for bio form and complex configuration elements. They decrease product price, increase the quality and the speed of elements’ production.
This paper provides one illustration of the application of described techniques in real industrial production,
production of bio forms, implants, art works, ornaments, jewellery and the so-called “ImPossible Design” elements.
Researchers are expected to put a lot of effort and financial investment to make additive technologies more accessible in everyday production.
Acknowledgement
The paper presents a case that is a result of the application of multidisciplinary research in the domain of bioengineering in real medical practice. The research project (Virtual human osteoarticular system and its application in preclinical and clinical practice) is sponsored by the Ministry of Education, Science and Technological Development of the Republic of Serbia- project id III 41017 for the period of 2011-2015.
References
[1] M. Trajanović et al., Computer-aided rapid manufacturing technologies, monographs, Faculty of Mechanical Engineering in Kragujevac, 2008.
[2] O. Diegel, Additive Manufacturing – An overview, in Comprehensive Materials Processing, Volume 10, pp. 3-18.
[3] S. Holst, et al., Digitizing implant position locators on master casts: comparison of a noncontact scanner and a contact-probe scanner, The International Journal of Oral & Maxillofacial Implants 27(1): 29-35, 2012,
[4] D. Ganguly et al., Medical Imaging: A Review, Proceedings of Security-Enriched Urban Computing and Smart Grid First International Conference, SUComS 2010, Springer Berlin Heidelberg, 78, pp 504-516, 2010,
[5] J. Milovanović, M. Trojenović, Application of commercial rapid-prototyping technology in the tire industry, Journal of the Institute IMK "14.oktobrar", Krusevac, 2003.
[6] N. Grujović et al., 3D printing technology in education environment, Proceedings of the 34th International Conference on Production Engineering, Niš, Serbia, str. 323-326, 2011.
[7] J. Milovanovic, Application of Additive Technologies in Fabrication of Anatomical Custom Made (Shaped) Scaffolds for Bone Tissue Reconstruction, PhD dissertation, Faculty of Mechanical Engineering, University of Nis, 2014.

ISBN 978-86-80593-52-4
141
Application of Computed Tomography in
Diagnostics and Management of Osteoporosis
Nikola Korunović1, Jelena Rajković2, Slađana Petrović3, Stevo Najman4, Dragan Mihailović5
1University of Niš, Faculty of Mechanical Engineering, Niš, Serbia 2University of Niš, Faculty of Science and Mathematics, Department of Biology and Ecology, Niš, Serbia
3Clinical Centre Nis, Center of Radiology, Niš, Serbia 4University of Niš, Faculty of Medicine, Department of Biology and Human Genetics, Niš, Serbia
5University of Niš, Faculty of Medicine, Institute of Pathology, Niš, Serbia
[email protected]; [email protected]; [email protected]; [email protected];
Abstract—Osteoporosis is one of the main causes of bone fracture in elderly population and it represents a notable health and social problem. Standard methods for diagnosis and management of osteoporosis, like dual-energy X-ray absorptiometry (DXA), are not always sufficient in prediction of osteoporosis induced bone fracture risk. Computational tomography (CT) can be applied instead of standard diagnostic methods with the same purpose of finding bone mineral density (BMD) at critical places such as spine or hip, but it can also be used on patients whose health condition prevents the use of standard methods. More importantly, CT gives the insight into trabecular microstructure that enables a more precise prediction of bone fracture risk than bone mineral density (BMD) results alone. The paper describes the most important CT imaging techniques related to osteoporosis, compares them to standard ones and outlines their main advantages.
I. INTRODUCTION
Osteoporosis is defined as "a skeletal disease, characterized by low bone mass and micro-architectural deterioration of bone tissue, with a consequent increase in bone fragility and susceptibility to fracture" [2]. The main aim of diagnostic activities and treatment of osteoporosis is to prevent bone fracture [3].
Computational tomography (CT) is a medical imaging method, based on X-radiation and tomographic reconstruction, widely used for variety of diagnostic and therapeutic purposes [5]. Soon after its invention, CT was recognized as an efficient tool for diagnosis of osteoporosis [2] but the application of other methods, like Dual-energy X-ray absorptiometry (DXA), prevailed in daily medical practice. Comparing to CT, DXA and similar methods are faster, cheaper, simpler to use and characterized by modest amount of radiation [9]. Nevertheless, some of the inherent advantages of CT justify its application in diagnosis and management of osteoporosis, which became especially true with recent introduction of new CT techniques that produce high
resolution and localized CT scans. At the same time, CT based techniques are widely used in osteoporosis related research.
CT is a 3D method, which gives a detailed insight into bone structure or microstructure if high resolution devices are used. Thus, it enables separate observation of osteoporotic changes on cortical and spongious bone and serves as a useful source of data for bone strength prediction [1, 2, 6]. Unlike DXA, CT may be used with scoliosis patients and it also yields more accurate predictions on the obese patients [5]. Knowledge of bone microstructure facilitates more accurate evaluation of osteoporotic changes, via parameters that quantify the trabecular network [3].
This paper tends to give the overview of possible applications of CT in diagnosis and management of osteoporosis. It describes the most important CT based techniques used for this purpose, compares them to standard ones and outlines their main advantages.
II. NON-CT TECHNIQUES FOR DIAGNOSIS AND
MANAGEMENT OF OSTEOPOROSIS
This chapter describes non-CT based techniques that are used in diagnosis and management of osteoporosis. The best single measure used to diagnose osteoporosis, as well as to assess fracture risk, is bone mineral density (BMD) [7]. BMD represents the amount of bone mineral content per unit volume (or per unit area when DXA method is used) and it is usually measured at the hip and lumbal spine [8]. Lower BMD in these areas indicates a greater possibility of bone fracture.
Measurements of bone density, especially using DXA, should be performed on people with pre-estimated risk factor. BMD measuring are not recommended for children as well as any other group of people without significant fracture history and risk factors such as low BMD, clinical risk factors or biochemical factors (bone markers)[6, 8] .
ISBN 978-86-80593-52-4
142
Based on the risk factors, the further options for patients may be BMD testing or not, depending on professional evaluation [8].
Various noninvasive densitometric techniques for BMD measurement, which differ in precision, sensitivity and hazards to human health, have been developed. Some of those may provide additional information about the bone, beyond BMD. The most commonly used ones are Dual energy X-ray absorptiometry (DXA) and quantitative computed tomography (QCT) [9]. Other tests that can be used to measure bone density are QUS (Quantitive ultrasound densitometry), SXA (single energy X-ray absorptiometry), PDXA (peripheral dual energy X-ray absorptiometry), RA (radiographic absorptiometry), DPA (dual photon absorptiometry), SPA (single photon absorptiometry) and MRI (magnetic resonance imaging). Each of those has its own advantages and disadvantages, as described in [10].
A. DXA-(Dual-energy X-ray absorptiometry)
DXA is the most widely used non-invasive technique for BMD measurement as well as for assessment of fracture risk. DXA is based on the difference in the absorption of two photon beams of different energy levels by soft tissue and bone tissue. Second energy beam enables the correction of an X-ray energy absorption by the soft tissue [10, 11]. The image obtained using DXA is two-dimensional. In DXA, BMD is obtained when bone mineral content at the specific scanned site is divided by area of the scanned zone (real BMD, in grams per square centimeter). This measure is different from real volumetric BMD (in grams per cubic centimeter) [6, 10] that can be obtained using QCT.
The results obtained by DXA are expressed relative to the mean bone density of young healthy individuals (Fig. 1), 20-40 years old (T-score), or in relation to the value of a healthy group of the same age (Z score). DXA is based on the use of low-energy X rays, whose absorption is sensitive to the content of calcium, which is the main component of bone [8]. The mentioned principle can also represent a disadvantage of this technique. For example, the presence of osteomalacia, aortic calcification or osteoarthritis at the spine or hip in older people can lead to false-negative results that mask the clinical picture. Therefore, the method mostly concentrates on femoral neck area, where no factors exists that could hinder the assessment of density [7, 10, 12].
B. QUS – Quantitive ultrasound densitometry
QUS - Quantitive ultrasound densitometry is less reliable and less sensitive, but more economical and less harmful method than DXA (with less ultrasonic radiation). QUS is not a direct method for measuring BMD because density evaluation is based on the speed of sound (SOS) and broadband ultrasound attenuation (BUA) at peripheral sites, such as heel and patella [6, 11]. QUS based measurement provides structural and qualitative information of bone tissue, but not content of calcium, like DXA[13]. QUS belongs to the safe methods because the subjects are not exposed to ionizing radiation and there are no side effects. With the help of QUS, patients can be monitored more frequently because of its harmlessness to human health. But, there are also some disadvantages of this method. Although QUS predicts osteoporotic fractures of the hip and spine very well, it cannot be used
to monitor the response to the therapy, as BMD changes on the heel occur more slowly than on the hip or spine [14]. Another drawback of this method is the absence of standardization, which refers to the variation of parameters and body areas being tested[15].
Fig. 1. Normal limits of T-score and Z-score values in women [6]
C. SXA- Single energy X-ray absorptiometry
SXA measures BMD at wrist or heel and is not as common as DXA. It is less accurate than DXA as it uses a single energy X-ray beam for evaluation of BMD. Because single energy X-ray beam is used, the arm must be placed in the water to measure the correct absorption of rays by soft tissue [7, 10]. The picture obtained by SXA is two-dimensional as well as DXA picture [11]. SXA is based on the same principles as Single photon absorptiometry (SPA) except that instead of gamma rays it uses x-rays. Thus there is no need for isotopes [7, 16].
D. pDXA- Peripheral dual energy X-ray absorptiometry
pDXA is actually DXA adapted to the periphery of the skeleton and it is used to measure bone density at the wrist, heel, or finger [10]. pDXA also uses very low doses of radiation and, compared to DXA, yields faster results. pDXA is portable, with smaller instruments. It is less expensive and produces a lower dose of radiation because of the distance from sensitive organs. Some pDXA devices can predict osteoporotic fractures but not as efficiently as the standard DXA. This is not a method for clinical use in the osteoporosis diagnosis and is not effective for monitoring the effects of the treatments [17].
E. RA-Radiographic absorptiometry
With the computerized image processing development, RA became one of the methods for the diagnosis of osteoporosis whose accuracy can be compared with that of DXA and SXA [9]. RA measures BMD from radiographs. This is a fast and inexpensive technique that can rapidly measure bone loss. Bone measurements are usually performed on the hand and heel [10, 18]. This method uses an x-ray in the fingers and the aluminum wedge to calculate bone density [19].
F. DPA- Dual photon absorptiometry and SPA- Single
photon absorptiometry
DPA and SPA are photon absorptiometric methods that had been widely used in the past. DPA is designed for scanning both the peripheral and central parts of the skeleton. The measuring area is the spine, hip or total body [10]. SPA, an improved RA method, is an old test
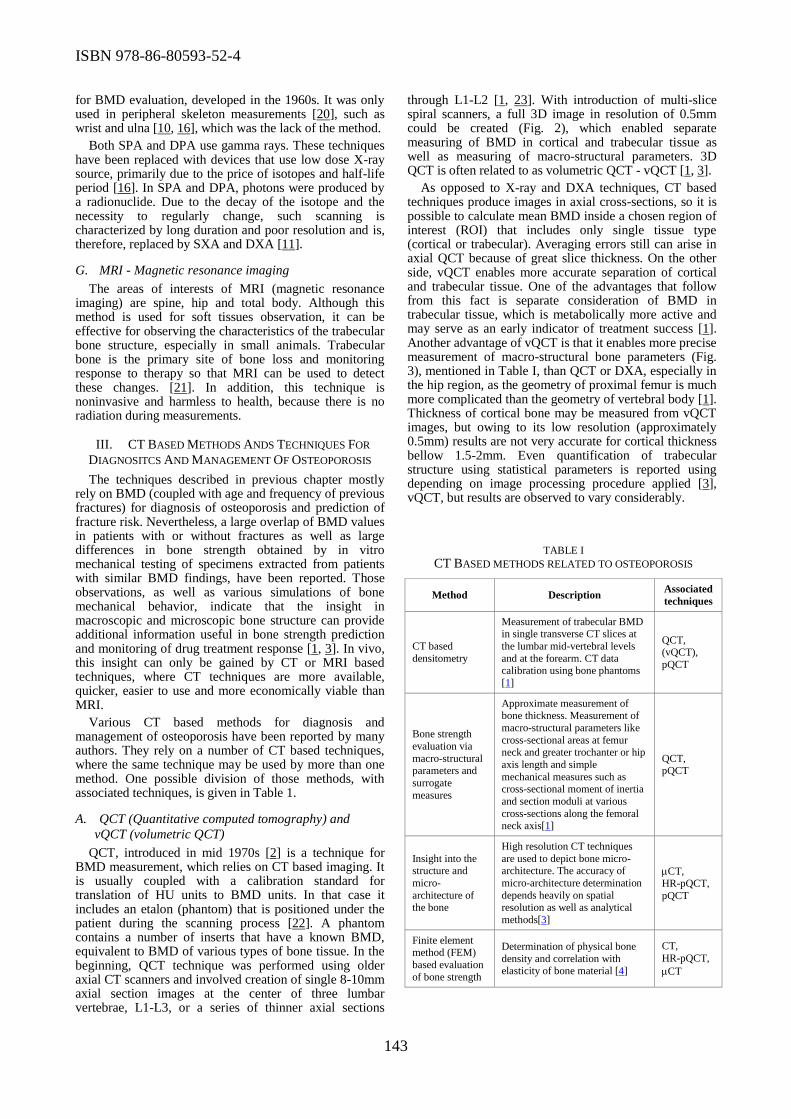
ISBN 978-86-80593-52-4
143
for BMD evaluation, developed in the 1960s. It was only used in peripheral skeleton measurements [20], such as wrist and ulna [10, 16], which was the lack of the method.
Both SPA and DPA use gamma rays. These techniques have been replaced with devices that use low dose X-ray source, primarily due to the price of isotopes and half-life period [16]. In SPA and DPA, photons were produced by a radionuclide. Due to the decay of the isotope and the necessity to regularly change, such scanning is characterized by long duration and poor resolution and is, therefore, replaced by SXA and DXA [11].
G. MRI - Magnetic resonance imaging
The areas of interests of MRI (magnetic resonance imaging) are spine, hip and total body. Although this method is used for soft tissues observation, it can be effective for observing the characteristics of the trabecular bone structure, especially in small animals. Trabecular bone is the primary site of bone loss and monitoring response to therapy so that MRI can be used to detect these changes. [21]. In addition, this technique is noninvasive and harmless to health, because there is no radiation during measurements.
III. CT BASED METHODS ANDS TECHNIQUES FOR
DIAGNOSITCS AND MANAGEMENT OF OSTEOPOROSIS
The techniques described in previous chapter mostly rely on BMD (coupled with age and frequency of previous fractures) for diagnosis of osteoporosis and prediction of fracture risk. Nevertheless, a large overlap of BMD values in patients with or without fractures as well as large differences in bone strength obtained by in vitro mechanical testing of specimens extracted from patients with similar BMD findings, have been reported. Those observations, as well as various simulations of bone mechanical behavior, indicate that the insight in macroscopic and microscopic bone structure can provide additional information useful in bone strength prediction and monitoring of drug treatment response [1, 3]. In vivo, this insight can only be gained by CT or MRI based techniques, where CT techniques are more available, quicker, easier to use and more economically viable than MRI.
Various CT based methods for diagnosis and management of osteoporosis have been reported by many authors. They rely on a number of CT based techniques, where the same technique may be used by more than one method. One possible division of those methods, with associated techniques, is given in Table 1.
A. QCT (Quantitative computed tomography) and
vQCT (volumetric QCT)
QCT, introduced in mid 1970s [2] is a technique for BMD measurement, which relies on CT based imaging. It is usually coupled with a calibration standard for translation of HU units to BMD units. In that case it includes an etalon (phantom) that is positioned under the patient during the scanning process [22]. A phantom contains a number of inserts that have a known BMD, equivalent to BMD of various types of bone tissue. In the beginning, QCT technique was performed using older axial CT scanners and involved creation of single 8-10mm axial section images at the center of three lumbar vertebrae, L1-L3, or a series of thinner axial sections
through L1-L2 [1, 23]. With introduction of multi-slice spiral scanners, a full 3D image in resolution of 0.5mm could be created (Fig. 2), which enabled separate measuring of BMD in cortical and trabecular tissue as well as measuring of macro-structural parameters. 3D QCT is often related to as volumetric QCT - vQCT [1, 3].
As opposed to X-ray and DXA techniques, CT based techniques produce images in axial cross-sections, so it is possible to calculate mean BMD inside a chosen region of interest (ROI) that includes only single tissue type (cortical or trabecular). Averaging errors still can arise in axial QCT because of great slice thickness. On the other side, vQCT enables more accurate separation of cortical and trabecular tissue. One of the advantages that follow from this fact is separate consideration of BMD in trabecular tissue, which is metabolically more active and may serve as an early indicator of treatment success [1]. Another advantage of vQCT is that it enables more precise measurement of macro-structural bone parameters (Fig. 3), mentioned in Table I, than QCT or DXA, especially in the hip region, as the geometry of proximal femur is much more complicated than the geometry of vertebral body [1]. Thickness of cortical bone may be measured from vQCT images, but owing to its low resolution (approximately 0.5mm) results are not very accurate for cortical thickness bellow 1.5-2mm. Even quantification of trabecular structure using statistical parameters is reported using depending on image processing procedure applied [3], vQCT, but results are observed to vary considerably.
TABLE I CT BASED METHODS RELATED TO OSTEOPOROSIS
Method Description Associated
techniques
CT based
densitometry
Measurement of trabecular BMD in single transverse CT slices at
the lumbar mid-vertebral levels
and at the forearm. CT data calibration using bone phantoms
[1]
QCT, (vQCT),
pQCT
Bone strength
evaluation via
macro-structural parameters and
surrogate
measures
Approximate measurement of bone thickness. Measurement of
macro-structural parameters like
cross-sectional areas at femur neck and greater trochanter or hip
axis length and simple
mechanical measures such as
cross-sectional moment of inertia
and section moduli at various
cross-sections along the femoral neck axis[1]
QCT, pQCT
Insight into the structure and
micro-
architecture of the bone
High resolution CT techniques
are used to depict bone micro-architecture. The accuracy of
micro-architecture determination
depends heavily on spatial resolution as well as analytical
methods[3]
CT, HR-pQCT,
pQCT
Finite element method (FEM)
based evaluation
of bone strength
Determination of physical bone
density and correlation with elasticity of bone material [4]
CT,
HR-pQCT,
CT
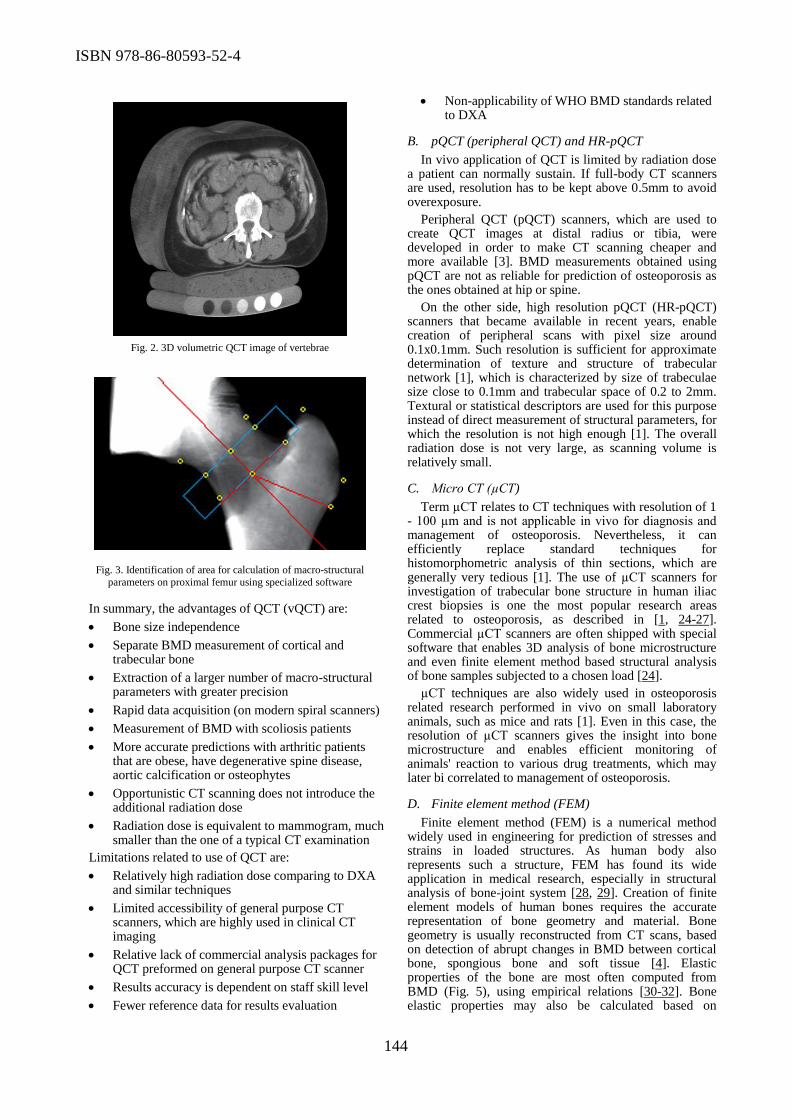
ISBN 978-86-80593-52-4
144
Fig. 2. 3D volumetric QCT image of vertebrae
Fig. 3. Identification of area for calculation of macro-structural
parameters on proximal femur using specialized software
In summary, the advantages of QCT (vQCT) are:
Bone size independence
Separate BMD measurement of cortical and trabecular bone
Extraction of a larger number of macro-structural parameters with greater precision
Rapid data acquisition (on modern spiral scanners)
Measurement of BMD with scoliosis patients
More accurate predictions with arthritic patients that are obese, have degenerative spine disease, aortic calcification or osteophytes
Opportunistic CT scanning does not introduce the additional radiation dose
Radiation dose is equivalent to mammogram, much smaller than the one of a typical CT examination
Limitations related to use of QCT are:
Relatively high radiation dose comparing to DXA and similar techniques
Limited accessibility of general purpose CT scanners, which are highly used in clinical CT imaging
Relative lack of commercial analysis packages for QCT preformed on general purpose CT scanner
Results accuracy is dependent on staff skill level
Fewer reference data for results evaluation
Non-applicability of WHO BMD standards related to DXA
B. pQCT (peripheral QCT) and HR-pQCT
In vivo application of QCT is limited by radiation dose a patient can normally sustain. If full-body CT scanners are used, resolution has to be kept above 0.5mm to avoid overexposure.
Peripheral QCT (pQCT) scanners, which are used to create QCT images at distal radius or tibia, were developed in order to make CT scanning cheaper and more available [3]. BMD measurements obtained using pQCT are not as reliable for prediction of osteoporosis as the ones obtained at hip or spine.
On the other side, high resolution pQCT (HR-pQCT) scanners that became available in recent years, enable creation of peripheral scans with pixel size around 0.1x0.1mm. Such resolution is sufficient for approximate determination of texture and structure of trabecular network [1], which is characterized by size of trabeculae size close to 0.1mm and trabecular space of 0.2 to 2mm. Textural or statistical descriptors are used for this purpose instead of direct measurement of structural parameters, for which the resolution is not high enough [1]. The overall radiation dose is not very large, as scanning volume is relatively small.
C. Micro CT (µCT)
Term µCT relates to CT techniques with resolution of 1 - 100 µm and is not applicable in vivo for diagnosis and management of osteoporosis. Nevertheless, it can efficiently replace standard techniques for histomorphometric analysis of thin sections, which are generally very tedious [1]. The use of µCT scanners for investigation of trabecular bone structure in human iliac crest biopsies is one the most popular research areas related to osteoporosis, as described in [1, 24-27]. Commercial µCT scanners are often shipped with special software that enables 3D analysis of bone microstructure and even finite element method based structural analysis of bone samples subjected to a chosen load [24].
µCT techniques are also widely used in osteoporosis related research performed in vivo on small laboratory animals, such as mice and rats [1]. Even in this case, the resolution of µCT scanners gives the insight into bone microstructure and enables efficient monitoring of animals' reaction to various drug treatments, which may later bi correlated to management of osteoporosis.
D. Finite element method (FEM)
Finite element method (FEM) is a numerical method widely used in engineering for prediction of stresses and strains in loaded structures. As human body also represents such a structure, FEM has found its wide application in medical research, especially in structural analysis of bone-joint system [28, 29]. Creation of finite element models of human bones requires the accurate representation of bone geometry and material. Bone geometry is usually reconstructed from CT scans, based on detection of abrupt changes in BMD between cortical bone, spongious bone and soft tissue [4]. Elastic properties of the bone are most often computed from BMD (Fig. 5), using empirical relations [30-32]. Bone elastic properties may also be calculated based on
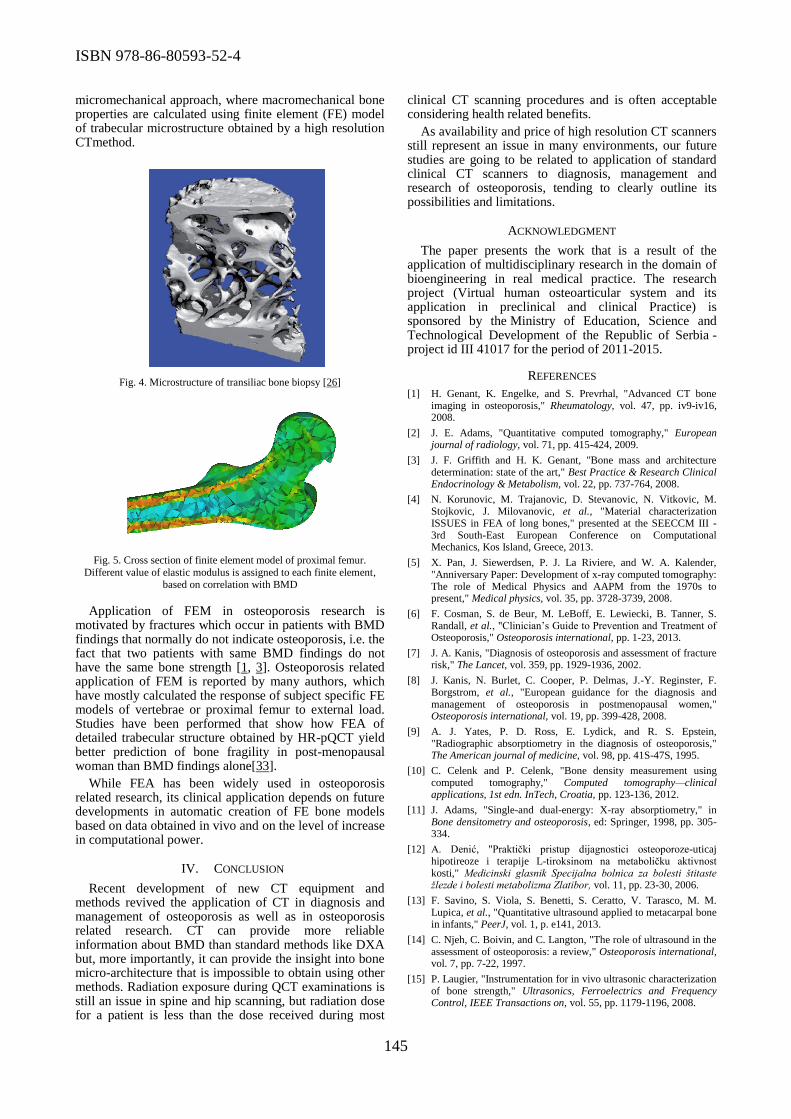
ISBN 978-86-80593-52-4
145
micromechanical approach, where macromechanical bone properties are calculated using finite element (FE) model of trabecular microstructure obtained by a high resolution CTmethod.
Fig. 4. Microstructure of transiliac bone biopsy [26]
Fig. 5. Cross section of finite element model of proximal femur.
Different value of elastic modulus is assigned to each finite element, based on correlation with BMD
Application of FEM in osteoporosis research is motivated by fractures which occur in patients with BMD findings that normally do not indicate osteoporosis, i.e. the fact that two patients with same BMD findings do not have the same bone strength [1, 3]. Osteoporosis related application of FEM is reported by many authors, which have mostly calculated the response of subject specific FE models of vertebrae or proximal femur to external load. Studies have been performed that show how FEA of detailed trabecular structure obtained by HR-pQCT yield better prediction of bone fragility in post-menopausal woman than BMD findings alone[33].
While FEA has been widely used in osteoporosis related research, its clinical application depends on future developments in automatic creation of FE bone models based on data obtained in vivo and on the level of increase in computational power.
IV. CONCLUSION
Recent development of new CT equipment and methods revived the application of CT in diagnosis and management of osteoporosis as well as in osteoporosis related research. CT can provide more reliable information about BMD than standard methods like DXA but, more importantly, it can provide the insight into bone micro-architecture that is impossible to obtain using other methods. Radiation exposure during QCT examinations is still an issue in spine and hip scanning, but radiation dose for a patient is less than the dose received during most
clinical CT scanning procedures and is often acceptable considering health related benefits.
As availability and price of high resolution CT scanners still represent an issue in many environments, our future studies are going to be related to application of standard clinical CT scanners to diagnosis, management and research of osteoporosis, tending to clearly outline its possibilities and limitations.
ACKNOWLEDGMENT
The paper presents the work that is a result of the application of multidisciplinary research in the domain of bioengineering in real medical practice. The research project (Virtual human osteoarticular system and its application in preclinical and clinical Practice) is sponsored by the Ministry of Education, Science and Technological Development of the Republic of Serbia - project id III 41017 for the period of 2011-2015.
REFERENCES
[1] H. Genant, K. Engelke, and S. Prevrhal, "Advanced CT bone imaging in osteoporosis," Rheumatology, vol. 47, pp. iv9-iv16, 2008.
[2] J. E. Adams, "Quantitative computed tomography," European journal of radiology, vol. 71, pp. 415-424, 2009.
[3] J. F. Griffith and H. K. Genant, "Bone mass and architecture determination: state of the art," Best Practice & Research Clinical Endocrinology & Metabolism, vol. 22, pp. 737-764, 2008.
[4] N. Korunovic, M. Trajanovic, D. Stevanovic, N. Vitkovic, M. Stojkovic, J. Milovanovic, et al., "Material characterization ISSUES in FEA of long bones," presented at the SEECCM III - 3rd South-East European Conference on Computational Mechanics, Kos Island, Greece, 2013.
[5] X. Pan, J. Siewerdsen, P. J. La Riviere, and W. A. Kalender, "Anniversary Paper: Development of x-ray computed tomography: The role of Medical Physics and AAPM from the 1970s to present," Medical physics, vol. 35, pp. 3728-3739, 2008.
[6] F. Cosman, S. de Beur, M. LeBoff, E. Lewiecki, B. Tanner, S. Randall, et al., "Clinician’s Guide to Prevention and Treatment of Osteoporosis," Osteoporosis international, pp. 1-23, 2013.
[7] J. A. Kanis, "Diagnosis of osteoporosis and assessment of fracture risk," The Lancet, vol. 359, pp. 1929-1936, 2002.
[8] J. Kanis, N. Burlet, C. Cooper, P. Delmas, J.-Y. Reginster, F. Borgstrom, et al., "European guidance for the diagnosis and management of osteoporosis in postmenopausal women," Osteoporosis international, vol. 19, pp. 399-428, 2008.
[9] A. J. Yates, P. D. Ross, E. Lydick, and R. S. Epstein, "Radiographic absorptiometry in the diagnosis of osteoporosis," The American journal of medicine, vol. 98, pp. 41S-47S, 1995.
[10] C. Celenk and P. Celenk, "Bone density measurement using computed tomography," Computed tomography—clinical applications, 1st edn. InTech, Croatia, pp. 123-136, 2012.
[11] J. Adams, "Single-and dual-energy: X-ray absorptiometry," in Bone densitometry and osteoporosis, ed: Springer, 1998, pp. 305-334.
[12] A. Denić, "Praktički pristup dijagnostici osteoporoze-uticaj hipotireoze i terapije L-tiroksinom na metaboličku aktivnost kosti," Medicinski glasnik Specijalna bolnica za bolesti štitaste žlezde i bolesti metabolizma Zlatibor, vol. 11, pp. 23-30, 2006.
[13] F. Savino, S. Viola, S. Benetti, S. Ceratto, V. Tarasco, M. M. Lupica, et al., "Quantitative ultrasound applied to metacarpal bone in infants," PeerJ, vol. 1, p. e141, 2013.
[14] C. Njeh, C. Boivin, and C. Langton, "The role of ultrasound in the assessment of osteoporosis: a review," Osteoporosis international, vol. 7, pp. 7-22, 1997.
[15] P. Laugier, "Instrumentation for in vivo ultrasonic characterization of bone strength," Ultrasonics, Ferroelectrics and Frequency Control, IEEE Transactions on, vol. 55, pp. 1179-1196, 2008.

ISBN 978-86-80593-52-4
146
[16] Đ. Jelić, D. Stefanović, M. Petronijević, and M. Anđelić-Jelić, "Zašto je dvostruka apsorpciometrija X-zraka zlatni standard u dijagnostici osteoporoze," Vojnosanitetski pregled, vol. 65, pp. 919-922, 2008.
[17] D. B. Hans, J. A. Shepherd, E. N. Schwartz, D. M. Reid, G. M. Blake, J. N. Fordham, et al., "Peripheral dual-energy X-ray absorptiometry in the management of osteoporosis: the 2007 ISCD Official Positions," Journal of Clinical Densitometry, vol. 11, pp. 188-206, 2008.
[18] S.-O. Yang, S. Hagiwara, K. Engelke, M. S. Dhillon, G. Guglielmi, E. J. Bendavid, et al., "Radiographic absorptiometry for bone mineral measurement of the phalanges: precision and accuracy study," Radiology, vol. 192, pp. 857-859, 1994.
[19] F. Cosman, B. Herrington, S. Himmelstein, and R. Lindsay, "Radiographic absorptiometry: a simple method for determination of bone mass," Osteoporosis international, vol. 2, pp. 34-38, 1991.
[20] R. L. Berg, J. S. Cassells, and J. Stokes, The second fifty years: Promoting health and preventing disability: National Academy Press Washington, DC, 1990, pp.96.
[21] C. J. Rosen, J. E. Compston, and J. B. Lian, Primer on the metabolic bone diseases and disorders of mineral metabolism: John Wiley & Sons, 2009.
[22] W. A. Kalender, D. Felsenberg, H. K. Genant, M. Fischer, J. Dequeker, and J. Reeve, "The European Spine Phantom—a tool for standardization and quality control in spinal bone mineral measurements by DXA and QCT," European journal of radiology, vol. 20, pp. 83-92, 1995.
[23] J. S. Bauer, S. Virmani, and D. K. Mueller, "Quantitative CT to assess bone mineral density as a diagnostic tool for osteoporosis and related fractures," MedicaMundi, vol. 54, pp. 31-37, 2010.
[24] B. Borah, G. J. Gross, T. E. Dufresne, T. S. Smith, M. D. Cockman, P. A. Chmielewski, et al., "Three‐dimensional microimaging (MRμI and μCT), finite element modeling, and rapid prototyping provide unique insights into bone architecture in osteoporosis," The anatomical record, vol. 265, pp. 101-110, 2001.
[25] E. Lespessailles, C. Chappard, N. Bonnet, and C. L. Benhamou, "Imaging techniques for evaluating bone microarchitecture," Joint Bone Spine, vol. 73, pp. 254-261, 2006.
[26] M. L. Brandi, "Microarchitecture, the key to bone quality," Rheumatology, vol. 48, pp. iv3-iv8, 2009.
[27] Z. GAO, W. HONG, and Y. XU, "Trabecular Bone Micro-CT Images Analysis for Osteoporosis Diagnosis⋆," Journal of Computational Information Systems, vol. 8, pp. 10341-10347, 2012.
[28] E. Schileo, F. Taddei, A. Malandrino, L. Cristofolini, and M. Viceconti, "Subject-specific finite element models can accurately predict strain levels in long bones," Journal of biomechanics, vol. 40, pp. 2982-2989, 2007.
[29] M. Viceconti, M. Davinelli, F. Taddei, and A. Cappello, "Automatic generation of accurate subject-specific bone finite element models to be used in clinical studies," Journal of biomechanics, vol. 37, pp. 1597-1605, 2004.
[30] E. Schileo, E. Dall’Ara, F. Taddei, A. Malandrino, T. Schotkamp, M. Baleani, et al., "An accurate estimation of bone density improves the accuracy of subject-specific finite element models," Journal of biomechanics, vol. 41, pp. 2483-2491, 2008.
[31] B. Helgason, E. Perilli, E. Schileo, F. Taddei, S. Brynjólfsson, and M. Viceconti, "Mathematical relationships between bone density and mechanical properties: a literature review," Clinical Biomechanics, vol. 23, pp. 135-146, 2008.
[32] N. Korunović, M. Trajanović, D. Stevanović, N. Vitković, D. Petković, and J. Milovanović, "Experimental determination of bone material properties for use in FEA," presented at the 35th international conference on production engineering, Kraljevo - Kopaonik, Serbia, 2013.
[33] S. Boutroy, B. Van Rietbergen, E. Sornay‐Rendu, F. Munoz, M. L. Bouxsein, and P. D. Delmas, "Finite element analysis based on in vivo HR‐pQCT images of the distal radius is associated with wrist fracture in postmenopausal women," Journal of Bone and Mineral Research, vol. 23, pp. 392-399, 2008.

ISBN 978-86-80593-52-4
147
Failure Mode and Effects Analysis as Support
Orthopedic Surgery
Sasa Ranđelović1, Igor Kostić2, Dejan Tanikić, Dalibor Đenadić3 1University of Niš, Faculty of Mechanical Engineering, Niš, Serbia
2Orthopaedic and Traumatology Clinic, Faculty of Medicine, Niš, Serbia 3University of Belgrade, Technical Faculty Bor, Serbia
Abstract— We live in a world full of risks with variable frequencies and a small but significant consequences. Risk analysis is a systematic tool used for the assessment of the activities within the process of considering the problems that accompany the same. Surgical procedures, in modern orthopedics, involve the use of conventional as well as new solutions, methods, materials and supplies that contribute to efficient operative and postoperative procedures. Each of these interventions entail risks and uncertainties that the patient may have a not-so-small effects in a shorter or longer period.
I. INTRODUCTION
In front of orthopedic surgery in the circumstances today are faced with very complex tasks that carry certain risks. In order to even the most complex development is carried out as soon as possible by applying new methods, materials and supplies surgeon is placed in an unenviable situation. Such surgical procedures requiring teamwork, both during the intervention and in its preparation and in the post operative period. If such risks record, systematize, analyze and continually deduct achieve the real goal of such methods 1. Developed countries have this method provides also the standards and procedures as an essential part of their health systems (ISO 14971). This raises the level of knowledge and skills of all participants of the health system, which every day becomes more complicated and complex, all with a view to respond to the demands of the high risk 2.
Implementation of this standard involves four phases which consisting of:
• the establishment of acceptable and unacceptable risk limits • identification and analysis of risks for surgical procedures, devices and equipment • risk assessment based on defined levels of risk • implementation of measurement and control activities in order to eliminate or minimize the effects of risk
Defining the boundaries of risk is a dynamic process in a time where there is a tendency to increase or decrease this limit with the aim of better quality of the process. One
of the most common orthopedic interventions, which are very frequently encountered in orthopedics are surgical
treatments trans trochantile fractures 3. These are surgical procedure in which a true sense of testing the entire medical system of the orthopedic clinic, both in terms of the health status of the patient, as well as human resources, organizational and technical levels. Each of these factors can not be sorted out separately but in the concrete conditions and environment can perceive certain advantages but also disadvantages which are crucial for the priority value risk.
II. TYPES OF FRACTURES
Bones are rigid, but they do bend or "give" somewhat when an outside force is applied. However, if the force is too great, the bones will break, just as a plastic ruler breaks when it is bent too far.
The severity of a fracture usually depends on the force that caused the break. If the bone's breaking point has been exceeded only slightly, then the bone may crack rather than break all the way through. If the force is extreme, such as in an automobile crash or a gunshot, the bone may shatter.
If the bone breaks in such a way that bone fragments stick out through the skin, or a wound penetrates down to the broken bone, the fracture is called an "open" fracture. This type of fracture is particularly serious because once the skin is broken, infection in both the wound and the bone can occur.
Common types of fractures include:
Stable fracture. The broken ends of the bone line up and are barely out of place (Fig. 1).
Open, compound fracture. The skin may be pierced by the bone or by a blow that breaks the skin at the time of the fracture. The bone may or may not be visible in the wound.
Transverse fracture. This type of fracture has a horizontal fracture line.
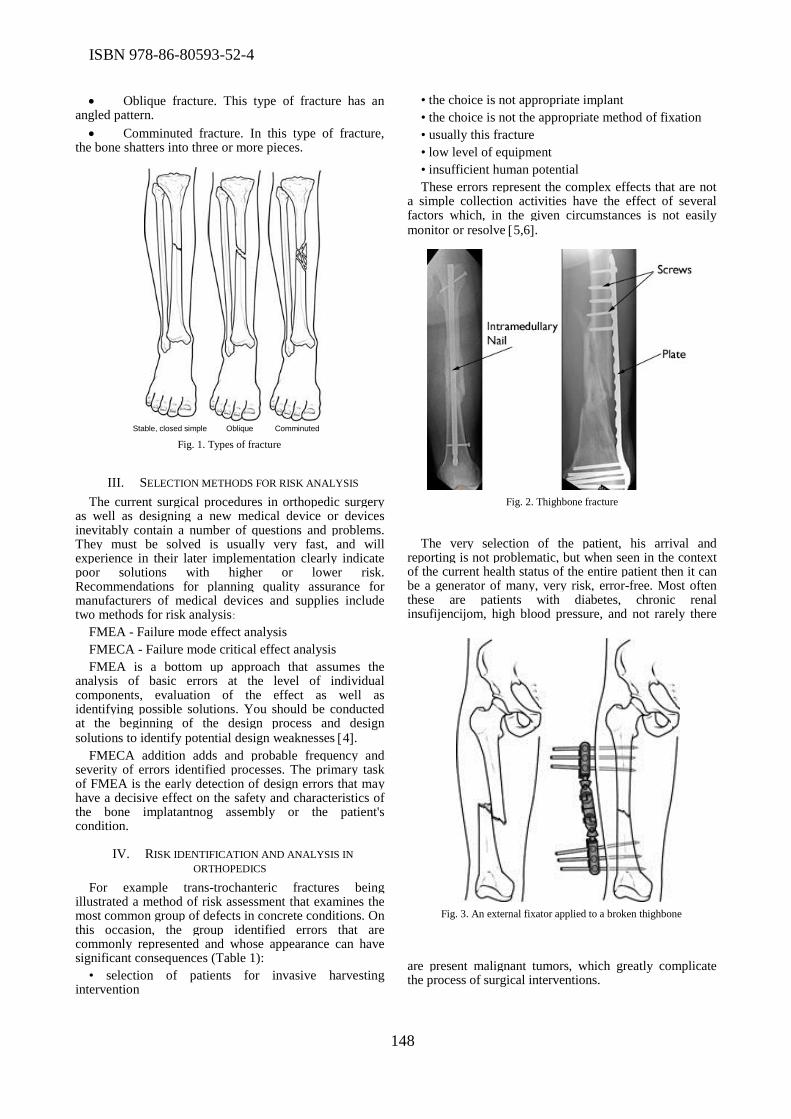
ISBN 978-86-80593-52-4
148
Stable, closed simple Oblique Comminuted
Fig. 1. Types of fracture
Fig. 3. An external fixator applied to a broken thighbone
Fig. 2. Thighbone fracture
Oblique fracture. This type of fracture has an angled pattern.
Comminuted fracture. In this type of fracture, the bone shatters into three or more pieces.
III. SELECTION METHODS FOR RISK ANALYSIS
The current surgical procedures in orthopedic surgery as well as designing a new medical device or devices inevitably contain a number of questions and problems. They must be solved is usually very fast, and will experience in their later implementation clearly indicate poor solutions with higher or lower risk. Recommendations for planning quality assurance for manufacturers of medical devices and supplies include two methods for risk analysis :
FMEA - Failure mode effect analysis
FMECA - Failure mode critical effect analysis
FMEA is a bottom up approach that assumes the analysis of basic errors at the level of individual components, evaluation of the effect as well as identifying possible solutions. You should be conducted at the beginning of the design process and design solutions to identify potential design weaknesses 4.
FMECA addition adds and probable frequency and severity of errors identified processes. The primary task of FMEA is the early detection of design errors that may have a decisive effect on the safety and characteristics of the bone implatantnog assembly or the patient's condition.
IV. RISK IDENTIFICATION AND ANALYSIS IN
ORTHOPEDICS
For example trans-trochanteric fractures being illustrated a method of risk assessment that examines the most common group of defects in concrete conditions. On this occasion, the group identified errors that are commonly represented and whose appearance can have significant consequences (Table 1):
• selection of patients for invasive harvesting intervention
• the choice is not appropriate implant
• the choice is not the appropriate method of fixation
• usually this fracture
• low level of equipment
• insufficient human potential
These errors represent the complex effects that are not a simple collection activities have the effect of several factors which, in the given circumstances is not easily monitor or resolve 5,6.
The very selection of the patient, his arrival and reporting is not problematic, but when seen in the context of the current health status of the entire patient then it can be a generator of many, very risk, error-free. Most often these are patients with diabetes, chronic renal insufijencijom, high blood pressure, and not rarely there
are present malignant tumors, which greatly complicate the process of surgical interventions.
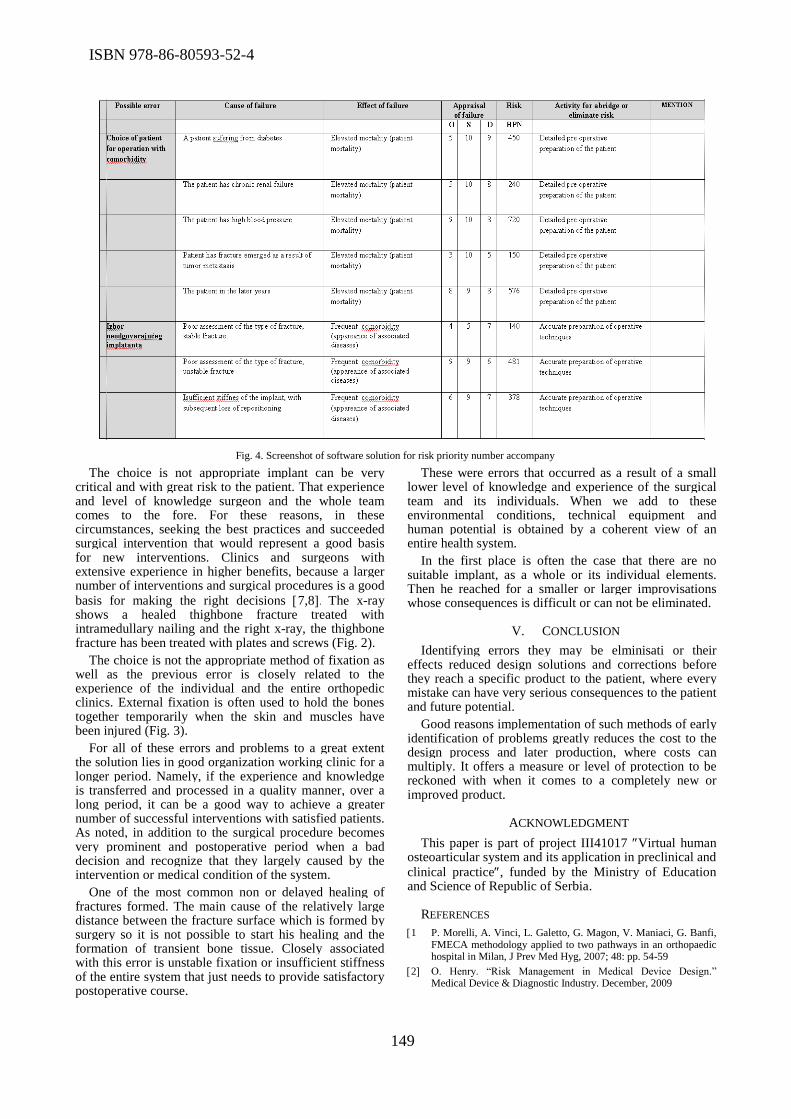
ISBN 978-86-80593-52-4
149
The choice is not appropriate implant can be very critical and with great risk to the patient. That experience and level of knowledge surgeon and the whole team comes to the fore. For these reasons, in these circumstances, seeking the best practices and succeeded surgical intervention that would represent a good basis for new interventions. Clinics and surgeons with extensive experience in higher benefits, because a larger number of interventions and surgical procedures is a good basis for making the right decisions 7,8. The x-ray shows a healed thighbone fracture treated with intramedullary nailing and the right x-ray, the thighbone fracture has been treated with plates and screws (Fig. 2).
The choice is not the appropriate method of fixation as well as the previous error is closely related to the experience of the individual and the entire orthopedic clinics. External fixation is often used to hold the bones together temporarily when the skin and muscles have been injured (Fig. 3).
For all of these errors and problems to a great extent the solution lies in good organization working clinic for a longer period. Namely, if the experience and knowledge is transferred and processed in a quality manner, over a long period, it can be a good way to achieve a greater number of successful interventions with satisfied patients. As noted, in addition to the surgical procedure becomes very prominent and postoperative period when a bad decision and recognize that they largely caused by the intervention or medical condition of the system.
One of the most common non or delayed healing of fractures formed. The main cause of the relatively large distance between the fracture surface which is formed by surgery so it is not possible to start his healing and the formation of transient bone tissue. Closely associated with this error is unstable fixation or insufficient stiffness of the entire system that just needs to provide satisfactory postoperative course.
These were errors that occurred as a result of a small lower level of knowledge and experience of the surgical team and its individuals. When we add to these environmental conditions, technical equipment and human potential is obtained by a coherent view of an entire health system.
In the first place is often the case that there are no suitable implant, as a whole or its individual elements. Then he reached for a smaller or larger improvisations whose consequences is difficult or can not be eliminated.
V. CONCLUSION
Identifying errors they may be elminisati or their effects reduced design solutions and corrections before they reach a specific product to the patient, where every mistake can have very serious consequences to the patient and future potential.
Good reasons implementation of such methods of early identification of problems greatly reduces the cost to the design process and later production, where costs can multiply. It offers a measure or level of protection to be reckoned with when it comes to a completely new or improved product.
ACKNOWLEDGMENT
This paper is part of project III41017 Virtual human osteoarticular system and its application in preclinical and clinical practice, funded by the Ministry of Education and Science of Republic of Serbia.
REFERENCES
1 P. Morelli, A. Vinci, L. Galetto, G. Magon, V. Maniaci, G. Banfi, FMECA methodology applied to two pathways in an orthopaedic hospital in Milan, J Prev Med Hyg, 2007; 48: pp. 54-59
2 O. Henry. “Risk Management in Medical Device Design.” Medical Device & Diagnostic Industry. December, 2009
Fig. 4. Screenshot of software solution for risk priority number accompany

ISBN 978-86-80593-52-4
150
3 “Pharmaceutical cGMPS for the 21st Century–A Risk-Based Approach: Second Progress Report and Implementation Plan.” U.S. Department of Health & Human Services. December, 2009.
4 R. Harvey, C. Sidebottom, The Role of Risk Management in the New IEC 60601-1. Medical Device & Diagnostic Industry. 2009.
5 S. Mike. “The Use and Misuse of FMEA in Risk Analysis.” Medical Device & Diagnostic Industry. December, 2009.
6 M. Mitković et al., Surgical treatment of pertrochanteric fractures using personal external fixation system and technique, Facta
Universitatis, Series: Medicine and Biology Vol.9, No 2, 2002, pp. 188 - 191
7 N. Yoshino et al., Implant failure of long Gamma nail in a patient with inter trochanteric sub trochanteric Fracture, J Orthop Sci (2006) 11: pp. 638–643
8 S. Milenković et al., Surgical treatment of the trochanteric fractures by using the external and internal fixation methods, Facta Universitatis, Series: Medicine and Biology Vol.10, No 2, 2003, pp. 79 – 83
ISBN 978-86-80593-52-4
151
Enhanced Coarse-fine Search Scheme for Digital
Image Correlation Samo Simončić1, Melita Kompolšek2, Primož Podržaj3
1Faculty of Mechanical Engineering, University of Ljubljana, Slovenia 2Higher Vocational College and Faculty of Industrial Engineering Novo Mesto, Slovenia
[email protected]; [email protected]; [email protected]
Abstract—The paper presents a newly developed fine search algorithm used in the application of digital correlation. In order to evaluate its performance a special purpose application was developed using C# language. The algorithm was then tested on a pre-prepared set of computer generated speckled images. It turned out to be much faster than a conventional fine search algorithm. Consequently it is a major step forward in a never ending quest for a fast digital correlation execution with sub pixel accuracy.
I. INTRODUCTION
In the last two decades, the research field of digital image correlation (DIC)[1], [2]hasbeen growing at an ever increasing pace. This can be attributed to its distinct advantages such as simple experimental set-up, low requirement on experimental environment and wide range of applicability. In addition, digital image correlation has been widely used for deformation and shape measurement, mechanical parameter characterization and numerical-experimental cross validations.
The basic idea behind the standard and most widely used subset-based DIC method is to track the subsets (or sub-images) specified in a reference image, through the sequence of deformed images. The result of this procedure gives us the information about the full-field motion and deformation.It is evident that the proposed approach is rather simple andintuitive, butsub-pixel registration accuracy and computational efficiency are two important aspects which need to be considered if the approach is to be applied.In the first case (accuracy of DIC measurements) the obtained accuracy depends on various factors, such as speckle pattern[3], subset size[4], correlation criterion[5], shape function[6], sub-pixel interpolation scheme[7] and sub-pixel registration algorithm[8] where the latter one has the major influence on the registration accuracy of DIC. For this purpose different types of sub-pixel registration methods have been developed in the literature. Currently, an iterative spatial domain cross-correlation approach (for example a Newton-Raphson [9] (NR) approach) is one of the most widely used sub-pixel registration algorithms. In the last decade, original NR approach [10] has been improved significantly [11]by reducing its computation complexity, improving its robustness and extending its applicability. In
this filed, it is considered as a gold standard for accurate and robust sub-pixel motion detection in digital image. Its ability totake into the account the relative deformation and rotation of the target subset is one of the main reasons for its wide applicability in various fields of science.It is also capable of providing thebest sub-pixel registration accuracy compared to the other methods in literature.
TheNR approachhowever needs the correlation function, which by natureis nonlinear with respect to the desired mapping parameters vector. This of course impliesnonlinear numerical optimization. In such a case the initial value of mapping parameters vector is required,which presents initial guess in the correlation procedure. It should be noted, that the initial guess must be defined as accurately as possible, because only in this way the convergence of the NR approach is guaranteed [11]. As alreadymentioned, the NR approach is very appropriate in the cases where the deformation and/or rotation of the target subset arepresent. On the other hand, if only rigid body translation of the target subset is considered, then it is possible to use the sub-pixel registration approaches which are not so demanding from the mathematical point of view. In many situations, this fact provides the possibility to use methods which are very simple from the theoretical point of view, and very straightforward for implementation which also means that they are computationallyefficient.
In our opinion, the coarse-fine search algorithm [12]is well suited for such a task. Because of that we decided to implement it together with some improvements which will be presented in detail. The basic idea behind the coarse-fine search strategy can be described by the following steps. In the first step, it calculates the predefined correlation coefficient for all points of interest in the searching area with a 1 pixel step. In order to improve its accuracy it is logical to reduce the searching step,for exampleto 0.1pixelor 0.01 pixel. In many cases, the coarse-fine searching strategy is able to handle only rigid body motionand consequently the shape changes of the deformed subset cannot be evaluated as in the case of the NR approach.If the searching step is less than 1 pixel, the gray level at sub-pixel locations must be reconstructed and for this purpose a certain interpolation scheme is needed. From the execution time point of view this is the most
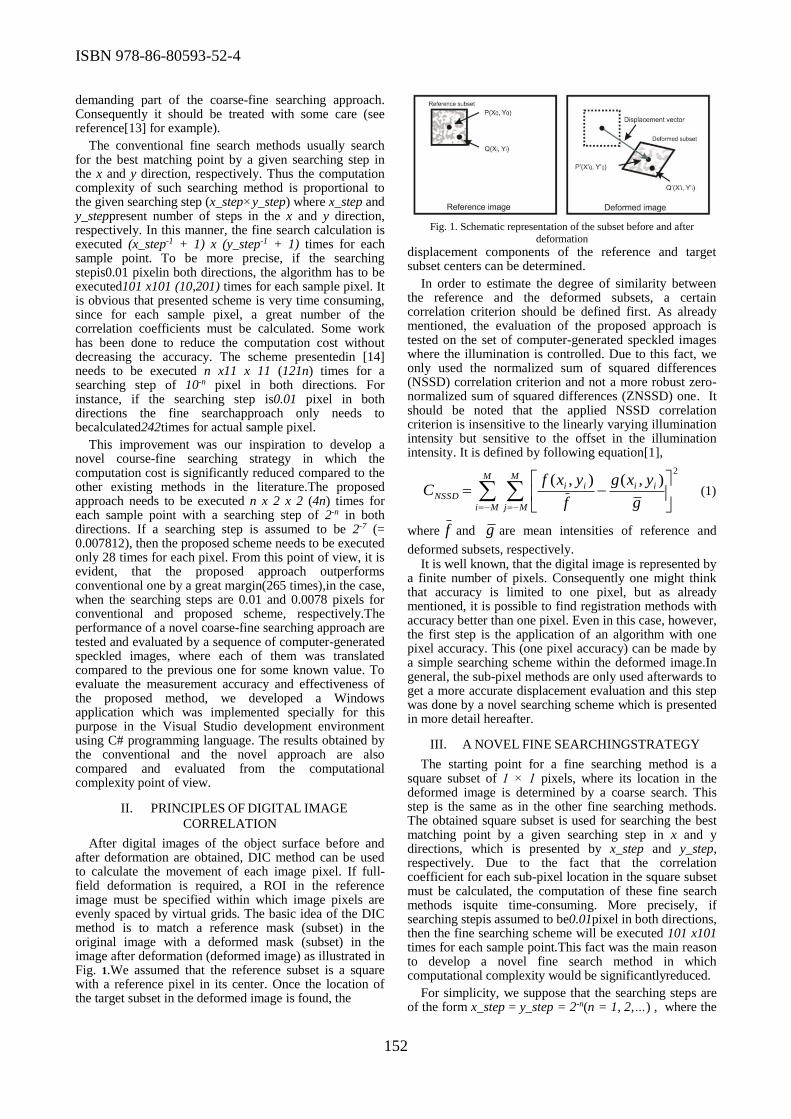
ISBN 978-86-80593-52-4
152
demanding part of the coarse-fine searching approach. Consequently it should be treated with some care (see reference[13] for example).
The conventional fine search methods usually search for the best matching point by a given searching step in the x and y direction, respectively. Thus the computation complexity of such searching method is proportional to the given searching step (x_step×y_step) where x_step and y_steppresent number of steps in the x and y direction, respectively. In this manner, the fine search calculation is executed (x_step-1 + 1) x (y_step-1 + 1) times for each sample point. To be more precise, if the searching stepis0.01 pixelin both directions, the algorithm has to be executed101 x101 (10,201) times for each sample pixel. It is obvious that presented scheme is very time consuming, since for each sample pixel, a great number of the correlation coefficients must be calculated. Some work has been done to reduce the computation cost without decreasing the accuracy. The scheme presentedin [14] needs to be executed n x11 x 11 (121n) times for a searching step of 10-n pixel in both directions. For instance, if the searching step is0.01 pixel in both directions the fine searchapproach only needs to becalculated242times for actual sample pixel.
This improvement was our inspiration to develop a novel course-fine searching strategy in which the computation cost is significantly reduced compared to the other existing methods in the literature.The proposed approach needs to be executed n x 2 x 2 (4n) times for each sample point with a searching step of 2-n in both directions. If a searching step is assumed to be 2-7 (= 0.007812), then the proposed scheme needs to be executed only 28 times for each pixel. From this point of view, it is evident, that the proposed approach outperforms conventional one by a great margin(265 times),in the case, when the searching steps are 0.01 and 0.0078 pixels for conventional and proposed scheme, respectively.The performance of a novel coarse-fine searching approach are tested and evaluated by a sequence of computer-generated speckled images, where each of them was translated compared to the previous one for some known value. To evaluate the measurement accuracy and effectiveness of the proposed method, we developed a Windows application which was implemented specially for this purpose in the Visual Studio development environment using C# programming language. The results obtained by the conventional and the novel approach are also compared and evaluated from the computational complexity point of view.
II. PRINCIPLES OF DIGITAL IMAGE
CORRELATION
After digital images of the object surface before and after deformation are obtained, DIC method can be used to calculate the movement of each image pixel. If full-field deformation is required, a ROI in the reference image must be specified within which image pixels are evenly spaced by virtual grids. The basic idea of the DIC method is to match a reference mask (subset) in the original image with a deformed mask (subset) in the image after deformation (deformed image) as illustrated in Fig. 1.We assumed that the reference subset is a square with a reference pixel in its center. Once the location of the target subset in the deformed image is found, the
Fig. 1. Schematic representation of the subset before and after
deformation displacement components of the reference and target subset centers can be determined.
In order to estimate the degree of similarity between the reference and the deformed subsets, a certain correlation criterion should be defined first. As already mentioned, the evaluation of the proposed approach is tested on the set of computer-generated speckled images where the illumination is controlled. Due to this fact, we only used the normalized sum of squared differences (NSSD) correlation criterion and not a more robust zero-normalized sum of squared differences (ZNSSD) one. It should be noted that the applied NSSD correlation criterion is insensitive to the linearly varying illumination intensity but sensitive to the offset in the illumination intensity. It is defined by following equation[1],
2
),(),(
M
Mi
M
Mj
iiiiNSSD
g
yxg
f
yxfC (1)
where f and g are mean intensities of reference and
deformed subsets, respectively. It is well known, that the digital image is represented by
a finite number of pixels. Consequently one might think that accuracy is limited to one pixel, but as already mentioned, it is possible to find registration methods with accuracy better than one pixel. Even in this case, however, the first step is the application of an algorithm with one pixel accuracy. This (one pixel accuracy) can be made by a simple searching scheme within the deformed image.In general, the sub-pixel methods are only used afterwards to get a more accurate displacement evaluation and this step was done by a novel searching scheme which is presented in more detail hereafter.
III. A NOVEL FINE SEARCHINGSTRATEGY
The starting point for a fine searching method is a square subset of 1 × 1 pixels, where its location in the deformed image is determined by a coarse search. This step is the same as in the other fine searching methods. The obtained square subset is used for searching the best matching point by a given searching step in x and y directions, which is presented by x_step and y_step, respectively. Due to the fact that the correlation coefficient for each sub-pixel location in the square subset must be calculated, the computation of these fine search methods isquite time-consuming. More precisely, if searching stepis assumed to be0.01pixel in both directions, then the fine searching scheme will be executed 101 x101 times for each sample point.This fact was the main reason to develop a novel fine search method in which computational complexity would be significantlyreduced.
For simplicity, we suppose that the searching steps are of the form x_step = y_step = 2-n(n = 1, 2,…) , where the
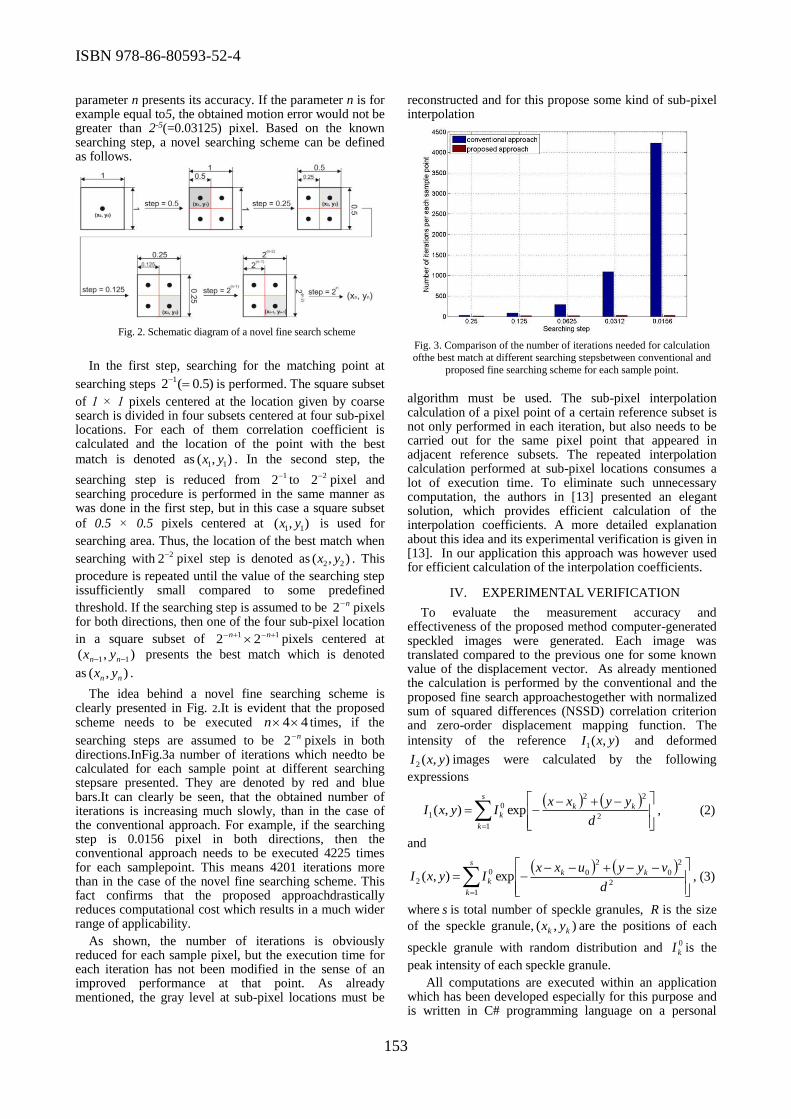
ISBN 978-86-80593-52-4
153
parameter n presents its accuracy. If the parameter n is for example equal to5, the obtained motion error would not be greater than 2-5(=0.03125) pixel. Based on the known searching step, a novel searching scheme can be defined as follows.
Fig. 2. Schematic diagram of a novel fine search scheme
In the first step, searching for the matching point at
searching steps )5.0(2 1 is performed. The square subset
of 1 × 1 pixels centered at the location given by coarse search is divided in four subsets centered at four sub-pixel locations. For each of them correlation coefficient is calculated and the location of the point with the best
match is denoted as ),( 11 yx . In the second step, the
searching step is reduced from 12 to 22 pixel and searching procedure is performed in the same manner as was done in the first step, but in this case a square subset
of 0.5 × 0.5 pixels centered at ),( 11 yx is used for
searching area. Thus, the location of the best match when
searching with 22 pixel step is denoted as ),( 22 yx . This
procedure is repeated until the value of the searching step issufficiently small compared to some predefined
threshold. If the searching step is assumed to be n2 pixels for both directions, then one of the four sub-pixel location
in a square subset of 11 22 nn pixels centered at
),( 11 nn yx presents the best match which is denoted
as ),( nn yx .
The idea behind a novel fine searching scheme is clearly presented in Fig. 2.It is evident that the proposed scheme needs to be executed 44n times, if the
searching steps are assumed to be n2 pixels in both directions.InFig.3a number of iterations which needto be calculated for each sample point at different searching stepsare presented. They are denoted by red and blue bars.It can clearly be seen, that the obtained number of iterations is increasing much slowly, than in the case of the conventional approach. For example, if the searching step is 0.0156 pixel in both directions, then the conventional approach needs to be executed 4225 times for each samplepoint. This means 4201 iterations more than in the case of the novel fine searching scheme. This fact confirms that the proposed approachdrastically reduces computational cost which results in a much wider range of applicability.
As shown, the number of iterations is obviously reduced for each sample pixel, but the execution time for each iteration has not been modified in the sense of an improved performance at that point. As already mentioned, the gray level at sub-pixel locations must be
reconstructed and for this propose some kind of sub-pixel interpolation
Fig. 3. Comparison of the number of iterations needed for calculation
ofthe best match at different searching stepsbetween conventional and
proposed fine searching scheme for each sample point.
algorithm must be used. The sub-pixel interpolation calculation of a pixel point of a certain reference subset is not only performed in each iteration, but also needs to be carried out for the same pixel point that appeared in adjacent reference subsets. The repeated interpolation calculation performed at sub-pixel locations consumes a lot of execution time. To eliminate such unnecessary computation, the authors in [13] presented an elegant solution, which provides efficient calculation of the interpolation coefficients. A more detailed explanation about this idea and its experimental verification is given in [13]. In our application this approach was however used for efficient calculation of the interpolation coefficients.
IV. EXPERIMENTAL VERIFICATION
To evaluate the measurement accuracy and effectiveness of the proposed method computer-generated speckled images were generated. Each image was translated compared to the previous one for some known value of the displacement vector. As already mentioned the calculation is performed by the conventional and the proposed fine search approachestogether with normalized sum of squared differences (NSSD) correlation criterion and zero-order displacement mapping function. The
intensity of the reference ),(1 yxI and deformed
),(2 yxI images were calculated by the following
expressions
2
22
1
0
1 exp),(d
yyxxIyxI kk
s
k
k , (2)
and
2
2
0
2
0
1
0
2 exp),(d
vyyuxxIyxI kk
s
k
k , (3)
where s is total number of speckle granules, R is the size
of the speckle granule, ),( kk yx are the positions of each
speckle granule with random distribution and 0
kI is the
peak intensity of each speckle granule.
All computations are executed within an application which has been developed especially for this purpose and is written in C# programming language on a personal
ISBN 978-86-80593-52-4
154
computer with an Intel Pentium i7, 2.30GHz processor and 8 GB memory. The graphical user interface of the developed program is presented in Fig. 4. The validation of the proposed and the conventional fine searching schemesis performed using the developed application.
Fig. 4. Graphical user interface of the developed program for
measurements displacements by proposed fine searching scheme
Fig. 5. compares the computation time of the conventional and proposed fine searching scheme at different searching steps, ranging from 0.25 to 0.0156 pixels for a fixed subset of 41 x 41 pixelsize. As shown, the computation time of the conventional approach begins to increase rapidly as searching step decreases. For example, if the value of the searching step is assumed to be 0.0156 pixels, the conventional approach needs more than 16seconds for each sample point to find the best match. On the other hand, the proposed approach only needs few milliseconds at the same searching step. From this fact, it is evident that the computation time is extremely reduced. It should be noted, that the results presented inFig. Fig. 5 have similar distribution with respect to the searching step as to the number of iterations for each sample point presented in Fig. 3. This is mainly due to the fact that the computation time is directly related to the number of iterations.
Fig. 5. Comparison of the computation time needed for calculation the
best match at different searching steps between conventional and
proposed fine searching scheme for each sample point.
V. CONCLUDING REMARKS
In order to test our idea of a newly developed fine searching method an application was made in Visual Studio using C# programming language. Within this application the algorithm was tested on a pre-prepared set of computer generated images, which were translated for some predetermined displacement. As expected from the theoretical analysis of both the approaches the results have clearly shown that the proposed fine searching scheme clearly outperforms the conventional method. As the newly developed method turns out to be roughly 1000 times faster for a typical searching step, it vastly widened the set of applicability of digital correlation for real life problems.
REFERENCES
[1] B. Pan, K. Qian, H. Xie and A. Asundi, Two-dimensional digital
image correlation for in-plane displacement and strain measurement: a review, Measurement Science and Technology,
vol. 20, no. 6, pp. 1-17, 2009.
[2] H. Schreier, J.-J. Orteu and M. A. Sutton, Image Corelation for Shape, Motion and Deformation Measurements, Springer, 2009.
[3] B. Pan, Z. Lu and X. Huimin, Mean intensity gradient: An
effective global parameter for quality assessment of the speckle patterns used in digital image correlation, Optics and Lasers in
Engineering, vol. 48, no. 4, pp. 469-477, 2010.
[4] B. Pan, X. Huimin, Z. Wang, K. Qian and Z. Wang, Study on subset size selection in digital image correlation for speckle
patterns, Optics Express, vol. 16, no. 10, pp. 7037-7048, 2008.
[5] B. Pan, H. Xie and Z. Wang, Equivalence of digital image correlation criteria for pattern matching, Applied Optics, vol. 49,
no. 28, pp. 5501-5509, 2010.
[6] H. W. Schreier and M. A. Sutton, Systematic errors in digital
image correlation due to undermatched subset shape functions,
Experimental Mechanics, vol. 42, no. 3, pp. 303-310, 2002.
[7] H. W. Schreier, J. R. Braasch and M. A. Sutton, Systematic errors in digital image correlation caused by intensity interpolation,
Optical Engineering, vol. 39, no. 11, pp. 2915-2921, 2000.
[8] P. Bing, X. Hui-min, X. Bo-qin and D. Fu-lonh, Performance of sub-pixel registration algorithms in digital image correlation,
Measurement Science and Technology, vol. 17, no. 6, 2006.
[9] Z. Wang, S. Wang and Z. Wang, An analysis on computational load of DIC based on Newton-Raphson scheme, Optics and Lasers
in Engineering, vol. 52, pp. 61-65, 2014.
[10] H. Bruck, S. McNeill, M. Sutton and W. Peters III, Digital image correlation using Newton-Raphson method of partial differential
correlation, Experimental Mechanics, vol. 29, no. 3, pp. 261-267,
1989.
[11] V. G. in K. W. G., Submicron deformation field measurements:
Part 2. Improved digital image correlation, Experimental
Mechanics, zv. 38, št. 2, pp. 86-92, 1998.
[12] W. Peters and W. Ranson, Digital Imaging Techniques in
Experimental Stress Analysis, Optical Engineering, vol. 21, no. 3,
1982.
[13] B. Pan and K. Li, A fast digital image correlation method for
determination measurement, Optics and Lasers in Engineering, vol. 49, no. 7, pp. 841-847, 2011.
[14] Z.-F. Zhang, Y.-L. Kang, H.-W. Wang, Q.-H. Qin, Y. Qiu and X.-
Q. Li, A novel coarse-fine search scheme for digital image correlation method, Measurement, vol. 39, no. 8, pp. 710-718,
2006.

ISBN 978-86-80593-52-4
155
Application of Telemedicine in Treatment of
Coxarthrosis Using Cementless Endoprosthesis of
the Hip Joint with Fitmore® Hip Stem
Ivan Golubović1, Zoran Baščarević2, Ivica Lalić3, Marko Kadija7, Zoran Golubović1,4, Predrag Stoiljković1, Stevo Najman4, Marija Trenkić-Božinović5, Slađana Petrović4,6, Zoran Radovanović4,6, Sanja
Stojanović4, Milica Stanisavljević4, Mila Janjić4, Saša Stojanović1, Sonja Stamenić1, Milan Ćirić4
1Clinical Center Niš, Clinic for Orthopaedic Surgery and Traumatology, Niš, Serbia; 2University of Belgrade, Faculty of Medicine, Institute of Orthopaedic Surgery Banjica, Belgrade, Serbia;
3Clinic for Orthopaedic Surgery and Traumatology, Novi Sad, Serbia 4University of Niš, Faculty of Medicine, Niš, Serbia;
5Clinical Center Niš, Clinic for Ophthalmology, Niš, Serbia; 6Clinical Center Niš, Center for Radiology, 18000 Niš, Serbia
Abstract— Coxarthrosis is a chronic degenerative disease of the hip joint which is characterized by pain and limitation of movements in the hip joint, which significantly disturbs the quality of life. Radiologically, narrowing of the joint space with destructive changes in the head and the acetabulum of the hip joint is present. Treatment of coxarthrosis in the early stage of disease is conservative, while in the later stages surgical treatment must be applied. By installing of endoprosthesis a diseased hip joint is replaced with artificial which helps eliminate the pain and provides a satisfactory range of movements in the operated hip. In this case, after complete preoperative preparation, cementless endoprosthesis of the hip joint with Fitmore® Hip Stem by Zimmer was implanted. The entire surgical procedure was broadcasted via video beam to the collegium of orthopaedic clinic, since it was a new type of stem of the hip joint endoprosthesis which was for the first time implanted into a patient at the Clinic for Orthopaedic Surgery and Traumatology Niš. The doctors from Clinic watched the whole operation via video beam from the medical room and asked questions during the operation to which they immediately received responses from surgeons from the operating room. Cementless endoprosthesis with Fitmore® Hip Stem represents the treatment of choice in patients of younger age.
I. INTRODUCTION
Coxarthrosis is a chronic degenerative disease with clinical manifestations usually in the fifth, sixth and seventh decade of life. Causes of coxarthrosis are different and most frequently quoted are congenital abnormalities of the hip joint, abnormalities obtained during growth, excessive loading of the hip joint, traumatic damage of the hip joint such as dislocation of the femoral head, fracture of the femoral head or acetabulum, microtrauma,
hormonal disorders and aging process (1,2). The main signs of coxarthrosis are pain and limitation of movements which significantly alter the quality of life. Treatment of coxarthrosis depends on the stage of disease. In the initial phase of the disease treatment does not require surgical intervention while in more developed stage of the disease it is necessary by implantation of endoprosthesis of the hip joint.
II. MATERIALS AND METHODS
This paper presents a patient with advanced clinical symptoms of coxarthrosis (constantly present pain and limitation of movements in the hip joint) which was treated surgically by cementless endoprosthesis of the hip joint with Fitmore® Hip Stem by Zimmer. The entire surgical procedure was broadcasted via video beam to the collegium of orthopaedic clinic, since it was a new type of stem of the hip joint endoprosthesis which was for the first time implanted into the patient at the Clinic for Orthopaedic Surgery and Traumatology Niš. The doctors from Clinic watched the whole operation via video beam from the medical room and asked questions during the operation to which they immediately received responses from surgeons from the operating room.
III. CASE REPORT
Patient C.D. was treated repeatedly ambulatory using antirheumatics and physical therapy, because of the pain and limitation of movements in the right hip joint, with variable success (Figure 1).
When all methods of non-operative treatment were exhausted, the patient was admitted to the Clinic for
ISBN 978-86-80593-52-4
156
Orthopaedic Surgery and Traumatology Niš for implantation of cementless endoprosthesis of the right hip joint. After a complete preoperative preparation surgical procedure was performed. Using approach by Gibson we came to the right hip joint and after osteotomy of the neck we processed the acetabulum and acetabular component was placed. After processing the medullary canal Fitmore® Hip Stem was placed. The head of the endoprosthesis was set and we performed repositioning. An early postoperative period was regular. On the control X-ray the implanted components of endoprosthesis shows good position (Fig. 2).
Figure 1. X-ray of the right hip joint with narrowed joint space,
marginal osteophytes and areas of sclerosis in the region of acetabulum
and femoral head.
The wound healed per primam. Patient was activated using underarm crutches with relieving reliance on the operated leg. After removing the stitches the patient was sent to physical therapy. Upon the completion of physical therapy, the patient has returned to working and life activities.
Figure 2. X-ray of the right hip joint after implantation of cementless
endoprosthesis of the hip joint with Fitmore® Hip Stem by Zimmer.
IV. DISCUSION
The predominant symptoms of developed clinical features of coxarthrosis are pain and limitation of movements. In the initial stage of disease the local painful sensitivity in the region of the hip, which increases during physical stress is present. The pain appears in the upper thigh and knee due to the irritation of n. obturatorius and n. femoralis. As the disease progresses the range of movements in the hip area is getting smaller. Contracture of the hip becomes more pronounced, so problems occur during walking. Walking becomes more and more painful. The patient is helping with a stick during walking. In the later stages of the disease movements in the hip are very limited with shortening of the leg on affected side. Replacement of the hip joint with alloplastic material is one of the greatest achievements in orthopedic surgery and traumatology. Progress that has been made in alloarthroplastic replacement of the hip joint is closely related to the results of biomechanical and biotechnological research. The goal of arthroplasty of the hip joint is to achieve a painless, stable and moving hip joint. Application of Fitmore® Hip Stem is indicated for total hip arthroplasty in patients with noninflammatory degenerative hip joint disease, avascular necrosis of the femoral head, osteoarthritis, rheumatoid arthritis and revision of previously failed hip arthroplasty (3,4,5). Fitmore® Hip Stem is a curved uncemented stem with a trapezoidal cross-section, which is coated proximally with Ti-VPS (Titanium Vacuum Plasma Spray) and rough-blasted distally. To preserve bone material of the greater trochanter Fitmore® Hip Stem is characterized by curved shape and trapezoidal cross-section for maximum rotational stability. A three-dimensional shape and proximal Ti-VPS coating for press-fit fixation provides good fixation and osseointegration which is one of the requirements for re-establishment of the biomechanics of the hip joint (6,7,8).
V. CONCLUSION
Coxarthrosis is a chronic degenerative disease of the hip joint which is characterized by pain and limitation of movements in the hip joint, which significantly disturbs the quality of life. Radiologically, narrowing of the joint space with destructive changes in the head and the acetabulum of the hip joint is present. Treatment of coxarthrosis in the early stage of disease is conservative, while in the later stages surgical treatment must be applied. With implantation of endoprosthesis of the hip joint, diseased hip joint is replaced with artificial, which helps eliminate the pain, provides a satisfactory range of movements in the operated hip and stable support. Cementless endoprosthesis with Fitmore® Hip Stem represents the treatment of choice in patients of younger age.
REFERENCES
[1] Z. Golubović, M. Mitković, Degenerativna oboljenja zgloba kuka. U: M. Višnjić (editor). Hirurgija. “Prosveta”, Medicinski Fakultet Niš. str. 315 – 316, 2013.
[2] I. Ruszkowski, D. Orlić, and O. Muftić, Endoproteza zgloba kuka. JUMENA, Zagreb, 1985.
[3] P. von Roth et al. Reproducibility of femoral offset following short stem and straight stem total hip arthroplasty. Orthopedics. 37(7): e678-84, 2014.

ISBN 978-86-80593-52-4
157
[4] E. Gasbarra et al., Osseointegration of Fitmore stem in total hip arthroplasty. J Clin Densitom. 17(2): 307-13, 2014.
[5] W. Pepke et al., Primary stability of the Fitmore stem: biomechanical comparison. Int Orthop. 38(3): 483-8, 2014.
[6] M. R. Streit et al., High survival in young patients using a second generation uncemented total hip replacement. Int Orthop. 36(6): 1129-36. 2012.
[7] J. G. Yerasimides, Use of the Fitmore® hip stem bone-preserving system for the minimally invasive anterior-supine approach in hip replacement, Am J Orthop., 39(10 Suppl): 13-6, 2010.
[8] K. Gustke, Short stems for total hip arthroplasty: initial experience with the Fitmore stem. J Bone Joint Surg Br., 94(11 Suppl A): 47-51. 2012.

ISBN 978-86-80593-52-4
158
Problems for Development of E-Government IN
Republic of SrpskaDalibor Drljača1, Branko Latinović2
1University of East Sarajevo, Lukavica, Bosnia and Herzegovina 2Pan European University APEIRON Banja Luka, Bosnia and Herzegovina
[email protected]; [email protected];
Abstract - Republic of Srpska’s Government is facing with a numerous of problems related to successful implementation of e-government initiative. Public administration in Republic of Srpska is still using traditional means for communication with its stakeholders – fax, postal mail, telephone – that prevent increase of quality and transparency of provided services. The intention of public administration in Republic of Srpska is to become modern, transparent and efficient in daily operations and communication with its stakeholders. This paper points on major problems for implementation of e-government initiative and provide contribution in form of suggestions on how to resolve some of observed problems.
I. INTRODUCTION
Every government intention is to increase wellbeing in its country and to grow confidence of citizens in its work. Citizens usually criticise work of every public administration stating that it is slow, non-transparent and inefficient. Therefore, each government needs to work on improvement in order to resolve these problems. There are numerous of ways to improve work of public administration – from better structuring, staffing and improvement of infrastructure and introduction of new processes to complete reform of public administration.
Primary in reform of public administration towards provision of quality and effective services is implementation of electronic government (e-government) concept. This concept assumes comprehensive reform of public administration’s work with introduction of modern information and communication technologies (ICT).
So, the crucial aspects driving implementation of e-government can be seen as:
optimisation of service delivery,
active participation of citizens, and
transformation of internal and external relationships in public administration using ICT.
In order to meet these crucial aspects, Government of Republic of Srpska (RS) needs to introduce comprehensive reform of its public administration system. This will not be an easy task, nor cheap, having in mind
status of economy in RS. Some steps are undertaken, but complete process is far from being over. At the moment, Bosnia and Herzegovina (BiH) public administration is finalizing part of public administration reform project, initiated in 2007.
The intention of this paper was not to provide new model of measurement of e-government, but to use various indicators and indexes in order to have clear picture on evaluation of readiness for implementation in RS. The paper establishes the readiness of RS administration to implement e-government identifying key problems and proposes generic solutions.
From the results obtained, it is obvious that RS needs to implement full reform of its public administration system in order to be able to transfer to e-government. Authors defined that reform has to go in three directions:
reform of human potential,
reform of infrastructure and
reform of processes and operative procedures.
There are numerous of questions related to implementation issue that should be treated in separate research, such as economic aspects of implementation (cost effectiveness, budgetary issues etc.), nor social aspects (how to persuade citizens to improve level of usability and implementation, accepting novelties).
II. RELATED WORK
New economy based on knowledge and introduction of information society presenting most important pillars of EUROPE2020 strategy [1] and its initiative called Digital Agenda for Europe – DAE [2]. DAE provides strategic actions and measures for strengthening of ICT sector in Europe and contribution of ICT to overall development of EU. Issue of e-government in DAE for Europe is tackled in “Pillar VII: ICT enabled benefits for EU society” [3] where number of actions related to e-government are foreseen.
Gartner Inc. in 2000 defined e-government as “the continuous optimisation of service delivery, constituency participation, and governance by transforming internal

ISBN 978-86-80593-52-4
159
and external relationships through technology, the Internet, and new media” [1]4]. Improving service delivery and responsiveness to citizens, in the long run, will generate greater public confidence in government’s work.
DAE, in chapter 2.7.4, points on importance of e-government services: “eGovernment services offer a cost-effective route to better service for every citizen and business and participatory open and transparent government. eGovernment services can reduce costs and save time for public administrations, citizens and businesses. They can also help mitigate the risks of climate change, natural and man-made hazards by including the sharing of environmental data and environment-related information. Today, despite a high level of availability of eGovernment services in Europe, differences still exist amongst Member States and the take-up of eGovernment services by citizens is low. In 2009, only 38% of EU citizens used the internet for accessing eGovernment services, compared to 72% of businesses. General internet take up will be lifted if the usage and quality and accessibility of public online services rises.”[5]
In order to establish insight in readiness of RS Government for introduction of e-government, it is necessary to compare it with other countries. There are two most important sets of indicators accepted by world-wide, and these are: ICT development index (IDI) and Networked Readiness Index (NRI).
ICT Development Index –IDI [6] is a complex index, constituted from 11 different indicators combined in one referent measure that serves for monitoring and comparison of ICT development in some country. The index was created by International Telecommunication Union – ITU in 2008. First edition was published in 2009 for measures done in 2008 for over 140 countries. Since then, this index is used for measuring of country’s readiness for implementation of information society.
The Global Information Technology Report (GITR) [7] is being prepared for 12 years by the World Economic Forum (WEF). This is one of most competent world documents pointing on status and influence of ICT world-wide with parallel measuring of ICT readiness. Networked Readiness Index (NRI is a part of this report) [8] presents a conceptual framework for the assessment of ICT impact at the global level. It connects ICT (tools, services and models) with the importance of competitiveness, progress and development activities in selected economy. The importance of this index reflects in the fact that it identifies areas that require political intervention, through investments, by adopting better regulation, by providing incentives and by other measures to reinforce the impact of ICT on growth and development
In order to better understand preconditions for quality implementation of e-government and importance of two-way communication with citizens, integrated four layer architecture framework for e-government was necessary to study [9].
Numerous of other researches examine this issue of measuring readiness factors from different aspects and with geographic specificity [10] [11] [12].
III. METHODS AND MATERIALS
First phase of this research considered desk review of available literature and collection of experiences. It was necessary to make consultation and analysis of national government policy and strategy documents, as well as existing international studies on the issues of interest. Most of literature consulted was found on Internet and publicly available libraries. Review of EU legislation was of primer interest due to nature of research and intention of BiH to become member state.
Especially, it was necessary to find out actual domestic resources in the field of interest. It should be noted that the volume of domestic literature in this area is quite small and limited to a theoretical interpretations of general knowledge about e-business and e-government. Very few research papers approached the problem of status and effects of e-governance introduction in Public Administration of the Republic of Srpska.
For this paper, authors used previously done analyses of on-line presence done by Agency for Information Society of Republic of Srpska1 (AIDRS). These analyses were done from 2011 each year, and they provide report with evaluation of web sites of RS public administration, but also local communities (municipalities). Web sites were evaluated based on 10 criteria, of which 6 were eliminatory (contact, updating, information, completeness, design, size of first page). In order to be evaluated they should meet minimum requirements.
Second phase of research included data processing and formulation of conclusions. The data on presence of public administration on social media were collected by reviewing four most important social media: Facebook, Twitter, LinkedIn and YouTube. In order to perform this review it was necessary to investigate number of public administration organs and institutions of interest, as well as their electronic addresses and web presentations. For analysis of social media presence were used data collected from the web site of Ministry of public administration and local self-governance and Union of Towns and Municipalities in Republic of Srpska. Both sources were used due to irregular updating at the web site of the Ministry, which should have updated and accurate information.
Comparative method was used in order to observe position of BiH among other countries in the World using data obtained from two indexes: ICT Development Index and Networked Readiness Index.
IV. PROBLEM ANALYSIS
Bosnia and Herzegovina’s (BiH) intention (as a country) is to become a part of EU and it has to be done through expensive and long-term process of reform. It is already a moment to act in line with DAE in order to make accession feasible in adequate period of time. Neighbouring countries are advancing in implementation of DAE. Croatia, as new member state, already started implementation of actions from DAE through its Ministry of Maritime Affairs, Transport and Infrastructure and Croatian Post and Electronic Communications Agency, as two main implementing institutions [13]. Although not a member state, Serbia is planning and adapting its measures in line with these described in DAE. Within the
1 http://www.aidrs.org

ISBN 978-86-80593-52-4
160
Ministry of Foreign and Internal Trade and Telecommunications, Serbian government established in 2011 the Direction for Digital Agenda2 with responsibilities and obligations related to national strategy for e-government, public administration reform and strategy for information society.
As the creator of policy and legislation on entity level, the Government of RS is aware of actual strategies EU and already in 2007 established AIDRS with similar aims.
First problem in implementation of e-government in RS is reform of human potential, where it is necessary to create positive climate among civil servants in order to relax and decrease possible resistance to change. Human potential is main driver of overall public administration reform and therefore it is necessary to have constant and continuous improvement of knowledge and skills of employees.
Second aspect refers to reform of infrastructure. This aspect is one of the most expensive one since quality infrastructure means establishment of secure and safe (protected) infrastructure including hardware and software solutions that provide safe electronic exchange of data; something similar to X-Road infrastructure3 introduced in 2001 in Estonia.
Third aspect is reform of processes and operational procedures. The processes and procedures in e-government are based on ICT tools and Internet and should contribute to decrease of operational costs of public administration. Introduction of ICTs in processes and services must be planned carefully in order to achieve effective use of ICT capacities.
V. RESULTS AND DISCUSSION
To define readiness for implementation of e-government in RS, it was necessary to see on-line presence of RS public administration, both on Web and in social media. The fact is that Web sites are becoming “second-level” importance, a place where citizens will come when they see something interesting on social media. So, important fact is to see how these institutions are represented in these two media.
Only 81% of Web presentations of RS institutions were available on-line during the survey and this can be one of possible causes for problems in G2C and C2G on-line communication [14]. Analysing level of on line presence of local self-governances (municipalities) in RS, the conclusion is that they show progress from year to year related to increase of successful on line presence. According to most recent AIDRS analysis 25 out of 56 analysed municipalities had Web presentation satisfying prescribed 10 criteria [15].
The analysis with aim to determine the presence of Republic level institutions in social media was implemented in period July – August 2013. The research sample covered 84 institutions that met AIDRS criterions for analysis on-line presence of Republic institutions [16]. The analysis approved assumption that the potential of social media in case of RS’s public administration is poorly utilized. Only 14 institutions (16%) investigated have some kind of social media. However, majority of analysed institutions (84%) is not using any social media,
2 http://www.digitalnaagenda.gov.rs/en/ 3 http://e-estonia.com/component/x-road/
which can be result of non-existence of social media strategy in RS Public Administration. The most frequently used social network is Facebook with 8 institutions using it, while second position is shared between Twitter and YouTube (4 institutions per each) and LinkedIn with only 2 institutions that are using it.
The reasons for poor utilization of such free-of-charge tools for communication were not considered in the analysis. It is obvious that RS government does not have policy for use of social media in its institutions, while at the same time employees are not aware of its potential for everyday operations. These are two main reasons for such result. But these are just assumptions and this could be topic for another research in future.
NRI index classifies BiH in the middle group of countries related to development and use of ICT. Comparing to other former Yugoslav republics (Figure 1), only Serbia is left behind BiH according to summary NRI, while other countries are advancing faster. RS government, as well as BiH as whole, is investing in ICT from year to year. Therefore, it is not surprising that the importance of ICT to government vision, places BiH at position 113 with the index value of 3.3.
It seems that the issue of e-services is little bit better, but this has to be taken with precaution. An Index on-line government service (on a scale of 0 to 1) is 0.37 that puts BiH on the 95 place. This looks positive, but it has to be taken in consideration that BiH is forced to implement some services compare to some other less developed countries.
In terms of government success in ICT promotion, BiH is placed as 85 with the index value of 4.1. However, e-participation index (on a scale of 0 to 1) was 0.00 which placed BiH at the 124 position. The low participation index is mainly related to low level of infrastructure development, both computer networks and mobile communications infrastructures.
The total value of NRI for BiH in 2013 amounted to 3.80 as BiH ranks at position 78 of the 144 observed states. According to newest data for 2014 the situation is a little bit favourable for BiH in total. This year’s total value of NRI for BiH shows moderate increase amounted to 3.99 ranking BiH at position 68 of the 148 observed states. The reasons for this slight improvement can be justified with intensification of public administration reform processes in BiH.
A. Reform of human potential
The pillar “Government usage” is identified and defined by three indicators (variables) that provide insight into the importance the Government attaches to the implementation of ICT policies for competitiveness and improving the welfare of citizens, efforts to make the implementation of the vision of ICT development, as well as the number of on-line services that the government provides. However, some indicators crucial for implementation of e-government concept are below expected. For instance, the indicators for usage of ICT are in decrease compare to previous years, except for individual usage. This is not positive indicator for country that intents to implement such reform. These data suggest that, in fact, most of the ICT is used by individuals - citizens in their daily lives for a variety of purposes, as
ISBN 978-86-80593-52-4
161
Fig. 1. Position of BiH compare to other neighbouring countries in
2013 (source: Global Information Technology Report 2013, World
Economic Forum)
well as insufficient use of ICT for business, or public administration.
Based on the results from this year's report [17], among the 148 analysed countries, BiH is located at:
61 place regarding individual use of ICT (individual usage)
126 place on the use of ICT by businesses (business usage), and
123 place on the use of ICT by governments (governmental usage).
The conclusion arising from this is that the citizens of BiH are ready to use on-line services of the public administration (e-services). Putting it in the context with other surrounding countries, it shows that BiH is at the back related to the use of ICT in the work of public administration and related to the number of available e-services. Comparing to previous years, it is possible to observe constant increase in individual use opposite to constant decrease in business and governmental use. There are numerous of reasons that can explain this situation. However, the aim of this work was not to analyse these factors and reasons, but it can be a subject of some future work.
According to report from AIDRS on digital literacy, RS is facing with low digital literacy among citizens, which presents potential risk for implementation and full acceptance of e-services. Citizens need further education and training for use of e-services, but the education should be done also for civil servants since they lack digital skills too, especially skills that are related to Web based application and e-services. In educational system, in RS, teaching of informatics (synonym for digital skills) is introduced in all levels of education – from primary schools to universities. Also, the institutions for lifelong learning also offer various courses and trainings. Usually these trainings are ECDL (European Computer Driving Licence) courses, or courses for internationally recognized certificates from CISCO, ADOBE or Microsoft. Since ECDL provides basic skills and mostly for use of Microsoft based applications, that training is not sufficient for work with e-services. It is necessary to engage domestic higher education institutions to organise specialised courses for public administration and for citizens too, on use of advanced e-commerce applications
used for governmental e-services as well as for targeted use of social media in communication with stakeholders.
Low level of digital literacy and traditionally slow changes combined with high bureaucracy are intent to keep traditional and non-flexible systems of public administration. Civil servants are afraid to accept any computerisation of processes in public administration due to possible loss of position and/or jobs and therefore they create certain level of resistance to changes. This resistance is observed among citizens due to the fact that they have certain level of scepticism to novelties and to transparency of public administration’s work combined with low digital skills. The challenge therefore is to motivate and to attract critical mass of users for e-services in order to economically justified introduction of e-services. The problem with civil servants resisting the changes can be resolved with further training and education or with adequate staff allocation. Use of interactive and 24/7 “helpdesks” is strongly recommended.
B. Reform of infrastructure
Comparing data and performing literature and other reviews, this paper recognized following five categories of problems for successful implementation of e-government:
Lack of adequate legislation,
Lack of adequate funds for implementation of public administration reform,
Lack of adequate ICT infrastructure – computer networks and communications,
Lack of adequate ICT skills among stakeholders,
Resistance to implementation of reform.
At the moment, RS faces with insufficient institutional, legal and technological infrastructure, lack of financial and human resources and other factors that have negative influence on implementation of reforms. It is very important, from aspect of implementation of e-government in RS, to upgrade and to prepare new legislation primarily for setting up new processes in office operations related to full implementation of electronic signature and electronic document.
Compare to legal basis from Estonia, Austria and Germany, which served as basis for analysis, it is recommended to bring as soon as possible following laws in RS:
Law on electronic trade,
Law on e-money,
Law on e-finances,
Law on e-profit / e-income tax,
Law on Protection of Personal Data,
Amendment to Law on telecommunications – related to collection, retain and distribution of personal data,
Amendment to Law on telecommunications – related to domain name protection (trade name),
Amendment to Law on IPR - related to e-media and e-content,
Amendment to Law on electronic media – related to transfer and use of e-content,
Law on prevention of e-criminal,

ISBN 978-86-80593-52-4
162
Law on e-ID,
Other relevant acts and laws.
According to recent census in RS live over 1.4 million of inhabitants. Having in mind this figure as potential users of e-services such as car registration, issuing of IDs, birth certificates and other, it is obvious that supporting infrastructure must be adequate. For G2B services, such as e-Tender, e-Procurement and similar, it is necessary to provide highly secured media for electronic transactions (Virtual Private Networks).
There are two world-class studies suggesting that investments in these technologies are cost-effective and contributing to increase of the gross domestic product, which presents a measure of the welfare in the country. OECD study from May 2009 states that increase of investments in electronic communications for 8% increases gross domestic product for 1% [18]. Second study coming from the World Bank came to a similar conclusion that the increase in broadband penetration (number of subscribers to broadband connections) of 10% ensures the growth of gross domestic product by 1.38% [19]. Additional arguments are found in the World Bank report from 2012 that concludes that the mobile applications not only empower individuals but have significant effects on the cascade stimulating growth, entrepreneurship and productivity in the economy as a whole [20].The same report concludes that governments focusing on both elements “mobile” and “government” will become more accountable, responsive and transparent.
According to report from AIDRS, most of households (over 63%) have computer and use it regularly (49.51%). But, most of them (51%) do not have Internet access from home. Primary use of computers is for Web search (42.5%) and e-mail correspondence (40%), while for e-services such as e-banking only 1.56% [21].
C. Reform of processes and operative procedures
From the analysis and biannual report on implementation of public administration reform in BiH in 2013 Error! Reference source not found., it is obvious that reform process in on half-way. According to the report on implementation, the most of reform was completed in the area of “Institutional communication” -67,44%, while the least was done in the area of “Information technologies” - 45,25%. The last one is very important for establishment of efficient work of public administration from the implementation point of view
since this is related to use of ICT and its tools. There are capacities by Government and interest by citizens for e-services and use of ICT for communication.
VI. CONCLUSION
RS public administration is facing with significant changes in organization and functioning due to inefficient system. In order to provide transparency of public administration’s work and improvement of two-way communication with its stakeholders (G2C, G2B but also G2G) the way to overcome problems identified in this paper is complete reform and introduction of e-government. This concept is able to increase efficiency and transparency of public administration’s work with parallel decrease of operational costs. As the result, citizens will be more and active engaged and public administration will gain more confidence from its stakeholders.
Having in mind results of analyses performed and data compared, it can be concluded that RS public administration is not ready for introduction of e-government. The fact is that a lot of prerequisites are missing – legislation, infrastructure (both network and equipment), IT skills – but there is significant potential expressed in two indexes produced by relevant international authorities.
It is obvious that RS needs to implement full reform of its public administration system in order to be able to transfer to e-government that has to go in three directions:
reform of human potential,
reform of infrastructure and
reform of processes and operative procedures.
The most complex issue in public administration reform towards e-government is implementation of e-governance concept in its form and content. The implementation in RS is conditioned by number of preconditions and challenges, such as:
To improve and update existing legislation in order to create trust in electronic commerce and governance and to make it equal with traditional one,
To invest significant financial means primarily in communication infrastructure, but also in hardware and software solutions that facilitate new model of work for public administration (so called e-Infrastructure),
To engage adequate ICT infrastructure, especially mobile broadband network that are in trend to take primate compare to wired broadband networks,
To respond on challenge for global education and training of employees, citizens and other users of e-services of public administration,
To minimize or completely remove resistance towards reform processes among all stakeholders, and
To build safe and secure computer network between public administration and local level governments for G2G services.
TABLE I. NUMBER OF WEB PRESENTATIONS OF MUNICIPALITIES THAT
RECEIVED POSITIVE EVALUATION
Year Total Positive evaluation Percentage
2011 54 18 33
2012 54 26 48
2013 51 23 45
2014 56 25 45

ISBN 978-86-80593-52-4
163
Each reform requires investment of significant funds, especially for communication infrastructure and ICT equipment and networks. Funds for implementation of reform towards e-government can be found in sources as follows:
Government of RS budget – regular funds,
Foundation for public administration reform in BiH (PAR),
IPA (Instruments for pre-accession assistance),
EU Programme Horizon2020,
Public-private partnerships,
Various bilateral governmental projects and programmes,
Grant funds from international development agencies (JICA, USAID, UN…),
Additional taxes, bounds and other financial papers issued by government.
This is not exhaustive list of possible funds. It is possible to find other sources of funding – donations, crowdsourcing etc. However, the last one – additional taxes and bounds – should be used in last line, due to non-favourable conditions and further overloading of citizens and business.
Slowness in adopting new solutions is a typical characteristic of the authorities, so the percentage of institutions that use social networks for communication or interaction with citizens, is very low - 16%. Slow introduction of these technologies is the result of a lack of confidence in existing networks whose current technical and technological deficiencies can have serious consequences, such as abuse or anti-phishing and the like.
REFERENCES
[1] European Commission. EUROPE2020 Strategy. http://ec.europa.eu/europe2020/index_en.htm (accessed on 24.7.2014).
[2] European Commission. Digital Agenda for Europe. http://ec.europa.eu/digital-agenda (accessed on 23.7.2014)
[3] European Commission. Digital Agenda for Europe – Pillar VII. http://ec.europa.eu/digital-agenda/en/our-goals/pillar-vii-ict-enabled-benefits-eu-society (accessed on 24.7.2014).
[4] C. H. Baum, A. Di Maio, F. Caldwell, “What is E-Government? Gartner’s Definition”, Gartner Inc., 2000, available at https://www.gartner.com/doc/308454/egovernment-gartners-definitions (accessed on 20.7.2013.)
[5] European Commission. Digital Agenda for Europe - COM(2010)245 final, pg. 31 http://eur-lex.europa.eu/legal-content/EN/TXT/PDF/?uri=CELEX:52010DC0245&rid=8 (accessed on 24.7.2014).
[6] International Telecommunication Union. ICT Development index. http://www.itu.int/ITU-D/ict/publications/idi/ (accessed on 23.7.2014).
[7] World Economic Forum. The Global Information Technology Report (GITR). http://www.weforum.org/issues/global-information-technology (accessed on 23.7.2014).
[8] World Economic Forum. Data platform. http://www.weforum.org/global-information-technology-report-2014-data-platform (accessed on 23.7.2014).
[9] Z. Ebrahim, Z. Irani, "E-government adoption: architecture and barriers", Business Process Management Journal, Vol. 11 Iss: 5(2005), pp.589 – 611.
[10] S. M. Mutula, P. van Brakelb, “An evaluation of e-readiness assessment tools with respect to information access: Towards an integrated information rich tool”, International Journal of Information Management, Volume 26, Issue 3, June 2006, pp.212–223.
[11] C. E. Koh, V. R. Prybutok, X. Zhang, “Measuring e-government readiness”, Information & Management, Volume 45, Issue 8, December 2008, pp.540-546.
[12] C.L.Brown, "G-8 collaborative initiatives and the digital divide: readiness for e-government." System Sciences, 2002. HICSS. Proceedings of the 35th Annual Hawaii International Conference on. IEEE, 2002.
[13] European Commission. Digital Agenda for Europe – Country information. https://ec.europa.eu/digital-agenda/en/country-information-croatia (accessed on 24.7.2014).
[14] S. Mitrović, “Review of Web presentations of RS institutions“, Agency for Information Society in Republic of Srpska, Banja Luka, 2013
[15] M. Radinković, S. Mitrović, „ Review of Web presentations of local governments in Republic of Srpska “, Agency for Information Society in Republic of Srpska, Banja Luka, 2014
[16] M. Radinković, S. Mitrović, “Review of Web presentations of local governments in Republic of Srpska”, Agency for Information Society in Republic of Srpska, Banja Luka, 2013.
[17] B. Bilbao-Osorio, S. Dutta, B.Lanvin, Editors, “The Global Information Technology Report 2014 Rewards and Risks of Big Data” World Economic Forum, 2014.
[18] OECD, The Role of Communication Infrastructure investment in economic recovery, 29. May 2009. http://www.oecd.org/internet/broadband/42799709.pdf (acessed on 23.7.2014.)
[19] The World Bank, „Information and Communications for Development 2009: Extending Reach and Increasing Impact“ , http://web.worldbank.org/WBSITE/EXTERNAL/TOPICS/EXTINFORMATIONANDCOMMUNICATIONANDTECHNOLOGIES/EXTIC4D/0,,contentMDK:22229759~menuPK:5870649~pagePK:64168445~piPK:64168309~theSitePK:5870636,00.html (accessed on 15.7.2014.)
[20] The World Bank, „Information and Communications for Development 2012: Maximizing mobile“ http://siteresources.worldbank.org/EXTINFORMATIONANDCOMMUNICATIONANDTECHNOLOGIES/Resources/IC4D-2012-Report.pdf (accessed on 15.7.2014.)
[21] Presentation, “Digital literacy in RS”, Agency for Information Society in Republic of Srpska, Banja Luka, 2010

AUTHOR INDEX
A
Aleksić, Nataša
Arsić, Stojanka
B
Baščarević , Zoran
Beko, Marko
Bečejski Vujaklija,
Dragana
Božanić, Darko
C, Ć
Cvetanović, Svetlana
Cvetković, Milan
Ćirić, Milan
D, Đ
Declercq, David
Dinis, Rui
Drljača, Dalibor
Dupraz, Elsa
Đenadić, Dalibor
Đorđević, Tijana
G
Gocić, Milan
Golubović, Ivan
Golubović, Zoran
H
Huzak, Vladimir
I
Ilić, Velimir
J
Janjić, Aleksandar
Janjić, Mila
K
Kajan, Ejub
Karović, Samed
Komazec, Nenad
Kompolšek, Melita
Konjović, Zora
Korunović, Nikola
Kostić, Igor
L
Latinović, Branko
M
Mačužić, Jelena
Madić, Milos
Majstorović , Vidosav
Manče, Ivan
Manić, Miodrag
Manojlov, Dragan
Marić, Milica
Mihailović, Dragan
Mihajlović, Ljilјana
Mihajlović, Bojana
Milinčić, Mirolјub
Milovanović, Jelena
Mišić, Dragan
Mišić, Milena
N
Najman, Stevo
Nejković, Valentina
Nikolić, Vesna
P
Pajić, Ana
Pamučar, Dragan
Petrović, Slađana
Podržaj, Primož
R
Radovanović, Zoran
Radulović, Siniša
Rajković, Jelena
Ranđelović, Dragan
Ranđelović, Saša
Raspopović, Miroslava
S
Savić, Goran
Segedinac, Milan
Sendelj, Ramo
Sibalija, Tatjana
Simić, Goran
Simončić, Samo
Stamenić, Sonja
Stamenković, Zoran
Stanisavljević, Milica
Stanković, Miomir
Stoiljković, Predrag
Stojanović, Miloš
Stojanović, Sanja
Stojanović, Saša
Stojković, Miloš
T
Tanikić, Dejan
Trajanović, Miroslav
Trenkić Božinović, Marija
Trifunović, Milan
Tomić, Slaviša
V
Vasić, Bane
Vasić, Vuk
Vasiljević Blagojević,
Milica
Velimirović, Lazar
Vitković, Nikola
Z
Zdravković, Milan
Related Documents