Fourth International Conference Modelling and Development of Intelligent Systems October 28 - November 1, 2015 “Lucian Blaga” University Sibiu - Romania Power Monitoring Scheme of a Net Metering Miniature System Jeffrel Hermias, Rashid Jull De Luna, Anthony Joseph Lavilla, Marven Jabian, Noel Estoperez Abstract Net Metering is an electricity policy wherein renewable power sources at home are integrated into the power utility. One of the reasons these sources must be integrated is to give the excess power to the utility when net generation is produced. However, if this renewable source cannot provide enough power to sustain the exact amount of needed electricity, there is a need to request for more at the utility; thus, the Net Metering policy was established. This paper aims to validate a Net Metering miniature setup with respect to its power monitoring scheme and seeks to evaluate said power monitoring scheme. We formulated a miniature Net Metering system design to model the actual commercial net meter system and test the validity of the setup by performing three cases for switching action while monitoring power data from the AC analyzer on a real-time basis. There are also three switching action cases for the power monitoring scheme, as well as three different cases for the design‟s implementation. Real-time power monitoring is executed using Matlab and its xlswrite function; upon performing three different load cases, data is gathered to show the power monitoring method. During case shifting, there is a negligible delay of displaying power data in the GUI due to data communication from AC analyzer to the Matlab GUI and is negligible enough to invalidate the setup. 1 Introduction A continuing increasing demand for energy world-wide and the exhaustion of available energy resources compels people to find alternative solutions [1]. With the progress of science and technology and the continuous improvement of living standards, various electric equipment are being used on a wider scale. However, such use may lead to the electric power network becoming so overloaded that a widespread power outage seems immenent; therefore, monitoring the operation data of electric equipment is very important. [2] The domestic use of electricity is the basic unit of social modernized development; therefore, the house is an important place for people's daily lives, work and entertainment. The monitoring of electrical equipment helps users gauge the status of household electricity load in order to further formulate a reasonable energy-saving plan and reduce energy consumption and expenditures [3]. Therefore, strengthening the monitoring of electrical equipment, especially the monitoring of power consumption, is important in enhancing our power utilization rate and realizing the energy [4]. 59

Welcome message from author
This document is posted to help you gain knowledge. Please leave a comment to let me know what you think about it! Share it to your friends and learn new things together.
Transcript
FFoouurrtthh IInntteerrnnaattiioonnaall CCoonnffeerreennccee MMooddeelllliinngg aanndd DDeevveellooppmmeenntt ooff IInntteelllliiggeenntt SSyysstteemmss OOccttoobbeerr 2288 -- NNoovveemmbbeerr 11,, 22001155
““LLuucciiaann BBllaaggaa”” UUnniivveerrssiittyy
SSiibbiiuu -- RRoommaanniiaa
Power Monitoring Scheme of a Net Metering Miniature
System
Jeffrel Hermias, Rashid Jull De Luna, Anthony Joseph Lavilla,
Marven Jabian, Noel Estoperez
Abstract
Net Metering is an electricity policy wherein renewable power sources at home are integrated into
the power utility. One of the reasons these sources must be integrated is to give the excess power to the
utility when net generation is produced. However, if this renewable source cannot provide enough
power to sustain the exact amount of needed electricity, there is a need to request for more at the
utility; thus, the Net Metering policy was established.
This paper aims to validate a Net Metering miniature setup with respect to its power monitoring
scheme and seeks to evaluate said power monitoring scheme. We formulated a miniature Net Metering
system design to model the actual commercial net meter system and test the validity of the setup by
performing three cases for switching action while monitoring power data from the AC analyzer on a
real-time basis. There are also three switching action cases for the power monitoring scheme, as well as
three different cases for the design‟s implementation. Real-time power monitoring is executed using
Matlab and its xlswrite function; upon performing three different load cases, data is gathered to show
the power monitoring method. During case shifting, there is a negligible delay of displaying power data
in the GUI due to data communication from AC analyzer to the Matlab GUI and is negligible enough
to invalidate the setup.
1 Introduction
A continuing increasing demand for energy world-wide and the exhaustion of available energy
resources compels people to find alternative solutions [1]. With the progress of science and technology
and the continuous improvement of living standards, various electric equipment are being used on a
wider scale. However, such use may lead to the electric power network becoming so overloaded that a
widespread power outage seems immenent; therefore, monitoring the operation data of electric
equipment is very important. [2]
The domestic use of electricity is the basic unit of social modernized development; therefore, the
house is an important place for people's daily lives, work and entertainment. The monitoring of
electrical equipment helps users gauge the status of household electricity load in order to further
formulate a reasonable energy-saving plan and reduce energy consumption and expenditures [3].
Therefore, strengthening the monitoring of electrical equipment, especially the monitoring of
power consumption, is important in enhancing our power utilization rate and realizing the energy [4].
59
PPoowweerr MMoonniittoorriinngg SScchheemmee ooff aa NNeett MMeetteerriinngg MMiinniiaattuurree SSyysstteemm
Renewable sources of energy are all around us. The UV rays of the sun, the energy and
gravitational force of falling water, and the force of the wind are all sources of energy that cannot be
depleted. Households that generally own small renewable energy facilities such as solar modules,
micro hydro power plants, and even small wind turbines, can actually integrate these systems into the
electric utility. These facilities sometimes cannot provide enough power to sustain the exact amount of
electricity needed to operate some household task that requires power. Thus, there is a need to acquire
electric power from the electric utility when the renewable facility cannot sustain the household‟s
needed power. This kind of electricity policy is called “Net Metering”. [5] Under this metering, the
household receives credit for the portion of electricity they generate from the renewable facility when
there is net power available after the deduction of the household‟s consumption. This amount of
electricity is then forwarded to the utility. [6]
However, this metering system is still only available in some other countries, most of them first
world nations like Australia. [7] Thus, a third world nation like the Philippines needs to further
develop available technology in a way adapts this kind of metering system to its own context. We wish
to show the power monitoring circuit design available in the research; the concept of this paper is to
give the reader the background and basic concept of the power monitoring scheme on a Net Metering
Miniature System.
The focus of this study is on the power monitoring scheme of how the Net Metering system works
in different load cases; in particular, the process of the net meter system while different load cases are
being executed. The project‟s goal is designed to promote the concept of a Net Metering system so
that further studies about the system will be developed, leading to the patenting of a new method of
Net Metering that can be applied in the Philippines or else mimic the current commercial Net Metering
system device for much cheaper.
The scope of this project is only the power monitoring scheme of the Net Metering system. We
wish to show only the power monitoring scheme of the designed circuitry in order to impart the
significance of the Net Metering system miniature program‟s relation to the unsurpassable current Net
Metering system used in first world nations. After procuring all the materials and creating the circuit
layout, the project can be accomplished in a short period of time.
This study is limited only to the power monitoring indications from the arduino and power analyzer
setup available. Matlab will be used for online power monitoring of the setup with the aid of the
arduino hardware. Matlab will provide the reading of the Net Metering system miniature through the
power monitoring scheme of the power analyzer. This project wants to impart the power monitoring
scheme to all grid systems that do not apply the Net Metering systems yet in their respective settings
so that further research may be implemented.
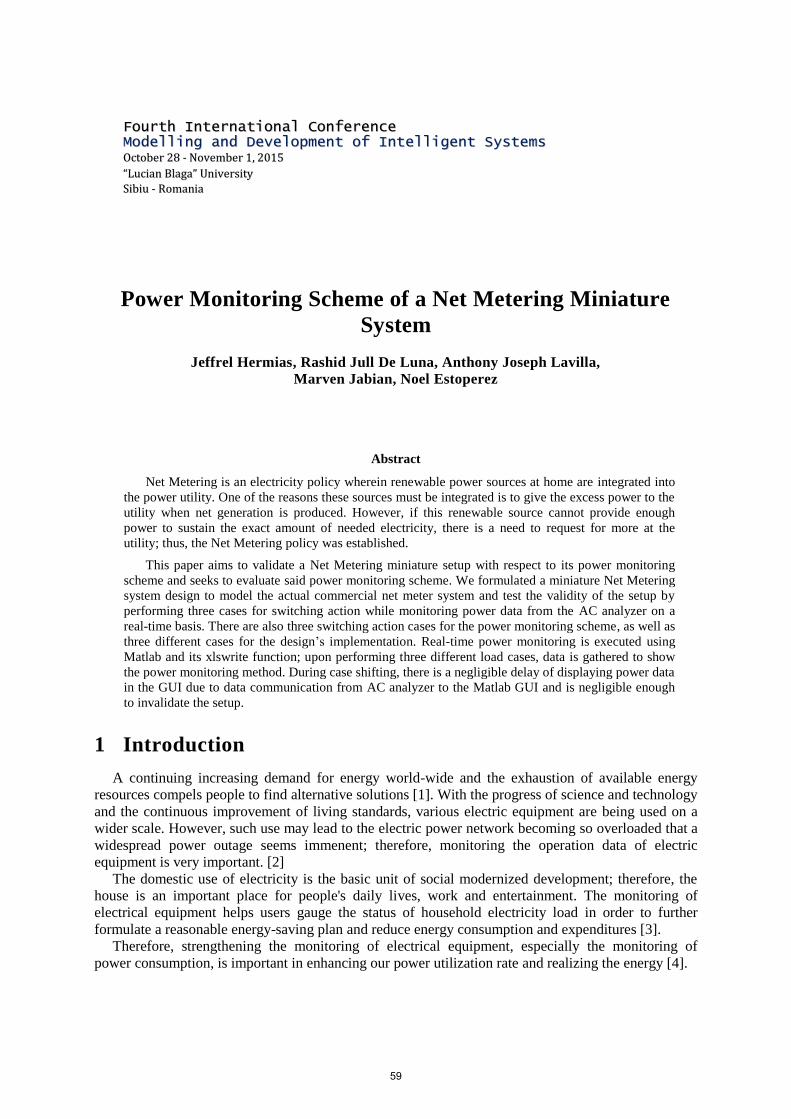
Fig. 1 shows the conceptual framework of the research design for the power monitoring scheme to
be used. The loading system (1, 2 or 3) will be further explained in Section 2.5 and Section 3.
Fig. 1. Conceptual Framework of the Power Monitoring Net Metering Miniature System Design
Case determination based on the loading system (1, 2 or 3)
Performance evaluation of the power consumation
according to cases thru Matlab GUI Monitoring
Adjustments in the loading system to vary the
process switching cases
60
JJeeffffrreell HHeerrmmiiaass,, RRaasshhiidd JJuullll DDee LLuunnaa,, AAnntthhoonnyy JJoosseepphh LLaavviillllaa,, MMaarrvveenn JJaabbiiaann,, NNooeell EEssttooppeerreezz
2 Methodology and Research Design
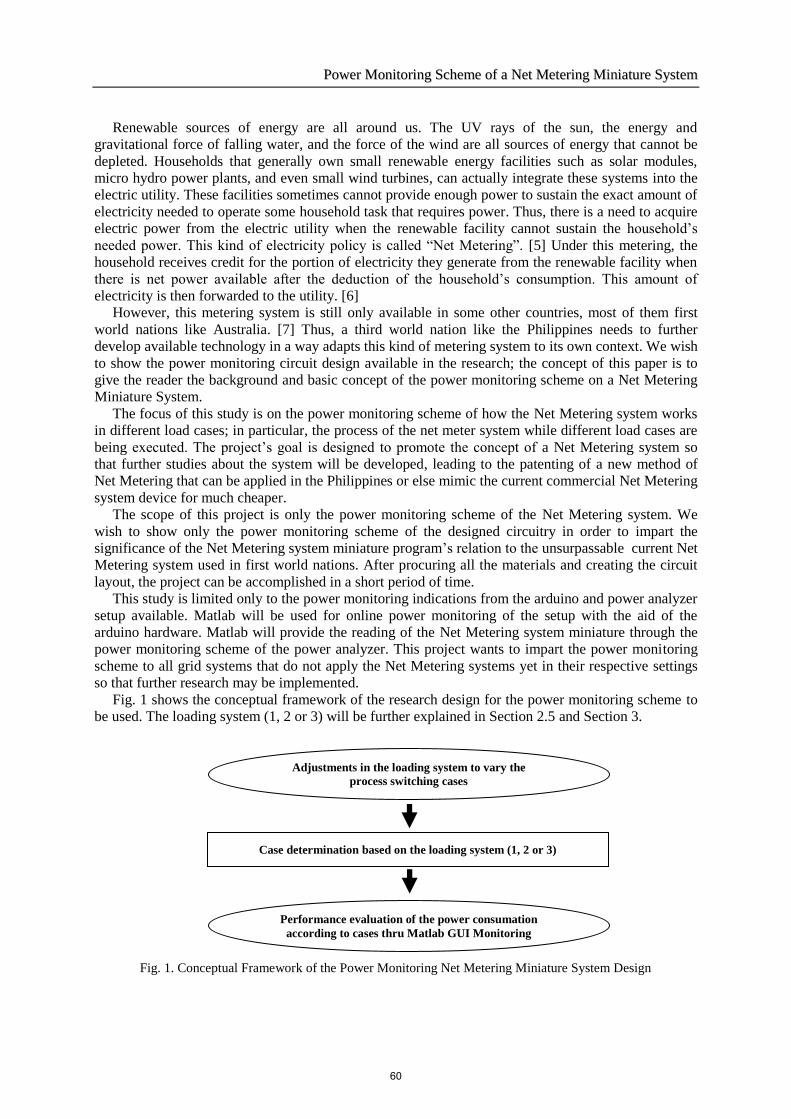
We formulated our own Net Metering Miniature System design, modeled against the actual
commercial net meter system. The following miniature system will demonstrate the switching actions
on the net meter system. Refer to Fig. 2 for the design layout.
Fig. 2. Research design layout for the net metering miniature system.
2.1 Power Supply and Power Monitoring Module 1 (PMM 1)
The Power Supply represents the utility grid in the actual net meter system, with the power derived
from the Lab-Volt ElectroMechanical Traning System (EMS) Module 8821. This module is a primary
component in the Lab-Volt EMS. The power supply provides variable single phase AC, variable three-
phase AC, and variable DC power levels. However, in the miniature system, the project only needs a
220-volt AC for the setup of the project.
Power Monitoring Module 1 allows for the reading and acquisition of the real-time data of. This
monitoring module is an AC power analyzer from e-Gizmo, based on an energy metering IC, as well
as a single-phase power analyzer front-end measuring module that can easily be integrated into any
circuit and systems requiring AC power measurement functionalities. It can accurately measure RMS
voltage and current, and with phase information, resolve into data components essential for a
comprehensive AC power analysis.
2.2 Switching Device 1 and 2 (SD 1 and SD 2)
SD 1 is a solid-state relay that connects directly to the power supply discussed on the power supply.
The relay triggers the switches on switches on and off depending on the case of the load. Each case
has a corresponding switch signal to whether give it an on or off. This relay primarily serves as a
switching device for the utility representation part. SD 2 is a solid-state relay that is the same as that of
the SD 1. The relay triggers the switches on and off depending on the cases of the load. This switching
device serves the generator part of the design. Both SD 1 and SD 2 are interconnected to the zero-
crossing detector circuit.
2.3 Generator
The renewable power system is well represented by a generator module. The generator is derived
from Lab-Volt EMS Module 8241. This module is a three-phase asynchronous motor and can
simultaneously serve as a generator.
Each phase of the stator windings of this machine is independently terminated and identified on the
faceplate to permit operation in either delta or star (wye) configuration. The rotor of this machine is
equipped with a squirrel-cage damper. Variable DC excitation is fed through externally mounted slip
61

PPoowweerr MMoonniittoorriinngg SScchheemmee ooff aa NNeett MMeetteerriinngg MMiinniiaattuurree SSyysstteemm
rings and brushes, which are pre-wired to a rheostat and control switch mounted on the faceplate. This
is accomplished by tapping from two terminals only at the synchronous machine.
2.4 Zero Crossing or Zero Cross Function
When connecting the power supply line and the generator line through SD 1 and SD 2, the zero
cross function is an important device to be considered. In order to sync into the existing AC line,
which is the generator line, the power supply line must be connected to the zero cross function. During
zero-reference crossing or first conduction cycle, both AC waves will meet in order to be synchronized
with each other. Thus, merging these two AC lines will eventually create a new AC line that will work
on the loading system. This new line provides greater current capability compared to the individual
AC lines prior to synchronization at the zero cross function. The new AC line then provides power for
the load on the condition that the two lines are hereby needed by the principle of Net Metering system.
The zero cross function causes the relay to switch on when the AC load power supply approaches 0
V to suppress noise generated when the load current rises suddenly.
There are two types of noise: the noise in power lines and the noise emitted into open spaces. The
zero cross function is effective against both types of noise. A very large inrush current flows when
lamps and similar equipment are switched on, but the zero cross function causes the load current to
flow always from a point near zero so that inrush current can be more effectively suppressed compared
to Solid-state Relays (SSRs) that do not have the zero cross function. Ideally, the function switches on
near 0 V, but restrictions in the circuit configuration cause it to operate within the range of 0 V ±20 V.
This voltage is called zero cross voltage. [8]
2.5 Power Monitoring Module 2, Loading System, Diversion Loading System,
and Switching Device 3
As cited on the Power Monitoring Module 1, Power Monitoring Module 2 (PMM 2) allows us to
read and acquire the real time data of the power supply. However, PMM 2 gathers data from the AC
line after the zero cross function. Be it the generator line only, power supply line or both, PMM 2
acquires its real time data. The same kit is used in PMM 1 and PMM 2.
The Loading System (Load) is where the loads are installed for application of power consumed.
The three cases can occur depending on whether the loading system is lesser than the generator, equal
to the generator or even greater than the generator‟s capability. Given at an instant, the generator‟s
power capacity is limited; that is where the switching action comes in, based on the loading system.
Diversion loads are designed due to the inability of a bidirectional current in the area. The scope of
this project is limited only to the availability of a bidirectional system. Since there is no available
bidirectional system for research, we designed the said loading system in such a way that when the
generator capacity is greater than that of the load and instead passing the excess power to the utility
grid, it is hereby directed to the diversion load for consumption. However, Net Metering still applies.
This demonstration is for the purpose of sending excess power to the utility grid.
Switching Device 3 (SD 3) is connected to the diversion load. This is the part that switches a line
connected to the diversion load on or off, depending on what loading case the current situation is in.
3 Implementation Details
We designed three switching action cases to accurately evaluate the system for power monitoring.
There are three different cases of this design implementation. In the first case (Case 1), the generator
capacity is greater than the loading system; in the second case (Case 2), the generator capacity is at
full load condition; and in the third case (Case 3), the generator capacity is lesser than the loading
system. The switching action evaluation will be published in another research paper separate from this
paper.
62
JJeeffffrreell HHeerrmmiiaass,, RRaasshhiidd JJuullll DDee LLuunnaa,, AAnntthhoonnyy JJoosseepphh LLaavviillllaa,, MMaarrvveenn JJaabbiiaann,, NNooeell EEssttooppeerreezz
4 Power Monitoring Scheme Through Arduino and Matlab
The research design cannot work or be monitored without the controlling setup of the Arduino
(microcontroller) and Matlab power monitoring scheme. The switching devices (SD 1, SD 2, and SD
3) are connected to the Arduino, specifically Gizduino (the name varies because Gizduino is from e-
Gizmo and Arduino is from Dynamodo, though they basically have the same function). The codes are
set up in Gizduino 1 and sends signals to the switches depending on the loading‟s case. Through the
aide of PMM 1, Gizduino 1 is able to identify the loading system‟s case status, thus making the
switching devices switch on and off accordingly.
Meanwhile, the PMM 2 constantly monitors the power information from the Power Supply
(representation of the utility) to make sure that the AC line from the utility is providing enough power,
especially during Case 3. Both power modules 1 and 2 are then multiplexed so that a single Gizduino
can be used for both analyzer kits. Gizduino 2 is the microcontroller that connects to the multiplexer,
and at the same time, to the computer for the Matlab monitoring program. Fig. 3 shows the power
monitoring scheme of the power analyzer kit and the Arduino.
Fig. 3. Monitoring Scheme of the Gizduino Microcontrollers for the switching action, power monitoring and
Matlab integration of the project design.
4.1 Arduino 1 and Arduino 2
In order to allow for the switching action of the switching devices connected to Gizduino 1, a
certain coding program is constructed. Gizduino 2 allows the monitoring of the two power analyzers
connected to it through multiplexer, and then sends data to the Matlab. In order to actually monitor the
power analyzer, another coding program is constructed. After which, the data is then forwarded to
Matlab for easy monitoring scheme. Then data is then saved in an Excel file through the xlswrite
Matlab function.
4.2 Matlab Monitoring Program (GUI)
The Matlab GUI program was created for the power monitoring scheme from the power supply and
the loading system. It allows the user to easily interpret the results with the help of the GUI. Fig. 4 is
the actual design for this project‟s research on the Net Metering Miniature System. The „GRID‟ data is
merely represented by the actual readings of the diversion loading, as provided previously. The „Main
Load‟ data is taken from the actual readings of the loading system.
63

PPoowweerr MMoonniittoorriinngg SScchheemmee ooff aa NNeett MMeetteerriinngg MMiinniiaattuurree SSyysstteemm
Fig. 4. GUI of the Matlab Monitoring Program
5 Data Gathering Procedure
To truly test the hardware setup, the power monitoring scheme and data acquisition must be
effective in performing its operation and function accordingly. Thus, on the power monitoring scheme,
the xlswrite function in the Matlab must also work accordingly. The Matlab functions as an online
monitoring software and at the same time, a data gathering instrument. From the Arduino to Matlab,
there is a code created for pasting data into an active Excel file that will automatically add data once
read in the Arduino. The data from the Gizduino that connects the two power analyzers will be
automatically saved to the Excel file; and the data from the arduino that is connected to the switching
devices will also be copied but in a different sense; and then, later on the data will be checked based
on the data gathered by Matlab. Also, users can gather real-time power consumption data from
Dynamodo‟s Arduino software and manually segregate the data according to cases.
6 Results and Discussion
Upon thorough construction of the prototype and setting up available laboratory equipment, the
hardware prototype was constructed and deemed able to perform according to its design. The
following figures show the setup and components of the Net Metering Miniature System integrating
the power monitoring scheme hardware and software.
Fig. 5(a) shows the loading system and the diversion loading system (rightmost column of bulbs) of
the miniature setup. Fig. 5(b) shows two Arduino (left) and two power analyzers (right) which are
integrated into the net meter system in order to facilitate the power monitoring scheme and the
switching action performance.
Fig. 5. (a) Loading and Diversion Loading System; (b) The arduino and power analyzer of the net meter system
a b
64
JJeeffffrreell HHeerrmmiiaass,, RRaasshhiidd JJuullll DDee LLuunnaa,, AAnntthhoonnyy JJoosseepphh LLaavviillllaa,, MMaarrvveenn JJaabbiiaann,, NNooeell EEssttooppeerreezz
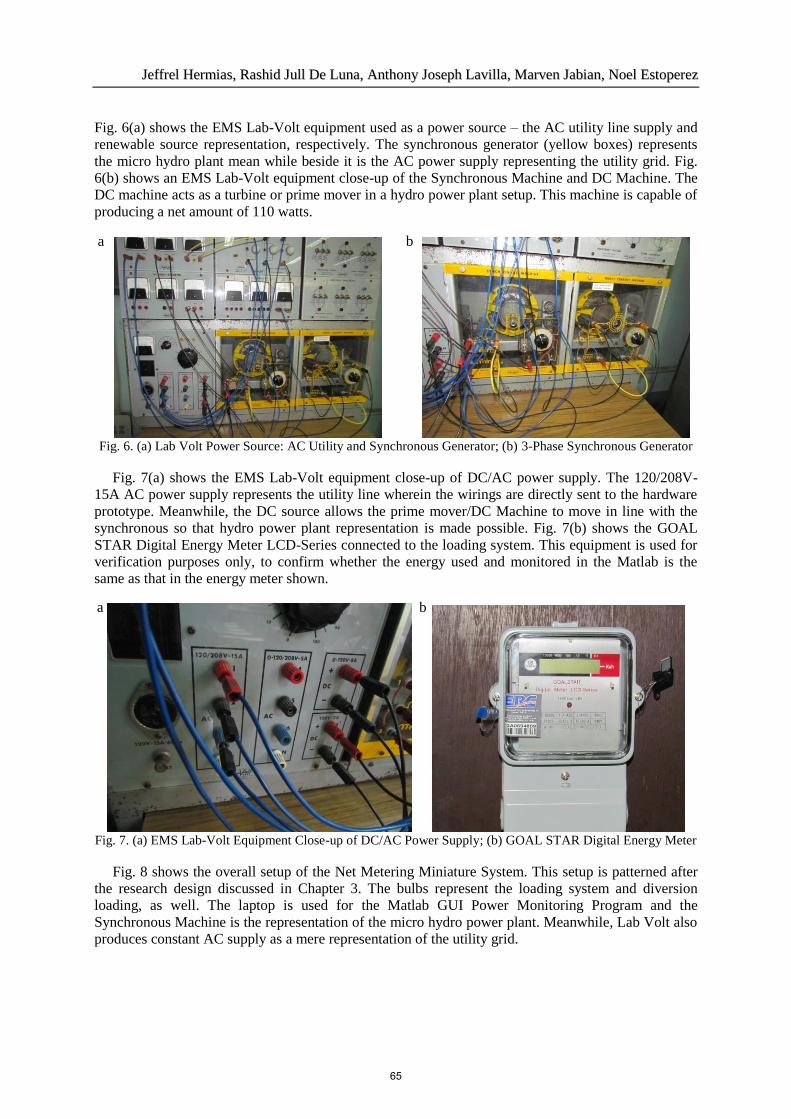
Fig. 6(a) shows the EMS Lab-Volt equipment used as a power source – the AC utility line supply and
renewable source representation, respectively. The synchronous generator (yellow boxes) represents
the micro hydro plant mean while beside it is the AC power supply representing the utility grid. Fig.
6(b) shows an EMS Lab-Volt equipment close-up of the Synchronous Machine and DC Machine. The
DC machine acts as a turbine or prime mover in a hydro power plant setup. This machine is capable of
producing a net amount of 110 watts.
Fig. 6. (a) Lab Volt Power Source: AC Utility and Synchronous Generator; (b) 3-Phase Synchronous Generator
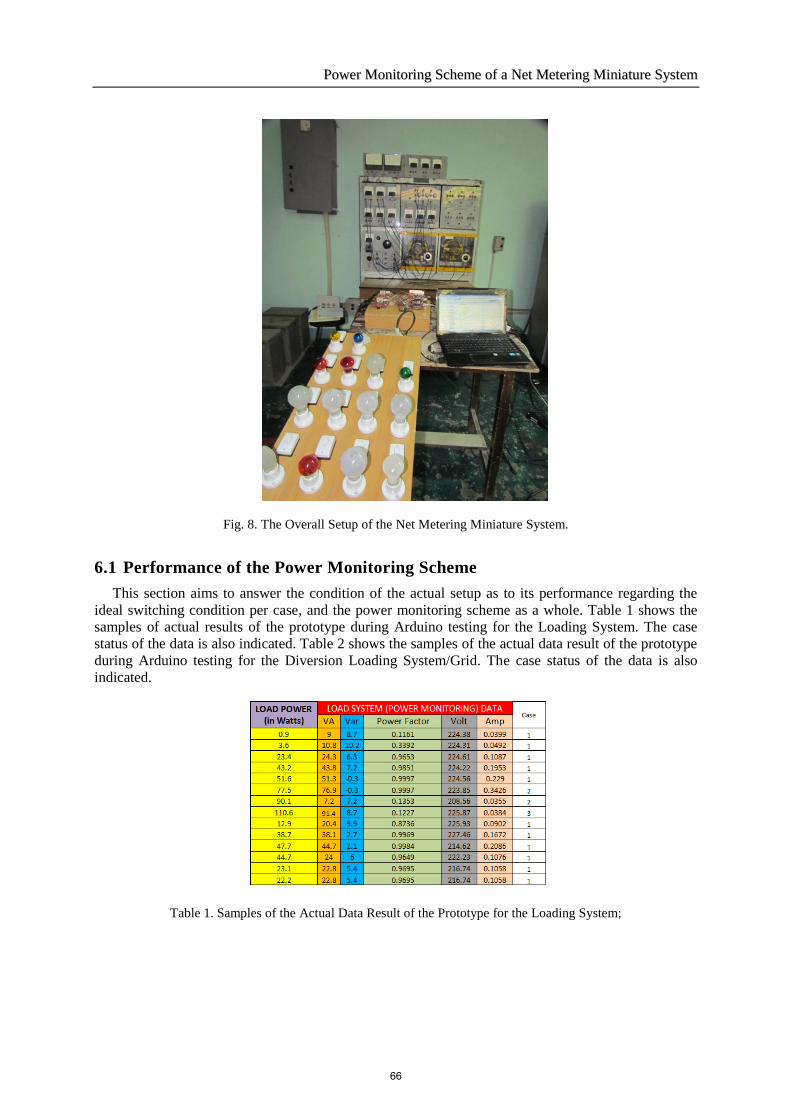
Fig. 7(a) shows the EMS Lab-Volt equipment close-up of DC/AC power supply. The 120/208V-
15A AC power supply represents the utility line wherein the wirings are directly sent to the hardware
prototype. Meanwhile, the DC source allows the prime mover/DC Machine to move in line with the
synchronous so that hydro power plant representation is made possible. Fig. 7(b) shows the GOAL
STAR Digital Energy Meter LCD-Series connected to the loading system. This equipment is used for
verification purposes only, to confirm whether the energy used and monitored in the Matlab is the
same as that in the energy meter shown.
Fig. 7. (a) EMS Lab-Volt Equipment Close-up of DC/AC Power Supply; (b) GOAL STAR Digital Energy Meter
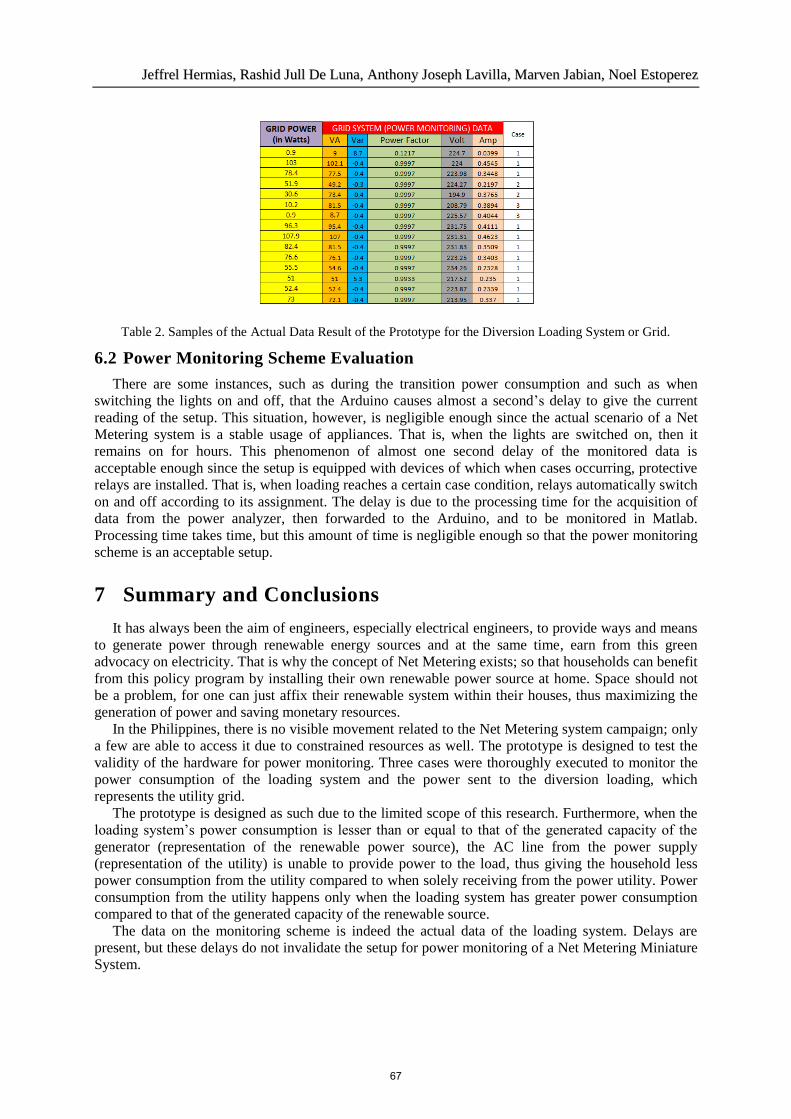
Fig. 8 shows the overall setup of the Net Metering Miniature System. This setup is patterned after
the research design discussed in Chapter 3. The bulbs represent the loading system and diversion
loading, as well. The laptop is used for the Matlab GUI Power Monitoring Program and the
Synchronous Machine is the representation of the micro hydro power plant. Meanwhile, Lab Volt also
produces constant AC supply as a mere representation of the utility grid.
a b
a b
65
PPoowweerr MMoonniittoorriinngg SScchheemmee ooff aa NNeett MMeetteerriinngg MMiinniiaattuurree SSyysstteemm
Fig. 8. The Overall Setup of the Net Metering Miniature System.
6.1 Performance of the Power Monitoring Scheme
This section aims to answer the condition of the actual setup as to its performance regarding the
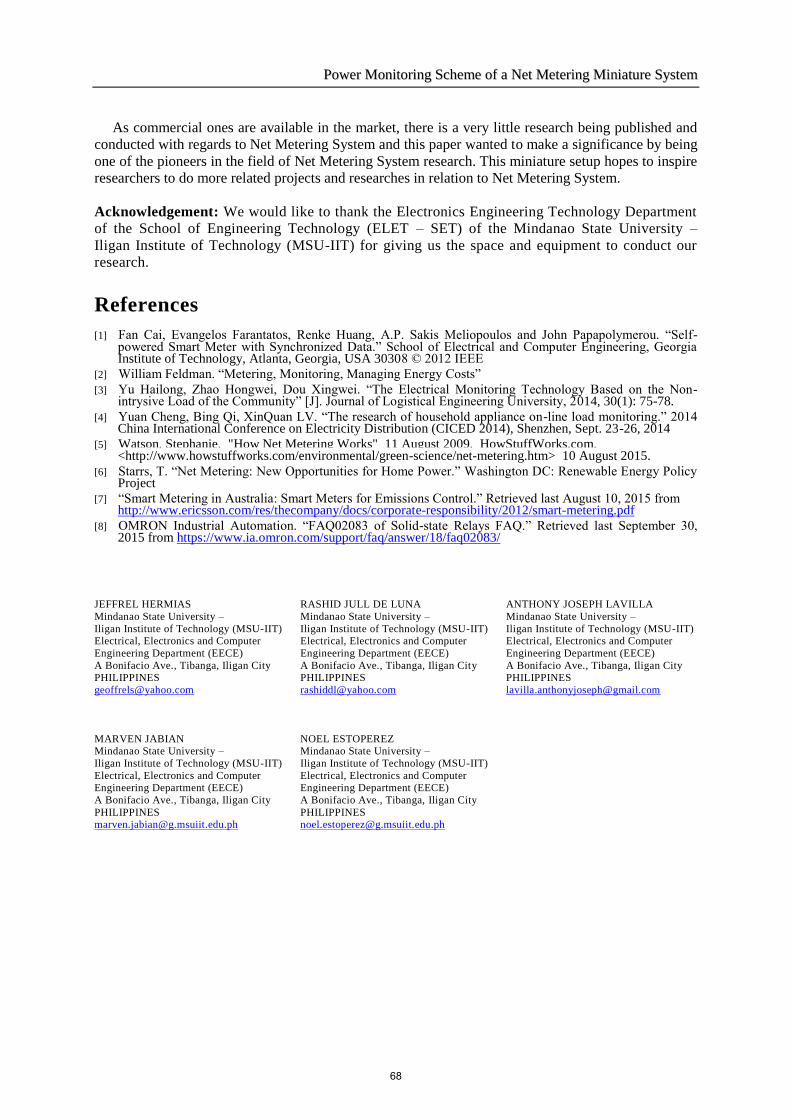
ideal switching condition per case, and the power monitoring scheme as a whole. Table 1 shows the
samples of actual results of the prototype during Arduino testing for the Loading System. The case
status of the data is also indicated. Table 2 shows the samples of the actual data result of the prototype
during Arduino testing for the Diversion Loading System/Grid. The case status of the data is also
indicated.
Table 1. Samples of the Actual Data Result of the Prototype for the Loading System;
66
JJeeffffrreell HHeerrmmiiaass,, RRaasshhiidd JJuullll DDee LLuunnaa,, AAnntthhoonnyy JJoosseepphh LLaavviillllaa,, MMaarrvveenn JJaabbiiaann,, NNooeell EEssttooppeerreezz
Table 2. Samples of the Actual Data Result of the Prototype for the Diversion Loading System or Grid.
6.2 Power Monitoring Scheme Evaluation
There are some instances, such as during the transition power consumption and such as when
switching the lights on and off, that the Arduino causes almost a second‟s delay to give the current
reading of the setup. This situation, however, is negligible enough since the actual scenario of a Net
Metering system is a stable usage of appliances. That is, when the lights are switched on, then it
remains on for hours. This phenomenon of almost one second delay of the monitored data is
acceptable enough since the setup is equipped with devices of which when cases occurring, protective
relays are installed. That is, when loading reaches a certain case condition, relays automatically switch
on and off according to its assignment. The delay is due to the processing time for the acquisition of
data from the power analyzer, then forwarded to the Arduino, and to be monitored in Matlab.
Processing time takes time, but this amount of time is negligible enough so that the power monitoring
scheme is an acceptable setup.
7 Summary and Conclusions
It has always been the aim of engineers, especially electrical engineers, to provide ways and means
to generate power through renewable energy sources and at the same time, earn from this green
advocacy on electricity. That is why the concept of Net Metering exists; so that households can benefit
from this policy program by installing their own renewable power source at home. Space should not
be a problem, for one can just affix their renewable system within their houses, thus maximizing the
generation of power and saving monetary resources.
In the Philippines, there is no visible movement related to the Net Metering system campaign; only
a few are able to access it due to constrained resources as well. The prototype is designed to test the
validity of the hardware for power monitoring. Three cases were thoroughly executed to monitor the
power consumption of the loading system and the power sent to the diversion loading, which
represents the utility grid.
The prototype is designed as such due to the limited scope of this research. Furthermore, when the
loading system‟s power consumption is lesser than or equal to that of the generated capacity of the
generator (representation of the renewable power source), the AC line from the power supply
(representation of the utility) is unable to provide power to the load, thus giving the household less
power consumption from the utility compared to when solely receiving from the power utility. Power
consumption from the utility happens only when the loading system has greater power consumption
compared to that of the generated capacity of the renewable source.
The data on the monitoring scheme is indeed the actual data of the loading system. Delays are
present, but these delays do not invalidate the setup for power monitoring of a Net Metering Miniature
System.
67
PPoowweerr MMoonniittoorriinngg SScchheemmee ooff aa NNeett MMeetteerriinngg MMiinniiaattuurree SSyysstteemm
As commercial ones are available in the market, there is a very little research being published and
conducted with regards to Net Metering System and this paper wanted to make a significance by being
one of the pioneers in the field of Net Metering System research. This miniature setup hopes to inspire
researchers to do more related projects and researches in relation to Net Metering System.
Acknowledgement: We would like to thank the Electronics Engineering Technology Department
of the School of Engineering Technology (ELET – SET) of the Mindanao State University –
Iligan Institute of Technology (MSU-IIT) for giving us the space and equipment to conduct our
research.
References
[1] Fan Cai, Evangelos Farantatos, Renke Huang, A.P. Sakis Meliopoulos and John Papapolymerou. “Self-powered Smart Meter with Synchronized Data.” School of Electrical and Computer Engineering, Georgia Institute of Technology, Atlanta, Georgia, USA 30308 © 2012 IEEE
[2] William Feldman. “Metering, Monitoring, Managing Energy Costs”
[3] Yu Hailong, Zhao Hongwei, Dou Xingwei. “The Electrical Monitoring Technology Based on the Non-intrysive Load of the Community” [J]. Journal of Logistical Engineering University, 2014, 30(1): 75-78.
[4] Yuan Cheng, Bing Qi, XinQuan LV. “The research of household appliance on-line load monitoring.” 2014 China International Conference on Electricity Distribution (CICED 2014), Shenzhen, Sept. 23-26, 2014
[5] Watson, Stephanie. "How Net Metering Works" 11 August 2009. HowStuffWorks.com. <http://www.howstuffworks.com/environmental/green-science/net-metering.htm> 10 August 2015.
[6] Starrs, T. “Net Metering: New Opportunities for Home Power.” Washington DC: Renewable Energy Policy Project
[7] “Smart Metering in Australia: Smart Meters for Emissions Control.” Retrieved last August 10, 2015 from http://www.ericsson.com/res/thecompany/docs/corporate-responsibility/2012/smart-metering.pdf
[8] OMRON Industrial Automation. “FAQ02083 of Solid-state Relays FAQ.” Retrieved last September 30, 2015 from https://www.ia.omron.com/support/faq/answer/18/faq02083/
JEFFREL HERMIAS
Mindanao State University –
Iligan Institute of Technology (MSU-IIT) Electrical, Electronics and Computer
Engineering Department (EECE)
A Bonifacio Ave., Tibanga, Iligan City PHILIPPINES
MARVEN JABIAN Mindanao State University –
Iligan Institute of Technology (MSU-IIT)
Electrical, Electronics and Computer Engineering Department (EECE)
A Bonifacio Ave., Tibanga, Iligan City
PHILIPPINES [email protected]
RASHID JULL DE LUNA
Mindanao State University –
Iligan Institute of Technology (MSU-IIT) Electrical, Electronics and Computer
Engineering Department (EECE)
A Bonifacio Ave., Tibanga, Iligan City PHILIPPINES
NOEL ESTOPEREZ Mindanao State University –
Iligan Institute of Technology (MSU-IIT)
Electrical, Electronics and Computer Engineering Department (EECE)
A Bonifacio Ave., Tibanga, Iligan City
PHILIPPINES [email protected]
ANTHONY JOSEPH LAVILLA
Mindanao State University –
Iligan Institute of Technology (MSU-IIT) Electrical, Electronics and Computer
Engineering Department (EECE)
A Bonifacio Ave., Tibanga, Iligan City PHILIPPINES
68
Related Documents