P197041 N°0 UNCLASSIFIED O o •O O oc < O AGARD-R-600 AGARD REPORT No. 600 on Problems of Wind Tunnel Design and Testing NORTH ATLANTIC TREATY ORGANIZATION DISTRIBUTION AND AVAILABILITY ON BACK COVER

Welcome message from author
This document is posted to help you gain knowledge. Please leave a comment to let me know what you think about it! Share it to your friends and learn new things together.
Transcript

P197041 N°0 UNCLASSIFIED
Oo•O
Ooc<O
AGARD-R-600
AGARD REPORT No. 600
on
Problems of Wind TunnelDesign and Testing
NORTH ATLANTIC TREATY ORGANIZATION
DISTRIBUTION AND AVAILABILITYON BACK COVER


AGARD-R-600
NORTH ATLANTIC TREATY ORGANIZATION
ADVISORY GROUP FOR AEROSPACE RESEARCH AND DEVELOPMENT
(ORGANISATION DU TRAITE DE L'ATLANTIQUE NORD)
AGARD Report No.600
PROBLEMS OF WIND TUNNEL DESIGN AND TESTING
<<*' X
This Report is sponsored by the Fluid Dynamics Panel of AGARD as a complementary paperto AGARD Advisory Report No.60 of the Large Wind Tunnels Working Group.
The AGARD Fluid Dynamics Panel wishes to thank Dr. R. Gothert, M. Ph. Poisson-Quinton,M.M. de Maistre and Mr. J.P. Hartzuiker for their contribution in editing papers included
in this Report.

THE MISSION OF AGARD
The mission of AGARD is to bring together the leading personalities of the NATO nations in the fields ofscience and technology relating to aerospace for the following purposes:
— Exchanging of scientific and technical information;
- Continuously stimulating advances in the aerospace sciences relevant to strengthening the common defenceposture;
— Improving the co-operation among member nations in aerospace research and development;
- Providing scientific and technical advice and assistance to the North Atlantic Military Committee in thefield of aerospace research and development;
— Rendering scientific and technical assistance, as requested, to other NATO bodies and to member nationsin connection with research and development problems in the aerospace field;
- Providing assistance to member nations for the purpose of increasing their scientific and technical potential;
- Recommending effective ways for the member nations to use their research and development capabilitiesfor the common benefit of the NATO community.
The highest authority within AGARD is the National Delegates Board consisting of officially appointed seniorrepresentatives from each member nation. The mission of AGARD is carried out through the Panels which arecomposed of experts appointed by the National Delegates, the Consultant and Exchange Program and the AerospaceApplications Studies Program. The results of AGARD work are reported to the member nations and the NATOAuthorities through the AGARD series of publications of which this is one.
Participation in AGARD activities is by invitation only and is normally limited to citizens of the NATO nations.
Part of the material in this publication has been reproduceddirectly from copy supplied by AGARD or the author.
Published December 1973
533.6.071
Printed by Technical Editing and Reproduction LtdHarford'House, 7-9 Charlotte St. London. W1P 1HD

PREFACE
The Large Wind Tunnels Working Group (LaWs) of the Fluid Dynamics Panel of AGARDhas been helped considerably in its deliberations by a large number of non-member scientistsand engineers from the participating countries, who investigated particular problems, providedspecially-written papers, or took part in the discussions. This help was very much appreciatedby the members of the Group, and the information contained in the LaWs Papers, in particular,has proved to be very valuable. However, the number of LaWs Papers is so large (over 130)that it was not possible to publish them all or to include them in full in the Report of theGroup (AGARD Advisory Report 60 entitled "The Need for Large Wind Tunnels in Europe").On the other hand, some of the LaWs Papers present substantial surveys of particular fieldsand others describe possible options for future wind tunnels in detail. These papers supplementthe Report of the Group in essential respects. The Group decided, therefore^ to publish aselection of the LaWs Papers in AGARD Reports, so that they are generally available and canbe read in conjunction with the Report of the Group.
As a result, four AGARD Reports are being published, collecting a number of paperstogether on subjects related to the design and operation of low-speed and transonic windtunnels, with particular reference to possible future large wind tunnels in Europe. Thereare thus three further Reports in addition to the present Report. Their contents are listedin Appendix I at the end of this Report.
Wherever appropriate, the individual papers have been edited by a member of the LaWsWorking Group. On behalf of the members of the LaWs Group, the undersigned wishes tothank all those who helped the Group and especially the authors of the papers publishedhere.
D.KuchemannChairman, LaWs Working Group
November 1972

CONTENTS
Page
PREFACE iii
Reference
SOME CONSIDERATIONS OF FUTURE LOW-SPEED TUNNELS FOR EUROPEby A.Spence and B.M.Spee 1
PROJECT STUDY OF A LARGE EUROPEAN TRANSONIC LUDWIEG TUBE WINDTUNNELby H.Ludwieg, H.Grauer-Carstensen and W.Lorenz-Meyer 2
THE DEVELOPMENT OF AN EFFICIENT AND ECONOMICAL SYSTEM FOR THE GENERATIONOF QUIET TRANSONIC FLOWS SUITABLE FOR MODEL TESTING AT HIGH REYNOLDSNUMBER
by P.G.Pugh 3
THE INJECTOR DRIVEN TUNNELby P.Carriere 4
SOUFFLERIE A COMPRESSEUR HYDRAULIQUEpar M.Menard and F.Chometon 5
FACILITIES FOR AERODYNAMIC TESTING AT HYPERSONIC SPEEDSby F.Jaarsma and W.B. de Wolf 6
APPENDIX I - DETAILS OF OTHER DOCUMENTS COMPLEMENTARY TO ADVISORYREPORT 60
Note:
Another paper, "Testing at Supersonic Speeds", was intended for inclusion in thisReport and is referenced in AR60 and in the complementary documents.
It is regretted that it has not been possible to include this paper.

SOME CONSIDERATIONS OF FUTURE LOW-SPEED TUNNELS FOR EUROPE
by
A.Spence — RAE Farnboroughand
B.M.Spee - NLR Amsterdam
SUMMARY
At the request of the AGARD LaWs Working Group, two series of possible future low-speed windtunnels havebeen studied. The first series are high-Reynolds-number tunnels having a product of working section width inmetres and maximum pressure in atmospheres kept constant at a value of 45, but including in addition a 60matmospheric tunnel. The second series comprises atmospheric tunnels of widths ranging from 8m to 25m, andthese are of more modest cost and generally lower capability than the first series. Very broad estimates of possiblecapital and running costs are given as an indication of the scale of expenditure which might be involved; noprecise quotations have been obtained. Brief statements are made of the capabilities of the tunnels considered.
Each series in turn appears to offer attractive possibilities for future provision of low-speed tunnels in Europe.
1. INTRODUCTION
During the discussions of the AGARD LaWs Working Group, attention was given to Europe's needs for futurelow-speed tunnels. In order to provide a basis for these discussions, the present authors were asked to study twoseries of tunnels, to summarise their capabilities and to make cost estimates.
The first series studied consists of tunnels which could give high maximum Reynolds number, the value beingthe same for each tunnel at any chosen Mach number up to 0.2. The product of the working section width inmetres and the maximum pressure in atmospheres is kept constant at a value of 45. But since there is a case forrequiring the maximum Reynolds number to increase as the maximum pressure decreases because one then has asmaller range of Reynolds number (at constant Mach number) from which to extrapolate, a 60m atmospherictunnel was added to the series.
In view of the very high capital costs of this first series, some thought has been given to several possibleways of reducing the cost, including
(a) shortening the air circuit
(b) using unconventional drives
(c) using reinforced concrete instead of steel for pressure shells
(d) using Eiffel type tunnels.
Also, a second series of tunnels has been studied, comprising atmospheric tunnels having working sectionwidths from 8m to 25m, which could meet some of the requirements at more modest costs.
The authors each made completely independent estimates of the capital costs. Their totals agreed to better than15 per cent, though it is not expected that the absolute values are as accurate as that might suggest. Mean values ofthe two estimates are given and it is believed that the orders of cost are correctly indicated. The figures given areall based on 1971 price levels. Estimates have also been made of the running costs of each facility.

1-2
2. THE FIRST SERIES; HIGH-REYNOLDS-NUMBER TUNNELS
2.1 Tunnels considered and their capabilities
Conventional return-circuit tunnels have been studied covering a range of working size and pressure from11.25m wide at 4 atmospheres to 45m and 60m wide at atmospheric pressure. In all cases the ratio of workingsection width to height is 4:3.
In respect of four aircraft categories used by the LaWs Working Group in its studies, the capabilities of thisseries of tunnels may be summarised as follows: —
1 For CTOL/RTOL aircraft with maximum lift coefficient < 4. These tunnels could give three times the Reynoldsnumber of tunnels currently proposed or under construction, for those cases which justify the extra cost ofutilising this extra capability or of needing the use of a larger model.
2 For RTOL/STOL aircraft with maximum lift coefficient between 4 and 8. The tunnels could give maximumReynolds numbers for this category of aircraft similar to those which can be reached in tunnels currently beingbuilt or planned for Category 1 above. For example, an STOL model at CL = 8 , sized ;to limit the tunnelconstraint effect on the angle of incidence to 2°, could be tested at a Reynolds number d'f about 6 millions at arepresentative approach speed of 30 m/s.
3 For powered-lift aircraft with effective lift coefficients greater than 8. This series of tunnels can offer a greatlyenhanced capability (by a factor of about 6 on Reynolds number and of 2 to 6 on scale o'f model) over what iscurrently available.
4 For rotary-winged aircraft. This category defines the power of each tunnel in the sgries as that required togive a maximum speed of 130 m/s at atmospheric pressure. Rotors of diameter two-thirds of the working sectionwidth could be tested at speeds from 130 m/s down to about 30 m/s. Lower speeds would require either a largertandem working section or the use of a smaller model.
The Reynolds numbers, available in these tunnels (based on a length of 0.1 times the; square root of the workingsection area) are shown as a function of Mach number in Figures 1 and 2, and are compared with those of existingand currently-planned tunnels.
2.2 Assumptions and Methods of Estimation
It has been assumed that the desirable standard of flow is similar to that intended in the RAE 5m tunnel orthe NLR 8m x 6m tunnel. Accordingly, tunnel shell surface areas are those for return-circuit tunnels with acontraction ratio of about 8:1. Tunnel power factors have been taken from those of the above-mentioned tunnelswith reductions for the increased Reynolds numbers and for the smaller models in relation to working section size.
For the pressurised tunnels it is assumed that the pressure shells would be made of steel. Since hoop stresslargely determines the thickness required and this is proportional to the size and the pressure difference, the weightof steel is thus proportional to the cube of the scale and to the pressure difference. The cost is taken to beproportional to the weight, and therefore, based on the cost of the shell of the RAE 5m tunnel,
Shell cost (£M) = 20(P-1) (W/15)3
where P is the maximum pressure in atmospheres and W is the working section width in metres.
For the atmospheric tunnels, it is assumed that the shells would be made of reinforced concrete. One of theauthors (AS) made the drastic assumption that such a shell would cost i of'the price of a'f steel shell designed for1 atmosphere differential pressure. The other (BMS) extrapolated from the value estimated for the NLR LST8m x 6m, and since the two sets of estimates were in fair agreement if screens, corner varies and motor housingwere included, one can express the cost approximately by
Shell cost (£M) = 2.5 (W/15)3
but this is considered to be applicable only to tunnels larger than about 20rh:
As stated earlier, each tunnel is powered to give a top speed of 130 m/i'at atmospheric pressure because ofthe requirements of rotor testing. The maximum speed at other pressures varies as follow|, depending on whetheror not the fan blade angle can be varied
Pressure (atm) 2 3 4Fixed fan V(m/s) 92 75 65JVariable fan V(m/s) 103 90 82

1-3
Either set of speeds is considered adequate since it would be acceptable to reduce the pressure when needinghigher speeds for V/STOL transition work etc.
The costs of the main drive were estimated from a rough rule of £32K per megawatt. For the cooling andtemperature control system of pressurised tunnels, a figure of £2IK per megawatt has been used; in the case ofatmospheric tunnels, however, an air interchange system would suffice and a lower cost has been taken for this ofabout £10K per megawatt.
Provision of pressurised air supplies becomes of major and increasing importance as the tunnel size increases,both for pumping up the pressurised tunnels and for use in engine representation in models in all tunnels. It isclear that pumping up the tunnels considered here would require impossibly large pumping capacity unless a largestore of air is provided. For the pressurised tunnels the costs for the air system correspond to assuming pumpssufficient to fill the tunnel to maximum pressure in 6 hours and storage of enough air for one fill. For the atmospherictunnels, a simple figure of about 4 to 5 per cent of the capital cost of the facility is taken for a model blowing airsystem.
Additional costs other than those mentioned above are estimated to vary from about 20 per cent of the totalcost for an 11.25m, 4 atmosphere tunnel, to about 10 per cent for 45m and 60m atmospheric tunnels. Thisfinal addition completes the estimate and leads to capital costs which are set out in the next section.
2.3 Main Characteristics and Capital Costs of High-Reynolds-Number Tunnels
Item
Max pressure (atm)
Working section (m)
Power factor at130 m/s, 1 atm
Power for130 m/s (MW)
Power for200 m/s (MW)
Air mass tofill (Mkg)
Reynolds number*for RTOL/STOLH- 106
Cost of shell(% of total)
Estimated totalcost (£M)
Tunnel A
4
11.25 x 8.5
0.315
40
134
0.84
1.5 - 6.0
67
35
B
3
15 x 11.25
0.30
69
233
1.32
2.0 - 6.0
69
55
C
2>/2
18 x 13.5
0.295
96
324
1.73
2.4 - 6.0
71
70
D
2
22.5 x 17
0.285
147
496
2.23
3.0 - 6.0
73
90
E
1
45 x 34
0.26
530
1800
_
6.0
65
110
F
1
60 x 45
0.25
900
3040
—
8.0
75
225
* The Reynolds numbers quoted are those for a model with a maximum lift coefficient of about 8, sized to limitthe tunnel constraint effect on the angle of incidence to 2°, and tested at a representative approach speed of30 m/s. For an aspect ratio of 8, such a model would have a mean chord 0.08 times the square root of the cross-sectional area of the working section.
All the costs are estimated for continuous running at a maximum speed of 130 m/s at atmospheric pressure;the cost of the shells of the atmospheric tunnels as well as the cost of the drives of all the tunnels would increaseif the maximum speed were higher.
In these estimates, the costs of compressed air systems were based on the known cost of providing pumps forthe RAE 5m tunnel, together with a rough rule for storage vessels of £1 per pound of stored air. For tunnels Ato D, the amount of air stored and the rate of pumping appear sufficient for model blowing requirements andengine simulation. Further study may well suggest that part of the flow should be compressed to a higherpressure than the 22 bars to which half the flow for the RAE 5m tunnel can be pumped; it may also be desirableto store some air at higher pressure. No allowance for this has been made in the cost estimates, but it seems un-likely that it would have a major effect since, as shown in the Table below, the costs of the pumps and airstorage is estimated at only about 8% of the total capital cost of the whole facility.

1-4
For the atmospheric tunnels E and F, the tunnel itself has no pumping requirement, and a simple crudeassumption of about 4 to 5 per cent of the total capital cost has been made for a model blowing system.
Costs of Air Pumping for High-Reynolds-Number Tunnels
Item
Pumping rate (kg/s)Cost of pumps (£M)Air stored (Mkg)Cost of storage (£M)Estimate of rate of
flow required formodel with internaljet flap (kg/s)
Estimated total costof air system (£M)
Tunnel A
391.1
0.841.8
120
2.9
B
611.7
1.322.9
160
4.6
C
802.3
1.733.8
200
6.1
D
1052.9
2.234.9
250
7.8
E
_——_
490
5
F
__—_
870
9
The cost estimates agree fairly well with NASA estimates given in LaWs Group Paper No. 19. There thecost of a 150 ft x 75 ft atmospheric tunnel is about £60M. The working section area of this is the same as thatof a 37im x 28m tunnel, for which the methods of the present report would give £70M, but the latter tunnel wouldhave a longer circuit and a larger contraction ratio.
2.4 Running Costs of High-Reynolds-Number Tunnels
Estimates of running costs have been made, broadly on the lines used by Hills in LaWs Group Paper No. 49and in Section 8.6 of the LaWs Group Report. The main assumptions are as follows: —
1 Each tunnel is powered for continuous running at 130 m/s at atmospheric pressure.
2 Tunnel usage is divided 40 per cent to rotary wing aircraft and 60 per cent to fixed-wing aircraft of theother three categories listed in Section 2.1. Since the latter are tested at lower tunnel speeds, the power used forthem is reduced more in atmospheric tunnels than in pressurised tunnels in which the pressure would be raised forsuch tests. The ratio of mean power to maximum power has been taken to fall from 0.75 in a 4 atmospheretunnel to 0.375 in the atmospheric tunnels.
3 The maximum power has been taken to be the sum of the main drive power and the pumping power.
4 Since testing of rotary wing aircraft will not usually demand compressed air, but for other types of workthe pumps will require to run about twice the tunnel running hours for pressurised tunnels, the mean powerconsumption of these tunnels has been taken to be the sum of the mean power of the main drive and the maximumpower of the pumps. For the atmospheric tunnels, a guess has been made that the average pumping power will beabout a quarter of the .maximum.
5 The same electricity charges have been used as in LaWs Group Paper No. 49, ie a maximum demand chargeof £2500 per megawatt and a power consumption charge of £4.3 per megawatthour.
6 Again as in LaWs Group Paper No. 49 the costs of labour, materials and equipment are assumed to be £350Kfor 1000 hr/yr of running, and £41 OK for 2000 hr/yr.
7 It has been assumed that the average rate of data recording is 5 polars/hr for all types of work.
These running cost estimates are set out in the following table, both for 1000 hr/yr and 2000 hr/yr of runningtime and both including and excluding amortisation and interest on capital taken as a total of 10 per cent of theestimated capital cost.

Running Costs of High-Reynolds-Number Tunnels
1-5
Item
Max drive power (MW)Factor to mean powerMean drive power (MW)Max pumping power (MW)Power for max demand (MW)Mean power used (MW)Max demand cost £2500/MW10 per cent of capital cost
I For 1000 hr/yrPower charge, £4.3/MW hrLabour etc.Total (without interest etc)Total (with interest etc)Cost/polar (without interest)Cost/polar (with interest)
II For 2000 hr/yrPower charge, £4.3/MW hrLabour etc.Total (without interest, etc)Total (with interest, etc)Cost/polar (without interest)Cost/polar (with interest)
Tunnel A
400.7530195949
£ 147K£3500K
£ 210K£ 350K£ 707K£4200K£ 141£ 840
£ 420K£ 410K£ 977K£4500K£ 98£ 450
B
690.625
43309973
£ 247K£5500K
£ 314K£ 350K£ 911K£6400K£ 182£1280
£ 628K£ 410K£1285K£6800K£ 128£ 680
C
960.56544113795
£ 342K£7000K
£ 408K£ 350K£1100K£8100K£ 220£1620
£ 816K£ 410K£1568K£8600K£ 157£ 860
D
1470.507356
203129
£ 510K£ 9000K
£ 555K£ 350K£ 1415K£10400K-£ 283£ 2080
£ 1110K£ 410K£ 2030K£11000K£ 203£ 1100
E
5300.37520037567209
£ 1410K£11000K
£ 900K£ 350K£ 2660K£13700K£ 532£ 2740
£ 1800K£ 410K£ 3620K£14600K£ 362£ 1460
F
9000.37534067967357
£ 2420K£22500K
£ 1530K£ 350K£ 4300K£26800K£ 860£ 5360
£ 3060K£ 410K£ 5890K£28400K£ 589£ 2840
2.5 Possibilities for Reducing the Costs
Because of the very high costs of all the tunnels in this series, some consideration has been given to variousways of reducing the costs of the tunnel shells and also of reducing the power requirements.
One possibility is to use reinforced concrete instead of steel in the construction of the shells of pressurisedtunnels. Very brief discussions with UK experts in the use of concrete have suggested that the construction ofa tunnel such as Tunnel B above is feasible and that the cost of the shell in reinforced concrete might be of theorder of three-quarters of that for a steel shell. This suggestion was based on 2 man-days of work and for a betterestimate a design study lasting about 3 months would be needed.
Another possibility is illustrated in Figure 3. This is based on two main ideas, first that the pressurisedtunnels might well spend three-quarters of their usage at atmospheric pressure and therefore perhaps could dowithout the kind of access arrangements to the working section which are being provided in the RAE 5m tunnel;second that the compressed air supplies envisaged could be used for boundary layer control in rapid diffusers. Arather extreme circuit is shown in Figure 3 which keeps all its corners the same sizes as in the conventionalcircuit, but has its first and second diffusers shortened by a factor of 4, and the rapid expansion after the thirdcorner by a factor of 2. If such a circuit could be made to work acceptably, the shell cost for a 15m, 3atm tunnelcould be reduced by about £15M, though this would be offset to some extent by greater development costs andby the costs of the b.l.c. system. It is not clear how big the nett saving could be.
The high power requirements of the tunnels considered arise from the need to provide high speeds forrotor testing. Some thought has been given to the possibility of reducing the power level. The authors believethat, for a long time to come, it will be necessary to provide continuous running for V/STOL work, even more sothan for CTOL/RTOL work, and discussions about testing of rotary-wing aircraft suggest that, as a minimum, a slow,controlled run-up and run-down are needed, leading to a total run time measured in minutes rather than seconds.Brief consideration has therefore been given to a scheme in which an electric drive is sized to drive the tunnelat a modest speed by means of a fan and the higher speeds are reached by use of stored compressed air applied tothe fan in the form of a jet flap. In the case of the pressurised tunnels, the cost estimates included an allowancefor storing sufficient air to fill the tunnel to maximum pressure. First results suggest that this method could beused to drive a 15m, 3atm tunnel for 3 minutes every hour at 130 m/s at atmospheric pressure, provided there wasan electric drive sufficient to drive the tunnel at half speed at three atmospheres and this required 26 MW instead of69 MW. For atmospheric tunnels, the savings in drive power could lead to greater percentage reductions in theoverall capital costs than for pressurised tunnels, but this would be offset by the need for a large increase incompressed air supply.

1-6
It is sometimes suggested that for atmospheric tunnels, the Eiffel type would be considerably cheaper than areturn-circuit tunnel. The authors' experience suggests that for the same, good quality of flow and the same drivepower, 'the costs would be much the same even if the Eiffel tunnel has its diffuser divided so that it could beshortened. It may be that the cost could be reduced by having less diffusion and a larger power requirement, butwe would not expect the cost reduction to be large.
2.6 Relative Merits of the Pressurised and the Atmospheric Tunnels
Although it is not possible to make any definite recommendations it seems desirable at this point to set outsome of the main differences between the pressurised and the atmospheric tunnels.
1 For a given maximum Reynolds number, the pressurised tunnel will be considerably cheaper both in capitalcost and in running cost.
2 The use of pressurisation gives a range of Reynolds number at constant Mach number, from which toextrapolate towards full scale and the required maximum Reynolds number may therefore be lower. However,it may not be safe to rely on this in all cases because of our limited ability to define Reynolds numbers abovewhich scale effect will be regular and understandable.
3 It is expected that the smaller models for the pressurised tunnels will generally be quicker and cheaper tomake in spite of the higher loading.
4 The large atmospheric tunnels offer the advantage of testing a larger range of full-scale hardware including realengines and real aircraft, but such tests will usually have to wait until a later stage in the development of a project.
2.7 Concluding Remarks on the Series of High-Reynolds-Number Tunnels
1 It is clear that both the capital costs and the running costs of these tunnels are extremely high and that theyrise rapidly with increasing size.
2 In the opinion of the authors, tunnel A (11.25m, 4atm) is too small and that its high maximum pressurewould make for serious difficulties arising from model distortion.
3 Tunnel B (15m, 3atm) is the smallest and cheapest facility of this series which deserves serious considerationif the high Reynolds numbers aimed at in this series are to be achieved.
4 Tunnel B is limited in its size and would not suffice to do much of the full-scale hardware testing discussedin Section 2.6.
5 The use of reinforced concrete pressure shells and of unconventional circuits and drives should be studiedfurther as means of reducing the costs of these facilities.
3 THE SECOND SERIES: ATMOSPHERIC TUNNELS OF MORE MODEST COST
3.1 Cost Estimates
In view of the very high capital and running costs of the high-Reynolds-number tunnels discussed in Section 2,some thought has been given to atmospheric tunnels of more modest size and cost and to the question of whetherthese offer particular attractions in their capabilities. In this second series of windtunnels, the sizes of tunnelconsidered range from 8m to 25m, with a height which is three quarters of the width. The assumptions are consistentwith those of Section 2:
1 Conventional return circuits with contraction ratio of 8:1.
2 Maximum speed 130m/sec, to satisfy conventional helicopter needs.
3 Tunnel shell constructed in reinforced concrete.
The main characteristics and costs of this series of windtunnels are given in the Table on page 1-7.
In the size range above 25m, it could be assumed that the mean thickness of concrete is proportional to thelinear scale and, therefore, the weight of concrete and the cost of the shell are proportional to the cube of thescale. Below 25m, however, the mean thickness of concrete required is thought to be fairly constant and,therefore, the shell cost varies with the square of the scale. At the same time the ratio of shell cost to totalcost falls from 0.46 for a 25m tunnel to about 0.24 for an 8m tunnel.

1-7
On these bases, a consistent set of estimates was made, which is given in the Table below.
Main Characteristics and Capital Costs of Atmospheric Tunnels
Item
Working section (m)Power factor (130m/s, 1 bar)Power for 130m/s (MW)Power for 200m/s (MW)Reynolds number for RTOL/
STOL tests (+ 106)Cost of shell (% of total)Estimated total cost (£M)
Tunnel 1
8 x 60.332275
1.05245
2
10 x 7.50.325
33112
1.3286'/2
3
12 x 90.3247159
1.6328'/2
4
14 x 10.50.3161207
1.853411
5
16 x 120.3078
264
2.13713
6
18 x 13.50.295
96325
2.44015
7
20 x 150.29117380
2.64218
8
25x18.750.28177600
3.34625
It is worth noting that the total cost of the main drive motors and cooling system for the RAE 5m tunnel isabout £53K per MW. Taking half the cost for the cooling system, the drive and cooling costs for the aboveatmospheric tunnels are about two-thirds of the costs of the tunnel shell when the top speed is 130 m/sec. If thespeed requirement were raised to 200 m/sec, the drive cost would be more than trebled and this would increase thecapital cost of any of the above tunnels by about 60% without allowing for the extra costs of the thicker tunnelshell which would be needed.
Estimates of running costs have also been made, using the same assumptions as for the series of high-Reynolds-number tunnels. These are given in the Table below.
Running Costs of Atmospheric Tunnels
Item
Max drive power (MW)Factor to mean powerMean drive power (MW)Max pumping power (MW)Power for max demand (MW)Mean power used (MW)Max demand cost, £2500/MW10 per cent of capital cost
I For 1000 hr/yrPower charge, £4.3/MW hrLabour etcTotal (without interest etc)Total (with interest etc)Cost/polar (without interest)Cost/polar (with interest)
II For 2000 hr/yrPower chargeLabour chargeTotal (without interest etc)Total (with interest)Cost/polar (without interest)Cost/polar (with interest)
Tunnel 1
220.375
81
238
£ 58K£ 500K
£ 35K£ 350K£ 443 K£ 943 K£ 89£ 189
£ 70K£ 410K£ 538K£1040K£ 54£ 104
2
330.375
122
3512!/2
£ 87K£ 650K
£ 54K£ 350K£ 491K£1140K£ 98£ 228
£ 108K£ 410K£ 605K£1260K£ 60£ 126
3 .
470.375
183
5019
£ 125K£ 850K
£ 82K£ 350K£ 557K£1410K£ 111£ 282
£ 164K£ 410K£ 699K£1550K£ 70£ 155
4
610.375
234
6524
£ 162K£1100K
£ 103K£ 350K£ 615K£1715K£ 123£ 343
£ 206K£ 410K£ 778K£1880K£ 78£ 188
5
780.375
295
8330
£ 207K£1300K
£ 129K£ 350K£ 686K£1990K£ 137£ 398
£ 258K£ 410K£ 875K£2180K£ 88£ 218
6
960.375
366
10238
£ 255K£1500K
£ 163K£ 350K£ 768K£2270K£ 154£ 454
£ 326K£ 410K£ 991K£2490K£ 99£ 249
7
1170.375
447
12446
£ 310K£1800K
£ 198K£ 350K£ 858K£2660K£ 172£ 532
£ 396K£ 410K£1116K£2920K£ 112£ 292
8
1770.375
6611
18869
£ 470K£2500K
£ 296K£ 350K£1120K£3620K£ 224£ 724
£ 592K£ 410K£1472K£3970K£ 147£ 397
3.2 Capabilities of the Series of Atmospheric Tunnels
Tunnels 1 to 4 of the above series were included mainly in order to connect the series back to existing andplanned tunnels. They do not offer very significant advances over the latter.
Tunnels 6 to 8 (5 being a borderline case) are considered to offer very real advantages. Tunnel 6 (18m wide)could provide for testing rotors of a size ( l l m diameter) sufficient for use on a demonstrator aircraft. All threetunnels, to an increasing extent as size increases, could permit: —

1-8
1 tests on experimental aircraft and other small aircraft,
2 tests on full-scale engines,
3 noise measurements covering a considerably larger field surrounding a model than are currently possible inEurope.
Indeed, tunnels in this range are broadly equivalent to the NASA 40ft x 80ft tunnel, and the continuing usefulnessand pressure of work of this tunnel argue strongly in favour of the provision of a tunnel of at least similarcapability in Europe.
However, it must be noted that: —
1 the Reynolds numbers achieved in tunnels of this range are low compared with those of the first seriesdiscussed in Section 2,
2 even in Tunnel 8 (25m), the largest RTOL/STOL model or aircraft which could be tested at a lift coefficientof 8 say, would be only about 13 or 14m span.
4 CONCLUDING REMARKS
In order to help in the deliberations of the AGARD LaWs Working Group, two series of low-speed tunnelshave been studied, their capabilities briefly surveyed, and estimates of both their capital costs and running costsgiven. The cost data shown are based on the authors' own estimates and it should be appreciated that a moredetailed assessment would be needed to establish reliable cost information. In effect the conclusions are to befound in the report of the LaWs Group.

O-l O-I5 O-2 M O-2S O-3 O-35 O-4
Fig. 1 Maximum Reynolds numbers of low-speed windtunnels
4O
xlfl"*30
2 5
2O
15
IO9
8
7
6
3
2 - 5
1 - 5
CURVES LABELLED X/y
WHERE X - W.S. WIDTH (m)y = MAX PRESSURE (BARS)
I
O-l O-I5 O-2 M O-25 O-3 O-35 O-4
Fig. 2 Operating envelopes of various low-speed windtunnels

CONVENTIONAL CIRCUIT WITH ACCESS ARRANGEMENT
MINIMUM CIRCUIT WITH B.L.C. DIFFUSERS
Fig.3 Layouts for low-speed windtunnels

2-1
PROJECT STUDY OF A LARGE EUROPEAN TRANSONIC LUDWIEG TUBE WINDTUNNEL
*) **) **<)by H. Ludwieg , H. Grauer-Carstensen , W. Lorenz-Meyer
Deutsche Forschungs- und Versuchsanstalt fiir Luft- und Raumfahrt e. V.
- Aerodynamische Versuchsanstalt Gottingen -Institut fiir Stromungsmechanik
SUMMARY
A Study of a transonic L u d w i e g Tube windtunnel is presented. For a reliable extrapolation of wind-tunnel measurements to full-scale flight conditions of modern aircraft, a realistic simulation of flightR e y n o l d s Numbers at transonic speeds becomes increasingly important. It is shown, how the needfor a high R e y n o l d s Number experimental facility can be satisfied by a Ludwieg Tube tunnel. TheLudwieg Tube is characterized by its unsurpassed simplicity which guarantees a high degree of reliability.Design data, dimensions, and cost estimates for the described tube windtunnel are presented. The basicfacility characteristics are given in PART A and in a supplementary PART B , which adapts the tunnelcharacteristics to the LaWs-Specifications.
NOTATION
a = V y R
tube
E
F
Ftube
M = —
m
N
Re = U O.I
Re -<L_f im n
R
T
U
V
o
Speed of sound
Diameter of the charge tube
Energy
Test section area
Cross section of chargetube
Length of tube
M a c h Number
Mass
Mass rate
Power
Pressure
Dynamic pressure
R e y n o l d s Number
Unit R e y n o l d s Number
Gas constant(= 287.1 Joule/kg grd)
Temperature
Velocity
Volume
Density
*)
**)
***)
Chief, Fluid Dynamics Department
Senior Scientist Fluid Dynamics Department
Deputy Chief, Fluid Dynamics Department
U
Subscripts
O'
0"
1
01
02
03
CO
ad
Tunnel run time
Non-dimensional run time
Ratio of specific heats
Efficiency
Viscosity
Charge tube (tube 1)
Recovery tube (tube 2)
Free-stream conditions intube 1 behind expansion wave
Free-stream conditions intube 2 behind diffusor
Free-stream conditionsbetween contact surfaceand shock
Stagnation conditions in tube 1behind expansion wave
Stagnation conditions in tube 2downstream of the diffusor
Stagnation conditions betweencontact surface and shock
Free-stream conditions inthe test section
Adiabatic

2-2
at
test
Atmospheric
Test section
comp
term
Compressor
Terminal conditions in thecharge tube
PART A
1. INTRODUCTION
In recent years, the need for transonic test facilities at very high R e y n o l d s Numbers was recognizedafter it has been demonstrated, that data obtained from existing windtunnels can not be extrapolated tofull-scale flight conditions with sufficient reliability (see Ref. [2], [3]). Because of the extremely highpower requirements, a continuously running windtunnel does not appear to be feasible and one dependson intermittently working tunnels with energy storage. Among other possibilities, a tube windtunnel, asdescribed first by L u d w i e g [1], is a suitable facility. Although all known windtunnel facilities of theL u d w i e g -Tube-type have very short run times, it will be shown in this study, that also the LaWs-requirements with a run time of about r = 10 seconds clean flow can be satisfied perfectly by a tubewindtunnel. A corresponding project proposal is outlined in the following.
2. GENERAL FACILITY REQUIREMENTS FOR A EUROPEAN TRANSONIC WINDTUNNEL
Projecting a transonic intermittent windtunnel, certain design data - such as M a c h Number range,maximum R e y n o l d s Number, stagnation pressure, tunnel run time and utilization (number of testsper hour) - are determined by the requirements of the prospective users. Principally, the stagnationtemperature can be chosen independently, in practice, however, its value is bound by the operatingprinciple of the tunnel if one wants to avoid expensive refrigeration. In order to determine the designdata mentioned above, the following requirements should be satisfied in the authors' opinion.
2.1 M a c h Number Range
The M a c h Number range should cover the entire transonic and the compressible subsonic range, i.e.the M a c h Number should range from about Mm = 0 . 3 to M00= 1.4. But as M a c h Numbers higherthan 1. 3 make it necessary to provide a flexible nozzle upstream of the transonic test section, it seemsbetter to us, to restrict the M a c h Number range to MQQ = 1 . 3 at the maximum.
2 .2 R e y n o l d s Number Range
It should be possible to achieve a maximum R e y n o l d s Number (based on mean wing chord) of 30 to40 Million at a reference M a c h Number of MQ-, = 1.0. This means a R e y n o l d s Number of 4 to 5xl08
based on VF (F = area of test section). In addition, the R e y n o l d s Number should be largely variableby variation of the total pressure (see also SECTION 2. 3).
2.3 Stagnation Pressure
Admissible forces on models and model-supports put a restraint on the total pressures at maximumR e y n o l d s Number [Ref. 6]. With regard to the fact that the projected windtunnel will be used mainlyfor measurements on airplane models, it appears to be reasonable to limit the stagnation pressure tovalues between 5 and 8 bar (1 bar = 1 0 ^ N/m^), or else to risk that the tunnel capability can not be utilizedfully. It should be possible, however, to run the tunnel at largely reduced stagnation pressure with goodflow quality. On the other hand the structure of the tunnel should be designed so that stagnation pressuresof 11 bars are feasible to achieve much higher R e y n o l d s Numbers on special models.
2 .4 Tunnel Run Time
Rather than the actual running time r a relevant parameter is a scaled nondimensional run timeis defined (in the form of a reciprocal St . r 'ouhal Number) by
which
= r (D
Comparing windtunnels of different sizes (especially at equal stagnation pressures) the frequency ofdisturbances (unsteadiness of the flow, model oscillations) is about inversely proportional to the tunnelsize. Thus, in order to eliminate the disturbances by a time averaging procedure, the test job requiresa certain value of ^ (and not T).

2-3
The run time should be sufficiently long, so that at least a complete six- component polar or a completepressure distribution at fixed angle of attack can be measured with high accuracy during a single tunnelrun. It should also be possible to a certain extent to investigate unsteady aerodynamic phenomena.
In order to meet these requirements we feel that a value of 400 to 700 for "r is appropriate. For a4. 5 x 4. 5 m^ tunnel this corresponds to an actual run time from 6 to 10 seconds.
From an economic point of view it is advantageous, if the tunnel can be operated with reduced run time.Thus, times for starting and stopping the tunnel should be as short as possible in order to save storageenergy.
2. 5 Run Frequency
The run frequency, which will satisfy future needs for high R e y n o l d s Number transonic testing, canhardly be predicted. As a tentative estimate, we feel, that a run frequency of 20 to 40 tunnel runs per8 hour shift at maximum R e y n o l d s Number and transonic M a c h Numbers is entirely sufficient. Itshould be mentioned that the run frequency can considerably be increased when tests are performed atlower R e y n o l d s Numbers, low M a c h Numbers or reduced run time.
2.6 Stagnation Temperature
For the tunnel under consideration one should aim at a low stagnation temperature T . For fixedR e y n o l d s Number, stagnation pressure, and scaled run time a simple calculation yields^that totalmass per tunnel run (m), total volume per tunnel run (V) and linear scale of the tunnel (vF) depend inthe following way on T01 :
^ , 0 . 7 6assuming that / U ~ T Q J
Thus, construction costs (~V) and operational costs (~ m) decrease more than proportional with thestagnation temperature TQJ .
2 . 7 Flow Quality
Beside the LaWs-Pequirement, that the new tunnel should be substantially better than existing tunnels -with the cleanest and quietest possible airstream - there are for an intermittent tunnel special require-ments regarding the flow uniformity in time. Expecially the presence of velocity fluctuations with mediumfrequencies (order 1 Hertz) would reduce the accuracy of force measurements if the test duration is ofthe order 1 sec.
2.8 Economic Requirements
Apart from technical needs it is important for a tunnel of this size, to keep construction costs and operationcosts low. Also, the facility should be dependable in order to avoid deadlocks and easy to handle. A simpleconstruction is favourable if construction time shall be saved.
3. FULFILMENT OF THE REQUIREMENTS BY A TUBE WINDTUNNEL
The requirements with regard to M a c h Number range, maximum R e y n o l d s Number, stagnationpressure and test duration (Sections 2. 1 to 2. 4) can be satisfied by a tube windtunnel if test section area,storage pressure, diffusor cross section and tube length are chosen appropriately.
The simultaneous fulfilment of the two requirements regarding test duration (2 .4 ) and good flow quality(2. 7) has to be discussed in some more detail. The operating principle of the tube tunnel, viz. the wayof accelerating the gas flow, yields initially a highly uniform flow. However, after starting the flow inthe tube, a time dependent boundary layer is formed on the wall of the tube, whose thickness increaseswith time. The rate of growth of this boundary layer depends on the flow velocity, the M a c h Number,the R e y n o l d s Number and the roughness of the tube wall. A certain time T\ after starting the tunnel,the outer edge of this boundary layer will reach the axis of the tube near the nozzle entrance, wherereaching the tube axis means that time at which the first velocity fluctuations of the boundary layer reachthe axis. This time TI slightly differs from a time v^ • marking that moment, at which the turbulentboundary layer profile has been fully established-. at tj£ nozzle entrance. Experimental investigations ofE. P i l t z [7] show that 73 exceeds r\ by approximately 30$. Cautious estimates of the boundary layergrowth assuming a hydraulically smooth wall show, according to theoretical and experimental studies of

2-4
P i l t z , that for a design tube M a c h Number of MI = 0. 3 the chosen running time (10s observationtime plus 1 s starting time) is well within 73- All this considerations, however, are related to thevelocity distribution within the charge tube upstream of the nozzle. It has to be discussed now which isthe influence of this velocity distribution on the velocity profile within the test section. If one assumesfor this purpose, that, at the end of the run time, the turbulent pipe flow following an 1/11 power law hasbeen fully established, one can compute the velocity distribution within the test section (for a test sectionM a c h Number of MQQ = 0. 9) by assuming constant total pressure along each stream line during theexpansion through the nozzle. This assumption is certainly valid except for a very thin region close to thewall, where a new boundary layer is formed, which exists in all types of tunnels and which has nothing todo with the L u d w i e g tube principle .
The resulting velocity profile in the test section computed for the end of the observation time is presentedin Fig 3 in a normalized form and compared to the profile ahead of the nozzle, assuming, for simplicity,a circular test section. The analysis shows, that the velocity distribution of a 63 $ core remains within+ 0. 5 <f0 and that of a 90 <fa core within + 1. 0 <f<, of the mean velocity.
The real distribution will be even better since, f i r s t the fully developed turbulent profile of a flowthrough a tube is fuller at high R e y n o l d s Numbers than described by the 1/11 power law and s e c o n d ,as cited above already, the fully developed profile ahead of the nozzle has not been established at the endof the run time.
Another consequence of the continuous growth of the boundary layer is a slight change - linear with time -of the stagnation pressure. In Ref. [7] , however, it is shown that for tube M a c h Numbers in the regionof Mj = 0. 2 to MI = 0.3 the time variation of the stagnation pressure becomes very small, apparentlydue to compensation of opposing effects. More detailed estimates of the behaviour of the tube wall boun-dary layer are given by E. B e c k e r [8, 9].
The radiation of noise from the charge tube into the test section is - due to the low flow velocity in thecharge tube - insignificant and far below the unavoidable noise radiated from the boundary layer on nozzleand test- section walls. » >t , ...
There are two more arguments in favour of a tube windtunnel. The unsteady expansion wave reduces thestagnation temperature Tnibelow its value in the charge tube. The advantage of a low stagnation tempe-rature was outlined in section (2 .6) .
The requirements of dependability, little service, and simple construction (2. 8) are met in a perfectway by the principle of the tube tunnel, as there are no moving parts except for the opening valve.
With regard to the requirement of low costs, two different systems must be distinguished. If constructioncosts shall be saved, the first system is preferable. In this case, the tunnel blows into the open air. Inorder to recharge the tunnel, the air must be compressed from atmospheric to charge pressure. Thesecond system, which keeps operating costs low, can be achieved by joining a pressure container at thedownstream end of the diffusor. This container can be a normal pressure vessel or a secondary tube asit was used by A. W e i s e for his shock windtunnel. Both kinds of containers have advantages and dis-advantages. We decided for a secondary tube. This tube is charged to a pressure just as high that thetunnel can still be started. During the test, a shockwave travels from the diffusor exit to the end of thetube and back, increasing thereby the pressure in the "recovery tube". To recharge the tunnel, the airis pumped back from the "recovery tube" into the charge tube. The energy savings that can be achievedin this way amount to 75 <fa - 80 <f0 when the tunnel is operated at maximum stagnation pressure. Thesavings on compressor and air dryer systems make up for part of the additional costs of the "recoverytube". Another argument in favour of the "recovery tube" is that it reduces the emission of noise intothe environment. Figure 1 gives an overall view of the proposed facility with an indication of the con-struction groups.
4. EVALUATION AND SPECIFICATION OF THE REGIME OF OPERATION OF THE TUNNEL
In the preceding sections, crucial reasons for selecting the L u d w i e g - T u b e concept to meet the datarequirements were outlined. The most important aerodynamic design data which were selected in closeagreement with LaWs-Specifications are summarized below. They are valid for a test section M a c hNumber of MOO = 1 . 0 . The data are followed by an example of the computational procedures utilized inderiving the geometric tunnel parameters.
4. 1 Project Data
R e y n o l d s Number (based on 0. 1 F) Re = 4 6 - 10
Stagnation pressure pQ1 = 7.0 bar
Dimensionless run time T" = 700
M a c h Number range MOD = 0-3 to 1.3

• 2-5
The determination of the tunnel geometry requires further the knowledge of the tube M a c h Number Mjand the air temperature in the charge tube prior to the start of the tunnel
Tube M a c h Number Mj = 0 . 3
Temperature in the charge tube TQ = 308 K
The notation used in the following sections is shown in Figure 2. The slight deviation from the termino-logy commonly used, results from the L u d w i e g - Tube concept.
4 .2 Tube M a c h Number
The ratio of test section area F to tube cross section F^g can be obtained for a given tube M a c hNumber and a test-section M a c h Number of M^ = 1.0 from standard gasdynamic flow tables. Here
01 Ui °™ U™F/F. . = — - - - (M, = 0 . 3 ) / — - 22. (M = 1) = 0.4914
tube POI a01 1 p01 a01 co
The area ratio allows the computation of the tube M a c h Number for a given test section M a c h Numberwith the aid of the following equation
p • U p • U0 . 4 9 1 4 - — - — (M ) = — - - — = f (M, (M )) (2)
P o l ' a01 °° P0l ' a01 ' °°
Figure 4 shows the variation of the tube M a c h Number with M^ •
4. 3 Stagnation Temperature
The specified storage temperature of T' = 308 K is somewhat arbitrary, however, this temperaturerepresents an upper limit, which is reached under unfavourable weather conditions which affect thecooling and drying processes.
The ratio of stagnation temperature TQ! to storage temperature TQ is for the L u d w i e g - T u b e tunnela function of the tube M a c h Number Mj
-T01 1 + " M 1_5^ = _ t _ L_ (3)T1 v 1 2T0 (1 +^-1 Mjr
Figure 4 shows the variation of stagnation temperature TQJ (in Centigrades) with MQQ.
4. 4 Pressure Range
The maximum stagnation pressure was, selected to be poj = 7. 0 bar. The relation between charge andstagnation pressure for a L u d w i e g -Tube tunnel is
^P01 1 +*^- M* y- 1
£7- = 1 .!- M 2 j <4)
Equation (4) allows the calculation of the charge pressure corresponding to (POl)max at Mco = 1- 0:
PO = 10 bar.
The stagnation pressure that can be achieved with this charge pressure is plotted in Figure 5 as functionof MQQ. The lower limit in stagnation pressure results from the requirement of being able to start thetunnel. The minimum stagnation pressure at MQJ, = 1.0 is, assuming atmospheric exhaust (Case 1) anda well designed diffusor, p01 min = 1 . 5 bar. The corresponding charge pressure ist pQ = 2. 12 bar. Thelatter determines the lower boundary of the stagnation pressure range. Also plotted in Fig. 5 ist therange of dynamic pressure q^,.

2-6
4. 5 R e y n o l d s Number, Test Section Area and Tube Diameter
With the aid of the design R e y n o l d s Number of Remax = 46 • 10^ one can now easily determine thetest section area F. At a M a c h Number of M^ = 1 . 0 (T0i = 279 K, poi = 7. 0 bar), the unit R e y n o l d sNumber is Rem = 109. 5 • 106 m -1.
This results in a test section area of
' *° ' Re = 4 .2 m (5)
The R e y n o l d s Number range of the tunnel is shown in Figure 6. The characteristic length here is1/10. vF. At higher M a c h Numbers, 1 /12.vF is sometimes used. The R e y n o l d s Number rangecorresponding to the latter is indicated by the dashed line.
Tube cross section area and tube diameter can now be derived from the known test section area F andthe ratio F/Ftube.
F. , = F / 0.49139 = 35.898m 2 - fc-D t, = 6 . 7 6 mtube ' tube
4. 6 Run Time, Charge Tube Length
The actual run time r can be determined from the given dimensionless run time f .
T = r • F / U = 9.61 sCO
The length of the charge tube L^ corresponding to a given T may be obtained with the aid of
5 + 5 MLl = T ' a6 ' 10 + 6 M l
(6)
For a tube M a c h Number of Mj = 0 .3 , ag = 351.8 m/s and T = 9. 61 s, the charge tube length be-comes : LI = 1862 m.
Fig. 7 shows the actual run time ^ versus test section M a c h Number MQQ.
5. ENERGY - AND POWER - REQUIREMENTS
In considering the energy requirement of the tunnel, which is essentially given by the necessity to gene-rate compressed air and move it into the charge tube, one must destinguish between two cases (seeSECTION 3)
Case 1 The tunnel discharges downstream of the diffusor into the atmosphere, thereby wastingthe energy still present in the air. The air consumption is identical to the amount goingthrough the test section. The compressor recharges the charge tube by taking in air fromthe atmosphere.
Case 2 The air is discharged downstream of the diffusor into a second tube (recovery tube).During this process, a shock wave travels into the tube whose length L,^ is dependent onthe desired run time T . Here, one has a closed system with energy losses essentiallyrestricted to the total pressure losses occuring in the test section and diffusor. The com-pressor has to pump a certain amount of air from the recovery tube back to the chargetube.
The determination of energy and power requirements makes it necessary to consider mass flow andpressure ratios for both cases.
Case 1 The mass flow through the test section during a run is
m. = p U F • T. (7)test oo co

2-7
Figure 8 gives an indication of the rate of mass flow through the tunnel. If one assumes 3 runs per hour,the air corresponding to mtest must be replaced within 20 minutes. This requires a compressor massflow rate of
m = m. J12QO [kg/s] (8)comp test' i « = / J
During a run, the charge pressure drops theoretically to 0. 5 p'g (Eqn. (4)). However, considering un-
avoidable losses due to leaks, the pressure will. Under maximum conditions, drop further to aboutPterm = 4. 5 bar. The compressor must increase the pressure during the recharging process fromPterm to PO • Tne amount of energy per second required during the recharging period is, assumingsingle intercooling during compression,
dE /dt = _ 2 L T . R . m' -
.ad' y - 1 at comp I p
Ell
Assuming now a linear increase of charge pressure with time, one obtains by integration
3y- 1 3y- 1
E „ I-?*. T . R . m f - PJ*—. (A ^ -(!*2EHL) 2* ) - l ] (10)r.y-1 at test [ pQ -Pterm 3y- 1 Pftt pat J
The power, N, to be installed depends on the final pressure ratio Po/Pat ant^ *ne rate of mass flow
N = •'-r T ' R ' m j ( ) - 1 f (11)71 y- 1 at comp I p J
The following table lists the performance data (efficiency of compression r\ = 0.8) for Case 1 atM~ = 0 . 8 and M~ = 1.0
MCO
0.8
1.0
mtest
kg
277 500
284 500
mcomp
kg/s
231. 0
237. 0
E
kWh
18 200
18 700
N
kW
65 800
67 500
Case 2 The addition of the second tube does not affect the test section flow. It serves only to reducethe energy consumption. Its treatment was, therefore, postponed up till now. Nevertheless, the determi-nation of the pressure ratio and the mass flow makes it necessary, to consider briefly the conditions inthe recovery tube.
Subsequent to the start of the tunnel (opening of the quick opening valve), three distinct areas exist inthe second tube (Fig. 2 ) :
a) Upstream of the Shockwave : The air is at rest under the conditions (PQ, TQ )set prior to the start of the tunnel.
b) Immediately downstream of the Shockwave : The shock has caused an increase in totalpressure and total temperature. The following equations allow a determination of the stagna-tion conditions in this regime.
T03 _ 1 +^i~ M3 (12)T" v- 1 2
0 <1 - V M3 '
p03 _ r1 + V M 3 ^ ^ (13)

2-8
c) Immediately downstream of the diffusor : The flow through the test section of a windtunneldoes not effect its total enthalpy. Accordingly, one may write for stagnation temperatureand speed of sound Tg2 = TQJ and a02 = agj respectively.
The tube M a c h Number M2 can be derived from standard gasdynamic tables with thestream density P2 U% /pQ2 a02 as mPut< where P2 13% follows directly from the mass flowmtest an^ *ne chosen area of the secondary tube while po2 can be computed by means of thetotal pressure losses in the test section using the simple relation
"02P02
A jump in temperature separates this area c) from area b). Velocity and static pressureremain unchanged in going from b) to c). Tube M a c h Number and total pressure changeat the contact surface according to the following relations
M2M = -—————.—-^—=-— (16)J r^r\\ '
0T02
02
Thus, all changes in conditions at the two boundaries are known. The tube length L,2 rnay now bederived from
25 - 4M2
L 2 O ' ' 10 ( 5 - M J«J
The known run time T ensures the correspondence of L^ and L2-
Now the calculation of energy consumption and power requirement is given for a test section M a c hNumber of Mm =0.8.
P02Pressure loss in the test section: - = 0.819 - *• p „ = 5. 76 bar
from Eqn. (15) Mg = 0.361
" (16) Mg = 0.318
(17) pQ3 = 5. 64 bar
" (13) p» = 3. 32 bar
" (18) L- = 1781 mtt
Thus, both the pressure in the recovery tube prior to the start of the tunnel (which is equal to the mini-mum starting pressure) pg, and the tube length L2 are known.
During a run, the pressure in the recovery tube increases according to Eqn. (13) while the pressure intube 1 decreases according to Eqn. (4). After the run, the pressure in tube 2 is, in the present example,higher than in the charge tube. It is possible, therefore, that, during a pressure equalization process,a part of the air m^est flows back into the charge tube. The system pressure after equalization is
p = 6. 64 bar*m
The amount of air, remaining to be transfered back to the charge tube, is
Am = 239 900 kg
The compressor must now pump this amount from 2 to 1 ; the pressure in 1 increases during this processwhile the pressure in 2 drops. The pump energy can be determined from

2-9
t• R • T / ( " ... ) - 1 m • dt (19)
J I PQ (t) J comp0
The pressure ratio is comprised of two time-dependent pressures. Assuming a linear variation of thepressures ( t j = 20 min), one obtains by means of graphic integration for the pump energy required atMm = 0 . 8 (T? = 0.8).
E = 3980 kWh
The corresponding calculation for M = 1 . 0 yields
E = 4440 kWh
The power, N, to be installed is determined by the maximum pressure ratio
1 2v f Pn 2y 1N = - — f — • R • T • m • (—£-) - 1 } (20)
Tt y - 1 comp { p" max j
This pressure ratio will occur at M,.,-, = 1 . 0 and the calculation for these conditions yields
N = 29 100 kW
The following table lists the performance data (efficiency of compression T? = 0.8) for Case 2 atMQO = 0. 8 and 1. 0. The data in parenthesis are for Case 1.
M m E Noo comp
kg/s kWh kW
0.8 200 3 980
(231) (18 200)
1.0 208 4 440 29 100
(237) (18 700) (67 500)
The results of the preceding computations are summarized in APPENDIX 1 .
6. DESCRIPTION OF THE PROPOSED PLANT
6. 1 Survey of the Plant
Characteristic of a L u d w i e g Tube (Fig. 1) is the longcharge tube (1). After opening a valve, a flow isestablished from the charge tube through the nozzle into the test section (2) and further into the open air(or into a second tube). For a L u d w i eg Tube, no moving parts or regulating devices are required tomaintain constant flow conditions after starting.
For L u d w i e g Tubes operating at subsonic and transonic speeds the outlet valve is suitably locateddownstream of the test section in order not to impair the flow uniformity by any disturbing devices.
With this arrangement of the outlet valve, the pressure within the test section is - between runs - thesame as in the pressure tube. In order to enter the test section, the pressure must be released. Iffrequent access to the test section is necessary a test section isolation valve should be provided upstreamof the test section, so that only the test section has to be discharged while the remaining energy in thepressure tube is saved.
The high pressure air supply is provided by a compressor plant (3). The air enters the tube at the endopposite of the test section. For large facilities, 'the whole compressor plant will be located at thisplace.

2-10
The buildings (4) with installations for signal handling, data acquisition and processing and operationcontrol are close to the test section.
In the following sections it will be outlined, how a L u d w i e g Tube with the dimensions given inAPPENDIX 1 can be realized.
6. 2 Proposed Construction Elements
In order not to depend on mere estimations concerning the technical realization of the plant, a number ofmanufactures with special practice in the field have been asked to issue specified proposals to solve thedifferent problems. In view of the restrictions under which the present study had to be accomplished onlyrough schemes could be established. Previous experience with the consulting companies let expect, thatonly proposals were made which render possible the solution of remaining detail problems.
6.2.1 Charge Tube and Test Section
The charge tube is 1862 m long and 6. 76 m in diameter. There are no special requirements on the tube,except that its inner suface should be hydraulically smooth, which can be achieved by coating the other-wise untreated surface.
Furthermore, the tube should be protected against sunlight by a light roofing in order to avoid non uni-form heating of the tube and a resulting temperature gradient within the stored air. For details seeAPPENDIX 2.
The test section unit consists of the following elements :
Nozzle and test section isolation valve,Transonic test section,Model mount,Quick opening outlet valve,Choke.
A view of this unit is given in Fig. 9. Its length in 68. 9 m. The nozzle entrance is directly attached tothe end of the charge tube.
A predominant facility requirement is, to comply with static requirements as well as with aerodynamicneeds (as simulation range and transonic properties) and operational demands (as quick achievement ofsteady flow conditions). The entire unit between storage tube and outlet valve downstream of the modelmount is normally at operating pressure of max. 10 bars.
7Consequently the structure is subject to axial forces of more than 3 • 10' N. To avoid expensive forcetransmitting constructious, the structure had to be designed in a way that the stress flux is not disrupted.All elements of the unit are therefore placed inside of a continuous tube to guarantee a simple stressflux.
A fixed nozzle connects pressure tube and transonic test section. Supersonic test M a c h Number up toMQP = 1 . 3 can be achieved by wall suction and variation of wall angles.
The test section isolation valve at the end of the nozzle allows access to the test section with high pressurein the charge tube and makes it possible to conserve large amounts of energy. The isolation valve is de-signed in a way that the flow is not impaired when the valve is in its open position.
The test section is not quadratic but a dodecagon (ref. to Fig. 10). By this means the dead volume be-tween test section walls and surrounding pressure tube can be minimized. This is important to keep thetunnel starting time as short as possible. Also, pressure loads on the test section walls are easier tohandle. The single wall elements are smaller and can be manufactured more easily and at less expense.The inclination angle of the twelve wall elements is adjustable and the permeability of the perforatedwalls can be varied.
The entire wall structure is self supporting. It can be moved 5. 5 m upstream and the mounted modelbecomes accessible from a working platform which is shifted under the model through a door in thesurrounding pressure tube (Fig. 10).
The model mount has to withstand forces up to 3 • 10^ N. It is supported by a separate foundation, whichis independent on the rest of the tunnel structure. An hydraulic cylinder carries the dead weight of themodel mount; the angle of attack of the model is varied by means of a second cylinder. The position ofthe centre of motion of the model can be varied, too.
The independent foundation of the model mount minimizes the transmission of vibrations from the tunnelstructure onto the model.

2-11
The fixpoint of the facility is located at the housing of the outlet valve. This outlet valve is driven by thepressure difference between charge and atmospheric pressure. Opening times of less than one secondcan thus be obtained easily. The test M a c h Number can be preselected by setting the limit plug position.Suction rate -at the test section walls may be adjusted by means of a group of special throttle valves.
The outlet valve is integrated into the central body of the choke. The choke allows to run the tunnel atlow stagnation pressure and therefore extends the range of R e y n o l d s Number of the facility.
The outblow of the tunnel is axisymmetric. Thus there is no objection to the attachment of another storagetube downstream of the diffuser, a "recovery tube". The operating principle of the recovery tube is thesame as that of the L ud wie g Tube.
All units were designed under consideration of present day technologies in spite of the extreme facilitydimensions.
6 . 2 . 2 Compressed Air Supply
Pumping power requirements for a facility with only one tube are very high. Nevertheless, pumping powerrequirements can be matched by approved standard compressors, which meet the requirement of highreliability of the plant.
It is suggested to utilize sets of two or three independently driven motorpump units. The units can beconnected in series or parallel in order to obtain partial load operation with good effeciency. The use 6fseparate compressor units favour multi stage air cooling for high thermic efficiency. The use of separatemotors facilitates operation of the plant.
Utilization of electric power has been assumed although under certain conditions other kinds of drivingpower may be advantageous. The pressure ratios of the single compressor units are chosen so that iden-tical motors may be used. Details are listed in APPENDIX 2.
Before the pressurized air is filled into the charge tube, it must be cooled and desiccated. Coolers havebeen offered together with the compressor plants (see APPENDIX 2). A quotation for a desiccating plantis given in APPENDIX 2.
6.3 Estimate of Costs
6.3.1 Construction Costs
In order to estimate the construction costs of the suggested facility, two different groups of constructionelements must be distinguished.
First, there are those elements of the plant whose design data, dimensions, and characteristics aredetermined solely by aerodynamic and operational requirements. Only for these elements definite offerscan be obtained. Examples are the charge tube, the test section and the compressor plant.
On the other hand there are elements whose design depends to a high extent on climatic and geologicconditions of the construction site. For this group of elements only tentative cost estimates can be given.Here we have the costs for cooling water supply, for land acquisition, foundations and buildings. Thesignal handling equipment depends very much on individual needs and conceptions and can, therefore,only poorly be estimated, too.
For the first category, the following offers have been submitted (APPENDIX 2).
1. Charge tube 26 .0Mio. DM2. Test section 25. 0 Mio. DM3. Compressor plant 11.5 Mio. DM
62. 5 Mio. DM
These costs are valid for a facility with one tube only. For a facility with charge tube and recovery tubethe costs for the recovery tube must be added, i.e. an amount about equal to the costs of the charge tube.The costs for the compressor plant, on the otherhand, will be reduced in this case, so that a total increaseof about 20. 0 Mio. DM will result.
Regarding the costs of the elements of the second category the following figures are considered to givethe correct magnitude :

2-12
1. Buildings and foundations 11 Mio. DM2. Land acquisition 3 Mio. DM3. Cooling water supply 1 Mio. DM4. Data acquisition equipment 5 Mio. DM
20 Mio. DM
The following analysis of the expected standing charges are therefore based on total costs of 80 Mi. DMfor a one tube facility or 100 Mio. DM respectively for a facility with two tubes.
6 . 3 . 2 Standing Charges
After a detailed estimate of the construction costs we will now briefly consider the standing charges.
From a business point of view, both, operating expenses and capital costs, are part of the standingcharges.
Frequently only operating costs are considered at installations funded by the government. Since thisgives important distortions of the calculation, both kind of costs are taken into account in the presentstudy.
Operating costs : The operating costs of a windtunnel facility consist in essence of three parts
- labour costs- power charges- materials (new equipment, repairs, replacements etc. )
The expenses depend strongly on the frequency and mode of operation. In a paper by R. H i l l s [10],e .g. , it is suggested to take a productivity of 5000 polars per year at maximum R e y n o l d s Number(six-component force measurements, pressure distribution measurements and miscellaneous tasks).It should be possible to achieve this productivity with a staff of 100 people of different qualification in asingle shift plus some overtime (about 2000 h occupation time of the tunnel) [10].
Based on the German labour conditions, one must consider an average salary of about DM 25. 000,-- p. a.for every employee.
Concerning electricity costs, it is common practice of the German power companies to make a maximumdemand charge based on the maximum power taken during any quarter of an hour during the year (DM/MWand year) and a mega-watt-hour charge for the actual power consumed (DM/MWh).
But a well balanced relation between the maximum demand charge and the actual power charge, which isnormally subject to an individual contract with the power company, leads to an average power charge ofDM 120, - /MWh (including maximum demand charge) based on present day prices.
The material costs under the operating conditions considered can amount to as much as DM 1. 5 Mio.(according to H i l l s [10]).
Capital costs : The capital costs are determined by the amount of investment and consist of depreciationand running interest. The capital costs are independent of the operating conditions.
The depreciations are established so, that after ten years the tunnel will be written off (i. e. 10 $ p. a.),and the rate of interest is fixed at a value of 8 <fo p. a.
All costs are based on a productivity of 5000 polars per year and related to a single polar.
The two cases of tunnel design, which were described in detail in the previous sections, are regarded inthe following tables.
For Case 1 the construction costs amount to DM 80. Mio. ; for Case 2 the construction costs amount toDM 100. Mio. ; however, the higher amount of investment yields, compared to Case 1 an essential reduc-tion in power charges.
The comparison of costs shows that, at the specified operating conditions (5000 polars per year at maxi-mum R e y n o l d s Number) Case 2 is to be preferred in spite of the higher initial investment. (APPENDIX3).
Changes in operating conditions, however, (e.g., only a small part of the total productivity is done undermaximum conditions or the number of polars is substantially decreased) can change the superiority ofCase 2.

2-13
7. CONCLUSIONS
This paper presents a review of the basic requirements that are to be satisfied by a common Europeantransonic windtunnel. It is shown in turn that all the requirements can be satisfied perfectly by aL u d w i e g Tube tunnel. Subsequently, a project proposal is given for a L u d w i e g Tube, that can beoperated in the M a c h Number range from M^, = 0. 3 to Mm = 1 . 3 at a maximum R e y n o l d s Number(based on mean wing chord) of 40 Million, with a stagnation pressure of 7 bar. The tunnel run time is10 sec. The tunnel has a test section area of 4. 2 x 4. 2 m^, a charge tube of 1860 m length and 6. 76 mdiameter. The tunnel blows either into the open air (Case 1) or into a recovery tube of about the samesize as the charge tube (Case 2). In Case 2, the recovery tube is charged just so much, that the tunnelcan still be started. The pressure at the diffusor exit remains constant during the full run time, whena shock wave travels along the recovery tube and back according to the principle of the tube tunnel.
The alternative Case 1 has the advantage of lower construction costs while Case 2 provides essentialsavings in operating costs. The energy costs, which are, for a tunnel of this size, the main portion ofthe operating costs, can be reduced by about 75 $ to 80 $ when Case 2 is utilized. Part of the additionalconstruction costs for the recovery tube are made up for by savings in the compressor and air dryersystem. Another advantage of Case 2 is, that noise emitted into the environment is effectively dampedwithout additional expenses for an exhaust silencer.
A L u d w i e g Tube of the described type is characterized by its simple construction which guaranteeshigh reliability and a flow free of low frequency oscillations. Except for a simple quick opening valve- for which there are no special demands concerning the time law of the opening process - there are nomoving parts that could cause failure. Stagnation pressure and temperature are kept constant withoutregulation merely by utilizing the principle of the L u d w i e g Tube. None of the tunnel components goesbeyond present day technology or require special developing effort. There is no need for a demonstratortunnel because every desired information can be delivered by existing L u d w i e g Tubes.
Finally, an estimate of construction and operating costs, based on specified bids of leading companies,is given.
PART B
8. PRELIMINARY REMARKS
During the course of the discussion on LaWs Paper No. 98 (PART A) at Rome, the authors were askedby the LaWs-Group to reinvestigate the development of instationary boundary layer in the charge tubebehind the expansion wave and, as there is a claim for a very clean flow within the test section, to reducethe tube M a c h Number if necessary.
Furthermore, the design data should be adapted to the final specifications stated by the Group, in orderto facilitate comparisons between different options.
9. ADAPTION OF DESIGN DATA TO BASIC LAWS-SPECIFICATIONS AND INFLUENCE OFREDUCTION OF TUBE MACH NUMBER
Independent of the driving mechanism of a tunnel, the run time and the utilization, for a proper tunneldesign it is necessary to fix at least three parameters of which only two are independent. These para-meters are the R e y n o l d s Number, the stagnation pressure, and the test section area.
During several LaWs-Meetings (Farnborough, Jan. 6 - 7 , and Porz-Wahn, Mai 9 - 10, 1972) specifi-cations were discussed but not stated. The proposal for a L u d w i e g Tube windtunnel as outlined inPART A was based on these first estimates, and the derived performance data are summarized inAPPENDIX 1.
Specifications were stated at the Rome Meeting of the Group (July, 5 - 7 , 1972) :
C
R e y n o l d s Number Re = 40 • 10(based on 0. 1 <\/F~' at M^ » 0. 9)
Stagnation pressure (normal) PQJ = 7 bars
Stagnation pressure (maximum) pgi * 11 bars
M a c h Number capability Moo < 1.3
Number of runs per hour n = 5 h
Run time (clean flow) T = 10 s
Test section : rectangular, aspect ratio 4 . 2 : 5

2-14
,At the end of September, 1972, data were communicated by R. H i l l s , which were claimed to be thefinal specifications of the Group, and which state
Stagnation pressure P01 = 6 bars
Test section area F = 4 . 2 m x 5 m
In the following, we refer to these data as the final specification.
Further, to obtain very small influences of the tube wall boundary layer on the test section flow, thetube M a c h Number is reduced from Mj = 0.3 to Mj = 0 .2 .
Although the flow quality which can be achieved with a tube M a c h Number of Mj = 0. 3 seems fullysufficient in our opinion (see PART A; Fig. 3) we would like to give some estimates on the improvementsobtainable by decreasing the tube M a c h Number to Mj = 0. 2. A computation as given in PART A,SECTION 3, based on the same assumptions, yields a velocity profile in the test section with relativevelocity variations of less than + 0. 25 $ within 67 $ and less than + 0. 5 $ within 92 <f0 of the test sectiondiameter (Fig. 11) . These deviations, however, do not occur until towards the end of the run time.
The above considerations show that a decrease of the tube M a c h Number yields a considerable improve-ment of the spatial uniformity of the velocity within the test section. The tube M a c h Number has thusbeen assumed to be
Tube M a c h Number Mj = 0 . 2
All these informations now form the basis for a new computation. The results for pgj = 6 bar as well asfor pQ1 = 7 bar are summarized in APPENDIX 1.
Regarding the costs quoted in PART A , the following should be noted.
The claim for a rectangular test section gives an increase of the costs of this part of thetunnel. But a realistic estimate of the costs can be made only after a new engineeringstudy, which is not available at present time.
The fcompressor plant will change essentially, according to new requirements caused bythe recovery tube. Since the total power decreases, the price will decrease, too.
The price for the charge tube depends on the steel consumption only. Taking the originalprices quoted in the report, it is possible to get anew price estimate by means of thefactor f
L p0 D 2f = — — ( — )
Ll PUI Dl '
where L is the tube length, pg the charge pressure, D the tube diameter and thesubscript 1 means the characteristics of the already quoted tube.
The following table gives the factor f for the cases considered.
p.. 6 bar 7 bar
f 1.50 1.26
The diameter of the recovery tube can be chosen independently of the M a c h Numberwithin the charge tube and therefore gives no increase in price.
10. REFERENCES
[1] Ludwieg, H. Der RohrwindkanalZ.f . Flugwiss. Vol. 3 (1955), p. 206 - 216
[2] Whitfield, J.D. High R e y n o l d s Number Transonic Wind Tunnels-SlowdownSchueler, C. J. or L u d w i e g Tube?Starr, R. F. AGARD Conf. Proc. No. 83 (1971), p. 29 - 1 to 17
[3] Dietz, R.O. AGARD Study of High R e y n o l d s Number Wind Tunnel Requirementset. al. for the North Atlantic Treaty Organisation Nations
AGARD Conf. Proc. No. 83 (1971), p. 32-1 to 9

2-15
[4] Evans, J.Y.G.
[5] Poisson-Quinton, Ph.
[6] Evans, J .Y.G.Taylor, C. R.
[7] Piltz, E.
[8] Becker, E.
[9] Becker, E.
[10] Hills, R.
A Scheme for- a Quiet Transonic Flow Suitable for Model Testingat High R e y n o l d s NumbersAGARD Conf. Proc. No. 83 (1971), p. 35-1 to 5
Note sur la conception d' un grand centre aerodynamique pouressais en sub-transonique et en supersoniqueLaWs-Paper No. 31 (1972)
Some Factors Relevant to the Simulation of Full-Scale Flowsin Model Tests and to the Specification of New H i g h - R e y n o l d s -Number Transonic TunnelsAGARD Conf. Proc. No. 83 (1971), p. 31-1 to 13
Druckanderung als Grenzschichteffekt im RohrwindkanalThesis Abstract D 17, Darmstadt 1971
Das Anwachsen der Grenzschicht in und hinter einer ExpansionswelleIng.-Arch. Vol. 25 (1957), p. 155- 163
Reibungswirkungen im RohrwindkanalMitt. Max-Planck-Inst. /Aerodynamische VersuchsanstaltNo. 20 Gottingen 1958
Comparison of Tunning Costs of Transonic Tunnels (Revised version)ARA MEMO No. 126LaWs Paper No. 49 (1972)
LIST OF FIGURES
FIG..
1 Transonic L u d w i e g Tube
2 Scheme of Flow Cycle
3 Normalized Velocity Distribution in the Charge Tube (dotted line) and in theTest Section (drawn line) at the End of the Observation Time. Mj = 0. 3 (M^ = 0. 9)
4 Variation of Tube M a c h Number and Stagnation Temperature with M a c h Number
5 Variation of Stagnation Pressure and Kinetic Pressure with M a c h Number
6 R e y n o l d s Number Capability of the L u d w i e g Tube Project
7 Run Time of L u d w i e g Tube Versus M a c h Number
8 Rate of Mass-Flow Through Nozzle Versus M a c h Number
9 Project: Test-Section of L u d w i e g Tube
10 Project: Test-Section of L u d w i e g Tube, Profiles
11 Normalized Velocity Distribution in the Charge Tube (dotted line) and in the Test-Section(drawn line) at the End of the Observation Time. Mj = 0. 2 (M^ = 0. 9)

2-16
APPENDIX 1 Results of thewith Recovery
Gasdynamic Calculation for the L u d w i e g TubeTube
a.) Design Parameters
R e y n o l d s Number(based on 0. 1 VFDimensionless run time
Total run time
Storage temperature
M a c h Number range
Number of test per hour
Tube M a c h Number
Stagnation pressure
3) Derived Parameters
Test section area
Charge pressure
Run time
Diameter, tube 1
Diameter, tube 2
Length, tube 1
Length, tube 2
Energy consumption each test
Power requirement
Design conceptgiven in PART A
at MQO
Re
rT
ToMcon
Ml
POI
F
POr
DlD2LlL2E
N
1.0
46 • 106
700
-
308
0.3 - 1.3
3
0.3
7.0
17.64
10
9.61
6. 76
6.76
1. 862
1. 781
4 440
29 100
Design concept according toLaWs-Specifications (PART
0.9
40 • 106
-
11
308
0 . 3 - 1 .
5
0.2
6 .0
20.5
7.7
-
8. 76
8.00
2.073
2 023
4 600
55 100
3
7. 0
14.9
8.9
-
7.46
7.00
2.073
2 020
3 800
45 500
B)
-
-
s
K
h"1
-
bar
2m
bar
s
m
m
m
m
kWh
kW
APPENDIX 2 Quotations for Charge Tube, Test Section, and High Pressure Air Supply
I. Charge Tube
(Turbo Lufttechnik GmbH., Zweibriicken, Quotation No. 65168)
Design Data : Length of cylindrical tube
Inner diameter
Thickness of wall
Distance of supports
Max. operating pressure
1 780 m
6. 76 m
mm24.5
49
10
m
bar
Extent of Quotation : Tube, propping belts, supports, protection roof over total length, freight andassembling costs, conservation..
Estimated Costs : ca. 26. 000. 000,-- DM
II. Test Section
(Hausammann + Isler, Consulting Engineers, Zurich, Quotation of May 31, 1972)
2Design Data: Area of test section 17.6
Diameter of test section (Dodecagon) 4. 7
Total length(nozzle entrance to choke exit)
Max. operating pressure
Weight ca.
Extent of Quotation : Corresponding to Fig. 9 and 10
Estimated Costs :
m
m
68.9 m
10 bar
1 6000 Mp
ca. 25.000.000,-- DM

2-17
III. High Pressure Air Supply
(Assuming tunnel without recovery tube)
III. A Version 1 (2 Units)
(DEMAG AG. , Duisburg, Quotation No. 9181/5786
Low Pressure High Pressure
Design Data: Compressors 1 x Ax 600 - 8V8 1 x Ax 250 - 8V8
Intake mass rate 240 240 kg/sQ
Intake volume 716 700 236 500 m /h
Intake pressure 1.0 3 .2 bar
Outlet pressure 3.3 9.9 bar
Outlet temperature 146 161 °C
Revolutions 3 000 4 700 rpm
Power requirements 32 600 32 700 kW3
Cooling water requirements 5 400 m /h
Cooling water temperature 20 C
Extent of Quotation : 2 compressors plus accessories, 2 electric motors of 36 MW each,2 transmissions, lubricating oil supply, air filter, coolers, connecting pipers.
Estimated costs : ca. 10. 000. 000,-- DM
III. B Version 2 (3 Units)
(GUTEHOFFNUNGSHUTTE AG. , Sterkrade, Quotation m 72/10 181a)
Low Pressure High Pressure
Design Data: Compressors 2 x Agr 12/12L 1 x Agr 11/7L(in parallel)
3Intake mass 350 000 each 700 000 Nm /h
Intake pressure 0.98 bar
Outlet pressure 9.8 bar
Outlet temperature (cooled) ca. 30 C
Revolutions 3 000 3 000 rpm
Power requirements 67 800 kW
Power of motors 27 000 27 000 kW
Extent of Quotation : 3 compressors plus accessories, 3 electric motors of 27 MW each, coolers,connecting piper, transformer.
Estimated Costs : ca. 13. 500. 000,-- DM
IV. Air Desiccation Unit
(SILICA GEL GES. , Berlin, Quotation No. 8012)
Design Data: Mass rate 230 kg/s
Operating pressure 4 . 5 - 10 bar
Max. intake temperature 30 C
Intake humidity saturated
Outlet humidity (dew-point at 1 bar) -40 C
Operating capacity 5 h
Regeneration time 10 h
Construction 5 adsorbers in parallel
Length 14 m
Diameter 2.8 m

2-18
Extent of Quotation : 5 adsorbers incl. regeneration units, filling with Silica Gel KC-desiccatingpebbles, assembling costs, thermic isolation, motors.
Estimated Costs : 1.400. 000,-- DM
APPENDIX 3 Standing Charges (Operating Costs and Capital Costs) of theL u d w i e g Tube Facility Proposed in PART A
Kind of Charge
Operating costs : Labour costs
Power charge
Materials
Total operating costs :
Capital costs : Depreciation
Interest
Total capital costs
Total standing charges
unit charge
DM 25.000,-- /man and year
DM 120, --/MWh
D,M 1. 5 Mio. p. a.
10% p. a.
8 % p. a.
Case
expensejer polar
0.02man, year
18. 7 MWh
-
-
-
-
-
1
costs perpolar
500,--
2 .240 , - -
300,--
3. 040,--
1.600,--
1.280,--
2.880,--
5.920,--
Case 2
expenseper polar
0.02man, year
4. 5 MWh
--
-
-
-
costs perpolar
500,--
540,--
300,--
1.340,--
2 .000, - -
1. 600,--
3.600,--
4.940,--

TRANSONIC LUDWIEG TUBE
GENERAL SURVEY OF PLANT
2-19
3 COMPRESSOR PLANT COOLING WATER
•i SIGNAL CONOITIONING . DATA PROCESSING
AND OPERATION CONTROL
2 TEST SECTKW { PECOVEW TUBE )
NOZZLE TEST SBn WIVE • DIFFUSOR RECOVEJW TUBE
7.*Sm*7
DETAIL OF TEST SECTION *>rsoo
NOZZIE TEST SECTION MOD MOUNT START WUVE DIFFUSOR
Fig. 1: Transonic L u d w i e g Tube
15 *orstagnation pressure p-' i %
. \
^o nr" -._ J JL-1
stagnation temperature TQ g TQ;
stagnation density § 9gj
static pressure J p.
static temperature f*
velocity
velocity of
awnd OQ
MQC/I -namOer
dynamc pressure
UJ
M,
<*» i
"" 11
-
1
r02 | fe S rfl"
)? W %3
P- P? & P3r. ^ s T3
Um U2
Mm M2
9.
U3
M3
°o"
Fig. 2 : Scheme of Flow Cycle

2-20
^»
(F-
^^^
At
'
"£:
~
-i 7%
*--*os
0 -Qft -0.6 -Q< -Q
— — charge tube
/Ifl
/)fi
V.-Q<
rt?
— —
t
? 0 Q
M, = 0,3 |
^^^^^B —
.
~
\
I
*
? O/ QS 0.8 U
*"R
Fig. 3 : Normalized Velocity Distribution in the ChargeTube (dotted line) and in the Test Section (drawnline) at the End of the Observation Time.Ml = 0. 3 (Mo-, = 0 .9 )
M,
)1
Q2 /
\\
Storage
A
/
\\
Temper
^
^
ature t ?'
rut
s«
e-Macl
ignation
mumber
Temper
M,
Ountg
toOxri
SO
25
"HI
"01
P0'-tO bar
P0' -10 bar
0.3 0.5 0.7 0.9 I.I 1.3 -Mm0.3 as 0.7 as ;.; 1.3
Fig. 4 : Variation of Tube M a c h Numberand Stagnation Temperature withM a c h Number
Fig. 5 : Variation of Stagnation Pressure andKinetic Pressure with M a c h Number

2-21
Re-)
\a>
30
X
m
u'6
0.
- Ktynoldinumton O.I -V
- Reynoldsnumlbastd
on 0083- V
.3
/
///
1
/
//
^^^
/
f /—t—/ ~/
/,/
jrj*
<er_ 6os
>/
/
forage
'o'
/
^
td
^'/
tempera
• 3S°C
^-—
""
-— -
-—
ture
—
UI"
rage pn-lOb
ssun~or
1 Storage pressure[ P0 ' - S bar
.1*.
' "0
•age pn'2.12
tssunbar
>" O5 0.7 0.9 1.1 13 ^-«.
Fig. 6 : R e y n o l d s Number Capability ofthe L u d w i e g Tube Project
\Tube-Length i,« 1862 m \
O.I 0.6 0.8 1.0 12 U
mf*9 SK]
/
/
^
^
/
^
^ "
x^
^
— -. V
V
"o'
• X) to
- S bai
- 2.12 t tar
0.3 0.5 o.? as ;.; 1.3 •• M.
Fig. 7 : Run Time of L u d w i e g Tube VersusM a c h Number
Fig. 8 : Rate of Mass-Flow Through NozzleVersus M a c h Number
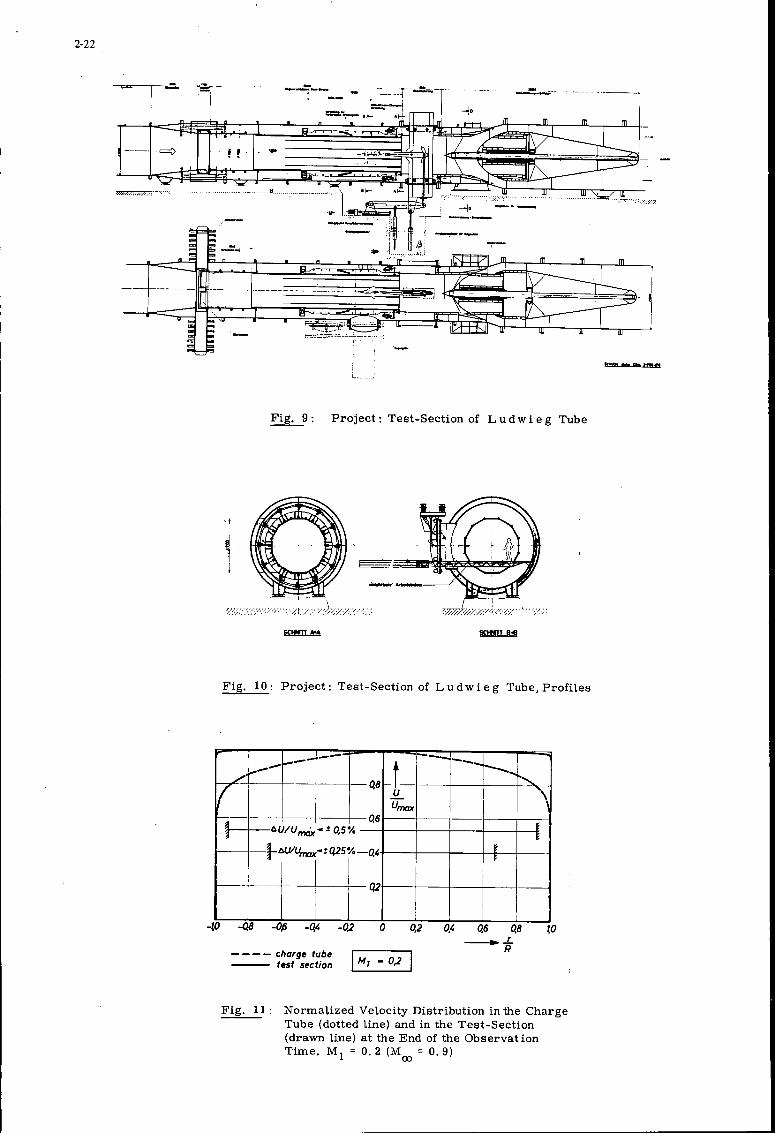
2-22
Fig. 9 : Project: Test-Section of L u d w i e g Tube
SCHMTT »A
Fig. 10: Project: Test-Section of L u d w i e g Tube, Profiles
,x-f\1
0 -fl
^*"
,A(,
a -o
ktfCL^
6 -0.
,~~*~~
- ± OS
^ -a
no(40
n/rt
/„ .n/
2 e
tuUmax
> Q2 0
— — -.
< 0.
""" *s,
.
S 0
1.
\f
*
B U
charge tubetest section
..L/?
Fig. 11 : Normalized Velocity Distribution in the ChargeTube (dotted line) and in the Test-Section(drawn line) at the End of the ObservationTime. M, = 0. 2 (M = 0. 9)
1 oo

3-1
THE DEVELOPMENT OP AN EFFICIENT AND ECONOMICAL SYSTEM FOR THE GENERATION OF QUIETTRANSONIC FLOWS SUITABLE FOR MODEL TESTING AT HIGH REYNOLDS NUMBER
P. fr. Pugh
Royal Aircraft Establishment, Bedford, England
SUMMARY
Current work on the development of the ECT drive system is reviewed. It is shown that this is aparticularly economical and effective means of providing a radical improvement in the Reynolds numbersat which transonic, wind-tunnel tests can be performed. Experimental trials which confirmed the practica-bility of the essential features of this system are described, and the problems of optimising the designof a particular wind-tunnel are discussed.
NOTATION
(see also Fig 10)
a initial acoustic speed in air in charge tube
A/
C pressure coefficient based on rms value of fluctuating component of the test-sectionstatic pressure and the dynamic pressure of the flow through the test-section
F. cross-sectional area of charge tube
L.J length of charge tube
M.. Mach number of flow in charge tube
M Mach number of flow through test-section
p . stagnation pressure of flow through the test-section
Ap pressure change effected by part of expansion wave
Ap^ total pressure change due to either the expansion or the compression wave
Ap pressure change effected by part of compression wave
A A.Apr » Apr etc peak to peak amplitude of disturbances of stagnation pressure due to imperfect wave
1 2 cancellation
R maximum usable Reynolds number (see section 5)
TQ initial temperature of air in the charge tube
t time elapsed since start of run
*e time at which the head of the expansion wave passes a station in the tube
t time at which the piston is released
T) energy efficiency as defined in section 16
TI mass efficiency, as defined in section 1
T duration of steady flow through the test-section
TO time taken, at start of the run, to establish steady flow in the teat-section
1 INTRODUCTION
The need for transonic wind-tunnels giving much higher Reynolds numbers than can be attained in exis-ting facilities is now firmly established1 . There can be little doubt that such new tunnels will be builtduring the next decade, providing that efficient and economical drive systems are used.
The extent of the improved performance that is required has been extensively debated1'2. It clearlydepends upon the anticipated nature of the workload of the facility. This report concentrates upon the

3-2
specification prepared by the LaWs group, although it should be noted that the general considerations areequally applicable to the design of less ambitious facilities - such as might be built as demonstratorfacilities or to serve some forms of research and development. The LaWs group specification calls for aReynolds number, based on 0.1 V test-section area, of kO x 10° at a test Mach number (M ) of 0.9 and arectangular test-section whose dimensions are 5m x 4.2m. For a stagnation temperature of 25°C, this cor-responds to a stagnation pressure of 6 atm. The maximum Mach number is 1.35 and runa of 10s duration arerequired at M^ = 0.9.
Unhappily, straightforward increases in the size of existing conventional continuously running wind-tunnels yields solutions which are quite unacceptable both as regards capital cost and peak power demand.For example a wind-tunnel with atmospheric stagnation pressure of the size required to meet the LaWs groupspecification would cost around £540011 and need a power supply of about 6000M1V. These astronomical fig-ures can be reduced by increasing pressure rather than size as a means of attaining higher Reynolds num-bers. However, there are limits to the pressures which can be used and the most economical design of con-tinuously running wind tunnel of this performance may cost around £150M and may require a power supply ofci round. 1 OOOMW,
Thus, the design of large wind tunnels has reached the end of one stage of its development. Oneroad is blocked by exorbitant running and capital costs. Some form of stored energy system (intermittentoperation) , in which energy is put into store at a modest rate and suddenly released over a short periodis necessary if the peak power demands (and, hence, running costs) are to be kept within tolerable limitsFortunately, the last decade, or so, has seen dramatic advances in experimental techniques. In particularthe rate at which aerodynamic data can be acquired has greatly increased. Thus, despite the tendencytowards more complex and demanding experiments, the utilisation and amount of testing in one year could beabout the same in an intermittent tunnel as in existing continuous wind tunnels1 »3.
While intermittent operation is a necessary condition of the achievement of acceptable costs it isn°*i ln.ltsflf> sufficient. Stored energy systems are less efficient than continuously operating systemsperforming the same function. They suffer from conversion losses ie energy can be dissipated, but nevercreated, during its input to storage and its subsequent release and use. Accordingly, low efficienciescan largely offset the benefits of energy storage (in the reduction of peak power demand) which then ceaseto be commensurate with the reductions in useful testing time. Also, the capital cost of a wind tunnel isstrongly influenced by the amount of steel-work required for construction. This is, in turn, closely rela-ted to the quantity of air that can be stored within the circuit. Indeed, for a given standard and type ofpressure vessel design, the weight of steel used is approximately proportional to the maximum mass of airthat can be stored. Thus, if the capital cost is to be minimised, the wind tunnel design must be such thata.iarse proportion °f the air that oan be stored within its circuit is passed through the test-sectionwithin the useful run-time. It must be noted that the relevant quantity of stored air is not the massactually stored within the wind tunnel, but is the mass of air that could be stored if eaohTection of thewind tunnel was simultaneously charged with air at the maximum pressure which is attained in that sectionat any time during the operating cycle, ie the maximum working pressure of that section. It is the maxi-mum working pressures that determines the structural strengths and, hence, the weights of steel usedThus two efficiencies can be defined, each of which must be high if the design is to be economical.flif i an energy (or drive) efficiency (T,,,) can be defined as the ratio of the minimum energy needed todrive the air through the test-section and the total energy actually expended in performing a%un. Thiswill be related to the running costs of the tunnel. It should be noted that the minimurelergyTequiredflownthr Y?hrS? af°°ia*ed ™"h driving the air through the test-section during the tboe fS- which theflow through the test-section is steady (ie the period during which aerodynamic data can be acquired);energy expended while starting and stopping the flow is energy wasted. Secondly, a mass efficiency (n )can be used. This is the ratio of the mass of air that flows through the test-section during' the steadypart of a run to the total mass of air contained in the wind tunnel when each section is charged to itsmaximum working pressure. This efficiency will be related to the capital cost of the tunnel. Thus asatisfactory design must have high values of T and r,e, give an adequate run duration (T) and must notgenerate aerodynamic noise within the test-section.
tunnel1"*^ J ^ T "l f "pon two forms of short-duration wind tunnel namely the blowdown windtunnel, which is a well established device for smaller scale testing, and the Ludwies tube? which has bf>enboth ofT £ f°r/U?ef°nic testi*S <«« 0. Unfortunately, J' their original^ simpS? fomssoecilLati'on t?"" +T tunnel have poor energy efficiencies. For example! in designs to the'LawTspecification, air must be pumped through a pressure ratio of at least 6 from atmosphere into the highpressure storage vessel (the charge tube or the storage bottles); whereas a pressure r™±orf, typicSly
aiout 0?06. 1S re<1 malntain fl°W thr°Ugh the teat-secti°n during a run. Thus, T,e'can£ot Seed
°f theSG f0m3 °f anort-duration facilities emerged as further study identi-
" .the temperature variations induced by sudden changes in pressure in both the air storage a
Revnolds number iT ? S*?8 oha»bef oause difficulties in maintaining an acceptably constanti^f^i^iin rsSquis ie&i:Ti:^^Te:ouli be deveioped °n *— aua-
^"SH?Hff^HS:55^^H " -l-~"78-t fis is
The following sections of this paper first outline the operating principles of an EOT. A design to

3-3
the LaWs specification is then described; followed by a resume of recent experimental work which has con-firmed both the practicability of the mutual wave cancellation that is a basic feature of the ECT and alsothe absence of noise generated by the drive system. The performances of the ECT, LT and LT and RT systemsare then compared. Finally, some comments are made on the development of optimum designs of wind tunnels.
2 THE ECT DRIVE SYSTEM
2.1 Principles of operation
In the ECT, the settling chamber of a conventional wind tunnel is extended as a long tube. Air isallowed to settle quietly in this tube before the start of a run, during which it is pushed through thetest-section by moving a piston along the tube. Downstream of the test-section, the air is decelerated ina conventional, high-efficiency, diffuser and returned under pressure to the upstream side of the piston,thus giving a drive efficiency similar to that of a continuously running tunnel. If the flow were startedby merely accelerating the piston, a compression wave would travel down the tube and be reflected from thecontraction section only to be reflected again .from the piston, continuing in this manner until the pres-sure had attained the steady-state condition. During this period, much of the piston travel time would bewasted. This is avoided by a controlled opening of a valve at the end of the diffuser, which allows airto escape into the return circuit and thereby starts an expansion wave travelling towards the piston. Bysuitable timing, this expansion wave reaches the piston when the piston is started. The expansion andcompression waves then mutually cancel so that uniform flow is maintained throughout the travel of thepiston along the tube. Virtually all the air originally contained in the tube is exhausted through thetest-section and provides usable testing time thus ensuring a high mass efficiency. This process is illus-trated by the v;ave diagram included in Fig (2).
A convenient way of moving the piston is to make use of the pressurised air within the circuit tooperate a group of counterbalancing (or "driving") pistons which are mechanically connected to the mainpiston. If these pistons draw air from suitable points in the main tube, they also function as a boundarylayer bleed system which obviates the temporal and spatial variations in the flow into the nozzle thatoften limits the performance of Ludwieg tubes. The avoidance of troubles due to the growth of the boundarylayer within the main (or charge) tube is greatly helped also by the fact that the run time is governed bythe volume of the main tube rather than, as in a Ludwieg tube, by its length. Thus, it is practicable forthe main tube of an ECT to be short and of a comparatively large diameter, as compared to the charge tubeof a Ludwieg tube. Thus, not only does the boundary layer occupy a smaller fraction of the diameter of thetube but also-the larger contraction ratios, consequent upon the larger diameters, are more effective inthinning down this boundary layer prior to the entry to the test-section. Accordingly, the ECT is welladapted to providing flows of the required duration and quality at an acceptable cost and with a tolerablepeak power demand.
2.2 A design to the LaWs specification
A design to meet the LaWs group functional requirements is illustrated in Fig (3). In this, the con-traction ratio between the charge tube and the test-section is 8:1. The charge tube has a diameter of14.5m and is 270m long. The maximum speed of the piston is 25.5m/sec, which corresponds to sonic speed atthe test-section. At a test-section Mach number (M.,,) of 0.9, the piston traverses the tube at a maximumspeed of 25.2m/sec.
As noted in the proceeding section, the attainment of steady flow requires that each run is initiatedby a controlled opening of the valve downstream of the test-section, whereby an expansion wave is generated.This travels towards the piston and establishes the flow in the working section and in the tube. Mutualcancellation of the expansion and compression waves is possible through the matching of the valve openingand piston motion by suitable time-laws. Then, by starting the piston at the moment when the head of theexpansion wave arrives at the piston, the two waves cancel each other out. During the subsequent travel ofthe piston along the charge tube uniform flows are maintained in the tube and in the test-section.
The expansion wave reduces the pressure and the temperature of the air in the main tube. To have astagnation pressure (po1) of 6 atm in the test-section at M , = 0.9, the initial pressure (po
1) of the airin the charge tube must be 6.6 atm. The reduction in temperature (of about 8°C) increases the unit Reynoldsnumber of the flow in the test-section. The required Reynolds number (Rd) of 40 x 10° can then be achievedin a test-section of the size 4.86m x 4.00m.
The cyclic changes in pressure and temperature (once per run) are small enough in this scheme not tocause any significant structural fatigue problems as might be the case if a smaller contraction ratio wereused.
Downstream of the test-section, the air passes through a second throat. The flow through this ischoked (at sonic speed) during a run so that repeatability and constancy of the Mach number M , is assured,and so that aerodynamic noise, which may be generated in the diffuser or in the exhaust valve, cannot betransmitted to the test-section. The second throat is followed by a conventional diffuser in which the airis decelerated with the minimum loss of energy. The air then passes the exhaust valve and enters the returncircuit which leads to the upstream side of the piston. The difference in pressure across the piston, whichis needed to sustain the flow, will be somewhat less than in a conventional wind tunnel circuit because ofthe absence of coolers, screens, etc. On the basis of experience with large conventional wind tunnels,including some specially-devised, large-scale experiments in the RAE 3ft x 3ft wind tunnel9, the stagnationpressure ratio (p) is estimated as 1.10 for M^ = 0.9 and as 1.15 for M.,, = 1.35. Thus, the maximum pressuredifference across the piston will be 1.65 atm for a Mach number of 0.9 and po1 = 6.0 atm. During the star-ting process this will fall to 0.55 atm. Corresponding values for M = 1.35 and the same stagnation pressureare 1.88 atm and 0.80 atm.
The driving pistons, used to counterbalance the load on the main piston, are connected to the latterby cables and pulleys. These driving pistons have a near-vacuum on the opposite face, so that the forceproduced is proportional to the stagnation pressure. In this way, the pressure ratio across the main

3-4
piston is determined by the geometry of the system and is independent of the stagnation pressure.
The force needed to balance the pressure load on the main piston is higher at the start than duringthe steady run. The drive tubes can be sized so that the piston is in balance prior to a run. Restric-tions in the form of conventional throttles are built into the upstream ends of the drive tubes so that,as the main piston and the drive pistons accelerate and air is drawn into the drive tubes, the pressureacting on the drive pistons falls progressively. By suitable sizing of the restrictors, this fall inpressure can be made just sufficient to bring the main piston into balance during the run also.
A design, which is of ECT type and in which the air for the drive pistons is drawn from the chargetube, uses 9 drive tubes, each having a diameter of 1.88m. These are equally spaced around the peripheryof the main tube. A merit of this arrangement is that the combined cross-sectional area of the drivetubes, and hence the pressure ratio, can be matched to the minimum ratio needed to sustain flow at thechosen value of M*,. In this design, all 9 pistons are operative for M,, = 1.35; but for M , = 0.9, 3 of thetubes are rendered inoperative (these tubes will be spaced at 120° to each other). Fine adjustments tothe pressure ratio can be made by small changes to the flow restriotors on the active tubes. By drawingair for the drive cylinders from the charge tube, the drive tubes are kept small and an effective boundary-layer bleed system is provided.
In order to meet the LaWs requirement that the airstream should be quiet and steady throughout therun, it is essential that the boundary layer on the walls of the test-section should be thin and shouldnot grow significantly during a run. Similar requirements are also necessary to obtain sensibly constantwall interference effects throughout a run. The ECT scheme is well suited to fulfil these requirements,mainly because the airspeed in the charge tube is low (and the contraction ratio is high) and partlybecause an effective boundary-layer bleed is incorporated. In the proposed design, the maximum thicknessof the boundary-layer at the beginning of the contraction (at the end of the run) is estimated to be 0.8mand the maximum displacement thickness 0.1m. The innermost 60fi of the total boundary layer is removed bythe bleed action of the drive tubes. The remaining boundary layer is greatly thinned down when the airpasses through the contraction. In the working section, opposite to the model, the displacement thicknessof the boundary layer is estimated to grow from 0.012m to 0.0124m during a run without bleed, and to 0.0122mwith bleed. The variation during a run of this boundary-layer thickness is thus kept below 2%.
Precautions are taken to avoid secondary flows and to prevent air from the boundary layer in thecharge tube being swept up by the piston and pushed ahead of it in the middle of the charge tube. A gap isleft between the outer edge of the piston and the walls of the charge tube (during a run). It is estimatedthat a gap of between 0.04m and 0.06m will suffice for this purpose.
The main piston can be comparatively light, and a feasible target for the weight of the piston isconsidered to be about 20000Kg. The achievement of a light piston is aided by the fact that the highestpressure difference across the piston is only a small fraction of the stagnation pressure and also by thelong wavelength of the expansion wave, which allows the use of a domed piston. The piston is supported bywheels running on rails which are mounted on the inner surface of the charge tube.
Three important consequences stem from the smallness of the weight of the piston compared to theaerodynamic forces acting upon it.
Firstly, the frictional forces, tending to retard the piston, are very small compared with the air-loads. Thus, the pressure of the air in the charge tube is very insensitive to variations in these fric-tional forces.
Secondly, this feature eases the task of arranging for the mutual cancellation of the expansion andcompression waves at the beginning of the run. The responsiveness of the piston to changes in airloads issuch that there is a favourable interaction between the expansion wave and the motion of the piston. Anydeviation of the piston acceleration from the correct time-law calls into play large pressure forces ten-ding to restore the piston motion to the correct form.\
Thirdly, this feature obviates any tendency for the piston to oscillate during its travel along thetube. The variation of the pressure loads with piston motion provides essentially damping forces and,since the weight is small compared with these airloads, the product of the stiffness and inertia constantsis relatively small and oscillatory motion is prevented.
Both the compression and the expansion waves are weak so that the highest precision in matching thetwo waveforms is not necessary in order to achieve satisfactory constancy of the stagnation pressure duringa run. It is, therefore, not necessary to provide for very high rates of opening of the valve or extremeaccelerations of the piston. The minimum time required to establish a steady flow in the test-section willlimit useful reductions of the time taken to open the valve to little less than the 2 sec proposed in thisdesign. This implies an average piston acceleration of, at most, 13m/sec2 ie 1.3g, which is relativelymodest. Similar accelerations of a plug exhaust valve are needed. Control of the acceleration of the pis-ton is facilitated by an actuator which operates during the first 20m of travel. The maximum force requiredfrom the accelerator will not exceed twice the weight of the piston.
Uniformity of the flow in the return circuit is not important so that this component can be routedwith economy and engineering convenience as primary considerations. It can be smaller and of a simpler andcheaper construction than in conventional wind tunnels. For large wind tunnels like the proposed design,reduction of its length, compatability with suitable designs of exhaust valves, and land costs will favoureither annular or multiple return circuit designs. (For smaller wind tunnels the availability of standardcomponents and the possibility of shop fabrication will favour a single,'separate return circuit10). In theannular design of the proposed wind tunnel the overall diameter of the complete pressure vessel is 19.9mand its total length is 350m. The pressure loads on the walls of the charge tube are relatively small,unidirectional, and favourable to the use of relatively lightweight construction. Initial design studiesshow that the dimensional tolerances required in normal codes of practise for pressure vessels are adequateboth for the charge tube and for the remainder of the circuit.

3-5
Several different designs are possible for the valve. A plug valve has the merit that, during theopening at the start of a run, inertia loads are opposed by the pressure loads. This facilitates accuratecontrol of the valve opening. Alternatively, a design could be based on the "digital" valves which haverecently found favour for computer controlled systems11. These comprise an array of small valves ofvarious sizes, chosen so that any flow area, within the range of the device, may be obtained by opening aselection of the small valves. By choosing the sizes to be some variant of a binary series, quantisationerrors can be kept small. For the present application less than 10 small valves would provide adequateresolution. Control of such a device involves only the timing of the rapid opening and closure of smallvalves of low inertia and not the precise control of the time law of each opening or closure.
When the main piston approaches the downstream end of the charge tube, the drive pistons pass aporting arrangement in the drive tubes, which allows high pressure air to by-pass the drive pistons, thusunbalancing the load on the main piston and causing it to decelerate quickly. Some further decelerationmay also be accomplished by mechanical systems which must be provided for emergency use also. The mass ofair in the circuit is much larger than that of the piston and its inertia tends to reaccelerate the piston.This is prevented by closing the exhaust valve and by the provision of non-return valves in the main pistonitself, which open under 'any reversal of the pressure difference across the piston and allow air to flowthrough it. These valves also ensure the unidirectionality of the pressure difference on the charge tube.
To prepare for a subsequent run, air is pumped from the return circuit into the charge tube at apoint downstream of the main piston. This first raises the pressure there until the pressure ratio acrossthe piston is equal to that needed during the run. The forces on the main piston are then balanced andcontinued pumping causes the piston to move back along the main tube to its starting position. Furtherpumping raises the pressure in the charge tube and reduces that in the return circuit until the tunnel isready for another run. The pressure ratios through which the air has to be pumped are low (a maximum of1.34 for operation at H , = 0.9). A conventional wind tunnel fan, and cooler, can be used for this duty.The required fan diameter is about 1.2m. The fan should be designed to operate with high efficiency overa wide range of flow rates and pressures, eg by using variable pitch blades. By such means a relativelyhigh isothermal efficiency (90$ say) can be achieved. With motor and transmission efficiencies each of80$ (ie 58$ overall), an installed motor input power of 8.3MJY will be required in order to recharge thewind tunnel in 10 min, after a run at a stagnation pressure of 6 atm and M» = 0.9, and for an identicalsubsequent run. The power input to an ideal isothermal compressor would be 4.75MW, and the energy effi-ciency T]e = 0.82. For runs at a stagnation pressure of 6 atm and M = 1.35, the minimum time between runs,including 2 min settling time, is about 15 min.
The complete wind tunnel circuit contains 6.24 x 10 Kg of air when charged to 6atm. To fill thesystem up from 1atm to 6atm in 8 hours requires a compressor of about 3.3MW power, assuming typical effi-ciencies: compressor (isothermal) 60$, motor 80$, gearbox 80$. However, this air will need to be driedand it may be more economical to do this at a higher pressure of 10atm, say. Then, the input power ofthe revised compressor is about 6.6MW.
The working section is contained within a separate pressure sphere so that access to the model doesnot require depressurising of the whole circuit.
If the maximum stagnation pressure were raised to 11atm, the recharge times, pressures and pressuredifferences must be increased pro-rata. The dynamics of the piston motion, the ease of wave cancellationetc are unaffected because the inertia and pressure loads increase in proportion.
3 EXPERIMENTAL TRIALS
3.1 Purpose
The experiments that have been conducted to date were aimed at confirming the feasibility of imple-menting the basic aerodynamic ideas and establishing that the potential merits of the ECT system can berealised in practice. To this end a simple test rig was constructed. It was not a complete scale modelof an ECT - from which it differed primarily in having an unrepresentative form of drive for the main pis-ton. Based on the results thus obtained, and on design studies of large, complete, ECT systems, a newfully-representative, small pilot wind tunnel has been designed and is now nearing completion.
3.2 Experimental apparatus and techniques
The rig used is illustrated schematically in Fig (4), and comprised a barrel of 0.305m diameter£?£"!! at °ne end via a va/ve d flow restrictor to a large reservoir of compressed air (in fact theRAE Vertical Spinning Tunnel (VST)). At its other end, the barrel was connected to an axisymmetric con-traction and a parallel "test-Section", 6lmm in diameter and 152mm long. Air flow through the test-sectionexhausted to atmosphere via a conical diffuser of 5?° half-angle which had an exit diameter of 229mm Thedownstream end of the diffuser could be closed by the exhaust valve. Running in the barrel was a light-weight piston constructed of foamed plastic with a glass-cloth and araldite outer skin. Leakage of airpast the piston was prevented by a peripheral sliding leather seal carried on the rear of the pistonWeights could be added to the rear face of the piston to increase its mass from the normal 2.63K* to theheavy piston" value of 3.45Kg. The distance from the front face of the piston to the upstream end of thethroat when the former was in its most upstream position, was either 12.65m or 21.8m, this change beineeffected by varying the length of the barrel. 6
Steady pressures were measured using self-balancing, weighbeam manometers to an accuracy of + 35N/m2.Transient static pressures in the test-section were measured using variable-capacitance differentialtransducers ' referenced to atmospheric pressure.
Preparations for a run began with the piston at the upstream end of the barrel and hooked-up to abomb release. The barrel was charged to a pressure of typically 1.23atm (using valve 10) and the pressurein the VST adjusted to the desired value (typically 1.44atm). The upstream side of the barrel was thenconnected to the VST (by opening valve 9), thus applying a higher pressure to the rear of the piston 'The

3-6
piston remained stationary, being restrained by the bomb release.
The run was started by closing a switch on the control unit (14), which thereafter controlled therun. The first action of the control unit was to send a signal to the valve bomb release (4) which openedand allowed the weight (18) to fall. After falling a distance of up to 0.91m (this distance being variedto alter the opening time of the exhaust valve), the weight snatched the cam plate. The action of pullingthe cam plate down opened the exhaust valve, thus establishing flow through the test-section and causingan expansion wave to travel upstream towards the piston. The commencement of opening of the exhaust valvebroke a pair of electrical contacts. This caused the control unit, after a pre-programmed delay, to send asignal to the piston bomb release unit (5). On receipt of this signal, the piston was released and acceler-ated rapidly, under the action of the pressure difference across it, thus producing a compression wave whichinteracted with the expansion wave. The motion of the piston also caused air to flow from the VST into theupstream end of the barrel. The pressure of this air fell on passing through the flow restriction (17),the pressure loss being the greater the larger the flow rate, ie the pressure acting on the upstream faceof the piston fell as the piston velocity increased. The pressure in the VST had been set before the runso that the pressure difference across the piston fell from an initial value of l8KN/m2 to the 0.7KN/nrrequired to balance mechanical friction when the piston was travelling at the speed corresponding to asteady stagnation pressure of the flow through the test-section (7.74m/s for M., = 1.0).
The run terminated when the piston reached the end of the barrel, after which the barrel was shut offfrom the VST (using valve 9) and vented to atmosphere (through valve 11).
As noted above, variable capacitance transducers were used to measure transient pressures, operatingat an excitation frequency of 400kHz. The output signal from each transducer was demodulated to obtain ananalogue do voltage (proportional to the pressure applied to the transducer) which was recorded on a multi-channel ultra-violet oscillograph, running at a paper speed of 330mm/s. The recorder traces, typical exam-ples of which are given in Figs (5 and 6), display histories of the following quantities:-
TABLE 1
Recorder traces
Tracenumber
1
2
3
45 & 6
Quantity
Pressure in barrel at most upstreamtransducer station
Pressure in barrel at intermediatetransducer station
Pressure in barrel at most downstreamtransducer station (stagnationpressure)
Pressure on wall of test-section
Traces used for event marking
Pressure change to produce 25.4mm(1 .0 in) deflection of recorder trace
8.6kN/m2
8.6kN/m2
6.2kN/m2
15.2kN/m2
-
(The recorder deflections mentioned above refer to the original traces and not to the reproductions givenin this report which are considerably reduced in size. The interval between the horizontal lines super-imposed on the traces was 2.54mm (0.1 in) on the original records, and the interval between the verticallines corresponds to a time interval of 10 ms).
All components of the pressure measuring system were suitable for use with do and low-frequency sig-nals. The bandwidth of the system was thus determined by the combined effect of the upper frequency limitsof the various components. Significant factors in determining this were:-
a) the natural frequency of the diaphragm of the pressure transducers (27.7kHz)
b) acoustical resonance of the short inlet pipe to the transducers. The lowest frequency at which suchresonances could occur was estimated to be 27kHz
c) the upper frequency limit of the demodulator (20kHz)
d) the frequency response of the galvanometers in the ultra-violet oscillograph. These had undampednatural frequencies of 833Hz and were less than critically damped giving a frequency response which wasflat (to within ± 5$) up to approximately 700Hz.
Thus, the frequency response of the complete pressure recording system was flat to within ± 5$ from0 to 700Hz, within ± 3dB to 1kHz (at which it was about 3dB down), and rolled off at approximately - 6dBper octave thereafter ie broadly the characteristics of a low-pass filter of bandwidth 0 to 1kHz. Accor-dingly, the aerodynamic noise levels infered from the recorder traces correspond to the range of frequencyparameter n of 0 s n « 0.2. They cover the range of n in which troublesome, low-frequency, flow unsteadi-ness is often found for conventional wind tunnels13.
3.3 Typical pressure histories
The start of a run is shown in Fig (5). The passage of the expansion wave, due to the opening of theexhaust valve (the start of which is indicated by the discontinuity in trace 6), across each transducercaused the initial fall in pressure which can readily be seen on each of the traces 1, 2, 3 and 4. Trace 4indicates the establishment of sonic flow through the test-section approximately 50ms after the start of theopening of the exhaust valve. For a short time thereafter, the stagnation pressure was constant. During

3-7
this period, which was identical to the useful run time of the rig when run as a Ludwieg tube, the pistonwas released (as indicated by the discontinuity in trace 5). This period ended with the return of thereflected expansion wave and the superimposed compression wave. Since the stagnation pressure transducer(trace 3) was situated close to the end of the barrel, the distance between the transducer and the end ofthe barrel was short compared to the length of either wave. Thus, the compression wave (or the reflectedexpansion wave) as seen by the stagnation pressure transducer was, in fact, composed of each wave super-imposed on an identical wave delayed by the time required for the return trip from the transducer stationto the end of the barrel. Accordingly, the stagnation pressure transducer sensed a pressure change whoseamplitude was twice that of the incident wave and which was slightly different in shape from the latter.
In the absence of the compression wave, the stagnation pressure would fall by a total pressuredifference Apf. in a manner described by ApeA = ( (t - tc) where te is the time at which the head of
the reflected expansion wave first passes the transducer. In the absence of the reflected expansion wave,the stagnation pressure would rise by a total amount Apf in a manner described by Ap /Apf = f? (t - tfl),where td is the time at which the piston was released. ^
If the two waves were perfectly matched in shape and time, the stagnation pressure would remain con-stant. If the matching were imperfect, the algebraic addition of the contributions from the expansion andcompression waves resulted in a ripple of peak to peak amplitude Aprt . Subsequent reflections at the con-traction and at the piston resulted in subsequent ripples of peak to peak amplitude Ap^, Ap ,..., Ap^.These successive ripples were of diminishing amplitude. They can be seen on Fig 5 and their oscillatorymotion in the tube can be followed by observing the relative times at which ripples occur on traces 1 2and 3. '
The shape of the expansion wave could be obtained directly from the recorder traces, while the shapeof the compression wave was obtained algebraically differencing the measured pressure histories and theinfluence of a reflected expansion wave (computed from the measured shape of the expansion wave).
3.4 Discussion of results
In this section, the salient experimental results are described. Space does not permit inclusion ofdetails of all the data nor of the theoretical methods 'which were developed in order to explain and predictthe observed phenomena. Reference should be made to earlier and more complete accounts1'f»15 for suchdetails.
The first of the essential features to be substantiated by experiment was the ability to vary theshape of the expansion wave so as to match that of the compression wave. This was done by varying theshape of the cam which controlled the opening of the exhaust valve and by adjusting its speed of operation.The making of these changes was guided by a simple theory11*-, and typical comparisons between theory andexperiment are provided in Fig 7. It will be seen that the theory is generally in good agreement withexperiment as regards the shape of the expansion wave although there is a small discrepancy in the timesat which a given value of Ape is reached. The experimental data show a period of between 4ms and 6ms atthe start of the wave during which Ape changes very little. This behaviour and length of time is consis-tent with the expected behaviour of the compliant seal between the exhaust valve and its seating at theend of the diffuser. At the start of the valve opening, the compression of this seal is released so thatthe seal expands, reducing the mass flow from the diffuser below that assumed by the theory.
The comparison shown for 'bam F at slow speed" is of especial interest since it demonstrates thesuccessful use of the theory to design a cam profile to obtain a specified expansion wave. This cam wasdesigned with the aim of obtaining a match with a target variation, provided by a measured compressionwave, over the period 0 S (t - t ) S 38ms. A most satisfactory match was obtained. This diagram alsoillustrates an overshoot of the final pressure (ie Ap > Apf) in the target wave. This corresponds to anovershoot in the measured compression wave (Ap > Apf), which arose from the type of drive system used forthe piston. This drive system, while convenient and suitable for the purposes of these tests, was not rep-resentative of that proposed for a full scale wind tunnel (see section 2) for which this overshoot caneasily be avoided. The overshoot on the compression wave set a limit to the extent to which the expansionand compression waves could be matched and, thus, in the absence of any interaction between the expansionwave and the motion of the piston, to the quality of the wave cancellation ie to the minimum value of
In Fig 8, predicted and measured values of AJL, are compared as a function of ta for two combinationsof cam shape and speed. Data for both barrel lengtns (Lf = 12.65m and Lf = 21.8m) are plotted in thisfigure. The main causes of scatter in the experimental data were errors in the measurement of tfl and var-iations in the time taken by the piston release mechanism. These were estimated to have a combined effecton the measured times equivalent to a standard deviation of about 1ms. The theory used a compression waveshape which was calculated theoretically1 . This was algebraically combined with the calculated shapes ofthe expansion waves, neglecting any interaction between the piston motion and the expansion wave withappropriate relative timings of the two waves.
It will be seen from Fig (8) that an optimum value of td exists in the sense that ApV, is a minimumfor td - Lf/a 1 1 . The theory appeared to predict both this optimum value of td and the penalty, in termsof increased Ap^ , for deviations from this value. The absolute values of Ap^, tended to be lower than the
e ' 0> POSSible " the Oam "Fn dto o a i n ™ T POSSible' " the Oam ("Fn) deaisned to cl° fflatch the compression,to obtain values of Ap^ which were consistently lower than the overshoot in the compression wave (indicatedas "piston overshoot" on Fig 8). Both these effects were attributed to the favourable interaction betweenthe expansion wave and the motion of the piston. Detailed analysis of the recorder traces confined tnatthe two waves tended, by such means, to "lock together". wu. i-maa. ma*
in*!ra°tion was also manifest in the diminishing amplitude of the ripples in the stagnationeT rnT S % suooessive P"3^63 of the small amplitude wave left following deliberately per-cancellation of the compression and expansion waves. Each time that this wave wls reflected from the
piston it induced small variations in the motion of the piston which acted so as to partially cancel the wOTe

3-8
Experimental values of this decay were difficult to measure because of the smallness of Ap^ . Some data,albeit scattered, was obtained from those runs during which td was deliberately made widely different fromits optimum value. Those data are presented in Fig 9 and compared with theoretical estimates1'1'. Withinthe admittedly limited accuracy of the experimental data, the theory was in reasonable accord with experi-ment and, hence, confirmed the nature of the favourable interaction between the piston and the waves.
The quality of the wave cancellation achieved demonstrated the practicability of achieving a suffi-ciently small level of fluctuations in the stagnation pressure to give the required stability of stagnationpressure in a full-scale tunnel. It was clear that yet further reductions in Ap^ could be obtained if theovershoot in the compression wave were eliminated. This was difficult to achieve with the unrepresentativepiston drive used in these experiments because the damping forces acting on the piston were closely coupledto the stiffness forces and the final velocity of the piston. In the full-scale drive system the stiffnessand damping can be more easily controlled and the damping can be uncoupled from the final piston velocity.In this way Ap^ can be considerably improved.
Preliminary measurements of the aerodynamic noise levels were also made . Comparison of the recor-dings of test-section static pressure after flow establishment (trace 4) either with the same signal priorto opening of the exhaust valve or with the (do) signals on traces 5 and 6 enabled the level of aerodynamicnoise in the test-section to be estimated. As can be seen from Figs 5 and 6, this was extremely small.The unsteady pressure coefficient C was found to be no greater than 0.002. This is less than half thatwhich it is reasonable to assume would be permissible even for most dynamic tests1 . Some noise was obser-ved on the stagnation pressure (trace 3) of rms amplitude of about 0.07$ of the sta nation pressure andwith a predominant frequency of about 300Hz. This is extremely small and was due1 5 to noise generation ina component of the piston drive which was not representative of a complete ECT facility. Thus, a full-scale tunnel would be expected to have an even quieter flow.
In order to obtain such quiet flows it is essential, of course, to prevent the aerodynamic transmis-sion to the test-section of noise originating in the diffuser. This requires that flow be at sonic speedeither in the test-section or in a second-throat located immediately downstream of the test-section. Thishas been demonstrated both for the rig described above1i»-, and for ventilated test-sections .
4 GENERALISED PERFORMANCE ANALYSIS
Having experimentally confirmed that the proposed drive system was aerodynamically feasible, it wasappropriate to analyse its performance in a generalised manner. This analysis served both to indicatedesirable values for the main design parameters and also to compare the ECT with other drive systems. Byadopting a fundamental and generalised approach to the making of such a comparison it was possible todistinguish any important differences between the various drive systems without the need to developdetailed specific designs. This was advantageous because the time and effort involved in developing speci-fic designs would preclude the provision of enough examples for systematic analysis. Further, comparisonsbetween a limited number of specific designs can easily be obscured by the effects of differences in struc-tural design codes, engineering implementations of various components, etc which are not germane to thestudy of the fundamental characteristics of various drive systems.
Three systems were considered. These were the Ludwieg tube (LT), the Ludwieg tube with the additionof a recovery tube (LT and RT). and the ECT. Their performances were compared in terms of the mass andenergy efficiencies (r\m and T]e) defined in section 1. In all three systems, the air is initially accelera-ted by an expansion wave which travels along the charge tube. In principle, the same mass of air can beprocessed and used during the test, and the same quality of flow and the same run time can be achieved,whether the expansion wave is reflected from an end wall or cancelled by the motion of a piston. Moregenerally, all three types of tunnel can be represented by a single diagram, Fig 10, where for conveniencethe wind tunnel circuit has been laid out along a straight line. In the LT and LT + RT systems, the extremeends of the charge and recovery tubes are closed, whereas, in the ECT, the tunnel forms a closed loop sothat the pistons shown in the diagram at the extreme ends are, in fact, one and the same. Also, the counter-balancing pistons used in the ECT are not shown although their influence on the performance was accountedfor. The test medium was assumed to be air with a ratio of specific heats of 1.4 and the Mach number ofthe flow through the test-section during a run was taken to be unity. However, the relative merits of thedrive systems considered are insensitive to M.. providing that this remains within the transonic speed range.
When calculating the energy requirements of the pumping processes involved in the different drivesystems (and in the calculation of the theoretical minimum energy requirements), it was assumed that iso-thermal compressors were employed. This means that the calculated energy efficiencies (r\ ) are correct ifall the compressors used have the same isothermal efficiencies. This is a reasonable assumption, but mayhave the effect of being somewhat optimistic for cases where rie is low because the isothermal efficienciesof compressors pumping air through high pressure ratios are usually lower than the isothermal efficienciesof low-pressure-ratio compressors.
Figure 10 shows the flow processes occurring within the tunnel at a time shortly after the flow throughthe test-section has been established. During a run, the air flow rates are high and the run duration isshort. Thus, the aerodynamic processes are essentially adiabatic. After the run has been completed equili-brium is established between the air in the charge tube and in the recovery tube (or return circuit). Therun, taken together with the subsequent establishment of equilibrium, then constitutes a gigantic version ofJoule's Classic experiment. Thus, the temperature of the air returns to be everywhere equal to its initialvalue TO . All the drive systems are prepared for a subsequent run by returning air to the charge tube. Ina LT facility, this involves pumping air from atmosphere into the charge tube. In a LT + RT wind tunnelthe air is transferred from the recovery tube to the charge tube. Similarly, in an ECT, air is pumped fromthe return circuit into the volume between the main piston and the contraction. These processes are rela-tively slow, taking typically 50 to 150 times the duration of a run, and the aerodynamic processes withinthe wind tunnel are then essentially isothermal. Although there are inputs of heat (due to degredation ofmechanical energy by irreversible thermodynamic processes), this heat must be lost to the atmosphere ifnecessary via active cooling devices, if repeatability of test conditions and the absence of large scaleconvection currents is to be ensured.

3-9
In order to calculate the mass and energy efficiencies corresponding to specified values of theindependent variables (run time, Reynolds number, test-section size etc), it is necessary to calculate thepressures that must be set up prior to the commencement of a run. To do this, the stagnation pressure ofthe flow through the test-section (during the run) must be determined. This can be found from the Reynoldsnumber requirements and the specified area of the test-section. In the calculations that have been made,the Reynolds number was taken, in accordance with the LaWs group specification, to be 40 x 10° when basedon test-section "free-stream" conditions and the mean chord of the model. The latter was assumed to be0.1 /Fa, (FO, being the cross-sectional area of the test-section), Allowance was made for the reduction instagnation temperature due to the passage of the expansion wave through the charge tube, and the stagna-tion pressure was adjusted to keep the Reynolds number constant. While this is a normal procedure, recentevidence suggests that it may not be entirely valid. The reduction in stagnation temperature implies thatthere will be heat-transfer from the model to the airstream during a run. Preliminary calculations18 sug-gest that this heat-transfer has a significant effect on the boundary-layer over the model. A net increasein stagnation pressure may be required in order to obtain similar boundary-layers to those occurring at thedesired Reynolds number and zero-heat transfer. This effect is small, but, if substantiated by further work,may require a small reduction in the values of r^ and r\e at high values of charge tube Mach number.
The remaining independent variable is the Mach number of the flow, downstream of the expansion wave,in the charge tube (M.,). This is determined by the contraction ratio F /F . This Mach number characterisesthe design of the wind tunnel in the sense that it is the only primary variable whose value may be selectedby the designer once the performance required of the wind tunnel has been fixed. Hence the broad outlines,and many of the details, of the design of the wind tunnel are fixed by the choice of M-). Also, the combina-tion of M1, the running time T, the test-section area FM and the stagnation pressure po1 determine thegrowth of the boundary layer within the charge tube.
Space permits neither an account of the details of the thennodynamic calculations1^ nor a full accountof all the results. Instead, some typical results are shown as Fig (11). This illustrates both the gen-eral trends found in all the data and also the influence of variations in the time required to establishsteady flow (TO). The latter effect is small (as are the influences of likely variations in other varia-bles) when compared with the differences between the efficiencies of the various drive systems and theeffect of changes in &,.
The Ludwieg tube drive system has an inherently poor drive efficiency, but this can be greatly impro-ved by the addition of a recovery tube. However, this gain is obtained at the expense of a serious loss inmass efficiency. A further difficulty arises from the fact that high energy efficiencies are attained atlow values of the charge tube Mach number, when the mass efficiency is low; whereas the best mass efficien-cies are obtained at high charge tube Mach numbers, when the energy efficiency is low.
The ECT drive system, when operated at low charge-tube Mach numbers, attains high values of both massand energy efficiencies. It is a more balanced and superior design since the virtues of high mass effi-ciency and high energy efficiency can be realised in a single wind tunnel. The ECT drive system can pro-vidfs the highest energy efficiencies of any of the systems considered. The .mass efficiencies that can beobtained using an ECT system are at least as good as those which can be realised using a LT drive. Thesuperiority of the ECT drive system in terms of high mass and energy efficiencies will be strongly reflectedin economy of both capital and running costs.
Further effects become apparent when the effects of boundary-layer growth in the charge tube are con-sidered. This causes a variation with time of the uniformity of the flow entering the contraction, and ofthe thickness of the boundary-layer on the walls of the test-section (and, hence, of wall interferenceeffects). These effects must be kept small throughout the run. Unfortunately, not only are uncertaintiesintroduced into the calculation of the growth of the boundary-layer in the charge tube by the virtuallyunprecedently high Reynolds numbers involved, but also it is difficult to quantify the influence of thisboundary-layer on the quality of the flow in the test-section. However, approximate calculations have beenmade16". Also, it seems to be clear that it is possible to obtain satisfactory flow quality in the test-section using all three schemes when the run time is short, ie of the order of 2s or 3s, even when thecharge-tube Mach number is as high as 0.4 or 0.5. Accordingly, it is prudent to require that conditionsin the charge tube be varied in such a way as to preserve a similar flow quality when the run time isincreased to 10s. A simple, order of magnitude, argument makes this point clear. At the end of a run,the boundary-layer in the charge tube has developed over a length of approximately VU,T (where u, is thevelocity of the air entering the contraction). Since, for 11, < 0.5, the unit Reynolds number and a. areboth approximately proportional to , the thickness of this boundary-layer is proportional to (tti'ij/(It, T)V7 ie M-,-5/' TO/7. For fy < 0.5, and a constant value of Fro, the area Ft, is approximately propor-tional to 1/M.,. Hence, the diameter of the charge tube is proportional to M..~2 and the fraction of thediameter of the charge tube that is occupied by the boundary layer is proportional to M-)17/14 T°/7. Thus,if the uniformity of the stagnation pressure of the flow entering the contraction is to be kept constant,then MI must vary as t~1'v1'. Accordingly, if satisfactory flow is obtained for T = 2s and M1 = 0.5, thesame quality will not be obtained for T = 10s unless M-) « 0.16.
More refined calculations' , including estimates of the temporal variation of the thickness of theboundary layer in the test-section, support this conclusion. It was found that the growth of the boundary-layer in the charge tube imposed a severe limitation, which is common to all three types of drive system,and constrains their operation, for run times of the order of 10s, to low charge tube Mach numbers, near0.1 or 0.2 at the most. This limit is above the values at which the ECT achieves its best performance,but it precludes the attainment of high mass efficiencies by the other two systems. Thus, the ECT has'added merit when run times of the order of 10s are required, as in the LaWs specification.
5 OPTIMISATION OF THE DESIGN
The functional performance of a wind tunnel is defined primarily in terms of the run time, the Machnumber range, and the Reynolds numbers that must be achieved. Before embarking on detailed designs, itremains to decide the most economic and effective manner in which this performance can be achieved.
In common with any engineering construction, the wind tunnel is an assembly of mutually compatible

3-10
components. The total cost of the tunnel comprises the sum of the costs of the individual components, dueallowance being made in each cost for their assembly and erection to make the completed wind tunnel. If aspecific, near optimum, design is prepared and costed it will be possible to break it down into sub-assem-blies whose individual functions are relatively simple. Accordingly, from fundamental physical relation-ships, supplemented as necessary by additional design studies, it will be possible to set up a series ofequations. Each equation will represent the variation of a cost element with the primary design parameters,ie linear scale, operating pressure, and run-time. In a study of the costs of a particular wind tunnel1',a set of 23 such equations were used in a computer based optimisation procedure. This degree of complexityis essential when performing detailed optimisation studies for specific designs. However, some generalrules emerge which are neither complex nor specific to particular designs.
The most important of these general rules concerns the means by which a desired Reynolds number isachieved. Reynolds number can be increased either by increasing the pressure or by increasing the size ofthe test-section. Almost invariably, the most economical way is by increasing the pressure. However, inpractice, the pressure cannot be increased advantageously beyond some limit even when to do so results ina more economic tunnel structure. The limits on the pressure which it is practicable to use are at theirmost severe when testing models with swept wings. They arise because Reynolds number is not the solearbiter of the utility of a transonic wind tunnel and increasing pressure aggravates other problems ofsimulation such as model strength, aeroelastic distortion, and errors in shape due to model supports.Unfortunately, current knowledge does not permit of the combining of all these effects into a single mea-sure of the utility of a given combination of model size and static pressure. However, providing that theReynolds number is high enough to ensure that the flow patterns about the model have no gross differencesfrom full-scale, it can be shown2 that increases in test-section static pressure above about 3.5 atm or5 atm are disadvantageous because the benefits of increasing Reynolds number are more than balanced by theworsening of model stresses, aeroelastic distortions and sting interference effects. Having regard to theMach number range and likely uses of the proposed wind tunnel which was the subject of detailed optimisa-tion studies17, it appeared that this upper limit to pressure would be at about a stagnation pressure of10 atm. Accordingly, a measure of the utility of different designs could be defined as the "maximum usableReynolds number", R. This was the Reynolds number, based on the mean chord of a typical wing, during testsat sonic speed and at a stagnation pressure, of either the maximum allowed by the strength of the tunnelstructure or 10 atm (whichever was the less).
The implications of this on the design of high Reynolds number wind tunnels is illustrated by Fig 12which shows the variation of maximum usable Reynolds number R as a function of stagnation pressure poi forfixed capital cost. Two curves are shown in the figure, corresponding to two different capital costs. Itis clear that the use of a high stagnation pressure enables higher Reynolds numbers to be obtained for afixed capital cost. However, if the design po exceeds that which is usable in practice (in this example10 atmospheres), the maximum usable Reynolds number is less than that which would result from designingfor Pot equal to the maximum usable stagnation pressure. Funds are then being expended upon unnecessarystrength in the structure. This can be seen by considering a design having a maximum po above 10 atm (iea design corresponding to a point such as X on the dotted extension of the curve for po < 10 atm). Ifthe maximum stagnation pressure cannot be used for a particular test, then po must be reduced. Since thetunnel size (and, hence, model size) is then fixed, the Reynolds number is proportional to poi so that theoperating conditions of a given tunnel lie on a straight line through the origin as indicated. It can beseen that this line lies below the curved locus of the design points of the family of designs having afixed cost. Thus, operating a facility at less than its designed maximum po< results in a lower Reynoldsnumber than can be obtained from a second facility having the same cost but designed ab initio for a maxi-mum p01 equal to the operating value.
In thus restricting the maximum stagnation pressure there is, of course, a loss in performance com-pared to a tunnel having a higher maximum pressure whenever the test is such as to permit larger than nor-mal usable pressures (po-) Z 10.4 atm in the example shown).
The tunnel design is strongly influenced, therefore, by the requirements of the most important testsfor which it will be used. In general, the most economic design is obtained by designing the tunnel for po-,as high, but no higher, than the maximum at which the most important tests can be run. It also followsthat the greater the extent to which the work load of the tunnel can be defined, prior to the design of thewind tunnel, the higher the performance of the tunnel. Uncertainties in the nature of the workload, espec-ially in the maximum usable stagnation pressure, can easily lead to an incorrect choice of po-, and conse-quently either failure to achieve the maximum performance or unnecessary expenditure.
The lower curve, which is for a low cost facility, illustrates an additional effect. For pQ^ o 4 atm,the maximum usable Reynolds number rises rapidly with increasing stagnation pressure. This reflects thefact that, for a fixed total cost, the size of the tunnel decreases with increasing po-j. Thus, at stagesin this process, it becomes possible to fabricate some components at the manufacturers works rather thanon site. This change from site to shop fabrication is accompanied by a decrease in the cost of a givendesign so that, if the total cost is fixed, a more potent design becomes possible. Similar departures fromthe general trend may be caused by variations in the extent to which existing equipment can be re-used etc.
6 CONCLUSIONS
The work described in this report is part of a continuing effort directed at the development of trans-onic wind tunnels giving radical improvements in the Reynolds numbers at which tests can be conducted. Thishas, so far, established the following points:-
1) neither conventional, continuously-running wind tunnels nor established forms of short durationfacilities can give the required performance without exorbitant capital and/or running costs
2) use of an ECT drive system will enable the required performance to be obtained at capital and runningcosts which are comparable, with those of existing, lower performance, continuously running wind tunnels
3) the practicability of the mutual wave cancellation, which is a basic feature of the ECT, has beenconfirmed experimentally

3-11
4) experiments have also confirmed that an ECT driven wind tunnel will generate an exceptionally clean,quiet airflow
5) the ECT is a more efficient and balanced design than other, related, intermittent drive systems. Ithas especial advantages when run times of the order of 10s are required
6) the maximum benefit will be derived from a fixed capital cost if a new wind tunnel is designed for amaximum stagnation pressure equal to the maximum at which the most important tests can be conducted.
REFERENCES
1. LaWs Group report.
2. Evans, J.Y.G., and C.R.Taylor, "Some Factors relevant to the simulation of Full Scale Flows in ModelTests and to the Specification of New High Reynolds Number Transonic Tunnels", Paper 31 presented atAGARD Specialists' Meeting at GBttingen, April 1971, (AGARD Conference Proceedings No 83).
3. Hills, R., "Comparison of Running Costs of Transonic Tunnels", ARA Memo 126 (LaWs Paper 49),March 1972.
4. Whitfield, J.D., C.J. Sohueler and R.F.Starr, "High Reynolds-Number Transonic Wind Tunnels - Slowdownor Ludwieg Tube?", Paper No 29 presented at AGARD Specialists' Meeting at GBttingen, April 1971,(AGARD Conference Proceedings No 83).
5. Leavey, L.E., "A Note on the Temperature Transients in a Supersonic Slowdown Wind Tunnel", J. RoyalAero Soc, August 1958.
6. Evans, J.Y.G., "A Scheme for a Quiet Transonic Flow suitable for Model Testing at High ReynoldsNumber", RAE Technical Report 71112, May 1971-
7. Ludwieg, H., N. Grauer-Carstensen and W.Lorenz-Meyer, "Project Study of a Large European TransonicLudwieg Tube V/ind Tunnel", DFVLR Report 062 72A, June 1972.
8. Ludwieg, H., "Tube Wind Tunnel - A Special Form of Slowdown Tunnel", AGARD Report 143, (1957).
9. Pugh, P.G., T.Gell and '11.A. Beckett, "RAE Report in Preparation".
10. Evans, J.Y.G., and P.G. Pugh, "A Proposed High Reynolds-Number, ECT-Driven, Transonic V/ind Tunnel atRAE Bedford", RAE Technical Report 72054, (March 1972).
11. Wingrove, A.A., Private Communication.
12. Macdonald, W.R., and P.M. Cole, "A Subminiature Differential Pressure Transducer for use in WindTunnel Models", RAE Tech Note, Instn 169, (1961).
13- Mabey, D.G., "Flow Unsteadiness and Model Vibration in Wind Tunnels at Subsonic and Transonic Speeds",ARC Current Paper 1155, (1970).
14. Pugh, P.G., "Experimental Trials of a Novel (ECT) Drive System for a Transonic Wind Tunnel", RAETechnical Report 71208, (1971).
15. Pugh, P.G., and G.R. Spavins, "Some Preliminary Measurements of the Quality of Flows Generated by anECT", RAE Tech Memo, Aero 1389, (1972).
16. Pugh, P.G., and J.Y.G. Evans, "RAE Report to be Published, (LaWs 100).
17. Pugh, P.G., and J.Y.G. Evans, "Optimisation of the Design of a Transonic Wind Tunnel for Tests atHigh Reynolds Number", RAE Tech Memo, Aero 1427, (1972).
18. Green, J.E., D.J. Weeks and P.G. Pugh, "Some Observations upon the Influence of Charge-Tube MachNumber upon the Utility of Flows Generated by Expansion Waves", unpublished RAE work.
ACKNOWLEDGEMENT
This paper is British Crown Copyright reproduced by permission of the Controller of Her BrittanicMajesty's Stationery Office.

3-12
MOTOR
ATM.
SCREENS
RUNNINGTUNNEL
SCREENSH.P. STORAGE
ATM.
EXHAUST VALVE
DRIVE TUBE
FIG. I CONVENTIONAL WIND TUNNELS
LUDWIEG
TUBE
RETURN CIRCUIT
EXHAUST
VALVE
RUN
TIME
TUBE
BARREL
UNIFORM FLOWTO NOZZLE
/PISTON ATM.
PISTON
EXPANSION WAVE
AIR AT REST
FIG. 2 ECT DRIVEN WIND TUNNEL

35Om
TO & FROM COMPRESSORS
VACUUM
PUMPS
DRIVETUBES (|-8B m
ANNULARRETURN
\ \MANIFOLD DRIVE MAIN PISTON ANNULAR INTAKE TEST-SECTION SECOND THROAT PLUG VALVE& PORTING PISTONS (DOMED PLATE SPHERE
ON SPACE-FRAME)
RAILS FORMAIN PISTON
MAIN TUBEO 5 m lOm
SECTION OF DRIVE ALTERNATIVE END('DIGITAL VALVE)
FIG. 3 GENERAL LAYOUT OF ECT TRANSONIC WINDTUNNEL

16KEY
FIG. 4 SCHEMATIC DIAGRAM OF TEST RIG
12
3
4,5
6
7B
9,10
13
14
IS
16
17
16
PISTONEXHAUST VALVE
CAM PLATE
BOMB RELEASESBARREL
TEST SECTIONTRANSDUCERS
,11,12 VALVES
CONTRACTION
CONTROL UNIT
U.V. RECORDER
MIDWOOD MANOMETERS
FLOW RESTRICTOR
WEIGHT

3-15
Wl
FIG. 5 START OF ECT RUN
FIG.6 ECT RUN (SONIC SPEED)

3-16
(t-te)ms
2O 4O 6O
O-S
I-O
CAM A FAST SPEED
O-5 •
ACHIEVED
-TARGET
CAM V SLOW SPEED
FIG. 7 EFFECT OF THE EXPANSION WAVE (CAMS. A & F)
LfI-O
O-8
0-6
O-4
0-2
f\
y —/\^.]t_ + CAM A^flf t ^ o CAM F
AA., ( inHq} A^ NORMAL2-O
1-5
I-O
. O-5
n
^-THEORY (CAM
N. yf-• + \ + / +
+ "^Vfo7, *"TO O
(FAST)(SLOW)PISTON
«s"1-
— PISTONOVERSh
-15 -IO -5 O +5 +IO +15 + 2O
FIG. 8 MUTUAL CANCELLATION OF COMPRESSION AND EXPANSION WAVES
A A
NB. m is THE NUMBER' OF THERIPPLE ON THE STAGNATIONPRESSURE TRACE(SEE SECTIONS OF TEXT)
I-OO-9
O-8
O-7
O-6
0-5
O-4
o.
^•^% + NB.
• \^
Z\ +0 N Xo . x
^ A r- THEORY
<| I
\ ^o \ c
DIFFERENT SYMBOLSINDICATE DATA FROMDIFFERENT RUNS
\
O-2
FIG. 9 ATTENUATION OF RESIDUAL DISTURBANCES IN STAGNATION PRESSURE

3-17
WORKING LEG
PISTON(OR END WALLOF TUBE)
|I
STAGNATION PRESSURE
STAGNATION TEMPERATURE
STATIC PRESSURE
STATIC TEMPERATURE
VELOCITY
SPEED OF SOUND
MACH NUMBER
CHARGE TUBE CONTRACTION DIFFUSE(OR BARREL)LENGTH L,
AREA F, S ii||l
Po'
TO'
Po'
TO'
a<>'
Po,
TO,
P.
T,
u,
a,
M,
EXPANSIONWAVE
TEST.-SECTION
\ — — •AREA F.
/ ^--
Poo
T»
Uo.
do.
M.
1 RECOVERY TUBE (OREXHAUST RETURN CIRCUIT)
VALVE LENGTH L2
/^v
~"* T\/
Po2
T.2
Pj
^
M2
AREAI S PISTONi (OR END WALL
2 !l H OF TUBE)
Po,
T«3
P3
'•
:;
Po"
To"II
Po
To"
a,"
CONTACT COMPRESSIONSURFACE WAVE OR SHOCK
FIG. IO NOMENCLATURE & FLOW CYCLES OF LT, LT + RT, & ECT DRIVE SYSTEMS
40.10
VARYING STARTING TIME
T^m (MASS)
Tj« (ENERGY)
|0
LT
ECT
LT»RT
LT + RT
O O-l O-2 O-3 O-4 O-S M ^
FIG. U INFLUENCE OF VARYING STARTING TIME ON MASS AND ENERGY EFFICIENCIES
fit
7 MO
6x|O
4 MO
3x |O
2 MO
I MO
LOCUS OFDESIGN POINTS
TYPICAL LOCUS OFOPERATING CONDITIONS
EFFECT OF CHANGINGPROPORTIONOF SITE WORK
2-O 4-O 6-O 8-O IO-O I2-O I4-O I6O( a tm)
FIG. 12 INFLUENCE OF MAXIMUM USABLE PRESSURE AND SITE WORK
ON PERFORMANCE ATTAINED FOR FIXED COST


4-1
THE INJECTOR DRIVEN TUNNEL
by
Pierre CarriereOffice National d'Etudes et de Recherches Aerospatiales (ONERA)
92320 Chatillon, France
Note: A brief description of the LaWs project of IDT can be found in AGARD Advisory Report AR60.
MAIN NOTATION
p pressure
Pi isentropic stagnation pressure
h enthalpy
hj adiabatic stagnation enthalpy
s entropy
p density
a velocity of sound
T absolute temperature
M Mach number
Cp, Cv specific heat coefficients
7 = Cp/Cv
u axial velocity
cj sectional area
j = p + pu2 , dynalpy (in French: dynalpie)
m mass flow, injected (>0) or extracted (<0)
f frictional force at the wall ^ per unit area
q heat flow, injected (>0) or extracted (<0)
m', j', f, q' = — (m.j.f.q)dx
Cf friction coefficient
x abscissa
t time
jet exit area CO;
mixing chamber area com

4-2
<lme
injected mass flow = moo
extracted mass flow
qm: injected mass flow
qmi driven mass flow
w(M)
5
h6
Q(h)
D(h)
eq
ed
n(x)
u
Pi,
Pirn
Pi,
1 +
1
M2
2 7-1 V(7+i)/[2(7-i)]+ M2
M \7 + 1 7 + 1
(1 + 7M2)c3(M)Z(M)
boundary layer thickness
height of the boundary layer bleed system
pu
- Llh Jft
(p + pu2)
'o Pi + PX
auxiliary functions for boundary layer losses computation
mass flow non-uniformity parameter = 1 — Q(h)
dynalpy non-uniformity parameter = 1 — D(h)
Pip
Pin
, stagnation pressure loss coefficient
uao
s
aao
log —Po
CL>
log —
X
L

4-3
Subscripts
Superscripts
bar
reference state
inductor jet exit
main flow at the ejector exit section
mixing chamber exit, or mean flow
testing chamber
particular value for adapted regime (pj
non-dimensional quantity
INTRODUCTION
In this paper the specific problems attached to a project of an Injector Driven Tunnel are examined:
(a) methods for evaluating and optimizing its performance in steady continuous flow,
(b) analysis of unsteady phenomena during the wind tunnel start,
(c) problems of intense noise generated by the jets.
Some general indications will also be presented on the orders of magnitude of certain basic technological data.
Appendix I presents the main features of an IDT pilot wind tunnel, under construction at the Toulouse Centreof ONERA.
Appendix II presents some mathematical developments used in the paper.
Fig.1 BASIC CONSIDERATIONS ON THE INDUCTION TYPE WIND TUNNEL
Fromcompressed
airsupply
h (enthalpy)
Settlingchamber
fc.-K-l
Initialstagnation
pressure
Stagnation— enthalpy
(a) PRINCIPLE
I I s (entropy)Total i losses
(b) THERMODYNAMIC CYCLE (steady)
Figure la gives the operating sketch of the active part of an Induction Driven Tunnel (IDT).
It includes a supersonic ejector, supplied by a source of compressed air, and placed within the flow (1) at aconvenient location downstream of the testing chamber. The jet (j) emitted by the ejector mixes with flow (1) in amixing chamber, from where both flows emerge in a theoretically uniform state (m). The circuit, being closed, mustinclude an extraction system so that a steady condition can establish itself and be sustained.
Figure Ib outlines the thermodynamic cycle on a Mollier diagram: the air, practically at rest in the settlingchamber, state (i0), expands almost isentropically up to the testing chamber, then recompresses up to pressure PJat the entrance of the mixing chamber, where losses (entropy rise) accumulated along the circuit are at their maximum.The induction system overcompensates these losses, so that at its return to the settling chamber the air is back in itsinitial state i0 .

4-4
Fig.2 SOME EXISTING INDUCTION DRIVEN WIND TUNNELS
URSS
ISRAEL
U K
Central Aerodynamic and Hydro dynamic
Institute (TS AG 1), Joukovski URSS
T (109) 1943
Technion Israel Institute of
Technology Haifa ( 1970 )
(1972)
National Physical Laboratory
N P L (1956)
Testsectionsize (m)
2,25x2,25
0,6 x 0,8
1,5 x 1,5
0,63 x Q51
Mach
number
0,5-* 3,6
1,1
1,2
0,3 — 1,8
Stagnationpressure(arm)
6
2
5
1
Figure 2 shows, in a few examples, that the application of the operating principle to a wind tunnel is not new,even for large scale facilities such as the T109 wind tunnel of TSAGI, whose performance easily includes the tran-sonic domain. This tunnel is some thirty years old and is pressurized at quite a high level for that time.
One of the most recent IDT facilities is the new Israeli wind tunnel at the Technion, whose performance,(pressure and Mach number) is near to that proposed by the LaWs Group, but at I /3 length scale.
It should however be noted that all these facilities are based on concepts that now look somewhat obsolete,and that, in particular, no special precaution was taken against propagation of internal noise up to the testing chamber.
They include a technologically very simple injection system, made up either by a central ejector in a low speedleg of the circuit, or by a peripheral blowing slit, installed along the wall at the testing chamber outlet.
It will be shown that it is possible to apply to this concept very noticeable improvements in order to increasethe quality and the cost-effectiveness of this type of wind tunnel.
Two projects including present-day technology are under study at the NASA (Langley Research Center andAmes): the test section and the corner vanes are acoustically treated. The test section dimensions will be 2 x 2 m,and the planned maximum stagnation pressure is about 13 bars. A pilot wind tunnel of this type, at 1/13 scale, hasbeen built in 1972. The characteristics of the Ames project will be of the same order.
Fig.3 IDT MAIN SPECIFIC PROBLEMS
(2) Steady conditions
• Location "I
• Performance > of an induction system
• Size and design J
• Type and location of exhaust
(?) Unsteady conditions
• Starting process
• Noise (generation, attenuation)
(3^ Technology
• Storage
• Compressed air conditioning
• Compressed air delivery
Figure 3 gives a list of the questions that will be considered and which constitute the principal specific problemsof an IDT.

4-5
Fig.4 LOSSES EVALUATION
Assumptions, Definitions
onedirectional flow
P = P ^ C , 1
(Er): uniform reference flow
Ur = arbitrary f about main stream
velocity
Pr = P (»0 hir = hiin
(Em): mean uniform equivalent flow
Pm um<J = /pudu = pr Ur U ( 1 + £q )
rh = o
£q , £d : non uniformity parameters of the
actual flow (E)
Figure 4 presents the method that will be used to characterize the stagnation pressure losses suffered by theflow throughout the circuit.
In each cross-section, of area w , it is assumed:
(i) that the flow is one-directional (velocity u ),
(ii) that pressure is uniform within (GO) at any time, but it may vary with time,
(iii) that stagnation enthalpy (i.e. stagnation temperature) is invariant except, possibly, while crossing a heatexchanger.
We assume known the real flow (E), i.e. the velocity pertaining to every elementary area dco within GO .Then we arbitrarily choose a uniform flow (Er) as a reference, which approximately represents the central flow insection GO(X) , e.g. the flow at the limit of the boundary layer, or the ideal flow that would result from an isen-tropic expansion up to section co(x) . Choosing ur , pr and hjo determines all the other parameters pertainingto (Er), in particular its stagnation pressure p jr .
This being done, we determine a uniform mean flow (Em), equivalent to the real flow, i.e. having the same flowrates of mass, dynalpy and energy, and occupying the same section area GO , which defines it completely (um , pm ,pm , etc.). Then, by comparing (Er) and (Em), we can define two non-uniformity parameters of the real flow (E),eq (concerning the flow rate) and e^ (concerning the dynalpy) globally expressing the difference (E) — (Er) .

4-6
Fig.5 LOSSES EVALUATION
a) Main stream losses
p.
main stream(reference)
,' B.L.
(x)/ / / / / / / / / /b) Non uniformity losses computation
6p = pm - Pr = o
Um-prUr = £qprUr
6h = 0 5s =
Tr 5s+-^-+ ur 5u =0
TT
This being done, we can first calculate the loss FIr localized in the reference flow, i.e. in the central flow:this loss would be that which would be obtained if the real flow were perfectly uniform and identical to (Er). [Thisloss would naturally be nil if (Er) had been chosen as the perfectly isentropic flow up to GO(X) .]
Then we have to calculate the complementary loss due to the non-uniformity of the real flow, as compared toflow (Er).
Equations (1), (2), (3), (4) express this comparison and speak for themselves. It is assumed that the differencesconsidered are small enough for the second order to be neglected.
In these conditions, the identity dh = Tds + dp/p permits us to deduce the entropy difference 5s , and hence,by considering the stagnation state (6Tj = 0), the complementary loss due to non-uniformity; we shall denote it asEg to express that it is essentially due to the boundary layer, if (Er) was properly chosen.
Naturally, the total loss is II5 + IIr at abscissa (x). Thence the framed equation which underlines the influenceof ej and €„ .
Let me insist on the fact that the distinction between nr and fig , though rather arbitrary, will be very con-venient for discussing the choice of the extraction zone location, as it is clear that this extraction will be all the morebeneficial if it is located in a zone where Fig is high.
Let us also note that, owing to the various causes of boundary layer diffusion, losses ng are not necessarilyincreasing along (x): in certain zones they decrease, being transferred to IIr . Only the total IIr + Ilg increasesalong the circuit but, obviously, at singular points, such as inductor, exhaust, etc. It is clear, in particular, that justbehind the settling screen, if it is efficient, Ilj must be nil, total losses being uniformly diffused in the stream.

4-7
Fig.6 NUMERICAL EXAMPLES
a) Example of losses (main stream).
em;
b) B.L. |osses(dlFFuser exir)
i
R
J S
o _= 0.74
a = -
5d=-0,073
H5 = 0,04
The calculation method of losses is illustrated by two examples.
Figure 6a — An obstacle with drag X placed in the flow creates a wake, and thence a dynalpy loss expressedby the parameter e^ , from which there results, according to the preceding theory, at M = 0.9 and forX = 0.02copr corresponding to an aircraft model at moderate angle of attack, a loss FIr = 0.01 (this loss obviouslydiffuses within the main flow).
Figure 6b — At the first diffuser outlet the boundary layer profile can be expressed by a power law (n = 1/5).
One can immediately deduce
/ \2 r° pu I u \ 27M?H5 = 7M?cq-(l + 7M*)ed = 7MJ - / • ( ! dy = ——l-
R J0 ^iui \ ui/ R
where R is the' hydraulic radius of the section being considered. With the 5/R values experimentally determinedin the non-pressurized transonic wind tunnel S3 existing at Chalais-Meudon, one finds:
= 0.04, for. 5
= 0.6 and - = 0.04.R

4-8
Fig.7 PRESSURE LOSSES IN THE CIRCUIT
0,05 -
r 6Pi2- —
- P< //v—
$/ /£' Q /
-— - "* * ***
'-^^^^ Q^^
c <? ^ t
/* £/ fc /£>£ °
Mv = 0.9|
Boundary layer
^ Mam stream
100i
+^ & Diffuser^ .c
A A A A A
„„._.._._,..-.-"
200i ^1 ^^— -*-
^ c" ,?cc ^? *
.0 & A
Figure 7 sums up the evaluation made by this method, based on experimental readings of boundary layer andstagnation pressure in the circuit of the S3 Chalais-Meudon wind tunnel (0.75 m2 cross-section, atmospheric pressure)of the total losses II for M, = 0.9 , transposed to a 21 m2 test section wind tunnel, without taking into accountthe reduction to be expected from a rise in Reynolds number in the ratio
6 atm.
1
This curve, very conservative, will be used as a basis in the following discussion.
Fig.8 TOTAL PRESSURE LOSSES
n=-6Pi/p.0.2 _
O.I
Designpoint
Wall
J_I
0.6 0.7 0.8 0.9 1.2 1.3 M
Figure 8 sums up the evolution of losses as a function of Mach number, and makes clear the distribution ofthese losses between main flow and boundary layer flow.
Applications made from now on will use the design point:
M, = 0.9-n total = 0.1 ,
a value estimated as prudently cautious.

4-9
Fig.9 THEORY OF EJECTORS
(Steady conditions)
Basic equations
• »•
T 1
(1)
Assumptions : U = Cfe
(D : P, , M, , p, ....
(j; •' Pj , Mj , pj ....
(m) : Pm , Mm , pm ....
no losses at the wall
1)
uniform flows
Conservation laws
Mass
Dynalpy
Energy
Definition
h*j =
Pj Uj T
=pmum
Pm
/m
Figure 9 —
* For simplicity's sake, the constant section configuration has been chosen for the mixing chamber.
* Losses due to wall friction along the mixing chamber are included in the overall evaluation. They arediscussed later.
* The classical Fabri et al. notation makes use of X = 1/r . Parameter T , which in our case is small, willbe used; this will lead to a simplified theory.

4-10
Fig.10 THEORY OF EJECTORS
Numerical computation
.4Given : Mi , Mj , jut ,
_X
Tabulatedfunchons
*(n)=(*+ '=±ntr?r -±_8 ' ~ju
Figure 10 — Introducing the classical functions of isentropic expansion Go(M), Z(M) permits us to write theconservation equations as:
Pir
S(Mj) 2(Mm)
T)Pi iG3(M,)(l + 7M2) + 2Pij5(Mj)(l + 7M?) = Pi 7M2n) .
Combination of these two equations introduces a function 0(M) and parameters X (determining the injectionpressure) and Y (useful effect). Figure 1 0 gives the method for calculating
Y(M, , Mj , M"1 , r) and X(M, , Mj , M"1 ,

4-11
Fig.11 SIMPLIFIED FORMULAE FOR LARGE INDUCED MASS FLOW
T « 1
IffT(J
5u
U)m- ( ,= 5(J # TU,,
Basic equations
(?) 5( pu) =&m
(f) 6(p+pu2) =Sj
(D 6 hi = 0
With 5m = (pj uj - p1u1 ) T
Sj = [pj + pj uj2 -fp^ftu,2
)-^T15s + H+ U S u = 0
=Sj-UiSm.,
5s
small
X = Pij
Figure 11 - The above calculations (Fig. 10) permit us to establish exact numerical tables of u~l , r , Y asfunctions of X , for given M, and Mj .
But in the case where f1 and i are small with respect to unity it is interesting to write simplified formulae,valid up to the second order.
The basic equations are rigorously transformed into (1), (2), (3): 5m and 5j denote respectively the comple-ments of mass and dynalpy flux brought up by the jet, per unit area of the mixing chamber total cross-section.
One can then write, up to the second order
with
j = 6 ( h + — ) = 5h, -f u,5u
6p5h, = T,6s + — .
Pi
But in the local isentropic stagnation state:
5Tj 5Pi6s = C D — I - - T —
• P TJ Pi
whence8s 6pj- = - -2- , (5Tj = 0)
which justifies the framed formulae, where functions GJJ = w(Mj) ; 2j = Z(Mj) were introduced, as well as thedefinition of X = PJJ/PJ .
It is thus seen that for a given injector (7, M , , Mj) the useful effect 6pj /pj is a linear function of injectionpressure. This effect is proportional to T , i.e. to the jet emissive section.

4-12
Fig.12 EJECTOR PERFORMANCE
a ) General case fa- & fa
•C.-fu
x=%-D(Mj,n,j
0.5
0 Q5_ b)Adaptotion
M,
•+<! j~j «- _
--TOL E-* * <P«-^=^-tef (T "TTf aJj-5j -i-^
A)/see fi913
Figure 12 expresses the preceding relation in the form of a function D(M,, Mj) knowledge of which permitsthe immediate approximate calculation of 6p;/pj , if X and T are given.
On the figure the discrepancies of these results are underlined, exact to the first order, compared with someexact results for T = 0.05 . It is seen that when ^ is small enough the solution is satisfactory.
0.5
Fig.13 EJECTOR PERFORMANCE
(Simplified formulae)
Special case: p, = pT (adaptation)
Mj = 2.0
1.0
05
M1
0.5
* exact computation
Figure 13 describes the particular case where the ejector functions at the adapted regime, i.e. when the jet isemitted at a pressure PJ equal to pressure p r of the main flow; in this case a free parameter disappears;X = Pij/Pj, is fixed by the choice of M j and Mj , so that T can be expressed as a function of u~* (see Fig. 10)and, to the approximation degree chosen, Spj/p; is proportional to I /M = M ~ ' -
The correction curve allows us to estimate the error of this simplified formula or, if necessary, to calculate amore precise result for relatively large values of /r1 .
The function E(M,, Mj) expresses this proportionality and makes it clear that, for each value of M-. , thereexists an optimal value of M, . This is a very important result for design purposes.

Fig.14 EXAMPLE OF INJECTOR PERFORMANCE
Mj = 0.6 ; Mj = 1.6
4-13
(a)
03
0.2
0.1
01.1 1.2 1.3
(b)
, T
0.05
1.2 1.3
(c)
1.1 1.2
Pi
1.3
Figure 14 expresses the preceding results, as an example, in a typical particular case: M, = 0.6 , M;as a function of the compression ratio Y = p\m/Pil . It gives the values of
qmj injected air flow rate
= 1.6
qmi flow rate to be entrained
emission area
mixing chamber area
PJJ injection pressure
PJJ local stagnation pressure
It is clearly seen that for high values of Y , corresponding to high testing Mach numbers, it is mandatory toforgo the adapted regime in order to minimize the expenditure of compressed air. Using the adaptation regime isin fact suggested only in order to limit the intensity of the noise proceeding up to the test section from the mixingchamber; it is then obvious that this regime can be dispensed with in supersonic tests, provided that the return circuitis acoustically treated.

4-14
Fig.15 EXPENDED MASS FLOW
versus mixing chamber length
«, H •"° = "-1°
fTTo = total losses withouf mixing chamber.( M o = total
0.40
030
o.ao
0.10
03 O.A 0.5 0.6
Figure 15 — The mixing chamber problem consists in a compromise between the mixing efficiency and thefriction losses, which increase with length / .
If w is the crosswise characteristic dimension of the mixing chamber, it is generally assumed that in the caseof a single central jet //w should be in the order of 10 (at least).
The classical boundary layer theory gives for the losses the expression
nm = 47M2Cf-.
Fabri2 recommends taking Cf = 0.005 (which is a conservative value); whence
nm = 0.028 M2 / /w.
If no represents the total losses in the circuit (apart from the mixing chamber), and qmjo the theoretical'-rate m
defined byflow-rate necessary to compensate them, the actual flow-rate qmj for a mixing chamber of non-zero length is then
= 1 + Hrr
nn
qmjo and IIm being functions of M, , the figure represents the influence of M, , and that of //w , for threetypical values of M; , and no = 0.10 (nominal case), and an ejector functioning at adaptation.
One may notice the interest there is to choose, (i) Mj as high as possible and, (ii) for a given Mj , the value//w = 2 , which seems feasible with a multiple ejector, as will be seen later.
The optimum of M, happens to be around M, = 0.6 , and is rather flat. In the following, we shall keep thisvalue for the numerical examples, but the experiments which are in progress at ONERA could demonstrate that aslightly lower value would be better — for example M, ~ 0.5 .

MIXING PROCESS OF A CASCADE OF FREE JETS
4-15
Fig.16 Velocity profiles Fig.17 Efficiency of mixing
Mj = 1.6,
Pi - 0.2
200
Figure 16 sums up recent results obtained at ONERA by O.Leuchter* in the study of isobaric, parallel, free jetsby a finite difference method and the use of a turbulent friction model based on a recently improved mixing lengthconcept.
The isobaric assumption can be maintained here for a mixing chamber of constant section, as the length-wisevariations of p are small.
The figure shows the ejvolution of the mixing profiles as a function of x/h0 (h0 being the half-height of theslit).
It should be noted that if, in the width w of the mixing chamber, we set N equidistant injector vanes, wehave, by definition,
T =2Nhn
w
The half spacing of the jets is given by
wVe =
h« 2Nhn
It is shown that, in the typical case Mj = 1.6 ,xe = 300 h0 , i.e. xe = 1.25w.
j = 0.6 , T ' = 16.8 , N = 8 , the jets join up for
Figure 17 presents, in the same typical case as in Figure 16, the mixing efficiency as a function of length.
At the location where the jets join up (/ = 1.25 w), the difference Au of axial and lateral velocities is in theorder of 30% of the initial difference; at the location 500 h0 (//w ~ 2), the difference Au is reduced to 15%;as a consequence, it is considered that this limit (//w = 1) can be accepted for the mixing chamber length, as:
(i) the velocity increase near the wall will then have reached about half of its theoretical final value, at thediffuser entrance,
(ii) a partial evacuation of the boundary layer at this point is possible,
(iii) within the flow, mixing will continue to take place in the diffuser.
Experiments under way at ONERA verify this statement.
Other calculations are also undertaken to study the effect of mixing at increasing pressure, which should permitreduction of the length of the mixing chamber to almost zero (see Figure 43).

4-16
Fig.18 OPTIMIZATION OF EXHAUST
/ / / / / / / / / / / / / / / / / / .J_ f0 return
_ —_ circuit/ / /
.;qmj(G'j (Q"j
Cjwo = r(rirest j'fiao) = Given.
Ho =Toral losses wirhouf exhausl- effect.
G-Jwrz Reduction of losses due to c(c\mi.
Q .n0=ReducMon of losses due to (1-^jqmj.
cjn>jo = K.lt0.C|(no withouf exhausK
Clmj = K.n^.Cjmi. For di=£ 0
= Cjmo _ ot cjmj
Example: oU 4 = G'=G"=o; 3!2i!L= 0.2r ' ^m0
C|mj= 0.8qffj0
Figure 18 - To maintain steady conditions it is obviously necessary to evacuate a flow rate qme equal tothe injected flow rate qm j . In pressurized wind tunnels as considered here, this raises no problem of supplementaryenergy expenditure. This condition may be utilized to reduce air consumption;
If we evacuate qme between the test section, where the total flow rate is qm o , and the injector, we reducethe entrained flow rate by the same quantity, as shown by the numerical example. I°f, moreover, we take advantageof this evacuation to eliminate part of the boundary layer, the losses to be compensated are reduced. In this respect,it may be advantageous to reserve a part (1 -a)qmj of the flow rate to be evacuated to improve the losses in themixing chamber and in the second diffuser.
It should be noted that if a part of the mixing chamber boundary layer is evacuated before location xe ,where the action of the jets starts being felt along the wall, this flow rate should be included in the part aqmj .
The formula sums up the discussion and can be used as a basis for optimizing the evacuation, provided G'and G" are known as functions of a and of the position of exhaust.

4-17
Fig.19 REDUCTION OF LOSSES BY BOUNDARY LAYER BLEED
=t>
L
*
b
Ui
U
*Jl J/
hS
TT' 4
_ ^
Total caprure area
>g _ lateral extension oF bleed /3BsecHonal perimeter B
Non uniformity functions.
Bleed mass Flow Cjme = f4-U-4
• Variation of non uniformil'y coefficienf
due ro bleed : '
Figure 19 sums up the method applicable for calculating the reduction of losses by boundary layer bleed, as afunction of the assumed shapes as well as the velocity profile.
We assume a bleed of height h6 , extending over a fraction 0 of the perimeter B of the section considered,of total area co,.
The calculation takes account of the functions Q(h) = 1 -I- eq and D(h) = 1 + e,j given in Appendix II,which express respectively the non-uniformity in flow rate and in dynalpy of the bled flow, relative to the mainflow taken as a reference.
This way, we determine by a very simple calculation the variations Aeq and Ae,j of the non-uniformityparameters of the whole flow between the sections upstream and downstream of the bleed, the values of whichdetermine the loss reduction factor G .

4-18
Fig.20 LOSS DUE TO NON-UNIFORMITY
Figure 20 shows how, from the previous considerations, we can deduce the variation All of the losses andthe corresponding evacuated flow qme , as functions of relative height h and of the parameter 0 of transverseextension defined in Figure 19.
The numerical example illustrates in a typical case the application of this method, and shows that withqme ~ 0.10 qmv , we evacuate 35% of the boundary layer losses; if IIg/no ~ 0.5 , G = 0.17 .

4-19
Fig.21 VARIOUS TYPES OF BLEED
(a)
(b)
(c)
(d)
Figure 21 gives a few examples of cases which are less simple to calculate than the preceding one, in which weassumed that the bleed brought no perturbation to the flow.
The same bleed, badly adjusted in flow rate, may function according to models (a) or (b).
In case (a) the evacuated flow rate is insufficient, and there is a risk of separation at the entrance, on theexternal side, thence an evacuation efficiency loss.
In case (b) (too large evacuated flow) the supplementary loss is nil on the external side, but there is a risk ofblockage of the bleed flow at the entrance.
In both cases, the main flow is subject to a positive or negative acceleration between sections (1) and (!').
Case (c) represents another possibility, a limit of case (b) for h -» 0 (submerged air intake).
Case (d) represents a type of continuous bleed through porous walls.
The methods for calculating these various cases are rather complicated; they will not be discussed here; it is tobe observed that these various bleed configurations could also be very different from the acoustic point of view.

4-20
Fig.22 INJECTOR DESIGN BASIS
Assumptions
• Losses given : fig 8
(Taking account of non-optimized boundary layer bleed)
(regulation of injected mass flow by. -T- -TT-i ]varying A = o j
ftj 30 bars Mj = 1.6 (forp- l6 11 bars)
|MV> 1| A = "C"1 constant
regulation by <|HJ
0.2
0.1
0
10
0 Mv
0.4 Q8 12 0.4 0.8 1.2 OA 0.8 12
Figure 22 — Losses in the circuit that have been previously defined (Fig.7) are derived from data provided byexisting non-pressurized wind tunnels. Moreover they do not take into account the gains made possible by boundarylayer bleed optimization. Though these evaluations are pessimistic, they will be taken as a basis for conservativeejector dimensioning.
It is recalled that
• for My < 1 , it is assumed that operation of adapted regime is used; jet piloting must therefore be donewith T variable;
• for My > 1 , on the contrary, T maximum is used, and piloting is done through injection pressure.
Lastly, we reckon that PJJ must not exceed 30 bars in order to avoid excessive storage pressure or capacity.
A. simple calculation shows that if we want to reach exceptionally test stagnation pressures up to 10 bars, Mjshould be taken at 1.6 to fulfil this condition.
It is then possible to trace the ejector functioning curves as a function of the test Mach number - see at bottomof figure.

Fig.23 INJECTOR DESIGN
(a)
External Flow
Equilibrationhole
(b)
1
^
1
*-
s>*
~^
1* '
-*.
-*
-»
•»
-»•
•*»
•*•
w
•L
rL
r'.
- CD
(2)
(3)
• (4)
.
Fig.24 PERSPECTIVE OF AN INJECTOR VANE
(?)©
View from downstream of thet injection
systemw
Example :
Figure 23a - Shows a possible sketch of the ejector located in one of the vanes of corner 1. It is planned todivide it into four equal compartments, individually supplied with air.
Air entering into a compartment is distributed as evenly as possible through orifices bored in the supply tubing.
In order to stabilize pressure pSj and to avoid any pulsation, a system of pressure drops is inserted betweenthe air plenum chamber and the Mj = 1.6 nozzle. A properly calibrated small orifice is bored in the wall separatingtwo neighbouring compartments:
• to equalize the pressures p^ if they are supplied simultaneously at full rate,
• to provide a moderate blowing flow reducing the base drag if the compartment is not in use.
Figure 23b — Shows, from downstream, the emission system with 8 vanes, i.e. 32 compartments.
In the subsonic regime, governed by the parameter T , the number of operating compartments will determinethis parameter. The grouping to be realized for obtaining the best functioning must be the subject of a special study,planned on the pilot wind tunnel T2 of ONERA (the grouping shown here is only given as an example).
Figure 24 — gives a perspective of the vane just described.

4-22
Fig.25 EJECTOR VANE DESIGN
a) Sectionalprofile
N = 8 vanes
b) Wall pressure distribution
max
Figure 25 sums up the theoretical study of the external shroud profile of the ejector vane. Calculations arefirst made in ideal fluid by the hodograph method of R.Legendre; the ir/2 deviation at infinity is imposed. Thehodograph chosen depends on two free parameters which permit the velocity distribution to be varied within abroad range. A boundary layer calculation permits elimination of solutions which would involve flow separationand calculation of the profile losses of each acceptable solution.
The figure gives the result of these calculations. Naturally the computed profiles are not closed at the trailingedge and leave room for the nozzle exhaust.

4-23
Fig.26 SECONDARY FLOW NEAR THE SIDE WALL
(Without boundary layer bleed)
Figure 26 - Shows the three-dimensional behaviour of the boundary layer, observed on the lateral walls,between two successive vanes.
The vortex sheet which forms from the separation lines of the lateral boundary layer also creates a secondaryflow entailing non-negligible losses.
An ONERA research on large deviation vane cascades showed that a boundary layer suction convenientlylocated on the lateral walls permits almost complete elimination of this effect provided the suction rate is sufficient;in the case considered, this rate would be of about 2% of that of the main flow, in nominal operating conditions(M, = 0.6).
Fig.27 LOSSES THROUGH CORNER No.1
Assumptions Mi=0,6 ; Jh,^ = 6 bars.
C — 2 ;w= 5 m.
.Sectional B.L. _ ^ =0.004
• Secondary flow 0.010
Total loss (without bleed) : 0.014
• With a bleed on the sidewalls,
^""e /yDD?) ( secondary flows disappears.^rru /
( from O.N.E.RA's recent results)
Figure 27 sums up these tesults, and shows that the total losses in the corner may be brought down from 0.014to 0.004 by suction which, at Mv = 0.9 , represents a saving of 14% on compressed air expenditure (qmj = 0.15 qm<))and means an evacuation of 1.5% of the main mass flow qmo .

4-24
STARTING PROCESS ANALYSIS
INTRODUCTION
Starting the inductor initiates in the wind tunnel circuit a transient process whose duration is governedessentially by three characteristic times:
• 0 : time necessarily for the inductor to reach its maximum flow rate, an a priori arbitrary time.
• L/a0 : time taken by an acoustic wave to travel the whole circuit length L . This time is in the order ofone second in the case considered.
• L/umean : time taken by a fluid particle to travel the whole circuit length, in the order of 5 to 10 seconds.
To these characteristic times are associated two types of phenomena:
(i) The establishment of a steady pressure and velocity regime by action of the acoustic waves emitted by theinductor. This problem may be discussed rather simply by a one-dimensional, unsteady calculation method(x, t ) .
(ii) The formation and propagation of a main vortex at the start of the inductor, carried along by the flowand whose intensity depends on the starting law of the inductor.
We shall analyze these two types of phenomena one after the other.

4-25
Fig.28 STARTING PROCESS ONE-DIMENSIONAL ANALYSIS
I U,~,Injector (X)
Schematic drawing of the circuit developped along sc
Basic equations
fi (CC) (Given)
0
SC
(1) Log-£ =uo
(2) -2-dt
(3) A
(4) A
With h
= m'u
= A(pu)+q'u
perunitlength
um'= injected (or extracted )mass flow
(J j' = n ( // ^momentumflow
U) f ' = drag force
CJ q'= injected (or extracted )heat flowp = effective pressure at the wall,fw
Figure 28 sums up the bases of the unsteady study of the establishment of the flow, by the one-dimensionalmethod.
The circuit is supposed developed along the x axis, between abscissae O andarbitrarily placed. Naturally the conditions (p , u , s) acquired at time t at abscissaeidentical.
L , the end point beingx = L and x = O are
Evolution laws of the cross-section area co are given in the form of Equation ( 1 ) where o>0 represents areference area, arbitrarily chosen, e.g. the test section area.
Equation (2) expresses mass conservation; the right-hand side m'cj represents the lengthwise derivative ofthe flow rate that may be introduced (>0) or extracted (<0) at section o> , and supposedly evenly distributed inthis section (m' = 3m/3x).
Equation (3) expresses the momentum theorem in conservative form; on the right-hand side there is first theterm pw 3<o/3x , which represents the axial impulse given to the flow by the wall pressure effect on diverging(3co/3x > 0) or converging (3co/3x < 0) walls; the term j' expresses the momentum flux per unit length(j ' = 3j/3x) and per unit sectional area, and permits us to account for the effects of inductor or boundary layerbleeds; the term f ' corresponds to friction or drag forces per unit length, supposedly evenly distributed overw (f = 3f/3x).
In Equation (4), which expresses energy conservation, we placed on the right-hand side a term q' = dq/dxwhich corresponds to the effect of a possible heat exchanger, or to the introduction of a stagnation enthalpy fluxattached to injection or extraction of a mass flow rate m . If, for example, we inject the rate m of a fluid whosespecific stagnation enthalpy is hj , we write: q = mhj .

4-26
Fig.29 STARTING PROCESS ANALYSIS
Main dependent variables: Z = log p, U =— , S =
Characteristics equations prom (2), (3),
dimensionless variables
L 'LV *2S= U +A —-A-C'Z* o\l = (Q'+AP')oV
= U - A ^ -A- 5"Z - 6U= (-Q'+AP')5> *
dS = R'dr*
or(I)
(S) S- U
p' \ . .J linear combinations of
Q' f .... . j.
6r*
/W
P
/I' /(S)
\k
(b
standard
method of
computation
known (Fixed grid)
Standard algebraic derivations leading to the characteristic equations of the basic system are omitted here (seeAppendix II). It is convenient to make use of non-dimensional parameters for computation:
xx* = -
L
a _ p sA = — p = — s = — Z = log p/p0
L L a0 a0 p0 C^
Expressions m ' , f ' , j ' , q' of the right-hand side are also non-dimensionalized.
The three classical families of characteristics are naturally found:
• (TJ) acoustic waves propagating faster than the flow (velocity U + A),
• (I) acoustic waves travelling upstream (velocity U — A),
• (S) trajectories (x, t) of fluid particles (velocity U).
To any displacement, of duration 6 t , along each of these characteristics in the (x*,t*) plane, is associated arelation expressing the variations of Z , S , U (the three functions of state which determine the flow at everypoint). Functions P' , Q' , R' from the right-hand sides of the basic equations are simple linear combinationsof m' , j ' , f , q ' , n ' = dlogw/dx* .
At the bottom of the figure is recalled the classical outline of the calculation method of Z , U , S at a pointp(t + 6t) when their values are known at every point at time t . It is advantageous to carry out a calculation on afixed network (x*, t*), appropriately chosen in each case.

4-27
Fig.30 UNSTATIONARY INJECTOR ANALYSIS
mixing chamber
• Mm
1(1) (n
I t = mixing length
Injected mass flow m —» m'= —-^
" dynalpy J —»• J = —
" total enthalpyq—- q'= nYr^: = m'l\H
P'Q'R'
Induction system
Characteristics equation for induction system traverse
f
s3 -
Calculation along the mixing chamber, by the general method outlined in Figure 30, would require informationon the evolution of mixing between end sections ( I ) and (m).
One may, for example, assume a linear evolution with x of mco and jw (jet mass and dynalpy contribu-tions), as well as of cross-section w . These assumptions determine m ' , j ' , fi' and, consequently, the right-handsides P' , Q', R' of the characteristic equations (parameter q' , expressing the total enthalpy contribution,eliminates itself, as hy = hj ( by hypothesis; if not, it should be taken into account).
The sketch in the centre of the figure shows for example how point 3 at the mixing chamber outlet would becalculated from the relations of the characteristics: (TJ)^ (acoustic wave), (8)53 (stream line) both expressing theinductor effect, and of the characteristic (g) coming from upstream at point 3. These three relations would determineZ3 , U 3 , S3 . Then, point 2 would be calculated from point 3 [characteristic (g)] and from information broughtfrom downstream by characteristics (T?) and (S), intersecting at this new point.
The equations at the bottom of the page show the characteristic relations to be applied across the mixingchamber; they contain the global effect of the mixing chamber alone:
P = P'/
Q = Q7
R = R'/ .

4-28
Fig.31 INJECTOR MODELIZATION
t*
—. o*I nn'={ =n'
Injector
Integration of the basic equation through the injector(t = constant)
dx
puu
(p+pu2)u
Pj Uj TO)
Fig.32 FIXED GRID METHODOF CHARACTERISTICS
Region of induction system
puuhj, pj uj hi TCJ
<t —•• 0 : steady conditions ( fig 11)
6(pu) = 5m
6(p+pu2) = 5j with
6h; = 0
t - fdt
(S)
ycNr—(—
AU
AZ
AS
. tInjector
+ mixing chamber
K, L,J : known at time t
N N, unknown
linear functions of 5m, 6j
(0 ^
IS) SNl- SL bf
Inductioneffect
functions of 5m,5j
= AZ
= AU
= AS
6 unknown quantities (Z= logp,U, S) N,N2
6 relations
Study of the result of Figure 30 suggests the schematic representation proposed in Figure 31, in which theinductor unit is represented by a discontinuity. The three general equations of movement integrated at time tacross the cut determine a system linear in AU , AZ , AS . The terms in 3/3t eliminate themselves when themixing chamber length tends toward zero, and the indicated relations to determine the discontinuities at the con-sidered time are obtained. In these expressions, P , Q , R , let us remember, are linear functions of flow rate m ,of jet dynalpy j , of injector wall friction f — which is subtracted from j - and of the injector geometric para-meter T = 1 /X .
It will then be sufficient in practice to place the corresponding cut between two successive lines x* andx* + Ax* of the network, and to proceed as indicated in Figure 32 for calculating points N, and N2 .

4-29
Fig.33 INJECTOR START ANALYSIS
for 1=0.
U=0
i,ro0/inducMonparameters
(small at. 1=0*)
=0
Initial induction effect
UN»
double-piston-like behaviour
of starting process
compression~ wave
The study of injector start, as shown in Figure 33, is quite instructive. At the initial time (t* = 0) everything isat rest. A short moment later (t* = 0+), injector parameters j, m take finite but small values, j0 ,meters Z , U , S at N, , N2 can be calculated by the method described in Figure 33.
m Para-
The characteristic equations are then simplified, and give immediately the initial pressure and velocity jumps inNj and N2 , i.e. determine the intensities of the two waves (£0) and (TJO) emitted respectively upwards and down-wards at injector start. It is seen that wave (T70) emitted downwards can be assimilated to a shock wave generatedby a velocity jump 5u2 and proportional to:
6u. Jo +mo[ P j - p
while expansion wave (£) is expressed, at its origin, by:
6u,
2TP,[Pj -P + pjUj(Uj-a 0 ) ] .
The initial effect of injection start may thus be represented as equivalent to that produced by an extensiblepiston whose rearward front would progress faster than its forward front. The velocity of the centre of gravity ofthis piston is defined by j0 (the jet dynalpy), and the relative velocity of the two ends by m0 (the jet mass flow).The distance between the two ends of the piston is then interpreted as the volume necessary to insert the fluidemitted by the jet between the two masses of fluid driven downstream and sucked from upstream.

4-30
SIMPLIFIED APPROACH TO THE STARTING PROCESS
Let us suppose that at each instant the flow regime is quasi-stationary in the circuit, which permits us to writethe two following relations:
puw = qm(t) (1)
p(x,t) = p0(t)g[u(x)] . (2)
The first equation expresses the fact that at each instant the flow is the same in all sections, and the secondthat the pressure distribution law in the circuit remains self-similar. Let us then integrate the momentum equationat instant t on the whole circuit.
3 P P 3 P 3w P— (tpuwdx -I- <p — (p + pu 2 )dx = (bp — dx + j (t) — d> f dx .3t J J 3x J 3x J
One verifies immediately that, taking account of (1) and (2), this equation is reduced to:
^~ = J ( t ) -F( t ) (3)dt
where L = circuit length
F(t) = sum of friction and drag losses.
When, at time 0 , the steady condition is reached d(qmj)/dt = 0
j = J , F(0) = J .
At any intermediary instant, one can write:
F(0) umax qm
as losses are everywhere proportional to the square of velocity; on the other hand, the jet impulse j will be con-sidered here as proportional to its mass rate, viz:
J 1m max
Equation (3) then becomes
L dqm qmj _ / qm VJ dt 1m max Vlmmax/
from which, by integration from 0 to 0 , the total consumption for the starting phase becomes:
ayLet us write:
"o 1m max
and
1m
/
0 a2U— dt = teq (loss of useful running time due to starting)
1m max
1m max= 6(t) .

4-31
6(t) represents the flow starting law in the circuit. We thus obtain:
T
teq. = j(lm)max + j® «*(« <" • (4)
If we note that, by definition of M
Mlmj = (im)max
and that
M = Pj"jj Pid
it is easily found that the first term of (4) is equivalent to
L(lm)max = 0-8 L
J 0(Mj) a0
i.e., for M; = 1.6 ,
teq. = 3.5-+ / 6 5 > d t .ao °
If we assume, for instance, a linear starting law 5 = t/0 we then get:
leq.L 1
= 3.5 — + -© .a0 3
It is finally seen that the equivalent starting time includes a fixed term corresponding to the momentum variationof the air mass contained in the circuit, and a second term depending on the law chosen to reach the steady condition.
In the particular case considered (L — 250 m , a0 = 330 m/s), we have:
teq. = 2.6+-.0
3
If, as an example, we assume © = 3 seconds , the starting process will cost about 3.5 seconds of useful duration.It is also seen that there is no great interest in reducing © to a large extent, as the minimum loss is already 2.6seconds.
REMARK
A calculation of the same type shows easily that if, the steady condition being established, injection is stopped,the velocity decrease law is:
u(t) 1 / a0t
l + t*/3.5 V L /
It thus takes 2.6 seconds for the velocity to be reduced by half, in the particular case considered.

4-32
Figure 34a Figure 34b
testchamber
-0.02 -0.01 +0.01 +0.02
The preceding approximate method is obviously only a first approximation: it does not take into account thetransient aspects of the problem, which can be characterized by the propagation duration L/a0 (~0.75 sec) of anacoustic wave in the air at rest in the circuit, and by the duration 0' = #dx/u of the run of a fluid particle roundthe circuit, in steady conditions.
Figure 34a represents the run diagrams of a few typical particles, during the initial phase: if we call 0 theinstant from which the steady velocity regime is approximately established in the circuit, the particle crossing theexit section (x = 0) of the injector has the trajectory Q(0) , and completes its first complete circuit at time 0 + 0' ;it is the first fluid particle subjected to losses FI foreseen in steady conditions. Any particle crossing x = 0 beforeinstant 0 + 0' is affected by only part of losses II : it is thus necessary to adjust accordingly the injection rateqmj for 0 < t < 0 + ©' in order to ensure a constant stagnation pressure at the test chamber entrance afterinstant t = 0 + 0' .
Let 0g be the complete circuit time for the particle near x = 0 at t = 0 (trajectory Q0). It is obviousthat the particles crossing the test chamber between t = 0 and t = ©„ will have increasing entropies. If the initialjet opening has been very fast, there will be, moreover, a fast decrease of entropy at the crossing of (Q0). We shouldthus expect in any case a stagnation pressure variation in the test section for a duration in the order of 0 + 0'.
Figure 34b gives an example of this stagnation pressure variation, calculated step by step by the x , t non-stationary method, in a particular case: 0 = 3 sec , ©' = 7.5 sec , corresponding to a 250-m long circuit and anMv = 0.9 .
On the other hand, the Mach number Mv in the test chamber can be established quickly (0* ~ 4), and main-tained constant by a properly adjusted sonic throat at the diffuser entrance, as shown on Figure 35c.
It thus appears that, thanks to a proper adjustment of the injection law and a continuous measurement of thestagnation pressure, it is possible to limit the starting phase unusable for measurements to about 0 = 4.5 L/a0 ,i.e. about 4 seconds in the case considered. '

4-33
Figure 35a Figure 35b
Reducedmomentum flux
*_ Start of thesonic throat shock
wave
1 ' 4 6 e ' fb~0.25 0.75 sonic
throat
Figure 35c Figure 35d
Start of the sonic throat5 = 5-5,
0.02
-0.02
! > 4 £ a m 7^-0.04
0\jector 0.25exit
0.5 0.75 Injectorentry
Figure 35a shows, to substantiate the previous considerations, a few interesting details of the results obtainedby a step by step calculation with the x*t* numerical method in a particular case. The adopted injection lawincludes, in a first phase, a rapidly increasing flow rate, followed by a plateau up to the starting of a sonic throat atthe first diffuser inlet. Immediately after that starting the flow rate is reduced so as to maintain the shock wavenear the diffuser throat.
Figure 35b shows that the velocity distribution in the circuit remains, during the build-up phase, practicallysimilar to the final distribution; this validates the assumption adopted in the previously described simplified theory.
Figure 35c presents the evolution of the Mach number in the chamber, which stabilizes quite well after timet* = 4.5 .
Figure 35d outlines the entropy distribution along the circuit at various moments during the initial phase. Wecan clearly see the evolution of the entropy pocket predicted by the considerations of Figure 34. The strong initialvariations decrease gradually, but for t* = 8.96 (i.e. 7 seconds), they are still in the order of 6S = 0.02 , corres-ponding to a 7% variation of stagnation pressure.
Though the initial injection law had not been optimized in this respect, we have little chance of totally sup-pressing this slow entropy drift unless we accept a considerable lengthening of the build-up phase: it will thus benecessary, for a correct interpretation of the results, to continuously measure the stagnation pressure in the testchamber.

4-34
Fig.36 STARTING VORTICES
{H.Werle visualization)
The velocity discontinuity occurring at injection start entails the formation, around each jet, of a vortex whoseintensity increases with rate of jet pressure build-up (Fig.36).
This vortex will then travel along the circuit at the same velocity as the fluid: we have seen (Fig.35) that itspassage through the testing chamber might occur during the useful part of the run, if its diffusion were not yetcompleted.
To facilitate this diffusion, various processes may be considered:
• slow build-up of each elementary jet (compare Figures 36a and 36b);
• successive opening of jets;
• it will also be noted that, in the proposed system of parallel jet planes, two neighbouring vortices arecontra-rotative, with is favourable.
Moreover, the successive corners crossed, and the settling screen (Figs.36c, 36d, 36e) assist completion of therequired diffusion.

Fig.37 PRELIMINARY PILOT IDT
J_\L); acoustic pressure transducers
4-35
Ejector unit
/—I1
vyLo— H—*HiA>
CDC
V
D1
C M Dj
_ /
r?» <T>
Injector parameters
X = 2 3
fimox=3.5P,
To study experimentally some of the difficulties which might be raised by the use of an IDT, a small scaleinstallation (10-cm square test section) was operated at Chalais-Meudon. It functions in a circuit open to atmosphere,according to the layout of Figure 37. The constituent elements of this facility are interchangeable in order to allowthe variation of a number of parameters.
Experiments already undertaken, at present in a developing stage, have already been the source of some veryinteresting observations, which will be briefly commented upon. They concern:
(a) noise problems,
(b) performance verification.
As regards noise problems, we installed acoustic sensors with very short response time (piezo-electric ceramics)in the wall, at various points of the circuit [elements (1), (2), (3), (4), etc.], and we recorded spectra by a classicalmethod, for various conditions of installation and operation. We also recorded supply pressure spectra.
As regards performance problems, we record crosswise soundings, upstream and downstream of the ejectors.
This installation will soon be transferred to Toulouse, to be incorporated in a closed circuit where experimentswill be carried out at various pressures above atmospheric.
The whole pilot operation, called Tj , aims at developing a research wind tunnel, called T2 , whose construc-tion is under way, at a larger (fourfold) scale under the responsibility of Dr R.Michel, Chief of AerothermodynamicResearch Department (DERAT).

4-36
Fig.38 EXAMPLE OF NOISE SPECTRUMOBTAINED AT T^
(Station 1: testing chamber)
( mb \ Injector\V3octJ parameters
1 _
f (Hz)
Noise measurements carried out up till now were performed at first without any special precautions. They ledto interesting observations.
Figure 38 - The spectrum recorded in the testing chamber includes two zones of high intensity. The first one,in the low frequency range, is generated by the evacuation system, where flow separation takes place. The suppressionof this separation made this first singularity disappear completely, so that it presents no further problem.
The second high intensity zone, appearing at the right end of the spectrum, is due to the jet itself, and tomechanical vibrations of the induction unit, whose natural frequencies happen to be in this range. The spectrumconsidered here corresponds to a very much under-expanded jet (PJ/P, ~ 3.5).
Fig.39 NOISE ATTENUATION BETWEEN MIXING CHAMBERAND TESTING CHAMBER
1.5
UPrmsQ . ,r \ V
OprmsfTi 1.5
0.5
0
0.5
_rms ._
F(Hz)
10' 102 103
(a) EFFECT OF CORNER C,
102 103 10s
(b) COMBINED EFFECT OF CORNER C,
AND DIFFUSER Dj
Figure 39 emphasizes the effect of acoustic attenuation to be observed upstream, between the noise source(mixing chamber) and various points of the circuit; we verify, in particular, the favourable effect of the corner,except at a very high frequency where, on the contrary, an intensity increase can be noted (Fig.39a). The explana-tion of this phenomenon is simple: the relevant frequency is the natural frequency of the vanes, and is excited bythe underexpanded jet, radiating directly on the pick-up placed upstream of the corner. Let us note once morethai'-no acoustical treatment of the walls has yet been applied.' ' ' '

4-37
Fig.40 ACOUSTIC NOISE IN THE TESTING CHAMBERWITH ADAPTED JET PRESSURE
10
exhaust noise—I I-—
Pj - 3-5 p,
Pj « Pi( slightly
under-expanded )
T(Hz)
Figure 40 shows the considerable effect on acoustic intensity of the confluence of the jet with the main stream.We have traced on this figure the noise spectrum, for a pressure ratio where the adaptation condition (PJ = p,) isfulfilled, and for a case where it is not.
The general pressure level being, in our present tests, fixed by ambient atmosphere, we had, to obtain theadaptation conditions, to act on the supply pressure py . But as, in all cases, the jet is turbulent, it is reasonableto admit that, everything else being unchanged, the part of Aprms coming from the jet is proportional to py .
This result confirms the validity of the choice we made to adjust the inductor to operate at adaptation (p: = p,),at least as long as there is no risk of direct travel of noise upstream to the testing chamber. This favourable effectof adaptation is clearly linked to the disappearance of shock wave disks forming in a non-adapted free jet, whichconstitute intense noise sources by their very instability.
Fig.41 FLUCTUATIONS OF JET STAGNATION PRESSURE
101
6f
102 103 10'
F(Hz)
10=
Figure 41 reveals another cause of noise initiation in jets, and concerns the pulsations of supply pressure py .
In our present experimental set-up, no special steps have been taken to settle the supply air before its eventualexpansion. The measured p;: spectrum shows very large fluctuating amplitudes. It is quite obvious that dis-continuities, in magnitude and in direction, that result in the jet outlet velocity constitute a very important acousticexcitation source.
That is why we proposed, in Figure 23, to insert between the vane plenum chamber and the nozzle of theejector a pressure drop sufficient to dampen the inevitable pulsations of the supply air, at its entrance into eachcompartment.

4-38
Fig.42 ACOUSTIC DAMPING DUE TO ABSORBING MATERIALS
1.5
0.5
f\t ('\
M 3 o c t )
. with
. without
01
j.
O1
e
' "J \
X. |
102
xhaust nc
--"--. ^""^^"^^
103 10 4
I>ise under ex p
f
10s
3nded
(Hz)
' jet eFFect
Figure 42 shows, by comparison with Figure 38, the attenuation effect obtained by acoustical treatment ofthe mixing chambers and upstream diffuser walls with a standard available material, in the case of an under-expandedjet; the experiment with adapted jet and absorbing material has not been made yet.
Following these various observations, a new, much more sophisticated experimental set-up has been designedand is in the course of fabrication. It will permit checking of the preceding conclusions; the acoustic spectrumwhich will characterize it will determine the choice of absorbing materials to be installed in order to attenuate theresidual noise as much as possible.
Taking account of the acquired results, we can already estimate that the overall noise in the testing chamber*at nominal regime (Mv = 0.9), will reach the following values, expressed as v = Aprms/0.7 pMj .
Acoustical treatment of the walls
NO YES
Underexpanded jet(Pj -3p , )
Jet near adaptation(Pj- 1-2 P l)
0.0067
0.0067
0.0052
0.0014
* Without sonic throat at its exit.

4-39
Fig.43 ENTRAPMENT COEFFICIENT FORTWO MIXING CHAMBER LENGTHS
(Tj results)
V-'6
4
2
0
(three injecting
-
'• ^
_ x^ *"""" .
Theoretical curve
-
1 1 1
vanes]
1.ur
"*— -O°«— .
1
8.4
»
1 __
Long mixing chamber
Theoretical curve
b) Shorl mixing chamber
x=p7;Figure 43 is intended to show that the entrainment coefficients of the injector system used in the pilot instal-
lation, equipped with three injecting vanes in the first corner of the circuit, are in agreement with the theoreticalpredictions, for two mixing chamber lengths respectively equivalent to //w = 8.4 and //w = 5.1 .
Experimental points were calculated from flow rates qmv measured in the test section (boundary layers beingaccounted for), flow rates qm measured at injector entrance, and injection pressurespressure
. Isentropic stagnationtaken as reference for X , was deduced from initial pressure PJ (atmospheric pressure) minus the
mj
losses observed at the corner entrance and the estimated losses through the vanes.
Theoretical curves were deduced, for each case, from the known parameters (X, n, T , Mj = 1) and from Machnumber M j at inductor entrance, evaluated from the measured local pressure.
The two diagrams confirm that a mixing chamber with a length //w = 2.5 gives satisfactory results with thedesign proposed (eight injecting vanes).

4-40
Fig.44 ADIABATIC TEMPERATURE LOSSES OFTHE COMPRESSED AIR DURING THE RUN
(b)
60.
40.
20
0
1-
0 0.5
200
100
-AT
10
0
-AT Joule-Thomson losses
[^v°= 20 b
OH
10
Figure 44 summarizes the essential data for the system of compressed air production and conditioning. As abasic reference, we assumed the storage pressure to be 60 bars.
In these conditions, the upper curve shows the pressure isentropic decrease in the tank, during the run, as afunction of the fraction m/m0 of the expended air mass. The nominal conditions of the project require a minimumpressure of 20 bars; the result is that we can use during a run at most 50% of the stored air.
The corresponding temperature decrease is shown on the middle curve, in degrees K; we see that it reachedconsiderable values.
The virial effect in the adiabatic expansion which takes place in the pressure regulator (Joule-Thomson effect)is indicated in the bottom curve.
The sum of these two effects must be compensated by a heat exchanger. We propose to use to this end a heataccumulator of the hot water pool type, maintained at about 80°C, in which tubing of a sufficient length is immersed.A fraction a(t) of the cold air is diverted through the exchanger, then mixed with the rest (1 —a), upstream ofthe regulator, thus avoiding any icing in this device. A simple calculation shows that, to recover there the tempera-ture of initial storage, supposed equal to the wind tunnel stagnation temperature, a varies regularly betweena(0) = 0.10 at start of operation and a = 0.50 for m/m0 = 0.5 .

4-41
REMARKS
1. The installation of an IDT industrial wind tunnel should not be considered except at an important aero-dynamic centre including other subsonic or supersonic tunnels, whose operation also requires large quantities ofcompressed air. Therefore the dimensioning of the storage capacity should not be determined for this facility alone:it is always possible to avoid using all facilities at maximum consumption at the same time.
In such a test centre, the production and storage facility should be planned so as to allow further extensions;it is not necessary to build ab initio the maximum imaginable potential (which, by the way, is unlimited).
2. To fulfil the LaWs specifications it would be absurd, with such an IDT installation, to limit the maximumrun duration to 10 seconds; it would be much preferable to consider runs of the order of 30 seconds at the rate oftwo per hour, which would ensure a test rate much higher than with a system limited, by its very principle, to 10-secruns every 12 minutes. The two systems are equivalent only if no work on the model is necessary between twoconsecutive runs; but it is almost impossible, in a pressurized tunnel of that size, to assume that any sort of workcould be completed in less than a half-hour interval between runs. In this case, the IDT rate is not affected; in a10-sec tunnel, any such intervention is equivalent to the loss of three runs. If it is assumed that work on the modelis necessary every ten 10-sec runs, the efficiency loss of a 10-sec wind tunnel is thus 25%.
Furthermore, it is certain that 10-sec runs are not sufficient for all types of tests: the inconvenience could beaccepted if the test can be separated in 10-sec fractions - e.g. very extended polars. But if not, the test is impossible:the solution suggested by the champions of 10-sec runs is to plan a test section of half size, which leads to the useof a special model, and above all which reduces the Reynolds number by 30%.
3. An IDT wind tunnel, having by nature a closed circuit, allows tests at continuously variable pressure orMach number which is of great interest, especially in transonic flow for flutter and buffeting tests and, above all,for tests on motorized models.
CONCLUSIONS
I hope to have shown that the main problems pertaining to an IDT are now well understood. Research in pro-gress on small pilot wind tunnels (T2', T2) at the DERAT (Appendix I), in Toulouse, under the direction of R.Michel,will soon permit us to ascertain some parameters, only briefly mentioned here, such as the regulation mode to beadopted for this type of wind tunnel. It could then be considered that the detailed design of a large industrialtransonic wind tunnel of this type would not meet with any fundamental difficulty.
The main objection raised against the use of this solution concerns the injector-generated noise level in thetesting chamber. Though the experimental programme undertaken at ONERA is not yet completed, the resultsalready acquired are sufficient to define the essential precautions to be taken to eliminate this objection. In par-ticular, the adjustment of the inductor jets at the adaptation regime is of paramount importance for subsonic testing.Some other design features such as the positioning of inducting jets at the trailing edges of the tunnel corner vanes,an efficient settling of air supply pressure and, obviously, acoustic treatment of the walls, still improve the system.
As regards noise in the testing chamber, it must be emphasized that the essential problem, not discussed hereas it is not specific to IDT, remains that of the transonic treatment of the test section walls, the main noise sourcein present-day conventional solutions.
Another conclusion of this study is that the IDT solution is not very appropriate for very short runs, such asthose proposed by the LaWs Group. An IDT solution fulfilling the general LaWs specifications (50 seconds of usefulrun time per hour) should be planned, for example, on the basis of 30-second runs followed by 30-minute rests:this would clearly permit to carry out in a single run a programme identical to that that would require three runswith the competitive solutions, with the advantage of an interruption time compatible with a relatively importantintervention on the model without breaking the mean output rate of results. But above all, some tests in industrialwind tunnels such as unsteady flow measurements, flutter studies or work on motorized models, which would prob-ably raise very severe, if not absolutely insolvable problems in a facility with ten-second runs, would undoubtedlybe much easier to handle in an IDT.
If, after a first period of operation, it appeared necessary to increase the maximum duration or the repetition rateof the tests, a relatively modest expense would be sufficient to raise the compressed air storage or production capacity.
It should also be noted that the installation of an IDT would call only upon technological means and processesin current application in many industrial installations.
These advantages are not without counterparts: only through a thorough technological study will it be possibleto characterize this solution as regards cost effectiveness, for a complete comparison with competitive solutions.

4-42
APPENDIX I
PILOT WIND TUNNEL, T2
The transonic, pressurized wind tunnel, called T2, is studied for two purposes:
(a) To provide a more precise knowledge of the possibilities of and to solve problems raised by the inductionentrainment principle;
(b) to be used later for fundamental research.
With this in view, it was decided to build it at the ONERA Toulouse Centre (CERT).
1. MAIN CHARACTERISTICS
• Pressurized closed circuit with vertical return (see diagram A1).
• Square test section, 0.4 x 0.4 m. Contraction ratio: 20.
• Operation by discrete runs (mean nominal duration: 35 seconds).
• Stagnation conditions: room temperature; max. pressure: 5 bars.
• Entrainment by induction (max. induction flow rate: 35 kg/sec; jet stagnation pressure: 30 bars; stagnationtemperature: 350°K).
• Air storage: 45 m3 at 80 bars.
2. PARTICULAR POINTS OF THE PROJECT
• Injection is planned in the vanes of No.l corner, by means of adapted nozzles (Mj = 1.6): 6 vanes with 14nozzles each, supplied in groups of 3 or 4 permitting variation of T in order to obtain induction appropriateto the tunnel regime.
• Constant pressure and temperature of injector supply will be ensured by a noise-limiting pressure reducer andby a hot-water pool heat exchanger.
• Evacuation of injected air is planned in several locations along the circuit: about 60% upstream of No.l corner,40% between No.l and No.2 corners. An 8% flow rate could also be bled from a plenum chamber that wouldbe part of the ventilated wall transonic equipment.
No.2 corner is of diffusing type.
The pressure loss calculation in a part of the circuit from collector to second diffuser for various distribu-tions of ejected flow rates was carried out for: PJ = 1 bar ; Tj = 293°K ; Mv = 0.9 (Fig.A2). This exampleshows the importance of the gain obtained: more than 50% with an 11.3% bleed properly distributed amongthe diffusers.
3. PRESENT STATE
The design of the aerodynamic circuit and of its installation and its ancillary equipment is complete, apart froma few details. Financing and construction authorization have been obtained. Responses to bids for external supplies(compressors, tanks, etc.) have been received. On these bases, and taking account of expected construction delays,the planned date for starting operation is the first semester of 1974.

—i Inje.cfion corner
Fig.A! T2 IDT PILOT WIND TUNNEL - INJECTION IN THE FIRST TURNING VANE

Q06 Pi
0.04
0.02
DiFFuser Corner 2^dDiFFuser
t4tr—rr
2 3 4 5 6 7
Fig.A2 EVOLUTION OF PRESSURE LOSSES AS A FUNCTION OF BLEED (T2)
9 bleed 2%
5.6%
9.1 %
11.3%
15%
214%
8x m

4-45
APPENDIX II
SOME COMPLEMENTARY THEORETICAL EXPLANATIONS
1. SUMMARY OF EJECTOR THEORY
Assumptions and Notation
The case of constant section mixing chamber is considered a priori; it will be seen that, in the domain ofapplication envisaged, the pressure total variation along such a mixing chamber is very low, so that the thermo-dynamic behaviour of the flow remains very close to that of an isobaric flow; even though this isobaric flow istheoretically better, the gain to be expected with it would not justify the complication that the correspondingshape would imply.
Fig.AS NOTATION
TOO
1
— *J1
^1 **(^ m
*
'
(u)
r, p, , u, : main now,
Figure A3 provides the notation:
(1) P! , P;I , hj j ,
(j) Pj , Pij , h;j , MJ , PJ , Uj : injector jet flow,
(m) pm , pim , . . . : mixed flow,
(jj : total mixing chamber area,
TOO : jet emission area.
• Jet flow (j) will always be considered as supersonic (Mj > 1). But it will not be assumed a priori that thejet is adapted (PJ =£ p,); this case will however be eventually retained in the applications.
• Only mixed regimes (Mj , Mm < 1) will be considered.
• The total enthalpies (hj = h + u2/2) are the same in (1), (j) and (m), thence:
MI MJ Mm
As usual, the mass rate ratio is denoted by
Qmj
but the interesting parameter is really M"1 , which characterizes the compressed air consumption.
Basic Equations and General Calculation Methods
They result from the conservation laws between (1) and (m).
(a) Mass Flow (qm)
(D
(2)
Each flow rate can be written:
qm =
coc being the critical area of the flow considered.

4-46
As 7 and Tj are common to the three flows we may write:
PiiWC] Pijwci ~ Pim^cm •
If we introduce the function
co 1 / 2 7-1 \(7+D/[2(7-DlZ(M) = — = - + M2
wc M W + 1 7 -f 1 J
and if we note that
M-i =
we find, from (3):
(4)Pi,
(b) Dynalpy Conservation
The walls being parallel to the flow, their action on the movement is reduced to a friction force F . In theseconditions we must have the relation
Introducing a function 0(M) :
0(M) = — (M)Pi
permits us to write (5) in the form:
Pimwim0(Mm) = pijWc,*, + PijWc j0j - F ,
or, taking account of (3):
viz., after dividing by Pi,toCi an(^ introducing \rl :
."> + u-'AfM:) - 5d>.(5)
*0(Mj) — 60,
with: F F2(M.)60, = = .
Pi:wc, Pi,w
The influence of this term will be neglected in the following calculation, as we shall include them, by conven-tion, in the evaluation of the stagnation pressure losses throughout the circuit.
(c) Energy
Energy conservation is expressed by Equation (1).
SOLUTION:
M, , MJ , T , AT1 are given; Equation (5), with 60, = 0 , gives Mm which, carried into (4), gives theejector compression ratio Y . Supply pressure p,j remains to be determined. One has the obvious relation

4-47
and the last term gives X :
-, l~T S3M r S, '
(6)
Particular Case of Adaptation: Pj = Pj = p,
It will be seen that this case presents a great practical interest for jet noise reduction.
The preceding equations remain valid, but we introduce the constraint
Pj = Pj = Pi
(all quantities concerning the adapted regime will be overlined).
If we introduce the function
P / 7-1 Vx/(7-Dcj (M) = — (M) = 1 + - M2
Pi
we have
y - P'J = P'J . Pj. . Pl
Pi, Pj Pl Pi,
Equation (6) then gives the relation
(6')
i.e., in developing:
— f MJ1-f M.
\
/I 1 7-1 M2
/ 2 J
/ 1 1 7 ~ ! M2
1 2 l
(7)
There are only three independent parameters left, viz., M, , Mj , f , Equation (7) giving /T1. From there,the solution is obtained as for the general case, and we finally obtain
X = Pii ^7 Pirn ~~Z7Y = u 'Pi, Pi,
as functions of M, , Mj , f .
All these calculations are easily performed on a computer.
Simplified Formulae for Ejectors with Large Induced Flow
The formulation can be greatly simplified and the interesting properties can be emphasized when r is smallrelative to unity - which is the case considered here.
um = ui + 5u
Pm = Pi + 6p
6u—«: i ,
com = co, -f 6to , with 5co = rco .

4-48
with
The conservation equations are then written
6(pu) = 5m ,
6(p + pu2) = 5j ,
5hj = 0 ,
6m = r(pjUj-p,u , ) ,
6j = T[(p + pu2): — (p + pu2). ]J *
A simple combination of Equations (8) and (9) gives
5p -f p,u,6u = 5j — u,5m .
Then, Equation (10) becomes
/ uA 6p5(h + — ) = T,6s + — + u,6u = 0 ,
V ^J Pi
whence, taking account of (12):
6s 5j + u,6m 5j + u,6m
r rp,T, p,
As Tjm = TJJ , we may write, for the stagnation conditions:
6s Cp 6Tj 6p; 5pjT 'r r 1: p.- P:1, ^1, r,j
and the stagnation pressure increase due to the injector becomes:
5pj 5j — u,6m
Pi, Pi
and, replacing j and m by their values (11):
T Piwhich can be written, as a function of X = PJJ/P, :
1 5Pj cojT Pi, "i
.- _
/. . 7 - l M a
/ 2 MJ(1 + 7M. ) 7M,M. / ' • • • - •
\ 1 1 7 ~ ' M2
V 2 '
1
(8)
(9)
(10)
(11)
(12)
(13)
(14)
(15)
Thus, the compression effect 6pj/p; is a linear function of X = PJJ/PJ, , for a given M, and a supersonicinjector of a given geometry (which fixes Mj and T).
Figure 12 represents the function
CO;D ( M , , M j ) = -
J /-iCO,
1 + '- M2
7M|) - 7M,Mj 7 ~M?
(16)

4-49
from which the calculation of 5pj/pj is immediate:
— = T X D ( M , M j ) - r .Pi
At adaptation (pj/p,), Equation (14) is simplified:
jII = 7 M 2 - 7 M j M ,
Pj J J
Equation (7) gives
Mj a i
,,-.M
(7')
and, as r <S 1 , we may as a first approximation write (14) in the form:
6Pi —M
Pit
_ !
/I 1 7~' M2
/ 2 'yM,Mj / , T'i
\ 1 I 7 M2
V 2 J
(17)
viz.:
— = M'1 E (M. , M j ) .Pi, J
E(M,, MJ) , the expression between brackets in Equation (17), is represented in Figure 13. It becomes null forM! = 0 and M, = Mj and, for a given Mj , passes through a maximum. This fundamental result shows that, fora given Mj , there is an optimal value for M, .
For Mj values in the order of 1.5, this optimum is around M, ~ 0.6 , and Eopl is then in the order of 0.5.As a consequence, jiT1 is in the order of 26pj /p j for such values of Mj .
Figure 14 shows the functioning diagrams of an ejector for Mj = 1.6 , established according to the precedingsimplified equations. We traced on these diagrams an auxiliary curve showing the discrepancies between these resultsand those resulting from exact formulae. It can thus be verified that the simplified method is sufficient in thisdomain of application.
Study of Ejector Starting Conditions
The wind tunnel being at rest, we have
M, = 0 , P, = Po , Pi = Po . a, = a0 , . . . .
The general formulae are then in error but Equation (14) gives directly, if we assume the injector immediately startedat MJ and at outlet pressure PJ :
Pi
Pi + 7 M j 2 ) - 1 (18)
In Equation (8) we may identify u, to zero and um to 5u . We then find, assuming pnl =£ p0 :
(19)Po

4-50
If the adaptation regime is realized (PJ = p, = p0) as soon as injector start, we find:
6p S
Po Pi
5 u = ^ y i + V M J •EXAMPLE:
= 1.6 ; T = 0.04 .
The global stagnation pressure jump realized at the instantaneous start in adaptation conditions gives:
(-30 m/sec) .6p 6u— = 0.143 ; — = 0.08Po ao
It has been seen that this discontinuity appears actually as two waves: a shock wave downstream and anexpansion wave upstream; we then find:
- for the shock: 5 p ~ 0 . 1 2 p 0 ; 5u ~ 24 m/s ;
— for the expansion: 6p 0.03 p0 ; 6 u ~ 6 m / s .
2. ONE-DIMENSIONAL ANALYSIS OF THE STARTING PROCESS
The circuit, of length L , is supposed to be developed along the x axis, from an arbitrary section: the resultis that at each instant the flow state is the same at x = 0 and x = L .
It is assumed that in every cross section (x) the flow is uniform, defined by the three variables u , p , s ,considered as average values, i.e. respecting at the instant considered the conservation laws in the said cross section.
The area evolution law co(x, t) is given in the form
log— = fi(x,t) .
In certain parts of the circuit we may inject or extract a mass of fluid, or momentum, or energy. We shall callrespectively m'codx , j 'codx , q'codx the quantities injected in a continuous manner between x and x + dxin the co cross section.
In these conditions, the conservation equations can be written:
3 3— (pco) -\ (pucj) = m co ,3t 9x
9 3 aco 3co— (puco) + — (pucohj) + p — = p — + j'co ,dt 3x at 3x
— pco e -f —at V
a 3co+ — (pucohj) + p — = q co
3x at
with: h j = e -) 1p e
After some calculations, these equations may also be written:
dp 3u— + —pdt 3x
m—p
du 1 3p j' + m'u
dt p 3x p
d h j _ 1 3p q ' -m 'h j
dt p dt p
(Al)
(A2)
(A3)

4-51
with:
d 3 3 d /co\— = h u — and n = — log J .dt 3t 3x dt \co0//
REMARKS
• In a part of the circuit where there is no injection, we have: m' = q' = 0 and j' is reduced to the wallfriction effect:
j' = pu2Cf = — f ' (Dj, : hydraulic diameter).Dh
• In a part with boundary layer bleed, the extracted flow rate m' (<0) entrains with it an axial momentum:j' = m'ku , and an energy: q' = m'hj (assuming the total enthalpy is uniform in the whole boundary layer).
• In a part, of length Ax , where an obstacle imparts a drag X to the flow, we can write:
X X
with Q? being the volume of the part of the circuit in which we assume that the drag effect diffusion takesplace. To this effect is added that of the wall friction — f' .
In the same manner, through a possible heat exchanger occupying a volume Q-? of the circuit, we shall assumethat the total heat H is continuously extracted, at the rate q' = H/Q-? and that the drag X of the deviceappears as:
Through the injection and mixing zone, if nij is the injected mass flow rate through section coj , at velocityUj and pressure PJ , and if we call Q? the volume of this zone, we shall have
= = (Pj-p + Pjupcoj = (pj
in the same manner, if the total enthalpy of the injected flux is
a _3 ~T '
TRANSFORMATION OF EQUATIONS
Let us consider Equation (A3), and develop the left-hand side:
dhj ds 1 dp du- = T -- 1 ---- l - u - .dt dt p dt dt
Taking account of Equation (A2), Equation (A3) becomes:
+ m' - + CDT - uj'ds q ' - m ' ( h j - u 2 ) - u j ' H '" \2
dt pT pT
This relation permits us to eliminate dp/dt from Equation (Al) , as:
ds dp dp— = 7 — .Cv p p
(A'3)

4-52
The system to be integrated is then written
1 1 dp 3u
7 p dt 3x
m' uj'
p 2CpT• +
PC T
du 1 3p m'u j '
dt p 3x p p
ds m' /u2 \ uj' q'— = CpT + —dt p T \ 2 p ' -T -nrpT pT
It is interesting to introduce dimensionless values:
-L
t* = Hoi.
u UM = - = - :
L '
m'L
Poao
.,. = J 'L
Poao '
dS2 3J2 3S2= + U
dt* 3t* 3x*
q'* =
Z = l o g — ;Po
Poao '
The system then becomes:
1 dZ_ 3_U_
7 dt* 3x*
dU A2 3Z-I- —
dt* 7 3x*
dJ
dt*— = R'
with:
P' =7-1 , M2 U 1
m '*T- jV+<1^
m
p*
7-1M 2 - 1
7-1A2
a'*-Uj'*
REMARK: In a part of the circuit with fixed geometry, we have
= Udx*
The characteristics of system (cf*) are then obtained in a classical way; the equation in S is already incharacteristic form. Thus it is sufficient to form with the other two the two combinations:
A(c/*) ± (of*)
and to set
5+
5t*
d 3+ A
dt* 3x*0?)
6-
6t*
d _ 3
dt* 3x*

4-53
to obtain the two characteristic equations
A 6+ 6 +Z ± U = AP
7 5t* 6t* • * « • { :respectively associated with the acoustic wave directions
= u ± A .
3. AUXILIARY FUNCTIONS FOR BOUNDARY LAYER LOSSES COMPUTATION
Let us consider a flow defined as abscissa x by a non-uniform velocity profile between ordinates y = 0(wall) and y = 6 (external part of the boundary layer). We assume that 3p/3y = 0 and 3hj/3y = 0 .
The discussion on losses is based on the use of auxiliary functions
puQ(h) =
*
Jo
P + pu2
dy and D(h) = / — dypeue J0 p + peu
in which pe , ue are respectively the external flow data. From the equation of state and the assumptions:
p = Cst and hj = — + CpT = Cst ,
we immediately deduce
Pe1 +
7-1M2 1 - (D
Let us assume that the velocity profile is given as a function of f = y/5 , in the classical form
and that
_ = ,,/r
7-1
(f < D (2)
We can then write at order 0^(7— OM2.]2
tihS pu n\dy = 5 /
Jo Peue J0
nhS nu^ phI dy = 6 I
J0 Peue J0
—M2 + —M 2 f 2 /ne e
M2 + y—- Me2r2/n f2/n d?
The computation of losses and of boundary layer bleed was based on the use of non-uniformity functionsdefined by
Q(h) = 1 + eq =pu dy
"r 6

4-54
D(h) = 1 + ed =h5 p + pu2 dy
J0 p + p ru2 5
where h5 is the boundary layer function considered, and p ru r the supposedly uniform flow for y > 5 .
We also assumed that, at abscissa x , we had
p = Cgt and h j = — + CpT = Cst ;
we immediately deduce:
Pe Te1 +
In the applications considered here, we can always assume that
M| <C 1 ;
then, to the second order in [(7 — l ) /2 ]Mg , we have
— = 1 -.Pe 2
M2 1-^\ ueV
if we assume that the velocity profile is in the form
u
u,,with f = — ;
5
we then find
Q(h) =n -f 1
Me ___ n(n+l)/n _ n(n+3)/n).n + 1 n +3 /
Peuli \
1 + l^-i D(h) = h
/ P" h(n+2)/n - - - M2 f "
n + 2 2 e V n + 2h(n+2)/n h(n+4)/n ]
n +4 J
REMARKS:
— If we consider the whole boundary layer (h = 1), we have
n 7 — 1 2nQ(l) = — M2
n + 1 2
i2 /
(n 3)
7 — 2n
V^ P / p \n + 2 2 " (n + 2)(n + 4 ) J
— If we consider a height H > 1 of the flow, including the whole boundary layer, we have
Q(H) =
D(H) =
— If we consider a height H > 1 of the flow including only the part (1 — h) of the boundary layer we have
Q(H) = Q( l ) -Q(h) + H-1 ,
D(H) = D( l ) - D(h) + H- 1 .
Figure A4 represents the functions Q(H) and D(H) in the particular case where Me = 0.6 for n = 5and n = 7 .

Q(h)
0,5h
0 0.5
Fig.A4 DYNALPY AND MASS FLOW DEFECT IN THE TURBULENT BOUNDARY LAYER

4-56
REFERENCES
1. Roy, M. Tuyeres, Trompes, Fusees et Projectiles. P.S.T. Ministere de 1'Air, Paris, No.203, 1947.
2. Fabri, J. Etude Aerodynamique des Trompes Supersoniques. Jahrb. 1953 der W.G.L. Braun-et al. schweig, pp.101-110.
3. Ginoux, J.J. Supersonic Ejectors. AGARDograph No.163, 1972.(Editor)
4. Leuchter, O. Exemple de Calcul Numerique du Melange Turbulent Isobare ou Non Isobare de JetsPlans Paralleles. (To be published in Recherche Aerospatiale).
5. Holder, D.W. The 9 x 3 inch Induced Flow High Speed Wind Tunnel at NPL. R & M No.2781, 1953.North, R.J.
6. Knowler, A.E. The Efficiency of High Speed Wind Tunnels of the Induction Type. R & M No.2448,Holder, D.W. 1954.
7. Kogan, A. Preliminary Development of an Annular Jet Injector. Bull. Res. Council of Israel,Victor, M. Vol.9c, 1961.
8. Salomon, M. Characteristics of the 60 x 80 cm Induction Driven Close Return Transonic W. T. atet al. the Aeronautical Research Center (Haiffa). Israel Journ. Techn., Vol.8, No.1-2, 1970.

5-1
SOUFFLERIE A COMPRESSEUR HYDRAULIQUE
par
Maurice MENARDDirecteur de 1'Institut Aerotechnique de St-Cyr
78210 - St-Cyr-L'Ecole
et
Francis CHOMETONMaftre Assistant du Conservatoire National
des Arts et Metiers75013 - Paris
RESUME
La presente note est relative a un nouveau systeme moteur pour les souffleries transso-niques a grands nombres de Reynolds. Une description sommaire de 1'installation permet d'en com-prendre Ie fonctionnement. Une etude theorique du cycle thermodynamique de base donne la possibilityd'eValuer la puissance absorbee par 1'installation. Pour permettre une realisation plus economique dela soufflerie projetee, des solutions technologiques sont proposees, aussi bien pour la constructiondes reservoirs que pour la construction de la veine proprement dite. Un dessin d'ensemble donne unerealisation possible d'une soufflerie 5 m x 4, 20 m de section de veine.
Enfin, 1'etude theorique et experimentale de 1'amorc.age de la soufflerie a ete effectueesur un modele experimental de diametre de veine 0 80 mm afin de mettre en Evidence 1'importance etla duree des effets instationnaires en fonction de la loi d'ouverture de la vanne de mise en fonctionne-ment et de la longueur de la chambre de tranquillisation.
1. INTRODUCTION
La realisation de tres grands nombres de Reynolds en soufflerie transsonique, exige despuissances motrices importantes, les differents projets en etude ont pour but de reduire la puissanceabsorbed, ce qui entraine une diminution du cout des essais et dans une certaine mesure Ie montantdes investissements necessaires ci la construction.
La soufflerie continue, dont Ie prix de construction est trop eleve, est eliminee pour larealisation d'installations de dimensions importantes. Seule la construction des souffleries k rafalespeut 6tre envisaged.
Parmi les differents types de souffleries a rafales les plus connus, nous retiendrons :
- Le tunnel a piston ECT- Le tube de Ludwieg

5-2
- La soufflerie a compresseur hydraulique- La soufflerie a induction- La soufflerie & rafales par detente directe
Les souffleries des trois premiers types cites ci-dessus ont un systeme moteur "volume-trique" permettant d'obtenir des temps de rafales qui pour un nombre de Mach donne sont indepen-dents de la pression generatrice d'essai.
Ce systeme moteur est bien adapte & 1'obtention de pressions generatrices eievees maisne constitue pas 1'optimum pour la realisation de pressions generatrices moderees 2 a 3 barspar exemple.
Les souffleries a induction ou & detente directe pr^sentent de nombreux avantages lorsqu'ils'agit d'obtenir des pressions generatrices relativement peu eievees 2 a 3 bars, mais les fraisd'investissement et d'exploitation augmentent tres rapidement lorsque la pression generatrice aug-mente.
2. DESCRIPTION DU COMPRESSEUR HYDRAULIQUE
Sous sa forme la plus schematique, Ie systeme moteur propose se compose essentiellementde deux reservoirs R^ et R2 de volumes identiques disposes 1'un au-dessus de 1'autre (fig. 1).
Une canalisation 1 est fixee a la partie inferieure du reservoir R~ et plonge dans Ie reser-voir Rj.
A la partie superieure du reservoir R^ est connectee une canalisation 2 qui est raccordee4 la soufflerie S. A 1'aval de la soufflerie se trouve une vanne V puis une canalisation 3.
Sur la canalisation 3 se trouve une vanne de regulation 4 qui debouche a 1'exterieur.
Une canalisation 5 fixee 4 la partie superieure du reservoir Rj permet I'introduction de gazcomprime dans Ie systeme.
Le reservoir Rj est rempli de liquide.
Le fonctionnement de 1'installation comporte deux phases :
Phase 1Stockage d'energie potentielle :
On introduit par la conduite 5 un gaz comprime au-dessus de la surface libre du liquidecontenu dans Ie reservoir Rj, la vanne V est fermee et la vanne 4 legerement ouverte.
Le liquide monte alors par la canalisation 1 du reservoir Rj dans Ie reservoir R2.
L'operation de remplissage du reservoir R2 est terminee lorsque la surface libre duliquide contenu dans Ie reservoir Rj atteint la partie inferieure du tube plongeur 1.
Phase 2Transformation de 1'energie potentielle du liquide en energie cinetique du gaz (fig. 2) :
L'admission de gaz comprime en 5 est arrgtee.
La vanne V est progressivement ouverte pour assurer Ie debit gazeux necessaire au fonc-tionnement de la soufflerie.
Le liquide contenu dans R, descend sous 1'action des forces de gravite dans Ie reservoirRp la surface libre du liquide monte dans Rj en comprimant Ie gaz qui passe dans la soufflerie S.
Du fait de la detente qui s 'effectue dans la soufflerie, Ie debit volume du gaz, en aval dela tuyere subit une augmentation proportionnelle au taux de detente de la tuyere.
La vanne 4 permet a la fois d'evacuer vers 1'exterieur I'exces de gaz et de maintenir cons-tante la pression generatrice durant toute la rafale.
Pour ameiiorer Ie rendement energetique de 1'installation, la vanne 4 (fig. 3) est relivea un reservoir Rg dans lequel est stocke Ie gaz en exces.

5-3
Le fonctionnement de 1 'installation est Ie suivant :
Phase 1 :
La vanne V est fermee, la vanne 4 fermee, un compresseur C transvase en Ie com-primant Ie gaz de R3 dans R,, puis il transvase dans R, Ie gaz contenu dans Ie reservoir R Ces com-pressions sont accompagnees d'un transfert dans Ie reservoir R2 du liquide contenu dans Ie reservoirR!.
Phase 2 :
L 'installation utilise Ie cycle de fonctionnement precedemment d6crit (fig. 4).
Le liquide utilise dans Ie compresseur hydraulique peut 6tre de 1'eau. Pour 6viterIe contact entre Ie gaz et 1'eau, on introduit dans Ie systeme un liquide de faible densite non misciblea 1'eau et dont la tension de vapeur est. tres faible (huile par exemple). Cette huile assure une etan-cheite suffisante entre 1'eau et Ie gaz pour que la tension de vapeur de 1'eau contenue dais Ie gaz soittres faible.
3 ETUDE THEORIQUE DU FONCTIONNEMENT DE L'INSTALLATION3. 1 Conditions initiales :
Soit Hi la denivellation maximum exprimee en metre entre la surface libre de 1'eaudu reservoir R} et du reservoir R2 (fig. 5).
La pression correspondant a cette colonne d'eau est :
fa = aS H pascalg
oil 2<T = poids volumique de 1'eau (9810 N/m ).
La pression p^ exprimee en bar a pour valeur :*, _ <*H _ 9610 H i H_r" 1OS 10s ~ 10
L'6tat initial correspond a 1 'instant t apres Ie debut de la rafale, lorsque Ie regimepeut-6tre considere comme permanent.
La pression dans Ie r6servoir R-^ est pj^
La pression dans Ie reservoir R2 est p2^
La pression dans Ie reservoir Rg est pgj
La relation entre pn et p2j est :
/*-£*••+•la perte de charge due a 1'ecoulement de 1'eau dans les canalisations
verticales.
3. 2 Conditions finales :
Soit Hf la denivellation minimum entre la surface libre de 1'eau du r6servoir Rj etdu reservoir R2 (fig. 5). Liquation des pressions est :
Comme 1'on impose la Constance de la pression generatrice de la soufflerie duranttoute la duree de la rafale cela implique que :
L'air qui etait contenu dans Ie reservoir RI au debut de la rafale, stocke a la pres-sion PL se retrouve en fin de rafale, en partie dans Ie reservoir R2 £ la pression P2^ et en partie dansIe reservoir R3 4 la pression P3-.
En fin de rafale, la vanne de regulation (4) (fig. 3) est completement ouverte et1'on a :
Le rapport de pression n6cessaire au fonctionnement de la soufflerie est defini par

5-4
(on neglige les pertes par frottement de 1'air Ie long des canalisations, la vitesse est choisie danstout Ie circuit pour 6tre comprise entre 20 et 40 m/s. ).
Si 1'on admet un fonctionnement isotherme de 1 'installation a •
?.^= C*
comme d'apres (3) f>£f ^f* > ce Qui entrafhe :
Le volume de 1'air apres passage dans la soufflerie est plus important que Ie volumed'air stocke dans Ri.
Si 1'on admet que les volumes des reservoirs Rj, R2 et Rg sont identiques, celaimplique un echappement de 1'air de RI vers n%.
Liquation de conservation de la masse d'air contenue dans 1 'installation s'ecrit :
P = masse volumique de 1'air
^r = volume d'un reservoir
ou AM3 represente la masse d'air excedentaire qui est envoye dans RS_ Comme
De 1 'equation (2) on deduit :
10Hf =10^1.+ 10 A (4)
Hf represente la hauteur minimum entre les surfaces libres de 1'eau contenue dansles reservoirs RI et R2 pour que la soufflerie demeure en fonctionnement.
Si 1'on ecrit :
Hi* Uf+AH= 10 & (£^)+ 10 Ap +AHou AH represente la variation totale des niveaux des surfaces libres dans R1 et R2.
L'egalite (1) peut s'ecrire :
De 1'egalite (5) on deduit :
. _ „'*<• '1 10 10
et en remplacant Hf par sa valeur (3).
(7)
3. 3 Conditions initiales (installation & 1'arrfit)
La pression dans Ie reservoir R, doit etre egale & pi et rester constante pendant larafale. De 1'egalite (1) on deduit :
avec
. 7C/^O est la pression qui doit regner dans Ie reservoir R2 k 1'arrgt avant la rafale pour que la souf-
flerie puisse fonctionner normalement.
3. 4 Conditions finales (installation & 1'arrgt)
La vanne d'isolement de la soufflerie est fermee. L'ecoulement de 1'eau dans lescanalisations verticales diminue progressivement de vitesse jusqu'^ une valeur nulle.
Si 1'on considere que Ie volume disponible au-dessus de la surface libre de 1'eau dureservoir RI est petit devant les volumes des reservoirs Rj et Rg.

5-5
De l'6galite
On deduit :
ou Pzfo est -a Pression qui doit r6gner au-dessus de la surface libre de 1'eau dans Ie reservoirR! lorsque la rafale est terminee et pour que la pression demeure constante dans Rj et egale & p^.
3. 5 Definition des niveaux de pression initiale et finale dans Rg
La conservation de la masse totale de 1'air contenu dans 1'installation impose :
avec 1'hypothese que les capacites des reservoirs RI( R2 et Rg sont identiques on a :
comme Pyts Puf avec
ce qui entraine
3. 6 Estimation de la puissance necessaire au fonctionnement de ^installation
La compression isentropique de 1'air necessite une energie par unite de masse qui estegale a :
£ r— _ =r l^p X(T finale - T initiale)M '
M = masse totale d'air & comprimer (Kg)Cp= chaleur massique & pression constante = 1000 J/Kg°KT - temperature absolue de 1'air _
La puissance correspondante est egale a :
oft t est Ie temps pendant lequel s'effectue la compression.
3. 6. 1. Puissance absorbee par la compression de 1'air contenu dans R2
Pour retrouver en partant les conditions finales de pression, les conditions initiales quipermettent Ie fonctionnement de 1'installation, il faut comprimer en la transferant dans R^ la massed'air M~ contenue dans R0.z ^
Cette masse d'air se trouve 4 la pression p,., il faut I'amener au niveau de pression p^pendant qui s'effectuera Ie transfert, la pression dans R2 passera progressivement de la pressionp0, au debut du transfert £ la pression p,. en fin de transfert.
• 61O ^1O
Le rapport de compression au debut du transfert sera —— et en fin de transfert
La puissance moyenne correspondante sera :

5-6
3. 6. 2. Puissance necessaire 4 la compression de 1'air excedentaire contenu dans Rg
Pour aspirer la masse excedentaire d'air A 1^3 contenue dans RS et la transferee en lacomprimant dans R,, la puissance necessaire est egale a :
La puissance totale necessaire est done : Wt - ^R2tnoy. -h W%3 tnoy.
O)
Si Ie rendement des compresseurs est de 0, 8 :
w - Wt
"*- «T3. 7 Application numerique au projet du Laws Working Group
Les grandeurs physiques caracterisant Ie projet du Laws Working Group, sont :
- Dimensions de veine 5 m x 4, 2 m- Temps de rafale utile 10 secondes- Pression generatrice de fonctionnement 6 bars- Temps de compression 10 minutes- Nombre de Mach maximum 1, 3- Rapport de pression de la soufflerie /3 - 1, 10
Q O
Le debit volume & Mach 1 de la soufflerie est d'environ 195 m /s/m , cequi implique pour un temps de fonctionnement de 11 secondes.
vl = V2 = V3 = 45- °°° m3
Pour une vitesse de descente de 1'eau dans les canalisations verticales de 7 m/s. , la pertede charge est estimee a 0, 25 bar.
La variation totale de niveau dans Rj et R, est arbitrairement choisie & la valeur raison-nable de :
AH = 4, 5 m
Pour un rapport de pression A = 1, 10 et une pression p1 = 6 bars d'apres (4) on a :
Hf = #* 6(1- j^)^2,5 27, 95m
Hi = Hf+AU = 7, 95 +4, 50 - 1?. 65 md'apres 1'expression 6
fa = _ OA5 *
fa* *.*>*"avec TI = 288° K
= 1,225x5.45 ^ 6,

5-7
La pression initiale dans Ie reservoir Rg donnee par (8) est egale £ :
Psi = LMasse totale d'air contenu dans
*1, 226* 6*45000 = 330 OOO Kg
AM3 = fa -f*ai\ c^= ($67-5, 98) x 65 000 Z 31 OOO %
Mf?2 = 33OOOO- 31 OOO = 299 OOO Kg
En appliquant la formule (9) on trouve que la puissance absorbee par les compresseursest de :
Wt * 1070O K*
4 INFLUENCE DE DIFFERENTS PARAMETRES GEOMETRIQUES
4. 1 Diametre des canalisations verticales :
La pression p2j qui est egale a :
est independante de la perte de charge dans les canalisations.
De mfime, la pression pgj est independante de la perte de charge dans les canalisationsverticales.
Par contre, la pression P2jo, pression qui existe dans R2 avant la rafale et p2f , pres-sion qui apparait dans R_ lorsque 1 'installation est arr&tee, sont fonction de cette perte de chargeet 1'on a :
La puissance totale de compression est done fonction de la vitesse de descente de 1'eaudans les canalisations, en effet la formule (9) peut s'ecrire :
Sur la fig. 6 est representee Involution de la puissance de. compression en fonction de lavitesse de descente de 1'eau dans les canalisations verticales pour Vj = V2 = Vg = 45. 000 m .
D'autres grandeurs sont aussi fonction de la vitesse de descente de 1'eau dans les canali-sations verticales. En effet cette vitesse fixe aussi les hauteurs des surfaces libres de 1'eau dansles reservoirs en fin de rafale, en effet :
Hf = 10 p, (f- +Les courbes correspondent &. differentes valeurs de p^, /3 et Afe sont donnees fig. 7.
4. 2 Influence de la variation du niveau de 1'eau dans les reservoirs :
La puissance de compression exprimee par la formule (10) peut encore s'ecrire avec :p . _ _fr_ AH?2* ~ 3 --- W

t _ 100onnee~ 081
.AM.[fir+j£)^ ,]La formule 11 montre que la puissance de compression est aussi fonction de la difference
des niveaux de r'eau dans les reservoirs RI et R2.
La courbe montrant la variation de la puissance necessaire en fonction de la differencedes niveaux AH est donnee fig. 8.
4. 3 Influence de la capacite du reservoir Rg
Lors du fonctionnement de 1'installation, la conservation de la masse d'air impose :
ou AM, est la variation de la masse d'air contenue dans Ie reservoir Rg durant la rafale.
On a ; si V} = V2
avec
En introduisant cette valeur de pgj dans la formule (11). On montre alors que la puissancetotale necessaire & la compression de 1'air est fonction du rapport des volumes.
°«
_ 112.
Sur la fig. 9 est representee Involution de la puissance de compression en fonction durapport des volumes des reservoirs Rj et Rg.
5 REGULATION DE LA PRESSION GENERATRICE DE LA SOUFFLERIE
La~ pression initiale dans R2 est definie par :
La pression initiale dans Rg est d6finie par :
t> *> fe-fi } If - %
Le rapport de pression^jjyj&.est 6gal a :

5-9
et, en tenant compte de 1'egalite (7)
2-fi
et finalement
r_ ft* ~ f~P iQf><
' 1OpiLe rapport des pressions fift' /tog^ evoluera done de : ^—_^_^_____ en debut
de rafale a •» - = 7 en fin de rafale.frfSur la fig. 10 est representee 1'evolution du rapport "2 pour differentes valeurs de p,.
Remarque :Le compresseur utilise pour mettre 1'installation complete en pression doit fonctionner
avec un rapport de pression de 6 est du type compresseur a piston.
Par contre, Ie compresseur qui est utilise pour Ie transfert de 1'eau, et dont Ie rapportde pression max. est de 1, 4 environ peut-6tre du type centrifuge ou axial.
6 DESSIN DE CONSTRUCTION DE LA SOUFFLERIE
6. 1 Construction en acier
Dans Ie but de diminuer la puissance necessaire au transvasement de 1'eau, des paroiscourbes sont disposees dans les reservoirs Rj et R2 comme Ie montre la fig. 5.
Ces parois courbes determinent des cavites inferieures et superieures qui constituentles reservoirs Ro.
Pour une meme surface transversale des reservoirs, les variations des hauteursdes surfaces libres de 1'eau dans les reservoirs sont plus faibles avec la solution proposee fig. 5 quepour un reservoir de section circulaire, ce qui permet d'apres la courbe de la fig. 8 de reduire lapuissance necessaire au transvasement de 1'eau.
Un diffuseur axi-symetrique est dispose & la partie inferieure de chaque canalisationverticale pour reduire la vitesse d'admission de 1'eau dans Rj, done les pertes de charges.
L'installation utilisant cette conception de reservoir est representee fig. 11.
Cette installation comporte deux ensembles de 18 reservoirs, 1'un dispose au niveau dusol et 1'autre & environ 10 metres au-dessus des reservoirs inferieurs.
Chaque reservoir a un diametre de 5 metres et une longueur de 190 metres, la capacitetotale de ces reservoirs est de 3 x 45000 m3. Les parties superieures des reservoirs RI sont relieesa deux canalisations transversales horizontales de sections evolutives. Chacune des canalisations estconnectee & la chambre de tranquillisation de la soufflerie.
La soufflerie proprement dite comporte de 1'amont vers 1'aval :
- La chambre de tranquillisation equipee de grillages et filtre en nid d'abeilles.
- La tuyere transsonique equipee d'un col amont reglable constitue par des demi-corps fuseies se de-plagant contre les parois verticales planes et paralleles de la tuyere, dans la partie convergente decelle-ci.
- La chambre de mesure equipee de parois perforees & permeabilite longitudinale controiee. Le nom-bre de Mach d'essai en ecoulement subsonique est regie par un col Sonique aval bidimensionnel (se-cond col).
En aval du diffuseur subsonique se trouve une vanne plane Si ouverture rapide qui permetci la fois d'assurer 1'etancheite entre les reservoirs Rj et R2 et de declencher la rafale.
A 1'extremite de la soufflerie se trouve la vanne de contr31e qui assure 1'ecoulement de

5-10
1'air excedentaire vers Rg et permet de maintenir la pression generatrice de la soufflerie constantedurant toute la rafale.
6. 2 Construction d'un reservoir unique en beton precontraint
La Societe Europe Etudes a etabli un projet de reservoir unique qui repond pratiquementa tous les problemes que pose la realisation de trois reservoirs superposes de 45. 000 m3 de capa-cite unitaire, par 1'utilisation d'une structure en beton precontraint.
Le dessin d'un tel reservoir est represente fig. 12. Le reservoir Rg est situe 4 la par-tie inferieure, Ie reservoir R2 a la partie superieure, Ie reservoir Rj est situe entre Rg et R2.
Une poutre centrale de section circulaire permet de transmettre par 1'intermediaire devoiles radiaux, les efforts qui s'exercent sur les parois exterieures du reservoir.
Le transvasement de 1'eau du reservoir Rj dans R2 s 'effectue par un canal annulaireexterieur. La vitesse de descente de 1'eau durant la rafale peut etre facilement abaissee a 2 m/s.
La chambre de tranquillisation de la soufflerie ainsi qu'une partie importante de latuyere peuvent 6tre placees entre les reservoirs RI et R2, la soufflerie est alors alimentee en airpar un canal annulaire. Le rapport de contraction de la veine est d'environ 6.
Le circuit de retour de la soufflerie s'effectue par deux conduites circulaires horizon-tales qui aboutissent 4 deux compartiments situes de part et d'autre de la chambre de tranquillisation.Des parois verticales permettent 1'ecoulement de 1'air vers la partie superieure du reservoir R2.
Enfin, une conduite relie la vanne de reglage au reservoir Rg.
7 ETUDE THEORIQUE ET EXPERIMENTALE DE L'AMORCAGE DE LA SOUFFLERIE
7. 1 But de 1'etude
Une soufflerie actionnee par un compresseur hydraulique comporte a 1'amont un ensem-ble de reservoirs situes dans deux plans horizontaux superposes. Les reservoirs situes dans Ie plansuperieur sont remplis d'eau, Ie transfert par gravite de 1'eau du niveau superieur au niveau inferieurassure la compression de 1'air necessaire au fonctionnement de la soufflerie.
En aval de la veine d'essai se trouve une vanne dont 1'ouverture provoque la mise enmouvement de 1'air dans la chambre d'essai.
L'ouverture plus ou moins rapide de cette vanne peut donner naissance & une onde dedetente qui se propage £ la vitesse du son de 1'aval vers 1'amont de la soufflerie.
Cette onde de detente en se refiechissant sur les parois des reservoirs peut revenir vers1'aval puis, se refiechissant a nouveau sur les parois aval de la soufflerie revenir vers 1'amont jus-qu'4 amortissement complet du phenomene.
Les mouvements de ces ondes parasites peuvent entrainer des variations de pressiongeneratrice qui nuisent au fonctionnement normal de la soufflerie.
Le but de la presente etude est de rechercher par voie theorique et experimentale quelleest la nature des perturbations provoquees par 1'ouverture de la vanne aval, d'en etudier 1'amortisse-ment et d'eventuellement rechercher des moyens propres a reduire 1'intensite de ces ondes parasites.Le but des calculs, dans cette etape de 1'etude, a ete de preciser du point de vue de 1'instationnaire1'influence des differents parametres geometriques et physiques de 1'ecoulement et egalement depr6parer Ie programme des essais.
7. 2 Bases theoriques
L'ecoulement est suppose instationnaire monodimensionnel, les sections faiblement 6vo-lutives, Ie fluide a proprietes physiques constantes, non visqueux et revolution isentropique f _ 2 ]
Dans ces conditions les equations devolution sont les suivantes, ou f3, fc U. et Adesignent respectivement la masse volumique, la pression, la vitesse et 1'aire d'une section d'abs-cisse x. t designe Ie temps :
Equation de conservation de la masse :
1£ = 0 fl2)
Equation de la dynamique :
(13)

5-11
Equation thermodynamique :
f) - kP ( *•• rapport des chaleurs specifiques)
Les equations (12), (13), (14) s'ecrivent sous la forme ci-dessous, ou a d6signe lalocale du son, definie par &* = Jf/CP
-. o as). (16)
Le systeme d'6quation aux d6riv6es partielles (15), (16) est r6solu C13 par la me-thode des caracteristiques : les deux directions caracteristiques sont donn6es par :
dt~Les equations des caracteristiques 6tant :
±^- •& = 0r-f A c/xSoit f, une fonction des variables x et t, ( O^t £ T ). Nous d6signerons par £•
1 'approximation de f, a 1'abscisse X c i Ax ( i s 1t A/ ) et au temps t- n. . At , ces nota-tions etant pr^cisees sur la figure ci-dessous, od les caracteristiques C et C" correspondent a unecoulement subsonique ( Z£-<9 <O ).
Figure 13
nAt
(17) s'ecrit :Un schema aux differences finies du premier ordre correspondant aux deux equations
(#*)
Les valeurs de a et u aux abscisseslineaire a partir des valeurs en X^-j , X+ et TC^
et X ^,1 sont obtenues par interpolation
-
I u. *u*ri+&tfu*-a*)']~u* (*£-*?)( -" < / +AX( 4 */ / *-'( " 'fat)

5-12
Les valeurs de a et u a 1'instant t+At sont obtenues a partir de la resolutiondes equations aux differences deduites des deux equations (18), c'est-a-dire :
soit
~ ' " "' ".'..,-A )**Ai
Lorsque 1'ecoulement est localement supersonique ( -U-3 >O )t seules les relations(20 b) sont modifiees, les valeurs de £i.+f et •£^ sont alors calcuiees a partir de a et uaux abscisses X^-_- et x^
Les conditions aux limites de ce probleme sont les suivantes :
- £ 1'abscisse x = X1 : "entree" de fluide a partir d'un reservoir £ pression supposee constante, /> =f,
- a 1'abscisse x = M.Ax : "sortie" de fluide vers une enceinte £ pression supposee constante p = pau travers d'une section evolutive en fonction du temps. e
Dans les deux cas, les conditions aux limites sont traitees en faisant 1'hypothese que1'ecoulement, & ces abscisses, est_"quasi-stationnaire " a chaque instant.
Par exemple, a 1'abscisse x = xj, €3"*' et U ""*' sont calcu!6s par resolution dusysteme :
equations etant respectivement liquation de 1'energie et I'equation (21 b) ouTI etant la temperature du fluide dans Ie reservoir R
8 RESULTATS DU CALCUL NUMERIQUE, COMPARAISON AVEC L'EXPERIENCE
Les resultats theoriques present6s sont relatifs aux deux configurations decrites surla figure 14.
Dans Ie premier cas, la veine d'exp6rience est situee a la distance Lj = 2, 34 m dureservoir d'alimentation. Dans Ie second cas L: = 4, 24 m, les autres parametres geom6triques res-tant inchang6s ainsi que la loi d'ouverture de la vanne aval.
Les conditions initiales sont dans les deux cas :
Pi = 6, 5 bars, Tj = 278°K, p = 1 bar
Les conditions aux limites sont :
a) pj = cte, Tj = cte, pe = cte
b) loi d'ouverture de la vanne de la forme :
A-f.1~rt*}t*+kk avec:
^> 't0 = 0, 45 s. : temps d'ouverture de la vanne
k =(^r/ = (0, 60) ~* sec ~*
et _

5-13
Les calculs * ont 6t6 effectues pour la configuration la plus d6favorable du point de
'ecoulementetant fonction de ces deux variables.
Sur les figures 15 a et 16 a sont trac6es, pour les deux cas, revolution theorique
ft -Psou p designe }a pression p = p (t) dans la veine et ps la valeur stationnaire finale atteinte au mfimepoint.
Ces r6sultats sont & comparer aux courbes experimentales obtenues pour les m6mesconditions physiques et geometriques, tracees figures 15 b et 16 b.
Sur les figures 17 et 18 sont trac6es les evolutions theoriques de :
-3Le coefficient Cp est negligeable ou inf6rieur a 1.10 a partir du temps t = 0. 45 sdans Ie premier cas et t - 0. 5 s dans Ie second cas.
De 1'ensemble des calculs effectues on a egalement deduit les elements simplessuivants :
a) L'existence d'une section sonique presente 1'avantage de constituer une "barriere" pour lesondes, pendant la phase instationnaire.
b) Lorsque la vitesse du son n'est pas atteinte dans cette section, les ondes provenant de 1'ouver-ture de la vanne se refiechissent sur 1'entree, la vanne, Ie convergent et Ie diffuseur de lasoufflerie et constituent un systeme oscillant dont la frequence est une fonction de LI et L2.
c) Lorsque la vitesse du son est atteinte au col, la region aval n'a plus d'action sur 1'ecoulementdans la veine. Le systeme d'ondes instationnaires amorti a alors une frequence fonction de LIseul de valeur
C *v
ou <3 may est la ceierite du son moyenne pendant cette phase.
d) L'amortissement du phenomene instationnaire provoque par 1'ouverture de la vanne est en gran-de partie du aux effets dynamiques conjugues des conditions aux limites : Ie convergent de lasoufflerie (paroi solide), la section d'entree de fluide au niveau du reservoir (paroi isobare) etIe col sonique (non passage des ondes "& gauche" ** ).
9 EXPERIMENTATION
Les resultats presentes sont relatifs aux deux configurations etudiees th6oriquement,1'etude portant dans ce cas sur 1'influence de la loi d'ouverture de la vanne et de la longueur de lachambre de tranquillisation.
L'etude experimental utilise les r6servoirs d'air comprime de la soufflerie £4 Bde 1'Institut A6rotechnique de Saint-Cyr.
gLes deux reservoirs R\ et R2 (figure 19) d'un volume unitaire de 50 m sont relies
entre eux par une canalisation de 0 450 mm ayant la forme d'un U inverse dont les branches descen-dantes plongent dans les reservoirs Rj^ et R2.
Le reservoir R2 est reli6 a un ensemble de reservoirs Rg dont Ie volume total estde 600 m3.
Le reservoir Rj est reli6 par une canalisation de 0 225 mm a une tuyere convergentedivergente de 0 80 mm.
* Calculs effectues sur UNIVAC 1108 :& 1110, Faculte des Sciences d'Orsay - ORSAY (France)
** Left Travelling Wave 2

5-14
En aval de la tuyere se trouve la vanne de regulation de la soufflerie S 4 B.
9.1 Materiel de mesure :
n est essentiellement constitue par des capteurs de pression a circuit depose de fre-quence propre eieve (10. 000 Hz) relies a un enregistreur UV 6quip6 de galvanometres dont la fre-quence propre est voisine de 200 Hz et par une chaine a tres court temps de reponse (capteur aquartz, amplificateur de charge et oscilloscope).
Un capteur de pression mesure la pression d'arrgt dans la conduite de 0 225 plac6e en amontde la tuyere convergente divergente, un autre capteur mesure la pression statique veine.
9. 2 Programme des essais :
L'air est comprime dans les reservoirs RI, R2 et R3 jusqu'a une valeur maximum dela pression egale a 6, 5 bars.
La pression dans Ie reservoir Rj est ajustee de telle maniere que Ie niveau de 1'eauarrive au niveau de 1'extremite du tube en U.
Lorsque la vanne de regulation de la soufflerie S4 B est ouverte Ie transfert automa-tique de 1'eau du reservoir R2 dans Ie reservoir Rj provoque 1'ecoulement de 1'air dans la tuyereconvergente divergente. Le nombre de Mach est maintenu constant par un col sonique fixe placeen fin de veine dans la tuyere convergente divergente.
La vanne de regulation de la soufflerie S4 B dont 1'ouverture declenche la rafale aune loi d'ouverture programmable par 1'ordinateur CII 90-10 de la soufflerie S4 B.
Les positions de la vanne de regulation et les differentes pressions sont enregistreessimultan6ment de maniere a etudier la loi de mise en regime de l'6coulement transitoire qui s'eta-blit dans les differents elements de la canalisation.
9. 3 Resultats experimentaux :
Configuration n° 1 (Lj = 2, 34 m) :
Sur la figure 20 est portee revolution en fonction du temps de la pression statique etde la pression d'arre't dans la veine, pour un temps d'ouverture t = 0, 50 s.
p'i designe la pression d'arre't mesuree, p'j = P'-(t)
A partir du temps t = 0, 25 s., 1'ecoulement dans la veine est parfaitement stabilise.
Configuration n" 2 (Lj = 4, 24 m) :
Sur les figures 21 et 22 sont portees les m6mes evolutions, pour des temps d'ouverturet0 = 0, 72 s. et t0 = 1, 69 s. On remarquera que pour Ie temps d'ouverture Ie plus long, 1'ecoulementapres I'amor^age de la tuyere, n'est pas perturbe.
Sur la figure 23 est representee revolution de la pression statique dans la chambre detranquillisation, a 1'abscisse x = 1, 40 m, pour des temps d'ouverture variables de la vanne deregulation. Ces enregistrements sont obtenus a partir de la chafne pi6zoeiectrique.
Oscillogramme n° 1 (temps d'ouverture to = 1, 63 s. )
Pendant Ie debut de 1'ouverture, c'est-a-dire avant que la tuyere ne soit amorcee,Ap/p est de 1'ordre de 3. 10'3. Au temps t £ 0, 9 s., Ap/p est non decelable sur les en-
registrements. '
Oscillogramme n° 2 (temps d'ouverture to = 0, 90 s. )
La premiere onde est plus importante que dans Ie cas precedent ; ( Ap/p 2 6. 10"3).Au temps t £ 0, 2 s. , les oscillations sont amorties puis deviennent negligeables.
Oscillogramme n° 3 (temps d'ouverture to = 0, 75 s.)
L'onde de detente est amortie a t £ 0, 4 s. (1'onde de compression au tempst S 0, 8 s. provient de la fermeture de la vanne).
10. AMORTISSEMENT DES ONDES : EXPERIENCES PRELIMINAIRES
II a paru interessant d'amorcer 1'etude de dispositifs statiques, places a 1'entree dela soufflerie et dont Ie but est de reduire Ie temps d'amortissement du phenomene ou meme d'eviterIe retour vers la veine de 1'onde de detente issue de 1'ouverture de la vanne ou de toute autre pertur-bation.

5-15
Parmi les solutions a ce probleme, une, consiste a cr6er sur une limite, une paroiabsorbante du point de vue de 1'instationnaire et par exemple constituee d'6iements du type "paroisolide" et du type "paroi isobare".
Quelques resultats d'essais preiiminaires sont trac6s sur la figure 24 : il s'agit deinvolution en fonction du temps de la pression en un point d'un tube a choc dont 1'extremite de lachambre basse-pression est ouverte sur 1'atmosphere. Le dispositif est done atteint par une ondede choc de faible intensite qui se ref!6chit soit en detente, soit en onde de choc selon que 1'extre-mite est ouverte ou fermee. Les enregistrements montrent que 1'on peut passer d'une manierecontinue de 1'une a 1'autre de ces conditions et done absorber 1'onde incidente.
D'autres dispositifs sont a 1'etude.
REFERENCES
1 Ralston & Wilf : Mathematical methods for digital computer - John Wiley
2 The dynamics and Thermodynamics of Compressible Fluid Flow AsherH. SHAPIRO Ronald.

5-16

5-17
Fig 3
Vanne.detencheike.
ouverturz Sectrbnde. mdsurz
Comjoresseur C

5-18
Fig 4

5-19
Fig 5
Mw
13
12-
11
10
8
Fig6 0 1 2 3 4 5 6 7 8 9 1 0 Vm/4

5-20
00
Fig 71 bars
Mv
14
13
12
11
10
9
8C
fV
X1
X-"•
XX
*^
/xx
XX
r
/
2 3 4 5 6 7 8 9 . 1 0 AHm.
Fig 8
19
18
17
16
15
14
13
12
11
10— -
t*^1^
X
//
//
tlI/
0 1 2 3 4 5 6 7 8 9
Fig 9

5-21
8/F
1,11
0,9QB07
05
0;4
03
02
*
Fig lO
6 Rhars
t F_.
Ctp.iili.RJ.
Fig 11

5-22
W)

5-23
CM
—•*Ctrla
aao
Sf2
'
CM
*
1.Z5
1.0
0.75
0.50
O.Z5
0. 0
(P-PsV(Pi-Ps)
-0.25
.CUL
0. 0 0.25 0.50 0.75 1. 0
FIG.15B, P STflTiQUE VEIHE
t (SEC)
1.25
1.0
0.75
0^0.
(P-PsV(Pi-Ps)
0.0
-OJ50.0 0.25 0^0 0^5 1.0
fc(SEC)
0.0
-0.10
,P ORRET
t(SEC)
RG.Ir MODELE THEORIQUE FIG. 15b. EXPER'IEMCE

5-24
1.25
1.0
075
0,50
0.25
0.0
(P-Ps)/(R-Ps>
.CflLCUL THEORiqUE
0.0 0.25 0.50
FiG.16a/P STRTiHUE UEINE,
(P-Ps)/(Pi-P5)
-0.25
0.10
0.0
-0.10
0.0 0.25(Pi-Pi )/Pi
0^0
FIG. 16 EXPERIENCE.
t(SEC)1.0
t(SEC)
P RRRET
t(SEC)

CpxIO CpxIO
0.0 0.2 0.3 OA
FIG.1?,Cp VEiHECCRSD
Col sonique fixe
t (SEC)0.6
Tube U inverse0.2 0.3 QA
FiG.1B/CpVEiHE(CRS2)
Tuyereconvergente - divergente
Vanne de regulationde
R2
Capacite 50 m3Capacite 50 m Capacite 600 m:
tCSEO
CT3
Co
P

5-26
•f
aen
g
C\l
CO
K? 3
aenOU
Jin
cff
X
II
oOJ
c£>
O
CD

5-27
1.25
1.0
075
0.50
0.25
0.0
(P-Ps)/(Pi-Ps)
-0.25
EXPERlEfTE
0.0 0.25 0.50 075
0.10
0.0
-0.10
.P RRRET
Fl 'G.22 /EXP.CRS2 (t0= 1,695)
3.1S
EXP AIEBCEJP=F
b (SEC)1.0
k (SEC)
V
_o•
*=>
^
p.1S
W^"
"
EXP•
;RIE^^
ICE,
• ^
P=(
• ^
(k)
•* —
b0= V63 S
;pER£«qM
D.1S
.3., t0= Q,75 S
,F(t)
JL., 10=0,905
FI'G.23, P CHflMBRE DE TRQMqu'lL-
LJSflTiOM, b0 VflPl'flBLE .

5-28
It CIOE IT
0.5
TEMFE R-FLEME
ms DJV
H/D H/D=0.26
H/D=0.07
H/D=0.0
P.PCW

6-1
FACILITIES FOR AERODYNAMIC TESTING AT HYPERSONIC SPEEDS
by
F.Jaarsma and W.B. de WolfNational Aerospace Laboratory, NIR
Amsterdam, the Netherlands
SUMMARY
An assessment is made of the usefulness and potential of existing European hypersonic facilities, on the basisof the planned U.S. space shuttle project and a hypothetical hypersonic transport aircraft. With respect toaerodynamic testing of space shuttle type of vehicles it is pointed out that a significant gap exists betweenM = 10 and M= 15.
At low-hypersonic Mach numbers the facilities in Europe will generally meet the minimum requirements fortesting hypersonic transport models. European capabilities appear to be rather similar to those in the U.S.hypersonic wind tunnels, though the U.S. capabilities will be increased considerably in the near future.
It is further concluded that European facilities fall short in their performance of what is required, in the fieldof propulsion (including supersonic combustion tests) and also of hardware testing.
1. INTRODUCTION
This LaWs paper will be mainly concerned with the requirements for aerodynamic and propulsion testing inwind tunnel facilities for developmental work in the hypersonic speed regime i.e. on vehicles flying at Machnumbers greater than about 5. Two types of vehicles are of current interest, namely the space shuttle and thehypersonic transport aircraft (H.S.T.).
The space shuttle is to enter the development phase by mid 1972. Outside the U.S. European participation inthe project has been considered (Ref. 1) but is not very likely at the moment of writing (Ref. 2). The system underdevelopment will be propelled by rocket engines. In order to make regular space launches more economical, however,an airbreathing propulsion has to be used. It is generally expected that such a system will be developed after therocket system under current development. This line of thought may eventually lead to the hypersonic transportsystem at the end of this century yielding less sonic boom problems at cruise as compared with the SST.
Advanced hypersonic missiles, either rocket or (sc)ramjet propelled are also to come, though little is knownof the requirements.
The chances that Europe may participate with the U.S. in the development of one of these projects in thenext few years are probably small. On the other hand much work of a more exploratory or fundamental nature,such as described for instance in References 3 and 4 respectively, has to be done before the development phase of aramjet/scramjet propelled hypersonic transport can be initiated. In this field the present wind tunnel facilities inEurope with only limited performance, compared with full scale requirements are certainly of great value.
Before the development of a HST can be started the economic feasibility of the system has to be demonstrated.The payload being only a small percentage of the total weight, the aerodynamic, propulsive and structuralcharacteristics should be known with a high degree of accuracy (Ref. 3). To accomplish this, facilities must beavailable where aerodynamic testing at high enough Reynolds numbers is possible and where engine-airframe integrationcan be studied with representative intake and exhaust jet simulation, to mention just one aerodynamic problem.Also high performance long duration facilities are needed for hardware testing of the propulsion system and of thestructure of the vehicle which will be subjected to severe aerodynamic heating.
In the next discussion on hypersonic facilities the requirements will be centered on the requirements for thedevelopment work on the space shuttle and the hypersonic transport taking two typical examples.* Hence ajudgement can be made on the work that can be done in the European facilities that is of fundamental and ofpractical interest, and in which areas of research and development European hypersonic facilities show shortcomings.
* In a recent article (Ref.84) military hypersonic cruise aircraft are foreseen in the late 1980's which would open a new corridor forweapons delivery. With speeds of Mach 5 — 12 at over 100,000 ft altitude it would have performances of a missile and flexibility andrecallibility of an aircraft. The requirements will be comparable with those of the HST.

6-2
In the past, several European facilities have been used for military project development (i.e. tactical andballistic missiles). This type of activities will undoubtedly remain in the future but the merits will not be discussedin the present paper, due to lack of detailed information. It can be remarked however that for such applicationsthe usefulness and potential of present European facilities are quite satisfactory.
Typical trajectories for the various types of hypersonic vehicles are found in the altitude-velocity diagram ofFigure 1, which is a compilation of data found in the literature.
1.1 Basic studies
Before being able to write down realistic specifications for hypersonic vehicles such as semi-ballistic entryvehicles (Gemini, Apollo), lifting entry vehicles (Space shuttle) and the hypersonic transport, many basic questionshave to be answered first. As far as the fluid dynamic aspect is concerned, information is needed on topics suchas boundary layer transition (location and occurrence), radiative heat transfer during re-entry, fuel injection in ascramjet engine, and ablation heat shield properties, mentioning only a few arbitrary examples.
Not only in the United States, which is the only Western nation that has developed manned hypersonicvehicles such as the Apollo, the X-15 and presently the space shuttle, but also in Europe a rather extensivehypersonic research program exists. An inventory of the European research and facilities can be found inReferences 5—7. This inventory is the result of the initiative to create Eurohyp, a more or less informal bodyto bring people together working in the same field, to disseminate information on the hypersonic work in Europeand to create a better co-operation. A summary of the activities of Eurohyp since 1968 can be found in theintroduction of Reference 5.
It is concluded from the survey that a significant amount of work is being done in Europe and much of itwill be applicable to the design of the real hypersonic vehicles that will be discussed in the subsequent sections.
1.2 The space shuttle
The proposed U.S. space shuttle will be a two-stage system, consisting of unmanned wingless solid propellantrecoverable boosters and a manned orbiter. The orbiter will be a delta winged lifting vehicle with a length of33.6 m and a span of 22.6 m. The wing load during re-entry is estimated to be somewhere between 200 and250 kg/m2. The landing weight will be about 75 tons. Orbiter propulsion is by three liquid rocket engines. Themaximum acceleration during launch or re-entry is limited to 3 g (Ref. 1, 8 and 9). Stage separation will occurat about Mach 7 at an altitude of about 60 km.
Experimental studies in Europe have been largely devoted to lifting bodies with lift/drag ratios higher than thepresent U.S. design. Quite a lot of work has been done in Germany (Ref. 4, 10) not only at hypersonic speeds butalso in the transonic and subsonic speed regime. In the U.K. high L/D configurations have been studied by the RAE.A good discussion on this subject may be found in Reference 11.
For the proposed U.S. space shuttle, a cross range of 1100 naut. miles (Ref. 1) will correspond with a hyper-sonic lift/drag ratio L/D = 1.3 (Ref. 11). The aerodynamic coefficients of such a vehicle are considered to berepresented accurately enough for the calculation of the flight trajectories by the data from Reference 12.
These data give
a
(deg)
2555
CL-
0.30.7
L/D
-
1.30.6
CN
-
0.371.36
cx-
0.080.10
Condition
Maximum L/DMaximum CL
For a wing loading W/S = 200 kg/m2 three equilibrium re-entry glide trajectories have been calculated, definedas re-entry with constant L/D and bank angle 0 (Ref. 13) and zero vertical acceleration. The pull-out phase whichoccurs at a flight altitude of about 80 km is not considered. Also viscous effects which affect the L/D ratio athigh altitude have not been considered, following Reference 13. The following three conditions have beencalculated.
1. , 0 = 0 which minimizes the heat transfer rates to the vehicle
2. (L/D)max , 0 = 0 which gives the maximum range (zero cross range)
3. (L/D)max , 0 = 60° . This bank angle gives an acceleration in the horizontal plane of about 2.3 g, which is

6-3
well below the maximum permissible value of 3. The cross range for this non-modulated trajectory hasbeen calculated by a numerical integration in crude steps (13 steps for the complete trajectory) and wasfound to be about 925 naut. miles, which is not too far from the required maximum cross range. Thissimplified trajectory seems therefore a reasonable approximation of the real maximum cross rangetrajectory.
The results have been plotted in the altitude-velocity diagram of Figure 2.
Finally it should be noted that the descent trajectory of the boosters is not indicated due to lack of data.When booster recovery is required however, the aerodynamic behaviour should certainly be studied.
1.3 The hypersonic transport
For quite some years the hypersonic transport concept has been studied. A review on the subject is for instancepresented in Reference 14. Early studies considered flight speeds up to Mach 15 but more recent studies by NASAare rather concentrated on the Mach 6-8 speed, range. A typical example is the vehicle, presented in Reference 15powered with four hydrogen-fueled turboramjet engines designed to fly at a cruise Mach number of 6 at an altitudeof about 30 km. The vehicle should carry a pay load of about 23 tons which is about 9% of the gross take-off weight.It has a length of 76.5 m and a span of 38 m.
The hypersonic transport will typically accelerate at q = .5 kg/cm2 until the cruise Mach number and will thenincrease its altitude towards the level of optimal cruise (Ref. 15) at close to maximal lift-over drag ratio. (Fig. 1and 2). For a wing loading of 200 kg/m2 (Ref. 15) the lift coefficient is then CL = 0.04 . The airbreathingspace shuttle which might come after the rocket powered launchers and orbiters will closely follow the same ascenttrajectory as the HST (Ref. 16).
At sustained hypersonic flight the vehicles will be propelled by ramjets or by scramjets (supersonic combustionramjets), the former for low hypersonic Mach numbers (M < 6 to 7) and the latter for high hypersonic Machnumbers (M > 6 to 7). Figure 3 (Ref. 14, 16) illustrates the superiority of the scramjet operation over thesubsonic burning ramjet at high Mach numbers (H2 fuel). Dual-mode scramjets which can operate with eithersubsonic or supersonic burning of fixed geometry are studied in the USA by AirResearch/NASA and in Europe byONERA (Ref. 17). ONERA has also performed an extensive wind tunnel testing program on hypersonic transportconfigurations (Ref. 18). The other establishments in Europe who performed detailed studies on hypersoniclifting vehicles are the RAE and the DFVLR (Ref. 4). Much work has been concerned with wave riders, based onsimple flow fields such as wedge flows and cone flows. The significance of these shapes is seen not only for thehypersonic transport (Refs. 19, 20, 21) but also for the space shuttle (Ref. 11). It is advocated as a distinctlyEuropean contribution to the design of lifting propulsive bodies (Ref. 22).
1.4 Scramjets
The advantage of supersonic combustion is mainly due to the increased inlet performance relative to thesubsonic burning mode (the flow remains supersonic, hence less static pressure rise and no normal shock losses),the low static temperature in the burner (~ 1000°K versus well over 2000°K and hence more sensitive heataddition due to less dissociation after combustion) and, last but not least, improved nozzle performance due toless freezing of chemical species in the expansion process (Ref. 23). In case of a subsonic burning ramjet the inletcan be tested separately from the combustor and the combustor usually does not yield much performance problemssince the subsonic combustor technology is well established. The increase in flight speed will only ease the burningrate problem due to the increased temperatures; however, cooling and material problems will show up.
The technology of supersonic combustion is however still rather new and much should still be done beforegood performance assessment is possible, particularly if the engine has to be run both at the subsonic and super-sonic burning mode during the acceleration phase. A good match must be made between the three components:inlet, combustor and nozzle.
Two main problems exist for scramjet propelled aircraft namely, the performance assessment of the isolatedengine and the engine integration into the airframe. At hypersonic speed the required engine frontal area (or freestream capture area) increases strongly with respect to the supersonic speed case. For example for Concorde thetotal inlet area is less than 1% of the wing area whereas for a M = 7 airplane this ratio is of the order of 3 to4%. This increase is mainly due to the fact that the net thrust is only a small fraction of the engine gross thrust(the same situation as with high by-pass ratio fan engines at subsonic speed). This means that inlet, supersoniccombustor and nozzle performances are very critical since a 1% gross thrust loss might give a 10% increase infuel consumption. Further, this large relative inlet area increases the engine-interference problems, both at theinlet side, but mainly at the nozzle side.
Studies (Ref. 24) have shown that deflection of the large gross thrust vector can yield significant gains inlift with little loss in available thrust. In addition the pressures of an under-expanded nozzle flow of a HSTconfiguration could provide favourable interference effects if the exhaust flow washed a large area of the winglower surface (Ref. 25). These engine forces will cause trimming problems of the aircraft.
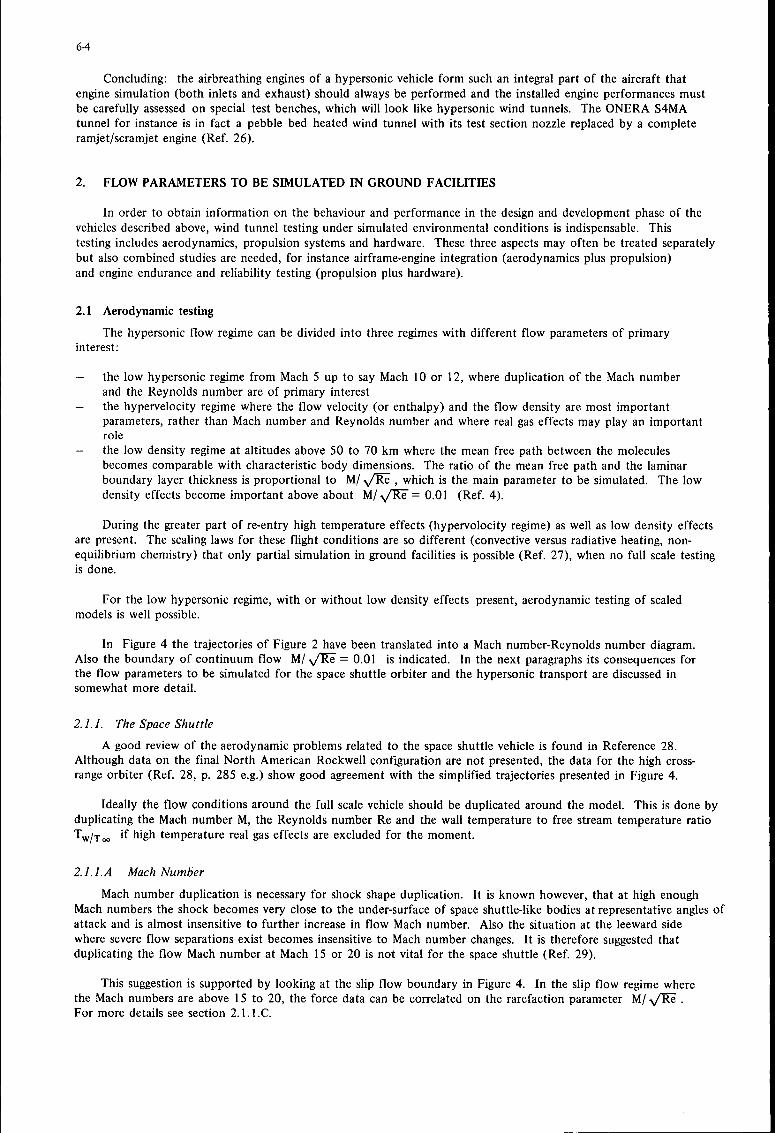
6-4
Concluding: the airbreathing engines of a hypersonic vehicle form such an integral part of the aircraft thatengine simulation (both inlets and exhaust) should always be performed and the installed engine performances mustbe carefully assessed on special test benches, which will look like hypersonic wind tunnels. The ONERA S4MAtunnel for instance is in fact a pebble bed heated wind tunnel with its test section nozzle replaced by a completeramjet/scramjet engine (Ref. 26).
2. FLOW PARAMETERS TO BE SIMULATED IN GROUND FACILITIES
In order to obtain information on the behaviour and performance in the design and development phase of thevehicles described above, wind tunnel testing under simulated environmental conditions is indispensable. Thistesting includes aerodynamics, propulsion systems and hardware. These three aspects may often be treated separatelybut also combined studies are needed, for instance airframe-engine integration (aerodynamics plus propulsion)and engine endurance and reliability testing (propulsion plus hardware).
2.1 Aerodynamic testing
The hypersonic flow regime can be divided into three regimes with different flow parameters of primaryinterest:
— the low hypersonic regime from Mach 5 up to say Mach 10 or 12, where duplication of the Mach numberand the Reynolds number are of primary interest
— the hypervelocity regime where the flow velocity (or enthalpy) and the flow density are most importantparameters, rather than Mach number and Reynolds number and where real gas effects may play an importantrole
- the low density regime at altitudes above 50 to 70 km where the mean free path between the moleculesbecomes comparable with characteristic body dimensions. The ratio of the mean free path and the laminarboundary layer thickness is proportional to M/ •y/Re , which is the main parameter to be simulated. The lowdensity effects become important above about M/>/Re = 0.01 (Ref. 4).
During the greater part of re-entry high temperature effects (hypervolocity regime) as well as low density effectsare present. The scaling laws for these flight conditions are so different (convective versus radiative heating, non-equilibrium chemistry) that only partial simulation in ground facilities is possible (Ref. 27), when no full scale testingis done.
For the low hypersonic regime, with or without low density effects present, aerodynamic testing of scaledmodels is well possible.
In Figure 4 the trajectories of Figure 2 have been translated into a Mach number-Reynolds number diagram.Also the boundary of continuum flow M/ y/'R"e~ = 0.01 is indicated. In the next paragraphs its consequences forthe flow parameters to be simulated for the space shuttle orbiter and the hypersonic transport are discussed insomewhat more detail.
2.1.1. The Space Shuttle
A good review of the aerodynamic problems related to the space shuttle vehicle is found in Reference 28.Although data on the final North American Rockwell configuration are not presented, the data for the high cross-range orbiter (Ref. 28, p. 285 e.g.) show good agreement with the simplified trajectories presented in Figure 4.
Ideally the flow conditions around the full scale vehicle should be duplicated around the model. This is done byduplicating the Mach number M, the Reynolds number Re and the wall temperature to free stream temperature ratioTW/T M if high temperature real gas effects are excluded for the moment.
2.1.1. A Mach Number
Mach number duplication is necessary for shock shape duplication. It is known however, that at high enoughMach numbers the shock becomes very close to the under-surface of space shuttle-like bodies at representative angles ofattack and is almost insensitive to further increase in flow Mach number. Also the situation at the leeward sidewhere severe flow separations exist becomes insensitive to Mach number changes. It is therefore suggested thatduplicating the flow Mach number at Mach 15 or 20 is not vital for the space shuttle (Ref. 29).
This suggestion is supported by looking at the slip flow boundary in Figure 4. In the slip flow regime wherethe Mach numbers are above 15 to 20, the force data can be correlated on the rarefaction parameterFor more details see section 2.1.1.C.

6-5
2.1.1.B Reynolds Number
Reynolds number duplication and temperature ratio TW/T00 duplication is required for duplication of theboundary layer thickness and the kind of boundary layer (laminar or turbulent).
For a proper design of the thermal protection system knowledge of the location of the boundary layertranstition region is essential. According to Reference 30, there is yet no definite conclusion how the transitiondata, found in wind tunnels, should be interpreted for the full scale vehicle.
In Reference 31 some new free flight transition data are presented and various transition criteria are discussed. Forlocal Mach numbers above 5, the Reynolds number based on the conditions at the edge of the boundary layerand the wetted length Rext which indicates the onset of transition was somewhere between 106 and 107 (datascatter). Below Me «= 4 values of Rext between 104 and 5 x 10⁶ are found with a data scatter of about two ordersof magnitude. These lower Rext values are obtained at high angles of attack on the lower side of the vehicle andare probably largely influenced by 3-dimensional effects. It should be remarked that Rex is not the best correlatingparameter but rather Re based on a boundary layer thickness, in combination with the local Mach number andReynolds number per unit length (Ref. 31). In Reference 31 it was found that for a a = 40° re-entry onset oftransition starts on the lower side of the vehicle somewhere between 70 and 80 km but Reference 32 gives about65 km.
Comparison of these data with Figures 2 and 4 indicates that the somewhat vague boundary between continuumflow and slip flow coincides more or less with the boundary between full laminar flow and laminar plustransitional flow. Left and above this boundary in Figure 4 the Mach number and the Reynolds number are themain flow parameters.
The required Reynolds numbers for correct boundary layer transition duplication in wind tunnels seems to bean unsolved problem, considering the accuracies required for the design of an optimum thermal protection system.
In this context the parameter TW/T00 should also be mentioned. This is an important parameter not onlyfor the skin friction coefficient or the heat transfer coefficient (see for instance Reference 33), but also for theboundary layer transition point (see for instance Reference 34).
The wall temperature will depend on the method of cooling but may vary between 600 and 1700°K alongthe vehicle wall, which means that T^y/T^ will vary between about 3 and 8. For wind tunnel testing the maximumReynolds number is attained when the free stream temperature is as low as possible, the limitation being thecondensation temperature of the gas which varies between 30 and 60° K for air and nitrogen, the value increasingwith stagnation pressure (Ref. 35). A wall temperature of the model equal to room temperature may be a reasonablevalue to simulate an average of the non-uniform wall temperature of the full scale vehicle.
In conclusion the best way to deal with the transition problem seems to duplicate the Reynolds number and ifpossible the temperature ratio TW/T00 in the continuum regime indicated in Figure 4. The boundary layer thicknesswill then be properly simulated and the transition region generally will be more upstream than on the full scale vehicle(see data of Reference 31), which generally will not lead to too optimistic predictions for the thermal protectionrequirements. Mach number-Reynolds number duplication also eliminates the necessity for possible Reynolds numbercorrections for the phenomena on the leeward side of the vehicle where large regions of separated flow exist.
2.1.1. C Visuous Interactions and Low Density Effects
The space shuttle orbiter will experience peak heating and deceleration at 60—70 km altitude (Ref. 28, 36),where low density effects can certainly not be neglected. The slip flow regime which extends roughly betweenM/yT^e = 0.01 and 0.1 is indicated in Figure 4. The low density regimes at higher altitudes such as the nearfree molecule and the free molecule regime are of less importance for the space shuttle re-entry from a practical pointof view. From Reference 29 the following remarks are quoted.
The most significant practical effects, as far as overall performance is concerned, occur on slender, high L/Dvehicles. Not only are much larger viscous interaction induced forces generated on this type of vehicle, resultingin a large reduction in L/D (see Reference 4 for instance), but the effects extend to relatively lower altitudes thanthe other low density effects.
In the case of the space shuttle a large percentage of the re-entry flight time is spent in manoeuvring in thehigh altitude regions dominated by rarefield flow effects. It has been established that rarefaction effects arelikely to be significant over the whole of a slender vehicle, over localized regions such as on control surfaces,if the value of the viscous interaction parameter M/y^Rioo , L is greater than about 0.01. For a 20m longvehicle this corresponds to about 75 km altitude over the forward surfaces if they were at 40° incidence to about55 km over the leeward surface at about —10° incidence (end of quotation).

6-6
In order to have an indication of the viscous interaction effects on the longitudinal range, calculations havebeen made for the highest re-entry trajectory of Figure 2, where these effects will be most significant. For thesake of simplicity it is assumed that CL remains unaffected. The effect on L/D is assumed to be representedby Reference 37, Figure 26: at M/^/fc; = 0.1 the L/D value is half the inviscid value of 0.6.
Starting from the vertical equilibrium condition at an altitude of 90 km the following longitudinal range isattained when the flight velocity has decreased to 1 km/sec: L/D = const. R = 6200 km and if L/D influencedby viscous effects R = 4600 km or about 75 percent of the inviscid value. This is the result of a rather crudecalculation (numerical integration in eleven steps).
For vehicles with much higher L/D values for the samel W/SCL the influence of viscous interaction on therange performance is even much larger. In Reference 38 calculations show for a L/D = 4 vehicle reductions inrange of more than 50%. For a discussion on the relevance of such high L/D vehicles the reader is referred toReferences 11 and 39.
The examples mentioned show that knowledge of the aerodynamic behaviour at high altitudes is essential for theassessment of the vehicle performance. Analyses which do not take low density effects into account can givemisleading results.
It is concluded from Figure 4 that aerodynamic testing of the vehicle behaviour should be done for values ofM/ v^Ke between 0.01 and 0.1 at Mach numbers above, say 15 (see also sub 2.1.LA). Its significance should beconsidered against the background of the influence of high temperature real gas effects.
2.1.1.D High Temperature Real Gas Effects
At very high altitude, where the flow is completely free molecular and at low altitudes where the air iscontinuum, forces acting on a vehicle can be predicted theoretically with a good degree of certainty. Betweenthese limits, however, the flow is a complex function of each type and most of our understanding has to be gainedby experiments in wind tunnels (Ref. 29). Very unfortunately in this same area high temperature real gas effectscomplicate the picture considerably.
A discussion on the problems of aerodynamic testing in this hypervelocity regime where the flow velocityitself and the free stream density are the primary flow parameters can be found in Reference 27. Proper scalingis difficult and often completely impossible: radiative heat transfer for instance is proportional to the nose radiusof the vehicle and convective heat transfer is proportional to the inverse of the square root of the nose radius.Also non-equilibrium effects may become important, especially at higher altitudes : relaxation lengths of the orderof several meters may occur on a space shuttle (Ref. 40).
The dissociation and ionisation of the air in the stagnation region and elsewhere around the vehicle could leadto adverse effects on lift, trim and heat transfer. Prediction of these effects is still uncertain; they cannot beinvestigated in a wind tunnel of the usual blow down type, for the very process of expansion through a nozzlefrom stagnation conditions representative of high altitude re-entry causes thermodynamic non-equilibrium in thenozzle flow which is not like the flow around the vehicle in the real atmosphere.
Another reason is the incompatibility of the scaling laws for convective and radiative heat transfer and fornon-equilibrium chemistry (binary and tertiary collisions of recombining molecules for instance) (Ref. 27).
What can be done in this area experimentally is providing data for theoretical predictions such as chemicalreaction rates and radiative heat transfer data obtained from facilities like shock tubes, expansion tubes and plasmafacilities, eventually boosted by a magneto hydrodynamic device and the development of high performancefacilities where flow non-equilibrium is largely avoided (see Ref. 41).
2.1.2 The Hypersonic Transport
In Figure 2 the trajectory is given of a hypersonic transport accelerating at a constant dynamic pressureof q = 0.5 atm up to a non-specified cruise Mach number (Ref. 15). The corresponding flight conditions areplotted in the Mach number-Reynolds number diagram of Figure 4. It is seen that the Reynolds numbers basedon vehicle length for a given Mach number, are one to two orders of magnitude larger for the HST than for thespace shuttle during re-entry. The consequences for the aerodynamic parameters to be simulated are discussedbelow.
2.7.2./I Mach Number
The Mach number must be duplicated in wind tunnel tests to obtain the same shock shape as in real flight.This requirement should not be violated as was permitted for the high Mach number tests for the space shuttle.This may be illustrated by referring to the engine intake region where the position of the shock waves fromthe external compression surface relative to the intake lip should be duplicated accurately.

6-7
2.1.2.B Reynolds Number
From Figure 4 it follows that a hypersonic transport designed for a cruise Mach number of 6 to 8 (see Ref. 15for a typical example) will fly at Reynolds numbers well above 108, based on the total vehicle length. Althoughthe significance of the transition data obtained m wind tunnels for the full scale vehicle is still not definitelysettled (Ref. 30), the Reynolds numbers at which the HST will operate are so large that the boundary .layer onthe vehicle will be almost completely turbulent.
In Reference 42 shock tunnel measurements are described on a HST-model over a Reynolds number rangefrom about 0.5 million to 160 million. It is found that transitional boundary layer effects on the axial forcecoefficient begin to emerge at ReL of about 2 million. These effects predominate for about a decade in Reynoldsnumber until the turbulent boundary layer exerts the major influence at Reynolds numbers of about 20 million.
From this Figure it is concluded that a Reynolds number of about ReL = 20 million is a minimum requirementfor wind tunnel tests for the development of hypersonic transport aircraft where absolute performance data shouldbe obtained. Reliable extrapolation to the much higher full scale Reynolds numbers seems feasible in that case(Ref. 42).
The value ReL = 20 million is in fact still open to discussion. A value of 50 million as was presented in thefirst provisional version of the present paper is probably on the safe side but a value of 5 million as suggested inReference 29 is apparently too low when the drag data of reference 42 are considered. Up to what value ofReL testing is necessary will also depend on the required accuracy of the data which have to be extrapolated tofull scale ReL values.
When the model is tested at Reynolds numbers below say 20 million, the transition region moves too fardownstream. In that case the transition might be moved upstream again by artifical trips, but at hypersonicvelocities the trips must be so large that even the flow outside the boundary layer is disturbed, causing an additiveinterference drag (Ref. 29, 43, 44). Artificial boundary layer transition is therefore not an attractive method athypersonic speeds.
For cases where the boundary layer itself is an important parameter such as for engine intakes preceded by acompression ramp and for Shockwave-boundary layer interaction as for instance occurs near flap hinges, theconsequences of testing at lower Reynolds numbers than the full scale values should be considered with greatcare. The turbulent boundary layer thickness being inversely proportional with the one-fifth power of the Reynoldsnumber, testing at ReL = 2 x 10⁷ gives a boundary layer thickness which is about 60% larger than testing at thereal value of ReL = 2 x 10⁸ at Mach 8. Isolated testing of partial models in the correct flow environment mayyield usable results in these cases.
The average wall temperature/free stream temperature ratio in the wind tunnel will have a value of the sameorder as for the full scale vehicle when the tunnel is operated near its condensation limit and the model is atroom temperature (see also 2.I.I.B.).
2.1.2. C Low Density and Real Gas Effects
Only near the leading edges viscous interaction effects may occur. Testing at too low Reynolds numbers maylead to undue conclusions such as concerning aerodynamic heating. Partial model testing may be useful in thisarea. At speeds up to, say Mach 8 the high temperature real gas effects on the aerodynamic behaviour are still small.For refined measurements, however, they may be taken into account.
As an example Reference 45 gives for the lower side of a flat plate flying at 30 km altitude at Mach 8 at anangle of incidence of 20° a pressure coefficient which is about 1 percent lower than in a wind tunnel where thefree stream temperature is 55°K.
High temperature real gas effects are however very important as far as the airbreathing propulsion isconcerned (see section 2.2).
2.7.5 Conclusion for Aerodynamic Testing
For space shuttle type of vehicles the following is concluded for the flow parameters to be simulated forwind tunnel testing.
The Mach number should be duplicated up to about 15 to 20. Above this Mach number the viscousparameter M/-y/R"e is of primary importance for the aerodynamic behaviour, when M/-y/R"e > 0.01. WhenM/ -^/Re is smaller than this value, the flow behaves as a continuum and for the space shuttle this coincidesapproximately with the onset of boundary layer transition. Interpretation of wind tunnel transition data forfull scale flight behaviour still being in discussion, the best to do is testing at duplicating Mach number and Reynoldsnumber when M/yrRT< 0.01. This also gives the correct boundary layer thickness.

6-8
A model temperature equal to room temperature will provide a reasonable T^T,,, value in many cases. Inpractice, however Tw is non-uniform.
High temperature real gas effects such as occur during a great part of the re-entry may be studied experimentallyby partial simulation only.
For hypersonic transports development testing in wind tunnels the following conclusions are made.
Mach number duplication is essential to duplicate the shock shape. The boundary layer being predominatlyturbulent, in many cases wind tunnel testing at Reynolds numbers above, say 20 million allows probably goodprediction of the vehicle performance by a correction of the skin friction to the full scale Reynolds number value.
For cases where the boundary layer itself is an important parameter such as for engine intakes and Shockwave-boundary layer interaction, Reynolds number duplication and/or partial model testing will be necessary.
A model temperature equal to room temperature will provide a reasonable T^T^ -value in many cases. Hightemperature real gas effects on the aerodynamic performance are rather small up to say Mach 8.
2.2 Propulsion Testing
Since the ramjet and scramjet do not contain devices to increase the total pressure of the internal flow(turbomachinery), the engine flow simulation at hypersonic airplane models is in principle easier to achieve thanat the lower speed regimes. If the internal flow is not heated, either in a subsonic or supersonic stream, the nozzletotal pressure will not be matched with the scaled nozzle geometry and the stream tube leaving the nozzle willbe too small. Hence, the interference with the outer flow is wrongly matched. Two methods are available toobtain the simulated nozzle flow field and pressure distribution, namely by adding large quantities of additionalgas such that rh yTTT is simulated for the nozzle, or burning a fuel within the internal flow. In the latter caseit is required to use air as the tunnel fluid and the total temperature of the air should be duplicated if the samefuel is used as for the full scale flight. In that case the scaling law for the burning rate process is approximatelyequal to the scaling law for the Reynolds number (p. 1. = constant). The high total temperature required forduplication however, is in conflict with the lowest possible stagnation temperature for maximal Reynolds numberand wall-free stream temperature ratio. Until recently few tests have been performed on HST models with simulationof the engine flow (Ref. 24 and 25).
In a scramjet the heat release within the supersonic flow is either of a 2-dimensional or 3-dimensional nature.As yet a good understanding of heat release in multidimensional supersonic flows has not been attained. A verystrong unknown interplay exists between the chemical kinetics, mixing, fuel jet penetration, shock waves and ductarea. Local heat release in supersonic flow will cause thermal compression, however shock waves should beavoided. In supersonic combustion tests the entrance Mach number, pressure level, temperature and chemicalcomposition are of primary importance. For propulsion testing the total engine mass flow and flow duration giveadditional requirements to the test facilities.
Figure 5 gives in the flight Mach number-altitude plot the required stagnation temperatures, pressure and massflow per unit capture area of the inlet for complete environment duplication. For large hypersonic Mach numbersthese conditions are hard to achieve in the laboratory as is also the case for hypersonic wind tunnels. Therefore inthe next discussion emphasis will be focussed on the parameters which are of primary importance for engineand combustion tests.
2.2.A Mach Number in the Combustor
It is evident that Mach number duplication in the combustor is essential due to the strong interaction betweenthe flow field (compression) and local heat release. In the following it will be always assumed that the Machnumber is duplicated.
2.2.B Temperature
For low static temperature at the supersonic combustor entrance the overall reaction rate will be limited bythe chemical kinetics, whereas at sufficient high static temperature the turbulent mixing between the fuel and airwill be the rate limiting factor. Hence static temperature duplication in the combustor is of primary importanceat low hypersonic Mach numbers, since if the flow is decelerated from hypersonic speed to supersonic speed in thecombustor, the static temperature will be between the ambient static temperature and stagnation temperaturedepending upon the Mach number ratio. For various performance reasons, a rough rule of thumb is that thecombustor entrance Mach number is about one-third of the flight Mach number (Ref. 23). Figure 6 gives the typicalstatic temperatures versus Mach number for the NASA Hypersonic Research Engine (HRE) burning hydrogen(Ref. 46). Figure 7 shows the importance of the initial temperature for hydrogen as fuel. Since hydrogen is themost probable fuel for scramjets for performance and cooling reasons, the combustor entrance static temperatureshould be above about 1000°K. Over about 1500°K mixing will be the dominant factor. These conditions occur at

6-9
M > 10 to 11. This means that for supersonic combustion tests the stagnation temperature should be duplicatedup to M = 10 to 12, hence T0 = 4000°K to 5000°. Other fuels might also be used such as the metalizedfuels (for example Trime- tylaluminium, Triethylaluminium, Trimethylborane) or hydrocarbons (Ref. 23). Thefirst group will yield spontaneous ignition even at atmospheric temperatures, whereas the latter group will alsoneed preheated air for fast ignition.
2.2.C Pressure
The static pressure level in the supersonic combustion chamber depends primarily on the flight altitude, theinlet process efficiency (KD) and inlet Mach number ratio. The actual value will be at about 1 kg/cm2 (say 1/5to 5 kg/cm2). Figure 8 gives some typical inlet values as will be encountered in flight, respectively total pressureratio, and static pressure levels (Ref. 48). Particularly in this pressure regime and for temperatures between1000 and 1500°K the ignition delay time for hydrogen is a strong irregular function of the pressure, making useof appropriate scaling laws for pressure unsuitable (Fig. 9). For higher temperatures the induction time is inverselyproportional to the pressure level (r;t p = f (T) .
Once the chemical-reaction is started the characteristic reaction time for hydrogen is proportional to p"1-65.For hydrocarbon the reaction time is proportional to p"1'8 (sometimes also taken as p~2). (See also Ref. 49).
Therefore for good understanding of the combustor phenomena the pressure level should be duplicated aswell as the geometry. Scaling laws can only be used if the overall chemical kinetics behaviour can be describedby simple rules and if variable induction times do not exist.
Ideally the hypersonic engine (scramjet) should be placed in the freejet of a hypersonic facility, duplicating thestagnation condition (temperature and pressure) and free stream Mach number in which the complete system canbe tested (inlet, combustor and nozzle). This may be difficult to achieve in a hypersonic wind tunnel due to thehigh required stagnation levels, particularly if the duplicated Mach number approaches the value 8 (see section 3.2).
One means of omitting the high stagnation pressure level is to utilize a direct connection set-up at which theflow is expanded only to the required supersonic speed in the combustor (See Fig. 10 of ONERA from Ref. 50).This will reduce the required tunnel reservoir pressure by the ratio as indicated in Figure 8 (typically a factor 2 to5, depending inlet geometry). The inlet performance and combustor extrance flow field can be determined inseparate wind tunnel tests at the full scale Reynolds number (but reduced temperature) at the representativerelative boundary layers thickness.
2.2.D Mass Flow
The required mass flow for propulsion testing depends primarily on the required net thrust to overcome drag,to accelerate and to climb. The first term is of primary importance and depends on the flight I/D ratio of thevehicle. For a cruise vehicle this value will be between 4 and 6. For a hypothetical 200 ton HST with four enginesthe net thrust should be over 10 tons. Flying for example at M = 7 where the thrust coefficient is aboutCT = 0.6 ,
1 ^capture
for a hydrogen fueled engine, the required mass flow per engine is about 200 kg/sec. This value increases forother fuels. Typically, using kerosine the required mass flow will roughly double the value using H2 atM = 7 . It can be computed that the HRE of NASA-Lewis consumes about 5 kg air per second at M = 7 and100 000 ft altitude.
A mass flow rate of 200 kg/sec requires a combustor entrance of 0.4 m2 at M entrance = 2.3 . Theseconditions are rather typical for medium size unheated supersonic wind tunnels, but are exhaustive for hypersonicwind tunnels, which are necessarily fitted with a heating system. Only the Tripltee tunnels at NASA Langleyand at AEDC (under design) fulfil these conditions up to M « 7 (Ref. 51 and 52).
2.3 Hardware Testing
2.3.A Ablation testing
For the structure of hypersonic vehicles one of the most significant parameters is the aerodynamic heat loadto which it will be subjected. The magnitude of the heat load and the exposure time are rather different for thespace shuttle and for the hypersonic transport and hence the structural concepts which deal with these heat loads.The feasibility of these concepts will have to be verified by hardware testing under simulated flight conditions.

6-10
For the space shuttle the heat transfer rates are one order of magnitude larger than for the HST (Ref. 53),but the total heat transferred to the vehicle (per unit wetted surface and per flight cycle) will be much smallerthan for the HST.
For the space shuttle a passive heat protection system has been considered for early versions consisting ofablative material on an aluminium substructure, which requires refurbishment after each flight (Ref. 8). At themoment of writing this paper, three different insulation systems are foreseen: a low-weight elastromer on the uppersurface (up to 340°C), a new ceramic material on the lower surface (up to 1370°C) and a new oxidation-inhibited,reinforced carbon material for the wing leading edges and the nose cap where temperatures up to 1650°C areanticipated (Ref. 54).
A discussion on the testing of ablative materials which is also useful to understand the problems of testingof non-ablative protective coatings can be found in Reference 55.
For ablation studies near the nose region of a re-entry body the major requirement is to simulate the stagnationenthalpy and the pitot pressure on the model (Ref. 27). For the shuttle lower re-entry trajectory of Figure 2the following conditions are found at the vehicle stagnation point (equilibrium flow assumed) (Ref. 56).
Altitude H (kft) 300 250 200 150
Velocity u (kft/sec) 25.8 25.0 22.6 12.1
Stagn. enthalpy hs/R (°K) 10.8 x 10⁴ 10.2 x 10⁴ 8.8 x 10⁴ 2.4 x 10⁴
Pitot pressure ps (atm) 1.39xlQ-3 1 .97xlQ- 2 1.20x10-' 2.3x10- '
q is the convective heat transfer rate at the stagnation point and rn is the nose radius in inches. For nose radii upto 1 foot the radiative heat transfer is more than one order of magnitude less than the convective heat transfer(Ref. 57).
It is found that the required values of stagnation enthalpy can be generated in arc heater facilities but forns/R =ios °K tne reservoir pressure should not exceed 5 atm (Ref. 58, state of the art 1961). The total pressure ina wind tunnel, required for flow duplication, is however of the order of 103 to 106 atm.
The solution is to duplicate the stagnation enthalpy and to test the model at fairly low Mach numbers, typicallyMach 2-5 (Ref. 27,55).
2.3. B Structure Testing
For the hypersonic transport a rather simple passive thermal protection system as for the space shuttle will not beemployed, but the walls are to be cooled by the hydrogen fuel. This cooling may be accomplished directly, using wallmaterials with good thermal conductivity, or indirectly by blowing pre-cooled sheets of air over the outer wall surfacei.e. by slot cooling (Ref. 53). These active cooling systems are much more vulnerable to failures and extensive testingwill be necessary on reliability, thermal fatigue, effect of transients, etc. The same arguments are valid for the testingof the HST propulsion system. A discussion on the development and hardware testing of airbreathing engines for largehypersonic vehicles can be found in Reference 5 1 .
The facility requirements for development testing of full or large-scale airbreathing propulsion systems andassociated airframe can be appreciated by considering the requirements as described in Section 2.2. The same require-ments for complete flow duplication (pt, Tt, M) are valid, and result in the use of large tripltee tunnels. The requiredrunning time of these tunnels will largely influence the design of the tunnel heating systems. It is generally agreed thatat least a few minutes running time is required, however, aeropropulsion people quote figures as high as 1 5 minutes.
It should be noted that such a large facility allows also Mach number-Reynolds number duplication of theHST up to Mach 7 when the tunnel is operated at equilibrium condensation condition (see Fig. 1 1), p0Lm
being of the order of 750 atm.m.
3 PRACTICAL AND PRINCIPAL LIMITATIONS FOR GROUND TEST FACILITIES
3.1 Hypersonic Wind Tunnels for Aerodynamic Testing
For the bulk of aerodynamic tests at hypersonic speeds in ground test facilities the primary aim is toduplicate the Mach number and the Reynolds number of the full scale flight condition (see Section 2.1). In orderto achieve this with the least amount of energy the tunnel is operated at the lowest possible temperature.This temperature follows from the requirement that the static temperature in the test section flow should not bebelow the condensation temperature (Ref. 35). In Figure 1 1, which will be discussed later, the stagnation temperatures,

6-11
necessary to avoid equilibrium condensation are indicated as a function of Mach number and stagnation pressurefor a perfect gas (dashed lines). For a real gas the minimum stagnation temperatures are lower than indicated inFigure 1 1 .
Calculations for a real gas (with Refs. 35, 45 and 59) show that at Mach 18 at minimum stagnation temperaturethe degree of dissociation of the gas in the stagnation region of a blunt body model in the test section is about1% for stagnation pressures between 10 and 1000 atm. It is concluded that in a wind tunnel operated at minimumstagnation temperature, high temperature real gas effects are restricted to molecular vibration only, when the testsection Mach number is below Mach 18. The discussion on aerodynamic facilities in this Section 3.1 will beconfined to facilities operating under conditions where molecular vibration is the only high temperature real gaseffect to be taken into account. Its effect may, however, still be considerable: the pitot pressure may be 65% ofthe ideal gas value for instance (Ref. 45, Fig. 20).
Methods to correct the wind tunnel data for the full scale vehicle real gas effects such as dissociation andionization will not be discussed here. They may be provided by theoretical analyses supported by experimentaldata of a more fundamental character such as radiative heat transfer measurements and chemical reaction ratedata and partical flow simulation.
The "pure" aerodynamic phenomena are duplicated when the Mach number and Reynolds number around thevehicle are duplicated and the correct wall temperature-free stream temperature ratio T^/T^ exists. For practicalreasons the non-uniform wall temperature distribution along the full scale vehicle is often approximated by auniform wall temperature of the wind tunnel model (room temperature). Non-uniform increase of the walltemperature during wind tunnel tests should not be overlooked. At flight conditions where M/ yT^e is largerthan about 0.01, i.e. during high altitude re-entry, the parameter M/\/Re should be duplicated, rather thanM and Re separately.
In order to find the stagnation pressures needed to generate the necessary Reynolds numbers, indicated inFigure 4, calculations have been performed for a wind tunnel model with a standard length of 1 meter, operatedat the equilibrium condensation temperature for air (Ref. 35). This will give the highest Reynolds number for a givenstagnation pressure and Mach number. No real gas effects have been taken into account. The results have beenplotted in Figure 1 1 .
Real gas effects however, may have considerable influence as is indicated in the example below, calculated withaid of Reference 59.
real
Po
atm
488
1072
2308
4920
gas
TO
°K
1500
1500
1500
1500
Re/m at Mcond
m-'
2.2 x l O 6 12.77
6.5 x l O 6 12.56
18.7 x 10⁶ 12.48
50.7 x 10⁶ 12.80
equivalentperfect gas
Po To
atm °K
379 1671
1085 1736
3241 1846
10960 2084
The real gas effects are in fact twofold, namely high pressure effects (van der Waals effects) and high temperatureeffects. For given free stream conditions at hypersonic Mach numbers the stagnation temperature is lower thanaccording to the perfect gas calculations and the stagnation pressure can be either higher or lower.
In Reference 60 the combination of both effects has been considered and is presented in graphical form, twofigures being reproduced as Figures 1 2a and 1 2b of the present paper, valid for nitrogen, which closely resemblesair. These graphs can be used in combination with Figure 1 1 , which is valid for a perfect gas, to calculate thereal required tunnel stagnation conditions.
As was already pointed out, above M/yrRT= 0.01 the viscous interaction parameter M/vHKe should beduplicated rather than Mach number and Reynolds number. From Figure 1 1 it follows that this procedure allowstesting at lower stagnation temperatures and pressures than if Re and M both had to be duplicated along thecomplete re-entry trajectory of a space shuttle. This is a very important consideration from a facility engineeringpoint of view.

6-12
It can be discussed whether M-Re duplication for the lower shuttle re-entry trajectory should be pursuedup to Mach 19 where M/y^Re = 0.01 , because of the necessary high values for p0L and T0 (facilityengineering and high-temperature real gas effects). For a model length Lm = 1 meter Figures 11 and 12 giveas required real gas stagnation conditions about p0 = 2600 atm and T0 = 2900°K at the point considered.
1
A minimum tunnel requirement may be that M-Re duplication must be possible up to such a value thatinterpolation to the M/i/R~e > 0.01 data is possible with acceptable and reasonable accuracy. This value maybe different for tests where for instance boundary layer transition is important (heat transfer for example) orfor force tests where M and M/ y'RlT are more important. In the following sections the practical and principallimitations will be discussed, which are important for validation of the performance of hypersonic facilitiesfor aerodynamic testing.
3.1.A Stresses in the Sting Support
Due to the aerodynamic forces stresses will develop in the model and the sting which supports it. For agiven model and sting support these stresses are a function of the angle of incidence and the dynamic pressure onlyand a weak function of the flow Mach number. The stress in the sting with diameter ds at the model base iscalculated for a static load assuming that the normal force N (perpendicular to the model axis) acts on a pointat a distance 2/3 Lm from the nose.
For the space shuttle a minimum sting diameter ds = 0.1 L may be employed (about equal to the basediameter of the vehicle) and for the HST a value ds = 0.04 L is a realistic value (Ref. 61). The bending stressesdue to aerodynamic forces in the sting are then calculated from the moment
M = (1-|) LN = |L3 CNq.-^-
where L is the model length, S the reference area for the normal force coefficient CN and q is the dynamicpressure. For a solid circular sting follows
A value a = 5000 kg/cm2 at normal static aerodynamic load is considered as the structural limit: startingand stopping loads and a safety factor are not included. Also the strength of the model itself and the allowableelastic deformation of model and support are not considered.
When a maximum normal force coefficient CN is assumed for the space shuttle CN = 1.5 (see chapter 1.2),which is the modified Newtonion pressure coefficient for an angle of incidence of 65 degrees, and for the HST amaximum CN = 0.25 corresponding with an angle of attack of 16° for a typical configuration at Mach 6 (Ref. 62)the following maximum dynamic pressures qm are calculated for a stress in the sting am = 5000 kg/cm2 from
/ds\ 3 L2 iqm = 0.3 ami—) — —
\ ^/ ^ *~N
This gives a maximum dynamic pressure qm = 1.5 kg/cm2 for the space shuttle and qm = 2.2 kg/cm2 for theHST, This may limit the performance for facilities with high stagnation pressure capabilities at low hypersonicMach numbers.
For instance at Mach 8 a maximum stagnation pressure of 325 atm is allowed for space shuttle testing ifq is limited to 1.5 kg/cm2 and to 480 atm for HST-testing at CN = 0.25 . In Reference 42, however, a HST-model has been tested at a stagnation pressure of 1300 atm. In that case however, CN was about 0.085 andthe sting diameter ds was about 0.05 Lm . This will give a stress in the sting of 2400 kg/cm2 which is wellbelow the limit set at 5000 kg/cm2. For ds = 0.04 Lm the stress would have been 4600 kg/cm2, which indicatesthat the limits for qm of 1.5 kg/cm2 for the space shuttle and 2.2 kg/cm2 for the HST are not exact boundaries.It will be largely dependent on model-sting geometry and safety factor which has to include starting and stoppingloads which are also facility dependent and the maximum q at which the HST is to be tested.
Another criterion may be derived from the assumption that the space shuttle model should be tested atvalues of dynamic pressure and angle of incidence where the normal force is four times the weight of the vehiclealong the full scale trajectory (3-g is maximum design acceleration) and for the HST a normal force of two timesthe weight of the vehicle is attained, corresponding with a 2-g turn.

6-13
For a full-scale model and flow duplication the stresses in the sting would then be calculated from
w wwhere CN. qf = 4— = 800 kg/m2 for the space shuttle and CN qf = 2— = 500 kg/m2 for the HST. However,
O O
due to the fact that the tunnel can operate at a much lower temperature, the Reynolds number can be increased bya factor of about 4 (was 3 in the draft version of the present paper) when M-Re duplication is employed at tunnelequilibrium condensation conditions instead of flow duplication.
Introducing a scale factor B = Lf/Lm , the ratio between the full scale length and the model length, one findsfor M-Re duplication of the N = 4W and N = 2W conditions that am/B = i af = 22 kg/cm2 for the spaceshuttle and 111 kg/cm2 for the HST (a is proportional with q or p0).
For a maximum stress a = 5000 kg/cm2 the maximum scale factor B or minimum model length Lm isfound as
Space shuttle Bmax = 228 Lmmin = 0 .15m
Hypersonic transport Bmax = 45 Lmmin = 1.70 m
When ReL = 2 x 10⁷ is required and not full scale ReL duplication then the model size can be decreasedproportionally, keeping the stagnation conditions constant.
Both sting load criteria can be worked out and the results are found in Figure 13. The p0 = constantcurves for M-Re simulation were calculated from Figure 11. The sting load limits are indicated in Figure 13as CN = 1.5 (0.25), which is equivalent with qm = 1.5 (2.2) kg/cm3 and as N = 4W (2W) valid for the spaceshuttle (HST).
Although these sting load criteria are not to be used as exact figures it follows from Figure 13 that both criteriaindicate approximately the same minimum model size (within a factor 2) and that the minimum model size forM-Re duplication of the HST is one order of magnitude larger than for M-Re duplication of the space shuttleand testing of a HST-model at ReL = 2 x 10⁷ .
3.1.B Maximum Stagnation Pressure
In Figure 11 the stagnation pressures are presented which generate the required Reynolds numbers overa model with a standard length of 1 meter. The wind tunnel is operated at the equilibrium condensation limit.The curves are valid for a perfect gas.
The results of Figure 4 and 11 are used to calculate the required model length Lm for M-Re duplicationfor various stagnation pressures. The results are plotted in Figure 13. Also the minimum model lengths as determinedby the tolerable sting loads as was calculated in Section 3.1.A are indicated.
From a practical point of view a value of 5000 atm should be considered as an upper limit for the stagnationpressure p0 which can be contianed in the reservoir of a blow down wind tunnel: the highest design value ofpresent facilities is 60,000 psi or 4200 atm (Ref. 36, 63). This limit is also indicated in Figure 13.
For force testing of wind tunnel models with an internal balance, fairly small models can be used. In Reference64 for instance force tests are reported on a space shuttle configuration in a gun tunnel with a length of 0.10 meter.For more detailed measurements, however, such as pressure and heat transfer distribution on the model surface,larger models are required. For a well instrumented model, such as used for development work, a model lengthof more than 0.3 to 0.5 m seems to be a sensible requirement. It also makes aerodynamic loading of the sting andthe model less critical.
From Figure 11 it follows that for a HST configuration with a model length Lm = 0.50 m , ReL = 2 x 10⁷
can be obtained up to Mach 8 with a reservoir pressure p0 = 200 atm. Recent HST studies do not indicate higherdesign Mach numbers (see also Section 13).
For M-Re duplication of the space shuttle lower trajectory conditions the requirement are more demanding thanfor a HST model at Mach 8 and ReL = 2 x 10⁷ as can be seen from Figures 11 and 13. This is due to the factthat the Mach number range of interest is much higher than for the HST. If for instance M-Re duplication isnecessary up to Mach 15, a stagnation pressure p0 = 2000 atm is required for a model length of 0.50 m.

6-14
It is concluded from Figure 13 that stagnation pressures larger than p0 = 2000 atm and models smallerthan about Lm = 0.3 to 0.5 m are not very interesting for development testing of the space shuttle or HST-configurations when the "pure" aerodynamic phenomena along the whole trajectory should be simulated, includingboundary layer transition.
For M-Re duplication of the HST up to Mach 8 only large models with Lm ~ 2 meter and p0 ~ 1 000 atmcan keep model and sting loads within acceptable values when testing up to CN = 0.25 (a ~ 16°) is required.
3.1.C Facility Power
It is found that already for a small hypersonic wind tunnel for development work with a test section of 0.50 m anda stagnation pressure of 1000 atm operating at the condensation limit, very large energies are contained in the flow. Forexample at Mach 5 the total energy flux through the test section would be about 600 MWatt and at Mach 10 about 50MWatt. This lower figure for a higher Mach number is due to the fact that although the velocity is about 50 percentlarger, the throat area is only 5% of the value at Mach 5. From these illustrative figures it is clear that only blow downfacilities are to be considered. Such a facility is charged between the runs with a limited power (compressors, storageheaters, capacitor). The accumlated energy is released during the running time which is only a small fraction of thetime interval between the successive runs.
The released power P can be written as
P = uA.u2 = |ReLM2a2// —L,
For a given Mach number and Reynolds number and a given free stream temperature, which determines thelocal speed of sound a and viscosity M , it is found that the released power increases proportional with a lineardimension of the facility. From this point of view a small facility, working at a high stagnation pressure is attractive.Also facility and model costs will be generally lower than for large wind tunnels working at the same Reynoldsnumber. The minimum size will be determined by considerations, discussed elsewhere in this Chapter 3.1.
3.1.D Throat Erosion and Cooling
The feasability of a high pressure facility however, is not only limited by the strength of the pressure reservoirbut also by the limit of throat melting. This becomes a problem at high Mach numbers when high reservoir temper-atures are required to avoid condensation of the test gas.
The heat transfer to the wall of the nozzle throat is higher than anywhere in the facility. Its value is given as(Ref. 65, p. 192):
Q = 0.0014 p*u*Cp(T0 - Tw)
where p* and u* are the density and flow velocity in the throat. This equation can be written to:
Q = 0 .56 P o T 0 M-^- W a t t
where p0 is the stagnation pressure in atm and T0 the stagnation temperature in °K.
For water cooled nozzle throats limits for the tolerable heat load are given in Reference 58. A practical upperlimit is 5 kW/cm2. For a given p0 this determines the maximum Mach number for condensation free flow in afacility with a water cooled nozzle. It follows for a wall temperature Tw = 600°K (Ref. 65).
P0 (atm): 100 500 1000 2000 5000
T0 (°K): 9100 1225 860 720 645umax
When these figures are compared with Figure 11, it follows that for a wind tunnel with a water cooled nozzlethroat only limited possibilities exist when M-Re duplication is to be realized.
Instead of water cooling also film or transpiration cooling of the nozzle throat may be employed such as inthe NASA Ames 3.5 ft tunnel (helium cooling) (no reference known with detailed information) and the NorthropMach 10 hypersonic facility (Ref. 66). Less than 10 percent of the tunnel weight flow is injected upstream of thethroat. For a more analytical approach to the problem, see Reference 67 to 69.
Much higher heat fluxes than 5 kW/cm2 can be tolerated when running times are employed which are soshort that the surface temperature rise is acceptable. In Reference 41 the heat flux required to melt a tungstenthroat within 1 millisecond is presented as a function of reservoir pressure and temperature (melting temperatureis 3700°K) and oxygen-free nitrogen must be used as a test gas to prevent throat erosion.

6-15
The permissible pressure is inversely proportional with the square root of the running time (Ref. 70) andfrom Reference 41, Figure 6, the following maximum reservoir pressures are omitted for a running time of 100milliseconds:
P0 (atm): 100 500 1000 2000 5000
T0max (°K): 1000° 575° 470° 400° 370°
It is concluded that throat heating does not limit the M-Re duplication capabilities as required in Figure 11,when the maximum Mach number is limited to Mach 18 (see Section 3.1) and for running times shorter than100 millisec. For longer running times and other materials the Mach number limit may be lower.
3.1.E Real Gas Effects
Almost all hypersonic facilities are based on the blow-down principle where the gas is rapidly expanded andaccelerated in a converging-diverging nozzle from the stagnation or reservoir condition. This may happen sorapidly that the various degrees of freedom cannot accommodate rapidly enough and flow non-equilibrium occursin the nozzle. A certain amount of the available enthalpy "freezes" and cannot be transformed into kineticenergy of the test section flow. Non-equilibrium effects make the flow diagnosis and definition of the testsection flow conditions much more complicated and should be avoided, if possible (Ref. 71).
In Reference 41 a value for the entropy S/R < 32 is selected as the criterion for equilibrium flow to bepresent, Reference 71 prefers S/R < 31 . Reference 59 gives for these entropies (real gas effects included):
P0 = 200 atm S/R = 31 T0 = 4700°K
32 5260°K
PO = 1000 atm S/R = 3 1 6080° K
32 6870°K
As was pointed out in the general remarks of Section 3.1 high temperature real gas effects in the wind tunnelcan be restricted to molecular vibration only, when the test section Mach number is below Mach 18 and the tunnel isoperated at its equilibrium condensation temperature.
For tunnels operating at these conditions, comparison of the figures quoted above with Figure 11 would indicatethat no-equilibrium nozzle flow is completely avoided. In fact however, Reference 41 sets S/R = 32 as theboundary for chemical non-equilibrium. Vibrational non-equilibrium however, appears to be present at muchlower entropy values than S/R = 3 1 or 32 as is concluded from the data, presented in Reference 72.
For a throat diameter of 0.25 inch = 6.35 mm and a 5 degree half angle nozzle with a parabolic throatcontour, which is a realistic case for the present discussion, it was found (Ref. 72) that for a stagnation pressurePo = 4000 psi = 280 atm the frozen enthalpy is about 3.7% of the stagnation enthalpy for T0 = 2000°K and4.1% for TO = 3000°K. These stagnation conditions correspond with entropy values S/R =25.6 andS/R = 27.6 respectively.
It is concluded that vibrational non-equilibrium effects in the nozzle flow as well as around the model(Ref. 72) are in many cases not negligible. They can be minimized by using slender nozzles. For a fixedvalue of TO and of p0Lm and thus also p0x throat diameter (if Lm is proportional to the test section diameter),the slenderness of the throat and the nozzle is the only parameter that affects the vibrational non-equilibriumphenomena (Ref. 72).
3.1.F Running Time
Finally, some lower limits for the running time should be considered.^
Firstly, the running time must be long enough to permit steady flow to be established in the test section andaround the model. For facilities with short running times, say less than 100 milliseconds, the flow is startedimpulsively in general by breaking a diaphragm near the nozzle throat. The starting process has been described inthe literature, see for instance References 13 and 14.
A practical definition of the start time is the time during which the steady flow through the nozzle throatis not transformed into a steady flow in the test section but is rather passing through unsteady expansion wavesand/or shock waves which exist in the nozzle during the starting processes. As follows from consideration of thedata presented in Reference 73 and 74, this time is found by constructing the u-a characteristic for the steady-statenozzle flow in a wave diagram along the nozzle, the singularity at the throat being discussed in Reference 73 and

6-16
the particle trajectory of the steady state flow. The starting time is then equal to the ordinate in the wavediagram (or x-t diagram) in the throat where x = 0, of the particle trajectory which arrives at the same time inthe test section as the u-a characteristic from the origin of the wave diagram (Ref. 74). This applies for an initialpressure below the free stream static pressure that will be generated when the tunnel has started. For a conicalnozzle with a throat radius rt , a nozzle half-angle tangent j3 and a sound speed a0 at reservoir conditionsthe nozzle starting times ts have been calculated and also the time tb between the breaking of the throatdiaphragm and the establishment of steady flow in the test section.
M : 5 10 15 20
t s 0 — : 1.35 2.65 4.14 5.85rt
t b 0 — : 3.54 13.30 32.10 62.06rt
For instance a Mach 15 conical nozzle with a half-angle of 5 degrees at T0 = 2000° K and an exit diameter of100 cm would give ts = 0.5 millisec and tb = 3.9 millisec (rt = 0.95 cm with high temperature real gas effectsincluded). A contoured nozzle, which is about twice as long as a conical nozzle with the same maximum half-angleand exit diameter (without boundary layer effects) will have starting times which are roughly two times longer thanthe values from the table above.
For the flow establishment around the model stabilization of separated flows is the governing factor. Forlaminar separated flows it has been found that about 30 body lengths of flow were required for the pressure inthe base region of a sphere to stabilize (body length equal to sphere diameter) and for the heat transfer a factor of twolonger time was needed to reach equilibrium. For shock induced separation the flow establishment times are muchshorter for the cases of interest (Ref. 75). On the leeward side of the space shuttle larger regions of laminarseparated flow may occur during re-entry at large angles of incidence. The diameter of the fuselage being of theorder of 0. 1 5 of the length and assuming that 60 diameters are required for flow establishment (a somewhat arbitraryvalue) the flow establishment time te is 9 L/u, where u is the free stream velocity. For a local sonic speed of1 50 m/sec (near condensation) it is found that te = 60 L/M millisec, where L is the body length in meters. Thisfigure should be considered as an order of magnitude and will depend on the body geometry and flow conditionssuch as Reynolds number etc.
For a contoured nozzle with a test section diameter of 1 meter and a maximum wall angle of 5 degrees and amodel length of 1 meter the following data on starting times are found
M
T
5
500
10.0
6.9
18.0
12.0
18.9
10
1000
2.23
2.1
10.7
6.0
8.1
15
2000
0.95
1.0
7.6
4.0
5.0
°K
cm
millisec
millisec
millisec
millisec
The quantity ts + te is to be considered as a maximum for the non-useful duration of flow from the reservoir.In practice this time will be shorter because ts and te will partially overlap each other. Shock tunnels are infact the only facilities which have been used for configuration testing which have running times that are so shortthat the question of flow establishment time arises. The throat size of such a facility must be compatible with thepreceding shock tube diameter. A throat diameter of 20 cm as required for a Mach 5 nozzle with an exit diameterof 1 meter is certainly not realistic for present or even future high-pressure shock tunnel technology. In fact thenozzle of the Cornell shock tunnel which has been used for HST-configuration testing (Ref.42 ) has a 0.61 mdiameter nozzle when operating between Mach 5.5 and 8.2 and a 1.22 m nozzle for Mach numbers between 10 and17.
The running time is 2 to 13 milliseconds, the high value being for the lowest stagnation temperatures (Ref.76).
The flow establishment times being proportional with the linear dimension of the tunnel and the model it isconcluded from this discussion, that possibilities of shock tunnel testing of models with a length larger than 0.5meter are marginal at low hypersonic Mach numbers from considerations of the required running time.
Another minimum testing time criterion follows from the requirement that force measurements on completevehicle models should be made. The consequences for the required running times are discussed in Refeeence 7 1 .In impulse facilities such as shock tunnels and hot shot tunnels the force data are obtained with accelerationcompensated balances. These are designed on the premise that the test model being evaluated, vibrates as a rigid

6-17
body (Ref. 71). Slender bodies and/or large models tend to generate vibrations within the model, yielding imperfectinertia compensation. When these bending resonance frequencies are high enough, they can be filtered out. Forshock tunnels a minimum frequency of roughly 1000 Hz can be tolerated and this limits the model scale to some-thing of the order of 45 cm for a model slenderness ratio of 10. For the same model geometry this frequencyis inversely proportional with the model length. When a balance system, based on the premises mentioned inReference 71 is employed, facilities with test times of the order of 50 milliseconds or more should be used fordevelopment work where model lengths of more than 0.5 meter are tested and shock tunnels fall short of thisrequirement.
It should be noted, however that at Cornell Aero Labs force testing was done with a HST-model with a lengthof 0.66 meter (Ref. 42). Interference of the vibration modes with the inertial compensation may have been avoided inthis case by placing several accelerometers inside the model and then excite the model on a shaker to establish thecompensation required in analogue circuits (Ref. 29).
Free flight testing techniques (Ref. 77 for instance) are probably not attractive for the development testingdescribed in this paper because of the relatively large aerodynamic loads and the required integrity of the lightweight model during flight and of the facility after impact of the model. Also the cost of complicated throw-awaymodels should be considered.
In summary it is concluded that the running times of present shock tunnels which are of the order of10 millisecond are marginal for development testing of models longer than, say 0.5 meter but testing is notimpossible. Test times of the order of 50 milliseconds require much less attention as far as flow starting times andinertia compensation for force measurements is concerned. Also the feasibility of probe traverses (Ref. 78),scannivalves (Ref. 79) and variation of the angle of incidence during the run (Ref. 43) is greatly increased, whichwill increase the efficiency of each run. Also dynamic testing is facilitated when the running time is 50 millisecondsor more.
3.1. G Conclusions
The practical and principal limitations of hypersonic wind tunnel facilities for Mach number-Reynolds numberduplication can be summarised as follows.
1. Acceptable sting loads require for M-Re duplication of hypersonic transport aircraft models with a length ofthe order of 2 meters. For testing up to Mach 8 reservoir pressures of the order of 1000 atm are thenrequired. Whether the construction and use of such a facility is justified is open to discussion.
2. For the case of M-Re duplication of a space shuttle and for boundary layer transition close to theleading edges of a hypersonic transport (ReL = 2 x 10⁷) flying not faster than Mach 10 the requirements oftunnel size/stagnation pressure are largely overlapping (Fig. 13). If one facility should do both jobs thedesign should lie within the following limits:
(a) Model length Lm > 0.3 to 0.5 m to prevent excessive sting loads and to allow ample instrumentation
(b) Stagnation pressure p0 < 5000 atm from structural considerations for the tunnel
(c) Stagnation pressures p0Lm > 500 atm.m (beter is p0Lm > 1000 atm.m) in order to duplicate theReynolds number up to large enough Mach numbers.
(d) Up to Mach 18 at equilibrium condensation conditions high temperature real gas effects are restricted tovibrational excitation of the molecules only, and up to that Mach number the required Reynolds numbercan be generated without severe throat erosion problems for running times shorter than 100 millisecondsfor a tungsten throat and oxygen-free nitrogen as test gas
(e) Running times of less than 10 milliseconds are marginal for development testing on models longer than0.5 m from the point of view of flow establishment times. A running time of more than 50 millisecondsoffers more flexibility in this respect and in measurement techniques.
3.2 Facilities for Combustion and Propulsion Testing (Including Hardware Testing).
Many of the arguments which are discussed in Section 3.1 hold also for the facilities for scramjetcombustion and propulsion tests. These facilities must generate the correct environment in the supersonic combustionchamber with regard to Mach number, pressure and temperature. For a given flight Mach number simulation,these facilities will run at higher stagnation temperatures and lower stagnation pressures than wind tunnels,which means that no direct limitations exist with respect to stress levels, either in the tunnel reservoir or in thecombustor model. Limitations will show up with respect to tunnel power and heating system, throat cooling anderosion, running time and the composition of the air.

6-18
3.2.A Facility Power and Air Heating
For mass flows of the order of 200 kg/sec as quoted in Section 2.2 a power is required of the order of103 MWatts during the run. This power is equal to a large power station and hence prohibitive in many circumstances.Therefore short running facilities with accumulation energy storage are developed. The compression heatingsystems (shock tunnels and gun tunnels) are the cheapest facilities in this respect. The shock tunnel might givetoo short running times ( < 10 msec), but gives almost unlimited stagnation temperature duplication (Ref. 48).Calculations show that a gun tunnel with preheated barrel may generate about 3000°K during 50 msec, with massflows in the 10-50 kg per second range. Also hot shots (arc heating) show this performance (Ref. 48). In thegun tunnel the temperature drop due to cooling may be compensated by increasing stagnation pressure duringthe run (see Ref. 78 for a pressure record); in the hot shot this cooling effect is much more troublesome (seealso 3.2.C).
Regeneration heating systems (such as the pebble bed) are limited by the maximal solid material temperaturesattainable, typically less than 2500°K. The running times may be however several seconds to a minute or longerand therefore show good promise for hardware testing (see also 2.3).
An attractive means to increase the stagnation temperature of the supersonic burning test facility is to burnupstream of the nozzle a hydro-carbon, hydrogen or nitrogen containing fuel (NH3, N2 H4) and add additionaloxygen (Ref. 80, 81). The air is then called vitiated air. The attainable temperature in combination with theregenerative heating system might be in the 3000°K range.
The only means to obtain higher temperatures for long periods of time, > 10 sec, is to use arc heating. How-ever continous arc heating is limited to only moderate pressures (a few hundred atm) (Ref. 55), decreasing withincreasing temperatures and hence flight Mach number, conflicting with the requrement that the tunnel stagnationpressure must increase with Mach number to allow flow duplication. The flight altitude for which arc heaterfacilities can provide flow duplication above say Mach 8 to 10 is therefore too far above the HST real flightaltitude to allow realistic hardware testing in free jet test sections of the blow down type. However, continuousarc facilities are very useful for ablation testing, since pitot pressure and wall static pressure duplication is requiredrather than Mach number.
3.2.B Throat Cooling
The heat transfer equation of Section 3.1.D is used to compute the temperature-pressure limitation ofcontinuous propulsion and hardware test facilities. This line is represented in Figure 5 (upper boundary). Ifthe connected pipe supersonic combustion testing method is used (Fig. 10) the lower line in Figure 5 is obtainedtaking into account the total pressure recovery of Figure 8. These lines probably will coincide with the archeating capacilities of the former section. Hence it can be concluded that for hardware testing (long run times)the laboratory facilities are limited to approximately free flight Mach number of 8 for free jet facilities, and toM = 10 for connected pipe testing for a q = 0.5 kg/cm2 flight condition (Fig. 2).
3.2.C Flow Duration
The least required flow duration is of primary consideration for facility type, heating system design and throatcooling requirements. Two kinds of tests can be distinguished, namely: first, fundamental flow field andcombustion tests and second, hardware tests. The first kind can be performed in short duration facilities in whichthe certainty of flow establishment is the main criterion apart from data collection time considerations. Reference48 reveals that a few milliseconds seem to be sufficient, through Reference 49 indicates that tests in a hot shottunnel, having a 200 msec runtime, yields difficulties interpreting the results, mainly due to temperature variation.Test times of at least 10 msec seem preferable. Hardware tests should be of representative duration, hence of theorder of several minutes (see also Section 2.3).
3.2.D Air Contamination
From power requirements point of view the vitiated air system is very attractive, since direct heating occursby burning. However, almost all fuels for the vitiation system contain hydrogen, so that free radicals such asOH will be present at the entrance of the combustor. These free radicals will substantially shorten the ignition delaytimes in the combustor, and hence will yield unrepresentative results. Furthermore the thrust as produced by thenozzle will be typically 10% less than for clean heated air (Ref. 80). Many facilities use the vitiated cycle as atopping cycle for regenerative heated air (Ref. 81). Caution must be exercised to translate results from vitiatedfacilities to flight conditions. For duration tests and mixing tests vitiated air systems will be useful.
3.2.E Conclusions
For long duration combustion and propulsion tests (> 1 sec) complete scramjet performance assessment islimited to M — 8 , due to throat cooling capabilities. The same is true for structural testing in the real flowenvironment. For combustor and nozzle tests the flight Mach number duplication is limited to about 10 in thelaboratory. For higher Mach number free flight testing is the only means. For scramjet hardware test a vitiated

6-19
air system gives an economical solution with respect to power requirements. For supersonic combustion andaerodynamic performance tests of scramjets short duration facilities can be used with sufficient running time.Facilities with a combination of preheating and compression heating such as gun tunnels with preheated barrelor tunnels such as the ONERA R4Ch will probably show good prospects. Also shock tunnels such as SheffieldUniversity are very useful though the latter might be short of flow duration. For ablation studies continuous archeaters are the best choice.
4 REMARKS ON EUROPEAN FACILITIES FOR HYPERSONIC TESTING
This section will present a brief evaluation of the performance of the major hypersonic facilities in Europe.In these facilities as well as in the smaller facilities which are located mainly at colleges and universities much workhas been done of a more fundamental or exploratory character, as was mentioned in Section 1.1. (see also Ref. 5,6 and 7). In this section, however, the usefulness of the available major facilities will be considered against thebackground of the requirements for testing related to the development of the space shuttle and the hypersonictransport as described in the previous sections.
4.1 Aerodynamic Testing
In Reference 7 information is presented on all hypersonic facilities existing in Europe. Their usefulness fordevelopment testing at high enough Reynolds numbers as described in the preceding chapters can be appreciatedif their maximum p0Lm performance (stagnation pressure x model length) is plotted as a function of theMach number at which the facility can be operated. Figure 11 where the required p0Lm values are plottedis then the background against which the available p0Lm can be projected.
During re-entry the space shuttle will fly at angles of attack of 25° to 60°. In order to avoid blockage of thewind tunnel flow, the model length Lm should not exceed half the core diameter (Ref. 29). For the presentevaluation Lm =0.5 Dm is assumed for the space shuttle with Dm equal to the nominal test section diameter,which is listed in Reference 7.
For the HST which is much more slender than the space shuttle and which is tested only at small angles ofattack up to say 10° or 15° (Ref. 42, 62) the model length Lm can be much larger without blockage. For thepresent case Lm = Dm is assumed for the HST.
In Reference 7 only the maximum stagnation pressure p0 of each facility is given. Having no detailedinformation on the dependence of p0 on the Mach number it is assumed that all facilities operate at their maximumPo over the full Mach number range with the restriction that the maximum dynamic pressure qm is not exceeded.This is assumed to be qm = 1.5 kg/cm2 for space shuttle testing and 2.2 kg/cm2 for HST testing (Section 3.1.A).
This assumption on p0 can be criticized, but if the true p0 - M data had been plotted in Figures 14 and15 this had to be done for all facilities to obtain a fair basis of comparison. These data are presently not available.It is suggested that these should be included in the next edition of Reference 7. and/or it should be stated at whatMach numbers the Reynolds numbers, mentioned in Reference 7 are attained. Some remarks dealing with the p0
assumptions are given in the next sections.
From the facilities listed in Reference 7 the "major" facilities should be selected. The following criteria havebeen used:
Test section diameter Dm > 0.25 m. This means that not only facilities for models longer than say 0.3 m areincluded as was required for development testing (see Section 3.1.G), but also smaller facilities which are suitablefor more basic or exploratory studies.
p0Lm > 10 atm.m. Lower values allow adequate M-Re simulation below Mach 5, which is outside thehypersonic regime.
Running time longer than 5 milliseconds, so that most shock tunnels may also be included.
An exception is made for the few arc heater facilities and low density tunnels where no restriction is made onP0 Lm . The arc heater facilities can in fact be used as low density facilities, but also high temperature phenomenasuch as occur during re-entry can be studied.
The relevant characteristics of the remaining facilities from Reference 7, together with some additionalinformation from Reference 4, 29 and 30 can be found in Table 1. The resulting p0Lm performance is plottedin Figure 14 and 15.
It should be remarked that most facilities operate only at specific Mach numbers rather than infinitly variableMach numbers and the lines in Figures 14 and 15 are to be considered as facility potential performance, which canoften be used by simply employing different throat blocks. Also operation at lower values of Pol^ than indicated

6-20
is of course possible. For the HST, facilities which operate only at Mach numbers above 15 and/or which havemaximum ReL-capability below 106 have not been plotted in Figure 15. For shock tunnels the maximum modellength is assumed to be 0.5 meter to avoid too large difficulties with flow establishment times (see Section 3.1.F).
From the data on tunnel performance the following conclusions may be drawn:
4.1.A Hypersonic Testing of Space Shuttle Configurations
From Figure 14 it is concluded that the estimated performance of the large shock tunnel at TH Aachencovers the required M-Re performance for space shuttle re-entry above Mach 7.5. It is not known whether therunning time is long enough, while it is given in Reference 7 as 1-10 millisec. Also the conical nozzle is adisadvantage because this entails axial pressure gradients which makes corrections necessary.
In the low hypersonic regime between Mach 5 and Mach 9 several facilities are available which have Reynoldsnumber performance close to the lower trajectory. Some remarks are made below.
The Imperial College gun tunnel is probably still the only gun tunnel with a test section larger than 0.25 mpresently available in Europe since work at Bristol and RARDE (both in the U.K.) has come to an end (Ref. 30).Although the model length is rather limited (Lm ^ 0.15 m) the Reynolds numbers are rather high, which combinedwith a good parallel flow quality, makes the facility a useful tool in the European hypersonic tunnel inventory.In a recent note data became available of a gun tunnel at the Institute de MSchanique des Fluides at Marseille. Thoughthis tunnel has good performances the flow in the test section is of the source type and the running time is onlylimited.
The ONERA S4MA blow down tunnel has an attractive Reynolds number potential capability. The facilitycan also be used as a combustion tunnel for ramjet/scramjet testing.
The smaller shock tunnel of TH Aachen shows no superior performance while the disadvantages are the sameas for the large shock tunnel.
The blow down facilities of FFA (Sweden), ARA (U.K.) and of CEAT and the ONERA R3Ch (France) haveabout the same performance. Model size and tunnel costs will have to be considered.
From an economic point of view the Ludwieg tube facilities of the DFVLR and the ONERA R4Ch slowpiston tunnel are attractive but their present performance is rather low.
It is doubted whether the DFVLR arc facility PK2 can work at a stagnation pressure of 100 atm down toa Mach number of 6 as indicated in Figure 14. The performance envelopes shown in Reference 4 show rathera constant maximum ReL between M = 5 and 15. It is therefore supposed that the PK2 facility is not suitablefor M-Re duplication and is to be used exclusively as a low density and/or high enthalpy facility.
Between about Mach 10 and 15 a gap exists where no M-Re duplication on space shuttle wind tunnel modelscan be realized.
Above Mach 15 the simulation of the Mach number is less urgent (see section 2.1.1.A) but several facilitiesfor testing between Mach 15 and 20 are available in Europe namely the VKI long shot and the hot shot tunnels ofONERA. The Sud shock tunnel has the same performance as the hot shots but with a considerably shorterrunning time. The Reynolds number performance of the long shot duplicates ReL at Mach 15 for the lowertrajectory and is twice the hot shot tunnel ReL performance. The model length Lm is of the order of 0.30 mfor all M > 15 facilities. A disadvantage is the divergence of the test section flow caused by the conical nozzleexcept for the ONERA Arc 2 tunnel, which has a contoured nozzle.
It should be noted that testing at lower Mach numbers with the present long shot and hot shot facilities hasonly limited possibilities. This is because for both facility types the test gas flows out of a rather small reservoir witha constant volume, causing the stagnation pressure to drop during the run. This drop is proportional with the throatsize and hence lower Mach numbers bring about a faster pressure drop (and temperature drop) during the run. Thisdisadvantage is not present in gun tunnels and slow piston tunnels.
For low density testing several facilities are available as is shown in Table 1. It should be noted that the inviscidcore diameter of the test section flow is considerably smaller than the nominal nozzle exit diameter for low densityfacilities due to the thick boundary layers. Therefore only the largest facilities should be considered for testingcomplex models. These are the DFVLR PK2 tunnel with a 60 cm nozzle diameter and the new RAE low densitytunnel with a 76 cm nozzle. The PK2 facility has a uniform core diameter of 10 cm at Re/cm = 5000 at Mach15 (?) (Ref. 4), giving a viscous interaction parameter M/y/T^e = 0.7 for a model length of 10 cm which is probablytoo small for development testing.

6-21
It is concluded that up to Mach 9 several facilities exist or are planned in Europe which offer good possibilitiesfor space shuttle tests at duplication Reynolds numbers. A facility with a larger test section diameter of about 1meter would offer a ReL simulation capability covering the lower trajectory requirement as indicated in Figure 14without being limited by the q = 1.5 kg/cm2 boundary set for excessive sting loads. A model length of 0.5 mcould then be accommodated, which allows more detailed measurements than presently available. Also extension ofthe M-Re duplication capability to higher Mach numbers to say Mach 12 is advisable to close the gap between thepresent Imperial College Mach 9 gun tunnel and the VKI Mach 15-20 long shot facility.
It should be noted that the lower flight altitude boundary given in this paper (Fig. 2) may shift to largeraltitudes when vehicles are operated at higher lift coefficients than the present shuttle to alleviate aerodynamicheating (Ref. 11) with a corresponding decrease in maximum Reynolds number requirement. For low densityresearch and development a facility which is large enough to accept large and complex models is presently notavailable in Europe. Such a tunnel should cover values of M/y'Ke between 0.1 and 0.5. Provisions should be madein the tunnel pumping system for accepting not only nozzle flows but also exhaust gases from motors, reaction jetsor mass injection gas (Ref. 29).
4.1.B Hypersonic Testing of HST Configuration
For testing of hypersonic configurations up to Mach 8 at ReL = 2 x 10⁷ European facility performance isadequate as can be concluded from Figure 15. Reynolds number duplications requires test section diameters oneorder of magnitude larger than presently available. The HST is a more slender configuration than the space shuttleand force measurements will be more sensitive to axial pressure gradients. Conical nozzles as employed for instancein the shock tunnels of TH Aachen are therefore unsuitable for HST tests, which require great accuracies to determinethe economic feasibility of a HST system. It is questionable whether the available facilities are suitable for HST.development testing where the aerodynamic behaviour of the complete airframe-engine system should be properlysimulated. This requires proper engine flow simulation and a correct boundary layer thickness (at the engine intakefor instance). Then higher Reynolds numbers are required which can only be realized in large facilities to avoidexcessive sting loads. This requires a facility like the large Tripltee tunnels described in Section 4.2.
4.1.C Comparison with U.S. Facilities
In Reference 82 data on hypersonic facilities in the United States are presented, excluding those of the AEDC.The older AEDC facility data can be found in Reference 65. These data have been plotted in Figure 16 from which aperformance envelope could be drawn. For the lower Mach numbers no dynamic pressure limits are set and onlyfacilities with contoured nozzles have been selected. It should be noted that p0 times the test section diameterDm is plotted rather than p0 times the model length Lm as was done in Figures 14 and 15.
In the same figure the performance envelope of the European hypersonic facilities with contoured and conicalnozzles has been plotted. The S4MA facility which is presently used exclusively for propulsion testing is indicatedseparately.
It is found that up to about Mach 10 the M-Re duplication performance of the European facilities and theselected U.S. facilities is not very different. However, when the larger Tripltee facilities mentioned in Section 2.3,fitted with contoured nozzles are added, the picture is drastically changed. The NASA Langley 8 ft structurestunnel attains p0Dm = 670 atm.m at Mach 7.5 which is close the HST Reynolds number duplication requirementand one order of magnitude larger than the performance of European facilities.
Between Mach 10 and Mach 15 there is a wide gap between U.S. and European facility Reynolds numberperformance, which has been widened by the new NOL 5 foot blow down facility which is to be operational bylate 1972 (Ref. 63). Between Mach 15 and 29 this facility with contoured nozzles has even a higher ReL capabilitythan the VKI long shot.
When only facilities with contoured nozzles should be considered it should be noted that above Mach 15no facilities are available in Europe, except for the Imperial College gun tunnel fitted with a Mach 18 nozzle andthe ONERA Arc 2 tunnel.
4.1 Combustion, Propulsion and Hardware Testing
Table 2 gives a review of the facilities as used in Europe for scramjet tests and supersonic burning studies. Acomparison is made with the largest facilities in the U.S. at NASA.
The main capability in Europe, the S4MA tunnel of ONERA and the main facility in the U.S. are projectedin Figure 5 also. It shows that research and testing in the field of supersonic combustion and scramjets is as yetonly possible at the very lower end of the practical applicability region for this propulsion means. Hence, thereis a need for better facilities for this field of research and development if the hypersonic flight with the economicalair breathing propulsion units is going to come.

6-22
In Europe good work of fundamental nature in the field of supersonic burning is done at the University ofSheffield in the high enthalpy shock tunnel and at the DFVLR at Porz Wahn in the pebble heated facilities.
For heat shield ablation testing the arc heated facilities of the DFVLR might be used in principle, theirstagnation temperature being of the order of 5000°K (air, nitrogen) to 10000°K (argon). In order to duplicatethe pitot pressure of the full scale vehicle during re-entry the facility will have to be operated at low Mach numbers,between say Mach 2 and 5 (see Section 2.3).
The PK2 facility which is the largest facility available has a power supply of 1000 KW and operates at reservoirpressures between 0.1 and 100 atm (Ref. 4). This is well within the range of the facilities for ablation testinglisted in Reference 55.
On the other hand at the sixth meeting of the LaWs working group it was stated that ablation tests cannot beperformed adequately in Europe. It seems therefore open to discussion whether the PK1 facility is large enoughfor ablation testing on a development scale.
For hardware testing connected with the hypersonic transport and its propulsion system no facility is availablein Europe with sufficiently long running times, which should be more than several minutes.
However considerable effort is put in the U.S. in the design and development of Tripltee tunnels as might beconcluded from the next survey.
Tripltee facilities with a test section diameter of about 1 meter are the NASA Lewis facility which recentlybecame operational (temperature duplication up to Mach 7) and the Aerodynamic and Propulsion Test Unit(APTU), presently under construction at AEDC (Ref. 52). The NASA Lewis Hypersonic Propulsion ResearchFacility has a nozzle exit diameter of 1.06 meters and operates at a maximum stagnation pressure of 80 atm (Ref.81) and a stagnation temperature of 2300°K which can be boosted to 2670°K by vitiation. The running time is2 to 3 minutes.
In the APTU clean air flow duplication is possible up to Mach 6 (clean air) and the maximum stagnationpressure is 210 atm, which allows flow duplication at Mach 6 down to 17 km. The NASA Lewis facility wasdesigned for testing ramjet type engines which operate at high altitudes. The APTU will provide the higher pressuresand massflows needed for testing low-level and run-in missile engines (Ref. 52).
Nominally these facilities will produce the desired test flows at less than 1 m diameters. Free jet testing ofmissile engines can therefore be conducted only at small angles-of-attack. Succesful development of the ramjet andair-augmented rocket engines has long awaited availability of these facilities. However, these facilities are not largeenough to test the small research and missile engines at high angle-of-attack conditions or any of the largerengines which will be needed for aircraft applications.
Large Tripltee facilities are the NASA Langley 8-Foot High Temperature Structures Tunnel which has beenconsidered for testing structural test engines to be adopted for the HST (Ref. 51). In this blow-down Mach 7.5tunnel stagnation pressures up to 280 atm and temperatures up to 2500°K can be generated (Ref. 65).
At AEDC a large Tripltee facility has been designed of the same category i.e. a nozzle with an exit diameterof 10.2 ft (3.2. meter), a stagnation pressure of 240 atm and a stagnation temperature of 2400°K. At thesestagnation conditions the flow at Mach 7.7 at an altitude of about 25 km is duplicated and the running time isthen about two minutes (Ref. 52). Running times of 30 minutes are possible when the flow is duplicated at Mach7 and 43 km altitude or Mach 4 at 30 km altitude.
The performance of these U.S. Tripltee facilities corresponds with the requirements already discussed in Section 3.2.
5 CONCLUSIONS
1. During the past two decades hypersonic research has been substantial in Europe. Present activities and facilitiesare reflected in the Eurohyp inventory. Up to now the European facilities have been used primarily for researchof a more fundamental and exploratory character. Much of this work will be applicable -to the design of thespace shuttle and the hypersonic transport.
2. For the space shuttle aerodynamic development testing, M-Re duplication is necessary up to about Mach 15to include boundary layer transition effects. For the lower re-entry trajectory of the present space shuttleorbiter design this corresponds with ReL = 3 x 10⁷ at Mach 6 and 6 x 10⁶ at Mach 15.At high flight altitudes and velocities where the boundary layer is fully laminar, high altitude phenomena occurin the form of viscous interactions. For M/ \/Rs> 0.01 this viscous interaction parameter should be duplicatedrather than M and Re separately.High temperature real gas effects cannot be duplicated in sub-scale testing due to conflicting scaling laws.Partial simulation and experiments of a more basic nature should provide the required information.

6-23
3. For the hypersonic transport attention is focussed to Mach 6-8 cruise conditions. The Reynolds number ReL
for a 75 m long vehicle is then of the order of 2 x 10⁸, giving a boundary layer which is almost completelyturbulent. ReL = 2 x 10⁷ is considered as a minimum requirement for HST development testing whereabsolute performance data should be obtained. Reliable extrapolation to the full scale ReL seems then feasible.The boundary layer thickness at ReL = 2 x 10⁷ is however 60% larger than at ReL = 2 x 10⁸, theconsequences of which should be considered with care.
4. For scramjet propulsion testing the Mach number in the combustor must be duplicated. For hydrogen fueledscramjets the combustor entrance static temperature should be above 1000°K and up to about 1500°Kreaction rates are dominant over mixing in the combustion process. This corresponds with a flight Machnumber of 10 to 12 or a stagnation temperature of 4000°K to 5000°K. Up to these temperatures T0 duplicationis essential. For good understanding of the combustion phenomena the pressure level should be duplicated aswell as the geometry. Scaling laws can only be used if the overall chemical kinetics behaviour can be describedby simple rules and if variable induction times do not exist.
5. Hardware testing of ablative materials is generally performed in arc heated facilities where the stagnationenthalpy and the pressure on the vehicle are the primary simulation parameters. For hardware testing of theHST airframe and propulsion system large true temperature tunnels (Tripltee facilities) are required with runningtimes of at least several minutes. Typical characteristics are po = 250 atm , To = 2500°K and a testsection diameter of the order of 3 meters.
6. For aerodynamic testing of space shuttle and HST configurations the following limitations were found:
(a) Sting loads. For space shuttle testing the dynamic pressure should not exceed about 1.5 atm when testingat maximum normal force coefficient. For HST models the dynamic pressure limit will be determined bythe angle of attack range. At CN = 0.25 the dynamic pressure should not exceed about 2 atm (cruisecondition is CN — 0.04). Starting and stopping loads have not been considered.
(b) The tunnel reservoir pressure should not exceed 5000 atm for structural reasons.
(c) Up to Mach 18 throat heat transfer does not limit the Reynolds number capacity when the tunnel isoperated at minimum temperature for condensation free flow and for running times shorter than 100 milli-seconds (tungsten throat, nitrogen test gas). For longer running times and other materials the Machnumber limit may be lower.
(d) Real gas effects can be restricted to molecular vibration only, if the flow Mach number is below 18 whenthe tunnel is operated at equilibrium condensation conditions.
(e) A running time of the order of 10 milliseconds as is current shock tunnel practice is marginal for testingof models longer than say 0.5 meter due to tunnel starting and flow establishing times.
7. For propulsion testing the following factors affect the facility performance. For long duration (> 1 sec) testcomplete scramjet performance assessment, including intake performance, is limited to about Mach 8 due tothroat cooling capabilities. For combustor and nozzle tests the flight Mach number is limited to about 10 in thelaboratory. For scramjet hardware testing a vitiated air system gives an economical solution with respect topower requirements. For combusting and aerodynamic performance tests of scramjets short duration facilitiescan be used. Gun tunnels with preheated barrel or shock tunnels will show good prospects, though the lattermay be short of flow duration.
8. The following conclusions are made on the European facility performance for aerodynamic development testing:
(a) For testing of space shuttle configurations at duplicating Reynolds numbers and of HST configurations atReL = 2 x 10⁷ several facilities are available in Europe up to Mach 9. Betweeen Mach 9 and Mach 15 nofacilities exist with high enough Reynolds numbers. Between Mach 15 and 20 some facilities with highenough Reynolds numbers are present but they have conical nozzles which give no parallel test sectionflow. Low density phenomena can be simulated up to M/v/Ke values of more than 1.
(b) The model sizes which can be accommodated are rather small and sometimes even too small for develop-ment work. Space shuttle models with a length of about 0.3 m can be accommodated and in the lowdensity facilities the model length will be of the order of 0.1 m at high M/^/RT values. For HST configura-tions a model length of about 0.5 m can be accepted and this is again rather small for development work.
(c) For HST development testing at duplicating Reynolds numbers no facility is available in Europe.
(d) Three extensions of the present European testing capability can be considered:
(i) A facility with a contoured nozzle with an exit diameter of about 1 meter and operating up to Mach12 or 15 and a maximum stagnation pressure of the order of 1000 atm.
(ii) A low density facility which can accommodate fairly large and complex models in which also jetpluming phenomena (reaction jets for instance) can be studied. The facility should cover values ofMA/R"e between 0.1 and 0.5 and the inviscid core diameter should be of the order of at least 0.5 m.

6-24
(iii) A large facility with a test section diameter of about 3 m, and stagnation conditions of 250 atmoperating up to Mach 7 or 8 for HST development testing.
9. On the combustion testing capability in Europe it is concluded that this is presently only possible up tocorresponding flight Mach numbers of about 6 which is at the very lower end of the applicability region ofscramjets. The work in the Sheffield University shock tunnel at high stagnation temperatures but rather shortrunning times and the available longer duration facilities (> 1 sec) might be complemented by a 100 milli-second facility with a stagnation temperature capability of 2500-3000°K and mass flows between 10 and100 kg/sec.
10. For hardware testing the following is concluded. For ablation tests on a reasonable scale the facility perfor-mance of the largest available arc heated facilities is marginal and possibly not adequate. For hardware testingconnected with the hypersonic transport a large Tripltee facility with a running time of several minutes orlonger is required. No such facility at present exists in Europe.
ACKNOWLEDGEMENT
The authors wish to thank Dr L.Pennelegion of RAE for his valuable comments on the draft version of thepresent paper.
1. Ulsemer, E.
2. Anon.
3. Ceresuela, R.
4. Koppenwallner, G.
5. Davies, L.(ed.)
6. Davies, L.(ed.)
7. Rogers, E.W.E.,Davies, L. (ed.)
8. Hieronymus, W.S.
9. Anon.
10. Tolle, H.et al.
11. Townend, L.H.
12. Mysliwetz, F.,Przibila, H.
13. Tannas, L.E.
14. Eggers, A.J.et al.
15. Bencze, D.P.,Sorensen, N.E.
REFERENCES
Almost all Conditions are "Go" for the Space Shuttle. Aerospace International,May-June 1972, pp.6-16.
European Delay Post-Apollo Meeting. Aviation Week and Space Technology, July 17,1972, p.19.
Stabilite et Controle d'Avions Hypersoniques. L'Ae"ronautique et L'Astronautique,1971, 5, pp.33-47.
Wind Tunnel Testing on Real Configurations in Hypersonic Flow. A summary ofcurrent studies at DFVLR. DLR FB 71-49.
Eurohyp, European Hypersonic Research. Par t i . List of programme items. RAETech Memo Aero 1345, 1971.
Eurohyp, European Hypersonic Research. Part 2. Comments on current work. RAETech Memo Aero 1351, 1971.
European Hypersonic Research: Experimental Facilities. 2nd (revised) edition RAETech Memo Aero 1308, 1971.
Three Shuttle Concepts Studied. Aviation Week and Space Technology, Jan. 10, 1972,pp.46-48.
Sortie Module may cut Experiment Cost. Aviation Week and Space Technology, Jan.17, 1972, p.17.
Entwicklung der Konflguration eines aerodynamischen Wiedereintrittsflugversuchkorpersunter besonderen Berucksichtigung der Stabilitdt und der Manovrierbarkeit. Presentedat 7th ICAS, 1970 and in DGLR Jahrbuch 1970, p.59-74.
Some Design Aspects of Space Shuttle Orbiters. RAE TR 70139, 1970.
Aerodynamische Erwarmung in Hyperschallbereich und Flugeigenschaften vonRaumflugkorper. Teil II. BMBW-FB, W71-49, 1971.
Re-Entry Guidance through Closed-Form Equations. AIAA J., June 1967,pp. 1102-1109.
Hypersonic Aircraft Technology and Applications. Astronautics and Aeronautics,June 1970,p.30^1.
A Comparative Study of Three Axisymmetric Inlets for a Hypersonic Cruise Mission.J. Aircraft, July 1971. p.516-522.

6-25
16. Escher, W.J.D.
17. Marguet, R.,Huet, C.
18. Ceresuela, R.
19. Kiichemann, D.
20. Seddon, J.,Spence, A.
21. Kipke, K.
22. Kuchemann, D.
23. Fuhs, A.E.
24. Johnson, P.J.et al.
25. Cubbage, J.M.,Kirkham, F.S.
26. Soulier, C.et al.
27. Van der Bliek, J.A.
28. NASA
29. Pennelegion, L.
30. StoUery, J.L.
31. Johnson, C.B.
Composite (Rocket I Airbreathing) Engines Overview and Technology Assessment.UTST-VKI Lecture Series on Technology of Space Shuttle Vehicles, November 1970.
Recherche d'une Solution Optimale de Stato-Reacteur a Geometric Fixe, de Mach 3 aMach 7, avec Combustion Subsonique, puts Supersonique. T.P. ONERA No.656.E (1968).
Aerodynamique d'un Avion Propulse a Mach 7. L'Aeronautique et 1'Astronautique1969-6, pp.45-55.
Hypersonic Aircraft and their Aerodynamic Problems. RAE Tech Memo Aero 849, 1964.
The Use of Known Flow Fields as an Approach to the Design of High Speed Aircraft.AGARD Conf. Proc. No.30, 1968.
Experimental Investigation of Wave Riders in the Mach Number Range from 8 to 75,.AGARD C.P.30, 1968.
A Survey of Some European Hypersonic Research. RAE Tech Memo Areo 1239, 1970.
Combustion Research Problem Associated with Advanced Air Breathing Engines.AIAA Paper 71-1. AIAA 9th Aerospace Sciences Meeting, Jan. 1971.
Studies of Engine Airframe Integration on Hypersonic Aircraft. Journal of Aircraft,Vol.8, No.7, July 1971.
Investigation of Engine-Exhaust-Air frame Interference on a Cruise Vehicle at Mach 6.NASA TND-6060, Jan. 1971.
La Soufflerie Hypersonique S4MA. Utilisation pour des Essais de Statoreacteurs aCombustion Supersonique d'Hydrogene. L'A6ronautique et 1'Astronautique. No.36,1972-4, pp.25-36.
Aerodynamic Testing at High Velocities. Von Karman Institute CN45, 1964.
NASA Space Shuttle Technology Conference. Volume I — Aero thermodynamics,Configurations and Flight Mechanics. NASA TM X-2272, 1971.
Comments on LaWs Paper 87. Private communication. June 1972.
A Position Paper on Hypersonic Boundary Layer Research. Techn Rep. ARC 33 491HYp. 893, 1972.
Boundary Layer Transition and Heating Criteria Applicable to Space Shuttle Configurationsfrom Flight and Ground Tests. NASA TM X-2272, Paper 5 (see Ref. 25).
32. McNamara, J.
33. Hopkins, E.J.Inouye, M.
34. Van Dries, E.R.,Boison, J.C.
35. Daum, F.L.,Gyarmathy, G.
36. Anon.
37. Wuest, W.,Koppenwallner, G.
38. Hidalgo, H.,Vaglio-Laurin, R.
Orbiter Entry Trajectory Control. Part I: High Speed Entry Phase. NASA TMX-2272, Paper 19-1 (see Ref.25).
An Evaluation of Theories for Predicting Turbulent Skin Friction and Heat Transferon Flat Plates at Supersonic and Hypersonic Mach Numbers. AIAA J. June 1971,pp.993-1003.
Experiments on Boundary Layer Transition at Supersonic Speeds. J. Aeron. Sciences,Dec. 1957, pp.885-899.
Condensation of Air and Nitrogen in Hypersonic Wind Tunnels. AIAA Journal, March1968, pp.458-465.
Capabilities of the Von Karman Institute for Fluid Dynamics Relevant to the SpaceShuttle Program. Issued November 1970.
Experimented und theoretische Untersuchungen verschiedener Konflgurationene vontragenden Wiedereintrittskorpem in hypersonischer Stromung geringer Dichte.Presented at 7th ICAS, 1970 and in DGLR Jahrbuch 1970, pp.75-90.
High Altitude Aerodynamics and its Effects on Lifting Re-Entry performance. Proc. of18th Intern. Astronautical Congress, Belgrade 1967. Propulsion and Re-entry, Vol. III.

6-26
39. Susz, A.
40. Bray, K.N.C.
41. Leonard, R.L.,Rose, P.H.
42. Penland, J.A.,Romeo, D.J.
43. Poisson-Quinton, Ph.
44. Whitehead, A.J.
45. Ames Research Staff
46. Rubert, K.F.
47. Just, Th.,Schmelz, F.
48. Swithenbank, J.,Parsons, R.J.
49. Osgerby, I.T.,Smithson, H.K.
50. ONERA
51. Henry, J.R.McLellan, C.H.
52. Anon.
53. Becker, J.V.
54. Anon.
55. Hurwicz, H.
56. Lewis, C.H.,Burgess, E.G. Ill
57. Kivel, B.
58. Cann, G.L.,Buhler, R.D.
59. Brahinsky, H.S.,Neel, C.A.
60. Culotta, S.,Richards, B.E.
61. O'Lone, R.G.
62. Ellison, J.C.
Studie iiber die Nutzlichkeit steuerbarer auftriebserzeugender Wiedereintrittskorper.BMBW-FB W70-49, 1970.
Non Equilibrium Flow Problems of Space Shuttles. ARC 32, 408 Hyp. 834, 1970.
Feasability of a High Performance Aerodynamic Impulse Facility. AIAA Journal,March 1969, pp.448-457.
Advances in Hypersonic Extrapolation Capability Wind Tunnel to Flight. AIAAPaper No. 71-132, 1971 or J. Aircraft, Nov. 1971, pp.881-884.
From Wind Tunnel to Flight, the Role of the Laboratory in Aerospace Design.J. Aircraft, May-June 1968, pp. 193-214.
Flow Field and Drag Characteristics of Several Boundary Layer Tripping Elements inHypersonic Flow. NASA TN D-5454, 1969.
Equations, Tables and Charts for Compressible Flow. NACA Rep. 1135, 1953.
Hypersonic Ramjets for Space Shuttle. UTST-VKI Lecture Series on Technology ofSpace Shuttle Vehicles, Nov. 1970.
Measurements of Ignition Delays of Hydrogen-Air Mixtures under Simulated Conditionsof Supersonic Combustion Chambers. AGARD C.P. 34, Sept. 1968.
Experimental Techniques for Supersonic Combustion Research in a Shock Tunnel.AGARD C.P.38, Sept. 1967.
Operation of Hotshot Tunnel F with Air as Test Gas. Fifth Hypervelocity TechniquesSymposium, Vol.1, Univ. of Denver, March 1967.
Activites 1970, p.6 and idem 1971, p. 142.
Air-Breathing Launch Vehicle for Earth-Orbit Shuttle. New technology anddevelopment approach. J. Aircraft, May 1971, pp.381-387.
AEDC hypersonic true temperature tunnel (Tripltee).
Prospects for the Actively Cooled Hypersonic Transport. Astronautics and Aero-nautics, Aug. 1971, pp.32-39.
Two Sides of the Shuttle. Flight International, 6 July 1972, pp.30 and 31.
Aerothermo chemistry studies in ablation. In: Combustion and Propulsion, HighTemperature Phenomena, Fifth AGARD Colloquium held in Braunschweig, April1962, Edited by R.P.Hagerthy et al. Pergamon Press 1963.
Altitude-Velocity Table and Charts for Imperfect Air. AEDC-TDR-64-214, 1965.
Radiation from Hot Air and its Effect on Stagnation Point Heating. J. AerospaceSciences, Febr. 1961.
A Survey and Prediction of the Performance Capability of Co-Axial Arc Heaters.AGARDograph 84, Part I, pp.283-321, 1964.
Tables of Equilibrium Thermodynamic Properties of Air. Vol. III. Constant entropy.AEDC-TR-69-89, 1969.
Methods for Determining Conditions in Real Nitrogen Expanding Flows. VKI TN 58,1970.
Hypersonic Transport Study Grows. Aviation Week and Space Technology, June 22,1970, pp.44-50.
Investigation of the Aerodynamic Characteristics of a HST Model at Mach Numbersto 6. NASA TN D-6191, 1971.

6-27
63. Giowacke, W.J.et al.
64. Davies, L.et al.
65. Pope, A.,Coin, K.L.
66. Wong, W.F.
67. Librizzi, J.Cresci, R.J.
68. Roland, H.C.et al.
69. Lewis, H.F.,Horn, D.D.
70. Cox, R.N.,Winter, D.F.T.
71. Neumann, R.D.
72. Stollery, J.L.et al.
73. Smith, C.E.
74. Marmey, R.,Guibergia, J.P.
75. Holden, M.S.
76. Anon.
77. Enkenhus, K.R.et al.
78. Perry, J.H.,East, R.A.
79. Hawkins, R.,Charlton, E.
80. Edelman, R.B.,Spadaccini, L.J.
81. Pirrello, C.J.,et al.
82. Pirrello, C.J.,et al.
83. Suttrop, F.
84. Stewart, J.T.
The NOL Hypervelocity Wind Tunnel. AIAA Paper No. 71-253, 1971.
Experiments on Flat Delta Wings and Waveriders up to Angles of Incidence and MachNumbers Suitable for Lifting Re-Entry. Proc. of 8th Internal. Shock Tube Symposium,London 1971, Ed. J.L.Stollery et al.
High Speed Wind Tunnel Testing. John Wiley, New York, 1965.
Comments on Film Cooling of the Nozzle Throat of the Northrop Aerosciences Lab.(NAL) Mach 10 Hypersonic Facility. Private Communication Ref. 3744-70-8, 1970.
Transpiration Cooling of a Turbulent Boundary Layer in an Axisymmetric Nozzle.AIAA Journal, April 1964, pp.617-624.
Film and Transpiration Cooling of a Nozzle Throat. AEDC-TR-66-88, 1966.
A Film Cooling Experiment on a Convergent-Divergent Nozzle. AEDC-TR-66-78,1966.
The Light Gas Hypersonic Gun Tunnel at ARDE. AGARD Rep. 139, 1957.
Special Topics in Hypersonic Flow, Section IV: Ground Test Facilities. AGARDLecture Series No.42, Vol.1, Lecture 7, edited 1972.
The Effects of Vibrational Relaxation on Hypersonic Nozzle Flows. Chapter 3 of:The High Temperature Aspects of Hypersonic Flow. AGARDograph 68, 1964.
The Starting Process in a Hypersonic Nozzle. J. Fluid Mechanics, Vol.24, Part 4,pp.625-640, 1966.
Etude Experimental des Phenomenes Accompagnant I'amorcage d'une TuyereHypersonique. Comptes Rendus, Acad. des Sciences de Paris, Tome 271, 15juillet 1970. Serie A, pp.106-109.
Establishment Time of Laminar Separated Flows. AIAA Journal, Nov. 1971,pp.2296-2298.
Description and Capabilities of the Cornell Aeronautical Laboratory HypersonicShock Tunnel. May 1969.
Free Flight Static Stability Measurements of Cones in Hypersonic Flow. Von KarmanInstitute VKI TN 66, 1970.
Experimental Measurements of Cold Wall Turbulent Hypersonic Boundary Layers.In: Hypersonic Boundary Layers and Flow Fields. AGARD Conference Proc. No.30,1968.
The Use of a Gun Tunnel for Hypersonic Intake Calibration. Bristol Rep. No. AP5477, 1967.
Theoretical Effects of Vitiated Air Contamination on Ground Testing of HypersonicAirbreathing Engines. Journal of Spacecraft, Vol.6, No.12, Dec. 1969.
An Inventory of Aeronautical Ground Research Facilities. Vol.11 Air BreathingEngine Test Facilities. NASA CR-1875, November 1971.
An Inventory of Aeronautical Ground Research Facilities. Vol. I Wind Tunnels.NASA CR-1874 or ARC 33485, November 1971.
Ueberschallverbrennung, Zweck und eigene Versuchseinrichtungen. Jahrbuch 1963der WGLR.
Evolving Strategic Air Power and B-l. Astronautics and Aeronautics, June 1972.

6-28
TABLE 1
Hypersonic Wind Tunnels in Europe (Ref.38)
Test section > 0.25 m diameter or heightRunning time > 5 millisecTest gas: air or nitrogenStagnation pressure x test section diameter > 10 atm-m
Blow Down Tunnels (running time more than 2 seconds)
Facility
ONERA R2ChONERA R3ChONERA S4MAONERA S4MACEAT PoitiersDFVLR Hyp H2DFVLR Us AHCRACRAFFA Hyp 500RAE Bedford 3 'x4 'ARA BedfordBAG 18"
Tube Tunnels
DFVLR Gottingen
Slow Piston Tunnels
ONERA R4Ch
Hot Shot Tunnels
ONERA ARC1ONERA ARC2CRA Hot shot
Long Shot Tunnels
VKI
Gun Tunnels
Test section/diameter
m
0.330.330.69
0.7 - 0.90.630.60
0.30 x 0.300.350.350.50
0.92 x 1.220.30
0.46 x 0.46
M
5 , 6 , 75-1067-127, 8.26-11.2-6.36-810-127.1556 , 7 , 86
P«max
atm
8017040
1501006040
100100120
12200
20-34
T0max
°K
650110018501850 .10001400570800
1400800420850460
Runningtime
sec.
3510-35
6010-60
40120
30-603040
180cont.
60380
Countourednozzle
-
yesyes
plannedyes
yesyes
0.50.5
0.325
0.500.700.60
0.61
5-79-12
10-15
15-2015-2010-20
15-20
millisec
40 400-600 300150 750-1100 300
200
20001500
4000
1700
500070008000
2600
200
100100
40-70
10-40
yes
no
Imperial College No. 2Imperial College No.2I.M.F. Marseille
Shock TunnelsSud C2
TH AachenTH AachenRAE Farnborough 15"
ARC Heaters
DFVLR PK1DFVLR PK2DFVLR Gottingen
0.310.460.35
1.200.50*2.00*
0.38 x 0.38
0.300.600.25
9189-10
186-156-257-15
5-205-204-10
700700400
1000200
2000250
1010(100)
0-4
15001500
-1500
4500700080004500
500060008000
2020
5-10
12-161-101-10
10
cont.cont.cont.
yesyesno
noyes, to be uprated
(Continued)
* A maximum throat diameter of 5 cm — which is current shock tunnel practice (Ref.76) — has been assumed, giving a smaller testsection at the lower Mach numbers. No real gas effects are taken into account for calculation of this test section diameter.

6-29
Table 1 continued
Facility
Low Density Tunnels
Test section/diameter
m
M Por
atm
Runningtime
sec.
ONERA R5CNRS SR3
Low Density Tunnels
DFVLR Gottingen VKIDFVLR Gottingen VK2RAE LOT
0.350.36
0.250.400.76
7-1018,20
7,2510, 15, 206, 10
~14
3;5003050
11001800
300012001400(Air)2300(N2)
50cont.
8 hrcont.cont.
Contourednozzle
yes, to be uprated
TABLE 2
Facilities in Europe for Hypersonic Engine Tests and US Tripltee Facilities
Institute, name Po mass flow combustion kind of heating run time Ref.test section
ONERA S4MA*
R4Ch
Univ. of Sheffield
DFVLR P.W.
P.W.?
NASA Langley8 ft HTST
°K
1850
1850
1700
2000-6000
1800
1800
2500
atm
15
150
3.7(afterthrottling)
500
60
280
kg/sec
5a tT 0 = 1850°K
35
2.5atT 0 = 1700°K
0.15
1
areacm2
-130
80
80
25
47000(free jet)
NASA Lewis TTT 2300(2670)
AEDC APTU
AEDC TTT(design)
1700
2400
80
210
240
100
2300
130 pebble bed
pebble bed
80 slow pistoncompression inpreheated tube
shock tunnel
25 pebble bed
pebble bed
8000 inductive(free jet) heating (with
vitiation)
pebble bed
80000 pebble bed
sec.
10-60 26
0.2 17
0.004 48
83
83
65
120-180 81
52
30-3600 52
* Condition for a particular case

6.30
S (VELOCITY k"V«K
FIG. I TRAJECTORIES OF VARIOUS FLYING AND HYPOTHETICAL VEHICLES WITH AIRBREATHING ENGINES.
ALTITUDEkm
120 r
100
10
.60
20
Orbiter re-entry: Ci = 0 7 at L/0 = 0.6Lmi»
Wing loading W/S - 250 kg/m'
Staging for rocketbootter aicend
q=OSkg /cm2 trajectory for airbreathing aicend
7 tVELOCITY
FIG. 2 SPACE SHUTTLE TRAJECTORIES FOR ASCEND AND DESCEND.

6.31
5000
4000
1000 •
II? S 2000 -
1000 -
. Lew bn»» fan
' Rarnjtt .
aT •'. ONtHA lot rnuit l»7J
s
1 2
10
3
IS k't/tec =M
SVELOCITY
FIG. 3 SPECIFIC IMPULSE VS. FLIGHT SPEED FOR VARIOUS ENGINES.
FIG. 4 REYNOLDS NUMBER - MACH NUMBER CHART FOR THE SPACE SHUTTLE
AND A HYPERSONIC TRANSPORT.

6.32
E *5- S
NASA liwit 100 <»
ONERA S-4 Ciopi 35 IS
throat ooling limittor complrtt ftcramjrt
FIG. 5 STAGNATION CONDITIONS FOR FLOW DUPLICATION AND REQUIRED MASS FLOW PER UNIT CAPTURE AREA FOR GROUND
TEST PROPULSION FACILITIES.
TEMPERATURE °K
2500 r
2000
500
Short induction duUnce
T h eoretical low er limi 1 olauto-ignit ion
E ipenmental tower limM otauto-ignition
H2 fuelno llamt noldrrt
7 1 9
FLIGHT MACH MJMBEh
FIG. 6 COMBUSTOR ENTRANCE TEMPERATURE FOR A RANGE OF FLIGHT MACH NUMBER.

6.33
STATIC TEMPERATURE *K1100
MM
T, : 1200 •«-',: 2733 •«
T,: I1SO»K-T, : 2716 *K
•- -practical limit
: 0 05-
Delay time by Just and SchmeU (Ret 47]
P : I 0 atmosphere!9 : ef fect ive fuel burned
20 40 10 10 100 120 140 110 110 200 220 2(0 210 210 100 120 140 1(0 MO (00
TIME, mkroitcondi
FIG. 7 COMBUSTION TEMPERATURE VARIATION WITH TIME FOR PREMIXED STOICHIOMETRIC HYDROGEN.
STATIC COMiUSTOHEHfUNCE nttssankg/en 2
7 t 11 l> l>M
FIG. « TYPICAL TOTAL PRESSURE RECOVERIES FOR SCRAMJETINLETS AND CHAMBER STATIC PRESSURE LEVEL VERSUSFLIGHT MACH NUMBER I REF. 44).

6.34
INDUCTION TIME, seconds
FIG. 9 STOICHIOMETRIC K DROGEN- AIR INDUCTION TIME VERSUS STATIC PRESSURE AND TEMPERATURE.OH CONCENTRATION AT IO'5MOLES/LITER.
WIMP TunnEL I
J1450 <T;< 1650 «K
J10 < p, < 15 bars
I 3.6 < "„> < 6.0Z S < Z < 5O km
FIG. ID SCRAMJET SIMULATION WITH CONNECTED PIPE (ONERA-ESOPE).

6.35
10'
10
rT. = 500
T, = 500
//
5000 °K4000\\
Space shuttle re-entry
m
Lower t ra jectory
I ReL dupl icat ionI /I / .I Upper t ra jectory
\s^rv,* ' A/ \i\
\ i|0 03
/ > /
/ /
' / ^1 / / '' / / I M
I / / l 355^ /
'\ 'I \ II \l I
1 / v
'\(X/ I
II
'//I
/jgUoio
\^e ,
/ I
I /
I
Minimum stagnation temperature (perfect gat)2000 3000 4000 5000 °K
J I , I-T-10
—T"15
—20 25 30
PERFECT GASEQUILIBRIUM CONDENSATION LIMIT
MODEL LENGTH Lm o I METERSEE ALSO FIG. 4
FIG. 11 WIND TUNNEL STAGNATION PRESSURE TIMES MODEL LENGTH. REQUIRED FOR REYNOLDSNUMBER DUPLICATION.

6.36
[Vpert
18
1.7
1.6
1.5
1.3
1.2
1.0
FIO. I2o EQUIVALENT PERFECT CORRECTION FACTORS FROM MEASUREDSUPPLY CONDITIONS ( FROM REF. 60).
4.0
'P.'pert
PO
3.0
1.0
0.9
O.S
0.7
0.6
FIG. 12b EQUIVALENT PERFECT CORRECTION FACTORS FROM MEASUREDSUPPLY CONDITIONS ( FROM REF. 60 I.

N=2W;
P0=100 atm
--,2000
—^5000 atm
mai. st i r g load
10 20 30M
Space shuttle lower trajectoryM-Re duplication
m3
5000
CN =0.25max. sting load
N=2W
10 20
Hypersonic transportM-Re duplication
30
P0=100 atm
1000
5000
CN=0 25max. stii
10
Hypersonic transportReL = 2 x 10⁷
20
FIG. 13 MODEL LENGTH L m REQUIRED FOR MACH NUMBER - REYNOLDS NUMBER DUPLICATION, CALCULATED FOR APERFECT GAS ( S E E FIG. 11 ).

6.38
atm-m
1039
e7
6
S
Symbols:
0 Blow down > 10 tecd Ludwieg tube
C) Slow piiton tunnelA Hot shotQ Long shotO Gun tunnelV Shock tunnel
Arc heater /TH Aachenlarge shock tunnel^/ (estimated)/
10'OFVLR
10 IS 20
MODEL LENGTH Lm ch TEST SECTION DIAMETER Dm.DYNAMIC PRESSURE q< 1.5kg. cm2. TRAJECTORY DATA FROM FIG. II
FIG. U MACH NUMBER-REYNOLDS NUMBER SIMULATION CAPABILITY OFEUROPEAN WIND TUNNELS - SPACE SHUTTLE TESTING.

6.39
I02
9B76
10
Symbols see Fig 14
Re, = 2« I0 7
D^VLR _j* t^-- g" ' ~~V )
TCRA I [CRAk I I
TH Aachentarge shock tunnel
i i i
10 IS M
MODEL LENGTH Lm = TEST SECTION DIAMETER Dm.DYNAMIC PRESSURE q < 3.2 kg/cm 2.TRAJECTORY DATA FROM FIG. II.
FIG. IS MACH NUMBER-REYNOLDS NUMBER SIMULATION CAPABILITY OF EUROPEANWIND TUNNELS - HYPERSONIC TRANSPORT TESTING.

6.40
s
3
2
P. °m
itm-m
103
17
6
5
.
3 -
2
102
9t7
6
S
4
3
2
10
XXXXXXUS tacililiei »\\XS\X European facilities Shocl1 tunntl1 Mcludtd /^
US facilities with /Newcontoured nozzles only X
Symbols: see Fig 14 XData: Ret 12 No model dynamic /
prMsurv limit /
y y/vvxv'/x'x,
/ ;///// ^
V //r/
oJ ,» o/// o//
ImpColl /
Y ^i7//' ° o
J - • — "^^ |^** i0 o o ,1 o
]S OFVLH i
O-r-p- r ! O isV\O\\N*XV'sl HaCh o
^ fev^^^ \\\\\^NN\
< ^ V^\NV y
/ \
£ ^ 0 ^ 8X \ o o
( / S O
1NOL facility (M 63) j
1VKI J
^ /y/xV/y conieal '/ '//
; /
^^ 0 /^ /
^ x;j /^ /^ 'A//////\ /\ /\ <>^ V /
^ X f
^ '.\ X>> x>
\ conical
\S,
^contoured""^
< j^v\^ o o
r o T
x O^ o o oo
. . • — 1 — 1 — 1 — 1 — 1 — 1 — 1 — 1 — 1 — •S • 10
FIG. 16 PERFORMANCE OF US HYPERSONIC FACILITIES.

A-l
APPENDIX I
This Report is one of four issued as documents complementary to Advisory Report 60 of the Large WindTunnels Working Group of the AGARD Fluid Dynamics Panel. The other reports in the series are as follows:
AGARD REPORT No.598
EXPERIMENTS ON MANAGEMENT OF FREE-STREAM TURBULENCE: by R.I.Loerke and H.N.Nagib
AGARD REPORT No.601
PROBLEMS IN WIND TUNNEL TESTING TECHNIQUES
Review of some problems related to the design and operation of low-speed wind tunnels for V/STOLtesting: by M.Carbonaro.
Survey of methods for correcting wall constraints in transonic wind tunnels: by J.C.Vayssaire.
Interference effects of model support systems: by E.C.Carter.
Minimum required measuring times to perform instationary measurements in transonic wind tunnels:by J.W.G.van Nunen, G.Coupry and H.Forsching.
Some considerations of tests under dynamic conditions in low-speed wind tunnels: by D.N.Foster.
Use of model engines (V/S/CTOL): by E.Melzer and R.Wulf.
Wind tunnel requirements for helicopers: by I.A.Simons and H.Derschmidt.
Acoustic considerations for noise experiments at model scale in subsonic wind tunnels: by T.A.Holbeche.and J.Williams.
AGARD REPORT No.602
FLUID MOTION PROBLEMS IN WIND TUNNEL DESIGN
The influence of the free-stream Reynolds Number on transition in the boundary layer on an infiniteswept wing: by E.H.Hirschel.
Some examples of the application of methods for the prediction of boundary-layer transition on shearedwings: by D.A.Treadgold and J.A.Beasley.
The need for High-Reynolds-Number Transonic Tunnels: by C.R.Taylor.
The influence of free-stream turbulence on a turbulent boundary layer, as it relates to wind tunnel testingat subsonic speeds: by J.E.Green.
Effects of turbulence and noise on wind tunnel measurements at transonic speeds: by A.Timme.
Design of ventilated walls, with special emphasis on the aspect of noise generation: by R.N.Cox andM.M.Freestone.


AGARD Report No.600Advisory Group for Aerospace Research andDevelopment, NATOPROBLEMS OF WIND TUNNEL DESIGN ANDTESTINGPublished December 1973180 pages
This Report, together with R598, R60I and R602 isissued as a complementary document to AdvisoryReport 60 of the Large Wind Tunnels Working Group.It contains six papers prepared for the Working Group,dealing with European needs Tor low-speed wind-tunnels, project studies for transonic tunnels usingLudwieg tube, ECT, induction and hydraulic systems,and testing at hypersonic speeds.
AGARD-R-600533.6.071
Wind tunnelsDesignTest facilitiesSubsonic wind tunnelsTransonic wind tunnelsHypervelocity wind
tunnelsHydraulic equipment
AGARD Report No.600Advisory Group Tor Aerospace Research andDevelopment, NATOPROBLEMS OF WIND TUNNEL DESIGN ANDTESTINGPublished December 1973180 pages
This Report, together with R598, R601 and R602 isissued as a complementary document to AdvisoryReport 60 of the Large Wind Tunnels Working Group.It contains six papers prepared for the Working Group,dealing with European needs for low-speed wind-tunnels, project studies for transonic tunnels usingLudwieg tube, ECT, induction and hydraulic systems,and testing at hypersonic speeds.
AGARD-R-600533.6.071
AGARD Report No.600Advisory Group tor Aerospace Research andDevelopment, NATOPROBLEMS OF WIND TUNNEL DESIGN ANDTESTINGPublished December 1973180 pages
This Report, together with R598, R601 and R602 isissued as a complementary document to AdvisoryReport 60 of the Large Wind Tunnels Working Group.It contains six papers prepared for the Working Group,dealing with European needs for low-speed wind-tunnels, project studies for transonic tunnels usingLudwieg tube, ECT, induction and hydraulic systems,and testing at hypersonic speeds.
Wind tunnelsDesignTest facilitiesSubsonic wind tunnelsTransonic wind tunnelsHypervelocity wind
tunnelsHydraulic equipment
AGARD-R-600533.6.071
Wind tunnelsDesignTest facilitiesSubsonic wind tunnelsTransonic wind tunnelsHypervelocity wind
tunnelsHydraulic equipment

NATIONAL DISTRIBUTION CENTRES FOR UNCLASSIFIED AGARD PUBLICATIONS
Unclassified AGARD publications are distributed to NATO Member Nat ionsthrough the unclassified National Distribution Centres listed below
BELGIUMCoordonnateur AGARD - VSLEtat-Major de la Force AerienneCaserne Prince BaudouinPlace Dailiy, 1030 Bruxelles
CANADADirector of Scient i f ic Information ServicesDefence Research BoardDepartment of National Defence - 'A' BuildingOttawa, Ontario
D E N M A R KDanish Defence Research Board0sterbrogades KaserneCopenhagen 0
FRANCEO.N.E.R.A. (Direction)29, Avenue de la Division Leclerc92, Chatillon-sous-Bagneux
GERMANYZentralstelle fiir Luftfahrtdokumentat ionund InformationMaria-Theresia Str. 218 Miinchen 27
GREECEHellenic Armed Forces CommandD Branch, Athens
ICELANDDirector of Aviat ionc/o FlugradReykjavik
ITALYAeronautica MilitareUfficio del Delegato Nazionale all 'AGARD3, Piazzale AdenauerRoma/EUR
LUXEMBOURGObtainable through BELGIUM
NETHERLANDSNetherlands Delegation to AGARDNational Aerospace Laboratory, NLRP.O. Box 126Delft
NORWAYNorwegian Defense Research EstablishmentMain Library,P.O. Box 25N-2007 Kjeller
PORTUGALDireccao do Service de Materialda Forca AereaRua de Escola Politecnica 42LisboaAttn of AGARD National Delegate
TURKEYTurkish General Staff (ARGE)Ankara
UNITED KINGDOMDefence Research Information CentreSta t ion Square HouseSt. Mary CrayOrpington, Kent BR5 3RE
UNITED STATESNational Aeronautics and Space Administration (NASA)Langley Field, Virginia 23365Attn : Report Distribution and Storage Unit
If copies of the original publication are not available at these centres, the following may be purchased f rom:
Microfiche or Photocopy Microfiche Microfiche
National TechnicalInformation Service (NTIS)5285 Port Royal RoadSpringfieldVirginia 2 2 1 5 1 , USA
ESRO/ELDO SpaceDocumentation ServiceEuropean SpaceResearch Organization114, Avenue Charles de Gaulle92200, Neui l ly sur Seine, France
Technology ReportsCentre (DTI)Station Square HouseSt. Mary CrayOrpington, Kent BR5 3REEngland
The request for microfiche or photocopy of an AGARD document should include the AGARD serial number,ti t le, author or editor, and publication date. Requests to NTIS should include the NASA accession report number.
Full bibliographical references and abstracts of the newly issued AGARD publicat ions are given in the followingbi-monthly abstract journals with indexes:
Scientific and Technical Aerospace Reports (STAR)published by NASA,Scientific and Technical Information Facility,P.O. Box 33, College Park,Maryland 20740, USA
Government Reports Announcements (GRA),published by the National TechnicalInformation Services, Springfield,Virginia 22151, USA.
Printed by Technical Editing and Reproduction LtdHarford House, 7-9 Charlotte St. London. W1P IHD
Related Documents