A&A 422, 651–663 (2004) DOI: 10.1051/0004-6361:20040482 c ESO 2004 Astronomy & Astrophysics Probing the inner wind of AGB stars: Interferometric observations of SiO millimetre line emission from the oxygen-rich stars R Dor and L 2 Pup F. L. Sch¨ oier 1 , H. Olofsson 1 , T. Wong 2,3 , M. Lindqvist 4 , and F. Kerschbaum 5 1 Stockholm Observatory, AlbaNova, 106 91 Stockholm, Sweden e-mail: [email protected] 2 CSIRO Australia Telescope National Facility, PO Box 76, Epping NSW 1710, Australia 3 School of Physics, University of New South Wales, Sydney NSW 2052, Australia 4 Onsala Space Observatory, 439 92 Onsala, Sweden 5 Institut f¨ ur Astronomie, T¨ urkenschanzstraße 17, 1180 Wien, Austria Received 19 March 2004 / Accepted 8 April 2004 Abstract. High angular resolution Australia Telescope Compact Array (ATCA) observations of SiO “thermal” millimetre line emission towards the two oxygen-rich, low mass loss rate AGB stars R Dor and L 2 Pup are presented. In both cases the emission is resolved with an overall spherical symmetry. Detailed radiative transfer modelling of the SiO line emission has been performed, and the comparison between observations and models are conducted in the visibility plane, maximizing the sensitivity. The excitation analysis suggests that the abundance of SiO is as high as 4 × 10 −5 in the inner part of the wind, close to the predicted values from stellar atmosphere models. Beyond a radius of ≈1 × 10 15 cm the SiO abundance is significantly lower, about 3 × 10 −6 , until it decreases strongly at a radius of about 3 × 10 15 cm. This is consistent with a scenario where SiO first freezes out onto dust grains, and then eventually becomes photodissociated by the interstellar UV-radiation field. In these low expansion velocity sources the turbulent broadening of the lines plays an important role in the line formation. Micro- turbulent velocity widths in the range 1.1−1.5 km s −1 result in a very good reproduction of the observed line shapes even if the gas expansion velocity is kept constant. This, combined with the fact that the SiO and CO lines are well fitted using the same gas expansion velocity (to within 5−10%), suggest that the envelope acceleration occurs close to the stellar photosphere, within < ∼ 20−30 stellar radii. Key words. stars: AGB and post-AGB – stars: carbon – stars: late-type – stars: mass-loss 1. Introduction The intense winds that low to intermediate mass stars develop in their final evolutionary stage, as they ascend the asymp- totic giant branch (AGB), return enriched stellar material to the interstellar medium. In addition to significantly contribut- ing to the chemical evolution of galaxies, the mass loss will dictate the time scale for the future evolution of the star to- wards the planetary nebula phase. Considering its importance little is known with certainty about the mechanism(s) behind the mass loss. Partly this is due to a lack of observational con- straints, in particular close to the stellar photosphere where the wind is accelerated, and partly due to the complexity of the physical/chemical processes involved. Among other things, the formation of dust grains is thought to play an impor- tant role in these radiatively driven winds. Most of the in- formation on this region comes from observations of infrared ro-vibrational molecular lines in absorption, mainly towards the carbon star IRC+10216 (e.g., Keady & Ridgway 1993; Winters et al. 2000a), infrared continuum emission from the circumstellar dust (e.g., Danchi et al. 1994), and SiO maser ra- dio line emission from excited vibrational states (e.g., Cotton et al. 2004). Information can also be gained from radio observations of suitable circumstellar molecular species towards stars having low to intermediate mass loss rates. A major survey of CO ra- dio line emission from circumstellar envelopes (CSEs) around oxygen-rich AGB stars of different variability types were done by Kerschbaum & Olofsson (1999) and Olofsson et al. (2002). These data were modelled in detail to derive stellar mass loss rates and terminal gas expansion velocities (Olofsson et al. 2002). Subsequently, a survey of “thermal” SiO radio line emission, meaning emission from the ground vibrational state rotational lines which are normally not (strongly) masering, was done and the data were interpreted using a detailed numeri- cal radiative transfer modelling presented in Gonz´ alez Delgado et al. (2003). An immediate conclusion from these large surveys is that the SiO and CO radio line profiles are different from each other. The SiO line profiles are narrower in the sense that the

Welcome message from author
This document is posted to help you gain knowledge. Please leave a comment to let me know what you think about it! Share it to your friends and learn new things together.
Transcript
A&A 422, 651–663 (2004)DOI: 10.1051/0004-6361:20040482c© ESO 2004
Astronomy&
Astrophysics
Probing the inner wind of AGB stars: Interferometric observationsof SiO millimetre line emission from the oxygen-rich
stars R Dor and L2 Pup
F. L. Schoier1, H. Olofsson1, T. Wong2,3, M. Lindqvist4, and F. Kerschbaum5
1 Stockholm Observatory, AlbaNova, 106 91 Stockholm, Swedene-mail: [email protected]
2 CSIRO Australia Telescope National Facility, PO Box 76, Epping NSW 1710, Australia3 School of Physics, University of New South Wales, Sydney NSW 2052, Australia4 Onsala Space Observatory, 439 92 Onsala, Sweden5 Institut fur Astronomie, Turkenschanzstraße 17, 1180 Wien, Austria
Received 19 March 2004 / Accepted 8 April 2004
Abstract. High angular resolution Australia Telescope Compact Array (ATCA) observations of SiO “thermal” millimetreline emission towards the two oxygen-rich, low mass loss rate AGB stars R Dor and L2 Pup are presented. In both cases theemission is resolved with an overall spherical symmetry. Detailed radiative transfer modelling of the SiO line emission hasbeen performed, and the comparison between observations and models are conducted in the visibility plane, maximizing thesensitivity. The excitation analysis suggests that the abundance of SiO is as high as 4 × 10⁻⁵ in the inner part of the wind, closeto the predicted values from stellar atmosphere models. Beyond a radius of ≈1 × 1015 cm the SiO abundance is significantlylower, about 3 × 10⁻⁶, until it decreases strongly at a radius of about 3 × 1015 cm. This is consistent with a scenario whereSiO first freezes out onto dust grains, and then eventually becomes photodissociated by the interstellar UV-radiation field. Inthese low expansion velocity sources the turbulent broadening of the lines plays an important role in the line formation. Micro-turbulent velocity widths in the range 1.1−1.5 km s−1 result in a very good reproduction of the observed line shapes even if thegas expansion velocity is kept constant. This, combined with the fact that the SiO and CO lines are well fitted using the samegas expansion velocity (to within 5−10%), suggest that the envelope acceleration occurs close to the stellar photosphere, within<∼20−30 stellar radii.
Key words. stars: AGB and post-AGB – stars: carbon – stars: late-type – stars: mass-loss
1. Introduction
The intense winds that low to intermediate mass stars developin their final evolutionary stage, as they ascend the asymp-totic giant branch (AGB), return enriched stellar material tothe interstellar medium. In addition to significantly contribut-ing to the chemical evolution of galaxies, the mass loss willdictate the time scale for the future evolution of the star to-wards the planetary nebula phase. Considering its importancelittle is known with certainty about the mechanism(s) behindthe mass loss. Partly this is due to a lack of observational con-straints, in particular close to the stellar photosphere wherethe wind is accelerated, and partly due to the complexity ofthe physical/chemical processes involved. Among other things,the formation of dust grains is thought to play an impor-tant role in these radiatively driven winds. Most of the in-formation on this region comes from observations of infraredro-vibrational molecular lines in absorption, mainly towardsthe carbon star IRC+10216 (e.g., Keady & Ridgway 1993;Winters et al. 2000a), infrared continuum emission from the
circumstellar dust (e.g., Danchi et al. 1994), and SiO maser ra-dio line emission from excited vibrational states (e.g., Cottonet al. 2004).
Information can also be gained from radio observations ofsuitable circumstellar molecular species towards stars havinglow to intermediate mass loss rates. A major survey of CO ra-dio line emission from circumstellar envelopes (CSEs) aroundoxygen-rich AGB stars of different variability types were doneby Kerschbaum & Olofsson (1999) and Olofsson et al. (2002).These data were modelled in detail to derive stellar mass lossrates and terminal gas expansion velocities (Olofsson et al.2002). Subsequently, a survey of “thermal” SiO radio lineemission, meaning emission from the ground vibrational staterotational lines which are normally not (strongly) masering,was done and the data were interpreted using a detailed numeri-cal radiative transfer modelling presented in Gonzalez Delgadoet al. (2003).
An immediate conclusion from these large surveys is thatthe SiO and CO radio line profiles are different from eachother. The SiO line profiles are narrower in the sense that the
652 F. L. Schoier et al.: Probing the inner wind of AGB stars
main fraction of the emission comes from a velocity rangesmaller by about 10−20% than twice the expansion velocitydetermined from the CO data. On the other hand, the SiO lineprofiles have weak wings, such that the total velocity widthof its emission is very similar to that of the CO emission.Furthermore, it appears that the SiO line profiles change char-acter with the mass loss rate, at low mass loss rates they are nar-row with weak extended wings, while at high mass loss ratesthey become distinctly triangular. These “peculiar” SiO lineprofiles have been interpreted as being due to the influenceof gas acceleration in the region which produces most of theSiO line emission (Bujarrabal et al. 1986). However, as illus-trated in Gonzalez Delgado et al. (2003), the SiO lines are usu-ally strongly self-absorbed also for low mass loss rate objectsand this produces narrower lines. There is some controversy inthe literature over the scale length of the acceleration region. Inthe only previously published works where thermal SiO emis-sion have been observed towards AGB stars using interferome-try, Sahai & Bieging (1993) find no need for the slowly varyingvelocity fields introduced by Lucas et al. (1992).
Other conclusions come from the detailed radiative trans-fer modelling of the SiO line data. This is in many respectsa more difficult enterprise than the CO line modelling. TheSiO line emission predominantly comes from a region closerto the star than does the CO line emission, and this is a regionwhere we have fewer observational constraints. The SiO excita-tion is also normally far from thermal equilibrium with the gaskinetic temperature, and radiative excitation plays a major role.Finally, there exists no detailed chemical model for calculatingthe radial SiO abundance distribution. Gonzalez Delgado et al.(2003) adopted the assumption that the gas-phase SiO abun-dance stays high only very close to the star, since further outthe SiO molecules are adsorbed onto the grains. Beyond thisthe abundance stays low until the molecules are eventually dis-sociated by the interstellar UV radiation. This photodissocia-tion radius, which is crucial to the modelling, was estimatedusing both SiO multi-line modelling and existing interferome-ter data (Lucas et al. 1992; Sahai & Bieging 1993), but only fora few sources. The result of the radiative transfer modelling isa circumstellar SiO abundance that is roughly the same as thatobtained from stellar atmosphere equilibrium chemistry for lowmass loss rate objects, and which declines with mass loss ratereaching an abundance about two orders of magnitude lowerfor high mass loss rate objects.
Thus, there are strong indications that “thermal” SiO radioline emission is a useful probe of the formation and evolutionof dust grains in a CSE, as well as of its dynamics. Hence, cir-cumstellar SiO line emission potentially carries information onthe properties of the region where the mass loss of AGB starsis initiated.
Presented here are results from high spatial resolutionimaging of the two M-type semiregular AGB stars R Dorand L2 Pup. Both sources studied have low mass loss rates(M <∼ 1 × 10⁻⁷ M� yr−1) and low terminal velocities of theirwinds (<∼6 km s−1). It has been suggested from hydrodynamicalcalculations (Bowen 1988; Winters et al. 2000b, 2002, 2003;Struck et al. 2004) that the main driving mechanism behind
these tenuous winds is stellar pulsation and that dust plays onlya secondary role.
The observations, performed with the Australia TelescopeCompact Array1 (ATCA), are presented in Sect. 2. ATCA isan array of six 22 m dishes operating from 1.4−26 GHz andwith an upgrade to 85−105 GHz operation in progress. Its lo-cation makes it a unique instrument to study molecular-linesources in the southern hemisphere at high angular resolution,and we have recently used it to conduct a study of circumstellarHCN emission from the carbon star R Scl (Wong et al. 2004).The analysis in Sect. 3 and comparison with envelope modelsin Sect. 4 are carried out in the uv-plane in order to maximizethe sensitivity and resolution of the data. The modelling is fol-lowed by a discussion in Sect. 5 and conclusions are presentedin Sect. 6.
2. Observations and data reduction
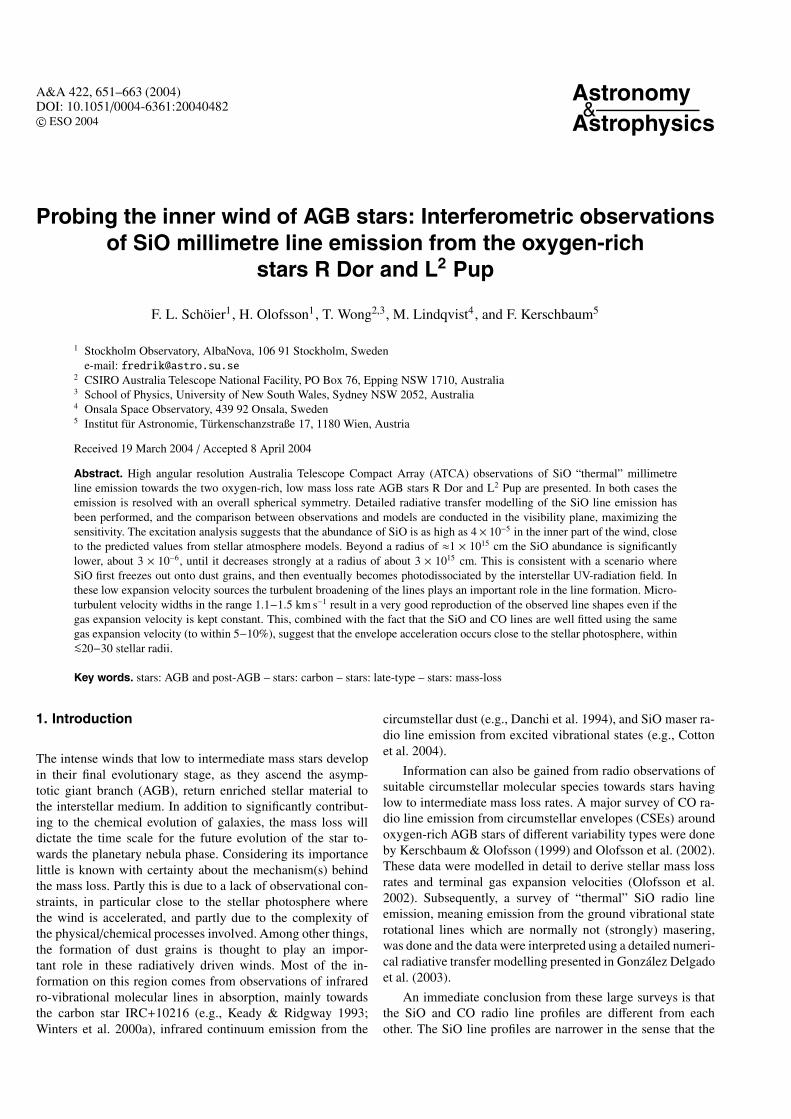
At the time of the observations, the ATCA had three antennasof 22 m diameter equipped with dual polarisation 3-mm re-ceivers covering the bands 84.9−87.3 and 88.5−91.3 GHz. Weobserved R Dor and L2 Pup between August and October 2003in three different array configurations: EW367 (baselines of 45,90, and 135 m), 750B (60, 165, and 225 m), and H214 (75,135, and 210 m). EW367 and 750B provided east-west base-lines whereas H214 provided north-south baselines. The ob-servations in each configuration occurred on single nights. Thecombined visibility plane coverage is shown in Fig. 1.
All observations were conducted in clear to partly cloudyweather, with above-atmosphere single-sideband system tem-peratures of T ∗sys ≈ 350−500 K near the zenith. The correlatorwas configured to receive both linear polarisations in two fre-quency windows: a narrowband (spectral line) window centredon the “thermal” SiO v = 0, J = 2→ 1 line at 86.847 GHz with128 channels across 32 MHz, and a wideband window centredon the “maser” SiO v = 1, J = 2 → 1 line at 86.243 GHz with32 channels across 128 MHz. The pointing and phase centrewas at α2000 = 04h36m45 .s67, δ2000 = −62◦04′37.′′9 for R Dorand at α2000 = 07h13m32 .s31, δ2000 = −44◦38′24.′′1 for L2 Pup.The field of view is determined by the ATCA primary beamwhich has a FWHM of about 36′′ at 86 GHz.
As an initial step in the reduction of the 750B andH214 data, an elevation-dependent gain curve was appliedbased on observations of an SiO maser taken on 2003 Sep. 4.No such gain curve was available for the earlier EW367 ob-servation. Gain calibration as a function of time was then per-formed by assuming the SiO maser emission comes from apoint source located at the phase centre. Since the maser emis-sion is known to emanate from a region only a few AU in radius(e.g., Cotton et al. 2004), this is a reasonable assumption for ourresolution of a few arcseconds (1 AU = 20 milliarcsec at thedistance of our nearest source, R Dor). To derive the amplitudegains we also assumed that the integrated SiO maser flux wasconstant throughout each observation. We found that the vari-ation in the gain was generally dominated by an uncorrected
1 The Australia Telescope is funded by the Commonwealth ofAustralia for operation as a National Facility managed by CSIRO.
F. L. Schoier et al.: Probing the inner wind of AGB stars 653
Fig. 1. Coverage of the visibility plane for R Dor and L2 Pup obtainedafter combining the three ATCA configurations used (EW367, 750B,and H214).
gain-elevation dependence, limiting any intrinsic flux variationto <∼10%.
The amplitude and phase gains were transferred from themaser to the spectral line window after applying scaling fac-tors determined from a half-hour integration on the bandpasscalibrator (3C 279 or PKS B1921-293), which was also used todetermine the channel-dependent gains. In the case of L2 Pup,the transfer of the phase gains could not be performed suc-cessfully because of an inconsistency in the frequency setupbetween the source and bandpass calibrator; consequently wehave applied phase self-calibration to the thermal SiO emissionfrom this source assuming that it is circularly symmetric. Foran interferometer the astrometry is determined by the qualityof the phase calibration. For R Dor the phase errors were ∼5◦and one would expect the position error to be about 0.1′′ for a100 m baseline.
Uranus was used to set the flux scale, assuming a uniformdisk with brightness temperature of 134 K. However, for theEW367 array, where the Uranus observation occurred in poor
weather, the flux scale was tied to that of the 750B obser-vation by assuming the SiO maser fluxes from both sourceswere unchanged over the 17-day gap between the observations.Assuming that any actual flux variations for the two sourceswere uncorrelated, the derived gains suggest an uncertainty inthe flux scale for this configuration of ≈30%. We also adjustedthe antenna pointing once an hour on the SiO masers; typicalpointing shifts were ≈5′′.
All data processing was conducted using the MIRIADpackage (Sault et al. 1995). The calibrated visibilities wereFourier transformed using uniform weighting and a 0.′′5 pixelsize with a channel spacing of 1 km s−1 (roughly the effec-tive velocity resolution given the original channel spacing of0.25 MHz ≈ 0.8 km s−1). The maps were then CLEANed(Hogbom 1974) down to a 2σ level over the inner 20′′ × 20′′.
The actual analysis and comparison with the model will becarried out in the uv-plane to maximize the sensitivity and reso-lution of the data. Thus we expect to obtain usable informationon scales as low as 1′′, corresponding to the longest baselines.
3. Observational results
3.1. R Dor
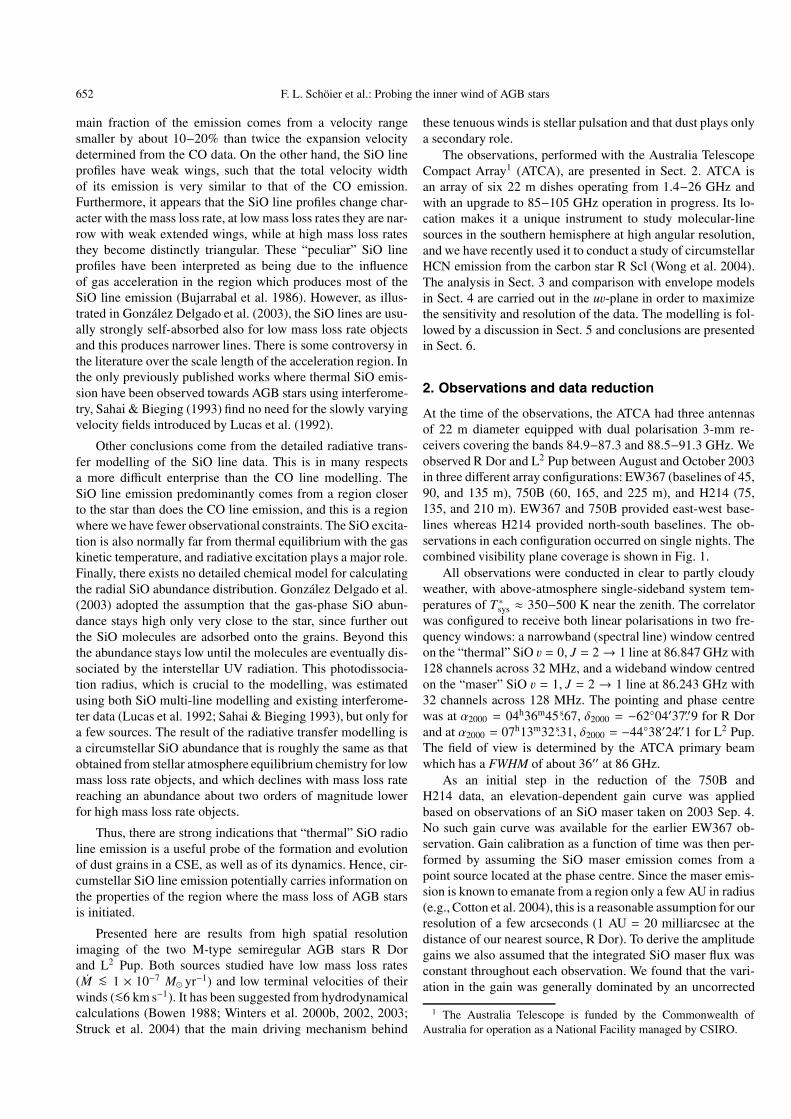
The SiO v = 0, J = 2 → 1 velocity channel maps of R Dor,binned into 2 km s−1 channels, are shown in Fig. 2. The syn-thesised beam is 2.′′6 × 2.′′0 with a position angle of −56◦and the rms noise in the 1 km s−1 velocity channel maps isσ = 30 mJy beam−1, as estimated from regions free of sourceemission. The signal-to-noise ratio is high with the peak emis-sion reaching a level of about 300σ.
The velocity channel maps suggest that the SiO v = 0, J =2→ 1 emission towards R Dor is moderately resolved, a resultwhich is confirmed by the visibility analysis (see below). Thebrightness distribution appears to have an overall circular sym-metry. From fitting two-dimensional Gaussian brightness dis-tributions to the individual channel maps, it is concluded thatno systematic variations in position with velocity are present.The individual offsets are smaller than 0.′′1, within the pointinguncertainty (Sect. 2), confirming the adopted source position.Across the peak of the line profile, from 6−8 km s−1 (LSR),the average values of the major and minor axes are 3.′′3and 3.′′7 (FWHM), respectively. The beam has not been decon-volved from these values.
As interferometers lacks sensitivity to large scale emis-sion it is of interest to find out whether part of the emis-sion is resolved out in the ATCA data. In Fig. 3 theATCA SiO data has been restored with a 57′′ circularbeam (solid line; this represents the beam of the Swedish-ESO Submillimetre Telescope, SEST). A comparison withthe equivalent SEST spectrum from Gonzalez Delgado et al.(2003) (histogram) shows a striking resemblance both withregard to the peak flux (≈20 Jy) and the overall line shape.This strongly suggests that all the flux is recovered by theATCA interferometer, at least within the 57′′ SEST beam, andthat virtually all of the SiO emission comes from the central
654 F. L. Schoier et al.: Probing the inner wind of AGB stars
Fig. 2. Velocity channel maps of SiO v = 0, J = 2 → 1 emission from R Dor. The contour levels are 0.03n Jy beam−1, wheren = −9,−3, 3, 9, 27, 81, 243 (negative values have dashed contours), and the beam size is 2.′′6 × 2.′′0 with a position angle of −56◦ as indi-cated in the lower right hand corner of each panel. The velocity channels (given in the LSR frame and indicated in the upper left corner)have been binned to 2 km s−1. The systemic velocity is 7 km s−1 as determined from CO observations. Offsets in position are relative toα2000 = 04h36m45 .s67, δ2000 = −62◦04′37.′′9.
component. The SEST spectrum has been converted from mainbeam brightness temperature scale to Jy using
S = ηmbΓ−1Tmb, (1)
where the main-beam efficiency ηmb = 0.75 and the sensitivityΓ−1 = 25 Jy K−1. The telescope parameters are taken from theSEST homepage2.
Assuming that the emission has an overall spherical sym-metry, circularly symmetric Gaussians have been fitted fittedto the visibilities. Given the higher sensitivity in the uv-planethere appears to be a systematic trend with velocity as shownin Fig. 4. The largest offsets are measured at the extreme ve-locities, i.e., the blue- and redshifted emissions are displacedfrom each other. Lindqvist et al. (2000), when analysing severalmolecular line emissions from the high mass loss rate carbonstar CIT 6, also noted that there was a common trend in posi-tion with velocity. A reasonable explanation for this behaviour
2 www.ls.eso.org/lasilla/Telescopes/SEST/SEST.html
is that the CSE is asymmetric to some degree, perhaps a bipo-lar outflow, but the present angular resolution is not enough tomake this apparent in the channel maps, Fig. 2.
The resulting FWHM of Gaussians fitted to the azimuthallyaveraged visibilities are plotted in Fig. 5. The overall vari-ation in size with line-of-sight velocity is as expected for awell resolved expanding envelope, where gas moving orthog-onal to the line of sight subtends a larger solid angle thanradially moving gas near the extreme velocities. The largestangular extent of the emission is 3.′′0 ± 0.′′2 in the velocityrange 6−8 km s−1 (LSR). This corresponds to a radial size of1.0 × 1015 cm at the distance of 45 pc. We note that a sin-gle Gaussian provides a reasonable fit to the visibilities onall baselines except those close to the systemic velocity at7 km s−1 (LSR). Introducing an offset in the flux scale, repre-senting an unresolved additional component, significantly im-proves the fit at those velocities. In Sect. 4.3 it is shown that thevisiblilities obtained for this source are best fitted using two
F. L. Schoier et al.: Probing the inner wind of AGB stars 655
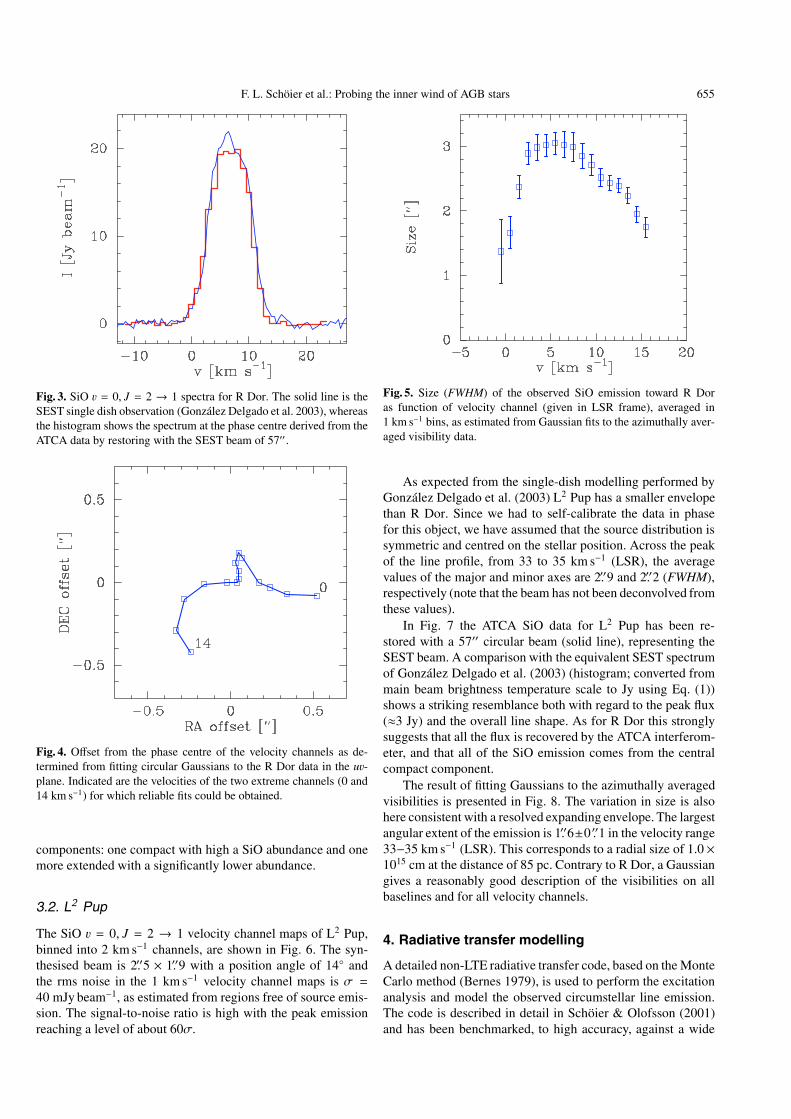
Fig. 3. SiO v = 0, J = 2 → 1 spectra for R Dor. The solid line is theSEST single dish observation (Gonzalez Delgado et al. 2003), whereasthe histogram shows the spectrum at the phase centre derived from theATCA data by restoring with the SEST beam of 57′′ .
Fig. 4. Offset from the phase centre of the velocity channels as de-termined from fitting circular Gaussians to the R Dor data in the uv-plane. Indicated are the velocities of the two extreme channels (0 and14 km s−1) for which reliable fits could be obtained.
components: one compact with high a SiO abundance and onemore extended with a significantly lower abundance.
3.2. L2 Pup
The SiO v = 0, J = 2 → 1 velocity channel maps of L2 Pup,binned into 2 km s−1 channels, are shown in Fig. 6. The syn-thesised beam is 2.′′5 × 1.′′9 with a position angle of 14◦ andthe rms noise in the 1 km s−1 velocity channel maps is σ =40 mJy beam−1, as estimated from regions free of source emis-sion. The signal-to-noise ratio is high with the peak emissionreaching a level of about 60σ.
Fig. 5. Size (FWHM) of the observed SiO emission toward R Doras function of velocity channel (given in LSR frame), averaged in1 km s−1 bins, as estimated from Gaussian fits to the azimuthally aver-aged visibility data.
As expected from the single-dish modelling performed byGonzalez Delgado et al. (2003) L2 Pup has a smaller envelopethan R Dor. Since we had to self-calibrate the data in phasefor this object, we have assumed that the source distribution issymmetric and centred on the stellar position. Across the peakof the line profile, from 33 to 35 km s−1 (LSR), the averagevalues of the major and minor axes are 2.′′9 and 2.′′2 (FWHM),respectively (note that the beam has not been deconvolved fromthese values).
In Fig. 7 the ATCA SiO data for L2 Pup has been re-stored with a 57′′ circular beam (solid line), representing theSEST beam. A comparison with the equivalent SEST spectrumof Gonzalez Delgado et al. (2003) (histogram; converted frommain beam brightness temperature scale to Jy using Eq. (1))shows a striking resemblance both with regard to the peak flux(≈3 Jy) and the overall line shape. As for R Dor this stronglysuggests that all the flux is recovered by the ATCA interferom-eter, and that all of the SiO emission comes from the centralcompact component.
The result of fitting Gaussians to the azimuthally averagedvisibilities is presented in Fig. 8. The variation in size is alsohere consistent with a resolved expanding envelope. The largestangular extent of the emission is 1.′′6±0 .′′1 in the velocity range33−35 km s−1 (LSR). This corresponds to a radial size of 1.0×1015 cm at the distance of 85 pc. Contrary to R Dor, a Gaussiangives a reasonably good description of the visibilities on allbaselines and for all velocity channels.
4. Radiative transfer modelling
A detailed non-LTE radiative transfer code, based on the MonteCarlo method (Bernes 1979), is used to perform the excitationanalysis and model the observed circumstellar line emission.The code is described in detail in Schoier & Olofsson (2001)and has been benchmarked, to high accuracy, against a wide
656 F. L. Schoier et al.: Probing the inner wind of AGB stars
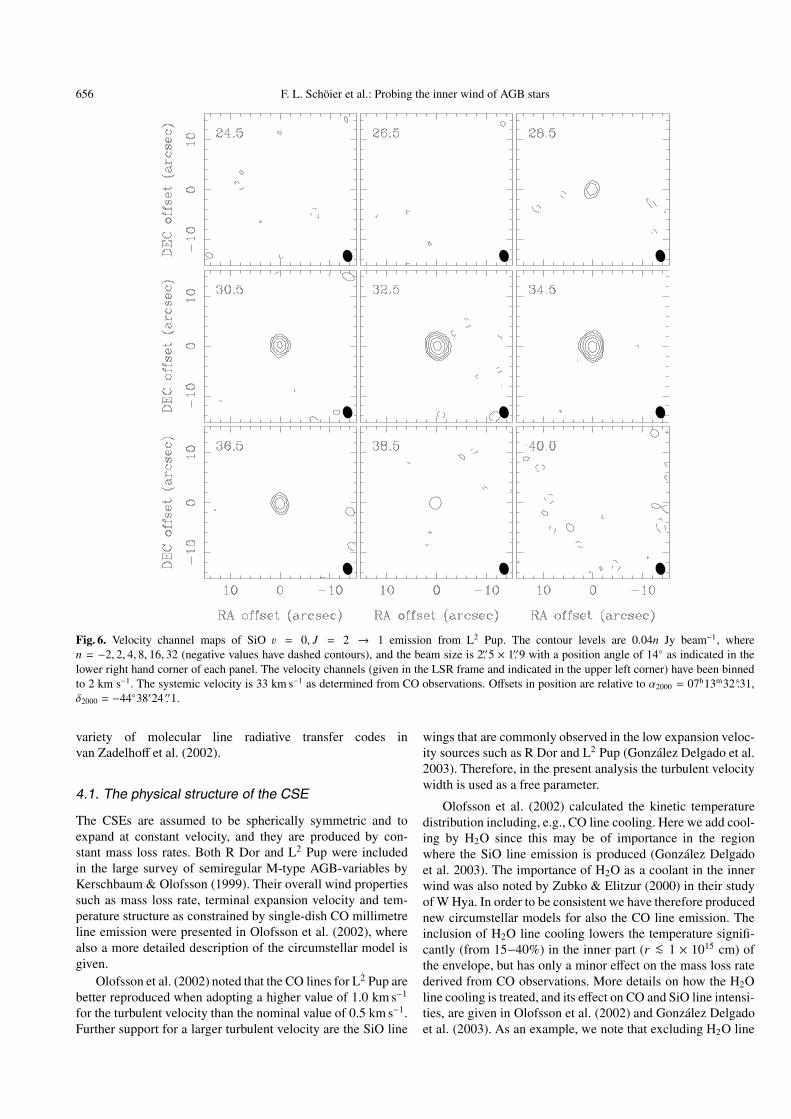
Fig. 6. Velocity channel maps of SiO v = 0, J = 2 → 1 emission from L2 Pup. The contour levels are 0.04n Jy beam−1, wheren = −2, 2, 4, 8, 16, 32 (negative values have dashed contours), and the beam size is 2.′′5 × 1.′′9 with a position angle of 14◦ as indicated in thelower right hand corner of each panel. The velocity channels (given in the LSR frame and indicated in the upper left corner) have been binnedto 2 km s−1. The systemic velocity is 33 km s−1 as determined from CO observations. Offsets in position are relative to α2000 = 07h13m32 .s31,δ2000 = −44◦38′24 .′′1.
variety of molecular line radiative transfer codes invan Zadelhoff et al. (2002).
4.1. The physical structure of the CSE
The CSEs are assumed to be spherically symmetric and toexpand at constant velocity, and they are produced by con-stant mass loss rates. Both R Dor and L2 Pup were includedin the large survey of semiregular M-type AGB-variables byKerschbaum & Olofsson (1999). Their overall wind propertiessuch as mass loss rate, terminal expansion velocity and tem-perature structure as constrained by single-dish CO millimetreline emission were presented in Olofsson et al. (2002), wherealso a more detailed description of the circumstellar model isgiven.
Olofsson et al. (2002) noted that the CO lines for L2 Pup arebetter reproduced when adopting a higher value of 1.0 km s−1
for the turbulent velocity than the nominal value of 0.5 km s−1.Further support for a larger turbulent velocity are the SiO line
wings that are commonly observed in the low expansion veloc-ity sources such as R Dor and L2 Pup (Gonzalez Delgado et al.2003). Therefore, in the present analysis the turbulent velocitywidth is used as a free parameter.
Olofsson et al. (2002) calculated the kinetic temperaturedistribution including, e.g., CO line cooling. Here we add cool-ing by H2O since this may be of importance in the regionwhere the SiO line emission is produced (Gonzalez Delgadoet al. 2003). The importance of H2O as a coolant in the innerwind was also noted by Zubko & Elitzur (2000) in their studyof W Hya. In order to be consistent we have therefore producednew circumstellar models for also the CO line emission. Theinclusion of H2O line cooling lowers the temperature signifi-cantly (from 15−40%) in the inner part (r <∼ 1 × 1015 cm) ofthe envelope, but has only a minor effect on the mass loss ratederived from CO observations. More details on how the H2Oline cooling is treated, and its effect on CO and SiO line intensi-ties, are given in Olofsson et al. (2002) and Gonzalez Delgadoet al. (2003). As an example, we note that excluding H2O line
F. L. Schoier et al.: Probing the inner wind of AGB stars 657
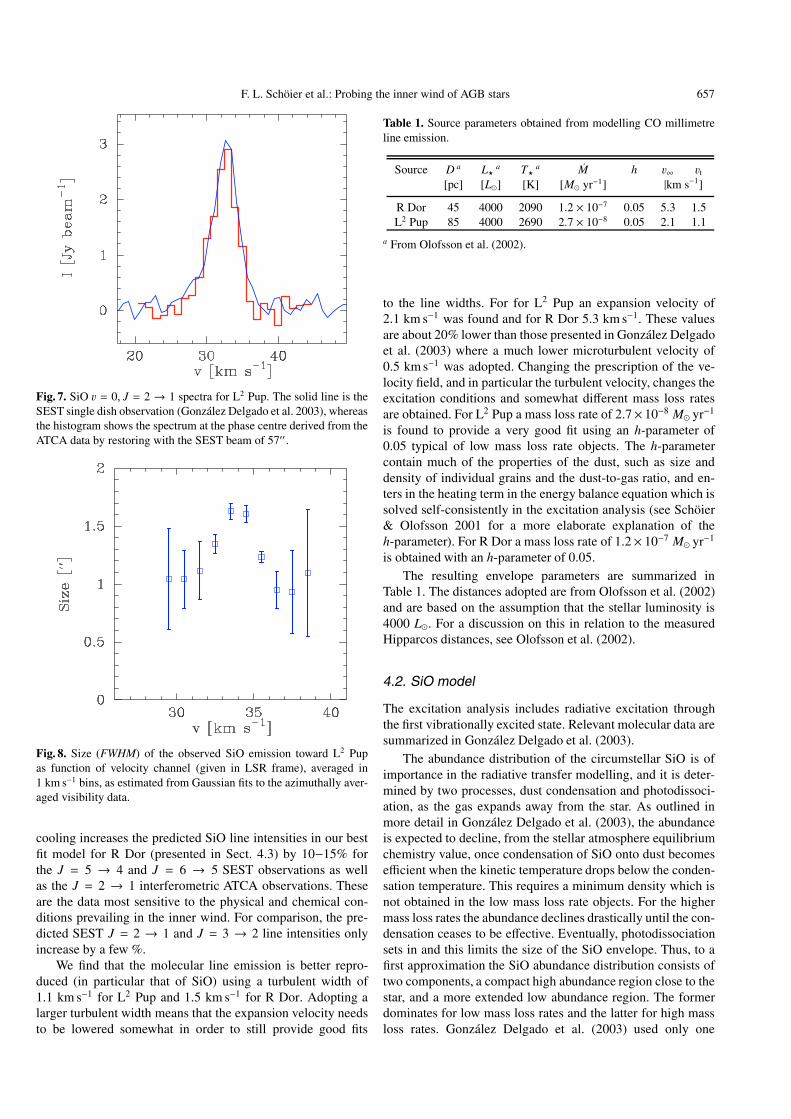
Fig. 7. SiO v = 0, J = 2 → 1 spectra for L2 Pup. The solid line is theSEST single dish observation (Gonzalez Delgado et al. 2003), whereasthe histogram shows the spectrum at the phase centre derived from theATCA data by restoring with the SEST beam of 57′′ .
Fig. 8. Size (FWHM) of the observed SiO emission toward L2 Pupas function of velocity channel (given in LSR frame), averaged in1 km s−1 bins, as estimated from Gaussian fits to the azimuthally aver-aged visibility data.
cooling increases the predicted SiO line intensities in our bestfit model for R Dor (presented in Sect. 4.3) by 10−15% forthe J = 5 → 4 and J = 6 → 5 SEST observations as wellas the J = 2 → 1 interferometric ATCA observations. Theseare the data most sensitive to the physical and chemical con-ditions prevailing in the inner wind. For comparison, the pre-dicted SEST J = 2 → 1 and J = 3 → 2 line intensities onlyincrease by a few %.
We find that the molecular line emission is better repro-duced (in particular that of SiO) using a turbulent width of1.1 km s−1 for L2 Pup and 1.5 km s−1 for R Dor. Adopting alarger turbulent width means that the expansion velocity needsto be lowered somewhat in order to still provide good fits
Table 1. Source parameters obtained from modelling CO millimetreline emission.
Source D a L� a T� a M h v∞ vt[pc] [L�] [K] [M� yr−1] |km s−1]
R Dor 45 4000 2090 1.2 × 10⁻⁷ 0.05 5.3 1.5L2 Pup 85 4000 2690 2.7 × 10⁻⁸ 0.05 2.1 1.1
a From Olofsson et al. (2002).
to the line widths. For for L2 Pup an expansion velocity of2.1 km s−1 was found and for R Dor 5.3 km s−1. These valuesare about 20% lower than those presented in Gonzalez Delgadoet al. (2003) where a much lower microturbulent velocity of0.5 km s−1 was adopted. Changing the prescription of the ve-locity field, and in particular the turbulent velocity, changes theexcitation conditions and somewhat different mass loss ratesare obtained. For L2 Pup a mass loss rate of 2.7× 10⁻⁸ M� yr−1
is found to provide a very good fit using an h-parameter of0.05 typical of low mass loss rate objects. The h-parametercontain much of the properties of the dust, such as size anddensity of individual grains and the dust-to-gas ratio, and en-ters in the heating term in the energy balance equation which issolved self-consistently in the excitation analysis (see Schoier& Olofsson 2001 for a more elaborate explanation of theh-parameter). For R Dor a mass loss rate of 1.2× 10⁻⁷ M� yr−1
is obtained with an h-parameter of 0.05.The resulting envelope parameters are summarized in
Table 1. The distances adopted are from Olofsson et al. (2002)and are based on the assumption that the stellar luminosity is4000 L�. For a discussion on this in relation to the measuredHipparcos distances, see Olofsson et al. (2002).
4.2. SiO model
The excitation analysis includes radiative excitation throughthe first vibrationally excited state. Relevant molecular data aresummarized in Gonzalez Delgado et al. (2003).
The abundance distribution of the circumstellar SiO is ofimportance in the radiative transfer modelling, and it is deter-mined by two processes, dust condensation and photodissoci-ation, as the gas expands away from the star. As outlined inmore detail in Gonzalez Delgado et al. (2003), the abundanceis expected to decline, from the stellar atmosphere equilibriumchemistry value, once condensation of SiO onto dust becomesefficient when the kinetic temperature drops below the conden-sation temperature. This requires a minimum density which isnot obtained in the low mass loss rate objects. For the highermass loss rates the abundance declines drastically until the con-densation ceases to be effective. Eventually, photodissociationsets in and this limits the size of the SiO envelope. Thus, to afirst approximation the SiO abundance distribution consists oftwo components, a compact high abundance region close to thestar, and a more extended low abundance region. The formerdominates for low mass loss rates and the latter for high massloss rates. Gonzalez Delgado et al. (2003) used only one
658 F. L. Schoier et al.: Probing the inner wind of AGB stars
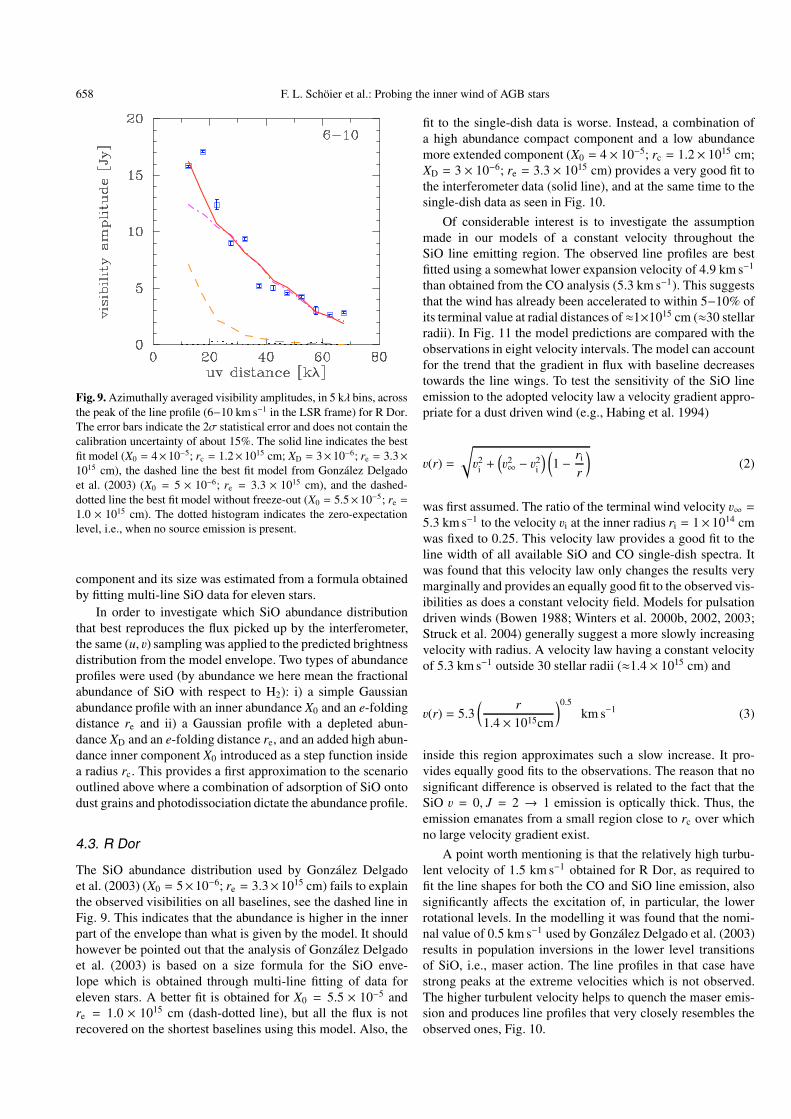
Fig. 9. Azimuthally averaged visibility amplitudes, in 5 kλ bins, acrossthe peak of the line profile (6−10 km s−1 in the LSR frame) for R Dor.The error bars indicate the 2σ statistical error and does not contain thecalibration uncertainty of about 15%. The solid line indicates the bestfit model (X0 = 4×10⁻⁵; rc = 1.2×1015 cm; XD = 3×10⁻⁶; re = 3.3×1015 cm), the dashed line the best fit model from Gonzalez Delgadoet al. (2003) (X0 = 5 × 10⁻⁶; re = 3.3 × 1015 cm), and the dashed-dotted line the best fit model without freeze-out (X0 = 5.5× 10⁻⁵; re =
1.0 × 1015 cm). The dotted histogram indicates the zero-expectationlevel, i.e., when no source emission is present.
component and its size was estimated from a formula obtainedby fitting multi-line SiO data for eleven stars.
In order to investigate which SiO abundance distributionthat best reproduces the flux picked up by the interferometer,the same (u, v) sampling was applied to the predicted brightnessdistribution from the model envelope. Two types of abundanceprofiles were used (by abundance we here mean the fractionalabundance of SiO with respect to H2): i) a simple Gaussianabundance profile with an inner abundance X0 and an e-foldingdistance re and ii) a Gaussian profile with a depleted abun-dance XD and an e-folding distance re, and an added high abun-dance inner component X0 introduced as a step function insidea radius rc. This provides a first approximation to the scenariooutlined above where a combination of adsorption of SiO ontodust grains and photodissociation dictate the abundance profile.
4.3. R Dor
The SiO abundance distribution used by Gonzalez Delgadoet al. (2003) (X0 = 5×10⁻⁶; re = 3.3×1015 cm) fails to explainthe observed visibilities on all baselines, see the dashed line inFig. 9. This indicates that the abundance is higher in the innerpart of the envelope than what is given by the model. It shouldhowever be pointed out that the analysis of Gonzalez Delgadoet al. (2003) is based on a size formula for the SiO enve-lope which is obtained through multi-line fitting of data foreleven stars. A better fit is obtained for X0 = 5.5 × 10⁻⁵ andre = 1.0 × 1015 cm (dash-dotted line), but all the flux is notrecovered on the shortest baselines using this model. Also, the
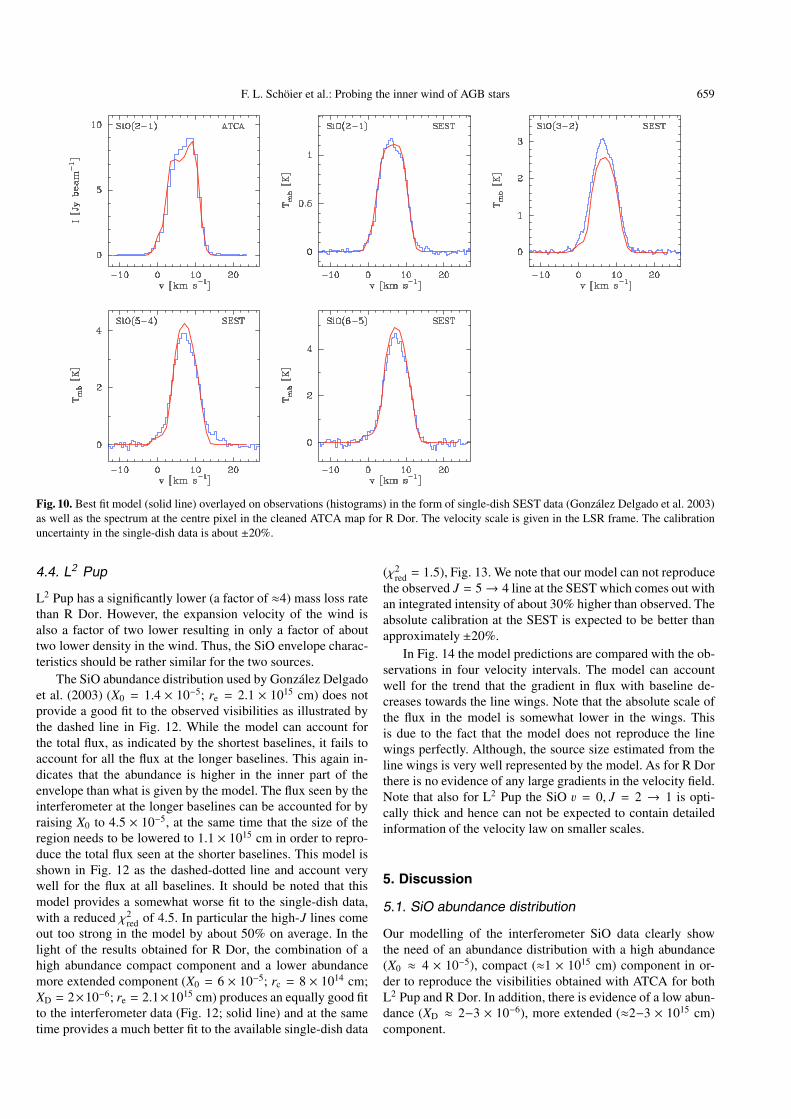
fit to the single-dish data is worse. Instead, a combination ofa high abundance compact component and a low abundancemore extended component (X0 = 4 × 10⁻⁵; rc = 1.2× 1015 cm;XD = 3 × 10⁻⁶; re = 3.3 × 1015 cm) provides a very good fit tothe interferometer data (solid line), and at the same time to thesingle-dish data as seen in Fig. 10.
Of considerable interest is to investigate the assumptionmade in our models of a constant velocity throughout theSiO line emitting region. The observed line profiles are bestfitted using a somewhat lower expansion velocity of 4.9 km s−1
than obtained from the CO analysis (5.3 km s−1). This suggeststhat the wind has already been accelerated to within 5−10% ofits terminal value at radial distances of ≈1×1015 cm (≈30 stellarradii). In Fig. 11 the model predictions are compared with theobservations in eight velocity intervals. The model can accountfor the trend that the gradient in flux with baseline decreasestowards the line wings. To test the sensitivity of the SiO lineemission to the adopted velocity law a velocity gradient appro-priate for a dust driven wind (e.g., Habing et al. 1994)
v(r) =
√v2i +(v2∞ − v2i
) (1 − ri
r
)(2)
was first assumed. The ratio of the terminal wind velocity v∞ =5.3 km s−1 to the velocity vi at the inner radius ri = 1× 10¹⁴ cmwas fixed to 0.25. This velocity law provides a good fit to theline width of all available SiO and CO single-dish spectra. Itwas found that this velocity law only changes the results verymarginally and provides an equally good fit to the observed vis-ibilities as does a constant velocity field. Models for pulsationdriven winds (Bowen 1988; Winters et al. 2000b, 2002, 2003;Struck et al. 2004) generally suggest a more slowly increasingvelocity with radius. A velocity law having a constant velocityof 5.3 km s−1 outside 30 stellar radii (≈1.4 × 1015 cm) and
v(r) = 5.3( r
1.4 × 1015cm
)0.5km s−1 (3)
inside this region approximates such a slow increase. It pro-vides equally good fits to the observations. The reason that nosignificant difference is observed is related to the fact that theSiO v = 0, J = 2 → 1 emission is optically thick. Thus, theemission emanates from a small region close to rc over whichno large velocity gradient exist.
A point worth mentioning is that the relatively high turbu-lent velocity of 1.5 km s−1 obtained for R Dor, as required tofit the line shapes for both the CO and SiO line emission, alsosignificantly affects the excitation of, in particular, the lowerrotational levels. In the modelling it was found that the nomi-nal value of 0.5 km s−1 used by Gonzalez Delgado et al. (2003)results in population inversions in the lower level transitionsof SiO, i.e., maser action. The line profiles in that case havestrong peaks at the extreme velocities which is not observed.The higher turbulent velocity helps to quench the maser emis-sion and produces line profiles that very closely resembles theobserved ones, Fig. 10.
F. L. Schoier et al.: Probing the inner wind of AGB stars 659
Fig. 10. Best fit model (solid line) overlayed on observations (histograms) in the form of single-dish SEST data (Gonzalez Delgado et al. 2003)as well as the spectrum at the centre pixel in the cleaned ATCA map for R Dor. The velocity scale is given in the LSR frame. The calibrationuncertainty in the single-dish data is about ±20%.
4.4. L2 Pup
L2 Pup has a significantly lower (a factor of ≈4) mass loss ratethan R Dor. However, the expansion velocity of the wind isalso a factor of two lower resulting in only a factor of abouttwo lower density in the wind. Thus, the SiO envelope charac-teristics should be rather similar for the two sources.
The SiO abundance distribution used by Gonzalez Delgadoet al. (2003) (X0 = 1.4 × 10⁻⁵; re = 2.1 × 1015 cm) does notprovide a good fit to the observed visibilities as illustrated bythe dashed line in Fig. 12. While the model can account forthe total flux, as indicated by the shortest baselines, it fails toaccount for all the flux at the longer baselines. This again in-dicates that the abundance is higher in the inner part of theenvelope than what is given by the model. The flux seen by theinterferometer at the longer baselines can be accounted for byraising X0 to 4.5 × 10⁻⁵, at the same time that the size of theregion needs to be lowered to 1.1 × 1015 cm in order to repro-duce the total flux seen at the shorter baselines. This model isshown in Fig. 12 as the dashed-dotted line and account verywell for the flux at all baselines. It should be noted that thismodel provides a somewhat worse fit to the single-dish data,with a reduced χ2
red of 4.5. In particular the high-J lines comeout too strong in the model by about 50% on average. In thelight of the results obtained for R Dor, the combination of ahigh abundance compact component and a lower abundancemore extended component (X0 = 6 × 10⁻⁵; rc = 8 × 1014 cm;XD = 2×10⁻⁶; re = 2.1×1015 cm) produces an equally good fitto the interferometer data (Fig. 12; solid line) and at the sametime provides a much better fit to the available single-dish data
(χ2red = 1.5), Fig. 13. We note that our model can not reproduce
the observed J = 5→ 4 line at the SEST which comes out withan integrated intensity of about 30% higher than observed. Theabsolute calibration at the SEST is expected to be better thanapproximately ±20%.
In Fig. 14 the model predictions are compared with the ob-servations in four velocity intervals. The model can accountwell for the trend that the gradient in flux with baseline de-creases towards the line wings. Note that the absolute scale ofthe flux in the model is somewhat lower in the wings. Thisis due to the fact that the model does not reproduce the linewings perfectly. Although, the source size estimated from theline wings is very well represented by the model. As for R Dorthere is no evidence of any large gradients in the velocity field.Note that also for L2 Pup the SiO v = 0, J = 2 → 1 is opti-cally thick and hence can not be expected to contain detailedinformation of the velocity law on smaller scales.
5. Discussion
5.1. SiO abundance distribution
Our modelling of the interferometer SiO data clearly showthe need of an abundance distribution with a high abundance(X0 ≈ 4 × 10⁻⁵), compact (≈1 × 1015 cm) component in or-der to reproduce the visibilities obtained with ATCA for bothL2 Pup and R Dor. In addition, there is evidence of a low abun-dance (XD ≈ 2−3 × 10⁻⁶), more extended (≈2−3 × 1015 cm)component.
660 F. L. Schoier et al.: Probing the inner wind of AGB stars
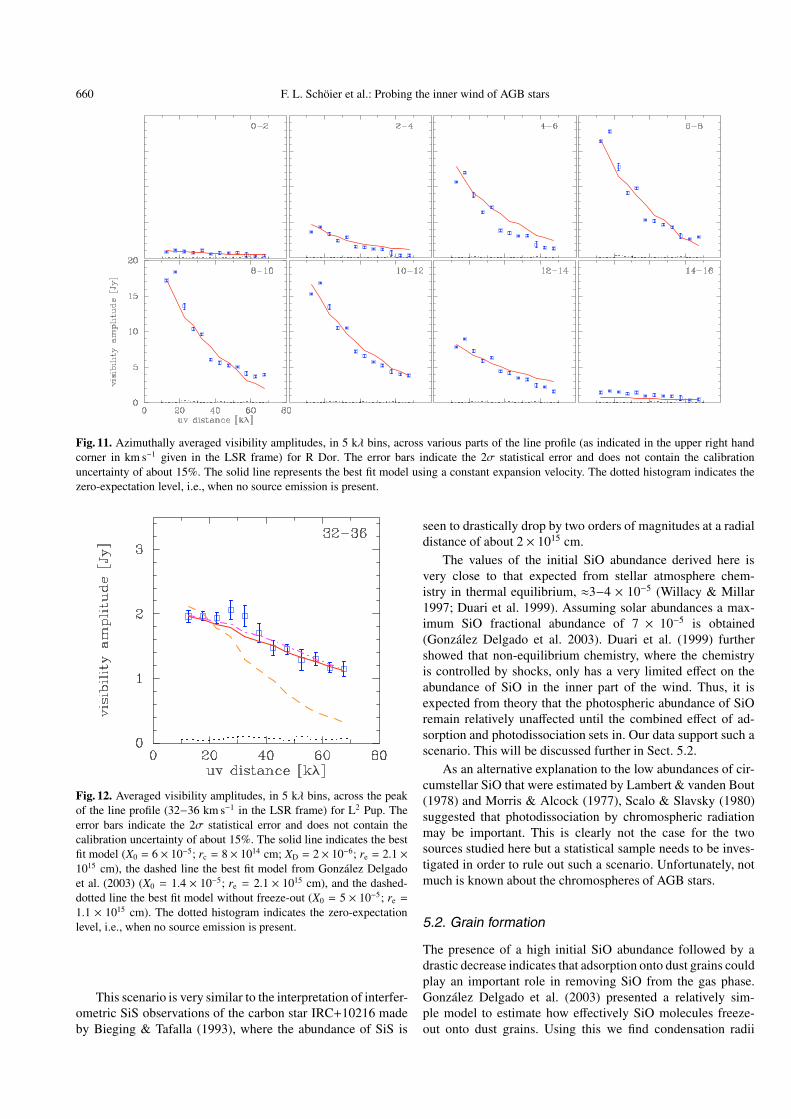
Fig. 11. Azimuthally averaged visibility amplitudes, in 5 kλ bins, across various parts of the line profile (as indicated in the upper right handcorner in km s−1 given in the LSR frame) for R Dor. The error bars indicate the 2σ statistical error and does not contain the calibrationuncertainty of about 15%. The solid line represents the best fit model using a constant expansion velocity. The dotted histogram indicates thezero-expectation level, i.e., when no source emission is present.
Fig. 12. Averaged visibility amplitudes, in 5 kλ bins, across the peakof the line profile (32−36 km s−1 in the LSR frame) for L2 Pup. Theerror bars indicate the 2σ statistical error and does not contain thecalibration uncertainty of about 15%. The solid line indicates the bestfit model (X0 = 6 × 10⁻⁵; rc = 8 × 1014 cm; XD = 2 × 10⁻⁶; re = 2.1 ×1015 cm), the dashed line the best fit model from Gonzalez Delgadoet al. (2003) (X0 = 1.4 × 10⁻⁵; re = 2.1 × 1015 cm), and the dashed-dotted line the best fit model without freeze-out (X0 = 5 × 10⁻⁵; re =
1.1 × 1015 cm). The dotted histogram indicates the zero-expectationlevel, i.e., when no source emission is present.
This scenario is very similar to the interpretation of interfer-ometric SiS observations of the carbon star IRC+10216 madeby Bieging & Tafalla (1993), where the abundance of SiS is
seen to drastically drop by two orders of magnitudes at a radialdistance of about 2 × 1015 cm.
The values of the initial SiO abundance derived here isvery close to that expected from stellar atmosphere chem-istry in thermal equilibrium, ≈3−4 × 10⁻⁵ (Willacy & Millar1997; Duari et al. 1999). Assuming solar abundances a max-imum SiO fractional abundance of 7 × 10⁻⁵ is obtained(Gonzalez Delgado et al. 2003). Duari et al. (1999) furthershowed that non-equilibrium chemistry, where the chemistryis controlled by shocks, only has a very limited effect on theabundance of SiO in the inner part of the wind. Thus, it isexpected from theory that the photospheric abundance of SiOremain relatively unaffected until the combined effect of ad-sorption and photodissociation sets in. Our data support such ascenario. This will be discussed further in Sect. 5.2.
As an alternative explanation to the low abundances of cir-cumstellar SiO that were estimated by Lambert & vanden Bout(1978) and Morris & Alcock (1977), Scalo & Slavsky (1980)suggested that photodissociation by chromospheric radiationmay be important. This is clearly not the case for the twosources studied here but a statistical sample needs to be inves-tigated in order to rule out such a scenario. Unfortunately, notmuch is known about the chromospheres of AGB stars.
5.2. Grain formation
The presence of a high initial SiO abundance followed by adrastic decrease indicates that adsorption onto dust grains couldplay an important role in removing SiO from the gas phase.Gonzalez Delgado et al. (2003) presented a relatively sim-ple model to estimate how effectively SiO molecules freeze-out onto dust grains. Using this we find condensation radii
F. L. Schoier et al.: Probing the inner wind of AGB stars 661
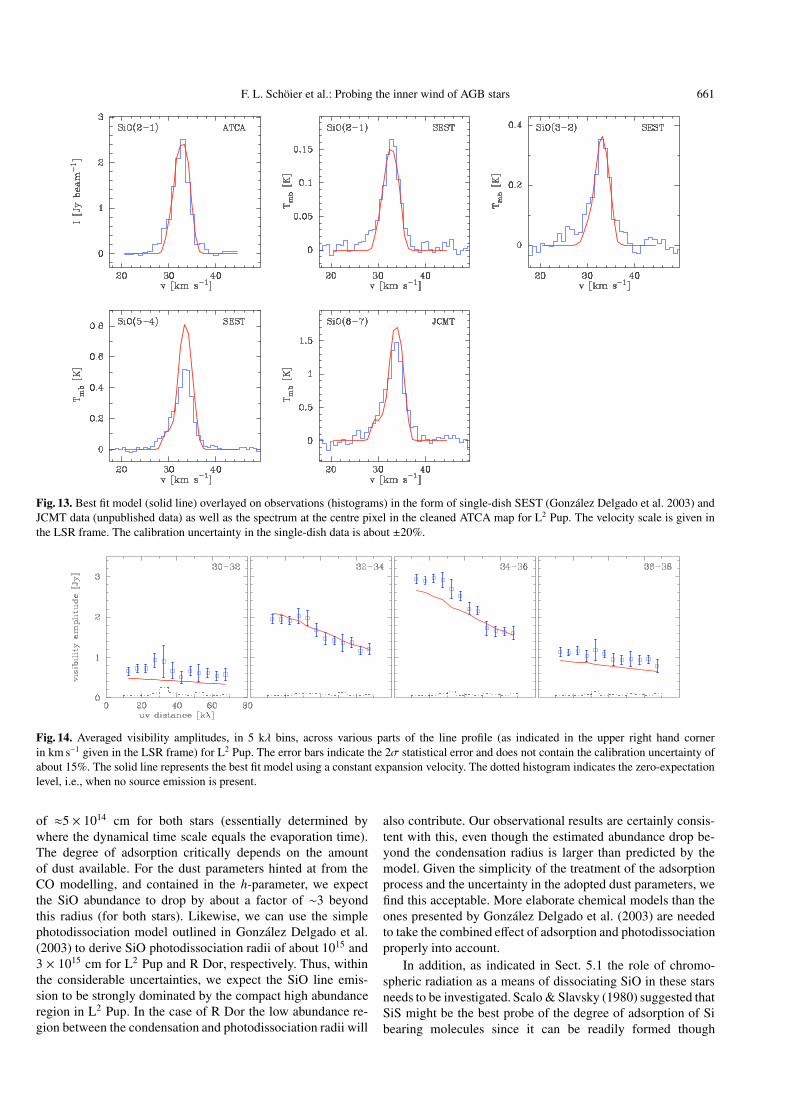
Fig. 13. Best fit model (solid line) overlayed on observations (histograms) in the form of single-dish SEST (Gonzalez Delgado et al. 2003) andJCMT data (unpublished data) as well as the spectrum at the centre pixel in the cleaned ATCA map for L2 Pup. The velocity scale is given inthe LSR frame. The calibration uncertainty in the single-dish data is about ±20%.
Fig. 14. Averaged visibility amplitudes, in 5 kλ bins, across various parts of the line profile (as indicated in the upper right hand cornerin km s−1 given in the LSR frame) for L2 Pup. The error bars indicate the 2σ statistical error and does not contain the calibration uncertainty ofabout 15%. The solid line represents the best fit model using a constant expansion velocity. The dotted histogram indicates the zero-expectationlevel, i.e., when no source emission is present.
of ≈5 × 1014 cm for both stars (essentially determined bywhere the dynamical time scale equals the evaporation time).The degree of adsorption critically depends on the amountof dust available. For the dust parameters hinted at from theCO modelling, and contained in the h-parameter, we expectthe SiO abundance to drop by about a factor of ∼3 beyondthis radius (for both stars). Likewise, we can use the simplephotodissociation model outlined in Gonzalez Delgado et al.(2003) to derive SiO photodissociation radii of about 1015 and3 × 1015 cm for L2 Pup and R Dor, respectively. Thus, withinthe considerable uncertainties, we expect the SiO line emis-sion to be strongly dominated by the compact high abundanceregion in L2 Pup. In the case of R Dor the low abundance re-gion between the condensation and photodissociation radii will
also contribute. Our observational results are certainly consis-tent with this, even though the estimated abundance drop be-yond the condensation radius is larger than predicted by themodel. Given the simplicity of the treatment of the adsorptionprocess and the uncertainty in the adopted dust parameters, wefind this acceptable. More elaborate chemical models than theones presented by Gonzalez Delgado et al. (2003) are neededto take the combined effect of adsorption and photodissociationproperly into account.
In addition, as indicated in Sect. 5.1 the role of chromo-spheric radiation as a means of dissociating SiO in these starsneeds to be investigated. Scalo & Slavsky (1980) suggested thatSiS might be the best probe of the degree of adsorption of Sibearing molecules since it can be readily formed though
662 F. L. Schoier et al.: Probing the inner wind of AGB stars
reactions with H and H2 in the inner wind. In contrast thereis no easy means of forming SiO. However, this was based onthe assumption that all Si-molecules were destroyed by chro-mospheric radiation. Nevertheless, observations of SiS is animportant complement to the SiO observations, and it has beendetected in O-rich envelopes (Lindqvist et al. 1988; Olofssonet al. 1998).
5.3. Wind dynamics
The success of the modelling using a constant velocity (and ahigher micro-turbulent velocity width) strongly suggests thatthe wind has reached its terminal velocity already within∼20−30 stellar radii. This is further supported by the fact thatthe SiO and CO line data can be modelled using the same ex-pansion velocity (within 5−10%). The marked difference inshapes between the SiO and the CO lines is attributed to strongself absorption of emission in the part of the wind moving to-wards the observer in the case of SiO. Thus, we support theconclusion by Sahai & Bieging (1993) rather than that of Lucaset al. (1992) where an extended region of acceleration was ad-vocated, but also note that we have so far studied only two lowmass loss rate objects.
It has been suggested from hydrodynamical calculations(Bowen 1988; Winters et al. 2000b, 2002, 2003; Struck et al.2004) that in very low mass loss rate (M <∼ 5 × 10⁻⁷ M� yr−1),low expansion velocity (<∼5 km s−1) objects, such as R Dorand L2 Pup, the main driving mechanism behind these tenu-ous winds is stellar pulsation, and the wind acceleration is low.This is in contrast to winds which reach higher mass loss ratesand expansion velocities where dust plays a primary role, andwhere the wind acceleration is very efficient. From the presentdata we can not distinguish between these competing scenar-ios mainly due to the SiO emission being optically thick, andtherefore most of the emission emanates from a region wherethe wind is close to the terminal velocity. Observations of opti-cally thin SiS lines could possibly be useful to probe the veloc-ity field. However, the SiS line emission is expected to be morethan an order of magnitude weaker than that of SiO.
5.4. Predictions for high-J SiO lines
Presented here in Table 2 are estimated line intensities for se-lected transitions of SiO based on our models for R Dor usinga 12 m telescope. The differences between the one-componentmodel derived by Gonzalez Delgado et al. (2003), and the newmodels required to fit the interferometer data presented here,increase as higher frequency transitions are considered. Thisshows the potential of single-dish telescopes such as CSO,JCMT and the upcoming APEX3 and ASTE telescopes to studythe properties of stellar winds close to the central star.
3 The Atacama Pathfinder EXperiment (APEX), is a collabora-tion between Max Planck Institut fur Radioastronomie (in collabora-tion with Astronomisches Institut Ruhr Universitat Bochum), OnsalaSpace Observatory and the European Southern Observatory (ESO) toconstruct and operate a modified ALMA prototype antenna as a singledish on the high altitude site of Llano Chajnantor.
Table 2. Predicted SiO line intensities (integrated over the line and inmain-beam brightness scale using a 12 m telescope) towards R Dorfor selected rotational transitions.
Transition ν θmb Model 1a Model 2b Model 3c
[GHz] [′′] [K km s−1] [K km s−1] [K km s−1]
5→ 4 217.1 29 20 19 248→ 7 347.3 18 28 33 39
11 → 10 477.5 13 30 46 5516 → 15 694.1 9 28 58 6320 → 19 867.5 7 27 65 6330 → 29 1300.5 5 15 52 64
a Best fit model from Gonzalez Delgado et al. (2003) (X0 = 5 × 10⁻⁶;re = 3.3 × 1015 cm).b High abundance compact component (X0 = 5.5 × 10⁻⁵; re = 1.0 ×1015 cm).c Best fit model (X0 = 4 × 10⁻⁵; rc = 1.2 × 1015 cm; XD = 3 × 10⁻⁶;re = 3.3 × 1015 cm).
APEX and ASTE are of particular interest since they willeventually open up the THz region for observations. They willalso be the only telescopes at the southern hemisphere beingable to observe at sub-milimetre wavelengths.
6. Conclusions
High resolution, interferometric, millimetre observations at≈1′′ resolution of SiO v = 0, J = 2 → 1 line emission towardsthe two O-rich AGB stars L2 Pup and R Dor have been per-formed. The emission is resolved, very centrally peaked, andsuggests an overall spherical symmetry, even though there is anindication of a departure from spherical symmetry in the caseof R Dor at the arcsecond scale. A detailed excitation analysiswas performed suggesting that the SiO abundance is very high(≈4×10⁻⁵) in the inner part (<∼1×1015 cm) of the circumstellarenvelopes around both stars, consistent with predictions fromLTE stellar atmosphere chemistry. For R Dor the interferometerdata further suggests that there is an additional, more extended,component with a significantly lower SiO abundance. We in-terpret this as the result of effective adsorption of SiO onto dustgrains. Such a conclusion is less clear in the case of L2 Pup.
A comparison of model and observed line profiles fur-ther suggests that micro-turbulent motions are of the order of1−1.5 km s−1. This is a significant fraction of the wind velocityin these slowly expanding winds (<∼5 km s−1), and it producesstrong self absorption of the blue-shifted emission giving theSiO line profiles their characteristic shape. Additionally, theinterferometer data provide constraints on the size of the re-gion in which the wind is being accelerated. It is found thata constant velocity over the SiO emitting region can success-fully account for the visibility amplitudes obtained at differentvelocity intervals. Furthermore, it is possible to model the lineshapes of both SiO and CO emission using the same expansionvelocity (within 5−10%) for both our sources. This constrainsthe acceleration region to within <∼20−30 stellar radii.
We conclude that SiO line emission plays a very importantrole in the study of circumstellar envelopes, both with respect
F. L. Schoier et al.: Probing the inner wind of AGB stars 663
to its dynamics and the gas and grain chemistry. However, itshould be remembered that both sources studied here have verylow mass loss rates and expansion velocities and that a morerepresentative sample of O-rich sources needs to be studied inorder to solidify the conclusion reached here. This could alsobe used to investigate the role of chromospheric radiation inphotodissociation of SiO molecules. Such an effort is currentlyunderway, and it justifies the development of a more elaboratemodel to describe the abundance distribution of SiO.
Acknowledgements. F.L.S., H.O. and M.L. are grateful to TheSwedish Research council for financial support. T.W. is supported byan ARC-CSIRO Linkage Grant to the University of New South Wales.
References
Bernes, C. 1979, A&A, 73, 67Bieging, J. H., & Tafalla, M. 1993, AJ, 105, 576Bowen, G. H. 1988, ApJ, 329, 299Bujarrabal, V., Planesas, P., Martin-Pintado, J., Gomez-Gonzalez, J.,
& del Romero, A. 1986, A&A, 162, 157Cotton, W. D., Mennesson, B., Diamond, P. J., et al. 2004, A&A, 414,
275Danchi, W. C., Bester, M., Degiacomi, C. G., Greenhill, L. J., &
Townes, C. H. 1994, AJ, 107, 1469Duari, D., Cherchneff, I., & Willacy, K. 1999, A&A, 341, L47Gonzalez Delgado, D., Olofsson, H., Kerschbaum, F., et al. 2003,
A&A, 411, 123Hogbom, J. A. 1974, A&AS, 15, 417Habing, H. J., Tignon, J., & Tielens, A. G. G. M. 1994, A&A, 286,
523Keady, J. J., & Ridgway, S. T. 1993, ApJ, 406, 199
Kerschbaum, F., & Olofsson, H. 1999, A&AS, 138, 299Lambert, D. L., & vanden Bout, P. A. 1978, ApJ, 221, 854Lindqvist, M., Nyman, L.-Å., Olofsson, H., & Winnberg, A. 1988,
A&A, 205, L15Lindqvist, M., Schoier, F. L., Lucas, R., & Olofsson, H. 2000, A&A,
361, 1036Lucas, R., Bujarrabal, V., Guilloteau, S., et al. 1992, A&A, 262, 491Morris, M., & Alcock, C. 1977, ApJ, 218, 687Olofsson, H., Gonzalez Delgado, D., Kerschbaum, F., & Schoier, F. L.
2002, A&A, 391, 1053Olofsson, H., Lindqvist, M., Nyman, L.-Å., & Winnberg, A. 1998,
A&A, 329, 1059Sahai, R., & Bieging, J. H. 1993, AJ, 105, 595Sault, R. J., Teuben, P. J., & Wright, M. C. H. 1995, in ASP Conf. Ser.,
77, Astronomical Data Analysis Software and Systems IV, 4, 433Scalo, J. M., & Slavsky, D. B. 1980, ApJ, 239, L73Schoier, F. L., & Olofsson, H. 2001, A&A, 368, 969Struck, C., Smith, D. C., Willson, L. A., Turner, G., & Bowen, G. H.
2004, MNRAS, submittedvan Zadelhoff, G.-J., Dullemond, C. P., van der Tak, F. F. S., et al.
2002, A&A, 395, 373Willacy, K., & Millar, T. J. 1997, A&A, 324, 237Winters, J. M., Keady, J. J., Gauger, A., & Sada, P. V. 2000a, A&A,
359, 651Winters, J. M., Le Bertre, T., Jeong, K. S., Helling, C., & Sedlmayr,
E. 2000b, A&A, 361, 641Winters, J. M., Le Bertre, T., Nyman, L.-Å., Omont, A., & Jeong, K. S.
2002, A&A, 388, 609Winters, J. M., Le Bertre, T., Jeong, K. S., Nyman, L.-Å., & Epchtein,
N. 2003, A&A, 409, 715Wong, T., Schoier, F. L., Lindqvist, M., & Olofsson, H. 2004, A&A,
413, 241Zubko, V., & Elitzur, M. 2000, ApJ, 544, L137
Related Documents