Probing confined and unconfined hemoglobin molecules with photoacoustics Ratan K. Saha* a , Subhajit Karmakar b , and Madhusudan Roy a a Surface Physics and Material Science Division, Saha Institute of Nuclear Physics, Kolkata, India; b University Science Instrumentation Centre, The University of Burdwan, Bardhaman, India ABSTRACT Photoacoustic (PA) measurements on confined and unconfined hemoglobin molecules are presented. In vitro experiments were performed with porcine red blood cells (RBCs) at 532 and 1064 nm at various laser fluences. Fluence was gradually changed from 8 to 21 mJ/cm 2 /pulse for 532 nm and 353 to 643 mJ/cm 2 /pulse for 1064 nm. PA signals from suspended RBCs (SRBCs) and hemolyzed RBCs (HRBCs) were measured using a needle hydrophone at hematocrits ranging from 10 to 60%. PA amplitude was found to be varied linearly with the laser fluence for each type of samples at the above two optical radiations. At 532 nm, PA signals from SRBCs and HRBCs were measured to be nearly equal, whereas, at 1064 nm, signal amplitude for SRBCs was approximately 2 times higher than that of HRBCs. The results suggest that it may be feasible to detect hemolysis with PAs. Keywords: Red blood cells, hemoglobin, hemolysis, photoacoustics 1. INTRODUCTION 1.1 Hemolysis and its detection Under various circumstances red blood cell (RBC) membrane may get ruptured resulting in the release of cellular content [i.e. hemoglobin (Hb)] into the ambient medium, known as hemolysis 1,2 . It hampers normal functioning (i.e. transportation of nutrients, oxygen and waste) of blood circulatory system and may cause severe health problems leading to multi-organ failure. Bacterial and parasitic infections are sometimes responsible for in vivo hemolysis. Some autoimmune and genetic disorders can also cause in vivo premature break down of RBC membrane. In vitro puncture of RBC membrane can take place mainly due to human errors during blood collection, processing, and transportation. Besides, there are other factors (e.g. rapid temperature variation, pH change, effect of anticoagulation agents) that may also lead to hemolysis. The amount of free Hb in blood plasma with respect to the total Hb defines the degree of hemolysis and it needs to be quantified at various clinical situations for treatment planning. The quantification of hemolysis through visual inspection is a simple and fast method, although it is not very accurate. It appears from literature survey that best approaches to detect and quantify Hb in blood plasma remain to be the spectroscopy based methods 1 . To the best of our knowledge the effect of hemolysis has never been studied with photoacoustics (PAs). 1.2 Review of photoacoustic imaging technique PA technology has grown as a promising biomedical imaging modality over the past decade 3,4,5 . Biological tissue to be imaged is illuminated by a nano-second pulsed laser radiation belonging to the visible or near-infrared part of the electromagnetic spectrum (550-900 nm). Tissue chromophores absorb light energy resulting in a temperature rise on the order of mK and ultrasonic waves are induced due to thermoelastic expansion. The pressure waves after propagating through the tissue medium are detected using an ultrasonic transducer. PA imaging modality has been found to be implemented at two settings, namely, PA microscopy and PA tomography 3,4,5 . In the first case, confocal arrangement is preferred to efficiently deliver light and ultrasonic waves are received with a focused transducer. A depth resolved A-line is obtained for such a configuration and transverse scanning generates a 3D image 3,4 . In the second case, pressure waves from a planner region are captured in general using transducers positioned at various angular locations and an image is formed via a reconstruction algorithm 3,5 . *[email protected] Photons Plus Ultrasound: Imaging and Sensing 2014, edited by Alexander A. Oraevsky, Lihong V. Wang, Proc. of SPIE Vol. 8943, 89434L · © 2014 SPIE · CCC code: 1605-7422/14/$18 · doi: 10.1117/12.2040403 Proc. of SPIE Vol. 8943 89434L-1 Downloaded From: http://proceedings.spiedigitallibrary.org/ on 03/08/2014 Terms of Use: http://spiedl.org/terms

Welcome message from author
This document is posted to help you gain knowledge. Please leave a comment to let me know what you think about it! Share it to your friends and learn new things together.
Transcript
Probing confined and unconfined hemoglobin molecules with photoacoustics
Ratan K. Saha*a, Subhajit Karmakarb, and Madhusudan Roya
aSurface Physics and Material Science Division, Saha Institute of Nuclear Physics, Kolkata, India; bUniversity Science Instrumentation Centre, The University of Burdwan, Bardhaman, India
ABSTRACT
Photoacoustic (PA) measurements on confined and unconfined hemoglobin molecules are presented. In vitro experiments were performed with porcine red blood cells (RBCs) at 532 and 1064 nm at various laser fluences. Fluence was gradually changed from 8 to 21 mJ/cm2/pulse for 532 nm and 353 to 643 mJ/cm2/pulse for 1064 nm. PA signals from suspended RBCs (SRBCs) and hemolyzed RBCs (HRBCs) were measured using a needle hydrophone at hematocrits ranging from 10 to 60%. PA amplitude was found to be varied linearly with the laser fluence for each type of samples at the above two optical radiations. At 532 nm, PA signals from SRBCs and HRBCs were measured to be nearly equal, whereas, at 1064 nm, signal amplitude for SRBCs was approximately 2 times higher than that of HRBCs. The results suggest that it may be feasible to detect hemolysis with PAs. Keywords: Red blood cells, hemoglobin, hemolysis, photoacoustics
1. INTRODUCTION 1.1 Hemolysis and its detection
Under various circumstances red blood cell (RBC) membrane may get ruptured resulting in the release of cellular content [i.e. hemoglobin (Hb)] into the ambient medium, known as hemolysis1,2. It hampers normal functioning (i.e. transportation of nutrients, oxygen and waste) of blood circulatory system and may cause severe health problems leading to multi-organ failure. Bacterial and parasitic infections are sometimes responsible for in vivo hemolysis. Some autoimmune and genetic disorders can also cause in vivo premature break down of RBC membrane. In vitro puncture of RBC membrane can take place mainly due to human errors during blood collection, processing, and transportation. Besides, there are other factors (e.g. rapid temperature variation, pH change, effect of anticoagulation agents) that may also lead to hemolysis. The amount of free Hb in blood plasma with respect to the total Hb defines the degree of hemolysis and it needs to be quantified at various clinical situations for treatment planning. The quantification of hemolysis through visual inspection is a simple and fast method, although it is not very accurate. It appears from literature survey that best approaches to detect and quantify Hb in blood plasma remain to be the spectroscopy based methods1. To the best of our knowledge the effect of hemolysis has never been studied with photoacoustics (PAs). 1.2 Review of photoacoustic imaging technique
PA technology has grown as a promising biomedical imaging modality over the past decade3,4,5. Biological tissue to be imaged is illuminated by a nano-second pulsed laser radiation belonging to the visible or near-infrared part of the electromagnetic spectrum (550-900 nm). Tissue chromophores absorb light energy resulting in a temperature rise on the order of mK and ultrasonic waves are induced due to thermoelastic expansion. The pressure waves after propagating through the tissue medium are detected using an ultrasonic transducer. PA imaging modality has been found to be implemented at two settings, namely, PA microscopy and PA tomography3,4,5. In the first case, confocal arrangement is preferred to efficiently deliver light and ultrasonic waves are received with a focused transducer. A depth resolved A-line is obtained for such a configuration and transverse scanning generates a 3D image3,4. In the second case, pressure waves from a planner region are captured in general using transducers positioned at various angular locations and an image is formed via a reconstruction algorithm3,5.
Photons Plus Ultrasound: Imaging and Sensing 2014, edited by Alexander A. Oraevsky, Lihong V. Wang, Proc. of SPIE Vol. 8943, 89434L · © 2014 SPIE · CCC code: 1605-7422/14/$18 · doi: 10.1117/12.2040403
Proc. of SPIE Vol. 8943 89434L-1
Downloaded From: http://proceedings.spiedigitallibrary.org/ on 03/08/2014 Terms of Use: http://spiedl.org/terms

PA microscopy technique has been successfully utilized by Wang group to generate anatomical images of both the superficial epidermis and deep dermis4. Longitudinal imaging of tumor angiogenesis has also been performed by the same group using their set up in rat model elucidating that complexity of vascular network is higher in tumor region than surrounding healthy tissue. Tissue oxygenation map in mice was also generated based on PA measurements at four different optical wavelengths. It may be mentioned here that Esenaliev et al., developed a multi-wavelength PA system for noninvasive monitoring of cerebral venous oxygenation6,7. They applied the system for in vivo assessment of cerebral venous oxygenation from the area of sheep neck and found good correlation between measured PA profile and actual blood oxygenation. PA tomography imaging technique, on the other hand, has been explored in various branches of biology and medicine5. Examples include vascular biology, oncology, neurology, ophthalmology, dermatology etc.
Many investigators demonstrated that PA technique may contribute to cancer imaging8,9,10. In many cases metallic and nonmetallic nanoparticles have been used to achieve higher sensitivity of this technique. For example, Eghtedari et al., used spherical gold nanoparticles attach to monoclonal antibody to target cell surface of breast cancer cells9. They showed that PA tomography technique is capable to detect a tumor region containing nanoparticle targeted cells implanted at a depth 5-6 cm in a breast phantom. Zerda et al., revealed that single-walled carbon nanotubes conjugated with cyclic Arg-Gly-Asp (RGD) peptides can be used as a contrast agent for PA imaging of tumours in living mice10. Intravenous administration of these targeted nanotubes to mice bearing tumours showed eight times greater PA signal in the tumour than mice injected with non-targeted nanotubes.
1.2 Photoacoustic measurements from circulating and single cells
PA technique has also been employed to detect melanoma cells in circulatory systems11,12,13. In an earlier study, Weight et al. showed that PA technique has the ability to detect melanotic melanoma cells in a test solution11. Galanzha et al., built a time-resolved PA flow cytometry set up capable to detect circulating squamous cell carcinoma cells labeled with gold nanorods in vivo and nonlabeled melanoma cells in relatively slow lymph nodes12. Strohm et al., carried out PA measurements of melanoma cells using ultra high frequency bandwidth transducers (~ 375 MHz)13. The advantage of use of such transducers is that it enables to perform spectral analysis over a wide frequency range. It has been shown that spectral features depend upon size and shape of the single cells13,14. For instance, power spectrum for a spherical RBC passes through minima, whose locations are known from theory15. 1.3 Single particle theoretical model and photoacoustic tissue characterization
Such an observation confirms that acoustic emission takes place in the cellular level, however, light absorption takes place in the molecular level. This has been served as a fundamental assumption of a recently developed theoretical model16. The model considers tissue as a collection of cells and PA field generated by a tissue can be expressed as the sum of fields emitted by the individual cells. For example, in case of blood, RBCs act as the sources of acoustic waves and PA field generated by blood can be obtained by summing the fields produced by those RBCs (other corpuscles in blood do not contain any chromophores and thus, do not produce acoustic waves.). This is known as single particle approach. This framework successfully explains various experimental results16,17,18. It also predicts that it may be feasible to stage intraerythrocytic development of malarial parasite with PAs if suitable optical radiations are used to excite the cells19. Further, it suggests that tissue characterization may be possible with PAs by analyzing PA signals in the ultrasonic frequency domain and by employing correlation models. Wang et al., recently based on this approach accurately measured the dimensions (49, 94.8 and 199 μm) of particles hidden in turbid phantoms20.
Figure 1. (a) Photographs of samples with HRBCs (left test tube) and SRBCs (right test tube). (b) and (c) Microscopic images of HRBCs and SRBCs, respectively.
(a) (b) (c)
Proc. of SPIE Vol. 8943 89434L-2
Downloaded From: http://proceedings.spiedigitallibrary.org/ on 03/08/2014 Terms of Use: http://spiedl.org/terms
J
DC couplerIA
n
Oscilloscope
Nd:YAG laser
Hydrophone
1.4 Photoacoustics as a blood characterization tool
An important aspect of this model is that it assumes chromophores are confined within the cells. It seems to be a valid approximation for blood because Hb is a strong absorber of light and packaged within RBCs. The discrete nature of PA sources is not clearly discussed in the earlier literature3-7 and moreover, it appears that chormophores are assumed to be homogeneously distributed in blood in those studies. In this work, we experimentally investigate the role of confinement of Hb on PA emission. Therefore, in vitro PA measurements have been conducted with suspended RBCs (SRBCs) for which Hb molecules are confined and hemolyzed RBCs (HRBCs) for which Hb molecules are unconfined at 532 and 1064 nm incident laser radiations. Our results exhibit that PA responses of these samples are light frequency dependent.
2. MATERIALS AND METHODS 2.1 Sample preparation
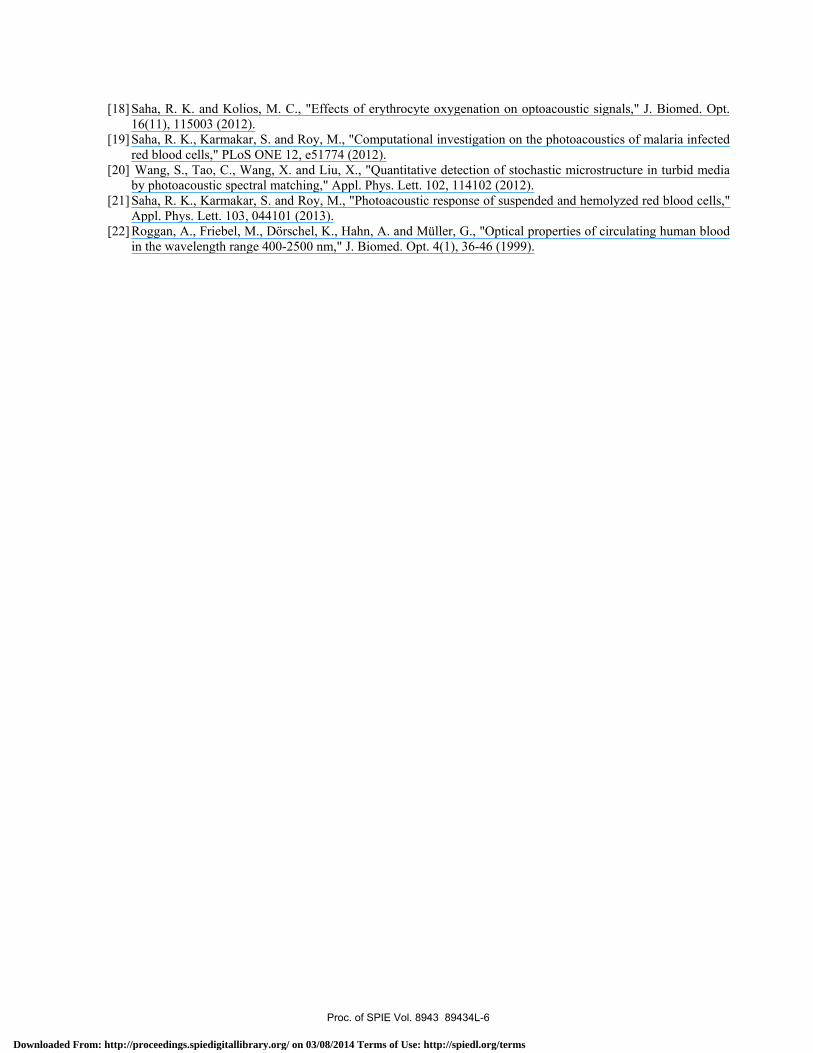
Fresh pig blood was collected from a local slaughterhouse and ethylene diamine tetra acetic acid (EDTA) was mixed with the blood at 3 g/l to avoid its coagulation. The blood was centrifuged at 3000 rpm for 30 min at 4 oC to separate RBCs from other blood contents. Concentrated RBCs were obtained by carefully removing plasma, buffy coat and white blood cells. RBC concentrate was then washed twice with phosphate buffered saline (PBS). PBS was prepared by dissolving 8.0 g/l sodium chloride, 0.2 g/l potassium chloride, 1.45 g/l disodium phosphate, and 0.24 g/l monopotassium phosphate in distilled water (pH was adjusted to 7.4). A batch of samples was prepared by suspending concentrated RBCs in PBS to achieve hematocrits of about 10, 20, 30, 40, 50 and 60%. Another batch of samples at those hematocrit levels was prepared by pouring packed RBCs in hypotonic solution. The hypotonic solution was prepared by mixing 5 mM sodium phosphate buffer with pH 7.4, 1mM EDTA and 20 μg/ml phenylmethylsulfonyl fluoride. Note that each sample of this batch was left undisturbed for 1 h. This allowed water to go inside the cells making them to swell and finally releasing their contents into the medium due to explosion. These samples were further centrifuged at 14000 rpm for 1 h to prepare lysates. Fig. 1(a) displays a photograph of samples with HRBCs and SRBCs at 40% hematocrit. The solution with SRBCs looks cloudy due to scattering of light by the cells. However, the other solution is relatively transparent because it does not to contain any cells to scatter light. Two sample t-test was performed on SRBC and HRBC data at 5% significance level for 532 nm input beam.
Figure 2. (a) Block diagram of the experimental arrangement.
2.2 Microscopy studies
Microscopic images of HRBCs and SRBCs are shown in Figs. 1(b) and (c), respectively (Axiovert 40 C, Carl Zeiss, GmbH Austria). Fig. 1(b) illustrates that the blood sample lost its cellular structure, instead turned into a solution being filled in by small dots known as debris. On the contrary, Fig. 1(c) exhibits that the blood sample retains its cellular morphology.
2.3 Photoacoustic measurements
A Q-switched pulsed Nd:YAG laser with 20 Hz pulse repetition frequency, 5 ns pulse width and 6 mm beam diameter (Brilliant, Quantel, France) was used to illuminate the samples. PA measurements were performed at 532 and 1064 nm wavelengths. PA signals were measured at energy levels 8, 13, 18 and 21 mJ/cm2/pulse for 532 nm incident beam and at
Proc. of SPIE Vol. 8943 89434L-3
Downloaded From: http://proceedings.spiedigitallibrary.org/ on 03/08/2014 Terms of Use: http://spiedl.org/terms

>
5
0
M SRBCsMa HRBCsf t.
(a)
Qa20
10
0
(b)
= =
8 13 18 21
Energy (mJ /cm2 /pulse)
M SRBCs- E HRBCs
1I(e)
E -
5
01.
353 525 618 643
Energy (mJ /cm2 /pulse)
353, 525, 618 and 643 mJ/cm2/pulse for 1064 nm laser radiation. PA signals were detected by a needle hydrophone of 1 mm diameter in the forward direction (Precision Acoustics, UK). The signals were displayed and recorded in a digital oscilloscope (TDS5034B, Tektronix Inc., USA). For each sample 100 such signals were recorded. A schematic diagram of the experimental arrangement is shown in Fig. 2. PA measurements were conducted at the room temperature and within 12 h from blood collection. A transparent glass cuvette was used to load a sample (Optiglass, UK; 45- x 12.5- x 32.5 mm). The cuvette was placed in the central region of the water tank in the path of the laser beam. Moreover, each sample was shaken rigorously to attain homogeneity before loading into the cleaned and dried cuvette.
3. RESULTS AND DISCUSSION 3.1 Experimental results
Representative plots of experimental data are shown in Fig. 3. PA amplitudes as a function of laser energy are displayed in Fig. 3(a) for SRBCs and HRBCs at 20% hematocrit and for 532 nm incident beam. It can be noticed that signal amplitude increases as the excitation energy increases for both types of samples. Further, PA amplitude for HRBCs is marginally higher (p << 0.05) than that of SRBCs for 20 and 60% hematocrits at 13, 18 and 21 mJ of laser energies and at 40% hematocrit at 21 mJ of laser energy as shown in Figs. 3(a), (b) and (c). However, mean PA amplitudes for HRBC and SRBC samples are equal (p > 0.05) at 40% hematocrit level for first three laser energies and at 60% hematocrit level for minimum incident laser fluence [see Figs. 3(b) and (c)]. Fig. 3(e) illustrates how PA amplitude varies with the input laser energy at 20% hematocrit when 1064 nm beam irradiates the sample. PA amplitude increases with increasing laser energy for both the samples in this case too. However, PA amplitude for SRBCs is about 2 times higher than that of HRBCs at each energy level. This trend is also observed for 40 and 60% hematocrits as demonstrated in Figs. 3(f) and (g), respectively.
Figure 3. (a), (b), (c) Plots of PA amplitude as a function of incident laser energy at 532 nm beam for 20, 40 and 60% hematocrits, respectively. (e), (f), (g) Same as (a), (b), (c), respectively but for 1064 nm exciting radiation.
3.2 Interpretation of the results
It is observed that PA signal amplitude increases linearly with incident beam energy for each radiation as well as for each type of samples. It is expected because PA signal strength varies linearly with laser fluence. It can further be seen that at 532 nm SRBCs and HRBCs produce PA signals of almost equal amplitudes, however, at 1064 nm difference in PA amplitudes is significant at each energy level and each hematocrit. It may be noted that absorption of light by Hb is equal for both SRBCs and HRBCs. Nevertheless, scattering and internal reflections of photons at the cellular boundaries may play roles contributing to such an optical wavelength dependent PA behavior for SRBCs with respect to HRBCs21,22. It is known that scattering of light contributes to loss of photons but internal reflections of photons enhance light absorption owing to increased optical path length. At 532 nm scattering of light by cells is high and therefore, these two factors may have counter balanced each other and accordingly, the difference in PA amplitude from SRBCs and HRBCs is insignificant. In case of 1064 nm, scattering of light by cells is less and therefore, the other factor may dominate leading to greater PA emission from SRBCs than that of HRBCs.
Proc. of SPIE Vol. 8943 89434L-4
Downloaded From: http://proceedings.spiedigitallibrary.org/ on 03/08/2014 Terms of Use: http://spiedl.org/terms

4. CONCLUSIONS The effect of hemolysis was studied with PAs by conducting in vitro experiments with porcine RBCs. PA signals from SRBCs and HRBCs at two incident optical wavelengths were measured. Hb molecules are confined for SRBCs and unconfined for HRBCs. The signal strengths for SRBCs and HRBCs were found to be nearly equal at 532 nm. However, PA amplitude for SRBCs was observed to be approximately 2 times higher than that of HRBCs at 1064 nm. This work suggests that hemolysis could be detected using PA technique. In future, an attempt may be made to investigate PA signals from partially hemolyzed blood samples mimicking real situations and to examine the sensitivity and accuracy of this technique.
5. ACKNOWLEDGEMENTS The financial support of CSIR awarded to R K Saha is gratefully acknowledged. The authors would like to thank Profs. S Basu, A Chakraborty, R Banerjee, C C Dey and A Datta of SINP and N Chattopadhyay of JU for providing laboratory facilities. The assistance from S Mallik, A Goshal and S Barman are also gratefully acknowledged.
REFERENCES
[1] Sowemimo-Coker, S. O., "Red blood cell hemolysis during processing," Transfus. Med. Rev. 16(1), 46-60 (2002).
[2] Choudhury, N. and Mathur, A., "Visual detection of hemolysis in a blood bag before issue," Asian J. Transfus. Sci. 5(1), 61-62 (2011).
[3] Beard, P., "Biomedical photoacoustic imaging," Interface Focus 1, 602-631 (2011). [4] Zhang, H. F., Maslov, K., Stoica, G. and Wang, L. V., "Functional photoacoustic microscopy for high-
resolution and noninvasive in vivo imaging," Nature Biotechnology 24(7), 848-851 (2006). [5] Wang, L. V. and Hu, S., "Photoacoustic Tomography: In Vivo Imaging of Organelles to Organs", Science 335,
1458-1462 (2012). [6] Esenaliev, R. O., Larina, I. V., Larin, K. V., Deyo, D. J., Motamedi, M., and Prough, D. S., "Optoacoustic
technique for noninvasive monitoring of blood oxygenation: a feasibility study," Appl. Opt. 41(22), 4722-4731 (2002).
[7] Brecht, H. P., Prough, D. S., Petrov, Y. Y., Patrikeev, I., Petrova, I. Y., Deyo, D. J., Cicenaite, I., and Esenaliev, R. O., "In vivo monitoring of blood oxygenation in large veins with a triple-wavelength optoacoustic system," Opt. Express 15(24), 16261-16269 (2007).
[8] Mallidi, S., Luke, G. P., Emelianov, S., "Photoacoustic imaging in cancer detection diagnosis, and treatment guidance," Trends Biotechnol. 29(5), 213-221 (2011).
[9] Eghtedari, M., Motamedi, M., Popov, V. L., Kotov, N. A., and Oraevsky, A. A., "Optoacoustic imaging of gold nanoparticles targeted to breast cancer cells," Proc. SPIE 5320, 21-28 (2004).
[10] Zerda, A. D. L., et al., "Carbon nanotubes as photoacoustic molecular imaging agents in living mice," Nature Nanotechnology 3, 557-562 (2008).
[11] Weight, R. M., Viator, J. A., Dale, P. S., Caldwell, C. W., and Lisle, A. E., "Photoacoustic detection of metastatic melanoma cells in the human circulatory system," Opt. Lett. 31(20), 2998-3000 (2006).
[12] Galanzha, E., et al., "In vivo, noninvasive, label-free detection and eradication of circulating melanoma cells using two-color photoacoustic cytometry with a diode laser," Cancer Res. 69(20), 7926-7934 (2009).
[13] Strohm, E., Berndl, E. S. L., and Kolios, M. C., "High frequency label-free photoacoustic microscopy of single cells," Photoacoustics 1, 49-53 (2013).
[14] Strohm, E., Berndl, E. S. L., and Kolios, M. C., "Probing red blood cell morphology using high frequency photoacoustics," Biophysical Journal 105(1), 59-67 (2013).
[15] Diebold,G. J., Sun, T. and Khan, M. I., "Photoacoustic monopole radiation in one, two, and three dimensions," Phys. Rev. Lett. 67, 3384-3387 (1991).
[16] Saha, R. K. and Kolios, M. C., "A simulation study on photoacoustic signals from red blood cells," J. Acoust. Soc. Am. 129(5), 2935-2943 (2011).
[17] Hysi, E., Saha, R. K. and Kolios, M. C., "Photoacoustic ultrasound spectroscopy for assessing red blood cell aggregation and oxygenation," J. Biomed. Opt. 17(12), 125006 (2012).
Proc. of SPIE Vol. 8943 89434L-5
Downloaded From: http://proceedings.spiedigitallibrary.org/ on 03/08/2014 Terms of Use: http://spiedl.org/terms
[18] Saha, R. K. and Kolios, M. C., "Effects of erythrocyte oxygenation on optoacoustic signals," J. Biomed. Opt. 16(11), 115003 (2012).
[19] Saha, R. K., Karmakar, S. and Roy, M., "Computational investigation on the photoacoustics of malaria infected red blood cells," PLoS ONE 12, e51774 (2012).
[20] Wang, S., Tao, C., Wang, X. and Liu, X., "Quantitative detection of stochastic microstructure in turbid media by photoacoustic spectral matching," Appl. Phys. Lett. 102, 114102 (2012).
[21] Saha, R. K., Karmakar, S. and Roy, M., "Photoacoustic response of suspended and hemolyzed red blood cells," Appl. Phys. Lett. 103, 044101 (2013).
[22] Roggan, A., Friebel, M., Dӧrschel, K., Hahn, A. and Müller, G., "Optical properties of circulating human blood in the wavelength range 400-2500 nm," J. Biomed. Opt. 4(1), 36-46 (1999).
Proc. of SPIE Vol. 8943 89434L-6
Downloaded From: http://proceedings.spiedigitallibrary.org/ on 03/08/2014 Terms of Use: http://spiedl.org/terms
Related Documents