Probability Matching-based Adaptive Strategy Selection vs. Uniform Strategy Selection within Differential Evolution An Empirical Comparison on the BBOB-2010 Noiseless Testbed Álvaro Fialho Microsoft Research – INRIA Joint Centre Parc Orsay Université 91893 Orsay, France alvaro.fi[email protected] Wenyin Gong School of Computer Science China University of Geosciences Wuhan, 430074 P.R. China [email protected] Zhihua Cai School of Computer Science China University of Geosciences Wuhan, 430074 P.R. China [email protected] ABSTRACT Different strategies can be used for the generation of new candidate solutions on the Differential Evolution algorithm. However, the definition of which of them should be ap- plied to the problem at hand is not trivial, besides be- ing a sensitive choice with relation to the algorithm per- formance. In this paper, we use the BBOB-2010 noiseless benchmarking suite to further empirically validate the Prob- ability Matching-based Adaptive Strategy Selection (PM- AdapSS-DE ) [4], a method proposed to automatically select the mutation strategy to be applied, based on the relative fitness improvements recently achieved by the application of each of the available strategies on the current optimiza- tion process. It is compared with what would be a time- less (na¨ ıve) choice, the uniform strategy selection within the same sub-set of strategies. Categories and Subject Descriptors G.1.6 [Numerical Analysis]: Optimization—global opti- mization, unconstrained optimization; F.2.1 [Analysis of Algorithms and Problem Complexity]: Numerical Al- gorithms and Problems General Terms Algorithms Keywords Benchmarking, Black-box optimization, Adaptive Strategy Selection, Differential Evolution. 1. INTRODUCTION Differential Evolution (DE) is a simple yet powerful evo- lutionary algorithm, that uses the weighted difference be- tween two or more candidate solutions to generate a new Permission to make digital or hard copies of all or part of this work for personal or classroom use is granted without fee provided that copies are not made or distributed for profit or commercial advantage and that copies bear this notice and the full citation on the first page. To copy otherwise, to republish, to post on servers or to redistribute to lists, requires prior specific permission and/or a fee. GECCO’10, July 7–11, 2010, Portland, Oregon, USA. Copyright 2010 ACM 978-1-4503-0073-5/10/07 ...$10.00. one. Proposed by Storn and Price [13], the DE algorithm was initially provided with a single mutation strategy for its offspring generation. Ten other strategies were lately sug- gested by the same authors [11], increasing the robustness of the algorithm with relation to many different application domains, such as data mining, pattern recognition, digital filter design, neural network training, etc. But, although bringing advantages, such flexibility creates an extra difficulty to the user. Given an optimization prob- lem, there are no definitive guidelines or rules-of-thumb to assist the user into the definition of which strategy should be used. Such critical choice is usually done following the intuition, or by means of statistics over an expensive set of experiments (off-line tuning). The latter approach can be always used to find the best strategy; however, besides being computationally and timely expensive, it will very probably yield a sub-optimal choice. Intuitively, a subsequent use of strategies with different char- acteristics during the optimization process should achieve better performance, as the search tends to migrate from a global (early) exploration of the search space to a more fo- cused, exploitation-like behavior. This is the main motivation for the use of adaptive param- eter control methods, that automatically selects the strategy that should be applied for the generation of each offspring while solving the problem, based on their recent performance on the current optimization process, what is referred to as Adaptive Strategy Selection. In this paper, the BBOB-2010 noiseless benchmarking suite is used to further empirically validate a technique re- cently proposed to do so, the PM-AdapSS-DE [4]. For the sake of self-containedness, the description of the proposed adaptive method is resumed in Section 2, referring the reader to the original paper [4] for more a complete and detailed view. The rest of the paper is organized as follows. The settings used for the empirical comparison are presented in Section 3. The complete results are shown in Section 4, while Section 5 presents the timing complexity of each algorithm. Some final considerations conclude the paper in Section 6. 2. THE PM-ADAPSS-DE ALGORITHM Inspired by some recent works in the Genetic Algorithms community (see, e.g., [14, 1]), Adaptive Strategy Selection aims at automatically selecting between the available (pos- sibly ill-known) mutation strategies while solving the prob- inria-00494538, version 1 - 23 Jun 2010 Author manuscript, published in "GECCO 2010 Workshop on Black-Box Optimization Benchmarking (2010)"

Welcome message from author
This document is posted to help you gain knowledge. Please leave a comment to let me know what you think about it! Share it to your friends and learn new things together.
Transcript
Probability Matching-based Adaptive Strategy Selectionvs. Uniform Strategy Selection within Differential Evolution
An Empirical Comparison on the BBOB-2010 Noiseless Testbed
Álvaro FialhoMicrosoft Research – INRIA
Joint CentreParc Orsay Université91893 Orsay, France
Wenyin GongSchool of Computer Science
China University ofGeosciences
Wuhan, 430074 P.R. [email protected]
Zhihua CaiSchool of Computer Science
China University ofGeosciences
Wuhan, 430074 P.R. [email protected]
ABSTRACTDi!erent strategies can be used for the generation of newcandidate solutions on the Di!erential Evolution algorithm.However, the definition of which of them should be ap-plied to the problem at hand is not trivial, besides be-ing a sensitive choice with relation to the algorithm per-formance. In this paper, we use the BBOB-2010 noiselessbenchmarking suite to further empirically validate the Prob-ability Matching-based Adaptive Strategy Selection (PM-AdapSS-DE) [4], a method proposed to automatically selectthe mutation strategy to be applied, based on the relativefitness improvements recently achieved by the applicationof each of the available strategies on the current optimiza-tion process. It is compared with what would be a time-less (naıve) choice, the uniform strategy selection within thesame sub-set of strategies.
Categories and Subject DescriptorsG.1.6 [Numerical Analysis]: Optimization—global opti-mization, unconstrained optimization; F.2.1 [Analysis ofAlgorithms and Problem Complexity]: Numerical Al-gorithms and Problems
General TermsAlgorithms
KeywordsBenchmarking, Black-box optimization, Adaptive StrategySelection, Di!erential Evolution.
1. INTRODUCTIONDi!erential Evolution (DE) is a simple yet powerful evo-
lutionary algorithm, that uses the weighted di!erence be-tween two or more candidate solutions to generate a new
Permission to make digital or hard copies of all or part of this work forpersonal or classroom use is granted without fee provided that copies arenot made or distributed for profit or commercial advantage and that copiesbear this notice and the full citation on the first page. To copy otherwise, torepublish, to post on servers or to redistribute to lists, requires prior specificpermission and/or a fee.GECCO’10, July 7–11, 2010, Portland, Oregon, USA.Copyright 2010 ACM 978-1-4503-0073-5/10/07 ...$10.00.
one. Proposed by Storn and Price [13], the DE algorithmwas initially provided with a single mutation strategy for itso!spring generation. Ten other strategies were lately sug-gested by the same authors [11], increasing the robustnessof the algorithm with relation to many di!erent applicationdomains, such as data mining, pattern recognition, digitalfilter design, neural network training, etc.
But, although bringing advantages, such flexibility createsan extra di"culty to the user. Given an optimization prob-lem, there are no definitive guidelines or rules-of-thumb toassist the user into the definition of which strategy shouldbe used. Such critical choice is usually done following theintuition, or by means of statistics over an expensive set ofexperiments (o!-line tuning).
The latter approach can be always used to find the beststrategy; however, besides being computationally and timelyexpensive, it will very probably yield a sub-optimal choice.Intuitively, a subsequent use of strategies with di!erent char-acteristics during the optimization process should achievebetter performance, as the search tends to migrate from aglobal (early) exploration of the search space to a more fo-cused, exploitation-like behavior.
This is the main motivation for the use of adaptive param-eter control methods, that automatically selects the strategythat should be applied for the generation of each o!springwhile solving the problem, based on their recent performanceon the current optimization process, what is referred to asAdaptive Strategy Selection.
In this paper, the BBOB-2010 noiseless benchmarkingsuite is used to further empirically validate a technique re-cently proposed to do so, the PM-AdapSS-DE [4]. For thesake of self-containedness, the description of the proposedadaptive method is resumed in Section 2, referring the readerto the original paper [4] for more a complete and detailedview. The rest of the paper is organized as follows. Thesettings used for the empirical comparison are presented inSection 3. The complete results are shown in Section 4, whileSection 5 presents the timing complexity of each algorithm.Some final considerations conclude the paper in Section 6.
2. THE PM-ADAPSS-DE ALGORITHMInspired by some recent works in the Genetic Algorithms
community (see, e.g., [14, 1]), Adaptive Strategy Selectionaims at automatically selecting between the available (pos-sibly ill-known) mutation strategies while solving the prob-
inria
-004
9453
8, v
ersi
on 1
- 23
Jun
201
0Author manuscript, published in "GECCO 2010 Workshop on Black-Box Optimization Benchmarking (2010)"
lem. Two components are needed to achieve such objective:the Credit Assignment scheme defines how to assess the per-formance of each strategy, measuring the impact of its appli-cations on the progress of the current search/optimizationprocess; while the Strategy (or Operator) Selection mech-anism sets how the strategies are chosen, based on theirknown performance.
In the PM-AdapSS-DE algorithm, the relative fitness im-provement !i, proposed in [9], was adopted to assess theperformance of each strategy application, which can be for-malized as follows:
!i ="
cfi· |pfi ! cfi| (1)
where i = 1, · · · , NP , being NP the population size, " thefitness of the best-so-far solution in the population, and pfi
and cfi, the fitness of the target parent and of its o!spring,respectively. In case of no improvement (i.e., the o!springis worse than or equal to its target parent), a null reward isawarded. Finally, the credit assigned to each strategy is theabsolute average value (referred to as AvgAbs in the originalpaper [4]) of the rewards received by them during a givenperiod (a generation in this case).
This credit is used by the Probability Matching (PM)technique to update the known empirical quality of eachstrategy. Its impact on the update of this estimate is weightedby a user-defined parameter, the adaptation rate # ! ]0, 1][3]. The probability of selection of each strategy is then de-fined proportionally to its known performance, possibly be-ing lower bounded by another user-defined parameter, theminimal probability pmin, which ensures that no strategygets lost during the process [14].
The coupling of such elements with the DE algorithm,referred to as the PM-AdapSS-DE, is shown in Algorithm 1,reproduced from [4]. The modified steps with respect to theclassical DE algorithm are marked with a left arrow “"”.Summarizing, at each generation t, for each target parent i,a strategy SIi is selected based on the probability of eachstrategy. The o!spring is generated with such strategy, andits impact (the relative fitness improvement !i) is calculatedand stored in the set SSIi . Consequently, at the end of eachgeneration, the assigned credit, quality, and probability ofeach strategy are updated.
3. EXPERIMENTAL SETTINGSGiven that the objective of the present work is to vali-
date the ability of the proposed Adaptive Strategy Selectionapproach, a sub-set of 4 strategies was arbitrarily chosen,listed as follows.
1) “DE/rand/1”: vi = xr1 + F ·`xr2 # xr3
´
2) “DE/rand/2”: vi = xr1+F ·`xr2#xr3
´+F ·
`xr4#xr5
´
3) “DE/rand-to-best/2”: vi = xr1 + F ·`xbest # xr1
´+
F ·`xr2 # xr3
´+ F ·
`xr4 # xr5
´
4) “DE/current-to-rand/1”:vi = xi + F ·
`xr1 # xi
´+ F ·
`xr2 # xr3
´
where xi represents the current individual, xbest is the bestindividual in the current generation, r1, r2, r3, r4, r5 are in-dividuals randomly chosen from the population, being r1 $=r2 $= r3 $= r4 $= r5 $= i. F is the mutation scaling factor.
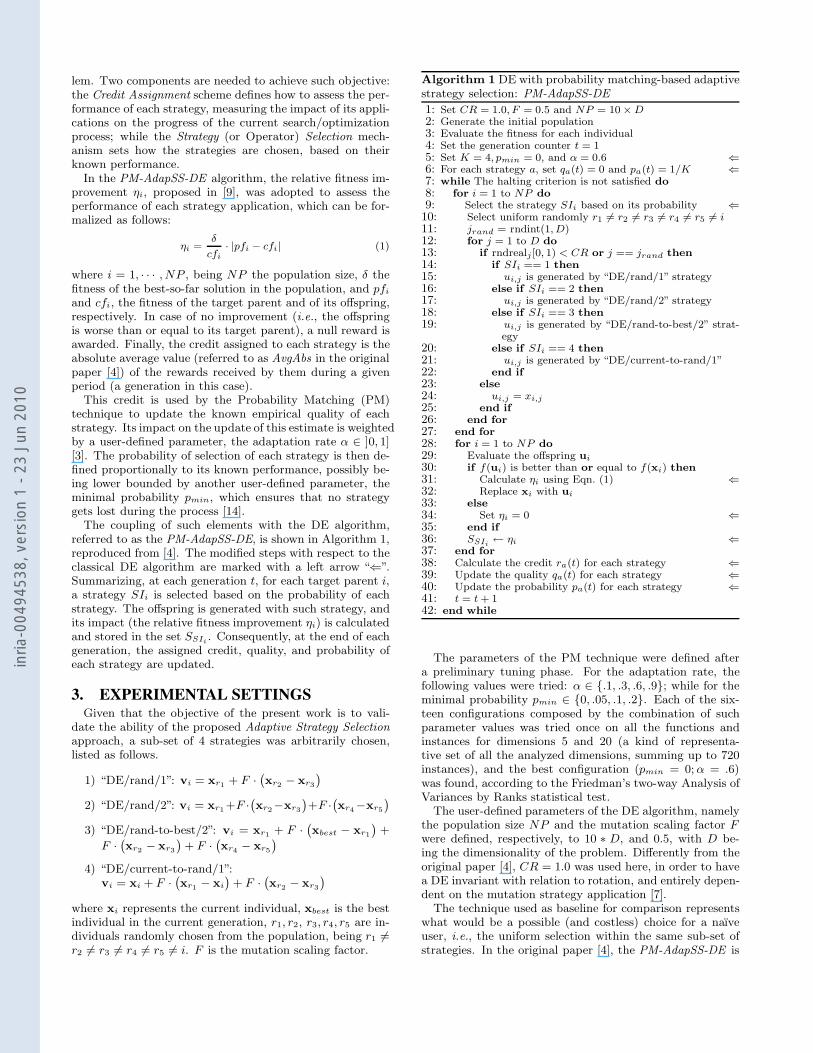
Algorithm 1 DE with probability matching-based adaptivestrategy selection: PM-AdapSS-DE1: Set CR = 1.0, F = 0.5 and NP = 10 " D2: Generate the initial population3: Evaluate the fitness for each individual4: Set the generation counter t = 15: Set K = 4, pmin = 0, and # = 0.6 #6: For each strategy a, set qa(t) = 0 and pa(t) = 1/K #7: while The halting criterion is not satisfied do8: for i = 1 to NP do9: Select the strategy SIi based on its probability #10: Select uniform randomly r1 $= r2 $= r3 $= r4 $= r5 $= i11: jrand = rndint(1, D)12: for j = 1 to D do13: if rndrealj [0, 1) < CR or j == jrand then14: if SIi == 1 then15: ui,j is generated by “DE/rand/1” strategy16: else if SIi == 2 then17: ui,j is generated by “DE/rand/2” strategy18: else if SIi == 3 then19: ui,j is generated by “DE/rand-to-best/2” strat-
egy20: else if SIi == 4 then21: ui,j is generated by “DE/current-to-rand/1”22: end if23: else24: ui,j = xi,j25: end if26: end for27: end for28: for i = 1 to NP do29: Evaluate the o!spring ui30: if f(ui) is better than or equal to f(xi) then31: Calculate !i using Eqn. (1) #32: Replace xi with ui33: else34: Set !i = 0 #35: end if36: SSIi % !i #37: end for38: Calculate the credit ra(t) for each strategy #39: Update the quality qa(t) for each strategy #40: Update the probability pa(t) for each strategy #41: t = t + 142: end while
The parameters of the PM technique were defined aftera preliminary tuning phase. For the adaptation rate, thefollowing values were tried: # ! {.1, .3, .6, .9}; while for theminimal probability pmin ! {0, .05, .1, .2}. Each of the six-teen configurations composed by the combination of suchparameter values was tried once on all the functions andinstances for dimensions 5 and 20 (a kind of representa-tive set of all the analyzed dimensions, summing up to 720instances), and the best configuration (pmin = 0; # = .6)was found, according to the Friedman’s two-way Analysis ofVariances by Ranks statistical test.
The user-defined parameters of the DE algorithm, namelythe population size NP and the mutation scaling factor Fwere defined, respectively, to 10 % D, and 0.5, with D be-ing the dimensionality of the problem. Di!erently from theoriginal paper [4], CR = 1.0 was used here, in order to havea DE invariant with relation to rotation, and entirely depen-dent on the mutation strategy application [7].
The technique used as baseline for comparison representswhat would be a possible (and costless) choice for a naıveuser, i.e., the uniform selection within the same sub-set ofstrategies. In the original paper [4], the PM-AdapSS-DE is
inria
-004
9453
8, v
ersi
on 1
- 23
Jun
201
0
also compared to a DE implementing each of the strategiesalone, and to yet another adaptive scheme, known as SaDE[12] (with fixed CR and F in this case).
The experiments were performed following the BBOB guide-lines [5], with the maximum number of evaluations beingfixed at 105 %D. The mentioned parameter values were usedon all the experiments, for all dimensions, thus crafting ef-fort is equal to zero.
4. RESULTSResults from experiments according to [5] on the bench-
mark functions given in [2, 6] are presented in Figures 1,2 and 3 and in Table 1. The expected running time(ERT), used in the figures and table, depends on a giventarget function value, ft = fopt +#f , and is computed overall relevant trials as the number of function evaluations exe-cuted during each trial while the best function value did notreach ft, summed over all trials and divided by the numberof trials that actually reached ft [5, 10]. Statistical signif-icance is tested with the rank-sum test for a given target#ft (10!8 in Figure 1) using, for each trial, either the num-ber of needed function evaluations to reach #ft (invertedand multiplied by #1), or, if the target was not reached, thebest #f -value achieved, measured only up to the smallestnumber of overall function evaluations for any unsuccessfultrial under consideration.
5. CPU TIMING EXPERIMENTSFor the timing experiments, both algorithms were run on
f8 and restarted until at least 30 seconds (according to [5]).The experiments have been conducted with an Intel XeonE5345 processor (2.33 GHz) running Linux 2.6.31.12. Forthe PM-AdapSS-DE, the results were 1.6, 1.6, 1.6, 1.8, 2.1and 2.9 &10!6 seconds per function evaluation, for the di-mensions 2, 3, 5, 10, 20, 40 respectively. For the baselinetechnique, the Uniform-DE, the results were 3.3, 3.5 4.0,5.5, 8.3 and 16 &10!7 seconds per function evaluation, forthe dimensions 2, 3, 5, 10, 20, 40 respectively. The sameC++ implementation (gcc version 4.4.1) was used for both,with the only di!erence being the portions of code that re-fer to the strategy selection, thus the timing di!erence showsexactly the price to be paid for using this adaptive scheme.
6. FINAL CONSIDERATIONSThis work presented a more extensive empirical valida-
tion of the PM-AdapSS-DE, recently proposed in [4]. Thismethod provides Adaptive Strategy Selection capabilities tothe DE algorithm, by means of the Probability Matchingstrategy selection scheme, that selects the operators accord-ing to the relative fitness improvements brought by theirrecent applications.
The objective of this work was not to compete with thestate-of-the-art continuous optimizers, but rather to analyzethe advantages brought by the adaptive method when com-pared to the naıve (uniform) choice. Although in the multi-modal and weak-structure group of functions it was lessclear, improvements were achieved over the baseline methodin most of the functions, especially for the larger dimensions,being statistically equivalent otherwise. A possible explana-tion for the fewer successes concerning the smaller dimen-sions might lie in the fact that those experiments were tooshort to allow the adaptive scheme to learn and show its
skills. The ill-conditioned functions were the ones in whichthe advantages of the adaptive scheme was better shown.
There is still a lot of space for further improvements, espe-cially concerning the strategy selection mechanism. Otherschemes, such as the Adaptive Pursuit [14] and the Bandit-based approaches [1] should be analyzed. Another paththat could also be explored lies in the automatic adapta-tion of other DE parameters, the crossover rate CR andthe mutation scaling factor F , as proposed for the SaDE[12] scheme. Besides, especially concerning the multi-modalfunctions, the diversity could also be considered somehowby the credit assignment scheme, as proposed in [8].
7. REFERENCES[1] A. Fialho, M. Schoenauer, and M. Sebag. Analysis of
adaptive operator selection techniques on the royalroad and long k-path problems. In Proc. GECCO,pages 779–786, 2009.
[2] S. Finck, N. Hansen, R. Ros, and A. Auger.Real-parameter black-box optimization benchmarking2009: Presentation of the noiseless functions.Technical Report 2009/20, Research Center PPE,2009. Updated February 2010.
[3] D. E. Goldberg. Probability matching, the magnitudeof reinforcement, and classifier system bidding. Mach.Learn., 5(4):407–425, 1990.
[4] W. Gong, A. Fialho, and Z. Cai. Adaptive strategyselection in di!erential evolution. In J. Branke et al.,editor, Proc. GECCO. ACM Press, 2010.
[5] N. Hansen, A. Auger, S. Finck, and R. Ros.Real-parameter black-box optimization benchmarking2010: Experimental setup. Technical Report RR-7215,INRIA, 2010.
[6] N. Hansen, S. Finck, R. Ros, and A. Auger.Real-parameter black-box optimization benchmarking2009: Noiseless functions definitions. Technical ReportRR-6829, INRIA, 2009. Updated February 2010.
[7] A. W. Iorio and X. Li. Improving the performance andscalability of di!erential evolution. In Proc. SEAL,pages 131–140. Springer-Verlag, 2008.
[8] J. Maturana, F. Lardeux, and F. Saubion.Autonomous operator management for evolutionaryalgorithms. J. of Heuristics, 2010.
[9] Y.-S. Ong and A. J. Keane. Meta-Lamarckian learningin memetic algorithms. IEEE Trans. on Evol.Comput., 8(2):99–110, Apr 2004.
[10] K. Price. Di!erential evolution vs. the functions of thesecond ICEO. In Proc. CEC, pages 153–157, 1997.
[11] K. Price, R. Storn, and J. Lampinen. Di!erentialEvolution: A Practical Approach to GlobalOptimization. Springer-Verlag, Berlin, 2005.
[12] A. K. Qin, V. L. Huang, and P. N. Suganthan.Di!erential evolution algorithm with strategyadaptation for global numerical optimization. IEEETrans. on Evol. Comput., 13(2):398–417, Apr 2009.
[13] R. Storn and K. Price. Di!erential evolution - Asimple and e"cient heuristic for global optimizationover continuous spaces. J. of Global Optim.,11(4):341–359, Dec 1997.
[14] D. Thierens. An adaptive pursuit strategy forallocating operator probabilities. In Proc. GECCO,pages 1539–1546, 2005.
inria
-004
9453
8, v
ersi
on 1
- 23
Jun
201
0
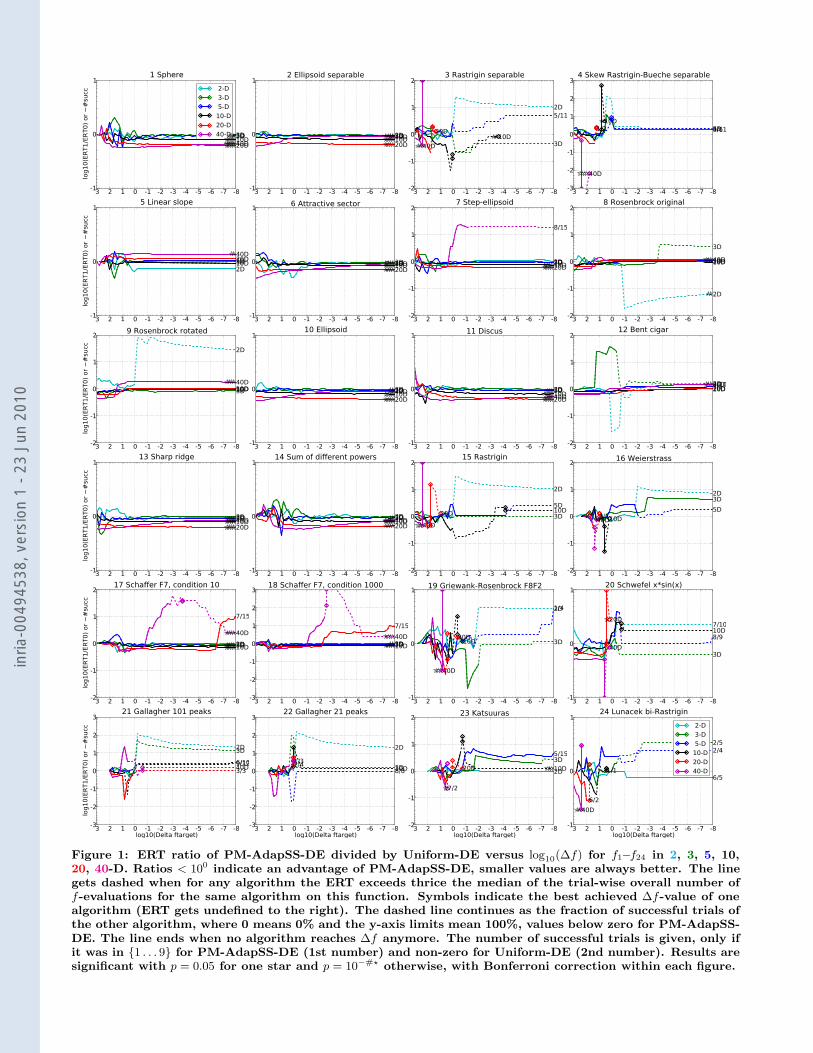
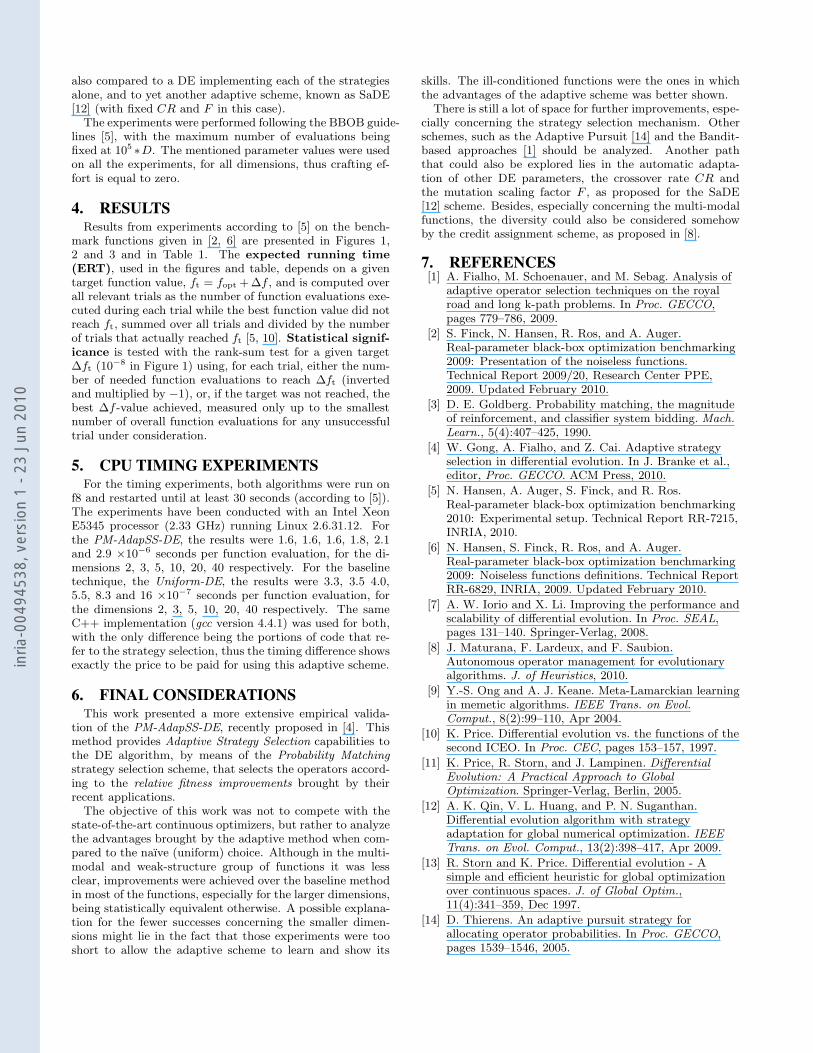
Figure 1: ERT ratio of PM-AdapSS-DE divided by Uniform-DE versus log10(#f) for f1–f24 in 2, 3, 5, 10,20, 40-D. Ratios < 100 indicate an advantage of PM-AdapSS-DE, smaller values are always better. The linegets dashed when for any algorithm the ERT exceeds thrice the median of the trial-wise overall number off-evaluations for the same algorithm on this function. Symbols indicate the best achieved #f-value of onealgorithm (ERT gets undefined to the right). The dashed line continues as the fraction of successful trials ofthe other algorithm, where 0 means 0% and the y-axis limits mean 100%, values below zero for PM-AdapSS-DE. The line ends when no algorithm reaches #f anymore. The number of successful trials is given, only ifit was in {1 . . . 9} for PM-AdapSS-DE (1st number) and non-zero for Uniform-DE (2nd number). Results aresignificant with p = 0.05 for one star and p = 10!#! otherwise, with Bonferroni correction within each figure.
inria
-004
9453
8, v
ersi
on 1
- 23
Jun
201
0
1Sphe
re
2Elli
pso
idse
par
able
3Ras
trig
inse
par
able
4Ske
wRas
trig
in-B
uec
he
5Lin
ear
slop
e
6Att
ract
ive
sect
or
7Ste
p-e
llipso
id
8Ros
enbr
ock
orig
inal
9Ros
enbr
ock
rota
ted
10Elli
psoi
d
11D
iscu
s
12B
ent
ciga
r
13Sha
rpridg
e
14Sum
ofdi!.pow
ers
15Ras
trig
in
16W
eier
stra
ss
17Sch
a!er
F7,
cond
.10
18Sch
a!er
F7,
cond
.100
0
19G
riew
ank-
Ros
enbr
ock
20Sch
wef
elx*
sin(
x)
21G
alla
gher
101
pea
ks
22G
alla
gher
21pea
ks
23K
atsu
uras
24Lun
acek
bi-R
astr
igin
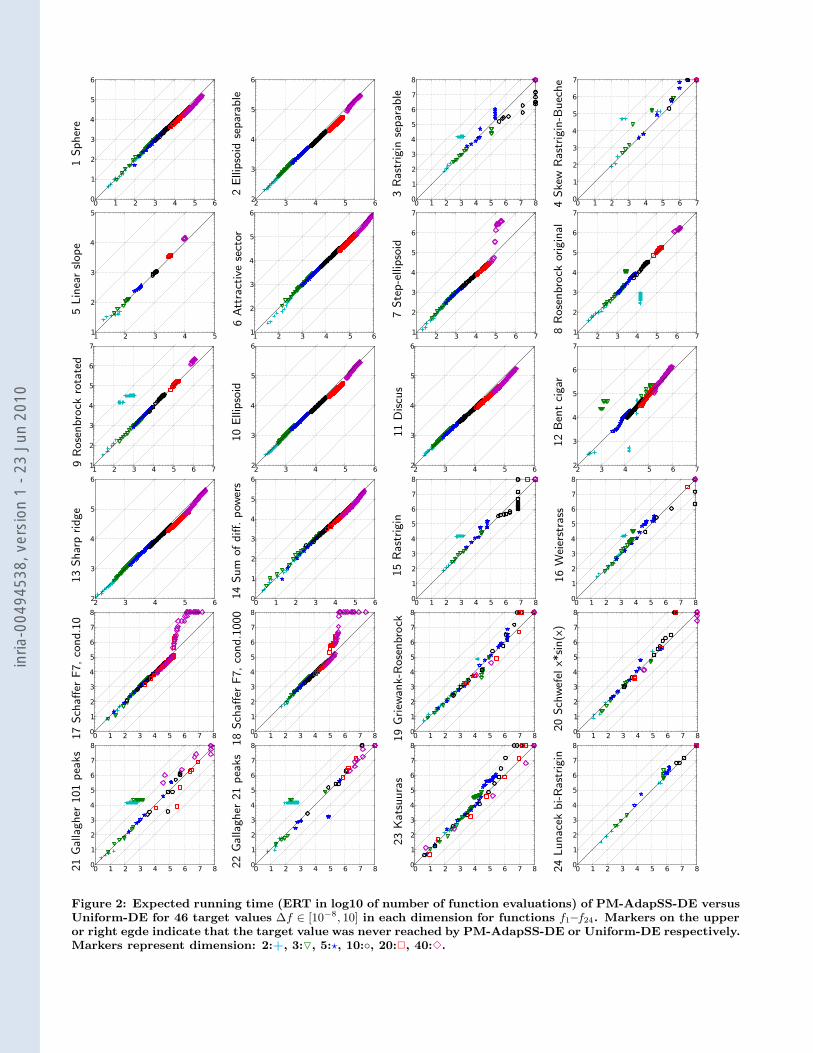
Figure 2: Expected running time (ERT in log10 of number of function evaluations) of PM-AdapSS-DE versusUniform-DE for 46 target values #f ! [10!8, 10] in each dimension for functions f1–f24. Markers on the upperor right egde indicate that the target value was never reached by PM-AdapSS-DE or Uniform-DE respectively.Markers represent dimension: 2:+, 3:!, 5:$, 10:', 20:!, 40:".
inria
-004
9453
8, v
ersi
on 1
- 23
Jun
201
0
5-D 20-Dal
lfu
nct
ions
separ
able
fcts
moder
ate
fcts
ill-co
ndit
ioned
fcts
mult
i-m
odal
fcts
wea
kst
ruct
ure
fcts
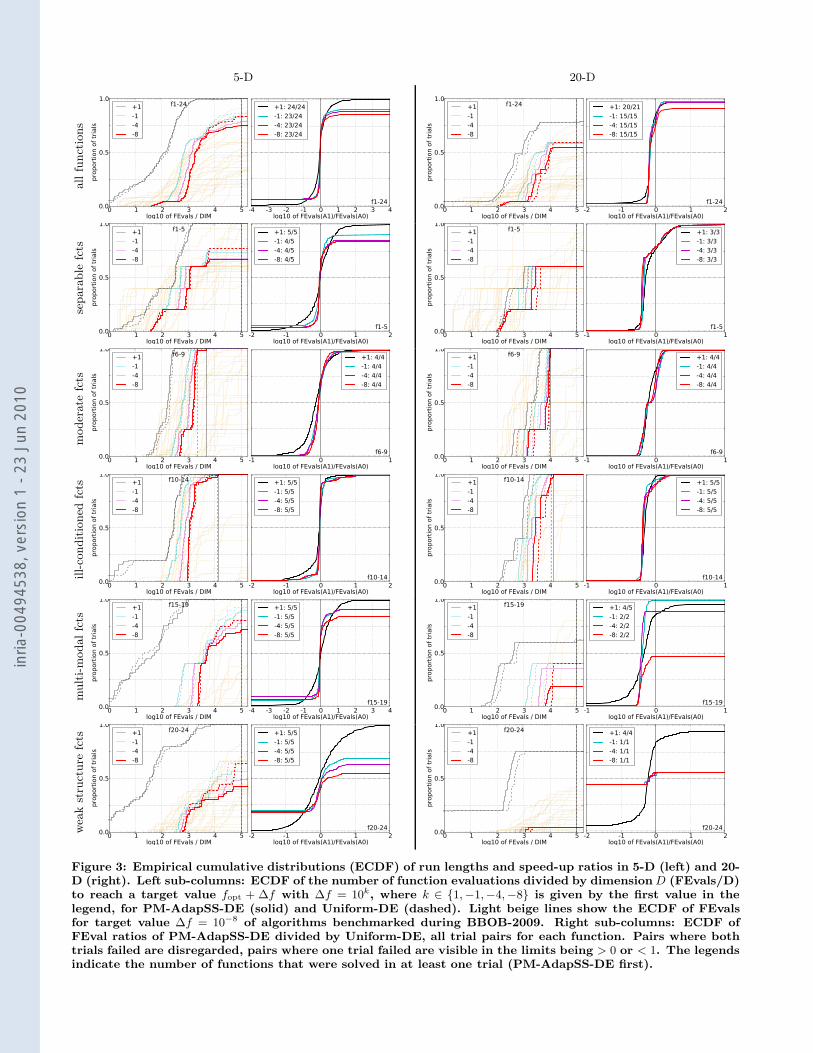
Figure 3: Empirical cumulative distributions (ECDF) of run lengths and speed-up ratios in 5-D (left) and 20-D (right). Left sub-columns: ECDF of the number of function evaluations divided by dimension D (FEvals/D)to reach a target value fopt + #f with #f = 10k, where k ! {1,#1,#4,#8} is given by the first value in thelegend, for PM-AdapSS-DE (solid) and Uniform-DE (dashed). Light beige lines show the ECDF of FEvalsfor target value #f = 10!8 of algorithms benchmarked during BBOB-2009. Right sub-columns: ECDF ofFEval ratios of PM-AdapSS-DE divided by Uniform-DE, all trial pairs for each function. Pairs where bothtrials failed are disregarded, pairs where one trial failed are visible in the limits being > 0 or < 1. The legendsindicate the number of functions that were solved in at least one trial (PM-AdapSS-DE first).
inria
-004
9453
8, v
ersi
on 1
- 23
Jun
201
0
5-D 20-D
!f 1e+11e+0 1e-1 1e-3 1e-5 1e-7 #succf1 11 12 12 12 12 12 15/15
0: Uniform 8.6 42 80 160 240 310 15/151: AdapSS 4.8 39 74 140 220 290!2 15/15
f2 83 87 88 90 92 94 15/150: Uniform20 24 30 40 50 58 15/151: AdapSS19 24 28 38 47! 55!2 15/15
f3 720 1600 1600 1600 1700 1700 15/150: Uniform 3.5 12 130 130 130 130 11/151: AdapSS 4.9 33 170 360 620 620 5/15
f4 810 1600 1700 1800 1900 1900 15/150: Uniform 5.1 630 1.9e3 1.8e3 1.7e3 1.7e3 2/151: AdapSS 4.9 4.3e3 ! ! ! !5.0e5 0/15
f5 10 10 10 10 10 10 15/150: Uniform20 34 35 35 35 35 15/151: AdapSS24 33 36 36 36 36 15/15
f6 110 210 280 580 1000 1300 15/150: Uniform 9 9.2 10 7.8 6.1 6.1 15/151: AdapSS 8.1 8.1 9 7.3 5.7 5.7!2 15/15
f7 24 320 1200 1600 1600 1600 15/150: Uniform14 2.7 1.2 1.4 1.4 1.6 15/151: AdapSS12 2.5 1.2 1.3 1.3 1.5 15/15
f8 73 270 340 390 410 420 15/150: Uniform15 10 14 17 18 20 15/151: AdapSS13 9.4 15 19 20 21 15/15
f9 35 130 210 300 340 370 15/150: Uniform30 23 21 21 22 22 15/151: AdapSS25 22 21 21 21 22 15/15
f10 350 500 570 630 830 880 15/150: Uniform 4.5 4.2 4.6 5.5 5.4 6.2 15/151: AdapSS 4.6 4 4.3 5.3 5.2 5.9 15/15
f11 140 200 760 1200 1500 1700 15/150: Uniform 6.2 6.6 2.4 2.4 2.6 2.8 15/151: AdapSS 6.3 6.5 2.3 2.3 2.4! 2.7!2 15/15
f12 110 270 370 460 1300 1500 15/150: Uniform28 21 21 22 10 11 15/151: AdapSS24 16 24 27 12 13 15/15
f13 130 190 250 1300 1800 2300 15/150: Uniform11 12 13 3.7 3.8 3.7 15/151: AdapSS 9.9! 11! 12! 3.4!3 3.5!3 3.4!3 15/15
f14 9.8 41 58 140 250 480 15/150: Uniform 2.3 10 16 15 13 9.3 15/151: AdapSS 1 9.4 17 15 12 8.9 15/15
f15 510 9300 1.9e4 2.0e4 2.1e4 2.1e4 14/150: Uniform 4.8 2.2 3 3 2.9 2.9 14/151: AdapSS 5.4 6.3 3.2 3.2 7.6 7.4 12/15
f16 120 610 2700 1.0e4 1.2e4 1.2e4 15/150: Uniform 4.3 44 20 17 16 15 12/151: AdapSS 3.9 120 55 20 28 27 11/15
f17 5.2 210 900 3700 6400 7900 15/150: Uniform 3.8 4.3 2.7 1.6 1.5 1.6 15/151: AdapSS 4.2 4 2.3! 1.4!2 1.3!3 1.4!3 15/15
f18 100 380 4000 9300 1.1e4 1.2e4 15/150: Uniform 4 4.3 0.81 0.73 0.95 1.1 15/151: AdapSS 4.3 4.1 0.76 0.67 0.89 1 15/15
f19 1 1 240 1.2e5 1.2e5 1.2e5 15/150: Uniform35 3.4e3 1.6e3 13 13 13 4/151: AdapSS37 2.0e3 2.1e3 19 19 29 1/15
f20 16 850 3.8e4 5.4e4 5.5e4 5.5e4 14/150: Uniform11 10 9.2 6.4 6.4 6.4 9/151: AdapSS11 14 9.4 6.6 6.6 6.6 8/15
f21 41 1200 1700 1700 1700 1800 14/150: Uniform 4.5 33 76 75 74 74 12/151: AdapSS 4 33 200 200 200 190 9/15
f22 71 390 940 1000 1000 1100 14/150: Uniform 6.6 200 470 440 420 410 8/151: AdapSS 4.1 4.6470 440 420 410 8/15
f23 3 520 1.4e4 3.2e4 3.3e4 3.4e4 15/150: Uniform 2 11 2.5 3.6 5.5 7.2 15/151: AdapSS 1.8 8.9 12 14 21 27 5/15
f24 1600 2.2e5 6.4e6 9.6e6 1.3e7 1.3e7 3/150: Uniform 4.3 3.7 0.17 0.15 0.11 0.11 4/151: AdapSS 5.9 6.8 0.24 0.36 0.27 0.27 2/15
!f 1e+1 1e+0 1e-1 1e-3 1e-5 1e-7 #succf1 43 43 43 43 43 43 15/15
0: Uniform 150 300 440 730 1.0e3 1.3e3 15/151: AdapSS100!3 200!3 290!3 470!3 650!3 830!3 15/15
f2 380 390 390 390 390 390 15/150: Uniform 77 92 110 140 170 200 15/151: AdapSS 52!3 63!3 73!3 93!3 110!3 130!3 15/15
f3 5100 7600 7600 7600 7600 7700 15/150: Uniform ! ! ! ! ! !2.0e6 0/151: AdapSS ! ! ! ! ! !2.0e6 0/15
f4 4700 7600 7700 7700 7800 1.4e5 9/150: Uniform ! ! ! ! ! !2.0e6 0/151: AdapSS ! ! ! ! ! !2.0e6 0/15
f5 41 41 41 41 41 41 15/150: Uniform 69 83 85 86 86 86 15/151: AdapSS 82 92 96 96 96 96 15/15
f6 1300 2300 3400 5200 6700 8400 15/150: Uniform 29 23 20 20 20 20 15/151: AdapSS 20!3 16!3 15!3 14!3 14!3 14!3 15/15
f7 1400 4300 9500 1.7e4 1.7e4 1.7e4 15/150: Uniform 8.4 5.2 3.3 2.7 2.7 2.7 15/151: AdapSS 5.9!3 3.4!3 2.1!3 1.6!3 1.6!3 1.7!3 15/15
f8 2000 3900 4000 4200 4400 4500 15/150: Uniform 34 31 33 35 37 39 15/151: AdapSS 35 35 38 39 40 41 15/15
f9 1700 3100 3300 3500 3600 3700 15/150: Uniform 41 39 41 43 45 46 15/151: AdapSS 37 41 43 45 46 47 15/15
f10 7400 8700 1.1e4 1.5e4 1.7e4 1.7e4 15/150: Uniform 3.9 4.1 3.9 3.6 3.9 4.6 15/151: AdapSS 2.7!3 2.8!3 2.6!3 2.4!3 2.6!3 3!3 15/15
f11 1000 2200 6300 9800 1.2e4 1.5e4 15/150: Uniform 11 8.1 3.8 3.8 4 4.2 15/151: AdapSS 8.7!3 5.7!3 2.6!3 2.5!3 2.6!3 2.7!3 15/15
f12 1000 1900 2700 4100 1.2e4 1.4e4 15/150: Uniform 44 27 25 26 12 13 15/151: AdapSS 29!3 18!3 20 24 12 13 15/15
f13 650 2000 2800 1.9e4 2.4e4 3.0e4 15/150: Uniform 43 20 19 4.1 4.2 4.2 15/151: AdapSS 28!3 13!3 12!3 2.6!3 2.6!3 2.6!3 15/15
f14 75 240 300 930 1600 1.6e4 15/150: Uniform 53 50 64 38 31 4.2 15/151: AdapSS 43!2 34!3 43!3 25!3 20!3 2.8!3 15/15
f15 3.0e4 1.5e5 3.1e5 3.2e5 4.5e5 4.6e5 15/150: Uniform 980 ! ! ! ! !2.0e6 0/151: AdapSS ! ! ! ! ! !2.0e6 0/15
f16 1400 2.7e4 7.7e4 1.9e5 2.0e5 2.2e5 15/150: Uniform 2.1e4 ! ! ! ! !2.0e6 0/151: AdapSS 2.2e4 ! ! ! ! !2.0e6 0/15
f17 63 1000 4000 3.1e4 5.6e4 8.0e4 15/150: Uniform 38 19 10 3 3.2 2.8 15/151: AdapSS 23 13!3 6.6!3 1.9!3 1.8!3 18 7/15
f18 620 4000 2.0e4 6.8e4 1.3e5 1.5e5 15/150: Uniform 18 7.8 2.8 1.7 1.5 1.6 15/151: AdapSS 13!3 5.4!3 1.9!3 8.4 6.5 7.8 7/15
f19 1 1 3.4e5 6.2e6 6.7e6 6.7e6 15/150: Uniform 2.8e3 9.5e6 ! ! ! !2.0e6 0/151: AdapSS 1.8e3! ! ! ! ! !2.0e6 0/15
f20 82 4.6e4 3.1e6 5.5e6 5.6e6 5.6e6 14/150: Uniform 76 ! ! ! ! !2.0e6 0/151: AdapSS 46!3 ! ! ! ! !2.0e6 0/15
f21 560 6500 1.4e4 1.5e4 1.6e4 1.8e4 15/150: Uniform 21 460 570 550 520 460 3/151: AdapSS 12!3 350 570 550 520 460 3/15
f22 470 5600 2.3e4 2.5e4 2.7e4 1.3e5 12/150: Uniform 1.6e3 990 ! ! ! !2.0e6 0/151: AdapSS 1.6e3 2.3e3 ! ! ! !2.0e6 0/15
f23 3.2 1600 6.7e4 4.9e5 8.1e5 8.4e5 15/150: Uniform 3 6.0e3 ! ! ! !2.0e6 0/151: AdapSS 1.5 8.5e3 ! ! ! !2.0e6 0/15
f24 1.3e6 7.5e6 5.2e7 5.2e7 5.2e7 5.2e7 3/150: Uniform ! ! ! ! ! !2.0e6 0/151: AdapSS ! ! ! ! ! !2.0e6 0/15
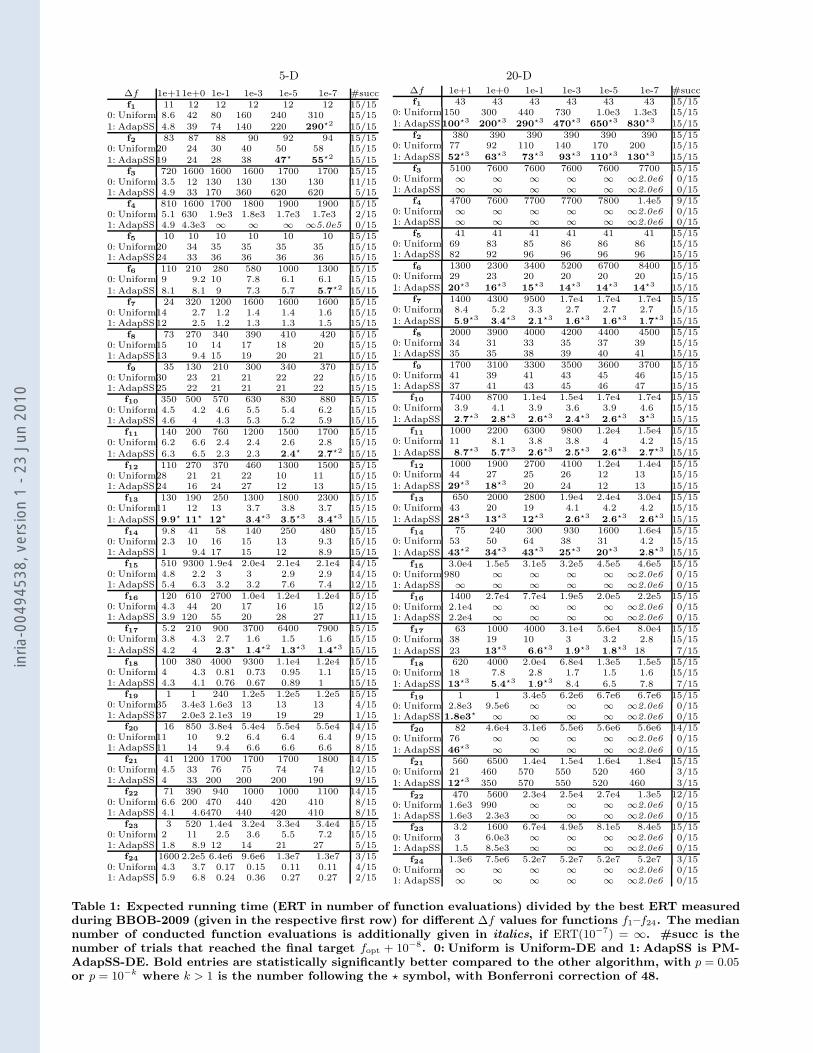
Table 1: Expected running time (ERT in number of function evaluations) divided by the best ERT measuredduring BBOB-2009 (given in the respective first row) for di!erent #f values for functions f1–f24. The mediannumber of conducted function evaluations is additionally given in italics, if ERT(10!7) = (. #succ is thenumber of trials that reached the final target fopt + 10!8. 0: Uniform is Uniform-DE and 1: AdapSS is PM-AdapSS-DE. Bold entries are statistically significantly better compared to the other algorithm, with p = 0.05or p = 10!k where k > 1 is the number following the $ symbol, with Bonferroni correction of 48.
inria
-004
9453
8, v
ersi
on 1
- 23
Jun
201
0
Related Documents

![[inria-00502441, v1] Benchmarking the (1,4)-CMA-ES With ...dimo.brockhoff/publicationListFiles/abh2010k.pdftial selection on the BBOB-2010 noisy testbed. Independent restarts are conducted](https://static.cupdf.com/doc/110x72/6044e73ad25d8f668a78bb64/inria-00502441-v1-benchmarking-the-14-cma-es-with-dimobrockhoffpublicationlistfilesabh2010kpdf.jpg)
![[inria-00502430, v1] Comparing the (1+1)-CMA-ES with a ...dimo.brockhoff/publicationListFiles/abh2010a.pdfthe BBOB-2009 workshop on the noiseless and noisy testbed [3, 4]. The overall](https://static.cupdf.com/doc/110x72/6044e73ad25d8f668a78bb66/inria-00502430-v1-comparing-the-11-cma-es-with-a-dimobrockhoffpublicationlistfilesabh2010apdf.jpg)


