Probability Grid: A Location Estimation Scheme for Wireless Sensor Networks Presented by cychen Date : 3/7 In Secon (Sensor and Ad Hoc Communications and Networks ) 2004

Probability Grid: A Location Estimation Scheme for Wireless Sensor Networks Presented by cychen Date : 3/7 In Secon (Sensor and Ad Hoc Communications and.
Dec 21, 2015
Welcome message from author
This document is posted to help you gain knowledge. Please leave a comment to let me know what you think about it! Share it to your friends and learn new things together.
Transcript
Probability Grid: A Location Estimation Scheme for Wireless Sensor Networks
Presented by cychenDate : 3/7
In Secon (Sensor and Ad Hoc Communications and Networks) 2004

Outline
Introduction The Probability Grid Localization
Scheme The Localization Scheme Performance Evaluation System Implementation And
Evaluation
Introduction
Propose a location estimation scheme completely decentralized not require special location or range
finding infrastructure uses a probabilistic approach makes use of additional knowledge of
topology deployment
Introduction
Assume a sensor network is deployed in a controlled manner The goal is to form a grid topology. The deployment is not completely
random an approximation to a uniform or even grid
distribution

The anchor nodes only a small percentage either equipped with GPS or can acquire thei
r location information through other means. do not have any increased communication r
ange The remaining sensor nodes are unaware
of their location
The sensor nodes

The Probability Grid Localization Scheme Assumption :
the nodes are deployed in a grid topology the unit length of the grid is known to all the nodes in
the network allow small errors in the true positioning of nodes ar
ound the vertexes of a grid. Our localization problem
To identify the correct position in the grid for each sensor node.
The localization error leave for future research

Parameter Definitions M x N : the dimensions of the grid topology S : the set of all the nodes A : the set of all the anchors
Both sets, S and A, are sets of ordered pairs (i,j) representing the grid points where the nodes are located.
: hop-count vector the hop count from each of the anchors in the set A to
the node ‘k’ is the hop count from anchor 1 to node k.
A-Sk),h,...,h,(hH kA
k2
k1
k
k1h
The Probability Grid Matrix
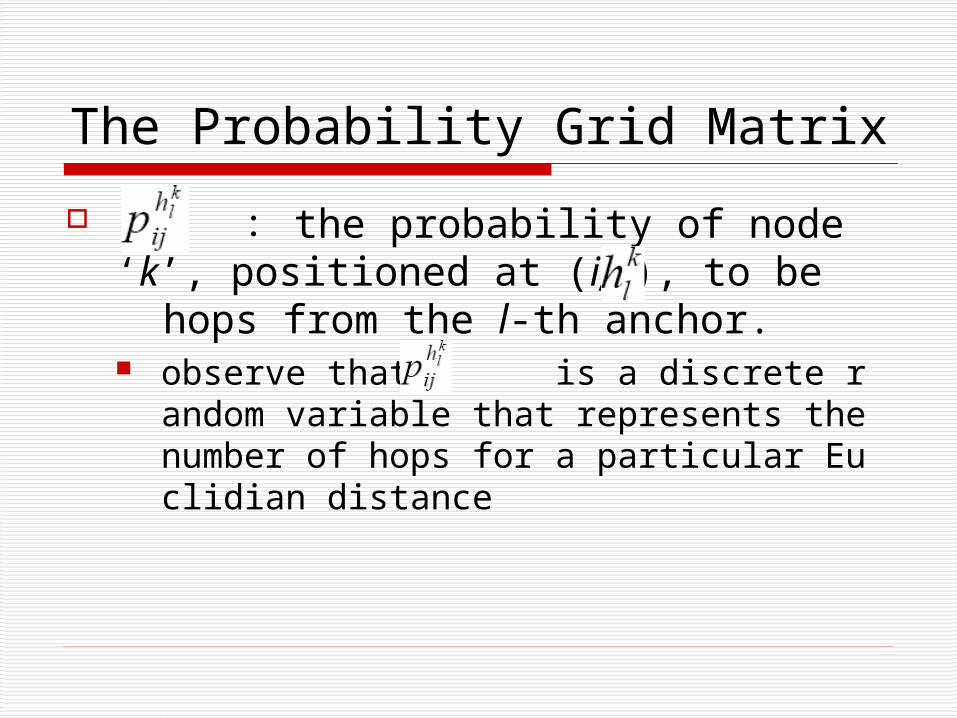
: the probability of node ‘k’, positioned at (i, j), to be hops from the l-th anchor. observe that is a discrete random variable
that represents the number of hops for a particular Euclidian distance

The Probability Grid Matrix
The main features that the distribution function needs to exhibit are: : the distance between the node and one
anchor : the number of hops existent between th
e node and the anchor

The Probability Grid Matrix Narrow and skewed positively for small
values of λ For smaller values of λ
τ has a limited range of possible values with higher and higher values being less and less probable (positively skewed).
Become broader and relatively symmetric for larger values of λ. λ increases, the number of possibilities for the
hop count (τ) increases and the distribution becomes bell-shaped
The Probability Grid Matrix
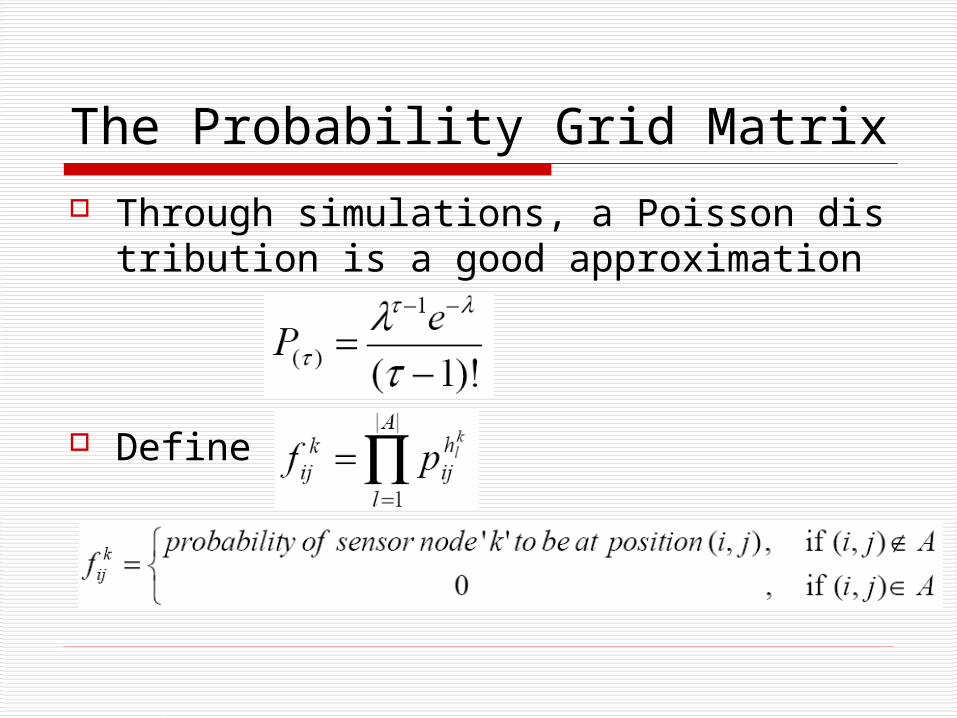
Through simulations, a Poisson distribution is a good approximation
Define

The Probability Grid Matrix Obtain the Probability Grid Matrix
Let The position of node k in the grid : The location of node k :
),( maxmax ji

The Localization Scheme
Our localization protocol is similar to the DV-Hop scheme
But it improves upon it by exploiting deployment information.

Phase 1 - Flooding The anchors flood the network with packets
containing their IDs, their location and a hop count, initially set to zero. global flooding or controlled flooding (all nodes
are expected to hear from at least three anchors).
During the flooding period, sensor nodes keep track of the shortest distance (number of hops) to each of the anchors they heard from.
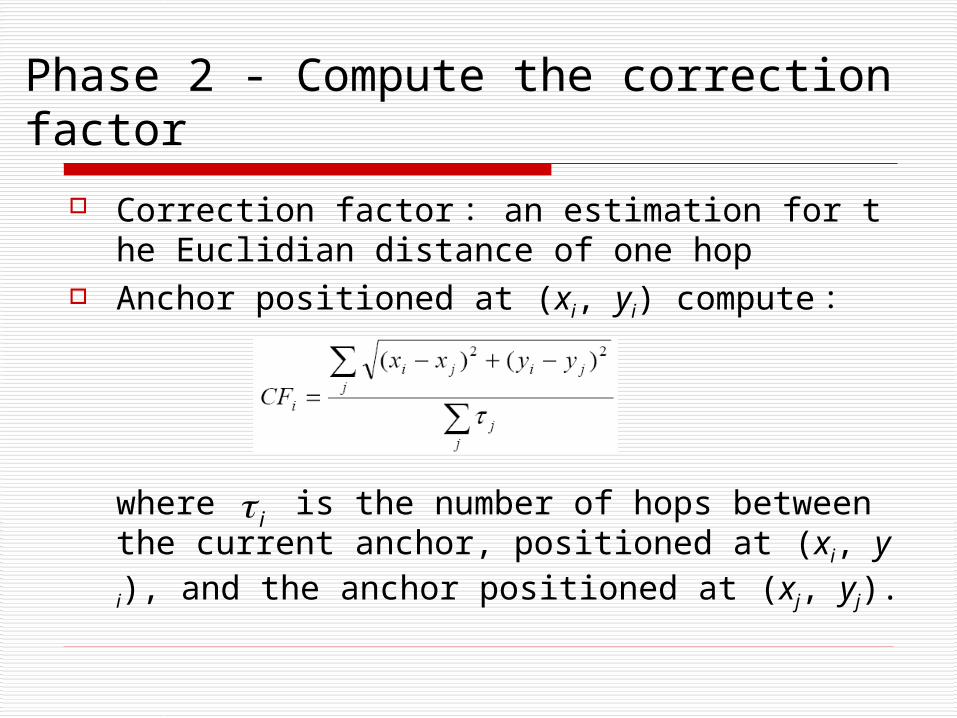
Phase 2 - Compute the correction factor
Correction factor : an estimation for the Euclidian distance of one hop
Anchor positioned at (xi, yi) compute :
where is the number of hops between the current anchor, positioned at (xi, yi), and the anchor positioned at (xj, yj).
i

Phase 2 - Compute the correction factor
The correction factor is received only by the sensor nodes in the vicinity of the anchor.
Sensor node only uses the “first” correction factor it received to estimate its location.

Phase 3 - Invoke The Probability Grid algorithm
1. Calculate λ the distance, in hop count units, between the evalua
ted grid point and one anchor.
PS. is the actual hop count
2. Calculate , and the Probability Grid matrix Fk to estimation the location of node k, kS-A
factor correction
anchor andpoint gridbetween distance
kijf
klh

Performance Evaluation
Experimental results obtained through Simulations using GloMoSim, a discrete-event simulator developed at UCLA
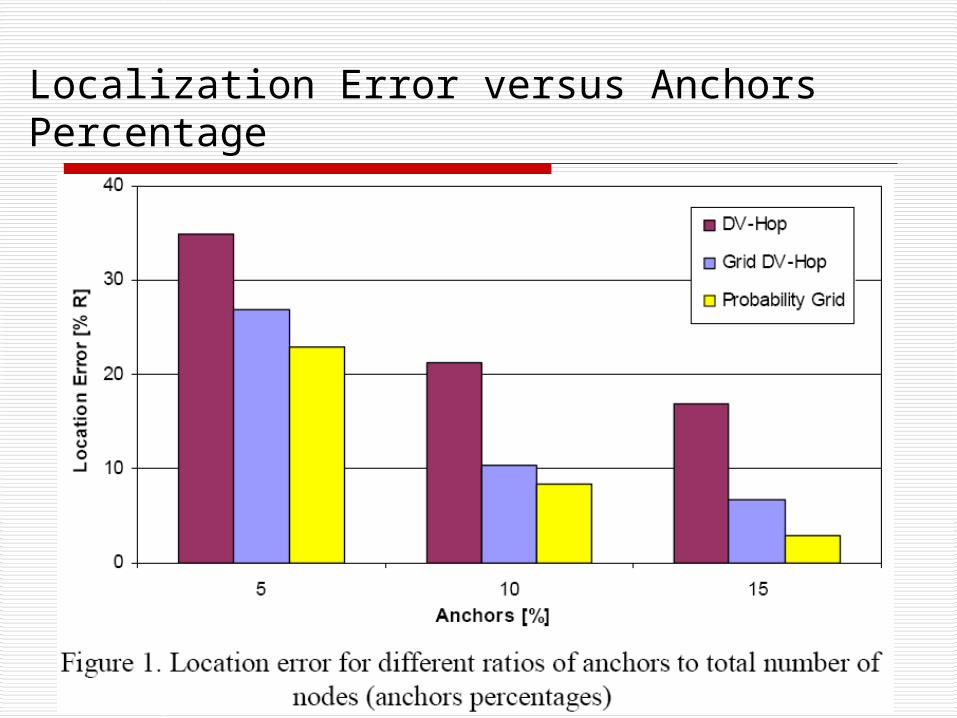
Localization Error versus Anchors Percentage

Localization Error versus Network Size

Localization Error versus Number of Neighbors

Localization Error versus Imprecision in Anchor Positioning

System Implementation & Evaluation
The implementation was done on MICA2 motes from Berkeley. consisted of 25 motes, positioned in a 5x5 gri
d, approximately 12 meters apart.
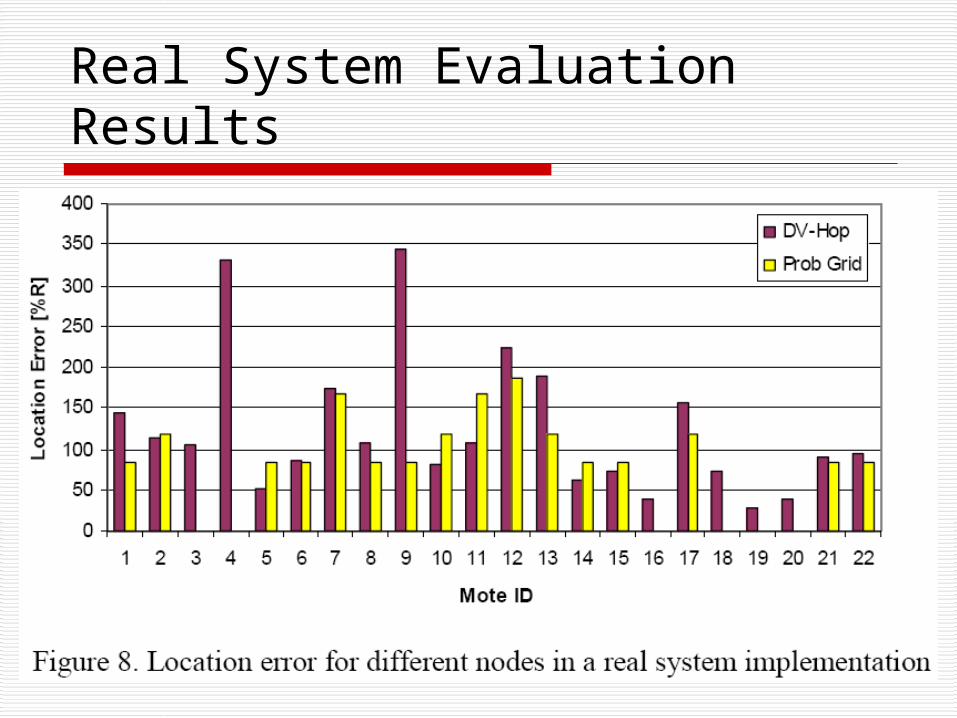
Real System Evaluation Results

Real System Evaluation Results
Related Documents