Probability Distributions & expected values Syeda Mustajab Zahra

Probability distributions & expected values
Aug 13, 2015
Welcome message from author
This document is posted to help you gain knowledge. Please leave a comment to let me know what you think about it! Share it to your friends and learn new things together.
Transcript
Probability Distributions & expected values
Syeda Mustajab
Zahra

Probability
Probability is the study of randomness and uncertainty
• Meaning • Set• Subset• Random Experiment • Mutually Exclusive Events • Equally Like Events• Sample Space

A random variable is a variable that takes on numerical values determined by the outcome of a random experiment.
Random Variables
Discrete Random Variables
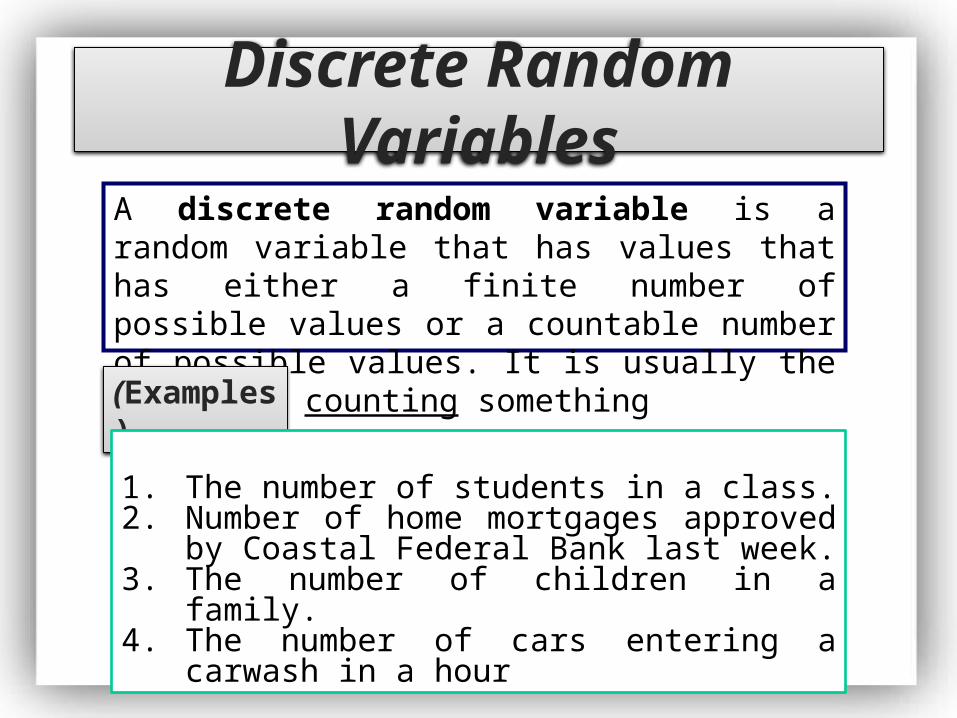
A discrete random variable is a random variable that has values that has either a finite number of possible values or a countable number of possible values. It is usually the result of counting something
(Examples)
1. The number of students in a class. 2. Number of home mortgages approved by Coastal
Federal Bank last week.3. The number of children in a family.4. The number of cars entering a carwash in a hour
Continuous Random Variables
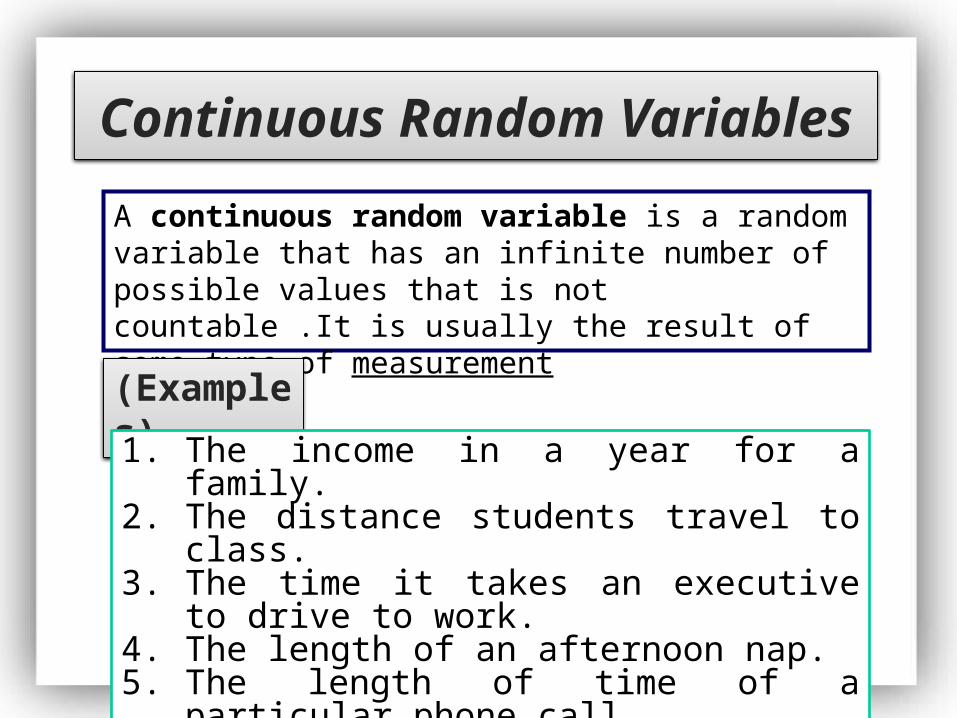
A continuous random variable is a random variable that has an infinite number of possible values that is not countable .It is usually the result of some type of measurement
(Examples)
1. The income in a year for a family.2. The distance students travel to class.3. The time it takes an executive to drive to work.4. The length of an afternoon nap.5. The length of time of a particular phone call

Example: expected value• Recall the following probability
distribution of ER arrivals:
x 10 11 12 13 14P(x) .4 .2 .2 .1 .1
5
1
3.11)1(.14)1(.13)2(.12)2(.11)4(.10)(i
i xpx

Expected Value and Variance
• All probability distributions are characterized by an expected value (mean) and a variance (standard deviation squared).
8
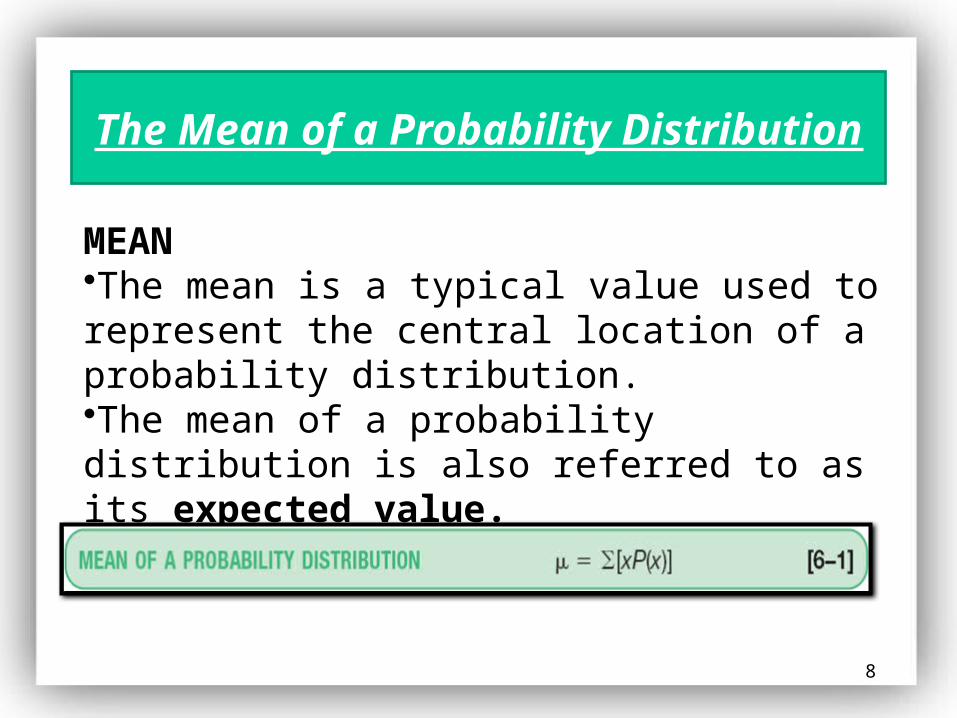
The Mean of a Probability Distribution
MEAN•The mean is a typical value used to represent the central location of a probability distribution.•The mean of a probability distribution is also referred to as its expected value.

9
The Variance, and StandardDeviation of a Probability Distribution
Variance and Standard Deviation
• Measures the amount of spread in a distribution• The computational steps are:
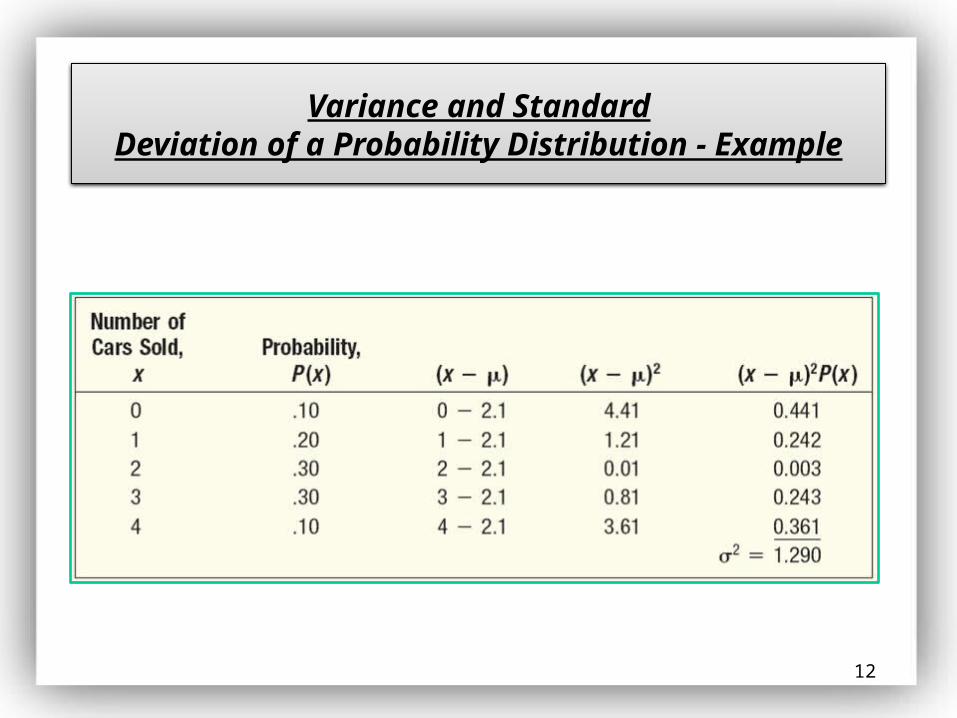
1. Subtract the mean from each value, and square this difference.2. Multiply each squared difference by its probability.3. Sum the resulting products to arrive at the variance.The standard deviation is found by taking the positive square root of the variance.

10
Mean, Variance, and StandardDeviation of a Probability Distribution - Example
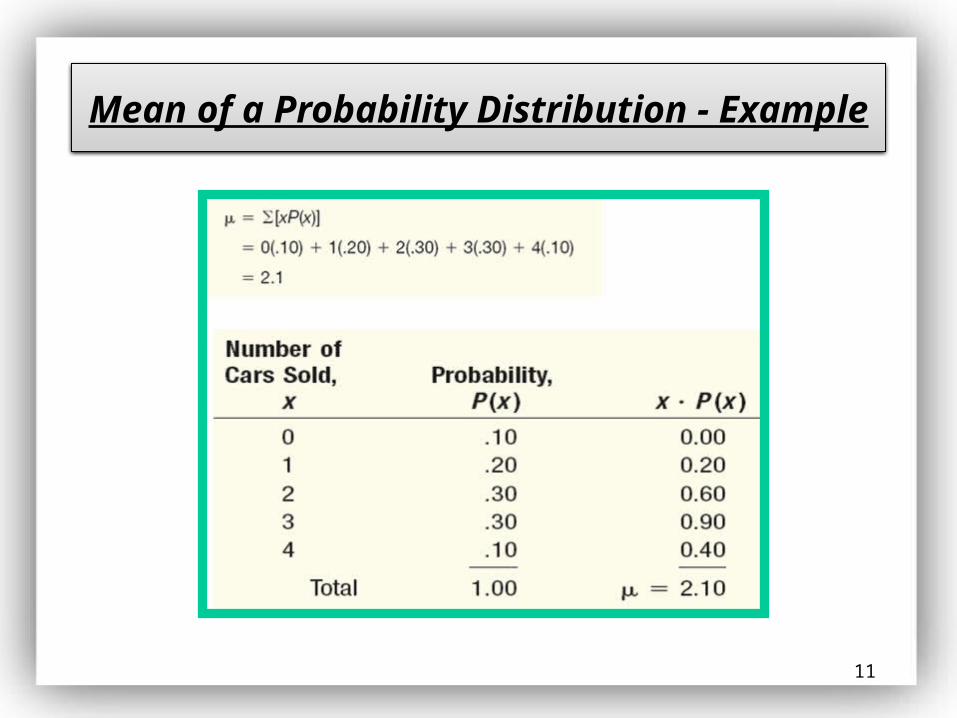
John Ragsdale sells new cars for Pelican Ford. John usually sells the largest number of cars on Saturday. He has developed the following probability distribution for the number of cars he expects to sell on a particular Saturday.
11
Mean of a Probability Distribution - Example
12
Variance and StandardDeviation of a Probability Distribution - Example

The Binomial Distribution
The Bernoulli process is described by the binomial probability distribution.
• The experiment consists of a sequence of n identical trials•All possible outcomes can be classified into two categories, usually called success and failure•The probability of an success, p, is constant from trial to trial•The outcome of any trial is independent of the outcome of any other trial
14
Binomial Probability Distribution
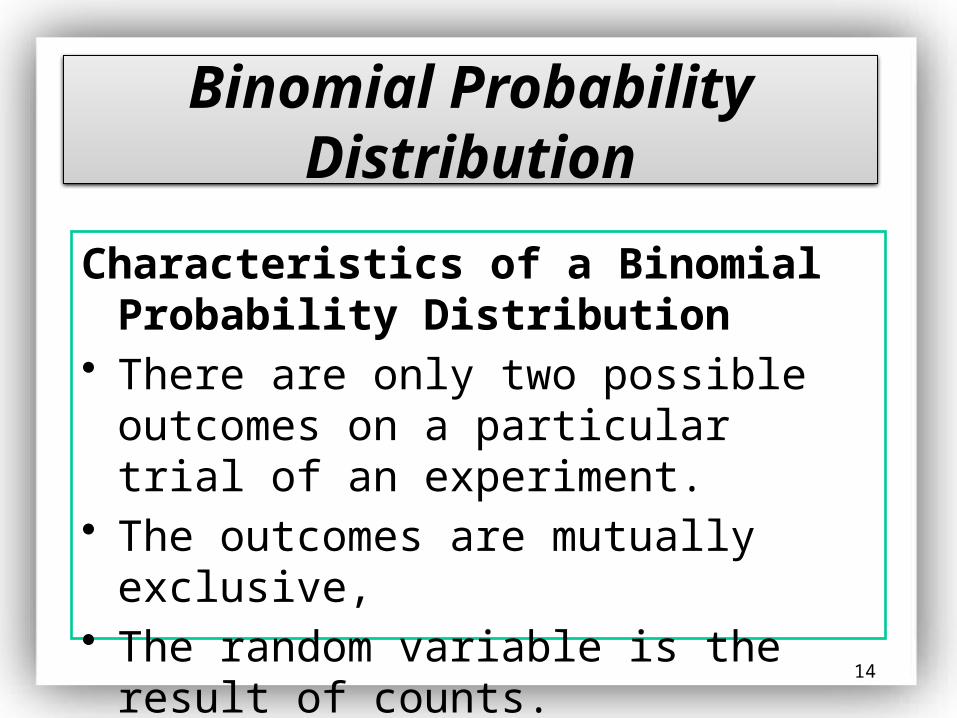
Characteristics of a Binomial Probability Distribution
• There are only two possible outcomes on a particular trial of an experiment.
• The outcomes are mutually exclusive, • The random variable is the result of counts.• Each trial is independent of any other trial

15
Binomial Probability Formula

16
Binomial Probability - Example
There are five flights daily from Pittsburgh via US Airways into the Bradford, Pennsylvania, Regional Airport. Suppose the probability that any flight arrives late is .20. What is the probability that none of the flights are late today?
17
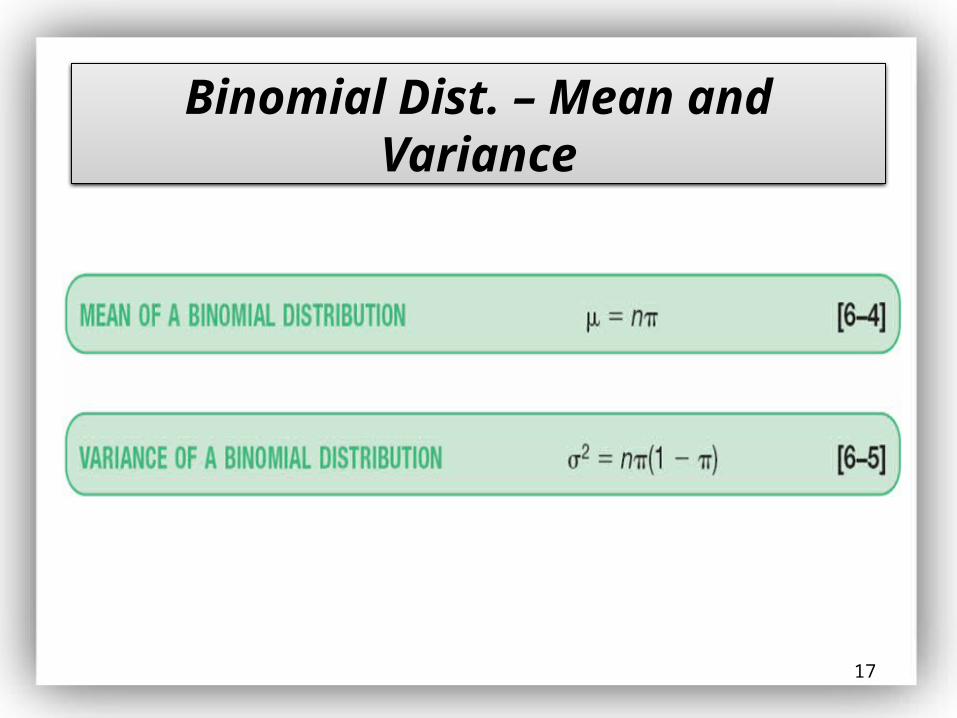
Binomial Dist. – Mean and Variance

18
For the example regarding the number of late flights, recall that =.20 and n = 5.
What is the average number of late flights?
What is the variance of the number of late flights?
Binomial Dist. – Mean and Variance: Example

19
Binomial Dist. – Mean and Variance: Another Solution
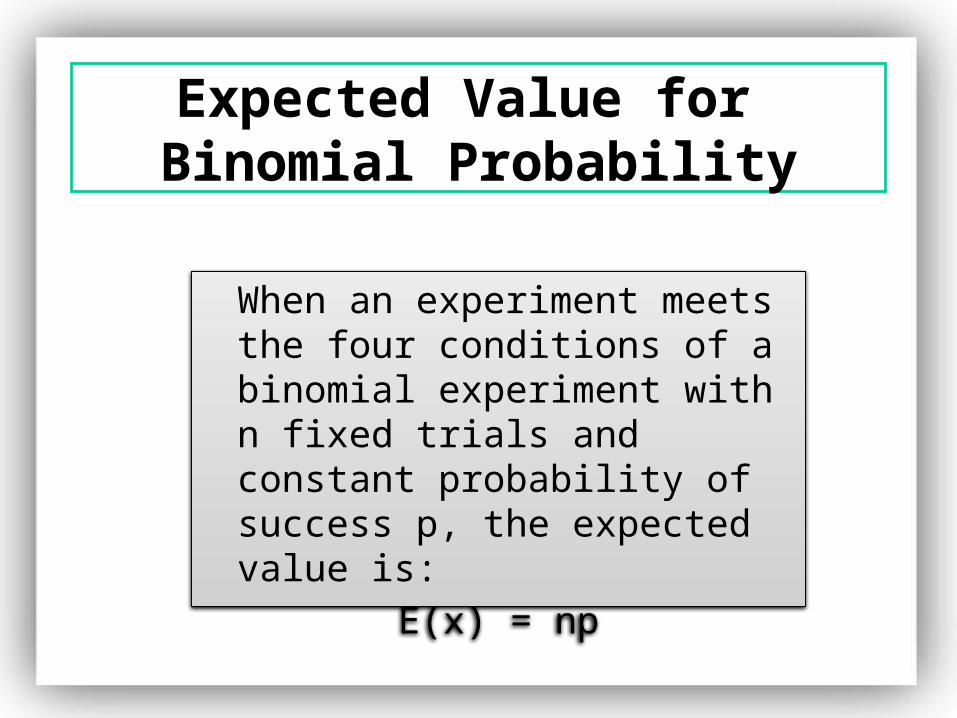
Expected Value for Binomial Probability
When an experiment meets the four conditions of a binomial experiment with n fixed trials and constant probability of success p, the expected value is:
E(x) = np

Hyper Geometric Distribution
The hyper geometric distribution has the following characteristics:
• There are only 2 possible outcomes.• The probability of a success is not the
same on each trial.• It results from a count of the number of
successes in a fixed number of trials.

22
Hyper geometric Distribution
Use the hyper geometric distribution to find the probability of a specified number of successes or failures if:– the sample is selected from a finite
population without replacement – the size of the sample n is greater than
5% of the size of the population N (i.e. n/N .05)

23
Hyper geometric Distribution

24
Hyper geometric Distribution - Example
Playtime Toys, Inc., employs 50 people in the Assembly Department. Forty of the employees belong to a union and ten do not. Five employees are selected at random to form a committee to meet with management regarding shift starting times. What is the probability that four of the five selected for the committee belong to a union?

25
Hyper geometric Distribution - Example

• Mean
= n(k/N)
• Variance
= npq(N-n/N-1)
Hyper geometric Distribution

Poisson Distribution
The Poisson probability distribution describes the number of times some event occurs during a specified interval. The interval may be time, distance, area, or volume.
• Assumptions of the Poisson Distribution
(1)The probability is proportional to the length of the interval.
(2)The intervals are independent.

28
Poisson Probability Distribution
The Poisson distribution can be described mathematically using the formula:
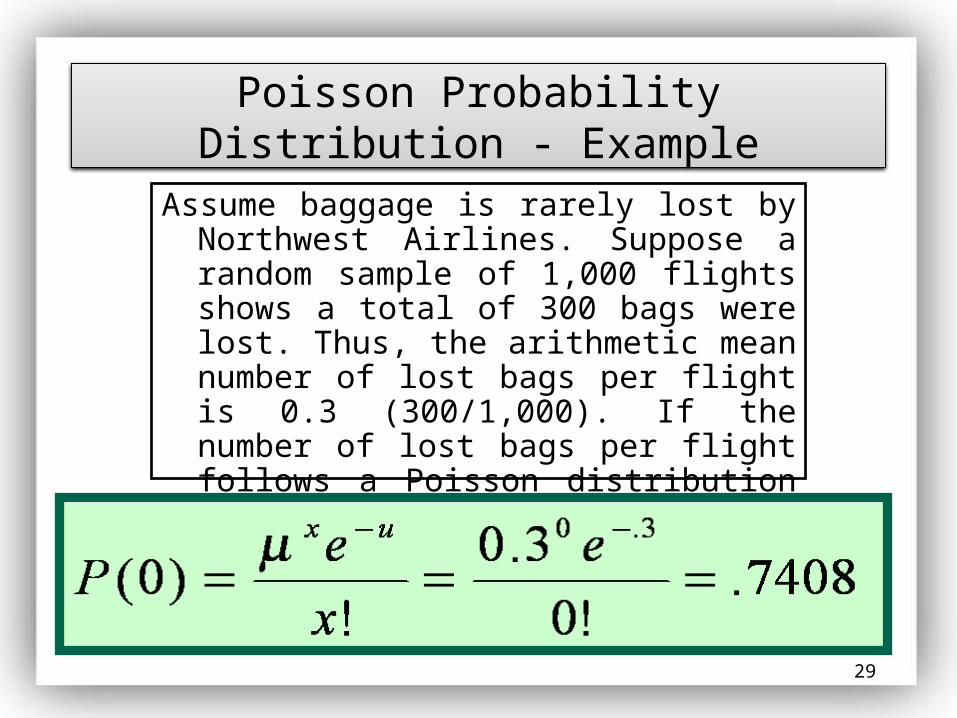
29
Assume baggage is rarely lost by Northwest Airlines. Suppose a random sample of 1,000 flights shows a total of 300 bags were lost. Thus, the arithmetic mean number of lost bags per flight is 0.3 (300/1,000). If the number of lost bags per flight follows a Poisson distribution with u = 0.3, find the probability of not losing any bags.
Poisson Probability Distribution - Example

30
Poisson Probability Distribution
• The mean number of successes can be determined in binomial situations by n, where n is the number of trials and the probability of a success.
• The variance of the Poisson distribution is also equal to n .

EXPECTED VALUE
Suppose the random variable x can take on the n values x1, x2, …, xn. Also, suppose the probabilities that these values occur are respectively p1, p2, …, pn. Then the expected value of the random variable is:
E(x) = x1p1 + x2p2 + …. + xnpn

Example
X 1 2 3 4 5
P(x) .13 .29 .38 .13 .08
Find the expected value of x in the probability distribution below:
Find Ans …


Related Documents