Probability and Statistics in Geology Probability and statistics are an important aspect of Earth Science. Understanding the details, population of a data sample How rounded are these pebbles ? Where did they come from ? How likely is an earthquake here in Northridge ?

Welcome message from author
This document is posted to help you gain knowledge. Please leave a comment to let me know what you think about it! Share it to your friends and learn new things together.
Transcript

Probability and Statistics in Geology
Probability and statistics are an important aspect of Earth Science. Understanding the details, population of a data sample How rounded are these pebbles ? Where did they come from ? How likely is an earthquake here in Northridge ?

Probability and Statistics in Geology
Statistics Histograms Probability Error Analysis Regression
] Discuss next week

Are Statistics Always Right ? Can They be Misleading ?
Toss a coin 6 times....”Heads or tails ? ” What is most unlikely ? What is more likely ?
.....six tails.....3 heads and 3 tails
So is HTHTHT more likely than TTTTTT ? ...No, both areequally unlikely!

Are Statistics Always Right ? Can They be Misleading ?
The result 3 heads and 3 tails is more likely only because There are many combinations where this can occur (e.g. HHTHTT, or HTHTTH, or HHHTTT...) Let's try it...

What is a Statistic ?
Is this a statistic ?
“ In 1970, the oil refining capacity of Belgium was 32.6 million tonnes per year”
This is actually, just a fact – not a statistic
What is a Statistic ?
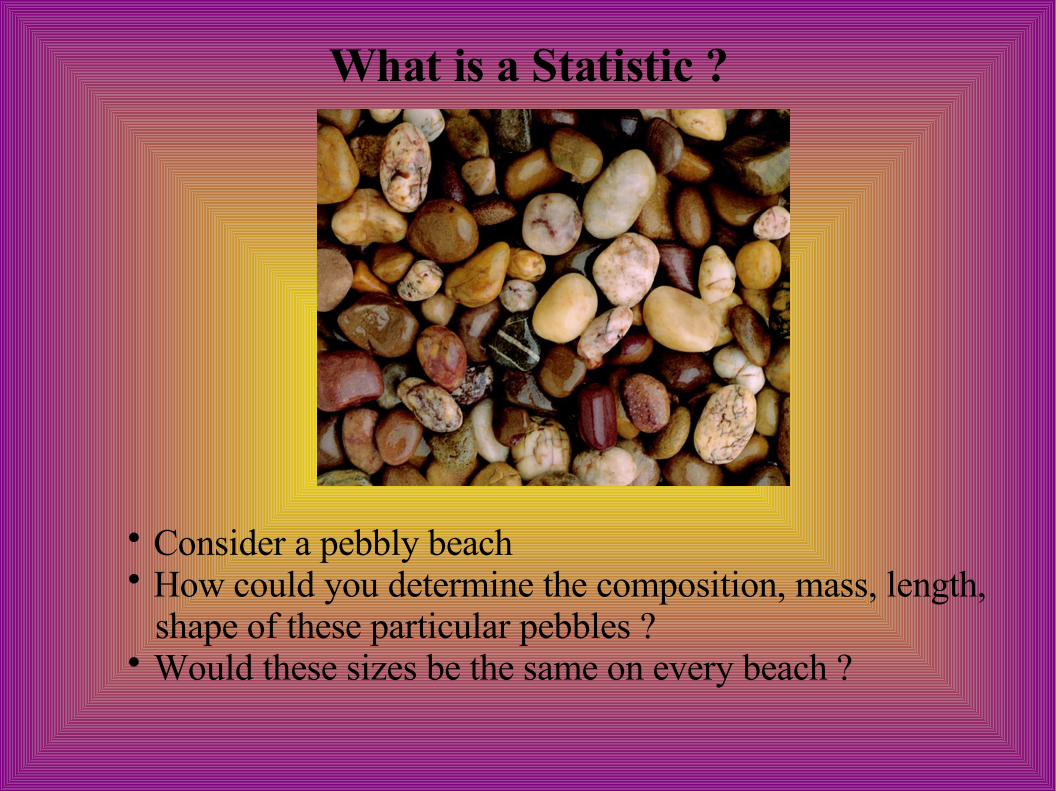
Consider a pebbly beach How could you determine the composition, mass, length, shape of these particular pebbles ? Would these sizes be the same on every beach ?

What is a Statistic ? - Specimen
Let's pick up a pebble and look at it – this is a specimen This pebble could probably give us the composition but would it be inclusive of all the pebbles ? Is it typical ? How could be improve this specimen ?

What is a Statistic ? - Sample
We could pick up 100 pebbles, this is a sample from the beach This should give you a much better idea of your beach rocks Could we do any better ?

What is a Statistic ? - Population
Or we could sample ALL the pebbles on the beach! This is the population of all pebbles Now measure the composition, size, shape, of each Is this a realistic plan ?

What is a Statistic ? - Population
Specimen: One object Sample: A subset number of objects Population: All the objects
These terms are often misused in science and literature.

Faults in Southern California
Above is a map of faults found in southern California If we just study the San Jacinto fault, what is this called statistically ?If we study the system, San Jacinto, Elsinor, and San Andreas what is this called statistcally ?

So What is a Statistic ?
Is the average mass of a pebble a statistic ? This depends on whether this average is determine From a sample of pebbles or the total population...
If we take the average of the total population – this considered a parameter and is now a simple fact The average of a sample, however, is a statistic.
So What is a Statistic ?
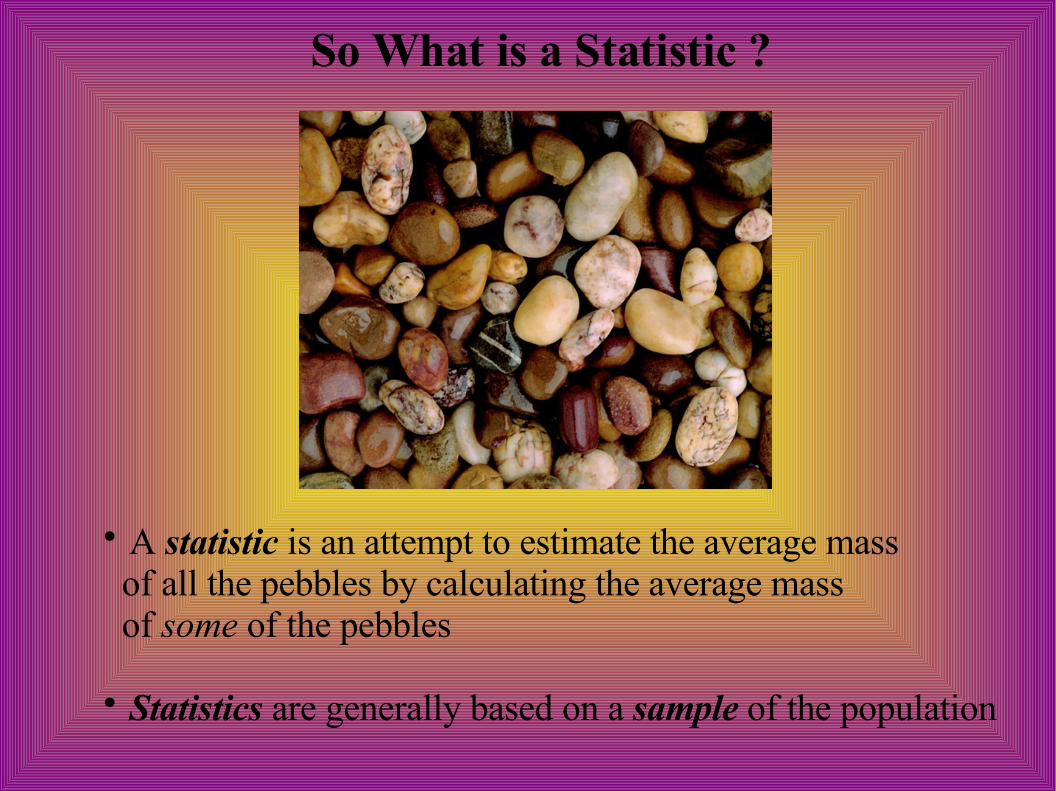
A statistic is an attempt to estimate the average mass of all the pebbles by calculating the average mass of some of the pebbles
Statistics are generally based on a sample of the population

Election Polls
Polling question: “ Who did the best job in the debate ?”Obama 54%McCain 30%
Estimates of voter intentions obtained before an election are statistics...a sample of the population

Election PollsObama 365McCain 162
The final result of an election, however, is an election parameter The final result is a fact, a measure of the entire voting population
Obama 66,882,230McCain 58,343,671
Back to the Pebbly BeachAverage, Mean, and Median
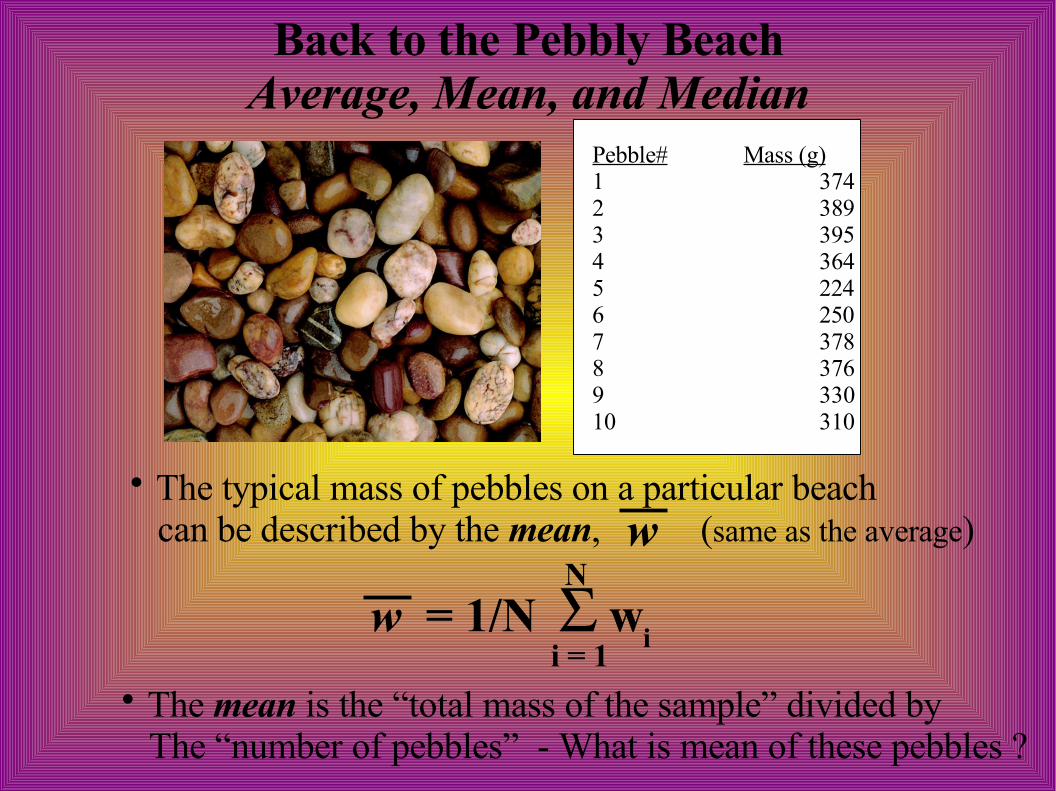
Pebble# Mass (g)1 3742 3893 3954 3645 2246 2507 3788 3769 33010 310
The typical mass of pebbles on a particular beach can be described by the mean, (same as the average)w
w = 1/N wi
i = 1
N
The mean is the “total mass of the sample” divided by The “number of pebbles” - What is mean of these pebbles ?

Back to the Pebbly BeachAverage, Mean, and Median
Pebble# Mass (g)1 2252 2503 3104 3305 3646 3747 3768 3789 38910 39511 399
Another way of finding the typical mass of pebbles is to use the median value. Median means “middle” and is the weight of the middle Pebble if all are lined up (ranked) from lightest to heaviest. You must have an odd number of pebbles to get the median
In the above example, pebble #6 has a mass of 374 g which gives the median value of this pebble sample
Back to the Pebbly BeachAverage, Mean, and Median
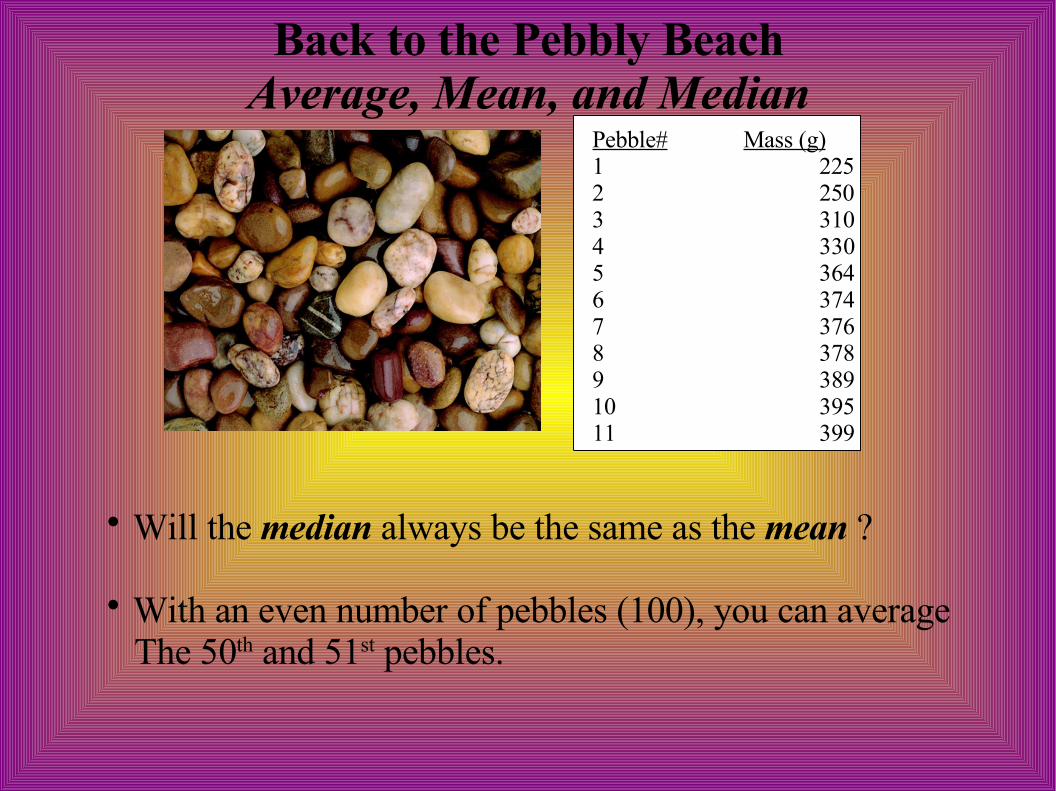
Will the median always be the same as the mean ?
With an even number of pebbles (100), you can average The 50th and 51st pebbles.
Pebble# Mass (g)1 2252 2503 3104 3305 3646 3747 3768 3789 38910 39511 399

Back to the Pebbly Beach- Dispersion
What about other aspects of the distribution of pebbles ? How can we tell if the pebbles are similar in size (i.e. well or poorly sorted)
Pebble# Mass (g)1 2252 2503 3104 3305 3646 3747 3768 3789 38910 39511 399
We could give the total range of sizes – known as the dispersion But how much does this tell us about all the sample pebbles ?
Back to the Pebbly Beach- Dispersion
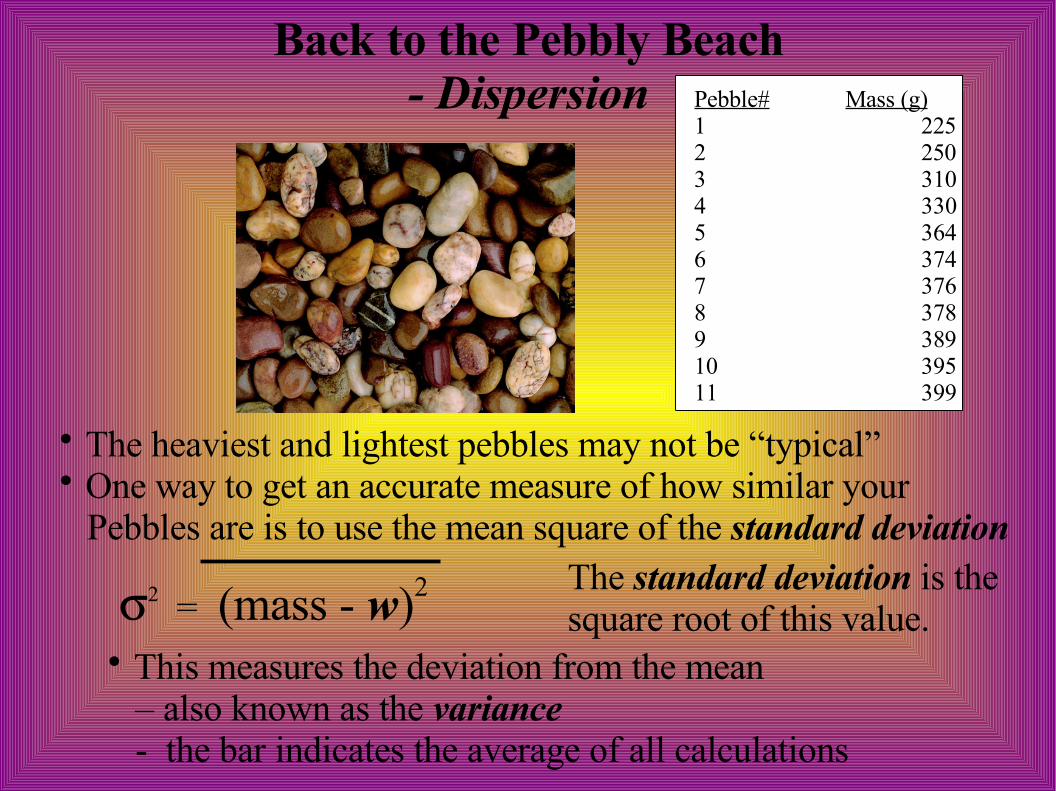
The heaviest and lightest pebbles may not be “typical” One way to get an accurate measure of how similar your Pebbles are is to use the mean square of the standard deviation
Pebble# Mass (g)1 2252 2503 3104 3305 3646 3747 3768 3789 38910 39511 399
2 = (mass - w)2
This measures the deviation from the mean – also known as the variance - the bar indicates the average of all calculations
The standard deviation is thesquare root of this value.
Back to the Pebbly Beach- Dispersion Pebble# Mass (g)
1 2252 2503 3104 3305 3646 3747 3768 3789 38910 39511 399
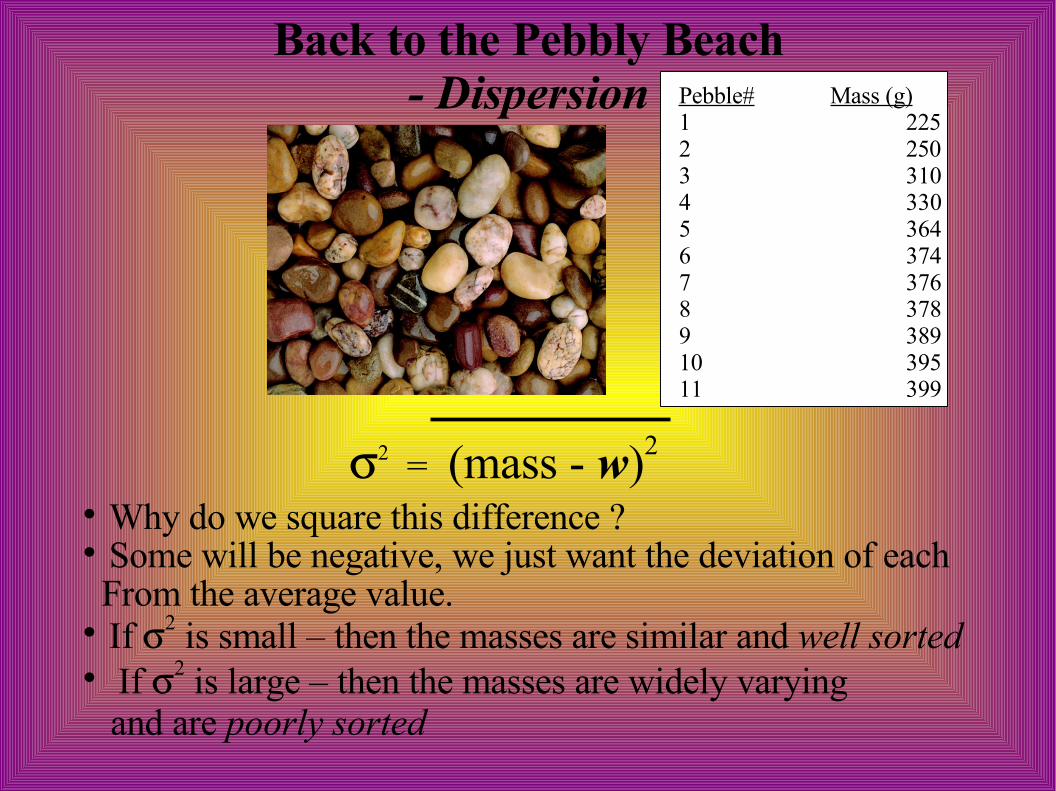
2 = (mass - w)2
Why do we square this difference ? Some will be negative, we just want the deviation of each From the average value. If 2 is small – then the masses are similar and well sorted If 2 is large – then the masses are widely varying and are poorly sorted

Visualizing Distribution of Data
How can you display graphically the distribution of a large number of pebbles ?
Which sizes occur most often ? Which are fairly rare ?

Visualizing Distribution of Data: Histogram
A histogram displays the pebble mass count in bins (10 bins shown) We first count the number of occurences (frequency) in each bin and list them in a table called the frequency distribution Then plot this frequency as a bar chart against mass
Pebble mass (g)
Fre
quen
cy
Range(g) Number
200-235 1236-260 3261-285 7286-315 9316-335 16336-365 22366-385 19386-415 14416-435 6436-465 2
Frequency Distribution
Histograms in Matlab (or Octave)
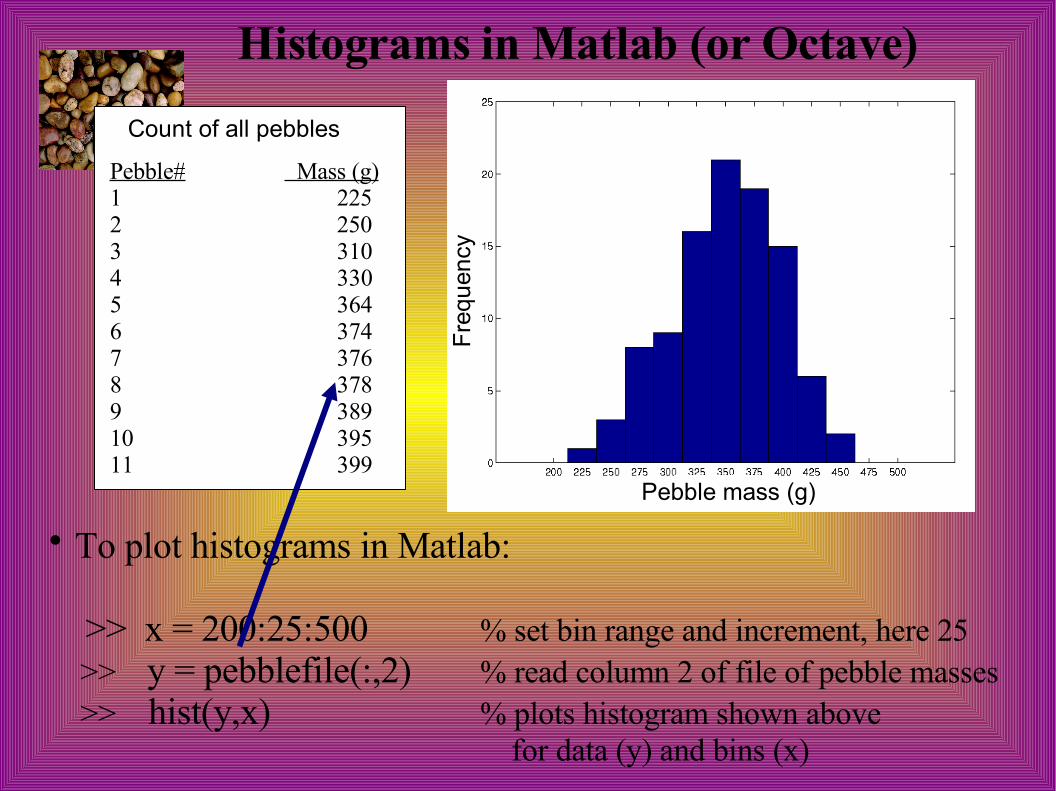
To plot histograms in Matlab:
>> x = 200:25:500 % set bin range and increment, here 25 >> y = pebblefile(:,2) % read column 2 of file of pebble masses >> hist(y,x) % plots histogram shown above
for data (y) and bins (x)
Pebble mass (g)F
requ
ency
Pebble# Mass (g)1 2252 2503 3104 3305 3646 3747 3768 3789 38910 39511 399
Count of all pebbles

Visualizing Distribution of DataMarine seismic study, Weeraratne et al., 2007
We're interested in earthquake paths which come from every possible azimuth within 360o (the back azimuth).
How can we graphically represent the distribution of cyclical data or direction ?

Visualizing Distribution of Data: Rose Diagrams
A rose diagram is like plottinga histogram on a polar graph.
The direction is represented byThe angle around the plot andThe frequency is proportionalTo distance from the center.
Here frequency ranges from0 to 6 and an angle of 30o is the most frequent occuring 6 times.
A list of fault dip angles could be plotted in this way.

Plotting Rose Diagrams in Matlab (or Octave)
To plot rose diagrams in Matlab:
>> dip = faultdipfile(:,1) % reads first column of data input >> dipradians = dip.*pi./180 % converts angles to radians >> bins = 100 % specify the number of bins >> rose(dipradians,bins) % plot the rose diagram

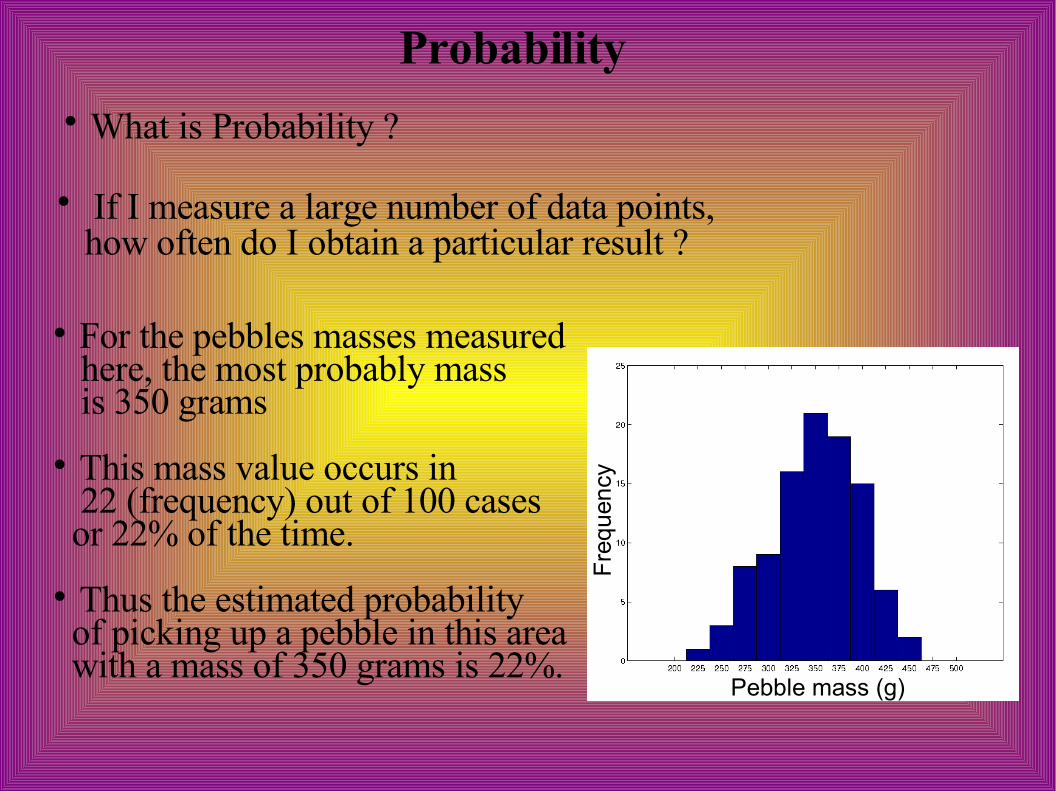
Probability What is Probability ?
If I measure a large number of data points, how often do I obtain a particular result ?
Pebble mass (g)
Fre
quen
cy
For the pebbles masses measured here, the most probably mass is 350 grams
This mass value occurs in 22 (frequency) out of 100 cases or 22% of the time.
Thus the estimated probability of picking up a pebble in this area with a mass of 350 grams is 22%.

Probability
We can then add another column to the data which shows the probability for each bin size
You can now plot probability in a histogram
Pebble mass (g)
Pro
bab
ility
Range(g) Number Probability
200-235 1 .01236-260 3 .03261-285 7 .07286-315 9 .09316-335 16 .16336-365 22 .22366-385 19 .19386-415 14 .14416-435 6 .06436-465 2 .02
Frequency Distribution & Probability

Probability: What is Normal ?
You can compare your data distribution to theoretical estimates
The most common distribution used is a normal distribution also known as a Gaussian distribution.
Pebble mass (g)
Pro
bab
ility
Range(g) Number Probability
200-235 1 .01236-260 3 .03261-285 7 .07286-315 9 .09316-335 16 .16336-365 22 .22366-385 19 .19386-415 14 .14416-435 6 .06436-465 2 .02
Frequency Distribution & Probability

Gaussian Distribution
P(x) = e[-(x-x)2/22]
sqrt(22)
The Gaussian distribution is written as above and describes the relative probability of obtaining the value, x.
Here is the standard deviation and x is the average of all x

x
P(x)
Gaussian Distribution
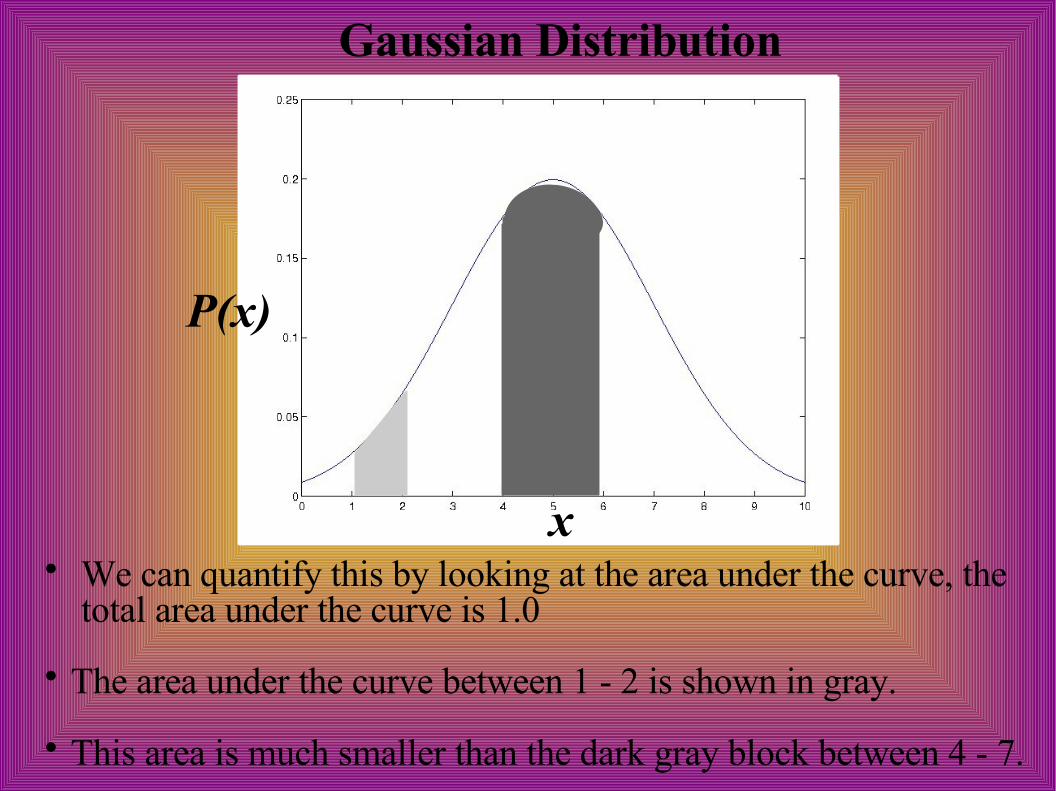
This is a Gaussian distribution for xmean
= 5.0 and = 2.0 You are more likely to obtain a value between 4-6 where the graph is high And less likely to obtain a value between 1-2, or 9-10
P(x) = e[-(x-x)2/22]
sqrt(22)
Gaussian Distribution
We can quantify this by looking at the area under the curve, the total area under the curve is 1.0
The area under the curve between 1 - 2 is shown in gray.
This area is much smaller than the dark gray block between 4 - 7.
x
P(x)

Gaussian Distribution
The area under the curve between 3-7 is 0.683 and is termed 1.0 (this is known as the 68% confidence limit)
The area under the curve between 1-9 is 0.954 and is termed(this is known as the 95% confidence limit)
x
P(x
) 1.0
2.0
To quantify these “areas” we use established values for multiples of the standard deviation from the mean

Linear Regression:How to Fit a Line to Scattered Data
Now that we've learned statistical analysis of a single variable
We can also consider statistical analysis of two related variables.
We may be able to approximate this relationship by a straight line.
How do we find this line ? Which line is best ?
Pebble diameter
Dis
tanc
e fr
om s
hore
(m
)

Linear Regression:How to Fit a Line to Scattered Data
The line draw to the right is one possibility.
How can we determine whether this line is better than another – in a quantitative way ?
Pebble diameter
Dis
tanc
e fr
om s
hore
(m
)
y
We can calculate the mean square deviation by looking the distance each point is from the predicted line
The devation of one point is shown by y and is estimated in the “y direction” only.

Linear Regression:How to Fit a Line to Scattered Data
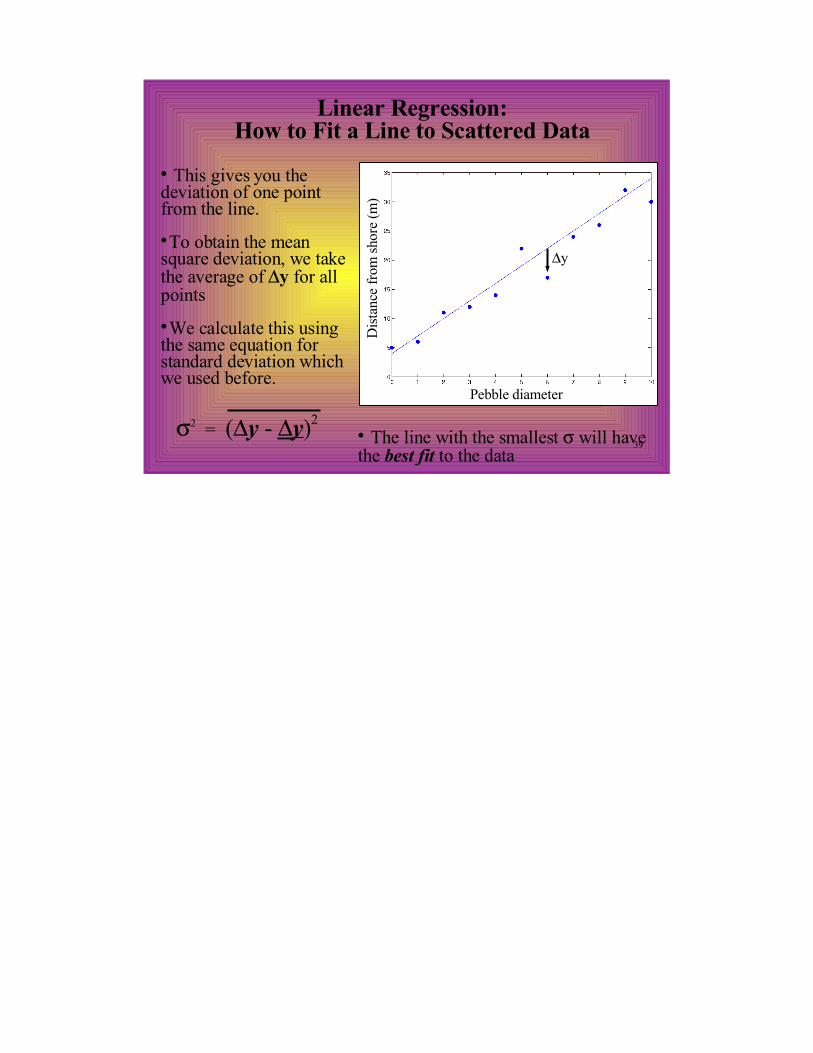
This gives you the deviation of one point from the line.
To obtain the mean square deviation, we take the average ofy for all points
We calculate this using the same equation for standard deviation which we used before.
Pebble diameter
Dis
tanc
e fr
om s
hore
(m
)
y
2 = (y - y)2 The line with the smallest will havethe best fit to the data


37
Linear Regression:How to Fit a Line to Scattered Data
Now that we've learned statistical analysis of a single variable
We can also consider statistical analysis of two related variables.
We may be able to approximate this relationship by a straight line.
How do we find this line ? Which line is best ?
Pebble diameter
Dis
tanc
e fr
om s
hore
(m)

38
Linear Regression:How to Fit a Line to Scattered Data
The line draw to the right is one possibility.
How can we determine whether this line is better than another – in a quantitative way ?
Pebble diameter
Dis
tanc
e fr
om s
hore
(m)
y
We can calculate the mean square deviation by looking the distance each point is from the predicted line
The devation of one point is shown by y and is estimated in the “y direction” only.
39
Linear Regression:How to Fit a Line to Scattered Data
This gives you the deviation of one point from the line.
To obtain the mean square deviation, we take the average ofy for all points
We calculate this using the same equation for standard deviation which we used before.
Pebble diameter
Dis
tanc
e fr
om s
hore
(m)
y
2 = (y - y)2 The line with the smallest will havethe best fit to the data
Related Documents