Probability and Statistics

Probability and Statistics. General goals: –Familiarize ourselves with common probability distributions that arise in nature –Take a data set and decide.
Dec 22, 2015
Welcome message from author
This document is posted to help you gain knowledge. Please leave a comment to let me know what you think about it! Share it to your friends and learn new things together.
Transcript

Probability and Statistics

Probability and Statistics
General goals:
– Familiarize ourselves with common probability distributions that arise in nature
– Take a data set and decide on an appropriate statistical test

Probability and Statistics
TODAY:• Random variables• Probability distributions• Point estimation
NEXT WEEK:• Confidence intervals• Hypothesis testing• Independence & covariance• Correlation coefficient & regression

Random Variables
A random variable is:
a function that associates a numerical value with every outcome of an experiment
A random variable IS NOT:
a mathematical variable that can be assigned a numerical value.

Random Variables
For example:
X is a random variable that describes the outcomes of flipping a coin.
X could be 0 for heads and 1 for tails

Random Variables
For example:
X is a random variable that describes the outcomes of rolling a die.
X could be 1 when you roll a 1; 2 when you roll a 2; and so on…

2 types of Random Variables
• A discrete random variable can only have a countable number of values– e.g. outcome of rolling dice, number of trials a
monkey gets correct, number of flies that exhibit a particular phenotype
• A continuous random variable can take on any real number as a value– e.g. amount of time something takes, the distance
between two objects

Probability DistributionsA probability distribution assigns a probability (i.e. likelihood of occurrence) for every value of the random variable (i.e. for every potential outcome of the experiment)
x 1 2 3 4 5 6
P(X=x)
=f(x)
1/6 1/6 1/6 1/6 1/6 1/6
P(X=2)=1/6
P(X>3)=3/6
X is the random variable; x is an outcome of the experiment

Discrete Probability Distributions
Probability mass function
f (x) P(X x)
# of students on time to class
prob
abili
ty
What’s the probability that exactly 4 students are on time to class?
P(X 4) f (4) 0.18
What’s the probability that less than 5 students are on time to class?
P(X 5) f (x)x5
f(x)
X describes the # of students on time to class.

Probability Distributions
The sum of all the possible outcomes must be 1.
0 f (x) 1
f (x) 1
The probability of any given outcome is greater than or equal to 0, and less than or equal to 1.

Continuous Probability Distributions
f (x)dxa
b
P(a X b)
change in size of dendritic tree
prob
abili
ty
What’s the probability that the dendritic tree changes by 1.2 mm?
P(X 1.2) f (x)dx1.2
1.2
0
What’s the probability that the dendritic tree changes between 1.1 and 1.3 mm?
P(1.1 X 1.3) f (x)dx1.1
1.3
Probability density function (pdf)
f(x)
X represents the change in size of the dendritic tree.

Continuous Probability Distributions
change in size of dendritic tree
prob
abili
ty
What’s the probability that the dendritic tree change is negative (i.e., the tree shrinks)?
P(X 0) f (x)dx
0
0.5
f (x)dxa
b
P(a X b)
Probability density function (pdf)
f(x)
X represents the change in size of the dendritic tree.

A random variable can have any probability distribution
f(x)
x
f(x)
x
f(x)
x
f(x)
x

Figuring out the distribution of your data
Let’s say you collected some data.
How can you determine its probability density function?
Just bin your data (make a histogram). That’s an approximation for the pdf.
The more data, the better the approximation.
n=20
n=100
n=1000

Two important ways to characterize the distribution of a
random variable
• Mean
• Variance

Mean
• Average outcome of the random variable
xx
xXxPxxfXE )()()(
5.3
)6/16()6/15()6/14()6/13()6/12()6/11(
)(
XE
Note that E(X) does not have to be a possible value for X.
Example: throwing a die

Mean: Roulette
37 out of every 38 times: Lose $1 1 out of every 38 times: Win $35
E(X) xP(X x) P(X=-1)=37/38P(X=35)=1/38
E(X) = -1*P(X=-1) +35*P(X=35) = -$0.0526

Variance
Variance measures how spread out (or variable) the outcomes of the experiment are.
)()(]))([()( 22 xXPxXEXEXVarx

Variance: Roulette
37 out of every 38 times: Lose $1 1 out of every 38 times: Win $35
P(X=-1)=37/38P(X=35)=1/38
=E(X)=-1*P(X=-1) +35*P(X=35)=-$0.0526
Var(X)= (-1+0.0526)2*P(X=-1) +(35-0.0526) 2 *P(X=35) = $32.2
)()()(
]])[[()(2
2
xXPxXVar
XEXEXVar
x

Probability density functions with different means &
variance

Common Probability Distributions

Why?
• These distributions arise commonly arise in nature.
• Fitting your data to a distribution helps you characterize the process underlying the distribution.
• Identifying the distribution you’re working with is important for deciding on the appropriate statistical test to use.

Discrete Distributions
Binomial
Poisson

Binomial DistributionsWhat’s the probability of a certain number of “successes” in n trials, where each trial is either a “success” or a “failure”, and there is a fixed probability of success?
• For example,
– The probability of getting a certain number of heads, when a coin is tossed 50 times.
– The probability of a certain number of children being born with a homozygous mutation when both parents are heterozygous for the mutation and there are 3 children.
– The probability that an animal chooses one of two choices a certain number of times, given 20 trials.

Binomial Distribution
What is the probability of getting k successes in n trials when p is the probability of getting a success on any one trial?
P(X k) n
k
pk (1 p)n k
# of different ways of distributing k successes in a sequence of n trials
Probability of k successes
Probability of n-k failures
n
k
n!
k!(n k)!
x!x (x 1)(x 2)...1

Binomial Distribution

• What is the average number of successes you’d expect in n trials?
Binomial Distribution
E(X) np
Var (X) np(1 p)
• What is the variance in the number of successes you’d expect in n trials?

Binomial distribution (example)
Two parents each carry the recessive gene for cystic fibrosis (CF). They have 5 kids.
p=.25; n=5
• What’s the probability that only 1 child has CF (k=1)?
P(X k) n
k
pk (1 p)n k
n
k
n!
k!(n k)!
P(X 1) 5!
4!1!.25* .754 0.40

Binomial distribution (example)
Two parents each carry the recessive gene for cystic fibrosis (CF). They have 5 kids.
p=.25; n=5
E(X) np 5* .25 1.25
What’s the average # of children to have CF?
What’s the variance in the # of children to have CF?
94.75.*25.*5)1()var( pnpX

Binomial distribution in neuroscience
HYPOTHESIS: AMPA receptors exhibit multiple distinguishable conductance levels
Smith, T. C. et al. J. Neurosci. 2000; 20:2073-2085
Cu
rre
nt (
pA
)

Binomial distribution in neuroscience
But they need to control for the possibility of MULTIPLE channels in their patch.
If that were the case, the current distribution should be binomial.
Binomial distribution
Data
HYPOTHESIS: AMPA receptors exhibit multiple distinguishable conductance levels
Smith, T. C. et al. J. Neurosci. 2000; 20:2073-2085

Poisson Distribution
• A Poisson distribution expresses the probability of a number of events occurring in a fixed period if these events– occur with a known average
rate ()– are independent of each
other
P(X k) e k
k!
Probability mass function

Key stuff about Poisson distributions
• The mean and variance of a Poisson distribution are both .
• The Poisson distribution is the limit of the Binomial distribution for large n and small p (=np).
• Thus, when n is large (>20), and p is small (<.05), you only need to know the rate .

Poisson Distribution & Mutation Rates
• Example: If there are 3x10⁹ base pairs in the human genome and the mutation rate per generation per base pair is 10-9, what is the probability that a child will have 3 new mutations?
E(X) Var (X) 3
P(X 3) e 3 33
3!.23
P(X k) e k
k! =
= (mutation rate/base pair) * (number of base pairs)
= 3*109 * 10-9 = 3
k = 3

The Binomial distribution gives the same answer
• Example: If there are 3x10⁹ base pairs in the human genome and the mutation rate per generation per base pair is 10-9, what is the probability that a child will have 3 new mutations?
P(X 3) 3*109
3
(10 9)3(1 10 9)10 9 3
P(X k) n
k
pk (1 p)n k
n
k
n!
k!(n k)!
p= 10-9 n= 3x10⁹ k=3

The Poisson distribution and
the Prussian cavalry
Ladislaus Bortkiewicz analyzed the # of cavalry soldiers killed each year by horse kicks, and compared the distribution he measured to the Poisson distribution.

The Poisson distribution and
the Prussian cavalry• He made a histogram of the number of soldiers killed
each year over 20 years.
• He plotted the Poisson distribution, plugging in for the average number of deaths per year ().
• The two plots matched!
• This confirmed the ability of the Poisson distribution to predict the probability of occurrence of independent events, given only their rate.

Poisson distribution: quantal neurotransmitter release
Fatt & Katz

Poisson distribution: quantal neurotransmitter release
Fatt & Katz found the post-synaptic response to presynaptic stimulation fluctuated in a step-like manner.• sometimes there was no response • sometimes the response resembled the spontaneous
potential• sometimes the response was 2 or 3 times larger
“Quantal” hypothesis

Poisson distribution: quantal neurotransmitter release
• They realized they needed to do statistics to validate the quantal release hypothesis.
• Binomial distribution: presynaptic terminal contains lots of packets of neurotransmitter (n), each with a probability of being released in response to a nerve impulse (p). But how to estimate n and p?
• Instead, they used Poisson distribution, where they only needed to estimate (=np), the average quanta release/stimulation.

Poisson distribution: quantal neurotransmitter release
They estimated , the # of quanta released per trial, by
mean amplitude of evoked potential mean amplitude of spontaneous potential=
They compared it to the predicted by a Poisson distribution when the number of events (k) is 0.
P(X k) e k
k!
P(X 0) e 0
0!e
Frequency of no response
= -ln(P(X=0))

Poisson distribution: quantal neurotransmitter release
They found a good match between their 2 estimates of . Since one of the estimates depended on the Poisson distribution and the other did not, this supported the hypothesis of quantal release.
(Evoked potential)/(Spontaneous potential)
-ln(
prob
of
no r
espo
nse)

Poisson distribution: quantal neurotransmitter release
To prove that a Poisson distribution can describe neurotransmitter release, we need to predict the entire probability distribution.
CONCLUSIONS:
• Neurotrasmitter release is quantal.• The release of the quanta are statistically independent from each other.• The release probabilities can be described entirely by the rate of release per trial.
Variance of spontaneous potentials
Data
Poisson distribution (taking into account variance)

Poisson process & the spiking neuron
• In order to characterize a neural firing pattern, people often compare the mean and variance of the number of spikes.
• If the mean ≈ variance, you likely have a Poisson process (often true in cortex).
• That means firing RATE can completely characterize the process -- spike timing is irrelevant.

BREAK

Continuous Distributions
Uniform
Exponential
Normal

Uniform Distributions
Within a certain interval, the event has an equal probability of happening. It never happens outside that interval.
f (x) 1
b a, a x b
0, otherwise
E(X) a b
2
Var (X) (b a)2
12
a b
For example:
• The probability that a meteor will hit any position on earth
• The probability of an ion channel located at a particular position on the membrane

Exponential Distributions
• If there are independent events that occur at a rate , then the time between events is exponentially distributed:
f (x) e x
Probability density function
E(X) 1
; Var (X)
1
2

When do we see exponentially distributed
variables?• the time until you have your next car accident;• the time until a radioactive particle decays, or the
time between beeps of a geiger counter;• the time until a large meteor strike causes a mass
extinction event.
• the distance between mutations on a DNA strand;• the distance between roadkill on a given street;

Exponential Distributions• Example: Let be the rate at which you get into car
accidents. The time until your next accident would be described by an exponential distribution (assuming that does not change over time)
f (x) e x
E(X) 1
;
Var (X) 1
2
1.5 /year
1 /year
.5 /year

Exponential distributions: transition probabilities
• A common neuroscience application of the exponential distribution is for describing the probability that an ion channel remains opened or closed for a certain amount of time.
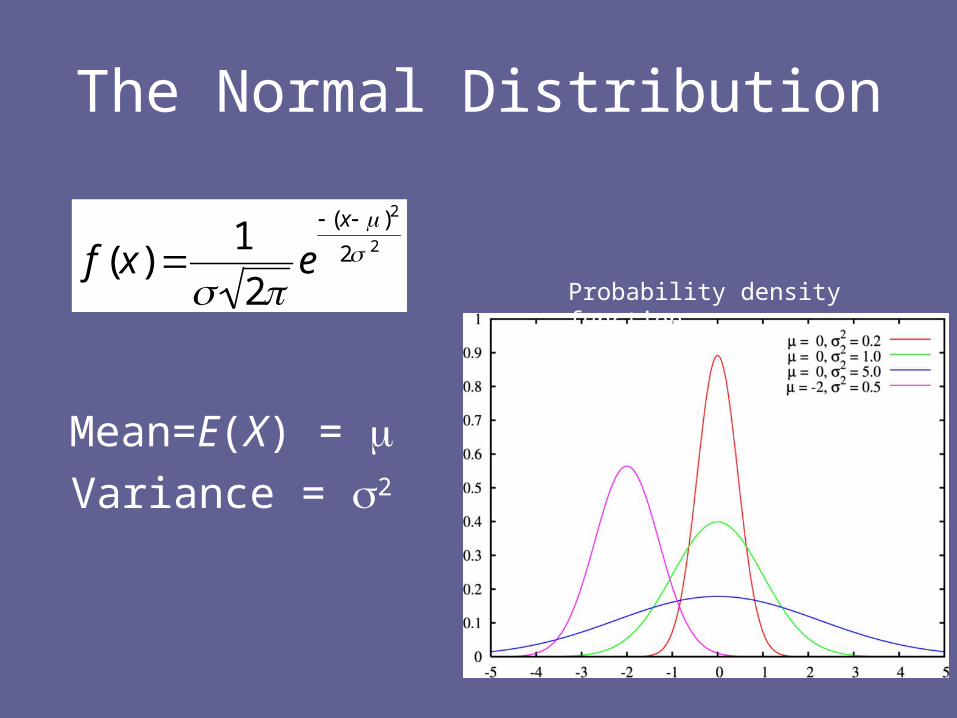
The Normal Distribution
Mean=E(X) = Variance = 2
f (x) 1
2e
(x )2
2 2
Probability density function

Why is everything so normal?
• When the sample size is big enough, the means of ANY independent, identically distributed random variables form a normal distribution.
• This is true no matter what the distribution of the original variables looks like.
The Central Limit Theorem (CLT)

Demonstration of CLT for a uniform distribution

CLT is THE most important result from statistics
because …• It explains the ubiquity of the normal distribution in
nature. – If one assumes many small (independent) effects contribute
to each observation in an additive fashion, the CLT dictates that the distribution will be normal.
• The ubiquity of the normal distribution allows us to use one distribution to calculate probabilities and estimate statistics and parameters.

Let’s say you collected some data
What you really care about is the probability distribution that underlies your data.
But all you can do is sample a finite amount of data from the distribution.
n=20
n=100
n=1000
How do you estimate a parameter (e.g. mean, variance) of the underlying distribution based on your sampled data?

Point estimation
• You want to know the mean, or variance, (or something) of a distribution.
• You don’t know the true distribution -- all you can do is repeat your experiment and sample a population from that distribution.
• Point estimation is used to estimate the parameter (e.g., the mean) of the true distribution based on your sampled population.

Example: Estimating the mean of the underlying normal distribution based on 20 data points (y1, y2,… y20).
= our estimate of
ˆ y i
20 .3
i
the point estimate
= mean of the underlying distribution
Notice that the estimated mean differs from the true mean.

ˆ 2 (y i y)2
20i
Example: Estimating the variance of the underlying normal distribution based on 20 data points (y1, y2,… y20).
2 = our estimate of 2
the point estimate
2 = variance of the underlying distribution

• Confidence intervals!• They give you the probability that the
parameter of the underlying distribution falls within some interval.
How good is your point estimate?
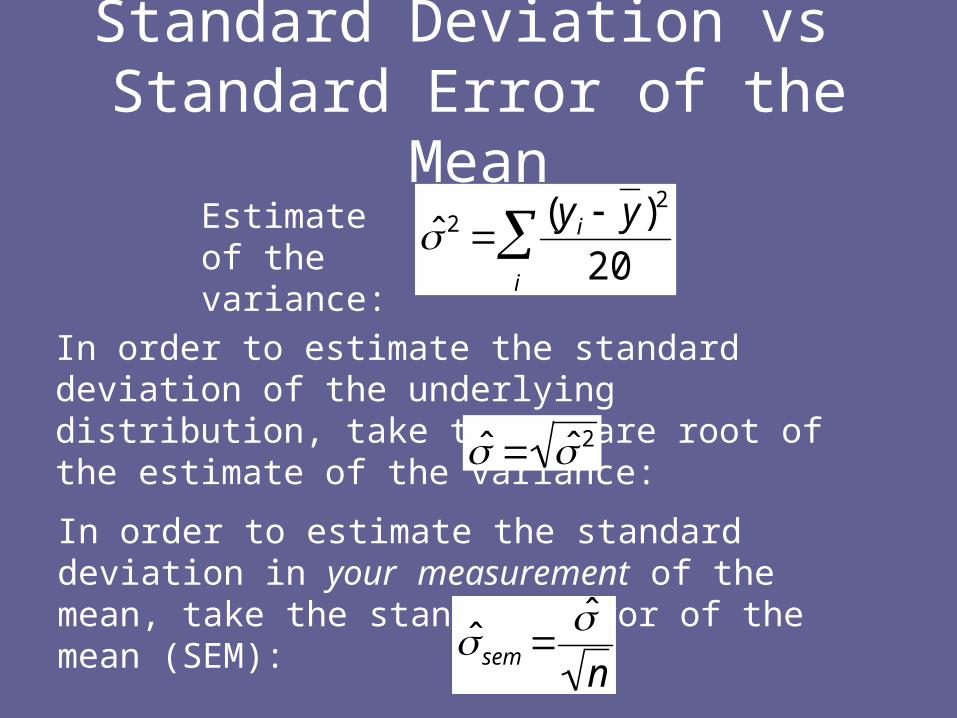
Standard Deviation vs Standard Error of the Mean
In order to estimate the standard deviation in your measurement of the mean, take the standard error of the mean (SEM):
In order to estimate the standard deviation of the underlying distribution, take the square root of the estimate of the variance:
ˆ ˆ 2
ˆ sem ˆ n
ˆ 2 (y i y)2
20i
Estimate of the variance:

Bar graphs are used todisplay the mean and the
standard error of the mean
0 4 8
4
2

So far, we’ve talked about ….• Random variables• Probability distributions• Point estimation
Next week, we’ll cover …• Confidence intervals• Hypothesis testing• Independence & covariance• Correlation coefficient and regression


We need an “estimator” to go from our data to an estimate of the parameter
in the true distribution
There are TONS of estimators. Here are 2 popular ones:
• Minimum variance unbiased estimator -- of all estimators that are right on average, this one has the minimum variance.
• Maximum likelihood estimator -- maximizes the likelihood of observing the sampled data (may not be right on average)

Point Estimates (for a normal distribution)
Maximum likelihood estimator
Minimum variance unbiased estimator
VarianceMean
x x i
ni
2 (x i x)2
ni
x x i
ni
2 (x i x)2
n 1i
Related Documents