630 Chapter 12 Probability and Statistics Probability and Statistics • permutation (p. 638) • combination (p. 640) • probability (p. 644) • measures of central tendency (p. 664) • measures of variation (p. 665) Key Vocabulary • Lessons 12-1 and 12-2 Solve problems involving independent events, dependent events, permutations, and combinations. • Lessons 12-3, 12-4, 12-5, and 12-8 Find probability and odds. • Lesson 12-6 Find statistical measures. • Lesson 12-7 Use the normal distribution. • Lesson 12-9 Determine whether a sample is unbiased. Being able to analyze data is an important skill for every citizen. Business decision-makers rely on statistical measures to ensure quality products, medical researchers test and design new treatments by performing experiments with sample populations, and sports coaches use probabilities to design a winning team. Each day during a presidential election campaign, journalists report the results of public opinion polls. Pollsters must make sure that the sample they choose accurately represents all of the voters. You will investigate how opinion polls are used in political campaigns in Lesson 12-9. 630 Chapter 12 Probability and Statistics

Welcome message from author
This document is posted to help you gain knowledge. Please leave a comment to let me know what you think about it! Share it to your friends and learn new things together.
Transcript

630 Chapter 12 Probability and Statistics
Probability andStatistics
• permutation (p. 638)• combination (p. 640)• probability (p. 644)• measures of central tendency (p. 664)• measures of variation (p. 665)
Key Vocabulary• Lessons 12-1 and 12-2 Solve problemsinvolving independent events, dependent events,permutations, and combinations.
• Lessons 12-3, 12-4, 12-5, and 12-8 Findprobability and odds.
• Lesson 12-6 Find statistical measures.
• Lesson 12-7 Use the normal distribution.
• Lesson 12-9 Determine whether asample is unbiased.
Being able to analyze data is animportant skill for every citizen.Business decision-makers rely onstatistical measures to ensure qualityproducts, medical researchers test anddesign new treatments by performingexperiments with sample populations,and sports coaches use probabilities todesign a winning team.
Each day during a presidentialelection campaign, journalists reportthe results of public opinion polls.Pollsters must make sure that thesample they choose accuratelyrepresents all of the voters. You will
investigate how opinion polls are used in
political campaigns in Lesson 12-9.
630 Chapter 12 Probability and Statistics

Probability and Statistics Make this Foldable to help you organize your notes.Begin with one sheet of 11" by 17" paper.
Reading and Writing As you read and study the chapter, you can write notes and examples on indexcards and store the cards in the Foldable pockets.
Prerequisite Skills To be successful in this chapter, you’ll need to masterthese skills and be able to apply them in problem-solving situations. Reviewthese skills before beginning Chapter 12.
For Lesson 12-3 Find Simple Probability
Find each probability if a die is rolled once.
1. P(2) 2. P(5) 3. P(even number)
4. P(odd number) 5. P(numbers less than 5) 6. P(numbers greater than 1)
For Lesson 12-6 Box-and-Whisker Plots
Make a box-and-whisker plot for each set of data. (For review, see pages 826 and 827.)
7. {24, 32, 38, 38, 26, 33, 37, 39, 23, 31, 40, 21}
8. {25, 46, 31, 53, 39, 59, 48, 43, 68, 64, 29}
9. {51, 69, 46, 27, 60, 53, 55, 39, 81, 54, 46, 23}
10. {13.6, 15.1, 14.9, 15.7, 16.0, 14.1, 16.3, 14.3, 13.8}
For Lesson 12-6 Evaluate Expressions
Evaluate ��� for each set of values. (For review, see Lesson 5-6.)
11. a � 4, b � 7, c � 1, d � 5 12. a � 2, b � 6, c � 9, d � 5
13. a � 5, b � 1, c � 7, d � 4 14. a � 3, b � 4, c � 11, d � 10
For Lesson 12-8 Expand Binomials
Expand each binomial. (For review, see Lesson 5-2.)
15. (a � b )3 16. (c � d)4 17. (m � n)5 18. (x � y)6
(a � b)2 � (c � b)2���
d
Fold
Staple and Label
Refold along the width. Staple each pocket. Labelpockets as The Counting Principle, Permutationsand Combinations, Probability, and Statistics.
Fold and Cut
Fold 2'' tabs on each ofthe short sides.
Then fold in half in bothdirections. Open and cutas shown.
Chapter 12 Probability and Statistics 631

INDEPENDENT EVENTS An is the result of a single trial. Forexample, the trial of flipping a coin once has two outcomes: head or tail. The set ofall possible outcomes is called the . An consists of one or moreoutcomes of a trial. The choices of letters and digits to be put on a license plate arecalled because each letter or digit chosen does not affect thechoices for the others.
For situations in which the number of choices leads to a small number of totalpossibilities, you can use a tree diagram or a table to count them.
independent events
eventsample space
outcome
Vocabulary• outcomes• sample space• event• independent events• Fundamental Counting
Principle• dependent events
The Counting Principle
632 Chapter 12 Probability and Statistics
• Solve problems involving independent events.
• Solve problems involving dependent events.
Most states have letters and digits on theirlicense plates. The number of possible platesis too great to count by listing all of thepossibilities. It is much more efficient to countthe number of possibilities by using theFundamental Counting Principle.
Independent EventsFOOD A sandwich cart offers customers a choice of hamburger, chicken, or fishon either a plain or a sesame seed bun. How many different combinations ofmeat and a bun are possible?
First, note that the choice of the type of meat does not affect the choice of the typeof bun, so these events are independent.
Method 1 Tree DiagramLet H represent hamburger, C, chicken, F, fish, P, plain, and S, sesame seed. Make atree diagram in which the first row shows the choice of meat and the second rowshows the choice of bun.
Meat H C F
Bun P S P S P S
Possible Combinations HP HS CP CS FP FS
There are six possible outcomes.
Method 2 Make a TableMake a table in which each row represents a type of meat and each column represents a type of bun.
This method also shows that there are six outcomes.
Example 1Example 1
HP HS
CP CS
FP FS
Bun
Plain Sesame
Hamburger
Meat Chicken
Fish
can you count the maximum number of license plates a state can issue?can you count the maximum number of license plates a state can issue?

Lesson 12-1 The Counting Principle 633
More than Two Independent EventsCOMMUNICATION Many answering machines allow owners to call home andget their messages by entering a 3-digit code. How many codes are possible?
The choice of any digit does not affect the other two digits, so the choices of thedigits are independent events.
There are 10 possible first digits in the code, 10 possible second digits, and 10possible third digits. So, there are 10 � 10 � 10 or 1000 possible different codenumbers.
Example 3Example 3
Fundamental Counting Principle
• Words If event M can occur in m ways and event N can occur in n ways, thenevent M followed by event N can occur in m • n ways.
• Example If event M can occur in 2 ways and event N can occur in 3 ways, thenM followed by N can occur in 2 • 3 or 6 ways.
Notice that in Example 1, there are 3 ways to choose the type of meat, 2 ways tochoose the type of bun, and 3 • 2 or 6 total ways to choose a combination of the two.This illustrates the .Fundamental Counting Principle
Fundamental Counting PrincipleMultiple-Choice Test Item
Read the Test Item
Her choice of a restaurant does not affect her choice of a sporting event, so theseevents are independent.
Solve the Test Item
There are 3 ways she can choose a restaurant and there are 4 ways she can choosethe sporting event. By the Fundamental Counting Principle, there are 3 • 4 or 12total ways she can choose her two prizes. The answer is B.
Example 2Example 2
Kim won a contest on a radio station. The prize was a restaurant gift certificateand tickets to a sporting event. She can select one of three different restaurantsand tickets to a football, baseball, basketball, or hockey game. How manydifferent ways can she select a restaurant followed by a sporting event?
7 12 15 16DCBA
StandardizedTest Practice
DEPENDENT EVENTS Some situations involve dependent events. With, the outcome of one event does affect the outcome of another
event. The Fundamental Counting Principle applies to dependent events as well as independent events.
dependent events
This rule can be extended to any number of events.
The Fundamental Counting Principle can be used to count the number ofoutcomes possible for any number of successive events.
Test-Taking TipRemember that you cancheck your answer bymaking a tree diagramor a table showing theoutcomes.
www.algebra2.com/extra_examples

• Words If the outcome of an event does not affect the outcome of anotherevent, the two events are independent.
• Example Tossing a coin and rolling a die are independent events.
• Words If the outcome of an event does affect the outcome of another event,the two events are dependent.
• Example Taking a piece of candy from a jar and then taking a second piecewithout replacing the first are dependent events because taking thefirst piece affects what is available to be taken next.
Independent and Dependent Events
1. List the possible outcomes when a coin is tossed three times. Use H for headsand T for tails.
2. OPEN ENDED Describe a situation in which you can use the FundamentalCounting Principle to show that there are 18 total possibilities.
3. Explain how choosing to buy a car or a pickup truck and then selecting the colorof the vehicle could be dependent events.
State whether the events are independent or dependent.
4. choosing the color and size of a pair of shoes
5. choosing the winner and runner-up at a dog show
Solve each problem.
6. An ice cream shop offers a choice of two types of cones and 15 flavors of icecream. How many different 1-scoop ice cream cones can a customer order?
7. Lance’s math quiz has eight true-false questions. How many different choices forgiving answers to the eight questions are possible?
8. For a college application, Macawi must select one of five topics on which to writea short essay. She must also select a different topic from the list for a longer essay.How many ways can she choose the topics for the two essays?
9. A bookshelf holds 4 different biographies and 5 different mystery novels. Howmany ways can one book of each type be selected?
1 9 10 20DCBA
634 Chapter 12 Probability and Statistics
Dependent EventsSCHOOL Charlita wants to take 6 different classes next year. Assuming thateach class is offered each period, how many different schedules could she have?
When Charlita schedules a given class for a given period, she cannot schedule thatclass for any other period. Therefore, the choices of which class to schedule eachperiod are dependent events.
There are 6 classes Charlita can take during first period. That leaves 5 classes shecan take second period. After she chooses which classes to take the first twoperiods, there are 4 remaining choices for third period, and so on.
There are 6 � 5 � 4 � 3 � 2 � 1 or 720 schedules that Charlita could have.Note that 6 � 5 � 4 � 3 � 2 � 1 = 6!.
Example 4Example 4
GUIDED PRACTICE KEY
Look BackTo review factorials, seeLesson 11-7.
Study Tip
1st 2nd 3rd 4th 5th 6th
6 5 4 3 2 1
Period
Number of Choices
Concept Check
Guided Practice
StandardizedTest Practice

Lesson 12-1 The Counting Principle 635
Practice and ApplyPractice and Apply
You can use theFundamental CountingPrinciple to list possibleoutcomes in games. Visitwww.algebra2.com/webquest to continuework on your WebQuestproject.
State whether the events are independent or dependent.
10. choosing a president, vice president, secretary, and treasurer for StudentCouncil, assuming that a person can hold only one office
11. selecting a fiction book and a nonfiction book at the library
12. Each of six people guess the total number of points scored in a basketball game.Each person writes down his or her guess without telling what it is.
13. The letters A through Z are written on pieces of paper and placed in a jar. Fourof them are selected one after the other without replacing any of them.
Solve each problem.
14. Tim wants to buy one of three different albums he sees in a music store. Each is available on tape and on CD. From how many combinations of album andformat does he have to choose?
15. A video store has 8 new releases this week. Each is available on videotape andon DVD. How many ways can a customer choose a new release and a format torent?
16. Carlos has homework to do in math, chemistry, and English. How many wayscan he choose the order in which to do his homework?
17. The menu for a banquet has a choice of 2 types of salad, 5 main courses, and 3 desserts. How many ways can a salad, main course, and dessert be selected to form a meal?
18. A golf club manufacturer makes drivers with 4 different shaft lengths, 3 different lofts, 2 different grips, and 2 different club head materials. Howmany different combinations are possible?
19. Each question on a five-question multiple-choice quiz has answer choiceslabeled A, B, C, and D. How many different ways can a student answer the fivequestions?
20. How many ways can six different books be arranged on a shelf if one of thebooks is a dictionary and it must be on an end?
21. In how many orders can eight actors be listed in the opening credits of a movieif the leading actor must be listed first or last?
22. PASSWORDS Abby is registering at a Web site. She must select a passwordcontaining 6 numerals to be able to use the site. How many passwords areallowed if no digit may be used more than once?
23. ENTERTAINMENT Solve the problem in the comic strip below. Assume that thebooks are all different.
24. CRITICAL THINKING The members of the Math Club need to elect a presidentand a vice-president. They determine that there are a total of 272 ways that theycan fill the positions with two different members. How many people are in theMath Club?
Peanuts®
ForExercises
10–2325–27
SeeExamples
1–4
Extra Practice See page 854.
Extra Practice See page 854.
www.algebra2.com/self_check_quiz

Area CodesBefore 1995, area codeshad the following format.
(XYZ)X = 2, 3, …, or 9Y = 0 or 1Z = 0, 1, 2, …, or 9Source: www.nanpa.com
25. HOME SECURITY How many different 5-digit codes are possible using the keypad shown at the right if the first digit cannot be 0 and no digit may be used more than once?
AREA CODES For Exercises 26 and 27, refer to the information about telephonearea codes at the left.
26. How many area codes were possible before 1995?
27. In 1995, the restriction on the middle digit was removed, allowing any digit in that position. How many total codes were possible after this change wasmade?
28. RESEARCH Use the Internet or other resource to find the configuration ofletters and numbers on license plates in your state. Then find the number ofpossible plates.
29. Answer the question that was posed at the beginning ofthe lesson.
How can you count the maximum number of license plates a state can issue?
Include the following in your answer:• an explanation of how to use the Fundamental Counting Principle to find the
number of different license plates in a state such as Florida, which has 3 lettersfollowed by 3 numbers, and
• a way that a state can increase the number of possible plates withoutincreasing the length of the plate number.
30. How many numbers between 100 and 999, inclusive, have 7 in the tens place?
90 100 110 120
31. A coin is tossed four times. How many possible sequences of heads or tails are possible?
4 8 16 32
For Exercises 32 and 33, use the following information.A is a collection of points, called
, and segments, called , connecting the vertices. For example, the graph shown at the right has 4 vertices and 2 edges.
32. Suppose a graph has 10 vertices and eachpair of vertices is connected by exactly oneedge. Find the number of edges in thegraph. (Hint: If you use the FundamentalCounting Principle, be sure to count eachedge only once.)
33. TRANSPORTATION The table shows thedistances in miles of the roads betweensome towns. Draw a graph in which thevertices represent the towns and the edgesare labeled with the lengths of the roads.Use your graph to find the length of theshortest route from Greenville to Red Rock.
edgesverticesfinite graph
verticesedges
DCBA
DCBA
WRITING IN MATH
636 Chapter 12 Probability and Statistics
Extending the Lesson
StandardizedTest Practice
Route Miles
Greenville to Roseburg 14
Greenville to Bluemont 12
Greenville to Whiteston 9
Roseburg to Bluemont 8
Bluemont to Whiteston 5
Roseburg to Red Rock 7
Bluemont to Red Rock 9
Whiteston to Red Rock 11

Lesson 12-1 The Counting Principle 637
Maintain Your SkillsMaintain Your Skills
Mixed Review 34. Prove that 4 � 7 � 10 ••• � (3n � 1) � �n(3n
2�5)� for all positive integers n.
(Lesson 11-8)
Find the indicated term of each expansion. (Lesson 11-7)
35. third term of (x � y)8 36. fifth term of (2a � b)7
Evaluate each expression. (Lesson 10-2)
37. log2 128 38. log3 243 39. log9 3
Simplify each expression. (Lesson 9-1)
40. ��xx
2 �
�
yy
2� � �
x �1
y� 41.
42. CARTOGRAPHY Edison is located at (9, 3) in the coordinate system on a roadmap. Kettering is located at (12, 5) on the same map. Each side of a square onthe map represents 10 miles. To the nearest mile, what is the distance betweenEdison and Kettering? (Lesson 8-1)
Solve each equation. (Lesson 7-3)
43. x4 � 5x2 � 4 � 0 44. y4 � 4y3 � 4y2 � 0
Write an equation of the form y � a(x � h)2 � k for the parabola with the givenvertex that passes through the given point. (Lesson 6-6)
45. vertex (3, 2) 46. vertex (�1, 4) 47. vertex (0, 8)
point (5, 6) point (�2, 2) point (4, 0)
Solve each equation. (Lesson 5-8)
48. �2x � 1� � 3 49. 3 � �x � 1� � 5 50. �x� � �x � 5� � 5
Find the inverse of each matrix, if it exists. (Lesson 4-7)
51. � � 52. � � 53. � �
Write an equation in slope-intercept form for each graph. (Lesson 2-4)
54. 55.
PREREQUISITE SKILL Evaluate each expression.(To review factorials, see Lesson 11-7.)
56. �52
!!� 57. �
64
!!� 58. �
73
!!� 59. �
61
!!�
60. �24!2!!
� 61. �26!4!!
� 62. �38!5!!
� 63. �55!0!!
�
y
xO
y
xO
24
�3�6
�5�1
42
11
3�4
�x2 �
x2
25y2�
���5y
x� x�
Getting Ready forthe Next Lesson

PERMUTATIONS When a group of objects or people are arranged in a certainorder, the arrangement is called a . In a permutation, the order of theobjects is very important. The arrangement of objects or people in a line is called a
.
Notice that 7 � 6 � 5 � 4 is the product of the first 4 factors of 7!. You can rewrite thisproduct in terms of 7!.
7 � 6 � 5 � 4 � 7 � 6 � 5 � 4 � �33
��
22
��
11
� Multiply by �33��
22
��
11
� or 1.
7 � 6 � 5 � 4 � or �73
!!� 7! = 7 � 6 � 5 � 4 � 3 � 2 � 1 and 3! = 3 � 2 � 1
Notice that 3! is the same as (7 � 4)!.
The number of ways to arrange 7 people or objects taken 4 at a time is written P(7, 4). The expression for the softball lineup above is a case of the followingformula.
7 � 6 � 5 � 4 � 3 � 2 � 1���
3 � 2 � 1
linear permutation
permutation
Vocabulary• permutation • linear permutation• combination
Permutations andCombinations
638 Chapter 12 Probability and Statistics
• Solve problems involving linear permutations.
• Solve problems involving combinations.
When the manager of a softball team fills outher team’s lineup card before the game, theorder in which she fills in the names isimportant because it determines the order inwhich the players will bat.
Suppose she has 7 possible players in mind forthe top 4 spots in the lineup. You know from theFundamental Counting Principle that there are 7 � 6 � 5 � 4 or 840 ways that she could assignplayers to the top 4 spots.
Reading MathThe expression P(n, r) isread the number ofpermutations of n objectstaken r at a time. It issometimes written as nPr .
Study Tip
PermutationsThe number of permutations of n distinct objects taken r at a time is given by
P(n, r) � �(n
n�
!r)!
�.
PermutationFIGURE SKATING There are 10 finalists in a figure skating competition. Howmany ways can gold, silver, and bronze medals be awarded?
Since each winner will receive a different medal, order is important. You must findthe number of permutations of 10 things taken 3 at a time.
Example 1Example 1
do permutations and combinations apply to softball?do permutations and combinations apply to softball?

Lesson 12-2 Permutations and Combinations 639
Notice that in Example 1, all of the factors of (n - r)! are also factors of n!. Instead of writing all of the factors, you can also evaluate the expression in the following way.
�(10
1�0!
3)!� � �
170!!
� Simplify.
� �10 � 9
7�!8 � 7!� �
77!!
� � 1
� 10 � 9 � 8 or 720 Multiply.
Suppose you want to rearrange the letters of the word geometry to see if you canmake a different word. If the two e’s were not identical, the eight letters in the wordcould be arranged in P(8, 8) or 8! ways. To account for the identical e’s, divide P(8, 8)or 40,320 by the number of arrangements of e. The two e’s can be arranged in P(2, 2)or 2! ways.
�PP
((82,,
82))
� � �82
!!� Divide.
� or 20,160 Simplify.
Thus, there are 20,160 ways to arrange the letters in geometry.
When some letters or objects are alike, use the rule below to find the number ofpermutations.
8 � 7 � 6 � 5 � 4 � 3 � 2!���
2!
Permutation with RepetitionHow many different ways can the letters of the word MISSISSIPPI be arranged?
The second, fifth, eighth, and eleventh letters are each I.
The third, fourth, sixth, and seventh letters are each S.
The ninth and tenth letters are each P.
You need to find the number of permutations of 11 letters of which 4 of one letter,4 of another letter, and 2 of another letter are the same.
�4!
141!!2!
� � or 34,650
There are 34,650 ways to arrange the letters.
11 � 10 � 9 � 8 � 7 � 6 � 5 � 4!���
4!4!2!
Example 2Example 2
Permutations with Repetitions
The number of permutations of n objects of which p are alike and q are alike is �pn!q!!
�.
This rule can be extended to any number of objects that are repeated.
P(n, r) � �(n �
n!r)!
� Permutation formula
P(10, 3) � �(10
1�0!
3!)� n � 10, r � 3
� �170!!
� Simplify.
� or 720 Divide by common factors.
The gold, silver, and bronze medals can be awarded in 720 ways.
1 1 1 1 1 1 110 � 9 � 8 � 7 � 6 � 5 � 4 � 3 � 2 � 1����
7 � 6 � 5 � 4 � 3 � 2 � 11 1 1 1 1 1 1
www.algebra2.com/extra_examples

COMBINATIONS An arrangement or selection of objects in which order is notimportant is called a . The number of combinations of n objects taken rat a time is written C(n, r). It is sometimes written nCr .
You know that there are P(n, r) ways to select r objects from a group of n if theorder is important. There are r! ways to order the r objects that are selected, so thereare r! permutations that are all the same combination. Therefore,
C(n, r) = �P(nr!, r)� or �(n �
n!r)!r!�.
combination
640 Chapter 12 Probability and Statistics
Permutations andCombinations• If order in an
arrangement isimportant, thearrangement is apermutation.
• If order is notimportant, thearrangement is acombination.
Study Tip
Deck of CardsIn this text, a standarddeck of cards alwaysmeans a deck of 52playing cards. There are 4 suits—clubs (black),diamonds (red), hearts(red), and spades(black)—with 13 cards in each suit.
Study TipMultiple Events
Five cards are drawn from a standard deck of cards. How many hands consist ofthree clubs and two diamonds?
By the Fundamental Counting Principle, you can multiply the number of ways toselect three clubs and the number of ways to select two diamonds.
Only the cards in the hand matter, not the order in which they were drawn, so usecombinations.
C(13, 3) Three of 13 clubs are to be drawn.
C(13, 2) Two of 13 diamonds are to be drawn.
C(13, 3) � C(13, 2) � �(13 �
13!3)!3!� � �(13 �
13!2)!2!� Combination formula
� �1103!3!!
� � �1113!2!!
� Subtract.
� 286 � 78 or 22,308 Simplify.
There are 22,308 hands consisting of 3 clubs and 2 diamonds.
Example 4Example 4
CombinationsThe number of combinations of n distinct objects taken r at a time is given by
C(n, r) � �(n �
n!r)!r!�.
In more complicated situations, you may need to multiply combinations and/orpermutations.
CombinationA group of seven students working on a project needs to choose two from theirgroup to present the group’s report to the class. How many ways can they choosethe two students?
Since the order they choose the students is not important, you must find thenumber of combinations of 7 students taken 2 at a time.
C(n, r) � �(n �
n!r)!r!� Combination formula
C(7, 2) � �(7 �
7!2)!2!� n = 7 and r = 2
� �57!2!!
� or 21 Simplify.
There are 21 possible ways to choose the two students.
Example 3Example 3

Lesson 12-2 Permutations and Combinations 641
GUIDED PRACTICE KEY
Practice and ApplyPractice and Apply
1. OPEN ENDED Describe a situation in which the number of outcomes is givenby P(6, 3).
2. Show that C(n, n � r) � C(n, r).
3. Determine whether the statement C(n, r) � P(n, r) is sometimes, always, or nevertrue. Explain your reasoning.
Evaluate each expression.
4. P(5, 3) 5. P(6, 3) 6. C(4, 2) 7. C(6, 1)
Determine whether each situation involves a permutation or a combination. Thenfind the number of possibilities.
8. choosing 2 different pizza toppings from a list of 6
9. seven shoppers in line at a checkout counter
10. an arrangement of the letters in the word intercept
11. SCHOOL The principal at Cobb County High School wants to start amentoring group. He needs to narrow his choice of students to be mentored tosix from a group of nine. How many ways can a group of six be selected?
Evaluate each expression.
12. P(8, 2) 13. P(9, 1)
14. P(7, 5) 15. P(12, 6)
16. C(5, 2) 17. C(8, 4)
18. C(12, 7) 19. C(10, 4)
20. C(12, 4) � C(8, 3) 21. C(9, 3) � C(6, 2)
Determine whether each situation involves a permutation or a combination. Thenfind the number of possibilities.
22. the winner and first, second, and third runners-up in a contest with 10 finalists
23. selecting two of eight employees to attend a business seminar
24. an arrangement of the letters in the word algebra
25. placing an algebra book, a geometry book, a chemistry book, an English book,and a health book on a shelf
26. selecting nine books to check out of the library from a reading list of twelve
27. an arrangement of the letters in the word parallel
28. choosing two CDs to buy from ten that are on sale
29. selecting three of fifteen flavors of ice cream at the grocery store
30. MOVIES The manager of a four-screen movie theater is deciding which of 12available movies to show. The screens are in rooms with different seatingcapacities. How many ways can he show four different movies on the screens?
31. LANGUAGES How many different arrangements of the letters of the Hawaiianword aloha are possible?
32. GOVERNMENT How many ways can five members of the 100-member United States Senate be chosen to be put on a committee?
Concept Check
Guided Practice
Application
ForExercises
12–1516–1920, 21,32–3522–31
SeeExamples
134
1–3
Extra Practice See page 854.
Extra Practice See page 854.
www.algebra2.com/self_check_quiz

642 Chapter 12 Probability and Statistics
Extending the Lesson
StandardizedTest Practice
Card GamesHanafuda cards are oftencalled “flower cards”because each suit isdepicted by a differentflower. Each flower isrepresentative of thecalendar month in whichthe flower blooms.Source: www.gamesdomain.com
33. How many ways can a hand of five cards consisting of four cards from one suitand one card from another suit be drawn from a standard deck of cards?
34. How many ways can a hand of five cards consisting of three cards from one suitand two cards from another suit be drawn from a standard deck of cards?
35. LOTTERIES In a multi-state lottery, the player must guess which five of fortynine white balls numbered from 1 to 49 will be drawn. The order in which theballs are drawn does not matter. The player must also guess which one of forty-two red balls numbered from 1 to 42 will be drawn. How many ways can theplayer fill out a lottery ticket?
36. CARD GAMES Hanafuda is a Japanese game that uses a deck of cards made upof 12 suits, with each suit having four cards. How many 7-card hands can beformed so that 3 are from one suit and 4 are from another?
37. CRITICAL THINKING Show that C(n � 1, r) � C(n � 1, r � 1) � C(n, r).
38. Answer the question that was posed at the beginning ofthe lesson.
How do permutations and combinations apply to softball?
Include the following in your answer:• an explanation of how to find the number of 9-person lineups that are
possible, and • an explanation of how many ways there are to choose 9 players if 16 players
show up for a game.
39. How many ways can eight runners in an Olympic race finish in first, second,and third places?
8 24 56 336
40. How many diagonals can be drawn in the pentagon?
5 1015 20
When n distinct objects are arranged in a circle, there are n ways that thearrangement can be rotated to obtain an arrangement that is really the same as the original. For example, the two arrangements of three objects shown below are the same. Therefore, the number of of n distinct objects
is �nn!
� or (n � 1)! Note that the keys are not turned over.
Find the number of possibilities for each situation.
41. a basketball huddle of 5 players
42. four different dishes on a revolving tray in the middle of a table at a Chineserestaurant
43. six quarters with designs from six different states arranged in a circle on top ofyour desk
circular permutations
DC
BA
DCBA
WRITING IN MATH

Lesson 12-2 Permutations and Combinations 643
Maintain Your SkillsMaintain Your Skills
Mixed Review
Getting Ready forthe Next Lesson
44. Darius can do his homework in pencil or pen, using lined or unlined paper, andon one or both sides of each page. How many ways can he prepare hishomework? (Lesson 12-1)
45. A customer in an ice cream shop can order a sundae with a choice of 10 flavorsof ice cream, a choice of 4 flavors of sauce, and with or without a cherry on top.How many different sundaes are possible? (Lesson 12-1)
Find a counterexample to each statement. (Lesson 11-8)
46. 1 � 2 � 3 � … � n � 2n � 1 47. 5n � 1 is divisible by 6.
Solve each equation or inequality. (Lesson 10-5)
48. 3ex � 1 � 2 49. e2x � 5 50. ln (x � 1) � 3
51. CONSTRUCTION A painter works on a job for 10 days and is then joined by anassociate. Together they finish the job in 6 more days. The associate could havedone the job in 30 days. How long would it have taken the painter to do the jobalone? (Lesson 9-6)
Write an equation for each ellipse. (Lesson 8-4)
52. 53.
Find p(�1) and p(5) for each function. (Lesson 7�1)
54. p(x) � �12
�x2 � 3x � 1 55. p(x) � x4 � 4x3 � 2x � 7
Solve each equation by factoring. (Lesson 6-3)
56. x2 � 16 � 0 57. x2 � 3x � 10 � 0 58. 3x2 � 8x � 3 � 0
Simplify. (Lesson 5-6)
59. �128� 60. �3x6y4� 61. �20� � 2�45� – �80�
Solve each system of equations by using inverse matrices. (Lesson 4-8)
62. x � 2y � 5 63. 5a � 2b � 43x � 3y � �12 �3a � b � 2
Find the slope of the line that passes through each pair of points. (Lesson 2-3)
64. (2, 1), (5, �3) 65. (0, 4), (7, �2) 66. (5, 3), (2, 3)
Solve each equation. Check your solutions. (Lesson 1-4)
67. x � 4 � 11 68. 2x � 2 � �3
PREREQUISITE SKILL Evaluate the expression �x �
xy
� for the given values of x
and y. (To review evaluating expressions, see Lesson 1-1.)
69. x � 3, y � 2 70. x � 4, y � 4
71. x � 2, y � 8 72. x � 5, y � 10
y
xO
y
xO

Vocabulary• probability• success• failure• random• odds• random variable• probability distribution• uniform distribution• relative-frequency
histogram
Probability
644 Chapter 12 Probability and Statistics
• Find the probability and odds of events.
• Create and use graphs of probability distributions.
The risk of getting struck by lightning in anygiven year is 1 in 750,000. The chances ofsurviving a lightning strike are 3 in 4. Theserisks and chances are a way of describing theprobability of an event. The of anevent is a ratio that measures the chances ofthe event occurring.
probability
Reading MathWhen P is followed by anevent in parentheses, Pstands for probability.When there are twonumbers in parentheses, Pstands for permutations.
Study Tip
Probability of Success and FailureIf an event can succeed in s ways and fail in f ways, then the probabilities ofsuccess, P(S), and of failure, P(F), are as follows.
P(S) � �s �
sf
� P(F ) � �s �
ff
�
The probability of an event occurring is always between 0 and 1, inclusive. Thecloser the probability of an event is to 1, the more likely the event is to occur. Thecloser the probability of an event is to 0, the less likely the event is to occur.
PROBABILITY AND ODDS Mathematicians often use tossing of coins androlling of dice to illustrate probability. When you toss a coin, there are only twopossible outcomes—heads or tails. A desired outcome is called a . Any otheroutcome is called a . failure
success
ProbabilityWhen two coins are tossed, what is the probability that both are tails?
You can use a tree diagram to find the sample space.
There are 4 possible outcomes. You can confirm this using the FundamentalCounting Principle. There are 2 possible results for the first coin and 2 for thesecond coin, so there are 2 • 2 or 4 possible outcomes. Only one of these outcomes,TT, is a success, so s � 1. The other three outcomes are failures, so f � 3.
P(two tails) � �s �
sf
� Probability formula
� �1 �
13
� or �14
� s � 1, f � 3
The probability of tossing two heads is �14
�. This probability can also be written as a decimal,0.25, or as a percent, 25%.
H
H
HH
T
HT
T
H
TH
T
TT
First coin
Second coin
Possible outcomes
Example 1Example 1
do probability and odds tell you about life’s risks?do probability and odds tell you about life’s risks?

Lesson 12-3 Probability 645
In more complicated situations, you may need to use permutations and/orcombinations to count the outcomes. When all outcomes have an equally likelychance of occurring, we say that the outcomes occur at .random
Probability with CombinationsMonifa has a collection of 32 CDs—18 R&B and 14 rap. As she is leaving for atrip, she randomly chooses 6 CDs to take with her. What is the probability thatshe selects 3 R&B and 3 rap?
Step 1 Determine how many 6-CD selections meet the conditions.C(18, 3) Select 3 R&B CDs. Their order does not matter.C(14, 3) Select 3 rap CDs.
Step 2 Use the Fundamental Counting Principle to find the number of successes.
C(18, 3) � C(14, 3) � �1158!3!!
� � �1114!3!!
� or 297,024
Step 3 Find the total number, s � f, of possible 6-CD selections.
C(32, 6) � �2362!6!!
� or 906,192 s � f � 906,192
Step 4 Determine the probability.
P(3 R&B CDs and 3 rap CDs) � �s �
sf
� Probability formula
� �29
90
76
,,01
29
42
� Substitute.
� 0.32777 Use a calculator.
The probability of selecting 3 R&B CDs and 3 rap CDs is about 0.32777 or 33%.
Example 2Example 2
OddsLIFE EXPECTANCY According to the U.S. National Center for Health Statistics,the chances of a male born in 1990 living to be at least 65 years of age are about3 in 4. For females, the chances are about 17 in 20.
a. What are the odds of a male living to be at least 65?
Three out of four males will live to be at least 65, so the number of successes(living to 65) is 3. The number of failures is 4 � 3 or 1.
odds of a male living to 65 � s: f Odds formula
� 3:1 s � 3, f � 1
The odds of a male living to at least 65 are 3:1.
Example 3Example 3
OddsThe odds that an event will occur can be expressed as the ratio of the number ofways it can succeed to the number of ways it can fail. If an event can succeed in sways and fail in f ways, then the odds of success and of failure are as follows.
Odds of success � s:f Odds of failure � f:s
Another way to measure the chance of an event occurring is with odds. The that an event will occur can be expressed as the ratio of the number of successes tothe number of failures.
odds
www.algebra2.com/extra_examples

PROBABILITY DISTRIBUTIONS Many experiments, such as rolling a die,have numerical outcomes. A is a variable whose value is thenumerical outcome of a random event. For example, when rolling a die we can letthe random variable D represent the number showing on the die. Then D can equal1, 2, 3, 4, 5, or 6. A for a particular random variable is afunction that maps the sample space to the probabilities of the outcomes in thesample space. The table below illustrates the probability distribution for rolling a die.A distribution like this one where all of the probabilities are the same is called a .
P(D � 4) � �16
�
To help visualize a probability distribution, you can use a table of probabilities ora graph, called a .relative-frequency histogram
uniform distribution
probability distribution
random variable
646 Chapter 12 Probability and Statistics
Probability DistributionSuppose two dice are rolled. The table and the relative-frequency histogramshow the distribution of the sum of the numbers rolled.
a. Use the graph to determine which outcome is most likely. What is itsprobability?
The most likely outcome is a sum of 7, and its probability is �16
�.
b. Use the table to find P(S � 9). What other sum has the same probability?
According to the table, the probability of a sum of 9 is �19
�. The other outcome
with a probability of �19
� is 5.
Sum of Numbers Showing on the Dice
54320
Pro
bab
ility
6 7 8 9 10 11 12Sum
165
36191
121
181
36
Example 4Example 4
2 3 4 5 6 7 8 9 10 11 12
�316� �
118� �
112� �
19
� �356� �
16
� �356� �
19
� �112� �
118� �
316�
S � Sum
Probability
1 2 3 4 5 6
�16
� �16
� �16
� �16
� �16
� �16
�
D � Roll
Probability
b. What are the odds of a female living to be at least 65?
Seventeen out of twenty females will live to be at least 65, so the number ofsuccesses in this case is 17. The number of failures is 20 � 17 or 3.odds of a female living to be 65 � s:f Odds formula
� 17:3 s � 17, f � 3
The odds of a female living to at least 65 are 17:3.
Reading MathThe notation P(X � n) isused with randomvariables. P(D � 4) � �
16
�
is read the probability thatD equals 4 is one sixth.
Study Tip

Lesson 12-3 Probability 647
GUIDED PRACTICE KEY
0 1 2 3
�18
� �38
� �38
� �18
�
H � Heads
Probability
c. What are the odds of rolling a sum of 7?Step 1 Identify s and f. Step 2 Find the odds.
P(rolling a 7) � �16
� Odds � s:f
� �s �
sf
� s � 1, f � 5 � 1:5
So, the odds of rolling a sum of 7 are 1:5.
Concept Check
Guided Practice
Application
1. OPEN ENDED Describe an event that has a probability of 0 and an event thathas a probability of 1.
2. Write the probability of an event whose odds are 3:2.
3. Verify the probabilities given for sums of 2 and 3 in Example 4.
Suppose you select 2 letters at random from the word compute. Find eachprobability.
4. P(2 vowels) 5. P(2 consonants) 6. P(1 vowel, 1 consonant)
Find the odds of an event occurring, given the probability of the event.
7. �89
� 8. �16
� 9. �29
�
Find the probability of an event occurring, given the odds of the event.
10. 6:5 11. 10:1 12. 2:5
The table and the relative-frequency histogram show the distribution of the number of heads when 3 coins are tossed. Find each probability.
13. P(H � 0)
14. P(H � 2)
GEOGRAPHY For Exercises 15–18, find each probability if a state is chosen atrandom from the 50 states.
15. P(next to the Pacific Ocean) 16. P(has at least five neighboring states)
17. P(borders Mexico) 18. P(is surrounded by water)
Heads in Coin Toss
3210
0
Pro
bab
ility
Heads
18
14
38
MEXICO
AtlanticOcean
PacificOcean
CANADA

Entrance TestsIn addition to the MCAT,most medical schoolsrequire applicants to havehad one year each ofbiology, physics, andEnglish, and two years ofchemistry in college.
648 Chapter 12 Probability and Statistics
Major Students
biological 15,819sciences
humanities 963
math or statistics 179
physical sciences 2770
social sciences 2482
specialized 1431health sciences
other 1761
Practice and ApplyPractice and Apply
Ebony has 4 male kittens and 7 female kittens. She picks up 2 kittens to give to afriend. Find the probability of each selection.
19. P(2 male) 20. P(2 female) 21. P(1 of each)
Bob is moving and all of his CDs are mixed up in a box. Twelve CDs are rock,eight are jazz, and five are classical. If he reaches in the box and selects them atrandom, find each probability.
22. P(3 jazz) 23. P(3 rock)
24. P(1 classical, 2 jazz) 25. P(2 classical, 1 rock)
26. P(1 jazz, 2 rock) 27. P(1 classical, 1 jazz, 1 rock)
28. P(2 rock, 2 classical) 29. P(2 jazz, 1 reggae)
30. LOTTERIES The state of Florida has a lottery in which 6 numbers out of 53 are drawn at random. What is the probability of a given ticket matching all 6 numbers in any order?
ENTRANCE TESTS For Exercises 31–33,use the table that shows the college majors of the students who took the Medical College Admission Test (MCAT) in April 2000. If a student taking the test were randomly selected, find each probability. Express as decimals rounded to the nearest thousandth.
31. P(math or statistics)
32. P(biological sciences)
33. P(physical sciences)
Find the odds of an event occurring, given the probability of the event.
34. �12
� 35. �38
� 36. �1121� 37. �
58
�
38. �47
� 39. �15
� 40. �141� 41. �
34
�
Find the probability of an event occurring, given the odds of the event.
42. 6:1 43. 3:7 44. 5:6 45. 4:5
46. 9:8 47. 1:8 48. 7:9 49. 3:2
50. GENEOLOGY The odds that an American is of English ancestry are 1:9. What isthe probability that an American is of English ancestry?
GENETICS For Exercises 51 and 52, use the following information.Eight out of 100 males and 1 out of 1000 females have some form of color blindness.
51. What are the odds of a male being color-blind?
52. What are the odds of a female being color-blind?
53. EDUCATION Josefina’s guidance counselor estimates that the probabilityshe will get a college scholarship is �
45
�. What are the odds that she will notearn a scholarship?
ForExercises19–33, 54
34–5355–60
SeeExamples
1, 234
Extra Practice See page 854.
Extra Practice See page 854.

Lesson 12-3 Probability 649
54. CARD GAMES The game of euchre is played using only the 9s, 10s, jacks,queens, kings, and aces from a standard deck of cards. Find the probability ofbeing dealt a 5-card euchre hand containing all four suits.
Three students are selected at random froma group of 3 sophomores and 3 juniors. The table and relative-frequency histogram show the distribution of the number ofsophomores chosen. Find each probability.
55. P(0 sophomores) 56. P(1 sophomore)
57. P(2 sophomores) 58. P(3 sophomores)
59. P(2 juniors) 60. P(1 junior)
61. WRITING Josh types the 5 entries in the bibliography of his term paper inrandom order, forgetting that they should be in alphabetical order by author.What is the probability that he actually typed them in alphabetical order?
62. CRITICAL THINKING Find the probabilitythat a point chosen at random in the figure is in the shaded region. Write your answer in terms of �.
63. Answer the question that was posed at the beginning ofthe lesson.
What do probability and odds tell you about life’s risks?
Include the following in your answer:• the odds of being struck by lightning and surviving the lightning strike, and• a description of the meaning of success and failure in this case.
64. �62
!!� � ?
3 60 360 720
65. A jar contains 4 red marbles, 3 green marbles, and 2 blue marbles. If a marble isdrawn at random, what is the probability that it is not green?
�29
� �13
� �49
� �23
�
is determined using mathematical methods and assumptionsabout the fairness of coins, dice, and so on. is determinedby performing experiments and observing the outcomes.Determine whether each probability is theoretical or experimental. Then find theprobability.
66. Two dice are rolled. What is the probability that the sum will be 12?
67. A baseball player has 126 hits in 410 at-bats this season. What is the probabilitythat he gets a hit in his next at-bat?
68. A bird watcher observes that 5 out of 25 birds in a garden are red. What is theprobability that the next bird to fly into the garden will be red?
69. A hand of 2 cards is dealt from a standard deck of cards. What is the probabilitythat both cards are clubs?
Experimental probabilityTheoretical probability
DCBA
DCBA
WRITING IN MATH
4
Number of Sophomores
32100
Pro
bab
ility
Sophomores
25
310151
10
Extending the Lesson
0 1 2 3
�210� �
290� �
290� �
210�
Sophomores
Probability
StandardizedTest Practice
www.algebra2.com/self_check_quiz

650 Chapter 12 Probability and Statistics
Practice Quiz 1Practice Quiz 1
1. At the Burger Bungalow, you can order your hamburger with or without cheese,with or without onions or pickles, and either rare, medium, or well-done. Howmany different ways can you order your hamburger? (Lesson 12-1)
2. For a particular model of car, a dealer offers 3 sizes of engines, 2 types of stereos, 18 body colors, and 7 upholstery colors. How many different possibilities areavailable for that model? (Lesson 12-1)
3. How many codes consisting of a letter followed by 3 digits can be made if no digitcan be used more than once? (Lesson 12-1)
Evaluate each expression. (Lesson 12-2)
4. P(12, 3) 5. C(8, 3)
Determine whether each situation involves a permutation or a combination. Thenfind the number of possibilities. (Lesson 12-2)
6. 8 cars in a row parked next to a curb 7. a hand of 6 cards from a standard deck of cards
Two cards are drawn from a standard deck of cards. Find each probability. (Lesson 12-3)
8. P(2 aces) 9. P(1 heart, 1 club) 10. P(1 queen, 1 king)
Lessons 12-1 through 12-3
Maintain Your SkillsMaintain Your Skills
Mixed Review
Getting Ready forthe Next Lesson
Determine whether each situation involves a permutation or a combination. Thenfind the number of possibilities. (Lesson 12-2)
70. arranging 5 different books on a shelf
71. arranging the letters of the word arrange
72. picking 3 apples from the last 7 remaining at the grocery store
73. A mail-order computer company offers a choice of 4 amounts of memory, 2 sizesof hard drives, and 2 sizes of monitors. How many different systems areavailable to a customer? (Lesson 12-1)
74. How many ways can 4 different gifts be placed into 4 different gift bags if eachbag gets exactly 1 gift? (Lesson 12-1)
Identify the type of function represented by each graph. (Lesson 9-5)
75. 76.
Solve each matrix equation. (Lesson 4-1)
77. [x y] � [y 4] 78. � � � � �
BASIC SKILL Find each product if a � �35
�, b � �27
�, c � �34
�, and d � �13
�.
79. ab 80. bc 81. cd 82. bd 83. ac actice
x � 8y – x
3y2x
O
y
x
O
y
x

Multiplying Probabilities
Vocabulary• area diagram
• Find the probability of two independent events.
• Find the probability of two dependent events.
Reggie Miller of the Indiana Pacers is one of the best free-throw shooters in the National Basketball Association. The table shows the five highest season free-throw statistics of his career. For any year, you can determine the probability that Miller will make two free throws in a row based on the probability of his making one free throw.
Area Diagrams
Suppose there are 1 red and 3 blue paper clips in one drawer and 1 goldand 2 silver paper clips in anotherdrawer. The area diagram representsthe probabilities of choosing onecolored paper clip and one metallicpaper clip if one of each is chosen atrandom. For example, rectangle Arepresents drawing 1 silver clip and1 blue clip.
Model and Analyze1. Find the areas of rectangles A, B, C,
and D, and explain what each arearepresents.
2. What is the probability of choosing a red paper clip and a silver paper clip?
3. What are the length and width of the whole square? What is the area? Why does the area need to have this value?
4. Make an area diagram that represents the probability of each outcome if you spin eachspinner once. Label the diagram and describewhat the area of each rectangle represents.
blue
Colored
Metallic
34
silver23
gold13
red14
A
C D
B
PROBABILITY OF INDEPENDENT EVENTS In a situation with two eventslike shooting a free throw and then shooting another one, you can find theprobability of both events occurring if you know the probability of each eventoccurring. You can use an to model the probability of the two eventsoccurring at the same time.
area diagram
does probability apply to basketball?does probability apply to basketball?
Lesson 12-4 Multiplying Probabilities 651
Source: Sporting News
Season FT%
1990–91 91.8
1993–94 90.8
1998–99 91.5
1999–00 92.9
2000–01 92.8

652 Chapter 12 Probability and Statistics
Probability of Two Independent Events
If two events, A and B, are independent, then the probability of both eventsoccurring is P(A and B) = P(A) � P(B).
In Exercise 4 of the activity, spinning one spinner has no effect on the secondspinner. These events are independent.
Two Independent EventsAt a picnic, Julio reaches into an ice-filled cooler containing 8 regular softdrinks and 5 diet soft drinks. He removes a can, then decides he is not reallythirsty, and puts it back. What is the probability that Julio and the next personto reach into the cooler both randomly select a regular soft drink?
Explore These events are independent since Julio replaced the can that heremoved. The outcome of the second person’s selection is not affectedby Julio’s selection.
Plan Since there are 13 cans, the probability of each person’s getting a regular soft drink is �
183�.
Solve P(both regular) � P(regular) � P(regular) Probability ofindependent events
� �183� � �
183� or �1
6649
� Substitute and multiply.
The probability that both people select a regular soft drink is �16649
� orabout 0.38.
Examine You can verify this result by making atree diagram that includes probabilities.Let R stand for regular and D stand for diet.
P(R, R) � �183� � �
183�
R
R
DR
D
D
813
513
813
513
513
813
Example 1Example 1
The formula for the probability of independent events can be extended to anynumber of independent events.
Three Independent EventsIn a board game, three dice are rolled to determine the number of moves for the players. What is the probability that the first die shows a 6, the second dieshows a 6, and the third die does not?
Let A be the event that the first die shows a 6. → P(A) � �16
�
Let B be the event that the second die shows a 6. → P(B) � �16
�
Let C be the event that the third die does not show a 6. → P(C) � �56
�
Example 2Example 2
This formula can be applied to any number of independent events.
AlternativeMethodYou could use theFundamental CountingPrinciple to find thenumber of successes and the number of totaloutcomes. both regular � 8 � 8 or 64total outcomes �
13 � 13 or 169 So, P(both reg.) � �
16649
�.
Study Tip

Probability of Two Dependent Events
If two events, A and B, are dependent, then the probability of both events occurringis P(A and B ) � P(A ) � P(B following A ).
Lesson 12-4 Multiplying Probabilities 653
PROBABILITY OF DEPENDENT EVENTS In Example 1, what is theprobability that both people select a regular soft drink if Julio does not put his backin the cooler? In this case, the two events are dependent because the outcome of thefirst event affects the outcome of the second event.
First selection Second selection
P(regular) � �183� P(regular) � �
172�
Notice that when Julio removes his can,there is not only one fewer regular soft drink but also one fewer drink in the cooler.
P(both regular) = P(regular) � P(regular following regular)
� �183� � �
172� or �
13
49� Substitute and multiply.
The probability that both people select a regular soft drink is �13
49� or about 0.36.
P(A, B, and C) � P(A) � P(B) � P(C) Probability of independent events
� �16
� � �16
� � �56
� or �2516� Substitute and multiply.
The probability that the first and second dice show a 6 and the third die does not is �356�.
This formula can be extended to any number of dependent events.
Two Dependent EventsThe host of a game show is drawing chips from a bag to determine the prizesfor which contestants will play. Of the 10 chips in the bag, 6 show television, 3show vacation, and 1 shows car. If the host draws the chips at random and doesnot replace them, find each probability.
Because the first chip is not replaced, the events are dependent. Let T represent atelevision, V a vacation, and C a car.
a. a vacation, then a car
P(V, then C) � P(V) � P(C following V) Dependent events
� �130� � �
19
� or �310�
After the first chip is drawn,there are 9 left.
The probability of a vacation and then a car is �310� or about 0.03.
b. two televisions
P(T, then T) � P(T) � P(T following T) Dependent events
� �160� � �
59
� or �13
�If the first chip shows television, then 5 of the remaining 9 show television.
The probability of the host drawing two televisions is �13
�.
Example 3Example 3
ConditionalProbabilityThe event of getting aregular soft drink thesecond time given thatJulio got a regular softdrink the first time iscalled a conditionalprobability.
Study Tip
www.algebra2.com/extra_examples
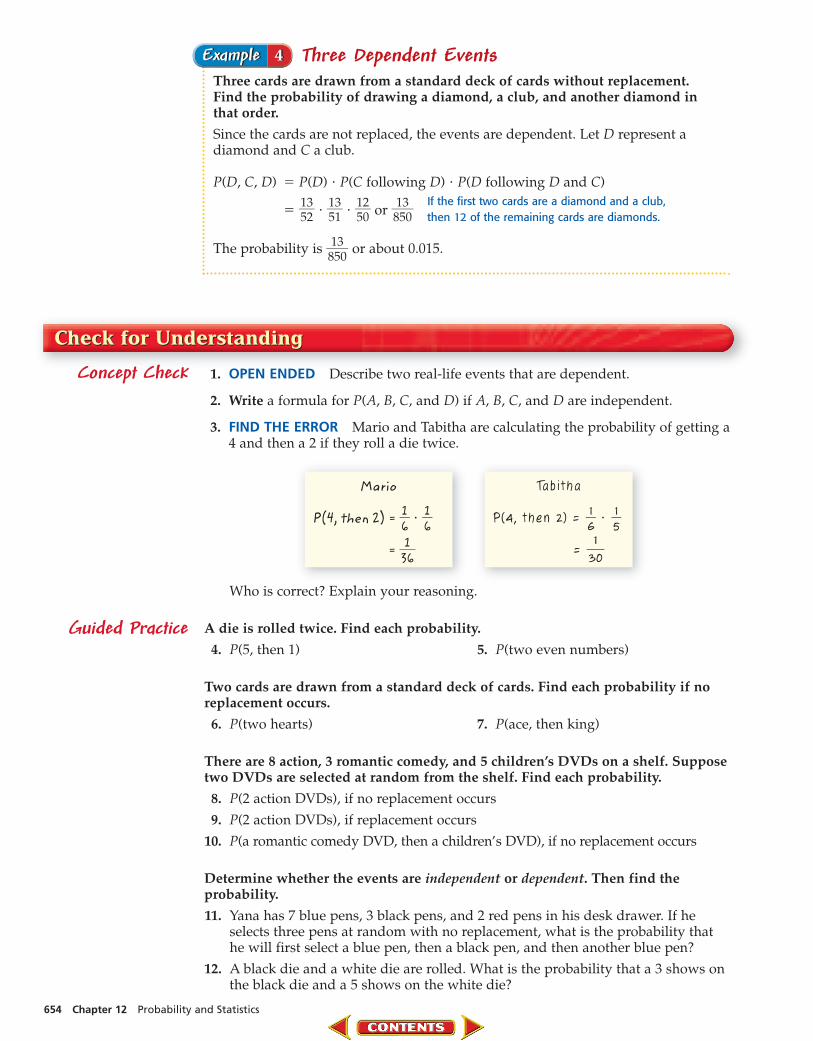
Tabi tha
P(4 , then 2 ) = �6
1� � �
5
1�
= �3
1
0�
Mario
P(4, then 2) = �6
1� � �
6
1�
= �3
1
6�
654 Chapter 12 Probability and Statistics
GUIDED PRACTICE KEY
Three Dependent EventsThree cards are drawn from a standard deck of cards without replacement. Find the probability of drawing a diamond, a club, and another diamond in that order.
Since the cards are not replaced, the events are dependent. Let D represent adiamond and C a club.
P(D, C, D) � P(D) � P(C following D) � P(D following D and C)
� �15
32� � �
15
31� � �
15
20� or �8
1530
�If the first two cards are a diamond and a club, then 12 of the remaining cards are diamonds.
The probability is �81530
� or about 0.015.
Example 4Example 4
Concept Check
Guided Practice
Who is correct? Explain your reasoning.
A die is rolled twice. Find each probability.
4. P(5, then 1) 5. P(two even numbers)
Two cards are drawn from a standard deck of cards. Find each probability if noreplacement occurs.
6. P(two hearts) 7. P(ace, then king)
There are 8 action, 3 romantic comedy, and 5 children’s DVDs on a shelf. Supposetwo DVDs are selected at random from the shelf. Find each probability.
8. P(2 action DVDs), if no replacement occurs
9. P(2 action DVDs), if replacement occurs
10. P(a romantic comedy DVD, then a children’s DVD), if no replacement occurs
Determine whether the events are independent or dependent. Then find theprobability.
11. Yana has 7 blue pens, 3 black pens, and 2 red pens in his desk drawer. If heselects three pens at random with no replacement, what is the probability thathe will first select a blue pen, then a black pen, and then another blue pen?
12. A black die and a white die are rolled. What is the probability that a 3 shows onthe black die and a 5 shows on the white die?
1. OPEN ENDED Describe two real-life events that are dependent.
2. Write a formula for P(A, B, C, and D) if A, B, C, and D are independent.
3. FIND THE ERROR Mario and Tabitha are calculating the probability of getting a4 and then a 2 if they roll a die twice.

Lesson 12-4 Multiplying Probabilities 655
13. ELECTIONS Tami, Sonia, Malik, and Roger are the four candidates for studentcouncil president. If their names are placed in random order on the ballot, whatis the probability that Malik’s name will be first on the ballot followed by Sonia’sname second?
Application
Practice and ApplyPractice and Apply
A die is rolled twice. Find each probability.
14. P(2, then 3) 15. P(no 6s)
16. P(two 4s) 17. P(1, then any number)
18. P(two of the same number) 19. P(two different numbers)
The tiles A, B, G, I, M, R, and S of a word game are placed face down in the lid ofthe game. If two tiles are chosen at random, find each probability.
20. P(R, then S), if no replacement occurs
21. P(A, then M), if replacement occurs
22. P(2 consonants), if replacement occurs
23. P(2 consonants), if no replacement occurs
24. P(B, then D), if replacement occurs
25. P(selecting the same letter twice), if no replacement occurs
Ashley takes her 3-year-old brother Alex into an antique shop. There are 4 statues,3 picture frames, and 3 vases on a shelf. Alex accidentally knocks 2 items off theshelf and breaks them. Find each probability.
26. P(breaking 2 vases)
27. P(breaking 2 statues)
28. P(breaking a picture frame, then a vase)
29. P(breaking a statue, then a picture frame)
Determine whether the events are independent or dependent. Then find theprobability.
30. There are 3 miniature chocolate bars and 5 peanut butter cups in a candy dish.Judie chooses 2 of them at random. What is the probability that she chooses 2 miniature chocolate bars?
31. A bowl contains 4 peaches and 5 apricots. Maxine randomly selects one, puts itback, and then randomly selects another. What is the probability that bothselections were apricots?
32. A bag contains 7 red, 4 blue, and 6 yellow marbles. If 3 marbles are selected insuccession, what is the probability of selecting blue, then yellow, then red, ifreplacement occurs each time?
33. Joe’s wallet contains three $1 bills, four $5 bills, and two $10 bills. If he selectsthree bills in succession, find the probability of selecting a $10 bill, then a $5 bill,and then a $1 bill if the bills are not replaced.
34. What is the probability of getting heads each time if a coin is tossed 5 times?
35. When Diego plays his favorite video game, the odds are 3 to 4 that he will reachthe highest level of the game. What is the probability that he will reach thehighest level each of the next four times he plays?
ForExercises
14–19, 36–39,44–4620–2930–3540–43
SeeExamples
1, 2
1, 31–43
Extra Practice See page 855.
Extra Practice See page 855.
www.algebra2.com/self_check_quiz

SpellingThe National Spelling Beehas been held every yearsince 1925, except for1943-1945. Of the first 76champions, 42 were girlsand 34 were boys.Source: www.spellingbee.com
For Exercises 36–39, suppose you spin the spinner twice.
36. Sketch a tree diagram showing all of the possibilities. Use it to find the probability of spinning red and then blue.
37. Sketch an area diagram of the outcomes. Shade the region on your area diagram corresponding to getting the same color twice.
38. What is the probability that you get the same color on both spins?
39. If you spin the same color twice, what is the probability that the color is red?
Find each probability if 13 cards are drawn from a standard deck of cards and noreplacement occurs.
40. P(all clubs) 41. P(all black cards)
42. P(all one suit) 43. P(no aces)
44. UTILITIES A city water system includes a sequence of 4 pumps as shownbelow. Water enters the system at point A, is pumped through the system bypumps at locations 1, 2, 3, and 4, and exits the system at point B.
If the probability of failure for any one pump is �1100�, what is the probability that
water will flow all the way through the system from A to B?
45. SPELLING Suppose a contestant in a spelling bee has a 93% chance of spellingany given word correctly. What is the probability that he or she spells the firstfive words in a bee correctly and then misspells the sixth word?
46. LITERATURE The following quote is from The Mirror Crack’d, which waswritten by Agatha Christie in 1962.
A B
1 4
2 3
656 Chapter 12 Probability and Statistics
“I think you’re begging the question,” said Haydock, “and I can see loomingahead one of those terrible exercises in probability where six men have white hats and six men have black hats and you have to work it out bymathematics how likely it is that the hats will get mixed up and in whatproportion. If you start thinking about things like that, you would go roundthe bend. Let me assure you of that!”
If the twelve hats are all mixed up and each man randomly chooses a hat, whatis the probability that the first three men get their own hats? Assume that noreplacement occurs.
For Exercises 47–49, use the following information.You have a bag containing 10 marbles. In this problem, a cycle means that you drawa marble, record its color, and put it back.
47. You go through the cycle 10 times. If you do not record any black marbles, canyou conclude that there are no black marbles in the bag?
48. Can you conclude that there are none if you repeat the cycle 50 times?
49. How many times do you have to repeat the cycle to be certain that there are noblack marbles in the bag? Explain your reasoning.
50. CRITICAL THINKING If one bulb in a string of holiday lights fails to work, thewhole string will not light. If each bulb in a set has a 99.5% chance of working,what is the maximum number of lights that can be strung together with at leasta 90% chance of the whole string lighting?

Lesson 12-4 Multiplying Probabilities 657
51. Answer the question that was posed at the beginning ofthe lesson.
How does probability apply to basketball?
Include the following in your answer:• an explanation of how a value such as one of those in the table at the
beginning of the lesson could be used to find the chances of Reggie Millermaking 0, 1, or 2 of 2 successive free throws, assuming the 2 free throws areindependent, and
• a possible psychological reason why 2 free throws on the same trip to the foulline might not be independent.
52. The spinner is spun four times. What is the probabilitythat the spinner lands on 2 each time?
�12
� �14
�
�116� �2
156�
53. A coin is tossed and a die is rolled. What is the probability of a head and a 3?�14
� �18
� �112� �
214�DCBA
DC
BA
1 2
4 3
WRITING IN MATH
StandardizedTest Practice
Maintain Your SkillsMaintain Your Skills
A gumball machine contains 7 red, 8 orange, 9 purple, 7 white, and 5 yellowgumballs. Tyson buys 3 gumballs. Find each probability, assuming that themachine dispenses the gumballs at random. (Lesson 12-3)
54. P(3 red) 55. P(2 white, 1 purple)
56. P(1 purple, 1 orange, 1 yellow)
57. PHOTOGRAPHY A photographer is taking a picture of a bride and groomtogether with 6 attendants. How many ways can he arrange the 8 people in arow if the bride and groom stand in the middle? (Lesson 12-2)
Solve each equation. Check your solutions. (Lesson 10-3)
58. log5 5 � log5 x � log5 30 59. log16 c – 2log16 3 � log16 4
Given a polynomial and one of its factors, find the remaining factors of thepolynomial. Some factors may not be binomials. (Lesson 7-4)
60. x3 � x2 � 10x � 6; x � 3 61. x3 � 7x2 � 12x; x � 3
Graph each inequality. (Lesson 6-7)
62. y � x2 � x � 2 63. y x2 � 4 64. y � x2 � 3x
Simplify. (Lesson 5-5)
65. �(153)2� 66. �3�729� 67. �16
b16� 68. �25a8b6�
Solve each system of equations. (Lesson 3-2)
69. z � 4y � 2 70. j � k � 4 71. 3x � 1 � �y � 1z � �y � 3 2j � k � 35 2y � �4x
BASIC SKILL Find each sum if a � �12
�, b � �16
�, c � �23
�, and d � �34
�.
72. a � b 73. b � c 74. a � d
75. b � d 76. c � a 77. c � d
Mixed Review
Getting Ready forthe Next Lesson

Vocabulary• simple event• compound event• mutually exclusive events• inclusive events
Adding Probabilities
658 Chapter 12 Probability and Statistics
• Find the probability of mutually exclusive events.
• Find the probability of inclusive events.
The graph shows the results of a survey about bedtime rituals.Determining the probability that a randomly selected personreads a book or brushes his orher teeth before going to bedrequires adding probabilities.
Probability of Mutually Exclusive Events• Words If two events, A and B, are mutually exclusive, then the probability
that A or B occurs is the sum of their probabilities.
• Symbols P(A or B) � P(A) � P(B)
This formula can be extended to any number of mutually exclusive events.
does probabilityapply to yourpersonal habits?
does probabilityapply to yourpersonal habits?
MUTUALLY EXCLUSIVE EVENTS When you roll a die, an event such asrolling a 1 is called a because it consists of only one event. An eventthat consists of two or more simple events is called a . Forexample, the event of rolling an odd number or a number greater than 5 is acompound event because it consists of the simple events rolling a 1, rolling a 3,rolling a 5, or rolling a 6.
When there are two events, it is important to understand how they are relatedbefore finding the probability of one or the other event occurring. Suppose youdraw a card from a standard deck of cards. What is the probability of drawing a 2 or an ace? Since a card cannot be both a 2 and an ace, these are called
. That is, the two events cannot occur at the same time. Theprobability of drawing a 2 or an ace is found by adding their individualprobabilities.
P(2 or ace) � P(2) � P(ace) Add probabilities.
� �542� � �
542� There are 4 twos and 4 aces in a deck.
� �582� or �
123� Simplify.
The probability of drawing a 2 or an ace is �123�.
exclusive eventsmutually
compound eventsimple event
Brushing teeth
ing alarm 57%Setting alarm
ding a book 38%
5
Reading a book
ing clothes for n8%Preparing clo
medicationTaking medic
Brushing teeth
Setting alarm
Reading a book
Preparing clothes for next day
Taking medication28%
28%
38%
57%
81%
By Cindy Hall and Bob Laird, USA TODAY
Getting ready for bedWhich of the following areregular bedtime rituals:
Source: Opinion Research CorporationInternational for Schwarz Pharma
USA TODAY Snapshots®

Lesson 12-5 Adding Probabilities 659
INCLUSIVE EVENTS What is the probability of drawing a queen or a diamondfrom a standard deck of cards? Since it is possible to draw a card that is both a queen and a diamond, these events are not mutually exclusive. These are called
.
P(queen) P(diamond) P(diamond, queen)
�542� �
15
32� �
512�
1 queen in diamonds queen of diamondseach suit
In the first two fractions above, the probability of drawing the queen ofdiamonds is counted twice, once for aqueen and once for a diamond. To find the correct probability, you must subtractP(queen of diamonds) from the sum of the first two probabilities.
DiamondsQueens
QQQ
Q
A 2 3
8 9J K
104 5 6 7
inclusive events
Two Mutually Exclusive EventsKeisha has a stack of 8 baseball cards, 5 basketball cards, and 6 soccer cards. If she selects a card at random from the stack, what is the probability that it is a baseball or a soccer card?
These are mutually exclusive events, since the card cannot be both a baseball cardand a soccer card. Note that there is a total of 19 cards.
P(baseball or soccer) � P(baseball) � P(soccer) Mutually exclusive events
� �189� � �
169� or �
11
49� Substitute and add.
The probability that Keisha selects a baseball or a soccer card is �11
49�.
Example 1Example 1
Three Mutually Exclusive EventsThere are 7 girls and 6 boys on the junior class homecoming committee. Asubcommittee of 4 people is being chosen at random to decide the theme for the class float. What is the probability that the subcommittee will have at least 2 girls?
At least 2 girls means that the subcommittee may have 2, 3, or 4 girls. It is notpossible to select a group of 2 girls, a group of 3 girls, and a group of 4 girls all inthe same 4-member subcommittee, so the events are mutually exclusive. Add theprobabilities of each type of committee.
P(at least 2 girls) � P(2 girls) � P(3 girls) � P(4 girls)
2 girls, 2 boys 3 girls, 1 boy 4 girls, 0 boys
� �C(7,
C2()13
�
,C4()6, 2)
� � �C(7,
C3()1�
3,C4()6, 1)
� � �C(7,
C4()1�
3,C4()6, 0)
�
� �37
11
55
� � �27
11
05
� � �73155
� or �11412
3� Simplify.
The probability of at least 2 girls on the subcommittee is �11412
3� or about 0.78.
Example 2Example 2
CommonMisconceptionIn mathematics, unlikeeveryday language, theexpression A or B allowsthe possibility of both Aand B occurring.
Study Tip
Choosing aCommitteeC(13, 4) refers to choosing4 subcommittee membersfrom 13 committeemembers. Since orderdoes not matter, thenumber of combinationsis found.
Study Tip
www.algebra2.com/extra_examples

P(queen or diamond) � P(queen) � P(diamond) � P(queen of diamonds)
� �542� � �
15
32� � �
512� or �
143�
The probability of drawing a queen or a diamond is �143�.
660 Chapter 12 Probabilities and Statistics
1. OPEN ENDED Describe two mutually exclusive events and two inclusiveevents.
2. Draw a Venn diagram to illustrate Example 3.
3. FIND THE ERROR Refer to the comic below.
Why is the weather forecaster’s prediction incorrect?
A die is rolled. Find each probability.
4. P(1 or 6) 5. P(at least 5) 6. P(less than 3)
7. P(prime) 8. P(even or prime) 9. P(multiple of 2 or 3)
Concept Check
Guided Practice
Probability of Inclusive Events• Words If two events, A and B, are inclusive, then the probability that A or B
occurs is the sum of their probabilities decreased by the probability ofboth occurring.
• Symbols P(A or B) � P(A) � P(B) � P(A and B)
The Born Loser®
Inclusive EventsEDUCATION The enrollment at Southburg High School is 1400. Suppose 550students take French, 700 take algebra, and 400 take both French and algebra.What is the probability that a student selected at random takes French oralgebra?
Since some students take both French and algebra, the events are inclusive.
P(French) � �1545000
� P(algebra) � �1740000
� P(French and algebra) � �1440000
�
P(French or algebra) � P(French) � P(algebra) � P(French and algebra)
� �1545000
� � �1740000
� � �1440000
� or �12
78� Substitute and simplify.
The probability that a student selected at random takes French or algebra is �1278�.
Example 3Example 3

Lesson 12-5 Adding Probabilities 661
A card is drawn from a standard deck of cards. Determine whether the events aremutually exclusive or inclusive. Then find the probability.
10. P(6 or king) 11. P(queen or spade)
12. SCHOOL There are 8 girls and 8 boys on the student senate. Three of thestudents are seniors. What is the probability that a person selected from thestudent senate is not a senior?
Practice and ApplyPractice and Apply
Lisa has 9 rings in her jewelry box. Five are gold and 4 are silver. If she randomlyselects 3 rings to wear to a party, find each probability.
13. P(2 silver or 2 gold) 14. P(all gold or all silver)
15. P(at least 2 gold) 16. P(at least 1 silver)
Seven girls and six boys walk into a video store at the same time. There are fivesalespeople available to help them. Find the probability that the salespeople willfirst help the given numbers of girls and boys.
17. P(4 girls or 4 boys) 18. P(3 girls or 3 boys)
19. P(all girls or all boys) 20. P(at least 3 girls)
21. P(at least 4 girls or at least 4 boys) 22. P(at least 2 boys)
For Exercises 23–26, determine whether the events are mutually exclusive orinclusive. Then find the probability.
23. There are 3 literature books, 4 algebra books, and 2 biology books on a shelf. If abook is randomly selected, what is the probability of selecting a literature bookor an algebra book?
24. A die is rolled. What is the probability of rolling a 5 or a number greater than 3?
25. In the Math Club, 7 of the 20 girls are seniors, and 4 of the 14 boys are seniors.What is the probability of randomly selecting a boy or a senior to represent theMath Club at a statewide math contest?
26. A card is drawn from a standard deck of cards. What is the probability ofdrawing an ace or a face card? (Hint: A face card is a jack, queen, or king.)
27. One tile with each letter of the alphabet is placed in a bag, and one is drawn atrandom. What is the probability of selecting a vowel or a letter from the wordequation?
28. Each of the numbers from 1 to 30 is written on a card and placed in a bag. If onecard is drawn at random, what is the probability that the number is a multipleof 2 or a multiple of 3?
Two cards are drawn from a standard deck of cards. Find each probability.
29. P(both kings or both black) 30. P(both kings or both face cards)
31. P(both face cards or both red) 32. P(both either red or a king)
WORLD CULTURES For Exercises 33–36, refer to the information at the left.When tossing 3 cane dice, if three round sides land up, the player advances 2 lines.If three flat sides land up, the player advances 1 line. If a combination is thrown, theplayer loses a turn. Find each probability.
33. P(advancing 2 lines) 34. P(advancing 1 line)
35. P(advancing at least 1 line) 36. P(losing a turn)
GUIDED PRACTICE KEY
World CulturesTotolospi is a Hopi game ofchance. The players usecane dice, which have botha flat side and a roundside, and a counting boardinscribed in stone.
Application
ForExercises
13–22,33–4223–2627–32,43–46
SeeExamples
1, 2
1–33
Extra Practice See page 855.
Extra Practice See page 855.
www.algebra2.com/self_check_quiz

For Exercises 37–42, use the following information.Each of the numbers 1 through 30 is written on a table tennis ball and placed in awire cage. Each of the numbers 20 through 45 is written on a table tennis ball andplaced in a different wire cage. One ball is chosen at random from each spinningcage. Find each probability.
37. P(each is a 25) 38. P(neither is a 20)
39. P(exactly one is a 30) 40. P(exactly one is a 40)
41. P(the numbers are equal) 42. P(the sum is 30)
43. RECYCLING In one community, 300 people were surveyed to see if they wouldparticipate in a curbside recycling program. Of those surveyed, 134 said theywould recycle aluminum cans, and 108 said they would recycle glass. Of those,62 said they would recycle both. What is the probability that a randomlyselected member of the community would recycle aluminum or glass?
SCHOOL For Exercises 44–46, use the Venn diagram that shows the number ofparticipants in extracurricular activities for a junior class of 324 students.Determine each probability if a student is selected at random from the class.
44. P(drama or music)
45. P(drama or athletics)
46. P(athletics and drama, or music and athletics)
47. CRITICAL THINKING Consider the following probability equation.
P(A and B) � P(A) � P(B) � P(A or B)
A textbook gives this equation for events A and B that are mutually exclusive orinclusive. Is this correct? Explain.
48. Answer the question that was posed at the beginning ofthe lesson.
How does probability apply to your personal habits?
Include the following in your answer:• an explanation of whether the events listed in the graphic are mutually
exclusive or inclusive, and• an explanation of how to determine the probability that a randomly selected
person reads a book or brushes his or her teeth before going to bed if in asurvey of 2000 people, 600 said that they do both.
49. In a jar of red and white gumballs, the ratio of white gumballs to red gumballsis 5:4. If the jar contains a total of 180 gumballs, how many of them are red?
45 64 80 100
50. � �12
�x if x is composite. � 2x if x is prime. What is the value
of � ?
23 46 50 64DCBA
187
xx
DCBA
WRITING IN MATH
Drama
Athletics
Music11
12715
51 63
108
662 Chapter 12 Probabilities and Statistics
RecyclingThe United States recycles28% of its waste.Source: The U.S. Environmental
Protection Agency
StandardizedTest Practice

Lesson 12-5 Adding Probabilities 663
C12-202C-827999
Maintain Your SkillsMaintain Your Skills
A die is rolled three times. Find each probability. (Lesson 12-4)
51. P(1, then 2, then 3) 52. P(no 4s)
53. P(three 1s) 54. P(three even numbers)
Find the odds of an event occurring, given the probability of the event.(Lesson 12-3)
55. �45
� 56. �19
� 57. �27
� 58. �58
�
Find the sum of each series. (Lessons 11-2 and 11-4)
59. 2 � 4 � 8 � ��� � 128 60. �3
n�1(5n � 2)
Find the exact solution(s) of each system of equations. (Lesson 8-7)
61. y � �10 62. x2 � 144
y2 � x2 � 36 x2 � y2 � 169
63. Use the graph of the polynomial function atthe right to determine at least one binomialfactor of the polynomial. Then find allfactors of the polynomial. (Lesson 7-4)
Find the maxima and minima of each function. Round to the nearest hundredth.(Lesson 6-2)
64. f(x) � x3 � 2x2 � 5 65. f(x) � x3 � 3x2 � 2x � 1
Graph each system of inequalities. Name the coordinates of the vertices of thefeasible region. Find the maximum and minimum values of the given function forthis region. (Lesson 3-4)
66. y x � 2 67. y 2x � 3x 0 1 � x � 3y � 2 � x y � x � 2f(x, y) � 3x � y f(x, y) � x � 4y
SPEED SKATING For Exercises 68 and 69, use the following information.In the 1988 Winter Olympics, Bonnie Blair set a world record for women’s speedskating by skating approximately 12.79 meters per second in the 500-meter race.(Lesson 2-6)
68. Suppose she could maintain that speed. Write an equation that represents howfar she could travel in t seconds.
69. What type of equation is the one in Exercise 68?
PREREQUISITE SKILL Find the mean, median, mode, and range for each set of data. Round to the nearest hundredth, if necessary.(To review mean, median, mode, and range, see pages 822 and 823.)
70. 298, 256, 399, 388, 276 71. 3, 75, 58, 7, 34
72. 4.8, 5.7, 2.1, 2.1, 4.8, 2.1 73. 80, 50, 65, 55, 70, 65, 75, 50
74. 61, 89, 93, 102, 45, 89 75. 13.3, 15.4, 12.5, 10.7
xO
f (x)
�5
5
10
�10
�1 1 2�2
f (x) � x 5 � x 4 � x � 1
Mixed Review
Getting Ready forthe Next Lesson

MEASURES OF CENTRAL TENDENCY Data with one variable, such as thetest scores, is called . Sometimes it is convenient to have one numberthat describes a set of univariate data. This number is called a
, because it represents the center or middle of the data. The mostcommonly used measures of central tendency are the mean, median, and mode.
When deciding which measure of central tendency to use to represent a set ofdata, look closely at the data itself.
tendencymeasure of central
univariate data
Vocabulary• univariate data• measure of central
tendency• measure of variation• dispersion• variance• standard deviation
Statistical Measures
664 Chapter 12 Probability and Statistics
• Use measures of central tendency to represent a set of data.
• Find measures of variation for a set of data.
On Mr. Dent’s most recent Algebra 2 test, his students earned these scores.
When his students ask how they did on the test, which measure of centraltendency should Mr. Dent use to describe the scores?
72
71
70
84
77
89
76
67
90
19
68
85
81
75
86
66
34
80
94
94
statistics should a teacher tell the class after a test?statistics should a teacher tell the class after a test?
Measures of TendencyUse When . . .
mean the data are spread out, and you want an average of the values.
median the data contain outliers.
mode the data are tightly clustered around one or two values.
Choose a Measure of Central TendencySWEEPSTAKES A sweepstakes offers a first prize of $10,000, two second prizesof $100, and one hundred third prizes of $10.
a. Which measure of central tendency best represents the available prizes?
Since 100 of the 103 prizes are $10, the mode ($10) best represents the availableprizes. Notice that in this case the median is the same as the mode.
b. Which measure of central tendency would the organizers of the sweepstakesbe most likely to use in their advertising?
The organizers would be most likely to use the mean (about $109) to makepeople think they had a better chance of winning more money.
Example 1Example 1
Look BackTo review outliers, seeLesson 2-5.
Study Tip

Lesson 12-6 Statistical Measures 665
Standard Deviation
If a set of data consists of the n values x1, x2, …, xn and has mean x�, then thestandard deviation � is given by the following formula.
� � ����(x1 � x�)2 � (x2 � x�)2 � ••• � (xn � x�)2�����
n
Standard DeviationSTATES The table shows the populations in millions of 11 eastern states as of the 2000 Census. Find the variance and standard deviation of the data to thenearest tenth.
Source: U.S. Census Bureau
Step 1 Find the mean. Add the data and divide by the number of items.
x� �
� 5.41�8� The mean is about 5.4 people.
Step 2 Find the variance.
�2 � Variance formula
�34
141.4
� Simplify.
31.30�9� The variance is about 31.3 people.
Step 3 Find the standard deviation.
�2 31.3 Take the square root of each side.
� 5.594640292 The standard deviation is about 5.6 people.
(19.0 � 5.4)2 � (12.3 � 5.4)2 � ••• � (0.8 � 5.4)2 � (0.6 � 5.4)2�������
11
(x1 � x�)2 � (x2 � x�)2 � ••• � (xn � x�)2�����
n
19.0 � 12.3 � 8.4 � 6.3 � 5.3 � 3.4 � 1.3 � 1.2 � 1.0 � 0.8 � 0.6��������
11
Example 2Example 2
State Population State Population State Population
NY 19.0 MD 5.3 RI 1.0
PA 12.3 CT 3.4 DE 0.8
NJ 8.4 ME 1.3 VT 0.6
MA 6.3 NH 1.2 — —
MEASURES OF VARIATION or measurehow spread out or scattered a set of data is. The simplest measure of variation tocalculate is the range, the difference between the greatest and the least values in aset of data. Variance and standard deviation are measures of variation that indicatehow much the data values differ from the mean.
To find the �2 of a set of data, follow these steps.
1. Find the mean, x�.
2. Find the difference between each value in the set of data and the mean.
3. Square each difference.
4. Find the mean of the squares.
The � is the square root of the variance.standard deviation
variance
dispersionMeasures of variation
TEACHING TIP
Reading MathThe symbol � is the lowercase Greek letter sigma.x� is read x bar.
Study Tip
www.algebra2.com/extra_examples

666 Chapter 12 Probability and Statistics
Concept Check
Guided Practice
GUIDED PRACTICE KEY
1. OPEN ENDED Give a sample set of data with a variance and standard deviation of 0.
2. Find a counterexample for the following statement.The standard deviation of a set of data is always less than the variance.
3. Write the formula for standard deviation using sigma notation. (Hint: To reviewsigma notation, see Lesson 11-5.)
Find the variance and standard deviation of each set of data to the nearest tenth.
4. {48, 36, 40, 29, 45, 51, 38, 47, 39, 37}
5. {321, 322, 323, 324, 325, 326, 327, 328, 329, 330}
6. {43, 56, 78, 81, 47, 42, 34, 22, 78, 98, 38, 46, 54, 67, 58, 92, 55}
Most of the members of a set of data are within 1 standard deviation of the mean.The populations of the states in Example 2 can be broken down as shown below.
Looking at the original data, you can see that most of the states’ populations werebetween 2.4 million and 20.2 million. That is, the majority of members of the data setwere within 1 standard deviation of the mean.
You can use a TI-83 Plus graphing calculator to find statistics for the data inExample 2.
�11.4
x
�5.8 �0.2
1 standard deviation from the mean
5.4 11 16.6 22.2
2 standard deviations from the mean
3 standard deviations from the mean
x � 3(5.6) x � 2(5.6) x � 5.6 x � 5.6 x � 2(5.6) x � 3(5.6)
One-Variable Statistics
The TI-83 Plus can compute a set of one-variable statistics from a list of data. These statistics include the mean, variance, and standard deviation. Enter the data into L1.
KEYSTROKES: 19.0 12.3 ...
Then use 1 to show the statistics. The mean x� is about 5.4, the sum of the values �x is 59.6, the standard deviation �x is about 5.6,and there are n � 11 data items. If you scroll down, you will see the leastvalue (minX � .6), the three quartiles (1, 3.4, and 8.4), and the greatestvalue (maxX � 19).
Think and Discuss1. Find the variance of the data set.2. Enter the data set in list L1 but without the outlier 19.0. What are the new
mean, median, and standard deviation?3. Did the mean or median change less when the outlier was deleted?
ENTERSTAT
ENTERENTERENTERSTAT

BasketballChamique Holdsclaw of theWashington Mystics ledthe Women’s NationalBasketball Association inrebounding in 2003 with284 rebounds in 26 games,an average of about 10.9rebounds per game.Source: WNBA
Lesson 12-6 Statistical Measures 667
EDUCATION For Exercises 7 and 8, use the following information.The table below shows the amounts of money spent on education per student in1998 in two regions of the United States.
Source: National Education Association
7. Find the mean for each region.
8. For which region is the mean more representative of the data? Explain.
Application
Pacific States Southwest Central States
StateExpenditures
StateExpenditures
per Student ($) per Student ($)
Alaska 10,650 Texas 6291
California 5345 Arkansas 5222
Washington 6488 Louisiana 5194
Oregon 6719 Oklahoma 4634
Stem Leaf
5 7 7 7 8 9
6 3 4 5 5 6 7
7 2 3 4 5 6 6|3 � 63
Stem Leaf
4 4 5 6 7 7
5 3 5 6 7 8 9
6 7 7 8 9 9 9 4|5 � 45
Online Research Data Update For the latest rebounding statistics for both women’s and men’s professional basketball, visit:www.algebra2.com/data_update
Practice and ApplyPractice and Apply
Find the variance and standard deviation of each set of data to the nearest tenth.
9. {400, 300, 325, 275, 425, 375, 350}
10. {5, 4, 5, 5, 5, 5, 6, 6, 6, 6, 7, 7, 7, 7, 8, 9}
11. {2.4, 5.6, 1.9, 7.1, 4.3, 2.7, 4.6, 1.8, 2.4}
12. {4.3, 6.4, 2.9, 3.1, 8.7, 2.8, 3.6, 1.9, 7.2}
13. {234, 345, 123, 368, 279, 876, 456, 235, 333, 444}
14. {13, 14, 15, 16, 17, 18, 19, 20, 21, 23, 67, 56, 34, 99, 44, 55}
15. 16.
BASKETBALL For Exercises 17 and 18, use the following information.The table below shows the rebounding totals for the 2003 Los Angeles Sparks.
17. Find the mean, median, and mode of the data to the nearest tenth.
18. Which measure of central tendency best represents the data? Explain.
EDUCATION For Exercises 19 and 20, use the following information. TheMillersburg school board is negotiating a pay raise with the teacher’s union.Three of the administrators have salaries of $80,000 each. However, a majority of the teachers have salaries of about $35,000 per year.
19. You are a member of the school board and would like to show that the currentsalaries are reasonable. Would you quote the mean, median, or mode as the“average” salary to justify your claim? Explain.
20. You are the head of the teacher’s union and maintain that a pay raise is in order.Which of the mean, median, or mode would you quote to justify your claim?Explain your reasoning.
ForExercises
17–269–16,27–33
SeeExamples
12
Extra Practice See page 855.
Extra Practice See page 855.
141 231 220 126 175 55 29 68 19 32 19 21 6 23 1
Source: WNBA
www.algebra2.com/self_check_quiz

668 Chapter 12 Probability and Statistics
ADVERTISING For Exercises 21–23, use the following information. A camera store placed an ad in the newspaper showing five digital cameras for sale.The ad says, “Our digital cameras average $695.” The prices of the digital camerasare $1200, $999, $1499, $895, $695, $1100, $1300, and $695.
21. Find the mean, median, and mode of the prices.
22. Which measure is the store using in its ad? Why did they choose this measure?
23. As a consumer, which measure would you want to see advertised? Explain.
SHOPPING MALLS For Exercises 24–26, use the following information. The table lists the areas of some large shopping malls in the United States.
Source: Blackburn Marketing Service
24. Find the mean, median, and mode of the gross leasable areas.
25. You are a realtor who is trying to lease mall space in different areas of thecountry to a large retailer. Which measure would you talk about if the customerfelt that the malls were too large for his store? Explain.
26. Which measure would you talk about if the customer had a large inventory?Explain.
FOOTBALL For Exercises 27–30, use the weights in pounds of the startingoffensive linemen of the football teams from three high schools.
Jackson Washington King170, 165, 140, 188, 195 144, 177, 215, 225, 197 166, 175, 196, 206, 219
27. Find the standard deviation of the weights for Jackson High.
28. Find the standard deviation of the weights for Washington High.
29. Find the standard deviation of the weights for King High
30. Which team had the most variation in weights? How do you think this variationwill impact their play?
SCHOOL For Exercises 31–33, use the frequency table at the right that shows the scores on a multiple-choice test.
31. Find the variance and standard deviation of the scores.
32. What percent of the scores are within one standarddeviation of the mean?
33. What percent of the scores are within two standarddeviations of the mean?
MallGross
Leasable Area (ft2)
1 Del Amo Fashion Center, Torrance, CA 3,000,000
2 South Coast Plaza/Crystal Court, Costa Mesa, CA 2,918,236
3 Mall of America, Bloomington, MN 2,472,500
4 Lakewood Center Mall, Lakewood, CA 2,390,000
5 Roosevelt Field Mall, Garden City, NY 2,300,000
6 Gurnee Mills, Gurnee, IL 2,200,000
7 The Galleria, Houston, TX 2,100,000
8 Randall Park Mall, North Randall, OH 2,097,416
9 Oakbrook Shopping Center, Oak Brook, IL 2,006,688
10 Sawgrass Mills, Sunrise, FL 2,000,000
10 The Woodlands Mall, The Woodlands, TX 2,000,000
10 Woodfield, Schaumburg, IL 2,000,000
Score Frequency
90 3
85 2
80 3
75 7
70 6
65 4
ShoppingWhile the Mall of Americadoes not have the mostgross leasable area, it isthe largest fully enclosedretail and entertainmentcomplex in the UnitedStates. Source: Mall of America

Lesson 12-6 Statistical Measures 669
For Exercises 34–36, consider the two graphs below.
Monthly Sales
Sale
s ($
)
$22,000
$23,000
$21,000$20,000
$24,000
$25,000
$26,000
MonthMFJ M JA J A S O N D
Monthly Sales
Sale
s ($
)
$10,000
$15,000
$5,0000
$20,000
$25,000
$30,000
MonthMFJ M JA J A S O N D
34. Explain why the graphs made from the same data look different.
35. Describe a situation where the first graph might be used.
36. Describe a situation where the second graph might be used.
CRITICAL THINKING For Exercises 37 and 38, consider the two sets of data.
A � {1, 2, 2, 2, 2, 3, 3, 3, 3, 4}, B � {1, 1, 2, 2, 2, 3, 3, 3, 4, 4}
37. Find the mean, median, variance, and standard deviation of each set of data.
38. Explain how you can tell which histogram below goes with each data setwithout counting the frequencies in the sets.
39. Answer the question that was posed at the beginning ofthe lesson.
What statistics should a teacher tell the class after a test?
Include the following in your answer:• the mean, median, and mode of the given data set, • which measure of central tendency best represents the test scores and why, and• how the measures of central tendency are affected if Mr. Dent adds 5 points to
each score.
40. What is the mean of the numbers represented by x � 1, 3x � 2, and 2x � 5?
2x � 2 �6x
3� 7� �
x �
31
� x � 4
41. Manuel got scores of 92, 85, and 84 on three successive tests. What score must heget on a fourth test in order to have an average of 90?
96 97 98 99
is another method of dispersion. It is the mean of the deviations ofthe data from the mean of the data. If a set of data consists of n values x1, x2, …, xnand has mean xx�, then the mean deviation is given by the following formula.
MD � or �n1
� �n
i�1xi � xx�
Find the mean deviation of each set of data to the nearest tenth.
42. {95, 91, 88, 86} 43. {10.4, 11.4, 16.2, 14.9, 13.5}
44. Suppose two sets of data have the same mean and different standard deviations.Describe their mean deviations.
x1 � xx� � x2 � xx� � … � xn � xx������
n
Mean deviation
DCBA
DCBA
WRITING IN MATH
4321
23
1
0
4
Freq
uen
cy
Number4321
23
1
0
4
Freq
uen
cy
Number
StandardizedTest Practice
Extendingthe Lesson
Reading MathMean deviation is alsosometimes called meanabsolute deviation.
Study Tip

Practice Quiz 2Practice Quiz 2
A bag contains 5 red marbles, 3 green marbles, and 2 blue marbles. Two marbles are drawn at random from the bag. Find each probability. (Lesson 12-4)
1. P(red, then green) if replacement occurs 2. P(red, then green) if no replacement occurs
3. P(2 red) if no replacement occurs 4. P(2 red) if replacement occurs
A twelve-sided die has sides numbered 1 through 12. The die is rolled once. Find each probability. (Lesson 12-5)
5. P(4 or 5) 6. P(even or a multiple of 3) 7. P(odd or a multiple of 4)
Find the variance and standard deviation of each set of data to the nearest tenth. (Lesson 12-6)
8. {5, 8, 2, 9, 4} 9. {16, 22, 18, 31, 25, 22} 10. {425, 400, 395, 415, 420}
Lessons 12-4 through 12-6
670 Chapter 12 Probability and Statistics
Maintain Your SkillsMaintain Your Skills
Determine whether the events are mutually exclusive or inclusive. Then find theprobability. (Lesson 12-5)
45. A card is drawn from a standard deck of cards. What is the probability that it isa 5 or a spade?
46. A jar of change contains 5 quarters, 8 dimes, 10 nickels, and 19 pennies. If a coin is pulled from the jar at random, what is the probability that it is a nickel or a dime?
Two cards are drawn from a standard deck of cards. Find each probability.(Lesson 12-4)
47. P(ace, then king) if replacement occurs
48. P(ace, then king) if no replacement occurs
49. P(heart, then club) if no replacement occurs
50. P(heart, then club) if replacement occurs
51. Find the coordinates of the vertices and foci and the slopes of the asymptotes for
the hyperbola given by �8y1
2� � �
2x5
2� � 1. (Lesson 8-5)
If f(x) � x � 7, g(x) � 4x2 , and h(x) � 2x � 1, find each value. (Lesson 7-7)
52. ƒ[g(�1)] 53. h[ƒ(15)] 54. ƒ ° h(2)
55. BUSINESS The Energy Booster Company keeps their stock of Health Aidliquid in a rectangular tank whose sides measure x � 1 centimeters, x � 3centimeters, and x � 2 centimeters. Suppose they would like to bottle theirHealth Aid in x � 3 containers of the same size. How much liquid in cubiccentimeters will remain unbottled? (Lesson 7-2)
Use Cramer’s Rule to solve each system of equations. (Lesson 4-6)
56. 2x � 6y � 28 57. 7c – 3d � �8 58. m – 2n � �7�x � 4y � �20 4c � d � 9 �3m � n � �4
BASIC SKILL Find each percent.
59. 68% of 200 60. 68% of 500 61. 95% of 400
62. 95% of 500 63. 99% of 400 64. 99% of 500
Mixed Review
Getting Ready forthe Next Lesson
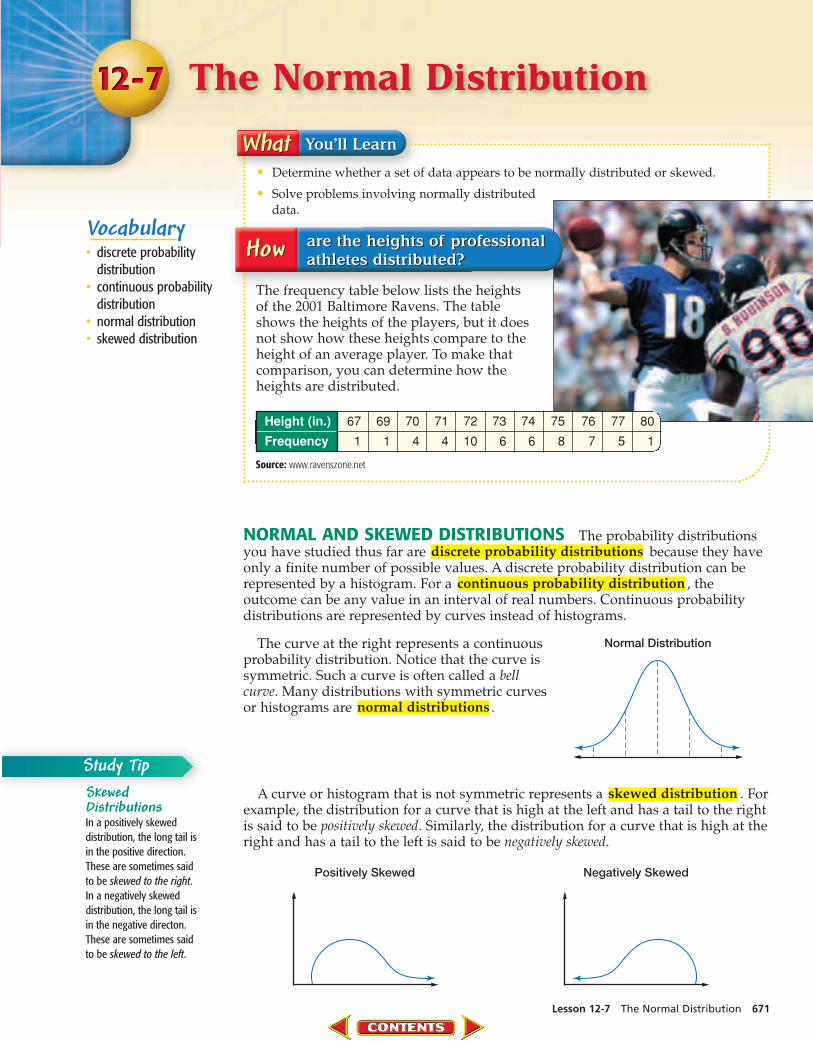
NORMAL AND SKEWED DISTRIBUTIONS The probability distributionsyou have studied thus far are because they haveonly a finite number of possible values. A discrete probability distribution can berepresented by a histogram. For a , theoutcome can be any value in an interval of real numbers. Continuous probabilitydistributions are represented by curves instead of histograms.
The curve at the right represents a continuousprobability distribution. Notice that the curve issymmetric. Such a curve is often called a bellcurve. Many distributions with symmetric curvesor histograms are .
A curve or histogram that is not symmetric represents a . Forexample, the distribution for a curve that is high at the left and has a tail to the rightis said to be positively skewed. Similarly, the distribution for a curve that is high at theright and has a tail to the left is said to be negatively skewed.
Negatively SkewedPositively Skewed
skewed distribution
normal distributions
Normal Distribution
continuous probability distribution
discrete probability distributions
The Normal Distribution
Lesson 12-7 The Normal Distribution 671
Vocabulary• discrete probability
distribution• continuous probability
distribution• normal distribution• skewed distribution
• Determine whether a set of data appears to be normally distributed or skewed.
• Solve problems involving normally distributed data.
The frequency table below lists the heights of the 2001 Baltimore Ravens. The tableshows the heights of the players, but it doesnot show how these heights compare to theheight of an average player. To make thatcomparison, you can determine how theheights are distributed.
Source: www.ravenszone.net
67 69 70 71 72 73 74 75 76 77 80
1 1 1 4 4 10 6 6 8 7 5 1
Height (in.)
Frequency
are the heights of professionalathletes distributed?are the heights of professionalathletes distributed?
SkewedDistributionsIn a positively skeweddistribution, the long tail isin the positive direction.These are sometimes saidto be skewed to the right.In a negatively skeweddistribution, the long tail isin the negative directon.These are sometimes saidto be skewed to the left.
Study Tip

USE NORMAL DISTRIBUTIONS Normal distributions occur quitefrequently in real life. Standardized test scores, the lengths of newborn babies, theuseful life and size of manufactured items, and production levels can all berepresented by normal distributions. In all of these cases, the number of data valuesmust be large for the distribution to be approximately normal.
672 Chapter 12 Probability and Statistics
NormalDistributionIf you randomly select anitem from data that arenormally distributed, theprobability that the oneyou pick will be withinone standard deviation ofthe mean is 0.68. If youdo this 1000 times, about680 of those picked willbe within one standarddeviation of the mean.
Study Tip Normal DistributionNormal distributions have these properties.
About 68% of the values are within one standard deviation of the mean.
About 95% of the values are within two standard deviations of the mean.
About 99% of the values are within three standard deviations of the mean.
The graph ismaximizedat the mean.
The mean,median, andmode are about equal.
2%0.5% 2%13.5% 13.5%34%34%
0.5%
Normal DistributionPHYSIOLOGY The reaction times for a hand-eye coordination test administeredto 1800 teenagers are normally distributed with a mean of 0.35 second and astandard deviation of 0.05 second.
a. About how many teens had reaction times between 0.25 and 0.45 second?
Draw a normal curve. Label themean and the mean plus or minusmultiples of the standard deviation.
The values 0.25 and 0.45 are 2 standarddeviations below and above the mean,respectively. Therefore, about 95% ofthe data are between 0.25 and 0.45.
1800 � 95% � 1710 Multiply 1800 by 0.95.
About 1710 of the teenagers had reaction times between 0.25 and 0.45 second.
0.2 0.25 0.3 0.35
34% 34%
13.5% 13.5% 2%2%
0.5%
0.4 0.45 0.5
0.5%
Example 2Example 2
11 12 13 14 15
1 1 1 3 4 3
Value
Frequency
Classify a Data DistributionDetermine whether the data {14, 15, 11, 13, 13, 14, 15, 14, 12, 13, 14, 15} appear tobe positively skewed, negatively skewed, or normally distributed.
Make a frequency table for the data. Then use the table to make a histogram.
Since the histogram is high at the right and has a tail to the left, the data arenegatively skewed.
14 15131211
23
1
0
4
Freq
uen
cy
Value
Example 1Example 1

Lesson 12-7 The Normal Distribution 673
GUIDED PRACTICE KEY
b. What is the probability that a teenager selected at random had a reaction timegreater than 0.4 second?
The value 0.4 is one standard deviation above the mean. You know that about100% � 68% or 32% of the data are more than one standard deviation awayfrom the mean. By the symmetry of the normal curve, half of 32%, or 16%, ofthe data are more than one standard deviation above the mean.
The probability that a teenager selected at random had a reaction time greaterthan 0.4 second is about 16% or 0.16.
1. OPEN ENDED Sketch a positively skewed graph. Describe a situation in whichyou would expect data to be distributed this way.
2. Compare and contrast the means and standard deviations of the graphs.
3. Explain how to find what percent of a set of normally distributed data is morethan 3 standard deviations above the mean.
4. The table at the right shows female mathematics SAT scores in 2000. Determine whether the data appear to be positively skewed, negatively skewed,or normally distributed.
For Exercises 5–7, use the following information.Mrs. Sung gave a test in her trigonometry class. The scores were normallydistributed with a mean of 85 and a standard deviation of 3.
5. What percent would you expect to score between 82 and 88?
6. What percent would you expect to score between 88 and 91?
7. What is the probability that a student chosen at random scored between 79 and 91?
QUALITY CONTROL For Exercises 8–11, use the following information.The useful life of a radial tire is normally distributed with a mean of 30,000 milesand a standard deviation of 5000 miles. The company makes 10,000 tires a month.
8. About how many tires will last between 25,000 and 35,000 miles?
9. About how many tires will last more than 40,000 miles?
10. About how many tires will last less than 25,000 miles?
11. What is the probability that if you buy a radial tire at random, it will lastbetween 20,000 and 35,000 miles?
x � 50 x � 50 x � 50
Concept Check
Guided Practice
Application
Score Percent of Females
200–299 3
300–399 14
400–499 33
500–599 31
600–699 15
700–800 4
Source: www.collegeboard.org
www.algebra2.com/extra_examples

674 Chapter 12 Probability and Statistics
Record Low Temperatures in the 50 States
Temperature Number(°F) of States
�80 to �65 4
�64 to �49 12
�48 to �33 19
�32 to �17 12
�16 to �1 2
0 to 15 1
Source: The World Almanac
Practice and ApplyPractice and Apply
Determine whether the data in each table appear to be positively skewed,negatively skewed, or normally distributed.
12. 13.
14. SCHOOL The frequency table at the right shows the grade-point averages (GPAs) of the juniors atStanhope High School. Do the data appear to bepositively skewed, negatively skewed, or normally distributed? Explain.
FOOD For Exercises 15–18, use the followinginformation.The shelf life of a particular dairy product is normallydistributed with a mean of 12 days and a standarddeviation of 3.0 days.
15. About what percent of the products last between 9 and 15 days?
16. About what percent of the products last between 12 and 15 days?
17. About what percent of the products last less than 3 days?
18. About what percent of the products last more than 15 days?
VENDING For Exercises 19–21, use the following information.The vending machine in the school cafeteria usually dispenses about 6 ounces of softdrink. Lately, it is not working properly, and the variability of how much of the softdrink it dispenses has been getting greater. The amounts are normally distributedwith a standard deviation of 0.2 ounce.
19. What percent of the time will you get more than 6 ounces of soft drink?
20. What percent of the time will you get less than 6 ounces of soft drink?
21. What percent of the time will you get between 5.6 and 6.4 ounces of soft drink?
MANUFACTURING For Exercises 22–24, use the following information.A company manufactures 1000 CDs per hour that are supposed to be 120 millimeters in diameter. These CDs are made for drives 122 millimeters wide. The sizes of CDs made by this company are normally distributed with a standarddeviation of 1 millimeter.
22. What percent of the CDs would you expect to be greater than 120 millimeters?
23. In one hour, how many CDs would you expect to be between 119 and 122 millimeters?
24. About how many CDs per hour will be too large to fit in the drives?
U.S. Population
Age Percent
0–19 28.7
20–39 29.3
40–59 25.5
60–79 13.3
80–99 3.2
100� 0.0
GPA Frequency
0.0–0.4 4
0.5–0.9 4
1.0–1.4 2
1.5–1.9 32
2.0–2.4 96
2.5–2.9 91
3.0–3.4 110
3.5–4.0 75
Source: U.S. Census Bureau
ForExercises
12–1415–26
SeeExamples
12
Extra Practice See page 856.
Extra Practice See page 856.

Maintain Your SkillsMaintain Your Skills
Lesson 12-7 The Normal Distribution 675
HEALTH For Exercises 25 and 26, use the following information.A recent study showed that the systolic blood pressure of high school students ages14–17 is normally distributed with a mean of 120 and a standard deviation of 12.Suppose a high school has 800 students.
25. About what percent of the students have blood pressures below 108?
26. About how many students have blood pressures between 108 and 144?
27. CRITICAL THINKING The graphing calculator screen shows the graph of a normaldistribution for a large set of test scores whosemean is 500 and whose standard deviation is100. If every test score in the data set wereincreased by 25 points, describe how the mean,standard deviation, and graph of the datawould change.
28. Answer the question that was posed at the beginning ofthe lesson.
How are the heights of professional athletes distributed?
Include the following items in your answer:• a histogram of the given data, and• an explanation of whether you think the data are normally distributed.
29. If x � y � 5 and xy � 6, what is the value of x2 � y2?
13 17 25 3730. Which of the following is not the square of a rational number?
0.04 0.16 �49
� �23
�
Find the variance and standard deviation of each set of data to the nearest tenth.(Lesson 12-6)
31. {7, 16, 9, 4, 12, 3, 9, 4} 32. {12, 14, 28, 19, 11, 7, 10}
A card is drawn from a standard deck of cards. Find each probability. (Lesson 12-5)
33. P(jack or queen) 34. P(ace or heart) 35. P(2 or face card)
Find all of the rational zeros for each function. (Lesson 7-6)
36. f(x) � x3 � 4x2 � 5x 37. p(x) � x3 � 3x2 � 10x � 24
38. h(x) � x4 � 2x2 � 1 39. ƒ(x) � 4x4 � 13x3 � 13x2 � 28x � 6
METEOROLOGY For excercises 40 and 41, use the following information.Weather forecasters can determine the approximate time that a thunderstorm willlast if they know the diameter d of the storm in miles. The time t in hours can befound by using the formula 216t2 � d3. (Lesson 6-2)
40. Graph y � 216t2 � 53 and use it to estimate how long a thunderstorm will last ifits diameter is 5 miles.
41. Find how long a thunderstorm will last if its diameter is 5 miles and comparethis time with your estimate in Exercise 40.
PREREQUISITE SKILL Find the indicated term of each expression.(For review of binomial expansions, see Lesson 5-2.)
42. third term of (a � b)7 43. fourth term of (c � d)8 44. fifth term of (x � y)9
DCBA
DCBA
WRITING IN MATH
[200, 800] scl: 100 by [0, 0.005] scl: 0.001
Mixed Review
Getting Ready forthe Next Lesson
HealthA systolic blood pressurebelow 130 is normal andbetween 130 and 139 is“high normal.”Source: National Institutes of
Health
StandardizedTest Practice
www.algebra2.com/self_check_quiz

BINOMIAL EXPANSIONS You can use theBinomial Theorem to find probabilities in certainsituations where there are two possible outcomes.The 5 possible ways of getting 4 questions right rand 1 question wrong w are shown at the right. Thischart shows the combination of 5 things (answerchoices) taken 4 at a time (right answers) or C(5, 4).
The terms of the binomial expansion of (r + w)5 can be used to find theprobabilities of each combination of right and wrong.
(r � w)5 � r5 � 5r4w � 10r3w2 � 10r2w3 � 5rw4 � w5
Vocabulary• binomial experiment
Binomial Experiments
676 Chapter 12 Probability and Statistics
What is the probability of getting exactly4 questions correct on a 5-questionmultiple-choice quiz if you guess at everyquestion?
• Use binomial expansions to find probabilities.
• Find probabilities for binomial experiments.
Look BackTo review the BinomialTheorem, see Lesson 11-7.
Study Tip
The probability of getting a question right that you guessed on is �14
�. So, the
probability of getting the question wrong is �34
�. To find the probability of getting
4 questions right and 1 question wrong, substitute �14
� for r and �34
� for w in the term 5r4w.
P(4 right, 1 wrong) � 5r4w
� 5�14
��4�
34
�� r = �14
� , w = �34
�
� �110
524� Multiply.
The probability of getting exactly 4 questions correct is �110
524� or about 1.5%.
Coefficient Term Meaning
C(5, 5) = 1 r 5 1 way to get all 5 questions right
C(5, 4) = 5 5r 4w 5 ways to get 4 questions right and 1 question wrong
C(5, 3) = 10 10r 3w 2 10 ways to get 3 questions right and 2 questions wrong
C(5, 2) = 10 10r 2w 3 10 ways to get 2 questions right and 3 questions wrong
C(5, 1) = 5 5rw 4 5 ways to get 1 question right and 4 questions wrong
C(5, 0) = 1 w 5 1 way to get all 5 questions wrong
w r r r r
r w r r r
r r w r r
r r r w r
r r r r w
Quiz1. What are thedimensions of a
rectangle if the 1. What are?dimensions of a
rectangle ihrter? 1. What arheorem?What is a rectangle?
How many sides doesan octagon have?
A B C D
A B C D
A B C D
A B C D
A B C D
can you determine whetherguessing is worth it?can you determine whetherguessing is worth it?

Lesson 12-8 Binomial Experiments 677
Binomial TheoremIf a family has 4 children, what is the probability that they have 3 boys and 1 girl?
There are two possible outcomes for the gender of each of their children: boy or
girl. The probability of a boy b is �12
�, and the probability of a girl g is �12
�.
(b � g)4 � b4 � 4b3g � 6b2g2 � 4bg3 � g4
The term 4b3g represents 3 boys and 1 girl.
P(3 boys, 1 girl) � 4b3g
� 4�12
��3�
12
�� b � �12
�, g � �12
�
� �14
� Multiply.
The probability of 3 boys and 1 girl is �14
� or 25%.
Example 1Example 1
Binomial ExperimentsA binomial experiment exists if and only if all of these conditions occur.
• There are exactly two possible outcomes for each trial.
• There is a fixed number of trials.
• The trials are independent.
• The probabilities for each trial are the same.
Binomial ExperimentSPORTS Suppose that when hockey star Jaromir Jagr takes a shot, he has a �
17
�
probability of scoring a goal. He takes 6 shots in a game one night.
a. What is the probability that he will score exactly 2 goals?
The probability that he scores a goal on a given shot is �17
�. The probability that
he does not score on a given shot is �67
�. There are C(6, 2) ways to choose the 2 shots that score.
P(2 goals) � C(6, 2)�17
��2�
67
��4
If he scores on 2 shots, he fails to score on 4 shots.
� �6
2• 5��
17
��2�
67
��4
C(6, 2) � �46!2!!
�
� �11197,4,6
4409
� Simplify.
The probability that Jagr will score exactly 2 goals is �11197,,464409
� or about 0.17.
Example 2Example 2SportsThe National HockeyLeague record for mostgoals in a game by oneplayer is seven. A playerhas scored five or moregoals in a game 53 times in league history.Source: NHL
A binomial experiment is sometimes called a Bernoulli experiment.
Suppose that in the application at the beginning of the lesson, the first 3 questionsare answered correctly. Then the last 2 are answered incorrectly. The probability
of this occurring is �14
� � �14
� � �14
� � �34
� � �34
� or �14
��3�
34
��2. In general, there are C(5, 3) ways
to arrange 3 correct answers among the 5 questions, so the probability of exactly
3 correct answers is given by C(5, 3)�14
��3�
34
��2.
BINOMIAL EXPERIMENTS Problems like Example 1 that can be solved usingbinomial expansion are called .binomial experiments
www.algebra2.com/extra_examples

678 Chapter 12 Probability and Statistics
1. OPEN ENDED Describe a situation for which the P(2 or more) can be found byusing a binomial expansion.
2. Refer to the application at the beginning of the lesson. List the possiblesequences of 3 right answers and 2 wrong answers.
3. Explain why each experiment is not binomial.
a. rolling a die and recording whether a 1, 2, 3, 4, 5, or 6 comes up
b. tossing a coin repeatedly until it comes up heads
c. removing marbles from a bag and recording whether each one is black orwhite, if no replacement occurs
Find each probability if a coin is tossed 3 times.
4. P(exactly 2 heads) 5. P(0 heads) 6. P(at least 1 head)
Four cards are drawn from a standard deck of cards. Each card is replaced beforethe next one is drawn. Find each probability.
7. P(4 jacks) 8. P(exactly 3 jacks) 9. P(at most 1 jack)
SPORTS For Exercises 10 and 11, use the following information.Jessica Mendoza of Stanford University was the 2000 NCAA women’s softballbatting leader with an average of .475. This means that the probability of her gettinga hit in a given at-bat was 0.475.
10. Find the probability of her getting 4 hits in 4 at-bats.
11. Find the probability of her getting exactly 2 hits in 4 at-bats.
Concept Check
Guided Practice
Application
GUIDED PRACTICE KEY
Practice and ApplyPractice and Apply
b. What is the probability that he will score at least 2 goals?
Instead of adding the probabilities of getting exactly 2, 3, 4, 5, and 6 goals, it iseasier to subtract the probabilities of getting exactly 0 or 1 goal from 1.
P(at least 2 goals) � 1 � P(0 goals) � P(1 goal)
� 1 � C(6, 0)�17
��0�
67
��6
� C(6, 1)�17
��1�
67
��5
� 1 � �14167,,665469
� � �14167,,665469
� Simplify.
� �12147,,363479
� Subtract.
The probability that Jagr will score at least 2 goals is �12147,,363479
� or about 0.21.
Find each probability if a coin is tossed 4 times.
12. P(4 tails) 13. P(0 tails)
14. P(exactly 2 tails) 15. P(exactly 1 tail)
16. P(at least 3 tails) 17. P(at most 2 tails)
Find each probability if a die is rolled 5 times.
18. P(exactly one 5) 19. P(exactly three 5s)
20. P(at most two 5s) 21. P(at least three 5s)
ForExercises
12–37
SeeExamples
1, 2
Extra Practice See page 856.
Extra Practice See page 856.

Lesson 12-8 Binomial Experiments 679
As an apartment manager, Jackie Thomas is responsible for showing prospectiverenters different models of apartments. When showing a model, the probabilitythat she selects the correct key from her set is �
14
�. If she shows 5 models in a day,find each probability.
22. P(never the correct key) 23. P(always the correct key)
24. P(correct exactly 4 times) 25. P(correct exactly 2 times)
26. P(no more than 2 times correct) 27. P(at least 3 times correct)
Prisana guesses at all 10 true/false questions on her history test. Find eachprobability.
28. P(exactly 6 correct) 29. P(exactly 4 correct)
30. P(at most half correct) 31. P(at least half correct)
If a thumbtack is dropped, the probability of it landing point-up is 0.4. If 12 tacksare dropped, find each probability.
32. P(at least 9 points up) 33. P(at most 4 points up)
34. CARS According to a recent survey, about 1 in 3 new cars is leased rather than bought. What is the probability that 3 of 7 randomly-selected new cars are leased?
35. INTERNET In 2001, it was estimated that 32.5% of U.S. adults use the Internet.What is the probability that exactly 2 out of 5 randomly-selected U.S. adults usethe Internet?
WORLD CULTURES For Exercises 36 and 37, use the following information.The Cayuga Indians played a game of chance called Dish, in which they used 6 flattened peach stones blackened on one side. They placed the peach stones in awooden bowl and tossed them. The winner was the first person to get a prearrangednumber of points. The table below shows the points that were given for each toss.Assume that each face (black or neutral) of each stone has an equal chance ofshowing up.
36. Copy and complete the table byfinding the probability of eachoutcome.
37. Find the probability that a playergets at least 1 point for a toss.
38. CRITICAL THINKING Write anexpression for the probability ofexactly m successes in n trials of abinomial experiment where theprobability of success in a giventrial is p.
39. Answer the question that was posed at the beginning ofthe lesson.
How can you determine whether guessing is worth it?
Include the following in your answer:• an explanation of how to find the probability of getting any number of
questions right on a 5-question multiple-choice quiz, and• the probability of each score.
WRITING IN MATH
InternetThe word Internet wasvirtually unknown until the mid-1980s. By 1997, 19 million Americans were using the Internet.That number tripled in1998 and passed 100 million in 1999.Source: UCLA
Outcome Points Probability
6 black 5
5 black, 1 neutral 1
4 black, 2 neutral 0
3 black, 3 neutral 0
2 black, 4 neutral 0
1 black, 5 neutral 1
6 neutral 5
www.algebra2.com/self_check_quiz

680 Chapter 12 Probability and Statistics
StandardizedTest Practice
Maintain Your SkillsMaintain Your Skills
For Exercises 44–46, use the following information. A set of 400 test scores is normally distributed with a mean of 75 and a standarddeviation of 8. (Lesson 12-7)
44. What percent of the test scores lie between 67 and 83?
45. How many of the test scores are greater than 91?
46. What is the probability that a randomly-selected score is less than 67?
47. A salesperson had sales of $11,000, $15,000, $11,000, $16,000, $12,000, and$12,000 in the last six months. Which measure of central tendency would he belikely to use to represent these data when he talks with his supervisor? Explain.(Lesson 12-6)
Graph each inequality. (Lesson 2-7)
48. x �3 49. x � y � 4 50. y � 5x
PREREQUISITE SKILL Evaluate 2��p(1
n�� p)�� for the given values of p and n. Round
to the nearest thousandth, if necessary. (For review of radical expressions, see Lesson 5-6.)
51. p = 0.5, n = 100 52. p = 0.5, n = 400
53. p = 0.25, n = 500 54. p = 0.75, n = 1000
55. p = 0.3, n = 500 56. p = 0.6, n = 1000
40. GRID IN In the figure, if DE � 2, what is the sumof the area of �ABE and the area of �BCD?
41. What is the net result if a discount of 5% isapplied to a bill of $340.60?
$306.54 $323.57
$335.60 $357.63
BINOMIAL DISTRIBUTION You can use a TI-83 Plus to investigate the graph of abinomial distribution.
Step 1 Enter the number of trials in L1. Start with 10 trials.
KEYSTROKES: 1 [LIST] 5
0 10
Step 2 Calculate the probability of success for each trial in L2.
KEYSTROKES: [DISTR] 0 10 .5 [L1]
Step 3 Graph the histogram.
KEYSTROKES: [STATPLOT]
Use the arrow and keys to choose ON, the histogram, L1 as the Xlist,and L2 as the frequency. Use the window [0, 10] scl:1 by [0, 0.5] scl: 0.1.
42. Replace the 10 in the keystrokes for steps 1 and 2 to graph the binomialdistribution for several values of n less than or equal to 47. You may have toadjust your viewing window to see all of the histogram. Make sure Xscl is 1.
43. What type of distribution does the binomial distribution start to resemble as nincreases?
ENTER
2nd
ENTER)2nd,,2nd
ENTER),,
X,T,�,n,X,T,�,n2ndSTAT
DC
BA
2
B D
C
A E
x˚
x˚
Mixed Review
Getting Ready forthe Next Lesson
GraphingCalculator

Investigating Slope-
A Follow-Up of Lesson 12-8
A uses a probability experiment to mimic a real-life situation. You canuse a simulation to solve the following problem about .
A brand of cereal is offering one of six different prizes in every box. If the prizes areequally and randomly distributed within the cereal boxes, how many boxes, onaverage, would you have to buy in order to get a complete set of the six prizes?
Collect the DataWork in pairs or small groups to complete steps 1 through 4.
Step 1 Use the six numbers on a die to represent the sixdifferent prizes.
Step 2 Roll the die and record which prize was in the first boxof cereal. Use a tally sheet like the one shown.
Step 3 Continue to roll the die and record the prize numberuntil you have a complete set of prizes. Stop as soon asyou have a complete set. This is the end of one trial inyour simulation. Record the number of boxes requiredfor this trial.
Step 4 Repeat steps 1, 2, and 3 until your group has carried out 25 trials. Use a new tally sheet for each trial.
Analyze the Data1. Create two different statistical graphs of the data collected for 25 trials.
2. Determine the mean, median, maximum, minimum, and standard deviation ofthe total number of boxes needed in the 25 trials.
3. Combine the small-group results and determine the mean, median, maximum,minimum, and standard deviation of the number of boxes required for all thetrials conducted by the class.
Make a Conjecture4. If you carry out 25 additional trials, will your results be the same as in the first
25 trials? Explain.
5. Should the small-group results or the class results give a better idea of theaverage number of boxes required to get a complete set of superheroes? Explain.
6. If there were 8 superheroes instead of 6, would you need to buy more boxes ofcereal or fewer boxes of cereal on average?
7. What if one of the 6 prizes was more common than the other 5? For instance,suppose that one prize, Amazing Amy, appears in 25% of all the boxes and theother 5 prizes are equally and randomly distributed among the remaining 75% ofthe boxes? Design and carry out a new simulation to predict the average numberof boxes you would need to buy to get a complete set. Include some measures ofcentral tendency and dispersion with your data.
expected valuesimulation
Simulations
Algebra Activity Simulations 681
Simulation Tally Sheet
Prize Number Boxes Purchased
1
2
3
4
5
6
Total Needed

BIAS When polling organizations want to find how the public feels about anissue, they do not have the time or money to ask everyone. Instead, they obtain theirresults by polling a small portion of the population. To be sure that the results arerepresentative of the population, they need to make sure that this portion is arandom or of the population. A sample of size n is random whenevery possible sample of size n has an equal chance of being selected.
unbiased sample
Vocabulary• unbiased sample • margin of sampling error
Sampling and Error
682 Chapter 12 Probability and Statistics
• Determine whether a sample is unbiased.
• Find margins of sampling error.
About a month before the 2000 presidential election, Mason-Dixon Polling & Research surveyedthe preferences of Florida voters. The results shownwere published in the Orlando Sentinel.
Biased and Unbiased SamplesState whether each method would produce a random sample. Explain.
a. asking every tenth person coming out of a health club how many times aweek they exercise to determine how often people in the city exercise
This would not result in a random sample because the people surveyed wouldprobably exercise more often than the average person.
b. surveying people going into an Italian restaurant to find out people’s favoritetype of food
This would probably not result in a random sample because the peoplesurveyed would probably be more likely than others to prefer Italian food.
Example 1Example 1
Margin of Sampling Error
If the percent of people in a sample responding in a certain way is p and the size ofthe sample is n, then 95% of the time, the percent of the population responding inthat same way will be between p � ME and p � ME, where
ME � 2��p(1
n�� p)��.
That is, the probability is 0.95 that p � ME will contain the true population results.
Bush47%Other
2%
Undecided7%
Gore44%
are opinion polls used inpolitical campaigns?are opinion polls used inpolitical campaigns?
MARGIN OF ERROR As the size of a sample increases, it more accuratelyreflects the population. If you sampled only three people and two prefer Brand A,you could say, “Two out of three people chose Brand A over any other brand,” butyou may not be giving a true picture of how the total population would respond.The gives a limit on the difference between how asample responds and how the total population would respond.
margin of sampling error (ME)
Law of LargeNumbersThe principle that assample size increases, thecloser the experimentalprobability is to thetheoretical probability iscalled the Law of LargeNumbers.
Study Tip

Lesson 12-9 Sampling and Error 683
Find a Margin of Error In a survey of 1000 randomly selected adults, 37% answered “yes” to a particularquestion. What is the margin of error?
ME � 2��p(1
n�� p)�� Formula for margin of sampling error
� 2��0.37(11�0
�
000.3�7)
�� p � 37% or 0.37, n � 1000
� 0.030535 Use a calculator.
The margin of error is about 3%. This means that there is a 95% chance that thepercent of people in the whole population who would answer “yes” is between 37 � 3 or 34% and 37 � 3 or 40%.
Example 2Example 2
HealthThe percent of smokers in the United Statespopulation declined from38.7% in 1985 to 25.8% in1999. New therapies, likethe nicotine patch, arehelping more people toquit.Source: U.S. Department of
Health and HumanServices
Published survey results often include the margin of error for the data. You canuse this information to determinine the sample size.
Concept Check 1. Describe how sampling techniques can influence the results of a survey.
2. OPEN ENDED Give an example of a good sample and a bad sample. Explainyour reasoning.
3. Explain what happens to the margin of sampling error when the size of thesample n increases. Why does this happen?
Analyze a Margin of ErrorHEALTH In a recent Gallup Poll, 25% of the people surveyed said they hadsmoked cigarettes in the past week. The margin of error was 3%.
a. What does the 3% indicate about the results?
The 3% means that the probability is 95% that the percent of people in thepopulation who had smoked cigarettes in the past week was between 25 � 3 or22% and 25 � 3 or 28%.
b. How many people were surveyed?
ME � 2��p(1
n�� p)�� Formula for margin of sampling error
0.03 � 2��0.25(1�n� 0.2�5)�� ME � 0.03, p � 0.25
0.015 � ��0.25(
n0�.75)�� Divide each side by 2.
0.000225 � �0.25(
n0.75)� Square each side.
n � �00..2050(002.7255)
� Multiply by n and divide by 0.000225.
n � 833.33 Use a calculator.
About 833 people were surveyed.
Example 3Example 3
www.algebra2.com/extra_examples

684 Chapter 12 Probability and Statistics
Guided Practice
Application
PRACTICE KEY
Practice and ApplyPractice and Apply
Determine whether each situation would produce a random sample. Write yes orno and explain your answer.
11. pointing with your pencil at a class list with your eyes closed as a way to find asample of students in your class
12. putting the names of all seniors in a hat, then drawing names from the hat toselect a sample of seniors
13. calling every twentieth person listed in the telephone book to determine whichpolitical candidate is favored
14. finding the heights of all the boys in a freshman physical education class todetermine the average height of all the boys in your school
For Exercises 15–24, find the margin of sampling error to the nearest percent.
15. p � 81%, n � 100 16. p � 16%, n � 400 17. p � 54%, n � 500
18. p � 48%, n � 1000 19. p � 33%, n � 1000 20. p � 67%, n � 1500
21. A poll asked people to name the most serious problem facing the country. Forty-six percent of the 800 randomly selected people said crime.
22. Although skim milk has as much calcium as whole milk, only 33% of 2406adults surveyed in Shape magazine said skim milk is a good calcium source.
23. Three hundred sixty-seven of 425 high school students said pizza was theirfavorite food in the school cafeteria.
24. Nine hundred thirty-four of 2150 subscribers to a particular newspaper saidtheir favorite sport was football.
25. ECONOMICS In a poll conducted by ABC News, 83% of the 1020 peoplesurveyed said they supported raising the minimum wage. What was the marginof error?
Determine whether each situation would produce a random sample. Write yes orno and explain your answer.
4. the government sending a tax survey to everyone whose social security numberends in a particular digit
5. surveying students in the honors chemistry classes to determine the averagetime students in your school study each week
For Exercises 6–8, find the margin of sampling error to the nearest percent.
6. p � 72%, n � 100 7. p � 31%, n � 500
8. In a survey of 520 randomly-selected high school students, 68% of thosesurveyed stated that they were involved in extracurricular activities at their school.
MEDIA For Exercises 9 and 10, use the following information.According to a survey in American Demographics, 77% of Americans age 12 or older saidthey listen to the radio every day. Suppose the survey had a margin of error of 5%.
9. What does the 5% indicate about the results?
10. How many people were surveyed?
ForExercises
11–1415–2627–28
SeeExamples
123
Extra Practice See page 856.
Extra Practice See page 856.

‘Minesweeper’: Secret to Age-Old Puzzle?
It is time to complete your project. Use the information and datayou have gathered about the history of mathematics to prepare apresentation or web page. Be sure to include transparencies and asample mathematics problem or idea in the presentation.
www.algebra2.com/webquest
Maintain Your SkillsMaintain Your Skills
PhysicianPhysicians diagnoseillnesses and prescribe andadminister treatment.
Online ResearchFor information about a career as a physician, visit: www.algebra2.com/careers
Lesson 12-9 Sampling and Error 685
26. PHYSICIANS In a recent Harris Poll, 61% of the 1010 people surveyed said theyconsidered being a physician to be a very prestigious occupation. What was themargin of error?
27. SHOPPING According to a Gallup Poll, 33% of shoppers planned to spend$1000 or more during a recent holiday season. The margin of error was 3%. Howmany people were surveyed?
28. CRITICAL THINKING One hundred people were asked a yes-or-no question inan opinion poll. How many said “yes” if the margin of error was 9.6%?
29. Answer the question that was posed at the beginning ofthe lesson.
How are opinion polls used in political campaigns?
Include the following in your answer:• a description of how a candidate could use statistics from opinion polls to
determine where to make campaign stops, • the margin of error for Bush if 807 people were surveyed, and• an explanation of how to use the margin of error to determine the range of
percent of Florida voters who favored Bush.
30. In rectangle ABCD, what is x � y in terms of z?
90 � z 190 � z180 � z 270 � z
31. If xy�2 � y�1 = y�2, then the value of x cannot equal which of the following?
� 1 0 1 2DCBA
DC
BA
B
DC
A
x˚
z˚
y˚
WRITING IN MATH
A student guesses at all 5 questions on a true-false quiz. Find each probability.(Lesson 12-8)
32. P(all 5 correct) 33. P(exactly 4 correct) 34. P(at least 3 correct)
A set of 250 data values is normally distributed with a mean of 50 and a standarddeviation of 5.5. (Lesson 12-7)
35. What percent of the data lies between 39 and 61?
36. How many data values are less than 55.5?
37. What is the probability that a data value selected at random is greater than 39?
38. Given x3 � 3x2 � 4x � 12 and one of its factors x � 2, find the remaining factorsof the polynomial. (Lesson 7-4)
Mixed Review
StandardizedTest Practice
www.algebra2.com/extra_examples

686 Investigating
686 Chapter 12 Probability and Statistics
A Follow-Up of Lesson 12-9
A is a statement to be tested. Testing ahypothesis to determine whether it is supported by thedata involves five steps.Step 1 State the hypothesis. The statement should
include a null hypothesis, which is the hypothesisto be tested, and an alternative hypothesis.
Step 2 Design the experiment.Step 3 Conduct the experiment and collect the data.Step 4 Evaluate the data. Decide whether to reject the
null hypothesis.Step 5 Summarize the results.
Test the following hypothesis.
People react to sound and touch at the same rate.
You can measure reaction time by having someone drop a ruler and then havingsomeone else catch it between their fingers. The distance the ruler falls will dependon their reaction time. Half of the class will investigate the time it takes to reactwhen someone is told the ruler has dropped. The other half will measure the time it takes to react when the catcher is alerted by touch.
Step 1 The null hypothesis H0 and alternative hypothesis H1 are as follows. These statements often use �, , , �, , and �.
• H0: reaction time to sound � reaction time to touch• H1: reaction time to sound reaction time to touch
Step 2 You will need to decide the height from which the ruler is dropped, theposition of the person catching the ruler, the number of practice runs, andwhether to use one try or the average of several tries.
Step 3 Conduct the experiment in each group and record the results.
Step 4 Organize the results so that they can be compared.
Step 5 Based on the results, do you think the hypothesis is true? Explain.
AnalyzeState the null and alternative hypotheses for each conjecture.1. A teacher feels that playing classical music during a math test will cause the test
scores to change (either up or down). In the past, the average test score was 73.
2. An engineer thinks that the mean number of defects can be decreased by usingrobots on an assembly line. Currently, there are 18 defects for every 1000 items.
3. A researcher is concerned that a new medicine will cause pulse rates to risedangerously. The mean pulse rate for the population is 82 beats per minute.
4. MAKE A CONJECTURE Design and conduct an experiment to test the followinghypothesis. Interpret the data and present your results. Pulse rates increase 20%after moderate exercise.
hypothesis
Testing Hypotheses

Chapter 12 Study Guide and Review 687
Choose the letter of the term that best matches each statement or phrase.
1. the ratio of the number of ways an event can succeed to the number of possible outcomes
2. an arrangement of objects in which order does not matter3. two or more events in which the outcome of one event
affects the outcome of another event4. a sample in which every member of the population has
an equal chance to be selected5. an arrangement of objects in which order matters6. two events in which the outcome can never be the same7. the ratio of the number of ways an event can succeed to
the number of ways it can fail
The Counting PrincipleConcept Summary
• Fundamental Counting Principle: If event M can occur in m ways and event N canoccur in n ways, then event M followed by event N can occur in m � n ways.
• Independent Events: The outcome of one event does not affect the outcome ofanother.
• Dependent Events: The outcome of one event does affect the outcome of another.
How many different license plates are possible with two letters followed bythree digits?
There are 26 possibilities for each letter. There are 10 possibilities, the digits 0–9, foreach number. Thus, the number of possible license plates is as follows.
26 � 26 � 10 � 10 � 10 = 262 � 103 or 676,000
area diagram (p. 651)binomial experiment (p. 677)combination (p. 640)compound event (p. 658)continuous probability distribution
(p. 671)dependent events (p. 633)discrete probability distributions
(p. 671)event (p. 632)failure (p. 644)Fundamental Counting Principle
(p. 633)
inclusive events (p. 659)independent events (p. 632)linear permutation (p. 638)margin of sampling error (p. 682)measure of central tendency
(p. 664)measure of variation (p. 665)mutually exclusive events (p. 658)normal distribution (p. 671)odds (p. 645)outcome (p. 632)permutation (p. 638)probability (p. 644)
probability distribution (p. 646)random (p. 645)random variable (p. 646)relative-frequency histogram (p. 646)sample space (p. 632)simple event (p. 658)skewed distribution (p. 671)standard deviation (p. 665)success (p. 644)unbiased sample (p. 682)uniform distribution (p. 646)univariate data (p. 664)variance (p. 665)
Vocabulary and Concept CheckVocabulary and Concept Check
a. dependent eventsb. combinationc. probabilityd. permutatione. mutually exclusive eventsf. oddsg. unbiased sample
www.algebra2.com/vocabulary_review
See pages632–637.
12-112-1
ExampleExample

688 Chapter 12 Probability and Statistics
Exercises Solve each problem. See Examples 2 and 3 on page 633.
8. The letters a, c, e, g, i, and k are used to form 6-letter passwords for a movietheater security system. How many passwords can be formed if the letters canbe used more than once in any given password?
9. How many 4-digit personal identification codes can be formed if each numeralcan only be used once?
Permutations and CombinationsConcept Summary
• In a permutation, the order of objects is important.
• In a combination, the order of objects is not important.
A basket contains 3 apples, 6 oranges, 7 pears, and 9 peaches. How many wayscan 1 apple, 2 oranges, 6 pears, and 2 peaches be selected?
This involves the product of four combinations, one for each type of fruit.
C(3, 1) � C(6, 2) � C(7, 6) � C(9, 2) � �(3 �
3!1)!1!� � �(6 �
6!2)!2!� � �(7 �
7!6)!6!� � �(9 �
9!2)!2!�
� 3 � 15 � 7 � 36 or 11,340
There are 11,340 different ways to choose the fruit from the basket.
Exercises Solve each problem. See Example 4 on page 640.
10. A committee of 3 is selected from Jillian, Miles, Mark, and Nikia. How manycommittees contain 2 boys and 1 girl?
11. Five cards are drawn from a standard deck of cards. How many different handsconsist of four queens and one king?
12. A box of pencils contains 4 red, 2 white, and 3 blue pencils. How many differentways can 2 red, 1 white, and 1 blue pencil be selected?
ProbabilityConcept Summary
• P(success) � �s �
sƒ
�; P(failure) � �s +
ƒƒ
�
• odds of success � s:ƒ; odds of failure � ƒ:s
A bag of golf tees contains 23 red, 19 blue, 16 yellow, 21 green, 11 orange, 19 white, and 17 black tees. What is the probability that if you choose a tee from the bag at random, you will choose a green tee?
There are 21 ways to choose a green tee and 23 � 19 � 16 � 11 � 19 � 17 or 105 ways not to choose a green tee. So, s is 21 and ƒ is 105.
P(green tee) � �s �
sƒ
�
� �21 �
21105� or �
16
� The probability is 1 out of 6 or about 16.7%.
See pages638–643.
12-212-2
ExampleExample
Chapter 12 Study Guide and ReviewChapter 12 Study Guide and Review
See pages644–650.
12-312-3
ExampleExample

Chapter 12 Study Guide and Review 689
Exercises Find the odds of an event occurring, given the probability of the event.See Example 3 on pages 645 and 646.
13. �14
� 14. �58
� 15. �172� 16. �
37
� 17. �25
�
18. The table shows the distribution of the number of heads occurring when four coins are tossed. Find P(H � 3).See Example 4 on page 646.
Multiplying ProbabilitiesConcept Summary
• Probability of two independent events: P(A and B) � P(A) � P(B)
• Probability of two dependent events: P(A and B) � P(A) � P(B following A)
There are 3 dimes, 2 quarters, and 5 nickels in Langston’s pocket. If he reaches inand selects three coins at random without replacing any of them, what is theprobability that he will choose a dime d, then a quarter q, then a nickel n?
Because the outcomes of the first and second choices affect the later choices, these aredependent events.
P(d, then q, then n) � �130� � �
29
� � �58
� or �214� The probability is �
214� or about 4.2%.
Chapter 12 Study Guide and ReviewChapter 12 Study Guide and Review
0 1 2 3 4
�116� �
14
� �38
� �14
� �116�
H � Heads
Probability
See pages651–657.
12-412-4
ExampleExample
ExampleExample
See pages658–663.
12-512-5
Exercises Determine whether the events are independent or dependent. Then findthe probability. See Examples 1–4 on pages 652 and 654.
19. Two dice are rolled. What is the probability that each die shows a 4?20. Two cards are drawn from a standard deck of cards without replacement. Find the
probability of drawing a heart and a club, in that order.
21. Luz has 2 red, 2 white, and 3 blue marbles in a cup. If she draws two marbles atrandom and does not replace the first one, find the probability of a white marbleand then a blue marble.
Adding ProbabilitiesConcept Summary
• Probability of mutually exclusive events: P(A or B) � P(A) � P(B)
• Probability of inclusive events: P(A or B) � P(A) � P(B) � P(A and B)
Trish has four $1 bills and six $5 bills. She takes three bills from her wallet atrandom. What is the probability that Trish will select at least two $1 bills?
P(at least two $1 bills) � P(two $1, one $5) � P(three $1, no $5)
� �C(4,
C2()10
�,C3()6, 1)
� � �C(4,
C3()10
�,C3()6, 0)
�
� �
� �13260
� � �1
420� or �
13
� The probability is �13
� or about 0.333.
C(10, 3)C(10, 3)
4! � 6!���(4 � 3)!3!(6 � 0)!0!
4! � 6!���(4 � 2)!2!(6 � 1)!1!

690 Chapter 12 Probability and Statistics
Exercises Determine whether the events are mutually exclusive or inclusive. Thenfind the probability. See Examples 1–3 on pages 659 and 660.
22. There are 5 English, 2 math, and 3 chemistry books on a shelf. If a book israndomly selected, what is the probability of selecting a math book or achemistry book?
23. A die is rolled. What is the probability of rolling a 6 or a number less than 4?24. A die is rolled. What is the probability of rolling a 6 or a number greater than 4?25. A card is drawn from a standard deck of cards. What is the probability of
drawing a king or a red card?
Statistical MeasuresConcept Summary
• To represent a set of data, use the mean if the data are spread out and youwant an average of the values, the median when the data contain outliers,or the mode when the data are tightly clustered around one or two values.
• Standard deviation for n values:
� � ����, x� is the mean
Find the variance and standard deviation for {100, 156, 158, 159, 162, 165, 170, 190}.
Step 1 Find the mean.
x� �Add the data and divideby the number of items.
� �12860�
� 157.5
Step 2 Find the variance.
�2 �
�
� �46
800� Simplify.
� 575 Use a calculator.
Step 3 Find the standard deviation.�2 � 575 Take the square root of each side.
� � 23.98 Use a calculator.
Exercises Find the variance and standard deviation of each set of data to thenearest tenth. See Examples 1 and 2 on pages 664 and 665.
26. {56, 56, 57, 58, 58, 58, 59, 61}27. {302, 310, 331, 298, 348, 305, 314, 284, 321, 337}28. {3.4, 4.2, 8.6, 5.1, 3.6, 2.8, 7.1, 4.4, 5.2, 5.6}
(100 � 157.5)2 � (156 � 157.5)2 � ... � (170 � 157.5)2 � (190 � 157.5)2��������
8
(x1 � x�)2 � (x2 � x�)2 � ... � (xn � x�)2�����
n
100 � 156 � 158 � 159 � 162 � 165 � 170 � 190������
8
(x1 � x�)2 � (x2 � x�)2 � ... �(xn – x�)2����
n
Chapter 12 Study Guide and ReviewChapter 12 Study Guide and Review
See pages664–670.
12-612-6
ExampleExample

Chapter 12 Study Guide and Review 691
The Normal Distribution Concept SummaryNormal distributions have these properties.
• The graph is maximized and the data are symmetric at the mean.
• The mean, median, and mode are about equal.
• About 68% of the values are within one standard deviation of the mean.
• About 95% of the values are within two standard deviations of the mean.
• About 99% of the values are within three standard deviations of the mean.
Mr. Byrum gave an exam to his 30 Algebra 2students at the end of the first semester. Thescores were normally distributed with a meanscore of 78 and a standard deviation of 6.a. What percent of the class would you expect
to have scored between 72 and 84?Since 72 and 84 are 1 standard deviation to the left and right of the mean, respectively, 34% � 34% or 68% of the students scored within this range.
b. What percent of the class would you expect to have scored between 90 and 96?90 to 96 on the test includes 2% of the students.
c. Approximately how many students scored between 84 and 90?84 to 90 on the test includes 13.5% of the students. 0.135 � 30 � 4 students
d. Approximately how many students scored between 72 and 84?34% � 34% or 68% of the students scored between 72 and 84.0.68 � 30 � 20 students
Exercises For Exercises 29–32, use the following information.
The utility bills in a city of 5000 households are normally distributed with a mean of$180 and a standard deviation of $16. See Example 2 on pages 672 and 673.
29. About how many utility bills were between $164 and $196?30. About how many bills were more than $212?31. About how many bills were less than $164?32. What is the probability that a household selected at random will have a utility bill
between $164 and $180?
Binomial ExperimentsConcept SummaryA binomial experiment exists if and only if all of these conditions occur.
• There are exactly two possible outcomes for each trial.
• There is a fixed number of trials.
• The trials are independent.
• The possibilities for each trial are the same.
60 66 72 78
34% 34%
13.5% 13.5% 2%2%
0.5%
84 90 96
0.5%
Chapter 12 Study Guide and ReviewChapter 12 Study Guide and Review
See pages671–675.
12-712-7
See pages676–680.
12-812-8
ExampleExample

692 Chapter 12 Probability and Statistics
To practice for a jigsaw puzzle competition, Laura and Julian completed four
jigsaw puzzles. The probability that Laura places the last piece is �35
�, and the
probability that Julian places the last piece is �25
�. What is the probability that
Laura will place the last piece of at least two puzzles?
P � L4 � 4L3J � 6L2J2 P(last piece in 4) � P(last piece in 3) � P(last piece in 2)
� �35
��4� 4�
35
��3�25
�� � 6�35
��2�25
��2L � �
35
�, J � �25
�
� �68215
� � �26
12
65
� � �26
12
65
� or 0.8208 The probability is 82.08%.
Exercises See Example 2 on pages 677 and 678.
33. Find the probability of getting 7 heads in 8 tosses of a coin.34. Find the probability that a family with seven children has exactly five boys.
Find each probability if a die is rolled twelve times.
35. P(twelve 3s) 36. P(exactly one 3) 37. P(six 3s)
Sampling and ErrorConcept Summary
• Margin of sampling error: ME � 2��p(1
n�� p)�� if the percent of people in
a sample responding in a certain way is p and the size of the sample is n
In a survey taken at a local high school, 75% of the student body stated that theythought school lunches should be free. This survey had a margin of error of 2%.How many people were surveyed?
ME � 2��p(1
n�� p)�� Formula for margin of sampling error
0.02 � 2��0.75(1�n� 0.7�5)�� ME � 0.02, p � 0.75
0.01 � ��0.75(1�n� 0.7�5)�� Divide each side by 2.
0.0001 � �0.75(
n0.25)� Square each side of the equation.
n � �0.
07.50(000.215)
� Multiply each side by n and divide each side by 0.0001.
n � 1875 There were about 1875 people in the survey.
Exercises
38. In a poll asking people to name their most valued freedom, 51% of the randomlyselected people said it was the freedom of speech. Find the margin of samplingerror if 625 people were randomly selected. See Example 2 on page 683.
39. According to a recent survey of mothers with children who play sports, 63% ofthem would prefer that their children not play football. Suppose the margin oferror is 4.5%. How many mothers were surveyed? See Example 3 on page 683.
• Extra Practice, see pages 854–856.• Mixed Problem Solving, see page 837.
See pages682–685.
12-912-9
ExampleExample
ExampleExample

Chapter 12 Practice Test 693
Vocabulary and ConceptsVocabulary and Concepts
Skills and ApplicationsSkills and Applications
Match the following terms and descriptions.
1. data are symmetric about the mean a. measures of central tendency2. variance and standard deviation b. measures of variation3. mode, median, mean c. normal distribution
Evaluate each expression.
4. P(7, 3) 5. C(7, 3) 6. P(13, 5)
Solve each problem.
7. How many ways can 9 bowling balls bearranged on the upper rack of a bowling ballrack?
9. How many ways can the letters of the wordprobability be arranged?
11. In a row of 10 parking spaces in a parking lot,how many ways can 4 cars park?
13. A number is drawn at random from a hat thatcontains all the numbers from 1 to 100. What isthe probability that the number is less thansixteen?
15. A shipment of ten television sets contains 3 defective sets. How many ways can a hospital purchase 4 of these sets and receive at least 2 of the defective sets?
17. Ten people are going on a camping trip in 3 carsthat hold 5, 2, and 4 passengers, respectively.How many ways is it possible to transport the 10people to their campsite?
8. How many different outfits can be made if youchoose 1 each from 11 skirts, 9 blouses, 3 belts,and 7 pairs of shoes?
10. How many different soccer teams consisting of11 players can be formed from 18 players?
12. Eleven points are equally spaced on a circle.How many ways can 5 of these points be chosenas the vertices of a pentagon?
14. Two cards are drawn in succession from astandard deck of cards without replacement.What is the probability that both cards aregreater than 2 and less than 9?
16. While shooting arrows, William Tell can hit anapple 9 out of 10 times. What is the probabilitythat he will hit it exactly 4 out of 7 times?
18. From a box containing 5 white golf balls and 3 redgolf balls, 3 golf balls are drawn in succession,each being replaced in the box before the nextdraw is made. What is the probability that all 3 golf balls are the same color?
For Exercises 19–21, use the following information.In a ten-question multiple-choice test with four choices for each question, a student who was not prepared guesses on each item. Find each probability.19. six questions correct 20. at least eight questions correct21. fewer than eight questions correct
22. STANDARDIZED TEST PRACTICE Lila throws a die and writes downthe number showing. If she throws the number cube again, what is theprobability that the second throw will have the same number showingas the first throw?
�12
� �13
� �14
� �16
�DCBA
www.algebra2.com/chapter_test

694 Chapter 12 Standardized Test Practice
Part 1: MULTIPLE CHOICE
Record your answers on the answer sheetprovided by your teacher or on a sheet ofpaper.
1. In a jar of red and green gumdrops, the ratioof red gumdrops to green gumdrops is 7 to 3.If the jar contains a total of 150 gumdrops,how many gumdrops are green?
21 30
45 105
2. � �12
�x if x is composite and � 2x
if x is prime. What is the value of
� ?
10 30
54 60
3. In rhombus ABCD, which of the following aretrue?
I. �s and �x are congruent.
II. �t and �v are congruent.
III. �z and �t are congruent.
I only
II only
I and II only
I, II, and III
4. What is the area of an isosceles right trianglewith hypotenuse 3�2� units?
1.5�2� units2
4.5 units2
9 units2
6 � 3�2� units2
5. What is the solution set for t(t � 7) � 18?
{�2, 9}
{�3, 6}
{0, 18}
{�9, 2}
6. The equation 3x � 8 � 5x2 � y representswhich of the following conic sections?
hyperbola
parabola
circle
ellipse
7. If the equations x2 � y2 � 16 and y � x2 � 4are graphed on the same coordinate plane,how many points of intersection exist?
none
one
two
three
8. A number is chosen at random from the set{1, 2, 3, …20}. What is the probability that thenumber is odd and divisible by 3?
�230� �
130�
�270� �
12
30�
9. What is the least positive integer that isdivisible by 3, 4, 5, and 6?
60 180
240 360
10. If 4y � 5x � 6xy � 50 � 0 and x � 7 � 13,then what is y � 5?
2 6
7 11DC
BA
DC
BA
DC
BA
D
C
B
A
D
C
B
A
D
C
B
A
D
C
B
A
D
C
B
A
B
D C
As t v
xw
yz
DC
BA
1116
xx
DC
BA
Part 1 Multiple Choice

Record your answers on the answer sheetprovided by your teacher or on a sheet ofpaper.
11. In a high school, 250 students take math and50 students take art. If there are 280 studentsenrolled in the school and they all take atleast one of these courses, how manystudents take both math and art?
12. If 20 y 30 and x and y are both integers,what is the greatest possible value for x?
13. Four numbers are selected at random. Theiraverage (arithmetic mean) is 45. The fourthnumber selected is 34. What is the sum ofthe other three numbers?
14. If one half of an even positive integer andthree fourths of the next greater even integerhave a sum of 24, what is the mean of thetwo integers?
15. Shane has six tiles, each of which has one ofthe letters A, B, C, D, E, or F on it. If one ofthe letters must be A and the last letter mustbe F, how many different arrangements ofthree letters (such as ADF) can Shane createwith these titles?
16. The lunch special at Wally’s Hot Dog Standoffers a sandwich, snack, and a drink for$3.99. How many different lunchcombinations can be ordered?
17. A gumball machine contains 84 gumballs.Of the gumballs, 19 are yellow, 32 are red,and 33 are green. Each gumball sold isselected at random. If a yellow gumball issold, what is the probability that the nextgumball is also yellow?
18. Esteban is the place kicker on his high schoolfootball team. Based on past experience, theprobability that Esteban will succeed inkicking an extra point is �
190�. What is the
probability that he will succeed on exactlythree of the four extra point attempts in agame?
Record your answers on a sheet of paper.Show your work.For Exercises 19-21, use the followinginformation.
Twenty-five students took an English examinationand received the following scores.76, 62, 78, 69, 88, 82, 79, 70, 81, 87, 90, 71, 75, 78,88, 83, 91, 93, 95, 78, 80, 82, 86, 89, 79
19. Find the mean, median, mode, and standarddeviation of the data. If necessary, round tothe nearest hundredth.
20. How many students scored within onestandard deviation of the mean?
21. Do the results of the examination approximatea normal distribution? Justify your answer.
x˚ x˚
y˚
Part 3 Extended Response
Chapter 12 Standardized Test Practice 695
Part 2 Short Response/Grid In
Preparing for Standardized TestsFor test-taking strategies and more practice, see pages 877–892.
Test-Taking TipQuestion 10When answering questions, read carefully and make surethat you know exactly what the question is asking youto find. For example, if you only find the value of y inQuestion 10, you have not solved the problem. You needto find the value of y � 5.
Wally's lunch specials
Snacks: potato chips, pretzels, or corn chips
Drinks: diet soda, regular cola, lemon-lime
bot tled soda, or bot tled water
Sandwiches: hotdog, a bratwurst, or Italian
sausage
www.algebra2.com/standardized_test
Related Documents