VCE Maths Methods - Unit 2 - Probability Probability • Probability • Tree diagrams • Laice diagrams • Venn diagrams • Karnough maps • Probability tables • Union & intersection rules • Conditional probability • Markov chains 1

Welcome message from author
This document is posted to help you gain knowledge. Please leave a comment to let me know what you think about it! Share it to your friends and learn new things together.
Transcript

VCE Maths Methods - Unit 2 - Probability
Probability
• Probability• Tree diagrams• Laice diagrams• Venn diagrams• Karnough maps• Probability tables• Union & intersection rules• Conditional probability• Markov chains
1

VCE Maths Methods - Unit 2 - Probability
Probability
• Probability is the mathematics of chance.• While an outcome of a random event can only be can’t determined in advance, we
can use a prediction based on experimental or theoretical probability.• Probabilities can be expressed as fractions, decimals or percentages.• 0 = no chance at all, 100% = absolutely certain.• The chances of an event happening or not happening add to make 1.
2
Pr (E') = 1 - Pr (E)
0 ≤ Pr (E) ≤1
0% - no chance
25% - unlikely
50% - even chance
75% - likely
100% - certain
VCE Maths Methods - Unit 2 - Probability
Probability
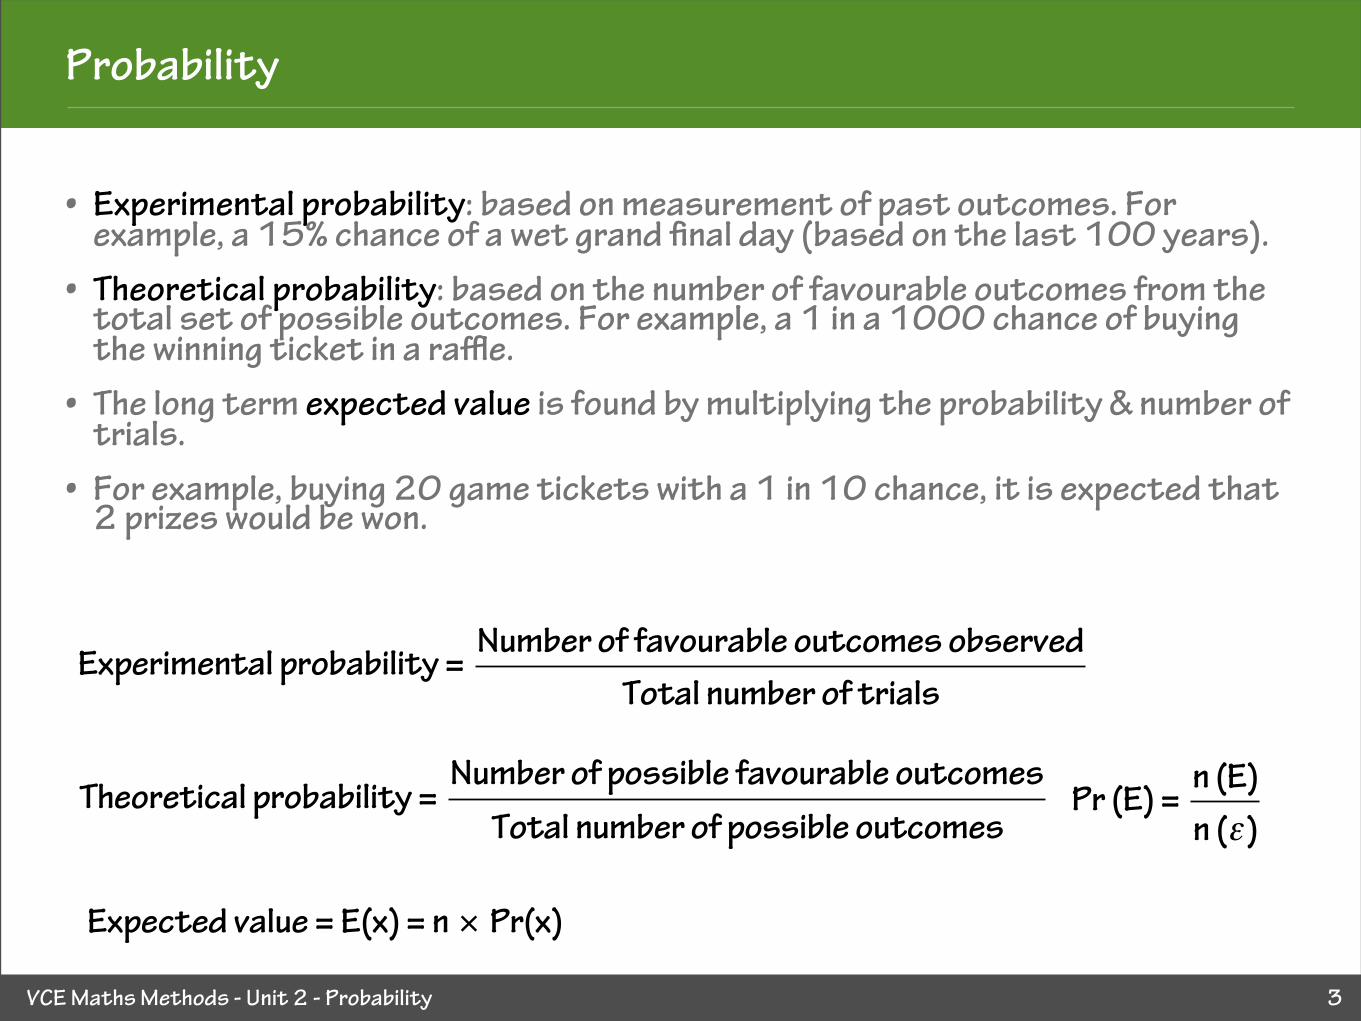
• Experimental probability: based on measurement of past outcomes. For example, a 15% chance of a wet grand final day (based on the last 100 years).
• Theoretical probability: based on the number of favourable outcomes from the total set of possible outcomes. For example, a 1 in a 1000 chance of buying the winning ticket in a raffle.
• The long term expected value is found by multiplying the probability & number of trials.
• For example, buying 20 game tickets with a 1 in 10 chance, it is expected that 2 prizes would be won.
3
Experimental probability = Number of favourable outcomes observed
Total number of trials
Theoretical probability =
Number of possible favourable outcomesTotal number of possible outcomes
Pr (E) = n (E)n (ε)
Expected value = E(x) = n × Pr(x)
VCE Maths Methods - Unit 2 - Probability
Calculating probability - tree diagrams
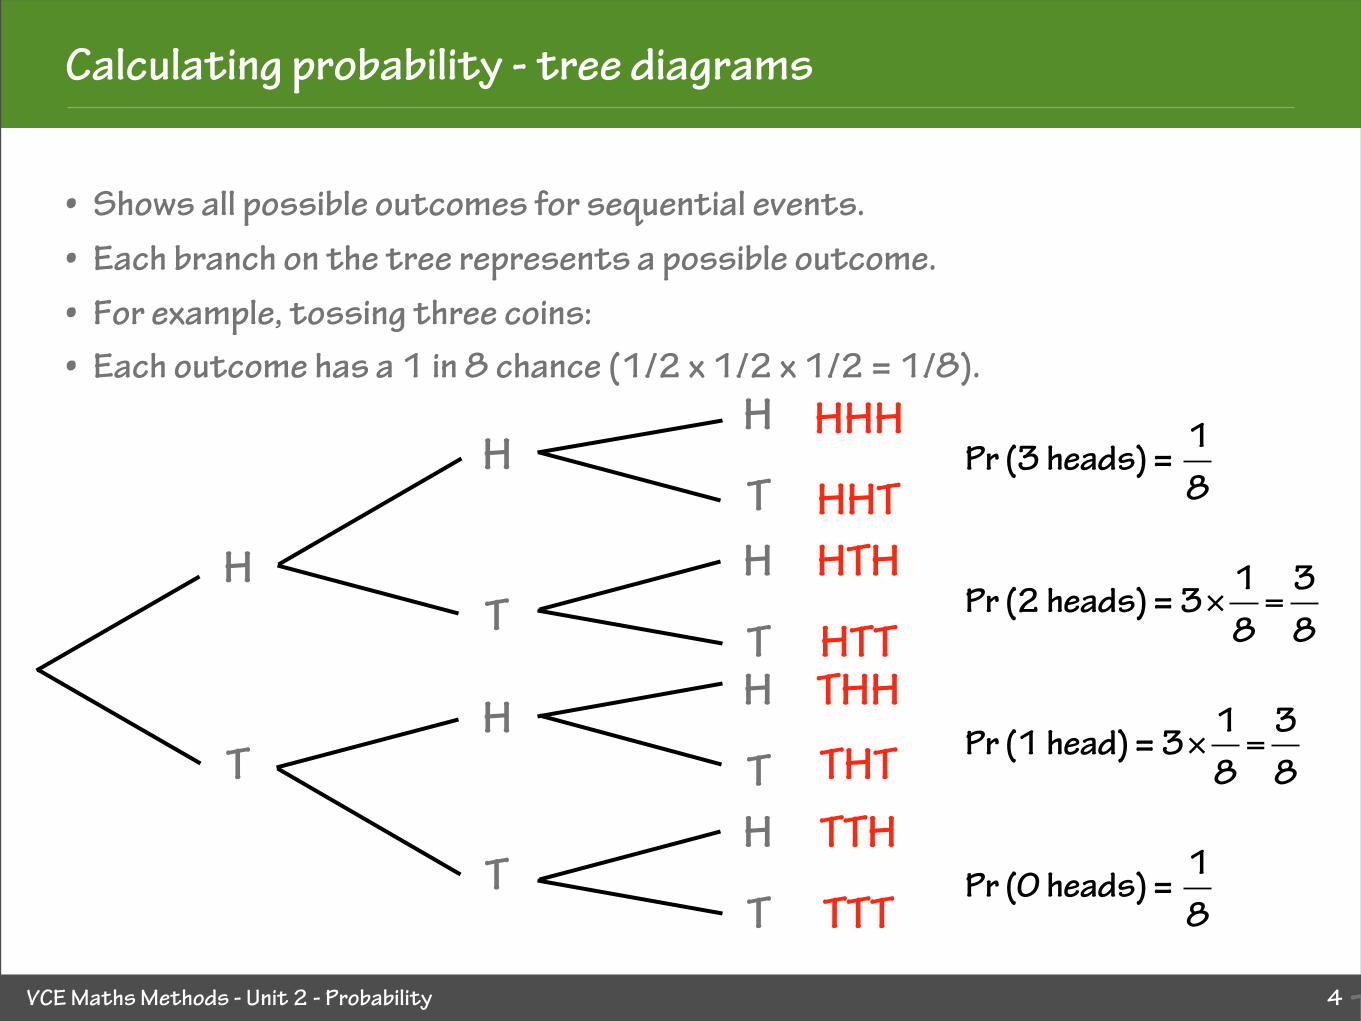
• Shows all possible outcomes for sequential events.• Each branch on the tree represents a possible outcome.• For example, tossing three coins:• Each outcome has a 1 in 8 chance (1/2 x 1/2 x 1/2 = 1/8).
4
Pr (3 heads) = 1
8
H
T
H
T
H
T
T
T
H
T
H
T
H
T
H
HHH
HHTHTH
HTTTHHTHTTTH
TTT
Pr (2 heads) = 3× 1
8=
38
Pr (1 head) = 3× 1
8=
38
Pr (0 heads) = 1
8

VCE Maths Methods - Unit 2 - Probability
Calculating probability - laice diagrams
• Shows the possible outcomes from two sequential events.• Easier to draw than a tree diagram if there is a large number of outcomes.• For example, rolling two dice & finding the product.
5
Pr (6) = 4× 1
36 = 1
9
1 2 3 4 5 6
1 1 2 3 4 5 6
2 2 4 6 8 10 12
3 3 6 9 12 15 18
4 4 8 12 16 20 24
5 5 10 15 20 25 30
6 6 12 18 24 30 36
The chance of scoring 6:
Pr (36) = 1× 1
36 = 1
36
The chance of scoring 36:
VCE Maths Methods - Unit 2 - Probability
Venn diagrams
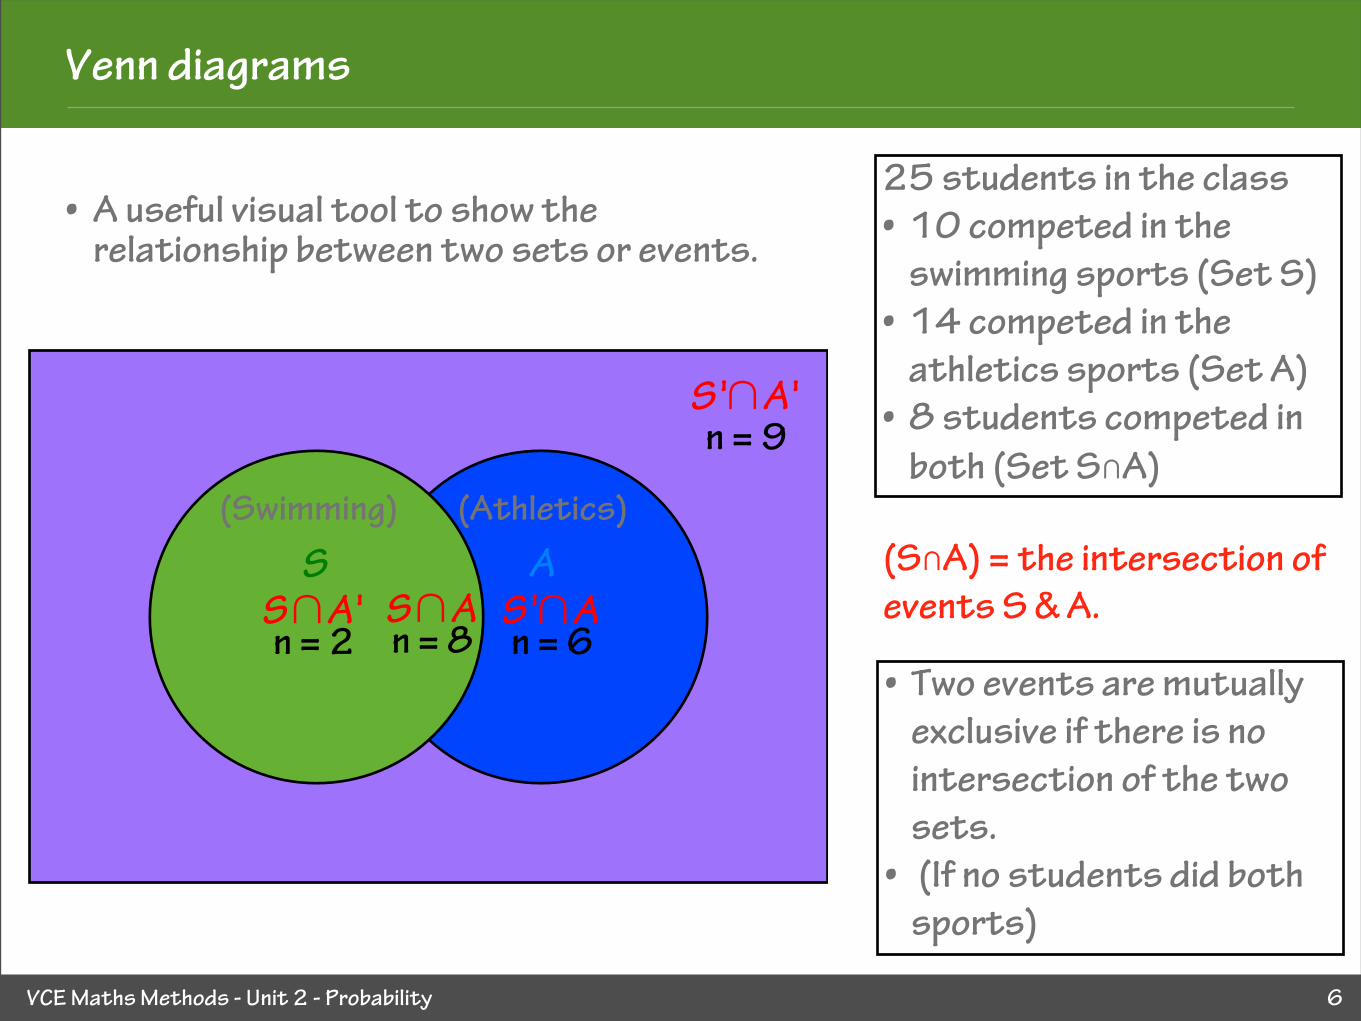
• A useful visual tool to show the relationship between two sets or events.
6
S '∩A '
A
25 students in the class• 10 competed in the
swimming sports (Set S)• 14 competed in the
athletics sports (Set A)• 8 students competed in
both (Set S∩A)
S∩An = 8 S∩A '
n = 2 S '∩An = 6
n = 9
(Swimming) (Athletics)
• Two events are mutually exclusive if there is no intersection of the two sets.
• (If no students did both sports)
(S∩A) = the intersection of events S & A.
S

VCE Maths Methods - Unit 2 - Probability
Union & intersection rules
7
What is the chance that a student that is randomly selected:
a) Is a swimmer?
b) Is an athlete?
c) Is a swimmer and an athlete?
d) Is a swimmer or an athlete?
Pr(S)=10
25=40%
Pr=14
25=56%
Pr= 8
25=32% (Intersection)
Pr=10
25+
1425
−8
25=
1625
=64% (Union)
Pr(A∪B)=Pr(A)+Pr(B)−Pr(A∩B)
Pr(A∪B)=1−Pr(A '∩B ')

VCE Maths Methods - Unit 2 - Probability
Karnough maps
8
A A’
S
S’
25 students in the class• 10 competed in the
swimming sports (Set S)• 14 competed in the
athletics sports (Set A)• 8 students competed in
both (Set S∩A)
8 2 10
6 9 15
14 11 25
• Used to show the number of elements of two overlapping sets.

VCE Maths Methods - Unit 2 - Probability
Karnough maps
9
B B’
A
A’
n(A∩B) n(A∩B ') n(A)
n(A '∩B) n(A '∩B ') n(A ')
n(B) n(B ') n
VCE Maths Methods - Unit 2 - Probability
Probability tables
10
B B’
A
A’
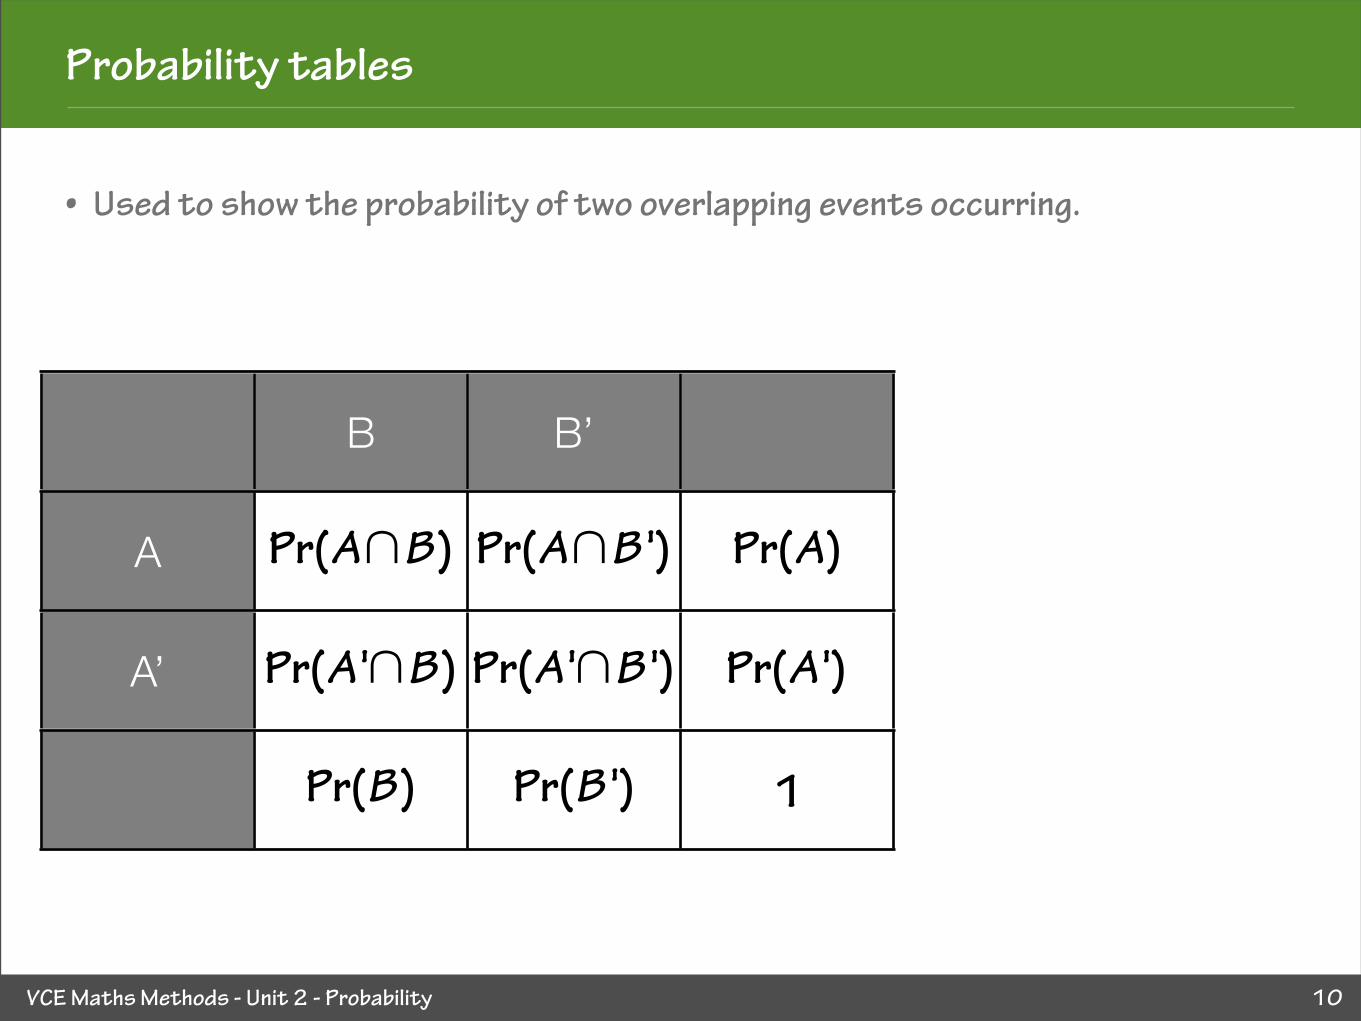
• Used to show the probability of two overlapping events occurring.
Pr(A∩B) Pr(A∩B ') Pr(A)
Pr(A '∩B) Pr(A '∩B ') Pr(A ')
Pr(B) Pr(B ') 1
VCE Maths Methods - Unit 2 - Probability
Conditional probability
11
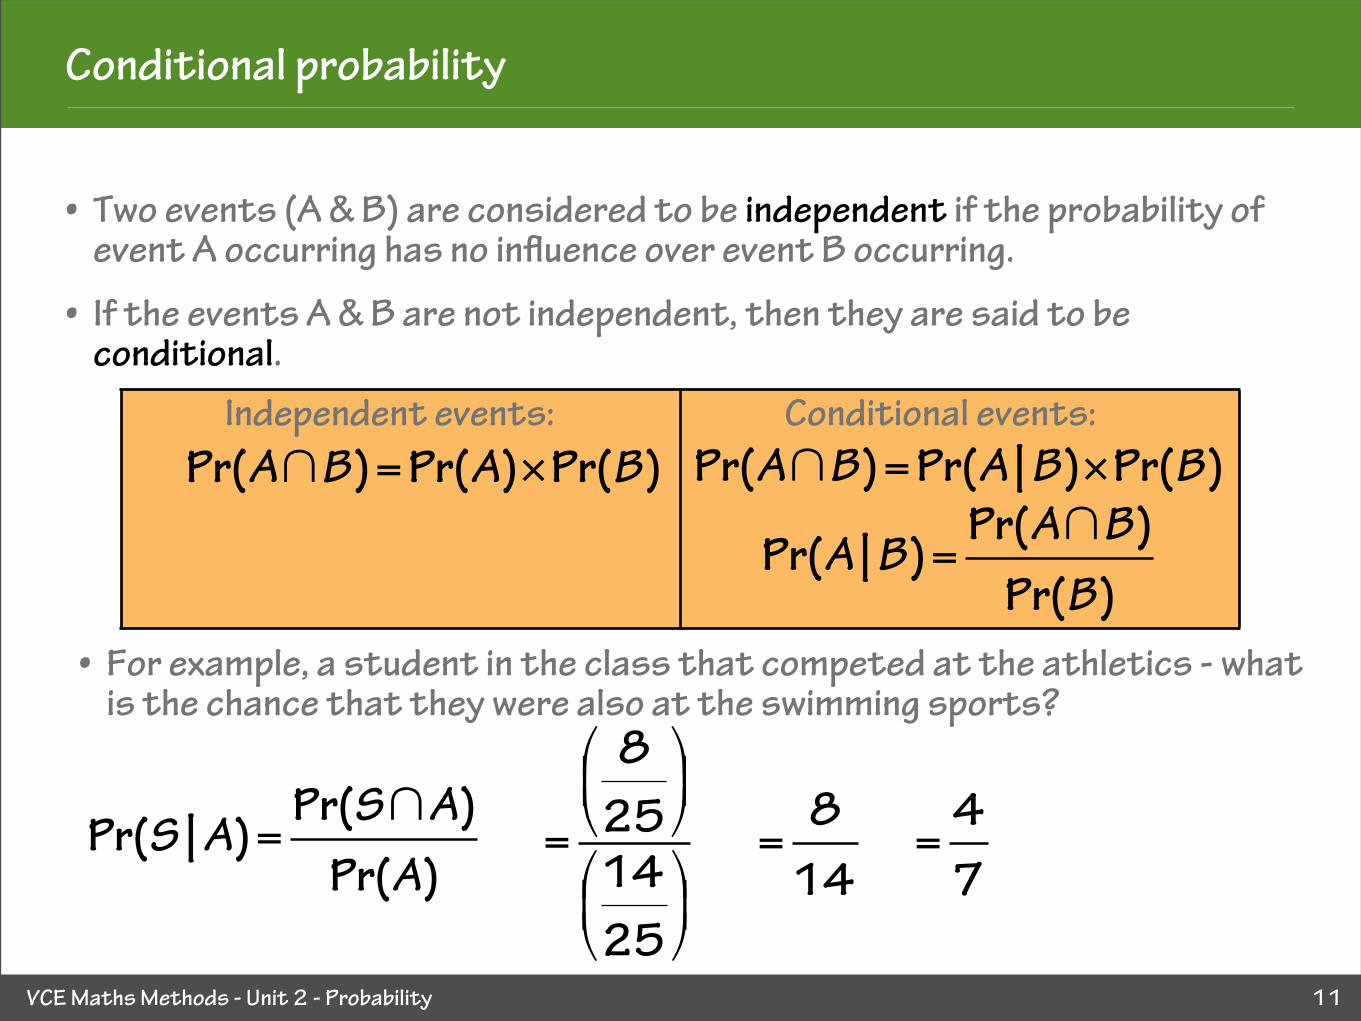
• Two events (A & B) are considered to be independent if the probability of event A occurring has no influence over event B occurring.
• If the events A & B are not independent, then they are said to be conditional.
Pr(A∩B)=Pr(A | B)×Pr(B)
Pr(A | B)= Pr(A∩B)
Pr(B)• For example, a student in the class that competed at the athletics - what
is the chance that they were also at the swimming sports?
Pr(S | A)= Pr(S∩A)
Pr(A)
=
825⎛⎝⎜
⎞⎠⎟
1425⎛⎝⎜
⎞⎠⎟
=8
14 =
47
Independent events: Conditional events:
Pr(A∩B)=Pr(A)×Pr(B)

VCE Maths Methods - Unit 2 - Probability
Markov chains
12
• For example, the chance of a team winning is 80% following a win, but only 40% following a loss.
• What is the chance that after winning the first game, the team also wins the third?
• This could be expressed as a tree diagram......
W1
W2
W2’
80%
20%
W3
W3’
80%
20%
Pr(W2∩W3 ) = 80% x80% = 64%
Pr(W2∩W3 ') = 80% x20% = 16%
Pr(W2 '∩W3 ) = 20% x40% = 8%
Pr(W2 '∩W3 ') = 20% x60% = 12%
W3
W3’
40%
60%
Pr(W3 )=Pr(W2∩W3 ) + Pr(W2 '∩W3 ) = 64% + 8% = 72%
Pr(W2∩W3 ) = Pr(W3 | W2 )×Pr(W2 )
Pr(W2∩W3 ') = Pr(W3 ' | W2 )×Pr(W2 )
Pr(W2 '∩W3 ) = Pr(W3 | W2 ')×Pr(W2 ')
Pr(W2 '∩W3 ) = Pr(W3 | W2 ')×Pr(W2 ')

VCE Maths Methods - Unit 2 - Probability
Markov chains
13
• Used to find the long term probability of a sequence of a number of repeated events, where the conditional probabilities remain constant.
Pr(B)Pr(B ')
⎡
⎣⎢⎢
⎤
⎦⎥⎥=
Pr(B | A) Pr(B | A ')Pr(B ' | A) Pr(B ' | A ')
⎡
⎣⎢⎢
⎤
⎦⎥⎥
nPr(A)Pr(A ')
⎡
⎣⎢⎢
⎤
⎦⎥⎥
Sn = (Result) State matrix (n states)
T= Transition matrix(probabilities)
S0= State matrix(initial state)
Pr(B) = Pr(B | A)×Pr(A)+Pr(B | A')×Pr(A')
Sn =T n ×S0

VCE Maths Methods - Unit 2 - Probability
Markov chains
14
• From the previous example:
0.8 0.4
0.2 0.6⎡
⎣⎢
⎤
⎦⎥
210
⎡
⎣⎢
⎤
⎦⎥
= 0.72
0.28⎡
⎣⎢
⎤
⎦⎥
S2 = State (Result) matrix (after 2 more games)T= Transition matrix
(probabilities)S0 = State matrix
(initial state)• As the number of states is increased, the overall probabilities will
converge to defined limits.
n =1,Pr=0.800 n =4,Pr=0.675
n =3,Pr=0.688 n =2,Pr=0.720 n =15,Pr=0.667
Overall chance of winning = 0.4 / (0.4 + 0.2)
= 2/3 n =100,Pr=0.667
Winning
Following a win
Losing
Following a loss
The first game was a win
Related Documents