Published in IET Renewable Power Generation Received on 31st January 2012 Revised on 9th March 2013 Accepted on 26th March 2013 doi: 10.1049/iet-rpg.2012.0265 ISSN 1752-1416 Probabilistic voltage stability assessment considering renewable sources with the help of the PV and QV curves Adriano Batista Almeida 1 , Eliane Valença De Lorenci 1 , Rafael Coradi Leme 2 , Antonio Carlos Zambroni de Souza 1 , Benedito Isaias Lima Lopes 3 , Kwok Lo 4 1 Electrical and Energy Systems Institute, Federal University of Itajubá, Brazil 2 Institute of Industrial Engineering and Management, Federal University of Itajubá, Brazil 3 Systems Engineering and Information Technology Institute, Federal University of Itajubá, Brazil 4 Department of Electronic & Electrical Engineering, University of Strathclyde, Glasgow, UK E-mail: [email protected] Abstract: The use of renewable energy sources has increased year-on-year. Thus, there is an increasing rate of small generating units connected directly to distribution networks and micro-grids close to consumers. At the same time, these micro-sources must provide stability and reliability of electrical energy to the power network to which they are connected. In the technical literature, several studies have been done to ensure power systems with traditional generating sources to operate in a stable and reliable way, but there is an issue regarding generation uncertainty when a distribution system has many micro-sources. This is because of the uncertainty of primary sources, for example, wind and radiation intensity, and could result in intermittent generation. In this study, stability and reliability of voltage in a power system with distributed generation is analysed using simulation techniques. In the proposed method in this study voltage security analysis is jointly considered with probability laws. Moreover reliability theory is also considered in the proposed voltage collapse analysis methodology. The responsibility of generator in the voltage collapse process, the probabilistic risk of voltage collapse of each operating point and the probability of enlarging the system load as a function of different operating points are the outcome of the methodology, and it is validated by using the IEEE34 test feeder. 1 Introduction Distributed energy resources (DER) usage is quickly increasing their share in power systems around the world. An advantage of this scenario is that energy is generated in small scale as close as possible to the load centre, and in some cases, could well be placed on the consumer side of metre [1]. This reduces the electrical distance between generation and loads, improving energy efficiency and postponing new investments [2]. As environmental policies are being discussed in many countries, DER appears as an attractive alternative to centralised generation [3, 4]. Many emerging DER technologies present lower emissions, such as wind power, photovoltaic systems, fuel cells, geothermal and gas micro-turbines. These DER are known as renewable energy sources (RES). Nevertheless, the use of DER also impacts network power flow [5], voltage stability [6], protection [7] and quality of power supply [8]. Indeed, the intermittent nature of RES makes the system stability control a very difficult task, and many researchers have been focusing on control strategy and stability evaluation [9–13]. When the focus is voltage collapse [14], multiple scenarios and/or contingencies are considered, and often the continuation power flow method is employed to determine load margins, margin to thermal limits [15] and voltage violations. Voltage collapse, normally studied for transmission systems, has also been addressed for distribution systems, as shown in [16–18]. Williams et al. [19] discusse an interaction between the transmission and distribution systems by describing a real event. The study shows that a fault in the transmission system may cause a voltage dip, stalling some air conditioners and driving the system to voltage instability, illustrating how the distribution system may affect the system overall voltage stability. Voltage collapse is associated with the singularity of the power flow Jacobian matrix [20]. At this singular point, known as saddle-node bifurcation, the power flow Jacobian matrix presents a zero eigenvalue and no solution can be obtained beyond this critical point, which is the system maximum loadability point. Induced limits bifurcation may also occur as a consequence of sudden exhaustion of important reactive power sources. Calculating the system load margin, that is, the amount of load variation that the system may sustain plays a crucial role. In this paper, the continuation method is employed for this purpose. In order to provide a more complete set of information to operators, QV curve may also be used [21]. Such a curve computes the reactive www.ietdl.org IET Renew. Power Gener., pp. 1–10 1 doi: 10.1049/iet-rpg.2012.0265 & The Institution of Engineering and Technology 2013

Welcome message from author
This document is posted to help you gain knowledge. Please leave a comment to let me know what you think about it! Share it to your friends and learn new things together.
Transcript
Published in IET Renewable Power GenerationReceived on 31st January 2012Revised on 9th March 2013Accepted on 26th March 2013doi: 10.1049/iet-rpg.2012.0265
ISSN 1752-1416
Probabilistic voltage stability assessment consideringrenewable sources with the help of the PV and QVcurvesAdriano Batista Almeida1, Eliane Valença De Lorenci1, Rafael Coradi Leme2,
Antonio Carlos Zambroni de Souza1, Benedito Isaias Lima Lopes3, Kwok Lo4
1Electrical and Energy Systems Institute, Federal University of Itajubá, Brazil2Institute of Industrial Engineering and Management, Federal University of Itajubá, Brazil3Systems Engineering and Information Technology Institute, Federal University of Itajubá, Brazil4Department of Electronic & Electrical Engineering, University of Strathclyde, Glasgow, UK
E-mail: [email protected]
Abstract: The use of renewable energy sources has increased year-on-year. Thus, there is an increasing rate of small generatingunits connected directly to distribution networks and micro-grids close to consumers. At the same time, these micro-sources mustprovide stability and reliability of electrical energy to the power network to which they are connected. In the technical literature,several studies have been done to ensure power systems with traditional generating sources to operate in a stable and reliable way,but there is an issue regarding generation uncertainty when a distribution system has many micro-sources. This is because of theuncertainty of primary sources, for example, wind and radiation intensity, and could result in intermittent generation. In this study,stability and reliability of voltage in a power system with distributed generation is analysed using simulation techniques. In theproposed method in this study voltage security analysis is jointly considered with probability laws. Moreover reliability theory isalso considered in the proposed voltage collapse analysis methodology. The responsibility of generator in the voltage collapseprocess, the probabilistic risk of voltage collapse of each operating point and the probability of enlarging the system load as afunction of different operating points are the outcome of the methodology, and it is validated by using the IEEE34 test feeder.
1 Introduction
Distributed energy resources (DER) usage is quicklyincreasing their share in power systems around the world.An advantage of this scenario is that energy is generated insmall scale as close as possible to the load centre, and insome cases, could well be placed on the consumer side ofmetre [1]. This reduces the electrical distance betweengeneration and loads, improving energy efficiency andpostponing new investments [2]. As environmental policiesare being discussed in many countries, DER appears as anattractive alternative to centralised generation [3, 4]. Manyemerging DER technologies present lower emissions, suchas wind power, photovoltaic systems, fuel cells, geothermaland gas micro-turbines. These DER are known asrenewable energy sources (RES).Nevertheless, the use of DER also impacts network power
flow [5], voltage stability [6], protection [7] and quality ofpower supply [8]. Indeed, the intermittent nature of RESmakes the system stability control a very difficult task, andmany researchers have been focusing on control strategyand stability evaluation [9–13]. When the focus is voltagecollapse [14], multiple scenarios and/or contingencies areconsidered, and often the continuation power flow method
is employed to determine load margins, margin to thermallimits [15] and voltage violations. Voltage collapse,normally studied for transmission systems, has also beenaddressed for distribution systems, as shown in [16–18].Williams et al. [19] discusse an interaction between thetransmission and distribution systems by describing a realevent. The study shows that a fault in the transmissionsystem may cause a voltage dip, stalling some airconditioners and driving the system to voltage instability,illustrating how the distribution system may affect thesystem overall voltage stability. Voltage collapse isassociated with the singularity of the power flow Jacobianmatrix [20]. At this singular point, known as saddle-nodebifurcation, the power flow Jacobian matrix presents a zeroeigenvalue and no solution can be obtained beyond thiscritical point, which is the system maximum loadabilitypoint. Induced limits bifurcation may also occur as aconsequence of sudden exhaustion of important reactivepower sources. Calculating the system load margin, that is,the amount of load variation that the system may sustainplays a crucial role. In this paper, the continuation methodis employed for this purpose. In order to provide a morecomplete set of information to operators, QV curve mayalso be used [21]. Such a curve computes the reactive
www.ietdl.org
IET Renew. Power Gener., pp. 1–10 1doi: 10.1049/iet-rpg.2012.0265 & The Institution of Engineering and Technology 2013

margin of each bus and is an important indication of a bus’robustness. Combining the information obtained by PV andQV curves is also exploited here for stability analysis.Regarding reliability studies, many researches focus on
optimal DER location for improving reliability indices[22–24]. However, when renewable sources are consideredin electrical power supply in a DER layout, a factor ofuncertainty also arises on voltage security monitoring. Forthis sake, simulation techniques [25] and reliability theory[26] may be used to evaluate the system operating conditions.A powerful reliability analysis is that of Monte Carlo
simulation (MCS), which samples power system states, anduses load flow, dispatch algorithms and operating policiesto infer information from the samples. In this work, MCS involtage security analysis is considered. Owing to thedifficulty of obtaining parametric distribution in jointfunctions, empirical distribution function (EDF) approach isused [27]. Reliability measures such as survival and hazardfunctions are used.This paper addresses the probabilistic risk of voltage
collapse by considering an uncertainty in the amount ofgeneration provided by the DER. The focus lies onstudying different generating scenarios and evaluating theload margin with respect to a base case considered. Thelink of these results with the ones provided by the QVcurve is explored, stressing the importance of a goodreactive power control. The main contributions of this papermay be summarised as
† The responsibility of generator in the voltage collapseprocess is determined.† The relation between reactive power margin of a generatorand the system load margin is studied.† The probabilistic risk of voltage collapse of each operatingpoint is assessed.† The probability of enlarging the system load margin iscalculated as a function of different operating points.
This paper is organised as follows: Section 2 brieflydiscusses some aspects about voltage stability. Section 3introduces some features of DER. The simulation of thevoltage stability index and the voltage collapse reliabilityare addressed in Section 4. Finally, Section 5 presents testresults and discussion.
2 Voltage stability assessment
Power systems voltage stability depends on the relationshipsbetween the load bus voltage magnitude (V ), the reactivepower injection or absorption (Q) and the power supplied tothe load (P). Traditionally, the PV curve (Fig. 1) displaysthe relationship between voltage (V ) and transmitted power(P), while the QV curve (Fig. 2) plots the relationshipbetween the voltage level (V ) in a bus (if it is a PQ-type, itis fictitiously considered as a generation unit) and itsreactive power injection (Q) [28].As depicted in Fig. 1, the point A corresponds to the critical
operating point, which is the maximum loadability point.Only the operating points above A represent satisfactoryoperating conditions. On the other hand, as shown inFig. 2, the minimum in the QV curve (for which dQ/dV =0) represents the voltage stability limit. The system is stablein the region where dQ/dV > 0. Hence, an increase in Q isaccompanied by an increase in V. Finally, the system isunstable in the region where is dQ/dV < 0. The information
provided by the QV curve has faced some criticisms in theliterature [29], but recently, it has been shown that tracingthis curve may unfold a variety of reactive power controlcharacteristics [30]. For this reason, this curve is used here,hence the connection between the system load margin andthe reactive power reserve is considered.Voltage stability properties of power systems can be
analysed by computing PV and QV characteristics. This isbecause they provide different pieces of information, sincethe PV curve depicts the system load margin when load andgeneration vary according to a pre-specified pattern;whereas the QV curve measures the robustness of a buswith respect to the reactive support to the system. Thesecurves can be generated by executing a large number ofpower flows using conventional approaches. Conventionalpower flow algorithms may fail to converge at operatingpoints near the loadability limit, because the power flowJacobian matrix becomes ill conditioned. In contrast withthe conventional methods, the PV and QV curves can betraced by using the continuation method [21], which is aniterative process that works with predictor and correctorsteps. The power flow equations are reformulated, assuming
Fig. 1 PV curve
Fig. 2 QV curve
www.ietdl.org
2 IET Renew. Power Gener., pp. 1–10& The Institution of Engineering and Technology 2013 doi: 10.1049/iet-rpg.2012.0265

the form
f (x, l) = 0 (1)
where x represents the state variables and λ is the systemparameter that moves the system from an equilibrium pointto another. The value for λ is such that 0≤ Δλ≤ Δλcriticaland Δλ = 0 represents the base case. Beginning from aknown operating point (xi, λi), a tangent predictor is used toestimate the solution (xi + Δxi, λi + Δλi), which is correctedby the corrector step. The tangent predictor can be obtainedby manipulating the power flow Jacobian
DuDV
[ ]= [J ]−1 DP
DQ
[ ](2)
where θ is the vector of bus voltage angles and V is the vectorof bus voltage magnitudes. Relating (2) to (1), P and Q areassociated with λ, whereas θ and V are represented by x.Let the active and reactive powers into each bus beexpressed as P = Po(1+ Δλ) and Q=Qo(1+ Δλ),respectively. Po and Qo, respectively, stand for the initialnet active and reactive power at each bus. Using theseassumptions in (2) yields
TV =Du
DlDV
Dl
⎡⎢⎣
⎤⎥⎦ = [J ]−1 Po
Qo
[ ](3)
Since the parameter step size must diminish as the systemapproaches a bifurcation point, the following equation isemployed to control the step size variation
Dl = K
||TV|| (4)
where ||TV|| stands for tangent vector Euclidian norm and K isa parameter adjusting the ‘velocity’ of the process. Thetangent vector determines how the state variables (θ and V )change as the system parameter λ is varied. Equation (4)resolves the problem of the predictor step. As for thecorrector step, it is carried out in this paper by consideringthe predictor step as the initial guess of a power flowprogram. As described in the literature, this convergesrapidly for the actual solution [21].
3 Features of RES
There are commonly accepted benefits of distributedgeneration in power system operation. In distributionsystems, if large blocks of generation are distant electricallyor the transmission system is close to its limits, DER mayplay an important role. If the DER technology used is RES,the energy conversion emits low (or near to zero)greenhouse gases, which is a great advantage in comparisonwith traditional fossil-fuelled generation systems. Manyother advantages with respect to technical, environmental orinvestment aspects may be found in [3]. Nevertheless, theuse of DER may deteriorate the power quality and bringsome technical drawbacks, such as inversion of energyflow, difficult in voltage control and/or problems in systemprotection devices.Another important difference of some RES is the
intermittent characteristic of generation. Unlike
conventional fuel fossil generators, RES relies onavailability of primary (natural) resources to generatepower, which cannot be controlled. Note that RES canprovide energy with no fuel cost and reduced emissions.However, it cannot guarantee full power generation duringpeak hour. For this reason the term capacity credit (CC) iscreated which represents the reduction (in %) ofconventional power generation that can be made withoutaffecting the reliability index, ‘loss of load probability’.Thus, CC represents assured RES power for the system.Altogether, voltage collapse and intermittent generation
should not be analysed deterministically. An alternative andmore realistic way of analysis is the incorporation of pastexperience, associating their likelihood or probability ofoccurrence. Once the past experience is represented bystatistical parameters, the next step, comprising theapplication of special analysis and design techniques, iscarried out within this stochastic environment. Thisprocedure forms the basis of the probabilistic approach.Therefore past performance can be understood and futureperformance can be consistently predicted for the systemoperating planning.In this paper, uncertainty is assumed in RES generation.
Each generator is modelled by normal density functiontruncated between generator limits. Note, however, that anyother stochastic approach can be used.
4 Probabilistic features on simulating RES
As discussed in the previous sections, the intermittentgenerating characteristics of RES may be modelled by astochastic process. Hence, MCS technique may be used totest different system operating conditions.The system of Fig. 3 is used to introduce voltage stability
reliability [The system data and base case are presented inAppendix 1.]. Each generator is modelled by a normaldensity function truncated between generator limits, whichare considered between 0 and 60 MW for generator G1 and0 and 75 MW for generator G2, respectively. The meanvalues are 40 and 60 MW for G1 and G2, respectively.Such a normal density function is usually adopted in thiskind of study, as is reported in [31]. For each dispatchsampling, a load flow is executed, providing active loadmargin λP and reactive power margin λQ. If there exists nofeasible solution (voltage instability), λP is assumednegative [In this case, load shedding would be required inorder to restore a feasible operating point. Such a conditionis treated as a separate case in the simulations.] and λQ doesnot exist.The random variables λP and λQ are modelled using the
EDF approach [27]. If the size sample n is generated by aprobability distribution f, the EDF f is defined as a discreterandom variable whose each outcome has a probability of1/n. The EDF may be represented by the frequency functionof (5) and (6)
f lP . lP0
( )= 1
n
∑ni=1
1 lP . lP0
{ }(5)
g lQ . lQ0
( )= 1
n
∑ni=1
1 lQ . lQ0
{ }(6)
In (5) and (6), 1{A} indicates the occurrence of an event A, forinstance lP . lP0 and lQ . lQ0
. It is straightforward that for
www.ietdl.org
IET Renew. Power Gener., pp. 1–10 3doi: 10.1049/iet-rpg.2012.0265 & The Institution of Engineering and Technology 2013

a given lP0 , 1{lP . lP0} is a Bernoulli random variable with
parameter p, and n f (x) represents a binomial random variablewith mean n f(x) and variance n f(x)[1 − f (x)]. Thus, f (x) is anunbiased estimator of f (x) (see [27] for a fuller explanation).The same results are obtained for g. This result enables oneto use the plug-in principle to estimate parameters fromsamples using (7), as follows
g = t(f ) (7)
where g is the estimated parameter γ and t(·) is a function ofthe EDF. Note that one may also use the EDF to model thejoint distributions. Fig. 4 presents two examples of jointEDF. In Fig. 4a, one can see the joint EDF of RES dispatchand active load margin λP. Likewise, Fig. 4b depicts thejoint EDF of RES dispatch and reactive power margin λQ.From Fig. 4, one can see that RES dispatch and active load
margin λP may be considered as a normal distribution. On theother hand, reactive power margin λQ seems to follow, forinstance, a shifted gamma distribution.
4.1 Voltage collapse reliability
Reliability theory is concerned to measure the risk of anundesirable random event. In this sense, the random natureof system parameters may be modelled with the help of theprobabilistic theory.Usually, reliability analysts are interested in the probability
of a system working in a time interval such as its failure rate,remain life and availability. The results are then considered insystem expansion, maintenance and operation planning.Sometimes, the concept of time is translated to othermeasures, such as distance or volume.Owing to the intermittent nature of DER generation,
discussed in Section 3, it has created uncertainty in theoperating condition of distribution systems. Thus, somequestions may be addressed
† How does the RES generation impact the operatingconditions?† What is the probability or risk of a system voltage collapsein the next time interval?† What are the best points in the system to generate reactivepower, bearing in mind the cost-benefit relation, in order tominimise the risk of voltage collapse for the next, or afuture, time interval?
If the RES generation is modelled by a stochastic process,one may answer the above questions from a probabilisticpoint of view and efficiently plan the distribution systemoperation. In this case, the concept of time is translated toRES dispatch. Thus, this work enables measurements of therisk of voltage collapse in distribution systems with RESpenetration.
Fig. 3 Four-bus test system
Fig. 4 Joint and Marginal EDF for
a RES dispatch and λPb RES dispatch and λQ
www.ietdl.org
4 IET Renew. Power Gener., pp. 1–10& The Institution of Engineering and Technology 2013 doi: 10.1049/iet-rpg.2012.0265

When analysing the reliability of a system, somedistribution representations may be used: probability,cumulative probability, survivor and hazard functions.Probability function gives the probability of a specific
value of occurrence of a random variable. Note thatprobability distribution is the EDF discussed in a previoussection and is obtained by simulation. Moreover,cumulative probability yields information on intervaloccurrence. If the probability of a load margin below lP0 isof interest, one may then use the cumulative probabilityfunction to obtain this query. For a discrete random variablesuch as EDF, cumulative probability function is a sum ofprobability distribution up to the threshold value of interest,as given in (8)
F(x) = p lP , lP0
( )=
∑j|xj,lP0
f xj
( )(8)
Likewise, the probability of an active load margin greater thanthe base case (lP . lP0) for an RES generation below aspecific amount (Pg , Pg0
) can be obtained with the helpof the conditional probability law, as follows
f lP . lP0 |Pg , Pg0
( )=
f lP . lP0 > Pg , Pg0
( )
f Pg , Pg0
( ) (9)
Note, from (9), that (lP . lP0 > Pg , Pg0) partitions the
sample space and f (lP . lP0 > Pg , Pg0) is the
probability of events lP . lP0 and Pg , Pg0to happen
simultaneously. Note also, that f (lP . lP0 |Pg , Pg0) may
be seen as the hazard function of usual reliability analysis.Hazard function, which is the most popular reliabilitymeasure, gives the occurrence rate of an event of interest,that is, the risk associated to the system at a specific valuex. It is an intuitive representation of the risk and itsusefulness in comparing the change of risk over time forseveral populations (operating conditions) its importance is
widely acknowledged. In voltage stability analysis underDER penetration, it may represent the risk associated to asystem operating condition.If one is interested in measuring the risk associated with the
reactive power margin, the hazard function (9) may be writtenas
g lQ . lQ0|Pg , Pg0
( )=
g lQ . lQ0> Pg , Pg0
( )
f Pg , Pg0
( ) (10)
Note that the risk analysis may be extended to any othersystem random variable, such as voltage level, power flowand system loss. For this sake, the next section exploitssome numerical results for voltage collapse analysis underintermittent DER penetration.
5 Test results
To address the points proposed in the foregoing sections, theIEEE34 test feeder shown in Fig. 5 is used [The system dataand base case are presented in Appendix 2.]. Only RES areassumed as random variables. Thus, uncertainty because ofthe equipment unavailability, such as load and transmissionsystem equipment, is not considered in this paper.Furthermore, reactive power limits are considered in theload margin calculation. Simulation results are obtained bythe methodology described in Section 4. The probabilisticapproach is used to analyse the risks on the systemoperating and planning conditions. Both approaches arediscussed in the next subsections.
5.1 System operating condition analysis
In the first approach stressed in this paper, one is interested inextracting some pieces of information about the systemoperating condition with RES penetration. Thus, theprobability approach discussed in Section 4 is applied.Table 1 shows some probability indices obtained through
the simulated data. The sample space is constrained by the
Fig. 5 IEEE34 test feeder
www.ietdl.org
IET Renew. Power Gener., pp. 1–10 5doi: 10.1049/iet-rpg.2012.0265 & The Institution of Engineering and Technology 2013

conditions displayed in the first column of Table 1. It is worthnoting that from the second column of Table 1 the risk ofobtaining no solution for the sampling case is reduced asthe RES generation increases.For those sampling cases with a feasible initial solution, the
active and reactive load margins are obtained and hazardfunctions are computed according to (9) and (10),respectively. Hence, for a given RES aggregated dispatchinterval, one can estimate the risk of the system to present aload margin lower than a pre-specified value. In this paper,this value is given by the load margin associated with thebase case. An important observation of Table 1 is the effecton the system when RES is dispatching < 600 kW, sincethe load margin obtained is smaller than the one calculatedfor the base case, and thus dispatching RES < 600 kWproduces a serious deterioration in system operatingconditions. The voltage collapse hazard function may bedepicted in a Cartesian plot, such as the one shown inFig. 6. In that figure, the curves represent different loadmargins obtained when the power generation at G1 and G2varies.From Fig. 6 it can be observed that when the RES dispatch
increases the system load margin also increases. The approachemployed enables one to assess the risks and costs associatedwith each generation value, since the gain in the load marginincrease is probabilistically determined.Tables 2 and 3 show the same results of Table 1 when using
marginal EDF for G1 and G2, respectively. One can concludethat G1 and G2 have almost the same efficiency when one
aims to reduce the risk of voltage collapse (or when theload margin increase is the objective).The result discussed above is closely related to the reactive
power margin behaviour. Fig. 7 depicts the joint probabilitydistribution for the simulated data of the active load marginλP and the reactive power margin λQ. Note that thecorrelation between λP and λQ is very strong. As aconsequence, a good reactive power margin is associatedwith a larger load margin, rendering reactive power marginas a good tool for effective reactive power controls.The probabilistic approach may also be used for system
operating planning, as will be discussed in the nextsubsection.
5.2 Planning system operation
In planning distribution systems operation, the operator isinterested in setting a benchmark index for securityoperation. For this reason, the results previously obtainedmay be used. For instance, if one is interested in operatingthe system while maintaining a secured distance fromvoltage collapse, the active load margin should be biggerthan a pre-specified value. This specified value of themargin is determined by how much reserve generation is
Table 1 Probability indices – IEEE test feeder
RES Generation(G1 +G2), kW
Risk of voltageinstabilityλP < 0, %
Active load marginprobability lower than the
base caselP , lP0 , %
≤ 100 100.00 100.00≤ 200 81.03 100.00≤ 300 37.97 100.00≤ 400 18.27 100.00≤ 600 6.58 99.76≤ 800 3.69 97.78≤ 1000 2.86 76.10≤ 1200 2.68 71.23
Fig. 6 Hazard functions for voltage collapse assessment– IEEEtest feeder
Table 2 Probability indices for G1 – IEEE test feeder
RES generation(G1), kW
Risk of voltageinstabilityλP < 0, %
Active load marginprobability lower than thebase case lP , lP0 , %
≤ 100 13.37 100.00≤ 300 6.13 95.27≤ 450 3.66 82.70≤ 600 2.68 71.23
Table 3 Probability indices for G2 – IEEE test feeder
RES generation(G2), kW
Risk of voltageinstabilityλP < 0, %
Active load marginprobability lower than thebase case lP , lP0 , %
≤ 100 21.54 100.00≤ 300 6.17 96.83≤ 450 3.67 84.22≤ 600 2.68 71.23
Fig. 7 Joint and Marginal EDF for λP and λQ – IEEE test feeder
www.ietdl.org
6 IET Renew. Power Gener., pp. 1–10& The Institution of Engineering and Technology 2013 doi: 10.1049/iet-rpg.2012.0265

available and the priority level of the load being supplied.Table 4 presents six generation scenarios and the riskassociated with them. Each scenario is given by thecomposition of generation at units 1 and 2 (G1 + G2).Columns 2–5 are obtained with the help of (9). Note fromTable 4 that the risk of having an unstable operating pointis very low, which suggests there is no need of reactivepower support for the base case. Furthermore, one canmeasure the probability of the system load margin beingbigger than any threshold value, such as 0.50lP0 , lP0 ,1.30lP0 , for example. This table may then be used as areference table for the system operation, where bulkoperating conditions reduce the expected load margin.
5.3 Comparison between the four-bus test systemand the IEEE34 test feeder
Further important conclusions may arise if different operatingscenarios are considered. As discussed above for the IEEE34test feeder, G1 and G2 have similar influence on the systemload margin. Besides, the reactive power margins of bothgenerators present negative values. The reader not familiarwith the meaning of positive and negative reactive powermargins is referred to [30], where a discussion about theQV curve features is carried out. In order to show someimportant information that can be obtained about the systemoperating conditions, the same indices obtained in theprevious section are presented here for the four-bus testsystem.Table 5 shows some probability indices obtained through
the simulated data for the four-bus test system. As expected,the same behaviour is observed when compared withTable 1, that is, the risk of obtaining no solution for thesampling case reduces as the RES generation increases.The voltage collapse hazard function is shown in Fig. 8,
has the same meaning as discussed in Fig. 6.Tables 6 and 7, however, presents some discrepancies with
respect to the results shown in Tables 2 and 3. Unlike
observed for the IEEE34 test feeder, when both generatorsplay similar role in the system load margin, this time G1 ismore efficient than G2 if the risk of voltage collapse (or theload margin increase) is the main issue.Another important aspect to be discussed regards the
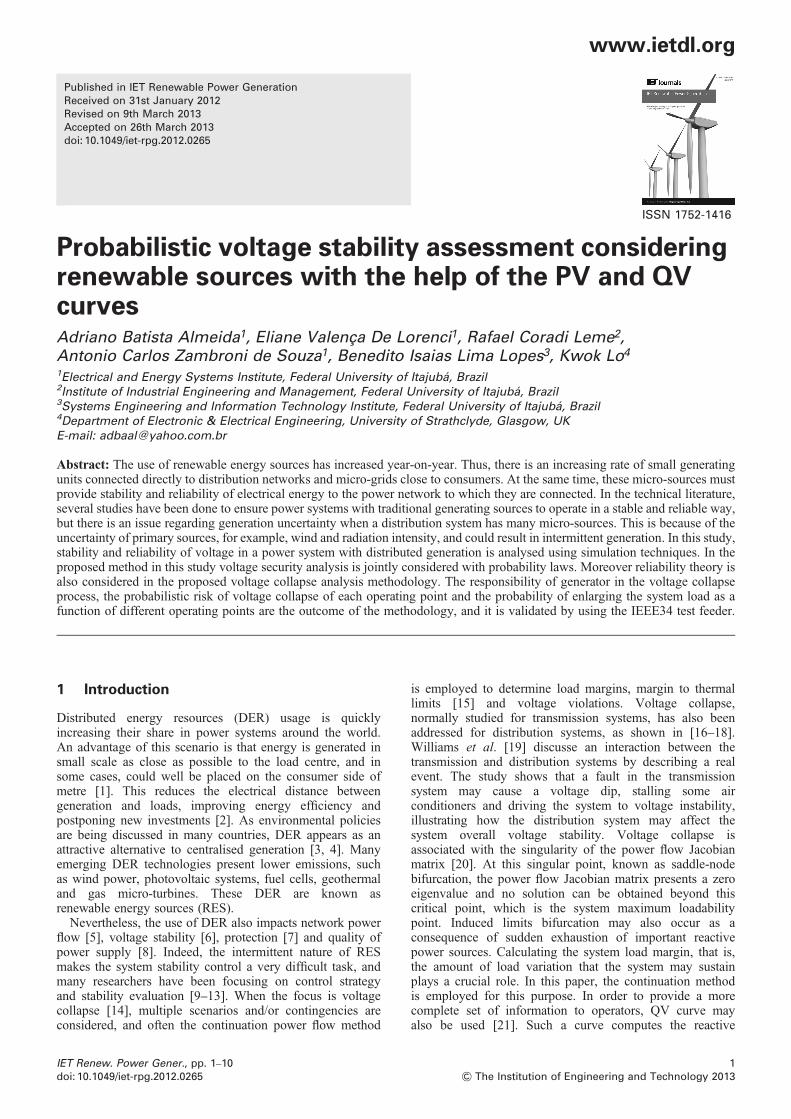
reactive power margin. Fig. 9 depicts the joint probabilitydistribution for simulated data of the active load margin λPand the reactive power margin λQ, respectively. Once again,the correlation between λP and λQ is very strong.
Table 4 Reference table for the system operation – IEEE test feeder
RES generation(G1 +G2), kW
VoltageInstabilityλP < 0, %
Load margin probability higherthan half of base case,%
Load margin probabilityhigher than the base case,%
Load margin probability 30%higher than the base case,%
≥ 100 2. 20 73.65 28.91 6.63≥ 300 0.00 78.70 30.89 7.08≥ 500 0.00 96.31 38.50 8.83≥ 700 0.00 100.00 66.73 15.30≥ 900 0.00 100.00 100.00 42.00≥ 1100 0.00 100.00 100.00 100.00
Table 5 Probability indices – four-bus test system
RES generation(G1 +G2), MW
Risk of voltageinstabilityλP < 0, %
Active load marginprobability lower than thebase case lP , lP0 , %
≤ 10 71.89 100.00≤ 20 32.19 100.00≤ 30 19.31 100.00≤ 50 5.81 100.00≤ 55 4.38 99.76≤ 60 3.67 98.77≤ 70 2.19 93.92≤ 90 1.06 79.25≤ 110 0.74 63.52
Fig. 8 Hazard functions for voltage collapse assessment –four-bus test system
Table 6 Probability indices for G1 – four-bus test system
RES generation(G1), MW
Risk of voltageinstabilityλP < 0, %
Active load marginprobability lower than thebase case lP , lP0 , %
≤ 10 1.11 62.03≤ 20 1.02 60.57≤ 30 0.92 59.85≤ 40 0.82 59.16
Table 7 Probability indices for G2 – four-bus test system
RES generation(G2), MW
Risk of voltageinstabilityλP < 0, %
Active load marginprobability lower than thebase case lP , lP0 , %
≤ 10 22.07 100.00≤ 30 3.23 100.00≤ 40 1.78 100.00≤ 50 1.16 98.25
www.ietdl.org
IET Renew. Power Gener., pp. 1–10 7doi: 10.1049/iet-rpg.2012.0265 & The Institution of Engineering and Technology 2013
Recalling that when λQ > 0 stands for the lack of reactivepower margin, flagging imminent voltage collapseproblems. This was not observed in Fig. 7, when nopositive reactive power margin is shown. It can be observedin Fig. 9, that a low value of load margin (λP = 0.05) isobserved when λQ > 0. There exists 2.5% of chance tooperate in this situation.
6 Conclusions
This work discusses the use of distributed and renewableenergy resources in electrical distribution systems regardingtheir voltage stability and reliability. Voltage collapse isstudied by employing the PV and QV curves; hence thesystem load margin and the reactive power margin of eachbus are computed. A discussion on DER when RES ispresent, emphasising the drawbacks of reactive powerconsumption and the intermittent nature of RES generators.The voltage collapse and the intermittent generation are
analysed jointly with the help of MCS and EDF. Theresults obtained stress different operating ranges and theirassociated risk of collapse. In addition to that, the resultsobtained for the reactive power margin flag an importantcharacteristic of reactive power control, since this margin isreflected in the system load margin.
7 Acknowledgments
The authors would like to thank CNPq, CAPES andFAPEMIG for the financial support.
8 References
1 Invernizzi, A., Buchholz, B., Stubbe, M., Jenkins, N., Dowd, B.,Ceraolo, M.: ‘Distribution systems and dispersed generation: A newfocus for CIGRE’, Electra, 2004, No. 213, pp. 17–21
2 Coleen Madonna Flood Williams, C.M.F.: ‘CHP systems: small,powerful products with big benefits’, Distributed Energy, 2004, 2, (2),pp. 57–59
3 Bayod-Rújula, A.A.: ‘Future development of the electricity systems withdistributed generation’, Energy, 2009, 34, (3), pp. 377–383
4 El-Khattam, W., Salama, M.M.A.: ‘Distributed generation technologies,definitions and benefits’, Electr. Power Syst. Res., 2004, 71, (2),pp. 119–128
5 Dai, M., Nanda, M., Jung, J.-W.: ‘Power flow control of a singledistributed generation unit’, IEEE trans. Power Electron., 2008, 23,(1), pp. 343–352
6 Sun, Q., Li, Z., Zhang, H.: ‘Impact of distributed generation onvoltage profile in distribution system’. Int. Joint Conf. onComputational Sciences and Optimization, Sanya, Hainan, April 2009,pp. 249–252
7 El-Khattam, W., Sidhu, T.S.: ‘Restoration of directional overcurrentrelay coordination in distributed generation systems utilizingfault current limiter’, IEEE Trans. Power Deliv., 2008, 23, (2), pp.576–585
8 Chau-Shing, W., Devaney, M.J.: ‘Incandescent lamp flicker mitigationand measurement’, IEEE Trans. Instrum. Meas., 2004, 53, (4),pp. 1028–1034
9 Alonso, M., Amarís, H.: ‘Voltage stability in distribution networks withDG’. IEEE Bucharest Power Tech Conf., Bucharest, Romania, June2009, pp. 1–6
10 Hazel, T.G., Hiscock, N., Hiscock, J.: ‘Voltage regulation at sites withdistributed generation’, IEEE Trans. Ind. Appl., 2008, 44, (2),pp. 445–454
11 Vandoorn, T.L., Meersman, B., Degroote, L., Renders, B., Vandevelde,L.: ‘A control strategy for islanded microgridswith DC-link voltagecontrol’, IEEE Trans. Power Deliv., 2011, 26, (2), pp. 703–713
12 Senjyu, T., Miyazato, Y., Yona, A., Urasaki, N., Funabashi, T.:‘Optimal distribution voltage control and coordination withdistributed generation’, IEEE Trans. Power Deliv., 2008, 23, (2), pp.1236–1242
13 Calderaro, V., Milanovic, J.V., Kayikci, M., Piccolo, A.: ‘The impact ofdistributed synchronous generators on quality of electricity supply andtransient stability of real distribution network’, Electr. Power Syst.Res., 2009, 79, (l), pp. 134–l43
14 Zambroni de Souza, A.C.: ‘Discussions on some voltage collapseindices’, Electr. Power Syst. Res., 2000, 53, (1), pp. 53–58
15 Zambroni de Souza, A.C., Glavic, M., Alvarado, F.: ‘Continuationpower flow with overload and redispatch’. North American PowerSymp. (XXIII NAPS), Waterloo, 2000
16 El-Amary, A.N.H., El Safty, B.S.: ‘Early detection of voltage instabilityin distribution system utilizing phasor measurement units’. Int. Conf. onRenewable Energies and Power Quality (ICREPQ’10), Granada, Spain,23th to 25th March, 2010
17 Augugliaro, A., Dusonchet, L., Mangione, S.: ‘Voltage collapseproximity indicators for radial distribution networks’. Ninth Int. Conf.on Electrical Power Quality and Utilisation (EPQU 2007), Barcelona,2007, pp. 1–6
18 Hamada, M.M.: ‘Fast detection of voltage collapse proximity in radialdistribution systems’. Proc. 41st Int. Universities Power EngineeringConf. (UPEC’06), 6–8 September 2006, vol. 3, pp. 1006–1010
19 Williams, B.R., Schmus, W.R., Dawson, D.C.: ‘Transmission voltagerecovery delayed by stalled air conditioner compressors’, IEEE Trans.Power Syst., 1992, 7, (3), pp. 1173–1181
20 Seydel, R.: ‘From equilibrium to chaos - Practical bifurcation andstability analysis’ (Elsevier Science, North-Holland, 1988, 1st edn.)
21 Mohn, F.W., Zambroni de Souza, A.C.: ‘Tracing PV and QV curveswith the help of a CRIC continuation method’, IEEE Trans. PowerSyst., 2006, 21, (3), pp. 1115–1122
22 Borges, C.L.T., Falcão, D.M.: ‘Optimal distributed generation allocationfor reliability, losses, and voltage improvement’, Electr. Power EnergySyst., 2006, 28, (6), pp. 413–420
23 Novoa, C., Jin, T.: ‘Reliability centered planning for distributedgeneration considering wind power volatility’, Electr. Power Syst.Res., 2011, 81, (8), pp. 1654–1661
24 Khodr, H.M., Silva, M.R., Vale, Z., Ramos, C.: ‘A probabilisticmethodology for distributed generation location in isolatedelectrical service area’, Electr. Power Syst. Res., 2010, 80, (4), pp.390–399
25 Law, A.L.: ‘Simulation modeling and analysis’ (McGraw-Hill,New York, NY, 2007, 4th edn.)
26 Leemis, L.M.: ‘Reliability: probabilistic models and statistical methods’(Lawrence Lemmis, 2009, 2nd edn.)
27 Efron, A.B., Tibshirani, R.J.: ‘An introduction to the bootstrap’(Chapman and Hall/CRC, 1994, 1st edn.)
28 Kundur, P.: ‘Power system stability and control’ (McGraw-Hill, 1994,1st edn.)
29 Chowdhury, B.H., Taylor, C.W.: ‘Voltage stability analysis: V-Q powerflow simulation versus dynamic simulation’, IEEE Trans. Power Syst.,2000, 15, (4), pp. 1354–1359
30 Zambroni de Souza, A.C., Mohn, F.W., Borges, I.F., Ocariz, T.R.:‘Using PV and QV curves with the meaning of static contingencyscreening and planning’, Electr. Power Syst. Res., 2011, 81, (7),pp. 1491–1498
31 Silva, A.M.L., Coutinho, I.P., Zambroni de Souza, A.C., Prada, R.B.,Rei, A.M.: ‘Voltage collapse risk assessment’, Electr. Power Syst.Res., 2000, 54, (3), pp. 221–227
Fig. 9 Joint and Marginal EDF for λP and λQ – four-bus testsystem
www.ietdl.org
8 IET Renew. Power Gener., pp. 1–10& The Institution of Engineering and Technology 2013 doi: 10.1049/iet-rpg.2012.0265

9 Appendix
9.1 Appendix 1
The four-bus test system data are shown in Tables 8 and 9.
9.2 Appendix 2
The IEEE34 fest feeder data are shown in Tables 10 and 11.
Table 8 Data bus – four-bus test system
Bus Type V, p.u. θ, rad Pg, MW Qg, MVar PLPL, MW QL, MVar Qmin, MVar Qmin, MVar shunt, MVar
1 Swing 1.020 0.0 65.7 9.3 0.0 0.0 – – –2 PV 1.000 − 3.59 40.0 − 7.6 40.0 12.5 − 20.0 30.0 –3 PQ 0.976 − 12.11 0.0 0.0 50.0 16.5 – – 25.04 PV 1.000 − 14.31 50.0 29.9 60.0 12.5 − 20.0 30.0 –Load margin: 0.4362 p.u.
Table 9 Branch data – four-bus test system
Branch R, p.u. X, p.u.
1–2 0.02 0.102–3 0.10 0.204–3 0.10 0.20
Table 10 Data bus – IEEE34 test feeder
Bus Type V, p.u. θ, rad Pg, kW Qg, kVar PL, kW QL, kVar Qmin, kVar Qmax, kVar shunt, kVar
800 Swing 1.050 0.00 2,688.6 1,036.4 0.0 0.0 – – –802 PQ 1.047 − 0.09 0.0 0.0 55.0 29.0 – – –806 PQ 1.044 − 0.14 0.0 0.0 55.0 29.0 – – –808 PQ 1.004 − 1.23 0.0 0.0 16.0 8.0 – – –810 PQ 1.004 − 1.23 0.0 0.0 16.0 8.0 – – –812 PQ 0.959 − 2.60 0.0 0.0 0.0 0.0 – – –814 PQ 0.924 − 3.78 0.0 0.0 0.0 0.0 – – –850 PQ 1.010 − 4.33 0.0 0.0 0.0 0.0 – – –816 PQ 1.010 − 4.34 0.0 0.0 5.0 2.0 – – –818 PQ 1.009 − 4.35 0.0 0.0 34.0 17.0 – – –820 PQ 1.005 − 4.58 0.0 0.0 169.0 87.0 – – –822 PQ 1.004 − 4.61 0.0 0.0 135.0 70.0 – – –824 PQ 0.997 − 4.64 0.0 0.0 49.0 24.0 – – –826 PQ 0.997 − 4.63 0.0 0.0 40.0 20.0 – – –828 PQ 0.996 − 4.66 0.0 0.0 11.0 5.0 – – –830 PQ 0.972 − 5.25 0.0 0.0 97.0 43.0 – – –854 PQ 0.972 − 5.27 0.0 0.0 4.0 2.0 – – –852 PQ 0.932 − 6.37 0.0 0.0 0.0 0.0 – – –832 PQ 1.000 − 6.75 0.0 0.0 15.0 7.0 – – –858 PQ 0.995 − 6.88 0.0 0.0 49.0 25.0 – – –834 PQ 0.990 − 7.02 0.0 0.0 178.0 90.0 – – –842 PQ 0.990 − 7.03 0.0 0.0 9.0 5.0 – – –844 PQ 0.989 − 7.06 0.0 0.0 864.0 658.0 – – 300.0846 PQ 0.991 − 7.11 0.0 0.0 68.0 34.0 – – –848 PV 0.991 − 7.11 400.0 250.0 143.0 107.0 250.0 − 250.0 450.0860 PQ 0.989 − 7.03 0.0 0.0 348.0 212.0 – – –836 PQ 0.988 − 7.03 0.0 0.0 122.0 63.0 – – –840 PQ 0.988 − 7.03 0.0 0.0 94.0 62.0 – – –862 PQ 0.988 − 7.03 0.0 0.0 28.0 14.0 – – –838 PQ 0.988 − 7.03 0.0 0.0 28.0 14.0 – – –864 PQ 0.995 − 6.88 0.0 0.0 2.0 1.0 – – –888 PQ 1.000 − 7.04 0.0 0.0 0.0 0.0 – – –890 PV 0.997 − 7.65 400.0 250.0 450.0 225.0 250.0 − 250.0 –856 PQ 0.972 − 5.26 0.0 0.0 4.0 2.0 – – –Load margin: 0.1688 p.u.
www.ietdl.org
IET Renew. Power Gener., pp. 1–10 9doi: 10.1049/iet-rpg.2012.0265 & The Institution of Engineering and Technology 2013

Table 11 Branch data – IEEE34 test feeder
Branch R, p.u. X, p.u.
800–802 0.00235 0.00244802–806 0.00157 0.00164806–808 0.02934 0.03048808–810 0.00858 − 0.00332808–812 0.03414 0.03547812–814 0.02706 0.02812814–850 0.00001 0.00900816–818 0.00056 0.00146816–824 0.01383 0.01009818–820 0.01590 0.04108820–822 0.00454 0.01172824–826 0.00448 − 0.00173824–828 0.00114 0.00083828–830 0.02769 0.02019830–854 0.00070 0.00051832–858 0.00664 0.00484832–888 0.09500 0.20400834–860 0.00274 0.00200834–842 0.00038 0.00028836–840 0.00117 0.00085836–862 0.00038 0.00028842–844 0.00183 0.00133844–846 0.00493 0.00360846–848 0.00072 0.00052850–816 0.00042 0.00031852–832 0.00001 0.00900854–856 0.03447 − 0.01334854–852 0.04990 0.03638858–864 0.00053 0.00138858–834 0.00790 0.00576860–836 0.00363 0.00265862–838 0.00567 − 0.00127888–890 0.34442 0.35781
www.ietdl.org
10 IET Renew. Power Gener., pp. 1–10& The Institution of Engineering and Technology 2013 doi: 10.1049/iet-rpg.2012.0265
Related Documents