FRPRCS-11 Joaquim Barros & José Sena-Cruz (Eds) UM, Guimarães, 2013 1 Probabilistic Models for Mechanical Properties of Prefabricated CFRP S. Gomes 1 , L. Neves 2 , D. Dias-da-Costa 3 , P. Fernandes 4 , E. Júlio 5 1 ICIST, Departamento de Engenharia Civil, Universidade de Coimbra, [email protected] 2 University of Notthingham, e UNIC, Universidade Nova de Lisboa 3 INESC, Departamento de Engenharia Civil, Universidade de Coimbra 4 ICIST, Departamento de Engenharia Civil, Instituto Politécnico de Leiria 5 ICIST, Departamento de Engenharia Civil e Arquitetura, IST, Universidade Técnica de Lisboa Keywords: Data analysis; Laminate; CFRP; Tensile tests. SUMMARY Fibre reinforced polymer (FRP) composites present a number of interesting mechanical properties for civil engineering. For this reason, the use of this material in structural engineering applications has grown in the last years, leading to the need for better understand of mechanical properties variability. This paper presents a probabilistic study of 1368 specimens, manufactured with carbon fibres and epoxy matrices. The studied properties are: Young's modulus; tensile strength; and ultimate strain. Results show that the Weibull distribution can be used to model all mechanical properties. A low variability of the mechanical properties was also observed. Furthermore, correlation analysis between properties is performed, showing the existence of a high correlation between tensile strength and ultimate strain. Based on the results, probabilistic models are proposed. 1. INTRODUCTION During the last decades, fibre reinforced polymer (FRP) composites have been intensively used in civil construction, in particular in repair and retrofitting of existing structures, due to their technical and economical advantages. However, and despite the increased interest in this material, little research has been dedicated to study the variability of FRP mechanical properties. As known, FRP properties have a significant influence on structural safety, thus making vital the quantification of their variability, associated with uncertainties resulting from the manufacturing process, material properties or experimental characterisation [1]. At present, the lack of probabilistic studies focusing on mechanical properties variability, implies the absence of proper probabilistic models for FRP. Also, the lack of a solid and large database which contains mechanical properties information, allows the existence of statistical studies based on small size samples (e.g., Atadero [2] or Zureick [3]). In this paper, a probabilistic assessment of 1368 tensile tests carried out by S&P Clever Reinforcement Ibérica during a period of 4 years, focusing on carbon FRP (CFRP) specimens was performed. All specimen tests are pre-cured laminates of epoxy matrices and carbon fibres, produced under the same conditions by the same manufacturer. According to the manufacturer, the average Young's modulus adopted for design is 165 GPa, and the recommended design tensile strengths are 1000 MPa (at elongation 0.6%) and 1300 MPa (at elongation 0.8%). Statistical analysis of the mechanical properties: i) Young's modulus, E f , ii) tensile strength, f f , and iii) ultimate strain, ε fu , were performed. Correlation analysis between properties were also carried out.

Welcome message from author
This document is posted to help you gain knowledge. Please leave a comment to let me know what you think about it! Share it to your friends and learn new things together.
Transcript
FRPRCS-11 Joaquim Barros & José Sena-Cruz (Eds)
UM, Guimarães, 2013
1
Probabilistic Models for Mechanical Properties of Prefabricated CFRP
S. Gomes1, L. Neves2, D. Dias-da-Costa3, P. Fernandes4, E. Júlio5 1ICIST, Departamento de Engenharia Civil, Universidade de Coimbra, [email protected]
2University of Notthingham, e UNIC, Universidade Nova de Lisboa 3INESC, Departamento de Engenharia Civil, Universidade de Coimbra
4ICIST, Departamento de Engenharia Civil, Instituto Politécnico de Leiria 5ICIST, Departamento de Engenharia Civil e Arquitetura, IST, Universidade Técnica de Lisboa
Keywords: Data analysis; Laminate; CFRP; Tensile tests. SUMMARY Fibre reinforced polymer (FRP) composites present a number of interesting mechanical properties for civil engineering. For this reason, the use of this material in structural engineering applications has grown in the last years, leading to the need for better understand of mechanical properties variability. This paper presents a probabilistic study of 1368 specimens, manufactured with carbon fibres and epoxy matrices. The studied properties are: Young's modulus; tensile strength; and ultimate strain. Results show that the Weibull distribution can be used to model all mechanical properties. A low variability of the mechanical properties was also observed. Furthermore, correlation analysis between properties is performed, showing the existence of a high correlation between tensile strength and ultimate strain. Based on the results, probabilistic models are proposed. 1. INTRODUCTION During the last decades, fibre reinforced polymer (FRP) composites have been intensively used in civil construction, in particular in repair and retrofitting of existing structures, due to their technical and economical advantages. However, and despite the increased interest in this material, little research has been dedicated to study the variability of FRP mechanical properties. As known, FRP properties have a significant influence on structural safety, thus making vital the quantification of their variability, associated with uncertainties resulting from the manufacturing process, material properties or experimental characterisation [1]. At present, the lack of probabilistic studies focusing on mechanical properties variability, implies the absence of proper probabilistic models for FRP. Also, the lack of a solid and large database which contains mechanical properties information, allows the existence of statistical studies based on small size samples (e.g., Atadero [2] or Zureick [3]). In this paper, a probabilistic assessment of 1368 tensile tests carried out by S&P Clever Reinforcement Ibérica during a period of 4 years, focusing on carbon FRP (CFRP) specimens was performed. All specimen tests are pre-cured laminates of epoxy matrices and carbon fibres, produced under the same conditions by the same manufacturer. According to the manufacturer, the average Young's modulus adopted for design is 165 GPa, and the recommended design tensile strengths are 1000 MPa (at elongation 0.6%) and 1300 MPa (at elongation 0.8%). Statistical analysis of the mechanical properties: i) Young's modulus, Ef, ii) tensile strength, ff, and iii) ultimate strain, εfu, were performed. Correlation analysis between properties were also carried out.
Probabilistic Models for Mechanical Properties of Prefabricated CFRP S. Gomes, L. Neves, D. Dias-da-Costa, P. Fernandes, E. Júlio
2
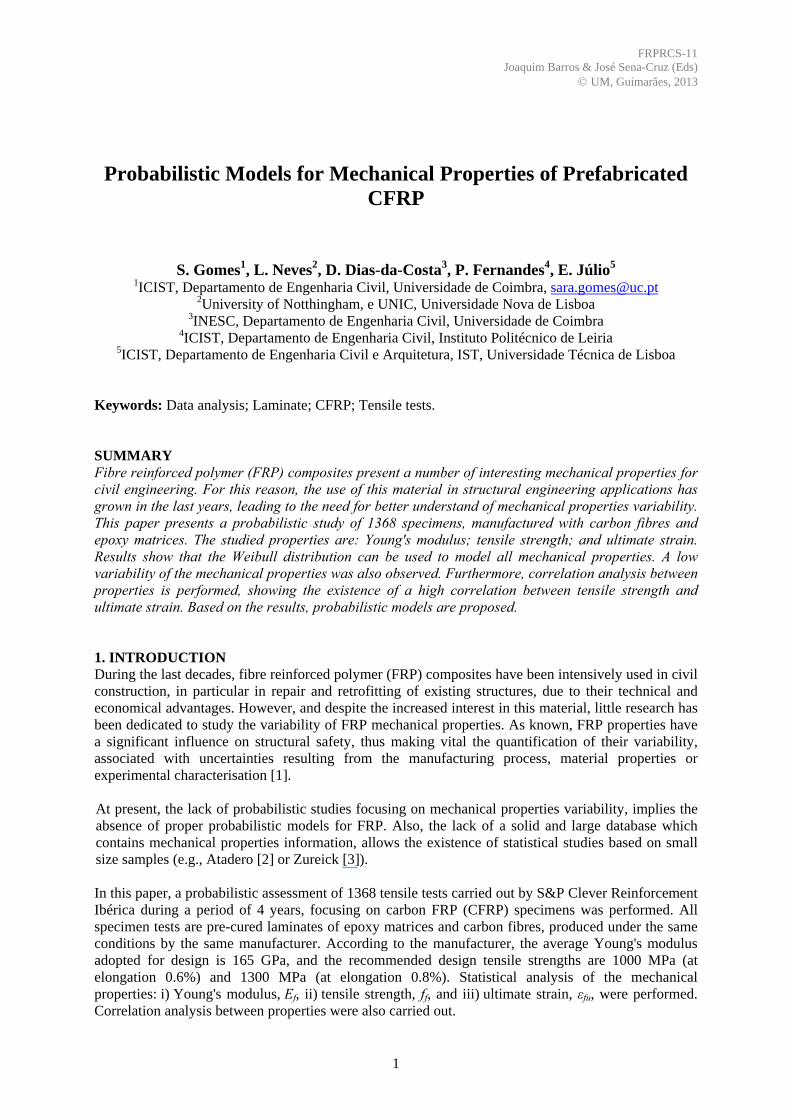
2. EXPERIMENTAL TESTS The tensile tests were carried out according to the test standard ISO 527 [4], on a Zwick Z100 tester machine. A pre-load of 100 N and a loading rate of 2 mm/min were adopted. Furthermore, a load cell and a strain gage were used to measure the loading and the strain, respectively. The test set-up is illustrated in Figure 1.
(a) (b)
Figure 1: Experimental test set-up: (a) scheme; and (b) overview. 3. STATISTICAL ANALYSIS The statistical analysis is performed through the consideration of ten different families of laminated defined by their dimensions: 50×1.2, 50×1.4, 60×1.4, 80×1.2, 80×1.4, 90×1.4, 100×1.2, 100×1.4, 120×1.2 and 120×1.4 mm. A summary of statistical properties of all families according to the laminate type are listed in Table 1. From this table, it is possible to see that the average, standard deviation, minimum and maximum values are very similar between families. In addition, the differences in the average and standard deviation between families are of the same order of magnitude, which indicates that the results are independent of the laminate size. In consequence, the statistical analysis was performed over the full data sets, considering all families merged as one.
Table 1: Statistical summary for each family. Sample type
(mm) 50×1.2 50×1.4 60×1.4 80×1.2 80×1.4 90×1.4 100×1.2 100×1.4 120×1.2 120×1.4
Sample size (#) 85 422 54 110 122 41 144 192 43 155
Av.
Ef (GPa) 172.33 176.01 173.81 177.06 172.19 173.12 176.00 170.83 174.67 174.01
ff (MPa) 2752.6 2617.0 2585.2 2731.5 2593.8 2690.0 2741.7 2642.9 2818.4 2703.2
εfu (%) 1.56 1.46 1.47 1.53 1.48 1.53 1.53 1.52 1.57 1.53
Std.
dev.
Ef (GPa) 8.15 8.53 9.33 6.57 8.89 8.57 5.45 7.73 6.25 5.44
ff (MPa) 257.39 202.36 152.88 219.49 221.88 180.62 229.31 167.27 139.98 194.67
εfu (%) 0.14 0.12 0.09 0.11 0.14 0.10 0.15 0.11 0.10 0.11
Min.
Ef (GPa) 154 141 136 154 118 151 161 139 156 149
ff (MPa) 2190 1780 2150 2090 2130 2240 2170 2050 2510 2230
εfu (%) 1.21 1.00 1.30 1.32 1.15 1.37 1.20 1.09 1.34 1.24
Max.
Ef (GPa) 189 218 189 191 192 185 188 191 186 187
ff (MPa) 3240 3140 2910 3240 3080 2980 3310 3070 3150 3110
εfu (%) 1.82 1.79 1.66 1.84 1.74 1.79 1.89 1.75 1.78 1.75
Two statistical distributions were fit to each data set: i) the Normal, and ii) the two-parameter Weibull. A two-parameter Weibull distribution was chosen instead a three-parameter Weibull distribution since the statistical characterisation of FRP is not improved by a three-parameter Weibull distribution [5]. The probability density function (PDF) of the normal distribution is present in Eq. (1) where μ is the
jaws
strain gages
tabs
CFRP specimen
Probabilistic Models for Mechanical Properties of Prefabricated CFRP S. Gomes, L. Neves, D. Dias-da-Costa, P. Fernandes, E. Júlio
3
mean and σ is the standard deviation. The PDF of the Weibull distribution is present in Eq. (2), where α is the shape parameter and β is the scale parameter.
2
1
21, ; 0; ,
2
x
y f x e x
(1)
1
, ; , 0;0x
xy f x e x
(2)
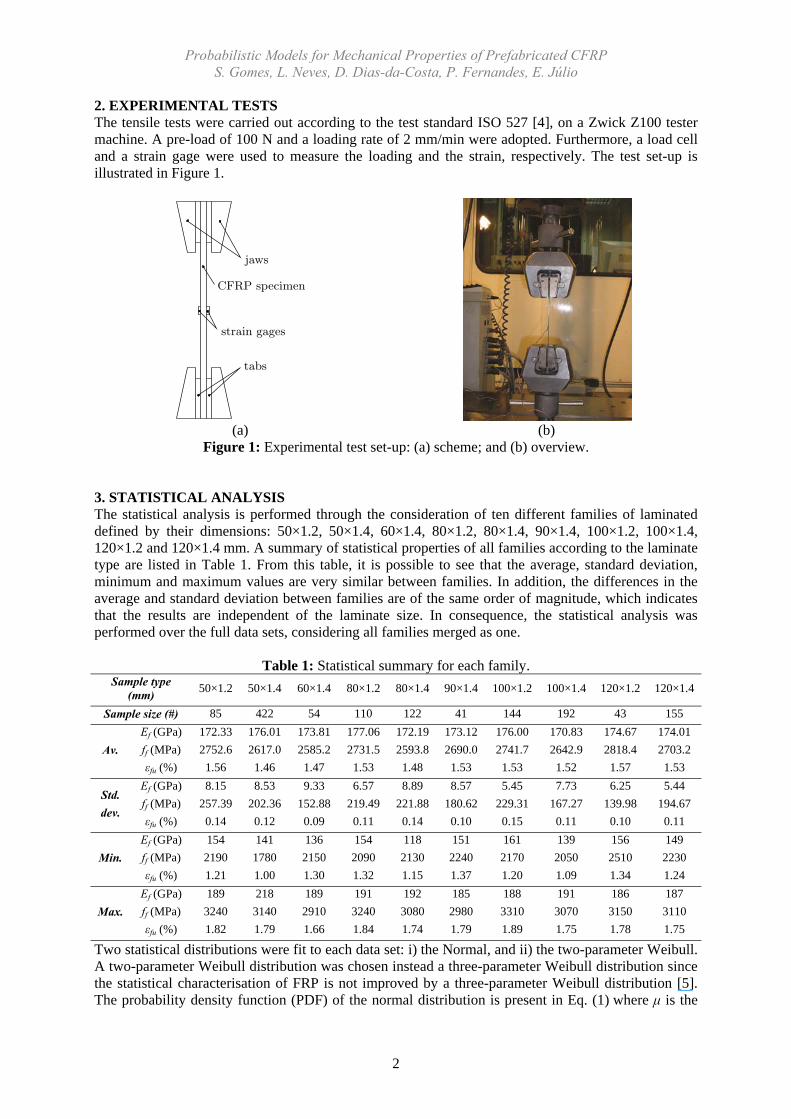
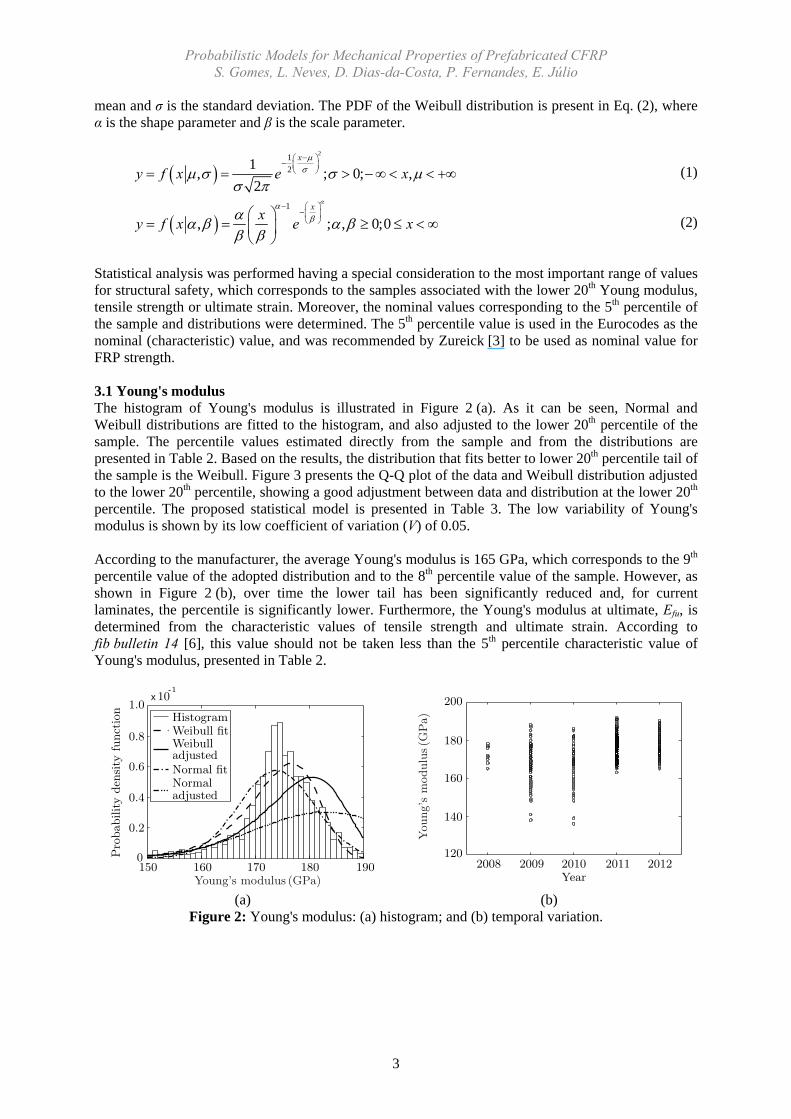
Statistical analysis was performed having a special consideration to the most important range of values for structural safety, which corresponds to the samples associated with the lower 20th Young modulus, tensile strength or ultimate strain. Moreover, the nominal values corresponding to the 5th percentile of the sample and distributions were determined. The 5th percentile value is used in the Eurocodes as the nominal (characteristic) value, and was recommended by Zureick [3] to be used as nominal value for FRP strength. 3.1 Young's modulus The histogram of Young's modulus is illustrated in Figure 2 (a). As it can be seen, Normal and Weibull distributions are fitted to the histogram, and also adjusted to the lower 20th percentile of the sample. The percentile values estimated directly from the sample and from the distributions are presented in Table 2. Based on the results, the distribution that fits better to lower 20th percentile tail of the sample is the Weibull. Figure 3 presents the Q-Q plot of the data and Weibull distribution adjusted to the lower 20th percentile, showing a good adjustment between data and distribution at the lower 20th percentile. The proposed statistical model is presented in Table 3. The low variability of Young's modulus is shown by its low coefficient of variation (V) of 0.05. According to the manufacturer, the average Young's modulus is 165 GPa, which corresponds to the 9th percentile value of the adopted distribution and to the 8th percentile value of the sample. However, as shown in Figure 2 (b), over time the lower tail has been significantly reduced and, for current laminates, the percentile is significantly lower. Furthermore, the Young's modulus at ultimate, Efu, is determined from the characteristic values of tensile strength and ultimate strain. According to fib bulletin 14 [6], this value should not be taken less than the 5th percentile characteristic value of Young's modulus, presented in Table 2.
(a) (b) Figure 2: Young's modulus: (a) histogram; and (b) temporal variation.
x
150 160 170 180 1900
0.2
0.4
0.6
10-1
Pro
bability
den
sity
funct
ion
0.8
1.0Histogram
adjusted
Weibull fitWeibull
NormalNormal fitadjusted
Young’s modulus (GPa)
2008 2009 2010Year
2011 2012120
140
160
180
200
Young’s
modulu
s(G
Pa)
Probabilistic Models for Mechanical Properties of Prefabricated CFRP S. Gomes, L. Neves, D. Dias-da-Costa, P. Fernandes, E. Júlio
4
Table 2: Percentile values of samples and distributions of Young's modulus (GPa).
Percentile Sample Weibull Weibull adjusted
Normal Normal adjusted
5th 162.00 160.16 161.49 162.51 161.13 20th 170.00 168.27 170.81 168.08 171.81
Figure 3: Q-Q plot of Young's modulus.
Table 3: Proposed statistical model of Young's modulus.
α β V 26.2 180.9 0.05
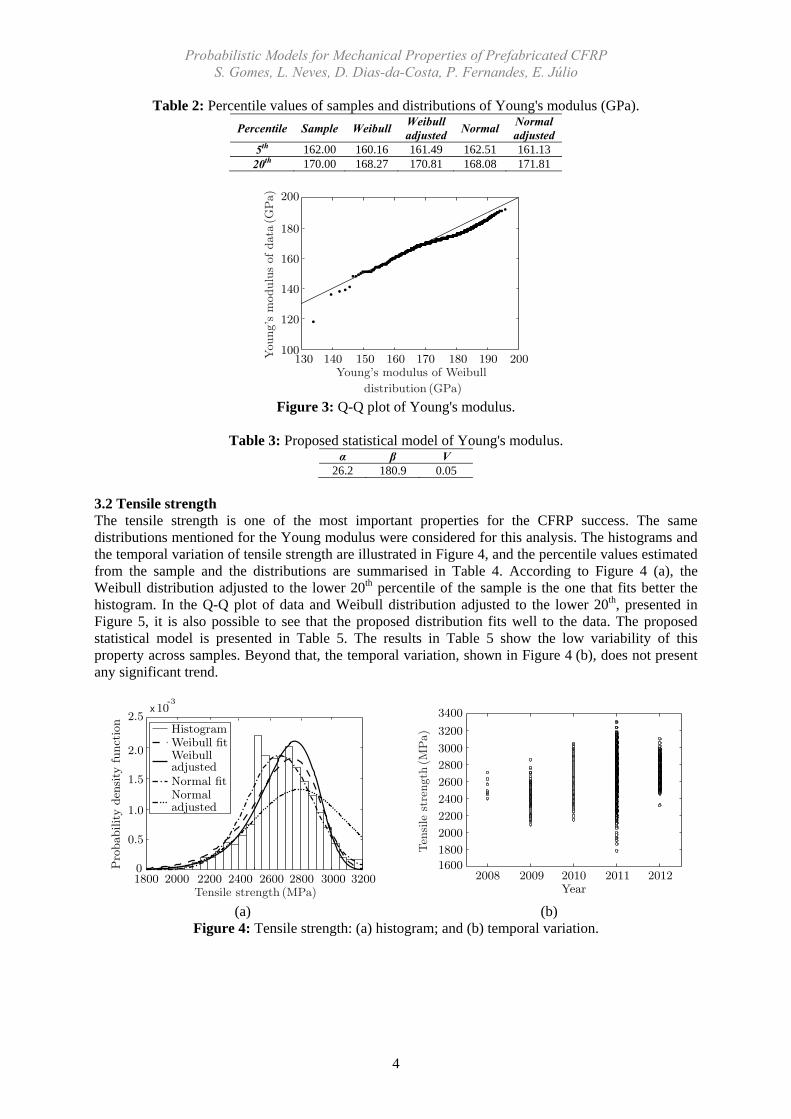
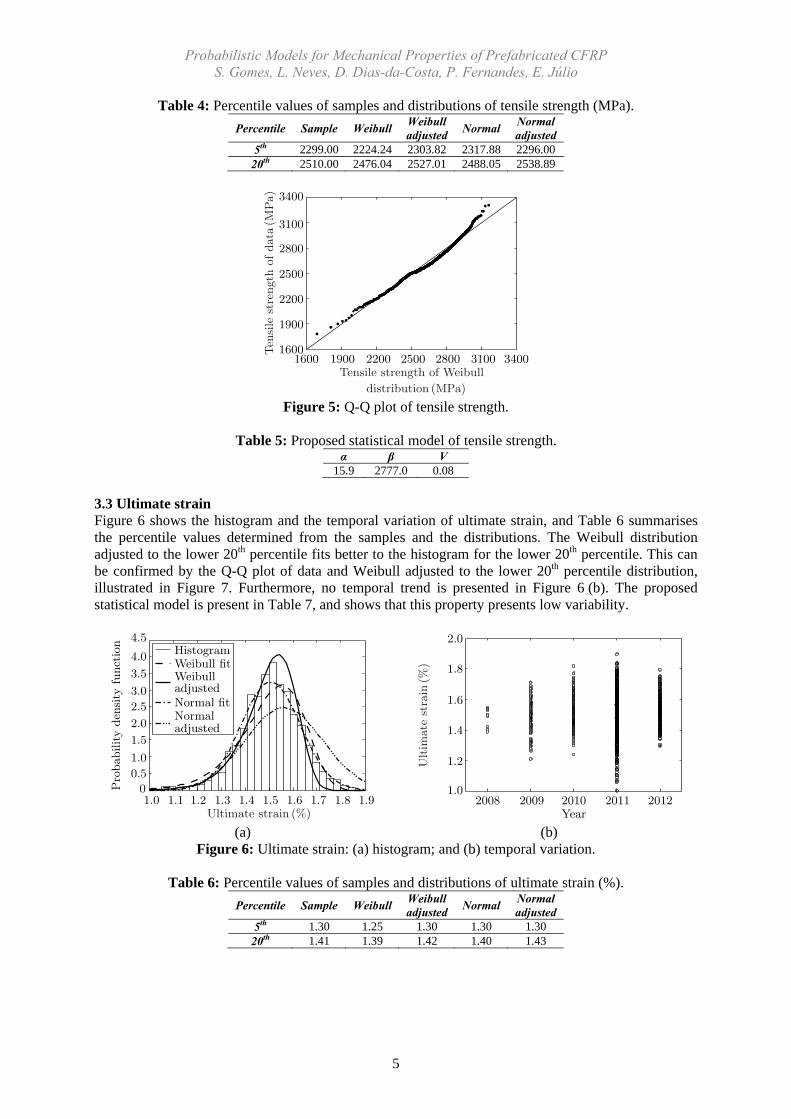
3.2 Tensile strength The tensile strength is one of the most important properties for the CFRP success. The same distributions mentioned for the Young modulus were considered for this analysis. The histograms and the temporal variation of tensile strength are illustrated in Figure 4, and the percentile values estimated from the sample and the distributions are summarised in Table 4. According to Figure 4 (a), the Weibull distribution adjusted to the lower 20th percentile of the sample is the one that fits better the histogram. In the Q-Q plot of data and Weibull distribution adjusted to the lower 20th, presented in Figure 5, it is also possible to see that the proposed distribution fits well to the data. The proposed statistical model is presented in Table 5. The results in Table 5 show the low variability of this property across samples. Beyond that, the temporal variation, shown in Figure 4 (b), does not present any significant trend.
(a) (b) Figure 4: Tensile strength: (a) histogram; and (b) temporal variation.
130 150140 160 170 190180 200100
120
140
160
180
200
Young’s
modulu
sofdata
(GPa)
distribution (GPa)
Young’s modulus of Weibull
x
1800 2000 2800260024002200 3000 32000
0.5
1.0
1.5
2.0
2.5
-310
Pro
bability
den
sity
funct
ion
Histogram
adjusted
Weibull fitWeibulladjustedNormal fitNormal
Tensile strength (MPa)
2008 2009 2010Year
2011 20121600
1800
2000
2200
2600
2800
2400
3200
3000
3400
Ten
sile
stre
ngth
(MPa)
Probabilistic Models for Mechanical Properties of Prefabricated CFRP S. Gomes, L. Neves, D. Dias-da-Costa, P. Fernandes, E. Júlio
5
Table 4: Percentile values of samples and distributions of tensile strength (MPa).
Percentile Sample Weibull Weibull adjusted
Normal Normal adjusted
5th 2299.00 2224.24 2303.82 2317.88 2296.00 20th 2510.00 2476.04 2527.01 2488.05 2538.89
Figure 5: Q-Q plot of tensile strength.
Table 5: Proposed statistical model of tensile strength.
α β V 15.9 2777.0 0.08
3.3 Ultimate strain Figure 6 shows the histogram and the temporal variation of ultimate strain, and Table 6 summarises the percentile values determined from the samples and the distributions. The Weibull distribution adjusted to the lower 20th percentile fits better to the histogram for the lower 20th percentile. This can be confirmed by the Q-Q plot of data and Weibull adjusted to the lower 20th percentile distribution, illustrated in Figure 7. Furthermore, no temporal trend is presented in Figure 6 (b). The proposed statistical model is present in Table 7, and shows that this property presents low variability.
(a) (b) Figure 6: Ultimate strain: (a) histogram; and (b) temporal variation.
Table 6: Percentile values of samples and distributions of ultimate strain (%).
Percentile Sample Weibull Weibull adjusted
Normal Normal adjusted
5th 1.30 1.25 1.30 1.30 1.30 20th 1.41 1.39 1.42 1.40 1.43
1600 1900 2200 2500 31002800 34001600
1900
2200
2800
3100
2500
3400
Ten
sile
stre
ngth
ofdata
(MPa)
distribution (MPa)
Tensile strength of Weibull
1.11.0 1.31.2 1.51.4 1.81.6 1.7 1.90
1.5
0.5
1.0
2.0
2.5
3.0
3.5
4.0
4.5
Pro
bability
den
sity
funct
ion
Histogram
Weibulladjusted
NormalNormal fit
adjusted
Weibull fit
Ultimate strain (%)2008 2009 2010
Year2011 2012
1.0
1.2
1.4
1.6
1.8
2.0
Ult
imate
stra
in(%
)

Probabilistic Models for Mechanical Properties of Prefabricated CFRP S. Gomes, L. Neves, D. Dias-da-Costa, P. Fernandes, E. Júlio
6
Figure 7: Q-Q plot of ultimate strain.
Table 7: Proposed statistical models of ultimate strain.
α β V 17.1 1.5 0.07
3.4 Correlation analysis Linear regression analysis was performed between: i) tensile strength and ultimate strain, ii) Young's modulus and ultimate strain, and iii) tensile strength and Young's modulus. Tensile strength and ultimate strain present a high correlation, as illustrated in Figure 8. This can be confirmed by the high correlation, R2=0.75. The relation between the two variables is estimated according Eq. (3), where ff is in MPa and Z~N(0,1).
0.17 0.0005014 0.0618 %fu ff Z (3)
Figure 8: Scatter diagram of tensile strength vs. ultimate strain (ff, εfu).
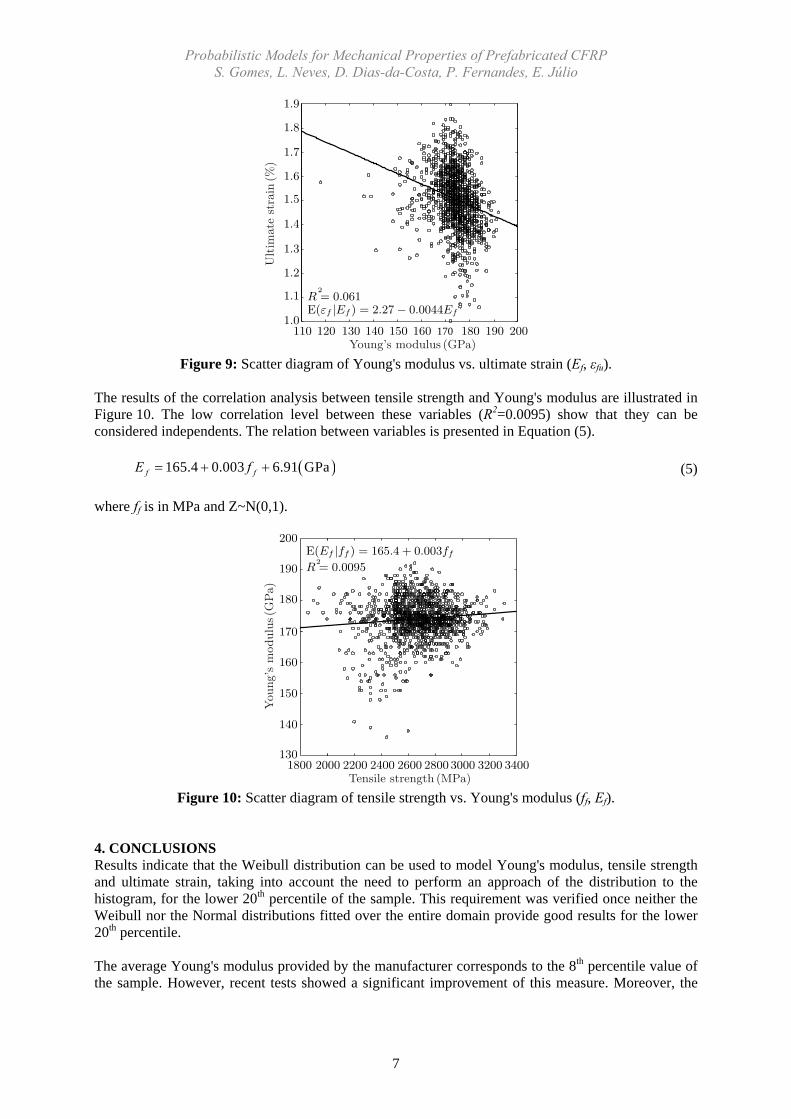
Figure 9 shows the correlation between Young's modulus and ultimate strain. Results show that these two properties exhibit low correlation (R2=0.061). In Eq. (4) the correlation between Young's modulus and ultimate strain is presented.
2.27 0.0044 0.119 %fu fE Z (4)
where Ef is in GPa and Z~N(0,1).
1.00.8 1.41.2 1.6 1.8 2.00.8
1.0
1.2
1.4
1.6
1.8
2.0
distribution (%)
Ultimate strain of WeibullU
ltim
ate
stra
inofdata
(%)
24002100 27001800 3000 33001.0
1.2
1.1
1.3
1.4
1.5
1.7
1.6
1.9
1.8 R = 0.752
Tensile strength (MPa)
Ult
imate
stra
in(%
)
E(ε|ff ) = 0.17 + 0.0005014ff
Probabilistic Models for Mechanical Properties of Prefabricated CFRP S. Gomes, L. Neves, D. Dias-da-Costa, P. Fernandes, E. Júlio
7
Figure 9: Scatter diagram of Young's modulus vs. ultimate strain (Ef, εfu).
The results of the correlation analysis between tensile strength and Young's modulus are illustrated in Figure 10. The low correlation level between these variables (R2=0.0095) show that they can be considered independents. The relation between variables is presented in Equation (5).
165.4 0.003 6.91 GPaf fE f (5)
where ff is in MPa and Z~N(0,1).
Figure 10: Scatter diagram of tensile strength vs. Young's modulus (ff, Ef).
4. CONCLUSIONS Results indicate that the Weibull distribution can be used to model Young's modulus, tensile strength and ultimate strain, taking into account the need to perform an approach of the distribution to the histogram, for the lower 20th percentile of the sample. This requirement was verified once neither the Weibull nor the Normal distributions fitted over the entire domain provide good results for the lower 20th percentile. The average Young's modulus provided by the manufacturer corresponds to the 8th percentile value of the sample. However, recent tests showed a significant improvement of this measure. Moreover, the
170110 120 130 140 190 200180150 1601.0
1.2
1.3
1.1
1.5
1.4
1.7
1.6
1.8
1.9
E(εf |Ef ) = 2.27 − 0.0044Ef
R = 0.0612
Young’s modulus (GPa)
Ult
imate
stra
in(%
)
2000 280026002200 300024001800 34003200130
140
150
160
170
180
190
200
R = 0.00952
E(Ef |ff ) = 165.4 + 0.003ff
Young’s
modulu
s(G
Pa)
Tensile strength (MPa)

Probabilistic Models for Mechanical Properties of Prefabricated CFRP S. Gomes, L. Neves, D. Dias-da-Costa, P. Fernandes, E. Júlio
8
recommended theoretical tensile strength for design, present values far below to the lower tensile strength of the sample. For all studied mechanical properties, the results show out their low variability, which helps to increase structural safety. The tensile strength is the mechanical property which presents the highest variability, and Young's modulus is the property that presents the lower variability. The correlation analysis between properties demonstrate a high correlation between tensile strength and ultimate strain. Furthermore, ultimate strain and Young's modulus present a low correlation and Young's modulus and tensile strength can be considered as independent variables. From this study, probabilistic models derived from 1368 CFRP tensile tests are proposed. Also, nominal values of the sample and the distributions are presented. However, given the different number of composites polymers used in the construction engineering field, further statistical studies for other type of FRP are needed. ACKNOWLEDGMENTS The experimental tests data provided by S&P Clever Reinforcement Ibérica and the financial support of the Portuguese Science and Technology Foundation (FCT), through Ph.D. Grant number SFRH/BD/76345/2011, are gratefully acknowledged. REFERENCES [1] Handbook-MIL17, T.C.M., "Guidelines for characterization of structural materials" Vol. 1. Published jointly by Technomic Publishing Co. and Materials Sciences Corporation in cooperation with ASTM, Lancaster (2002). [2] R. Atadero, "Development of Load and Resistance Factor Design for FRP Strengthening of Reinforced Concrete Structures", in Civil Engineering, University of California, San Diego (2006). [3] A. Zureick, R. Bennett and B.R. Ellingwood, "Statistical Characterization of Fiber-Reinforced Polymer Composite Material Properties for Structural Design", J. Struct. Eng.-ASCE, 132, 1320-1327 (2006). [4] ISO 527-5:2009, "Plastics - Determination of tensile properties - Part 5: Test conditions for unidirectional fibre-reinforced plastic composites" (2009). [5] M. Alqam, R. Bennett and A. Zureick, "Three-parameter vs. two-parameter Weibull distribution for pultruded composite material properties", Compos. Struct., 58, 497-503 (2002). [6] CEB/FIB, "FIB Bulletin 14 - Externally Bonded FRP Reinforcement for RC structures", Lausanne (2001).
Related Documents