272 IEEE TRANSACTIONS ON INTELLIGENT TRANSPORTATION SYSTEMS, VOL. 10, NO. 2,JUNE 2009 Probabilistic Lane Tracking in Difficult Road Scenarios Using Stereovision Radu Danescu and Sergiu Nedevschi, Member, IEEE Abstract—Accurate and robust lane results are of great sig- nificance in any driving-assistance system. To achieve robustness and accuracy in difficult scenarios, probabilistic estimation tech- niques are needed to compensate for the errors in the detection of lane-delimiting features. This paper presents a solution for lane estimation in difficult scenarios based on the particle-filtering framework. The solution employs a novel technique for pitch detection based on the fusion of two stereovision-based cues, a novel method for particle measurement and weighing using mul- tiple lane-delimiting cues extracted by grayscale and stereo data processing, and a novel method for deciding upon the validity of the lane-estimation results. Initialization samples are used for uniform handling of the road discontinuities, eliminating the need for explicit track initialization. The resulting solution has proven to be a reliable and fast lane detector for difficult scenarios. Index Terms—Cue fusion, lane detection, particle filtering, stereovision, tracking. I. I NTRODUCTION L ANE/ROAD detection has been a fertile research field for decades due to the great significance of accurate and robust road description results in any driving-assistance system. The algorithms have increasingly become complex, as the targeted scenarios increasingly became difficult. From the highway scenario, the lane-detection systems moved to city and country roads. With this move, the initial emphasis on lane- delimiting features, such as lane markings, was replaced by the emphasis on model parameter estimation techniques, which use static and dynamic knowledge-based probabilistic constraints to counteract possible noisy features and smooth the result. These constraints lead to probabilistic reasoning in the form of tracking, which is traditionally achieved by the use of the Kalman filter (KF). The use of KF tracking has the advantage of reducing the search space, eliminating the detection outliers, and smoothing the result. The features that make the KF solutions smooth and efficient are the very features that cause problems when the road is not continuous. Sharp turns, lane changes, and atypical road geometries pose problems to a tracker that represents the lane probability density as a Gaussian function, and the reduction of the search space around the past results makes it difficult to han- Manuscript received April 10, 2008; revised January 5, 2009 and January 28, 2009. First published April 28, 2009; current version published June 2, 2009. The Associate Editor for this paper was R. Hammoud. The authors are with the Technical University of Cluj-Napoca, 400 020 Cluj- Napoca, Romania (e-mail: [email protected]; Sergiu.Nedevschi@ cs.utcluj.ro). Color versions of one or more of the figures in this paper are available online at http://ieeexplore.ieee.org. Digital Object Identifier 10.1109/TITS.2009.2018328 dle new hypotheses and causes detection errors to accumulate if the search regions are drawn toward false delimiters. Particle filtering is a novel technology for probability-based tracking, allowing multiple-hypothesis tracking, simple mea- surement, and faster handling of road discontinuities. This paper describes a lane-detection system that combines the advantage of particle filtering, stereovision, and grayscale image processing to achieve robust lane-estimation results in difficult scenarios of city, highway, and country roads. II. PROBABILISTIC FOUNDATIONS OF LANE TRACKING While there is no universal definition of tracking, we can regard it as the process of reasoning about the state of a time- evolving entity, given a sequence of observations. In particular, lane tracking can be defined as the process of reasoning about the position and geometry of the lane, given a sequence of image-derived feature sets. The goal of tracking as probabilistic inference is to evaluate P (X i |Y 0 = y 0 ,..., Y i = y i ), i.e., to compute the conditional probability density of state X i , given the sequence of measure- ments from the past and current frames. Due to the fact that the tracking process must deliver results at each frame and that a tracker should be able to function in mostly the same way for an indefinite period of time, the process of estimation of P (X i |Y 0 = y 0 ,..., Y i = y i ) has to be written in a recursive manner, such that the results of the past frames can be reused in the estimation for the current frame. To achieve this, four concepts are used. 1) Dynamic model: P (X i |X i−1 ) is the probability of reach- ing some value of random variable X i , given the past state X i−1 , under the assumption that only the immediate past matters. 2) Prediction: Computation of the conditional probability density of the current state, given the past sequence of measurements, i.e., P (X i |Y 0 = y 0 ,..., Y i−1 = y i−1 ). Given the simplification assumption that only the imme- diate past matters, the prediction probability values can be recursively computed, given the past results and the dynamic model, i.e., P (X i |y 0 ,...,y i−1 ) = P (X i |X i−1 )P (X i−1 |y 0 ,...,y i−1 )dX i−1 . (1) 3) Data association: At each frame i, there may be several measurements that are available, and not all of them are equally useful. Denoting by y r i the rth measurement 1524-9050/$25.00 © 2009 IEEE

Welcome message from author
This document is posted to help you gain knowledge. Please leave a comment to let me know what you think about it! Share it to your friends and learn new things together.
Transcript
272 IEEE TRANSACTIONS ON INTELLIGENT TRANSPORTATION SYSTEMS, VOL. 10, NO. 2, JUNE 2009
Probabilistic Lane Tracking in Difficult RoadScenarios Using Stereovision
Radu Danescu and Sergiu Nedevschi, Member, IEEE
Abstract—Accurate and robust lane results are of great sig-nificance in any driving-assistance system. To achieve robustnessand accuracy in difficult scenarios, probabilistic estimation tech-niques are needed to compensate for the errors in the detectionof lane-delimiting features. This paper presents a solution forlane estimation in difficult scenarios based on the particle-filteringframework. The solution employs a novel technique for pitchdetection based on the fusion of two stereovision-based cues, anovel method for particle measurement and weighing using mul-tiple lane-delimiting cues extracted by grayscale and stereo dataprocessing, and a novel method for deciding upon the validityof the lane-estimation results. Initialization samples are used foruniform handling of the road discontinuities, eliminating the needfor explicit track initialization. The resulting solution has provento be a reliable and fast lane detector for difficult scenarios.
Index Terms—Cue fusion, lane detection, particle filtering,stereovision, tracking.
I. INTRODUCTION
LANE/ROAD detection has been a fertile research fieldfor decades due to the great significance of accurate
and robust road description results in any driving-assistancesystem. The algorithms have increasingly become complex, asthe targeted scenarios increasingly became difficult. From thehighway scenario, the lane-detection systems moved to city andcountry roads. With this move, the initial emphasis on lane-delimiting features, such as lane markings, was replaced by theemphasis on model parameter estimation techniques, which usestatic and dynamic knowledge-based probabilistic constraintsto counteract possible noisy features and smooth the result.These constraints lead to probabilistic reasoning in the formof tracking, which is traditionally achieved by the use of theKalman filter (KF). The use of KF tracking has the advantageof reducing the search space, eliminating the detection outliers,and smoothing the result.
The features that make the KF solutions smooth and efficientare the very features that cause problems when the road isnot continuous. Sharp turns, lane changes, and atypical roadgeometries pose problems to a tracker that represents the laneprobability density as a Gaussian function, and the reduction ofthe search space around the past results makes it difficult to han-
Manuscript received April 10, 2008; revised January 5, 2009 and January 28,2009. First published April 28, 2009; current version published June 2, 2009.The Associate Editor for this paper was R. Hammoud.
The authors are with the Technical University of Cluj-Napoca, 400 020 Cluj-Napoca, Romania (e-mail: [email protected]; [email protected]).
Color versions of one or more of the figures in this paper are available onlineat http://ieeexplore.ieee.org.
Digital Object Identifier 10.1109/TITS.2009.2018328
dle new hypotheses and causes detection errors to accumulateif the search regions are drawn toward false delimiters.
Particle filtering is a novel technology for probability-basedtracking, allowing multiple-hypothesis tracking, simple mea-surement, and faster handling of road discontinuities.
This paper describes a lane-detection system that combinesthe advantage of particle filtering, stereovision, and grayscaleimage processing to achieve robust lane-estimation results indifficult scenarios of city, highway, and country roads.
II. PROBABILISTIC FOUNDATIONS OF LANE TRACKING
While there is no universal definition of tracking, we canregard it as the process of reasoning about the state of a time-evolving entity, given a sequence of observations. In particular,lane tracking can be defined as the process of reasoning aboutthe position and geometry of the lane, given a sequence ofimage-derived feature sets.
The goal of tracking as probabilistic inference is to evaluateP (Xi|Y0 = y0, . . . ,Yi = yi), i.e., to compute the conditionalprobability density of state Xi, given the sequence of measure-ments from the past and current frames.
Due to the fact that the tracking process must deliver resultsat each frame and that a tracker should be able to functionin mostly the same way for an indefinite period of time, theprocess of estimation of P (Xi|Y0 = y0, . . . ,Yi = yi) has tobe written in a recursive manner, such that the results of the pastframes can be reused in the estimation for the current frame. Toachieve this, four concepts are used.
1) Dynamic model: P (Xi|Xi−1) is the probability of reach-ing some value of random variable Xi, given the past stateXi−1, under the assumption that only the immediate pastmatters.
2) Prediction: Computation of the conditional probabilitydensity of the current state, given the past sequence ofmeasurements, i.e., P (Xi|Y0 = y0, . . . ,Yi−1 = yi−1).Given the simplification assumption that only the imme-diate past matters, the prediction probability values canbe recursively computed, given the past results and thedynamic model, i.e.,
P (Xi|y0, . . . , yi−1)
=∫
P (Xi|Xi−1)P (Xi−1|y0, . . . , yi−1)dXi−1. (1)
3) Data association: At each frame i, there may be severalmeasurements that are available, and not all of themare equally useful. Denoting by yr
i the rth measurement
1524-9050/$25.00 © 2009 IEEE
DANESCU AND NEDEVSCHI: PROBABILISTIC LANE TRACKING IN DIFFICULT ROAD SCENARIOS USING STEREOVISION 273
Fig. 1. Analogy between a probability density function and a set of weightedsamples.
of frame i, the probability of this measurement beinguseful is expressed as P (Yi = yr
i |y0, . . . , yi−1). If eachmeasurement is conditionally independent of the others(the measurement independence assumption is taken), theusefulness of each measurement can be computed as
P (Yi = yri |y0, . . . yi−1)
=∫
P (Yi = yri |Xi) P (Xi|y0, . . . , yi−1)dXi. (2)
4) State update: State probability density P (Xi|Y0 = y0,. . . ,Yi = yi), which is the end result of the trackingprocess, is computed using Bayes’ rule, i.e.,
P (Xi|y0, . . . , yi)=P (yi|Xi)P (Xi|y0, . . . , yi−1)∫
P (yi|Xi)P (Xi|y0, . . . , yi−1)dXi. (3)
The equations of tracking as probabilistic inference are toocomplex to apply in the general case. Furthermore, the proba-bility densities involved are impossible to analytically representmost of the time and are therefore approximated. Approxi-mating means either coercing them to a known probabilitydensity function, such as a Gaussian, or maintaining a discretenumerical representation throughout the whole process. TheGaussian representation leads to the well-known KF solutions,and the representation as discrete samples leads to the particle-filtering solutions.
III. PARTICLE FILTERING
A practical approach to tracking general probability densityfunctions, i.e., particle filtering, is described in [3]. Instead oftrying to analytically approximate an unknown function, theirsystem uses N discrete values called “samples” or “particles.”At each given time t, a particle i is defined by a value xi
t and aweight πi
t, with the sum of all weights being 1 (see Fig. 1).The problem of tracking becomes the problem of evaluating
the values and the weights, given a dynamic model and anobservation density function.
For algorithm optimization purposes, a parameter is addedto each particle, changing the particle representation to{xi
t, πit, c
it, i = 1, . . . , N}. This parameter is defined as the sum
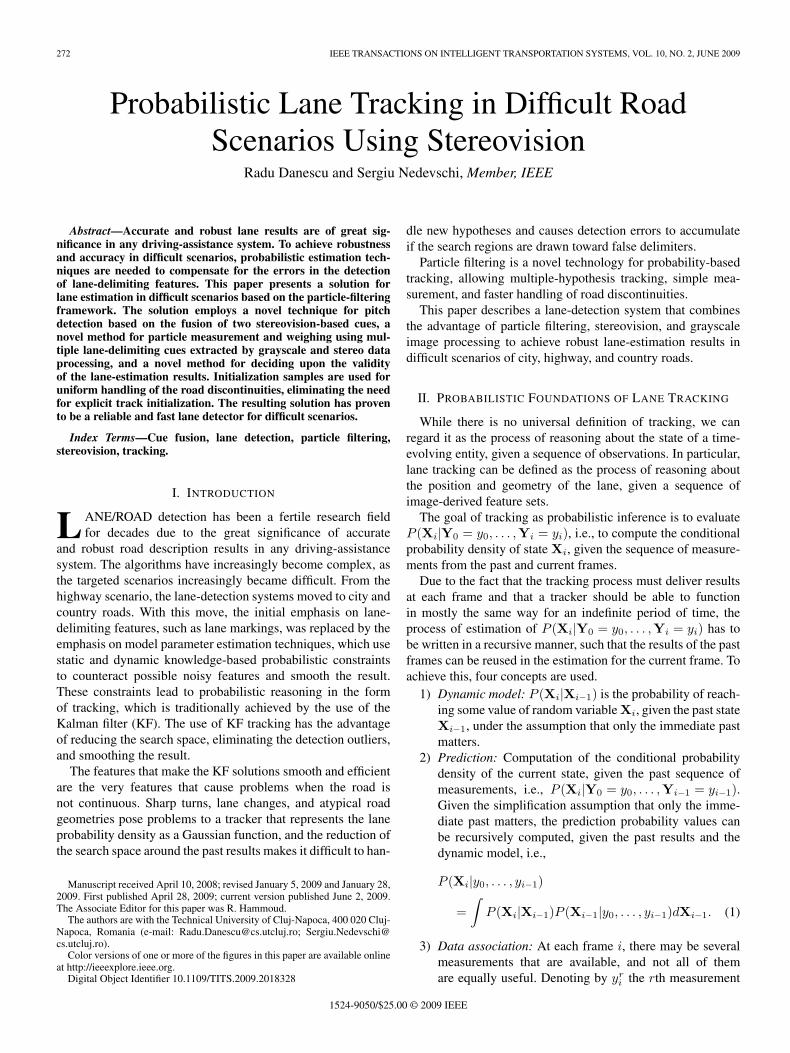
Fig. 2. Same probability density function approximated by weighted andweightless particles.
of the weights of each particle from 1 to i (a cumulativehistogram). Each iteration of the CONDENSATION algorithmhas the aim of evaluating a new set of particles, given theprevious set, the dynamic model, and the measurements.
The first step of the algorithm is resampling. A weightedsample set is transformed into a new set of samples of equalweight but uneven concentration through the domain of valuesof x. This is achieved by performing N random draws fromthe particle set using the particle weights as probabilities forparticle selection. A particle having a larger weight will beselected several times, whereas a particle having a low weightmay not be selected at all. The new set of weightless particlesand the weighted set approximate the same density function(see Fig. 2).
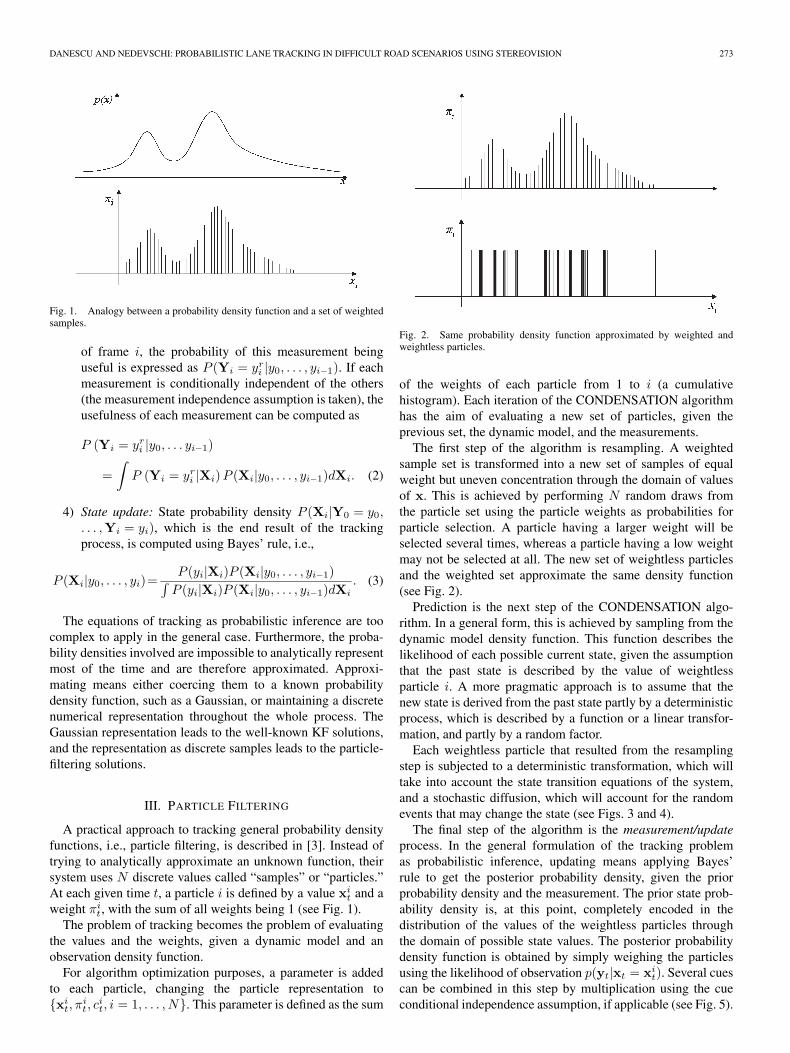
Prediction is the next step of the CONDENSATION algo-rithm. In a general form, this is achieved by sampling from thedynamic model density function. This function describes thelikelihood of each possible current state, given the assumptionthat the past state is described by the value of weightlessparticle i. A more pragmatic approach is to assume that thenew state is derived from the past state partly by a deterministicprocess, which is described by a function or a linear transfor-mation, and partly by a random factor.
Each weightless particle that resulted from the resamplingstep is subjected to a deterministic transformation, which willtake into account the state transition equations of the system,and a stochastic diffusion, which will account for the randomevents that may change the state (see Figs. 3 and 4).
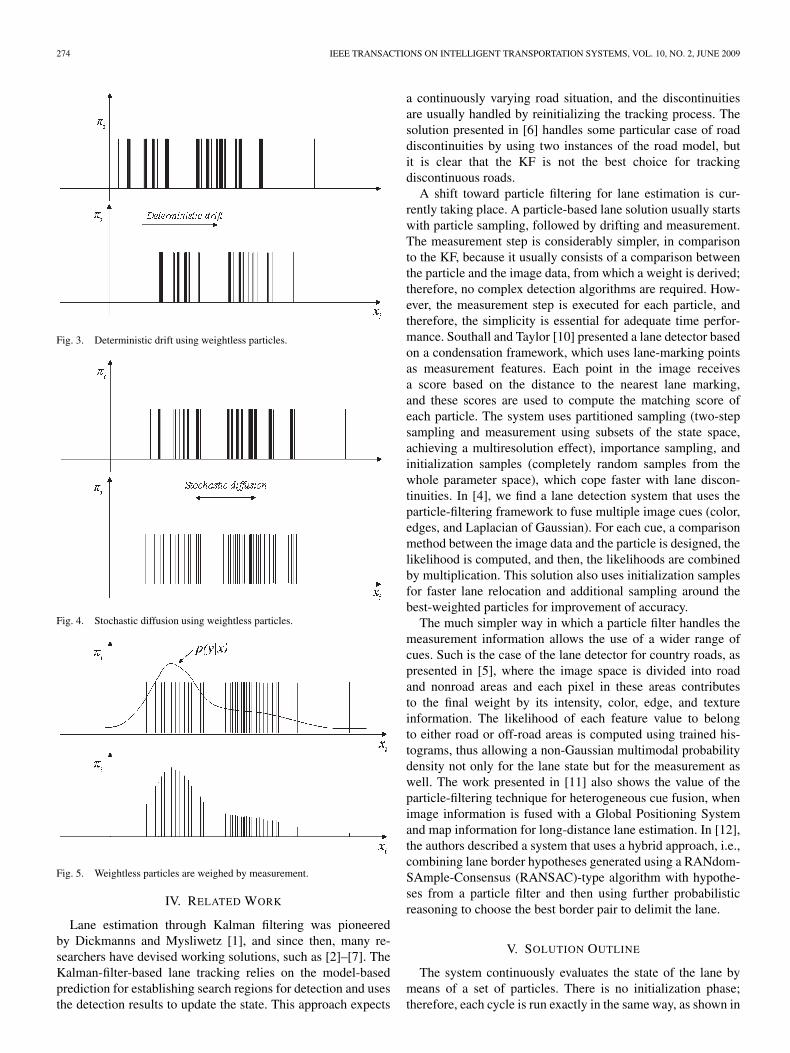
The final step of the algorithm is the measurement/updateprocess. In the general formulation of the tracking problemas probabilistic inference, updating means applying Bayes’rule to get the posterior probability density, given the priorprobability density and the measurement. The prior state prob-ability density is, at this point, completely encoded in thedistribution of the values of the weightless particles throughthe domain of possible state values. The posterior probabilitydensity function is obtained by simply weighing the particlesusing the likelihood of observation p(yt|xt = xi
t). Several cuescan be combined in this step by multiplication using the cueconditional independence assumption, if applicable (see Fig. 5).
274 IEEE TRANSACTIONS ON INTELLIGENT TRANSPORTATION SYSTEMS, VOL. 10, NO. 2, JUNE 2009
Fig. 3. Deterministic drift using weightless particles.
Fig. 4. Stochastic diffusion using weightless particles.
Fig. 5. Weightless particles are weighed by measurement.
IV. RELATED WORK
Lane estimation through Kalman filtering was pioneeredby Dickmanns and Mysliwetz [1], and since then, many re-searchers have devised working solutions, such as [2]–[7]. TheKalman-filter-based lane tracking relies on the model-basedprediction for establishing search regions for detection and usesthe detection results to update the state. This approach expects
a continuously varying road situation, and the discontinuitiesare usually handled by reinitializing the tracking process. Thesolution presented in [6] handles some particular case of roaddiscontinuities by using two instances of the road model, butit is clear that the KF is not the best choice for trackingdiscontinuous roads.
A shift toward particle filtering for lane estimation is cur-rently taking place. A particle-based lane solution usually startswith particle sampling, followed by drifting and measurement.The measurement step is considerably simpler, in comparisonto the KF, because it usually consists of a comparison betweenthe particle and the image data, from which a weight is derived;therefore, no complex detection algorithms are required. How-ever, the measurement step is executed for each particle, andtherefore, the simplicity is essential for adequate time perfor-mance. Southall and Taylor [10] presented a lane detector basedon a condensation framework, which uses lane-marking pointsas measurement features. Each point in the image receivesa score based on the distance to the nearest lane marking,and these scores are used to compute the matching score ofeach particle. The system uses partitioned sampling (two-stepsampling and measurement using subsets of the state space,achieving a multiresolution effect), importance sampling, andinitialization samples (completely random samples from thewhole parameter space), which cope faster with lane discon-tinuities. In [4], we find a lane detection system that uses theparticle-filtering framework to fuse multiple image cues (color,edges, and Laplacian of Gaussian). For each cue, a comparisonmethod between the image data and the particle is designed, thelikelihood is computed, and then, the likelihoods are combinedby multiplication. This solution also uses initialization samplesfor faster lane relocation and additional sampling around thebest-weighted particles for improvement of accuracy.
The much simpler way in which a particle filter handles themeasurement information allows the use of a wider range ofcues. Such is the case of the lane detector for country roads, aspresented in [5], where the image space is divided into roadand nonroad areas and each pixel in these areas contributesto the final weight by its intensity, color, edge, and textureinformation. The likelihood of each feature value to belongto either road or off-road areas is computed using trained his-tograms, thus allowing a non-Gaussian multimodal probabilitydensity not only for the lane state but for the measurement aswell. The work presented in [11] also shows the value of theparticle-filtering technique for heterogeneous cue fusion, whenimage information is fused with a Global Positioning Systemand map information for long-distance lane estimation. In [12],the authors described a system that uses a hybrid approach, i.e.,combining lane border hypotheses generated using a RANdom-SAmple-Consensus (RANSAC)-type algorithm with hypothe-ses from a particle filter and then using further probabilisticreasoning to choose the best border pair to delimit the lane.
V. SOLUTION OUTLINE
The system continuously evaluates the state of the lane bymeans of a set of particles. There is no initialization phase;therefore, each cycle is run exactly in the same way, as shown in
DANESCU AND NEDEVSCHI: PROBABILISTIC LANE TRACKING IN DIFFICULT ROAD SCENARIOS USING STEREOVISION 275
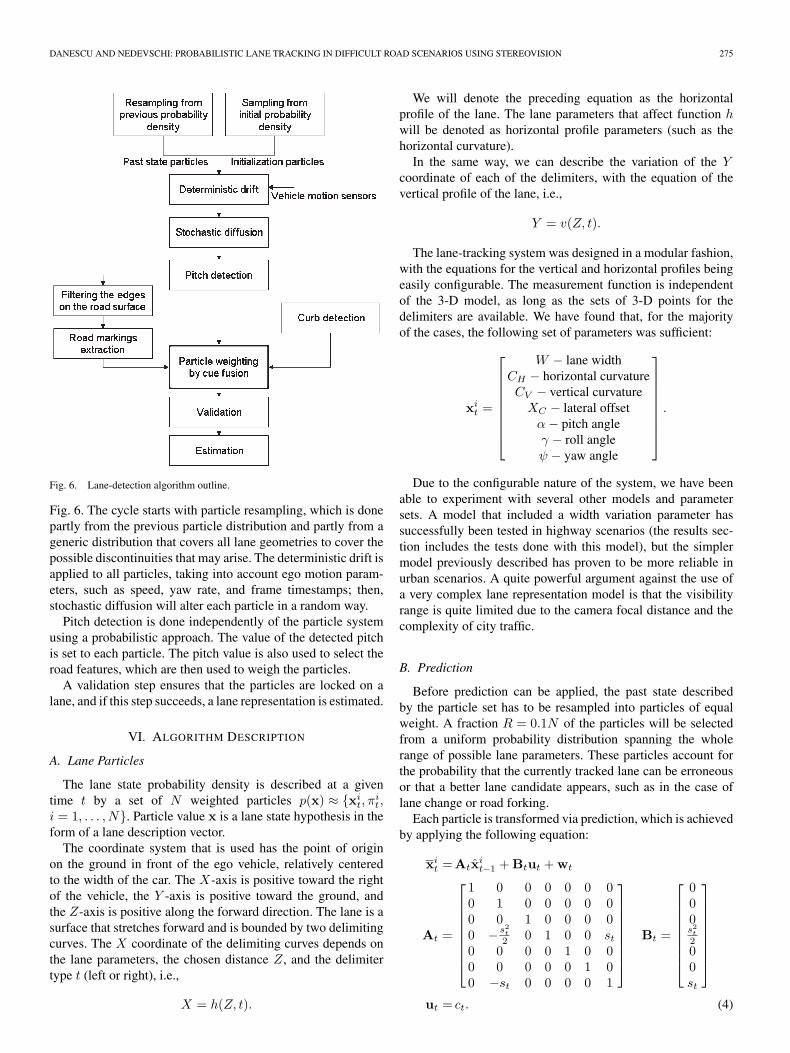
Fig. 6. Lane-detection algorithm outline.
Fig. 6. The cycle starts with particle resampling, which is donepartly from the previous particle distribution and partly from ageneric distribution that covers all lane geometries to cover thepossible discontinuities that may arise. The deterministic drift isapplied to all particles, taking into account ego motion param-eters, such as speed, yaw rate, and frame timestamps; then,stochastic diffusion will alter each particle in a random way.
Pitch detection is done independently of the particle systemusing a probabilistic approach. The value of the detected pitchis set to each particle. The pitch value is also used to select theroad features, which are then used to weigh the particles.
A validation step ensures that the particles are locked on alane, and if this step succeeds, a lane representation is estimated.
VI. ALGORITHM DESCRIPTION
A. Lane Particles
The lane state probability density is described at a giventime t by a set of N weighted particles p(x) ≈ {xi
t, πit,
i = 1, . . . , N}. Particle value x is a lane state hypothesis in theform of a lane description vector.
The coordinate system that is used has the point of originon the ground in front of the ego vehicle, relatively centeredto the width of the car. The X-axis is positive toward the rightof the vehicle, the Y -axis is positive toward the ground, andthe Z-axis is positive along the forward direction. The lane is asurface that stretches forward and is bounded by two delimitingcurves. The X coordinate of the delimiting curves depends onthe lane parameters, the chosen distance Z, and the delimitertype t (left or right), i.e.,
X = h(Z, t).
We will denote the preceding equation as the horizontalprofile of the lane. The lane parameters that affect function hwill be denoted as horizontal profile parameters (such as thehorizontal curvature).
In the same way, we can describe the variation of the Ycoordinate of each of the delimiters, with the equation of thevertical profile of the lane, i.e.,
Y = v(Z, t).
The lane-tracking system was designed in a modular fashion,with the equations for the vertical and horizontal profiles beingeasily configurable. The measurement function is independentof the 3-D model, as long as the sets of 3-D points for thedelimiters are available. We have found that, for the majorityof the cases, the following set of parameters was sufficient:
xit =
⎡⎢⎢⎢⎢⎢⎢⎢⎣
W − lane widthCH − horizontal curvatureCV − vertical curvature
XC − lateral offsetα − pitch angleγ − roll angleψ − yaw angle
⎤⎥⎥⎥⎥⎥⎥⎥⎦
.
Due to the configurable nature of the system, we have beenable to experiment with several other models and parametersets. A model that included a width variation parameter hassuccessfully been tested in highway scenarios (the results sec-tion includes the tests done with this model), but the simplermodel previously described has proven to be more reliable inurban scenarios. A quite powerful argument against the use ofa very complex lane representation model is that the visibilityrange is quite limited due to the camera focal distance and thecomplexity of city traffic.
B. Prediction
Before prediction can be applied, the past state describedby the particle set has to be resampled into particles of equalweight. A fraction R = 0.1N of the particles will be selectedfrom a uniform probability distribution spanning the wholerange of possible lane parameters. These particles account forthe probability that the currently tracked lane can be erroneousor that a better lane candidate appears, such as in the case oflane change or road forking.
Each particle is transformed via prediction, which is achievedby applying the following equation:
xit =Atx̂i
t−1 + Btut + wt
At =
⎡⎢⎢⎢⎢⎢⎢⎢⎣
1 0 0 0 0 0 00 1 0 0 0 0 00 0 1 0 0 0 00 − s2
t
2 0 1 0 0 st
0 0 0 0 1 0 00 0 0 0 0 1 00 −st 0 0 0 0 1
⎤⎥⎥⎥⎥⎥⎥⎥⎦
Bt =
⎡⎢⎢⎢⎢⎢⎢⎢⎣
000s2
t
200st
⎤⎥⎥⎥⎥⎥⎥⎥⎦
ut = ct. (4)
276 IEEE TRANSACTIONS ON INTELLIGENT TRANSPORTATION SYSTEMS, VOL. 10, NO. 2, JUNE 2009
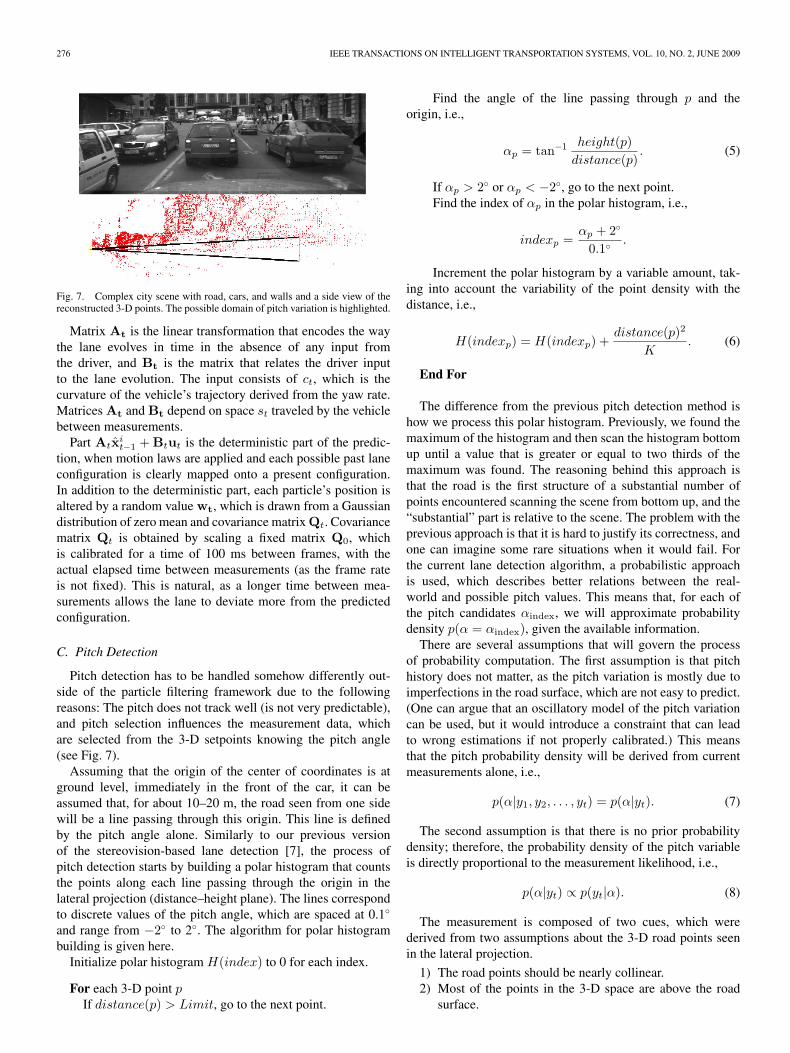
Fig. 7. Complex city scene with road, cars, and walls and a side view of thereconstructed 3-D points. The possible domain of pitch variation is highlighted.
Matrix At is the linear transformation that encodes the waythe lane evolves in time in the absence of any input fromthe driver, and Bt is the matrix that relates the driver inputto the lane evolution. The input consists of ct, which is thecurvature of the vehicle’s trajectory derived from the yaw rate.Matrices At and Bt depend on space st traveled by the vehiclebetween measurements.
Part Atx̂it−1 + Btut is the deterministic part of the predic-
tion, when motion laws are applied and each possible past laneconfiguration is clearly mapped onto a present configuration.In addition to the deterministic part, each particle’s position isaltered by a random value wt, which is drawn from a Gaussiandistribution of zero mean and covariance matrix Qt. Covariancematrix Qt is obtained by scaling a fixed matrix Q0, whichis calibrated for a time of 100 ms between frames, with theactual elapsed time between measurements (as the frame rateis not fixed). This is natural, as a longer time between mea-surements allows the lane to deviate more from the predictedconfiguration.
C. Pitch Detection
Pitch detection has to be handled somehow differently out-side of the particle filtering framework due to the followingreasons: The pitch does not track well (is not very predictable),and pitch selection influences the measurement data, whichare selected from the 3-D setpoints knowing the pitch angle(see Fig. 7).
Assuming that the origin of the center of coordinates is atground level, immediately in the front of the car, it can beassumed that, for about 10–20 m, the road seen from one sidewill be a line passing through this origin. This line is definedby the pitch angle alone. Similarly to our previous versionof the stereovision-based lane detection [7], the process ofpitch detection starts by building a polar histogram that countsthe points along each line passing through the origin in thelateral projection (distance–height plane). The lines correspondto discrete values of the pitch angle, which are spaced at 0.1◦
and range from −2◦ to 2◦. The algorithm for polar histogrambuilding is given here.
Initialize polar histogram H(index) to 0 for each index.
For each 3-D point pIf distance(p) > Limit, go to the next point.
Find the angle of the line passing through p and theorigin, i.e.,
αp = tan−1 height(p)distance(p)
. (5)
If αp > 2◦ or αp < −2◦, go to the next point.Find the index of αp in the polar histogram, i.e.,
indexp =αp + 2◦
0.1◦.
Increment the polar histogram by a variable amount, tak-ing into account the variability of the point density with thedistance, i.e.,
H(indexp) = H(indexp) +distance(p)2
K. (6)
End For
The difference from the previous pitch detection method ishow we process this polar histogram. Previously, we found themaximum of the histogram and then scan the histogram bottomup until a value that is greater or equal to two thirds of themaximum was found. The reasoning behind this approach isthat the road is the first structure of a substantial number ofpoints encountered scanning the scene from bottom up, and the“substantial” part is relative to the scene. The problem with theprevious approach is that it is hard to justify its correctness, andone can imagine some rare situations when it would fail. Forthe current lane detection algorithm, a probabilistic approachis used, which describes better relations between the real-world and possible pitch values. This means that, for each ofthe pitch candidates αindex, we will approximate probabilitydensity p(α = αindex), given the available information.
There are several assumptions that will govern the processof probability computation. The first assumption is that pitchhistory does not matter, as the pitch variation is mostly due toimperfections in the road surface, which are not easy to predict.(One can argue that an oscillatory model of the pitch variationcan be used, but it would introduce a constraint that can leadto wrong estimations if not properly calibrated.) This meansthat the pitch probability density will be derived from currentmeasurements alone, i.e.,
p(α|y1, y2, . . . , yt) = p(α|yt). (7)
The second assumption is that there is no prior probabilitydensity; therefore, the probability density of the pitch variableis directly proportional to the measurement likelihood, i.e.,
p(α|yt) ∝ p(yt|α). (8)
The measurement is composed of two cues, which werederived from two assumptions about the 3-D road points seenin the lateral projection.
1) The road points should be nearly collinear.2) Most of the points in the 3-D space are above the road
surface.
DANESCU AND NEDEVSCHI: PROBABILISTIC LANE TRACKING IN DIFFICULT ROAD SCENARIOS USING STEREOVISION 277
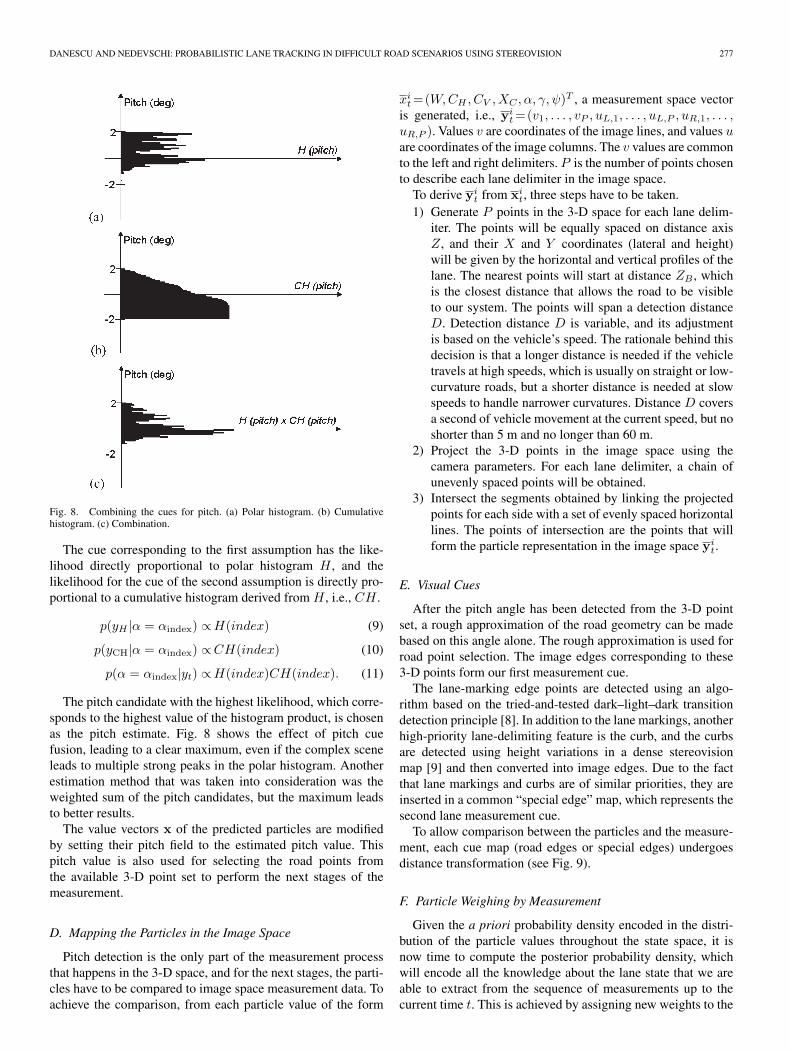
Fig. 8. Combining the cues for pitch. (a) Polar histogram. (b) Cumulativehistogram. (c) Combination.
The cue corresponding to the first assumption has the like-lihood directly proportional to polar histogram H , and thelikelihood for the cue of the second assumption is directly pro-portional to a cumulative histogram derived from H , i.e., CH .
p(yH |α = αindex) ∝H(index) (9)
p(yCH|α = αindex) ∝CH(index) (10)
p(α = αindex|yt) ∝H(index)CH(index). (11)
The pitch candidate with the highest likelihood, which corre-sponds to the highest value of the histogram product, is chosenas the pitch estimate. Fig. 8 shows the effect of pitch cuefusion, leading to a clear maximum, even if the complex sceneleads to multiple strong peaks in the polar histogram. Anotherestimation method that was taken into consideration was theweighted sum of the pitch candidates, but the maximum leadsto better results.
The value vectors x of the predicted particles are modifiedby setting their pitch field to the estimated pitch value. Thispitch value is also used for selecting the road points fromthe available 3-D point set to perform the next stages of themeasurement.
D. Mapping the Particles in the Image Space
Pitch detection is the only part of the measurement processthat happens in the 3-D space, and for the next stages, the parti-cles have to be compared to image space measurement data. Toachieve the comparison, from each particle value of the form
xit =(W,CH , CV ,XC , α, γ, ψ)T , a measurement space vector
is generated, i.e., yit =(v1, . . . , vP , uL,1, . . . , uL,P , uR,1, . . . ,
uR,P ). Values v are coordinates of the image lines, and values uare coordinates of the image columns. The v values are commonto the left and right delimiters. P is the number of points chosento describe each lane delimiter in the image space.
To derive yit from xi
t, three steps have to be taken.1) Generate P points in the 3-D space for each lane delim-
iter. The points will be equally spaced on distance axisZ, and their X and Y coordinates (lateral and height)will be given by the horizontal and vertical profiles of thelane. The nearest points will start at distance ZB , whichis the closest distance that allows the road to be visibleto our system. The points will span a detection distanceD. Detection distance D is variable, and its adjustmentis based on the vehicle’s speed. The rationale behind thisdecision is that a longer distance is needed if the vehicletravels at high speeds, which is usually on straight or low-curvature roads, but a shorter distance is needed at slowspeeds to handle narrower curvatures. Distance D coversa second of vehicle movement at the current speed, but noshorter than 5 m and no longer than 60 m.
2) Project the 3-D points in the image space using thecamera parameters. For each lane delimiter, a chain ofunevenly spaced points will be obtained.
3) Intersect the segments obtained by linking the projectedpoints for each side with a set of evenly spaced horizontallines. The points of intersection are the points that willform the particle representation in the image space yi
t.
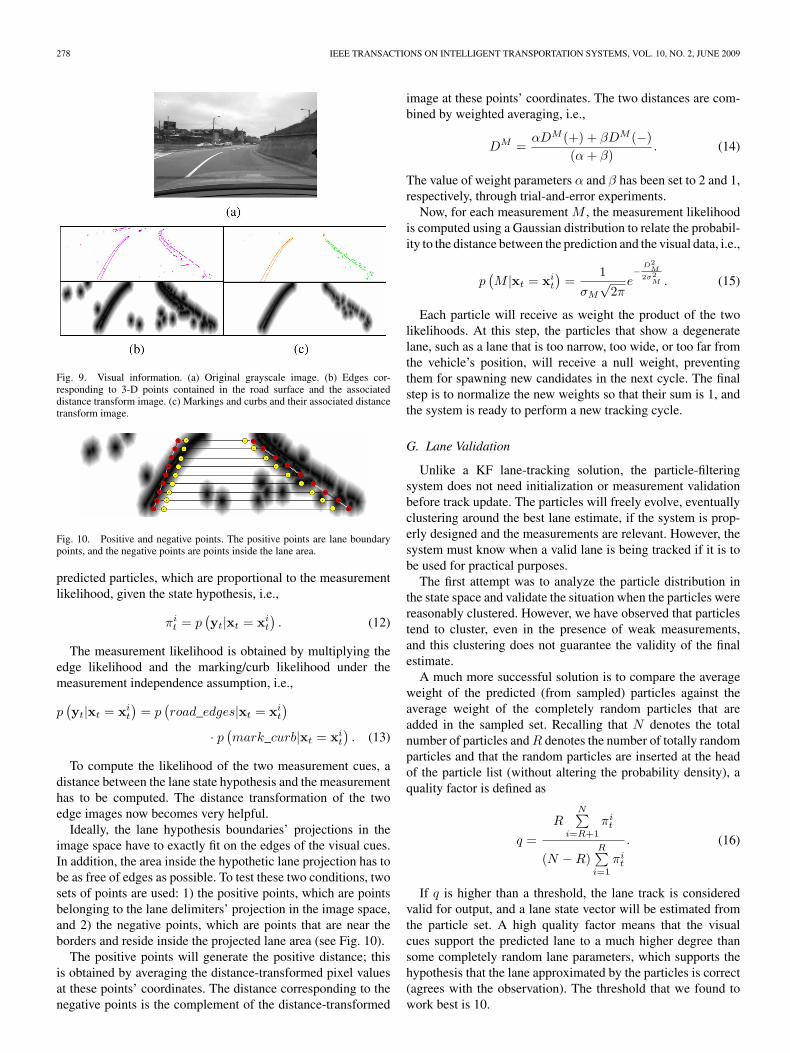
E. Visual Cues
After the pitch angle has been detected from the 3-D pointset, a rough approximation of the road geometry can be madebased on this angle alone. The rough approximation is used forroad point selection. The image edges corresponding to these3-D points form our first measurement cue.
The lane-marking edge points are detected using an algo-rithm based on the tried-and-tested dark–light–dark transitiondetection principle [8]. In addition to the lane markings, anotherhigh-priority lane-delimiting feature is the curb, and the curbsare detected using height variations in a dense stereovisionmap [9] and then converted into image edges. Due to the factthat lane markings and curbs are of similar priorities, they areinserted in a common “special edge” map, which represents thesecond lane measurement cue.
To allow comparison between the particles and the measure-ment, each cue map (road edges or special edges) undergoesdistance transformation (see Fig. 9).
F. Particle Weighing by Measurement
Given the a priori probability density encoded in the distri-bution of the particle values throughout the state space, it isnow time to compute the posterior probability density, whichwill encode all the knowledge about the lane state that we areable to extract from the sequence of measurements up to thecurrent time t. This is achieved by assigning new weights to the
278 IEEE TRANSACTIONS ON INTELLIGENT TRANSPORTATION SYSTEMS, VOL. 10, NO. 2, JUNE 2009
Fig. 9. Visual information. (a) Original grayscale image. (b) Edges cor-responding to 3-D points contained in the road surface and the associateddistance transform image. (c) Markings and curbs and their associated distancetransform image.
Fig. 10. Positive and negative points. The positive points are lane boundarypoints, and the negative points are points inside the lane area.
predicted particles, which are proportional to the measurementlikelihood, given the state hypothesis, i.e.,
πit = p
(yt|xt = xi
t
). (12)
The measurement likelihood is obtained by multiplying theedge likelihood and the marking/curb likelihood under themeasurement independence assumption, i.e.,
p(yt|xt = xi
t
)= p
(road_edges|xt = xi
t
)· p
(mark_curb|xt = xi
t
). (13)
To compute the likelihood of the two measurement cues, adistance between the lane state hypothesis and the measurementhas to be computed. The distance transformation of the twoedge images now becomes very helpful.
Ideally, the lane hypothesis boundaries’ projections in theimage space have to exactly fit on the edges of the visual cues.In addition, the area inside the hypothetic lane projection has tobe as free of edges as possible. To test these two conditions, twosets of points are used: 1) the positive points, which are pointsbelonging to the lane delimiters’ projection in the image space,and 2) the negative points, which are points that are near theborders and reside inside the projected lane area (see Fig. 10).
The positive points will generate the positive distance; thisis obtained by averaging the distance-transformed pixel valuesat these points’ coordinates. The distance corresponding to thenegative points is the complement of the distance-transformed
image at these points’ coordinates. The two distances are com-bined by weighted averaging, i.e.,
DM =αDM (+) + βDM (−)
(α + β). (14)
The value of weight parameters α and β has been set to 2 and 1,respectively, through trial-and-error experiments.
Now, for each measurement M , the measurement likelihoodis computed using a Gaussian distribution to relate the probabil-ity to the distance between the prediction and the visual data, i.e.,
p(M |xt = xi
t
)=
1σM
√2π
e−
D2M
2σ2M . (15)
Each particle will receive as weight the product of the twolikelihoods. At this step, the particles that show a degeneratelane, such as a lane that is too narrow, too wide, or too far fromthe vehicle’s position, will receive a null weight, preventingthem for spawning new candidates in the next cycle. The finalstep is to normalize the new weights so that their sum is 1, andthe system is ready to perform a new tracking cycle.
G. Lane Validation
Unlike a KF lane-tracking solution, the particle-filteringsystem does not need initialization or measurement validationbefore track update. The particles will freely evolve, eventuallyclustering around the best lane estimate, if the system is prop-erly designed and the measurements are relevant. However, thesystem must know when a valid lane is being tracked if it is tobe used for practical purposes.
The first attempt was to analyze the particle distribution inthe state space and validate the situation when the particles werereasonably clustered. However, we have observed that particlestend to cluster, even in the presence of weak measurements,and this clustering does not guarantee the validity of the finalestimate.
A much more successful solution is to compare the averageweight of the predicted (from sampled) particles against theaverage weight of the completely random particles that areadded in the sampled set. Recalling that N denotes the totalnumber of particles and R denotes the number of totally randomparticles and that the random particles are inserted at the headof the particle list (without altering the probability density), aquality factor is defined as
q =R
N∑i=R+1
πit
(N − R)R∑
i=1
πit
. (16)
If q is higher than a threshold, the lane track is consideredvalid for output, and a lane state vector will be estimated fromthe particle set. A high quality factor means that the visualcues support the predicted lane to a much higher degree thansome completely random lane parameters, which supports thehypothesis that the lane approximated by the particles is correct(agrees with the observation). The threshold that we found towork best is 10.
DANESCU AND NEDEVSCHI: PROBABILISTIC LANE TRACKING IN DIFFICULT ROAD SCENARIOS USING STEREOVISION 279
If the quality factor indicates a valid lane, the parameters ofthis lane are estimated by a weighted average of the particlevalues. Only particles that have a weight that is higher thanaverage are considered for estimation.
VII. TEST AND RESULT
A. Comparison With a KF Solution
The stereovision-based particle-filtering lane detection sys-tem has been designed mainly to improve the handling ofdifficult situations, when the KF solution had significant prob-lems. Even if the scenarios posing problems to a KF solutioncan be various, they can be summarized by a single term,i.e., “discontinuous road” (which is sometimes called roadsingularity). The most common situations that can be regardedas road discontinuities are lane appearance and disappearance,lane change maneuvers, lane forking/joining, sharp changes ofdirection, sharp changes of curvature, and temporary sensorfailure due to internal or external conditions. (The most oftenproblem encountered is image saturation.)
A KF solution has problems with road discontinuities due tofour characteristics.
1) There is only one possible lane configuration that istracked at one moment in time.
2) The current state is used to predict search areas for thenext detection; this is a feature that drops all measure-ments that indicate a road discontinuity.
3) The system requires time to drop a track and time toinitialize a new track.
4) Initializing a new track means running detection algo-rithms for the whole image, without the benefit of areduced search region.
We have tested the particle-filtering solution in scenarioscontaining the specified problems, and the system has shownfive behaviors.
1) Lane appearance and disappearance: Due to the fact thatthere is no detection in the classical sense, no additionaltime is needed to start or drop a track. The particles willcluster around the best lane visual information, and theoutput is validated after two to three frames.
2) In lane-changing maneuvers, there are two aspects of ouralgorithm that make the transition as smooth as possible:1) the ability to track multiple hypotheses and 2) the useof random particles to keep an eye on new tracks. Therandom particles will seed a new cluster, and due to themotion of the vehicle toward the new lane, the particlesof the new cluster will receive increasingly more weightuntil the old lane is left behind. When the lane changemaneuver is completed, the new lane is already tracked.
3) The forking/joining situations are handled in the sameway as the lane change maneuvers. The system is alwaysready to track a lane that has a better chance of being theright lane.
4) Sharp changes of curvature are handled either by gen-erating the right hypothesis fast enough to cope withthe change, similarly to the way situations 2 and 3 arehandled or, if this is not possible due to the severity of
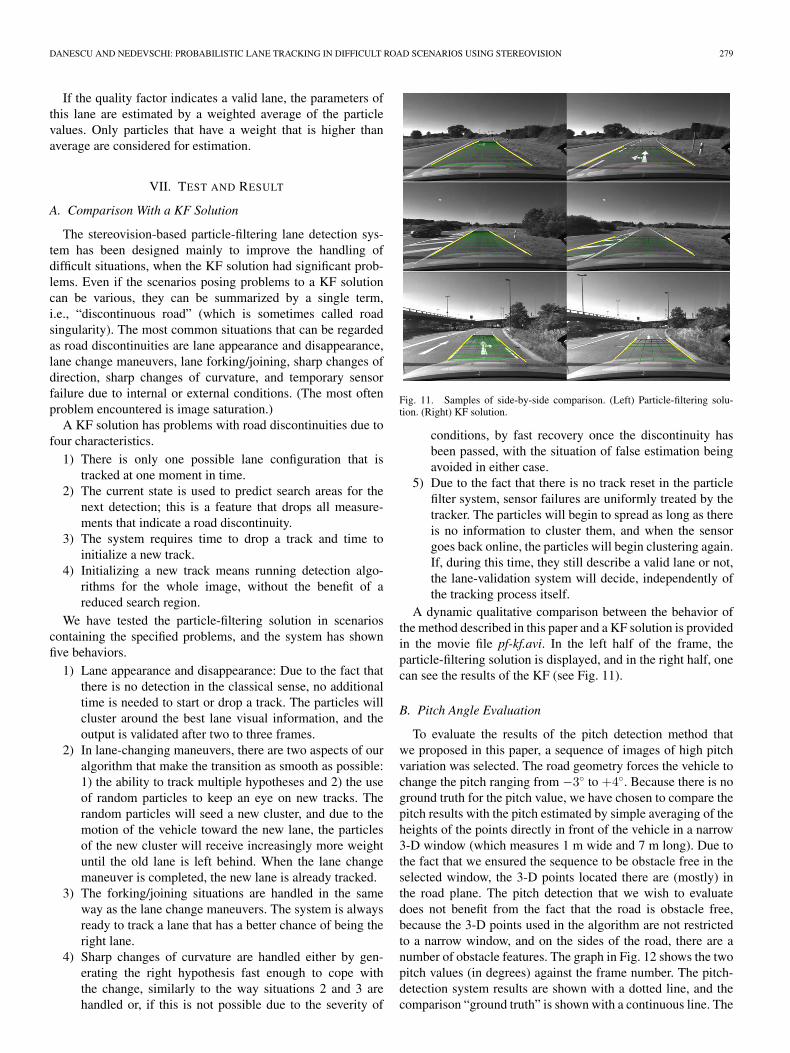
Fig. 11. Samples of side-by-side comparison. (Left) Particle-filtering solu-tion. (Right) KF solution.
conditions, by fast recovery once the discontinuity hasbeen passed, with the situation of false estimation beingavoided in either case.
5) Due to the fact that there is no track reset in the particlefilter system, sensor failures are uniformly treated by thetracker. The particles will begin to spread as long as thereis no information to cluster them, and when the sensorgoes back online, the particles will begin clustering again.If, during this time, they still describe a valid lane or not,the lane-validation system will decide, independently ofthe tracking process itself.
A dynamic qualitative comparison between the behavior ofthe method described in this paper and a KF solution is providedin the movie file pf-kf.avi. In the left half of the frame, theparticle-filtering solution is displayed, and in the right half, onecan see the results of the KF (see Fig. 11).
B. Pitch Angle Evaluation
To evaluate the results of the pitch detection method thatwe proposed in this paper, a sequence of images of high pitchvariation was selected. The road geometry forces the vehicle tochange the pitch ranging from −3◦ to +4◦. Because there is noground truth for the pitch value, we have chosen to compare thepitch results with the pitch estimated by simple averaging of theheights of the points directly in front of the vehicle in a narrow3-D window (which measures 1 m wide and 7 m long). Due tothe fact that we ensured the sequence to be obstacle free in theselected window, the 3-D points located there are (mostly) inthe road plane. The pitch detection that we wish to evaluatedoes not benefit from the fact that the road is obstacle free,because the 3-D points used in the algorithm are not restrictedto a narrow window, and on the sides of the road, there are anumber of obstacle features. The graph in Fig. 12 shows the twopitch values (in degrees) against the frame number. The pitch-detection system results are shown with a dotted line, and thecomparison “ground truth” is shown with a continuous line. The
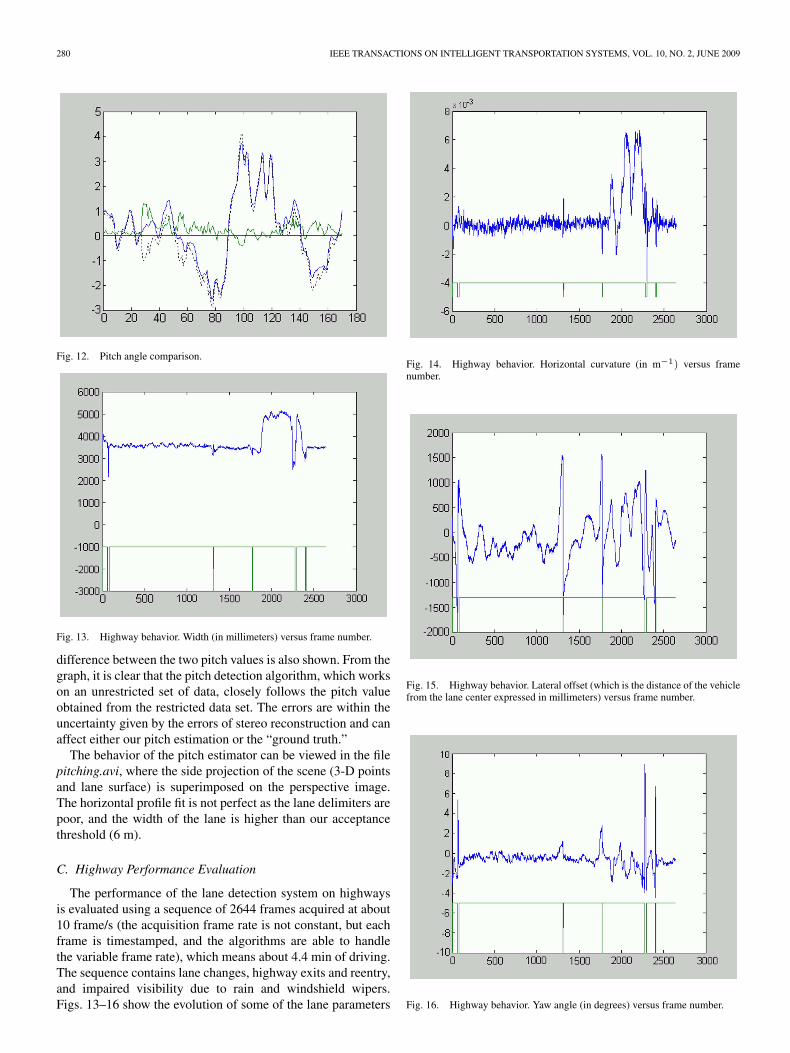
280 IEEE TRANSACTIONS ON INTELLIGENT TRANSPORTATION SYSTEMS, VOL. 10, NO. 2, JUNE 2009
Fig. 12. Pitch angle comparison.
Fig. 13. Highway behavior. Width (in millimeters) versus frame number.
difference between the two pitch values is also shown. From thegraph, it is clear that the pitch detection algorithm, which workson an unrestricted set of data, closely follows the pitch valueobtained from the restricted data set. The errors are within theuncertainty given by the errors of stereo reconstruction and canaffect either our pitch estimation or the “ground truth.”
The behavior of the pitch estimator can be viewed in the filepitching.avi, where the side projection of the scene (3-D pointsand lane surface) is superimposed on the perspective image.The horizontal profile fit is not perfect as the lane delimiters arepoor, and the width of the lane is higher than our acceptancethreshold (6 m).
C. Highway Performance Evaluation
The performance of the lane detection system on highwaysis evaluated using a sequence of 2644 frames acquired at about10 frame/s (the acquisition frame rate is not constant, but eachframe is timestamped, and the algorithms are able to handlethe variable frame rate), which means about 4.4 min of driving.The sequence contains lane changes, highway exits and reentry,and impaired visibility due to rain and windshield wipers.Figs. 13–16 show the evolution of some of the lane parameters
Fig. 14. Highway behavior. Horizontal curvature (in m−1) versus framenumber.
Fig. 15. Highway behavior. Lateral offset (which is the distance of the vehiclefrom the lane center expressed in millimeters) versus frame number.
Fig. 16. Highway behavior. Yaw angle (in degrees) versus frame number.
DANESCU AND NEDEVSCHI: PROBABILISTIC LANE TRACKING IN DIFFICULT ROAD SCENARIOS USING STEREOVISION 281
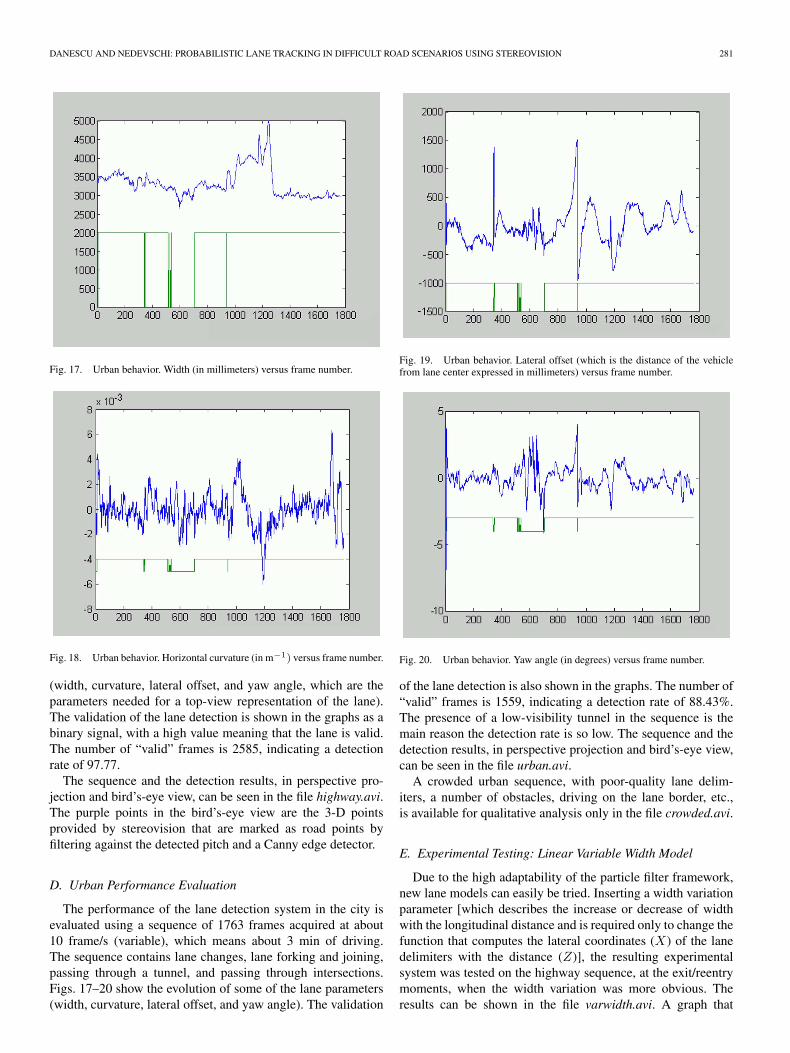
Fig. 17. Urban behavior. Width (in millimeters) versus frame number.
Fig. 18. Urban behavior. Horizontal curvature (in m−1) versus frame number.
(width, curvature, lateral offset, and yaw angle, which are theparameters needed for a top-view representation of the lane).The validation of the lane detection is shown in the graphs as abinary signal, with a high value meaning that the lane is valid.The number of “valid” frames is 2585, indicating a detectionrate of 97.77.
The sequence and the detection results, in perspective pro-jection and bird’s-eye view, can be seen in the file highway.avi.The purple points in the bird’s-eye view are the 3-D pointsprovided by stereovision that are marked as road points byfiltering against the detected pitch and a Canny edge detector.
D. Urban Performance Evaluation
The performance of the lane detection system in the city isevaluated using a sequence of 1763 frames acquired at about10 frame/s (variable), which means about 3 min of driving.The sequence contains lane changes, lane forking and joining,passing through a tunnel, and passing through intersections.Figs. 17–20 show the evolution of some of the lane parameters(width, curvature, lateral offset, and yaw angle). The validation
Fig. 19. Urban behavior. Lateral offset (which is the distance of the vehiclefrom lane center expressed in millimeters) versus frame number.
Fig. 20. Urban behavior. Yaw angle (in degrees) versus frame number.
of the lane detection is also shown in the graphs. The number of“valid” frames is 1559, indicating a detection rate of 88.43%.The presence of a low-visibility tunnel in the sequence is themain reason the detection rate is so low. The sequence and thedetection results, in perspective projection and bird’s-eye view,can be seen in the file urban.avi.
A crowded urban sequence, with poor-quality lane delim-iters, a number of obstacles, driving on the lane border, etc.,is available for qualitative analysis only in the file crowded.avi.
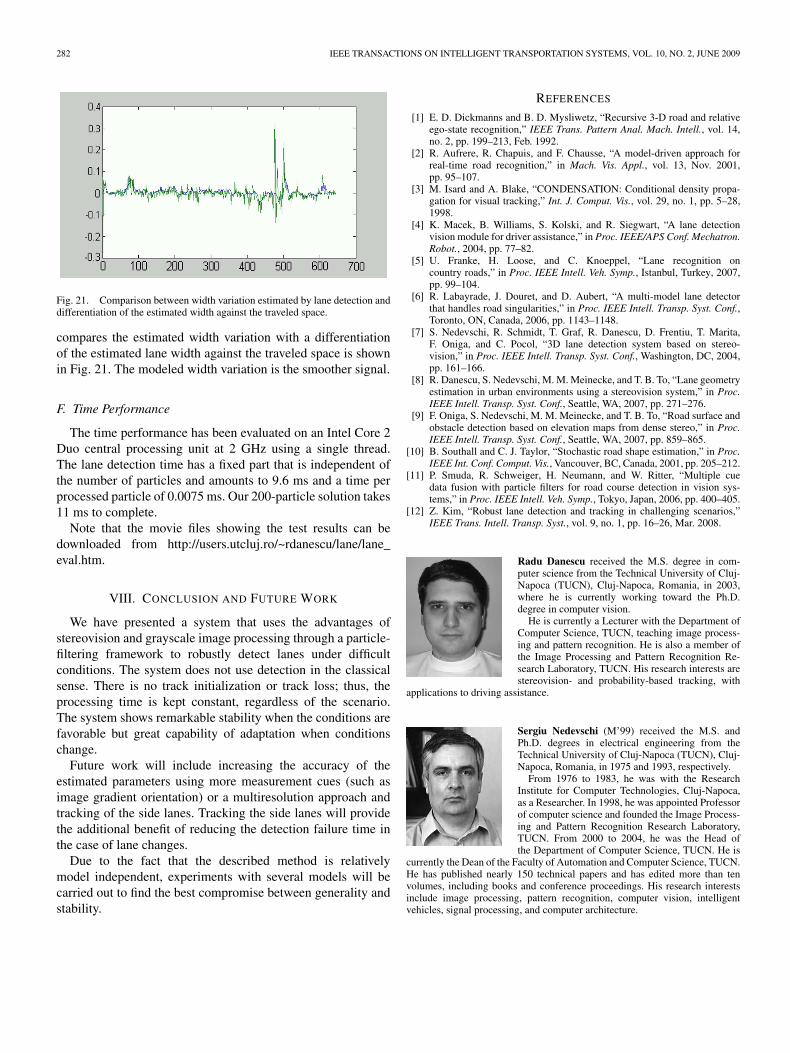
E. Experimental Testing: Linear Variable Width Model
Due to the high adaptability of the particle filter framework,new lane models can easily be tried. Inserting a width variationparameter [which describes the increase or decrease of widthwith the longitudinal distance and is required only to change thefunction that computes the lateral coordinates (X) of the lanedelimiters with the distance (Z)], the resulting experimentalsystem was tested on the highway sequence, at the exit/reentrymoments, when the width variation was more obvious. Theresults can be shown in the file varwidth.avi. A graph that
282 IEEE TRANSACTIONS ON INTELLIGENT TRANSPORTATION SYSTEMS, VOL. 10, NO. 2, JUNE 2009
Fig. 21. Comparison between width variation estimated by lane detection anddifferentiation of the estimated width against the traveled space.
compares the estimated width variation with a differentiationof the estimated lane width against the traveled space is shownin Fig. 21. The modeled width variation is the smoother signal.
F. Time Performance
The time performance has been evaluated on an Intel Core 2Duo central processing unit at 2 GHz using a single thread.The lane detection time has a fixed part that is independent ofthe number of particles and amounts to 9.6 ms and a time perprocessed particle of 0.0075 ms. Our 200-particle solution takes11 ms to complete.
Note that the movie files showing the test results can bedownloaded from http://users.utcluj.ro/~rdanescu/lane/lane_eval.htm.
VIII. CONCLUSION AND FUTURE WORK
We have presented a system that uses the advantages ofstereovision and grayscale image processing through a particle-filtering framework to robustly detect lanes under difficultconditions. The system does not use detection in the classicalsense. There is no track initialization or track loss; thus, theprocessing time is kept constant, regardless of the scenario.The system shows remarkable stability when the conditions arefavorable but great capability of adaptation when conditionschange.
Future work will include increasing the accuracy of theestimated parameters using more measurement cues (such asimage gradient orientation) or a multiresolution approach andtracking of the side lanes. Tracking the side lanes will providethe additional benefit of reducing the detection failure time inthe case of lane changes.
Due to the fact that the described method is relativelymodel independent, experiments with several models will becarried out to find the best compromise between generality andstability.
REFERENCES
[1] E. D. Dickmanns and B. D. Mysliwetz, “Recursive 3-D road and relativeego-state recognition,” IEEE Trans. Pattern Anal. Mach. Intell., vol. 14,no. 2, pp. 199–213, Feb. 1992.
[2] R. Aufrere, R. Chapuis, and F. Chausse, “A model-driven approach forreal-time road recognition,” in Mach. Vis. Appl., vol. 13, Nov. 2001,pp. 95–107.
[3] M. Isard and A. Blake, “CONDENSATION: Conditional density propa-gation for visual tracking,” Int. J. Comput. Vis., vol. 29, no. 1, pp. 5–28,1998.
[4] K. Macek, B. Williams, S. Kolski, and R. Siegwart, “A lane detectionvision module for driver assistance,” in Proc. IEEE/APS Conf. Mechatron.Robot., 2004, pp. 77–82.
[5] U. Franke, H. Loose, and C. Knoeppel, “Lane recognition oncountry roads,” in Proc. IEEE Intell. Veh. Symp., Istanbul, Turkey, 2007,pp. 99–104.
[6] R. Labayrade, J. Douret, and D. Aubert, “A multi-model lane detectorthat handles road singularities,” in Proc. IEEE Intell. Transp. Syst. Conf.,Toronto, ON, Canada, 2006, pp. 1143–1148.
[7] S. Nedevschi, R. Schmidt, T. Graf, R. Danescu, D. Frentiu, T. Marita,F. Oniga, and C. Pocol, “3D lane detection system based on stereo-vision,” in Proc. IEEE Intell. Transp. Syst. Conf., Washington, DC, 2004,pp. 161–166.
[8] R. Danescu, S. Nedevschi, M. M. Meinecke, and T. B. To, “Lane geometryestimation in urban environments using a stereovision system,” in Proc.IEEE Intell. Transp. Syst. Conf., Seattle, WA, 2007, pp. 271–276.
[9] F. Oniga, S. Nedevschi, M. M. Meinecke, and T. B. To, “Road surface andobstacle detection based on elevation maps from dense stereo,” in Proc.IEEE Intell. Transp. Syst. Conf., Seattle, WA, 2007, pp. 859–865.
[10] B. Southall and C. J. Taylor, “Stochastic road shape estimation,” in Proc.IEEE Int. Conf. Comput. Vis., Vancouver, BC, Canada, 2001, pp. 205–212.
[11] P. Smuda, R. Schweiger, H. Neumann, and W. Ritter, “Multiple cuedata fusion with particle filters for road course detection in vision sys-tems,” in Proc. IEEE Intell. Veh. Symp., Tokyo, Japan, 2006, pp. 400–405.
[12] Z. Kim, “Robust lane detection and tracking in challenging scenarios,”IEEE Trans. Intell. Transp. Syst., vol. 9, no. 1, pp. 16–26, Mar. 2008.
Radu Danescu received the M.S. degree in com-puter science from the Technical University of Cluj-Napoca (TUCN), Cluj-Napoca, Romania, in 2003,where he is currently working toward the Ph.D.degree in computer vision.
He is currently a Lecturer with the Department ofComputer Science, TUCN, teaching image process-ing and pattern recognition. He is also a member ofthe Image Processing and Pattern Recognition Re-search Laboratory, TUCN. His research interests arestereovision- and probability-based tracking, with
applications to driving assistance.
Sergiu Nedevschi (M’99) received the M.S. andPh.D. degrees in electrical engineering from theTechnical University of Cluj-Napoca (TUCN), Cluj-Napoca, Romania, in 1975 and 1993, respectively.
From 1976 to 1983, he was with the ResearchInstitute for Computer Technologies, Cluj-Napoca,as a Researcher. In 1998, he was appointed Professorof computer science and founded the Image Process-ing and Pattern Recognition Research Laboratory,TUCN. From 2000 to 2004, he was the Head ofthe Department of Computer Science, TUCN. He is
currently the Dean of the Faculty of Automation and Computer Science, TUCN.He has published nearly 150 technical papers and has edited more than tenvolumes, including books and conference proceedings. His research interestsinclude image processing, pattern recognition, computer vision, intelligentvehicles, signal processing, and computer architecture.
Related Documents