i UNIVERSITY OF GHANA PRIVATE INVESTMENT, LABOUR DEMAND AND SOCIAL WELFARE IN SUB-SAHARAN AFRICA BY SAMUEL KWAKU AGYEI A THESIS SUBMITTED TO THE DEPARTMENT OF FINANCE, UNIVERSITY OF GHANA BUSINESS SCHOOL, UNIVERSITY OF GHANA, LEGON IN PARTIAL FULFILMENT OF THE REQUIREMENT FOR THE AWARD OF PHD IN BUSINESS ADMINISTRATION (FINANCE OPTION) DEGREE JUNE 2016 University of Ghana http://ugspace.ug.edu.gh

Welcome message from author
This document is posted to help you gain knowledge. Please leave a comment to let me know what you think about it! Share it to your friends and learn new things together.
Transcript
i
UNIVERSITY OF GHANA
PRIVATE INVESTMENT, LABOUR DEMAND AND SOCIAL WELFARE IN
SUB-SAHARAN AFRICA
BY
SAMUEL KWAKU AGYEI
A THESIS SUBMITTED TO THE DEPARTMENT OF FINANCE,
UNIVERSITY OF GHANA BUSINESS SCHOOL, UNIVERSITY OF GHANA,
LEGON IN PARTIAL FULFILMENT OF THE REQUIREMENT FOR THE
AWARD OF PHD IN BUSINESS ADMINISTRATION (FINANCE OPTION)
DEGREE
JUNE 2016
University of Ghana http://ugspace.ug.edu.gh

ii
DECLARATION
I do hereby declare that this thesis is the result of my own research and has neither in
whole nor in part been submitted to this university or any other institution for the
award of any degree. All ideas other than my own have duly recognized.
I also hereby accept full responsibility for any shortcomings that may result from this
work.
……………………………………… ………………………………..
AGYEI, SAMUEL KWAKU DATE
(10292234)
University of Ghana http://ugspace.ug.edu.gh

iii
CERTIFICATION
We hereby certify that this thesis was supervised in accordance with procedures laid
down by the University.
SUPERVISORS:
………………………………… .…………………………..........
PROF. ANTHONY Q. Q. ABOAGYE DATE
………………………………….. ………………………………….
PROF. KOFI A. OSEI DATE
………………………………………… …………………………………
DR. LORD MENSAH DATE
University of Ghana http://ugspace.ug.edu.gh

iv
DEDICATION
I dedicate this work to my lovely wife, Mrs Ellen Animah Agyei and wonderful
children, Nana Boatemaa Sefa-Agyei, Maame Boatemaa Sefa-Agyei and Kofi
Konadu Boadi Agyei for their support in this life.
University of Ghana http://ugspace.ug.edu.gh

v
ACKNOWLEDGEMENTS
I sincerely thank the Almighty God for His protection, guidance and love. I am
highly indebted to the Lord for the knowledge and strength He bestowed upon me
and my family throughout my period of study. I am grateful to Jehovah for taking us
this far.
I wish to also express my heartfelt gratitude to my supervisors, Prof. Anthony Q. Q.
Aboagye, Prof. Kofi Acheampong Osei and Dr. Lord Mensah, for their guidance and
assistance at all times. May the Lord grant their heart desires. Again, I thank all
senior members of the Department of Finance for their constructive criticisms,
suggestions and encouragement.
Moreover, I am grateful to University of Cape Coast for sponsoring this programme.
The efforts of Prof. Edward Marfo-Yiadom, Dr. Siaw Frimpong, Mr. Mohammed
Anokye Adam, Mr. Kwabena Nkansah Darfur, Mr. Cyprain Amankwah, faculty
members of the Department of Accounting and Finance of the University of Cape
Coast and that of Kofi Ababio and Kwasi Adu-Boateng cannot be expended
unappreciated.
Furthermore, I would like to thank Ms Selina Owusu-Konadu, Mr. Kwasi Acquah
Sefa-Bonsu, Mr Mark Owusu-Asenso, Mr. Kwadwo Owusu Boateng and the late Mr.
Charles Kofi Owusu for their assistance throughout my study.
Finally, I appreciate the help of my colleagues, Dr. Sarpong-Kumankuma and David,
during the entire period of the programme.
University of Ghana http://ugspace.ug.edu.gh

vi
TABLE OF CONTENTS
Declaration …..…………………………………………………………………...…..ii
Certification..…………………….…………………..…………………………..…..iii
Dedication .…………………….……………………………………………..……..iv
Acknowledgement ……………………………………………………….…………..v
Table of content………….……………………………………………….….…...….vi
List of tables..………….…………………………………………………...…...……x
List of figures ..…………………………………………………………..……...….xii
List of acronyms………………………………………………………….…...…....xiv
Abstract…………..……………………………….……………………….…....…xvii
CHAPTER ONE: INTRODUCTION
1.0 Background of the Study………………………………………………...............1
1.1 Stylised Facts………………………………………………………………...…..6
1.1.1 Investment Trends in SSA………………………… …………………...….6
1.1.2 Employment Trends in SSA ……………………………………...………14
1.1.3 Welfare Trends in SSA………………………………………………...….16
1.2 Problem Statement ……………………………………………..........................17
1.2.1 Interrelationship between Private and Public Investments ..………....…...17
1.2.2 Private Investment and Labour Demand in Africa ………………....…….19
1.2.3 Private Investment, Labour Demand and Social Welfare in SSA ..……... 20
1.3 Objectives of the study………………………………………………..………..21
1.4 Hypotheses…………………………………………………………...…………21
University of Ghana http://ugspace.ug.edu.gh

vii
1.5 Significance of the study ………………………………………………….…....22
1.6 Scope and limitation for the study .…………………………………….………23
1.5 Chapter disposition ………………………………………….…………….........23
References to chapter One ……………………………………………….…………25
Appendices to chapter ……………………………………………………………...33
CHAPTER TWO: INTERRELATIONSHIP BETWEEN PRIVATE AND
PUBLIC INVESTMENTS IN SUB-SAHARAN AFRICA
Abstract ………………………………….………………………………...….....34
2.0Introduction ………..……………………………………………………..….....35
2.1 Literature Review……….…………………………………..…………………..38
2.1.1 Theoretical Literature Review…………………………..……..……….….38
The Keynessian Theory of Investment …………………..…..………....38
The Classical Theory of Investment …………………………...……….41
2.1.2 Empirical Literature Review …………………………………..………….44
Determinants of Private Investment ………………….……….…..…44
Determinants of Public Investment ……………………….………....56
2.2 Methodology……..……………………………………………….…….............57
2.3.0 Analysis and Discussions……………………………………….………...…..83
2.3.1 Descriptive Statistics ……………….…………………………………..…83
2.3.2 Multicollinearity ………..……………………..……………………...........85
2.3.3 Discussion of Regression Results……………..……………………...……88
Bi-causal relationship between private and public investment………….88
University of Ghana http://ugspace.ug.edu.gh

viii
Determinants of private and public investments in SSA………...……...96
2.4 Conclusion………….……………..…………………………….….…………103
References to chapter two ………………………………………………..………105
Appendices to chapter two………………………………………………..………117
CHAPTER THREE: PRIVATE INVESTMENT AND LABOUR DEMAND IN
SUB-SAHARAN AFRICA
Abstract ……………………………………….……………………….…….…… 140
3.1Introduction………………………………………………………………..........140
3.2Literature Review……………………………………………………….............147
3.2.1Neoclassical Theory of Employment…….…………………….…….……147
3.2.2 Empirical Literature Review………………..……………...…..…………152
3.3Methodology ……………………………………………………..…………….160
3.3.1 Theoretical Justification of the Neoclassical Labour Demand Model ...…160
3.3.2 Study sample ………………………………….……………………...…..169
3.3.3 Data …………………………………………………….…………...……169
3.3.4 Panel Data Methodology………….……………………………………....170
3.4.1Dynamic Labour Demand…………………………………….…....170
3.5 Analysis and Discussion………………………………………………………..181
3.5.1 Descriptive Statistics………………………………………………..….....181
3.5.2 Multicollinearity ……………………………………………….................182
3.5.3 Discussion of Regression Results………………………………...……….185
3.6 Conclusion……………………………………………………………..……….193
University of Ghana http://ugspace.ug.edu.gh

ix
References to chapter three………………………………………………..….……196
Appendices to chapter three………………………………………….……….……212
CHAPTER FOUR: PRIVATE INVESTMENT, EMPLOYMENT AND
SOCIAL WELFARE IN SUB- SAHARAN AFRICA
Abstract ……………………………………………………………….…………..214
4.1.0 Introduction ……………………………………………………………….....214
4.2.0 Literature Review………………………………………………….…………220
4.3.0 Methodology……………………………………………………….…….......225
4.3.1Theoretical Justification of the Model…………………….………..….….225
4.3.2 Panel Data Methodology………………..…….……………..……………230
4.4.0 Analysis and Discussion of Results …………………………………….……237
4.4.1 Descriptive Statistics …………………………………………….……….237
4.4.2 Multicollinearity Test …………………………………………………….240
4.4.3 Discussion of Regression Results ………………………………………..243
4.5.0 Conclusion ………………………………………..……………………...….246
References to chapter four………………………..……………………………….248
Appendices to chapter four…………………………………………………..……259
CHAPTER FIVE: SUMMARY, CONCLUSION AND RECOMMENDATIONS
5.0 Introduction ……………………………………………………………………262
5.1 Summary …………………………………………………...………………….262
5.2 Conclusion ……………………………………….………………….…....……264
5.3 Recommendations ……………………………….…………………….....…….267
University of Ghana http://ugspace.ug.edu.gh
x
LIST OF TABLES
TABLE PAGE
Table 1.1: Investment Trends in SSA, with regional indicators…………….……....13
Table 1.2: Employment Trends in SSA………………………………………..……15
Table1.3: Poverty Reductions in SSA and SAS …………………………..………..17
Table 1.4: Private Investment, Employment and Social Welfare ………………..…17
Table 2.1: Two Stage Least Squares regression. Dependent Variable: PRINV ..…..67
Table 2.2: Definition of variables (proxies) and Expected signs for Determinants of
Private and Public Investment……………………………………….….…….75
Table 2.3: Components of Country Governance Index……………………..………82
Table 2.4: Descriptive Statistics of Determinants of Private and Public Investment
variables ……………………………………..……………………….……….85
Table 2.5A: Variance Inflation Factor Tables…………………………….…..……..86
Table 2.5B: Correlation Matrix…………………………….…………………..……87
Table 2.6: Panel Unit root Test for Variables in the Panel VAR………………...…88
Table 2.7: Panel VAR Estimation Results…...…………………………………...…90
Table 2.8: Granger Causality Results of the Estimated System Variables……....….94
Table 2.9: Variance Decomposition Results…………………………………...……95
Table 2.10: Regression Results based on Arellano and Bond Dynamic Panel
Estimation ….....................................................................................................98
Table 3.1: Definition and Expected signs of variables used for the study on Private
Investment and Labour Demand in SSA…………………………………….175
University of Ghana http://ugspace.ug.edu.gh
xi
Table 3.2: Descriptive Statistics of the variables used for Private Investment and
Labour Demand study……………………………………………………......182
Table 3.3: Variance inflation Factor Test………………………………………..…183
Table 3.4: Correlation Matrix………………………………………..……………..184
Table 3.5A: Regression Results for models 24, 25 and 26………………………...187
Table 3.5B: Regression Results for models 27, 28 and 29………………….……..192
Table 4.1: Variable names, measurement and expected signs for the study on the
relationship between Private Investment, Employment and Social Welfare in
SSA…………………………………………………………………………232
Table 4.2A: Descriptive Statistics of variables used for Private Investment,
Employment and Social Welfare in SSA……….…………….…………....239
Table 4.2B: Regional Distribution of below average performance countries .…….239
Table 4.3A: Variance Inflation factor Analysis…………………………………....240
Table 4.3B: Correlation Matrix…………………………………………………….241
Table 4.4: Regression Results - Dependent Variable HD…………………………243
University of Ghana http://ugspace.ug.edu.gh
xii
LIST OF FIGURES
FIGURE PAGE
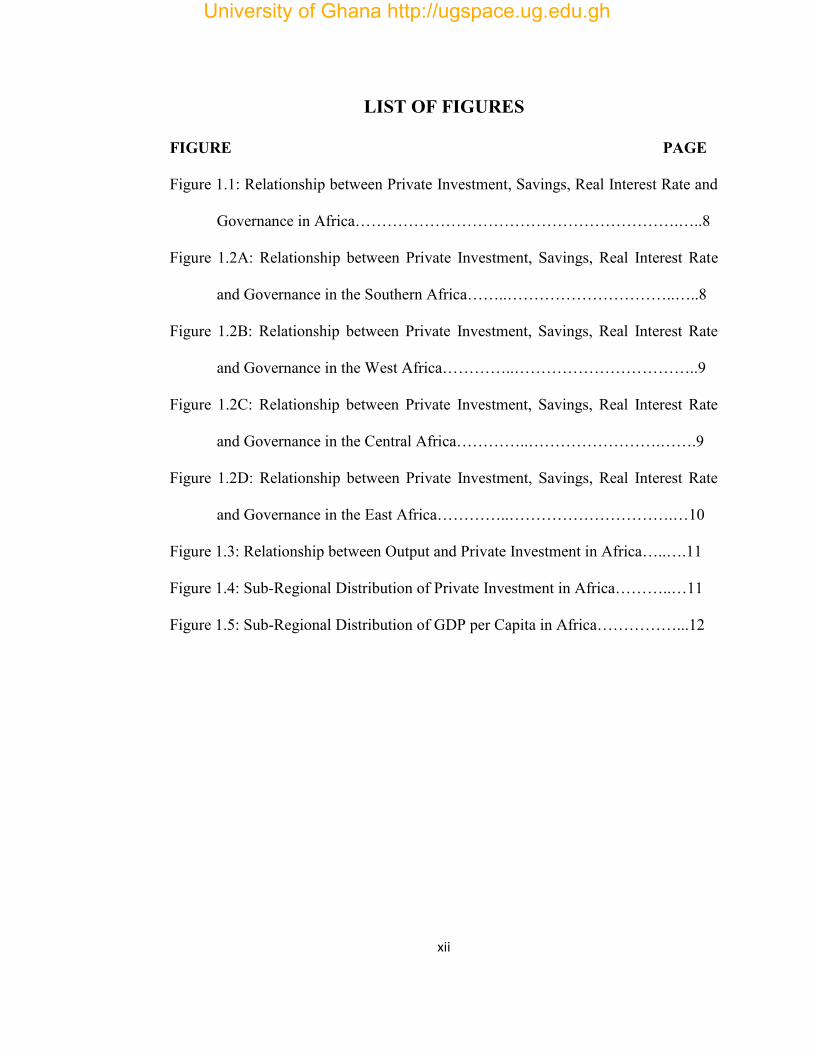
Figure 1.1: Relationship between Private Investment, Savings, Real Interest Rate and
Governance in Africa…………………………………………………….…..8
Figure 1.2A: Relationship between Private Investment, Savings, Real Interest Rate
and Governance in the Southern Africa……..…………………………..…..8
Figure 1.2B: Relationship between Private Investment, Savings, Real Interest Rate
and Governance in the West Africa…………..……………………………..9
Figure 1.2C: Relationship between Private Investment, Savings, Real Interest Rate
and Governance in the Central Africa…………..…………………….…….9
Figure 1.2D: Relationship between Private Investment, Savings, Real Interest Rate
and Governance in the East Africa…………..………………………….…10
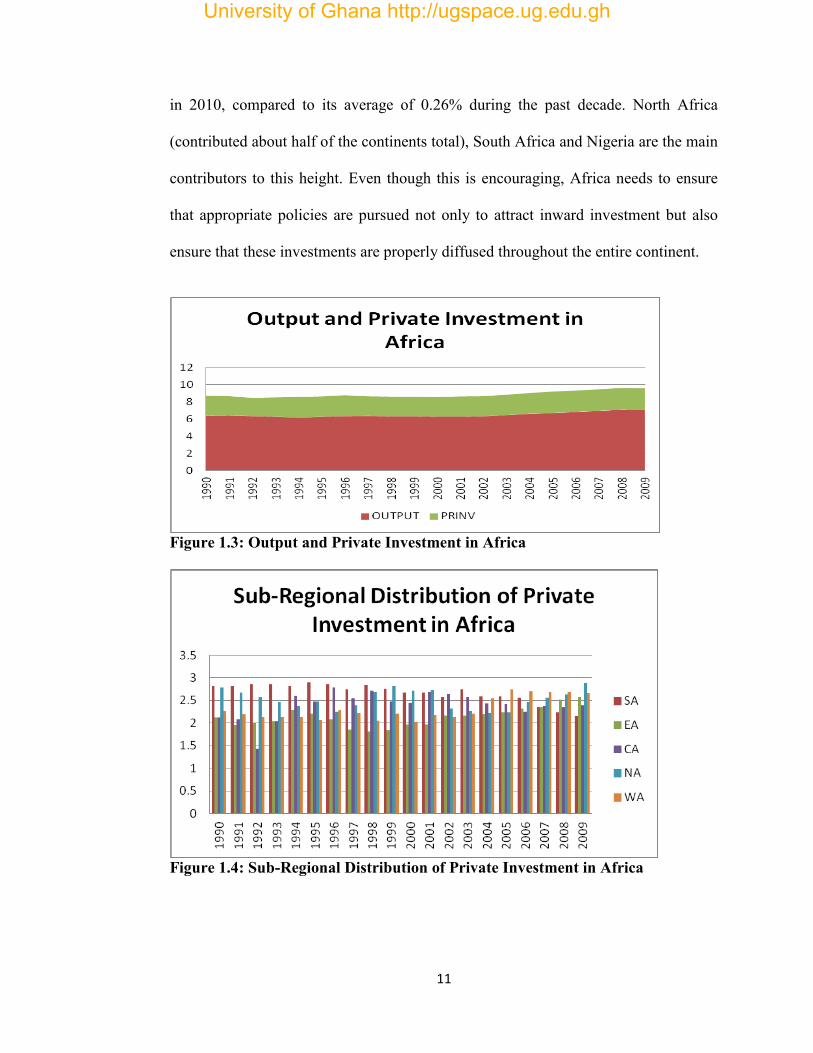
Figure 1.3: Relationship between Output and Private Investment in Africa…..….11
Figure 1.4: Sub-Regional Distribution of Private Investment in Africa………..…11
Figure 1.5: Sub-Regional Distribution of GDP per Capita in Africa……………...12
University of Ghana http://ugspace.ug.edu.gh

xiii
LIST OF ACRONYMS
AB - Arellano-Bond
AB-GMM - Arellano Bond General Moments Method
ADF - Augmented Dickey Fuller
ADI - African Development Index
AfDB –African Development Bank
API - Agricultural Productivity Index
CA - Central Africa
CBB - Current Budget Balance
CC - Control of Corruption GDP - Gross Domestic Product
CGI – Country Governance Index
DCPS - Domestic Credit to Private Sector
EA - East Africa
EDS - External Debt Stocks
EMPFEM - Female Employment
EMPFEMY - Youth and Female Employment
EMPMAL - Male Employment
EMPMALY - Youth and Male Employment
EMPTOT - Total Employment
EMPTOTY - Total Youth employment
EMU - European Monetary Union
FDI – Foreign Direct Investment
FRL - Fiscal Responsibility Law
University of Ghana http://ugspace.ug.edu.gh

xiv
GDP - Gross Domestic Product
GE - Government Effectiveness
GMM - General Methods of Moments
GPINV - Public Investment
HD - Human Development
HDI - Human Development Index
IAWG - Inter-Agency Working Group
IFC - International Financial Corporation
IFC- International Finance Corporation
IFIs - International Financial Institutions
IGF - Internally generated funds
ILO - International Labour Organisation
IMF - International Monetary Fund
INF – Inflation
IRF - Impulse Response Functions
ISSER - Institute of Statistical Social and Economic Research
IV - Instrumental Variable
MDG – Millennium Development Goal
MENA - Middle-East and North Africa
MNC – Multi – National Corporation
MPPL - Marginal Physical Product of Labour
NA - North Africa
NGO - Non-Governmental Organisations
University of Ghana http://ugspace.ug.edu.gh
xv
OBB - Overall budget deficit
ODA - Gross Official Development Agency’s
OECD - Organisation for Economic Development
OLS - ordinary least squares
PCA - Principal Component Analysis
POL - Political Discretion/Constraint
PPP - Public private partnership
PRINV- Private Investment
PS - Political Stability
PVAR - Panel-Data Vector Autoregression
RIR - Real Interest Rate
RL - Rule of Law
RQ - Regulatory Quality
RWR - Real Wage Rate
SA - Southern Africa
SAS - South Asia
SME – Small and Medium scale Enterprise
SOEs - State-Owned Enterprises
SSA - Sub-Saharan Africa
TOPEN - Trade openness
UNCTAD - United Nations Commission for Trade and Development
UNDP – United Nations Development Program
UNECA - United Nations Economic Commission for Africa
University of Ghana http://ugspace.ug.edu.gh
xvi
USA - United States of America
VA - Voice and Accountability
VIF - Variance Inflation Factors
WA - West Africa
WES - World Bank Enterprise Survey
WTO - World Trade Organisation
2SLS - Two-Stage Least Squares
University of Ghana http://ugspace.ug.edu.gh
xvii
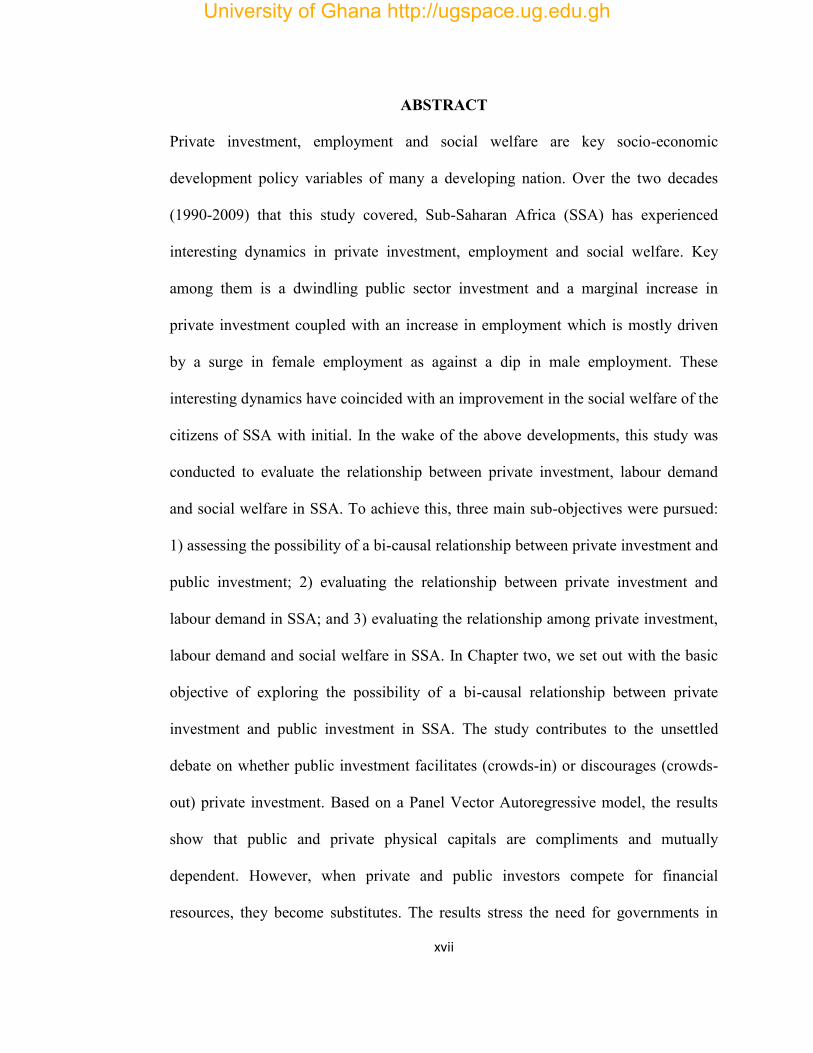
ABSTRACT
Private investment, employment and social welfare are key socio-economic
development policy variables of many a developing nation. Over the two decades
(1990-2009) that this study covered, Sub-Saharan Africa (SSA) has experienced
interesting dynamics in private investment, employment and social welfare. Key
among them is a dwindling public sector investment and a marginal increase in
private investment coupled with an increase in employment which is mostly driven
by a surge in female employment as against a dip in male employment. These
interesting dynamics have coincided with an improvement in the social welfare of the
citizens of SSA with initial. In the wake of the above developments, this study was
conducted to evaluate the relationship between private investment, labour demand
and social welfare in SSA. To achieve this, three main sub-objectives were pursued:
1) assessing the possibility of a bi-causal relationship between private investment and
public investment; 2) evaluating the relationship between private investment and
labour demand in SSA; and 3) evaluating the relationship among private investment,
labour demand and social welfare in SSA. In Chapter two, we set out with the basic
objective of exploring the possibility of a bi-causal relationship between private
investment and public investment in SSA. The study contributes to the unsettled
debate on whether public investment facilitates (crowds-in) or discourages (crowds-
out) private investment. Based on a Panel Vector Autoregressive model, the results
show that public and private physical capitals are compliments and mutually
dependent. However, when private and public investors compete for financial
resources, they become substitutes. The results stress the need for governments in
University of Ghana http://ugspace.ug.edu.gh
xviii
SSA to reduce their activities in the domestic financial markets by being fiscally
disciplined probably through strong commitment to Fiscal Responsibility Laws. This
would not only facilitate private investment but also reduce the burden on
governments for public investments. Thus, we argue that a public-private
partnership based on a thorough comparative analysis of the respective strengths and
weaknesses of public and private investment would facilitate development in SSA.
In Chapter three, we concentrated on the second objective, that is, assess whether
employment generation (total, male, female and youth) is part of the benefits that
SSA economies get from private investment. We estimated a derived neoclassical
labour demand model that allows for the inclusion of private investment, real labour
cost, human capital and public investment. The results indicate that while private
investment has a substitutive effect on employment (total, male and female), public
investment compliments employment. Also, real wage rate and human capital have
significantly negative relationships with labour demand. Meanwhile the result on the
youth employment effect of private investment is inconclusive. Thus it is suggested
that employment incentives policies should be offered to private investors to help
mitigate their negative impact on labour demand while measures to sustain public
investment are undertaken. Also, in Chapter four, the study concentrated on the last
objective of assessing the effect of private investment and employment on social
welfare in SSA, after accounting for economic inequality. We estimated a derived
welfare function within the framework of random effects panel methodology. The
results offer support for the growth-poverty-nexus by showing that growth
components like investment and employment help explain social welfare dynamics.
University of Ghana http://ugspace.ug.edu.gh
xix
Also, economic inequality and poverty worsen the social welfare condition of the
citizens of SSA. Consequently, SSA countries should intensify policies aimed at
improving per capita private investment, enhancing the efficiency of per capita public
investment, offering good jobs and reducing poverty and inequality since they are
conduits for improving the social wellbeing of the citizenry. These policies should
target real interest rate and wage cost reductions, tax reforms that will motivate
private sector to employ more while at the same time getting more tax revenue from
the rich to facilitate social intervention programmes, fiscal discipline, control
corruption and population and encourage labour intensive economic growth.
University of Ghana http://ugspace.ug.edu.gh
1
CHAPTER ONE
GENERAL INTRODUCTION
1.0 Background
Significant disparities in global standards of living are a source of worry not only to
economists and politicians but also to religious bodies and social activist. In fact,
bridging this gap is one of the main reasons in support of aid, grant and many
activities of international donor agencies and non-governmental organizations. Miles
and Scott (2005) argue that differences in overall value of physical capital among
countries can account for a substantial part, but by no means, most of the differences
in standard of living. In other words, the benefits that can be derived from investment
can help advance the standard of living of the citizenry of any nation. Earlier,
Cherian (1998) argued that investment may be considered the most important
component of Gross Domestic Product (GDP) because (1) Plant and Equipment have
a long-term effect on the economy’s productive capacity, (2) Changes in investment
spending directly affect levels of employment and worker’s incomes in durable goods
industries and (3) supply and demand are sensitive to changes in investment. Miles
and Scott (2005) contend that understanding what drives investment is critical not
only for understanding movements in the standard of living of countries but also
business cycles. Probably, this may be as a result of the fact that investment has the
potential to influence welfare and productivity through employment.
In view of the importance of investment in explaining the differences in global
standards of living, empirical knowledge of the co-existence of the two main types of
University of Ghana http://ugspace.ug.edu.gh
2
investment (public and private) is of paramount importance. The empirical literature
is rich with studies on determinants of investment in general, with some seeming
overconcentration on private investment. But there is no consistent conclusion on
whether public investment amplifies or curtails private investment. Empirical
knowledge about the interrelationship between public investment and private
investment is pertinent because a vibrant private sector is good for employment
generation and poverty alleviation, which are traditionally considered to be the direct
responsibility of government. Government can assist the private sector to achieve this
through the provision of infrastructure and proper regulation. Unfortunately,
however, when government compete with the private sector in search of factors of
production like capital the negative effects of such actions on private investment can
outweigh their positive effects.
Those who argue that public investment facilitates (crowds in) private investment
explain that the provision of basic infrastructure like roads, power, education and
health facilities and the provision of public goods that are complements to private
goods are the main channels for the crowding-in effect. (Aschauer, 1989a, 1989b,
1990; Munnell, 1990; Cashin, 1995; Asante, 2000; Ghura & Barry, 2010; Altin,
Moisiu & Agim, 2012). On the other hand, those who support the view that public
investment curtails (crowds out) private investment contend that when public
investment is in the provision of substitute products, crowding out is possible
(Tatom, 1991; Holtz-Eakin, 1994; Evans & Karras, 1994; Deverajan, Easterly &
Pack, 1999; Ajide & Olukemi, 2012; Munthali, 2012). In the midst of this debate,
University of Ghana http://ugspace.ug.edu.gh
3
some researchers argue that whether public investment crowds out or crowds in
private investment depends on the stage of development of the economy (Belloc &
Vertola, 2004; Erden & Holcombe, 2005; Munthali, 2008, 2012). They further
explain that a crowding out relationship is more associated with a developed
economy while a crowding in relationship is associated with a developing economy.
In spite of this, some empirical results on developing economies, especially Africa,
are not consistent with this conclusion (Asante, 2000; Altin, et al, 2012; Deverajan, et
al, 1999; Ajide & Olekumi, 2012). Asante (2000) concluded from a study on the
determinants of private investment in Ghana and also from time series data that
private investment and public investment are compliments. Altin, et al, (2012) also
explain that the relationship between public investment and private investment, even
though positive, diminishes as a country moves from less developed to more
developed. But Deverajan, et al, (1999) in a study of whether investment in Africa
was too high or too low argued that public investment has a possibility of crowding
out private investment than crowding in private investment. Ajide and Olekumi
(2012) support the findings of Deverajan, et al, (1999) but with data from Nigeria.
Thus, the relationship between public investment and private investment still remains
an empirical question.
Meanwhile, researchers have overly concentrated on finding out whether public
investment crowds-in or crowds-out private investment generally to the neglect of
assessing the possibility of a reverse causality between public investment and private
investment. In other words, does private investment crowd in or crowd out public
University of Ghana http://ugspace.ug.edu.gh
4
investment in Africa, where private investment sometimes leads public investment?
Except under public private partnership (PPP) agreements, it is uncommon for
private and public investments to coincide. What is likely, is for private investment to
either precede or follow public investments. Depending on the kind of products
(complements or substitutes) that public investments are made in, private investment
may also crowd in or crowd out public investments. Also, if more public investments
are in infrastructure and not in commercial goods then the presence of private
investment may serve as an attraction for public investment projects. Again, the way
in which public investments are funded would also play a key role in helping to
resolve the crowding-in and crowding-out (herein referred to as crowding-in-out)
debate. Where public investments are funded through internally generated funds
(IGF) of government and not on the meagre domestic credit, the crowding out effect
of public investment on private is likely to be minimal. The existing empirical
literature on the crowding-in-out debate provides little or no information on this
aspect of literature. This general empirical oversight, in the researcher’s view, would
not help us have a better understanding and conclusion of the crowding-in-out
hypothesis. Thus, this study contributes to the existing literature by reassessing the
crowding-in crowding-out hypothesis and the possibility of a bi-causal relationship
between private and public investment in an SSA setting.
In spite of the uncertainty surrounding the relationship between public and private
investment, it is less debatable that investment facilitates economic development.
Through job creation which increases living standards, raises productivity and
University of Ghana http://ugspace.ug.edu.gh
5
facilitates social cohesion (World Bank, 2013) private investment may influence
economic development. A developed economy is one that gives its citizens
employment opportunities in order to empower them economically to meet, at least,
the basic needs of life. Unfortunately, however, the 2008 global economic meltdown
seems to have worsened the global unemployment challenge, in recent times. The
International Finance Corporation (IFC-2014) indicates that unemployment estimates
for 2020 show that most of the world’s needs for jobs would have to come from
Africa and Asia. These regions, especially Africa, need special attention because
even in periods of rising economic growth, Emery (2003) warned of a decreasing
employment content and rising inequality in Africa. Meanwhile, SSA has not only
witnessed a steady rise in private investment but also a dwindling public investment
component of a rising total investment, when the two decades (1990-1999 and 2000-
2009) of the study period are compared. Consequently, this study also assessed,
empirically, the contribution of the private sector to employment generation in the
SSA, since limited studies (Asiedu, 2004; Sackey, 2007; Asiedu & Gyimah-
Brempong, 2008; Aterido & Hallward-Driemeier, 2010) exist in this area and none of
them considers it in a derived neoclassical labour demand model that expressly
factors in private investment. Neoclassical labour demand models predict a negative
relationship between real wage rate and employment (Symons, 1982; Andrews &
Nickell, 1982; Sparrow, Ortmann, Lyne & Darroch, 2008) even though some other
studies argue in favour of a positive association, especially in a recession (Keynes,
1936; Michaillat & Saez, 2013). So, eventually, this study also contributes to the
University of Ghana http://ugspace.ug.edu.gh
6
discussion on the relationship between real wage rate and labour demand while
assessing the contribution of private investment to labour demand.
Another way of assessing the economic developmental impact of private investment
is through its impact on social welfare. Generally, economic growth is considered
the single most important factor that influences welfare (Donaldson, 2008), when
such growth benefits the poor (Thurlow & Wobst, 2006). In other words, when
income inequality is reduced, it enhances the quality of growth to facilitate social
welfare (Kalwij & Verschoor 2007; Ravallion, 2007; Fosu, 2008, 2010). Also,
according to Adams (2004) when economic growth is labour intensive, it can be an
appropriate channel through which growth can benefit the poor. Pfeffermann (2001)
adds that a dynamic private sector is a key ingredient for ensuring long-run economic
development. Given that economic growth influences social welfare and private
investment as well as employment enhances economic growth (Alfaro, Chanda,
Kalemli-Ozcan, & Sayek, 2010 and; Apergis, Lyroudia, & Vamvakidis, 2008), it
would not be farfetched for one to conjecture that private investment and
employment may influence social welfare, especially when some stylised facts
suggest so. This, in effect, allows us to assess which growth structure influences
social welfare.
University of Ghana http://ugspace.ug.edu.gh
7
1.1 Stylised Facts
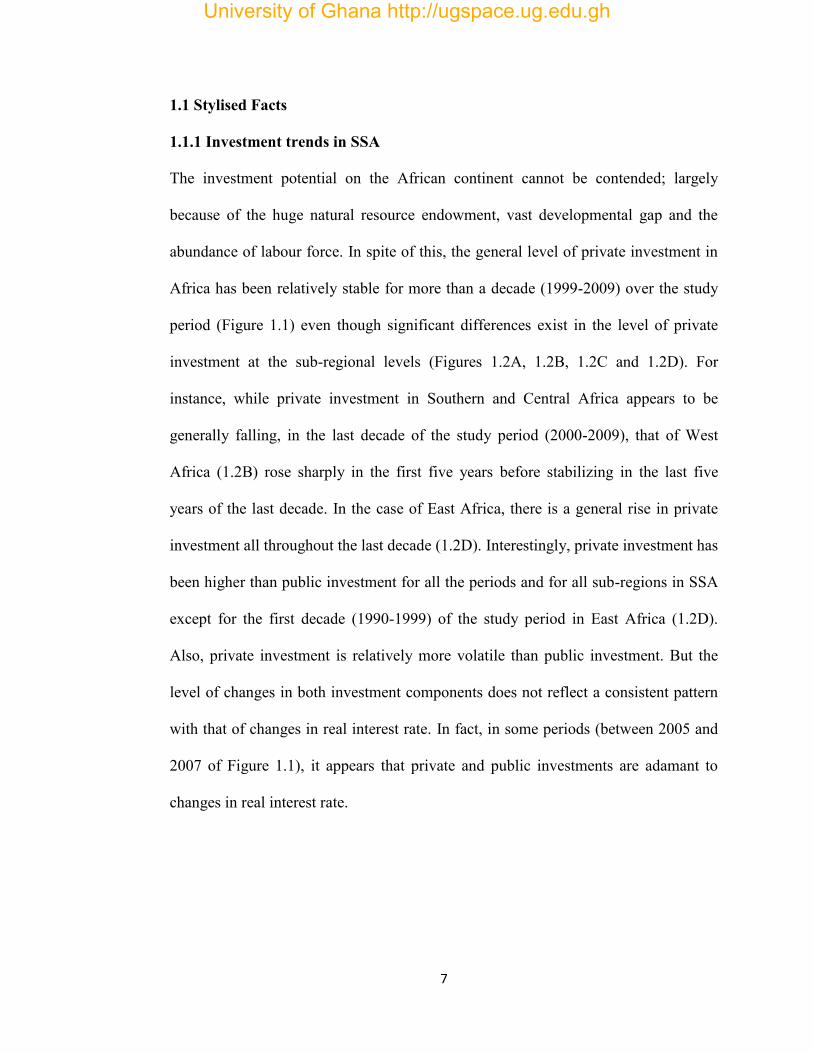
1.1.1 Investment trends in SSA
The investment potential on the African continent cannot be contended; largely
because of the huge natural resource endowment, vast developmental gap and the
abundance of labour force. In spite of this, the general level of private investment in
Africa has been relatively stable for more than a decade (1999-2009) over the study
period (Figure 1.1) even though significant differences exist in the level of private
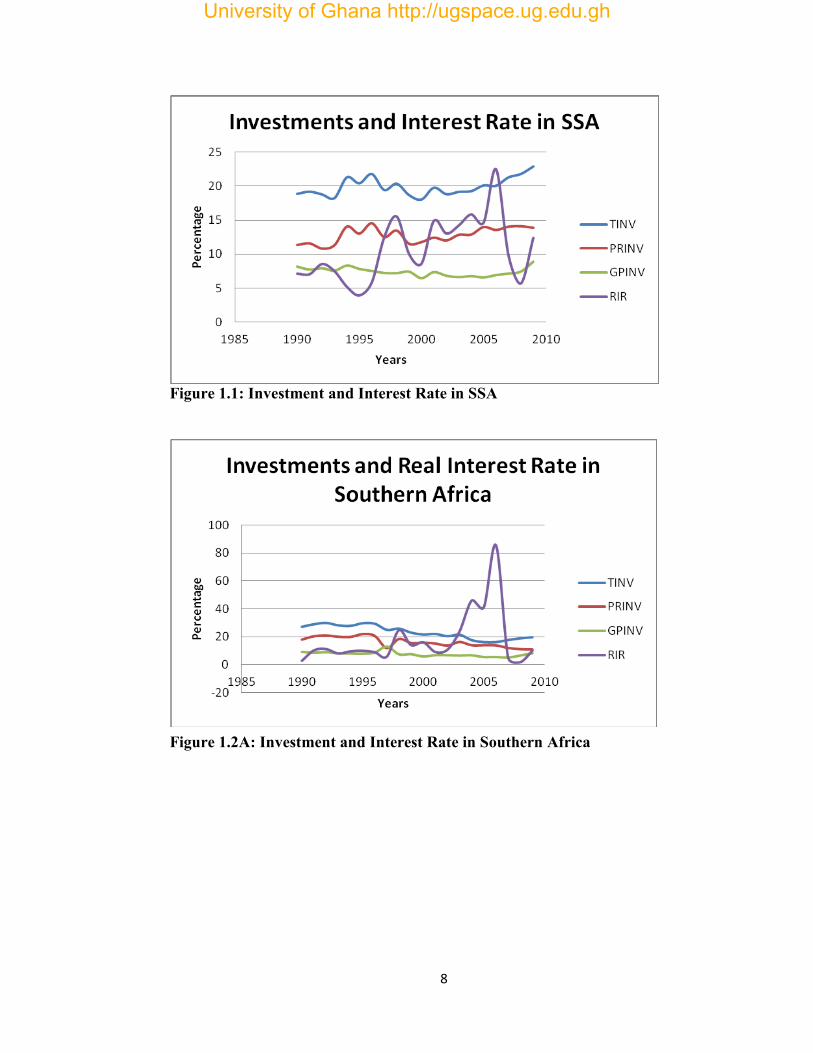
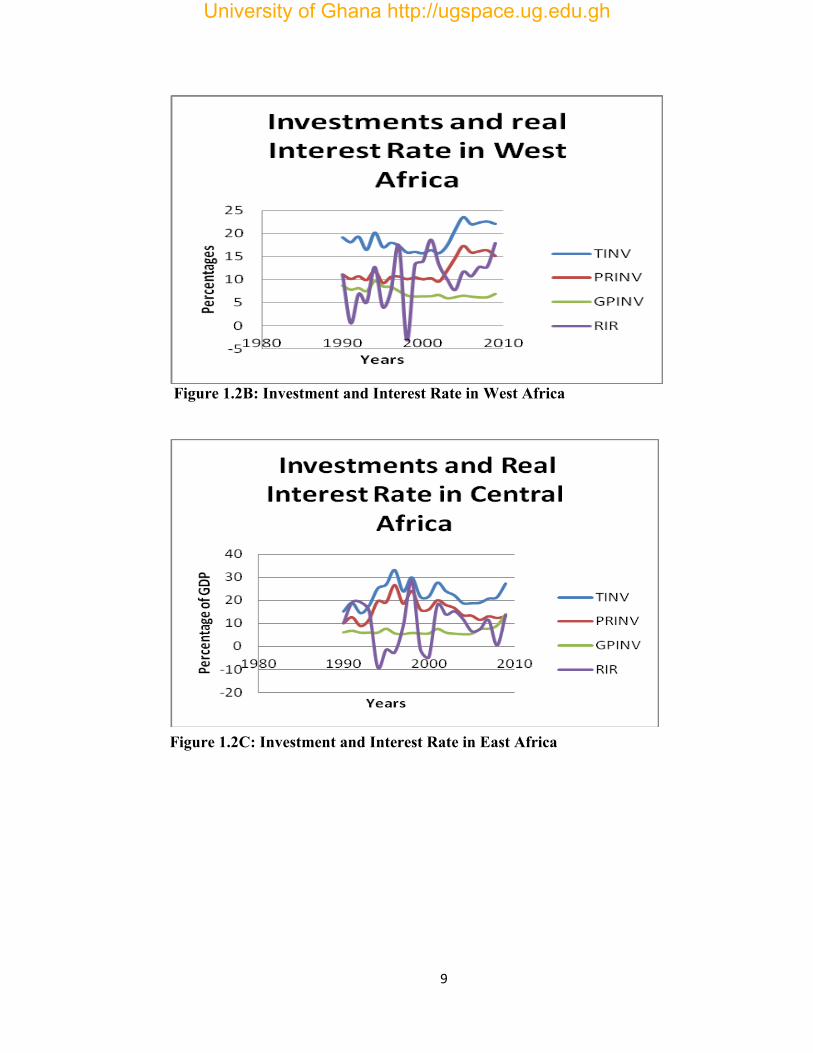
investment at the sub-regional levels (Figures 1.2A, 1.2B, 1.2C and 1.2D). For
instance, while private investment in Southern and Central Africa appears to be
generally falling, in the last decade of the study period (2000-2009), that of West
Africa (1.2B) rose sharply in the first five years before stabilizing in the last five
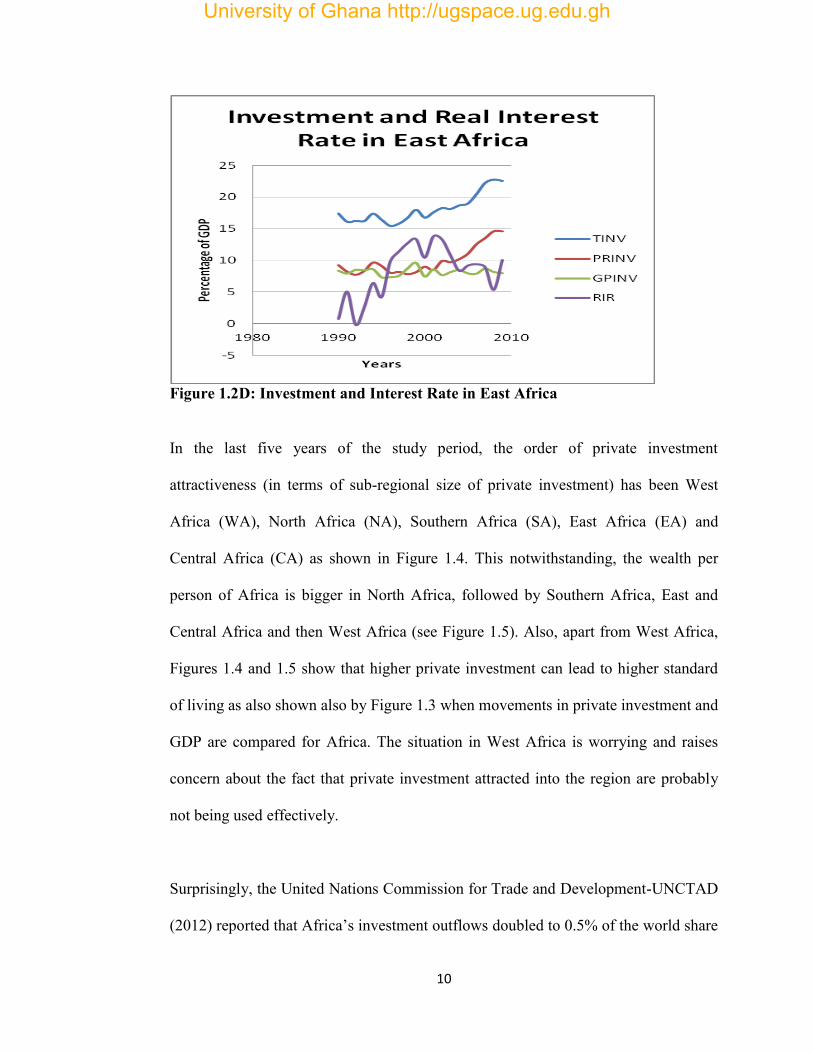
years of the last decade. In the case of East Africa, there is a general rise in private
investment all throughout the last decade (1.2D). Interestingly, private investment has
been higher than public investment for all the periods and for all sub-regions in SSA
except for the first decade (1990-1999) of the study period in East Africa (1.2D).
Also, private investment is relatively more volatile than public investment. But the
level of changes in both investment components does not reflect a consistent pattern
with that of changes in real interest rate. In fact, in some periods (between 2005 and
2007 of Figure 1.1), it appears that private and public investments are adamant to
changes in real interest rate.
University of Ghana http://ugspace.ug.edu.gh
8
Figure 1.1: Investment and Interest Rate in SSA
Figure 1.2A: Investment and Interest Rate in Southern Africa
University of Ghana http://ugspace.ug.edu.gh
9
Figure 1.2B: Investment and Interest Rate in West Africa
Figure 1.2C: Investment and Interest Rate in East Africa
University of Ghana http://ugspace.ug.edu.gh
10
Figure 1.2D: Investment and Interest Rate in East Africa
In the last five years of the study period, the order of private investment
attractiveness (in terms of sub-regional size of private investment) has been West
Africa (WA), North Africa (NA), Southern Africa (SA), East Africa (EA) and
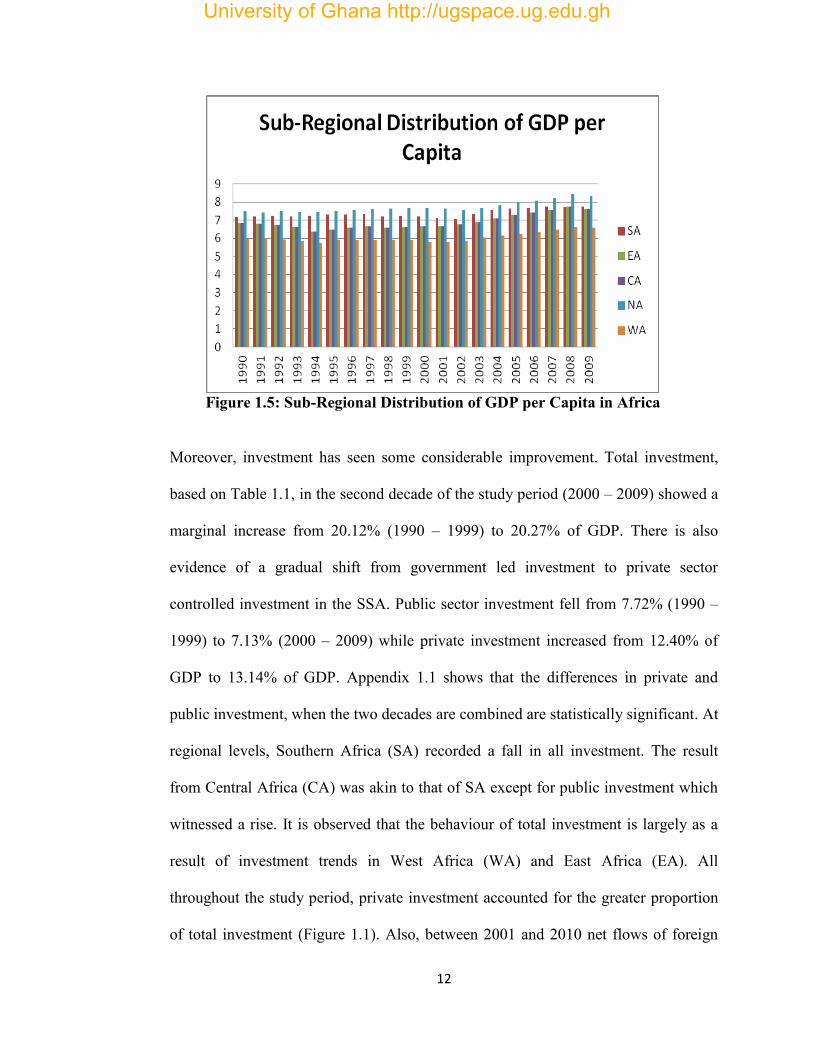
Central Africa (CA) as shown in Figure 1.4. This notwithstanding, the wealth per
person of Africa is bigger in North Africa, followed by Southern Africa, East and
Central Africa and then West Africa (see Figure 1.5). Also, apart from West Africa,
Figures 1.4 and 1.5 show that higher private investment can lead to higher standard
of living as also shown also by Figure 1.3 when movements in private investment and
GDP are compared for Africa. The situation in West Africa is worrying and raises
concern about the fact that private investment attracted into the region are probably
not being used effectively.
Surprisingly, the United Nations Commission for Trade and Development-UNCTAD
(2012) reported that Africa’s investment outflows doubled to 0.5% of the world share
University of Ghana http://ugspace.ug.edu.gh
11
in 2010, compared to its average of 0.26% during the past decade. North Africa
(contributed about half of the continents total), South Africa and Nigeria are the main
contributors to this height. Even though this is encouraging, Africa needs to ensure
that appropriate policies are pursued not only to attract inward investment but also
ensure that these investments are properly diffused throughout the entire continent.
Figure 1.3: Output and Private Investment in Africa
Figure 1.4: Sub-Regional Distribution of Private Investment in Africa
University of Ghana http://ugspace.ug.edu.gh
12
Figure 1.5: Sub-Regional Distribution of GDP per Capita in Africa
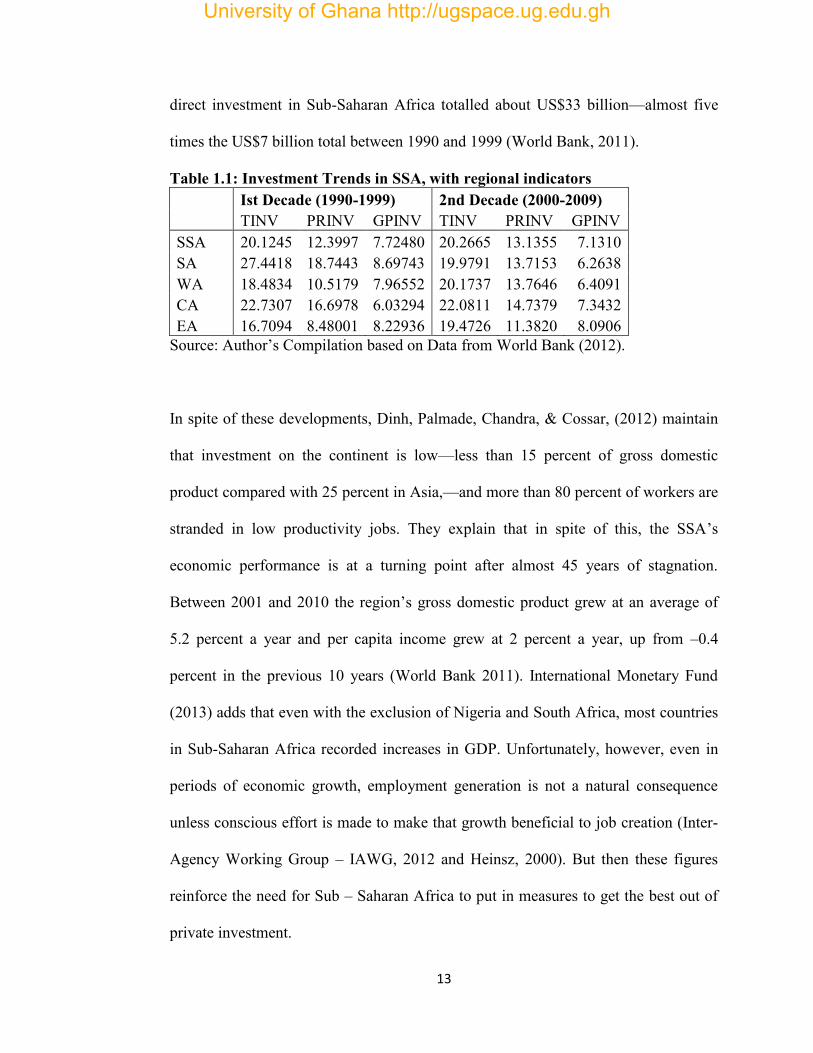
Moreover, investment has seen some considerable improvement. Total investment,
based on Table 1.1, in the second decade of the study period (2000 – 2009) showed a
marginal increase from 20.12% (1990 – 1999) to 20.27% of GDP. There is also
evidence of a gradual shift from government led investment to private sector
controlled investment in the SSA. Public sector investment fell from 7.72% (1990 –
1999) to 7.13% (2000 – 2009) while private investment increased from 12.40% of
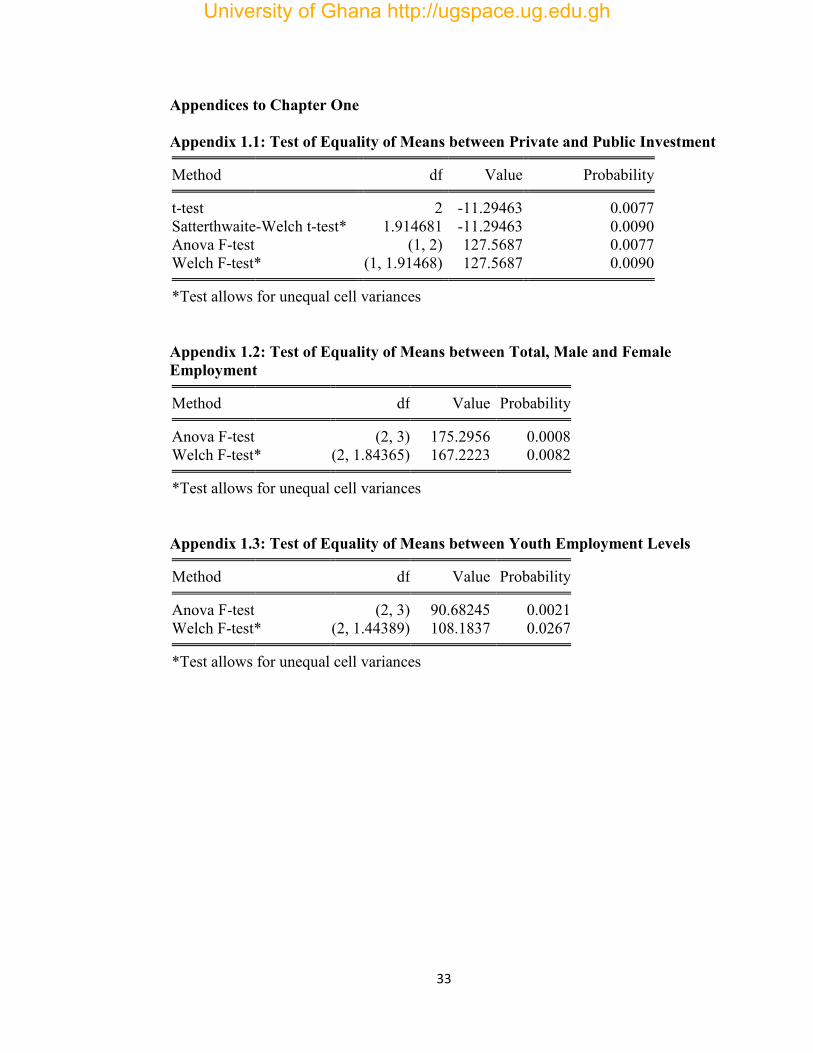
GDP to 13.14% of GDP. Appendix 1.1 shows that the differences in private and
public investment, when the two decades are combined are statistically significant. At
regional levels, Southern Africa (SA) recorded a fall in all investment. The result
from Central Africa (CA) was akin to that of SA except for public investment which
witnessed a rise. It is observed that the behaviour of total investment is largely as a
result of investment trends in West Africa (WA) and East Africa (EA). All
throughout the study period, private investment accounted for the greater proportion
of total investment (Figure 1.1). Also, between 2001 and 2010 net flows of foreign
University of Ghana http://ugspace.ug.edu.gh
13
direct investment in Sub-Saharan Africa totalled about US$33 billion—almost five
times the US$7 billion total between 1990 and 1999 (World Bank, 2011).
Table 1.1: Investment Trends in SSA, with regional indicators Ist Decade (1990-1999) 2nd Decade (2000-2009) TINV PRINV GPINV TINV PRINV GPINV SSA 20.1245 12.3997 7.72480 20.2665 13.1355 7.1310 SA 27.4418 18.7443 8.69743 19.9791 13.7153 6.2638 WA 18.4834 10.5179 7.96552 20.1737 13.7646 6.4091 CA 22.7307 16.6978 6.03294 22.0811 14.7379 7.3432 EA 16.7094 8.48001 8.22936 19.4726 11.3820 8.0906
Source: Author’s Compilation based on Data from World Bank (2012).
In spite of these developments, Dinh, Palmade, Chandra, & Cossar, (2012) maintain
that investment on the continent is low—less than 15 percent of gross domestic
product compared with 25 percent in Asia,—and more than 80 percent of workers are
stranded in low productivity jobs. They explain that in spite of this, the SSA’s
economic performance is at a turning point after almost 45 years of stagnation.
Between 2001 and 2010 the region’s gross domestic product grew at an average of
5.2 percent a year and per capita income grew at 2 percent a year, up from –0.4
percent in the previous 10 years (World Bank 2011). International Monetary Fund
(2013) adds that even with the exclusion of Nigeria and South Africa, most countries
in Sub-Saharan Africa recorded increases in GDP. Unfortunately, however, even in
periods of economic growth, employment generation is not a natural consequence
unless conscious effort is made to make that growth beneficial to job creation (Inter-
Agency Working Group – IAWG, 2012 and Heinsz, 2000). But then these figures
reinforce the need for Sub – Saharan Africa to put in measures to get the best out of
private investment.
University of Ghana http://ugspace.ug.edu.gh
14
Generally, movement in interest rates is deemed to predict investment behaviour. In
Africa, the relationship between real interest rate and private investment has been
mostly inverse (between 1990-1997), occasionally direct (1997-1998) but recently
indifferent (2005-2009, see Figure 1.1). Apparently, this is a reflection of the mixed
relationships observed at the sub-regional level (Figures 1.2). Impliedly, not all
changes in real interest rate necessitate changes in private investment, all times. This
offers some support for the reason why both the classical and Keynesian theories
emphasize different kinds of fluctuation of the investment curve. Whilst Classical
economists believe that major changes in investment is brought about by changes in
real interest rate, Keynesian economists stress that external factors that shift the
investment demand curve account for large fluctuations in investment (Parker, 2010).
Empirically, results have been largely concentrated at the firm level (Hu, 1999;
Chatelain & Tiomo, 2001; Bokpin & Onumah, 2009) and also on developed
economies where interest rates are less volatile.
1.1.2 Employment trends in SSA
Even though the Sub-Saharan African (SSA) region’s unemployment rate, as at 2011,
(about 8.8% of total labour force) was better than that of North Africa (about 10.9%
of total labour force), Middle East (about 10.5% of total labour force), Central and
South-Eastern Europe (about 9% of total labour force), it was about 2.4 percentage
points worse than the global average. Also, most of the jobs in the SSA region seem
not to be good, as the region was the second worse region in the world in terms of
share of working poor. About 65% of total employment in 2011 was found to belong
University of Ghana http://ugspace.ug.edu.gh
15
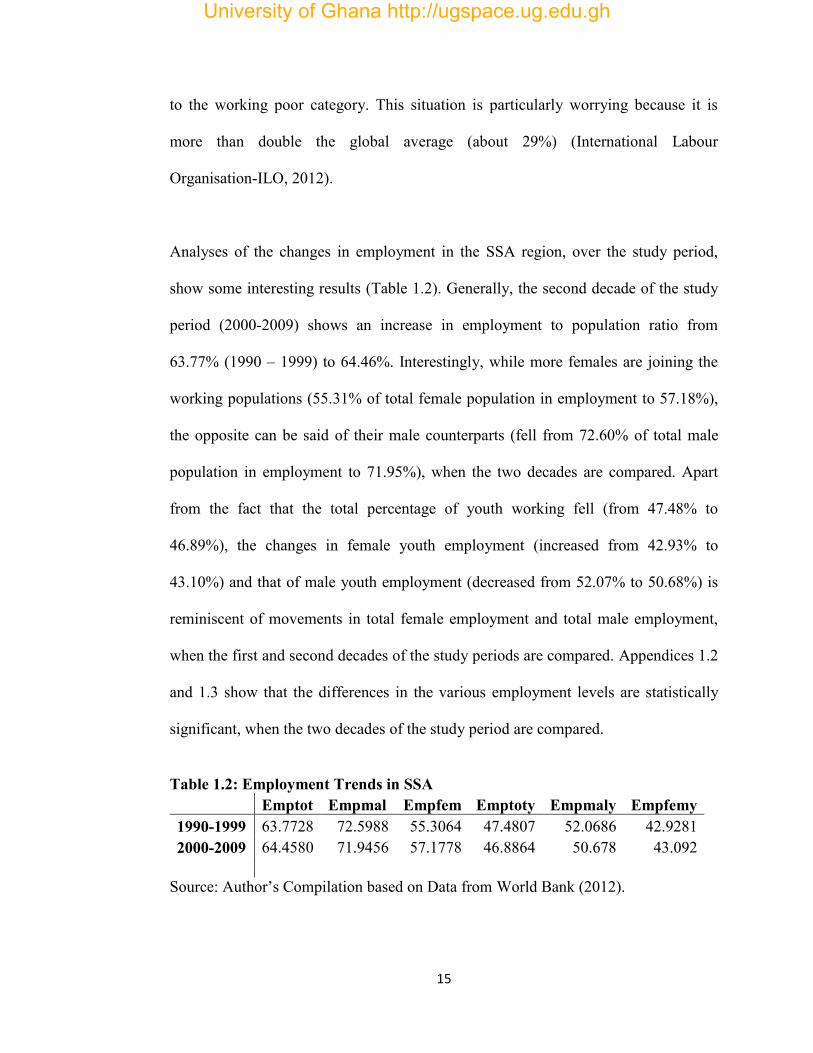
to the working poor category. This situation is particularly worrying because it is
more than double the global average (about 29%) (International Labour
Organisation-ILO, 2012).
Analyses of the changes in employment in the SSA region, over the study period,
show some interesting results (Table 1.2). Generally, the second decade of the study
period (2000-2009) shows an increase in employment to population ratio from
63.77% (1990 – 1999) to 64.46%. Interestingly, while more females are joining the
working populations (55.31% of total female population in employment to 57.18%),
the opposite can be said of their male counterparts (fell from 72.60% of total male
population in employment to 71.95%), when the two decades are compared. Apart
from the fact that the total percentage of youth working fell (from 47.48% to
46.89%), the changes in female youth employment (increased from 42.93% to
43.10%) and that of male youth employment (decreased from 52.07% to 50.68%) is
reminiscent of movements in total female employment and total male employment,
when the first and second decades of the study periods are compared. Appendices 1.2
and 1.3 show that the differences in the various employment levels are statistically
significant, when the two decades of the study period are compared.
Table 1.2: Employment Trends in SSA Emptot Empmal Empfem Emptoty Empmaly Empfemy 1990-1999 63.7728 72.5988 55.3064 47.4807 52.0686 42.9281 2000-2009 64.4580 71.9456 57.1778 46.8864 50.678 43.092
Source: Author’s Compilation based on Data from World Bank (2012).
University of Ghana http://ugspace.ug.edu.gh
16
1.1.3 Welfare Trends in SSA
Even though the world has made progress towards achieving the global target of
reducing poverty by halve by 2015 (millennium Development Goal-MDG- 1), many
countries in Sub-Saharan Africa (SSA) and Southeast Asia have not made significant
progress (Kozak, Lombe, & Miller, 2012). Global extreme poverty level-people
living on less than $1.25 a day- has reduced by half from 1990 (36% of the world’s
population) to 2010 (18% of the world’s population). But two (Nigeria and Congo
DR) of the world’s five countries (including India, China and Bangladesh) that make
up two-thirds of the world’s extreme poor are in SSA (Word Bank, 2014). The report
further states that five (Congo DR, 88%; Liberia, 84%; Burundi, 81%; Madagascar,
81% and Zambia, 75%) out of the high extreme poverty smaller countries are in SSA.
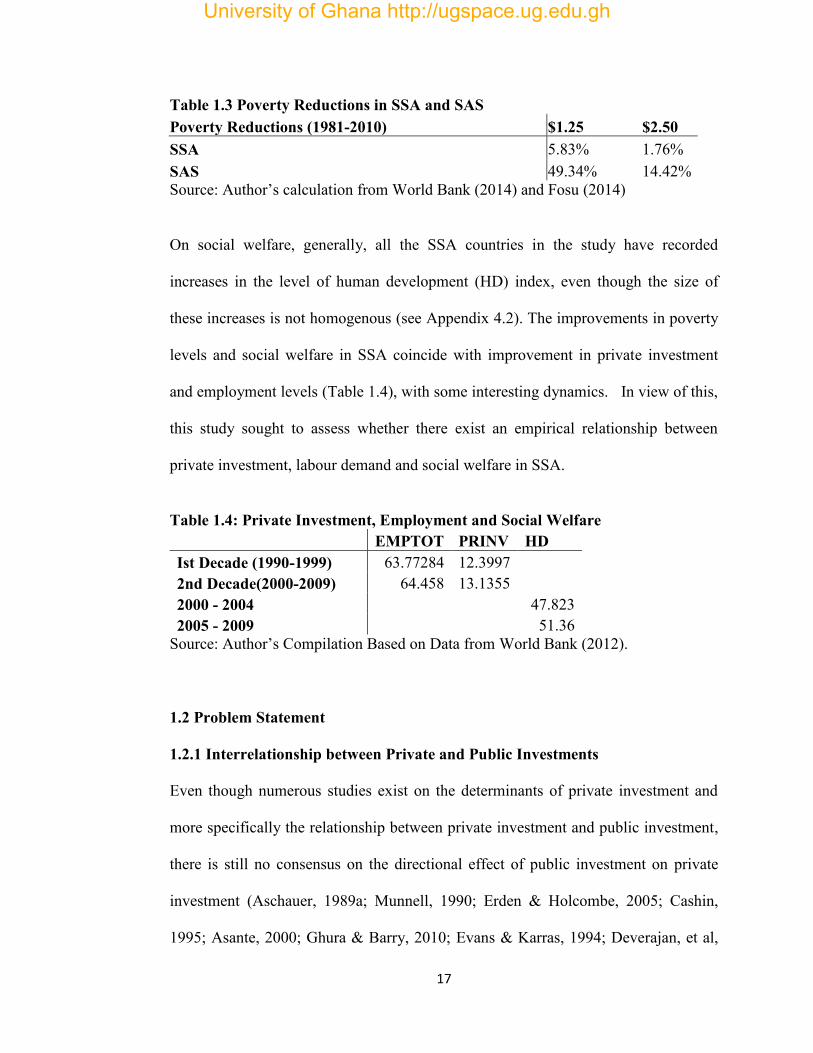
A comparison of historical poverty records of SSA and South Asia (SAS) shows that
the two sub-regions have recorded poverty reductions between 1981 and 2010 but
SAS has made the most gains. SSA achieved a reduction of 5.83% in poverty levels
while that of SAS was 49.34%, based on headcount ratio using $1.25 standard.
Similar results were recorded when the $2.50 standard was used. While SAS
recorded a reduction of 14.42%, SSA achieved a reduction of 1.76% (Table 1.3).
Also, current poverty levels (as at 2010), using $1.25 standard, shows that poverty
level in SAS is about 17.5% lower than SSA but on the basis of $2.50 standard, SSA
is about 1.4% lower than SAS (Appendix 4.1). Obviously, SSA appears to be less
aggressive in pursuing the poverty reduction agenda.
University of Ghana http://ugspace.ug.edu.gh
17
Table 1.3 Poverty Reductions in SSA and SAS Poverty Reductions (1981-2010) $1.25 $2.50 SSA 5.83% 1.76% SAS 49.34% 14.42% Source: Author’s calculation from World Bank (2014) and Fosu (2014)
On social welfare, generally, all the SSA countries in the study have recorded
increases in the level of human development (HD) index, even though the size of
these increases is not homogenous (see Appendix 4.2). The improvements in poverty
levels and social welfare in SSA coincide with improvement in private investment
and employment levels (Table 1.4), with some interesting dynamics. In view of this,
this study sought to assess whether there exist an empirical relationship between
private investment, labour demand and social welfare in SSA.
Table 1.4: Private Investment, Employment and Social Welfare EMPTOT PRINV HD Ist Decade (1990-1999) 63.77284 12.3997
2nd Decade(2000-2009) 64.458 13.1355 2000 - 2004
47.823
2005 - 2009
51.36 Source: Author’s Compilation Based on Data from World Bank (2012).
1.2 Problem Statement
1.2.1 Interrelationship between Private and Public Investments
Even though numerous studies exist on the determinants of private investment and
more specifically the relationship between private investment and public investment,
there is still no consensus on the directional effect of public investment on private
investment (Aschauer, 1989a; Munnell, 1990; Erden & Holcombe, 2005; Cashin,
1995; Asante, 2000; Ghura & Barry, 2010; Evans & Karras, 1994; Deverajan, et al,
University of Ghana http://ugspace.ug.edu.gh
18
1999; Ajide & Olukemi, 2012; Munthali, 2012). In other words, empirical results are
divided on whether public investment crowds out (Tatom, 1991; Holtz-Eakin, 1994;
Evans & Karras, 1994; Deverajan et al, 1999; Ajide & Olukemi, 2012) or crowds in
(Aschauer, 1989a, 1989b, 1990; Munnell, 1990; Cashin, 1995; Asante, 2000; Ghura
& Barry, 2010; Altin et al, 2012) private investment. In fact, in some situations, the
results have been inconclusive (Misati & Nyamongo, 2011; Munthali, 2012). In the
process, what has emerged, though, is a conclusion that public investment crowds out
private investment in developed economies while public investment exerts a
crowding-in effect on private investment in a developing economy (Belloc &
Vertola, 2004; Erden & Holcombe, 2005; Munthali, 2008, 2012).
However, this conclusion does not hold entirely because results from some
developing economies of Africa (Asante, 2000; Ndikumana, 2000; Munthali, 2012)
do not tell the same story. Also, it is quite surprising that in an attempt to find out
whether public investment crowds in/out private investment, the closest we have
come to assessing the possibility of a bi-causal relationship between public
investment and private investment is a mention by Munthali (2012) that it deserves
investigating. In view of this, it is pertinent for us to re-visit the crowding-in-out
hypothesis in a developing economy setting like SSA especially when it is certain
that existing studies seem to have controlled for different kinds of important
conditioning variables at a time. Also, we tested, empirically, for the possibility of a
bi-causal relationship between private investment and public investment in SSA
using a derived public investment model.
University of Ghana http://ugspace.ug.edu.gh
19
1.2.2 Private Investment and Labour Demand in Africa
Africa and Asia need to create good jobs in order to help the global economy
ameliorate the rising unemployment challenge. According to Nickell (2010), the
2008 global economic meltdown has partly caused the recent unemployment
challenge. Meanwhile, Cherian (1998) argues that changing investment spending
does not only affect levels of employment but also workers income. In fact, the
stylised facts point to the direction that increases in total investment and private
investment in particular seem to be associated with increases in labour demand.
In Africa, little is known about the employment benefits of private investment.
Asiedu (2004) looked at the determinants of employment in SSA using data from
foreign affiliates of US multinational enterprises in Africa; Sackey (2007) considered
employment impact of private investment using a sample of SMEs from some
African economies; Asiedu and Gyimah - Brempong (2008) studied the effect of
liberalization of investment policies on investment and employment of multinational
corporations in Africa; and Aterido and Hallward-Driemeier (2010) used firm-level
survey data from 104 developing economies which included 31 sub-saharan countries
to find out whether investment climate fosters employment growth.
This study fills the gap in literature by using national data to assess the relationship
between private investment (Not only from USA, foreigners or SMEs) and
employment (total, male, female, total youth, male youth and female youth) in SSA
after considering the effect of the credit crunch, using a derived neoclassical labour
University of Ghana http://ugspace.ug.edu.gh
20
demand model. The neoclassical labour demand theory predicts a negative
association between labour cost, real factor cost and labour demand and a positive
relationship between output and labour demand (Symons, 1982 and; Andrews and
Nickell, 1982 and Sparrow, Ortmann, Lyne and Darroch, 2008). In spite of this, other
researchers argue that a positive association between wage cost and labour demand is
possible, through the aggregate demand channel, especially in a recession (Keynes,
1936; Michaillat & Saez, 2013).
1.2.3 Private Investment, Labour Demand and Social Welfare in SSA
The dynamics in investment behaviour does not only coincide with labour market
dynamics but also with social welfare indicators. Empirical studies conclude that
economic growth is good for the poor. Meanwhile knowledge of the structure and
pattern of growth that supports poverty reduction or ensures improvement in social
welfare is limited, even though Nissanke & Thorbecke (2006) consider that benefits
from such empirical knowledge cannot be overemphasized. In situations where
attempts have been made to unravel the impact of certain growth components on
social welfare (Gohou & Somoure, 2012), income inequality has not been
considered. But the real impact of growth on poverty reduction or social welfare
improvements can be ascertained when the distribution of the entire economy’s
income has been factored in the analysis (Ravallion, 1997; Ravallion 2001; Ravallion
& Chen, 2007; Kalwij & Verschoor 2007; Ravallion, 2007; Fosu, 2008, 2010).
Unfortunately, however, the only known study on the African continent that assesses
the impact of FDI on welfare assumes a fairly distributed income and thus ignores the
University of Ghana http://ugspace.ug.edu.gh
21
possible effect of inequality on social welfare dynamics (Gohou & Somoure, 2012).
This study, therefore, bridges this gap in the literature by showing which growth
components and structure facilitates social welfare improvements when inequality
has been accountered for, using a derived welfare model that builds on a proposed
function by Todaro and Smith (2012).
1.3 Objectives of the study
The general objective of this study was to ascertain the relationship between private
investment, labour demand and social welfare in Sub-Saharan Africa. The following
specific objectives were pursued in order to achieve the general objective:
1. assess whether public investment crowds out or crowds in private investment
in SSA;
2. evaluate the possibility of a bi-causal relationship between private investment
and public investment in SSA;
3. ascertain the relationship between private investment and labour demand in
SSA and;
4. evaluate whether private investment and labour demand help explain social
welfare dynamics in SSA.
1.4 Hypotheses
1. H0: Public investment does not crowd out private investment in SSA.
2. H0: There is no bi-causal relationship between private investment and public
investment in SSA.
University of Ghana http://ugspace.ug.edu.gh
22
3. H0: There is no relationship between private investment and labour demand in
SSA.
4. H0: Private investment and labour demand have no effect on social welfare in
SSA.
1.5 Significance of the Study
This study sought to ascertain the relationship between private investment, labour
demand and social welfare in SSA. The study makes the following theoretical and
empirical contributions to the literature:
1. It provides further evidence on the debate on whether public investment
crowds out or crowds in private investment and also extends the debate
further on whether there is a bi-causal relationship between public investment
and private investment.
2. The study also tests the neoclassical labour demand theory in SSA by
expanding its application to assessing the impact of private investment on
labour, using a derived neoclassical labour demand model.
3. The study further expands the growth-poverty nexus, by deriving a welfare
model that builds on a welfare function proposed by Todaro and Smith
(2012), to show which growth components or structure enhances social
welfare in SSA.
4. Practically, the study offers directions to economic managers of SSA on how
to attract private investment, explore the relationship between private and
University of Ghana http://ugspace.ug.edu.gh
23
public investments, facilitate employment generation and improve on social
welfare.
1.6 Scope and Limitation
The study was done in the context of SSA, using various samples over the period of
1980 to 2009. So, findings from this study generally apply to SSA but cannot be
taken to depict the specific conditions of the countries in SSA. Specific country-level
studies could be undertaken not only to know how the findings fit in the general
models but also to prescribe specific policies for these economies.
Also, insufficient data on certain key variables like inequality, poverty level and
welfare made it difficult to estimate the derived model in its dynamic form or apply
all the theoretical prescriptions to the letter. In spite of these challenges, the
researcher believes the methods and estimation techniques used were appropriate for
the available data. Also, the findings are robust enough for a general application to
the SSA region.
1.6 Chapter Disposition
The entire study on private investment, labour demand and social welfare is
organised as follows. Chapter ‘one’ offered an introduction to the study. It discussed
the background to the study including stylised facts about some key variables, the
problem statement, objectives of the study, hypotheses and the scope and limitations.
Chapter ‘two’ is an empirical paper that assesses whether public investment crowds
in or crowds out private investment and whether there exists a bi-causal relationship
University of Ghana http://ugspace.ug.edu.gh
24
between public and private investment. Next, the researcher presented another
empirical paper in chapter ‘three’ on the relationship between private investment and
labour demand in SSA while chapter ‘four’ covered the last empirical paper on the
relationship between private investment, labour demand and social welfare in SSA.
In chapter five, the researcher presented the summary, conclusion and
recommendations for the entire study.
University of Ghana http://ugspace.ug.edu.gh
25
References to Chapter One
Adams, R. Jr. (2004). Economic growth, inequality and poverty: Estimating the
growth elasticity of poverty. World Development, 32(12), 1989–2014.
doi:10.1016/j.worlddev.2004.08.006.
Ajide, K. B., & Olukemi, L. (2012). Modelling the Long-run Determinants of
Domestic Private Investment in Nigeria. Asian Social Science, 8(13), 8(13),
139-152. doi:10.5539/ass.v8n13p139
Alfaro, L., Chanda, A., Kalemli-Ozcan, S., & Sayek, S. (2010). Does foreign direct
investment promote growth? Exploring the role of financial markets on
linkages. Journal of Development Economics, 91(2), 242–256.
Andrews, M. and Nickell, S. (1982). Unemployment in the United Kingdom since the
War. Review of Economics Studies, 49(special), 731-59.
Apergis, N., Lyroudia, K., & Vamvakidis, A. (2008). The relationship between
foreign direct investment and economic growth: Evidence from transitional
countries. Transition Studies Review, 15(1), 37–51.
Asante, Y. (2000). Determinants of Private Investment Behaviour (No. 100). AERC
Research Paper, Nairobi: African Economic Research Consortium.
Asiedu, E. (2004). The Determinants of Employment of Affiliates of US
Multinational Enterprises in Africa” Development Policy Review, 22(4), 371-379.
Asiedu, E., & Gyimah-Brempong, K. (2008). The Effect of the Liberalization of
Investment Policies on Employment and Investment of Multinational
Corporations in Africa. African Development Review, 20(1), 49-66.
University of Ghana http://ugspace.ug.edu.gh
26
Aschauer, D.A. (1989a). Is public expenditure productive? Journal of Monetary
Economics. 23, 177–200.
Aschauer, D.A.( 1989b). Does public capital crowds out private capital? Journal of
Monetary Economics 24, 171–88.
Aschauer, D. A. (1990). Why is infrastructure important? Is there a shortfall in
public capital investment? Alicia Munnell. Boston: Conference Series of
Federal Reserve Bank of Boston.
Aterido, R. & Hallward-Driemeier, M. (2010). The Impact of the Investment Climate
on Employment Growth: Does Sub-Saharan Africa Mirror Other Low-
Income Regions? (No. 5218). Policy Research Working Paper,
Developmental Research Group, World Bank.
Belloc, M., & P. Vertova. 2004. How does public investment affect economic growth
in HIPC? An empirical assessment. Department of Economics,
University of Sienna.
Bokpin, G. A., & Onumah, J. M. (2009). An Empirical Analysis of the Determinants
of Corporate Investment Decisions: Evidence from Emerging Market
Firms. International Research Journal of Finance and Economics, 33, 134-
141.
Cashin, P.( 1995). Government spending, taxes, economic growth. IMF Staff Papers
42(2), 237-269.
Chatelain, J-B. & Tiomo, A. (2001). Investment, the Cost Of Capital, and Monetary
Policy in the Nineties in France: A Panel Data Investigation (No. 106).
Banque de France Working Paper.
University of Ghana http://ugspace.ug.edu.gh
27
Cherian, S. (1998). The investment decision: A re-examination of competing theories
using panel data. Applied Economics, 30(1), 95–104.
Devarajan, S., Easterly, W., & Pack, H. (1999). Is Investment in Africa Too High or
Too Low? Macro and Micro Evidence. Journal of African Economies, 10
(2), 81-108.
Dinh, H. T., Palmade, V. T., Chandra, V. & Cossar, F. (2012). Light Manufacturing
in Africa: Targeted Policies to Enhance Private Investment and create
Jobs (67209). African Development Forum, World Bank.
Donaldson, J. A. (2008). Growth is Good for Whom, When, How? Economic Growth
and Poverty Reduction in Exceptional Cases. World Development, 36(11),
2127–2143.
Emery, J. J. (2003). Governance, Transparency and Private Investment in Africa. A
paper presented at the Global Forum on International Investment,
Johannesburg, South Africa OECD-Africa Investment Roundtable 19
November 2003, 1-16.
Erden, L., & Holcombe, R. (2005). The effects of public investment in developing
economies. Public Finance Review, 33(5), 575–602.
Evans, P., & Karras, G. (1994). Are government activities productive? Evidence
from a panel of U.S. states. Review of Economics and Statistics 76(1),
1-11.
Fosu, A. K. (2008). Inequality and the impact of growth on poverty: Comparative
evidence for Sub-Saharan Africa (No.2008.107). Research paper /
UNU-WIDER.
University of Ghana http://ugspace.ug.edu.gh
28
Fosu, A. K. (2010). Does inequality constrain poverty reduction programs? Evidence
from Africa. Journal of Policy Modeling, 32, 818–827.
http://dx.doi.org/10.1016/j.jpolmod.2010.08.007.
Ghura, D., & Barry, G.(2000). Determinants of Private Investment: A Cross-
Regional Empirical Investigation. Applied Economics, 32, 1819-1829.
Henisz, W. J. (2000). The Institutional Environment for Economic Growth.
Economics and Politics, 12(1), 1-31.
Holtz-Eakin, D.( 1994). Public-sector capital and productivity puzzle. Review of
Economics and Statistics, 76 (1), 12-21.
Hu, C. X. (1999). Leverage, Monetary Policy, and Firm Investment. FRBSF
Economic Review, 2, 32 – 39.
Inter-Agency Working Group (IWAG) (2012). Promoting responsible investment for
sustainable development and job creation - Final report to the High-Level
Development Working Group on the work of the Private Investment and Job
Creation Pillar of the G20 multi-year action plan on development,
Mexico Summit. Pp. 1-23. Accessed from
http://unctad.org/en/Pages/DIAE/G-20/Private-Investment-and-Job
Creation.aspx.
International Monetary Fund (2013). Regional Economic Outlook: Sub-Saharan
Africa, Building momentum in a Multi-Speed World. World Economic and
Financial Survey.
International Labour Organisation (2012). Global Employment Trends 2012.
International Labor Office, Geneva.
University of Ghana http://ugspace.ug.edu.gh
29
International Labour Organisation (ILO, 2014). Global Employment Trends 2014:
Risk of a jobless recovery? International Labour Office, Geneva. Kalwij, A. & Verschoor, A. (2007). Not by growth alone: The role of the
distribution of income in regional diversity in poverty reduction. European
Economic Review, 51, 805–829.
Keynes, J.M. (1936). The General Theory of Employment, Interest, and Money,
Harcourt.
Kozak R., S., Lombe, M. & Miller, K. (2012). Global Poverty and Hunger: An
Assessment of Millennium Development Goal #1. Journal of Poverty,
16(4), 469-485. doi: 10.1080/10875549.2012.720661
Michaillat, P. and Saez, E. (2013). A Model of Aggregate Demand and
Unemployment (CEPDP1235. London School of Economics, Centre for
Economic Performance Paper.
Miles D. & Scott A. (2005). Macroeconomics: Understanding the Wealth of Nations
(2nd Ed.). Wiley.
Munthali, T. C. (2012) Interaction of public and private investment in Southern
Africa: a dynamic panel analysis. International Review of Applied Economics,
26(5), 597-622. doi:10.1080/02692171.2011.624500.
Munnell, A. H. (1990).Why has productivity growth declined? Productivity and
public investment. New England Economic Review, January/February, 3-
22.
Munthali, T.C. (2008). Investment in Southern Africa: Interaction of the public and
private sectors. PhD thesis, April 2008, University of Leeds, UK.
University of Ghana http://ugspace.ug.edu.gh
30
Ndikumana, L. (2000). Financial Determinants of Domestic Investment in Sub-
Saharan Africa: Evidence from Panel Data. World Development, 28(2),
381-400.
Nickell, S. (2010). The Unemployment Challenge in Europe. CESifo Forum, Ifo
Institutefor Economic Research at the University of Munich, 11(1), 3-6, 04.
Nissanke, M. and Thorbecke, E. (2006). Channels and policy debate in the
globalization–inequality–poverty nexus. World Development, 34(8), 1338–
1360, doi:10.1016/j.worlddev.2005.10.008
Parker, J. (2010). Theories of Investment Expenditures, Economics 314 Coursebook,
Chapter 15. Accessed on 20th December, 2012 Available at
academic.reed.edu/economics/parker/s11/314/book/Ch15.pdf
Pfeffermann, G. (2001). Poverty Reduction in Developing Countries: the role of the
Private Sector. Finance and Development, A quarterly magazine of the IMF.
38 (2).
Ravallion, M. (2007). Economic growth and poverty reduction: Do poor countries
need to worry about inequality? 2020 focus brief on the world’s poor and
hungry people. Washington, DC: International Food Policy Research Institute.
Ravallion, M., & Chen. S. (2007). China’s (Uneven) Progress against Poverty.
Journal of Development Economics, 82(1), 1-42.
Ravallion, M. & Chen, S. (1997). What can new survey data tell us about recent
changes in Distribution and Poverty. World Bank Economic Review. 11(2),
357-382.
University of Ghana http://ugspace.ug.edu.gh
31
Ravillion, M. (2001). Growth, Inequality and Poverty: Looking Beyond Averages.
World Development, 29(11), 1803 – 1815.
Sackey, H. A. (2007). Private Investment for Structural Transformation and Growth
in Africa: Where do Small and Medium-Sized Enterprises Stand?
Proceedings of the African Economic Conference, pp. 371-398.
Sparrow, G. N., Ortmann, G. F., Lyne, M. C. & Darroch, M. A. G. (2008).
Determinants of the demand for Regular Farm Labour in South Africa,
1960-2002. Agrekon, 47(1), 52-75.
Symons. J.S.(1982). Relative Prices and the Demand for Labour in British
Manufacturing (No. 137). London School of Economics, Centre for
Labour Economics Discussion Paper.
Tatom, J. A. (1991). Public Capital and Private Sector Performance. Fed. Res. Bank
of St. Louis Rev., 73(3), 3-15.
Todaro, M. P. & Smith, S. C. (2012). Economic Development, 11th ed. Pearson.
Thurlow, J. & Wobst, P. (2006). Not all growth is equally good for the poor: The
case of Zambia.” Journal of African Economies, 15(4), 603–625.
doi:10.1093/jae/ejk012
Ucal, M. S. (2014). Panel data analysis of foreign direct investment and poverty
from the perspective of Developing Countries. Procedia - Social and
Behavioral Sciences, 109, 1101 – 1105.
UNCTAD (2012), Global investment Trends Monitor No. 8, January 2012, UNCTAD, Geneva.
World Bank. (2011). World Development Indicators 2011. Washington, DC: World
Bank.
University of Ghana http://ugspace.ug.edu.gh
32
World Bank (2013). World Development Report 2013: Jobs World Bank,
Washington, D.C.
World Bank (2014). Prosperity for all-ending extreme poverty. A note for the World
Bank Group spring meetings.
University of Ghana http://ugspace.ug.edu.gh
33
Appendices to Chapter One
Appendix 1.1: Test of Equality of Means between Private and Public Investment Method df Value Probability t-test 2 -11.29463 0.0077 Satterthwaite-Welch t-test* 1.914681 -11.29463 0.0090 Anova F-test (1, 2) 127.5687 0.0077 Welch F-test* (1, 1.91468) 127.5687 0.0090 *Test allows for unequal cell variances
Appendix 1.2: Test of Equality of Means between Total, Male and Female Employment Method df Value Probability Anova F-test (2, 3) 175.2956 0.0008 Welch F-test* (2, 1.84365) 167.2223 0.0082 *Test allows for unequal cell variances
Appendix 1.3: Test of Equality of Means between Youth Employment Levels Method df Value Probability Anova F-test (2, 3) 90.68245 0.0021 Welch F-test* (2, 1.44389) 108.1837 0.0267 *Test allows for unequal cell variances
University of Ghana http://ugspace.ug.edu.gh
34
CHAPTER TWO
INTERRELATIONSHIP BETWEEN PRIVATE AND PUBLIC
INVESTMENTS IN SUB-SAHARAN AFRICA
Abstract
The basic objective in this chapter is to revisit the crowding-in crowding-out
hypothesis by exploring the possibility of a bi-causal relationship between private
investment and public investment in SSA. Based on a Panel Vector Autoregressive
model, the results show that public and private physical capitals are compliments and
mutually dependent. However, when private and public investors compete for
financial resources, they become substitutes. The results stress the need for
governments in SSA to reduce their activities in the domestic financial markets by
being fiscally disciplined probably through strong commitment to Fiscal
Responsibility Laws. This would not only facilitate private investment but also
reduce the burden on governments for public investments.
University of Ghana http://ugspace.ug.edu.gh

35
2.0 Introduction
Generally, empirical literature is divided on the directional effect of public
investment on private investment (Aschauer, 1989b, 1990; Munnell, 1990; Erden &
Holcombe, 2005; Cashin, 1995; Asante, 2000; Ghura & Barry, 2010; Evans &
Karras, 1994; Deverajan, et al, 1999; Ajide & Olukemi, 2012; Munthali, 2012).
While some studies point to a crowding-in effect of public investment on private
investment (Aschauer, 1989a, 1989b, 1990; Munnell, 1990; Cashin, 1995; Asante,
2000; Ghura & Barry, 2010; Altin et al, 2012) others claim public investment
crowds-out private investment (Tatom, 1991; Holtz-Eakin, 1994; Evans & Karras,
1994; Deverajan et al, 1999; Ajide & Olukemi, 2012; Munthali, 2012; Tchouassi &
Ngangue, 2014). This dichotomy appears to be related to the stage of development of
the economy of study. It is claimed that crowding out effect is associated with
developed economies while crowding-in is related to developing economies (Belloc
& Vertola, 2004; Erden & Holcombe, 2005; Munthali, 2008, 2012).
Unfortunately, however, other studies on developing economies, especially Africa,
reveal that the matter is still unresolved. For instance, Asante (2000) and Gin and
Agim (2012) argue in favour of crowding-in effect but Deverajan et al., (1999), Ajide
and Olekumi (2012) favour the crowding-out hypothesis. So the relationship between
public investment and private investment still remains an empirical question in
Africa. Also, researchers who have investigated this empirical question, either
directly or indirectly, seem to have only highlighted certain key control variables and
left out others that other researchers consider to be pertinent in resolving this debate.
University of Ghana http://ugspace.ug.edu.gh
36
For instance, Ndikumana (2000) investigated the crowding-in crowding-out
hypothesis after controlling for financial sector development, government claims,
government consumption interest rate and trade. This study did not consider
governance or investment uncertainty as mediating factors. Nyamongo and Misati
(2011) controlled for economic growth, public investment, fiscal deficit, financial
sector development, corruption and economic freedom. Their study overlooked the
role of trade, uncertainty and considered only one aspect of governance, corruption.
Munthali (2012) factored in the accelerator effects, cost of capital, capital
availability, risk and uncertainty, economic freedom and profitability but also ignored
trade and governance as mediating factors. Tchouassi and Ngangue (2014) controlled
for trade openness, GDP, domestic credit to private sector, external debt and
population to conclude that public investment crowds out private investment. Their
study obviously ignored the mediating effects of governance and uncertainty.
Mlambo and Oshikoya (2001) factors, virtually, all the important mediating factors in
their analysis of the macroeconomic determinants of private investment but not in a
dynamic framework neither do they test for the possibility of a bi-causal relationship
between private and public investment.
Related to this, is the fact that an important control variable, governance, has been
ignored even though political stability has been factored in other studies. Governance
systems in Africa prior to the 1990s were mostly characterized by political instability
through coup d’etats and in some cases colonial rule. From 1990, the continent
started embracing democracy which is expected to offer some benefits probably
University of Ghana http://ugspace.ug.edu.gh
37
including private investment. The effect of this can be recognised through
improvement in governance institutions like rule of law, control of corruption,
government effectiveness, political stability, regulatory quality and voice and
accountability.
Furthermore, quite surprisingly, researchers’ attention appears to be over-
concentrated on the effect of public investment on private investment, ignoring the
possibility of a reverse causality. In developed economies, it is not uncommon for
public investments in roads, water, telecommunication and electricity to lead private
commercial or household investment. But in developing economies like Africa,
private investments may prompt public investment (Sturm, 2001). In other words,
attention of governments in developing economies is sometimes drawn to the
provision of basic infrastructure for certain areas of their economy because of private
investment activities in such areas. Also, in some cases, government investment
activities are undertaken in certain sectors of the economy, like provision of transport
services, because private sector involvement brings hardship to its citizens. Again,
the way in which public investments are funded would also play a key role in helping
to resolve the crowding-in and crowding-out debate. Where public investments are
funded through internally generated funds of government and not on the meagre
domestic credit, the crowding out effect of public investment on private is likely to be
minimal. Thus, private investment activities may attract or reduce public investment.
Unfortunately, to the best of the researcher’s knowledge, the abundant literature on
the crowding-in-out debate seems to have ignored this important issue, especially in
University of Ghana http://ugspace.ug.edu.gh
38
SSA. It is only Munthali (2012) who mentioned the possibility of bi-causal
relationship but failed to test it.
This study contributes to the discussion on crowding-in-out hypothesis by: 1) re-
examining the relationship between private investment and public investment after
controlling for some relevant factors (including governance) in a dynamic panel
framework; and 2) testing for the possibility of a bi-causal relationship between
private investment and public investment.
2.1 Literature Review
Recent theories advanced to explain private investment behaviour include the
accelerator, the neoclassical, the Tobin q and the cash flow theories (Koyck, 1954;
Tobin, 1969; Jorgenson,1971; Kopcke, 1985; Cherain, 1998; Bazoumana, 2005; Kul
& Mavrotas, 2005) but only the accelerator and neoclassical theories are deemed to
represent developing countries better, based on estimation feasibility (Misati
&Nyamongo, 2011).
2.1.1 Theoretical Literature Review
The Keynessian Theory of Investment
Even though Keynesians recognize the effect of interest rate on investment, they
deem this effect to be minimal and also recognize that interest rate alone does not tell
the whole investment story. Unlike Classical economists, Keynesians believe that the
economy is operating at less than full capacity. In view of this, increasing
University of Ghana http://ugspace.ug.edu.gh
39
government spending, for instance, causes minimal increase in interest rate while
increasing output and income. They also contend that government expenditure
increases private spending due to the positive effect of government spending on
investors’ expectations (Olweny & Chiluwe, 2012).
Keynes attributed the volatility of the investment-demand curve to firm’s
expectations of the profitability of investment. He was of the view that investors’
sense of optimism or pessimism motivated by their own natural energy and spirit
(‘animal spirit’) was the main driving force for investment or disinvestment. He
explains further that factors that affect the market conditions of products of investors
like political stability, cost of production and business climate have a strong influence
on investors’ mood or expectations. In fact, Keynesians contend that the level of
government spending is one way investors’ pick their expectations (Olweny &
Chiluwe, 2012). In a situation where the economy shows signs of booming, investors
expectation of continuing economic boom lead them to invest more in order to take
advantage of expected favourable future market conditions. This then triggers
demand for the capital goods, which are products of other companies, leading to
economic expansion. On the other hand, where the economy shows signs of
recession, investors’ expectation of continuing abysmal economic performance
discourage them from investment. Eventually, this reduces demand for capital goods
(other company’s products) which has the tendency of fuelling economic recession.
Because these expectations normally precede the actual economic conditions, they
may tend to cause the opposite. For instance, the optimist may realize that contrary to
University of Ghana http://ugspace.ug.edu.gh
40
expectation, the economy is not booming large enough to sustain the level of
productivity that additional investment would bring and therefore stop investing. This
initiates recession as demand falls. It falls to the level where, due to wear and tear,
the productivity of existing property, plant and equipment will not be enough to meet
demand which also sparks of economic booming. This phenomenon, within the
general Keynes theory that output is determined by aggregate demand (consumption
and investment), also explains the business cycle.
The accelerator principle and the multiplier-accelerator model are two related models
that explain Keynes theory of investment. The Accelerator Principle contends that the
level of new investment is brought about partly by the changes in the level of national
income (output). It, therefore, postulates that it is the rate of change of income and
not its level which determines investment. This position is in line with a much held
view of Keynes that the aggregate demand of the private sector is subject to
fluctuations which can have destabilising effect on the economy (Beardshaw,
Brewster, Cormack & Ross, 1998). The basic assumption of the accelerator model is
that since the focus is on short-run business cycle fluctuations, firms desired capital
output ratio is constant. According to Parker (2010) the simplest accelerator model
predicts that investment is proportional to the increase in output in the coming year
and that firms observe a rise or decline in output and extrapolates that change into the
future in determining their investment spending.
University of Ghana http://ugspace.ug.edu.gh
41
On the other hand, the multiplier- accelerator model explains that changes in
consumption will amplify the effect of any change in investment on total output and
income. This is against the assumption that aggregate demand – consumption and
investment- explains output. Explained through the marginal propensity to consume
principle, the multiply- accelerator model represents the total impact on the economy
of an initial increase in demand like investment (Miles & Scott, 2005). For instance,
if technological breakthrough causes investment to increase, the change in investment
will cause an increase in income or output in the economy. A portion of that increase
in income will be consumed and this will also cause another increase in the output
thereby starting a new cycle. These cyclical effects will cause a more than
proportionate change in output and investment, when there is an initial change in
investment.
The Classical Theory of Investment
The Classical economists (Adam Smith, David Richardo and John Stuart Mill) use
the general equilibrium principle to establish a relationship among interest rate,
investment and savings. They are of the view that, through market forces, the rate of
interest is fixed when the demand for investment is equal to the willingness to save,
given a certain level of income. They base this conclusion on the assumption that the
economy is at full employment. The return from any good investment should be able
to cover the cost of the capital invested in that project. The cost of capital which is
taken as the interest to be paid on the amount of money borrowed to fund viable
projects is, therefore, considered by classical economists to be of utmost importance
University of Ghana http://ugspace.ug.edu.gh
42
in the investment decisions. Even in a situation where an organization decides to fund
viable projects from internally generated funds, the cost of borrowed funds cannot be
overlooked since there is an opportunity cost associated with putting the internally
generated funds in the investment project. In other words, the organization could
have at least lent that money for some returns-which would have been forgone as a
result of undertaking the investment project.
It is the real interest rate which is of paramount importance and not the nominal. The
real interest rate has accounted for the effect of inflation and therefore allows the
investor to compare the expected return from the proposed investment against the
interest rate that maintains the purchasing power of capital. The other important
variable that explains investment decisions, to the classical economists, is the
expected return on the investment project to be undertaken. Investments which have
their expected return high enough to cover the cost of capital is therefore considered
to be worthwhile. McConnel and Bruce (2005) summarize that the investment
decision can be conveniently classified as a marginal-benefit-marginal-cost decision
(with marginal benefit being expected return and marginal cost being interest on
borrowed funds).
Included in the classical theory is the idea that because the economy is operating at
full capacity, monetary policy especially government domestic debt has a negative
effect on private sector investment. They argue that government borrowing crowds
out private sector investment because of the reduction in loanable funds caused by
University of Ghana http://ugspace.ug.edu.gh
43
government borrowing (Olweny & Chiluwe, 2012). As government borrowing
increases the demand for loanable funds, debt becomes expensive to the private
sector. Government borrowing in the domestic market may go up as a result of tax
cut or an increase in government spending (Barro, 1997).
The classical theory has received a number of criticisms albeit largely from Keynes.
Keynes argue that the assumption of full employment is unrealistic, savings and
investment are not interest-elastic, the theory ignored the function of money as a
store of value; interest is the price for not hoarding and the price for not spending;
equality of saving and investment is not brought by changes in rate of interest but
changes in the level of income and that the theory itself is indeterminate.
The neoclassical theory explains that, as a result of diminishing marginal returns
from investment, organizations undertake investment projects until the point at which
the marginal benefit equals the marginal cost. In other words, if an organization aims
at maximizing profit, then an investment project should be rejected if the expected
rate of return on capital (i.e. the marginal product of capital which is the additional
revenue or output as a result of adding on an extra unit of capital) is just the same as
the user (rental) cost of capital.
In conclusion, the difference between Keynes theory investment and the classical
theory of investment comes from what each theory emphasizes as the main driving
force of investment behaviour. While Classicists believe that movement in real
University of Ghana http://ugspace.ug.edu.gh
44
interest rates that lead to movements on the investment-demand curve account for a
greater portion of changes in investment, Keynes argue that investors’ expectations
which lead to shifts in the investment-demand curves are responsible for large
changes in investment (Parker, 2010).
2.1.2 Empirical Literature Review
Determinants of Private Investment
Relationship between public investment and private investment
Discussions on whether public investment crowds-in or crowds out private
investment has been generally inconclusive. A forcefully emerging conclusion is that
public investment crowds out private investment when the economy is developed but
crowds in private investment when the economy is developing (Erden & Holocombe,
2005; Munthali, 2012; Altin, Moisiu & Agim, 2012). For instance, Erden and
Holocombe (2005) conclude based on data from 19 developing countries (including 4
African countries) and 12 developed countries that while developed countries
experience crowding out, public investment crowds in private investment in
developing countries.
Supporters of the crowding-in hypothesis (Khan & Gill, 2009) argue that public
infrastructure like roads and power (Pereira & Andraz, 2010; Escobal & Ponce, 2011;
DFID, 2012; Sahoo, Dash, & Nataraj, 2010; Tadeu & Silva, 2013) support the
private sector in the discharge of their duties and thus amplifies their productive
ability. Also through the growth channel, public investment serves as an indirect
University of Ghana http://ugspace.ug.edu.gh
45
means of accelerating private investment. According to Aschauer (1989) economy’s
productivity slow down can be linked to fall in public infrastructure, as witnessed by
the United States of America (USA) in the 1980s. Cavallo and Daude (2011)
concluded from a sample of 116 developing countries between 1980-2006 that public
investment crowds-in private investment in the presence of strong institutions and
access to finance. Oshikoya (1994) document that public investment crowds in
private investment using data from 1970 to 1988 that covered seven African
countries (Cameroon, Mauritius, Morocco, Tunisia, Kenya, Malawi and Tanzania).
Similar results were found by Mlambo and Oshikoya (2001) after expanding the
sample size to 18 countries and the time frame to 1996 and also factoring in some
macroeconomic variables and political stability. At the country level, Asante (2000)
provides support for crowding-in using data from Ghana (see similar results for
Kenya (Maana et al., 2008).
Some empirical literature also show that public investment may crowd out private
investment (Christensen, 2005; Emran & Farazi, 2009) if they compete for the same
resources and/or markets (Erden & Holocombe, 2005). Ndikumana (2000) uses data
from 31 Sub-Saharan African (SSA) countries between 1970 and 1995 to conclude
that credit to governments crowds out private investment. Similarly, Tchouassi and
Ngangue (2014) recently corroborated the crowding out hypothesis, using 14 selected
Africa countries (13 SSA countries and Tunisia). Based on data from Nigeria, Ajide
and Olekumi (2012) support crowding out hypothesis corroborating that of
University of Ghana http://ugspace.ug.edu.gh
46
Bakare (2011) (see also similar results from Malawi (Maganga & Abdi, 2012),
Argentina (Acosta and Loza, 2005) and India (Pradhan, Ratha & Sarma, 1990; Mitra,
2006).
Apparently, empirical results in Africa have supported both sides of the crowding-in-
out debate or are inconclusive. In effect, empirical results from the African continent,
with virtually developing economies, are still inconsistent. This casts significant
doubt on the emerging conclusion on the debate that crowding-out is associated with
developed economies while crowding-in relates to developing economies. This
inconsistency in results, the researcher believes, partly emanates from the
inconsistency in the choice of control variables that condition the crowding-in-out
effect. Certain key factors like financial sector development, economic uncertainty,
cost of capital, accelerator effects, adjustment cost, trade openness, debt overhung,
political stability and governance have been established in literature as important
mediating factors. Unfortunately, however, none of the studies on the continent has
tested for the crowding-in-out hypothesis in the presence of all of these control
factors. Also, only two studies (Ndikumana, 2000; Misati & Nyamongo, 2011) are
known to have studied the crowding-in-out hypothesis in SSA, but indirectly. Misati
and Nyamongo (2011) cannot be taken to be purely an SSA study, even though it was
captioned as such, because the study sample included Tunisia, Egypt, Algeria and
Morocco. Ndikumana (2000) covered 31 SSA countries from 1970-1995. This study
extends her study, by using 48 countries and including governance as an important
variable that condition crowding-in-out relationship, in a more recent context (1990-
University of Ghana http://ugspace.ug.edu.gh
47
2010). Also, the empirical literature is silent on whether there exist a bi-causal
relationship between public investment and private investment in the crowding-in-out
debate. Thus, we believe the crowding-in-out hypothesis in the SSA sub-region needs
to be empirically re-examined. This study is meant to provide further evidence on the
crowding-in-out hypothesis and also test for the possibility of a bi-causal relationship
between private and public investments using data from SSA, in a dynamic
framework.
Other Determinants of Private Investment
Investments can be classified as autonomous or induced. Autonomous investment is
brought about by exogenous factors like technological advancement even though
there may not be any change in income. On the contrary, induced investment which
is linked to the accelerator principle is that part of investment which is brought about
as a result of changes in an endogenous (to the model of the economy) variable like
income. Because it is difficult to split investment into these categories, the discussion
of the factors that are likely to influence investment decisions does not take this
distinction into consideration. Indeed, the present study does not consider whether a
particular investment is autonomous or induced, investment is considered in total.
Several important factors have been identified as the major contributors to the level
of investment. Among these are financial sector development (Ndikumana, 2000;
Misati & Nyamongo, 2011), governance (Wei, 2000; Emery, 2003; Svensson, 2005;
Morrissey & Udomkerdmongkol, 2012), government domestic debt (Christensen,
University of Ghana http://ugspace.ug.edu.gh
48
2005; Khan and Gill, 2009 and Hubbard, 2012), accelerator (Beardshaw et al., 1998;
McConnel & Bruce, 2005).
Financial Sector Development
Well developed financial and credit market facilitates private investment, especially
in the long-run (Acosta & Loza, 2005). Possibly, through the reduction of financial
constraint and the growth channel, financial intermediation improves domestic
private investment irrespective of whether the financial system is bank-based or
market-based (Ndikumana, 2005). Also, the nature of financial reforms like credit
controls, liquidity and reserve requirements have effect on private investment (Ang,
2009). Thus, a developed financial market facilitates the channelling of financial
resources from surplus spending units to deficit spending units making funds
available at cheaper cost.
The ‘state of credit’ is an important determinant of investment (Keynes, 1937, 1973).
Africa, over the years, has not benefited large enough from inflows of private foreign
capital as compared to other developing economies like Latin America and Asian
economies (Kasekende & Bhundia, 2000). This puts pressure on domestic credit as a
means of financing the few investment projects that are undertaken by both private
and public investors. Neoclassical theorists postulate that the cost of capital exerts a
negative influence on private investment because of its ability to reduce the return on
investment. On the other hand, the relationship between cost of capital and
investment could be positive (as in Bokpin & Onumah, 2009) because high deposit
University of Ghana http://ugspace.ug.edu.gh
49
rates encourage savings which in turn supports domestic investment (McKinnon,
1973; Shaw, 1973). Meanwhile, availability of finance is widely considered as a key
ingredient for fostering private investment (Ndikumana, 2000; Erden & Holcombe,
2005; Misati & Nyamongo, 2011; Munthali, 2012). Emran and Farazi (2009)
concluded that private investment in developing countries critically depends on the
availability of bank credit especially given that the capital market is not well
developed and that evidence of crowding out is detrimental to both private
investment and economic growth.
Chatelain et al., (2002) tested for the existence of not just the credit channel but the
interest rate channel among the four largest countries of the euro area with micro
dataset (1985 to 1999) for each country. For each of these countries they estimated
the neo-classical investment relationship, (ie explaining investment by its user cost,
sales and cash flow) and concluded that investment is sensitive to user cost changes
in all the countries. Thus, they found support for the operation of the interest rate
channel in these countries but did not find enough support for the broad credit
channel as implied by Hu (1999). This notwithstanding, Chatelain and Tiomo (2001)
confirmed the direct effect of the interest rate channel on investment, operating
through the cost of capital in France (there is also an indirect effect of monetary
policy shocks on the macroeconomic growth of sales, which also affects corporate
investment) and the existence of a broad credit channel operating through corporate
investment in France. The researchers applied a panel data methodology on 6,946
French manufacturing firms, from 1990 to 1999.
University of Ghana http://ugspace.ug.edu.gh
50
Bokpin and Onumah (2009) used data from emerging market firms to analyze the
impact of macroeconomic factors and financial market development on corporate
investment. They concluded that bond market development, GDP per capita and firm
level factors like past investment, profitability, firm size, growth opportunities and
free cash flows are significant factors that influence corporate investment decision.
The study included firm’s from four African countries (Egypt, Morroco, South Africa
and Zimbabwe) and monetary policy but did not find monetary policy as a significant
factor that influences corporate investment decision. Earlier and much more
specifically on the African continent, between1970-2001, Ndikumana (2005) sought
to answer the question: “Can macroeconomic policy stimulate private investment in
South Africa? The study was conducted on both aggregated data and disaggregated
data of 27 sub-sectors of the manufacturing sector .The result indicated that
government has a significant means of stimulating private investment through
engaging in public spending, lowering of interest rates and minimizing exchange rate
instability. At firm level, profitability was also found to stimulate private investment.
Government debt
High external debt reduces domestic investment. Countries would have to meet their
debt obligations from a portion of total income which can lead to debt overhang
(Krugman, 1988) or the extent of debt can deter international financial institutions
from funding investment projects and also increases economic uncertainty (Greene &
Villaneuva, 1991; Jenkins, 1998; Ndikumana, 2000). But Maana et al., (2008) argue
that considerable level of financial development can help mitigate the negative effect
University of Ghana http://ugspace.ug.edu.gh
51
of government debt on private investment. This notwithstanding, considerable
amount of empirical findings point to the fact that debt overhung reduces private
investment (Ndikumana, 2000; Misati & Nyamongo, 2011; Tchouassi & Ngangue,
2014).
Governance
The study postulates that the benefits of good governance practices may not only be
limited to corporate entities (Kyereboah –Coleman, 2007) but could also influence
certain sectors of the general economy if applied at the national level. Indeed, Emery
(2003) puts it more succinctly that the quality of governance directly affects the level
and nature of private investment in a country which in turn influences economic
growth and standard of living. Rules and regulations instituted to ensure
transparency and accountability in country governance have the potential of either
enticing private investment or even driving away existing ones. This is because if
good governance practices are designed and instituted they will not only help reduce
corruption, ensure accountability, political stability, effectiveness of government but
will also help increase the confidence of existing and potential investors in the
Africa.
Wei (2000) reported that investors are deterred by corruption, irrespective of the level
of incentives offered by host countries. This could be as a result of the fact that
corruption has a negative effect on the growth of firms, just as taxation (Fisman &
Svensson (2007). Also, Svensson (2005) contended that corruption deter investment
University of Ghana http://ugspace.ug.edu.gh
52
because it can negatively bias an entrepreneur’s assessment of the risks and returns
associated with an investment. Agency problem is heightened with corrupt
politicians and officials through directing state and private investment to areas which
maximize their returns and not those of the society (Krueger 1993; Alesina &
Angeletos, 2005; Jain 2011). In Africa, Gyimah-Brempong (2002, 2005) concluded
that income inequality and corruption move in the same direction. Political and
economic instability are harmful to investment in Nigeria (Tadeu & Silva, 2013).
Political instability enhances the crowding out effect of FDI on domestic private
investment in developing economies (Morrissey & Udomkerdmongkol, 2012)
Government policies influence the level of investment in their economies by directly
undertaking investments and initiating policies that are attractive to private investors.
In underdeveloped and some developing economies, government is the main investor
whose actions or inactions regulate the level of investment in their economies. Also,
through taxation (for example, tax incentives and amount of corporate tax charged)
governments are able to affect the size of income available for investment. This can
be looked at from the point of view of the free cash flow theory (McConnel &Bruce,
2005; Beardshaw et al., 1998). Aysan et al., (2006) depict the role of governance in
private investment decisions is material. Specifically, their results support the notion
that administrative quality in the form of control of corruption, bureaucratic quality,
investment-friendly profile of administration, and law and order, as well as for
“Political Stability” help encourage private investment in the Middle-East and North
Africa (MENA) countries. The level of political stability, which is also under the
University of Ghana http://ugspace.ug.edu.gh
53
influence of governments, can serve as an attractive force for future investment or
discourage investment. Generally, the system of governance practiced, freedom of
speech of the media and the citizenry, the independence of the judiciary and level of
threat of expropriation are all indicative of the level of political stability.
Although many Governments have been working on improving public governance,
very few have done so in the context of investment promotion. If governments want
to improve on governance with the objective of attracting investment then their
governance strategy should have the following important elements; predictability,
accountability, transparency and participation (UNCTAD, 2004). The study
combines the country governance indicators provided by the World Bank into an
index in order to cater for corruption, voice and accountability, rule of law,
government effectiveness, regulatory quality and political stability. It is expected that
good country governance should lead to higher private investment. Governance is
measured with two proxies. The first variable Country Governance Index (CGI) is an
index constructed by the researcher using Principal Component Analysis (PCA)
applied to the new governance data from World Bank and the second index is an
already constructed index (Polconiii) by Henisz (2010).
Accelerator Effects of GDP
According to the classical economists, investments should be undertaken so long as
the expected return of an investment exceeds the interest rate. Investment decisions
are thus influenced, to a large extent, by the expected returns from an investment.
University of Ghana http://ugspace.ug.edu.gh
54
Future expectations of an organizations return are dependent on how future cost of
operations and sales would be. All these depend on the future social, political and
economic conditions of the economy in which the organization operates. For
instance, population size and growth, taste and preferences, political state, economic
condition, educational level, income levels and standard of living are among the key
variables that are likely to shape the expected returns of an investment and effectively
the level of investment. Consequently, an investor who holds an optimistic view
about an investment would not be perturbed about funding an investment with a high
interest cost, while it would be extremely difficult, if not impossible, to convince a
pessimistic investor to fund an investment even with a low interest cost (McConnel &
Bruce, 2005; Beardshaw et al., 1998).
We capture the expectations of investors by using the growth of GDP. The
relationship between the level of income and investment can be looked at from both
direct and indirect viewpoints. Directly, when organizations make income large
enough to cover the amount needed to cover operating activities, all other things
being equal, the size of their investments increase. Indirectly, the level of income of
an economy influences the size of investment through the expectations channel.
Economies with large income can influence investors to be optimistic about the
future returns of an investment. This notwithstanding, the relationship between the
level of income and investment is considered to be bi-directional. The size of
investment undertaken has the tendency of also influencing the level of income
(Beardshaw et al., 1998). On the other hand, the Keynesian view of investment
University of Ghana http://ugspace.ug.edu.gh
55
considers that it is the rate of change in the national income and not the level of
income that influences investors’ expectations. In this way, the accelerator principle
of investment can be explained. Research findings are consistent that growth in GDP
positively influences private investment (Ndikumana, 2000; Erden & Holcombe,
2005; Munthali, 2012).
Uncertainty
The possibility of not knowing the exact outcome of an action like undertaking
investment may influence investors’ decision especially in developing economies
where economies are rarely stable. Shocks on returns, such as exchange rate, inflation
and trade liberalization, affect investment decisions (Acosta & Loza, 2005). In
southern Africa, Munthali (2012) find that macroeconomic uncertainty reduces
private investment but Ndikumana (2000) and Erden and Holcombe (2005) do not
find economic uncertainty as a key factor that explains private investment. The
researcher measured uncertainty with inflation rate and postulated that it will have a
negative effect on private investment.
Trade openness
Even though some African countries went through some economic reforms in an
attempt to reduce economic deficit on the continent, the effectiveness of such reforms
is largely contended. In spite of this, the importance of structural reforms in
facilitating profitability of private investment appears apparent. In this study, trade
openness is used as a proxy for structural reforms. Trade openness facilitates private
University of Ghana http://ugspace.ug.edu.gh
56
investment through increasing competitiveness and providing access to enlarged
markets (Balassa, 1978; Feder, 1982); originating economies of scale and
productivity gains (Aysan, et al., 2006) and; enabling the use of tradable goods as a
source of collateral for external finance (Caballero & Krishnamurthy, 2001)
Human Capital
Human capital can facilitate the attraction and maintenance of private investment
through enhancing the benefits that could be derived from physical capital. Skilled
workers increase the efficiency of physical capital, assist in dealing with changes, can
handle new technologies better and provide strategies for expanding businesses (see
Aysan, et al, 2006)
Determinants of Public Investment
Empirical literature on determinants of public investment is scarce. In his seminal
work, Aschauer (1989) hypothesized that economy’s productivity slow down can be
linked to fall in public infrastructure, as witnessed by the United States of America
(USA) in the 1980s. Turrini (2004) suggested, based on a theoretical model of public
investment, that trend output, output gap, primary fiscal balance (total revenues less
non-interest spending), public debt and the long-term real interest rate describe the
trend in public investment. Mehrotra and Välilä (2006) modified the model advanced
by Turrini (2004) to include a dummy for participation in European Monetary Union
(EMU), net lending and components of net lending (current receipts and current
disbursement). They concluded that public investment is determined by national
University of Ghana http://ugspace.ug.edu.gh
57
income, the stance of budgetary policies and fiscal sustainability considerations.
Neither the cost of financing nor the fiscal rules embodied in EMU have had a
systemic impact on public investment.
Earlier, Sturm (2001) concluded that Politico-institutional variables, like ideology,
political cohesion, political stability and political business cycles do not seem to be
important when explaining government capital formation in less-developed
economies. On the other hand, variables like public deficits, private investment and
foreign aid are significantly related to public capital spending. The study shows that
contemporaneous variable of private investment has a significantly negative
relationship with public investment but the lag or private investment exhibit a
significantly positive relationship with public investment. This implies that public
investment follows private investment but eventually crowds out private investment.
Possibly, the crowding out effect is as a result of the fact that public investment
follows private investment to compete with private investors but not with supporting
public infrastructure. Where supporting infrastructure is provided, a crowding in
effect will be expected. All these are matters that require empirical investigation in
SSA.
2.2 Methodology
The main purpose of this study is to reassess the crowding-in-out hypothesis after
controlling for financial sector development, government debt, country governance,
political stability, cost of capital, uncertainty, trade openness, and credit crunch using
University of Ghana http://ugspace.ug.edu.gh
58
data from SSA and also examine whether there is a bi-causal relationship between
private investment and public investment. We estimate our regression for the first
objective based on a modified flexible accelerator investment model derived by Erden
and Holcombe (2005). The flexible accelerator model, propounded by Chenery (1952)
and Koyck (1954) builds on the rigid accelerator model by factoring in the dynamic
nature of investment. The proportion of the discrepancy between desired and actual
output in each period facilitates the adjustment of capital towards its desired level
(Antonakis, 1987).This model allows for the inclusion of institutional and structural
characteristics of SSA. The model is based on the assumption that desired capital stock
is proportional to the level of expected output. The basic model is specified as follows:
,)1()1(1 ,1,0,2,1,0, titititietiti uPIaGIYLPI (1)
where tiPI , is private investment level; etiY , is the expected level of output assumed to be
future aggregate demand of country i in time t; tiGI , is public investment; ti, is a
vector of control variables deemed to include financial sector development, government
debt, country governance, uncertainty, trade openness, political stability and credit
crunch; 1, tiPI is last year’s level of private investment meant to capture the adjustment
process; the subscripts i = 1,..., N and t = 1,…T represent the cross-section and time-
series dimension of the panel data, and tiu , is assumed to be equal iti where i is
the country specific variable and it is the white noise. The coefficient of etiY , captures
the accelerator effect and is expected to be positive; represents depreciation rate. It is
assumed that government and private investment depreciate at the same rate. As a
result of the difficulty in getting depreciation rates for the countries in the study, the
University of Ghana http://ugspace.ug.edu.gh
59
study used an arbitrarily chosen value of 0 based on studies by Blejer and Khan (1984)
and Ramirez (1994). Their studies show that sensitivity analysis using depreciation
values between 0 and 5 show no significant differences in results for developing
economies. Similar results were also reported by Erden and Holcombe (2005) and
Muthali (2012). The coefficient of GI can be positive or negative depending on
whether public investment crowds in or crowds out private investment.
Thus,
),,,,,( 262524232221 ititititititit CBBEDSAIDTOPENPOLRIRfX (2)
When equation (2) is substituted in (1), it leads to:
itiitititit
itititite
itit
OBBINFPOLTOPENRIRDCPSGIPIYLPI
)1(])1(1([
26252423
22211100 (3)
Equation 3 can be re-written as follows:
itiitititit
itititite
itit
OBBINFPOLTOPENRIRDCPSGIPIYLPI
])1(1([
8765
432110 (4)
where,
00 , 10 )1( , 21 , 321 , 422 , 523 , 624 , 725 ,
826
Assuming depreciation of private investment is 0, we get
itiititit
ititititite
itit
OBBINFPOLTOPENRIRDCPSGIPIYPI
876
54321110 (5)
The study then tested for the effect of private investment on public investment in a
derived model that allows for the inclusion of other control variables that condition
University of Ghana http://ugspace.ug.edu.gh
60
the relationship. This is to help check the robustness of the relationship between
private investment and public investment.
An empirical Model of Public investment
The model used in this part of the study relies on a similar derivation by Erden and
Holcombe (2005) who build a private investment model from a flexible accelerator.
According to Blejer and Kahn (1984) and Ramirez (1994), the flexible accelerator
model begins on the premise that desired capital stock is proportional to the level of
expected output:
,* eitgitK (6)
where *gitK is the desired public capital stock of country i in time t while e
it is the
expected level of output –taken to be future aggregate demand- of country i in time t.
In the absence of adjustment process and its associated cost, actual public capital
stock and the desired or target public capital should be the same. But in reality, due to
technical constraints and the time it takes to plan, decide, build and install new
capital, adjustment process may be costly and not instantaneous. This implies that the
adjustment process is partial. In other words, adjustment cost stalls the process of
fully adjusting public capital stock from previous year’s level to the current year.
According to Salmon (1982), the partial adjustment function can be derived from the
minimisation of the following cost function, J. Thus, we capture this dynamic
structure of public investment behaviour by introducing a one-period quadratic
adjustment cost function,
University of Ghana http://ugspace.ug.edu.gh
61
,))(1()( 21
2* gitgitgitgit KKKKJ (7)
where gitK is actual public capital stock of country i in time t and 1gitK is the lag of
actual public stock of country i in time t. The first term of equation (7) is the cost of
disequilibrium, and the second term, the cost of adjusting toward equilibrium. The
following partial adjustment mechanism can be derived from minimizing the cost of
adjustment with respect to gitK :
)( 1*
1 gitgitgitgit KKKK ,10 (8)
The evolution of public capital stock takes the following standard form
11)( gitgitgitgit KKKI (9)
where gitI is gross public investment and is the depreciation rate of public capital
stock.
Equation (9) can be re-arranged as follows:
,])1(1[ gitgit KLI (9a)
The steady state of equation (9a) can be specified as follows:
** ])1(1[ gitgit KLI (9b)
When we substitute equation (6) in (9b) we get
eitgit YLI ])1(1[* (9c)
The partial adjustment process in equation (8) can be written in terms of gitI , for
empirical purposes, as follows:
)( 1*
1 gitgitgitgit IIII (10)
University of Ghana http://ugspace.ug.edu.gh
62
Based on the assumption that private investment and other relevant factors affect the
speed at which the gap between actual public investment adjust towards the desired
level in each short run period, the speed of adjustment can be specified in a linear
function as follows:
),)](/(1[ 211*
0 itpitgitgit III (11)
Where 0 is the intercept, pitI is private investment and it is the vector of other
relevant factors that condition the adjustment process.
When equation (11) is substituted in (10), it leads to
))}()](/(1[{ 1*
211*
01 gitgititpitgitgitgitgit IIIIIII (12)
Re-arranging equation (12) leads to
itpitgitgitgitgit IIIII 211*
01 )( (13)
When we substitute equation (9c) in (13) we get
itpitgite
itgitgit IIYLII 21101 )])1(1([ (14)
Re-arranging equation (14) leads to
tiitpitgite
itgit uIIYLI ,21100 )1(])1(1([ (15)
),,,,,( 262524232221 ititititititit CBBEDSAIDTOPENCGIRIRfX (16)
When equation (16) is substituted in (15), it leads to:
tiitititit
ititpitgite
itgit
uCBBEDSAIDTOPENCGIRIRIIYLI
,26252423
122211100 )1(])1(1([
(17)
Equation (17) can be re-written as follows:
University of Ghana http://ugspace.ug.edu.gh
63
tiitititit
ititpitgite
itgit
uCBBEDSAIDTOPENCGIRIRIIYLI
,26765
432110 ])1(1([
(18)
where,
00 , 10 )1( , 21 , 321 , 422 , 523 , 624 , 725 ,
826
Assuming depreciation of public investment is 0, we get
tiititit
itititpitgite
itgit
uCBBEDSAIDTOPENCGIRIRIIYI
,2676
54321110
(19)
Basically, equation (19) says that additions to public capital stock ( gitI ) is influenced
by expected output levels ( eitY ), previous year’s public investment level ( 1gitI ), current
level of private investment ( pitI ), a host of other relevant factors ( it ) and tiu , is
assumed to be equal iti where i is the country specific variable and it is the
white noise.. The coefficient of expected output could be positive or negative because it
is used to capture the effect of cyclical factors on public capital expenditure. In a
situation where the economy is not performing well, governments’ stabilization policies
would be geared towards increasing capital expenditure to correct the down turn and
vice versa. Also the coefficient of private investment is ambiguous. If governments
respond to private investments with the provision of basic infrastructure to facilitate
their business, then a positive relationship would be expected. On the other hand, if
private investments into SSA region are basically through acquisition of state-owned
enterprises (SOEs) or governments respond to private investments with the
establishment of competitive SOEs, a negative relationship would be expected. The
University of Ghana http://ugspace.ug.edu.gh
64
coefficient of the lagged dependent variable is expected to be positive. Also, it is
assumed that government and private investment depreciate at the same rate of zero
based on previous empirical findings (for example Blejer & Khan, 1984; Ramirez,
1994; Erden & Holcombe, 2005; Muthali, 2012).
In order to reduce the bias in the coefficient estimates of expected output, private
investment and lagged dependent variable and also to capture the other relevant
factors that condition the adjustment process, we include other control variables that
other researchers have found to influence public investment. Generally, these
variables are grouped into macro-economic and politico-institutional variables
(Turrini, 2004). Those included in this study are aid, budget deficit, trade openness
(Sturm, 2001), interest rate, governance (Henrekson, 1988; Roubini & Sachs, 1989;
De Haan & Sturm, 1997; Mogues, 2013)), fiscal discipline and external public debt
(Sturm, 2001; Turrini, 2004; Mehrotra & Välilä, 2006). These are captured in it .
Test of Endogeneity
Before we estimate the above two models (private investment and public investment
models in equations 5 and 19 respectively), we examine whether, empirically, there
exists a bi-causal relationship between private investment and public investment by
first subjecting the assumption of endogeneity to test, using the two-stage least squares
(2SLS) approach. In the presence of endogeneity, an instrumental variable approach
(IV) offers consistent parameter estimates which help to overcome the inconsistencies
in the parameter estimates of ordinary least squares (OLS).
University of Ghana http://ugspace.ug.edu.gh
65
The 2SLS is based on a reduced form private investment model that controls for trade
openness and domestic credit to the private sector and accounts for public investment
as an endogenous variable. Other instruments used for the endogenous variable, in
addition to trade openness and credit to the private sector included regional dummies
and dummy for credit crunch.
Firstly, the variables are subjected to unit root test using the Augmented Dickey
Fuller (ADF) option of the Fisher-type unit root test for panels. The Fisher-type unit
root test conducts unit-root test on each panel’s series separately and then combines
the p-values to obtain an overall test of whether the panel series contains a unit root
(Whitehead, 2002, sec. 9.8). The combination of the p-values is based on the inverse,
inverse-normal, inverse-logit and modified inverse transformation methods proposed
by Choi (2001). The Fisher-type unit root test the null hypothesis that all panels
contain unit root against the alternate that at least one panel is stationary. The
researcher used the no-trend option and zero lags but included the drift option
because we do not expect the means of the variables included in the work to be
nonzero. Meanwhile, the cross-sectional means of the variables are removed by
demeaning the data. The results of the panel unit root test, as shown in appendix 2.1,
show that the four variables (lnPRINV, lnGPINV, lnTOPEN and lnDCPS) are
stationary.
The 2SLS is used for this study because of its popularity. The general form of the IV
model is specified below:
University of Ghana http://ugspace.ug.edu.gh
66
iiii BBYy 21 1 (20)
iiiiY 21 21 (21)
where iy is the dependent variable (Private Investment) for the ith observation, iY
represents the endogenous regressor (Public Investment), i1 represents the included
exogenous regressors (trade openness and domestic credit to private sector) and i2
represents the excluded exogenous regressors (regional dummies and dummy for
credit crunch). i1 and i2 are collectively called the instruments. i and i are
zero-mean error terms, and the correlations between i and the elements of i are
presumably nonzero.
Subsequent to the estimation of the 2SLS, the Durbin (1954) and Wu–Hausman (Wu
1974; Hausman 1978) tests were used to test the null hypothesis that public
investment is exogenous. In all cases, if the test statistic is significant, then the
variables being tested must be treated as endogenous. The results of the 2SLS and the
Durbin (1954) and Wu–Hausman (Wu 1974; Hausman 1978) tests are reported in
Table 2.1. The results indicate that all the two tests of endogeneity reject the null
hypothesis in favour of the alternate. Thus, we conclude that public investment is
endogenous.
University of Ghana http://ugspace.ug.edu.gh
67
Table 2.1: Two Stage Least Squares regression. Dependent Variable: lnPRINV
Variables Coef. Std. Err Z Prob.
lnGPINV -0.7539 0.30213 -2.50 0.013
lnTOPEN 0.3432 0.04697 7.31 0.000
lnDCPS 0.2599 0.05579 4.66 0.000
Constant 1.9328 0.5118 3.78 0.000
Obs. 714
Durbin(Score) Chi2 12.5424 (0.0004)
Wald Chi2(3) 111.61
Wu-Hausman
F(1,709) 12.6773 (0.0004)
Prob. 0.0000
Instrumented: lnGPINV
Instruments: lnTOPEN, lnDCPS, 2.Catvr, 3.Catvr, 4.Catvr and Creditcrunch
where lnPRINV is private investment; lnGPINV is public investment; lnTOPEN is
trade openness; lnDCPS is domestic credit to private sector; 2.Catvr, 3.Catvr and
4.Catvr are regional dummies for west, east and central Africa; and Credit crunch is a
dummy variable for the global credit crunch stating from 2008.
Panel Vector Autoregression Approach
This chapter also has an objective of assessing the possibility of a bi-causal
relationship between private investment and public investment. A panel-data vector
autoregression (PVAR) approach introduced by Holtz-Eakin, Newey and Rosen
(1988) was used in order to simultaneously estimate the system of equations
specified below. All variables in the specified system are assumed to be endogeneous
University of Ghana http://ugspace.ug.edu.gh
68
and each variable is regressed on its lagged values and the lagged values of all other
variables in the system, after controlling for the unobserved individual heterogeneity
in that system of equations. Thus, the approach combines the advantages of normal
vector autoregression approach and benefits from panel data analysis.
Following Abrigo and Love (2015), Ahlfeldt, Moeller and wendland (2014) and Love
and Zicchino (2006), a k-variate PVAR model of order p with country specific and
time specific fixed effects can be specified generally as follows:
ittipitpititit evuYAYAYAY ...2211 (22)
}20,...2,1{},48,....2,1{ ti
where itY is a (1 x k) vector of dependent variables (public investment, LNGPINV;
private investment, LNPRINV; and economic growth per capita, LNGDPit-1); iu ,
tv and ite is the (1 x k) vectors of dependent variable-specific country and time fixed-
effects and idiosyncratic errors, respectively. The (k x k) matrices 1A , 2A ,... and pA are
parameters to be estimated. The innovations are assumed to have the following
characteristics: ][,0][ 'ititit eeEeE and 0][ ' isit eeE for all st . The estimation
of the above parameters, either jointly with the fixed-effects or separately (after some
transformation) using equation-by-equation ordinary least squares would lead to
biased results even with large N, because of the presence of lagged dependent
variables in the independent variables of the system of equations (Nickell, 1981;
Abrigo & Love, 2015). This bias cannot be assumed to be getting to zero in this
particular study, as is generally considered when T becomes larger, because
University of Ghana http://ugspace.ug.edu.gh
69
significant bias was found by Judson and Owen (1999) even when T=30. One way to
eliminate this bias and offer consistent results, especially with small T and large N, is
to base the estimations on the General Methods of Moments (GMM) conditions. This
method uses the lagged levels of endogenous regressors as instruments and
transforms the data by first differencing it (Holtz-Eakin, Newey & Rosen, 1988).
The inclusion of the time specific and country specific dummies in equation (1)
makes the model for the system of equations close to reality, by showing that the
underlying structure is not the same for each cross-sectional unit. Meanwhile, these
variables may be correlated with the other regressors because of the lagged
dependent variables. The time-specific dummies are eliminated through the
differencing approach. The country specific dummies are eliminated by applying the
‘Helmert procedure’ which uses the forward mean-differencing approach to remove
only the forward mean, the mean of all future observations available for each
country. The ‘Helmert procedure’ preserves the orthogonality between transformed
variables and lagged regressors so that the lagged regressors can be used as
instruments and the coefficient of the system of equations estimated by system of
GMM (Arellano & Bover, 1995; Love & Zicchino, 2006). Meanwhile, the
application of the ‘Helmert procedure’ requires that all various are time demeaned,
first.
Generally, PVAR estimation requires that the variables should be stationary. In view
of this, all the variables included in the system estimation were subjected to
University of Ghana http://ugspace.ug.edu.gh
70
stationarity test using the Fisher-type unit root test because of the nature (large N and
small T) of the panel data used.
After estimating the PVAR, we also presented the impulse response functions (IRF)
as well as the variance decompositions. The IRFs were estimated in order to assess
the responses of private and public investments to shocks to any of these variables
(private and public investment) and how long the effect of these shocks persist in the
short run. The variance decomposition depicts the total percentage change in one
variable which is explained by a shock in another variable, over a specific period.
These were done with the intention of knowing the specific effects of private
investment on public investment and vice versa when other factors are held constant.
Based on the general PVAR form, the following specific system of equations was
estimated:
ittiitititit evuLNGDPLNPRINVLNGPINVLNGPINV 111211111 (23)
ittiitititit evuLNGDPLNPRINVLNGPINVLNPRINV 222221212 (24)
ittiitititit evuLNGDPLNPRINVLNGPINVLNGDP 3332313131 (25)
where , and are parameters to be estimated in the equations in the system. The
lag of economic growth per capita was used in the system in order to cater for the
possibility of simultaneity between economic growth and the two investment
variables. Thus, 2itLNGDP is the lag of economic growth per capita. The lag length
for the variables included in the model was selected based on the Hannan-Quinn
Information Criterion (see appendix 2.5) and the constant series was used as
University of Ghana http://ugspace.ug.edu.gh
71
exogenous variable. All other variables assume the meaning as indicated in equation
22. Equation 23 in the system shows that current levels of public investment are not
influenced by contemporaneous factors of private investment and economic growth
because of the time-to-build effect but on its own previous levels, previous levels of
private investment and economic growth. This is because, it is argued that public
investment may follow private investment either to provide infrastructure to
compliment private investment efforts or offer competitive products/services in order
to mitigate the hardship on its citizens. Meanwhile, public investment may follow
economic growth because of the fact that resources may be available to fund them or
in order to accelerate growth.
Equation 24 is premised on the assumption that private investment is influenced by
its lag and the lags of public investment and economic growth. Public investment
may precede private investment because the existence of good public infrastructure
may serve as an attraction for private investment. Also, in some instances, private
investors’ means of entry into certain industries are based on acquisition of existing
public investments. Private investors use economic growth to gauge the attractiveness
of economies and either follow it or not. Equation 25 simply reiterate the widely held
economic view that physical capital of an economy explains its growth and that
because of the time-to-build effect such relationship is not expected to be
contemporaneous.
University of Ghana http://ugspace.ug.edu.gh
72
Study sample
The study included data from all SSA countries except South Sudan. The exclusion
of South Sudan was basically based on lack of data. In all, 48 countries were included
in the study over a 20 year period, from 1990 to 2009.
Dynamic Panel Methodology
The nature of data used for the study allows for panel data methodology. Panel data
methodology allows researchers to undertake cross-sectional observations over
several time periods and also control for individual heterogeneity due to hidden
factors, which, if neglected in time-series or cross-section estimations leads to biased
results (Baltagi, 1995). The general form of the panel data model can be specified as:
Yit= a + ßXit+eit (26)
Where the subscript i denotes the cross-sectional dimension and t represents the time-
series dimension. Yit, represents the dependent variable in the model. X contains the set
of explanatory variables in the estimation model. a is the constant and ß represents the
coefficients. eit is the error term. According to Baltagi (2005), most panel data
applications have been limited to a single regression with error components
disturbances which is explained as:
Yit = ßXit +μi +λt + vit (27)
where the subscript i denotes individuals and t represents the time. Yit, represents the
dependent variable in the model. Xit is a vector of observations on k explanatory
variables. ß is a vector of unknown coefficients. μi is an unobserved individual
specific effect. λt is an unobserved time specific effect. v it is a zero mean
University of Ghana http://ugspace.ug.edu.gh
73
random disturbance with variance .
The nature of the test to be carried out requires that a dynamic panel methodology is
applied. In addition to other benefits associated with panel data methodology,
dynamic panel allows for measuring the speed of adjustment (through the lagged
dependent variable) using the partial adjustment based approach. The dynamic panel
approach accounts for individual effects, which mostly is the cross sectional (see
Baltagi, 2005) even though the time specific effects can also be included. The
dynamic error components regression is characterized by the presence of a lagged
dependent variable among the regressors i.e.
Yit= Yit-1 +ßXit+ μi + vit , (28)
where Yit is the dependent variable in country i for time t, Yit-1 is the dependent variable
in the previous period, ßXit is a vector of explanatory variables, i is equal to
1……48, t is equal to 1..…20.
In this particular study, the Arellano Bond General Moments Method (AB-GMM
(1991)) approach, first proposed by Holtz-Eakin, Newey and Rosen (1988), was used
because of its popularity in dynamic panel modelling. The Arellano-Bond GMM
approach is designed with the ability to handle the econometric problems that may
arise in estimating equations (5) and (19). It also uses the differencing (first
differencing) GMM approach to wipe out the time invariant country specific effects
(which may be correlated with the explanatory variables) and also caters for the
University of Ghana http://ugspace.ug.edu.gh
74
problem of autocorrelation which may be caused by the inclusion of the lagged
dependent variable. Lastly, the AB approach has been designed for small-T (20
years) and large-N (48 countries) panels (Mileva, 2007).
Diagnostic Tests
The Sargan test and autocorrelation test are the two main diagnostic tests relevant to
this study. The Sargan test for over-identifying restrictions is used to determine if the
instruments are suitable. The null hypothesis states that “the instruments as a group
are exogenous”. Consequently, a higher p-value is preferred. The null hypothesis of
no autocorrelation is applied to the differenced residuals (Mileva, 2007). Sargan test
results and results for AR (1) and AR (2) test reported in Table 2.10 show that the
model is well specified.
Two models are used: Equation (29) is used to re-assess the crowding-in-out hypothesis
in the presence of good governance; and equation (30) is to test for the determinants of
public investment and private investment in expanded models.
lnPRINV it = β0lnGDPit-1 +β1lnPRINVit-1 + β2lnGPINVit + β3 lnDCPS it + β4lnRIRit +
β5 lnTOPENit + β6lnPOLit + β7lnINFit + β8lnOBBit + iti (29)
lnPINV it = φ0lnGDP it-1 + φ1lnGPINV it-1 + φ2lnPRINV it + φ3lnRIR it + φ4lnCGIit +
φ5lnTOPENit + φ6lnAIDit + φ7lnEDSit + φ8lnCBBit + (30)
where the variables are explained in Table 2.2 below
iti zx
University of Ghana http://ugspace.ug.edu.gh
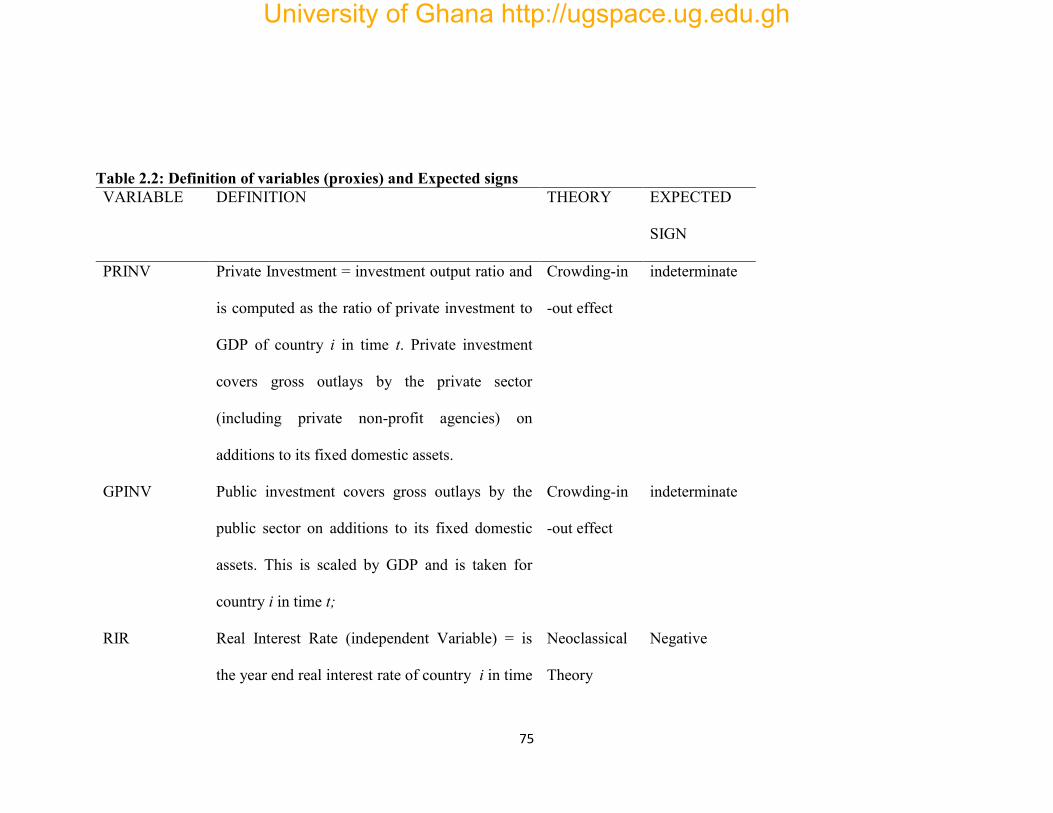
75
Table 2.2: Definition of variables (proxies) and Expected signs VARIABLE DEFINITION THEORY EXPECTED
SIGN
PRINV Private Investment = investment output ratio and
is computed as the ratio of private investment to
GDP of country i in time t. Private investment
covers gross outlays by the private sector
(including private non-profit agencies) on
additions to its fixed domestic assets.
Crowding-in
-out effect
indeterminate
GPINV Public investment covers gross outlays by the
public sector on additions to its fixed domestic
assets. This is scaled by GDP and is taken for
country i in time t;
Crowding-in
-out effect
indeterminate
RIR Real Interest Rate (independent Variable) = is
the year end real interest rate of country i in time
Neoclassical
Theory
Negative
University of Ghana http://ugspace.ug.edu.gh
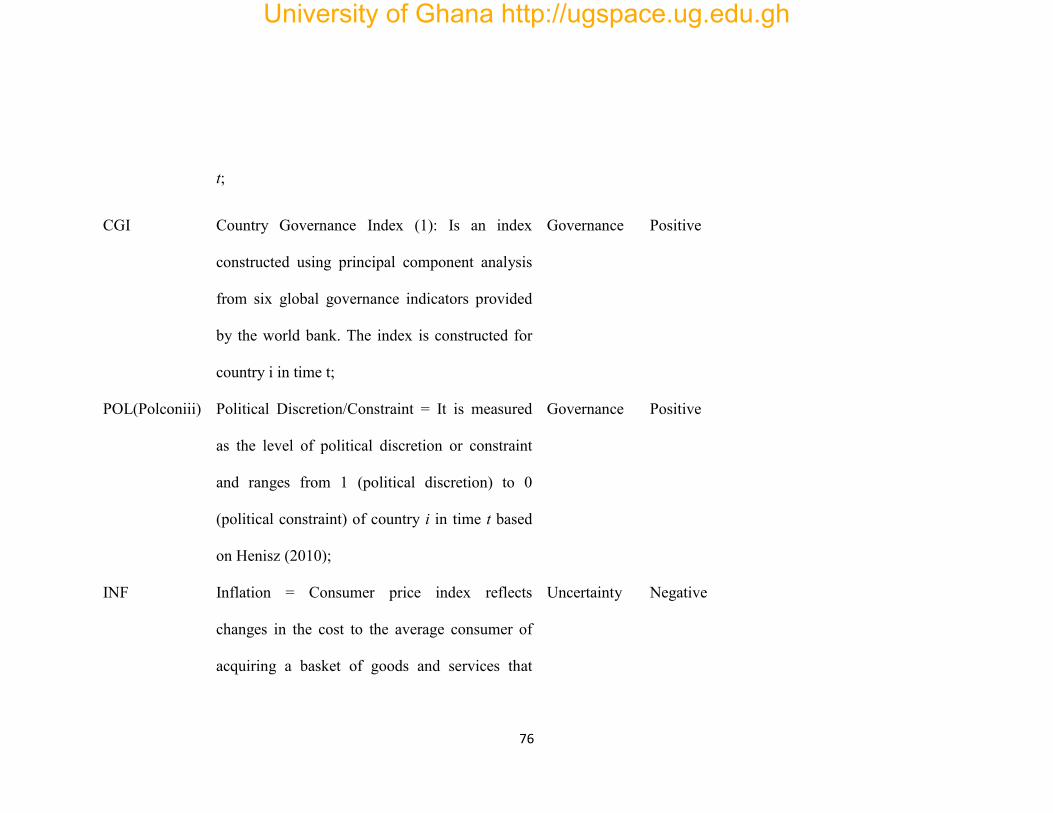
76
t;
CGI Country Governance Index (1): Is an index
constructed using principal component analysis
from six global governance indicators provided
by the world bank. The index is constructed for
country i in time t;
Governance Positive
POL(Polconiii) Political Discretion/Constraint = It is measured
as the level of political discretion or constraint
and ranges from 1 (political discretion) to 0
(political constraint) of country i in time t based
on Henisz (2010);
Governance Positive
INF Inflation = Consumer price index reflects
changes in the cost to the average consumer of
acquiring a basket of goods and services that
Uncertainty Negative
University of Ghana http://ugspace.ug.edu.gh
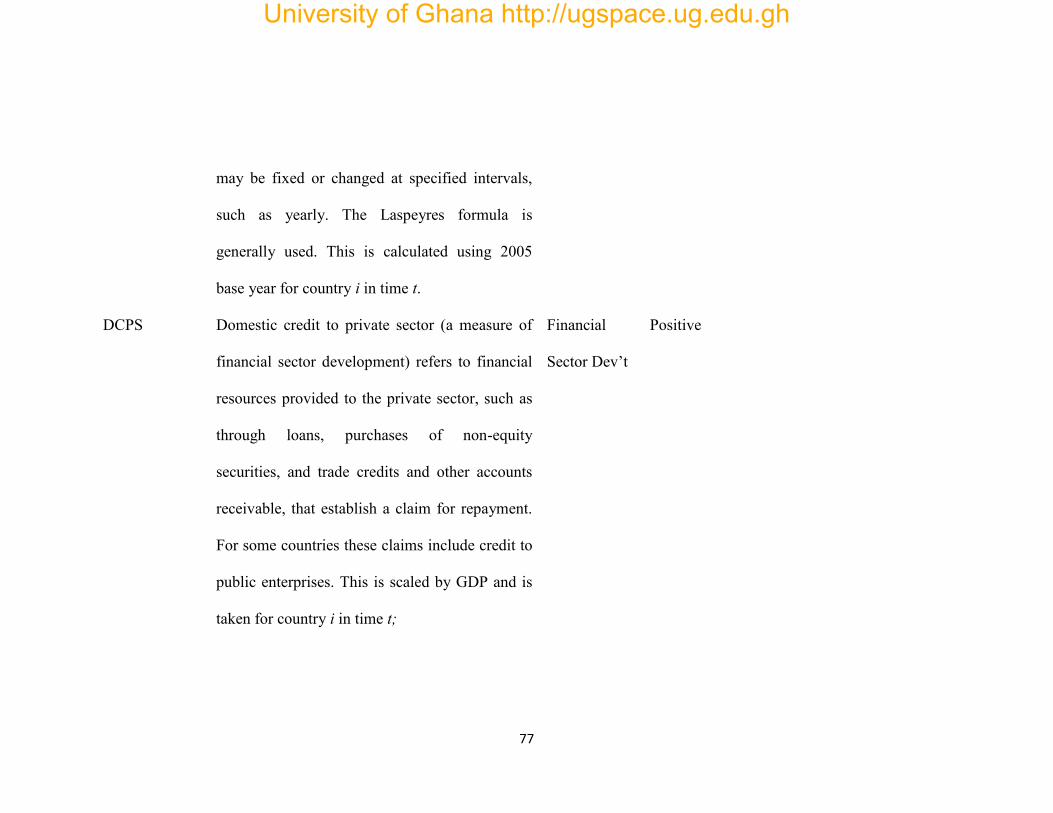
77
may be fixed or changed at specified intervals,
such as yearly. The Laspeyres formula is
generally used. This is calculated using 2005
base year for country i in time t.
DCPS Domestic credit to private sector (a measure of
financial sector development) refers to financial
resources provided to the private sector, such as
through loans, purchases of non-equity
securities, and trade credits and other accounts
receivable, that establish a claim for repayment.
For some countries these claims include credit to
public enterprises. This is scaled by GDP and is
taken for country i in time t;
Financial
Sector Dev’t
Positive
University of Ghana http://ugspace.ug.edu.gh
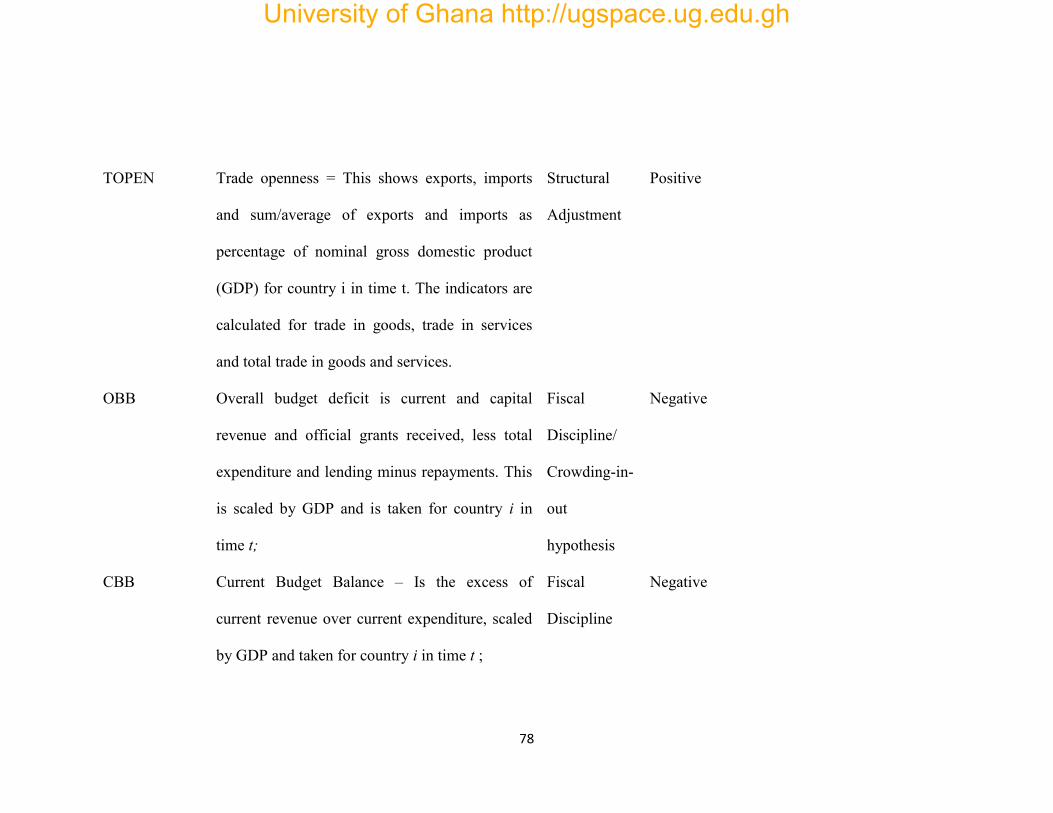
78
TOPEN Trade openness = This shows exports, imports
and sum/average of exports and imports as
percentage of nominal gross domestic product
(GDP) for country i in time t. The indicators are
calculated for trade in goods, trade in services
and total trade in goods and services.
Structural
Adjustment
Positive
OBB Overall budget deficit is current and capital
revenue and official grants received, less total
expenditure and lending minus repayments. This
is scaled by GDP and is taken for country i in
time t;
Fiscal
Discipline/
Crowding-in-
out
hypothesis
Negative
CBB Current Budget Balance – Is the excess of
current revenue over current expenditure, scaled
by GDP and taken for country i in time t ;
Fiscal
Discipline
Negative
University of Ghana http://ugspace.ug.edu.gh
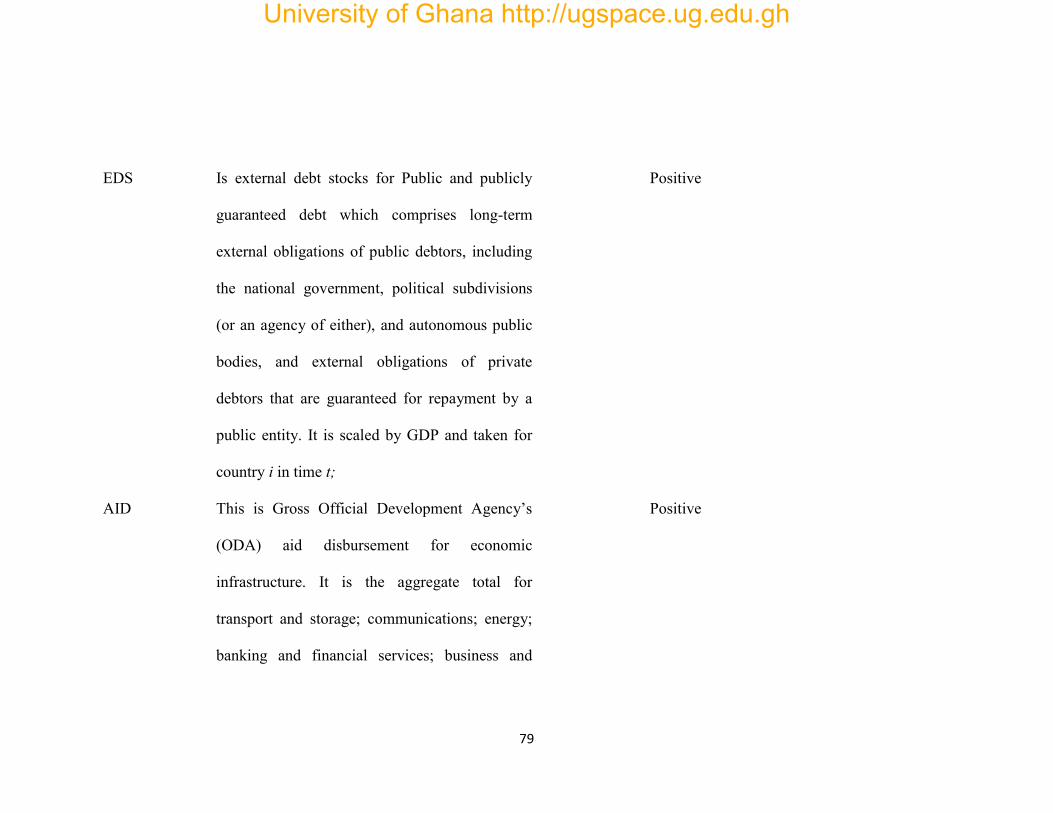
79
EDS Is external debt stocks for Public and publicly
guaranteed debt which comprises long-term
external obligations of public debtors, including
the national government, political subdivisions
(or an agency of either), and autonomous public
bodies, and external obligations of private
debtors that are guaranteed for repayment by a
public entity. It is scaled by GDP and taken for
country i in time t;
Positive
AID This is Gross Official Development Agency’s
(ODA) aid disbursement for economic
infrastructure. It is the aggregate total for
transport and storage; communications; energy;
banking and financial services; business and
Positive
University of Ghana http://ugspace.ug.edu.gh
80
other services. It is scaled by GDP and taken for
country i in time t;
Are the country specific and white noise
iti ,
University of Ghana http://ugspace.ug.edu.gh
81
Data
All the data were taken from the online edition of the African development index of
the World Bank except that of Trade openness and Polconiii. The variable for trade
openness was taken from UNCTAD but that of Polconiii is an index built by Henisz
(2010). All the variables are presented in their natural log form in order to control for
heteroskedasticity and also help in the determination of their elasticities.
Country Governance Indexes
Two main governance variables (which are also indexes) are used in the study. The
first variable (CGI) is constructed by the researcher using Principal Component
Analysis applied to the governance data from World Bank and the second index is an
already constructed index (Polconiii) by Henisz (2010).
Polconiii measures the level of political discretion or political constraints using data
drawn from political science databases. These data give information about the
number of independent branches of government with veto power over policy change.
In this model investors are interested in the extent to which a given political actor is a
constraint in his or her choice of future policies. Thus, the level of political discretion
and constraint ranges from 1 (political discretion) to 0 (political constraint).
Henisz (2002) states that “The strength of the measure is that it is structurally derived
from a simple spatial model of political interaction which incorporates data on the
number of independent political institutions with veto power in a given polity and
University of Ghana http://ugspace.ug.edu.gh
82
data on the alignment and heterogeneity of the political actors that inhabit those
institutions. The first weakness of the measure is that its validity is based upon the
validity of the assumptions imposed upon the spatial model in order to generate
quantitative results. Another weakness is that many features of interest are left out of
the model including agenda setting rights, decision costs, other relevant procedural
issues, the political role of the military and/or church, cultural/racial tensions, and
other informal institutions which impact economic outcomes.”
Apart from Polconiii, CGI variable is measured as an index constructed by the
researcher (using the Principal Component Analysis - PCA) from the global
governance indicators published by the World Bank. The following equation was
used for the construction of the governance index.
CGIt = W1CCt +W2GEt + W3PSt+ W4RQt + W5RLt+ W6VAt (31)
where the components have been explained in the Table 2.3 below:
Table 2.3: Components of Country Governance Index Variable Meaning Measurement
CC Control of Corruption Number of sources
GE Government Effectiveness Number of Sources
PS Political Stability Number of sources
RQ Regulatory Quality Number of sources
RL Rule of Law Number of sources
VA Voice and Accountability Number of sources
University of Ghana http://ugspace.ug.edu.gh
83
The variance proportions of the various countries used in the study, as shown in
Appendix 2.2 below shows that, in all the countries, the first composition gives the
best weights to be used in the calculation of the governance index.
2.3.0 Analysis and Discussion
2.3.1 Descriptive Statistics
Table 2.4 presents the descriptive statistics for the study. On the average private
investment to gross domestic product (in percentage) was as low as about 12.75%
with a variation of 9.54. Some economies recorded as low as -2.64% with others as
high as 112.35% in some years. The wide difference between the minimum and
maximum ratios also attests to the fact that private investment activities on the
continent are not evenly distributed. While others were able to attract even more than
their national output in certain years, others experienced a reduction in private
investment in certain years over the study period. A comparison of the size of credit
to the private sector (17.87%) and the size of private investment over the period
shows that a greater proportion of credit to private sector (71.35%) goes into capital
projects. Again, private investment as a percentage of GDP was almost double that of
public investment (7.41%), depicting a gradual shift from the fact that governments
in Africa invest more than the private sector.
Meanwhile, real interest rate on the continent, averaged at 10.8% but with huge
disparities. The minimum and maximum rates were -96.87% and 508.74%
respectively meaning that real interest rates on the continent are far from being
University of Ghana http://ugspace.ug.edu.gh
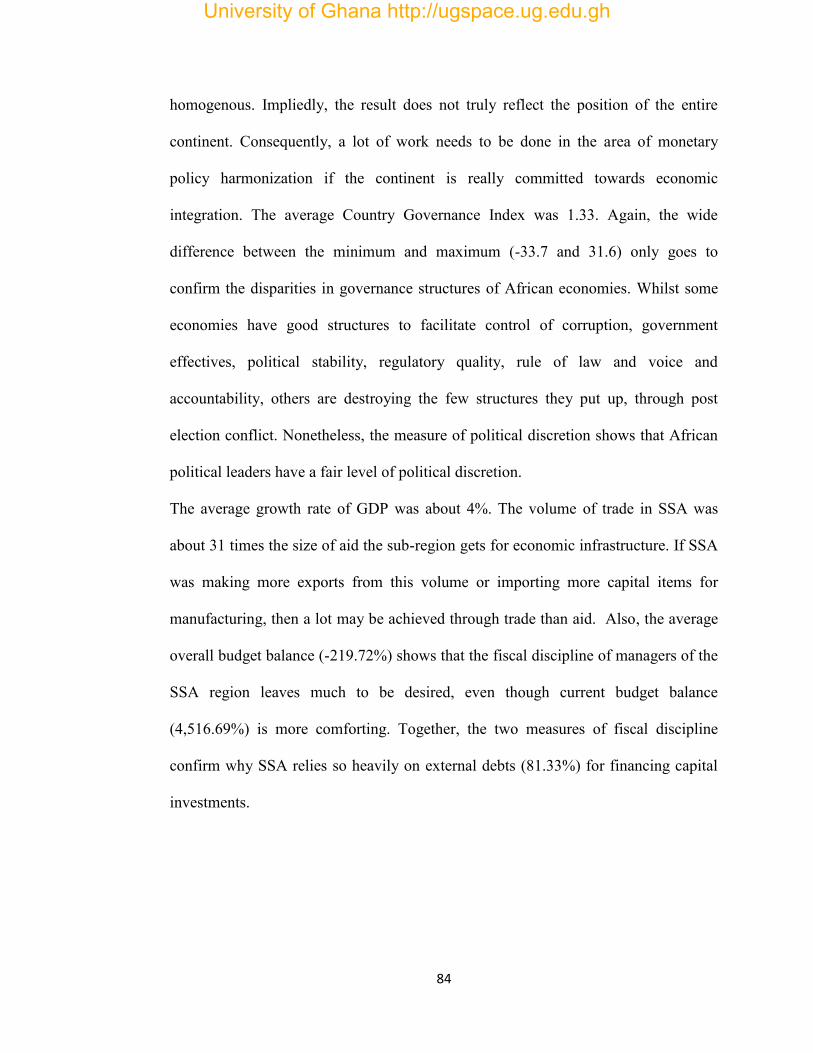
84
homogenous. Impliedly, the result does not truly reflect the position of the entire
continent. Consequently, a lot of work needs to be done in the area of monetary
policy harmonization if the continent is really committed towards economic
integration. The average Country Governance Index was 1.33. Again, the wide
difference between the minimum and maximum (-33.7 and 31.6) only goes to
confirm the disparities in governance structures of African economies. Whilst some
economies have good structures to facilitate control of corruption, government
effectives, political stability, regulatory quality, rule of law and voice and
accountability, others are destroying the few structures they put up, through post
election conflict. Nonetheless, the measure of political discretion shows that African
political leaders have a fair level of political discretion.
The average growth rate of GDP was about 4%. The volume of trade in SSA was
about 31 times the size of aid the sub-region gets for economic infrastructure. If SSA
was making more exports from this volume or importing more capital items for
manufacturing, then a lot may be achieved through trade than aid. Also, the average
overall budget balance (-219.72%) shows that the fiscal discipline of managers of the
SSA region leaves much to be desired, even though current budget balance
(4,516.69%) is more comforting. Together, the two measures of fiscal discipline
confirm why SSA relies so heavily on external debts (81.33%) for financing capital
investments.
University of Ghana http://ugspace.ug.edu.gh
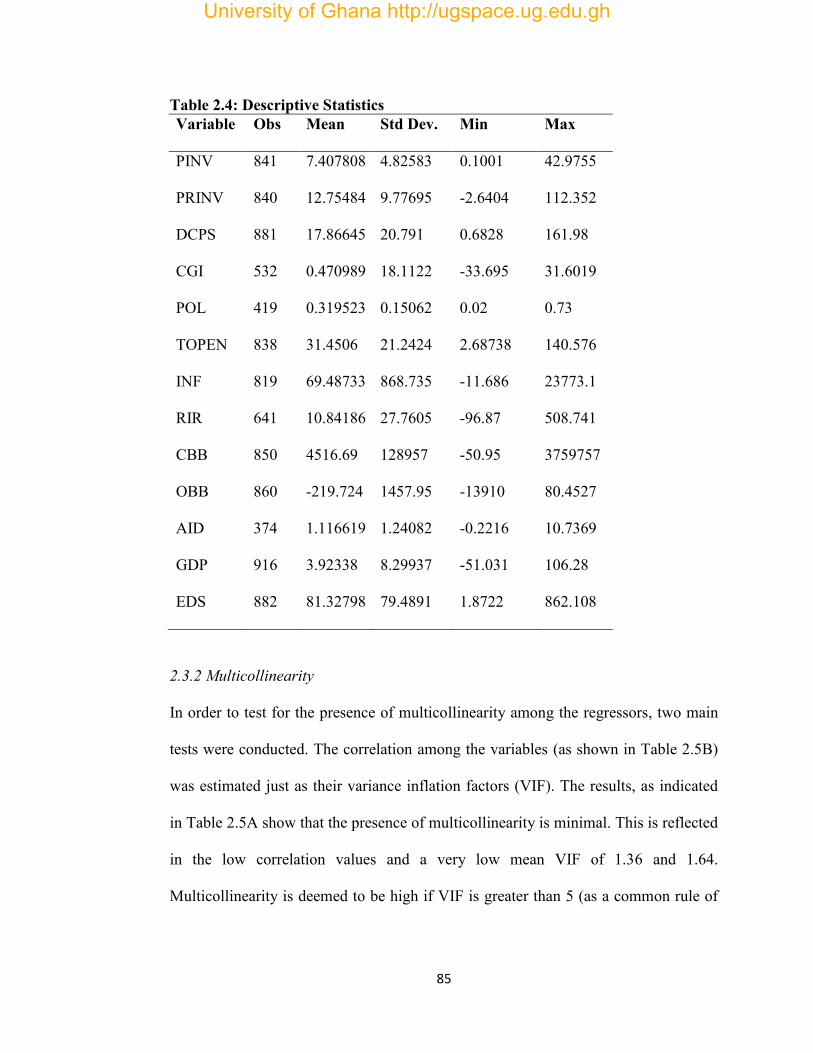
85
Table 2.4: Descriptive Statistics Variable Obs Mean Std Dev. Min Max
PINV 841 7.407808 4.82583 0.1001 42.9755
PRINV 840 12.75484 9.77695 -2.6404 112.352
DCPS 881 17.86645 20.791 0.6828 161.98
CGI 532 0.470989 18.1122 -33.695 31.6019
POL 419 0.319523 0.15062 0.02 0.73
TOPEN 838 31.4506 21.2424 2.68738 140.576
INF 819 69.48733 868.735 -11.686 23773.1
RIR 641 10.84186 27.7605 -96.87 508.741
CBB 850 4516.69 128957 -50.95 3759757
OBB 860 -219.724 1457.95 -13910 80.4527
AID 374 1.116619 1.24082 -0.2216 10.7369
GDP 916 3.92338 8.29937 -51.031 106.28
EDS 882 81.32798 79.4891 1.8722 862.108
2.3.2 Multicollinearity
In order to test for the presence of multicollinearity among the regressors, two main
tests were conducted. The correlation among the variables (as shown in Table 2.5B)
was estimated just as their variance inflation factors (VIF). The results, as indicated
in Table 2.5A show that the presence of multicollinearity is minimal. This is reflected
in the low correlation values and a very low mean VIF of 1.36 and 1.64.
Multicollinearity is deemed to be high if VIF is greater than 5 (as a common rule of
University of Ghana http://ugspace.ug.edu.gh
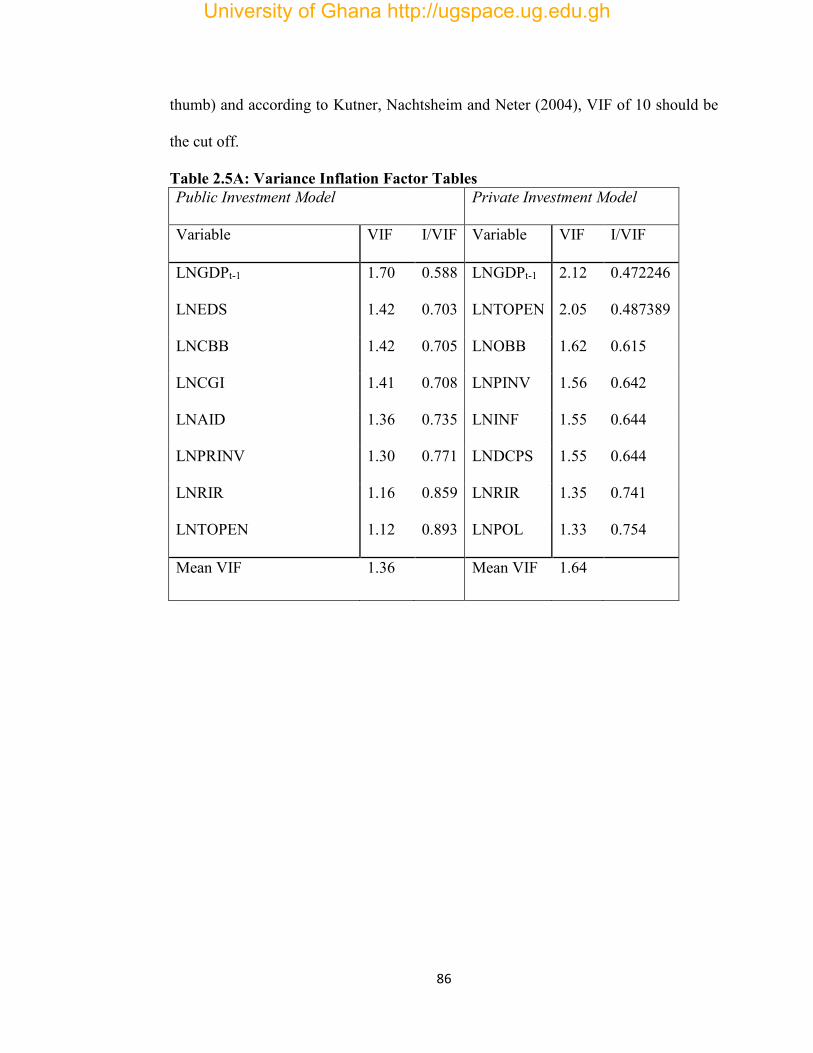
86
thumb) and according to Kutner, Nachtsheim and Neter (2004), VIF of 10 should be
the cut off.
Table 2.5A: Variance Inflation Factor Tables Public Investment Model
Private Investment Model
Variable VIF I/VIF Variable VIF I/VIF
LNGDPt-1 1.70 0.588 LNGDPt-1 2.12 0.472246
LNEDS 1.42 0.703 LNTOPEN 2.05 0.487389
LNCBB 1.42 0.705 LNOBB 1.62 0.615
LNCGI 1.41 0.708 LNPINV 1.56 0.642
LNAID 1.36 0.735 LNINF 1.55 0.644
LNPRINV 1.30 0.771 LNDCPS 1.55 0.644
LNRIR 1.16 0.859 LNRIR 1.35 0.741
LNTOPEN 1.12 0.893 LNPOL 1.33 0.754
Mean VIF 1.36 Mean VIF 1.64
University of Ghana http://ugspace.ug.edu.gh
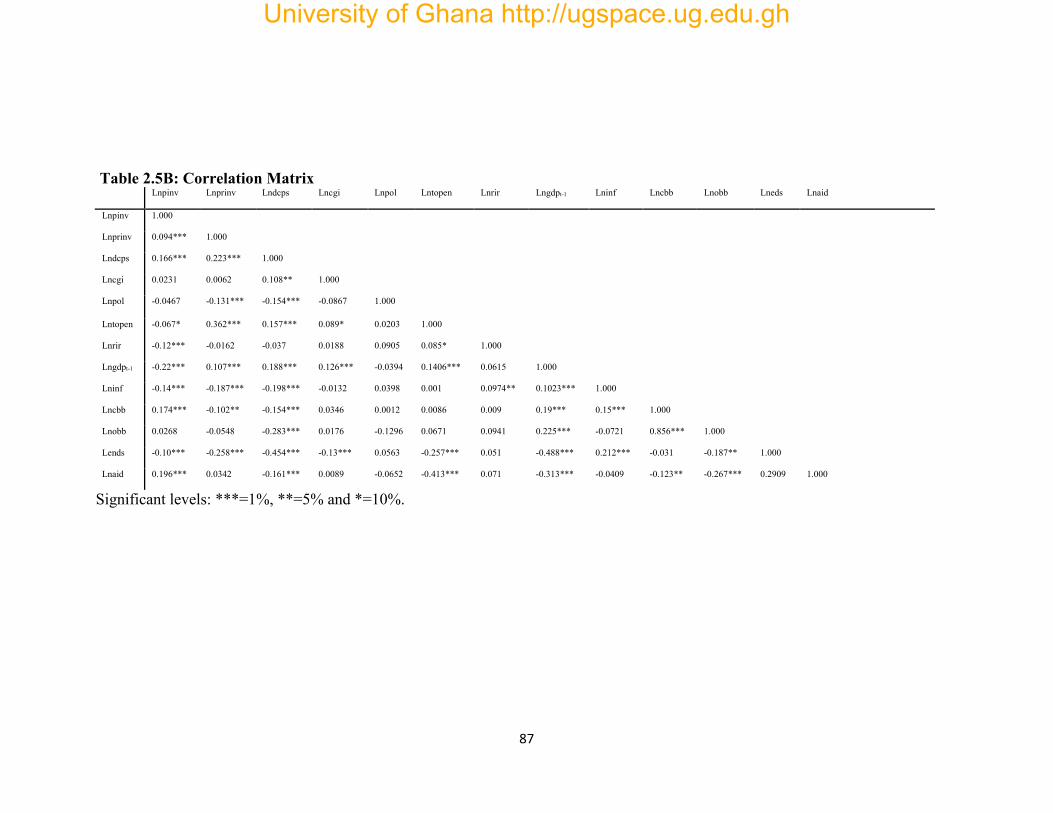
87
Table 2.5B: Correlation Matrix Lnpinv Lnprinv Lndcps Lncgi Lnpol Lntopen Lnrir Lngdpt-1 Lninf Lncbb Lnobb Lneds Lnaid
Lnpinv 1.000
Lnprinv 0.094*** 1.000
Lndcps 0.166*** 0.223*** 1.000
Lncgi 0.0231 0.0062 0.108** 1.000
Lnpol -0.0467 -0.131*** -0.154*** -0.0867 1.000
Lntopen -0.067* 0.362*** 0.157*** 0.089* 0.0203 1.000
Lnrir -0.12*** -0.0162 -0.037 0.0188 0.0905 0.085* 1.000
Lngdpt-1 -0.22*** 0.107*** 0.188*** 0.126*** -0.0394 0.1406*** 0.0615 1.000
Lninf -0.14*** -0.187*** -0.198*** -0.0132 0.0398 0.001 0.0974** 0.1023*** 1.000
Lncbb 0.174*** -0.102** -0.154*** 0.0346 0.0012 0.0086 0.009 0.19*** 0.15*** 1.000
Lnobb 0.0268 -0.0548 -0.283*** 0.0176 -0.1296 0.0671 0.0941 0.225*** -0.0721 0.856*** 1.000
Lends -0.10*** -0.258*** -0.454*** -0.13*** 0.0563 -0.257*** 0.051 -0.488*** 0.212*** -0.031 -0.187** 1.000
Lnaid 0.196*** 0.0342 -0.161*** 0.0089 -0.0652 -0.413*** 0.071 -0.313*** -0.0409 -0.123** -0.267*** 0.2909 1.000
Significant levels: ***=1%, **=5% and *=10%.
University of Ghana http://ugspace.ug.edu.gh
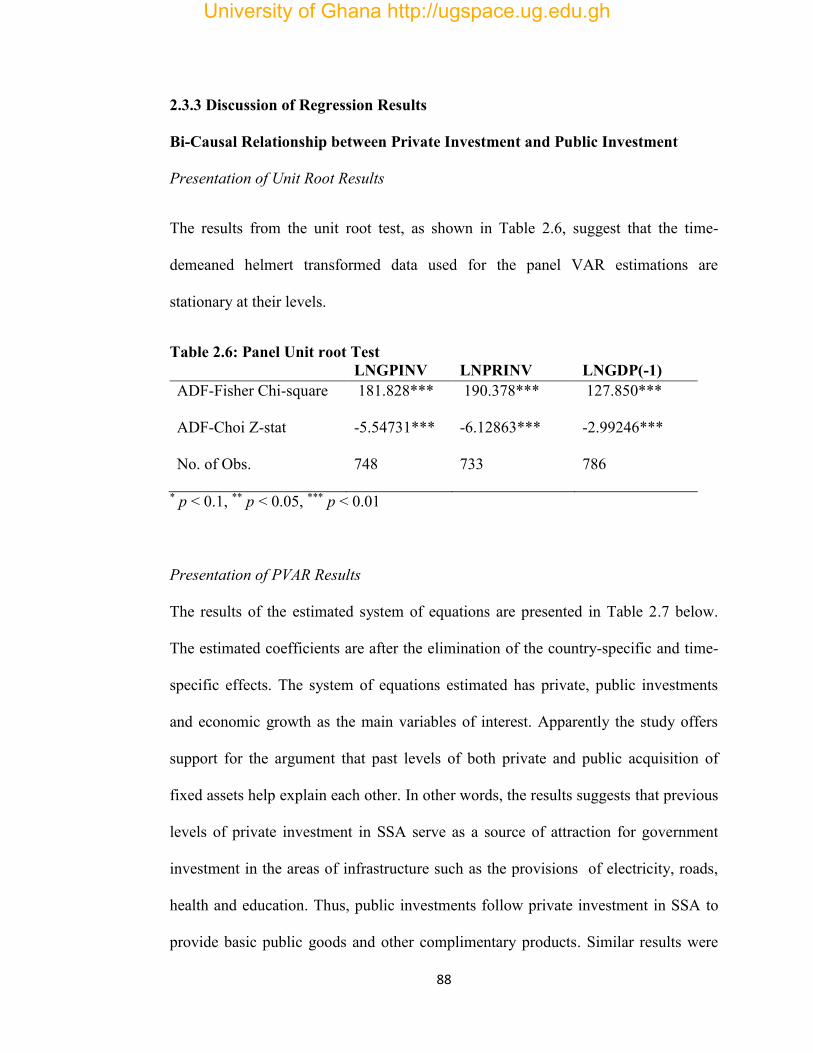
88
2.3.3 Discussion of Regression Results
Bi-Causal Relationship between Private Investment and Public Investment
Presentation of Unit Root Results
The results from the unit root test, as shown in Table 2.6, suggest that the time-
demeaned helmert transformed data used for the panel VAR estimations are
stationary at their levels.
Table 2.6: Panel Unit root Test LNGPINV LNPRINV LNGDP(-1) ADF-Fisher Chi-square 181.828*** 190.378*** 127.850***
ADF-Choi Z-stat -5.54731*** -6.12863*** -2.99246***
No. of Obs. 748 733 786
* p < 0.1, ** p < 0.05, *** p < 0.01
Presentation of PVAR Results
The results of the estimated system of equations are presented in Table 2.7 below.
The estimated coefficients are after the elimination of the country-specific and time-
specific effects. The system of equations estimated has private, public investments
and economic growth as the main variables of interest. Apparently the study offers
support for the argument that past levels of both private and public acquisition of
fixed assets help explain each other. In other words, the results suggests that previous
levels of private investment in SSA serve as a source of attraction for government
investment in the areas of infrastructure such as the provisions of electricity, roads,
health and education. Thus, public investments follow private investment in SSA to
provide basic public goods and other complimentary products. Similar results were
University of Ghana http://ugspace.ug.edu.gh
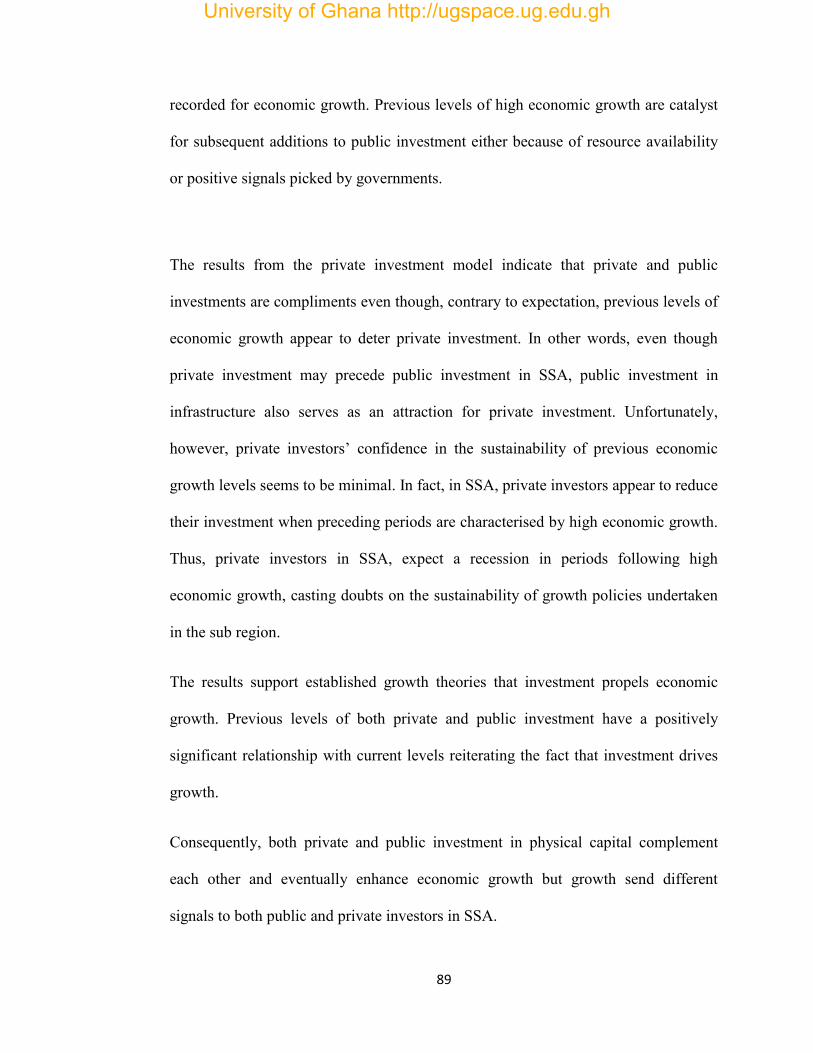
89
recorded for economic growth. Previous levels of high economic growth are catalyst
for subsequent additions to public investment either because of resource availability
or positive signals picked by governments.
The results from the private investment model indicate that private and public
investments are compliments even though, contrary to expectation, previous levels of
economic growth appear to deter private investment. In other words, even though
private investment may precede public investment in SSA, public investment in
infrastructure also serves as an attraction for private investment. Unfortunately,
however, private investors’ confidence in the sustainability of previous economic
growth levels seems to be minimal. In fact, in SSA, private investors appear to reduce
their investment when preceding periods are characterised by high economic growth.
Thus, private investors in SSA, expect a recession in periods following high
economic growth, casting doubts on the sustainability of growth policies undertaken
in the sub region.
The results support established growth theories that investment propels economic
growth. Previous levels of both private and public investment have a positively
significant relationship with current levels reiterating the fact that investment drives
growth.
Consequently, both private and public investment in physical capital complement
each other and eventually enhance economic growth but growth send different
signals to both public and private investors in SSA.
University of Ghana http://ugspace.ug.edu.gh
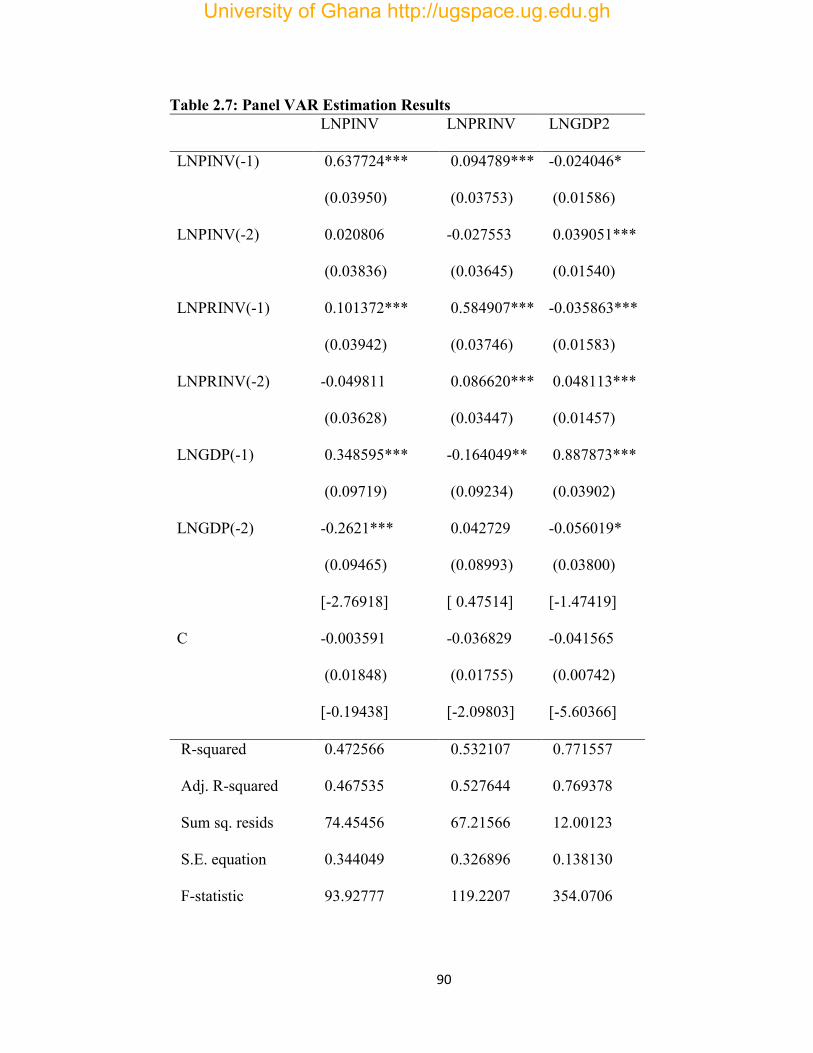
90
Table 2.7: Panel VAR Estimation Results LNPINV LNPRINV LNGDP2
LNPINV(-1) 0.637724*** 0.094789*** -0.024046*
(0.03950) (0.03753) (0.01586)
LNPINV(-2) 0.020806 -0.027553 0.039051***
(0.03836) (0.03645) (0.01540)
LNPRINV(-1) 0.101372*** 0.584907*** -0.035863***
(0.03942) (0.03746) (0.01583)
LNPRINV(-2) -0.049811 0.086620*** 0.048113***
(0.03628) (0.03447) (0.01457)
LNGDP(-1) 0.348595*** -0.164049** 0.887873***
(0.09719) (0.09234) (0.03902)
LNGDP(-2) -0.2621*** 0.042729 -0.056019*
(0.09465) (0.08993) (0.03800)
[-2.76918] [ 0.47514] [-1.47419]
C -0.003591 -0.036829 -0.041565
(0.01848) (0.01755) (0.00742)
[-0.19438] [-2.09803] [-5.60366]
R-squared 0.472566 0.532107 0.771557
Adj. R-squared 0.467535 0.527644 0.769378
Sum sq. resids 74.45456 67.21566 12.00123
S.E. equation 0.344049 0.326896 0.138130
F-statistic 93.92777 119.2207 354.0706
University of Ghana http://ugspace.ug.edu.gh
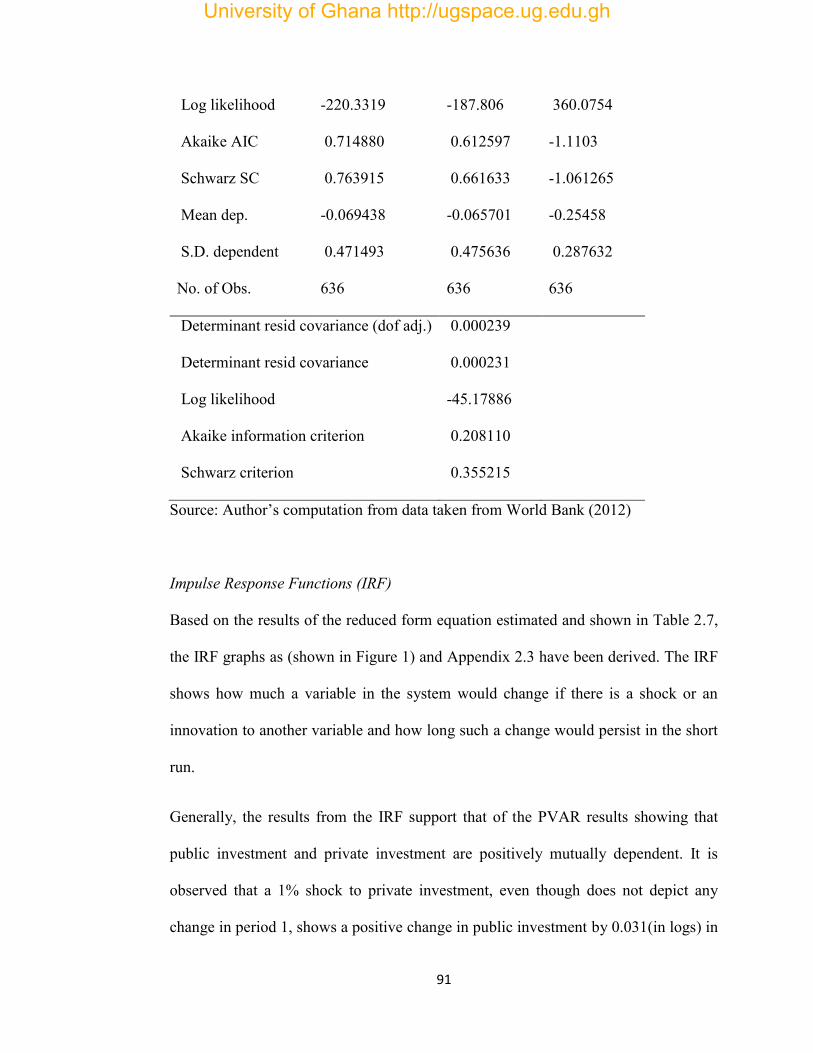
91
Log likelihood -220.3319 -187.806 360.0754
Akaike AIC 0.714880 0.612597 -1.1103
Schwarz SC 0.763915 0.661633 -1.061265
Mean dep. -0.069438 -0.065701 -0.25458
S.D. dependent 0.471493 0.475636 0.287632
No. of Obs. 636 636 636
Determinant resid covariance (dof adj.) 0.000239
Determinant resid covariance 0.000231
Log likelihood -45.17886
Akaike information criterion 0.208110
Schwarz criterion 0.355215
Source: Author’s computation from data taken from World Bank (2012)
Impulse Response Functions (IRF)
Based on the results of the reduced form equation estimated and shown in Table 2.7,
the IRF graphs as (shown in Figure 1) and Appendix 2.3 have been derived. The IRF
shows how much a variable in the system would change if there is a shock or an
innovation to another variable and how long such a change would persist in the short
run.
Generally, the results from the IRF support that of the PVAR results showing that
public investment and private investment are positively mutually dependent. It is
observed that a 1% shock to private investment, even though does not depict any
change in period 1, shows a positive change in public investment by 0.031(in logs) in
University of Ghana http://ugspace.ug.edu.gh
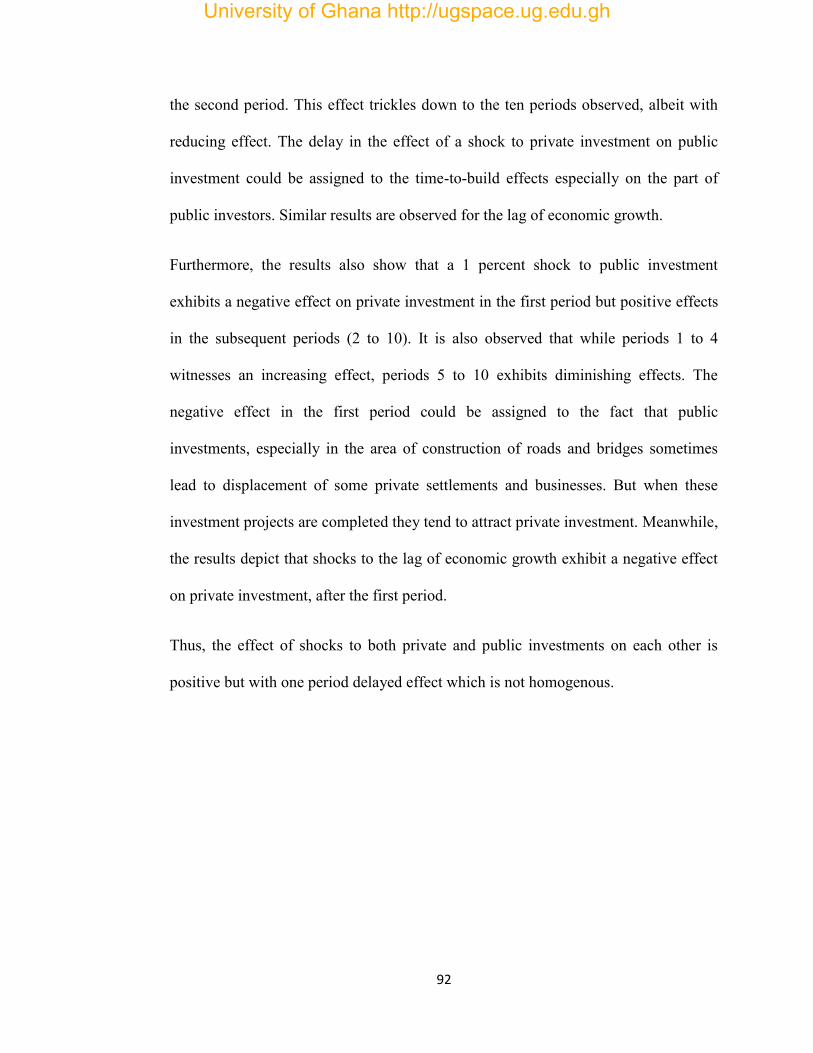
92
the second period. This effect trickles down to the ten periods observed, albeit with
reducing effect. The delay in the effect of a shock to private investment on public
investment could be assigned to the time-to-build effects especially on the part of
public investors. Similar results are observed for the lag of economic growth.
Furthermore, the results also show that a 1 percent shock to public investment
exhibits a negative effect on private investment in the first period but positive effects
in the subsequent periods (2 to 10). It is also observed that while periods 1 to 4
witnesses an increasing effect, periods 5 to 10 exhibits diminishing effects. The
negative effect in the first period could be assigned to the fact that public
investments, especially in the area of construction of roads and bridges sometimes
lead to displacement of some private settlements and businesses. But when these
investment projects are completed they tend to attract private investment. Meanwhile,
the results depict that shocks to the lag of economic growth exhibit a negative effect
on private investment, after the first period.
Thus, the effect of shocks to both private and public investments on each other is
positive but with one period delayed effect which is not homogenous.
University of Ghana http://ugspace.ug.edu.gh
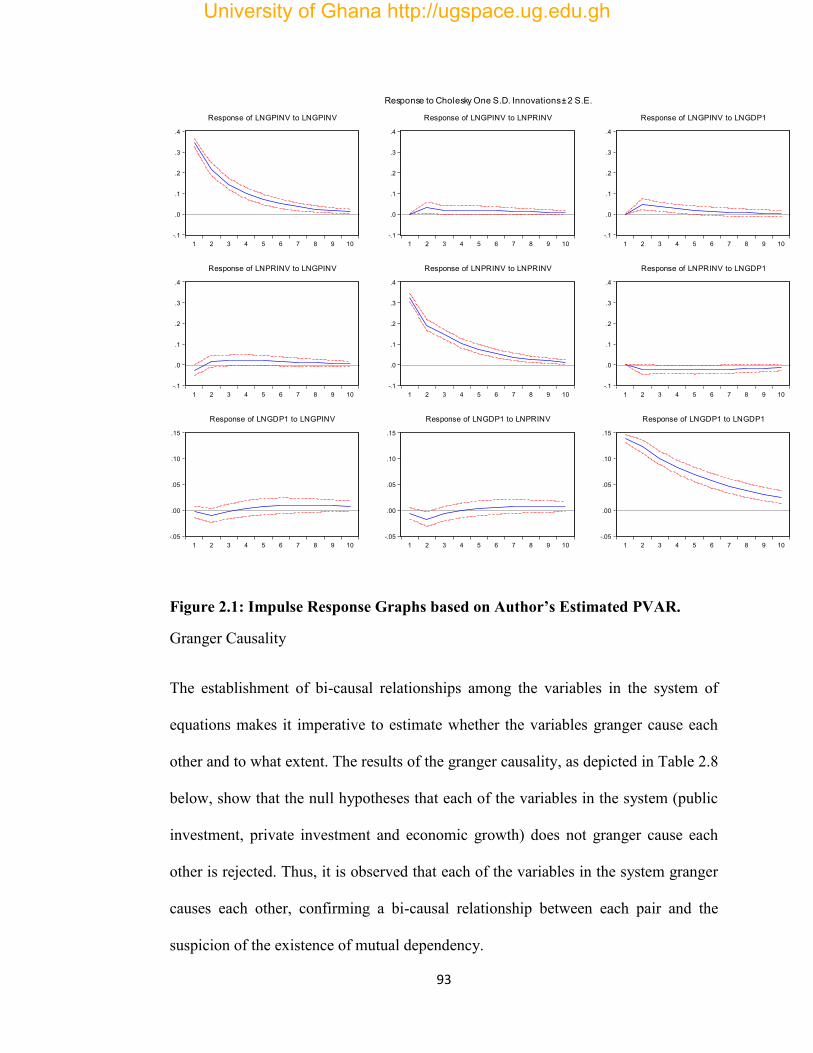
93
-.1
.0
.1
.2
.3
.4
1 2 3 4 5 6 7 8 9 10
Response of LNGPINV to LNGPINV
-.1
.0
.1
.2
.3
.4
1 2 3 4 5 6 7 8 9 10
Response of LNGPINV to LNPRINV
-.1
.0
.1
.2
.3
.4
1 2 3 4 5 6 7 8 9 10
Response of LNGPINV to LNGDP1
-.1
.0
.1
.2
.3
.4
1 2 3 4 5 6 7 8 9 10
Response of LNPRINV to LNGPINV
-.1
.0
.1
.2
.3
.4
1 2 3 4 5 6 7 8 9 10
Response of LNPRINV to LNPRINV
-.1
.0
.1
.2
.3
.4
1 2 3 4 5 6 7 8 9 10
Response of LNPRINV to LNGDP1
-.05
.00
.05
.10
.15
1 2 3 4 5 6 7 8 9 10
Response of LNGDP1 to LNGPINV
-.05
.00
.05
.10
.15
1 2 3 4 5 6 7 8 9 10
Response of LNGDP1 to LNPRINV
-.05
.00
.05
.10
.15
1 2 3 4 5 6 7 8 9 10
Response of LNGDP1 to LNGDP1
Response to Cholesky One S.D. Innovations ± 2 S.E.
Figure 2.1: Impulse Response Graphs based on Author’s Estimated PVAR.
Granger Causality
The establishment of bi-causal relationships among the variables in the system of
equations makes it imperative to estimate whether the variables granger cause each
other and to what extent. The results of the granger causality, as depicted in Table 2.8
below, show that the null hypotheses that each of the variables in the system (public
investment, private investment and economic growth) does not granger cause each
other is rejected. Thus, it is observed that each of the variables in the system granger
causes each other, confirming a bi-causal relationship between each pair and the
suspicion of the existence of mutual dependency.
University of Ghana http://ugspace.ug.edu.gh
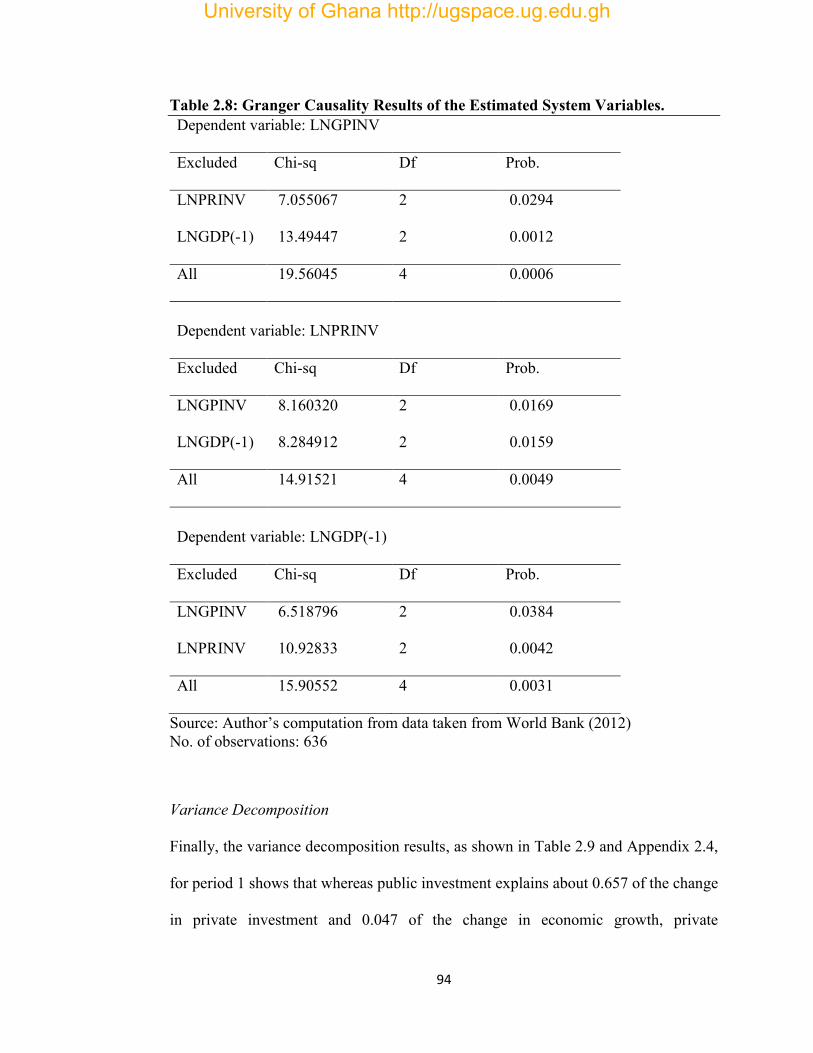
94
Table 2.8: Granger Causality Results of the Estimated System Variables. Dependent variable: LNGPINV
Excluded Chi-sq Df Prob.
LNPRINV 7.055067 2 0.0294
LNGDP(-1) 13.49447 2 0.0012
All 19.56045 4 0.0006
Dependent variable: LNPRINV
Excluded Chi-sq Df Prob.
LNGPINV 8.160320 2 0.0169
LNGDP(-1) 8.284912 2 0.0159
All 14.91521 4 0.0049
Dependent variable: LNGDP(-1)
Excluded Chi-sq Df Prob.
LNGPINV 6.518796 2 0.0384
LNPRINV 10.92833 2 0.0042
All 15.90552 4 0.0031
Source: Author’s computation from data taken from World Bank (2012) No. of observations: 636
Variance Decomposition
Finally, the variance decomposition results, as shown in Table 2.9 and Appendix 2.4,
for period 1 shows that whereas public investment explains about 0.657 of the change
in private investment and 0.047 of the change in economic growth, private
University of Ghana http://ugspace.ug.edu.gh
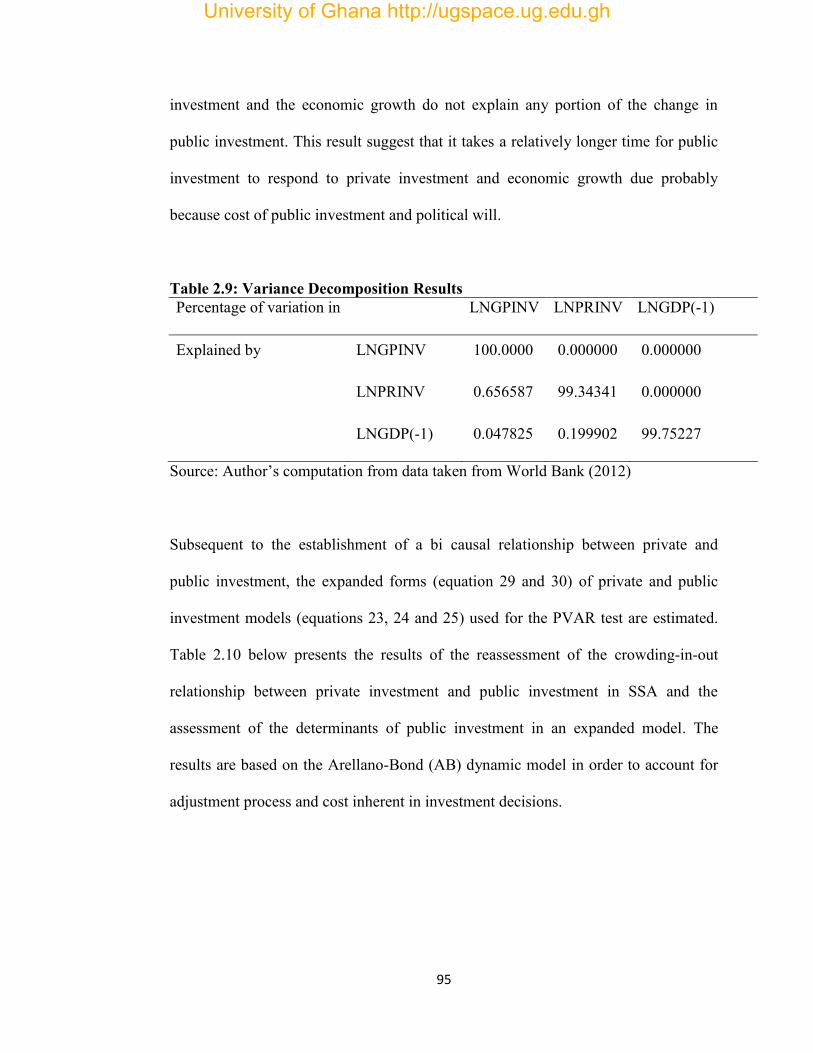
95
investment and the economic growth do not explain any portion of the change in
public investment. This result suggest that it takes a relatively longer time for public
investment to respond to private investment and economic growth due probably
because cost of public investment and political will.
Table 2.9: Variance Decomposition Results Percentage of variation in LNGPINV LNPRINV LNGDP(-1)
Explained by LNGPINV 100.0000 0.000000 0.000000
LNPRINV 0.656587 99.34341 0.000000
LNGDP(-1) 0.047825 0.199902 99.75227
Source: Author’s computation from data taken from World Bank (2012)
Subsequent to the establishment of a bi causal relationship between private and
public investment, the expanded forms (equation 29 and 30) of private and public
investment models (equations 23, 24 and 25) used for the PVAR test are estimated.
Table 2.10 below presents the results of the reassessment of the crowding-in-out
relationship between private investment and public investment in SSA and the
assessment of the determinants of public investment in an expanded model. The
results are based on the Arellano-Bond (AB) dynamic model in order to account for
adjustment process and cost inherent in investment decisions.
University of Ghana http://ugspace.ug.edu.gh
96
Determinants of Private and Public Investments
Re-assessment of the Crowding-in-out Hypothesis
Directly, the relationship between private investment and public investment is
negative but insignificant. Indirectly, through the credit channel (Overall Budget
Balance-OBB- variable), the relationship can be seen not only to be negative but
significant at 1% conventional level. When governments are not disciplined and over
spend, they move beyond the option of funding investment and other recurrent
expenditures from internally generated funds to borrowing, either internally or
externally. This situation has the potential of harming private investment in SSA. In
fact, for every 1% change in overall budget balance, private investment reduces by
0.049. Thus, we argue that government involvement in the credit market, as a result
of budget imbalance, squeeze out the little credit available for private investment.
Where the available credit is to be rationed between government and private
investors, private investors lose out because generally, investors consider business
with government as risk-free. Thus, this study is indifferent about the relationship
between private investment and public investment when the measure of public
investment is physical public investment but supports the crowding out hypothesis,
strongly, when the basis for measurement is through the credit channel. In effect the
study sits well with the strand of literature on the African continent that concludes
that public investment crowds-out private investment (Ndikumana, 2000) but casts
doubt on the conclusion that crowding-in is associated with developing economies
while crowding-out is associated with developed economies (Erden & Holcombe,
2005).
University of Ghana http://ugspace.ug.edu.gh
97
The size of the effect of fiscal imbalance on private investment in SSA is akin to that
of the relationship between real interest rate and private investment. The results
depict a strong negative relationship between real interest rate and investment in
Africa (in line with the neoclassical theory). The result suggests that as real interest
rate is increased, it tends to have an inverse relationship with the level of private
investment in Africa. Specifically, a 1% increase in real interest rate wipes out
private investment by 0.054. An increase in the real interest rate makes it more
expensive to acquire loanable funds for private investment projects. In a continent
where most of the secondary markets are underdeveloped and size of businesses are
not as large as that of developed economies, dependence on bank loans is a major
way of financing. This places particular significance on changes in real interest rate.
Thus, economic managers could undertake policies that lead to increase in the real
interest rate if they intend to cause a reduction in the level of private investment on
the continent and vice versa. In order words, embarking on a policy change that could
lead to a certain directional change in real interest rate is an indication of the desired
direction of private investment on the continent.
Surprisingly, the relationship between growth and private investment is not only
negative but also significant at 1%. Plainly, the results depict that private investors
base their current investment decisions on the previous year’s performance of the
economy. Not only that, the result also says that where the economy performed well
in the previous year, private investors are likely to invest less in the current year and
vice versa. Similar results were recorded for Cameroon (Oshikoya, 1994) although
University of Ghana http://ugspace.ug.edu.gh
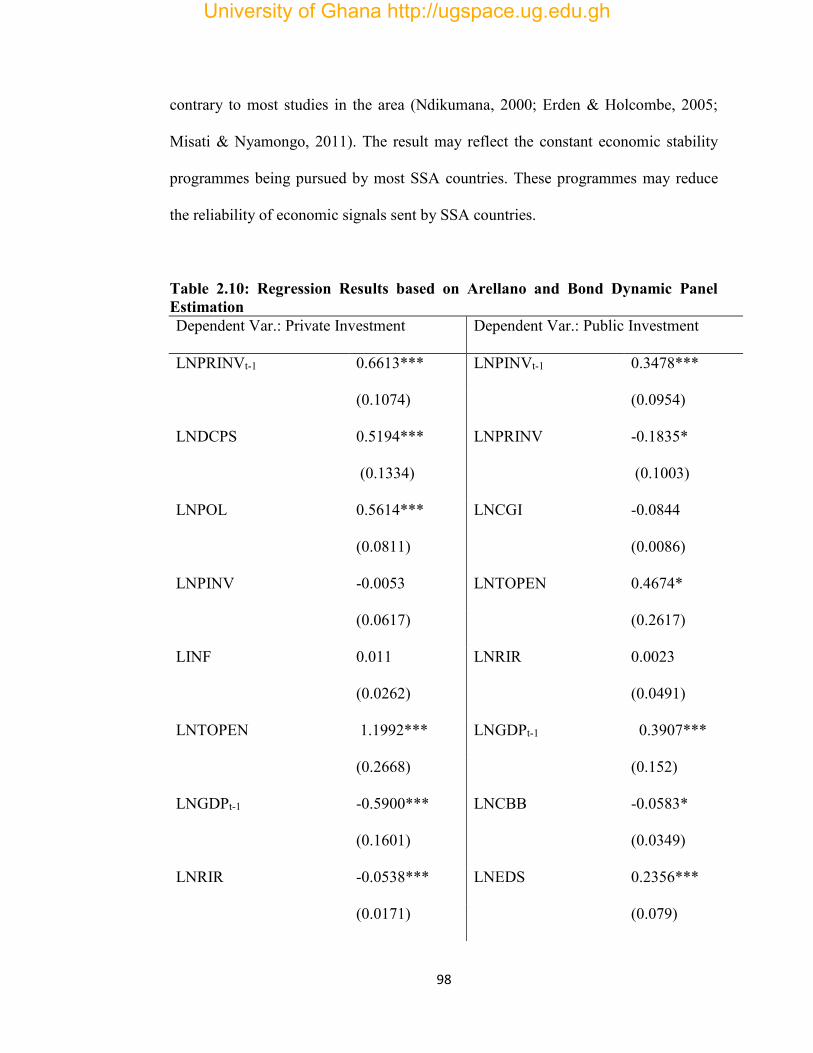
98
contrary to most studies in the area (Ndikumana, 2000; Erden & Holcombe, 2005;
Misati & Nyamongo, 2011). The result may reflect the constant economic stability
programmes being pursued by most SSA countries. These programmes may reduce
the reliability of economic signals sent by SSA countries.
Table 2.10: Regression Results based on Arellano and Bond Dynamic Panel Estimation Dependent Var.: Private Investment Dependent Var.: Public Investment
LNPRINVt-1 0.6613*** LNPINVt-1 0.3478***
(0.1074)
(0.0954)
LNDCPS 0.5194*** LNPRINV -0.1835*
(0.1334)
(0.1003)
LNPOL
0.5614*** LNCGI
-0.0844
(0.0811)
(0.0086)
LNPINV
-0.0053 LNTOPEN 0.4674*
(0.0617)
(0.2617)
LINF
0.011 LNRIR 0.0023
(0.0262)
(0.0491)
LNTOPEN
1.1992*** LNGDPt-1
0.3907***
(0.2668)
(0.152)
LNGDPt-1
-0.5900*** LNCBB -0.0583*
(0.1601)
(0.0349)
LNRIR
-0.0538*** LNEDS
0.2356***
(0.0171)
(0.079)
University of Ghana http://ugspace.ug.edu.gh
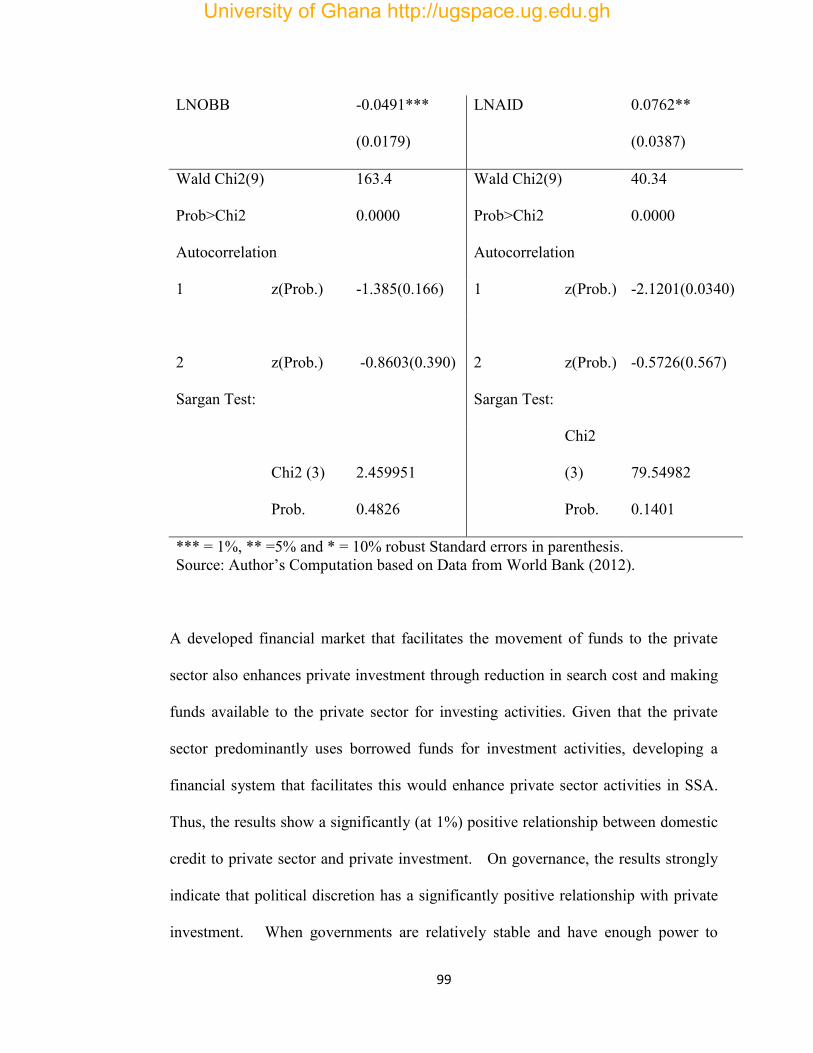
99
LNOBB
-0.0491*** LNAID
0.0762**
(0.0179) (0.0387)
Wald Chi2(9) 163.4 Wald Chi2(9) 40.34
Prob>Chi2
0.0000 Prob>Chi2 0.0000
Autocorrelation
Autocorrelation
1 z(Prob.) -1.385(0.166) 1 z(Prob.) -2.1201(0.0340)
2 z(Prob.) - -0.8603(0.390) 2 z(Prob.)
-0.5726(0.567)
Sargan Test:
Sargan Test:
Chi2 (3) 2.459951
Chi2
(3) 79.54982
Prob. 0.4826 Prob. 0.1401
*** = 1%, ** =5% and * = 10% robust Standard errors in parenthesis. Source: Author’s Computation based on Data from World Bank (2012).
A developed financial market that facilitates the movement of funds to the private
sector also enhances private investment through reduction in search cost and making
funds available to the private sector for investing activities. Given that the private
sector predominantly uses borrowed funds for investment activities, developing a
financial system that facilitates this would enhance private sector activities in SSA.
Thus, the results show a significantly (at 1%) positive relationship between domestic
credit to private sector and private investment. On governance, the results strongly
indicate that political discretion has a significantly positive relationship with private
investment. When governments are relatively stable and have enough power to
University of Ghana http://ugspace.ug.edu.gh
100
exercise their discretion, it gives confidence to private investors and reassures them
that their investments are safe. In effect, private investors prefer economies where
bureaucratic procedures do not unnecessarily hinder or delay government decisions.
Structural adjustment, as proxied by trade openness offers support for private
investment. Specifically, countries that export more are more likely to improve upon
their private fixed capital formation to meet their increased demand. Also, more
imports go with expansion/construction of warehouses, acquisition of delivery vans
and importation of capital equipments. Furthermore, trade openness does not only
expose firms to improved technology but can also enable them to benefit from
technological spillovers. In view of this, it is imperative for the sub-region to trade
more among themselves and with the rest of the world. Blanket tax policies meant to
discourage all forms of imports and make short-term returns are not totally helpful.
Taxes on capital goods should be moderate since the long-term benefits of these
items on the economy far outweigh the cost of the partial or full waiver.
The effect of Private Investment on Public Investment
Results from Table 2.6 show that key factors that influence public investment include
private investment, adjustment cost, aid, external debt, economic growth, trade
openness and current budget deficit.
The results show that private investment reduces public investment. This may,
probably be as a result of privatization of state-owned enterprises and private sector
University of Ghana http://ugspace.ug.edu.gh
101
engagement in social activities that lead to the provision of social goods. It, therefore,
suggests that more private investment may be an alternative means of reducing the
burden on public sector, in terms of provision of economic and social infrastructure.
In effect, this result in a way completes the crowding-in-crowding-out story in SSA.
In SSA, private investment and public investments are substitutes. In other words,
private investors are partners in the development of SSA. A thorough assessment of
the relative strengths and weaknesses of each of these major forms of investment
would enable a more formidable formulation of public private partnerships that
would speed up the development of the sub-region. The need for private sector
protection such as building strong institutions and less participation of governments
in the domestic credit markets is encouraged.
There is a widely held assertion that most infrastructures in Africa are funded by aid
from development agencies or loans, with very few supported by internally generated
funds (IGF). This study confirms the special role played by development agencies in
the development of Sub-Saharan Africa. Aid has a significantly positive relationship
with public infrastructure. Thus, aid that supports economic infrastructural
development is a major source of public investment in SSA. Similarly, trade and
external debt stocks facilitate public investment just like aid. Governments benefit
from trade, through taxes on imports and exports and accessibility of capital goods,
facilitates public capital formation. Also, as the region borrows more, externally,
public investment also increases. This relationship could emanate from the discipline
that international financial institutions (IFIs) instill in countries when they borrow
University of Ghana http://ugspace.ug.edu.gh
102
from them. Also, these debts go with restrictive covenants and strict supervision from
the IFIs. Governments, therefore, find it difficult to use their discretion to divert these
borrowed funds, as is common with IGF budgetary allocations. Comparatively,
external debt stock (significant at 1%) has the biggest impact on public investment,
followed by aid (significant at 5%) and trade openness (significant at 10%). This
calls to question recent agitation of the African continent for trade instead of aid, as
the results point to the fact that public investment benefits more from aid than trade.
Apparently the continent needs to strategize to benefit more from trade if trade is to
be a good substitute for aid. Also, the sub-region needs to build the needed capacity
to attract external loans to fund public investment, if IGF proves futile. This would
not only enhance public investment but would reduce governments’ activity in the
domestic credit market, thereby, reducing its crowding-out effect on private
investment.
Fiscal indiscipline harms public investment. When governments are not able to
maintain current budget balance, it reduces public investment. Current budget deficit
increases governments’ activities in the domestic financial market reducing credit to
the private sector. When governments find it difficult to even meet their current
budget requirements, nothing or little is left for infrastructural development. Thus,
fiscal discipline enhances the IGF of governments in order to generate funds for
investment. IGF could also improve through the growth channel. Economic growth
has a significantly positive relationship with public investment. Thus, ensuring high
economic growth could also be an avenue of reducing governments’ over-
University of Ghana http://ugspace.ug.edu.gh
103
dependence on the domestic market, thereby enabling more domestic credit to go into
private investment funding.
2.4 Conclusion
This study sought to reassess the unsettled crowding-in-out hypothesis and also
examine the possibility of a bi-causal relationship between private and public
investments in SSA, using two separate models in a dynamic panel framework and a
panel vector autoregressive approach.
We conclude that private investment crowds out public investment much the same as
public investment does to private investment when they compete for financial
resources. Directly, through the public investment variable, the result is inconclusive
on whether public investment crowds in or crowds out private investment in Sub-
Saharan Africa. Even though there exists a negative relationship between public
investment and private investment, this relationship is not significant. But indirectly,
through fiscal indiscipline (overall budget balance), public investment crowds-out
private investment. This result is conditioned on the fact that a political system that
gives enough room for the executive to make decisions, benefits from trade and a
developed financial sector that channels enough funds to the private sector facilitate
private investment while real interest rate and unfavourable budget balance harm
private investment.
University of Ghana http://ugspace.ug.edu.gh
104
However, in assessing the possibility of a reverse causality, it is evident that private
and public investments are mutually dependent and that public physical capital
compliments private physical capital. Meanwhile, economic and infrastructural aid,
discipline from external borrowing, economic growth and trade are reliable sources
for enhancing public investment while fiscal indiscipline is not. Thus, the results
reiterate the need for governments to be fiscally disciplined, put in measures to get
the maximum benefit from trade and grow the economy so as to reduce their
activities in the domestic credit market in order to allow private investors to have
more access to domestic credit. These would not only facilitate private investment
but also reduce the burden on governments for public investments.
University of Ghana http://ugspace.ug.edu.gh
105
References to Chapter Two
Abrigo, M. R., & Love, I.(2015). Estimation of Panel Vector Autoregression in Stata: a Package of Programs.
Acosta, P. & Loza, A. (2005). Short and long run determinants of private
Investment in argentina Journal of Applied Economics. VIII (2), 389-
406.
Ahfeldt, G. M., Moeller, K. & Wendland, N. (2014). Chicken or Egg? The PVAR
Econometrics of Transportation. Spatial Economics Research Centre, SERC
Discussion Paper No. 158.
Ajide, K. B., & Olukemi, L. (2012). Modelling the Long-run Determinants of
Domestic Private Investment in Nigeria. Asian Social Science, 8(13), 139-
152. doi:10.5539/ass.v8n13p139
Alesina, A. F. & Angeletos, G. M. (2005). Corruption, Inequality and Fairness.
Journal of Monetary Economics, 52 (7), 1227-1244.
Altin, G., Moisiu, D. and Agim, A. (2012). Crowding-out Effects of Public
Investment on Private Investment: an empirical investigation. Journal of
Business & Economics Research (JBER), 10(5), 269-276.
Ang, J. B. (2009). Private Investment and Financial Sector Policies in India and
Malaysia. World Development, 37(7), 1261–1273.
Arvind K. & Jain, A. K. (2011). Corruption: Theory, Evidence and Policy. CESifo
DICE Report 2/2011.
Asante, Y. (2000). Determinants of Private Investment Behaviour (No. 100). AERC
Research Paper, Nairobi: African Economic Research Consortium.
University of Ghana http://ugspace.ug.edu.gh
106
Aschauer, D.A. (1989a). Is public expenditure productive? Journal of Monetary
Economics. 23, 177–200.
Aschauer, D.A.( 1989b). Does public capital crowds out private capital? Journal of
Monetary Economics 24, 171–88.
Aschauer, D. A. (1990). Why is infrastructure important? Is there a shortfall in
public capital investment? Alicia Munnell. Boston: Conference Series of
Federal Reserve Bank of Boston.
Assa, M., & Abdi, E. K. (2012). Selected Macroeconomic Variables Affecting
Private Investment in Malawi. mpra.ub.uni-muenchen.de
Aysan, A. F., Nabli, M. K., & Véganzonès–Varoudakis, M-A. (2006). Governance
and Private Investment in the Middle East and North Africa (No. 3934).
World Bank Policy Research Working Paper.
Bakare, A. S. (2011). A theoretical analysis of capital formation and growth in
Nigeria. Far East Journal of Psychology and Business, 3(2), 11-24.
Balassa, B. (1978). Exports and Economic Growth-Further Evidence. Journal of
Development Economics, 5(2), 181-189.
Baltagi, B. H., (1995). Testing for Correlated Effects in Panels. Econometric Theory,
11(02), 401-402.
Baltagi, B. H., (2005). Econometric Analysis of Panel Data. John Wiley & Sons, Ltd.
Barro, R. J. (1997). Myopia and Inconsistency in the Neoclassical Growth Model
(No.6317). NBER Working Papers, National Bureau of Economic
Research, Inc.
University of Ghana http://ugspace.ug.edu.gh
107
Bazoumana, O. (2005). Modeling the long run determinants of private investment in
Senegal (No. 04/05). Credit Research Paper.
Beardshaw, J., Brewster, D., Cormack, P. & Ross, A. (1998). Economics: A students
Guide (4th Ed.). 280 – 428. Pearson, Edinburgh.
Blejer, M., & Khan, M. S. (1984). Government policy and private investment in
developing countries. IMF Staff Papers, 31(2), 379–403.
Belloc, M., & P. Vertova. 2004. How does public investment affect economic growth
in HIPC? An empirical assessment. Department of Economics,
University of Sienna.
Bokpin, G. A., & Onumah, J. M. (2009). An Empirical Analysis of the Determinants
of Corporate Investment Decisions: Evidence from Emerging Market
Firms. International Research Journal of Finance and Economics, 33, 134-
141.
Caballero, R., & Arvind, K. (2001). A Dual Liquidity Model for Emerging Markets
(No.8758). NBER Working Paper, National Bureau of Economic
Research, Cambridge, Massachusetts.
Cashin, P.( 1995). Government spending, taxes, economic growth. IMF Staff Papers
42(2), 237-269.
Cavallo, E., & Daude, C. (2011). Public investment in developing countries: A
blessing or a curse? Journal of Comparative Economics 39 (1), 65–81.
Chatelain, J-B., Generale, A., Hernando, I., Von Kalckreuth, U. &Vermeulen, P.,
(2002). Firm Investment and Monetary Policy Transmission in the Euro
Area (No. 97). Banque de France Working papers.
University of Ghana http://ugspace.ug.edu.gh
108
Chatelain, J-B., Generale, A., Hernando, I., Von Kalckreuth, U. &Vermeulen, P.,
(2003). New Findings on Firm Investment and Monetary Policy
Transmission in the Euro Area. Oxford Review of Economic Policy, 19
(1), 1-11.
Chatelain, J-B. & Tiomo,. (2001). Investment, the Cost Of Capital, and Monetary
Policy in the Nineties in France: A Panel Data Investigation (No. 106).
Banque de France Working Paper
Chenery, H.B. (1952). Overcapacity and the Acceleration Principle. Econometrica:
Journal of the Econometric Society, 1- 28.
Cherian, S. (1998). The investment decision: A re-examination of competing theories
using panel data. Applied Economics, 30(1), 95–104.
Choi, I. (2001). Unit root tests for panel data. Journal of International Money and
Finance, 20: 249–272.
Christensen, J. (2005). Domestic Debt Markets in Sub-Saharan Africa. IMF Staff
Papers, 52 (3) 518 – 538.
de Haan, J., & J.E. Sturm (1997). Political and economic determinants of OECD
budget deficits and government expenditures: A reinvestigation. European
Journal of Political Economy, 13, 739-750.
Devarajan, S., Easterly, W., & Pack, H. (1999). Is Investment in Africa Too High or
Too Low? Macro and Micro Evidence. Journal of African Economies, 10
(2), 81-108.
Durbin, J. (1954). Errors in variables. Review of the International Statistical Institute
22, 23–32.
University of Ghana http://ugspace.ug.edu.gh
109
Emery, J. J. (2003). Governance, Transparency and Private Investment in Africa. A
paper presented at the Global Forum on International Investment,
Johannesburg, South Africa OECD-Africa Investment Roundtable 19
November 2003, 1-16.
Emran, M. S., & Farazi, S. (2009). Lazy Banks? Government Borrowing and Private
Credit in Developing Countries (IIEPWP20099). Institute for
International Economic Policy Working Paper Series.
Erden, L., & Holcombe, R. (2005). The effects of public investment in developing
economies. Public Finance Review, 33(5), 575–602.
Escobal J.A., & Ponce C. (2011). Access to public infrastructure, institutional
thickness and pro-poor growth in Rural Peru. Journal of International
Development, 23(3), 358 379.
Evans, P., & Karras, G. (1994). Are government activities productive? Evidence
from a panel of U.S. states. Review of Economics and Statistics 76(1),
1-11.
Feder, G. (1982). On Exports and Economic Growth. Journal of Development
Economics, 12, 59-73.
Fisman, R., & Svensson, J. (2007). Are Corruption and Taxation Really Harmful to
Firm Growth? Firm Level Evidence. Journal of Development
Economics, 83, 63–75.
Ghura, D., & Barry, G.(2000). Determinants of Private Investment: A Cross-
Regional Empirical Investigation. Applied Economics, 32, 1819-1829.
University of Ghana http://ugspace.ug.edu.gh
110
Gjini, A., & Kukeli, A. (2012). Crowding-out Effects of Public Investment on Private
Investment; An Empirical Investigation. Journal of Business and Economic
Research, 10(5), 269-276.
Greene, J., & Villanueva, D. (1991). Private investment in developing countries. IMF
Staff Papers, 38 (1), 33-58.
Gyimah-Brempong, K. (2002). Corruption, Economic Growth and Income Inequality
in Africa. Economics of Governance, 2, 183–209.
Henrekson, M. (1988), Swedish Government Growth: A Disequilibrium Analysis, in:
J.A. Lybeck and M. Henrekson (eds.), Explaining the Growth of
Government, Amsterdam: North Holland.
Holtz-Eakin, D., Newey, W., & Rosen, H. S. (1988). Estimating vector
autoregressions with panel data. Econometrica, 56, 1371 – 1395.
Holtz-Eakin, D.( 1994). Public-sector capital and productivity puzzle. Review of
Economics and Statistics, 76 (1), 12-21.
Hu, C. X. (1999). Leverage, Monetary Policy, and Firm Investment. FRBSF
Economic Review, 2, 32 – 39.
Hubbard, G. (2012). Consequences of Government Deficits and Debt. Journal of
Central Banking, 8 (1), 203 – 235.
Jenkins, C. (1998). Determinants of private investment in Zimbabwe. Journal of
African Economies, 7 (1), 34-61.
Jorgenson, D. W. (1971). Econometric Studies of Investment Behavior: A Survey.
Journal of Economic Literature, 9(4), 1111-1147.
University of Ghana http://ugspace.ug.edu.gh
111
Keynes, M. J. (1937). The general theory of employment, interest, and money. New
York, Harcourt Brace Jovanovich.
Keynes, M. J. (1973). The collected writings of John Maynard Keynes. London:
Macmillan.
Khan, R. E. A. & Gill, A. R. (2009) Crowding Out Effect of Public Borrowing: A
Case of Pakistan (No. 16292). MPRA Paper. Online at http://mpra.ub.uni-
muenchen.de/16292/
Kopcke, R. (1985). The determinants of investment spending. In New England
Econometric Review. Federal Reserve Bank of Boston, 19–35.
Koyck, L. M. (1954). Distributed lags and investment analysis. North Holland.
Krueger, A. O. (1993), Virtuous and Vicious Circles in Economic Development.
American Economic Review, 83(2), 351–55.
Krugman, P. (1988). Financing vs. forging a debt overhang. Journal of Development
Economics, 29, 253-268.
Kul, L.,& Mavrotas, G. (2005). Examining private investment heterogeneity:
Evidence from a dynamic model (No. 2005/11). UNU-WIDER, Discussion
Paper.
Kutner, M., Nachtsheim, C. & Neter, J. (2004). Applied Linear Regression Models
(4th Ed.). McGraw-Hill Irwin.
Kyereboah-Coleman, A. (2007) Corporate Governance and Firm Performance in
Africa: A Dynamic Panel Data Analysis. A Paper Presented at the
International Conference on Corporate Governance in Emerging Markets
organized by the Global Corporate Governance Forum (GCGF) and Asian
University of Ghana http://ugspace.ug.edu.gh
112
Institute of Corporate Governance (AICG) 15th
17th
November, 2007, Sabanci
University, Istanbul, Turkey.
Kyereboah-Coleman, A., (2007). The impact of capital structure on the performance
of micro finance institution. The Journal of Risk Finance, 8(1), 56-71.
Love, I. & Zicchino, L. (2006). Financial development and dynamic investment
behaviour: Evidence from panel VAR. The Quarterly Review of Economics
and Finance, 46, 190-210.
Maana, I., Owino, R. & Mutai, N. (2008). Domestic Debt and its Impact on the
Economy – The Case of Kenya. A Paper Presented During the 13th
Annual African Econometric Society Conference in Pretoria, South Africa
from 9th to 11th July 2008 pp. 1-27.
McConnel, C. R., & Bruce, S. L. (2005). Economics: Principles, problems and
Policies.16th (Ed). 159 – 164. McGraw-Hill Irwin (1)
McKinnon, R. (1973). Money and capital in economic development. Washington DC,
Brookings Institution.
Mehrotra, A. and Välilä, T. (2006). Public Investment in Europe: Evolution and
Determinants in Perspective. Fiscal Studies, 27(4), 443–471.
Miles D. & Scott A. (2005). Macroeconomics: Understanding the Wealth of Nations
(2nd Ed.). Wiley.
Mileva, E (2007). Using Arellano – Bond Dynamic GMM Estimators in Stata:
Tutorials with Examples using Stata 9.0 (Retrieved from the internet on
2/9/2013).
University of Ghana http://ugspace.ug.edu.gh
113
Misati, R. N. & Nyamongo, M. E. (2011). Financial development and private
investment in Sub Saharan Africa. Journal of Economics and Business,
63, 139–151.
Mitra, P. (2006). Has Government Investment Crowded out Private Investment in
India? The American Economic Review, 96(2), 337-341.
Mlambo, K., & Oshikoya, T. W. (2001). Macroeconomic factors and investment in
Africa. Journal of African Economies, 10(suppl 2), 12-47.
Mora, N., & Logan, A. (2012). Shocks to bank capital: evidence from UK banks at
home and away. Applied Economics, 44(9), 1103-1119.
Morrissey, O., & Udomkerdmongkol,M.(2012). Governance, Private Investment and
Foreign Direct Investment in Developing Countries. World
Development, 40(3), 437–445. doi:10.1016/j.worlddev.2011.07.004
Mogues, T. (2013) Political Economy Determinants of Public Investment-Decision
Making in Agriculture: Lessons from and for Africa (No. 032). Ghana
Strategy Support Programme, International Food Policy Research Institute,
Discussion Paper.
Munthali, T. C. (2012) Interaction of public and private investment in Southern
Africa: a dynamic panel analysis. International Review of Applied Economics,
26(5), 597-622. doi:10.1080/02692171.2011.624500.
Munnell, A. H. (1990).Why has productivity growth declined? Productivity and
public investment. New England Economic Review, January/February, 3-
22.
University of Ghana http://ugspace.ug.edu.gh
114
Munthali, T.C. (2008). Investment in Southern Africa: Interaction of the public and
private sectors. PhD thesis, April 2008, University of Leeds, UK.
Ndikumana, L. (2000). Financial Determinants of Domestic Investment in Sub-
Saharan Africa: Evidence from Panel Data. World Development, 28(2),
381-400.
Ndikumana, L. (2005). Financial development, financial structure, and domestic
investment: International evidence. Journal of International Money and
Finance, 24, 651-673.
Olweny, T., & Chiluwe, M. (2012). The effect of monetary policy on private sector
investment in Kenya. Journal of applied finance & banking, 2(2), 239-287.
Oshikoya, T. W. (1994). Macroeconomic determinants of domestic private
investment in Africa: an empirical analysis. Economic Development and
Cultural Change, 42(3), 573-596.
Parker, J. (2010). Theories of Investment Expenditures, Economics 314 Coursebook,
Chapter 15. Accessed on 20th December, 2012 Available at
academic.reed.edu/economics/parker/s11/314/book/Ch15.pdf
Pereira, M. A. and Andraz, J. M. (2010). On the economic effects of public
infrastructure investment: A survey of the International evidence (No. 108)
Universidade do Algarve, College of William and Mary, Department of
Economics Working Paper, 1-33.
Pradhan, B. K., Ratha, D. K. & Sarma, A.(1990). Complementarity between public
and private investment in India. Journal of Development Economics, 33,
101-l16.
University of Ghana http://ugspace.ug.edu.gh
115
Ramírez, D. (1994). Public and private investment in Mexico, 1950–90: An empirical
analysis. Southern Economic Journal, 61(1), 1–17.
Roubini, N., & J. Sachs (1989), Government Spending and Budget Deficits in the
Industrial Countries. Economic Policy, 8, 99-132..
Sahoo, P., Dash, R. K., & Nataraj, G. (2010). Infrastructure development and
economic growth in China (261). Institute of Developing Economies (IDE)
Discussion Paper.
Salmon, M. (1982). Error correction mechanisms. The Economic Journal, 615-629.
Shaw, E. S. (1973). Financial deepening in economic development. New York:
Oxford University Press.
Sturm, J. E. (2001). Determinants of public capital spending in less-developed countries. University of Groningen.
Suri, T. (2011). Selection and Comparative Advantage in Technology Adoption.
Econometrica, 79, 159–209. doi: 10.3982/ECTA7749
Svensson, J. (2005). Eight Questions about Corruption. Journal of Economic
Perspectives, 19(3), 19-42.
Tadeu, H. F. B., & Silva, J. T. M. (2013). The Determinants of the Long Term
Private Investment in Brazil: An Empyrical Analysis Using Cross-section and
a Monte Carlo Simulation. Journal of Economics, Finance and
Administrative Science, 18, 11-17.
Tatom, J. A. (1991). Public Capital and Private Sector Performance. Fed. Res. Bank
of St. Louis Rev., 73(3), 3-15.
University of Ghana http://ugspace.ug.edu.gh
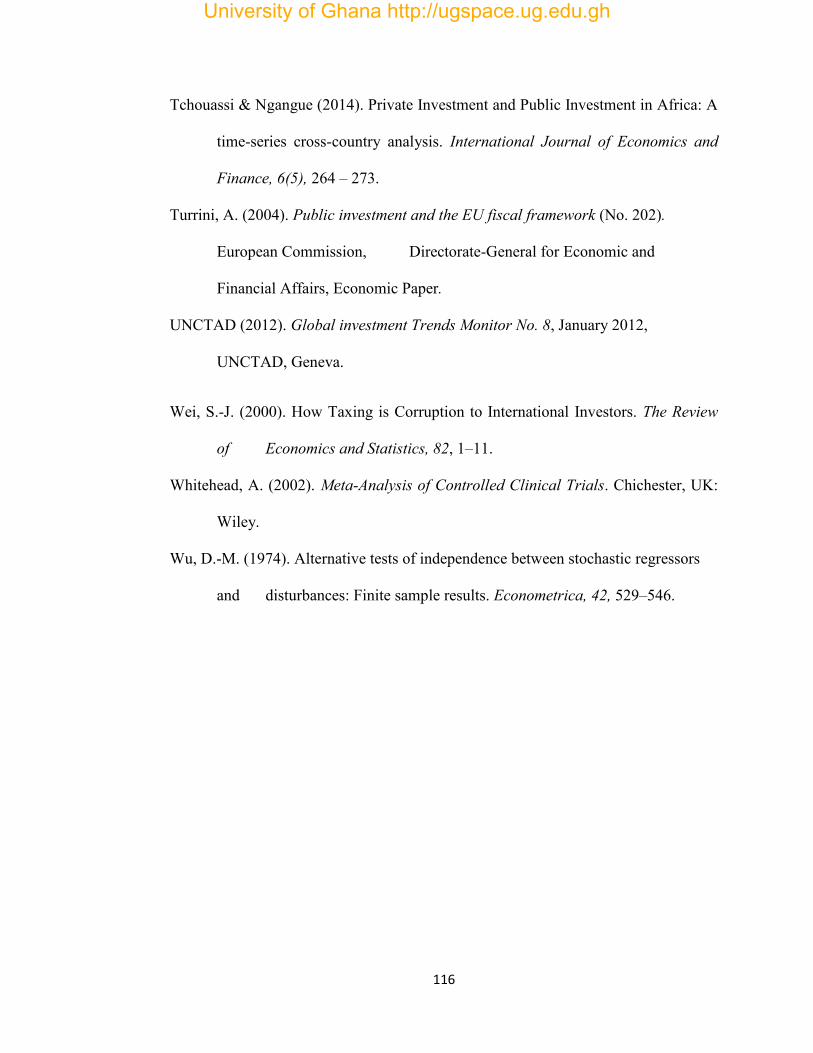
116
Tchouassi & Ngangue (2014). Private Investment and Public Investment in Africa: A
time-series cross-country analysis. International Journal of Economics and
Finance, 6(5), 264 – 273.
Turrini, A. (2004). Public investment and the EU fiscal framework (No. 202).
European Commission, Directorate-General for Economic and
Financial Affairs, Economic Paper.
UNCTAD (2012). Global investment Trends Monitor No. 8, January 2012,
UNCTAD, Geneva.
Wei, S.-J. (2000). How Taxing is Corruption to International Investors. The Review
of Economics and Statistics, 82, 1–11.
Whitehead, A. (2002). Meta-Analysis of Controlled Clinical Trials. Chichester, UK:
Wiley.
Wu, D.-M. (1974). Alternative tests of independence between stochastic regressors
and disturbances: Finite sample results. Econometrica, 42, 529–546.
University of Ghana http://ugspace.ug.edu.gh
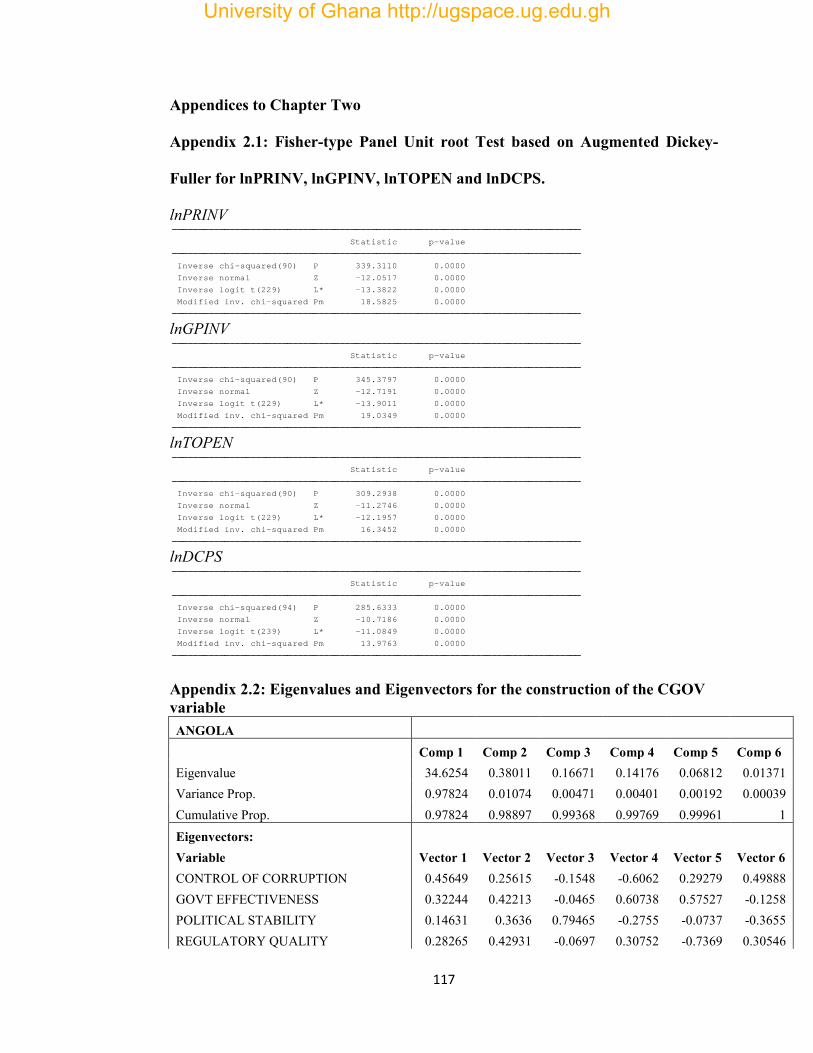
117
Appendices to Chapter Two
Appendix 2.1: Fisher-type Panel Unit root Test based on Augmented Dickey-
Fuller for lnPRINV, lnGPINV, lnTOPEN and lnDCPS.
lnPRINV
Modified inv. chi-squared Pm 18.5825 0.0000
Inverse logit t(229) L* -13.3822 0.0000
Inverse normal Z -12.0517 0.0000
Inverse chi-squared(90) P 339.3110 0.0000
Statistic p-value
lnGPINV
Modified inv. chi-squared Pm 19.0349 0.0000
Inverse logit t(229) L* -13.9011 0.0000
Inverse normal Z -12.7191 0.0000
Inverse chi-squared(90) P 345.3797 0.0000
Statistic p-value
lnTOPEN
Modified inv. chi-squared Pm 16.3452 0.0000
Inverse logit t(229) L* -12.1957 0.0000
Inverse normal Z -11.2746 0.0000
Inverse chi-squared(90) P 309.2938 0.0000
Statistic p-value
lnDCPS
Modified inv. chi-squared Pm 13.9763 0.0000
Inverse logit t(239) L* -11.0849 0.0000
Inverse normal Z -10.7186 0.0000
Inverse chi-squared(94) P 285.6333 0.0000
Statistic p-value
Appendix 2.2: Eigenvalues and Eigenvectors for the construction of the CGOV variable ANGOLA Comp 1 Comp 2 Comp 3 Comp 4 Comp 5 Comp 6 Eigenvalue 34.6254 0.38011 0.16671 0.14176 0.06812 0.01371 Variance Prop. 0.97824 0.01074 0.00471 0.00401 0.00192 0.00039 Cumulative Prop. 0.97824 0.98897 0.99368 0.99769 0.99961 1 Eigenvectors:
Variable Vector 1 Vector 2 Vector 3 Vector 4 Vector 5 Vector 6 CONTROL OF CORRUPTION 0.45649 0.25615 -0.1548 -0.6062 0.29279 0.49888 GOVT EFFECTIVENESS 0.32244 0.42213 -0.0465 0.60738 0.57527 -0.1258 POLITICAL STABILITY 0.14631 0.3636 0.79465 -0.2755 -0.0737 -0.3655 REGULATORY QUALITY 0.28265 0.42931 -0.0697 0.30752 -0.7369 0.30546
University of Ghana http://ugspace.ug.edu.gh
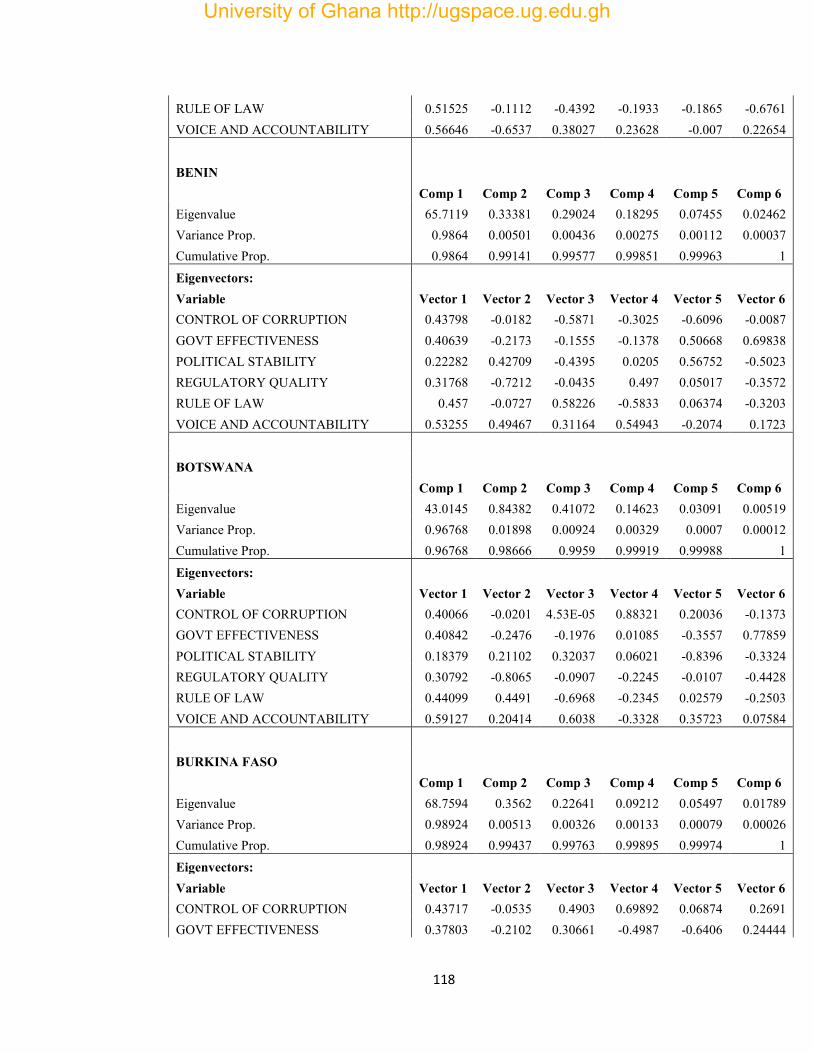
118
RULE OF LAW 0.51525 -0.1112 -0.4392 -0.1933 -0.1865 -0.6761 VOICE AND ACCOUNTABILITY 0.56646 -0.6537 0.38027 0.23628 -0.007 0.22654
BENIN Comp 1 Comp 2 Comp 3 Comp 4 Comp 5 Comp 6
Eigenvalue 65.7119 0.33381 0.29024 0.18295 0.07455 0.02462 Variance Prop. 0.9864 0.00501 0.00436 0.00275 0.00112 0.00037 Cumulative Prop. 0.9864 0.99141 0.99577 0.99851 0.99963 1
Eigenvectors:
Variable Vector 1 Vector 2 Vector 3 Vector 4 Vector 5 Vector 6 CONTROL OF CORRUPTION 0.43798 -0.0182 -0.5871 -0.3025 -0.6096 -0.0087 GOVT EFFECTIVENESS 0.40639 -0.2173 -0.1555 -0.1378 0.50668 0.69838 POLITICAL STABILITY 0.22282 0.42709 -0.4395 0.0205 0.56752 -0.5023 REGULATORY QUALITY 0.31768 -0.7212 -0.0435 0.497 0.05017 -0.3572 RULE OF LAW 0.457 -0.0727 0.58226 -0.5833 0.06374 -0.3203 VOICE AND ACCOUNTABILITY 0.53255 0.49467 0.31164 0.54943 -0.2074 0.1723
BOTSWANA
Comp 1 Comp 2 Comp 3 Comp 4 Comp 5 Comp 6 Eigenvalue 43.0145 0.84382 0.41072 0.14623 0.03091 0.00519 Variance Prop. 0.96768 0.01898 0.00924 0.00329 0.0007 0.00012 Cumulative Prop. 0.96768 0.98666 0.9959 0.99919 0.99988 1
Eigenvectors:
Variable Vector 1 Vector 2 Vector 3 Vector 4 Vector 5 Vector 6 CONTROL OF CORRUPTION 0.40066 -0.0201 4.53E-05 0.88321 0.20036 -0.1373 GOVT EFFECTIVENESS 0.40842 -0.2476 -0.1976 0.01085 -0.3557 0.77859 POLITICAL STABILITY 0.18379 0.21102 0.32037 0.06021 -0.8396 -0.3324 REGULATORY QUALITY 0.30792 -0.8065 -0.0907 -0.2245 -0.0107 -0.4428 RULE OF LAW 0.44099 0.4491 -0.6968 -0.2345 0.02579 -0.2503 VOICE AND ACCOUNTABILITY 0.59127 0.20414 0.6038 -0.3328 0.35723 0.07584
BURKINA FASO
Comp 1 Comp 2 Comp 3 Comp 4 Comp 5 Comp 6 Eigenvalue 68.7594 0.3562 0.22641 0.09212 0.05497 0.01789 Variance Prop. 0.98924 0.00513 0.00326 0.00133 0.00079 0.00026 Cumulative Prop. 0.98924 0.99437 0.99763 0.99895 0.99974 1 Eigenvectors:
Variable Vector 1 Vector 2 Vector 3 Vector 4 Vector 5 Vector 6 CONTROL OF CORRUPTION 0.43717 -0.0535 0.4903 0.69892 0.06874 0.2691 GOVT EFFECTIVENESS 0.37803 -0.2102 0.30661 -0.4987 -0.6406 0.24444
University of Ghana http://ugspace.ug.edu.gh
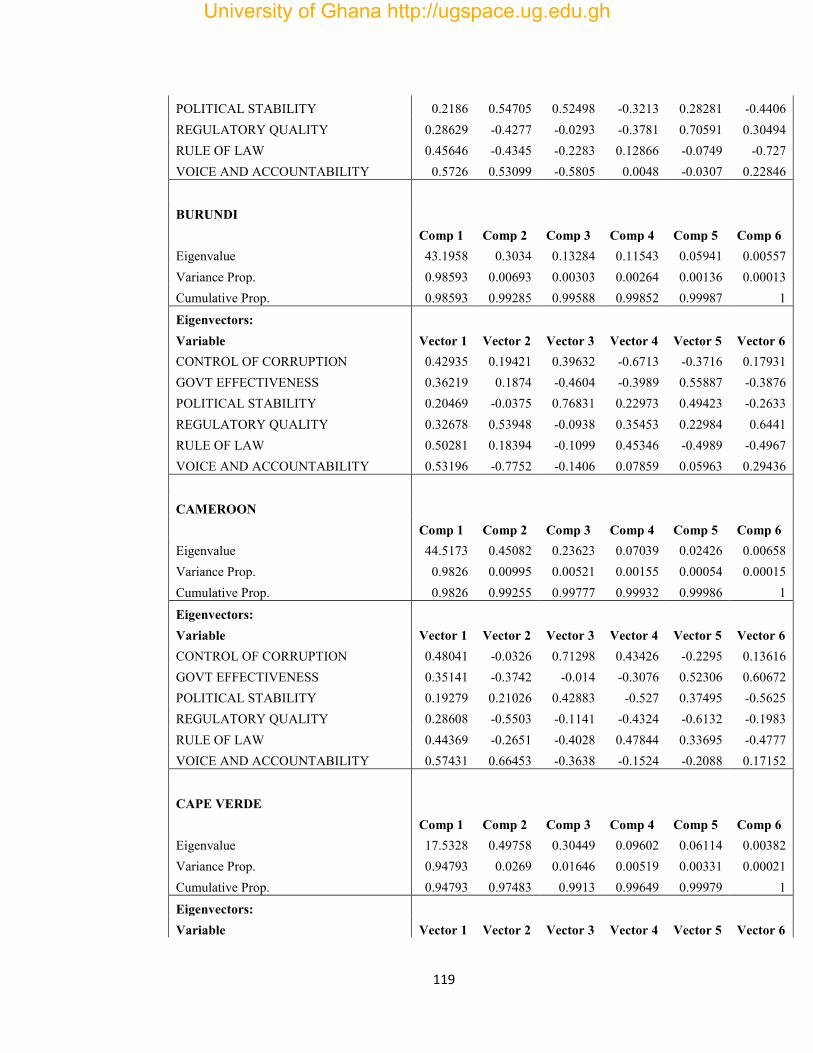
119
POLITICAL STABILITY 0.2186 0.54705 0.52498 -0.3213 0.28281 -0.4406 REGULATORY QUALITY 0.28629 -0.4277 -0.0293 -0.3781 0.70591 0.30494 RULE OF LAW 0.45646 -0.4345 -0.2283 0.12866 -0.0749 -0.727 VOICE AND ACCOUNTABILITY 0.5726 0.53099 -0.5805 0.0048 -0.0307 0.22846
BURUNDI
Comp 1 Comp 2 Comp 3 Comp 4 Comp 5 Comp 6 Eigenvalue 43.1958 0.3034 0.13284 0.11543 0.05941 0.00557 Variance Prop. 0.98593 0.00693 0.00303 0.00264 0.00136 0.00013 Cumulative Prop. 0.98593 0.99285 0.99588 0.99852 0.99987 1 Eigenvectors:
Variable Vector 1 Vector 2 Vector 3 Vector 4 Vector 5 Vector 6 CONTROL OF CORRUPTION 0.42935 0.19421 0.39632 -0.6713 -0.3716 0.17931 GOVT EFFECTIVENESS 0.36219 0.1874 -0.4604 -0.3989 0.55887 -0.3876 POLITICAL STABILITY 0.20469 -0.0375 0.76831 0.22973 0.49423 -0.2633 REGULATORY QUALITY 0.32678 0.53948 -0.0938 0.35453 0.22984 0.6441 RULE OF LAW 0.50281 0.18394 -0.1099 0.45346 -0.4989 -0.4967 VOICE AND ACCOUNTABILITY 0.53196 -0.7752 -0.1406 0.07859 0.05963 0.29436
CAMEROON
Comp 1 Comp 2 Comp 3 Comp 4 Comp 5 Comp 6 Eigenvalue 44.5173 0.45082 0.23623 0.07039 0.02426 0.00658 Variance Prop. 0.9826 0.00995 0.00521 0.00155 0.00054 0.00015 Cumulative Prop. 0.9826 0.99255 0.99777 0.99932 0.99986 1 Eigenvectors:
Variable Vector 1 Vector 2 Vector 3 Vector 4 Vector 5 Vector 6 CONTROL OF CORRUPTION 0.48041 -0.0326 0.71298 0.43426 -0.2295 0.13616 GOVT EFFECTIVENESS 0.35141 -0.3742 -0.014 -0.3076 0.52306 0.60672 POLITICAL STABILITY 0.19279 0.21026 0.42883 -0.527 0.37495 -0.5625 REGULATORY QUALITY 0.28608 -0.5503 -0.1141 -0.4324 -0.6132 -0.1983 RULE OF LAW 0.44369 -0.2651 -0.4028 0.47844 0.33695 -0.4777 VOICE AND ACCOUNTABILITY 0.57431 0.66453 -0.3638 -0.1524 -0.2088 0.17152
CAPE VERDE
Comp 1 Comp 2 Comp 3 Comp 4 Comp 5 Comp 6 Eigenvalue 17.5328 0.49758 0.30449 0.09602 0.06114 0.00382 Variance Prop. 0.94793 0.0269 0.01646 0.00519 0.00331 0.00021 Cumulative Prop. 0.94793 0.97483 0.9913 0.99649 0.99979 1 Eigenvectors:
Variable Vector 1 Vector 2 Vector 3 Vector 4 Vector 5 Vector 6
University of Ghana http://ugspace.ug.edu.gh
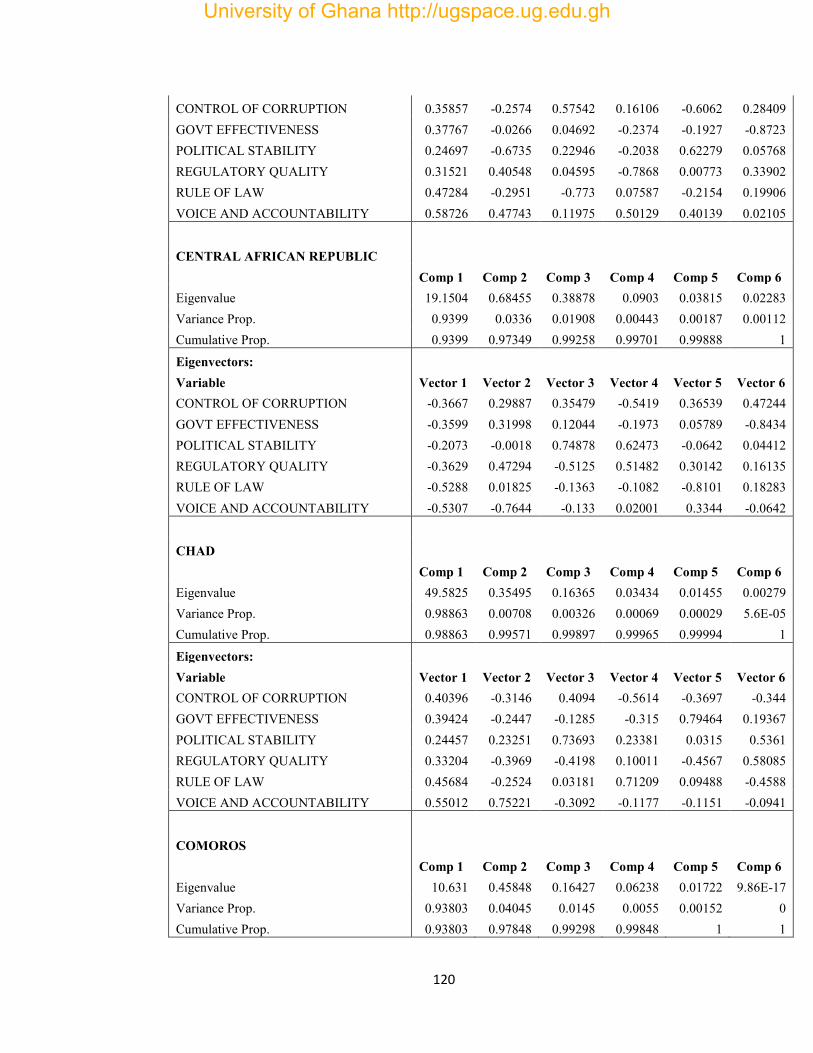
120
CONTROL OF CORRUPTION 0.35857 -0.2574 0.57542 0.16106 -0.6062 0.28409 GOVT EFFECTIVENESS 0.37767 -0.0266 0.04692 -0.2374 -0.1927 -0.8723 POLITICAL STABILITY 0.24697 -0.6735 0.22946 -0.2038 0.62279 0.05768 REGULATORY QUALITY 0.31521 0.40548 0.04595 -0.7868 0.00773 0.33902 RULE OF LAW 0.47284 -0.2951 -0.773 0.07587 -0.2154 0.19906 VOICE AND ACCOUNTABILITY 0.58726 0.47743 0.11975 0.50129 0.40139 0.02105
CENTRAL AFRICAN REPUBLIC
Comp 1 Comp 2 Comp 3 Comp 4 Comp 5 Comp 6 Eigenvalue 19.1504 0.68455 0.38878 0.0903 0.03815 0.02283 Variance Prop. 0.9399 0.0336 0.01908 0.00443 0.00187 0.00112 Cumulative Prop. 0.9399 0.97349 0.99258 0.99701 0.99888 1
Eigenvectors:
Variable Vector 1 Vector 2 Vector 3 Vector 4 Vector 5 Vector 6 CONTROL OF CORRUPTION -0.3667 0.29887 0.35479 -0.5419 0.36539 0.47244 GOVT EFFECTIVENESS -0.3599 0.31998 0.12044 -0.1973 0.05789 -0.8434 POLITICAL STABILITY -0.2073 -0.0018 0.74878 0.62473 -0.0642 0.04412 REGULATORY QUALITY -0.3629 0.47294 -0.5125 0.51482 0.30142 0.16135 RULE OF LAW -0.5288 0.01825 -0.1363 -0.1082 -0.8101 0.18283 VOICE AND ACCOUNTABILITY -0.5307 -0.7644 -0.133 0.02001 0.3344 -0.0642
CHAD
Comp 1 Comp 2 Comp 3 Comp 4 Comp 5 Comp 6 Eigenvalue 49.5825 0.35495 0.16365 0.03434 0.01455 0.00279 Variance Prop. 0.98863 0.00708 0.00326 0.00069 0.00029 5.6E-05 Cumulative Prop. 0.98863 0.99571 0.99897 0.99965 0.99994 1
Eigenvectors:
Variable Vector 1 Vector 2 Vector 3 Vector 4 Vector 5 Vector 6 CONTROL OF CORRUPTION 0.40396 -0.3146 0.4094 -0.5614 -0.3697 -0.344 GOVT EFFECTIVENESS 0.39424 -0.2447 -0.1285 -0.315 0.79464 0.19367 POLITICAL STABILITY 0.24457 0.23251 0.73693 0.23381 0.0315 0.5361 REGULATORY QUALITY 0.33204 -0.3969 -0.4198 0.10011 -0.4567 0.58085 RULE OF LAW 0.45684 -0.2524 0.03181 0.71209 0.09488 -0.4588 VOICE AND ACCOUNTABILITY 0.55012 0.75221 -0.3092 -0.1177 -0.1151 -0.0941
COMOROS
Comp 1 Comp 2 Comp 3 Comp 4 Comp 5 Comp 6 Eigenvalue 10.631 0.45848 0.16427 0.06238 0.01722 9.86E-17 Variance Prop. 0.93803 0.04045 0.0145 0.0055 0.00152 0 Cumulative Prop. 0.93803 0.97848 0.99298 0.99848 1 1
University of Ghana http://ugspace.ug.edu.gh
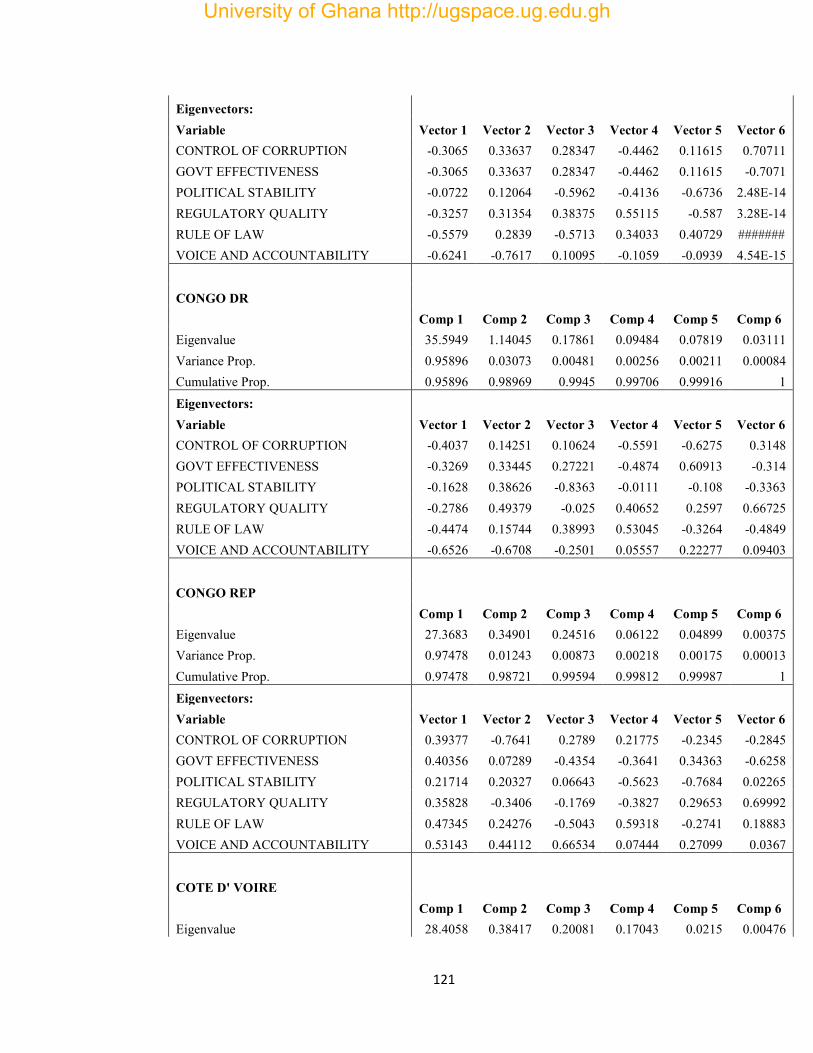
121
Eigenvectors:
Variable Vector 1 Vector 2 Vector 3 Vector 4 Vector 5 Vector 6 CONTROL OF CORRUPTION -0.3065 0.33637 0.28347 -0.4462 0.11615 0.70711 GOVT EFFECTIVENESS -0.3065 0.33637 0.28347 -0.4462 0.11615 -0.7071 POLITICAL STABILITY -0.0722 0.12064 -0.5962 -0.4136 -0.6736 2.48E-14 REGULATORY QUALITY -0.3257 0.31354 0.38375 0.55115 -0.587 3.28E-14 RULE OF LAW -0.5579 0.2839 -0.5713 0.34033 0.40729 ####### VOICE AND ACCOUNTABILITY -0.6241 -0.7617 0.10095 -0.1059 -0.0939 4.54E-15
CONGO DR
Comp 1 Comp 2 Comp 3 Comp 4 Comp 5 Comp 6 Eigenvalue 35.5949 1.14045 0.17861 0.09484 0.07819 0.03111 Variance Prop. 0.95896 0.03073 0.00481 0.00256 0.00211 0.00084 Cumulative Prop. 0.95896 0.98969 0.9945 0.99706 0.99916 1 Eigenvectors:
Variable Vector 1 Vector 2 Vector 3 Vector 4 Vector 5 Vector 6 CONTROL OF CORRUPTION -0.4037 0.14251 0.10624 -0.5591 -0.6275 0.3148 GOVT EFFECTIVENESS -0.3269 0.33445 0.27221 -0.4874 0.60913 -0.314 POLITICAL STABILITY -0.1628 0.38626 -0.8363 -0.0111 -0.108 -0.3363 REGULATORY QUALITY -0.2786 0.49379 -0.025 0.40652 0.2597 0.66725 RULE OF LAW -0.4474 0.15744 0.38993 0.53045 -0.3264 -0.4849 VOICE AND ACCOUNTABILITY -0.6526 -0.6708 -0.2501 0.05557 0.22277 0.09403
CONGO REP
Comp 1 Comp 2 Comp 3 Comp 4 Comp 5 Comp 6 Eigenvalue 27.3683 0.34901 0.24516 0.06122 0.04899 0.00375 Variance Prop. 0.97478 0.01243 0.00873 0.00218 0.00175 0.00013 Cumulative Prop. 0.97478 0.98721 0.99594 0.99812 0.99987 1 Eigenvectors:
Variable Vector 1 Vector 2 Vector 3 Vector 4 Vector 5 Vector 6 CONTROL OF CORRUPTION 0.39377 -0.7641 0.2789 0.21775 -0.2345 -0.2845 GOVT EFFECTIVENESS 0.40356 0.07289 -0.4354 -0.3641 0.34363 -0.6258 POLITICAL STABILITY 0.21714 0.20327 0.06643 -0.5623 -0.7684 0.02265 REGULATORY QUALITY 0.35828 -0.3406 -0.1769 -0.3827 0.29653 0.69992 RULE OF LAW 0.47345 0.24276 -0.5043 0.59318 -0.2741 0.18883 VOICE AND ACCOUNTABILITY 0.53143 0.44112 0.66534 0.07444 0.27099 0.0367
COTE D' VOIRE
Comp 1 Comp 2 Comp 3 Comp 4 Comp 5 Comp 6 Eigenvalue 28.4058 0.38417 0.20081 0.17043 0.0215 0.00476
University of Ghana http://ugspace.ug.edu.gh
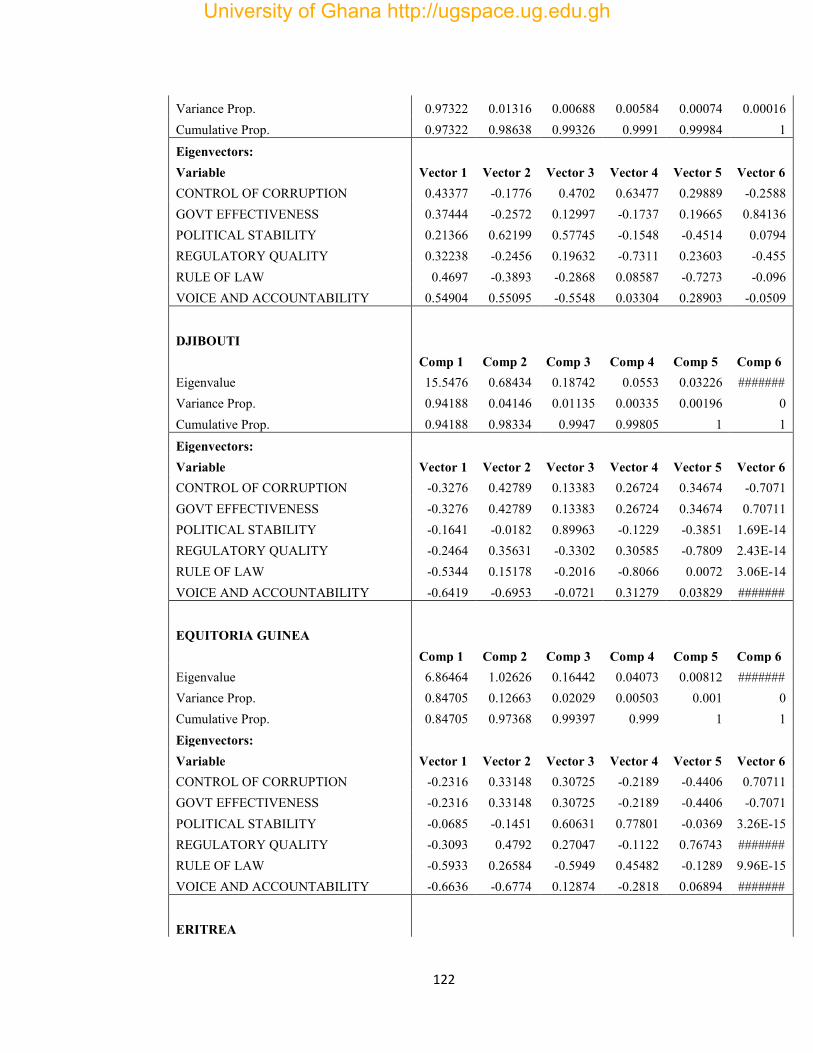
122
Variance Prop. 0.97322 0.01316 0.00688 0.00584 0.00074 0.00016 Cumulative Prop. 0.97322 0.98638 0.99326 0.9991 0.99984 1 Eigenvectors:
Variable Vector 1 Vector 2 Vector 3 Vector 4 Vector 5 Vector 6 CONTROL OF CORRUPTION 0.43377 -0.1776 0.4702 0.63477 0.29889 -0.2588 GOVT EFFECTIVENESS 0.37444 -0.2572 0.12997 -0.1737 0.19665 0.84136 POLITICAL STABILITY 0.21366 0.62199 0.57745 -0.1548 -0.4514 0.0794 REGULATORY QUALITY 0.32238 -0.2456 0.19632 -0.7311 0.23603 -0.455 RULE OF LAW 0.4697 -0.3893 -0.2868 0.08587 -0.7273 -0.096 VOICE AND ACCOUNTABILITY 0.54904 0.55095 -0.5548 0.03304 0.28903 -0.0509
DJIBOUTI
Comp 1 Comp 2 Comp 3 Comp 4 Comp 5 Comp 6 Eigenvalue 15.5476 0.68434 0.18742 0.0553 0.03226 ####### Variance Prop. 0.94188 0.04146 0.01135 0.00335 0.00196 0 Cumulative Prop. 0.94188 0.98334 0.9947 0.99805 1 1 Eigenvectors:
Variable Vector 1 Vector 2 Vector 3 Vector 4 Vector 5 Vector 6 CONTROL OF CORRUPTION -0.3276 0.42789 0.13383 0.26724 0.34674 -0.7071 GOVT EFFECTIVENESS -0.3276 0.42789 0.13383 0.26724 0.34674 0.70711 POLITICAL STABILITY -0.1641 -0.0182 0.89963 -0.1229 -0.3851 1.69E-14 REGULATORY QUALITY -0.2464 0.35631 -0.3302 0.30585 -0.7809 2.43E-14 RULE OF LAW -0.5344 0.15178 -0.2016 -0.8066 0.0072 3.06E-14 VOICE AND ACCOUNTABILITY -0.6419 -0.6953 -0.0721 0.31279 0.03829 #######
EQUITORIA GUINEA
Comp 1 Comp 2 Comp 3 Comp 4 Comp 5 Comp 6 Eigenvalue 6.86464 1.02626 0.16442 0.04073 0.00812 ####### Variance Prop. 0.84705 0.12663 0.02029 0.00503 0.001 0 Cumulative Prop. 0.84705 0.97368 0.99397 0.999 1 1 Eigenvectors:
Variable Vector 1 Vector 2 Vector 3 Vector 4 Vector 5 Vector 6 CONTROL OF CORRUPTION -0.2316 0.33148 0.30725 -0.2189 -0.4406 0.70711 GOVT EFFECTIVENESS -0.2316 0.33148 0.30725 -0.2189 -0.4406 -0.7071 POLITICAL STABILITY -0.0685 -0.1451 0.60631 0.77801 -0.0369 3.26E-15 REGULATORY QUALITY -0.3093 0.4792 0.27047 -0.1122 0.76743 ####### RULE OF LAW -0.5933 0.26584 -0.5949 0.45482 -0.1289 9.96E-15 VOICE AND ACCOUNTABILITY -0.6636 -0.6774 0.12874 -0.2818 0.06894 #######
ERITREA
University of Ghana http://ugspace.ug.edu.gh
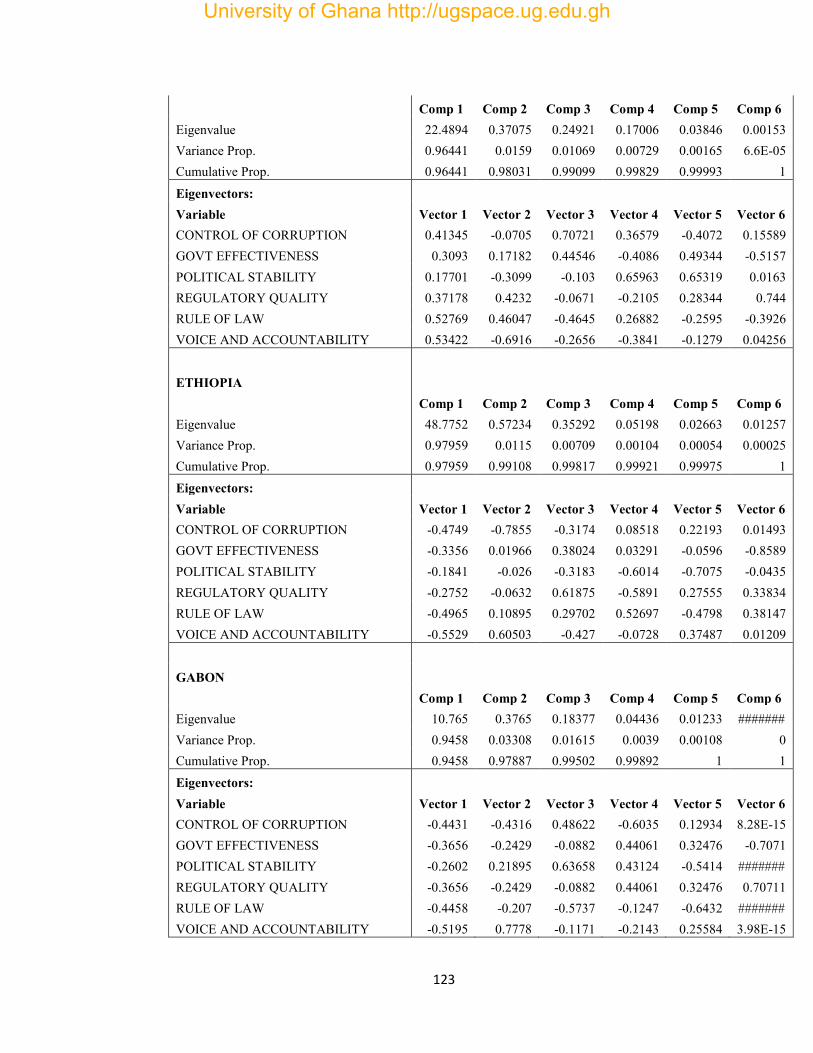
123
Comp 1 Comp 2 Comp 3 Comp 4 Comp 5 Comp 6 Eigenvalue 22.4894 0.37075 0.24921 0.17006 0.03846 0.00153 Variance Prop. 0.96441 0.0159 0.01069 0.00729 0.00165 6.6E-05 Cumulative Prop. 0.96441 0.98031 0.99099 0.99829 0.99993 1
Eigenvectors:
Variable Vector 1 Vector 2 Vector 3 Vector 4 Vector 5 Vector 6 CONTROL OF CORRUPTION 0.41345 -0.0705 0.70721 0.36579 -0.4072 0.15589 GOVT EFFECTIVENESS 0.3093 0.17182 0.44546 -0.4086 0.49344 -0.5157 POLITICAL STABILITY 0.17701 -0.3099 -0.103 0.65963 0.65319 0.0163 REGULATORY QUALITY 0.37178 0.4232 -0.0671 -0.2105 0.28344 0.744 RULE OF LAW 0.52769 0.46047 -0.4645 0.26882 -0.2595 -0.3926 VOICE AND ACCOUNTABILITY 0.53422 -0.6916 -0.2656 -0.3841 -0.1279 0.04256
ETHIOPIA
Comp 1 Comp 2 Comp 3 Comp 4 Comp 5 Comp 6 Eigenvalue 48.7752 0.57234 0.35292 0.05198 0.02663 0.01257 Variance Prop. 0.97959 0.0115 0.00709 0.00104 0.00054 0.00025 Cumulative Prop. 0.97959 0.99108 0.99817 0.99921 0.99975 1 Eigenvectors:
Variable Vector 1 Vector 2 Vector 3 Vector 4 Vector 5 Vector 6 CONTROL OF CORRUPTION -0.4749 -0.7855 -0.3174 0.08518 0.22193 0.01493 GOVT EFFECTIVENESS -0.3356 0.01966 0.38024 0.03291 -0.0596 -0.8589 POLITICAL STABILITY -0.1841 -0.026 -0.3183 -0.6014 -0.7075 -0.0435 REGULATORY QUALITY -0.2752 -0.0632 0.61875 -0.5891 0.27555 0.33834 RULE OF LAW -0.4965 0.10895 0.29702 0.52697 -0.4798 0.38147 VOICE AND ACCOUNTABILITY -0.5529 0.60503 -0.427 -0.0728 0.37487 0.01209
GABON
Comp 1 Comp 2 Comp 3 Comp 4 Comp 5 Comp 6 Eigenvalue 10.765 0.3765 0.18377 0.04436 0.01233 ####### Variance Prop. 0.9458 0.03308 0.01615 0.0039 0.00108 0 Cumulative Prop. 0.9458 0.97887 0.99502 0.99892 1 1 Eigenvectors:
Variable Vector 1 Vector 2 Vector 3 Vector 4 Vector 5 Vector 6 CONTROL OF CORRUPTION -0.4431 -0.4316 0.48622 -0.6035 0.12934 8.28E-15 GOVT EFFECTIVENESS -0.3656 -0.2429 -0.0882 0.44061 0.32476 -0.7071 POLITICAL STABILITY -0.2602 0.21895 0.63658 0.43124 -0.5414 ####### REGULATORY QUALITY -0.3656 -0.2429 -0.0882 0.44061 0.32476 0.70711 RULE OF LAW -0.4458 -0.207 -0.5737 -0.1247 -0.6432 ####### VOICE AND ACCOUNTABILITY -0.5195 0.7778 -0.1171 -0.2143 0.25584 3.98E-15
University of Ghana http://ugspace.ug.edu.gh
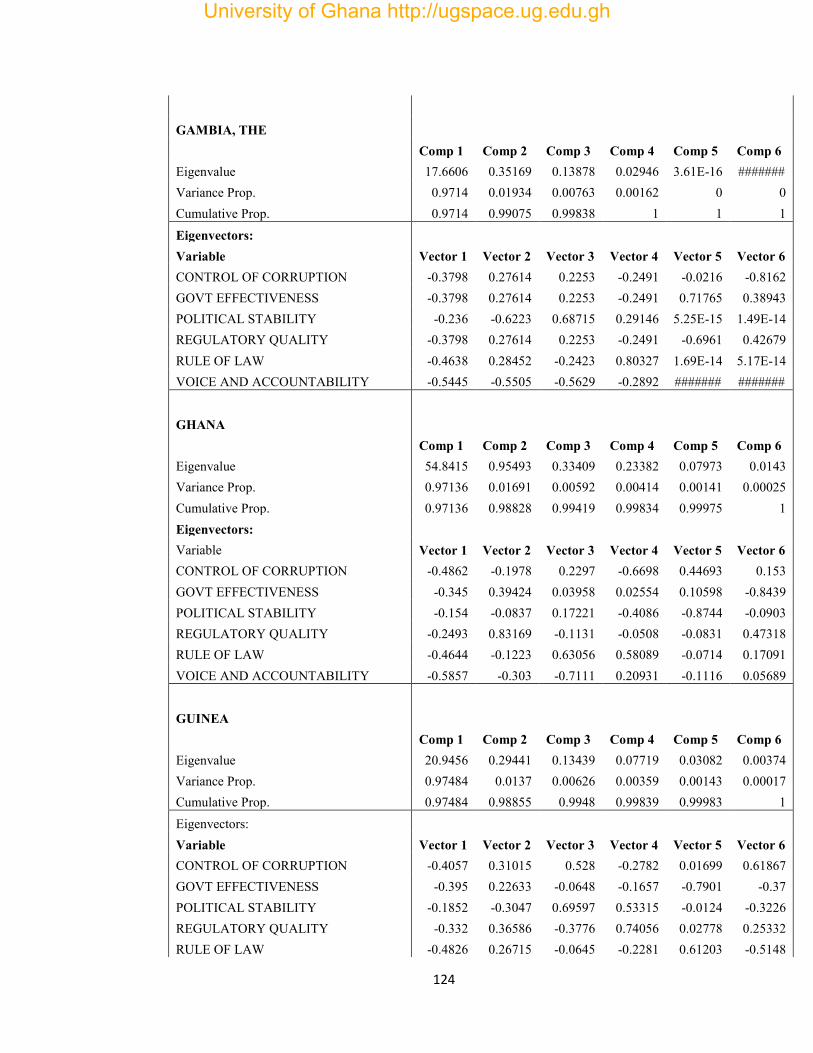
124
GAMBIA, THE
Comp 1 Comp 2 Comp 3 Comp 4 Comp 5 Comp 6 Eigenvalue 17.6606 0.35169 0.13878 0.02946 3.61E-16 ####### Variance Prop. 0.9714 0.01934 0.00763 0.00162 0 0 Cumulative Prop. 0.9714 0.99075 0.99838 1 1 1 Eigenvectors:
Variable Vector 1 Vector 2 Vector 3 Vector 4 Vector 5 Vector 6 CONTROL OF CORRUPTION -0.3798 0.27614 0.2253 -0.2491 -0.0216 -0.8162 GOVT EFFECTIVENESS -0.3798 0.27614 0.2253 -0.2491 0.71765 0.38943 POLITICAL STABILITY -0.236 -0.6223 0.68715 0.29146 5.25E-15 1.49E-14 REGULATORY QUALITY -0.3798 0.27614 0.2253 -0.2491 -0.6961 0.42679 RULE OF LAW -0.4638 0.28452 -0.2423 0.80327 1.69E-14 5.17E-14 VOICE AND ACCOUNTABILITY -0.5445 -0.5505 -0.5629 -0.2892 ####### #######
GHANA
Comp 1 Comp 2 Comp 3 Comp 4 Comp 5 Comp 6 Eigenvalue 54.8415 0.95493 0.33409 0.23382 0.07973 0.0143 Variance Prop. 0.97136 0.01691 0.00592 0.00414 0.00141 0.00025 Cumulative Prop. 0.97136 0.98828 0.99419 0.99834 0.99975 1 Eigenvectors:
Variable Vector 1 Vector 2 Vector 3 Vector 4 Vector 5 Vector 6 CONTROL OF CORRUPTION -0.4862 -0.1978 0.2297 -0.6698 0.44693 0.153 GOVT EFFECTIVENESS -0.345 0.39424 0.03958 0.02554 0.10598 -0.8439 POLITICAL STABILITY -0.154 -0.0837 0.17221 -0.4086 -0.8744 -0.0903 REGULATORY QUALITY -0.2493 0.83169 -0.1131 -0.0508 -0.0831 0.47318 RULE OF LAW -0.4644 -0.1223 0.63056 0.58089 -0.0714 0.17091 VOICE AND ACCOUNTABILITY -0.5857 -0.303 -0.7111 0.20931 -0.1116 0.05689
GUINEA
Comp 1 Comp 2 Comp 3 Comp 4 Comp 5 Comp 6 Eigenvalue 20.9456 0.29441 0.13439 0.07719 0.03082 0.00374 Variance Prop. 0.97484 0.0137 0.00626 0.00359 0.00143 0.00017 Cumulative Prop. 0.97484 0.98855 0.9948 0.99839 0.99983 1 Eigenvectors:
Variable Vector 1 Vector 2 Vector 3 Vector 4 Vector 5 Vector 6 CONTROL OF CORRUPTION -0.4057 0.31015 0.528 -0.2782 0.01699 0.61867 GOVT EFFECTIVENESS -0.395 0.22633 -0.0648 -0.1657 -0.7901 -0.37 POLITICAL STABILITY -0.1852 -0.3047 0.69597 0.53315 -0.0124 -0.3226 REGULATORY QUALITY -0.332 0.36586 -0.3776 0.74056 0.02778 0.25332 RULE OF LAW -0.4826 0.26715 -0.0645 -0.2281 0.61203 -0.5148
University of Ghana http://ugspace.ug.edu.gh
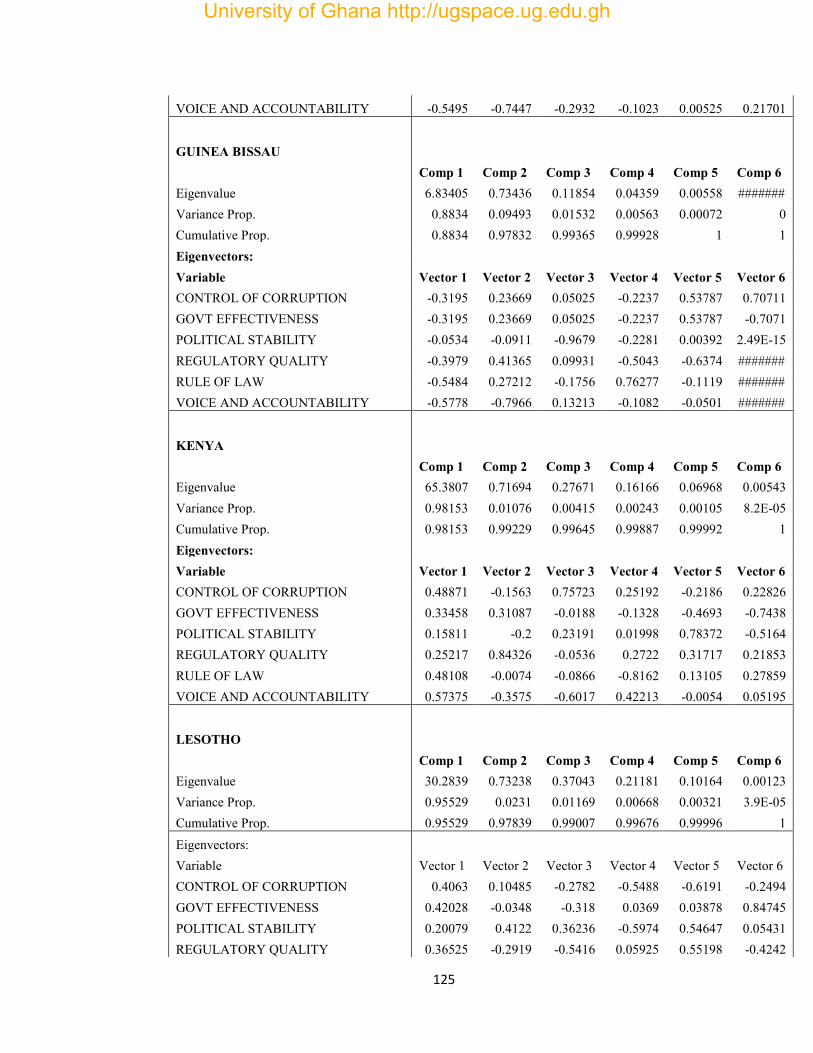
125
VOICE AND ACCOUNTABILITY -0.5495 -0.7447 -0.2932 -0.1023 0.00525 0.21701
GUINEA BISSAU
Comp 1 Comp 2 Comp 3 Comp 4 Comp 5 Comp 6 Eigenvalue 6.83405 0.73436 0.11854 0.04359 0.00558 ####### Variance Prop. 0.8834 0.09493 0.01532 0.00563 0.00072 0 Cumulative Prop. 0.8834 0.97832 0.99365 0.99928 1 1 Eigenvectors:
Variable Vector 1 Vector 2 Vector 3 Vector 4 Vector 5 Vector 6 CONTROL OF CORRUPTION -0.3195 0.23669 0.05025 -0.2237 0.53787 0.70711 GOVT EFFECTIVENESS -0.3195 0.23669 0.05025 -0.2237 0.53787 -0.7071 POLITICAL STABILITY -0.0534 -0.0911 -0.9679 -0.2281 0.00392 2.49E-15 REGULATORY QUALITY -0.3979 0.41365 0.09931 -0.5043 -0.6374 ####### RULE OF LAW -0.5484 0.27212 -0.1756 0.76277 -0.1119 ####### VOICE AND ACCOUNTABILITY -0.5778 -0.7966 0.13213 -0.1082 -0.0501 #######
KENYA
Comp 1 Comp 2 Comp 3 Comp 4 Comp 5 Comp 6 Eigenvalue 65.3807 0.71694 0.27671 0.16166 0.06968 0.00543 Variance Prop. 0.98153 0.01076 0.00415 0.00243 0.00105 8.2E-05 Cumulative Prop. 0.98153 0.99229 0.99645 0.99887 0.99992 1 Eigenvectors:
Variable Vector 1 Vector 2 Vector 3 Vector 4 Vector 5 Vector 6 CONTROL OF CORRUPTION 0.48871 -0.1563 0.75723 0.25192 -0.2186 0.22826 GOVT EFFECTIVENESS 0.33458 0.31087 -0.0188 -0.1328 -0.4693 -0.7438 POLITICAL STABILITY 0.15811 -0.2 0.23191 0.01998 0.78372 -0.5164 REGULATORY QUALITY 0.25217 0.84326 -0.0536 0.2722 0.31717 0.21853 RULE OF LAW 0.48108 -0.0074 -0.0866 -0.8162 0.13105 0.27859 VOICE AND ACCOUNTABILITY 0.57375 -0.3575 -0.6017 0.42213 -0.0054 0.05195
LESOTHO
Comp 1 Comp 2 Comp 3 Comp 4 Comp 5 Comp 6 Eigenvalue 30.2839 0.73238 0.37043 0.21181 0.10164 0.00123 Variance Prop. 0.95529 0.0231 0.01169 0.00668 0.00321 3.9E-05 Cumulative Prop. 0.95529 0.97839 0.99007 0.99676 0.99996 1 Eigenvectors:
Variable Vector 1 Vector 2 Vector 3 Vector 4 Vector 5 Vector 6 CONTROL OF CORRUPTION 0.4063 0.10485 -0.2782 -0.5488 -0.6191 -0.2494 GOVT EFFECTIVENESS 0.42028 -0.0348 -0.318 0.0369 0.03878 0.84745 POLITICAL STABILITY 0.20079 0.4122 0.36236 -0.5974 0.54647 0.05431 REGULATORY QUALITY 0.36525 -0.2919 -0.5416 0.05925 0.55198 -0.4242
University of Ghana http://ugspace.ug.edu.gh
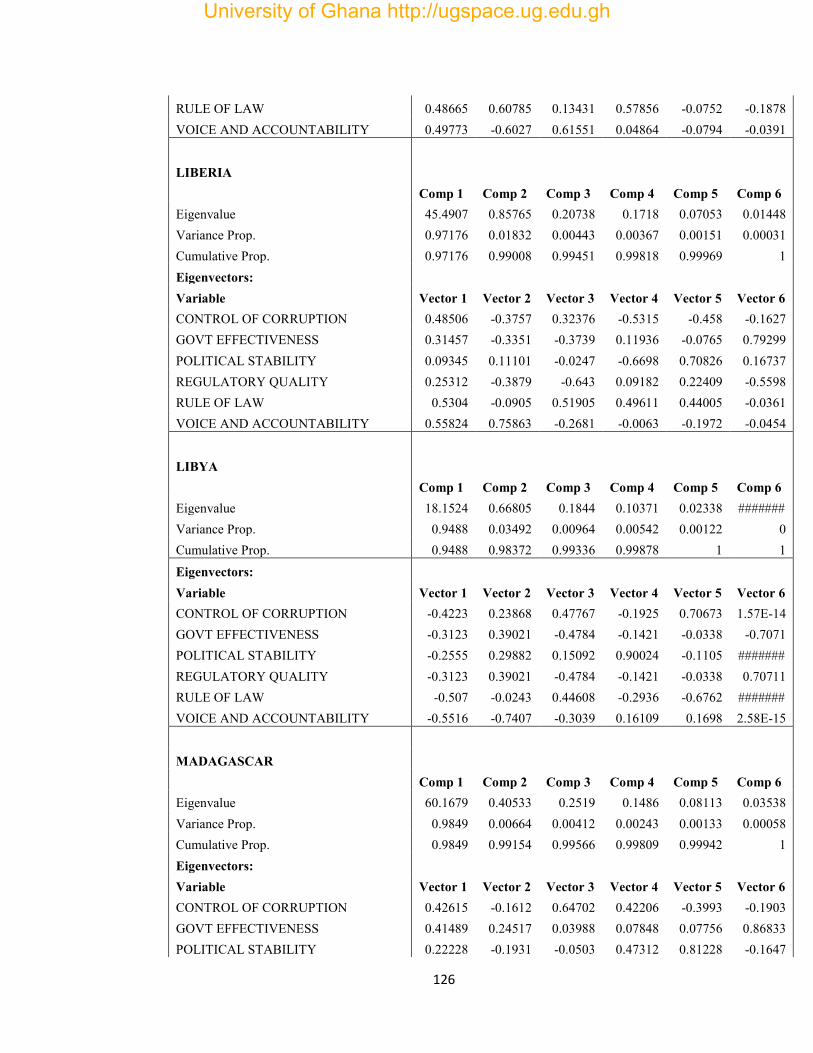
126
RULE OF LAW 0.48665 0.60785 0.13431 0.57856 -0.0752 -0.1878 VOICE AND ACCOUNTABILITY 0.49773 -0.6027 0.61551 0.04864 -0.0794 -0.0391
LIBERIA
Comp 1 Comp 2 Comp 3 Comp 4 Comp 5 Comp 6 Eigenvalue 45.4907 0.85765 0.20738 0.1718 0.07053 0.01448 Variance Prop. 0.97176 0.01832 0.00443 0.00367 0.00151 0.00031 Cumulative Prop. 0.97176 0.99008 0.99451 0.99818 0.99969 1 Eigenvectors:
Variable Vector 1 Vector 2 Vector 3 Vector 4 Vector 5 Vector 6 CONTROL OF CORRUPTION 0.48506 -0.3757 0.32376 -0.5315 -0.458 -0.1627 GOVT EFFECTIVENESS 0.31457 -0.3351 -0.3739 0.11936 -0.0765 0.79299 POLITICAL STABILITY 0.09345 0.11101 -0.0247 -0.6698 0.70826 0.16737 REGULATORY QUALITY 0.25312 -0.3879 -0.643 0.09182 0.22409 -0.5598 RULE OF LAW 0.5304 -0.0905 0.51905 0.49611 0.44005 -0.0361 VOICE AND ACCOUNTABILITY 0.55824 0.75863 -0.2681 -0.0063 -0.1972 -0.0454
LIBYA
Comp 1 Comp 2 Comp 3 Comp 4 Comp 5 Comp 6 Eigenvalue 18.1524 0.66805 0.1844 0.10371 0.02338 ####### Variance Prop. 0.9488 0.03492 0.00964 0.00542 0.00122 0 Cumulative Prop. 0.9488 0.98372 0.99336 0.99878 1 1 Eigenvectors:
Variable Vector 1 Vector 2 Vector 3 Vector 4 Vector 5 Vector 6 CONTROL OF CORRUPTION -0.4223 0.23868 0.47767 -0.1925 0.70673 1.57E-14 GOVT EFFECTIVENESS -0.3123 0.39021 -0.4784 -0.1421 -0.0338 -0.7071 POLITICAL STABILITY -0.2555 0.29882 0.15092 0.90024 -0.1105 ####### REGULATORY QUALITY -0.3123 0.39021 -0.4784 -0.1421 -0.0338 0.70711 RULE OF LAW -0.507 -0.0243 0.44608 -0.2936 -0.6762 ####### VOICE AND ACCOUNTABILITY -0.5516 -0.7407 -0.3039 0.16109 0.1698 2.58E-15
MADAGASCAR
Comp 1 Comp 2 Comp 3 Comp 4 Comp 5 Comp 6 Eigenvalue 60.1679 0.40533 0.2519 0.1486 0.08113 0.03538 Variance Prop. 0.9849 0.00664 0.00412 0.00243 0.00133 0.00058 Cumulative Prop. 0.9849 0.99154 0.99566 0.99809 0.99942 1 Eigenvectors:
Variable Vector 1 Vector 2 Vector 3 Vector 4 Vector 5 Vector 6 CONTROL OF CORRUPTION 0.42615 -0.1612 0.64702 0.42206 -0.3993 -0.1903 GOVT EFFECTIVENESS 0.41489 0.24517 0.03988 0.07848 0.07756 0.86833 POLITICAL STABILITY 0.22228 -0.1931 -0.0503 0.47312 0.81228 -0.1647
University of Ghana http://ugspace.ug.edu.gh
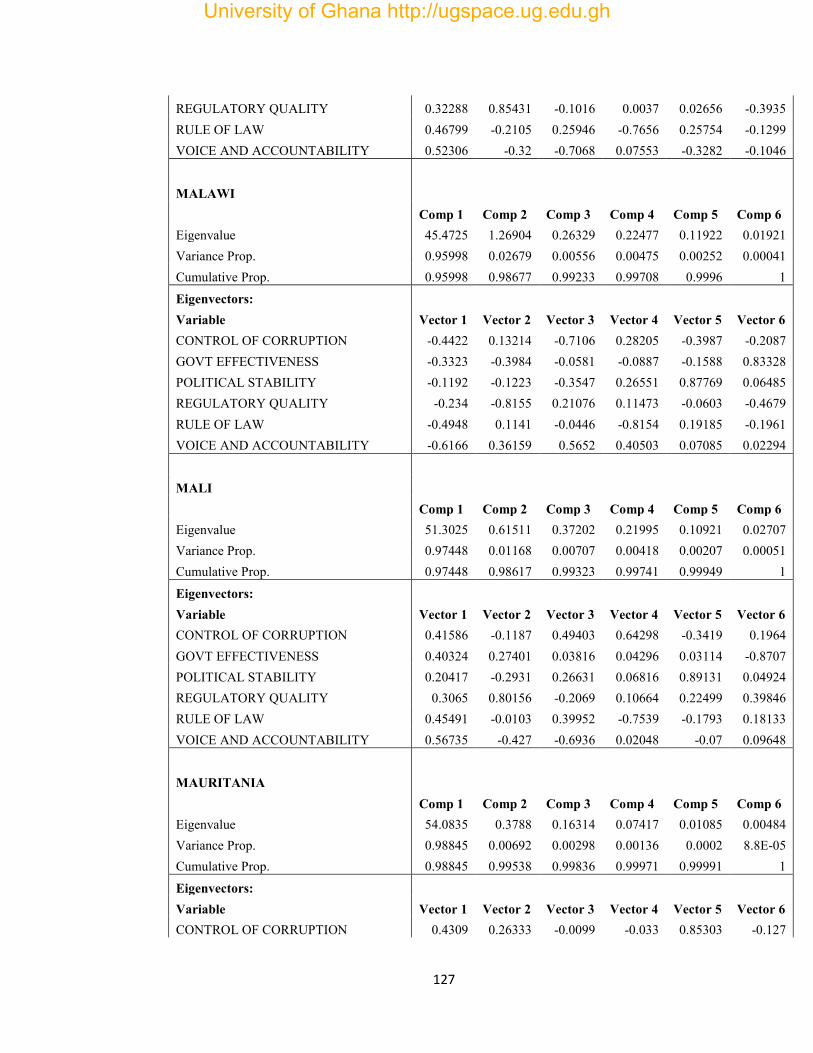
127
REGULATORY QUALITY 0.32288 0.85431 -0.1016 0.0037 0.02656 -0.3935 RULE OF LAW 0.46799 -0.2105 0.25946 -0.7656 0.25754 -0.1299 VOICE AND ACCOUNTABILITY 0.52306 -0.32 -0.7068 0.07553 -0.3282 -0.1046
MALAWI
Comp 1 Comp 2 Comp 3 Comp 4 Comp 5 Comp 6 Eigenvalue 45.4725 1.26904 0.26329 0.22477 0.11922 0.01921 Variance Prop. 0.95998 0.02679 0.00556 0.00475 0.00252 0.00041 Cumulative Prop. 0.95998 0.98677 0.99233 0.99708 0.9996 1 Eigenvectors:
Variable Vector 1 Vector 2 Vector 3 Vector 4 Vector 5 Vector 6 CONTROL OF CORRUPTION -0.4422 0.13214 -0.7106 0.28205 -0.3987 -0.2087 GOVT EFFECTIVENESS -0.3323 -0.3984 -0.0581 -0.0887 -0.1588 0.83328 POLITICAL STABILITY -0.1192 -0.1223 -0.3547 0.26551 0.87769 0.06485 REGULATORY QUALITY -0.234 -0.8155 0.21076 0.11473 -0.0603 -0.4679 RULE OF LAW -0.4948 0.1141 -0.0446 -0.8154 0.19185 -0.1961 VOICE AND ACCOUNTABILITY -0.6166 0.36159 0.5652 0.40503 0.07085 0.02294
MALI
Comp 1 Comp 2 Comp 3 Comp 4 Comp 5 Comp 6 Eigenvalue 51.3025 0.61511 0.37202 0.21995 0.10921 0.02707 Variance Prop. 0.97448 0.01168 0.00707 0.00418 0.00207 0.00051 Cumulative Prop. 0.97448 0.98617 0.99323 0.99741 0.99949 1
Eigenvectors:
Variable Vector 1 Vector 2 Vector 3 Vector 4 Vector 5 Vector 6 CONTROL OF CORRUPTION 0.41586 -0.1187 0.49403 0.64298 -0.3419 0.1964 GOVT EFFECTIVENESS 0.40324 0.27401 0.03816 0.04296 0.03114 -0.8707 POLITICAL STABILITY 0.20417 -0.2931 0.26631 0.06816 0.89131 0.04924 REGULATORY QUALITY 0.3065 0.80156 -0.2069 0.10664 0.22499 0.39846 RULE OF LAW 0.45491 -0.0103 0.39952 -0.7539 -0.1793 0.18133 VOICE AND ACCOUNTABILITY 0.56735 -0.427 -0.6936 0.02048 -0.07 0.09648
MAURITANIA
Comp 1 Comp 2 Comp 3 Comp 4 Comp 5 Comp 6 Eigenvalue 54.0835 0.3788 0.16314 0.07417 0.01085 0.00484 Variance Prop. 0.98845 0.00692 0.00298 0.00136 0.0002 8.8E-05 Cumulative Prop. 0.98845 0.99538 0.99836 0.99971 0.99991 1
Eigenvectors:
Variable Vector 1 Vector 2 Vector 3 Vector 4 Vector 5 Vector 6 CONTROL OF CORRUPTION 0.4309 0.26333 -0.0099 -0.033 0.85303 -0.127
University of Ghana http://ugspace.ug.edu.gh
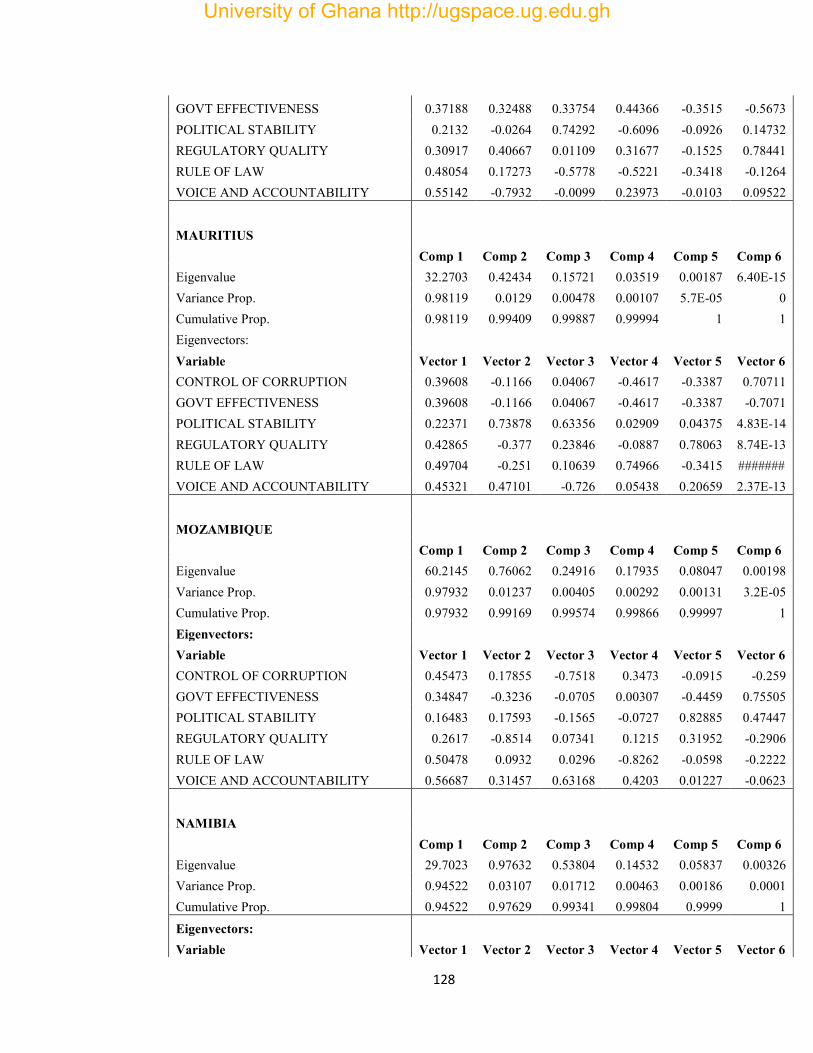
128
GOVT EFFECTIVENESS 0.37188 0.32488 0.33754 0.44366 -0.3515 -0.5673 POLITICAL STABILITY 0.2132 -0.0264 0.74292 -0.6096 -0.0926 0.14732 REGULATORY QUALITY 0.30917 0.40667 0.01109 0.31677 -0.1525 0.78441 RULE OF LAW 0.48054 0.17273 -0.5778 -0.5221 -0.3418 -0.1264 VOICE AND ACCOUNTABILITY 0.55142 -0.7932 -0.0099 0.23973 -0.0103 0.09522
MAURITIUS
Comp 1 Comp 2 Comp 3 Comp 4 Comp 5 Comp 6 Eigenvalue 32.2703 0.42434 0.15721 0.03519 0.00187 6.40E-15 Variance Prop. 0.98119 0.0129 0.00478 0.00107 5.7E-05 0 Cumulative Prop. 0.98119 0.99409 0.99887 0.99994 1 1 Eigenvectors:
Variable Vector 1 Vector 2 Vector 3 Vector 4 Vector 5 Vector 6 CONTROL OF CORRUPTION 0.39608 -0.1166 0.04067 -0.4617 -0.3387 0.70711 GOVT EFFECTIVENESS 0.39608 -0.1166 0.04067 -0.4617 -0.3387 -0.7071 POLITICAL STABILITY 0.22371 0.73878 0.63356 0.02909 0.04375 4.83E-14 REGULATORY QUALITY 0.42865 -0.377 0.23846 -0.0887 0.78063 8.74E-13 RULE OF LAW 0.49704 -0.251 0.10639 0.74966 -0.3415 ####### VOICE AND ACCOUNTABILITY 0.45321 0.47101 -0.726 0.05438 0.20659 2.37E-13
MOZAMBIQUE
Comp 1 Comp 2 Comp 3 Comp 4 Comp 5 Comp 6 Eigenvalue 60.2145 0.76062 0.24916 0.17935 0.08047 0.00198 Variance Prop. 0.97932 0.01237 0.00405 0.00292 0.00131 3.2E-05 Cumulative Prop. 0.97932 0.99169 0.99574 0.99866 0.99997 1 Eigenvectors:
Variable Vector 1 Vector 2 Vector 3 Vector 4 Vector 5 Vector 6 CONTROL OF CORRUPTION 0.45473 0.17855 -0.7518 0.3473 -0.0915 -0.259 GOVT EFFECTIVENESS 0.34847 -0.3236 -0.0705 0.00307 -0.4459 0.75505 POLITICAL STABILITY 0.16483 0.17593 -0.1565 -0.0727 0.82885 0.47447 REGULATORY QUALITY 0.2617 -0.8514 0.07341 0.1215 0.31952 -0.2906 RULE OF LAW 0.50478 0.0932 0.0296 -0.8262 -0.0598 -0.2222 VOICE AND ACCOUNTABILITY 0.56687 0.31457 0.63168 0.4203 0.01227 -0.0623
NAMIBIA
Comp 1 Comp 2 Comp 3 Comp 4 Comp 5 Comp 6 Eigenvalue 29.7023 0.97632 0.53804 0.14532 0.05837 0.00326 Variance Prop. 0.94522 0.03107 0.01712 0.00463 0.00186 0.0001 Cumulative Prop. 0.94522 0.97629 0.99341 0.99804 0.9999 1
Eigenvectors:
Variable Vector 1 Vector 2 Vector 3 Vector 4 Vector 5 Vector 6
University of Ghana http://ugspace.ug.edu.gh
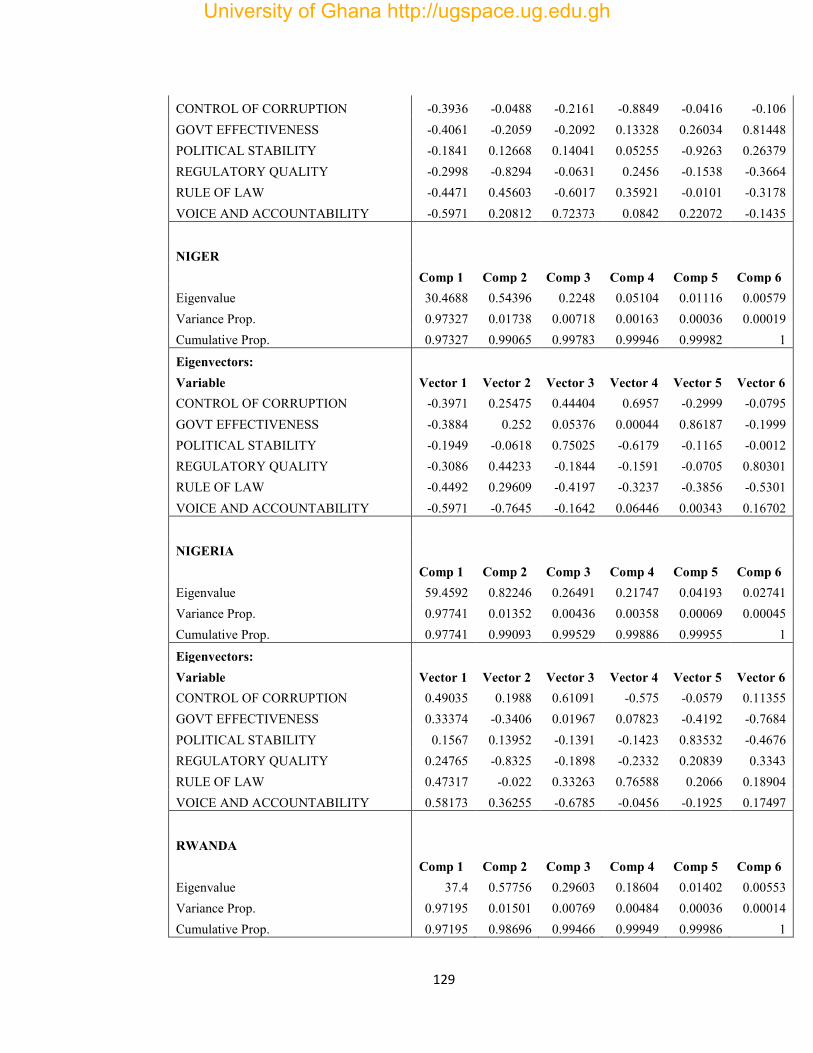
129
CONTROL OF CORRUPTION -0.3936 -0.0488 -0.2161 -0.8849 -0.0416 -0.106 GOVT EFFECTIVENESS -0.4061 -0.2059 -0.2092 0.13328 0.26034 0.81448 POLITICAL STABILITY -0.1841 0.12668 0.14041 0.05255 -0.9263 0.26379 REGULATORY QUALITY -0.2998 -0.8294 -0.0631 0.2456 -0.1538 -0.3664 RULE OF LAW -0.4471 0.45603 -0.6017 0.35921 -0.0101 -0.3178 VOICE AND ACCOUNTABILITY -0.5971 0.20812 0.72373 0.0842 0.22072 -0.1435
NIGER
Comp 1 Comp 2 Comp 3 Comp 4 Comp 5 Comp 6 Eigenvalue 30.4688 0.54396 0.2248 0.05104 0.01116 0.00579 Variance Prop. 0.97327 0.01738 0.00718 0.00163 0.00036 0.00019 Cumulative Prop. 0.97327 0.99065 0.99783 0.99946 0.99982 1
Eigenvectors:
Variable Vector 1 Vector 2 Vector 3 Vector 4 Vector 5 Vector 6 CONTROL OF CORRUPTION -0.3971 0.25475 0.44404 0.6957 -0.2999 -0.0795 GOVT EFFECTIVENESS -0.3884 0.252 0.05376 0.00044 0.86187 -0.1999 POLITICAL STABILITY -0.1949 -0.0618 0.75025 -0.6179 -0.1165 -0.0012 REGULATORY QUALITY -0.3086 0.44233 -0.1844 -0.1591 -0.0705 0.80301 RULE OF LAW -0.4492 0.29609 -0.4197 -0.3237 -0.3856 -0.5301 VOICE AND ACCOUNTABILITY -0.5971 -0.7645 -0.1642 0.06446 0.00343 0.16702
NIGERIA
Comp 1 Comp 2 Comp 3 Comp 4 Comp 5 Comp 6 Eigenvalue 59.4592 0.82246 0.26491 0.21747 0.04193 0.02741 Variance Prop. 0.97741 0.01352 0.00436 0.00358 0.00069 0.00045 Cumulative Prop. 0.97741 0.99093 0.99529 0.99886 0.99955 1
Eigenvectors:
Variable Vector 1 Vector 2 Vector 3 Vector 4 Vector 5 Vector 6 CONTROL OF CORRUPTION 0.49035 0.1988 0.61091 -0.575 -0.0579 0.11355 GOVT EFFECTIVENESS 0.33374 -0.3406 0.01967 0.07823 -0.4192 -0.7684 POLITICAL STABILITY 0.1567 0.13952 -0.1391 -0.1423 0.83532 -0.4676 REGULATORY QUALITY 0.24765 -0.8325 -0.1898 -0.2332 0.20839 0.3343 RULE OF LAW 0.47317 -0.022 0.33263 0.76588 0.2066 0.18904 VOICE AND ACCOUNTABILITY 0.58173 0.36255 -0.6785 -0.0456 -0.1925 0.17497
RWANDA
Comp 1 Comp 2 Comp 3 Comp 4 Comp 5 Comp 6 Eigenvalue 37.4 0.57756 0.29603 0.18604 0.01402 0.00553 Variance Prop. 0.97195 0.01501 0.00769 0.00484 0.00036 0.00014 Cumulative Prop. 0.97195 0.98696 0.99466 0.99949 0.99986 1
University of Ghana http://ugspace.ug.edu.gh
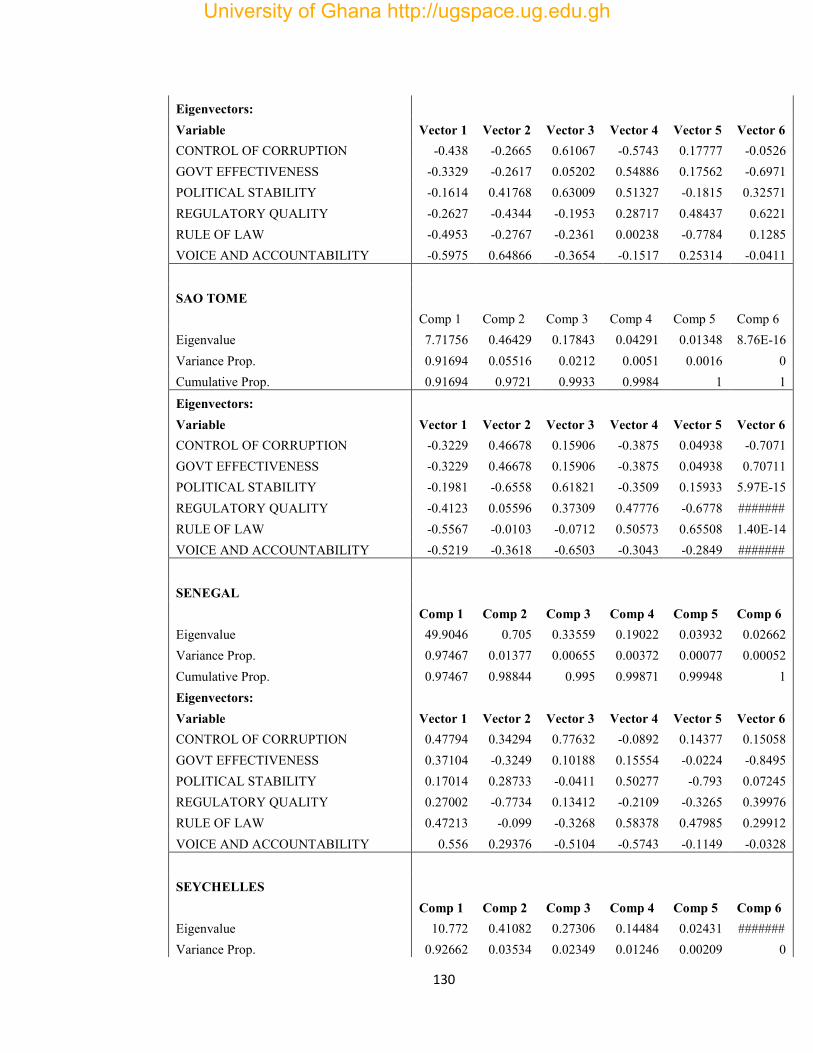
130
Eigenvectors:
Variable Vector 1 Vector 2 Vector 3 Vector 4 Vector 5 Vector 6 CONTROL OF CORRUPTION -0.438 -0.2665 0.61067 -0.5743 0.17777 -0.0526 GOVT EFFECTIVENESS -0.3329 -0.2617 0.05202 0.54886 0.17562 -0.6971 POLITICAL STABILITY -0.1614 0.41768 0.63009 0.51327 -0.1815 0.32571 REGULATORY QUALITY -0.2627 -0.4344 -0.1953 0.28717 0.48437 0.6221 RULE OF LAW -0.4953 -0.2767 -0.2361 0.00238 -0.7784 0.1285 VOICE AND ACCOUNTABILITY -0.5975 0.64866 -0.3654 -0.1517 0.25314 -0.0411
SAO TOME
Comp 1 Comp 2 Comp 3 Comp 4 Comp 5 Comp 6 Eigenvalue 7.71756 0.46429 0.17843 0.04291 0.01348 8.76E-16 Variance Prop. 0.91694 0.05516 0.0212 0.0051 0.0016 0 Cumulative Prop. 0.91694 0.9721 0.9933 0.9984 1 1 Eigenvectors:
Variable Vector 1 Vector 2 Vector 3 Vector 4 Vector 5 Vector 6 CONTROL OF CORRUPTION -0.3229 0.46678 0.15906 -0.3875 0.04938 -0.7071 GOVT EFFECTIVENESS -0.3229 0.46678 0.15906 -0.3875 0.04938 0.70711 POLITICAL STABILITY -0.1981 -0.6558 0.61821 -0.3509 0.15933 5.97E-15 REGULATORY QUALITY -0.4123 0.05596 0.37309 0.47776 -0.6778 ####### RULE OF LAW -0.5567 -0.0103 -0.0712 0.50573 0.65508 1.40E-14 VOICE AND ACCOUNTABILITY -0.5219 -0.3618 -0.6503 -0.3043 -0.2849 #######
SENEGAL
Comp 1 Comp 2 Comp 3 Comp 4 Comp 5 Comp 6 Eigenvalue 49.9046 0.705 0.33559 0.19022 0.03932 0.02662 Variance Prop. 0.97467 0.01377 0.00655 0.00372 0.00077 0.00052 Cumulative Prop. 0.97467 0.98844 0.995 0.99871 0.99948 1 Eigenvectors:
Variable Vector 1 Vector 2 Vector 3 Vector 4 Vector 5 Vector 6 CONTROL OF CORRUPTION 0.47794 0.34294 0.77632 -0.0892 0.14377 0.15058 GOVT EFFECTIVENESS 0.37104 -0.3249 0.10188 0.15554 -0.0224 -0.8495 POLITICAL STABILITY 0.17014 0.28733 -0.0411 0.50277 -0.793 0.07245 REGULATORY QUALITY 0.27002 -0.7734 0.13412 -0.2109 -0.3265 0.39976 RULE OF LAW 0.47213 -0.099 -0.3268 0.58378 0.47985 0.29912 VOICE AND ACCOUNTABILITY 0.556 0.29376 -0.5104 -0.5743 -0.1149 -0.0328
SEYCHELLES
Comp 1 Comp 2 Comp 3 Comp 4 Comp 5 Comp 6 Eigenvalue 10.772 0.41082 0.27306 0.14484 0.02431 ####### Variance Prop. 0.92662 0.03534 0.02349 0.01246 0.00209 0
University of Ghana http://ugspace.ug.edu.gh
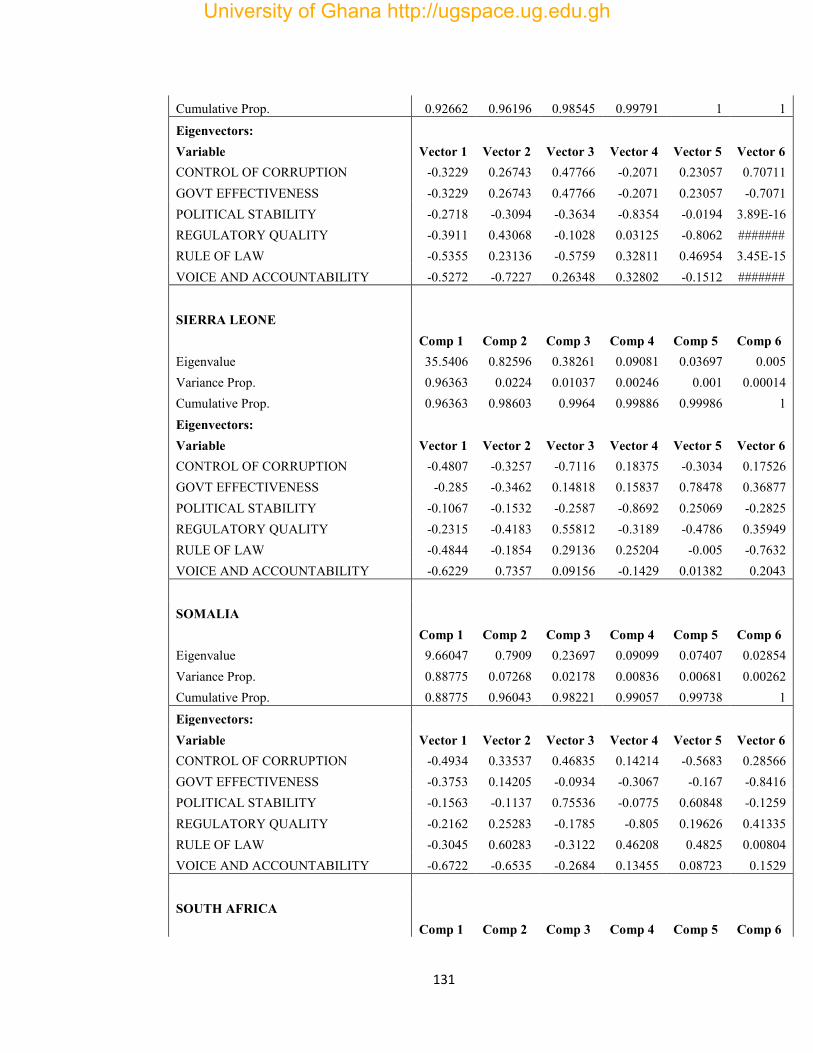
131
Cumulative Prop. 0.92662 0.96196 0.98545 0.99791 1 1
Eigenvectors:
Variable Vector 1 Vector 2 Vector 3 Vector 4 Vector 5 Vector 6 CONTROL OF CORRUPTION -0.3229 0.26743 0.47766 -0.2071 0.23057 0.70711 GOVT EFFECTIVENESS -0.3229 0.26743 0.47766 -0.2071 0.23057 -0.7071 POLITICAL STABILITY -0.2718 -0.3094 -0.3634 -0.8354 -0.0194 3.89E-16 REGULATORY QUALITY -0.3911 0.43068 -0.1028 0.03125 -0.8062 ####### RULE OF LAW -0.5355 0.23136 -0.5759 0.32811 0.46954 3.45E-15 VOICE AND ACCOUNTABILITY -0.5272 -0.7227 0.26348 0.32802 -0.1512 #######
SIERRA LEONE
Comp 1 Comp 2 Comp 3 Comp 4 Comp 5 Comp 6 Eigenvalue 35.5406 0.82596 0.38261 0.09081 0.03697 0.005 Variance Prop. 0.96363 0.0224 0.01037 0.00246 0.001 0.00014 Cumulative Prop. 0.96363 0.98603 0.9964 0.99886 0.99986 1 Eigenvectors:
Variable Vector 1 Vector 2 Vector 3 Vector 4 Vector 5 Vector 6 CONTROL OF CORRUPTION -0.4807 -0.3257 -0.7116 0.18375 -0.3034 0.17526 GOVT EFFECTIVENESS -0.285 -0.3462 0.14818 0.15837 0.78478 0.36877 POLITICAL STABILITY -0.1067 -0.1532 -0.2587 -0.8692 0.25069 -0.2825 REGULATORY QUALITY -0.2315 -0.4183 0.55812 -0.3189 -0.4786 0.35949 RULE OF LAW -0.4844 -0.1854 0.29136 0.25204 -0.005 -0.7632 VOICE AND ACCOUNTABILITY -0.6229 0.7357 0.09156 -0.1429 0.01382 0.2043
SOMALIA
Comp 1 Comp 2 Comp 3 Comp 4 Comp 5 Comp 6 Eigenvalue 9.66047 0.7909 0.23697 0.09099 0.07407 0.02854 Variance Prop. 0.88775 0.07268 0.02178 0.00836 0.00681 0.00262 Cumulative Prop. 0.88775 0.96043 0.98221 0.99057 0.99738 1 Eigenvectors:
Variable Vector 1 Vector 2 Vector 3 Vector 4 Vector 5 Vector 6 CONTROL OF CORRUPTION -0.4934 0.33537 0.46835 0.14214 -0.5683 0.28566 GOVT EFFECTIVENESS -0.3753 0.14205 -0.0934 -0.3067 -0.167 -0.8416 POLITICAL STABILITY -0.1563 -0.1137 0.75536 -0.0775 0.60848 -0.1259 REGULATORY QUALITY -0.2162 0.25283 -0.1785 -0.805 0.19626 0.41335 RULE OF LAW -0.3045 0.60283 -0.3122 0.46208 0.4825 0.00804 VOICE AND ACCOUNTABILITY -0.6722 -0.6535 -0.2684 0.13455 0.08723 0.1529
SOUTH AFRICA
Comp 1 Comp 2 Comp 3 Comp 4 Comp 5 Comp 6
University of Ghana http://ugspace.ug.edu.gh
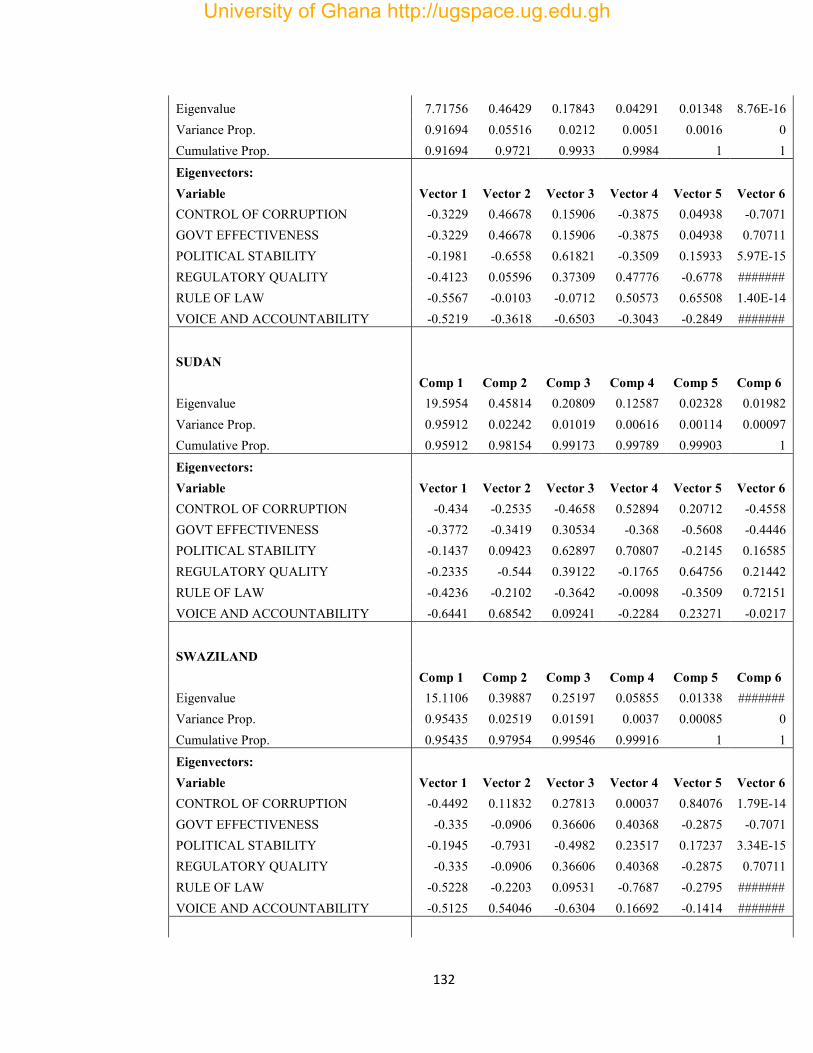
132
Eigenvalue 7.71756 0.46429 0.17843 0.04291 0.01348 8.76E-16 Variance Prop. 0.91694 0.05516 0.0212 0.0051 0.0016 0 Cumulative Prop. 0.91694 0.9721 0.9933 0.9984 1 1 Eigenvectors:
Variable Vector 1 Vector 2 Vector 3 Vector 4 Vector 5 Vector 6 CONTROL OF CORRUPTION -0.3229 0.46678 0.15906 -0.3875 0.04938 -0.7071 GOVT EFFECTIVENESS -0.3229 0.46678 0.15906 -0.3875 0.04938 0.70711 POLITICAL STABILITY -0.1981 -0.6558 0.61821 -0.3509 0.15933 5.97E-15 REGULATORY QUALITY -0.4123 0.05596 0.37309 0.47776 -0.6778 ####### RULE OF LAW -0.5567 -0.0103 -0.0712 0.50573 0.65508 1.40E-14 VOICE AND ACCOUNTABILITY -0.5219 -0.3618 -0.6503 -0.3043 -0.2849 #######
SUDAN
Comp 1 Comp 2 Comp 3 Comp 4 Comp 5 Comp 6 Eigenvalue 19.5954 0.45814 0.20809 0.12587 0.02328 0.01982 Variance Prop. 0.95912 0.02242 0.01019 0.00616 0.00114 0.00097 Cumulative Prop. 0.95912 0.98154 0.99173 0.99789 0.99903 1 Eigenvectors:
Variable Vector 1 Vector 2 Vector 3 Vector 4 Vector 5 Vector 6 CONTROL OF CORRUPTION -0.434 -0.2535 -0.4658 0.52894 0.20712 -0.4558 GOVT EFFECTIVENESS -0.3772 -0.3419 0.30534 -0.368 -0.5608 -0.4446 POLITICAL STABILITY -0.1437 0.09423 0.62897 0.70807 -0.2145 0.16585 REGULATORY QUALITY -0.2335 -0.544 0.39122 -0.1765 0.64756 0.21442 RULE OF LAW -0.4236 -0.2102 -0.3642 -0.0098 -0.3509 0.72151 VOICE AND ACCOUNTABILITY -0.6441 0.68542 0.09241 -0.2284 0.23271 -0.0217
SWAZILAND
Comp 1 Comp 2 Comp 3 Comp 4 Comp 5 Comp 6 Eigenvalue 15.1106 0.39887 0.25197 0.05855 0.01338 ####### Variance Prop. 0.95435 0.02519 0.01591 0.0037 0.00085 0 Cumulative Prop. 0.95435 0.97954 0.99546 0.99916 1 1 Eigenvectors:
Variable Vector 1 Vector 2 Vector 3 Vector 4 Vector 5 Vector 6 CONTROL OF CORRUPTION -0.4492 0.11832 0.27813 0.00037 0.84076 1.79E-14 GOVT EFFECTIVENESS -0.335 -0.0906 0.36606 0.40368 -0.2875 -0.7071 POLITICAL STABILITY -0.1945 -0.7931 -0.4982 0.23517 0.17237 3.34E-15 REGULATORY QUALITY -0.335 -0.0906 0.36606 0.40368 -0.2875 0.70711 RULE OF LAW -0.5228 -0.2203 0.09531 -0.7687 -0.2795 ####### VOICE AND ACCOUNTABILITY -0.5125 0.54046 -0.6304 0.16692 -0.1414 #######
University of Ghana http://ugspace.ug.edu.gh
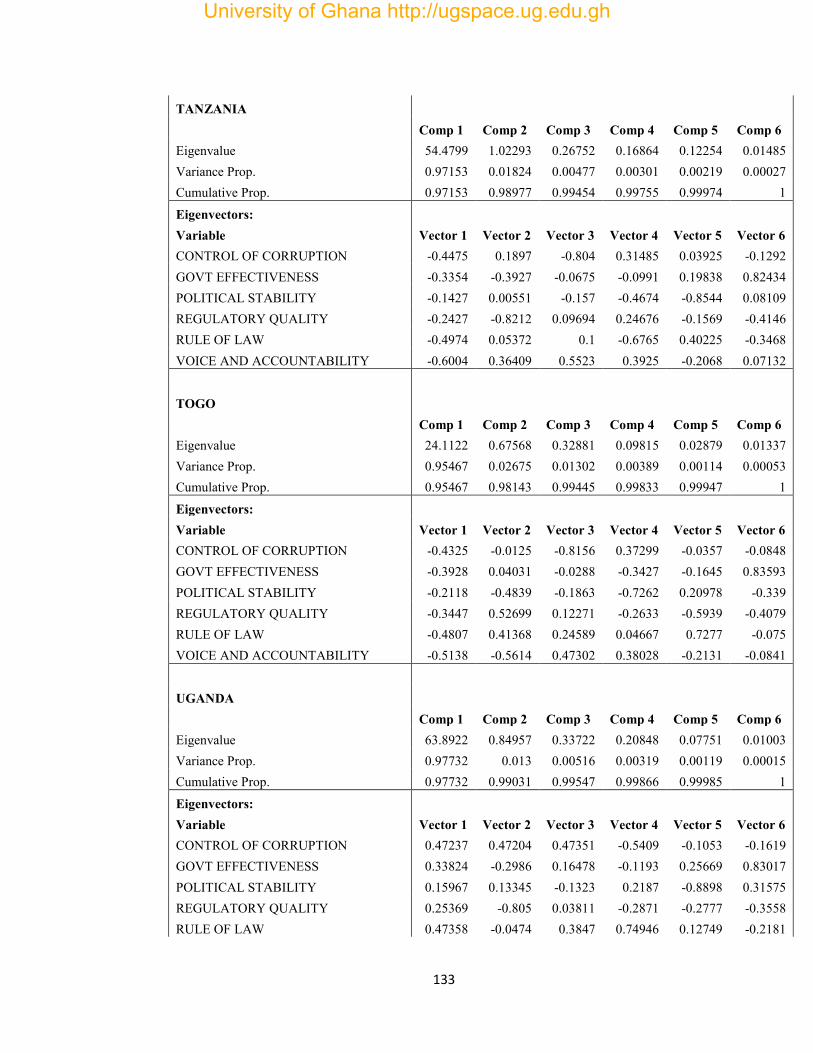
133
TANZANIA
Comp 1 Comp 2 Comp 3 Comp 4 Comp 5 Comp 6 Eigenvalue 54.4799 1.02293 0.26752 0.16864 0.12254 0.01485 Variance Prop. 0.97153 0.01824 0.00477 0.00301 0.00219 0.00027 Cumulative Prop. 0.97153 0.98977 0.99454 0.99755 0.99974 1
Eigenvectors:
Variable Vector 1 Vector 2 Vector 3 Vector 4 Vector 5 Vector 6 CONTROL OF CORRUPTION -0.4475 0.1897 -0.804 0.31485 0.03925 -0.1292 GOVT EFFECTIVENESS -0.3354 -0.3927 -0.0675 -0.0991 0.19838 0.82434 POLITICAL STABILITY -0.1427 0.00551 -0.157 -0.4674 -0.8544 0.08109 REGULATORY QUALITY -0.2427 -0.8212 0.09694 0.24676 -0.1569 -0.4146 RULE OF LAW -0.4974 0.05372 0.1 -0.6765 0.40225 -0.3468 VOICE AND ACCOUNTABILITY -0.6004 0.36409 0.5523 0.3925 -0.2068 0.07132
TOGO
Comp 1 Comp 2 Comp 3 Comp 4 Comp 5 Comp 6 Eigenvalue 24.1122 0.67568 0.32881 0.09815 0.02879 0.01337 Variance Prop. 0.95467 0.02675 0.01302 0.00389 0.00114 0.00053 Cumulative Prop. 0.95467 0.98143 0.99445 0.99833 0.99947 1
Eigenvectors:
Variable Vector 1 Vector 2 Vector 3 Vector 4 Vector 5 Vector 6 CONTROL OF CORRUPTION -0.4325 -0.0125 -0.8156 0.37299 -0.0357 -0.0848 GOVT EFFECTIVENESS -0.3928 0.04031 -0.0288 -0.3427 -0.1645 0.83593 POLITICAL STABILITY -0.2118 -0.4839 -0.1863 -0.7262 0.20978 -0.339 REGULATORY QUALITY -0.3447 0.52699 0.12271 -0.2633 -0.5939 -0.4079 RULE OF LAW -0.4807 0.41368 0.24589 0.04667 0.7277 -0.075 VOICE AND ACCOUNTABILITY -0.5138 -0.5614 0.47302 0.38028 -0.2131 -0.0841
UGANDA
Comp 1 Comp 2 Comp 3 Comp 4 Comp 5 Comp 6 Eigenvalue 63.8922 0.84957 0.33722 0.20848 0.07751 0.01003 Variance Prop. 0.97732 0.013 0.00516 0.00319 0.00119 0.00015 Cumulative Prop. 0.97732 0.99031 0.99547 0.99866 0.99985 1
Eigenvectors:
Variable Vector 1 Vector 2 Vector 3 Vector 4 Vector 5 Vector 6 CONTROL OF CORRUPTION 0.47237 0.47204 0.47351 -0.5409 -0.1053 -0.1619 GOVT EFFECTIVENESS 0.33824 -0.2986 0.16478 -0.1193 0.25669 0.83017 POLITICAL STABILITY 0.15967 0.13345 -0.1323 0.2187 -0.8898 0.31575 REGULATORY QUALITY 0.25369 -0.805 0.03811 -0.2871 -0.2777 -0.3558 RULE OF LAW 0.47358 -0.0474 0.3847 0.74946 0.12749 -0.2181
University of Ghana http://ugspace.ug.edu.gh
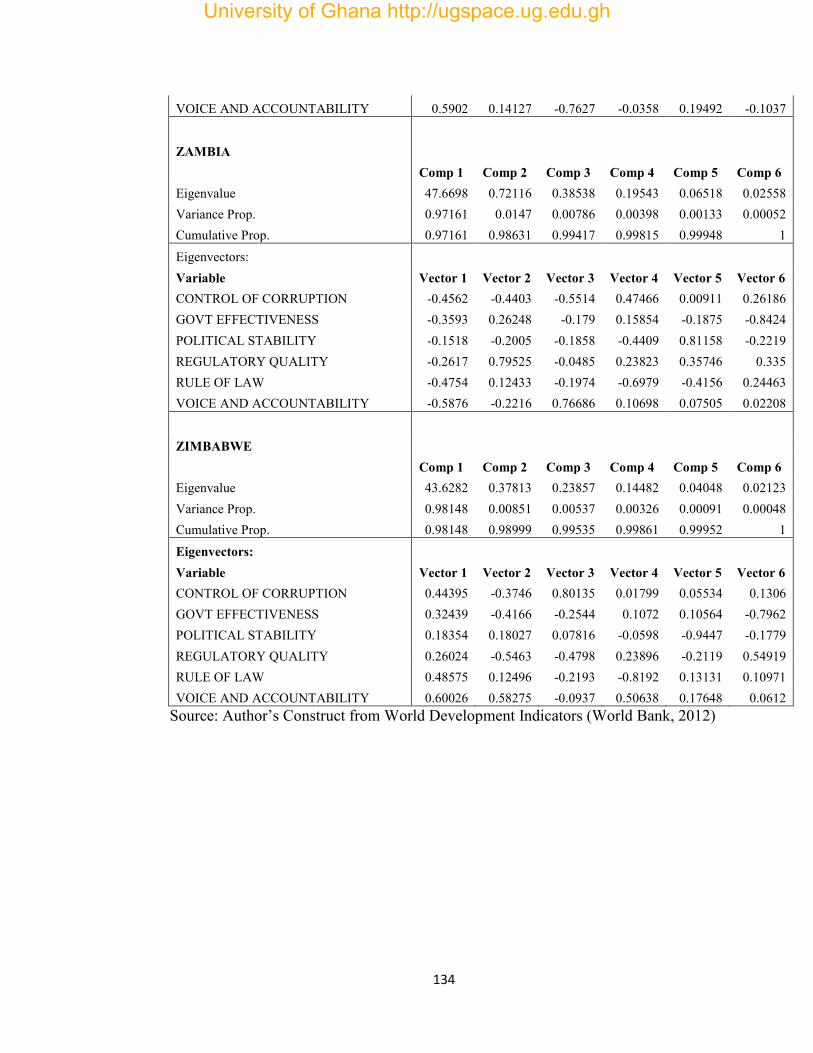
134
VOICE AND ACCOUNTABILITY 0.5902 0.14127 -0.7627 -0.0358 0.19492 -0.1037
ZAMBIA
Comp 1 Comp 2 Comp 3 Comp 4 Comp 5 Comp 6 Eigenvalue 47.6698 0.72116 0.38538 0.19543 0.06518 0.02558 Variance Prop. 0.97161 0.0147 0.00786 0.00398 0.00133 0.00052 Cumulative Prop. 0.97161 0.98631 0.99417 0.99815 0.99948 1 Eigenvectors:
Variable Vector 1 Vector 2 Vector 3 Vector 4 Vector 5 Vector 6 CONTROL OF CORRUPTION -0.4562 -0.4403 -0.5514 0.47466 0.00911 0.26186 GOVT EFFECTIVENESS -0.3593 0.26248 -0.179 0.15854 -0.1875 -0.8424 POLITICAL STABILITY -0.1518 -0.2005 -0.1858 -0.4409 0.81158 -0.2219 REGULATORY QUALITY -0.2617 0.79525 -0.0485 0.23823 0.35746 0.335 RULE OF LAW -0.4754 0.12433 -0.1974 -0.6979 -0.4156 0.24463 VOICE AND ACCOUNTABILITY -0.5876 -0.2216 0.76686 0.10698 0.07505 0.02208
ZIMBABWE
Comp 1 Comp 2 Comp 3 Comp 4 Comp 5 Comp 6 Eigenvalue 43.6282 0.37813 0.23857 0.14482 0.04048 0.02123 Variance Prop. 0.98148 0.00851 0.00537 0.00326 0.00091 0.00048 Cumulative Prop. 0.98148 0.98999 0.99535 0.99861 0.99952 1 Eigenvectors:
Variable Vector 1 Vector 2 Vector 3 Vector 4 Vector 5 Vector 6 CONTROL OF CORRUPTION 0.44395 -0.3746 0.80135 0.01799 0.05534 0.1306 GOVT EFFECTIVENESS 0.32439 -0.4166 -0.2544 0.1072 0.10564 -0.7962 POLITICAL STABILITY 0.18354 0.18027 0.07816 -0.0598 -0.9447 -0.1779 REGULATORY QUALITY 0.26024 -0.5463 -0.4798 0.23896 -0.2119 0.54919 RULE OF LAW 0.48575 0.12496 -0.2193 -0.8192 0.13131 0.10971 VOICE AND ACCOUNTABILITY 0.60026 0.58275 -0.0937 0.50638 0.17648 0.0612
Source: Author’s Construct from World Development Indicators (World Bank, 2012)
University of Ghana http://ugspace.ug.edu.gh
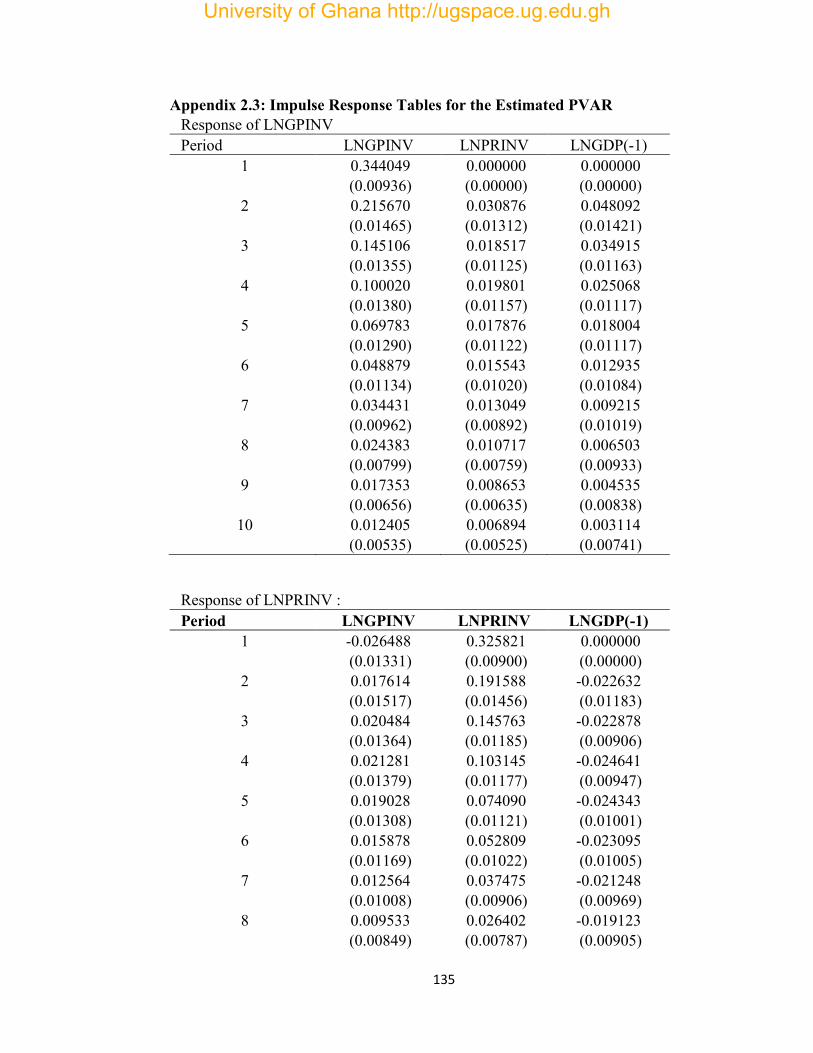
135
Appendix 2.3: Impulse Response Tables for the Estimated PVAR Response of LNGPINV Period LNGPINV LNPRINV LNGDP(-1)
1 0.344049 0.000000 0.000000
(0.00936) (0.00000) (0.00000)
2 0.215670 0.030876 0.048092
(0.01465) (0.01312) (0.01421)
3 0.145106 0.018517 0.034915
(0.01355) (0.01125) (0.01163)
4 0.100020 0.019801 0.025068
(0.01380) (0.01157) (0.01117)
5 0.069783 0.017876 0.018004
(0.01290) (0.01122) (0.01117)
6 0.048879 0.015543 0.012935
(0.01134) (0.01020) (0.01084)
7 0.034431 0.013049 0.009215
(0.00962) (0.00892) (0.01019)
8 0.024383 0.010717 0.006503
(0.00799) (0.00759) (0.00933)
9 0.017353 0.008653 0.004535
(0.00656) (0.00635) (0.00838)
10 0.012405 0.006894 0.003114 (0.00535) (0.00525) (0.00741)
Response of LNPRINV : Period LNGPINV LNPRINV LNGDP(-1)
1 -0.026488 0.325821 0.000000
(0.01331) (0.00900) (0.00000)
2 0.017614 0.191588 -0.022632
(0.01517) (0.01456) (0.01183)
3 0.020484 0.145763 -0.022878
(0.01364) (0.01185) (0.00906)
4 0.021281 0.103145 -0.024641
(0.01379) (0.01177) (0.00947)
5 0.019028 0.074090 -0.024343
(0.01308) (0.01121) (0.01001)
6 0.015878 0.052809 -0.023095
(0.01169) (0.01022) (0.01005)
7 0.012564 0.037475 -0.021248
(0.01008) (0.00906) (0.00969)
8 0.009533 0.026402 -0.019123
(0.00849) (0.00787) (0.00905)
University of Ghana http://ugspace.ug.edu.gh
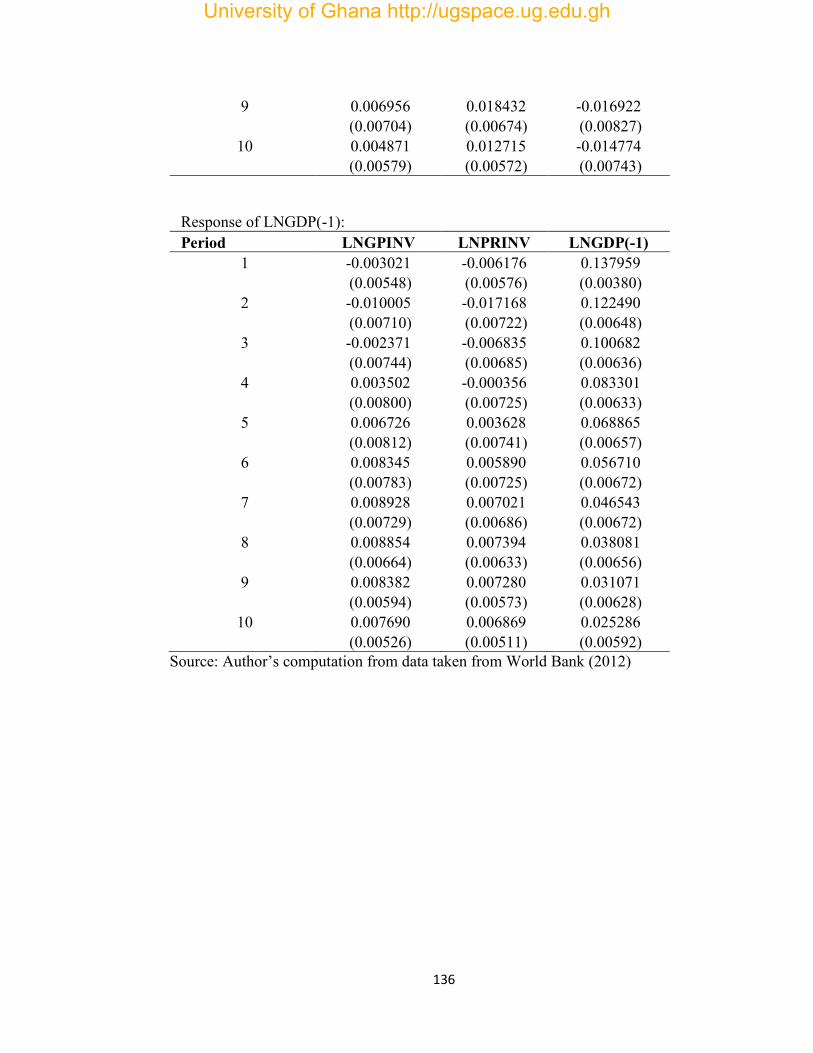
136
9 0.006956 0.018432 -0.016922
(0.00704) (0.00674) (0.00827)
10 0.004871 0.012715 -0.014774 (0.00579) (0.00572) (0.00743)
Response of LNGDP(-1): Period LNGPINV LNPRINV LNGDP(-1)
1 -0.003021 -0.006176 0.137959
(0.00548) (0.00576) (0.00380)
2 -0.010005 -0.017168 0.122490
(0.00710) (0.00722) (0.00648)
3 -0.002371 -0.006835 0.100682
(0.00744) (0.00685) (0.00636)
4 0.003502 -0.000356 0.083301
(0.00800) (0.00725) (0.00633)
5 0.006726 0.003628 0.068865
(0.00812) (0.00741) (0.00657)
6 0.008345 0.005890 0.056710
(0.00783) (0.00725) (0.00672)
7 0.008928 0.007021 0.046543
(0.00729) (0.00686) (0.00672)
8 0.008854 0.007394 0.038081
(0.00664) (0.00633) (0.00656)
9 0.008382 0.007280 0.031071
(0.00594) (0.00573) (0.00628)
10 0.007690 0.006869 0.025286 (0.00526) (0.00511) (0.00592)
Source: Author’s computation from data taken from World Bank (2012)
University of Ghana http://ugspace.ug.edu.gh
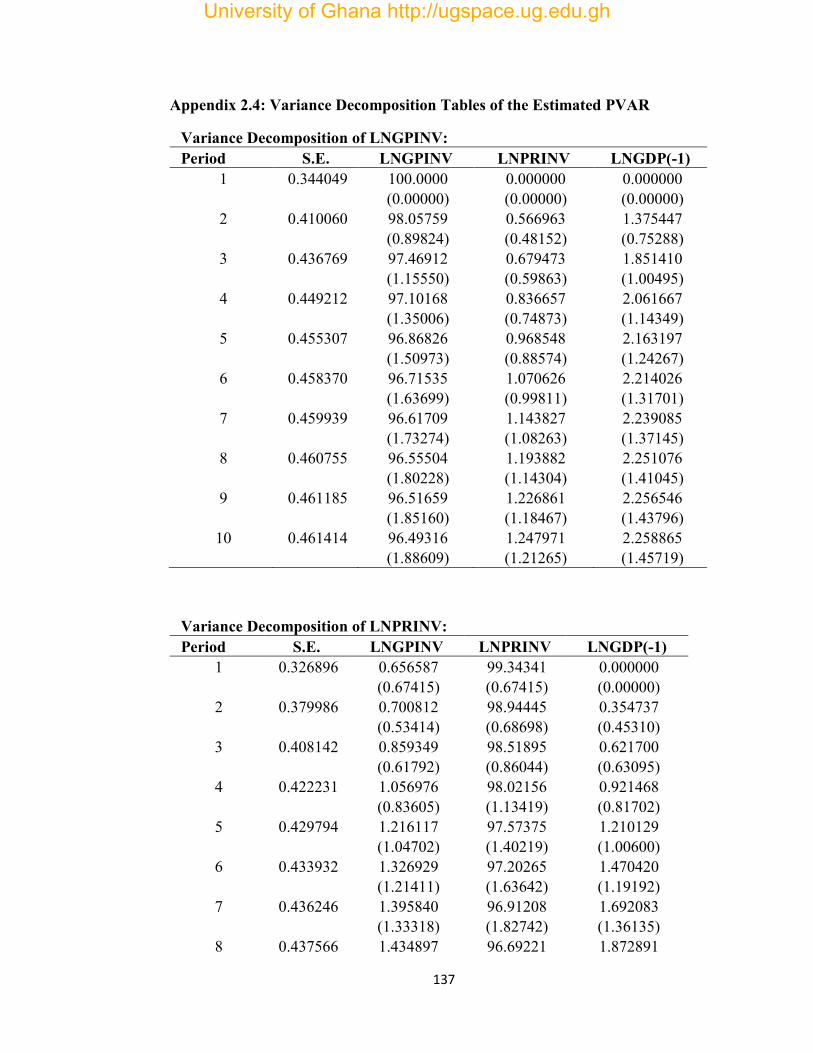
137
Appendix 2.4: Variance Decomposition Tables of the Estimated PVAR
Variance Decomposition of LNGPINV: Period S.E. LNGPINV LNPRINV LNGDP(-1)
1 0.344049 100.0000 0.000000 0.000000
(0.00000) (0.00000) (0.00000)
2 0.410060 98.05759 0.566963 1.375447
(0.89824) (0.48152) (0.75288)
3 0.436769 97.46912 0.679473 1.851410
(1.15550) (0.59863) (1.00495)
4 0.449212 97.10168 0.836657 2.061667
(1.35006) (0.74873) (1.14349)
5 0.455307 96.86826 0.968548 2.163197
(1.50973) (0.88574) (1.24267)
6 0.458370 96.71535 1.070626 2.214026
(1.63699) (0.99811) (1.31701)
7 0.459939 96.61709 1.143827 2.239085
(1.73274) (1.08263) (1.37145)
8 0.460755 96.55504 1.193882 2.251076
(1.80228) (1.14304) (1.41045)
9 0.461185 96.51659 1.226861 2.256546
(1.85160) (1.18467) (1.43796)
10 0.461414 96.49316 1.247971 2.258865 (1.88609) (1.21265) (1.45719)
Variance Decomposition of LNPRINV: Period S.E. LNGPINV LNPRINV LNGDP(-1)
1 0.326896 0.656587 99.34341 0.000000
(0.67415) (0.67415) (0.00000)
2 0.379986 0.700812 98.94445 0.354737
(0.53414) (0.68698) (0.45310)
3 0.408142 0.859349 98.51895 0.621700
(0.61792) (0.86044) (0.63095)
4 0.422231 1.056976 98.02156 0.921468
(0.83605) (1.13419) (0.81702)
5 0.429794 1.216117 97.57375 1.210129
(1.04702) (1.40219) (1.00600)
6 0.433932 1.326929 97.20265 1.470420
(1.21411) (1.63642) (1.19192)
7 0.436246 1.395840 96.91208 1.692083
(1.33318) (1.82742) (1.36135)
8 0.437566 1.434897 96.69221 1.872891
University of Ghana http://ugspace.ug.edu.gh
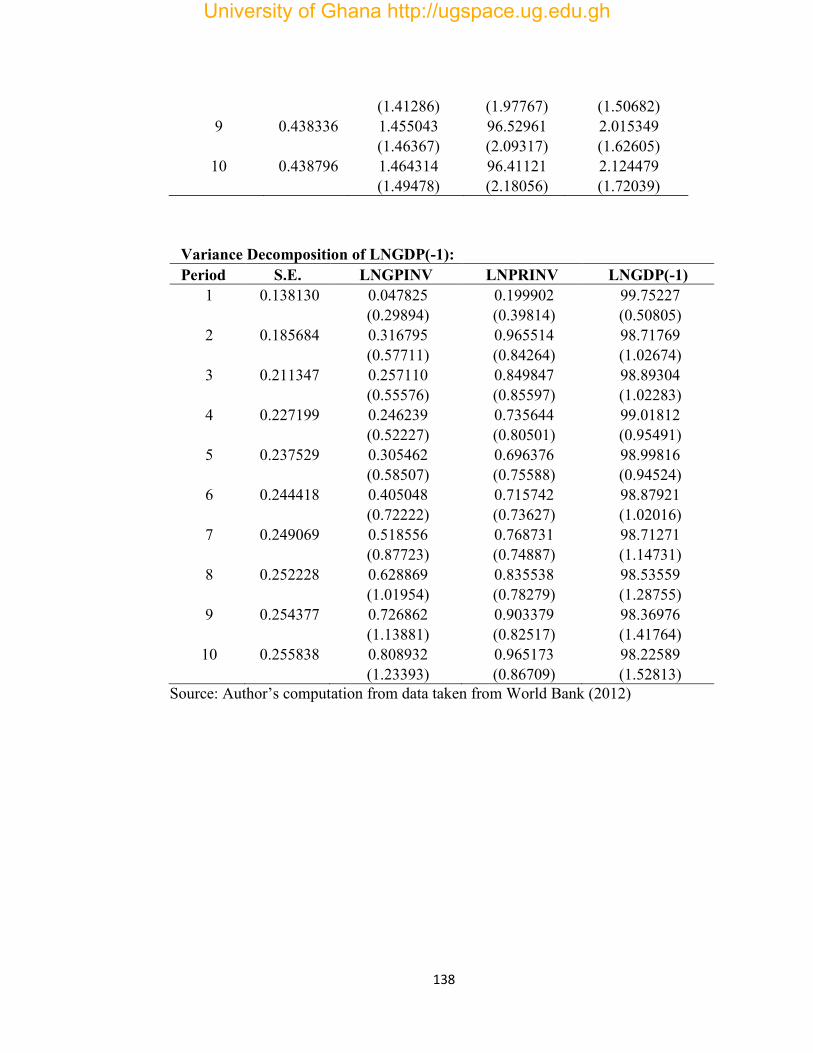
138
(1.41286) (1.97767) (1.50682)
9 0.438336 1.455043 96.52961 2.015349
(1.46367) (2.09317) (1.62605)
10 0.438796 1.464314 96.41121 2.124479 (1.49478) (2.18056) (1.72039)
Variance Decomposition of LNGDP(-1): Period S.E. LNGPINV LNPRINV LNGDP(-1)
1 0.138130 0.047825 0.199902 99.75227
(0.29894) (0.39814) (0.50805)
2 0.185684 0.316795 0.965514 98.71769
(0.57711) (0.84264) (1.02674)
3 0.211347 0.257110 0.849847 98.89304
(0.55576) (0.85597) (1.02283)
4 0.227199 0.246239 0.735644 99.01812
(0.52227) (0.80501) (0.95491)
5 0.237529 0.305462 0.696376 98.99816
(0.58507) (0.75588) (0.94524)
6 0.244418 0.405048 0.715742 98.87921
(0.72222) (0.73627) (1.02016)
7 0.249069 0.518556 0.768731 98.71271
(0.87723) (0.74887) (1.14731)
8 0.252228 0.628869 0.835538 98.53559
(1.01954) (0.78279) (1.28755)
9 0.254377 0.726862 0.903379 98.36976
(1.13881) (0.82517) (1.41764)
10 0.255838 0.808932 0.965173 98.22589 (1.23393) (0.86709) (1.52813)
Source: Author’s computation from data taken from World Bank (2012)
University of Ghana http://ugspace.ug.edu.gh
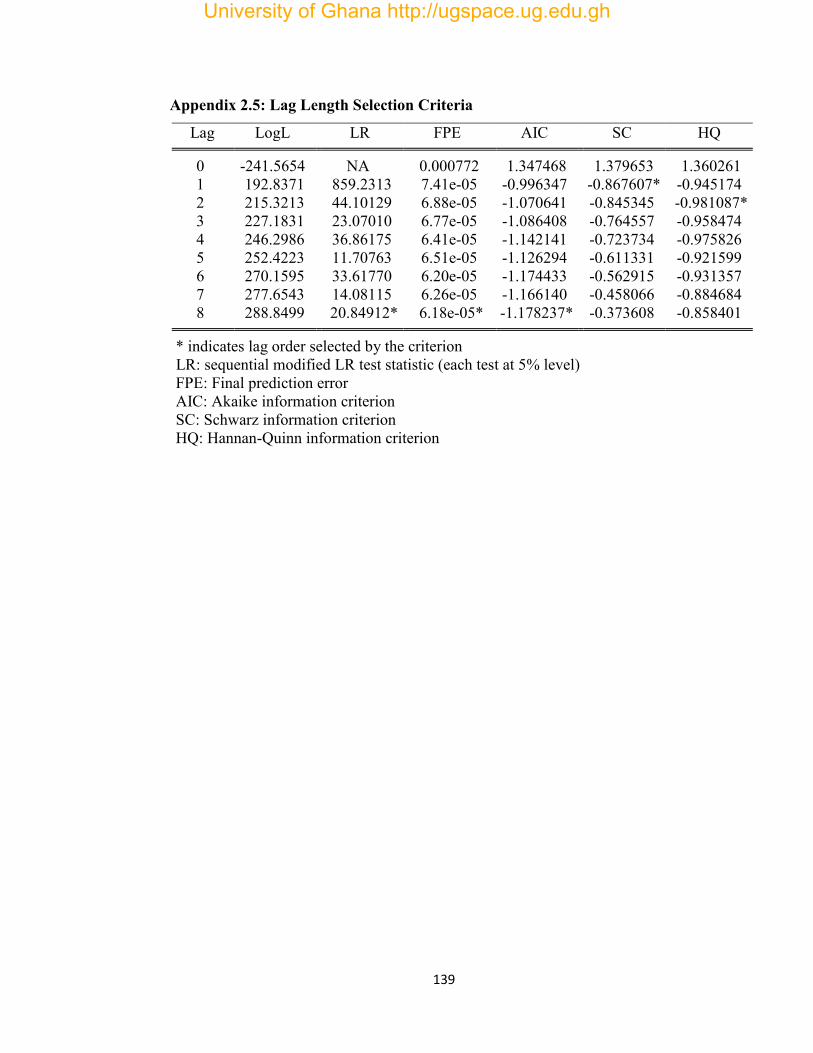
139
Appendix 2.5: Lag Length Selection Criteria Lag LogL LR FPE AIC SC HQ 0 -241.5654 NA 0.000772 1.347468 1.379653 1.360261 1 192.8371 859.2313 7.41e-05 -0.996347 -0.867607* -0.945174 2 215.3213 44.10129 6.88e-05 -1.070641 -0.845345 -0.981087* 3 227.1831 23.07010 6.77e-05 -1.086408 -0.764557 -0.958474 4 246.2986 36.86175 6.41e-05 -1.142141 -0.723734 -0.975826 5 252.4223 11.70763 6.51e-05 -1.126294 -0.611331 -0.921599 6 270.1595 33.61770 6.20e-05 -1.174433 -0.562915 -0.931357 7 277.6543 14.08115 6.26e-05 -1.166140 -0.458066 -0.884684 8 288.8499 20.84912* 6.18e-05* -1.178237* -0.373608 -0.858401 * indicates lag order selected by the criterion
LR: sequential modified LR test statistic (each test at 5% level) FPE: Final prediction error AIC: Akaike information criterion SC: Schwarz information criterion HQ: Hannan-Quinn information criterion
University of Ghana http://ugspace.ug.edu.gh
140
CHAPTER THREE
PRIVATE INVESTMENT AND LABOUR DEMAND IN SUB-
SAHARAN AFRICA
Abstract
This chapter presents the empirical work on the second objective. That is, assessing
whether employment generation (total, male, female and youth) is part of the benefits
that Sub Saharan African (SSA) economies get from private investment. I estimated a
derived neoclassical labour demand model that allows for the inclusion of private
investment, real labour cost, human capital and public investment. The results
indicate that while private investment has a substitutive effect on employment (total,
male and female), public investment compliments employment. Also, real wage rate
and human capital have significantly negative relationships with labour demand.
Meanwhile the result on the youth employment effect of private investment is
inconclusive. Thus, it is suggested that employment incentive policies through tax
reliefs and exemptions should be offered to private investors while measures to
sustain public investment are undertaken.
3.1.0 Introduction
The development of every nation is the ultimate goal of all economic, social and
political policies. Job creation contributes to development by boosting living
standards, raising productivity, and fostering social cohesion (World Bank, 2013).
Unfortunately, however, some 200 million people (predominantly young people) are
unemployed (International Financial Corporation-IFC, 2013). ILO (2014) report
University of Ghana http://ugspace.ug.edu.gh
141
indicates that global unemployment increased in 2013 by five million people. The
estimates are even gloomier because apart from the fact that about 600 million new
jobs would have to be created by 2020 (mainly in Africa and Asia), these jobs need to
be good (IFC, 2013).
Some claim that the global credit crunch is responsible for worsening an already
deteriorating global employment condition. The effect of the crunch on employment
has been a dipping global employment level, further aggravating an age-long
problem. Nickell (2010) asserted that the worldwide credit crunch and collapse of
aggregate demand should be blamed for the recent rise in unemployment. Earlier,
Kessing (2003) argued that the effect of the economic crises on public sector
employment has been a reduction in real wage and not the level of employment. But
recently, the International Labour Organisation – ILO (2013) report indicated that
global employment trends do not only show a rise in unemployment but with
significant regional differences. The report further states that five years after the
outbreak of the global financial crisis, labour markets remain deeply depressed and
unemployment has started to rise again as the economic outlook worsens. Through
spillovers, the African economy was not insulated from the negative effect of the
crunch including that of the growing global unemployment challenge (ILO, 2013).
The employment condition in Africa needs special attention not only in periods of
economic down turn but also in eras of rising economic growth. Emery (2003)
warned of a decreasing employment content of growth and increasing inequality over
University of Ghana http://ugspace.ug.edu.gh
142
the preceding few decades. Thus, employment generation still remains a global
challenge especially for Africa which need not just create more jobs but good ones.
These have resuscitated a new search for fighting unemployment and its related
problems. In the search for solutions for this global challenge, Guy Ryder - ILO
director, advices (in ILO Report 2013) that “The global nature of the crisis means
countries cannot resolve its impact individually and with domestic measures only.”
He explained that the cloud of uncertainty surrounding investment and job creation
means that countries need to take concerted actions to help resolve this growing
global challenge. Investment is one of the traditional ways of curbing unemployment
basically because manpower compliments or serves as a substitute for physical
capital. Cherian (1998) argued that investment may be considered the most important
component of GDP because (1) Plant and Equipment have a long-term effect on the
economy’s productive capacity, (2) Changes in investment spending directly affect
levels of employment and worker’s incomes in durable goods industries, and (3)
supply and demand are sensitive to changes in investment. In an analysis of the
relationship between governance, transparency and private investment in Africa,
Emery (2003) observed that private investment in a country had positive effects not
only on growth but also on the incidence of poverty. Impliedly, private sector
investment, including domestic and foreign direct private investment, when operated
in a conducive environment, can be a key driver of economic development, job
creation and inclusive growth. Consequently, the role of the private sector in solving
University of Ghana http://ugspace.ug.edu.gh
143
this global challenge cannot be underestimated, especially in developing economies
where about 90% of jobs are provided by the private sector (IFC, 2013).
Even though the Sub-Saharan African (SSA) region’s unemployment rate, as at 2011,
(about 8.8%) was better than that of North Africa (about 10.9%), Middle East (about
10.5%), Central and South-Eastern Europe (about 9%), the performance of the region
was about 2.4 percentage points worse than the global average. Also, most of the jobs
in the SSA region seem not to be good, as the region was the second worse region in
the world in terms of share of working poor. About 65% of total employment in 2011
was found to belong to this category. This situation is particularly worrying because
it is more than double the global average (about 29%) (International Labour
Organisation-ILO, 2012). Analyses of the changes in employment in the SSA region,
over the study period, show some interesting results. Generally, the second decade of
the study period (2000-2009) shows an increase in employment to population ratio
from 63.77% (1990 – 1999) to 64.46%. Interestingly, while more females are joining
the working populations (55.31% to 57.18%), the opposite can be said of their male
counterparts (fell from 72.60% to 71.95%), when the two decades are compared.
Apart from the fact that the total percentage of youth working fell (from 47.48% to
46.89%), the changes in female youth employment (increased from 42.93% to
43.10%) and that of male youth employment (decreased from 52.07% to 50.68%) is
reminiscent of movements in total female employment and total male employment,
when the first and second decades of the study periods are compared.
University of Ghana http://ugspace.ug.edu.gh
144
Meanwhile investment has seen some considerable improvement, based on data used
for the study. Total investment in the second decade of the study period (2000 –
2009) showed a marginal increase from 19.72% (1990 – 1999) to 20.06% of GDP.
There is also evidence of a gradual shift from government led investment to private
sector controlled investment in SSA. Public sector investment fell from 7.72% (1990
– 1999) to 7.10% (2000 – 2009) while private investment increased from 12.40% of
GDP to 13.10% of GDP. All throughout the study period, private investment
accounted for the greater proportion of total investment (Table 1.1). Also, between
2001 and 2010 net flows of foreign direct investment in Sub-Saharan Africa totaled
about US$33 billion—almost five times the US$7 billion total between 1990 and
1999 (World Bank, 2011).
In spite of these developments, Dinh et al., (2012) maintain that investment on the
continent is low—less than 15 percent of gross domestic product compared with 25
percent in Asia,—and more than 80 percent of workers are stranded in low
productivity jobs. They explain that in spite of this, the continent’s largest
geographical bloc’s, Sub-Saharan Africa’s (SSA) economic performance is at a
turning point after almost 45 years of stagnation. Between 2001 and 2010 the
region’s gross domestic product grew at an average of 5.2 percent a year and per
capita income grew at 2 percent a year, up from –0.4 percent in the previous 10 years
(World Bank, 2011). International Monetary Fund (2013) adds that even with the
exclusion of Nigeria and South Africa, most countries in Sub-Saharan Africa
recorded increases in GDP. Unfortunately, however, even in periods of economic
University of Ghana http://ugspace.ug.edu.gh
145
growth, employment generation is not a natural consequence unless conscious effort
is made to make that growth beneficial to job creation (Inter-Agency Working Group
– IAWG, 2012 and Heinsz, 2000). But then, these figures reinforce the need for Sub
– Saharan Africa to put in measures to get the best out of private investment. One
way of doing so is by assessing the employment benefits of private investment.
Empirically, little is known on the employment benefits of private investment.
Discussions on the continent on private investment have largely been concentrated on
how to attract private investment (Oshikoya, 1994; Mlambo & Oshikoya, 2001). In
1999, Devarajan, Easterly & Pack opened the argument box on whether it is the size
of private investment on the continent that should be of grave concern or the
productivity of private investment. They concluded that investment on the continent
was not low because what even existed, at the time of their study, was largely not
productive. Also, quite recently, AfDB,OECD,UNECA and UNDP (2012) reported
that even though FDI remains the largest external financial flow to Africa, the
increase in investment in recent decades did not produce more inclusive growth or
sufficient jobs as most of the finance went onto the hunt for resources. These studies
seem to cast doubt on the actual benefits of private investment to the African
continent. But to Kaplinsky and Morris (2009), SSA should use their resource
endowment to get the maximum benefit from their investment relations with large
state-owned Chinese firms and other large firms who seek to benefit from their
resource endowment. These benefits, the study believes may include employment
generation.
University of Ghana http://ugspace.ug.edu.gh
146
On employment in Africa, Asiedu (2004) looked at the determinants of employment
in SSAs using data from foreign affiliates of US multinational enterprises in Africa;
Sackey (2007) considered employment impact of private investment using a sample
of SMEs from some African economies; Asiedu and Gyimah - Brempong (2008)
studied the effect of liberalization of investment policies on investment and
employment of multinational corporations in Africa; and Aterido and Hallward-
Driemeier (2010) used firm-level survey data from 104 developing economies which
included 31 sub-saharan countries to find out whether investment climate fosters
employment growth.
This study differs from that of Asiedu (2004), Sackey (2007), Asiedu and Gyimah-
Brempong (2008) and Aterido and Hallward-Driemeier (2010) because it uses
national data to assess the relationship between private investment (Not only from
USA, foreigners or SMEs) and employment in SSA using a derived neoclassical
labour demand model. The neoclassical labour demand theory predicts a negative
association between labour cost, real factor cost and labour demand and a positive
relationship between output and labour demand (Symons, 1982; Andrews &Nickell,
1982; and Sparrow, Ortmann, Lyne & Darroch, 2008). In spite of this, other
researchers argue that a positive association between wage cost and labour demand is
possible, through the aggregate demand channel, especially in recession (Keynes,
1936 and Michaillat & Saez, 2013).
University of Ghana http://ugspace.ug.edu.gh
147
Thus, the study contributes to the discussion on the benefits of private investment to
the African continent through the channel of employment generation using a derived
neoclassical labour demand model. The study is concentrated in this particular area
because: 1) even though job creation contributes to development, it has become a
global challenge, especially after the crunch (World bank, 2013 and ILO, 2013); 2)
job creation is a way of testing empirically for one of the pillars for assessing private
investment impact (IAWG, 2012); 3) it is an appropriate channel to economic growth
which has seen some improvements in Africa in recent times and seem to coincide
with improvements in FDIs as well (World Bank, 2011; Dinh et al., 2012); 4)
employment seems to be an appropriate channel for ameliorating poverty (Emery,
2003) -one of the deep seated problems of the African Continent- and as a possible
means of achieving Millennium Development Goal – MDG 1; 5) the study
contributes towards the discussion on the effect of wage cost on labour demand and;
6) insufficient labour demand is among the biggest causes of unemployment in
Africa and indeed the biggest obstacles to youth employment on the continent (AfDB
et al., 2012). It is postulated that vigorous private investment is an important vehicle
for creating jobs not only for young people (AfDB et al, 2012) but also for the entire
working population.
3.2.0 Literature Review
3.2.1 Neoclassical Theory of Employment
This study relates to the neoclassical theory of employment. The neoclassical theory
is popular in the area of demand for capital and labour (Van Reenen & Bond, 2005).
University of Ghana http://ugspace.ug.edu.gh
148
The classical employment analysis is based on the Market Law (Say, 1834) of
exchange activity: "Supply creates its own demand." Based on this view, Classicists
view unemployment as voluntary, temporary and partial. The theory explains that
when labour supply is more than labour demand, employees are expected to accept
pay cut so that employers can be motivated to employ more people in order to restore
equilibrium in the labour market through the self- equilibrating tendency of the
economic forces. The theory positions itself on the assumptions that the economy
operates at full employment and that prices and wages are flexible. A firm's labour
demand is then based on its marginal physical product of labour (MPPL).
The theory is criticized by Keynes (1936) on the grounds that the market law which
forms the bedrock of the classical labour demand theory can only exist in a barter
economy but not in a modern economy where money plays a major role as a medium
of exchange. Thus, this casts doubt on the self-equilibrating tendency of the
economic forces. Also, Keynes argues that prices and wages flexibility does not
always create equilibrium conditions. For instance a reduction in wage rates in
periods of deep depression in an attempt to curb unemployment may worsen the
unemployment situation because it would reduce aggregate demand. Thus, aggregate
demand better explains employment than wage rate.
Earlier researches failed to establish the predicted negative relationship between
wage rate and employment as postulated by the neoclassical theory (Dunlop, 1938).
Some of the reasons assigned to this were poor data quality (Symons & Layard,
University of Ghana http://ugspace.ug.edu.gh
149
1986), the size of expected output (Barro & Grossman, 1971) and costly adjustment
of workforce (Sargent, 1978). But latter studies supported the theory albeit after
accounting for the simultaneous effect of real price of raw materials and lags of real
wage (Symons, 1982; Andrews & Nickell, 1982). These studies, therefore, placed
particular importance on the effect of adjustment cost in determining the magnitude
of wage shocks on labour demand (Kessing, 2003). It was Oi (1962) who set the tone
for this area of research in labour demand. He explained that because of adjustment
cost, labour is not a perfectly flexible factor of production.
Kessing (2003) explains that changes in real wage rate do not sometimes have the
desired impact on labour demand because changes in labour demand are affected by
the adjustment process and its related cost. In other words, it takes time and money,
for instance, to employ more people as a result of a fall in real wages because it
requires training of new employees and expansion of existing facility. Weak labour
mobility also stalls the adjustment process. Thus, firm response to wage changes is
smaller in the short term than in the intermediate or long-term (Lichter , Peichl &
Siegloch, 2013).
Job security provisions like high firing costs also have the likelihood of improving
long-run employment outlook for all workers. But then firing cost might reduce
average labour demand for seasonal jobs. Turnover cost affects employment
dynamics more than average employment (Lazear, 1990; Bentolila & Bertola 1990;
Bertola, 1990; Bertola, 1991). Bertola (1991) concluded that firing cost may increase
University of Ghana http://ugspace.ug.edu.gh
150
average employment while hiring cost reduces average employment. Hamermesh
(1988) revealed that employment levels only changes with large shocks and not with
smaller shocks signalling that adjustment cost influences employment responses to
policy changes. Goux, Maurin and Pauchet (2001) found in France that the firing
cost of indefinite –term contracts is greater than their hiring cost and that because of
the relative cost of hiring and firing workers, it is less costly to adjust the number of
fixed term contracts than to adjust the number of indefinite-term contracts. From their
study, the effect of hiring and firing cost is of particular importance to non-
production workers than for production workers.
Following from these, some studies have sought to estimate the speed of the
adjustment and generally concluded that the adjustment period is faster, within a year
(Hamermesh, 1993). Exceptions to this include Nickell and Wadhwani (1991),
Bentolila and Gilles (1992) and Mairesse and Dormont (1985). The presence of
adjustment cost makes it imperative to use dynamic models in modeling labour
demand, in order to account for the inclusion of both contemporaneous and lagged
values of the variables (Lichter et al., 2013).
Empirical results on the relationship between real factor costs and labour demand
have been generally negative. Symons and Layard (1984) concluded that real factor
prices (real wage cost and raw material cost) are more important in determining the
level of employment than aggregate demand. Also, Boug (1999) reports, using data
from Norwegian manufacturing and time series analysis that labour demand is
University of Ghana http://ugspace.ug.edu.gh
151
influenced positively by production and negatively by the stock of real capital, real
factor prices and total factor productivity. Pierluigi and Roma (2008) depict, based on
data from the five largest Euro area countries, that job creation is enhanced through
labour cost moderation, even though, the extent of enhancement varies across
countries and sectors. But, according to Köllő, Kőrösi and Surányi (2003), when
labour is assumed to be homogeneous, the cost of capital has no significant role in
labour demand. They also concluded that Production and labour costs are equally
important explanatory variables of firm-level labour demand and that labour demand
was more elastic downward than upward. Furthermore, in South Africa, Sparrow et
al., (2008) reported that an increase in the cost of regular farm labour as a result of
minimum wage legislation, resulted in a marked structural decline in the demand for
regular farm labour.
Inspite of the generally negative results found on the relationship between real wage
cost and employment, the debate on the exact impact of wage cost on employment
seems to be far from being resolved. Quite recently, Michaillat and Saez (2013) posit
that when profits and wage are not equally distributed, a rise in wage rate may
stimulate aggregate demand and reduce unemployment. This position casts doubt on
the neoclassical theory but supports the Keynes view of employment.
Knowledge about the wage elasticities of labour demand is important not only for
economic research but also for policy analysis (Lichter et al., 2013; Hamermesh,
1993). Own wage elasticities of demand is not homogeneous across countries and
University of Ghana http://ugspace.ug.edu.gh
152
that differences in institutional regulations play a major role in influencing this
behaviour (Pierluigi & Roma, 2008; Lichter et al., 2013). In the short-run, the
neoclassical model considers only wage cost as the main determinant of labour
demand while wage cost, real interest cost and output are seen to influence long-run
labour demand. This study contributes to the neoclassical theory by using
disaggregated demand variable, private investment, to assess its impact on labour
demand after controlling for other important factors like public investment and
political stability in Sub-Saharan Africa.
3.2.2 Empirical Literature Review
This study tests, empirically, the potency of private investment in generating
employment, as espoused in literature (Cherain, 1996; Emery, 2003), using data from
Sub-Saharan Africa. Researches in this area have largely been concentrated on the
employment impact of: FDI (Driffield & Taylor, 2000; Henneberger & Ziegler, 2006;
Karlsson, Lundin, Sjöholm, & He, 2007; Ndikumana & Sher, 2008; Mucuk &
Demirsel, 2013; Habib & Sarwar, 2013) minimum wage (Neumark & Wascher,
2006; Neumark & Wascher, 2007; Herr, Kazandziska & Mahnkopf-Praprotnik
,2009); infrastructure investment (Garrett-Peltier, 2010; Pereira & Andraz, 2012);
Wage cost (Peichl & Siegloch, 2012); Technology and innovations (Berman, Bound
& Griliches,1994; Machin, Van Reenen & Ryan,1996; Van Reenen, 1997; Falk &
Koebel, 2004; and Addison, Bellman, Schank & Paulino, 2008); globalization
(Hijzen, Gorg & Hine, 2005; and Hijzen & Swaim , 2010); ownership structure
(Barba Navaretti, Turrini & Chcchi, 2003) and; capital structure (Funke, Maurer &
University of Ghana http://ugspace.ug.edu.gh
153
Strulik, 1999). Very few concentrate on private investment (foreign and domestic), in
total, on labour demand (Psaltopoulos, Skuras &Thomson, 2011).
Blomstrom, Fors and Lipsey (1997) revealed that in US larger foreign production is
associated with lower parent employment, because of relatively low productive
activities in parent country. They further explained that foreign production in
developing economies and not developed countries was the main source of lower
parent employment and that U.S. firms were enticed by lower wages in those regions.
On the other hand, Swedish parents exhibited the opposite because their overseas
production was more capital intensive. Impliedly, the study also brings to bear the
employment effects of the nature of production systems. Capital intensive production
systems have relatively low labour demand content and labour intensive production
systems obviously have relatively high labour content. Thus, the trade-off between
the labour cost and physical capital cost is probably an important determinant of
labour demand. Also, Harrison and McMillan (2004) postulate that increased capital
mobility may be associated with negative labour outcomes for both the US and
abroad.
Garrett-Peltier (2010) assessed the employment impact of the US economy’s
investment in renewable energy and energy efficiency and reported that this
investment would lead to approximately three jobs being created in clean energy
sectors for each job lost in the fossil fuel sector.
University of Ghana http://ugspace.ug.edu.gh
154
From rural areas in southern Europe, Psaltopoulos et al., (2011) show that private
investment in agriculture showed a moderate impact on regional employment even
though analysis of economy-wide jobs created showed that gross cost per job was
significantly lower. Pereira and Andraz (2012) concluded in Portugal that
investment in railway infrastructure does not only crowd in private investment and
employment at the aggregate level but also show similar effects even at the regional
level.
The effect of FDI on employment depends on the type of FDI (inward or outward)
and the predominant type of production system (machine intensive and labour
intensive) in use. Henneberger and Ziegler (2006) concluded that FDI can have both
complimentary and substitutive effect on the labour market but the positive effect of
FDI on employment is minimal. This partially supports Rosen’s (1969) and
Griliches’ (1969) hypothesis that capital and skills are compliments. Masso, Varblane
and Vahter (2007) investigated the employment effects of outward FDI on Estonia, a
low-cost medium- income transition economy. They revealed that outward FDI had
a positive impact on home country employment and the employment effects of
domestic Estonian firms investing abroad was higher than that of foreign firms in
Estonia investing abroad. To the researchers, better economic management magnified
these employment benefits and that the service industry performed better than the
manufacturing firms. In Taiwan, overseas production is generally detrimental to
domestic employment even though it has the tendency to increase domestic
employment through increased domestic output, from enhanced competitiveness
University of Ghana http://ugspace.ug.edu.gh
155
(Chen & Ku, 2003). Görg and Hanley (2005) stress that international outsourcing
leads to significant decreases in plant level labour demand but outsourcing of
services appear to have lesser negative impact than outsourcing of materials.
Karlsson et al., (2007) report a positive relationship between FDI and job creation
and this is facilitated by some firm specific characteristics particularly access to
export markets. This included direct employment by foreign owned firms and
spillover effects on domestic firms. Thus, in the long run, FDI influences
employment (Jayaraman & Singh, 2007)
Driffield and Taylor (2000) observe that increase in FDIs increase the demand for
skilled labour directly and indirectly through technological spillovers which increases
the relative skilled labour demand of domestic firms. Habib and Sarwar (2013)
conclude, from time series analysis, that FDI and per capita GDP have positive
relationship with employment levels in Parkistan. Buzás and Foti (2006) assert that
FDI leads to job creation in Hungary. Malik, Chaudhry, and Javed (2011) opine that
while FDI creates employment opportunities in Parkistan, trade openness and social
and political dimensions of globalisation negatively affects employment. On the other
hand, although FDI affects development in general it may also lead to wage
inequalities (ODI, 2002). Subsequent OECD-ILO (2008) report indicated that
workers engaged in MNEs tend to earn comparatively higher pay in their host
countries.
University of Ghana http://ugspace.ug.edu.gh
156
Mehmet and Demirsel (2013) investigated the relationship between FDI and
unemployment in seven developing countries (Argentina, Chile, Colombia,
Philippines, Thailand, Turkey and Uruguay) by using panel data analysis. They
revealed that FDI and unemployment have long-run relationship but their relationship
is not homogeneous. While FDI was found to increase unemployment in Argentina
and Turkey, it was found to reduce unemployment in Thailand.
Klette and Førre (1998) argue that research and development investment and high-
tech industries do not lead to job creation, using data from Norwegian Manufacturing
firms. They cast doubt on the optimistic view about job creation in R&D intensive
firms and high-tech industries (Katsoulacos, 1984). But partially supports
Schumpeter’s (1943) creative destruction view.
In Iran, government consumption and investment expenditures affect employment
differently. While increase in government consumption expenditure is associated
with decreases in production, employment and investment, increase in government
investment expenditure - apart from industry and mining sectors - increases
employment, Fouladi (2010).
In an attempt to meet the forecasted employment needs of some 100 million new jobs
in the Middle East and North Africa (MENA), the World Bank (2004) reported that
the new development model for that region should be based on a reinvigorated
private sector. The report further explained that this model should also include better
University of Ghana http://ugspace.ug.edu.gh
157
governance, greater integration into the world economy, and better management of
the oil resources in the region. In the same region, Ianchovichina, Estache, Foucart,
Garsous and Yepes (2012) report that, for the following decade, if the region is able
to meet the infrastructural investment needs of about 6.9 percent of gross domestic
product, annual job creation (direct and indirect) would be about 4.5million.This is in
spite of the fact that job creation from this channel alone would not be enough to
solve the region’s unemployment. Also, in the 2000s and in the MENA region,
Infrastructure investment in the construction sector was a major source of
employment for the citizenry, as compared to other countries and sectors (World
Bank, 2013b). The study further predicts that if the MENA region is able to commit
to infrastructural investment estimated at $106million annually through 2020, it
would generate approximately 2.5million infrastructure related jobs (Estache,
Ianchovichina, Bacon & Salamon, 2013).
In Africa, Ndikumana and Sher (2008) posit that the continent has witnessed an
increase in FDI inflow but the effect of this resource inflow on economic
development is yet to be ascertained. Even though the study recognised that one of
the ways of assessing economic development impact of FDI is through its
employment impact, the study did not do so. However, they concluded that FDI and
domestic private investment are compliments in Africa rather than substitutes. Huang
and Ren (2013) report from a survey of 16 Chinese enterprises in Johannesburg
(South Africa) that these investments brought about job increment to the local people
University of Ghana http://ugspace.ug.edu.gh
158
(local-skilled and unskilled labour) partially refuting international observers’
assumption that Chinese investment in Africa lacks significant employment content.
In Egypt, lack of access to the private sector is a recipe for unemployment. For
instance, during the transition to private-sector-led economy in Egypt, unemployment
was more prevalent among young educated women than their male counterparts, as a
reflection of the fact that unemployment was becoming less generalized but more
concentrated among groups that have a difficulty in accessing the private sector
(Assaad, El-Hamidi & Ahmed, 2000).
Notably, the present study is particularly related to that of Asiedu (2004), Sackey
(2007), Asiedu and Gyimah - Brempong (2008) and Aterido and Hallward-Driemeier
(2010). Asiedu (2004) concluded that good infrastructure, higher income, openness
to trade and an educated labour force have a significantly positive impact on
employment. Even though the study was on the determinants of employment in Sub-
Saharan Africa, it only used data from foreign affiliates of US multinational
enterprises in Africa. In addition, this study concentrates on the effect of private
investment (foreign or domestic) on labour demand. It further analyses this effect
from the point of view of total, male, female and youth employment and also controls
for additional important variables such as public investment and political stability.
Again, the current study also tests for the dynamic nature of labour demand because
of adjustment cost effect.
University of Ghana http://ugspace.ug.edu.gh
159
Sackey (2007) as part of a broader work of analysing the role played by small and
medium scale enterprises (SMEs) in how private investment influences structural
transformation and economic growth in Africa also considered employment impact
of private investment using a sample of SMEs including some African economies.
The study concluded, using a probit model, that investing firms are more likely to
record net additions to employment than non-investing firms. Apart from the fact that
the study was not domiciled solely in Sub-Saharan Africa, it did not also consider the
employment impact of private investment beyond SMEs. In addition, the study did
not consider whether private investment in SMEs had the same impact on the various
employment components (like male, female and youth) just as it did on total
employment. Also, certain key factors that the researcher believes would influence
the level of employment in the SSA like political stability and trade openness were
also left out. This study factors all these observations in an SSA setting.
In another related study, Asiedu and Gyimah-Brempong (2008) studied the effect of
liberalization of investment policies on investment and employment of multinational
corporations in Africa. They revealed that liberalization has a significantly positive
effect on investment and that its relationship on multinational employment is indirect.
Data on employment was from employment of US affiliates in MNCs in Africa.
Thus, the Wage variable used, may be distorted because it carried within it the impact
of the wage conditions that exist in the mother company since it included
compensation of expatriates employed by the American affiliate in the host country.
University of Ghana http://ugspace.ug.edu.gh
160
Aterido and Hallward-Driemeier (2010) used firm-level survey data from 104
developing economies which included 31 SSA countries to find out whether
investment climate (like number of outages, share of firms with bank loans and
others) fosters employment growth and whether there exist some similarities among
the countries. They concluded that average firm level employment growth rate is
quite similar in spite of differences in the quality of investment climate. Although
this study offers useful insights from disaggregated data it fails to test directly the
effect of investment and in particular private investment on employment in SSA,
which is the focus of this chapter.
3.3.0 Methodology
3.3.1 Theoretical Justification of the Neoclassical Labour Demand Model
The focus of this chapter is to assess, empirically, whether the benefits from private
investment include employment, using data from SSA and within an Arellano-Bond
dynamic framework. A derived neoclassical labour demand model that allows for the
explicit inclusion of real wage rate, private investment, public investment human
capital and other relevant external factors that may condition labour demand in SSA
is estimated.
Neoclassical labour demand model depicts that labour demand is wage elastic. The
model also specifies that labour should be hired up to the point where marginal
revenue is just equal to marginal cost, based on diminishing marginal returns
principle. The demand for labour is derived from the demand for output. The
University of Ghana http://ugspace.ug.edu.gh
161
derivation of this neoclassical labour demand model relies on related ones like
Layard, Nickell and Jackman (1991) and Lewis and MacDonald (2002) that use a
Cobb Douglas production function. But other studies use a constant elasticity of
substitution (CES) function (Rowthorn, 1999; Pierlugi & Roma, 2008). Following
Mankiw, Romer and Weil (1992), consider a Harrod-neutral (deemed to be consistent
with the existence of steady state - Barro and Sala-i-Martin, 2004) three-factor Cobb-
Douglas (1928) production function as follows:
1,, itititit HALKHLKfQ , α > 0, β> 0, α + β < 1 (1)
Where H is human capital, K is physical capital, A is labour augmenting
technological progress, L is labour and Q is ouput. Also, α, β and 1-α-β are the
physical capital, labour and human capital elasticities respectively. i represents
countries and t represents time.
The marginal product of labour (MPL) is the change in output with respect to a unit
change in labour which is stated mathematically as:
MPL =
it
it
LQ
OR it
it
LQ
(2)
Given that
1itititit HALKQ , when we multiply both sides of the output equation by
L it
leads to
)(L
1
it
itititit
it
HALKQL
=MPL (3)
University of Ghana http://ugspace.ug.edu.gh
162
LMP
11ititit
it
it HLAKLQ
(4)
We are interested in the effect of private investment on labour demand. So we
decompose the total capital stock variable into private and public components, with
some conditions. These conditions are necessary because, even though, private
investment and public investment are shown to be substitutes (based on results of
Chapter 2), a certain minimum level of public investment in basic infrastructure is
necessary for private investment to thrive. Thus, the relationship between private and
public investments is shown below:
Let pitgitit KKK 0, a
pitagit KK , 10 (5)
where
gitK = is public capital Stock;
pitK = is private capital stock.
The evolution of the private and public capital stocks takes the following standard
forms;
11)( pitpitpitpit KKKI (5A)
11)( gitgitgitgit KKKI (5B)
where pitI and gitI are the private and public investments, respectively; is the
depreciation rate of investment, assumed to be the same for both private and public. As
a result of the difficulty in getting depreciation rates for the countries in the study, the
University of Ghana http://ugspace.ug.edu.gh
163
study used an arbitrarily chosen value of 0 based on studies by Blejer and Khan (1984)
and Ramirez (1994). Their studies show that sensitivity analysis using depreciation
values between 0 and 5 show no significant differences in results for developing
economies. Similar results were also reported by Erden & Holcombe (2005) and
Muthali (2012).
When equation (5) is substituted into (4), we get
11)( itititpgL HLKKAMP (6)
The profit maximizing level of employment occurs at the point where marginal
revenue product of labour (MRPL) is equal to nominal wages, which is stated
mathematically as:
wMRPL (7)
wMPp L (8)
pwMPL , (9)
where LMRP is further explained as the product of marginal revenue ( p ), which is
equal to the price of each unit of output sold and LMP . That is equation (8)
Equations (6) and (9) are then equated as follows:
(10)
Taking the natural logarithm of both sides of equation (10) leads to
itititpitgit p
wHLKKA lnln)1(ln)1(lnln)ln( (11)
ititititpg p
wHLKKA
11)(
University of Ghana http://ugspace.ug.edu.gh
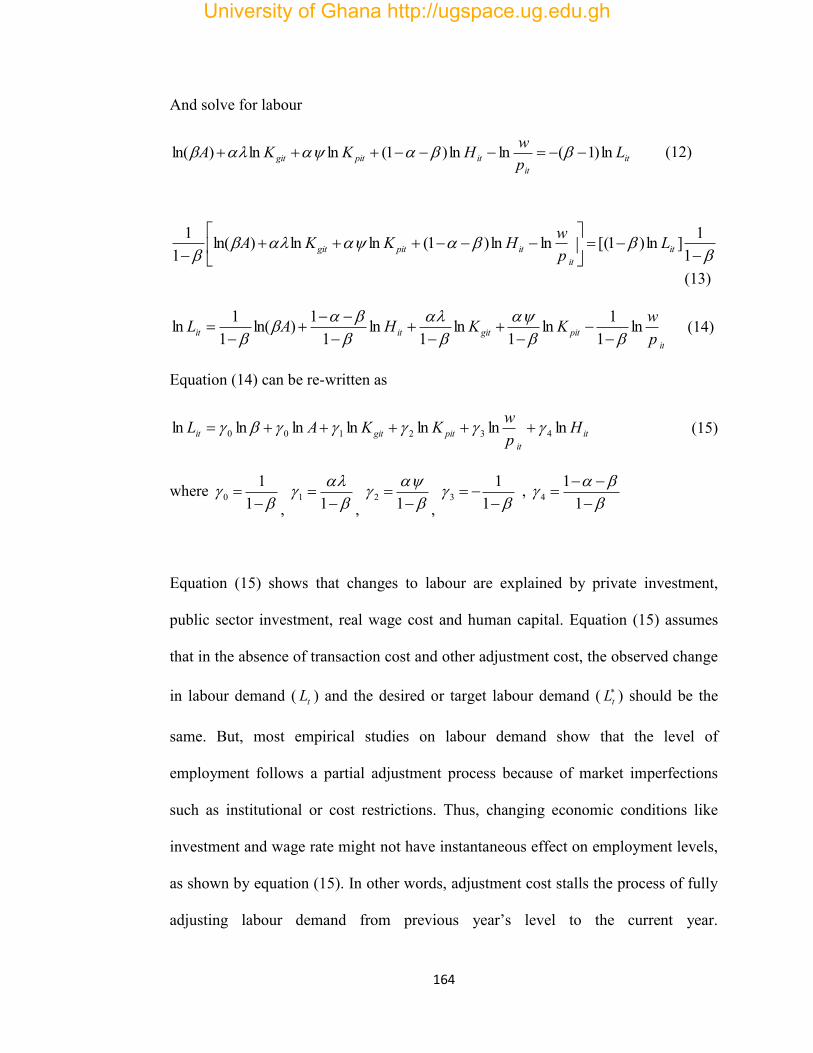
164
And solve for labour
itit
itpitgit LpwHKKA ln)1(lnln)1(lnln)ln( (12)
11]ln)1[(lnln)1(lnln)ln(
11
itit
itpitgit LpwHKKA
(13)
itpitgititit p
wKKHAL ln1
1ln1
ln1
ln1
1)ln(1
1ln
(14)
Equation (14) can be re-written as
itit
pitgitit HpwKKAL lnlnlnlnlnlnln 432100 (15)
where
1
10
,
11,
12,
11
3 ,
11
4
Equation (15) shows that changes to labour are explained by private investment,
public sector investment, real wage cost and human capital. Equation (15) assumes
that in the absence of transaction cost and other adjustment cost, the observed change
in labour demand ( tL ) and the desired or target labour demand (
tL ) should be the
same. But, most empirical studies on labour demand show that the level of
employment follows a partial adjustment process because of market imperfections
such as institutional or cost restrictions. Thus, changing economic conditions like
investment and wage rate might not have instantaneous effect on employment levels,
as shown by equation (15). In other words, adjustment cost stalls the process of fully
adjusting labour demand from previous year’s level to the current year.
University of Ghana http://ugspace.ug.edu.gh
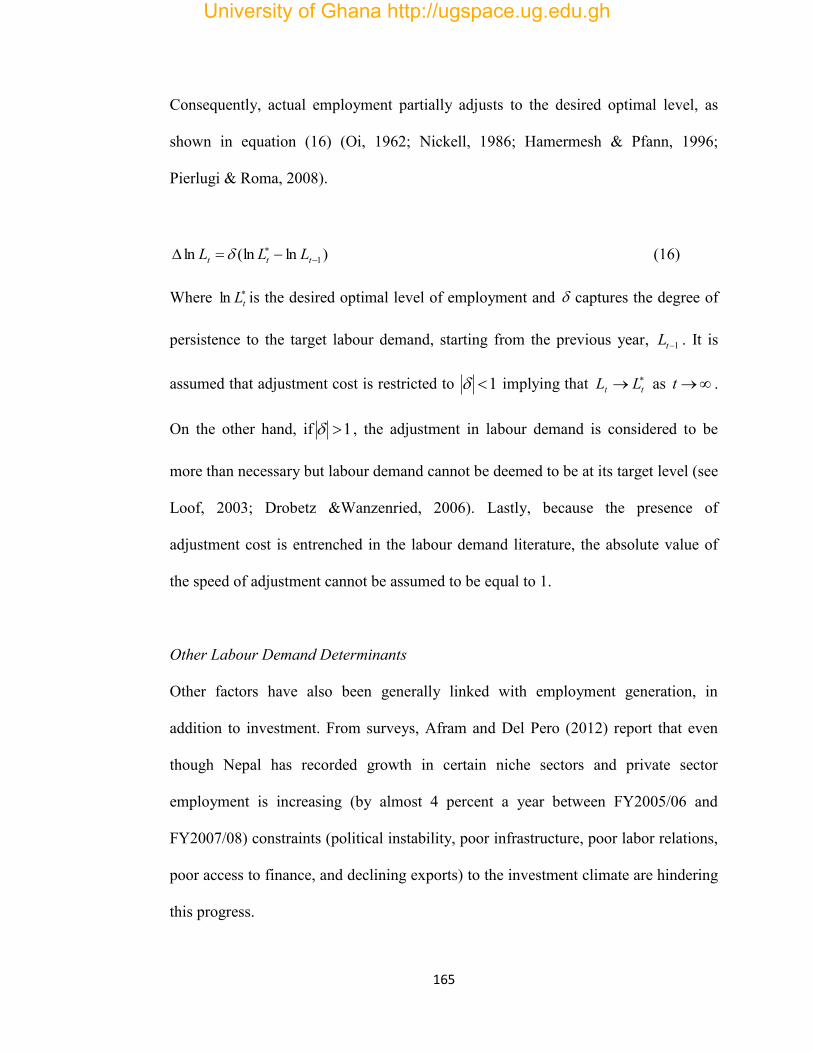
165
Consequently, actual employment partially adjusts to the desired optimal level, as
shown in equation (16) (Oi, 1962; Nickell, 1986; Hamermesh & Pfann, 1996;
Pierlugi & Roma, 2008).
)ln(lnln 1 ttt LLL (16)
Where
tLln is the desired optimal level of employment and captures the degree of
persistence to the target labour demand, starting from the previous year, 1tL . It is
assumed that adjustment cost is restricted to 1 implying that tt LL as t .
On the other hand, if 1 , the adjustment in labour demand is considered to be
more than necessary but labour demand cannot be deemed to be at its target level (see
Loof, 2003; Drobetz &Wanzenried, 2006). Lastly, because the presence of
adjustment cost is entrenched in the labour demand literature, the absolute value of
the speed of adjustment cannot be assumed to be equal to 1.
Other Labour Demand Determinants
Other factors have also been generally linked with employment generation, in
addition to investment. From surveys, Afram and Del Pero (2012) report that even
though Nepal has recorded growth in certain niche sectors and private sector
employment is increasing (by almost 4 percent a year between FY2005/06 and
FY2007/08) constraints (political instability, poor infrastructure, poor labor relations,
poor access to finance, and declining exports) to the investment climate are hindering
this progress.
University of Ghana http://ugspace.ug.edu.gh
166
Aterido, Hallward-Driemeier and Pagés (2007) reveal that business environment that
does not support access to finance and business regulation reduce the employment
growth of all firms but micro and small firms suffer the most. Also, corruption and
poor access to infrastructure are detrimental to employment growth of medium size
and large firms. These conclusions were based on World Bank Enterprise Survey
(WES) data from about 70,000 enterprises in 107 countries. In other words,
institutional and structural variables play a key role in labour demand analysis
(Pierluigi & Roma, 2008)
Heinsz (2001) postulated that increases in political instability explain the largest
portion of the decline in the rate of investment in South Africa. In that study,
econometric estimates showed significant negative effects of higher average product
wages and greater political unrest on the labor-capital ratio. Also, among South
African manufacturing firms, Edwards and Behar (2006) report that trade
liberalization and technological change have affected the skill structure of
employment. They explain that export orientation, raw materials imports, training,
investment in computers and firm age are positively associated with the skill intensity
of production.
Some research also link employment with human capital development (Pryor &
Schaffer, 1999; Card, 1999; Wolman, Young & Blumenthal, 2008). In Nigeria,
Aromolaran (2004) postulates that even though private returns to schooling
associated with levels of educational attainment for wage and self employed workers
University of Ghana http://ugspace.ug.edu.gh
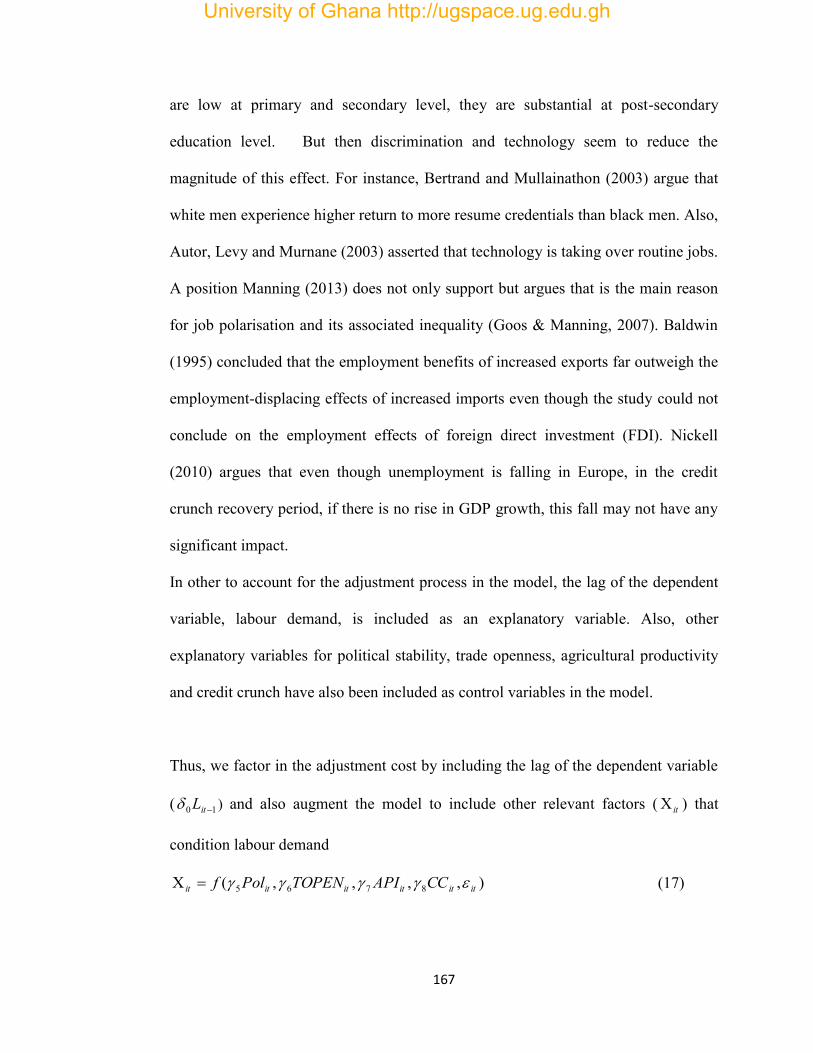
167
are low at primary and secondary level, they are substantial at post-secondary
education level. But then discrimination and technology seem to reduce the
magnitude of this effect. For instance, Bertrand and Mullainathon (2003) argue that
white men experience higher return to more resume credentials than black men. Also,
Autor, Levy and Murnane (2003) asserted that technology is taking over routine jobs.
A position Manning (2013) does not only support but argues that is the main reason
for job polarisation and its associated inequality (Goos & Manning, 2007). Baldwin
(1995) concluded that the employment benefits of increased exports far outweigh the
employment-displacing effects of increased imports even though the study could not
conclude on the employment effects of foreign direct investment (FDI). Nickell
(2010) argues that even though unemployment is falling in Europe, in the credit
crunch recovery period, if there is no rise in GDP growth, this fall may not have any
significant impact.
In other to account for the adjustment process in the model, the lag of the dependent
variable, labour demand, is included as an explanatory variable. Also, other
explanatory variables for political stability, trade openness, agricultural productivity
and credit crunch have also been included as control variables in the model.
Thus, we factor in the adjustment cost by including the lag of the dependent variable
( 10 itL ) and also augment the model to include other relevant factors ( it ) that
condition labour demand
),,,,( 8765 itititititit CCAPITOPENPolf (17)
University of Ghana http://ugspace.ug.edu.gh
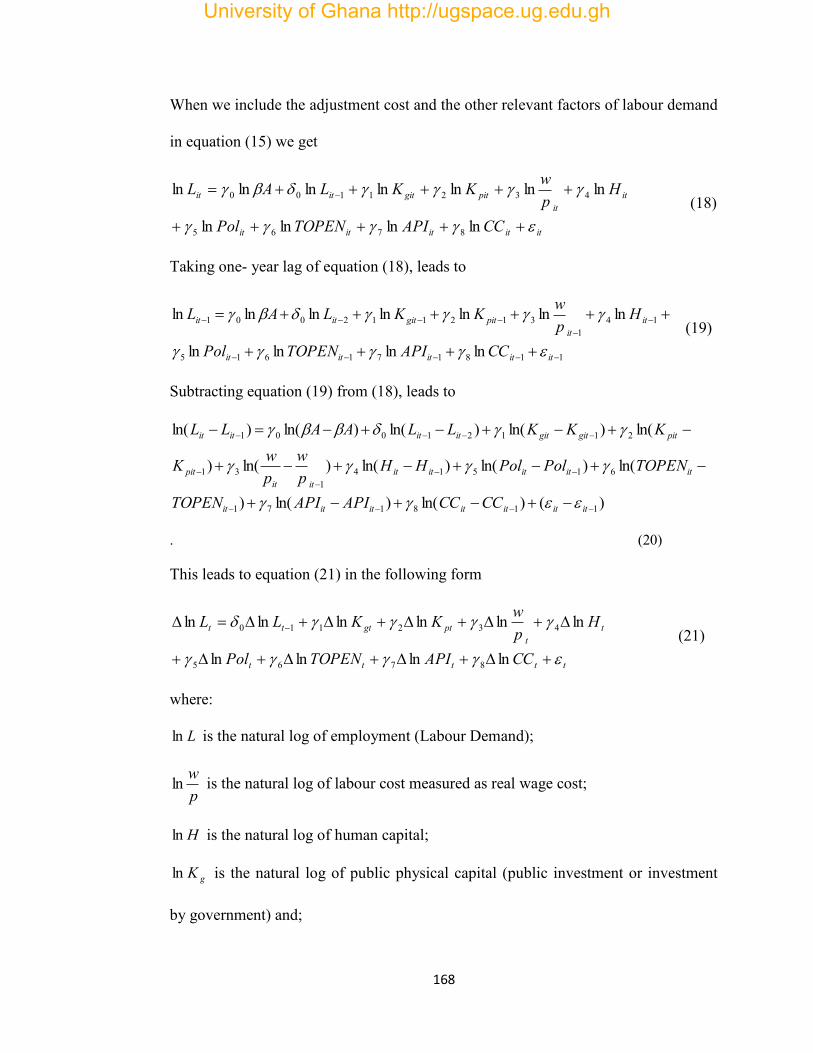
168
When we include the adjustment cost and the other relevant factors of labour demand
in equation (15) we get
ititititit
itit
pitgititit
CCAPITOPENPol
HpwKKLAL
lnlnlnln
lnlnlnlnlnlnln
8765
4321100 (18)
Taking one- year lag of equation (18), leads to
118171615
141
312112001
lnlnlnln
lnlnlnlnlnlnln
ititititit
itit
pitgititit
CCAPITOPENPol
HpwKKLAL
(19)
Subtracting equation (19) from (18), leads to
)()ln()ln()
ln()ln()ln()ln()
ln()ln()ln()ln()ln(
118171
615141
31
21121001
ititititititit
ititititititit
pit
pitgitgititititit
CCCCAPIAPITOPEN
TOPENPolPolHHpw
pwK
KKKLLAALL
. (20)
This leads to equation (21) in the following form
ttttt
tt
ptgttt
CCAPITOPENPol
HpwKKLL
lnlnlnln
lnlnlnlnlnln
8765
432110 (21)
where:
Lln is the natural log of employment (Labour Demand);
pwln is the natural log of labour cost measured as real wage cost;
Hln is the natural log of human capital;
gKln is the natural log of public physical capital (public investment or investment
by government) and;
University of Ghana http://ugspace.ug.edu.gh
169
pKln is the measure of private investment.
Pol is a measure of political discretion
TOPENln is a measure of trade openness
APIln is agricultural productivity index
CC is a dummy for credit crunch
In order to check whether private investment influence the demand for total labour
the same way as male labour demand, female labour demand, total youth, male and
female youth labour demands, separate models are written in respect of each of the
labour demands. This resulted in estimating six main models.
3.3.2 Study sample
The study included data from 48 countries in Sub-Saharan Africa excluding South
Sudan. The exclusion of South Sudan was basically based on lack of data. All these
countries are studied over a 20 year period, from 1990 to 2009.
3.3.3 Data
All the data were taken from the online edition of the African Development Index
(ADI) of the World Bank except that of Trade openness and Polconiii. The variable
for trade openness was taken from UNCTAD but that of Political Discretion (Pol) is
an index built by Henisz (2010). All the variables, except political discretion (Pol),
human capital and Agricultural Productivity Index (API), are presented in their
natural log form in order to control for heteroskedasticity.
University of Ghana http://ugspace.ug.edu.gh
170
3.3.4 Panel Data Methodology
The nature of the data allows for the use of panel data methodology for the analysis.
Panel data methodology has the advantage of not only allowing researchers to
undertake cross-sectional observations over several time periods, but also control for
individual heterogeneity due to hidden factors, which, if neglected in time-series or
cross-section estimations leads to biased results (Baltagi, 2005). The general form of
the panel data model can be specified as:
ititit XY (22)
where the subscript i denotes the cross-sectional dimension (equal to 1……48), and
t represents the time-series dimension (1 to 20 years). Yit, represents the dependent
variables in the model, which are total, male and female employment. X contains the
set of explanatory variables in the estimation model and ß represents the
coefficients. itiit where i is an unobserved individual specific effect, and
it is a zero mean random disturbance with a variance of 2 .
3.4.1 Dynamic Labour Demand
The nature of the test to be carried out requires that a dynamic panel methodology is
applied. In addition to other benefits associated with panel data methodology,
dynamic panel allows for measuring the speed of adjustment (through the lagged
dependent variable) using the partial adjustment based approach. The dynamic panel
approach accounts for individual effects which mostly are the cross sectional effects
(see Baltagi, 2005), even though the time specific effects can also be included. The
University of Ghana http://ugspace.ug.edu.gh
171
dynamic error components regression is characterized by the presence of a lagged
dependent variable among the regressors i.e.
itiititit XYY 1 (23)
Where itY is the dependent variable in country i for time t, 1itY is the dependent
variable in the previous period, itX is a vector of explanatory variables, i is
equal to 1……48, and t is equal to 1..…20.
The inclusion of the lagged dependent variable makes the ordinary least squares
(OLS) estimator bias and inconsistent even if there is no serial correlation in the
it ’s. This occurs as a result of the fact that the lagged dependent variable is
correlated with the error term. A condition created by the fact that itY is a function of
i .The fixed effect model estimator does not totally help solve the problem created
by the autoregressive nature of dynamic panel models, even though the within
transformation wipes out the i s. Also, the random effects General Least Squares
Regression (GLS) is not helpful in a dynamic panel model. Because the quasi-
demeaning that is performed when using GLS still makes the 1* itY to be correlated
with i (See Anderson & Hsiao, 2003; Sevestre & Trognon, 1985; Baltigi, 2005)
One way of getting around this problem as proposed by Anderson and Hsiao (1981),
is to first difference the model to eliminate the i and then apply an Instrumental
Variable (IV) method. However, even though this method leads to consistent results,
it does not necessarily lead to efficient estimates because not all available moment
University of Ghana http://ugspace.ug.edu.gh
172
conditions are used (Ahn & Schmidt, 1995) and does not take into account the
differenced structure on the residual disturbances (Baltigi, 2005).
In view of the weakness in the methodology proposed by Anderson and Hsiao
(1981), Arellano and Bond (1991) suggest that after taking the first difference to
eliminate the individual effects, one should then use all past information of the
dependent variable as instruments. This, they argue, gives a more efficient estimation
procedure. They make this proposition on the grounds that additional instruments can
be obtained if one uses the orthogonality conditions that exist between itY and it .
Thus, in all the dynamic models, the Arellano and Bond-AB- (1991) estimation
technique was used. It is an instrumental variable (IV) estimator that accounts for
correlated fixed effects and endogenous regressors (Asiedu & Gyimah-Brempong,
2008). Subsequent to the AB estimation the Sargan (1958) and autocorrelation tests
were applied to identify whether the models were well specified. The Sargan (1958)
test for over-identifying restrictions is used to determine if the instruments are
suitable. The null hypothesis states that “the instruments as a group are exogenous”.
Consequently, a higher p-value is preferred. The null hypothesis of no autocorrelation
is applied to the differenced residuals (Mileva, 2007). Sargan test results and results
for AR (1) and AR (2) test results reported in Tables 3.5A and 3.5B show that the
models are well specified.
Also, the study used one year lag of the investment (public and private) variables but
University of Ghana http://ugspace.ug.edu.gh
173
maintained the level of real wage cost in the dynamic models estimated. The
assumption is that real wage cost and investment sometimes have delayed effect on
employment because of adjustment cost (Oi, 1962; Kessing, 2003; Asiedu &
Gyimah-Brempong, 2008). But in the case of real wage cost, the time lag of
adjustment is restricted to within a year because the general conclusion, from annual
data, is that the adjustment takes place within 6 to 12 months and even faster when
number of working hours is used instead of level of employment (Hamermesh, 1993;
Köllo et al., 2003).
The following expanded six main models were, thus, estimated:
lnEMPTOTit = β1lnEMPTOTit-1 +β2lnRWRit + β3lnHDIit + β4lnGPINVit-1 +
β5lnPRINVit-1 +β6lnPOLit + β7lnTOPENit + β8 lnAPIit + β9 CCit + iti
. (24)
lnEMPMALit = β1lnEMPMALit-1 +β2lnRWRit + β3lnHDIit + β4lnGPINVit-1 +
β5lnPRINVit-1 +β6lnPOLit + β7lnTOPENit + β8 lnAPIit + β9 CCit + iti
. (25)
lnEMPFEMit = β1lnEMPFEMit-1 + β2lnRWRit + β3lnHDIit + β4lnGPINVit-1 +
β5lnPRINVit-1 +β6lnPOLit + β7lnTOPENit + β8 lnAPIit + β9 CCit + iti
. (26)
lnEMPTOTYit = β1lnEMPTOTYit-1 + β2lnRWRit + β3lnHDIit + β4lnGPINVit-1 +
β5lnPRINVit-1 +β6lnPOLit + β7lnTOPENit + β8 lnAPIit + β9 CCit + iti
. (27)
University of Ghana http://ugspace.ug.edu.gh
174
lnEMPMALYit = β1lnEMPMALYit-1 + β2lnRWRit + β3lnHDIit + β4lnGPINVit-1 +
β5lnPRINVit-1 +β6lnPOLit + β7lnTOPENit + β8 lnAPIit + β9 CCit + iti
. (28)
lnEMPFEMYit = β1lnEMPFEMYit-1 + β2lnRWRit + β3lnHDIit + β4lnGPINVit-1 +
β5lnPRINVit-1 +β6lnPOLit + β7lnTOPENit + β8 lnAPIit + β9 CCit + iti
. (29)
The definition of the variables used in the study and their expected signs are provided
in Table 3.1 below
University of Ghana http://ugspace.ug.edu.gh
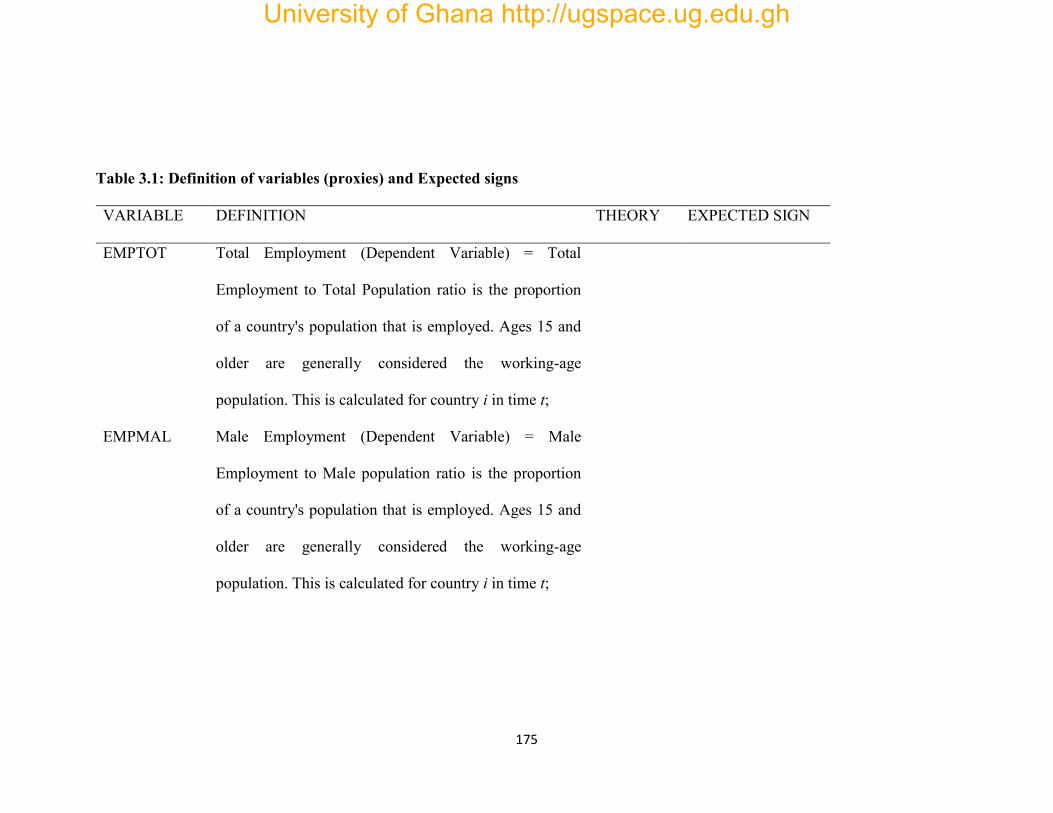
175
Table 3.1: Definition of variables (proxies) and Expected signs
VARIABLE DEFINITION THEORY EXPECTED SIGN
EMPTOT Total Employment (Dependent Variable) = Total
Employment to Total Population ratio is the proportion
of a country's population that is employed. Ages 15 and
older are generally considered the working-age
population. This is calculated for country i in time t;
EMPMAL Male Employment (Dependent Variable) = Male
Employment to Male population ratio is the proportion
of a country's population that is employed. Ages 15 and
older are generally considered the working-age
population. This is calculated for country i in time t;
University of Ghana http://ugspace.ug.edu.gh
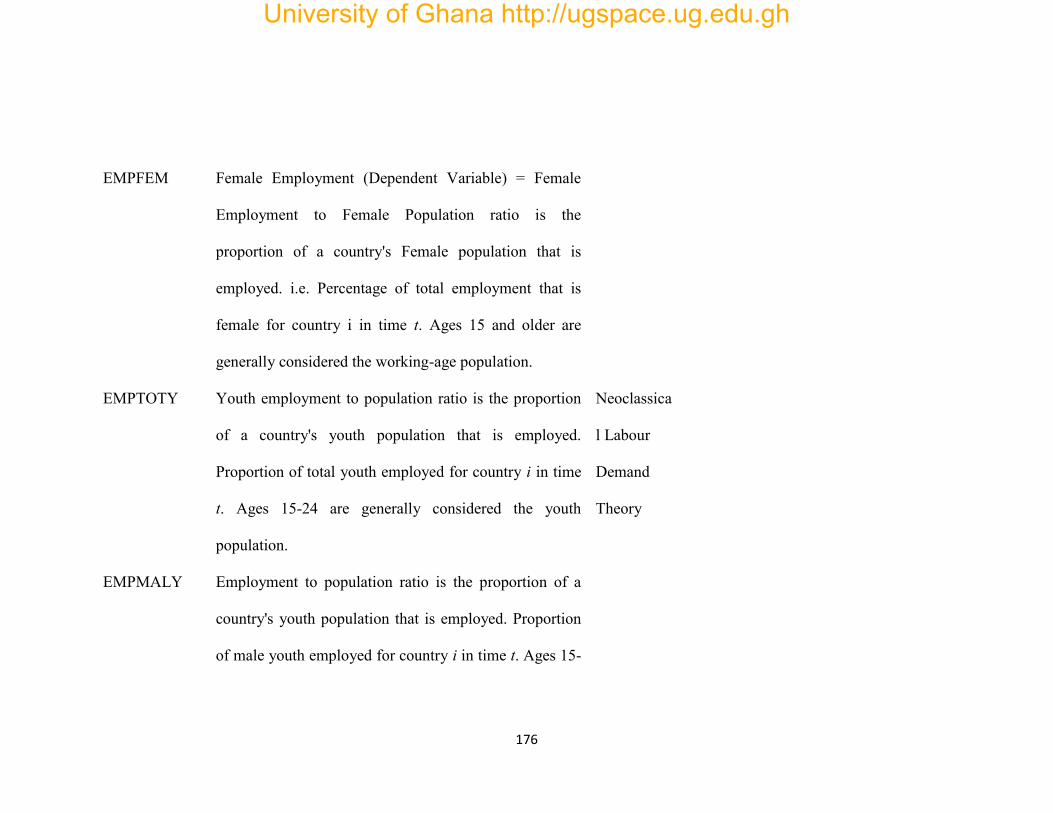
176
EMPFEM Female Employment (Dependent Variable) = Female
Employment to Female Population ratio is the
proportion of a country's Female population that is
employed. i.e. Percentage of total employment that is
female for country i in time t. Ages 15 and older are
generally considered the working-age population.
EMPTOTY Youth employment to population ratio is the proportion
of a country's youth population that is employed.
Proportion of total youth employed for country i in time
t. Ages 15-24 are generally considered the youth
population.
Neoclassica
l Labour
Demand
Theory
EMPMALY Employment to population ratio is the proportion of a
country's youth population that is employed. Proportion
of male youth employed for country i in time t. Ages 15-
University of Ghana http://ugspace.ug.edu.gh
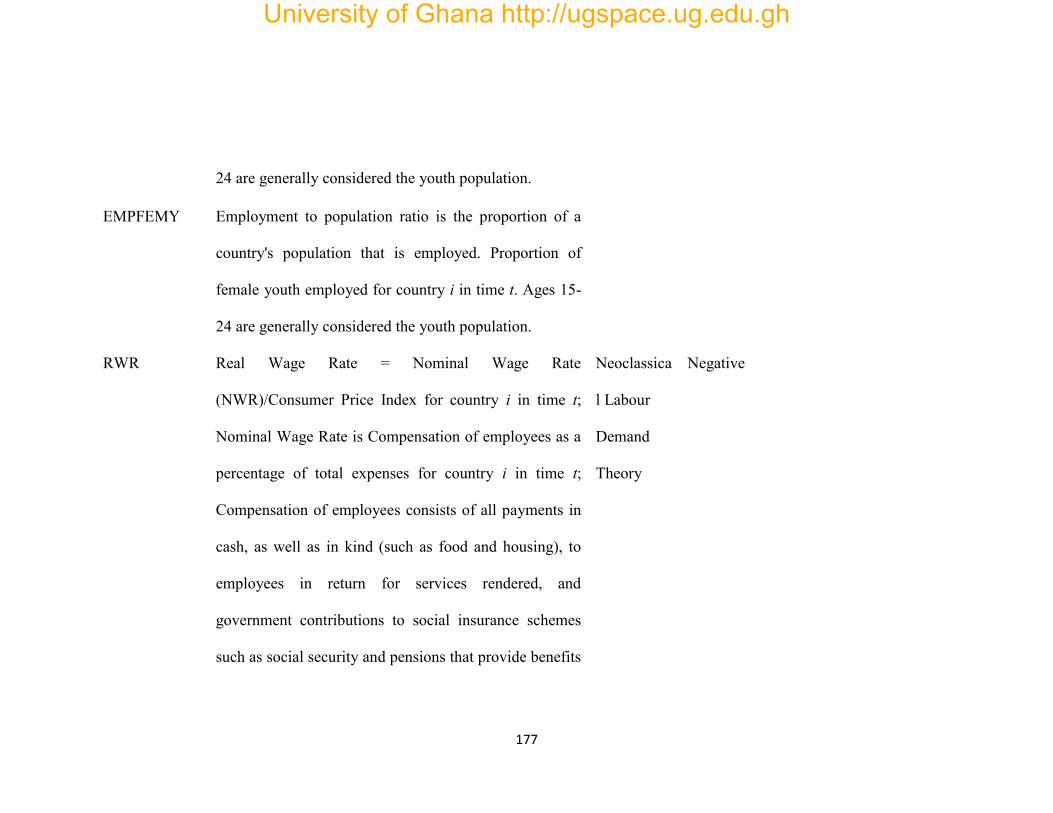
177
24 are generally considered the youth population.
EMPFEMY Employment to population ratio is the proportion of a
country's population that is employed. Proportion of
female youth employed for country i in time t. Ages 15-
24 are generally considered the youth population.
RWR Real Wage Rate = Nominal Wage Rate
(NWR)/Consumer Price Index for country i in time t;
Nominal Wage Rate is Compensation of employees as a
percentage of total expenses for country i in time t;
Compensation of employees consists of all payments in
cash, as well as in kind (such as food and housing), to
employees in return for services rendered, and
government contributions to social insurance schemes
such as social security and pensions that provide benefits
Neoclassica
l Labour
Demand
Theory
Negative
University of Ghana http://ugspace.ug.edu.gh
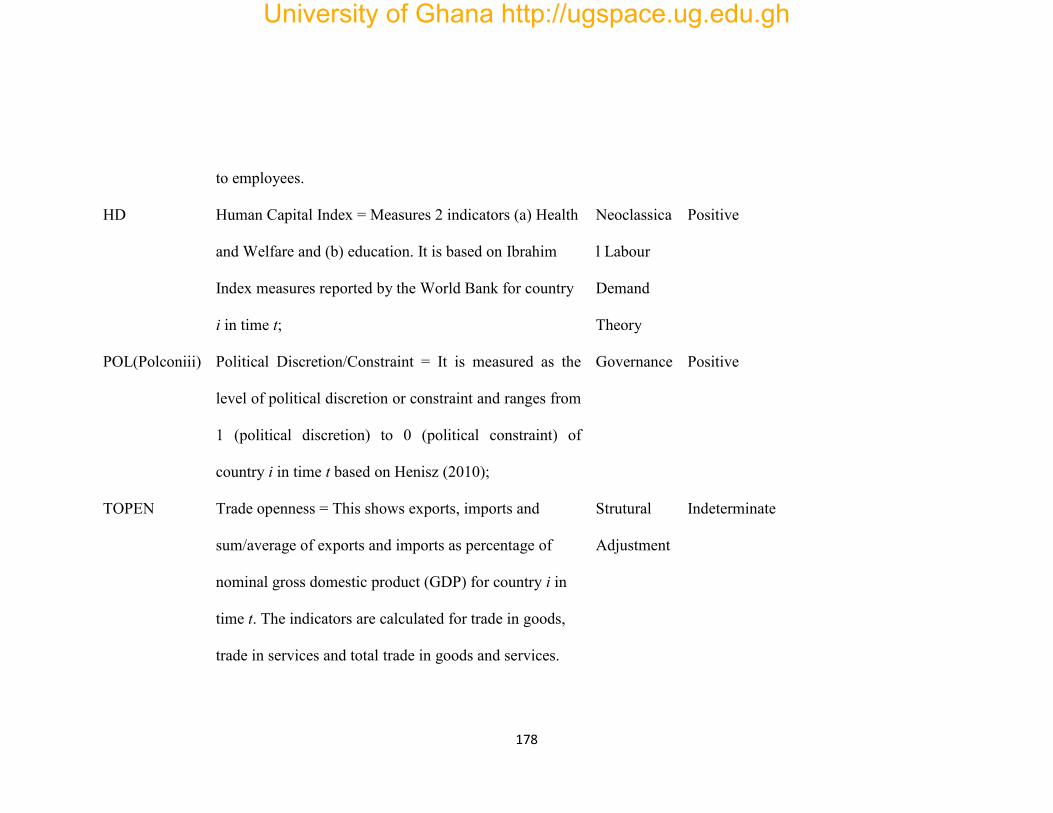
178
to employees.
HD Human Capital Index = Measures 2 indicators (a) Health
and Welfare and (b) education. It is based on Ibrahim
Index measures reported by the World Bank for country
i in time t;
Neoclassica
l Labour
Demand
Theory
Positive
POL(Polconiii) Political Discretion/Constraint = It is measured as the
level of political discretion or constraint and ranges from
1 (political discretion) to 0 (political constraint) of
country i in time t based on Henisz (2010);
Governance Positive
TOPEN Trade openness = This shows exports, imports and
sum/average of exports and imports as percentage of
nominal gross domestic product (GDP) for country i in
time t. The indicators are calculated for trade in goods,
trade in services and total trade in goods and services.
Strutural
Adjustment
Indeterminate
University of Ghana http://ugspace.ug.edu.gh
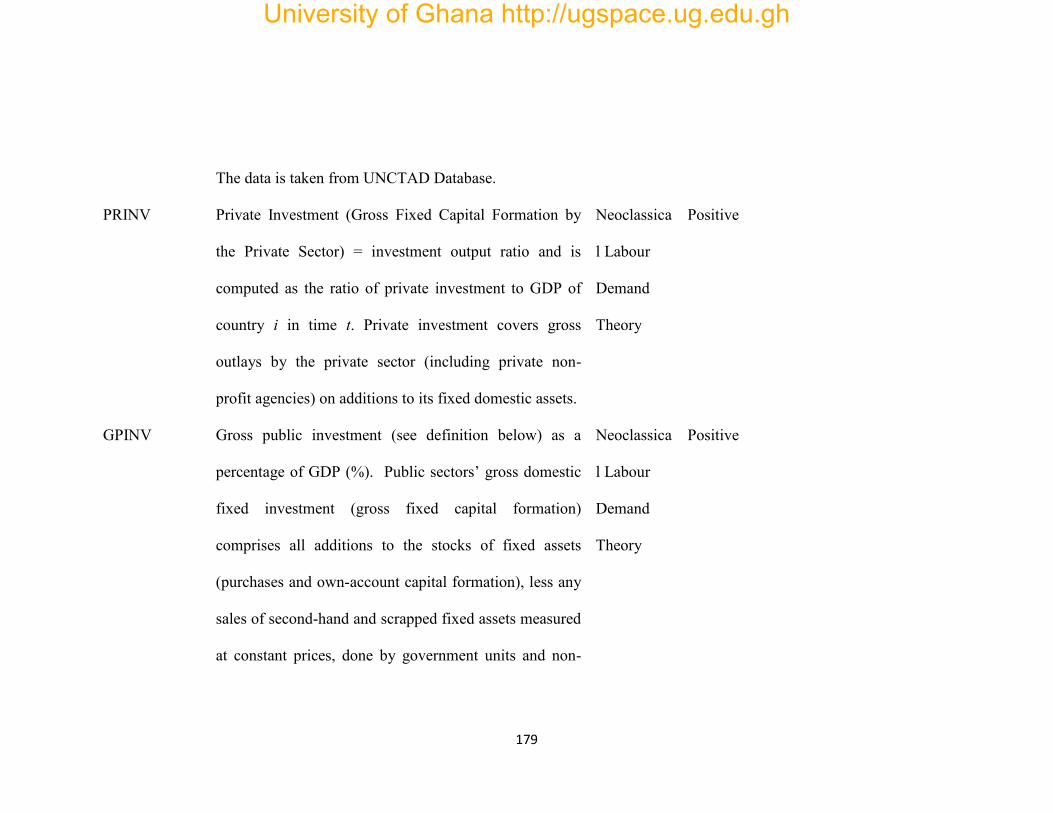
179
The data is taken from UNCTAD Database.
PRINV Private Investment (Gross Fixed Capital Formation by
the Private Sector) = investment output ratio and is
computed as the ratio of private investment to GDP of
country i in time t. Private investment covers gross
outlays by the private sector (including private non-
profit agencies) on additions to its fixed domestic assets.
Neoclassica
l Labour
Demand
Theory
Positive
GPINV Gross public investment (see definition below) as a
percentage of GDP (%). Public sectors’ gross domestic
fixed investment (gross fixed capital formation)
comprises all additions to the stocks of fixed assets
(purchases and own-account capital formation), less any
sales of second-hand and scrapped fixed assets measured
at constant prices, done by government units and non-
Neoclassica
l Labour
Demand
Theory
Positive
University of Ghana http://ugspace.ug.edu.gh
180
financial public enterprises. Most outlays by government
on military equipment are excluded. It is calculated for
country i in time t;
API Agricultural Production Index =The FAO indices of
agricultural production show the relative level of the
aggregate volume of agricultural production for each
year in comparison with the base period 1999-2001.
They are based on the sum of price-weighted quantities
of different agricultural commodities produced after
deductions of quantities used as seed and feed weighted
in a similar manner. The resulting aggregate represents,
therefore, disposable production for any use except as
seed and feed. This is calculated for country i in time t;
Positive
Are the country specific and white noise iti ,
University of Ghana http://ugspace.ug.edu.gh
181
3.5.0 Analysis and Discussion
3.5.1 Descriptive Statistics
Table 3.2 gives the descriptive statistics of the variables used in the study. Total
employment level among the working population in Africa is about 64.13%.
Expectedly, more men (72.26%) are engaged in employment than women (56.29%)
because of the traditional role of men in most African cultures. The dispersion among
female employment is quite worrying. The records showed that some countries
recorded as low as 12.7% while others as high as 88.2%. Mauritania recorded the
minimum total female, female youth and total employment levels while Rwanda
achieved the maximum total female, female youth, and total employment levels.
Meanwhile, the maximum levels of total investment, public investment and private
investment were recorded by Equatorial Guinea (see Appendix 3.1)
During the study period, employers spent about 35% of their total expenses on their
workforce for engaging their services, with the lowest and highest rates being 10.2%
and 60.6% respectively. Meanwhile real interest rate averaged at 10.8%. Private
investment (12.6%), over the two decades of study, was greater than the level of
governments’ (7.5% of GDP) involvement in investment activities. Privatization of
state-owned enterprises and the proliferation of non-governmental organisation could
be contributing factors. This notwithstanding, the productivity of the agricultural
sector appeared to be relatively representative.
University of Ghana http://ugspace.ug.edu.gh
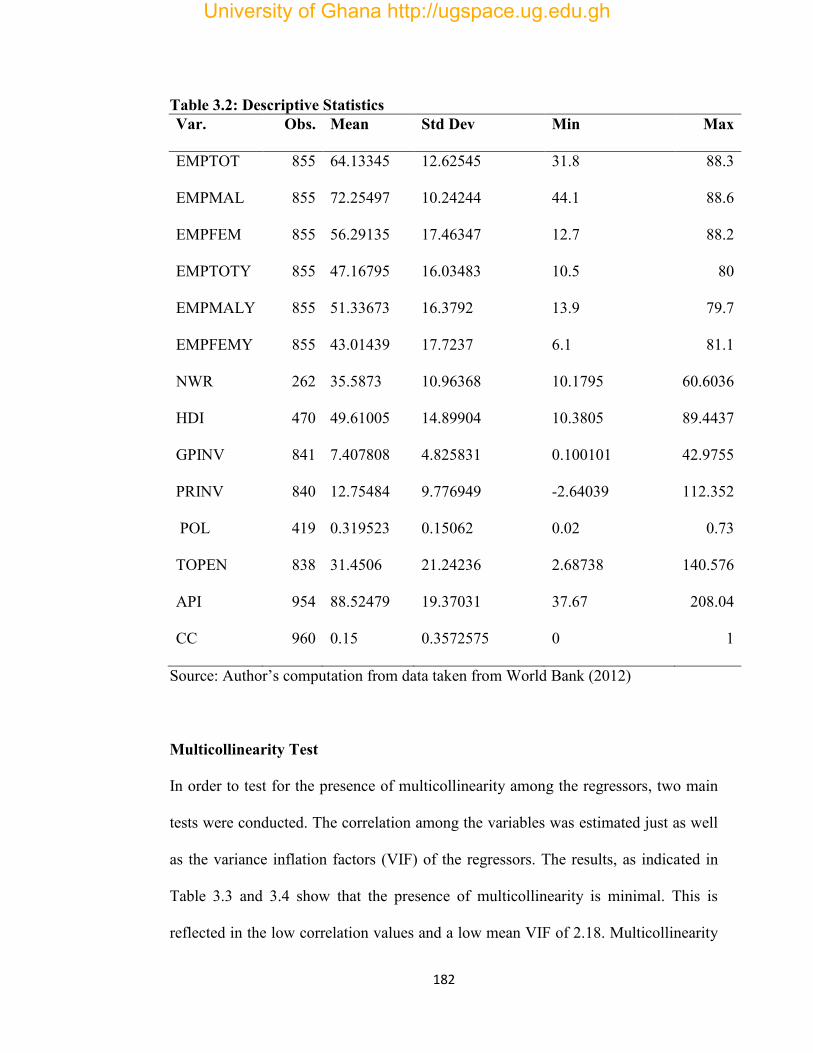
182
Table 3.2: Descriptive Statistics Var. Obs. Mean Std Dev Min Max
EMPTOT 855 64.13345 12.62545 31.8 88.3
EMPMAL 855 72.25497 10.24244 44.1 88.6
EMPFEM 855 56.29135 17.46347 12.7 88.2
EMPTOTY 855 47.16795 16.03483 10.5 80
EMPMALY 855 51.33673 16.3792 13.9 79.7
EMPFEMY 855 43.01439 17.7237 6.1 81.1
NWR 262 35.5873 10.96368 10.1795 60.6036
HDI 470 49.61005 14.89904 10.3805 89.4437
GPINV 841 7.407808 4.825831 0.100101 42.9755
PRINV 840 12.75484 9.776949 -2.64039 112.352
POL 419 0.319523 0.15062 0.02 0.73
TOPEN 838 31.4506 21.24236 2.68738 140.576
API 954 88.52479 19.37031 37.67 208.04
CC 960 0.15 0.3572575 0 1
Source: Author’s computation from data taken from World Bank (2012)
Multicollinearity Test
In order to test for the presence of multicollinearity among the regressors, two main
tests were conducted. The correlation among the variables was estimated just as well
as the variance inflation factors (VIF) of the regressors. The results, as indicated in
Table 3.3 and 3.4 show that the presence of multicollinearity is minimal. This is
reflected in the low correlation values and a low mean VIF of 2.18. Multicollinearity
University of Ghana http://ugspace.ug.edu.gh
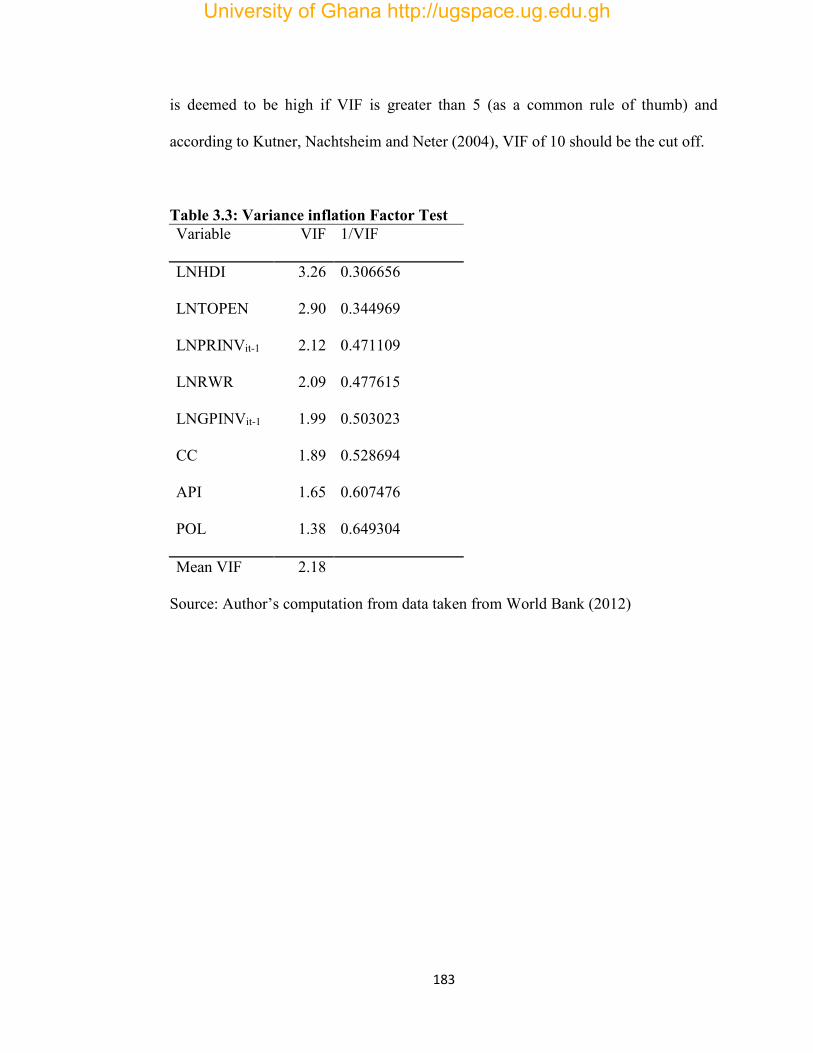
183
is deemed to be high if VIF is greater than 5 (as a common rule of thumb) and
according to Kutner, Nachtsheim and Neter (2004), VIF of 10 should be the cut off.
Table 3.3: Variance inflation Factor Test Variable VIF 1/VIF
LNHDI 3.26 0.306656
LNTOPEN 2.90 0.344969
LNPRINVit-1 2.12 0.471109
LNRWR 2.09 0.477615
LNGPINVit-1 1.99 0.503023
CC 1.89 0.528694
API 1.65 0.607476
POL 1.38 0.649304
Mean VIF 2.18
Source: Author’s computation from data taken from World Bank (2012)
University of Ghana http://ugspace.ug.edu.gh
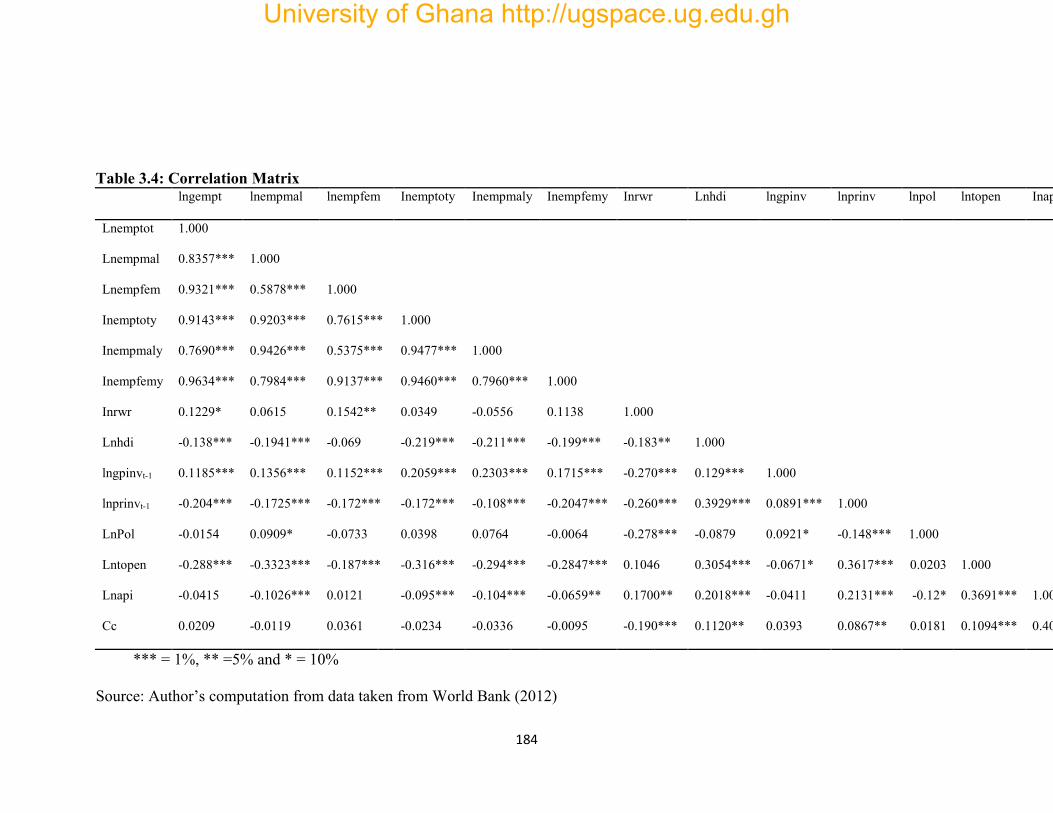
184
Table 3.4: Correlation Matrix lngempt lnempmal lnempfem Inemptoty Inempmaly Inempfemy Inrwr Lnhdi lngpinv lnprinv lnpol lntopen Inapi CC
Lnemptot 1.000
Lnempmal 0.8357*** 1.000
Lnempfem 0.9321*** 0.5878*** 1.000
Inemptoty 0.9143*** 0.9203*** 0.7615*** 1.000
Inempmaly 0.7690*** 0.9426*** 0.5375*** 0.9477*** 1.000
Inempfemy 0.9634*** 0.7984*** 0.9137*** 0.9460*** 0.7960*** 1.000
Inrwr 0.1229* 0.0615 0.1542** 0.0349 -0.0556 0.1138 1.000
Lnhdi -0.138*** -0.1941*** -0.069 -0.219*** -0.211*** -0.199*** -0.183** 1.000
lngpinvt-1 0.1185*** 0.1356*** 0.1152*** 0.2059*** 0.2303*** 0.1715*** -0.270*** 0.129*** 1.000
lnprinvt-1 -0.204*** -0.1725*** -0.172*** -0.172*** -0.108*** -0.2047*** -0.260*** 0.3929*** 0.0891*** 1.000
LnPol -0.0154 0.0909* -0.0733 0.0398 0.0764 -0.0064 -0.278*** -0.0879 0.0921* -0.148*** 1.000
Lntopen -0.288*** -0.3323*** -0.187*** -0.316*** -0.294*** -0.2847*** 0.1046 0.3054*** -0.0671* 0.3617*** 0.0203 1.000
Lnapi -0.0415 -0.1026*** 0.0121 -0.095*** -0.104*** -0.0659** 0.1700** 0.2018*** -0.0411 0.2131*** -0.12* 0.3691*** 1.000
Cc 0.0209 -0.0119 0.0361 -0.0234 -0.0336 -0.0095 -0.190*** 0.1120** 0.0393 0.0867** 0.0181 0.1094*** 0.4054** 1.000
*** = 1%, ** =5% and * = 10%
Source: Author’s computation from data taken from World Bank (2012)
University of Ghana http://ugspace.ug.edu.gh
185
3.5.3 Discussion of Regression Results
This study assessed the impact of private investment on employment in SSA. The
results, from the Arellano-Bond dynamic model, as shown in Table 3.5A and 3.5B
show that private investment together with public investment, real wage cost,
previous levels of labour demand, human capital, trade openness and productivity of
the agric sector are among the key factors that influence labour demand in SSA.
Previous year’s private investment does not enhance employment in SSA. The results
indicate a significantly negative (at 1%) relationship between the lag of private
investment and labour demand. Thus, as investment in physical assets gradually
becomes fully operational, they tend to destroy labour demand. This partially
supports Schumpeter’s (1943) creative destruction view of innovation and suggests
that technology is gradually taking over jobs (Autor et al., 2003; Manning, 2013). It
does not suggest that technology totally replaces labour but suggest that private
sector investment activities lead to more job displacements than placements. In fact,
those who eventually continue to keep their employment or gain employment are
those with the requisite skills to work with technologies associated with private
investments.
The main driver for the negative relationship between private investment and labour
demand may be profitability. Decisions by private investors are driven more by profit
than any other motive, such as employment. In view of this employment and other
social benefits that emanate from private investment decisions are mostly unintended.
University of Ghana http://ugspace.ug.edu.gh
186
Also, most of the largest external financial flow (FDI) into the African continent goes
in to hunt for resources (AfDB et al., 2012). Meanwhile, the extractive industry does
not only have weak linkages with the other sectors but also has weak labour
absorption rate as against the manufacturing sectors (see Aryeetey & Baah –
Boateng, 2007). Also, as these natural resources deteriorate over time, initial stages
of private investments may be accompanied by increased labour demand but later
stages would be associated with a reduction in labour demand, when the resources
start depleting. Again, in situations where these private investments are created at the
instance of construction contracts by either public or private institutions, the life span
of the projects would normally determine its effect on labour demand. In any case,
the results indicate, unequivocally, that private investment is not a reliable source of
labour demand for Africa. As a result, it is paramount for economic managers to
attract private investment into longer term employment sustainable sectors (like
manufacturing). Motivations through tax incentives for manufacturing and
employment are also encouraged.
University of Ghana http://ugspace.ug.edu.gh
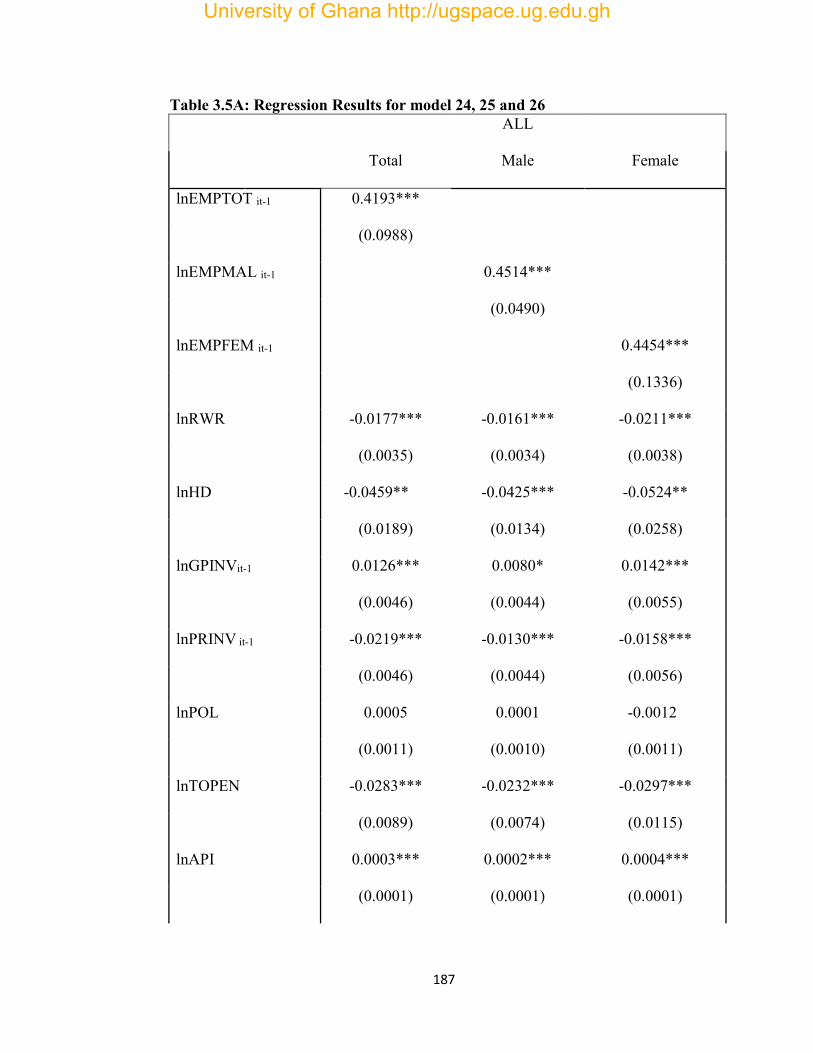
187
Table 3.5A: Regression Results for model 24, 25 and 26
ALL
Total Male Female
lnEMPTOT it-1 0.4193***
(0.0988)
lnEMPMAL it-1
0.4514***
(0.0490)
lnEMPFEM it-1
0.4454***
(0.1336)
lnRWR -0.0177*** -0.0161*** -0.0211***
(0.0035) (0.0034) (0.0038)
lnHD -0.0459** -0.0425*** -0.0524**
(0.0189) (0.0134) (0.0258)
lnGPINVit-1 0.0126*** 0.0080* 0.0142***
(0.0046) (0.0044) (0.0055)
lnPRINV it-1 -0.0219*** -0.0130*** -0.0158***
(0.0046) (0.0044) (0.0056)
lnPOL 0.0005 0.0001 -0.0012
(0.0011) (0.0010) (0.0011)
lnTOPEN -0.0283*** -0.0232*** -0.0297***
(0.0089) (0.0074) (0.0115)
lnAPI 0.0003*** 0.0002*** 0.0004***
(0.0001) (0.0001) (0.0001)
University of Ghana http://ugspace.ug.edu.gh
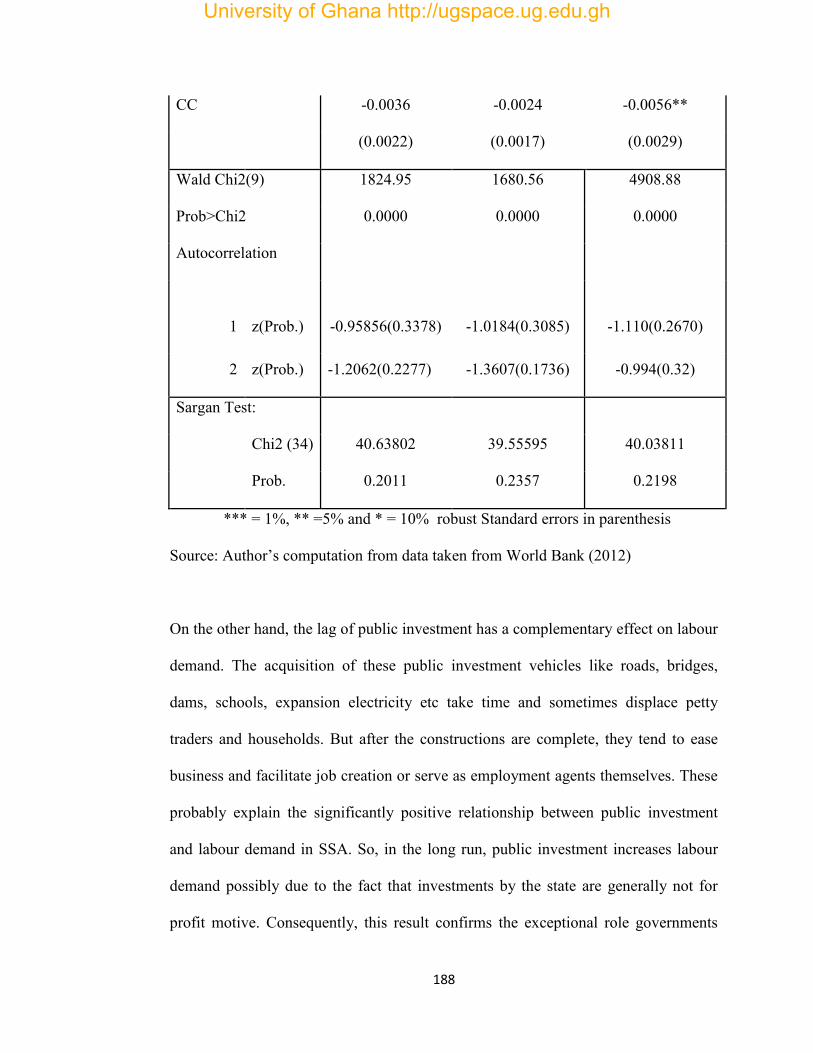
188
CC -0.0036 -0.0024 -0.0056**
(0.0022) (0.0017) (0.0029)
Wald Chi2(9) 1824.95 1680.56 4908.88
Prob>Chi2 0.0000 0.0000 0.0000
Autocorrelation
1 z(Prob.)
-0.95856(0.3378) -1.0184(0.3085) -1.110(0.2670)
2 z(Prob.) -1.2062(0.2277) -1.3607(0.1736) -0.994(0.32)
Sargan Test:
Chi2 (34) 40.63802 39.55595 40.03811
Prob. 0.2011 0.2357 0.2198
*** = 1%, ** =5% and * = 10% robust Standard errors in parenthesis
Source: Author’s computation from data taken from World Bank (2012)
On the other hand, the lag of public investment has a complementary effect on labour
demand. The acquisition of these public investment vehicles like roads, bridges,
dams, schools, expansion electricity etc take time and sometimes displace petty
traders and households. But after the constructions are complete, they tend to ease
business and facilitate job creation or serve as employment agents themselves. These
probably explain the significantly positive relationship between public investment
and labour demand in SSA. So, in the long run, public investment increases labour
demand possibly due to the fact that investments by the state are generally not for
profit motive. Consequently, this result confirms the exceptional role governments
University of Ghana http://ugspace.ug.edu.gh
189
play in employment generation on the African continent and probably offers an
explanation why certain public entities operate unprofitably. It is, therefore, pertinent
that public investments are undertaken more efficiently since it is a reliable conduit
for employment generation either directly or indirectly through facilitating the
activities of the citizens. Thus, while public investment increases labour demand
private investment reduces labour demand. The results then show that investment can
have both complimentary and substitutive effect on labour depending on the nature of
that investment (Rosen, 1969; Griliches, 1969; Henneberger & Ziegler, 2006).
The study depicts that changes in current levels of wage rates has an inverse
relationship with employment levels. At 1% significant level, current real wage rate
has a negative relationship with labour demand. When wage rates are increased in
SSA, the general reaction of employers is that jobs are cut unlike when wage rates
are reduced. In order to be competitive, SSA economies should work towards
keeping wage rates at their barest minimum. This would facilitate employment
generation. But this should be done cautiously since it also has implications for
economic empowerment, economic growth and social welfare improvements. The
result is in line with the predictions of the neoclassical labour demand theory that
there is a negative relationship between real wage rate and labour demand.
Trade openness does not favour employment in SSA mainly because the continent is
a net importer. Even though the continent is endowed with a lot of primary resources,
its weak manufacturing sector means that most of these resources are exported at
University of Ghana http://ugspace.ug.edu.gh
190
their raw stages at very low competitive prices than their eventual final products.
Ironically, the continent serves as a major market for these final products, worsening
our net export position. In effect, the SSA sub-region ends up creating markets and
for that matter jobs for the countries that manufacture the final products. Thus, an
increase in consumption of these goods and services increases the employment
demand of the manufacturing country and not the consuming country.
Surprisingly, human capital measured as human development index consistently and
significantly shows a negative relationship with employment demand. This could
probably be as a result of the fact that, given the developmental stage of the
continent, there do not exist enough job openings for highly skilled workers. Also,
the negative relationship between human capital and employment seem to suggest
that the SSA economy has not been expanding large enough to accommodate the
kind of human capital that exists in the region. Consequently, any improvement in
human capital which increases the productivity per worker means that less people
will have to be engaged, thereby harming employment. This position is similar to the
negative effect technological advancement has on employment. Also, even though
the effect of the credit crunch on labour demand in SSA has been negative in all the
models estimated, its effect is significant on female labour demand and youth labour
demand. It suggests that female employment and youth employment were the hardest
hit by the credit crunch and more attention should be given to them in employment
recovery plans.
University of Ghana http://ugspace.ug.edu.gh
191
Meanwhile, the results show a positive and significant relationship between
agricultural productivity index and employment. This result reiterates the exceptional
role of the agricultural sector to the SSA sub-region. Measures to enhance the agric
sector through subsidies on fertilizers, insecticides and cost of use of tractors should
be encouraged. Conscious efforts should be made to diffuse the notion that the agric
sector is the preserve of the poor, illiterate and the old. Agric-based policies such as
national service personnel getting involved in agric must be encouraged.
The dynamic models show strongly that employment level in the previous year
positively informs employment level in the current year, at 1% significant level.
Implying that factors that influenced previous year’s employment translate to the
current year confirming that labour demand follows a partial adjustment process ((Oi,
1962; Nickell, 1986; Hamermesh & Pfann, 1996; Pierlugi & Roma, 2008). The
results are consistent for all the labour demand models estimated. Also, the results of
the Sargan (1958) and autocorrelation test conclude that the models are well
specified.
University of Ghana http://ugspace.ug.edu.gh
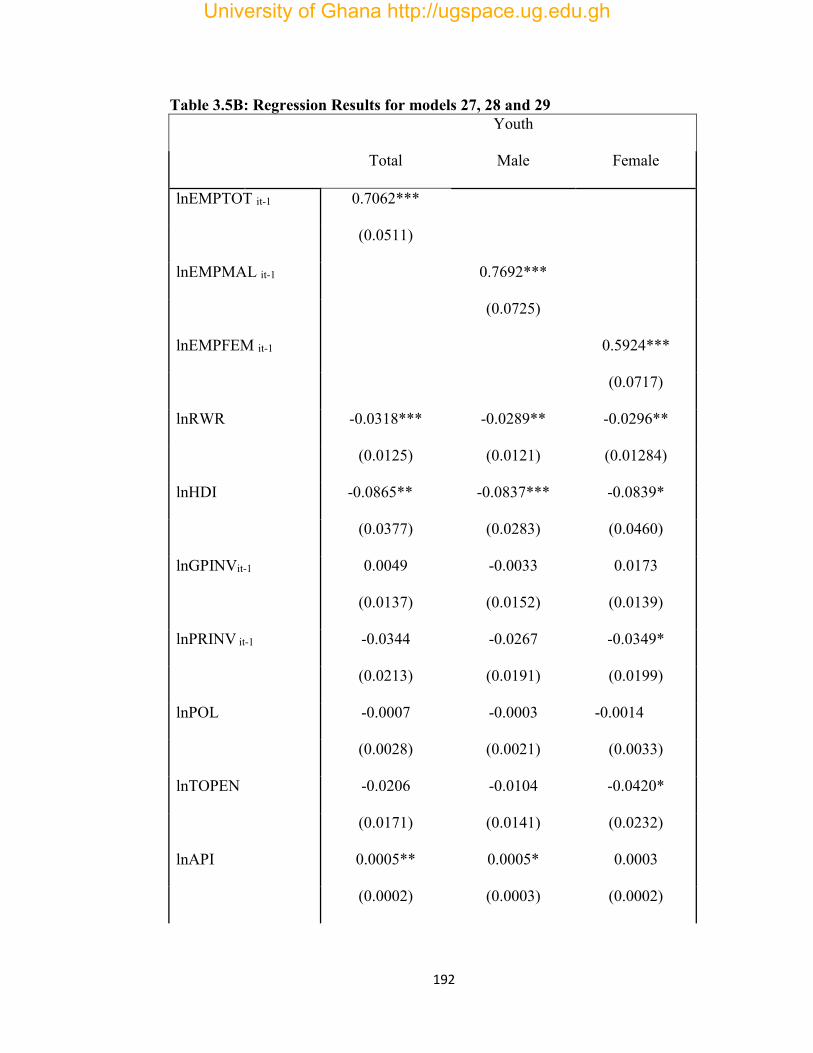
192
Table 3.5B: Regression Results for models 27, 28 and 29
Youth
Total Male Female
lnEMPTOT it-1 0.7062***
(0.0511)
lnEMPMAL it-1
0.7692***
(0.0725)
lnEMPFEM it-1
0.5924***
(0.0717)
lnRWR -0.0318*** -0.0289** -0.0296**
(0.0125) (0.0121) (0.01284)
lnHDI -0.0865** -0.0837*** -0.0839*
(0.0377) (0.0283) (0.0460)
lnGPINVit-1 0.0049 -0.0033 0.0173
(0.0137) (0.0152) (0.0139)
lnPRINV it-1 -0.0344 -0.0267 -0.0349*
(0.0213) (0.0191) (0.0199)
lnPOL -0.0007 -0.0003 -0.0014
(0.0028) (0.0021) (0.0033)
lnTOPEN -0.0206 -0.0104 -0.0420*
(0.0171) (0.0141) (0.0232)
lnAPI 0.0005** 0.0005* 0.0003
(0.0002) (0.0003) (0.0002)
University of Ghana http://ugspace.ug.edu.gh
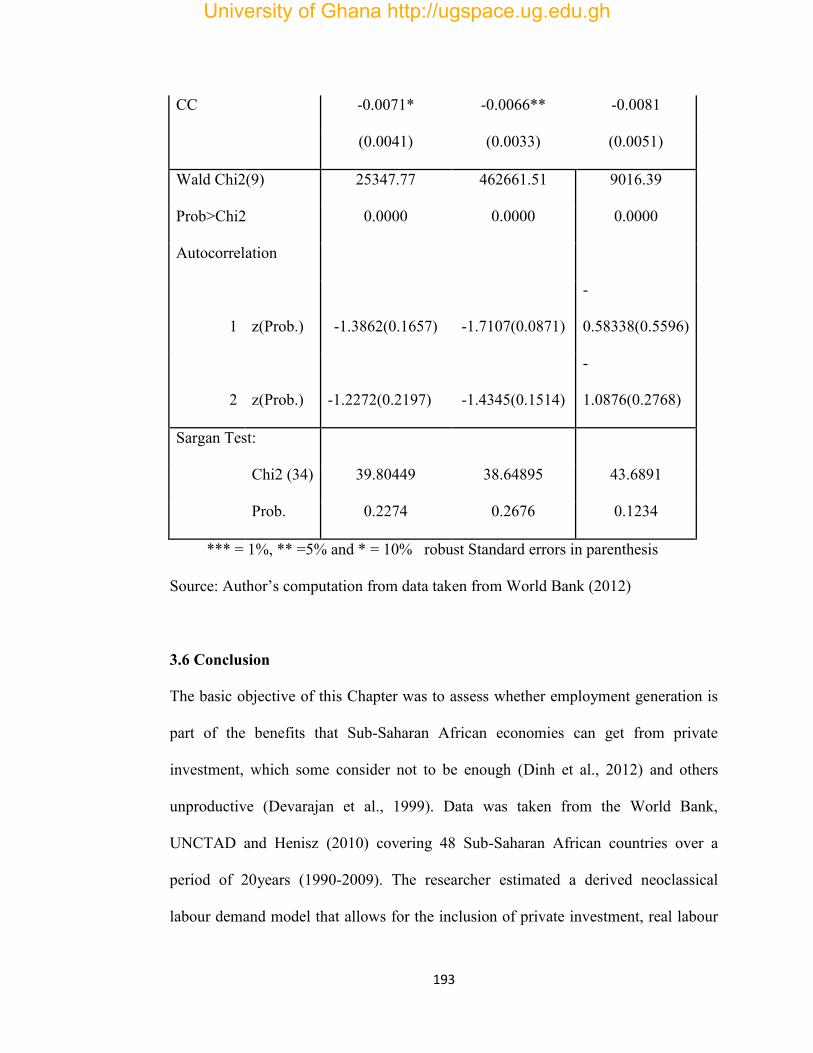
193
CC -0.0071* -0.0066** -0.0081
(0.0041) (0.0033) (0.0051)
Wald Chi2(9) 25347.77 462661.51 9016.39
Prob>Chi2 0.0000 0.0000 0.0000
Autocorrelation
1 z(Prob.)
-1.3862(0.1657) -1.7107(0.0871)
-
0.58338(0.5596)
2 z(Prob.) -1.2272(0.2197) -1.4345(0.1514)
-
1.0876(0.2768)
Sargan Test:
Chi2 (34) 39.80449 38.64895 43.6891
Prob. 0.2274 0.2676 0.1234
*** = 1%, ** =5% and * = 10% robust Standard errors in parenthesis
Source: Author’s computation from data taken from World Bank (2012)
3.6 Conclusion
The basic objective of this Chapter was to assess whether employment generation is
part of the benefits that Sub-Saharan African economies can get from private
investment, which some consider not to be enough (Dinh et al., 2012) and others
unproductive (Devarajan et al., 1999). Data was taken from the World Bank,
UNCTAD and Henisz (2010) covering 48 Sub-Saharan African countries over a
period of 20years (1990-2009). The researcher estimated a derived neoclassical
labour demand model that allows for the inclusion of private investment, real labour
University of Ghana http://ugspace.ug.edu.gh
194
cost, human capital and investment by the public sector. The model also controls for
political stability, trade openness, agricultural productivity and credit crunch. Within
the framework of dynamic panel methodology, the model was then estimated for
total, male, female and youth labour demands with the Arellano and Bond (1991)
GMM technique.
The results indicate that while private investment has a substitutive effect on labour
demand public investment has a complementary effect on labour demand. Also,
increase in real wage rate reduces labour demand just as advances in human capital,
trade openness and credit crunch. Meanwhile, agricultural productivity has a
significantly positive relationship with labour demand. The models are well specified
and the results consistent with all the estimated models.
Consequently, the SSA region should intensify measures to attract private investment
to more productive areas especially manufacturing, motivate the private sector
through tax incentives, improve on the judicious use of public investment through
checking corruption and ensuring value for money investments, promote exports, and
embark on policies that grow the economy. In addition, conscious effort should be
made to assess the impact of investment on the economy. This impact assessment
should include employment impact of investment assessment which should be
handled by a body independent of that which granted the permit for investment, in
order to ensure objectivity. The study, thus, offers partial support for the
neoclassical labour demand theory in SSA region. Specific country-level studies
University of Ghana http://ugspace.ug.edu.gh
195
(especially for countries that performed well and badly, in terms of private
investment size and employment levels) are encouraged for specific actions. Also, it
would be instructive for the sub-region to know the effect of private investment on
different types of labour (skilled and unskilled, fixed contract and indefinite contract,
etc).
University of Ghana http://ugspace.ug.edu.gh
196
References to Chapter Three
Addison, J., L. Bellmann, T. Schank, & Paulino (2008). The Demand for Labor:An
Analysis Using Matched Employer - Employee Data from the Germna LIAB.
Will the High Unskilled Worker Own-Wage Elasticity Please Stand
Up? Journal of Labor Research 29(2), 114 -137.
AfDB,OECD, UNECA & UNDP (2012). Africa Economic Outlook; Promoting
Youth Employment, pp. 37-58.
Afram, G. G. & Del Pero, A. S. (2012). Nepal’s Investment Climate: Leveraging the
Private Sector for Job Creation and Growth. Directions in Development
(Private Sector development) World Bank Report 67525. doi:
10.1596/978-0-8213-9465-6abi
Ahn, S.C. & Schmidt, P. (1995). Efficient estimation of models for dynamic panel
data. Journal of Econometrics, 68, 5-27.
Anderson, T. W. & Hsiao, C. (1982). Formulation and estimation of dynamic models
using panel data. Journal of Business and Economic Statistics, 9, 317-323.
Andrews, M. and Nickell, S. (1982). Unemployment in the United Kingdom since the
War. Review of Economics Studies, 49(special), 731-59.
Arellano, M., & Bond, S. (1991). Some Tests of Specification for Panel Data: Monte
Carlo Evidence and an Application to Employment Equations. The Review of
Economic Studies, 58, 277-297.
Aromolaran, A. B. (2004). Wage Returns to Schooling in Nigeria. African
Development Review, 16(3), 433 – 455.
University of Ghana http://ugspace.ug.edu.gh
197
Asiedu, E. (2004). The Determinants of Employment of Affiliates of US
Multinational Enterprises in Africa. Development Policy Review, 22(4), 371-
379.
Asiedu, E., & Gyimah-Brempong, K. (2008). The Effect of the Liberalization of
Investment Policies on Employment and Investment of Multinational
Corporations in Africa. African Development Review, 20(1), 49-66.
Assaad, R., El-Hamidi, F., & Ahmed, A. U. (2000). The Determinants of
Employment Status in Egypt (No. 88). International Food Policy Research
Institute – Food Consumption and Nutrition Division (IFPRI- FCND)
Discussion Paper, pp. 1-107.
Aterido, R., Hallward-Driemeier, M. & Pagés, C. (2007). Investment Climate and
Employment Growth: The Impact of Access to Finance, Corruption and
Regulations across Firms (No. 3138). Forschungsinstitut zur Zukunft der
Arbeit. Institute for the Study of Labor Discussion Paper IZA.
Aterido, R. & Hallward-Driemeier, M. (2010). The Impact of the Investment Climate
on Employment Growth: Does Sub-Saharan Africa Mirror Other Low-
Income Regions? (No. 5218). Policy Research Working Paper,
Developmental Research Group, World Bank.
Autor, D., Levy, F. & Murnane, R. (2003). The Skill Content of Recent
Technological Change: An Empirical Exploration. Quarterly Journal of
Economics, 118(4), 1279-1333.
University of Ghana http://ugspace.ug.edu.gh
198
Aryeetey, E. & Baah-Boateng, W. (2007). Growth, Investment and Employment in
Ghana (No. 80). Working paper, Policy integration Department, Internatinal
Labour Organisation.
Baldwin, R. E. (1995). The Effects of Trade and Foreign Direct Investment on
Employment and Relative Wages (No. 4). OECD Jobs Study Working
Papers, OECD Publishing. http://dx.doi.org/10.1787/888157653682.
Baltagi, B. H., (2005). Econometric Analysis of Panel Data. John Wiley & Sons, Ltd.
Barba N, G., Turrini, A. & Checchi, D. (2003). Adjusting Labor Demand:
Multinational Versus National Firms: A Cross-European Analysis. Journal of
the European Economic Association, 1(2-3), 708 - 719.
Barro, R. J. & Grossman, H. I. (1971). A General Disequilibrium Model of Income
and Employment. The American Economic Review, 61(1), 82-93. URL:
http://www.jstor.org/stable/1910543
Barro, R. J. & Sala-i-Martin, X. (2004). Economic Growth (2nd Ed.). The MIT Press,
Cambridge.
Bentolila, S. & Gilles, S. P. (1992). The Macroeconomic Impact of Flexible Labor
Contracts, with an Application to Spain. European Economic Review, 36(5),
1013–1053.
Bentolila, S. & Bertola, G. (1990). Firing Cost and Labour Demand: How Bad is
Euroclerosis? Review of Economic studies, 57, 381 – 402.
Berman, E., Bound, J. & Griliches Z. (1994). Changes in the demand for skilled labor
within US manufacturing industries: Evidence from the Annual survey of
manufacturing. Quarterly Journal of Economics, 109, 367-98.
University of Ghana http://ugspace.ug.edu.gh
199
Bertrand, M. & Sendhil M. (2003). Are Emily and Greg More Employable than
Lakisha and Jamal? A Field Experiment on Labor Market
Discrimination (No. 9873). Cambridge, Massachusetts: National Bureau
of Economic Research working paper.
Bertola, G. (1990). Job Security, Employment and Wages. European Economic
Review, 34, 851 – 886.
Bertola, G. (1991). Labour turnover cost and Average Labour Demand (No. 3866).
NBER Working Paper.
Blejer, M., & Khan, M. S. (1984). Government policy and private investment in
developing countries. IMF Staff Papers, 31(2), 379–403.
Blomstrom, M., Fors, G. & Lipsey, R. E. (1997). Foreign Direct Investment and
Employment: Home Country experience in the United States and Sweden (No.
6205). NBER Working Paper Series. www.nber.org/papers/w6205.
Boug, P. (1999). The Demand for Labour and the Lucas Critique: Evidence from
Norwegian Manufacturing Statistics (No. 256). Norway Research
Department, Discussion Papers.
Buzás, S. & Fóti, K. (2006). Industrial Competitiveness and Labour Market
Transformation in Hungary: Macroeconomic Developments and
Empirical Analysis (No. 174). Institute For World Economics Hungarian
Academy of Sciences W o r k i n g P a pe r s.
Card, D. (1999). The Causal Effect of Education on Earnings. Handbook of Labor
Economics, 3, 1801-1863.
University of Ghana http://ugspace.ug.edu.gh
200
Chen, T. & Ku, Y. (2003). The Effect of Overseas Investment on Domestic
Employment (10156). NBER Working Paper. Available at
http://www.nber.org/papers/w10156.
Cherian, S. (1998). The investment decision: A re-examination of competing theories
using panel data. Applied Economics, 30(1), 95–104.
Cobb, C. W. & Douglas P. H. (1928). A Theory of Production. American Economic
Review 18(1), 139‐165.
Devarajan, S., Easterly, W. & Pack, H. (1999). Is Investment in Africa Too High or
Too Low? Macro and Micro Evidence. Journal of African Economies, 10
(supplement 2) pp. 81-108.
Dinh, H. T., Palmade, V. T., Chandra, V. & Cossar, F. (2012). Light Manufacturing
in Africa: Targeted Policies to Enhance Private Investment and create
Jobs (67209). African Development Forum, World Bank.
Driffield, N. & Taylor, K. (2000). FDI and the labour market: A review of the
evidence and policy implications. Oxford Review of Economic Policy,
16(3), 90 - 103.
Drobetz, W. & Wanzenried, G. (2006). What determines the speed of
adjustment to the target capital structure? Applied Financial Economics,
16, 941–958.
Dunlop, J. T. (1938). The Movement of Real and Money Wage Rates. Economic
Journal, 48, 413-434.
Edwards, L. & Behar, A. (2006). Trade Liberalisation and Labour Demand within
South African Manufacturing Firms. J. Stud. Econ. Econometrics, 30(2), 1-21.
University of Ghana http://ugspace.ug.edu.gh
201
Emery, J. J. (2003). Governance, Transparency and Private Investment in Africa.
OECD Global Forum on International Investment, Johannesburg, 17-18
November 2003, pp. 1-16.
Erden, L., & Holcombe, R. (2005). The effects of public investment in developing
economies. Public Finance Review, 33(5), 575–602.
Estache, A., Ianchovichina, E., Bacon, R. & Salamon, I. (2013). Infrastructure and
Employment Creation in the Middle East and North Africa (74918).
International Bank for Reconstruction and Development / The World Bank
Policy Research Working Paper.
Falk, M. & Koebel, B. (2004). The impact of office machinery, and computer capital
on the demand for heterogeneous labour. Labour Economics, 11 (1),
99 -117.
Flaig, G. & Steiner, V. (1989). Stability and Dynamic Properties of Labour Demand
in West-German Manufacturing. Oxford Bulletin of Economics and
Statistics, 51, 395 - 412.
Fouladi, M. (2010). The Impact of Government Expenditure on GDP, Employment
and Private Investment a CGE Model Approach” Iranian Economic
Review, 15(27), 53 – 76.
Funke, M., Maurer, W. & Strulik, H. (1999). Capital Structure and Labour Demand:
Investigations Using German Micro Data. Oxford Bulletin of Economics and
Statistics, 61(2), 199 – 215.
University of Ghana http://ugspace.ug.edu.gh
202
Garrett-Peltier, H. (2010). The Employment Impacts of Economy-Wide Investments in
Renewable Energy and Energy Efficiency. An unpublished PhD Thesis
submitted to the Graduate School of the University of Massachusetts
Amherst.
Goos, M. & Manning, A. (2007). Lousy and Lovely Jobs: The Rising Polarization of
Work in Britain. Review of Economics and Statistics, 89(1), 118-133.
Görg, H. & Hanley, A. (2005). Labour demand effects of international outsourcing:
Evidence from plant level data. International Review of Economics and
Finance, 14(3) 365-376.
Goux, D., Maurin, E. & Pauchet, M. (2001). Fixed-term contracts and the dynamics
of labour demand. European Economic Review, 45, 533 – 552.
Griliches, Z. (1969). Capital-skill complementarity. Review of Economics and
Statistics, 51( 4), 465-468.
Habib, M. D. & Sarwar, S. (2013). Impact of Foreign Direct Investment on
Employment Level In Pakistan: A Time Series Analysis. Journal of Law,
Policy and Globalization, 10, 46-55.
Hamermesh, D. S. (1988). Labour Demand and Structure of Adjustment Costs (No.
2572). NBER Working Paper.
Hamermesh, D. S. (1993). Spatial and Temporal Aggregation in the Dynamics of
Labor Demand. In: Jan, C. – Pfann, J. A. – Ridder, G. (ed): Labor Demand
and Equilibrium Wage Formation. North-Holland, Amsterdam, pp. 91–
108.
University of Ghana http://ugspace.ug.edu.gh
203
Harrison, A. E. & McMillan, M. S. (2004). The Impact of Overseas Investment by
US Multinationals on Wages and Employment. Conference Paper
presented at the 2005 ASSA Conference, see: http://www.aeaweb.org/assa/
2005 /0108_1430_0402.pdf
Henisz, W. J. (2000). The Institutional Environment for Economic Growth.
Economics and Politics, 12(1), 1-31.
Henisz, W. J. (2002). The institutional environment for infrastructure investment.
Industrial and Corporate Change, 11(2), 355 -389.
Henisz, W. J. (2010). POLCON 2010 codebook. Manuscript, University of
Pennsylvania.
Henneberger, F. & Ziegler, A. (2006). Employment Effects of Foreign Direct
Investment in the Service Sector: A Systematic Approach (Nr. 109) der Reihe
Diskussionspapiere des Forschungsinstituts für Arbeit und Arbeitsrecht an
der Universität St. Gallen
Herr, H., Kazandziska, M. & Mahnkopf-Praprotnik, S. (2009, February). The
Theoretical Debate about Minimum Wages (No. 6). Global Labour
University Working Papers.
Hijzen, A., H. Gorg, & R. C. Hine (2005). International Outsourcing and the Skill
Structure of Labour Demand in The United Kingdom. The Economic Journal,
115(506), 860-878.
Hijzen, A. & Swaim, P. (2010). Off shoring, labour market institutions and the
elasticity of labour demand. European Economic Review, 54(8), 1016 -
1034.
University of Ghana http://ugspace.ug.edu.gh
204
Hsiao, C. (2003). Analysis of Panel Data, Cambridge University Press.
Huang, M. & Ren, P. (2013). A Study on the Employment Effect of Chinese
Investment in South Africa (No. 5/2013). Centre for Chinese Studies,
Discussion Paper, Stellenbosch University.
Ianchovichina, E., Estache, A., Renaud Foucart, R., Garsous, G. & Tito Yepes, T.
(2012) . Job Creation through Infrastructure Investment in the Middle East
and North Africa (No. 6164). World Bank Policy Research Working
Paper.
Inter-Agency Working Group (IWAG) (2012). Promoting responsible investment for
sustainable development and job creation - Final report to the High-Level
Development Working Group on the work of the Private Investment and Job
Creation Pillar of the G20 multi-year action plan on development,
Mexico Summit. Pp. 1-23. Accessed from
http://unctad.org/en/Pages/DIAE/G-20/Private-Investment-and-Job
Creation.aspx.
International Finance Corporation (2013). IFC Jobs Study: Assessing Private Sector
Contributions to Job Creation and Poverty Reduction. IFC, Washington, D.C.
International Monetary Fund (2013). Regional Economic Outlook: Sub-Saharan
Africa, Building momentum in a Multi-Speed World. World Economic and
Financial Survey.
International Labour Organisation (2012). Global Employment Trends 2012.
International Labor Office, Geneva.
University of Ghana http://ugspace.ug.edu.gh
205
International Labour Organisation (ILO, 2013). Global Employment Trends:
Recovering from a second jobs dip. International Labour Office, Geneva.
International Labour Organisation (ILO, 2014). Global Employment Trends 2014:
Risk of a jobless recovery? International Labour Office, Geneva. Jayaraman, T. K. & Singh, B. (2007, May). Foreign Direct Investment and
Employment Creation in Pacific Island Countries: An empirical study of Fiji
(No. 35). Asia-Pacific Research and Training Network on Trade Working
Paper Series.
Kaplinsky, R. & Morris, M. (2009). “Chinese FDI in Sub-Saharan Africa: engaging
with large dragons.” European Journal of Development Research, 21(4), 551-
569. http://dx.doi.org/doi:10.1057/ejdr.2009.24.
Karlsson, S., Lundin, N., Sjöholm, F. & He, P. (2007). FDI and Job Creation in
China (No. 723). IFN Working Paper.
Katsoulacos, Y. S. (1984). Product innovation and employment. European Economic
Review 26, 83-108.
Kessing, S. G. (2003). A note on the determinants of labour share movements.
Economics Letters, 81, 9–12.
Keynes, J.M. (1936). The General Theory of Employment, Interest, and Money,
Harcourt.
Klette, J. & Førre, S. E. (1998). Innovation and Job Creation In A Small open
Economy Evidence From Norwegian Manufacturing Plants 1982–92.
Economics of Innovation and New Technology, 5(2-4), 247-272.
doi:10.1080/10438599800000007
University of Ghana http://ugspace.ug.edu.gh
206
Köllo, J., Korösi, G. & Surányi, É. (2003). Labour – the Demand Side, in: Fazekas,
K. and J. Koltay (szerk.). The Hungarian Labour Market, Review and
Analysis, IEHAS, 91–131.
Kutner, M., Nachtsheim, C. & Neter, J. (2004). Applied Linear Regression Models,
(4th ed.). McGraw-Hill Irwin.
Layard, R., Nickell, S. J. & Jackman, R. (1991). Unemployment: Macroeconomic
performance and the labour market. Oxford: Oxford University Press.
Lazear, E. P. (1990). Job Security Provisions and Employment. Quarterly Journal of
Economics CV, 699 – 726.
Lewis, P.E.T., & MacDonald, G. (2002). The elasticity of demand for labour in
Australia. Economic Record, 78, 240 18–30.
Lichter, A., Peichl, A. & Siegloch, S. (2013). Labor Demand Elasticities in Europe:
A Meta-Analysis (No. D10.7). Neujobs Working Paper, pp. 1- 30.
Loof H. (2003). Dynamic optimal capital structure and technical change (No. 03-
06). ZEW Discussion Paper.
Machin, S.J., A. Ryan & J. Van Reenen (1996). Technology and changes in the skill
structure: evidence from an international panel of industries. Discussion
Paper, Centre for Economic Policy Research.
Mairesse, J. & Dormont, B. (1985). Labor and Investment Demand at the Firm Level:
A Comparison of French, German and U.S. Manufacturing, 1970–79.
European Economic Review, 28(1– 2), 201–231.
University of Ghana http://ugspace.ug.edu.gh
207
Malik, S., Chaudhry, S. I. & Javed, H. I. (2011). Globalization and Employment:
Evidence from Pakistan. Pakistan Journal of Social Sciences (PJSS),
31(2), 215-226.
Mankiw, G. N., Romer, D. & Weil, D. N. (1992). A contribution to the empirics of
economic growth. The Quarterly Journal of Economics, 107(2), 407- 437.
Manning, A. (2013). Lousy and Lovely Jobs. London School of Economics
(CEPCP398). Centre for Economic Performance, Paper.
Masso, J., Varblane, U. & Vahter, P. (2007). The Impact of Outward FDI on Home
Country Employment in a Low-Cost Transition Economy (No. 873). William
Davidson Institute Working Paper.
Manning, A. (2013). Lousy and Lovely Jobs (No. CEPCP398). London School of
Economics. Centre for Economic Performance Paper.
Mehmet M. and Demirsel, M. T. (2013). The Effect of Foreign Direct Investments on
Unemployment: Evidence from Panel Data for Seven Developing Countries.
Journal of Business, Economics and Finance, 2(3), 53 – 66.
Michaillat, P. and Saez, E. (2013). A Model of Aggregate Demand and
Unemployment (CEPDP1235. London School of Economics, Centre for
Economic Performance Paper.
Mileva, E. (2007). Using Arellano – Bond Dynamic GMM Estimators in Stata:
Tutorials with Examples using Stata 9.0. (Retrieved from the internet on
2/9/2013).
Mlambo, K., & Oshikoya, T. (2001). Macroeconomic factors and investment in
Africa, Journal of African Economies AERC, 10(2), 12–47.
University of Ghana http://ugspace.ug.edu.gh
208
Munthali, T. C. (2012). Interaction of public and private investment in Southern
Africa: a dynamic panel analysis. International Review of Applied Economics,
26(5), 597-622. doi: 10.1080/02692171.2011.624500.
Ndikumana, L. & Sher, V. (2008). The linkages between FDI and domestic
investment: unravelling the developmental impact of foreign investment in
Sub Saharan Africa (No. 3296). IZA Discussion Papers.
http://hdl.handle.net/10419/35246.
Neumark, D. & Wascher, W. (2006). Minimum Wages and Employment: A Review
of Evidence from the New Minimum Wage Research (No. 12663).
National Bureau of Economic Research, Working Paper.
http://www.nber.org/papers/w12663.
Neumark, D. & Wascher, W. L. (2007). Minimum Wages and Employment.
Foundations and Trends in Microeconomics, 3(1–2), 1–182.
doi:10.1561/0700000015
Nickell, S. (1986). Dynamic Models of Labour Demand. In: Ashenfelter, O. –
Layard, R. (ed): Handbook of Labour Economics. Volume I. Elsevier
Science Publishers, Amsterdam-New York. pp. 473–522.
Nickell, S. & Wadhwani, S. (1991). Employment Determination in British Industry:
Investigations Using Micro- Data. Review of Economic Studies, 58(5), 329–
345.
Nickell, S. (2010). The Unemployment Challenge in Europe. CESifo Forum, Ifo
Institutefor Economic Research at the University of Munich, 11(1), 3-6, 04.
ODI (2002). Foreign Direct Investment: Who Benefits? ODI Briefing Paper.
University of Ghana http://ugspace.ug.edu.gh
209
OECD-ILO Report (2008). Employment and Industrial Relations – Promoting
responsible business conduct in a Globalising Economy. Conference on
Corporate Social Responsibility held in Paris on 23-24 June 2008.
Oi, W. Y. (1962). Labor as a Quasi Fixed Factor. Journal of Political Economy,
70(6), 538–555.
Oshikoya, T. W. (1994). Macroeconomic determinants of domestic private
investment in Africa: An empirical analysis. Economic Development
and Cultural Change, 42, 573-96.
Peichl, A. & Siegloch, S. (2012). Accounting for labor demand effects in structural
labor supply models. Labour Economics, 19(1), 129 -138.
Pereira, A. M. & Andraz, J. M. (2012). On the Economic Effects of Investment in
Railroad Infrastructures in Portugal. Journal of Economic Development,
37(2), 79 – 107.
Pierluigi, B & Roma, M. (2008). Labour cost and employment across euro area
countries and sectors (No. 912). European Central Bank Working Paper
Series.
Pryor, F. & Schaffer, D. (1999). Who's Not Working and Why. Cambridge,
Massachusetts: Cambridge University Press.
Psaltopoulos, D., Skuras, D. & Thomson, K. J. (2011). Employment effects of private
investment initiatives in rural areas of southern Europe: a regional SAM
approach. Agricultural Economics Review, 12(2), 50-61.
Ramírez, D. (1994). Public and private investment in Mexico, 1950–90: An empirical
analysis. Southern Economic Journal, 61(1), 1–17.
University of Ghana http://ugspace.ug.edu.gh
210
Rosen, S. (1969). On the Inter-Industry Wage and Hours Structure. Journal of
Political Economy, 77( 2), 249–273.
Rowthorn, R.E. (1999). Unemployment, wage bargaining and capital–labour
substitution. Cambridge Journal of Economics, 23(4), 413–25.
Sackey, H. A. (2007). Private Investment for Structural Transformation and Growth
in Africa: Where do Small and Medium-Sized Enterprises Stand?
Proceedings of the African Economic Conference, pp. 371-398.
Sargan, J. D. (1958). The estimation of economic relationships using instrumental
variables. Econometrica, 26, 393–415.
Sargent, T.J. (1978). Estimation of Dynamic Labor Demand Schedules under
Rational Expectations. Journal of Political Economy, 86, 1009-1044.
Say, J-B (1834). A Treatise on Political Economy (sixth American ed.). Philadelphia:
Grigg & Elliott. This is an English translation of Say's Traité d'economie
politique, first published in 1803.
Sevestre, P. & Trognon, A. (1985). A note on autoregressive error component
models. Journal of Econometrics, 28, 231-245.
Schumpeter, J.A. (1943). Capitcllism, socialism and democracy. George Allen &
Unwin Ltd., U.K.
Sparrow, G. N., Ortmann, G. F., Lyne, M. C. & Darroch, M. A. G. (2008).
Determinants of the demand for Regular Farm Labour in South Africa,
1960-2002. Agrekon, 47(1), 52-75.
University of Ghana http://ugspace.ug.edu.gh
211
Symons. J.S.(1982). Relative Prices and the Demand for Labour in British
Manufacturing (No. 137). London School of Economics, Centre for
Labour Economics Discussion Paper.
Symons, S. & Layard, R. (1984). Neoclassical Demand for Labour Functions for
Economies. The Economic Journal, 94(376), 788-799. URL:
http://www.jstor.org/stable/2232295
Van Reenen, J. & Bond, Steve (2005). Micro-economic models of investment and
employment. In: Heckman, Jim and Leamer, E, (eds.) Handbooks of
econometrics volume VI. Elsevier Science Ltd, Amsterdam.
Van Reenen, J. (1997). Employment and Technological Innovation: Evidence from
U.K. Manufacturing Firms. Journal of Labor Economics, 15(2), 255 - 284.
Wolman, H., Levy, A., Young, G. & Blumenthal, P. (2008). Economic
Competitiveness and the Determinants of Sub-national Area
Economic Activity. Washington, DC: Prepared for the Office of
Revenue Analysis in the DC Office of the Chief Financial Officer.
World Bank (2004) MENA Development Report: Unlocking the Employment
Potential in the Middle East and North Africa-Towards a New Social
Contract. No. 28815.
World Bank. (2011). World Development Indicators 2011. Washington, DC: World
Bank.
World Bank (2013). World Development Report 2013: Jobs World Bank,
Washington, D.C.
University of Ghana http://ugspace.ug.edu.gh
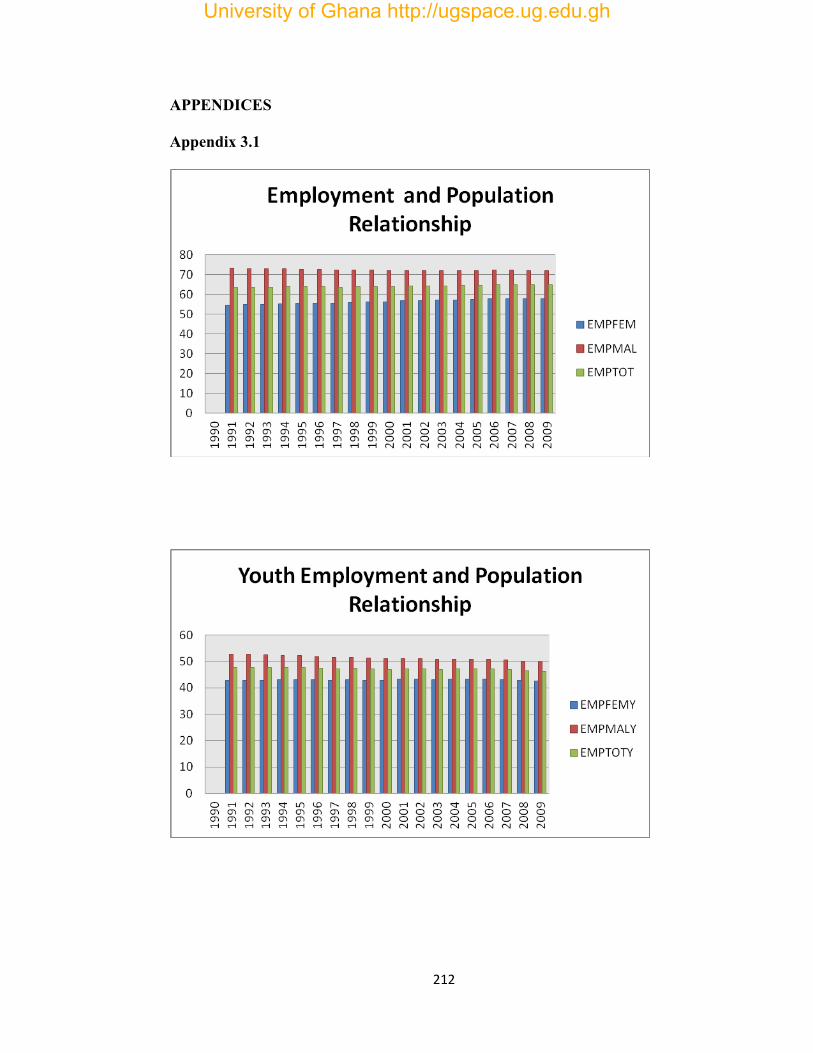
212
APPENDICES
Appendix 3.1
University of Ghana http://ugspace.ug.edu.gh
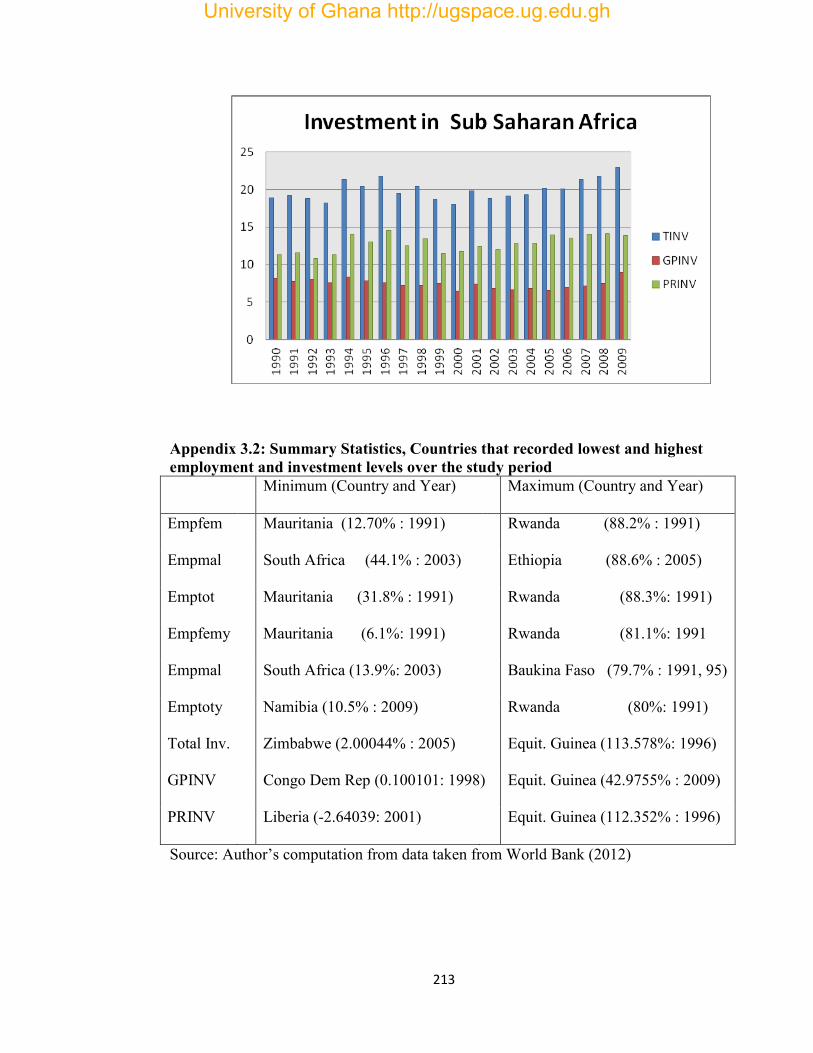
213
Appendix 3.2: Summary Statistics, Countries that recorded lowest and highest employment and investment levels over the study period Minimum (Country and Year) Maximum (Country and Year)
Empfem
Mauritania (12.70% : 1991)
Rwanda (88.2% : 1991)
Empmal
South Africa (44.1% : 2003)
Ethiopia (88.6% : 2005)
Emptot
Mauritania (31.8% : 1991)
Rwanda (88.3%: 1991)
Empfemy
Mauritania (6.1%: 1991)
Rwanda (81.1%: 1991
Empmal
South Africa (13.9%: 2003)
Baukina Faso (79.7% : 1991, 95)
Emptoty
Namibia (10.5% : 2009)
Rwanda (80%: 1991)
Total Inv. Zimbabwe (2.00044% : 2005)
Equit. Guinea (113.578%: 1996)
GPINV
Congo Dem Rep (0.100101: 1998) Equit. Guinea (42.9755% : 2009)
PRINV Liberia (-2.64039: 2001) Equit. Guinea (112.352% : 1996)
Source: Author’s computation from data taken from World Bank (2012)
University of Ghana http://ugspace.ug.edu.gh
214
CHAPTER FOUR
PRIVATE INVESTMENT, EMPLOYMENT AND SOCIAL
WELFARE IN SUB- SAHARAN AFRICA
Abstract
This chapter assesses the effect of private investment and employment on social
welfare in Sub-Saharan Africa (SSA), after accounting for income inequality. We
estimate a derived welfare model that builds on a proposed welfare function by
Todaro and Smith (2012). This model allows for the inclusion of private investment,
public investment, employment, initial poverty level and inequality. The results offer
support for the growth-poverty-nexus by showing that growth components like
investment and employment help explain social welfare dynamics. Also, poverty and
inequality are harmful to social development. Consequently, SSA countries should
intensify policies aimed at attracting and maintaining private investment and offering
good jobs since they are conduits for improving the social wellbeing of the citizenry.
4.1.0 Introduction
Deliberations on improving social welfare and reducing poverty have taken centre
stage in almost all major developmental discussions by the so-called unholy trinity
(Peet, 2003); International Monetary Fund (IMF), the World Bank and the World
Trade Organisation (WTO). A position largely criticized by Peet (2003) and Bøa°s
and McNeill (2003), even though Cammack (2004) sees that the World Bank’s view
of poverty reduction is more deep seated and serious. Needless to say, poverty is not
good for the world neither is it a recent phenomenon. Poor people lag behind non-
University of Ghana http://ugspace.ug.edu.gh
215
poor people in terms of educational achievement, employment opportunities, access
to secure housing, outstanding payments, access to health care, portable water and
skilled work (Milcher, 2006; Nguyen, Linh, & Nguyen, 2013). No matter how
unacceptable it is, given the state of global development, poverty has and still is with
us so the world has to deal with it. As the American economist Henry George
remarked in the 1870s that ‘the association of poverty with progress is the greatest
enigma of our times’ (as cited in Wade, 2004, p. 163). The current nature of this old
statement is probably the main reason why the first Millennium Development Goal is
to halve poverty by 2015.
Even though the world has made progress towards achieving the global target of
reducing poverty by halve by 2015 (millennium Development Goal-MDG- 1), many
countries in Sub-Saharan Africa (SSA) and Southeast Asia have not made significant
progress (Kozak, Lombe, & Miller, 2012). Global extreme poverty level, people
living on less than $1.25 a day, has reduced by half from 1990 (36%) to 2010 (18%).
But two (Nigeria and Congo DR) of the world’s five countries (including India,
China and Bangladesh) that make up two-thirds of the world’s extreme poor are in
Sub-Saharan Africa (SSA) (Word Bank, 2014). The report further states that five
(Congo DR, 88%; Liberia, 84%; Burundi, 81%; Madagascar, 81% and Zambia, 75%)
out of the high extreme poverty smaller countries are in SSA. A comparison of
historical poverty records of SSA and South Asia (SAS) shows that the two sub-
regions have recorded poverty reductions between 1981 and 2010 but SAS has made
the most gains. SSA achieved a reduction of 5.83% in poverty levels while that of
University of Ghana http://ugspace.ug.edu.gh
216
SAS was 49.34%, based on headcount ratio using $1.25 standard. Similar results
were recorded when the $2.50 poverty headcount ratio standard was used. While
SAS recorded a reduction of 14.42% in poverty levels, SSA achieved a reduction of
1.76%. in addition, current poverty levels (as at 2010), using $1.25 standard, show
that poverty level in SAS is about 17.5% lower than SSA but on the basis of $2.50
standard, SSA is about 1.4% lower than SAS (Appendix 4.1). Obviously, SSA
appears to be less aggressive in pursuing the poverty reduction agenda.
In spite of these developments, studies in this millennium show that poverty level in
Africa has moved from that of a worry to that of hope. Collier and Dollar (2001)
espoused that if the world is to halve poverty by 2015, most of the reduction would
come from Asia, while Africa would only witness a slight reduction. Subsequently,
Cornell, Institute of Statistical Social and Economic Research (ISSER) and World
Bank (2005) indicated that non achievement of MDGs in SSA was virtually certain,
if nothing different was done. Three years later, the World Bank (2008) report still
was of the view that Africa was far from reaching this target. In fact the report further
projected that if nothing was done then, the poverty level in SSA could worsen to the
extent that about half of the world’s poor would be living in SSA. Earlier, Bigsten
and Shimeles (2007) had argued that Africa can still achieve the MDG 1 if only the
region could ensure a relatively modest growth in per capita household consumption
given the existing level of inequality. Generally, ensuring growth in per capita
consumption would require labour intensive investment that would eventually
increase the purchasing power of the working class. But the dynamics in employment
University of Ghana http://ugspace.ug.edu.gh
217
levels in SSA make it difficult for one to conclude that increases in total employment
levels, mainly driven by increases in female employment would lead to poverty
reduction especially when male employment have reduced between 1990 - 2009.
Also, generally, all the SSA countries in this study have recorded increases in the
level of human development (HD), even though the size of these increases is not
homogenous (see Appendix 4.2). With the exception of Rwanda, it is also apparent
that most countries (for instance South Africa, Seychelles, Botswana, Namibia,
Swaziland, Gabon and Kenya) that have the highest levels of human development are
not among the best gainers (Niger, Angola, Liberia and Sierra Leone) when the
opening and closing levels of HD are compared. Countries that have low levels of
initial HD are better motivated to make improvements than those that have a
relatively higher level of development. This is probably due to the fact that countries
have desired levels of HDs, so, as they move towards this level their additions to HD
increases but a decreasing rate unlike those who are remote from their target levels.
The improvements in the general level of social welfare (human development) in
SSA have coincided not only with improvements in poverty reductions but also with
a gradual shift from public investment to private investment and some interesting
dynamics in the labour market.
Recent historical (1990 - 2009) analyses of the changes in investment and
employment in the SSA region show some interesting results. Generally, the second
decade (2000-2009) shows a marginal increase in employment to population ratio
University of Ghana http://ugspace.ug.edu.gh
218
from 63.77% (1990 – 1999) to 64.46%. Interestingly, while more females are joining
the working populations (55.31% to 57.18%), the opposite can be said of their male
counterparts (fell from 72.60% to 71.95%), when the two decades are compared.
Meanwhile investment has seen some considerable improvement. Total investment in
the second decade (2000 – 2009) showed a marginal increase from 19.72% (1990 –
1999) to 20.06% of GDP. There is also evidence of a gradual shift from government
led investment to private sector controlled investment in the SSA. Public sector
investment fell from 7.72% (1990 – 1999) to 7.10% (2000 – 2009) while private
investment increased from 12.40% of GDP to 13.10% of GDP. It is clear that
employment and private investment levels have improved during the study period
(2000-2009) but what is yet to be ascertained, empirically, is whether these
improvements can help explain improvements in the social welfare in SSA.
Generally, economic growth is considered the single most important factor that
influences poverty reduction (Donaldson, 2008) even though not all growth benefits
the poor (Thurlow & Wobst, 2006). In Africa, poverty studies have followed the
global trend. Growth and poverty reduction has taken centre stage, even though
growth and poverty are weakly linked, in Africa (Page & Shimeles, 2014) or at best
give confusing results (Fosu, 2010). Fosu (2010) explains that economic growth is
significant in poverty increases and decreases in developing economies even though a
fairly distributed income could enhance the poverty reduction ability of economic
growth. Adams (2004) argues that labour intensive economic growth can be an
appropriate channel through which poor people in developing economies can get out
University of Ghana http://ugspace.ug.edu.gh
219
of poverty. A position that is largely supported by Page and Shimeles (2014) that
insufficient jobs in the economic growth of Africa is the main reason for the weak
link between economic growth and poverty reduction. Gradually, discussions on the
growth- poverty-nexus are being shifted to the relationship between the structure of
growth and poverty and not just growth per se.
In addition to pursuing labour intensive economic growth, Pfeffermann (2001) argues
that very few people would disagree with the fact that, in the long run, economic
development cannot occur without a dynamic private sector. Given that private
investment enhances economic growth (Alfaro, Chanda, Kalemli-Ozcan, & Sayek,
2010; and Apergis, Lyroudia, & Vamvakidis, 2008), it follows almost naturally for
one to conjecture that there could be a relationship between private investment and
welfare (poverty reduction) assuming a perfectly positive correlation between
economic growth and welfare. This assumption, though, will not suffice (Anand &
Sen, 2000) especially in the presence of income inequality (Ravallion, 1997;
Ravallion, 2001; Ravallion & Chen, 2007; Kalwij & Verschoor 2007; Ravallion,
2007; Fosu, 2008, 2010).
Apart from inculcating inequality in studies that link economic growth and welfare
(poverty reduction), Nissanke and Thorbecke (2006) argue that knowledge of the
structure and pattern of growth that best contributes to poverty alleviation should be
known. Page and Shimeless (2014) follows that of MacMillan and Rodrik (2011) to
study the linkage between employment in the agricultural services and industry
University of Ghana http://ugspace.ug.edu.gh
220
sectors in the African economy and poverty reduction. The study did not find that
employment in those sectors reduce poverty for the African sample. Even though the
study factors in the importance of inequality in explaining poverty behaviour, it does
not consider that of investment. Gohou and Somoure (2012) tested the relationship
between Foreign Direct Investment (FDI) and welfare (poverty reduction) in Africa
and concluded that FDI net inflows have a significantly positive relationship with
poverty reduction but with significant differences among Africa’s economic and
geographic regions. In spite of the important insights from this study, it did not
consider the crucial role played by inequality in poverty behaviours, which Fosu
(2010) believes should not be glossed over. Also, it did not consider the importance
of employment in their poverty model neither did it study Sub-Saharan Africa (SSA)
as a bloc.
Consequently, this study seeks to find out which aspect of growth in the economy
(employment and/or investment) influences social welfare in SSA. We achieve this
objective by using a derived welfare model that builds on a proposed welfare
function by Todaro and Smith (2012). In fact, the model allows for the simultaneous
testing of the relationship between private investment, public investment and
employment on welfare after controlling for inequality and poverty level.
4.2.0 Literature Review
Theoretically, Dollar and Kraay (2002) argue that ‘growth is good for the poor’ after
finding from their study that growth in national income was associated with growth
University of Ghana http://ugspace.ug.edu.gh
221
in the income of the poor. But, on the grounds that poverty goes beyond income to
include disempowerment and insecurity and also has other social and political causes,
Dollar and Kraay’s findings have been challenged by many (Gore, 2007). This
extended definition of poverty reduction means that a comprehensive poverty
reduction strategy ensures social welfare. It also explains why these two terms are
sometimes used interchangeably (Gohou & Somoure, 2012) even though Todaro and
Smith (2012) believe that poverty level as well as per capita income and inequality
influences social welfare.
According to Gore (2007), a theory that enables a good explanation of pro-poor
growth by allowing for the inclusion of policy variables that can be implemented to
enhance poverty reduction (social welfare) is appropriate for such studies. The model
used for this study, relies on the principles of neoclassical growth theory to factor in
economic (investment and employment) and institutional (political stability)
variables that can be manipulated to achieve social welfare. The basic neoclassical
economic growth theory shows how a steady state economic growth can be achieved
through a careful combination of the amounts of capital and labour, in the presence of
technological change.
Empirically, economic growth could either reduce or increase poverty, especially in
an economy where inequality exists. Fosu (2010) reports that even though economic
growth is significant in poverty increases or decreases in developing countries, the
crucial role played by inequality in poverty behaviours cannot be glossed over. He
University of Ghana http://ugspace.ug.edu.gh
222
further argues that relatively fairly distributed income could enhance the poverty
reduction ability of economic growth in developing countries. In other words, not all
growth benefit the poor (Son, 2004), especially in the presence of income inequality
(Fosu, 2010). Wodon (2007) corroborate this position, with a study on West Africa,
that economic growth reduces poverty especially when attention is given to
inequality which restricts growth impact on poverty. Extreme income inequality leads
to economic inefficiency, undermine social stability and solidarity and is generally
considered unfair (Todaro & Smith, 2012). Thus, United Nations Commission on
Trade and Development-UNCTAD (2011) advocates that new poverty reduction
strategies could be sustained if they operate in an environment of rapid and sustained
economic growth and job creation and according to Ravallion (2007) and Wodon
(2007), with less inequality.
Adams (2004) advanced, after controlling for income inequality, that the definition of
economic growth determines the extent to which economic growth reduces poverty in
developing economies. He says that even though growth in per capita income does
not significantly reduce poverty, growth in survey mean income (expenditure) does.
According to Martins (2013) the impressive record of Africa’s growth has not been
gainful in terms of reducing poverty partly because sufficient productive employment
has not been part of it. Thus, labour intensive economic growth can be an appropriate
channel through which poor people in developing economies can get out of poverty
(Adams, 2004 and Taylor, 2009). But Marx (2007) argues that the exceptional
employment growth achieved by Netherland in the 1980s and 1990s only led to small
University of Ghana http://ugspace.ug.edu.gh
223
reductions in absolute poverty and a rise in relative poverty because of the nature of
the economic and social policies pursued. His results imply that poverty reduction
and relatively equitable distribution of income cannot be deemed to be natural
consequences of employment growth if they are not backed by appropriate economic
and social policies.
Using data from some selected African countries, Christiaensen, Demery and
Paternostro (2003a) and Fosu (2008) explain that income poverty is not
homogeneous among selected African countries and also conclude that economic
growth in Africa in the 1990s was pro-poor even though aggregate figures showed
that some groups and regions have been left behind (see also Christiaensen, Demery
& Paternostro, 2003b) . Fosu (2008) concluded in a comparative study of SSAs and
non-SSAs that initial inequality reduces the impact of economic growth on poverty
reduction for both regions, even though it is less for SSAs.
Investment is shown to affect poverty reduction mainly through the economic growth
channel (Borensztein, De Gregorio & Lee, 1998; Jalilian & Weiss, 2002; and
Kalirajan & Singh, 2009). Yahie (2000) explains that the search for a holistic solution
for economic growth and poverty reduction in Africa should not leave out the private
sector. Private investment is not just the engine of growth but is also crucial for
increasing the pace of growth and the pattern of growth necessary for poverty
reduction and economic development (Organisation for Economic Co-operation and
Development – OECD- 2006 and Harvey, 2008). In testing for this effect, empirically
University of Ghana http://ugspace.ug.edu.gh
224
in Africa, studies have linked FDI to poverty reduction through its ability to facilitate
technological transfers which leads to economic growth. Also, the effect of corporate
social responsibility activities like provision of water, electricity, good roads and
scholarship schemes undertaken by foreign direct investors cannot be underestimated
(Klein, Aaron, & Hadjimichael, 2001). They stress that potentially desirable effects
of FDI such as financial stability, good corporate governance, contribution to tax
revenue and enhancement in labour conditions enhance the quality of economic
growth for poverty reduction. Recently, Ucal, (2014) concluded using data from
selected developing countries and panel data methodology that FDI reduces poverty.
In Tanzania, Fan, Nyamge & Rao (2005) reveal that public investment in agricultural
research, roads and education reduce poverty, as in Asia. Anderson, de Renzio and
Levy (2006) adds that evidence exist, in developing countries, that support the fact
that public investment in transport and communication, irrigation and agricultural
research and development help reduce poverty.
Gohou and Soumare (2012) assess whether FDI reduces poverty in Africa and
whether there are regional differences in this relationship. They conclude that FDI
inflows and poverty reduction are significantly positively related but with significant
regional differences. They also reveal that the effect of FDI on poorer regions (like
Central and East Africa) is bigger than richer regions (like North and South Africa).
They based their study on the assumption of perfect positive correlation between
economic growth and welfare: an assumption which has been questioned (Anand &
Sen, 2000) especially in the presence of inequality (Ravallion, 1997; Ravallion, 2007;
University of Ghana http://ugspace.ug.edu.gh
225
and Fosu, 2008, 2010). Ealier, Cornell/ISSER/World Bank (2005) concluded that
shared growth would help Africa meet its MDGs.
Pages and Shimeles (2014) decomposes output but into sectors, akin to that of
MacMillan and Rodrik (2011), and tests for whether employment amplifies the effect
of aid on poverty. They conclude that insufficient jobs in the economic growth of
Africa are the main reason for the weak link between economic growth and poverty
reduction.
Studies linking economic growth to poverty are prolific in literature, what is scarce is
empirical knowledge of the aspect of economic growth that drives poverty when
inequality is accounted for. Consequently, this study contributes to the discussion on
the growth structure and pattern that best contributes to poverty reduction by finding
out which aspect of growth in the economy (employment and/or investment)
influences social welfare.
4.3.0 Methodology
4.3.1Theoretical Justification of the Model
The growth-poverty-nexus has received some attention from researchers using
several approaches. Son (2004) proposes ‘poverty growth curve’ to assess which
economic growth benefit the poor. Ravallion and Chen (1997) builds a panel model
from household survey data to assess how inequality and growth affect poverty,
while Agénor et al., (2008) uses constant elasticity of demand approach to estimate a
welfare function that factors in aid, public investment and poverty. This study,
University of Ghana http://ugspace.ug.edu.gh
226
though related to that of Agénor et al., (2008) in terms of model derivation, builds on
a welfare function proposed by Todaro and Smith (2012). Todaro and Smith (2012)
advance that poverty level as well as per capita income and inequality influences
social welfare.
),,( PIyfW (1)
where W is welfare, y is income per capita, I is inequality, and P is absolute poverty.
The model predicts that while income has a positive relationship with welfare,
inequality and absolute poverty would exhibit a negative relationship with welfare.
Assuming that the function in (1) takes the following functional form
iteXPIyW ititititit
(2)
Where itX is a set of other important variables that have the potential to influence
welfare, ite represents the error term and the other variables are as explained above.
We explain per capita income by using the standard aggregate production function
(APF). The APF may allow for the inclusion of “unconventional inputs” like trade,
political stability and agricultural productivity index in addition to “conventional
inputs” like labour and capital, as used in neoclassical production function, when
assessing their effects on economic growth (Feder, 1983; Herzer, Nowak-Lehmann &
Siliverstovs, 2006; and Frimpong & Oteng-Abayie, 2006). Consider a Harrod-neutral
(deemed to be consistent with the existence of steady state - Barro and Sala-i-Martin,
2004) two-factor Cobb-Douglas (1928) production function as follows:
University of Ghana http://ugspace.ug.edu.gh
227
1)(, itititit LAKLKfY , 10 (3)
where itK is physical capital stock, itA is labour augmenting technological progress,
itL is raw labour stock and itY is aggregate production. i and t represent country and
time respectively, while α and 1- α are the physical capital and labour elasticities
respectively.
From equation (3), income per capita can be written as
aititititit
aititit LALAKLAY 111 )/()()/( (4)
(5)
Because we are interested in the effect of private capital stock on welfare, we
decompose total per capita stock into private and public per capita stock.
Let apit
agit
ait kkk , 0, a
pitagit kk , 10 (6)
where:
agitk = is public capital stock per capita
apitk = is private capital stock per capita
The evolution of the private and public capital stocks takes the following standard
forms;
11)( pitpitpitpit KKKI (6A)
11)( gitgitgitgit KKKI (6B)
where pitI and gitI are the per capita private and public investments, respectively; is
the depreciation rate of investment, assumed to be the same for both private and public.
As a result of the difficulty in getting depreciation rates for the countries in the study,
itit ky
University of Ghana http://ugspace.ug.edu.gh
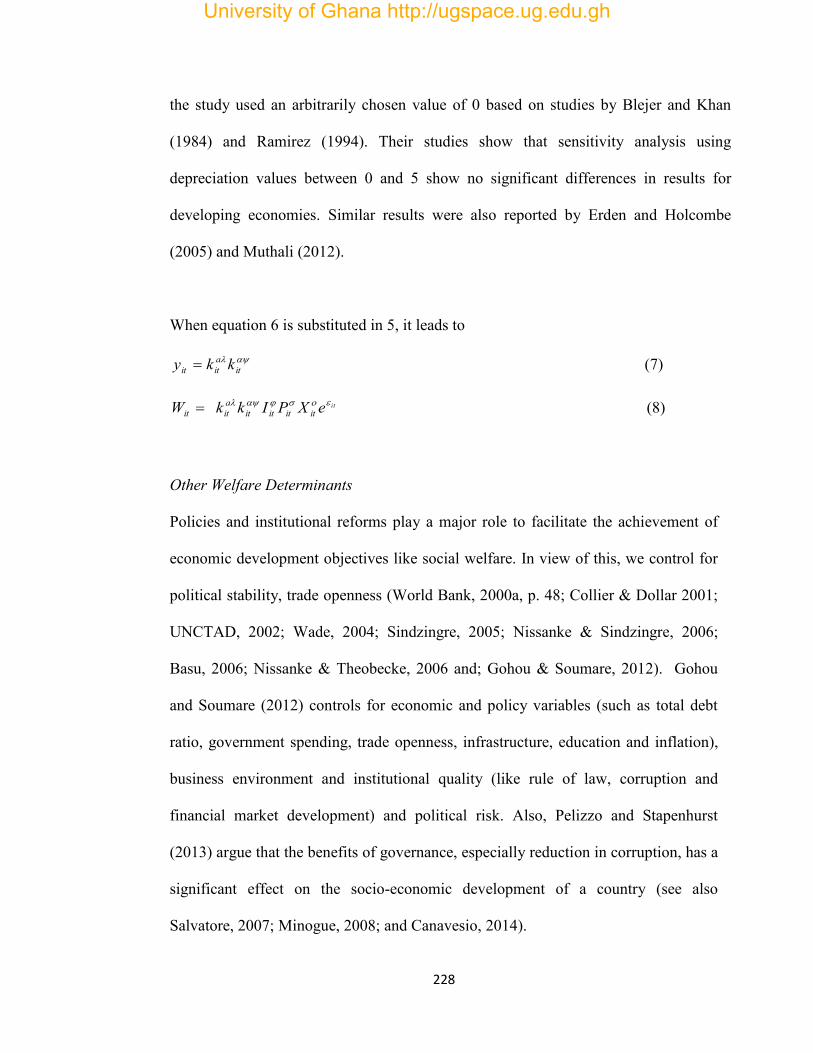
228
the study used an arbitrarily chosen value of 0 based on studies by Blejer and Khan
(1984) and Ramirez (1994). Their studies show that sensitivity analysis using
depreciation values between 0 and 5 show no significant differences in results for
developing economies. Similar results were also reported by Erden and Holcombe
(2005) and Muthali (2012).
When equation 6 is substituted in 5, it leads to
it
aitit kky (7)
iteXPIkkW ititititaitit
(8)
Other Welfare Determinants
Policies and institutional reforms play a major role to facilitate the achievement of
economic development objectives like social welfare. In view of this, we control for
political stability, trade openness (World Bank, 2000a, p. 48; Collier & Dollar 2001;
UNCTAD, 2002; Wade, 2004; Sindzingre, 2005; Nissanke & Sindzingre, 2006;
Basu, 2006; Nissanke & Theobecke, 2006 and; Gohou & Soumare, 2012). Gohou
and Soumare (2012) controls for economic and policy variables (such as total debt
ratio, government spending, trade openness, infrastructure, education and inflation),
business environment and institutional quality (like rule of law, corruption and
financial market development) and political risk. Also, Pelizzo and Stapenhurst
(2013) argue that the benefits of governance, especially reduction in corruption, has a
significant effect on the socio-economic development of a country (see also
Salvatore, 2007; Minogue, 2008; and Canavesio, 2014).
University of Ghana http://ugspace.ug.edu.gh
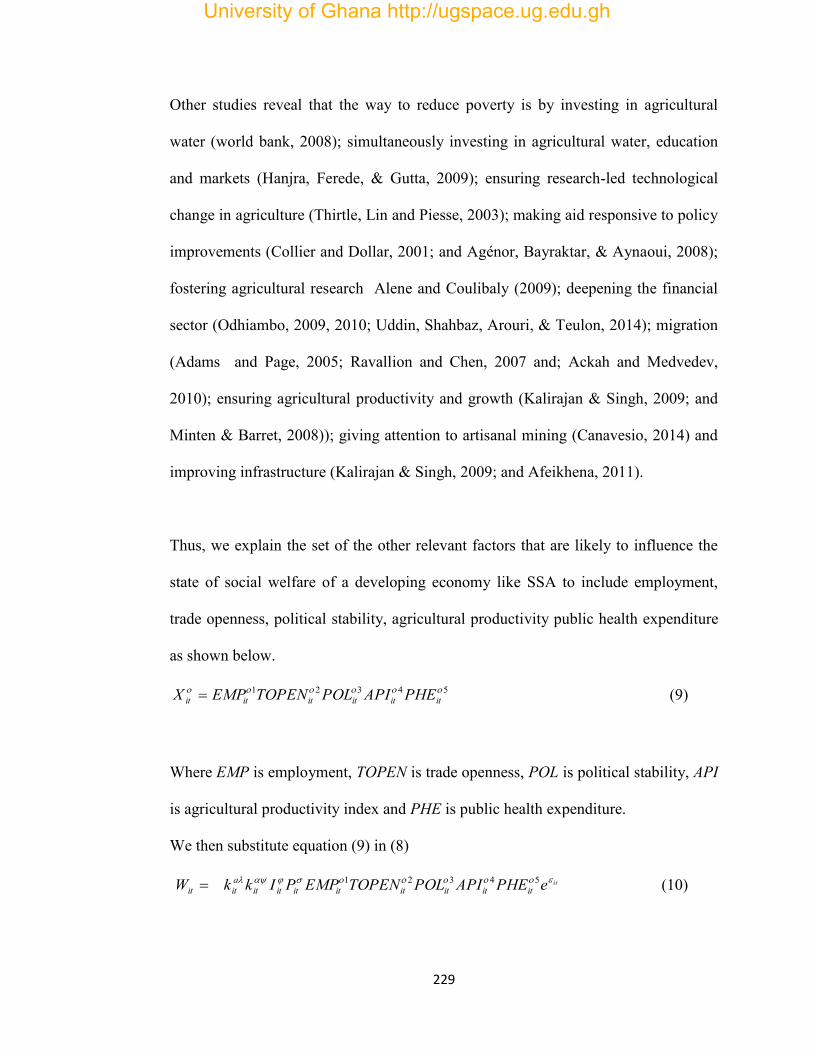
229
Other studies reveal that the way to reduce poverty is by investing in agricultural
water (world bank, 2008); simultaneously investing in agricultural water, education
and markets (Hanjra, Ferede, & Gutta, 2009); ensuring research-led technological
change in agriculture (Thirtle, Lin and Piesse, 2003); making aid responsive to policy
improvements (Collier and Dollar, 2001; and Agénor, Bayraktar, & Aynaoui, 2008);
fostering agricultural research Alene and Coulibaly (2009); deepening the financial
sector (Odhiambo, 2009, 2010; Uddin, Shahbaz, Arouri, & Teulon, 2014); migration
(Adams and Page, 2005; Ravallion and Chen, 2007 and; Ackah and Medvedev,
2010); ensuring agricultural productivity and growth (Kalirajan & Singh, 2009; and
Minten & Barret, 2008)); giving attention to artisanal mining (Canavesio, 2014) and
improving infrastructure (Kalirajan & Singh, 2009; and Afeikhena, 2011).
Thus, we explain the set of the other relevant factors that are likely to influence the
state of social welfare of a developing economy like SSA to include employment,
trade openness, political stability, agricultural productivity public health expenditure
as shown below.
54321 itititititit PHEAPIPOLTOPENEMPX (9)
Where EMP is employment, TOPEN is trade openness, POL is political stability, API
is agricultural productivity index and PHE is public health expenditure.
We then substitute equation (9) in (8)
itePHEAPIPOLTOPENEMPPIkkW ititititititititaitit
54321 (10)
University of Ghana http://ugspace.ug.edu.gh
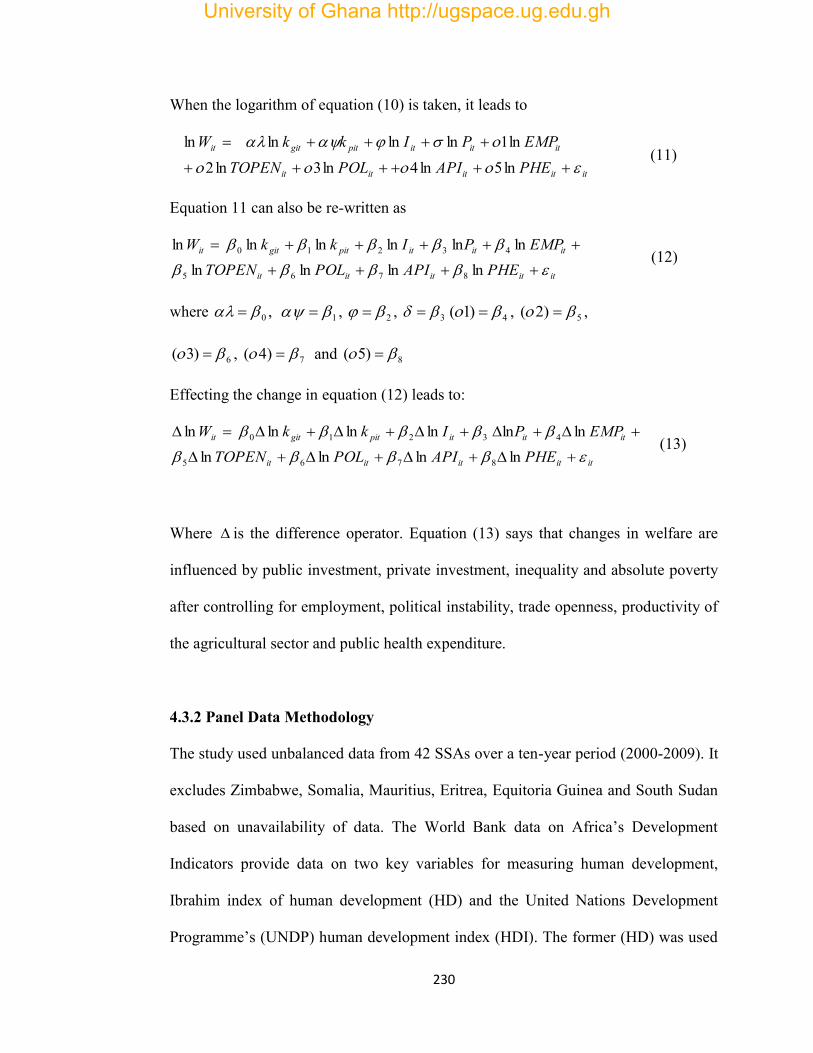
230
When the logarithm of equation (10) is taken, it leads to
ititititit
itititpitgitit
PHEAPIPOLTOPENEMPPIkkW
ln5ln4ln3ln2ln1lnlnln ln
(11)
Equation 11 can also be re-written as
ititititit
itititpitgitit
PHEAPIPOLTOPENEMPPIkkW
lnlnlnlnlnln lnlnln ln
8765
43210 (12)
where ,0 1 , 2 , 3 4)1( , 5)2( ,
6)3( , 7)4( and 8)5(
Effecting the change in equation (12) leads to:
ititititit
itititpitgitit
PHEAPIPOLTOPENEMPPIkkW
lnlnlnlnlnln lnlnln ln
8765
43210 (13)
Where is the difference operator. Equation (13) says that changes in welfare are
influenced by public investment, private investment, inequality and absolute poverty
after controlling for employment, political instability, trade openness, productivity of
the agricultural sector and public health expenditure.
4.3.2 Panel Data Methodology
The study used unbalanced data from 42 SSAs over a ten-year period (2000-2009). It
excludes Zimbabwe, Somalia, Mauritius, Eritrea, Equitoria Guinea and South Sudan
based on unavailability of data. The World Bank data on Africa’s Development
Indicators provide data on two key variables for measuring human development,
Ibrahim index of human development (HD) and the United Nations Development
Programme’s (UNDP) human development index (HDI). The former (HD) was used
University of Ghana http://ugspace.ug.edu.gh
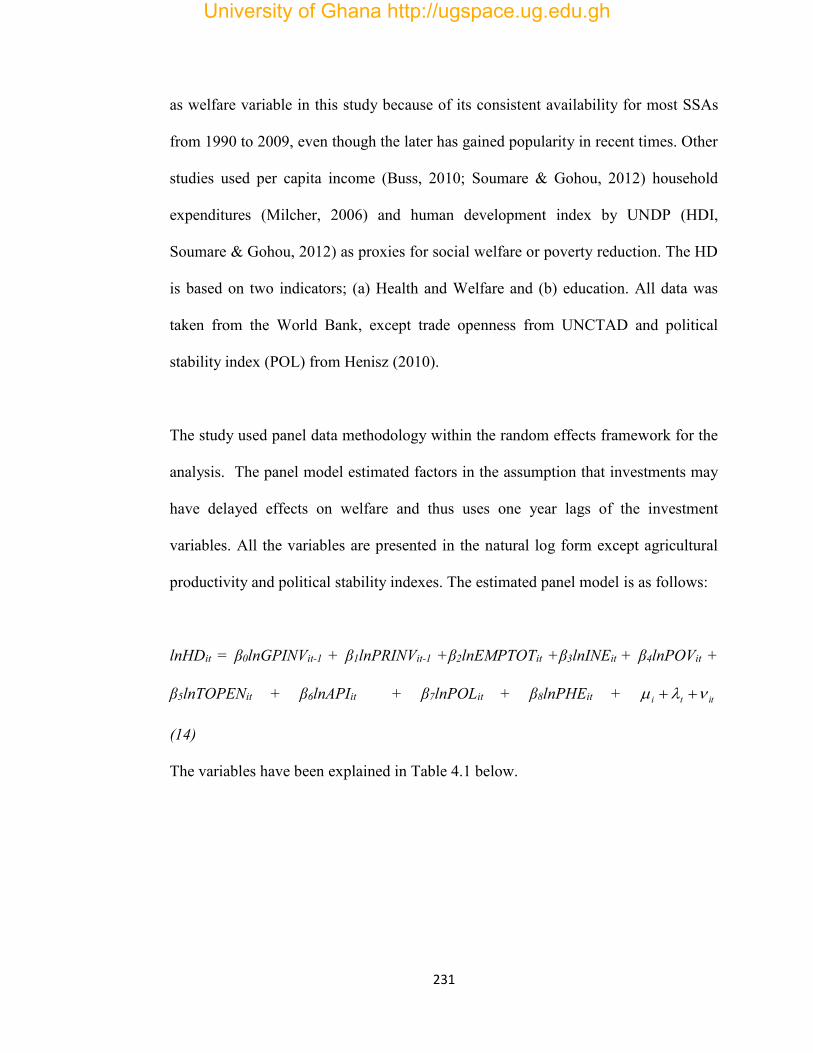
231
as welfare variable in this study because of its consistent availability for most SSAs
from 1990 to 2009, even though the later has gained popularity in recent times. Other
studies used per capita income (Buss, 2010; Soumare & Gohou, 2012) household
expenditures (Milcher, 2006) and human development index by UNDP (HDI,
Soumare & Gohou, 2012) as proxies for social welfare or poverty reduction. The HD
is based on two indicators; (a) Health and Welfare and (b) education. All data was
taken from the World Bank, except trade openness from UNCTAD and political
stability index (POL) from Henisz (2010).
The study used panel data methodology within the random effects framework for the
analysis. The panel model estimated factors in the assumption that investments may
have delayed effects on welfare and thus uses one year lags of the investment
variables. All the variables are presented in the natural log form except agricultural
productivity and political stability indexes. The estimated panel model is as follows:
lnHDit = β0lnGPINVit-1 + β1lnPRINVit-1 +β2lnEMPTOTit +β3lnINEit + β4lnPOVit +
β5lnTOPENit + β6lnAPIit + β7lnPOLit + β8lnPHEit + itti
(14)
The variables have been explained in Table 4.1 below.
University of Ghana http://ugspace.ug.edu.gh
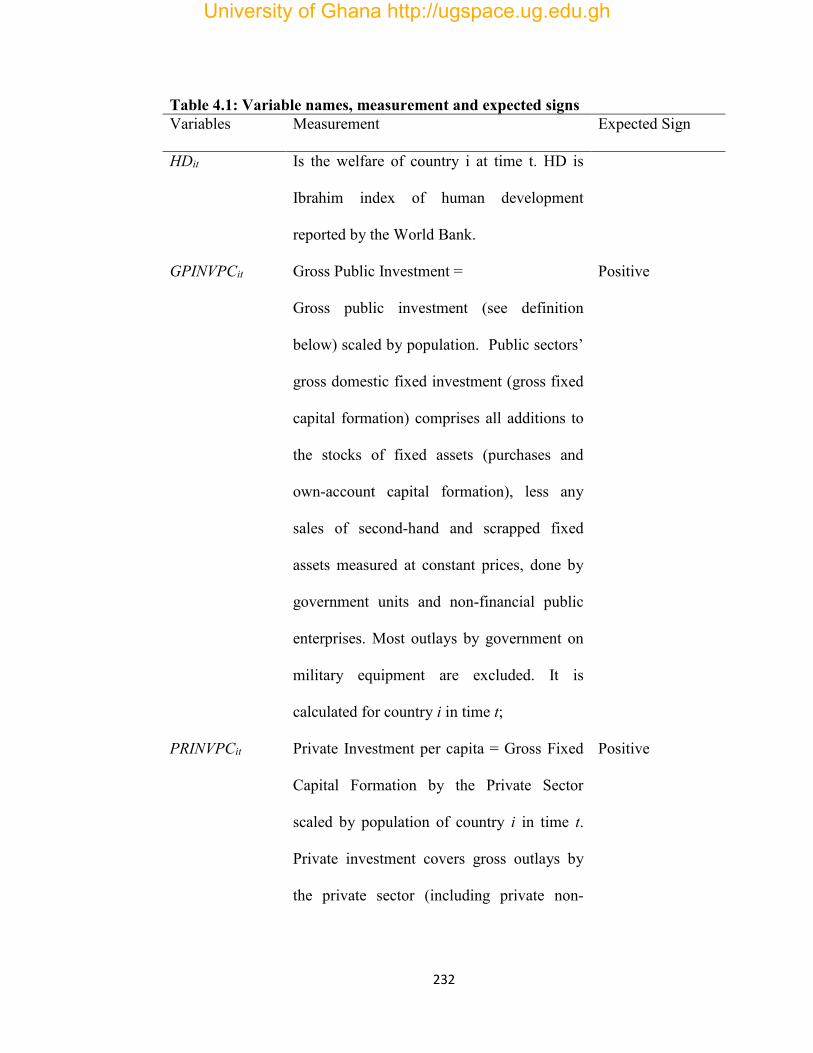
232
Table 4.1: Variable names, measurement and expected signs Variables Measurement Expected Sign
HDit Is the welfare of country i at time t. HD is
Ibrahim index of human development
reported by the World Bank.
GPINVPCit Gross Public Investment =
Gross public investment (see definition
below) scaled by population. Public sectors’
gross domestic fixed investment (gross fixed
capital formation) comprises all additions to
the stocks of fixed assets (purchases and
own-account capital formation), less any
sales of second-hand and scrapped fixed
assets measured at constant prices, done by
government units and non-financial public
enterprises. Most outlays by government on
military equipment are excluded. It is
calculated for country i in time t;
Positive
PRINVPCit Private Investment per capita = Gross Fixed
Capital Formation by the Private Sector
scaled by population of country i in time t.
Private investment covers gross outlays by
the private sector (including private non-
Positive
University of Ghana http://ugspace.ug.edu.gh
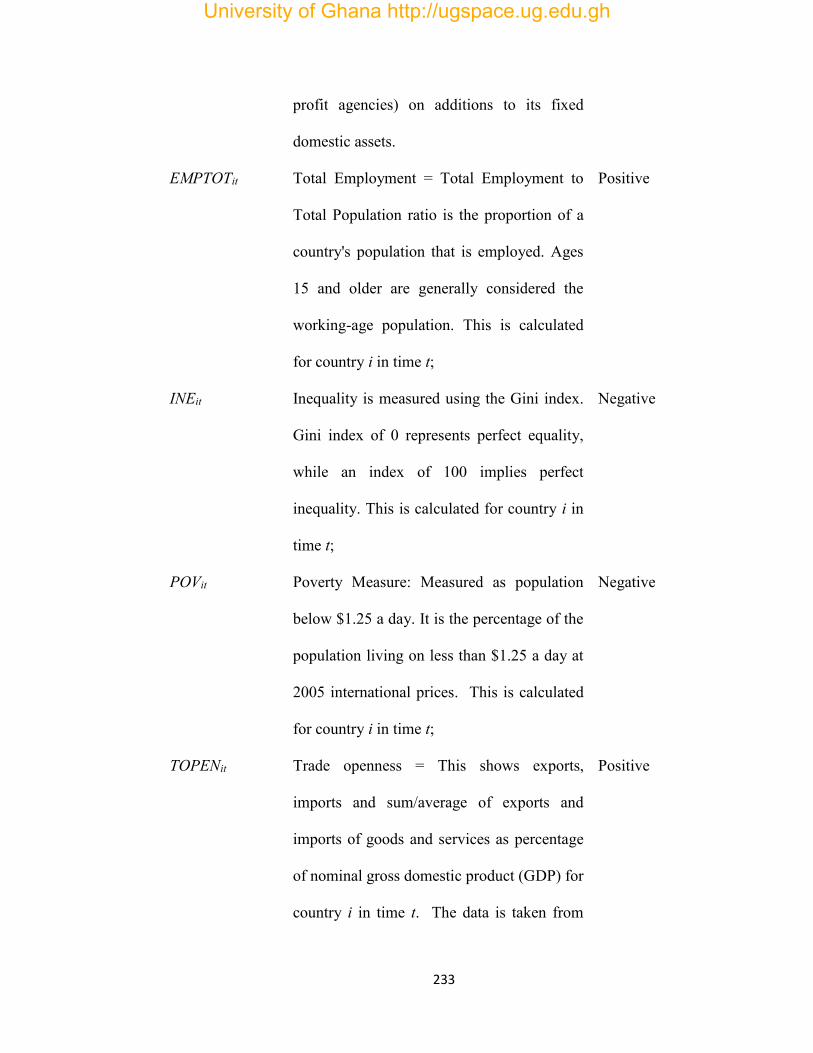
233
profit agencies) on additions to its fixed
domestic assets.
EMPTOTit Total Employment = Total Employment to
Total Population ratio is the proportion of a
country's population that is employed. Ages
15 and older are generally considered the
working-age population. This is calculated
for country i in time t;
Positive
INEit
Inequality is measured using the Gini index.
Gini index of 0 represents perfect equality,
while an index of 100 implies perfect
inequality. This is calculated for country i in
time t;
Negative
POVit
Poverty Measure: Measured as population
below $1.25 a day. It is the percentage of the
population living on less than $1.25 a day at
2005 international prices. This is calculated
for country i in time t;
Negative
TOPENit Trade openness = This shows exports,
imports and sum/average of exports and
imports of goods and services as percentage
of nominal gross domestic product (GDP) for
country i in time t. The data is taken from
Positive
University of Ghana http://ugspace.ug.edu.gh
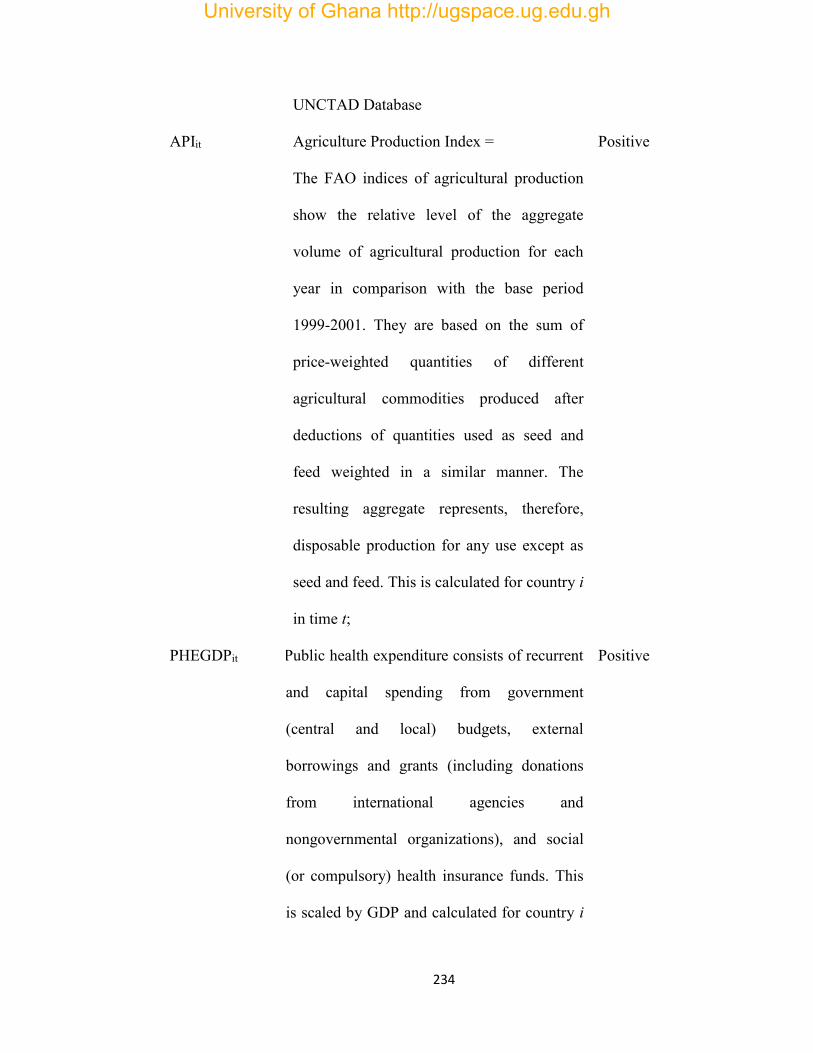
234
UNCTAD Database
APIit Agriculture Production Index =
The FAO indices of agricultural production
show the relative level of the aggregate
volume of agricultural production for each
year in comparison with the base period
1999-2001. They are based on the sum of
price-weighted quantities of different
agricultural commodities produced after
deductions of quantities used as seed and
feed weighted in a similar manner. The
resulting aggregate represents, therefore,
disposable production for any use except as
seed and feed. This is calculated for country i
in time t;
Positive
PHEGDPit Public health expenditure consists of recurrent
and capital spending from government
(central and local) budgets, external
borrowings and grants (including donations
from international agencies and
nongovernmental organizations), and social
(or compulsory) health insurance funds. This
is scaled by GDP and calculated for country i
Positive
University of Ghana http://ugspace.ug.edu.gh
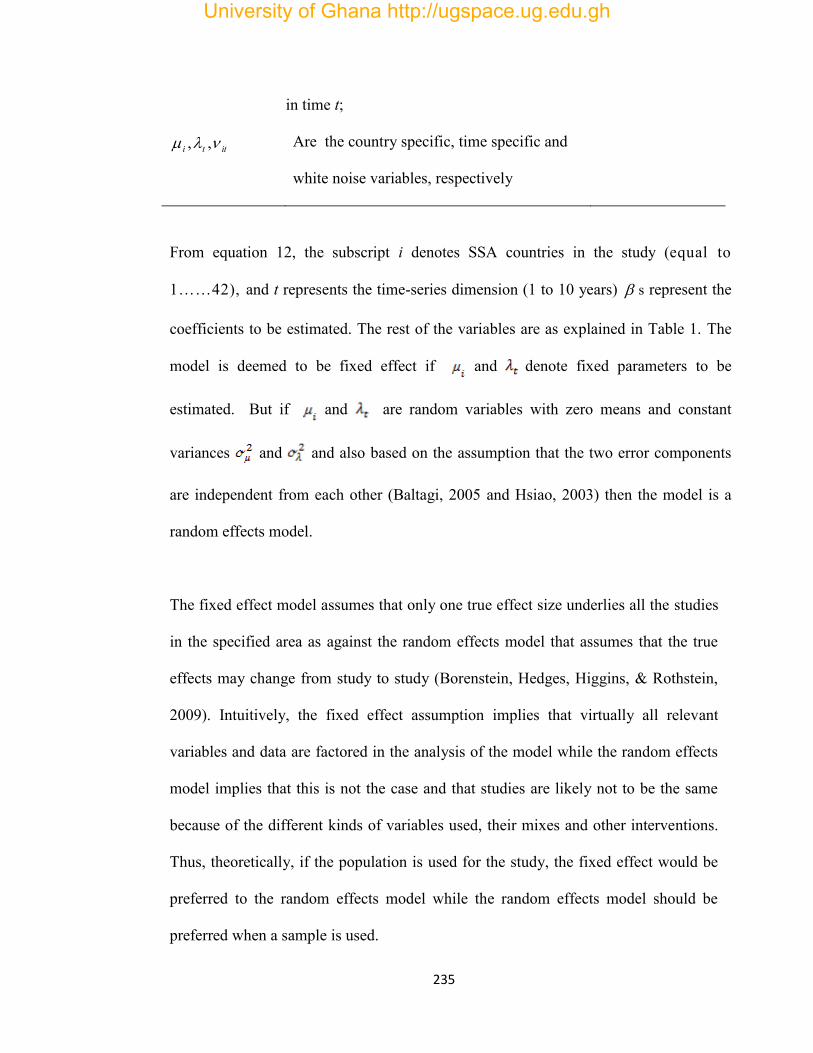
235
in time t;
itti ,, Are the country specific, time specific and
white noise variables, respectively
From equation 12, the subscript i denotes SSA countries in the study (equal to
1……42), and t represents the time-series dimension (1 to 10 years) s represent the
coefficients to be estimated. The rest of the variables are as explained in Table 1. The
model is deemed to be fixed effect if and denote fixed parameters to be
estimated. But if and are random variables with zero means and constant
variances and and also based on the assumption that the two error components
are independent from each other (Baltagi, 2005 and Hsiao, 2003) then the model is a
random effects model.
The fixed effect model assumes that only one true effect size underlies all the studies
in the specified area as against the random effects model that assumes that the true
effects may change from study to study (Borenstein, Hedges, Higgins, & Rothstein,
2009). Intuitively, the fixed effect assumption implies that virtually all relevant
variables and data are factored in the analysis of the model while the random effects
model implies that this is not the case and that studies are likely not to be the same
because of the different kinds of variables used, their mixes and other interventions.
Thus, theoretically, if the population is used for the study, the fixed effect would be
preferred to the random effects model while the random effects model should be
preferred when a sample is used.
University of Ghana http://ugspace.ug.edu.gh
236
According to Clark and Linzer (2012) the choice between fixed and random should
be based on the researcher’s preference in the trade-off between bias and variance in
the estimates generated under each model. Even though the fixed effect model
produces unbiased estimates, the probability that the estimates would differ from
sample to sample is high especially when there are few observations per unit or the
changes in the independent variable is not as large as the changes in the dependent
variable. On the contrary, the random effects model would reduce the variance in the
estimates but, in most cases, introduce bias. Normally, to deal with this bias, the
random effects model assumes that there is no correlation between the independent
variable and the unobserved variables (as captured in the intercept).
In addition, the size and characteristics of the available dataset can influence the
quality of inferences made on the estimates. The nature of the data used for the study
means that theoretically, the random effects model should be preferred. Data in SSA
are purely unbalanced especially that of measures for inequality (like GINI Index)
and poverty (poverty head count ratio). Also, the study excluded six countries from
the analysis because they did not have enough data. Finally, the choice of random
effects model was settled on because the Hausman (1978) specification test preferred
the random model to the fixed model. In the Hausman test the null hypothesis is that
the preferred model is random-effects. In other words, the unique errors ( are not
correlated with the regressors (Greene, 2008). The Hausman test subjects this
assumption underlying the random effects model to examination to detect if there are
violations. If there are no violations in this assumption then the coefficient estimates
University of Ghana http://ugspace.ug.edu.gh
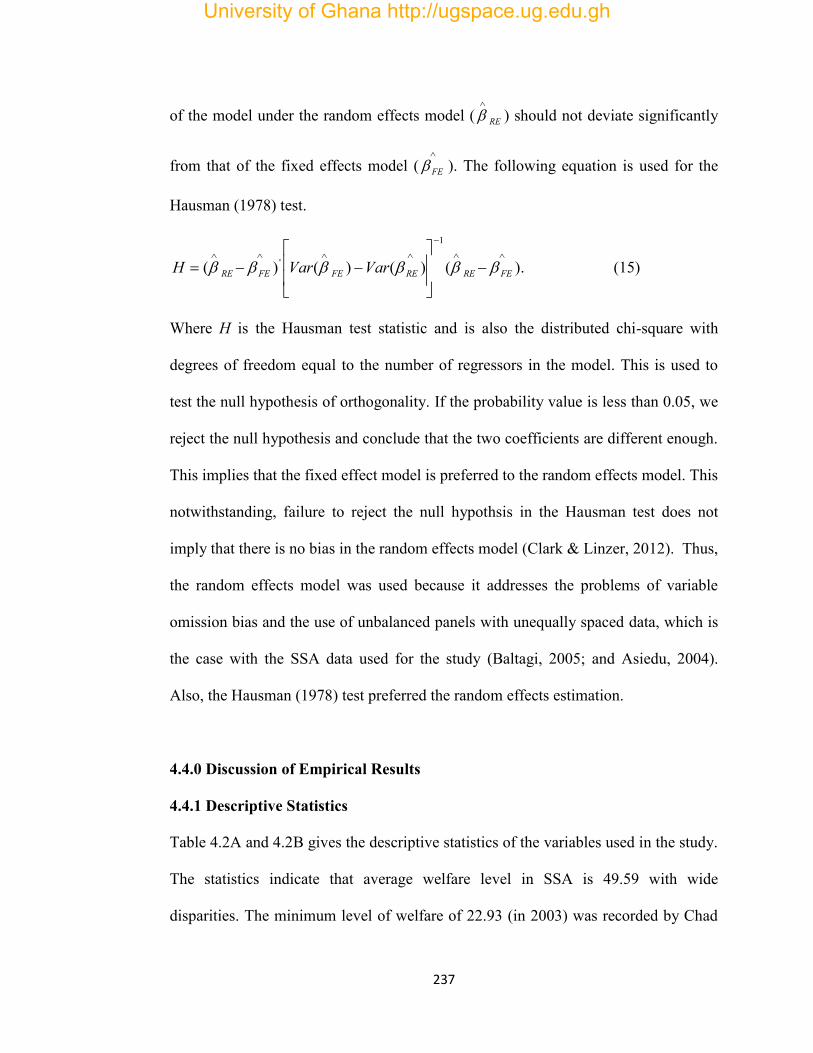
237
of the model under the random effects model ( RE
) should not deviate significantly
from that of the fixed effects model (
FE ). The following equation is used for the
Hausman (1978) test.
).()()()(
1
'
FEREREFEFERE VarVarH (15)
Where H is the Hausman test statistic and is also the distributed chi-square with
degrees of freedom equal to the number of regressors in the model. This is used to
test the null hypothesis of orthogonality. If the probability value is less than 0.05, we
reject the null hypothesis and conclude that the two coefficients are different enough.
This implies that the fixed effect model is preferred to the random effects model. This
notwithstanding, failure to reject the null hypothsis in the Hausman test does not
imply that there is no bias in the random effects model (Clark & Linzer, 2012). Thus,
the random effects model was used because it addresses the problems of variable
omission bias and the use of unbalanced panels with unequally spaced data, which is
the case with the SSA data used for the study (Baltagi, 2005; and Asiedu, 2004).
Also, the Hausman (1978) test preferred the random effects estimation.
4.4.0 Discussion of Empirical Results
4.4.1 Descriptive Statistics
Table 4.2A and 4.2B gives the descriptive statistics of the variables used in the study.
The statistics indicate that average welfare level in SSA is 49.59 with wide
disparities. The minimum level of welfare of 22.93 (in 2003) was recorded by Chad
University of Ghana http://ugspace.ug.edu.gh
238
whiles the maximum level of 89.44 (in 2008) was made by Seychelles. Also, 18
countries out of the sample could not achieve the average level of development
recorded and most (11) of these countries are in West Africa. In SSA, total
employment stands at about 65%, over the study period. Mauritania (in 2000)
recorded the least level of employment whiles the highest level was achieved by
Rwanda (in 2000). Fifteen (15) countries had their employment levels below the
average, with virtually half of them in West Africa. Investment on the continent was
dominated by the private sector. Private sector investment averaged at about 13% of
GDP while that of public sector was about 7%. Once again, the disparities were wide
even though the number of countries (10) that could not achieve an above average
investment by private sector was higher than that of public investment (4). The
bigger size of the per capita private investment over public investment also confirms
the dominance of private investment over public investment in SSA. Also, countries
over the study period, spent on average, 3% of their GDP on public health.
Meanwhile, eight of the below average private investment countries also fell below
the average human development level. In all, Cote d’lvoire’s performance fell short
of the average investment, employment and human development indicators for the
sample.
University of Ghana http://ugspace.ug.edu.gh
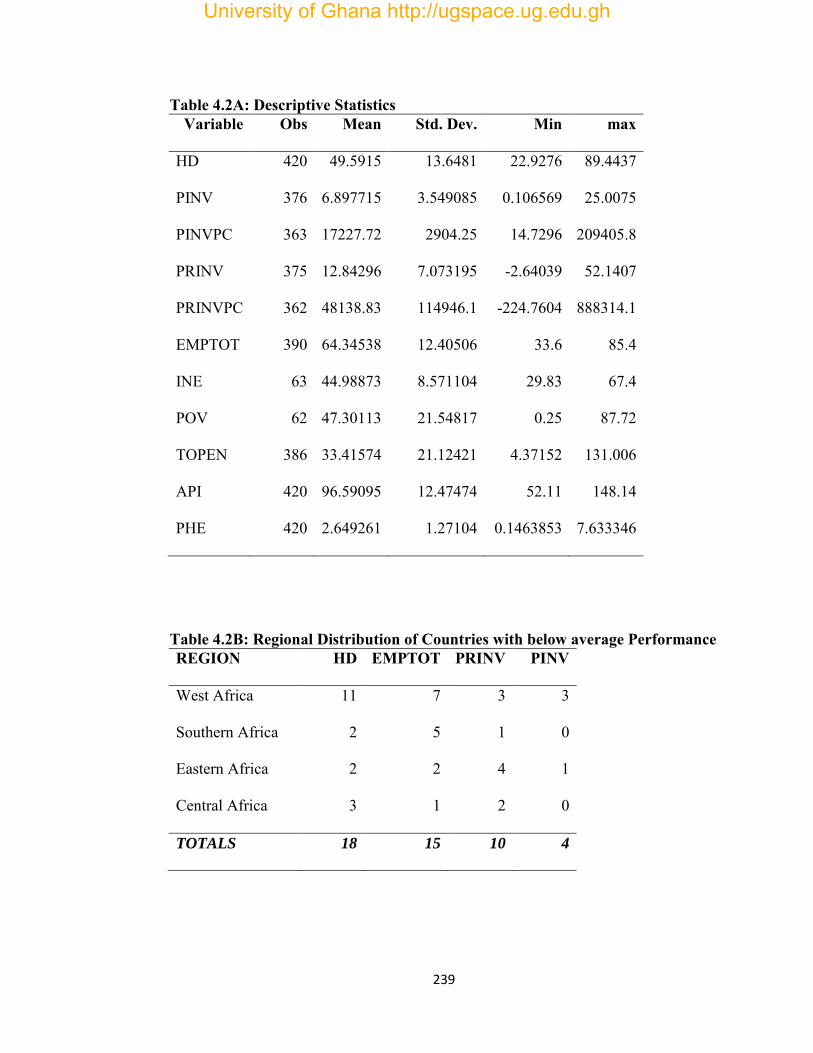
239
Table 4.2A: Descriptive Statistics Variable Obs Mean Std. Dev. Min max
HD 420 49.5915 13.6481 22.9276 89.4437
PINV 376 6.897715 3.549085 0.106569 25.0075
PINVPC 363 17227.72 2904.25 14.7296 209405.8
PRINV 375 12.84296 7.073195 -2.64039 52.1407
PRINVPC 362 48138.83 114946.1 -224.7604 888314.1
EMPTOT 390 64.34538 12.40506 33.6 85.4
INE 63 44.98873 8.571104 29.83 67.4
POV 62 47.30113 21.54817 0.25 87.72
TOPEN 386 33.41574 21.12421 4.37152 131.006
API 420 96.59095 12.47474 52.11 148.14
PHE 420 2.649261 1.27104 0.1463853 7.633346
Table 4.2B: Regional Distribution of Countries with below average Performance REGION HD EMPTOT PRINV PINV
West Africa 11 7 3 3
Southern Africa 2 5 1 0
Eastern Africa 2 2 4 1
Central Africa 3 1 2 0
TOTALS 18 15 10 4
University of Ghana http://ugspace.ug.edu.gh
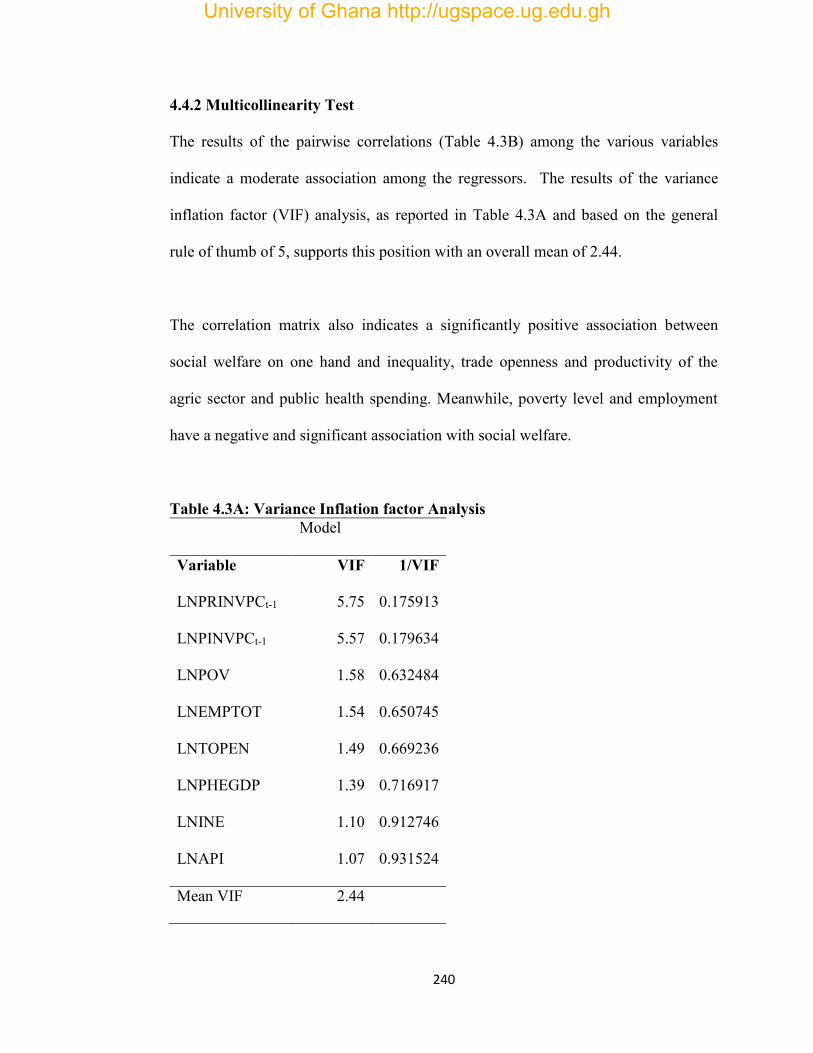
240
4.4.2 Multicollinearity Test
The results of the pairwise correlations (Table 4.3B) among the various variables
indicate a moderate association among the regressors. The results of the variance
inflation factor (VIF) analysis, as reported in Table 4.3A and based on the general
rule of thumb of 5, supports this position with an overall mean of 2.44.
The correlation matrix also indicates a significantly positive association between
social welfare on one hand and inequality, trade openness and productivity of the
agric sector and public health spending. Meanwhile, poverty level and employment
have a negative and significant association with social welfare.
Table 4.3A: Variance Inflation factor Analysis Model
Variable VIF 1/VIF
LNPRINVPCt-1 5.75 0.175913
LNPINVPCt-1 5.57 0.179634
LNPOV 1.58 0.632484
LNEMPTOT 1.54 0.650745
LNTOPEN 1.49 0.669236
LNPHEGDP 1.39 0.716917
LNINE 1.10 0.912746
LNAPI 1.07 0.931524
Mean VIF 2.44
University of Ghana http://ugspace.ug.edu.gh
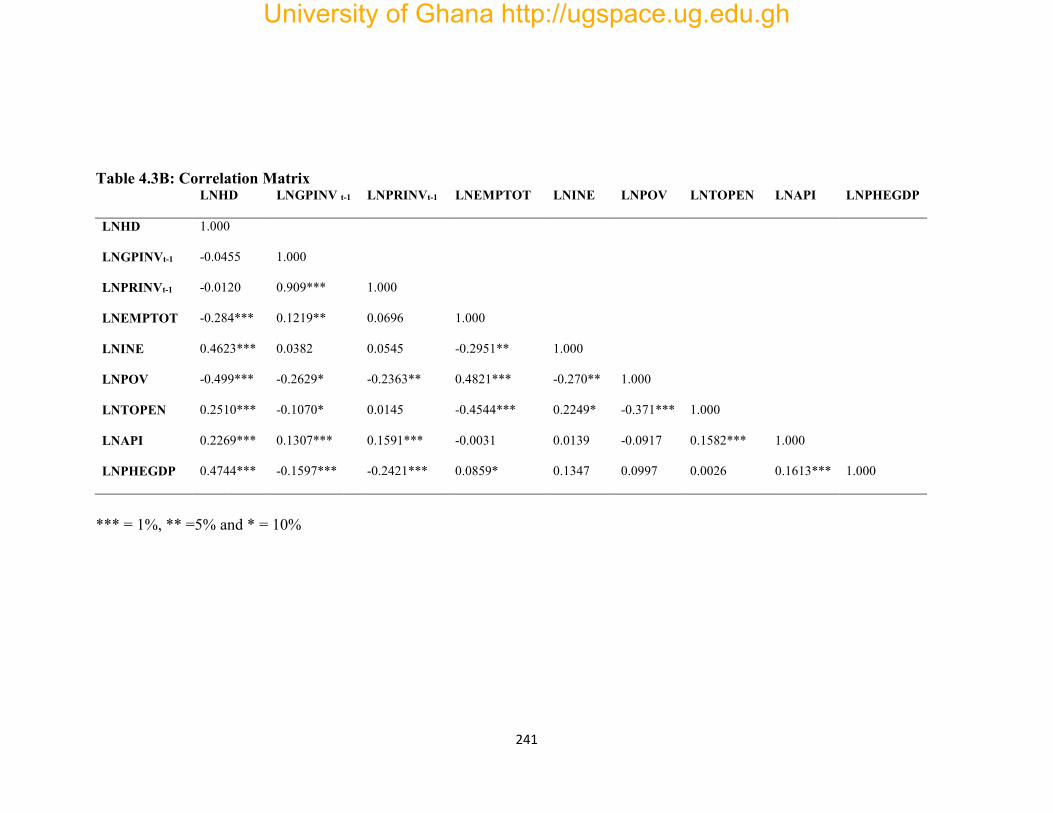
241
Table 4.3B: Correlation Matrix LNHD LNGPINV t-1 LNPRINVt-1 LNEMPTOT LNINE LNPOV LNTOPEN LNAPI LNPHEGDP
LNHD 1.000
LNGPINVt-1 -0.0455 1.000
LNPRINVt-1 -0.0120 0.909*** 1.000
LNEMPTOT -0.284*** 0.1219** 0.0696 1.000
LNINE 0.4623*** 0.0382 0.0545 -0.2951** 1.000
LNPOV -0.499*** -0.2629* -0.2363** 0.4821*** -0.270** 1.000
LNTOPEN 0.2510*** -0.1070* 0.0145 -0.4544*** 0.2249* -0.371*** 1.000
LNAPI 0.2269*** 0.1307*** 0.1591*** -0.0031 0.0139 -0.0917 0.1582*** 1.000
LNPHEGDP 0.4744*** -0.1597*** -0.2421*** 0.0859* 0.1347 0.0997 0.0026 0.1613*** 1.000
*** = 1%, ** =5% and * = 10%
University of Ghana http://ugspace.ug.edu.gh
242
4.4.3 Discussion of Regression Results
The main thrust of this study was to find out the relationship between private
investment per capita, employment and social welfare. Based on the results from the
Hausman test, as shown in Table 4.4, the random effects model was used for the
analysis. The results indicate that private investment per capita, public health
expenditure and productivity of the agric sector have a significantly positive
relationship with social welfare (human development). On the contrary, public
investment per capita, poverty level, and inequality have a significantly negative
relationship with social welfare.
The results indicate that private investment per capita helps improve on human
development through the direct channel of engaging in numerous corporate social
responsibility activities and the indirect channel of offering employment, paying
taxes to government and spillovers. Most private investors engage in other non core
activities like the construction of schools, hospitals, roads and portable water to
communities in which they operate. These actions help to improve on the living
standards of the communities in which they operate. Also, investment in most non-
governmental organisations (NGOs) has the primary aim of reducing poverty in
deprived communities by empowering the citizenry and ensuring quality community
health. Moreover, private investors compliment government efforts in the provision
of employment and also provide financial resources to government through the
payment of taxes and other levies to help fund government’s social intervention
programmes. Thus, the results indicate that these efforts are a source of significant
University of Ghana http://ugspace.ug.edu.gh
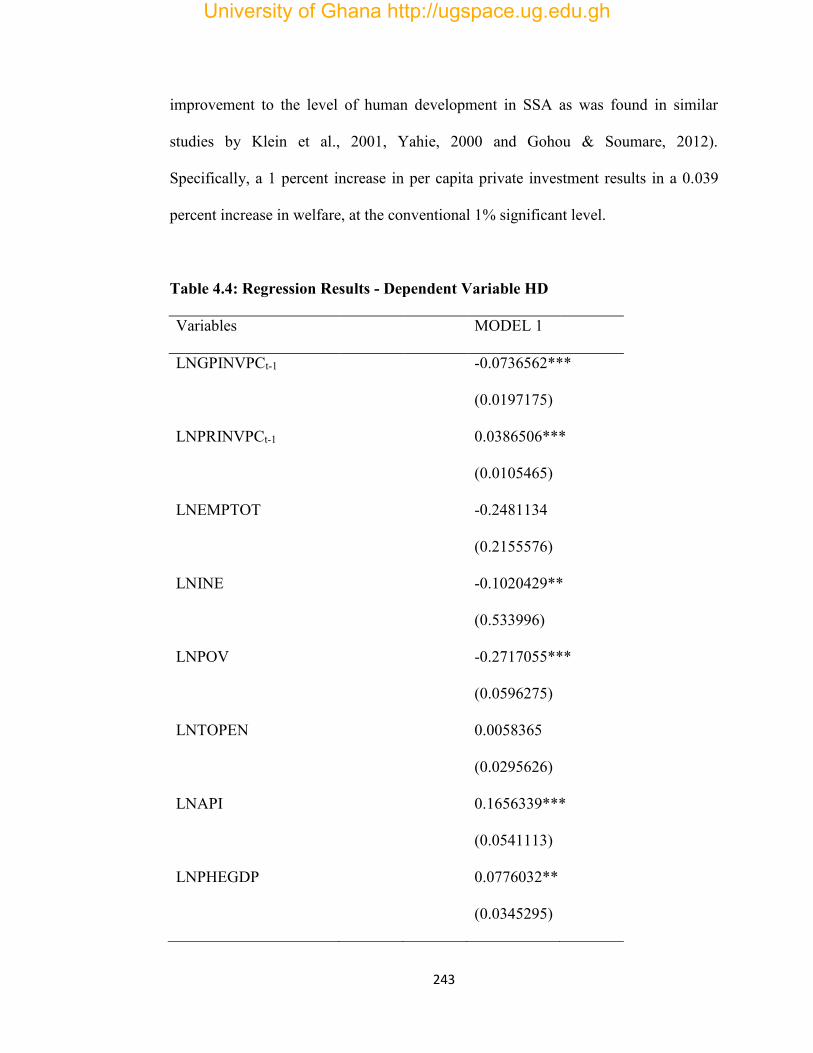
243
improvement to the level of human development in SSA as was found in similar
studies by Klein et al., 2001, Yahie, 2000 and Gohou & Soumare, 2012).
Specifically, a 1 percent increase in per capita private investment results in a 0.039
percent increase in welfare, at the conventional 1% significant level.
Table 4.4: Regression Results - Dependent Variable HD
Variables MODEL 1
LNGPINVPCt-1
-0.0736562***
(0.0197175)
LNPRINVPCt-1
0.0386506***
(0.0105465)
LNEMPTOT
-0.2481134
(0.2155576)
LNINE
-0.1020429**
(0.533996)
LNPOV
-0.2717055***
(0.0596275)
LNTOPEN
0.0058365
(0.0295626)
LNAPI
0.1656339***
(0.0541113)
LNPHEGDP
0.0776032**
(0.0345295)
University of Ghana http://ugspace.ug.edu.gh
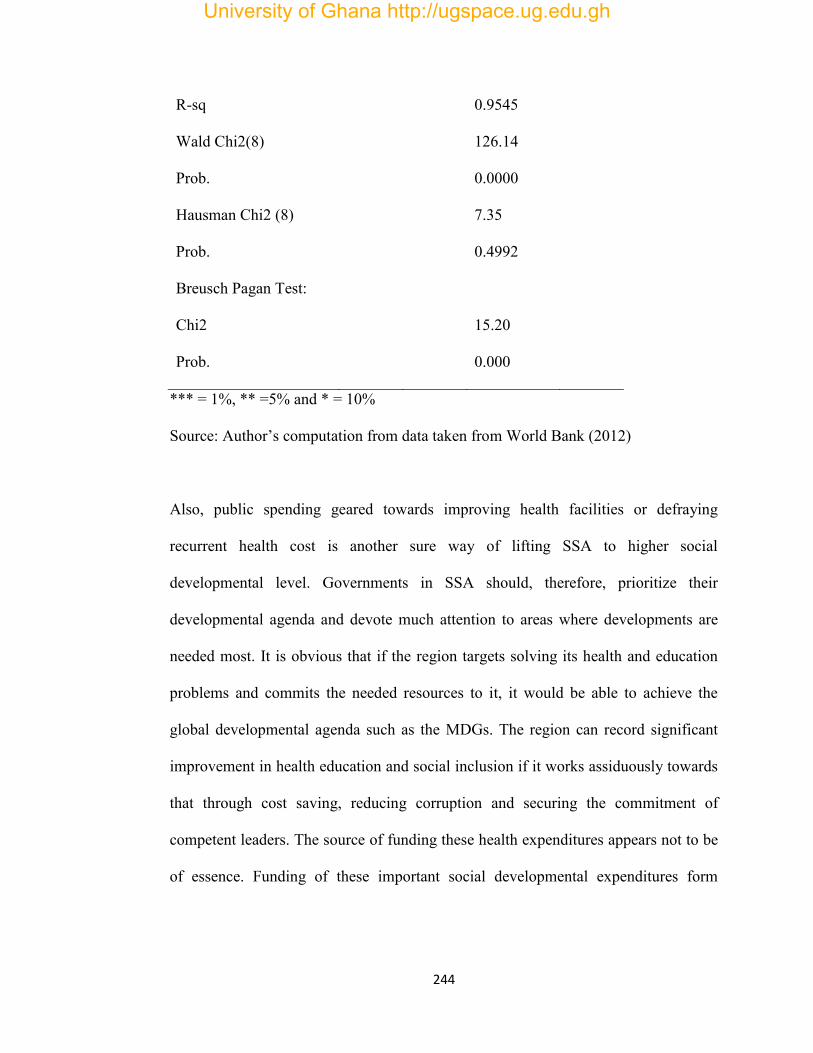
244
R-sq
0.9545
Wald Chi2(8)
126.14
Prob.
0.0000
Hausman Chi2 (8)
7.35
Prob.
Breusch Pagan Test:
Chi2
Prob.
0.4992
15.20
0.000
*** = 1%, ** =5% and * = 10%
Source: Author’s computation from data taken from World Bank (2012)
Also, public spending geared towards improving health facilities or defraying
recurrent health cost is another sure way of lifting SSA to higher social
developmental level. Governments in SSA should, therefore, prioritize their
developmental agenda and devote much attention to areas where developments are
needed most. It is obvious that if the region targets solving its health and education
problems and commits the needed resources to it, it would be able to achieve the
global developmental agenda such as the MDGs. The region can record significant
improvement in health education and social inclusion if it works assiduously towards
that through cost saving, reducing corruption and securing the commitment of
competent leaders. The source of funding these health expenditures appears not to be
of essence. Funding of these important social developmental expenditures form
University of Ghana http://ugspace.ug.edu.gh
245
central or local government, development agencies or NGOs or even through
borrowing still facilitate social development.
Surprisingly per capita public investment exhibits a significantly negative
relationship with welfare. By measuring public investment as per capita we are
assessing the benefit of public investment to a citizen in terms of social welfare
improvement. Thus, the results though counter-intuitive offer some insight. First of
all, because of the poor state of the existing public facilities, they are less beneficial
to the citizens, in terms of social welfare improvements. In other words, provision of
inferior goods and services by the state may worsen the social welfare of the citizens.
It is also possible that inequality in public infrastructure which may be fuelled by
corruption could thwart the social welfare implications of public investment. In other
words, where social interventions do not go to the needy, it affects social welfare in
SSA. Thus, the size of government investment per person is woefully inadequate- as
reflected by the fact that public investment per capita is about 2.79 times lower than
private investment per capita- to meet the social needs of the individual citizens in
SSA. Also, in a capitalist economy, the development of the citizens mostly is in their
own hands and so reduces the citizens’ reliance on public investment. In effect the
results reinforce the need for SSA to not only bridge the huge infrastructural deficit
but also ensure the proper functioning and equitable distribution of existing facilities.
Improvement in agricultural sector productivity is a major source of welfare
improvement. The agric sector is a major source of employment for the people of
SSA so any effort that improves the sector does not only enhance employment but
University of Ghana http://ugspace.ug.edu.gh
246
also offers other employment-linked benefits like social welfare (poverty reduction)
through economic empowerment.
The results also offer support for the expectations of Todaro and Smith (2012) that
poverty and inequality are harmful to social development. Poor people lack basic
needs like food clothing, shelter, access to good health care and social pride. This is
partially as a result of their inability to generate enough resources to meet these basic
needs of life. When people live on less than $1.25 cents a day, it is hard to imagine
how that sum would be shared among the basic necessities of life, in a region that
seems to lack even the basic things they produce themselves and are expected to have
in abundance. The results further state that this condition is aggravated when the little
wealth that exists in the SSA sub-region is concentrated among the few. Generally,
rich people are attracted by things that do not lead to the benefit of the majority of the
citizenry like buying expensive personal effects, going on luxurious holidays
acquiring huge mansions and keeping their monies in safe havens abroad. Also, the
rich save a smaller portion of their marginal income invested. Inequality may lead to
inefficient allocation of assets such as emphasising on higher education at the
expense of quality universal basic education (Todaro & Smith, 2012).
4.5.0 Conclusion
The study analyses the relationship between private investment, employment and
welfare in SSA using panel data from 42 countries over a 10-year period, within the
random effects framework. We estimate a derived model, based on a proposed
University of Ghana http://ugspace.ug.edu.gh
247
function by Todaro and Smith (2012), which allows for the inclusion of inequality,
poverty level, trade openness, agric sector productivity and public health expenditure.
The results show that private investment per capita, public health expenditure and
productivity of the agric sector have a significantly positive relationship with social
welfare (human development). On the contrary, public investment per capita,
poverty, and inequality have a significantly negative relationship with social welfare.
In all, the results offer partial support for the growth-poverty-nexus by showing that
while growth component like private per capita investment facilitates social welfare,
public per capita investment reduces social welfare because it is probably inefficient
or insufficient. The result from employment is inconclusive. Consequently, SSA
countries should intensify policies aimed at attracting and maintaining private
investment per capita, improve on the level of public investment per capita. Also
improvement in agricultural sector productivity, reduction in poverty levels and
enduring equitable distribution of the limited national income are also appropriate
conduits for enhancing social welfare development in the sub-region. Specifically,
SSA countries should target reducing cost of doing business through measures like
keeping the policy rate low to motivate manufacturing, agricultural and other sectors
that have linkages with the entire economy and encourage private investors to
employ more through tax incentives linked to employment.
University of Ghana http://ugspace.ug.edu.gh
248
References to Chapter Four
Ackah, C. & Medvedev, D. (2010). Internal migration in Ghana; Determinants
and welfare impacts (WPS5273). Policy Research Working Paper, The World
Bank Africa Region, West Africa Poverty Reduction and Economic
Management Unit.
Adams Jr., Richard H., & Page, J. (2005). Do international migration and
remittances reduce poverty in Developing Countries? World Development,
33(10), 1645–1669.
Adams, R. Jr. (2004). Economic growth, inequality and poverty: Estimating the
growth elasticity of poverty. World Development, 32(12), 1989–2014.
doi:10.1016/j.worlddev.2004.08.006.
Afeikhena, J (2011). Infrastructure, economic growth and poverty reduction in
Africa. Journal of Infrastructure Development. 3(2) 127–151. doi:
10.1177/097493061100300203.
Agénor P. R., Bayraktar, N., & Aynaoui K. E. (2008). Roads out of poverty?
Assessing the links between aid, public investment, growth, and poverty
reduction. Journal of Development Economics, 86, 277–295.
Alene, A. D. & Coulibaly, O. (2009). The impact of agricultural research on
productivity and poverty in sub-Sahara Africa. Food Policy, 34, 198–209.
Alfaro, L., Chanda, A., Kalemli-Ozcan, S., & Sayek, S. (2010). Does foreign direct
investment promote growth? Exploring the role of financial markets on
linkages. Journal of Development Economics, 91(2), 242–256.
University of Ghana http://ugspace.ug.edu.gh
249
Anderson, E., de Renzio P. & Levy, S. (2006). The Role of Public Investment in
Poverty Reduction: Theories, Evidence and Methods (263). ODI
Working Paper, 263.
Anand, S. & Sen, A. (2000). Human Development and Economic Sustainability.
World Development , 28(12), 2029-2049.
Apergis, N., Lyroudia, K., & Vamvakidis, A. (2008). The relationship between
foreign direct investment and economic growth: Evidence from transitional
countries. Transition Studies Review, 15(1), 37–51.
Asiedu, E. (2004). The Determinants of Employment of Affiliates of US
Multinational Enterprises in Africa. Development Policy Review, 22(4), 371-
379.
Baltagi, B. H. (2005). Econometric analysis of panel data. John Wiley & Sons, Ltd.
Basu, K. (2006). Globalization, poverty, and inequality: What is the relationship?
What Can be done? World Development, 34(8), 1361–1373.
doi:10.1016/j.worlddev.2005.10.009.
Bigsten, A. & Shimeles, A. (2007). Can Africa Reduce Poverty by half by 2015?
Development Policy Review, 25(2), 147-166. DOI:
10.1111/j.14677679.2007.00364.x
Bøa°s, M. and McNeill, D. (2003). Multilateral institutions: A critical introduction.
pp. 47 and 71–2.
Borenstein, M., Hedges, L. V., Higgins, J. P. T. & Rothstein, H. R. (2009).
Introduction to meta-analysis. John Wiley & Sons, Ltd.
University of Ghana http://ugspace.ug.edu.gh
250
Borensztein, E., De Gregorio, J. & Lee, J-W (1998) How does foreign direct
investment affect economic growth? Journal of International Economics,
45, 115–135.
Buss, J. A. (2010). Have the Poor Gotten Poorer?: The American Experience from
1987 to 2007. Journal of Poverty, 14(2), 183-196. doi:
10.1080/10875541003711813.
Cammack, P. (2004). What the World Bank means by poverty reduction, and why it
matters. New Political Economy, 9(2), 189-211.
Canavesio, R. (2014). Formal mining investments and artisanal mining in southern
Madagascar: Effects of spontaneous reactions and adjustment policies on
poverty alleviation. Land Use Policy, 36, 145–154.
http://dx.doi.org/10.1016/j.landusepol.2013.08.001
Christiaensen, L., Demery, L. & Paternostro, S. (2003a). Macro and micro
perspectives of growth and overty in Africa. The World Bank Economic
Review, 17(3), 317-347. doi: 10.1093/wber/Ihg025
Christiaensen, L., Demery, L. & Paternostro, S. (2003b). Reforms, remoteness and
risk in Africa: Understanding inequality and poverty during the 1990s
(No. 2003/70).WIDER Discussion Papers // World Institute for
Development Economics (UNU-WIDER).
Collier, P. & Dollar, D. (2002) Aid allocation and poverty reduction. European
Economic Review, 46, 1475–1500.
University of Ghana http://ugspace.ug.edu.gh
251
Collier, P. & Dollar, D. (2001). Can the world cut poverty by half? How Policy
Reforms and Effective Aid Can Meet Internationsl Development Goals.
World Development, 29 (11), 1787-1802.
Cornell/ISSER/World Bank (2005) International Conference on Shared Growth in
Africa. Held in Accra, Ghana, on July 21-22, 2005.
Dollar, D. & Kraay A. (2002). Growth is Good for the Poor. Journal of Economic
Growth, 7(3), 195–225. http://ideas.repec.org/a/kap/jecgro/v7y2002i3p195-
225.html.
Donaldson, J. A. (2008). Growth is Good for Whom, When, How? Economic Growth
and Poverty Reduction in Exceptional Cases. World Development, 36(11),
2127–2143.
Fan, S., Nyange D. & Rao, N. (2005). Public Investment and Poverty Reduction in
Tanzania: evidence from Household Survey Data (No. 18). DSDG
Discussion Paper, Development and Strategy and Governance Division,
International Food Policy Research Institute.
Feder, G. (1983). On exports and economic growth. Journal of Development
Economics, 12, 59-73.
Fosu, A. K. (2008). Inequality and the impact of growth on poverty: Comparative
evidence for Sub-Saharan Africa (No.2008.107). Research paper /
UNU-WIDER.
Fosu, A. K. (2010). Does inequality constrain poverty reduction programs? Evidence
from Africa. Journal of Policy Modeling, 32, 818–827.
http://dx.doi.org/10.1016/j.jpolmod.2010.08.007.
University of Ghana http://ugspace.ug.edu.gh
252
Fosu, A. K. (2014). Growth, Inequality, and Poverty in Sub-Saharan Africa: Recent
Progress in a Global Context (WPS/2014-17). Centre for the Study of
African Economies (CSAE) Working Paper.
Frimpong, J. M. and Oteng-Abayie, E. F. (2006). Bounds testing approach to
cointegration: An examination of foreign direct investment, trade and growth
Relationships. American Journal of Applied Sciences, 3(11), 2079-2085.
Gore, C. (2007). Which growth theory is good for the poor? The European Journal
of Development Research. 19(1), 30–48. doi:
10.1080/09578810601144269.
Hanjra, M. A., Ferede, T. & Gutta, D. G. (2009). Pathways to breaking the
poverty trap in Ethiopia: Investments in agricultural water, education, and
markets. Agricultural Water Management, 96, 1596–1604.
Harvey, P. (2008). Poverty Reduction Strategies: opportunities and threats for
sustainable rural water services in sub-Saharan Africa. Progress in
Development Studies. 8( 1), 115–128.
Hausman, J. A. 1978. Specification tests in econometrics. Econometrica, 46, 1251–
1271. Henisz, W. J. (2010). POLCON 2010 codebook. Manuscript, University
of Pennsylvania.
Herzer, D., Nowak-Lehmann, D.F. & Siliverstovs, B.( 2006). Export-led growth in
Chile: Assessing the role of export composition in productivity growth. The
Developing Economy, 44 (3), 306-328.
http://ideas.repec.org/a/eee/ecolet/v82y2004i3p307-314.html
University of Ghana http://ugspace.ug.edu.gh
253
Hsiao, C. (2003), Analysis of Panel Data, (2nd ed.) Econometric Society Monograph
36, New York: Cambridge University Press.
Jalilian, H. & Weiss, J. (2002). Foreign direct investment and poverty in the ASEAN
Region. ASEAN Economic Bulletin, 19(3), 231-253.
Kalirajan, K. & Singh, K. (2009). The pace of poverty reduction across the globe: An
exploratory analysis. International Journal of Social Economics, 36(6), 692-
705. doi: 10.1108/03068290910956921.
Kalwij, A. & Verschoor, A. (2007). Not by growth alone: The role of the
distribution of income in regional diversity in poverty reduction. European
Economic Review, 51, 805–829.
Klein, M., Aaron, C. & Hadjimichael, B. (2001), Foreign Direct Investment and
Poverty Reduction. Paper presented at the OECD Conference on New
Horizons and Policy Challenges for Foreign Direct Investment in the 21st
Century, 26–27 November (Mexico City).
Kozak R., S., Lombe, M. & Miller, K. (2012). Global Poverty and Hunger: An
Assessment of Millennium Development Goal #1. Journal of Poverty,
16(4), 469-485. doi: 10.1080/10875549.2012.720661
Martins, P. (2013). Growth, Employment and Poverty in Africa: Tales of Lions and
Cheetahs. Background Paper prepared for the World Development Report.
Marx, I. (2007). The Dutch ‘Miracle’ revisited: The impact of employment growth on
poverty. Journal of Social Policy, 36, 383-397.
doi:10.1017/S0047279407001092
University of Ghana http://ugspace.ug.edu.gh
254
McMillan, M., & Rodrik, D. (2011). Globalization, structural change and
productivity growth (No. 17/143). NBER Working Paper. Cambridge:
National Bureau of Economic Research.
Milcher, S. (2006). Poverty and the determinants of welfare for Roma and other
vulnerable groups in Southeastern Europe. Comparative Economic Studies,
48, 20-35. doi:10.1057/palgrave.ces.8100148
Minogue, M. (2008). What connects regulatory governance to poverty? The
Quarterly Review of Economics and Finance, 48, 189–201.
Minten, B. & Barrett, C. B. (2008). Agricultural technology, productivity, and
poverty in Madagascar”. World Development, 36(5), 797–822.
doi:10.1016/j.worlddev.2007.05.004
Nguyen, C., Linh, V & Nguyen T. (2013). Urban poverty in Vietnam: Determinants
and policy implications. International Journal of Development Issues,
12(2), 110-139. doi: 10.1108/IJDI-08-2012-0049
Nissanke, M. and Thorbecke, E. (2006). Channels and policy debate in the
globalization–inequality–poverty nexus. World Development, 34(8), 1338–
1360, doi:10.1016/j.worlddev.2005.10.008
Nissanke, M. & Sindzingre, A. (2006). Institutional foundations for shared growth in
Sub-Saharan Africa. Journal Compilation African Development Bank. 353-
391 Blackwell Publishing Ltd, Oxford.
Odhiambo, N. M. (2009). Finance-Growth-Poverty nexus in South Africa: A
dynamic causality linkage. The Journal of Socio-Economics, 38, 320–
325.
University of Ghana http://ugspace.ug.edu.gh
255
Odhiambo, N. M. (2010). Financial deepening and poverty reduction in Zambia: an
empirical investigation. International Journal of Social Economics, 37(1), 41-
53. doi: 10.1108/03068291011006166
OECD (2006). Promoting pro-poor growth: Private sector development. An extract
from the publication Promoting Pro-Poor Growth: Policy Guidance for
Donors.
Page, J. & Shimeles, A. (2014). Aid, employment, and poverty reduction in Africa
(No. 2014/043). WIDER Working Paper.
Peet, R. (2003). Unholy Trinity: The IMF, World Bank and WTO, 200, 222–3.
Pelizzo, R. & Stapenhurst, F. (2013). The dividends of good governance. Poverty and
Public Policy, 5(4), 370-384.
Pfeffermann, G. (2001). Poverty Reduction in Developing Countries: the role of the
Private Sector. Finance and Development, A quarterly magazine of the IMF.
38 (2).
Ravallion, M. (1997). Can high-inequality developing countries escape poverty?
Economics Letters. 56, 51-57.
Ravallion, M. (2007). Economic growth and poverty reduction: Do poor countries
need to worry about inequality? 2020 focus brief on the world’s poor and
hungry people. Washington, DC: International Food Policy Research Institute.
Ravallion, M., & Chen. S. (2007). China’s (Uneven) Progress against Poverty.
Journal of Development Economics, 82(1), 1-42.
University of Ghana http://ugspace.ug.edu.gh
256
Ravallion, M. & Chen, S. (1997). What can new survey data tell us about recent
changes in Distribution and Poverty. World Bank Economic Review. 11(2),
357-382.
Ravillion, M. (2001). Growth, Inequality and Poverty: Looking Beyond Averages.
World Development, 29(11), 1803 – 1815.
Salvatore, D. (2007). Growth, international inequalities, and poverty in a globalizing
world. Journal of Policy Modeling, 29, 635–641.
Sindzingre, A. (2005). Explaining threshold effects on globalization on poverty: An
institutional perspective (No. 2005/53). WIDER Research Paper. Helsinki:
UNU-WIDER.
Taylor, L. (2009). Growth, development policy, job creation and poverty reduction
(No. 90ST/ESA/2009/DWP/90). DESA Working Paper
Thirtle, C., Lin L. & Piesse, J. (2003) The Impact of Research-Led Agricultural
Productivity Growth on Poverty Reduction in Africa, Asia and Latin
America. World Development, 31(12), 1959–1975.
doi:10.1016/j.worlddev.2003.07.001
Thurlow, J. & Wobst, P. (2006). Not all growth is equally good for the poor: The
case of Zambia.” Journal of African Economies, 15(4), 603–625.
doi:10.1093/jae/ejk012
Todaro, M. P. & Smith, S. C. (2012). Economic Development, 11th ed. Pearson.
Ucal, M. S. (2014). Panel data analysis of foreign direct investment and
poverty from the perspective of Developing Countries. Procedia -
Social and Behavioral Sciences, 109, 1101 – 1105.
University of Ghana http://ugspace.ug.edu.gh
257
Uddin G. S., Shahbaz, M., Arouri M., & Teulon, F. (2014). Financial development
and poverty reduction nexus: A cointegration and causality analysis in
Bangladesh. Economic Modelling, 36, 405–412.
UNCTAD (2002). Economic Development in Africa From Adjustment to Poverty
Reduction: What is New?” UNCTAD/GDS/AFRICA/2.
UNCTAD (2011). Development of productive capacities and trade: the key to
inclusive and sustainable growth. Fourth United Nations Conference on the
Least Developed Countries (LDC-IV) Special Event of the UN-CEB
Cluster on Trade and Productive Capacity held at Istanbul on 9 May
2011. UNCTAD/TC/2011/1
Wade, R. H. (2004). On the causes of increasing world poverty and inequality, or
why the Matthew effect prevails. New Political Economy, 9(2), 163-188. doi:
10.1080/1356346042000218050
Wodon, Q. (2007). Growth and poverty reduction in West Africa: A brief overview
(No. 11086). MPRA Paper. http://mpra.ub.uni-muenchen.de/11086/
World Bank (2000). Can Africa Claim the 21st Century? Washington, DC.
World Bank (2014). Prosperity for all-ending extreme poverty. A note for the World
Bank Group spring meetings.
World Bank (2008). Investment in agricultural water for poverty reduction and
economic growth in Sub-Saharan Africa. Synthesis Report A
collaborative programme of the AFDB, FAO, IFAD, IWMI and the World
Bank.
University of Ghana http://ugspace.ug.edu.gh
258
Yahie, A. M. (2000). Poverty reduction in sub-Saharan Africa: Is there a role for the
private sector? (No. 52). African Development Bank Economic Research
Papers.
University of Ghana http://ugspace.ug.edu.gh
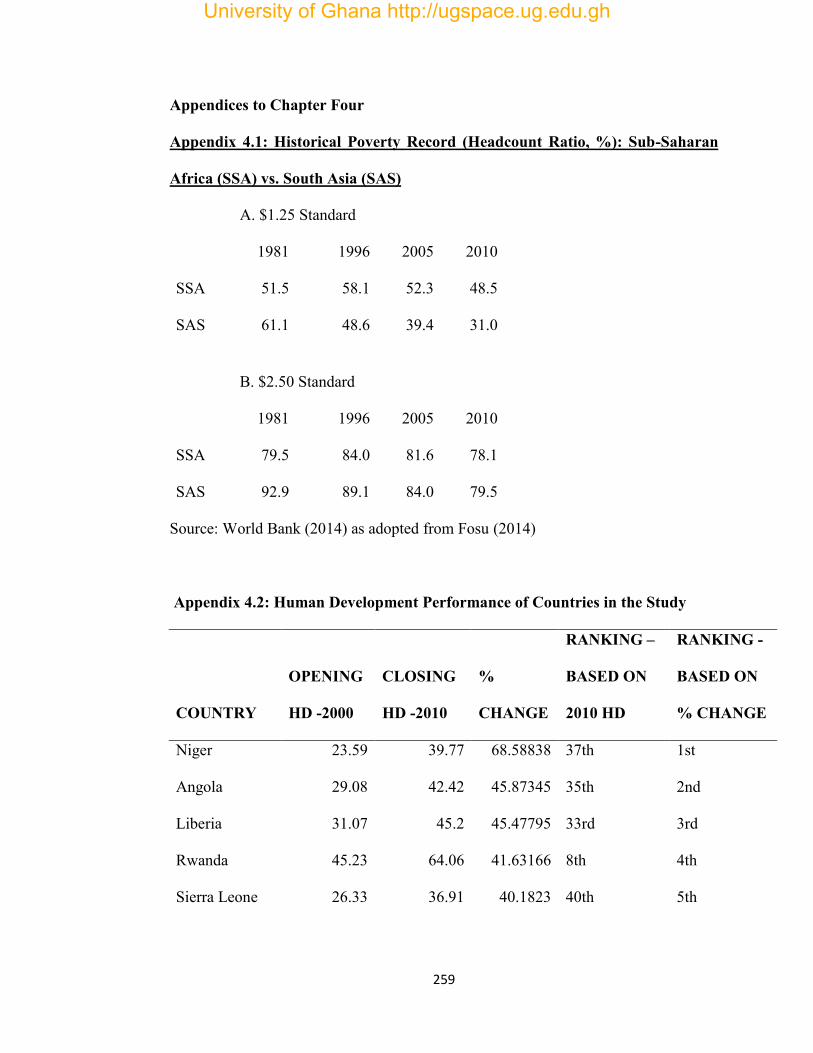
259
Appendices to Chapter Four
Appendix 4.1: Historical Poverty Record (Headcount Ratio, %): Sub-Saharan
Africa (SSA) vs. South Asia (SAS)
A. $1.25 Standard
1981 1996 2005 2010
SSA 51.5 58.1 52.3 48.5
SAS 61.1 48.6 39.4 31.0
B. $2.50 Standard
1981 1996 2005 2010
SSA 79.5 84.0 81.6 78.1
SAS 92.9 89.1 84.0 79.5
Source: World Bank (2014) as adopted from Fosu (2014)
Appendix 4.2: Human Development Performance of Countries in the Study
COUNTRY
OPENING
HD -2000
CLOSING
HD -2010
%
CHANGE
RANKING –
BASED ON
2010 HD
RANKING -
BASED ON
% CHANGE
Niger 23.59 39.77 68.58838 37th 1st
Angola 29.08 42.42 45.87345 35th 2nd
Liberia 31.07 45.2 45.47795 33rd 3rd
Rwanda 45.23 64.06 41.63166 8th 4th
Sierra Leone 26.33 36.91 40.1823 40th 5th
University of Ghana http://ugspace.ug.edu.gh
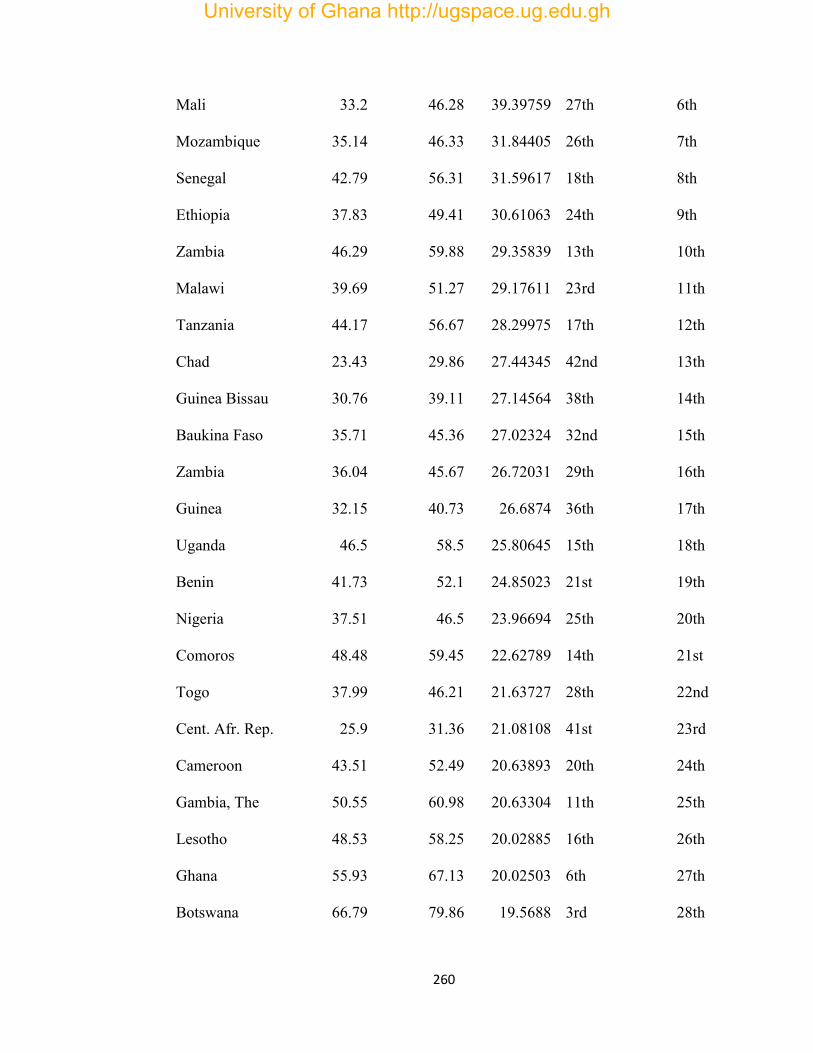
260
Mali 33.2 46.28 39.39759 27th 6th
Mozambique 35.14 46.33 31.84405 26th 7th
Senegal 42.79 56.31 31.59617 18th 8th
Ethiopia 37.83 49.41 30.61063 24th 9th
Zambia 46.29 59.88 29.35839 13th 10th
Malawi 39.69 51.27 29.17611 23rd 11th
Tanzania 44.17 56.67 28.29975 17th 12th
Chad 23.43 29.86 27.44345 42nd 13th
Guinea Bissau 30.76 39.11 27.14564 38th 14th
Baukina Faso 35.71 45.36 27.02324 32nd 15th
Zambia 36.04 45.67 26.72031 29th 16th
Guinea 32.15 40.73 26.6874 36th 17th
Uganda 46.5 58.5 25.80645 15th 18th
Benin 41.73 52.1 24.85023 21st 19th
Nigeria 37.51 46.5 23.96694 25th 20th
Comoros 48.48 59.45 22.62789 14th 21st
Togo 37.99 46.21 21.63727 28th 22nd
Cent. Afr. Rep. 25.9 31.36 21.08108 41st 23rd
Cameroon 43.51 52.49 20.63893 20th 24th
Gambia, The 50.55 60.98 20.63304 11th 25th
Lesotho 48.53 58.25 20.02885 16th 26th
Ghana 55.93 67.13 20.02503 6th 27th
Botswana 66.79 79.86 19.5688 3rd 28th
University of Ghana http://ugspace.ug.edu.gh
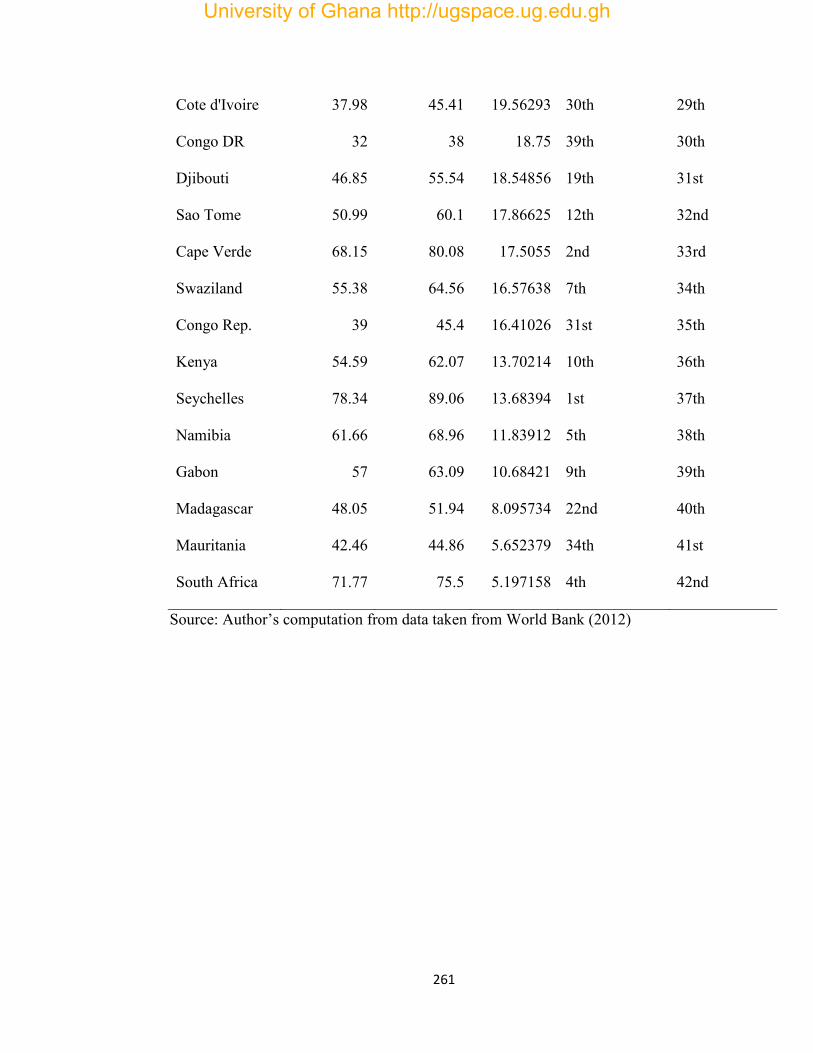
261
Cote d'Ivoire 37.98 45.41 19.56293 30th 29th
Congo DR 32 38 18.75 39th 30th
Djibouti 46.85 55.54 18.54856 19th 31st
Sao Tome 50.99 60.1 17.86625 12th 32nd
Cape Verde 68.15 80.08 17.5055 2nd 33rd
Swaziland 55.38 64.56 16.57638 7th 34th
Congo Rep. 39 45.4 16.41026 31st 35th
Kenya 54.59 62.07 13.70214 10th 36th
Seychelles 78.34 89.06 13.68394 1st 37th
Namibia 61.66 68.96 11.83912 5th 38th
Gabon 57 63.09 10.68421 9th 39th
Madagascar 48.05 51.94 8.095734 22nd 40th
Mauritania 42.46 44.86 5.652379 34th 41st
South Africa 71.77 75.5 5.197158 4th 42nd
Source: Author’s computation from data taken from World Bank (2012)
University of Ghana http://ugspace.ug.edu.gh
262
CHAPTER FIVE
SUMMARY, CONCLUSION AND RECOMMENDATIONS
5.0 Introduction
This chapter presents the summary, conclusion and recommendations for the three
empirical works undertaken in the Private Investment, Labour Demand and Social
Welfare thematic area. The chapter begins with the summary of the entire work,
followed by the conclusion and then recommendations.
5.1 Summary of key findings
Private investment, labour demand and social welfare are key socio-economic
development policy variables of many a developing nation. Over the two decades
(1990-2009) that this study covered, Sub-Saharan Africa has experienced interesting
dynamics in these policy variables. Key among them is a dwindling public sector
investment and a marginally increasing private investment coupled with an increase
in employment levels mostly driven by a surge in female employment as against a
dip in male employment. These interesting dynamics have coincided with
improvements in the social welfare of the citizens of SSA with initial poor
performers being the most gainers.
In the wake of these stylised facts, empirical results on a key factor that drives private
investment in SSA and globally seems to be divided along the lines of crowding-in-
out conclusions. Also, the sub-region has not been endowed with empirical findings
on the employment benefits of private investment, neither is there evidence on the
University of Ghana http://ugspace.ug.edu.gh
263
pattern and structure of economic growth that enhances social welfare even though
the relationship between growth and welfare is well documented in the literature.
In view of the above, the general objective of this study was to ascertain the
relationship between private investment, labour demand and social welfare in Sub-
Saharan Africa. Specifically, the study tested for: 1) whether public investment
crowds in or crowds out private investment; 2) the possibility of a bi-causal
relationship between private and public investment; 3) whether increased labour
demand is one of the benefits that the sub-region can derive from private investment
and; 4) the relationship among private investment, employment and social welfare
when income inequality has been accounted for. The first three specific objectives
were estimated using an augmented Erden & Holocombe, (2005) private investment
model, a derived public investment model and a derived neoclassical labour demand
model respectively within the Arellano Bond Dynamic General Methods of Moments
technique. In the fourth objective, the researcher estimated a derived welfare model
that builds on a proposed welfare function by Todaro and Smith (2012) within the
framework of random effects panel methodology.
Chapter ‘one’ offered an introduction to the study. It discussed the background to the
study including stylised facts about some key variables, the problem statement,
objectives of the study hypotheses and the scope and limitations. Chapter ‘two’ was
an empirical paper that assesses whether public investment crowds in or crowds out
private investment and whether there exists a bi-causal relationship between public
University of Ghana http://ugspace.ug.edu.gh
264
and private investment. Next, the researcher presented another empirical paper in
chapter ‘three’ on the relationship between private investment and labour demand in
SSA while chapter ‘four’ covered the last empirical paper on the relationship
between private investment, labour demand and social welfare in SSA. In this
chapter, chapter ‘five’, the researcher presents the summary, conclusion and
recommendations for the entire study.
5.2 Conclusions of the study
The researcher set out with the aim of achieving four objectives from this study on
the thematic area: Private Investment, Labour Demand and Social Welfare in SSA.
The following are the key results from the study, as organized according to the
objectives.
5.2.1 Specific Objective 1: Does Public Investment Crowds out Private
Investment?
1. Apart from the fact that total investment in the second decade (2000 – 2009)
showed a marginal increase from 20.12% (1990 – 1999) to 20.27% of GDP,
there is also evidence of a dwindling public investment component of a rising
total investment in SSA apparently driven by private sector investments.
2. In assessing the possibility of a reverse causality, it is evident that private and
public investments are mutually dependent and that public physical capital
compliments private physical capital.
University of Ghana http://ugspace.ug.edu.gh
265
3. But, it is also evident that public investment crowds out private investment in
SSA, when they compete for financial resources.
4. Meanwhile, key factors that enhance private investment in SSA include a
political system that offers enough executive discretion, more trade and a
financial system that channels enough funds to the private sector.
5. These, notwithstanding, high real interest rate and unfavourable overall
budget balance are detrimental to private investment.
5.2.2 Specific Objective 2: Is there a bi-causal relationship between Public and
Private Investments?
1. The results reveal that private investment exerts a substitutive effect on public
investment, based on a significantly negative relationship between the two
variables.
2. Also, improvements in public sector investment are revealed to emanate from
economic and infrastructural aid, discipline from external borrowing,
previous level of economic growth and more trade.
3. But fiscal indiscipline thwarts public investment.
5.2.3 Specific Objective 3: Do the benefits from Private Investment include an
enhanced Labour Demand?
1. Generally, the second decade (2000-2009) shows a marginal increase in
employment to population ratio from 63.77% (1990 – 1999) to 64.46%. This
University of Ghana http://ugspace.ug.edu.gh
266
increase was propelled by increase in female employment than male
employment.
2. The results suggest that private investment exerts a substitutive effect on total,
male, female and female youth labour demands while public investment
enhances total, male and female labour demands with no significant results
for youth labour demands.
3. Another important factor that can help SSA to improve on its employment
condition is enhancing the productivity of the agricultural sector.
4. Increase in real wage rate, human capital, trade and the recent economic
crunch affect labour demand in SSA, badly.
5.2.4 Specific Objective 4: what relationship exists between Private Investment,
Employment and Social Welfare in SSA?
1. Generally, all the SSA countries in the study have recorded increases in the
level of social welfare, even though the size of these increases is not
homogenous. With the exception of Rwanda, it is also apparent that most
countries (for instance South Africa, Seychelles, Botswana, Namibia,
Swaziland, Gabon and Kenya) that had the highest levels of human
development were not among the best gainers (Niger, Angola, Liberia and
Sierra Leone) when the opening and closing levels of HD are compared.
2. From the results, it is evident that increase in per capita private investment
help increase social welfare in SSA.
University of Ghana http://ugspace.ug.edu.gh
267
3. Additionally, public health spending and increase in agricultural sector
productivity are appropriate conduits for securing enhancement in social
welfare in SSA.
4. Surprisingly, the results suggest that public investment per capita does not
support social welfare probably because of its inefficiency or insufficiency.
5. The result on the relationship between employment and social welfare in SSA
was inconclusive.
6. The study offers support for the fact that increase in poverty level and income
inequality reduces the social welfare of SSA citizens.
5.3 Recommendations
Based on the above findings, the following recommendations have been advanced:
1. ATTRACTING MORE PRIVATE INVESTMENT INTO KEY SECTORS
OF THE SSA ECONOMY
In view of the fact that private investment in SSA help reduce the burden on
the state in the provision of some public goods and services and also
facilitate improvement in social welfare, encouraging their activities and
attracting more would not be out of place. Specifically, SSA countries should
target reducing cost of doing business, through measures like keeping the
policy rate low to motivate manufacturing, agricultural and other sectors that
have linkages with the entire economy. It also implies that the benefits of
inflation targeted monetary policy, pursued by some SSA countries, need to
University of Ghana http://ugspace.ug.edu.gh

268
be assessed and evaluated since it may be detrimental to the course of
fostering private investment especially in high inflationary periods.
Meanwhile, the results also show that high private investment brings with it
the cost of reduced employment levels. The sub-region could mitigate this
effect and encourage private investors to employ more through tax incentives
linked to employment and diverting private investment effort to more labour
intensive sectors like farming and manufacturing other than trading and hunt
for resources.
2. EVALUATION OF THE IMPACT OF PRIVATE INVESTMENT ON SSA
In view of the significant role played by the private sector in the socio-
economic development of SSA, it is important that their activities are
periodically assessed in order to facilitate revision of policies designed for
them and formulation of new policies to meet emerging trends. This private
investment impact assessment should include their impact on economic
activities like trade, employment, economic growth and the dynamics of their
activities in the manufacturing, farming, service and social services. The
assessment should be done at both the regional level and country level. It
should also be handled by an independent body separate from that which
grants permission to do business.
University of Ghana http://ugspace.ug.edu.gh
269
3. ENSURING LABOUR INTENSIVE ECONOMIC GROWTH
Economic growth is good for the poor when that growth empowers most
citizens to be able to afford the basic necessities of life. If these necessities of
life are not bequeathed to us by the state, Non-governmental Organisations
and development agencies, one needs to acquire them with economic
resources generated, probably from employment. Unfortunately, however,
the results from the study indicate that employment is not a reliable source of
improving access to education, health and fostering social recognition. This
is quite intriguing but possible in SSA because the employment content of
economic growth has been found to be low and also most of the jobs in the
region do not offer good compensation as the size of working poor is quite
significant. SSA should pursue upgrade of skills of the citizens to meet the
current technological needs. Policies to encourage entrepreneurial activities
and ensure growth of the manufacturing sector, that is more labour intensive,
while simultaneously expanding the economy to offer opportunities for these
developments should be pursued. These would help harness the social
welfare benefits of employment in SSA.
4. ALIGNING LABOUR PRODUCTIVITY WITH LABOUR COST
Since real labour cost reduces employment of all kinds it is imperative that
employers get the maximum benefit from the amount of money spent on
labour. Citizens of SSAs should be willing to not only accept moderate
wages but eschew laziness. Governments, through appropriate agencies,
University of Ghana http://ugspace.ug.edu.gh
270
should sensitize the public on developing the right attitude to work.
Appropriate measures should be put in place to ensure the proper
measurement of labour output in order not to worsen the already
deteriorating unemployment problem with unnecessary wage increase
demands. Firms should take the lead in this.
5. FACILITATING GROWTH IN FEMALE EMPLOYMENT AND
ARRESTING THE DECLINE IN MALE EMPLOYMENT
The SSA region needs to encourage the growth in female employment.
Interestingly, one of the significant dynamics of the labour market of SSA is
a gradual increase in the level of female employment while their male
counterparts witness a reduction in their levels. Similar observations are
made for female youth employment and male youth employment. The region
could facilitate this growth by reducing discrimination against females in the
labour market, eliminating all forms of harassment on female and
encouraging more females in less physically intensive jobs. Improvement in
the productivity of the agric sector and other physical intensive activities like
construction and mining would help arrest the situation.
An investigation into the causes of the fall in male employment would help
in designing other policies to help arrest the situation. This investigation
should cover discrimination against men on employment issues, changing
attitudes of men towards work, aging pattern of men and certain affirmative
University of Ghana http://ugspace.ug.edu.gh
271
actions like promoting girl-child education. Similarly, an assessment of the
socio-economic impact of this changing trend in the labour market would
also be useful.
6. IMPROVING THE PRODUCTIVITY OF PER CAPITA PUBLIC
INVESTMENT
SSA needs to embark on serious infrastructural investment, as the existing
per capita investment does not address the health, education and social
inclusion needs of the sub region. Each country should set up an
infrastructural development fund funded through taxation. In order to gauge
the level of improvement in per capita public investment in SSA, a base year
could be chosen (such as 2010) and each year’s addition compared to it. The
results also imply that it is not only the level of public investment that should
be of grave concern to SSA but also the extent to which existing levels are
useful to the citizens. It appears that due to inefficiencies and probably
inadequate maintenance, the productivity of existing private investment is
low culminating in the significantly inverse relationship between public
investment per capita and social welfare.
Also, a constant assessment of the developmental impact of public
investment in SSA, at both country and regional level, could facilitate
revision and/or alignment of public investment policies. In addition, more
trade, discipline from external borrowing, previous level of economic
University of Ghana http://ugspace.ug.edu.gh
272
growth and attracting economic and infrastructural aid while reducing fiscal
indiscipline could help improve on the level of public investment per capita,
assuming that population growth is controlled.
7. ENSURING FISCAL DISCIPLINE
Government of SSA should maintain adequate control over their finances to
keep their spending within budget. Fiscal indiscipline increases governments’
activities in the financial market. Given that governments are deemed to be
risk-free borrowers, most financial institutions would prefer doing business
with them than private corporate entities and individuals. In effect, it is either
the cost of borrowing that increases or credit availability to the private sector
is squeezed. Any of these, has the potential for reducing private investment
and public investment as well. Reduced private investment also has the
potential for slowing economic growth and social welfare and putting
pressure on public investment.
To ensure fiscal discipline, every country in the sub-region should have a
comprehensive development agenda handed down to executives to
implement. The implementation of this development agenda should be
should be supervised by a team of eminent citizens who will publish the
achievement level the executive half-yearly. This is to help reduce the
pressure to pursue or complete projects in election years for short-term
political gains. The activities of this team should be properly backed by law.
University of Ghana http://ugspace.ug.edu.gh
273
Also, each country should have clearly defined fiscal rules covering specific
limits on fiscal indicators such as budgetary balance, debt levels, government
spending, taxation and other government revenues. All these may be
enshrined in a Fiscal Responsibility Law (FRL) as pioneered by New
Zealand. Again, the commitment of the executive arm of government to
allowing institutions to check fiscal indiscipline and ensuring fiscal discipline
itself is paramount to ensuring fiscal discipline. The basic advice is that
nations in the SSA sub-region should learn how to live within their means, at
all times.
8. GETTING THE BEST OUT OF OPENNESS TO TRADE
Trade is good or bad depending on whether a country is a net importer or a
net exporter. At one breath, trade openness facilitates SSA region’s private
capital formation and public investment. It appears that the region’s high
level of dependence on imports leads to more private sector investment in
capital assets that facilitate importation of goods and services than exports.
Thus, openness to trade facilitates private investments in warehouses and
distribution vehicles and equipments. Also, the less likely reason may be the
fact that trade improves on private investment because of the importation of
more capital equipments.
At another breath, trade reduces employment because by being a net
importer, the SSA region ends up increasing the demand of products that are
University of Ghana http://ugspace.ug.edu.gh
274
not produced in the region and therefore does not require the labour or skills
of their citizenry. In view of the above, it is pertinent that the region gets
adequate information on which aspect of trade it is promoting at any point in
time so that an appropriate strategy could be designed to correct any
anomaly. Policies to encourage exports should be reinvigorated just as
policies to encourage importation of productive equipments that can help
expand the region’s manufacturing base. Alternatively, the region could also
strategise to get the best from importation of consumable goods through
increase in taxes.
9. UNDERTAKING STRATEGIC TAX REFORMS
Governments in the SSA region can achieve a lot in facilitating private
investment and encouraging employment or even social welfare by
refocusing their tax policies. Private investors can be enticed into employing
more by offering them additional tax reliefs based on the wage/salary cost of
new recruits or on the growth in their level employment. Taxes on imports
and exports should be carefully designed. Blanket tax reforms that
discourage all forms of imports and encourage all forms of exports may not
be entirely beneficial. For instance, tax policies should encourage
importation of capital goods and discourage export of technical knowledge.
University of Ghana http://ugspace.ug.edu.gh
275
10. INSTITUTING PROPER GOVERNANCE STRUCTURES
SSA countries should ensure that their governance structures are devoid of
unnecessary procedures that limit or delay decisions on private investment.
Also, unnecessary interference by opinion leaders, hindering the work of
institutions, should be discouraged. Discipline, rule of law and respect for
institutions should be part of the early stages of the sub-region’s educational
system. Policies to name and shame corrupt officials as well as those to
recognise and reward leaders who practice good governance should be
encouraged.
Major Contributions of the study
To the best of the researcher’s knowledge, this is the first time a welfare
model that enables the testing of the effect of growth components on
welfare ,when inequality has been factored in the model, has been derived
and tested.
This is the first study that test the crowding-in crowding-out hypothesis from
the point of view of both the private and public investment
University of Ghana http://ugspace.ug.edu.gh
Related Documents