PRIVATE AND PUBLIC SCHOOLING IN GHANA: A CENSUS AND COMPARATIVE SURVEY JAMES TOOLEY, PAULINE DIXON and ISAAC AMUAH Abstract – A census and survey of schools in the district of Ga, Ghana, explored the nature and extent of private education, and compared inputs to public and private schooling. Three quarters of all schools found were private, with almost as many unreg- istered private as government schools. Several important differences between registered and unregistered private schools were noted, including age, fee levels charged, teacher salaries and class size. A range of inputs, such as teacher activity, availability of desks, chairs, libraries, toilets and drinking water, were used to compare inputs to government, unregistered and registered private schools. Some conclusions are explored about the potential role for the private sector in helping meet ‘‘education for all’’ targets. Re´ sume´ – E ´ DUCATION PRIVE ´ E ET PUBLIQUE AU GHANA: RECENSEMENT ET E ´ VALUATION COMPARATIVE Lors dÕun recensement et dÕune e´valuation des e´coles dans le district de Ga au Ghana, on a sonde´ la nature et lÕampleur de lÕe´ ducation prive´e et compare´ les donne´es dans lÕe´ducation prive´e et publique. Parmi toutes les e´coles recense´es, les trois quarts dÕentre elles e´taient prive´es, avec presque autant dÕe´ coles prive´es enregistre´es et non enregistre´es que dÕe´coles gouvernementales. On a note´ plusieurs diffe´rences importantes entre les e´coles prive´es enregistre´es et non enregistre´es, comprenant lÕaˆ ge, les niveaux de frais facture´s, les salaires des professeurs et la taille des classes. Un assortiment de donne´es, telles que lÕactivite´ des professeurs, la disponibilite´ de bureaux, de chaises, de bibliothe`ques, de toilettes et dÕeau potable a e´te´ utilise´ afin de comparer les donne´es des e´coles gouvernementales avec celles des e´coles prive´es non enregistre´es et enregistre´es. Certaines de ces conclusions ont e´te´ examine´es a` propos du roˆle potentiel du secteur prive´ pour aider a` satisfaire aux objectifs de ‘‘lÕe´ducation pour tous’’. Zusammenfassung – PRIVATE UND O ¨ FFENTLICHE SCHULBILDUNG IN GHANA: ZA ¨ HLUNG UND VERGLEICHENDE UMFRAGE In einer Untersu- chung zur Art und Anzahl von Schulen im Distrikt Ga in Ghana wurde der Umfang privater Bildung erforscht und es wurde der Umfang der Investitionen in o¨ ffentliche und private Beschulung miteinander in Vergleich gesetzt. Dreiviertel aller aufgefundenen Schulen waren privat. Es gab fast genauso viele unregistrierte Privatschulen wie staatliche Schulen. Es liessen sich verschiedene bedeutende Unterschiede zwischen registrierten und unregistrierten Privatschulen feststellen, die sich auf Fragen des Alters, der Schulgebu¨hren, der Lehrergeha¨lter und der Klassengro¨ße bezogen. Zur Vergleichsl- iste der Investitionen in staatliche, registrierte und unregistrierte Privatschulen za¨hlten Eingaben wie Lehreraktivita¨t und die Verfu¨gbarkeit von Schreibtischen, Stu¨hlen, Bu¨chereien, Toiletten und Trinkwasser. Abschliessend wurde das Potential des privaten Sektors bei der Unterstu¨tzung des Ziels ‘‘Bildung fu¨r alle’’ untersucht. Review of Education (2007) 53:389–415 Ó Springer 2007 DOI 10.1007/s11159-007-9042-3

Welcome message from author
This document is posted to help you gain knowledge. Please leave a comment to let me know what you think about it! Share it to your friends and learn new things together.
Transcript
PRIVATE AND PUBLIC SCHOOLING IN GHANA: A CENSUS
AND COMPARATIVE SURVEY
JAMES TOOLEY, PAULINE DIXON and ISAAC AMUAH
Abstract – A census and survey of schools in the district of Ga, Ghana, explored thenature and extent of private education, and compared inputs to public and privateschooling. Three quarters of all schools found were private, with almost as many unreg-istered private as government schools. Several important differences between registeredand unregistered private schools were noted, including age, fee levels charged, teachersalaries and class size. A range of inputs, such as teacher activity, availability of desks,chairs, libraries, toilets and drinking water, were used to compare inputs to government,unregistered and registered private schools. Some conclusions are explored about thepotential role for the private sector in helping meet ‘‘education for all’’ targets.
Resume – EDUCATION PRIVEE ET PUBLIQUE AU GHANA: RECENSEMENTET EVALUATION COMPARATIVE Lors d�un recensement et d�une evaluation desecoles dans le district de Ga au Ghana, on a sonde la nature et l�ampleur de l�educationprivee et compare les donnees dans l�education privee et publique. Parmi toutes lesecoles recensees, les trois quarts d�entre elles etaient privees, avec presque autant d�ecolesprivees enregistrees et non enregistrees que d�ecoles gouvernementales. On a noteplusieurs differences importantes entre les ecoles privees enregistrees et non enregistrees,comprenant l�age, les niveaux de frais factures, les salaires des professeurs et la taille desclasses. Un assortiment de donnees, telles que l�activite des professeurs, la disponibilitede bureaux, de chaises, de bibliotheques, de toilettes et d�eau potable a ete utilise afin decomparer les donnees des ecoles gouvernementales avec celles des ecoles privees nonenregistrees et enregistrees. Certaines de ces conclusions ont ete examinees a propos durole potentiel du secteur prive pour aider a satisfaire aux objectifs de ‘‘l�education pourtous’’.
Zusammenfassung – PRIVATE UND OFFENTLICHE SCHULBILDUNG INGHANA: ZAHLUNG UND VERGLEICHENDE UMFRAGE In einer Untersu-chung zur Art und Anzahl von Schulen im Distrikt Ga in Ghana wurde der Umfangprivater Bildung erforscht und es wurde der Umfang der Investitionen in offentliche undprivate Beschulung miteinander in Vergleich gesetzt. Dreiviertel aller aufgefundenenSchulen waren privat. Es gab fast genauso viele unregistrierte Privatschulen wiestaatliche Schulen. Es liessen sich verschiedene bedeutende Unterschiede zwischenregistrierten und unregistrierten Privatschulen feststellen, die sich auf Fragen des Alters,der Schulgebuhren, der Lehrergehalter und der Klassengroße bezogen. Zur Vergleichsl-iste der Investitionen in staatliche, registrierte und unregistrierte Privatschulen zahltenEingaben wie Lehreraktivitat und die Verfugbarkeit von Schreibtischen, Stuhlen,Buchereien, Toiletten und Trinkwasser. Abschliessend wurde das Potential des privatenSektors bei der Unterstutzung des Ziels ‘‘Bildung fur alle’’ untersucht.
Review of Education (2007) 53:389–415 � Springer 2007DOI 10.1007/s11159-007-9042-3
Resumen – LA ENSENANZA PUBLICA Y PRIVADA EN GHANA UN CENSO YESTUDIO COMPARATIVO Con un censo y estudio de escuelas en el distrito de Ga,Ghana, se ha explorado la naturaleza y la extension de la educacion privada,comparandose asimismo los recursos que recibe la ensenanza publica y los que recibenlas escuelas privadas. Las tres cuartas partes de todas las escuelas analizadas eranprivadas, con casi tantas escuelas privadas no registradas como escuelas publicas. Sehan notado varias grandes diferencias entre las escuelas privadas registradas y las noregistradas, tales como edades, importes de tasas escolares, salarios de los docentes ytamano de las clases. Se han utilizado una serie de valores, tales como las actividades delos docentes, disponibilidad de mesas, sillas, bibliotecas, aseos y agua potable, paracomparar los recursos que reciben las escuelas publicas y las escuelas privadas noregistradas y registradas. Se estan explorando algunas conclusiones sobre el papelpotencial que podrıa desempenar el sector privado en cuanto a su contribucion paralograr los objetivos de ‘‘educacion para todos’’.
Background
Concerns are expressed in recent international development literature aboutthe existence of a low-cost private education sector serving the poor in devel-oping countries. In particular, apprehension is raised about the purportedlow quality of schools that are not registered with, or approved by, govern-ment. One aim of the current research, funded by the John TempletonFoundation, conducted between April 2003 and June 2005, was to explorethese concerns through an assessment of the relative quality of unregisteredprivate vis-a-vis government and registered private schools. Parallel researchwas undertaken in selected low-income areas of India, China, Ghana,Nigeria and Kenya. This article reports on findings from the District of Gain the Greater Accra Region of Ghana only.
390 J. Tooley et al.
The Oxfam Education Report suggests that for developing countries ingeneral, ‘‘... the notion that private schools are servicing the needs of a smallminority of wealthy parents is misplaced ... a lower cost private sector hasemerged to meet the demands of poor households’’ (Watkins 2000: 229–230).Concerning sub-Saharan Africa, in Uganda and Malawi, for instance,private schools have ‘‘mushroomed due to the poor quality governmentprimary schools’’ (Rose 2002: 6 and Rose 2003: 80), while in Kenya ‘‘thedeteriorating quality of public education... created demand for private alter-natives’’ (Bauer et al. 2002). In the Kumasi Metropolitan area of Ghana,Nsiah-Peprah (2004: 57) notes that, at primary and junior secondary levels,‘‘private schools far outnumber the public ones’’. In Nigeria, it is noted that‘‘unapproved schools are providing schooling opportunities to a significantnumber of children, particularly in urban and peri-urban areas’’ (Adelabuand Rose 2004: 64), with estimates that about 40% of the 2.5 million school-children in Lagos State are in private ‘‘unapproved’’ schools, while in EnuguState, there are ‘‘as many illegal [private] schools as there are street corners’’(Adelabu and Rose 2004: 50).
A similar phenomenon is noted in southern Asia: for example, research invillages in four north Indian states reports that ‘‘even among poor familiesand disadvantaged communities, one finds parents who make great sacrificesto send some or all of their children to private schools, so disillusioned arethey with government schools’’ (The Probe Team 1999: 103). Reporting onevidence from Haryana, Uttar Pradesh and Rajasthan, it is noted that ‘‘pri-vate schools have been expanding rapidly in recent years’’ and that these‘‘now include a large number of primary schools which charge low fees’’, inurban as well as rural areas (De et al. 2002: 148). For the poor in Calcutta(Kolkata) there has been a ‘‘mushrooming of privately managed unregulated... primary schools’’ (Nambissan 2003: 52).
Reasons given for this ‘‘mushrooming’’ highlight the low quality ofgovernment schools for the poor, including problems of teacher absenteeismand lack of teacher commitment. In government primary schools in WestBengal it is reported that ‘‘teachers do not teach’’ and ‘‘teaching is the lastpriority for the teachers’’ (Rana et al. 2002: 64, 67). The Probe Team foundthat in their sample, only 53% of government schools was there any teach-ing going on at all (The Probe Team 1999: 53). The Human DevelopmentReport 2003 notes that in India and Pakistan ‘‘poor households cited teacherabsenteeism in public schools as their main reason for choosing privateones.’’ (UNDP 2003: 112). Studies of government teacher absence in sixcountries – Bangladesh, Ecuador, India, Indonesia, Peru and Uganda –found teacher absence rates to be between 11% and 27% (Chaudhury et al.2004; Rogers et al. 2004: 142; Akhmadi and Suryadarma 2004). A study intwo rural districts of Kenya found that government teachers were absentnearly 30% of the time and present at school but not physically in the class-room 12.4% of the time (Glewwe et al. 2004).
391Private and public schooling in Ghana
However, whilst this literature indicates that one of the reasons poor par-ents send their children to private schools is the perceived low quality ofpublic education, the quality of the private schools to which parents turn asalternatives is seen as suspect, especially those not approved by government.The Oxfam Education Report,for instance, notes that while ‘‘there is nodoubting the appalling standard of provision in public education systems’’,the private schools that poor parents are using instead are of ‘‘inferior qual-ity’’, offering ‘‘a low-quality service’’ that will ‘‘restrict children�s futureopportunities.’’ (Watkins 2000: 230). In Kumasi, Ghana, it is suggested that,although private school enrolment has increased because parents ‘‘demandhigh quality education for their children’’, not met by government schools,there are still worries about the quality of the private schools that parentschoose as an alternative: the Kumasi Metropolitan Education Directorateclassified 62% of even its registered private schools as ‘‘low quality’’: ‘‘theprivate schools ... face problems which include inadequate funds, poor infra-structure and poor teacher quality’’ (Nsiah-Peprah 2004: 63–64). In Nigeria,Adelabu and Rose argue that, although their case study indicates that the‘‘unapproved’’ private schools serving the poor have ‘‘grown in response tostate failure to provide primary schooling which is both accessible and ofappropriate quality’’ (Adelabu and Rose 2004: p. 63), this does not meanthat the education offered in the private sector is acceptable: the privateunapproved schools offer a ‘‘low quality of education’’ (p. 48), ‘‘below adesirable level’’ (p. 64); they are ‘‘a low cost, low quality substitute’’ for pub-lic education (p. 74). Similarly, considering evidence from Uganda, Malawiand Tanzania it is suggested that ‘‘The provision of low quality private edu-cation for the poor is not serving their needs, but rather using up theirscarce resources with limited benefits’’ (Rose 2002: 16)
However, none of these sources offers detailed evidence for the claim oflow quality in private schools for low-income families: Adelabu and Rose inNigeria, for instance, based their conclusions on the low quality of privateschools on ‘‘interviews with key informants undertaken over a period of oneweek’’ and some brief observations in schools (Adelabu and Rose 2004: 47).Indeed, it is suggested that quantitative evidence is not readily available(Watkins 2000: 230; UNDP 2003: 115). The current research project aimedto add to the limited evidence available to increase understanding of private,particularly, unregistered schools.
Method
The field research in Ga District, conducted from March to May 2004, con-sisted of two main parts: a census of schools and survey of inputs. The cen-sus aimed to discover the extent of primary and junior secondary privateschools in the District of Ga, Ghana. (After the survey was conducted, Gawas split into two Districts, East and West – the research preceded this
392 J. Tooley et al.
bifurcation). The survey of inputs reported below focuses only on thoseschools serving primary sections, comparing inputs in private and govern-ment schools.
We followed customary usage (e.g., Nsiah-Peprah 2004: 57) and defined twomanagement types of school in Ghana: public and private. Public (govern-ment) schools receive all their funding from the state, and are owned by thestate. These include many church and Islamic schools, nationalised in Ghanain the 1970s, and which now operate as government schools, but with somevestiges of private management under state regulations (Nsiah-Peprah 2004).Private schools are both privately managed and privately funded. Privateschools can be considered to be of two sub-types: Registered private schoolsare those that have, purportedly, met state regulations and been inspected.Unregistered private schools are those that either have not applied to be regis-tered, or have not (yet) been said to have met these regulations.
Ga is classified by the Ghana Statistical Service as low-income peri-urbanand rural. The Ga District Planning Coordinating Unit (2004) suggests thatabout 30% of the population of 500,000 lives below the poverty line, while40% live on the poverty line. Ga includes poor fishing villages along thecoast, subsistence farms inland, as well as large dormitory towns for workersserving the industries and businesses of Accra itself; most of the districtlacks basic social amenities such as potable water, sewage systems, electricityand paved roads, (Ga District Assembly 2002, 2004).
A team of 30 researchers – graduate students at the University of CapeCoast – were trained in methods of locating and gaining access to schools,the use of an interview schedule for school managers and headteachers, andan observation schedule, which was trialled to ensure reliability of observa-tions made. The team leaders were experienced senior education academicsat the University of Cape Coast and directors of the Educational Assessmentand Research Centre, Accra. Lists of all government and registered privateschools were requested from the Ga District Education Department, butthese were not forthcoming until after the field research had been completed.
Given the major interest in finding unregistered private schools and thefact that official lists were not forthcoming, researchers were requested firstto search for unregistered private primary or junior secondary schools, andwhen one was located, to locate any registered private and/or governmentprimary and junior secondary schools in the vicinity. (Nursery only andsenior secondary only schools were excluded from the study, as was non-for-mal education provision, such as learning centres and after-school clubs). Todo this, researchers were trained to make enquiries in market places, shopsand of people in the street of the existence of any private school. It wasfound particularly useful to enquire about ‘‘small’’ schools, or ‘‘nursery’’schools; the latter would often turn out to be a combined nursery and pri-mary school. Researchers also observed signboards and the movement ofchildren on their way to and from school. A total of 561 primary and juniorsecondary schools were found: 141 unregistered private, 154 government,
393Private and public schooling in Ghana
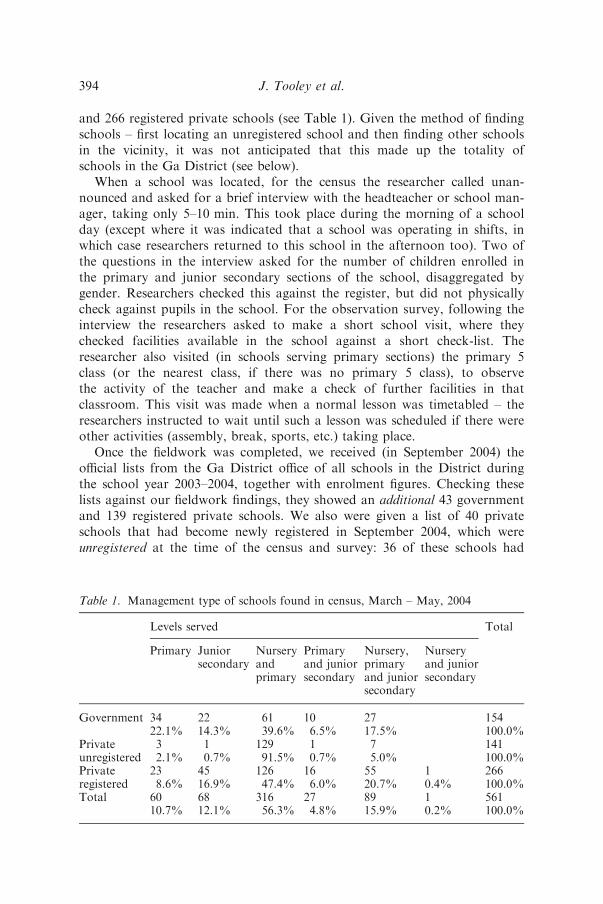
and 266 registered private schools (see Table 1). Given the method of findingschools – first locating an unregistered school and then finding other schoolsin the vicinity, it was not anticipated that this made up the totality ofschools in the Ga District (see below).
When a school was located, for the census the researcher called unan-nounced and asked for a brief interview with the headteacher or school man-ager, taking only 5–10 min. This took place during the morning of a schoolday (except where it was indicated that a school was operating in shifts, inwhich case researchers returned to this school in the afternoon too). Two ofthe questions in the interview asked for the number of children enrolled inthe primary and junior secondary sections of the school, disaggregated bygender. Researchers checked this against the register, but did not physicallycheck against pupils in the school. For the observation survey, following theinterview the researchers asked to make a short school visit, where theychecked facilities available in the school against a short check-list. Theresearcher also visited (in schools serving primary sections) the primary 5class (or the nearest class, if there was no primary 5 class), to observethe activity of the teacher and make a check of further facilities in thatclassroom. This visit was made when a normal lesson was timetabled – theresearchers instructed to wait until such a lesson was scheduled if there wereother activities (assembly, break, sports, etc.) taking place.
Once the fieldwork was completed, we received (in September 2004) theofficial lists from the Ga District office of all schools in the District duringthe school year 2003–2004, together with enrolment figures. Checking theselists against our fieldwork findings, they showed an additional 43 governmentand 139 registered private schools. We also were given a list of 40 privateschools that had become newly registered in September 2004, which wereunregistered at the time of the census and survey: 36 of these schools had
Table 1. Management type of schools found in census, March – May, 2004
Levels served Total
Primary Juniorsecondary
Nurseryandprimary
Primaryand juniorsecondary
Nursery,primaryand juniorsecondary
Nurseryand juniorsecondary
Government 34 22 61 10 27 15422.1% 14.3% 39.6% 6.5% 17.5% 100.0%
Privateunregistered
3 1 129 1 7 1412.1% 0.7% 91.5% 0.7% 5.0% 100.0%
Privateregistered
23 45 126 16 55 1 2668.6% 16.9% 47.4% 6.0% 20.7% 0.4% 100.0%
Total 60 68 316 27 89 1 56110.7% 12.1% 56.3% 4.8% 15.9% 0.2% 100.0%
394 J. Tooley et al.
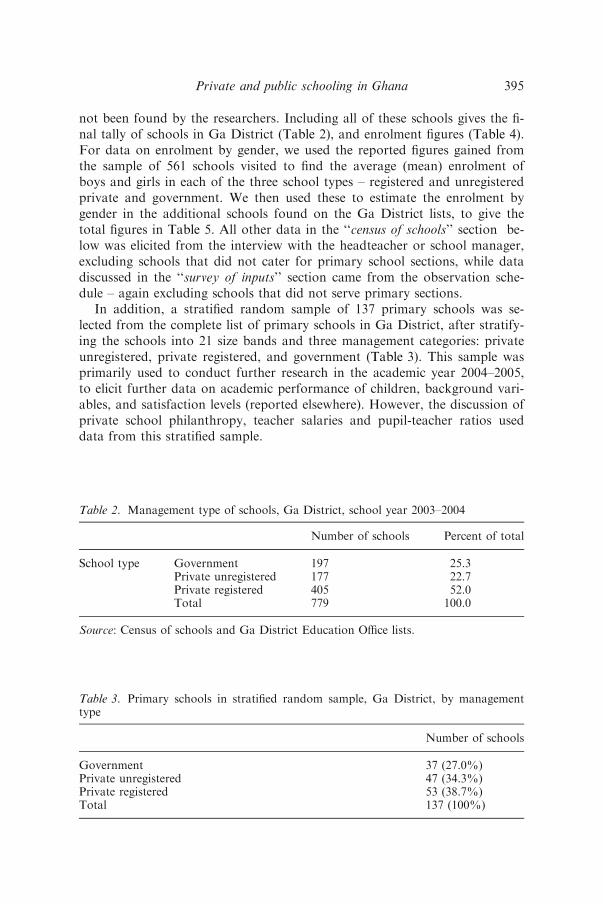
not been found by the researchers. Including all of these schools gives the fi-nal tally of schools in Ga District (Table 2), and enrolment figures (Table 4).For data on enrolment by gender, we used the reported figures gained fromthe sample of 561 schools visited to find the average (mean) enrolment ofboys and girls in each of the three school types – registered and unregisteredprivate and government. We then used these to estimate the enrolment bygender in the additional schools found on the Ga District lists, to give thetotal figures in Table 5. All other data in the ‘‘census of schools’’ section be-low was elicited from the interview with the headteacher or school manager,excluding schools that did not cater for primary school sections, while datadiscussed in the ‘‘survey of inputs’’ section came from the observation sche-dule – again excluding schools that did not serve primary sections.
In addition, a stratified random sample of 137 primary schools was se-lected from the complete list of primary schools in Ga District, after stratify-ing the schools into 21 size bands and three management categories: privateunregistered, private registered, and government (Table 3). This sample wasprimarily used to conduct further research in the academic year 2004–2005,to elicit further data on academic performance of children, background vari-ables, and satisfaction levels (reported elsewhere). However, the discussion ofprivate school philanthropy, teacher salaries and pupil-teacher ratios useddata from this stratified sample.
Table 2. Management type of schools, Ga District, school year 2003–2004
Number of schools Percent of total
School type Government 197 25.3Private unregistered 177 22.7Private registered 405 52.0Total 779 100.0
Source: Census of schools and Ga District Education Office lists.
Table 3. Primary schools in stratified random sample, Ga District, by managementtype
Number of schools
Government 37 (27.0%)Private unregistered 47 (34.3%)Private registered 53 (38.7%)Total 137 (100%)
395Private and public schooling in Ghana
Results: census of schools
Proportion of schools
Of the 779 schools serving primary and junior secondary sections in Ga(including those found during the fieldwork combined with the additionalschools located on official lists), 25.3% (197 schools) were government, andthe rest – 74.7% of the total (582 schools) – private schools. That is, a largemajority of schools at the time of the census was private. Of these, the larg-est number was registered, (405 schools or 52.0% of the total), while 177private schools were unregistered (22.7% of the total) There were almost asmany private unregistered schools as government schools (Table 2). Thisfigure must be taken as indicating a lower bound on the numbers of privateunregistered schools that existed at the time of the census, as we cannot besure we found all such schools, as there were obviously no official lists withwhich to compare our findings.
Proportion of pupils
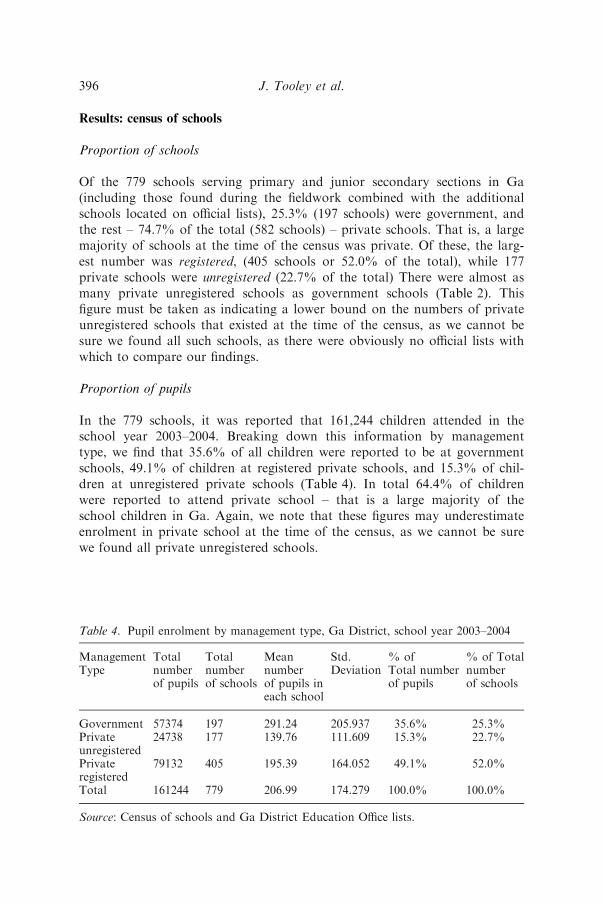
In the 779 schools, it was reported that 161,244 children attended in theschool year 2003–2004. Breaking down this information by managementtype, we find that 35.6% of all children were reported to be at governmentschools, 49.1% of children at registered private schools, and 15.3% of chil-dren at unregistered private schools (Table 4). In total 64.4% of childrenwere reported to attend private school – that is a large majority of theschool children in Ga. Again, we note that these figures may underestimateenrolment in private school at the time of the census, as we cannot be surewe found all private unregistered schools.
Table 4. Pupil enrolment by management type, Ga District, school year 2003–2004
ManagementType
Totalnumberof pupils
Totalnumberof schools
Meannumberof pupils ineach school
Std.Deviation
% ofTotal numberof pupils
% of Totalnumberof schools
Government 57374 197 291.24 205.937 35.6% 25.3%Privateunregistered
24738 177 139.76 111.609 15.3% 22.7%
Privateregistered
79132 405 195.39 164.052 49.1% 52.0%
Total 161244 779 206.99 174.279 100.0% 100.0%
Source: Census of schools and Ga District Education Office lists.
396 J. Tooley et al.
Gender
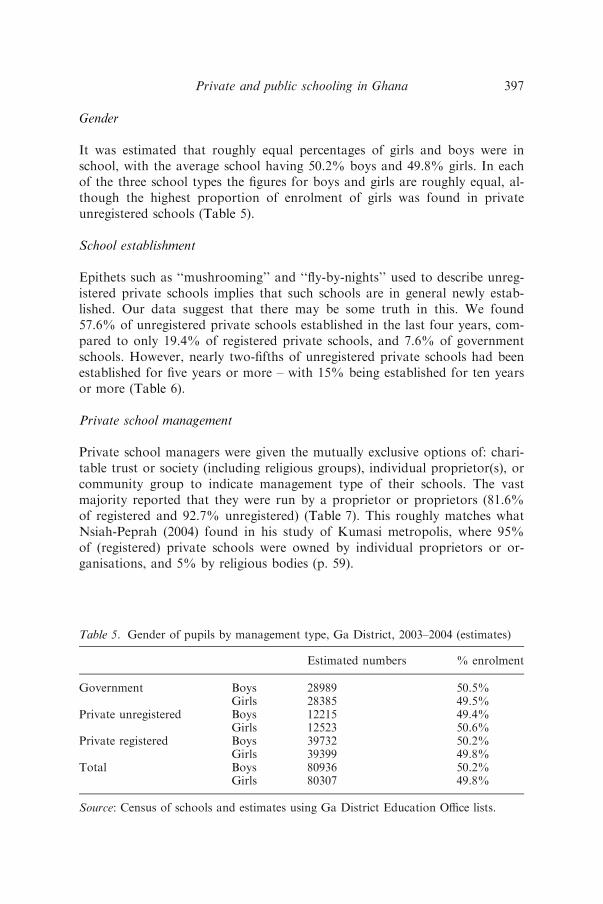
It was estimated that roughly equal percentages of girls and boys were inschool, with the average school having 50.2% boys and 49.8% girls. In eachof the three school types the figures for boys and girls are roughly equal, al-though the highest proportion of enrolment of girls was found in privateunregistered schools (Table 5).
School establishment
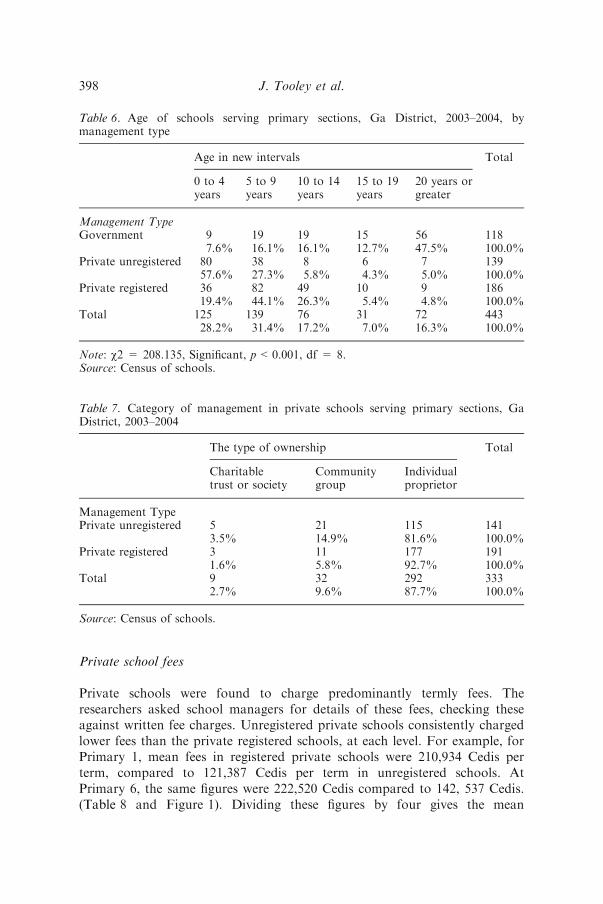
Epithets such as ‘‘mushrooming’’ and ‘‘fly-by-nights’’ used to describe unreg-istered private schools implies that such schools are in general newly estab-lished. Our data suggest that there may be some truth in this. We found57.6% of unregistered private schools established in the last four years, com-pared to only 19.4% of registered private schools, and 7.6% of governmentschools. However, nearly two-fifths of unregistered private schools had beenestablished for five years or more – with 15% being established for ten yearsor more (Table 6).
Private school management
Private school managers were given the mutually exclusive options of: chari-table trust or society (including religious groups), individual proprietor(s), orcommunity group to indicate management type of their schools. The vastmajority reported that they were run by a proprietor or proprietors (81.6%of registered and 92.7% unregistered) (Table 7). This roughly matches whatNsiah-Peprah (2004) found in his study of Kumasi metropolis, where 95%of (registered) private schools were owned by individual proprietors or or-ganisations, and 5% by religious bodies (p. 59).
Table 5. Gender of pupils by management type, Ga District, 2003–2004 (estimates)
Estimated numbers % enrolment
Government Boys 28989 50.5%Girls 28385 49.5%
Private unregistered Boys 12215 49.4%Girls 12523 50.6%
Private registered Boys 39732 50.2%Girls 39399 49.8%
Total Boys 80936 50.2%Girls 80307 49.8%
Source: Census of schools and estimates using Ga District Education Office lists.
397Private and public schooling in Ghana
Private school fees
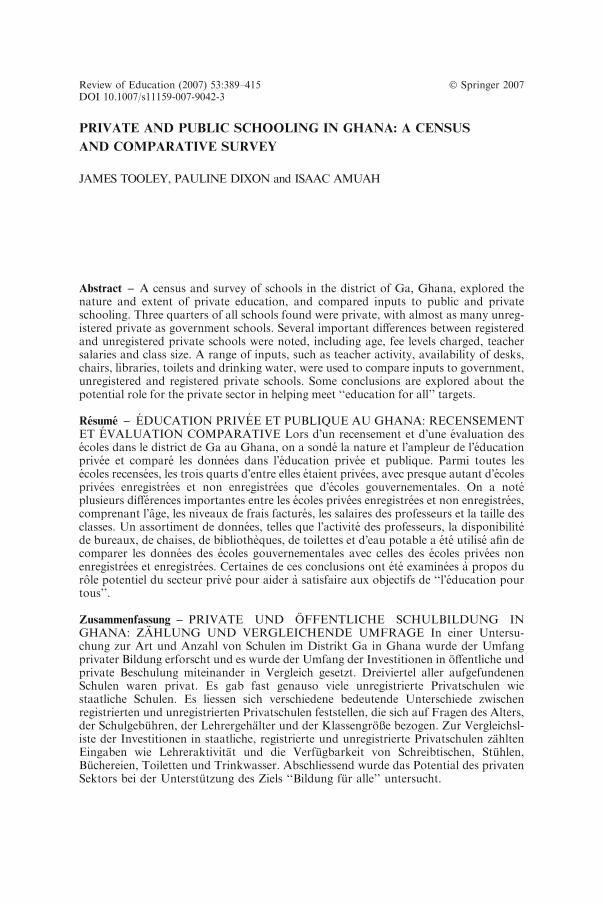
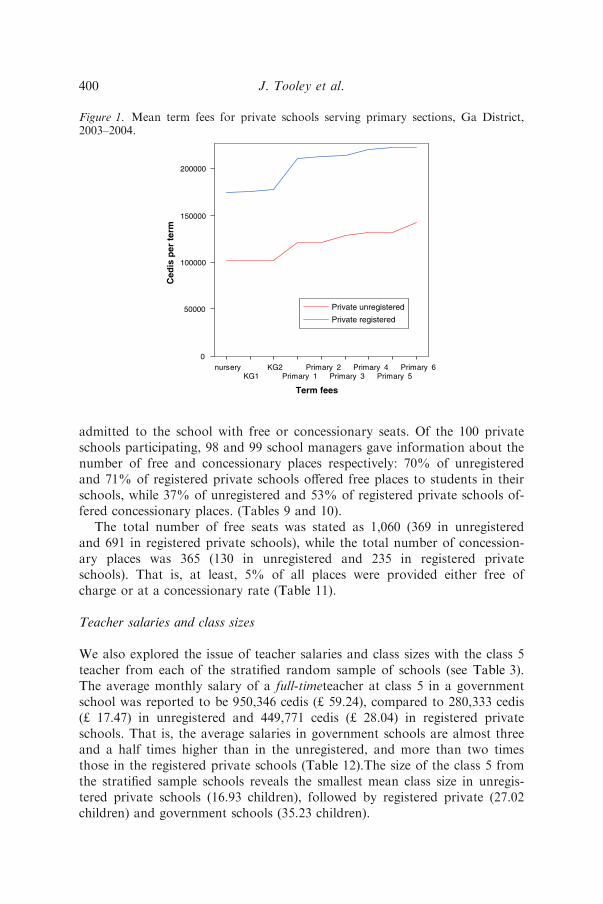
Private schools were found to charge predominantly termly fees. Theresearchers asked school managers for details of these fees, checking theseagainst written fee charges. Unregistered private schools consistently chargedlower fees than the private registered schools, at each level. For example, forPrimary 1, mean fees in registered private schools were 210,934 Cedis perterm, compared to 121,387 Cedis per term in unregistered schools. AtPrimary 6, the same figures were 222,520 Cedis compared to 142, 537 Cedis.(Table 8 and Figure 1). Dividing these figures by four gives the mean
Table 6. Age of schools serving primary sections, Ga District, 2003–2004, bymanagement type
Age in new intervals Total
0 to 4years
5 to 9years
10 to 14years
15 to 19years
20 years orgreater
Management TypeGovernment 9 19 19 15 56 118
7.6% 16.1% 16.1% 12.7% 47.5% 100.0%Private unregistered 80 38 8 6 7 139
57.6% 27.3% 5.8% 4.3% 5.0% 100.0%Private registered 36 82 49 10 9 186
19.4% 44.1% 26.3% 5.4% 4.8% 100.0%Total 125 139 76 31 72 443
28.2% 31.4% 17.2% 7.0% 16.3% 100.0%
Note: v2 = 208.135, Significant, p<0.001, df = 8.Source: Census of schools.
Table 7. Category of management in private schools serving primary sections, GaDistrict, 2003–2004
The type of ownership Total
Charitabletrust or society
Communitygroup
Individualproprietor
Management TypePrivate unregistered 5 21 115 141
3.5% 14.9% 81.6% 100.0%Private registered 3 11 177 191
1.6% 5.8% 92.7% 100.0%Total 9 32 292 333
2.7% 9.6% 87.7% 100.0%
Source: Census of schools.
398 J. Tooley et al.
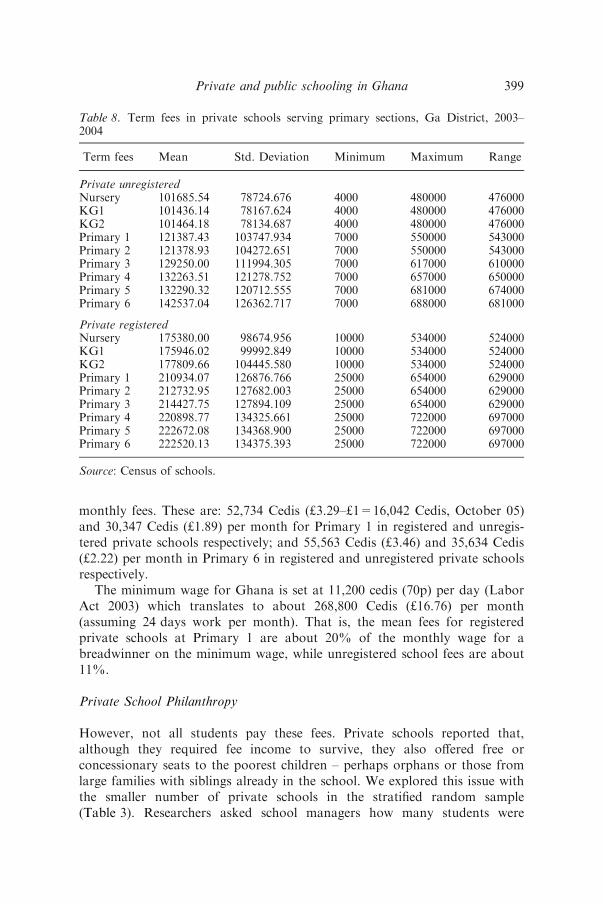
monthly fees. These are: 52,734 Cedis (£3.29–£1=16,042 Cedis, October 05)and 30,347 Cedis (£1.89) per month for Primary 1 in registered and unregis-tered private schools respectively; and 55,563 Cedis (£3.46) and 35,634 Cedis(£2.22) per month in Primary 6 in registered and unregistered private schoolsrespectively.
The minimum wage for Ghana is set at 11,200 cedis (70p) per day (LaborAct 2003) which translates to about 268,800 Cedis (£16.76) per month(assuming 24 days work per month). That is, the mean fees for registeredprivate schools at Primary 1 are about 20% of the monthly wage for abreadwinner on the minimum wage, while unregistered school fees are about11%.
Private School Philanthropy
However, not all students pay these fees. Private schools reported that,although they required fee income to survive, they also offered free orconcessionary seats to the poorest children – perhaps orphans or those fromlarge families with siblings already in the school. We explored this issue withthe smaller number of private schools in the stratified random sample(Table 3). Researchers asked school managers how many students were
Table 8. Term fees in private schools serving primary sections, Ga District, 2003–2004
Term fees Mean Std. Deviation Minimum Maximum Range
Private unregisteredNursery 101685.54 78724.676 4000 480000 476000KG1 101436.14 78167.624 4000 480000 476000KG2 101464.18 78134.687 4000 480000 476000Primary 1 121387.43 103747.934 7000 550000 543000Primary 2 121378.93 104272.651 7000 550000 543000Primary 3 129250.00 111994.305 7000 617000 610000Primary 4 132263.51 121278.752 7000 657000 650000Primary 5 132290.32 120712.555 7000 681000 674000Primary 6 142537.04 126362.717 7000 688000 681000
Private registeredNursery 175380.00 98674.956 10000 534000 524000KG1 175946.02 99992.849 10000 534000 524000KG2 177809.66 104445.580 10000 534000 524000Primary 1 210934.07 126876.766 25000 654000 629000Primary 2 212732.95 127682.003 25000 654000 629000Primary 3 214427.75 127894.109 25000 654000 629000Primary 4 220898.77 134325.661 25000 722000 697000Primary 5 222672.08 134368.900 25000 722000 697000Primary 6 222520.13 134375.393 25000 722000 697000
Source: Census of schools.
399Private and public schooling in Ghana
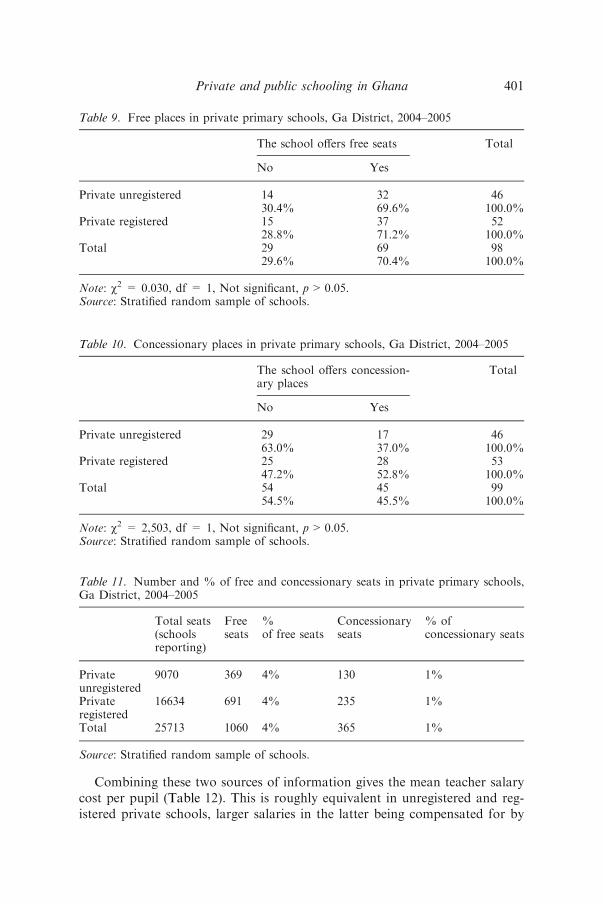
admitted to the school with free or concessionary seats. Of the 100 privateschools participating, 98 and 99 school managers gave information about thenumber of free and concessionary places respectively: 70% of unregisteredand 71% of registered private schools offered free places to students in theirschools, while 37% of unregistered and 53% of registered private schools of-fered concessionary places. (Tables 9 and 10).
The total number of free seats was stated as 1,060 (369 in unregisteredand 691 in registered private schools), while the total number of concession-ary places was 365 (130 in unregistered and 235 in registered privateschools). That is, at least, 5% of all places were provided either free ofcharge or at a concessionary rate (Table 11).
Teacher salaries and class sizes
We also explored the issue of teacher salaries and class sizes with the class 5teacher from each of the stratified random sample of schools (see Table 3).The average monthly salary of a full-timeteacher at class 5 in a governmentschool was reported to be 950,346 cedis (£ 59.24), compared to 280,333 cedis(£ 17.47) in unregistered and 449,771 cedis (£ 28.04) in registered privateschools. That is, the average salaries in government schools are almost threeand a half times higher than in the unregistered, and more than two timesthose in the registered private schools (Table 12).The size of the class 5 fromthe stratified sample schools reveals the smallest mean class size in unregis-tered private schools (16.93 children), followed by registered private (27.02children) and government schools (35.23 children).
Private unregistered
Private registered
nurseryKG1
KG2Primary 1
Primary 2Primary 3
Primary 4Primary 5
Primary 6
Term fees
Ced
is p
er t
erm
0
50000
100000
150000
200000
Figure 1. Mean term fees for private schools serving primary sections, Ga District,2003–2004.
400 J. Tooley et al.
Combining these two sources of information gives the mean teacher salarycost per pupil (Table 12). This is roughly equivalent in unregistered and reg-istered private schools, larger salaries in the latter being compensated for by
Table 9. Free places in private primary schools, Ga District, 2004–2005
The school offers free seats Total
No Yes
Private unregistered 14 32 4630.4% 69.6% 100.0%
Private registered 15 37 5228.8% 71.2% 100.0%
Total 29 69 9829.6% 70.4% 100.0%
Note: v2 = 0.030, df = 1, Not significant, p>0.05.Source: Stratified random sample of schools.
Table 10. Concessionary places in private primary schools, Ga District, 2004–2005
The school offers concession-ary places
Total
No Yes
Private unregistered 29 17 4663.0% 37.0% 100.0%
Private registered 25 28 5347.2% 52.8% 100.0%
Total 54 45 9954.5% 45.5% 100.0%
Note: v2 = 2,503, df = 1, Not significant, p>0.05.Source: Stratified random sample of schools.
Table 11. Number and % of free and concessionary seats in private primary schools,Ga District, 2004–2005
Total seats(schoolsreporting)
Freeseats
%of free seats
Concessionaryseats
% ofconcessionary seats
Privateunregistered
9070 369 4% 130 1%
Privateregistered
16634 691 4% 235 1%
Total 25713 1060 4% 365 1%
Source: Stratified random sample of schools.
401Private and public schooling in Ghana
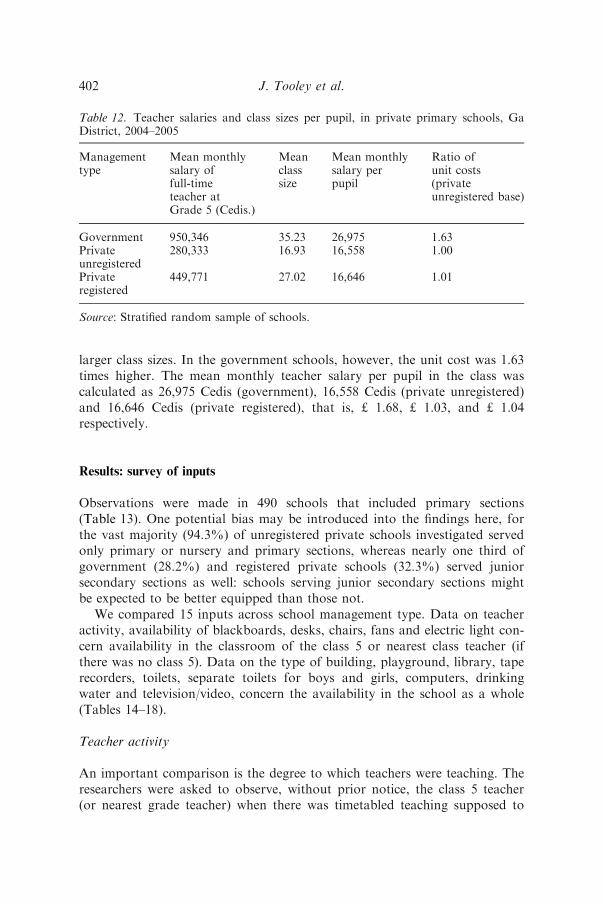
larger class sizes. In the government schools, however, the unit cost was 1.63times higher. The mean monthly teacher salary per pupil in the class wascalculated as 26,975 Cedis (government), 16,558 Cedis (private unregistered)and 16,646 Cedis (private registered), that is, £ 1.68, £ 1.03, and £ 1.04respectively.
Results: survey of inputs
Observations were made in 490 schools that included primary sections(Table 13). One potential bias may be introduced into the findings here, forthe vast majority (94.3%) of unregistered private schools investigated servedonly primary or nursery and primary sections, whereas nearly one third ofgovernment (28.2%) and registered private schools (32.3%) served juniorsecondary sections as well: schools serving junior secondary sections mightbe expected to be better equipped than those not.
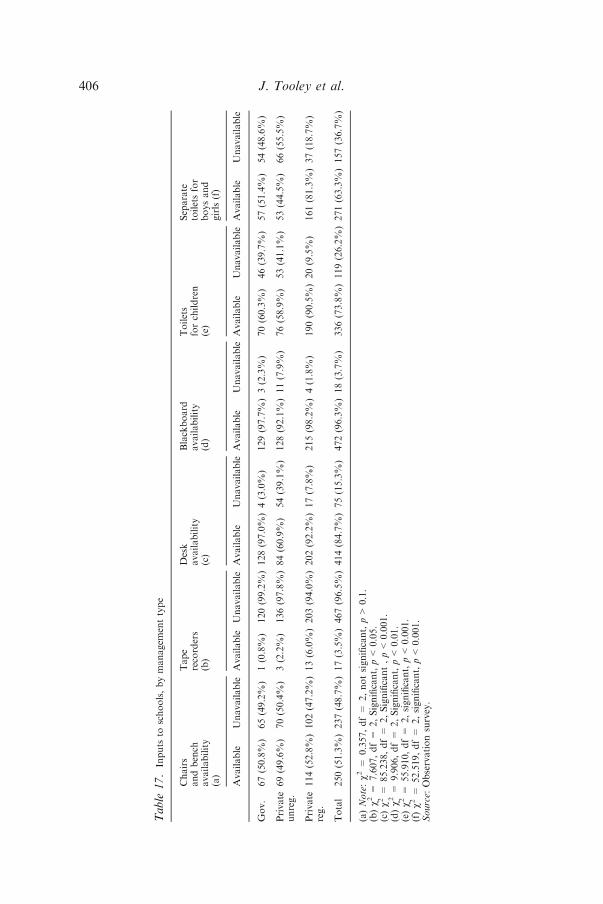
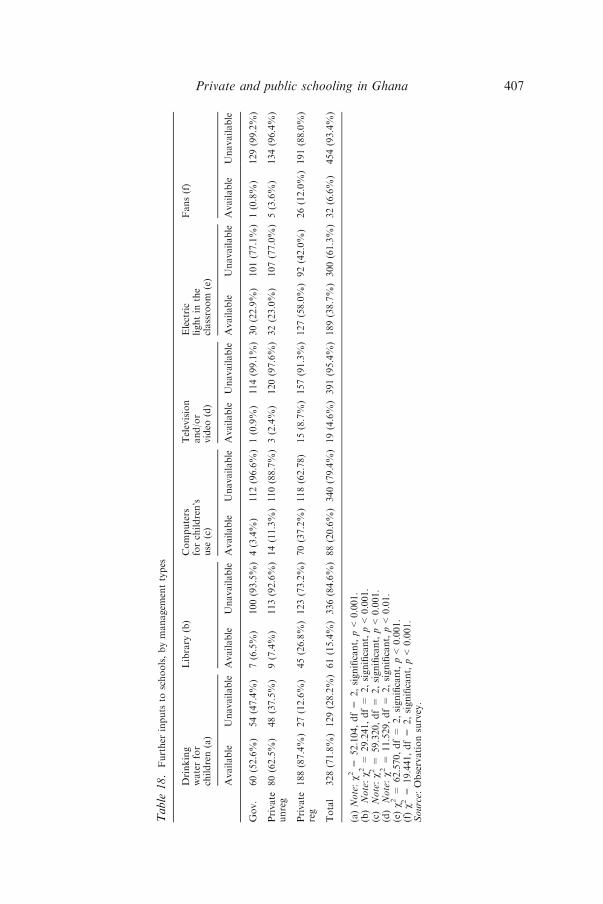
We compared 15 inputs across school management type. Data on teacheractivity, availability of blackboards, desks, chairs, fans and electric light con-cern availability in the classroom of the class 5 or nearest class teacher (ifthere was no class 5). Data on the type of building, playground, library, taperecorders, toilets, separate toilets for boys and girls, computers, drinkingwater and television/video, concern the availability in the school as a whole(Tables 14–18).
Teacher activity
An important comparison is the degree to which teachers were teaching. Theresearchers were asked to observe, without prior notice, the class 5 teacher(or nearest grade teacher) when there was timetabled teaching supposed to
Table 12. Teacher salaries and class sizes per pupil, in private primary schools, GaDistrict, 2004–2005
Managementtype
Mean monthlysalary offull-timeteacher atGrade 5 (Cedis.)
Meanclasssize
Mean monthlysalary perpupil
Ratio ofunit costs(privateunregistered base)
Government 950,346 35.23 26,975 1.63Privateunregistered
280,333 16.93 16,558 1.00
Privateregistered
449,771 27.02 16,646 1.01
Source: Stratified random sample of schools.
402 J. Tooley et al.
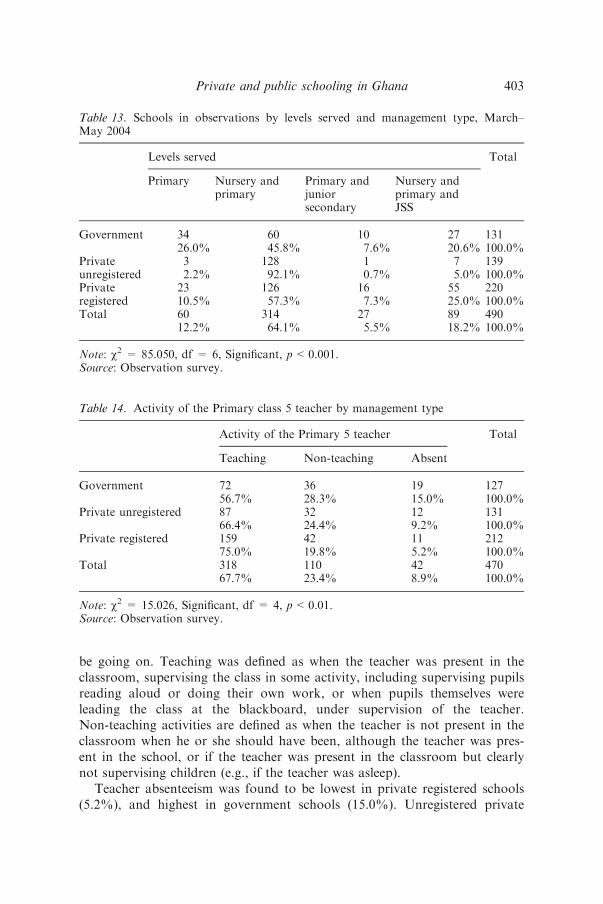
be going on. Teaching was defined as when the teacher was present in theclassroom, supervising the class in some activity, including supervising pupilsreading aloud or doing their own work, or when pupils themselves wereleading the class at the blackboard, under supervision of the teacher.Non-teaching activities are defined as when the teacher is not present in theclassroom when he or she should have been, although the teacher was pres-ent in the school, or if the teacher was present in the classroom but clearlynot supervising children (e.g., if the teacher was asleep).
Teacher absenteeism was found to be lowest in private registered schools(5.2%), and highest in government schools (15.0%). Unregistered private
Table 13. Schools in observations by levels served and management type, March–May 2004
Levels served Total
Primary Nursery andprimary
Primary andjuniorsecondary
Nursery andprimary andJSS
Government 34 60 10 27 13126.0% 45.8% 7.6% 20.6% 100.0%
Privateunregistered
3 128 1 7 1392.2% 92.1% 0.7% 5.0% 100.0%
Privateregistered
23 126 16 55 22010.5% 57.3% 7.3% 25.0% 100.0%
Total 60 314 27 89 49012.2% 64.1% 5.5% 18.2% 100.0%
Note: v2 = 85.050, df = 6, Significant, p<0.001.Source: Observation survey.
Table 14. Activity of the Primary class 5 teacher by management type
Activity of the Primary 5 teacher Total
Teaching Non-teaching Absent
Government 72 36 19 12756.7% 28.3% 15.0% 100.0%
Private unregistered 87 32 12 13166.4% 24.4% 9.2% 100.0%
Private registered 159 42 11 21275.0% 19.8% 5.2% 100.0%
Total 318 110 42 47067.7% 23.4% 8.9% 100.0%
Note: v2 = 15.026, Significant, df = 4, p<0.01.Source: Observation survey.
403Private and public schooling in Ghana
schools came midway, at 9.2%. Conversely, teachers were found to be teach-ing far less in government than private schools: In 56.7% of governmentschools was the teacher teaching, compared to roughly two-thirds (66.4%) inprivate unregistered and three quarters (75.0%) in private registered schools(Table 14).
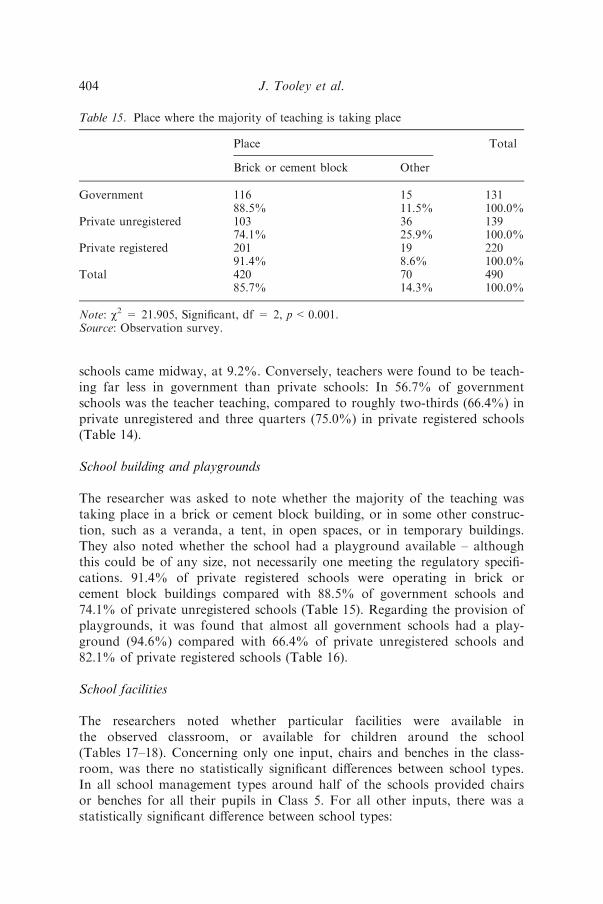
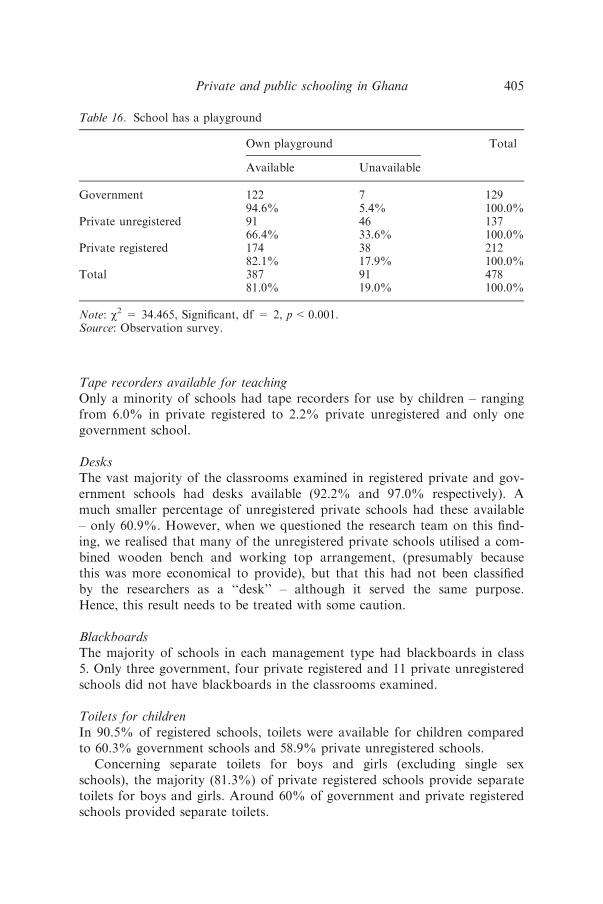
School building and playgrounds
The researcher was asked to note whether the majority of the teaching wastaking place in a brick or cement block building, or in some other construc-tion, such as a veranda, a tent, in open spaces, or in temporary buildings.They also noted whether the school had a playground available – althoughthis could be of any size, not necessarily one meeting the regulatory specifi-cations. 91.4% of private registered schools were operating in brick orcement block buildings compared with 88.5% of government schools and74.1% of private unregistered schools (Table 15). Regarding the provision ofplaygrounds, it was found that almost all government schools had a play-ground (94.6%) compared with 66.4% of private unregistered schools and82.1% of private registered schools (Table 16).
School facilities
The researchers noted whether particular facilities were available inthe observed classroom, or available for children around the school(Tables 17–18). Concerning only one input, chairs and benches in the class-room, was there no statistically significant differences between school types.In all school management types around half of the schools provided chairsor benches for all their pupils in Class 5. For all other inputs, there was astatistically significant difference between school types:
Table 15. Place where the majority of teaching is taking place
Place Total
Brick or cement block Other
Government 116 15 13188.5% 11.5% 100.0%
Private unregistered 103 36 13974.1% 25.9% 100.0%
Private registered 201 19 22091.4% 8.6% 100.0%
Total 420 70 49085.7% 14.3% 100.0%
Note: v2 = 21.905, Significant, df = 2, p<0.001.Source: Observation survey.
404 J. Tooley et al.
Tape recorders available for teachingOnly a minority of schools had tape recorders for use by children – rangingfrom 6.0% in private registered to 2.2% private unregistered and only onegovernment school.
DesksThe vast majority of the classrooms examined in registered private and gov-ernment schools had desks available (92.2% and 97.0% respectively). Amuch smaller percentage of unregistered private schools had these available– only 60.9%. However, when we questioned the research team on this find-ing, we realised that many of the unregistered private schools utilised a com-bined wooden bench and working top arrangement, (presumably becausethis was more economical to provide), but that this had not been classifiedby the researchers as a ‘‘desk’’ – although it served the same purpose.Hence, this result needs to be treated with some caution.
BlackboardsThe majority of schools in each management type had blackboards in class5. Only three government, four private registered and 11 private unregisteredschools did not have blackboards in the classrooms examined.
Toilets for childrenIn 90.5% of registered schools, toilets were available for children comparedto 60.3% government schools and 58.9% private unregistered schools.
Concerning separate toilets for boys and girls (excluding single sexschools), the majority (81.3%) of private registered schools provide separatetoilets for boys and girls. Around 60% of government and private registeredschools provided separate toilets.
Table 16. School has a playground
Own playground Total
Available Unavailable
Government 122 7 12994.6% 5.4% 100.0%
Private unregistered 91 46 13766.4% 33.6% 100.0%
Private registered 174 38 21282.1% 17.9% 100.0%
Total 387 91 47881.0% 19.0% 100.0%
Note: v2 = 34.465, Significant, df = 2, p<0.001.Source: Observation survey.
405Private and public schooling in Ghana
Table
17.
Inputs
toschools,bymanagem
enttype
Chairs
andbench
availability
(a)
Tape
recorders
(b)
Desk
availability
(c)
Blackboard
availability
(d)
Toilets
forchildren
(e)
Separate
toiletsfor
boysand
girls(f)
Available
Unavailable
Available
Unavailable
Available
Unavailable
Available
Unavailable
Available
Unavailable
Available
Unavailable
Gov.
67(50.8%)
65(49.2%)
1(0.8%)
120(99.2%)128(97.0%)4(3.0%)
129(97.7%)3(2.3%)
70(60.3%)
46(39.7%)
57(51.4%)
54(48.6%)
Private
unreg.
69(49.6%)
70(50.4%)
3(2.2%)
136(97.8%)84(60.9%)
54(39.1%)
128(92.1%)11(7.9%)
76(58.9%)
53(41.1%)
53(44.5%)
66(55.5%)
Private
reg.
114(52.8%)102(47.2%)13(6.0%)203(94.0%)202(92.2%)17(7.8%)
215(98.2%)4(1.8%)
190(90.5%)20(9.5%)
161(81.3%)37(18.7%)
Total
250(51.3%)237(48.7%)17(3.5%)467(96.5%)414(84.7%)75(15.3%)
472(96.3%)18(3.7%)
336(73.8%)119(26.2%)271(63.3%)157(36.7%)
(a)Note:v2=
0.357,df=
2,notsignificant,p>
0.1.
(b)
v2=
7.607,df=
2,Significant,p<
0.05.
(c)
v2=
85.238,df=
2,Significant,p<
0.001.
(d)
v2=
9.906,df=
2,Significant,p<
0.01.
(e)
v2=
55.910,df=
2,significant,p<
0.001.
(f)
v2=
52.519,df=
2,significant,p<
0.001.
Source:
Observationsurvey.
406 J. Tooley et al.
Table
18.
Further
inputs
toschools,bymanagem
enttypes
Drinking
waterfor
children(a)
Library
(b)
Computers
forchildren�s
use
(c)
Television
and/or
video
(d)
Electric
lightin
the
classroom
(e)
Fans(f)
Available
Unavailable
Available
Unavailable
Available
Unavailable
Available
Unavailable
Available
Unavailable
Available
Unavailable
Gov.
60(52.6%)
54(47.4%)
7(6.5%)
100(93.5%)4(3.4%)
112(96.6%)1(0.9%)
114(99.1%)30(22.9%)
101(77.1%)1(0.8%)
129(99.2%)
Private
unreg
80(62.5%)
48(37.5%)
9(7.4%)
113(92.6%)14(11.3%)110(88.7%)3(2.4%)
120(97.6%)32(23.0%)
107(77.0%)5(3.6%)
134(96.4%)
Private
reg
188(87.4%)27(12.6%)
45(26.8%)123(73.2%)70(37.2%)118(62.78)
15(8.7%)157(91.3%)127(58.0%)92(42.0%)
26(12.0%)191(88.0%)
Total
328(71.8%)129(28.2%)61(15.4%)336(84.6%)88(20.6%)340(79.4%)19(4.6%)391(95.4%)189(38.7%)300(61.3%)32(6.6%)
454(93.4%)
(a)Note:v2
=52.104,df=
2,significant,p<
0.001.
(b)Note:v2=
29.241,df=
2,significant,p<
0.001.
(c)Note:v2=
59.320,df=
2,significant,p<
0.001.
(d)Note:v2=
11.529,df=
2,significant,p<
0.01.
(e)v2=
62.570,df=
2,significant,p<
0.001.
(f)
v2=
19.441,df=
2,significant,p<
0.001.
Source:
Observationsurvey.
407Private and public schooling in Ghana
Drinking water52.6% of government classrooms had drinking water for their pupils, com-pared with 62.5% of private unregistered schools and 87.4% private regis-tered schools.
LibraryJust over one quarter of private registered schools provide a library for thechildren (26.8%). However, only 6.5% of government and 7.4% of privateunregistered schools provided a library for children�s use.
Computers for children�s useJust over one third of registered private schools had one or more computersfor the use of their students, compared with 11.3% of unregistered privateschools. Only 3.4% of government schools (that is 4 schools) had computersfor their pupils.
Television and/or video for teaching purposesThe majority of schools did not have a television or video. Only one govern-ment school and three (2.4%) private unregistered schools had the facility,while 15 (8.7%) private registered schools provided a television or video.
Electric LightJust under a quarter of government and private unregistered schools hadelectric light in their classrooms (22.9% and 23.0% respectively), comparedwith 58.0% of private registered schools.
FansOnly one government school (0.7%) had a fan in the classroom comparedwith five private unregistered (3.6%) and 26 private registered schools(12.0%).
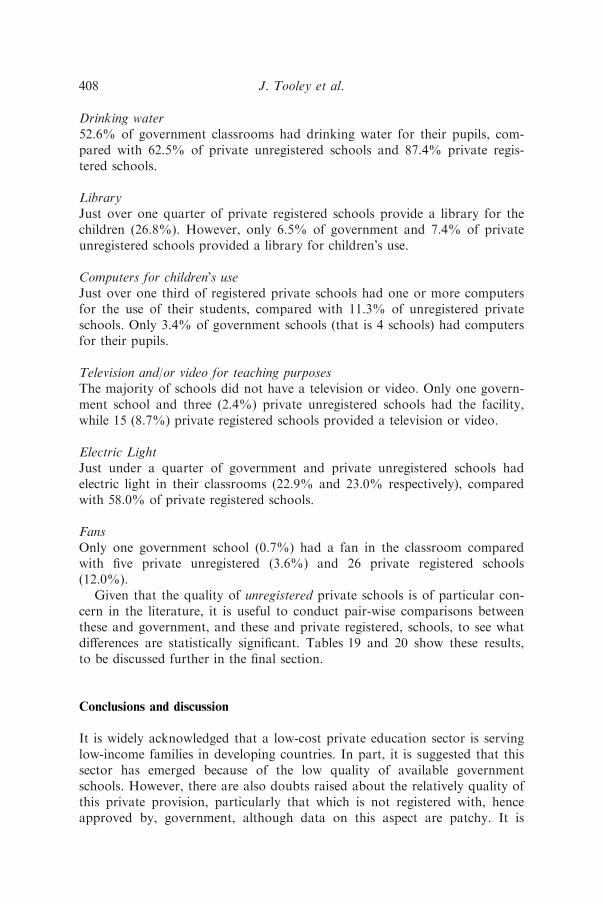
Given that the quality of unregistered private schools is of particular con-cern in the literature, it is useful to conduct pair-wise comparisons betweenthese and government, and these and private registered, schools, to see whatdifferences are statistically significant. Tables 19 and 20 show these results,to be discussed further in the final section.
Conclusions and discussion
It is widely acknowledged that a low-cost private education sector is servinglow-income families in developing countries. In part, it is suggested that thissector has emerged because of the low quality of available governmentschools. However, there are also doubts raised about the relatively quality ofthis private provision, particularly that which is not registered with, henceapproved by, government, although data on this aspect are patchy. It is
408 J. Tooley et al.
hoped that this paper, reporting on a study from the District of Ga, Ghana,exploring the nature and extent of private schools and comparing inputsacross school management types, can help improve our understanding of thisrelatively unexplored phenomenon.
Our study suggested that the private sector is certainly a significant pro-vider in Ga District. Of the total of 779 primary and junior secondaryschools in Ga, 75% were private. There were almost as many unregisteredprivate as government schools (23% compared to 25%). Given that we can-not be sure we found all the private unregistered schools, this gives a lowerbound for private sector involvement. Enrolment figures suggest that chil-dren in private schools make up about 64% of total school enrolment in theDistrict at the time of the Census. About 15% of total enrolment was re-ported in unregistered private schools.
Some limitations of the research are apparent: It would have been valu-able to have made more than one unannounced visit to gauge the extent towhich teachers were teaching over a prolonged period. However, this wasbeyond the resources of this current study. It may also have been useful todisaggregate government schools into different types – those run by differenttypes of church and the district – to ascertain differences between thesetypes. However, unfortunately we did not ask the researchers to classifyschools in this way. Checking numbers on the register against actual childrenin school would have been very useful, but this was felt by the local team to
Table 19. Ga District, observations in private registered and unregistered schoolsonly
Indicators with no significant difference
Tape recorders v = 2.928, df = 1, not significant, p>0.05Chairs and benches v = 0.333, df = 1, not significant, p>0.05Activity of the teacher v = 3.537, df = 1, not significant, p>0.05Blackboards v = 7.849, df = 1, not significant, p>0.05
(Fisher�s Exact Test)Indicators with significant differencein favour of private registered schoolsPlace where teaching is carried out v = 19.567, df = 1, significant, p<0.001Desks v = 52.280, df = 1, significant, p<0.001Fans v = 7.493, df = 1, significant, p<0.05Electric light v = 42.118, df = 1, significant, p<0.001Playground v = 11.156, df = 1, significant, p<0.05Drinking water v = 29.216, df = 1, significant, p<0.001Toilets for children v = 47.111, df = 1, significant, p<0.001Separate toilets for boys and girls v = 45.828, df = 1, significant, p<0.001Library v = 17.569, df = 1, significant, p<0.001Computers for children�s use v = 25.561, df = 1, significant, p<0.001Television and/or video v = 4.940, df = 1, significant, p<0.05
Source: Observation survey.
409Private and public schooling in Ghana
be too intrusive and unlikely to be allowed by school management. Clearly,research on the achievement levels of children in the different school types,controlled for background variables, and on satisfaction levels of pupils, par-ents and teachers, would add to our understanding of the relative quality ofpublic and private provision. The extended study explored these aspects, re-ported elsewhere. Notwithstanding these limitations, however, the researchreported here may raise issues that could contribute to discussions about theprivate – and in particular, unregistered – education sector: should itspresence be a cause for concern, as it appears in the literature, or can some-thing more positive be concluded about its potential role in contributing tothe Millennium Development Goal (MDG) of ‘‘education for all’’?
In the literature cited above, there appear to be two major concerns aboutthe role of private schools in general, and unregistered private schools inparticular, that the research findings here may usefully illuminate:
First, private schools charge fees, thus making them out of reach of thepoorest (e.g., The Probe Team 1999: 105; Watkins 2000: 207; UNDP 2003:115). But per se this might not be an insurmountable obstacle for private
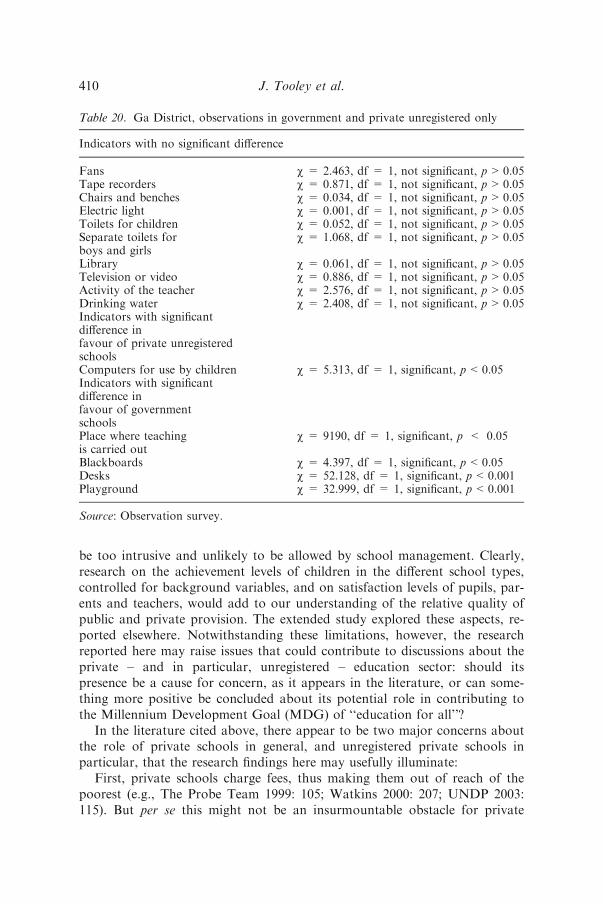
Table 20. Ga District, observations in government and private unregistered only
Indicators with no significant difference
Fans v = 2.463, df = 1, not significant, p>0.05Tape recorders v = 0.871, df = 1, not significant, p>0.05Chairs and benches v = 0.034, df = 1, not significant, p>0.05Electric light v = 0.001, df = 1, not significant, p>0.05Toilets for children v = 0.052, df = 1, not significant, p>0.05Separate toilets forboys and girls
v = 1.068, df = 1, not significant, p>0.05
Library v = 0.061, df = 1, not significant, p>0.05Television or video v = 0.886, df = 1, not significant, p>0.05Activity of the teacher v = 2.576, df = 1, not significant, p>0.05Drinking water v = 2.408, df = 1, not significant, p>0.05Indicators with significantdifference infavour of private unregisteredschoolsComputers for use by children v = 5.313, df = 1, significant, p<0.05Indicators with significantdifference infavour of governmentschoolsPlace where teachingis carried out
v = 9190, df = 1, significant, p < 0.05
Blackboards v = 4.397, df = 1, significant, p<0.05Desks v = 52.128, df = 1, significant, p<0.001Playground v = 32.999, df = 1, significant, p<0.001
Source: Observation survey.
410 J. Tooley et al.
schools assisting in meeting ‘‘education for all’’ goals. Above we noted thatprivate schools themselves engage in offering informal scholarships (free orconcessionary places) for some of the poorest children to attend, making upabout 5% of all places. One approach would be to extend this principle tocreate state and/or donor funded targeted vouchers for the poorest, or forgirls (although we found no gender disparity in enrolment), to use at privateschools, which could potentially overcome this objection. UNDP (2003) ac-cepts this as a possible way forward: ‘‘To ensure that children from poorfamilies unable to pay school fees are able to attend private schools, govern-ments could finance their education through vouchers.’’ (UNDP 2003: 115).It notes the success of two targeted voucher programmes, in Colombia andPakistan, the latter targeted at girls. There would seem to be no a priorireasons why such programmes could not be introduced into the Ghanaiancontext, which could potentially overcome this first objection to privateschools.
Moreover, it appears from the discussion above that providing suchvouchers might be a cost-effective way of increasing enrolment of the poor-est. For mean monthly teacher salaries and teacher salaries per pupil areconsiderably lower in private (registered and unregistered) than governmentschools (Table 12) – and teacher salaries are likely to make up the vastmajority of recurrent expenditure in schools (In developing countries as awhole, these are estimated to make up between 80% and 98% of all recur-rent expenditure in government primary schools, with Ghana suggested to beat the higher end: see Zymelman and Destefano 1989; Mingat and Winter2002; Nsiah-Peprah 2004: 55).
However, the second concern is of the quality of provision in privateschools, particularly unregistered ones – implying that extending access tosuch schools would not be desirable because of the low quality of educationwithin them. Our research findings offer some insights here. Considering the15 quality indicators investigated in the survey (Tables 14–20), plus class size(class 5), (Table 12), we find the following: Comparing government andunregistered private schools, on 10 of the 15 inputs, there was found to beno significant difference between school management types (Table 20). Onfour inputs (buildings, blackboards, desks and playground), inputs ingovernment schools were better (although ‘‘desks’’ is subject to the caveatnoted above). On the remaining input (computers for children) and classsize, private unregistered schools were superior.
This discussion suggests that concerns about extending access to privateschools, even unregistered ones, on grounds of their low quality may be mis-placed, for they don�t appear markedly different (at least according to theseinputs) to government schools – and no one appears to be suggesting that, ifgovernment schools are of low quality, access should not be extended tothem; instead ways are explored of improving their quality (e.g., Watkins2004: 11; World Bank 2003; UNDP 2003). The same consideration wouldseem to be possible concerning unregistered private schools. In the survey of
411Private and public schooling in Ghana
schools in the Kumasi Metropolis, several ways are noted in which privateschools can be improved to allow them ‘‘to continue with the positive contri-bution that they are making towards the development of education in thecountry’’ (Nsiah-Peprah 2004: 63). These include the Ghana Education Ser-vice (GES) providing in-service teacher training, and the central government,through District Assemblies, providing loans for ‘‘the construction of build-ings, purchase of library books, furniture and vehicles’’ (p. 64). Similarmethods would seem to be possible to help raise the standards of privateschools, including unregistered ones, in Ga District.
One way forward noted by many commentators is to bring unregisteredprivate schools under state regulations, to ensure that quality is improved(e.g., Save the Children UK, South and Central Asia 2002: 13, 9; Rose 2002:15). The findings of the research reveal that registered private schools aresignificantly different from unregistered private schools across 11 of the 15inputs, where registered private schools are significantly better than unregis-tered (Table 19). Only on four inputs (activity of the teacher, tape recorders,chairs and benches and blackboards) are differences between these schooltypes insignificant; finally, on class size, unregistered private schools appearsuperior (Table 12).
However, it is not clear whether the regulations alone have led to thesedifferences. In other developing countries, researchers (e.g., Nair no date:42–44, Tooley and Dixon 2005) note that becoming registered does not nec-essarily signify meeting regulations, but ‘‘unofficial payments’’ or bribes paidto inspectors. Informal discussions with private school managers in Ga indi-cated that a similar situation may prevail in Ghana, although research isneeded to explore this possibility further. It is also the case that registeredprivate schools are better than unregistered private schools on a range ofindicators that are not themselves subject to regulations, (e.g., fans, comput-ers and television/video). These considerations suggest that the impetus forimproved school inputs may come from factors other than, or in addition to,the desire to be registered by government, such as meeting parental demand.Again, further research is needed to uncover the factors that lead to thesuperior inputs in registered than unregistered private schools, although thefindings here suggest some useful leads: Unregistered private are consider-ably smaller (Table 4) and newer (Table 6) than registered private schools,and charge lower fees (Figure 1). One hypothesis worth exploring, supportedby these observations, is that private schools are able to seek registration asthey become more mature, attracting more students and raising their fees, sothat they are able to invest more in school improvement, and pay the costsof registration. Smaller class sizes, by this hypothesis, in unregistered privateschools may be a result of having vacancies in a classroom, rather than adeliberate policy, an advantage that would vanish if the unregistered schoolsbecame larger over time (although registered private schools have smallerclass sizes than government schools, so would still offer this advantage toparents and children).
412 J. Tooley et al.
Whatever such research might uncover, the conclusion of this paper isthat apprehensions expressed about the ‘‘mushrooming’’ of private schoolsmay not be overriding objections to exploring ways in which such schoolsmight become part of the solution to providing ‘‘education for all’’, ratherthan be seen as a cause for concern.
References
Adelabu, Modupe and Pauline Rose. 2004. Non-State Provision of Basic Education inNigeria. In: Nigeria: Study of Non-State Providers of Basic Services, Non-State Providersof Basic Services, ed. by Larbi, George., Modupe Adelabu, Pauline Rose, DawdaJawara, Obioma Nwaorgu, and Seema Vyas: University of Birmingham: Commissionedby Policy Division, Department of International Development (DfID), UK, CountryStudies, International Development Department, ISBN: 0 7044 2262 X.
Akhmadi, Syaikhu Usman, and Daniel Suryadarma. 2004. When Teachers are Absent:Where do they go and what is the impact on students? Indonesia: SMERU Field Report,SMERU Research Institute.
Bauer, Andrew, Frederick Brust, and Joshua Hybbert. 2002. Entrepreneurship: A casestudy in African Enterprise Growth, Expanding Private Education in Kenya: MaryOkelo and Makini Schools, Chazen Web Journal of International Business, Fall, 2002,Columbia Business School.
Chaudhury, Nazmul, Jeffrey Hammer, Michael Kremer, Karthik Muralidharan, andF. Halsey Rogers. 2004. Provider Absence in Schools and Health Clinics: http://worldbank.org, accessed October 6, 2004.
De, Anuradha, Manabi Majumdar, Meera Samson, and Claire Noronha. 2002. PrivateSchools and Universal Elementary Education In: India Education Report: A Profile ofBasic Education, ed. by R. Govinda, 131–150. Oxford and New Delhi: OxfordUniversity Press.
Ga District Assembly. 2004. Poverty Profile, Maps and Pro-Poor Programmes.Amasaman: Ga West District Assembly.
Ga District Assembly. 2002. Ghana Poverty Reduction Strategy – Three-Year MediumTerm Development Plan 2002–2004 District Planning Co-ordinating Unit. Amasaman:Ga District Assembly.
Glewwe, Paul, Nauman Ilias, and Michael Kremer. 2004. Teaching Incentives, NationalBureau of Economic Research Working Paper.
Mingat, Alain, and Carolyn Winter. 2002. Education for All by 2015. Finance andDevelopment 39(1): 1–6.
Nair, Padmaja. No date. India: Desk Study of Non-State Providers of Basic Services,Study commissioned by DfID, conducted by International Development Department,School of Public Policy, University of Birmingham, http://www.idd.bham.ac.uk/research/Projects/service-providers/NSP%20India%20report%20amended1.pdf, ac-cessed November 10, 2005.
Nambissan, Geetha, B. 2003. Educational deprivation and primary school provision: astudy of providers in the city of Calcutta, IDS Working Paper 187, Institute ofDevelopment Studies.
413Private and public schooling in Ghana
Nsiah-Peprah, Yaw. 2004. Assessment of the Role of Private Schools in theDevelopment of Education in Ghana: A study of the Kumasi Metropolis. Journal ofScience and Technology 24(2): 54–75.
Rana, Kumar, Abdur Rafique, and Amrita Sengupta 2002. The Delivery of PrimaryEducation: A Study in West Bengal. Delhi: TLM Books and Pratichi (India) Trust.
Rogers, Halsey. F., Jose Roberto Lopez-Calix, Nazmul Chaudhury, Jeffrey Hammer,Nancy Cordoba, Michael Kremer, and Karthik Muralidharan. 2004. Teacher Absenceand Incentives in Primary Education: Results from a national teacher tracking survey inEcuador. In: Ecuador: Creating Fiscal Space for Poverty Reduction: A FiscalManagement and Public Expenditure Review. 2: 136–162, Chapter 6, Washington DC:World Bank.
Rose, Pauline. 2002. Is the Non-State Education Sector Serving the needs of the Poor?:Evidence from east and Southern Africa, Paper prepared for DfID Seminar inpreparation for 2004 World Development Report.
Rose, Pauline. 2003. From the Washington to the Post-Washington Consensus: theinfluence of international agendas on education policy and practice in Malawi.Globalisation, Societies and Education 1(1): 67–86.
Save the Children UK, South and Central Asia. 2002. Private Sector Involvement inEducation: A perspective from Nepal and Pakistan, Submission to ‘‘The private sectoras service provider and its role in implementing child rights’’, Office of the HighCommissioner for Human Rights, Geneva, Friday 20 September 2002.
The Probe Team. 1999. Public Report on Basic Education in India. Oxford and NewDelhi: Oxford University Press.
Tooley, James, and Pauline Dixon. 2005. An Inspector Calls: the regulation of ‘‘budget’’private schools in Hyderabad, Andhra Pradesh, India. International Journal ofEducational Development 25: 269–285.
UNDP. 2003. Human Development Report 2003. New York: United Nations Develop-ment Programme.
Watkins, Kevin. 2000. The Oxfam Education Report. Oxford: Oxfam in Great Britain.
Zymelman, Manuel. and Joseph Destefano. 1989. Primary School Teachers Salaries inSub-Saharan Africa. World Bank Division Paper No. 45, Washington DC.
The authors
James Tooley PhD, is Professor of Education Policy (from July 1998 to present) atthe School of Education, Communication and Language Sciences, University of New-castle upon Tyne. His main fields of research are educational policy, internationaleducation and private education.
Contact address: School of Education, Communication and Language Sciences,University of Newcastle upon Tyne NE1 7RU, England. E-mail: [email protected]
Pauline Dixon PhD, is Research Co-ordinator (from April 2003 to present) at theE.G. West Centre, School of Education, Communication and Language Sciences,University of Newcastle Upon Tyne. Her main fields of research are educational pol-icy, international education and private education.
414 J. Tooley et al.
Contact address: School of Education, Communication and Language Sciences,University of Newcastle upon Tyne NE1 7RU, England.
Isaac Amuah PhD, is Senior Lecturer in Education at the University of CapeCoast and, until June 2005, was Director of EARC (Educational Assessment and Re-search Centre), Accra, Ghana.
Contact address: University of Cape Coast, University Post Office, Cape Coast,Ghana.
415Private and public schooling in Ghana
Related Documents